PwC Karnataka State Planning Board Urban Development in Karnataka February 2008

Welcome message from author
This document is posted to help you gain knowledge. Please leave a comment to let me know what you think about it! Share it to your friends and learn new things together.
Transcript
PwC
Karnataka State Planning BoardUrban Development in KarnatakaFebruary 2008
Agenda/Contents
IntroductionStatus Report on Urban Sector in KarnatakaRole of GovernmentKey issues and challenges

Section one
IntroductionStatus Report on Urban Sector in KarnatakaRole of GovernmentKey issues and challenges

Slide 4Urban Development in KarnatakaPricewaterhouseCoopers
February 2008
Background to the assignment
• Preparation of a Vision for the Karnataka in light of its current status• Study to facilitate objective sectoral allocations in the eleventh plan
keeping in view the change in GoI priorities and priorities of the state• Project commenced in September 2007• Analysis of the following sectors
1. Healthcare2. Education – a) School & b) Higher3. Social Sector – a) Woman & Child; b) SC/ ST/ OBC/ Minorities etc. 4. Agriculture and Allied Services 5. Rural Development 6. Irrigation & Flood Control 7. Industry – Minerals, Construction & Manufacturing8. Urban Development 9. Transport and Infrastructure10.Energy
Slide 5Urban Development in KarnatakaPricewaterhouseCoopers
February 2008
KD 3: Macroeconomic Profile & Comparative Analysis
KD 2: Perspectives, Dimensions and Strategies Paper
KD 1: Inception Presentation
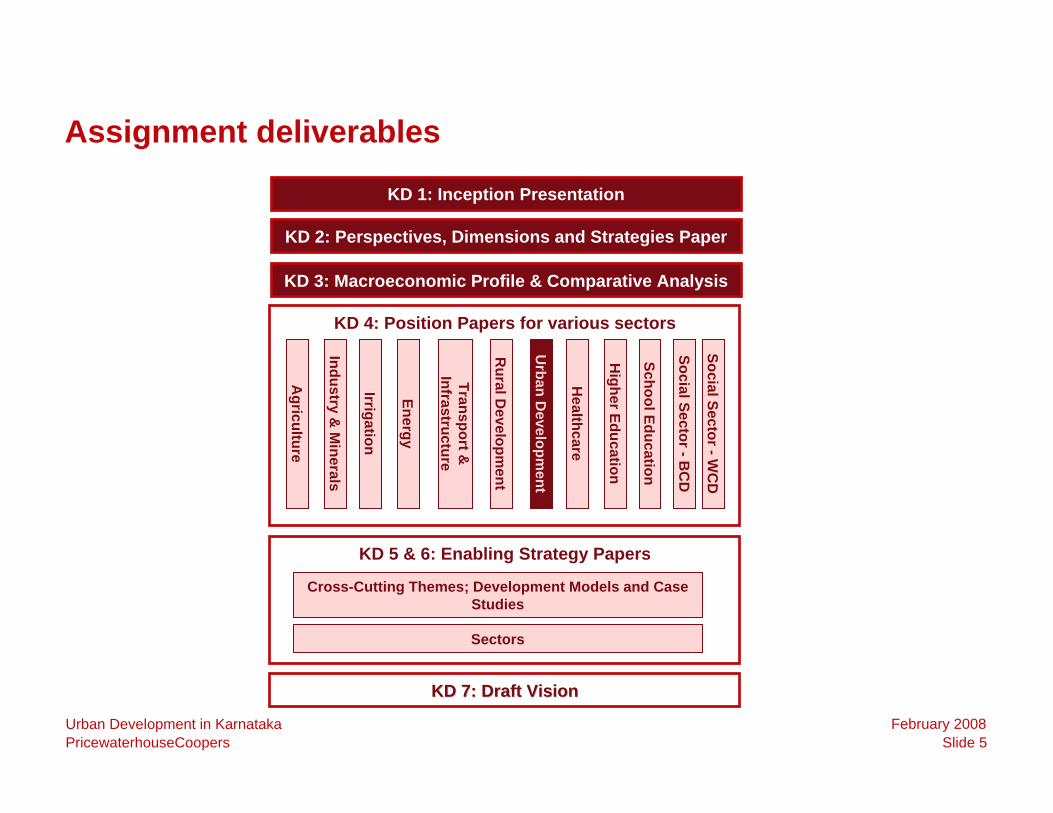
Assignment deliverables
KD 4: Position Papers for various sectors
Agriculture
Industry & M
inerals
Irrigation
Transport &
Infrastructure
Energy
Healthcare
School Education
Social Sector -WC
D
KD 5 & 6: Enabling Strategy Papers
KD 7: Draft VisionKD 7: Draft Vision
Rural D
evelopment
Urban D
evelopment
Cross-Cutting Themes; Development Models and Case Studies
Sectors
Higher Education
Social Sector -BC
D
Slide 6Urban Development in KarnatakaPricewaterhouseCoopers
February 2008
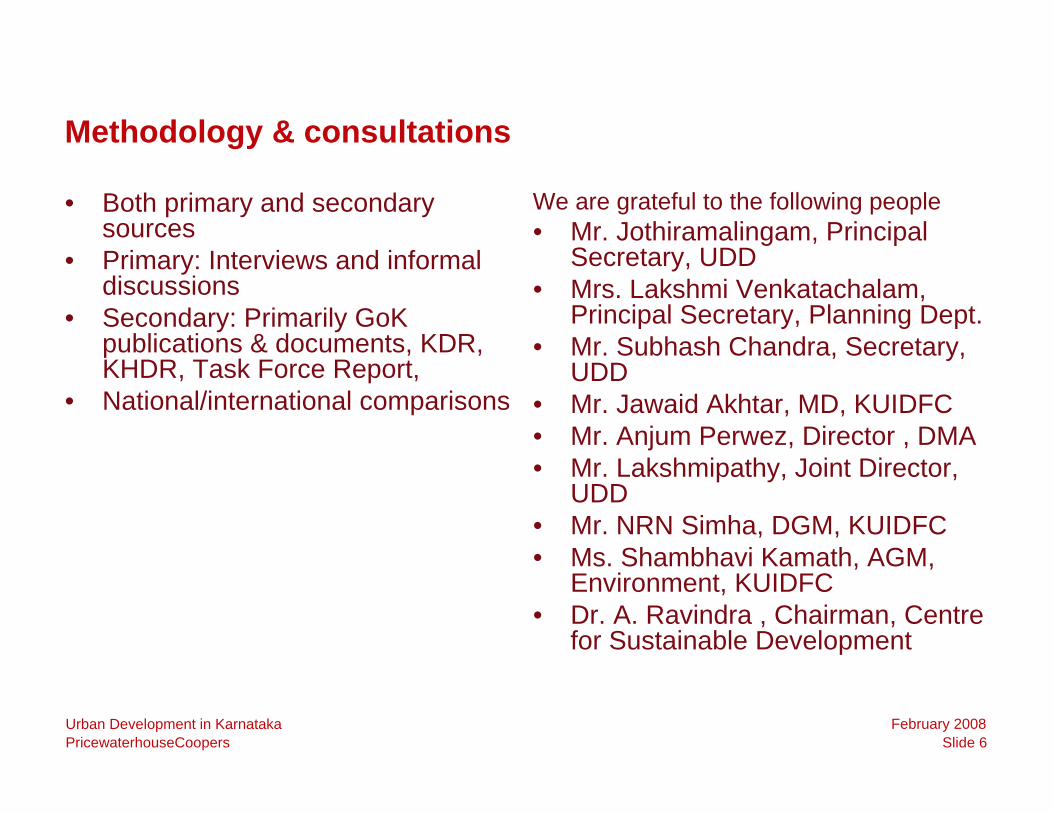
Methodology & consultations
• Both primary and secondary sources
• Primary: Interviews and informal discussions
• Secondary: Primarily GoK publications & documents, KDR, KHDR, Task Force Report,
• National/international comparisons
We are grateful to the following people • Mr. Jothiramalingam, Principal
Secretary, UDD• Mrs. Lakshmi Venkatachalam,
Principal Secretary, Planning Dept.• Mr. Subhash Chandra, Secretary,
UDD• Mr. Jawaid Akhtar, MD, KUIDFC• Mr. Anjum Perwez, Director , DMA• Mr. Lakshmipathy, Joint Director,
UDD• Mr. NRN Simha, DGM, KUIDFC• Ms. Shambhavi Kamath, AGM,
Environment, KUIDFC • Dr. A. Ravindra , Chairman, Centre
for Sustainable Development
Section Two
IntroductionStatus Report on Urban Sector in KarnatakaRole of GovernmentKey issues and challenges
Slide 8Urban Development in KarnatakaPricewaterhouseCoopers
February 2008
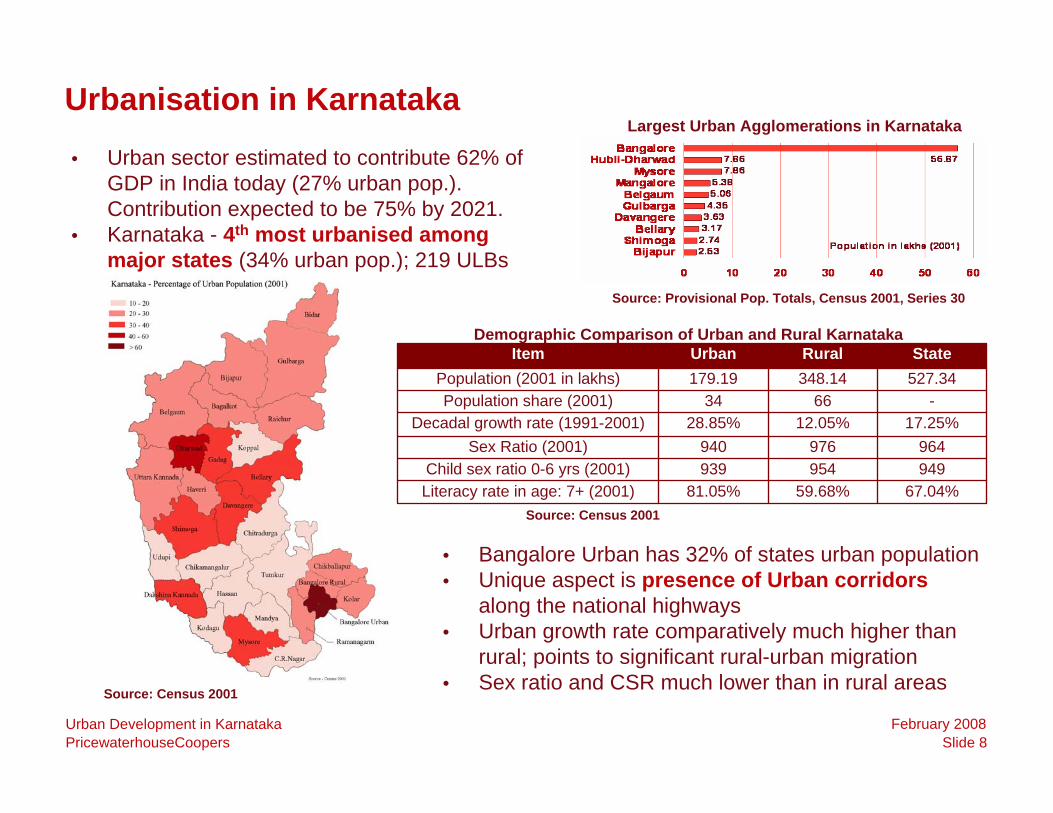
Urbanisation in Karnataka• Urban sector estimated to contribute 62% of
GDP in India today (27% urban pop.). Contribution expected to be 75% by 2021.
• Karnataka - 4th most urbanised among major states (34% urban pop.); 219 ULBs
Source: Census 2001
Source: Provisional Pop. Totals, Census 2001, Series 30
Largest Urban Agglomerations in Karnataka
67.04%59.68%81.05%Literacy rate in age: 7+ (2001)949954939Child sex ratio 0-6 yrs (2001)964976940Sex Ratio (2001)
17.25%12.05%28.85%Decadal growth rate (1991-2001)-6634Population share (2001)
527.34348.14179.19Population (2001 in lakhs)StateRuralUrbanItem
Source: Census 2001
Demographic Comparison of Urban and Rural Karnataka
• Bangalore Urban has 32% of states urban population• Unique aspect is presence of Urban corridors
along the national highways• Urban growth rate comparatively much higher than
rural; points to significant rural-urban migration• Sex ratio and CSR much lower than in rural areas
Slide 9Urban Development in KarnatakaPricewaterhouseCoopers
February 2008
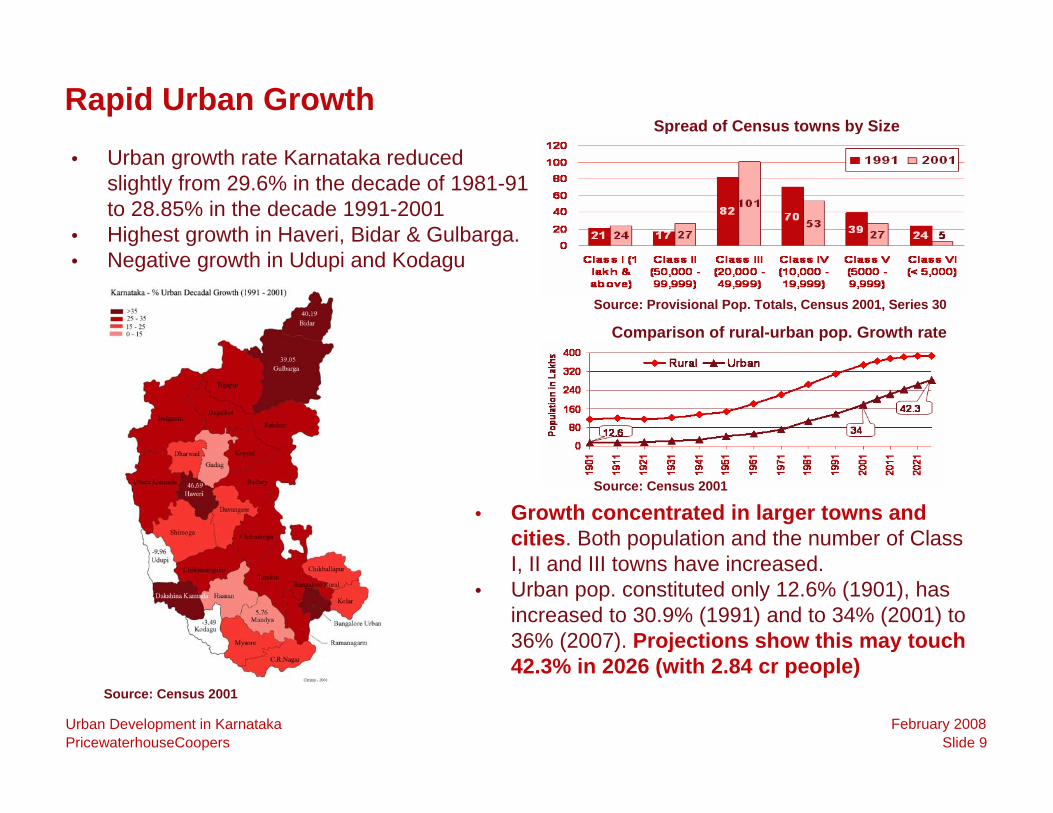
Rapid Urban Growth• Urban growth rate Karnataka reduced
slightly from 29.6% in the decade of 1981-91 to 28.85% in the decade 1991-2001
• Highest growth in Haveri, Bidar & Gulbarga.• Negative growth in Udupi and Kodagu
Source: Census 2001
Source: Provisional Pop. Totals, Census 2001, Series 30
Spread of Census towns by Size
• Growth concentrated in larger towns and cities. Both population and the number of Class I, II and III towns have increased.
• Urban pop. constituted only 12.6% (1901), has increased to 30.9% (1991) and to 34% (2001) to 36% (2007). Projections show this may touch 42.3% in 2026 (with 2.84 cr people)
Comparison of rural-urban pop. Growth rate
Source: Census 2001
Slide 10Urban Development in KarnatakaPricewaterhouseCoopers
February 2008
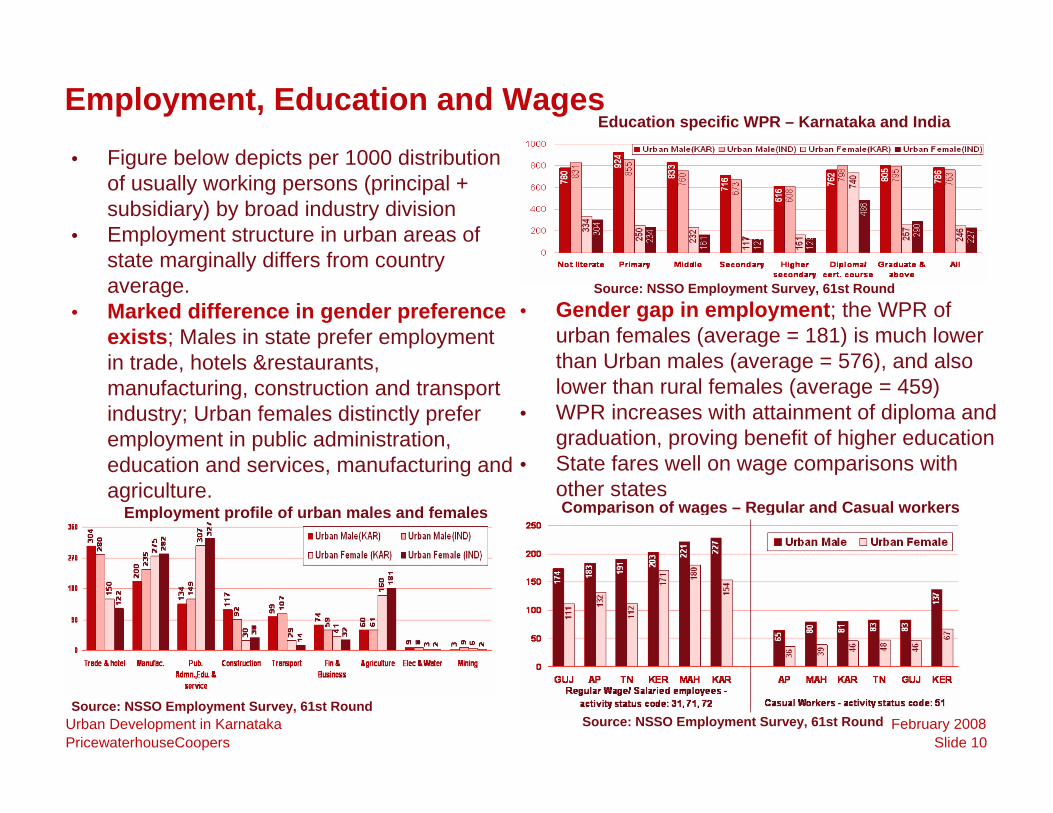
Employment, Education and Wages• Figure below depicts per 1000 distribution
of usually working persons (principal + subsidiary) by broad industry division
• Employment structure in urban areas of state marginally differs from country average.
• Marked difference in gender preference exists; Males in state prefer employment in trade, hotels &restaurants, manufacturing, construction and transport industry; Urban females distinctly prefer employment in public administration, education and services, manufacturing and agriculture.
Source: NSSO Employment Survey, 61st Round
Education specific WPR – Karnataka and India
• Gender gap in employment; the WPR of urban females (average = 181) is much lower than Urban males (average = 576), and also lower than rural females (average = 459)
• WPR increases with attainment of diploma and graduation, proving benefit of higher education
• State fares well on wage comparisons with other statesComparison of wages – Regular and Casual workersEmployment profile of urban males and females
Source: NSSO Employment Survey, 61st Round
Source: NSSO Employment Survey, 61st Round

Slide 11Urban Development in KarnatakaPricewaterhouseCoopers
February 2008
Poverty, Slums and Housing• Urban poverty ratio of 32.6% in Karnataka
is much higher than that of all the other states as well as the all India average.
Source: Press Information Bureau, Govt of India, March 2007
Comparison of select states – Slum Population
• MDG no 7, Indicator no 32 is “Proportion of households with access to secure tenure”. In terms of households by tenure, only 54.6% of the houses in urban areas in state are owned while 42% are rented. (Rural: 91.2% owned)
• Around 1,50,170 houses (4.2%) in urban areas are temporary structures.
Distribution of urban households by type of census house
Urban Poverty Levels across states: 2004-05
Source: Census 2001
Source: Census 2001
13
20.222.2
25.728
32.2 32.6
0
5
10
15
20
25
30
35
GUJ KER TN INDIA AP MAH KAR0
100
200
300
400
500
600
700
Urban Poverty Urban Poverty Line
• NSSO 58th round (2002) survey on condition of urban slums estimates 1983 slums with 4,83,828 households in class I cities in Karnataka. This is around 20.5% of population of these 24 cities.
• However, census 2001 reports 35 towns having slums with 7.8% of urban slum pop. Karnataka fares comparatively better than comparable states (except Kerala)
Slide 12Urban Development in KarnatakaPricewaterhouseCoopers
February 2008
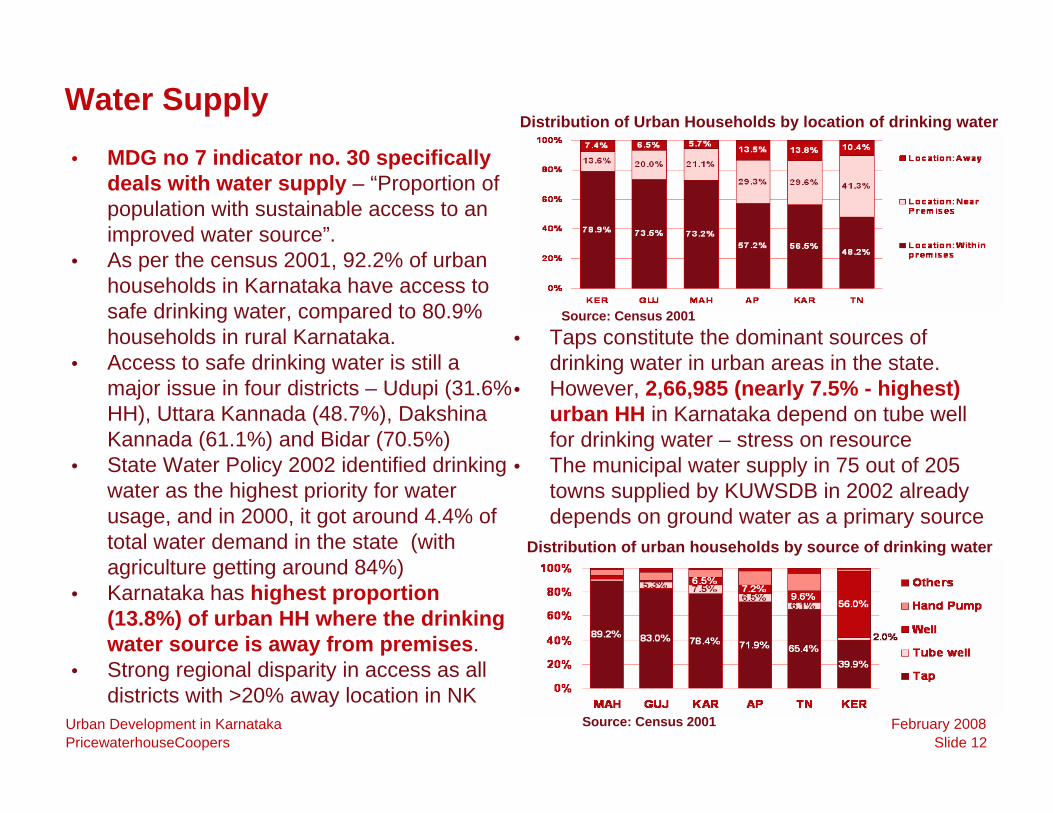
Water Supply• MDG no 7 indicator no. 30 specifically
deals with water supply – “Proportion of population with sustainable access to an improved water source”.
• As per the census 2001, 92.2% of urban households in Karnataka have access to safe drinking water, compared to 80.9% households in rural Karnataka.
• Access to safe drinking water is still a major issue in four districts – Udupi (31.6% HH), Uttara Kannada (48.7%), Dakshina Kannada (61.1%) and Bidar (70.5%)
• State Water Policy 2002 identified drinking water as the highest priority for water usage, and in 2000, it got around 4.4% of total water demand in the state (with agriculture getting around 84%)
• Karnataka has highest proportion (13.8%) of urban HH where the drinking water source is away from premises.
• Strong regional disparity in access as all districts with >20% away location in NK
Distribution of Urban Households by location of drinking water
• Taps constitute the dominant sources of drinking water in urban areas in the state.
• However, 2,66,985 (nearly 7.5% - highest) urban HH in Karnataka depend on tube well for drinking water – stress on resource
• The municipal water supply in 75 out of 205 towns supplied by KUWSDB in 2002 already depends on ground water as a primary source
Distribution of urban households by source of drinking water
Source: Census 2001
Source: Census 2001
Slide 13Urban Development in KarnatakaPricewaterhouseCoopers
February 2008
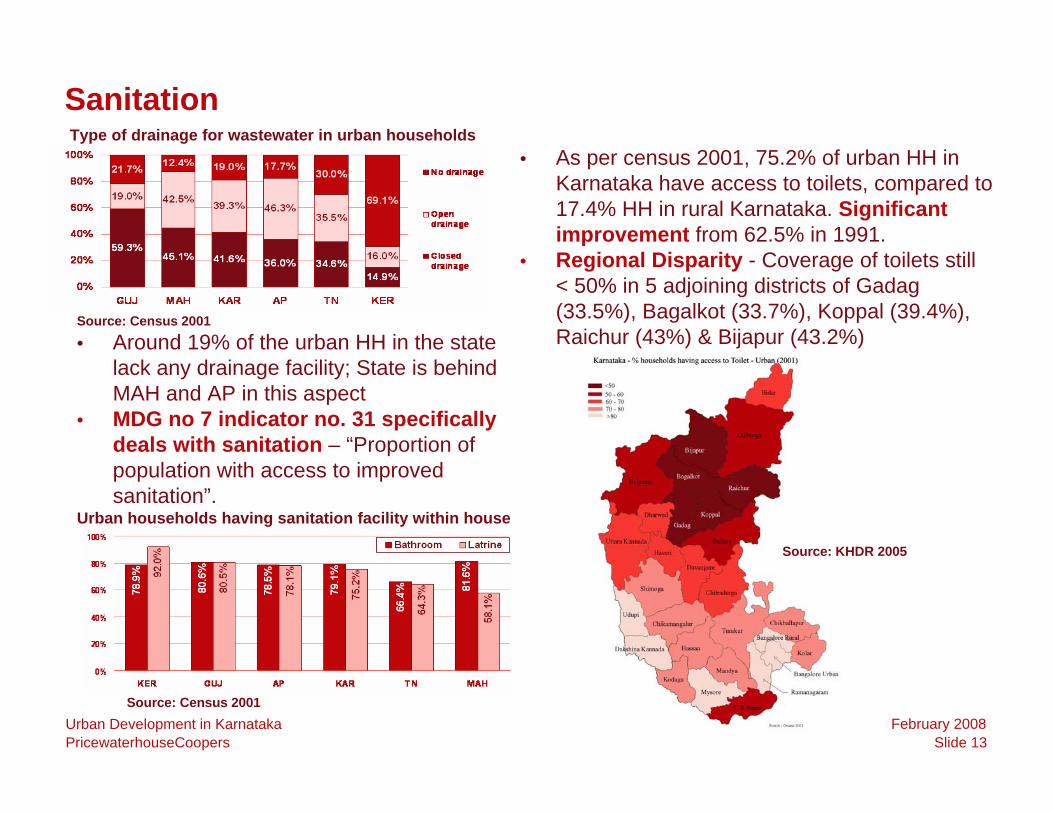
Sanitation
• Around 19% of the urban HH in the state lack any drainage facility; State is behind MAH and AP in this aspect
• MDG no 7 indicator no. 31 specifically deals with sanitation – “Proportion of population with access to improved sanitation”.
Type of drainage for wastewater in urban households• As per census 2001, 75.2% of urban HH in
Karnataka have access to toilets, compared to 17.4% HH in rural Karnataka. Significant improvement from 62.5% in 1991.
• Regional Disparity - Coverage of toilets still < 50% in 5 adjoining districts of Gadag (33.5%), Bagalkot (33.7%), Koppal (39.4%), Raichur (43%) & Bijapur (43.2%)
Urban households having sanitation facility within house
Source: Census 2001
Source: Census 2001
Source: KHDR 2005
Slide 14Urban Development in KarnatakaPricewaterhouseCoopers
February 2008
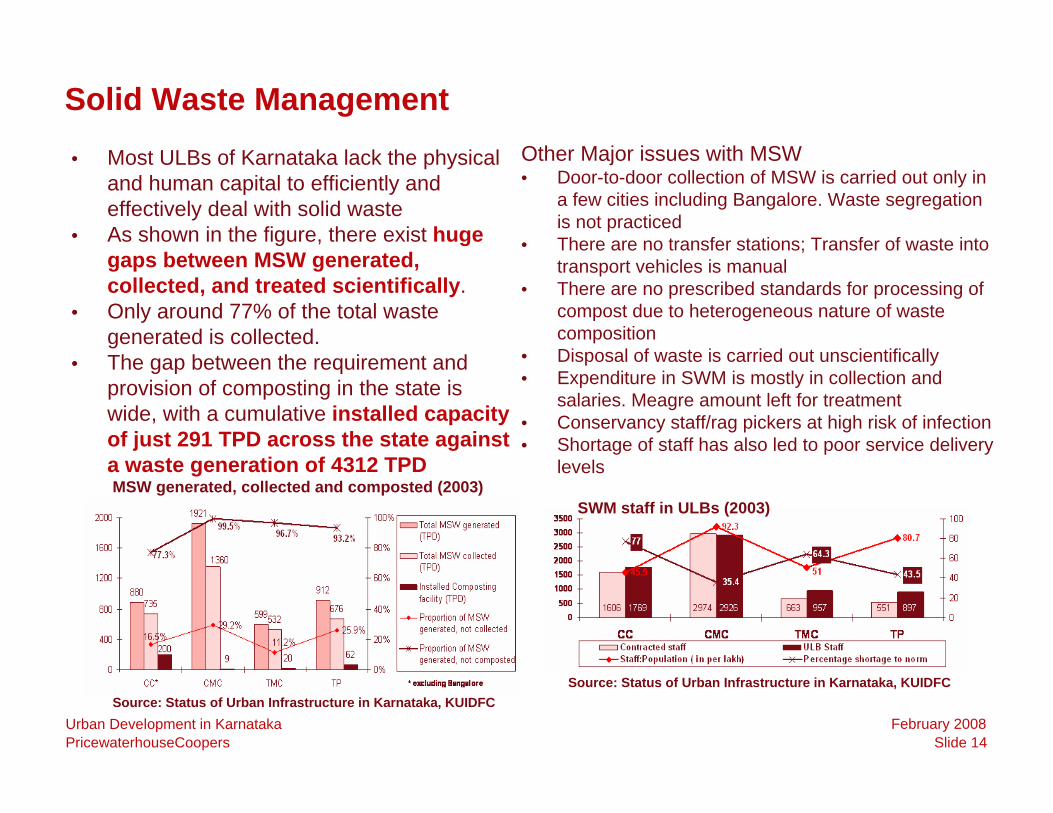
Solid Waste Management• Most ULBs of Karnataka lack the physical
and human capital to efficiently and effectively deal with solid waste
• As shown in the figure, there exist huge gaps between MSW generated, collected, and treated scientifically.
• Only around 77% of the total waste generated is collected.
• The gap between the requirement and provision of composting in the state is wide, with a cumulative installed capacity of just 291 TPD across the state against a waste generation of 4312 TPD
SWM staff in ULBs (2003)
Other Major issues with MSW• Door-to-door collection of MSW is carried out only in
a few cities including Bangalore. Waste segregation is not practiced
• There are no transfer stations; Transfer of waste into transport vehicles is manual
• There are no prescribed standards for processing of compost due to heterogeneous nature of waste composition
• Disposal of waste is carried out unscientifically• Expenditure in SWM is mostly in collection and
salaries. Meagre amount left for treatment• Conservancy staff/rag pickers at high risk of infection • Shortage of staff has also led to poor service delivery
levelsMSW generated, collected and composted (2003)
Source: Status of Urban Infrastructure in Karnataka, KUIDFCSource: Status of Urban Infrastructure in Karnataka, KUIDFC

Slide 15Urban Development in KarnatakaPricewaterhouseCoopers
February 2008
Domestic EnergyCooking
• In 1991, about 73% of urban HH in Karnataka used fuels such as wood, dung, kerosene and coal for cooking.
• There has been a marked reduction in firewood usage from 55.5% in 1990 to 27.6% in 2001.
• Usage of firewood is least among southern states, but higher than 12.5% and 9.9% urban households in GUJ and MAH resp.
• Kerosene consumption has decreased from 26.5% in 1993 to 23.8% in 2001.
• LPG sales have almost doubled from 247656 metric tons in 1998-1999 to 413358 metric tons in 2001-2002
Percentage of Urban Households having access to electricity
Source: KHDR 2005
Distribution of Urban Households by type of cooking fuel
Source: Census 2001 All Others112>90%
Bidar, Chikmagalur, Chitradurga, Davangere, Gulbarga, Kodagu
4285 –90%
Bellary, Bijapur, Chamrajnagar, Dharwad,Gadag, Haveri, Mandya
2580 –85%
Bagalkot, Koppal, Raichur03< 80%
Name of the districtsNo of districts in South
No of districts in North
Range
Lighting• Almost 90.5% urban HH in state use
electricity as primary source of lighting; State fares best among southern states, but trails MAH and GUJ
• Traces of regional disparity in access as 8/10 districts with <85% access in N. Kar.
Primary source of lighting in urban households
Source: Census 2001

Slide 16Urban Development in KarnatakaPricewaterhouseCoopers
February 2008
Urban Roadsa) Traffic Congestion• Poor conditions of roads and inadequate
road capacity are significant contributors to traffic congestion and vehicular pollution
• Study for Bangalore Metro indicated that avg. speed in city is 10-12 kmph
• Road density in most towns/ cities is poor, resulting in a high ratio of vehicles to road length; Indicative in high number of accidents
Type of Roads in Urban Karnataka
Source: Status of Urban Infrastructure in Karnataka, KUIDFC
c) Adjunct Infrastructure• Safety enhancing features such as
footpaths, signposts, medians, street lights, storm water drains and speed breakers need to be properly maintained which are form the lifeline of the roads.
d) Type of Roads• Quality of road is critical • 35.7% of the roads in CMCs, TMCs and
TPs are kutcha roads, whereas it is only 13.4% in CCs. Motor Vehicle accidents in Metros (2004)
Source: Indiastat
b) Obstruction/ impediments on the road• Potholes, depressions, waves etc cause
hindrance. In addition, household waste and construction debris encroach roads
Slide 17Urban Development in KarnatakaPricewaterhouseCoopers
February 2008
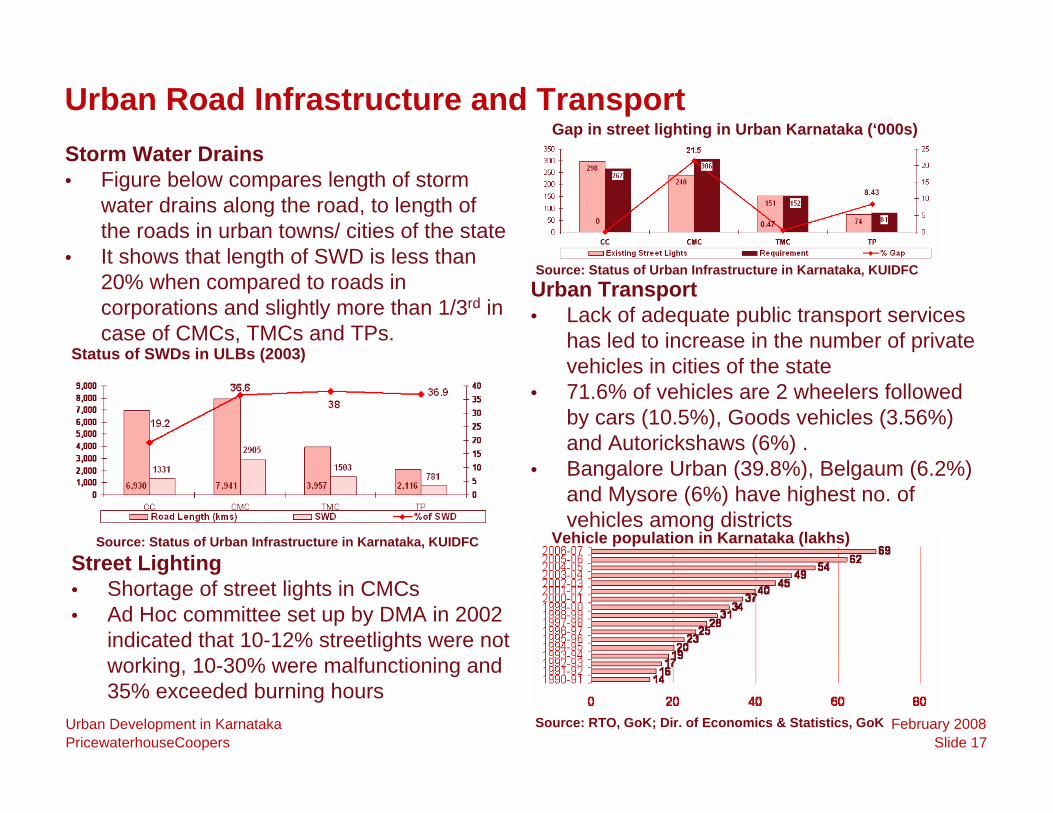
Urban Road Infrastructure and TransportStorm Water Drains• Figure below compares length of storm
water drains along the road, to length of the roads in urban towns/ cities of the state
• It shows that length of SWD is less than 20% when compared to roads in corporations and slightly more than 1/3rd in case of CMCs, TMCs and TPs.
Vehicle population in Karnataka (lakhs)
Source: RTO, GoK; Dir. of Economics & Statistics, GoK
Urban Transport• Lack of adequate public transport services
has led to increase in the number of private vehicles in cities of the state
• 71.6% of vehicles are 2 wheelers followed by cars (10.5%), Goods vehicles (3.56%) and Autorickshaws (6%) .
• Bangalore Urban (39.8%), Belgaum (6.2%) and Mysore (6%) have highest no. of vehicles among districts
Status of SWDs in ULBs (2003)
Source: Status of Urban Infrastructure in Karnataka, KUIDFC
Street Lighting• Shortage of street lights in CMCs• Ad Hoc committee set up by DMA in 2002
indicated that 10-12% streetlights were not working, 10-30% were malfunctioning and 35% exceeded burning hours
Gap in street lighting in Urban Karnataka (‘000s)
Source: Status of Urban Infrastructure in Karnataka, KUIDFC

Section Three
IntroductionStatus Report on Urban Sector in KarnatakaRole of GovernmentKey issues and challenges

Slide 19Urban Development in KarnatakaPricewaterhouseCoopers
February 2008
Policies and Legislations
Major Policies• State urban sector policy (1984)• National Housing Policy (1998)• GoK policy on Urban Drinking water
and sanitation (2002)• GoK Water policy (2002)• National Urban Transport Policy
(2006)• Integrated Solid Waste Management
policy• Draft National Urban Housing and
Habitat policy
Key Legislations• Karnataka Town and Country Planning
Act (1961)• Karnataka Municipalities Act (1964)• Karnataka Slum Clearance Act (1974)• Bangalore Development Authority Act
(1976)• Karnataka Municipal Corporations Act
(1976)• BMRDA Act (1985)• Karnataka Urban Development
Authority Act (1987)• The Constitution 74th Amendment Act
(1992)
Slide 20Urban Development in KarnatakaPricewaterhouseCoopers
February 2008
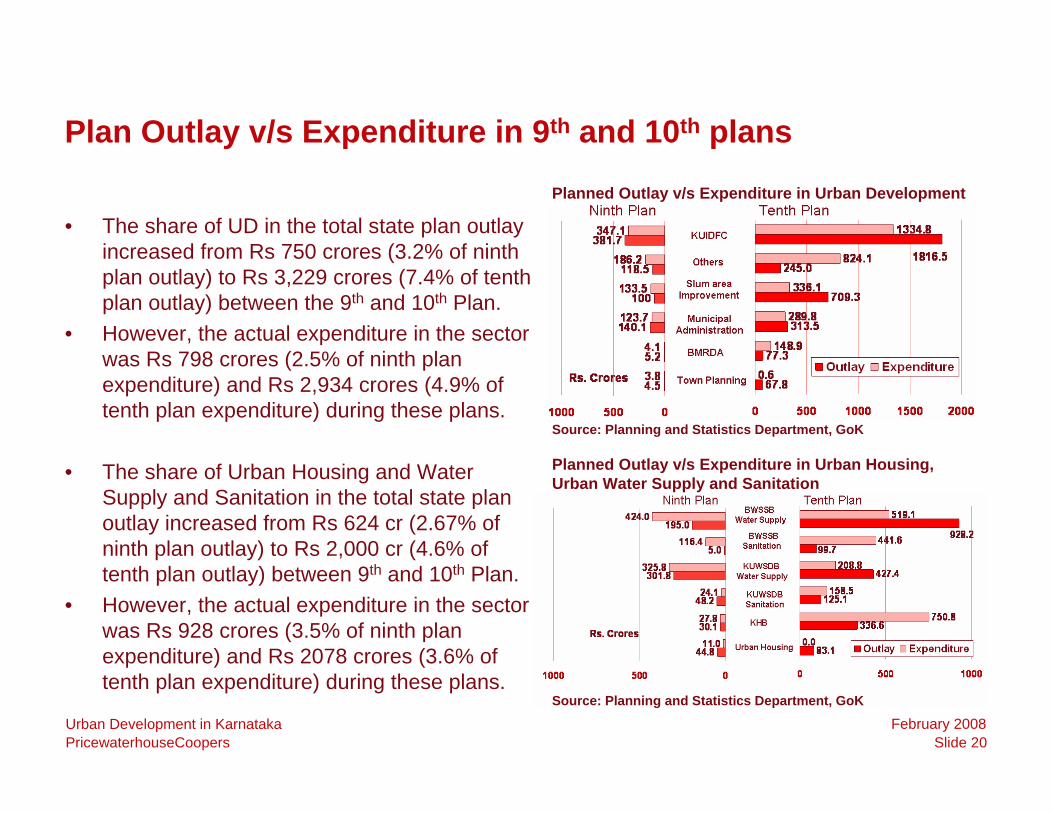
Plan Outlay v/s Expenditure in 9th and 10th plans
• The share of UD in the total state plan outlay increased from Rs 750 crores (3.2% of ninth plan outlay) to Rs 3,229 crores (7.4% of tenth plan outlay) between the 9th and 10th Plan.
• However, the actual expenditure in the sector was Rs 798 crores (2.5% of ninth plan expenditure) and Rs 2,934 crores (4.9% of tenth plan expenditure) during these plans.
• The share of Urban Housing and Water Supply and Sanitation in the total state plan outlay increased from Rs 624 cr (2.67% of ninth plan outlay) to Rs 2,000 cr (4.6% of tenth plan outlay) between 9th and 10th Plan.
• However, the actual expenditure in the sector was Rs 928 crores (3.5% of ninth plan expenditure) and Rs 2078 crores (3.6% of tenth plan expenditure) during these plans.
Planned Outlay v/s Expenditure in Urban Development
Source: Planning and Statistics Department, GoK
Planned Outlay v/s Expenditure in Urban Housing, Urban Water Supply and Sanitation
Source: Planning and Statistics Department, GoK

Slide 21Urban Development in KarnatakaPricewaterhouseCoopers
February 2008
Key Accomplishments• In the area of Urban Development, Karnataka has been a pioneer across many areas• State has benefited from involvement of external agencies such as ADB, World Bank & JBIC• The state has introduced Self Assessment of Property Tax for all ULBs. BBMP has initiated
several such schemes, (property tax, Building Plan Sanction and Trade license renewal)• Karnataka is one of the first states to institute an urban water policy and has been in the
forefront of structured institutional and financial reforms specific to the urban sector• State Directorate of Urban Land Transport and Bangalore Metropolitan Land Transport
Authority (for Bangalore Metropolitan Region) have been set up to enable integrated transport, develop proper strategic transport plans and implementation of transport infrastructure
• Double Entry / accrual system of accounting implemented in 63 ULBs, computerisation of 57 ULBs nearing completion on GIS supported property tax; Cadre and Recruitment rules were amended in 2004. 90 cadres rationalised to 40
• Out of 219 ULBs in the State 71 ULBs have been covered for provision of Urban Infrastructure under the various EAPs. City Level Investment Plans are available for 71 ULBs and they are being prepared for all the balance 146 ULBs with facilitation of KUIDFC.
• Novel institutional mechanisms are being experimented by the State as well as the ULBs involving NGOs, community and private sector in the provision of basic services. Launching of individual web sites of 57 cities under the Nirmal Nagar scheme with NGOs mediating the public grievance redressal system
• A Comprehensive Traffic and Transportation Plan (CTTP) has been made for Bangalore city in 2007 that has identified a host of measures and several projects to ease mobility within the City.
• GoK has created district urban development cells (DUDC) in 2003 that oversees the following activities with regard to urban areas in the district – poverty alleviation, SWM, Water supply & Sanitation, computerisation and other core municipal functions.
Section Four
IntroductionStatus Report on Urban Sector in KarnatakaRole of GovernmentKey issues and challenges1. High urban poverty - linked to housing and skill deficiency2. Inadequate basic facilities, with further rising demand3. Poor focus on environmental effects of urbanisation4. Metropolitanisation of Bangalore 5. Lack of integration in Urban Planning & Management of Urban Spaces & Urban Growth6. Inadequate empowerment of urban local bodies

Slide 23Urban Development in KarnatakaPricewaterhouseCoopers
February 2008
1. High urban poverty - linked to housing and skill deficiency• Karnataka’s Urban poverty ratio (32.6%) is
higher than comparable states & India avg.• Karnataka ranks a low 10th in Urban
Monthly Per Capita Consumption Expenditure (MPCE) among all states
• MPCE shows high inter-group disparity and this low MPCE indicates poor translation of the state’s strong economic position into actual purchasing power of its people.
• Karnataka State of Environment report (2003) reports severe deficiency in the provision of basic services in slums, posing severe health/ environmental concerns
• KSCB has identified 2511 slums in the state with an estimated pop. of 35.5 lakh. 66% notified slums in the state have no latrines, against the national average of 17%.
• The main reason for growth of slums is the lack of available land at affordable prices in the urban centres
• Coverage of urban poor under SJSRY has been around 20% though it has been implemented since 10 years. An evaluation of this scheme carried out in 2005-06 by the Human Settlement Management Institute has come out with recommendations to improve effectiveness.
• Skill development is essential to deal with migration and meeting increased demand
Comparison of select states - MPCE in Urban Areas
Source: Sachar Committee report, 2006
•Two critical issues affecting livelihood and impact poverty - i.e. space to live and carry out livelihood activity, & skill development,and these have had poor attention
Slide 24Urban Development in KarnatakaPricewaterhouseCoopers
February 2008
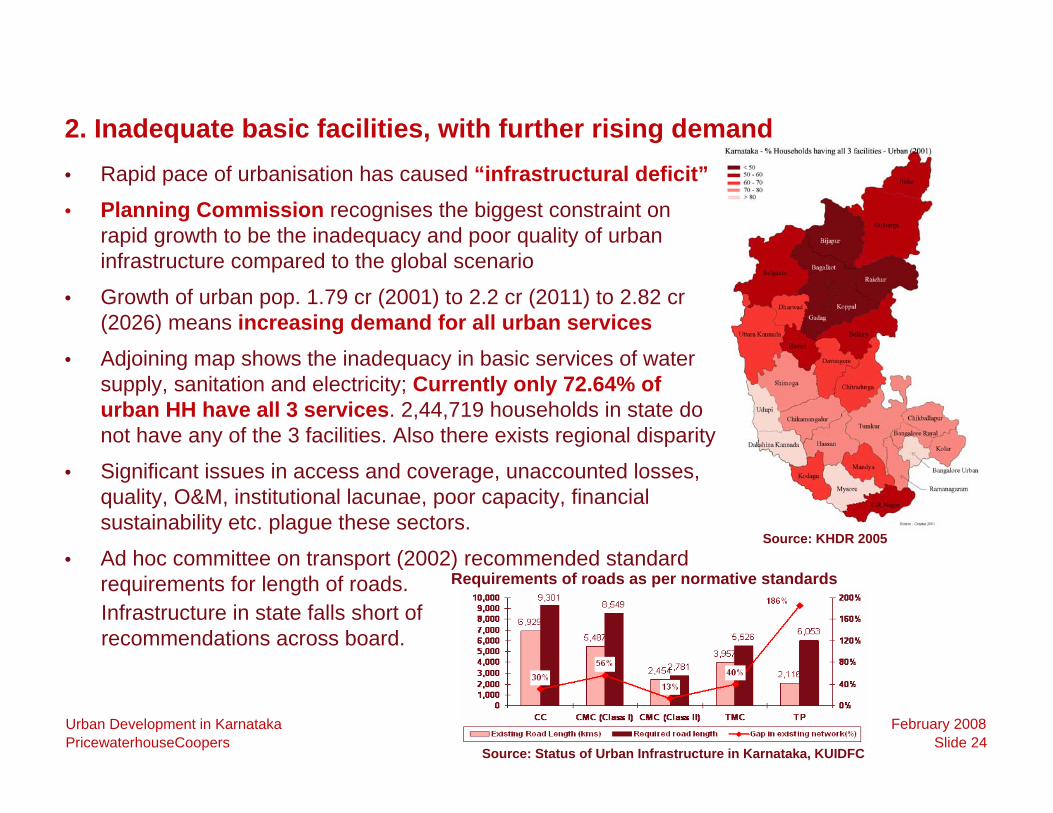
2. Inadequate basic facilities, with further rising demand• Rapid pace of urbanisation has caused “infrastructural deficit”• Planning Commission recognises the biggest constraint on
rapid growth to be the inadequacy and poor quality of urban infrastructure compared to the global scenario
• Growth of urban pop. 1.79 cr (2001) to 2.2 cr (2011) to 2.82 cr (2026) means increasing demand for all urban services
• Adjoining map shows the inadequacy in basic services of water supply, sanitation and electricity; Currently only 72.64% of urban HH have all 3 services. 2,44,719 households in state do not have any of the 3 facilities. Also there exists regional disparity
• Significant issues in access and coverage, unaccounted losses, quality, O&M, institutional lacunae, poor capacity, financial sustainability etc. plague these sectors.
• Ad hoc committee on transport (2002) recommended standard requirements for length of roads.
Source: KHDR 2005
Infrastructure in state falls short of recommendations across board.
Requirements of roads as per normative standards
Source: Status of Urban Infrastructure in Karnataka, KUIDFC
Slide 25Urban Development in KarnatakaPricewaterhouseCoopers
February 2008
3. Poor focus on environmental effects of urbanisation
Water supply and Sanitation• Growing dependence on tube-wells resulting
in falling water table leading to poor quality of drinking water and related health effects.
• Karnataka SOE report estimates that poor quality & inadequate quantity of water accounts for 10% of disease burden in state
• It also reports that in Bangalore, sewerage systems are sometimes not connected to the trunk sewers, and the effluents get into natural drains leading to tanks and lakes
• Lack of sanitation and poor sewerage facilities leads to soil pollution, and growth of pathogens that cause various diseases affecting public health. - Almost 25% urban HH do not have
latrines; 20.7% have pit latrines. - 19% urban HH do not have drainage;
39.3% have open drainage.- Large cities such as Belgaum, Hubli-
Dharwad and Davangere do not have sewage treatment plants
Solid Waste Management• State capacity for composting is only 291
TPD compared to 4312 TPD generated. Only 3303 TPD is collected;
• Unscientific disposal of wastes at dump sites results in land degradation and ground water pollution through leachate percolation; Plastic, bio-medical, industrial and e-waste require special handling.
Transport and Air Quality• Pollution problems are severe in Bangalore
with other urban centres such as Hubli-Dharwad, Mysore, Belgaum, and Mangalore reasonably better
• In a report released in January 2008 by KSPCB on the Greenhouse Gas Inventory in Bangalore, it is stated that 2-wheelers alone accounted for 56% of the carbon monoxide emission while heavy-duty diesel vehicles accounted for 60% of the carbon dioxide emission in the city

Slide 26Urban Development in KarnatakaPricewaterhouseCoopers
February 2008
4. Metropolitanisation of Bangalore
• Growth of Bangalore is one of the major challenges facing the state
• Keeping in view the growth, in 2006, 7 CMCs and 1 TMC (Kengeri) along with 110 villages around the city were brought under the jurisdiction of the ULB. Area increased from 226 sq km to 696 sq km and an est. pop. of 8 million. This growth is accompanied by concomitant increase in population, and the resultant demand in infrastructure and basic services.
• Bangalore is a key contributor to the state's economy; PwC study shows that Bangalore is the 4th largest city economy in the country and is expected to retain its position by 2020. Bangalore and Mumbai have the highest per capita income of $6923. However, Bangalore will be the second fastest growing city economy after Delhi, growing at 6.14% annually
• Growth of Bangalore threatened by insufficient resources and competition from other cities.
• If properly managed, Bangalore holds significant potential to lead the state on the path of development and improve the quality of life of lakhs of citizens.
Population growth of Bangalore
Source: Bangalore CDP for JNNURM
Comparison of Key Indian City Economies (2005-2020)
Source: Which are the largest city economies in the world and how might this change by 2020, PwC Economics, March 2007

Slide 27Urban Development in KarnatakaPricewaterhouseCoopers
February 2008
5. Lack of integration in Urban Planning & Management of Urban Spaces & Urban Growth
• Karnataka Town and Country planning act 1961, “Physical planning has to precede economic planning as otherwise, cities, towns and villages in our country will grow to unmanageable sizes without proper planning, resulting in unhealthy surroundings”.
• SOE reports that critical aspects integral to urban planning, such as environmental impact assessment and transportation requirements, have largely been neglected so far
• Plans and actual development on the ground seem to exist independent of each other- Planning norm for density adopted is 125 persons/ ha; old BMP already had 287 persons/ha in 2006- Norm for parks and open spaces in 15% of total land use; only 1 town, Rabakavi-Banahatti, meets this
• Planning Commission has commented that the “master plan” concept is not well suited to rapidly growing cities and multi-jurisdiction urban agglomerations and is not in wide use in the world. By locking in supply of buildable land and space, the master plan, inter-alia, inhibits the development of housing markets
• Stupendous growth of urban centres has led to haphazard and unplanned development and growth of "revenue sites" especially in peri-urban areas which usually lack provision of basic services
• Housing activity in tank beds is another consequence of poor planning and implementation. Nearly 17 major lakes/ tanks in Bangalore have been encroached by urban structures
• In terms of infrastructure provision, technological developments have given rise to many options. However, the typical approach currently taken is to adopt the least upfront cost option, not a lifecycle cost option. Poor planning and option evaluation results in non-optimal choices.
• UDAs were created to ensure orderly development of urban areas have shown poor performance. KDR reports that only 4/27 UDAs show cumulative profits of more than Rs 10 cr (1995-2002)
• The 74th amendment to the constitution has put a major thrust on regional planning and mandated the integration of planning between urban and rural areas through the formation of District Planning Committee (DPC) and Metropolitan Planning Committee (MPC). The implementation of this statute needs to be hastened to co-ordinate planning and implementation to rapidly give results.

Slide 28Urban Development in KarnatakaPricewaterhouseCoopers
February 2008
6. Inadequate empowerment of urban local bodies
Issues with Governance• 74th amendment stipulates audit of accounts of the
Municipal Corporations by CAG of India and laying of reports before the State Legislature. However, this process needs significant improvement in quality of information divulged. Standarisation of reporting formats/ social audit are critically required
• The structure of municipal governance and tenure of the mayor (currently 1 year) needs to be addressed.
• The KARC report (2001), has come out with a series of recommendations regarding policy and institutional reforms in the departments serving the urban sector which need to be revisited.
• KARC reports that the discretion and limits in financial approvals accorded to directorates and ULBs is low, and this causes administrative delays.
Poor state of Municipal finances• Decentralisation initiatives through the 74th
amendment have transferred greater responsibility for planning and financing investment projects to local governments.
• However, many ULBs in the state face fiscal imbalances in the form of large budgetary deficits, very slow growth in non tax revenues, and a rising share of non development expenditures.
• ULBs have poor revenue generation from own source of revenue.
• The state has moved towards capital value system (CVS). However even this system has been unable to generate potential gains due to the absence of a well functioning real estate market in many cities and poor information
Limited access to funds and dependence on state grants
• ULBs lack creditworthiness and are unable to raise funds from the market; Professional skills for structuring and development of commercially bankable projects are necessary;
• Lack of confidence amongst the lenders about the ability of local governments to service the debt coupled with poor information availability
• ULBs are increasingly dependent on state grants for their O&M requirements; They have limited powers to raise taxes
• State Transfers are a disincentive to own revenue mobilisation as plan or budgetary allocations are treated as soft money. Efforts for Pricing and cost recovery, therefore, may not be taken up fully

© 2008 PricewaterhouseCoopers. All rights reserved. “PricewaterhouseCoopers” refers to the network of member firms of PricewaterhouseCoopers International Limited, each of which is a separate and independent legal entity. *connectedthinking is a trademark of PricewaterhouseCoopers LLP (US).
PwC
Thank You!
Related Documents