KANSAI INTERNATIONAL AIRPORT Kara Mcclement Yuli Liu

Welcome message from author
This document is posted to help you gain knowledge. Please leave a comment to let me know what you think about it! Share it to your friends and learn new things together.
Transcript
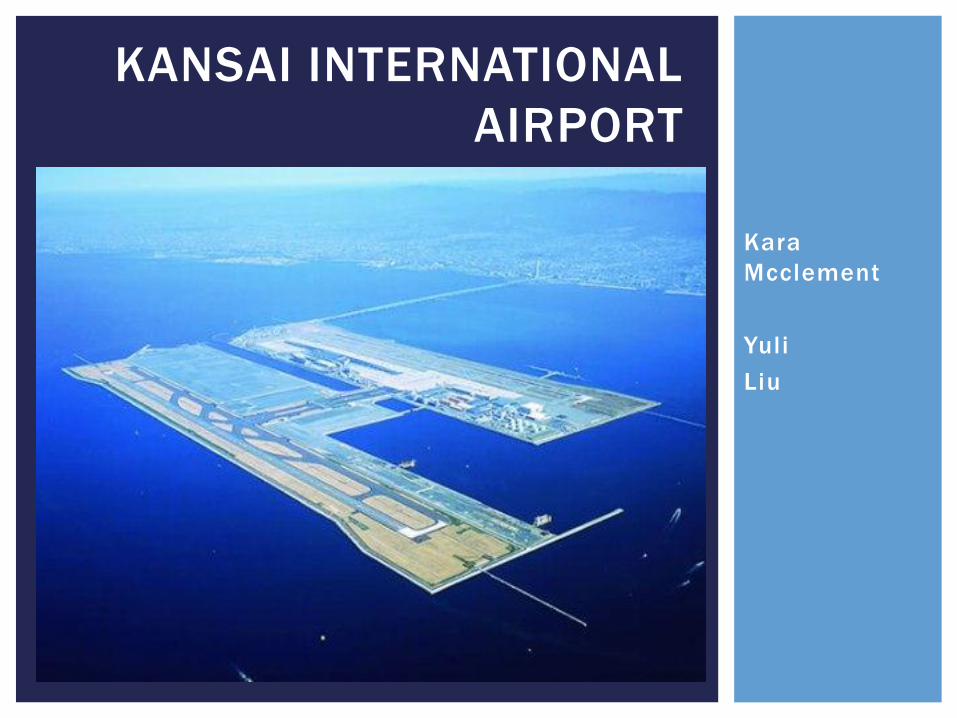
KANSAI INTERNATIONAL
AIRPORT
Kara
Mcclement
Yuli
Liu

MOTIVATION
The goal is to find the location of a third runway that
minimizes the energy and power of the waves on the terminal
building to further protect it from hazards.
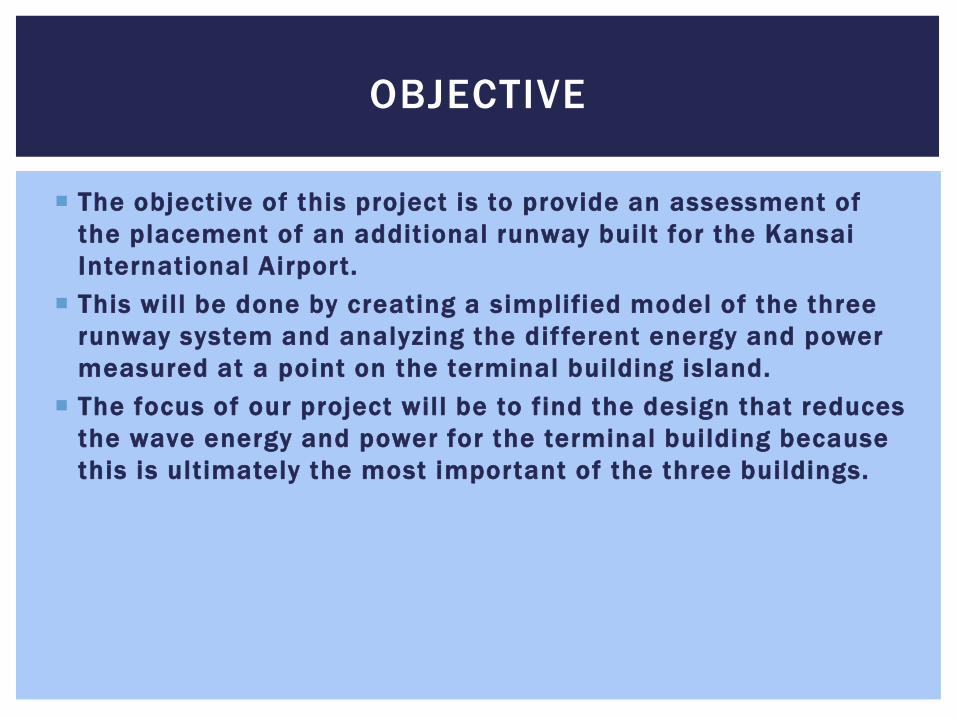
OBJECTIVE
The objective of this project is to provide an assessment of
the placement of an additional runway built for the Kansai
International Airport.
This will be done by creating a simplified model of the three
runway system and analyzing the dif ferent energy and power
measured at a point on the terminal building island.
The focus of our project will be to find the design that reduces
the wave energy and power for the terminal building because
this is ultimately the most important of the three buildings.
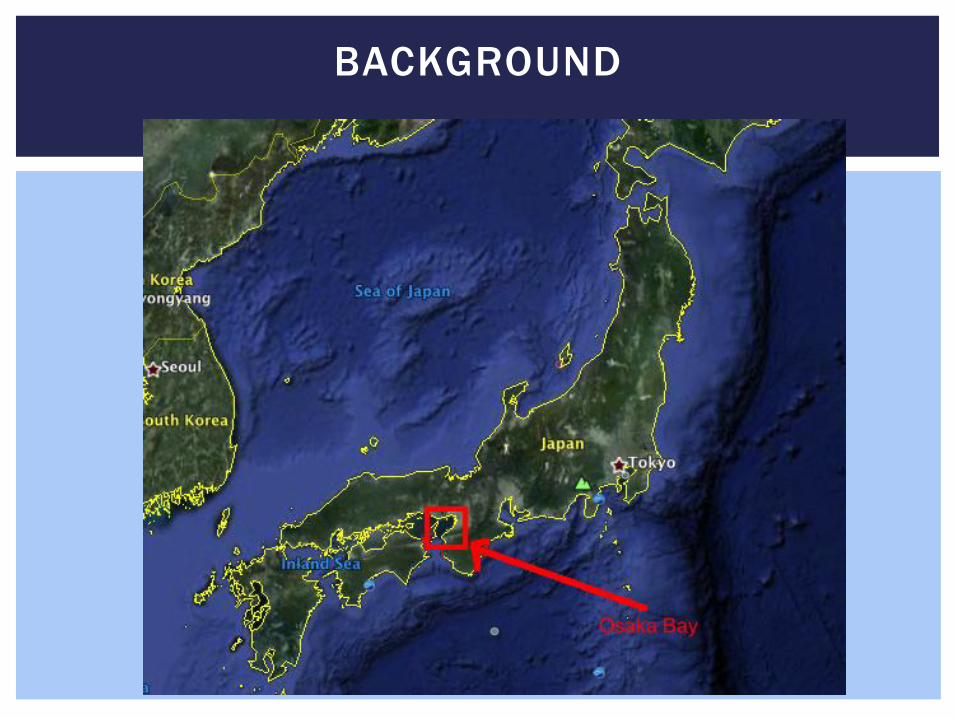
BACKGROUND
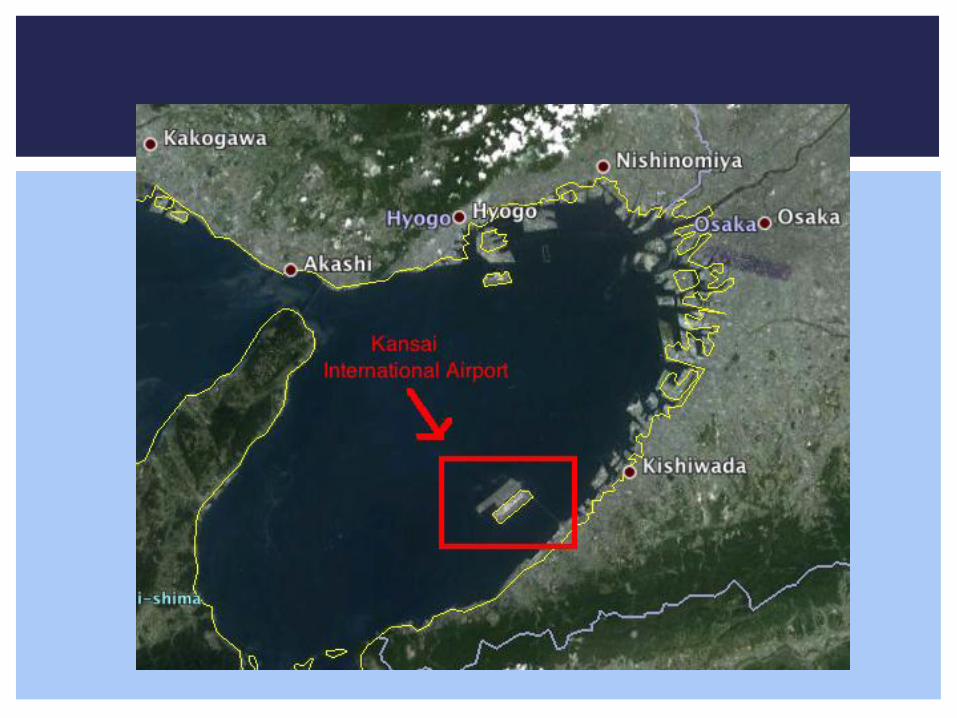
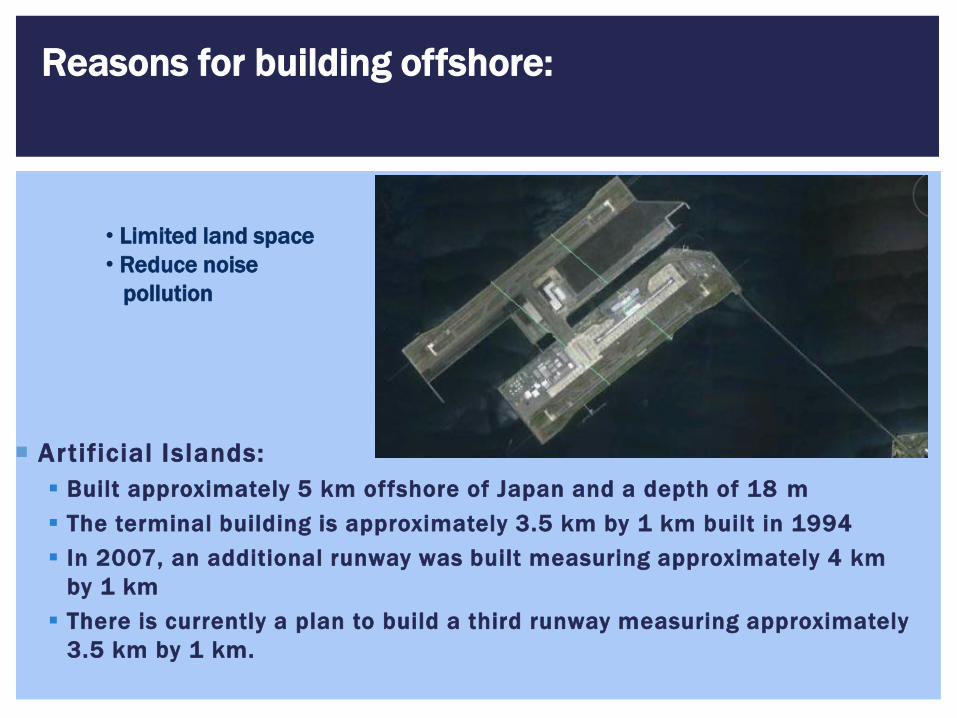
Artificial Islands:
Built approximately 5 km offshore of Japan and a depth of 18 m
The terminal building is approximately 3.5 km by 1 km built in 1994
In 2007, an additional runway was built measuring approximately 4 km
by 1 km
There is currently a plan to build a third runway measuring approximately
3.5 km by 1 km.
Reasons for building offshore:
• Limited land space
• Reduce noise
pollution

Estimates on sinking ranged from 19ft to 25ft.
Built as if it would only sink 19 f t
Kansai sunk 27 f t by 1990 and continues to sink today. To
solve this problem, more soil needed to be added.
The airport was specifically designed to deal with this
foreseen sinking and has adjustable doors and support beams
that used hydraulic jacks to keep the building even.
THE SINKING PROBLEM
DEALING WITH HAZARD
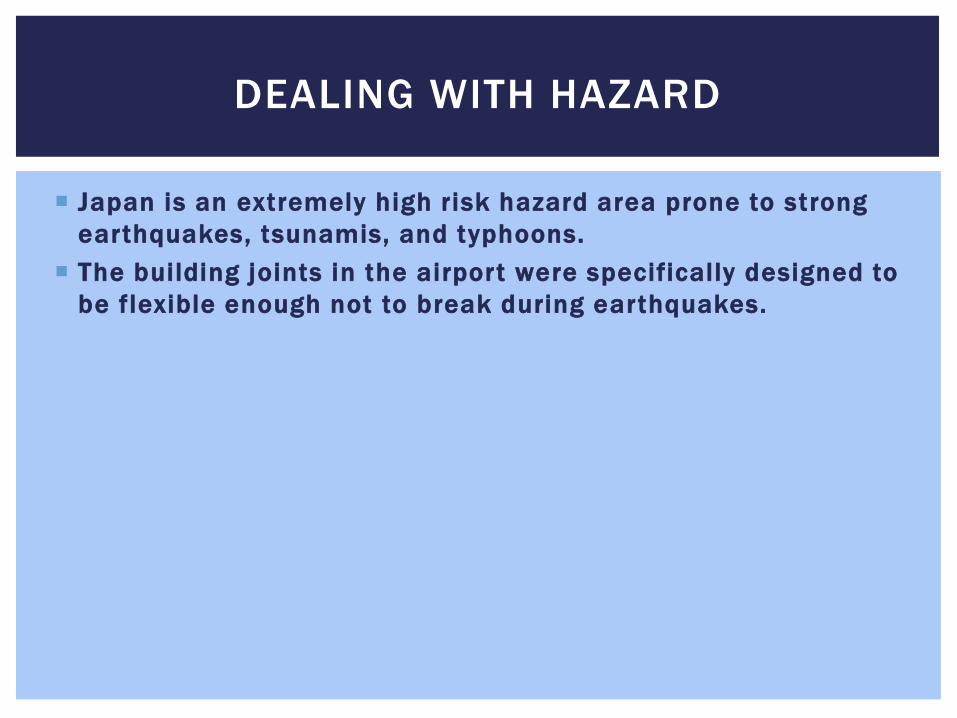
Japan is an extremely high risk hazard area prone to strong
earthquakes, tsunamis, and typhoons.
The building joints in the airport were specifically designed to
be flexible enough not to break during earthquakes.
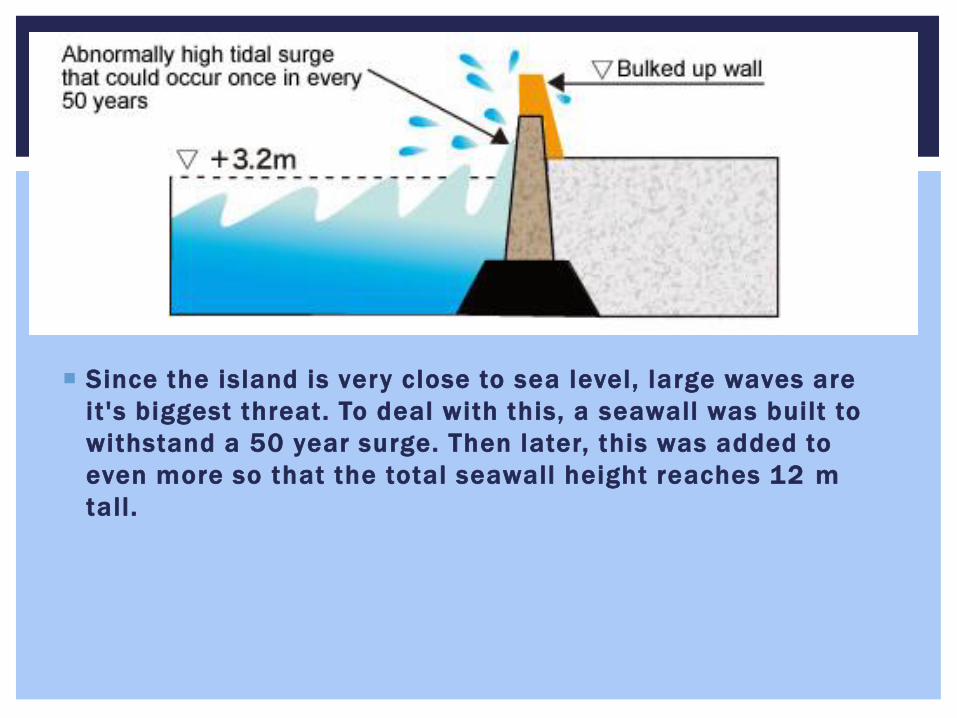
Since the island is very close to sea level, large waves are
it's biggest threat. To deal with this, a seawall was built to
withstand a 50 year surge. Then later, this was added to
even more so that the total seawall height reaches 12 m
tall.

KOBE EARTHQUAKE
In 1995, 4 months after KIA
opened, a 7.2 magnitude
earthquake occurred just 20 km
away.
The airport came out almost
completely unscathed.

Physical model
Flow pattern observation
Wave energy calculation
METHODS

DIFFERENT SET-UPS
Original Set-up
Set-up 2 Set-up 1
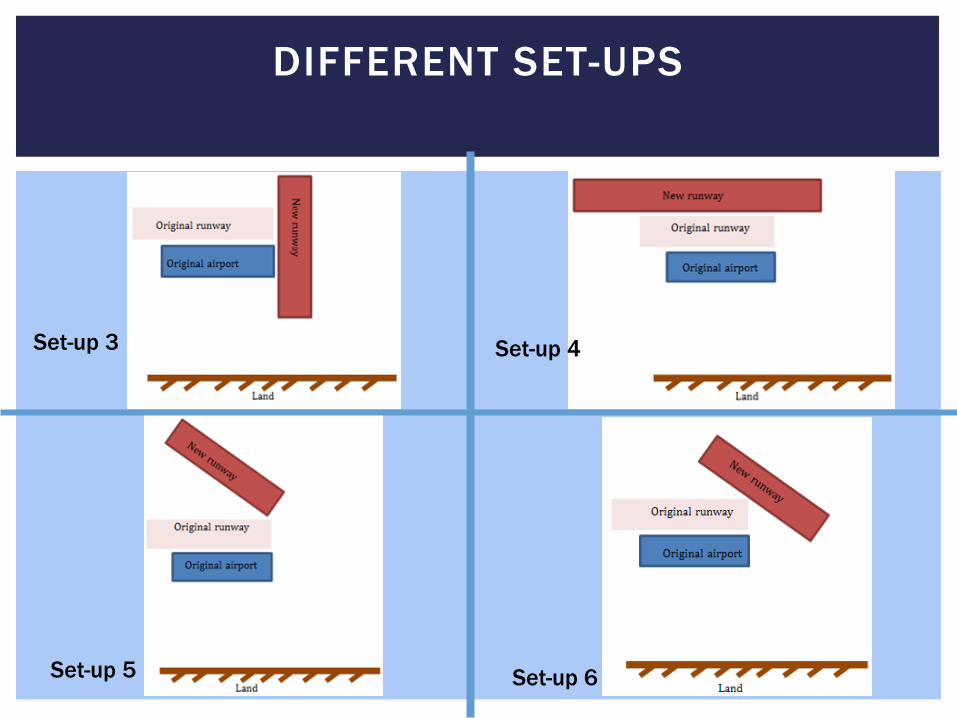
DIFFERENT SET-UPS
Set-up 5
Set-up 3 Set-up 4
Set-up 6

Clay model, scaled
Measure wave height at three location
Calculate wave energy
FIRST TRIAL: INITIAL IDEA
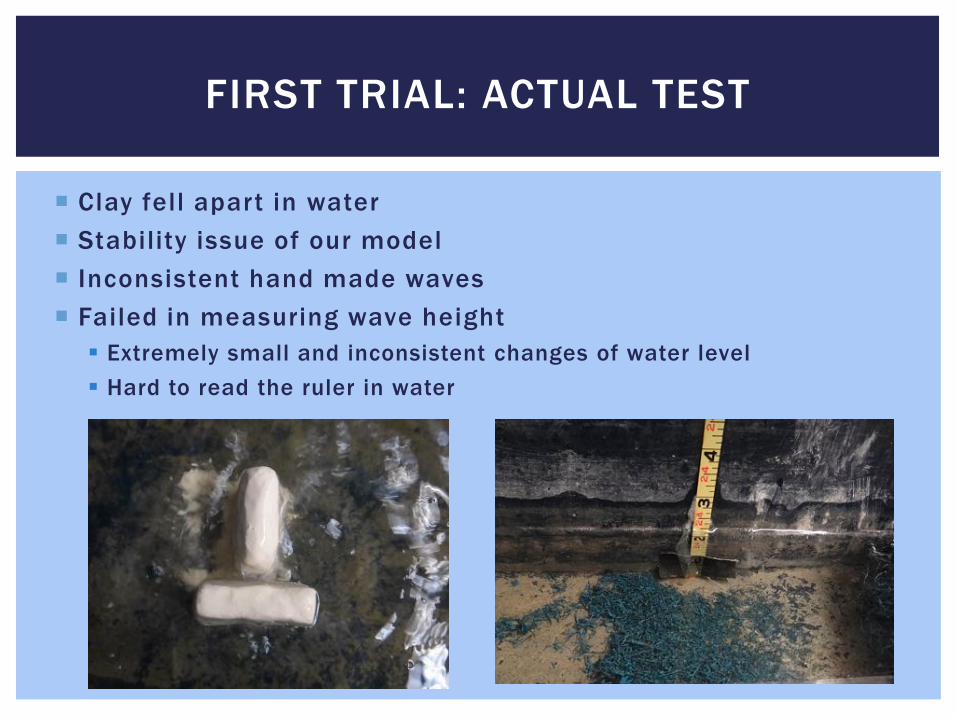
Clay fell apart in water
Stability issue of our model
Inconsistent hand made waves
Failed in measuring wave height
Extremely small and inconsistent changes of water level
Hard to read the ruler in water
FIRST TRIAL: ACTUAL TEST

Focus on the observation of wave
flow pattern
The effects of dif fraction at the
area close to the airport structure
plastic lunch box fil led with sand
to and brick model
SECOND TRIAL: MODIFIED IDEA

Bricks model
Inconsistent hand made waves
Diffraction was observed
Space and lighting condition limitation affects video quality
SECOND TRIAL: ACTUAL TEST

In set up 2, 4, 5, water was more calm at the area near the
airport structure
SECOND TRIAL: OBSERVATION RESULTS
Set-up 5 Set-up 2
Set-up 4
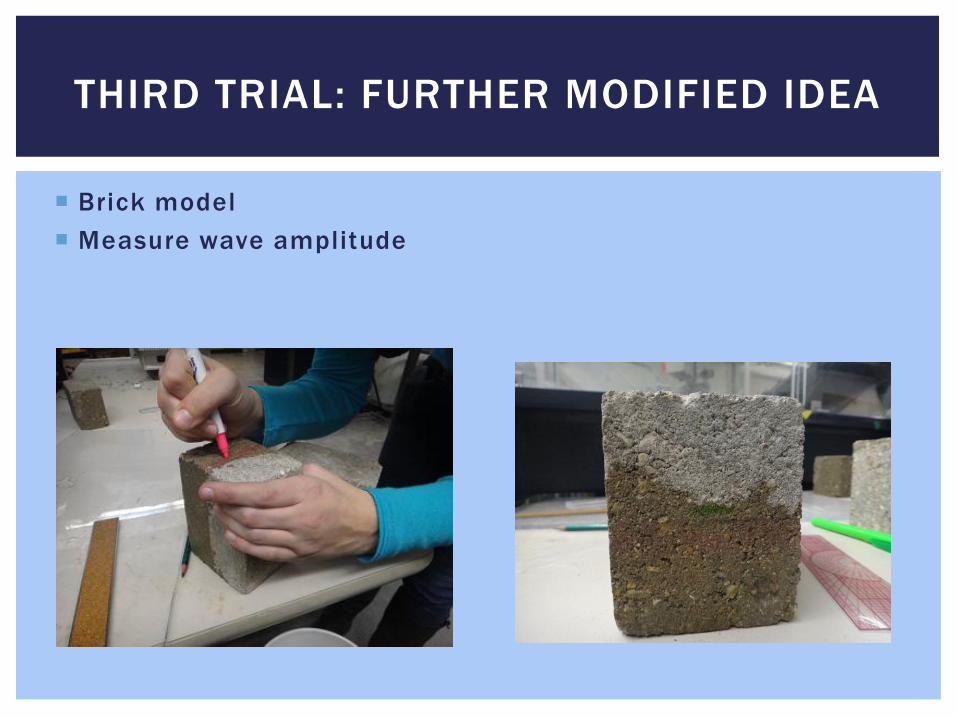
Brick model
Measure wave amplitude
THIRD TRIAL: FURTHER MODIFIED IDEA
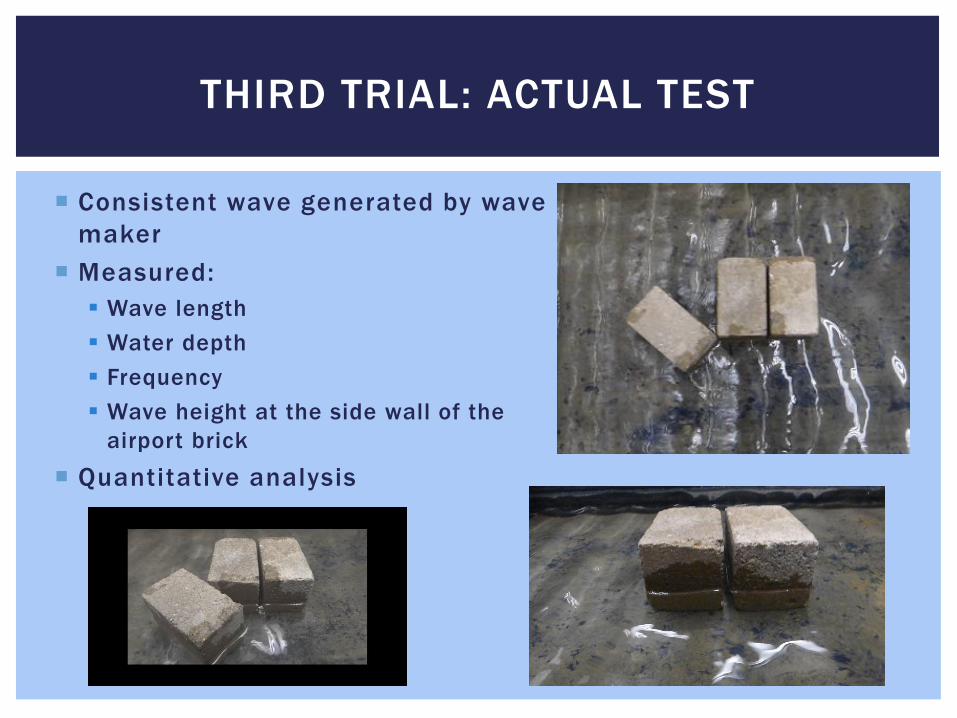
Consistent wave generated by wave
maker
Measured:
Wave length
Water depth
Frequency
Wave height at the side wall of the
airport brick
Quantitative analysis
THIRD TRIAL: ACTUAL TEST
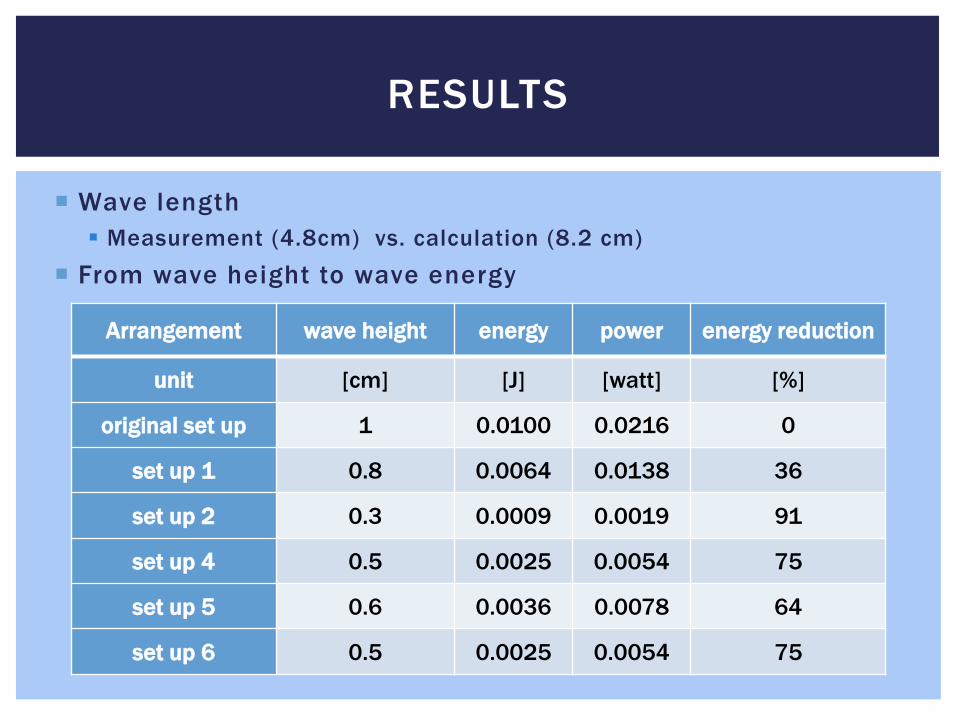
Wave length
Measurement (4.8cm) vs. calculation (8.2 cm)
From wave height to wave energy
RESULTS
Arrangement wave height energy power energy reduction
unit [cm] [J] [watt] [%]
original set up 1 0.0100 0.0216 0
set up 1 0.8 0.0064 0.0138 36
set up 2 0.3 0.0009 0.0019 91
set up 4 0.5 0.0025 0.0054 75
set up 5 0.6 0.0036 0.0078 64
set up 6 0.5 0.0025 0.0054 75

0
10
20
30
40
50
60
70
80
90
100
Comparison of Wave Energy Reduction in
Different Set-ups (%)
Set up 1 Set up 2 Set up 4 Set up 5 Set up 6
RESULTS: COMPARISON
Set-up 2 achieved the greatest energy reduction in the area near the airport structure
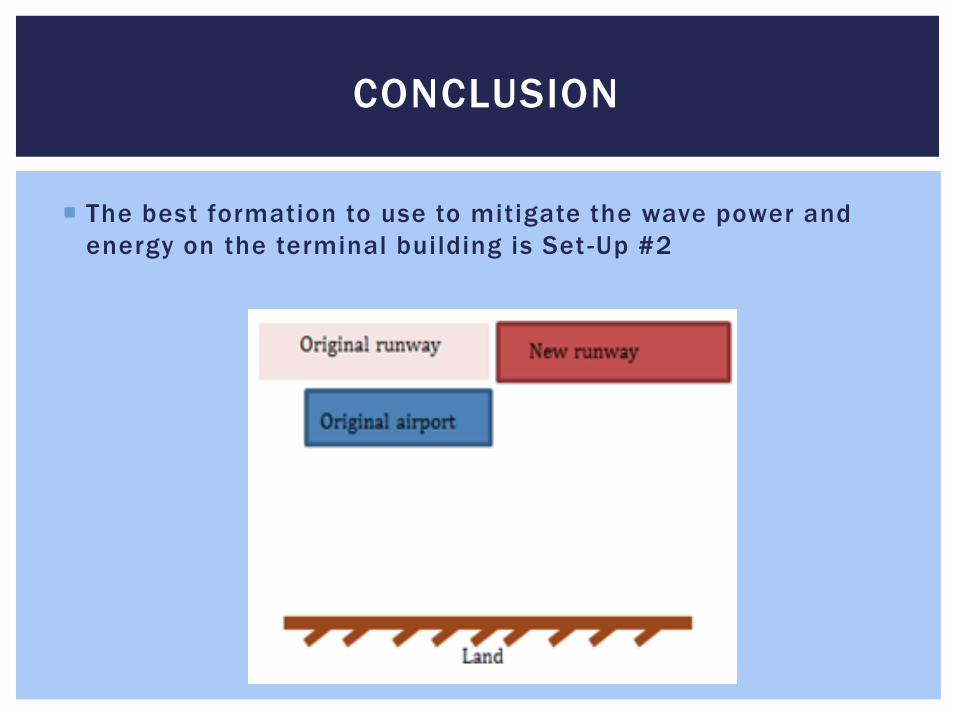
CONCLUSION
The best formation to use to mitigate the wave power and
energy on the terminal building is Set -Up #2

KANSAI’S DESIGN
Artist representation:

Set up #6 is very similar to the
final design of the airport
• Set-up #6 is tied for the second
lowest power and energy values
• This set up was most likely
chosen for two main reasons:
• Cheaper to add on to an island
than make an entirely new one.
• May strengthen the airport
more as a whole instead of
focusing on protecting the
terminal building.
CONCLUSION
"The Construction of the Kansai Airport." The Construction of the Kansai Airport. N.p., n.d. Web. 10 Dec. 2012.
"Kansai Airport : Image of the Day." Kansai Airport : Image of the Day.N.p., n.d. Web. 10 Dec. 2012.
"New Kansai International Airport Co., Ltd | Technical Information | Measures Against Natural Disasters." New Kansai International Airport Co., Ltd. N.p., n.d. Web. 10 Dec. 2012.
Teredesai, Rajul. "Kansai International Airport (Phase -I) Foundation Case Study." N.p., n.d. Web. 10 Dec. 2012. <faculty -staff.ou.edu/C /Amy.B.Cerato- 1/KansaiAirport2005.ppt>.
REFERENCES
Related Documents