Grow your system from good to awesome! Kanban Metrics in practice @ SNS GOOD CRAP AWESOME! @BattistonMattia

Kanban Metrics in practice at Sky Network Services
Jul 16, 2015
Welcome message from author
This document is posted to help you gain knowledge. Please leave a comment to let me know what you think about it! Share it to your friends and learn new things together.
Transcript

Grow your system from good to awesome!
Kanban Metricsin practice
@ SNSGOOD
CRAP
AWESOME!
@BattistonMattia

About me
● from Verona, Italy
● software dev & continuous improvement
● Kanban “helper”
● ~1.5 year Sky Network Services
Mattia Battiston
@BattistonMattia
Ciao!

Why are we here?
OUR EXPERIENCE
WHY
HOW
IMPROVING
LESSONS LEARNT
FORECASTING

Kan...what?
a little knowledge of Kanban helps(limiting WIP, lead time, value vs waste, queues, batches, etc.)

Why do we need metrics?
#1: drive continuous improvement #2: forecast the future

But I thought metrics were bad....
Typical problems:
gamingdysfunctions

Good vs Bad metrics
● look at improving the whole system ● reward/punish individuals
“95% performance is attributable to
the system, 5% to the people”
W. Edwards Deming
● actionable -> help take decisions ● vanity -> make you feel better
● gaming leads to good ● gaming leads to bad
● in team’s influence ● can’t do anything about it
● feedback about state of reality ● used as target
● usually expressed as trends ● usually expressed as single numbers
● leading (let you change behaviour) ● lagging (tell you about the past)
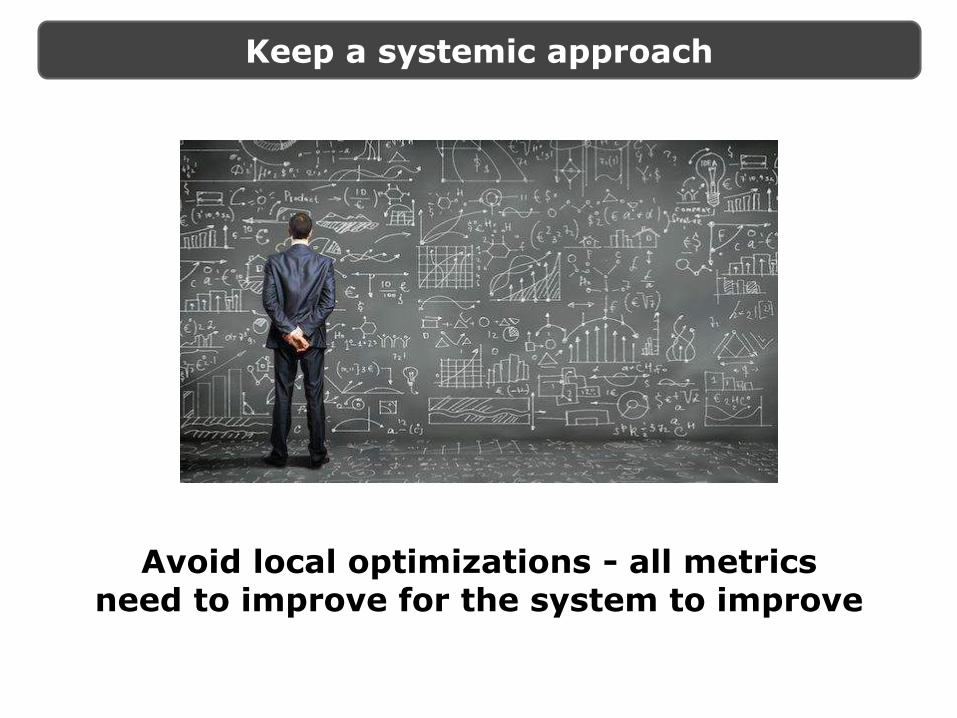
Keep a systemic approach
Avoid local optimizations - all metricsneed to improve for the system to improve

Our system
Iteration-Based
On-demand
Direct

How do we collect the data?

The Spreadsheet
Inputs: story details; start time and duration of each state; # stories per state;

Metrics Characteristics
● Purpose: which fitness criteria does it help me with?
delivery time, predictability, quality, continuous improvement
● Objective: what do we use this metric for?
leading, retrospect, forecast
● Frequency/time frame: how often do we refresh and look at this metric? what time
frame does it look at?
daily (short term), iteration (long term)

All the maths you need
● Min, Max
Normal: data is distributed
around a central value
e.g. height of UK population
Skewed: data has a long tail
on one side (positive or
negative)
e.g. income of UK population
(positive skew)
Lead time of stories follows
skewed distribution
● Average (mean)
avg(1,2,2,2,3,14) = (1+2+2+2+3+14)/6 = 4
● Median: separates the high half from the low half. Less impacted by outliers
median(1,2,2,2,3,14) = 2
● Mode: value that occurs more frequently
mode(1,2,2,2,3,14) = 2
● Standard Deviation: measures the amount of dispersion from the average. When
high, values are spread over a large range.
stdev(1,2,2,2,3,14) = 4.5; stdev(1,2,2,2,3,5) =1.2;
● Percentile: percentage of elements that fall within a range
50% perc(1,2,2,3,7,8,14) = 3; 80% perc(1,2,2,3,7,8,14) = 7.8;
● Normal Distribution vs Skewed Distribution:
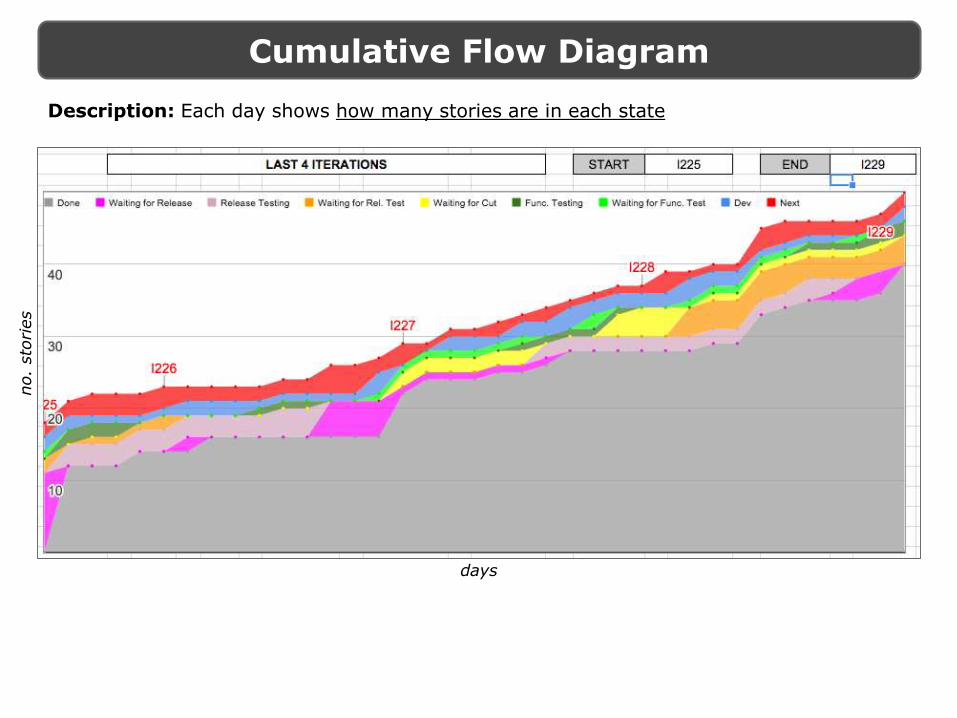
Cumulative Flow Diagram
Description: Each day shows how many stories are in each state
no.
sto
ries
days

Cumulative Flow Diagram
● Objective: retrospect (but needs a good facilitator)
CFD used for Retrospective
● Objective: demonstrate effectiveness of changes
changed WIP limit in DEV to 2
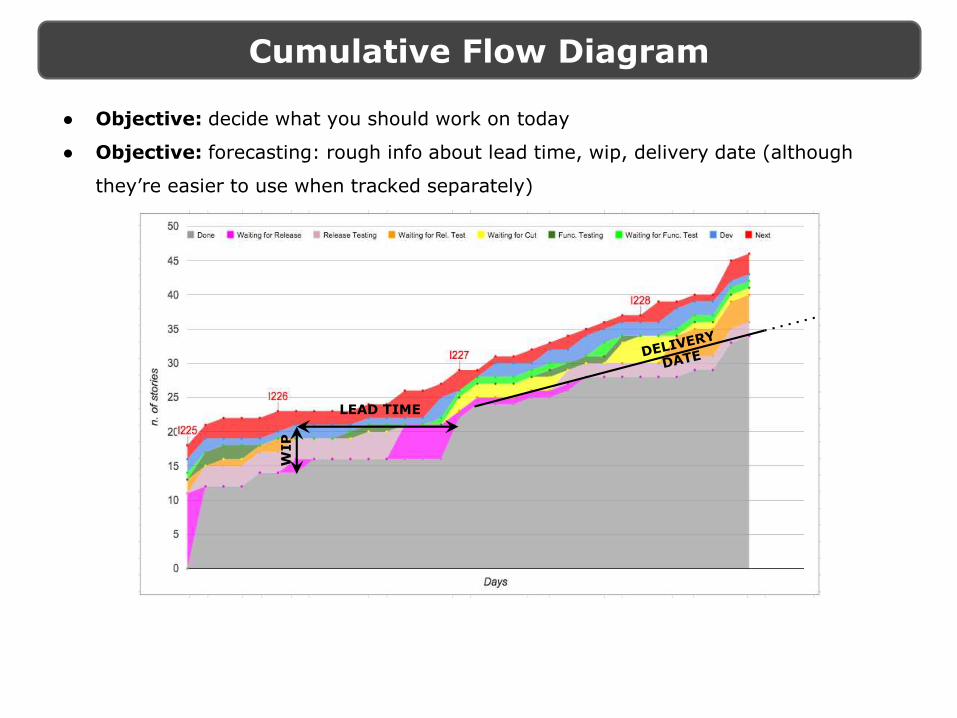
Cumulative Flow Diagram
● Objective: decide what you should work on today
● Objective: forecasting: rough info about lead time, wip, delivery date (although
they’re easier to use when tracked separately)
WIP
LEAD TIME
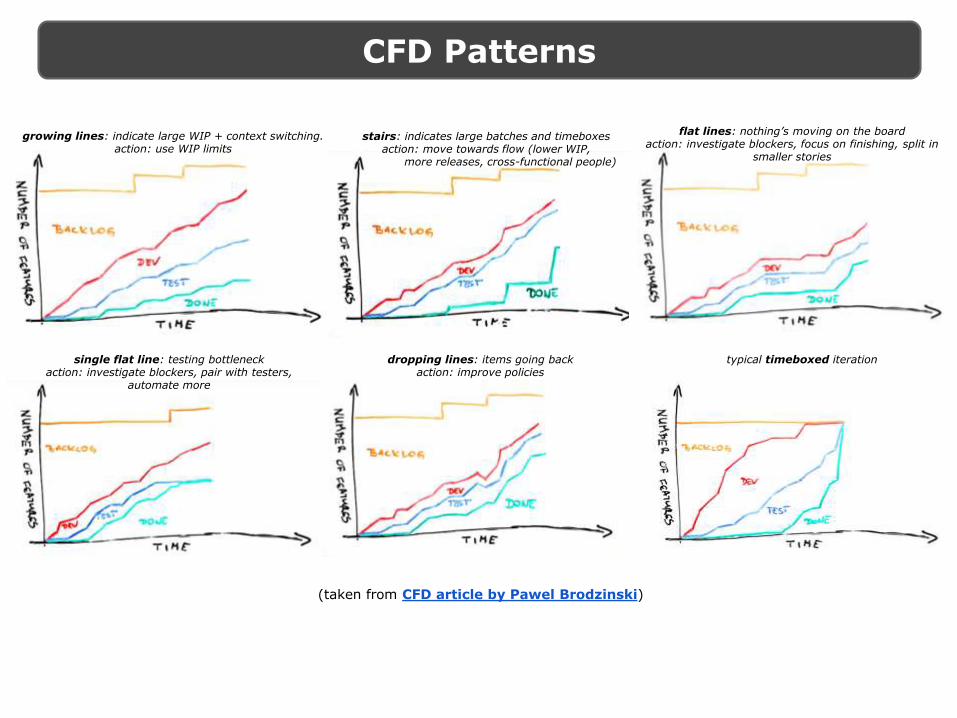
CFD Patterns
(taken from CFD article by Pawel Brodzinski)
growing lines: indicate large WIP + context switching. action: use WIP limits
stairs: indicates large batches and timeboxesaction: move towards flow (lower WIP,
more releases, cross-functional people)
flat lines: nothing’s moving on the boardaction: investigate blockers, focus on finishing, split in
smaller stories
single flat line: testing bottleneckaction: investigate blockers, pair with testers,
automate more
typical timeboxed iterationdropping lines: items going backaction: improve policies
metrics for
Delivery Time

Control Chart
Description: For each story it shows how long it took. Displays Upper and Lower controllimits; when a story falls out of limits something went wrong and you should talk about it.
stories
cycle
tim
e (
days)

Cycle/Lead Time stats + History
Description: Stats to get to know your cycle time and lead time. They let you predict “how
long is the next story likely to take?”. Visualize trends of improvement

Lead Time distribution
50%
85%
cycle time (days)
no.
sto
ries t
hat
took t
hat
long
Description: For each lead time bucket (#days), how many stories have taken that long.
Useful to show as a percentage to know probability.
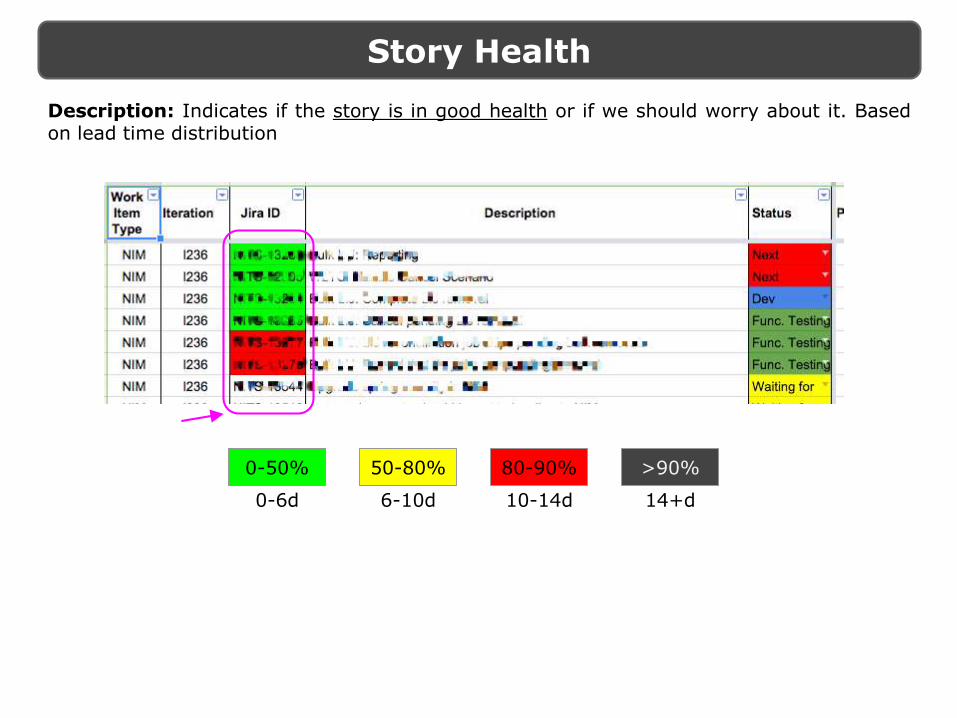
Story Health
50-80% >90%80-90%0-50%
Description: Indicates if the story is in good health or if we should worry about it. Basedon lead time distribution
0-6d 6-10d 10-14d 14+d

Cycle Time vs Release Prep. Time
stories
days
Description: For each story shows how long it spent in the iteration and in release
preparation (Context specific). Used to discuss cost vs value of release testing.
metrics for
Predictability
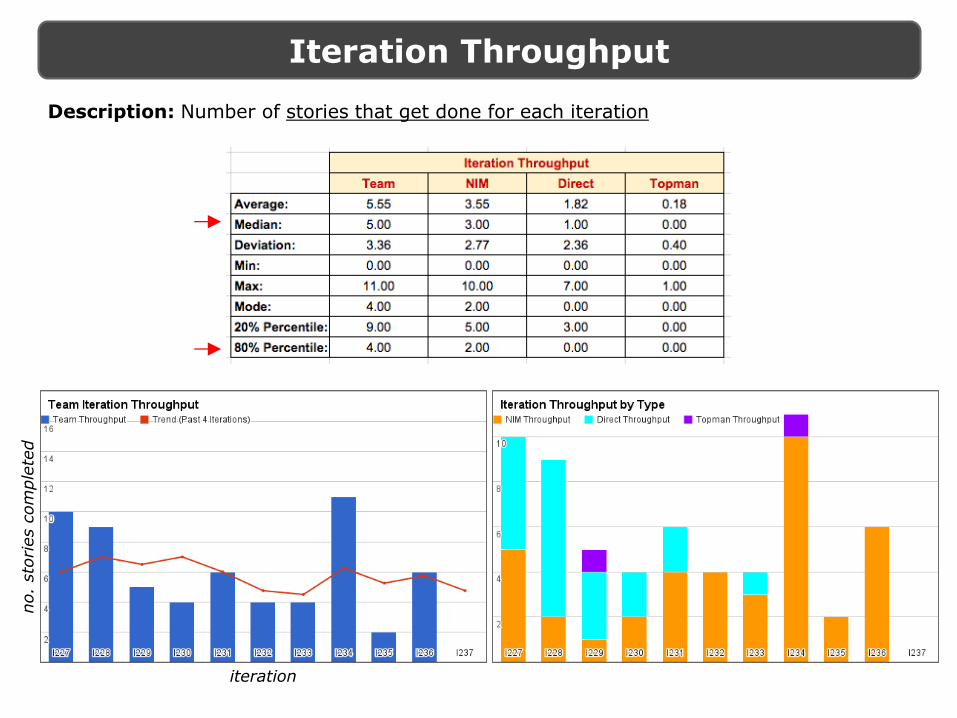
Iteration Throughput
iteration
no.
sto
ries c
om
ple
ted
Description: Number of stories that get done for each iteration

Daily Throughput
day
no.
sto
ries c
om
ple
ted
Description: Number of stories that get done daily. Should worry when nothing gets done
for a while.

WIP
iteration
avg d
aily W
IP
Description: For each iteration, the average daily WIP.

Little’s Law
more visible here
Description: Lead Time = WIP / Throughput
Should demonstrate that when WIP decreases then Lead Time goes down and Throughput
goes up.

Points vs Cycle Time
cycle
tim
e (
days)
story points
Description: Shows low correlation between estimated points and actual cycle time
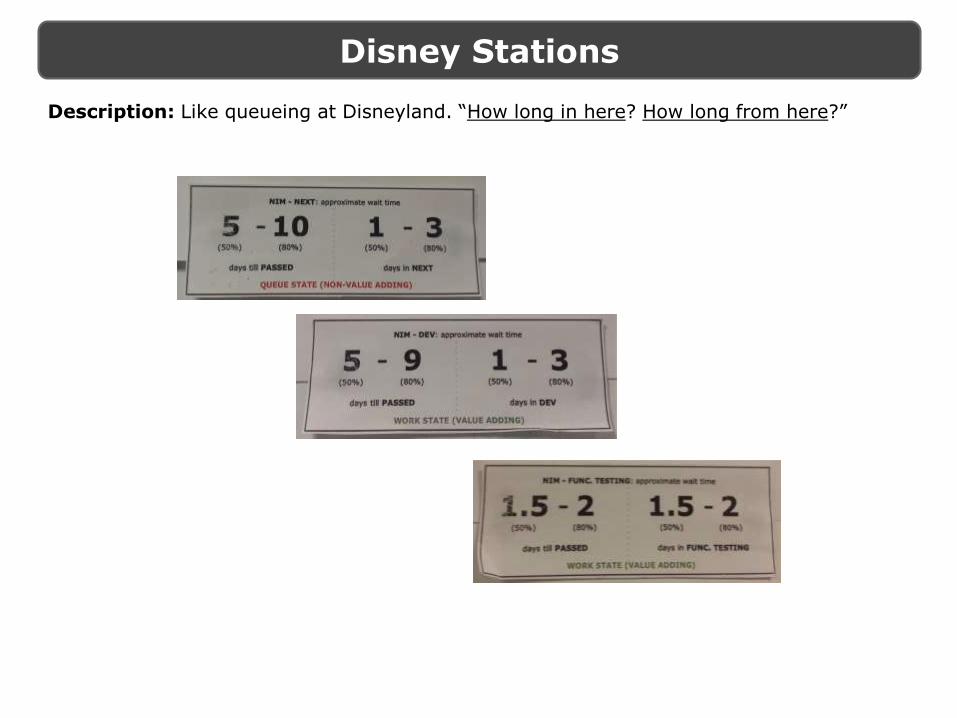
Disney Stations
Description: Like queueing at Disneyland. “How long in here? How long from here?”

Task Time
Description: Shows how long tasks usually take (context specific). Gives you an idea of
how long a story will take based on n. of tasks

metrics for
Quality

Bugs percentage
Description: Percentage of bugs over stories. Also expressed as “1 bug every X stories”
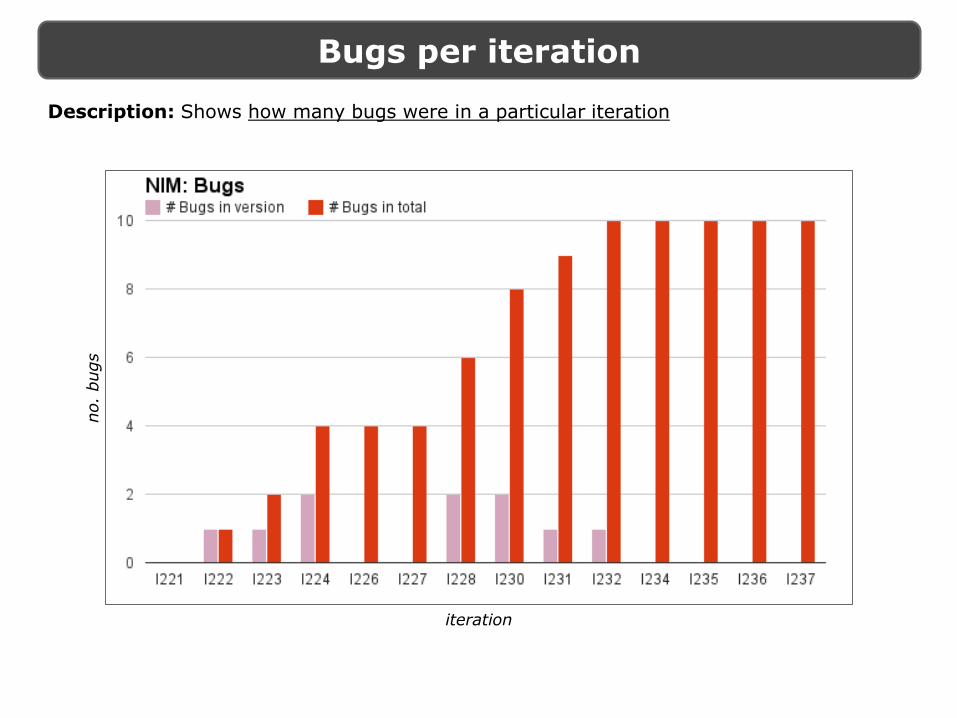
Bugs per iteration
iteration
no.
bugs
Description: Shows how many bugs were in a particular iteration
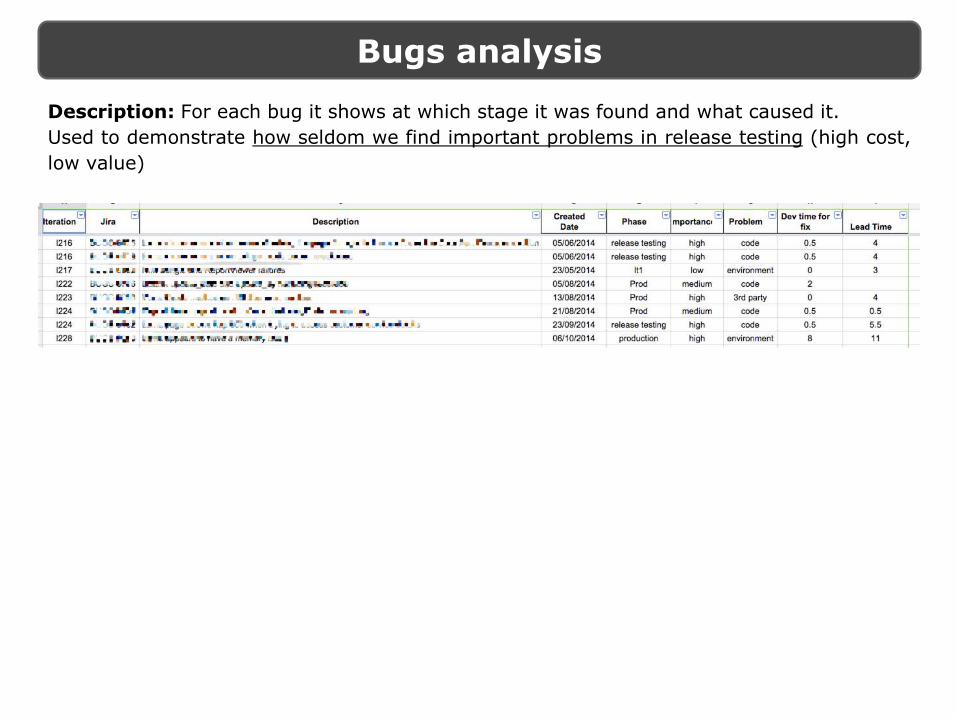
Bugs analysis
Description: For each bug it shows at which stage it was found and what caused it.
Used to demonstrate how seldom we find important problems in release testing (high cost,
low value)

metrics for
Continuous Improvement

Flow Efficiency
Description: Shows how long stories have spent in queues - nobody was working on
them. Shows how much you could improve if you removed waiting time.
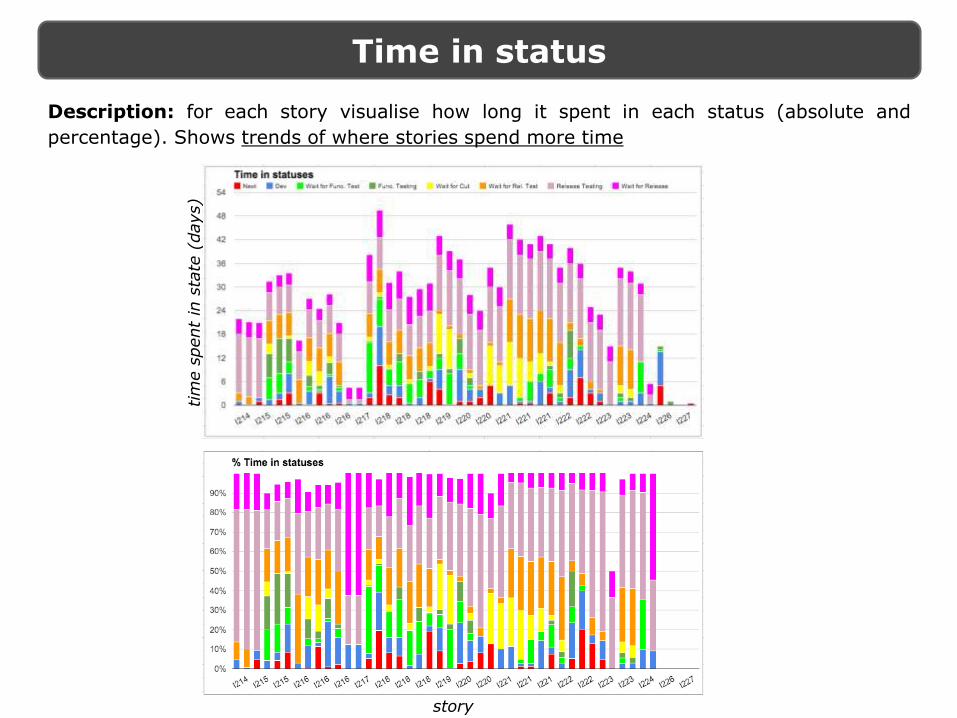
Time in status
tim
e s
pent
in s
tate
(days)
story
Description: for each story visualise how long it spent in each status (absolute and
percentage). Shows trends of where stories spend more time

Stats per Status
Description: control chart, cycle time distribution and stats for each status. Helps forecast
how long stories are going to take; gives indications on where you should improve.

Retrospective

Resources
Presentations
● Troy Magennis LKUK13 LKCE13 Agile 2014
● David Anderson Kanban's 3 Agendas LKUK13
● Hakan Forss The Red Brick Cancer
Articles
● Cycle-time Analysis and Monte Carlo Simulation Results (Troy Magennis)
● The Seven Deadly Sins of Agile Measurement (Larry Maccherone)
● A Tool for tracking Kanban projects (Emily Webber)
● FocusedObjective@Github
● Lean Forecasting Tutorial by Troy Magennis
● Cumulative Flow Diagram (Pawel Brodzinski)
Case Studies
Siemens Health Services Sandvik IT Ericsson SAP Lean Kanban Case Studies series
● Dan Brown Flow Like Ketchup (LLKD14)
● Dimitar Bakardzhiev LKUK14 webinar
● Larry Maccherone LKUK14
● Analyzing Lead Time Distribution Chart (Alexei Zheglov)
● Inside a Lead Time Distribution (Alexei Zheglov)
● Forecasting Your Oranges (Dan Brown)
● worldofchris@github (Chris Young)
Books
Thank you!
@BattistonMattia
really, really appreciated! Help me improve
Related Documents