1 Strategic Insight for Social Good TM Kaipara District Compost Options Assessment Feasibility Study Funding support from: Report Commissioned by: Independent Reporting: Report Dated: 12 th December 2020 – Version 3

Welcome message from author
This document is posted to help you gain knowledge. Please leave a comment to let me know what you think about it! Share it to your friends and learn new things together.
Transcript
1
Strategic Insight for Social Good TM
Kaipara District Compost Options
Assessment Feasibility Study
Funding support from:
Report Commissioned by:
Independent Reporting:
Report Dated: 12th December 2020 – Version 3
2
Report Disclaimer Notes:
Evidence Based Decisions We believe that the best decisions are realistic, evidence based and consider multiple
perspectives. As such, we provide independent reporting to help stakeholders make
informed decisions and give their projects and activities the best possible chance of success.
Independence:
In providing this report Impact Consulting are providing an independent assessment of the
proposed project or activity, based on available and gathered evidence and information.
The views of Impact Consulting and/or its consultants may or may not coincide with the
views of the client. In order to help the client and associated stakeholders make informed
decisions, Impact Consulting shall not be constrained in expressing its view, but will outline
the rationale behind the views expressed. Alongside this we commit to remaining open to
feedback and additional information from project stakeholders, with potential to adjust
recommendations or project outcomes where deemed appropriate and well-reasoned.
Partnership | Community Lead Projects We believe that partnership is important, that community facing projects have the greatest positive impact, and that sustainability is essential for long-term community
benefit. As such, we work in partnership with local government, businesses and community groups to gather relevant data to inform decisions. Disclaimer:
Information, data and general assumptions used in the compilation of this report have been obtained from sources believed to be reliable. Impact Consulting NZ Ltd has used this
information in good faith and makes no warranties or representations, expressed or implied, concerning the accuracy or completeness of this information. Interested parties should perform their own due diligence, analysis and projections on key factors or issues,
prior to acting in relation to this report.
All work is done, and services rendered at the request of, and for the purposes of the client
only. Neither Impact Consulting NZ Ltd nor any of its employees accepts any responsibility on any grounds whatsoever, including negligence, to any other person. While every effort
is made by Impact Consulting NZ Ltd to ensure that the information, opinions and forecasts provided to the client are accurate and reliable, Impact Consulting NZ Ltd shall not be liable for any adverse consequences of the client’s decisions made in reliance of any report provided by Impact Consulting NZ Ltd.
Project Contacts
Impact Consulting Company: Impact Consulting NZ Ltd
www.impactconsulting.co.nz
Josh Bruce [email protected]
021 165 6305
Report Dated: December 2020
Sustainable Kaipara Organisation: Sustainable Kaipara Ltd
www.sustainablekaipara.org
Stephanie Gibson 021 0274 2331
Project Lead [email protected]
Director - Community lead
3
Contents Contents ............................................................................................... 3
Executive Summary................................................................................ 4
Acknowledgements................................................................................ 7
SECTION 1
Needs Assessment ................................................................................. 9
Survey Results ..................................................................................... 20
Business and Community Organisations.................................................. 26
SECTION 2
Organic Waste Management Options Summary....................................... 30
Composting Basics ............................................................................... 33
Feedstock ........................................................................................... 34
Household Scale Organic Waste Options................................................. 36
Community Scale Organic Waste Options ............................................... 39
Case Study: Kaicycle ............................................................................. 43
Case Study: Extreme Zero Waste ........................................................... 45
Commercial Scale Options Summary ...................................................... 48
Case Study: Envirofert .......................................................................... 52
SECTION 3
Recommendations Section.................................................................... 55
Recommendations ............................................................................... 66
4
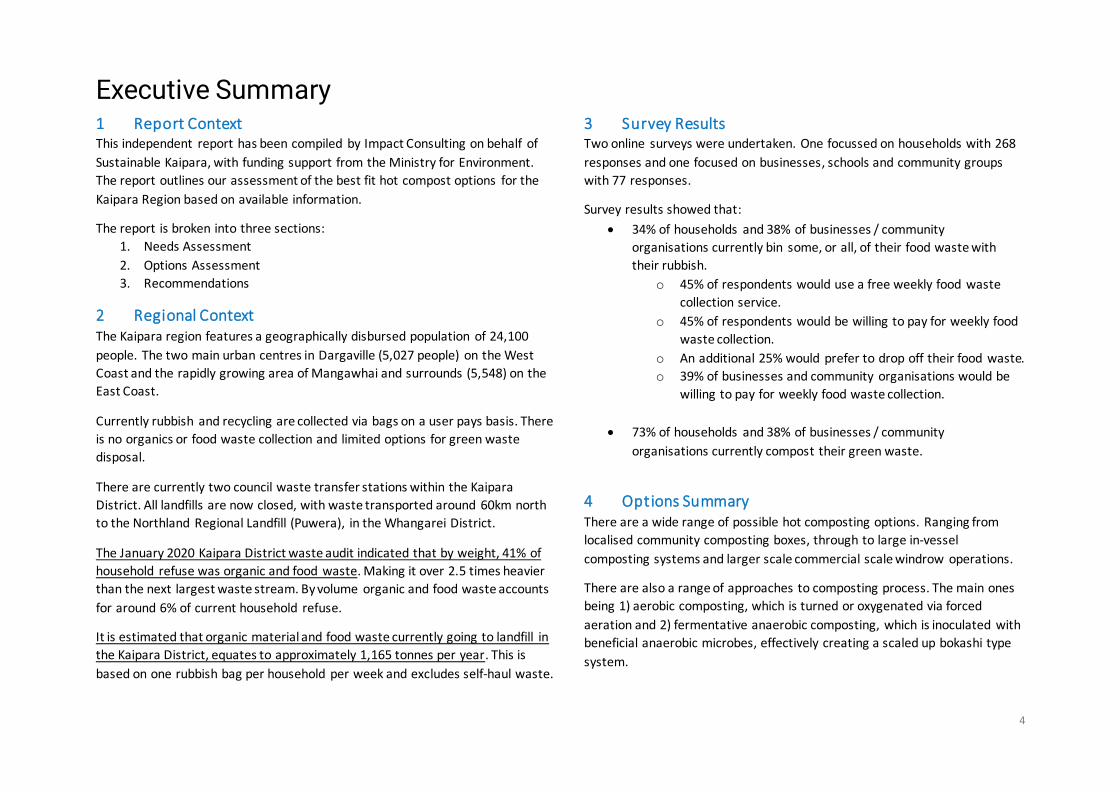
Executive Summary 1 Report Context This independent report has been compiled by Impact Consulting on behalf of
Sustainable Kaipara, with funding support from the Ministry for Environment.
The report outlines our assessment of the best fit hot compost options for the
Kaipara Region based on available information.
The report is broken into three sections:
1. Needs Assessment
2. Options Assessment
3. Recommendations
2 Regional Context The Kaipara region features a geographically disbursed population of 24,100
people. The two main urban centres in Dargaville (5,027 people) on the West
Coast and the rapidly growing area of Mangawhai and surrounds (5,548) on the
East Coast.
Currently rubbish and recycling are collected via bags on a user pays basis. There
is no organics or food waste collection and limited options for green waste
disposal.
There are currently two council waste transfer stations within the Kaipara
District. All landfills are now closed, with waste transported around 60km north
to the Northland Regional Landfill (Puwera), in the Whangarei District.
The January 2020 Kaipara District waste audit indicated that by weight, 41% of
household refuse was organic and food waste. Making it over 2.5 times heavier
than the next largest waste stream. By volume organic and food waste accounts
for around 6% of current household refuse.
It is estimated that organic material and food waste currently going to landfill in
the Kaipara District, equates to approximately 1,165 tonnes per year. This is
based on one rubbish bag per household per week and excludes self-haul waste.
3 Survey Results Two online surveys were undertaken. One focussed on households with 268
responses and one focused on businesses, schools and community groups
with 77 responses.
Survey results showed that:
• 34% of households and 38% of businesses / community
organisations currently bin some, or all, of their food waste with
their rubbish.
o 45% of respondents would use a free weekly food waste
collection service.
o 45% of respondents would be willing to pay for weekly food
waste collection.
o An additional 25% would prefer to drop off their food waste.
o 39% of businesses and community organisations would be
willing to pay for weekly food waste collection.
• 73% of households and 38% of businesses / community
organisations currently compost their green waste.
4 Options Summary There are a wide range of possible hot composting options. Ranging from
localised community composting boxes, through to large in-vessel
composting systems and larger scale commercial scale windrow operations.
There are also a range of approaches to composting process. The main ones
being 1) aerobic composting, which is turned or oxygenated via forced
aeration and 2) fermentative anaerobic composting, which is inoculated with
beneficial anaerobic microbes, effectively creating a scaled up bokashi type
system.
5
5 Recommendations
In terms of environmental impact, removing food waste from landfill is one
of the simplest things that, we as individuals and Kaipara as a region, can do
to reduce our contribution to greenhouse gas emissions.
If global food waste were a country, it would be the third largest producer
of greenhouse gasses and carbon emissions, behind China and the USA.1
The number one objective of the Kaipara District Council Waste
Management and Minimisation Plan (WMMP) 2017, is to:
1. To reduce the quantity of recoverable material entering landfill.
With the initial target being:
1.1 To decrease the annual quantity of waste disposed of to landfill
from the Kaipara district to below 200kg per capita per year
(equates to > 30% diversion).
Removing food and organic waste from rubbish bags provides the greatest
potential gains in terms of achieving the Kaipara District Council’s waste
minimisation objectives (a weight-based target).
5.1 Implications for current system Indications are that removal of food wate from household refuse would
result in a 41% decrease in refuse to landfill by weight and 6% by volume.
This means that households would theoretically buy 6% less rubbish bags.
This is anticipated to have minimal impact on the viability of current services,
with the worst case being the need for a $0.19c increase in bag price (6%).
5.2 Financial Incentive for Diversion • There is currently very minimal financial incentive for households to
divert their organic and green waste from landfill.
1 Love Food Hate Waste
• Even with proposed landfill Waste Disposal Levy increases over the
next 4 years from $10 per tonne to $60 per tonne, there is currently
insufficient financial benefit for waste contractors to setup, staff and
run an organics diversion system themselves, without additional
funding input or establishment support, from Council or other public
funding sources.
5.3 Funding There are several potential funding models for hot composting and diversion
of organic material from landfill. The following progression is recommended:
1. Short-term: User pay + waste minimisation grants
2. Medium-term: Waste minimisation funding
3. Long-term: Targeted or general rate
5.4 Recommendations It is our view that as far as possible, localised solutions which limit
transportation, employ local people, and produce high quality outputs should
be prioritised. This includes encouraging home-based solutions first and
foremost.
The following recommendations made based on our assessment of the best
fit hot compost options for the Kaipara Region.
1. HOME: Community Education
It is recommended that Kaipara District Council tag some waste
minimisation funding for home composting education, encouraging
home-based food waste solutions such as bokashi, worm farming
and home composting. Recommended allowance: $15K per year.
6
2. LOCAL: Community Composting
It is recommended that community hot composting initiatives are
supported at schools, marae and community gardens. These
activities are localised, minimise waste transport and have a huge
range of community building and educational benefits. Education of
volunteers and effective ongoing management / support for these
systems is important to get the best results. As such is it
recommended that an annual site management / support
contribution is funded by the Kaipara District Council, with the
collection and composting activities locally funded by service users,
or via other funding sources, or run by volunteers.
Recommended allowance: $2,750 annual grant per community
composting site, with an initial objective of x10 sites regionally.
It is recommended that this funding is maintained for each new site,
for a minimum of x3 years to enable them to get established, with
consideration of longer-term support based on results.
3. REGIONAL: Larger Scale Composting
It is recommended that a Horizontal Composting Unit and/or a HotRot
in vessel composting system are investigated in more detail and
business case prepared, as potential future solutions for the Kaipara
District. Depending transport logistics and site suitability, the
composting hub/s may be located at waste transfer stations in the
Dargaville and/or Mangawhai areas. Consideration should be given to
the comparative advantage of having two sites, given the potential for
staff to also run other transfer station activities, verses a single hub
and with increased transport costs and environmental impact.
Projected population growth should also be considered.
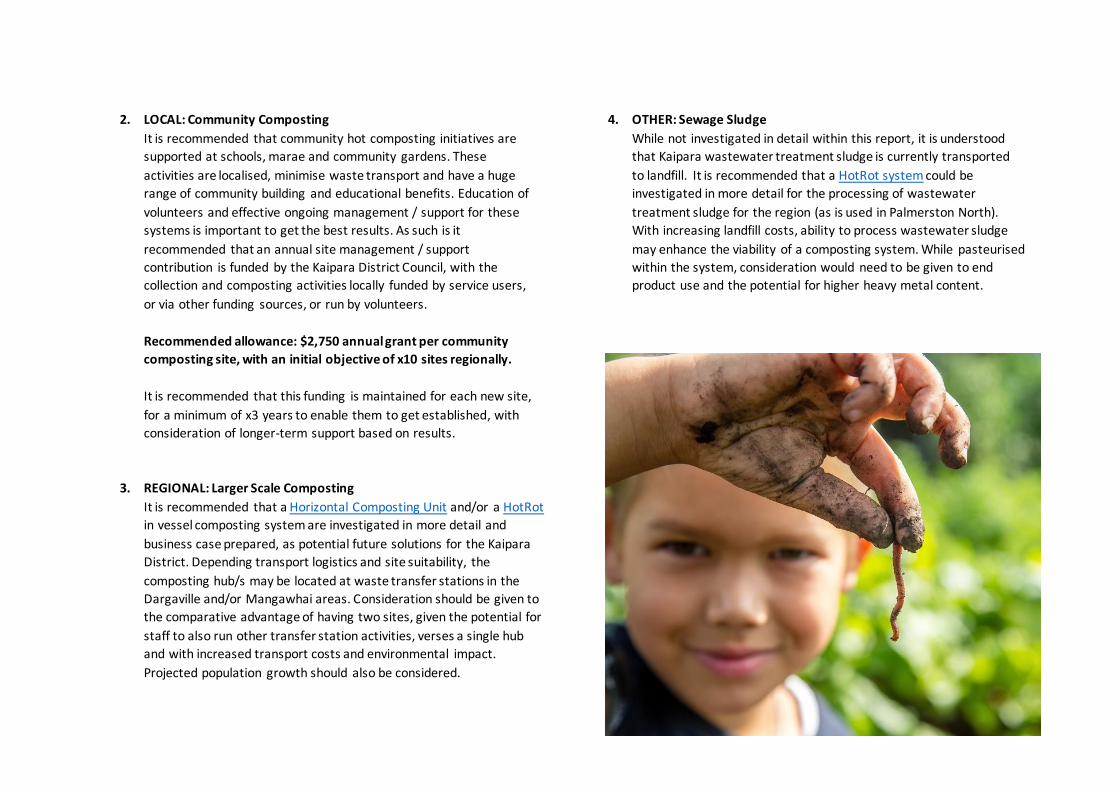
4. OTHER: Sewage Sludge
While not investigated in detail within this report, it is understood
that Kaipara wastewater treatment sludge is currently transported
to landfill. It is recommended that a HotRot system could be
investigated in more detail for the processing of wastewater
treatment sludge for the region (as is used in Palmerston North).
With increasing landfill costs, ability to process wastewater sludge
may enhance the viability of a composting system. While pasteurised
within the system, consideration would need to be given to end
product use and the potential for higher heavy metal content.
7
Acknowledgements THANKS TO: Impact Consulting would like to thank Sustainable Kaipara and the following
organisations and individuals for their time and input into our research for
this project. We hope it will prove to be a valuable resource.
Please note that while care has been taken in research, reporting and
subsequent recommendations, this is an independent report and as such has
not had direct input from the organisations listed. It therefore cannot be
considered to represent the views of the Kaipara District Council or any of
the individuals or organisations acknowledged or referenced.
KAIPARA
Stephanie Gibson - Sustainable Kaipara Compost Project Co-ordinator
Sarah Bray - Sustainable Kaipara
Kate Matheson - Sustainable Kaipara
Donna Powell - Kaipara District Council Solid Waste Manager
Victoria del la Varis-Woodcock - Kaipara District Councillor & Love Kaipara
Rob Battcher - Kaipara Refuse
Kaipara Residents and Businesses - x345 Survey Respondents
OTHER NORTHLAND ORGANISATIONS Trish Allen - Mangawhai Waste Busters
Susan Karels - Northland Eviroschools Co-ordinator
Andrew Sclater - Northland Waste
CONVERSATIONS WITH COMPOSTERS
Paul McGuire - Envirofert
Kate Walmsley - Kaicycle
Jess Barnes - Hampshire Urban Farm
Shannon Gormley - We Compost
Tim Bowater - OMG Auckland
Richard Wallis, Tim Bowater, Teresa Marinovich - The CarbonCycle Company
Rick Thorpe and Liz Stanway - Raglan Extreme Zero Waste
Ben Bushell - Community Compost
Prashanti Lovegrove - The Compost Co. Waiheke Resources Trust
OTHER CONVERSATIONS
Owen Embling - Convex Plastics (including compostable packaging)
Robert Murray – BioGro (organic certification)
Efforts were made to meet with additional Kaipara District Council and Northland
Regional Council Staff and councillors. However, these were not possible, due to
Auckland Covid-19 lockdown and resulting travel schedule changes.
8
NEEDS
ASSESSMENT
SE
CT
ION
1
9
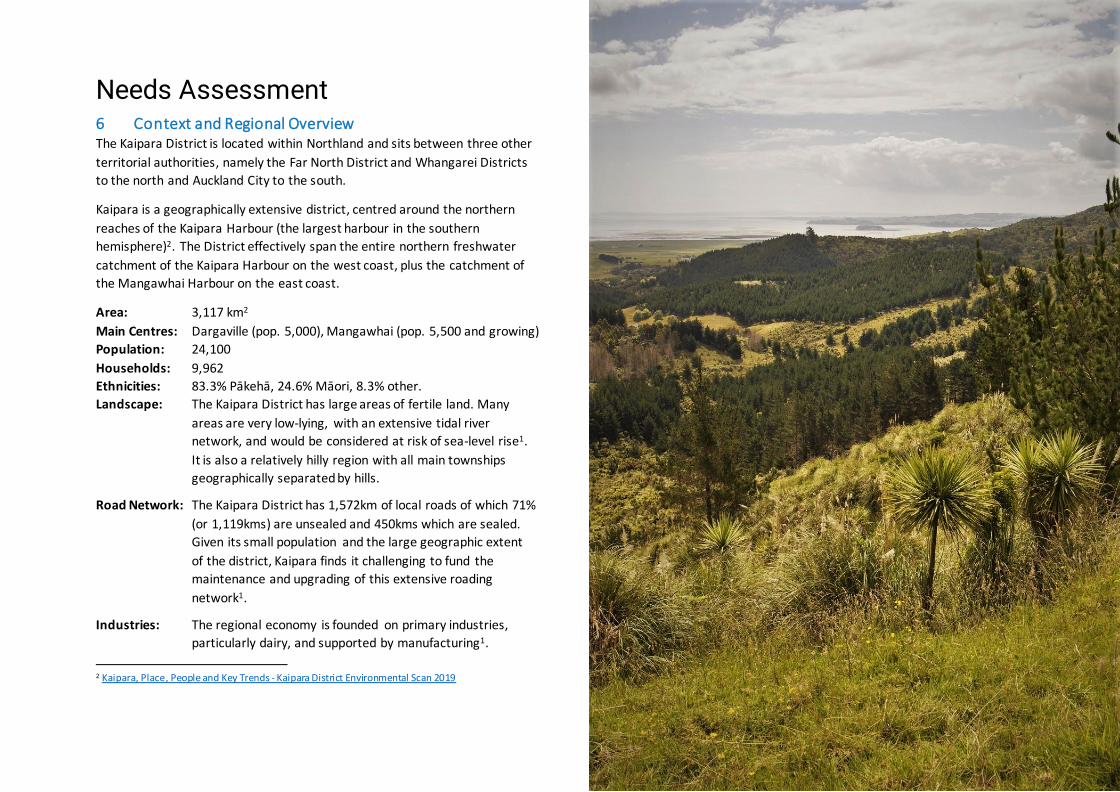
Needs Assessment 6 Context and Regional Overview The Kaipara District is located within Northland and sits between three other
territorial authorities, namely the Far North District and Whangarei Districts
to the north and Auckland City to the south.
Kaipara is a geographically extensive district, centred around the northern
reaches of the Kaipara Harbour (the largest harbour in the southern
hemisphere)2. The District effectively span the entire northern freshwater
catchment of the Kaipara Harbour on the west coast, plus the catchment of
the Mangawhai Harbour on the east coast.
Area: 3,117 km2
Main Centres: Dargaville (pop. 5,000), Mangawhai (pop. 5,500 and growing)
Population: 24,100
Households: 9,962
Ethnicities: 83.3% Pākehā, 24.6% Māori, 8.3% other.
Landscape: The Kaipara District has large areas of fertile land. Many
areas are very low-lying, with an extensive tidal river
network, and would be considered at risk of sea-level rise1.
It is also a relatively hilly region with all main townships
geographically separated by hills.
Road Network: The Kaipara District has 1,572km of local roads of which 71%
(or 1,119kms) are unsealed and 450kms which are sealed.
Given its small population and the large geographic extent
of the district, Kaipara finds it challenging to fund the
maintenance and upgrading of this extensive roading
network1.
Industries: The regional economy is founded on primary industries,
particularly dairy, and supported by manufacturing1.
2 Kaipara, Place, People and Key Trends - Kaipara District Environmental Scan 2019
10
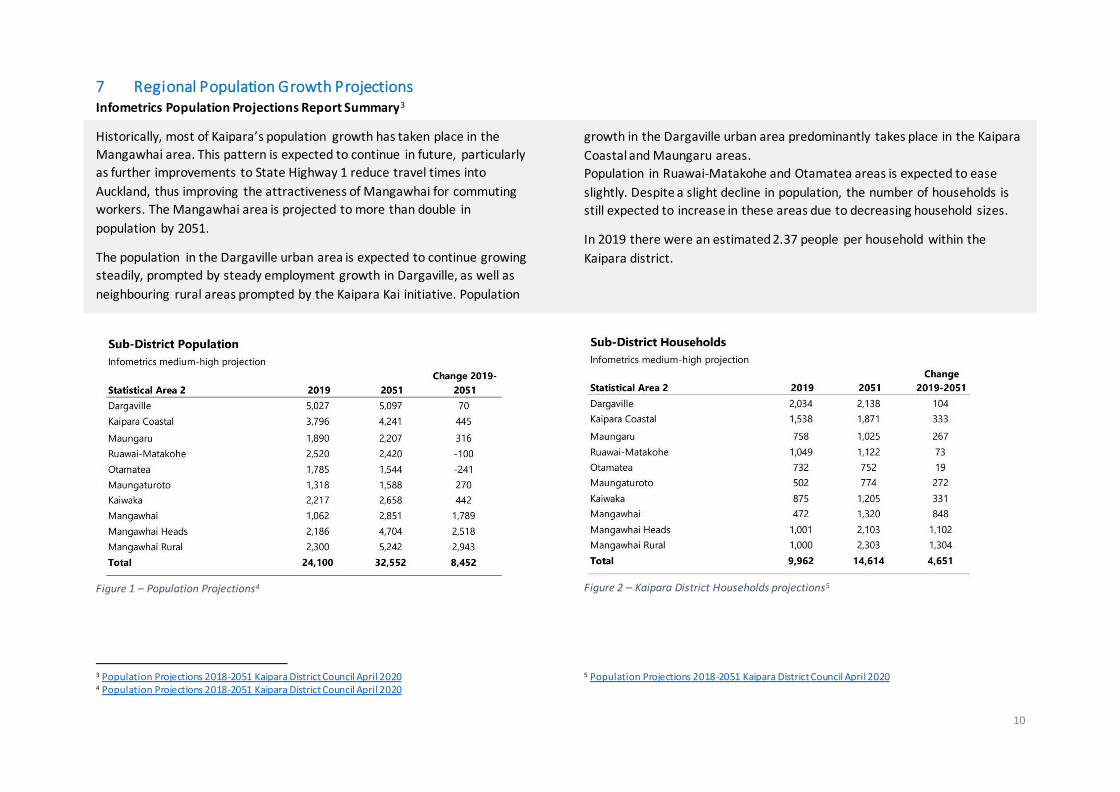
7 Regional Population Growth Projections Infometrics Population Projections Report Summary3
Historically, most of Kaipara’s population growth has taken place in the
Mangawhai area. This pattern is expected to continue in future, particularly
as further improvements to State Highway 1 reduce travel times into
Auckland, thus improving the attractiveness of Mangawhai for commuting
workers. The Mangawhai area is projected to more than double in
population by 2051.
The population in the Dargaville urban area is expected to continue growing
steadily, prompted by steady employment growth in Dargaville, as well as
neighbouring rural areas prompted by the Kaipara Kai initiative. Population
Figure 1 – Population Projections4
3 Population Projections 2018-2051 Kaipara District Council April 2020 4 Population Projections 2018-2051 Kaipara District Council April 2020
growth in the Dargaville urban area predominantly takes place in the Kaipara
Coastal and Maungaru areas.
Population in Ruawai-Matakohe and Otamatea areas is expected to ease
slightly. Despite a slight decline in population, the number of households is
still expected to increase in these areas due to decreasing household sizes.
In 2019 there were an estimated 2.37 people per household within the
Kaipara district.
Figure 2 – Kaipara District Households projections5
5 Population Projections 2018-2051 Kaipara District Council April 2020
https://www.kaipara.govt.nz/uploads/documents/p/Infometrics%20Kaipara%20projection%20report%20v2.pdf
11
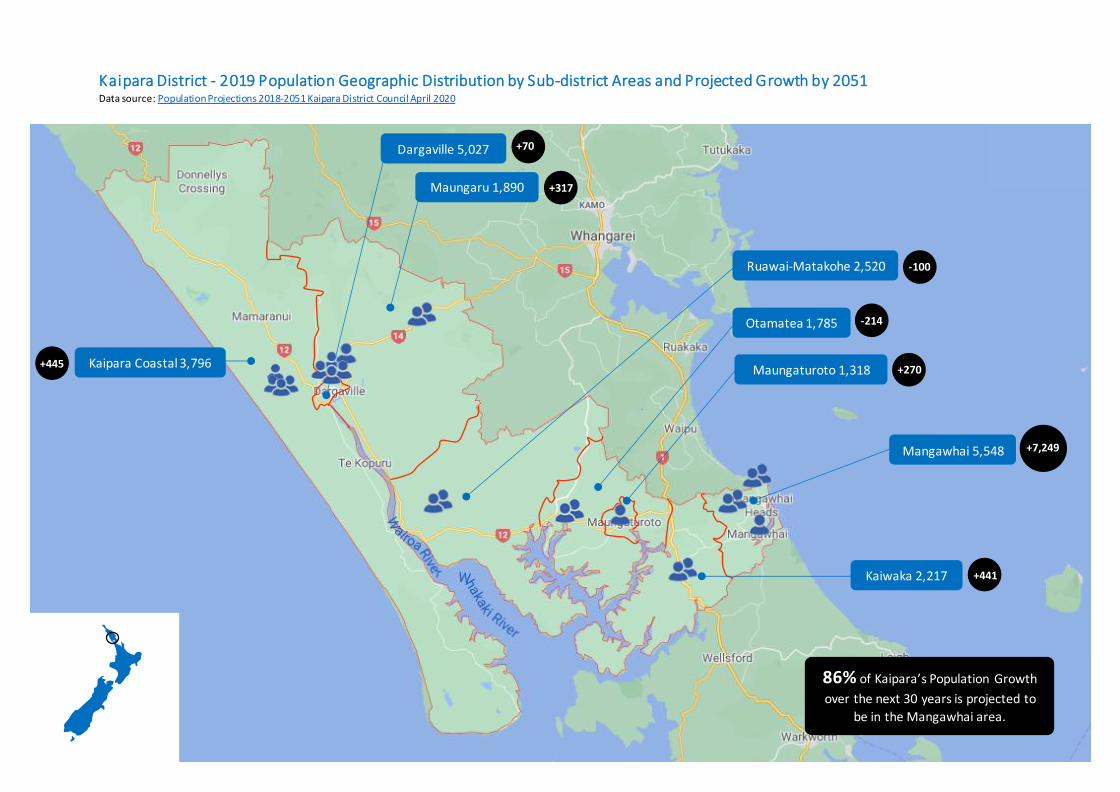
Dargaville 5,027
Kaipara Coastal 3,796
Maungaru 1,890
Ruawai-Matakohe 2,520
Otamatea 1,785
Maungaturoto 1,318
Kaiwaka 2,217
Mangawhai 5,548
Kaipara District - 2019 Population Geographic Distribution by Sub-district Areas and Projected Growth by 2051 Data source: Population Projections 2018-2051 Kaipara District Council April 2020
+445
+70
+317
-100
-214
+270
+7,249
+441
86% of Kaipara’s Population Growth
over the next 30 years is projected to
be in the Mangawhai area.
12
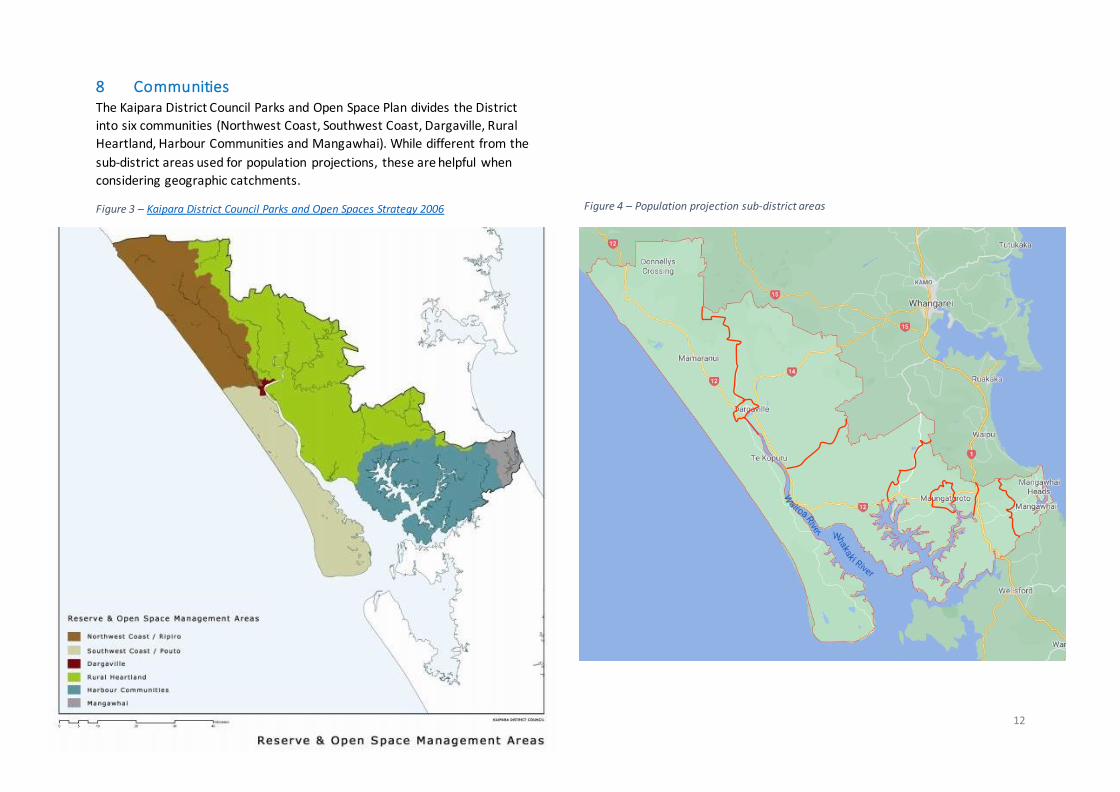
8 Communities The Kaipara District Council Parks and Open Space Plan divides the District
into six communities (Northwest Coast, Southwest Coast, Dargaville, Rural
Heartland, Harbour Communities and Mangawhai). While different from the
sub-district areas used for population projections, these are helpful when
considering geographic catchments.
Figure 3 – Kaipara District Council Parks and Open Spaces Strategy 2006
Figure 4 – Population projection sub-district areas
13
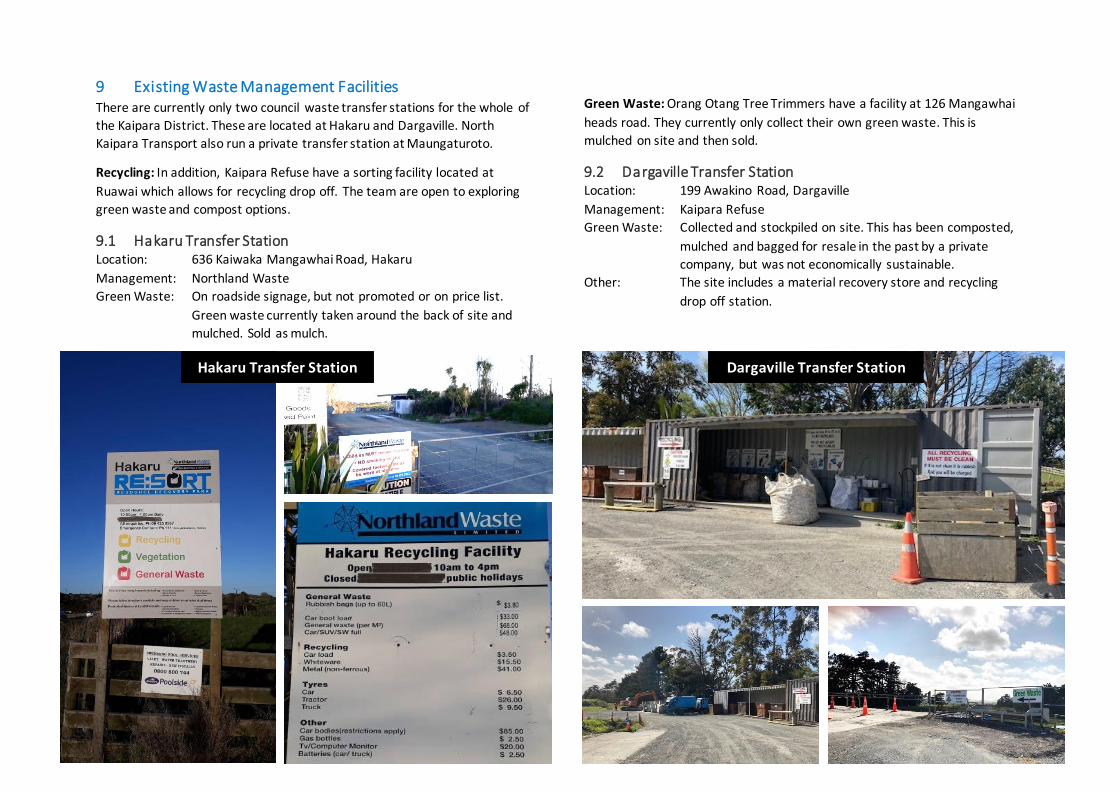
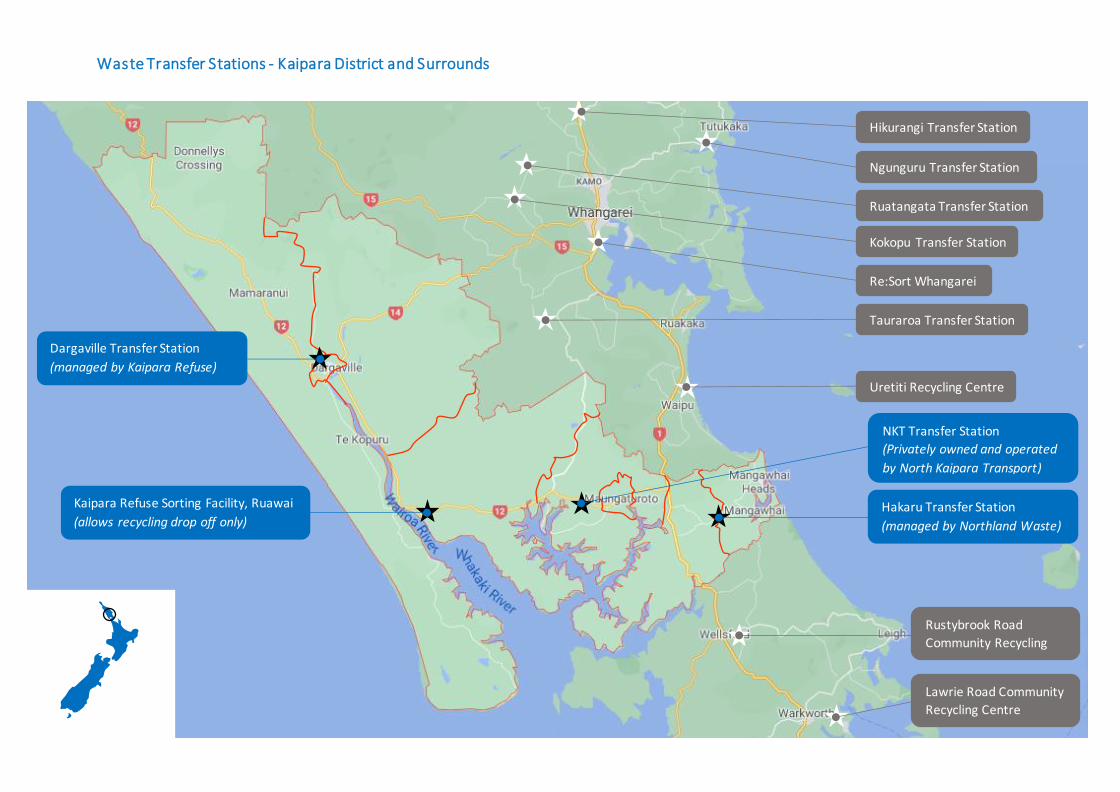
9 Existing Waste Management Facilities There are currently only two council waste transfer stations for the whole of
the Kaipara District. These are located at Hakaru and Dargaville. North
Kaipara Transport also run a private transfer station at Maungaturoto.
Recycling: In addition, Kaipara Refuse have a sorting facility located at
Ruawai which allows for recycling drop off. The team are open to exploring
green waste and compost options.
9.1 Hakaru Transfer Station Location: 636 Kaiwaka Mangawhai Road, Hakaru
Management: Northland Waste
Green Waste: On roadside signage, but not promoted or on price list.
Green waste currently taken around the back of site and
mulched. Sold as mulch.
Green Waste: Orang Otang Tree Trimmers have a facility at 126 Mangawhai
heads road. They currently only collect their own green waste. This is
mulched on site and then sold.
9.2 Dargaville Transfer Station Location: 199 Awakino Road, Dargaville
Management: Kaipara Refuse
Green Waste: Collected and stockpiled on site. This has been composted,
mulched and bagged for resale in the past by a private
company, but was not economically sustainable.
Other: The site includes a material recovery store and recycling
drop off station.
Hakaru Transfer Station Dargaville Transfer Station
14
Uretiti Recycling Centre
Ngunguru Transfer Station
Lawrie Road Community
Recycling Centre
Rustybrook Road
Community Recycling
Centre
Re:Sort Whangarei
Tauraroa Transfer Station
Hikurangi Transfer Station
Ruatangata Transfer Station
Kokopu Transfer Station
Hakaru Transfer Station
(managed by Northland Waste)
Dargaville Transfer Station
(managed by Kaipara Refuse)
Kaipara Refuse Sorting Facility, Ruawai
(allows recycling drop off only)
Waste Transfer Stations - Kaipara District and Surrounds
NKT Transfer Station
(Privately owned and operated
by North Kaipara Transport)
15
10 Travel Times
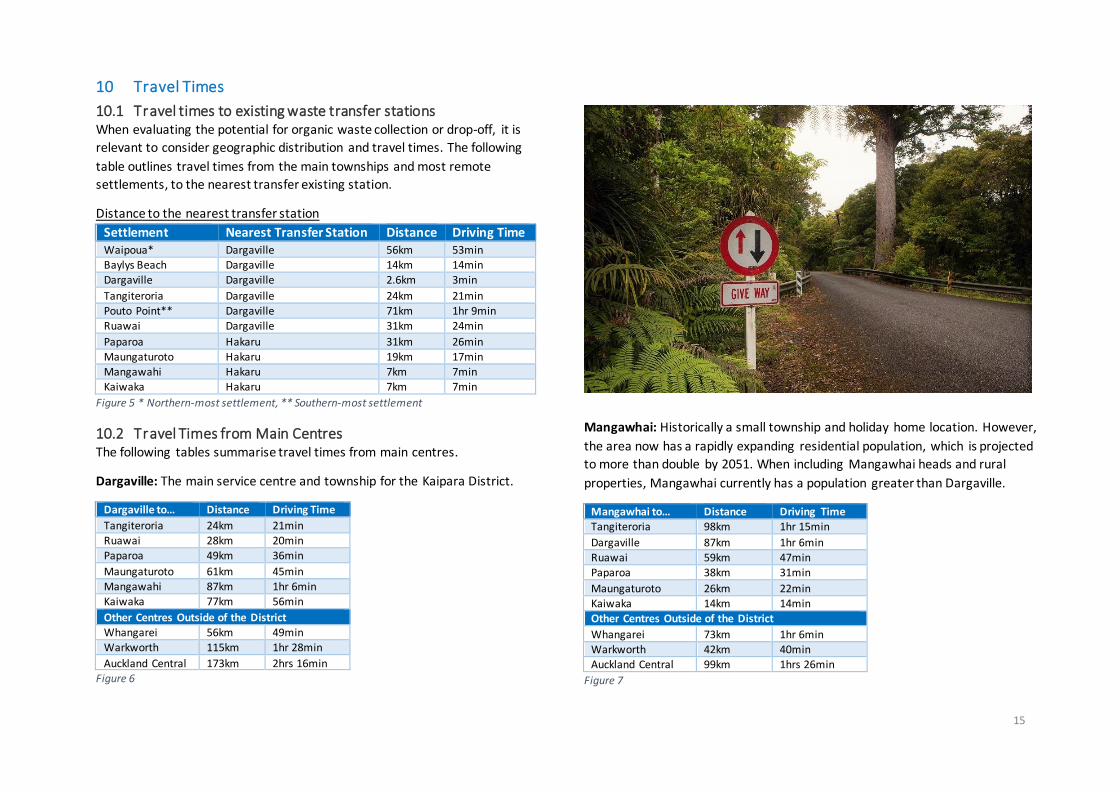
10.1 Travel times to existing waste transfer stations When evaluating the potential for organic waste collection or drop-off, it is
relevant to consider geographic distribution and travel times. The following
table outlines travel times from the main townships and most remote
settlements, to the nearest transfer existing station.
Distance to the nearest transfer station
Settlement Nearest Transfer Station Distance Driving Time Waipoua* Dargaville 56km 53min Baylys Beach Dargaville 14km 14min
Dargaville Dargaville 2.6km 3min
Tangiteroria Dargaville 24km 21min Pouto Point** Dargaville 71km 1hr 9min
Ruawai Dargaville 31km 24min
Paparoa Hakaru 31km 26min
Maungaturoto Hakaru 19km 17min
Mangawahi Hakaru 7km 7min Kaiwaka Hakaru 7km 7min
Figure 5 * Northern-most settlement, ** Southern-most settlement
10.2 Travel Times from Main Centres The following tables summarise travel times from main centres.
Dargaville: The main service centre and township for the Kaipara District.
Dargaville to… Distance Driving Time
Tangiteroria 24km 21min
Ruawai 28km 20min
Paparoa 49km 36min
Maungaturoto 61km 45min
Mangawahi 87km 1hr 6min Kaiwaka 77km 56min
Other Centres Outside of the District
Whangarei 56km 49min Warkworth 115km 1hr 28min
Auckland Central 173km 2hrs 16min
Figure 6
Mangawhai: Historically a small township and holiday home location. However,
the area now has a rapidly expanding residential population, which is projected
to more than double by 2051. When including Mangawhai heads and rural
properties, Mangawhai currently has a population greater than Dargaville.
Mangawhai to… Distance Driving Time Tangiteroria 98km 1hr 15min
Dargaville 87km 1hr 6min
Ruawai 59km 47min Paparoa 38km 31min
Maungaturoto 26km 22min Kaiwaka 14km 14min
Other Centres Outside of the District
Whangarei 73km 1hr 6min Warkworth 42km 40min
Auckland Central 99km 1hrs 26min
Figure 7
16
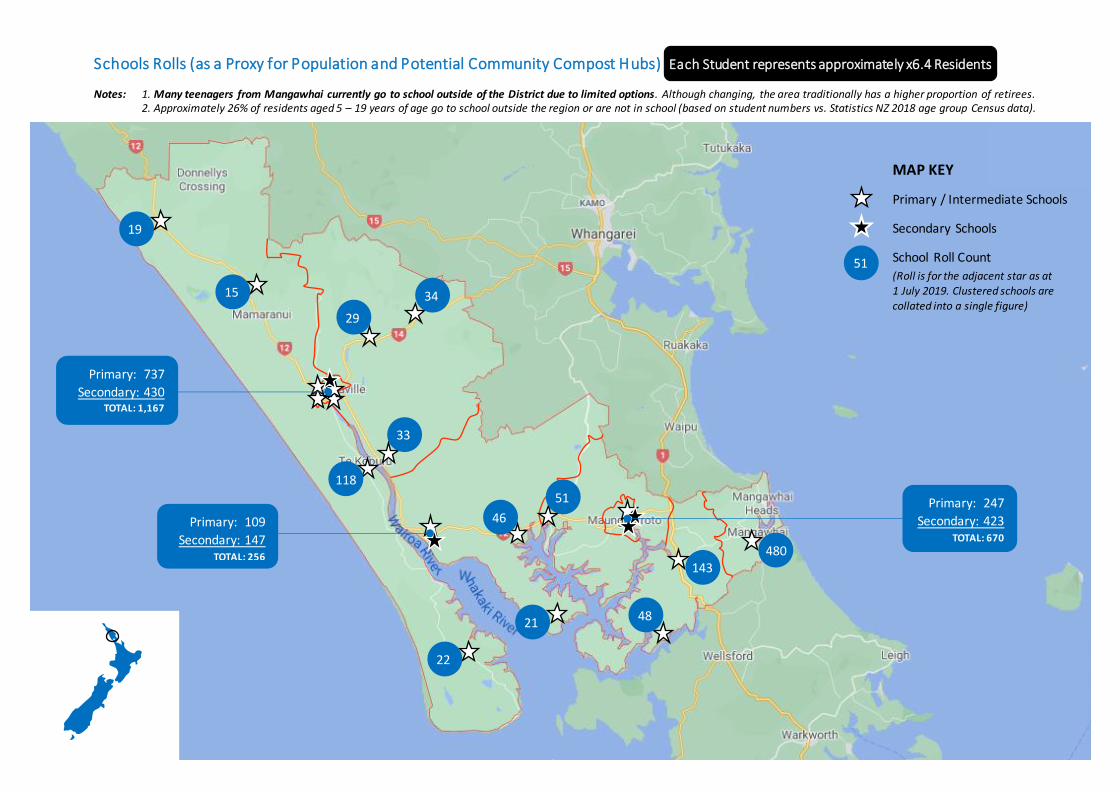
Primary: 737
Secondary: 430 TOTAL: 1,167
Primary: 109
Secondary: 147 TOTAL: 256
Primary: 247
Secondary: 423 TOTAL: 670
19
15
29
34
22
118
33
46
51
21 48
143
480
MAP KEY
Primary / Intermediate Schools
Secondary Schools
School Roll Count
(Roll is for the adjacent star as at 1 July 2019. Clustered schools are
collated into a single figure)
Schools Rolls (as a Proxy for Population and Potential Community Compost Hubs) Each Student represents approximately x6.4 Residents
Notes: 1. Many teenagers from Mangawhai currently go to school outside of the District due to limited options. Although changing, the area traditionally has a higher proportion of retirees. 2. Approximately 26% of residents aged 5 – 19 years of age go to school outside the region or are not in school (based on student numbers vs. Statistics NZ 2018 age group Census data).
51
17
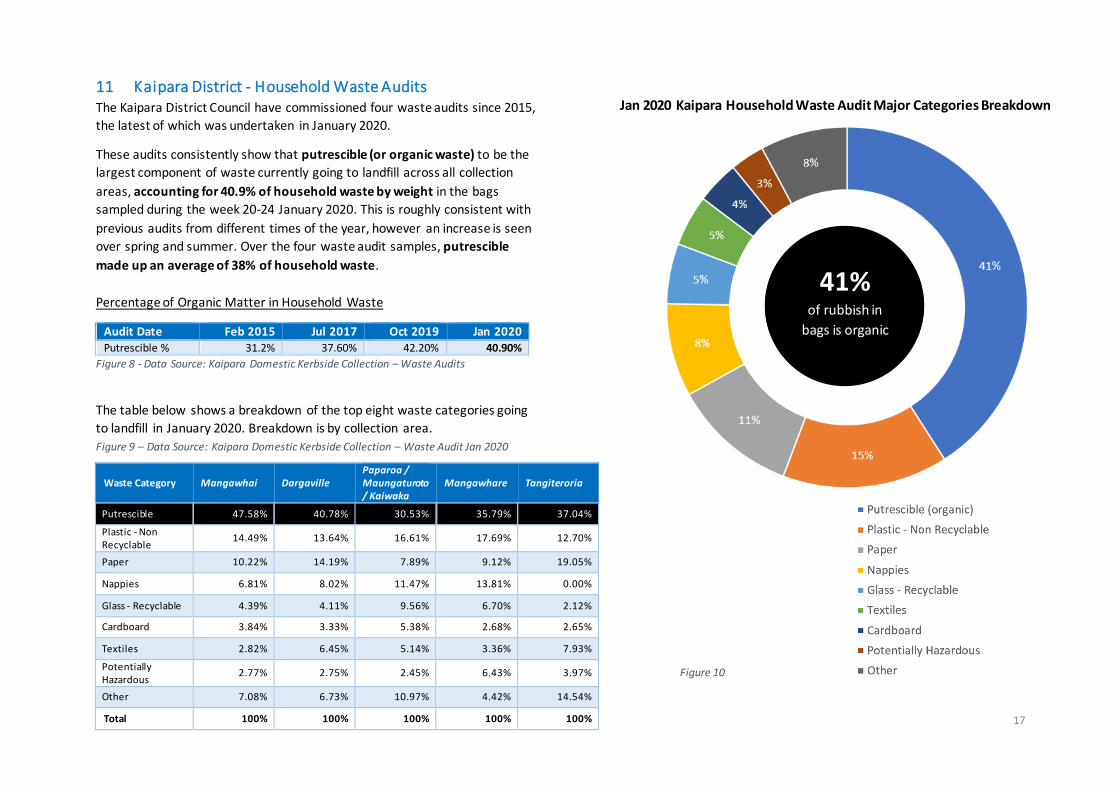
11 Kaipara District - Household Waste Audits The Kaipara District Council have commissioned four waste audits since 2015,
the latest of which was undertaken in January 2020.
These audits consistently show that putrescible (or organic waste) to be the
largest component of waste currently going to landfill across all collection
areas, accounting for 40.9% of household waste by weight in the bags
sampled during the week 20-24 January 2020. This is roughly consistent with
previous audits from different times of the year, however an increase is seen
over spring and summer. Over the four waste audit samples, putrescible
made up an average of 38% of household waste.
Percentage of Organic Matter in Household Waste
Audit Date Feb 2015 Jul 2017 Oct 2019 Jan 2020 Putrescible % 31.2% 37.60% 42.20% 40.90%
Figure 8 - Data Source: Kaipara Domestic Kerbside Collection – Waste Audits
The table below shows a breakdown of the top eight waste categories going
to landfill in January 2020. Breakdown is by collection area.
Figure 9 – Data Source: Kaipara Domestic Kerbside Collection – Waste Audit Jan 2020
Figure 10
Waste Category Mangawhai Dargaville Paparoa / Maungaturoto / Kaiwaka
Mangawhare Tangiteroria
Putrescible 47.58% 40.78% 30.53% 35.79% 37.04%
Plastic - Non Recyclable
14.49% 13.64% 16.61% 17.69% 12.70%
Paper 10.22% 14.19% 7.89% 9.12% 19.05%
Nappies 6.81% 8.02% 11.47% 13.81% 0.00%
Glass - Recyclable 4.39% 4.11% 9.56% 6.70% 2.12%
Cardboard 3.84% 3.33% 5.38% 2.68% 2.65%
Textiles 2.82% 6.45% 5.14% 3.36% 7.93%
Potentially Hazardous
2.77% 2.75% 2.45% 6.43% 3.97%
Other 7.08% 6.73% 10.97% 4.42% 14.54%
Total 100% 100% 100% 100% 100%
Jan 2020 Kaipara Household Waste Audit Major Categories Breakdown
41%
of rubbish in
bags is organic
18
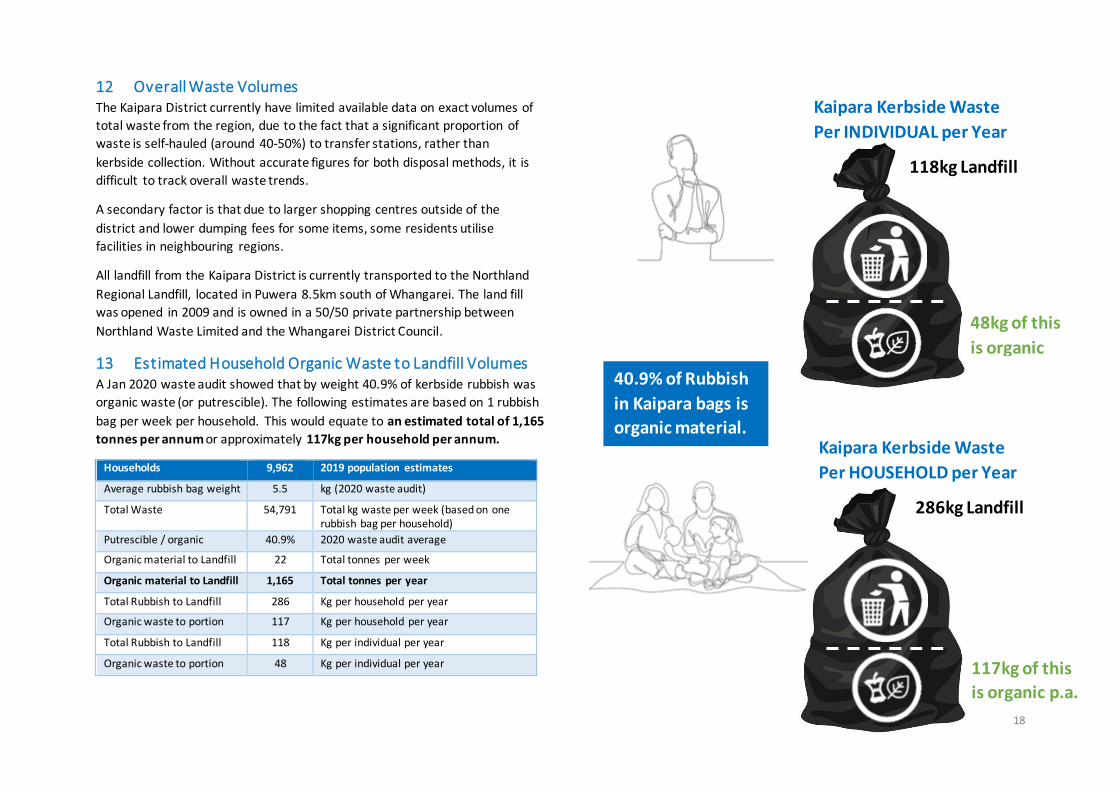
12 Overall Waste Volumes The Kaipara District currently have limited available data on exact volumes of
total waste from the region, due to the fact that a significant proportion of
waste is self-hauled (around 40-50%) to transfer stations, rather than
kerbside collection. Without accurate figures for both disposal methods, it is
difficult to track overall waste trends.
A secondary factor is that due to larger shopping centres outside of the
district and lower dumping fees for some items, some residents utilise
facilities in neighbouring regions.
All landfill from the Kaipara District is currently transported to the Northland
Regional Landfill, located in Puwera 8.5km south of Whangarei. The land fill
was opened in 2009 and is owned in a 50/50 private partnership between
Northland Waste Limited and the Whangarei District Council.
13 Estimated Household Organic Waste to Landfill Volumes A Jan 2020 waste audit showed that by weight 40.9% of kerbside rubbish was
organic waste (or putrescible). The following estimates are based on 1 rubbish
bag per week per household. This would equate to an estimated total of 1,165
tonnes per annum or approximately 117kg per household per annum.
Households 9,962 2019 population estimates
Average rubbish bag weight 5.5 kg (2020 waste audit)
Total Waste 54,791 Total kg waste per week (based on one rubbish bag per household)
Putrescible / organic 40.9% 2020 waste audit average
Organic material to Landfill 22 Total tonnes per week
Organic material to Landfill 1,165 Total tonnes per year
Total Rubbish to Landfill 286 Kg per household per year
Organic waste to portion 117 Kg per household per year
Total Rubbish to Landfill 118 Kg per individual per year
Organic waste to portion 48 Kg per individual per year
117kg of this
is organic p.a.
Kaipara Kerbside Waste
Per INDIVIDUAL per Year
118kg Landfill
Kaipara Kerbside Waste
Per HOUSEHOLD per Year
286kg Landfill
48kg of this
is organic
40.9% of Rubbish
in Kaipara bags is
organic material.
19
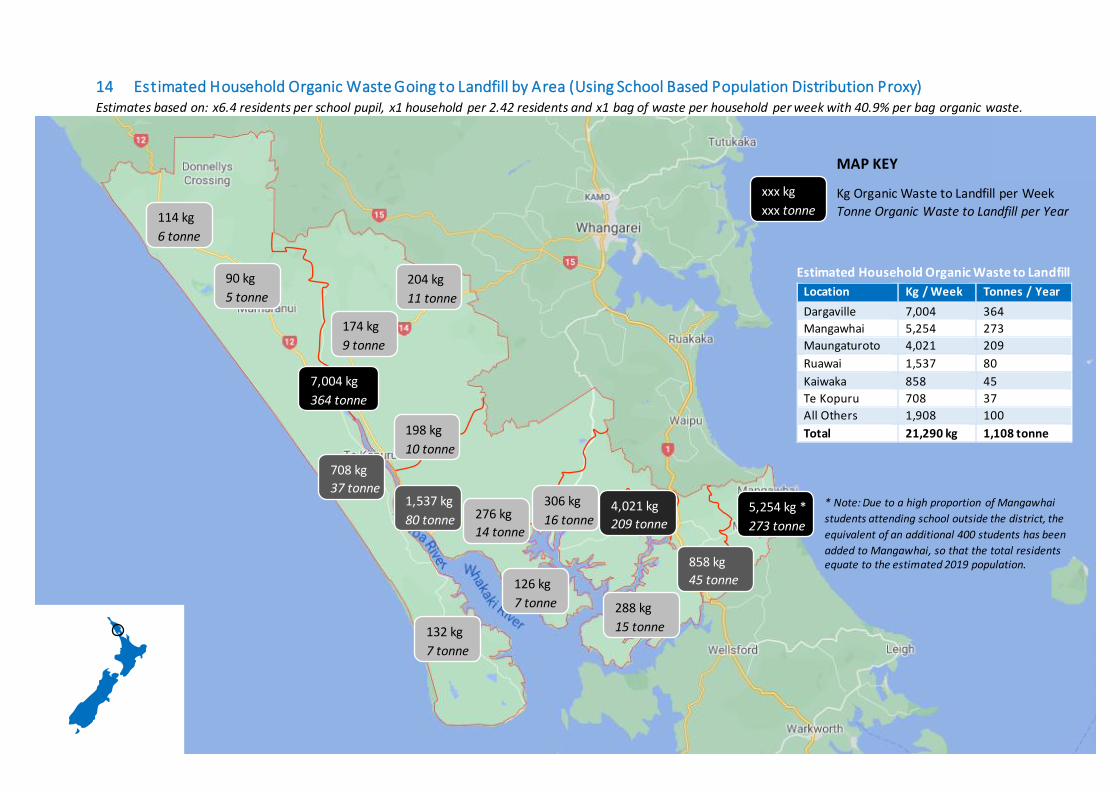
14 Estimated Household Organic Waste Going to Landfill by Area (Using School Based Population Distribution Proxy) Estimates based on: x6.4 residents per school pupil, x1 household per 2.42 residents and x1 bag of waste per household per week with 40.9% per bag organic waste.
114 kg
6 tonne
MAP KEY
Kg Organic Waste to Landfill per Week
Tonne Organic Waste to Landfill per Year
90 kg
5 tonne
204 kg
11 tonne
174 kg
9 tonne
7,004 kg
364 tonne
198 kg
10 tonne
132 kg
7 tonne
708 kg
37 tonne
276 kg
14 tonne
306 kg
16 tonne
126 kg
7 tonne
4,021 kg
209 tonne
288 kg
15 tonne
858 kg
45 tonne
5,254 kg *
273 tonne
xxx kg
xxx tonne
* Note: Due to a high proportion of Mangawhai
students attending school outside the district, the
equivalent of an additional 400 students has been
added to Mangawhai, so that the total residents equate to the estimated 2019 population.
Estimated Household Organic Waste to Landfill
Location Kg / Week Tonnes / Year
Dargaville 7,004 364
Mangawhai 5,254 273
Maungaturoto 4,021 209
Ruawai 1,537 80
Kaiwaka 858 45
Te Kopuru 708 37
All Others 1,908 100
Total 21,290 kg 1,108 tonne
1,537 kg
80 tonne
20
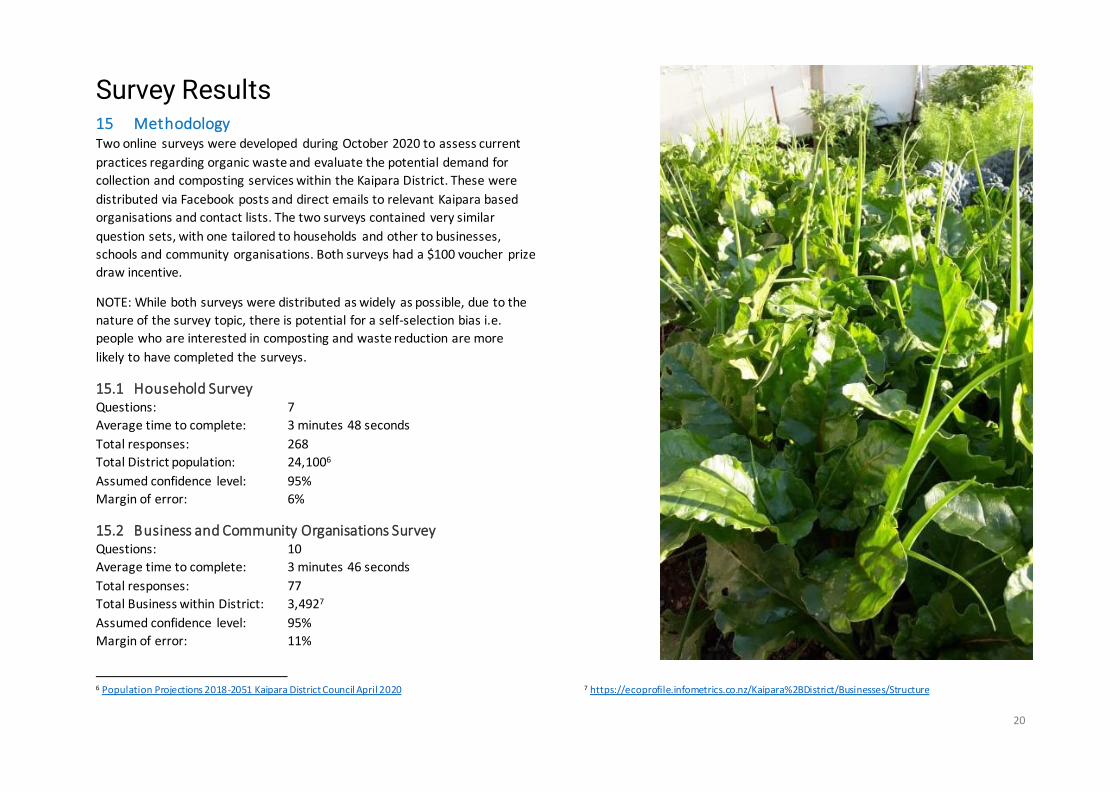
Survey Results 15 Methodology Two online surveys were developed during October 2020 to assess current
practices regarding organic waste and evaluate the potential demand for
collection and composting services within the Kaipara District. These were
distributed via Facebook posts and direct emails to relevant Kaipara based
organisations and contact lists. The two surveys contained very similar
question sets, with one tailored to households and other to businesses,
schools and community organisations. Both surveys had a $100 voucher prize
draw incentive.
NOTE: While both surveys were distributed as widely as possible, due to the
nature of the survey topic, there is potential for a self-selection bias i.e.
people who are interested in composting and waste reduction are more
likely to have completed the surveys.
15.1 Household Survey Questions: 7
Average time to complete: 3 minutes 48 seconds
Total responses: 268
Total District population: 24,1006
Assumed confidence level: 95%
Margin of error: 6%
15.2 Business and Community Organisations Survey Questions: 10
Average time to complete: 3 minutes 46 seconds
Total responses: 77
Total Business within District: 3,4927
Assumed confidence level: 95%
Margin of error: 11%
6 Population Projections 2018-2051 Kaipara District Council April 2020
7 https://ecoprofile.infometrics.co.nz/Kaipara%2BDistrict/Businesses/Structure
21
1% 1%
19%
5% 0.4%
3%
3%
0.4%
0.4%
1%
6%
0.4%
18% 3%
1%
3%
12%
3%
1%
1%
0.7%
0.4%
6%
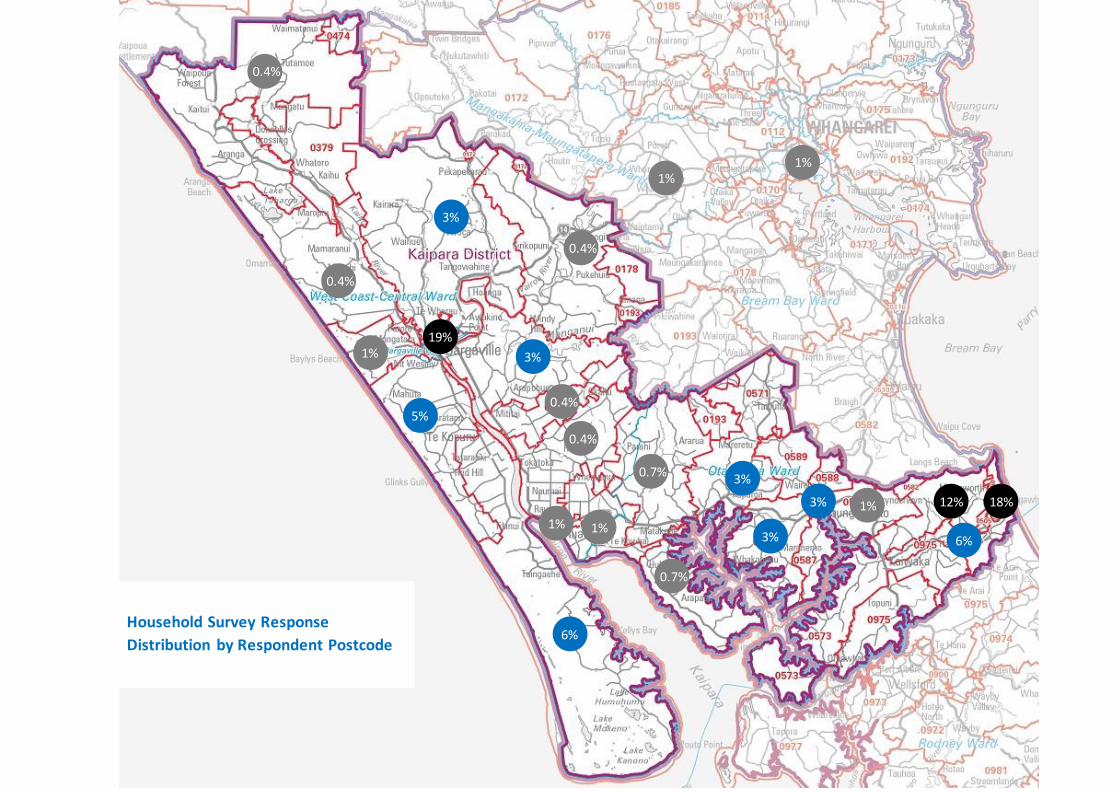
0.7%
Household Survey Response
Distribution by Respondent Postcode
22
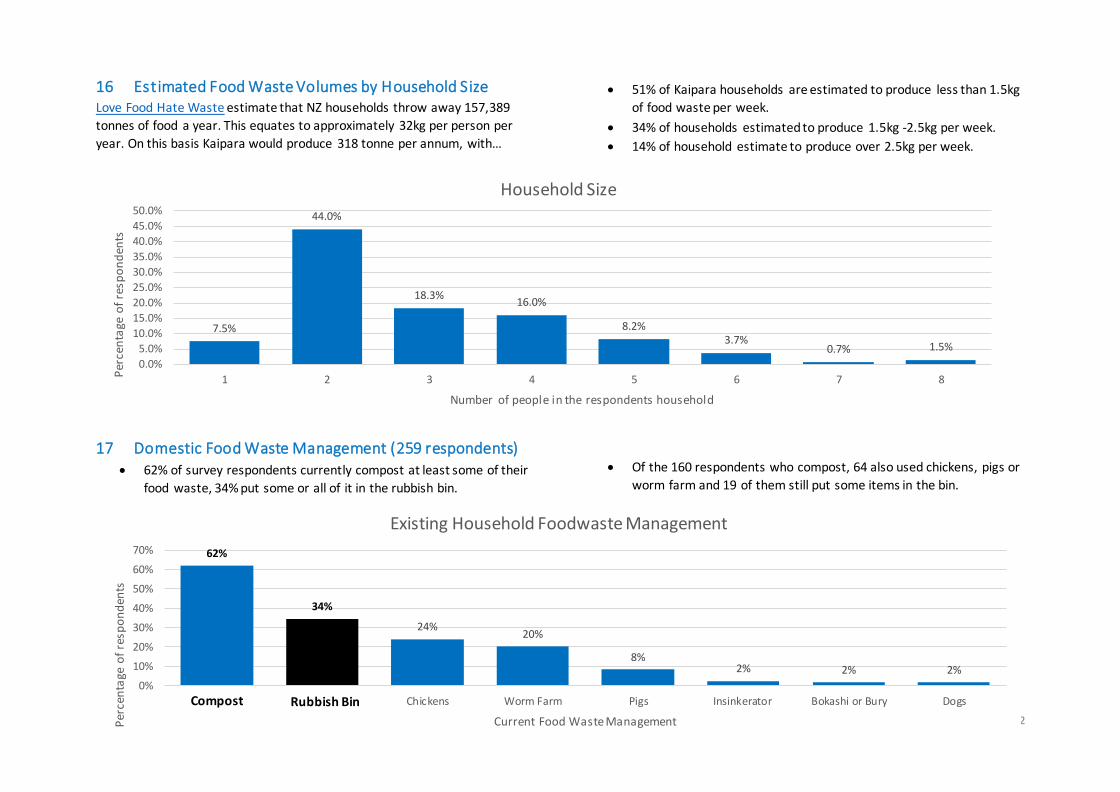
16 Estimated Food Waste Volumes by Household Size Love Food Hate Waste estimate that NZ households throw away 157,389
tonnes of food a year. This equates to approximately 32kg per person per
year. On this basis Kaipara would produce 318 tonne per annum, with…
17 Domestic Food Waste Management (259 respondents) • 62% of survey respondents currently compost at least some of their
food waste, 34% put some or all of it in the rubbish bin.
• 51% of Kaipara households are estimated to produce less than 1.5kg
of food waste per week.
• 34% of households estimated to produce 1.5kg -2.5kg per week.
• 14% of household estimate to produce over 2.5kg per week.
• Of the 160 respondents who compost, 64 also used chickens, pigs or
worm farm and 19 of them still put some items in the bin.
Compost
62%
34%
24%20%
8%2% 2% 2%
0%
10%
20%
30%
40%
50%
60%
70%
Compost Rubbish Bin Chickens Worm Farm Pigs Insinkerator Bokashi or Bury Dogs
Per
cen
tage
of
resp
on
den
ts
Current Food Waste Management
Existing Household Foodwaste Management
7.5%
44.0%
18.3%16.0%
8.2%3.7%
0.7% 1.5%
0.0%
5.0%
10.0%
15.0%
20.0%
25.0%
30.0%
35.0%
40.0%
45.0%
50.0%
1 2 3 4 5 6 7 8Per
cen
tage
of
resp
on
den
ts
Number of people in the respondents household
Household Size
Compost Rubbish Bin
23
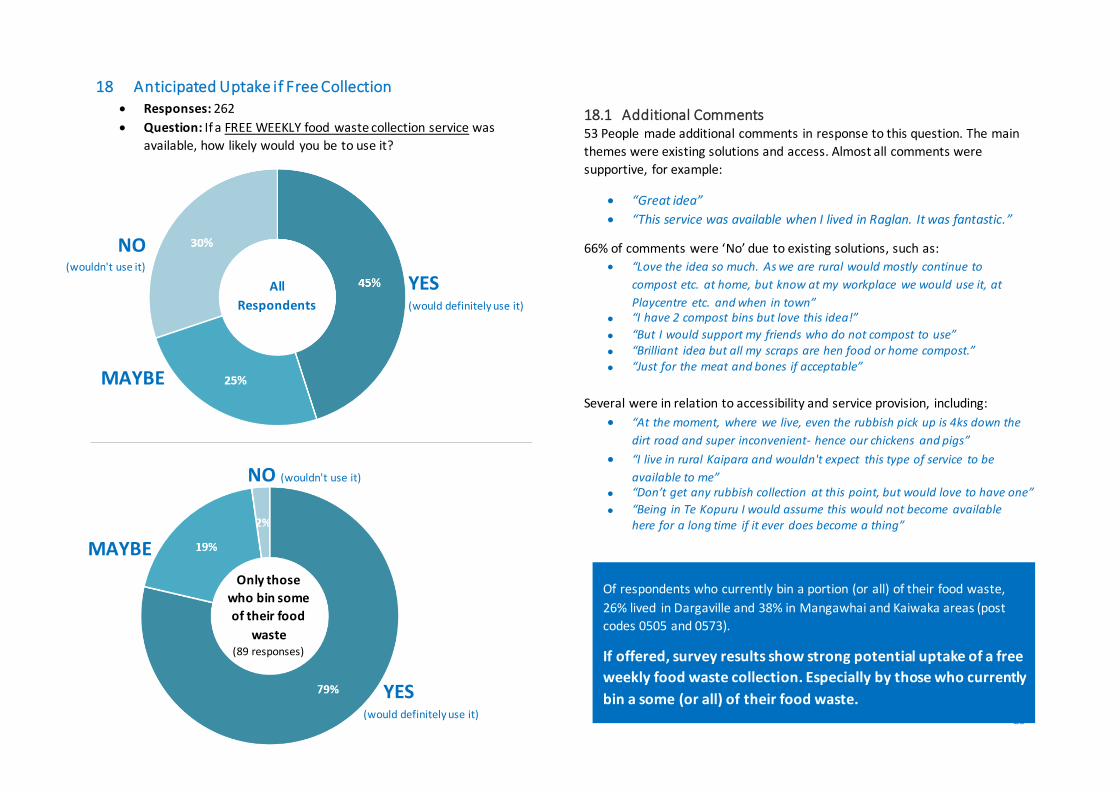
18 Anticipated Uptake if Free Collection • Responses: 262
• Question: If a FREE WEEKLY food waste collection service was
available, how likely would you be to use it?
18.1 Additional Comments 53 People made additional comments in response to this question. The main
themes were existing solutions and access. Almost all comments were
supportive, for example:
• “Great idea”
• “This service was available when I lived in Raglan. It was fantastic.”
66% of comments were ‘No’ due to existing solutions, such as:
• “Love the idea so much. As we are rural would mostly continue to
compost etc. at home, but know at my workplace we would use it, at
Playcentre etc. and when in town” • “I have 2 compost bins but love this idea!”
• “But I would support my friends who do not compost to use”
• “Brilliant idea but all my scraps are hen food or home compost.”
• “Just for the meat and bones if acceptable”
Several were in relation to accessibility and service provision, including:
• “At the moment, where we live, even the rubbish pick up is 4ks down the
dirt road and super inconvenient- hence our chickens and pigs”
• “I live in rural Kaipara and wouldn't expect this type of service to be
available to me” • “Don’t get any rubbish collection at this point, but would love to have one”
• “Being in Te Kopuru I would assume this would not become available here for a long time if it ever does become a thing”
NO (wouldn't use it)
YES (would definitely use it)
MAYBE
All
Respondents
Only those
who bin some
of their food
waste (89 responses)
YES (would definitely use it)
MAYBE
Of respondents who currently bin a portion (or all) of their food waste,
26% lived in Dargaville and 38% in Mangawhai and Kaiwaka areas (post
codes 0505 and 0573).
If offered, survey results show strong potential uptake of a free
weekly food waste collection. Especially by those who currently
bin a some (or all) of their food waste.
NO (wouldn't use it)
24
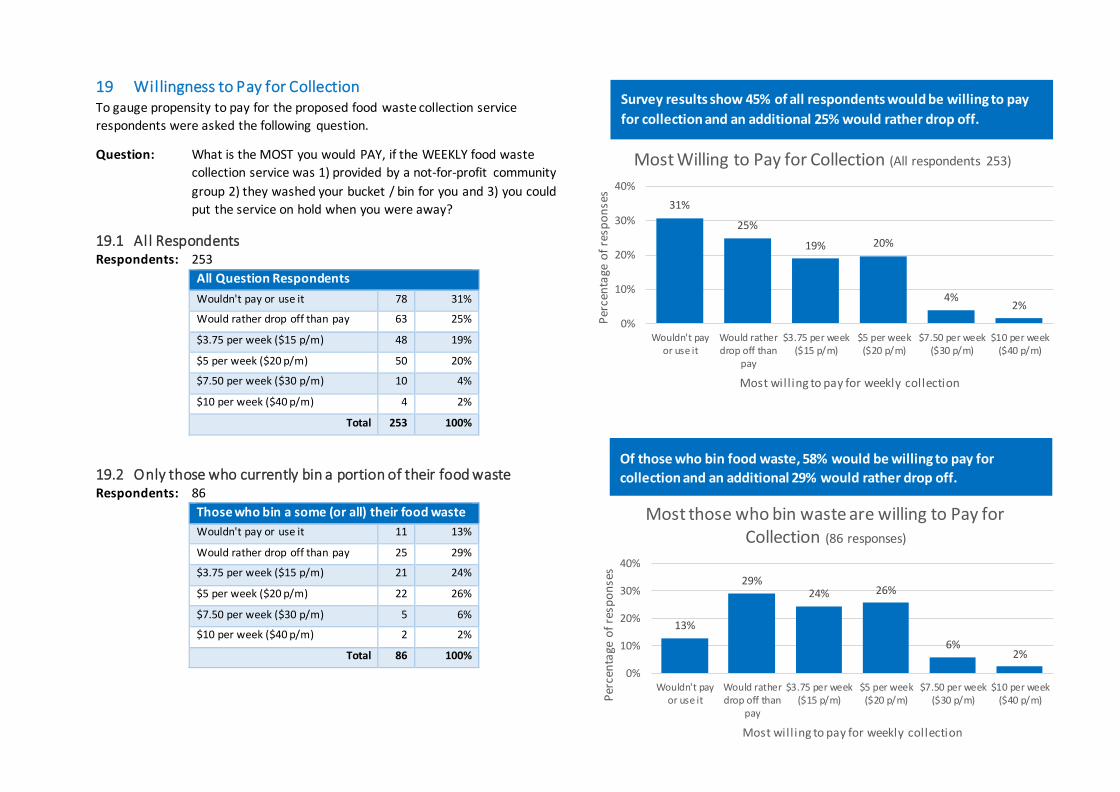
19 Willingness to Pay for Collection To gauge propensity to pay for the proposed food waste collection service
respondents were asked the following question.
Question: What is the MOST you would PAY, if the WEEKLY food waste
collection service was 1) provided by a not-for-profit community
group 2) they washed your bucket / bin for you and 3) you could
put the service on hold when you were away?
19.1 All Respondents Respondents: 253
All Question Respondents
Wouldn't pay or use it 78 31%
Would rather drop off than pay 63 25%
$3.75 per week ($15 p/m) 48 19%
$5 per week ($20 p/m) 50 20%
$7.50 per week ($30 p/m) 10 4%
$10 per week ($40 p/m) 4 2%
Total 253 100%
19.2 Only those who currently bin a portion of their food waste Respondents: 86
Those who bin a some (or all) their food waste
Wouldn't pay or use it 11 13%
Would rather drop off than pay 25 29%
$3.75 per week ($15 p/m) 21 24%
$5 per week ($20 p/m) 22 26%
$7.50 per week ($30 p/m) 5 6%
$10 per week ($40 p/m) 2 2%
Total 86 100%
31%
25%
19% 20%
4%2%
0%
10%
20%
30%
40%
Wouldn't payor use it
Would ratherdrop off than
pay
$3.75 per week($15 p/m)
$5 per week($20 p/m)
$7.50 per week($30 p/m)
$10 per week($40 p/m)
Per
cen
tage
of
resp
on
ses
Most will ing to pay for weekly collection
Most Willing to Pay for Collection (All respondents 253)
13%
29%24% 26%
6%2%
0%
10%
20%
30%
40%
Wouldn't payor use it
Would ratherdrop off than
pay
$3.75 per week($15 p/m)
$5 per week($20 p/m)
$7.50 per week($30 p/m)
$10 per week($40 p/m)P
erce
nta
ge o
f re
spo
nse
s
Most will ing to pay for weekly collection
Most those who bin waste are willing to Pay for Collection (86 responses)
Of those who bin food waste, 58% would be willing to pay for
collection and an additional 29% would rather drop off.
Survey results show 45% of all respondents would be willing to pay
for collection and an additional 25% would rather drop off.
25
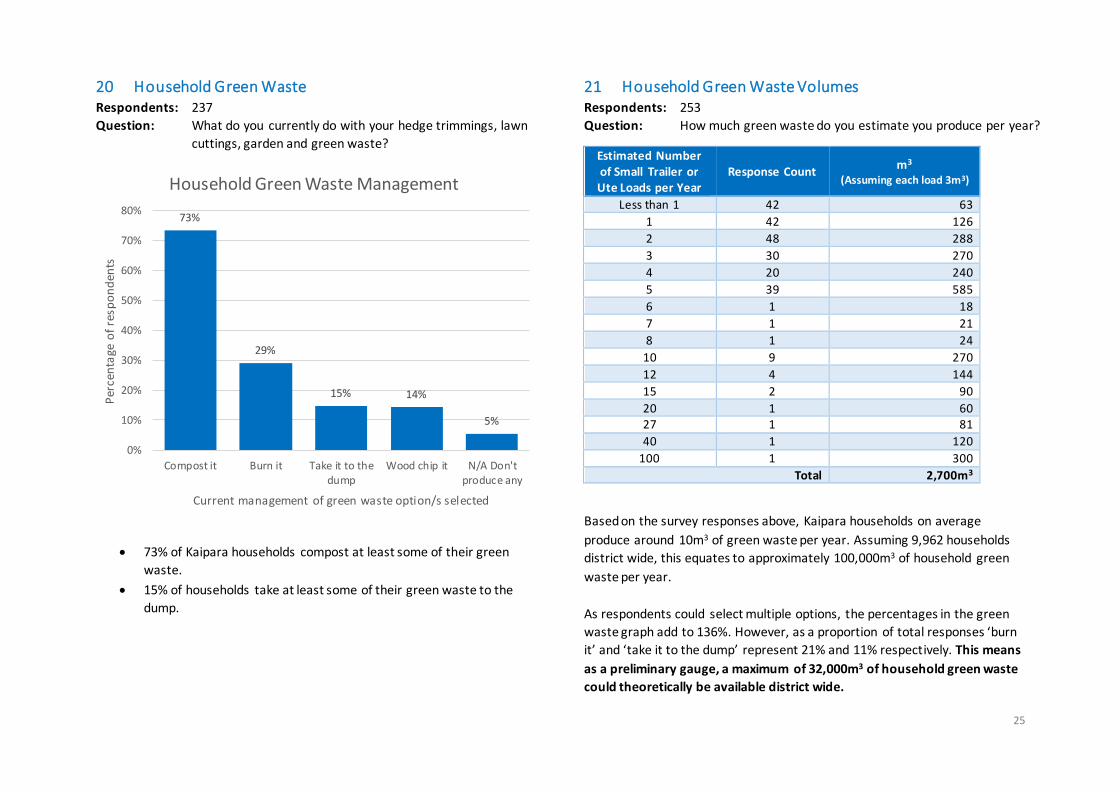
20 Household Green Waste Respondents: 237
Question: What do you currently do with your hedge trimmings, lawn
cuttings, garden and green waste?
• 73% of Kaipara households compost at least some of their green
waste.
• 15% of households take at least some of their green waste to the
dump.
21 Household Green Waste Volumes Respondents: 253
Question: How much green waste do you estimate you produce per year?
Estimated Number of Small Trailer or
Ute Loads per Year Response Count
m3 (Assuming each load 3m3)
Less than 1 42 63
1 42 126
2 48 288
3 30 270
4 20 240
5 39 585
6 1 18
7 1 21
8 1 24
10 9 270
12 4 144
15 2 90
20 1 60 27 1 81
40 1 120
100 1 300
Total 2,700m3
Based on the survey responses above, Kaipara households on average
produce around 10m3 of green waste per year. Assuming 9,962 households
district wide, this equates to approximately 100,000m3 of household green
waste per year.
As respondents could select multiple options, the percentages in the green
waste graph add to 136%. However, as a proportion of total responses ‘burn
it’ and ‘take it to the dump’ represent 21% and 11% respectively. This means
as a preliminary gauge, a maximum of 32,000m3 of household green waste
could theoretically be available district wide.
73%
29%
15% 14%
5%
0%
10%
20%
30%
40%
50%
60%
70%
80%
Compost it Burn it Take it to thedump
Wood chip it N/A Don'tproduce any
Per
cen
tage
of
resp
on
den
ts
Current management of green waste option/s selected
Household Green Waste Management
26
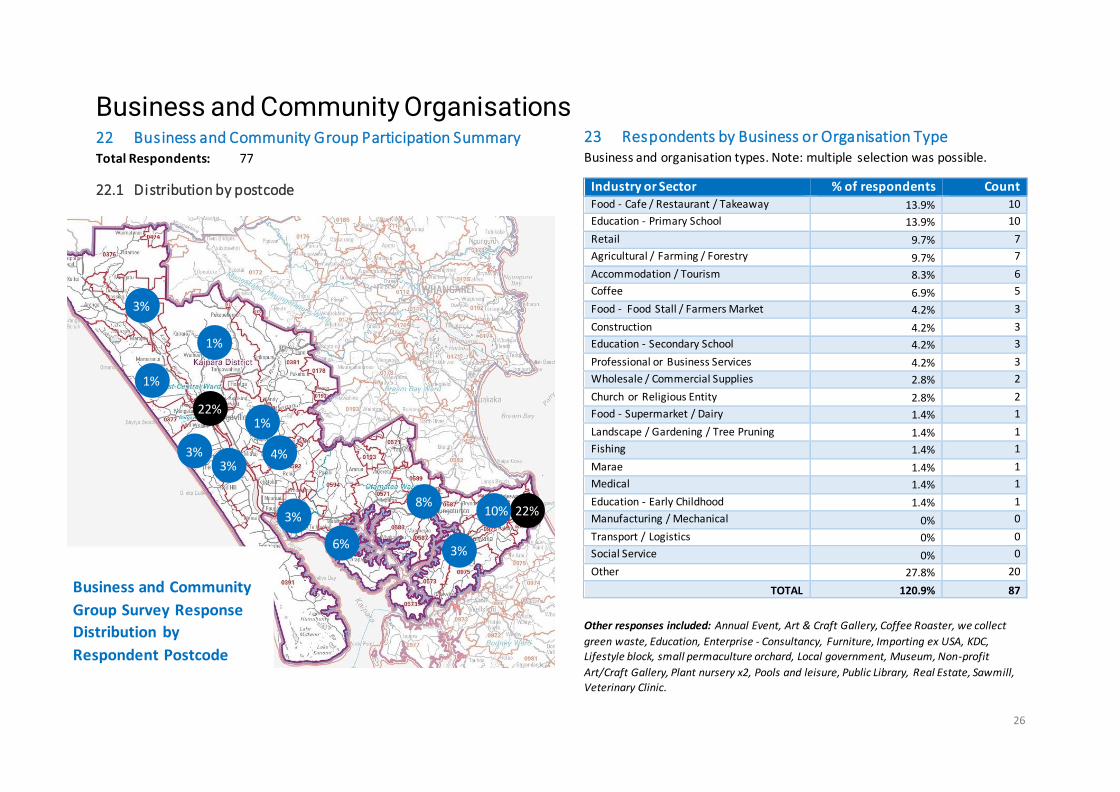
Business and Community Organisations 22 Business and Community Group Participation Summary Total Respondents: 77
22.1 Distribution by postcode
23 Respondents by Business or Organisation Type Business and organisation types. Note: multiple selection was possible.
Industry or Sector % of respondents Count Food - Cafe / Restaurant / Takeaway 13.9% 10
Education - Primary School 13.9% 10
Retail 9.7% 7
Agricultural / Farming / Forestry 9.7% 7
Accommodation / Tourism 8.3% 6
Coffee 6.9% 5
Food - Food Stall / Farmers Market 4.2% 3
Construction 4.2% 3
Education - Secondary School 4.2% 3
Professional or Business Services 4.2% 3
Wholesale / Commercial Supplies 2.8% 2
Church or Religious Entity 2.8% 2
Food - Supermarket / Dairy 1.4% 1
Landscape / Gardening / Tree Pruning 1.4% 1
Fishing 1.4% 1
Marae 1.4% 1
Medical 1.4% 1
Education - Early Childhood 1.4% 1
Manufacturing / Mechanical 0% 0
Transport / Logistics 0% 0
Social Service 0% 0
Other 27.8% 20
TOTAL 120.9% 87
Other responses included: Annual Event, Art & Craft Gallery, Coffee Roaster, we collect
green waste, Education, Enterprise - Consultancy, Furniture, Importing ex USA, KDC, Lifestyle block, small permaculture orchard, Local government, Museum, Non-profit
Art/Craft Gallery, Plant nursery x2, Pools and leisure, Public Library, Real Estate, Sawmill,
Veterinary Clinic.
Business and Community
Group Survey Response
Distribution by
Respondent Postcode
22%
8% 22% 10%
6%
3%
3%
3%
3%
1%
1%
1%
3% 4%
27
24 Organic Waste Types (excluding food) Respondents: 50
Question: What organic or green waste does your business or
organisation generate?
Waste Type Count %
None (OR food waste only) 30 42%
Green Waste - Pruning, clippings, branches 23 32%
Organic or Compostable Manufacturing by-product (eg. saw dust, brewing dregs, husks)
3 4%
Untreated Timber Waste 3 4%
Animal Manure - Stables, Calf Sheds, Woolsheds, Chicken Manure
6 8%
Other (please specify) 6 8%
Total Responses 71 100%
‘Other’ included: Food and green waste, General office paper and fish carcases / frames,
Old clothing, Paper, Paper and student lunches, takeaway cups and plates, Napkins.
25 Business and Community Organic Waste Management Respondents: 58
Question: What do you currently do with your organic, manufacturing
or green waste?
Management % Count
Compost it 38% 29
Take it to the dump 11% 8
Wood chip it 9% 7
Burn it 9% 7
Spread it on paddocks 7% 5
Sell it 3% 2
Burry it 1% 1
Don’t produce any 22% 17
Total Responses 100% 76
26 Organic Waste Volumes (excluding food) The following volumes are approximated based on a range of responses. The
only entity / respondent producing significant quantities of organic waste
was a sawmill, who currently burn, bury and sell their organic waste.
Approx. volume per week Count m3 per week None 3 0 Less than 1 bucket 11 0.11
Less than a rubbish bag 5 0.3
Less than 500 ltr 3 0.75
Less than a trailer 5 15 30+ m3 1 30
Total 28 46.16m3
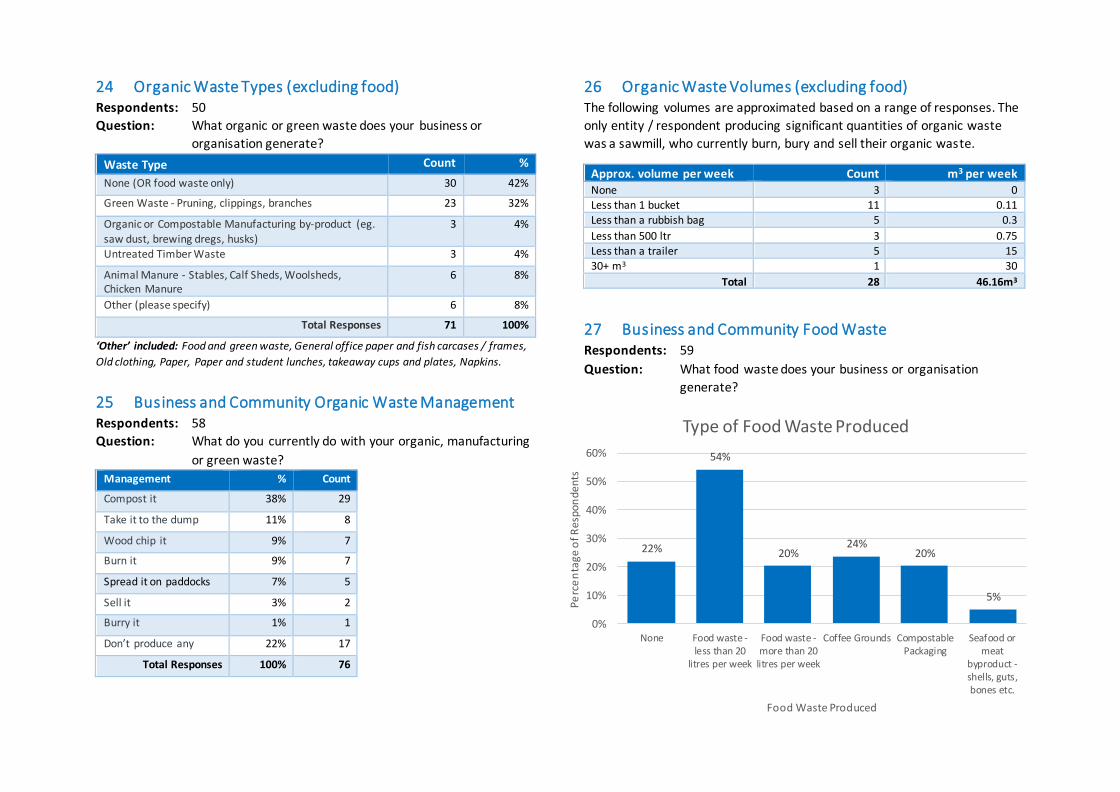
27 Business and Community Food Waste Respondents: 59
Question: What food waste does your business or organisation
generate?
22%
54%
20%24%
20%
5%
0%
10%
20%
30%
40%
50%
60%
None Food waste -less than 20
litres per week
Food waste -more than 20
litres per week
Coffee Grounds CompostablePackaging
Seafood ormeat
byproduct -shells, guts,bones etc.
Pe
rce
nta
ge o
f Res
po
nd
ents
Food Waste Produced
Type of Food Waste Produced
28
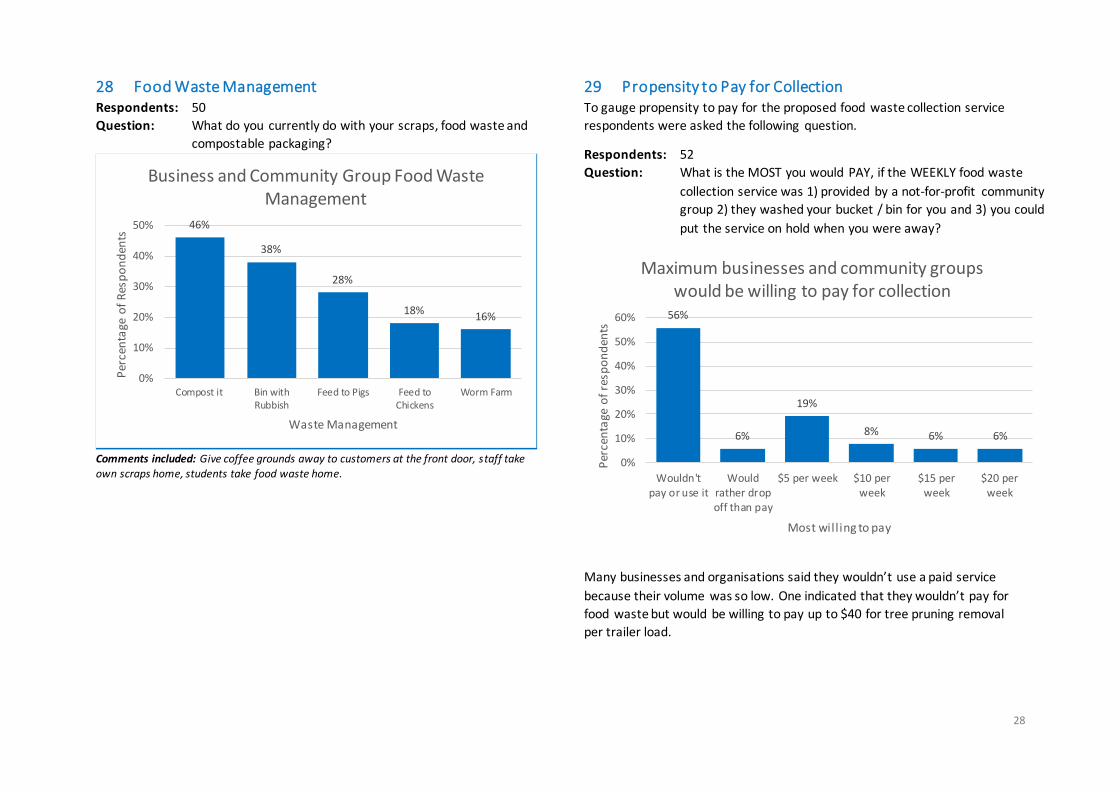
28 Food Waste Management Respondents: 50
Question: What do you currently do with your scraps, food waste and
compostable packaging?
Comments included: Give coffee grounds away to customers at the front door, staff take own scraps home, students take food waste home.
29 Propensity to Pay for Collection To gauge propensity to pay for the proposed food waste collection service
respondents were asked the following question.
Respondents: 52
Question: What is the MOST you would PAY, if the WEEKLY food waste
collection service was 1) provided by a not-for-profit community
group 2) they washed your bucket / bin for you and 3) you could
put the service on hold when you were away?
Many businesses and organisations said they wouldn’t use a paid service
because their volume was so low. One indicated that they wouldn’t pay for
food waste but would be willing to pay up to $40 for tree pruning removal
per trailer load.
46%
38%
28%
18%16%
0%
10%
20%
30%
40%
50%
Compost it Bin withRubbish
Feed to Pigs Feed toChickens
Worm Farm
Per
cen
tage
of
Res
po
nd
ents
Waste Management
Business and Community Group Food Waste Management
56%
6%
19%
8% 6% 6%
0%
10%
20%
30%
40%
50%
60%
Wouldn'tpay or use it
Wouldrather dropoff than pay
$5 per week $10 perweek
$15 perweek
$20 perweek
Per
cen
tage
of
resp
on
den
ts
Most will ing to pay
Maximum businesses and community groups would be willing to pay for collection

29
OPTIONS
ASSESSMENT
30
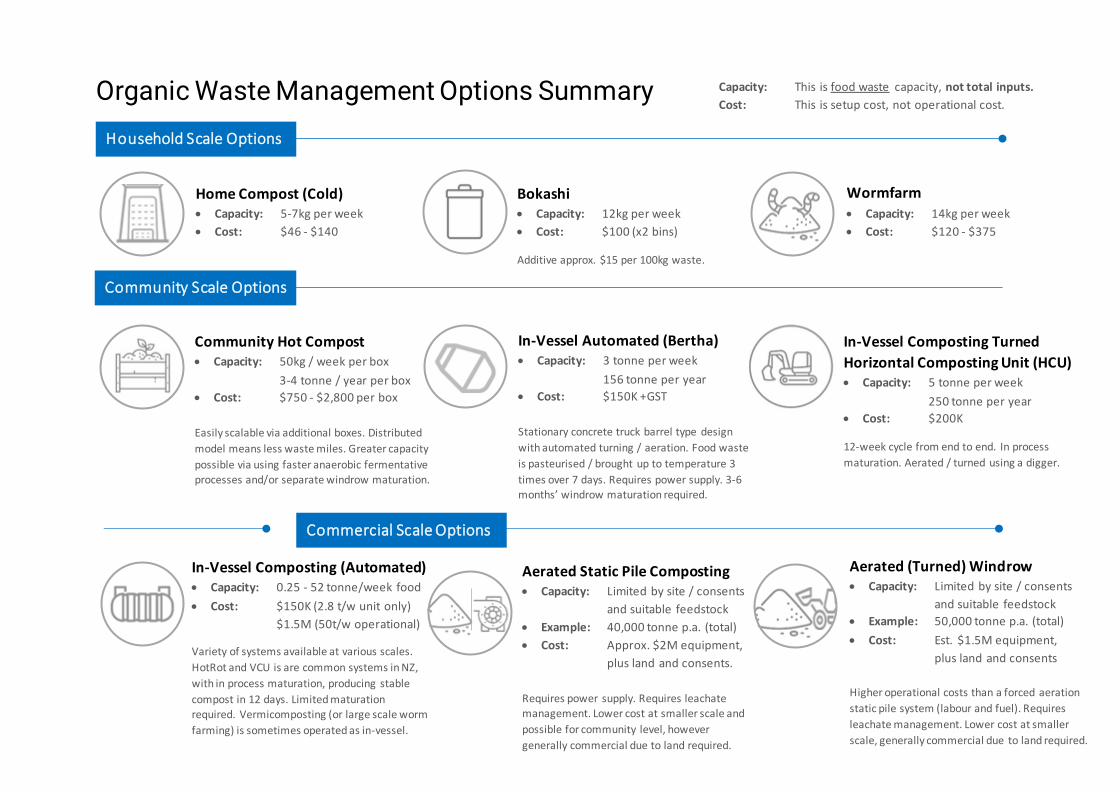
Organic Waste Management Options Summary
Aerated (Turned) Windrow • Capacity: Limited by site / consents
and suitable feedstock
• Example: 50,000 tonne p.a. (total)
• Cost: Est. $1.5M equipment,
plus land and consents
Higher operational costs than a forced aeration
static pile system (labour and fuel). Requires
leachate management. Lower cost at smaller
scale, generally commercial due to land required.
Home Compost (Cold) • Capacity: 5-7kg per week
• Cost: $46 - $140
Bokashi • Capacity: 12kg per week
• Cost: $100 (x2 bins)
Additive approx. $15 per 100kg waste.
Household Scale Options
Community Scale Options
Commercial Scale Options
Wormfarm • Capacity: 14kg per week
• Cost: $120 - $375
Community Hot Compost • Capacity: 50kg / week per box
3-4 tonne / year per box
• Cost: $750 - $2,800 per box
Easily scalable via additional boxes. Distributed
model means less waste miles. Greater capacity
possible via using faster anaerobic fermentative
processes and/or separate windrow maturation.
In-Vessel Automated (Bertha) • Capacity: 3 tonne per week
156 tonne per year
• Cost: $150K +GST
Stationary concrete truck barrel type design
with automated turning / aeration. Food waste
is pasteurised / brought up to temperature 3
times over 7 days. Requires power supply. 3-6 months’ windrow maturation required.
In-Vessel Composting Turned
Horizontal Composting Unit (HCU) • Capacity: 5 tonne per week
250 tonne per year
• Cost: $200K
12-week cycle from end to end. In process
maturation. Aerated / turned using a digger.
Aerated Static Pile Composting • Capacity: Limited by site / consents
and suitable feedstock
• Example: 40,000 tonne p.a. (total)
• Cost: Approx. $2M equipment,
plus land and consents.
Requires power supply. Requires leachate
management. Lower cost at smaller scale and
possible for community level, however
generally commercial due to land required.
In-Vessel Composting (Automated) • Capacity: 0.25 - 52 tonne/week food
• Cost: $150K (2.8 t/w unit only)
$1.5M (50t/w operational)
Variety of systems available at various scales.
HotRot and VCU is are common systems in NZ,
with in process maturation, producing stable
compost in 12 days. Limited maturation
required. Vermicomposting (or large scale worm
farming) is sometimes operated as in-vessel.
Capacity: This is food waste capacity, not total inputs.
Cost: This is setup cost, not operational cost.
31
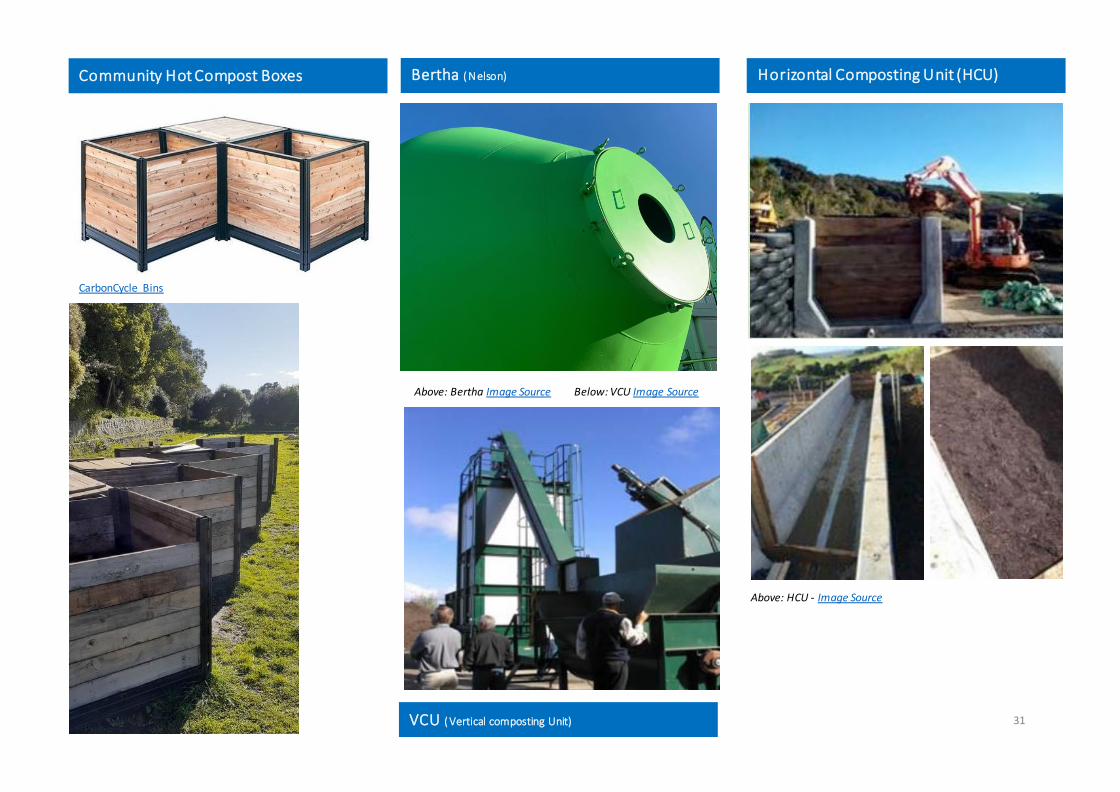
Community Hot Compost Boxes Bertha ( Nelson) Horizontal Composting Unit (HCU)
Above: HCU - Image Source
CarbonCycle Bins
Above: Bertha Image Source Below: VCU Image Source
VCU ( Vertical composting Unit)
32
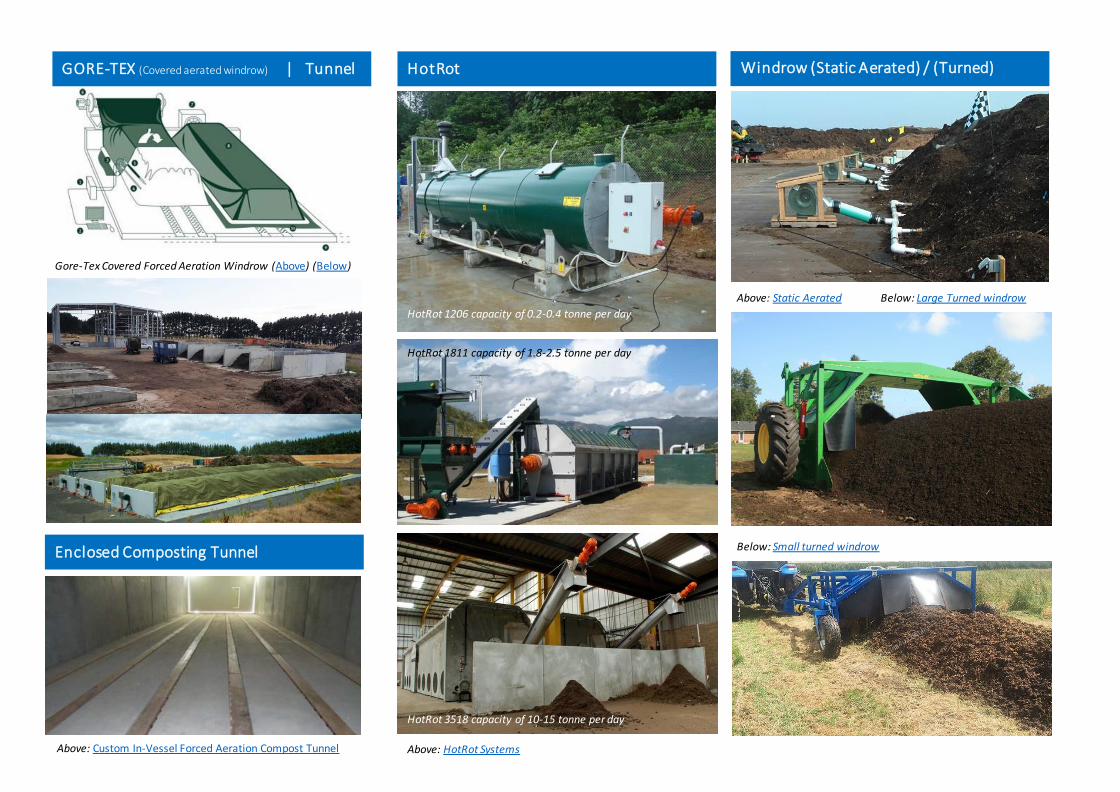
Gore-Tex Covered Forced Aeration Windrow (Above) (Below)
GORE-TEX (Covered aerated windrow) | Tunnel HotRot Windrow (Static Aerated) / (Turned)
HotRot 1206 capacity of 0.2-0.4 tonne per day
HotRot 1811 capacity of 1.8-2.5 tonne per day
HotRot 3518 capacity of 10-15 tonne per day
Above: HotRot Systems
Above: Static Aerated Below: Large Turned windrow
Below: Small turned windrow
Above: Custom In-Vessel Forced Aeration Compost Tunnel
Enclosed Composting Tunnel
33
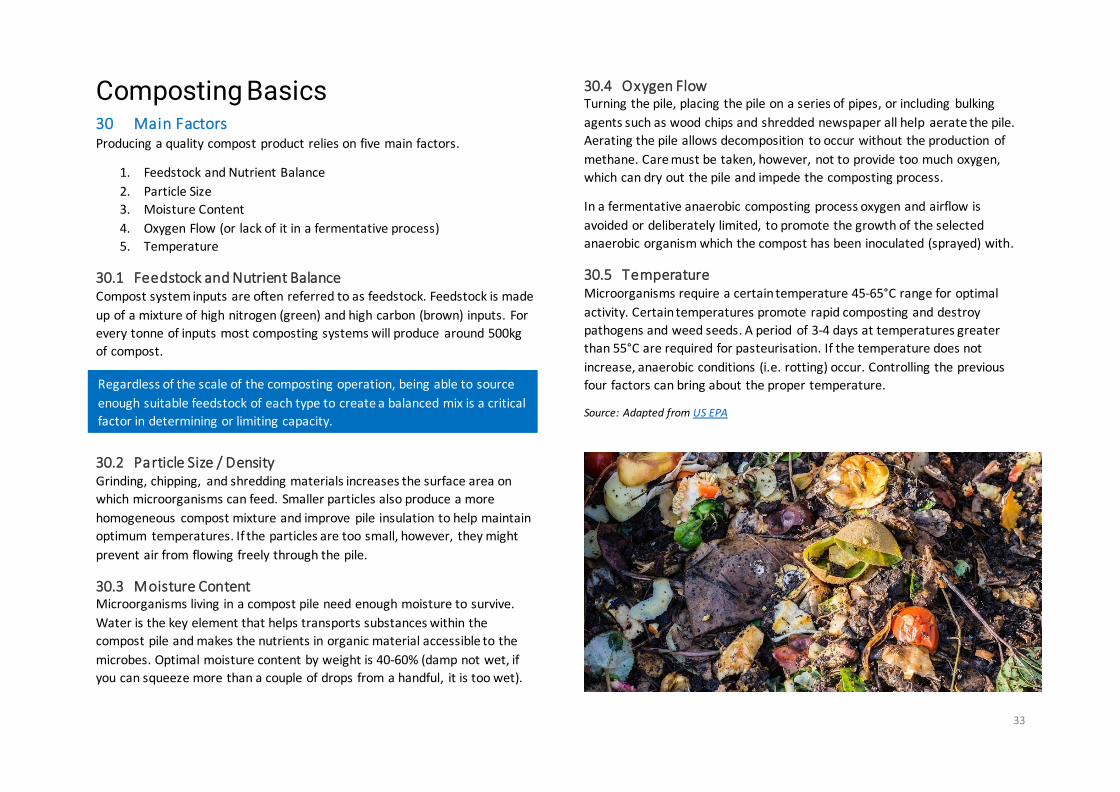
Composting Basics 30 Main Factors Producing a quality compost product relies on five main factors.
1. Feedstock and Nutrient Balance
2. Particle Size
3. Moisture Content
4. Oxygen Flow (or lack of it in a fermentative process)
5. Temperature
30.1 Feedstock and Nutrient Balance Compost system inputs are often referred to as feedstock. Feedstock is made
up of a mixture of high nitrogen (green) and high carbon (brown) inputs. For
every tonne of inputs most composting systems will produce around 500kg
of compost.
30.2 Particle Size / Density Grinding, chipping, and shredding materials increases the surface area on
which microorganisms can feed. Smaller particles also produce a more
homogeneous compost mixture and improve pile insulation to help maintain
optimum temperatures. If the particles are too small, however, they might
prevent air from flowing freely through the pile.
30.3 Moisture Content Microorganisms living in a compost pile need enough moisture to survive.
Water is the key element that helps transports substances within the
compost pile and makes the nutrients in organic material accessible to the
microbes. Optimal moisture content by weight is 40-60% (damp not wet, if
you can squeeze more than a couple of drops from a handful, it is too wet).
30.4 Oxygen Flow Turning the pile, placing the pile on a series of pipes, or including bulking
agents such as wood chips and shredded newspaper all help aerate the pile.
Aerating the pile allows decomposition to occur without the production of
methane. Care must be taken, however, not to provide too much oxygen,
which can dry out the pile and impede the composting process.
In a fermentative anaerobic composting process oxygen and airflow is
avoided or deliberately limited, to promote the growth of the selected
anaerobic organism which the compost has been inoculated (sprayed) with.
30.5 Temperature Microorganisms require a certain temperature 45-65°C range for optimal
activity. Certain temperatures promote rapid composting and destroy
pathogens and weed seeds. A period of 3-4 days at temperatures greater
than 55°C are required for pasteurisation. If the temperature does not
increase, anaerobic conditions (i.e. rotting) occur. Controlling the previous
four factors can bring about the proper temperature.
Source: Adapted from US EPA
Regardless of the scale of the composting operation, being able to source
enough suitable feedstock of each type to create a balanced mix is a critical
factor in determining or limiting capacity.
34
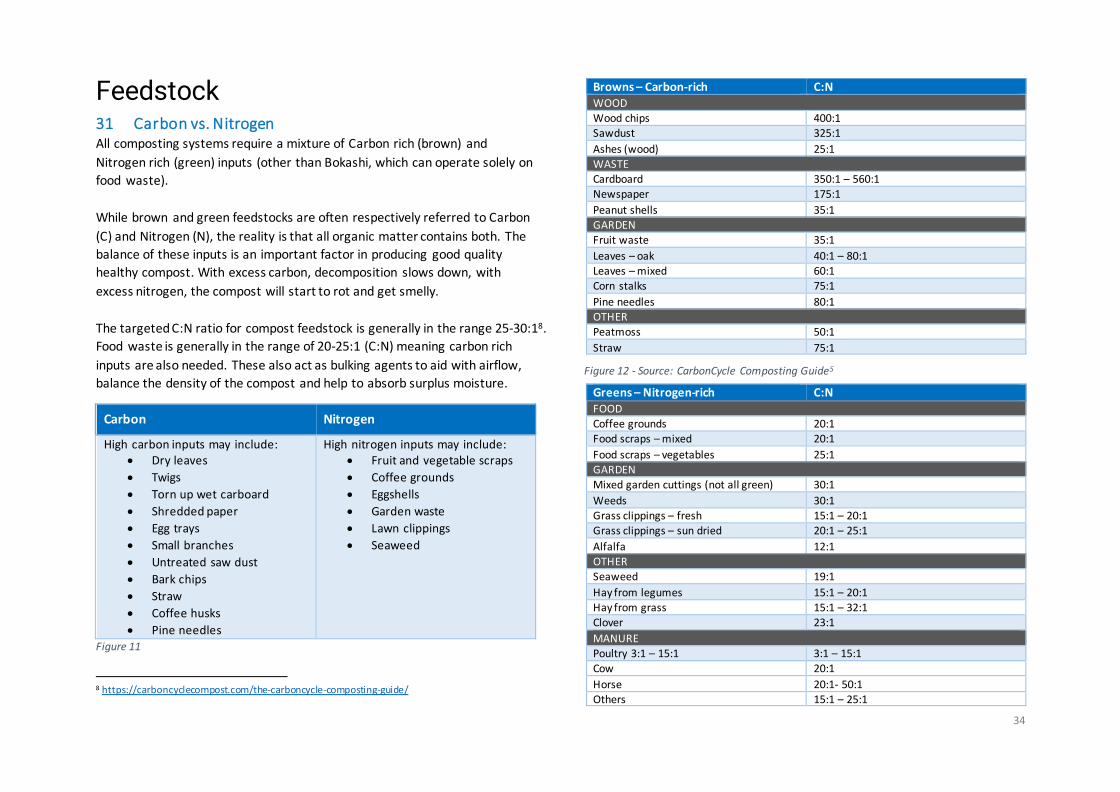
Feedstock 31 Carbon vs. Nitrogen All composting systems require a mixture of Carbon rich (brown) and
Nitrogen rich (green) inputs (other than Bokashi, which can operate solely on
food waste).
While brown and green feedstocks are often respectively referred to Carbon
(C) and Nitrogen (N), the reality is that all organic matter contains both. The
balance of these inputs is an important factor in producing good quality
healthy compost. With excess carbon, decomposition slows down, with
excess nitrogen, the compost will start to rot and get smelly.
The targeted C:N ratio for compost feedstock is generally in the range 25-30:18.
Food waste is generally in the range of 20-25:1 (C:N) meaning carbon rich
inputs are also needed. These also act as bulking agents to aid with airflow,
balance the density of the compost and help to absorb surplus moisture.
Carbon Nitrogen
High carbon inputs may include: • Dry leaves
• Twigs
• Torn up wet carboard
• Shredded paper
• Egg trays
• Small branches
• Untreated saw dust
• Bark chips
• Straw
• Coffee husks
• Pine needles
High nitrogen inputs may include: • Fruit and vegetable scraps
• Coffee grounds
• Eggshells
• Garden waste
• Lawn clippings
• Seaweed
Figure 11
8 https://carboncyclecompost.com/the-carboncycle-composting-guide/
Figure 12 - Source: CarbonCycle Composting Guide5
Browns – Carbon-rich C:N WOOD
Wood chips 400:1 Sawdust 325:1
Ashes (wood) 25:1
WASTE Cardboard 350:1 – 560:1
Newspaper 175:1
Peanut shells 35:1
GARDEN Fruit waste 35:1
Leaves – oak 40:1 – 80:1
Leaves – mixed 60:1 Corn stalks 75:1
Pine needles 80:1 OTHER
Peatmoss 50:1
Straw 75:1
Greens – Nitrogen-rich C:N FOOD
Coffee grounds 20:1 Food scraps – mixed 20:1
Food scraps – vegetables 25:1 GARDEN
Mixed garden cuttings (not all green) 30:1
Weeds 30:1
Grass clippings – fresh 15:1 – 20:1
Grass clippings – sun dried 20:1 – 25:1
Alfalfa 12:1
OTHER Seaweed 19:1
Hay from legumes 15:1 – 20:1
Hay from grass 15:1 – 32:1 Clover 23:1
MANURE Poultry 3:1 – 15:1 3:1 – 15:1
Cow 20:1
Horse 20:1- 50:1 Others 15:1 – 25:1
35
Household
Scale
Options
36
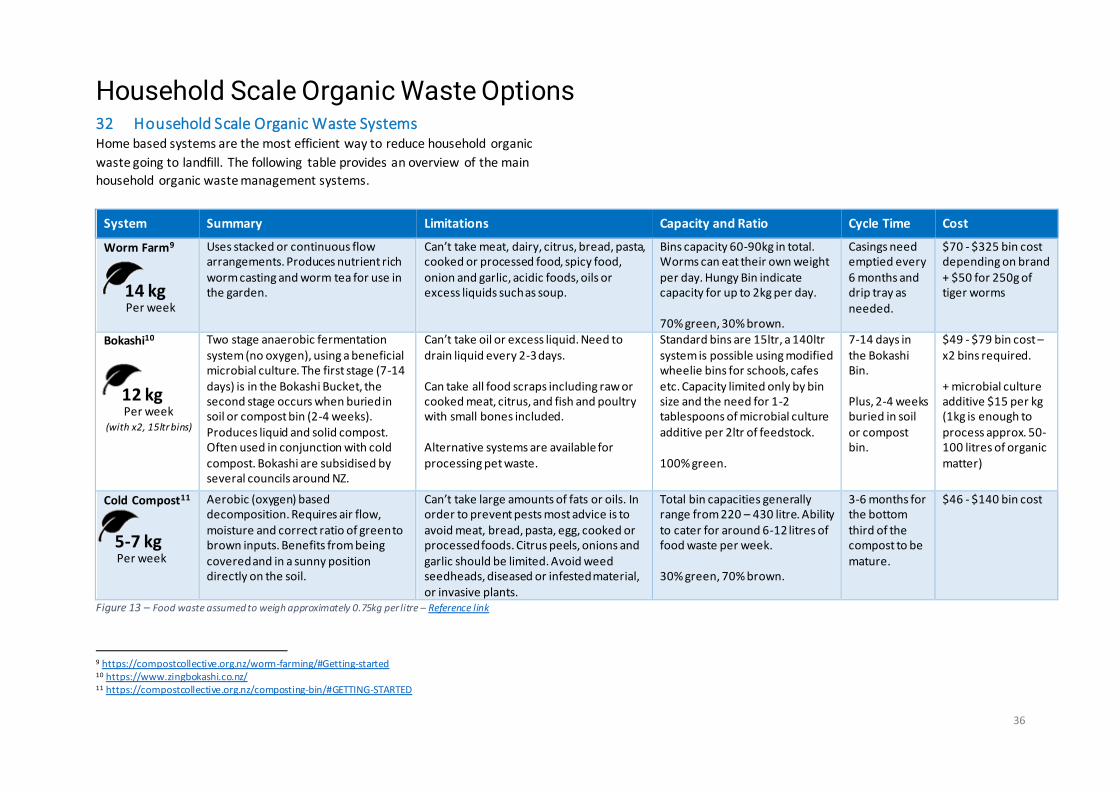
Household Scale Organic Waste Options 32 Household Scale Organic Waste SystemsHome based systems are the most efficient way to reduce household organic
waste going to landfill. The following table provides an overview of the main
household organic waste management systems.
System Summary Limitations Capacity and Ratio Cycle Time Cost
Worm Farm9 Uses stacked or continuous flow arrangements. Produces nutrient rich worm casting and worm tea for use in the garden.
Can’t take meat, dairy, citrus, bread, pasta, cooked or processed food, spicy food, onion and garlic, acidic foods, oils or excess liquids such as soup.
Bins capacity 60-90kg in total. Worms can eat their own weight per day. Hungy Bin indicate capacity for up to 2kg per day. 70% green, 30% brown.
Casings need emptied every 6 months and drip tray as needed.
$70 - $325 bin cost depending on brand + $50 for 250g of tiger worms
Bokashi10 Two stage anaerobic fermentation system (no oxygen), using a beneficial microbial culture. The first stage (7-14 days) is in the Bokashi Bucket, the second stage occurs when buried in soil or compost bin (2-4 weeks). Produces liquid and solid compost. Often used in conjunction with cold compost. Bokashi are subsidised by several councils around NZ.
Can’t take oil or excess liquid. Need to drain liquid every 2-3 days. Can take all food scraps including raw or cooked meat, citrus, and fish and poultry with small bones included. Alternative systems are available for processing pet waste.
Standard bins are 15ltr, a 140ltr system is possible using modified wheelie bins for schools, cafes etc. Capacity limited only by bin size and the need for 1-2 tablespoons of microbial culture additive per 2ltr of feedstock. 100% green.
7-14 days in the Bokashi Bin. Plus, 2-4 weeks buried in soil or compost bin.
$49 - $79 bin cost – x2 bins required. + microbial culture additive $15 per kg (1kg is enough to process approx. 50-100 litres of organic matter)
Cold Compost11 Aerobic (oxygen) based decomposition. Requires air flow, moisture and correct ratio of green to brown inputs. Benefits from being covered and in a sunny position directly on the soil.
Can’t take large amounts of fats or oils. In order to prevent pests most advice is to avoid meat, bread, pasta, egg, cooked or processed foods. Citrus peels, onions and garlic should be limited. Avoid weed seedheads, diseased or infested material, or invasive plants.
Total bin capacities generally range from 220 – 430 litre. Ability to cater for around 6-12 litres of food waste per week. 30% green, 70% brown.
3-6 months for the bottom third of the compost to be mature.
$46 - $140 bin cost
Figure 13 – Food waste assumed to weigh approximately 0.75kg per litre – Reference link
9 https://compostcollective.org.nz/worm-farming/#Getting-started 10 https://www.zingbokashi.co.nz/ 11 https://compostcollective.org.nz/composting-bin/#GETTING-STARTED
14 kg Per week
12 kg Per week
(with x2, 15ltr bins)
5-7 kg Per week
37
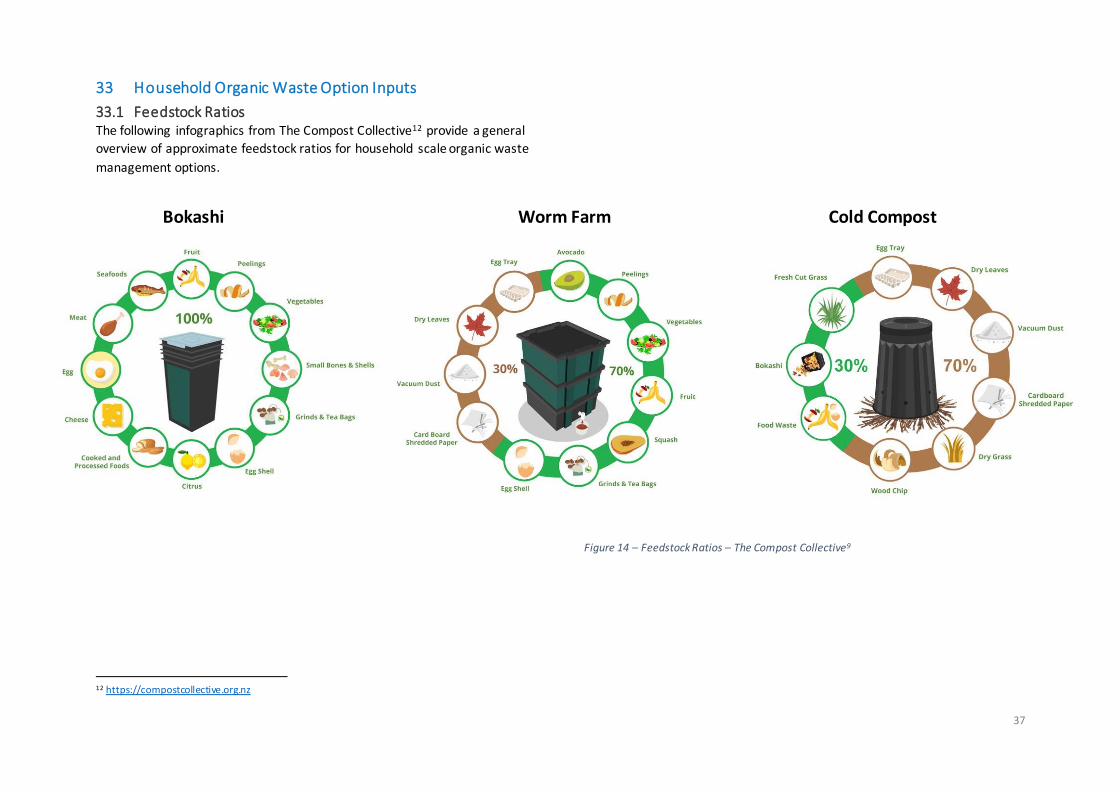
33 Household Organic Waste Option Inputs
33.1 Feedstock Ratios The following infographics from The Compost Collective12 provide a general
overview of approximate feedstock ratios for household scale organic waste
management options.
12 https://compostcollective.org.nz
Figure 14 – Feedstock Ratios – The Compost Collective9
Bokashi Worm Farm Cold Compost
38
Community
Scale
Options
Image source: www.CarbonCycleCompost.com
39
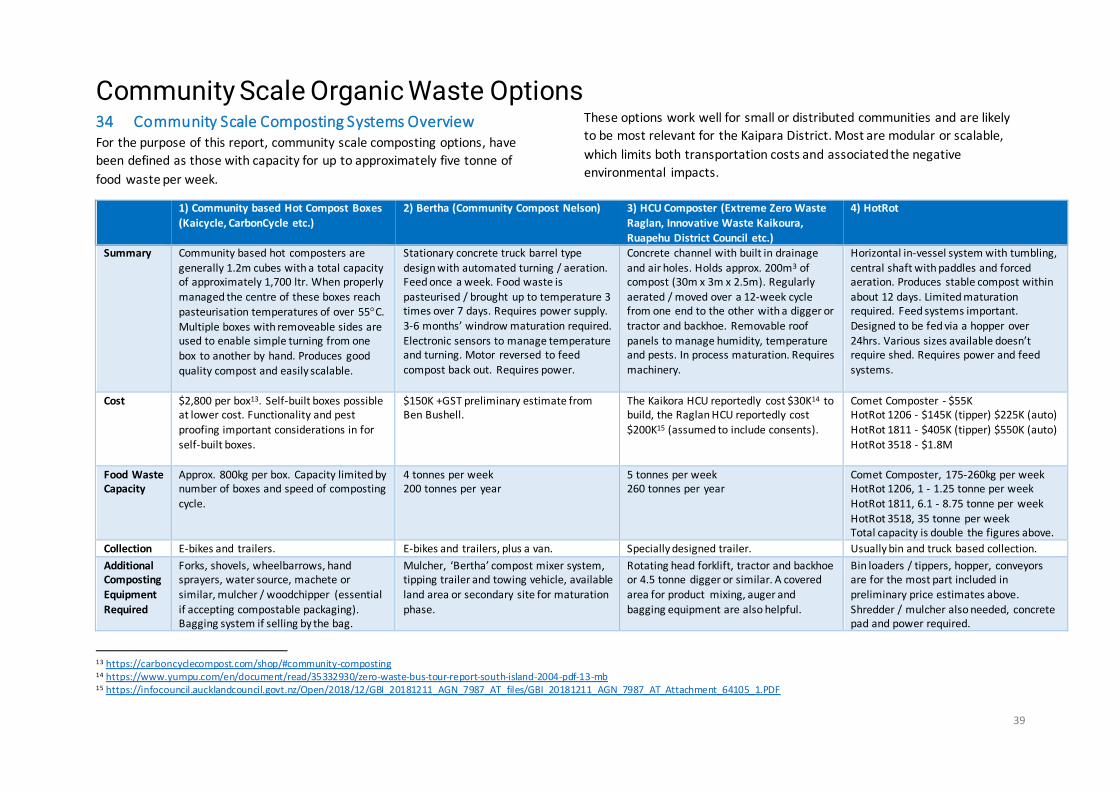
Community Scale Organic Waste Options 34 Community Scale Composting Systems Overview For the purpose of this report, community scale composting options, have
been defined as those with capacity for up to approximately five tonne of
food waste per week.
These options work well for small or distributed communities and are likely
to be most relevant for the Kaipara District. Most are modular or scalable,
which limits both transportation costs and associated the negative
environmental impacts.
1) Community based Hot Compost Boxes
(Kaicycle, CarbonCycle etc.)
2) Bertha (Community Compost Nelson) 3) HCU Composter (Extreme Zero Waste
Raglan, Innovative Waste Kaikoura, Ruapehu District Council etc.)
4) HotRot
Summary Community based hot composters are
generally 1.2m cubes with a total capacity of approximately 1,700 ltr. When properly
managed the centre of these boxes reach pasteurisation temperatures of over 55C.
Multiple boxes with removeable sides are used to enable simple turning from one
box to another by hand. Produces good quality compost and easily scalable.
Stationary concrete truck barrel type
design with automated turning / aeration. Feed once a week. Food waste is
pasteurised / brought up to temperature 3 times over 7 days. Requires power supply.
3-6 months’ windrow maturation required. Electronic sensors to manage temperature and turning. Motor reversed to feed compost back out. Requires power.
Concrete channel with built in drainage
and air holes. Holds approx. 200m3 of compost (30m x 3m x 2.5m). Regularly
aerated / moved over a 12-week cycle from one end to the other with a digger or
tractor and backhoe. Removable roof panels to manage humidity, temperature and pests. In process maturation. Requires machinery.
Horizontal in-vessel system with tumbling,
central shaft with paddles and forced aeration. Produces stable compost within
about 12 days. Limited maturation required. Feed systems important.
Designed to be fed via a hopper over 24hrs. Various sizes available doesn’t require shed. Requires power and feed systems.
Cost $2,800 per box13. Self-built boxes possible at lower cost. Functionality and pest
proofing important considerations in for self-built boxes.
$150K +GST preliminary estimate from Ben Bushell.
The Kaikora HCU reportedly cost $30K14 to build, the Raglan HCU reportedly cost
$200K15 (assumed to include consents).
Comet Composter - $55K HotRot 1206 - $145K (tipper) $225K (auto)
HotRot 1811 - $405K (tipper) $550K (auto) HotRot 3518 - $1.8M
Food Waste Capacity
Approx. 800kg per box. Capacity limited by number of boxes and speed of composting
cycle.
4 tonnes per week 200 tonnes per year
5 tonnes per week 260 tonnes per year
Comet Composter, 175-260kg per week HotRot 1206, 1 - 1.25 tonne per week
HotRot 1811, 6.1 - 8.75 tonne per week HotRot 3518, 35 tonne per week Total capacity is double the figures above.
Collection E-bikes and trailers. E-bikes and trailers, plus a van. Specially designed trailer. Usually bin and truck based collection.
Additional Composting Equipment
Required
Forks, shovels, wheelbarrows, hand sprayers, water source, machete or similar, mulcher / woodchipper (essential
if accepting compostable packaging). Bagging system if selling by the bag.
Mulcher, ‘Bertha’ compost mixer system, tipping trailer and towing vehicle, available land area or secondary site for maturation
phase.
Rotating head forklift, tractor and backhoe or 4.5 tonne digger or similar. A covered area for product mixing, auger and
bagging equipment are also helpful.
Bin loaders / tippers, hopper, conveyors are for the most part included in preliminary price estimates above.
Shredder / mulcher also needed, concrete pad and power required.
13 https://carboncyclecompost.com/shop/#community-composting 14 https://www.yumpu.com/en/document/read/35332930/zero-waste-bus-tour-report-south-island-2004-pdf-13-mb 15 https://infocouncil.aucklandcouncil.govt.nz/Open/2018/12/GBI_20181211_AGN_7987_AT_files/GBI_20181211_AGN_7987_AT_Attachment_64105_1.PDF
40
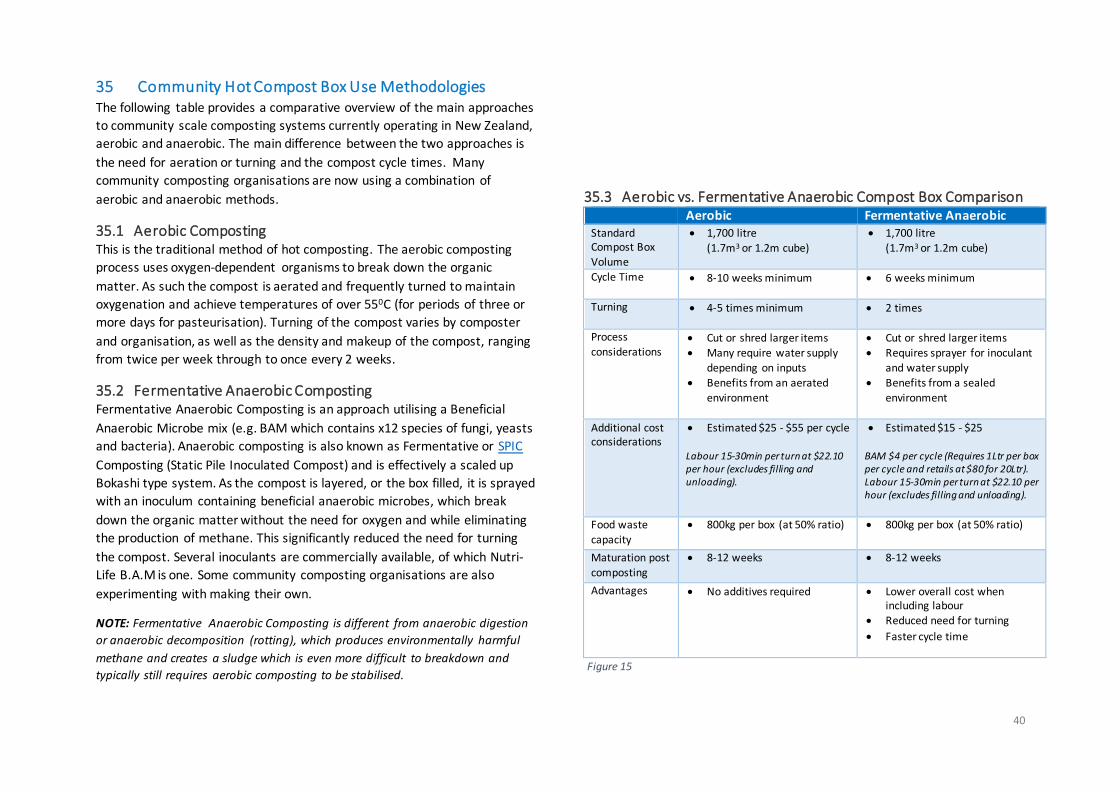
35 Community Hot Compost Box Use Methodologies The following table provides a comparative overview of the main approaches
to community scale composting systems currently operating in New Zealand,
aerobic and anaerobic. The main difference between the two approaches is
the need for aeration or turning and the compost cycle times. Many
community composting organisations are now using a combination of
aerobic and anaerobic methods.
35.1 Aerobic Composting This is the traditional method of hot composting. The aerobic composting
process uses oxygen-dependent organisms to break down the organic
matter. As such the compost is aerated and frequently turned to maintain
oxygenation and achieve temperatures of over 550C (for periods of three or
more days for pasteurisation). Turning of the compost varies by composter
and organisation, as well as the density and makeup of the compost, ranging
from twice per week through to once every 2 weeks.
35.2 Fermentative Anaerobic Composting Fermentative Anaerobic Composting is an approach utilising a Beneficial
Anaerobic Microbe mix (e.g. BAM which contains x12 species of fungi, yeasts
and bacteria). Anaerobic composting is also known as Fermentative or SPIC
Composting (Static Pile Inoculated Compost) and is effectively a scaled up
Bokashi type system. As the compost is layered, or the box filled, it is sprayed
with an inoculum containing beneficial anaerobic microbes, which break
down the organic matter without the need for oxygen and while eliminating
the production of methane. This significantly reduced the need for turning
the compost. Several inoculants are commercially available, of which Nutri-
Life B.A.M is one. Some community composting organisations are also
experimenting with making their own.
NOTE: Fermentative Anaerobic Composting is different from anaerobic digestion
or anaerobic decomposition (rotting), which produces environmentally harmful
methane and creates a sludge which is even more difficult to breakdown and
typically still requires aerobic composting to be stabilised.
35.3 Aerobic vs. Fermentative Anaerobic Compost Box Comparison Aerobic Fermentative Anaerobic Standard Compost Box Volume
• 1,700 litre
(1.7m3 or 1.2m cube)
• 1,700 litre
(1.7m3 or 1.2m cube)
Cycle Time
• 8-10 weeks minimum • 6 weeks minimum
Turning
• 4-5 times minimum • 2 times
Process
considerations • Cut or shred larger items
• Many require water supply depending on inputs
• Benefits from an aerated
environment
• Cut or shred larger items
• Requires sprayer for inoculant and water supply
• Benefits from a sealed
environment
Additional cost considerations
• Estimated $25 - $55 per cycle Labour 15-30min per turn at $22.10 per hour (excludes filling and unloading).
• Estimated $15 - $25 BAM $4 per cycle (Requires 1Ltr per box per cycle and retails at $80 for 20Ltr). Labour 15-30min per turn at $22.10 per hour (excludes filling and unloading).
Food waste
capacity
• 800kg per box (at 50% ratio)
• 800kg per box (at 50% ratio)
Maturation post composting
• 8-12 weeks
• 8-12 weeks
Advantages • No additives required
• Lower overall cost when including labour
• Reduced need for turning
• Faster cycle time
Figure 15
41
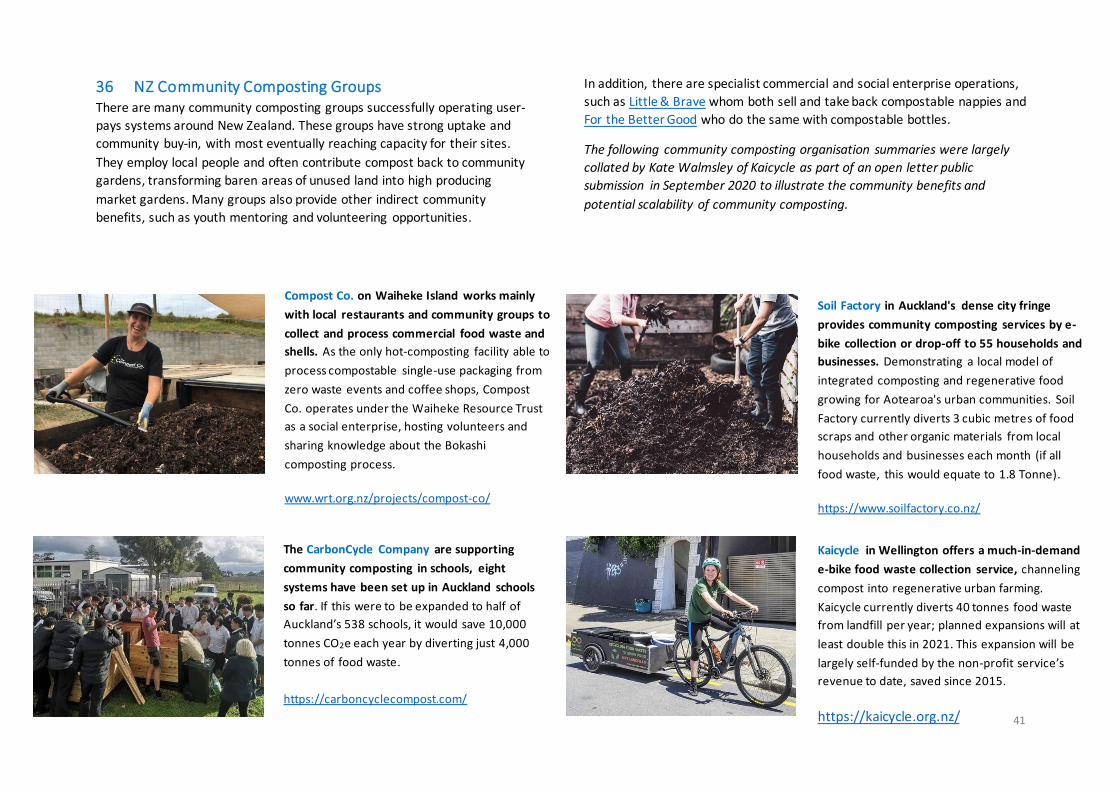
36 NZ Community Composting Groups There are many community composting groups successfully operating user-
pays systems around New Zealand. These groups have strong uptake and
community buy-in, with most eventually reaching capacity for their sites.
They employ local people and often contribute compost back to community
gardens, transforming baren areas of unused land into high producing
market gardens. Many groups also provide other indirect community
benefits, such as youth mentoring and volunteering opportunities.
In addition, there are specialist commercial and social enterprise operations,
such as Little & Brave whom both sell and take back compostable nappies and
For the Better Good who do the same with compostable bottles.
The following community composting organisation summaries were largely
collated by Kate Walmsley of Kaicycle as part of an open letter public
submission in September 2020 to illustrate the community benefits and
potential scalability of community composting.
Compost Co. on Waiheke Island works mainly
with local restaurants and community groups to
collect and process commercial food waste and
shells. As the only hot-composting facility able to
process compostable single-use packaging from
zero waste events and coffee shops, Compost
Co. operates under the Waiheke Resource Trust
as a social enterprise, hosting volunteers and
sharing knowledge about the Bokashi
composting process.
www.wrt.org.nz/projects/compost-co/
Soil Factory in Auckland's dense city fringe
provides community composting services by e-
bike collection or drop-off to 55 households and
businesses. Demonstrating a local model of
integrated composting and regenerative food
growing for Aotearoa's urban communities. Soil
Factory currently diverts 3 cubic metres of food
scraps and other organic materials from local
households and businesses each month (if all
food waste, this would equate to 1.8 Tonne).
https://www.soilfactory.co.nz/
The CarbonCycle Company are supporting
community composting in schools, eight
systems have been set up in Auckland schools
so far. If this were to be expanded to half of
Auckland’s 538 schools, it would save 10,000
tonnes CO2e each year by diverting just 4,000
tonnes of food waste.
https://carboncyclecompost.com/
Kaicycle in Wellington offers a much-in-demand
e-bike food waste collection service, channeling
compost into regenerative urban farming.
Kaicycle currently diverts 40 tonnes food waste
from landfill per year; planned expansions will at
least double this in 2021. This expansion will be
largely self-funded by the non-profit service’s
revenue to date, saved since 2015.
https://kaicycle.org.nz/
42
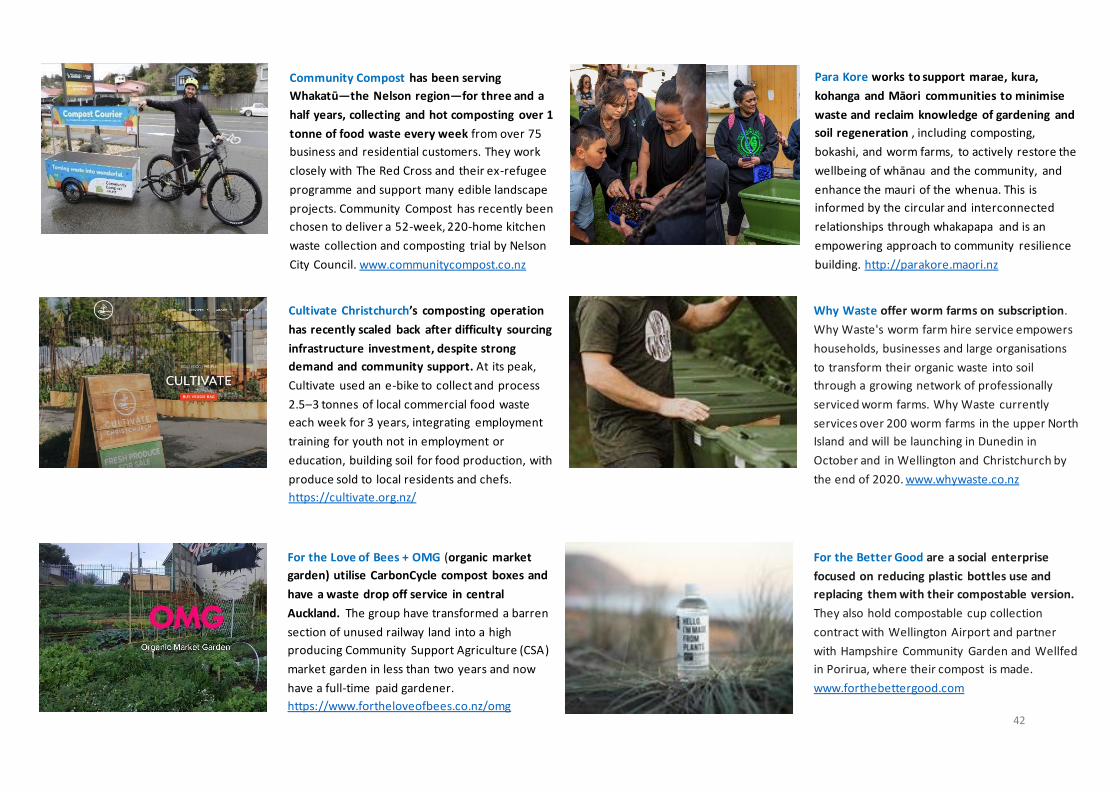
Para Kore works to support marae, kura,
kohanga and Maori communities to minimise
waste and reclaim knowledge of gardening and
soil regeneration , including composting,
bokashi, and worm farms, to actively restore the
wellbeing of whānau and the community, and
enhance the mauri of the whenua. This is
informed by the circular and interconnected
relationships through whakapapa and is an
empowering approach to community resilience
building. http://parakore.maori.nz
Community Compost has been serving
Whakatu—the Nelson region—for three and a
half years, collecting and hot composting over 1
tonne of food waste every week from over 75
business and residential customers. They work
closely with The Red Cross and their ex-refugee
programme and support many edible landscape
projects. Community Compost has recently been
chosen to deliver a 52-week, 220-home kitchen
waste collection and composting trial by Nelson
City Council. www.communitycompost.co.nz
Why Waste offer worm farms on subscription.
Why Waste's worm farm hire service empowers
households, businesses and large organisations
to transform their organic waste into soil
through a growing network of professionally
serviced worm farms. Why Waste currently
services over 200 worm farms in the upper North
Island and will be launching in Dunedin in
October and in Wellington and Christchurch by
the end of 2020. www.whywaste.co.nz
Cultivate Christchurch’s composting operation
has recently scaled back after difficulty sourcing
infrastructure investment, despite strong
demand and community support. At its peak,
Cultivate used an e-bike to collect and process
2.5–3 tonnes of local commercial food waste
each week for 3 years, integrating employment
training for youth not in employment or
education, building soil for food production, with
produce sold to local residents and chefs.
https://cultivate.org.nz/
For the Better Good are a social enterprise
focused on reducing plastic bottles use and
replacing them with their compostable version.
They also hold compostable cup collection
contract with Wellington Airport and partner
with Hampshire Community Garden and Wellfed
in Porirua, where their compost is made.
www.forthebettergood.com
For the Love of Bees + OMG (organic market
garden) utilise CarbonCycle compost boxes and
have a waste drop off service in central
Auckland. The group have transformed a barren
section of unused railway land into a high
producing Community Support Agriculture (CSA)
market garden in less than two years and now
have a full-time paid gardener.
https://www.fortheloveofbees.co.nz/omg
43
Case Study: Kaicycle 37 Summary Kaicycle is a non-profit community organisation operating in Newtown,
Wellington. They process 40 tonnes of food waste a year in conjunction with
a small urban farm. Collection is via e-bike through a subscription service.
38 System Details Capacity: Collect from 125 locations, a third of which are businesses. There
are 11 compost bins on site with approximately 1,700ltr capacity each.
Kaicycle are currently looking to expand their composting operation.
Nitrogen and Carbon sources: Food scraps make up the nitrogen component.
Carbon source is predominately shredded documents. Arborist wood mulch,
which is left to weather for 6 months, is used when available. This is free but
in high demand. Coffee chaff has been used in the past but had issues with
wind. Saw dust is used occasionally.
Decomposition: Kaicycle use an Anaerobic process using Beneficial Anaerobic
Microbes (BAM). This reduces the need to turn compost to 1-2 times over an
8-week composting cycle. In the previous aerobic method, compost needed
to be turned twice a week and would take around 45 minutes per bin.
Timing: Currently, a box is filled every 2-weeks, compost ready in 2 months.
39 Operations Collection: Food scrap buckets are collected weekly by bike. Buckets are
lined with compostable bin liners, which go into the compost. These make it
cleaner and more efficient and reduces staining of buckets (black buckets are
recommended for this reason). Buckets are rinsed with multipurpose cleaner
and returned. Collection takes place Wednesday 9-3pm and Friday 9-4pm via
two e-bikes with trailers (a small team works best as each run requires some
knowledge of the properties). Each e-bike does x2 runs per day and collects
around 50kg per run, totalling 400kg a week. One bike is owned by Kaicylcle,
the other rented from Switched-on-bikes.
Kaicyclists are paid a living wage $23 per hour. A compost manager works
around 15hrs per week, 10hrs of which is subscription management and
admin. On top of this they volunteer around 15 hrs per week towards
organisational / business development and community engagement.
Composting: Once on site, food waste is weighed and recorded, then mixed
with shredded paper in the compost box. The mix is then wet down with
water and inoculated (sprayed) with BAM mix. Approximately 1ltr of BAM
concentrate is used per m3 of compost (or per box) and is watered down at a
ratio of 1 part to 9 parts water. BAM contains 12 species of fungi / bacteria,
which break down the feedstock without the production of methane.
Benefits include faster compost process, higher carbon sequestration,
odourless, less turning and higher compost returns. No meat and dairy are
accepted for health and safety of team members.
Maintenance: Compost moisture levels are managed as the piles are formed
and covered with a tarp thereafter to keep birds out and prevent
evaporation. The boxes are turned 1-2 times in the 8-week composting cycle.
Outputs: Feedstock reduces to approximately half the size by the end of the
process. Currently almost all of the compost produced is used on the
associated urban 0.1 hectare urban farm which operates on the same site.
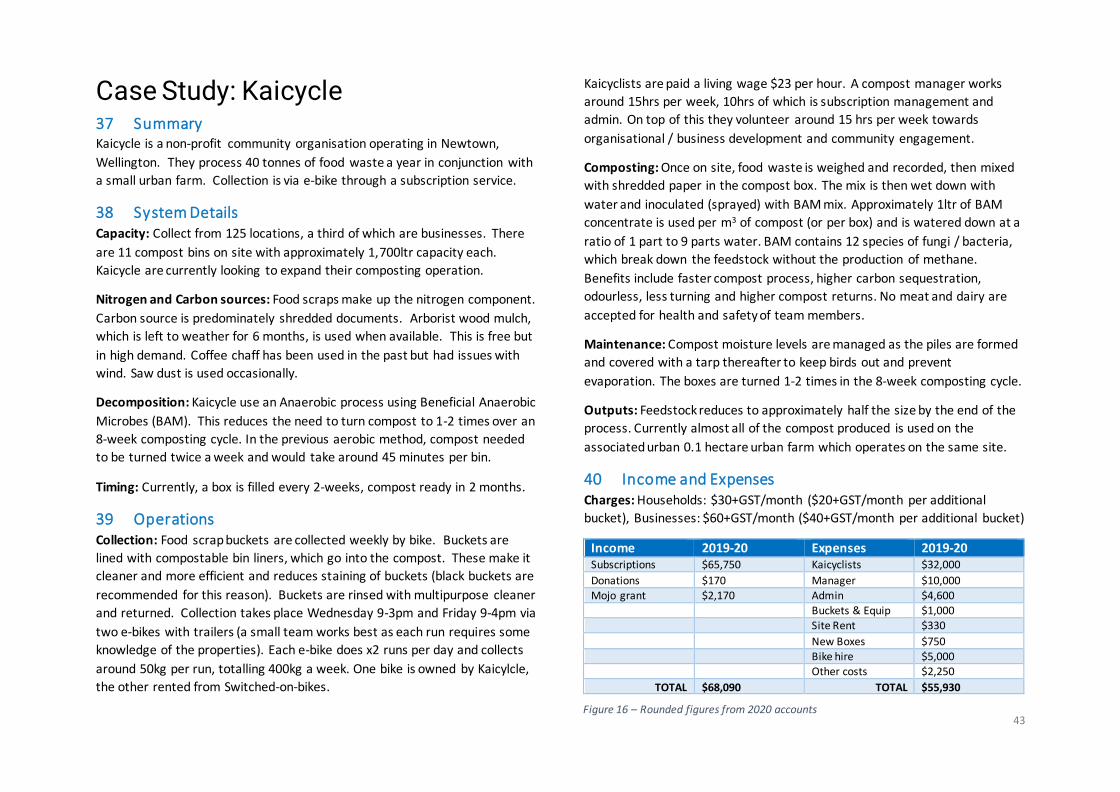
40 Income and Expenses Charges: Households: $30+GST/month ($20+GST/month per additional
bucket), Businesses: $60+GST/month ($40+GST/month per additional bucket)
Income 2019-20 Expenses 2019-20 Subscriptions $65,750 Kaicyclists $32,000
Donations $170 Manager $10,000 Mojo grant $2,170 Admin $4,600
Buckets & Equip $1,000 Site Rent $330
New Boxes $750 Bike hire $5,000
Other costs $2,250
TOTAL $68,090 TOTAL $55,930
Figure 16 – Rounded figures from 2020 accounts

44
Figure 17 – Rounded figures from 2020 accounts
Kaicycle Images
45
Case Study: Extreme Zero Waste 41 Summary Extreme Zero Waste is a non-profit community organisation operating all
rubbish and waste collection services for Raglan (5-6K population and 30K
over summer). Compost is one element of this, with a weekly kerbside food
waste collection service. Composting of food and green waste is via a 30m
long concrete Horizontal Composting Unit (HCU) capable of holding
approximately 200m3 of compost. Aeration is via a small digger. Strong
believers that composting is a whole system, not just infrastructure, and that
this needs greater emphasis when creating new sites. Happy to provide input
and advice for others, along with design improvement recommendations.
42 System details Capacity: Extreme Zero Waste processes around 5 tonnes of food waste from
Raglan per week, plus 10 tonnes of green waste. Started with a 5-year trial of
100 households. Now collect from 2,000.
Nitrogen and Carbon Sources: Food waste is mixed with green waste at a
ratio of approximately 1:2.
Decomposition: Extreme Zero Waste use two complimentary systems. The
HCU composter is classified as an aerobic in-vessel composting system and
takes all food waste plus a portion of green waste. Aeration is via a digger
and turning of the compost twice per week. The majority of green waste
collected (surplus to what is needed for the HCU) is composted via a windrow
on a site adjacent to the HCU. Branches are left whole to aid with aeration of
the windrow and turned occasionally. The whole pile is then chipped via by a
contractor once or twice a year at a cost of $1,500 per hour. The resulting
compost is much courser and is blended with the HCU compost to create
different garden mixes.
Timing: The composting cycle takes 12 weeks from inputs at one end to
coming out the other as maturate compost.
43 Operations Collections: Collect from 2,000 houses through a kerbside collection system.
Households have a kitchen caddie with compostable liner (the bags are 3kg
size and the caddie has holes in it to discourage liquids and allow evaporation
of some of the food waste moisture). When full, the bag is tied up and placed
into a lockable kerbside collection bucket.
Collection is weekly via a vehicle runners and buckets emptied into custom
designed trailer (a left-hand lift truck was initially tried, but had a lot of
problems). The trailer holds x4 dedicated food waste bins, which are
aluminium, so they don’t rust with acidic foods and are easier to clean. The
bins have forklift holes halfway up and are emptied into the composter via a
forklift with a rotating head.
All food waste is bagged and there is no handling of this. Extreme Zero Waste
don’t take fish waste as this ruptures the bags and gets smelly. Also,
discourage cut flowers as these also rupture the bags.
Composting: Food waste is added to the uncovered end of the HCU as it
arrives. It is immediately mixed-in to discourage birds and green waste
added. Each week, the compost is moved along the HCU with a digger and
mature compost removed after 12 weeks in the composter.
Maintenance: The compost in the HCU is turned twice per week with a 4.5
tonne digger. Aim for 650C temperature (if temperature goes above this the
compost loses nitrogen and produces nitrous oxide, ammonia and methane).
Outputs: The HCU produces high quality compost which is then bagged and
sold at $12 for a 30ltr bag. A $0.50c refund is given on returned bags.
Discounted rates are offered for bulk. Compost is lab tested once a year.
44 Income Council funded up until July 2020. Aiming to move to a targeted rating
model.
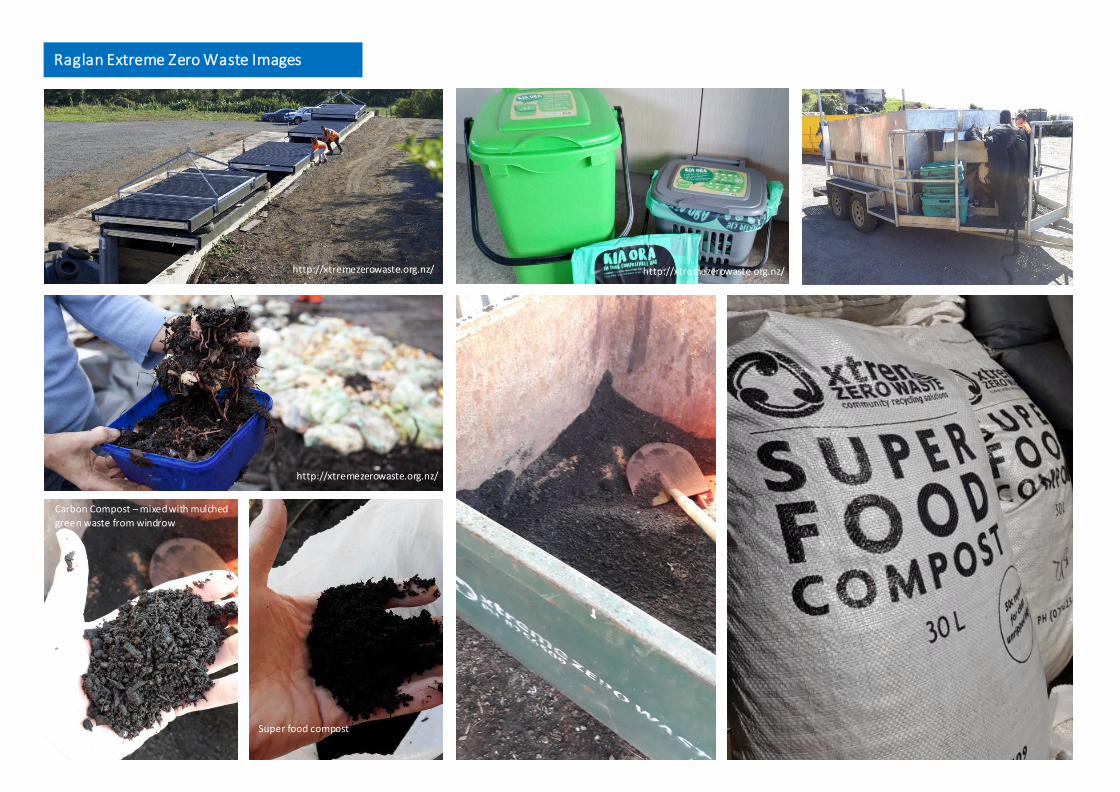
46
Raglan Extreme Zero Waste Images
http://xtremezerowaste.org.nz/ http://xtremezerowaste.org.nz/
http://xtremezerowaste.org.nz/
Carbon Compost – mixed with mulched
green waste from windrow
Super food compost
47
Commercial
Scale
Options
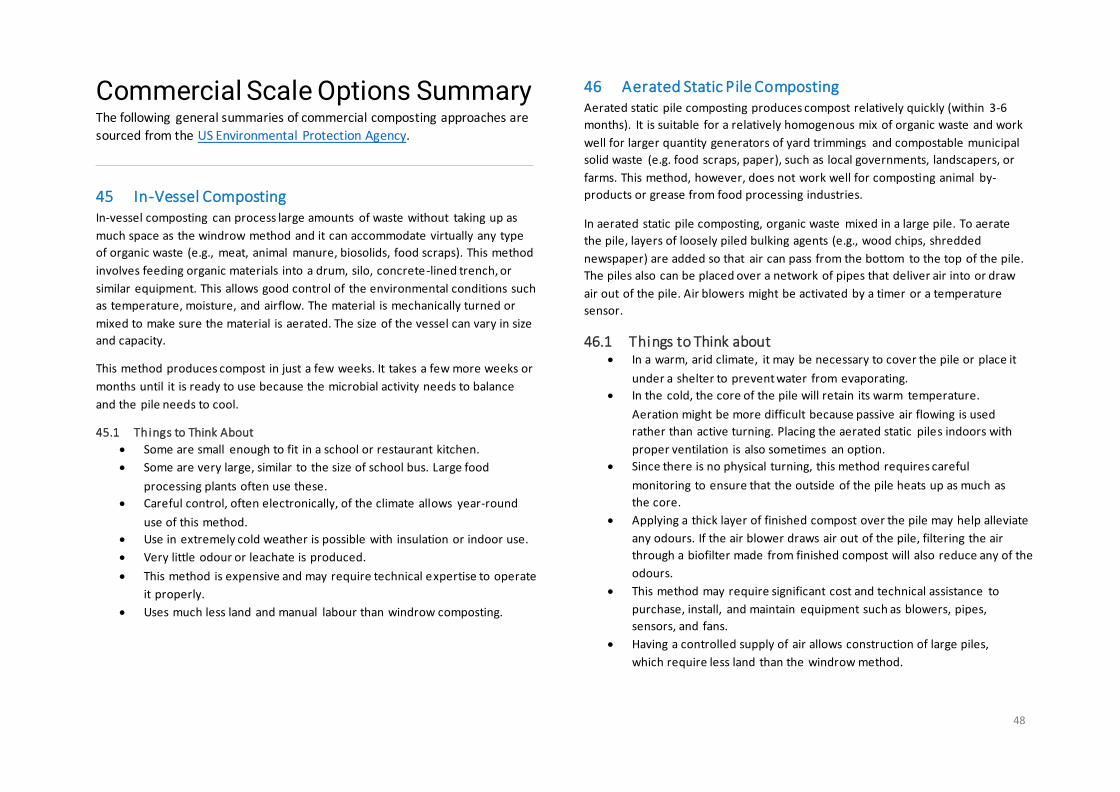
48
Commercial Scale Options Summary The following general summaries of commercial composting approaches are
sourced from the US Environmental Protection Agency.
45 In-Vessel Composting In-vessel composting can process large amounts of waste without taking up as
much space as the windrow method and it can accommodate virtually any type
of organic waste (e.g., meat, animal manure, biosolids, food scraps). This method
involves feeding organic materials into a drum, silo, concrete-lined trench, or
similar equipment. This allows good control of the environmental conditions such
as temperature, moisture, and airflow. The material is mechanically turned or
mixed to make sure the material is aerated. The size of the vessel can vary in size
and capacity.
This method produces compost in just a few weeks. It takes a few more weeks or
months until it is ready to use because the microbial activity needs to balance
and the pile needs to cool.
45.1 Things to Think About
• Some are small enough to fit in a school or restaurant kitchen.
• Some are very large, similar to the size of school bus. Large food
processing plants often use these.
• Careful control, often electronically, of the climate allows year-round
use of this method.
• Use in extremely cold weather is possible with insulation or indoor use.
• Very little odour or leachate is produced.
• This method is expensive and may require technical expertise to operate
it properly.
• Uses much less land and manual labour than windrow composting.
46 Aerated Static Pile Composting Aerated static pile composting produces compost relatively quickly (within 3-6
months). It is suitable for a relatively homogenous mix of organic waste and work
well for larger quantity generators of yard trimmings and compostable municipal
solid waste (e.g. food scraps, paper), such as local governments, landscapers, or
farms. This method, however, does not work well for composting animal by-
products or grease from food processing industries.
In aerated static pile composting, organic waste mixed in a large pile. To aerate
the pile, layers of loosely piled bulking agents (e.g., wood chips, shredded
newspaper) are added so that air can pass from the bottom to the top of the pile.
The piles also can be placed over a network of pipes that deliver air into or draw
air out of the pile. Air blowers might be activated by a timer or a temperature
sensor.
46.1 Things to Think about • In a warm, arid climate, it may be necessary to cover the pile or place it
under a shelter to prevent water from evaporating.
• In the cold, the core of the pile will retain its warm temperature.
Aeration might be more difficult because passive air flowing is used
rather than active turning. Placing the aerated static piles indoors with
proper ventilation is also sometimes an option.
• Since there is no physical turning, this method requires careful
monitoring to ensure that the outside of the pile heats up as much as
the core.
• Applying a thick layer of finished compost over the pile may help alleviate
any odours. If the air blower draws air out of the pile, filtering the air
through a biofilter made from finished compost will also reduce any of the
odours.
• This method may require significant cost and technical assistance to
purchase, install, and maintain equipment such as blowers, pipes,
sensors, and fans.
• Having a controlled supply of air allows construction of large piles,
which require less land than the windrow method.
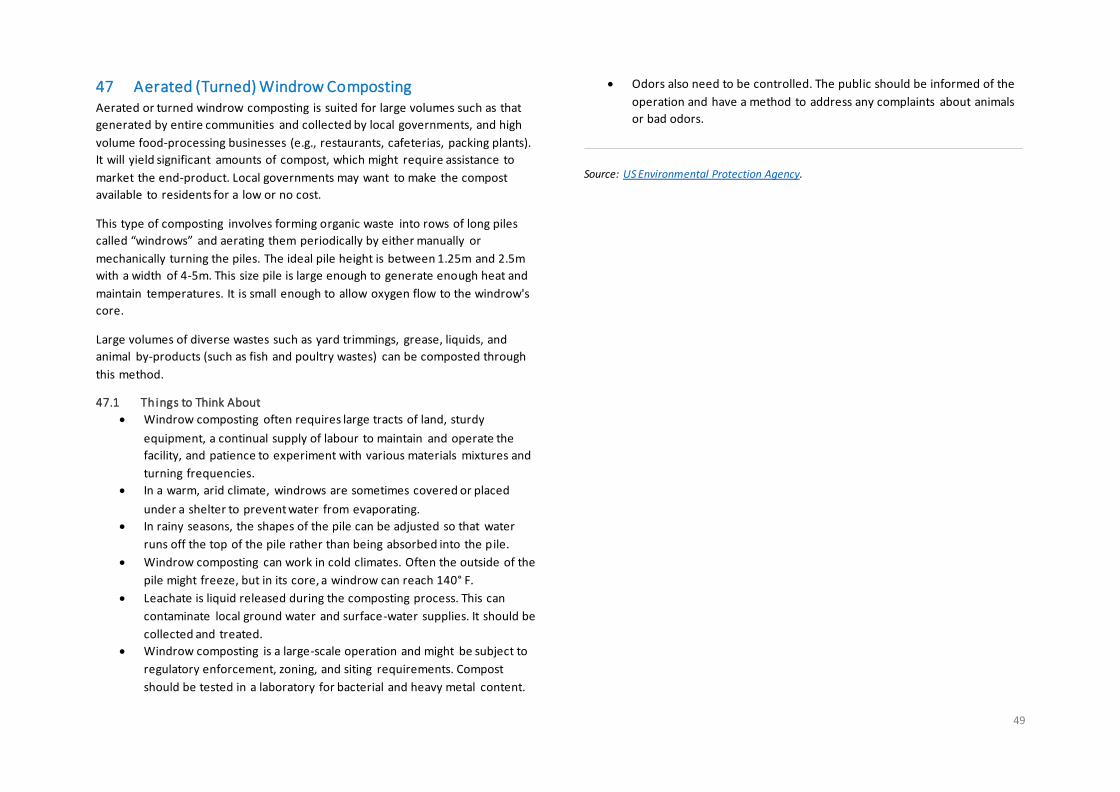
49
47 Aerated (Turned) Windrow Composting Aerated or turned windrow composting is suited for large volumes such as that
generated by entire communities and collected by local governments, and high
volume food-processing businesses (e.g., restaurants, cafeterias, packing plants).
It will yield significant amounts of compost, which might require assistance to
market the end-product. Local governments may want to make the compost
available to residents for a low or no cost.
This type of composting involves forming organic waste into rows of long piles
called “windrows” and aerating them periodically by either manually or
mechanically turning the piles. The ideal pile height is between 1.25m and 2.5m
with a width of 4-5m. This size pile is large enough to generate enough heat and
maintain temperatures. It is small enough to allow oxygen flow to the windrow's
core.
Large volumes of diverse wastes such as yard trimmings, grease, liquids, and
animal by-products (such as fish and poultry wastes) can be composted through
this method.
47.1 Things to Think About
• Windrow composting often requires large tracts of land, sturdy
equipment, a continual supply of labour to maintain and operate the
facility, and patience to experiment with various materials mixtures and
turning frequencies.
• In a warm, arid climate, windrows are sometimes covered or placed
under a shelter to prevent water from evaporating.
• In rainy seasons, the shapes of the pile can be adjusted so that water
runs off the top of the pile rather than being absorbed into the pile.
• Windrow composting can work in cold climates. Often the outside of the
pile might freeze, but in its core, a windrow can reach 140° F.
• Leachate is liquid released during the composting process. This can
contaminate local ground water and surface-water supplies. It should be
collected and treated.
• Windrow composting is a large-scale operation and might be subject to
regulatory enforcement, zoning, and siting requirements. Compost
should be tested in a laboratory for bacterial and heavy metal content.
• Odors also need to be controlled. The public should be informed of the
operation and have a method to address any complaints about animals
or bad odors.
Source: US Environmental Protection Agency.
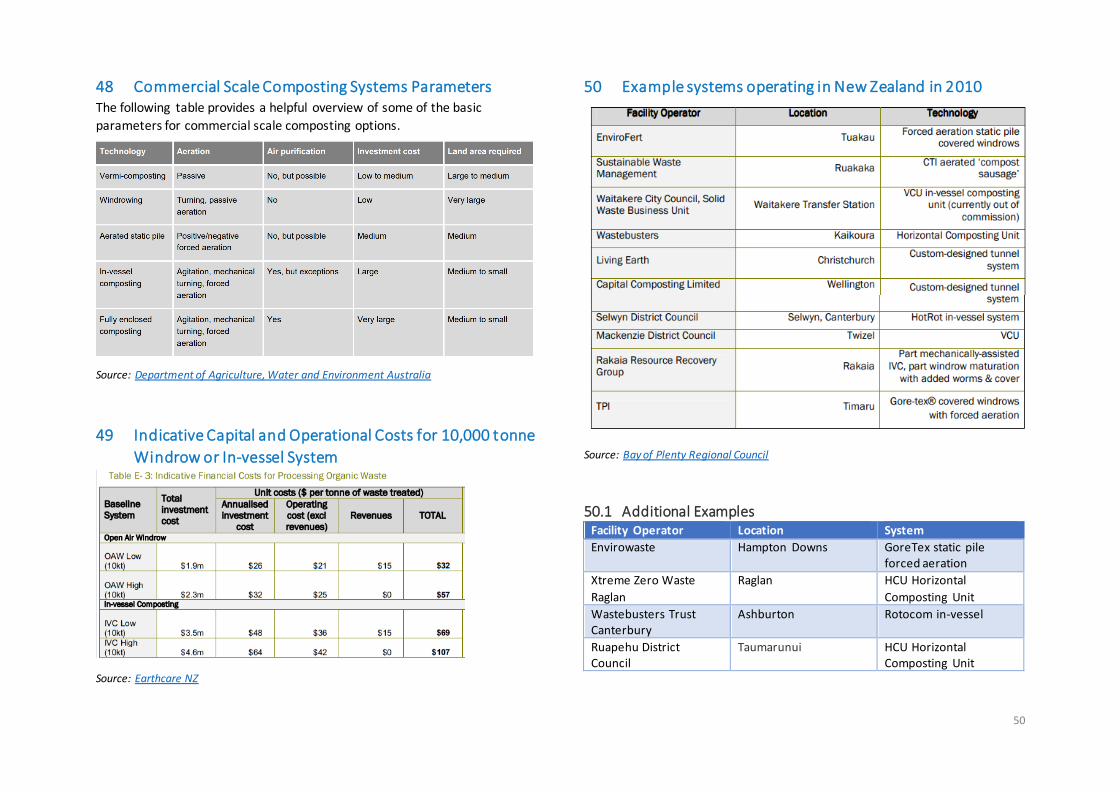
50
48 Commercial Scale Composting Systems Parameters The following table provides a helpful overview of some of the basic
parameters for commercial scale composting options.
Source: Department of Agriculture, Water and Environment Australia
49 Indicative Capital and Operational Costs for 10,000 tonne
Windrow or In-vessel System
Source: Earthcare NZ
50 Example systems operating in New Zealand in 2010
Source: Bay of Plenty Regional Council
50.1 Additional Examples Facility Operator Location System
Envirowaste Hampton Downs GoreTex static pile forced aeration
Xtreme Zero Waste
Raglan
Raglan HCU Horizontal
Composting Unit
Wastebusters Trust Canterbury
Ashburton Rotocom in-vessel
Ruapehu District Council
Taumarunui HCU Horizontal Composting Unit
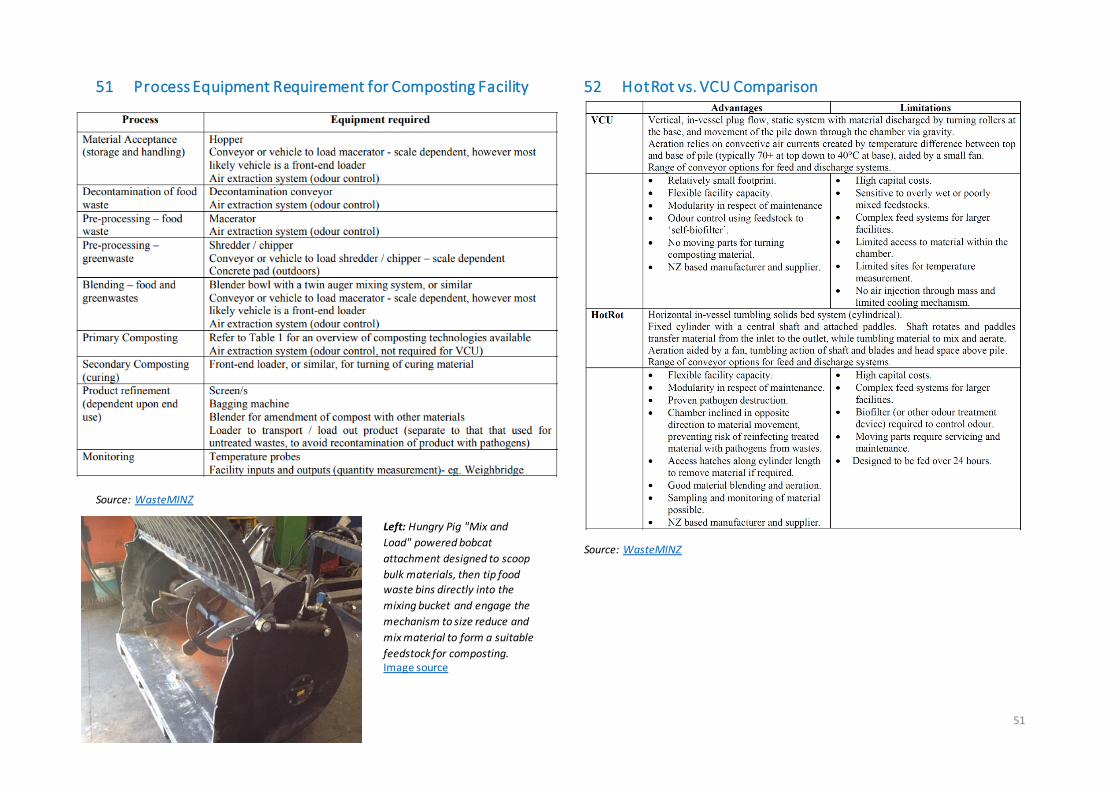
51
51 Process Equipment Requirement for Composting Facility
Source: WasteMINZ
Left: Hungry Pig "Mix and
Load" powered bobcat
attachment designed to scoop
bulk materials, then tip food
waste bins directly into the
mixing bucket and engage the
mechanism to size reduce and
mix material to form a suitable
feedstock for composting. Image source
52 HotRot vs. VCU Comparison
Source: WasteMINZ
52
Case Study: Envirofert 53 Summary Envirofert is a commercial forced aeration static window composting site
operating in Tuakau, northern Waikato. The facility processes regional green
waste, along with food waste and a limited amount of compostable
packaging from WeCompost in Auckland. The entire focus of the operation is
on the quality of resulting compost, which is made to meet the nutrient
requirements of a few large fruit growing customers. The Envirofert site is
28-hectares adjacent to the Waikato River. Only 6 hectares are used for
composting, with the remainder used to manage and spread leachate. These
paddocks are not grazed, but are used to grow hay and maize for sale and to
reduce nitrogen levels. Gaining and retaining resource consent is one of the
biggest challenges for any commercial composter, the site has 21 consents.
54 System Details Capacity: 30,000 – 40,000 ton inputs (6-8 tonnes food waste and 30-40,000
tonnes green waste).
Nitrogen and Carbon Sources: Carbon and Nitrogen is carefully monitored.
Nitrogen sources include green waste and food waste, they also accept some
zoo manure. Carbon sources include compostable packaging, sawdust (non-
tanalised) sourced from furniture manufactures, wood from shredder,
gypsum dust from GIB factory and wood bark from Tauranga wharf.
Decompositions - Aerobic forced aeration windrow system.
Timing: Each windrow takes 9-10 weeks, plus a maturation period.
55 Operations Collection: No private vehicles are allowed on the site. Drop off and pickup
are outsourced via other organisations such as WeCompost, Reclaim,
Rubbish Direct, Green Fingers and transfer station sites, with waste trucked
to Envirofert. This also avoids health and safety hassle. Envirofert provide a
wash-down facility for trucks.
Composting: Envirofert use a three-stage process. Phase 1 is the pre-mix
stage in which Nitrogen and Carbon sources are shredded and mixed. If
unshredded the composting process takes x2 longer and takes up more area.
Phase 2 uses static pile forced aeration windrow composting. Fans are used
to blow air into the piles via a series of pipes for 9-10 weeks. Each fan has x8
4 inch pipes and is around 30-50m long and spaced 1m apart. Windrows are
around 8-10m wide, 30-50m long and about 5m high. Fans are used to
manage temperature and are generally on for approximately 20 minutes and
off 40 minutes. The target temperature is around 650C. Only takes 6-8 hours
to lose oxygen from the pile.
Phase 3 involves maturation, screening and creation of any specific mix
requirements.
Maintenance: Compost is tested monthly for quality, in which they check
nutrient values including NPK, Sulphur, Calcium, Heavy Metal, Herbicides,
Pesticides and human pathogens.
Outputs: Envirofert produce 15-20,000 tonnes high grade nutrient rich
compost per annum, which is screened to 12-14mm. Most of production is
sold by advance order to fruit growers (6-8 big clients). For example, one new
180-hectare orchard site took 18,000 tonnes of compost. With compost
application bringing the first fruiting season for new trees forward by a year.
Inputs and resulting compost are monitored and Assure Quality Organic
Certification.
56 Income and Expenses Setup costs include site resource consent/s, shredder $900K and screener
$900k. Operational cost include power, machinery, staff and $1,200 per
month for lab testing. Compost is sold almost exclusively to kiwifruit and
avocado growers.
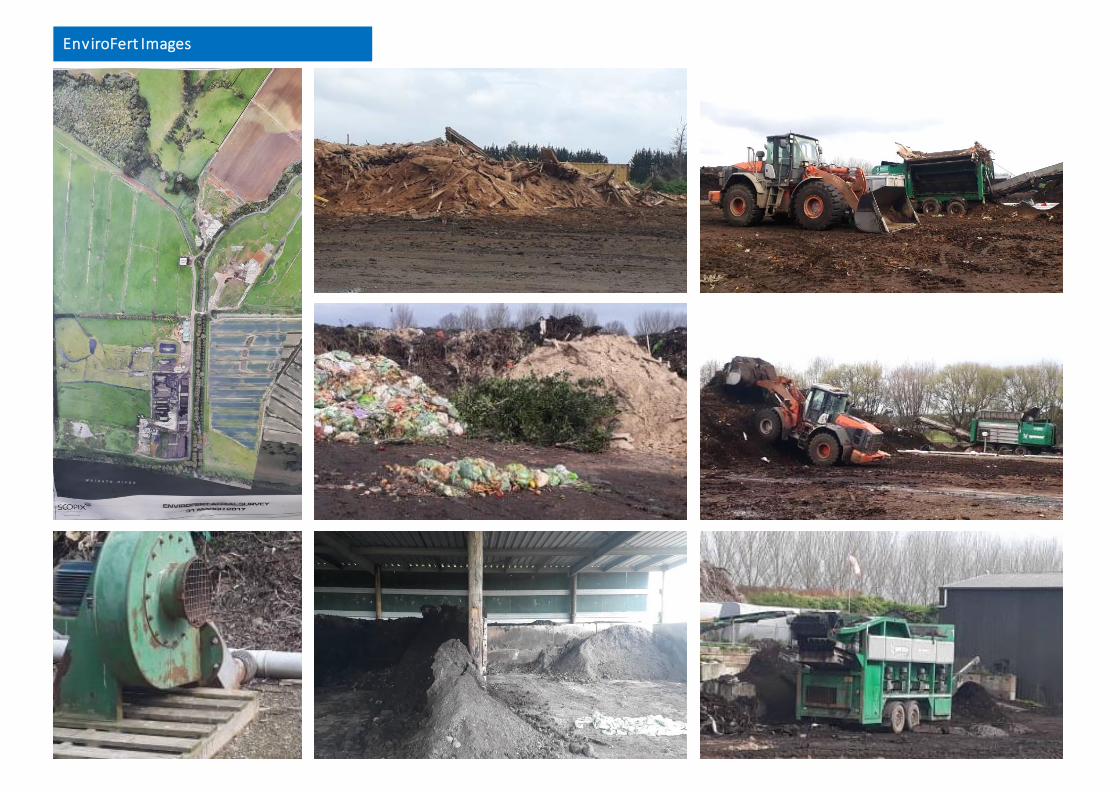
53
EnviroFert Images

54
RECOMMENDATIONS
SE
CT
ION
3
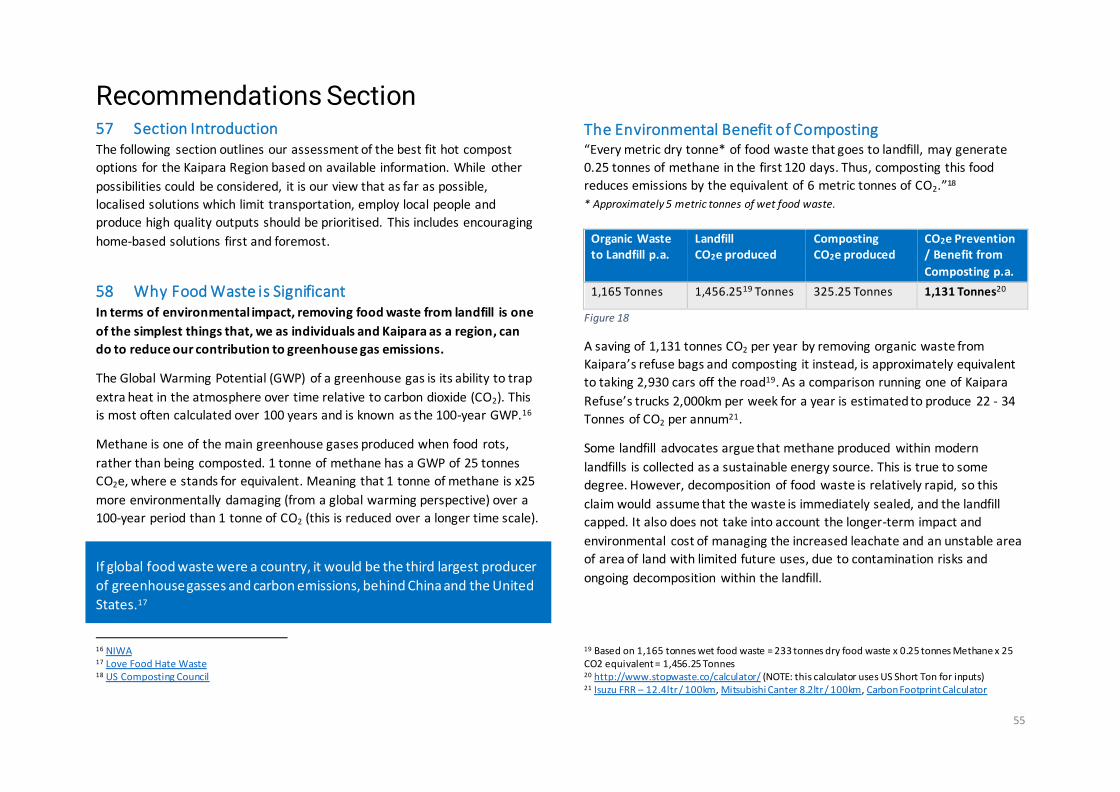
55
Recommendations Section 57 Section Introduction The following section outlines our assessment of the best fit hot compost
options for the Kaipara Region based on available information. While other
possibilities could be considered, it is our view that as far as possible,
localised solutions which limit transportation, employ local people and
produce high quality outputs should be prioritised. This includes encouraging
home-based solutions first and foremost.
58 Why Food Waste is Significant In terms of environmental impact, removing food waste from landfill is one
of the simplest things that, we as individuals and Kaipara as a region, can
do to reduce our contribution to greenhouse gas emissions.
The Global Warming Potential (GWP) of a greenhouse gas is its ability to trap
extra heat in the atmosphere over time relative to carbon dioxide (CO2). This
is most often calculated over 100 years and is known as the 100-year GWP.16
Methane is one of the main greenhouse gases produced when food rots,
rather than being composted. 1 tonne of methane has a GWP of 25 tonnes
CO2e, where e stands for equivalent. Meaning that 1 tonne of methane is x25
more environmentally damaging (from a global warming perspective) over a
100-year period than 1 tonne of CO2 (this is reduced over a longer time scale).
If global food waste were a country, it would be the third largest producer
of greenhouse gasses and carbon emissions, behind China and the United
States.17
16 NIWA 17 Love Food Hate Waste 18 US Composting Council
The Environmental Benefit of Composting “Every metric dry tonne* of food waste that goes to landfill, may generate
0.25 tonnes of methane in the first 120 days. Thus, composting this food
reduces emissions by the equivalent of 6 metric tonnes of CO2.”18
* Approximately 5 metric tonnes of wet food waste.
Organic Waste to Landfill p.a.
Landfill CO2e produced
Composting CO2e produced
CO2e Prevention / Benefit from
Composting p.a.
1,165 Tonnes 1,456.2519 Tonnes 325.25 Tonnes 1,131 Tonnes20
Figure 18
A saving of 1,131 tonnes CO2 per year by removing organic waste from
Kaipara’s refuse bags and composting it instead, is approximately equivalent
to taking 2,930 cars off the road19. As a comparison running one of Kaipara
Refuse’s trucks 2,000km per week for a year is estimated to produce 22 - 34
Tonnes of CO2 per annum21.
Some landfill advocates argue that methane produced within modern
landfills is collected as a sustainable energy source. This is true to some
degree. However, decomposition of food waste is relatively rapid, so this
claim would assume that the waste is immediately sealed, and the landfill
capped. It also does not take into account the longer-term impact and
environmental cost of managing the increased leachate and an unstable area
of area of land with limited future uses, due to contamination risks and
ongoing decomposition within the landfill.
19 Based on 1,165 tonnes wet food waste = 233 tonnes dry food waste x 0.25 tonnes Methane x 25 CO2 equivalent = 1,456.25 Tonnes 20 http://www.stopwaste.co/calculator/ (NOTE: this calculator uses US Short Ton for inputs) 21 Isuzu FRR – 12.4ltr / 100km, Mitsubishi Canter 8.2ltr / 100km, Carbon Footprint Calculator
56
59 Achieving Kaipara’s Waste Minimisation Objectives The number one objective of the Kaipara District Council Waste
Management and Minimisation Plan (WMMP) 201722, is to:
1. To reduce the quantity of recoverable material entering landfill.
With the initial target being:
1.1 To decrease the annual quantity of waste disposed of to landfill from the
Kaipara district to below 200kg per capita per year (equates to > 30%
diversion).
Organic waste currently makes up around 40.9% of Kaipara’s bagged refuse
by weight and is the largest proportion of the waste stream by weight (over
2.5 times larger than any other waste category by weight). By volume it
represents approximately 6% of the bagged refuse waste stream.
Removing food and organic waste from rubbish bags provides the greatest
potential gains in terms of achieving the Kaipara District Council’s waste
minimisation objectives (a weight-based target). However, to date, removal
of food and organic waste seems to have very little mention or detailed
consideration in Waste Minimisation Plans for the region.
60 Potential impacts of changing the status quo The current refuse collection system is user pays, with rubbish bag sales
covering the cost of collection and disposal. While there are implications for
removal of food waste, there are also numerous clear benefits. If food and
organic waste were removed from rubbish bags:
1. Landfill would reduce by up to 40% in weight per annum and up to
6% by volume per annum.
2. Issues with animals and pests would be significantly reduced.
22 KDC Waste Minimisation Plans
3. Residents would have less incentive to regularly replace their bags,
as they would not smell bad, so would make these last longer.
o The main remaining item which would potentially smell is
nappies. By weight, these currently make up 8% of Kaipara’s
bagged refuse. It is estimated that a child will go through 6,000
nappy changes in their first 2.5 years of life. This represents
more than a ton of waste per child. 23
o The smell, weight and volume of nappies can all be reduced by
emptying most of the solids into the toilet prior to binning the
nappies. This practice also reduces the negative environmental
impact of the nappies in landfill and should be encouraged.
o Assuming 1/3 nappies contain faeces, and that the faeces
represent 75% of the nappy weight. Then by encouraging this
practice alone, total nappies to landfill would reduce in weight
by 25%, generating a total waste to landfill reduction for the
Kaipara District of 2%, by weight. Other reduction strategies
should also be promoted ie. just one cloth nappy per day would
reduce the number of nappies in landfill by over 900 nappies
per child over their first 2.5 years.
4. Residents would (in theory) purchase around 6% fewer rubbish bags
based on the current average organic content of refuse bags by
volume. This is anticipated to have minimal impact on the viability of
current services, with the worst case being a $0.19c (6%) increase in
bag cost (this excludes increases resulting from landfill levy changes).
5. The waste minimisation landfill levy charges are based on weight, as
are the Kaipara District Council waste reduction targets. Removing
the heaviest waste stream from refuse bags is the most logical
approach to achieving these targets, whilst having the least impact
on the financial viability of existing refuse collection services.
23 NZ Geographic / Waste Free Parenting
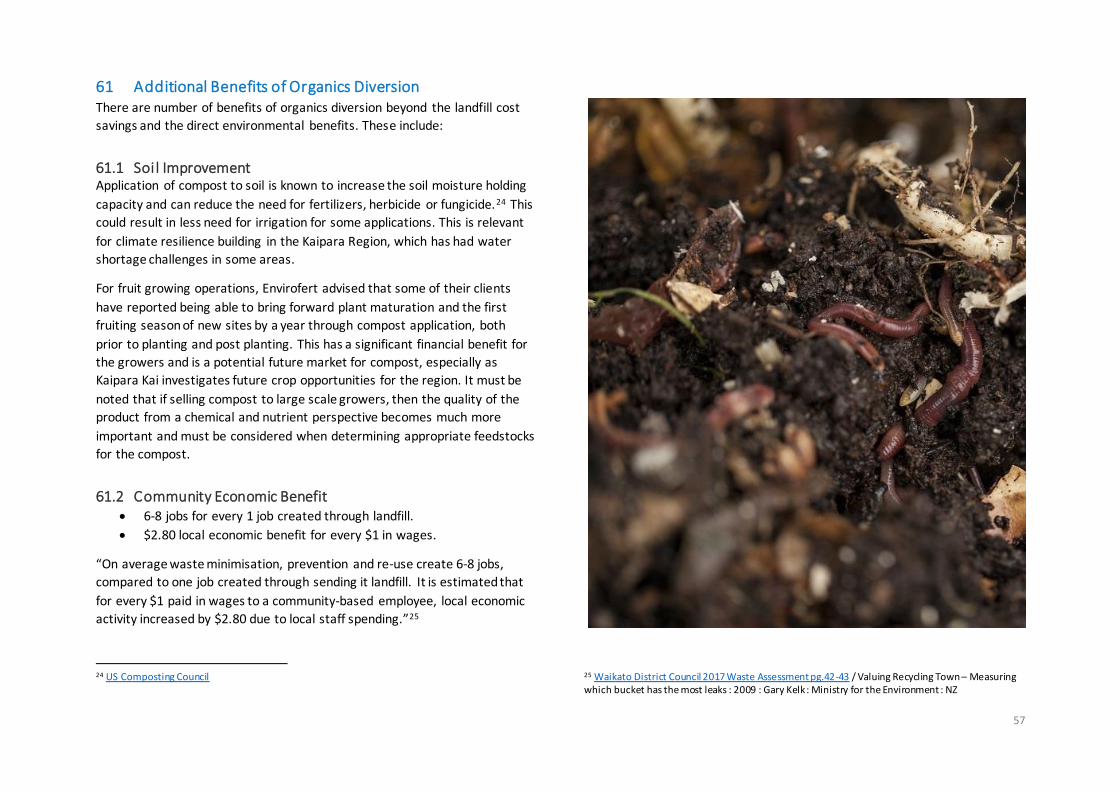
57
61 Additional Benefits of Organics Diversion There are number of benefits of organics diversion beyond the landfill cost
savings and the direct environmental benefits. These include:
61.1 Soi l Improvement Application of compost to soil is known to increase the soil moisture holding
capacity and can reduce the need for fertilizers, herbicide or fungicide.24 This
could result in less need for irrigation for some applications. This is relevant
for climate resilience building in the Kaipara Region, which has had water
shortage challenges in some areas.
For fruit growing operations, Envirofert advised that some of their clients
have reported being able to bring forward plant maturation and the first
fruiting season of new sites by a year through compost application, both
prior to planting and post planting. This has a significant financial benefit for
the growers and is a potential future market for compost, especially as
Kaipara Kai investigates future crop opportunities for the region. It must be
noted that if selling compost to large scale growers, then the quality of the
product from a chemical and nutrient perspective becomes much more
important and must be considered when determining appropriate feedstocks
for the compost.
61.2 Community Economic Benefit • 6-8 jobs for every 1 job created through landfill.
• $2.80 local economic benefit for every $1 in wages.
“On average waste minimisation, prevention and re-use create 6-8 jobs,
compared to one job created through sending it landfill. It is estimated that
for every $1 paid in wages to a community-based employee, local economic
activity increased by $2.80 due to local staff spending.”25
24 US Composting Council
25 Waikato District Council 2017 Waste Assessment pg.42-43 / Valuing Recycling Town – Measuring which bucket has the most leaks : 2009 : Gary Kelk : Ministry for the Environment : NZ
58
62 Best Fit Options Assessment The key factors in determining the best fit hot composting option/s for the
Kaipara Region are:
1. Collection viability - geography and population density
2. Volumes - Estimated food and green waste volumes
3. Sites - Potential sites and available space
4. Green waste - Ability to manage green waste on the same site
5. Funding - Potential funding models and anticipated uptake
6. Operations - Staffing and management requirements, practicality,
cost and community benefit
The first four factors are expanded on in the following table:
Factor Notes Collection Viability
Geography and population density have a large impact on collection viability from a practical and cost perspective.
Rural Areas Kaipara has a geographically dispersed population. The region has lots of narrow roads, many of which are gravel / unsealed and collection trucks frequently turn around. Due
to these factors it is not practical for existing refuse collection trucks to tow an organic waste trailer or economic for a regular stand-alone organics collection
service to operate in rural areas. An additional factor in these areas is that a larger proportion of residents already have alternative food waste options in place, including composting, chickens, pigs and worm farms.
The main possibilities for exploration in these areas are a dual waste stream collection truck or localised composting hubs. Composting and waste management are convenience
services, i.e. people generally do not go out of their way to seek these out. Therefore, localised composting hubs would be best located at schools, marae or spaces where people
already congregate. While collection may not be practical,
multiple drop off locations would be possible via wheelie
bins with sealable lids (as used on Waiheke Island). 25% of survey respondents indicated they would rather drop off their food waste than pay for collection.
Although some schools and marae already compost, additional support training and funding input would be required to ensure these sites well managed, safe and producing high quality compost outputs (which could be
sold as a fundraiser, if all other aspects of the system were funded through other sources).
Urban Areas While there are cost considerations, collection is considered a practical option for the main urban centres of Dargaville and Mangawhai. This could be via bike, van or food waste
trailer towed by existing refuse trucks.
Volumes Estimated food and organic waste volumes (based on x1 rubbish bag per household at 40.9% organic content) are: Dargaville: 7 Tonnes per week
Ruawai: 1.5 Tonnes per week Mangawhai: 5.25 Tonnes per week Maungaturoto: 4 Tonnes per week
Given the geography of the region, it would be preferable that waste was not transported 50-90km to a centralised site, unless this was achievable in conjunction with existing
refuse collection services. From a volume perspective, estimates indicate that if removing all organics from household refuse bags in urban
areas then a HCU or in-vessel composting system are the most appropriately scaled systems (multiple community compost box sites and small scale aerated static pile or
windrow are also possible). NOTE: Volumes would be significantly lower for an opt-in user pays system.
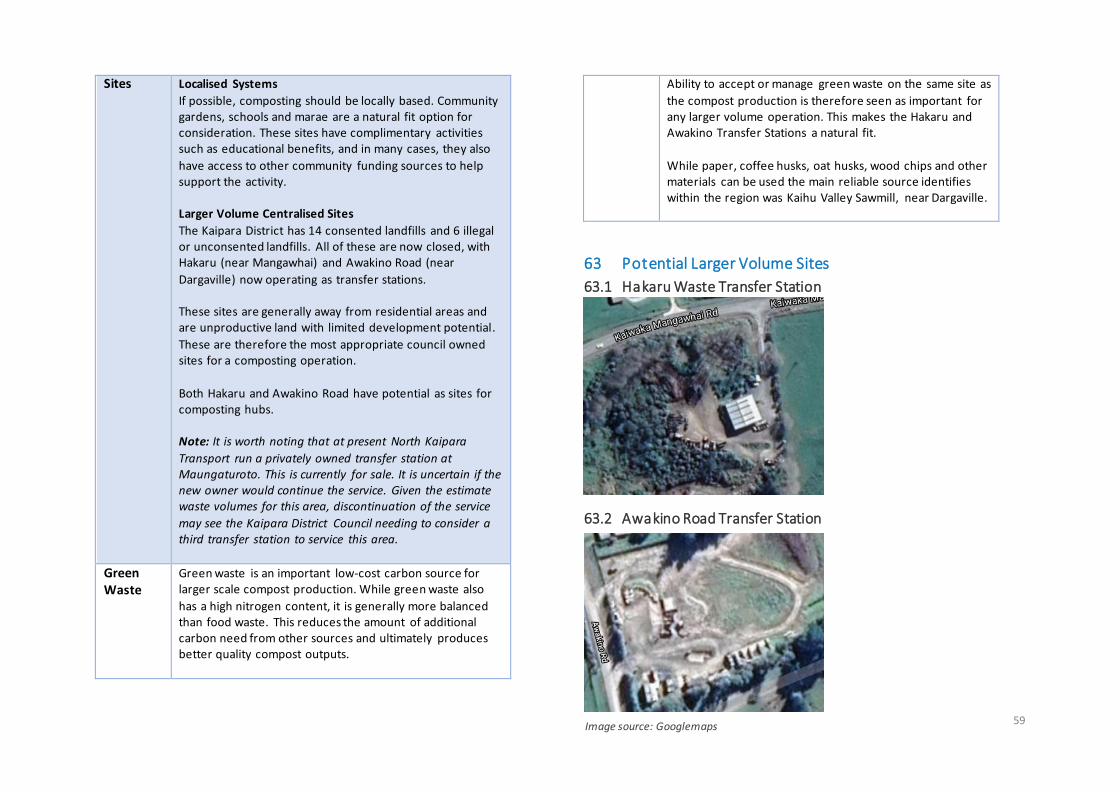
59
Sites Localised Systems
If possible, composting should be locally based. Community gardens, schools and marae are a natural fit option for consideration. These sites have complimentary activities such as educational benefits, and in many cases, they also
have access to other community funding sources to help support the activity. Larger Volume Centralised Sites
The Kaipara District has 14 consented landfills and 6 illegal or unconsented landfills. All of these are now closed, with Hakaru (near Mangawhai) and Awakino Road (near
Dargaville) now operating as transfer stations. These sites are generally away from residential areas and are unproductive land with limited development potential.
These are therefore the most appropriate council owned sites for a composting operation.
Both Hakaru and Awakino Road have potential as sites for composting hubs. Note: It is worth noting that at present North Kaipara
Transport run a privately owned transfer station at Maungaturoto. This is currently for sale. It is uncertain if the new owner would continue the service. Given the estimate waste volumes for this area, discontinuation of the service
may see the Kaipara District Council needing to consider a third transfer station to service this area.
Green Waste
Green waste is an important low-cost carbon source for larger scale compost production. While green waste also
has a high nitrogen content, it is generally more balanced than food waste. This reduces the amount of additional carbon need from other sources and ultimately produces better quality compost outputs.
Ability to accept or manage green waste on the same site as
the compost production is therefore seen as important for any larger volume operation. This makes the Hakaru and Awakino Transfer Stations a natural fit.
While paper, coffee husks, oat husks, wood chips and other materials can be used the main reliable source identifies within the region was Kaihu Valley Sawmill, near Dargaville.
63 Potential Larger Volume Sites
63.1 Hakaru Waste Transfer Station
63.2 Awakino Road Transfer Station
Image source: Googlemaps
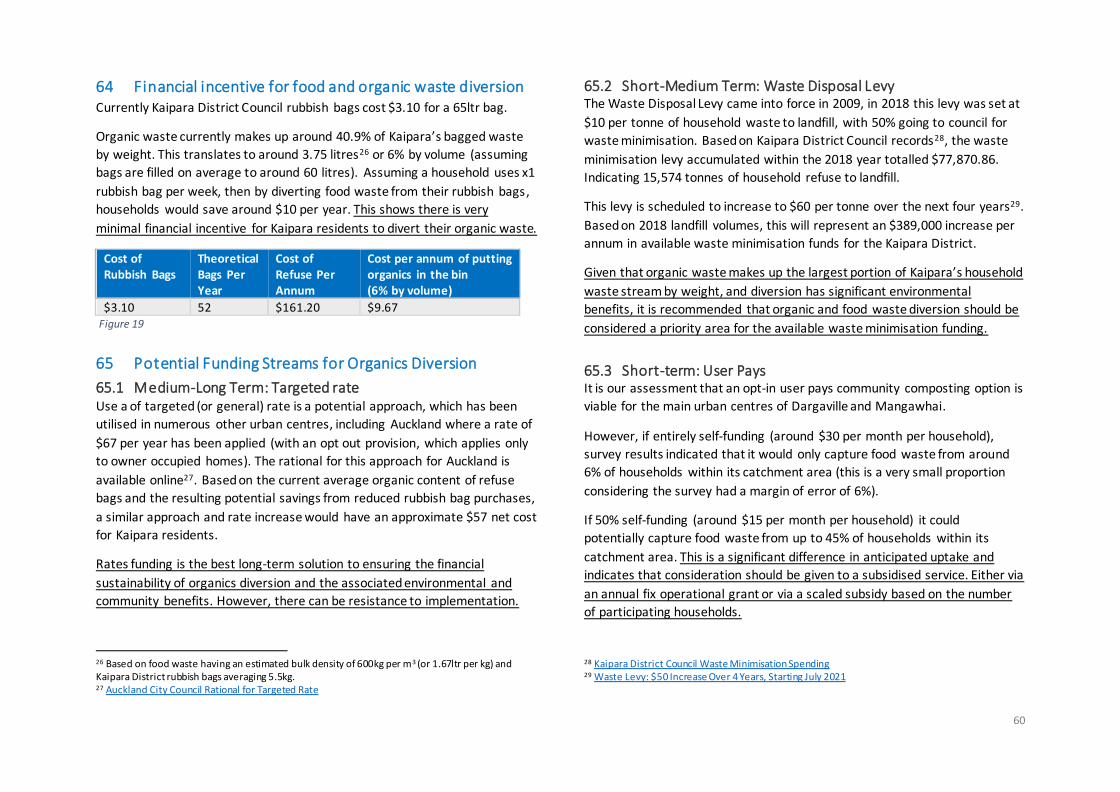
60
64 Financial incentive for food and organic waste diversion Currently Kaipara District Council rubbish bags cost $3.10 for a 65ltr bag.
Organic waste currently makes up around 40.9% of Kaipara’s bagged waste
by weight. This translates to around 3.75 litres26 or 6% by volume (assuming
bags are filled on average to around 60 litres). Assuming a household uses x1
rubbish bag per week, then by diverting food waste from their rubbish bags,
households would save around $10 per year. This shows there is very
minimal financial incentive for Kaipara residents to divert their organic waste.
Cost of Rubbish Bags
Theoretical Bags Per Year
Cost of Refuse Per Annum
Cost per annum of putting organics in the bin (6% by volume)
$3.10 52 $161.20 $9.67 Figure 19
65 Potential Funding Streams for Organics Diversion
65.1 Medium-Long Term: Targeted rate Use a of targeted (or general) rate is a potential approach, which has been
utilised in numerous other urban centres, including Auckland where a rate of
$67 per year has been applied (with an opt out provision, which applies only
to owner occupied homes). The rational for this approach for Auckland is
available online27. Based on the current average organic content of refuse
bags and the resulting potential savings from reduced rubbish bag purchases,
a similar approach and rate increase would have an approximate $57 net cost
for Kaipara residents.
Rates funding is the best long-term solution to ensuring the financial
sustainability of organics diversion and the associated environmental and
community benefits. However, there can be resistance to implementation.
26 Based on food waste having an estimated bulk density of 600kg per m3 (or 1.67ltr per kg) and Kaipara District rubbish bags averaging 5.5kg. 27 Auckland City Council Rational for Targeted Rate
65.2 Short-Medium Term: Waste Disposal Levy The Waste Disposal Levy came into force in 2009, in 2018 this levy was set at
$10 per tonne of household waste to landfill, with 50% going to council for
waste minimisation. Based on Kaipara District Council records28, the waste
minimisation levy accumulated within the 2018 year totalled $77,870.86.
Indicating 15,574 tonnes of household refuse to landfill.
This levy is scheduled to increase to $60 per tonne over the next four years29.
Based on 2018 landfill volumes, this will represent an $389,000 increase per
annum in available waste minimisation funds for the Kaipara District.
Given that organic waste makes up the largest portion of Kaipara’s household
waste stream by weight, and diversion has significant environmental
benefits, it is recommended that organic and food waste diversion should be
considered a priority area for the available waste minimisation funding.
65.3 Short-term: User Pays It is our assessment that an opt-in user pays community composting option is
viable for the main urban centres of Dargaville and Mangawhai.
However, if entirely self-funding (around $30 per month per household),
survey results indicated that it would only capture food waste from around
6% of households within its catchment area (this is a very small proportion
considering the survey had a margin of error of 6%).
If 50% self-funding (around $15 per month per household) it could
potentially capture food waste from up to 45% of households within its
catchment area. This is a significant difference in anticipated uptake and
indicates that consideration should be given to a subsidised service. Either via
an annual fix operational grant or via a scaled subsidy based on the number
of participating households.
28 Kaipara District Council Waste Minimisation Spending 29 Waste Levy: $50 Increase Over 4 Years, Starting July 2021
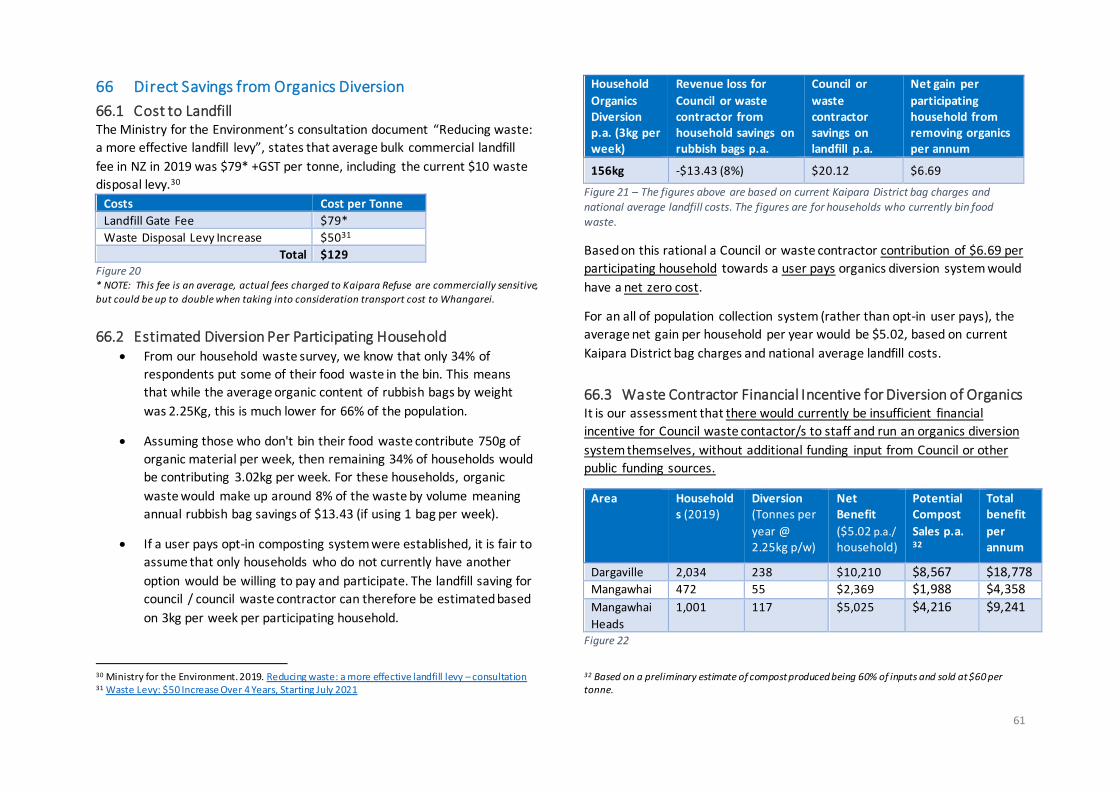
61
66 Direct Savings from Organics Diversion
66.1 Cost to Landfill The Ministry for the Environment’s consultation document “Reducing waste:
a more effective landfill levy”, states that average bulk commercial landfill
fee in NZ in 2019 was $79* +GST per tonne, including the current $10 waste
disposal levy.30
Costs Cost per Tonne
Landfill Gate Fee $79*
Waste Disposal Levy Increase $5031
Total $129 Figure 20 * NOTE: This fee is an average, actual fees charged to Kaipara Refuse are commercially sensitive,
but could be up to double when taking into consideration transport cost to Whangarei.
66.2 Estimated Diversion Per Participating Household • From our household waste survey, we know that only 34% of
respondents put some of their food waste in the bin. This means
that while the average organic content of rubbish bags by weight
was 2.25Kg, this is much lower for 66% of the population.
• Assuming those who don't bin their food waste contribute 750g of
organic material per week, then remaining 34% of households would
be contributing 3.02kg per week. For these households, organic
waste would make up around 8% of the waste by volume meaning
annual rubbish bag savings of $13.43 (if using 1 bag per week).
• If a user pays opt-in composting system were established, it is fair to
assume that only households who do not currently have another
option would be willing to pay and participate. The landfill saving for
council / council waste contractor can therefore be estimated based
on 3kg per week per participating household.
30 Ministry for the Environment. 2019. Reducing waste: a more effective landfill levy – consultation 31 Waste Levy: $50 Increase Over 4 Years, Starting July 2021
Household
Organics Diversion p.a. (3kg per week)
Revenue loss for
Council or waste contractor from household savings on rubbish bags p.a.
Council or
waste contractor savings on landfill p.a.
Net gain per
participating household from removing organics per annum
156kg -$13.43 (8%) $20.12 $6.69
Figure 21 – The figures above are based on current Kaipara District bag charges and national average landfill costs. The figures are for households who currently bin food
waste.
Based on this rational a Council or waste contractor contribution of $6.69 per
participating household towards a user pays organics diversion system would
have a net zero cost.
For an all of population collection system (rather than opt-in user pays), the
average net gain per household per year would be $5.02, based on current
Kaipara District bag charges and national average landfill costs.
66.3 Waste Contractor Financial Incentive for Diversion of Organics It is our assessment that there would currently be insufficient financial
incentive for Council waste contactor/s to staff and run an organics diversion
system themselves, without additional funding input from Council or other
public funding sources.
Area Households (2019)
Diversion (Tonnes per
year @ 2.25kg p/w)
Net Benefit
($5.02 p.a./
household)
Potential Compost
Sales p.a. 32
Total benefit
per annum
Dargaville 2,034 238 $10,210 $8,567 $18,778
Mangawhai 472 55 $2,369 $1,988 $4,358
Mangawhai
Heads
1,001 117 $5,025 $4,216 $9,241
Figure 22
32 Based on a preliminary estimate of compost produced being 60% of inputs and sold at $60 per tonne.
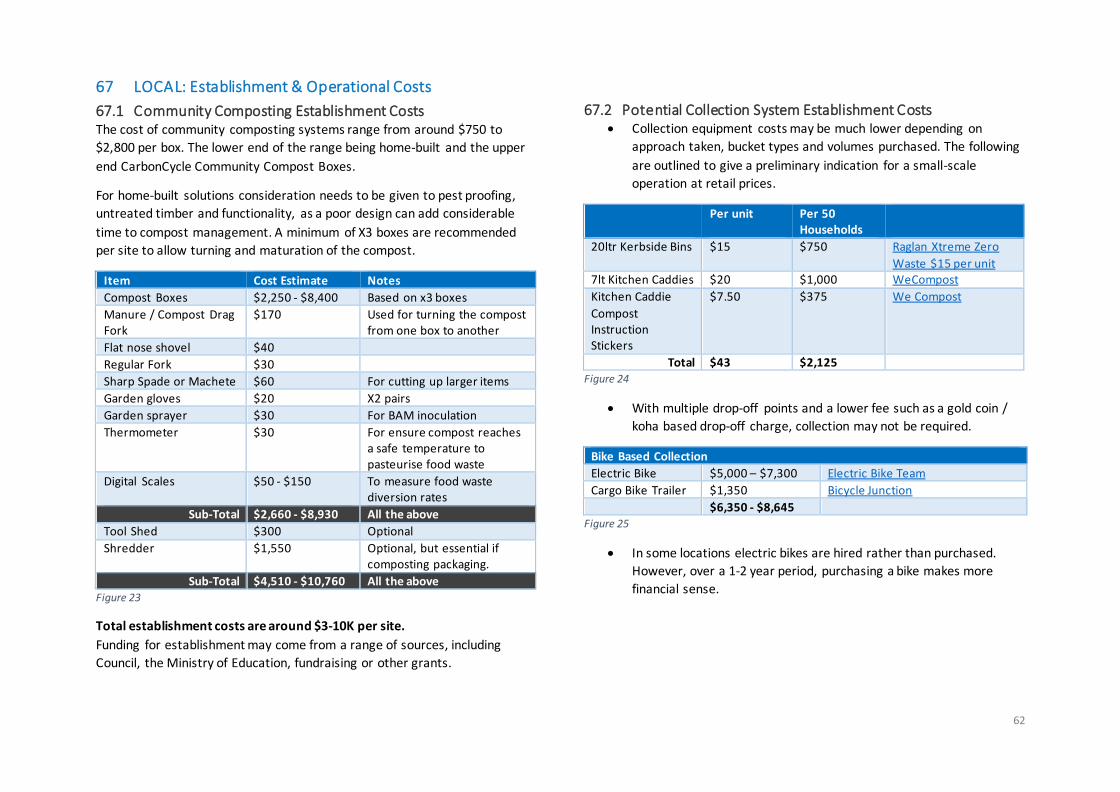
62
67 LOCAL: Establishment & Operational Costs
67.1 Community Composting Establishment Costs The cost of community composting systems range from around $750 to
$2,800 per box. The lower end of the range being home-built and the upper
end CarbonCycle Community Compost Boxes.
For home-built solutions consideration needs to be given to pest proofing,
untreated timber and functionality, as a poor design can add considerable
time to compost management. A minimum of X3 boxes are recommended
per site to allow turning and maturation of the compost.
Item Cost Estimate Notes
Compost Boxes $2,250 - $8,400 Based on x3 boxes
Manure / Compost Drag Fork
$170 Used for turning the compost from one box to another
Flat nose shovel $40
Regular Fork $30
Sharp Spade or Machete $60 For cutting up larger items
Garden gloves $20 X2 pairs
Garden sprayer $30 For BAM inoculation
Thermometer $30 For ensure compost reaches a safe temperature to pasteurise food waste
Digital Scales $50 - $150 To measure food waste diversion rates
Sub-Total $2,660 - $8,930 All the above
Tool Shed $300 Optional
Shredder $1,550 Optional, but essential if composting packaging.
Sub-Total $4,510 - $10,760 All the above Figure 23
Total establishment costs are around $3-10K per site.
Funding for establishment may come from a range of sources, including
Council, the Ministry of Education, fundraising or other grants.
67.2 Potential Collection System Establishment Costs • Collection equipment costs may be much lower depending on
approach taken, bucket types and volumes purchased. The following
are outlined to give a preliminary indication for a small-scale
operation at retail prices.
Per unit Per 50 Households
20ltr Kerbside Bins $15 $750 Raglan Xtreme Zero
Waste $15 per unit 7lt Kitchen Caddies $20 $1,000 WeCompost
Kitchen Caddie
Compost Instruction Stickers
$7.50 $375 We Compost
Total $43 $2,125 Figure 24
• With multiple drop-off points and a lower fee such as a gold coin /
koha based drop-off charge, collection may not be required.
Bike Based Collection
Electric Bike $5,000 – $7,300 Electric Bike Team
Cargo Bike Trailer $1,350 Bicycle Junction
$6,350 - $8,645 Figure 25
• In some locations electric bikes are hired rather than purchased.
However, over a 1-2 year period, purchasing a bike makes more
financial sense.
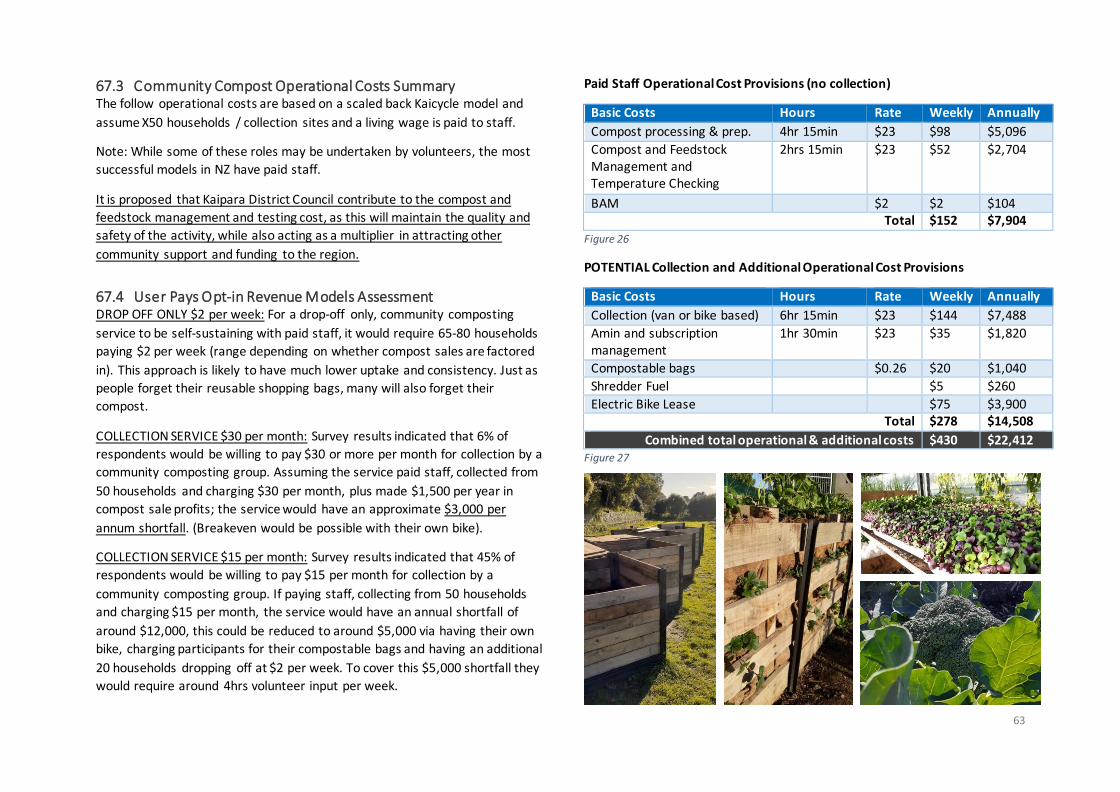
63
67.3 Community Compost Operational Costs Summary The follow operational costs are based on a scaled back Kaicycle model and
assume X50 households / collection sites and a living wage is paid to staff.
Note: While some of these roles may be undertaken by volunteers, the most
successful models in NZ have paid staff.
It is proposed that Kaipara District Council contribute to the compost and
feedstock management and testing cost, as this will maintain the quality and
safety of the activity, while also acting as a multiplier in attracting other
community support and funding to the region.
67.4 User Pays Opt-in Revenue Models Assessment DROP OFF ONLY $2 per week: For a drop-off only, community composting
service to be self-sustaining with paid staff, it would require 65-80 households
paying $2 per week (range depending on whether compost sales are factored
in). This approach is likely to have much lower uptake and consistency. Just as
people forget their reusable shopping bags, many will also forget their
compost.
COLLECTION SERVICE $30 per month: Survey results indicated that 6% of
respondents would be willing to pay $30 or more per month for collection by a
community composting group. Assuming the service paid staff, collected from
50 households and charging $30 per month, plus made $1,500 per year in
compost sale profits; the service would have an approximate $3,000 per
annum shortfall. (Breakeven would be possible with their own bike).
COLLECTION SERVICE $15 per month: Survey results indicated that 45% of
respondents would be willing to pay $15 per month for collection by a
community composting group. If paying staff, collecting from 50 households
and charging $15 per month, the service would have an annual shortfall of
around $12,000, this could be reduced to around $5,000 via having their own
bike, charging participants for their compostable bags and having an additional
20 households dropping off at $2 per week. To cover this $5,000 shortfall they
would require around 4hrs volunteer input per week.
Paid Staff Operational Cost Provisions (no collection)
Basic Costs Hours Rate Weekly Annually
Compost processing & prep. 4hr 15min $23 $98 $5,096
Compost and Feedstock Management and Temperature Checking
2hrs 15min $23 $52 $2,704
BAM $2 $2 $104 Total $152 $7,904
Figure 26
POTENTIAL Collection and Additional Operational Cost Provisions
Basic Costs Hours Rate Weekly Annually
Collection (van or bike based) 6hr 15min $23 $144 $7,488
Amin and subscription management
1hr 30min $23 $35 $1,820
Compostable bags $0.26 $20 $1,040
Shredder Fuel $5 $260
Electric Bike Lease $75 $3,900 Total $278 $14,508
Combined total operational & additional costs $430 $22,412 Figure 27
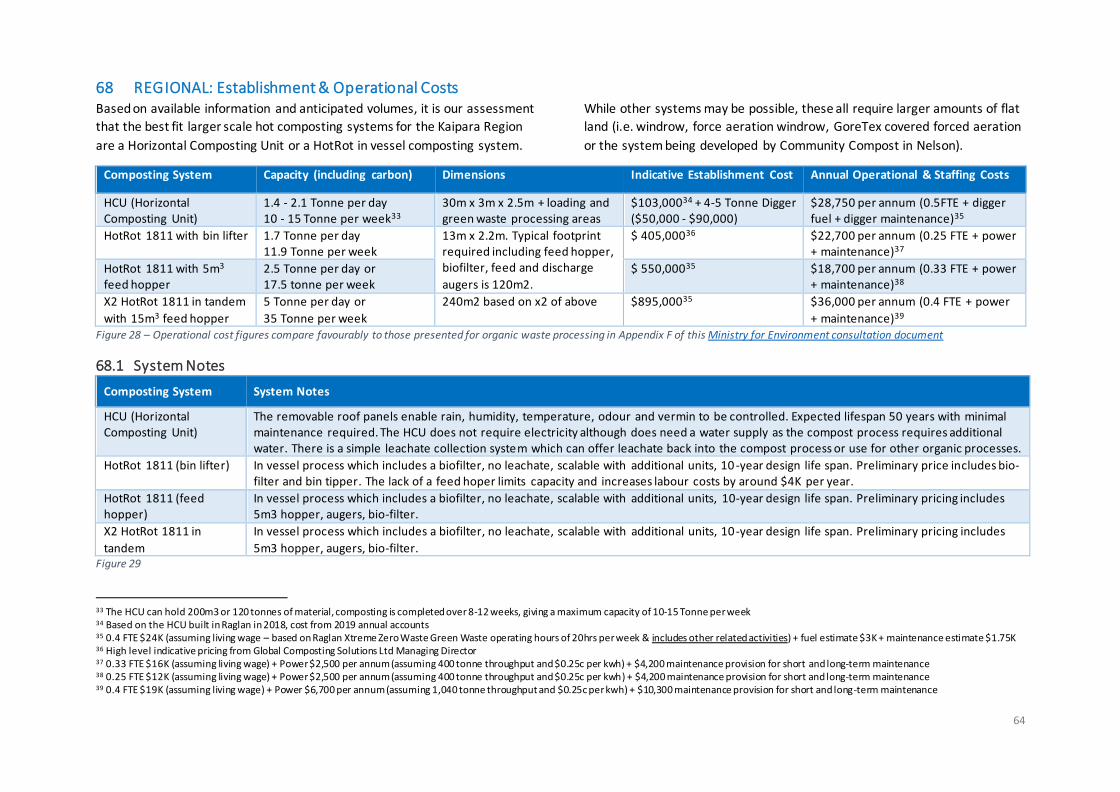
64
68 REGIONAL: Establishment & Operational Costs Based on available information and anticipated volumes, it is our assessment
that the best fit larger scale hot composting systems for the Kaipara Region
are a Horizontal Composting Unit or a HotRot in vessel composting system.
While other systems may be possible, these all require larger amounts of flat
land (i.e. windrow, force aeration windrow, GoreTex covered forced aeration
or the system being developed by Community Compost in Nelson).
Composting System Capacity (including carbon) Dimensions Indicative Establishment Cost Annual Operational & Staffing Costs
HCU (Horizontal Composting Unit)
1.4 - 2.1 Tonne per day 10 - 15 Tonne per week33
30m x 3m x 2.5m + loading and green waste processing areas
$103,00034 + 4-5 Tonne Digger ($50,000 - $90,000)
$28,750 per annum (0.5FTE + digger fuel + digger maintenance)35
HotRot 1811 with bin lifter 1.7 Tonne per day 11.9 Tonne per week
13m x 2.2m. Typical footprint required including feed hopper, biofilter, feed and discharge
augers is 120m2.
$ 405,00036 $22,700 per annum (0.25 FTE + power + maintenance)37
HotRot 1811 with 5m3 feed hopper
2.5 Tonne per day or 17.5 tonne per week
$ 550,00035 $18,700 per annum (0.33 FTE + power + maintenance)38
X2 HotRot 1811 in tandem
with 15m3 feed hopper
5 Tonne per day or
35 Tonne per week
240m2 based on x2 of above $895,00035 $36,000 per annum (0.4 FTE + power
+ maintenance)39 Figure 28 – Operational cost figures compare favourably to those presented for organic waste processing in Appendix F of this Ministry for Environment consultation document
68.1 System Notes
Composting System System Notes
HCU (Horizontal Composting Unit)
The removable roof panels enable rain, humidity, temperature, odour and vermin to be controlled. Expected lifespan 50 years with minimal maintenance required. The HCU does not require electricity although does need a water supply as the compost process requires additional water. There is a simple leachate collection system which can offer leachate back into the compost process or use for other organic processes.
HotRot 1811 (bin lifter) In vessel process which includes a biofilter, no leachate, scalable with additional units, 10 -year design life span. Preliminary price includes bio-filter and bin tipper. The lack of a feed hoper limits capacity and increases labour costs by around $4K per year.
HotRot 1811 (feed hopper)
In vessel process which includes a biofilter, no leachate, scalable with additional units, 10-year design life span. Preliminary pricing includes 5m3 hopper, augers, bio-filter.
X2 HotRot 1811 in
tandem
In vessel process which includes a biofilter, no leachate, scalable with additional units, 10-year design life span. Preliminary pricing includes
5m3 hopper, augers, bio-filter. Figure 29
33 The HCU can hold 200m3 or 120 tonnes of material, composting is completed over 8-12 weeks, giving a maximum capacity of 10-15 Tonne per week 34 Based on the HCU built in Raglan in 2018, cost from 2019 annual accounts 35 0.4 FTE $24K (assuming living wage – based on Raglan Xtreme Zero Waste Green Waste operating hours of 20hrs per week & includes other related activities) + fuel estimate $3K + maintenance estimate $1.75K 36 High level indicative pricing from Global Composting Solutions Ltd Managing Director 37 0.33 FTE $16K (assuming living wage) + Power $2,500 per annum (assuming 400 tonne throughput and $0.25c per kwh) + $4,200 maintenance provision for short and long-term maintenance 38 0.25 FTE $12K (assuming living wage) + Power $2,500 per annum (assuming 400 tonne throughput and $0.25c per kwh) + $4,200 maintenance provision for short and long-term maintenance 39 0.4 FTE $19K (assuming living wage) + Power $6,700 per annum (assuming 1,040 tonne throughput and $0.25c per kwh) + $10,300 maintenance provision for short and long-term maintenance
65
68.2 Urban Organic Waste Collection Costs Large scale urban organic waste collection is estimated to cost around $4540
per household per year. This rate will vary based on population density and
travel distances and would require negotiation with the selected contractor.
68.3 Establishment Costs The following are additional potential costs for establishment of organics
collection service.
Additional Costs Cost Notes
Kitchen Caddies $17,535 Estimated based on Raglan pricing of $5 and starting with 3,507 households
Kerbside Bins $52,605 Estimated based on Raglan pricing of
$15 and starting with 3,507 households
Additional Collection Equipment
$50,000 PC Sum - Compost Collection Trailer, Aluminium or Stainless, Compost Collection Bins, Rotating Head Forklift
Total $120,140 Figure 30
Note: Equipment cost is a basic provisional sum and has not been
investigated in depth as a number of approaches could be taken to collection.
40 https://www.tvnz.co.nz/one-news/new-zealand/critical-recycling-report-pushes-food-waste-collection-and-nationwide-approach
66
Recommendations 69 Kaipara Hot Composting Recommendations The following recommendations are made based on our assessment of the
best fit hot compost options for the Kaipara Region.
5. HOME: Community Education
It is recommended that Kaipara District Council tag some waste
minimisation funding for home composting education, encouraging
home-based food waste solutions such as bokashi, worm farming
and home composting. As a preliminary example the Waiheke
Resources Trust receive around $9K per annum via the Compost
Collective for composting and community garden workshops for a
population base of 7,600. Recommended allowance: $15K per year.
6. LOCAL: Community Composting
It is recommended that community composting initiatives are
supported. These activities are localised, minimise waste transport
and have a huge range of community building and educational
benefits. It is recommended that this is started with an initial trial
site run by Sustainable Kaipara in Mangawhai and then implemented
in other locations around the district with a focus on schools, marae
and community garden sites. Education of volunteers and effective
ongoing management / support for these systems is important to get
the best results. As such is it recommended that an annual site
management / support contribution is funded by the Kaipara District
Council, with the collection and composting activities locally funded
by service users, or via other funding sources, or run by volunteers.
Recommended allowance: $2,750 annual grant per community
composting site, with an initial objective of x10 sites regionally.
It is recommended that this funding is maintained for each new site, for a
minimum of x3 years to enable them to get established, with consideration
of longer-term support based on results.
In addition, it is suggested that council waste contractors could also be
approached to consider sponsorship of annual grants, of $5 per annum per
participating household, based on potential landfill cost savings. Funds
would be significant for the community groups, despite only equating to
only $250 per x50 households per annum.
7. REGIONAL: Larger Scale Composting
It is recommended that a Horizontal Composting Unit and/or a HotRot in
vessel composting system are investigated in more detail and business case
prepared, as a potential future solutions for the Kaipara District. The best
starting points for these investigations are Raglan Xtreme Zero Waste’s
consulting team and Global Composting Solutions. Depending transport
logistics and site suitability the composting hub/s may be located at waste
transfer stations in the Dargaville and/or Mangawhai areas. Consideration
should be given to the comparative advantage of having two sites, given the
potential for staff to also run other transfer station activities, verses a single
hub and with increased transport costs and environmental impact.
Projected population growth should also be considered.
8. OTHER: Sewage Sludge
While not investigated in detail within this report, it is understood that
Kaipara wastewater treatment sludge is currently transported to landfill. It
is recommended that a HotRot system could be investigated in more detail
for the processing of wastewater treatment sludge for the region (as is used
in Palmerston North). With increasing landfill costs, ability to process
wastewater sludge may enhance the viability of a composting system. While
pasteurised within the system, consideration would need to be given to end
product use and the potential for higher heavy metal content.
67
Research | Strategy | Feasibility | Business Case
w w w . i m pa ctc o nsul t i ng . c o. nz
We believe you should be passionate about where you are heading
and confident you can get there. Our team help you achieve both.
Related Documents


