ABSTRACT FINANCIAL PERFORMANCE ANALYSIS OF ZORAM INDUSTRIAL DEVELOPMENT CORPORATION LIMITED (ZIDCO): A CASE STUDY A DISSERTATION SUBMITTED IN PARTIAL FULFILMENT OF THE REQUIREMENTFOR THE DEGREE OF MASTER OF PHILOSOPHY K. LALRAMNGHAKA MZU REGN NO: 4564 of 2012 M.Phil. REGN. NO & DATE: 631 of 05.11.2020 DEPARTMENT OF MANGEMENT SCHOOL OF ECONOMIC MANAGEMENT AND INFORMATION SCIENCE JULY, 2021

Welcome message from author
This document is posted to help you gain knowledge. Please leave a comment to let me know what you think about it! Share it to your friends and learn new things together.
Transcript
ABSTRACT
FINANCIAL PERFORMANCE ANALYSIS OF ZORAM
INDUSTRIAL DEVELOPMENT CORPORATION LIMITED
(ZIDCO): A CASE STUDY
A DISSERTATION SUBMITTED IN PARTIAL FULFILMENT OF
THE REQUIREMENT FOR THE DEGREE OF MASTER OF
PHILOSOPHY
K. LALRAMNGHAKA
MZU REGN NO: 4564 of 2012
M.Phil. REGN. NO & DATE: 631 of 05.11.2020
DEPARTMENT OF MANGEMENT
SCHOOL OF ECONOMIC MANAGEMENT AND
INFORMATION SCIENCE
JULY, 2021
FINANCIAL PERFORMANCE ANALYSIS OF ZORAM
INDUSTRIAL DEVELOPMENT CORPORATION LIMITED
(ZIDCO): A CASE STUDY
BY
K. LALRAMNGHAKA
DEPARTMENT OF MANGEMENT
SUPERVISOR
Dr. BIDHU KANTI DAS
SUBMITTED
IN PARTIAL FULFILMENT OF THE REQUIREMENT FOR THE
DEGREE OF MASTER OF PHILOSOPHY IN MANGEMENT OF
MIZORAM UNIVERSITY,AIZAWL

DEPARTMENT OF MANAGEMENT
SCHOOL OF ECONOMICS, MANAGEMENT AND INFORMATION
SCIENCES, MIZORAM UNIVERSITY,
AIZAWL
2021
DECLARATION
I K. Lalramnghaka, hereby declared that the subject matter of this dissertation is the
record of work done by me, and the content of this dissertation did not form basis of
the award of any previous degree to me or to do the best of my knowledge to
anybody else, and that the dissertation has not been submitted by me for any research
degree in any other University / Institute.
This is being submitted to the Mizoram University for the degree of Master of
Philosophy in Management.
(K. Lalramnghaka)
Candidate
(Head) (Supervisor)
MIZORAM UNIVERSITY (A Central University Accredited ‘A’ Grade by NAAC)
Dr. Bidhu Kanti Das Department of Management
Assistant Professor School of EMIS, Aizawl-796009, India
Tel: 0389-2330710/2330261(O) Mob. 9485119670(M)
Email id: [email protected]
C E R T I F I C A T E
This is to certify that ―Zoram Industrial Development Corporation Limited (ZIDCO):
A Case Study‖ by K. Lalramnghaka has been written under my supervision.
He has fulfilled all the required norms laid down under the M. Phil Regulations of
Mizoram University. The dissertation is the result of his own investigation. Neither
the dissertation as a whole nor any part of it was ever submitted to any University for
any research degree.
Aizawl Dr. Bidhu Kanti Das
Dated: Supervisor
i
ACKNOWLEDGEMENT
For the accomplishment of this study, I have drawn from an unimaginable magnitude
from various individuals, institutions and sources. Therefore, it is only in the fitness
of things that I acknowledge it and register my profound indebtedness to such
individual and sources.
I wish to place on record first and foremost gratitude to my respected supervisor Dr.
Bidhu Kanti Das, Assistant Professor, Department of Management, Mizoram
University, Aizawl, who has supported and guide throughout the period and process
of my research work. He has provided me with timeless guidance, encouragement to
complete my research. His vibrant intellect and passion for knowledge were
important source of motivation for me in this study.
I am also grateful to all those auditors of articles, books and other resources whom I
quoted in my dissertation.
I also express my sincere gratitude to all my friends, faculty members, staff and
research scholars of Mizoram University, Aizawl for their cooperation, moral support
and help provided during the course of my research work.
On the home front I owe much to my parents Mr. K. Lalrinliana and Mrs.
Vanlalngaii for their support, encouragement and understanding to complete this
research work on time.
Last but not least I would like to thank our respected Head of Department Dr. Amit
Kumar Singh for his encouragement and support at the time of completion of the
thesis.
K. Lalramnghaka
ii
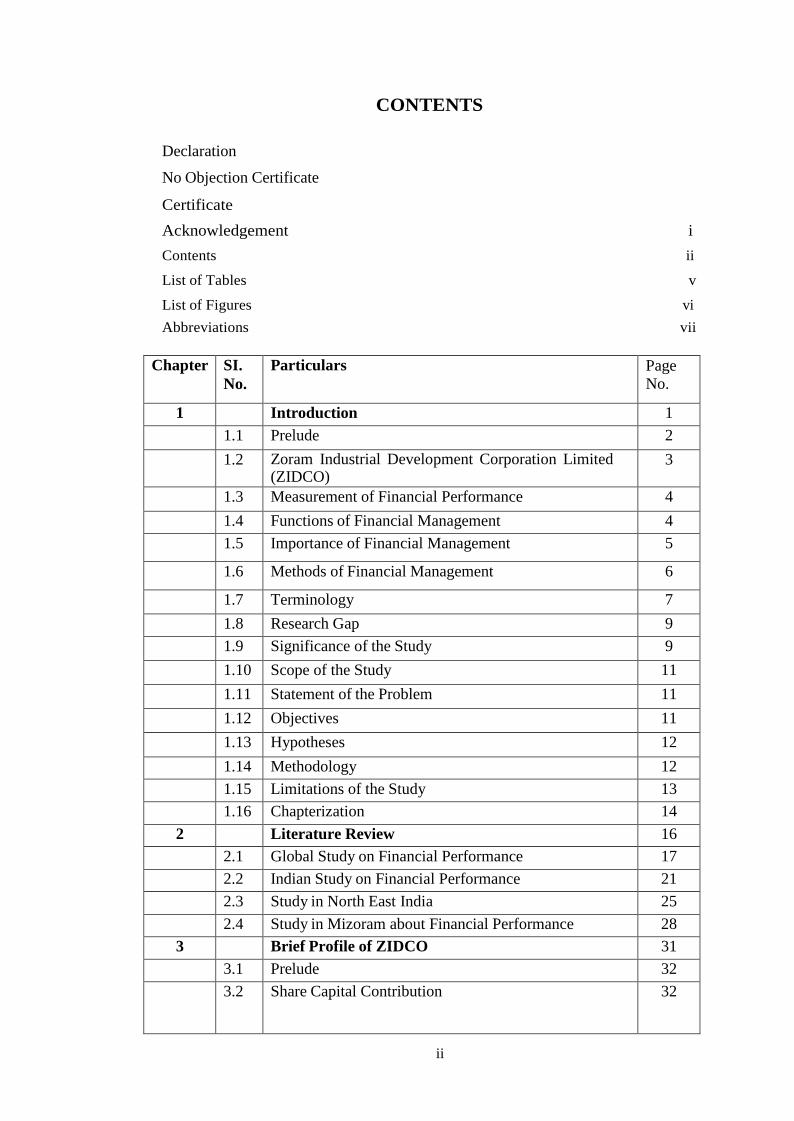
CONTENTS
Declaration
No Objection Certificate
Certificate
Acknowledgement
Contents
i
ii
List of Tables v
List of Figures vi
Abbreviations vii
Chapter SI.
No.
Particulars Page
No.
1 Introduction 1
1.1 Prelude 2
1.2 Zoram Industrial Development Corporation Limited (ZIDCO)
3
1.3 Measurement of Financial Performance 4
1.4 Functions of Financial Management 4
1.5 Importance of Financial Management 5
1.6 Methods of Financial Management 6
1.7 Terminology 7
1.8 Research Gap 9
1.9 Significance of the Study 9
1.10 Scope of the Study 11
1.11 Statement of the Problem 11
1.12 Objectives 11
1.13 Hypotheses 12
1.14 Methodology 12
1.15 Limitations of the Study 13
1.16 Chapterization 14
2 Literature Review 16
2.1 Global Study on Financial Performance 17
2.2 Indian Study on Financial Performance 21
2.3 Study in North East India 25
2.4 Study in Mizoram about Financial Performance 28
3 Brief Profile of ZIDCO 31
3.1 Prelude 32
3.2 Share Capital Contribution 32
iii
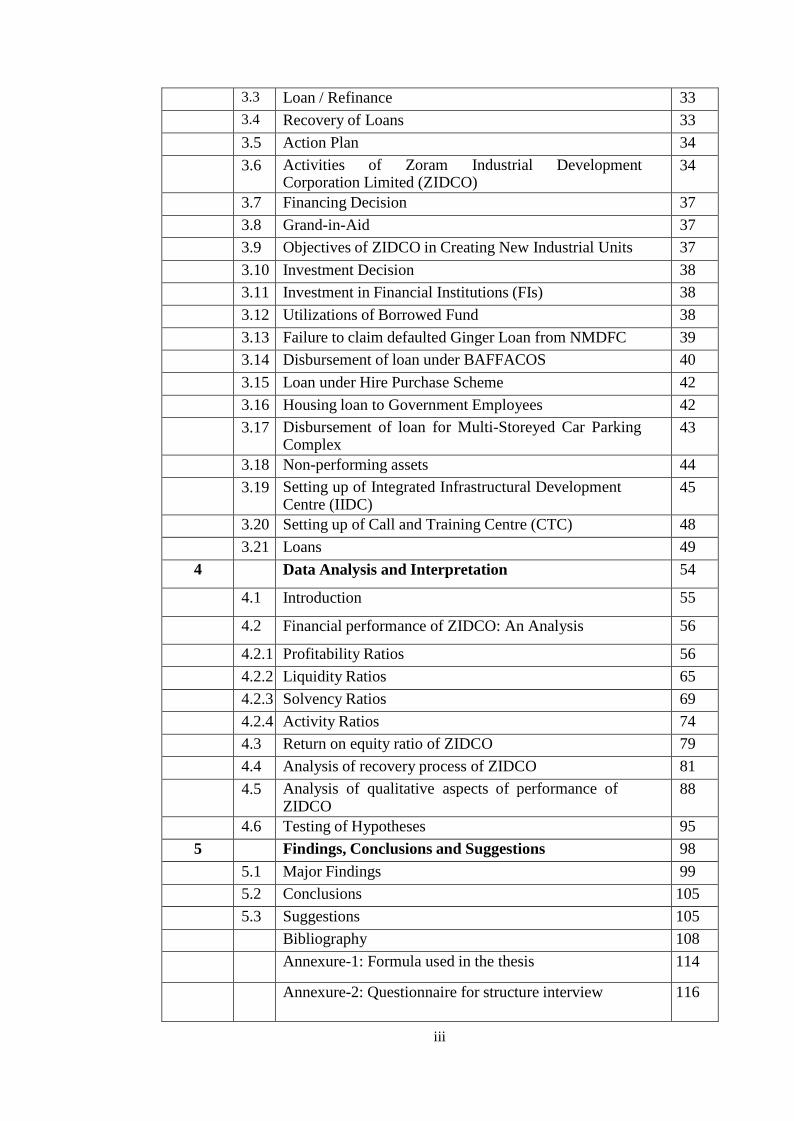
3.3 Loan / Refinance 33
3.4 Recovery of Loans 33
3.5 Action Plan 34
3.6 Activities of Zoram Industrial Development Corporation Limited (ZIDCO)
34
3.7 Financing Decision 37
3.8 Grand-in-Aid 37
3.9 Objectives of ZIDCO in Creating New Industrial Units 37
3.10 Investment Decision 38
3.11 Investment in Financial Institutions (FIs) 38
3.12 Utilizations of Borrowed Fund 38
3.13 Failure to claim defaulted Ginger Loan from NMDFC 39
3.14 Disbursement of loan under BAFFACOS 40
3.15 Loan under Hire Purchase Scheme 42
3.16 Housing loan to Government Employees 42
3.17 Disbursement of loan for Multi-Storeyed Car Parking Complex
43
3.18 Non-performing assets 44
3.19 Setting up of Integrated Infrastructural Development Centre (IIDC)
45
3.20 Setting up of Call and Training Centre (CTC) 48
3.21 Loans 49
4 Data Analysis and Interpretation 54
4.1 Introduction 55
4.2 Financial performance of ZIDCO: An Analysis 56
4.2.1 Profitability Ratios 56
4.2.2 Liquidity Ratios 65
4.2.3 Solvency Ratios 69
4.2.4 Activity Ratios 74
4.3 Return on equity ratio of ZIDCO 79
4.4 Analysis of recovery process of ZIDCO 81
4.5 Analysis of qualitative aspects of performance of ZIDCO
88
4.6 Testing of Hypotheses 95
5 Findings, Conclusions and Suggestions 98
5.1 Major Findings 99
5.2 Conclusions 105
5.3 Suggestions 105
Bibliography 108
Annexure-1: Formula used in the thesis 114
Annexure-2: Questionnaire for structure interview 116
iv
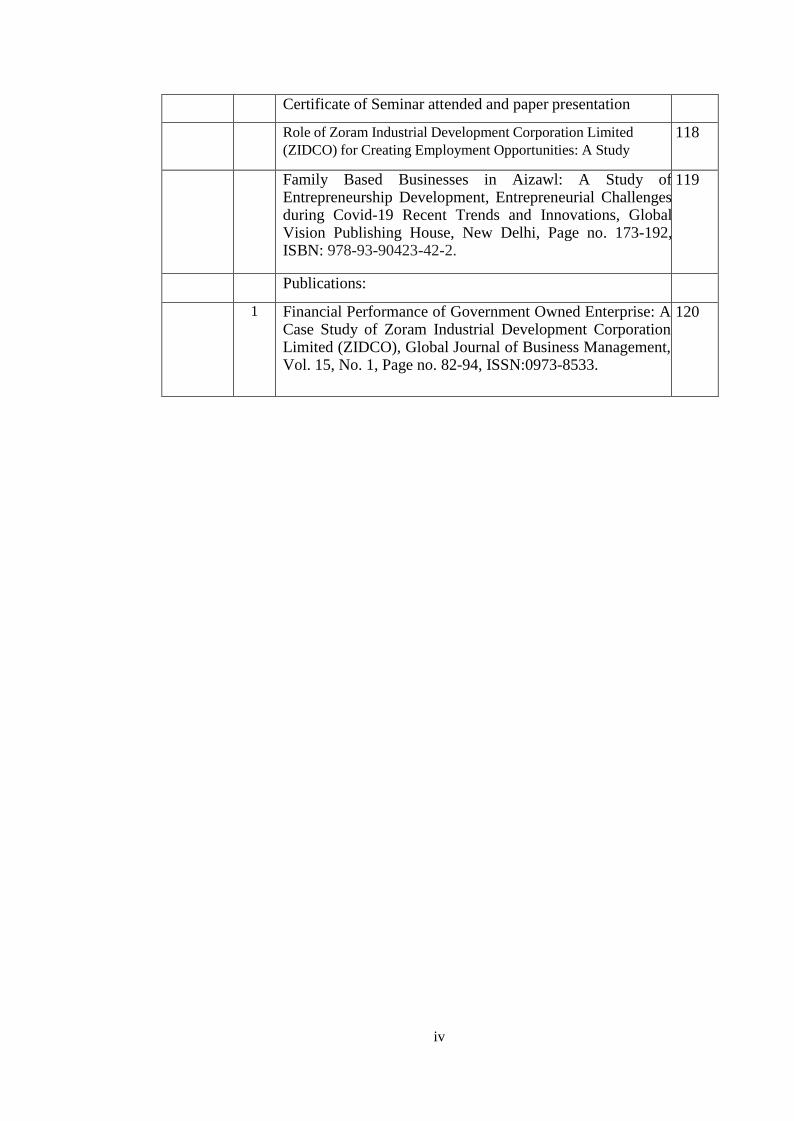
Certificate of Seminar attended and paper presentation
Role of Zoram Industrial Development Corporation Limited
(ZIDCO) for Creating Employment Opportunities: A Study
118
Family Based Businesses in Aizawl: A Study of Entrepreneurship Development, Entrepreneurial Challenges during Covid-19 Recent Trends and Innovations, Global Vision Publishing House, New Delhi, Page no. 173-192, ISBN: 978-93-90423-42-2.
119
Publications:
1 Financial Performance of Government Owned Enterprise: A Case Study of Zoram Industrial Development Corporation Limited (ZIDCO), Global Journal of Business Management, Vol. 15, No. 1, Page no. 82-94, ISSN:0973-8533.
120
v
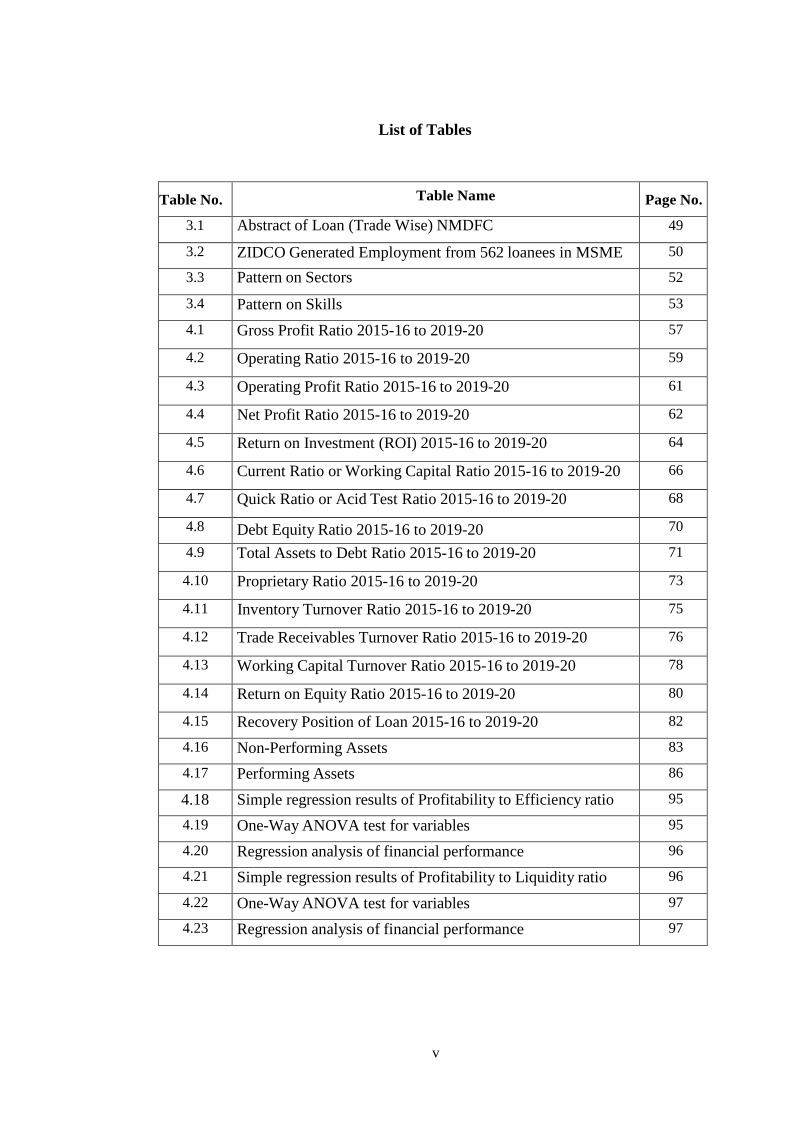
List of Tables
Table No. Table Name Page No.
3.1 Abstract of Loan (Trade Wise) NMDFC 49
3.2 ZIDCO Generated Employment from 562 loanees in MSME 50
3.3 Pattern on Sectors 52
3.4 Pattern on Skills 53
4.1 Gross Profit Ratio 2015-16 to 2019-20 57
4.2 Operating Ratio 2015-16 to 2019-20 59
4.3 Operating Profit Ratio 2015-16 to 2019-20 61
4.4 Net Profit Ratio 2015-16 to 2019-20 62
4.5 Return on Investment (ROI) 2015-16 to 2019-20 64
4.6 Current Ratio or Working Capital Ratio 2015-16 to 2019-20 66
4.7 Quick Ratio or Acid Test Ratio 2015-16 to 2019-20 68
4.8 Debt Equity Ratio 2015-16 to 2019-20 70
4.9 Total Assets to Debt Ratio 2015-16 to 2019-20 71
4.10 Proprietary Ratio 2015-16 to 2019-20 73
4.11 Inventory Turnover Ratio 2015-16 to 2019-20 75
4.12 Trade Receivables Turnover Ratio 2015-16 to 2019-20 76
4.13 Working Capital Turnover Ratio 2015-16 to 2019-20 78
4.14 Return on Equity Ratio 2015-16 to 2019-20 80
4.15 Recovery Position of Loan 2015-16 to 2019-20 82
4.16 Non-Performing Assets 83
4.17 Performing Assets 86
4.18 Simple regression results of Profitability to Efficiency ratio 95
4.19 One-Way ANOVA test for variables 95
4.20 Regression analysis of financial performance 96
4.21 Simple regression results of Profitability to Liquidity ratio 96
4.22 One-Way ANOVA test for variables 97
4.23 Regression analysis of financial performance 97
vi
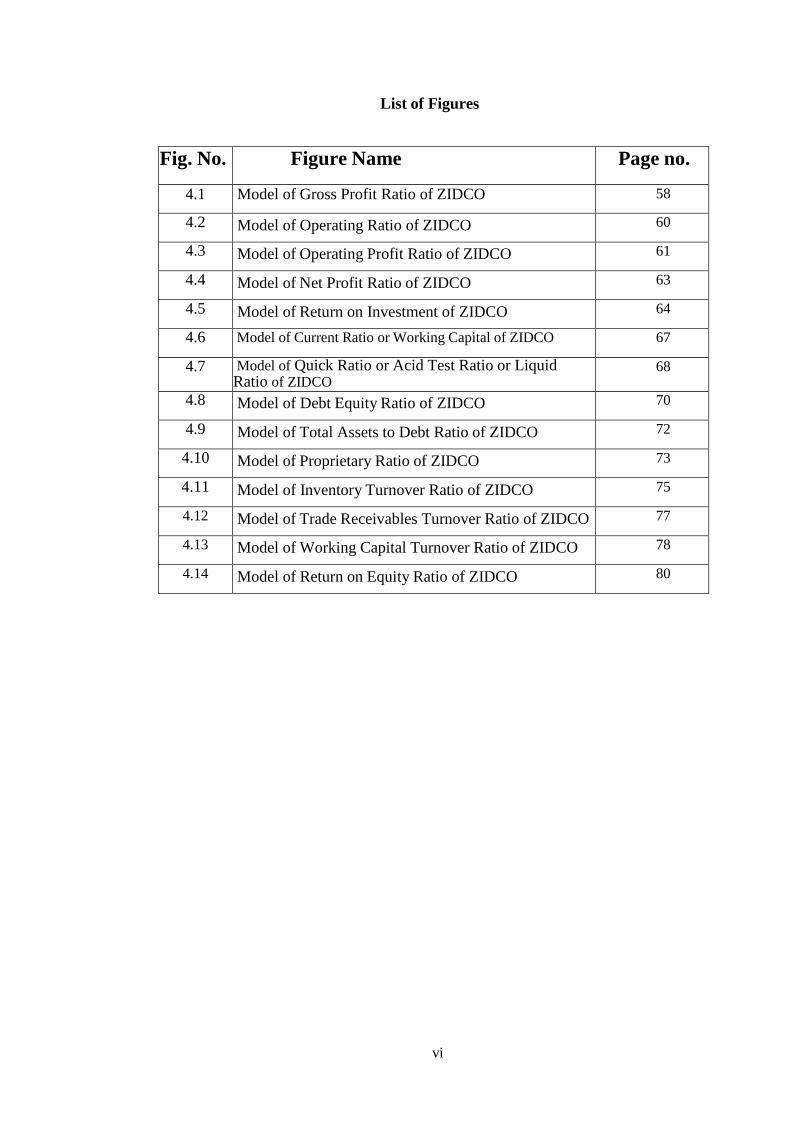
List of Figures
Fig. No. Figure Name Page no.
4.1 Model of Gross Profit Ratio of ZIDCO 58
4.2 Model of Operating Ratio of ZIDCO 60
4.3 Model of Operating Profit Ratio of ZIDCO 61
4.4 Model of Net Profit Ratio of ZIDCO 63
4.5 Model of Return on Investment of ZIDCO 64
4.6 Model of Current Ratio or Working Capital of ZIDCO 67
4.7 Model of Quick Ratio or Acid Test Ratio or Liquid Ratio of ZIDCO
68
4.8 Model of Debt Equity Ratio of ZIDCO 70
4.9 Model of Total Assets to Debt Ratio of ZIDCO 72
4.10 Model of Proprietary Ratio of ZIDCO 73
4.11 Model of Inventory Turnover Ratio of ZIDCO 75
4.12 Model of Trade Receivables Turnover Ratio of ZIDCO 77
4.13 Model of Working Capital Turnover Ratio of ZIDCO 78
4.14 Model of Return on Equity Ratio of ZIDCO 80
vii
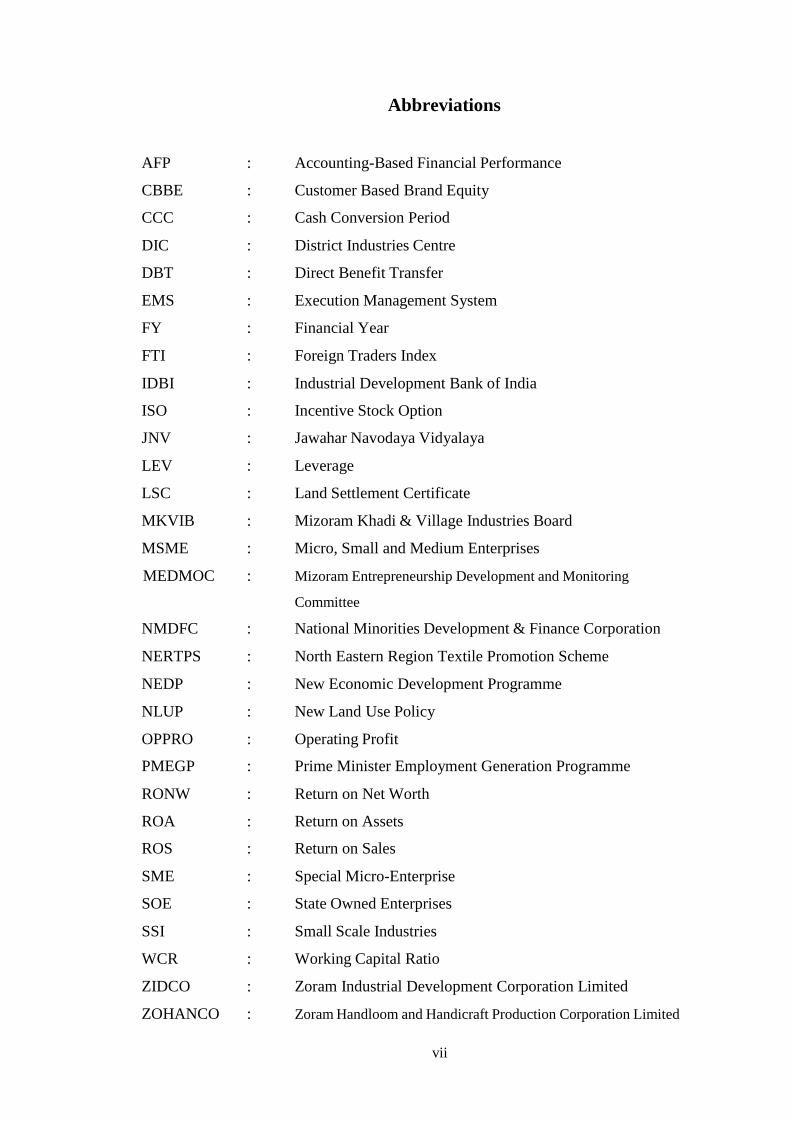
Abbreviations
AFP : Accounting-Based Financial Performance
CBBE : Customer Based Brand Equity
CCC : Cash Conversion Period
DIC : District Industries Centre
DBT : Direct Benefit Transfer
EMS : Execution Management System
FY : Financial Year
FTI : Foreign Traders Index
IDBI : Industrial Development Bank of India
ISO : Incentive Stock Option
JNV : Jawahar Navodaya Vidyalaya
LEV : Leverage
LSC : Land Settlement Certificate
MKVIB : Mizoram Khadi & Village Industries Board
MSME : Micro, Small and Medium Enterprises
MEDMOC : Mizoram Entrepreneurship Development and Monitoring
Committee
NMDFC : National Minorities Development & Finance Corporation
NERTPS : North Eastern Region Textile Promotion Scheme
NEDP : New Economic Development Programme
NLUP : New Land Use Policy
OPPRO : Operating Profit
PMEGP : Prime Minister Employment Generation Programme
RONW : Return on Net Worth
ROA : Return on Assets
ROS : Return on Sales
SME : Special Micro-Enterprise
SOE : State Owned Enterprises
SSI : Small Scale Industries
WCR : Working Capital Ratio
ZIDCO : Zoram Industrial Development Corporation Limited
ZOHANCO : Zoram Handloom and Handicraft Production Corporation Limited

1
Chapter-1
Introduction

2
1.1 Prelude
The word "performance" is derived from the word "parfourmen," meaning
'to do' or 'to make'. This applies to the act of execution, accomplishment,
satisfaction, etc. Output, in the context of the border, refers to the accomplishment
of a given mission calculated against preset levels of precision, completeness, price,
and rate. It refers, in other words, to the degree to which an achievement is being or
has been achieve (Tripathi, 1991). Performance is used to define increased attempts
to efficiently and consistently meet the goals. Objective attainment involves the
integrated used of human, financial and natural resources (Robert Alban, 1978).
By correctly identifying relationships between the items of the Balance
sheet and the record of gains and losses, the financial performance analysis
identifies the company's financial strengths and weaknesses. The first task is to
select data related to the decision under consideration from the total information
contained in the financial statements. The second is to organize the data in such a
way as to highlight substantial relationships (Trivedi, 2010).
Financial performance is a quantitative measure of an organization's ability
to generate revenue from its main business mode. The term can also be used as a
general indicator of a company's overall financial health over a period of time.
Financial statements were used by analysts and investors to compare similar
companies in the same industry or to measure industries or sectors. The financial
output determines how effectively a company produces income and handles its
assets, liabilities, and stakeholder financial interests. It is also a company’s level of
success for a given period of time, measured in terms of net gains and loss during
that time. Assessing the financial performance of businesses helps decision-makers
to evaluate the outcomes of company plans and operations in an analytical
monetary sense (Will Kenton, 2020).
In this study, an attempt was made to study the overall financial
performance of ZIDCO to assist the industrial sectors and entrepreneurship
programme in Mizoram and also will be crucial in motivating the society to
conducted new business activities which plays an important role in economic
development. The study was also helpful in the recovering process of loans
provided to the other industries and entrepreneurs.
3
1.2 Zoram Industrial Development Corporation Limited (ZIDCO)
Zoram Industrial Development Corporation Limited (ZIDCO) was founded
in 1978 and registered under the Companies Act, 1956. It was designed to be the
Corporation's twin. It is a joint venture between the Mizoram government and
Industrial Development Bank of India (IDBI). The Authorized Share Capital is
Rs.1500 lakhs i.e., (Rs.15 crores), out of this Rs.1370.10 lakhs are fully subscribed
and paid up. Out of the paid-up capital of Rs. 1370.10 lakhs, only 31.24% is
contributed by IDBI and Government of Mizoram holds 68.76% of the total share
capital contribution. As a result of economic liberalization, Government of India
stopped share capital contribution to IDBI and subsequently IDBI has completely
stopped contributing share capital to ZIDCO since 1991-92. In fact, Government
of Mizoram is only contributing share capital to ZIDCO. The registered office of
ZIDCO is located in Aizawl, the state capital of Mizoram. ZIDCO currently has
one branch office in Lunglei. Lunglei, Lawngtlai, and Siaha districts are all part of
the Branch Office.
ZIDCO's activities include assisting, financing, protecting, and promoting the
interests of Mizoram's industries, as well as procuring and distributing raw
materials to business ventures, facilitating licenses, establishing export and
marketing facilities, acquiring and developing plans for the development of
industries under ZIDCO's financing, power supply, and water supply, and
coordinating the procurement and distribution of raw materials to business ventures.
It is to enter into partnership, business and joint ventures with any other company,
firm or persons, carrying on manufacturing or other business in sharing of profits
within the objects of the company. IDBI and the Government of Mizoram are
making efforts to diversify their activities towards the mobilization of sources of
finance, industrial growth and other activities. Ministry of Textile (Govt. of India)
have setup Apparel and Garment Making Centre under the schemes of the North
Eastern Region Textile Promotion Scheme (NERTPS) and selected the Industrial
Growth Centre, Luangmual as to be the first place in Aizawl, Mizoram. ZIDCO has
been selected as the Project Implementing Agency by the Government of Mizoram.
ZIDCO has given Rs. 4575.85 lakhs loans to 4961 loanees. Repayment of
loans were received from the loanees only a sum of Rs. 6455.47 lakhs (including
the interest) till 30th
March, 2020. Different measures have been taken to recover
4
the loan and interest from the loan beneficiaries of ZIDCO. House to House
recovery drive has been conducted, retrieval of Industrial Assets, auctioning the
mortgaged L.S.C.
1.3 Measurement of Financial Performance
The financial statements of a firm (balance sheet, income statement, and
cash flow statement) are used to calculate a firm’s financial performance. The
balance sheet is a snapshot of an organization’s financial assets. It offers a
summary of how well the firm is handling its assets and liabilities. Analyst may
find information on the balance sheet about long-term vs short-term debt.
The income statement contains a year- round overview of the activities. The
declaration of income begins with revenue or profits, and ends with net profit. The
gross profit margin, product costs, operating profit margin, and net profit margin
are all included in the income statement, also known as the profit and loss
statement. This includes a summary of the number of outstanding securities as well
as a comparison to the previous year's performance. The balance sheet and the
income statement are combined in the cash flow statement. For some investors, the
cash flow statement is the most important financial statement because it compares
net profit and cash flow. This is where investors can see how much the company
has spent on equity sales, dividends, and capital expenditures. This also includes
the foundation and applications of sales, expenditure, and funding cash flow.
1.4 Functions of Financial Management:
Since finance is regarded as the most important factor in any company, it
necessitates special attention. The traditional approach to the finance feature of
business emphasizes the acquisition of funds for the company, but it overlooks the
effective and proper use of those funds for the company's success. Any company
requires funds for a variety of ventures and projects. Any concern should pay
careful attention to how much to allocate, when to allocate, and how to allocate the
necessary funds to a specific project.
The management must consider the benefits and drawbacks of each project,
as well as the amount of funding required and the sources from which to obtain it.
As a result, financial management is crucial in the acquisition, distribution, and
5
control of funds.
The finance manager is also required to coordinate the finance role with
other business functions in addition to preparing and procuring funds. As a result
of the tight and proper coordination between the financial departments, the key
roles that financial managers usually perform are as follows:
1. Capital requirement estimation
2. Assuring investors of a fair rate of return.
3. Identifying a suitable funding source
4. Determining the best and most appropriate capital structure for the company.
5. Overseeing the different departments' activities
6. Financial statement preparation, review, and interpretation.
7. Establishing a sound dividend strategy.
8. Negotiating for outside funding.
1.5 Importance of Financial Management:
It is impossible to overstate the value of financial management. Sound
financial management is required in every organization that deals with money.
"Poor production management and bad sales management have slain in the
hundreds, but defective financial management has slain in the thousands," says
Collin Brooks.
When a company takes a big decision, the consequences of that decision
will be felt in the organization. In both for profit and non-profit organizations,
good financial management is critical. Financial management aids in the efficient
allocation of funds between fixed assets and working capital. The finance manager
calculates the total amount of money needed in the short and long term. The
finance manager evaluates the company's financial position by calculating the
return on capital, debt-equity ratio, cost of capital from each source, and
comparing the capital structure to that of competitors.
Financial management also aids in determining how a company will
perform in the future by indicating whether the company will be able to raise
enough funds to fulfil its various obligations, such as debt repayments and the
redemption of other liabilities.
A company's financial management is critical to its success. It aids benefit
6
planning, capital expenditure, cost measurement, inventory tracking, accounts
payable, and so on. Financial management basically aids in optimizing the
performance from a given input of funds.
1.6 Methods of Financial Management:
The word "financial system" (or "financial tool") refers to any rational method or
strategy that is used to achieve the following two objectives:
1. Measuring the impact of a company's activities and decisions.
2. Assessing the soundness of decisions about potential projects that have
been accepted or rejected. The following are some of the most critical
financial instruments or strategies used by a financial planner in the
course of his duties.
1.6.1 Cost of Capital
It aids the finance manager in determining the sources from which funds
will be collected. When deciding between various sources of financing,
such as bonds, debentures, loans from financial institutions, banks,
public deposits, and so on, the finance manager considers the cost of
capital and chooses the cheapest option. When deciding the best capital
structure, the cost of capital is often taken into account.
1.6.2 Financial Leverage or Trading on Equity
It is also another method that aids the finance manager in growing the
return to stockholders.
1.6.3 Capital Budgeting Appraisal Methods
It includes payback period, average rate of return, internal rate of return,
net present value, profitability index, and other factors that aid the
finance manager in deciding which capital investment plan is the best.
1.6.4 ABC Analysis, Cash Management Models, Aging Schedule of
Inventories, Debtor's Turnover Ratio Etc.,
It aids the finance manager in managing current assets effectively.
1.6.5 Ratio Analysis
It is an additional tool for assessing various aspects of a business.
Different ratios serve different purposes.
1.6.6 Funds Flow Analysis and Cash Flow Analysis
Techniques assist the finance manager in deciding whether funds were
7
obtained from the best available source and used in the most efficient
manner possible. The finance manager will use estimated funds flow
analysis and projected cash flow analysis to estimate or plan for potential
working capital and cash needs.
1.7 Terminology:
Balance Sheet
Balance Sheet is a mirror, which reflects the true position of assets and liabilities on
a particular date. (Siddiqui and Siddiqui 2003)
Current Assets Turnover Ratio
This ratio establishes the relationship between current assets and net sales or cost of
goods sold. This ratio affects the efficiency in the utilization of working capital.
(Siddiqui and Siddiqui 2003)
Cost of Capital
Cost of capital is the required return necessary to make a capital budgeting project,
such as the construction of a new factory, worthwhile. As analysts and investors
analyses the cost of capital, they generally mean the weighted average of the
company's debt and equity costs combined. (Kenton 2020)
Capitalization Rate
In the world of commercial real estate, the capitalization rate (also known as the cap
rate) is used to denote the rate of return that is expected to be generated on real
estate investment property. (Chen 2020)
Debt Equity Ratio
This ratio expresses the relationship between long term debts and shareholder’s
funds. It indicates the proportion of funds which are acquired by long-term
borrowings in comparison to shareholder’s funds. (Goel, Goel and Goel 2017)
Financial Performance
The Financial Performance accurately identifies the relationship between the
balance sheet items and the profits and losses record to describe the company's
financial strengths and weaknesses. (Trivedi, 2010)
Fixed Assets Turnover Ratio
Fixed assets are used in the company for producing goods to be sold. The effective
utilization of fixed assets will result in increased production and reduce cost.
8
(Siddiqui and Siddiqui 2003)
Liquidity Ratio
These ratios are used to evaluate a company's short-term financial position. They
show whether the company can meet its current commitments with its current
resources. (Goel, Goel and Goel 2017)
Management of Funds
Management of Funds is the supervision and management of the cash flow of a
financial institution. The fund manager guarantees that the maturities of the deposits
are compatible with the demand for loans. To do this, the manager examines both
the liabilities and the assets that affect the ability of the bank to issue credit.
(Kenton 2018)
Profitability Ratio
Profitability ratios measure the various aspects of the profitability of a company,
such as the rate of profit on revenue from profit operations and whether the profits
are increasing or decreasing and if the decreasing the cause of their decrease. (Goel,
Goel and Goel 2017)
Quick Ratio
Quick ratio indicates whether the firm is in a position to pay its current liabilities
within a month or immediately. As such, the quick ratio is calculated by dividing
liquid assets by current liabilities. (Goel, Goel and Goel 2017)
Return on Equity Ratio
Return on equity (ROE) is a financial performance metric measured by dividing net
profits by the equity of shareholders. Since the equity of the shareholders equals the
assets of a corporation minus its debt, the return on net assets is considered to be
ROE. (Hargrave and Mansa 2020)
Source of Funds
Reference is made to the sources of the specific funds or some other monetary
instrument which is the subject of a transaction between the financial institution and
the client. (Low 2018)
Working Capital Ratio
This ratio explains the relationship between current assets and current liabilities of a
business. (Goel, Goel and Goel 2017)
9
1.8 Research Gap
From the available literature reviewed, it was found that various studies
have been made with relation to the financial performance analysis from different
industries around the world and different parts of India. But researches have never
been found on ZIDCO to study the proposed topic. It is an attempt to study the
financial performance of ZIDCO for the improvement of companies’ financial
performance and the study will be helpful for industries and entrepreneurship
programme in Mizoram. The annual Audited Report showing Statement of Profit and
Loss Account and Balance Sheet are usually adopted for realizing the reliability,
efficiency and profitability of a business. The present research highlights the
Financial Performance of ZIDCO by implementing different accounting ratios to
show Profitability Ratio consisting of Gross Profit Ratio, Operating Ratio, Operating
Profit Ratio, Net Profit Ratio and Return on Investment. And Liquidity Ratio,
consisting of Current Ratio or Working Capital Ratio, Quick Ratio or Acid Test
Ratio. Solvency Ratio consisting of Debt Equity Ratio, Total Assets to Debt Ratio,
Proprietary Ratio and Activity Ratio consisting of Inventory Turnover Ratio, Trade
Receivables Turnover Ratio, Working Capital Turnover Ratio. And lastly Return on
Equity Ratio.
So, this present study on, ―Financial Performance Analysis of Zoram
Industrial Development Corporation Limited (ZIDCO): A Case Study‖ is undertaken
to study in depth, the financial performance, the loan recovery process and
qualitative aspects of financial issues of ZIDCO for the last five years i.e., 2015-16 to
2019-20 Financial Year.
1.9 Significance of the study
Zoram Industrial Development Corporation Limited (ZIDCO) plays an
important role for Mizoram's development in providing capital to the general
entrepreneurs and industries through loans to support the people who are intended to
startup their own business industries. The study of Financial Performance Analysis
of ZIDCO focus on the financial performance of ZIDCO through the study of
financial issues being faced by ZIDCO. There is the occurrence of non- repayment of
loans from the borrowers which effects the financial institutions and are unable to
implement the updated financial schemes to ZIDCO.
10
In carrying out finance functions, the checking of financial results in a
company needs a lot of focus. It necessitates a retrospective examination of the
operating period in order to assess the wisdom and efficiency of financial planning.
The analysis of what occurred can be extremely useful in developing the standards,
techniques, and procedures. Financial statements are mainly used to make decisions.
Financial statements, also known as financial reports, are account balances that are
arranged in an effective and substantive order such that the facts and principles they
depict can be easily interpreted and used as a basis for decisions by those involved in
business matters.
In modern company, the term "financial statements" applies to two
documents: a balance sheet, which shows the assets, liabilities, and capital as of a
specific date, and an income statement, or profit and loss statement, which shows the
results obtained during a specific period and is prepared at the end of the accounting
year for a business entity. Adding a third statement of retained earnings has become
common practice, particularly among large corporations. Financial analysis is the
process of properly identifying the relationship between the balance sheet goods and
the profit and loss account in order to determine a company's financial strengths and
weaknesses. Comparative statements, schedules of adjustments in working capital,
common size ratios, funds analysis, trend analysis, and ratio analysis are some of the
tools or strategies used in financial statement analysis. The most important method in
financial analysis is the ratio analysis. The importance of financial analysis in
financial management cannot be overstated. Finally, the accurate study of a business
enterprise's financing is critical to its performance.
This research tells us about ZIDCO at the level of improving the financial
performance, recovery process, and overall management of the fund of the company.
The study of financial performance of ZIDCO is helpful for the same industry in the
state for improving their financial management. And also helpful in creation of
employment opportunities on the level of their pattern and employments generations
by ZIDCO in the state of Mizoram. This research would not only shed light on the
level of their issues on creation of employment opportunities but would also help to
improved their functions and performance in the future. The outcomes of the studies
are helpful for the state government for the management of state-owned enterprises.
Also, the outcome of the studies is also helpful for researcher, entrepreneur, and
11
society at large by improving economic performance of the enterprise.
1.10 Scope of the study
The study of Financial Performance Analysis of Zoram Industrial
Development Corporation Limited (ZIDCO) gathered insightful information on the
level of their financial performance of ZIDCO for the last five years and also
recovery methods of loan provided by ZIDCO. This research shed light on the level
of their financial issues and would also help to improved their functions and
performance in the future. The study was conducted within ZIDCO and its different
branches in Mizoram for a period of five years i.e., 2015-16 to 2019-20 Financial
Year.
Financial statement analysis and interpretation are attempts to assess the value
and purpose of financial statement data so that a prediction of potential earnings,
willingness to pay interest, and so on can be made. Financial statement analysis
focuses on determining the relationship between various financial factors in a
business as shown by a single set of financial statements, as well as the pattern of
these factors as seen in a series of statements. Although analysis entails calculating
ratios to resolve the statements, interpretation is the mental process of
comprehending the terms of such statements and forming opinions or inferences
about the financial health, profitability, performance, and other aspects of the
company. This type of financial analysis offers crucial details for control purposes.
1.11 Statement of the Problem
There was a financial performance problem in ZIDCO in terms of financial
results and repayment of loans from the borrowers which has to be studied in details
including the financial status, performance, and challenges of ZIDCO. The
organization was making losses for the period of more than 10 years i.e., (2004-
2014). And now turn around at least from loss making to operating profit-making
company.
1.12 Objectives:
i. To analyze the financial performance of ZIDCO for a period
of 5 years from FY 2015- 16 to FY 2019-20.
12
ii. To study the Return on equity ratio of the company for a
period of 5 years from FY 2015-16 to FY 2019-20.
iii. To examine the recovery process of ZIDCO loan provided to
the other industries and entrepreneurs.
iv. To assess the qualitative aspects of financial issues faced by
the organization with reference to the performance or non-
performance.
1.13 Hypotheses:
H1: There is a significant relationship in Profitability and Efficiency Ratio of
ZIDCO
H2: There is a significant relationship in Profitability and Liquidity Ratio of
ZIDCO
1.14 Methodology:
The present study on ―Financial Performance Analysis of Zoram Industrial
Development Corporation Limited (ZIDCO): A Case Study‖ studied and analyses
the financial performance of ZIDCO for the past 5 years with effect from 2015-16
to 2019-20 Financial Year and identified the main parameter of performance and
non-performance. And also finds the causes of performance and non-performance
and further suggested ZIDCO for better performance in the future. The details
of the methodology are mention below:
1.14.1 Data source
Both primary and secondary were collected. Secondary data were collected
from the Audited financial report, Balance Sheet and Annual handbook of ZIDCO.
Apart from this, books as well as papers from journals, different websites and the
reports of government department were consulted to understand the financial
performance of ZIDCO. Primary data were collected from the top officials of
ZIDCO through a set of schedule and structure interview to know the financial
issues faced by the organization with reference to the performance or non-
performance. The study of Zoram Industrial Development Corporation Limited
(ZIDCO) covers a period of 5 years, commencing from Financial Year 2015-16 to
2019-20.
13
1.14.2 Study Period
To assess on Zoram Industrial Development Corporation Limited (ZIDCO)
it was decided to study for a period of the past 5 years from financial year 2015-16
to 2019-20 about the financial performance and loan recovery processes of
ZIDCO.
1.14.3 Analysis tools
To analyze the financial performance of ZIDCO, financial accounting,
different statistical tools and Regression Analysis were used. For this purpose,
Profitability Ratio consisting of Gross Profit Ratio, Operating Ratio, Operating
Profit Ratio, Net Profit Ratio, Return on Investment, Liquidity Ratio consisting of
Current Ratio or Working Capital Ratio, Quick Ratio or Acid Test Ratio, Solvency
Ratio consisting of Debt Equity Ratio, Total Assets to Debt Ratio, Proprietary
Ratio, Activity Ratio consisting of Inventory Turnover Ratio, Trade Receivables
Turnover Ratio and Working Capital Turnover Ratio and Return on Equity Ratio
were adopted to identified the financial performance of ZIDCO which were
extracted from the Audited Report of ZIDCO from 2015-16 Financial Year to
2019-20 Financial Year. The hypotheses were tested by using statistical tool of
simple regression analysis, One-way ANOVA test and regression analysis of
financial performance as to find out the significant relationship between
profitability and efficiency ratio including the significant relationship between
profitability and liquidity ratio of ZIDCO.
1.15 Limitations of the study:
The following are some of the limitation’s studies:
The study duration is only 5 years long, which limits our ability to learn more
about ZIDCO's financial results. The performance for this five year may not
show the financial performance of ZIDCO for entire period (1978-2020 FY)
of the company. The larger size (More number of years) of analysis may
represent a different result of the study.
Since this analysis relies heavily on secondary data derived from ZIDCO's
published Annual Reports and Audited Report. So, findings of the study
depend on the authenticity of the data of ZIDCO.
14
There are a variety of approaches to analysing financial results, and experts
may have differing opinions.
The performance of the managers and top officials were not included in this
research, which is one of the crucial parts of the financial performance of the
company.
The expenditure on employees and the retired person were not included in
this study.
The present study is mainly on quantitative financial data. Qualitative data
like managers performance, timely reminder to loanees for repayment, timely
assessment of performing assets which are shifting to non-performing assets
and their reasons. Steps taken to revive non-performing assets were not
included in this study.
Time frame of the study was too small; the study was undertaken for last five
financial year starting from 2015-16 to 2019-20. Longer period of data may
represent different results.
This research relies heavily on financial ratio review, which has its own set of
drawbacks.
1.16 Chapterization:
Chapter-1: Introduction
This chapter include – Prelude - Zoram Industrial Development Corporation
Limited (ZIDCO) - Measurement of Financial Performance - Functions of Financial
Management - Importance of Financial Management - Methods of Financial
Management - Terminology - Research Gap - Significance of the Study - Scope of
the Study - Statement of the Problem – Objectives – Hypotheses – Methodology -
Limitations of the Study.
Chapter-2: Literature Review
This chapter talks about the research history of different studies conducted
various part of the world about Financial Performance Analysis. It discusses the
financial analysis of Banks, Small-Scale and Cottage Industries, Steel Industries,
Cement Industries, Textile Industries, Pharmaceutical Industries, State-Owned
Enterprises, Micro, Small and Medium Enterprises etc. It was segregated into four
15
sections i.e., Global Study on Financial Performance, Indian Study on Financial
Performance, Study in North East India, Study in Mizoram about Financial
Performance.
Chapter-3: Brief Profile of ZIDCO
This chapter include – Prelude - Share Capital Contribution - Loan /
Refinance - Recovery of Loans - Action Plan - Activities of Zoram Industrial
Development Corporation Limited (ZIDCO) - Financing Decision - Grand-in-Aid –
Objectives of ZIDCO in Creating New Industrial Units - Investment Decision -
Investment in Financial Institutions (FIs) - Utilizations of Borrowed Fund - Failure to
claim defaulted Ginger Loan from NMDFC - Disbursement of loan under
BAFFACOS - Loan under Hire Purchase Scheme - Housing loan to Government
Employees - Disbursement of loan for Multi-Storeyed Car Parking Complex - Non-
performing assets - Setting up of Integrated Infrastructural Development Centre
(IIDC) - Setting up of Call and Training Centre (CTC) - Brief History of National
Minorities Development and Financing Corporation Limited (NMDFC) Loans.
Chapter-4: Data Analysis and Interpretation
This chapter includes Financial Performance of ZIDCO for a period of five
years starting from 2015-16 to 2019-20 financial year. It is divided into 8 sections -
Profitability Ratios - Liquidity Ratios - Solvency Ratios - Activity Ratios - Return on
Equity Ratio of ZIDCO - Analysis of recovery process of ZIDCO - Analysis of
qualitative aspects of performance of ZIDCO - Testing of Hypotheses.
Chapter-5: Findings, Conclusions and Suggestions
This chapter includes the Major Findings on ZIDCO financial performance,
loan recovery processes, qualitative aspects of financial issues and hypothesis
testing. Conclusions were made and suggestions on the study, as well as a suggested
roadmap for improvement and future research areas.
16
Chapter-2
Review of Literature
17
Chapter-2: Review of Literature
2.1 Global Study on Financial Performance
Altman (1968) has examined and assess the problem as an analytical
approach, the consistency of ratio analysis in the United States of America. The
prediction of corporate bankruptcy is used in particular; a collection of financial and
economic ratios would be investigated in a context of bankruptcy prediction in which
a simple discriminant statistical approach is employed. The data used in the analysis
is limited to production companies. A brief overview of the history of conventional
ratio analysis as a corporate performance investigation methodology is discussed. In
a bankruptcy prediction sense, the shortcomings of this method are addressed and
simple discriminant analysis is incorporated with the emphasis centered on its
compatibility with ratio analysis. The discriminant model is created where an initial
sample of 66 firms is used to construct a function that discriminates best between
firms in two mutually exclusive groups: bankrupt and non-bankrupt firms. The
empirical results obtained from the initial sample and several secondary samples are
chosen to analyze the reliability as a predictive tool of the discriminant model. The
adaptability of the model to realistic decision-making circumstances and its possible
advantages are suggested in a number of situations.
Ohlson (1980) has examined the Financial Ratios and the Probabilistic
Bankruptcy Prediction. As demonstrated by the case of bankruptcy, this paper
presents some empirical findings of a study forecasting corporate collapse. The
major findings are summarized briefly, four fundamental factors could be described
as being statistically important in influencing the likelihood of failure (within one
year). These are: the company's size; (ii) a financial structure measures (iii) an
efficiency measures (iv) a current liquidity measure.
Capon et al., (1990) have studied that development is consistently
associated with higher financial performance. Growth in assets and sales individually
show positive relationships to performance at both industry and firm/business levels
of analysis. Market share is positively associated with financial performance. Size of
firm or business appears unrelated to financial performance. There is some evidence
supporting a positive performance relationship when size is measured as industry
level sales. Strength of capital investments indicates a favorable relationship to
industry-level financial performance. Higher investment is linked to lower
18
performance at the client/sector level.
Kangari et al., (1992) have studied the construction industry for predicting
company’s financial position. One method of fault analysis is the study of major
financial ratios to forecast a company’s results. Models built for the manufacturing
sector are not suitable for the construction industry. This paper provides a
quantitative model focused on financial ratios for assessing a construction company’s
financial performance and ranking, and its business survival chances. The model
takes into account the characteristics of various construction industry trades and the
effects of the scale of the enterprise.
Teruel and Solano (2007) have studied the impact of working capital
management on the performance of a sample of small and medium-sized Spanish
companies. The authors have compiled a panel of 8,872 small to medium-sized
enterprises (SMEs) covering the period 1996-2002. Using the panel data approach,
the authors evaluated the impact of working capital management on SME
profitability. The findings, which are robust in the presence of endogeneity, show
that by reducing their inventories and the number of days on which their accounts are
unpaid, managers can produce value. Moreover, shortening the period of cash
conversion also increases the profitability of the company.
Zariyawati et al., (2009) examine the relationship between management of
working capital and company profitability. The cash exchange period is used as an
indicator of the management of working capital. This study uses 1628 firm-year
panel data for the period 1996-2006, consisting of six distinct economic sectors listed
in Bursa Malaysia. A clear negative significant relationship between the cash
conversion period and firm profitability is given by the coefficient results of Pooled
OLS regression analysis. This shows that reducing the time of cash conversion
results in an improvement in profitability. Therefore, in order to generate shareholder
value, the business manager should be concerned with shortening the period of cash
conversion until the optimum amount is reached.
Yalcin et al., (2011) have studied that financial performance evaluate in a
highly competitive setting is very important for the manufacturing industries.
Hence, an objective and correct assessment of the results is important. As financial
performance metrics reflect a company’s competitiveness, they have to be carefully
defined in the evaluation process. Traditionally Accounting-Based Financial
19
Performance (AFP) metrics are commonly used for the performance evaluation.
Mansoori (2012) investigated the effects of working capital management on
firm’s profitability. Using panel data analysis, pooled OLS and Fixed Effect
estimation, for a sample of Singapore firms from 2004 to 2011, they find that
managers can increase profitability by managing working capital efficiently.
Moreover, managers can improve firms’ profitability by shortening receivable
conversion period and inventory conversion period. The analysis is applied at the
level of full sample as well as economic sectors. However, the results of industry
analysis suggested the effect of economic sector on relationship between working
capital management and profitability.
Guisse (2012) studies on Malaysian Banks have been carried out using
financial ratios in order to calculate output in terms of profitability, liquidity, ROA,
ROE and risk. The result shows that there are no substantial means of distinguishing
profitability between banks.
Karim and Alam (2013) have studied the performance of selected private
sector banks in Bangladesh which was calculated using financial ratios that mainly
indicate the adequacy of risk-based capital, credit growth, credit concentration, non-
performing credit position, liquidity gap analysis, liquidity ratio, return on assets
(ROA), return on equity (ROE), net interest margin (NIM). To understand the effect
on credit risk, operating efficiency and asset management, simple regression analysis
was conducted and a good-fit regression model was developed to forecast the
potential financial performance of these banks.
Tauringana and Afrifa (2013) studied the relative importance of the
management of working capital calculated by the Cash Conversion Period (CCP) and
its components (inventory, receivable accounts and payable accounts) to the
profitability of SMEs has been studied. The paper employs an analysis of panel data
regression and a questionnaire survey on a sample of 133 SMEs listed in the
Alternative Investment Market (AIM). The study of panel data uses financial data for
the period from 2005 to 2009. The survey results of the questionnaire are based on
19 responding SMEs. It was found that the results of the Panel data analysis indicate
that the management of accounts payable (AP) and receivable accounts (RA) is
essential for the profitability of SMEs. AP management, however, is relatively more
important than AR management. Management of inventories (INV) and CCP is not
necessary for the profitability of SMEs. The findings of the questionnaire indicate
20
that CCP management and all its components are considered to be essential for the
profitability of SMEs. AR management is most important in terms of relative value,
followed by AP, INV and CCP, respectively.
Adam (2014) has studied the analysis which was conducted to examine the
financial performance of the Erbil Bank for Investment and Finance, Kurdistan
Region of Iraq for the period 2009-2013. For the purpose of evaluating simple
variables that would influence the banking system in general, the author used a
statistical tool to assess if these variables are significantly associated with the bank's
financial performance. The results of the study show the positive behavior of Erbil
Bank's financial position and the financial success of the bank is affected by some
of its financial variables. The author also noted that Erbil Bank's overall financial
performance is improving in terms of liquidity ratios, asset or credit quality ratios,
profitability ratios, etc (NPM, ROA and ROE). In addition, the study proposes a
collection of recommendations regarding the growth and enhancement of certain
banking operations that will increase the profitability of the bank and boost the
bank's financial performance.
Milhem and Istaiteyeh (2015) studies on Islamic banks have been carried
out using financial ratios in order to calculate output in terms of profitability,
liquidity, ROA, ROE and risk. The result shows that there are no substantial means
of distinguishing profitability between banks.
Ijaz and Naqvi (2016) have studied the financial performance literature
regarding the cement industry in Pakistan which is presented in this paper. Studies
from Iran, India and Pakistan are included in the literature, but some foreign
evidence is also provided. Profitability ratios, asset usage ratios, debt ratios, liquidity
ratios and cash conversion periods from the period 2006-2014 are the financial ratios
used to assess the financial output of the cement industry. Return on Investment
(ROI) is taken as an expected variable and five parameters of the ratio are taken as
predictor variables. The study showed that all parameters except the leverage ratios
that have an insignificant relationship have a positive relationship with the dependent
variable.
21
2.2 Indian Study on Financial Performance
Chakraborty (1977) has also presented a research paper on the debt equity
ratio in India's private corporate sector. He looked at the relationship between debt
equity ratio and age, total assets, retained earnings, and profitability. Total assets and
capital intensity were found to be positively linked to debt equity ratio. He gave an
overview of the regional trends of debt-to-equity ratio in India's various industrial
centers. He also attempted a dept ratio forecast equation for each sector, as well as a
very basic cost of capital measurement methodology. He demonstrated the cost of
capital estimate for 22 businesses. The cost of capital rose from 7.36 percent to 12.36
percent, according to him.
Daga (1985) in his thesis, titled "Analysis of Financial Statements of the
Aluminium Industry in India," was written to examine the complicated financial
condition in which the Indian aluminium industry found itself from 1973 to 1983.
Mr. Daga attempted to examine the financial statements of Indian aluminium firms,
which had previously been a neglected field of analysis. An effort had been made to
ascertain the financial difficulties of various industry units. The research assisted in
the creation of realistic solutions to the major issues that have arisen as a result of
them. He gathered data for the analysis from publicly available accounting records
from aluminium firms. Via correspondence from the Indian Aluminium
Manufacturers Association, he was able to complement the knowledge he had
gathered with evidence.
Rao (1985) in his thesis "The effect of debt equity ratio on profitability-An
exploratory study of the Engineering Industry in India," he discovered a negative
relationship between profitability and debt equity ratio. Profitability declined in the
case of a high debt-equity ratio due to large interest payments, while profitability
improved in the case of a low debt-equity ratio due to low interest payments.
Sharma (1988) presented a research study on "Corporate Financial Structure"
with the following objectives: i) examine financial structure in order to determine car
companies' ability to make sound financial decisions; ii) recommend ways to
improve profitability without incurring additional financial obligations; iii) suggest
sources from which additional funds can be collected and the uses that can optimise
the concern's welfare. iv) to evaluate the firms' long-term and short-term solvency or
financial condition in order to propose ways to boost the financial solvency of the car
companies under investigation.
22
Patra (2005) in his research, considering the case of Tata Iron & Steel
Company Limited, the effect of liquidity on profitability was analyzed. The study of
the profitability effect of liquidity ratios showed a negative as well as a positive
correlation. Out of the seven liquidity ratios chosen for this analysis, four ratios
showed a negative correlation with the profitability ratio, namely the current ratio,
the acid test ratio, the current asset to total asset ratio and the inventory turnover
ratio. These co-efficient of co-relation, however, were not statistically important. The
remaining three ratios, namely the working capital turnover ratio, the receivable
turnover ratio and the cash turnover ratio, were positively related to the profitability
ratio, all of which were statistically important at the 5% significance level. The
consequence of all the co-efficient of correlation was as desirable except for the co-
efficient of correlation between the inventory turnover ratio and ROI. However, the
simple regression analysis did not accept this undesirable sign between ITR and ROI,
which indicated a positive correlation between these two variables. Profitability is
increasing and depends on several variables, including liquidity.
Gaur (2010) has studied the financial performance metrics of Indian non-
metallic group companies. The study uses financial data from 57 Indian non-metallic
mineral products industry market groups (cement, glass, gems & jewellery,
refractories, ceramic tiles, abrasives and abrasives, granite) over a 10-year time span
(1999-2008) and explores the financial results of the company using Operating Profit
(OPPRO) and Return on Net Worth success metrics (RONW). The Size (SIZE),
Leverage (LEV), Working Capital Ratio (WCR) and Age (AGE) of the firm are
included as determinants of firm performance.
Bhunia (2010) studied Indian Pharmaceutical Industry's Financial
Performance Report. By properly creating ties between the balance sheet products
and the profit and loss account, the financial performance review determines the
company's financial strengths and weaknesses. Therefore, to assess the company's
liquidity, profitability, and other metrics that the company is managed in a
reasonable and natural manner, the present paper is of critical importance; ensuring
sufficient returns to shareholders to retain at least their market value. In this context,
researchers have conducted a financial performance review of pharmaceutical
companies to understand how financial management plays a key role in growth. The
current research includes two BSE-listed public sector drug & pharmaceutical

23
enterprises. The research was performed from 1997-98 to 2008-09 for a period of 12
years. Various accounting ratios have been applied to assess financial performance in
terms of liquidity, solvency, profitability and financial quality. Statistical methods
have been used, i.e., linear simple regression analysis and hypothesis evaluation.
Zala and Virambhai (2010) studied Indian Textile Industry Productivity and
Financial Performance. It covers a group of companies' big textile plants. The focus
of this study is secondary data from a textile group of companies' annual reports and
accounts. The report's primary goal is to raise awareness of the financial performance
and efficiency analysis of the 7 (seven chosen units of the textile group of
companies). Public Sector Enterprise Issues, Literature Review, Problem Statement,
Study Objectives, Study Hypothesis, Study Universe, Study Period, Sampling
Design, Data Collection Method, Tools and Techniques are all covered in this
chapter. Different statistical measures like mean, standard deviation, regression, and
index number are included.
Minaxi (2011) in his research article on financial results, he pointed out and
suggested that financial statement analysis entails reviewing financial statements to
obtain details that can aid decision-making. It is a method of exploring the
relationship between financial statement component parts in order to achieve a better
understanding of the status and results of an entity.
Priyaaks (2012) according to his research article on financial results,
financial statement analysis is the process of analysing relationships among financial
statement components and making comparisons with relevant information. It's a
decision-making procedure for stocks, bonds, and other financial instruments.
Pal (2012) has studied a comparative analysis of Indian steel companies'
financial output under globalization. The study's goal was to examine the financial
performance of Indian steel companies and to establish a linear relationship between
liquidity, leverage, productivity, and profitability. For the twenty-year period from
1991-92 to 2010-11, Indian steel companies were chosen for the study on the basis of
market share in 2008-09. Following Tata Steel Limited, JSW Steel Limited, Essar
Steel Limited, JSW Ispat and Steel Limited, Rastriya Ispat Nigam Limited, Jindal
Steel and Power Limited, Bhushan Steel Limited, Llyods Steel Industries Limited
and National Steel and Agro Industries Limited, the public sector Steel Authority of
India holds the largest market share. Simple regression analysis was conducted to
24
estimate the effect of selected variables on profitability and the models were
projected for this reason.
Krishna and Pandey (2013) have studied an Indian Steel Industry Liquidity
Role Analysis Report. In this paper, an attempt was made to research the financial
efficiency and liquidity positions of the steel industry in India and their effects. The
study is focused on Jindal Steel, SAIL and TISCO's portrayal of the steel industry.
To analyze the results, ratio analysis and statistical tools such as standard deviation
and coefficient of variation were used in the study. Five types of financial ratios have
been determined in the present analysis, i.e., current ratio, rapid ratio, working
capital turnover ratio, inventory to working capital turnover ratio, and inventory
turnover ratio. The results showed that India's current steel industry ratio is very
satisfactory, meaning Indian steel companies retain a solid liquidity role in the
market. Liquid ratios demonstrated a strong liquidity status in the same way. But
separately, the outcome is not the same in every sector, as it is for the whole. The
proportion of working capital inventory owned by each company is approximately
the same and the same result is also expressed by the inventory turnover ratio. But in
the case of the Working Capital Turnover ratio, the negative picture shows that it is
very different in every sector, which shows that working capital is used
inappropriately by the Indian Steel Industry.
Manisha B (2014) studied on analysis of financial performance on the basis
of materials used and modes of operation. Financial results can be analyzed on the
basis of modus operandi such as a) Horizontal Analysis, the financial statements for
a number of years are checked and evaluated in this form of analysis. The current
year's figures are compared to the regular or base year, and changes are usually
expressed as percentages. The management was able to gain insight into the levels
and areas of strength and weakness as a result of this study. Dynamic Research is
another name for this type of study. (b) Vertical analysis in this form of research
study, the quantitative relationship of the various items of financial statements on a
given date is made. This study is useful when analyzing the output of many
companies in the same sector, or the same company’s divisions or departments. This
analysis is not very helpful in properly assessing the financial condition of the
company, since it relies on the data for one period. This analysis is also called Static
Analysis as it based on data from one date or for one accounting period.
25
Haque (2014) studies on major Indian Banks have been carried out using
financial ratios in order to calculate output in terms of profitability, liquidity, ROA,
ROE and risk. The result shows that there are no substantial means of
distinguishing profitability between banks.
Nataraja et al., (2018) studied the results of the three major private sector
banks listed on both the National Stock Exchange (NSE) and the Bombay Stock
Exchange (BSE) were analyzed. For statistical analysis of the results of banks,
financial ratios are used. Three main metrics, namely Return on Assets (ROA),
which measures internal efficiency, Tobin's Q formula (price/book ratio), which
measures market-based performance, and Return on Equity (ROE), which is a key
profitability ratio used by investors to calculate the sum of profits of a bank returned
as shareholder equity, were used to measure the financial performance of the selected
equity. The data was selected from the selected banks for the period 2006 to 2017. In
order to find the financial performance calculated by the three metrics based on
independent variables, bank size, credit risk, asset management, operating efficiency
and debt ratio, simple regression techniques were used. The results show that all of
the ratios chosen have an effect on private commercial banks' financial efficiency.
2.3 Study in North East India
Bhat and Nishant (2006) have studied the private hospitals' financial
performance in North East India. The study is based on data from private hospitals
from 1999 to 2004 on the financial statements. The study finds six key financial
dimensions with 25 key financial ratios. These include: fixed asset age, current asset
efficiency, functional efficiency, financial structure, the appropriation of
surpluses/profit and the profit/cost ratio in financial terms. The results indicate that
the financial performance of the hospitals over the year has increased marginally.
Even if the overall debt amount is not high, it is the debt costs and debt service
capabilities that increase the hospital's debt burden. Because of lower profitability
and less operative efficiency, the financial risks in this sector are high. The
consequences of the results are discussed.
Saikia (2012) has examined the financial performance of small-scale
industries in Assam in order to assess their production effectiveness. Efficient output
is the primary condition for any industry's production, which can boost the
26
economy's industrial growth. Industry can turn the entire spectrum of economic
activity from agriculture through intensive resource used in a country with high
population pressure. However, for the introduction of a technology, financial
performance often needs to be addressed. An attempt has been made in this paper to
evaluate the financial performance of small-scale industries in Assam using the tool
of Data Envelopment analysis.
Thangasamy (2013) has studied Nagaland Pulp and Paper Company Limited
(NPPC) financial performance. It was a secondary data-based empirical one. For this
study, a period of six years was considered. Subsequent data were gathered from
Nagaland Pulp and Paper Company Limited's annual reports, other newspapers,
Nagaland Government Publications, relevant books and journals. Even internet
services have also been used to generate useful secondary information. The primary
information was gathered through observations and personal interviews with
Nagaland Pulp and Paper Limited officials and personnel. The data collected were
subsequently classified and tabled according to the study requirement. In order to
determine the data inferences and conclusions, useful statistically relevant tools such
as average, percent, ratios, and correlation analyses have been used. The study shows
that the liquidity position of the company as a whole is poor and strong, highlighting
the better management of liquidity.
Dutta and Borah (2016) have studied Assam Food Processing Industries'
financial performance with regard to calculating various financial ratios. The study is
based on secondary information. Data are primarily collected from the Central
Statistical Office reports and publications; the Government of India. The ratios
revealed something of themselves and a different ratio. It revealed the business'
strong and weak points and thus provided clues for managing the problems that occur
and for taking appropriate remedial measures for the industry to function effectively.
The study revealed that the ratios of FPI in the state were poor. It has furthermore
found that Assam's profitability ratio and liquidity ratio is a long-term association.
Kakati and Roy (2017) have examined the Performance Score Method for
measuring Farmer Producer Companies (FPC) performance using financial ratios.
Using financial ratios, the researchers looked at four Farmer Producer Companies.
Using the Performance Score Method, the financial ratios were given performance
scores based on their efficiency and effectiveness. Liquidity, solvency, performance,
and profitability were the study's variables. The analysis relied on the financial
27
statements of four Farmer Producer Firms. During the three years under
investigation, the Farmer Producer Companies performed poorly in terms of
solvency, quality, and profitability, according to the study's findings. The companies'
liquidity positions are in a precarious state. The only variable that is found to be in
the yellow (average) category, while the others are in the red (poor) category, is the
Liquidity Variable. The overall Performance Score (Industry), which measures the
four FPCs' overall performance, was also in the red (poor) zone.
Dey and Choudhury (2018) studies the profitability and liquidity position of
selected small enterprises in Shillong city of Meghalaya. In this study, they have
selected few small enterprises as a sample and taken the financial data for the period
of five years from 2008-09 to 2012-13 and studied the effect of some of the different
components of working capital. The data was analysed using both primary and
secondary data. Consequently, the findings of the study were that, working capital
management practices were low amongst Small Enterprises as a majority had not
adopted formal working capital management routines and their financial performance
was low on an average. The study concluded that working capital management
practices have influence on the financial performance of Small Enterprises, hence
there was a need for managers to embrace efficient working capital management
practices as a strategy to improve their financial performance and survive in the
uncertain business environment.
Baruah and Bezbaruah (2020) have studied this paper which is based on an
analysis of such businesses in Assam, a state in northeast India where access to
finance is generally limited. The article investigates the degree to which the
availability of financial services influences the growth and financial output of
unorganised sector enterprises in Assam, using data from a customised survey. A
customised financial access index, a generalised linear model, and an ordered LOGIT
regression are among the tools used. The findings show that while the extent of an
enterprise's financial access has no major impact on its financial output, it is critical
to its development.
Arab, Masoumi and Barati (2015) studies with the financial performance
review of selected steel units. The ratios measured and evaluated in this analysis
include; Current ratio, Fast Ratio, Absolute Cash Ratio, Debt-Equity Ratio, Total
Assets to Debt Ratio, Proprietary Ratio, Interest Coverage Ratio, Total Assets
Turnover Ratio, Inventory Turnover Ratio. One approach is to test the hypotheses
28
using the ANOVA test. The study and testing of the hypotheses concluded that there
is a substantial difference in the financial output of the identified steel units in terms
of liquidity, solvency, operation and profitability. All the null hypotheses were
dismissed.
Selvakumar and Abima (2020) have studied in their paper and an attempt
has been made to analysis the results of short-term solvency, long-term solvency and
profitability for Assam Gramin Vikash Bank and Maharashtra Gramin Bank and
Karnataka Vikash Gramin Bank. The secondary information was compiled on
websites, newspapers, journals, books and annual reports. This study is restricted
exclusively to RRBs. It does not include commercial banks, cooperative banks and
banks for industrial development. It only takes into account the factor of financial
analysis; other factors are not known. It is concluded that the Assam Gramin Vikash
Bank, Maharashtra Gramin Bank and Karnataka Vikash Gramin Bank are good in
terms of financial performance. Only secondary data are used in the study.
2.4 Study in Mizoram About Financial Performance
Rodinga (1991) studied the growth of Mizoram's small and cottage
industries and the potential for further development of the industrial unit indicate that
Bairabi has been described as Mizoram's most prospective growth centre for small
and large industries. It was noticed that this area would be most appropriate for
locating any pulp and paper plant or medium density fibre board unit based on the
Bamboo industry line. If such a plant is established in Bairabi, the Tlawng, Teirei
and Tut reverine reserve forests will provide the required quantity of bamboo as the
basic raw material to sustain production for such a project. The achievement of small
and cottage industries is that different activities were initiated by the Zoram
Handloom and Handicraft Production Corporation Limited (ZOHANCO), which was
incorporated during 1988-99. The Corporation's Sales Emporium was opened in
Aizawl and Lunglei. In share capital, Rs. 30 lakhs were contributed. Grant-in-Aid
and Subsidy were supported by 214 numbers of Handloom artisans and 200 numbers
of Handicraft artisans under the Handloom and Handicraft scheme. For the
development of the electronics sector, a memorandum of understanding was assigned
to Electronic Commerce Technology Development Corporation (Government of
India) for a term of 3 years to assist the Governor and ZENICS in the development of
29
work in the electronics sector in the State.
Colney (1997) studies the industrial structure, distributional pattern and
growth patterns of the Small-Scale Industrial units in Mizoram. He noted factors
such as product marketability volatility, raw material scarcity, lack of fuel, transport
and communication, inefficiency of the attributes of entrepreneurs to the
characteristics of the Mizoram in industrial sector. During the period from October
1992 to March 1993, a stratified purpose sampling of 250 industrial units from each
trade of different categories was selected for his research and conducted a survey. He
revealed from the secondary data he collected that Mizoram experienced a rapid
annual growth rate of industrial jobs from 0.43 percent during the year 1961-1991 to
2.82 percent. The study found that four groups dominate the entire industrial
universe, such as service-based, food and allied industries, wood and wood products
and textile industries, employing more than 73% of the total industrial jobs in
Mizoram's industrial sector. The study also found that the relationship between the
size of urban centers and the growth of SSI units in Mizoram is positive and
extremely important.
Lalmuanpuii (2016) studied Mizoram Khadi & Village Industries Board's
position in fostering the state's entrepreneurship. It also discusses the role played by
entrepreneurs in creating jobs and their role in economic growth. It also explores the
relationship between entrepreneurship and Khadi and Village Industries and how
MKVIB is an agent for the implementation of KVIC's programme. It discusses the
various activities conducted by MKVIB to encourage entrepreneurship. Insufficient
financing is always a problem which hampers the functioning of the organisation.
The KVIC normal fund has stopped and replace by the new schemes of PMEGP
which have many drawbacks in its implementation as mentioned earlier.
Lalroluahpuia (2016) studies the performance of MSMEs in Lunglei
District, Mizoram has been studied and analysed. This research has shown that the
sector has provided workers with a number of employment opportunities, especially
those belonging to uneducated groups, and that its contribution is relevant at all
levels. Not only does it contribute to higher economic growth rates, but it also
increases demand for goods and services, contributing to inclusive and balanced
economic growth. While there have been a range of difficulties in the MSME sector,
one of the major issues facing the MSME sector is the lack of sufficient financing
30
facilities. At the moment of need, it is not very easy for entrepreneurs to collect or
acquire the necessary money. Different sources are helping entrepreneurs to increase
their finances, but they are facing more problems getting loans. The study considers
that for the growth and development of the MSME market, the government must
play the most important role. Fostering existing enterprises would therefore be fair
and should help build a favourable environment to promote the rapid growth of
MSMEs within the district, state and region.
Lalbiakzuali and Kumar (2020) has studied the Financial Management in
Mizoram State Owned Enterprises (SOEs) was researched and addressed the
financing, spending, and dividend decisions made by the Mizoram Government's
five SOEs. State enterprises are created to conduct economic activities while
considering the welfare of the people. The main goal of these SOEs is to promote
and develop the state's industrial sector, but they have not made a meaningful
contribution and have continued to lose money. In order to come up with potential
ideas and suggestions for change, an effort is made to research financial
management. From the viewpoint of financial, expenditure and dividend decisions,
the study of the financial management of state-owned enterprises has shed light on
serious problems with erroneous practices. It emphasises the importance of financial
management in the overall organisation and how it is largely responsible for a
company's success or failure. The state-owned enterprises under investigation lack
financial management professionalism, as evidenced by the fact that they have not
filed their own financialreport in up to ten years and their accounts are past due.
31
Chapter-3
Brief profile of ZIDCO
32
3.1 Prelude
Mizoram's oldest state-owned corporation, Zoram Industrial Development
Corporation Limited (ZIDCO), was established to provide aid, assistance, and
finance to industrial companies, projects, or businesses in the state of Mizoram in
order to develop industrial areas and promote entrepreneurship. The Zoram Industrial
Development Corporation Limited (ZIDCO), formerly Mizoram Small Industries
Development Corporation Limited (MSIDC), was established on February 27, 1978,
under the Companies Act, 1956. Mizoram Small Industries Development
Corporation Limited (MSIDC) was renamed Zoram Industrial Development
Corporation Limited. (ZIDCO) on September 13, 1985. There are 38 employees
under ZIDCO including 3 persons on Muster Roll and 2 other persons on Contract
Basis such as: -
Group-A = 9, Group-B = 12, Group-C = 8,
Group-D = 9, Contract = 2, Muster Roll = 3
It was established primarily as a financing institution to aid the state's efforts
to create an industrial environment. The Government of Mizoram and the Industrial
Development Bank of India (IDBI) formed ZIDCO as a joint venture with a 51:49
share ratio.
The board of directors appointed by the Governor of Mizoram is governed by
ZIDCO. One of the Directors, the Managing Director, who is also the corporation's
chief executive, was also nominated as a member, Secretary of the Board, by the
Governor. The Chairman of ZIDCO is Pu Lalthlengliana, Ex MLA, and the
Managing Director is Pu Lalramsanga Sailo, IRS.
3.2 Share Capital Contribution
The Authorized Share Capital is Rs.1500 lakhs i.e., (Rs.15 crores), out of this
Rs.1370.10 lakhs were fully subscribed and paid up. The Government of Mizoram
and IDBI are to make a matching contribution, as per the agreement. Every share
contribution was matched by IDBI until 1990-91, with the exception of the initial
contribution of Rs. 15 lakhs by the Mizoram Government. IDBI however, refused to
equal the contribution made by the government of Mizoram from 1991-92 onwards.
Out of the paid-up capital of Rs. 1370.10 lakhs, only 31.24% is contributed by IDBI
and Government of Mizoram holds 68.76% of the total share capital contribution. As
a result of economic liberalization, Government of India stopped share capital
33
contribution to IDBI and subsequently IDBI has completely stopped contributing
share capital to ZIDCO since 1991-92. In fact, Government of Mizoram is only
contributing share capital to ZIDCO. The Share Capital contribution made by IDBI
and Government of Mizoram ends in 1992 and 2000 respectively.
3.3 Loan / Refinance
ZIDCO's borrowings loans from IDBI, SIDBI, NMDFC and HUDCO.
ZIDCO received refinancing from 1982-83. On the grounds of weak repayment of
ZIDCO overdues to IDBI and SIDBI, they had refused to extend further refinancing
from the middle of 1991-92 financial year. Since 1992-93, ZIDCO has not obtained a
single refinancing rupee from IDBI and SIDBI. ZIDCO also obtained interest-free
loans of Rs. 150 lakhs in 1992-93 financial year and Rs. 225 lakhs in 1993-94
financial year from the Government of Mizoram, and the same interest-free loan has
already been paid back to the Government of Mizoram. Management efforts have
been made to begin refinancing from IDBI and SIDBI.
ZIDCO availed funding from Financial Institutions such as follow: -
SIDBI – Rs. 1045.14 lakhs (Liquidated in 2008)
NMDFC – Rs. 1446.58 lakhs
HUDCO – Rs. 1277.00 lakhs
3.4 Recovery of Loans
The key sources of ZIDCO funds are the recovery of loans from loan
holders. Loan repayments have been far from acceptable. There are a variety of
reasons for low overdue recovery. First of all, the projects/industries were not
launched and the loanee were not able to repay the loan. Secondly, in some
situations, the projects were introduced, but due to a lack of managerial expertise,
lack of demand for finished products and inadequate power supply, they could not be
properly managed. Thirdly, there are some borrowers that are not prepared to repay
the loan.
Several efforts have been undertaken to boost loan repayments. The recovery
workers are now visiting the maximum number of borrowers and the house-to-house
recovery drive is now frequently performed. The defaulters, especially Small Road
Transport Operator (S.R.T.O) loans, often seize their vehicles such as taxis, buses
34
and trucks to realize full recovery. Stern steps are also being taken, such as the
selling of mortgaged properties.
Efforts are also being made to assist the creditors in disposing of loanees'
immovable assets to either the public or the government. For them, the pending loan
bills in different departments are often pursued in the departments concerned. Many
defaulters are often referred to the court of law to take necessary legal actions.
3.5 Action Plan
In view of the huge overdues to ZIDCO, the following actions are being taken: -
i. Auction of properties mortgaged or buildings in case of hotels to realize the
overdues.
ii. Transfer ownership of management of sick units.
iii. Rehabilitation of sick Industrial units with the help of Small Industries
Service Institute, Department of Industries, Government of India and also
IDBI.
iv. Reduction in administrative expenses.
v. Diversification facilities.
vi. The Corporation now initiating One Time Settlement Package for better
recoveries of loan overdues by giving more incentives to defaulters. This
incentive packages will give opportunities to the defaulters to clear their
overdues, and hopefully it may transform the financial position of the
Corporation.
3.6 Activities of Zoram Industrial Development Corporation Limited
(ZIDCO):
ZIDCO's activities include assisting, financing, protecting, and promoting
the interests of Mizoram's industries, as well as procuring and distributing raw
materials to business ventures, facilitating licenses, establishing export and
marketing facilities, acquiring and developing plans for the development of
industries under ZIDCO's financing, power supply, water supply, and coordinating
the procurement and distribution of raw materials to business ventures.
It is to form partnerships, business ventures, and joint ventures with any other
company, firm, or person engaged in manufacturing or other business in exchange for a
share of profits within the company's objectives. The Mizoram government is attempting
35
to diversify its activities by focusing on the mobilization of financial resources, industrial
development, and other activities
3.6.1 Apparel and Garment Making Centre
Ministry of Textile (Govt. of India) have setup Apparel and Garment
Making Centre under the schemes of the North Eastern Region Textile Promotion
Scheme (NERTPS) and selected the Industrial Growth Centre, Luangmual as to be
the first place in Aizawl, Mizoram. ZIDCO has been selected as the Project
Implementing Agency by the Government of Mizoram. Three units were selected as
to occupy the Industrial Growth Centre such as: -
i. Vakiria Computerized Embroidery, Zarkawt.
ii. Vocational School of Education, Chaltlang.
iii. Computerized Embroidery, Millennium Centre.
All this Industrial units carry out certain type of businesses like Cloth Designing,
Tailoring i.e., (School Uniforms, Sport Dress, Cultural Dress etc.) and Training
Institute for Designing and Tailoring are conducted in Mizoram. All these three units
are one of the most continuously functioned in the North East States. This units
submitted a monthly rent of Rs. 75,000/- to ZIDCO. All the rental revenue is used for
renovations of the building and certain types of requirements.
3.6.2 Construction of JNV School (Phase-A) Siaha
Navodaya Vidyalaya Samiti, (Autonomous Organization, Ministry of Human
Resources Development) has appointed ZIDCO on April 2008 as Jawahar Navodaya
Vidyalaya (JNV) School, Siaha Construction Agency.
At the beginning the estimate for Jawahar Navodaya Vidyalaya School was
Rs. 1420.43 lakhs. In 2017 the project cost was revised to Rs. 2774.17. Out of the
total works 75% of the works are completed for Phase-A. ZIDCO has received
interest @10% from Construction Agency including 3% from Contingencies.
3.6.3 Entrepreneurship Development Scheme (EDS) under NEDP –
MEDMOC:
a) New Economic Development Programmed (NEDP) In collaboration
between Mizoram Entrepreneurship Development and Monitoring
Committee (MEDMOC) and ZIDCO, Entrepreneurship Training Centre
was established at ZIDCO Building. It was inaugurated by Commerce &
Industries Minister in September, 2017. There is well organize training

36
center for Skill Development under the supervision of Planning
Department and named as Entrepreneurship Knowledge Center (EKC)
and also Entrepreneurs can gather information regarding Industrial Data
and Guidelines.
b) MEDMOC Mizoram Outstanding Entrepreneur’s Award 2017 With
the collaboration between ZIDCO and MEDMOC, they organize
Mizoram Outstanding Entrepreneur’s Award for entrepreneurs with the
Chief Minister of Mizoram at Aijal Club on 15th
November, 2017.
Mementoes, Certificates and Cash Prize of Rs. 40,000\- were awarded to
certain categories mention below: -
i) Manufacturing Section (Men & Women)
ii) Service Sector (Men & Women)
iii) Innovation Sector
iv) Social Entrepreneurship Sector
v) Franchise Sector
The CAG Audit Report for Mizoram included a detailed examination of the
company's operations. The Committee on Public Undertakings (COPU) took up the
issue. The COPU's main recommendations on the management Action Taken Report
were as follows:
1. Management should then follow the presentation, appraisal,
effective monitoring, and post-disbursement inspection study
guidelines.
2. Management should take the necessary steps to identify overdue
loans in accordance with RBI guidelines.
3. The company should devise a realistic approach to recover all
overdue debts from creditors and recycle the funds for the benefit
of the state's people and industrial development;
4. Management should account for bad and doubtful debts in their
books.
5. Strict measures should be taken against defaulters, and
management should reduce unnecessary institution costs.
37
3.7 Financing Decision
The company's paid-up capital stood at Rs. 1370 lakhs, 31.24% is
contributed by Industrial Development Bank of India (IDBI) and 68.76% is
contributed by Government of Mizoram. Earlier this year, the Government of
Mizoram and the Industrial Development Bank of India (IDBI) reached an agreement
to make a matching contribution to the share capital. However, from the 1991-92
fiscal year onwards, IDBI ceased contributing to the share capital due to poor
repayment of loan overdues.
3.8 Grand-in-Aid
Since inception, the company has received grants-in-aid as a source of funds
annually. The capital grant of Rs. 7.35 crore from the Ministry of Small-Scale
Industries (MSSI), the Government of India (GOI) and Rs. 0.93 crore from the
Government of Mizoram (GOM) for the implementation of the Integrated
Infrastructure Development Centre (IIDC) at Pukpui and Zote was obtained by
ZIDCO. The revenue grant-in-aid of Rs. 3 crores were also obtained from the
Mizoram Government, which was intended to wipe out the remaining balance of
ginger loans borrowed from the New Delhi, National Minorities Development and
Finance Corporation (NMDFC).
The company, on the other hand, did not keep a separate ―grant-in-aid‖
register and assets register for the receipt and use of grants as required by the General
Financial Rules (GFR) (Rule No.19); the revenue grant of Rs. 3 crores were not
accounted for as income from other sources. The company did not account for the
receipt of grants from the GOI and GOM, as well as the subsequent expenditures on
capital work-in-progress and asset creation for the implementation of the IIDC.
The government claimed that because it lacked ownership rights, the state
enterprise maintained a separate set of accounts for IIDC implementation. The
response is in violation of the IIDC scheme's rules, which state that the implementing
agency has ownership rights to the IIDC Centers.
3.9 Objectives of ZIDCO in Creating New Industrial Units
ZIDCO's key objective is to provide assistance for the development of new
industrial units, as well as to extend, modernize and diversify existing units.
38
3.10 Investment Decision
ZIDCO is separate from the other state corporations; it is essentially a
financial institution, and it has had less difficulty getting funding. These funds, on
the other hand, are commonly used for specific purposes. The problem arises in the
effective and systematic execution of investment. On many occasions, the CAG has
seriously considered its poor financial management.
3.11 Investment in Financial Institutions (FIs)
ZIDCO did not formulate any investment strategy for parking grant-in-aid
surplus funds and lending funds obtained from FIs before disbursement. The
corporation put Rs. 2.06 crore into FIs and Rs. 2.12 lakh into Kisan Vikas Patra
(KVP). It also put Rs. 1.88 crore of its own money into the Life Insurance
Corporation of India (LIC) (Rs. 1.18 crore Market Plus scheme) and Bajaj Alliance
Life Insurance Corporation Ltd (BALICL) (Rs.70 lakh) Unit Benefit Plus schemes,
which mature after five and ten years, respectively. This investment was made in the
names of various company employees who had broken ZIDCO's RBI and Articles of
Association (AOA) rules. The BOD's approval for the aforementioned investments
was also not received. It made no attempt to calculate the market interest rates of
various Financial Institutions in order to ensure the company's best returns on
investment.
Thus, the company's officials' investment of Rs.1.88 crore in LIC and
BALICL not only failed to safeguard ZIDCO's interests, but also went against the
RBI and SOE's prescriptions and guidelines. The enterprise had received a signed
affidavit from the officials for whom the investments were made, according to the
government. The response is silent on why the SOE received an affidavit that is not
legally valid for the assignment of interest to the company without the permission of
the respective insurance company. ZIDCO purchased a community gratuity scheme
policy from LIC, Silchar branch priced at Rs. 48.90 lakh covering 60 employees for
which no administrative approval was obtained from the BOD and the State
Government.
3.12 Utilizations of Borrowed Fund
The State Government supported ZIDCO by providing a full guarantee of Rs. 24.67
crore to SIDBI and NMDFC for repayment of the term loan, as well as a grant and
39
loan for repayment of Rs.3 crore to NMDFC and Rs.8.72 crore to SIDBI. Instead of
recovering Rs.10.42 crore from creditors, the company made a loan payment to the
FIs of Rs.2.88 crore, diverting the remaining Rs.7.54 crore to cover administrative
and management costs.
By sanctioning the grant of Rs.3 crore and Rs. 8.72 crore interest free loans
for repayment of loans from NMDFC and SIDBI respectively, the State Government
was forced to bail out ZIDCO from the debt in order to avoid invoking guarantees
given to Financial Institutions due to irregular repayment. As a result of the diversion
of the borrowed sum and irregular repayment to the Financial Institutions in order to
obtain more funds from the Financial Institutions, the SOE faced a serious setback in
its lending activity, resulting in a shortage of disbursement funds and depleting the
State exchequer to the extent of the amount settled.
3.13 Failure to claim defaulted Ginger Loan from NMDFC
In April 2001, ZIDCO was nominated as the State Channeling Agency
(SCA) for the implementation of the NMDFC program for the disbursement of term
and cash margin loans to beneficiaries of notified minorities. The SOE disbursed a
ginger cultivation loan of Rs. 2.81 crore to 5620 ginger cultivators at a rate of Rs.
5000 each in 2000-01, against a penalty of Rs. 3 crores, and the balance of Rs. 0.19
crore was used for other purposes. According to the scheme, the borrowers were
required to repay the loan with a 6% annual interest rate within 12 months of the date
of disbursement. The dues of Rs. 3.56 lakh had not been recovered by the SOE
(principal Rs.3.20 lakh, interest Rs. 0.36 lakh). The farmers were unable to repay the
loan due to major blight and root-borer pests that had infected their crops.
Meanwhile, the NMDFC had come forward for a one-time settlement for
clearing ginger loan by waiving the compound interest of Rs. 51.82 lakh and
demanded Rs. 3.22 crore due to loan default since 2001-02. In response to the bid,
the Government of Mizoram submitted a grant to the SOE on February 28, 2007, to
repay the ginger loan of Rs. 3 crores to NMDFC without having to invoke a State
Government guarantee. In this regard, it was observed that the NMDFC had adopted
a mechanism, which was notified in November 2006, to write off the beneficiaries'
loans/dues in the event of death, disability, or calamity.
40
According to the scheme, the amount written off will be credited to the
State Channelizing Agency (SCA) loan/dues account in question and conveyed to the
SCA for accounting adjustments. Instead of attempting to write off the loan due to
natural calamities as provided for in the scheme, ZIDCO chose to repay the entire
sum of Rs.3 crore through a grant from the Government of Mizoram (GOM). In
addition, in the books of accounts, the company had removed unpaid ginger loans
amounting to Rs. 2.81 crore by writing off poor and dubious debts without BOD's
approval. The repayment made by the GOM would have been avoided if the SOE
had taken measures to demand a defaulted ginger loan of 2.78 crore from NMDFC.
Despite the new scheme announced by NMDFC in November 2006, the government
argued that GOM had committed to repaying the ginger loan on behalf of the
borrowers long before 2006 and needed to follow the process. The response does not
explain why ZIDCO has taken no action to date to write off the number of individual
borrowers in the BOD's account books and demand the default amount from the
NMDFC.
3.14 Disbursement of loan under BAFFACOS
The total assistance of Rs. 3.53 crore was disbursed to the borrowers by
ZIDCO against the total receipt of Rs. 3.95 crore under BAFFACOS during 2005-06
and 2006-07. For other factors, the undisbursed balance of Rs. 42 lakhs were kept by
ZIDCO. A term loan of Rs. 2.45 crore at a rate of 10 per cent interest on the M/s was
disbursed by ZIDCO. Mizoram Venus Bamboo Products Limited (MVBPL), Aizawl,
in two installments, with a repayment duration of five years, in August 2005 and
December 2005. In addition, the applicant M/s was sanctioned for the term loan.
MVBPL for the discharge of the borrower's liability to the Central Bank of India,
Kolkata, as directed by the Mizoram Government, by the provision of the
BAFFACOS fund as a share capital contribution.
In addition, in December 2005 and June 2006, ZIDCO also approved a
working capital loan of Rs.0.35 crore in two instalments, with a repayment period of
three years. As per ZIDCO's Articles of Association (AoA), the penalty and
disbursement of the term loan of Rs. 2.45 crore for settlement of the time-barred
unpaid dues of another FI (Central Bank of India, Kolkata) was not permissible. The
project assessment, such as credit worthiness, margin capital, repayment ability and
product promotion before disbursement of the loan, was not assessed. No
41
arrangement had been entered into to build charges such as land mortgage and plant
and machinery hypothecation and stock against the protection for disbursement of
Rs. 2.80 crore for term loan and working capital loan. No protection against the loan
was obtained.
No sum was repaid by the borrower. Thus, the recovery of the loan through
repossession of the properties was not enforceable under the State Finance
Corporation Act due to the penalty and disbursement of the loan of Rs. 2.80 crore in
breach of the procedure of lending without generating charges. Although accepting
the truth, the Government claimed that the loans were disbursed entirely out of the
funds given by them in the case of GOM. The reply does not clarify why ZIDCO did
not follow the penalty and disbursement process for the loan.
In another case, in November 2006, ZIDCO approved Rs. 26 lakh term
loan to M/s. R. P. Bamboo Industry for the purchase of 120 power operated bamboo
stick making machine slicers for the Agarbati stick manufacturing unit. In November
2006, ZIDCO paid the borrower the first instalment of Rs. 15.60 lakh. The borrower
had used the loan money to buy two Fine Silver Machines, one Stick Making
Machine, and 337 hand slicing and stick machines instead of buying a power
operated stick and slice machine, according to the loan sanction and disbursement
records; the collateral security of the land and building was not in the borrower's
name. ZIDCO had not agreed to the creation of charges against the security in the
enterprise's favour.
Since May 2007, the creditor had repaid Rs. 0.42 lakh, leaving an
outstanding balance of Rs.8.50 lakh. As a result, the loan was sanctioned and
disbursed without sufficient security, and the funds were used for other purposes,
resulting in non-recovery. M/s L. Z. Bamboo Industry, Aizawl was also approved by
ZIDCO in August 2006 for a term loan of Rs. 44.50 lakh to set up a bamboo stick
manufacturing unit, and the loan was disbursed in two instalments in August 2006
and March 2007. According to the Project Manager, despite the faulty project report,
ZIDCO had sanctioned the loan without considering the project's viability for
repayment; the borrower had only purchased 28 Bamboo Agarbati square stick
making machines for a total cost of Rs.7 lakh instead of 50 stick making machines.
The SOE had released the second instalment of Rs. 20 lakh without
determining whether the first instalment had been used for the intended purpose; the
42
SOE had not properly assessed the valuation of securities because the borrower had a
negligible collateral security of land; the entire project was financed by ZIDCO
without the borrower's contribution; and the project was not financed in a single
instalment. As a result, the loan was disbursed without sufficient security and the
second instalment was released without inspection, leaving only a slim chance of
recovery. The SOE has begun action to recover the loan, according to the
government.
3.15 Loan under Hire Purchase Scheme
ZIDCO approved and disbursed a loan of Rs. 25,000 to 50 members for the
purchase of Agarbati stick making machines with an interest of seven percent per
annum for repayment within three years, adding to the overall amount of Rs. 12.50
lakh. The method of borrowers' selection and identification was not made available,
no agreements were concluded with borrowers for the mortgage of plants and
equipment, and no pre and post inspections were carried out to ensure that borrowers
used the loan for the purchase of machinery, according to an analysis of the penalty
and disbursement of the loans. The marketability of the borrowers' goods was not
assessed prior to the loan being approved, and only Rs.9,392 was repaid against the
unpaid loan of Rs.12.50 lakh.
As a result, the loan's non-recovery, non-hypothecation of the plant and
equipment, irregular repayment, and non-assessment of the products' marketability
resulted in the loan's non-recovery. The government argued that the SOE had already
started repossession proceedings against the plant and machinery's defaulted
creditors. The data of the borrowers, as well as the repossession of their homes, were
not made available for auditing.
3.16 Housing loan to Government Employees
ZIDCO approved and disbursed 474 officials employed in the State /
Central Government / Public Sector Undertaking in Mizoram, funded by HUDCO
under the State Government Guarantee, with a housing loan of Rs.10 crore for the
construction of houses. The significant terms and conditions for the grant of housing
loans included, inter alia, that the borrower had to be in permanent government/PSU
service and that the loan had to be secured as collateral protection by the Land
Settlement Certificate. It was found that most of the borrowers did not meet

43
HUDCO's terms and conditions upon scrutiny of the penalty and disbursement.
Instead of submitting their own individual estimates according to the plan
of their property, the borrowers submitted the same standard estimates, on test check
of 30 cases, it was noted in 11 cases that the names of borrowers did not fit the
names given in the Land Settlement Certificates, the non-encumbrance certificate in
the name of the borrower was not obtained until the date of the approved loan. After
the disbursement of the housing loan, ZIDCO had not performed a post-inspection to
find out if the loan was used for construction; and the completion certificate of the
houses was not available on record.
3.17 Disbursement of loan for Multi-Storeyed Car Parking Complex
ZIDCO, however, disbursed Rs. 2.77 crore to three promoters depriving two
other promoters of a loan of Rs.1 crore. It was found out that ZIDCO had not
reassessed the Debt Equity Ratio, Margin of Safety and Means of Funding in
compliance with the Comprehensive Project Report for the assessment of repayment
ability while reviewing the records of penalties and disbursements. ZIDCO did not
receive the two months' payments from the borrowers as a fixed deposit with the
commercial bank or HUDCO's Public Deposit Scheme (PDS) by opening the escrow
account as provided for in the letter approved by HUDCO. The robust insurance
policies for the building of the multi-storeyed car parking complex were not obtained
from the borrowers to cover the loan sum against natural calamities and other
hazards. The Government reported that the SOE had ample protection to cover the
loan. The most critical component of any financing business for retaining its capacity
to fund and reduce debt risk is the timely and efficient recovery of dues. Pursuant to
the provisions of The State Financial Corporation Act, 1951, ZIDCO shall take
action against defaulting borrowers as follows:
1. Send a notice under Section 30 to the defaulting creditor to
discharge the company's liabilities immediately.
2. Issue of a notice pursuant to section 29 with a view to taking
over the control or ownership of properties or of all
industrial concerns.
3. Sale the promised, mortgaged, hypothecated or allocated
property as insurance.
44
3.18 Non-performing assets
Reserve Bank of India, released guidelines (March 1994) to classify loan
assets into four categories according to their chances of realization as standard assets,
sub-standard assets, questionable assets, and loss assets. The SOE, however, listed
the properties as normal assets and questionable assets only (non-performing assets).
ZIDCO did not examine the reasons for the decrease in loan recovery or take any
concrete measures to boost the recovery. No records of the number of units visited by
recovery personnel and the number of recovery campaigns carried out have been
made available. Also, periodic (monthly/quarterly) demand notices were not
routinely sent to the borrowers. At the top management level, the matter was not
properly controlled or monitored, nor did it get sufficient attention at the level of the
board.
Under The State Financial Corporation Act and Recovery Act, the SOE did
not file any petition for recovery of loans from defaulted borrowers. The SOE
implemented the One Time Settlement (OTS) system in 1999. The SOE recovered
the loan sum of Rs.4.43 crore under the OTS scheme (principal: Rs. 2.73 crore;
interest: Rs. 1.70 crore) by waiving unpaid interest of Rs.1.70 crore from 173
borrowers. It was found out that no time period for the introduction of the OTS
system was set by the SOE. As a result, the repayment of the loan by the borrowers
was affected on time and ZIDCO incurred a loss of Rs. 2.07 crore by waiving interest
due to insufficient monitoring of the action in normal circumstances, 98 instances of
part payment estimated at Rs. 3.23 crore were pending for a period of more than one
and a half years from the date of approval, and the balance was not adjusted against
the outstanding interest by removing the benefits under the package in compliance
with OTS Regulations No. 3 and 9.
Furthermore, ZIDCO did not take measures for the possession of properties
pursuant to section 29. In January 2003, the SOE approved the OTS scheme for the
repayment of the Hotel Ahimsa term loan of Rs.30.08 lakh in three installments
against the total outstanding of Rs. 55.06 lakh. In order to recover its dues, ZIDCO
did not take any action to repossess the assets under section 29 of the SFC Act.
The SOE introduced a new special OTS scheme for approval by the Board
of Director for the benefit of term loan defaulters. The borrowers had to repay the
principal within a year, as per the proposed plan, with the advantage of waiving the
entire outstanding interest. In consultation with SIDBI, the BOD approved the
45
Managing Director to formulate the modalities. It was noted in the audit that, the
SOE adopted the proposed package without obtaining the approval of the Board of
Director and Government of Mizoram and also did not formulate the guidelines. The
SOE had liquidated 51 borrowers' loans and obtained the principal of Rs. 50.71 lakh
by waiving the interest amount of Rs. 87.17 lakh. The waiving of interest was illegal
and unauthorized without the consent of the Board of Director and Government of
Mizoram.
3.19 Setting up of Integrated Infrastructural Development Centre
(IIDC)
The Integrated Infrastructure Development Centre (IIDC) scheme was
established in March 1994 by the Government of India's Ministry of Small-Scale
Industries (MSSI) for small-scale rural industries in rural/backward areas. In July
2001, GOM nominated ZIDCO as the implementing agency. Among other items, the
goals of the scheme were to provide:
a) Infrastructure for the development of small scale and tiny units in
backward districts/rural areas which are not covered by the Growth
Centre Scheme.
b) Agriculture and Business linkages.
c) In the selected center, traditional service facilities and technical backup
services.
Under the scheme, in the backward districts of Pukpui (Lunglei District)
and Zote (Champhai District), ZIDCO promoted two Integrated Infrastructure
Development Centers (IIDC) with a combined outlay of Rs. 9.37 crore with the
participation of the Government of India (80 percent) and the Government of
Mizoram (20 per cent). The IIDC work was completed at a total cost of Rs. 7.43
crore for IIDC Pukpui and Zote, respectively. The following paragraphs address the
application of the above system.
Out of the overall penalty of Rs. 9.37 crore, ZIDCO received a total grant
of Rs. 8.28 crore from the Government of India and the Government of Mizoram and
the balance of Rs. 1.09 crore has yet to be received. The total expenditure of Rs. 7.43
crore from the total grant plus interest of Rs.8.40 crore was incurred and Rs. 89 lakhs
were used in breach of the guidelines provided by the Government of India for
administration and management expenses. In breach of the rules of the legislative
46
regulations, the SOE did not receive the stamped receipts where the payment
exceeded Rs. 5,000. For more than 15 days, ZIDCO held huge sums in the savings
bank account without depositing the same amount in the fixed deposit account to
gain more interest. According to the Detailed Project Report (DPR), for housing
industrial units, ZIDCO had to build infrastructural facilities such as site
development & civil works, internal roads, drainage & sewerage system, water
supply and telecommunication system.
The study was carried out by the departmental project manager who was
allowed to incur expenditure in full accordance with the codal formalities and
accounting practices. Even after the completion of the IIDC project in Pukpui (May
2005), the SOE did not undertake any land transfer action on behalf of the SOE and,
as proposed, did not initiate an extension of the lease duration from 25 years to 33-66
years for the Zote IIDC. ZIDCO had not floated tenders for civil works to be
performed. As a result, it was not possible to determine the completion of the work
with respect to the economy through an audit. Against the estimates of Rs.6.51 crore
in some of the products in IIDCs Pukpui and Zote, the SOE had incurred expenditure
of Rs.3.07 crore. The cost incurred below estimates could not be vouch safe in
respect of omission/reduction/deviation of works in the absence of a completion
certificate for execution of work with regard to the DPR. In IIDC Pukpui and Zote,
the SOE had incurred expenditure of Rs. 94.46 lakh for the construction of guest
house and chowkidar quarters (Rs. 32.49 lakh), industrial shed (Rs. 11.92 lakh), tree
planting (Rs.1.09 lakh), black road topping (Rs. 47.53 lakh) and the procurement of
two motorcycles (Rs.1.09 lakh) which were not included in the authorized DPR
estimate.
Excess expenditure of Rs.13.56 lakh was also incurred by the SOE over
the approved sum for administrative block construction at IIDCs Pukpui. An
expenditure of Rs.49.05 lakh at Pukpui and Rs.52.26 lakh at Zote was incurred by
the SOE for the payment of labor fees for site construction and other works. The
payment could not be vouched with the actual work done in the absence of regular
payment registry, muster roll and calculation books. By hiring JCB for site
construction and other civil works without floating tenders, an expenditure of
Rs.31.71 lakh at Pukpui and Rs.26.56 lakh at Zote was incurred. The payments were
made without the correct bill of JCB owners by hand vouchers. The measurement
book for calculating the work was not maintained by the SOE. For the purchase of
47
groceries such as rice, chana and dal, a total of Rs.13.78 lakh was incurred for the
provision of food to workers at IIDC Pukpui. As one bill was received from the
supplier of construction material M/s, it appeared doubtful. C.T. Businesses for the
procurement of bulk groceries (average of 75 quintals) without sufficient storage on
the job site. For the planting of trees in IIDCs, a sum of Rs.1.42 lakh was charged
without getting the details of the source of purchase/reception of plants/trees.
Therefore, due to non-compliance with the codal formalities as defined by the
funding agencies, viz. The expenditure of Rs.7.43 crore as mentioned above lacked
adequate documentation from the Government of India and the Government of
Mizoram. Though acknowledging the truth, the Government claimed that due to
efficient management, the SOE had completed various works that incurred less
expenditure. Furthermore, due to the lack of a sufficient number of qualifying
contractors, the tendering procedure was not followed in selecting contractors. The
reply does not explain why the organization was unable to follow the codal
procedures with sufficient job execution documentation.
By incurring total spending of Rs.7.43 crore, ZIDCO produced 243 plots
(Pukpui 118 and Zote 125) from 272 plots in IIDCs. The SOE had not given any
letter of allocation or agreement with the entrepreneurs to lease out the plots in any
of the IIDCs. The SOE was responsible for the management and execution of the
project, as per the DPR. In addition, financial support, technical assistance,
information on grants and concessions offered by the Government and an adequate
training programmed are to be given to ensure the performance of the proposed units.
In July 2005, ZIDCO leased the IIDC Pukpui to the Mizoram Khadi & Village
Industries Board (MKVIB), Aizawl, immediately after the project was completed
without the approval of the funding agencies, the Government of India and the
Government of Mizoram. Rs.1.12 lakh for Pukpuii and Rs.0.30 lakh for Zote.
The construction of the infrastructure at IIDC Pukpui and Zote did not take
place on the basis of any minimum number of entrepreneurs applying for allocation
to build their center units and the SOE had not established any scheme or marketing
strategy for the lease-out of the parcels by extending financial assistance with
provisions for industrial subsidies to entrepreneurs as envisaged in Industrial Policy of
the State to establish the industrial units in the IIDC centre. Thus, the expenditure incurred
for Rs.7.43 crore turned out to be unproductive due to the move of IIDC Pukpui to
KVIB and non-allotment of IIDC Zote, and failed to achieve the objective of the
48
project. Though accepting the truth, the Government claimed that the IIDC Pukpui
was released to MKVIB as no single unit was able to make the best use of the center
by setting up industries at the time of completion and since a large number of small
and small units were financed by MKVIB. The reality remains that, in support of the
above claim, ZIDCO did not have any specifics of the allocation by MKVIB of the
plots of housing enterprises at IIDC Pukpui.
3.20 Setting up of Call and Training Centre (CTC)
ZIDCO and Public Soft Corporation (PSC) signed a Memorandum of
Understanding (MOU) for the establishment and operation of the Call Centre and
Information Technology Enabled Services (ITES) Training Centre (Call and Training
Centre) in Aizawl, Mizoram in order to create a core competence center in the IT
segment and to impart skills among educated young people to expand in the
industrial sector in order to generate employment opportunities in addition to
creating markets for local agro & forest products, handloom & handicraft and other
related products in other parts of the country and abroad.
According to the MOU, PSC was to provide its expert services, technology,
hardware, software, training, consultancy and other support for the establishment and
operation of a call center and an Information Technology Enabled Services (ITES)
training center under the supervision, administration and control of PSC. PSC will
also bear the burden of working capital and retain all services, including regular wear
and tear. The duties of ZIDCO were to provide an appropriate location to set up the
CTC, to assist in the selection of trainees and to provide for the project's capital cost
of Rs.1.09 crore. PSC was to be responsible for operating the CTC, and after one
year of successful CTC service and 20% of the membership fees received, ZIDCO
will earn Rs.1 lakh per month. ZIDCO will have no influence over the CTC's
management and oversight of the operation. Through mutual consent, the MOU may
be terminated in writing by all parties and would remain in effect for a period of 10
years unless prolonged by a written agreement between the parties. Later the
Government of Mizoram approved Rs.1 crore to ZIDCO for setting up the CTC that
was issued to PSC by ZIDCO.
The scrutiny revealed that the MOU executed with PSC by ZIDCO did not
safeguard ZIDCO's interest as it gave full control of the finances and assets generated
from ZIDCO's funds. ZIDCO had no influence over the management or assets
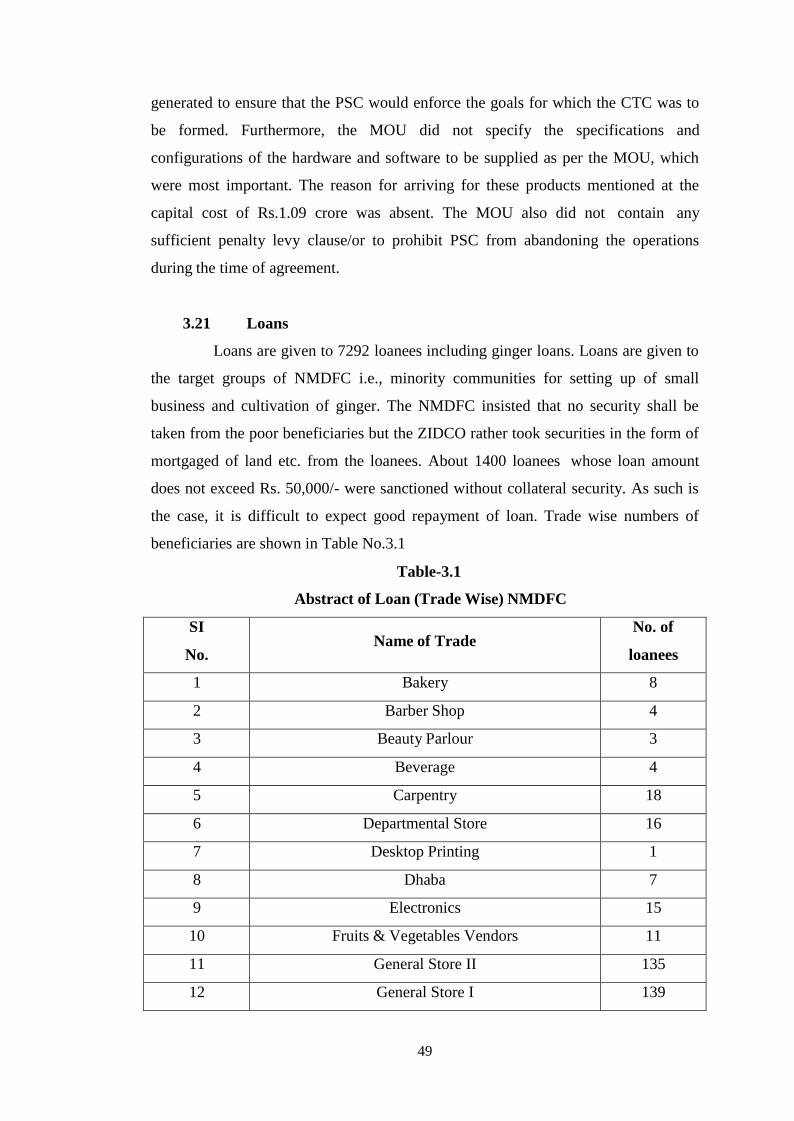
49
generated to ensure that the PSC would enforce the goals for which the CTC was to
be formed. Furthermore, the MOU did not specify the specifications and
configurations of the hardware and software to be supplied as per the MOU, which
were most important. The reason for arriving for these products mentioned at the
capital cost of Rs.1.09 crore was absent. The MOU also did not contain any
sufficient penalty levy clause/or to prohibit PSC from abandoning the operations
during the time of agreement.
3.21 Loans
Loans are given to 7292 loanees including ginger loans. Loans are given to
the target groups of NMDFC i.e., minority communities for setting up of small
business and cultivation of ginger. The NMDFC insisted that no security shall be
taken from the poor beneficiaries but the ZIDCO rather took securities in the form of
mortgaged of land etc. from the loanees. About 1400 loanees whose loan amount
does not exceed Rs. 50,000/- were sanctioned without collateral security. As such is
the case, it is difficult to expect good repayment of loan. Trade wise numbers of
beneficiaries are shown in Table No.3.1
Table-3.1
Abstract of Loan (Trade Wise) NMDFC
SI
No. Name of Trade
No. of
loanees
1 Bakery 8
2 Barber Shop 4
3 Beauty Parlour 3
4 Beverage 4
5 Carpentry 18
6 Departmental Store 16
7 Desktop Printing 1
8 Dhaba 7
9 Electronics 15
10 Fruits & Vegetables Vendors 11
11 General Store II 135
12 General Store I 139
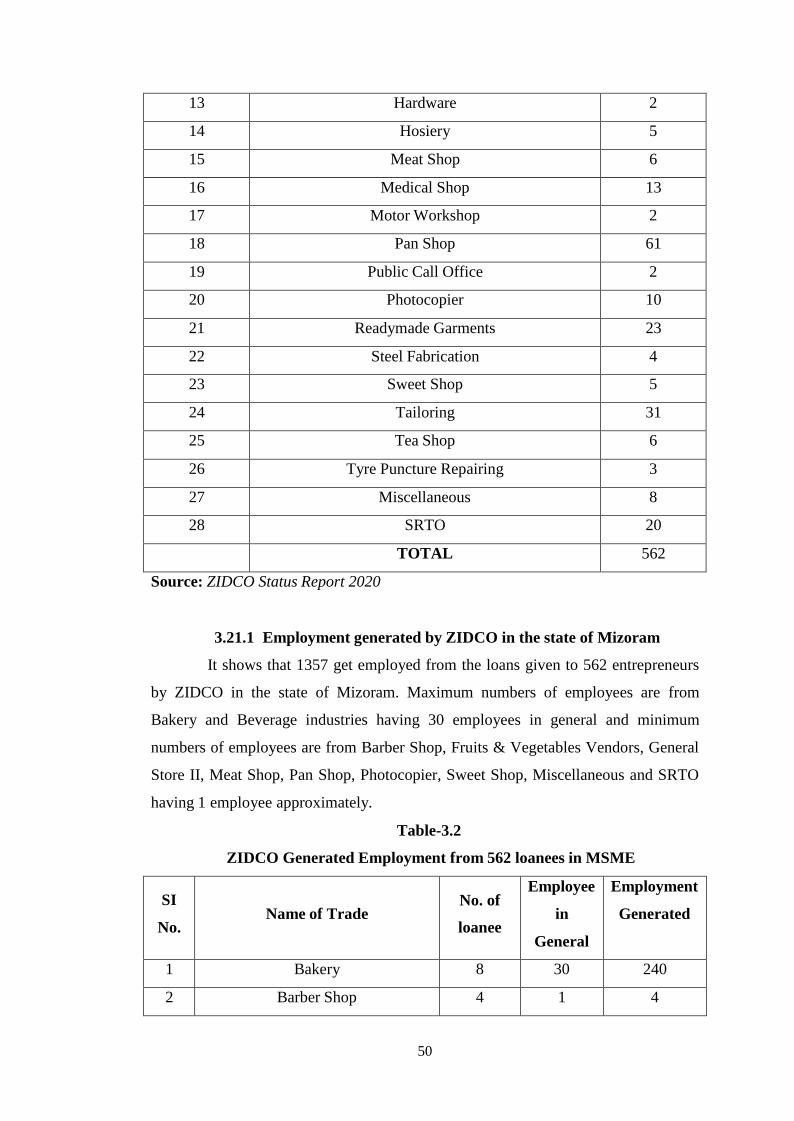
50
13 Hardware 2
14 Hosiery 5
15 Meat Shop 6
16 Medical Shop 13
17 Motor Workshop 2
18 Pan Shop 61
19 Public Call Office 2
20 Photocopier 10
21 Readymade Garments 23
22 Steel Fabrication 4
23 Sweet Shop 5
24 Tailoring 31
25 Tea Shop 6
26 Tyre Puncture Repairing 3
27 Miscellaneous 8
28 SRTO 20
TOTAL 562
Source: ZIDCO Status Report 2020
3.21.1 Employment generated by ZIDCO in the state of Mizoram
It shows that 1357 get employed from the loans given to 562 entrepreneurs
by ZIDCO in the state of Mizoram. Maximum numbers of employees are from
Bakery and Beverage industries having 30 employees in general and minimum
numbers of employees are from Barber Shop, Fruits & Vegetables Vendors, General
Store II, Meat Shop, Pan Shop, Photocopier, Sweet Shop, Miscellaneous and SRTO
having 1 employee approximately.
Table-3.2
ZIDCO Generated Employment from 562 loanees in MSME
SI
No.
Name of Trade
No. of
loanee
Employee
in
General
Employment
Generated
1 Bakery 8 30 240
2 Barber Shop 4 1 4
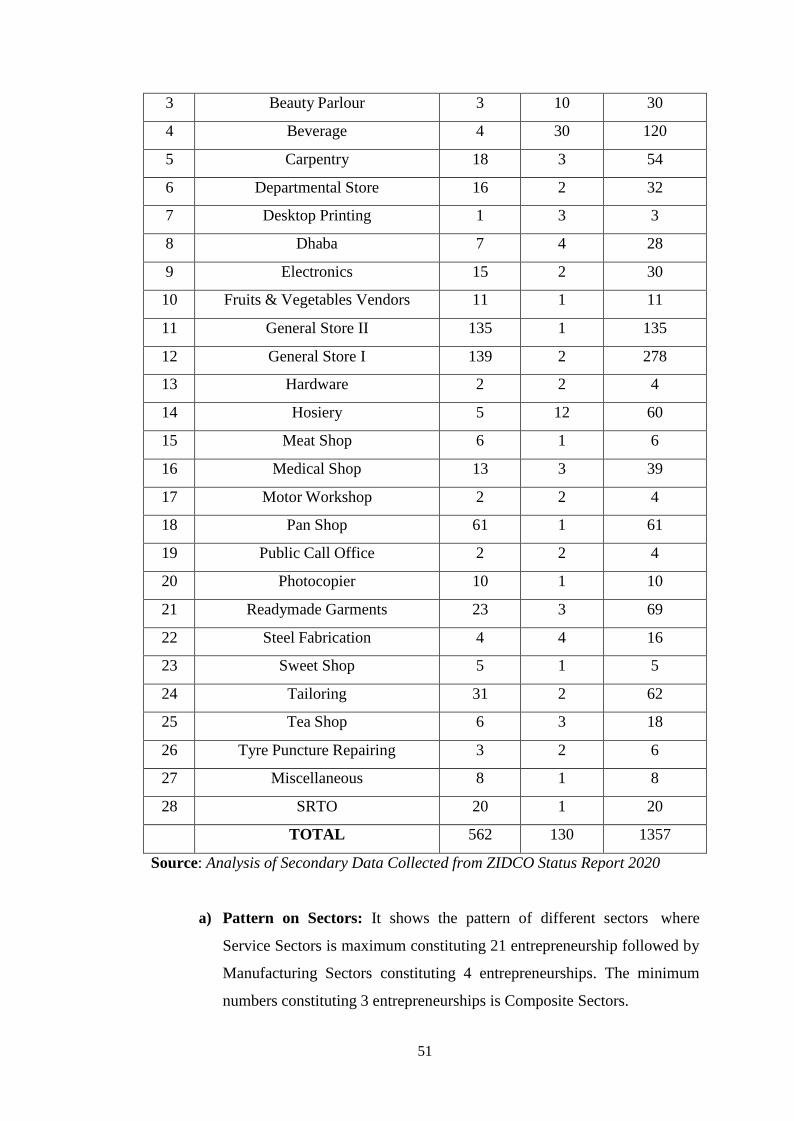
51
3 Beauty Parlour 3 10 30
4 Beverage 4 30 120
5 Carpentry 18 3 54
6 Departmental Store 16 2 32
7 Desktop Printing 1 3 3
8 Dhaba 7 4 28
9 Electronics 15 2 30
10 Fruits & Vegetables Vendors 11 1 11
11 General Store II 135 1 135
12 General Store I 139 2 278
13 Hardware 2 2 4
14 Hosiery 5 12 60
15 Meat Shop 6 1 6
16 Medical Shop 13 3 39
17 Motor Workshop 2 2 4
18 Pan Shop 61 1 61
19 Public Call Office 2 2 4
20 Photocopier 10 1 10
21 Readymade Garments 23 3 69
22 Steel Fabrication 4 4 16
23 Sweet Shop 5 1 5
24 Tailoring 31 2 62
25 Tea Shop 6 3 18
26 Tyre Puncture Repairing 3 2 6
27 Miscellaneous 8 1 8
28 SRTO 20 1 20
TOTAL 562 130 1357
Source: Analysis of Secondary Data Collected from ZIDCO Status Report 2020
a) Pattern on Sectors: It shows the pattern of different sectors where
Service Sectors is maximum constituting 21 entrepreneurship followed by
Manufacturing Sectors constituting 4 entrepreneurships. The minimum
numbers constituting 3 entrepreneurships is Composite Sectors.
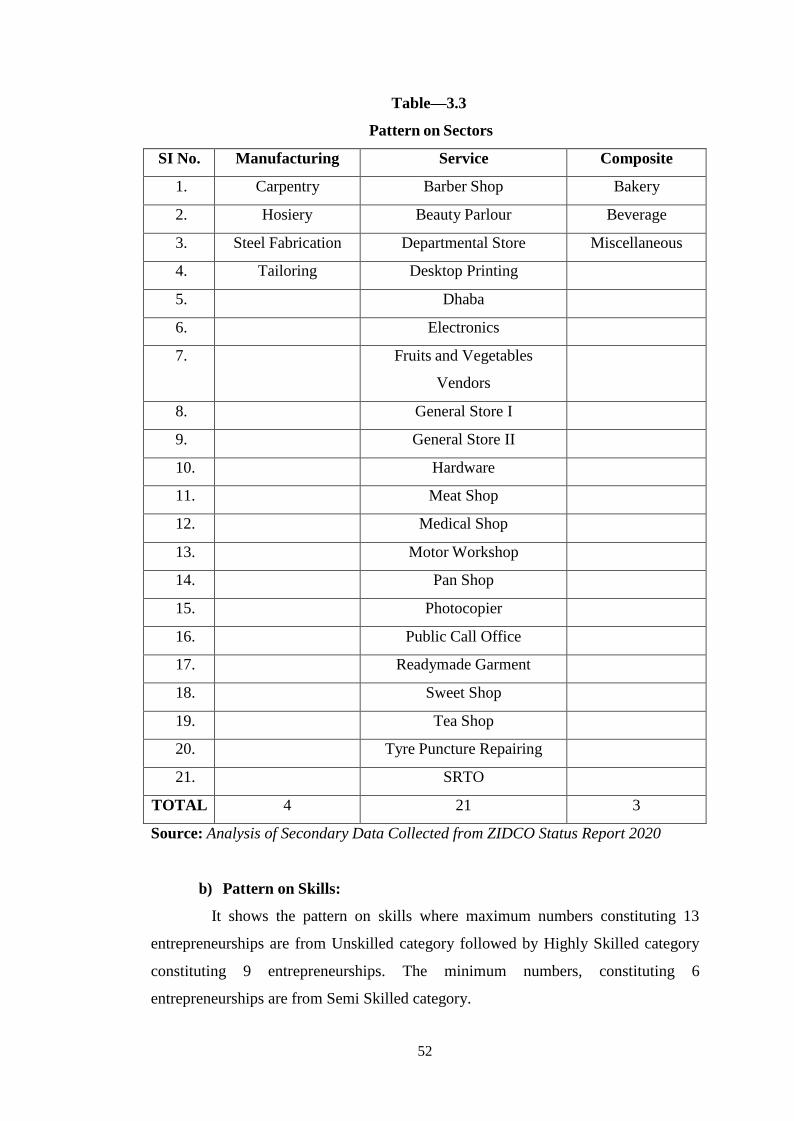
52
Table—3.3
Pattern on Sectors
SI No. Manufacturing Service Composite
1. Carpentry Barber Shop Bakery
2. Hosiery Beauty Parlour Beverage
3. Steel Fabrication Departmental Store Miscellaneous
4. Tailoring Desktop Printing
5. Dhaba
6. Electronics
7. Fruits and Vegetables
Vendors
8. General Store I
9. General Store II
10. Hardware
11. Meat Shop
12. Medical Shop
13. Motor Workshop
14. Pan Shop
15. Photocopier
16. Public Call Office
17. Readymade Garment
18. Sweet Shop
19. Tea Shop
20. Tyre Puncture Repairing
21. SRTO
TOTAL 4 21 3
Source: Analysis of Secondary Data Collected from ZIDCO Status Report 2020
b) Pattern on Skills:
It shows the pattern on skills where maximum numbers constituting 13
entrepreneurships are from Unskilled category followed by Highly Skilled category
constituting 9 entrepreneurships. The minimum numbers, constituting 6
entrepreneurships are from Semi Skilled category.
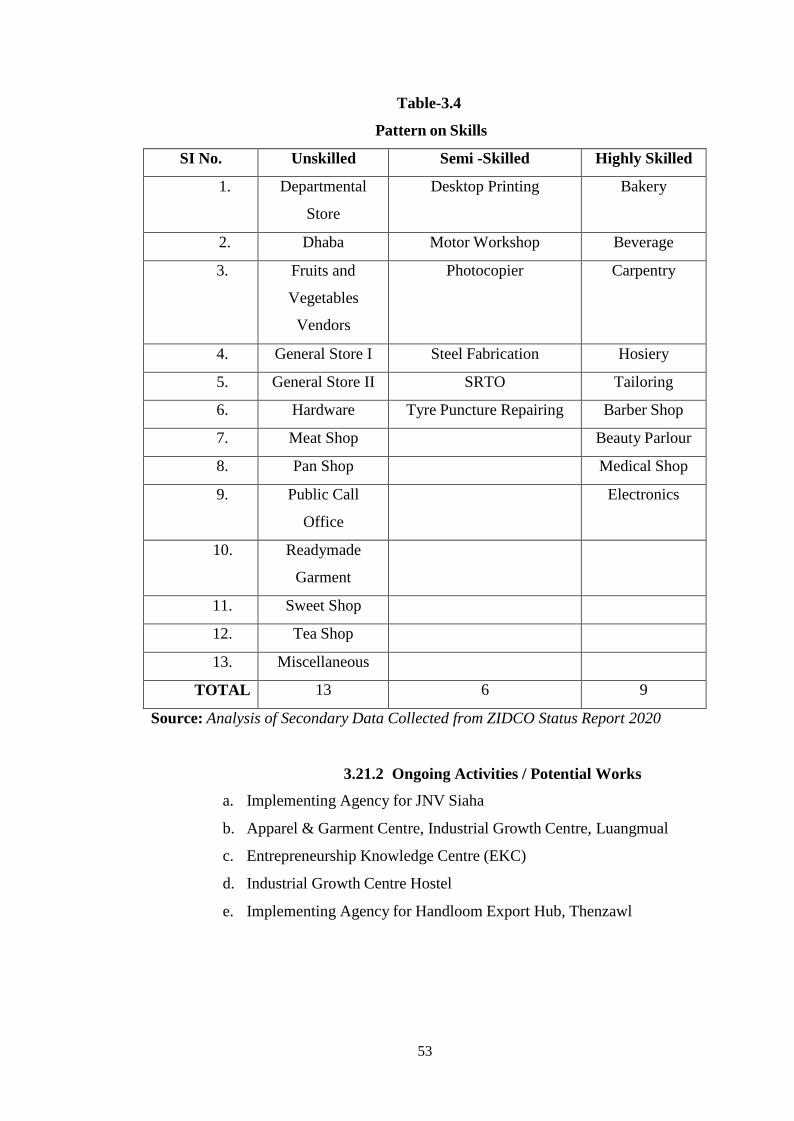
53
Table-3.4
Pattern on Skills
SI No. Unskilled Semi -Skilled Highly Skilled
1. Departmental
Store
Desktop Printing Bakery
2. Dhaba Motor Workshop Beverage
3. Fruits and
Vegetables
Vendors
Photocopier Carpentry
4. General Store I Steel Fabrication Hosiery
5. General Store II SRTO Tailoring
6. Hardware Tyre Puncture Repairing Barber Shop
7. Meat Shop Beauty Parlour
8. Pan Shop Medical Shop
9. Public Call
Office
Electronics
10. Readymade
Garment
11. Sweet Shop
12. Tea Shop
13. Miscellaneous
TOTAL 13 6 9
Source: Analysis of Secondary Data Collected from ZIDCO Status Report 2020
3.21.2 Ongoing Activities / Potential Works
a. Implementing Agency for JNV Siaha
b. Apparel & Garment Centre, Industrial Growth Centre, Luangmual
c. Entrepreneurship Knowledge Centre (EKC)
d. Industrial Growth Centre Hostel
e. Implementing Agency for Handloom Export Hub, Thenzawl
54
Chapter-4
Data Analysis and Interpretation
55
4.1 Introduction
It's important to note that the balance sheet, at its most basic stage,
represents the company's current financial condition. In comparison, a profit and loss
account are a document that is written for a particular fiscal year. Where an analyst
must depend on an audited financial statement for a particular company, success
must be calculated solely on the basis of the financial statement in India.
The financial statements of a company (balance sheet, income statement,
and cash flow statement) are used to determine the financial performance of the
company. To explain a company's financial performance, no single metric should be
used. A balance sheet is a representation of a company's financial assets. It
summarizes how well the company manages its assets and liabilities. Long-term vs.
short-term debt details can be found on the balance sheet.
The income statement gives a year-by-year summary of the company's
operations. The income statement starts with sales or gains and ends with net profit.
The gross profit margin, product costs, operating profit margin, and net profit margin
are all included in the income statement, also known as the profit and loss statement.
This includes a rundown of the number of outstanding securities as well as a
reference to the previous year's results.
The measures of two critical factors are financial statements:
a) Profitability and
b) Financial Soundness
As a result, analysis and evaluation of financial statements relates to the
handling of the details found in the Income statement and the Balance Sheet in order
to provide a complete diagnosis of the business's performance and financial
soundness. There is a distinction between the term’s "analysis" and "interpretation."
The term "study" refers to the systematic classification of data in financial
statements. If the statistics in the financial statements are condensed, they would not
be useful. The word interpretation means describing the purpose and importance of
the data so condensed. However, both ―Analysis and Interpretation‖ are
complementary to each other. Interpretation requires analysis, while Analysis is
useless without interpretation. ―Analysis and Interpretation of financial statements
are an attempt to determine the significance and meaning of the financial statement
data so that the forecast may be made of the prospects for future earnings, ability to
pay interest and debt maturities (both current and long term) and profitability of a
56
sound dividend policy.‖ (Kennedy and Muller, 1999)
4.2 Financial performance of ZIDCO: An analysis
Financial Performance of ZIDCO implemented different accounting ratios
to show Profitability Ratio consisting of Gross Profit Ratio, Operating Ratio,
Operating Profit Ratio, Net Profit Ratio and Return on Investment. And Liquidity
Ratio, consisting of Current Ratio or Working Capital Ratio, Quick Ratio or Acid
Test Ratio. Solvency Ratio consisting of Debt Equity Ratio, Total Assets to Debt
Ratio, Proprietary Ratio and Activity Ratio consisting of Inventory Turnover Ratio,
Trade Receivables Turnover Ratio, Working Capital Turnover Ratio. And also
Return on Debt Equity Ratio.
The ratio analysis is an important financial analysis tool. "The indicated
quotient of two mathematical expressions" is how a ratio is described. "The
relationship between two or more things," as well as "the relationship between two
or more things." A ratio is a metric used in financial analysis to assess a company's
financial condition and performance. A financial ratio, or simply ratio, is a
mathematically expressed relationship between two accounting figures. The ratio
aids in the summarization of a large qualitative assessment of a company's financial
results (Will Kenton, 2020).
The ratio analysis entails a comparison in order to analyse the financial
statement correctly. A single ratio does not mean whether a situation is favourable or
unfavourable. It should be compared to a benchmark. It gives an opportunity to study
the company for its financial performance for the last five years using different ratio
analysis.
4.2.1 PROFITABILITY RATIOS:
Profitability refers to a company's ability to produce sales and maintain
growth over the short and long term. Benefit inability refers to a company's inability
to make a profit and expand over time, both in the short and long term. A business
must make enough money to thrive and expand in the long run. Profits are important,
and any stakeholder in a company needs to know about its financial health and
profitability. If a company's management is interested in calculating its operational
performance by profitability, shareholders invest their capital in the hope of earning a
fair return. Thus, a company's operating performance and ability to offer sufficient
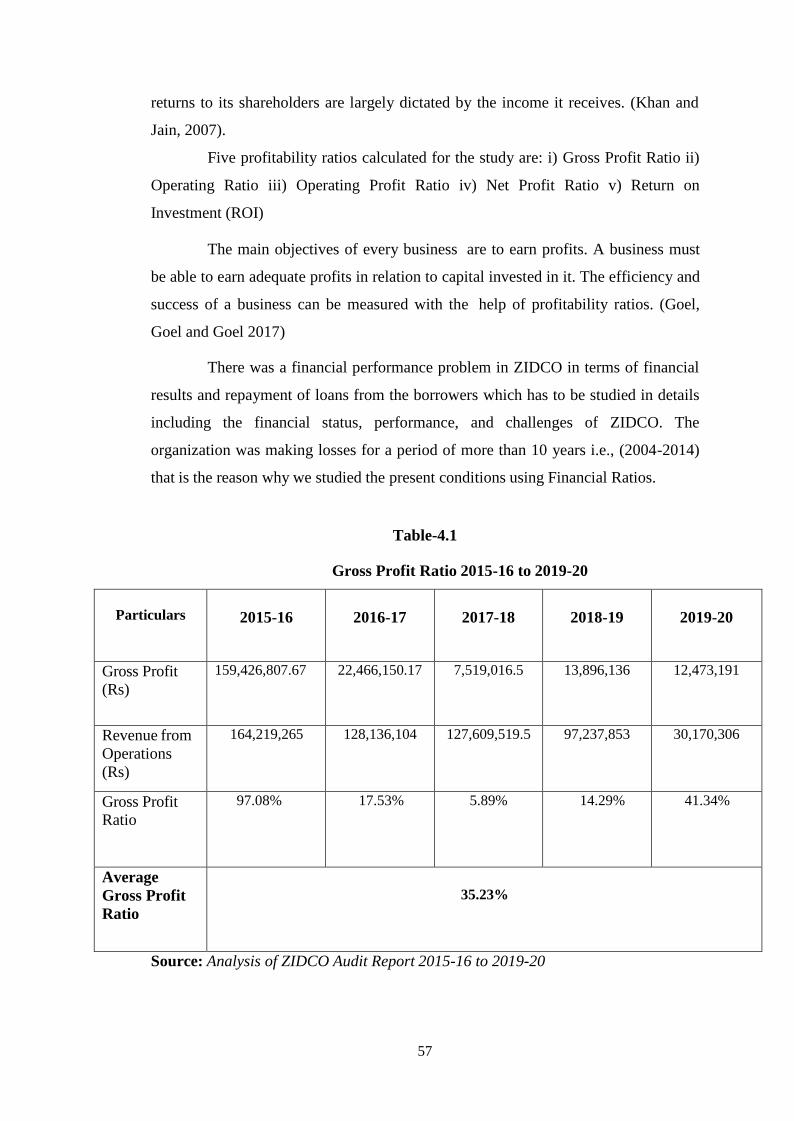
57
returns to its shareholders are largely dictated by the income it receives. (Khan and
Jain, 2007).
Five profitability ratios calculated for the study are: i) Gross Profit Ratio ii)
Operating Ratio iii) Operating Profit Ratio iv) Net Profit Ratio v) Return on
Investment (ROI)
The main objectives of every business are to earn profits. A business must
be able to earn adequate profits in relation to capital invested in it. The efficiency and
success of a business can be measured with the help of profitability ratios. (Goel,
Goel and Goel 2017)
There was a financial performance problem in ZIDCO in terms of financial
results and repayment of loans from the borrowers which has to be studied in details
including the financial status, performance, and challenges of ZIDCO. The
organization was making losses for a period of more than 10 years i.e., (2004-2014)
that is the reason why we studied the present conditions using Financial Ratios.
Table-4.1
Gross Profit Ratio 2015-16 to 2019-20
Particulars
2015-16
2016-17
2017-18
2018-19
2019-20
Gross Profit
(Rs)
159,426,807.67 22,466,150.17 7,519,016.5 13,896,136 12,473,191
Revenue from
Operations
(Rs)
164,219,265 128,136,104 127,609,519.5 97,237,853 30,170,306
Gross Profit
Ratio
97.08% 17.53% 5.89% 14.29% 41.34%
Average
Gross Profit
Ratio
35.23%
Source: Analysis of ZIDCO Audit Report 2015-16 to 2019-20

58
Gross Profit Ratio
120.00%
97.08% 100.00%
80.00%
60.00%
41.34%
40.00%
17.53% 20.00%
14.29% 5.89%
0.00%
2015-2016 2016-2017 2017-2018 2018-2019 2019-2020
Figure 4.1
Model of Gross Profit Ratio of ZIDCO
Source: Analysis of ZIDCO Audit Report 2015-16 to 2019-20
Interpretation: The above table and Chart depicts the gross profit ratio of ZIDCO.
The Gross Profit Ratio for the years stood as 97.08%, 17.53%, 5.89%, 14.29% and
41.34% for the year 2015-16, 2016-17, 2017-18, 2018-19 and 2019-20 it has been
fluctuating over the years. The maximum Gross Profit Ratio is 97.08% in 2015-16
financial year followed by 41.34% in 2019-20 financial year. The minimum Gross
Profit Ratio is 5.89% in 2017-18 financial year. The Average Gross Profit Ratio is
35.23%. Gross profit ratio has decreased from 2015-16 financial year till 2017-18
financial year. The decline in the gross profit ratio in comparison to the previous year
may be due to the rise in prices of material purchases or wages and other direct
charges may have increased but the sales prices may not have increased in the same
proportion.
This gross profit ratio calculates the profit margin available on Revenue
from Operations. The higher the gross profit ratio, the better. There is no perfect
requirement for this ratio, but the gross profit ratio should be sufficient not only to
cover operating expenses but also to pay for depreciation, interest on loans,
dividends and the development of reserves. In 2019-20 financial year profit margin
available on Revenue from Operations is 41.34%.
Gross Profit Ratio has consistently showing positive efforts for the last five
years and has continuously showing an upward trend and it is increasing more and
more from 2017-18, 2018-19 and 2019-20 with percentage of 5.89%, 14.29% and
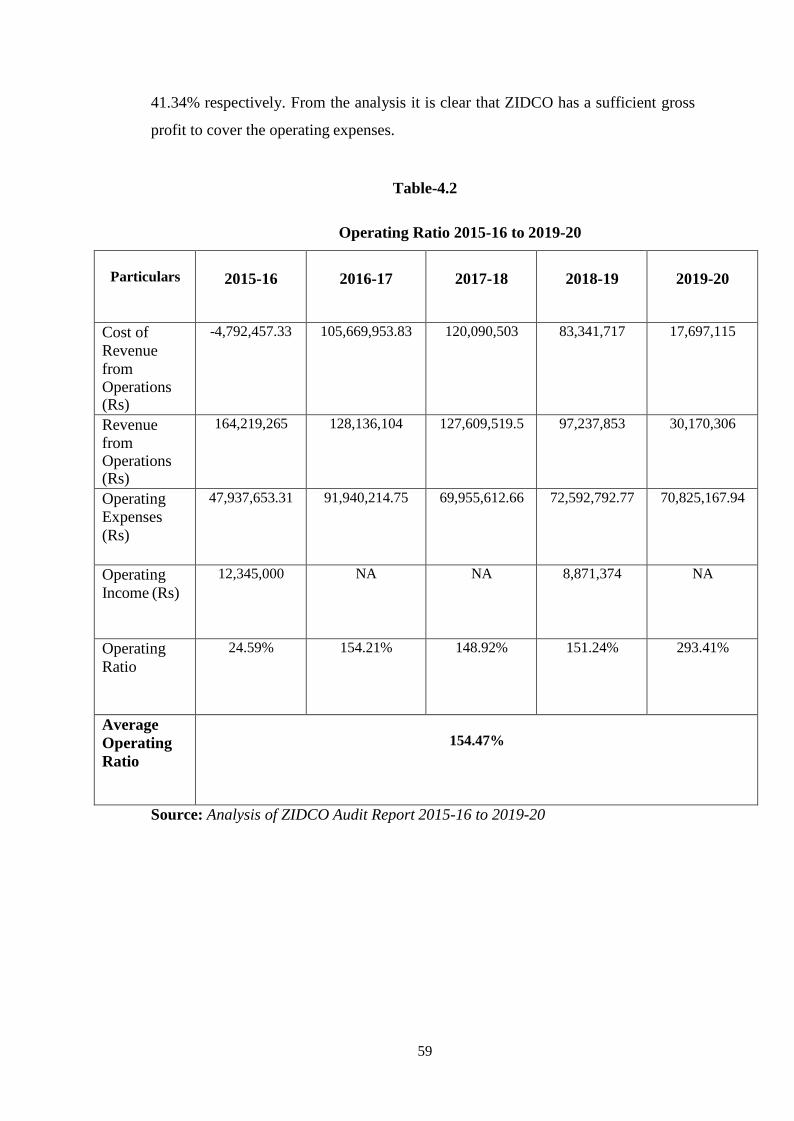
59
41.34% respectively. From the analysis it is clear that ZIDCO has a sufficient gross
profit to cover the operating expenses.
Table-4.2
Operating Ratio 2015-16 to 2019-20
Particulars
2015-16
2016-17
2017-18
2018-19
2019-20
Cost of
Revenue
from Operations (Rs)
-4,792,457.33 105,669,953.83 120,090,503 83,341,717 17,697,115
Revenue
from Operations (Rs)
164,219,265 128,136,104 127,609,519.5 97,237,853 30,170,306
Operating
Expenses
(Rs)
47,937,653.31 91,940,214.75 69,955,612.66 72,592,792.77 70,825,167.94
Operating
Income (Rs)
12,345,000 NA NA 8,871,374 NA
Operating
Ratio
24.59% 154.21% 148.92% 151.24% 293.41%
Average
Operating
Ratio
154.47%
Source: Analysis of ZIDCO Audit Report 2015-16 to 2019-20
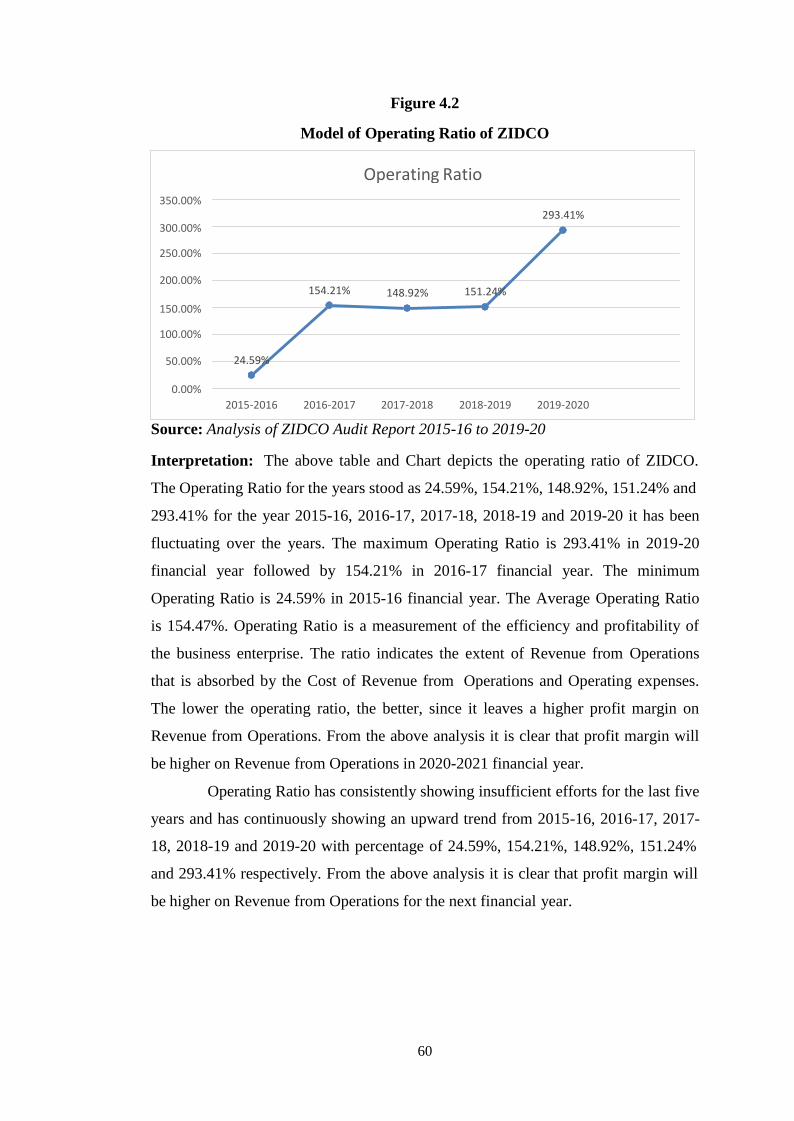
60
Operating Ratio
350.00% 293.41%
300.00%
250.00%
200.00% 154.21% 148.92% 151.24%
150.00%
100.00%
50.00% 24.59%
0.00%
2015-2016 2016-2017 2017-2018 2018-2019 2019-2020
Figure 4.2
Model of Operating Ratio of ZIDCO
Source: Analysis of ZIDCO Audit Report 2015-16 to 2019-20
Interpretation: The above table and Chart depicts the operating ratio of ZIDCO.
The Operating Ratio for the years stood as 24.59%, 154.21%, 148.92%, 151.24% and
293.41% for the year 2015-16, 2016-17, 2017-18, 2018-19 and 2019-20 it has been
fluctuating over the years. The maximum Operating Ratio is 293.41% in 2019-20
financial year followed by 154.21% in 2016-17 financial year. The minimum
Operating Ratio is 24.59% in 2015-16 financial year. The Average Operating Ratio
is 154.47%. Operating Ratio is a measurement of the efficiency and profitability of
the business enterprise. The ratio indicates the extent of Revenue from Operations
that is absorbed by the Cost of Revenue from Operations and Operating expenses.
The lower the operating ratio, the better, since it leaves a higher profit margin on
Revenue from Operations. From the above analysis it is clear that profit margin will
be higher on Revenue from Operations in 2020-2021 financial year.
Operating Ratio has consistently showing insufficient efforts for the last five
years and has continuously showing an upward trend from 2015-16, 2016-17, 2017-
18, 2018-19 and 2019-20 with percentage of 24.59%, 154.21%, 148.92%, 151.24%
and 293.41% respectively. From the above analysis it is clear that profit margin will
be higher on Revenue from Operations for the next financial year.
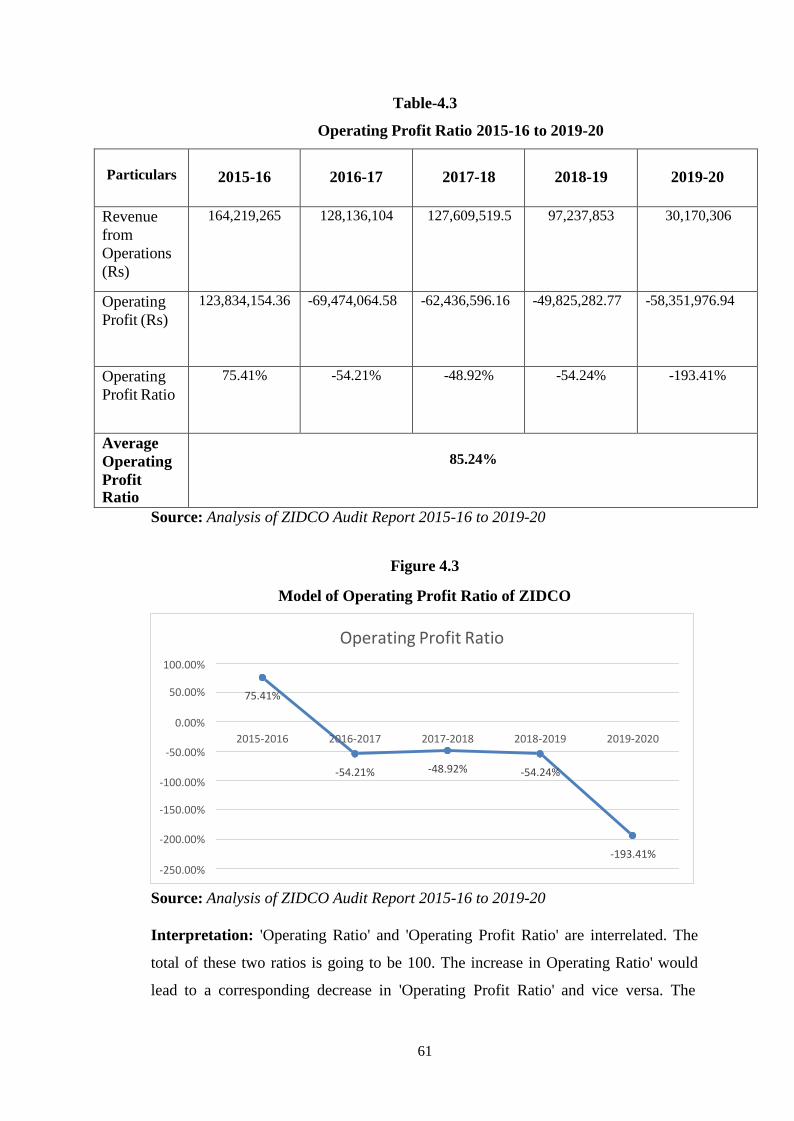
61
Operating Profit Ratio
100.00%
50.00% 75.41%
0.00%
2015-2016 2016-2017 2017-2018 2018-2019 2019-2020 -50.00%
-54.21% -48.92% -54.24% -100.00%
-150.00%
-200.00%
-193.41%
-250.00%
Table-4.3
Operating Profit Ratio 2015-16 to 2019-20
Particulars
2015-16
2016-17
2017-18
2018-19
2019-20
Revenue
from
Operations
(Rs)
164,219,265 128,136,104 127,609,519.5 97,237,853 30,170,306
Operating
Profit (Rs)
123,834,154.36 -69,474,064.58 -62,436,596.16 -49,825,282.77 -58,351,976.94
Operating
Profit Ratio
75.41% -54.21% -48.92% -54.24% -193.41%
Average
Operating
Profit Ratio
85.24%
Source: Analysis of ZIDCO Audit Report 2015-16 to 2019-20
Figure 4.3
Model of Operating Profit Ratio of ZIDCO
Source: Analysis of ZIDCO Audit Report 2015-16 to 2019-20
Interpretation: 'Operating Ratio' and 'Operating Profit Ratio' are interrelated. The
total of these two ratios is going to be 100. The increase in Operating Ratio' would
lead to a corresponding decrease in 'Operating Profit Ratio' and vice versa. The
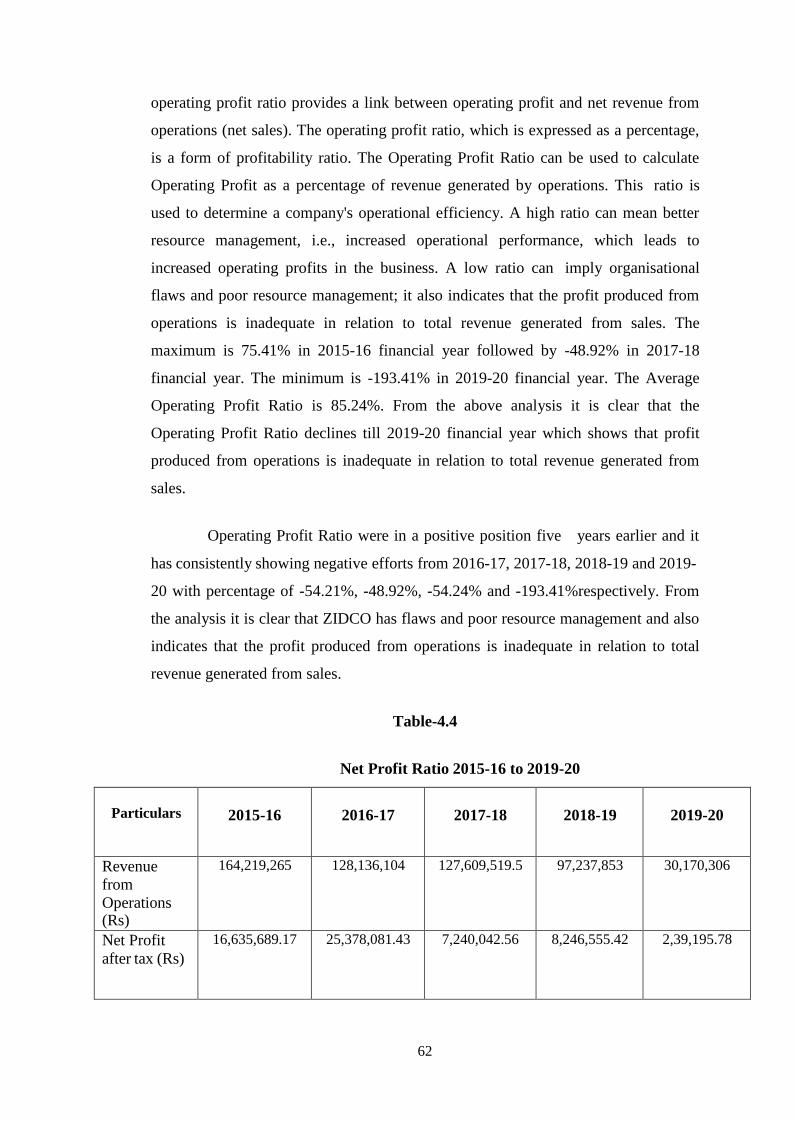
62
operating profit ratio provides a link between operating profit and net revenue from
operations (net sales). The operating profit ratio, which is expressed as a percentage,
is a form of profitability ratio. The Operating Profit Ratio can be used to calculate
Operating Profit as a percentage of revenue generated by operations. This ratio is
used to determine a company's operational efficiency. A high ratio can mean better
resource management, i.e., increased operational performance, which leads to
increased operating profits in the business. A low ratio can imply organisational
flaws and poor resource management; it also indicates that the profit produced from
operations is inadequate in relation to total revenue generated from sales. The
maximum is 75.41% in 2015-16 financial year followed by -48.92% in 2017-18
financial year. The minimum is -193.41% in 2019-20 financial year. The Average
Operating Profit Ratio is 85.24%. From the above analysis it is clear that the
Operating Profit Ratio declines till 2019-20 financial year which shows that profit
produced from operations is inadequate in relation to total revenue generated from
sales.
Operating Profit Ratio were in a positive position five years earlier and it
has consistently showing negative efforts from 2016-17, 2017-18, 2018-19 and 2019-
20 with percentage of -54.21%, -48.92%, -54.24% and -193.41%respectively. From
the analysis it is clear that ZIDCO has flaws and poor resource management and also
indicates that the profit produced from operations is inadequate in relation to total
revenue generated from sales.
Table-4.4
Net Profit Ratio 2015-16 to 2019-20
Particulars
2015-16
2016-17
2017-18
2018-19
2019-20
Revenue
from
Operations (Rs)
164,219,265 128,136,104 127,609,519.5 97,237,853 30,170,306
Net Profit
after tax (Rs)
16,635,689.17 25,378,081.43 7,240,042.56 8,246,555.42 2,39,195.78
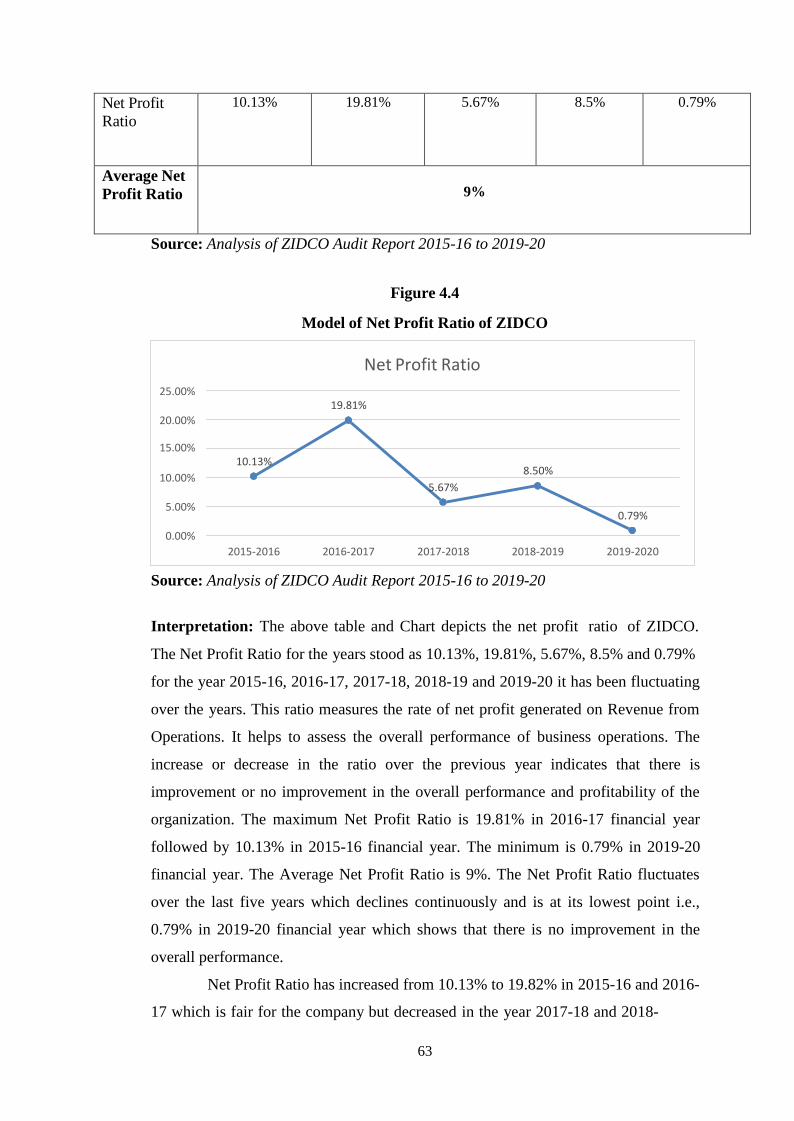
63
Net Profit Ratio
25.00% 19.81%
20.00%
15.00% 10.13%
10.00% 8.50%
5.67%
5.00% 0.79%
0.00%
2015-2016 2016-2017 2017-2018 2018-2019 2019-2020
Net Profit
Ratio
10.13% 19.81% 5.67% 8.5% 0.79%
Average Net
Profit Ratio
9%
Source: Analysis of ZIDCO Audit Report 2015-16 to 2019-20
Figure 4.4
Model of Net Profit Ratio of ZIDCO
Source: Analysis of ZIDCO Audit Report 2015-16 to 2019-20
Interpretation: The above table and Chart depicts the net profit ratio of ZIDCO.
The Net Profit Ratio for the years stood as 10.13%, 19.81%, 5.67%, 8.5% and 0.79%
for the year 2015-16, 2016-17, 2017-18, 2018-19 and 2019-20 it has been fluctuating
over the years. This ratio measures the rate of net profit generated on Revenue from
Operations. It helps to assess the overall performance of business operations. The
increase or decrease in the ratio over the previous year indicates that there is
improvement or no improvement in the overall performance and profitability of the
organization. The maximum Net Profit Ratio is 19.81% in 2016-17 financial year
followed by 10.13% in 2015-16 financial year. The minimum is 0.79% in 2019-20
financial year. The Average Net Profit Ratio is 9%. The Net Profit Ratio fluctuates
over the last five years which declines continuously and is at its lowest point i.e.,
0.79% in 2019-20 financial year which shows that there is no improvement in the
overall performance.
Net Profit Ratio has increased from 10.13% to 19.82% in 2015-16 and 2016-
17 which is fair for the company but decreased in the year 2017-18 and 2018-
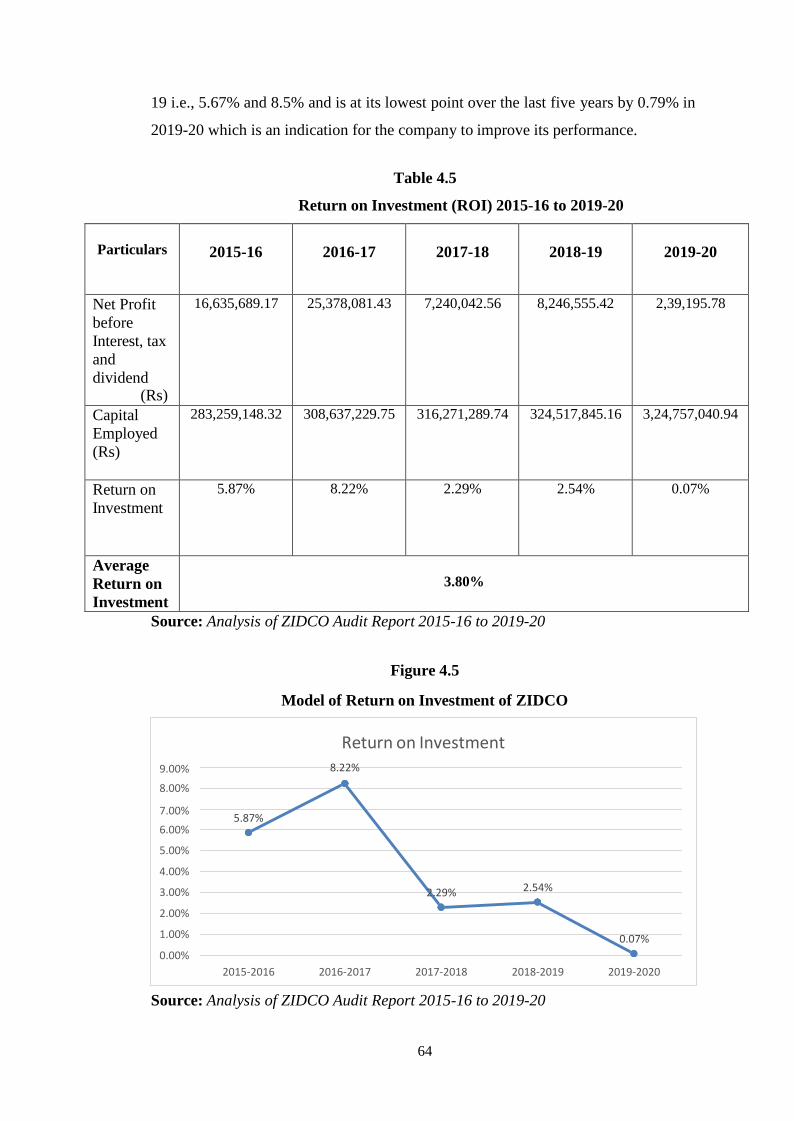
64
9.00%
8.00%
Return on Investment 8.22%
7.00%
6.00%
5.00%
4.00%
3.00%
2.00%
1.00%
0.00%
5.87%
2.29% 2.54%
0.07%
2015-2016 2016-2017 2017-2018 2018-2019 2019-2020
19 i.e., 5.67% and 8.5% and is at its lowest point over the last five years by 0.79% in
2019-20 which is an indication for the company to improve its performance.
Table 4.5
Return on Investment (ROI) 2015-16 to 2019-20
Particulars
2015-16
2016-17
2017-18
2018-19
2019-20
Net Profit
before
Interest, tax
and
dividend (Rs)
16,635,689.17 25,378,081.43 7,240,042.56 8,246,555.42 2,39,195.78
Capital
Employed
(Rs)
283,259,148.32 308,637,229.75 316,271,289.74 324,517,845.16 3,24,757,040.94
Return on
Investment
5.87% 8.22% 2.29% 2.54% 0.07%
Average
Return on
Investment
3.80%
Source: Analysis of ZIDCO Audit Report 2015-16 to 2019-20
Figure 4.5
Model of Return on Investment of ZIDCO
Source: Analysis of ZIDCO Audit Report 2015-16 to 2019-20
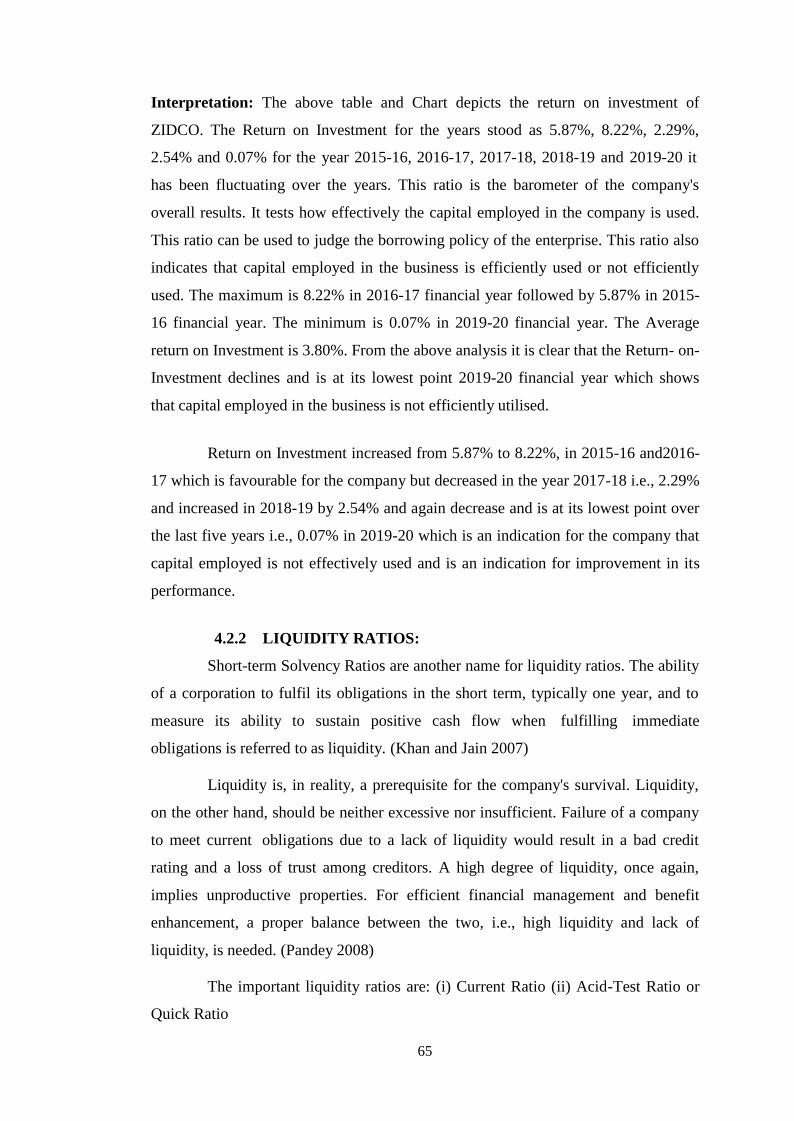
65
Interpretation: The above table and Chart depicts the return on investment of
ZIDCO. The Return on Investment for the years stood as 5.87%, 8.22%, 2.29%,
2.54% and 0.07% for the year 2015-16, 2016-17, 2017-18, 2018-19 and 2019-20 it
has been fluctuating over the years. This ratio is the barometer of the company's
overall results. It tests how effectively the capital employed in the company is used.
This ratio can be used to judge the borrowing policy of the enterprise. This ratio also
indicates that capital employed in the business is efficiently used or not efficiently
used. The maximum is 8.22% in 2016-17 financial year followed by 5.87% in 2015-
16 financial year. The minimum is 0.07% in 2019-20 financial year. The Average
return on Investment is 3.80%. From the above analysis it is clear that the Return- on-
Investment declines and is at its lowest point 2019-20 financial year which shows
that capital employed in the business is not efficiently utilised.
Return on Investment increased from 5.87% to 8.22%, in 2015-16 and2016-
17 which is favourable for the company but decreased in the year 2017-18 i.e., 2.29%
and increased in 2018-19 by 2.54% and again decrease and is at its lowest point over
the last five years i.e., 0.07% in 2019-20 which is an indication for the company that
capital employed is not effectively used and is an indication for improvement in its
performance.
4.2.2 LIQUIDITY RATIOS:
Short-term Solvency Ratios are another name for liquidity ratios. The ability
of a corporation to fulfil its obligations in the short term, typically one year, and to
measure its ability to sustain positive cash flow when fulfilling immediate
obligations is referred to as liquidity. (Khan and Jain 2007)
Liquidity is, in reality, a prerequisite for the company's survival. Liquidity,
on the other hand, should be neither excessive nor insufficient. Failure of a company
to meet current obligations due to a lack of liquidity would result in a bad credit
rating and a loss of trust among creditors. A high degree of liquidity, once again,
implies unproductive properties. For efficient financial management and benefit
enhancement, a proper balance between the two, i.e., high liquidity and lack of
liquidity, is needed. (Pandey 2008)
The important liquidity ratios are: (i) Current Ratio (ii) Acid-Test Ratio or
Quick Ratio
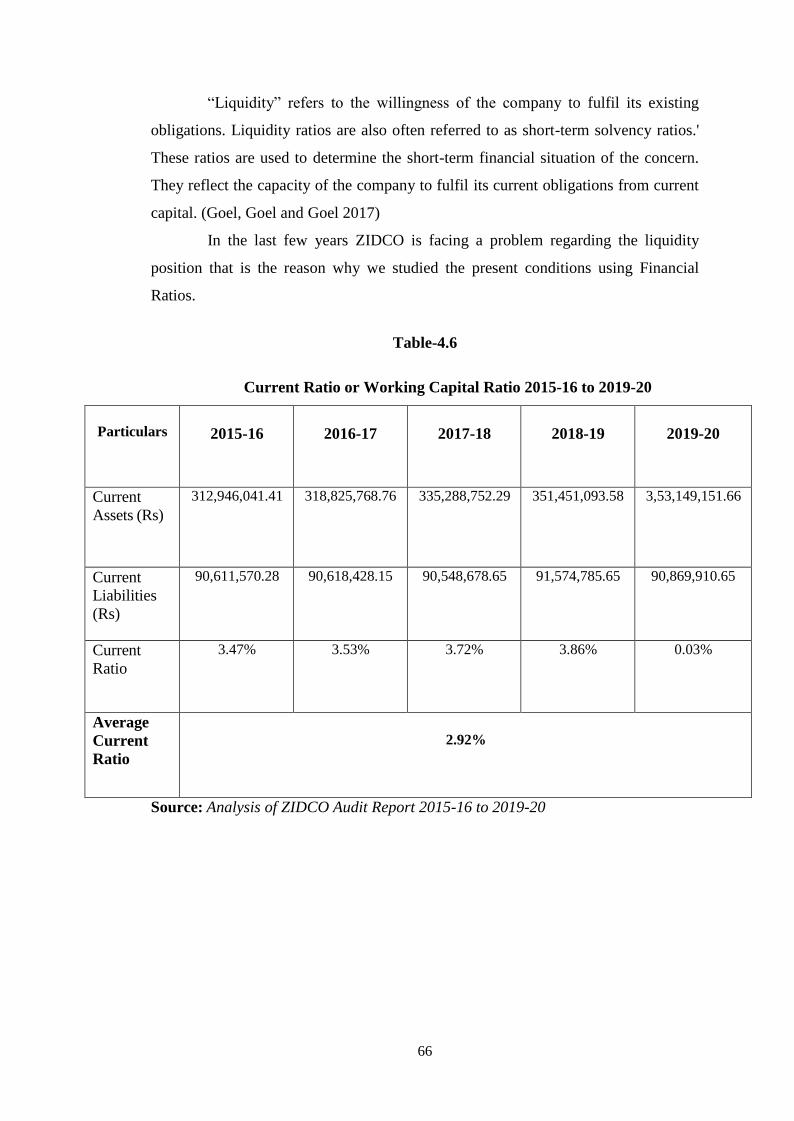
66
―Liquidity‖ refers to the willingness of the company to fulfil its existing
obligations. Liquidity ratios are also often referred to as short-term solvency ratios.'
These ratios are used to determine the short-term financial situation of the concern.
They reflect the capacity of the company to fulfil its current obligations from current
capital. (Goel, Goel and Goel 2017)
In the last few years ZIDCO is facing a problem regarding the liquidity
position that is the reason why we studied the present conditions using Financial
Ratios.
Table-4.6
Current Ratio or Working Capital Ratio 2015-16 to 2019-20
Particulars
2015-16
2016-17
2017-18
2018-19
2019-20
Current
Assets (Rs)
312,946,041.41 318,825,768.76 335,288,752.29 351,451,093.58 3,53,149,151.66
Current
Liabilities
(Rs)
90,611,570.28 90,618,428.15 90,548,678.65 91,574,785.65 90,869,910.65
Current
Ratio
3.47% 3.53% 3.72% 3.86% 0.03%
Average
Current
Ratio
2.92%
Source: Analysis of ZIDCO Audit Report 2015-16 to 2019-20
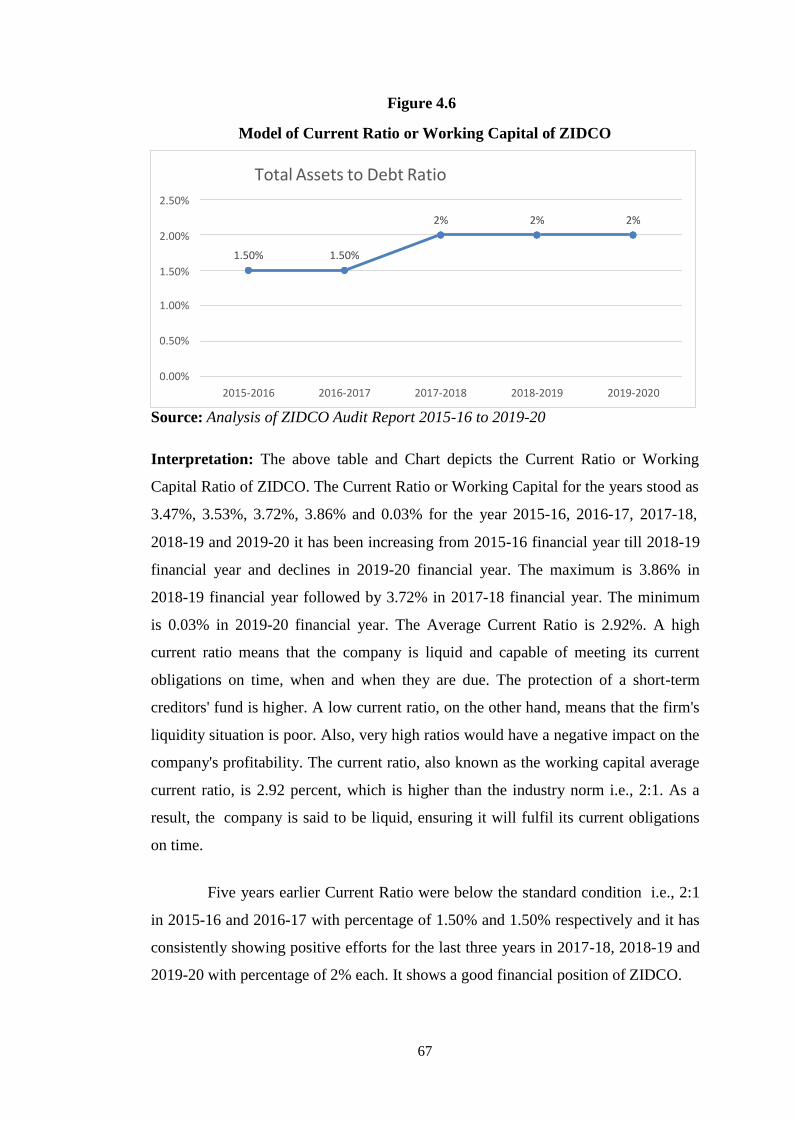
67
Total Assets to Debt Ratio
2.50%
2% 2% 2%
2.00%
1.50% 1.50%
1.50%
1.00%
0.50%
0.00%
2015-2016 2016-2017 2017-2018 2018-2019 2019-2020
Figure 4.6
Model of Current Ratio or Working Capital of ZIDCO
Source: Analysis of ZIDCO Audit Report 2015-16 to 2019-20
Interpretation: The above table and Chart depicts the Current Ratio or Working
Capital Ratio of ZIDCO. The Current Ratio or Working Capital for the years stood as
3.47%, 3.53%, 3.72%, 3.86% and 0.03% for the year 2015-16, 2016-17, 2017-18,
2018-19 and 2019-20 it has been increasing from 2015-16 financial year till 2018-19
financial year and declines in 2019-20 financial year. The maximum is 3.86% in
2018-19 financial year followed by 3.72% in 2017-18 financial year. The minimum
is 0.03% in 2019-20 financial year. The Average Current Ratio is 2.92%. A high
current ratio means that the company is liquid and capable of meeting its current
obligations on time, when and when they are due. The protection of a short-term
creditors' fund is higher. A low current ratio, on the other hand, means that the firm's
liquidity situation is poor. Also, very high ratios would have a negative impact on the
company's profitability. The current ratio, also known as the working capital average
current ratio, is 2.92 percent, which is higher than the industry norm i.e., 2:1. As a
result, the company is said to be liquid, ensuring it will fulfil its current obligations
on time.
Five years earlier Current Ratio were below the standard condition i.e., 2:1
in 2015-16 and 2016-17 with percentage of 1.50% and 1.50% respectively and it has
consistently showing positive efforts for the last three years in 2017-18, 2018-19 and
2019-20 with percentage of 2% each. It shows a good financial position of ZIDCO.
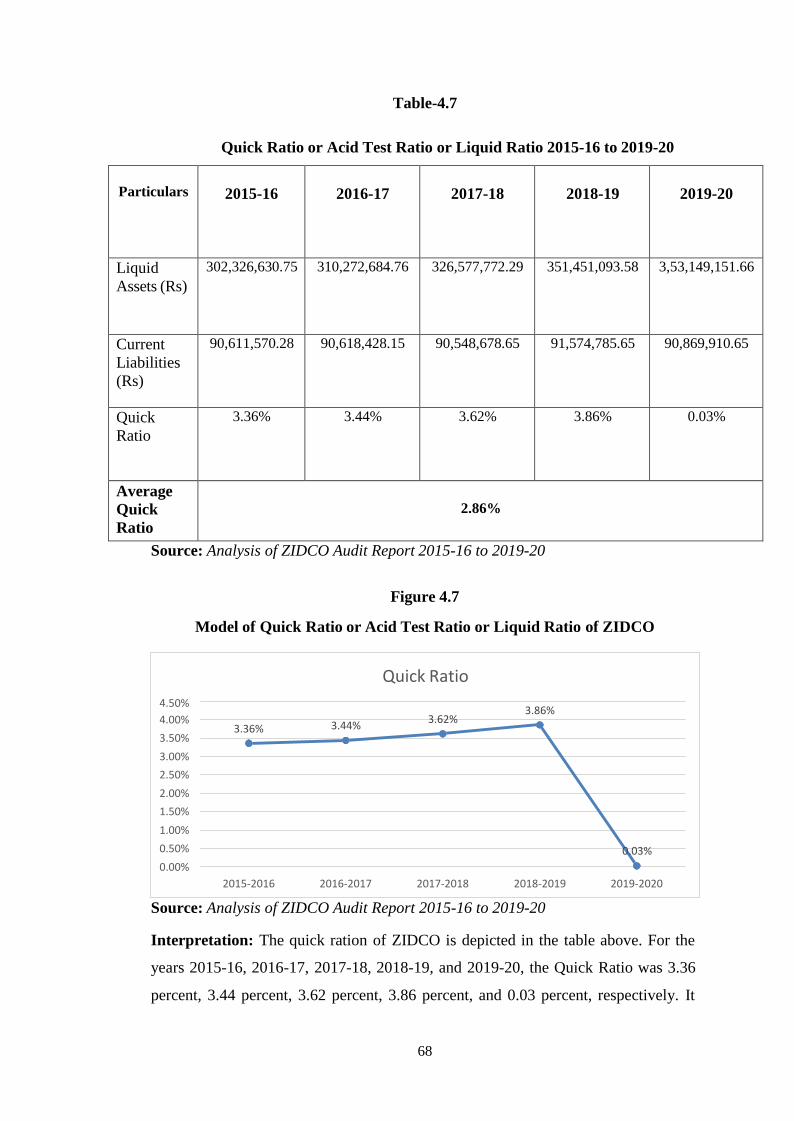
68
Quick Ratio
4.50%
4.00%
3.50%
3.00%
2.50%
2.00%
1.50%
1.00%
0.50%
0.00%
3.62% 3.86%
3.36% 3.44%
0.03%
2015-2016 2016-2017 2017-2018 2018-2019 2019-2020
Table-4.7
Quick Ratio or Acid Test Ratio or Liquid Ratio 2015-16 to 2019-20
Particulars
2015-16
2016-17
2017-18
2018-19
2019-20
Liquid
Assets (Rs)
302,326,630.75 310,272,684.76 326,577,772.29 351,451,093.58 3,53,149,151.66
Current
Liabilities
(Rs)
90,611,570.28 90,618,428.15 90,548,678.65 91,574,785.65 90,869,910.65
Quick
Ratio
3.36% 3.44% 3.62% 3.86% 0.03%
Average
Quick
Ratio
2.86%
Source: Analysis of ZIDCO Audit Report 2015-16 to 2019-20
Figure 4.7
Model of Quick Ratio or Acid Test Ratio or Liquid Ratio of ZIDCO
Source: Analysis of ZIDCO Audit Report 2015-16 to 2019-20
Interpretation: The quick ration of ZIDCO is depicted in the table above. For the
years 2015-16, 2016-17, 2017-18, 2018-19, and 2019-20, the Quick Ratio was 3.36
percent, 3.44 percent, 3.62 percent, 3.86 percent, and 0.03 percent, respectively. It
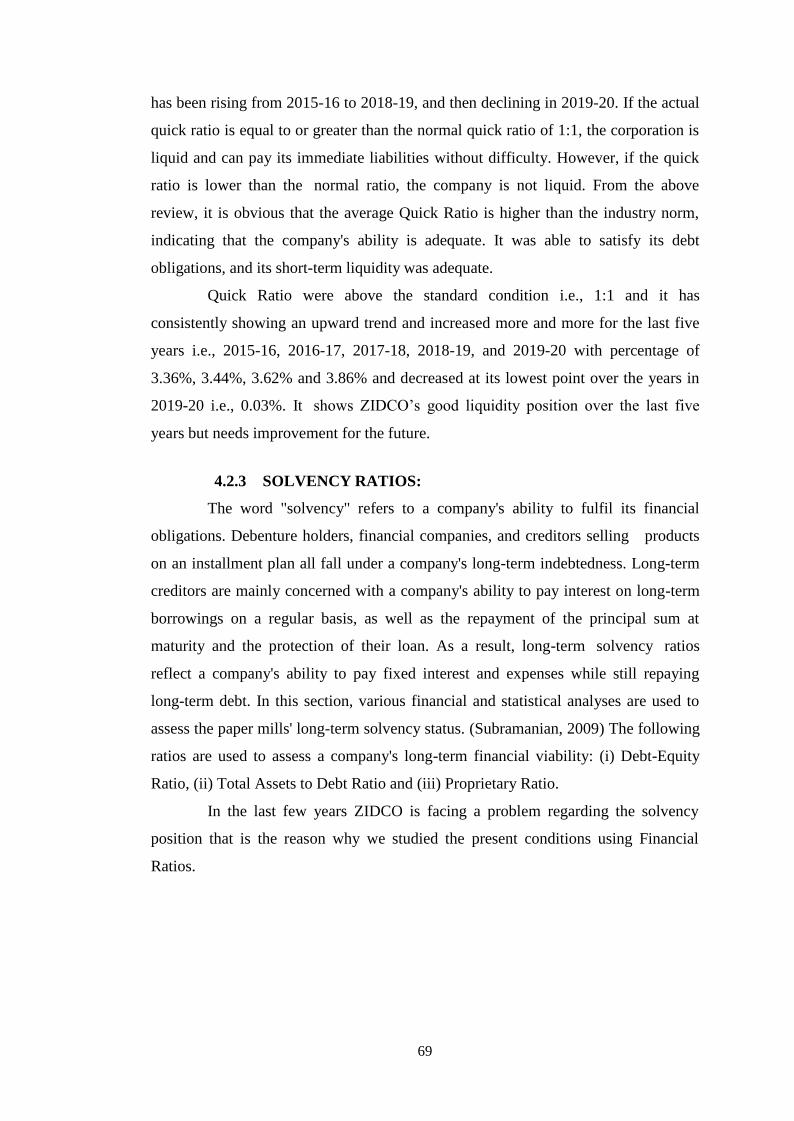
69
has been rising from 2015-16 to 2018-19, and then declining in 2019-20. If the actual
quick ratio is equal to or greater than the normal quick ratio of 1:1, the corporation is
liquid and can pay its immediate liabilities without difficulty. However, if the quick
ratio is lower than the normal ratio, the company is not liquid. From the above
review, it is obvious that the average Quick Ratio is higher than the industry norm,
indicating that the company's ability is adequate. It was able to satisfy its debt
obligations, and its short-term liquidity was adequate.
Quick Ratio were above the standard condition i.e., 1:1 and it has
consistently showing an upward trend and increased more and more for the last five
years i.e., 2015-16, 2016-17, 2017-18, 2018-19, and 2019-20 with percentage of
3.36%, 3.44%, 3.62% and 3.86% and decreased at its lowest point over the years in
2019-20 i.e., 0.03%. It shows ZIDCO’s good liquidity position over the last five
years but needs improvement for the future.
4.2.3 SOLVENCY RATIOS:
The word "solvency" refers to a company's ability to fulfil its financial
obligations. Debenture holders, financial companies, and creditors selling products
on an installment plan all fall under a company's long-term indebtedness. Long-term
creditors are mainly concerned with a company's ability to pay interest on long-term
borrowings on a regular basis, as well as the repayment of the principal sum at
maturity and the protection of their loan. As a result, long-term solvency ratios
reflect a company's ability to pay fixed interest and expenses while still repaying
long-term debt. In this section, various financial and statistical analyses are used to
assess the paper mills' long-term solvency status. (Subramanian, 2009) The following
ratios are used to assess a company's long-term financial viability: (i) Debt-Equity
Ratio, (ii) Total Assets to Debt Ratio and (iii) Proprietary Ratio.
In the last few years ZIDCO is facing a problem regarding the solvency
position that is the reason why we studied the present conditions using Financial
Ratios.
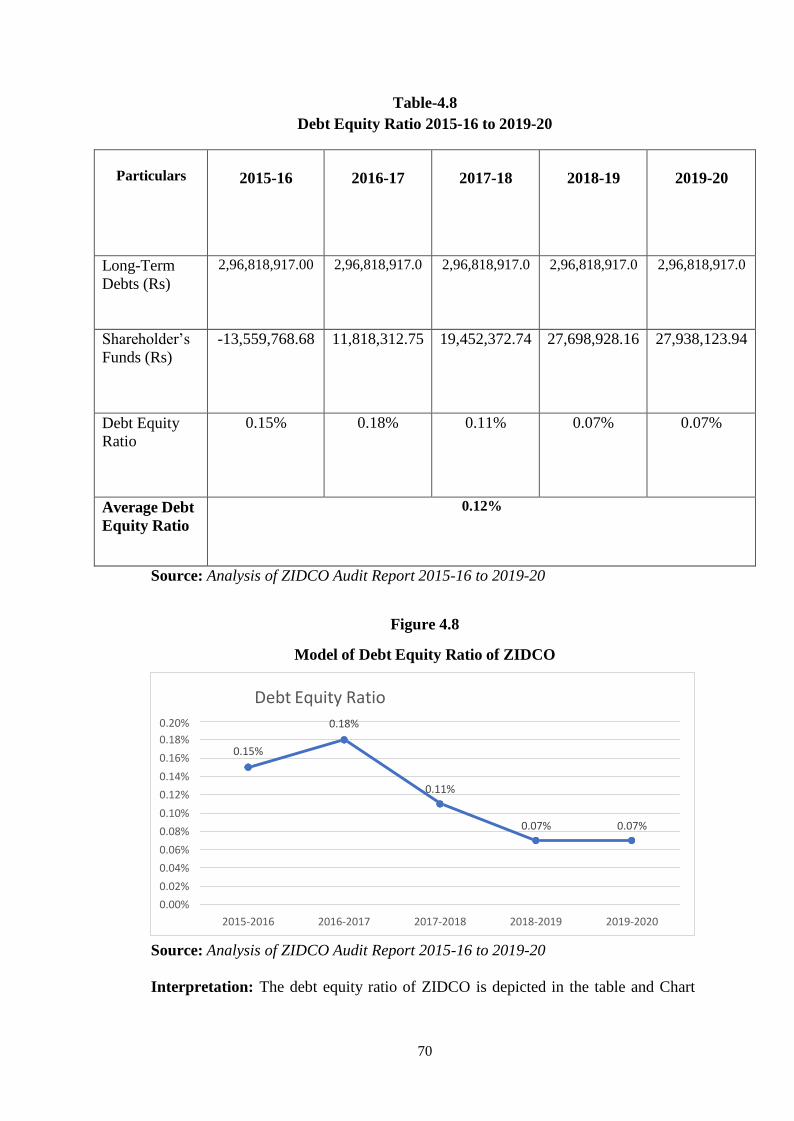
70
0.20%
0.18%
0.16%
0.14%
0.12%
0.10%
0.08%
0.06%
0.04%
0.02%
0.00%
Debt Equity Ratio
0.18%
0.15%
0.11%
0.07% 0.07%
2015-2016 2016-2017 2017-2018 2018-2019 2019-2020
Table-4.8
Debt Equity Ratio 2015-16 to 2019-20
Particulars
2015-16
2016-17
2017-18
2018-19
2019-20
Long-Term
Debts (Rs)
2,96,818,917.00 2,96,818,917.0 2,96,818,917.0 2,96,818,917.0 2,96,818,917.0
Shareholder’s
Funds (Rs)
-13,559,768.68 11,818,312.75 19,452,372.74 27,698,928.16 27,938,123.94
Debt Equity
Ratio
0.15% 0.18% 0.11% 0.07% 0.07%
Average Debt
Equity Ratio
0.12%
Source: Analysis of ZIDCO Audit Report 2015-16 to 2019-20
Figure 4.8
Model of Debt Equity Ratio of ZIDCO
Source: Analysis of ZIDCO Audit Report 2015-16 to 2019-20
Interpretation: The debt equity ratio of ZIDCO is depicted in the table and Chart
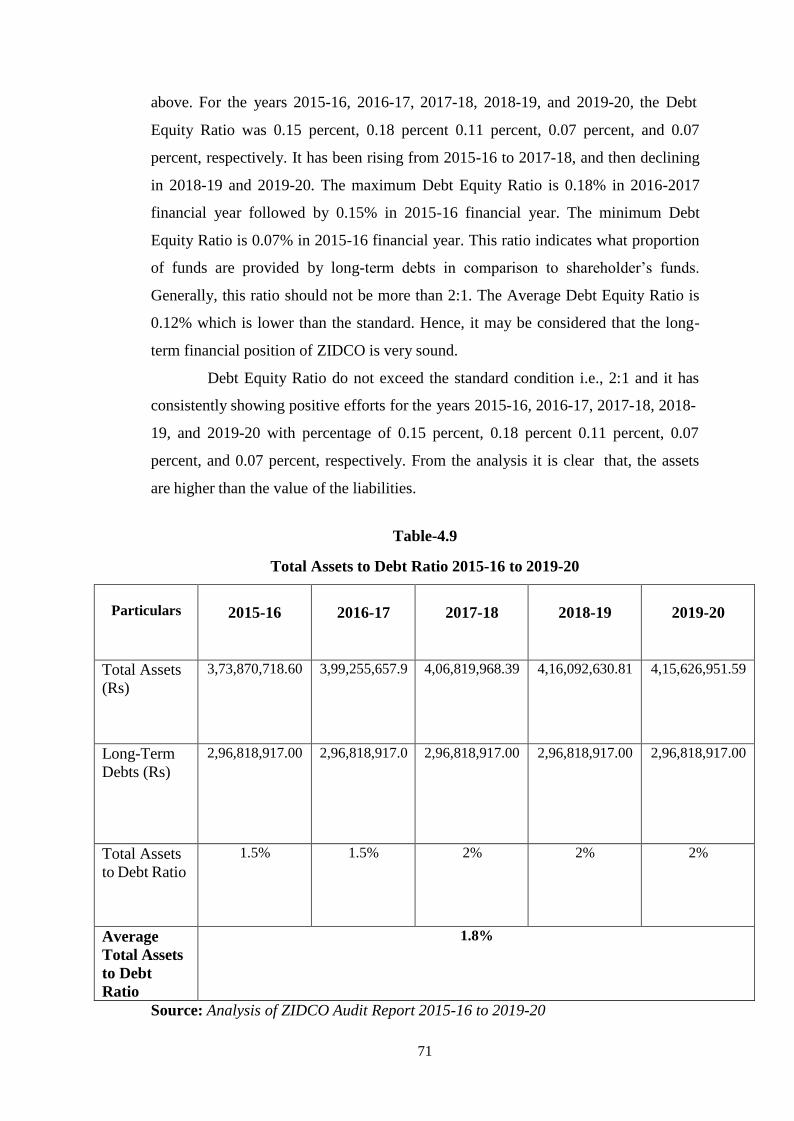
71
above. For the years 2015-16, 2016-17, 2017-18, 2018-19, and 2019-20, the Debt
Equity Ratio was 0.15 percent, 0.18 percent 0.11 percent, 0.07 percent, and 0.07
percent, respectively. It has been rising from 2015-16 to 2017-18, and then declining
in 2018-19 and 2019-20. The maximum Debt Equity Ratio is 0.18% in 2016-2017
financial year followed by 0.15% in 2015-16 financial year. The minimum Debt
Equity Ratio is 0.07% in 2015-16 financial year. This ratio indicates what proportion
of funds are provided by long-term debts in comparison to shareholder’s funds.
Generally, this ratio should not be more than 2:1. The Average Debt Equity Ratio is
0.12% which is lower than the standard. Hence, it may be considered that the long-
term financial position of ZIDCO is very sound.
Debt Equity Ratio do not exceed the standard condition i.e., 2:1 and it has
consistently showing positive efforts for the years 2015-16, 2016-17, 2017-18, 2018-
19, and 2019-20 with percentage of 0.15 percent, 0.18 percent 0.11 percent, 0.07
percent, and 0.07 percent, respectively. From the analysis it is clear that, the assets
are higher than the value of the liabilities.
Table-4.9
Total Assets to Debt Ratio 2015-16 to 2019-20
Particulars
2015-16
2016-17
2017-18
2018-19
2019-20
Total Assets
(Rs)
3,73,870,718.60 3,99,255,657.9 4,06,819,968.39 4,16,092,630.81 4,15,626,951.59
Long-Term
Debts (Rs)
2,96,818,917.00 2,96,818,917.0 2,96,818,917.00 2,96,818,917.00 2,96,818,917.00
Total Assets
to Debt Ratio
1.5% 1.5% 2% 2% 2%
Average
Total Assets
to Debt
Ratio
1.8%
Source: Analysis of ZIDCO Audit Report 2015-16 to 2019-20
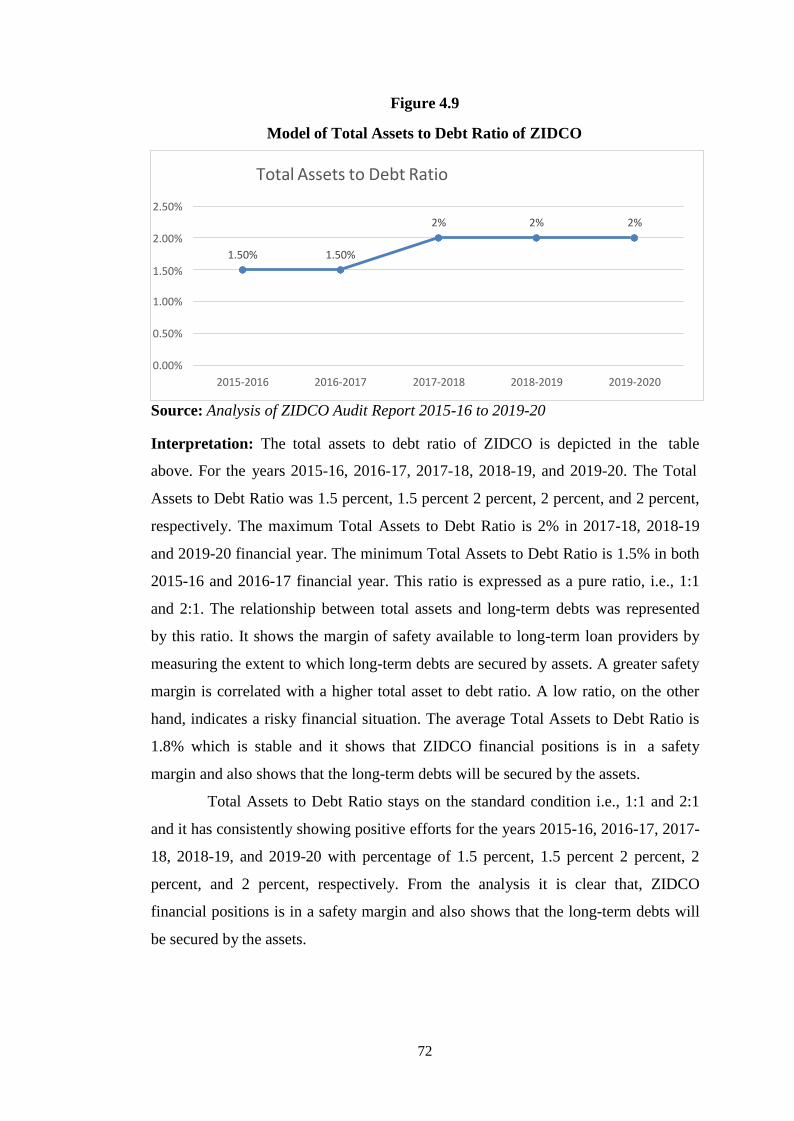
72
Total Assets to Debt Ratio
2.50%
2% 2% 2%
2.00%
1.50% 1.50%
1.50%
1.00%
0.50%
0.00%
2015-2016 2016-2017 2017-2018 2018-2019 2019-2020
Figure 4.9
Model of Total Assets to Debt Ratio of ZIDCO
Source: Analysis of ZIDCO Audit Report 2015-16 to 2019-20
Interpretation: The total assets to debt ratio of ZIDCO is depicted in the table
above. For the years 2015-16, 2016-17, 2017-18, 2018-19, and 2019-20. The Total
Assets to Debt Ratio was 1.5 percent, 1.5 percent 2 percent, 2 percent, and 2 percent,
respectively. The maximum Total Assets to Debt Ratio is 2% in 2017-18, 2018-19
and 2019-20 financial year. The minimum Total Assets to Debt Ratio is 1.5% in both
2015-16 and 2016-17 financial year. This ratio is expressed as a pure ratio, i.e., 1:1
and 2:1. The relationship between total assets and long-term debts was represented
by this ratio. It shows the margin of safety available to long-term loan providers by
measuring the extent to which long-term debts are secured by assets. A greater safety
margin is correlated with a higher total asset to debt ratio. A low ratio, on the other
hand, indicates a risky financial situation. The average Total Assets to Debt Ratio is
1.8% which is stable and it shows that ZIDCO financial positions is in a safety
margin and also shows that the long-term debts will be secured by the assets.
Total Assets to Debt Ratio stays on the standard condition i.e., 1:1 and 2:1
and it has consistently showing positive efforts for the years 2015-16, 2016-17, 2017-
18, 2018-19, and 2019-20 with percentage of 1.5 percent, 1.5 percent 2 percent, 2
percent, and 2 percent, respectively. From the analysis it is clear that, ZIDCO
financial positions is in a safety margin and also shows that the long-term debts will
be secured by the assets.
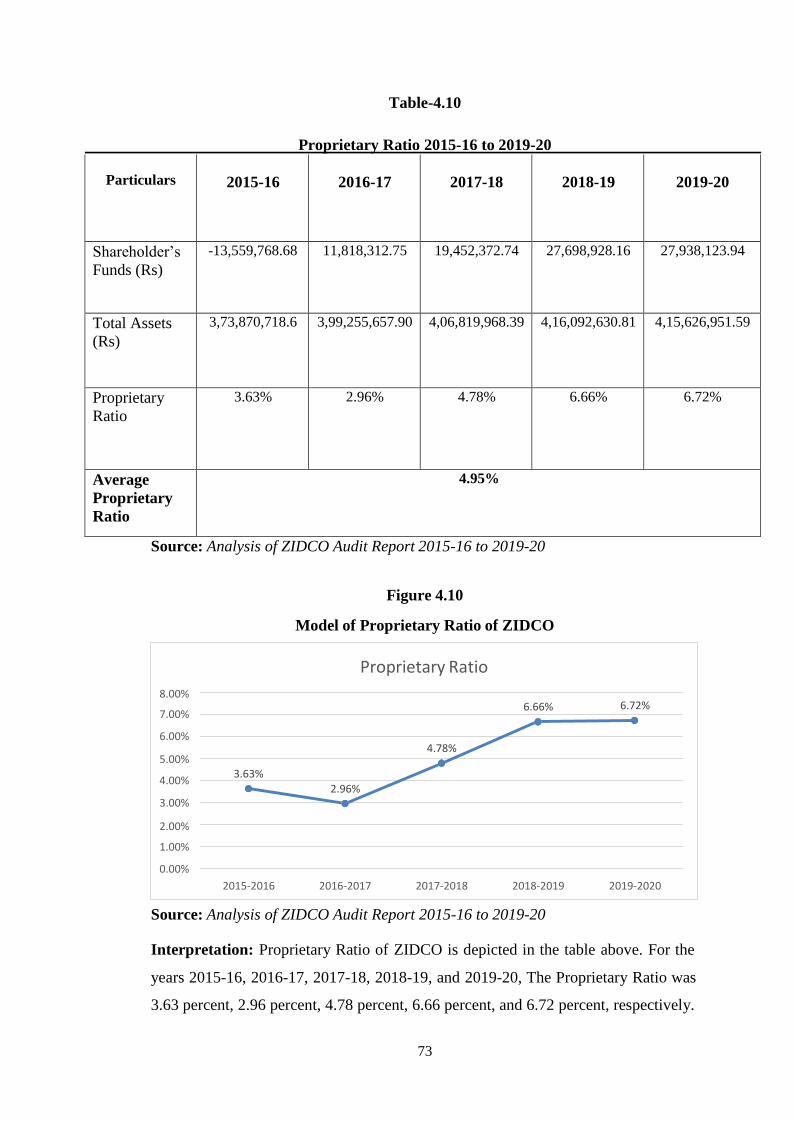
73
Proprietary Ratio
8.00%
7.00%
6.00%
5.00%
4.00%
3.00%
6.66% 6.72%
4.78%
3.63%
2.96%
2.00%
1.00%
0.00%
2015-2016 2016-2017 2017-2018 2018-2019 2019-2020
Table-4.10
Proprietary Ratio 2015-16 to 2019-20
Particulars
2015-16
2016-17
2017-18
2018-19
2019-20
Shareholder’s
Funds (Rs)
-13,559,768.68 11,818,312.75 19,452,372.74 27,698,928.16 27,938,123.94
Total Assets
(Rs)
3,73,870,718.6 3,99,255,657.90 4,06,819,968.39 4,16,092,630.81 4,15,626,951.59
Proprietary
Ratio
3.63% 2.96% 4.78% 6.66% 6.72%
Average
Proprietary
Ratio
4.95%
Source: Analysis of ZIDCO Audit Report 2015-16 to 2019-20
Figure 4.10
Model of Proprietary Ratio of ZIDCO
Source: Analysis of ZIDCO Audit Report 2015-16 to 2019-20
Interpretation: Proprietary Ratio of ZIDCO is depicted in the table above. For the
years 2015-16, 2016-17, 2017-18, 2018-19, and 2019-20, The Proprietary Ratio was
3.63 percent, 2.96 percent, 4.78 percent, 6.66 percent, and 6.72 percent, respectively.
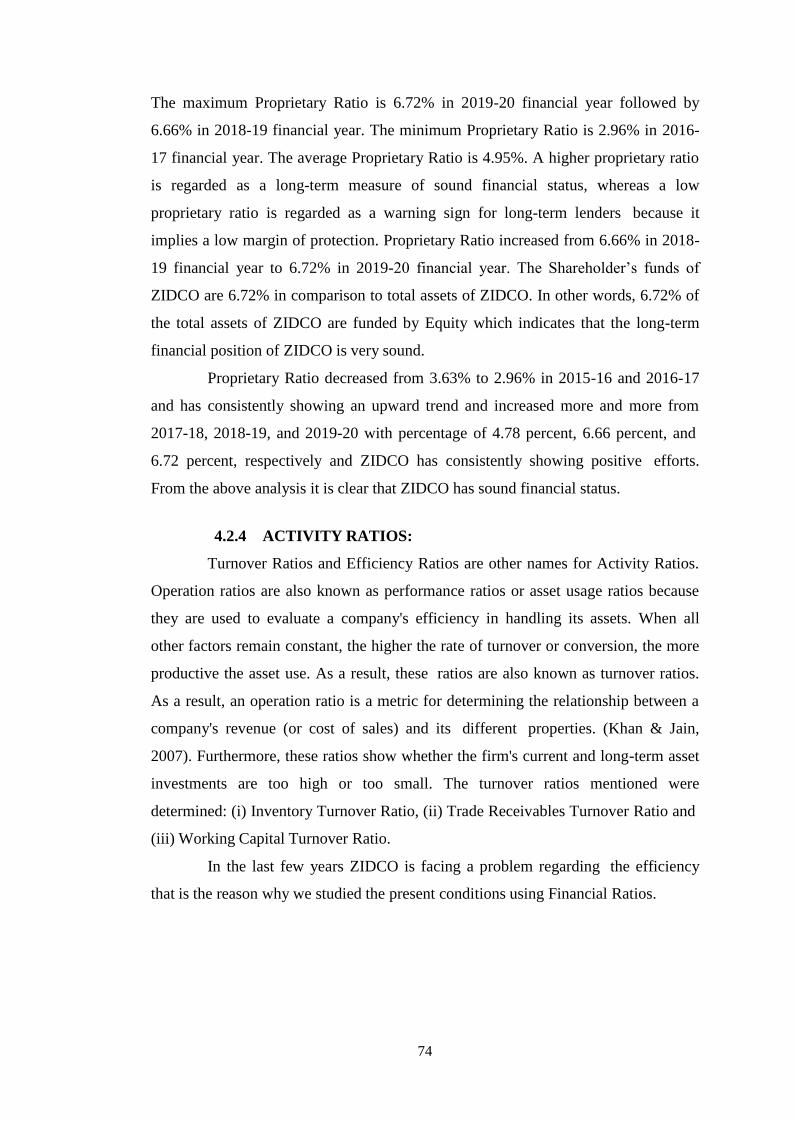
74
The maximum Proprietary Ratio is 6.72% in 2019-20 financial year followed by
6.66% in 2018-19 financial year. The minimum Proprietary Ratio is 2.96% in 2016-
17 financial year. The average Proprietary Ratio is 4.95%. A higher proprietary ratio
is regarded as a long-term measure of sound financial status, whereas a low
proprietary ratio is regarded as a warning sign for long-term lenders because it
implies a low margin of protection. Proprietary Ratio increased from 6.66% in 2018-
19 financial year to 6.72% in 2019-20 financial year. The Shareholder’s funds of
ZIDCO are 6.72% in comparison to total assets of ZIDCO. In other words, 6.72% of
the total assets of ZIDCO are funded by Equity which indicates that the long-term
financial position of ZIDCO is very sound.
Proprietary Ratio decreased from 3.63% to 2.96% in 2015-16 and 2016-17
and has consistently showing an upward trend and increased more and more from
2017-18, 2018-19, and 2019-20 with percentage of 4.78 percent, 6.66 percent, and
6.72 percent, respectively and ZIDCO has consistently showing positive efforts.
From the above analysis it is clear that ZIDCO has sound financial status.
4.2.4 ACTIVITY RATIOS:
Turnover Ratios and Efficiency Ratios are other names for Activity Ratios.
Operation ratios are also known as performance ratios or asset usage ratios because
they are used to evaluate a company's efficiency in handling its assets. When all
other factors remain constant, the higher the rate of turnover or conversion, the more
productive the asset use. As a result, these ratios are also known as turnover ratios.
As a result, an operation ratio is a metric for determining the relationship between a
company's revenue (or cost of sales) and its different properties. (Khan & Jain,
2007). Furthermore, these ratios show whether the firm's current and long-term asset
investments are too high or too small. The turnover ratios mentioned were
determined: (i) Inventory Turnover Ratio, (ii) Trade Receivables Turnover Ratio and
(iii) Working Capital Turnover Ratio.
In the last few years ZIDCO is facing a problem regarding the efficiency
that is the reason why we studied the present conditions using Financial Ratios.
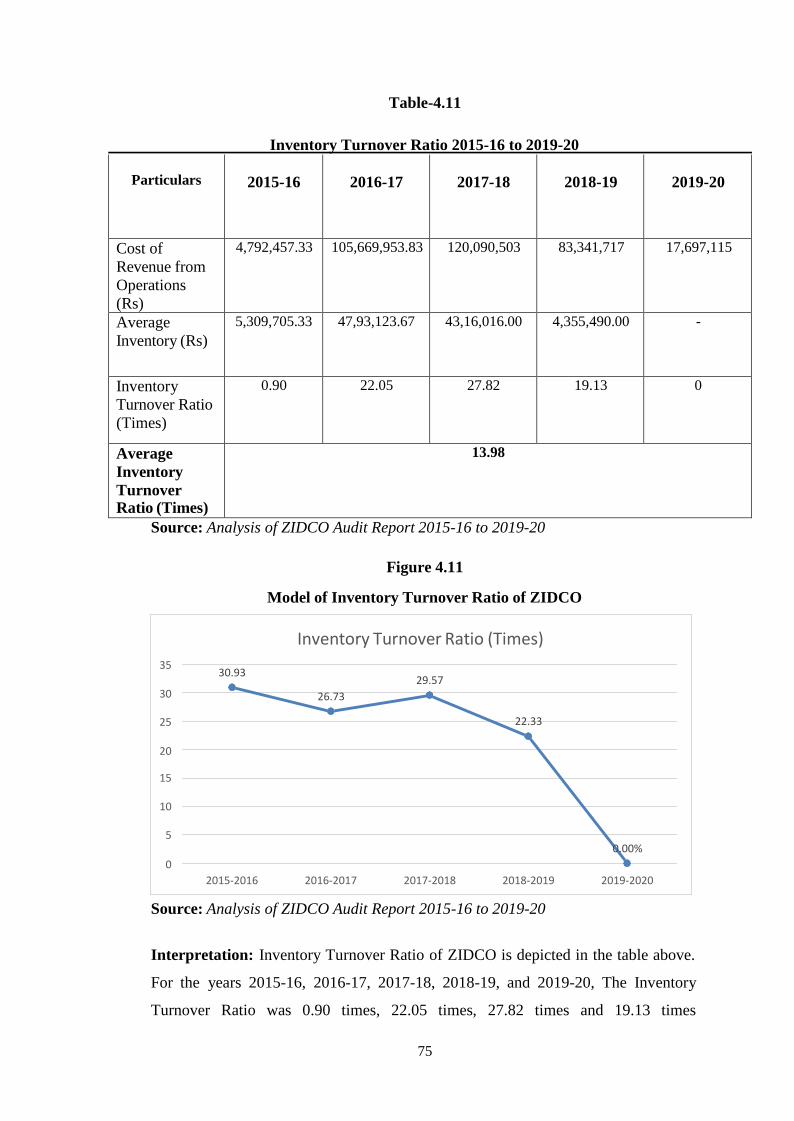
75
Inventory Turnover Ratio (Times)
35 30.93
29.57 30 26.73
25 22.33
20
15
10
5 0.00%
0
2015-2016 2016-2017 2017-2018 2018-2019 2019-2020
Table-4.11
Inventory Turnover Ratio 2015-16 to 2019-20
Particulars
2015-16
2016-17
2017-18
2018-19
2019-20
Cost of
Revenue from
Operations
(Rs)
4,792,457.33 105,669,953.83 120,090,503 83,341,717 17,697,115
Average
Inventory (Rs)
5,309,705.33 47,93,123.67 43,16,016.00 4,355,490.00 -
Inventory
Turnover Ratio
(Times)
0.90 22.05 27.82 19.13 0
Average
Inventory
Turnover Ratio (Times)
13.98
Source: Analysis of ZIDCO Audit Report 2015-16 to 2019-20
Figure 4.11
Model of Inventory Turnover Ratio of ZIDCO
Source: Analysis of ZIDCO Audit Report 2015-16 to 2019-20
Interpretation: Inventory Turnover Ratio of ZIDCO is depicted in the table above.
For the years 2015-16, 2016-17, 2017-18, 2018-19, and 2019-20, The Inventory
Turnover Ratio was 0.90 times, 22.05 times, 27.82 times and 19.13 times

76
respectively. There are no inventories in 2019-20 financial year and shows no
inventory turnover ratio. The maximum Inventory Turnover Ratio is 27.82 times in
2017-18 financial year followed 22.05 times in 2016-17 financial year. The
minimum Inventory Turnover Ratio is 0 times in 2019-20 financial year. The average
Inventory Turnover Ratio is 13.98 times. This ratio shows whether inventory has
been used effectively or not. It displays the rate at which inventory is rotated into
revenue from operations, as well as the amount of times inventory is rotated into
revenue from operations over the course of the year. As Inventory Turnover Ratio
declined from 27.82 times in 2017-18 to 19.33 times in 2018-19 and is at its lowest
point in 2019-20 financial year it shows that inventories are not efficiently used.
Inventory Turnover Ratio were declining from 27.82 times in 2017-18 to
19.33 times in 2018-19 respectively and zero inventory turnover in 2019-20 and it
has consistently showing negative efforts for the last five years. From the analysis it
is clear that inventories are not efficiently used and ZIDCO has to improved its
inventory management.
Table-4.12
Trade Receivables Turnover Ratio 2015-16 to 2019-20
Particulars
2015-16
2016-17
2017-18
2018-19
2019-20
Revenue from
Operations
(Rs)
164,219,265 128,136,104 127,609,519.5 97,237,853 30,170,306
Average Trade
Receivables
(Rs)
12,345,000.00 61,72,500.00 - 44,35,687.00 44,35,687.0
Trade
Receivables
Turnover Ratio
(Times)
13.30 20.76 0 21.92 6.80
Average
Trade
Receivables
Turnover Ratio (Times)
15.70
Source: Analysis of ZIDCO Audit Report 2015-16 to 2019-20
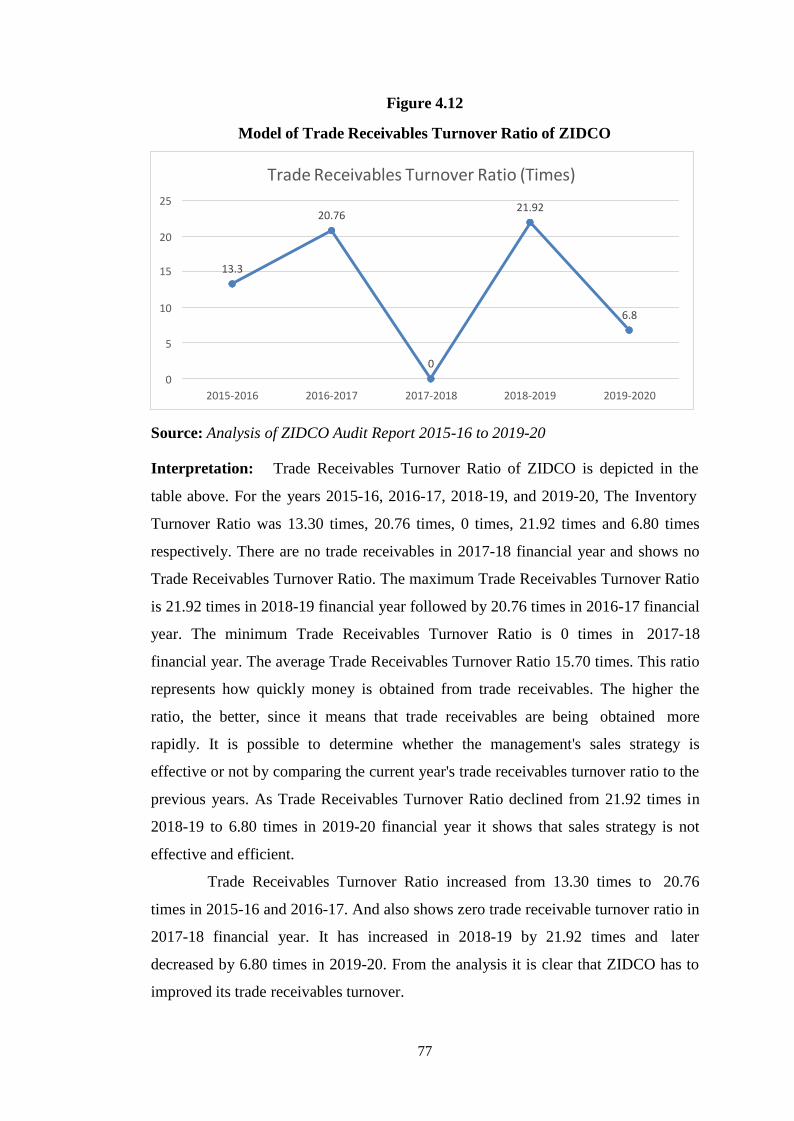
77
Trade Receivables Turnover Ratio (Times)
25 20.76
21.92
20
15 13.3
10 6.8
5
0
0
2015-2016 2016-2017 2017-2018 2018-2019 2019-2020
Figure 4.12
Model of Trade Receivables Turnover Ratio of ZIDCO
Source: Analysis of ZIDCO Audit Report 2015-16 to 2019-20
Interpretation: Trade Receivables Turnover Ratio of ZIDCO is depicted in the
table above. For the years 2015-16, 2016-17, 2018-19, and 2019-20, The Inventory
Turnover Ratio was 13.30 times, 20.76 times, 0 times, 21.92 times and 6.80 times
respectively. There are no trade receivables in 2017-18 financial year and shows no
Trade Receivables Turnover Ratio. The maximum Trade Receivables Turnover Ratio
is 21.92 times in 2018-19 financial year followed by 20.76 times in 2016-17 financial
year. The minimum Trade Receivables Turnover Ratio is 0 times in 2017-18
financial year. The average Trade Receivables Turnover Ratio 15.70 times. This ratio
represents how quickly money is obtained from trade receivables. The higher the
ratio, the better, since it means that trade receivables are being obtained more
rapidly. It is possible to determine whether the management's sales strategy is
effective or not by comparing the current year's trade receivables turnover ratio to the
previous years. As Trade Receivables Turnover Ratio declined from 21.92 times in
2018-19 to 6.80 times in 2019-20 financial year it shows that sales strategy is not
effective and efficient.
Trade Receivables Turnover Ratio increased from 13.30 times to 20.76
times in 2015-16 and 2016-17. And also shows zero trade receivable turnover ratio in
2017-18 financial year. It has increased in 2018-19 by 21.92 times and later
decreased by 6.80 times in 2019-20. From the analysis it is clear that ZIDCO has to
improved its trade receivables turnover.
78
Working Capital Turnover Ratio (Times)
0.8 0.74
0.7
0.6 0.56 0.52
0.5 0.37
0.4
0.3
0.2 0.12
0.1
0
2015-2016 2016-2017 2017-2018 2018-2019 2019-2020
Table-4.13
Working Capital Turnover Ratio 2015-16 to 2019-20
Particulars
2015-16
2016-17
2017-18
2018-19
2019-20
Revenue
from Operations (Rs)
164,219,265 128,136,104 127,609,519.50 97,237,853 30,170,306
Working
Capital
2,22,334,471.13 2,28,207,340.61 2,44,740,073.64 2,59,876,307.93 2,62,279,241.01
Working
Capital
Turnover Ratio (Times)
0.74 0.56 0.52 0.37 0.12
Average
Working
Capital
Turnover
Ratio (Times)
0.46
Source: Analysis of ZIDCO Audit Report 2015-16 to 2019-20
Figure 4.13
Model of Working Capital Turnover Ratio of ZIDCO
Source: Analysis of ZIDCO Audit Report 2015-16 to 2019-20

79
Interpretation: Working Capital Turnover Ratio of ZIDCO is depicted in the table
above. For the years 2015-16, 2016-17, 2018-19, and 2019-20, The Working Capital
Turnover Ratio was 0.74 times, 0.56 times, 0.52 times, 0.37 times and 0.12 times
respectively. The maximum Working Capital Turnover Ratio is 0.74 times in 2015-
16 financial year followed 0.56 times in 2016-17 financial year. Working Capital
Turnover Ratio declines from 2015-16 till 2019-20 financial year. The minimum
Working Capital Turnover Ratio is 0.12 times in 2019-20 financial year. The average
Working Capital Turnover Ratio 0.46 times. This ratio shows how effectively
working capital was used to generate Revenue from Operations. The number of times
working capital has been rotated in the production of Revenue from Operations is
shown. Working Capital Turnover Ratio continuously declines from 0.74 times in
2015-16 to 0.56 times in 2016-17, 0.52 times in 2017-18, 0.37 times in 2018-19 and
0.12 times in 2019-20 financial year which shows under-utilization of Working
Capital.
Working Capital Turnover Ratio were consistently declining for the years i.e.,
2015-16, 2016-17, 2017-18, 2018-19, and 2019-20 i.e., 0.74 times, 0.56 times, 0.52 times,
0.37 times and 0.12 times respectively. From the analysis it shows under-utilization of
Working Capital and it is clear that the used of working capital needs to be improved.
4.3 RETURN ON EQUITY RATIO OF ZIDCO:
The Return on Equity (ROE) ratio basically calculates the rate of return on a
company's common stock owned by its shareholders. The company's ability to
produce returns on the investment it earned from its shareholders is calculated by its
return on equity. ROE is more than a benefit measurement; it is also a productivity
measurement. (Khan and Jain 2007). Here in this table 4:14 an analysis was done for
the ZIDCO for last five years on their return equity ratio starting from 2015-16 to
2019-20.
We have studied the present condition comparing to the last five returns on
equity ratio of ZIDCO. For the present study we analyse the Return on Equity ratio
of ZIDCO using ratio analysis and found that five years earlier it is in a negative
position and it shows a positive effort for the last four years.
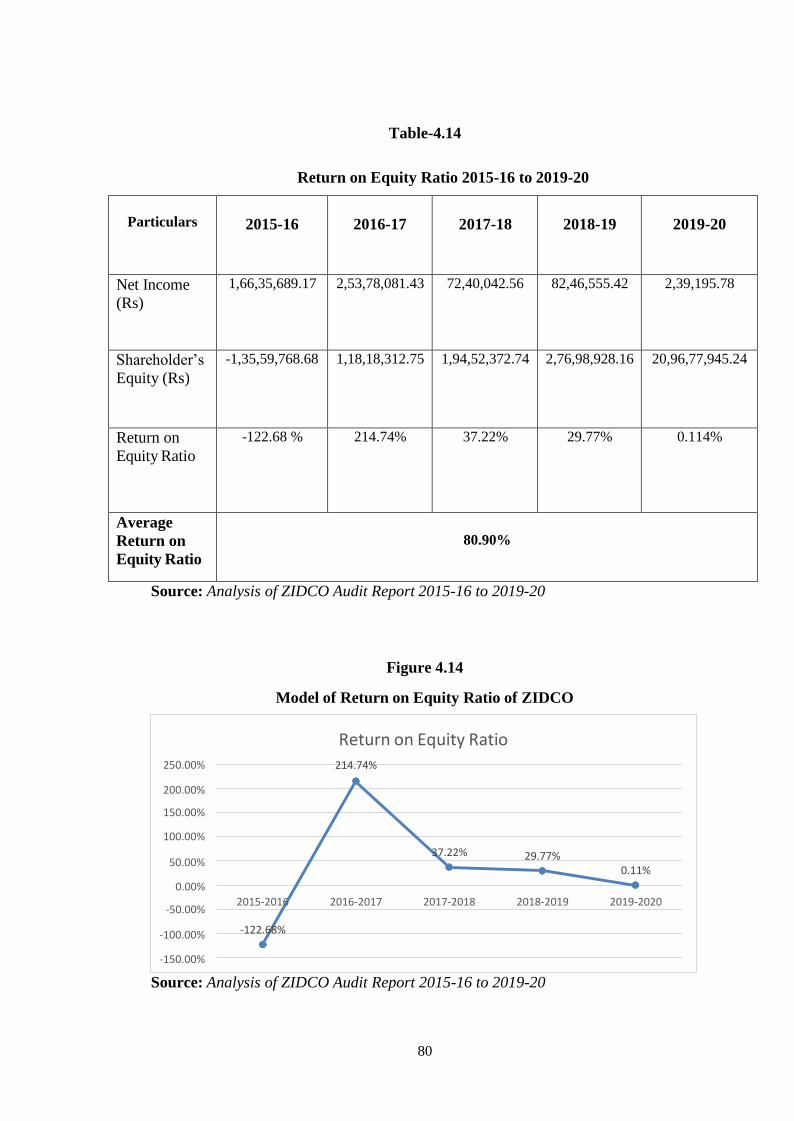
80
250.00%
Return on Equity Ratio
214.74%
200.00%
150.00%
100.00%
37.22% 50.00%
29.77% 0.11%
0.00%
-50.00% 2015-2016 2016-2017 2017-2018 2018-2019 2019-2020
-100.00% -122.68%
-150.00%
Table-4.14
Return on Equity Ratio 2015-16 to 2019-20
Particulars
2015-16
2016-17
2017-18
2018-19
2019-20
Net Income
(Rs)
1,66,35,689.17 2,53,78,081.43 72,40,042.56 82,46,555.42 2,39,195.78
Shareholder’s
Equity (Rs)
-1,35,59,768.68 1,18,18,312.75 1,94,52,372.74 2,76,98,928.16 20,96,77,945.24
Return on
Equity Ratio
-122.68 % 214.74% 37.22% 29.77% 0.114%
Average
Return on
Equity Ratio
80.90%
Source: Analysis of ZIDCO Audit Report 2015-16 to 2019-20
Figure 4.14
Model of Return on Equity Ratio of ZIDCO
Source: Analysis of ZIDCO Audit Report 2015-16 to 2019-20
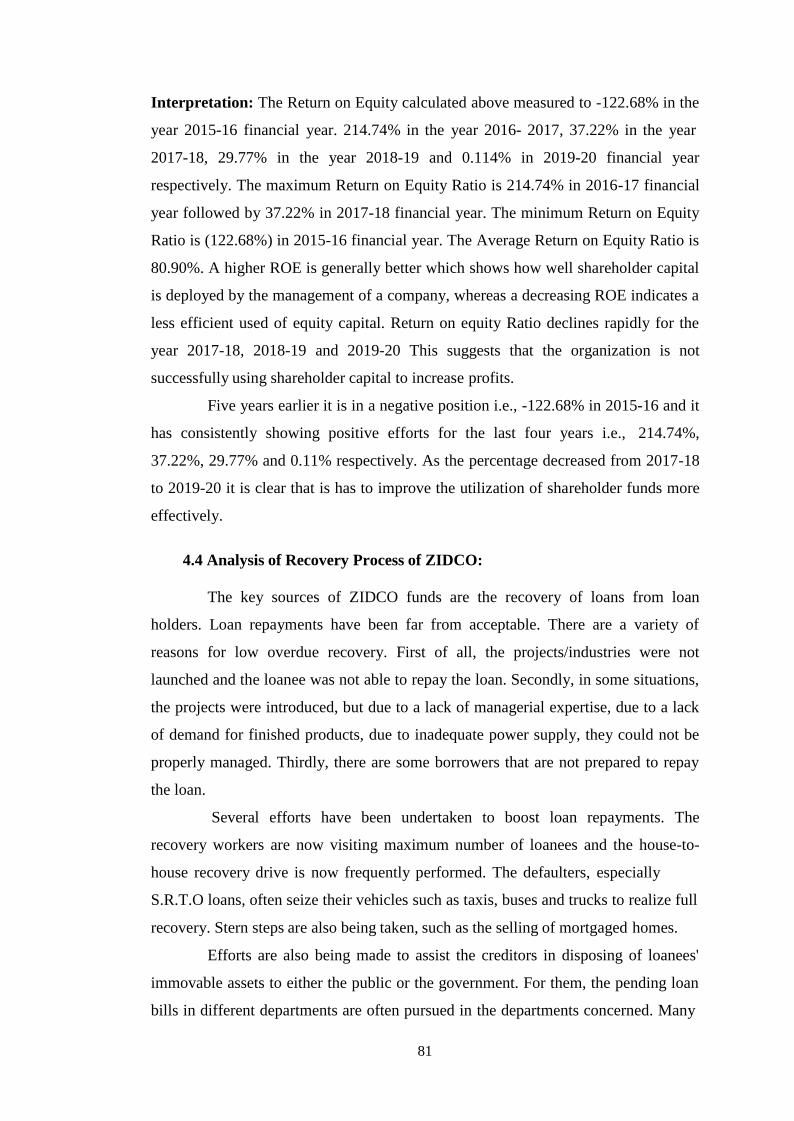
81
Interpretation: The Return on Equity calculated above measured to -122.68% in the
year 2015-16 financial year. 214.74% in the year 2016- 2017, 37.22% in the year
2017-18, 29.77% in the year 2018-19 and 0.114% in 2019-20 financial year
respectively. The maximum Return on Equity Ratio is 214.74% in 2016-17 financial
year followed by 37.22% in 2017-18 financial year. The minimum Return on Equity
Ratio is (122.68%) in 2015-16 financial year. The Average Return on Equity Ratio is
80.90%. A higher ROE is generally better which shows how well shareholder capital
is deployed by the management of a company, whereas a decreasing ROE indicates a
less efficient used of equity capital. Return on equity Ratio declines rapidly for the
year 2017-18, 2018-19 and 2019-20 This suggests that the organization is not
successfully using shareholder capital to increase profits.
Five years earlier it is in a negative position i.e., -122.68% in 2015-16 and it
has consistently showing positive efforts for the last four years i.e., 214.74%,
37.22%, 29.77% and 0.11% respectively. As the percentage decreased from 2017-18
to 2019-20 it is clear that is has to improve the utilization of shareholder funds more
effectively.
4.4 Analysis of Recovery Process of ZIDCO:
The key sources of ZIDCO funds are the recovery of loans from loan
holders. Loan repayments have been far from acceptable. There are a variety of
reasons for low overdue recovery. First of all, the projects/industries were not
launched and the loanee was not able to repay the loan. Secondly, in some situations,
the projects were introduced, but due to a lack of managerial expertise, due to a lack
of demand for finished products, due to inadequate power supply, they could not be
properly managed. Thirdly, there are some borrowers that are not prepared to repay
the loan.
Several efforts have been undertaken to boost loan repayments. The
recovery workers are now visiting maximum number of loanees and the house-to-
house recovery drive is now frequently performed. The defaulters, especially
S.R.T.O loans, often seize their vehicles such as taxis, buses and trucks to realize full
recovery. Stern steps are also being taken, such as the selling of mortgaged homes.
Efforts are also being made to assist the creditors in disposing of loanees'
immovable assets to either the public or the government. For them, the pending loan
bills in different departments are often pursued in the departments concerned. Many
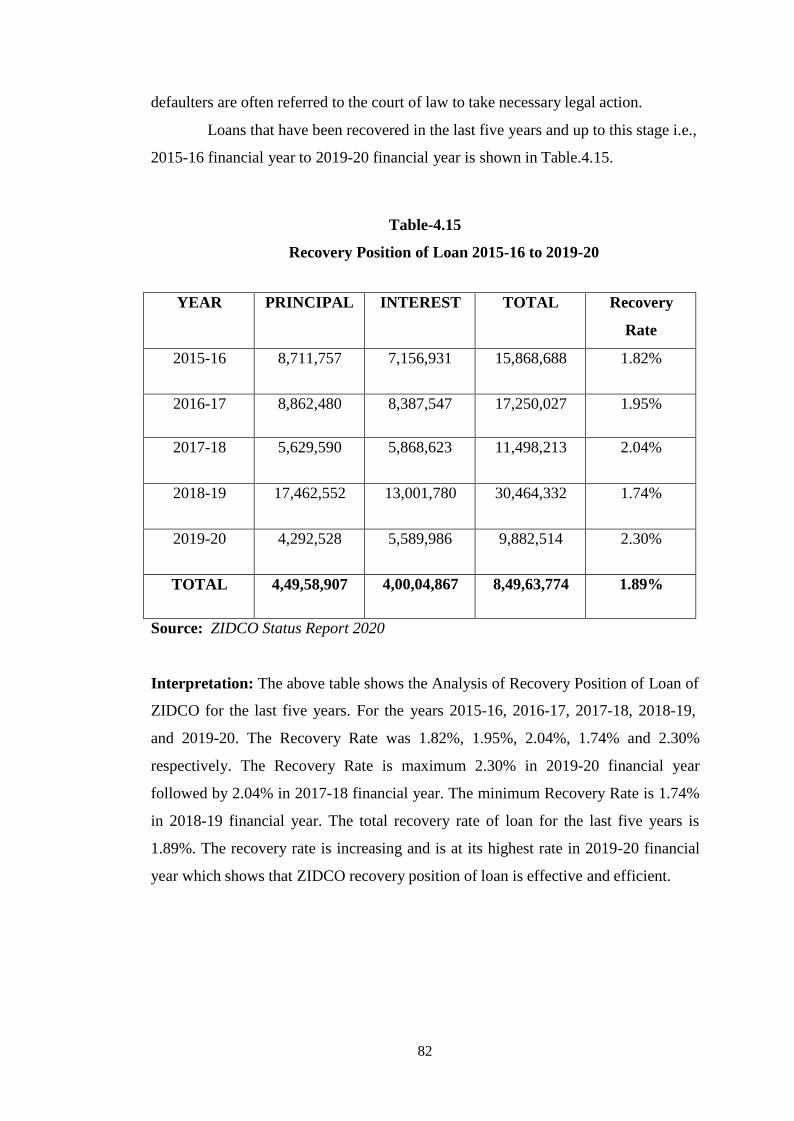
82
defaulters are often referred to the court of law to take necessary legal action.
Loans that have been recovered in the last five years and up to this stage i.e.,
2015-16 financial year to 2019-20 financial year is shown in Table.4.15.
Table-4.15
Recovery Position of Loan 2015-16 to 2019-20
YEAR PRINCIPAL INTEREST TOTAL Recovery
Rate
2015-16 8,711,757 7,156,931 15,868,688 1.82%
2016-17 8,862,480 8,387,547 17,250,027 1.95%
2017-18 5,629,590 5,868,623 11,498,213 2.04%
2018-19 17,462,552 13,001,780 30,464,332 1.74%
2019-20 4,292,528 5,589,986 9,882,514 2.30%
TOTAL 4,49,58,907 4,00,04,867 8,49,63,774 1.89%
Source: ZIDCO Status Report 2020
Interpretation: The above table shows the Analysis of Recovery Position of Loan of
ZIDCO for the last five years. For the years 2015-16, 2016-17, 2017-18, 2018-19,
and 2019-20. The Recovery Rate was 1.82%, 1.95%, 2.04%, 1.74% and 2.30%
respectively. The Recovery Rate is maximum 2.30% in 2019-20 financial year
followed by 2.04% in 2017-18 financial year. The minimum Recovery Rate is 1.74%
in 2018-19 financial year. The total recovery rate of loan for the last five years is
1.89%. The recovery rate is increasing and is at its highest rate in 2019-20 financial
year which shows that ZIDCO recovery position of loan is effective and efficient.

83
Table-4.16
Non-Performing Assets
SL
NO
NAME OF
TRADE
SANCTIONED
DATE
AMOUNT
DISBURSED
RECOVERIES OVERDUES
PRINCIPAL INTEREST TOTAL PRINCIPAL INTEREST TOTAL
1 2 3 4 5 6 7 8 9 10
2 Auto Rickshaw 29-Dec-99 63,000 22,271 14,540 36,811 40,729 52,047 92,776
3 Auto Rickshaw 29-Dec-99 7,000 636 827 1,463 6,364 25,227 31,591
4 Auto Rickshaw 07-Nov-01 63,000 20,201 15,585 35,786 42,799 49,796 92,595
5 Auto Rickshaw 02-Mar-00 56,500 34,028 12,685 46,713 22,472 27,588 50,060
6 Auto Rickshaw 15-May-01 63,000 37,756 10,644 48,400 25,244 45,820 71,064
7 City Bus/Bazar Bus
06-Apr-94 3,67,205 3,18,709 2,66,181 5,84,890 48,496 1,81,056 2,29,552
8 City Bus/Bazar Bus
16-Mar-88 2,39,600 1,06,489 1,64,472 2,70,916 1,33,111 4,13,512 5,46,623
9 Bakery 20-Jul-00 40,000 13,500 14,930 28,430 26,500 35,011 61,511
10 Bakery 13-Dec-02 50,000 14,500 19,000 33,500 35,500 43,392 78,892
11 Bakery 22-Sep-88 1,20,000 0 10,700 10,700 1,20,000 4,68,248 5,88,248
12 Bakery 25-Aug-99 24,000 0 119 119 24,000 7,213 31,213
13 Bakery 22-Aug-88 2,45,000 1,000 0 1,000 2,44,000 9,84,545 12,28,545
14 Bakery 18-Dec-85 25,000 5,552 7,053 12,605 19,448 63,622 83,070
15 Bakery 03-Feb-86 25,000 0 0 0 25,000 89,030 1,14,030
16 Bakery 03-Feb-86 25,000 700 1,000 1,700 24,300 87,063 1,11,363
17 Bakery 05-Mar-86 25,000 2,000 0 2,000 23,000 87,367 1,10,367
84
18 Bakery 14-Feb-03 50,000 48,118 23,035 71,153 1,882 32,759 34,641
19 High Income Group - I
03-Mar-06 3,00,000 2,44,424 2,21,448 4,65,872 55,576 1,02,042 1,57,618
20 High Income Group - I
03-Mar-06 3,50,000 2,49,182 2,41,523 4,90,705 1,00,808 2,14,032 3,14,850
21 Carpentry 07-Oct-86 1,75,000 22,250 59,750 82,000 1,52,750 6,56,827 8,09,577
22 Carpentry 21-Dec-87 1,75,000 1,100 18,705 19,805 1,73,900 7,16,873 8,90,773
23 BAMBOO
06-May-05 2,80,00,000 0 18,35,890 18,35,890 2,80,00,000 3,92,19,452 6,72,19,452
24 BAMBOO
25-Aug-06 44,50,000 6,12,587 4,97,413 11,10,000 38,37,413 31,44,144 69,81,557
25 BAMBOO
28-Nov-06 15,60,000 1,52,500 1,99,686 3,52,186 14,07,500 11,98,859 26,06,359
26 Seed Money 17-Nov-99 5,00,000 1,36,739 59,261 1,96,000 3,63,261 29,621 3,92,882
27 Seed Money 20-Jan-82 20,000 6,500 0 6,500 13,500 29,259 42,759
28 Seed Money 22-May-81 20,000 0 0 0 20,000 33,049 53,049
29 Seed Money 22-May-81 20,000 0 0 0 20,000 33,049 53,049
30 Seed Money 02-May-94 8,10,000 2,30,279 1,69,721 4,00,000 5,79,721 28,811 6,08,532
31 Seed Money 12-Jul-95 10,00,000 5,02,800 2,39,323 7,42,123 4,97,200 0 4,97,200
32 Seed Money 01-May-97 13,50,000 0 1,58,671 1,58,671 13,50,000 1,50,719 15,00,719
33 Slipper Industry 10-Apr-90 1,15,000 1,15,000 75,009 1,90,009 0 2,90,643 2,90,643
34 Slipper Fabrication
07-Nov-89 73,500 0 371 371 73,500 22,254 95,754
35 Slipper Fabrication
07-Nov-89 3,67,500 2,31,500 23,708 2,55,208 1,36,000 11,43,961 12,79,961
36 Slipper Fabrication
07-Nov-89 67,500 0 0 0 67,500 2,93,147 3,60,647
37
Computerised
Embroidery 23-Mar-17 5,00,000 1,35,000 1,35,000 2,70,000 3,65,000 63,370 4,28,370
TOTAL 4,13,41,805 32,65,321 44,96,250 77,61,526 3,80,76,474 5,00,63,408 8,81,39,892
85
Source: Analysis of Recovery Position of Loan of ZIDCO
Interpretation: The above table shows 37 numbers of Non-Performing Assets. The
loan or Project becomes Non-Performing Assets after 8 and half years. The
maximum amount of loan overdues is Rs. 6.72 Crores from Bamboo loan dated 6th
May, 2005 and the minimum amount of loan is Rs. 31,213 from Bakery loan dated
25th
August, 1999. The total amount of all the overdues is Rs. 8.81 Crores. Different
settlements are implemented by ZIDCO from the loanees. The defaulters, especially
Auto-Rickshaws and Buses loans were often seizing their vehicles to realize full
recovery. Stern steps are also being taken, such as the selling of mortgaged
properties. Efforts are also being made to assist the creditors in disposing of loanees'
immovable assets to either the public or the government. For them, the pending loan
bills in different departments are often pursued in the departments concerned. Many
defaulters are often referred to the court of law to take necessary legal actions.
Different Measures have been taken to recover the loan and interest from the loan
beneficiaries of ZIDCO. House to house recovery drive twice in a year had been
conducted and demand notices were given to loanees and Guarantors on quarterly
basis. As many as 1400 loanees were sanctioned without collateral security, it is as
such difficult to expect good repayment of loan. A number of Taxis are seized and
disposed for recovery. Some cases are also referred to Lok Adalat.
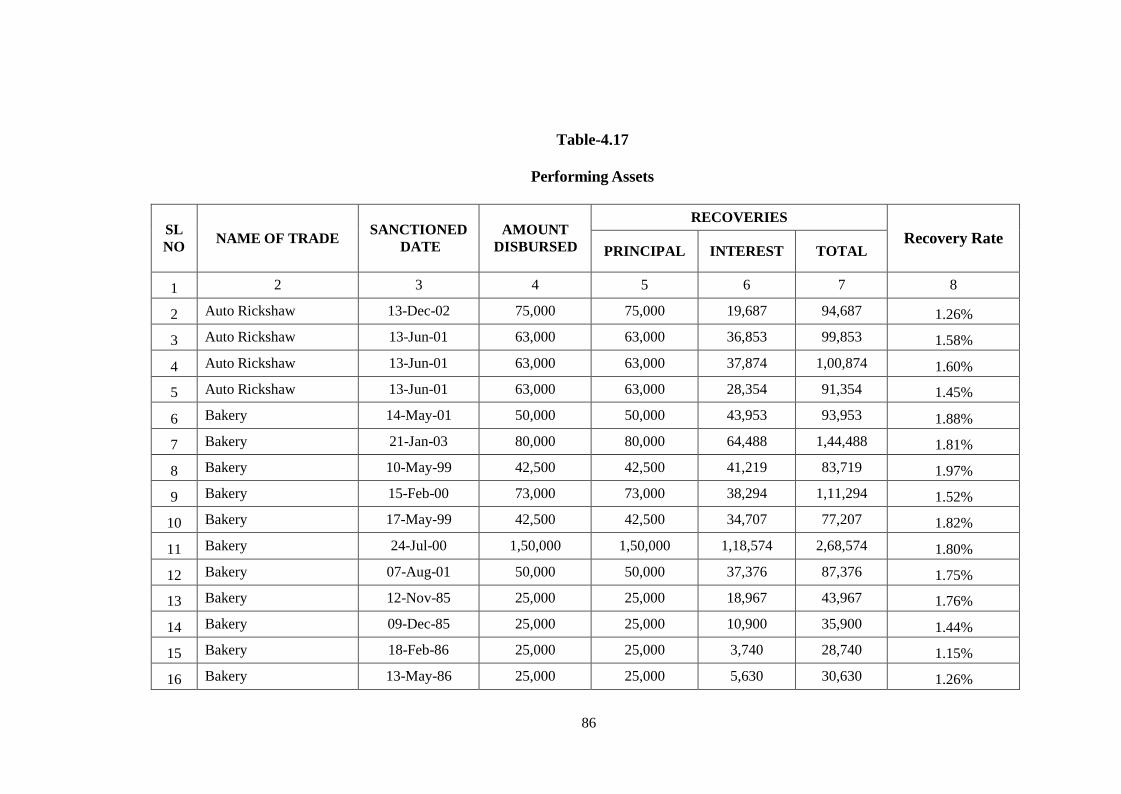
86
Table-4.17
Performing Assets
SL
NO
NAME OF TRADE
SANCTIONED
DATE
AMOUNT
DISBURSED
RECOVERIES Recovery Rate
PRINCIPAL INTEREST TOTAL
1 2 3 4 5 6 7 8
2 Auto Rickshaw 13-Dec-02 75,000 75,000 19,687 94,687 1.26%
3 Auto Rickshaw 13-Jun-01 63,000 63,000 36,853 99,853 1.58%
4 Auto Rickshaw 13-Jun-01 63,000 63,000 37,874 1,00,874 1.60%
5 Auto Rickshaw 13-Jun-01 63,000 63,000 28,354 91,354 1.45%
6 Bakery 14-May-01 50,000 50,000 43,953 93,953 1.88%
7 Bakery 21-Jan-03 80,000 80,000 64,488 1,44,488 1.81%
8 Bakery 10-May-99 42,500 42,500 41,219 83,719 1.97%
9 Bakery 15-Feb-00 73,000 73,000 38,294 1,11,294 1.52%
10 Bakery 17-May-99 42,500 42,500 34,707 77,207 1.82%
11 Bakery 24-Jul-00 1,50,000 1,50,000 1,18,574 2,68,574 1.80%
12 Bakery 07-Aug-01 50,000 50,000 37,376 87,376 1.75%
13 Bakery 12-Nov-85 25,000 25,000 18,967 43,967 1.76%
14 Bakery 09-Dec-85 25,000 25,000 10,900 35,900 1.44%
15 Bakery 18-Feb-86 25,000 25,000 3,740 28,740 1.15%
16 Bakery 13-May-86 25,000 25,000 5,630 30,630 1.26%
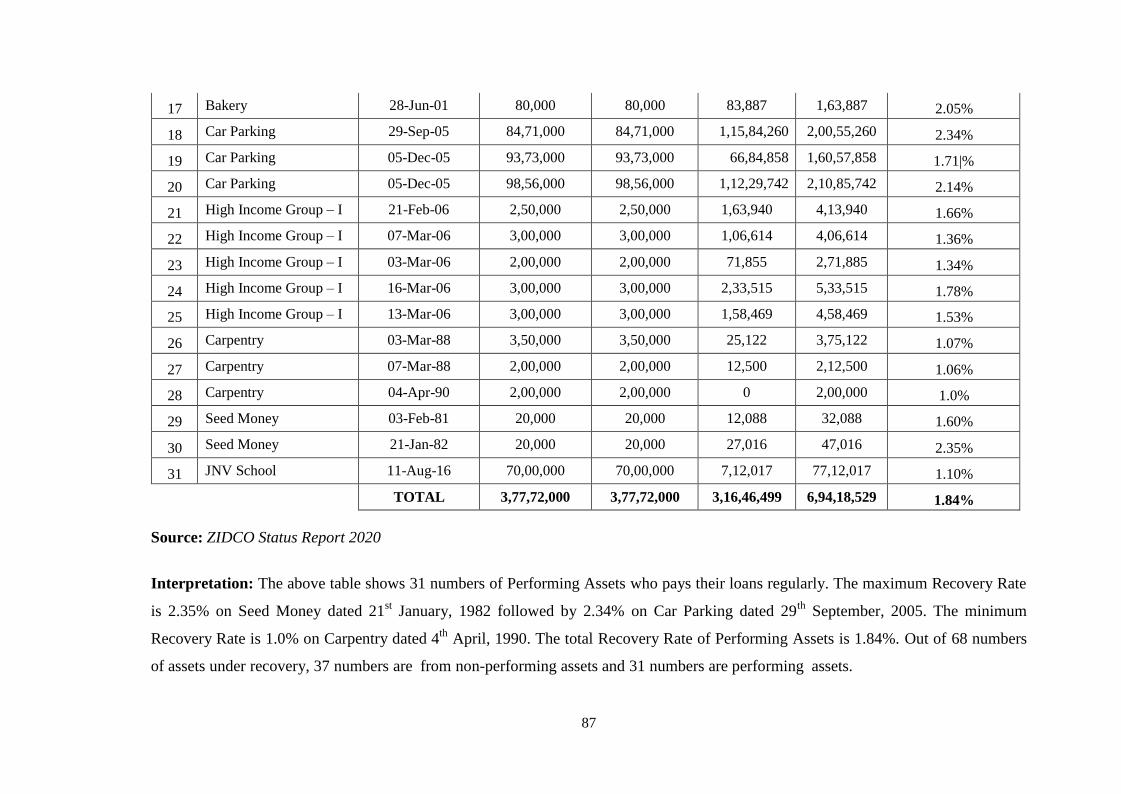
87
17 Bakery 28-Jun-01 80,000 80,000 83,887 1,63,887 2.05%
18 Car Parking 29-Sep-05 84,71,000 84,71,000 1,15,84,260 2,00,55,260 2.34%
19 Car Parking 05-Dec-05 93,73,000 93,73,000 66,84,858 1,60,57,858 1.71|%
20 Car Parking 05-Dec-05 98,56,000 98,56,000 1,12,29,742 2,10,85,742 2.14%
21 High Income Group – I 21-Feb-06 2,50,000 2,50,000 1,63,940 4,13,940 1.66%
22 High Income Group – I 07-Mar-06 3,00,000 3,00,000 1,06,614 4,06,614 1.36%
23 High Income Group – I 03-Mar-06 2,00,000 2,00,000 71,855 2,71,885 1.34%
24 High Income Group – I 16-Mar-06 3,00,000 3,00,000 2,33,515 5,33,515 1.78%
25 High Income Group – I 13-Mar-06 3,00,000 3,00,000 1,58,469 4,58,469 1.53%
26 Carpentry 03-Mar-88 3,50,000 3,50,000 25,122 3,75,122 1.07%
27 Carpentry 07-Mar-88 2,00,000 2,00,000 12,500 2,12,500 1.06%
28 Carpentry 04-Apr-90 2,00,000 2,00,000 0 2,00,000 1.0%
29 Seed Money 03-Feb-81 20,000 20,000 12,088 32,088 1.60%
30 Seed Money 21-Jan-82 20,000 20,000 27,016 47,016 2.35%
31 JNV School 11-Aug-16 70,00,000 70,00,000 7,12,017 77,12,017 1.10%
TOTAL 3,77,72,000 3,77,72,000 3,16,46,499 6,94,18,529 1.84%
Source: ZIDCO Status Report 2020
Interpretation: The above table shows 31 numbers of Performing Assets who pays their loans regularly. The maximum Recovery Rate
is 2.35% on Seed Money dated 21st January, 1982 followed by 2.34% on Car Parking dated 29
th September, 2005. The minimum
Recovery Rate is 1.0% on Carpentry dated 4th
April, 1990. The total Recovery Rate of Performing Assets is 1.84%. Out of 68 numbers
of assets under recovery, 37 numbers are from non-performing assets and 31 numbers are performing assets.
88
4.5 Analysis of qualitative aspects of performance of ZIDCO:
Personal interview with Mr. R. Lalsangzuala who joined as the General
Manager of ZIDCO with effect from 6th
August, 2019 were carried forward on 22nd
March, 2021 at 11:30 am regarding the qualitative aspects of performance of Zoram
Industrial Development Corporation Limited (ZIDCO).
1. In which sectors ZIDCO is investing?
Ans: The main function of ZIDCO was giving loans to entrepreneurs for
different industrial units. We are giving about 3000 loanees for running and
setting up of Industrial Loan, Housing Loan and for operating different kinds
of vehicle. Besides that, we are doing construction work at Integrated Industrial
Development Center (IIDC) at Pukpui, Lunglei and Zote, Champhai with a
project cost of around 5 Crores. And now we are doing a construction work of
Jawahar Navodaya Vidyalaya (JNV) School at Siaha with a project cost of 28
Crores besides that we are doing Rice supply for the whole of Mizoram. Lastly,
there is Industrial Growth Center at Luangmual under the supervision of
ZIDCO they are running Garment making units, three units are there with 100
numbers of modern stitching machines and that is the main investment done by
Zoram Industrial Development Corporation Limited (ZIDCO).
2. What are the factors responsible for making profit by ZIDCO for last few
years?
Ans: Actually, we are losing corporation but the Government of India has
given us Grant-in-Aid (GIA) with effect from 2010 onwards. Before that we
did not received any share capital contribution from the Government for more
than 10 years that is the reason, we could hardly manage ourselves for salary
and for administrative expenses so in reality we are not making any profit.
3. What are the major sources of Profit of ZIDCO? We have found out that
when conducting a ratio analysis from the Audit Report of ZIDCO you have
gain some profits but you have mention that ZIDCO did not make any profits.
Can you explain such kinds of profits?
Ans: Yes, in our Balance Sheet we have shown some profits for the last five
89
years. So, the main thing here is our Balance Sheet, the liabilities are not taken
into account because our money is actually in the hands of the public. And we
are still having some profit from our projects and from selling liquor in the past
years.
4. What are the major sources of Loss of ZIDCO?
Ans: The main reason is non-recovery of loans. The recovery rate of loan is
unfavourable which is less than 5%. And another thing is that we have not
receive share capital contribution from the Government of Mizoram. Majority
of our loan is a non-performing asset.
5. Are you taking any kind of collateral security for loan?
Ans: Below Rs. 50,000 and for this operating vehicle loan we do not insist any
kind of collateral security. Above Rs 50,000 we take collateral security in the
form of Land Settlement Certificate i.e., land & building.
6. Are you going for redemption of collateral security if any loan becomes Non-
Performing Assets (NPA)?
Ans: Yes, we have disposed of so many Land Settlement Certificate (LSC) i.e.,
land & building for those who do not repay their loans. More than 100 land &
building have been sold out to the public.
7. What are the criteria to be selected for receiving funds from ZIDCO by the
entrepreneurs?
Ans: Firstly, they have to clearly know their proposal for industrial units. We
are having screening committee that means whenever they apply for the loan
they appeared before the screening committee in which they are questioning
about their proposed project and after that we are having in-depth study
especially management appraisal and financial appraisal so if they gone
through that they are selected.
8. Who are those people who are eligible for Industrial loans from ZIDCO? Ans:
For Housing loan they must be a government servant people only and forother
loans they should not be a government servant.

90
9. What are the different categories of loan?
Ans: We have 10 different kinds of loan such as follow: -
i) Mahila Udyam Nidhi
ii) Single Window Scheme
iii) Working Capital Loan
iv) Composite Loan
v) Ex-Servicemen Loan
vi) Industrial Loan
vii) Small Road Transport Operator (SRTO)
viii) Bamboo Loan
ix) Housing Loan
x) Ginger Loan
10. Is there any verification being carried forward regarding implementing their
projects?
Ans: Yes, we used to disburse in three installments so at every installment we
conducted spot verifications and working progress to verified whether there is
mis-appropriation of funds and if we are satisfied then the other installments
are disbursed accordingly.
11. What steps were taken when a loan become NPA (Non-Performing Assets)?
Ans: One important thing is those NPA are referred to Lok Adalat which helps
us to recovered some amount. And also, disposal of mortgaged Land
Settlement Certificate (LSC) and then we are engaging most of our staff in
recovery drive every month or quarterly basis as convenience. So, they are still
pursuing those NPA loans.
12. How many months/installments becomes due to declare a loan become NPA?
Ans: We take is as Non-Performing Assets after their payment period is over.
The payment period is at the maximum of 8 and half years.
91
13. What is the reason that a project or loan become NPA?
Ans: It is the attitude of the loanees. Most of our loanees are well established
but they have no intention to repay the loan that is the main problem.
14. What steps you are taking for improving the performance of ZIDCO?
Ans: We are not very much interested now in giving loans. So now we are
thinking about turning ZIDCO sanction towards constructions that is the reason
we are planning to change our name from Zoram Industrial Development
Corporation Limited to Zoram Infrastructure and Industrial Development
Corporation Limited.
15. Who are the competitors of ZIDCO?
Ans: Different banks are the competitors.
16. How you are taking competition?
Ans: We are giving a low rate of interest. The lowest rate of interest is 7% only
and that is our advantage.
17. What is your market share compare to your competitors?
Ans: Previously, our market share is quite high, we are having major portion of
the market like more than 50%. Especially regarding this SRTO loan almost all
the buses, taxis and auto-rickshaw took loans from ZIDCO. But now the
Financial Institutions have stopped giving further loans to ZIDCO and the
market share is decreasing.
18. As I was going through your financial report, I observe that ZIDCO is
maintaining huge cash. What are the reasons that there are lots of un-used
cash i.e., Cash and Cash Equivalents in 2019-20 Financial Year?
Ans: Yes, that is correct. One important thing is now we are having huge
overused with Housing and Urban Development Corporation Limited
(HUDCO) so they are going to debt recovery tribunal and today itself is the
hearing date i.e., 22nd
March, 2021. We have maintained separated account
where all the repayments are kept or deposited which are received from the
92
loanees. As we are asking for one-time settlement, their recovery is
accumulated.
19. Are there any future plans for the better performance of ZIDCO? Please
explain.
Ans: As I have mention earlier, we are turning towards infrastructure
development works so we are proposing different projects under central
government ministries but due to Covid-19 situation it cannot be done quick
enough.
20. When ZIDCO will be a debt free company? Is there any plan of action?
Please explain.
Ans: Yes, that is very important for us. I cannot tell when ZIDCO will be a
debt free Company but certain actions are being carried forward. We are
getting refinance from National Minorities Development and Financing
Corporation (NMDFC), New Delhi and Housing and Urban Development
Corporation Limited (HUDCO), Kohima in which we are having overused. So,
this refinance is avail by ZIDCO under the guarantor of Government of
Mizoram. So, we are wholly depending upon the Government of Mizoram and
they are taking action to liquidated that overused.
21. Is there any other business plan by ZIDCO for improvement of its financial
performance?
Ans: Yes, we have taken so many economic measures to reduce our
administrative expenditure. As I have mention earlier, we are turning to
infrastructure development works and now Grade A empanel firm under the
Government of Mizoram so we will be taking different project in which we can
improve our financial performance. Also, recovery drive is still carried
forward.
Interpretation: ZIDCO received Share Capital contributions from IDBI and
Government of Mizoram till 1992 and 2000 respectively and did not received
any further share capital contributions. ZIDCO were a losing company for a
93
period of more than 10 years i.e., (2004-2014). And now turn around at least
from loss making to operating profit-making company. ZIDCO was making
profit for the last 5 years i.e., 2015-16 to 2019-20 financial year. It is clear that
ZIDCO is investing mostly in the manufacturing, constructions and service
sectors. And also, ZIDCO investment is done by giving loans to entrepreneurs,
it was found out that ZIDCO is a losing company but Grant-in-Aid (GIA) were
received from the Government of India for salary and for administrative
expenses. ZIDCO did not take their liabilities into account and is still having
profits from their project works and from the selling of liquor in the past years
i.e., (2015-2018). They also suffered huge losses due to insufficient repayment
of loan and they do not receive share capital contribution from the Government
of Mizoram. Majority of the loans are non-performing assets. ZIDCO did not
take any collateral security below the loan of Rs. 50,000\- and for the operating
vehicle loans. Collateral security is taken only above Rs. 50,000\- loans in the
form of Land Settlement Certificate. If any loan becomes non-performing
assets ZIDCO have taken measures in disposing their Land Settlement
Certificate (LSC) and more than 100 Land & Building have already been sold
out to the public. In order to be selected for receiving funds from ZIDCO the
entrepreneurs have to clearly knew about their proposal feasibility for
industrial units. Entrepreneurs have to pass through the screening committee in
which they are questioning about their proposed projects. The screening
committee will be having an in-depth study of the proposed project regarding
management appraisal and financial appraisal. Government servant people can
avail Housing loan from ZIDCO and all the other loans can be avail by non-
government servant people only. It is stated that ZIDCO has given out 10
different kinds of loans i.e., Mahila Udyam Nidhi, Single Window Scheme,
Working Capital Loan, Composite Loan, Ex-Servicemen Loan, Industrial
Loan, Small Road Transport Operator (SRTO), Bamboo Loan, Housing Loan,
Ginger Loan. Verification regarding implementation of the entrepreneur’s
projects is conducted by spot verifications and working progress to verified
whether there is mis-appropriation of funds before every installment are
disbursed and if satisfied then the other installments are disbursed accordingly.
It was found out that when a loan becomes non-performing assets, they are
referred to Lok Adalat for loan recovery. And also, disposal of mortgaged Land
94
Settlement Certificate (LSC) is carried forward and recovery drive are also
conducted every month or quarterly basis. Loan becomes non-performing
assets at the end of their payment period. The payment period is at the
maximum of 8 and half years. The project or loan becomes non-performing
assets base on the attitude of the loanees. It is also found out that most of the
loanees are well established but they have no intention to repay the loan which
is the main problem. ZIDCO is not very much interested in giving loans due to
insufficient repayment of loans. They intended on turning ZIDCO sanction
towards constructions for improving their performance and also planned to
change their names i.e., Zoram Industrial Development Corporation Limited to
Zoram Infrastructure and Industrial Development Corporation Limited. It was
found out that different kinds of banks are their competitors and ZIDCO have
more advantage than their competitors by giving low rate of interest which is
7% only. ZIDCO owned major portion of the market share in the last few
years. As financial institutions were not providing any further loans to ZIDCO,
market share of ZIDCO is decreasing. ZIDCO is maintaining huge cash in the
last previous years i.e., 2019-20 financial year due to the maintenance of
separated account for all the repayments made by the loanees which increases
the un-used cash i.e., cash and cash equivalents of ZIDCO. ZIDCO is turning
towards infrastructure development works in which they are proposing
different projects under the central government ministries but pending due to
the Covid-19 pandemic situation. There is an unclear future to when ZIDCO
will be a debt free Company. ZIDCO is depending on the Government of
Mizoram to liquidated their loans from National Minorities Development and
Financing Corporation (NMDFC), New Delhi and Housing and Urban
Development Corporation Limited (HUDCO), Kohima in order to get
refinance from them. Lastly, ZIDCO have taken measures to reduce their
administrative expenses and also, they are turning towards infrastructure
development works in which they will taking different projects to improve its
financial performance.
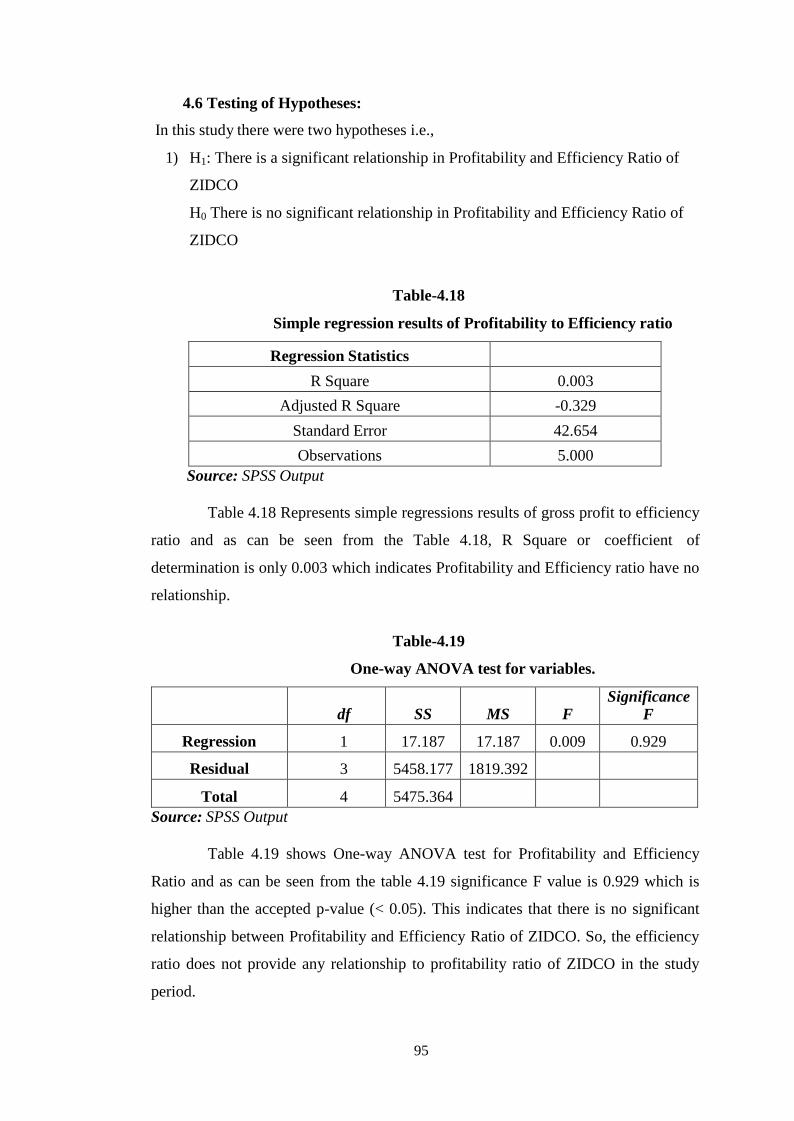
95
4.6 Testing of Hypotheses:
In this study there were two hypotheses i.e.,
1) H1: There is a significant relationship in Profitability and Efficiency Ratio of
ZIDCO
H0 There is no significant relationship in Profitability and Efficiency Ratio of
ZIDCO
Table-4.18
Simple regression results of Profitability to Efficiency ratio
Regression Statistics
R Square 0.003
Adjusted R Square -0.329
Standard Error 42.654
Observations 5.000
Source: SPSS Output
Table 4.18 Represents simple regressions results of gross profit to efficiency
ratio and as can be seen from the Table 4.18, R Square or coefficient of
determination is only 0.003 which indicates Profitability and Efficiency ratio have no
relationship.
Table-4.19
One-way ANOVA test for variables.
df
SS
MS
F Significance
F
Regression 1 17.187 17.187 0.009 0.929
Residual 3 5458.177 1819.392
Total 4 5475.364
Source: SPSS Output
Table 4.19 shows One-way ANOVA test for Profitability and Efficiency
Ratio and as can be seen from the table 4.19 significance F value is 0.929 which is
higher than the accepted p-value (< 0.05). This indicates that there is no significant
relationship between Profitability and Efficiency Ratio of ZIDCO. So, the efficiency
ratio does not provide any relationship to profitability ratio of ZIDCO in the study
period.
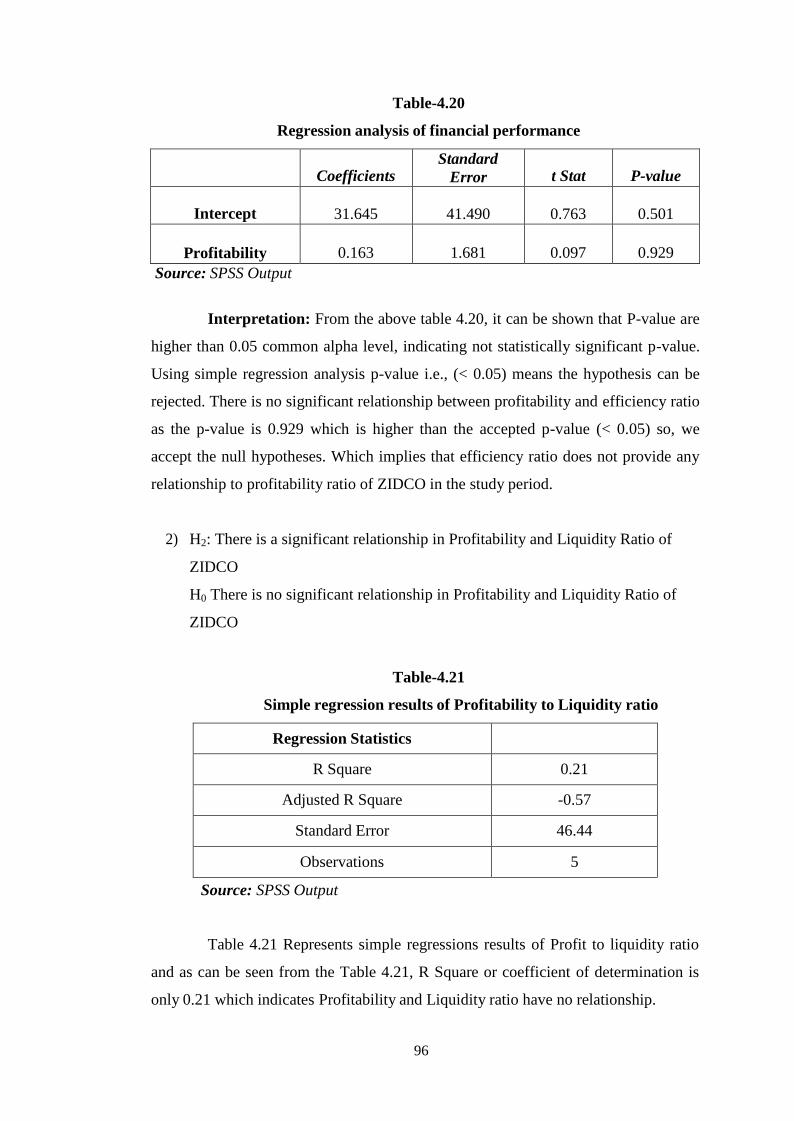
96
Table-4.20
Regression analysis of financial performance
Coefficients Standard
Error
t Stat
P-value
Intercept
31.645
41.490
0.763
0.501
Profitability
0.163
1.681
0.097
0.929
Source: SPSS Output
Interpretation: From the above table 4.20, it can be shown that P-value are
higher than 0.05 common alpha level, indicating not statistically significant p-value.
Using simple regression analysis p-value i.e., (< 0.05) means the hypothesis can be
rejected. There is no significant relationship between profitability and efficiency ratio
as the p-value is 0.929 which is higher than the accepted p-value (< 0.05) so, we
accept the null hypotheses. Which implies that efficiency ratio does not provide any
relationship to profitability ratio of ZIDCO in the study period.
2) H2: There is a significant relationship in Profitability and Liquidity Ratio of
ZIDCO
H0 There is no significant relationship in Profitability and Liquidity Ratio of
ZIDCO
Table-4.21
Simple regression results of Profitability to Liquidity ratio
Regression Statistics
R Square 0.21
Adjusted R Square -0.57
Standard Error 46.44
Observations 5
Source: SPSS Output
Table 4.21 Represents simple regressions results of Profit to liquidity ratio
and as can be seen from the Table 4.21, R Square or coefficient of determination is
only 0.21 which indicates Profitability and Liquidity ratio have no relationship.
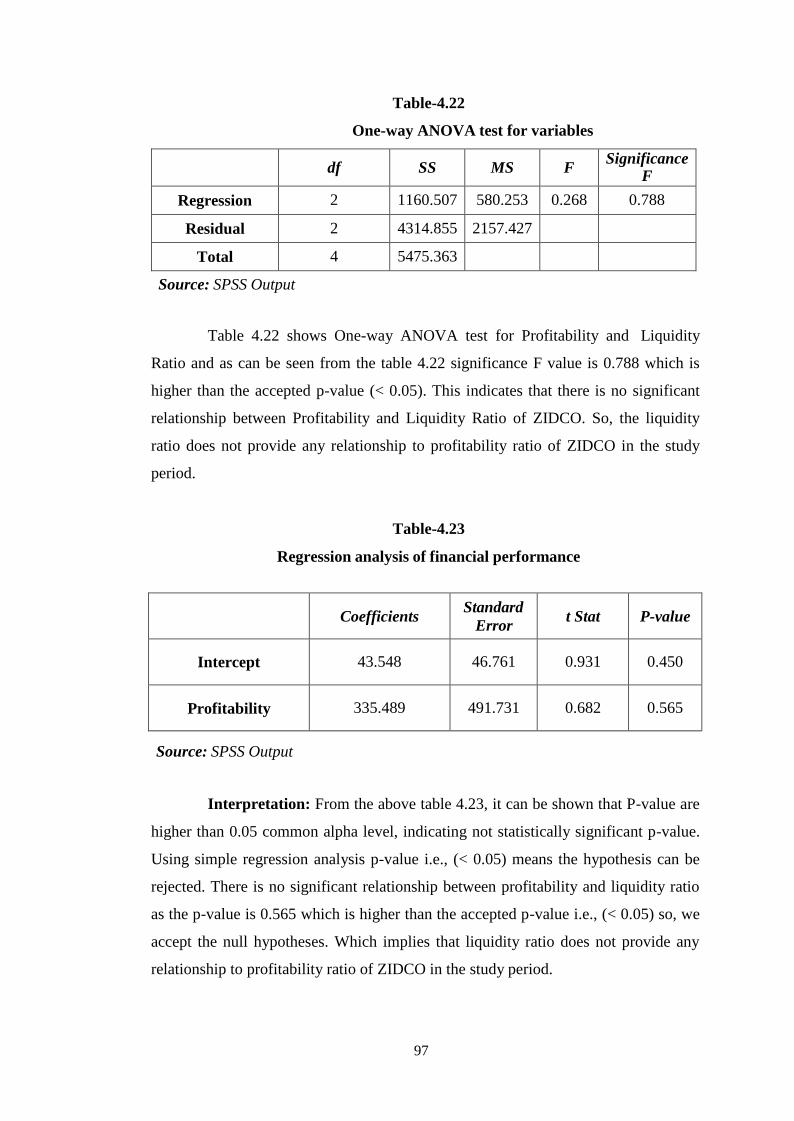
97
Table-4.22
One-way ANOVA test for variables
df SS MS F
Significance F
Regression 2 1160.507 580.253 0.268 0.788
Residual 2 4314.855 2157.427
Total 4 5475.363
Source: SPSS Output
Table 4.22 shows One-way ANOVA test for Profitability and Liquidity
Ratio and as can be seen from the table 4.22 significance F value is 0.788 which is
higher than the accepted p-value (< 0.05). This indicates that there is no significant
relationship between Profitability and Liquidity Ratio of ZIDCO. So, the liquidity
ratio does not provide any relationship to profitability ratio of ZIDCO in the study
period.
Table-4.23
Regression analysis of financial performance
Coefficients
Standard
Error t Stat P-value
Intercept 43.548 46.761 0.931 0.450
Profitability 335.489 491.731 0.682 0.565
Source: SPSS Output
Interpretation: From the above table 4.23, it can be shown that P-value are
higher than 0.05 common alpha level, indicating not statistically significant p-value.
Using simple regression analysis p-value i.e., (< 0.05) means the hypothesis can be
rejected. There is no significant relationship between profitability and liquidity ratio
as the p-value is 0.565 which is higher than the accepted p-value i.e., (< 0.05) so, we
accept the null hypotheses. Which implies that liquidity ratio does not provide any
relationship to profitability ratio of ZIDCO in the study period.
98
Chapter-5
Findings, Conclusions and
Suggestions
99
5.1 Major Findings:
Following is some of the observations that were discovered after the data was
analyzed:
1. Gross Profit Ratio has consistently showing positive for the last five years and
has continuously showing an upward trend and it is increasing more and more
from 2017-18, 2018-19 and 2019-20 with percentage of 5.89%, 14.29% and
41.34% respectively. From the analysis it is clear that ZIDCO has a sufficient
gross profit to cover the operating expenses.
2. Operating Ratio has continuously showing an upward trend from 2015-16,
2016-17, 2017-18, 2018-19 and 2019-20 with percentage of 24.59%,
154.21%, 148.92%, 151.24% and 293.41% respectively. From the above
analysis it is clear that profit margin will be higher on Revenue from
Operations.
3. Operating Profit Ratio were in a positive position five years earlier and it has
consistently showing negative efforts from 2016-17, 2017-18, 2018-19 and
2019-20 with percentage of -54.21%, -48.92%, -54.24% and -
193.41%respectively. From the analysis it is clear that ZIDCO has flaws and
poor resource management and also indicates that the profit produced from
operations is inadequate in relation to total revenue generated from sales.
4. Net Profit Ratio has increased from 10.13% to 19.82% in 2015-16 and 2016-
17 which is fair for the company but decreased in the year 2017-18 and 2018-
29 i.e., 5.67% and 8.5% and is at its lowest point over the last five years by
0.79% in 2019-20 which is an indication for the company to improve its
performance.
5. Return on Investment increased from 5.87% to 8.22%, in 2015-16 and 2016-
17 which is favourable for the company but decreased in the year 2017-18 i.e.,
2.29% and increased in 2018-19 by 2.54% and again decrease and is at its
lowest point over the last five years i.e., 0.07% in 2019-20 which is an
indication for the company that capital employed is not effectively used and is
an indication for improvement in its performance.
100
6. Current Ratio were below the standard condition i.e., 2:1 in 2015-16 and 2016-
17 with percentage of 1.50% and 1.50% respectively and it has consistently
showing positive efforts for the last three years in 2017-18, 2018-
19 and 2019-20 with percentage of 2% each. It shows a good financial
position of ZIDCO.
7. Quick Ratio were above the standard condition i.e., 1:1 and it has consistently
showing an upward trend and increased more and more for the last five years
i.e., 2015-16, 2016-17, 2017-18, 2018-19, and 2019-20 with percentage of
3.36 %, 3.44%, 3.62% and 3.86% and decreased at its lowest point over the
years in 2019-20 i.e., 0.03%. It shows ZIDCO’s good liquidity position over
the last five years but needs improvement for the future.
8. Debt Equity Ratio do not exceed the standard condition i.e., 2:1 and it has
consistently showing positive efforts for the years 2015-16, 2016-17, 2017-18,
2018-19, and 2019-20 with percentage of 0.15 percent, 0.18 percent 0.11
percent, 0.07 percent, and 0.07 percent, respectively. From the analysis it is
clear that, the assets are higher than the value of the liabilities.
9. Total Assets to Debt Ratio stays on the standard condition i.e., 1:1 and 2:1 and
it has consistently showing positive efforts for the years 2015-16, 2016-17,
2017-18, 2018-19, and 2019-20 with percentage of 1.5 percent, 1.5 percent 2
percent, 2 percent, and 2 percent, respectively. From the analysis it is clear
that, ZIDCO financial positions is in a safety margin and also shows that the
long-term debts will be secured by the assets.
10. Proprietary Ratio decreased from 3.63% to 2.96% in 2015-16 and 2016-17and
has consistently showing an upward trend and increased more and more from
2017-18, 2018-19, and 2019-20 with percentage of 4.78 percent, 6.66 percent,
and 6.72 percent, respectively and ZIDCO has consistently showing positive
efforts. From the above analysis it is clear that ZIDCO has sound financial
status.
11. Inventory Turnover Ratio were declining from 27.82 times in 2017-18 to
19.33 times in 2018-19 respectively and zero inventory turnover in 2019-20
101
and it has consistently showing negative efforts for the last five years. From
the analysis it is clear that inventories are not efficiently used and ZIDCO has
to improved its inventory management.
12. Trade Receivables Turnover Ratio increased from 13.30 times to 20.76 times
in 2015-16 and 2016-17. And also shows zero trade receivable turnover ratio
in 2017-18 financial year. It has increased in 2018-19 by 21.92 times and later
decreased by 6.80 times in 2019-20. From the analysis it is clear that ZIDCO
has to improved its trade receivables turnover.
13. Working Capital Turnover Ratio were consistently declining for the years i.e.,
2015-16, 2016-17, 2017-18, 2018-19, and 2019-20 i.e., 0.74 times, 0.56 times,
0.52 times, 0.37 times and 0.12 times respectively. From the analysis it shows
under-utilization of Working Capital and it is clear that the used of working
capital needs to be improved.
14. Five years earlier Return on Equity it is in a negative position i.e., -122.68% in
2015-16 and it has consistently showing positive efforts for the last four years
i.e., 214.74%, 37.22%, 29.77% and 0.11% respectively. As the percentage
decreased from 2017-18 to 2019-20 it is clear that is has to improve the
utilization of shareholder funds more effectively.
15. For the years 2015-16, 2016-17, 2017-18, 2018-19, and 2019-20. The
Recovery Rate was 1.82%, 1.95%, 2.04%, 1.74% and 2.30% respectively. The
Recovery Rate is maximum 2.30% in 2019-20 financial year followed by
2.04% in 2017-18 financial year. The minimum Recovery Rate is 1.74% in
2018-19 financial year. The total recovery rate of loan for the last five years is
1.89%. The recovery rate is increasing and is at its highest rate in 2019-20
financial year which shows that ZIDCO recovery position of loan is effective
and efficient.
16. There are 37 numbers of Non-Performing Assets. The loan or Project becomes
Non-Performing Assets after 8 and half years. The maximum amount of loan
overdues is Rs. 6.72 Crores from Bamboo loan dated 6th
May, 2005 and the
102
minimum amount of loan is Rs. 31,213 from Bakery loan dated 25th
August,
1999. The total amount of all the overdues is Rs. 8.81 Crores.
17. There are 31 numbers of Performing Assets who pays their loans regularly.
The maximum Recovery Rate is 2.35% on Seed Money dated 21st January,
1982 followed by 2.34% on Car Parking dated 29th
September, 2005. The
minimum Recovery Rate is 1.0% on Carpentry dated 4th
April, 1990. The total
Recovery Rate of Performing Assets is 1.84%. Out of 68 numbers of assets
under recovery, 37 numbers are from non-performing assets and 31 numbers
are performing assets.
18. It is clear that ZIDCO is investing mostly in the manufacturing, constructions
and service sectors. And also, investment is done by giving loans to
entrepreneurs.
19. ZIDCO is a losing company but Grant-in-Aid (GIA) were received from the
Government of India for salary and for administrative expenses.
20. ZIDCO did not take their liabilities into account and is still having profits
from their project works and from the selling of liquor in the past years.
21. ZIDCO suffered huge losses due to insufficient repayment of loan and they do
not receive share capital contribution from the Government of Mizoram.
Majority of the loans are non-performing assets.
22. ZIDCO did not take any collateral security below the loan of Rs. 50,000\- and
for the operating vehicle loans. Collateral security is taken only above Rs.
50,000\- loans in the form of Land Settlement Certificate.
23. If any loan becomes non-performing assets ZIDCO have taken measures in
disposing their Land Settlement Certificate (LSC). We have also found out
that more than 100 Land & Building have been sold out to the public.

103
24. In order to be selected for receiving funds from ZIDCO the entrepreneurs have
to clearly knew about their proposal feasibility for industrial units.
Entrepreneurs have to pass through the screening committee in which they are
questioning about their proposed projects. The screening committee will be
having an in-depth study of the proposed project regarding management
appraisal and financial appraisal.
25. Government servant people can avail Housing loan from ZIDCO and all the
other loans can be avail by non-government servant people only.
26. ZIDCO has given out 10 different kinds of loans i.e., Mahila Udyam Nidhi,
Single Window Scheme, Working Capital Loan, Composite Loan, Ex-
Servicemen Loan, Industrial Loan, Small Road Transport Operator (SRTO),
Bamboo Loan, Housing Loan, Ginger Loan.
27. Verification regarding implementation of the entrepreneur’s projects is
conducted by spot verifications and working progress to verified whether there
is mis-appropriation of funds before every installment are disbursed and if
satisfied then the other installments are disbursed accordingly.
28. When a loan becomes non-performing assets, they are referred to Lok Adalat
for loan recovery. And also, disposal of mortgaged Land Settlement
Certificate (LSC) is carried forward and recovery drive are also conducted
every month or quarterly basis.
29. Loan becomes non-performing assets at the end of their payment period. The
payment period is at the maximum of 8 and half years.
30. The project or loan becomes non-performing assets base on the attitude of the
loanees. It is also found out that most of the loanees are well established but
they have no intention to repay the loan which is the main problem.
104
31. ZIDCO is not very much interested in giving loans due to insufficient
repayment of loans. They intended on turning ZIDCO sanction towards
constructions for improving their performance and also planned to change
their names i.e., Zoram Industrial Development Corporation Limited to Zoram
Infrastructure and Industrial Development Corporation Limited.
32. Different kinds of banks are ZIDCO competitors.
33. ZIDCO have more advantage than their competitors by giving low rate of
interest which is 7% only.
34. ZIDCO is having major portion of the market share in the last few years. As
financial institutions were not providing any further loans to ZIDCO, market
share of ZIDCO is decreasing.
35. ZIDCO is maintaining huge cash in the last previous years i.e., 2019-20
financial year due to the maintenance of separated account for all the
repayments made by the loanees which increases the un-used cash i.e., cash
and cash equivalents of ZIDCO.
36. ZIDCO is turning towards infrastructure development works in which they are
proposing different projects under the central government ministries but
pending due to the Covid-19 pandemic situation.
37. It was found out that there is an unclear future to when ZIDCO will be a debt
free Company. ZIDCO is depending on the Government of Mizoram to
liquidated their loans from National Minorities Development and Financing
Corporation (NMDFC), New Delhi and Housing and Urban Development
Corporation Limited (HUDCO), Kohima in order to get refinance from them.
38. ZIDCO have taken measures to reduce their administrative expenses and also,
they are turning towards infrastructure development works in which they will
be taking different projects to improve its financial performance.
105
5.2 Conclusions:
The key objectives of the study were to find out the financial performance
of Zoram Industrial Development Corporation Limited (ZIDCO) for the last five
years starting from 2015-16 to 2019-20 financial year. This research gathered
insightful information on the level of their financial performance of ZIDCO from the
last available Audited Financial Report from 2015-16 to 2019-20 regarding their
Ratio Analysis which shows their Profitability and Efficiency Ratios, Liquidity Ratio
and Solvency Ratios. The recovery process of loan is studied with performing and
non-performing assets and lastly, interview is carried forward with the General
Manager of ZIDCO regarding qualitative aspects of performance of ZIDCO.
From the study we have found out that profitability ratios show positive
result and liquidity ratios shows a good financial position of ZIDCO. Solvency ratios
also indicates financial positions is in a safety margin and also shows that the long-
term debts will be secured by the assets. Activity ratios show that ZIDCO has to
improved its inventory management, trade receivables turnover and the used of its
working capital. It is also found out that Return on equity has to improve the
utilization of shareholder funds more effectively. Loan recovery rate is increasing
and is at its highest rate in 2019-20 financial year which shows that ZIDCO recovery
position of loan is effective and efficient.
5.3 Suggestions:
Based on the conclusions arrived from the analysis of financial
performance of Zoram Industrial Development Corporation Limited (ZIDCO), the
following suitable suggestions are offered to improve the situation, the following
suggestions are given.
106
5.3.1 Raising of Capital
From the Interview with General manager, it was found that ZIDCO were
facing a financial problem (New Capital infusion) for many years and also the
organization was making losses for a period of more than 10 years i.e., (2004-2014)
ZIDCO was making profit for the last 5 years i.e., 2015-16 to 2019-20 financial year.
So, ZIDCO will be able to raise capital by enlisting in stock markets such as Calcutta
Stock Exchange (CSE), National Stock Exchange of India Ltd (NSE), Bombay Stock
Exchange Ltd (BSE), etc. This will help the company to mitigate its capital related
problem and enhanced capital will lead to more business and profit.
5.3.2 Financing Mechanism
An entrepreneur pursuing financing facilities is still faced with difficulties
in securing bank financing even after being chosen by the selection committee. The
selection procedures should be updated in order to ensure simple funding of
approved schemes. For the past five years, Zoram Industrial Development
Corporation Limited (ZIDCO) has been profitable, but it continues to face challenges
due to flaws in financial management, project planning, implementation, operations
management, and monitoring which shows that it requires serious focus at this point
of level in order to avoid future losses. ZIDCO may generate new funds by listing in
stock exchanges or finding new investors to increase its capital.
5.3.3 Monitoring Mechanism
There is no proper control process in the current framework. Also, there is
no regular proper monitoring mechanism regarding implementation of the
entrepreneur’s projects. It is therefore proposed that there should be a proper
monitoring system to provide a practical image of jobs, functional units and accurate
information to resolve grassroots realities.
5.3.4 Convergence with other line departments
ZIDCO's key objectives are to support, advise, assist, finance, protect and
promote the interests of Industries in the state of Mizoram. In the meantime, different
government agencies have come up with the same inspiration and vision of
encouraging people to start up new businesses. So, information sharing with other
similar institutions is required. The ZIDCO projects would be more competitive and
107
would have major impacts if these schemes converged with the authority of ZIDCO.
5.3.5 Policy restructuring
ZIDCO’s needs to take constructive and effective measures to encourage
entrepreneurship in the state. Also, Zoram Industrial Development Corporation
Limited (ZIDCO) should restructure its financial management policy. ZIDCO had
not implemented a proper financial planning system, nor had it produced a business
plan or resource forecasting for debt repayment using borrowed funds from financial
institutions.
108
Bibliography
Alban, R. (1978). Managing towards Accountability for performance. 13-14.
Adam, M.H.M. (2014). Evaluating the financial performance of banks using financial
ratios: A case study of Erbil bank for investment and finance. European
Journal of Accounting Auditing and Finance Research, 2(6), 162- 177.
Arab, R.O., Masoumi, S.S and Barati, A. (2015). Financial Performance of the Steel
Industry in India: A Critical Analysis. Middle-East Journal of Scientific
Research, 23 (6), 1085-1090.
Altman, E. I. (1968). Financial Ratios, Discriminant Analysis and the Prediction of
Corporate Bankruptcy. The Journal of Finance, 23(4), 589-609.
Bhunia, A. (2010). Financial Performance of Indian Pharmaceutical Industry -
A Case Study. Asian Journal of Management Research, 427-451.
Baruah, P. B., and Bezbaruah, M. P. (2020). Financial Access and Business
Performance of Urban Unorganised Sector Enterprises: A Study of Assam in
Northeast India. The Journal of Entrepreneurship, 1-9.
Bhat, R. and Nishant, J. (2006). Financial Performance of Private Sector Hospitals in
India: Some Further Evidence. Indian Management Institute of Ahmedabad,
1-31.
Capon, N., Farley, J.U. and Hoenig, S. (1990), Determinants of Financial
Performance: A Meta- Analysis. Management Science, 1143-1159.
Colney, R. (1997). Small Scale and Cottage Industries: Mizoram, First Edition, L.B
Associates: Aizawl.
Chakraborty, S.K. (1977). Corporate Capital Structure and Cost of capital: A
Preliminary Study of the Indian Private Sector. Calcutta. Institute of Cost and
Works Accountants of India.
109
Chen. J, (2018), Real Estate Investing. Retrieved June 30, 2020. From
https://www.investopedia.com/terms/f/funds-management.asp
Dutta, S. and Borah, S. (2016). Financial performance of food processing industries
of Assam. European Academic Research, 3 (12), 13090 – 13104.
Daga, U.R. (1985). Analysis of Financial Statement of Aluminium Industry in India.
An unpublished Doctoral Dissertation, University of Jodhpur.
Dey, S. and Choudhury, S. R. D. (2018). The Profitability and Liquidity Position of
Selected Small Enterprises in Shillong City of Meghalaya. The research
journal of social sciences, 9(7), 168-178.
Gaur, J, (2010). Financial Performance Measures of Business Group Companies: A
Study of Indian Non-Metallic Mineral Products Industries. The IUP Journal
of Business Strategy, 7(4), 46- 53.
Guisse, M. L. (2012). Financial performance of the Malaysian banking industry:
Domestic vs. foreign banks, Institute of Graduate Studies and Research. 1-53.
Goel, D.K., Goel, R. and Goel, S. (2017), Analysis of Financial Statement. Arya
Publications, Delhi.
Hargrave, M and Mansa, J. (2020). Corporate Finance & Accounting: Financial
Ratios. Retrieved May 13, 2020, from Investopedia.com: https://diz.ae/8XvWn
Haque, A. (2014). Comparison of financial performance of commercial banks: A
case study in the context of India, Journal of Finance and Bank Management,
2(2), 1-14.
Ijaz, F. and Naqvi, F. (2016). Financial Performance of Firms: Evidence from
Pakistan Cement Industry. Journal of Teaching and Education, 5(01), 81–94.
Kenton, W. (2020) Financial Performance. Retrieved March 11, 2020, from
Investopedia.com: https://diz.ae/0y4uc
110
Kangari, R., Farid, F and Elgharib, H.M, (1992). Financial Performance Analysis for
Construction Industry. Journal of Construction Engineering and
Management, 118 (2), 349-361.
Kenton, W. (2018). Trading Skills & Essentials. Retrieved June 29, 2018, from
https://www.investopedia.com/terms/f/funds-management.asp
Kenton, W. (2020), Corporate Finance and Accounting. Retrieved June 23, 2020,
from https://www.investopedia.com/terms/c/costofcapital.asp
Krishna, D.A.R., and Pandey, D.S. (2013). An Analysis of Liquidity Position of
Indian Steel Industry. Journal of Commerce and Trade 8 (1,2), 19-27.
Karim, A.R. & Alam, T. (2013). An evaluation of financial performance of private
commercial banks in Bangladesh: Ratio analysis. Journal of Business Studies,
5(2), 66-77.
Kennedy, R.D. and Muller, S.Y.M. (1999). Analysis of Financial Statements, page
no 1.3.
Khan, M.Y. and Jain, P.K. (2007). Financial Management, Text, Problems and
Cases, Tata McGraw Hill Publishing Company Ltd., New Delhi, 4th ed., 7:
21-22.
Kakati, S. and Roy, A. (2017). A Study on the Financial Performance of Farmer
Producer Companies with Special Reference to Northeast India. Amity
Journal of Agribusiness 2(1), 38-57.
Lalbiakzuali, D. and Kumar, P.N.J. (2020). Financial Management in the State-
Owned Enterprises in Mizoram. IOSR Journal of Business and Management
(IOSR-JBM), 22(5), 31-35.
Lalbiakzuali, D. and Kumar, P.N.J. (2020). Financial Management in Zoram
Industrial Development Corporation Ltd. (ZIDCO). International Journal of
111
Advance Research (IJAR), 8(05), 378-388
Lalmuanpuii, K. (2016). Mizoram Khadi & Village Industries Board for Promoting
Entrepreneurship. Ph. D, Thesis. Mizoram University.
Lalroluahpuia, C. (2016). A Study on the Performance of MSMEs in Lunglei District,
Mizoram. M. Phil, Dissertation. Mizoram University.
Low, J. (2018). Source of Wealth / Source of Funds (SOW / SOF). Retrieved April
29, 2018, from https://aml-cft.net/library/source-wealth-source-fund-sow-sof/
Manisha, B. R. (2014). Financial Performance Analysis, Global Journal for Research
Analysis,9-10.
Milhem, M.M. and Istaiteyeh, R.M.S. (2015). Financial performance of Islamic and
conventional banks: Evidence from Jordan. Global Journal of Business
Research, 9(3), 27-41.
Mansoori, E. (2012). The Effect of Working Capital Management on Firm’s
Profitability: Evidence from Singapore. Interdisciplinary Journal of
Contemporary Research in Business, 4(5), 472-486.
Minaxi, A. R. (2011). Introduction to Management Accounting, Page no.3-88.
Nataraja, N.S., Chilale, N.R. and Ganesh, L. (2018). Financial Performance of
Private Commercial Banks in India: Simple Regression Analysis. Academy of
Accounting and Financial Studies Journal, vol 22 (2), 1-12.
Ohlson, J. A. (1980). Financial Ratios and the Probabilistic Prediction of Bankruptcy.
Journal of Accounting Research, 18(1), 109-131.
Pal, S. (2012). Comparative study of financial performance of Indian steel companies
under globalization, International Journal of Accounting and Financial
Management Research (IJAFMR), 2(4), 1-8.
Pandey, I.M., (2008). Financial Management, Vikas Pub. House Pvt. Ltd., Noida, 9th
112
ed. Reprint, 520.
Priyaaks. (2012). Financial Performance Analysis. Int. J. Business Performance
Management, Vol. 5, Page no.7.
Patra, S. (2005). Liquidity Vs. Profitability. Indian Journal of Accounting, 35(2), 39-
43.
Rodinga, H. (1991). A Study on The Development of Cottage and Small-Scale
Industries in Mizoram. Master’s Dissertation, North Eastern Hill University,
Shillong
Rao, P. D. (1985). Impact of Debt Equity Ratio on Profitability — An Exploratory
study of Engineering Industry Lok Udyog. Journal of Finance Vol XV, 118-
127.
Sharma, P.P. (2014) Financial Performance and Sustainability Issues of Subsidized
and Non-Subsidized Entities in North East India. Arthshastra Indian Journal
of Economics and Research, 3(6), 1-31.
Saikia, H. (2012). Measuring Financial Performance of Small-Scale Industries: Some
Evidences from India. Journal of Applied Economics and Business Research
JAEBR, 2(1), 46-54.
Selvakumar, S. and Abima, D. (2020). Appraisal of Financial Performance of
Regional Rural Banks with Special Reference to Assam Gramin Vikash
Bank, Maharashtra Gramin Vikash Bank and Karnataka Gramin Vikash
Bank. ternational Journal of Research in Engineering, Science and
Management, 3(12), 191-196.
Siddiqui, S. A. and Siddiqui, A. S. (2003). Financial Accountancy. Laxmi
Publications (P) Ltd. New Delhi.
Subramanian, T., 2009. Financial Performance of the Paper Mills in Tamil Nadu.
113
Ph.D. Thesis, University of Periyar, India.
Siddiqui, S. A. and Siddiqui, A.S. (2003). Accountancy. Laxmi Publications (P) Ltd.
New Delhi.
Thangasamy, E. (2013). Financial Performance of Nagaland Pulp & Paper Company
Limited: An Evaluative Study. International Research Journal of Commerce,
Arts and Science, 4(3). 283-300.
Teruel, P. J. G., and Solano, P. M. (2007). Effects of Working Capital Management
on SME Profitability. International Journal of Managerial Finance, 3(2),
164–177.
Tauringana, V., and Afrifa, G. A. (2013). The Relative Importance of Working
Capital Management and Its Components to SMEs’ Profitability. Journal of
Small Business and Enterprise Development, 20(3), 453–469.
Tripathi P. C., (1991). Research Methodology, New Delhi: Sultan Chand & Sons.
Trivedi S.M., (2010). An Analysis of Financial Performance of State Road
Transport Corporation in Gujarat. Master’s Thesis. Saurashtra
University, p.49.
Yalcin, N., Bayrakdaroglu, A., and Kahraman, C. (2011). Application of fuzzy multi-
criteria decision-making methods for financial performance evaluation of
Turkish manufacturing industries. Expert Systems with Applications, 39(1),
350–364.
Zala, Virambhai S., (2010). A Study of Productivity and Financial Efficiency of
Textile Industry of India, thesis PhD, Saurashtra University.
Zariyawati, M. A., Annuar, M. N., Taufiq, H. and Rahim, A. S. A. (2009). Working
capital management and corporate performance: Case of Malaysia. Journal of
Modern Accounting and Auditing, 5(11), 47-54.
114
ANNEXURE-1
To analyze the financial performance of ZIDCO different types of ratio
analysis formulae were adopted to identified the financial performance of ZIDCO
such as Profitability Ratio consisting of Gross Profit Ratio, Operating Ratio,
Operating Profit Ratio, Net Profit Ratio, Return on Investment, Liquidity Ratio
consisting of Current Ratio or Working Capital Ratio, Quick Ratio or Acid Test
Ratio, Solvency Ratio consisting of Debt Equity Ratio, Total Assets to Debt Ratio,
Proprietary Ratio, Activity Ratio consisting of Inventory Turnover Ratio, Trade
Receivables Turnover Ratio and Working Capital Turnover Ratio and Return on
Equity Ratio.
FORMULA USED IN THE THESIS: -
A) PROFITABILITY RATIOS:
1) Gross Profit Ratio = Gross Profit x 100
Net Sales/ Revenue from Operations
2) Operating Ratio =
Cost of Revenue from Operations + Operating Expenses – Operating Income x100
Revenue from Operations
3) Operating Profit Ratio = Operating Profit x 100
Revenue from Operations
4) Net Profit Ratio = Net Profit after tax x 100
Revenue from Operations
5) Return on Investment = Net Profit before Interest, tax and dividends x100
Capital Employed
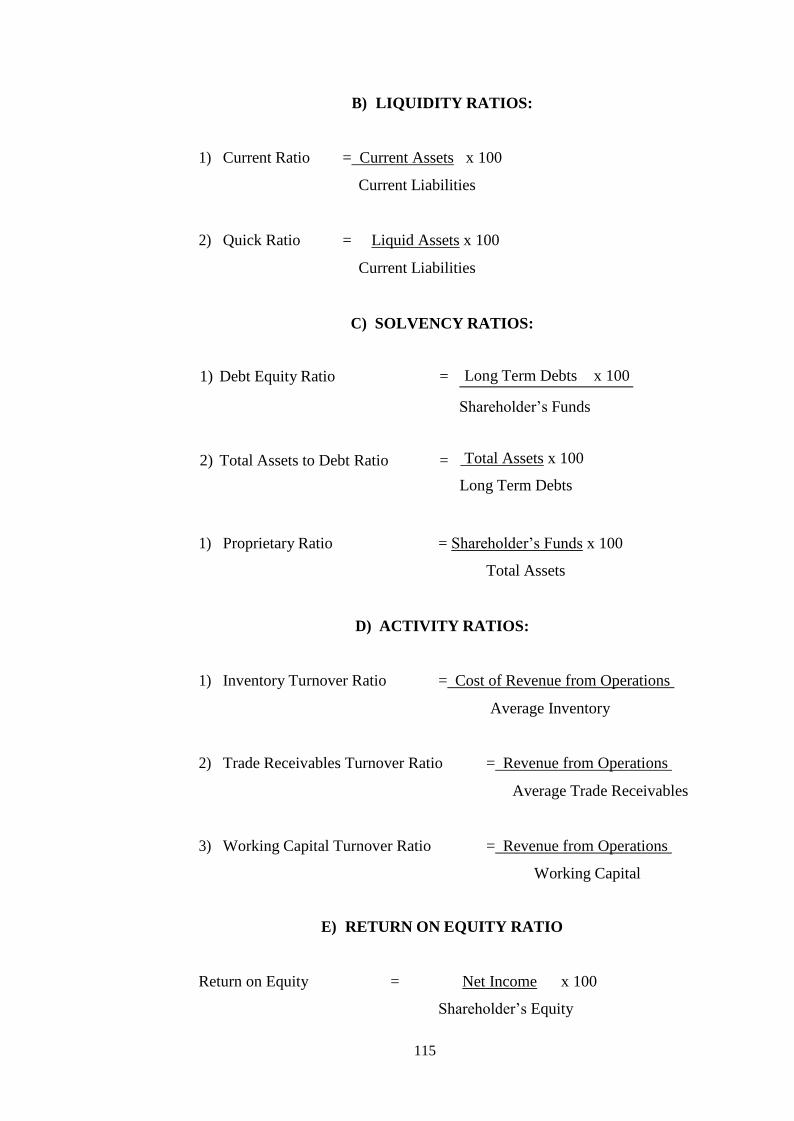
115
B) LIQUIDITY RATIOS:
1) Current Ratio = Current Assets x 100
Current Liabilities
2) Quick Ratio = Liquid Assets x 100
Current Liabilities
C) SOLVENCY RATIOS:
1) Debt Equity Ratio = Long Term Debts x 100
Shareholder’s Funds
2) Total Assets to Debt Ratio
= Total Assets x 100
Long Term Debts
1) Proprietary Ratio = Shareholder’s Funds x 100
Total Assets
D) ACTIVITY RATIOS:
1) Inventory Turnover Ratio = Cost of Revenue from Operations
Average Inventory
2) Trade Receivables Turnover Ratio = Revenue from Operations
Average Trade Receivables
3) Working Capital Turnover Ratio = Revenue from Operations
Working Capital
E) RETURN ON EQUITY RATIO
Return on Equity = Net Income x 100
Shareholder’s Equity
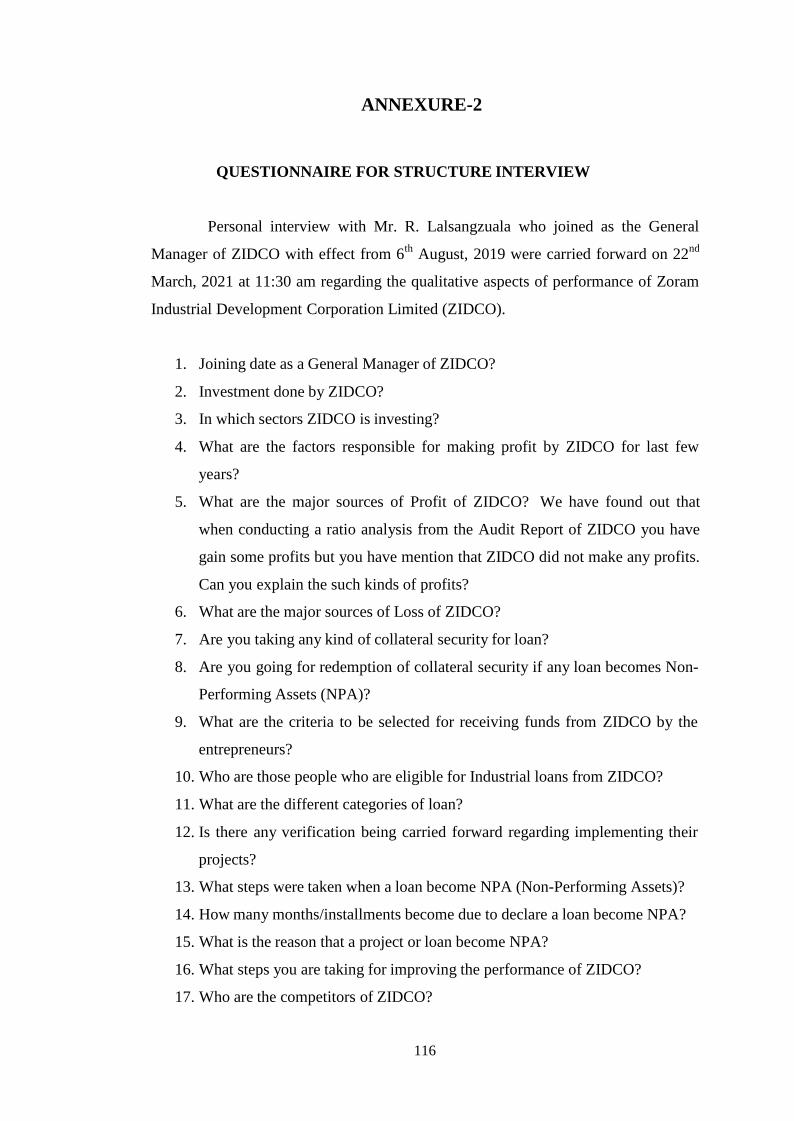
116
ANNEXURE-2
QUESTIONNAIRE FOR STRUCTURE INTERVIEW
Personal interview with Mr. R. Lalsangzuala who joined as the General
Manager of ZIDCO with effect from 6th
August, 2019 were carried forward on 22nd
March, 2021 at 11:30 am regarding the qualitative aspects of performance of Zoram
Industrial Development Corporation Limited (ZIDCO).
1. Joining date as a General Manager of ZIDCO?
2. Investment done by ZIDCO?
3. In which sectors ZIDCO is investing?
4. What are the factors responsible for making profit by ZIDCO for last few
years?
5. What are the major sources of Profit of ZIDCO? We have found out that
when conducting a ratio analysis from the Audit Report of ZIDCO you have
gain some profits but you have mention that ZIDCO did not make any profits.
Can you explain the such kinds of profits?
6. What are the major sources of Loss of ZIDCO?
7. Are you taking any kind of collateral security for loan?
8. Are you going for redemption of collateral security if any loan becomes Non-
Performing Assets (NPA)?
9. What are the criteria to be selected for receiving funds from ZIDCO by the
entrepreneurs?
10. Who are those people who are eligible for Industrial loans from ZIDCO?
11. What are the different categories of loan?
12. Is there any verification being carried forward regarding implementing their
projects?
13. What steps were taken when a loan become NPA (Non-Performing Assets)?
14. How many months/installments become due to declare a loan become NPA?
15. What is the reason that a project or loan become NPA?
16. What steps you are taking for improving the performance of ZIDCO?
17. Who are the competitors of ZIDCO?

117
18. How you are talking competition?
19. What is your market share compare to your competitors?
20. As I was going through your financial report, I observe ZIDCO is maintain
huge cash. What are the reasons that there are lots of un-used cash i.e., Cash
and Cash Equivalents in 2019-2020 Financial Year?
21. Are there any future plans for the better performance of ZIDCO? Please
explain.
22. When ZIDCO will be a debt free company? Is there any plan of action?
Please explain.
23. Is there any other business plan by ZIDCO for improvement of its financial
performance?
Thank you
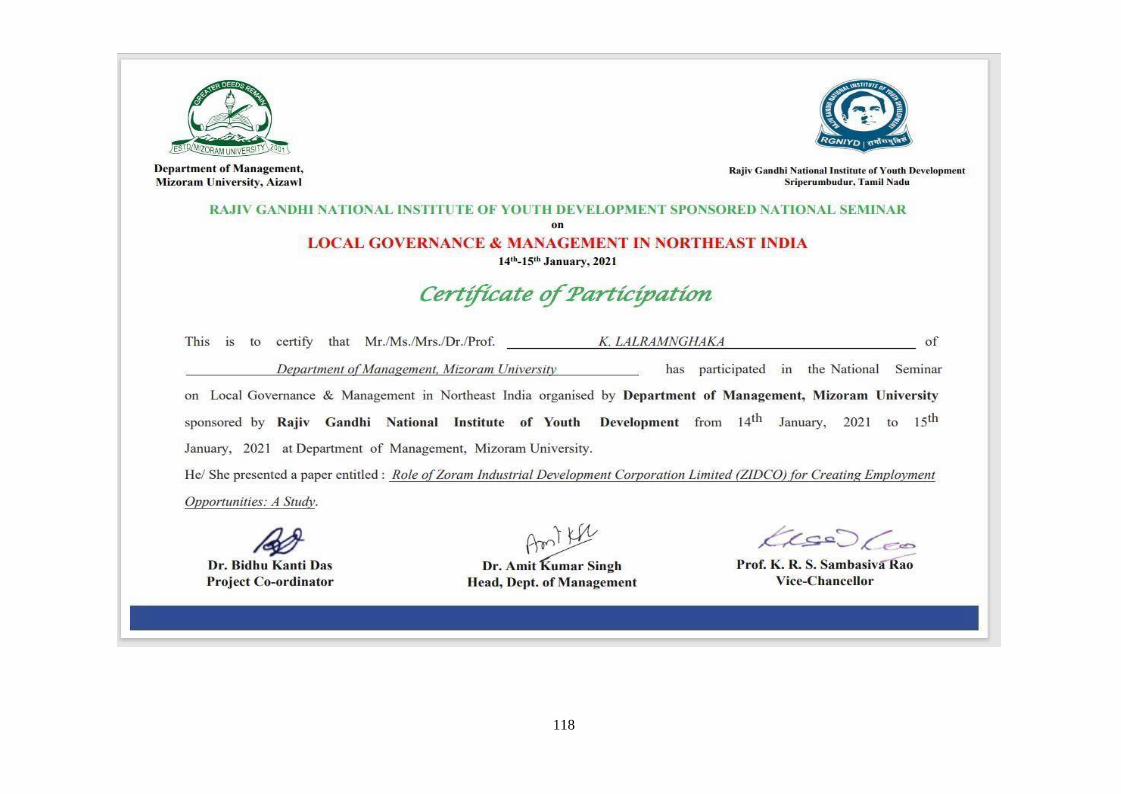
118

119
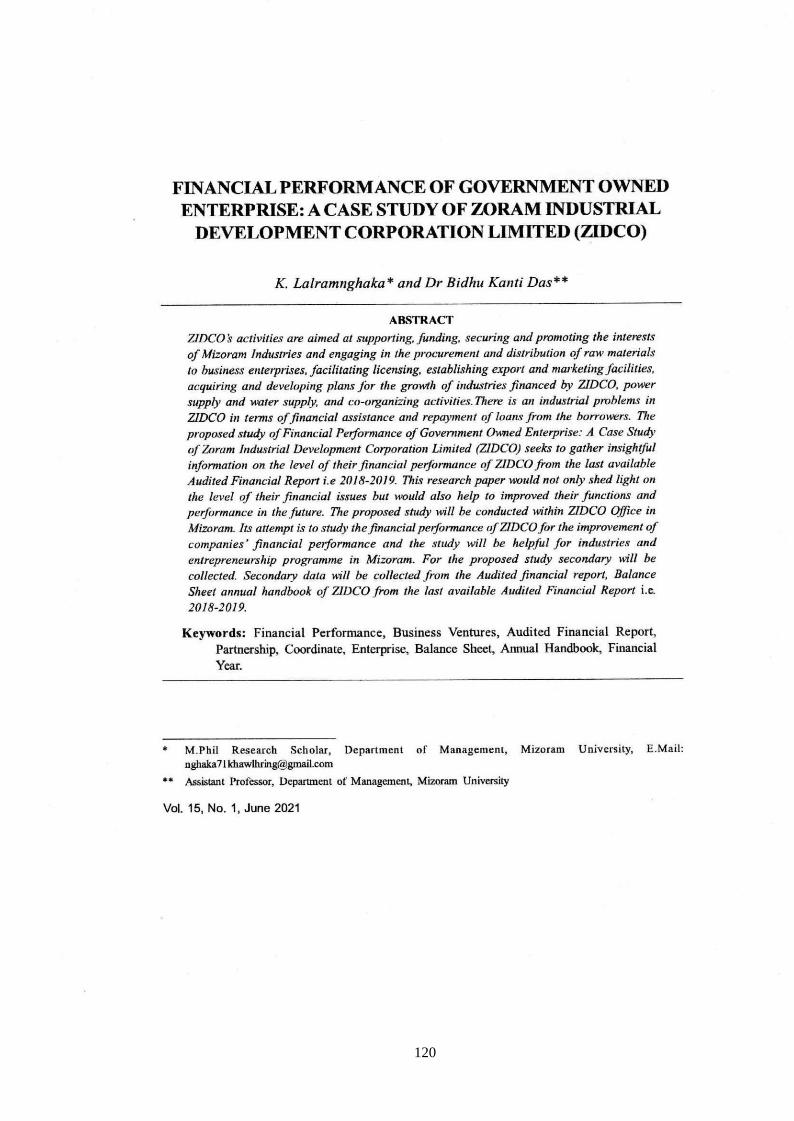
120
121
122
123
124
125
126
127
128
129
130
131
132
BRIEF BIO-DATA OF THE CANDIDATE
NAME : K. Lalramnghaka
FATHER’S NAME : K. Lalrinliana
DATE OF BIRTH : 09.09.1993
ADRESS : H.No. C-113-C, Tuikual
North, Aizawl, Mizoram.
796001
GENDER : MALE
RELIGION : Christianity
OCCUPATION : Student
MARITAL STATUS : Unmarried
EDUCATIONAL QUALIFICATION : B. Com,
M. Com, MBA
M.Phil REGISTRATION NO. & DATE : MZU/M.Phil./631 of 05.11.2020
DEPARTMENT : Management, Mizoram
University
TITLE OF THE DISSERTATION : FINANCIAL PERFORMANCE
ANALYSIS OF ZORAM INDUSTRIAL DEVELOPMENT CORPORATION
LIMITED (ZIDCO): A CASE STUDY
DEPARTMENT OF
MANAGEMENT
MIZORAM UNIVERSITY
AIZAWL-796004
NAME OF THE CANDIDATE : K. Lalramnghaka
DEGREE : M.Phil
DEPARTMENT : Management
TITTLE OF DISSERTATION : FINANCIAL PERFORMANCE
ANALYSIS OF ZORAM INDUSTRIAL DEVELOPMENT CORPORATION LIMITED
(ZIDCO): A CASE STUDY
DATE OF ADMISSION : 30.07.2019
COMMENCEMENT OF SECOND
SEM/DISSERTATION : 12.03.2020
APPROVAL OF RESEARCH PROPOSAL
1. DRC : 15.10.2020
2. BOS : 27.10.2020
3. SCHOOL BOARD : 05.11.2020
MZU REGISTRATION NO. : 4564 of 2012
M.Phil. REGISTRATION NO. & DATE : MZU/M.Phil./631 of 05.11.2020
DATE OF SUBMISSION : 15.07.2021
(Dr. Amit Kumar Singh)
Head (HOD)
Department of Education
Mizoram University
1/88
Document Information
Analyzed document MPhil Dessertation FN.docx (D110023029)
Submitted 7/1/2021 7:48:00 PM
Submitted by Bidhu Kanti Das
Submitter email [email protected]
Similarity 8%
Analysis address [email protected]
Sources included in the report
Performance Evaluation of Financial Institutions with reference to Industrial DevelopmentBank of IndiaURL: ff7c96e9-1839-4382-a0b7-8a5a77215e40
Fetched: 2/17/2019 7:33:38 AM
2
URL: https://www.slideshare.net/mathvanam121/financial-performance-analysis-47104973
Fetched: 9/30/2019 6:48:01 AM2
URL: https://zidco.mizoram.gov.in/page/status-report
Fetched: 3/29/2020 6:58:28 PM5
URL: https://de.slideshare.net/swetabharti3/desertation-report-58577031
Fetched: 12/14/2019 12:23:27 PM5
URL: https://magudeeswarana.files.wordpress.com/2016/01/magu-final.pdf
Fetched: 5/31/2020 5:39:40 PM2
URL: http://ir.amu.ac.in/9849/1/T9838.pdf
Fetched: 12/2/2020 3:26:59 AM3
URL: http://docshare02.docshare.tips/files/10049/100499750.pdf
Fetched: 12/15/2020 8:37:17 AM1
URL: https://www.slideshare.net/AARIFKHAN8/a-study-on-financial-performance-of-oil-and-
natural-gas-corporation-ongc
Fetched: 10/8/2019 11:11:48 AM
1
URL: https://www.cag.gov.in/uploads/old_reports/state/Mizoram/2008/Civil/Civil_Mizoram_2008/
chap_7.pdf
Fetched: 4/13/2021 8:01:00 AM
14
URL: http://www.journalijar.com/uploads/703_IJAR-31634.pdf
Fetched: 11/18/2020 8:41:41 PM79
URL: https://zidco.mizoram.gov.in/page/profile
Fetched: 7/1/2021 7:49:00 PM1
URL: https://www slideshare net/samimkhan4/jyoti-priya-a-training-report-71538746
i
FINANCIAL PERFORMANCE ANALYSIS OF ZORAM
INDUSTRIAL DEVELOPMENT CORPORATION
LIMITED (ZIDCO): A CASE STUDY
(ABSTRACT)
A Dissertation submitted in Partial fulfilment of the requirement
for the degree of Master of Philosophy
Submitted By
K. Lalramnghaka
Registration No:
MZU/M.Phil./631of 05.11.2020
DEPARTMENT OF MANGEMENT
SCHOOL OF ECONOMIC MANAGEMENT AND
INFORMATION SCIENCE
MIZORAM UNIVERSITY
TANHRIL, AIZAWL
(July, 2021)
2
FINANCIAL PERFORMANCE ANALYSIS OF ZORAM INDUSTRIAL
DEVELOPMENT CORPORATION LIMITED (ZIDCO): A CASE STUDY
Abstract
1. Introduction
1.1 Prelude:
The word "performance" is derived from the word "parfourmen," meaning 'to do' or
'to make'. This applies to the act of execution, accomplishment, satisfaction, etc. Output, in
the context of the border, refers to the accomplishment of a given mission calculated against
preset levels of precision, completeness, price, and rate. It refers, in other words, to the
degree to which an achievement is being or has been achieve (Tripathi, 1991). Performance
is used to define increased attempts to efficiently and consistently meet the goals. Objective
attainment involves the integrated used of human, financial and natural resources (Robert
Alban, 1978).
By correctly identifying relationships between the items of the Balance sheet and the
record of gains and losses, the financial performance analysis identifies the company's
financial strengths and weaknesses. The first task is to select data related to the decision
under consideration from the total information contained in the financial statements. The
second is to organize the data in such a way as to highlight substantial relationships
(Trivedi, 2010).
Financial performance is a quantitative measure of an organization's ability to
generate revenue from its main business mode. The term can also be used as a general
indicator of a company's overall financial health over a period of time. Financial statements
were used by analysts and investors to compare similar companies in the same industry or to
measure industries or sectors. The financial output determines how effectively a company
produces income and handles its assets, liabilities, and stakeholder financial interests. It is
also a company’s level of success for a given period of time, measured in terms of net gains
and loss during that time. Assessing the financial performance of businesses helps decision-
makers to evaluate the outcomes of company plans and operations in an analytical monetary
sense (Will Kenton, 2020).
In this study an attempt was made to study the overall financial performance of
ZIDCO to assist the industrial sectors and entrepreneurship programme in Mizoram and
also will be crucial in motivating the society to conducted new business activities which
3
plays an important role in economic development. The study was also helpful in the
recovering process of loans provided to the other industries and entrepreneurs.
1.2 Zoram Industrial Development Corporation Limited (ZIDCO):
Zoram Industrial Development Corporation Limited was founded in 1978, which
was registered under the Companies Act, 1956. It was designed to be the Corporation's
twin. It is a joint venture between the Mizoram government and Industrial Development
Bank of India (IDBI). The Authorised Share Capital is Rs.1500 lakhs i.e., (Rs.15 crores),
out of this Rs.1370.10 lakhs are fully subscribed and paid up. Out of the paid-up capital of
Rs. 1370.10 lakhs, only 31.24% is contributed by IDBI and Government of Mizoram holds
68.76% of the total share capital contribution. As a result of economic liberalization,
Government of India stopped share capital contribution to IDBI and subsequently IDBI has
completely stopped contributing share capital to ZIDCO since 1991-92. In fact,
Government of Mizoram is only contributing share capital to ZIDCO. The registered office
of ZIDCO is located in Aizawl, the state capital of Mizoram. ZIDCO currently has one
branch office in Lunglei. Lunglei, Lawngtlai, and Siaha districts are all part of the Branch
Office.
ZIDCO's activities include assisting, financing, protecting, and promoting the
interests of Mizoram's industries, as well as procuring and distributing raw materials to
business ventures, facilitating licenses, establishing export and marketing facilities,
acquiring and developing plans for the development of industries under ZIDCO's financing,
power supply, and water supply, and coordinating the procurement and distribution of raw
materials to business ventures. It is to enter into partnership, business and joint ventures
with any other company, firm or persons, carrying on manufacturing or other business in
sharing of profits within the objects of the company. IDBI and the Government of Mizoram
are making efforts to diversify their activities towards the mobilization of sources of
finance, industrial growth and other activities. Ministry of Textile (Govt. of India) have
setup Apparel and Garment Making Centre under the schemes of the North Eastern Region
Textile Promotion Scheme (NERTPS) and selected the Industrial Growth Centre,
Luangmual as to be the first place in Aizawl, Mizoram. ZIDCO has been selected as the
Project Implementing Agency by the Government of Mizoram.
ZIDCO has given Rs. 4575.85 lakhs loans to 4961 loanees. Repayment of loans
were received from the loanees only a sum of Rs. 6455.47 lakhs (including the interest) till
4
30th March, 2020. Different measures have been taken to recover the loan and interest from
the loan beneficiaries of ZIDCO. House to House recovery drive has been conducted,
retrieval of Industrial Assets, auctioning the mortgaged L.S.C.
1.3 Research Gap:
From the available literature reviewed, it was found that various studies have been
made with relation to the financial performance analysis from different industries around the
world and different parts of India. But researches have never been found on ZIDCO to study
the proposed topic. It is an attempt to study the financial performance of ZIDCO for the
improvement of companies’ financial performance and the study will be helpful for industries
and entrepreneurship programme in Mizoram. The annual Audited Report showing Statement
of Profit and Loss Account and Balance Sheet are usually adopted for realizing the reliability,
efficiency and profitability of a business. The present research highlights the Financial
Performance of ZIDCO by implementing different accounting ratios to show Profitability
Ratio consisting of Gross Profit Ratio, Operating Ratio, Operating Profit Ratio, Net Profit
Ratio and Return on Investment. And Liquidity Ratio, consisting of Current Ratio or
Working Capital Ratio, Quick Ratio or Acid Test Ratio. Solvency Ratio consisting of Debt
Equity Ratio, Total Assets to Debt Ratio, Proprietary Ratio and Activity Ratio consisting of
Inventory Turnover Ratio, Trade Receivables Turnover Ratio, Working Capital Turnover
Ratio. And lastly Return on Equity Ratio.
So, this present study on, “Financial Performance Analysis of Zoram Industrial
Development Corporation Limited (ZIDCO): A Case Study” is undertaken to study in depth,
the financial performance, the loan recovery process and qualitative aspects of financial
issues of ZIDCO for the last five years i.e., 2015-16 to 2019-20 Financial Year.
1.4 Significance of the study:
Zoram Industrial Development Corporation Limited (ZIDCO) plays an important
role for Mizoram's development in providing capital to the general entrepreneurs and
industries through loans to support the people who are intended to startup their own business
industries. The study of Financial Performance Analysis of ZIDCO focus on the financial
performance of ZIDCO through the study of financial issues being faced by ZIDCO. There is
the occurrence of non- repayment of loans from the borrowers which effects the financial
institutions and are unable to implement the updated financial schemes to ZIDCO.
5
In carrying out finance functions, the checking of financial results in a company
needs a lot of focus. It necessitates a retrospective examination of the operating period in
order to assess the wisdom and efficiency of financial planning. The analysis of what
occurred can be extremely useful in developing the standards, techniques, and procedures.
Financial statements are mainly used to make decisions. Financial statements, also known as
financial reports, are account balances that are arranged in an effective and substantive order
such that the facts and principles they depict can be easily interpreted and used as a basis for
decisions by those involved in business matters.
In modern company, the term "financial statements" applies to two documents: a
balance sheet, which shows the assets, liabilities, and capital as of a specific date, and an
income statement, or profit and loss statement, which shows the results obtained during a
specific period and is prepared at the end of the accounting year for a business entity. Adding
a third statement of retained earnings has become common practice, particularly among large
corporations. Financial analysis is the process of properly identifying the relationship
between the balance sheet goods and the profit and loss account in order to determine a
company's financial strengths and weaknesses. Comparative statements, schedules of
adjustments in working capital, common size ratios, funds analysis, trend analysis, and ratio
analysis are some of the tools or strategies used in financial statement analysis. The most
important method in financial analysis is the ratio analysis. The importance of financial
analysis in financial management cannot be overstated. Finally, the accurate study of a
business enterprise's financing is critical to its performance.
This research tells us about ZIDCO at the level of improving the financial
performance, recovery process, and overall management of the fund of the company. The
study of financial performance of ZIDCO is helpful for the same industry in the state for
improving their financial management. And also helpful in creation of employment
opportunities on the level of their pattern and employments generations by ZIDCO in the
state of Mizoram. This research would not only shed light on the level of their issues on
creation of employment opportunities but would also help to improved their functions and
performance in the future. The outcomes of the studies are helpful for the state government
for the management of state-owned enterprises. Also, the outcome of the studies is also
helpful for researcher, entrepreneur, and society at large by improving economic performance
of the enterprise.
6
1.5 Scope of the study
The study of Financial Performance Analysis of Zoram Industrial Development
Corporation Limited (ZIDCO) gathered insightful information on the level of their financial
performance of ZIDCO for the last five years and also recovery methods of loan provided by
ZIDCO. This research shed light on the level of their financial issues and would also help to
improved their functions and performance in the future. The study was conducted within
ZIDCO and its different branches in Mizoram for a period of five years i.e., 2015-16 to 2019-
20 Financial Year.
Financial statement analysis and interpretation are attempts to assess the value and
purpose of financial statement data so that a prediction of potential earnings, willingness to
pay interest, and so on can be made. Financial statement analysis focuses on determining the
relationship between various financial factors in a business as shown by a single set of
financial statements, as well as the pattern of these factors as seen in a series of statements.
Although analysis entails calculating ratios to resolve the statements, interpretation is the
mental process of comprehending the terms of such statements and forming opinions or
inferences about the financial health, profitability, performance, and other aspects of the
company. This type of financial analysis offers crucial details for control purposes.
1.6 Statement of the Problem:
There was a financial performance problem in ZIDCO in terms of financial results
and repayment of loans from the borrowers which has to be studied in details including the
financial status, performance, and challenges of ZIDCO. The organization was making losses
for the period of more than 10 years i.e., (2004-2014). And now turn around at least from loss
making to operating profit-making company.
1.7 Objectives:
i. To analyze the financial performance of ZIDCO for a period of 5 years
from FY 2015- 16 to FY 2019-20.
ii. To study the Return on equity ratio of the company for a period of 5
years from FY 2015-16 to FY 2019-20.
iii. To examine the recovery process of ZIDCO loan provided to the other
industries and entrepreneurs.
iv. To assess the qualitative aspects of financial issues faced by the
organization with reference to the performance or non-performance.
7
1.8 Hypotheses:
H1: There is a significant relationship in Profitability and Efficiency Ratio of ZIDCO
H2: There is a significant relationship in Profitability and Liquidity Ratio of ZIDCO
1.9 Methodology:
The present study on “Financial Performance Analysis of Zoram Industrial
Development Corporation Limited (ZIDCO): A Case Study” studied and analyses the
financial performance of ZIDCO for the past 5 years with effect from 2015-16 to 2019-20
Financial Year and identified the main parameter of performance and non-performance.
And also finds the causes of performance and non-performance and further suggested
ZIDCO for better performance in the future. The details of the methodology are
mention below:
1.9.1 Data source
Both primary and secondary were collected. Secondary data were collected from the
Audited financial report, Balance Sheet and Annual handbook of ZIDCO. Apart from this,
books as well as papers from journals, different websites and the reports of government
department were consulted to understand the financial performance of ZIDCO. Primary
data were collected from the top officials of ZIDCO through a set of schedule and structure
interview to know the financial issues faced by the organization with reference to the
performance or non-performance. The study of Zoram Industrial Development Corporation
Limited (ZIDCO) covers a period of 5 years, commencing from Financial Year 2015-16 to
2019-20.
1.9.2 Study Period
To assess on Zoram Industrial Development Corporation Limited (ZIDCO) it was
decided to study for a period of the past 5 years from financial year 2015-16 to 2019-20
about the financial performance and loan recovery processes of ZIDCO.
1.9.3 Analysis tools
To analyze the financial performance of ZIDCO, financial accounting, different
statistical tools and Regression Analysis were used. For this purpose, Profitability Ratio
consisting of Gross Profit Ratio, Operating Ratio, Operating Profit Ratio, Net Profit Ratio,
Return on Investment, Liquidity Ratio consisting of Current Ratio or Working Capital
Ratio, Quick Ratio or Acid Test Ratio, Solvency Ratio consisting of Debt Equity Ratio,
Total Assets to Debt Ratio, Proprietary Ratio, Activity Ratio consisting of Inventory
8
Turnover Ratio, Trade Receivables Turnover Ratio and Working Capital Turnover Ratio
and Return on Equity Ratio were adopted to identified the financial performance of ZIDCO
which were extracted from the Audited Report of ZIDCO from 2015-16 Financial Year to
2019-20 Financial Year. The hypotheses were tested by using statistical tool of simple
regression analysis, One-way ANOVA test and regression analysis of financial
performance as to find out the significant relationship between profitability and efficiency
ratio including the significant relationship between profitability and liquidity ratio of
ZIDCO.
1.10 Limitations of the study:
The following are some of the limitation’s studies:
• The study duration is only 5 years long, which limits our ability to learn more about
ZIDCO's financial results. The performance for this five year may not show the
financial performance of ZIDCO for entire period (1978-2020 FY) of the company.
The larger size (More number of years) of analysis may represent a different result of
the study.
• Since this analysis relies heavily on secondary data derived from ZIDCO's published
Annual Reports and Audited Report. So, findings of the study depend on the
authenticity of the data of ZIDCO.
• There are a variety of approaches to analysing financial results, and experts may have
differing opinions.
• The performance of the managers and top officials were not included in this research,
which is one of the crucial parts of the financial performance of the company.
• The expenditure on employees and the retired person were not included in this study.
• The present study is mainly on quantitative financial data. Qualitative data like
managers performance, timely reminder to loanees for repayment, timely assessment
of performing assets which are shifting to non-performing assets and their reasons.
Steps taken to revive non-performing assets were not included in this study.
• Time frame of the study was too small; the study was undertaken for last five
financial year starting from 2015-16 to 2019-20. Longer period of data may represent
different results.
• This research relies heavily on financial ratio review, which has its own set of
drawbacks.
9
2. LITERATURE RIVIEW
2.1 Global Study on Financial Performance
Milhem and Istaiteyeh (2015) studies on Islamic banks have been carried out using
financial ratios in order to calculate output in terms of profitability, liquidity, ROA, ROE and
risk. The result shows that there are no substantial means of distinguishing profitability
between banks.
Ijaz and Naqvi (2016) have studied the financial performance literature regarding
the cement industry in Pakistan which is presented in this paper. Studies from Iran, India and
Pakistan are included in the literature, but some foreign evidence is also provided.
Profitability ratios, asset usage ratios, debt ratios, liquidity ratios and cash conversion periods
from the period 2006-2014 are the financial ratios used to assess the financial output of the
cement industry. Return on Investment (ROI) is taken as an expected variable and five
parameters of the ratio are taken as predictor variables. The study showed that all parameters
except the leverage ratios that have an insignificant relationship have a positive relationship
with the dependent variable.
2.2 Indian Study on Financial Performance
Haque (2014) studies on major Indian Banks have been carried out using financial
ratios in order to calculate output in terms of profitability, liquidity, ROA, ROE and risk. The
result shows that there are no substantial means of distinguishing profitability between banks.
Nataraja et al., (2018) studied the results of the three major private sector banks
listed on both the National Stock Exchange (NSE) and the Bombay Stock Exchange (BSE)
were analyzed. For statistical analysis of the results of banks, financial ratios are used. Three
main metrics, namely Return on Assets (ROA), which measures internal efficiency, Tobin's
Q formula (price/book ratio), which measures market-based performance, and Return on
Equity (ROE), which is a key profitability ratio used by investors to calculate the sum of
profits of a bank returned as shareholder equity, were used to measure the financial
performance of the selected equity. The data was selected from the selected banks for the
period 2006 to 2017. In order to find the financial performance calculated by the three
metrics based on independent variables, bank size, credit risk, asset management, operating
efficiency and debt ratio, simple regression techniques were used. The results show that all of
the ratios chosen have an effect on private commercial banks' financial efficiency.
10
2.3 Study in North East India
Baruah and Bezbaruah (2020) have studied this paper which is based on an analysis
of such businesses in Assam, a state in northeast India where access to finance is generally
limited. The article investigates the degree to which the availability of financial services
influences the growth and financial output of unorganised sector enterprises in Assam, using
data from a customised survey. A customised financial access index, a generalised linear
model, and an ordered LOGIT regression are among the tools used. The findings show that
while the extent of an enterprise's financial access has no major impact on its financial
output, it is critical to its development.
Selvakumar and Abima (2020) have studied this paper and also an attempt have
been made to analysis the results of short-term solvency, long-term solvency and profitability
for Assam Gramin Vikash Bank and Maharashtra Gramin Bank and Karnataka Vikash
Gramin Bank. The secondary information was compiled on websites, newspapers, journals,
books and annual reports. This study is restricted exclusively to RRBs. It does not include
commercial banks, cooperative banks and banks for industrial development. It only takes into
account the factor of financial analysis; other factors are not known. It is concluded that the
Assam Gramin Vikash Bank, Maharashtra Gramin Bank and Karnataka Vikash Gramin Bank
are good in terms of financial performance. Only secondary data are used in the study.
2.4 Study in Mizoram About Financial Performance
Lalroluahpuia (2016) studies the performance of MSMEs in Lunglei District,
Mizoram has been studied and analysed. This research has shown that the sector has provided
workers with a number of employment opportunities, especially those belonging to
uneducated groups, and that its contribution is relevant at all levels. Not only does it
contribute to higher economic growth rates, but it also increases demand for goods and
services, contributing to inclusive and balanced economic growth. While there have been a
range of difficulties in the MSME sector, one of the major issues facing the MSME sector is
the lack of sufficient financing facilities. At the moment of need, it is not very easy for
entrepreneurs to collect or acquire the necessary money. Different sources are helping
entrepreneurs to increase their finances, but they are facing more problems getting loans. The
study considers that for the growth and development of the MSME market, the government
must play the most important role. Fostering existing enterprises would therefore be fair and
should help build a favourable environment to promote the rapid growth of MSMEs within
the district, state and region.
11
Lalbiakzuali and Kumar (2020) Financial Management in Mizoram State Owned
Enterprises (SOEs) was researched and addressed the financing, spending, and dividend
decisions made by the Mizoram Government's five SOEs. State enterprises are created to
conduct economic activities while considering the welfare of the people. The main goal of
these SOEs is to promote and develop the state's industrial sector, but they have not made a
meaningful contribution and have continued to lose money. In order to come up with
potential ideas and suggestions for change, an effort is made to research financial
management. From the view point of financial, expenditure and dividend decisions, the
study of the financial management of state-owned enterprises has shed light on serious
problems with erroneous practices. It emphasises the importance of financial management
in the overall organisation and how it is largely responsible for a company's success or
failure. The state-owned enterprises under investigation lack financial management
professionalism, as evidenced by the fact that they have not filed their own financial report
in up to ten years and their accounts are past due.
3. Brief Profile of ZIDCO
3.1 Prelude
Mizoram's oldest state-owned corporation, Zoram Industrial Development
Corporation Limited (ZIDCO), was established to provide aid, assistance, and finance to
industrial companies, projects, or businesses in the state of Mizoram in order to develop
industrial areas and promote entrepreneurship. The Zoram Industrial Development
Corporation Limited (ZIDCO), formerly Mizoram Small Industries Development
Corporation Limited (MSIDC), was established on February 27, 1978, under the Companies
Act, 1956. Mizoram Small Industries Development Corporation Limited (MSIDC) was
renamed Zoram Industrial Development Corporation Limited. (ZIDCO) on September 13,
1985. There are 38 employees under ZIDCO including 3 persons on Muster Roll and 2 other
persons on Contract Basis such as: -
Group-A = 9, Group-B = 12, Group-C = 8,
Group-D = 9, Contract = 2, Muster Roll = 3
It was established primarily as a financing institution to aid the state's efforts to
create an industrial environment. The Government of Mizoram and the Industrial
Development Bank of India (IDBI) formed ZIDCO as a joint venture with a 51:49 share
ratio.
The board of directors appointed by the Governor of Mizoram is governed by
12
ZIDCO. One of the Directors, the Managing Director, who is also the corporation's chief
executive, was also nominated as a member, Secretary of the Board, by the Governor. The
Chairman of ZIDCO is Pu Lalthlengliana, Ex MLA, and the Managing Director is Pu
Lalramsanga Sailo, IRS.
3.2 Share Capital Contribution
The Authorized Share Capital is Rs.1500 lakhs i.e., (Rs.15 crores), out of this
Rs.1370.10 lakhs were fully subscribed and paid up. The Government of Mizoram and IDBI
are to make a matching contribution, as per the agreement. Every share contribution was
matched by IDBI until 1990-91, with the exception of the initial contribution of Rs. 15 lakhs
by the Mizoram Government. IDBI however, refused to equal the contribution made by the
government of Mizoram from 1991-92 onwards. Out of the paid-up capital of Rs. 1370.10
lakhs, only 31.24% is contributed by IDBI and Government of Mizoram holds 68.76% of the
total share capital contribution. As a result of economic liberalization, Government of India
stopped share capital contribution to IDBI and subsequently IDBI has completely stopped
contributing share capital to ZIDCO since 1991-92. In fact, Government of Mizoram is only
contributing share capital to ZIDCO. The Share Capital contribution made by IDBI and
Government of Mizoram ends in 1992 and 2000 respectively.
3.3 Loan / Refinance
ZIDCO's borrowings loans from IDBI, SIDBI, NMDFC and HUDCO. ZIDCO
received refinancing from 1982-83. On the grounds of weak repayment of ZIDCO overdues
to IDBI and SIDBI, they had refused to extend further refinancing from the middle of 1991-
92 financial year. Since 1992-93, ZIDCO has not obtained a single refinancing rupee from
IDBI and SIDBI. ZIDCO also obtained interest-free loans of Rs. 150 lakhs in 1992-93
financial year and Rs. 225 lakhs in 1993-94 financial year from the Government of Mizoram,
and the same interest-free loan has already been paid back to the Government of Mizoram.
Management efforts have been made to begin refinancing from IDBI and SIDBI.
ZIDCO availed funding from Financial Institutions such as follow: -
• SIDBI – Rs. 1045.14 lakhs (Liquidated in 2008)
• NMDFC – Rs. 1446.58 lakhs
• HUDCO – Rs. 1277.00 lakhs
13
4. Data Analysis and Interpretation
4.1 Introduction:
Analysis and evaluation of financial statements relates to the handling of the details
found in the Income statement and the Balance Sheet in order to provide a complete
diagnosis of the business's performance and financial soundness. There is a distinction
between the term’s "analysis" and "interpretation." The term "study" refers to the systematic
classification of data in financial statements. If the statistics in the financial statements are
condensed, they would not be useful. The word interpretation means describing the purpose
and importance of the data so condensed. However, both “Analysis and Interpretation” are
complementary to each other. Interpretation requires analysis, while Analysis is useless
without interpretation. “Analysis and Interpretation of financial statements are an attempt to
determine the significance and meaning of the financial statement data so that the forecast
may be made of the prospects for future earnings, ability to pay interest and debt maturities
(both current and long term) and profitability of a sound dividend policy.” (Kennedy and
Muller, 1999)
4.2 Financial performance of ZIDCO
Financial Performance of ZIDCO implemented different accounting ratios to show
Profitability Ratio consisting of Gross Profit Ratio, Operating Ratio, Operating Profit Ratio,
Net Profit Ratio and Return on Investment. And Liquidity Ratio, consisting of Current Ratio
or Working Capital Ratio, Quick Ratio or Acid Test Ratio. Solvency Ratio consisting of Debt
Equity Ratio, Total Assets to Debt Ratio, Proprietary Ratio and Activity Ratio consisting of
Inventory Turnover Ratio, Trade Receivables Turnover Ratio, Working Capital Turnover
Ratio. And also Return on Debt Equity Ratio.
4.2.1 Profitability Ratios
Profitability position of ZIDCO were studied for five years i.e., 2015-16 to 2019-20
Financial Years using five profitability ratios for the study which are: i) Gross Profit Ratio ii)
Operating Ratio iii) Operating Profit Ratio iv) Net Profit Ratio v) Return on Investment
(ROI).
4.2.2 Liquidity Ratios
Liquidity position of ZIDCO were studied for a period of five year i.e., 2015-16 to
2019-20 Financial Year. The important liquidity ratios are: (i) Current Ratio (ii) Acid-Test
14
Ratio or Quick Ratio. In the last few years ZIDCO is facing a problem regarding the liquidity
position that is the reason why we studied the present conditions using Financial Ratios.
4.2.3 Solvency Ratios
The long-term solvency ratios reflect a company's ability to pay fixed interest and
expenses while still repaying long-term debt. The following ratios are used to assess a
company's long-term financial viability for five years i.e., 2015-16 to 2019-20 Financial
Year: (i) Debt-Equity Ratio, (ii) Total Assets to Debt Ratio and (iii) Proprietary Ratio.
4.2.4 Activity Ratios
Turnover Ratios and Efficiency Ratios are other names for Activity Ratios, these
ratios show whether the firm's current and long-term asset investments are too high or too
small. Efficiency ratio of ZIDCO were studied for five years i.e., 2015-16 to 2019-20 Financial
Years. The turnover ratios mentioned were determined: (i) Inventory Turnover Ratio, (ii)
Trade Receivables Turnover Ratio and (iii) Working Capital Turnover Ratio.
4.2.5 Return on Equity
The Return on Equity (ROE) ratio basically calculates the rate of return on a
company's common stock owned by its shareholders. The company's ability to produce
returns on the investment it earned from its shareholders is calculated by its return on equity.
ROE is more than a benefit measurement; it is also a productivity measurement. We have
studied the present condition comparing to the last five years i.e., 2015-16 to 2019-20
Financial Year.
5. Findings, Conclusions and Suggestions
5.1 Major Findings:
Following is some of the observations that were discovered after the data was analyzed:
1. Gross Profit Ratio has consistently showing positive for the last five years and has
continuously showing an upward trend and it is increasing more and more from 2017-
18, 2018-19 and 2019-20 with percentage of 5.89%, 14.29% and 41.34% respectively.
From the analysis it is clear that ZIDCO has a sufficient gross profit to cover the
operating expenses.
2. Operating Ratio has continuously showing an upward trend from 2015-16, 2016-17,
15
2017-18, 2018-19 and 2019-20 with percentage of 24.59%, 154.21%, 148.92%,
151.24% and 293.41% respectively. From the above analysis it is clear that profit
margin will be higher on Revenue from Operations.
3. Operating Profit Ratio were in a positive position five years earlier and it has
consistently showing negative efforts from 2016-17, 2017-18, 2018-19 and 2019-20
with percentage of -54.21%, -48.92%, -54.24% and -193.41%respectively. From the
analysis it is clear that ZIDCO has flaws and poor resource management and also
indicates that the profit produced from operations is inadequate in relation to total
revenue generated from sales.
4. Net Profit Ratio has increased from 10.13% to 19.82% in 2015-16 and 2016-17 which
is fair for the company but decreased in the year 2017-18 and 2018-29 i.e., 5.67% and
8.5% and is at its lowest point over the last five years by 0.79% in 2019-20 which is an
indication for the company to improve its performance.
5. Return on Investment increased from 5.87% to 8.22%, in 2015-16 and 2016-17 which
is favourable for the company but decreased in the year 2017-18 i.e., 2.29% and
increased in 2018-19 by 2.54% and again decrease and is at its lowest point over the
last five years i.e., 0.07% in 2019-20 which is an indication for the company that
capital employed is not effectively used and is an indication for improvement in its
performance.
6. Current Ratio were below the standard condition i.e., 2:1 in 2015-16 and 2016-17 with
percentage of 1.50% and 1.50% respectively and it has consistently showing positive
efforts for the last three years in 2017-18, 2018-19 and 2019-20 with percentage of 2%
each. It shows a good financial position of ZIDCO.
7. Quick Ratio were above the standard condition i.e., 1:1 and it has consistently showing
an upward trend and increased more and more for the last five years i.e., 2015-16,
2016-17, 2017-18, 2018-19, and 2019-20 with percentage of 3.36 %, 3.44%, 3.62%
and 3.86% and decreased at its lowest point over the years in 2019-20 i.e., 0.03%. It
shows ZIDCO’s good liquidity position over the last five years but needs improvement
for the future.
16
8. Debt Equity Ratio do not exceed the standard condition i.e., 2:1 and it has consistently
showing positive efforts for the years 2015-16, 2016-17, 2017-18, 2018-19, and 2019-
20 with percentage of 0.15 percent, 0.18 percent 0.11 percent, 0.07 percent, and 0.07
percent, respectively. From the analysis it is clear that, the assets are higher than the
value of the liabilities.
9. Total Assets to Debt Ratio stays on the standard condition i.e., 1:1 and 2:1 and it has
consistently showing positive efforts for the years 2015-16, 2016-17, 2017-18, 2018-
19, and 2019-20 with percentage of 1.5 percent, 1.5 percent 2 percent, 2 percent, and 2
percent, respectively. From the analysis it is clear that, ZIDCO financial positions is in
a safety margin and also shows that the long-term debts will be secured by the assets.
10. Proprietary Ratio decreased from 3.63% to 2.96% in 2015-16 and 2016-17and has
consistently showing an upward trend and increased more and more from 2017-18,
2018-19, and 2019-20 with percentage of 4.78 percent, 6.66 percent, and 6.72 percent,
respectively and ZIDCO has consistently showing positive efforts. From the above
analysis it is clear that ZIDCO has sound financial status.
11. Inventory Turnover Ratio were declining from 27.82 times in 2017-18 to 19.33 times
in 2018-19 respectively and zero inventory turnover in 2019-20 and it has consistently
showing negative efforts for the last five years. From the analysis it is clear that
inventories are not efficiently used and ZIDCO has to improved its inventory
management.
12. Trade Receivables Turnover Ratio increased from 13.30 times to 20.76 times in 2015-
16 and 2016-17. And also shows zero trade receivable turnover ratio in 2017-18
financial year. It has increased in 2018-19 by 21.92 times and later decreased by 6.80
times in 2019-20. From the analysis it is clear that ZIDCO has to improved its trade
receivables turnover.
13. Working Capital Turnover Ratio were consistently declining for the years i.e., 2015-
16, 2016-17, 2017-18, 2018-19, and 2019-20 i.e., 0.74 times, 0.56 times, 0.52 times,
0.37 times and 0.12 times respectively. From the analysis it shows under-utilization of
Working Capital and it is clear that the used of working capital needs to be improved.

17
14. Five years earlier Return on Equity it is in a negative position i.e., -122.68% in 2015-
16 and it has consistently showing positive efforts for the last four years i.e., 214.74%,
37.22%, 29.77% and 0.11% respectively. As the percentage decreased from 2017-18
to 2019-20 it is clear that is has to improve the utilization of shareholder funds more
effectively.
15. For the years 2015-16, 2016-17, 2017-18, 2018-19, and 2019-20. The Recovery Rate
was 1.82%, 1.95%, 2.04%, 1.74% and 2.30% respectively. The Recovery Rate is
maximum 2.30% in 2019-20 financial year followed by 2.04% in 2017-18 financial
year. The minimum Recovery Rate is 1.74% in 2018-19 financial year. The total
recovery rate of loan for the last five years is 1.89%. The recovery rate is increasing
and is at its highest rate in 2019-20 financial year which shows that ZIDCO recovery
position of loan is effective and efficient.
16. There are 37 numbers of Non-Performing Assets. The loan or Project becomes Non-
Performing Assets after 8 and half years. The maximum amount of loan overdues is
Rs. 6.72 Crores from Bamboo loan dated 6th May, 2005 and the minimum amount of
loan is Rs. 31,213 from Bakery loan dated 25th August, 1999. The total amount of all
the overdues is Rs. 8.81 Crores.
17. There are 31 numbers of Performing Assets who pays their loans regularly. The
maximum Recovery Rate is 2.35% on Seed Money dated 21st January, 1982 followed
by 2.34% on Car Parking dated 29th September, 2005. The minimum Recovery Rate is
1.0% on Carpentry dated 4th April, 1990. The total Recovery Rate of Performing
Assets is 1.84%. Out of 68 numbers of assets under recovery, 37 numbers are from
non-performing assets and 31 numbers are performing assets.
18. It is clear that ZIDCO is investing mostly in the manufacturing, constructions and
service sectors. And also, investment is done by giving loans to entrepreneurs.
19. ZIDCO is a losing company but Grant-in-Aid (GIA) were received from the
Government of India for salary and for administrative expenses.
18
20. ZIDCO did not take their liabilities into account and is still having profits from their
project works and from the selling of liquor in the past years.
21. ZIDCO suffered huge losses due to insufficient repayment of loan and they do not
receive share capital contribution from the Government of Mizoram. Majority of the
loans are non-performing assets.
22. ZIDCO did not take any collateral security below the loan of Rs. 50,000\- and for the
operating vehicle loans. Collateral security is taken only above Rs. 50,000\- loans in
the form of Land Settlement Certificate.
23. If any loan becomes non-performing assets ZIDCO have taken measures in disposing
their Land Settlement Certificate (LSC). We have also found out that more than 100
Land & Building have been sold out to the public.
24. In order to be selected for receiving funds from ZIDCO the entrepreneurs have to
clearly knew about their proposal feasibility for industrial units. Entrepreneurs have to
pass through the screening committee in which they are questioning about their
proposed projects. The screening committee will be having an in-depth study of the
proposed project regarding management appraisal and financial appraisal.
25. Government servant people can avail Housing loan from ZIDCO and all the other
loans can be avail by non-government servant people only.
26. ZIDCO has given out 10 different kinds of loans i.e., Mahila Udyam Nidhi, Single
Window Scheme, Working Capital Loan, Composite Loan, Ex-Servicemen Loan,
Industrial Loan, Small Road Transport Operator (SRTO), Bamboo Loan, Housing
Loan, Ginger Loan.
27. Verification regarding implementation of the entrepreneur’s projects is conducted by
spot verifications and working progress to verified whether there is mis-appropriation
of funds before every installment are disbursed and if satisfied then the other
19
installments are disbursed accordingly.
28. When a loan becomes non-performing assets, they are referred to Lok Adalat for loan
recovery. And also, disposal of mortgaged Land Settlement Certificate (LSC) is
carried forward and recovery drive are also conducted every month or quarterly basis.
29. Loan becomes non-performing assets at the end of their payment period. The payment
period is at the maximum of 8 and half years.
30. The project or loan becomes non-performing assets base on the attitude of the loanees.
It is also found out that most of the loanees are well established but they have no
intention to repay the loan which is the main problem.
31. ZIDCO is not very much interested in giving loans due to insufficient repayment of
loans. They intended on turning ZIDCO sanction towards constructions for improving
their performance and also planned to change their names i.e., Zoram Industrial
Development Corporation Limited to Zoram Infrastructure and Industrial
Development Corporation Limited.
32. Different kinds of banks are ZIDCO competitors.
33. ZIDCO have more advantage than their competitors by giving low rate of interest
which is 7% only.
34. ZIDCO is having major portion of the market share in the last few years. As financial
institutions were not providing any further loans to ZIDCO, market share of ZIDCO is
decreasing.
35. ZIDCO is maintaining huge cash in the last previous years i.e., 2019-20 financial year
due to the maintenance of separated account for all the repayments made by the
loanees which increases the un-used cash i.e., cash and cash equivalents of ZIDCO.
36. ZIDCO is turning towards infrastructure development works in which they are
proposing different projects under the central government ministries but pending due
20
to the Covid-19 pandemic situation.
37. It was found out that there is an unclear future to when ZIDCO will be a debt free
Company. ZIDCO is depending on the Government of Mizoram to liquidated their
loans from National Minorities Development and Financing Corporation (NMDFC),
New Delhi and Housing and Urban Development Corporation Limited (HUDCO),
Kohima in order to get refinance from them.
38. ZIDCO have taken measures to reduce their administrative expenses and also, they are
turning towards infrastructure development works in which they will be taking
different projects to improve its financial performance.
5.2 Conclusions:
The key objectives of the study were to find out the financial performance of Zoram
Industrial Development Corporation Limited (ZIDCO) for the last five years starting from
2015-16 to 2019-20 financial year. This research gathered insightful information on the level
of their financial performance of ZIDCO from the last available Audited Financial Report
from 2015-16 to 2019-20 regarding their Ratio Analysis which shows their Profitability and
Efficiency Ratios, Liquidity Ratio and Solvency Ratios. The recovery process of loan is
studied with performing and non-performing assets and lastly, interview is carried forward
with the General Manager of ZIDCO regarding qualitative aspects of performance of
ZIDCO.
From the study we have found out that profitability ratios show positive result and
liquidity ratios shows a good financial position of ZIDCO. Solvency ratios also indicates
financial positions is in a safety margin and also shows that the long-term debts will be
secured by the assets. Activity ratios show that ZIDCO has to improved its inventory
management, trade receivables turnover and the used of its working capital. It is also found
out that Return on equity has to improve the utilization of shareholder funds more effectively.
Loan recovery rate is increasing and is at its highest rate in 2019-20 financial year which
shows that ZIDCO recovery position of loan is effective and efficient.
21
5.3 Suggestions:
Based on the conclusions arrived from the analysis of financial performance of
Zoram Industrial Development Corporation Limited (ZIDCO), the following suitable
suggestions are offered to improve the situation, the following suggestions are given.
5.3.1 Raising of Capital
From the Interview with General manager, it was found that ZIDCO were facing a
financial problem (New Capital infusion) for many years and also the organization was
making losses for a period of more than 10 years i.e., (2004-2014) ZIDCO was making profit
for the last 5 years i.e., 2015-16 to 2019-20 financial year. So, ZIDCO will be able to raise
capital by enlisting in stock markets such as Calcutta Stock Exchange (CSE), National Stock
Exchange of India Ltd (NSE), Bombay Stock Exchange Ltd (BSE), etc. This will help the
company to mitigate its capital related problem and enhanced capital will lead to more
business and profit.
5.3.2 Financing Mechanism
An entrepreneur pursuing financing facilities is still faced with difficulties in
securing bank financing even after being chosen by the selection committee. The selection
procedures should be updated in order to ensure simple funding of approved schemes. For the
past five years, Zoram Industrial Development Corporation Limited (ZIDCO) has been
profitable, but it continues to face challenges due to flaws in financial management, project
planning, implementation, operations management, and monitoring which shows that it
requires serious focus at this point of level in order to avoid future losses. ZIDCO may
generate new funds by listing in stock exchanges or finding new investors to increase its
capital.
5.3.3 Monitoring Mechanism
There is no proper control process in the current framework. Also, there is no
regular proper monitoring mechanism regarding implementation of the entrepreneur’s
projects. It is therefore proposed that there should be a proper monitoring system to provide a
practical image of jobs, functional units and accurate information to resolve grassroots
realities.
22
5.3.4 Convergence with other line departments
ZIDCO's key objectives are to support, advise, assist, finance, protect and promote
the interests of Industries in the state of Mizoram. In the meantime, different government
agencies have come up with the same inspiration and vision of encouraging people to start up
new businesses. So, information sharing with other similar institutions is required. The
ZIDCO projects would be more competitive and would have major impacts if these schemes
converged with the authority of ZIDCO.
5.3.5 Policy restructuring
ZIDCO’s needs to take constructive and effective measures to encourage
entrepreneurship in the state. Also, Zoram Industrial Development Corporation Limited
(ZIDCO) should restructure its financial management policy. ZIDCO had not implemented a
proper financial planning system, nor had it produced a business plan or resource forecasting
for debt repayment using borrowed funds from financial institutions.
Bibliography
Alban, R. (1978). Managing towards Accountability for performance. 13-14.
Adam, M.H.M. (2014). Evaluating the financial performance of banks using financial ratios:
A case study of Erbil bank for investment and finance. European Journal of
Accounting Auditing and Finance Research, 2(6), 162- 177.
Arab, R.O., Masoumi, S.S and Barati, A. (2015). Financial Performance of the Steel Industry
in India: A Critical Analysis. Middle-East Journal of Scientific Research, 23 (6),
1085-1090.
Altman, E. I. (1968). Financial Ratios, Discriminant Analysis and the Prediction of Corporate
Bankruptcy. The Journal of Finance, 23(4), 589-609.
Bhunia, A. (2010). Financial Performance of Indian Pharmaceutical Industry A Case Study.
23
Asian Journal of Management Research, 427-451.
Baruah, P. B., and Bezbaruah, M. P. (2020). Financial Access and Business Performance of
Urban Unorganised Sector Enterprises: A Study of Assam in Northeast India. The
Journal of Entrepreneurship, 1-9.
Bhat, R. and Nishant, J. (2006). Financial Performance of Private Sector Hospitals in India:
Some Further Evidence. Indian Management Institute of Ahmedabad, 1-31.
Capon, N., Farley, J.U. and Hoenig, S. (1990), Determinants of Financial Performance: A
Meta- Analysis. Management Science, 1143-1159.
Colney, R. (1997). Small Scale and Cottage Industries: Mizoram, First Edition, L.B
Associates: Aizawl.
Chakraborty, S.K. (1977). Corporate Capital Structure and Cost of capital: A Preliminary
Study of the Indian Private Sector. Calcutta. Institute of Cost and Works Accountants
of India.
Chen. J, (2018), Real Estate Investing. Retrieved June 30, 2020. From
https://www.investopedia.com/terms/f/funds-management.asp
Dutta, S. and Borah, S. (2016). Financial performance of food processing industries of
Assam. European Academic Research, 3 (12), 13090 – 13104.
Daga, U.R. (1985). Analysis of Financial Statement of Aluminium Industry in India. An
unpublished Doctoral Dissertation, University of Jodhpur.
Dey, S. and Choudhury, S. R. D. (2018). The Profitability and Liquidity Position of Selected
Small Enterprises in Shillong City of Meghalaya. The research journal of social
sciences, 9(7), 168-178.
Gaur, J, (2010). Financial Performance Measures of Business Group Companies: A Study of
Indian Non-Metallic Mineral Products Industries. The IUP Journal of Business
Strategy, 7(4), 46- 53.
24
Guisse, M. L. (2012). Financial performance of the Malaysian banking industry: Domestic
vs. foreign banks, Institute of Graduate Studies and Research. 1-53.
Goel, D.K., Goel, R. and Goel, S. (2017), Analysis of Financial Statement. Arya Publications,
Delhi.
Hargrave, M and Mansa, J. (2020). Corporate Finance & Accounting: Financial Ratios.
Retrieved May 13, 2020, from Investopedia.com: https://diz.ae/8XvWn
Haque, A. (2014). Comparison of financial performance of commercial banks: A case study
in the context of India, Journal of Finance and Bank Management, 2(2), 1-14.
Ijaz, F. and Naqvi, F. (2016). Financial Performance of Firms: Evidence from Pakistan
Cement Industry. Journal of Teaching and Education, 5(01), 81–94.
Kenton, W. (2020) Financial Performance. Retrieved March 11, 2020, from
Investopedia.com: https://diz.ae/0y4uc
Kangari, R., Farid, F and Elgharib, H.M, (1992). Financial Performance Analysis for
Construction Industry. Journal of Construction Engineering and Management, 118
(2), 349-361.
Kenton, W. (2018). Trading Skills & Essentials. Retrieved June 29, 2018, from
https://www.investopedia.com/terms/f/funds-management.asp
Kenton, W. (2020), Corporate Finance and Accounting. Retrieved June 23, 2020, from
https://www.investopedia.com/terms/c/costofcapital.asp
Krishna, D.A.R., and Pandey, D.S. (2013). An Analysis of Liquidity Position of Indian Steel
Industry. Journal of Commerce and Trade 8 (1,2), 19-27.
Karim, A.R. & Alam, T. (2013). An evaluation of financial performance of private
commercial banks in Bangladesh: Ratio analysis. Journal of Business Studies, 5(2),
66-77.
Kennedy, R.D. and Muller, S.Y.M. (1999). Analysis of Financial Statements, page no 1.3.
25
Khan, M.Y. and Jain, P.K. (2007). Financial Management, Text, Problems and Cases, Tata
McGraw Hill Publishing Company Ltd., New Delhi, 4th ed., 7: 21-22.
Kakati, S. and Roy, A. (2017). A Study on the Financial Performance of Farmer Producer
Companies with Special Reference to Northeast India. Amity Journal of Agribusiness
2(1), 38-57.
Lalbiakzuali, D. and Kumar, P.N.J. (2020). Financial Management in the State- Owned
Enterprises in Mizoram. IOSR Journal of Business and Management (IOSR-JBM),
22(5), 31-35.
Lalbiakzuali, D. and Kumar, P.N.J. (2020). Financial Management in Zoram Industrial
Development Corporation Ltd. (ZIDCO). International Journal of Advance Research
(IJAR), 8(05), 378-388
Lalmuanpuii, K. (2016). Mizoram Khadi & Village Industries Board for Promoting
Entrepreneurship. Ph. D, Thesis. Mizoram University.
Lalroluahpuia, C. (2016). A Study on the Performance of MSMEs in Lunglei District,
Mizoram. M. Phil, Dissertation. Mizoram University.
Low, J. (2018). Source of Wealth / Source of Funds (SOW / SOF). Retrieved April 29, 2018,
from https://aml-cft.net/library/source-wealth-source-fund-sow-sof/
Manisha, B. R. (2014). Financial Performance Analysis, Global Journal for Research
Analysis,9-10.
Milhem, M.M. and Istaiteyeh, R.M.S. (2015). Financial performance of Islamic and
conventional banks: Evidence from Jordan. Global Journal of Business Research,
9(3), 27-41.
Mansoori, E. (2012). The Effect of Working Capital Management on Firm’s Profitability:
Evidence from Singapore. Interdisciplinary Journal of Contemporary Research in
Business, 4(5), 472-486.
26
Minaxi, A. R. (2011). Introduction to Management Accounting, Page no.3-88.
Nataraja, N.S., Chilale, N.R. and Ganesh, L. (2018). Financial Performance of Private
Commercial Banks in India: Simple Regression Analysis. Academy of Accounting and
Financial Studies Journal, vol 22 (2), 1-12.
Ohlson, J. A. (1980). Financial Ratios and the Probabilistic Prediction of Bankruptcy.
Journal of Accounting Research, 18(1), 109-131.
Pal, S. (2012). Comparative study of financial performance of Indian steel companies under
globalization, International Journal of Accounting and Financial Management
Research (IJAFMR), 2(4), 1-8.
Pandey, I.M., (2008). Financial Management, Vikas Pub. House Pvt. Ltd., Noida, 9th ed.
Reprint, 520.
Priyaaks. (2012). Financial Performance Analysis. Int. J. Business Performance
Management, Vol. 5, Page no.7.
Patra, S. (2005). Liquidity Vs. Profitability. Indian Journal of Accounting, 35(2), 39-43.
Rodinga, H. (1991). A Study on The Development of Cottage and Small-Scale Industries in
Mizoram. Master’s Dissertation, North Eastern Hill University, Shillong
Rao, P. D. (1985). Impact of Debt Equity Ratio on Profitability — An Exploratory study of
Engineering Industry Lok Udyog. Journal of Finance Vol XV, 118-127.
Sharma, P.P. (2014) Financial Performance and Sustainability Issues of Subsidized and Non-
Subsidized Entities in North East India. Arthshastra Indian Journal of Economics and
Research, 3(6), 1-31.
Saikia, H. (2012). Measuring Financial Performance of Small-Scale Industries: Some
Evidences from India. Journal of Applied Economics and Business Research JAEBR,
2(1), 46-54.
Selvakumar, S. and Abima, D. (2020). Appraisal of Financial Performance of Regional Rural
27
Banks with Special Reference to Assam Gramin Vikash Bank, Maharashtra Gramin
Vikash Bank and Karnataka Gramin Vikash Bank. ternational Journal of Research in
Engineering, Science and Management, 3(12), 191-196.
Siddiqui, S. A. and Siddiqui, A. S. (2003). Financial Accountancy. Laxmi Publications (P)
Ltd. New Delhi.
Subramanian, T., 2009. Financial Performance of the Paper Mills in Tamil Nadu. Ph.D.
Thesis, University of Periyar, India.
Siddiqui, S. A. and Siddiqui, A.S. (2003). Accountancy. Laxmi Publications (P) Ltd. New
Delhi.
Thangasamy, E. (2013). Financial Performance of Nagaland Pulp & Paper Company Limited:
An Evaluative Study. International Research Journal of Commerce, Arts and Science,
4(3). 283-300.
Teruel, P. J. G., and Solano, P. M. (2007). Effects of Working Capital Management on SME
Profitability. International Journal of Managerial Finance, 3(2), 164–177.
Tauringana, V., and Afrifa, G. A. (2013). The Relative Importance of Working Capital
Management and Its Components to SMEs’ Profitability. Journal of Small Business
and Enterprise Development, 20(3), 453–469.
Tripathi P. C., (1991). Research Methodology, New Delhi: Sultan Chand & Sons.
Trivedi S.M., (2010). An Analysis of Financial Performance of State Road Transport
Corporation in Gujarat. Master’s Thesis. Saurashtra University, p.49.
Yalcin, N., Bayrakdaroglu, A., and Kahraman, C. (2011). Application of fuzzy multi- criteria
decision-making methods for financial performance evaluation of Turkish
manufacturing industries. Expert Systems with Applications, 39(1), 350–364.
Zala, Virambhai S., (2010). A Study of Productivity and Financial Efficiency of Textile
Industry of India, thesis PhD, Saurashtra University.
28
Zariyawati, M. A., Annuar, M. N., Taufiq, H. and Rahim, A. S. A. (2009). Working capital
management and corporate performance: Case of Malaysia. Journal of Modern
Accounting and Auditing, 5(11), 47-54.
Related Documents