K A I S E R C O M M I S S I O N Medicaid and the Uninsured Figure 1 Medicaid: The Basics Diane Rowland, Sc.D. Executive Director Kaiser Commission on Medicaid and the Uninsured and Executive Vice President Kaiser Family Foundation June 2005 KaiserEDU.org Tutorial

K A I S E R C O M M I S S I O N O N Medicaid and the Uninsured Figure 0 Medicaid: The Basics Diane Rowland, Sc.D. Executive Director Kaiser Commission.
Dec 14, 2015
Welcome message from author
This document is posted to help you gain knowledge. Please leave a comment to let me know what you think about it! Share it to your friends and learn new things together.
Transcript
K A I S E R C O M M I S S I O N O N
Medicaid and the Uninsured
Figure 1
Medicaid: The Basics
Diane Rowland, Sc.D.
Executive Director
Kaiser Commission on Medicaid and the Uninsured
and
Executive Vice President Kaiser Family Foundation
June 2005KaiserEDU.org Tutorial
K A I S E R C O M M I S S I O N O N
Medicaid and the Uninsured
Figure 2
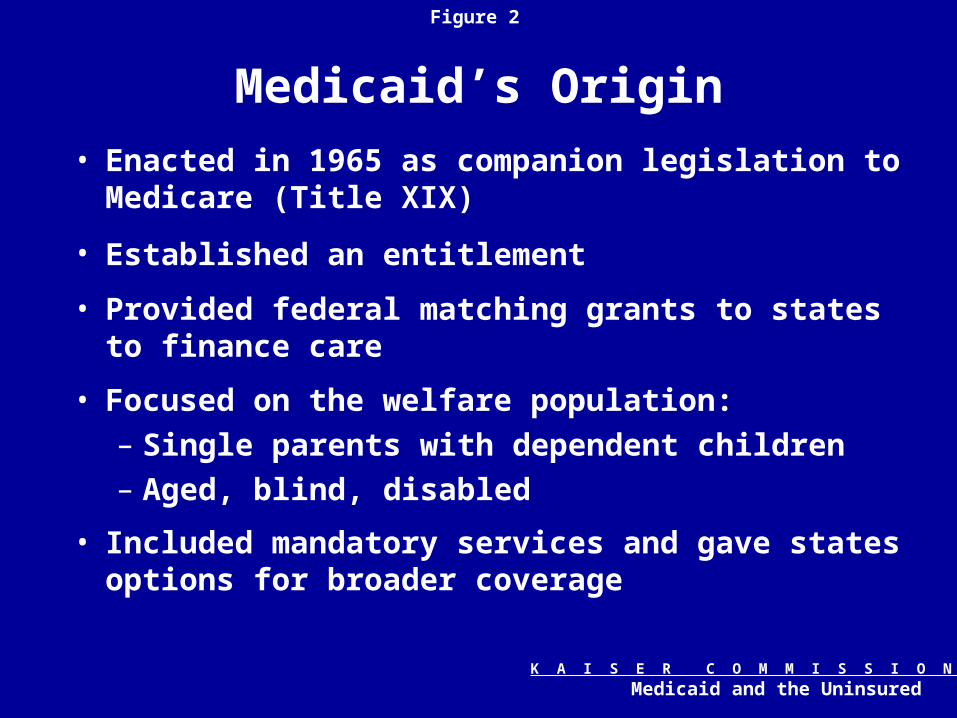
Medicaid’s Origin
• Enacted in 1965 as companion legislation to Medicare (Title XIX)
• Established an entitlement
• Provided federal matching grants to states to finance care
• Focused on the welfare population: – Single parents with dependent children– Aged, blind, disabled
• Included mandatory services and gave states options for broader coverage
K A I S E R C O M M I S S I O N O N
Medicaid and the Uninsured
Figure 3
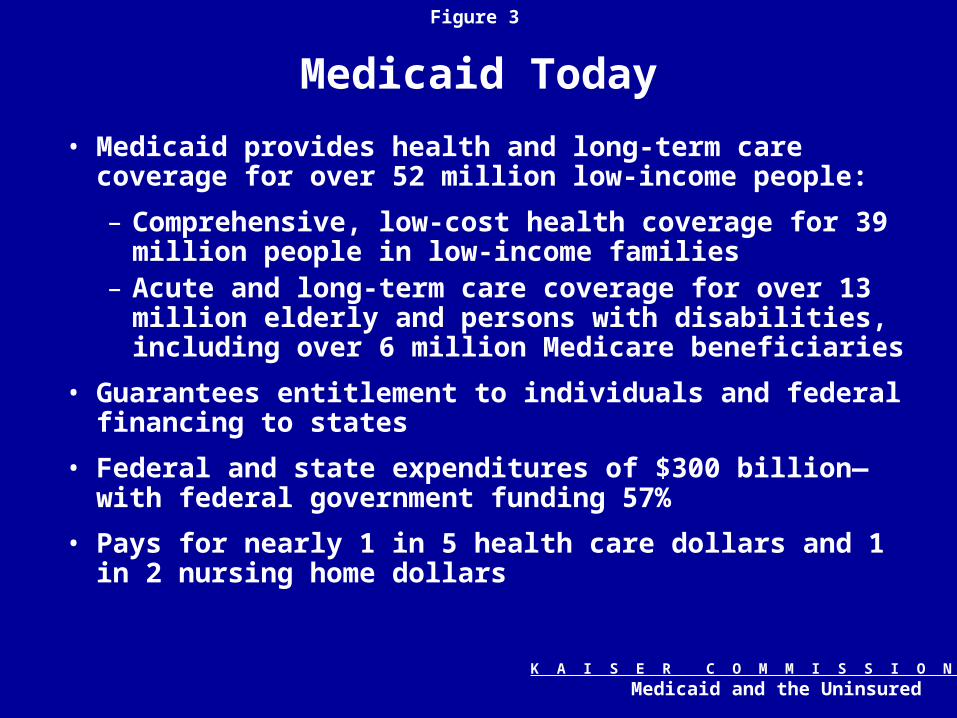
Medicaid Today
• Medicaid provides health and long-term care coverage for over 52 million low-income people:
– Comprehensive, low-cost health coverage for 39 million people in low-income families
– Acute and long-term care coverage for over 13 million elderly and persons with disabilities, including over 6 million Medicare beneficiaries
• Guarantees entitlement to individuals and federal financing to states
• Federal and state expenditures of $300 billion—with federal government funding 57%
• Pays for nearly 1 in 5 health care dollars and 1 in 2 nursing home dollars
K A I S E R C O M M I S S I O N O N
Medicaid and the Uninsured
Figure 4
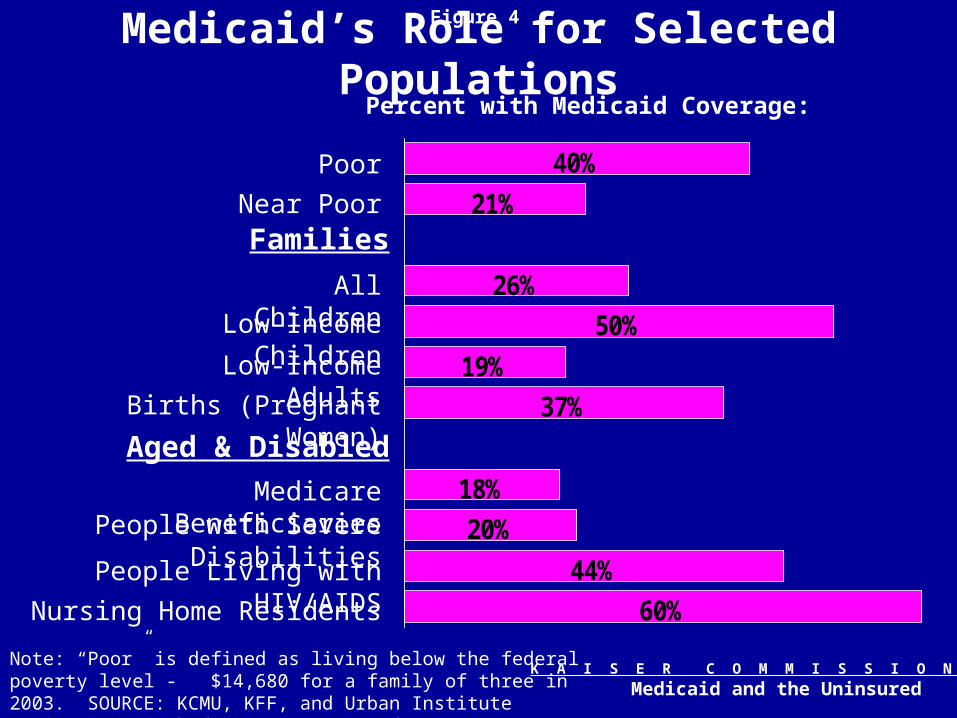
Medicaid’s Role for Selected Populations
Note: “Poor” is defined as living below the federal poverty level - $14,680 for a family of three in 2003. SOURCE: KCMU, KFF, and Urban Institute estimates; Birth data: NGA, MCH Update.
60%
44%
19%
50%
18%
20%
26%
40%
37%
21%
Percent with Medicaid Coverage:
Families
Aged & Disabled
Poor
Near Poor
All Children
Low-Income Children
Low-Income Adults
Births (Pregnant Women)
Medicare BeneficiariesPeople with Severe Disabilities
People Living with HIV/AIDS
Nursing Home Residents
K A I S E R C O M M I S S I O N O N
Medicaid and the Uninsured
Figure 5
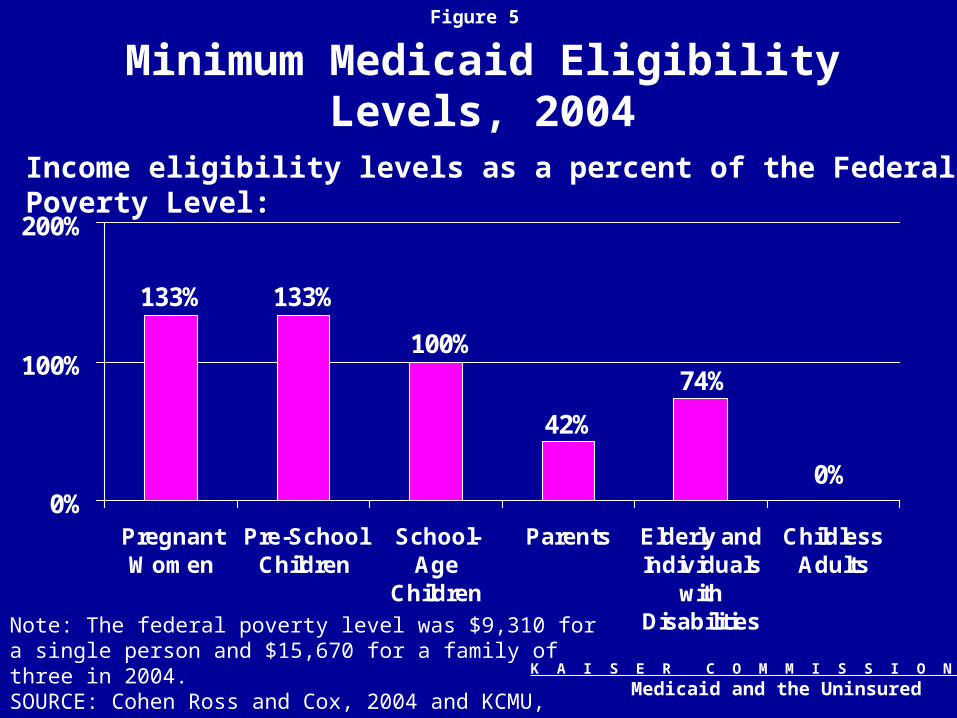
Minimum Medicaid Eligibility Levels, 2004
133%133%
100%
42%
74%
0%0%
100%
200%
PregnantWomen
Pre-SchoolChildren
School-Age
Children
Parents Elderly andIndividuals
withDisabilities
ChildlessAdults
Note: The federal poverty level was $9,310 for a single person and $15,670 for a family of three in 2004. SOURCE: Cohen Ross and Cox, 2004 and KCMU, Medicaid Resource Book, 2002.
Income eligibility levels as a percent of the Federal Poverty Level:
K A I S E R C O M M I S S I O N O N
Medicaid and the Uninsured
Figure 6
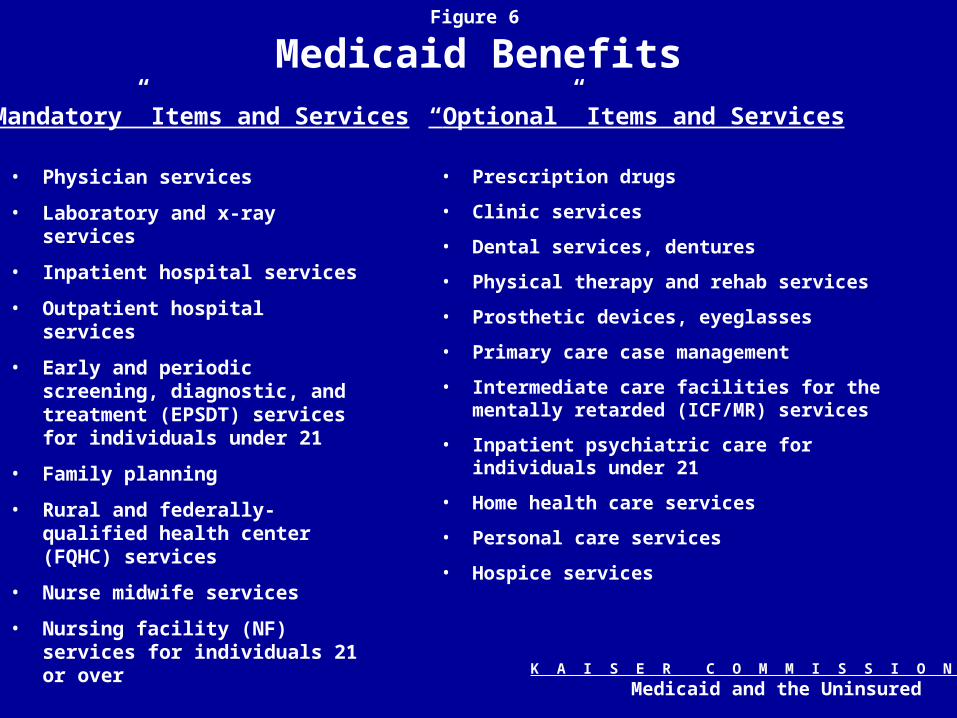
Medicaid Benefits
• Physician services
• Laboratory and x-ray services
• Inpatient hospital services
• Outpatient hospital services
• Early and periodic screening, diagnostic, and treatment (EPSDT) services for individuals under 21
• Family planning
• Rural and federally-qualified health center (FQHC) services
• Nurse midwife services
• Nursing facility (NF) services for individuals 21 or over
• Prescription drugs
• Clinic services
• Dental services, dentures
• Physical therapy and rehab services
• Prosthetic devices, eyeglasses
• Primary care case management
• Intermediate care facilities for the mentally retarded (ICF/MR) services
• Inpatient psychiatric care for individuals under 21
• Home health care services
• Personal care services
• Hospice services
“Mandatory” Items and Services “Optional” Items and Services
K A I S E R C O M M I S S I O N O N
Medicaid and the Uninsured
Figure 7
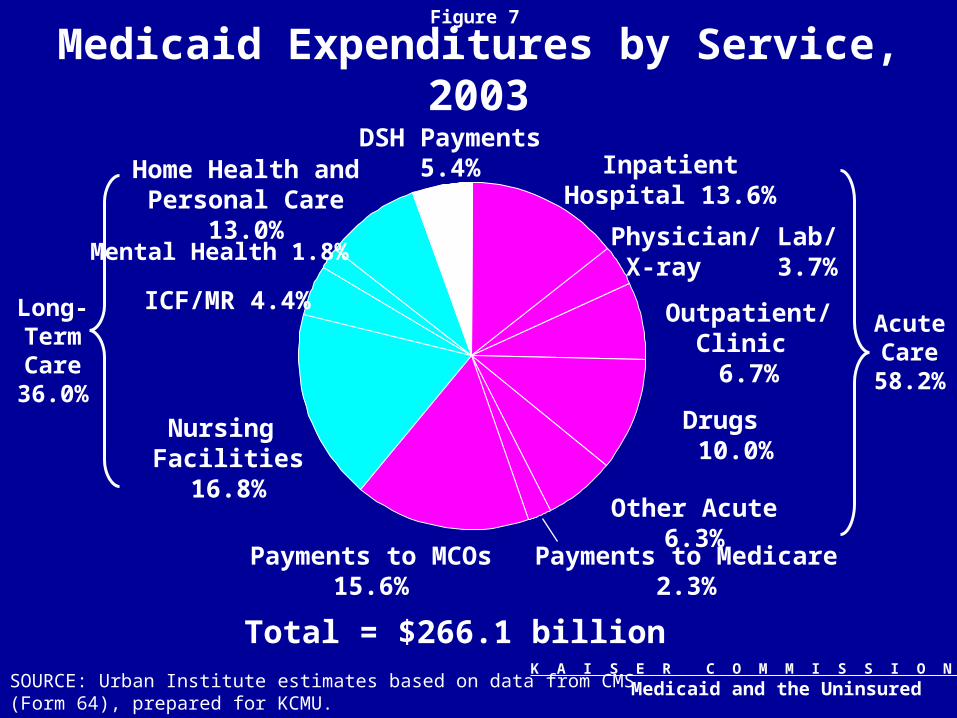
Medicaid Expenditures by Service, 2003
Total = $266.1 billionSOURCE: Urban Institute estimates based on data from CMS (Form 64), prepared for KCMU.
Inpatient Hospital 13.6%
Physician/ Lab/ X-ray 3.7%
Outpatient/Clinic 6.7%
Drugs 10.0%
Other Acute 6.3%
Payments to MCOs 15.6%
Nursing Facilities 16.8%
ICF/MR 4.4%
Mental Health 1.8%
Home Health and Personal Care 13.0%
Payments to Medicare 2.3%
DSH Payments5.4%
AcuteCare
58.2%
Long-TermCare
36.0%

K A I S E R C O M M I S S I O N O N
Medicaid and the Uninsured
Figure 8
Enrollees Expenditures
Medicaid Enrollees and Expendituresby Enrollment Group, 2003
Note: Total expenditures on benefits excludes DSH payments. SOURCE: KCMU estimates based on CBO and OMB data, 2004.
Children 19%
Elderly26%
Disabled43%
Adults 12%Children
48%
Elderly9%
Disabled16%
Adults27%
Total = 52.4 million Total = $252 billion
K A I S E R C O M M I S S I O N O N
Medicaid and the Uninsured
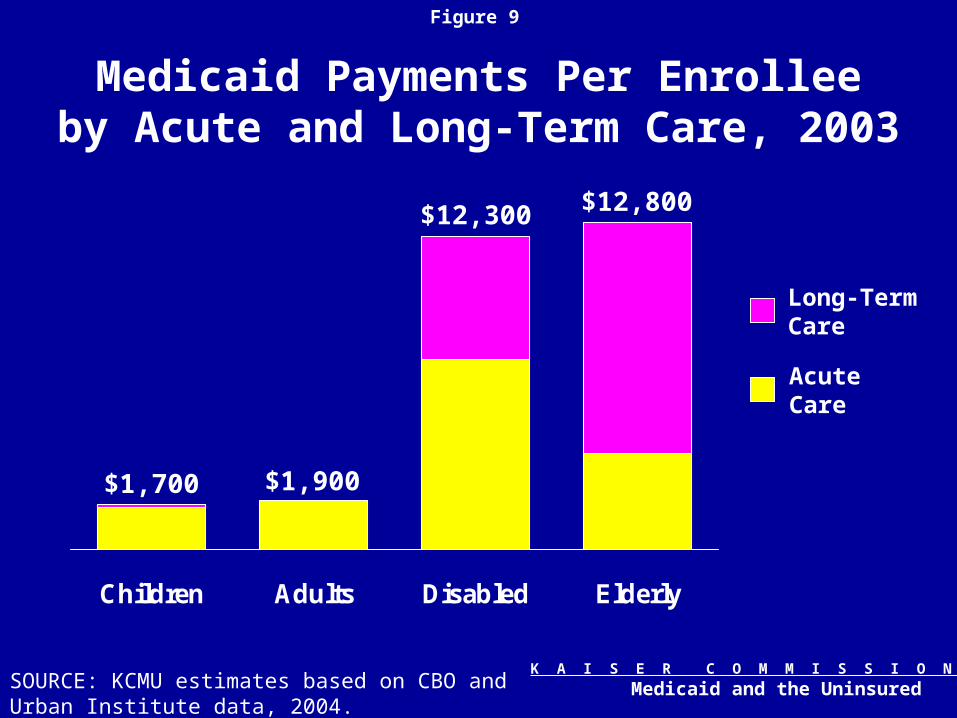
Figure 9
Medicaid Payments Per Enrolleeby Acute and Long-Term Care, 2003
Children Adults Disabled Elderly
$1,700 $1,900
$12,300 $12,800
SOURCE: KCMU estimates based on CBO and Urban Institute data, 2004.
Long-TermCare
AcuteCare
K A I S E R C O M M I S S I O N O N
Medicaid and the Uninsured
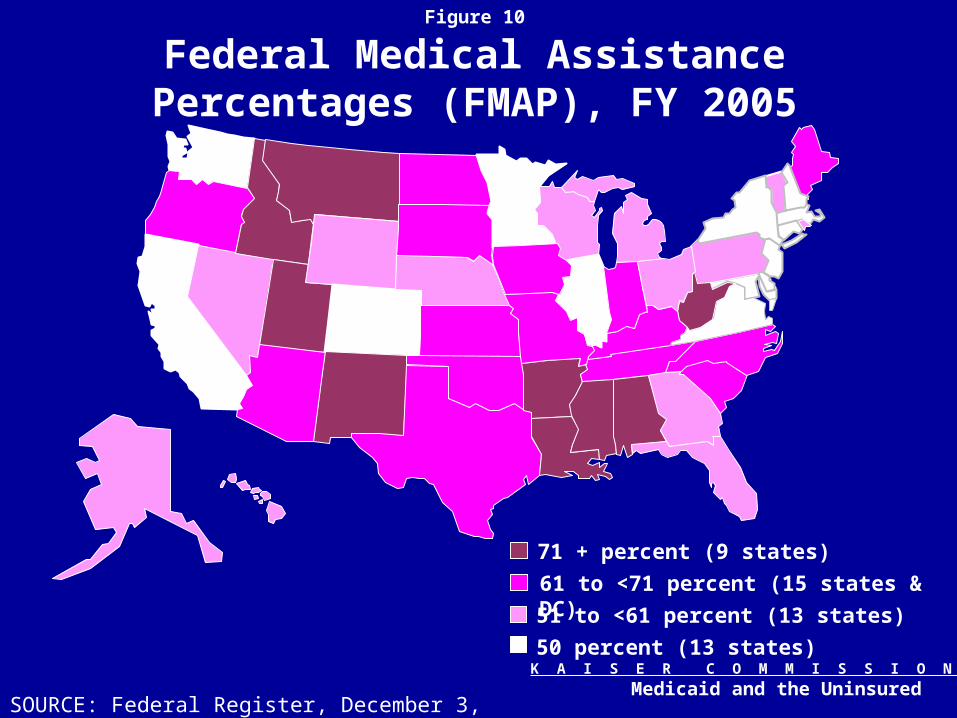
Figure 10
Federal Medical Assistance Percentages (FMAP), FY 2005
50 percent (13 states)
61 to <71 percent (15 states & DC)
51 to <61 percent (13 states)
71 + percent (9 states)
SOURCE: Federal Register, December 3, 2003

K A I S E R C O M M I S S I O N O N
Medicaid and the Uninsured
Figure 11
16%
28%
16%
37%
40%
61%
43%
26%
51%
20%
42%
16%
40%
46%
33%
43%
17%
23%
Medicaid/Other Public Employer/Other Private Uninsured
Poor
Near-Poor(<100% Poverty)
(100-199% Poverty)
Poor
Near-Poor(<100% Poverty)
(100-199% Poverty)
Poor
Near-Poor(<100% Poverty)
(100-199% Poverty)
Children
Parents
Adults without children
Note: Medicaid/Other Public includes SCHIP and other state programs, Medicare, and military-related coverage. The federal poverty level was $14,680 for a family of three in 2003. SOURCE: KCMU and Urban Institute analysis of March 2004 Current Population Survey.
Medicaid’s Role for Children and Adults, 2003

K A I S E R C O M M I S S I O N O N
Medicaid and the Uninsured
Figure 12
Medicaid’s Impact on Access to Health Care
13%16%
6%7%
20%
5%
30%
41%
24%
Medicaid Private UninsuredPercent Reporting
Did Not ReceiveNeeded Care
No Pap Test in Past Two Years
No Regular Source of Care
Adults Women Children
SOURCES: The 1997 Kaiser/Commonwealth National Survey of Health Insurance; Kaiser Women’s Health Survey, 2004; Dubay and Kenney, Health Affairs, 2001.

K A I S E R C O M M I S S I O N O N
Medicaid and the Uninsured
Figure 13
Medicaid Enrollees are Poorer and Sicker Than The Low-Income Privately Insured Population
61%
48%
69%
16% 15%
27%
0%
25%
50%
75%
100%
Percent of Enrolled Adults:
Poor Health Conditions that limit work
Fair or Poor Health
SOURCE: Coughlin et. al, 2004 based on a 2002 NSAF analysis for KCMU.
Medicaid Low-Income andPrivately Insured
K A I S E R C O M M I S S I O N O N
Medicaid and the Uninsured
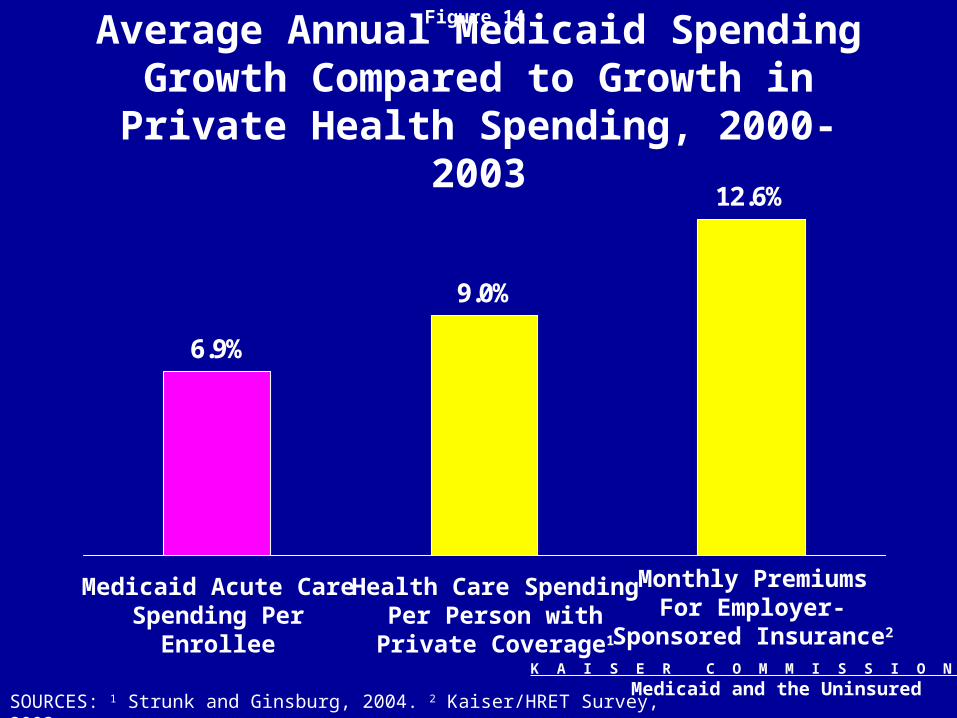
Figure 14
Average Annual Medicaid Spending Growth Compared to Growth in Private
Health Spending, 2000-2003
6.9%
9.0%
12.6%
Medicaid Acute CareSpending Per
Enrollee
Health Care SpendingPer Person with
Private Coverage1
Monthly PremiumsFor Employer-
Sponsored Insurance2
SOURCES: 1 Strunk and Ginsburg, 2004. 2 Kaiser/HRET Survey, 2003.
K A I S E R C O M M I S S I O N O N
Medicaid and the Uninsured
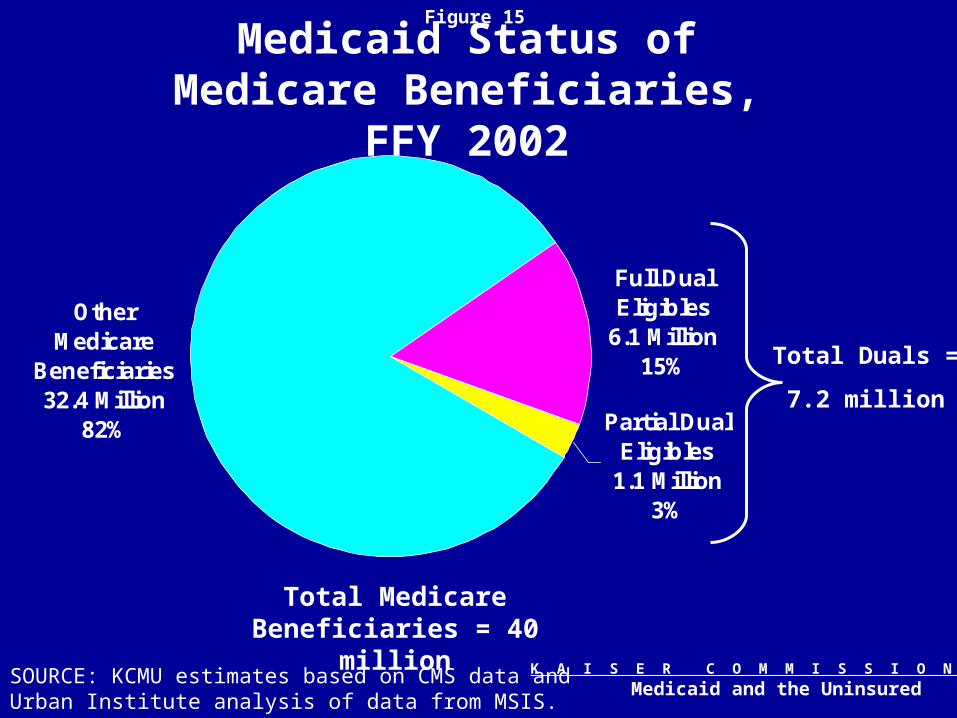
Figure 15
Other Medicare
Beneficiaries32.4 Million
82%
Full Dual Eligibles
6.1 Million 15%
Partial DualEligibles
1.1 Million 3%
Total Medicare Beneficiaries = 40 million
SOURCE: KCMU estimates based on CMS data and Urban Institute analysis of data from MSIS.
Total Duals =
7.2 million
Medicaid Status of Medicare Beneficiaries, FFY 2002
K A I S E R C O M M I S S I O N O N
Medicaid and the Uninsured
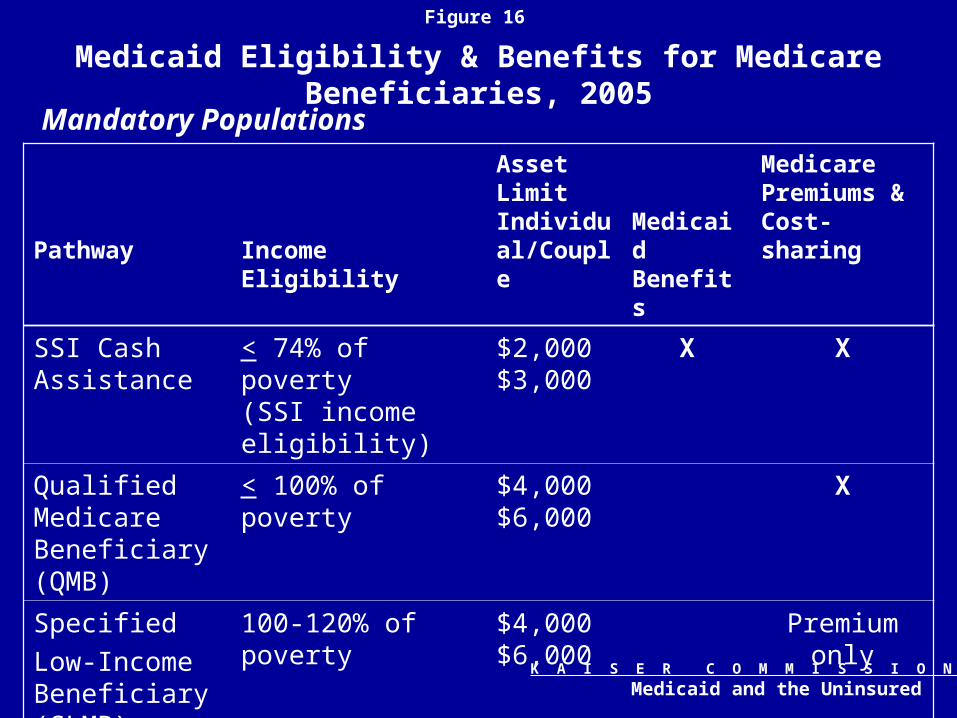
Figure 16
Medicaid Eligibility & Benefits for Medicare Beneficiaries, 2005
Pathway Income Eligibility
Asset LimitIndividual/Couple
Medicaid Benefits
Medicare Premiums & Cost-sharing
SSI Cash Assistance
< 74% of poverty(SSI income eligibility)
$2,000$3,000
X X
Qualified Medicare Beneficiary (QMB)
< 100% of poverty $4,000$6,000
X
Specified
Low-Income Beneficiary (SLMB)
100-120% of poverty
$4,000$6,000
Premium only
Mandatory Populations
K A I S E R C O M M I S S I O N O N
Medicaid and the Uninsured
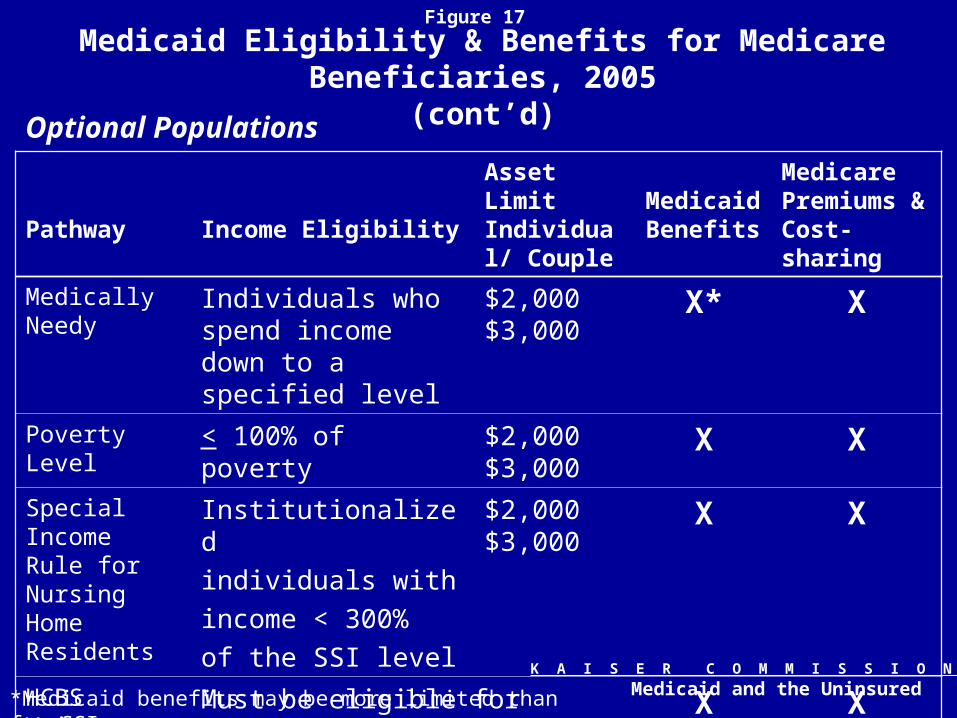
Figure 17
Medicaid Eligibility & Benefits for Medicare Beneficiaries, 2005(cont’d)
Pathway Income Eligibility
Asset LimitIndividual/ Couple
Medicaid Benefits
Medicare Premiums & Cost-sharing
Medically Needy
Individuals who spend income down to a specified level
$2,000$3,000
X* X
Poverty Level < 100% of poverty $2,000$3,000
X X
Special Income Rule for Nursing Home Residents
Institutionalized
individuals with
income < 300%
of the SSI level
$2,000$3,000
X X
HCBS Waivers
Must be eligible for institutional care X X
Optional Populations
*Medicaid benefits may be more limited than for SSI.

K A I S E R C O M M I S S I O N O N
Medicaid and the Uninsured
Figure 18
14%
24%
28%
22%
52%
11%
24%
13%
2%
9%
17%
71%
Stroke
Diabetes
MentalDisorders
Reside in LTCFacility
Income Below$10,000
Fair/Poor HealthStatus*
Dual Enrollees (MedicareBeneficiaries with Medicaid - 7.2 m)
Other Medicare Beneficiaries (32.4 m)
Dual Enrollees are Poorer and Sicker ThanOther Medicare Beneficiaries
*Community-residing individuals only.SOURCE: KCMU estimates based on analysis of MCBS Cost & Use 2000.
K A I S E R C O M M I S S I O N O N
Medicaid and the Uninsured
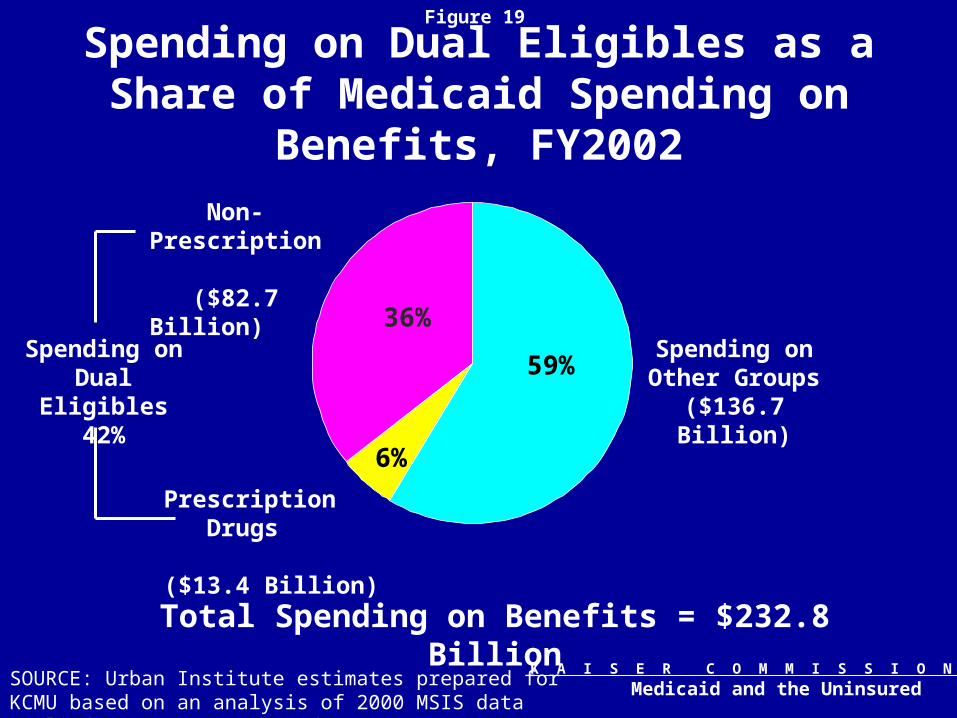
Figure 19
Spending on Dual Eligibles as a Share of Medicaid Spending on Benefits, FY2002
Total Spending on Benefits = $232.8 Billion
SOURCE: Urban Institute estimates prepared for KCMU based on an analysis of 2000 MSIS data applied to CMS-64 FY2002 data.
Spending on Dual Eligibles
42%
Prescription Drugs
($13.4 Billion)
Non-Prescription ($82.7 Billion)
Spending on Other Groups ($136.7 Billion)
36%
59%
6%
K A I S E R C O M M I S S I O N O N
Medicaid and the Uninsured
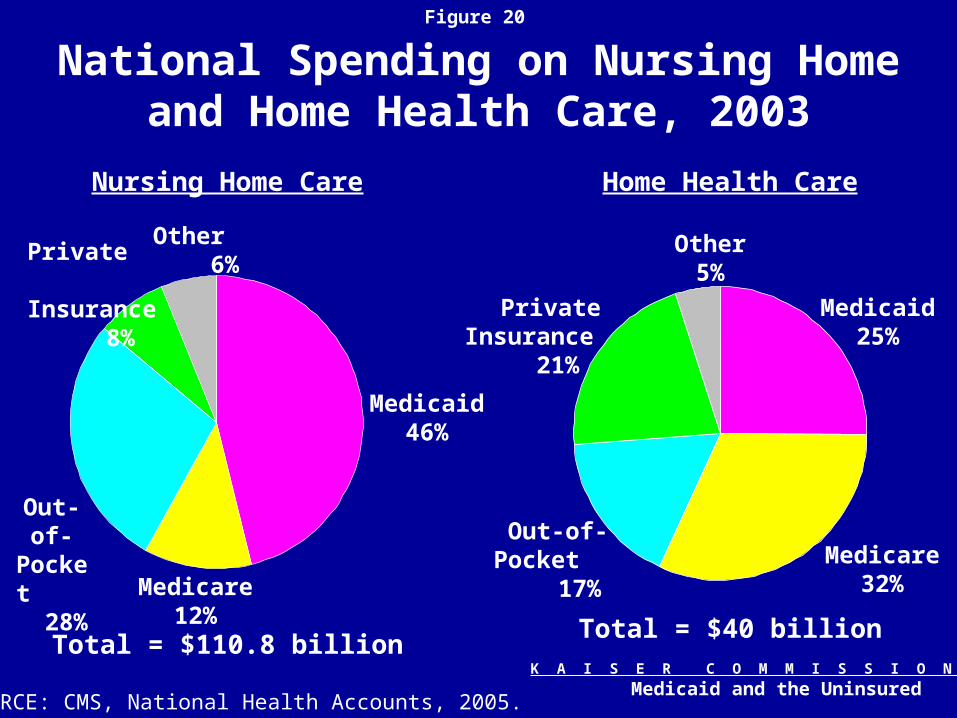
Figure 20
National Spending on Nursing Home and Home Health Care, 2003
Total = $110.8 billion
SOURCE: CMS, National Health Accounts, 2005.
Total = $40 billion
Nursing Home Care Home Health Care
Medicaid 46%
Medicare 12%
Out-of-Pocket
28%
Private Insurance
8%
Other 6%
Medicaid 25%
Medicare 32%
Out-of-Pocket
17%
Private Insurance
21%
Other 5%
K A I S E R C O M M I S S I O N O N
Medicaid and the Uninsured
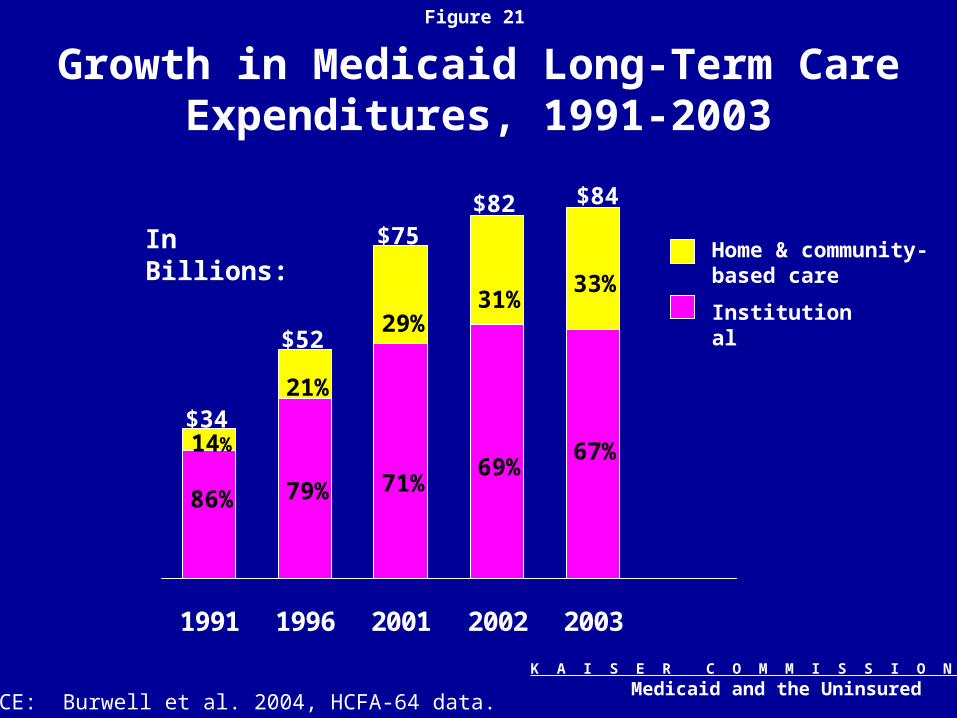
Figure 21
Growth in Medicaid Long-Term Care Expenditures, 1991-2003
1991 1996 2001 2002 2003
$34
$52
$75
86% 79% 71%
SOURCE: Burwell et al. 2004, HCFA-64 data.
In Billions:
14%
21%
29%31%
69%
$82 $84
33%
67%
Home & community-based care
Institutional

K A I S E R C O M M I S S I O N O N
Medicaid and the Uninsured
Figure 22
Average Annual Growth in Medicaid Expenditures, 1991-2003
27.0%
10.0%
3.6%
7.8%
11.8%
7.1%
1991-1992 '92-'95 '95-'98 '98-2000 '00-'02 '02-'03
SOURCE: Urban Institute, 2005; data from HCFA Financial Management Reports, 2004 (HCFA-64/CMS-64).

K A I S E R C O M M I S S I O N O N
Medicaid and the Uninsured
Figure 23
Growing Pressure on Government Spending
Medicaid17%
Public Assistance
2%Higher
Education12%
K-12 Education
35%
All Other34%
SOURCE: CBO, Baseline Budget Outlook, January 2005; National Association of State Budget Officers, 2003 State Expenditure Report, 2004.
State General Fund Spending
Total = $499 BillionTotal = $2.3 Trillion
Federal Outlays
Medicaid/ SCHIP
7%
Net Interest7%
Nondefense Discretionary
18%
Defense Discretionary
19%
Social Security
21%
Medicare12%
Other16%
K A I S E R C O M M I S S I O N O N
Medicaid and the Uninsured
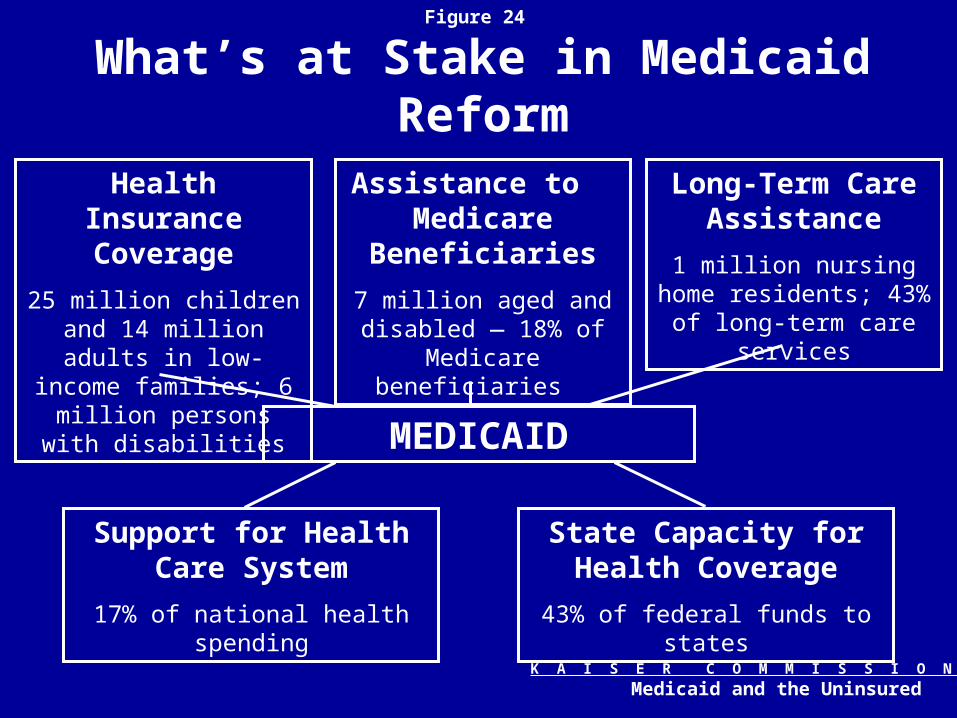
Figure 24
What’s at Stake in Medicaid Reform
Health Insurance Coverage
25 million children and 14 million adults in low-
income families; 6 million persons with disabilities
State Capacity for Health Coverage
43% of federal funds to states
MEDICAID
Support for Health Care System
17% of national health spending
Assistance to Medicare
Beneficiaries
7 million aged and disabled — 18% of
Medicare beneficiaries
Long-Term Care Assistance
1 million nursing home residents; 43% of long-
term care services
Related Documents