USING NCVS FOR SUBNATIONAL ESTIMATES OF VICTIMIZATION: A BJS UPDATE Justice Research and Statistics Association 720 7th Street, NW, Third Floor Washington, DC 20001 www.jrsa.org April 10, 2014 Training and Technical Assistance Webinar Series

Justice Research and Statistics Association 720 7th Street, NW, Third Floor Washington, DC 20001 April 10, 2014.
Dec 14, 2015
Welcome message from author
This document is posted to help you gain knowledge. Please leave a comment to let me know what you think about it! Share it to your friends and learn new things together.
Transcript
USING NCVS FOR SUBNATIONAL ESTIMATES OF
VICTIMIZATION: A BJS UPDATE
Justice Research and Statistics Association720 7th Street, NW, Third FloorWashington, DC 20001www.jrsa.org
April 10, 2014
Training and Technical Assistance Webinar Series

Subnational Estimates of VictimizationA BJS Update
Michael Planty, Ph.D.Victimization Unit Chief
Overview• National Crime Victimization Survey (NCVS):Basics
• Subnational Program: Approaches– Direct– Model-Based– Local victimization surveys
• Next Steps

NCVS Basics
• Omnibus Crime Survey: focus on violence and property crime
• Annual victimization counts/rates
• Provides a national measure of change
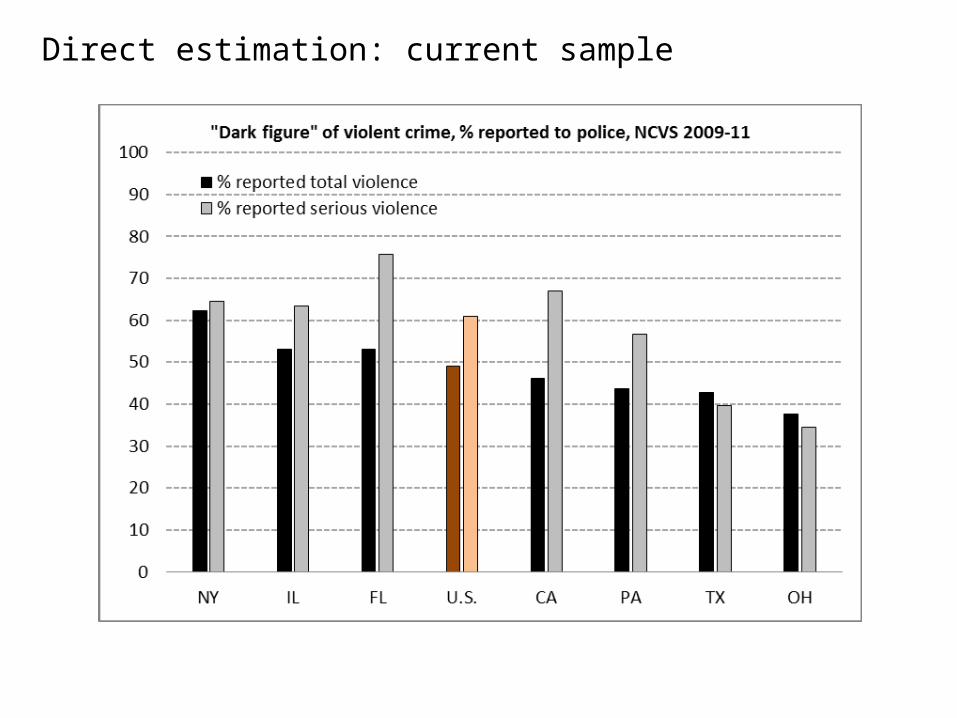
• “Dark figure”- unreported crime
• Standardized data collection process and instrument
• Incident and attribute based collection
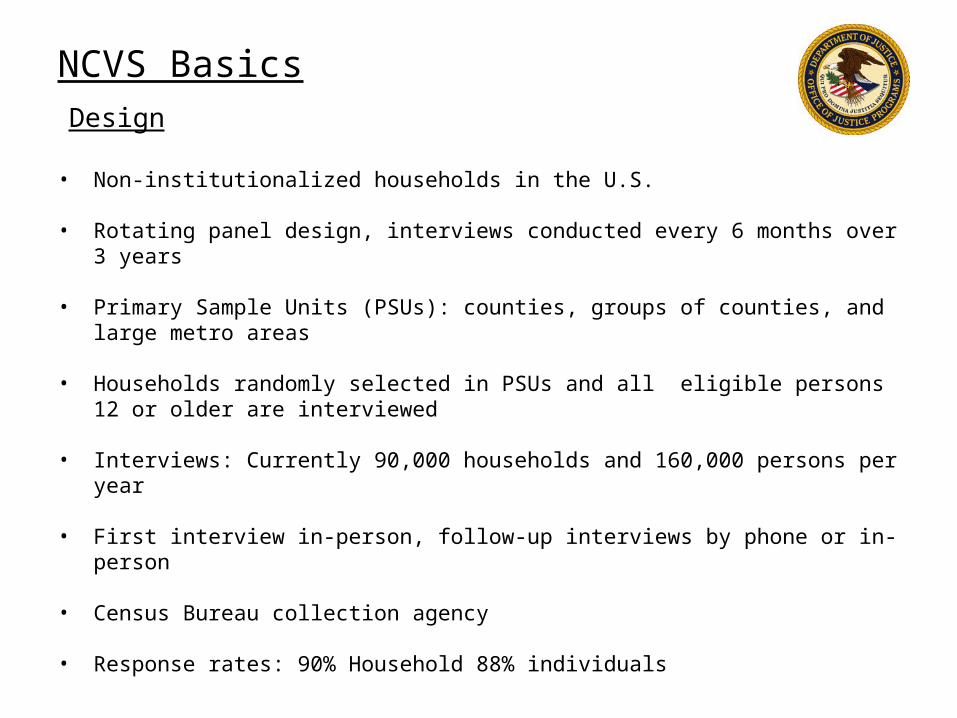
NCVS BasicsDesign
• Non-institutionalized households in the U.S.
• Rotating panel design, interviews conducted every 6 months over 3 years
• Primary Sample Units (PSUs): counties, groups of counties, and large metro areas
• Households randomly selected in PSUs and all eligible persons 12 or older are interviewed
• Interviews: Currently 90,000 households and 160,000 persons per year
• First interview in-person, follow-up interviews by phone or in-person
• Census Bureau collection agency
• Response rates: 90% Household 88% individuals
NCVS Subnational Program
• Needs and purpose
• Current limitations/challenges
• BJS approaches

Subnational Efforts: Needs and Purpose
NCVS Redesign and Modernization Activities
1. Cost Containment and Response Rates2. Increasing quality in field operations and processing3. Expand Portfolio of Products
• Access• Relevance• Timeliness
4. Sample Redesign- flexible and subnational focus5. Modernize instrument
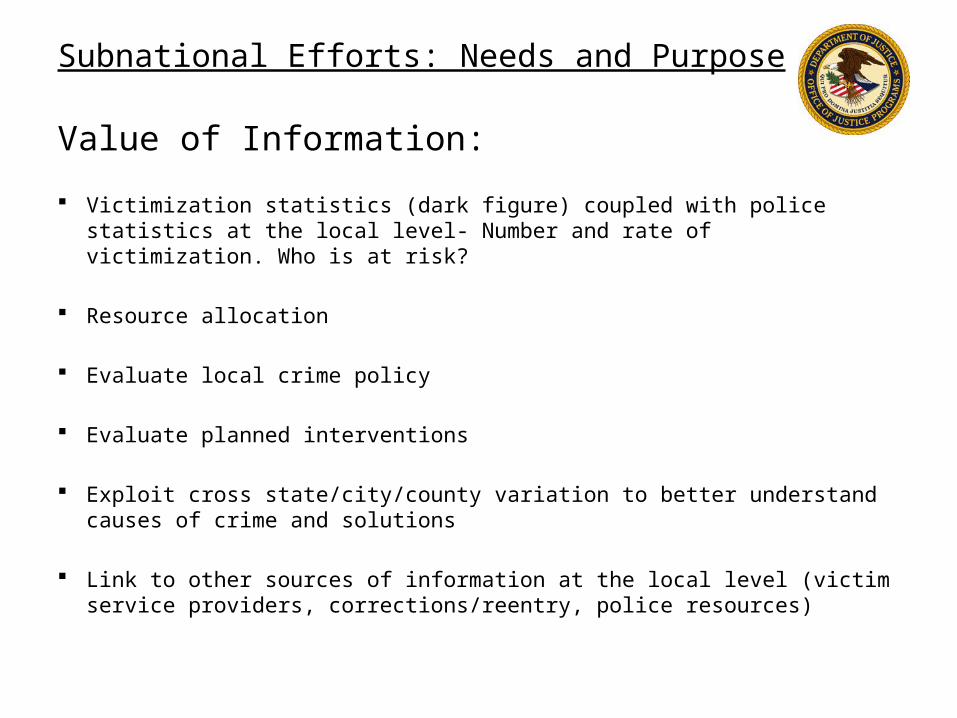
Subnational Efforts: Needs and Purpose
Value of Information:
Victimization statistics (dark figure) coupled with police statistics at the local level- Number and rate of victimization. Who is at risk?
Resource allocation
Evaluate local crime policy
Evaluate planned interventions
Exploit cross state/city/county variation to better understand causes of crime and solutions
Link to other sources of information at the local level (victim service providers, corrections/reentry, police resources)
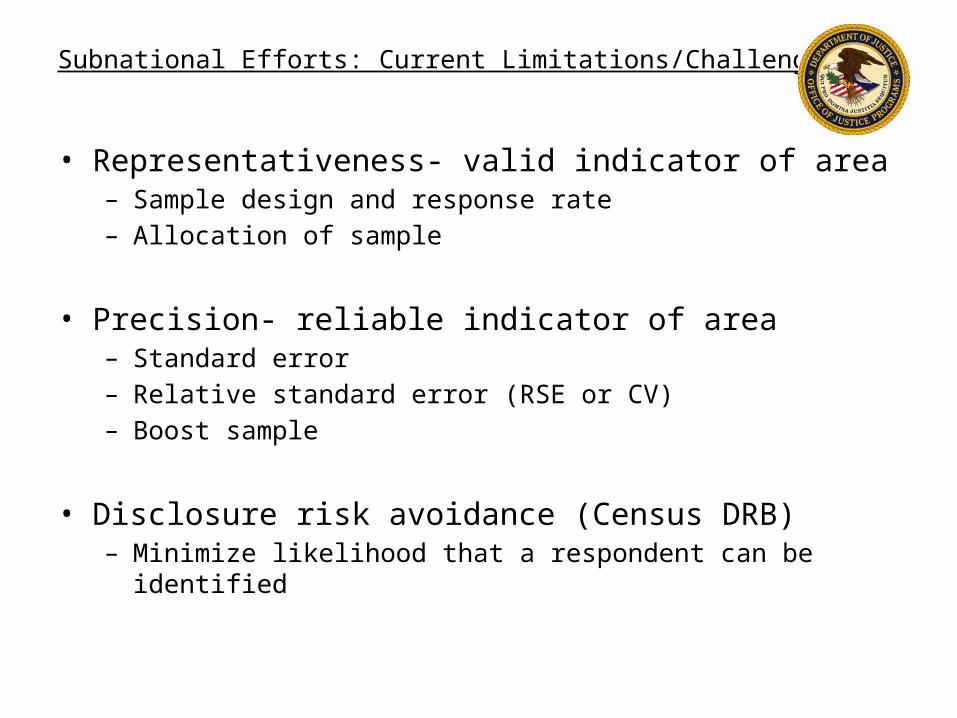
Subnational Efforts: Current Limitations/Challenges
• Representativeness- valid indicator of area– Sample design and response rate– Allocation of sample
• Precision- reliable indicator of area– Standard error– Relative standard error (RSE or CV)– Boost sample
• Disclosure risk avoidance (Census DRB)– Minimize likelihood that a respondent can be identified

Subnational Efforts: Current Limitations/Challenges
• Current NCVS sample is designed to be representative at the national-level, not necessarily for states, cities, or other smaller geographic areas
• Smaller geographic areas:– Lack reliability- small sample sizes lack precision– Representation- existing sample may not represent the
area
• Subsequently, can’t say much about specific states, cities, etc.
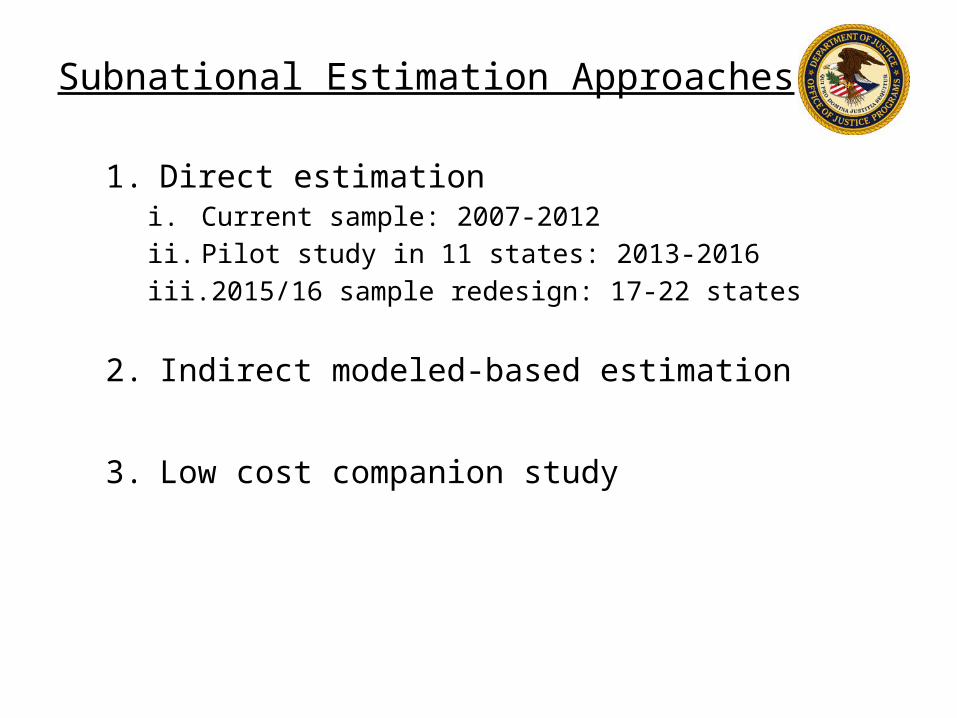
Subnational Estimation Approaches
1. Direct estimationi. Current sample: 2007-2012ii. Pilot study in 11 states: 2013-2016iii. 2015/16 sample redesign: 17-22 states
2. Indirect modeled-based estimation
3. Low cost companion study
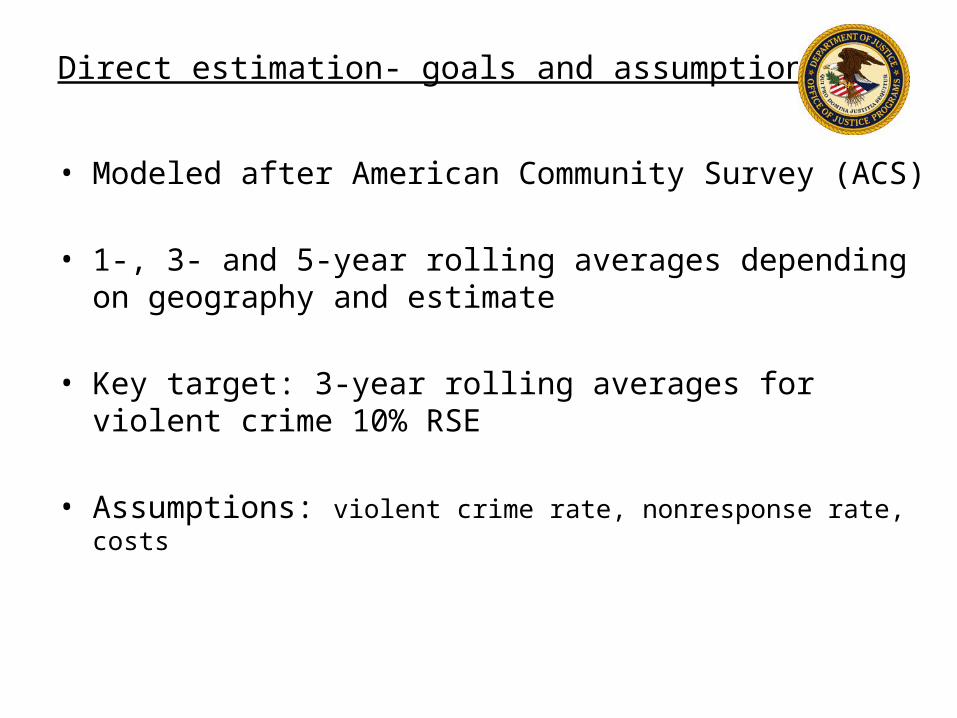
Direct estimation- goals and assumptions
• Modeled after American Community Survey (ACS)
• 1-, 3- and 5-year rolling averages depending on geography and estimate
• Key target: 3-year rolling averages for violent crime 10% RSE
• Assumptions: violent crime rate, nonresponse rate, costs
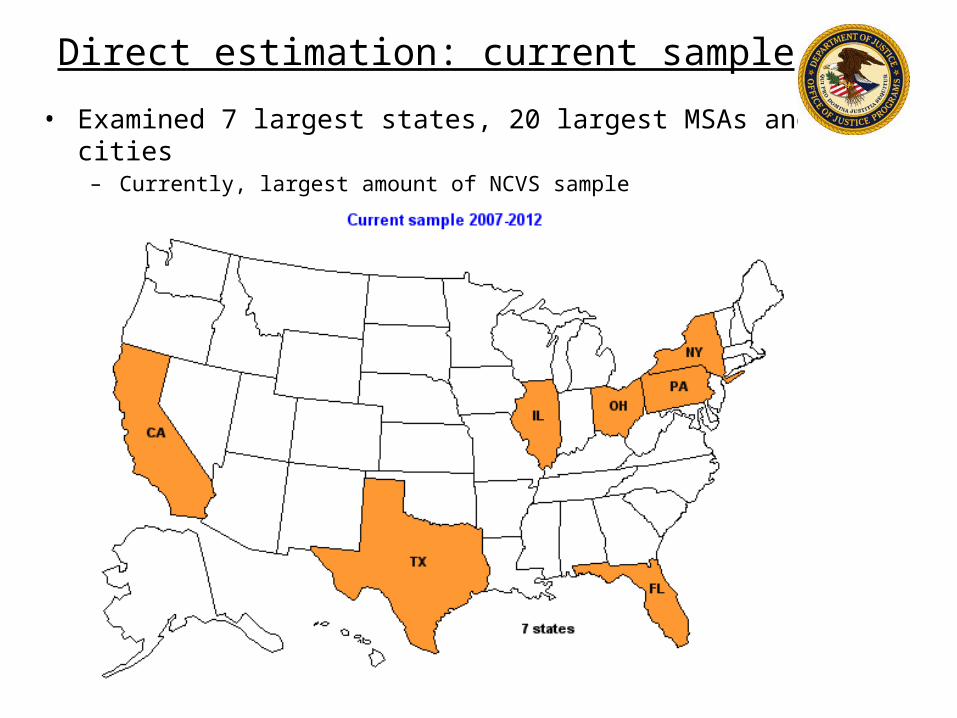
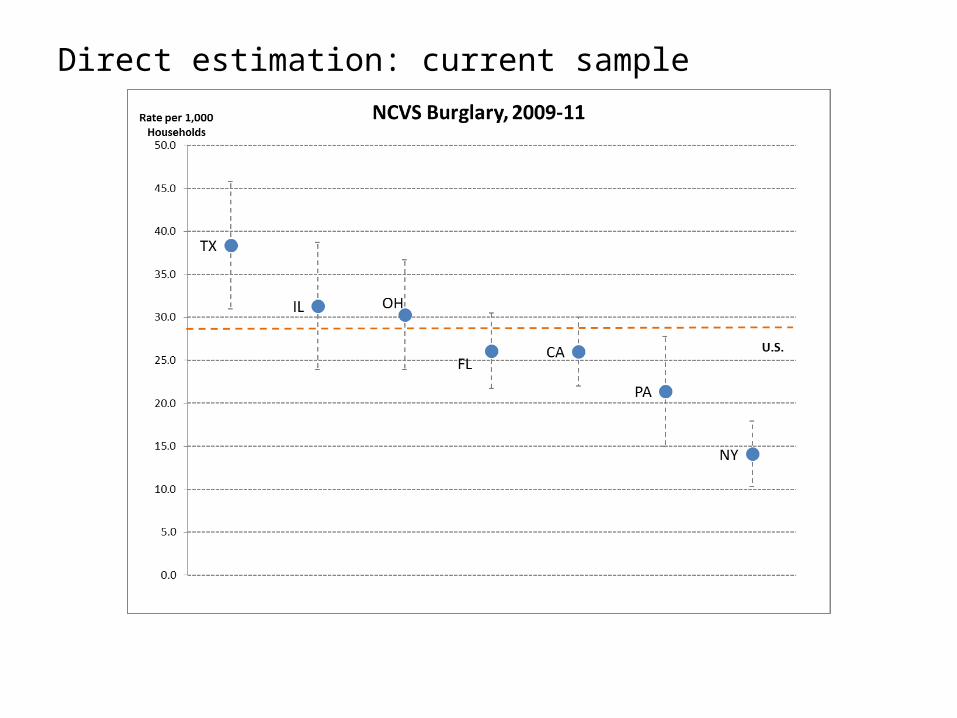
Direct estimation: current sample
• Examined 7 largest states, 20 largest MSAs and cities– Currently, largest amount of NCVS sample
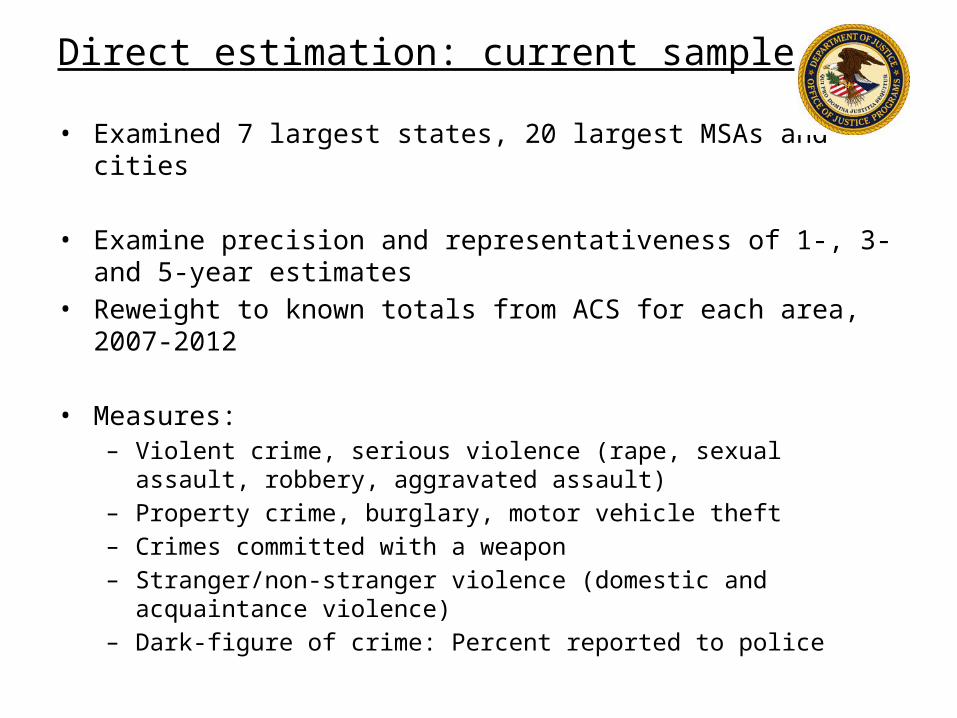
Direct estimation: current sample
• Examined 7 largest states, 20 largest MSAs and cities
• Examine precision and representativeness of 1-, 3- and 5-year estimates
• Reweight to known totals from ACS for each area, 2007-2012
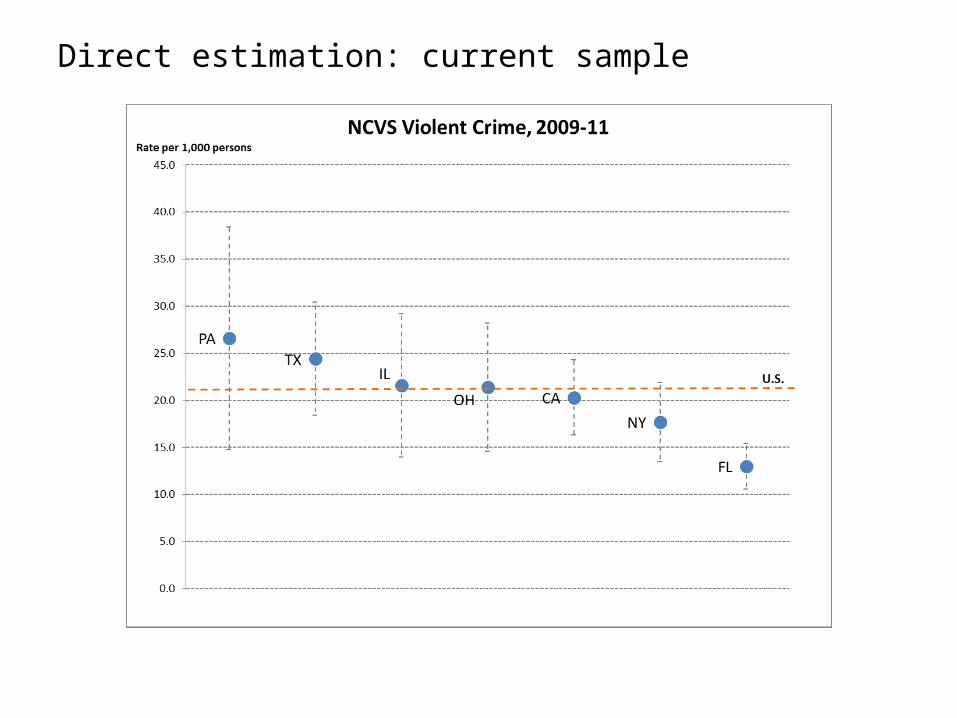
• Measures: – Violent crime, serious violence (rape, sexual assault, robbery,
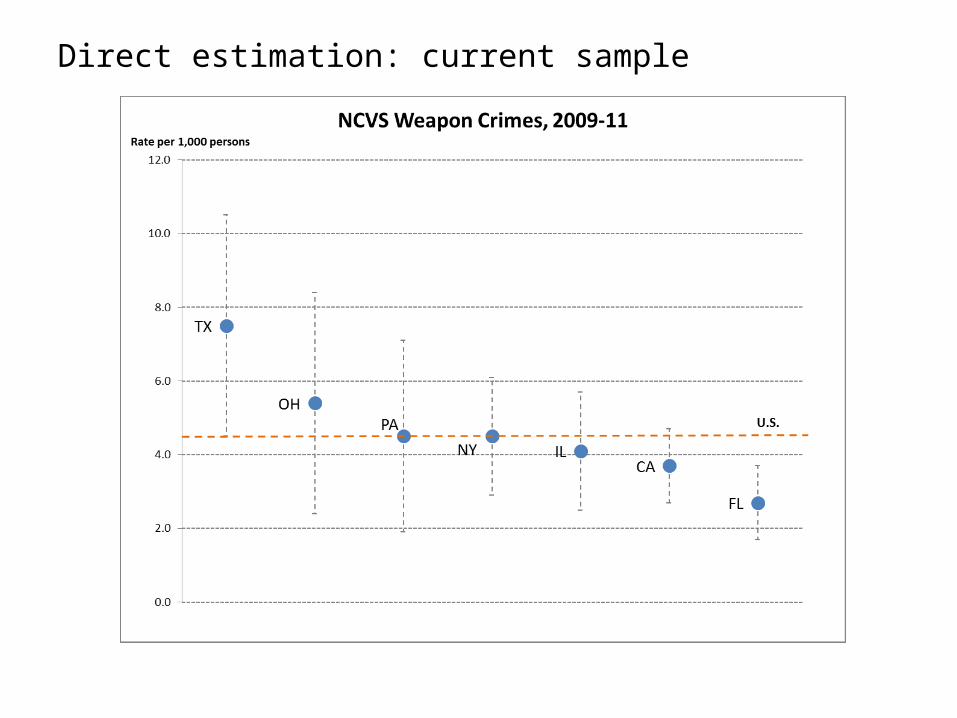
aggravated assault)– Property crime, burglary, motor vehicle theft– Crimes committed with a weapon– Stranger/non-stranger violence (domestic and acquaintance
violence)– Dark-figure of crime: Percent reported to police
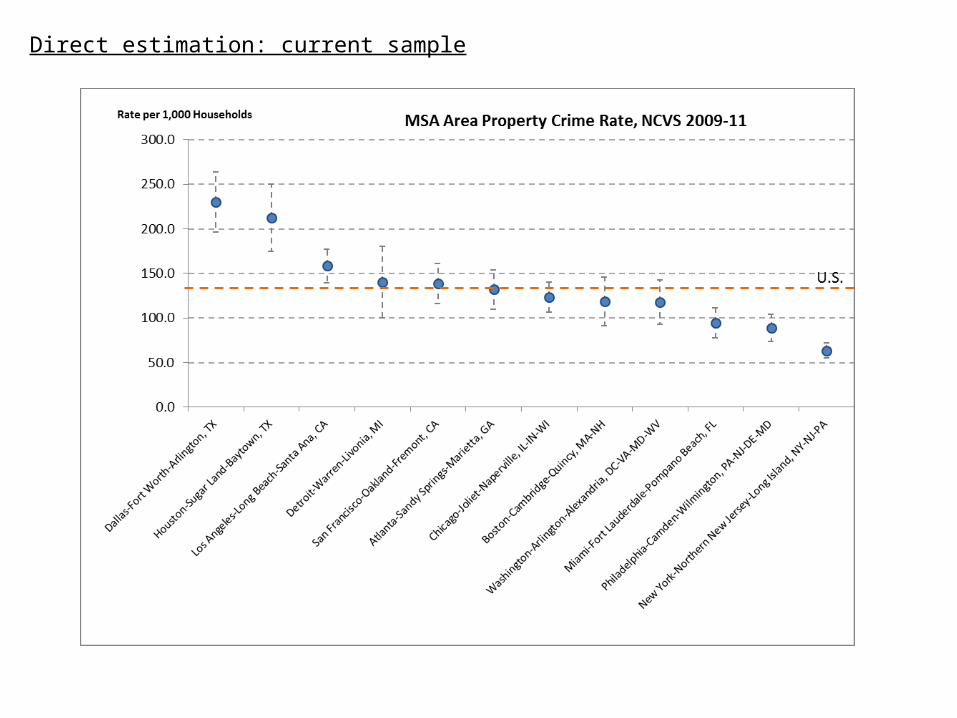
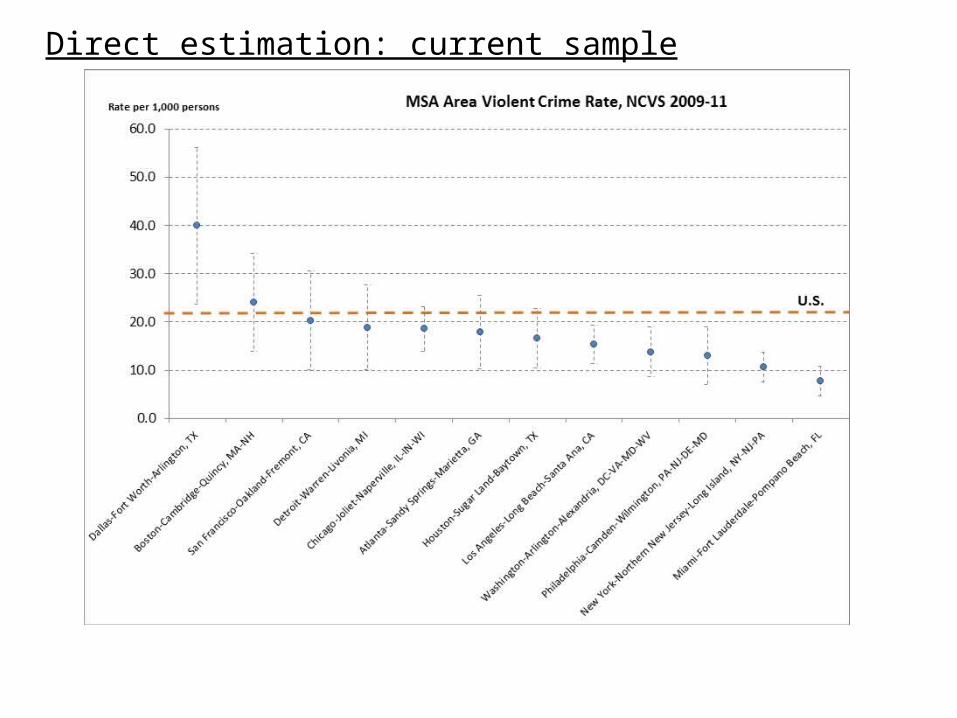
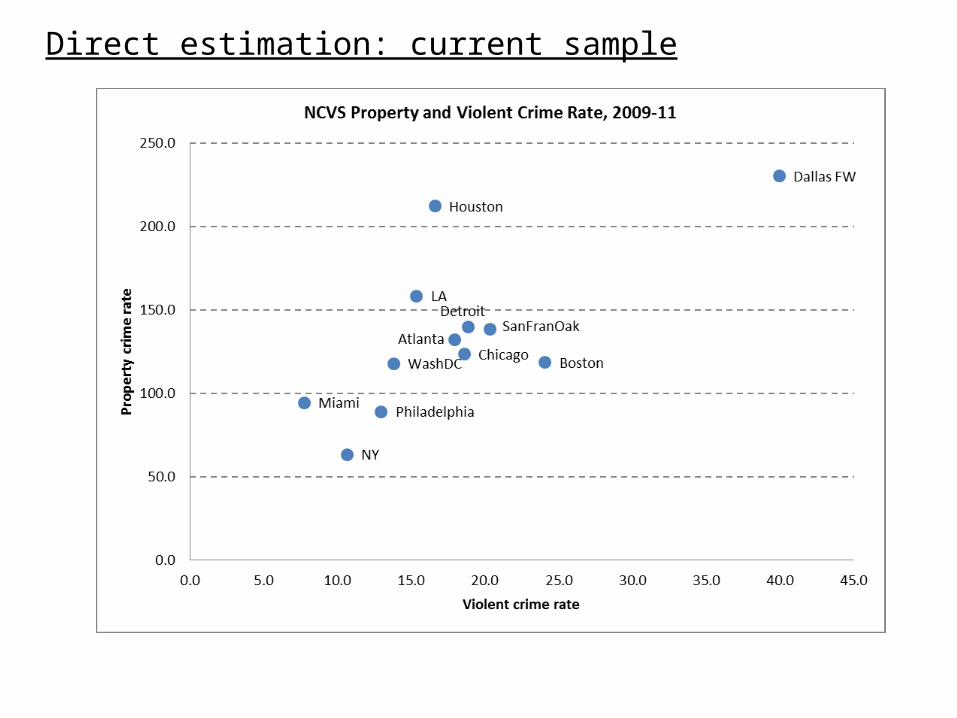
Direct estimation: current sample
Direct estimation: current sample

Direct estimation: current sample
Direct estimation: current sample
Direct estimation: current sample

Direct estimation: current sample

Direct estimation: current sample
Direct estimation: current sample
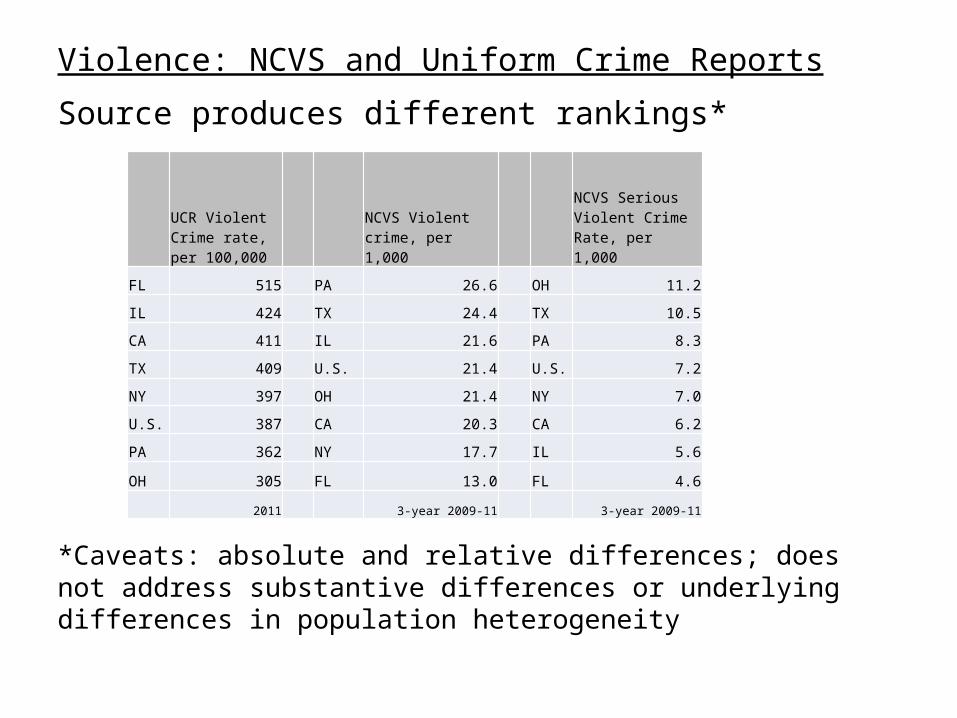
Violence: NCVS and Uniform Crime Reports
Source produces different rankings*
*Caveats: absolute and relative differences; does not address substantive differences or underlying differences in population heterogeneity
UCR Violent Crime rate, per 100,000
NCVS Violent crime, per 1,000
NCVS Serious Violent Crime Rate, per 1,000
FL 515 PA 26.6 OH 11.2
IL 424 TX 24.4 TX 10.5
CA 411 IL 21.6 PA 8.3
TX 409 U.S. 21.4 U.S. 7.2
NY 397 OH 21.4 NY 7.0
U.S. 387 CA 20.3 CA 6.2
PA 362 NY 17.7 IL 5.6
OH 305 FL 13.0 FL 4.6
2011 3-year 2009-11 3-year 2009-11
Direct estimation: current sample
Direct estimation: current sample
Direct estimation: current sample
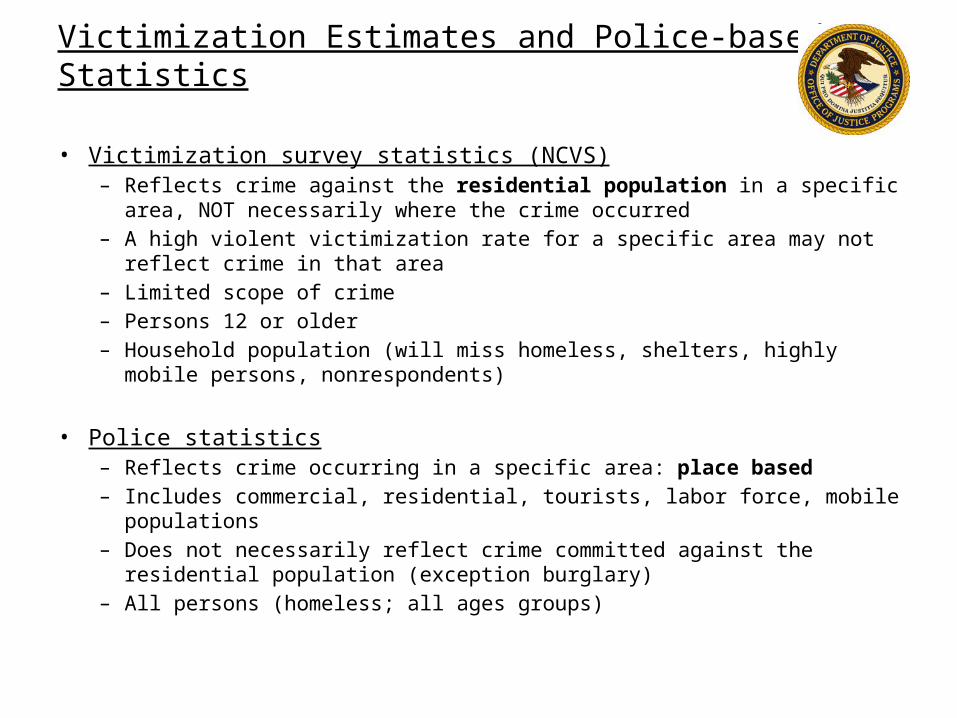
Victimization Estimates and Police-based Statistics
• Victimization survey statistics (NCVS)– Reflects crime against the residential population in a specific area,
NOT necessarily where the crime occurred– A high violent victimization rate for a specific area may not reflect
crime in that area – Limited scope of crime– Persons 12 or older– Household population (will miss homeless, shelters, highly mobile
persons, nonrespondents)
• Police statistics– Reflects crime occurring in a specific area: place based– Includes commercial, residential, tourists, labor force, mobile
populations– Does not necessarily reflect crime committed against the residential
population (exception burglary)– All persons (homeless; all ages groups)
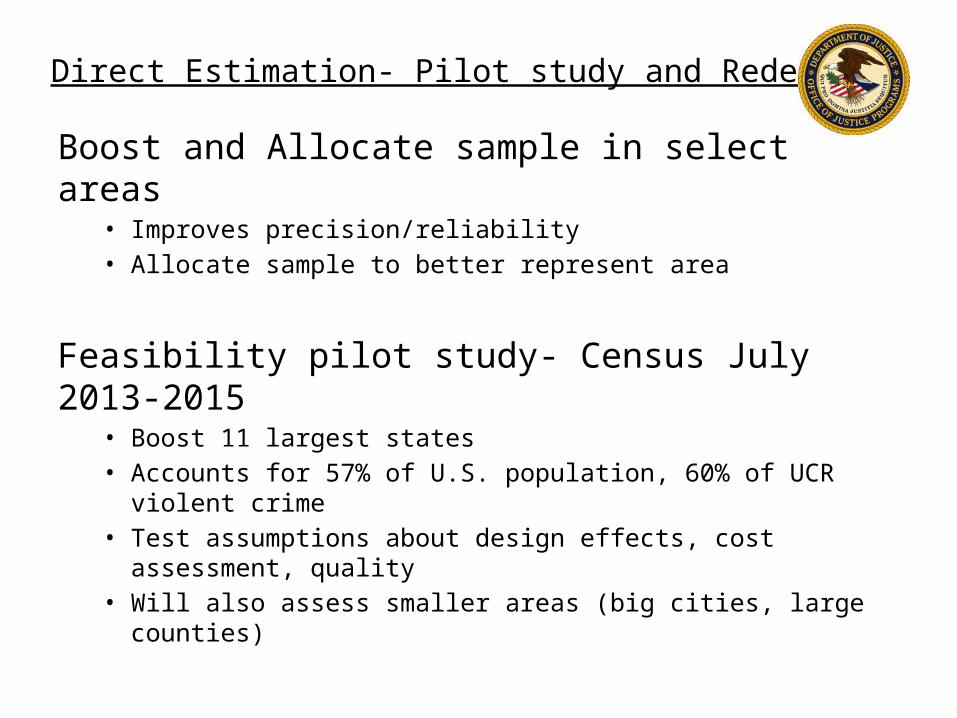
Direct Estimation- Pilot study and Redesign
Boost and Allocate sample in select areas• Improves precision/reliability• Allocate sample to better represent area
Feasibility pilot study- Census July 2013-2015
• Boost 11 largest states• Accounts for 57% of U.S. population, 60% of UCR violent
crime• Test assumptions about design effects, cost assessment,
quality• Will also assess smaller areas (big cities, large counties)
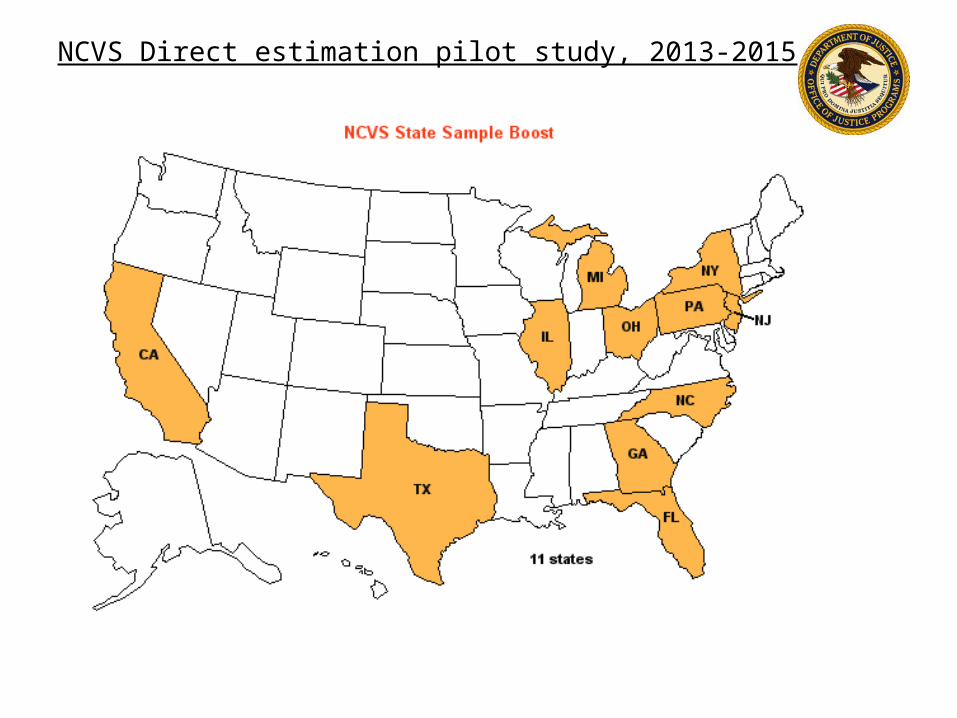
NCVS Direct estimation pilot study, 2013-2015

Expected precision 11 state boost, 2013-15
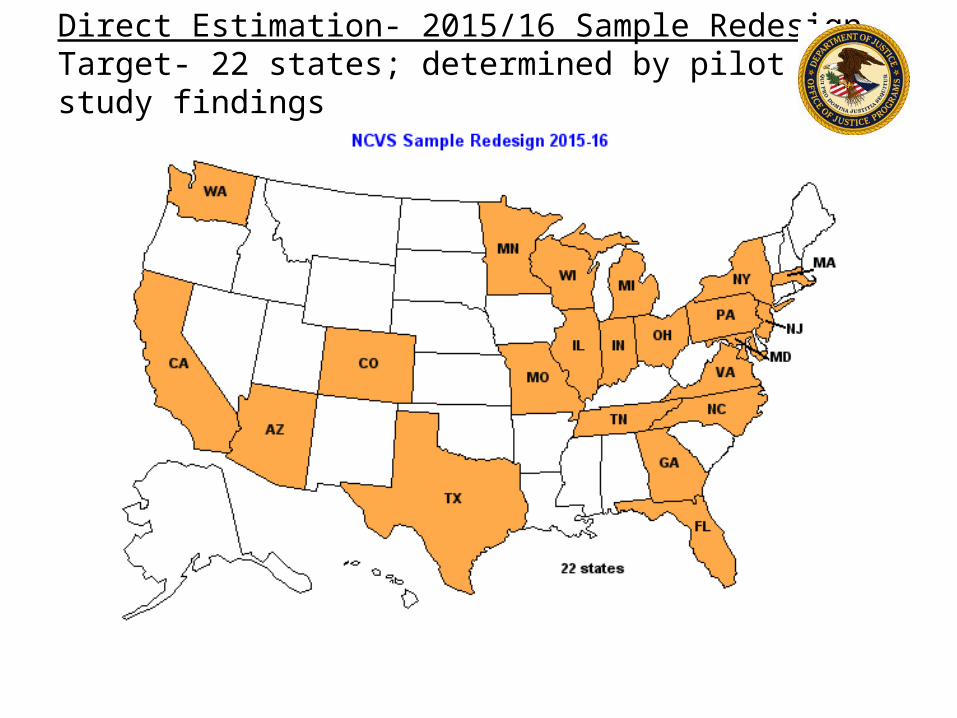
Direct Estimation- 2015/16 Sample RedesignTarget- 22 states; determined by pilot study findings
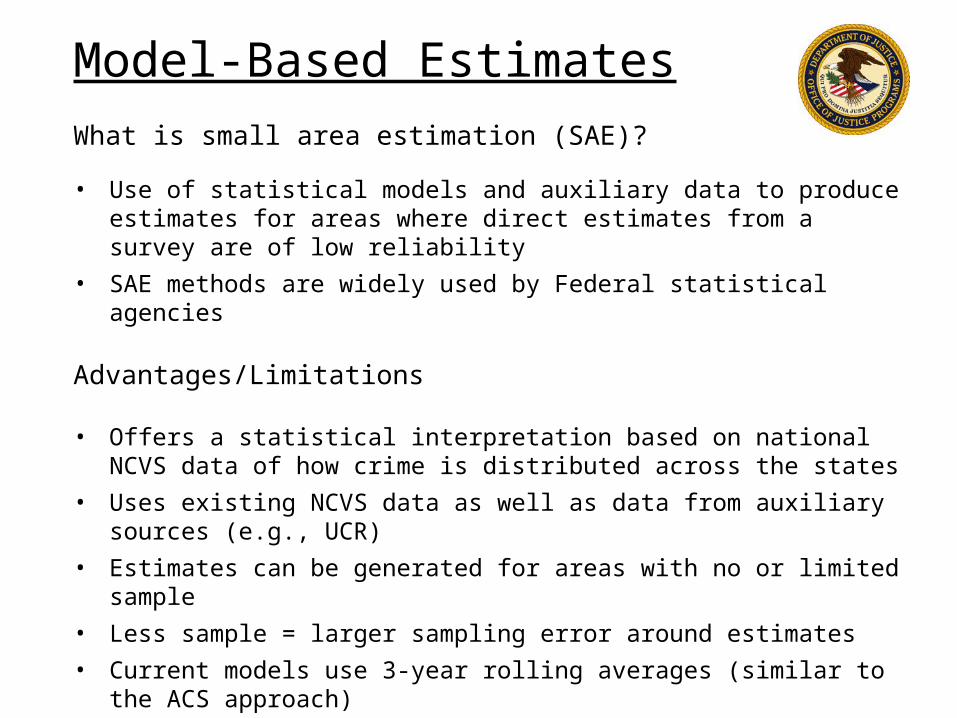
Model-Based EstimatesWhat is small area estimation (SAE)?
• Use of statistical models and auxiliary data to produce estimates for areas where direct estimates from a survey are of low reliability
• SAE methods are widely used by Federal statistical agencies
Advantages/Limitations
• Offers a statistical interpretation based on national NCVS data of how crime is distributed across the states
• Uses existing NCVS data as well as data from auxiliary sources (e.g., UCR)
• Estimates can be generated for areas with no or limited sample
• Less sample = larger sampling error around estimates
• Current models use 3-year rolling averages (similar to the ACS approach)
• Estimates can be generated for all states and all crime types
• Can be used to examine state crime trends
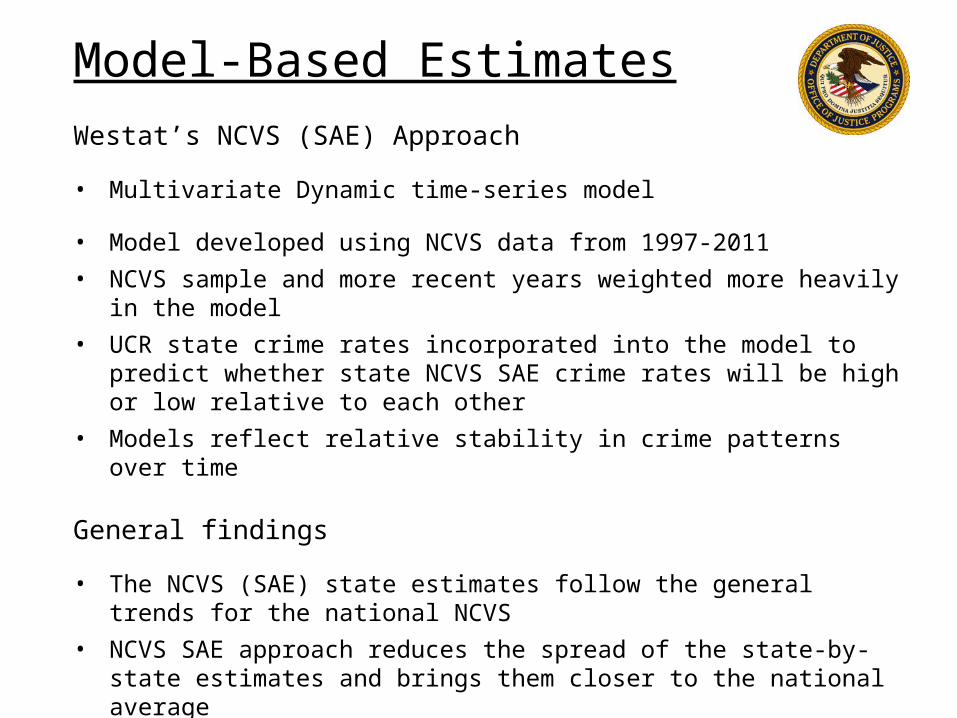
Model-Based EstimatesWestat’s NCVS (SAE) Approach
• Multivariate Dynamic time-series model
• Model developed using NCVS data from 1997-2011
• NCVS sample and more recent years weighted more heavily in the model
• UCR state crime rates incorporated into the model to predict whether state NCVS SAE crime rates will be high or low relative to each other
• Models reflect relative stability in crime patterns over time
General findings
• The NCVS (SAE) state estimates follow the general trends for the national NCVS
• NCVS SAE approach reduces the spread of the state-by-state estimates and brings them closer to the national average
• UCR state-by-state estimates are more varied compared to the national average
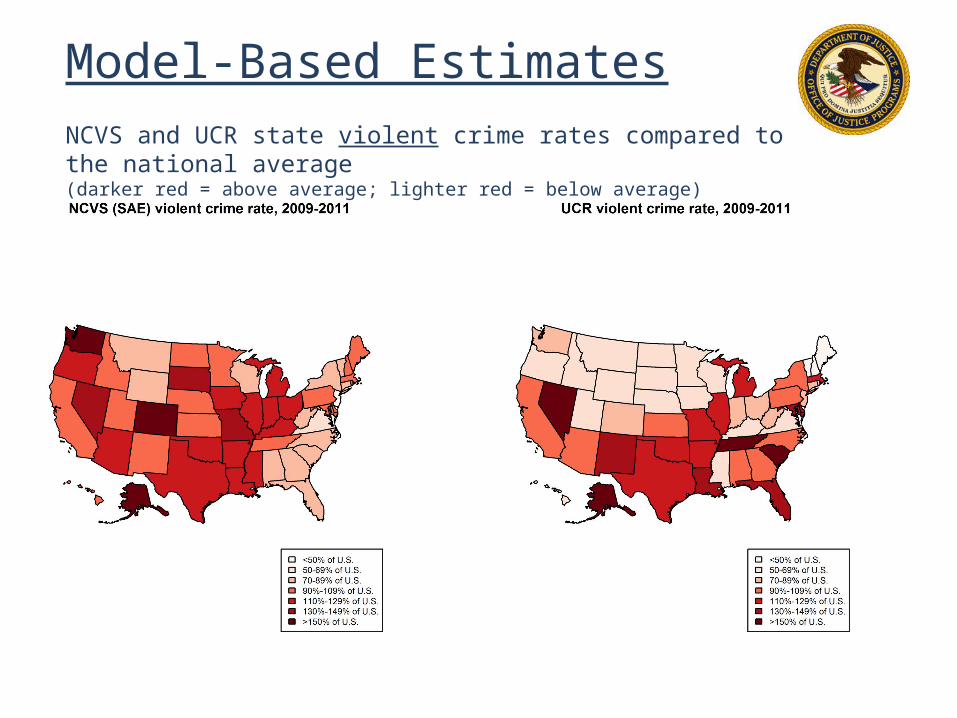
Model-Based EstimatesNCVS and UCR state violent crime rates compared to the national average(darker red = above average; lighter red = below average)
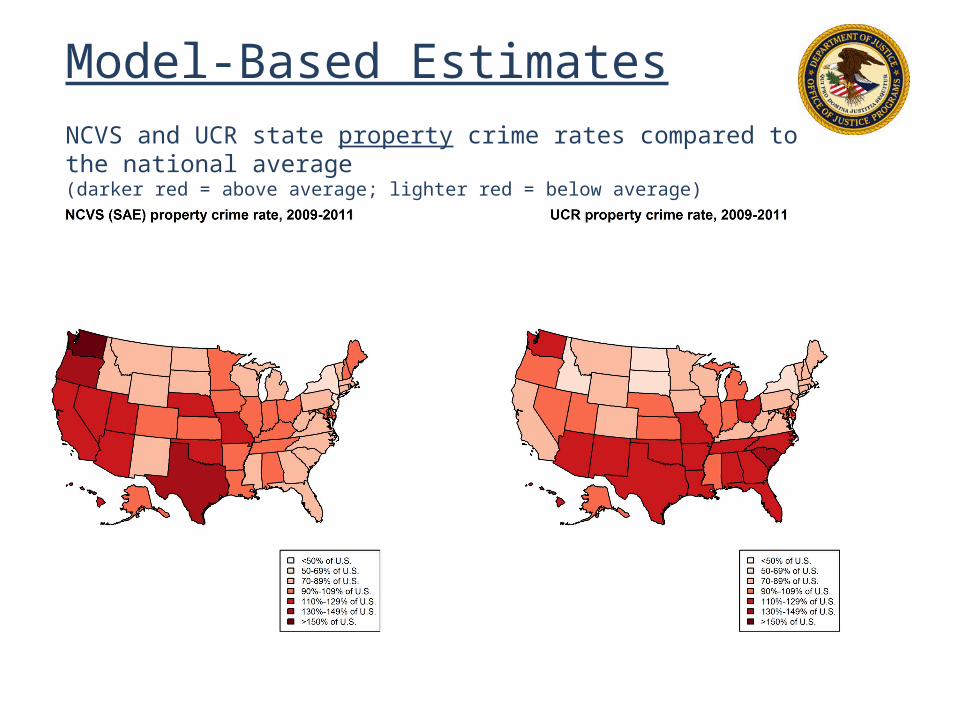
Model-Based EstimatesNCVS and UCR state property crime rates compared to the national average(darker red = above average; lighter red = below average)

Model-Based EstimatesNCVS rates for intimate partner and stranger violence compared to the national average(darker red = above average; lighter red = below average)
NCVS (SAE) rates for intimate partner violence, 2009-2011 NCVS (SAE) rates for stranger violence, 2009-2011

Model-Based EstimatesState profile example – Massachusetts • 2010 population = 6.5 million
• 1997-2011 MA average NCVS violent crime rate = 31.6 per 1,000 persons
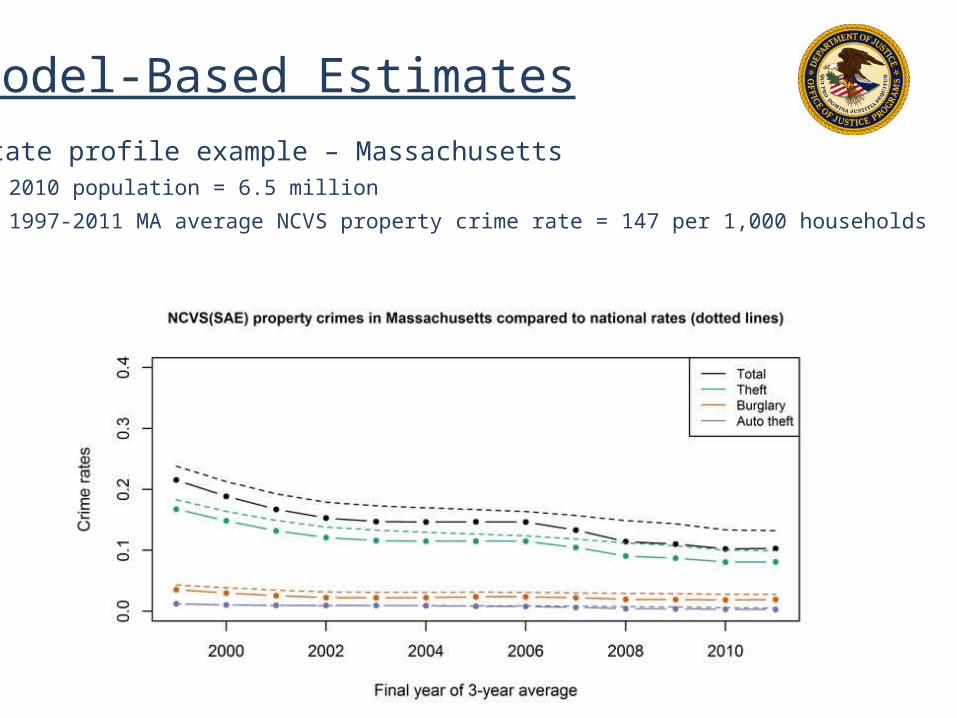
Model-Based EstimatesState profile example – Massachusetts • 2010 population = 6.5 million
• 1997-2011 MA average NCVS property crime rate = 147 per 1,000 households
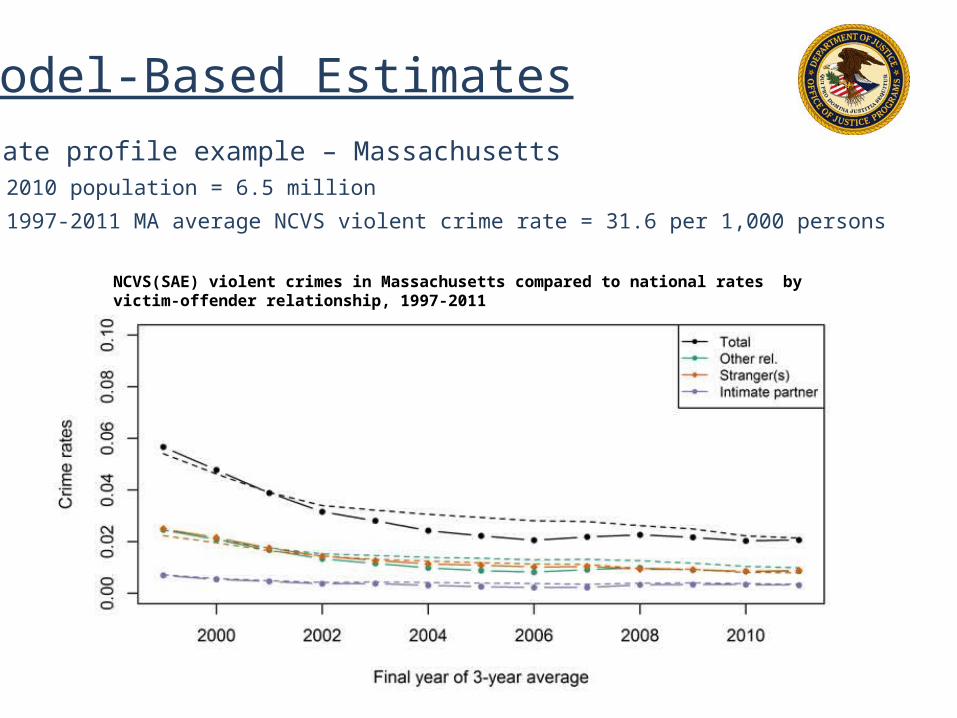
Model-Based EstimatesState profile example – Massachusetts • 2010 population = 6.5 million
• 1997-2011 MA average NCVS violent crime rate = 31.6 per 1,000 persons
NCVS(SAE) violent crimes in Massachusetts compared to national rates by victim-offender relationship, 1997-2011
References: Model-based estimation
• Li, J., Diallo, M.S., and Fay, R.E., (2012) “Small Area Estimation Alternatives for the National Crime Victimization Survey,” presented at the 2012 JSM, Montreal, Canada, August 3-8, 2012, available at http://www.amstat.org/sections/srms/proceedings/y2012/files/304438_73111.pdf
• Fay, R.E. and Li, J. (2012) “Rethinking the NCVS: Subnational Goals through Direct Estimation,” presented at the 2012 Federal Committee on Statistical Methodology Conference, Washington, DC, Jan. 10-12, 2012, available at http://www.fcsm.gov/ 12papers/Fay_2012FCSM_I-B.pdf
• Li, J., Diallo, M.S., and Fay, R.E., (2012) “Rethinking the NCVS: Small Area Approaches to Estimating Crime,” presented at the 2012 Federal Committee on Statistical Methodology Conference, Washington, DC, Jan. 10-12, 2012, available at http://www.fcsm.gov/12papers/Li_2012FCSM_I-B.pdf
• Fay, R.E., Diallo, M.S. and Planty, M. (2013) “Progress in Developing Small Area Estimates of Crime Based on the National Crime Victimization Survey” presented at the 2013 Federal Committee on Statistical Methodology Conference, Washington, DC, Nov. 4, 2013, http://www.copafs.org/UserFiles/file/fcsm/A2_Diallo_2013FCSM.pdf
Low-cost local area surveys
Current project:• Examine low-cost alternatives to in-person interviews• Address-based sample design with mailed out self-
administered survey (challenges)• Instrument design and feasibility test- measuring prevalence vs incidents• Definitional• Two-stage approach: cueing/screening for events and then classification • Disentangling incidents versus attributes• Concept of “presence”
• Ability to cluster sample in specific areas
• Use alternative measures to victimization counts (fear, safety, police performance)
• Focus on local crime problems
NCVS Instrument Redesign
Alternative measures of community safety and well-being
Perceptions of community disorder and well-being Perceptions of safety Fear Perceptions of police performance
Annual estimates- Victims and non-victims
Much better precision/distributions (not necessarily rare events)

NCVS redesign and subnational schedule
Timeline
Indirect model-based estimates• Report, state tables 2014
Direct subnational estimation work• 11 state feasibility study boost July 2013-2015• Testing non-crime items (2014-2016, companion study/instrument
redesign project)
• Assessment of historical data- RTI January-June 2014
Sample redesigned: implemented and expanded to 17-22 states in 2015/16
Instrument redesign (development & testing 2014-2016, implementation 2017)
Acknowledgements/Contact Information
• Census Bureau• RTI, International• Westat
Michael Planty, Ph.D.Chief, Victimization Statistics
Bureau of Justice StatisticsU.S. Department of Justice810 7th Street, NW, Room 2247Washington, DC 20531Office 202-514-9746Cell [email protected]

Questions?
Training and Technical Assistance Webinar Series

Featuring :Baron Blakley Research Specialist Virginia Department of Criminal Justice Services
Upcoming Webinar
Uses of Administrative Data from Jails: Virginia's Local Inmate Data System (LIDS)
May 1st 2-3:30 PM EDT
Related Documents