Just In Time Carbon Footprint Manu Gupta, Stephen Intille and Kent Larson MIT Media Lab, House_n [email protected] [email protected] [email protected]

Just In Time Carbon Footprint
Jan 16, 2016
Just In Time Carbon Footprint. Manu Gupta, Stephen Intille and Kent Larson MIT Media Lab, House_n. [email protected] [email protected] [email protected]. Carbon Footprint. Measurement & calculation of CO 2 emitted as part of daily life activities Why measure Conserve energy - PowerPoint PPT Presentation
Welcome message from author
This document is posted to help you gain knowledge. Please leave a comment to let me know what you think about it! Share it to your friends and learn new things together.
Transcript

Just In TimeCarbon Footprint
Manu Gupta, Stephen Intille and Kent Larson
MIT Media Lab, House_n

Carbon Footprint
Measurement & calculation of CO2 emitted as part of daily life activities
Why measure –Conserve energy–Allow people to be aware of their emission –Help people change usage patterns –Its our responsibility

Our Focus
Behavior change
Measuring and motivating energy conservation behavior at the personal level

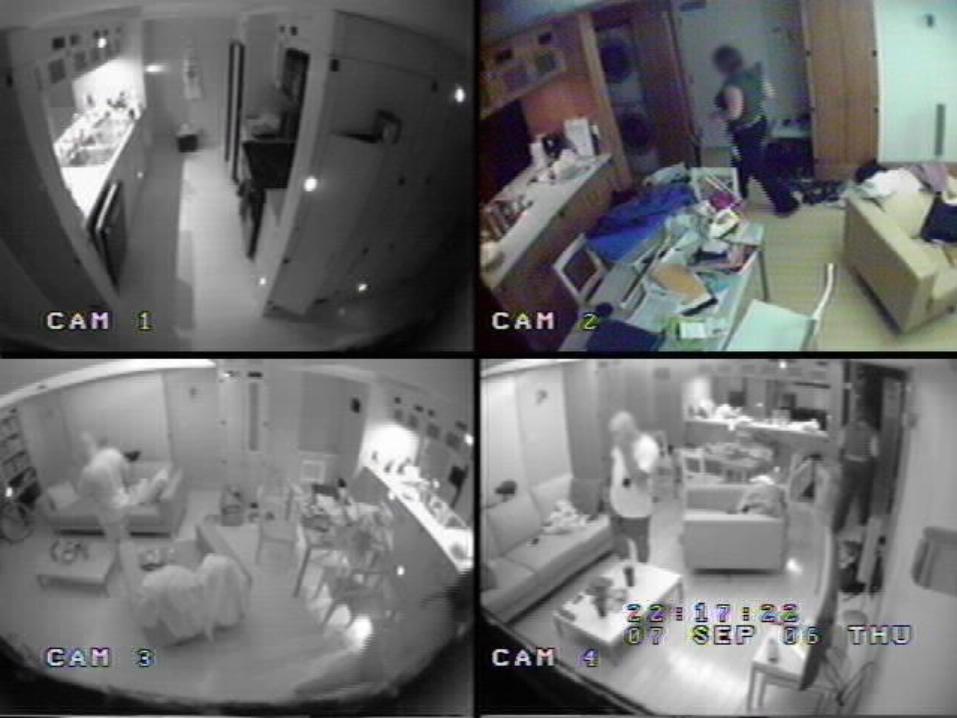
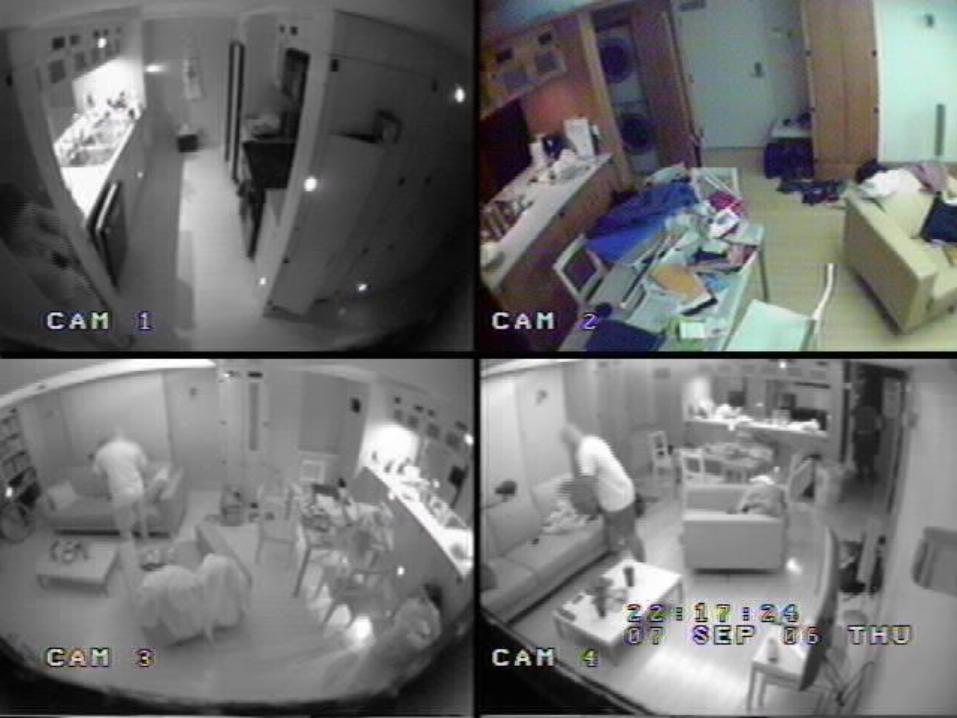
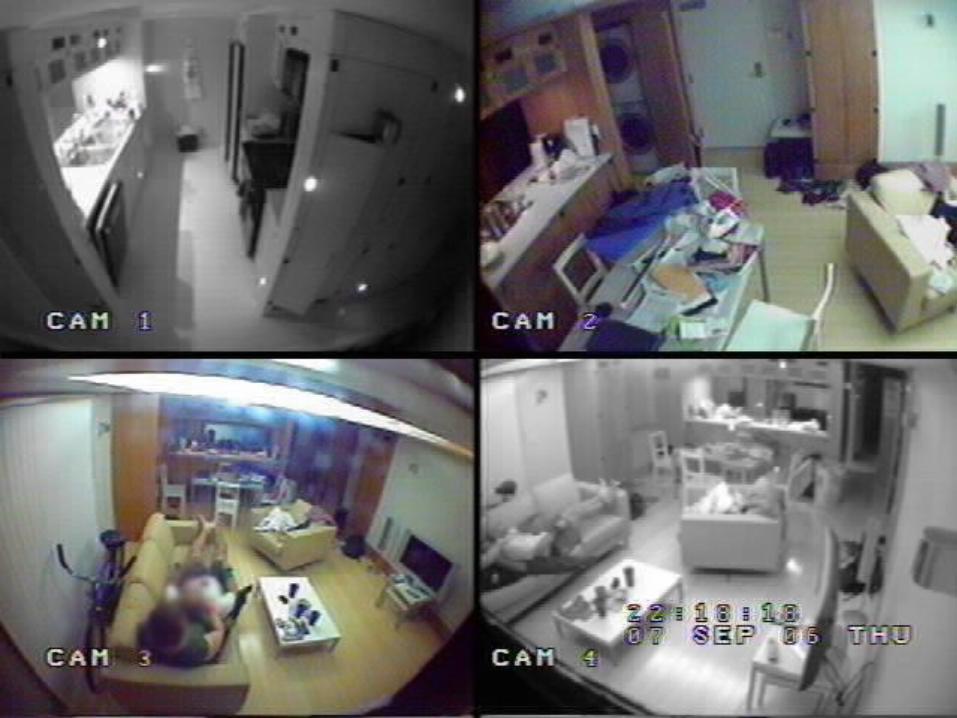
PlaceLab- A Live-In Laboratory
Data Collection– Only electric current information– 37 different electrical circuits fitted with current sensors– Circuits are divided into residential spaces and residential appliances

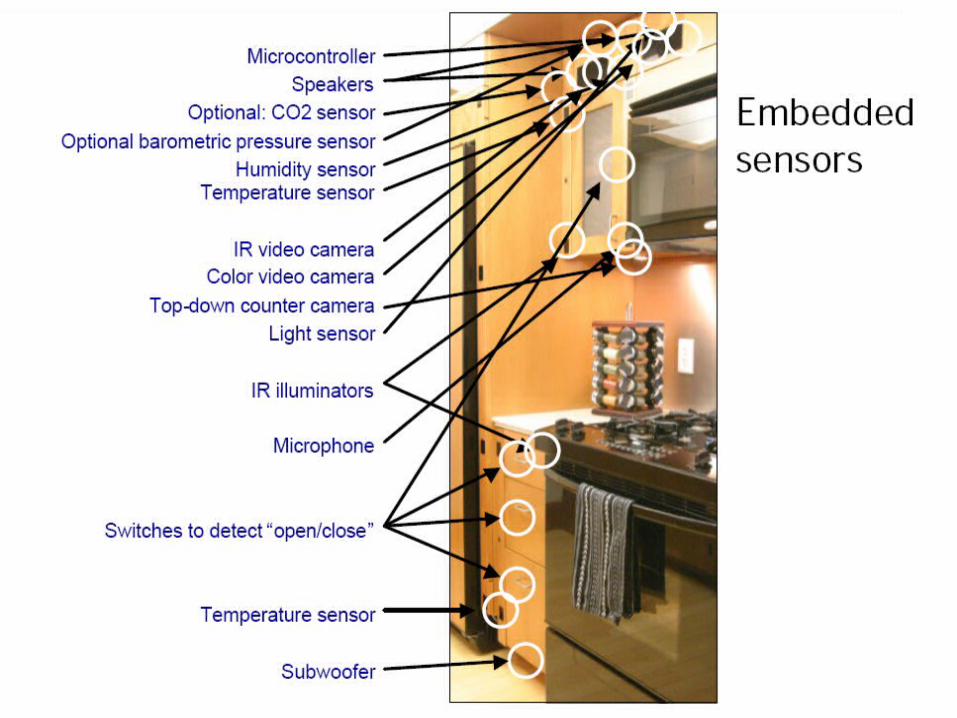
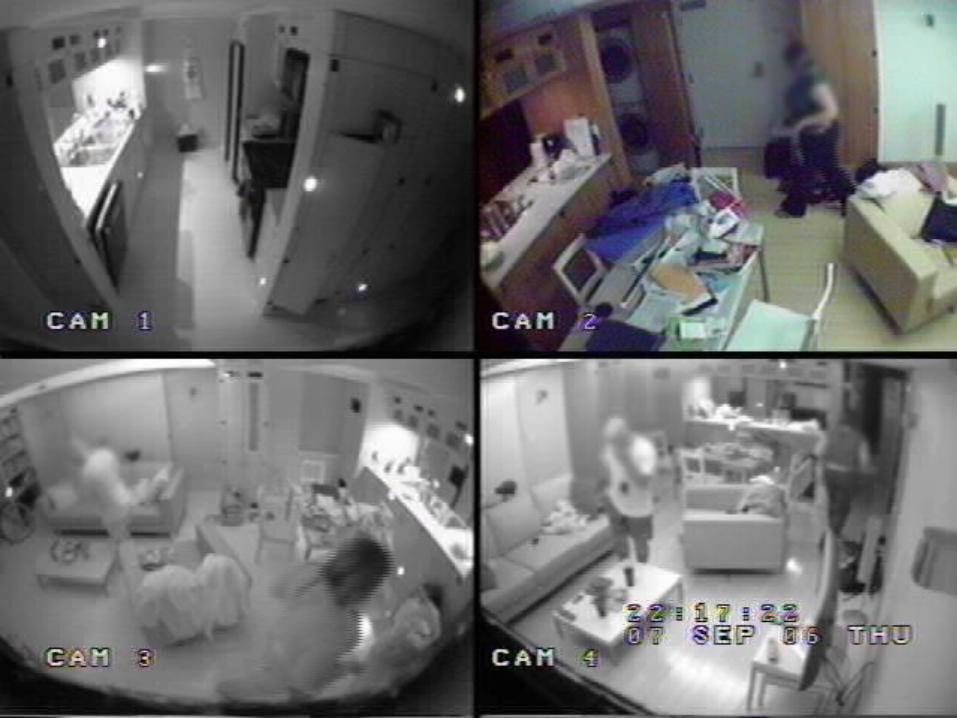
PlaceLab- A Live-In Laboratory
Data Analysis– A Couple lived in the PlaceLab for 10 weeks– One day analysis– Annotation
• Video analysis of usage, movement and behavior patterns – Current analysis
• Of each individual appliance/device’s energy consumption


Analysis ToolHandlense sensor visualization tool
–Developed at House_n
Unused lights & Devices
Vampire power sources
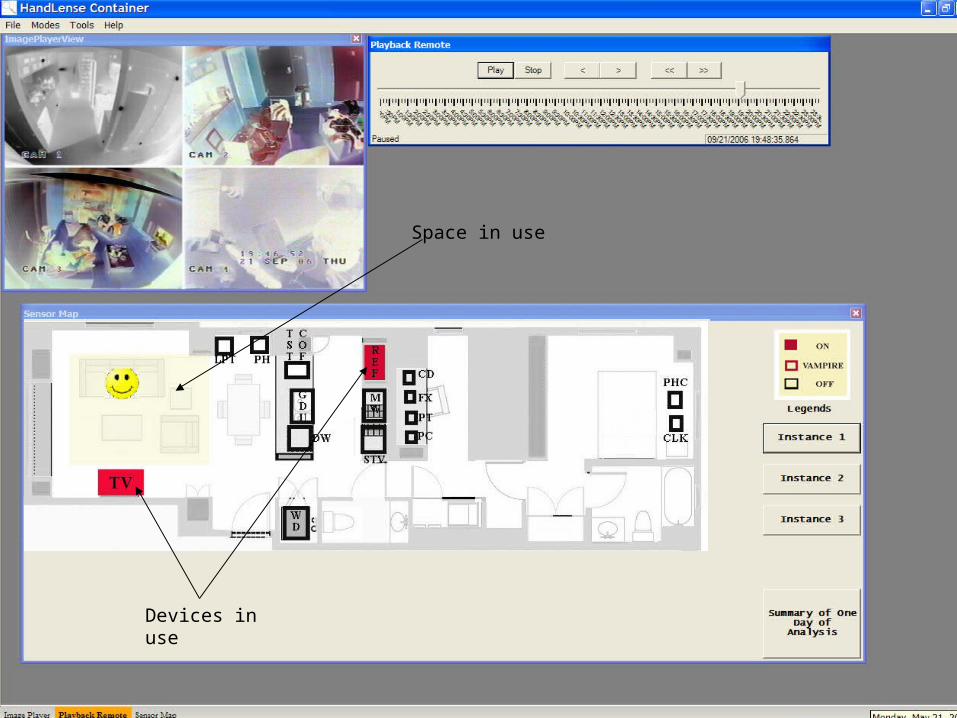
Projected Usage
Devices in use
Space in use

Results
Total electricity consumed in 1 day = 13.45 KWh
With an “optimal” change in behavior (but without impacting quality of life)
– They would have saved ~ 38% (5KWh) of the total
electricity consumed

Behavior Change Strategies
To motivate energy conservation behavior two strategies can be used
Responsive Automation*
Just in Time Intervention*
*Current research is on designing these strategies and testing how much energy can be saved using them.

Behavioral Change Interfaces
Exploring the use of phones for just-in-time positive reinforcement.
Key idea: positive reinforcement tied to small behavior changes (Detected by sensing)
May lead to gradual behavior change.

System Components
Sensor Network
Control and Actuation system
Mobile Devices
Intervention strategies

System Characteristics
Low power
Wireless
Affordable
Real Time interaction with mobile devices
Non intrusive
Right mix of automation and intervention

Thanks
Related Documents