J. Segara Vol.14 No.2 Agustus 2018: 69-78 THE ANALYSIS OF TIDAL CURRENT IN SURAMADU BRIDGE PIER FOR MARINE POWER GENERATION TEST SITE ANALISIS ARUS PASUT DI JEMBATAN SURAMADU UNTUK LOKASI PENGUJIAN PEMBANGKIT LISTRIK TENAGA ARUS LAUT R. Bambang Adhitya Nugraha 1) , Erwandi 2) , Hendry Syahputra 3) & La Ode Nurman Mbay 1) ABSTRACT Recently, the interest in renewable ocean energy has been growing rapidly among the ocean researchers in Indonesia. In this paper, the pattern of tidal current in Madura Strait was analyzed and it is used as First we present the general information of the structure of Suramadu Bridge and explain the purpose of installing tidal current turbine between its piers. Second, we develop the numerical model of Madura Strait. The bottom topography of Madura Strait is digitized from bathymetry map produced by Indonesian Navy. A nested hydrodynamic model has been developed to refine the specific area of interest around the piles of the Suramadu Bridge. MIKE-21 program is then employed to simulate the tidal current that passes between the piles of the bridge. Next, we validate the model by conducting the field measurement of the speed of tidal current between pile no. 56 and pile no. 57. We deployed ADCP and measured the current speed for 15 days. The obtained data is then compared with the numerical model. The results show that the simulated currents have similar pattern with the measured data. We also discuss the characteristics of the simulated tidal current comparing with the ADCP results. Finally, we estimate the possible produced power produced from the kinetic energy of the predicted tidal current of hydrodynamic. Keywords: Suramadu Bridge, Marine Power Generation, Tidal Energy, MIKE 21, Vertical Axis Turbine. 1) Agency for Marine and Fisheries Research and Human Resources (AMFRHR), Ministry of Marine Affairs and Fishery (MMAF), Jl. Pasir Putih I Ancol Timur Jakarta Indonesia; 2) Indonesian Hydrodynamic Laboratory, Agency for the Assessment and Application of Technology Jl. Hidrodinamika BPPT, Kompleks Kampus ITS, Sukolilo Surabaya, Indonesia; 3) Graduated Student of Diponegoro University Received: 5 May 2017; Revised: 30 Novmber 2017; Accepted: 5 Januari 2018 Corresponding author: Jl. Pasir Putih I Ancol Timur, Jakarta Utara 14430. Email: [email protected] Copyright © 2018 Jurnal Segara DOI: http://dx.doi.org/10.15578/segara.v14i2.6644 69 JURNAL SEGARA http://ejournal-balitbang.kkp.go.id/index.php/segara ISSN : 1907-0659 e-ISSN : 2461-1166 Nomor Akreditasi: 766/AU3/P2MI-LIPI/10/2016

Welcome message from author
This document is posted to help you gain knowledge. Please leave a comment to let me know what you think about it! Share it to your friends and learn new things together.
Transcript

J. Segara Vol.14 No.2 Agustus 2018: 69-78
THE ANALYSIS OF TIDAL CURRENT IN SURAMADU BRIDGE PIER FOR MARINE POWER GENERATION TEST SITE
ANALISIS ARUS PASUT DI JEMBATAN SURAMADU UNTUK LOKASI PENGUJIAN PEMBANGKIT LISTRIK TENAGA ARUS LAUT
R. Bambang Adhitya Nugraha1), Erwandi2), Hendry Syahputra3) & La Ode Nurman Mbay1)
ABSTRACT
Recently, the interest in renewable ocean energy has been growing rapidly among the ocean researchers in Indonesia. In this paper, the pattern of tidal current in Madura Strait was analyzed and it is used as First we present the general information of the structure of Suramadu Bridge and explain the purpose of installing tidal current turbine between its piers. Second, we develop the numerical model of Madura Strait. The bottom topography of Madura Strait is digitized from bathymetry map produced by Indonesian Navy. A nested hydrodynamic model has been developed to refine the specific area of interest around the piles of the Suramadu Bridge. MIKE-21 program is then employed to simulate the tidal current that passes between the piles of the bridge. Next, we validate the model by conducting the field measurement of the speed of tidal current between pile no. 56 and pile no. 57. We deployed ADCP and measured the current speed for 15 days. The obtained data is then compared with the numerical model. The results show that the simulated currents have similar pattern with the measured data. We also discuss the characteristics of the simulated tidal current comparing with the ADCP results. Finally, we estimate the possible produced power produced from the kinetic energy of the predicted tidal current of hydrodynamic.
Keywords: Suramadu Bridge, Marine Power Generation, Tidal Energy, MIKE 21, Vertical Axis Turbine.
1)Agency for Marine and Fisheries Research and Human Resources (AMFRHR), Ministry of Marine Affairs and Fishery (MMAF), Jl. Pasir Putih I Ancol Timur Jakarta Indonesia;
2)Indonesian Hydrodynamic Laboratory, Agency for the Assessment and Application of Technology Jl. Hidrodinamika BPPT, Kompleks Kampus ITS, Sukolilo Surabaya, Indonesia;
3)Graduated Student of Diponegoro University
Received: 5 May 2017; Revised: 30 Novmber 2017; Accepted: 5 Januari 2018
Corresponding author:Jl. Pasir Putih I Ancol Timur, Jakarta Utara 14430. Email: [email protected]
Copyright © 2018 Jurnal SegaraDOI: http://dx.doi.org/10.15578/segara.v14i2.6644 69
JURNAL SEGARA http://ejournal-balitbang.kkp.go.id/index.php/segara
ISSN : 1907-0659e-ISSN : 2461-1166Nomor Akreditasi: 766/AU3/P2MI-LIPI/10/2016

INTRODUCTION
For some reasons, a bridge structure can be very useful to test a prototype of tidal current turbine (Browne et al., 2009; Kyozuka & Gunji, 2005; Kyozuka & Ogawa, 2006; Kyozuka, 2008; Wosnik et al., 2009; Lim et al., 2016). Combining tidal energy conversion devices with bridging structure will be more efficient as it can save the cost for its installation and maintenance (Vennetti, 2012). Another advantage of combining the turbine and piers at the bridge is the proportional to increase flow rates and its velocity when it passes through the piles leading to higher energy output. In addition to above reasons, the Suramadu Bridge was chosen in this study because the location is close to all the supporting resources (i.e. hydrodynamic lab, vessel workshop, shipbuilding industry, harbor, scientific/technical support from universities and research agencies) that can easily to be accessed when the floating platform turbine is operated and evaluated. Madura Strait represents the characteristic of strait in Indonesia which has a low speed less than 1.5 m/s. It has sufficient resource potential to produce energy (Firdaus et al., 2015). Therefore we tried to develop a turbine that able to working at low speed.
A twin Darrieus turbine, with three vertical axis blades, respectively, was fabricated and prepared for testing on a floating pontoon in an open water environment such as in a strait. Before scaling up, the model scale of turbine was tested in a towing tank belongs to the Indonesian Hydrodynamic Laboratory (BPPH, Surabaya). The prototype was intended to measure the successful level of energy conversion system that has been designed prior to deployment in an operational demonstration project. It should be capable of performing all the functions that will be
The Analysis of Tidal Current ...... Generation Test Site (Nugraha, R.B.A., et al.)
70
required for the operational system. The prototype is expected with the power coefficient of 30 %, will produce power approximately 5 kW for each of the turbine or 10 kW in total. The crucial design of prototype is its blade profile NACA 0021 with chord length, thickness and span of 0.186 m, 39 mm and 2.183 m,. The turbine will work at cut in speed 0.7 m/s and able to maintain its strength of structure and performance up to the maximum speed of 2 m/s.
The aim of this study is to develop a hydrodynamic simulation using MIKE 21 FM HD in Madura Strait, particularly in the area around the Suramadu Bridge piers as the potential spot to test the turbine. A mounted bottom ADCP was deployed to measure the ocean current and compared with the numerical simulations model.
METHODOLOGY
General information of the site
Suramadu (stand for Surabaya-Madura) Bridge is the first impressive of 5.4 Km inter island bridge in Indonesia constructed across the Madura Strait, connecting the eastern part of Java Island and Madura Island (Figure 2). Madura Strait is connected to the Java Sea at the westward by a narrow and shallow water, and to Bali Strait at the eastward characterized by a wide and deep water (> 40 m). This shallow bathymetry at the west part is caused by the development of Suramadu Bridge and the sediment discharge from Porong River as the impact of mud volcano (Jennerjahn et al., 2013; Koropitan, 2007). Those activities have significantly contributed to the coastal sedimentation and silting problems.
Vertical axis twin turbine with three vertical blades (red arrows).Figure 1.

The bridge that standing on of those concrete has many piers with different distances between piers, in which the minimum length among them is 40 m. The prototype of tidal turbine will be placed between piles #56 and #57 which is part of the bridge that close to Madura side (Figure 3). The pile is rectangular in shape with a length of 25.5 m and a wide of 12 m as shown in Figure 3.
Setting up model
Model area and mesh
The bathymetry of Madura Strait was digitized
from a bathymetry map produced by the Hydro-Oceanography Division-Indonesian Navy (DISHIDROS TNI-AL) no.96 (2012) at a scale 1:75.000. A nested hydrodynamic model has been developed to refine the specific area of interest around the pile of the Suramadu Bridge. Two nested grids were used, with grid spacing of 150 m and 10 m. The coarse and finest domains represent respective area along the strait (maximum element area of 3,800,000 m2 and mesh size number of 150 m and 25 m), and around the piles #56 and #57 (maximum element area of 150 m2 and mesh size of 10 m) (Figure 4). The flow in the inner model (finest area) is driven by the flow in the outer model (coarse and medium areas), which in turn is driven by the boundary
J. Segara Vol.14 No.2 Agustus 2018: 69-78
71
a. Madura Strait, b. Suramadu Bridge and the research site.Figure 2.
Dimension of Piers (Pile #56 and #57) Suramadu Bridge.Figure 3.
b)
a)

The Analysis of Tidal Current ...... Generation Test Site (Nugraha, R.B.A., et al.)
72
conditions imposed along its boundaries.
Driving force
Wind and tidal data were used to generate the hydrodynamic model in Madura Strait. Wind stress data were taken from The European Center for Medium range Weather Forecasting (ECMWF) ERA-40,were re-analysed for periods of Mei-June 2015. These were 4 times daily (for every 6 hours) and have a horizontal resolution of 2.5 degree. The open boundary condition was obtained from the tidal prediction the transfer boundary tools in the hydrodynamic part of MIKE 21 toolbox (Global Tide Model). There were 2 open boundaries: the northern and eastern boundaries (Figure 5). For open boundaries, the 15-days period of water level (one spring neap tidal cycle) was used. This period is similar to the period of measurement using ADCP at Suramadu Bridge.
Model Running
The model was run for 15 days with the time step interval for every 600 seconds or 10 minutes (Table 1).
Field measurement
The tidal current at pile 56 was measured by using an ADCP (Acoustic Doppler Current Profiler) type multi Cell SonTek Argonaut-XR for about 15 days from 22 May 2015 at coordinates 7.178630° S and 112.780717° E. The ADCP uses three beams of 0.75 MHz and the
Parameter Value
Simulation mode Flow Model HD FM model using flexible mesh bathymetryNumber of nesting 2Mesh size-coarse mesh 150 mMesh size-finest mesh 10 mSimulation period 20 May-5 June 2015Time step 600 secTurbulence model horizontal Smagorinsky coefficient Boundaries 2 boundaries: tidal prediction at east and west of the straitBed resistance number 0.28
Model setting for the baseline simulationsTable 1.
Nested bathymetry of Madura Strait (a. 150 m, and b. 10 m).Figure 4.
a) b)
ADCP setting and placement on the sea bottom of the study area.
Figure 5.
J. Segara Vol.14 No.2 Agustus 2018: 69-78
73
Doppler effect to measure the current velocity by transmitting a short pulse of sound, listening to its echo and measuring the change in pitch frequency of the echo. The ADCP was set up on the seabed and the beams are divided into 7 depth layers (1.5 m, 3 m, 4.5 m, 6 m, 7.5 m, 9 m and 10,5 m) in which, the sample rate for each layer is 600 seconds. It also measured the water pressure to be converted into water level. The water depth at that location is about 12 m and the sea bottom is muddy and quite flat.
RESULTS AND DISCUSSION
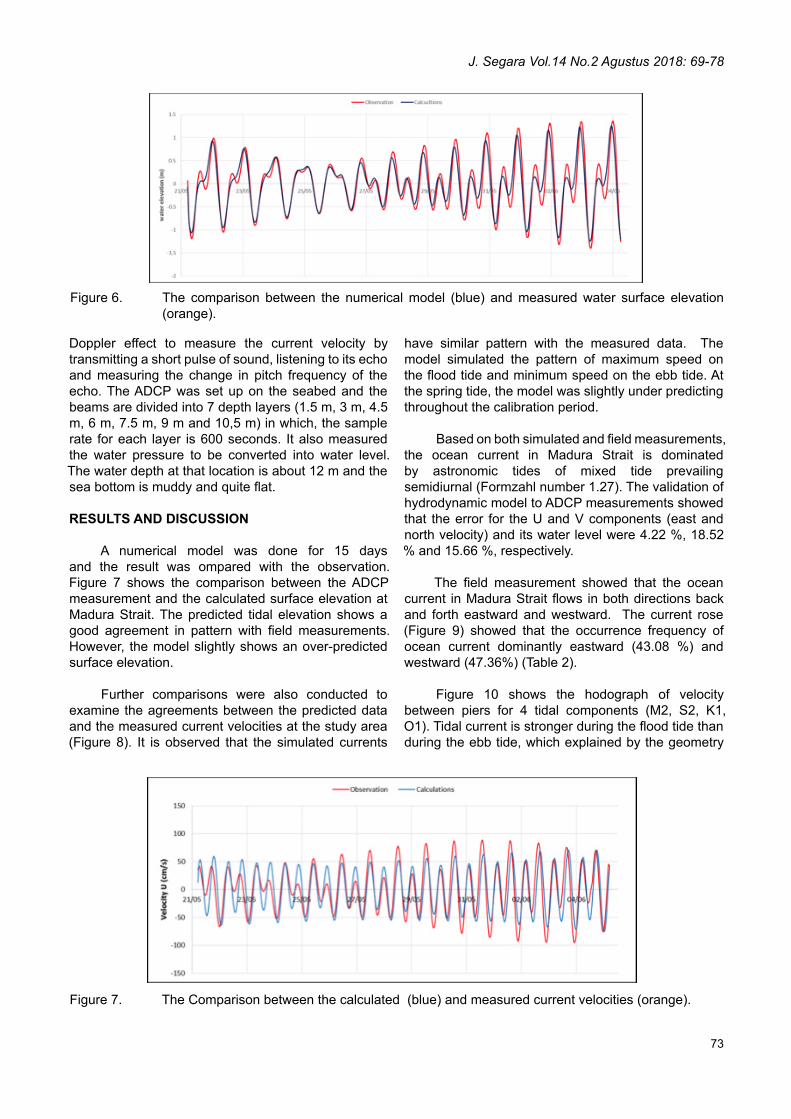
A numerical model was done for 15 days and the result was ompared with the observation. Figure 7 shows the comparison between the ADCP measurement and the calculated surface elevation at Madura Strait. The predicted tidal elevation shows a good agreement in pattern with field measurements. However, the model slightly shows an over-predicted surface elevation.
Further comparisons were also conducted to examine the agreements between the predicted data and the measured current velocities at the study area (Figure 8). It is observed that the simulated currents
have similar pattern with the measured data. The model simulated the pattern of maximum speed on the flood tide and minimum speed on the ebb tide. At the spring tide, the model was slightly under predicting throughout the calibration period.
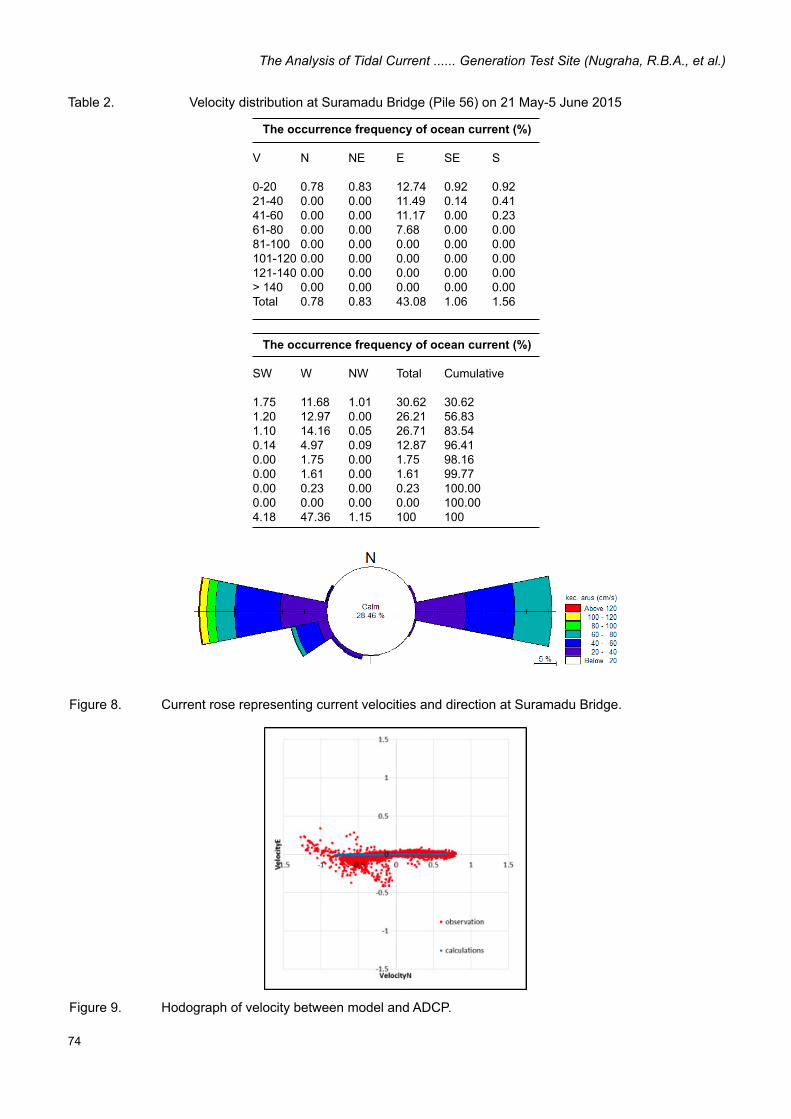
Based on both simulated and field measurements, the ocean current in Madura Strait is dominated by astronomic tides of mixed tide prevailing semidiurnal (Formzahl number 1.27). The validation of hydrodynamic model to ADCP measurements showed that the error for the U and V components (east and north velocity) and its water level were 4.22 %, 18.52 % and 15.66 %, respectively.
The field measurement showed that the ocean current in Madura Strait flows in both directions back and forth eastward and westward. The current rose (Figure 9) showed that the occurrence frequency of ocean current dominantly eastward (43.08 %) and westward (47.36%) (Table 2).
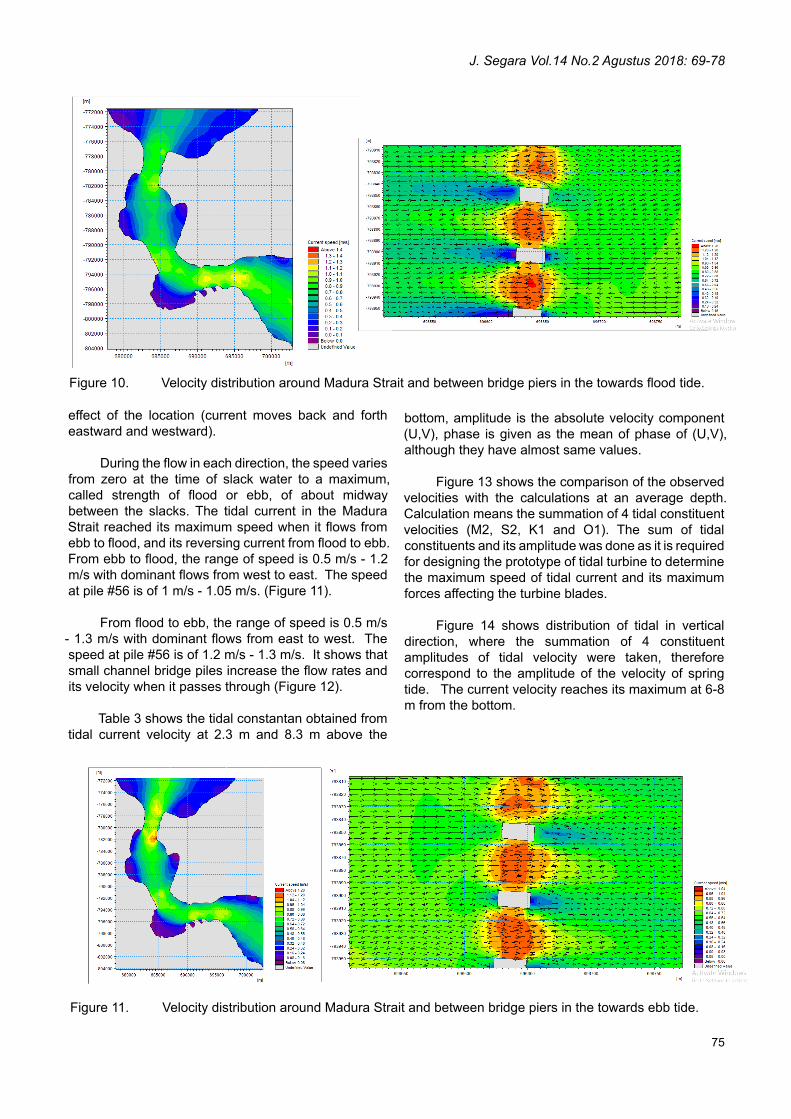
Figure 10 shows the hodograph of velocity between piers for 4 tidal components (M2, S2, K1, O1). Tidal current is stronger during the flood tide than during the ebb tide, which explained by the geometry
The comparison between the numerical model (blue) and measured water surface elevation (orange).
Figure 6.
The Comparison between the calculated (blue) and measured current velocities (orange).Figure 7.
The Analysis of Tidal Current ...... Generation Test Site (Nugraha, R.B.A., et al.)
74
The occurrence frequency of ocean current (%)
V N NE E SE S
0-20 0.78 0.83 12.74 0.92 0.9221-40 0.00 0.00 11.49 0.14 0.4141-60 0.00 0.00 11.17 0.00 0.2361-80 0.00 0.00 7.68 0.00 0.0081-100 0.00 0.00 0.00 0.00 0.00101-120 0.00 0.00 0.00 0.00 0.00121-140 0.00 0.00 0.00 0.00 0.00> 140 0.00 0.00 0.00 0.00 0.00Total 0.78 0.83 43.08 1.06 1.56
The occurrence frequency of ocean current (%)
SW W NW Total Cumulative
1.75 11.68 1.01 30.62 30.621.20 12.97 0.00 26.21 56.831.10 14.16 0.05 26.71 83.540.14 4.97 0.09 12.87 96.410.00 1.75 0.00 1.75 98.160.00 1.61 0.00 1.61 99.770.00 0.23 0.00 0.23 100.000.00 0.00 0.00 0.00 100.004.18 47.36 1.15 100 100
Velocity distribution at Suramadu Bridge (Pile 56) on 21 May-5 June 2015Table 2.
Current rose representing current velocities and direction at Suramadu Bridge.Figure 8.
Hodograph of velocity between model and ADCP.Figure 9.
J. Segara Vol.14 No.2 Agustus 2018: 69-78
75
effect of the location (current moves back and forth eastward and westward).
During the flow in each direction, the speed varies from zero at the time of slack water to a maximum, called strength of flood or ebb, of about midway between the slacks. The tidal current in the Madura Strait reached its maximum speed when it flows from ebb to flood, and its reversing current from flood to ebb. From ebb to flood, the range of speed is 0.5 m/s - 1.2 m/s with dominant flows from west to east. The speed at pile #56 is of 1 m/s - 1.05 m/s. (Figure 11).
From flood to ebb, the range of speed is 0.5 m/s - 1.3 m/s with dominant flows from east to west. The speed at pile #56 is of 1.2 m/s - 1.3 m/s. It shows that small channel bridge piles increase the flow rates and its velocity when it passes through (Figure 12).
Table 3 shows the tidal constantan obtained from tidal current velocity at 2.3 m and 8.3 m above the
bottom, amplitude is the absolute velocity component (U,V), phase is given as the mean of phase of (U,V), although they have almost same values.
Figure 13 shows the comparison of the observed velocities with the calculations at an average depth. Calculation means the summation of 4 tidal constituent velocities (M2, S2, K1 and O1). The sum of tidal constituents and its amplitude was done as it is required for designing the prototype of tidal turbine to determine the maximum speed of tidal current and its maximum forces affecting the turbine blades.
Figure 14 shows distribution of tidal in vertical direction, where the summation of 4 constituent amplitudes of tidal velocity were taken, therefore correspond to the amplitude of the velocity of spring tide. The current velocity reaches its maximum at 6-8 m from the bottom.
Velocity distribution around Madura Strait and between bridge piers in the towards flood tide.Figure 10.
Velocity distribution around Madura Strait and between bridge piers in the towards ebb tide.Figure 11.

The Analysis of Tidal Current ...... Generation Test Site (Nugraha, R.B.A., et al.)
76
Tidal Current Power Estimation
Theoretical value of tidal current power per unit sectional area (Pth) is given by:
P=0.593*0.5ρAV3 (watt)
Where P is a total power generated by tidal in certain length of area, ρ for density of water, and V for current velocity.
Figure 15 shows the comparison of the observation and calculation by 4 tidal components
during 15 days between two Piers Bridges (56-57). Tidal current energy was obtained by integrating the power with respect to the time. Average energy per day is calculated as follows:
E (observation) = 54.49 W/m2
E (calculation) = 75.76 W/m2
Maximum power exceeds 391.472 W/m2 at calculation power, and 441.855 W/m2 at observation power at the spring tide, but during the neap conditions, the value was less than 200 W/m2.
Tidal current velocity at 2.3 bottom
Constanta Amp (cm) Percent (%) Phase (deg)
M2 0.416 48.25986079 15.4S2 0.152 17.63341067 15.5K1 0.256 29.69837587 48.7O1 0.038 4.408352668 -39.0 0.862 100
Tidal current velocity at 2.3 bottom
Constanta Amp (cm) Percent (%) Phase (deg)
M2 0.519 47.61467890 19.1S2 0.225 20.64220183 189K1 0.277 25.41284404 40.6O1 0.069 6.330275229 88.6 1.09 100
Tidal current velocity at 2.3 and 8.3 m above bottomTable 3.
Comparison of tidal velocities, observation and calculation by 4 tidal constituents.Figure 12.

J. Segara Vol.14 No.2 Agustus 2018: 69-78
77
CONCLUSION
A high-resolution numerical model to determine the marine energy test site in Suramadu Bridge has been developed and calibrated against a dataset of observations. Although the location is not suitable for the placement of tidal turbines for long term, the Suramadu Bridge is an appropriate site for testing the prototype of tidal turbine to view and assess its performance. The speed of tidal currents in Madura Strait has range between 0.5-1.3 m/s (enough to set in motion the turbine blades), move back and forth in different direction following its ebb and flood pattern.
REFFERENCE
CBrowne, J., Buruchian, K., Deyer, D, Ducharme, T.,Dutile, K & Pelletier, M. (2009). Tidal Power Generation: infrastructure. Report. University of New Hampshire. College of Engineering and Physical Sciences. TECH 797: Ocean Project.
DHI. (2012). MIKE 21 Flow Model: Hydrodynamic Module User Guide. DHI Water and Environment.
http://www.hydroasia.org/jahia/webdav/site/hydroasia/shared/Document_public/Project/Manuals/WRS/MIKE21_HD.pdf.
Firdaus, A.M., Kusumastanto, T. & Jaya. I.W. (2015). Analisis Ekonomi dan Kebijakan Pengembangan Energi Arus Laut di Selat Madura, Provinsi Jawa Timur. Warta KIML. Vol. 13 No 1. Hal. 65-76.
Jennerjahn, T.C., Jänena, I., Proppa, C., Adib, S. & Nugroho, S.P. (2013). Environmental impact of mud volcano inputs on the anthropogenically altered Porong River and Madura Strait coastal waters, Java, Indonesia. Estuarine, Coastal and Shelf Science. Volume 130, 20 September 2013, Pages 152–160. doi:10.1016/j.ecss.2013.04.007
Koropitan, A. (2007). Transport of Mud Volcano-Sidoarjo (Lusi) in Madura Strait: A Numerical Modeling Experiment. ISSN: 1346-8901. ResearchGate. https://www.researchgate.net/publication/281677836_Transport_of_Mud_Volcano-Sidoarjo_Lusi_in_Madura_Strait_A_Numerical_Modeling_Experiment. Retrieved on
Velocity profile by summation of 4 tidal constituent amplitudes.Figure 13.
Comparison of power, observation and calculation by 4 tidal constituents.Figure 14.

The Analysis of Tidal Current ...... Generation Test Site (Nugraha, R.B.A., et al.)
78
23 January 2016.
Kyozuka, Y. (2008). Tidal Current Power Generation Making Use of a Pier of the Ikitsuki Bridge. In Proc. Of Civil Engineering in the Ocean
Kyozuk, Y. & Gunji, T. (2005). Tidal Current Power Generation by Making use of A Bridges Pier. In Proc. Of 2nd Joint Japan/Korea Workshop on Marine Environmental Engineering.
Kyozuka, Y. & Ogawa, K. (2006). Tidal Current Power Generation Making Use of a Bridge Pier. Kyushu University. Oceans 2006-Asia Pacific. IEEExplore. ISBN 978-1-4244-0138-3.
Lim, Hs., Yi, J., Kim, C. & Baek, W. (2016). Tidal Current Speed Analysis Near Offshore Bridges through Field Observation and Numerical Simulation. Proc. Of 3rd the Asian Wave and Tidal Energy Conference (AWTEC 2016). ISBN: 978-981-11-0782-5. doi: 10.3850/978-981-11-0782-5_119.
Vennetti, D. (2012). Wave and Tidal Energy Technology Survey for Ferry Free E39 Project. NPRA Report:Norwegian Public Roads Administration. SP Technical Research Institute of Sweden. ISSN 0284-5172.
Wosnik, M., Despins, R. & Swift, R. (2009). Tidal Energy Test Site at UNH-CORE. 1st Annual MREC Technical Conference.
Related Documents