June 27, 2012 DSSD CENSUS COVERAGE MEASUREMENT MEMORANDUM SERIES #2010-G-13 MEMORANDUM FOR Frank A. Vitrano Acting Chief, Decennial Statistical Studies Division From Patrick J. Cantwell (signed) Assistant Division Chief, Sampling and Estimation Decennial Statistical Studies Division Prepared by: Colt S. Viehdorfer Decennial Statistical Studies Division Subject: 2010 Census Coverage Measurement Estimation Report: Results for Puerto Rico This report provides estimation results from the 2010 Census Coverage Measurement program for Puerto Rico. This report summarizes the estimates of net coverage, components of census coverage, missing data, and characteristic imputation. For more information, contact Colt S. Viehdorfer on (301) 763-6796 or Patrick J. Cantwell on (301) 763-4982. cc: DSSD CCM Contacts List

Welcome message from author
This document is posted to help you gain knowledge. Please leave a comment to let me know what you think about it! Share it to your friends and learn new things together.
Transcript

June 27, 2012
DSSD CENSUS COVERAGE MEASUREMENT MEMORANDUM SERIES #2010-G-13
MEMORANDUM FOR Frank A. Vitrano
Acting Chief, Decennial Statistical Studies Division
From Patrick J. Cantwell (signed)
Assistant Division Chief, Sampling and Estimation
Decennial Statistical Studies Division
Prepared by: Colt S. Viehdorfer
Decennial Statistical Studies Division
Subject: 2010 Census Coverage Measurement Estimation Report: Results
for Puerto Rico
This report provides estimation results from the 2010 Census Coverage Measurement program
for Puerto Rico. This report summarizes the estimates of net coverage, components of census
coverage, missing data, and characteristic imputation.
For more information, contact Colt S. Viehdorfer on (301) 763-6796 or Patrick J. Cantwell on
(301) 763-4982.
cc:
DSSD CCM Contacts List

Census Coverage Measurement Estimation Report
Puerto Rico Results
Prepared by
Colt S. Viehdorfer
Decennial Statistical Studies Division
Table of Contents
Executive Summary ........................................................................................................................ 1
1. Introduction ............................................................................................................................. 2
2. Methods ................................................................................................................................... 2
2.1 Net Coverage Estimation for Persons .............................................................................. 2
2.2 Components of Census Coverage for Persons ................................................................. 4
2.3 Net Coverage Estimation for Housing Units.................................................................... 7
2.4 Components of Census Coverage for Housing Units ...................................................... 8
2.5 Measures of Uncertainty .................................................................................................. 8
2.6 Statistical Testing ............................................................................................................. 8
2.7 Characteristic Imputation ................................................................................................. 8
2.8 Missing Data for Net Coverage Estimation ..................................................................... 9
2.9 Missing Data for the Components of Census Coverage ................................................ 10
3. Limitations ............................................................................................................................. 12
3.1 Sampling Error ............................................................................................................... 12
3.2 Nonsampling Error ......................................................................................................... 12
3.3 Omissions ....................................................................................................................... 12
3.4 Missing Data .................................................................................................................. 13
4. Discussion of Results of Person Coverage ............................................................................ 13
4.1 Overall Estimates of Net Coverage and Components of Census Coverage ................... 13
4.2 Whole-Person Census Imputations ................................................................................ 14
4.3 Census Coverage by Tenure ........................................................................................... 15
4.4 Census Coverage by Age and Sex Groups ..................................................................... 15
4.5 Census Coverage by Municipio ..................................................................................... 16
4.6 Census Coverage by Metropolitan Statistical Area........................................................ 17
4.7 Component Estimates by Census Operational Outcomes .............................................. 17
4.8 Census Coverage by Type of Address ........................................................................... 21
5. Discussion of Results of Housing Unit Coverage ................................................................. 21
5.1 Overall Estimates of Net Coverage and Components of Census Coverage ................... 21
ii
5.2 Census Coverage by Occupancy and Tenure ................................................................. 23
5.3 Census Coverage by Municipio ..................................................................................... 24
5.4 Census Coverage by Metropolitan Statistical Area........................................................ 24
5.5 Component Estimates by Census Operational Outcomes .............................................. 25
5.6 Census Coverage by Type of Address ........................................................................... 28
6. Characteristic Imputation ...................................................................................................... 29
7. Missing Data Results for Net Coverage ................................................................................ 30
7.1 Noninterview Rates ........................................................................................................ 30
7.2 Missing Data Results for Persons................................................................................... 31
7.3 Missing Data Results for Housing Units ........................................................................ 32
7.4 Weight Trimming ........................................................................................................... 33
8. Missing Data Results for Components of Census Coverage ................................................. 34
8.1 Person Missing Data Results for Components of Census Coverage .............................. 34
8.2 Housing Unit Missing Data Results for Components of Census Coverage ................... 35
References ..................................................................................................................................... 36
1
Executive Summary
This document summarizes the Puerto Rico results for housing units and persons in housing units
produced by the 2010 Census Coverage Measurement program. This report includes estimates
of net coverage and the components of census coverage, results of characteristic imputation, and
results of missing data.
Results for Persons
The following are the key findings for the household population in Puerto Rico.
The 2010 Census had a significant net overcount of 160,300 persons (4.5%, 0.8%
standard error).
The Census Coverage Measurement estimated 290,000 erroneous enumerations (7.9%) in
the 2010 Census. Most of the erroneous enumerations (263,800) were due to duplication,
while the remaining 26,200 were erroneous enumerations due to other reasons.
All demographic characteristics were imputed for 79,500 census records. Of these,
32,000 were in housing units where a population count was obtained.
The Census Coverage Measurement estimated 209,200 omissions in the 2010 Census.
Part of this estimate of omissions may be attributed to the 79,500 records with all
characteristics imputed.
Results for Housing Units
The following are the key findings for housing units in Puerto Rico.
The 2010 Census did not have a significant percent net overcount. The Census Coverage
Measurement estimated a net overcount of 0.4% (1.4% standard error). When housing
units were broken down by occupancy status and tenure, no net overcount or net
undercount estimates were statistically different from zero.
The Census Coverage Measurement estimated 127,800 erroneous enumerations (7.8%) in
the 2010 Census. Of the 127,800 erroneous enumerations, 40,600 (2.5%) were due to
duplication to another housing unit, while 87,200 (5.3%) were due to other reasons,
including nonresidential or nonexistent housing units.
The Census Coverage Measurement estimated 120,800 housing unit omissions in the
2010 Census, which was 7.4% of the estimated housing unit total.

2
1. Introduction
As part of the 2010 Census, the U.S. Census Bureau conducted the Census Coverage
Measurement (CCM). The CCM program evaluated the coverage of the 2010 Census and
provided information to improve future censuses.
The major goals of the CCM program (Singh 2003) were
to continue to provide measures of net coverage error;
to begin producing measures of the components of census coverage, including erroneous
enumerations and omissions; and
to produce measures of coverage for demographic groups and geographic areas, as well
as for key census operations.
This document summarizes the 2010 coverage and missing data estimates produced by the CCM
program for persons and housing units in Puerto Rico. Section 2 provides background on the
estimation of net coverage and the components of census coverage. Methodology for
characteristic imputation and missing data is also included in Section 2. Section 3 provides
limitations on the results shown. Sections 4 through 8 present the results. This document
provides estimates of coverage of the 2010 Census in Puerto Rico, not analysis of possible
causes or errors. As we conduct testing and planning for the 2020 Census, we will investigate
solutions to improve the coverage.
2. Methods
The 2010 CCM survey was large and complex and had a target sample size of 7,500 housing
units in Puerto Rico. In the CCM survey, an independent enumeration of housing units and
persons in housing units was conducted. The results were matched to census enumerations to
identify coverage results. This section provides a brief description of the methodology for
Puerto Rico estimation. See the forthcoming methodology documentation for more details.
2.1 Net Coverage Estimation for Persons
The 2010 CCM survey relied on dual system estimation that required two independent systems
of measurement. The Population Sample, P sample, and the Enumeration Sample, E sample,
have traditionally defined the samples for dual system estimation. The P sample and the
E sample measured the same housing unit and household population. However, the P-sample
operations were conducted independent of the census. The E sample consisted of census housing
units and person enumerations in housing units in the same sample areas as the P sample. After
matching with the census lists and reconciliation, the P sample provided information about the
housing units and population missed in the census, whereas the E sample provided information
about erroneous census inclusions. This information was used in different ways to estimate the
net coverage and the components of census coverage.
For 2010, instead of using post-stratification like past post-enumeration surveys, more general
logistic regression modeling was used to estimate the parameters in the dual system estimate
3
(DSE) formula, i.e., data-defined, correct enumeration, and match probabilities. The DSE can be
expressed as
Cj jm
jce
jddCDSE)(
)(
)(
To obtain an estimate of the population in domain C, the predicted data-defined, correct
enumeration, and match probabilities for census case j ( dd(j), ce(j), m(j), respectively) were
obtained through logistic regression modeling. Note that in the U.S. the DSE formula also had
an adjustment for correlation bias using sex ratios from the Census Bureau’s Demographic
Analysis program. No adjustment for correlation bias was done in Puerto Rico.
To make predictions of the probability of being a data-defined enumeration, the probability of
being a correct enumeration, or the probability of being matched to the census, we used the same
independent variables (main effects) in each model. Research suggested that interactions should
not be included in the models. In general, Puerto Rico models used fewer terms than the U.S.
models because of the shorter list of candidate variables and the smaller sample size. The main
effects used in the models for Puerto Rico included the following:
Tenure (Owner and Renter)
Age/Sex groups (9 groups)
Metropolitan Statistical Area (San Juan MSA, Other MSA, Non MSA)
Tract-level Census Participation Rate (bottom- and top-coded at 40% and 70% then
squared)
See Olson (2012) for more information on the methods used for model selection.
2.1.1 Synthetic Estimation
The 2010 estimation approach used logistic regression modeling to produce synthetic estimates
of net coverage. The parameters in the model were based on the entire sample in Puerto Rico
and then were applied synthetically to each individual census case. Information collected at the
individual level could be easily used in conjunction with information collected at a more
aggregate level to provide estimates for various domains, even for small domains with little or no
sample.
2.1.2 Net Coverage Estimates
The estimate of net coverage is the difference between the true population (the DSE) and the
census count, resulting in either a net undercount or a net overcount. A positive estimate shows
an undercount and a negative estimate shows an overcount:
CensusDSEUndercountNet
4
This report also provides the estimate of percent net undercount. The percent net undercount is
the net undercount estimate divided by the DSE expressed as a percentage:
100DSE
CensusDSEUndercountNetPercent
2.2 Components of Census Coverage for Persons
The general estimation approach for components of census coverage for persons fell into four
categories:
estimates of correct enumerations
estimates of erroneous enumerations
tabulations of whole-person census imputations
estimates of omissions
The estimates of correct and erroneous enumerations were design-based estimates using the
matching, followup, and processing results of the sample of census housing units (that is, the
E sample). We also implemented missing data procedures for unresolved enumeration status and
missing characteristics. To control variance, we implemented an adjustment procedure to take
advantage of the finite population total of census enumerations. Estimates of correct and
erroneous enumerations were benchmarked to larger aggregates to ensure consistency of
estimates among the tables provided in this report. In addition to generating estimates of levels
of correct and erroneous enumerations, the CCM produced percentages as well. For these
percentages, the denominator was the census count.
2.2.1 Estimates of Correct Enumerations
In the CCM, we evaluated a sample of data-defined1 enumerations in the census to determine if
they were correct enumerations. For a person to be a correct enumeration for our component
estimation, the first requirement was that the census person record should have been enumerated
in a housing unit in the census. If a person was determined to have been included in the census
two or more times, the CCM had procedures to determine which enumeration was correct based
on the Person Interview and Person Followup information. The other enumerations were
classified as erroneous enumerations.
For Puerto Rico estimates, the geographic requirement for the enumeration to be considered
correct was that the record corresponded to a person that should have been included anywhere in
Puerto Rico in the coverage universe. This criterion applied to the estimates of the total
population and other domains, like demographic characteristics and census operations. For
municipio estimates, the definition narrowed to require that the person should have been
enumerated in that particular municipio.
1 A data-defined enumeration in the census had two reported characteristics, one of which can be name.
5
This definition of correct enumeration for components of census coverage was different from the
definition of correct enumeration used for estimating net coverage. The definition for net error
was stricter, as it applied additional criteria to minimize the bias in our DSEs. For net
estimation, the record must have (1) had sufficient identification information, that is, a valid
name and two other characteristics, and (2) been enumerated in the specific geographic area
referred to as the block cluster search area2. For component estimation, we used a different
definition that was more suitable for Puerto Rico and municipio estimates.
In addition to generating estimates of levels of correct enumerations, the CCM produced
percentages as well. For correct enumeration percentages, the denominator was the census
count.
2.2.2 Estimates of Erroneous Enumerations
For component estimation, we also estimated the number of erroneous enumerations. When
examining the reasons that a case was erroneous, we report the results for three categories:
persons that should not have been enumerated at all (“Other Reasons”)
erroneous enumerations due to duplication
enumerations included in the wrong location
There were several types of erroneous enumerations combined into the first category of “Other
Reasons.” Some of these included persons who should have been enumerated in a group
quarters, who were born after Census Day3 or who died before Census Day, and who were
fictitious enumerations.
The second group was erroneous enumerations due to duplication. A person enumerated two or
more times in the census for whom at least one of those enumerations was in a housing unit fell
into this category. If a person was enumerated correctly in a group quarters and enumerated
erroneously in a housing unit, the person enumeration in the housing unit was an erroneous
enumeration due to duplication.
The third category of erroneous enumerations, those included in the wrong location, by
definition does not exist for Puerto Rico estimates such as total population or owners and renters.
That is, any person was a correct enumeration if the person should have been counted in a
housing unit and was counted in a housing unit anywhere in Puerto Rico. For municipio
estimates, the CCM narrowed the geographic criterion of where the person should have been
counted to the municipio to determine whether the person was treated as erroneous or correct for
a given municipio.
2 The block cluster search area is the block cluster and the one ring of surrounding census blocks. A block cluster is
one or more contiguous blocks, and averages 30 housing units. 3 Census Day was April 1, 2010.
6
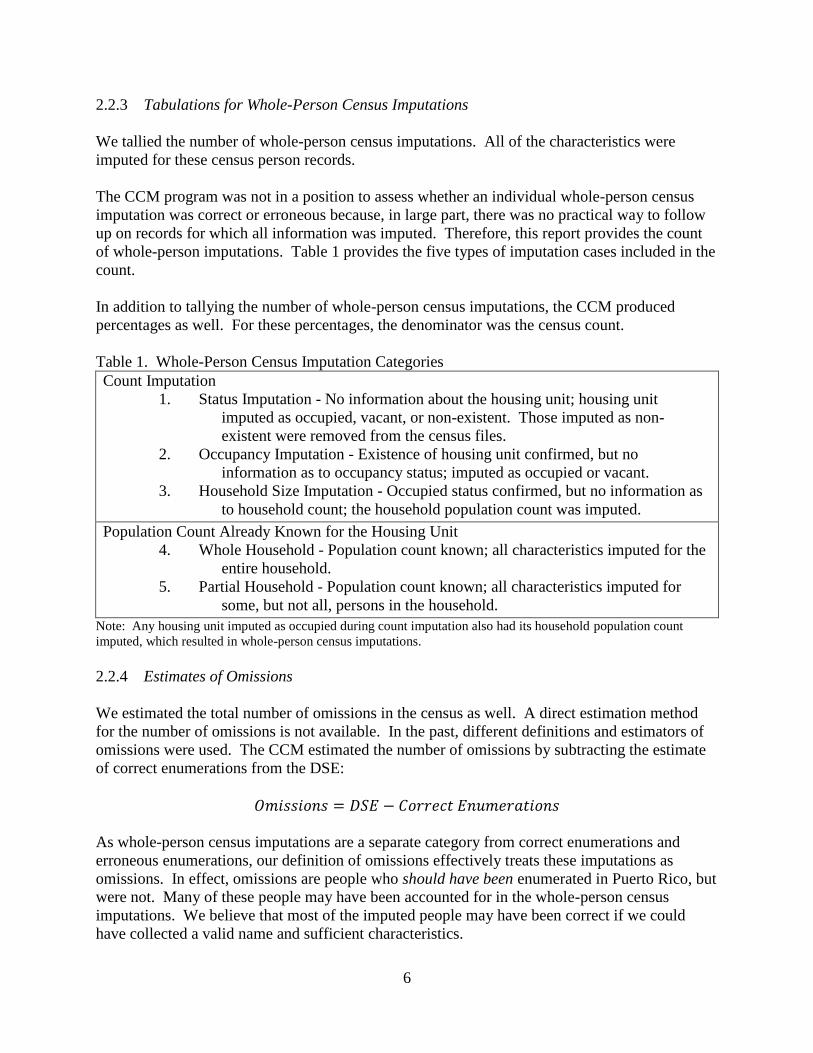
2.2.3 Tabulations for Whole-Person Census Imputations
We tallied the number of whole-person census imputations. All of the characteristics were
imputed for these census person records.
The CCM program was not in a position to assess whether an individual whole-person census
imputation was correct or erroneous because, in large part, there was no practical way to follow
up on records for which all information was imputed. Therefore, this report provides the count
of whole-person imputations. Table 1 provides the five types of imputation cases included in the
count.
In addition to tallying the number of whole-person census imputations, the CCM produced
percentages as well. For these percentages, the denominator was the census count.
Table 1. Whole-Person Census Imputation Categories
Count Imputation
1. Status Imputation - No information about the housing unit; housing unit
imputed as occupied, vacant, or non-existent. Those imputed as non-
existent were removed from the census files.
2. Occupancy Imputation - Existence of housing unit confirmed, but no
information as to occupancy status; imputed as occupied or vacant.
3. Household Size Imputation - Occupied status confirmed, but no information as
to household count; the household population count was imputed.
Population Count Already Known for the Housing Unit
4. Whole Household - Population count known; all characteristics imputed for the
entire household.
5. Partial Household - Population count known; all characteristics imputed for
some, but not all, persons in the household.
Note: Any housing unit imputed as occupied during count imputation also had its household population count
imputed, which resulted in whole-person census imputations.
2.2.4 Estimates of Omissions
We estimated the total number of omissions in the census as well. A direct estimation method
for the number of omissions is not available. In the past, different definitions and estimators of
omissions were used. The CCM estimated the number of omissions by subtracting the estimate
of correct enumerations from the DSE:
As whole-person census imputations are a separate category from correct enumerations and
erroneous enumerations, our definition of omissions effectively treats these imputations as
omissions. In effect, omissions are people who should have been enumerated in Puerto Rico, but
were not. Many of these people may have been accounted for in the whole-person census
imputations. We believe that most of the imputed people may have been correct if we could
have collected a valid name and sufficient characteristics.

7
In addition to levels, the CCM reports omissions as a percentage of the estimated population:
100DSE
OmissionsPercentageOmission
2.3 Net Coverage Estimation for Housing Units
Housing unit net coverage estimates for the 2010 CCM were calculated in the same manner as
the person net coverage estimates. We applied logistic regression to model the parameters in the
DSE formula and produced synthetic estimates. The DSE formula for housing units differs
slightly from the person DSE formula because housing unit estimation does not have an
analogous concept to a data-defined person:
Cj jm
jce
CDSE)(
)(
With respect to the given estimation domain C, the predicted correct enumeration and match
probabilities for census case j ( ce(j) and m(j), respectively) were obtained through logistic
regression modeling.
We used the same independent variables (main effects) in each model, but we did not use the
same interactions to make predictions of the probabilities of being correctly enumerated and of
matching to the census. As with persons, fewer terms were used in the Puerto Rico models than
were used in the U.S. The main effects used in the models for housing units in Puerto Rico
include
Metropolitan Statistical Area (San Juan MSA, Other MSA, Non MSA)
Occupancy and Tenure (Owner-Occupied, Renter-Occupied, and Vacant)
Census Enumeration List Rate4 (bottom-coded at 85% then squared)
When modeling the correct enumeration rate, we used one interaction: Occupancy and Tenure
crossed with the squared Enumeration List Rate. Similarly, we used one interaction when we
modeled the match rate: Occupancy and Tenure crossed with Combined MSA. Combined MSA
had two values: San Juan MSA and the balance of Puerto Rico.
4 See Olson (2012) for details on the Enumeration List Rate
8
2.4 Components of Census Coverage for Housing Units
Our approach for estimating the components of census coverage for housing units fell into the
following categories:
estimates of correct enumerations
estimates of erroneous enumerations
estimates of omissions
2.4.1 Estimates of Correct and Erroneous Enumerations
Design-based housing unit estimates of correct and erroneous enumerations were generated in
the same manner as the person estimates. Procedures were instituted to handle missing data, and
variance was controlled by implementing an adjustment procedure to take advantage of the finite
population total of census enumerations. Estimates of correct and erroneous enumerations were
benchmarked to larger aggregates, and percentages of the estimates were produced by the CCM
using the census count for the denominator.
2.4.2 Estimates of Omissions
The CCM program estimated the total number of omissions as well. The CCM estimated
omissions by subtracting the correct enumerations from the DSE. This was the same method that
was used to estimate person omissions, shown in section 2.2.
2.5 Measures of Uncertainty
We used delete-a-group jackknife replication to estimate standard errors of net coverage and
components of census coverage for persons and housing units. For municipio estimates, the
jackknife standard errors for net coverage might have underestimated the true error by not
capturing the potential bias introduced from synthetic estimation. Therefore, we produced
estimates of root mean squared error for these governmental entities. The root mean squared
error estimate adds an estimate of synthetic bias to the jackknife sampling variance estimate.
2.6 Statistical Testing
Statements of comparison in this report are statistically significant at the 90% confidence level
(α = 0.10) using a two-sided test. “Statistically significant” means that the difference is not
likely due to random chance alone. In the tables, percent net undercount estimates that are
significantly different from zero are identified by an asterisk (*).
2.7 Characteristic Imputation
A separate document gives a high-level overview of the features of the census characteristic
imputation system (Shores 2010). For the P sample, the CCM used the same characteristic
imputation system that was applied to the 2010 Census. Census characteristic imputation
9
contained two major components. These were the pre-edit and edit/allocation. The pre-edit
cleaned and validated the data, and changed or set to blank data values in some cases. Once the
pre-edit was completed, various edit and allocation processes filled in all remaining missing
values.
Editing was a fundamental part of the census characteristic imputation system. The editing rules
could alter the data to produce outcomes, such as those in effect for relationship, age, and sex,
that would achieve “consistent” households. As an example, a parent was required to be at least
15 years older than his or her biological children.
The census system drew from hot decks to impute missing values when it could not use other
methods of imputation. The hot decks were implemented by matrices whose cells were
categorized by attributes of persons in the household, the householder, or the overall household,
such as type of household or household composition.
2.8 Missing Data for Net Coverage Estimation
Before calculating DSEs, we had to account for missing information from the interviews of
P-sample people and from the matching and followup operations. Note that the term “missing
data” applied after all followup attempts were completed. We encountered two types of missing
data in the CCM and used two procedures to correct for them.
1. Household-level noninterviews in the P Sample. In a majority of these, we were unable to
contact the household or the interview was refused. In general, the noninterview
adjustment spread the weights of household noninterviews among households that were
interviewed in the same block cluster (the primary sampling unit) and had the same type
of basic address (single family, multi-unit address, or other).
2. Unresolved status. For some respondents in the P sample, there was not enough
information available to determine the inclusion status (whether or not the person should
have been included in the P sample), the mover status (whether or not the person was an
inmover), or the match status (whether or not the person matched to someone enumerated
in the census in the same block cluster search area). For housing units, unit status
determined whether the housing unit was in the P sample or not. Match status could also
be missing for housing units.
Similarly, for people and housing units in the E sample, there may not have been enough
information to determine whether the person or housing unit was correctly enumerated,
resulting in unresolved enumeration status. Generally, for cases with missing status, a
probability was assigned based on information available about the specific case and about
resolved cases with similar characteristics.
Note that E-sample people with insufficient information for dual system estimation processing5
were not unresolved for net coverage estimation, but were treated as erroneous enumerations,
5 Enumerations lacking a complete name and two characteristics were said to have insufficient information for dual
system estimation processing. They do not include whole-person census imputations.
10
that is, they were assigned a probability of correct enumeration of 0. In the P sample, if the
entire housing unit contained people without sufficient information for matching, the housing
unit was treated as a noninterview. Otherwise, each such person in an occupied housing unit had
an unresolved match status.
In the 2010 CCM, we used the post-enumeration survey (PES) B+ procedure to determine
P-sample persons, and an inclusion status was assigned based on whether or not the person was
in the P sample. For the 2010 CCM, the P sample comprised nonmovers, inmovers, and some
outmovers (those who had no chance of being captured in the P sample, e.g., people who moved
from the sample unit to a group quarters facility or to another country). Others were not included
in the P sample (never resident, outmovers who could be captured at their outmover address, and
persons out of scope). For situations where outmover persons were not determined to be in or
out of the P sample, they were treated as being out of the P sample for estimation purposes.
The 2010 CCM dealt with unresolved statuses by using imputation. Each person in the
P sample had a probability of matching to a person in the census. This probability was said to be
1 if the person matched and 0 if the person did not match. People whose match status was
“unresolved”—still unknown or unclear after all followup operations—were assigned a match
probability between 0 and 1 to compute the DSE. Similar methods were used to account for
unresolved inclusion status for P-sample people and enumeration status for E-sample people in
the 2010 CCM.
In the 2010 CCM procedure, all resolved cases were used in a logistic regression model to
predict a probability for the unresolved cases. Separate logistic regression models were used to
predict the P-sample match and inclusion statuses for cases with sufficient and insufficient
information for matching.
After applying methods to account for the two types of missing data, a weight trimming
procedure was implemented prior to the calculation of the DSE to reduce the influence of block
clusters that might have an undue effect on the estimates. Clusters were identified as being
influential clusters if they had a large difference between the number of E-sample erroneous
enumerations and P-sample nonmatches. 2.9 Missing Data for the Components of Census Coverage
To produce estimates of the components of census coverage, the strict definition of a correct
enumeration used for implementing dual system estimation and estimation of net coverage was
loosened. The stricter definition overstated the number of erroneous enumerations and
omissions in Puerto Rico. For example, a person counted outside of the correct block cluster
search area was considered to be erroneously enumerated for net coverage estimation. For
component estimation, the enumeration was correct in Puerto Rico if it was not an erroneous
enumeration due to duplication or due to other reasons.
Another way in which the component missing data methodology deviated from the net coverage
missing data methodology was in the handling of cases with insufficient information for dual
system estimation processing. As stated in the previous section, net coverage treated E-sample
records with insufficient information for dual system estimation processing as erroneous
11
enumerations. To avoid introducing bias to the DSE through incorrect match status or incorrect
enumeration status, no attempt was made to match these cases for net error. While some of these
cases may have been correct enumerations, they likely corresponded to P-sample nonmatches.
Therefore, for estimating net coverage, the errors balanced and bias was not introduced.
To estimate the components of census coverage, an attempt was made to match and assign an
enumeration status to the cases with insufficient information for dual system estimation
processing. Research showed that many of the cases with insufficient information could be
matched and an enumeration status could be determined. More details are found in Livermore
Auer (2005).
For component missing data calculations, resolved E-sample persons were classified into five
enumeration outcomes. The outcomes, along with their correct or erroneous classification by the
Puerto Rico definition6 are listed below:
1. Correctly Enumerated in the Block Cluster Search Area (BCSA), which consists of
the block cluster and the surrounding blocks
2. Correctly Enumerated in the same Municipio but Outside of the BCSA
3. Correctly Enumerated in a different Municipio
4. Erroneously Enumerated as a result of Duplication
5. Erroneously Enumerated for reasons other than Duplication
For component outcomes for persons, we applied the following steps to assign enumeration
status. For each of the five component outcomes, records were assigned a probability of 1 if the
status was “yes,” and a probability of 0 if the status was “no.” For any component outcome for
which a person was unresolved, we imputed a probability of that outcome using the method of
cell means. The probability for some of the component outcomes was adjusted to account for
duplication to persons in units in the sample block that were subsampled out of the E sample.
Then, the probability for each outcome underwent an adjustment so that the five component
outcomes for any record summed to one.
For any person record some statuses may have been resolved while others were unresolved. For
example, only records with a duplicate link to another census record were considered unresolved
duplicates, and as such, they were the only cases where a probability of being erroneously
enumerated as a result of duplication was imputed. For the remainder of the unresolved records
without a duplicate link, this probability was forced to be 0. There were some records in which it
was determined that the person should have been enumerated in a different location but we had
incomplete information on the address at which the person should have been counted. These
records were considered resolved as a “no” for outcomes 1, 4, and 5 but unresolved for a
combination of the remainder of the outcomes, dependent upon how much information we had
on the address at which they should have been counted.
6The five outcomes are classified as either correct or erroneous depending on the geography which one considers.
For example, persons who are correctly enumerated in a different municipio were considered correct by the Puerto
Rico definition but were considered erroneous when considering enumerations at a municipio level.

12
For component missing data calculations, E-sample housing units were classified into five
enumeration outcomes, listed below:
1. Correctly Enumerated in the Block Cluster
2. Correctly Enumerated in the Surrounding Ring of Blocks
3. Geocoding Error
4. Erroneously Enumerated as a Duplicate
5. Erroneously Enumerated for reasons other than Duplication
Unlike a person record that could have been resolved for some outcomes and unresolved for
others, each housing unit was either resolved for all five outcomes or unresolved for all five
outcomes. The probability for each outcome was assigned using the same methodology as was
used for the person records, though the cells were defined differently.
3. Limitations
In this section, we provide statements about the data that are worth noting when reading this
document.
3.1 Sampling Error
Because the CCM estimates were based on a sample survey, they were subject to sampling error.
As a result, the sample estimates differed from what would have been obtained if all housing
units had been included in the survey. The standard errors provided with the data reflect mainly
variations due to sampling and they do not in general account for nonsampling errors, which can
be the principal source of error for very small geographic areas. Thus, the standard errors and
root mean squared errors provide an indication of the minimum amount of error present in the
estimates.
3.2 Nonsampling Error
Nonsampling error is a catch-all term for errors that are not a function of selecting a sample.
They include errors that may occur during data collection and processing survey data. For
example, while an interview was in progress, the respondent may have made an error in
answering a question, or the interviewer may have made an error in asking a question or
recording the answer. Sometimes interviews failed to take place or households provided
incomplete data. Other examples of nonsampling error for the 2010 CCM program included
matching error, modeling error, synthetic error, and classification error. Unlike sampling error,
nonsampling error is difficult to quantify.
3.3 Omissions
Omissions are estimated by subtracting the estimate of correct enumerations from the DSE.
Because DSEs were not calculated for some estimation domains, such as census operational
outcomes, we cannot provide omissions for some types of estimates.
13
3.4 Missing Data
All of the missing data models assumed ignorability (Rubin 1976), which is that the probabilities
of match, residence, and enumeration status given a set of known covariates are the same for
resolved and unresolved cases.
For the components of census coverage, in some instances a person record was counted in a
different location and the address information that we collected of where the person should have
been counted was not complete, meaning we only knew the general area. If this general area
overlapped with the municipio where the person record should have been counted then it was
assumed the person was counted in the same municipio.
4. Discussion of Results of Person Coverage
This section presents results of net coverage and components of census coverage for persons in
Puerto Rico.
4.1 Overall Estimates of Net Coverage and Components of Census Coverage
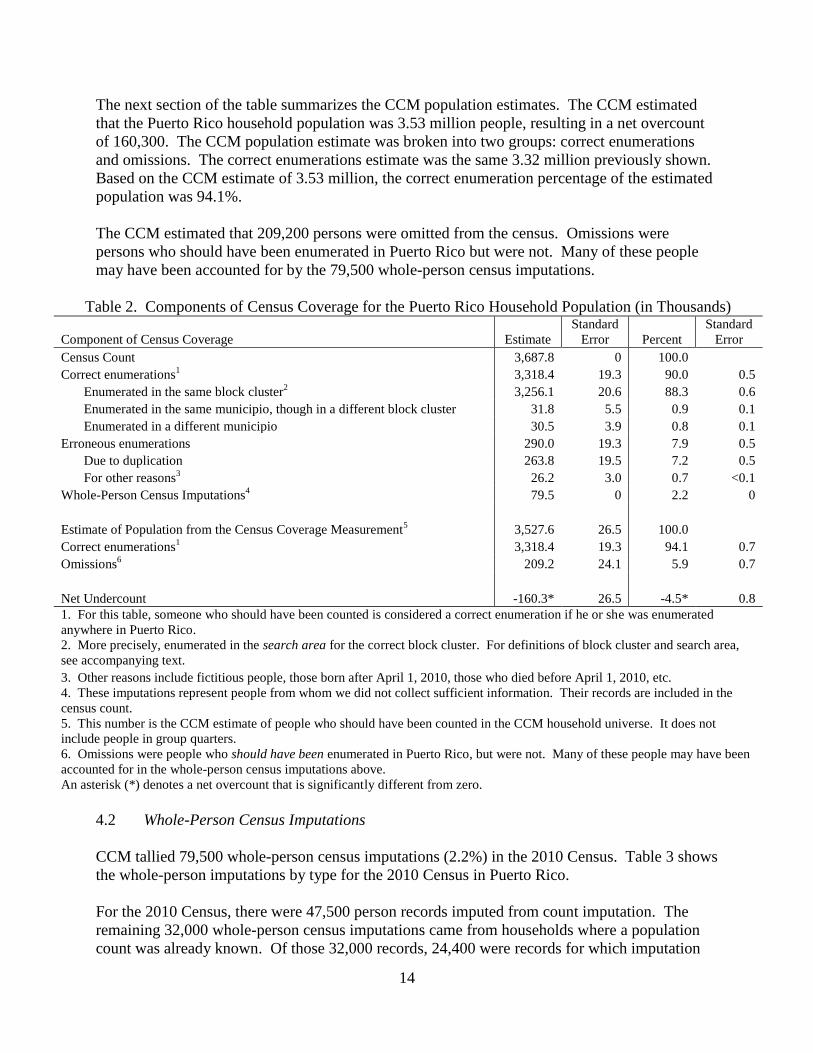
Table 2 shows the estimates of net coverage and the components of census coverage for the
household population in Puerto Rico (excluding group quarters). The first part of the table
shows how the census population count of 3.69 million was distributed among correct
enumerations, erroneous enumerations, and whole-person census imputations. The CCM
estimated 3.32 million (90.0%) correct enumerations, 290,000 (7.9%) erroneous enumerations,
and 79,500 (2.2%) whole-person census imputations. Whole-person imputations are discussed
further in section 4.2.
We estimated 3.32 million correct enumerations using the geographic requirement that the
person was in a housing unit anywhere in Puerto Rico. Table 2 provides a further breakdown of
the estimate using stricter geographic requirements.
CCM estimated that 3.26 million (88.3%) people were included in the correct CCM block cluster
search area, which was the CCM sample block cluster and the one ring of blocks that surround
the sample block cluster. See section 2.2.1 for more information on the CCM search area.
For the two remaining geographic requirements, CCM estimated that 31,800 (0.9%) people were
enumerated in the same municipio as where the person should have been enumerated but not in
the block cluster search area. Another 30,500 (0.8%) persons should have been included in a
different municipio within Puerto Rico.
The first part of the table continues by providing details about the 290,000 erroneous
enumerations in the 2010 Census. Of the total, 263,800 (7.2%) were erroneous enumerations
due to duplication, and 26,200 (0.7%) were erroneous enumerations for other reasons. The final
component of the census count was the 79,500 (2.2%) whole-person census imputations.
14
The next section of the table summarizes the CCM population estimates. The CCM estimated
that the Puerto Rico household population was 3.53 million people, resulting in a net overcount
of 160,300. The CCM population estimate was broken into two groups: correct enumerations
and omissions. The correct enumerations estimate was the same 3.32 million previously shown.
Based on the CCM estimate of 3.53 million, the correct enumeration percentage of the estimated
population was 94.1%.
The CCM estimated that 209,200 persons were omitted from the census. Omissions were
persons who should have been enumerated in Puerto Rico but were not. Many of these people
may have been accounted for by the 79,500 whole-person census imputations.
Table 2. Components of Census Coverage for the Puerto Rico Household Population (in Thousands)
Component of Census Coverage Estimate
Standard
Error Percent
Standard
Error
Census Count 3,687.8 0 100.0
Correct enumerations1 3,318.4 19.3 90.0 0.5
Enumerated in the same block cluster2 3,256.1 20.6 88.3 0.6
Enumerated in the same municipio, though in a different block cluster 31.8 5.5 0.9 0.1
Enumerated in a different municipio 30.5 3.9 0.8 0.1
Erroneous enumerations 290.0 19.3 7.9 0.5
Due to duplication 263.8 19.5 7.2 0.5
For other reasons3 26.2 3.0 0.7 <0.1
Whole-Person Census Imputations4 79.5 0 2.2 0
Estimate of Population from the Census Coverage Measurement5 3,527.6 26.5 100.0
Correct enumerations1 3,318.4 19.3 94.1 0.7
Omissions6 209.2 24.1 5.9 0.7
Net Undercount -160.3* 26.5 -4.5* 0.8
1. For this table, someone who should have been counted is considered a correct enumeration if he or she was enumerated
anywhere in Puerto Rico.
2. More precisely, enumerated in the search area for the correct block cluster. For definitions of block cluster and search area,
see accompanying text.
3. Other reasons include fictitious people, those born after April 1, 2010, those who died before April 1, 2010, etc.
4. These imputations represent people from whom we did not collect sufficient information. Their records are included in the
census count.
5. This number is the CCM estimate of people who should have been counted in the CCM household universe. It does not
include people in group quarters.
6. Omissions were people who should have been enumerated in Puerto Rico, but were not. Many of these people may have been
accounted for in the whole-person census imputations above.
An asterisk (*) denotes a net overcount that is significantly different from zero.
4.2 Whole-Person Census Imputations
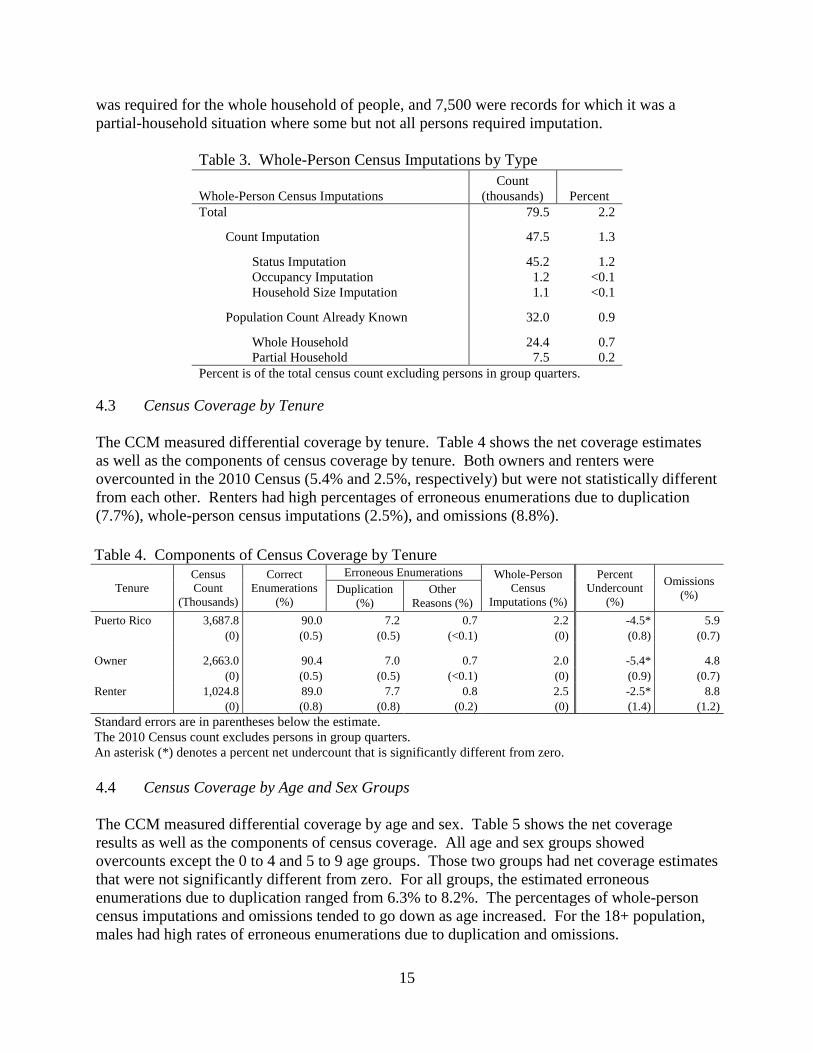
CCM tallied 79,500 whole-person census imputations (2.2%) in the 2010 Census. Table 3 shows
the whole-person imputations by type for the 2010 Census in Puerto Rico.
For the 2010 Census, there were 47,500 person records imputed from count imputation. The
remaining 32,000 whole-person census imputations came from households where a population
count was already known. Of those 32,000 records, 24,400 were records for which imputation
15
was required for the whole household of people, and 7,500 were records for which it was a
partial-household situation where some but not all persons required imputation.
Table 3. Whole-Person Census Imputations by Type
Whole-Person Census Imputations
Count
(thousands) Percent
Total 79.5 2.2
Count Imputation 47.5 1.3
Status Imputation 45.2 1.2
Occupancy Imputation 1.2 <0.1
Household Size Imputation 1.1 <0.1
Population Count Already Known 32.0 0.9
Whole Household 24.4 0.7
Partial Household 7.5 0.2
Percent is of the total census count excluding persons in group quarters.
4.3 Census Coverage by Tenure
The CCM measured differential coverage by tenure. Table 4 shows the net coverage estimates
as well as the components of census coverage by tenure. Both owners and renters were
overcounted in the 2010 Census (5.4% and 2.5%, respectively) but were not statistically different
from each other. Renters had high percentages of erroneous enumerations due to duplication
(7.7%), whole-person census imputations (2.5%), and omissions (8.8%).
Table 4. Components of Census Coverage by Tenure
Tenure
Census
Count
(Thousands)
Correct
Enumerations
(%)
Erroneous Enumerations Whole-Person
Census
Imputations (%)
Percent
Undercount
(%)
Omissions
(%) Duplication
(%)
Other
Reasons (%)
Puerto Rico 3,687.8 90.0 7.2 0.7 2.2 -4.5* 5.9
(0) (0.5) (0.5) (<0.1) (0) (0.8) (0.7)
Owner 2,663.0 90.4 7.0 0.7 2.0 -5.4* 4.8
(0) (0.5) (0.5) (<0.1) (0) (0.9) (0.7)
Renter 1,024.8 89.0 7.7 0.8 2.5 -2.5* 8.8
(0) (0.8) (0.8) (0.2) (0) (1.4) (1.2)
Standard errors are in parentheses below the estimate.
The 2010 Census count excludes persons in group quarters. An asterisk (*) denotes a percent net undercount that is significantly different from zero.
4.4 Census Coverage by Age and Sex Groups
The CCM measured differential coverage by age and sex. Table 5 shows the net coverage
results as well as the components of census coverage. All age and sex groups showed
overcounts except the 0 to 4 and 5 to 9 age groups. Those two groups had net coverage estimates
that were not significantly different from zero. For all groups, the estimated erroneous
enumerations due to duplication ranged from 6.3% to 8.2%. The percentages of whole-person
census imputations and omissions tended to go down as age increased. For the 18+ population,
males had high rates of erroneous enumerations due to duplication and omissions.

16
Table 5. Components of Census Coverage by Age and Sex Groupings
Age and Sex Group
Census
Count
(Thousands)
Correct
Enumerations
(%)
Erroneous Enumerations Whole-Person
Census
Imputations (%)
Percent
Undercount
(%)
Omissions
(%) Duplication
(%)
Other
Reasons (%)
Puerto Rico 3,687.8 90.0 7.2 0.7 2.2 -4.5* 5.9
(0) (0.5) (0.5) (<0.1) (0) (0.8) (0.7)
0 to 4 224.4 90.3 6.5 0.7 2.4 -1.4 8.4
(0) (1.0) (1.0) (0.3) (0) (2.1) (1.6)
5 to 9 239.8 90.7 6.7 0.2 2.4 -1.2 8.2
(0) (1.1) (1.0) (0.1) (0) (1.8) (1.5)
10 to 17 436.9 89.9 7.3 0.5 2.2 -4.1* 6.4
(0) (0.9) (0.9) (0.1) (0) (1.4) (1.0)
18 to 29 Males 299.1 88.2 8.0 1.3 2.5 -4.5* 7.9
(0) (1.0) (0.9) (0.3) (0) (1.9) (1.6)
18 to 29 Females 309.9 89.7 6.3 1.5 2.4 -5.1* 5.7
(0) (0.9) (0.8) (0.3) (0) (1.5) (1.1)
30 to 49 Males 456.4 90.1 6.6 1.0 2.2 -3.4* 6.8
(0) (0.7) (0.6) (0.2) (0) (1.4) (1.2)
30 to 49 Females 512.2 91.0 6.3 0.5 2.2 -2.8* 6.5
(0) (0.7) (0.7) (0.1) (0) (1.2) (1.0)
50+ Males 542.3 89.6 8.2 0.4 1.9 -6.7* 4.4
(0) (0.7) (0.7) (0.1) (0) (1.2) (0.8)
50+ Females 666.9 90.1 7.6 0.5 1.8 -7.3* 3.3
(0) (0.7) (0.7) (0.1) (0) (1.0) (0.7)
Standard errors are in parentheses below the estimate.
The 2010 Census count excludes persons in group quarters. An asterisk (*) denotes a percent net undercount that is significantly different from zero.
4.5 Census Coverage by Municipio
The CCM measured the net coverage of five municipios in Puerto Rico. Municipios not listed
individually in Table 6 are included in the balance of Puerto Rico. The five municipios listed
individually had a census count of at least 100,000 persons. Our population size criterion for
producing estimates of the components of census coverage for a municipio was 500,000 persons;
no municipio in Puerto Rico met the requirement. Therefore, estimates of the components of
census coverage were not produced for any municipios in Puerto Rico.
For municipio estimates of net coverage, we generated estimates of the root mean squared error
as discussed in the methods section. Based on the root mean squared error estimates, no
municipios had an estimate that was statistically different from zero.
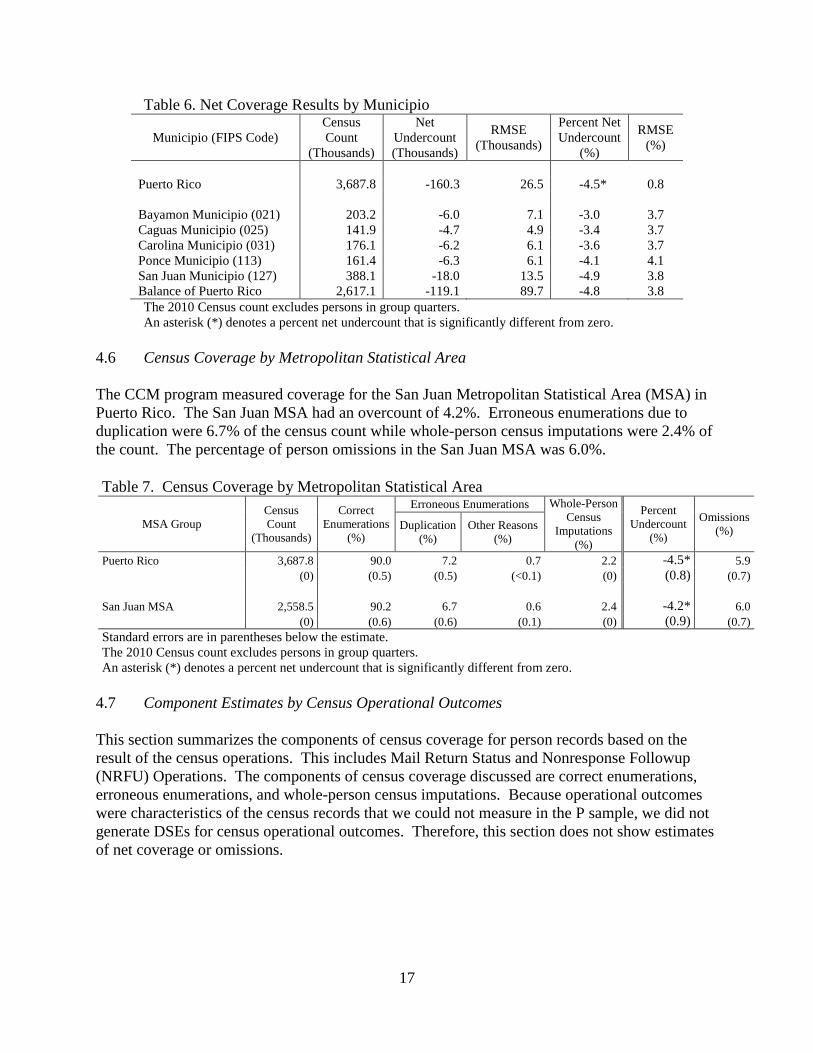
17
Table 6. Net Coverage Results by Municipio
Municipio (FIPS Code)
Census
Count
(Thousands)
Net
Undercount
(Thousands)
RMSE
(Thousands)
Percent Net
Undercount
(%)
RMSE
(%)
Puerto Rico 3,687.8 -160.3 26.5 -4.5* 0.8
Bayamon Municipio (021) 203.2 -6.0 7.1 -3.0 3.7
Caguas Municipio (025) 141.9 -4.7 4.9 -3.4 3.7
Carolina Municipio (031) 176.1 -6.2 6.1 -3.6 3.7
Ponce Municipio (113) 161.4 -6.3 6.1 -4.1 4.1
San Juan Municipio (127) 388.1 -18.0 13.5 -4.9 3.8
Balance of Puerto Rico 2,617.1 -119.1 89.7 -4.8 3.8
The 2010 Census count excludes persons in group quarters.
An asterisk (*) denotes a percent net undercount that is significantly different from zero.
4.6 Census Coverage by Metropolitan Statistical Area
The CCM program measured coverage for the San Juan Metropolitan Statistical Area (MSA) in
Puerto Rico. The San Juan MSA had an overcount of 4.2%. Erroneous enumerations due to
duplication were 6.7% of the census count while whole-person census imputations were 2.4% of
the count. The percentage of person omissions in the San Juan MSA was 6.0%.
Table 7. Census Coverage by Metropolitan Statistical Area
MSA Group
Census
Count
(Thousands)
Correct
Enumerations
(%)
Erroneous Enumerations Whole-Person
Census
Imputations
(%)
Percent
Undercount
(%)
Omissions
(%) Duplication
(%)
Other Reasons
(%)
Puerto Rico 3,687.8 90.0 7.2 0.7 2.2 -4.5* 5.9
(0) (0.5) (0.5) (<0.1) (0) (0.8) (0.7)
San Juan MSA 2,558.5 90.2 6.7 0.6 2.4 -4.2* 6.0
(0) (0.6) (0.6) (0.1) (0) (0.9) (0.7)
Standard errors are in parentheses below the estimate.
The 2010 Census count excludes persons in group quarters. An asterisk (*) denotes a percent net undercount that is significantly different from zero.
4.7 Component Estimates by Census Operational Outcomes
This section summarizes the components of census coverage for person records based on the
result of the census operations. This includes Mail Return Status and Nonresponse Followup
(NRFU) Operations. The components of census coverage discussed are correct enumerations,
erroneous enumerations, and whole-person census imputations. Because operational outcomes
were characteristics of the census records that we could not measure in the P sample, we did not
generate DSEs for census operational outcomes. Therefore, this section does not show estimates
of net coverage or omissions.

18
4.7.1 Mail Return Cases
Table 8 shows the component results by the mail return status of the housing unit where the
person was enumerated.
All of Puerto Rico was in the Update/Leave type of enumeration area. A census worker updated
the address list and delivered questionnaires to each address that was on the updated address list.
Respondents were instructed to return the form by mail. While most people in a housing unit for
which we have a valid mail return were included on the mail return for that unit, some of the
people in that housing unit were enumerated in a subsequent census operation. This analysis
does not differentiate between these cases. In addition to showing estimates for persons with a
valid mail return, we show the component estimates for persons who were in housing units in the
mail return universe but did not send back a valid return.
For completeness, the table shows the component structure of the 355,500 person records that
were not in the mail return universe. They included the enumerations of people in housing units
that a) were not eligible for NRFU, or b) were units deleted during the Update/Leave operation
that were later determined to be occupied.
Table 8 shows an erroneous enumeration due to duplication percentage of 4.8% for the persons
in a housing unit with a valid return. The erroneous enumeration due to duplication percentage
jumped to 9.8% for persons in the mail return universe but from whom a form was not returned,
and 14.2% for persons in housing units not in the mail return universe. The percentage of whole-
person imputations followed the same pattern with rates of 0.3%, 2.3%, and 13.4%, respectively.
Table 8. Components of Census Coverage by Mail Return
Mail Return Status
Census
Count
(Thousands)
Correct
Enumerations
(%)
Erroneous Enumeration Whole-Person
Imputations
(%) Duplication
(%)
Other
Reasons (%)
Puerto Rico 3,687.8 90.0 7.2 0.7 2.2
(0) (0.5) (0.5) (<0.1) (0)
Valid Return 2,258.1 94.3 4.8 0.6 0.3
(0) (0.6) (0.5) (0.1) (0)
In Mail Return Universe, No Return 1,074.3 86.9 9.8 1.0 2.3
(0) (1.2) (1.2) (0.2) (0)
Not in Mail Return Universe 355.5 71.9 14.2 0.4 13.4
(0) (2.2) (2.2) (0.2) (0)
Standard errors are shown in parentheses below the estimate.
The 2010 Census count excludes persons in group quarters.
19
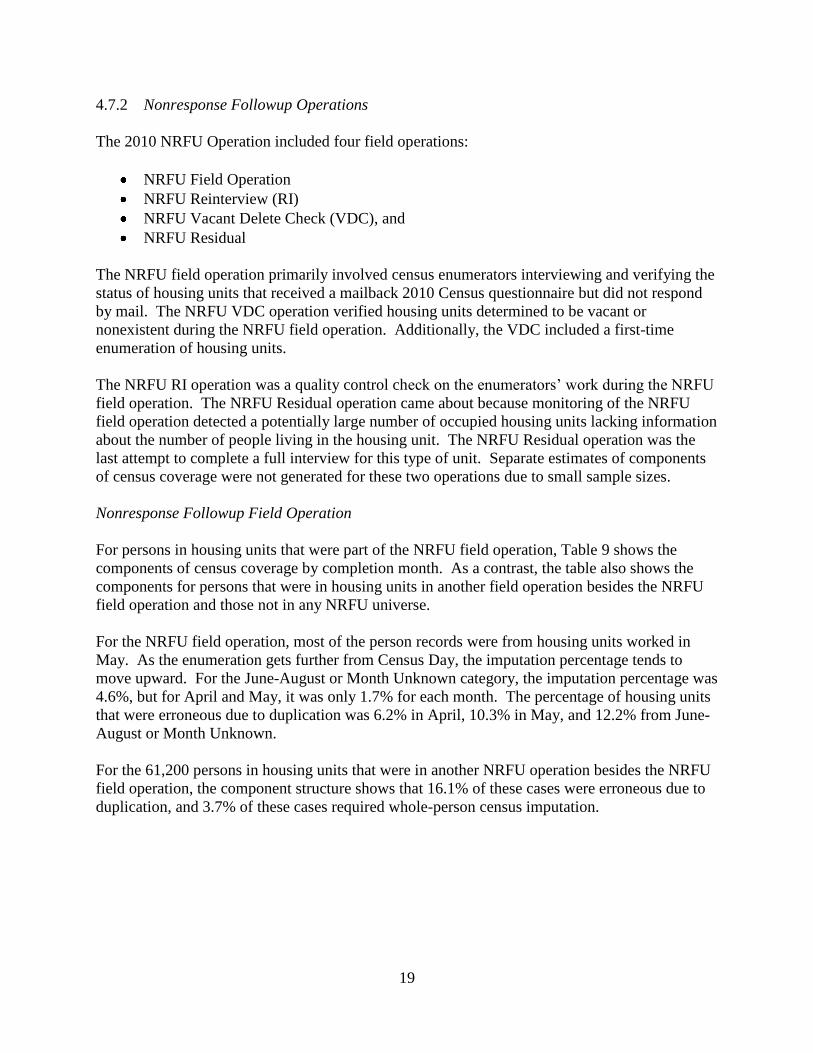
4.7.2 Nonresponse Followup Operations
The 2010 NRFU Operation included four field operations:
NRFU Field Operation
NRFU Reinterview (RI)
NRFU Vacant Delete Check (VDC), and
NRFU Residual
The NRFU field operation primarily involved census enumerators interviewing and verifying the
status of housing units that received a mailback 2010 Census questionnaire but did not respond
by mail. The NRFU VDC operation verified housing units determined to be vacant or
nonexistent during the NRFU field operation. Additionally, the VDC included a first-time
enumeration of housing units.
The NRFU RI operation was a quality control check on the enumerators’ work during the NRFU
field operation. The NRFU Residual operation came about because monitoring of the NRFU
field operation detected a potentially large number of occupied housing units lacking information
about the number of people living in the housing unit. The NRFU Residual operation was the
last attempt to complete a full interview for this type of unit. Separate estimates of components
of census coverage were not generated for these two operations due to small sample sizes.
Nonresponse Followup Field Operation
For persons in housing units that were part of the NRFU field operation, Table 9 shows the
components of census coverage by completion month. As a contrast, the table also shows the
components for persons that were in housing units in another field operation besides the NRFU
field operation and those not in any NRFU universe.
For the NRFU field operation, most of the person records were from housing units worked in
May. As the enumeration gets further from Census Day, the imputation percentage tends to
move upward. For the June-August or Month Unknown category, the imputation percentage was
4.6%, but for April and May, it was only 1.7% for each month. The percentage of housing units
that were erroneous due to duplication was 6.2% in April, 10.3% in May, and 12.2% from June-
August or Month Unknown.
For the 61,200 persons in housing units that were in another NRFU operation besides the NRFU
field operation, the component structure shows that 16.1% of these cases were erroneous due to
duplication, and 3.7% of these cases required whole-person census imputation.

20
Table 9. Components of Census Coverage by Nonresponse Followup Field Operation
Nonresponse Followup Field
Operation Status
Census
Count
(Thousands)
Correct
Enumerations
(%)
Erroneous Enumerations Whole-person
Imputations
(%) Duplication
(%)
Other
Reasons (%)
Puerto Rico 3,687.8 90.0 7.2 0.7 2.2
(0) (0.5) (0.5) (<0.1) (0)
In NRFU Field Operation
April 26.9 90.7 6.2 1.4 1.7
(0) (5.5) (5.4) (1.1) (0)
May 1,011.6 87.0 10.3 1.1 1.7
(0) (1.1) (1.1) (0.2) (0)
June-August or
Month Unknown
209.4 82.6 12.2 0.7 4.6
(0) (2.9) (2.9) (0.2) (0)
Not in NRFU Field Operation, but
in another NRFU operation
61.2 80.0 16.1 0.2 3.7
(0) (10.6) (10.4) (0.2) (0)
Not in any NRFU Universe 2,378.6 92.2 5.2 0.6 2.1
(0) (0.6) (0.5) (<0.1) (0)
Standard errors are shown in parentheses below the estimate.
The 2010 Census count excludes persons in group quarters.
Nonresponse Followup Vacant Delete Check
Table 10 shows the components of census coverage for the NRFU VDC field operation. The
results show that the census records in housing units that were part of the NRFU VDC field
operation had 23.0% erroneous enumerations due to duplication. Person records that were part
of the NRFU VDC field operation had a large percentage of whole-person imputations (4.1%).
Table 10. Components of Census Coverage by Nonresponse Followup Vacant Delete Check
NRFU Vacant VDC Field
Operation Status
Census
Count
(Thousands)
Correct
Enumerations
(%)
Erroneous Enumerations Whole-Person
Imputations (%) Duplication
(%)
Other
Reasons (%)
Puerto Rico 3,687.8 90.0 7.2 0.7 2.2
(0) (0.5) (0.5) (<0.1) (0)
In NRFU VDC 115.7 72.6 23.0 0.3 4.1
(0) (6.7) (6.6) (0.2) (0)
Not in NRFU VDC, but in 1,193.6 87.3 9.6 1.0 2.1
another NRFU operation (0) (1.0) (1.0) (0.2) (0)
Not in any NRFU Universe 2,378.6 92.2 5.2 0.6 2.1
(0) (0.6) (0.5) (<0.1) (0)
Standard errors are in parentheses below the estimate.
The 2010 Census count excludes persons in group quarters.
21
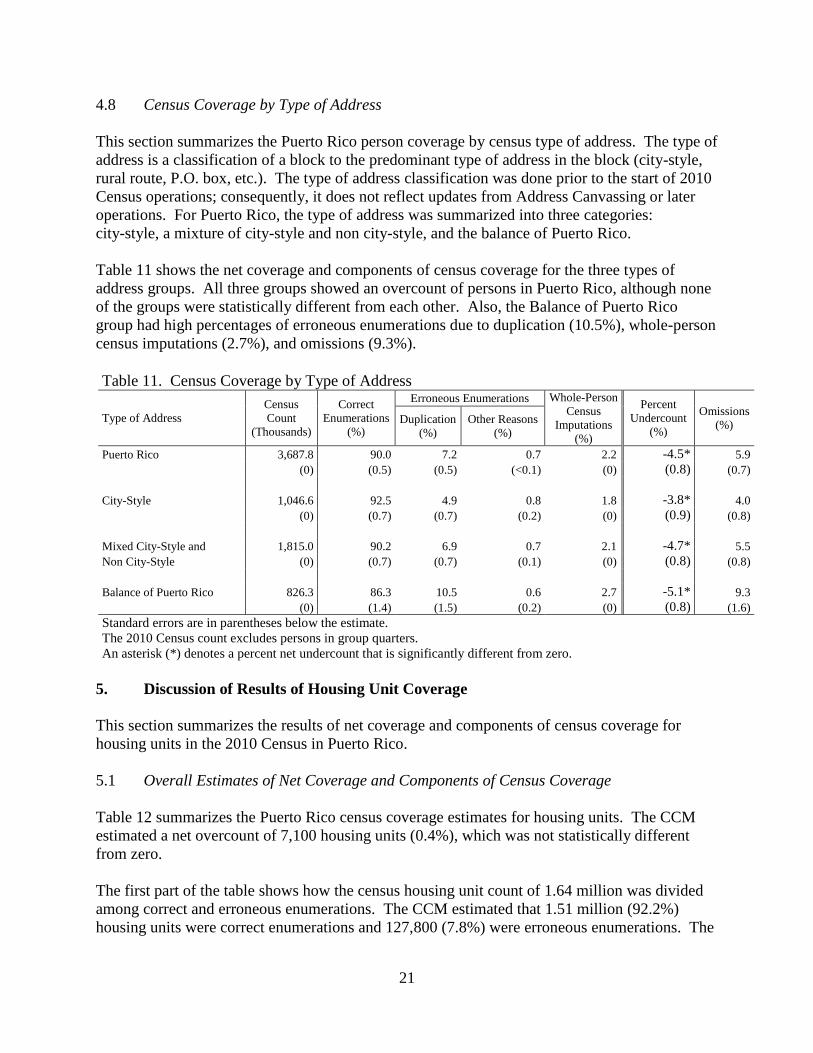
4.8 Census Coverage by Type of Address
This section summarizes the Puerto Rico person coverage by census type of address. The type of
address is a classification of a block to the predominant type of address in the block (city-style,
rural route, P.O. box, etc.). The type of address classification was done prior to the start of 2010
Census operations; consequently, it does not reflect updates from Address Canvassing or later
operations. For Puerto Rico, the type of address was summarized into three categories:
city-style, a mixture of city-style and non city-style, and the balance of Puerto Rico.
Table 11 shows the net coverage and components of census coverage for the three types of
address groups. All three groups showed an overcount of persons in Puerto Rico, although none
of the groups were statistically different from each other. Also, the Balance of Puerto Rico
group had high percentages of erroneous enumerations due to duplication (10.5%), whole-person
census imputations (2.7%), and omissions (9.3%).
Table 11. Census Coverage by Type of Address
Type of Address
Census
Count
(Thousands)
Correct
Enumerations
(%)
Erroneous Enumerations Whole-Person
Census
Imputations
(%)
Percent
Undercount
(%)
Omissions
(%) Duplication
(%)
Other Reasons
(%)
Puerto Rico 3,687.8 90.0 7.2 0.7 2.2 -4.5* 5.9
(0) (0.5) (0.5) (<0.1) (0) (0.8) (0.7)
City-Style 1,046.6 92.5 4.9 0.8 1.8 -3.8* 4.0
(0) (0.7) (0.7) (0.2) (0) (0.9) (0.8)
Mixed City-Style and 1,815.0 90.2 6.9 0.7 2.1 -4.7* 5.5
Non City-Style (0) (0.7) (0.7) (0.1) (0) (0.8) (0.8)
Balance of Puerto Rico 826.3 86.3 10.5 0.6 2.7 -5.1* 9.3
(0) (1.4) (1.5) (0.2) (0) (0.8) (1.6)
Standard errors are in parentheses below the estimate.
The 2010 Census count excludes persons in group quarters. An asterisk (*) denotes a percent net undercount that is significantly different from zero.
5. Discussion of Results of Housing Unit Coverage
This section summarizes the results of net coverage and components of census coverage for
housing units in the 2010 Census in Puerto Rico.
5.1 Overall Estimates of Net Coverage and Components of Census Coverage
Table 12 summarizes the Puerto Rico census coverage estimates for housing units. The CCM
estimated a net overcount of 7,100 housing units (0.4%), which was not statistically different
from zero.
The first part of the table shows how the census housing unit count of 1.64 million was divided
among correct and erroneous enumerations. The CCM estimated that 1.51 million (92.2%)
housing units were correct enumerations and 127,800 (7.8%) were erroneous enumerations. The

22
table provides more detail on where the correctly enumerated housing units were included in the
census.
The CCM program estimated that 1.50 million (91.4%) were included in the correct block
cluster. These housing units were enumerated either exactly or very close to where they were
supposed to be.
The CCM estimated that 9,500 (0.6%) housing units should have been included within one ring
of surrounding collection blocks around the block cluster. These housing units were still
included close to their actual location, but were slightly further away.
In the course of doing the field work, the CCM determined that 4,200 (0.3%) housing units were
geocoded outside the block cluster search area. These were geocoding errors. Based on the
limited searching outside of the CCM search area, this might be an underestimate of geocoding
error.
The first part of the table continues by providing details about the 127,800 erroneous
enumerations in the 2010 Census. Of the total, 40,600 (2.5%) were erroneous due to duplication
and 87,200 (5.3%) were erroneous for other reasons.
The next part of the table summarizes the CCM housing estimate. The CCM estimated that the
number of housing units was 1.63 million. The CCM housing unit estimate is broken into two
groups: correct enumerations and omissions. The correct enumerations are the same 1.51 million
previously shown. The percent estimate of 92.6% is different because the denominator is the
CCM housing unit estimate.
The CCM program estimated that 120,800 housing units were omitted from the census.
Omissions were housing units that should have been counted but were not.

23
Table 12. Components of Census Coverage for Housing Units (in Thousands)
Component of Census Coverage Estimate
Standard
Error Percent
Standard
Error
Census Count 1,636.9 0 100.0
Correct enumerations1 1,509.1 16.2 92.2 1.0
Enumerated in the same block cluster 1,495.4 16.4 91.4 1.0
Enumerated in the surrounding blocks2 9.5 2.6 0.6 0.2
Geocoded outside the search area 4.2 3.6 0.3 0.2
Erroneous enumerations 127.8 16.2 7.8 1.0
Due to duplication 40.6 5.0 2.5 0.3
For other reasons3 87.2 15.5 5.3 0.9
Estimate of Housing from the Census Coverage Measurement4 1,629.9 22.8 100.0
Correct enumerations1 1,509.1 16.2 92.6 0.8
Omissions5 120.8 14.2 7.4 0.8
Net Undercount -7.1 22.8 -0.4 1.4
1. For this table, a housing unit is considered a correct enumeration if it was enumerated anywhere in Puerto Rico.
2. For definitions of the surrounding blocks and search area, see accompanying text.
3. Other reasons include nonresidential (that is, group quarters, commercial, uninhabitable, and so on) or nonexistent (such
as vacant lots, demolished, burned down, and so on).
4. This number is the CCM estimate of housing units that should have been included in the CCM housing unit universe. It
does not include group quarters.
5. Omissions are housing units that should have been enumerated in Puerto Rico but were not.
5.2 Census Coverage by Occupancy and Tenure
Table 13 summarizes estimates of coverage by occupancy and tenure for the 2010 Census in
Puerto Rico. None of the net coverage estimates were significantly different from zero.
Vacant units had a very high percentage of erroneous enumerations (19.2%), and most of that
was attributed to the high percentage of erroneous enumerations due to other reasons (14.9%).
Owner-occupied units were erroneously enumerated due to other reasons at a rate of 3.8%,
renter-occupied units, at a rate of 2.8%. The CCM estimated housing units were omitted at a rate
of 20.2% for vacant units, 4.4% for owner-occupied units, and 6.3% for renter-occupied units.
Table 13. Census Coverage of Housing Units by Occupancy and Tenure
Occupancy
and Tenure
Census
Count
(Thousands)
Correct
Enumerations
(%)
Erroneous Enumerations Percent
Undercount
(%)
Omissions
(%) Duplication
(%)
Other
Reasons (%)
Puerto Rico 1,636.9 92.2 2.5 5.3 -0.4 7.4
(0) (1.0) (0.3) (0.9) (1.4) (0.8)
Occupied 1,376.5 94.3 2.1 3.5 -0.7 5.0
(0) (0.8) (0.3) (0.8) (1.1) (0.7)
Owner 986.2 94.1 2.1 3.8 -1.6 4.4
(0) (0.9) (0.3) (0.8) (1.1) (0.6)
Renter 390.4 95.0 2.1 2.8 1.4 6.3
(0) (0.9) (0.4) (0.7) (1.5) (1.3)
Vacant 260.4 80.8 4.3 14.9 1.2 20.2
(0) (2.8) (0.8) (2.8) (4.1) (2.2)
Standard errors are in parentheses below the estimate.
24
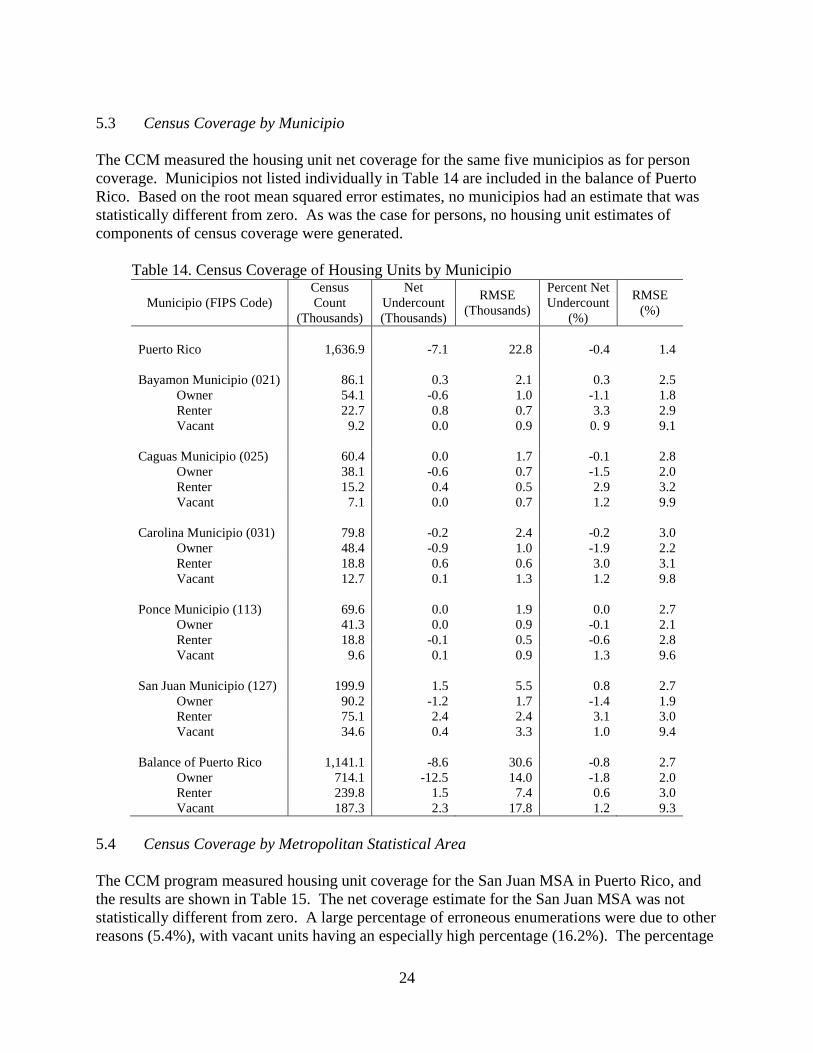
5.3 Census Coverage by Municipio
The CCM measured the housing unit net coverage for the same five municipios as for person
coverage. Municipios not listed individually in Table 14 are included in the balance of Puerto
Rico. Based on the root mean squared error estimates, no municipios had an estimate that was
statistically different from zero. As was the case for persons, no housing unit estimates of
components of census coverage were generated.
Table 14. Census Coverage of Housing Units by Municipio
Municipio (FIPS Code)
Census
Count
(Thousands)
Net
Undercount
(Thousands)
RMSE
(Thousands)
Percent Net
Undercount
(%)
RMSE
(%)
Puerto Rico 1,636.9 -7.1 22.8 -0.4 1.4
Bayamon Municipio (021) 86.1 0.3 2.1 0.3 2.5
Owner 54.1 -0.6 1.0 -1.1 1.8
Renter 22.7 0.8 0.7 3.3 2.9
Vacant 9.2 0.0 0.9 0. 9 9.1
Caguas Municipio (025) 60.4 0.0 1.7 -0.1 2.8
Owner 38.1 -0.6 0.7 -1.5 2.0
Renter 15.2 0.4 0.5 2.9 3.2
Vacant 7.1 0.0 0.7 1.2 9.9
Carolina Municipio (031) 79.8 -0.2 2.4 -0.2 3.0
Owner 48.4 -0.9 1.0 -1.9 2.2
Renter 18.8 0.6 0.6 3.0 3.1
Vacant 12.7 0.1 1.3 1.2 9.8
Ponce Municipio (113) 69.6 0.0 1.9 0.0 2.7
Owner 41.3 0.0 0.9 -0.1 2.1
Renter 18.8 -0.1 0.5 -0.6 2.8
Vacant 9.6 0.1 0.9 1.3 9.6
San Juan Municipio (127) 199.9 1.5 5.5 0.8 2.7
Owner 90.2 -1.2 1.7 -1.4 1.9
Renter 75.1 2.4 2.4 3.1 3.0
Vacant 34.6 0.4 3.3 1.0 9.4
Balance of Puerto Rico 1,141.1 -8.6 30.6 -0.8 2.7
Owner 714.1 -12.5 14.0 -1.8 2.0
Renter 239.8 1.5 7.4 0.6 3.0
Vacant 187.3 2.3 17.8 1.2 9.3
5.4 Census Coverage by Metropolitan Statistical Area
The CCM program measured housing unit coverage for the San Juan MSA in Puerto Rico, and
the results are shown in Table 15. The net coverage estimate for the San Juan MSA was not
statistically different from zero. A large percentage of erroneous enumerations were due to other
reasons (5.4%), with vacant units having an especially high percentage (16.2%). The percentage

25
of omissions in the San Juan MSA was about the same as the percentage of omissions in Puerto
Rico. Vacant units had a high percentage of omissions (20.6%) in the San Juan MSA.
Table 15. Census Coverage by Metropolitan Statistical Area
MSA Group
Census
Count
(Thousands)
Correct
Enumerations
(%)
Erroneous Enumerations Percent Net
Undercount
(%)
Omissions
(%) Duplication
(%)
Other
Reasons (%)
Puerto Rico 1,636.9 92.2 2.5 5.3 -0.4 7.4
(0) (1.0) (0.3) (0.9) (1.4) (0.8)
San Juan 1,125.9 92.4 2.2 5.4 -0.2 7.4
(0) (1.4) (0.3) (1.4) (1.8) (0.9)
Owner 683.5 94.3 2.1 3.7 -1.9 3.9
(0) (1.3) (0.4) (1.2) (1.4) (0.7)
Renter 273.0 95.1 1.9 3.0 3.0 7.8
(0) (1.1) (0.4) (1.0) (2.0) (1.6)
Vacant 169.3 80.3 3.5 16.2 1.1 20.6
(0) (3.8) (0.9) (3.9) (5.1) (2.8)
Standard errors are in parentheses below the estimate.
5.5 Component Estimates by Census Operational Outcomes
This section summarizes the components of census coverage for housing unit records based on
the result of the census operations. As outlined in section 4.7, estimates of net coverage and
omissions were not generated for census operational outcomes.
5.5.1 Mail Return Cases
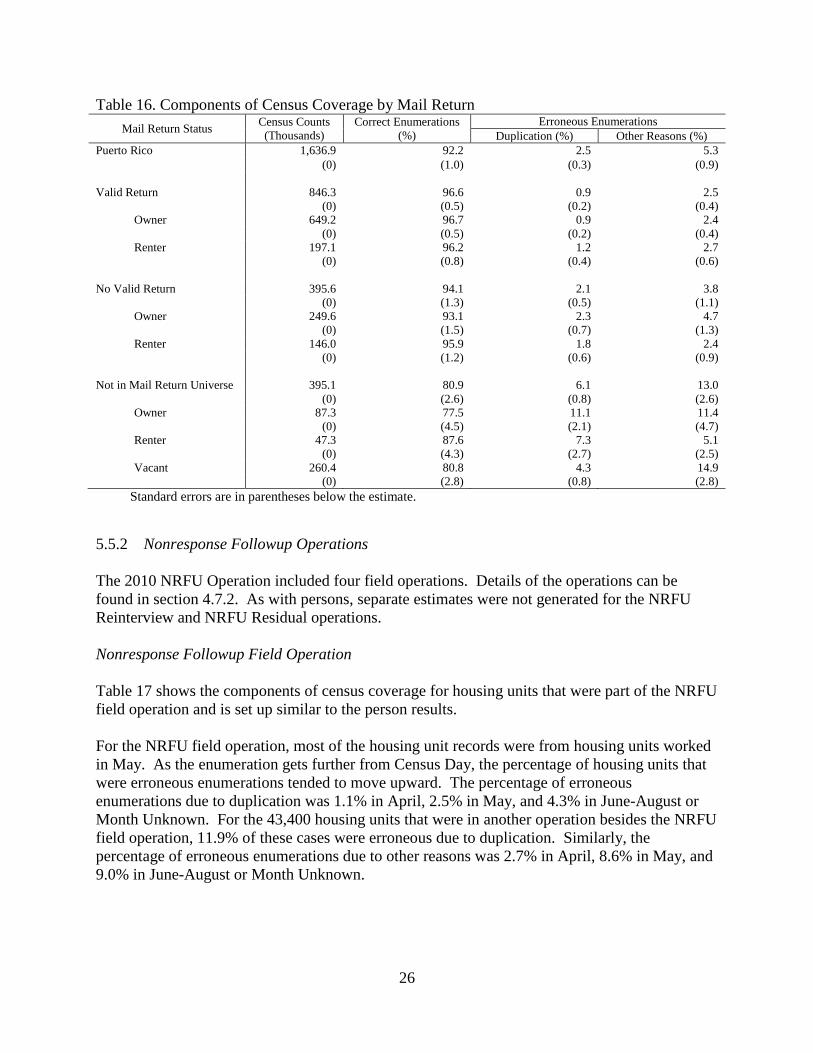
Table 16 shows the component results by mail return status of the housing unit. In addition to
showing estimates for housing units with a valid mail return, we show the component estimates
for housing units in the mail return universe where a form was not returned. As with the person
estimates, the table shows the component structure of the 395,100 housing unit records that were
not in the mail return universe. Again, these included the enumerations of housing units that a)
were not eligible for NRFU, or b) were units deleted during the Update/Leave operation that
were later determined to be occupied.
26
Table 16. Components of Census Coverage by Mail Return
Mail Return Status Census Counts
(Thousands)
Correct Enumerations
(%)
Erroneous Enumerations
Duplication (%) Other Reasons (%)
Puerto Rico 1,636.9 92.2 2.5 5.3
(0) (1.0) (0.3) (0.9)
Valid Return 846.3 96.6 0.9 2.5
(0) (0.5) (0.2) (0.4)
Owner 649.2 96.7 0.9 2.4
(0) (0.5) (0.2) (0.4)
Renter 197.1 96.2 1.2 2.7
(0) (0.8) (0.4) (0.6)
No Valid Return 395.6 94.1 2.1 3.8
(0) (1.3) (0.5) (1.1)
Owner 249.6 93.1 2.3 4.7
(0) (1.5) (0.7) (1.3)
Renter 146.0 95.9 1.8 2.4
(0) (1.2) (0.6) (0.9)
Not in Mail Return Universe 395.1 80.9 6.1 13.0
(0) (2.6) (0.8) (2.6)
Owner 87.3 77.5 11.1 11.4
(0) (4.5) (2.1) (4.7)
Renter 47.3 87.6 7.3 5.1
(0) (4.3) (2.7) (2.5)
Vacant 260.4 80.8 4.3 14.9
(0) (2.8) (0.8) (2.8)
Standard errors are in parentheses below the estimate.
5.5.2 Nonresponse Followup Operations
The 2010 NRFU Operation included four field operations. Details of the operations can be
found in section 4.7.2. As with persons, separate estimates were not generated for the NRFU
Reinterview and NRFU Residual operations.
Nonresponse Followup Field Operation
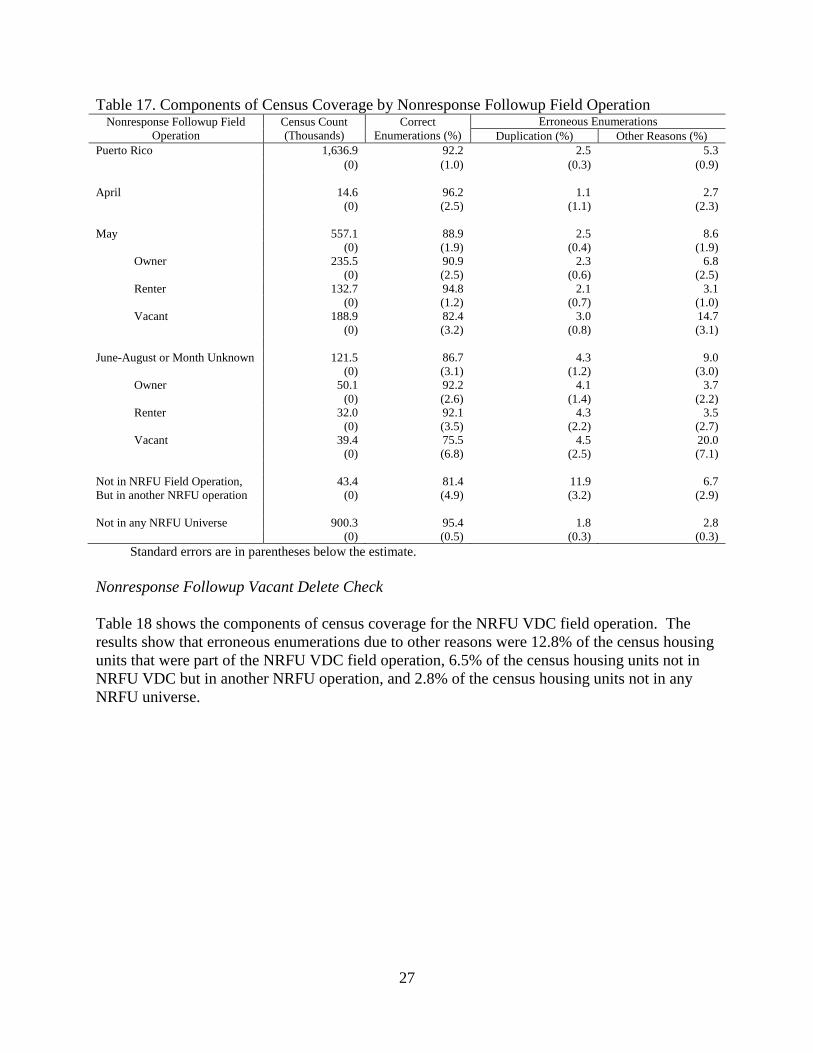
Table 17 shows the components of census coverage for housing units that were part of the NRFU
field operation and is set up similar to the person results.
For the NRFU field operation, most of the housing unit records were from housing units worked
in May. As the enumeration gets further from Census Day, the percentage of housing units that
were erroneous enumerations tended to move upward. The percentage of erroneous
enumerations due to duplication was 1.1% in April, 2.5% in May, and 4.3% in June-August or
Month Unknown. For the 43,400 housing units that were in another operation besides the NRFU
field operation, 11.9% of these cases were erroneous due to duplication. Similarly, the
percentage of erroneous enumerations due to other reasons was 2.7% in April, 8.6% in May, and
9.0% in June-August or Month Unknown.
27
Table 17. Components of Census Coverage by Nonresponse Followup Field Operation Nonresponse Followup Field
Operation
Census Count
(Thousands)
Correct
Enumerations (%)
Erroneous Enumerations
Duplication (%) Other Reasons (%)
Puerto Rico 1,636.9 92.2 2.5 5.3
(0) (1.0) (0.3) (0.9)
April 14.6 96.2 1.1 2.7
(0) (2.5) (1.1) (2.3)
May 557.1 88.9 2.5 8.6
(0) (1.9) (0.4) (1.9)
Owner 235.5 90.9 2.3 6.8
(0) (2.5) (0.6) (2.5)
Renter 132.7 94.8 2.1 3.1
(0) (1.2) (0.7) (1.0)
Vacant 188.9 82.4 3.0 14.7
(0) (3.2) (0.8) (3.1)
June-August or Month Unknown 121.5 86.7 4.3 9.0
(0) (3.1) (1.2) (3.0)
Owner 50.1 92.2 4.1 3.7
(0) (2.6) (1.4) (2.2)
Renter 32.0 92.1 4.3 3.5
(0) (3.5) (2.2) (2.7)
Vacant 39.4 75.5 4.5 20.0
(0) (6.8) (2.5) (7.1)
Not in NRFU Field Operation, 43.4 81.4 11.9 6.7
But in another NRFU operation (0) (4.9) (3.2) (2.9)
Not in any NRFU Universe 900.3 95.4 1.8 2.8
(0) (0.5) (0.3) (0.3)
Standard errors are in parentheses below the estimate.
Nonresponse Followup Vacant Delete Check
Table 18 shows the components of census coverage for the NRFU VDC field operation. The
results show that erroneous enumerations due to other reasons were 12.8% of the census housing
units that were part of the NRFU VDC field operation, 6.5% of the census housing units not in
NRFU VDC but in another NRFU operation, and 2.8% of the census housing units not in any
NRFU universe.

28
Table 18. Components of Census Coverage by Nonresponse Followup Vacant Delete Check
Nonresponse Followup Vacant
Delete Check
Census
Count
(Thousands)
Correct Enumerations
(%)
Erroneous Enumerations
Duplication (%) Other Reasons (%)
Puerto Rico 1,636.9 92.2 2.5 5.3
(0) (1.0) (0.3) (0.9)
In NRFU VDC 223.8 82.4 4.8 12.8
(0) (2.9) (0.8) (2.9)
Owner 28.1 86.3 9.5 4.2
(0) (4.0) (3.7) (1.9)
Renter 19.0 88.0 5.1 6.9
(0) (7.0) (3.4) (4.2)
Vacant 176.6 81.2 4.0 14.8
(0) (3.5) (0.9) (3.6)
Not in NRFU VDC, but in another 512.8 90.8 2.7 6.5
NRFU operation (0) (2.3) (0.4) (2.4)
Owner 277.8 91.5 2.4 6.1
(0) (2.4) (0.5) (2.4)
Renter 159.0 94.9 2.5 2.7
(0) (1.4) (0.7) (1.3)
Vacant 76.1 79.9 3.9 16.2
(0) (5.3) (1.2) (5.5)
Not in any NRFU Universe 900.3 95.4 1.8 2.8
(0) (0.5) (0.3) (0.3)
Standard errors are in parentheses below the estimate.
5.6 Census Coverage by Type of Address
Table 19 shows the net coverage and components of census coverage for the three types of
addresses. A description of the groups can be found in section 4.8. Renter-occupied housing
units in areas with predominantly city-style addresses had an undercount of 2.4%.

29
Table 19. Census Coverage by Type of Address
Type of Address
Census
Count
(Thousands)
Correct
Enumerations
(%)
Erroneous Enumerations Percent Net
Undercount
(%)
Omissions
(%) Duplication
(%)
Other
Reasons (%)
Puerto Rico 1,636.9 92.2 2.5 5.3 -0.4 7.4
(0) (1.0) (0.3) (0.9) (1.4) (0.8)
City-Style 479.8 96.5 1.3 2.2 0.3 3.8
(0) (0.5) (0.3) (0.4) (1.1) (1.1)
Owner 270.3 97.8 1.0 1.1 -1.0 1.2
(0) (0.5) (0.4) (0.3) (0.7) (0.7)
Renter 141.0 97.2 1.5 1.4 2.4* 5.2
(0) (0.8) (0.5) (0.5) (1.4) (1.4)
Vacant 68.5 90.1 2.0 8.0 1.0 10.9
(0) (2.0) (0.8) (1.9) (3.7) (3.7)
Mixed City-Style 807.3 91.6 2.4 6.0 -0.5 7.9
and Non City-Style (0) (1.8) (0.4) (1.8) (1.4) (1.2)
Owner 485.9 93.5 2.0 4.5 -1.6 5.0
(0) (1.6) (0.5) (1.6) (1.1) (1.1)
Renter 186.0 95.2 1.8 3.0 1.1 5.8
(0) (1.5) (0.6) (1.2) (1.5) (1.4)
Vacant 135.4 80.0 4.7 15.3 1.3 21.1
(0) (4.8) (1.2) (4.9) (4.1) (3.3)
Balance of Puerto Rico 349.9 87.5 4.3 8.1 -1.4 11.2
(0) (1.5) (0.7) (1.3) (2.1) (2.1)
Owner 230.0 90.9 3.8 5.3 -2.4 6.9
(0) (1.2) (0.7) (0.9) (1.7) (1.8)
Renter 63.4 89.6 4.6 5.8 0.1 10.5
(0) (1.9) (1.4) (1.3) (2.2) (2.5)
Vacant 56.5 71.6 6.0 22.5 1.1 29.2
(0) (5.5) (1.8) (5.8) (5.2) (5.8)
Standard errors are in parentheses below the estimate.
6. Characteristic Imputation
This section gives the results of characteristic imputation in the 2010 CCM for Puerto Rico. The
characteristics that were subject to imputation were relationship, age, sex, race, Hispanic origin,
and tenure. Because race and Hispanic origin were not used in modeling and were not used as
estimation domains in Puerto Rico, characteristic imputation results are not shown for those
characteristics.
Table 20 presents information about the effects of editing on the CCM data. It shows, for each
characteristic, the number of cases for which values were changed because of the census edit and
imputation system, and the percentage of the total number of records in the P sample that were
changed through this editing. For this table, the number of records changed for a characteristic
represents the number of times that a respondent-provided characteristic was changed, or edited,
by the census editing rules.
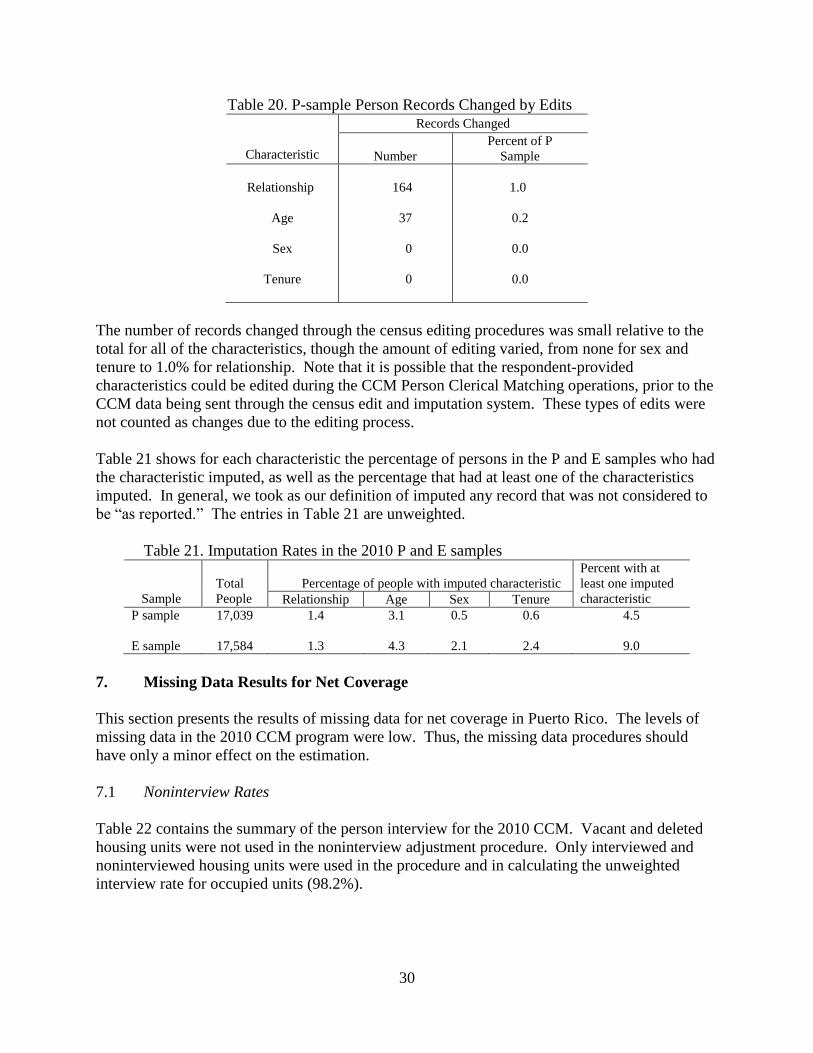
30
Table 20. P-sample Person Records Changed by Edits
Characteristic
Records Changed
Number
Percent of P
Sample
Relationship
Age
Sex
Tenure
164
37
0
0
1.0
0.2
0.0
0.0
The number of records changed through the census editing procedures was small relative to the
total for all of the characteristics, though the amount of editing varied, from none for sex and
tenure to 1.0% for relationship. Note that it is possible that the respondent-provided
characteristics could be edited during the CCM Person Clerical Matching operations, prior to the
CCM data being sent through the census edit and imputation system. These types of edits were
not counted as changes due to the editing process.
Table 21 shows for each characteristic the percentage of persons in the P and E samples who had
the characteristic imputed, as well as the percentage that had at least one of the characteristics
imputed. In general, we took as our definition of imputed any record that was not considered to
be “as reported.” The entries in Table 21 are unweighted.
Table 21. Imputation Rates in the 2010 P and E samples
Sample
Total
People
Percentage of people with imputed characteristic
Percent with at
least one imputed
characteristic Relationship Age Sex Tenure
P sample 17,039 1.4 3.1 0.5 0.6 4.5
E sample 17,584 1.3 4.3 2.1 2.4 9.0
7. Missing Data Results for Net Coverage
This section presents the results of missing data for net coverage in Puerto Rico. The levels of
missing data in the 2010 CCM program were low. Thus, the missing data procedures should
have only a minor effect on the estimation.
7.1 Noninterview Rates
Table 22 contains the summary of the person interview for the 2010 CCM. Vacant and deleted
housing units were not used in the noninterview adjustment procedure. Only interviewed and
noninterviewed housing units were used in the procedure and in calculating the unweighted
interview rate for occupied units (98.2%).
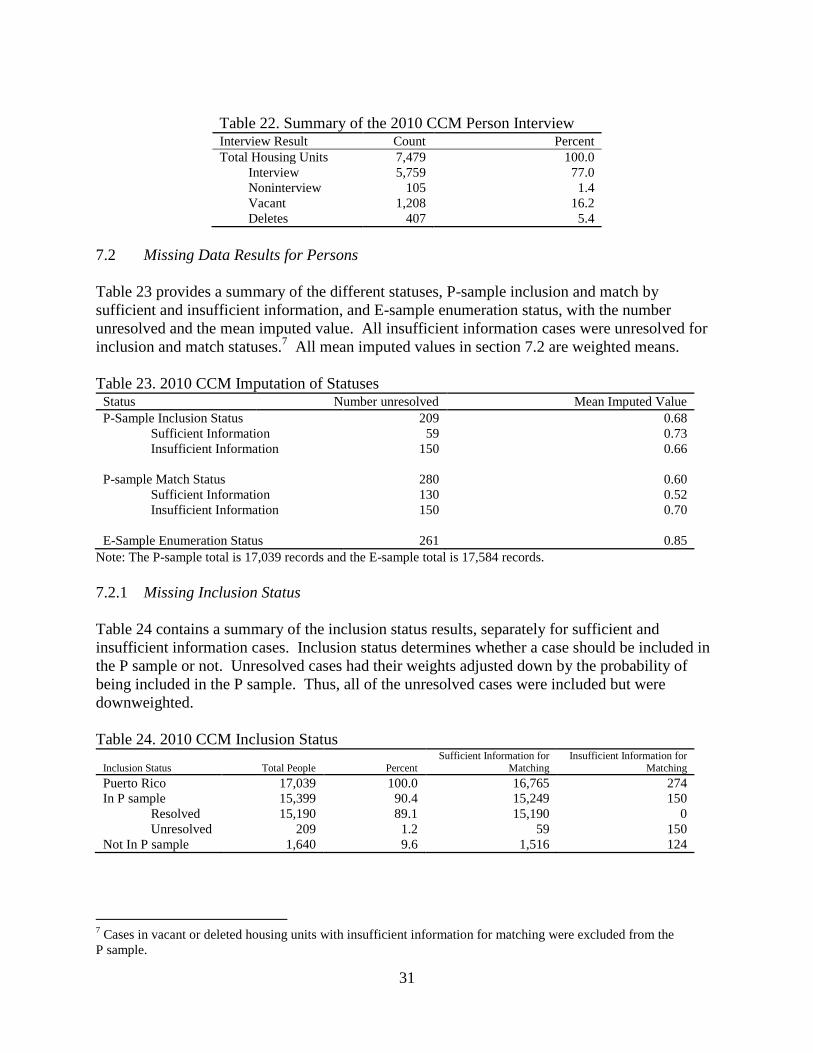
31
Table 22. Summary of the 2010 CCM Person Interview Interview Result Count Percent
Total Housing Units 7,479 100.0
Interview 5,759 77.0
Noninterview 105 1.4
Vacant 1,208 16.2
Deletes 407 5.4
7.2 Missing Data Results for Persons
Table 23 provides a summary of the different statuses, P-sample inclusion and match by
sufficient and insufficient information, and E-sample enumeration status, with the number
unresolved and the mean imputed value. All insufficient information cases were unresolved for
inclusion and match statuses.7 All mean imputed values in section 7.2 are weighted means.
Table 23. 2010 CCM Imputation of Statuses Status Number unresolved Mean Imputed Value
P-Sample Inclusion Status 209 0.68
Sufficient Information 59 0.73
Insufficient Information 150 0.66
P-sample Match Status 280 0.60
Sufficient Information 130 0.52
Insufficient Information
150
0.70
E-Sample Enumeration Status 261 0.85
Note: The P-sample total is 17,039 records and the E-sample total is 17,584 records.
7.2.1 Missing Inclusion Status
Table 24 contains a summary of the inclusion status results, separately for sufficient and
insufficient information cases. Inclusion status determines whether a case should be included in
the P sample or not. Unresolved cases had their weights adjusted down by the probability of
being included in the P sample. Thus, all of the unresolved cases were included but were
downweighted.
Table 24. 2010 CCM Inclusion Status
Inclusion Status Total People Percent
Sufficient Information for
Matching
Insufficient Information for
Matching
Puerto Rico 17,039 100.0 16,765 274
In P sample 15,399 90.4 15,249 150
Resolved 15,190 89.1 15,190 0
Unresolved 209 1.2 59 150
Not In P sample 1,640 9.6 1,516 124
7 Cases in vacant or deleted housing units with insufficient information for matching were excluded from the
P sample.
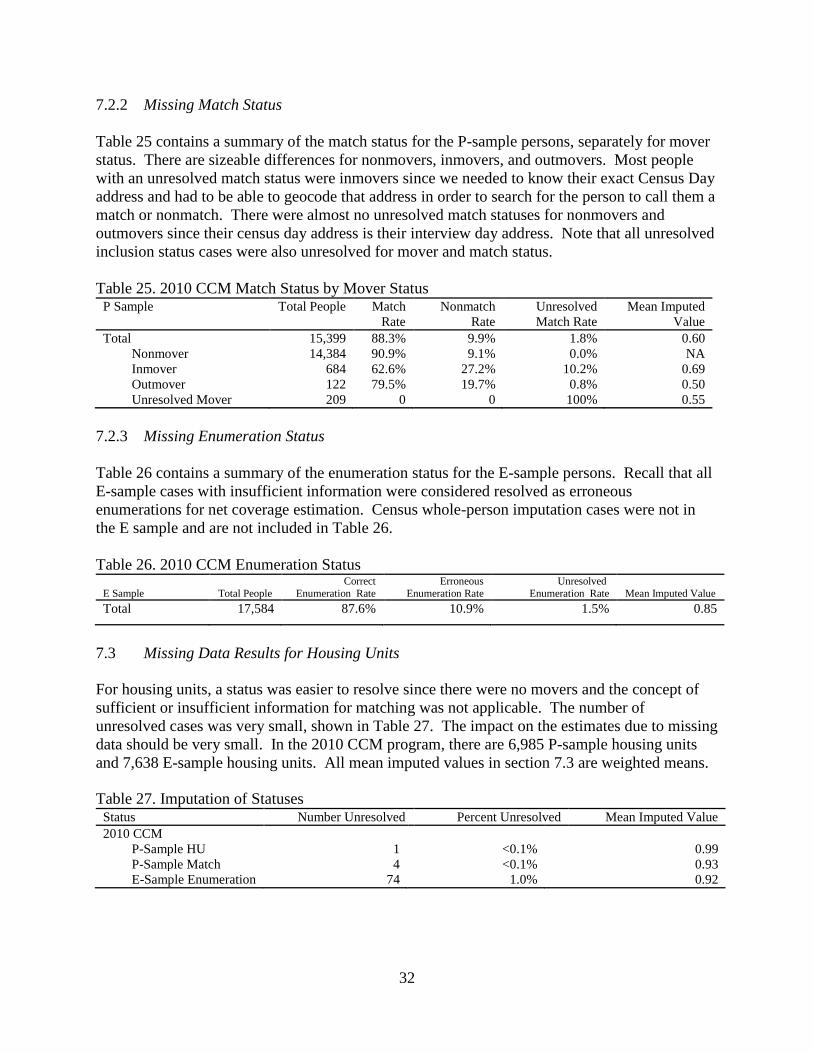
32
7.2.2 Missing Match Status
Table 25 contains a summary of the match status for the P-sample persons, separately for mover
status. There are sizeable differences for nonmovers, inmovers, and outmovers. Most people
with an unresolved match status were inmovers since we needed to know their exact Census Day
address and had to be able to geocode that address in order to search for the person to call them a
match or nonmatch. There were almost no unresolved match statuses for nonmovers and
outmovers since their census day address is their interview day address. Note that all unresolved
inclusion status cases were also unresolved for mover and match status.
Table 25. 2010 CCM Match Status by Mover Status P Sample Total People Match
Rate
Nonmatch
Rate
Unresolved
Match Rate
Mean Imputed
Value
Total 15,399 88.3% 9.9% 1.8% 0.60
Nonmover 14,384 90.9% 9.1% 0.0% NA
Inmover 684 62.6% 27.2% 10.2% 0.69
Outmover 122 79.5% 19.7% 0.8% 0.50
Unresolved Mover 209 0 0 100% 0.55
7.2.3 Missing Enumeration Status
Table 26 contains a summary of the enumeration status for the E-sample persons. Recall that all
E-sample cases with insufficient information were considered resolved as erroneous
enumerations for net coverage estimation. Census whole-person imputation cases were not in
the E sample and are not included in Table 26.
Table 26. 2010 CCM Enumeration Status
E Sample Total People
Correct
Enumeration Rate
Erroneous
Enumeration Rate
Unresolved
Enumeration Rate Mean Imputed Value
Total 17,584 87.6% 10.9% 1.5% 0.85
7.3 Missing Data Results for Housing Units
For housing units, a status was easier to resolve since there were no movers and the concept of
sufficient or insufficient information for matching was not applicable. The number of
unresolved cases was very small, shown in Table 27. The impact on the estimates due to missing
data should be very small. In the 2010 CCM program, there are 6,985 P-sample housing units
and 7,638 E-sample housing units. All mean imputed values in section 7.3 are weighted means. Table 27. Imputation of Statuses
Status Number Unresolved Percent Unresolved Mean Imputed Value
2010 CCM
P-Sample HU 1 <0.1% 0.99
P-Sample Match 4 <0.1% 0.93
E-Sample Enumeration 74 1.0% 0.92
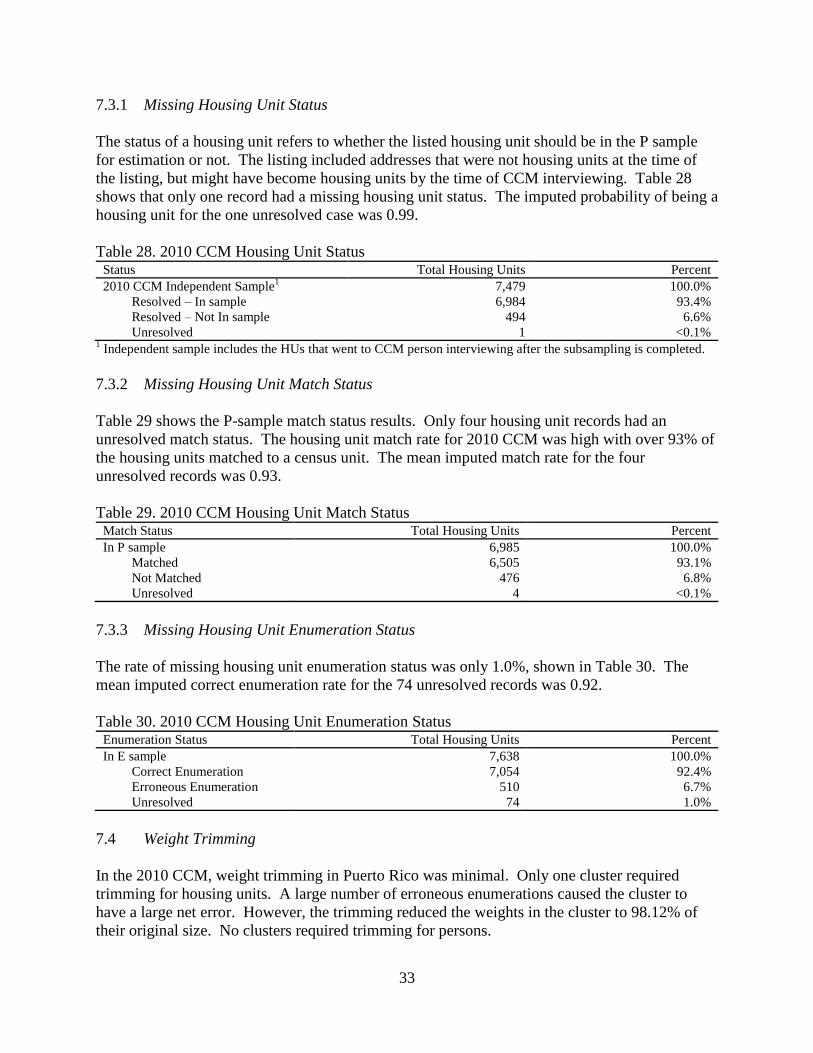
33
7.3.1 Missing Housing Unit Status
The status of a housing unit refers to whether the listed housing unit should be in the P sample
for estimation or not. The listing included addresses that were not housing units at the time of
the listing, but might have become housing units by the time of CCM interviewing. Table 28
shows that only one record had a missing housing unit status. The imputed probability of being a
housing unit for the one unresolved case was 0.99.
Table 28. 2010 CCM Housing Unit Status Status Total Housing Units Percent
2010 CCM Independent Sample1 7,479 100.0%
Resolved – In sample 6,984 93.4%
Resolved – Not In sample 494 6.6%
Unresolved 1 <0.1% 1 Independent sample includes the HUs that went to CCM person interviewing after the subsampling is completed.
7.3.2 Missing Housing Unit Match Status
Table 29 shows the P-sample match status results. Only four housing unit records had an
unresolved match status. The housing unit match rate for 2010 CCM was high with over 93% of
the housing units matched to a census unit. The mean imputed match rate for the four
unresolved records was 0.93.
Table 29. 2010 CCM Housing Unit Match Status Match Status Total Housing Units Percent
In P sample 6,985 100.0%
Matched 6,505 93.1%
Not Matched 476 6.8%
Unresolved 4 <0.1%
7.3.3 Missing Housing Unit Enumeration Status
The rate of missing housing unit enumeration status was only 1.0%, shown in Table 30. The
mean imputed correct enumeration rate for the 74 unresolved records was 0.92.
Table 30. 2010 CCM Housing Unit Enumeration Status Enumeration Status Total Housing Units Percent
In E sample 7,638 100.0%
Correct Enumeration 7,054 92.4%
Erroneous Enumeration 510 6.7%
Unresolved 74 1.0%
7.4 Weight Trimming
In the 2010 CCM, weight trimming in Puerto Rico was minimal. Only one cluster required
trimming for housing units. A large number of erroneous enumerations caused the cluster to
have a large net error. However, the trimming reduced the weights in the cluster to 98.12% of
their original size. No clusters required trimming for persons.

34
8. Missing Data Results for Components of Census Coverage
This section provides an overview of the amount of missing data for 2010 CCM component
estimation. As described in section 2.9, there are different amounts of missing data for each
component enumeration status. This section provides information on the average weighted
probabilities imputed for missing cases of each component enumeration status.
8.1 Person Missing Data Results for Components of Census Coverage
Table 31 presents the unweighted percentages of unresolved records for each component
outcome under their correct or erroneous classification by the Puerto Rico definition. As
previously discussed, a person record could be resolved for one outcome but unresolved for
another. The unresolved records had a probability imputed for each outcome for which they
were unresolved, and Table 31 also shows the average weighted probabilities imputed for
unresolved records. Standard errors of the imputed means were computed using a Taylor series
method, unlike other 2010 CCM coverage estimates that used a delete-a-group jackknife method.
Table 31. Amount of Missing Data and Probabilities Imputed for Component Status Outcomes for Person Records
Component Outcome Average Probability
Imputed
Standard
Error
Unresolved
(%)
Correctly Enumerated
In the Block Cluster Search Area (BCSA)
0.8946 0.0073 2.12
In the same Municipio but outside of the BCSA 0.0237 0.0012 2.74
In a different Municipio 0.0155 0.0006 2.74
Erroneously Enumerated
Duplication 0.3416 0.0084 0.12
Other Reasons*
0.0265 0.0007 2.12
*Includes Fictitious persons, those born after 4/1/10, and those that died before 4/1/10.
For most of the component outcomes, about 2% of the records are unresolved. Fewer records
were unresolved for the component outcome of erroneously enumerated due to duplication.
There was a much smaller amount of missing data here because only records with a duplicate
link to another census person were considered unresolved for the duplicate outcome.
The average probability imputed for correctly enumerated in the block cluster search area was
0.8946. The remaining outcomes that were considered correct in Puerto Rico had low average
probabilities imputed, the smallest of which is the average probability of being correctly
enumerated in a different municipio. On average, persons that had an unresolved duplicate status
were given a 0.3416 probability of being a duplicate. This probability may seem large, but it was
only imputed for the 0.12% of unresolved persons with a duplicate link to a census record.
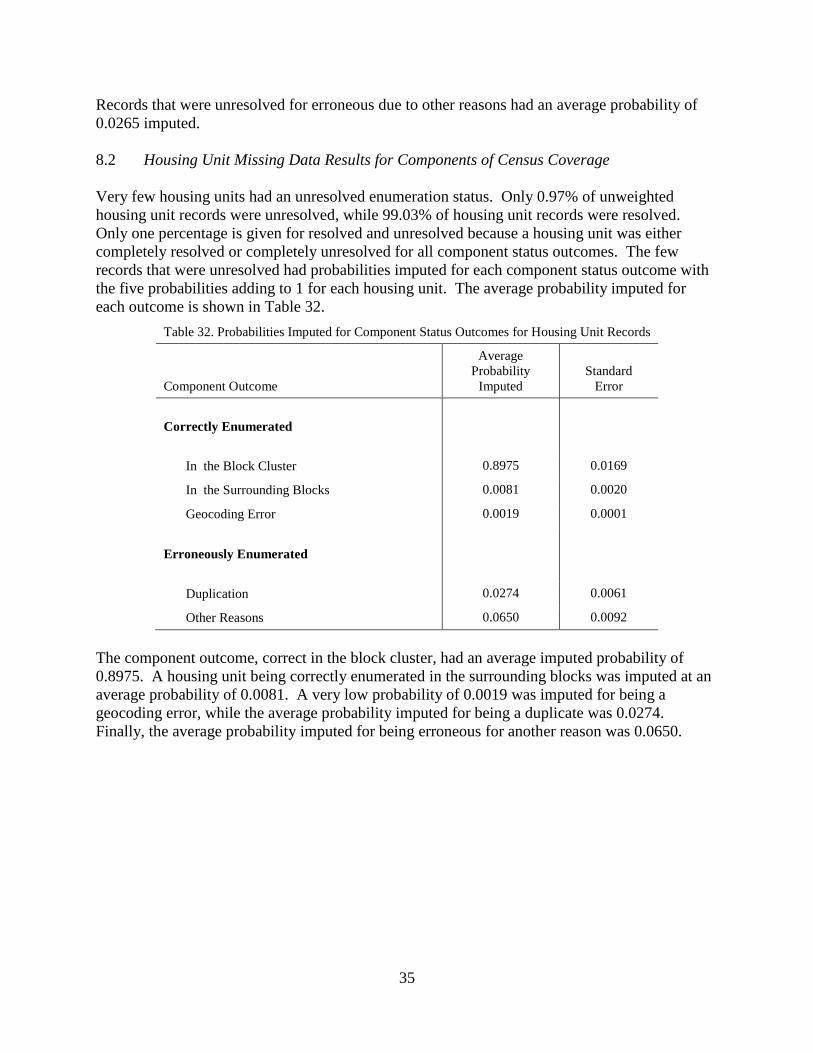
35
Records that were unresolved for erroneous due to other reasons had an average probability of
0.0265 imputed.
8.2 Housing Unit Missing Data Results for Components of Census Coverage
Very few housing units had an unresolved enumeration status. Only 0.97% of unweighted
housing unit records were unresolved, while 99.03% of housing unit records were resolved.
Only one percentage is given for resolved and unresolved because a housing unit was either
completely resolved or completely unresolved for all component status outcomes. The few
records that were unresolved had probabilities imputed for each component status outcome with
the five probabilities adding to 1 for each housing unit. The average probability imputed for
each outcome is shown in Table 32.
Table 32. Probabilities Imputed for Component Status Outcomes for Housing Unit Records
Component Outcome
Average
Probability
Imputed
Standard
Error
Correctly Enumerated
In the Block Cluster 0.8975 0.0169
In the Surrounding Blocks 0.0081 0.0020
Geocoding Error 0.0019 0.0001
Erroneously Enumerated
Duplication 0.0274 0.0061
Other Reasons 0.0650 0.0092
The component outcome, correct in the block cluster, had an average imputed probability of
0.8975. A housing unit being correctly enumerated in the surrounding blocks was imputed at an
average probability of 0.0081. A very low probability of 0.0019 was imputed for being a
geocoding error, while the average probability imputed for being a duplicate was 0.0274.
Finally, the average probability imputed for being erroneous for another reason was 0.0650.
36
References
Livermore Auer, P. (2005), “Results of Feasibility Study to Match Census Enumerations Coded
in A.C.E. as Insufficient Information for Matching and Followup,” DSSD 2010 Census Coverage
Measurement Memorandum Series #2010-B-01.
Olson, D. (2012), “2010 Census Coverage Measurement Estimation Report: Aspects of
Modeling,” DSSD 2010 Census Coverage Measurement Memorandum Series #2010-G-10.
Rubin, D.B. (1976), “Inference and Missing Data,” Biometrika, 63,581-590.
Singh, R. (2003), “2010 Census Coverage Measurement – Goals and Objectives (Executive
Brief),” DSSD 2010 Census Coverage Measurement Memorandum Series #2010-A-1.
Shores, R. (2010), “Census Imputation for 2010 – High Level Description,” DSSD 2010 Census
Coverage Measurement Memorandum Series #2010-E-24.
Related Documents