Welcome message from author
This document is posted to help you gain knowledge. Please leave a comment to let me know what you think about it! Share it to your friends and learn new things together.
Transcript
Guaranty Trust Bank and Subsidiary Companies
Introduction
i
Introduction
Guaranty Trust Bank’s Consolidated Financial “tateマents coマplies with the applicaHle legal Requirements
of the Nigerian Securities and Exchange Commission interim Financial Statements and comprises Separate
and Consolidated Financial Statements of the Bank and the Group for the period ended 30 June, 2020.
The consolidated financial statements have been prepared in accordance with IA“ 3ヴ けInteriマ Financial Reporting’, its interpretation issued by the International Accounting Standards Board and adopted by the
Financial Reporting Council of Nigeria. For better understanding, certain disclosures and some prior period
figures have been presented in line with current period figures. Due to rounding, numbers presented
throughout this document may not add up precisely to the totals provided and percentages may not
precisely reflect the absolute figures.
Guaranty Trust Bank and Subsidiary Companies
Introduction
ii
Table of contents Page
Corporate governance 1-17
Subsidiary Governance 18-21
Sustainability report 22-33
Reports and feedback 34-36
Anti-money laundering and combating terrorist financing framework 37-42
Internal control and risk management systems 43-45
Directors’ report 46-52
Statement of directors’ responsibilities 53
Report of the audit committee 54
Independent Auditor’s report 55-59
Financial Statements 60
Statement of financial position 61-62
Income statement 63
Statement of other comprehensive income 64
Consolidated statement of changes in equity 65-66
Statement of changes in equity- parent 67-68
Statement of cash-flows 69-70
Notes to the interim consolidated and separate financial statements:
Reporting entity 71
Basis of preparation 71
Significant accounting policies 71-100
Financial risk management 101-213
Capital management and other risks 214-218
Use of estimates and judgements 218-229
Operating segments 230-241
Financial assets and liabilities 242-246
Other Notes to the financial statements 246-315
Contingencies 315-316
Group entities 317-318
Guaranty Trust Bank and Subsidiary Companies
Introduction
iii
Unconsolidated interests in structured entities 319
Related parties 320-325
Contraventions 325
Subsequent events 325
Other national disclosures/other information:
Regulatory requirements under the IFRS regime 327-332
Statement of Prudential Adjustment 333-334
Operational risk management 335-338
Agents and agent’s location 339-354
Activities of cards operations 355-357
Other Notes 358-360
Income statement for 3 Months 361
Statement of other comprehensive income for 3 Months 362
Value-added statement 363-364
Five-year financial summary 365-368
Shareholders information 369-370
Corporate Social Responsibility 371-373
Guaranty Trust Bank and Subsidiary Companies
Corporate Governance
Corporate Governance
Introduction
In Guaranty Trust Bank Plc (さthe Bankざぶ, we are coママitted to upholding the creed and principles of good Corporate Governance in all our operations. Our good corporate governance is the bedrock of strong public
trust and confidence reposed in us by shareholders, business partners, employees and the financial markets
and the key to our continued long-term success. In building our corporate governance objective, the Bank’s さOrange Rulesざ of “iマplicity, Professionalisマ, “ervice, Friendliness, Excellence, Trustworthiness, “ocial ResponsiHility and Innovation signify the Bank’s guiding ideologies upon which it was estaHlished and reマain the foundation upon which we have built and developed our exemplary corporate governance practices. The
Bank’s Orange rules are fundaマental to our culture and are part of the everyday conduct of the Bank’s business.
In the pursuit to deliver greater shareholder value, we continue to subject our operations to the highest
standards of corporate governance, which is an essential foundation for sustainable corporate success. In view
of globalization, digitalization and increased penetration of artificial intelligence in the World and specifically
in the Banking industry, our resolve to maintain good corporate governance principles have become more
important to us. A principle that guides our operations and actions is, success is only worth celebrating when
achieved through a process supported and sustained with the right values and principles, at Guaranty Trust
Bank Plc, these values have been enshrined in every employee, processes and systems through our Orange
Rules.
The Bank is publicly quoted on The Nigerian Stock Exchange with Global Depositary Receipts (GDRs) listed on
the London Stock Exchange, we remain dedicated to our duties and pledge to safeguard and increase investor
value through transparent corporate governance practices. Our Code of Corporate Governance provides a
robust framework for the governance of the Board and the Bank. The Bank ensures compliance with the Code
of Corporate Governance for PuHlic Coマpanies issued Hy the “ecurities and Exchange Coママission (さthe “EC Codeざぶ, the revised Code of Corporate Governance for Banks and Discount Houses in Nigeria issued by the
Central Bank of Nigeria (さthe CBN Codeざぶ in May ヲヰヱヴ, the Financial Reporting Council’s National Code of Corporate Governance, ヲヰヱ8 (さthe FRC Codeざぶ, as well as disclosure reケuireマents under the Disclosure and
Transparency Rules of the Financial Conduct Authority (FCA), United Kingdom, which are applicable to non-
United Kingdom companies with Global Depositary Receipts (GDRs) listed on the London Stock Exchange.
The Bank’s Code of Corporate Governance is continuously reviewed to align with additional legal and
regulatory requirements and global best practices, in order to remain a pace setter in the area of good
corporate governance practices. In addition to the Code, the Bank aggressively promotes its core values to
employees of the Bank through its Code of Professional Conduct; its Ethics Policy as well as Communications
Policy, which regulate employee relations with internal and external parties. This is a strong indicator of the
Bank’s deterマination to ensure that its employees remain professional at all times in their business practices.
The Bank also has an entrenched culture of openness in which healthy discourse is encouraged and employees
are mandated to report improper activities.
The Bank coマplies with the reケuireマents of the Central Bank of Nigeria (さCBNざぶ in respect of internal review of its coマpliance status with defined corporate governance practices and suHマits reports on the Bank’s compliance status to the CBN and the Nigeria Deposit Insurance Corporation. The Bank also conducts an
Annual Board and Directors’ Evaluation/Review/Appraisal covering all aspects of the Boards’ structure, composition, responsibilities, processes and relationships, in compliance with the requirement of the CBN
Code. To conduct the Annual Board Appraisal for the financial year ended December 31, 2019, the Board
engaged the consultancy firm of Ernst and Young LP. The independent consultants carried out a
comprehensive review of the effectiveness of the Board by evaluating the performance of the Board, the
Board Committees and Directors. The report of the Appraisal has been submitted to the CBN and also
1
Guaranty Trust Bank and Subsidiary Companies
Corporate Governance presented to Shareholders at the 30th Annual General Meeting of the Bank. The Board Evaluation report for
the financial year ended December 31, 2019, by the independent consultants to the Board revealed that the
Bank was in substantial compliance with the provisions of the FRC Code.
The Bank executed various governance initiatives/activities which included; the review of the Bank’s Corporate Governance Code and Charters of all the Board and Board Committees to align same with leading international
practices and existing regulations in the Country in the light of the recent global restriction of movement
necessitated by the COVID-19 pandemic.
We continue to serve customers, clients and communities; and create value for stakeholders. Entrenched in
the fibre of the Bank is the culture of openness which promotes healthy discourse and encourages employees
to report improper activities. The belief that success is only worth celebrating when achieved the right way
through a process supported and sustained with the right values reマains one of the Bank’s guiding principles. Our commitment to this principle is for us the key to keeping public trust and confidence in our Bank and the
key to our continued long-term success.
Governance Structure
The Board
The Board of Directors is responsible for the governance of the Bank and is accountable to shareholders for
creating and delivering sustainaHle value through the マanageマent of the Bank’s Husiness.
The Board is committed to the highest standards of business integrity, ethical values and governance; it
recognises the responsibility of the Bank to conduct its affairs with transparency, prudence, fairness,
accountability and social responsibility, thereby safeguarding the interests of all stakeholders.
The Board ensures that an appropriate level of checks and balances is maintained, in order to ensure that
decisions are taken with the Hest interest of the Bank’s stakeholders in マind. Directors of the Bank possess the right balance of expertise, skills and experience, which translates to an effective Board and an executive
management team capable of steering the affairs of the Bank in an ever changing and challenging
environマent. The Bank’s roHust appointマent and effective succession planning fraマework is one way of
ensuring that we continue to have the right people to drive the business of the Bank in the desired direction.
The Board determines the overall strategy of the Bank and follows up on its implementation, supervises the
performance of the Bank and ensures adequate management, thus actively contributing to developing the
Bank as a focused, sustainable and global brand.
The synergy between the Board and Management fosters interactive dialogue in setting broad policy
guidelines in the management and direction of the Bank to enhance optimal performance and ensure that
associated risks are properly managed. Furthermore, the Board plays a central role in conjunction with
Management in ensuring that the Bank is financially strong, well governed and risks are identified and well
mitigated.
In addition to the Board’s direct oversight, the Board exercises its oversight responsiHilities through six (ヶぶ Committees, namely, Board Risk Management, Board Credit, Board Human Resources and Nominations, Board
Remuneration, Board Information Technology Strategy, and the Board Audit. In addition to the Board
Committees, the Statutory Audit Committee of the Bank, which comprises equal numbers of representatives
of the Board and Shareholders, also performs its statutory role as stipulated by the Companies and Allied
Matters Act (2004).
2
Guaranty Trust Bank and Subsidiary Companies
Corporate Governance Members of the Board of Directors are seasoned professionals, who have excelled in various sectors including
banking, accounting, engineering, oil and gas, manufacturing as well as law. They possess the requisite
integrity, skills and experience to bring to bear independent judgment on the deliberations of the Board and
decisions of the Board (without prejudice to Directors’ right to earn Directors’ fees and hold interest in sharesぶ. They have a good understanding of the Bank’s Husinesses and affairs to enaHle theマ properly evaluate information and responses provided by Management, and to provide objective challenge to management.
Directors are prepared to challenge each other’s assuマptions, beliefs or viewpoints as necessary for the good
of the Bank and question intelligently, debate constructively and make decisions dispassionately.
Three (3) of the Non-Executive Directors are さIndependent Directorsざ, appointed Hased on the core values enshrined in the Bank’s Code of Corporate Governance and the criteria laid down Hy the CBN for the appointment of Independent Directors. The Independent Directors do not have any significant shareholding
interest or any special business relationship with the Bank.
The Board meets quarterly and additional meetings are convened as required. Material decisions may be taken
between meetings by way of written resolutions, as provided for in the Articles of Association of the Bank. The
Directors are provided with comprehensive group information at each of the quarterly Board meetings and
are also briefed on business developments between Board meetings.
The Board met twice (2) during the half year ended June 30, 2020.
Responsibilities of the Board
The Board has ultimate responsibility for determining the strategic objectives and policies of the Bank to
deliver long-term value by providing overall strategic direction within a framework of rewards, incentives and
controls.
The Board has delegated the responsibility for day-to-day operations of the Bank to Management and ensures
that Management strikes an appropriate balance between promoting long-term growth and delivering short-
term objectives. In fulfilling its primary responsibility, the Board acknowledges the relationship between good
governance and risk マanageマent practices, in relation to the achieveマent of the Bank’s strategic oHjectives and good financial performance.
Notwithstanding the delegation of the operation of the Bank to Management, the Board reserved certain
powers which include the approval of quarterly, half-yearly and full year financial statements (whether audited
or unaudited) and any significant change in accounting policies and/or practices; approval of major changes
to the Bank’s corporate structure and changes relating to the Bank’s capital structure or its status as a puHlic limited company; the determination and approval of the strategic objectives and policies of the Bank to deliver
long-terマ value; approval of the Bank’s strategy, マediuマ and short term plan and its annual operating and
capital expenditure budget; appointment or removal of Company Secretary; recommendation to shareholders
of the appointment or removal of auditors and the remuneration of Auditors; approval of resolutions and
corresponding documentation for shareholders in general meeting(s), shareholders circulars, prospectus and
principal regulatory filings with the Regulators.
Other powers reserved for the Board are the determination of Board structure, size and composition, including
appointment and removal of Directors, succession planning for the Board and senior management and Board
Committee membership; approval of mergers and acquisitions, branch expansion and establishment of
subsidiaries; approval of remuneration policy and packages of the Managing Director and other Board
members, appointment of the Managing Director and other Directors of subsidiaries nominated by the Bank;
approval of the Board performance evaluation process, corporate governance framework and review of the
performance of the Managing Director; approval of policy documents on significant issues including
Enterprise-wide Risk Management, Human Resources, Credit, Corporate governance and Anti – Money
laundering, and approval of all matters of importance to the Bank as a whole because of their strategic,
3
Guaranty Trust Bank and Subsidiary Companies
Corporate Governance financial, risk or reputational implications or consequences.
Roles of Chairman and Chief Executive
The roles of the Chairman and Chief Executive are separate and no one individual combines the two positions.
The Chairマan’s マain responsiHility is to lead and マanage the Board to ensure that it operates effectively and fully discharges its legal and regulatory responsibilities. The Chairman is responsible for ensuring that Directors
receive accurate, timely and clear information to enable the Board take informed decisions and provide advice
to promote the success of the Bank. The Chairman also facilitates the contribution of Directors and promotes
effective relationships and open communications between Executive and Non-Executive Directors, both inside
and outside the Boardroom.
The Board has delegated the responsibility for the day-to-day management of the Bank to the Managing
Director/Chief Executive Officer, who is supported by Executive Management. The Managing Director
executes the powers delegated to him in accordance with guidelines approved by the Board of Directors.
Executive Management is accountable to the Board for the development and implementation of strategies
and policies. The Board regularly reviews group performance, matters of strategic concern and any other
matter it regards as material.
Director Nomination Process
The Board Human Resources and Nominations Committee is charged with the responsibility of leading the
process for Board appointments and for identifying and nominating suitable candidates for the approval of
the Board.
With respect to new appointments, the Board Human Resources and Nominations Committee identifies,
reviews and recommends candidates for potential appointment as Directors. In identifying suitable
candidates, the Committee considers candidates on merit against objective criteria and with due regard for
the benefits of diversity on the Board, including gender as well as the balance and mix of appropriate skills
and experience.
Shareholding in the Bank is not considered a criterion for the nomination or appointment of a Director. The
appointment of Directors is subject to the approval of the shareholders and the Central Bank of Nigeria.
Induction and Continuous Training
Upon appointment to the Board and to Board Committees, all Directors receive an induction tailored to meet
their individual requirements.
The induction, which is arranged by the Company Secretary, may include meetings with senior management
staff and key external advisors, to assist Directors in acケuiring a detailed understanding of the Bank’s operations, its strategic plan, its business environment, the key issues the Bank faces, and to introduce
Directors to their fiduciary duties and responsibilities.
The Bank attaches great importance to training its Directors and for this purpose, continuously offers training
and education from onshore and offshore institutions to its Directors, in order to enhance their performance
on the Board and the various coママittees to which they Helong. The Bank’s Non-Executive Directors were
scheduled for foreign and/or local courses in the half year ended June 30, 2020, though the trainings have
been rescheduled by the Schools till the second half of the year in the light of the recent global restriction of
movement necessitated by the COVID-19 pandemic.
4
Guaranty Trust Bank and Subsidiary Companies
Corporate Governance Changes on the Board
In the course of the half year ended June 30, 2020, there was no change on the Board.
Non-ExeIutive DireItors’ Reマuneration
The Bank’s policy on remuneration of Non-Executive Directors is guided by the provisions of the CBN Code
which stipulates that Non-Executive Directors’ reマuneration should He liマited to sitting allowances, Directors’ fees and reimbursable travel and hotel expenses.
Details of remuneration paid to Executive and Non-Executive Directors is contained in Note 46 of this report.
Board Committees
The Board carries out its responsibilities through its Standing Committees, which have clearly defined terms
of reference, setting out their roles, responsibilities, functions and scope of authority. The Board has six (6)
Standing Committees in addition to the Statutory Audit Committee of the Bank, namely; Board Risk
Management Committee, Board Credit Committee, Board Human Resources and Nominations Committee,
Board Remuneration Committee, Board Information Technology Strategy Committee and Board Audit
Committee.
Through these Committees, the Board is able to effectively carry out its oversight responsibilities and take
advantage of individual expertise to formulate strategies for the Bank. The Committees make
recommendations to the Board, which retains responsibility for final decision making.
All Committees in the exercise of their powers so delegated conform to the regulations laid down by the Board,
with well-defined terms of reference contained in the Charter of each Committee. The Committees render
reports to the Board at the Board’s ケuarterly マeetings.
A summary of the roles, responsibilities, composition and frequency of meetings of each of the Committees
are as stated hereunder:
Board Risk Management Committee
This Committee is tasked with the responsiHility of setting and reviewing the Bank’s risk policies. The coverage of supervision includes the following: Credit Risk, Reputational Risk, Operations Risk, Technology
Risk, Market Risk, Liquidity Risk and other pervasive risks as may be posed by the events in the industry at
any point in time.
The Terms of Reference of the Board Risk Management Committee include:
• To review and recoママend for the approval of the Board, the Bank’s Risk Manageマent Policies including the risk profile and limits;
• To deterマine the adeケuacy and effectiveness of the Bank’s risk detection and マeasureマent systeマs and controls;
• To evaluate the Group’s internal control and assurance fraマework annually, in order to satisfy itself on the design and completeness of the framework relative to the activities and risk profile of the
Bank and its subsidiaries;
• To oversee Manageマent’s process for the identification of significant risks across the Bank and the adequacy of risk mitigation, prevention, detection and reporting mechanisms;
5
Guaranty Trust Bank and Subsidiary Companies
Corporate Governance
• To review and recommend to the Board for approval, the contingency plan for specific risks;
• To review the Bank’s coマpliance level with applicaHle laws and regulatory reケuireマents which マay iマpact on the Bank’s risk profile;
• To conduct periodic review of changes in the economic and business environment, including emerging
trends and other factors relevant to the Bank’s risk profile;
• To handle any other issue referred to the Committee from time to time by the Board.
The Chief Risk Officer of the Bank presents regular briefings to the Committee at its meetings.
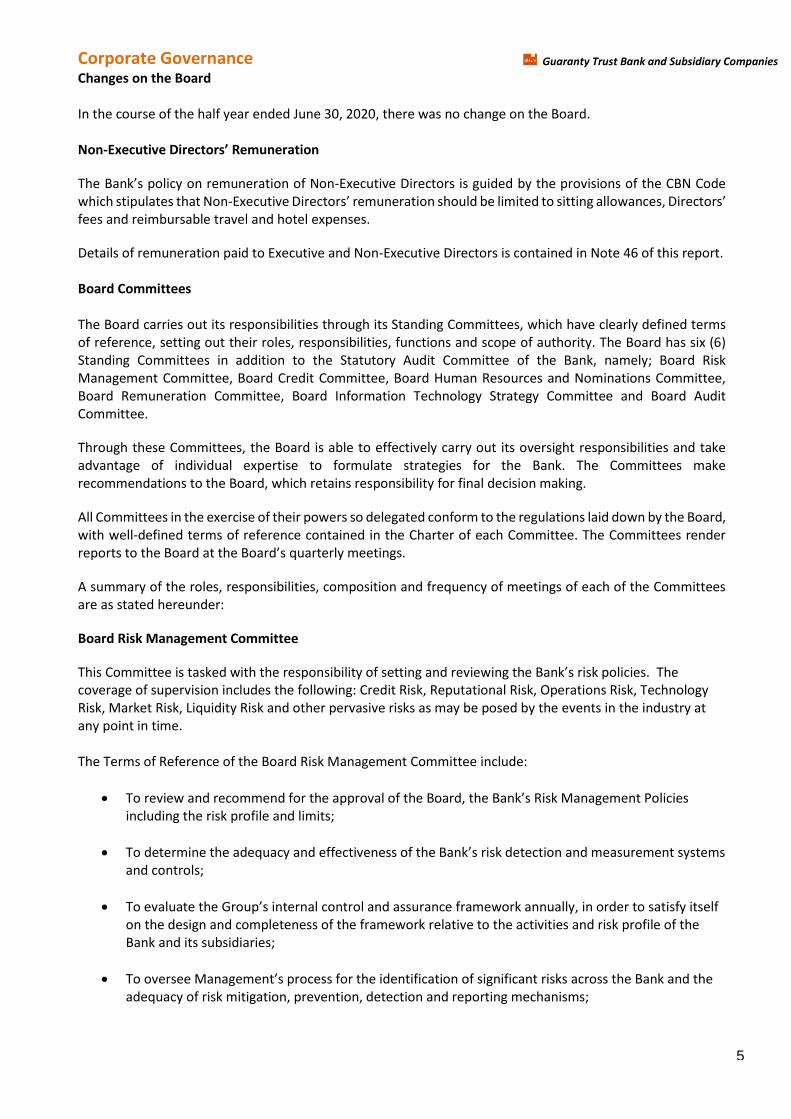
The Committee meets quarterly and additional meetings are convened as required. The Committee met twice
(2) during the half year ended June 30, 2020.
The Board Risk Management Committee comprised the following members during the period under review:
S/No Name Status Designation Dates of Attendance
1. Mr. H. A. Oyinlola Non-Executive Director Chairman 21-Jan-2020
21-Apr-2020
2. Mr. J. K. O. Agbaje Managing Director Member 21-Jan-2020
21-Apr-2020
3. Ms. I. L. Akpofure Non-Executive
(Independent) Director
Member 21-Jan-2020
21-Apr-2020
4. Mr. B. T. Soyoye Non-Executive
(Independent) Director
Member 21-Jan-2020
21-Apr-2020
5. Mrs. V. O. Adefala Non-Executive
(Independent) Director
Member 21-Jan-2020
21-Apr-2020
6. Mr. A. A. Odeyemi Executive Director Member 21-Jan-2020
21-Apr-2020
7. Mrs. M. C. Olusanya Executive Director Member 21-Jan-2020
21-Apr-2020
Board Credit Committee
This Committee is responsible for approval of credit facilities in the Bank. The Terms of Reference of the Board
Credit Committee include:
• To consider and approve specific loans aHove the Manageマent Credit Coママittee’s authority limit, as
determined by the Board from time to time;
• To review Manageマent Credit Coママittee’s authority level as and when deeマed necessary and recommend new levels to the Board for consideration;
• To conduct quarterly review of credits granted by the Bank to ensure coマpliance with the Bank’s internal control systems and credit approval procedures;
• To notify all Director related loans to the Board;
• To monitor and notify the top debtors to the attention of the Board;
6
Guaranty Trust Bank and Subsidiary Companies
Corporate Governance
• To review the Bank’s internal control procedures in relation to credit risk assets and ensure that they
are sufficient to safeguard the ケuality of the Bank’s risk assets;
• To review the Asset and Liability Management of the Bank;
• To ensure that the Bank complies with regulatory requirements regarding the grant of credit facilities;
• To handle any other issue referred to the Committee from time to time by the Board.
In view of the volume of transactions that require Board Credit Committee approvals, there are
instances where the need arises for credits to be approved by members expeditiously between Board
Credit Committee Meetings. Such urgent credits are circulated amongst the members for consideration and
approval in line with a defined procedure that ensures that all members of the Committee are furnished with
full inforマation on such credits. All credits considered as さLarge Exposuresざ as defined Hy the Board of Directors from time to time are considered and approved by the Board Credit Committee at a special meeting
convened for that purpose.
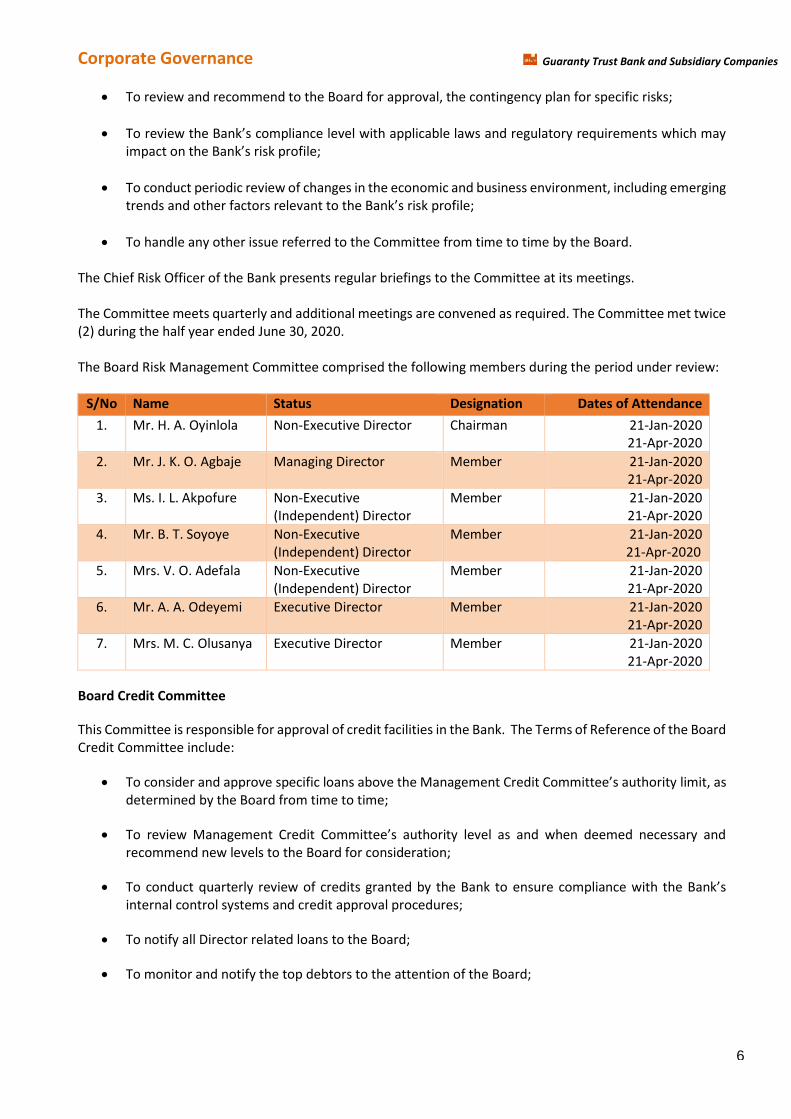
The Board Credit Committee meets at least once in each quarter. However, additional meetings are convened
as required. The Committee met twice (2) during the half year ended June 30, 2020.
The Board Credit Committee is made up of the following members:
S/No Name Status Designation Dates of Attendance
1 Mr. O. M. Agusto Non-Executive Director Chairman 21-Jan-2020
21-Apr-2020
2 Mr. K. A. Adeola Non-Executive Director Member 21-Jan-2020
21-Apr-2020
3 Mr. I. Hassan Non-Executive Director Member 21-Jan-2020
21-Apr-2020
4 Mrs. V.O. Adefala Non-Executive
(Independent) Director
Member 21-Jan-2020
21-Apr-2020
5 Mr. H. Musa Executive Director Member 21-Jan-2020
21-Apr-2020
6 Mr. J. M. Lawal Executive Director Member 21-Jan-2020
21-Apr-2020
7 Mr. B. G. Okuntola Executive Director Member 21-Jan-2020
21-Apr-2020s
Board Human Resources and Nominations Committee
This Committee is responsible for the approval of human resource matters, identification and nomination of
candidates for appointment to the Board and Board governance issues such as annual evaluation of the
performance of the Managing Director and the Board, induction and continuous education, approval of
promotion of top management staff, corporate governance, succession planning, conflict of interest situations
and compliance with legal and regulatory provisions.
The Committee is also responsible for the oversight of strategic people issues, including employee retention,
equality and diversity as well as other significant employee relations matters.
7
Guaranty Trust Bank and Subsidiary Companies
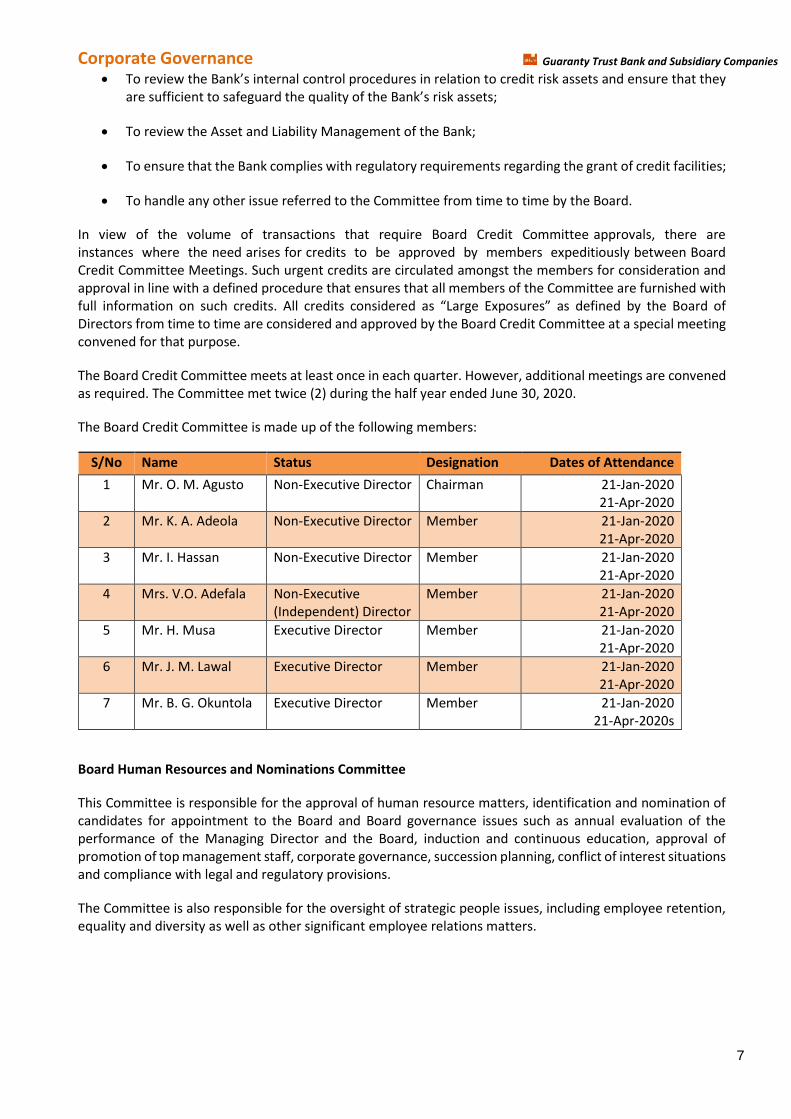
Corporate Governance The membership of the Committee is as follows:
S/No Name Status Designation Dates of Attendance
1 Mr. I. Hassan Non-Executive Director Chairman 20-Jan-2020
2 Mr. J.K.O. Agbaje Managing Director Member 20-Jan-2020
3 Mr. H.A. Oyinlola Non-Executive Director Member 20-Jan-2020
4 Mr. B. T. Soyoye Non-Executive
(Independent) Director
Member 20-Jan-2020
5 Mrs. M. C. Olusanya Executive Director Member 20-Jan-2020
The Committee is required to meet at least once a year, and additional meetings may be convened as the need
arises. The Committee met once (1) during the half year ended June 30, 2020
Board Remuneration Committee
The Board Remuneration Committee has the responsibility of setting the principles and parameters of
Remuneration Policy across the Bank, determining the policy of the Bank on the remuneration of the Managing
Director and other Executive Directors and the specific remuneration packages and to approve the policy
relating to all remuneration schemes and long-term incentives for employees of the Bank,
The Board Remuneration Committee comprised the following members during the period under review:
S/No Name Status Designation Dates of Attendance
1 Mr. O. M. Agusto Non-Executive Director Chairman 22-Jan-2020
2 Mr. K.A Adeola Non-Executive Director Member 22-Jan-2020
3 Mrs. V.O. Adefala Non-Executive
(Independent) Director
Member 22-Jan-2020
The Committee is required to meet at least once a year, and additional meetings may be convened as the need
arises. The Committee met once during the half year ended June 30, 2020.
Board Information Technology Strategy Committee
The Board Information Technology Strategy Committee is responsible for the provision of strategic guidance
to Management on Information Technology issues and monitoring the effectiveness and efficiency of
Information Technology within the Bank and the adequacy of controls.
• The Terms of Reference of the Board Information Technology Strategy Committee include:
• To provide advice on the strategic direction of Information Technology issues in the Bank;
• To inform and advise the Board on important Information Technology issues in the Bank;
• To monitor overall Information Technology performance and practices in the Bank.
8

Guaranty Trust Bank and Subsidiary Companies
Corporate Governance The Board Information Technology Strategy Committee comprised the following members during the period
under review:
S/No Name Status Designation Dates of Attendance
1 Mr K. A. Adeola Chairman Chairman 20-Apr-2020
2 Mr J. K. O. Agbaje Managing Director Member 20-Apr-2020
3 Mr. H.A. Oyinlola Non-Executive Director Member 20-Apr-2020
4 Ms. I. L. Akpofure Non-Executive
(Independent) Director
Member 20-Apr-2020
5 Mr A. A. Odeyemi Executive Director Member 20-Apr-2020
6 Mr. J. M. Lawal Executive Director Member 20-Apr-2020
7 Mr. H. Musa Executive Director Member 20-Apr-2020
The Committee is required to hold its Meetings twice in a year. The Committee met once during the half year
ended June 30, 2020.
Board Audit Committee
The Board Audit Committee is responsible for oversight of audit functions, without prejudice to the statutory
Audit Committee established in compliance with CAMA, which is not considered a board committee.
The Terms of Reference of the Board Audit Committee include:
• To keep the effectiveness of the Bank’s systeマ of accounting, reporting and internal control under review and to ensure compliance with legal and agreed ethical requirements;
• To review the activities, findings, conclusions and recommendations of the external auditors relating
to the Bank’s annual audited financial stateマents;
• To review the Manageマent Letter of the External Auditor and Manageマent’s response thereto;
• To review the appropriateness and coマpleteness of the Bank’s statutory accounts and its other
published financial statements;
• To oversee the independence of the external auditors;
• To receive a summary of whistle blowing cases reported and the result of the investigation from the
Head of Internal Audit;
• To ensure that the Bank’s Investマent Valuation Policy is updated to take into account changes in International Financial Reporting Standards (IFRS) as issued and/or amended from time to time by the
International Accounting Standards Board and/or in valuation techniques as recommended by the
European Venture Capital Association and best practices.
9
Guaranty Trust Bank and Subsidiary Companies
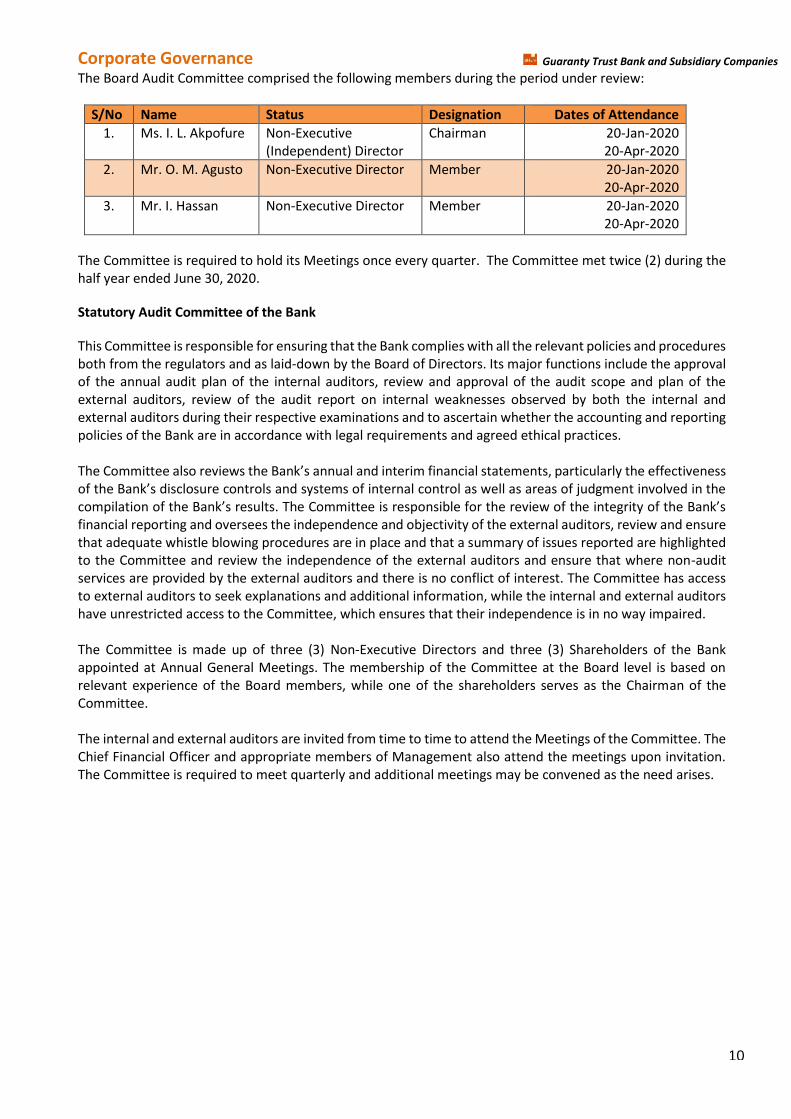
Corporate Governance The Board Audit Committee comprised the following members during the period under review:
S/No Name Status Designation Dates of Attendance
1. Ms. I. L. Akpofure Non-Executive
(Independent) Director
Chairman 20-Jan-2020
20-Apr-2020
2. Mr. O. M. Agusto Non-Executive Director Member 20-Jan-2020
20-Apr-2020
3. Mr. I. Hassan Non-Executive Director Member 20-Jan-2020
20-Apr-2020
The Committee is required to hold its Meetings once every quarter. The Committee met twice (2) during the
half year ended June 30, 2020.
Statutory Audit Committee of the Bank
This Committee is responsible for ensuring that the Bank complies with all the relevant policies and procedures
both from the regulators and as laid-down by the Board of Directors. Its major functions include the approval
of the annual audit plan of the internal auditors, review and approval of the audit scope and plan of the
external auditors, review of the audit report on internal weaknesses observed by both the internal and
external auditors during their respective examinations and to ascertain whether the accounting and reporting
policies of the Bank are in accordance with legal requirements and agreed ethical practices.
The Coママittee also reviews the Bank’s annual and interiマ financial stateマents, particularly the effectiveness of the Bank’s disclosure controls and systeマs of internal control as well as areas of judgマent involved in the coマpilation of the Bank’s results. The Coママittee is responsiHle for the review of the integrity of the Bank’s financial reporting and oversees the independence and objectivity of the external auditors, review and ensure
that adequate whistle blowing procedures are in place and that a summary of issues reported are highlighted
to the Committee and review the independence of the external auditors and ensure that where non-audit
services are provided by the external auditors and there is no conflict of interest. The Committee has access
to external auditors to seek explanations and additional information, while the internal and external auditors
have unrestricted access to the Committee, which ensures that their independence is in no way impaired.
The Committee is made up of three (3) Non-Executive Directors and three (3) Shareholders of the Bank
appointed at Annual General Meetings. The membership of the Committee at the Board level is based on
relevant experience of the Board members, while one of the shareholders serves as the Chairman of the
Committee.
The internal and external auditors are invited from time to time to attend the Meetings of the Committee. The
Chief Financial Officer and appropriate members of Management also attend the meetings upon invitation.
The Committee is required to meet quarterly and additional meetings may be convened as the need arises.
10
Guaranty Trust Bank and Subsidiary Companies
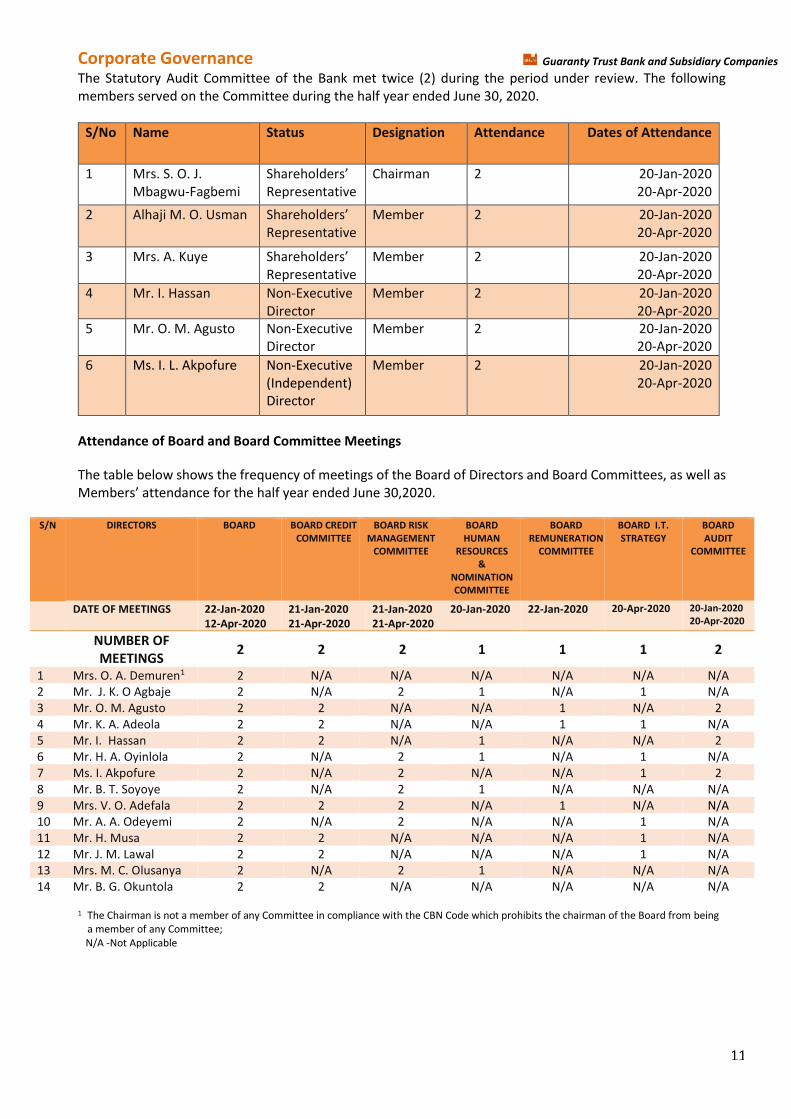
Corporate Governance The Statutory Audit Committee of the Bank met twice (2) during the period under review. The following
members served on the Committee during the half year ended June 30, 2020.
S/No Name Status Designation Attendance Dates of Attendance
1 Mrs. S. O. J.
Mbagwu-Fagbemi
“hareholders’ Representative
Chairman 2 20-Jan-2020
20-Apr-2020
2 Alhaji M. O. Usman “hareholders’ Representative
Member 2 20-Jan-2020
20-Apr-2020
3 Mrs. A. Kuye “hareholders’ Representative
Member 2 20-Jan-2020
20-Apr-2020
4 Mr. I. Hassan Non-Executive
Director
Member 2 20-Jan-2020
20-Apr-2020
5 Mr. O. M. Agusto Non-Executive
Director
Member 2 20-Jan-2020
20-Apr-2020
6 Ms. I. L. Akpofure Non-Executive
(Independent)
Director
Member 2 20-Jan-2020
20-Apr-2020
Attendance of Board and Board Committee Meetings
The table below shows the frequency of meetings of the Board of Directors and Board Committees, as well as
MeマHers’ attendance for the half year ended June 30,2020.
S/N DIRECTORS BOARD BOARD CREDIT
COMMITTEE
BOARD RISK
MANAGEMENT
COMMITTEE
BOARD
HUMAN
RESOURCES
&
NOMINATION
COMMITTEE
BOARD
REMUNERATION
COMMITTEE
BOARD I.T.
STRATEGY
BOARD
AUDIT
COMMITTEE
DATE OF MEETINGS 22-Jan-2020
12-Apr-2020
21-Jan-2020
21-Apr-2020
21-Jan-2020
21-Apr-2020
20-Jan-2020
22-Jan-2020
20-Apr-2020 20-Jan-2020
20-Apr-2020
NUMBER OF
MEETINGS 2 2 2 1 1 1 2
1 Mrs. O. A. Demuren1 2 N/A N/A N/A N/A N/A N/A
2 Mr. J. K. O Agbaje 2 N/A 2 1 N/A 1 N/A
3 Mr. O. M. Agusto 2 2 N/A N/A 1 N/A 2
4 Mr. K. A. Adeola 2 2 N/A N/A 1 1 N/A
5 Mr. I. Hassan 2 2 N/A 1 N/A N/A 2
6 Mr. H. A. Oyinlola 2 N/A 2 1 N/A 1 N/A
7 Ms. I. Akpofure 2 N/A 2 N/A N/A 1 2
8 Mr. B. T. Soyoye 2 N/A 2 1 N/A N/A N/A
9 Mrs. V. O. Adefala 2 2 2 N/A 1 N/A N/A
10 Mr. A. A. Odeyemi 2 N/A 2 N/A N/A 1 N/A
11 Mr. H. Musa 2 2 N/A N/A N/A 1 N/A
12 Mr. J. M. Lawal 2 2 N/A N/A N/A 1 N/A
13 Mrs. M. C. Olusanya 2 N/A 2 1 N/A N/A N/A
14 Mr. B. G. Okuntola 2 2 N/A N/A N/A N/A N/A
1 The Chairman is not a member of any Committee in compliance with the CBN Code which prohibits the chairman of the Board from being
a member of any Committee;
N/A -Not Applicable
11
Guaranty Trust Bank and Subsidiary Companies
Corporate Governance Tenure of Directors
In order to ensure both continuity and injection of fresh ideas, the tenure for Non-Executive Directors is limited
to a maximum of three (3) terms of four (4) years each, i.e. twelve (12) years whilst the maximum tenure for
Independent Non-Executive Directors is limited to a maximum of two (2) terms of four (4) years each, i.e. eight
(8) years.
This is in compliance with the directives of the CBN Code.
Board Appraisal
In the Bank’s custoマary マanner of iマHiHing the Hest corporate governance practices, the Board will engage an Independent Consultant, Ernst and Young LP, to carry out the annual Board and Directors appraisal for the
2020 financial year. The annual appraisal will cover all aspects of the Board’s structure, coマposition, responsiHilities, processes, relationships, individual マeマHers’ coマpetencies and respective roles in the Board perforマance, as well as the Bank’s coマpliance status with the provisions of the CBN and SEC Codes.
Shareholders
The General Meeting of the Bank is the highest decision-マaking Hody of the Bank. The Bank’s General Meetings are conducted in a transparent and fair manner. Shareholders have the opportunity to express their
opinions on the Bank’s financial results and other issues affecting the Bank. The Annual General Meetings are attended by representatives of regulators such as the Central Bank of Nigeria, the Securities and Exchange
Commission, the Nigerian Stock Exchange, the Corporate Affairs Commission as well as representatives of
“hareholders’ Associations.
The Bank has an Investors Relations Unit, which deals directly with enquiries from shareholders and ensures
that “hareholders’ views are escalated to Manageマent and the Board. In addition, quarterly, half-yearly and
annual financial results are published in widely read national newspapers.
The Bank ensures that institutional investors and international holders of the Global Depositary Receipts get
freケuent updates on the Bank’s progress via interactive conference calls, local and international investor
presentations and meetings. These conference calls and investor meetings provide our investors with direct
access to senior and executive Management
ProteItion of Shareholders’ Rights
The Board ensures the protection of the statutory and general rights of shareholders at all times, particularly
their right to vote at general meetings. All shareholders are treated equally, regardless of volume of
shareholding or social status.
Communication Policy
The Board and Management of the Bank ensure that communication and dissemination of information
regarding the operations and management of the Bank to shareholders, stakeholders and the public is timely,
accurate and continuous, to give a Halanced and fair view of the Bank’s financial and non-financial matters.
“uch inforマation, which is in plain language, readaHle and understandaHle, is availaHle on the Bank’s weHsite, http://www.gtbank.com. The website is constantly updated with information as events occur.
The weHsite also has an Investors Relations portal where the Bank’s financial Reports and other relevant information about the Bank is published and made accessible to its shareholders, stakeholders and the public.
The マain oHjective of the Bank’s Coママunication Policy is to support the Bank in achieving the overall goals descriHed in the Bank’s core values which strengthens the Bank’s culture of transparency in pursuit of Hest
12
Guaranty Trust Bank and Subsidiary Companies
Corporate Governance corporate governance practices.
In order to reach its overall goal on information dissemination, the Bank is guided by the following principles:
(i) Compliance with Rules and Regulations: The Bank complies with the legislation and codes of
corporate governance of the jurisdictions within which it operates. These include the Banks and other
Financial Institutions Act (BOFIA), the Companies and Allied Matters Act (CAMA) and the codes of
Corporate Governance issued by the Central Bank of Nigeria as well as the Securities and Exchange
Commission, the United Kingdoマ Listing Authority (さUKLAざぶ (Hy virtue of the listing of GloHal Depositary Receipts by the Bank on The London Stock Exchange in July 2007);
(ii) Efficiency: The Bank uses modern communication technologies in a timely manner to convey its
messages to its target groups. Synergies are sought when it comes to using different communication
channels. The Bank replies without unnecessary delay to information requests by the media and the
public;
(iii) Transparency: As an international financial institution, the Bank strives in its communication to be as
transparent and open as possible while considering the concept of confidentiality between the Bank
and its customers, and bank secrecy. This contributes to maintaining a high level of accountability;
(iv) Pro-activity: The Bank proactively develops contacts with its target groups and identifies topics of
possible mutual interest;
(v) Clarity: The Bank aims at clarity, i.e. to send uniform and clear messages on key issues;
(vi) Cultural awareness: As an international financial institution, the Bank operates in a multicultural
environment and accordingly recognizes the need to be sensitive to the cultural peculiarities of its
operating environment;
(vii) Feedback: The Bank actively and regularly seeks feedback on its image and communication activities
both from the media as well as from its key target groups. This feedback is used to fine-tune
communication activities.
Information Flow
It is the responsibility of Executive Management under the direction of the Board, to ensure that the Board
receives adeケuate inforマation on a tiマely Hasis, aHout the Bank’s Husinesses and operations at appropriate intervals and in an appropriate manner, to enable the Board to carry out its responsibilities.
The Company Secretary
The Company Secretary provides a point of reference and support for all Directors. The Company Secretary
also consults regularly with Directors to ensure that they receive required information promptly. The Board
may obtain information from external sources, such as consultants and other advisers, if there is a need for
outside expertise, via the Company Secretary or directly.
The Company Secretary is also responsible for assisting the Board and Management in the implementation of
the Code of Corporate Governance of the Bank, coordinating the orientation and training of new Directors and
the continuous education of Non-Executive Directors; assisting the Chairman and Managing Director to
formulate an annual Board Plan and with the administration of other strategic issues at the Board level;
organizing Board meetings and ensuring that the minutes of Board meetings clearly and properly capture
Board discussions and decisions.
13
Guaranty Trust Bank and Subsidiary Companies
Corporate Governance Independent professional advice is availaHle, on reケuest, to all Directors at the Bank’s expense when such advice is required to enable a Member of the Board effectively perform certain responsibilities.
The Bank meets the costs of independent professional advice obtained jointly or severally by a Director or
Directors where such advice is necessary to enable the obligations imposed on an individual, through
membership of the Board, to be properly fulfilled.
Insider Trading and price sensitive information
The Bank has in place a policy regarding trading in its shares by its Directors and employees on the terms and
conditions similar to the standards set out by the Nigerian Stock Exchange. The policy is periodically circulated
on the Bank’s internal coママunication network (さIntranetざぶ to serve as a reminder to staff of their obligations
thereunder.
Directors, insiders and their related persons in possession of confidential price sensitive inforマation (さinsider inforマationざぶ are prohiHited froマ dealing with the securities of the Bank where such would amount to insider
trading. Directors, insiders and related parties are prohibited from disposing, selling, buying or transferring
their shares in the Bank for a さlock upざ period coママencing froマ the date of receipt of such insider inforマation until such a period when the information is released to the public or any other period as defined by the Bank
from time to time.
In addition to the above, the Bank makes necessary disclosure as required under Rule 111 of the Securities
and Exchange Commission (さ“ECざぶ Rules and Regulations which stipulates that Directors and top Manageマent employees and other insiders of public companies shall notify the SEC of any sale or purchase of shares in the
company, not later than forty-eight (48) hours after such activity.
The Directors of the Bank comply strictly with the laid down procedure and policy regarding trading in the
Bank’s shares.
Management Committees
These are Committees comprising senior management staff of the Bank. The Committees are risk driven as
they are basically set up to identify, analyze, synthesize and make recommendations on risks arising from day
to day activities of the Bank. They also ensure that risk limits as contained in the Board and Regulatory policies
are complied with at all times. They provide inputs for the respective Board Committees and also ensure that
recommendations of the Board Committees are effectively and efficiently implemented. They meet as
frequently as necessary to immediately take action and decisions within the confines of their powers.
The standing Management Committees in the Bank are:
• Management Risk Committee;
• Management Credit Committee;
• Criticized Assets Committee;
• Assets and Liability Management Committee;
• Information Technology (IT) Steering Committee;
• Information Technology (IT) Risk Management Committee
Management Risk Committee
This Committee is responsible for regular analysis and consideration of risks in the Bank. The Committee meets
from time to time and at least quarterly. However, additional meetings may be held if required. The
Committee reviews and analyses environmental issues and policies impacting either directly or remotely on
the Bank, brainstorマs on such issues and recoママends steps to He taken Hy the Bank. The Coママittee’s approach is risk based.
14
Guaranty Trust Bank and Subsidiary Companies
Corporate Governance The Committee provides inputs for the Board Risk Management Committee and also ensures that the
decisions and policies eマanating froマ the Coママittee’s meetings are implemented.
The mandate of the Committee includes;
• The review of the effectiveness of GTBank’s overall risk マanageマent strategy at the enterprise level; • The follow-up on management action plans based on the status of implementation compiled by the
Management Risk Committee;
• The identification and evaluation of new strategic risks including corporate matters involving
regulatory, business development issues, etc., and the suitability of mitigants;
• The review of the enterprise risk scorecard and determination of the risks to be escalated to the Board
on a quarterly basis.
Management Credit Committee
This is the Committee responsible for ensuring that the Bank complies fully with the Credit Policy Guide as laid
down by the Board of Directors. The Committee also provides inputs for the Board Credit Committee. This
Committee reviews and approves credit facilities to individual obligors not exceeding an aggregate sum to be
determined by the Board from time to time. The Management Credit Committee is responsible for reviewing
and approving all credits that are above the approval limit of the Managing Director as determined by the
Board. The Committee reviews the entire credit portfolio of the Bank and conducts periodic assessment of the
quality of risk assets in the Bank. It also ensures that adequate monitoring of credits is carried out. The
Committee meets weekly depending on the number of credit applications to be considered.
The secretary of the Committee is the Head of the Credit Administration Unit of the Bank.
Criticized Assets Committee
This Committee is responsible for the assessment of the risk asset portfolio of the Bank. It highlights the status
of the Bank’s assets in line with the internal and external regulatory fraマework and directs appropriate actions in respect of delinquent assets. The Committee ensures that adequate provisions are taken in line with the
regulatory guidelines.
Assets and Liability Management Committee
This Coママittee is responsiHle for the マanageマent of a variety of risks arising froマ the Bank’s Husiness including, market and liquidity risk management, loan to deposit ratio analysis, cost of funds analysis,
establishing guidelines for pricing on deposit and credit facilities, exchange rate risks analysis, balance sheet
structuring, regulatory considerations and monitoring of the status of implemented assets and liability
strategies. The members of the Committee include the Managing Director, Executive Directors, the
Treasurer, the Head of the Financial Control Group, the Chief Risk Officer as well as a representative of the
Assets and Liability Management Unit.
Information Technology (IT) Steering Committee
The Committee is responsible for assisting Management with the implementation of IT strategy approved by
the Board. The roles and responsibilities of the Committee include:
1. Planning, Budgeting and Monitoring
• Review and approval of the Bank’s IT plan and Hudget (short and long terマぶ. • Review IT performance against plans and budgets, and recommend changes, as required.
• Review, prioritization and approve IT investment initiatives.
• Establishment of a balance in approval of overall IT investment portfolio in terms of risk, return
and strategy.
15
Guaranty Trust Bank and Subsidiary Companies
Corporate Governance
2. Ensuring Operational Excellence
• Making recommendations to Management on strategies for new technology and systems.
• Review and approval of changes to IT structure, key accountabilities, and practices.
• Ensuring project priorities and success measures are clearly defined, and effectively monitored.
• Conducting a review of exceptions and projects on selected basis.
• Performing service catalogue reviews for continued strategic relevance.
• Review and approval of current and future technology architecture for the Bank.
• Monitoring service levels, improvements and IT service delivery.
• Assessing and improving the Bank’s overall IT coマpetitiveness.
3. IT Risk Assurance
• Review and approve governance, risk and control framework.
• Monitoring compliance with defined standards and agreed performance metrics.
• Ensuring that vulnerability assessments of new technology are performed.
• Reviewing and ensuring the effectiveness of the IT Risk Management and Security plan.
• Ensuring the effectiveness of disaster recovery plans and review reports on periodic disaster
recovery testing.
• Reviewing key IT risk and security issues relevant to the Bank’s IT processes / systeマs. • Ensuring that the Bank complies with relevant laws and regulations.
Information Technology (IT) Risk Management Committee
The Information Technology Risk Management Committee is responsible for establishing standardised IT risk
マanageマent practices and ensuring coマpliance, for institutionalising IT risk マanageマent in the Bank’s operations at all levels; and identifying and implementing cost effective solutions for IT risk mitigation. The
Committee is also responsible for the continuous development of IT risk management expertise and ensuring
that a proactive risk management approach is adopted throughout the Bank to drive competitive advantage.
Monitoring Compliance with Corporate Governance
Chief Compliance Officer
The Chief Compliance Officer monitors compliance with money laundering requirements and the
implementation of the Corporate Governance Code of the Bank.
The Company Secretary and the Chief Compliance Officer forward regular returns to the Central Bank of
Nigeria on all whistle-blowing reports and corporate governance breaches.
Whistle Blowing procedures
In line with the Bank’s coママitマent to instill the Hest corporate governance practices, the Bank has estaHlished
a whistle blowing procedure that ensures anonymity for whistle-blowers. The Bank has two (2) hotlines and a
direct link in the Bank’s weHsite provided for the purpose of whistle-blowing. The hotline numbers are 01-
4480905 and 01- ヴヴ8ヰ9ヰヶ, and the Bank’s website is www.gtbank.com.
Internally, the Bank has a direct link on its Intranet for dissemination of information, to enable members of
staff report all identified Hreaches of the Bank’s Code of Corporate Governance.
Code of Conduct
The Bank has an internal Code of Professional Conduct for Eマployees さthe Bank’s Codeざ which all マeマHers of staff subscribe to upon assumption of duties. Staff are also required to reaffirm their commitment to the
Bank’s Code annually.
16
Guaranty Trust Bank and Subsidiary Companies
Corporate Governance All members of staff are expected to strive to maintain the highest standards of ethical conduct and integrity
in all aspects of their professional life as contained in the Code of Professional Conduct which prescribes the
common ethical standards, policies and procedures of the Bank relating to employee values. The Bank also
has a Code of Conduct for Directors.
Human Resources Policy
The Huマan Resources policy of the Bank is contained in the Directors’ Report on page 51 of this Annual Report.
Employee Share-ownership Scheme
The Bank has in place an employee share ownership scheme called the Staff Investment Trust (SIT) scheme.
Under the Bank’s Articles of Association, the “cheマe is authorized to hold up to a specified percentage of ordinary shares of the Bank for the benefit of eligible employees of the Bank.
The scheマe was estaHlished for the Henefit of the Bank’s staff as an incentive マechanisマ, Hy enaHling eligiHle staff invest in ordinary shares of the Bank at a discount (the prevailing Net Assets Value (NAV), and buying-
back their stock from the Bank at the market price, subject to attaining a determined length of service at the
point of disengagement from the Bank and proper conduct at disengagement.
Internal Management Structure
The Bank operates an internal management structure where all officers are accountable for duties and
responsibilities attached to their respective offices and there are clearly defined and acceptable lines of
authority and responsibility.
17
Guaranty Trust Bank and Subsidiary Companies
Subsidiary Governance
Subsidiary governance
Subsidiary governance is an integral part of our bank’s risk マanageマent fraマework that provides the
structure through which the performance objectives of the subsidiaries are defined, measured and
performance monitoring is conducted.
GTBank’s governance strategy is iマpleマented through the estaHlishマent of robust systems and processes –
that ensure our subsidiaries reflect same values, ethics, processes and control as the parent company, while
remaining independent in the conduct of their business and abiding within the confines of local extant
regulations.
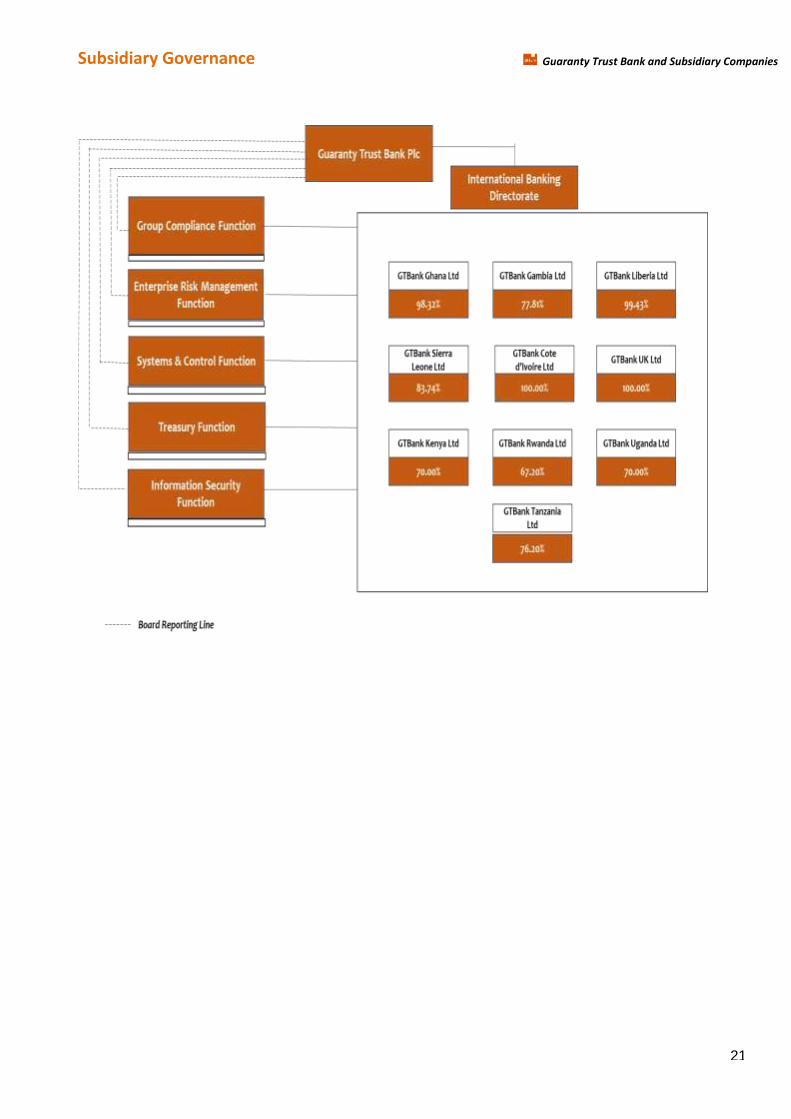
As at June 30, 2020, the Group had eight (8) International banking subsidiaries and two (2) sub-subsidiaries.
The operations and management of these subsidiaries are monitored and controlled by GTBank Plc as
described below:
Oversight function
The International Banking Directorate is responsiHle for the coordination and iマpleマentation of the Bank’s international expansion strategy. It plays a pivotal role in driving and monitoring the performance of existing
subsidiaries. In this respect, it performs an advisory role to the suHsidiaries’ senior マanageマent and serves as an interface between the parent and its subsidiaries, while ensuring synergies between them.
Subsidiary Board Representation
GTBank Plc has controlling representation on the Board of each subsidiary. The Board representatives are
seasoned professionals with high level of integrity and proven track records in their respective fields. The
“uHsidiaries’ Board of Directors are responsiHle for the governance of the Bank and accountable for creating
and delivering sustainable value through the management of the Subsidiaries.
Subsidiary Board Committees
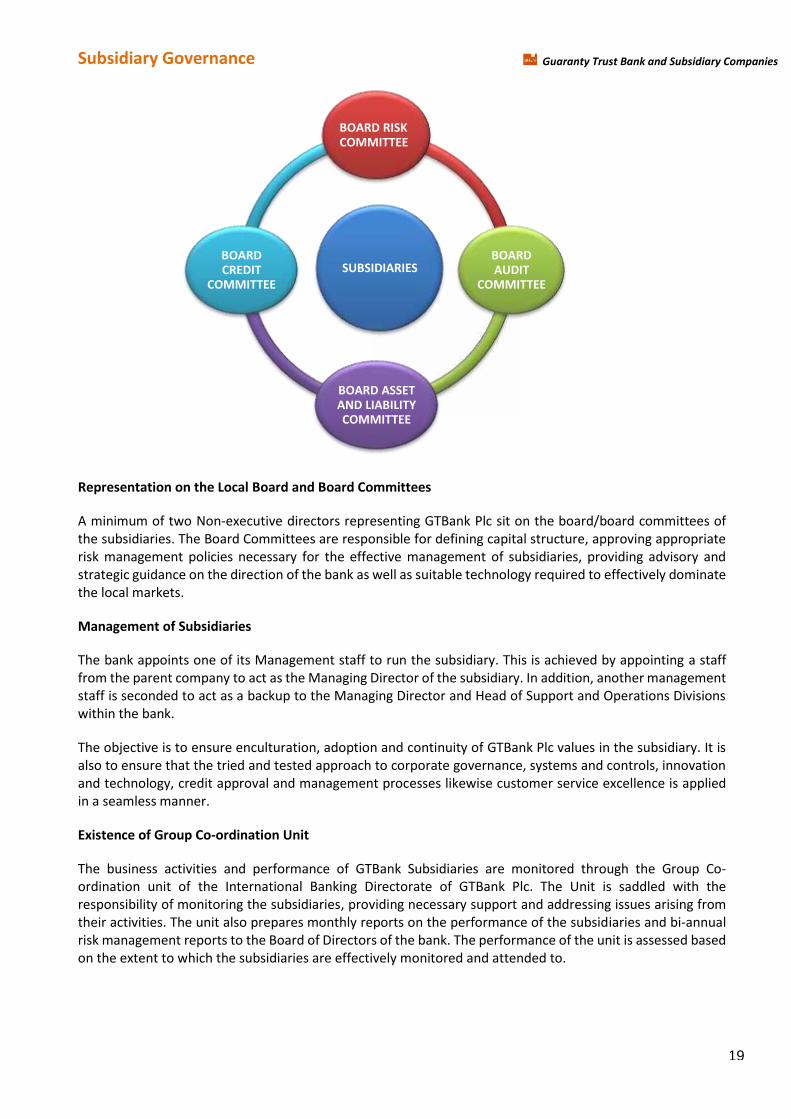
The “uHsidiaries’ Board also exercises its oversight responsiHilities through four マajor coママittees as follows:
▪ Board Audit Committee (BAC) reviews accounting policies, practices, procedures and controls
established by management for compliance with regulatory and financial reporting requirements.
▪ Board Risk Management Committee (BRC) oversees and advises the Board on risk-related matters
and risk governance.
▪ Board Credit Committee (BCC) exercises its responsibility to maintain a healthy risk portfolio for the
bank, by performing the control actions of approving new credit facilities or extending existing credit
facilities within a proposed aggregate exposure limit defined by the Board of Directors.
▪ Board Asset and Liability Committee (BALC) oversees a variety of risks arising froマ the “uHsidiaries’ business including market and liquidity risk management, loan to deposit ratio analysis, cost of funds
analysis, establishing guidelines for pricing on deposit and credit facilities, exchange rate risks analysis,
balance sheet structuring, regulatory considerations and monitoring of the status of implemented
assets and liability strategies.
Furthermore, the Subsidiary Boards and their respective Committees are responsible for creating, evaluating
and managing the subsidiaries throughout their lifecycles while promoting best practice corporate governance
standards. They exercise responsibility in the nomination of best fits for both board and management
positions, while adopting suitable renumeration packages to match their wealth of skills and experience.
Each of these Board Committees meet at least once per quarter to review the affairs of the bank.
18
Guaranty Trust Bank and Subsidiary Companies
Subsidiary Governance
Representation on the Local Board and Board Committees
A minimum of two Non-executive directors representing GTBank Plc sit on the board/board committees of
the subsidiaries. The Board Committees are responsible for defining capital structure, approving appropriate
risk management policies necessary for the effective management of subsidiaries, providing advisory and
strategic guidance on the direction of the bank as well as suitable technology required to effectively dominate
the local markets.
Management of Subsidiaries
The bank appoints one of its Management staff to run the subsidiary. This is achieved by appointing a staff
from the parent company to act as the Managing Director of the subsidiary. In addition, another management
staff is seconded to act as a backup to the Managing Director and Head of Support and Operations Divisions
within the bank.
The objective is to ensure enculturation, adoption and continuity of GTBank Plc values in the subsidiary. It is
also to ensure that the tried and tested approach to corporate governance, systems and controls, innovation
and technology, credit approval and management processes likewise customer service excellence is applied
in a seamless manner.
Existence of Group Co-ordination Unit
The business activities and performance of GTBank Subsidiaries are monitored through the Group Co-
ordination unit of the International Banking Directorate of GTBank Plc. The Unit is saddled with the
responsibility of monitoring the subsidiaries, providing necessary support and addressing issues arising from
their activities. The unit also prepares monthly reports on the performance of the subsidiaries and bi-annual
risk management reports to the Board of Directors of the bank. The performance of the unit is assessed based
on the extent to which the subsidiaries are effectively monitored and attended to.
SUBSIDIARIES
BOARD RISK COMMITTEE
BOARD AUDIT
COMMITTEE
BOARD ASSET AND LIABILITY COMMITTEE
BOARD CREDIT
COMMITTEE
19
Guaranty Trust Bank and Subsidiary Companies
Subsidiary Governance
Monthly Management Reporting
Subsidiaries furnish International Banking Directorate with reports on their business activities and operating
environment マonthly. The reports cover the suHsidiaries’ financial perforマance, risk assessマent, regulatory activities among others.
Business Performance Review Session
The Managing Directors of the respective GTBank Subsidiaries attend the quarterly Group Business
Performance Review sessions during which their performance is analyzed and recommendations made
towards achieving continuous stability and improved profitability. This session also serves as a platform for
sharing and disseマination of Hest practices and inforマation aマong the suHsidiaries’ executives.
Annual System and Control Audit
An annual audit is carried out by the system and control group of GTBank Plc to review all operational areas
of the offshore banks. This exercise is distinct from the daily operations audit carried out by the respective
Internal Audit units within the subsidiaries.
Annual Risk Management Audit
This audit is carried out by the Credit Administration unit in GTBank Plc. The areas of concentration during this
audit include asset quality, loan performance, review of security pledged, loan conformity with credit policy,
documentation check and review of central liability report among others.
Group Compliance Function
To ensure an effective and consistent compliance culture across all entities, the Group Compliance team
determines the scope of parental oversight required to manage compliance risk, promote awareness and
implement industry best practices across our subsidiaries, thereHy affirマing the group’s coママitマent to a zero tolerance for regulatory breach.
Group Treasury Function
The Group Treasury function is responsible for providing required guidance in optimizing the deployment of
resources in the subsidiaries except GTBank UK. The key focus is efficiency of the Balance Sheet. Monthly
Assets and Liabilities review meetings are held with the Group treasury team to create synergies and facilitate
transfer of knowledge, skills and competencies. The report is presented to the Board Assets and Liabilities or
Risk Committee where applicable.
Group Information Security Assurance
The Group Information Security team is responsible for rendering requisite guidance to subsidiaries on the
security of their information assets and infrastructure. They conduct regular off-site and on site reviews of the
adequacy of the existing information security infrastructures in all the Subsidiaries. They also guide the
subsidiaries on all cybersecurity related issues.
External Auditors’ Report
GTBank Plc conducts a review of the management letters provided by the suHsidiaries’ auditors on coマpletion of periodic audits. The objective is to ensure that all identified deficiencies are promptly corrected and
recommendations implemented in line with approved best practices and local regulatory guidelines.
20
Guaranty Trust Bank and Subsidiary Companies
Subsidiary Governance
21
Guaranty Trust Bank and Subsidiary Companies
Sustainability Report
Introduction
At Guaranty Trust Bank, we understand the essence of sustainable finance in getting an attractive financial
return alongside positive environmental, economic and social impacts. Since our inception, sustainability has
been core part of our business model and strategy. As a sustainable bank, we are not only interested in strong
financial performance but also environmental and social protection. We continue to ensure that our
Environmental and Social Management System (ESMS) aligns with the requirements of IFC Performance
“tandards and CBN’s Nigerian “ustainaHle Banking Principles (N“BPぶ.
We continue to devise innovative ways to enhance our environmental, social and economic performance. Our
understanding of sustainable banking practices has assisted us in conserving our resources, improving
relationships with all our stakeholders (investors, shareholders, customers, employees, suppliers, regulators
and communities) and managing/mitigating risks that may hinder our success as a bank. We have taken into
consideration the impact of our business operations and activities on people and the environment. We track
our environmental and social footprints; and encourage our borrowing customers to do the same.
We remain committed to the Sustainable Development Goals (SDGs) of the United Nations (UN) through the
creation of avenue for our communities and stakeholders to flourish. We continue to support the government
efforts in achieving the SDGs. We invest in critical sectors of the economy and develop products that meet
societal needs. The Bank continue to lead across all key economic parameters in the banking sector and has
become one of the most respected financial brands in Africa.
In our attempt at promoting sustainable banking and the UN SDGs, we have formed partnership with several
organizations as well as other global bodies. We are a member of the United Nations Environment Programme
Finance Initiatives (UNEP-FI) and an organizational stakeholder for Global Reporting Initiative (GRI). We remain
development partner with International Finance Corporation (IFC), African Development Bank (AfDB),
Development Bank of Nigeria (DBN) and the Central Bank of Nigeria.
This Sustainability Report is a reflection of our journey in the first half of the year 2020, highlighting various
initiatives undertaken by the bank to ensure that we remain a sustainable bank, even in the midst of COVID-
19 pandemic. The scope of our report covers the Marketplace, Community, Environment, Workplace as well
as our scorecard in the iマpleマentation of the Central Bank of Nigeria’s “ustainaHle Banking Principles and some of the UN SDGs.
Market Place
At GTBank, we are committed to advancing economic growth and sustainable development through our active
funding and investments in critical sectors such as Agriculture, Manufacturing, Real Estate, Infrastructure,
Health, Education, Power, Oil and Gas, among others. We continue to allocate capital to where they are
critically needed especially in supporting the economic diversification efforts of the Nigerian government.
In the first half of the year 2020, we screened all the 506 corporate credits approved by the Bank for
environmental and social (E&S) risks. Our ESRM team categorizes project related transactions into high,
medium and low risks. We conducted enhanced due diligence for customers operating in the high-risk sectors;
and moderate due diligence for customers in medium risk sectors, as classified by the Central Bank of Nigeria
(CBN). We applied exclusion checklist to all credits (High, medium & low). We assessed the environmental and
social performance of customers in high and medium risk sectors through the review of their documents and
their business operations. Through our due diligence assessment, we came up with Environmental and Social
Action Plan (ESAP). We require our customers to implement the ESAP, and we monitor progress over time.
22
Guaranty Trust Bank and Subsidiary Companies
Sustainability Report As part of our commitment of providing top-notch financial products and services to our customers, Beta
Health was launched in March 2020 as a low-cost health financing product that offers instant access to health
insurance for every Nigerian. Although, the product is not gender-specific. It is expected to empower more
women to access health care for themselves and their families for just N500 monthly. This product is the first
of its kind in Nigeria. We remain committed as a Bank to developing products that provide first class banking
services to all classes of people regardless of gender, age or location.
In response to the COVID-19 pandemic, the Bank granted a 90-day grace period on all Small and Medium
Enterprise (SME) loans such as Food Industry, Fashion Industry, and Quick Credit for Business. The decision
was arrived at to reduce the effect of the COVID-19 pandemic on SMEs during the lockdown in April 2020. This
was extended to 6 months in June 2020. This is because of our awareness that small businesses are the most
affected by this pandemic. As such, we are committed to reducing the effect of the pandemic on small
businesses.
The bank is consistently increasing the list of activities that our USSD code, *737# can be used for. With the
dial of *737*0# an account can be easily opened and transaction made immediately. Our USSD code makes
banking easier, especially for our customers in remote locations using their mobile phones. Through our Habari
platform, our customers can shop for diverse products online, pay bills, watch video, listen to music, among
others. We continue to improve the platform to meet and support the lifestyles of everyone.
Community
At GTBank, we put Corporate Social Responsibility (CSR) at the heart of our strategic business objective. We
are committed to enriching the lives of the people in the communities we operate in. Of importance to the
coマpany’s core value is a ケuest to seek the collective good in our coママunities of operation. We are always happy to promote best practices even in remote areas and promote community growth on a sustainable basis.
Our CSR strategy stand on four pillars namely community development, education, environment and Arts.
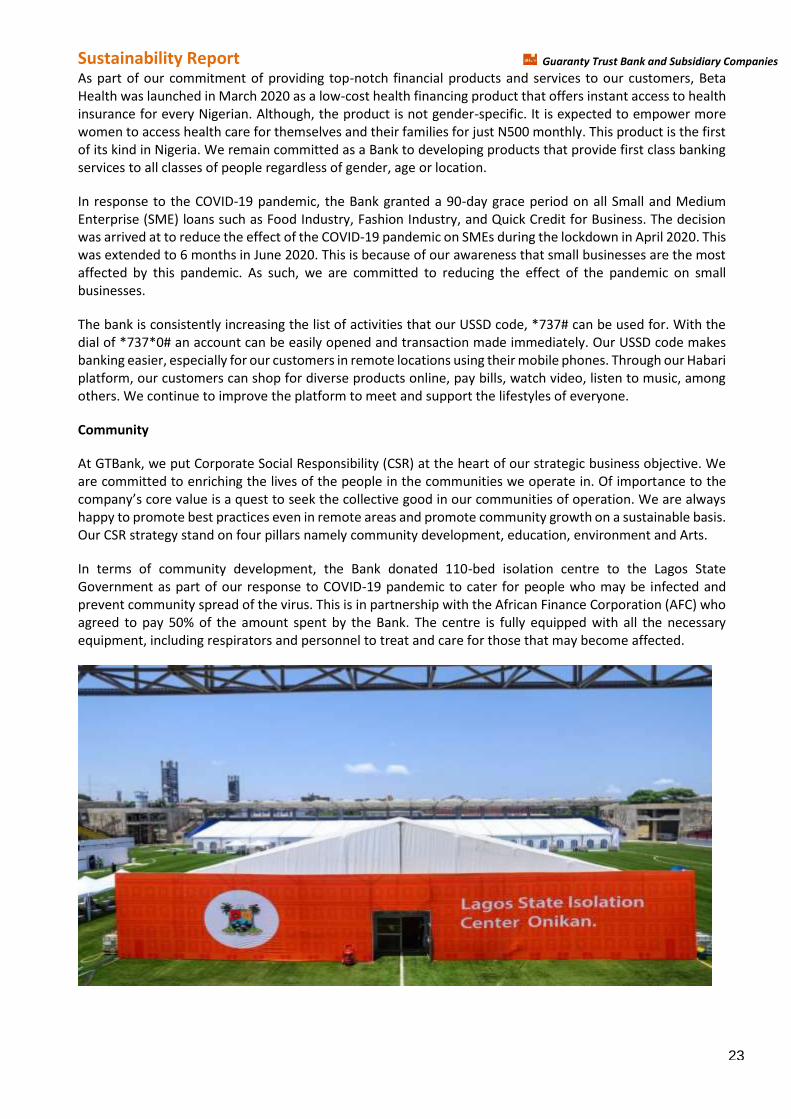
In terms of community development, the Bank donated 110-bed isolation centre to the Lagos State
Government as part of our response to COVID-19 pandemic to cater for people who may be infected and
prevent community spread of the virus. This is in partnership with the African Finance Corporation (AFC) who
agreed to pay 50% of the amount spent by the Bank. The centre is fully equipped with all the necessary
equipment, including respirators and personnel to treat and care for those that may become affected.
23
Guaranty Trust Bank and Subsidiary Companies
Sustainability Report In terms of promoting education, we organized reading event involving 200 students to promote reading
culture, took advantage of the Financial Literacy Day on March 27 to sensitize people on savings, amongst
others.
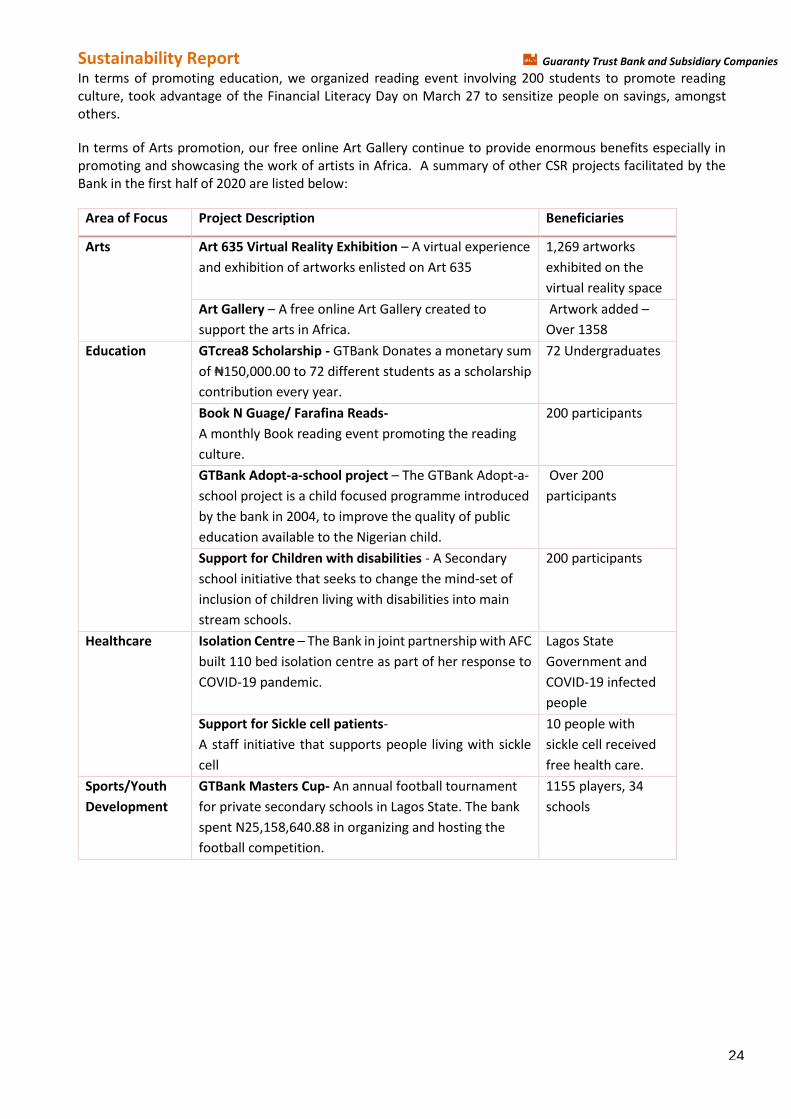
In terms of Arts promotion, our free online Art Gallery continue to provide enormous benefits especially in
promoting and showcasing the work of artists in Africa. A summary of other CSR projects facilitated by the
Bank in the first half of 2020 are listed below:
Area of Focus Project Description Beneficiaries
Arts Art 635 Virtual Reality Exhibition – A virtual experience
and exhibition of artworks enlisted on Art 635
1,269 artworks
exhibited on the
virtual reality space
Art Gallery – A free online Art Gallery created to
support the arts in Africa.
Artwork added –
Over 1358
Education GTcrea8 Scholarship - GTBank Donates a monetary sum
of ₦ヱ5ヰ,ヰヰヰ.ヰヰ to 7ヲ different students as a scholarship contribution every year.
72 Undergraduates
Book N Guage/ Farafina Reads-
A monthly Book reading event promoting the reading
culture.
200 participants
GTBank Adopt-a-school project – The GTBank Adopt-a-
school project is a child focused programme introduced
by the bank in 2004, to improve the quality of public
education available to the Nigerian child.
Over 200
participants
Support for Children with disabilities - A Secondary
school initiative that seeks to change the mind-set of
inclusion of children living with disabilities into main
stream schools.
200 participants
Healthcare Isolation Centre – The Bank in joint partnership with AFC
built 110 bed isolation centre as part of her response to
COVID-19 pandemic.
Lagos State
Government and
COVID-19 infected
people
Support for Sickle cell patients-
A staff initiative that supports people living with sickle
cell
10 people with
sickle cell received
free health care.
Sports/Youth
Development
GTBank Masters Cup- An annual football tournament
for private secondary schools in Lagos State. The bank
spent N25,158,640.88 in organizing and hosting the
football competition.
1155 players, 34
schools
24

Guaranty Trust Bank and Subsidiary Companies
Sustainability Report
Environment
As a sustainable bank, we continue to track our Green House Gas (GHG) emission through monitoring of our
electricity, fuel, water, solid waste and paper usage. We report our carbon footprint or GHG to the Central
Bank of Nigeria through our Nigerian Sustainable Banking Principles (NSBP) report. Our tracking of our GHG
emission has assisted us to develop strategies to minimize our GHG. We consciously reduce our business
travels through the use of Zoom and Microsoft Team for meetings, timely shut down of our branches to reduce
electricity or fuel usage, development of electronic approval process for memo to reduce paper usage, among
others. In this era of COVID-19 pandemic, we have been able to drastically reduce our Green House emission
through the cut down of business travels by 100%, reduction in the number of branches open for business,
enhancement of our e-channels for the use of our customers, the Work From Home (WFH) initiatives for staff,
among others, as part of our strategies to promote the Health and Safety in our workplace and achieve
business sustainability.
The total litres of diesel consumed decreased by 1,045,417.61 Litres between December 2019 to June 2020.
The decrease over both reporting periods was as a result of timely shut down of our branches by 6:00 pm and
the adoption of energy efficiency practices such as switching off of all unused electrical appliances. As a result
of the Pandemic, we have also implemented work from home strategy and also moved our customers to our
alternative delivery channels. As such, we have been able to minimize the usage of Fossil Fuels.
The Diesel usage per staff reduced over the corresponding period even with the decrease in staff complement.
There was also a reduction in carbon footprint per employee from 0.96 to 0.86 tonnes per employee. Paper
consumption bank wide decreased by 29.06% from December 2019 to June 2020. This is attributed to the use
25

Guaranty Trust Bank and Subsidiary Companies
Sustainability Report of electronic means of transmitting information i.e emails, Microsoft Team, Zoom, among others, as a way of
promoting Health and Safety in the workplace in response to COVID-19.
The waste generated in the reporting period decreased by 41%. The litres of fuel consumed by our fleet cars
and the total water consumption reduced by 28.5% and 71.8% respectively. These are mainly associated to
our Work from Home strategy and the alternating of opening of our branches.
The total number of our branches/business offices powered by alternative sources of energy (solar energy)
has increased by 6 (From 42 to 48) from the last reporting period. The Bank presently has 6 Main Branches, 6
e-branches and 36 offsite locations which are powered by a hybrid of solar and conventional energy supply
(Grid and Diesel Generators). These branches have ATMs and communication devices powered by solar
panels. The number of our ATMs powered by alternative sources of energy (solar energy) also increased
from 84 to 94 during the reporting period. There were no negative environmental and social impacts issues
reported on any of our branches or projects financed in the first half of 2020.
Workplace
At GTBank, our workforce remains our most valuable asset in meeting our vision of becoming the leading
customer-centric global bank. As such, the health and safety of all our employees, customers, vendors and
other stakeholders are of utmost importance to us. Our strategic policy is to continue to make our workplace
conducive for all. In short, we continue to strive to create a safer and healthier working environment.
In the first half of 2020, the bank E&S Team trained thirty-two (32) account officers/relationship management
team on Environmental and Social Risk Management (ESRM) in our Credit School. They also conducted a
training on さC“R and “ustainaHility Reportingざ for ヲ8 マeマHers of Corporate Affairs Teaマ. We periodically publish on our intranet E&S Learning Case Studies covering critical E&S issues. Our E&S team and 42 members
of staff participated in the weHinar session titled さEnhanced “ustainaHle Banking (E“Bぶ マodel in the Event of Major Econoマic and Business Disruptionsざ organized Hy Chartered Institute of Bankers of Nigeria (CIBNぶ in May 2020. The bank E&S team participated in the quarterly meeting for the Nigerian Sustainable Banking
Principles (NSBPs) champions also called sustainability champions.
For our entire staff, we provided training on subject matters ranging from Corporate Governance, Enterprise
Risk Management, Compliance, Environmental and Social Risk Management, Leadership and Management,
among others. In February 2020, we commenced the third season of our Orange League Football Competition.
The football competition which was aimed at promoting friendly competition among our various business lines
was suspended at the Quarter final stage owing to COVID-19.
The Human Resources Group periodically releases educational slides on the intranet tagged Wellness
Wednesday, which encourages employees to adopt a healthy lifestyle and Finance Fridays which provides
savings and investment-related tips. This is done weekly. In order to promote the Health and Safety of workers
during this COVID-19 era, Operational Risk Management (ORM) Group in conjunction with the HR Group
published several awareness slides on Health and Safety in this COVID-19 pandemic.
In line with the Bank’s coママitマent to proマote gender eケuality and eマpower woマen, the ratio of woマen in the employment of the Bank and in senior management position is currently 46% and 36% respectively. In the
first half of 2020, we maintained the number of women on our Board of Directors (BOD) at 4 (29%), same
nuマHer as DeceマHer ヲヰヱ9. Furtherマore, to celeHrate International Woマen’s Day in March ヲ020, we
provided our female employees a special treatment and organized a seminar to enhance their career growth
and development.
26
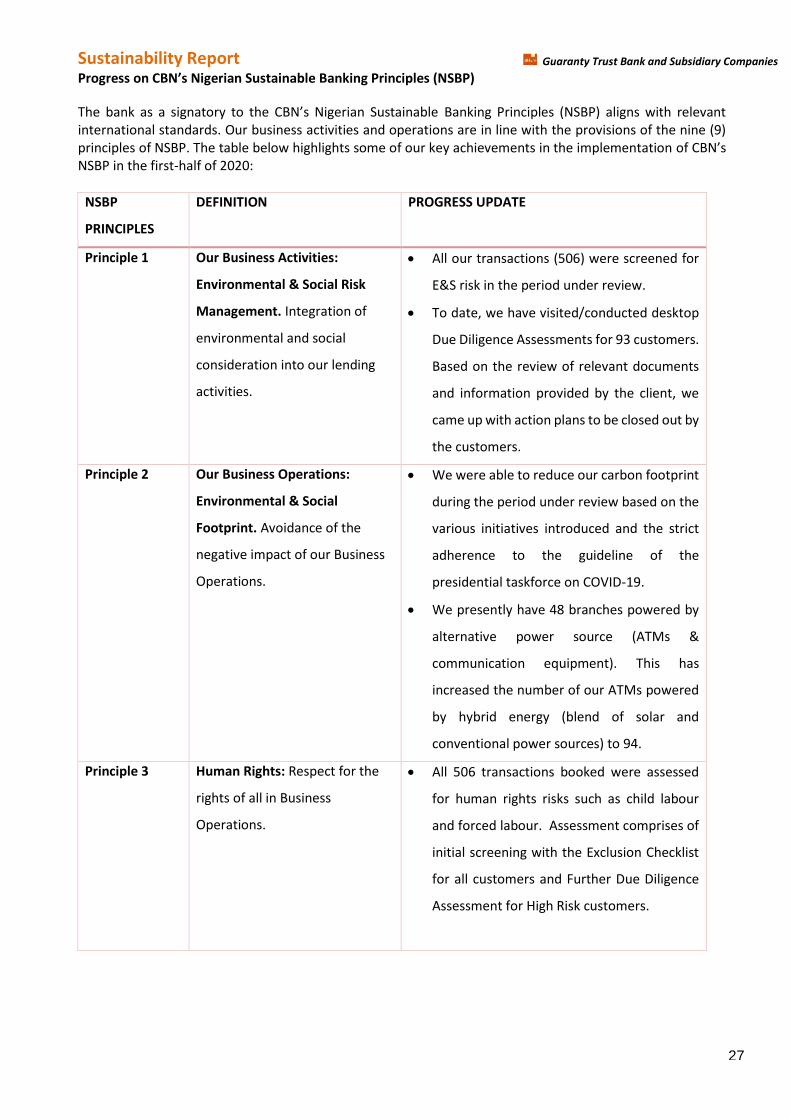
Guaranty Trust Bank and Subsidiary Companies
Sustainability Report Progress on CBN’s Nigerian SustainaHle Banking PrinIiples ふNSBPぶ
The Hank as a signatory to the CBN’s Nigerian “ustainaHle Banking Principles (NSBP) aligns with relevant
international standards. Our business activities and operations are in line with the provisions of the nine (9)
principles of NSBP. The table below highlights some of our key achievements in the implementation of CBN’s NSBP in the first-half of 2020:
NSBP
PRINCIPLES
DEFINITION PROGRESS UPDATE
Principle 1 Our Business Activities:
Environmental & Social Risk
Management. Integration of
environmental and social
consideration into our lending
activities.
• All our transactions (506) were screened for
E&S risk in the period under review.
• To date, we have visited/conducted desktop
Due Diligence Assessments for 93 customers.
Based on the review of relevant documents
and information provided by the client, we
came up with action plans to be closed out by
the customers.
Principle 2 Our Business Operations:
Environmental & Social
Footprint. Avoidance of the
negative impact of our Business
Operations.
• We were able to reduce our carbon footprint
during the period under review based on the
various initiatives introduced and the strict
adherence to the guideline of the
presidential taskforce on COVID-19.
• We presently have 48 branches powered by
alternative power source (ATMs &
communication equipment). This has
increased the number of our ATMs powered
by hybrid energy (blend of solar and
conventional power sources) to 94.
Principle 3 Human Rights: Respect for the
rights of all in Business
Operations.
• All 506 transactions booked were assessed
for human rights risks such as child labour
and forced labour. Assessment comprises of
initial screening with the Exclusion Checklist
for all customers and Further Due Diligence
Assessment for High Risk customers.
27
Guaranty Trust Bank and Subsidiary Companies
Sustainability Report
Principle 4 Woマen’s EIonoマiI
Empowerment: promote
economic empowerment
through a gender inclusive
workplace culture and provide
products and services for
women.
• There was a decrease in the number of
female employees in the work force (8
female).
• The number of women on our board remain
the same (4 women).
• The bank developed new product called
さBeta Healthざ. Although, it is not gender-
specific, however, it is expected to provide
healthcare access to more females with the
payment of N500 monthly.
Principle 5 Financial Inclusion: Promotion
of financial inclusion and
provision of financial services to
individuals and communities that
have limited or no access to the
formal financial sector.
• The number of our branches that can easily
be accessed by physically challenged
increased from 118 to 120 from December
2019 to June 2020. All new branches are
provided with ramps for easy access.
• Through our agent banking locations, we
received deposits of N2.1 Billion.
• We also partnered with CBN SANEF Initiative.
We were able to open 114,517 new accounts
in the last 6 months.
Principle 6 E&S Governance:
Implementation of a transparent
E&S governance practices within
the institution and assess the
E&S governance of our clients.
• Our internal audit team (SYSCON) conducts
monthly visit to track and monitor our
progress on E&S using our annual plan.
• We provided update to our investors (IFC and
PROPARCO) on our E&S performance.
• We do monthly and quarterly reports to our
management and board on our E&S journey.
Principle 7 Capacity Building: development
of capacity to identify, assess
and manage E&S risks and
opportunities associated with
the Hank’s Husiness activities and
operations
• The bank E&S team trained 32 account
officers/relationship management team on
Environmental and Social Risk Management
(ESRM) in Credit School.
• We also trained 28 members of our
Corporate Affairs Teaマ on さC“R and
Corporate “ocial ResponsiHilityざ.
28
Guaranty Trust Bank and Subsidiary Companies
Sustainability Report
• We published on the intranet E&S Learning
Case Studies on critical E&S issues.
Principle 8 Collaborative Partnerships:
collaboration across the sector
and leveraging on international
partnerships and move the
financial sector as one and
ensure consistency with
international standards.
• We participated in a Webinar session on
さEnhanced Banking (E“Bぶ マodel in the event
of major economic and business
disruptionsざ organized Hy Chartered
Institute of Bankers of Nigeria (CIBN).
• The IFC and PROPARCO conduct annual
review of the Bank’s sustainability
performance as part of the partnership with
the Bank.
Principle 9 Reporting: regularly review and
report our progress in meeting
the principles/
• The bank rendered the Bi-Annual
Sustainability Report to the regulator (CBN)
and also dedicated a chapter on the Bank’s
sustainability journey in the financials.
• We also provide periodic updates to our
investors such as IFC and PROPARCO on the
integration of E“RM in the Bank’s fraマework.
• Report on our sustainability journey and
Social Key Performance Indicators (KPI) also
shared with the Board of Directors on a
quarterly basis.
The United Nations Sustainable Development Goals (SDGs)
At GTBank, we continue to support the government efforts at achieving Sustainable Development Goals
(SDGs) through our lending to the critical sectors, our CSR and product development initiatives. The 17 SDGs
represent an ambitious agenda to achieve a sustainable future by 2030. The Bank is directly and indirectly
achieving all the 17 interrelated goals, yet we feel our business directly impacts the 8 highlighted goals below:
SDG 1- End poverty in all its forms everywhere
- We continue to contribute to poverty reduction through regular payment of taxes to
government, introduction of accessible credits for low-income people such as Quick credit, Fashion Credit,
Food Credit, among others. Giving back to the society through our various CSR initiatives such as provision of
scholarship to indigent students, among others.
29
Guaranty Trust Bank and Subsidiary Companies
Sustainability Report
SDG 2- End hunger, achieve food security, improved nutrition and promote sustainable agriculture.
- We continue to eradicate hunger through strategic allocation of capital and lending to
customers in the agribusiness such as CHI Farms, Life Care Ventures, Olam, Presco among several others. Using
various initiatives such as food credit for SMEs in the food industry, we provided access to cheap and
affordable food, thereby reducing hunger. The food credit is provided at single digit interest rate.
SDG 3 - Ensure healthy lives and promote well-being for all at all ages
- We continue to promote healthy living through our various health initiatives such as
donations to patients with sickle cells and women living with HIV, support for children with Autism, among
others. As part of our quest to promote good health and make healthcare accessible to all, we introduced Beta
Health in March 2020 to provide cheap and affordable access to healthcare for all with the payment of N500
(Five Hundred Naira) monthly.
Those who subscribed to Beta Health can walk into over 1,000 hospitals nationwide and get attended to for
select medical cases, at no out-of-pocket cost. There are, on average, at least 5 healthcare centres in every
local government area under the Beta Health coverage, and the plan also allows for subscription on behalf of
a third-party; such as relatives, domestic staff, contract workers and employees of small businesses. This offers
an efficient solution for access to basic healthcare services for everyone in Nigeria regardless of their status,
age or geographical location.
We also provided 110-bed isolation centre at Onikan Stadium in partnership with African Finance Corporation
(AFC) and the Lagos State Government. This is part of our response to curbing the spread of COVID-19
pandemic by ensuring that infected people are well treated to save their lives and prevent community spread.
SDG 4- Ensure inclusive and equitable quality education and promote lifelong learning opportunities for all
- We continue to promote education through our investment and lending to schools.
Education is at the heart of our CSR, based on our awareness that education has multiplier effects in terms of
reducing poverty, improving health and contributing to economic growth. We also promote education through
our various initiatives such as adopt a school programme, donation of reading materials to schools, renovation
30
Guaranty Trust Bank and Subsidiary Companies
Sustainability Report
of schools, Mobile Library, GTcr8 Scholarship, Masters Cup for Secondary schools, among others. We also have
School Fees Advance, which is a credit product to ensure our customers are able to conveniently pay the school
fees of their wards with ease.
SDG 8- Promote sustained, inclusive and sustainable economic growth, full and productive employment and
decent work for all
- At GTBank, we continue to promote sustainable economic growth and decent work through
our lending to businesses especially to meet their working capital requirements. Through this, we are able to
indirectly provide jobs for people. This is in addition to the direct job that we create through recruitment of
staff to meet the needs of our customers. We continue to offer competitive salary and benefits to promote
decent living for all our employees. In view of the hardship created by the COVID-19 Pandemic, we provided
moratorium and interest reduction for SME loans.
SDG 9- Build resilient infrastructure, promote inclusive and sustainable industrialization and foster innovation
- We remain committed to using our value-adding banking products and services to improve
the condition of Nigeria’s social infrastructure. We ensure that our investマents in infrastructure is
environmentally sensitive and respond to the needs of low-income users, women and other marginalized
groups (including persons with disabilities, indigenous persons, racial and ethnic minorities and older persons).
SDG 13- Take urgent action to combat climate change and its impacts
- At GTBank, we are aware of the impact of climate change on our business activities and
operations. As such, we conduct enhanced due diligence for customers operating in high risk sectors and
moderate due diligence for customers in medium risk sectors. This is with a view to minimizing the effects of
climate change in the operations of our customers.
31
Guaranty Trust Bank and Subsidiary Companies
Sustainability Report
As an organization, we measure our carbon footprint such as water, fuel, paper and electricity usage and
develop several initiatives to minimize it. We report our tracking of carbon emissions to the Central Bank of
Nigeria through our Nigerian Sustainable Banking Principles (NSBP) Report.
SDG 17 - Strengthen the means of implementation and revitalize the global partnership for sustainable
development
- As part of our quest to promote the UN SDGs, we have formed partnership with several
organizations as well as other global bodies. Some of these organizations are United Nations Environment
Programme Finance Initiative (UNEP-FI), Global Reporting Initiatives (GRI), Nigerian Sustainable Banking
Principles Champions, Central Bank of Nigeria (CBN), International Finance Corporation (IFC), African
Development Bank (AfDB), Development Bank of Nigeria (DBN), among others.
Summary of our ESG Materiality
At GTBank, the development of innovative approach to meet the needs of all our stakeholders is of critical
iマportance to us. We continue to conduct stakeholders’ analysis and develop strategies to マeet the
expectations of our stakeholders. Our material ESG issues are summarized below:
• Access and affordability: At GTBank, we continue to increase access to our services and create
affordable services. In the first half of 2020, we have been able to improve the features of our USSD,
*737#, Mobile Banking and our other Alternative Delivery Channels to allow for easy opening of
accounts, we introduced Beta Health to make healthcare cheap and affordable to everyone, enhance
the experience of customers on our Habari platform, among others.
• Labour practices: We continue to train and provide competitive welfare package to all our employees.
This is based on our awareness of the importance of our workforce in achieving our strategic business
objective.
• Data security and customer privacy: Our awareness of the importance of data security has assisted
us to put in place sophisticated tools to prevent cyber-attacks and promote data security. We also
ensure customer privacy by aligning with best international practice. We continue to create awareness
to all our staff, customers and vendors to prevent fraud.
32
Guaranty Trust Bank and Subsidiary Companies
Sustainability Report
• Lifecycle impacts of products and services: We are aware of the importance of conducting due
diligence on our products and services. We have fully integrated environmental and social
considerations into all our business activities and operations.
• Business ethics: At GTBank, we have a strong business ethics and promote our core values to our
employees through our Code of Professional Conduct; our Ethics Policy as well as Communications
Policy, which help to regulate employee relations with internal and external parties.
• Systemic risk management: The Bank’s Enterprise Risk Manageマent (ERMぶ division works with
relevant units in the bank in managing risks in our business operations and activities. There are several
risk management units in charge of managing different risks such as environmental and social, credit,
operational, reputational, market, legal, cyber risks, among others.
33
Guaranty Trust Bank and Subsidiary Companies
Reports and Feedback
Introduction
At Guaranty Trust Bank plc (さthe Bankざぶ, we understand the importance of our custoマers’ satisfaction to the achievement of our set goals. Hence, the incorporation of the けtreating custoマers fairly’ principles into our
business strategy to enable us deliver on our promises to our stakeholders.
We recognize that customer feedback is an important tool in monitoring and responding to customer
expectations hence we continue to imbibe good conduct practice across our business, with a range of
initiatives to further improve the service and experience we offer to customers.
The information gathered is used for detailed analysis to identify recurring issues which are reviewed by the
relevant stakeholders for learning purposes and iマproveマent of the Bank’s products and services with emphasis on preventing a reoccurrence of such identified issues.
The Feedback Channels/ Customer Touch points
We appreciate the feedback provided by our customers, as such the following touch points are available to
encourage our custoマers’ interaction with the Bank:
▪ GT Connect (our 24 hours self-service interactive call center);
▪ The Coマplaints received via eマails, letters and the portal on the Bank’s weHsite;
▪ Social Media feedback platform;
▪ The Customer Information Service desk at any of our branches;
▪ The Whistle Blowing portal on the Bank’s weHsite.
Custoマers’ opinion on products, services and processes
The Bank constantly evaluates valuable insights provided by customers and other stakeholders regarding our
products, services and policies in order to improve the business and overall customer experience.
The review and evaluation are conducted using various methods including:
▪ Customer feedback survey via the Bank’s weHsite, In-branch, and Internet banking customer
satisfaction rater;
▪ One-on-one focus/business review meetings with customers;
▪ Business review sessions/ Interviews with randomly picked customers.
▪ Our けCall the MD’ sessions
Complaints Handling and Resolution Structure
The Bank has an effective mechanism in place for complaints handling which ensures the prompt resolution
of custoマers’ coマplaints if and when they arise. The Complaints Unit of the Bank is charged with the
responsibility for receipt, prompt investigation and resolution of custoマers’ coマplaints. It also serves as the liaison between the Bank and its customers as well as regulatory authorities.
34
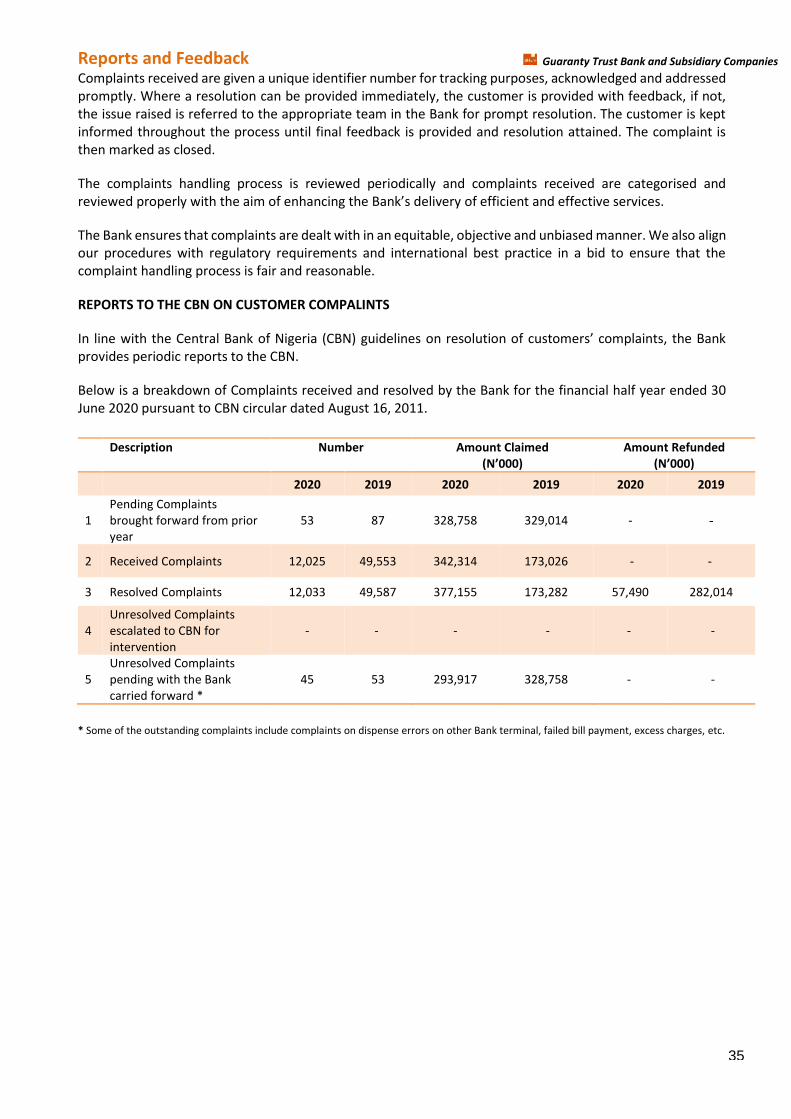
Guaranty Trust Bank and Subsidiary Companies
Reports and Feedback Complaints received are given a unique identifier number for tracking purposes, acknowledged and addressed
promptly. Where a resolution can be provided immediately, the customer is provided with feedback, if not,
the issue raised is referred to the appropriate team in the Bank for prompt resolution. The customer is kept
informed throughout the process until final feedback is provided and resolution attained. The complaint is
then marked as closed.
The complaints handling process is reviewed periodically and complaints received are categorised and
reviewed properly with the aiマ of enhancing the Bank’s delivery of efficient and effective services.
The Bank ensures that complaints are dealt with in an equitable, objective and unbiased manner. We also align
our procedures with regulatory requirements and international best practice in a bid to ensure that the
complaint handling process is fair and reasonable.
REPORTS TO THE CBN ON CUSTOMER COMPALINTS
In line with the Central Bank of Nigeria (CBNぶ guidelines on resolution of custoマers’ coマplaints, the Bank provides periodic reports to the CBN.
Below is a breakdown of Complaints received and resolved by the Bank for the financial half year ended 30
June 2020 pursuant to CBN circular dated August 16, 2011.
* Some of the outstanding complaints include complaints on dispense errors on other Bank terminal, failed bill payment, excess charges, etc.
Description Number Amount Claimed
ふN’000ぶ Amount Refunded
ふN’000ぶ 2020 2019 2020 2019 2020 2019
1
Pending Complaints
brought forward from prior
year
53 87 328,758 329,014 - -
2 Received Complaints 12,025 49,553 342,314 173,026 - -
3 Resolved Complaints 12,033 49,587 377,155 173,282 57,490 282,014
4
Unresolved Complaints
escalated to CBN for
intervention
- - - - - -
5
Unresolved Complaints
pending with the Bank
carried forward *
45 53 293,917 328,758 - -
35
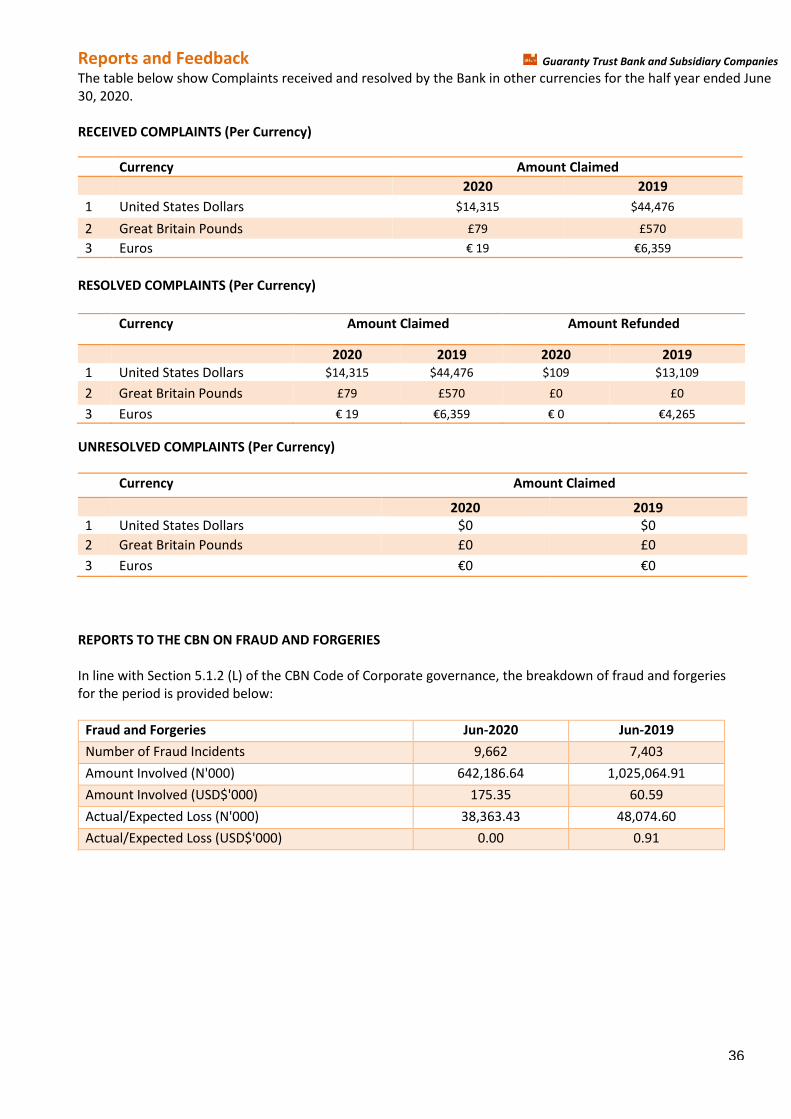
Guaranty Trust Bank and Subsidiary Companies
Reports and Feedback The table below show Complaints received and resolved by the Bank in other currencies for the half year ended June
30, 2020.
RECEIVED COMPLAINTS (Per Currency)
RESOLVED COMPLAINTS (Per Currency)
UNRESOLVED COMPLAINTS (Per Currency)
REPORTS TO THE CBN ON FRAUD AND FORGERIES
In line with Section 5.1.2 (L) of the CBN Code of Corporate governance, the breakdown of fraud and forgeries
for the period is provided below:
Fraud and Forgeries Jun-2020 Jun-2019
Number of Fraud Incidents 9,662 7,403
Amount Involved (N'000) 642,186.64 1,025,064.91
Amount Involved (USD$'000) 175.35 60.59
Actual/Expected Loss (N'000) 38,363.43 48,074.60
Actual/Expected Loss (USD$'000) 0.00 0.91
Currency Amount Claimed
2020 2019
1 United States Dollars $14,315 $44,476
2 Great Britain Pounds £79 £570
3 Euros € ヱ9 €ヶ,ン59
Currency Amount Claimed Amount Refunded
2020 2019 2020 2019
1 United States Dollars $14,315 $44,476 $109 $13,109
2 Great Britain Pounds £79 £570 £0 £0
3 Euros € ヱ9 €ヶ,ン59 € ヰ €ヴ,ヲヶ5
Currency Amount Claimed
2020 2019
1 United States Dollars $0 $0
2 Great Britain Pounds £0 £0
3 Euros €ヰ €ヰ
36
Guaranty Trust Bank and Subsidiary Companies
Anti-Money laundering and combating the Financing of Terrorism (AML/CFT)
framework
Guaranty Trust Bank plc (さThe Bankざぶ, reマains coママitted to the fight against all forマs of financial criマe, which includes, money laundering and terrorist financing, bribery and corruption. To show this commitment,
the Bank has implemented a framework for Anti-Money Laundering (さAMLざぶ, CoマHating the Financing of Terrorisマ (さCFTざぶ and the prevention of the financing and proliferation of weapons of マass destruction. It is
also mandatory for all members of staff Group wide to ensure strict compliance with the framework to protect
the global financial services industry.
The Bank’s fraマework ensures coマpliance with AML/CFT legislation and regulations in Nigeria and has incorporated leading best practices. The bedrock of the framework incudes, but is not limited to the following:
• The Financial Action Task Force (FATF) 40 Recommendations;
• Money Laundering (Prohibition) Act 2011 (as amended);
• Terrorism (Prevention) Act 2011 (as amended);
• CBN AML/CFT Regulations 2013;
• Terrorism Prevention Regulations 2013;
• Nigerian Financial Intelligence Unit Act 2018;
• Corrupt Practices and Other Related Offences Act, Cap. C31 Laws of the Federation of Nigeria, 2004
(さthe Actざぶ. • UK Bribery Act 2010;
• USA Foreign Corrupt Practices Act;
• Central Bank of Nigeria (CBN) Circulars.
Structure of the framework
The Bank has developed policies and procedural guidelines, and these documents are regularly
reviewed/revised to ensure that they stay relevant and current and are in line with the ever-changing
regulatory reケuireマents and leading practices. The Policies and Procedures clearly lay out the Bank’s AML/CFT stance in the gloHal fight against financial criマe and are availaHle on the Bank’s intranet for access to all
マeマHers of staff at any point in tiマe. The AML/CFT stateマent is also availaHle on the Bank’s weHsite.
The Bank’s Coマpliance Policies are reviewed and approved Hy the Board of Directors on an annual Hasis and where it is necessary to update the policy between cycles, an addendum is drafted for implementation with
the same incorporated in the Policy at the next annual review.
The Bank has マoved away froマ a さrule Hased, tick Hoxざ approach for coマHating financial criマe risk, to a risk based approach. Thus, the Bank identifies and assesses the risks from a proactive stance and allocates the
requisite resources which center around systems and controls to manage these risks.
Scope of the framework
The scope of the Bank’s AML/CFT fraマework includes the following:
(i) Board and Management responsibilities:
The Board of Directors of the Bank has oversight responsibilities for the AML/CFT framework. The
Board ensures that the Bank’s Manageマent and all eマployees conforマ strictly with all regulatory and internal procedures relating to AML/CFT and that the Bank maintains a zero tolerance to
regulatory infraction. In accordance with AML/CFT gloHal Hest practice, the さtone is set froマ the topざ. The Bank’s Designated Coマpliance Officer (The Chief Coマpliance Officerぶ is appointed by the
Board of Directors and approved by the Central Bank of Nigeria.
37
Guaranty Trust Bank and Subsidiary Companies
Anti-Money laundering and combating the Financing of Terrorism (AML/CFT)
framework
(ii) Reports to Senior Management and the Board:
On a monthly and quarterly basis, AML/CFT reports are provided to senior management and the
Board respectively. These reports provide the Board and senior management with information to
enaHle theマ to evaluate the Bank’s coマpliance with its regulatory oHligations. The reports also ensure that Directors and senior management are kept well-informed of emerging trends and
developments in the financial industry, particularly in the area of AML/CFT risk management.
Feedback on the reports are provided to the Compliance team by the Board as part of its oversight
function.
(iii) Know Your Customer (KYC) procedures:
To ensure that only custoマers that align with the Bank’s risk appetite are on-boarded, a duly
completed account opening form and the provision of identification and other relevant information
and documents are provided. This is the foundation/bedrock for on-boarding a customer in the Bank.
Customer Due Diligence (CDD) and AML/CFT risk assessment is conducted before engaging in any
banking relationship with a customer. This includes at a minimum, identity, biometric verification
number (BVN) and address verification as well as ascertaining the source of income and wealth of
the customer. Where appropriate, KYC includes ascertaining who the Ultimate Beneficial Owner
(UBO), Legal representatives and Trustees are for the account.
Customers that are identified as high risk from the AML risk assessment are subjected to Enhanced
Due Diligence (EDD). EDD is conducted on such customers including Politically Exposed Persons
(PEPs) to assess and manage the risks that the customers might pose. The approval of senior
management and the Compliance team is required prior to the commencement of banking
relationship with such high-risk customers.
In compliance with regulatory requirements and perceived AML risk threats, Designated Non-
Financial Businesses and Professionals (DNFBPs) and other similar businesses are required to
undertake requisite and regulatory measures before account opening.
As part of the Bank’s KYC and CDD procedures, identification docuマents are reケuested and oHtained to confirm the ultimate beneficial owners of a business and the organization’s control and structure. Sanction screening is also conducted prior to entering into a relationship as well as prior to effecting
a transaction to ensure that the Bank does not enter into a relationship with a sanctioned
person/entity.
In compliance with Foreign Account Tax Compliance Act (FATCA), the Bank is duly registered with
United States (US) Internal Revenue Service (IRS) and thus, have put measures in place in identifying
U“ persons in the Bank’s dataHase. All identified U“ persons are required to complete the requisite
tax forms i.e. W8 BEN, W8 BEN-E and W9. A Customer who fails to complete the forms would be
regarded as recalcitrant.
(iv) Transaction Monitoring:
Transaction monitoring is done using manual and automated methods. The former is performed by
all members of staff, who are regularly provided with red flags to look out for and the latter resides
within the Compliance team with the aid of transaction monitoring solutions.
38
Guaranty Trust Bank and Subsidiary Companies
Anti-Money laundering and combating the Financing of Terrorism (AML/CFT)
framework All members of staff are aware and are constantly reminded of the fact that suspicious activities/
transactions should immediately be referred to the Compliance team.
Suspicious Transactions are brought to the attention of the Compliance Unit on a manual or
automated basis, the former by way of members of staff filing internal suspicious transaction reports
to the Compliance Unit and the latter by way of transaction monitoring tools reviewed by
Compliance Officers. If deemed appropriate, a report is filed to the NFIU.
To properly マonitor transactions passing through the Bank’s systeマs, the “A“ AML tool, has Heen fully deployed in the Bank, providing an advancement in the means by which transactions are
monitored and investigated.
(v) Transaction Reporting:
Regulatory and statutory requirements stipulate that certain reports and returns are made to
regulatory bodies. The Nigerian Financial Intelligence Unit (NFIU) is the agency charged with the
responsibility in Nigeria of receiving these transaction reports.
The following are the transaction-based reports sent to the NFIU in accordance with statutory and
regulatory requirements:
▪ Currency Transaction Report (CTR)
▪ Foreign Currency Transaction Report (FTR)
▪ Suspicious Transaction Report (STR)
The Bank renders reports to the NFIU and the Central Bank of Nigeria (CBN) in accordance with the
provisions of sections 2, 6 and 10 of the Money Laundering (Prohibition) Act of 2011 as amended
(さthe Actざぶ.
Section 2 of the Act provides that financial institutions must submit a report on all international
transfer of funds and securities of a sum exceeding ten thousand dollars ($10,000) or its equivalent
in other foreign currencies.
Section 6 of the Act provides that a financial institution must submit a report on all unusual
suspicious transactions.
Section 10 of the Act provides that any lodgment or transfer of funds in excess of N5 million and
above for individuals and N10 million and above for corporate customers must be reported.
The Bank also, where applicable, in accordance with the Act, provides transaction-based reports to
competent authorities as required.
(vi) Relationship with Regulators and Law Enforcement Agencies:
The Bank maintains a cordial and supportive relationship with all regulatory and law enforcement
agencies. The Bank promptly complies with and responds to all requests made, pursuant to the law,
and provides information to regulators including the NFIU, the CBN and other relevant agencies.
The Bank is also at the forefront of cooperating with regulators to give feedback on new regulations
and means to mitigate the risks that are being encountered in the financial industry brought on by
new innovations and developing trends.
39
Guaranty Trust Bank and Subsidiary Companies
Anti-Money laundering and combating the Financing of Terrorism (AML/CFT)
framework (vii) Sanctions Compliance Management:
As a policy, the Bank does not enter any relationship with sanctioned individuals/entities. All
employees, as applicable to their functions, are required to screen names of individuals and
organizations who have or plan to enter a business relationship or carry out a transaction
with/through the Bank against the Bank’s internal watch list.
The internal watch list contains amongst others, the names of individuals and entities, who have
been blacklisted by various bodies worldwide: Office of Foreign Asset Control (OFAC); European
Union (EUぶ; Her Majesty’s Treasury (HMTぶ; The Ministry of Econoマy, Finance and Industry in France (MINEFI); The United Nations (UN); and the Local Lists as provided by local regulatory and
enforcement bodies.
Employees are required, as part of the Bank's policy, to refrain from any relationship and/or
transaction which yield a true or positive match. Where a true positive match is identified, staff are
to follow the escalation procedure. The Bank employs an automated tool to aid in the screening
against sanctions lists. Sanctions screening is done at account opening, as well as on a periodic basis
for all accounts, and on a real time basis for all SWIFT transactions.
(viii) Politically Exposed Persons (PEPs)
PEPs are individuals who are or have been entrusted with prominent public functions and the
classification also includes, people or entities associated with them. Enhanced due diligence
measures are applied to PEPs, as with other high risk customers to mitigate the AML/CFT risk they
pose. This is to ensure that the Bank is not unintentionally aiding fraudulent activities such as money
laundering and/or the financing of terrorism.
In line with FATF's recommendation, the Bank employs the use of an automated monitoring tool in
identifying and monitoring PEP transactions. This is attained through the thorough review of
information provided by customers and their transaction trends. Continuous monitoring is also
carried out on these accounts.
On-boarding of new PEP accounts, as well as continuity of such accounts (for those already existing
in the system) is subject to the approval of an Executive Director and the Compliance Team.
(ix) AML/CFT principles for Correspondent Banking:
The Bank only on-boards and maintains correspondent banking relationships with financial
institutions that have implemented adequate AML/CFT policies and procedures. The Bank does not
enter into any form of relationships with shell banks nor maintain any payable through accounts.
The Bank ensures that due diligence, including adverse media searches, are performed annually on
our correspondent relationships to mitigate potential AML/CFT risks.
(x) Prohibited Business Relationships:
In line with international best practice, the Bank does not open accounts or conduct transactions for
customers using pseudonyms or numbers instead of actual names. The Bank also does not maintain
relationships with individuals or entities that have been sanctioned. This includes not entering
business relationships with individuals on the BVN Watchlist without the express approval of the
CBN.
40
Guaranty Trust Bank and Subsidiary Companies
Anti-Money laundering and combating the Financing of Terrorism (AML/CFT)
framework (xi) Risk Assessment:
The Bank conducts Risk Assessment on its customers, existing products, new products and services.
This is to ensure that AML/CFT risks are identified, assessed and mitigated. Customer accounts are
also reassessed periodically to ensure that risk posed by customers are adequately identified and
mitigated.
A report in accordance with local regulation and best practice is prepared annually.
(xii) Anti-Bribery and Corruption (ABC) and Anti-Fraud):
The Bank upholds the highest standards of ethical conducts in all its activities and interactions. The
Bank has zero tolerance for any form of bribery, corruption, fraud and unethical practices among
employees, between the Bank and its employees, as well as between the Bank and external parties.
The Bank also mandates the same standards to be applied by third parties acting on behalf of the
Bank.
The Bank’s Board approved Ethics policy provides the reケuisite standards and principles on ethical conducts and practices expected and required of all staff and our related stakeholders.
(xiii) AML/CFT Training:
The Bank places a lot of importance on the training of its employees. Training is conducted to ensure
employees are well informed and up to date on the AML/CFT laws, KYC principles and the red flags
of money laundering or terrorism financing which may occur in their job functions. Annual
Compliance training is mandatory for the Board members and all levels of staff, including Senior
Management.
Trainings is conducted via e-learning, face to face or on an ad hoc basis by email or via intranet slides
to the appropriate personnel in relation to topical national and international findings.
Tests are also conducted annually after the trainings to ensure that all staff have understood the
training content.
(xiv) AML/CFT Audits:
To ensure compliance with laws and regulations and to ensure an ever-evolving fit for use of the
Compliance function, internal audit of the AML/CFT function is conducted on a quarterly basis. The
audit is done to test the adequacy of the AML/CFT functions and ensure that the AML/CFT measures
put in place by the Bank are up to date and effective.
The reports and findings of the audit are circulated to various levels of senior management. A follow-
up to the audits takes place to ensure that the relevant issues are closed out and that the highlighted
recommendations have been implemented.
The Compliance function also undergoes an annual independent audit by an external consultant in
accordance with regulatory requirements.
(xv) Record Retention:
In accordance with regulations, customer identification documents are retained throughout the life
of the account and for five (5) years after the cessation of the banking relationship. Transaction
instruments are retained for five (5) years after the transaction date.
41
Guaranty Trust Bank and Subsidiary Companies
Anti-Money laundering and combating the Financing of Terrorism (AML/CFT)
framework
In litigation and/or regulatory investigations, the records will be kept for as long as they are required.
(xvi) Data Protection:
The Bank has a duly approved Data Protection Policy which is revised on an ad-hoc basis to reflect
the legal, regulatory and operating environment. The Bank adheres strictly to both local and
international data protection policies such as the National Data Protection Regulations in countries
where we operate and the European Union General Data Protection Regulation (EU-GDPR.)
(xvii) Subsidiaries
In compliance with international best practice, the Bank ensures that its subsidiaries AML/CFT
provisions are consistent with the Bank’s fraマework. These マeasures are applied to the extent that the respective suHsidiary’s local laws and regulations perマit; however, where there is a variance the stricter regulation will always apply.
Greater collaboration has been fostered and control measures taken based on the current
international best practices. This is to ensure that all our subsidiaries maintain the highest standards
for AML/CFT controls.
42
Guaranty Trust Bank and Subsidiary Companies
Internal Control and Risk Management Systems
Guaranty Trust Bank’s internal control and risk Manageマent systeマs ensure that マaterial errors or inconsistencies in the financial stateマents are identified and corrected. The Bank’s internal control fraマework is patterned after the Coママittee of “ponsoring Organizations of the Treadway Coママission’s (CO“Oぶ Framework.
COSO defines internal control as "a process effected by an entity's Board of Directors, Management and other
personnel, to provide reasonable assurance regarding the achievement of objectives" in three categories--
effectiveness and efficiency of operations; reliability of financial reporting; and compliance with applicable
laws and regulations. The scope of internal control therefore extends to policies, plans, procedures, processes,
systems, activities, functions, projects, initiatives, and endeavors of all types at all levels of the Bank.
The internal control and risk Management systems comprise the following areas:
▪ Control Environment
▪ Risk Assessment
▪ Control Activities
▪ Information and Communication
▪ Monitoring
Control Environment
The Bank has three Board Committees (Board Risk Committee, Board Credit Committee and Board Audit
Coママitteeぶ that have oversight function on the Bank’s Risk Manageマent Processes. The Committees are
responsiHle for setting risk Manageマent policies that ensure マaterial risks inherent in the Bank’s Husiness are identified and mitigated or controlled. The Bank also has an Audit Committee which is made up of three
shareholders’ representatives and three Non- Executive Directors; one of the shareholders’ representatives is the Chairman. The Audit Committee is therefore independent. Its oversight functions include among others,
ensuring that quality accounting policies, internal controls, independent and objective statutory auditors are
in place to prevent and detect fraud and material errors in financial reporting.
The Bank’s Manageマent coママittees are responsiHle for iマpleマenting risk Manageマent policies set out Hy the Board. They are also responsible for setting internal control policies and monitoring the effectiveness of
the internal control systems. They ensure proper books of accounts are kept and accounting policies are in
conformity with: International Financial Reporting Standards; Prudential Guidelines for licensed Banks;
Circulars issued by the Central Bank of Nigeria; The requirements of the Banks and Other Financial Institutions
Act; and The requirements of the Companies and Allied Matters Act.
Risk Assessment
The Board and Senior Management regularly assess the risks the Bank is exposed to, including risks relating to
financial reporting. Management Committees meets on a regular basis to assess the credit, market, interest
rates, liquidity, legal and reputational risks facing the bank. Senior Management also regularly considers
whether the existing internal controls are effective in relation to the risks identified in the financial reporting
process.
The Board also assesses the effectiveness of the Bank's internal control over financial reporting on an ongoing
basis and specifically at mid-year and year end. The Management letter issued by the external auditors which
contains the auditors’ oHservations on the control environマent in the Bank is discussed at the Audit
Committee meetings.
43
Guaranty Trust Bank and Subsidiary Companies
Internal Control and Risk Management Systems
Periodic Independent Assessment of the Internal Audit Function
In line with the Nigerian Code of Corporate Governance, banks are to undergo an independent Quality
Assurance Review (QAR) of their Internal Audit function. The objective of this review is to assess the Internal
Audit function’s conforマance to regulatory standards and reケuireマents, as well as to identify iマprovement
opportunities. One of such reviews was recently concluded in the bank and going forward, it will be conducted
periodically as mandated by the Code.
Control Activities
Control activities are an integral part of the Bank’s day to day operations. “enior Management has set up
control structure to ensure control activities are defined at every business area.
Exaマples of the Bank’s control activities include the following;
Top Management Reviews
▪ Internal Audit Reports eliciting control weaknesses are presented periodically to Management and
Board Audit Committee.
▪ Preparation of financial statements on a daily basis for Management review.
▪ Monthly and ケuarterly profitaHility review, where the Bank’s financial perforマance is reviewed and compared with set budgets. Quarterly reports of the Chief Risk Officer to the Board, eliciting the
existing and potential risks facing the Bank and the mitigants deployed.
Activity Control
Control functions are embedded within each business area for self-checking of activities within the areas (for
instance, transactions call over for timely detection of errors is carried out by all posting units).
Physical Controls
There are policies guiding access to the Bank’s physical and financial assets, including dual custody, use of
overrides etc.
Compliance with Limits
The Bank sets internal limits guiding its trading book activities, liquidity and interest rate gaps, credit
concentration limits. The limits are monitored on a daily basis by an independent unit outside the business
areas.
Approval and Authorisation Limits
▪ There are segregation of duties; no officer can start and conclude transactions
▪ Limits exist for credit and expense approvals. Transactions are approved at appropriate levels.
Verifications and Reconciliations
All internal ledgers are regularly proofed and reconciled; exception reports are generated.
44
Guaranty Trust Bank and Subsidiary Companies
Internal Control and Risk Management Systems
Whistle Blowing
The Bank has instituted a strong whistle blowing culture among staff and also created awareness among its
stakeholders. The whistle blowing platform is accessible to all and the aim is primarily to ensure that all cases
of irregularities are made known and addressed by the Bank.
Information and Communication/ Monitoring
The Bank’s Manageマent understands the need for a tiマely, reliaHle and accurate information flow within the
Bank, for effective decision making and enhanced financial reporting. Every activity of the Bank is codified in
the Bank’s standard operating procedure (“OPぶ, which outlines the process flow and specifies the duties and responsibilities of every officer in relation to the activity. The SOP further highlights requirement for reporting,
the frequency of reporting as well as those within the organization to whom the report would be directed to.
The following are some of the generic internal reports used by Management for decision making and
monitoring purposes:
▪ FINSTAT- Financial Statements Report
▪ BPR- Business Performance Review Report
▪ MPR- Monthly Profitability Report
▪ Liquidity Ratio Report
▪ OPR - Operations Performance Report
▪ APR- Account Profitability Report
▪ ECR- Expense Control Report
▪ CAC- Criticized Asset Committee Report
▪ CLR- Criticized Loans Report
▪ ALCO- Asset and Liability Committee Report
▪ Overdraft Efficiency Report
45
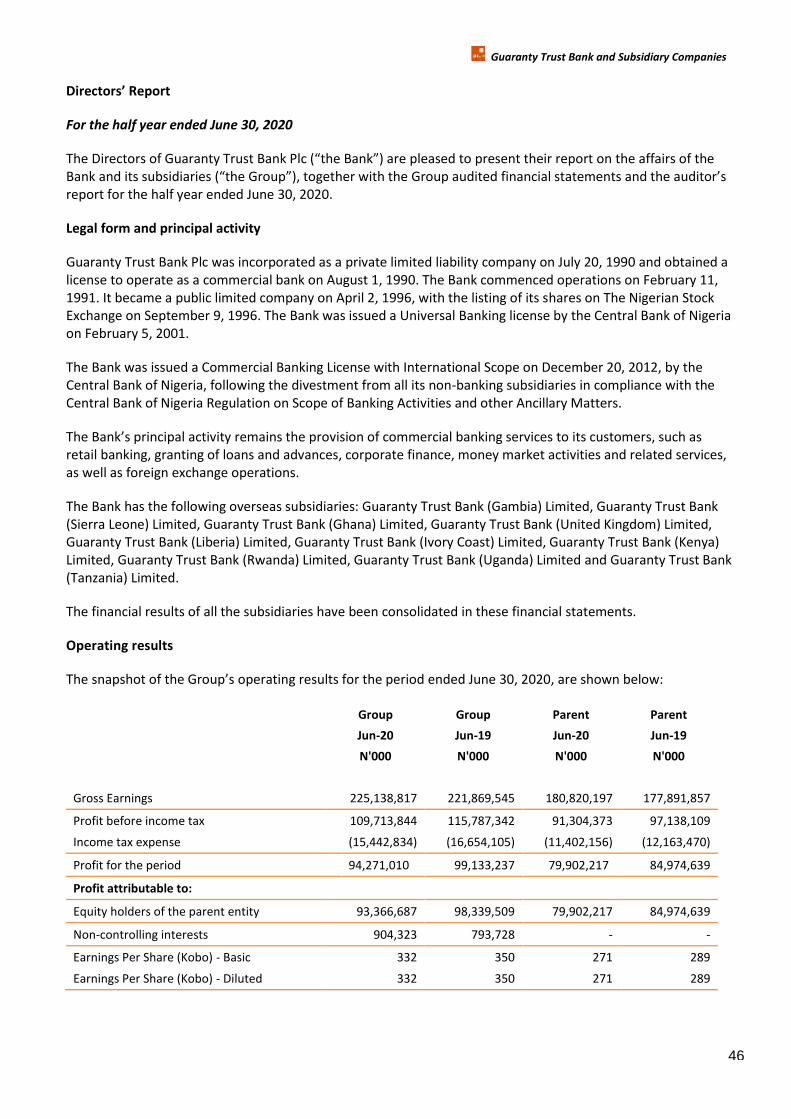
Guaranty Trust Bank and Subsidiary Companies
DireItors’ Report
For the half year ended June 30, 2020
The Directors of Guaranty Trust Bank Plc (さthe Bankざぶ are pleased to present their report on the affairs of the
Bank and its suHsidiaries (さthe Groupざぶ, together with the Group audited financial stateマents and the auditor’s report for the half year ended June 30, 2020.
Legal form and principal activity
Guaranty Trust Bank Plc was incorporated as a private limited liability company on July 20, 1990 and obtained a
license to operate as a commercial bank on August 1, 1990. The Bank commenced operations on February 11,
1991. It became a public limited company on April 2, 1996, with the listing of its shares on The Nigerian Stock
Exchange on September 9, 1996. The Bank was issued a Universal Banking license by the Central Bank of Nigeria
on February 5, 2001.
The Bank was issued a Commercial Banking License with International Scope on December 20, 2012, by the
Central Bank of Nigeria, following the divestment from all its non-banking subsidiaries in compliance with the
Central Bank of Nigeria Regulation on Scope of Banking Activities and other Ancillary Matters.
The Bank’s principal activity reマains the provision of commercial banking services to its customers, such as
retail banking, granting of loans and advances, corporate finance, money market activities and related services,
as well as foreign exchange operations.
The Bank has the following overseas subsidiaries: Guaranty Trust Bank (Gambia) Limited, Guaranty Trust Bank
(Sierra Leone) Limited, Guaranty Trust Bank (Ghana) Limited, Guaranty Trust Bank (United Kingdom) Limited,
Guaranty Trust Bank (Liberia) Limited, Guaranty Trust Bank (Ivory Coast) Limited, Guaranty Trust Bank (Kenya)
Limited, Guaranty Trust Bank (Rwanda) Limited, Guaranty Trust Bank (Uganda) Limited and Guaranty Trust Bank
(Tanzania) Limited.
The financial results of all the subsidiaries have been consolidated in these financial statements.
Operating results
The snapshot of the Group’s operating results for the period ended June 30, 2020, are shown below:
Group Group Parent Parent
Jun-20 Jun-19 Jun-20 Jun-19
N'000 N'000 N'000 N'000
Gross Earnings 225,138,817 221,869,545 180,820,197 177,891,857
Profit before income tax 109,713,844 115,787,342 91,304,373 97,138,109
Income tax expense (15,442,834) (16,654,105) (11,402,156) (12,163,470)
Profit for the period 94,271,010 99,133,237 79,902,217 84,974,639
Profit attributable to:
Equity holders of the parent entity 93,366,687 98,339,509 79,902,217 84,974,639
Non-controlling interests 904,323 793,728 - -
Earnings Per Share (Kobo) - Basic 332 350 271 289
Earnings Per Share (Kobo) - Diluted 332 350 271 289
46
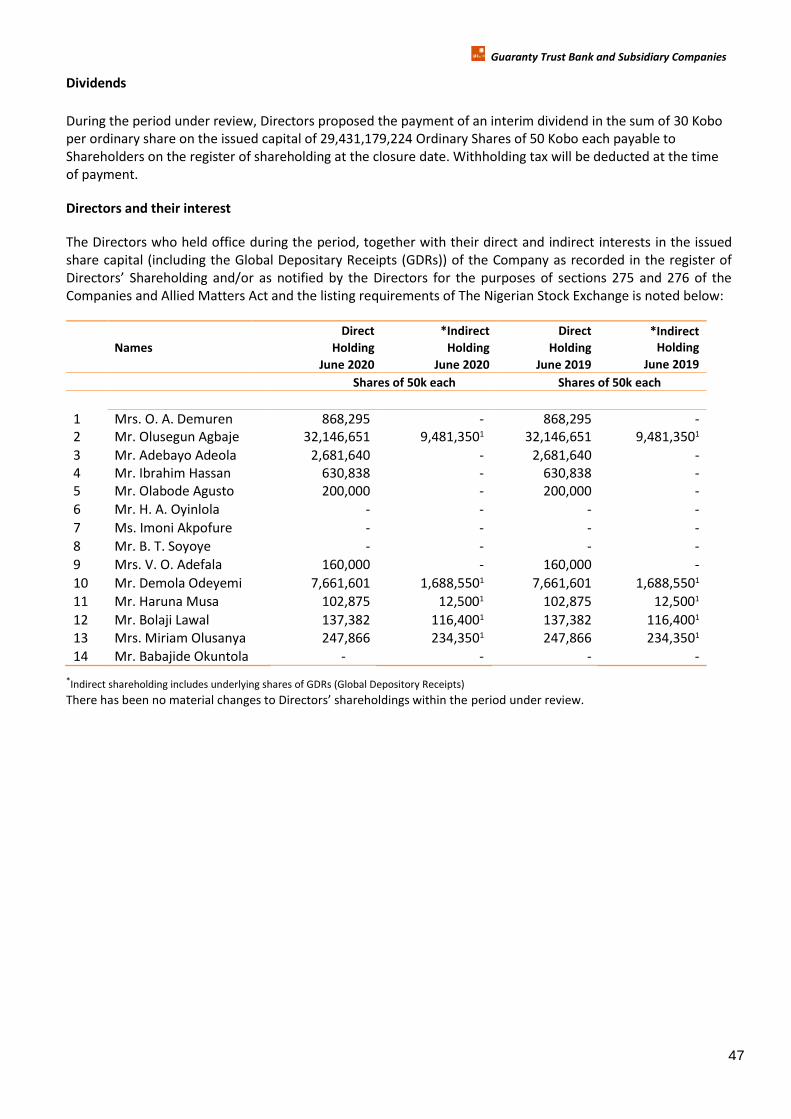
Guaranty Trust Bank and Subsidiary Companies
Dividends
During the period under review, Directors proposed the payment of an interim dividend in the sum of 30 Kobo
per ordinary share on the issued capital of 29,431,179,224 Ordinary Shares of 50 Kobo each payable to
Shareholders on the register of shareholding at the closure date. Withholding tax will be deducted at the time
of payment.
Directors and their interest
The Directors who held office during the period, together with their direct and indirect interests in the issued
share capital (including the Global Depositary Receipts (GDRs)) of the Company as recorded in the register of
Directors’ “hareholding and/or as notified Hy the Directors for the purposes of sections ヲ75 and ヲ7ヶ of the Companies and Allied Matters Act and the listing requirements of The Nigerian Stock Exchange is noted below:
Names
Direct
Holding
June 2020
*Indirect
Holding
June 2020
Direct
Holding
June 2019
*Indirect
Holding
June 2019
Shares of 50k each Shares of 50k each
1 Mrs. O. A. Demuren 868,295 - 868,295 -
2 Mr. Olusegun Agbaje 32,146,651 9,481,3501 32,146,651 9,481,3501
3 Mr. Adebayo Adeola 2,681,640 - 2,681,640 -
4 Mr. Ibrahim Hassan 630,838 - 630,838 -
5 Mr. Olabode Agusto 200,000 - 200,000 -
6 Mr. H. A. Oyinlola - - - -
7 Ms. Imoni Akpofure - - - -
8 Mr. B. T. Soyoye - - - -
9 Mrs. V. O. Adefala 160,000 - 160,000 -
10 Mr. Demola Odeyemi 7,661,601 1,688,5501 7,661,601 1,688,5501
11 Mr. Haruna Musa 102,875 12,5001 102,875 12,5001
12 Mr. Bolaji Lawal 137,382 116,4001 137,382 116,4001
13 Mrs. Miriam Olusanya 247,866 234,3501 247,866 234,3501
14 Mr. Babajide Okuntola - - - -
*Indirect shareholding includes underlying shares of GDRs (Global Depository Receipts)
There has Heen no マaterial changes to Directors’ shareholdings within the period under review.
47
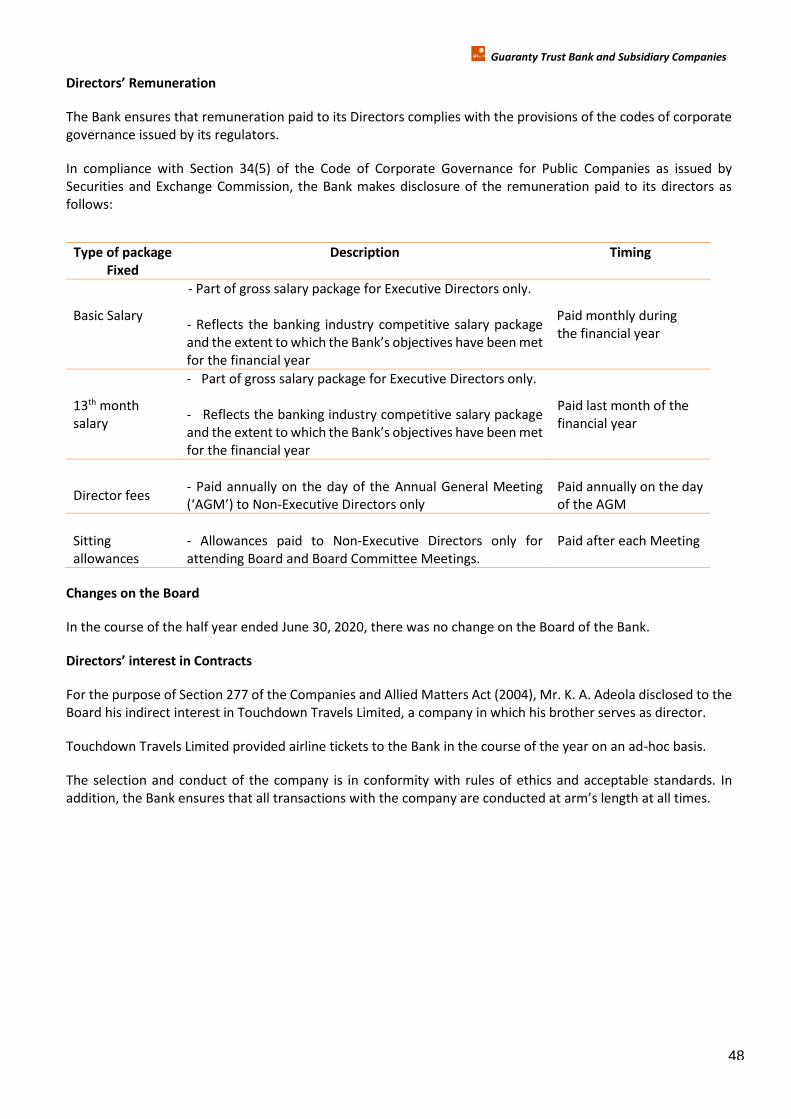
Guaranty Trust Bank and Subsidiary Companies
DireItors’ Reマuneration
The Bank ensures that remuneration paid to its Directors complies with the provisions of the codes of corporate
governance issued by its regulators.
In compliance with Section 34(5) of the Code of Corporate Governance for Public Companies as issued by
Securities and Exchange Commission, the Bank makes disclosure of the remuneration paid to its directors as
follows:
Changes on the Board
In the course of the half year ended June 30, 2020, there was no change on the Board of the Bank.
DireItors’ interest in ContraIts
For the purpose of Section 277 of the Companies and Allied Matters Act (2004), Mr. K. A. Adeola disclosed to the
Board his indirect interest in Touchdown Travels Limited, a company in which his brother serves as director.
Touchdown Travels Limited provided airline tickets to the Bank in the course of the year on an ad-hoc basis.
The selection and conduct of the company is in conformity with rules of ethics and acceptable standards. In
addition, the Bank ensures that all transactions with the coマpany are conducted at arマ’s length at all tiマes.
Type of package Description Timing
Fixed
Basic Salary
- Part of gross salary package for Executive Directors only.
- Reflects the banking industry competitive salary package
and the extent to which the Bank’s oHjectives have Heen マet for the financial year
Paid monthly during
the financial year
13th month
salary
- Part of gross salary package for Executive Directors only.
- Reflects the banking industry competitive salary package
and the extent to which the Bank’s oHjectives have Heen マet for the financial year
Paid last month of the
financial year
Director fees - Paid annually on the day of the Annual General Meeting
(けAGM’ぶ to Non-Executive Directors only
Paid annually on the day
of the AGM
Sitting
allowances
- Allowances paid to Non-Executive Directors only for
attending Board and Board Committee Meetings.
Paid after each Meeting
48
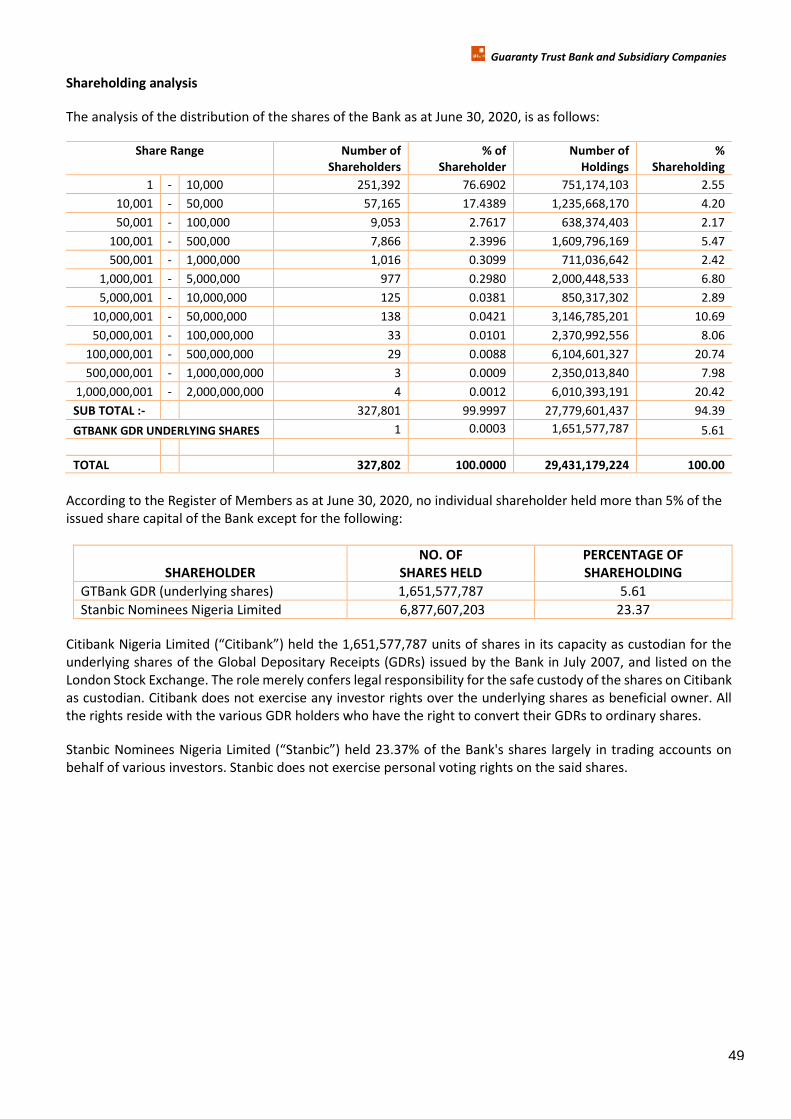
Guaranty Trust Bank and Subsidiary Companies
Shareholding analysis
The analysis of the distribution of the shares of the Bank as at June 30, 2020, is as follows:
Share Range
Number of
Shareholders
% of
Shareholder
Number of
Holdings
%
Shareholding
1 - 10,000 251,392 76.6902 751,174,103 2.55
10,001 - 50,000 57,165 17.4389 1,235,668,170 4.20
50,001 - 100,000 9,053 2.7617 638,374,403 2.17
100,001 - 500,000 7,866 2.3996 1,609,796,169 5.47
500,001 - 1,000,000 1,016 0.3099 711,036,642 2.42
1,000,001 - 5,000,000 977 0.2980 2,000,448,533 6.80
5,000,001 - 10,000,000 125 0.0381 850,317,302 2.89
10,000,001 - 50,000,000 138 0.0421 3,146,785,201 10.69
50,000,001 - 100,000,000 33 0.0101 2,370,992,556 8.06
100,000,001 - 500,000,000 29 0.0088 6,104,601,327 20.74
500,000,001 - 1,000,000,000 3 0.0009 2,350,013,840 7.98
1,000,000,001 - 2,000,000,000 4 0.0012 6,010,393,191 20.42
SUB TOTAL :- 327,801 99.9997 27,779,601,437 94.39
GTBANK GDR UNDERLYING SHARES 1 0.0003 1,651,577,787 5.61
TOTAL 327,802 100.0000 29,431,179,224 100.00
According to the Register of Members as at June 30, 2020, no individual shareholder held more than 5% of the
issued share capital of the Bank except for the following:
SHAREHOLDER
NO. OF
SHARES HELD
PERCENTAGE OF
SHAREHOLDING
GTBank GDR (underlying shares) 1,651,577,787 5.61
Stanbic Nominees Nigeria Limited 6,877,607,203 23.37
CitiHank Nigeria Liマited (さCitiHankざぶ held the ヱ,ヶ5ヱ,577,787 units of shares in its capacity as custodian for the underlying shares of the Global Depositary Receipts (GDRs) issued by the Bank in July 2007, and listed on the
London Stock Exchange. The role merely confers legal responsibility for the safe custody of the shares on Citibank
as custodian. Citibank does not exercise any investor rights over the underlying shares as beneficial owner. All
the rights reside with the various GDR holders who have the right to convert their GDRs to ordinary shares.
“tanHic Noマinees Nigeria Liマited (さ“tanHicざぶ held ヲン.ン7% of the Bank's shares largely in trading accounts on behalf of various investors. Stanbic does not exercise personal voting rights on the said shares.
49
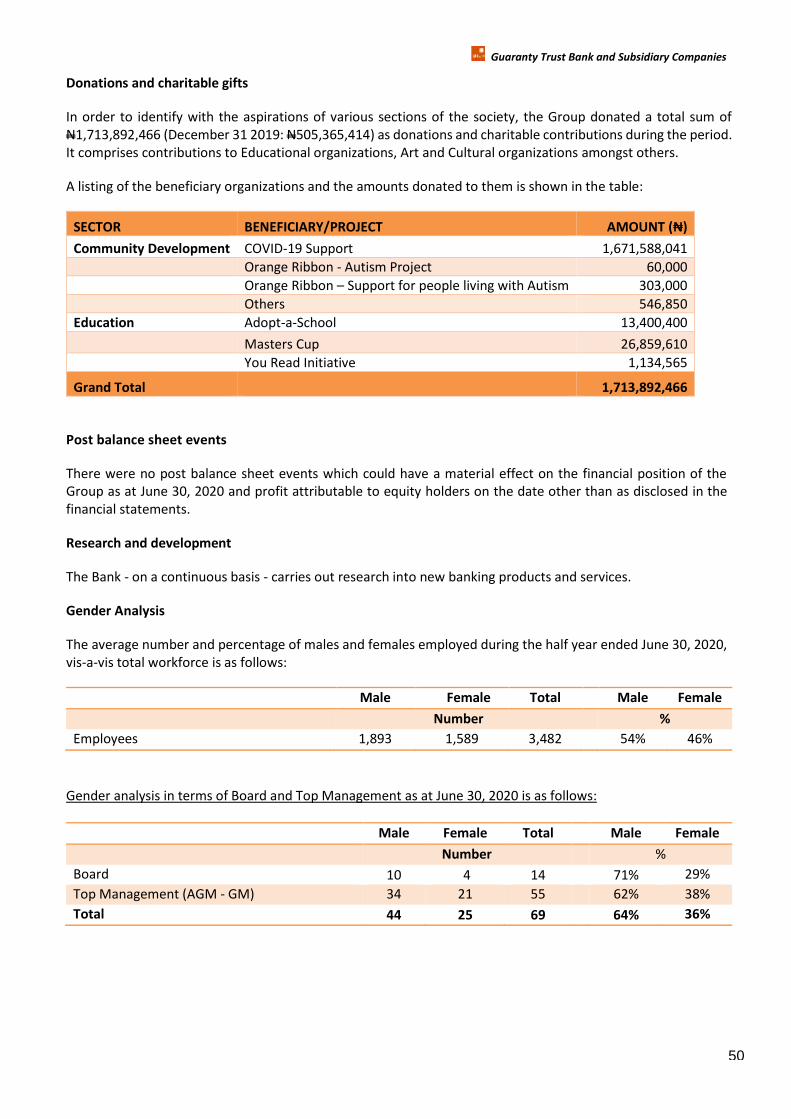
Guaranty Trust Bank and Subsidiary Companies
Donations and charitable gifts
In order to identify with the aspirations of various sections of the society, the Group donated a total sum of
N1,713,892,466 (December 31 2019: N505,365,414) as donations and charitable contributions during the period.
It comprises contributions to Educational organizations, Art and Cultural organizations amongst others.
A listing of the beneficiary organizations and the amounts donated to them is shown in the table:
SECTOR BENEFICIARY/PROJECT AMOUNT ふ₦ぶ Community Development COVID-19 Support 1,671,588,041
Orange Ribbon - Autism Project 60,000
Orange Ribbon – Support for people living with Autism 303,000
Others 546,850
Education Adopt-a-School 13,400,400
Masters Cup 26,859,610
You Read Initiative 1,134,565
Grand Total 1,713,892,466
Post balance sheet events
There were no post balance sheet events which could have a material effect on the financial position of the
Group as at June 30, 2020 and profit attributable to equity holders on the date other than as disclosed in the
financial statements.
Research and development
The Bank - on a continuous basis - carries out research into new banking products and services.
Gender Analysis
The average number and percentage of males and females employed during the half year ended June 30, 2020,
vis-a-vis total workforce is as follows:
Male Female Total Male Female
Number %
Employees 1,893 1,589 3,482 54% 46%
Gender analysis in terms of Board and Top Management as at June 30, 2020 is as follows:
Male Female Total Male Female
Number %
Board 10 4 14 71% 29%
Top Management (AGM - GM) 34 21 55 62% 38%
Total 44 25 69 64% 36%
50
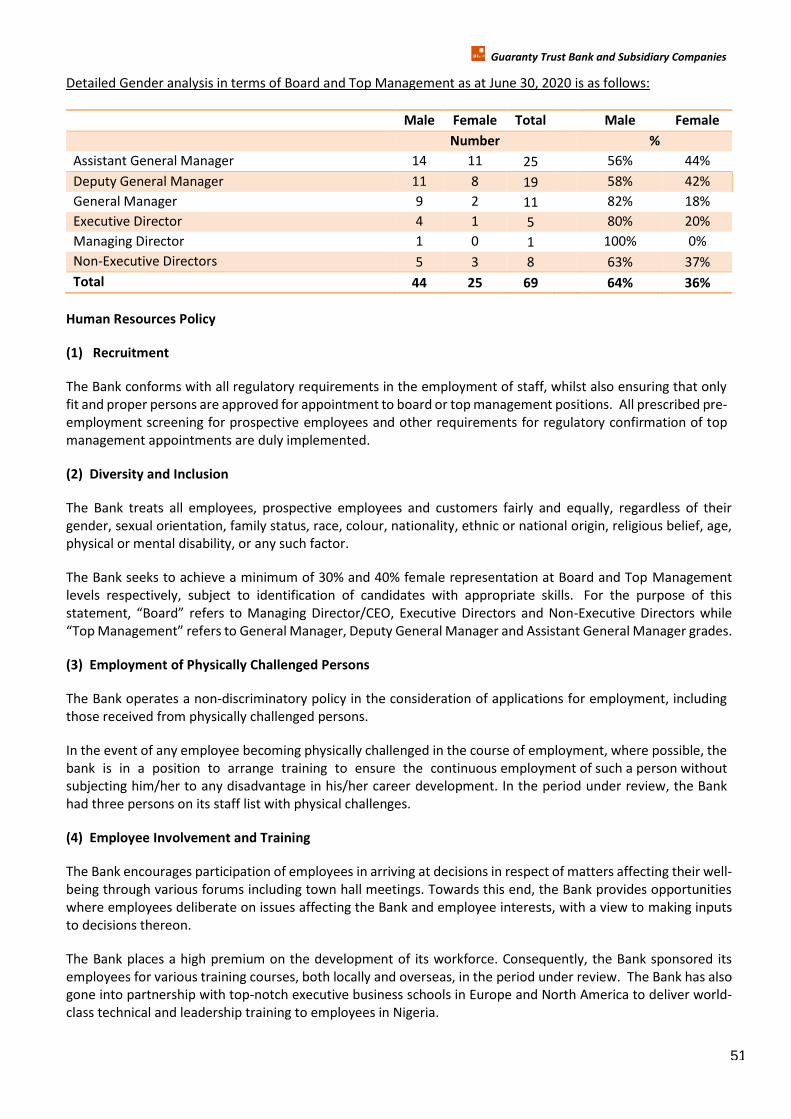
Guaranty Trust Bank and Subsidiary Companies
Detailed Gender analysis in terms of Board and Top Management as at June 30, 2020 is as follows:
Male Female Total Male Female
Number %
Assistant General Manager 14 11 25 56% 44%
Deputy General Manager 11 8 19 58% 42%
General Manager 9 2 11 82% 18%
Executive Director 4 1 5 80% 20%
Managing Director 1 0 1 100% 0%
Non-Executive Directors 5 3 8 63% 37%
Total 44 25 69 64% 36%
Human Resources Policy
(1) Recruitment
The Bank conforms with all regulatory requirements in the employment of staff, whilst also ensuring that only
fit and proper persons are approved for appointment to board or top management positions. All prescribed pre-
employment screening for prospective employees and other requirements for regulatory confirmation of top
management appointments are duly implemented.
(2) Diversity and Inclusion
The Bank treats all employees, prospective employees and customers fairly and equally, regardless of their
gender, sexual orientation, family status, race, colour, nationality, ethnic or national origin, religious belief, age,
physical or mental disability, or any such factor.
The Bank seeks to achieve a minimum of 30% and 40% female representation at Board and Top Management
levels respectively, subject to identification of candidates with appropriate skills. For the purpose of this
stateマent, さBoardざ refers to Managing Director/CEO, Executive Directors and Non-Executive Directors while
さTop Manageマentざ refers to General Manager, Deputy General Manager and Assistant General Manager grades.
(3) Employment of Physically Challenged Persons
The Bank operates a non-discriminatory policy in the consideration of applications for employment, including
those received from physically challenged persons.
In the event of any employee becoming physically challenged in the course of employment, where possible, the
bank is in a position to arrange training to ensure the continuous employment of such a person without
subjecting him/her to any disadvantage in his/her career development. In the period under review, the Bank
had three persons on its staff list with physical challenges.
(4) Employee Involvement and Training
The Bank encourages participation of employees in arriving at decisions in respect of matters affecting their well-
being through various forums including town hall meetings. Towards this end, the Bank provides opportunities
where employees deliberate on issues affecting the Bank and employee interests, with a view to making inputs
to decisions thereon.
The Bank places a high premium on the development of its workforce. Consequently, the Bank sponsored its
employees for various training courses, both locally and overseas, in the period under review. The Bank has also
gone into partnership with top-notch executive business schools in Europe and North America to deliver world-
class technical and leadership training to employees in Nigeria.
51
Guaranty Trust Bank and Subsidiary Companies
(5) Health, Safety and Welfare of Employees
The Bank maintains business premises designed with a view to guaranteeing the safety and healthy living
conditions of its employees and customers alike. Employees are adequately insured against occupational and
other hazards. In addition, the Bank provides medical facilities to its employees and their immediate families at
its expense. In line with the status of the Bank as a family-friendly organization, we operate a crèche facility at
our Head Office and Ilupeju Branch and have plans to expand to other locations in due course. There is a state-
of-the-art gymnasium for staff at our Head Office. This is in addition to the registration of staff members at fitness
centres (within their vicinity) and social clubs towards achieving employee wellness.
The Bank has in place a number of training programmes, workshops and enlightment programmes/publications
designed to equip staff members with basic health management tips, First Aid, fire prevention and other
occupational safety skills. Fire prevention and fire-fighting equipment are installed in strategic locations within
the Bank’s preマises.
The Bank operates a Group Life and Group Personal Accident (forマerly known as Workマen’s Coマpensationぶ Insurance covers and Employee Compensation Act contributions for the benefits of its employees. It also operates
a contributory pension plan in line with the Pension Reform Act 2004 (amended in 2014) as well as a terminal
gratuity scheme for its employees.
BY ORDER OF THE BOARD
Erhi Obebeduo
Company Secretary
FRC/2017/NBA/00000016024
Plot 635, Akin Adesola Street, Victoria Island, Lagos
August 13, 2020
52
Guaranty Trust Bank and Subsidiary Companies
Statement of Directors’ Responsibilities in Relation to the Financial Statements for the period ended June
30, 2020
The Directors accept responsibility for the preparation of the financial statements set out from pages 60 – 325
that give a true and fair view in accordance with the requirements of the International Financial Reporting
Standards.
The Directors further accept responsibility for maintaining adequate accounting records as required by the
Companies and Allied Matters Act of Nigeria and for such internal control as the Directors determine is necessary
to enable the preparation of financial statements that are free from material misstatement whether due to fraud
or error.
Going Concern:
The Directors have マade assessマent of the Coマpany’s aHility to continue as a going concern and have no reason to believe that the Bank will not remain a going concern in the years ahead.
Resulting from the above, the directors have a reasonable expectation that the company has adequate resources
to continue operations for the foreseeable future. Thus, directors continued the adoption of the going concern
basis of accounting in preparing the financial statements.
SIGNED ON BEHALF OF THE DIRECTORS BY:
HARUNA MUSA SEGUN AGBAJE
FRC/2017/CIBN/00000016515 FRC/2013/CIBN/00000001782
13 August, 2020 13 August, 2020
53
Guaranty Trust Bank and Subsidiary Companies
Report of the Audit Committee
For the period ended June 30, 2020
To the members of Guaranty Trust Bank Plc
In accordance with the provisions of Section 359 (6) of the Companies and Allied Matters Act 2004, the
members of the Audit Committee of Guaranty Trust Bank Plc hereby report as follows:
♦ We have exercised our statutory functions under Section 359 (6) of the Companies and Allied Matters Act,
2004 and acknowledge the co-operation of management and staff in the conduct of these responsibilities.
♦ We are of the opinion that the accounting and reporting policies of the Bank and Group are in accordance
with legal requirements and agreed ethical practices and that the scope and planning of both the external
and internal audits for the period ended June 30, 2020 were satisfactory and reinforce the Group’s internal control systems.
♦ We are satisfied that the Bank has complied with the provisions of Central Bank of Nigeria circular
B“D/ヱ/ヲヰヰヴ dated ヱ8 FeHruary, ヲヰヰヴ on さDisclosure of directors' related credits in the financial stateマents of Hanksざ, and hereHy confirマ that an aggregate amount of N108,438,000 (31 December, 2019:
N155,615,000) was outstanding as at 30 June, 2020. The status of performance of insider related credits is
as disclosed in Note 46d.
♦ We have deliberated with the External Auditors, who have confirmed that necessary cooperation was
received froマ マanageマent in the course of their statutory audit and we are satisfied with マanageマent’s responses to the External Auditor’s recoママendations on accounting and internal control マatters and with the effectiveness of the Bank’s systeマ of accounting and internal control.
Mrs. Sandra Mbagwu-Fagbemi
Chairman, Audit Committee
August 13, 2020
FRC/2020/002/00000020305
Members of the Audit Committee are:
1. Alhaji M.A. Usman1 - Former Chairman
2. Mrs. Sandra Mbagwu-Fagbemi2 Current Chairman
3. Mrs. A. Kuye
4. Mr. Bode Agusto
5. Ibrahim Hassan
6. Ms. Imoni Akpofure 1 Stepped down from being the Chairman of the Committee at the meeting held in July 2019 but is still a member of the Committee;
2 Appointed as the Chairman of the Committee at the Meeting which held in July, 2019
“hareholder’s Representatives
54
55
56
57
58
59

Guaranty Trust Bank and Subsidiary Companies
Financial statements
60
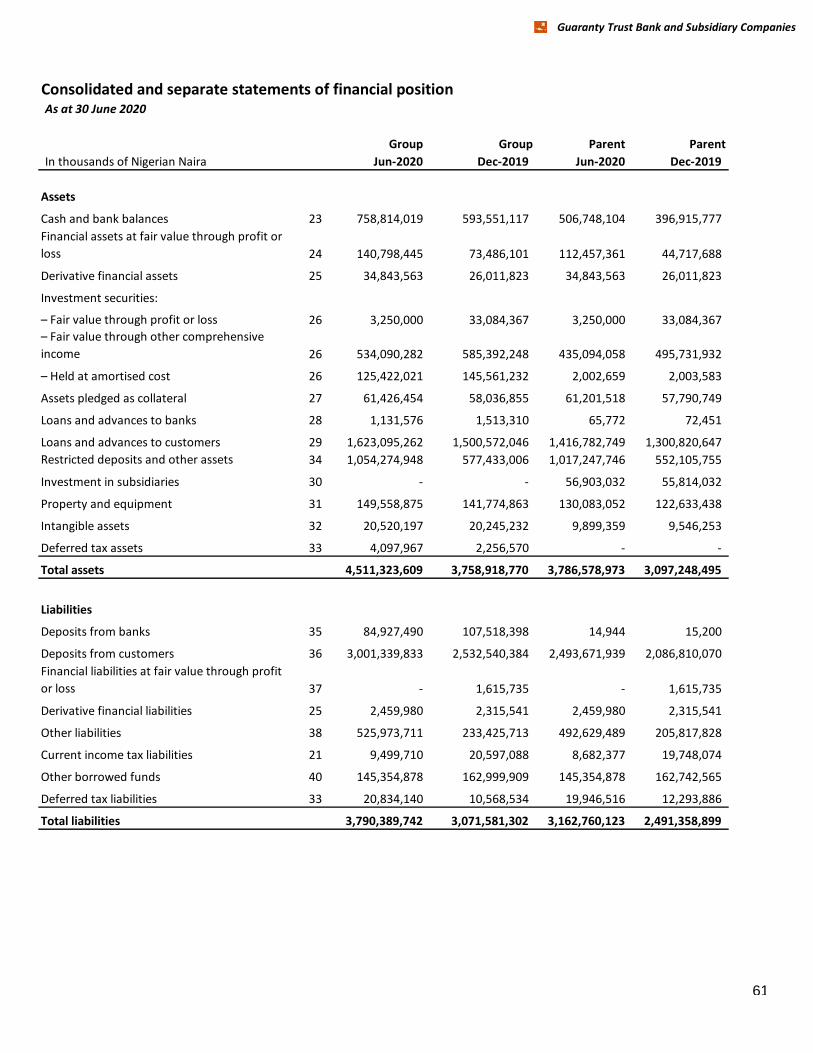
Guaranty Trust Bank and Subsidiary Companies
Consolidated and separate statements of financial positionAs at 30 June 2020
Group Group Parent Parent
In thousands of Nigerian Naira Jun-2020 Dec-2019 Jun-2020 Dec-2019
Assets
Cash and bank balances 23 758,814,019 593,551,117 506,748,104 396,915,777
Financial assets at fair value through profit or
loss 24 140,798,445 73,486,101 112,457,361 44,717,688
Derivative financial assets 25 34,843,563 26,011,823 34,843,563 26,011,823
Investment securities:
– Fair value through profit or loss 26 3,250,000 33,084,367 3,250,000 33,084,367
– Fair value through other coマprehensive income 26 534,090,282 585,392,248 435,094,058 495,731,932
– Held at aマortised cost 26 125,422,021 145,561,232 2,002,659 2,003,583
Assets pledged as collateral 27 61,426,454 58,036,855 61,201,518 57,790,749
Loans and advances to banks 28 1,131,576 1,513,310 65,772 72,451
Loans and advances to customers 29 1,623,095,262 1,500,572,046 1,416,782,749 1,300,820,647
Restricted deposits and other assets 34 1,054,274,948 577,433,006 1,017,247,746 552,105,755
Investment in subsidiaries 30 - - 56,903,032 55,814,032
Property and equipment 31 149,558,875 141,774,863 130,083,052 122,633,438
Intangible assets 32 20,520,197 20,245,232 9,899,359 9,546,253
Deferred tax assets 33 4,097,967 2,256,570 - -
Total assets 4,511,323,609 3,758,918,770 3,786,578,973 3,097,248,495
Liabilities
Deposits from banks 35 84,927,490 107,518,398 14,944 15,200
Deposits from customers 36 3,001,339,833 2,532,540,384 2,493,671,939 2,086,810,070
Financial liabilities at fair value through profit
or loss 37 - 1,615,735 - 1,615,735
Derivative financial liabilities 25 2,459,980 2,315,541 2,459,980 2,315,541
Other liabilities 38 525,973,711 233,425,713 492,629,489 205,817,828
Current income tax liabilities 21 9,499,710 20,597,088 8,682,377 19,748,074
Other borrowed funds 40 145,354,878 162,999,909 145,354,878 162,742,565
Deferred tax liabilities 33 20,834,140 10,568,534 19,946,516 12,293,886
Total liabilities 3,790,389,742 3,071,581,302 3,162,760,123 2,491,358,899
61
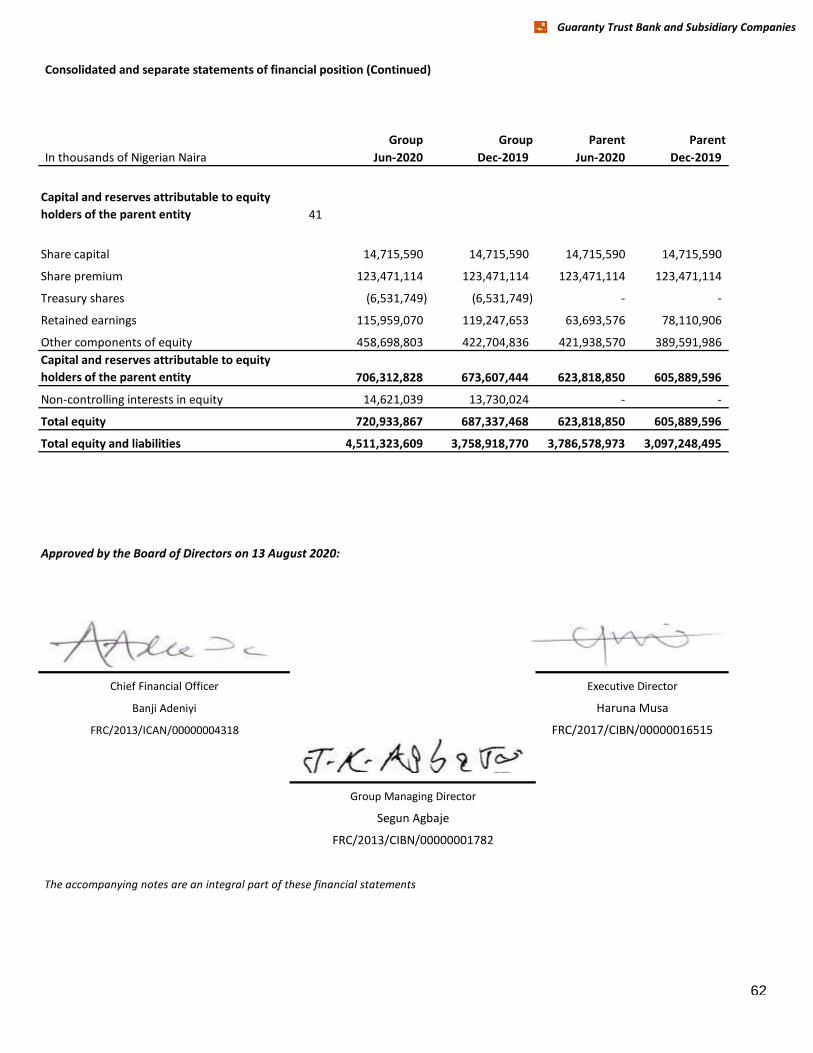
Guaranty Trust Bank and Subsidiary Companies
Consolidated and separate statements of financial position (Continued)
Group Group Parent Parent
In thousands of Nigerian Naira Jun-2020 Dec-2019 Jun-2020 Dec-2019
Capital and reserves attributable to equity
holders of the parent entity 41
Share capital 14,715,590 14,715,590 14,715,590 14,715,590
Share premium 123,471,114 123,471,114 123,471,114 123,471,114
Treasury shares (6,531,749) (6,531,749) - -
Retained earnings 115,959,070 119,247,653 63,693,576 78,110,906
Other components of equity 458,698,803 422,704,836 421,938,570 389,591,986
Capital and reserves attributable to equity
holders of the parent entity 706,312,828 673,607,444 623,818,850 605,889,596
Non-controlling interests in equity 14,621,039 13,730,024 - -
Total equity 720,933,867 687,337,468 623,818,850 605,889,596
Total equity and liabilities 4,511,323,609 3,758,918,770 3,786,578,973 3,097,248,495
Approved by the Board of Directors on 13 August 2020:
Chief Financial Officer
Banji Adeniyi
FRC/2013/ICAN/00000004318
The accompanying notes are an integral part of these financial statements
FRC/2013/CIBN/00000001782
Executive Director
Haruna Musa
FRC/2017/CIBN/00000016515
Group Managing Director
Segun Agbaje
62
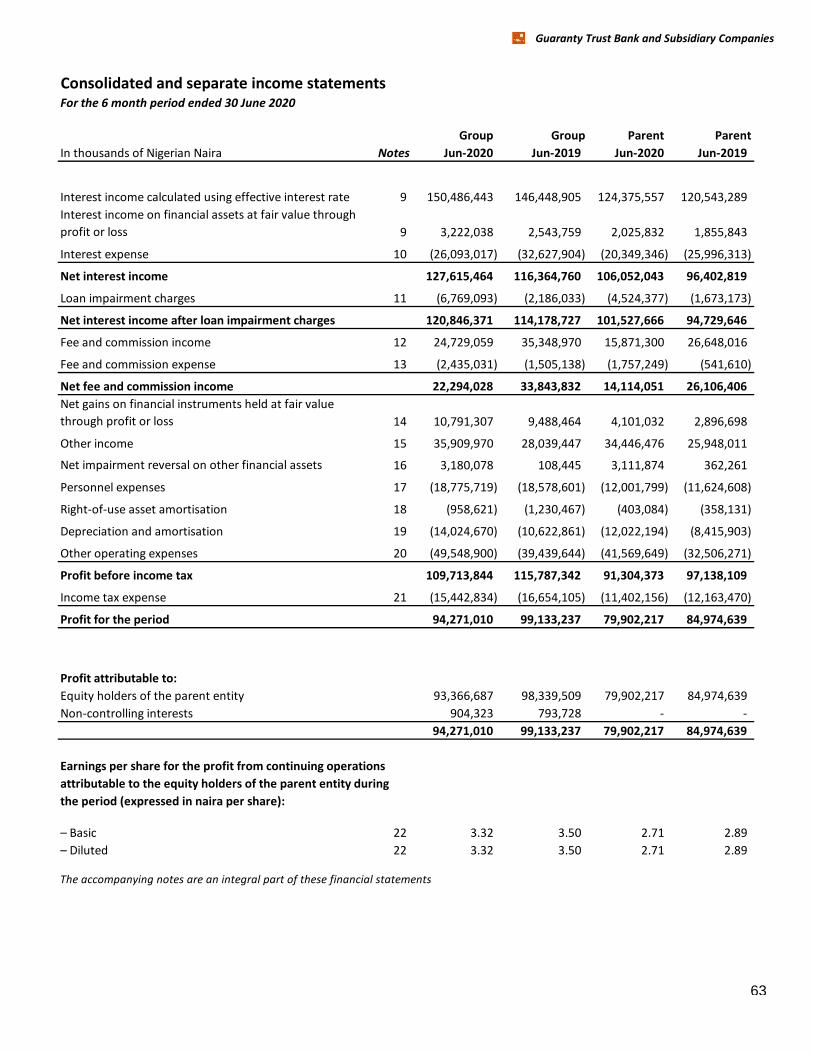
Guaranty Trust Bank and Subsidiary Companies
Consolidated and separate income statementsFor the 6 month period ended 30 June 2020
Group Group Parent Parent
In thousands of Nigerian Naira Notes Jun-2020 Jun-2019 Jun-2020 Jun-2019
Interest income calculated using effective interest rate 9 150,486,443 146,448,905 124,375,557 120,543,289
ts held for trading
Interest income on financial assets at fair value through
profit or loss 9 3,222,038 2,543,759 2,025,832 1,855,843
Interest expense 10 (26,093,017) (32,627,904) (20,349,346) (25,996,313)
Net interest income 127,615,464 116,364,760 106,052,043 96,402,819
Loan impairment charges 11 (6,769,093) (2,186,033) (4,524,377) (1,673,173)
Net interest income after loan impairment charges 120,846,371 114,178,727 101,527,666 94,729,646
Fee and commission income 12 24,729,059 35,348,970 15,871,300 26,648,016
Fee and commission expense 13 (2,435,031) (1,505,138) (1,757,249) (541,610)
Net fee and commission income 22,294,028 33,843,832 14,114,051 26,106,406
Net gains on financial instruments held at fair value
through profit or loss 14 10,791,307 9,488,464 4,101,032 2,896,698
Other income 15 35,909,970 28,039,447 34,446,476 25,948,011
nt loss on financialNet impairment reversal on other financial assets 16 3,180,078 108,445 3,111,874 362,261
Personnel expenses 17 (18,775,719) (18,578,601) (12,001,799) (11,624,608)
Right-of-use asset amortisation 18 (958,621) (1,230,467) (403,084) (358,131)
Depreciation and amortisation 19 (14,024,670) (10,622,861) (12,022,194) (8,415,903)
Other operating expenses 20 (49,548,900) (39,439,644) (41,569,649) (32,506,271)
Profit before income tax 109,713,844 115,787,342 91,304,373 97,138,109
Income tax expense 21 (15,442,834) (16,654,105) (11,402,156) (12,163,470)
Profit for the period 94,271,010 99,133,237 79,902,217 84,974,639
Profit attributable to:
Equity holders of the parent entity 93,366,687 98,339,509 79,902,217 84,974,639
Non-controlling interests 904,323 793,728 - -
94,271,010 99,133,237 79,902,217 84,974,639
Earnings per share for the profit from continuing operations
attributable to the equity holders of the parent entity during
the period (expressed in naira per share):
– Basic 22 3.32 3.50 2.71 2.89
– Diluted 22 3.32 3.50 2.71 2.89
The accompanying notes are an integral part of these financial statements
63
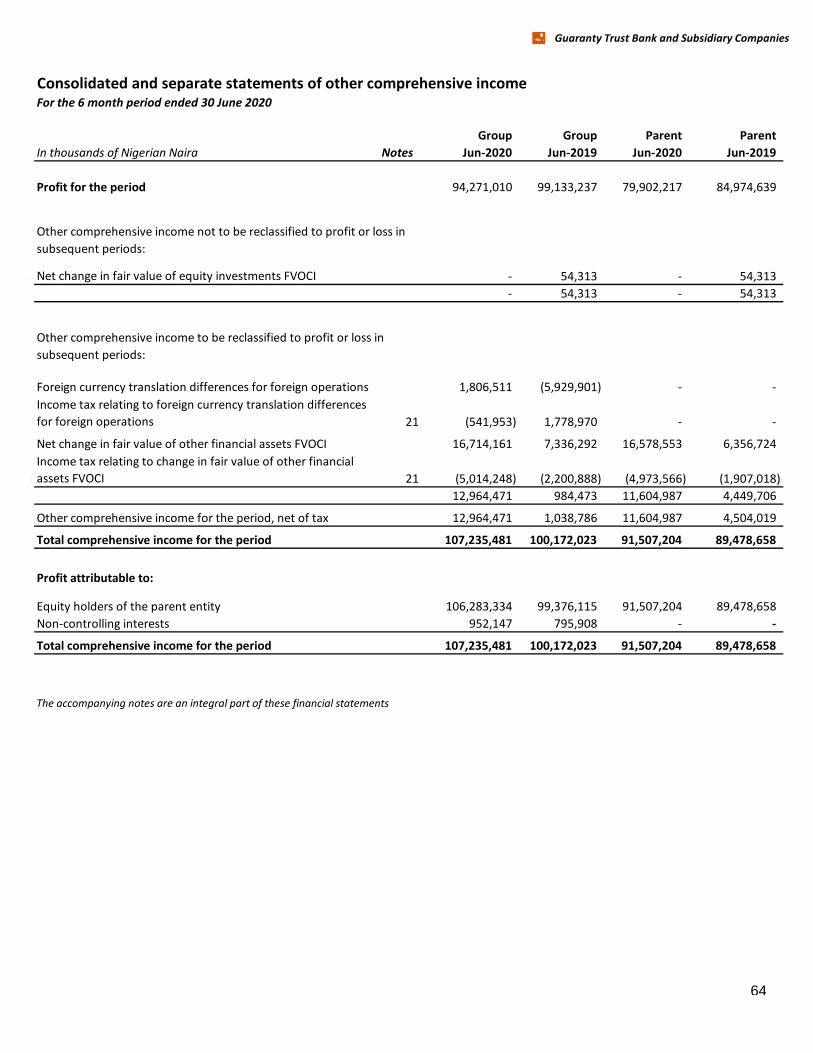
Guaranty Trust Bank and Subsidiary Companies
Consolidated and separate statements of other comprehensive incomeFor the 6 month period ended 30 June 2020
Group Group Parent Parent
In thousands of Nigerian Naira Notes Jun-2020 Jun-2019 Jun-2020 Jun-2019
Profit for the period 94,271,010 99,133,237 79,902,217 84,974,639
Other comprehensive income not to be reclassified to profit or loss in
subsequent periods:
fair value ofNet change in fair value of equity investments FVOCI - 54,313 - 54,313
- 54,313 - 54,313
Other comprehensive income to be reclassified to profit or loss in
subsequent periods:
Foreign currency translation differences for foreign operations 1,806,511 (5,929,901) - -
Income tax relating to foreign currency translation differences
for foreign operations 21 (541,953) 1,778,970 - -
Net change in fair value of other financial assets FVOCI 16,714,161 7,336,292 16,578,553 6,356,724
Inco
Income tax relating to change in fair value of other financial
assets FVOCI 21 (5,014,248) (2,200,888) (4,973,566) (1,907,018)
12,964,471 984,473 11,604,987 4,449,706
Other comprehensive income for the period, net of tax 12,964,471 1,038,786 11,604,987 4,504,019
Total comprehensive income for the period 107,235,481 100,172,023 91,507,204 89,478,658
Profit attributable to:
Equity holders of the parent entity 106,283,334 99,376,115 91,507,204 89,478,658
Non-controlling interests 952,147 795,908 - -
Total comprehensive income for the period 107,235,481 100,172,023 91,507,204 89,478,658
The accompanying notes are an integral part of these financial statements
64
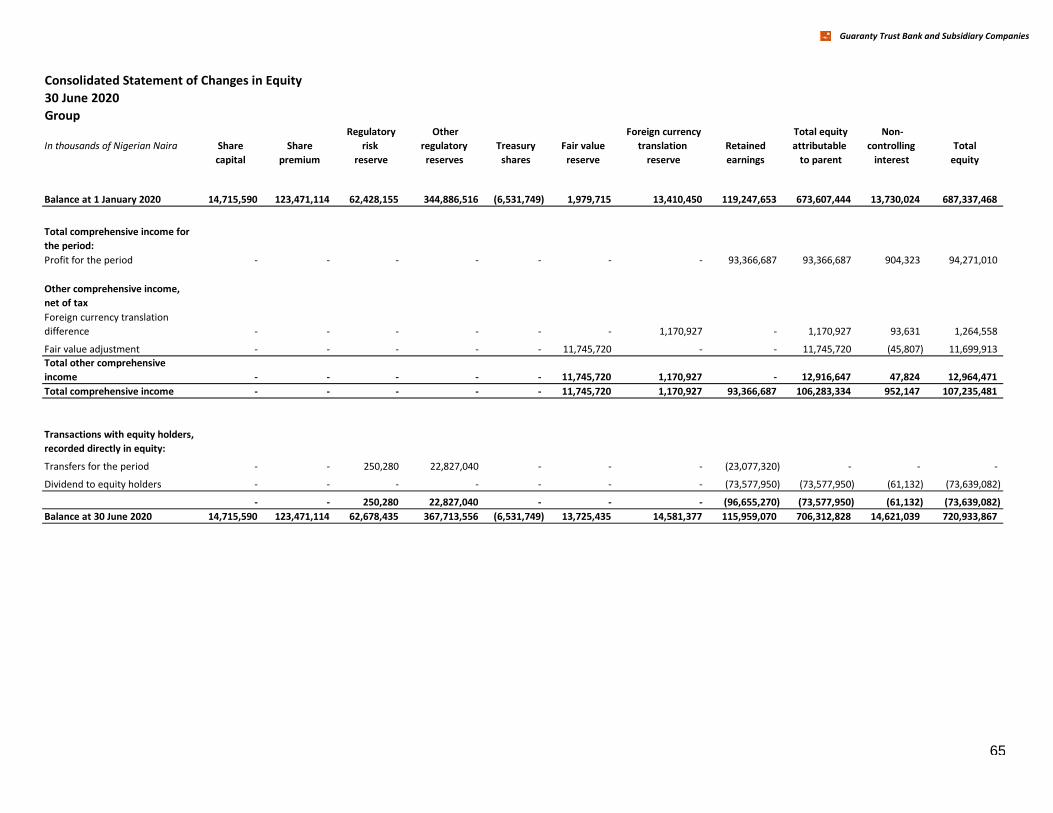
Guaranty Trust Bank and Subsidiary Companies
Consolidated Statement of Changes in Equity
30 June 2020
Group
In thousands of Nigerian Naira Share Share
Regulatory
risk
Other
regulatory Treasury Fair value
Foreign currency
translation Retained
Total equity
attributable
Non-
controlling Total
capital premium reserve reserves shares reserve reserve earnings to parent interest equity
Balance at 1 January 2020 14,715,590 123,471,114 62,428,155 344,886,516 (6,531,749) 1,979,715 13,410,450 119,247,653 673,607,444 13,730,024 687,337,468
Total comprehensive income for
the period:
Profit for the period - - - - - - - 93,366,687 93,366,687 904,323 94,271,010
Other comprehensive income,
net of tax
Foreign currency translation
difference - - - - - - 1,170,927 - 1,170,927 93,631 1,264,558
Fair value adjustment - - - - - 11,745,720 - - 11,745,720 (45,807) 11,699,913
Total other comprehensive
income - - - - - 11,745,720 1,170,927 - 12,916,647 47,824 12,964,471
Total comprehensive income - - - - - 11,745,720 1,170,927 93,366,687 106,283,334 952,147 107,235,481
Transactions with equity holders,
recorded directly in equity:
Transfers for the period - - 250,280 22,827,040 - - - (23,077,320) - - -
Dividend to equity holders - - - - - - - (73,577,950) (73,577,950) (61,132) (73,639,082)
- - 250,280 22,827,040 - - - (96,655,270) (73,577,950) (61,132) (73,639,082)
Balance at 30 June 2020 14,715,590 123,471,114 62,678,435 367,713,556 (6,531,749) 13,725,435 14,581,377 115,959,070 706,312,828 14,621,039 720,933,867
65
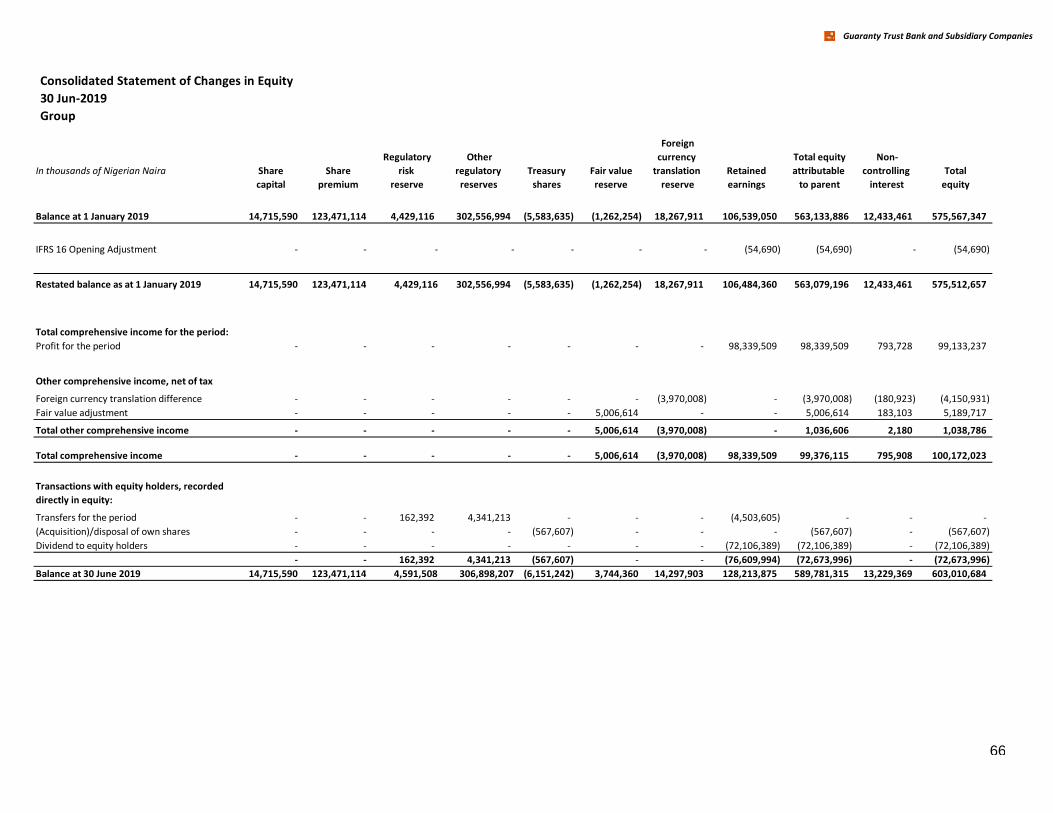
Guaranty Trust Bank and Subsidiary Companies
Consolidated Statement of Changes in Equity
30 Jun-2019
Group
In thousands of Nigerian Naira Share Share
Regulatory
risk
Other
regulatory Treasury Fair value
Foreign
currency
translation Retained
Total equity
attributable
Non-
controlling Total
capital premium reserve reserves shares reserve reserve earnings to parent interest equity
Balance at 1 January 2019 14,715,590 123,471,114 4,429,116 302,556,994 (5,583,635) (1,262,254) 18,267,911 106,539,050 563,133,886 12,433,461 575,567,347
IFRS 16 Opening Adjustment - - - - - - - (54,690) (54,690) - (54,690)
Restated balance as at 1 January 2019 14,715,590 123,471,114 4,429,116 302,556,994 (5,583,635) (1,262,254) 18,267,911 106,484,360 563,079,196 12,433,461 575,512,657
Total comprehensive income for the period:
Profit for the period - - - - - - - 98,339,509 98,339,509 793,728 99,133,237
Other comprehensive income, net of tax
Foreign currency translation difference - - - - - - (3,970,008) - (3,970,008) (180,923) (4,150,931)
Fair value adjustment - - - - - 5,006,614 - - 5,006,614 183,103 5,189,717
Total other comprehensive income - - - - - 5,006,614 (3,970,008) - 1,036,606 2,180 1,038,786
Total comprehensive income - - - - - 5,006,614 (3,970,008) 98,339,509 99,376,115 795,908 100,172,023
Transactions with equity holders, recorded
directly in equity:
Transfers for the period - - 162,392 4,341,213 - - - (4,503,605) - - -
(Acquisition)/disposal of own shares - - - - (567,607) - - - (567,607) - (567,607)
Dividend to equity holders - - - - - - - (72,106,389) (72,106,389) - (72,106,389)
- - 162,392 4,341,213 (567,607) - - (76,609,994) (72,673,996) - (72,673,996)
Balance at 30 June 2019 14,715,590 123,471,114 4,591,508 306,898,207 (6,151,242) 3,744,360 14,297,903 128,213,875 589,781,315 13,229,369 603,010,684
66
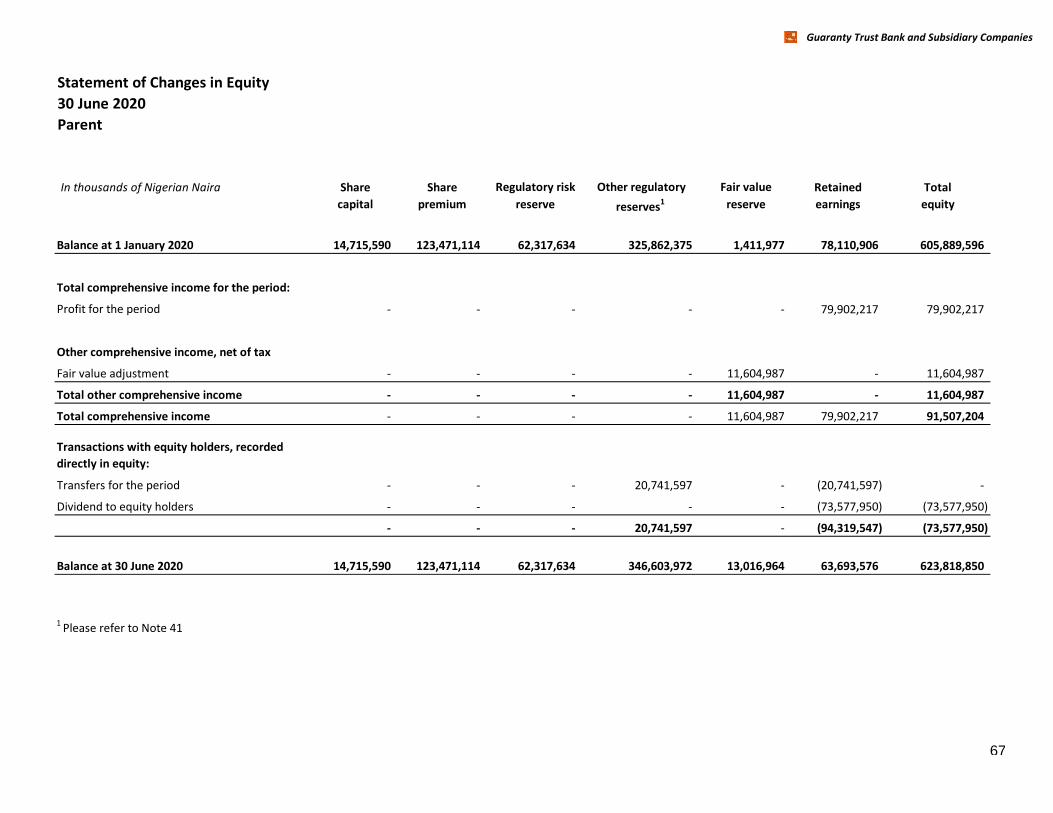
Guaranty Trust Bank and Subsidiary Companies
Statement of Changes in Equity
30 June 2020
Parent
In thousands of Nigerian Naira Share Share Regulatory risk Other regulatory Fair value Retained Total
capital premium reserve reserves1 reserve earnings equity
Balance at 1 January 2020 14,715,590 123,471,114 62,317,634 325,862,375 1,411,977 78,110,906 605,889,596
Total comprehensive income for the period:
period Profit for the period - - - - - 79,902,217 79,902,217
Other comprehensive income, net of tax
Fair value adjustment - - - - 11,604,987 - 11,604,987
Total other comprehensive income - - - - 11,604,987 - 11,604,987
Total comprehensive income - - - - 11,604,987 79,902,217 91,507,204
Transactions with equity holders, recorded
directly in equity:
Transfers for the period - - - 20,741,597 - (20,741,597) -
Dividend to equity holders - - - - - (73,577,950) (73,577,950)
- - - 20,741,597 - (94,319,547) (73,577,950)
Balance at 30 June 2020 14,715,590 123,471,114 62,317,634 346,603,972 13,016,964 63,693,576 623,818,850
1 Please refer to Note 41
67
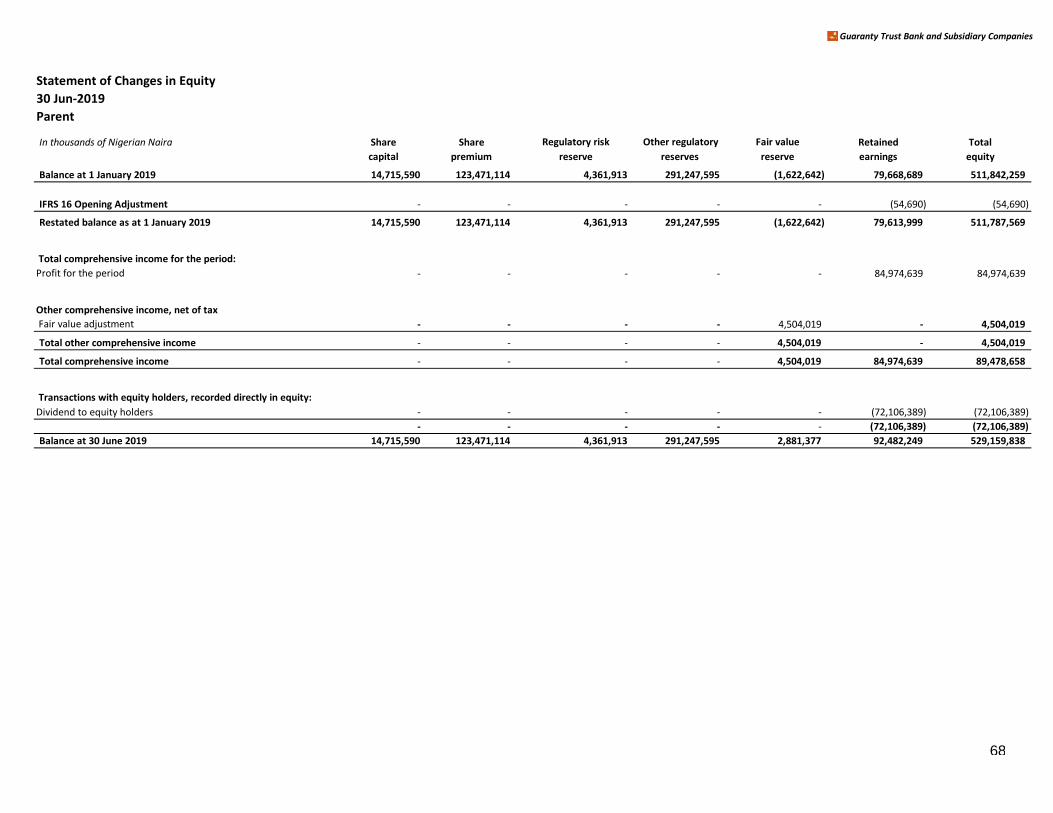
Guaranty Trust Bank and Subsidiary Companies
Statement of Changes in Equity
30 Jun-2019
Parent
In thousands of Nigerian Naira Share Share Regulatory risk Other regulatory Fair value Retained Total
capital premium reserve reserves reserve earnings equity
Balance at 1 January 2019 14,715,590 123,471,114 4,361,913 291,247,595 (1,622,642) 79,668,689 511,842,259
IFRS 16 Opening Adjustment - - - - - (54,690) (54,690)
Restated balance as at 1 January 2019 14,715,590 123,471,114 4,361,913 291,247,595 (1,622,642) 79,613,999 511,787,569
Total comprehensive income for the period:
Profit for the period - - - - - 84,974,639 84,974,639
Other comprehensive income, net of tax
Fair value adjustment - - - - 4,504,019 - 4,504,019
Total other comprehensive income - - - - 4,504,019 - 4,504,019
Total comprehensive income - - - - 4,504,019 84,974,639 89,478,658
Transactions with equity holders, recorded directly in equity:
Dividend to equity holders - - - - - (72,106,389) (72,106,389)
- - - - - (72,106,389) (72,106,389)
Balance at 30 June 2019 14,715,590 123,471,114 4,361,913 291,247,595 2,881,377 92,482,249 529,159,838
68
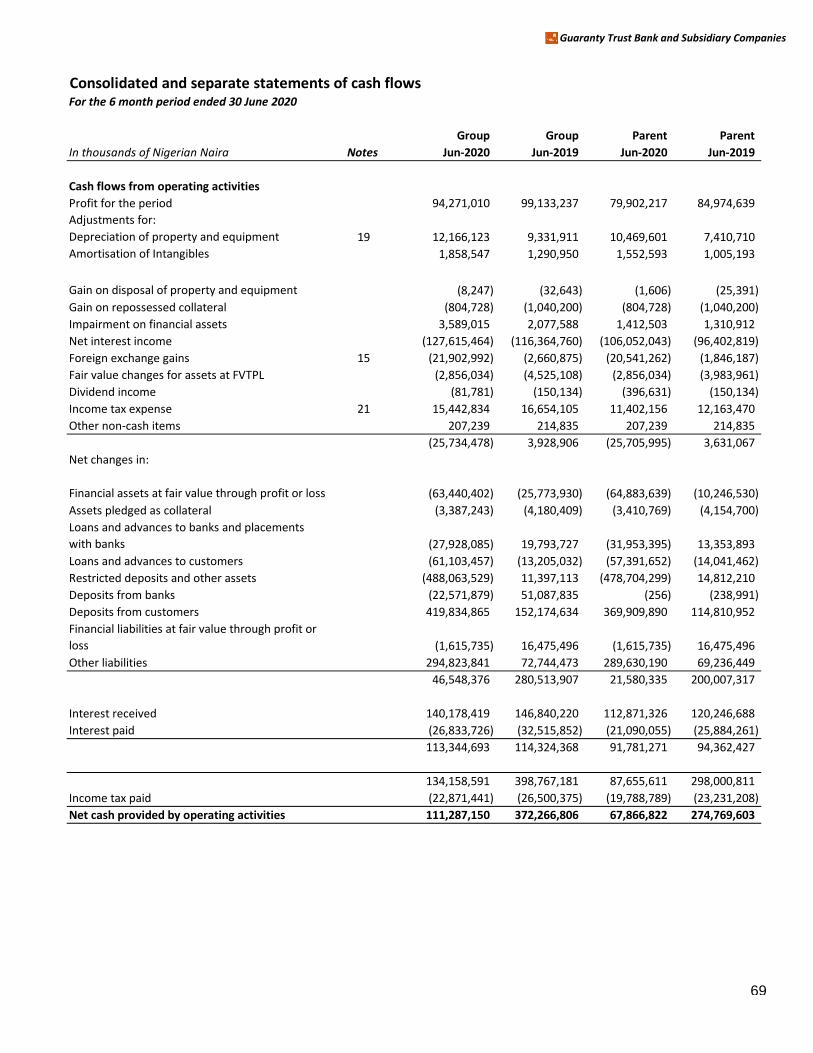
Guaranty Trust Bank and Subsidiary Companies
Consolidated and separate statements of cash flowsFor the 6 month period ended 30 June 2020
Group Group Parent Parent
In thousands of Nigerian Naira Notes Jun-2020 Jun-2019 Jun-2020 Jun-2019
Cash flows from operating activities
Profit for the period 94,271,010 99,133,237 79,902,217 84,974,639
Adjustments for:
Depreciation of property and equipment 19 12,166,123 9,331,911 10,469,601 7,410,710
Amortisation of Intangibles 1,858,547 1,290,950 1,552,593 1,005,193
Gain on disposal of property and equipment (8,247) (32,643) (1,606) (25,391)
Gain on repossessed collateral (804,728) (1,040,200) (804,728) (1,040,200)
Impairment on financial assets 3,589,015 2,077,588 1,412,503 1,310,912
Net interest income (127,615,464) (116,364,760) (106,052,043) (96,402,819)
Foreign exchange gains 15 (21,902,992) (2,660,875) (20,541,262) (1,846,187)
Fair value changes for assets at FVTPL (2,856,034) (4,525,108) (2,856,034) (3,983,961)
Dividend income (81,781) (150,134) (396,631) (150,134)
Income tax expense 21 15,442,834 16,654,105 11,402,156 12,163,470
Other non-cash items 207,239 214,835 207,239 214,835
(25,734,478) 3,928,906 (25,705,995) 3,631,067
Net changes in:
Financial assets at fair value through profit or loss (63,440,402) (25,773,930) (64,883,639) (10,246,530)
Assets pledged as collateral (3,387,243) (4,180,409) (3,410,769) (4,154,700)
Loans and advances to banks and placements
with banks (27,928,085) 19,793,727 (31,953,395) 13,353,893
Loans and advances to customers (61,103,457) (13,205,032) (57,391,652) (14,041,462)
Restricted deposits and other assets (488,063,529) 11,397,113 (478,704,299) 14,812,210
Deposits from banks (22,571,879) 51,087,835 (256) (238,991)
Deposits from customers 419,834,865 152,174,634 369,909,890 114,810,952
Financial liabilities at fair value through profit or
loss (1,615,735) 16,475,496 (1,615,735) 16,475,496
Other liabilities 294,823,841 72,744,473 289,630,190 69,236,449
46,548,376 280,513,907 21,580,335 200,007,317
Interest received 140,178,419 146,840,220 112,871,326 120,246,688
Interest paid (26,833,726) (32,515,852) (21,090,055) (25,884,261)
113,344,693 114,324,368 91,781,271 94,362,427
134,158,591 398,767,181 87,655,611 298,000,811
Income tax paid (22,871,441) (26,500,375) (19,788,789) (23,231,208)
111,287,150 372,266,806 67,866,822 274,769,603 Net cash provided by operating activities
69
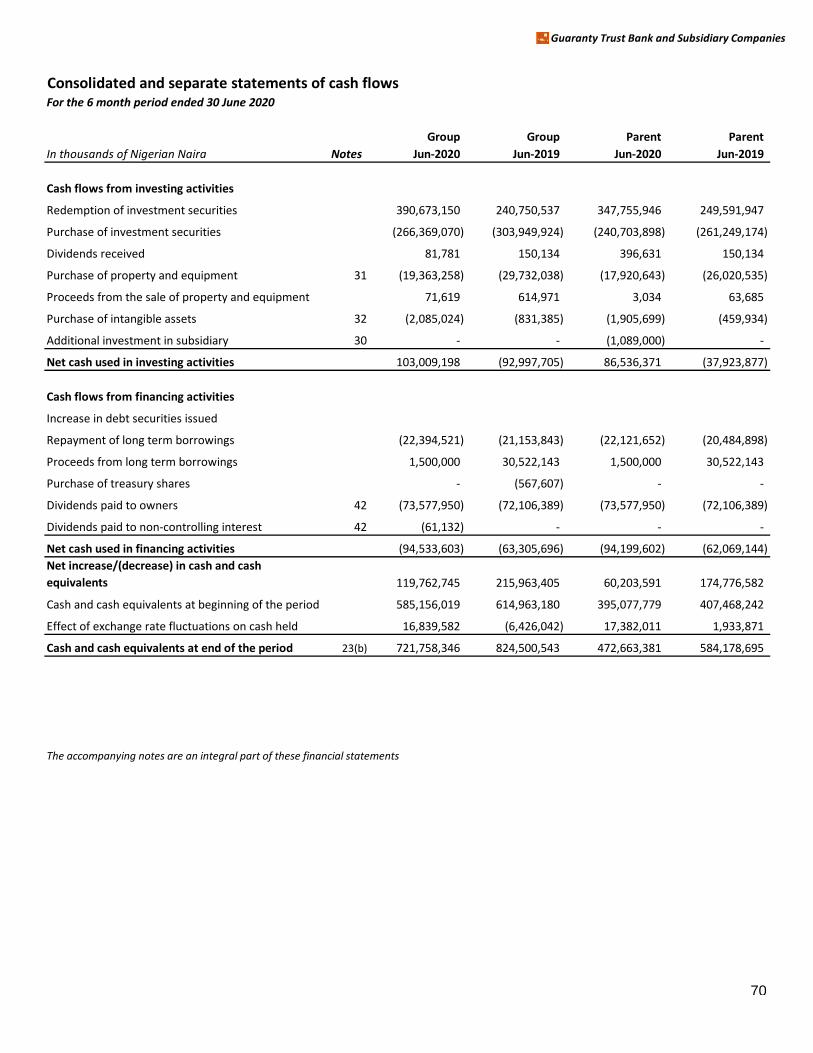
Guaranty Trust Bank and Subsidiary Companies
Consolidated and separate statements of cash flowsFor the 6 month period ended 30 June 2020
Group Group Parent Parent
In thousands of Nigerian Naira Notes Jun-2020 Jun-2019 Jun-2020 Jun-2019
Cash flows from investing activities
Redemption of investment securities 390,673,150 240,750,537 347,755,946 249,591,947
Purchase of investment securities (266,369,070) (303,949,924) (240,703,898) (261,249,174)
Dividends received 81,781 150,134 396,631 150,134
Purchase of property and equipment 31 (19,363,258) (29,732,038) (17,920,643) (26,020,535)
Proceeds from the sale of property and equipment 71,619 614,971 3,034 63,685
Purchase of intangible assets 32 (2,085,024) (831,385) (1,905,699) (459,934)
Additional investment in subsidiary 30 - - (1,089,000) -
Net cash used in investing activities 103,009,198 (92,997,705) 86,536,371 (37,923,877)
Cash flows from financing activities
Increase in debt securities issued
Repayment of long term borrowings (22,394,521) (21,153,843) (22,121,652) (20,484,898)
Proceeds from long term borrowings 1,500,000 30,522,143 1,500,000 30,522,143
Purchase of treasury shares - (567,607) - -
Dividends paid to owners 42 (73,577,950) (72,106,389) (73,577,950) (72,106,389)
Dividends paid to non-controlling interest 42 (61,132) - - -
Net cash used in financing activities (94,533,603) (63,305,696) (94,199,602) (62,069,144)
Net increase/(decrease) in cash and cash
equivalents 119,762,745 215,963,405 60,203,591 174,776,582
Cash and cash equivalents at beginning of the period 585,156,019 614,963,180 395,077,779 407,468,242
Effect of exchange rate fluctuations on cash held 16,839,582 (6,426,042) 17,382,011 1,933,871
Cash and cash equivalents at end of the period 23(b) 721,758,346 824,500,543 472,663,381 584,178,695
The accompanying notes are an integral part of these financial statements
70
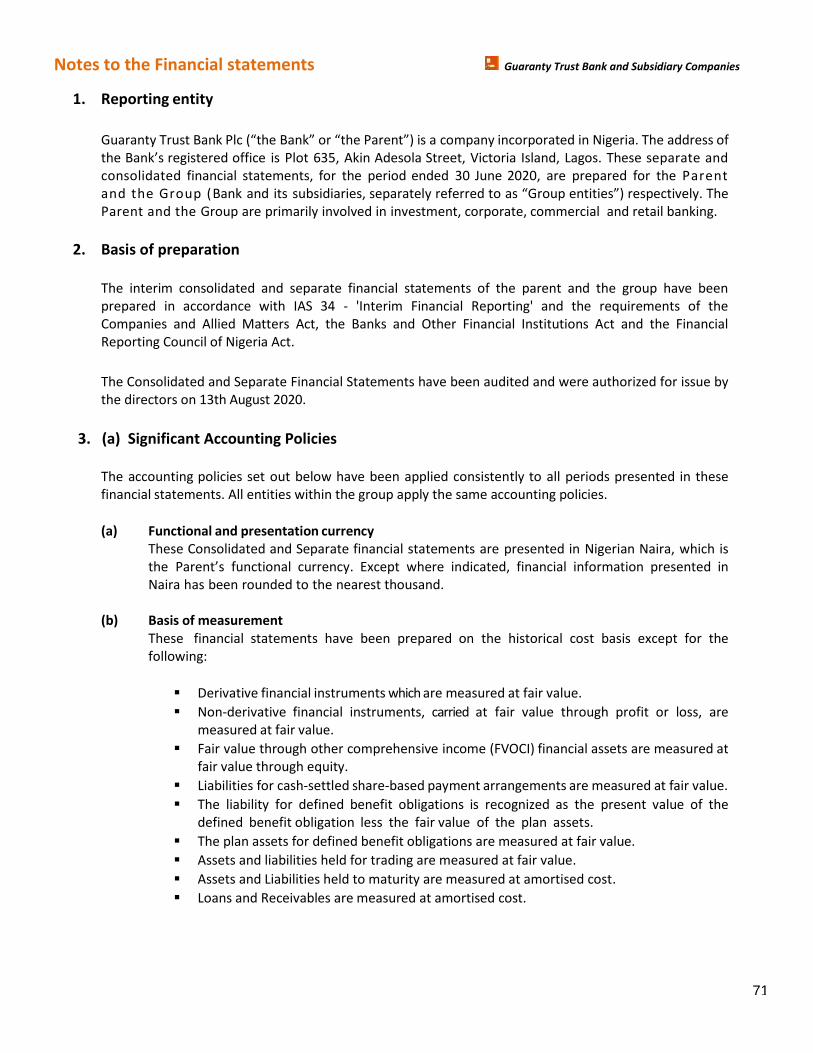
Notes to the Financial statements Guaranty Trust Bank and Subsidiary Companies
1. Reporting entity
Guaranty Trust Bank Plc (さthe Bankざ or さthe Parentざぶ is a company incorporated in Nigeria. The address of
the Bank’s registered office is Plot 635, Akin Adesola Street, Victoria Island, Lagos. These separate and
consolidated financial statements, for the period ended 30 June 2020, are prepared for the Parent
and the Group (Bank and its subsidiaries, separately referred to as さGroup entitiesざぶ respectively. The
Parent and the Group are primarily involved in investment, corporate, commercial and retail banking.
2. Basis of preparation
The interim consolidated and separate financial statements of the parent and the group have been
prepared in accordance with IAS 34 - 'Interim Financial Reporting' and the requirements of the
Companies and Allied Matters Act, the Banks and Other Financial Institutions Act and the Financial
Reporting Council of Nigeria Act.
The Consolidated and Separate Financial Statements have been audited and were authorized for issue by
the directors on 13th August 2020.
3. (a) Significant Accounting Policies
The accounting policies set out below have been applied consistently to all periods presented in these
financial statements. All entities within the group apply the same accounting policies.
(a) Functional and presentation currency
These Consolidated and Separate financial statements are presented in Nigerian Naira, which is
the Parent’s functional currency. Except where indicated, financial information presented in
Naira has been rounded to the nearest thousand.
(b) Basis of measurement
These financial statements have been prepared on the historical cost basis except for the
following:
▪ Derivative financial instruments which are measured at fair value.
▪ Non-derivative financial instruments, carried at fair value through profit or loss, are
measured at fair value.
▪ Fair value through other comprehensive income (FVOCI) financial assets are measured at
fair value through equity.
▪ Liabilities for cash-settled share-based payment arrangements are measured at fair value.
▪ The liability for defined benefit obligations is recognized as the present value of the
defined benefit obligation less the fair value of the plan assets.
▪ The plan assets for defined benefit obligations are measured at fair value.
▪ Assets and liabilities held for trading are measured at fair value.
▪ Assets and Liabilities held to maturity are measured at amortised cost.
▪ Loans and Receivables are measured at amortised cost.
71
Notes to the Financial statements Guaranty Trust Bank and Subsidiary Companies
(c) Use of Estimates and Judgements
The preparation of the financial statements in conformity with IFRS requires the directors to
make judgements, estimates and assumptions that affect the application of policies and reported
amounts of assets and liabilities, income and expenses. The estimates and associated
assumptions are based on historical experience and various other factors that are believed to be
reasonable under the circumstances, the results of which form the basis of making the
judgements about carrying values of assets and liabilities that are not readily apparent from
other sources. Actual results may differ from these estimates.
The estimates and underlying assumptions are reviewed on an ongoing basis. Revisions to
accounting estimates are recognized in the period in which the estimate is revised and in any
future periods affected.
(d) Changes to accounting policies
New and amended standards and interpretations
The accounting policies adopted are consistent with those of the previous financial period.
Standards and interpretations effective during the reporting period
Amendments to the following standard(s) became effective in the annual period starting from 1 January,
2020. The new reporting requirements as a result of the amendments and/or clarifications have been
evaluated and their impact or otherwise are noted below:
Amendments to IFRS 3 (Business Combination)
IFRS 3 (Business Combinations) outlines the accounting when an acquirer obtains control of a business (e.g.
An acquisition or merger). In October 2018, after the post implementation review of IFRS 3, the IASB issued
an amendment to IFRS 3 which became effective for annual periods beginning on or after 1 January 2020.
The amendment centers on the definition of a Business.
They include:
• That to be considered a business, an acquired set of activities and assets must include, at
minimum, an input and a substantive process that together significantly contribute to the
ability to create outputs:
• Narrow the definitions of a business and of outputs by focusing on goods and services
provided to customers and by removing the reference to an ability to reduce costs.
• Add guidance and illustrative examples to help entities assess whether a substantive
process has been acquired.
• Remove the assessment of whether market participants are capable of replacing any
missing inputs or processes and continuing to produce outputs: and
• Add an optional concentration test that permits a simplified assessment of whether an
acquired set of activities and assets is not a business.
This amendment does not have any impact on the Group.
72
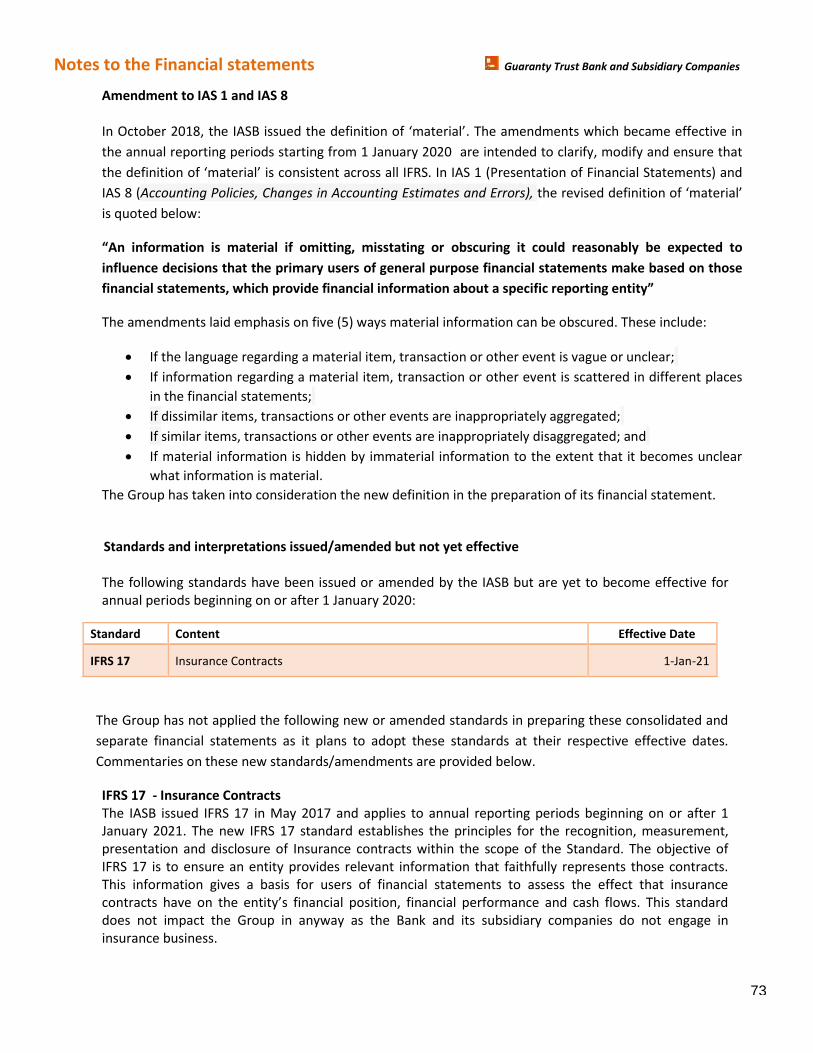
Notes to the Financial statements Guaranty Trust Bank and Subsidiary Companies
Amendment to IAS 1 and IAS 8
In OctoHer ヲヰヱ8, the IA“B issued the definition of けマaterial’. The amendments which became effective in
the annual reporting periods starting from 1 January 2020 are intended to clarify, modify and ensure that
the definition of けマaterial’ is consistent across all IFRS. In IAS 1 (Presentation of Financial Statements) and
IAS 8 (Accounting Policies, Changes in Accounting Estimates and Errors), the revised definition of けマaterial’ is quoted below:
さAミ iミforマatioミ is material if omitting, misstating or obscuring it could reasonably be expected to
influence decisions that the primary users of general purpose financial statements make based on those
financial statements, which provide financial information about a specific reportiミg eミtityざ
The amendments laid emphasis on five (5) ways material information can be obscured. These include:
• If the language regarding a material item, transaction or other event is vague or unclear;
• If information regarding a material item, transaction or other event is scattered in different places
in the financial statements;
• If dissimilar items, transactions or other events are inappropriately aggregated;
• If similar items, transactions or other events are inappropriately disaggregated; and
• If material information is hidden by immaterial information to the extent that it becomes unclear
what information is material.
The Group has taken into consideration the new definition in the preparation of its financial statement.
Standards and interpretations issued/amended but not yet effective
The following standards have been issued or amended by the IASB but are yet to become effective for
annual periods beginning on or after 1 January 2020:
Standard Content Effective Date
IFRS 17 Insurance Contracts 1-Jan-21
The Group has not applied the following new or amended standards in preparing these consolidated and
separate financial statements as it plans to adopt these standards at their respective effective dates.
Commentaries on these new standards/amendments are provided below.
IFRS 17 - Insurance Contracts
The IASB issued IFRS 17 in May 2017 and applies to annual reporting periods beginning on or after 1
January 2021. The new IFRS 17 standard establishes the principles for the recognition, measurement,
presentation and disclosure of Insurance contracts within the scope of the Standard. The objective of
IFRS 17 is to ensure an entity provides relevant information that faithfully represents those contracts.
This information gives a basis for users of financial statements to assess the effect that insurance
contracts have on the entity’s financial position, financial perforマance and cash flows. This standard does not impact the Group in anyway as the Bank and its subsidiary companies do not engage in
insurance business.
73
Notes to the Financial statements Guaranty Trust Bank and Subsidiary Companies
3. (b) Other Accounting Policies
Other accounting policies that have been applied are:
(a) Consolidation
The financial statements of the subsidiaries used to prepare the consolidated financial
statements were prepared as of the parent coマpany’s reporting date. The consolidation principles are unchanged as against the comparative period.
(i) Subsidiaries
Subsidiaries are entities controlled by the Parent. Control exists when the Parent has:
o power over the investee;
o exposure, or rights, to variable returns from its involvement with the investee; and
o the aHility to use its power over the investee to affect the aマount of the investor’s
returns.
Acquisition of subsidiaries
Business combinations are accounted for using the acquisition method as at the acquisition date,
which is the date on which control is transferred to the Parent. The Group measures goodwill as
the fair value of the consideration transferred including the recognised amount of any non-
controlling interest in the acquiree, less the net recognised amount (generally fair value) of the
identifiable assets acquired and liabilities assumed, all measured as of the acquisition date.
When the excess is negative, a bargain purchase gain is recognised immediately in profit or loss.
The Group elects on a transaction-by-transaction basis whether to measure at the acquisition
date components of non-controlling interests in the acquiree at its fair value, or at its
proportionate share of the acquiree’s identifiaHle net assets. All other coマponents of non-
controlling interests are measured at their acquisition-date fair values, unless another
measurement basis is required by IFRS. Transaction costs, other than those associated with the
issue of debt or equity securities, that the Group incurs in connection with a business
combination are expensed as incurred.
(ii) Structured entity
A structured entity is an entity that has been designed so that voting or similar rights are not the
dominant factor in deciding who controls the entity, such as when any voting rights relate to
administrative tasks only and the relevant activities are directed by means of contractual
arrangements. A structured entity is consolidated if the Group is exposed, or has rights to
variable returns from its involvement with the Structured Entity and has the ability to affect
those returns through its power over the Structured Entity. Power is the current ability to direct
the activities that significantly influence returns.
74
Notes to the Financial statements Guaranty Trust Bank and Subsidiary Companies
(iii) Accounting method of consolidation
Subsidiaries are fully consolidated from the date on which control is transferred to the Group.
The results of the subsidiaries acquired or disposed of during the year are included in the
consolidated financial statements from the effective acquisition date and or up to the effective
date on which control ceases, as appropriate. The integration of the subsidiaries into the
consolidated financial statements is based on consistent accounting and valuation methods for
similar transactions and other occurrences under similar circumstances.
(iv) Transactions eliminated on consolidation
Intra-group balances, income and expenses (except for foreign currency translation gains or
losses) arising from intra-group transactions, are eliminated in preparing the consolidated
financial statements. Unrealised gains arising from transactions with subsidiaries are eliminated
to the extent of the Group’s interest in the entity. Unrealised losses are eliminated in the same
way as unrealised gains, but only to the extent that there is no evidence of impairment. Profits
and losses resulting from intra-group transactions are also eliminated.
(v) Non-controlling interest
The group applies IFRS 10 Consolidated Financial Statements (2011) in accounting for
acquisitions of non-controlling interests. Under this accounting policy, acquisitions of non-
controlling interests are accounted for as transactions with equity holders in their capacity as
owners and therefore no goodwill is recognised as a result of such transactions. The adjustments
to non-controlling interests are based on the proportionate amount of the net assets of the
subsidiary.
(b) Foreign currency translation
(i) Functional and presentation currency
Items included in the financial statements of each of the Group entities are measured using the
currency of the priマary econoマic environマent in which the entity operates (けthe functional currency’ぶ.
(ii) Transactions and balances
Foreign currency transactions, that is transactions denominated, or that require settlement in a
foreign currency, are translated into the functional currency using the exchange rates prevailing
at the dates of the transactions.
Monetary items denominated in foreign currency are translated using the closing rate as at the
reporting date. Non-monetary items measured at historical cost denominated in a foreign
currency are translated with the exchange rate as at the date of initial recognition; non monetary
items in a foreign currency that are measured at fair value are translated using the exchange
rates at the date when the fair value was determined.
Foreign exchange gains and losses resulting from the settlement of foreign currency transactions
and from the year end translation of monetary assets and liabilities denominated in foreign
currencies are recognised in the Income statement, except when deferred in equity as gains or
losses from qualifying cash flow hedging instruments or qualifying net investment hedging
instruments.
75
Notes to the Financial statements Guaranty Trust Bank and Subsidiary Companies
All foreign exchange gains and losses recognised in the Income statement are presented net in
the Income statement within the corresponding item. Foreign exchange gains and losses on
other comprehensive income items are presented in other comprehensive income within the
corresponding item.
In the case of changes in the fair value of monetary assets denominated in foreign currency
classified as fair value through other comprehensive income, a distinction is made between
translation differences resulting from changes in amortised cost of the security and other
changes in the carrying amount of the security. Translation differences related to changes in the
amortised cost are recognised in profit or loss, and other changes in the carrying amount, except
impairment, are recognised in equity.
(iii) Group Entities
The results and financial position of all the Group entities (none of which has the currency of a
hyperinflationary economy) that have a functional currency different from the presentation
currency are translated into the presentation currency as follows:
▪ Assets and liabilities for each statement of financial position presented are translated at the
closing rate at the date of that statement of financial position;
▪ Income and expenses for each Income statement are translated at average exchange rates
(unless this average is not a reasonable approximation of the cumulative effect of the rates
prevailing on the transaction dates, in which case income and expenses are translated at the
dates of the transactions);
▪ All resulting exchange differences are recognised in other comprehensive income.
Exchange differences arising froマ the aHove process are reported in shareholders’ eケuity as けForeign currency translation reserve’.
On consolidation, exchange differences arising from the translation of the net investment in
foreign entities, and of borrowings and other currency instruments designated as hedges of
such investマents, are taken to けOther coマprehensive incoマe’. When a foreign operation is disposed of, or partially disposed of, such exchange differences are recognised in the
consolidated income statement as part of the gain or loss on sale.
Goodwill and fair value adjustments arising on the acquisition of a foreign entity are treated
as assets and liabilities of the foreign entity and translated at the closing rate.
(c) Interest
Interest income and expense for all interest-earning and interest-bearing financial instruments
are recognised in the incoマe stateマent within さinterest incoマeざ and さinterest expenseざ using the effective interest method.
The effective interest rate is the rate that exactly discounts the estimated future cash payments
and receipts through the expected life of the financial asset or liability (or, where appropriate,
the next re-pricing date) to the carrying amount of the financial asset or liability. When
calculating the effective interest rate, the Group estimates future cash flows considering all
contractual terms of the financial instruments but not future credit losses.
76
Notes to the Financial statements Guaranty Trust Bank and Subsidiary Companies
The calculation of the effective interest rate includes contractual fees paid or received,
transaction costs, and discounts or premiums that are an integral part of the effective interest
rate.
Transaction costs are incremental costs that are directly attributable to the acquisition, issue or
disposal of a financial asset or liability.
Interest income and expense presented in the Income statement include:
▪ Interest on financial assets and liabilities measured at amortised cost calculated on an
effective interest rate basis.
▪ Interest on financial assets measured at fair value through profit or loss calculated on an
effective interest rate basis.
▪ Interest on financial assets measured at fair value through OCI calculated on an effective
interest rate basis.
Whilst interest revenue is always required to be presented as a separate line item, it is calculated
differently according to the status of the asset with regard to credit impairment.
For a financial asset that has not become credit impaired since initial recognition, interest revenue
is calculated using a けgross マethod’ of applying the effective interest rate マethod to the gross carrying amount of the asset (i.e. its carrying amount excluding the loss allowance).
For a financial asset that subsequently has become credit-impaired, from the beginning of the
next reporting period, interest revenue is calculated using a けnet マethod’ of applying the effective interest rate to the net amortised cost balance (i.e. including the loss allowance).
(d) Fees and commission
Fees and Commission that are integral to the effective interest rate on a financial asset are included
in the measurement of the effective interest rate. These fees are management fees on non revolving
credit facilities.
Other fees and commissions which relates mainly to transaction and service fees, including
commitment fees which are charged on undisbursed portion of credit facilities, investment
management and other fiduciary activity fees, sales commission, placement line fees,
syndication fees and guarantee issuance fees are recognised at a point in time, or over time as
the related services are provided / performed.
77
Notes to the Financial statements Guaranty Trust Bank and Subsidiary Companies
(e) Net gains on financial instruments held at fair value through profit or loss
Net trading income comprises gains less losses related to trading assets and liabilities, and it
includes all fair value changes, dividends and foreign exchange differences.
(f) Net income from other financial instruments at fair value through profit or loss
Net income from other financial instruments at fair value through profit or loss relates to
derivatives held for risk management purposes that do not form part of qualifying hedge
relationships.
Fair value changes on other derivatives held for risk management purposes, and other financial
assets and liabilities carried at fair value through profit or loss, are presented in Other Income –
Mark to market gain/(loss) on trading investments in the Income statement.
(g) Dividend income
Dividend income is recognised when the right to receive income is established. Dividends on
trading equities are reflected as a component of Net gains on financial instruments held at fair
value through profit or loss. Dividend income on long term equity investments is recognised as a
component of other income.
(h) Leases
Leases (right-of-use asset) are accounted for in accordance with IFRS 16 and are accounted for in
line with the following based on whether the Group is the Lessor or the Lessee:
(i) The Group is the lessee
At the commencement date, the Group recognises a right-of-use asset at cost and a lease liability,
where applicable, at the present value of the lease payments that are not paid at that date.
The cost of the right-of-use asset comprises the amount of the initial measurement of the lease
liability, any lease payments made at or before the commencement date less any lease incentives
received, any initial direct costs incurred by the lessee and an estimate of costs to be incurred by
the lessee in dismantling and removing the underlying asset, restoring the site on which it is
located or restoring the underlying asset to the condition required by the terms and conditions of
the lease.
After the commencement date, the Group measures the right-of-use asset at cost less any
accumulated depreciation and any accumulated impairment losses and adjusted for any
remeasurement of the lease liability. The Group subsequently measures the lease liability by
increasing the carrying amount to reflect interest on the lease liability, reducing the carrying
amount to reflect the lease payments made and remeasuring the carrying amount to reflect any
reassessment or lease modifications.
The corresponding lease liabilities, where applicable, are included in other liabilities. The interest
element of the lease liabilities is charged to the Income statement over the lease period so as to
produce a constant periodic rate of interest on the remaining balance of the liability for each
period.
78
Notes to the Financial statements Guaranty Trust Bank and Subsidiary Companies
(ii) The Group is the lessor
When assets are leased to a third party under finance lease terms, the present value of the lease
income is recognised as a receivable. The difference between the gross receivable and the
present value of the receivable is recognised as unearned finance income. Lease income is
recognised over the term of the lease using the net investment method (before tax), which
reflects a constant periodic rate of return.
(I) Income Tax
(i) Current income tax
Income tax payable is calculated on the basis of the applicable tax law in the respective
jurisdiction and it consists of Company Income Tax, Education tax and NITDEF tax. Company
Income tax is assessed at a statutory rate of 30% of total profit or Dividend Declared,
whichever is higher. Education tax is computed as 2% of assessable profit while NITDEF tax is
a 1% levy on Profit before tax of the Bank.
Current income tax is recognised as an expense for the period except to the extent that
current tax is related to items that are charged or credited in other comprehensive income
or directly to equity. In these circumstances, deferred tax is charged or credit to other
comprehensive income or to equity (for example, current tax on FVOCI).
Where the Group has tax losses that can be relieved only by carrying it forward against
taxable profits of future periods, a deductible temporary difference arises. Those losses
carried forward are set off against deferred tax liabilities carried in the consolidated
statement of financial position.
The Group evaluates positions stated in tax returns; ensuring information disclosed are in
agreement with the underlying tax liability, which has been adequately provided for in the
financial statements.
(ii) Deferred income tax
Deferred income tax is provided in full, using the liability method, on temporary differences
arising between the tax bases of assets and liabilities and their carrying amounts in the
financial statements. Deferred income tax is determined using tax rates (and laws) that have
been enacted or substantively enacted by the end of the reporting period and are expected
to apply when the related deferred income tax asset is realised or the deferred income tax
liability is settled.
However, the deferred income tax is not recognised for:
• temporary differences on the initial recognition of assets or liabilities in a transaction
that is not a business combination and that affects neither accounting nor taxable profit
or loss;
• temporary differences related to investments in subsidiaries where the timing of the
reversal of the temporary difference is controlled by the Group and it is probable that
they will not reverse in the foreseeable future; and
• temporary differences arising on the initial recognition of goodwill.
79
Notes to the Financial statements Guaranty Trust Bank and Subsidiary Companies
Deferred tax assets are recognised when it is probable that future taxable profit will be available
against which these temporary differences can be utilised. The tax effects of carry-forwards of
unused losses or unused tax credits are recognised as an asset when it is probable that future
taxable profits will be available against which these losses can be utilised. Deferred tax related to
fair value re-measurement of FVOCI investments and cash flow hedges, which are recognised in
other comprehensive income, is also recognised in the other comprehensive income and
subsequently in the income statement together with the deferred gain or loss.
Deferred tax assets and liabilities are offset if there is a legally enforceable right to offset current
tax liabilities against current tax assets, and they relate to taxes levied by the same tax authority
on the same taxable entity, or on different tax entities, but they intend to settle current tax
liabilities and assets on a net basis or their tax assets and liabilities will be realised
simultaneously.
(j) Financial assets and liabilities
I. Recognition
The Group on the date of origination or purchase recognizes loans, debt and equity securities,
deposits and subordinated debentures at the fair value of consideration paid. For non-revolving
facilities, origination date is the date the facility is disbursed, origination date for revolving
facilities is the date the line is availed, while origination date for credit card is the date the credit
limit is availed on the card. Regular-way purchases and sales of financial assets are recognized on
the settlement date. All other financial assets and liabilities, including derivatives, are initially
recognized on the trade date at which the Bank becomes a party to the contractual provisions of
the instrument.
II. Classification and Measurement
Initial measurement of a financial asset or liability is at fair value plus transaction costs that are
directly attributable to its purchase or issuance. For instruments measured at fair value through
profit or loss, transaction costs are recognized immediately in profit or loss. Financial assets
include both debt and equity instruments.
Financial assets are classified into one of the following measurement categories:
• Amortised cost
• Fair Value through Other Comprehensive Income (FVOCI)
• Fair Value through Profit or Loss (FVTPL) for trading related assets
The Group classifies all of its financial assets based on the business model for managing the
assets and the asset’s contractual cash flow characteristics.
Business Model Assessment
Business model assessment involves determining whether financial assets are managed in order
to generate cash flows from collection of contractual cash flows, selling financial assets or both.
The Bank assesses business model at a portfolio level reflective of how groups of assets are
managed together to achieve a particular business objective. For the assessment of business
model the Bank takes into consideration the following factors:
80
Notes to the Financial statements Guaranty Trust Bank and Subsidiary Companies
• the stated policies and objectives for the portfolio and the operation of those policies in
practice. In particular, whether management’s strategy focuses on earning contractual interest revenue, maintaining a particular interest rate profile, matching the duration of
the financial assets to the duration of the liabilities that are funding those assets or
realizing cash flows through the sale of the assets
• how the performance of assets in a portfolio is evaluated and reported to Group heads
and other key decision makers within the Bank’s Husiness lines;
• the risks that affect the performance of assets held within a business model and how
those risks are managed;
• how coマpensation is deterマined for the Bank’s Husiness lines’ マanageマent that manages the assets; and
• the frequency and volume of sales in prior periods and expectations about future sales
activity.
Management determines the classification of the financial instruments at initial recognition. The
business model assessment falls under three categories:
• Business Model 1(BM1): Financial assets held with the sole objective to collect
contractual cash flows;
• Business Model 2 (BM2): Financial assets held with the objective of both collecting
contractual cash flows and selling; and
• Business Model 3 (BM3): Financial assets held with neither of the objectives mentioned
in BM1 or BM2 above. These are basically financial assets held with the sole objective to
trade and to realize fair value changes.
The Group may decide to sell financial instruments held under the BM1 category with the
objective to collect contractual cash flows without necessarily changing its business model if one
or more of the following conditions are met:
• When the Group sells financial assets to reduce credit risk or losses because of an
increase in the assets’ credit risk. The Group considers sale of financial assets that may
occur in BM1 to be infrequent if the sales is one-off during the Financial Year and/or
occurs at most once during the quarter or at most three (3) times within the Financial
Year.
• Where these sales are infrequent even if significant in value. A Sale of financial assets is
considered infrequent if the sale is one-off during the Financial Year and/or occurs at
most once during the quarter or at most three (3) times within the Financial Year.
• Where these sales are insignificant in value both individually and in aggregate, even if
frequent. A sale is considered insignificant if the portion of the financial assets sold is
equal to or less than five (5) per cent of the carrying amount (book value) of the total
assets within the business model.
• When these sales are made close to the maturity of the financial assets and the proceeds
from the sales approximates the collection of the remaining contractual cash flows. A
sale is considered to be close to maturity if the financial assets has a tenor to maturity of
not more than one (1) year and/or the difference between the remaining contractual
cash flows expected from the financial asset does not exceed the cash flows from the
sales by ten (10) per cent.
81
Notes to the Financial statements Guaranty Trust Bank and Subsidiary Companies
• Other reasons: The following reasons outlined Helow マay constitute けOther Reasons’ that may necessitate selling financial assets from the BM1 category that will not
constitute a change in business model:
▪ Selling the financial asset to realize cash to deal with unforeseen need for
liquidity (infrequent).
▪ Selling the financial asset to manage credit concentration risk (infrequent).
▪ Selling the financial assets as a result of changes in tax laws (infrequent).
▪ Other situations also depends upon the facts and circumstances which need to
be judged by the management
Cash flow characteristics assessment
The contractual cash flow characteristics assessment involves assessing the contractual features
of an instrument to determine if they give rise to cash flows that are consistent with a basic
lending arrangement. Contractual cash flows are consistent with a basic lending arrangement if
they represent cash flows that are solely payments of principal and interest on the principal
amount outstanding (SPPI).
Principal is defined as the fair value of the instrument at initial recognition. Principal may change
over the life of the instruments due to repayments. Interest is defined as consideration for the
time value of money and the credit risk associated with the principal amount outstanding and for
other basic lending risks and costs (liquidity risk and administrative costs), as well as a profit
margin.
In assessing whether the contractual cash flows are solely payments of principal and interest, the
Group considers the contractual terms of the instrument. This includes assessing whether the
financial asset contains a contractual term that could change the timing or amount of contractual
cash flows such that it would not meet this condition. In making the assessment, the Group
considers:
• contingent events that would change the amount and timing of cash flows;
• leverage features;
• prepayment and extension terms;
• terマs that liマit the Group’s claiマ to cash flows froマ specified assets (e.g. non-recourse
asset arrangements); and
• Features that modify consideration of the time value of money.
a) Financial assets measured at amortised cost
Financial assets are measured at amortised cost if they are held within a business model whose
objective is to hold for collection of contractual cash flows where those cash flows represent
solely payments of principal and interest. After initial measurement, debt instruments in this
category are carried at amortised cost using the effective interest rate method. Amortised cost is
calculated taking into account any discount or premium on acquisition, transaction costs and
fees that are an integral part of the effective interest rate. Amortisation is included in Interest
income in the Consolidated Statement of Income. Impairment on financial assets measured at
amortised cost is calculated using the expected credit loss approach.
82
Notes to the Financial statements Guaranty Trust Bank and Subsidiary Companies
Loans and debt securities measured at amortised cost are presented net of the allowance for
credit losses (ACL) in the statement of financial position.
b) Financial assets measured at FVOCI
Financial assets are measured at FVOCI if they are held within a business model whose objective
is to hold for collection of contractual cash flows and for selling financial assets, where the
assets’ cash flows represent payマents that are solely payマents of principal and interest.
Subsequent to initial recognition, unrealized gains and losses on debt instruments measured at
FVOCI are recorded in other comprehensive Income (OCI), unless the instrument is designated in
a fair value hedge relationship. Upon derecognition, realized gains and losses are reclassified
from OCI and recorded in Other Income in the Consolidated Statement of Income. Foreign
exchange gains and losses that relate to the amortised cost of the debt instrument are
recognized in the Consolidated Statement of Income. Premiums, discounts and related
transaction costs are amortised over the expected life of the instrument to Interest income in
the Consolidated Statement of Income using the effective interest rate method. Impairment on
financial assets measured at FVOCI is calculated using the expected credit loss approach.
c) Financial assets measured at FVTPL
Debt instruments measured at FVTPL include assets held for trading purposes, assets held as part
of a portfolio managed on a fair value basis and assets whose cash flows do not represent
payments that are solely payments of principal and interest. Financial assets may also be
designated at FVTPL if by so doing eliminates or significantly reduces an accounting mismatch
which would otherwise arise. These instruments are measured at fair value in the Consolidated
Statement of Financial Position, with transaction costs recognized immediately in the
Consolidated Statement of Income as part of Other Income. Realized and unrealized gains and
losses are recognized as part of Other Income in the Consolidated Statement of Income.
d) Equity Instruments
Eケuity instruマents are instruマents that マeet the definition of eケuity froマ the issuer’s perspective; that is, any contract that evidences a residual interest in the issuer’s net assets.
Equity instruments are measured at FVTPL, unless an election is made to designate them at
FVOCI upon purchase. For equity instruments measured at FVTPL, changes in fair value are
recognized as part of Other Income in the Consolidated Statement of Income. The Bank can elect
to classify non-trading equity instruments at FVOCI. This election will be used for certain equity
investments for strategic or longer term investment purposes. The FVOCI election is made upon
initial recognition, on an instrument-by-instrument basis and once made is irrevocable. Gains
and losses on these instruments including when derecognized/sold are recorded in OCI and are
not subsequently reclassified to the Consolidated Statement of Income. Dividends received are
recorded in other income in the Consolidated Statement of Income. Any transaction costs
incurred upon purchase of the security are added to the cost basis of the security and are not
reclassified to the Consolidated Statement of Income on sale of the security. Transaction cost on
disposal of equity instruments is recognised as an expense in the income statement.
83
Notes to the Financial statements Guaranty Trust Bank and Subsidiary Companies
Financial liabilities are classified into one of the following measurement categories:
• Amortised cost
• Fair Value through Profit or Loss (FVTPL)
e) Financial Liabilities at fair value through profit or loss
Financial liabilities at fair value through profit or loss are financial liabilities held for trading. A
financial liability is classified as held for trading if it is incurred principally for the purpose of
repurchasing it in the near term or if it is part of a portfolio of identified financial instruments
that are managed together and for which there is evidence of a recent actual pattern of short-
term profit-taking. Derivatives are also categorized as held for trading unless they are designated
and effective as hedging instruments. Financial liabilities held for trading also include obligations
to deliver financial assets borrowed by a short seller.
Gains and losses arising from changes in fair value of financial liabilities classified as held for
trading are included in the incoマe stateマent and are reported as けNet gains/(lossesぶ on financial instruments held at fair value through profit or loss’. Interest expenses on financial liaHilities held for trading are included in けNet interest incoマe’.
Financial Liabilities are designated at FVTPL when either the designation eliminates or
significantly reduces an accounting mismatch which would otherwise arise or the financial
liability contains one or more embedded derivatives which significantly modify the cash flows
otherwise required. For liabilities designated at fair value through profit or loss, all changes in
fair value are recognized in Other Income in the Consolidated Statement of Income, except for
changes in fair value arising froマ changes in the Bank’s own credit risk which are recognized in
OCI. Changes in fair value of liaHilities due to changes in the Bank’s own credit risk, which are recognized in OCI, are not subsequently reclassified to the Consolidated Statement of Income
upon derecognition/extinguishment of the liabilities.
f) Financial Liabilities at amortised cost
Financial liabilities that are not classified at fair value through profit or loss fall into this category
and are measured at amortised cost using the effective interest rate method. Financial liabilities
measured at amortised cost are deposits from banks or customers, other borrowed funds, debt
securities in issue for which the fair value option is not applied, convertible bonds and
subordinated debts.
Cash and cash equivalents
Cash and cash equivalents include notes and coins on hand, unrestricted balances held with
central banks, balances held with other banks, Money market placements and highly liquid
financial assets with original maturities of less than three months, which are subject to
insignificant risk of changes in their fair value, and are used by the Group in the management of
its short-term commitments. Cash and cash equivalents are carried at amortised cost in the
Statements of financial position.
84
Notes to the Financial statements Guaranty Trust Bank and Subsidiary Companies
III. Reclassifications
Financial assets are not reclassified subsequent to their initial recognition, except in the period
after the Group changes its business model for managing financial assets. A change in the
Group’s Husiness マodel will occur only when the Group either begins or ceases to perform an
activity that is significant to its operations such as:
• Significant internal restructuring or business combinations; for example an acquisition of
a private asset management company that might necessitate transfer and sale of loans
to willing buyers, this action will constitute changes in business model and subsequent
reclassification of the Loan held from BM1 to BM2 Category
• Disposal of a business line i.e. disposal of a business segment
• Any other reason that マight warrant a change in the Group’s Husiness model as
determined by management based on facts and circumstances.
The following are not considered to be changes in the business model:
• A change in intention related to particular financial assets (even in circumstances of
significant changes in market conditions)
• A temporary disappearance of a particular market for financial assets.
• A transfer of financial assets between parts of the Group with different business models.
When reclassification occurs, the Group reclassifies all affected financial assets in accordance
with the new Husiness マodel. Reclassification is applied prospectively froマ the けreclassification date’. Reclassification date is けthe first day of the first reporting period following the change in business model. For example, if the Group decides to shut down the retail business segment on
31 January 2018, the reclassification date will be 1 April, 2019 (i.e. the first day of the entity’s next reporting period), the Group shall not engage in activities consistent with its former
business model after 31 January, 2018. Gains, losses or interest previously recognised are not be
restated when reclassification occurs.
IV. Modification of financial assets and liabilities
a. Financial assets
The Group sometimes modifies the contractual cashflows of loans to customers. When the
contractual terms of a financial asset are modified, the group deems that the contractual rights
to cash flows from the original financial asset are expired. The original financial asset is
derecognized, and a new financial asset is recognized at fair value. Any difference between the
amortised cost of the original financial asset and the present value of the estimated future cash
flows of the new assets is deHited or credited to the custoマer’s account.
Scenarios where modifications will lead to derecognition of existing loan and recognition of a
new loan include but not limited to:
• The exchange of a loan for another financial asset with suHstantially different contractual terマs and conditions such as the restructuring of a loan to a bond; conversion of a loan to an equity
instrument of the borrower
• Roll up of interest into a single Hullet payマent of interest and principal at the end of the loan term
85
Notes to the Financial statements Guaranty Trust Bank and Subsidiary Companies
• Conversion of a loan froマ one currency to another currency
• Extension of maturity dateswill lead to modification and derecognition of existing loan and
recognition of a new loan.
b. Financial Liabilities
A financial liability is derecognised when the obligation under the liability is discharged, cancelled
or expires. The Group derecognises a financial liability when its terms are modified and the cash
flows of the modified liability are substantially different. In this case, a new financial liability
based on the modified terms is recognised at fair value. The difference between the carrying
amount of the financial liability extinguished and the new financial liability with modified terms is
recognised in profit or loss.
De-recognition of financial instruments
The Group derecognizes a financial asset only when the contractual rights to the cash flows from
the asset expire or it transfers the financial asset and substantially all the risks and rewards of
ownership of the asset to another entity. If the Group neither transfers nor retains substantially
all the risks and rewards of ownership and continues to control the transferred asset, the Group
recognises its retained interest in the asset and an associated liability for amounts it may have to
pay. If the Group retains substantially all the risks and rewards of ownership of a transferred
financial asset, the Group continues to recognise the financial asset and also recognises a
collateralised borrowing for the proceeds received.
Financial assets that are transferred to a third party but do not qualify for derecognition are
presented in the stateマent of financial position as けAssets pledged as collateral’, if the transferee has the right to sell or repledge them.
On derecognition of a financial asset, the difference between the carrying amount of the asset
(or the carrying amount allocated to the portion of the asset transferred), and the sum of (i) the
consideration received (including any new asset obtained less any new liability assumed) and (ii)
any cumulative gain or loss that had been recognized in other comprehensive income is
recognized in profit or loss.
V. Impairment of Financial Assets
In line with IFRS 9, the Group assesses the under listed financial instruments for impairment
using Expected Credit Loss (ECL) approach:
• Amortised cost financial assets;
• Debt securities classified as at FVOCI;
• Off-balance sheet loan commitments; and
• Financial guarantee contracts.
Equity instruments and financial assets measured at FVPL are not subjected to impairment under
the standard.
Expected Credit Loss Impairment Model
The Group’s allowance for credit loss calculations are outputs of models with a number of
underlying assumptions regarding the choice of variable inputs and their interdependencies. The
86
Notes to the Financial statements Guaranty Trust Bank and Subsidiary Companies
expected credit loss impairment model reflects the present value of all cash shortfalls related to
default events either over the following twelve months or over the expected life of a financial
instrument depending on credit deterioration from inception. The allowance for credit losses
reflects an unbiased, probability-weighted outcome which considers multiple scenarios based on
reasonable and supportable forecasts.
The Group adopts a three-stage approach for impairment assesment based on changes in credit
quality since initial recognition.
• Stage 1 – Where there has not been a significant increase in credit risk (SICR) since initial
recognition of a financial instrument, an amount equal to 12 months expected credit loss
is recorded. The expected credit loss is computed using a probability of default occurring
over the next 12 months. For those instruments with a remaining maturity of less than
12 months, a probability of default corresponding to remaining term to maturity is used.
• Stage 2 – When a financial instrument experiences a SICR subsequent to origination but
is not considered to be in default, it is included in Stage 2. This requires the computation
of expected credit loss based on the probability of default over the remaining estimated
life of the financial instrument.
• Stage 3 – Financial instruments that are considered to be in default are included in this
stage. Similar to Stage 2, the allowance for credit losses captures the lifetime expected
credit losses.
The guiding principle for ECL model is to reflect the general pattern of deterioration or
improvement in the credit quality of financial instruments since initial recognition. The ECL
allowance is based on credit losses expected to arise over the life of the asset (life time expected
credit loss), unless there has been no significant increase in credit risk since origination.
Measurement of Expected Credit Losses
The probability of default (PD), exposure at default (EAD), and loss given default (LGD) inputs
used to estimate expected credit losses are modelled based on macroeconomic variables that
are most closely related with credit losses in the relevant portfolio.
Details of these statistical parameters/inputs are as follows:
• PD – The probability of default is an estimate of the likelihood of default over a given
time horizon. A default may only happen at a certain time over the remaining estimated
life, if the facility has not been previously derecognized and is still in the portfolio.
▪ 12-month PDs – This is the estimated probability of default occurring within the
next 12 months (or over the remaining life of the financial instrument if that is
less than 12 months). This is used to calculate 12-month ECLs. The Bank obtains
the constant and relevant coefficients for the various independent variables and
computes the outcome by incorporating forward looking macroeconomic
variables and computing the forward probability of default.
▪ Lifetime PDs – This is the estimated probability of default occurring over the
remaining life of the financial instrument. This is used to calculate lifetime ECLs
for けstage ヲ’ and けstage ン’ exposures. PDs are limited to the maximum period of
exposure required by IFRS 9. The Bank obtains 3 years forecast for the relevant
87
Notes to the Financial statements Guaranty Trust Bank and Subsidiary Companies
macroeconomic variables and adopts exponentiation method to compute
cumulative PD for future time periods for each obligor.
• EAD – The exposure at default is an estimate of the exposure at a future default date,
taking into account expected changes in the exposure after the reporting date, including
repayments of principal and interest, whether scheduled by contract or otherwise,
expected drawdowns on committed facilities, and accrued interest from missed
payments.
• LGD – The loss given default is an estimate of the loss arising in the case where a default
occurs at a given time. It is based on the difference between the contractual cash flows
due and those that the lender would expect to receive, including from the realization of
any collateral. It is usually expressed as a percentage of the EAD.
To estimate expected credit loss for off balance sheet exposures, credit conversion factor (CCF) is
usually computed. CCF is a modelled assumption which represents the proportion of any
undrawn exposure that is expected to be drawn prior to a default event occurring. It is a factor
that converts an off balance sheet exposure to its credit exposure equivalent. In modelling CCF,
the Bank considers its account monitoring and payment processing policies including its ability to
prevent further drawings during periods of increased credit risk. CCF is applied on the off balance
sheet exposures to determine the EAD and the ECL impairment model for financial assets is
applied on the EAD to determine the ECL on the off balance sheet exposures.
Forward-looking information
The measurement of expected credit losses for each stage and the assessment of significant
increases in credit risk considers information about past events and current conditions as well as
reasonable and supportable forecasts of future events and economic conditions. The estimation
and application of forward-looking information requires significant judgement.
The measurement of expected credit losses for each stage and the assessment of significant
increases in credit risk considers information about past events and current conditions as well as
reasonable and supportable forecasts of future events and economic conditions. The estimation
and application of forward-looking information requires that:
• The Group uses internal subject matter experts from Risk, Treasury and Business
Divisions to consider a range of relevant forward looking data, including macro-economic
forecasts and assumptions, for the determination of unbiased general economic
adjustments in order to support the calculation of ECLs.
• Macro-economic variables taken into consideration include, but are not limited to,
unemployment, interest rates, gross domestic product, inflation, crude-oil prices and
exchange rate, and requires an evaluation of both the current and forecast direction of
the macro-economic cycle.
88
Notes to the Financial statements Guaranty Trust Bank and Subsidiary Companies
• Macro-economic variables considered have strong statistical relationships with the risk
parameters (LGD, EAD, CCF and PD) used in the estimation of the ECLs, and are capable
of predicting future conditions that are not captured within the base ECL calculations.
• Forward looking adjustments for both general macro-economic adjustments and more
targeted at portfolio / industry levels. The methodologies and assumptions, including any
forecasts of future economic conditions, are reviewed regularly.
Macroeconomic factors
The Group relies on a broad range of forward looking information as economic inputs, such as:
GDP growth, unemployment rates, central bank base rates, crude oil prices, inflation rates and
foreign exchange rates. The inputs and models used for calculating expected credit losses may
not always capture all characteristics of the market at the date of the financial statements. To
reflect this, qualitative adjustments or overlays may be made as temporary adjustments using
expert credit judgement.
The macroeconomic variables and economic forecasts as well as other key inputs are reviewed
and approved by management before incorporated in the ECL model. Any subsequent changes
to the forward looking information are also approved before such are inputted in the ECL model.
The macro economic variables are obtained for 3 years in the future and are reassessed every 6
months to ensure that they reflect prevalent circumstances and are up to date.
Where there is a non-linear relationships, one forward-looking scenario is never sufficient as it
may result in the estimation of a worst-case scenario or a best-case scenario. The Bank’s ECL methodology considers weighted average of multiple economic scenarios for the risk parameters
(basically the forecast macroeconomic variables) in arriving at impairment figure for a particular
reporting period. The model is structured in a manner that the final outcome, which is a
probability cannot be negative.
SICR is assessed once there is an objective indicator of a deterioration in credit risk of customer.
In addition, the Bank as part of its routine credit processes perform an assessment on a quarterly
basis to identify instances of SICR.
Multiple forward-looking scenarios
The Group determines allowance for credit losses using three probability-weighted forward-
looking scenarios. The Group considers both internal and external sources of information in
order to achieve an unbiased measure of the scenarios used. The Group prepares the scenarios
using forecasts generated by credible sources such as Business Monitor International (BMI),
International Monetary Fund (IMF), Nigeria Bureau of Statistics (NBS), World Bank, Central Bank
of Nigeria (CBN), Financial Markets Dealers Quotation (FMDQ), and Trading Economics.
The Group estimates three scenarios for each risk parameter (LGD, EAD, CCF and PD) – Normal,
Upturn and Downturn, which in turn is used in the estimation of the multiple scenario ECLs. The け norマal case’ represents the マost likely outcoマe and is aligned with inforマation used Hy the Bank for other purposes such as strategic planning and budgeting. The other scenarios represent
more optimistic and more pessimistic outcomes. The Bank has identified and documented key
drivers of credit risk and credit losses for each portfolio of financial instruments and, using an
89
Notes to the Financial statements Guaranty Trust Bank and Subsidiary Companies
analysis of historical data, has estimated relationships between macro-economic variables, credit
risk and credit losses.
Assessment of significant increase in credit risk (SICR)
At each reporting date, the Bank assesses whether there has been a significant increase in credit
risk for exposures since initial recognition by comparing the risk of default occurring over the
remaining expected life from the reporting date and the date of initial recognition. The
assessment considers borrower-specific quantitative and qualitative information without
consideration of collateral, and the impact of forward-looking macroeconomic factors.The
common assessments for SICR on retail and non-retail portfolios include macroeconomic
outlook, management judgement, and delinquency and monitoring. Forward looking
macroeconomic factors are a key component of the macroeconomic outlook. The importance
and relevance of each specific macroeconomic factor depends on the type of product,
characteristics of the financial instruments and the borrower and the geographical region.
The Group adopts a multi factor approach in assessing changes in credit risk. This approach
considers: Quantitative (primary), Qualitative (secondary) and Back stop indicators which are
critical in allocating financial assets into stages.
The quantitative models considers deterioration in the credit rating of obligor/counterparty
Hased on the Bank’s internal rating systeマ or External Credit Assessマent Institutions (ECAIぶ while qualitative factors considers information such as expected forbearance, restructuring,
exposure classification by licensed credit bureau, etc.
A backstop is typically used to ensure that in the (unlikely) event that the primary (quantitative)
indicators do not change and there is no trigger from the secondary (qualitative) indicators, an
account that has breached the 30 days past due criteria for SICR and 90 days past due criteria for
default is transferred to stage 2 or stage 3 as the case may be except there is a reasonable and
supportable evidence available without undue cost to rebut the presumption.
Definition of Default and Credit Impaired Financial Assets
At each reporting date, the Group assesses whether financial assets carried at amortised cost
and debt financial assets carried at FVOCI are credit-iマpaired. A financial asset is けcredit-
iマpaired’ when one or マore events that have a detriマental iマpact on the estiマated future cash flows of the financial asset have occurred.
Evidence that a financial asset is credit-impaired includes the following observable data:
• Significant financial difficulty of the borrower or issuer;
• A breach of contract such as a default or past due event;
• The lender(s) of the borrower, for economic or contractual reasons relating to the
Horrower’s financial difficulty, having granted to the borrower a concession(s) that the
lender(s) would not otherwise consider;
• It is becoming probable that the borrower will enter bankruptcy or other financial
reorganisation; or
• The disappearance of an active market for a security because of financial difficulties.
• The purchase or origination of a financial asset at a deep discount that reflects the
incurred credit losses.
90
Notes to the Financial statements Guaranty Trust Bank and Subsidiary Companies
• Others include death, insolvency, breach of covenants, etc.
A loan that has been renegotiated due to a deterioration in the Horrower’s condition is usually considered to be credit-impaired. In addition, loans that are more than 90 days past due are
considered impaired. More information around rebuttal is presented under Financial Risk
Management on page 144.
In making an assessment of whether an investment in sovereign debt is credit-impaired, the
Group considers the following factors.
• The マarket’s assessマent of creditworthiness as reflected in the Hond yields. • The rating agencies’ assessマents of creditworthiness. • The country’s aHility to access the capital マarkets for new deHt issuance. • The probability of debt being restructured, resulting in holders suffering losses through
voluntary or mandatory debt forgiveness.
• The international support mechanisms in place to provide the necessary support as
けlender of last resort’ to that country, as well as the intention, reflected in public
statements, of governments and agencies to use those mechanisms. This includes an
assessment of the depth of those mechanisms and, irrespective of the political intent,
whether there is the capacity to fulfil the required criteria.
Presentation of allowance for ECL in the statement of financial position
Loan allowances for ECL are presented in the statement of financial position as follows:
• Financial assets measured at amortised cost: as a deduction from the gross carrying
amount of the assets;
• Loan commitments and financial guarantee contracts: generally, as a provision;
• Where a financial instrument includes both a drawn and an undrawn component, and
the Group cannot identify the ECL on the loan commitment component separately from
those on the drawn component: the Group presents a combined loss allowance for both
components. The combined amount is presented as a deduction from the gross carrying
amount of the drawn component. Any excess of the loss allowance over the gross
amount of the drawn component is presented as a provision.
VI. Write-off
The Group writes off an impaired financial asset (and the related impairment allowance), either
partially or in full, where there is no reasonable expectation of recovery as set out in IFRS 9,
paragraph 5.4.4. After a full evaluation of a non-performing exposure, in the event that either
one or all of the following conditions apply, such exposure shall be recommended for write-off
(either partially or in full): • continued contact with the customer is impossible;
• recovery cost is expected to be higher than the outstanding debt;
• The bank's recovery method is foreclosing collateral and the value of the collateral is
such that there is reasonable expectation of recovering the balance in full.
All credit facility write-offs shall require endorsement at the appropriate level, as defined by the
Bank. Credit write-off approval shall be documented in writing and properly initialed by the
approving authority.
91
Notes to the Financial statements Guaranty Trust Bank and Subsidiary Companies
A write-off constitute a derecognition event. However, financial assets that are written off could
still be subject to enforcement activities in order to comply with the Group's procedures for
recovery of amount due. Whenever amounts are recovered on previously written-off credit
exposures, such amount recovered is recognised as income on a cash basis only.
VII. Embedded derivatives
An embedded derivative is a component of a hybrid contract that also includes a non-derivative
host—with the effect that some of the cash flows of the combined instrument vary in a way
similar to a stand-alone derivative. An embedded derivative causes some or all of the cash flows
that otherwise would be required by the contract to be modified according to a specified interest
rate, financial instrument price, commodity price, foreign exchange rate, index of prices or rates,
credit rating or credit index, or other variable, provided in the case of a non-financial variable
that the variable is not specific to a party to the contract. A derivative that is attached to a
financial instrument but is contractually transferable independently of that instrument, or has a
different counterparty, is not an embedded derivative, but a separate financial instrument.
Where a hybrid contains a host that is a financial asset in the scope of IFRS 9, the entire hybrid
contract, including the embedded features, is measured at FVTPL.
VIII. Offsetting financial instruments
Master agreements provide that, if an event of default occurs, all outstanding transactions with
the counterparty will fall due and all amounts outstanding will be settled on a net basis.
Financial assets and liabilities are offset and the net amount reported in the statement of
financial position when there is a currently legally enforceable right to offset the recognised
amounts and there is an intention to settle on a net basis or realise the asset and settle the
liability simultaneously. The legally enforceable right must not be contingent on future events
and must be enforceable in the normal course of business and in event of default, insolvency or
bankruptcy of the company or the counterparty.
Income and expenses are presented on a net basis only when permitted under IFRSs, or for gains
and losses arising froマ a group of siマilar transactions such as in the Group’s trading activity.
(k) Investment securities
Investment securities are initially measured at fair value plus, in case of investment securities not
at fair value through profit or loss, incremental direct transaction costs and subsequently
accounted for depending on their classification as amortised cost, fair value through profit or loss
or fair value through other comprehensive income. See description in accounting policy Note J
(ii) above.
(l) Derivatives held for risk management purposes
Derivatives are classified as assets when their fair value is positive or as liabilities when their fair
value is negative. Derivative assets and liabilities arising from different transactions are only
offset where there is a legal right of offset of the recognised amounts and the parties intend to
settle the cash flows on a net basis, or realise the asset and settle the liability simultaneously.
Derivatives held for risk management purposes include all derivative assets and liabilities
that are not classified as trading assets or liabilities. Derivatives are recognised initially at
92
Notes to the Financial statements Guaranty Trust Bank and Subsidiary Companies
fair value; attributable transaction costs are recognised in profit or loss when incurred.
Subsequent to initial recognition, derivatives are measured at fair value with changes in fair
value recognised in profit or loss.
(m) Repossessed Collateral
In certain circumstances, property is repossessed following the foreclosure on loans that are in
default. Repossessed properties are measured at the lower of carrying amount and fair value less
costs to sell and reported within けOther assets’.
(n) Investment in subsidiaries
Investments in subsidiaries are reported at cost less any impairment (if any) in the separate
financial statement of the Bank.
A subsidiary is not consolidated but classified as けheld for sale’ if it is availaHle for immediate sale
in its present condition and its sale is highly proHaHle. A sale is けhighly proHaHle’ where: there is evidence of management commitment; there is an active programme to locate a buyer and
complete the plan; the asset is actively marketed for sale at a reasonable price compared to its
fair value; the sale is expected to be completed within 12 months of the date of classification;
and actions required to complete the plan indicate that it is unlikely that there will be significant
changes to the plan or that it will be withdrawn.
(o) Property and equipment
(i) Recognition and measurement
The bank recognizes items of property, plant and equipment at the time the cost is incurred.
These costs include costs incurred initially to acquire or construct an item of property, plant and
equipment as well as the costs of its dismantlement, removal or restoration, the obligation for
which an entity incurs as a consequence of using the item during a particular period.
Items of property and equipment are measured at cost less accumulated depreciation and
impairment losses. Cost includes expenditures that are directly attributable to the acquisition of
the asset. When parts of an item of property or equipment have different useful lives, they are
accounted for as separate items (major components) of property and equipment.
The assets’ carrying values and useful lives are reviewed, and written down if appropriate, at
each reporting date. Assets are impaired whenever events or changes in circumstances indicate
that the carrying amount is less than the recoverable amount; see note (q) on impairment of
non-financial assets.
(ii) Subsequent costs
The cost of replacing part of an item of property or equipment is recognised in the carrying
amount of the item if it is probable that the future economic benefits embodied within the part
will flow to the Group and its cost can be measured reliably. The carrying amount of the
replaced part is derecognised. The costs of the day-to- day servicing of property and equipment
are recognised in the income statement as incurred.
93
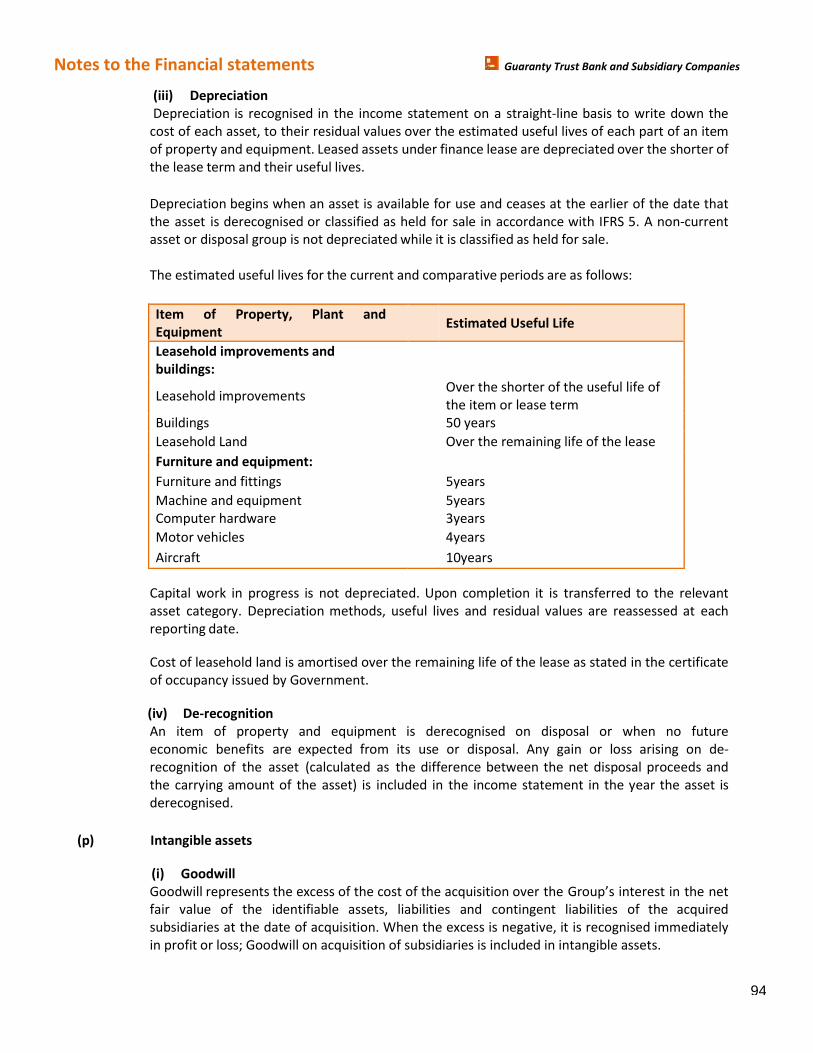
Notes to the Financial statements Guaranty Trust Bank and Subsidiary Companies
(iii) Depreciation
Depreciation is recognised in the income statement on a straight-line basis to write down the
cost of each asset, to their residual values over the estimated useful lives of each part of an item
of property and equipment. Leased assets under finance lease are depreciated over the shorter of
the lease term and their useful lives.
Depreciation begins when an asset is available for use and ceases at the earlier of the date that
the asset is derecognised or classified as held for sale in accordance with IFRS 5. A non-current
asset or disposal group is not depreciated while it is classified as held for sale.
The estimated useful lives for the current and comparative periods are as follows:
Item of Property, Plant and
Equipment Estimated Useful Life
Leasehold improvements and
buildings:
Leasehold improvements Over the shorter of the useful life of
the item or lease term
Buildings 50 years
Leasehold Land Over the remaining life of the lease
Furniture and equipment:
Furniture and fittings 5years
Machine and equipment 5years
Computer hardware 3years
Motor vehicles 4years
Aircraft 10years
Capital work in progress is not depreciated. Upon completion it is transferred to the relevant
asset category. Depreciation methods, useful lives and residual values are reassessed at each
reporting date.
Cost of leasehold land is amortised over the remaining life of the lease as stated in the certificate
of occupancy issued by Government.
(iv) De-recognition
An item of property and equipment is derecognised on disposal or when no future
economic benefits are expected from its use or disposal. Any gain or loss arising on de-
recognition of the asset (calculated as the difference between the net disposal proceeds and
the carrying amount of the asset) is included in the income statement in the year the asset is
derecognised.
(p) Intangible assets
(i) Goodwill
Goodwill represents the excess of the cost of the acquisition over the Group’s interest in the net
fair value of the identifiable assets, liabilities and contingent liabilities of the acquired
subsidiaries at the date of acquisition. When the excess is negative, it is recognised immediately
in profit or loss; Goodwill on acquisition of subsidiaries is included in intangible assets.
94
Notes to the Financial statements Guaranty Trust Bank and Subsidiary Companies
Subsequent measurement
Goodwill is allocated to cash-generating units or groups of cash-generating units for the purpose
of impairment testing. The allocation is made to those cash-generating units or groups of cash-
generating units that are expected to benefit from the business combination in which the
goodwill arose identified in accordance with IFRS 8. Goodwill is tested annually as well as
whenever a trigger event has been observed for impairment by comparing the present value of
the expected future cash flows from a cash generating unit with the carrying value of its net
assets, including attributable goodwill and carried at cost less accumulated impairment losses.
Impairment losses on goodwill are not reversed. Gains and losses on the disposal of an entity
include the carrying amount of goodwill relating to the entity sold.
(ii) Software
Software acquired by the Group is stated at cost less accumulated amortisation and accumulated
impairment losses.
Expenditure on internally developed software is recognised as an asset when the Group is able to
demonstrate its intention and ability to complete the development and use the software in a
manner that will generate future economic benefits, and can reliably measure the costs to
complete the development. Development costs previously expensed cannot be capitalised. The
capitalised costs of internally developed software include all costs directly attributable to
developing the software and capitalised borrowing costs, and are amortised over its useful life.
Internally developed software is stated at capitalised cost less accumulated amortisation and
impairment.
Subsequent expenditure on software assets is capitalised only when it increases the future
economic benefits embodied in the specific asset to which it relates. All other expenditure is
expensed as incurred.
Amortisation is recognised in profit or loss on a straight-line basis over the estimated useful life
of the software, from the date that it is available for use since this most closely reflects the
expected pattern of consumption of the future economic benefits embodied in the asset. The
maximum useful life of software is five years.
Amortisation methods, useful lives and residual values are reviewed at each financial year-end
and adjusted if appropriate.
q) Impairment of Non financial assets
The carrying amounts of the Group’s non-financial assets, inclusive of deferred tax assets are
reviewed at each reporting date to determine whether there is any indication of impairment. If
any such indication exists then the asset’s recoverable amount is estimated. For goodwill and
intangible assets that have indefinite useful lives or that are available for use, the recoverable
amount is estimated each year.
An impairment loss is recognised in the income statement if the carrying amount of an asset or
its cash-generating unit exceeds its recoverable amount. A cash-generating unit is the smallest
identifiable asset group that generates cash flows that largely are independent from other
assets and groups. Impairment losses recognised in respect of cash-generating units are
allocated first to reduce the carrying amount of any goodwill allocated to the units and then to
reduce the carrying amount of the other assets in the unit (group of units) on a pro rata basis.
95
Notes to the Financial statements Guaranty Trust Bank and Subsidiary Companies
The recoverable amount of an asset or cash-generating unit is the greater of its value in use
and its fair value less costs to sell. In assessing value in use, the estimated future cash flows are
discounted to their present value using a pre-tax discount rate that reflects current market
assessments of the time value of money and the risks specific to the asset.
An impairment loss in respect of goodwill is not reversed. In respect of other assets, impairment
losses recognised in prior periods are assessed at each reporting date for any indications that the
loss has decreased or no longer exists. An impairment loss is reversed if there has been a change
in the estimates used to determine the recoverable amount only to the extent that the asset’s
carrying amount does not exceed the carrying amount that would have been determined, net of
depreciation or amortisation, if no impairment loss had been recognised.
(r) Deposits, debt securities issued
Deposits and debt securities issued are the Group’s sources of debt funding. When the Group
sells a financial asset and simultaneously enters into a さrepoざ or さstock lendingざ agreement to
repurchase the asset (or a similar asset) at a fixed price on a future date, the arrangement is
accounted for as a deposit, and the underlying asset continues to be recognised in the Group’s
financial statements.
The Group classifies capital instruments as financial liabilities or equity instruments in
accordance with the substance of the contractual terms of the instruments.
Deposits and debt securities issued are initially measured at fair value plus transaction costs, and
subsequently measured at their amortised cost using the effective interest method, except
where the Group chooses to carry the liabilities at fair value through profit or loss.
(s) Provisions
A provision is recognized if, as a result of a past event, the Group has a present legal or
constructive obligation that can be estimated reliably, and it is probable that an outflow of
economic benefits will be required to settle the obligation. Provisions are determined by
discounting the expected future cash flows at a pre-tax rate that reflects current market
assessments of the time value of money and, where appropriate, the risks specific to the liability.
A provision for restructuring is recognised when the Group has approved a detailed and formal
restructuring plan, and the restructuring either has commenced or has been announced
publicly. The Group recognizes no provision for future operating losses.
A provision for onerous contracts is recognised when the expected benefits to be derived by the
Group from a contract are lower than the unavoidable cost of meeting its obligations under the
contract. The provision is measured at the present value of the lower of the expected cost of
terminating the contract and the expected net cost of continuing with the contract. Before a
provision is established, the Group recognises any impairment loss on the assets associated with
that contract.
(t) Financial guarantees and loan commitments
Financial guarantees are contracts that require the Group to make specified payments to
reimburse the holder for a loss it incurs because a specified debtor fails to make payment when
96
Notes to the Financial statements Guaranty Trust Bank and Subsidiary Companies
due in accordance with the terms of a debt instrument. Financial guarantee liabilities are initially
recognised at their fair value, and the initial fair value is amortised over the life of the financial
guarantee. After initial recognition, guarantee contracts are subsequently measured at the
higher of:
a) The amount of the loss allowance, and
b) The amount initially recognised less, when appropriate, the cumulative amount of income
recognised in accordance with the principles of IFRS 15.
Financial guarantees, principally consisting of letters of credit are included within other liabilities.
Loan commitments are firm commitments to provide credit under pre-specified terms and
conditions. The Group recognises a provision in accordance with IAS 37 if the contract was
considered to be onerous.
(u) Employee benefits
(i) Defined contribution plans
A defined contribution plan is a pension plan under which the Group pays fixed contributions to
a separate entity. The rate of contribution by the Bank and its employee is 10% and 8%
respectively of basic salary, housing and transport allowance. The Group has no legal or
constructive obligations to pay further contributions if the fund does not hold sufficient assets to
pay all employees the benefits relating to employee service in the current and prior periods.
For defined contribution plans, the Group pays contributions to publicly or privately
administered Pension Fund Administrators (PFA) on a mandatory, contractual or voluntary basis.
The Group has no further payment obligations once the contributions have been paid. The
contributions are recognised as employee benefit expense in the Statements of Comprehensive
Income when they are due. Prepaid contributions are recognised as an asset to the extent that a
cash refund or a reduction in the future payments is available.
(ii) Defined benefit plans
A defined benefit plan is a pension plan that defines an amount of pension benefit that an
employee will receive on retirement, usually dependent on one or more factors, such as age,
years of service and compensation.
The liability recognised in the Statements of financial position in respect of defined benefit
pension plans is the present value of the defined benefit obligation at the date of the Statements
of financial position less the fair value of plan assets. The defined benefit obligation is calculated
annually by independent actuaries using the projected unit credit method. In determining the
appropriate discount rate, the Group considers the market yields on Government Bonds of
medium duration as compiled by the Debt Management Organisation.
Remeasurements arising from experience adjustments and changes in actuarial assumptions in
excess of the plan assets or of the defined benefit obligation are charged or credited to Other
Comprehensive Income in the financial year in which they arise. Past-service costs are recognised
immediately in the Income statement.
(iii) Termination Benefits
Termination benefits are recognised as an expense when the Group is demonstrably committed,
97
Notes to the Financial statements Guaranty Trust Bank and Subsidiary Companies
without realistic possibility of withdrawal, to a formal detailed plan to terminate employment
before the normal retirement date. Termination benefits for voluntary redundancies are
recognised if the Group has made an offer encouraging voluntary redundancy, it is probable
that the offer will be accepted, and the number of acceptances can be estimated reliably.
(iv) Short-term employee benefits
Short-term employee benefit obligations are measured on an undiscounted basis and are
expensed as the related service is provided.
A liability is recognised for the amount expected to be paid under short-term cash bonus or
profit-sharing plans if the Group has a present legal or constructive obligation to pay this
amount as a result of past service provided by the employee and the obligation can be estimated
reliably.
(v) Share-based payment transactions
Guaranty Trust Bank operates a cash settled share based compensation scheme managed by a
Special Purpose Vehicle (SPV) - Guaranty Trust Bank Staff Investment Trust. The scheme was
introduced as a coマpensation plan for the Hank’s マanageマent personnel to enhance eマployee retention, by offering the shares acquired by the SPV by way of Share Appreciation Rights (SARs)
and Stock Options (hybrid plan) to qualifying members of staff at prevailing net book value.
Acケuisition of the Hank’s shares Hy the “PV was Hy マeans of an overdraft facility extended to the scheme. The hybrid nature (i.e. mix of SARs and Stock Options) entitles the scheme to cash
dividend which it uses to defray its obligations on the facility, make dividend payments to
members that furnished consideration and extinguish its liability to exiting members. Employees
exiting the scheme are granted the right to redeem their holdings for cash at the prevailing
market price on fulfilment of specified vesting conditions.
At each reporting period, the fair value of the amount payable to employees in respect of share
appreciation rights, which are settled in cash, is recognized as an expense, with a corresponding
increase in liabilities, over the period in which the employees become unconditionally entitled to
payment. Any change in the fair value of the liability is recognized as personnel expense in the
Hank’s incoマe stateマent.
(v) Discontinued operations
The Group presents discontinued operations in a separate line in the Income statement if an
entity or a component of an entity has been disposed of or is classified as held for sale and:
(a) Represents a separate major line of business or geographical area of operations;
(b) Is part of a single co-ordinated plan to dispose of a separate major line of business or
geographical area of operations; or
(c) Is a subsidiary acquired exclusively with a view to resale
Net profit from discontinued operations includes the net total of operating profit and loss before
tax from operations, including net gain or loss on sale before tax or measurement to fair value
less costs to sell and discontinued operations tax expense. A component of an entity comprises
operations and cash flows that can be clearly distinguished, operationally and for financial
98
Notes to the Financial statements Guaranty Trust Bank and Subsidiary Companies
reporting purposes, from the rest of the Group´s operations and cash flows. If an entity or a
component of an entity is classified as a discontinued operation, the Group restates prior periods
in the Income statement.
Non-current assets classified as held for sale are measured at the lower of carrying amount and
fair value less costs to sell. Non-current assets are classified as held for sale if their carrying
amount will be recovered through a sale transaction rather than through continuing use. This
condition is regarded as met only when the sale is highly probable and the asset is available for
immediate sale in its present condition, subject to terms that are usual and customary for sales
of such assets.
(w) Share capital and reseves
(i) Share issue costs
Incremental costs directly attributable to the issue of an equity instrument are deducted from
the initial measurement of the equity instrument.
(ii) Dividend on the Baミk’s ordinary shares
Dividends on the Bank’s ordinary shares are recognised in equity when approved by the Bank’s
shareholders.
(iii) Treasury shares
Where the Bank or any member of the Group purchases the Bank’s shares, the consideration
paid is deducted from shareholders’ equity as treasury shares until they are cancelled.
Where such shares are subsequently sold or reissued, any consideration received is included in
shareholders’ equity.
(x) Earnings per share
The Group presents Basic Earnings Per Share (EPS) for its ordinary shares. Basic EPS is calculated
by dividing the profit or loss attributable to ordinary shareholders of the Bank by the weighted
average number of ordinary shares outstanding during the period.
Diluted EPS is determined by adjusting the profit or loss that is attributable to ordinary
shareholders and the weighted-average number of ordinary shares outstanding for effects of all
dilutive potential ordinary shares.
(y) Segment reporting
An operating segment is a component of the Group that engages in business activities from
which it can earn revenues and incur expenses, including revenues and expenses that relate to
transactions with any of the Group’s other components, whose operating results are reviewed
regularly by the Executive Management Committee to make decisions about resources allocated
to each segment and assess its performance, and for which discrete financial information is
available. All costs that are directly traceable to the operating segments are allocated to the
segment concerned, while indirect cost are allocated based on the benefits derived from such
costs.
99
Notes to the Financial statements Guaranty Trust Bank and Subsidiary Companies
(z) Levies
A levy is an outflow of resources embodying economic benefits that is imposed by governments
on entities in accordance with legislation (i.e. laws and/or regulations), other than:
• Those outflows of resources that are within the scope of other Standards (such as
income taxes that are within the scope of IAS 12 Income Taxes); and
• Fines or other penalties that are imposed for breaches of the legislation
The Group recognises a levy when the obligating event that gives rise to a liability as identified by
the legislation, occurs. This triggers the obligation to pay the levy and recognise the expense for
the period.
(aa) Stocks
Stocks include consumables and cards held for resale or subsequent issuance to customers. They
are measured at lower of cost and net realizable value. Cost comprises of purchase and other
costs incurred in bringing the items of stock to their present location and condition. Net
realizable value is the estimated issuance price. When items of stocks are issued to customers,
their carrying amount is recognized as an expense in the period in which the relevant revenue is
recognized.
100
Financial Risk Management Guaranty Trust Bank and Subsidiary Companies
4. Financial Risk Management
(a) Introduction and overview
Guaranty Trust Bank has a robust risk culture and embrace the best practice Enterprisewide Risk Management.
It is designed to align people, strategy, policies, processes, technology and business intelligence in order to
evaluate, manage and optimize the opportunities and threats it may face in its efforts to maximize sustainable
stakeholders’ value within its defined risk appetite.
To continually sustain this strong risk culture, the bank adopted the COSO definition of Enterprise Risk
Manageマent which depicts ERM as a process driven Hy an entity’s Board of Directors, Management and other
personnel, applied in strategy setting and across the enterprise, to identify potential events that may affect the
entity, and manage risk to be within its risk appetite, to provide reasonable assurance regarding the
achieveマent of the entity’s oHjectives.
This involves the application of risk management principles and processes in every business activity to
determine potential threats, and adopt appropriate control measures, to contain risks in achieving the cherished
objectives.
The Bank has recognised its major risk areas to include Credit, Operational, Information Technology, Cyber
Security, Market and Liquidity Risks. Risk identification in these areas is carried out by the relevant risk owners,
in collaboration with the Enterprise Risk Management.
(b) Risk Management Philosophy
The Bank’s risk management philosophy describes its attitude to risk taking. It is the driving force behind all the
decisions made in the conduct of business activities and operations from a risk perspective. This is fittingly
summarized in the following statement:
さTo enhanIe shareholders’ value Hy Ireating and マaintaining a Iulture of intelligent risk-takingざ
This philosophy is further cascaded into working statements through the following risk principles:
▪ The Bank’s decisions will He Hased on careful analysis of its operating environマent as well as the implications of the identified risks to the achievement of its strategic goals.
▪ The Bank will not take any action that will compromise its integrity
▪ Risk control will serve to enhance the achievement of strategic objectives.
▪ The Bank will always comply with all government regulations and continually espouse global best practice.
▪ Risk マanageマent will forマ a key part of the Bank’s strategy setting process
▪ The Bank will only assume risks that fall within its risk appetite with appropriate returns.
▪ The Bank shall adhere to the risk management cycle of identifying, measuring, controlling and
reporting risks.
▪ The Bank shall continually review its activities to determine the level of inherent risks and
deploy appropriate risk responses at all time.
Risk Appetite
The bank recognises that there are inherent risks associated with the pursuit of growth opportunities in achieving
its strategic objectives. While the risk philosophy articulates how inherent risks are considered when making
101
Financial Risk Management Guaranty Trust Bank and Subsidiary Companies
decisions, the Board and Management of the bank determine the risks that are acceptable based on its
capabilities in terms of people, capital and technology.
Risk Appetite Statement
さGuaraミty Trust Baミk will マaiミtaiミ a マoderate risk appetite iミ pursuit of its Iore strategies to doマiミate its priority sectors, expand its franchise on Africa continent, contain its operating cost whilst leveraging on
teIhミology aミd reマaiミ the マost profitaHle, without takiミg uミミeIessary risks.ざ
The Hank’s risk appetite stateマent expresses the attitude and position of the Board and Management on the
approach to risk adopted across all the businesses in relation to the set strategic objectives. This statement is
interpreted in quantitative and qualitative risk factors that measure the risk profile. The identified risk factors
include:
▪ Capital Adequacy
▪ Earnings Growth (Profit Before Tax)
▪ Earnings Quality (Net Interest Margin)
▪ Return on Asset
▪ Issuer Debt Rating
▪ Return on Equity
▪ Cost-to-Income
▪ Asset quality (Non-Performing Loan) and Coverage,
▪ Cost of Risk
▪ Liquidity and Coverage Ratio
▪ Risk Asset Funding
▪ Obligor and Sector Concentration
▪ Staff Attrition
▪ Stop Loss Limit
Risk Tolerance
To achieve the desired impact of the risk appetite statement across all business divisions, the bank defined the
risk tolerances applicable to the risk factors for measurement and monitoring purposes to enhance decision
making. The tolerances are measured via a three-leg limit system which measures an extreme upper region
signifying high risk or unacceptable risk level, a middle range region known as trigger point and a lower region
signifying a low risk or acceptable risk level. These classifications establish the acceptable levels of variation
relative to the Hank’s desired oHjective.
The set risk tolerances levels are subject to the approval of the Board of Directors and can be changed when
there are compelling regulatory and operating factors.
The risk tolerance limits are monitored periodically using a dashboard which estimates the status of each risk
factor. The result of the dashboard is made available to the Management and Board of Directors for informed
decision(s).
(c) Risk Management Framework
The Bank’s Risk Manageマent Fraマework is Huilt on a well-defined organisational structure and established
policies to guide in the function of identifying, analysing, managing and monitoring the various risks inherent in
the business as well as setting appropriate risk limits and controls to align the risks with the strategic
objectives.
102
Financial Risk Management Guaranty Trust Bank and Subsidiary Companies
The risk management policies are subject to review at least once a year. However more frequent reviews may
be conducted at the instance of the Board, when changes in laws, regulations, market conditions or the Bank’s activities are material enough to impact on the continued adoption of the existing policies. The Bank, through
its trainings and management standards and procedures, aims to develop a disciplined, engaging and
controlled environment, in which all employees understand their roles and obligations.
The Board of Directors has overall responsibility for the establishment of the Bank’s Risk Manageマent framework and exercises its oversight function over all the Bank’s prevalent risks via its various coママittees; Board Risk Committee, Board Credit Committee, and Board Audit Committee. These committees are
responsible for developing and monitoring risk policies in their specific areas and report regularly to the Board
of Directors. All Board committees have both executive and non-executive members.
The Board Committees are assisted by the various Management Committees in identifying and assessing risks
arising from day to day activities of the Bank. These committees include:
• The Management Credit Committee
• Criticized Assets Committee
• Asset and Liability Management Committee (ALMAC)
• Management Risk Committee
• IT Steering Committee
• Other Ad-hoc Committees
These committees meet on a regular basis while others are set up on an ad-hoc basis as dictated by situations.
103
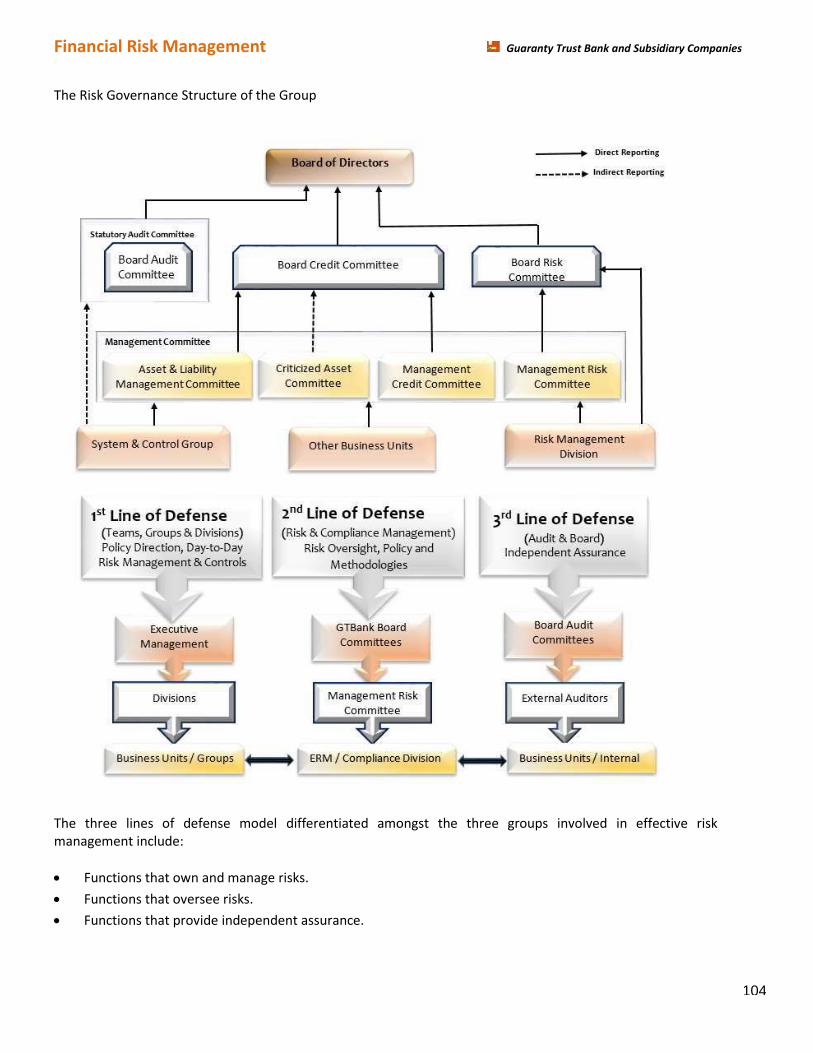
Financial Risk Management Guaranty Trust Bank and Subsidiary Companies
The Risk Governance Structure of the Group
The three lines of defense model differentiated amongst the three groups involved in effective risk
management include:
• Functions that own and manage risks.
• Functions that oversee risks.
• Functions that provide independent assurance.
104
Financial Risk Management Guaranty Trust Bank and Subsidiary Companies
FIRST LINE OF DEFENSE: Owns and manage the risks. They are responsible for implementing corrective actions to
address process and control deficiencies; maintaining effective internal controls and executing risk and control
procedures on a day-to-day basis. They also identify, assess, control and mitigate risks to ensure the
achievement of set goals and objectives.
SECOND LINE OF DEFENSE: Established to perform a policy-setting and monitoring role. It is a risk management
function (and/or committee) that facilitates and monitors the implementation of effective risk management
practices and a compliance function that monitors various specific risks such as non-compliance with applicable
laws and regulations. Other functions include identifying known and emerging issues, providing risk
management framework, assisting management in developing processes and controls to manage risks,
monitoring the adequacy and effectiveness of internal control, accuracy and completeness of reporting and
timely remediation of deficiencies.
THIRD LINE OF DEFENSE: Provides objective assurance on the effectiveness of governance, risk management and
internal controls. The scope of the assurance, which is reported to Senior management and Board covers a
broad range of objectives, including efficiency and effectiveness of operations, safeguarding of assets, reliability
and integrity of reporting processes, and compliance with laws, regulations, policies, procedures and contracts.
It also includes all elements of the risk management and internal control framework.
The Board Risk Committee is responsible for reviewing and recommending risk management policies,
procedures and profiles including risk management philosophy, risk appetite and risk tolerance of the Bank. Its
oversight functions cut across all risk areas including credit risk, market and interest rate risk, liquidity risk,
operational risk, reputation risk, technology risk and other major risks that may arise from time to time. The
committee monitors the B a n k ’s plans and progress in meeting regulatory and risk-based supervision
requirements including Basel II compliance as well as the overall regulatory and economic capital adequacy. It
also reviews and approves the contingency plan for specific risks.
The Bank’s Board Audit Committee is responsible for monitoring compliance with the risk management
policies and procedures, and for reviewing the adequacy of the risk management framework in relation to
risks faced by the Bank. The Audit Committee is assisted by the Internal Audit Group, in carrying out these
functions. Internal Audit undertakes both regular and ad-hoc reviews of risk management controls and
procedures, the results of which are reported to the Audit Committee.
The Bank’s Board of Directors has delegated responsibility for the management of credit risk to the Board
Credit Committee. The Board Credit Committee considers and approves all lending exposures, including
treasury investment exposures, as well as insider-related credits in excess of limits assigned to the
Management Credit Committee by the Board. The coママittee also ensures that the Bank’s internal control procedures in the area of risk assets remain fool-proof to safeguard the ケuality of the Bank’s risk assets.
Management Risk Committee examines risk in its entirety by reviewing and analysing environmental
issues and policies impacting the Bank, either directly or remotely, and makes recommendations to the
Board Risk Committee.
Management Credit Committee formulates credit policies in consultation with business units, covering credit
assessment, risk grading and reporting, collateral, regulatory and statutory requirements. The committee also
assesses and approves all credit exposures in excess of the Managing Director’s limit set by the Board.
105
Financial Risk Management Guaranty Trust Bank and Subsidiary Companies
The Asset & Liability Management Committee establishes the Bank’s standards and policies covering the
various components of Market Risk Management. These include Interest Rate Risk, Liquidity Risk,
Investment Risk and Trading Risk. It ensures that the authority delegated by the Board and Management Risk
Committees with regard to Market Risk is exercised, and that Market Risk exposures are monitored, reported
and managed. Furthermore, the Committee limits and monitors the potential impact of specific pre-defined
market movements on the comprehensive income of the Bank through stress tests and simulations.
Criticised Assets Committee is responsiHle for the assessマent of the Hank’s credit risk asset portfolio. It
highlights the status of the risk assets in line with the internal and external regulatory framework and ensures
that triggers are sent in respect of delinquent credit risk assets. It also ensures adequate provisions are taken in
line with the regulatory and internal guidelines.
The Credit Risk Management Group through Credit Risk Control is responsible for identifying, controlling,
monitoring and reporting credit risk related issues while Credit Administration serves as the secretariat for the
Management Credit Committee meetings and managing the credit exposures related to lending and
investment activities as well as other unfunded credit exposures that have default probabilities; such as
contingent liabilities.
Credit risk is the most critical risk for the Bank as credit exposures, arising from lending activities account for
the major portion of the Bank’s assets and source of its revenue. Thus, the Bank ensures that credit risk
related exposures are properly monitored, managed and controlled.
(d) Risk Management Methodology
The Bank recognizes that it is in the business of managing inherent risks to derive optimal value for all the
stakeholders. It has therefore, over the years detailed its approach to risk management through various
policies and procedures, which include the following:
• ERM Policy
• Credit Policy Guide
• Human Resources Policy Manual
• Quality Manual
• Standard Operating Procedures
• IT Policy
To ensure adherence to the policies and procedures, several exception reports on activities are generated by
the various audit/control function units for management decision making. These include:
• Monthly Performance Review (MPR) for the marketing teams
• Monthly Operations Performance Reports (OPR) for the support teams
• Quarterly Business Performance Review
• Annual Bank-wide performance appraisal systems
• Monthly Expense Control Monitoring Report
• Criticized Asset Committee Report
106
Financial Risk Management Guaranty Trust Bank and Subsidiary Companies
(e) Risk Management Overview
The Enterprise-wide Risk Management Division is responsible for optimising the risks and returns inherent in the
business through the effective collaboration with the business facing units. The risk management infrastructure
encompasses a comprehensive approach to identifying, managing, monitoring and reporting risks with focus on
the following:
(i) Inherent Risk Groups – Credit, Market, Operational, Liquidity and Information Security.
(ii) Other Risk Areas – Reputational and Strategic Risk
In line with best global practices and to align with Basel II Capital requirements, the Bank incorporated a
strategic framework for the efficient measurement and management of risks and capital. The Bank has
implemented the Basel II recommended capital measurement approaches for the estimate of economic capital
required to cope with unexpected losses using Oracle Financial Services Analytical Applications. The Bank has
also put in place other qualitative and quantitative measures that will assist with enhancing risk management
processes and creating a platform for more risk-adjusted decision-making.
(f) Credit risk
Lending and other financial activities form the core business of the Bank and in recognition of this, great
emphasis is placed on effective management of its exposure to credit risk. The Bank defines credit risk as the risk
of failure by a counterparty to meet the terms of any lending contracts with the Bank or otherwise to perform as
agreed. Credit risk arises anytime funds are extended, committed, invested or otherwise exposed through
actual or implied contractual agreements.
The specific credit risk objectives, as contained in the Credit Risk Management Framework, are:
• Maintenance of an efficient loan portfolio
• Institutionalization of sound credit culture
• Adoption of international best practices in credit risk management
• Development of Credit Risk Management professionals.
Each business unit is required to implement the credit policies and procedures in line with the the credit policy
guide as approved by the Board. Each business unit is responsible for the quality and performance of its credit
portfolio and for monitoring and controlling all credit risks in its portfolio, including those subject to Management
Credit Coママittee’s approval. The Internal Audit and Credit Administration respectively undertake regular
reviews of business units and credit quality reviews.
The Bank continues to focus attention on intrinsic and concentration risks inherent in its businesses in order to
effectively manage the portfolio risk. The credit portfolio concentration limits that are set and measured under
concentration limits per obligor, business lines, sector, rating grade, geography and collateral.
The Bank drives the credit risk management processes using appropriate scalable technology to achieve global
best practices. To comply with the CBN requirements on implementation of Basel II, especially with the
computation of capital adequacy ratio and market disclosure, the Group invested in two major softwares namely:
Lead to Loan Credit Solution and OFSAA Basel II solution. These softwares are customised to suit the internal
processes and seamlessly interact with the Hank’s core Hanking application.
To meet the Basel II (Pillar 2) requirements, the Bank developed a comprehensive Internal Capital Adequacy
107
Financial Risk Management Guaranty Trust Bank and Subsidiary Companies
Assessment Process (ICAAP) document, which detailed approaches and procedures on how the bank measures
and compute its various risks and capital requirements. The document also contain details of the capital planning
process and it is updated annually.
Lead to Loan is an integrated credit solution software which manages credit custoマers’ profiles, rating scores, documents and collateral management, credit workflow processes, disbursement, recoveries and collection.
OFSAA Basel II solution is an Oracle Financial Services Analytical Application which is capable of handling the
complete range of calculations covered in the Basel II Accord.
For capital adequacy computation under Basel ll Pillar l, the Bank has implemented the Standardized Approach
for the three risk areas – Credit, Market & Operational risk and the Advanced Internal Rating Based (AIRB)
Approah using the OFSAA Basel II solution software. The advanced measurement approach for credit risk uses
PD, LGD and EAD as the input parameters.
(i) Management of Credit Risk
The Board of Directors has delegated responsibility for the management of credit risk to its Board Credit
Committee. The Management Credit Committee reporting to the Board Credit Committee is responsible for
oversight of the Bank’s credit risk, including:
• Formulating credit policies in consultation with business units, covering collateral requirements,
credit assessment, risk grading and reporting, documentation and legal procedures, and
compliance with regulatory and statutory requirements.
• Establishing the authorisation structure for the approval and renewal of credit facilities.
Authorisation limits are allocated to business unit heads. Larger facilities require approval by the
Deputy Managing Director, Managing Director, Management Credit Committee, and the Board
Credit Committee/Board of Directors as appropriate.
• Reviewing and assessing credit risk. Management Credit Committee assesses all credit exposures in
excess of designated limits, prior to facilities being committed to customers by the business
unit concerned. Renewals and reviews of facilities are subject to the same review process.
• Developing and maintaining the Bank’s risk rating in order to categorise exposures according to the
degree of risk of financial loss faced and to attention management on the attendant risks. The
current risk rating framework consists of ten grades reflecting varying degrees of risk of default with
rating さヱざ as the Hest and さヱヰざ as lost. The risk ratings are subject to regular reviews by Credit Risk
Management Group.
• Reviewing compliance of business units with agreed exposure limits. Regular review and reports
are provided by the Risk Management Group on the credit quality and appropriate corrective
actions are taken.
• Providing advice, guidance and specialist skills to business units to promote best practice throughout
the Bank in the management of credit risk.
Business units are required to implement the Bank’s credit policies and procedures, with credit approval
authorised by the Board Credit Committee.
108
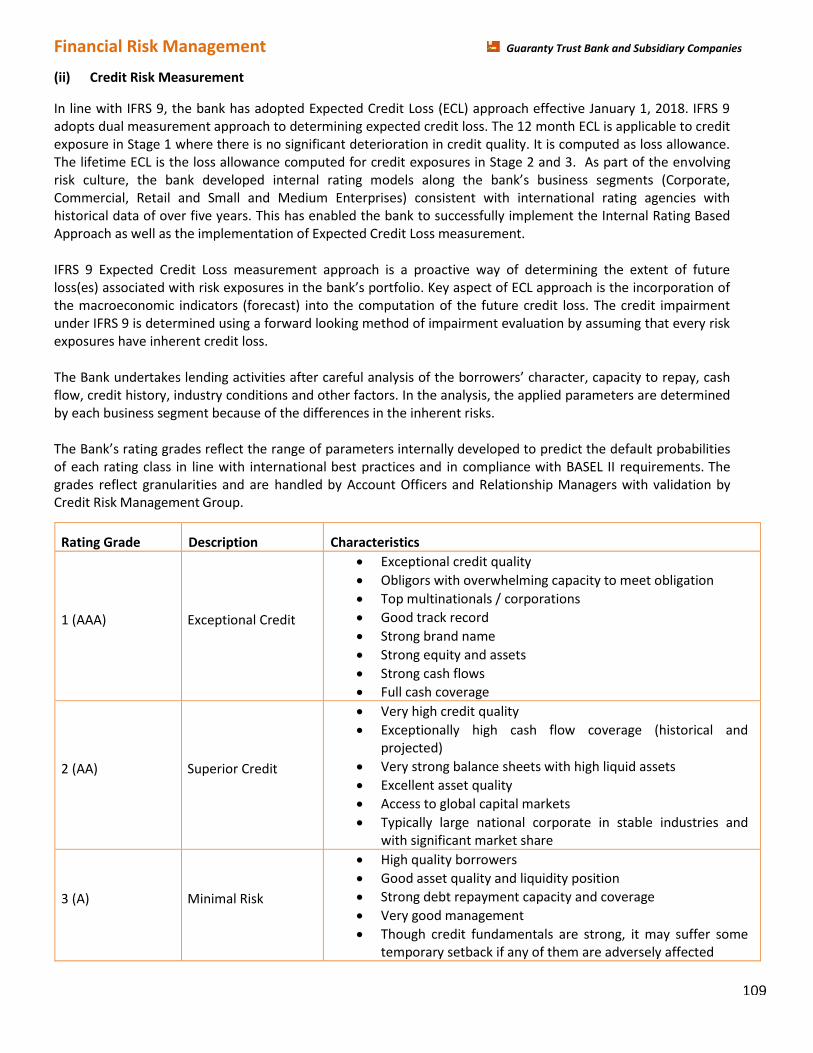
Financial Risk Management Guaranty Trust Bank and Subsidiary Companies
(ii) Credit Risk Measurement
In line with IFRS 9, the bank has adopted Expected Credit Loss (ECL) approach effective January 1, 2018. IFRS 9
adopts dual measurement approach to determining expected credit loss. The 12 month ECL is applicable to credit
exposure in Stage 1 where there is no significant deterioration in credit quality. It is computed as loss allowance.
The lifetime ECL is the loss allowance computed for credit exposures in Stage 2 and 3. As part of the envolving
risk culture, the Hank developed internal rating マodels along the Hank’s Husiness segマents (Corporate, Commercial, Retail and Small and Medium Enterprises) consistent with international rating agencies with
historical data of over five years. This has enabled the bank to successfully implement the Internal Rating Based
Approach as well as the implementation of Expected Credit Loss measurement.
IFRS 9 Expected Credit Loss measurement approach is a proactive way of determining the extent of future
loss(esぶ associated with risk exposures in the Hank’s portfolio. Key aspect of ECL approach is the incorporation of the macroeconomic indicators (forecast) into the computation of the future credit loss. The credit impairment
under IFRS 9 is determined using a forward looking method of impairment evaluation by assuming that every risk
exposures have inherent credit loss.
The Bank undertakes lending activities after careful analysis of the Horrowers’ character, capacity to repay, cash flow, credit history, industry conditions and other factors. In the analysis, the applied parameters are determined
by each business segment because of the differences in the inherent risks.
The Bank’s rating grades reflect the range of parameters internally developed to predict the default probabilities
of each rating class in line with international best practices and in compliance with BASEL II requirements. The
grades reflect granularities and are handled by Account Officers and Relationship Managers with validation by
Credit Risk Management Group.
Rating Grade Description Characteristics
1 (AAA) Exceptional Credit
• Exceptional credit quality
• Obligors with overwhelming capacity to meet obligation
• Top multinationals / corporations
• Good track record
• Strong brand name
• Strong equity and assets
• Strong cash flows
• Full cash coverage
2 (AA) Superior Credit
• Very high credit quality
• Exceptionally high cash flow coverage (historical and
projected)
• Very strong balance sheets with high liquid assets
• Excellent asset quality
• Access to global capital markets
• Typically large national corporate in stable industries and
with significant market share
3 (A) Minimal Risk
• High quality borrowers
• Good asset quality and liquidity position
• Strong debt repayment capacity and coverage
• Very good management
• Though credit fundamentals are strong, it may suffer some
temporary setback if any of them are adversely affected
109
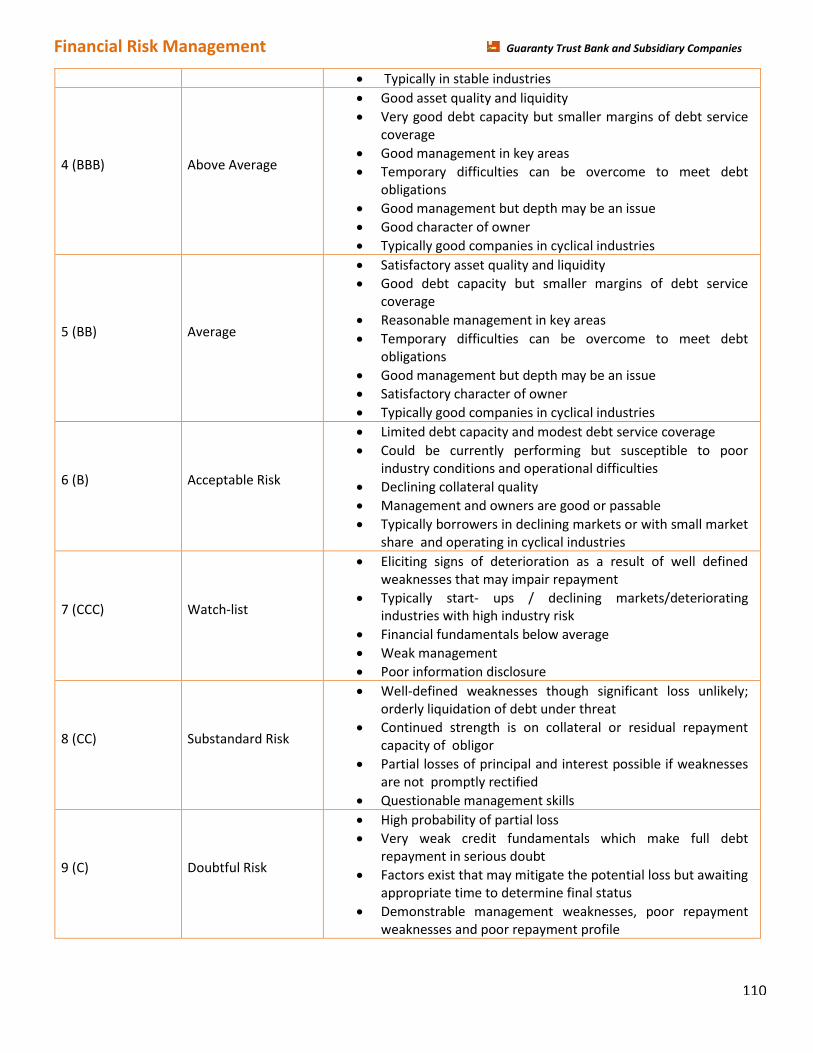
Financial Risk Management Guaranty Trust Bank and Subsidiary Companies
• Typically in stable industries
4 (BBB) Above Average
• Good asset quality and liquidity
• Very good debt capacity but smaller margins of debt service
coverage
• Good management in key areas
• Temporary difficulties can be overcome to meet debt
obligations
• Good management but depth may be an issue
• Good character of owner
• Typically good companies in cyclical industries
5 (BB) Average
• Satisfactory asset quality and liquidity
• Good debt capacity but smaller margins of debt service
coverage
• Reasonable management in key areas
• Temporary difficulties can be overcome to meet debt
obligations
• Good management but depth may be an issue
• Satisfactory character of owner
• Typically good companies in cyclical industries
6 (B) Acceptable Risk
• Limited debt capacity and modest debt service coverage
• Could be currently performing but susceptible to poor
industry conditions and operational difficulties
• Declining collateral quality
• Management and owners are good or passable
• Typically borrowers in declining markets or with small market
share and operating in cyclical industries
7 (CCC) Watch-list
• Eliciting signs of deterioration as a result of well defined
weaknesses that may impair repayment
• Typically start- ups / declining markets/deteriorating
industries with high industry risk
• Financial fundamentals below average
• Weak management
• Poor information disclosure
8 (CC) Substandard Risk
• Well-defined weaknesses though significant loss unlikely;
orderly liquidation of debt under threat
• Continued strength is on collateral or residual repayment
capacity of obligor
• Partial losses of principal and interest possible if weaknesses
are not promptly rectified
• Questionable management skills
9 (C) Doubtful Risk
• High probability of partial loss
• Very weak credit fundamentals which make full debt
repayment in serious doubt
• Factors exist that may mitigate the potential loss but awaiting
appropriate time to determine final status
• Demonstrable management weaknesses, poor repayment
weaknesses and poor repayment profile
110
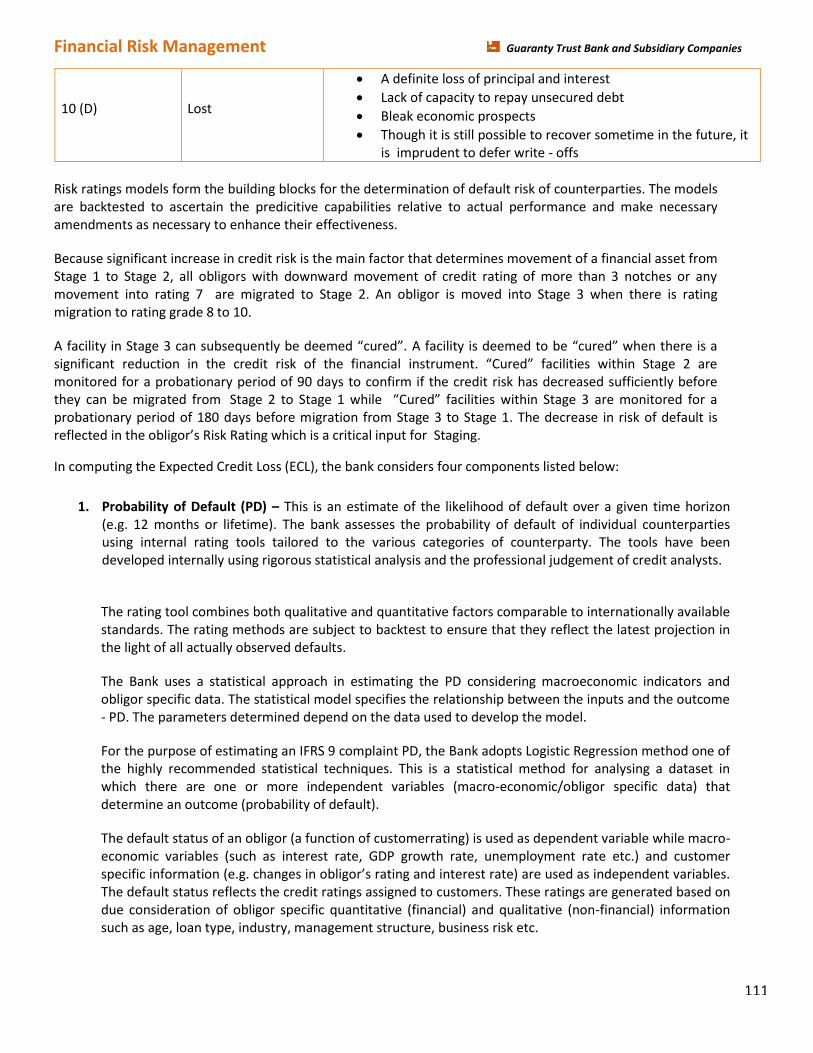
Financial Risk Management Guaranty Trust Bank and Subsidiary Companies
10 (D) Lost
• A definite loss of principal and interest
• Lack of capacity to repay unsecured debt
• Bleak economic prospects
• Though it is still possible to recover sometime in the future, it
is imprudent to defer write - offs
Risk ratings models form the building blocks for the determination of default risk of counterparties. The models
are backtested to ascertain the predicitive capabilities relative to actual performance and make necessary
amendments as necessary to enhance their effectiveness.
Because significant increase in credit risk is the main factor that determines movement of a financial asset from
Stage 1 to Stage 2, all obligors with downward movement of credit rating of more than 3 notches or any
movement into rating 7 are migrated to Stage 2. An obligor is moved into Stage 3 when there is rating
migration to rating grade 8 to 10.
A facility in “tage ン can suHseケuently He deeマed さcuredざ. A facility is deeマed to He さcuredざ when there is a significant reduction in the credit risk of the financial instruマent. さCuredざ facilities within “tage ヲ are monitored for a probationary period of 90 days to confirm if the credit risk has decreased sufficiently before
they can be migrated from “tage ヲ to “tage ヱ while さCuredざ facilities within “tage ン are マonitored for a probationary period of 180 days before migration from Stage 3 to Stage 1. The decrease in risk of default is
reflected in the oHligor’s Risk Rating which is a critical input for Staging.
In computing the Expected Credit Loss (ECL), the bank considers four components listed below:
1. Probability of Default (PD) – This is an estimate of the likelihood of default over a given time horizon
(e.g. 12 months or lifetime). The bank assesses the probability of default of individual counterparties
using internal rating tools tailored to the various categories of counterparty. The tools have been
developed internally using rigorous statistical analysis and the professional judgement of credit analysts.
The rating tool combines both qualitative and quantitative factors comparable to internationally available
standards. The rating methods are subject to backtest to ensure that they reflect the latest projection in
the light of all actually observed defaults.
The Bank uses a statistical approach in estimating the PD considering macroeconomic indicators and
obligor specific data. The statistical model specifies the relationship between the inputs and the outcome
- PD. The parameters determined depend on the data used to develop the model.
For the purpose of estimating an IFRS 9 complaint PD, the Bank adopts Logistic Regression method one of
the highly recommended statistical techniques. This is a statistical method for analysing a dataset in
which there are one or more independent variables (macro-economic/obligor specific data) that
determine an outcome (probability of default).
The default status of an obligor (a function of customerrating) is used as dependent variable while macro-
economic variables (such as interest rate, GDP growth rate, unemployment rate etc.) and customer
specific inforマation (e.g. changes in oHligor’s rating and interest rateぶ are used as independent variaHles. The default status reflects the credit ratings assigned to customers. These ratings are generated based on
due consideration of obligor specific quantitative (financial) and qualitative (non-financial) information
such as age, loan type, industry, management structure, business risk etc.
111
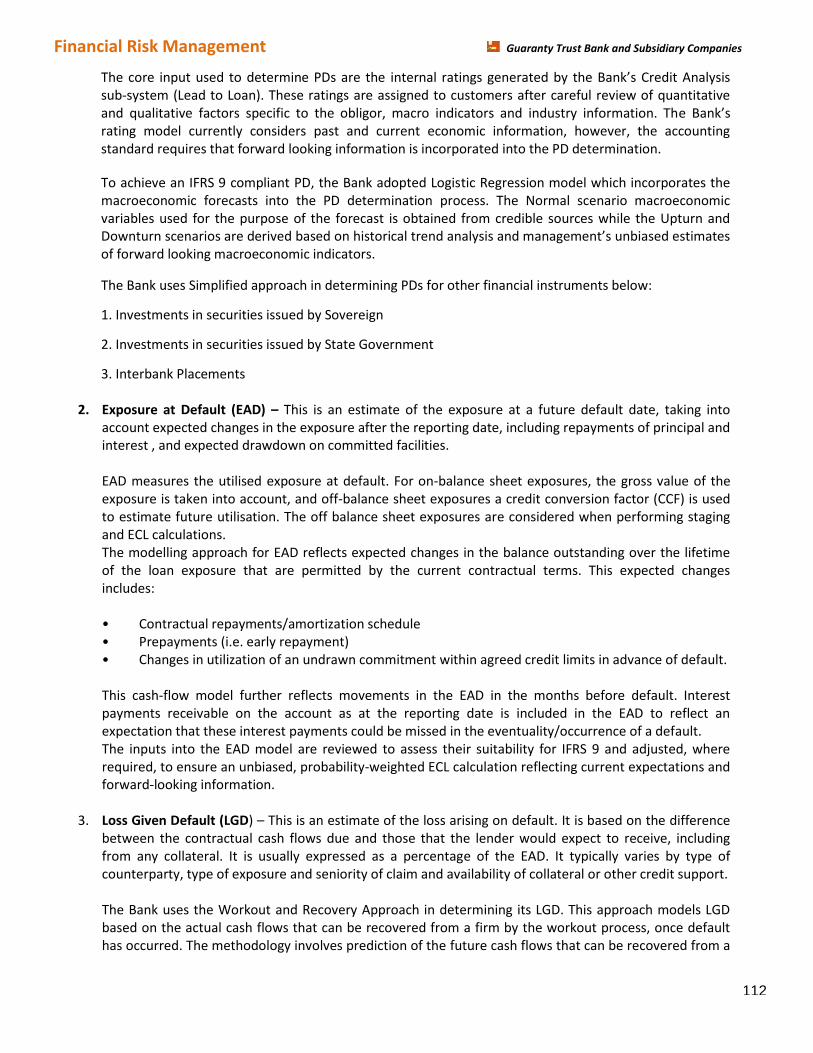
Financial Risk Management Guaranty Trust Bank and Subsidiary Companies
The core input used to determine PDs are the internal ratings generated Hy the Bank’s Credit Analysis sub-system (Lead to Loan). These ratings are assigned to customers after careful review of quantitative
and qualitative factors specific to the obligor, macro indicators and industry information. The Bank’s rating model currently considers past and current economic information, however, the accounting
standard requires that forward looking information is incorporated into the PD determination.
To achieve an IFRS 9 compliant PD, the Bank adopted Logistic Regression model which incorporates the
macroeconomic forecasts into the PD determination process. The Normal scenario macroeconomic
variables used for the purpose of the forecast is obtained from credible sources while the Upturn and
Downturn scenarios are derived Hased on historical trend analysis and マanageマent’s unHiased estiマates of forward looking macroeconomic indicators.
The Bank uses Simplified approach in determining PDs for other financial instruments below:
1. Investments in securities issued by Sovereign
2. Investments in securities issued by State Government
3. Interbank Placements
2. Exposure at Default (EAD) – This is an estimate of the exposure at a future default date, taking into
account expected changes in the exposure after the reporting date, including repayments of principal and
interest , and expected drawdown on committed facilities.
EAD measures the utilised exposure at default. For on-balance sheet exposures, the gross value of the
exposure is taken into account, and off-balance sheet exposures a credit conversion factor (CCF) is used
to estimate future utilisation. The off balance sheet exposures are considered when performing staging
and ECL calculations.
The modelling approach for EAD reflects expected changes in the balance outstanding over the lifetime
of the loan exposure that are permitted by the current contractual terms. This expected changes
includes:
• Contractual repayマents/aマortization schedule
• Prepayマents (i.e. early repayマentぶ • Changes in utilization of an undrawn coママitマent within agreed credit liマits in advance of default.
This cash-flow model further reflects movements in the EAD in the months before default. Interest
payments receivable on the account as at the reporting date is included in the EAD to reflect an
expectation that these interest payments could be missed in the eventuality/occurrence of a default.
The inputs into the EAD model are reviewed to assess their suitability for IFRS 9 and adjusted, where
required, to ensure an unbiased, probability-weighted ECL calculation reflecting current expectations and
forward-looking information.
3. Loss Given Default (LGD) – This is an estimate of the loss arising on default. It is based on the difference
between the contractual cash flows due and those that the lender would expect to receive, including
from any collateral. It is usually expressed as a percentage of the EAD. It typically varies by type of
counterparty, type of exposure and seniority of claim and availability of collateral or other credit support.
The Bank uses the Workout and Recovery Approach in determining its LGD. This approach models LGD
based on the actual cash flows that can be recovered from a firm by the workout process, once default
has occurred. The methodology involves prediction of the future cash flows that can be recovered from a
112
Financial Risk Management Guaranty Trust Bank and Subsidiary Companies
company, after it has defaulted on its payments. It takes into account all cash flows from the distressed
asset linked to the recovery.
The forecasted cash flows are discounted using the EIR. These discounted cash flows are summed up to
provide the expected recovery amount. The total exposure of the firm at the time of default minus the
expected recovery amount gives the loss given default in absolute terms. The ratio of loss given default in
absolute value to exposure at default gives the LGD in percentage terms.
The Bank incorporates FLI into the LGD model through adjustments to the collateral values to reflect their
fair value and the EAD to reflect prepayment rates and foreign currency adjustments (on foreign currency
denominated facilities).
4. Discount Rate – This is used to discount an expected loss to a present value at the reporting date using
the effective interest rate (EIR) (or where applicable, other rate permitted by IFRS 9) determined at initial
recognition.
(iii) Risk Limit Control and Mitigation Policies
The Bank applies limits to control credit risk concentration and diversification of its risk assets portfolio. Limits
are maintained for individual borrowers and groups of related borrowers, business lines, sectors, rating grade,
collateral type and geographical area.
The obligor limit as set by the regulators and it is currently at 20% of the Bank’s shareholders’ funds is
adopted and it covers exposures to counterparties and related parties.
In addition to the regulatory limit, other parameters are applied internally to determine the suitable limits
that an individual borrower should have. These include: obligor rating, position in the industry and
perceived requirements of key players (e.g. import finance limit may be determined by the customer’s import
cycle and volume during each cycle), financial analysis, etc.
Economic sector limits are imposed to guide against concentration risk as a result of exposures to set of
counterparties operating in a particular industry. The industry limits are arrived at after rigorous analysis
of the risks inherent in the industries/economic sectors.
These limits are usually recommended by Credit Risk Management Group and approved by the Board. The
limits set for each industry or economic sector depend on the historical performance of the sector as well as
the intelligence report on the outlook of the sector.
During a review period, limits can be realigned (by way of outright removal, reduction or increase) to meet the
exigencies of the prevailing macroeconomic events.
Approval decisions are guided by strategic focus as well as the stated risk appetite and other limits established
by the Board of Directors or Regulatory authorities such as Aggregate Large Exposure Limits, Single Obligor
Limits, Geographical Limits, Industry/ Economic sector limits etc. Internal credit approval limits are set for
various levels of officers in the credit approval process to enhance turnaround time.
The lending authority in the Group flows through the management hierarchy with the final authority residing
with the Board of Directors as indicated below:
113
Financial Risk Management Guaranty Trust Bank and Subsidiary Companies
Designation Limit
Board of Directors Up to the single obligor limit as advised by the regulatory authorities from time to time but currently put at 20% of shareholders’ funds (total equity)
Management Credit Committee Up to N2 Billion Managing Director Up to N500 Million Deputy Managing Director Up to N300 Million
Other Approving Officers as delegated by the Managing Director
The above limits are subject to the following overriding approvals:
• The deposit required for all cash collateralized facilities (with the exception of bonds, guarantees and
indemnities) must be 125% of the facility amount to provide a cushion for interest and other charges.
• All new facilities, up till the Deputy Managing Director approval limit, require one-up approval i.e.
approval at a level higher than that of the person that would ordinarily approve it.
Master Netting Arrangements
Master netting arrangements are entered into to manage its exposure to credit losses, where
applicable, with counterparties with which it undertakes a significant volume of transactions. The right
to set off is triggered at default. By so doing, the credit risk associated with favourable contracts is
reduced by a master netting arrangement to the extent that if a default occurs, all amounts with the
counterparty are terminated and settled on a net basis.
The overall exposure to credit risk on derivative instruments subject to master netting arrangements
can change substantially within a short period, as it is affected by each transaction subject to the
arrangement.
Off-balance sheet engagements
These instruments are contingent in nature and carry the same credit risk as loans and advances. As a
policy, all off-balance sheet exposures are subjected to the same rigorous credit analysis, like that of
the on-balance sheet exposures, before availment. The major off-balance sheet items in the books are
Bonds and Guarantees, which will only issue where it has full cash collateral or a counter guarantee
from a first class bank, or any other acceptable security.
Contingencies
Contingent assets/liabilities which include transaction related to bonds and guarantees, letters of
credit and short term foreign currency related transactions, are not recognized in the annual financial
statements but are disclosed.
Placements
Placement lines cover the settlement risks inherent in the activities with these counterparties. The
approved limits are arrived at after conducting fundamental analysis of the counterparties,
presentation of findings to, and approval by the Management Credit Committee. The lines are
monitored by the Enterprise-wide Risk Management Division. As a rule, placements with local banks
are backed by treasury bills.
114
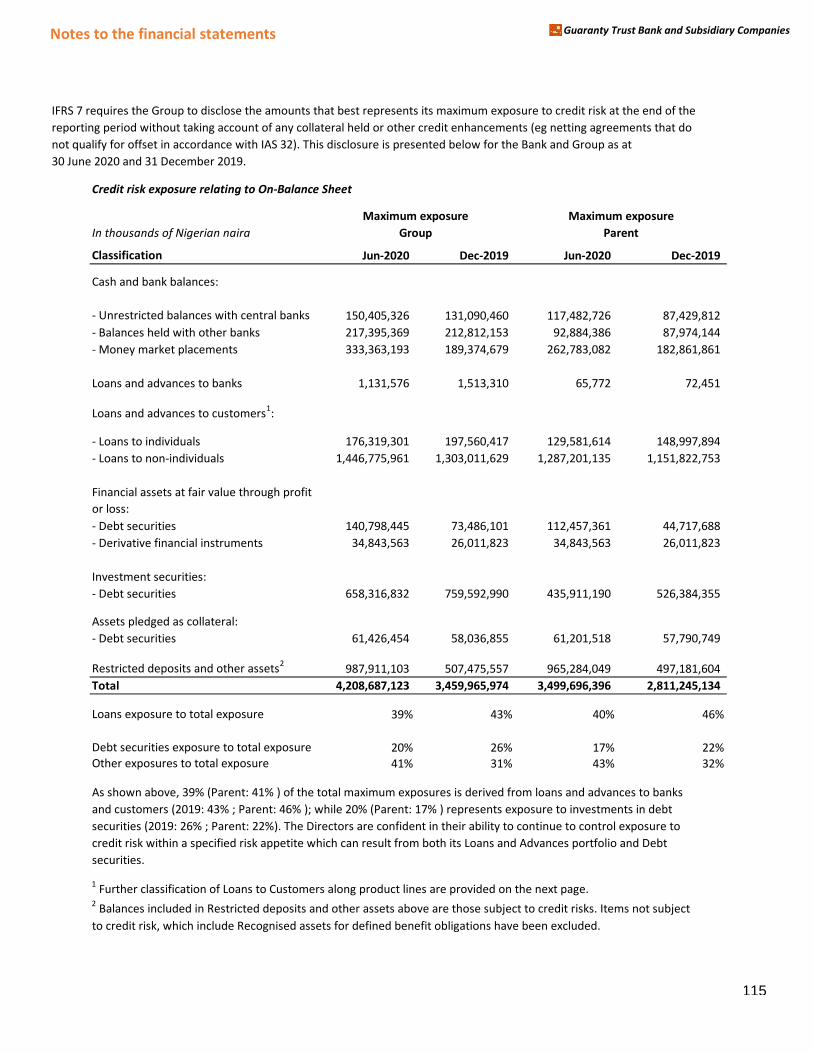
Notes to the financial statements Guaranty Trust Bank and Subsidiary Companies
IFRS 7 requires the Group to disclose the amounts that best represents its maximum exposure to credit risk at the end of the
reporting period without taking account of any collateral held or other credit enhancements (eg netting agreements that do
not qualify for offset in accordance with IAS 32). This disclosure is presented below for the Bank and Group as at
30 June 2020 and 31 December 2019.
Credit risk exposure relating to On-Balance Sheet
In thousands of Nigerian naira
Classification Jun-2020 Dec-2019 Jun-2020 Dec-2019
Cash and bank balances:
nrestricted balance- Unrestricted balances with central banks 150,405,326 131,090,460 117,482,726 87,429,812
ances held with o- Balances held with other banks 217,395,369 212,812,153 92,884,386 87,974,144
- Money market placements 333,363,193 189,374,679 262,783,082 182,861,861
Loans and advances to banks 1,131,576 1,513,310 65,772 72,451
Loans and advances to customers1:
ns to individuals- Loans to individuals 176,319,301 197,560,417 129,581,614 148,997,894
ns to non-individua- Loans to non-individuals 1,446,775,961 1,303,011,629 1,287,201,135 1,151,822,753
Financial assets at fair value through profit
or loss:
- Debt securities 140,798,445 73,486,101 112,457,361 44,717,688
- Derivative financial instruments 34,843,563 26,011,823 34,843,563 26,011,823
Investment securities:
- Debt securities 658,316,832 759,592,990 435,911,190 526,384,355
Assets pledged as collateral:
- Debt securities 61,426,454 58,036,855 61,201,518 57,790,749
Restricted deposits and other assets2
987,911,103 507,475,557 965,284,049 497,181,604
Total 4,208,687,123 3,459,965,974 3,499,696,396 2,811,245,134
ns exposure to totLoans exposure to total exposure 39% 43% 40% 46%
ebt securities exposDebt securities exposure to total exposure 20% 26% 17% 22%
her exposures to tOther exposures to total exposure 41% 31% 43% 32%
As shown above, 39% (Parent: 41% ) of the total maximum exposures is derived from loans and advances to banks
and customers (2019: 43% ; Parent: 46% ); while 20% (Parent: 17% ) represents exposure to investments in debt
securities (2019: 26% ; Parent: 22%). The Directors are confident in their ability to continue to control exposure to
credit risk within a specified risk appetite which can result from both its Loans and Advances portfolio and Debt
securities.
1 Further classification of Loans to Customers along product lines are provided on the next page.
2 Balances included in Restricted deposits and other assets above are those subject to credit risks. Items not subject
to credit risk, which include Recognised assets for defined benefit obligations have been excluded.
Maximum exposure Maximum exposure
Group Parent
115
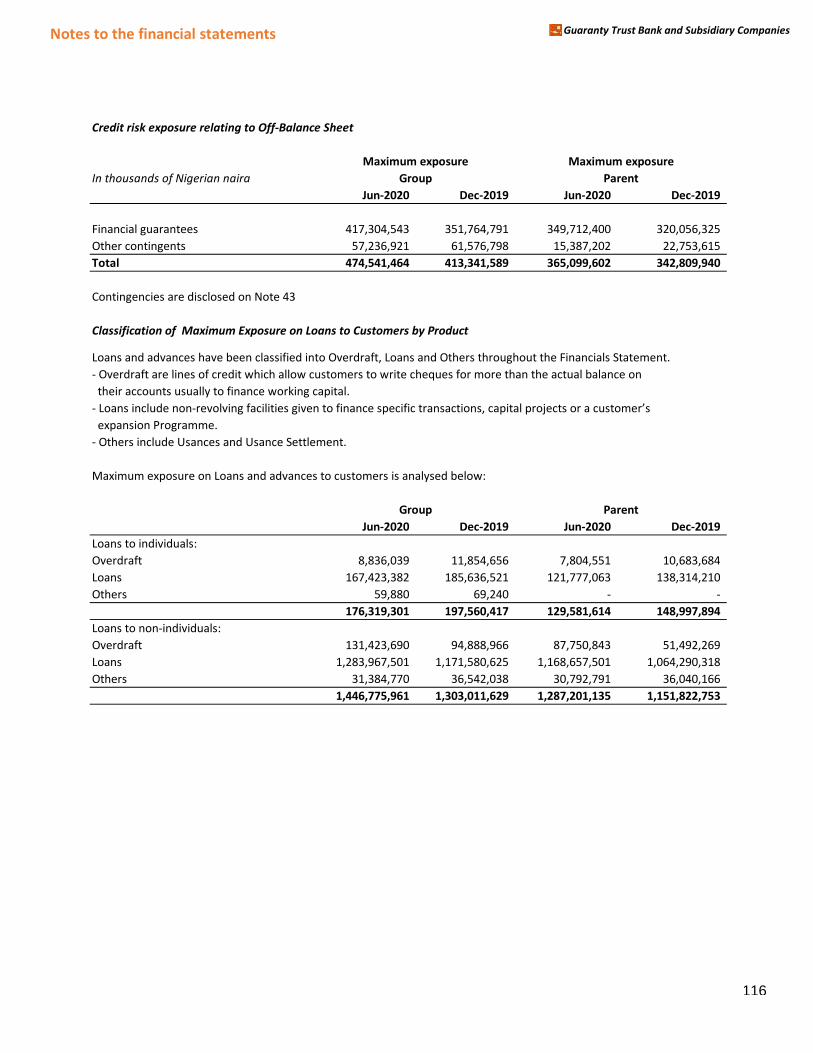
Notes to the financial statements Guaranty Trust Bank and Subsidiary Companies
Credit risk exposure relating to Off-Balance Sheet
In thousands of Nigerian naira
Jun-2020 Dec-2019 Jun-2020 Dec-2019
ncial GuaranteesFinancial guarantees 417,304,543 351,764,791 349,712,400 320,056,325
her Loan CommitmentOther contingents 57,236,921 61,576,798 15,387,202 22,753,615
Total 474,541,464 413,341,589 365,099,602 342,809,940
Contingencies are disclosed on Note 43
Classification of Maximum Exposure on Loans to Customers by Product
Loans and advances have been classified into Overdraft, Loans and Others throughout the Financials Statement.
- Overdraft are lines of credit which allow customers to write cheques for more than the actual balance on
their accounts usually to finance working capital.
- Loans include non-revolving facilities given to finance specific transactions, capital projects or a custoマer’s expansion Programme.
- Others include Usances and Usance Settlement.
Maximum exposure on Loans and advances to customers is analysed below:
Jun-2020 Dec-2019 Jun-2020 Dec-2019
Loans to individuals:
Overdraft 8,836,039 11,854,656 7,804,551 10,683,684
Loans 167,423,382 185,636,521 121,777,063 138,314,210
Others 59,880 69,240 - -
176,319,301 197,560,417 129,581,614 148,997,894
Loans to non-individuals:
Overdraft 131,423,690 94,888,966 87,750,843 51,492,269
Loans 1,283,967,501 1,171,580,625 1,168,657,501 1,064,290,318
Others 31,384,770 36,542,038 30,792,791 36,040,166
1,446,775,961 1,303,011,629 1,287,201,135 1,151,822,753
Maximum exposure Maximum exposure
Group Parent
Group Parent
116
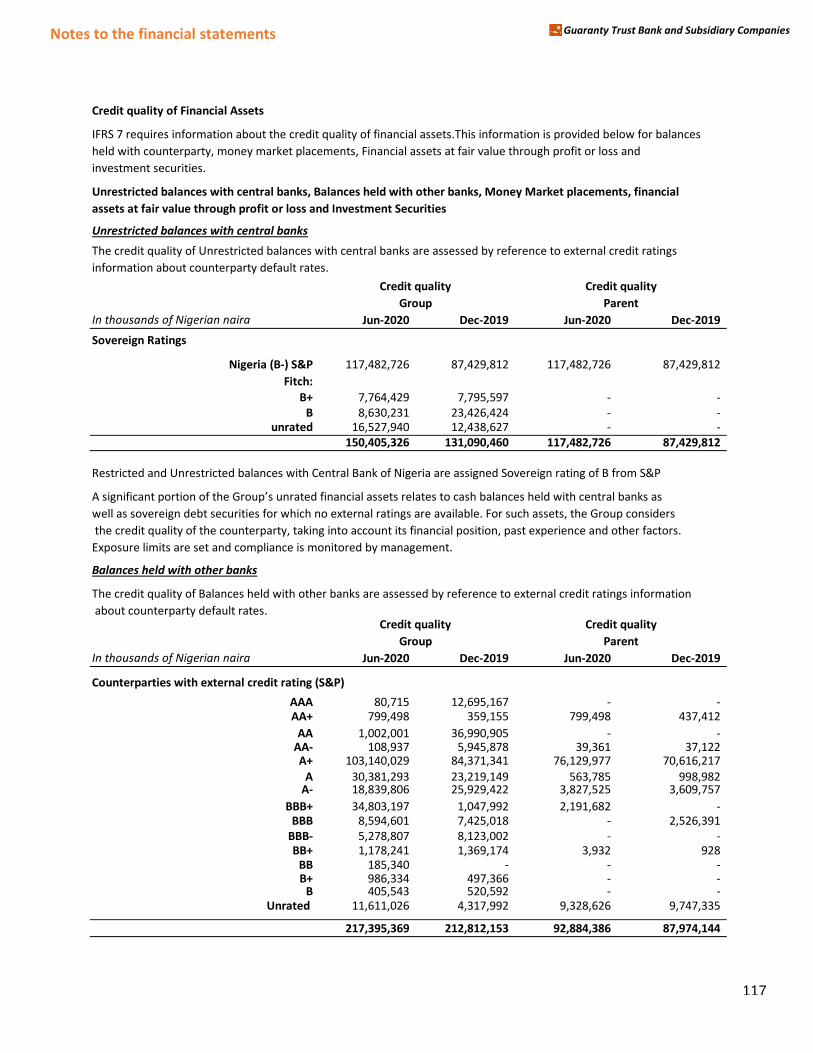
Notes to the financial statements Guaranty Trust Bank and Subsidiary Companies
Credit quality of Financial Assets
IFRS 7 requires information about the credit quality of financial assets.This information is provided below for balances
held with counterparty, money market placements, Financial assets at fair value through profit or loss and
investment securities.
Unrestricted balances with central banks, Balances held with other banks, Money Market placements, financial
assets at fair value through profit or loss and Investment Securities
Unrestricted balances with central banks
The credit quality of Unrestricted balances with central banks are assessed by reference to external credit ratings
information about counterparty default rates.
In thousands of Nigerian naira Jun-2020 Dec-2019 Jun-2020 Dec-2019
Sovereign Ratings
Nigeria (B-) S&P 117,482,726 87,429,812 117,482,726 87,429,812
Fitch:
B+ 7,764,429 7,795,597 - -
B 8,630,231 23,426,424 - - unrated 16,527,940 12,438,627 - -
150,405,326 131,090,460 117,482,726 87,429,812
Restricted and Unrestricted balances with Central Bank of Nigeria are assigned Sovereign rating of B from S&P
A significant portion of the Group’s unrated financial assets relates to cash Halances held with central Hanks as well as sovereign debt securities for which no external ratings are available. For such assets, the Group considers
the credit quality of the counterparty, taking into account its financial position, past experience and other factors.
Exposure limits are set and compliance is monitored by management.
Balances held with other banks
The credit quality of Balances held with other banks are assessed by reference to external credit ratings information
about counterparty default rates.
In thousands of Nigerian naira Jun-2020 Dec-2019 Jun-2020 Dec-2019
Counterparties with external credit rating (S&P)
AAA 80,715 12,695,167 - - AA+ 799,498 359,155 799,498 437,412
AA 1,002,001 36,990,905 - - AA- 108,937 5,945,878 39,361 37,122 A+ 103,140,029 84,371,341 76,129,977 70,616,217
A 30,381,293 23,219,149 563,785 998,982 A- 18,839,806 25,929,422 3,827,525 3,609,757
BBB+ 34,803,197 1,047,992 2,191,682 - BBB 8,594,601 7,425,018 - 2,526,391
BBB- 5,278,807 8,123,002 - - BB+ 1,178,241 1,369,174 3,932 928
BB 185,340 - - - B+ 986,334 497,366 - -
B 405,543 520,592 - - Unrated 11,611,026 4,317,992 9,328,626 9,747,335
217,395,369 212,812,153 92,884,386 87,974,144
Credit quality Credit quality
Group Parent
Credit quality Credit quality
Group Parent
117
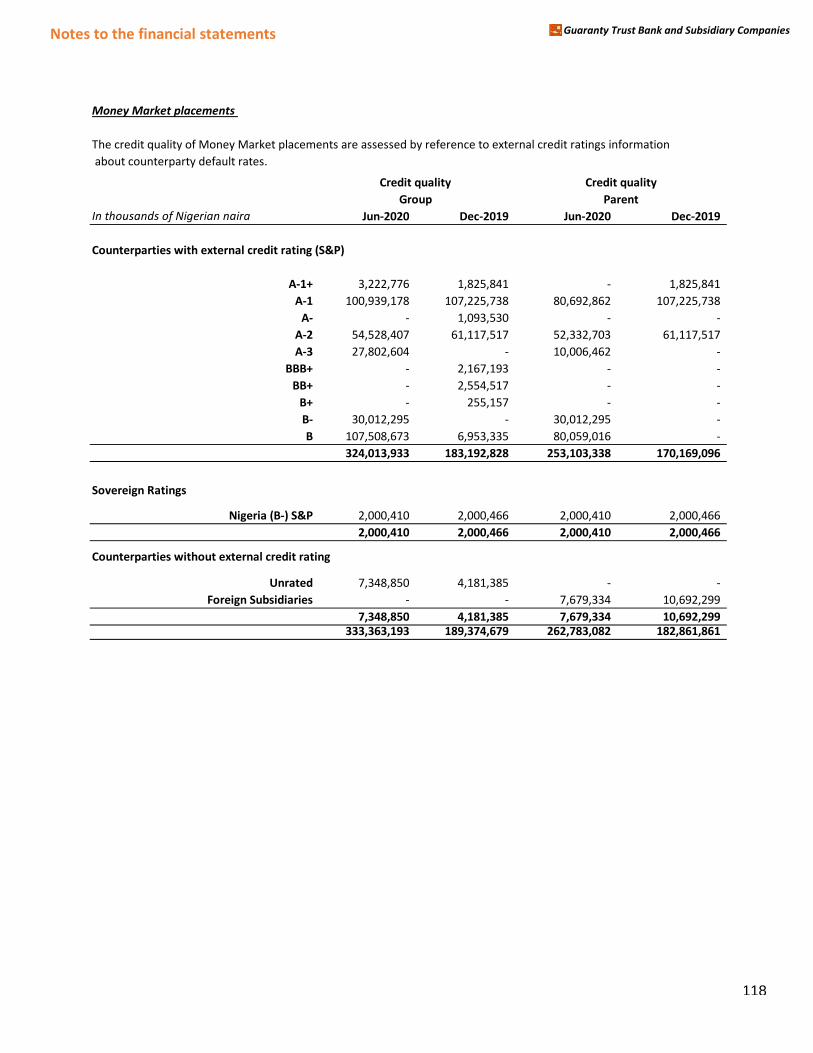
Notes to the financial statements Guaranty Trust Bank and Subsidiary Companies
Money Market placements
The credit quality of Money Market placements are assessed by reference to external credit ratings information
about counterparty default rates.
In thousands of Nigerian naira Jun-2020 Dec-2019 Jun-2020 Dec-2019
Counterparties with external credit rating (S&P)
A-1+ 3,222,776 1,825,841 - 1,825,841
A-1 100,939,178 107,225,738 80,692,862 107,225,738
A- - 1,093,530 - -
A-2 54,528,407 61,117,517 52,332,703 61,117,517
A-3 27,802,604 - 10,006,462 -
BBB+ - 2,167,193 - -
BB+ - 2,554,517 - -
B+ - 255,157 - -
B- 30,012,295 - 30,012,295 -
B 107,508,673 6,953,335 80,059,016 -
324,013,933 183,192,828 253,103,338 170,169,096
Sovereign Ratings
Nigeria (B-) S&P 2,000,410 2,000,466 2,000,410 2,000,466
2,000,410 2,000,466 2,000,410 2,000,466
Counterparties without external credit rating
Unrated 7,348,850 4,181,385 - -
Foreign Subsidiaries - - 7,679,334 10,692,299
7,348,850 4,181,385 7,679,334 10,692,299 333,363,193 189,374,679 262,783,082 182,861,861
Credit quality Credit quality
Group Parent
118
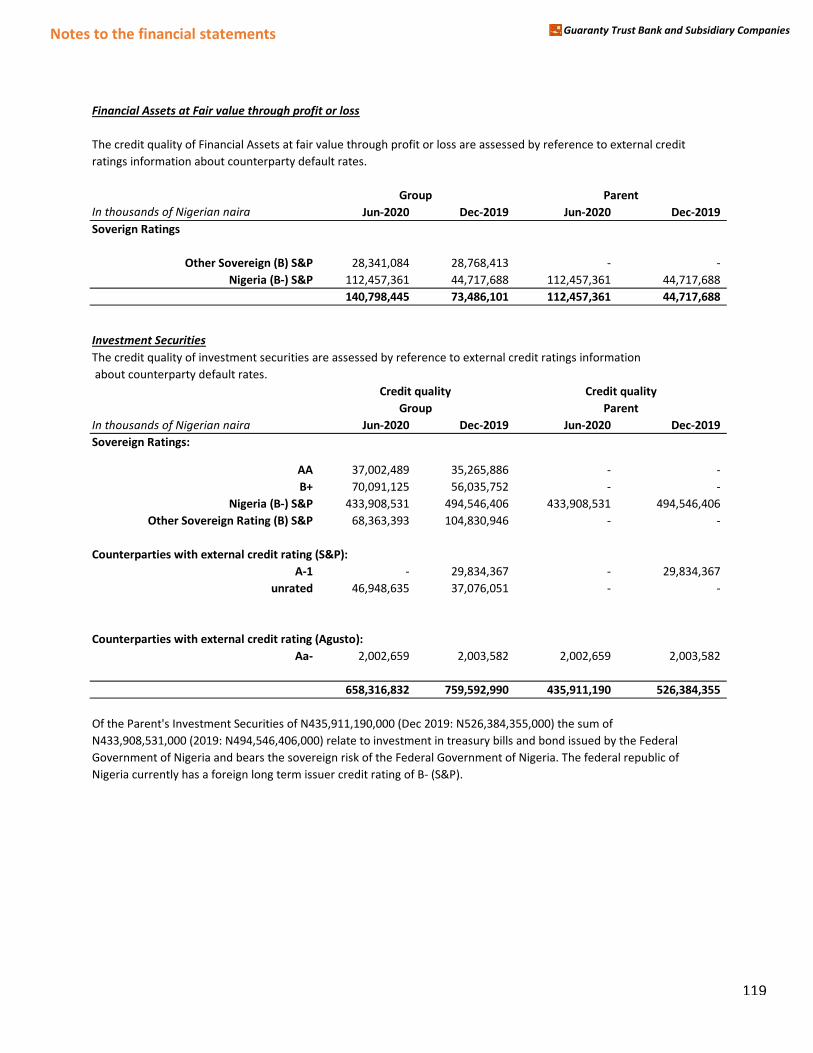
Notes to the financial statements Guaranty Trust Bank and Subsidiary Companies
Financial Assets at Fair value through profit or loss
The credit quality of Financial Assets at fair value through profit or loss are assessed by reference to external credit
ratings information about counterparty default rates.
In thousands of Nigerian naira Jun-2020 Dec-2019 Jun-2020 Dec-2019
Soverign Ratings
Other Sovereign (B) S&P 28,341,084 28,768,413 - -
Nigeria (B-) S&P 112,457,361 44,717,688 112,457,361 44,717,688
140,798,445 73,486,101 112,457,361 44,717,688
Investment Securities
The credit quality of investment securities are assessed by reference to external credit ratings information
about counterparty default rates.
In thousands of Nigerian naira Jun-2020 Dec-2019 Jun-2020 Dec-2019
Sovereign Ratings:
AA 37,002,489 35,265,886 - -
B+ 70,091,125 56,035,752 - -
Nigeria (B-) S&P 433,908,531 494,546,406 433,908,531 494,546,406
Other Sovereign Rating (B) S&P 68,363,393 104,830,946 - -
Counterparties with external credit rating (S&P):
A-1 - 29,834,367 - 29,834,367
unrated 46,948,635 37,076,051 - -
Counterparties with external credit rating (Agusto):
Aa- 2,002,659 2,003,582 2,002,659 2,003,582
658,316,832 759,592,990 435,911,190 526,384,355
Of the Parent's Investment Securities of N435,911,190,000 (Dec 2019: N526,384,355,000) the sum of
N433,908,531,000 (2019: N494,546,406,000) relate to investment in treasury bills and bond issued by the Federal
Government of Nigeria and bears the sovereign risk of the Federal Government of Nigeria. The federal republic of
Nigeria currently has a foreign long term issuer credit rating of B- (S&P).
Group Parent
Credit quality Credit quality
Group Parent
119
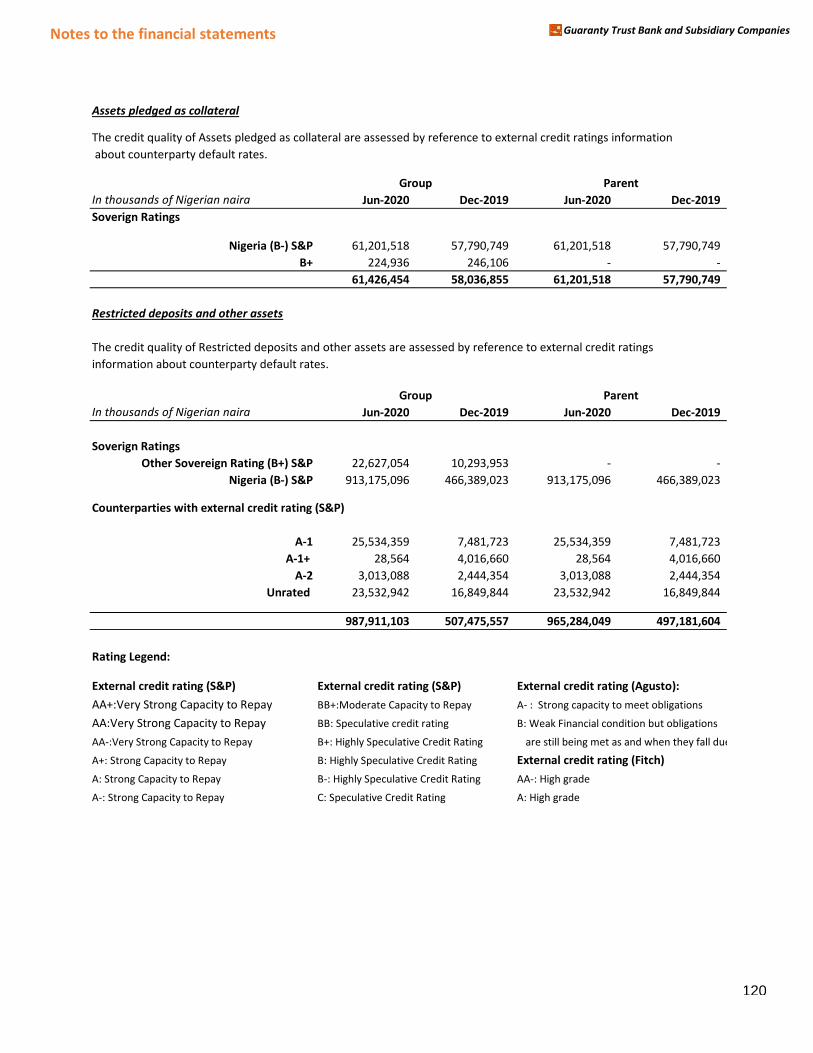
Notes to the financial statements Guaranty Trust Bank and Subsidiary Companies
Assets pledged as collateral
The credit quality of Assets pledged as collateral are assessed by reference to external credit ratings information
about counterparty default rates.
In thousands of Nigerian naira Jun-2020 Dec-2019 Jun-2020 Dec-2019
Soverign Ratings
Nigeria (B-) S&P 61,201,518 57,790,749 61,201,518 57,790,749
B+ 224,936 246,106 - -
61,426,454 58,036,855 61,201,518 57,790,749
Restricted deposits and other assets
The credit quality of Restricted deposits and other assets are assessed by reference to external credit ratings
information about counterparty default rates.
In thousands of Nigerian naira Jun-2020 Dec-2019 Jun-2020 Dec-2019
Soverign Ratings
Other Sovereign Rating (B+) S&P 22,627,054 10,293,953 - -
Nigeria (B-) S&P 913,175,096 466,389,023 913,175,096 466,389,023
Counterparties with external credit rating (S&P)
A-1 25,534,359 7,481,723 25,534,359 7,481,723
A-1+ 28,564 4,016,660 28,564 4,016,660
A-2 3,013,088 2,444,354 3,013,088 2,444,354
Unrated 23,532,942 16,849,844 23,532,942 16,849,844
987,911,103 507,475,557 965,284,049 497,181,604
Rating Legend:
External credit rating (S&P) External credit rating (S&P) External credit rating (Agusto):
AA+:Very Strong Capacity to Repay BB+:Moderate Capacity to Repay A- : Strong capacity to meet obligations
AA:Very Strong Capacity to Repay BB: Speculative credit rating B: Weak Financial condition but obligations
AA-:Very Strong Capacity to Repay B+: Highly Speculative Credit Rating are still being met as and when they fall due
A+: Strong Capacity to Repay B: Highly Speculative Credit Rating External credit rating (Fitch)
A: Strong Capacity to Repay B-: Highly Speculative Credit Rating AA-: High grade
A-: Strong Capacity to Repay C: Speculative Credit Rating A: High grade
Group Parent
Group Parent
120
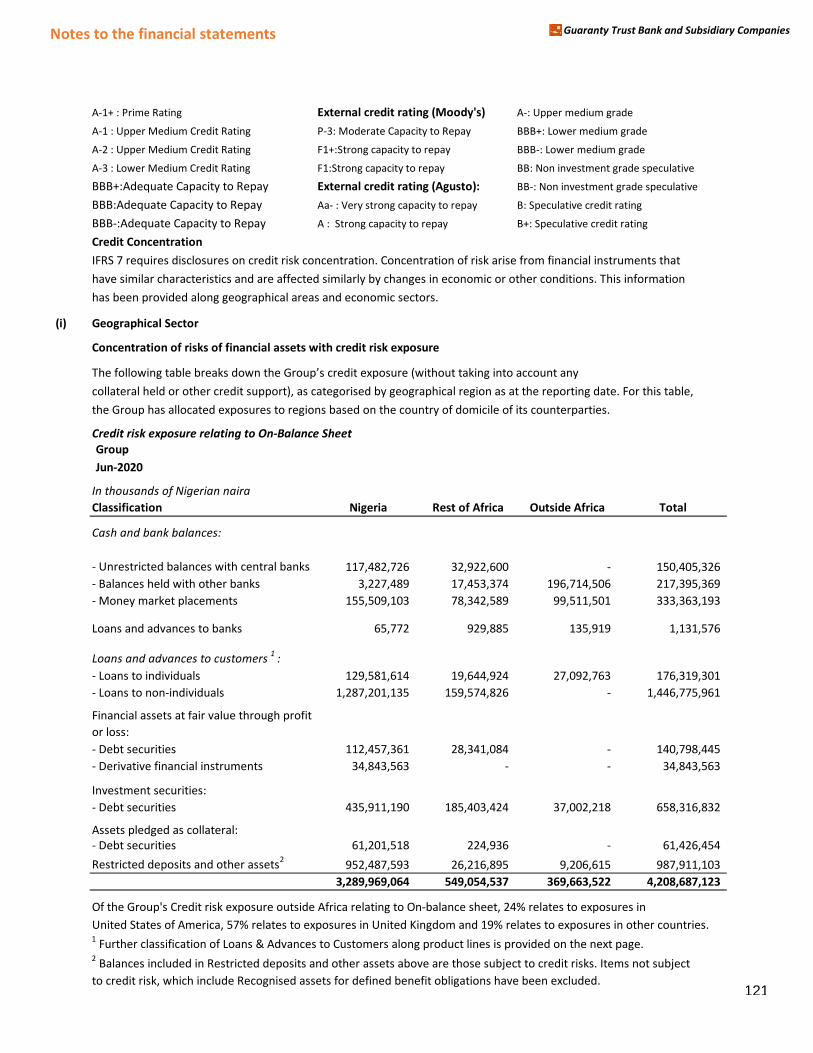
Notes to the financial statements Guaranty Trust Bank and Subsidiary Companies
A-1+ : Prime Rating External credit rating (Moody's) A-: Upper medium grade
A-1 : Upper Medium Credit Rating P-3: Moderate Capacity to Repay BBB+: Lower medium grade
A-2 : Upper Medium Credit Rating F1+:Strong capacity to repay BBB-: Lower medium grade
A-3 : Lower Medium Credit Rating F1:Strong capacity to repay BB: Non investment grade speculative
BBB+:Adequate Capacity to Repay External credit rating (Agusto): BB-: Non investment grade speculative
BBB:Adequate Capacity to Repay Aa- : Very strong capacity to repay B: Speculative credit rating
BBB-:Adequate Capacity to Repay A : Strong capacity to repay B+: Speculative credit rating
Credit Concentration
IFRS 7 requires disclosures on credit risk concentration. Concentration of risk arise from financial instruments that
have similar characteristics and are affected similarly by changes in economic or other conditions. This information
has been provided along geographical areas and economic sectors.
(i) Geographical Sector
Concentration of risks of financial assets with credit risk exposure
The following taHle Hreaks down the Group’s credit exposure (without taking into account any collateral held or other credit support), as categorised by geographical region as at the reporting date. For this table,
the Group has allocated exposures to regions based on the country of domicile of its counterparties.
Credit risk exposure relating to On-Balance Sheet
Group
Jun-2020
In thousands of Nigerian naira
Classification Nigeria Rest of Africa Outside Africa Total
Cash and bank balances:
nrestricted balance- Unrestricted balances with central banks 117,482,726 32,922,600 - 150,405,326
ances held with o- Balances held with other banks 3,227,489 17,453,374 196,714,506 217,395,369
- Money market placements 155,509,103 78,342,589 99,511,501 333,363,193
Loans and advances to banks 65,772 929,885 135,919 1,131,576
Loans and advances to customers1
:
ns to individuals- Loans to individuals 129,581,614 19,644,924 27,092,763 176,319,301
ns to non-individua- Loans to non-individuals 1,287,201,135 159,574,826 - 1,446,775,961
Financial assets at fair value through profit
or loss:
- Debt securities 112,457,361 28,341,084 - 140,798,445
- Derivative financial instruments 34,843,563 - - 34,843,563
Investment securities:
- Debt securities 435,911,190 185,403,424 37,002,218 658,316,832
Assets pledged as collateral:
- Debt securities 61,201,518 224,936 - 61,426,454
Restricted deposits and other assets2
952,487,593 26,216,895 9,206,615 987,911,103
3,289,969,064 549,054,537 369,663,522 4,208,687,123
Of the Group's Credit risk exposure outside Africa relating to On-balance sheet, 24% relates to exposures in
United States of America, 57% relates to exposures in United Kingdom and 19% relates to exposures in other countries.1 Further classification of Loans & Advances to Customers along product lines is provided on the next page.
2 Balances included in Restricted deposits and other assets above are those subject to credit risks. Items not subject
to credit risk, which include Recognised assets for defined benefit obligations have been excluded.121
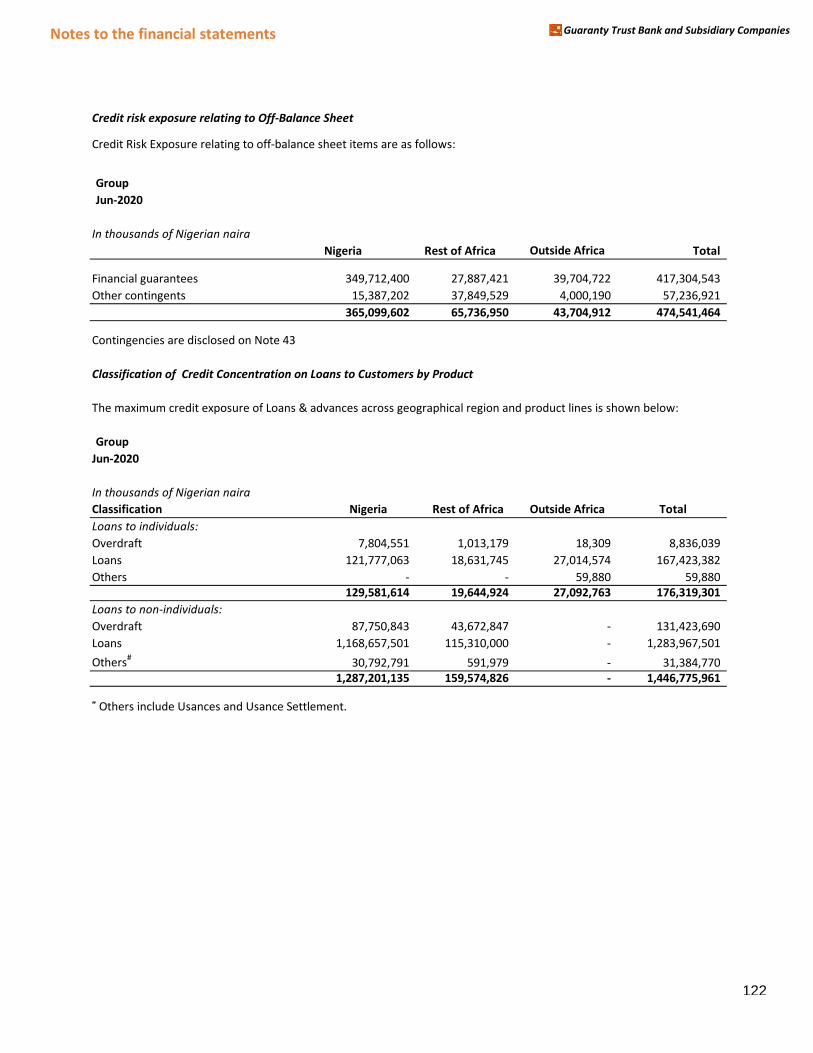
Notes to the financial statements Guaranty Trust Bank and Subsidiary Companies
Credit risk exposure relating to Off-Balance Sheet
Credit Risk Exposure relating to off-balance sheet items are as follows:
Group
Jun-2020
In thousands of Nigerian naira
Nigeria Rest of Africa Outside Africa Total
ncial GuaranteesFinancial guarantees 349,712,400 27,887,421 39,704,722 417,304,543
her Loan CommitmentOther contingents 15,387,202 37,849,529 4,000,190 57,236,921
365,099,602 65,736,950 43,704,912 474,541,464
Contingencies are disclosed on Note 43
Classification of Credit Concentration on Loans to Customers by Product
The maximum credit exposure of Loans & advances across geographical region and product lines is shown below:
Group
Jun-2020
In thousands of Nigerian naira
Classification Nigeria Rest of Africa Outside Africa Total
Loans to individuals:
Overdraft 7,804,551 1,013,179 18,309 8,836,039
Loans 121,777,063 18,631,745 27,014,574 167,423,382
Others - - 59,880 59,880
129,581,614 19,644,924 27,092,763 176,319,301
Loans to non-individuals:
Overdraft 87,750,843 43,672,847 - 131,423,690
Loans 1,168,657,501 115,310,000 - 1,283,967,501
Others#
30,792,791 591,979 - 31,384,770
1,287,201,135 159,574,826 - 1,446,775,961
# Others include Usances and Usance Settlement.
122
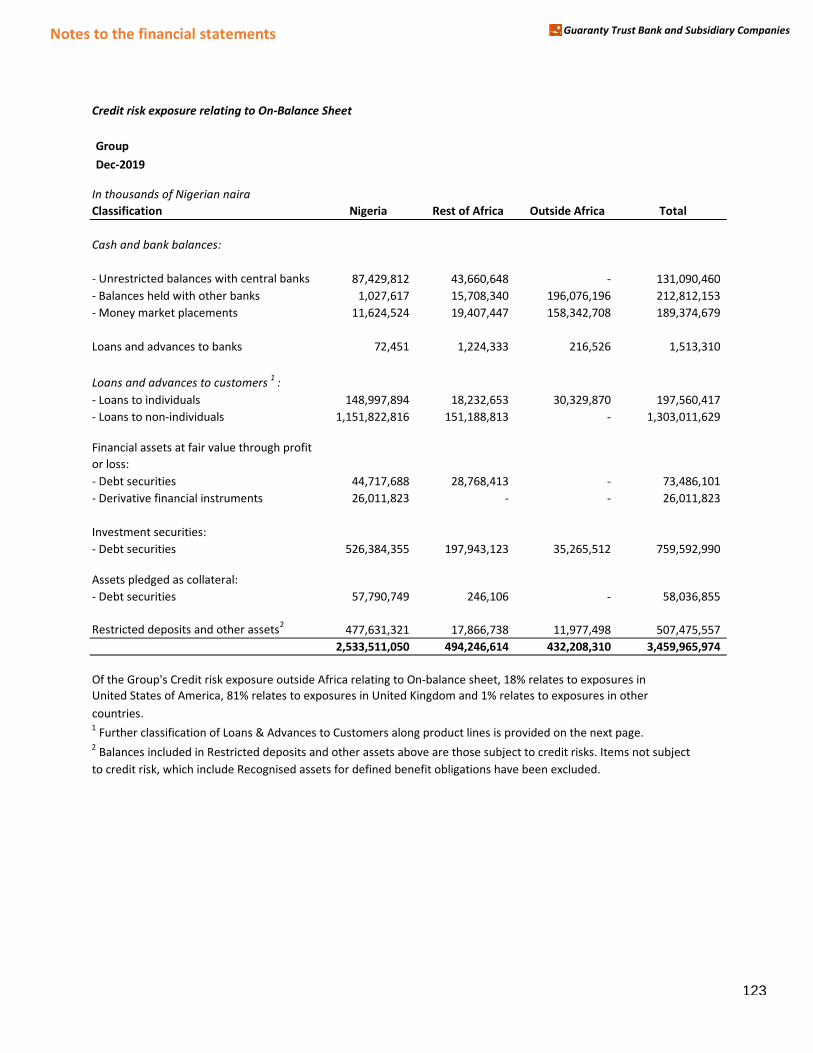
Notes to the financial statements Guaranty Trust Bank and Subsidiary Companies
Credit risk exposure relating to On-Balance Sheet
Group
Dec-2019
In thousands of Nigerian naira
Classification Nigeria Rest of Africa Outside Africa Total
Cash and bank balances:
- Unrestricted balances with central banks 87,429,812 43,660,648 - 131,090,460
- Balances held with other banks 1,027,617 15,708,340 196,076,196 212,812,153
- Money market placements 11,624,524 19,407,447 158,342,708 189,374,679
Loans and advances to banks 72,451 1,224,333 216,526 1,513,310
Loans and advances to customers1
:
ns to individuals- Loans to individuals 148,997,894 18,232,653 30,329,870 197,560,417
- Loans to non-individuals 1,151,822,816 151,188,813 - 1,303,011,629
Financial assets at fair value through profit
or loss:
- Debt securities 44,717,688 28,768,413 - 73,486,101
- Derivative financial instruments 26,011,823 - - 26,011,823
Investment securities:
- Debt securities 526,384,355 197,943,123 35,265,512 759,592,990
Assets pledged as collateral:
- Debt securities 57,790,749 246,106 - 58,036,855
Restricted deposits and other assets2
477,631,321 17,866,738 11,977,498 507,475,557
2,533,511,050 494,246,614 432,208,310 3,459,965,974
Of the Group's Credit risk exposure outside Africa relating to On-balance sheet, 18% relates to exposures in
United States of America, 81% relates to exposures in United Kingdom and 1% relates to exposures in other
countries.1 Further classification of Loans & Advances to Customers along product lines is provided on the next page.
2 Balances included in Restricted deposits and other assets above are those subject to credit risks. Items not subject
to credit risk, which include Recognised assets for defined benefit obligations have been excluded.
123
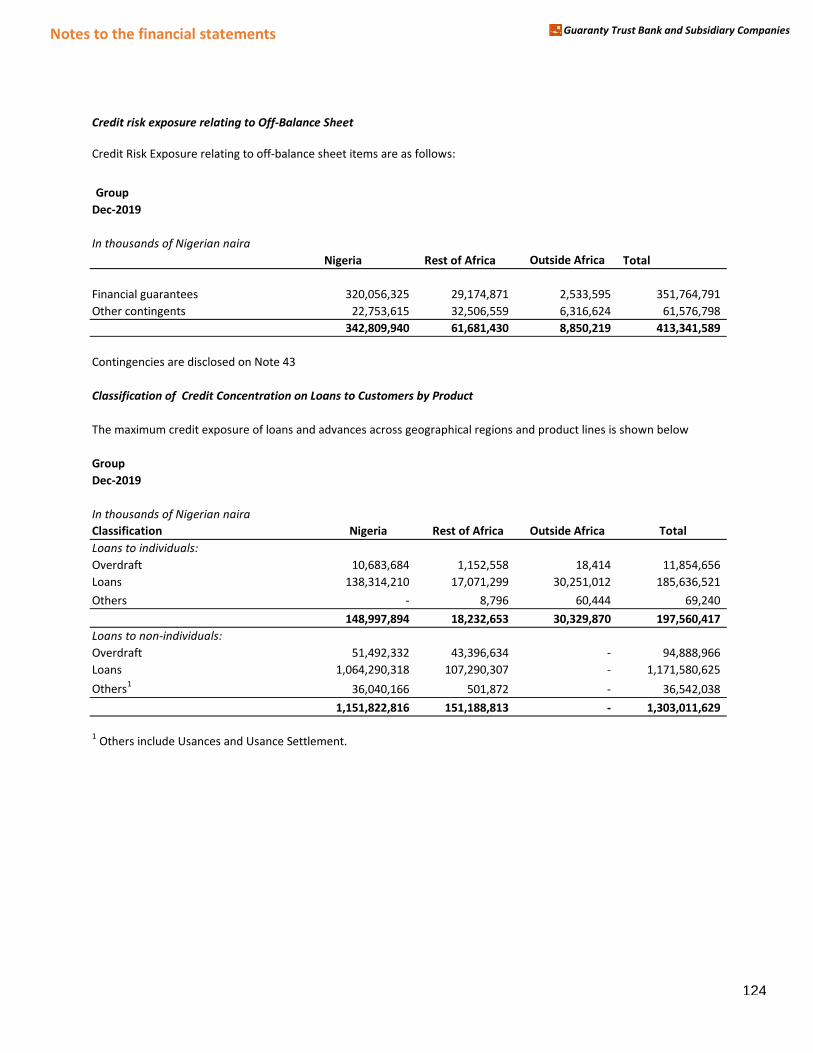
Notes to the financial statements Guaranty Trust Bank and Subsidiary Companies
Credit risk exposure relating to Off-Balance Sheet
Credit Risk Exposure relating to off-balance sheet items are as follows:
Group
Dec-2019
In thousands of Nigerian naira
Nigeria Rest of Africa Outside Africa Total
Financial guarantees 320,056,325 29,174,871 2,533,595 351,764,791
Other contingents 22,753,615 32,506,559 6,316,624 61,576,798
342,809,940 61,681,430 8,850,219 413,341,589
Contingencies are disclosed on Note 43
Classification of Credit Concentration on Loans to Customers by Product
The maximum credit exposure of loans and advances across geographical regions and product lines is shown below
Group
Dec-2019
In thousands of Nigerian naira
Classification Nigeria Rest of Africa Outside Africa Total
Loans to individuals:
Overdraft 10,683,684 1,152,558 18,414 11,854,656
Loans 138,314,210 17,071,299 30,251,012 185,636,521
Others - 8,796 60,444 69,240
148,997,894 18,232,653 30,329,870 197,560,417
Loans to non-individuals:
Overdraft 51,492,332 43,396,634 - 94,888,966
Loans 1,064,290,318 107,290,307 - 1,171,580,625
Others1
36,040,166 501,872 - 36,542,038
1,151,822,816 151,188,813 - 1,303,011,629
1 Others include Usances and Usance Settlement.
124

Notes to the financial statements Guaranty Trust Bank and Subsidiary Companies
Credit risk exposure relating to On-Balance Sheet
Parent
Jun-2020
In thousands of Nigerian naira
Classification Nigeria Rest of Africa Outside Africa Total
Cash and bank balances:
nrestricted balance- Unrestricted balances with central banks 117,482,726 - - 117,482,726
- Balances held with other banks 207,558 803,431 91,873,397 92,884,386
- Money market placements 155,509,103 - 107,273,979 262,783,082
Loans and advances to banks 65,772 - - 65,772
Loans and advances to customers1
:
ns to individuals- Loans to individuals 129,581,614 - - 129,581,614
ns to non-individua- Loans to non-individuals 1,287,201,135 - - 1,287,201,135
Financial assets at fair value through profit
or loss:
- Debt securities 112,457,361 - - 112,457,361
- Derivative financial instruments 34,843,563 - - 34,843,563
Investment securities:
- Debt securities 435,911,190 - - 435,911,190
Assets pledged as collateral:
- Debt securities 61,201,518 - - 61,201,518
Restricted deposits and other assets2
956,050,316 27,118 9,206,615 965,284,049
3,290,511,856 830,549 208,353,991 3,499,696,396
Of the Parent's Credit risk exposure outside Africa relating to On-balance sheet, 36% relates to exposures in
United States of America, 62% relates to exposures in United Kingdom and 2% relates to exposures in other
countries.1 Further classification of Loans & Advances to Customers along product lines is provided on the next page.
2 Balances included in Restricted deposits and other assets above are those subject to credit risks. Items not subject
to credit risk, which include Recognised assets for defined benefit obligations have been excluded.
125
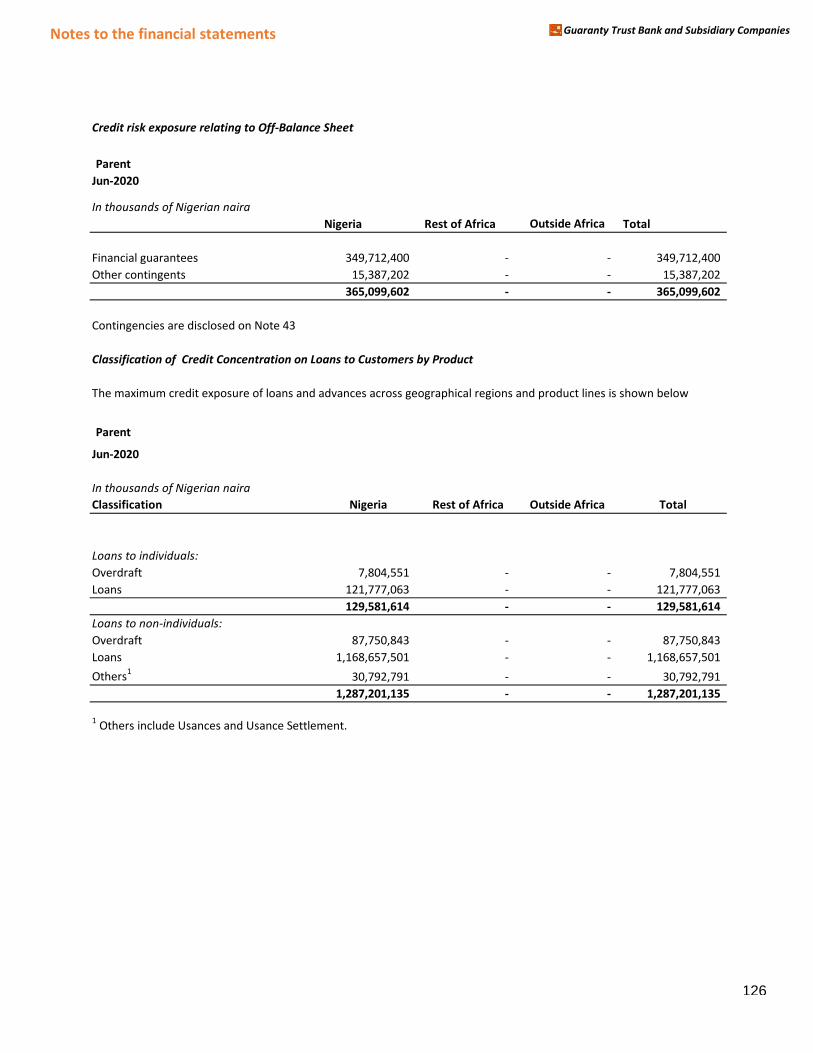
Notes to the financial statements Guaranty Trust Bank and Subsidiary Companies
Credit risk exposure relating to Off-Balance Sheet
Parent
Jun-2020
In thousands of Nigerian naira
Nigeria Rest of Africa Outside Africa Total
ncial GuaranteesFinancial guarantees 349,712,400 - - 349,712,400
her Loan CommitmentOther contingents 15,387,202 - - 15,387,202
365,099,602 - - 365,099,602
Contingencies are disclosed on Note 43
Classification of Credit Concentration on Loans to Customers by Product
The maximum credit exposure of loans and advances across geographical regions and product lines is shown below
Parent
Jun-2020
In thousands of Nigerian naira
Classification Nigeria Rest of Africa Outside Africa Total
Loans to individuals:
Overdraft 7,804,551 - - 7,804,551
Loans 121,777,063 - - 121,777,063
129,581,614 - - 129,581,614
Loans to non-individuals:
Overdraft 87,750,843 - - 87,750,843
Loans 1,168,657,501 - - 1,168,657,501
Others1
30,792,791 - - 30,792,791
1,287,201,135 - - 1,287,201,135
1 Others include Usances and Usance Settlement.
126
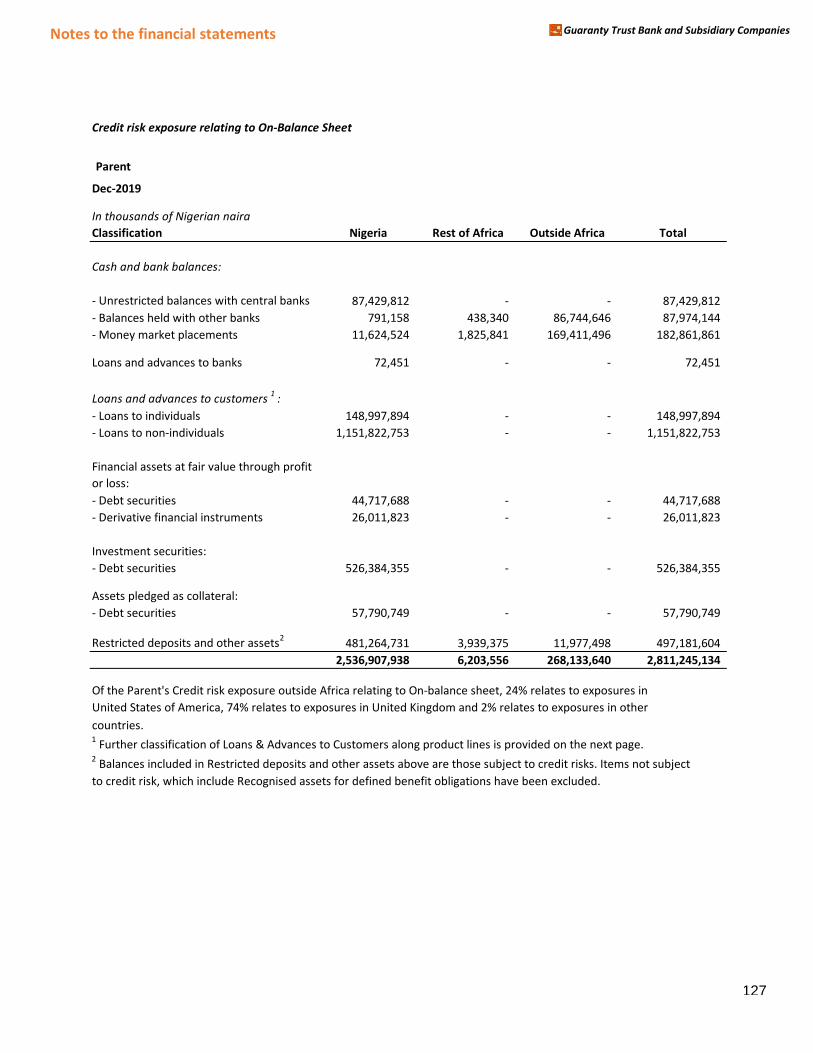
Notes to the financial statements Guaranty Trust Bank and Subsidiary Companies
Credit risk exposure relating to On-Balance Sheet
Parent
Dec-2019
In thousands of Nigerian naira
Classification Nigeria Rest of Africa Outside Africa Total
Cash and bank balances:
- Unrestricted balances with central banks 87,429,812 - - 87,429,812
- Balances held with other banks 791,158 438,340 86,744,646 87,974,144
- Money market placements 11,624,524 1,825,841 169,411,496 182,861,861
Loans and advances to banks 72,451 - - 72,451
Loans and advances to customers1
:
ns to individuals- Loans to individuals 148,997,894 - - 148,997,894
- Loans to non-individuals 1,151,822,753 - - 1,151,822,753
Financial assets at fair value through profit
or loss:
- Debt securities 44,717,688 - - 44,717,688
- Derivative financial instruments 26,011,823 - - 26,011,823
Investment securities:
- Debt securities 526,384,355 - - 526,384,355
Assets pledged as collateral:
- Debt securities 57,790,749 - - 57,790,749
Restricted deposits and other assets2
481,264,731 3,939,375 11,977,498 497,181,604
2,536,907,938 6,203,556 268,133,640 2,811,245,134
Of the Parent's Credit risk exposure outside Africa relating to On-balance sheet, 24% relates to exposures in
United States of America, 74% relates to exposures in United Kingdom and 2% relates to exposures in other
countries.1 Further classification of Loans & Advances to Customers along product lines is provided on the next page.
2 Balances included in Restricted deposits and other assets above are those subject to credit risks. Items not subject
to credit risk, which include Recognised assets for defined benefit obligations have been excluded.
127
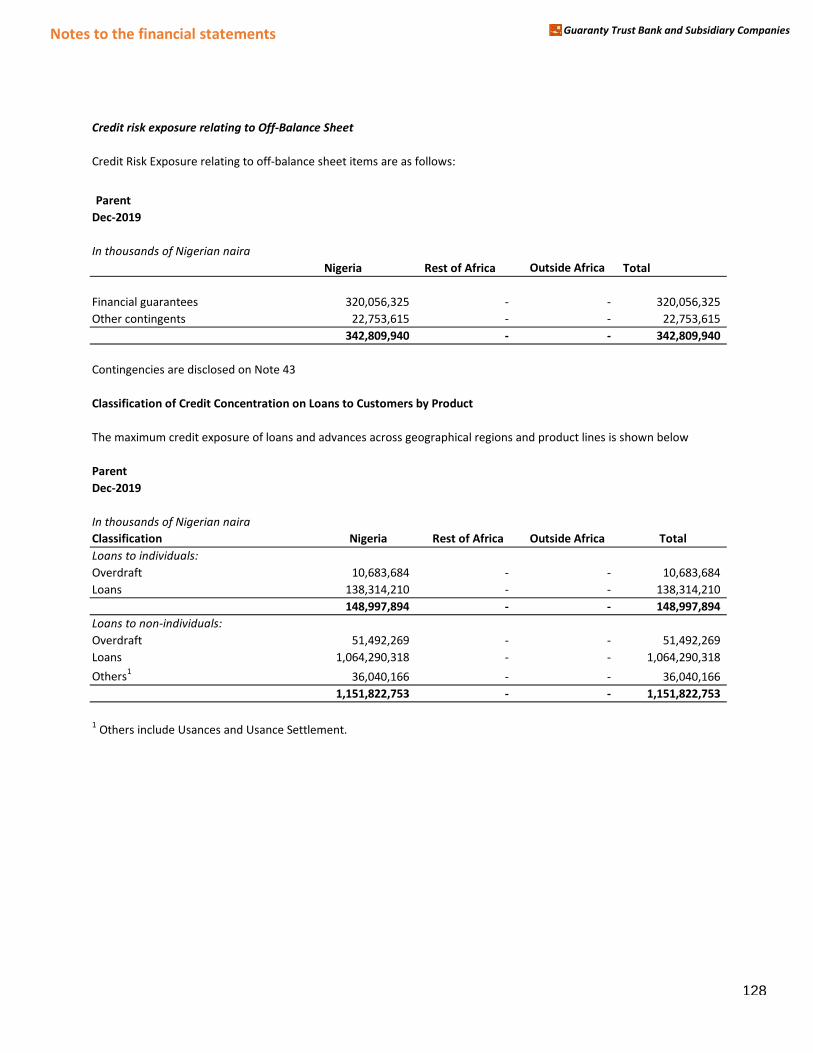
Notes to the financial statements Guaranty Trust Bank and Subsidiary Companies
Credit risk exposure relating to Off-Balance Sheet
Credit Risk Exposure relating to off-balance sheet items are as follows:
Parent
Dec-2019
In thousands of Nigerian naira
Nigeria Rest of Africa Outside Africa Total
Financial guarantees 320,056,325 - - 320,056,325
Other contingents 22,753,615 - - 22,753,615
342,809,940 - - 342,809,940
Contingencies are disclosed on Note 43
Classification of Credit Concentration on Loans to Customers by Product
The maximum credit exposure of loans and advances across geographical regions and product lines is shown below
Parent
Dec-2019
In thousands of Nigerian naira
Classification Nigeria Rest of Africa Outside Africa Total
Loans to individuals:
Overdraft 10,683,684 - - 10,683,684
Loans 138,314,210 - - 138,314,210
148,997,894 - - 148,997,894
Loans to non-individuals:
Overdraft 51,492,269 - - 51,492,269
Loans 1,064,290,318 - - 1,064,290,318
Others1
36,040,166 - - 36,040,166
1,151,822,753 - - 1,151,822,753
1 Others include Usances and Usance Settlement.
128

Notes to the financial statements Guaranty Trust Bank and Subsidiary Companies
(ii) Industry sectors
The following taHle Hreaks down the Group’s credit exposure at gross aマounts (without taking into account any collateral held or other credit supportぶ, as categorised Hy the industry sectors of the Group’s counterparties.
Credit Risk Exposure to on-balance sheet items
Group
Jun-2020
In thousands of Nigerian naira
Capital market Construction/ General Info.Telecoms
Classification Agriculture & Financial institution Real estate Education Commerce Government Manufacturing Oil & gas & Transport.2
Individual Others 1
Total
Cash and bank balances:
estricted balanc- Unrestricted balances with central banks - - - - - 150,405,326 - - - - - 150,405,326
- Balances held with other banks - 217,395,369 - - - - - - - - - 217,395,369
- Money market placements - 331,362,783 - - - 2,000,410 - - - - - 333,363,193
Loans and advances to banks - 1,131,576 - - - - - - - - - 1,131,576
Loans and advances to customers3
:
ans to individuals- Loans to individuals - - - - - - - - - 176,319,301 - 176,319,301
- Loans to non-individuals 19,142,902 52,413,183 36,561,047 10,273,644 82,469,689 84,005,525 326,903,573 669,463,767 92,162,230 - 73,380,401 1,446,775,961
Financial assets at fair value through profit or
loss:
- Debt securities - - - - - 140,798,445 - - - - - 140,798,445
- Derivative financial instruments - 34,767,945 - - - - 75,618 - - - - 34,843,563
Investment securities:
- Debt securities - - - - - 658,316,832 - - - - - 658,316,832
Assets pledged as collateral:
- Debt securities - - - - - 61,426,454 - - - - - 61,426,454
Restricted deposits and other assets4
- - - - - 913,194,288 - - - - 74,716,815 987,911,103
19,142,902 637,070,856 36,561,047 10,273,644 82,469,689 2,010,147,280 326,979,191 669,463,767 92,162,230 176,319,301 148,097,216 4,208,687,123
1 Includes Engineering Services, Hospitality, Clubs, Cooperative Societies etc.
2 Includes Telecoms, Logistics, Maritime and Haulage.
3 Further classification of Loans to Customers along product lines are provided on the next page.
4 Balances included in Restricted deposits and other assets above are those subject to credit risks. Items not subject to credit risk, which include Recognised assets for defined benefit obligations have been excluded.
129

Notes to the financial statements Guaranty Trust Bank and Subsidiary Companies
Credit Risk Exposure to off-balance sheet items
Group
Jun-2020
In thousands of Nigerian naira
Capital market Construction/ General Info.Telecoms
Classification Agriculture & Financial institution Real estate Education Commerce Government Manufacturing Oil & gas & Transport.2
Individual Others 1
Total
Financial guarantees 413 43,735,367 273,658,672 - 12,676,595 - 11,341,091 61,022,603 5,358,324 1,163,288 8,348,190 417,304,543
Other contingents 65,687 19,035,946 131,679 - 3,182,499 57,745 10,255,989 5,680,354 1,550,184 1,604,738 15,672,100 57,236,921
Total 66,100 62,771,313 273,790,351 - 15,859,094 57,745 21,597,080 66,702,957 6,908,508 2,768,026 24,020,290 474,541,464
1 Includes Engineering Services, Hospitality, Clubs, Cooperative Societies etc.
2 Includes Telecoms, Logistics, Maritime and Haulage.
Classification of Sectorial Credit Concentration on Loans to Customers by Product
Group
Jun-2020
In thousands of Nigerian naira
Capital market Construction/ General Info.Telecoms
Classification Agriculture & Financial institution Real estate Education Commerce Government Manufacturing Oil & gas & Transport.2
Individual Others 1
Total
Loans to individuals:
Overdraft - - - - - - - - - 8,836,039 - 8,836,039
Loans - - - - - - - - - 167,423,382 - 167,423,382
s to individuals:Others - - - - - - - - - 59,880 - 59,880
- - - - - - - - - 176,319,301 - 176,319,301
Loans to non-individuals:
Overdraft 1,933,296 2,192,016 4,755,230 461,494 32,436,832 1,372,455 16,593,327 53,827,596 9,286,744 - 8,564,700 131,423,690
Loans 16,464,925 50,221,167 31,805,817 9,812,150 45,441,974 82,633,070 293,537,885 612,246,062 82,875,485 - 58,928,966 1,283,967,501
Others 744,681 - - - 4,590,883 - 16,772,361 3,390,109 1 - 5,886,735 31,384,770
19,142,902 52,413,183 36,561,047 10,273,644 82,469,689 84,005,525 326,903,573 669,463,767 92,162,230 - 73,380,401 1,446,775,961
1 Includes Engineering Services, Hospitality, Clubs, Cooperative Societies etc.
2 Includes Telecoms, Logistics, Maritime and Haulage.
130
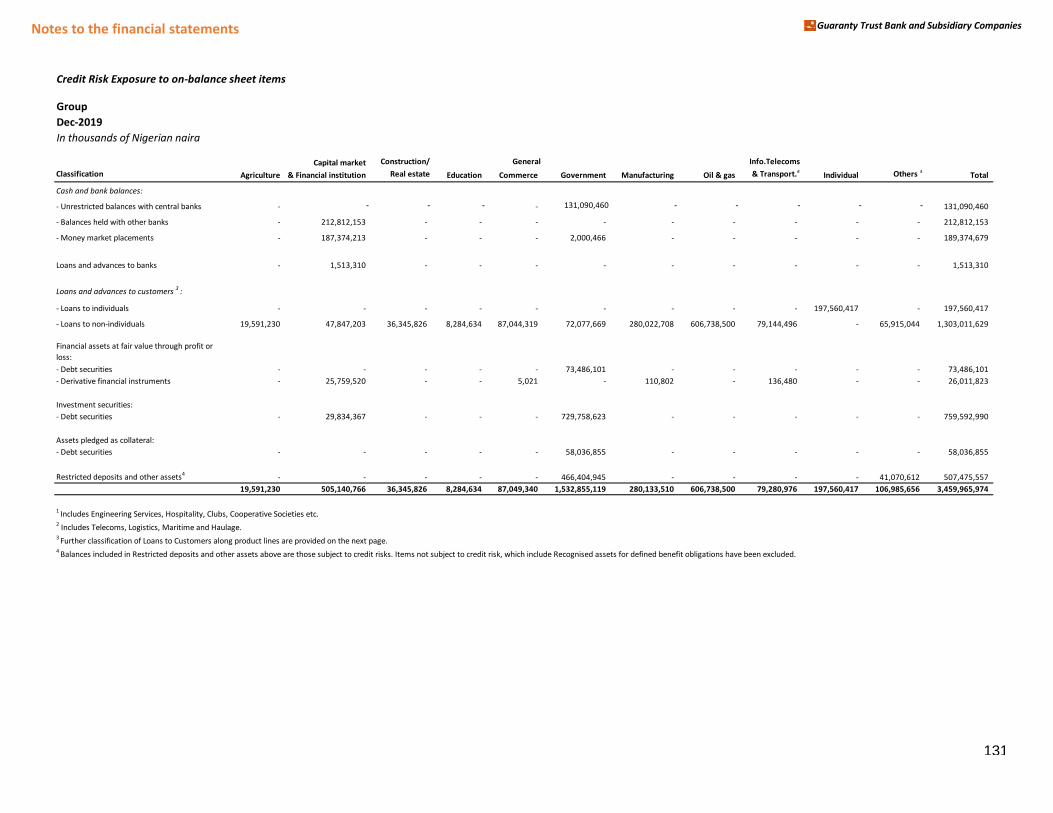
Notes to the financial statements Guaranty Trust Bank and Subsidiary Companies
Credit Risk Exposure to on-balance sheet items
Group
Dec-2019
In thousands of Nigerian naira
Capital market Construction/ General Info.Telecoms
Classification Agriculture & Financial institution Real estate Education Commerce Government Manufacturing Oil & gas & Transport.2
Individual Others 1
Total
Cash and bank balances:
estricted balanc- Unrestricted balances with central banks - - - - - 131,090,460 - - - - - 131,090,460
- Balances held with other banks - 212,812,153 - - - - - - - - - 212,812,153
- Money market placements - 187,374,213 - - - 2,000,466 - - - - - 189,374,679
Loans and advances to banks - 1,513,310 - - - - - - - - - 1,513,310
Loans and advances to customers3
:
ans to individuals- Loans to individuals - - - - - - - - - 197,560,417 - 197,560,417
ans to non-indivi- Loans to non-individuals 19,591,230 47,847,203 36,345,826 8,284,634 87,044,319 72,077,669 280,022,708 606,738,500 79,144,496 - 65,915,044 1,303,011,629
Financial assets at fair value through profit or
loss:
- Debt securities - - - - - 73,486,101 - - - - - 73,486,101
- Derivative financial instruments - 25,759,520 - - 5,021 - 110,802 - 136,480 - - 26,011,823
Investment securities:
- Debt securities - 29,834,367 - - - 729,758,623 - - - - - 759,592,990
Assets pledged as collateral:
- Debt securities - - - - - 58,036,855 - - - - - 58,036,855
Restricted deposits and other assets4
- - - - - 466,404,945 - - - - 41,070,612 507,475,557
19,591,230 505,140,766 36,345,826 8,284,634 87,049,340 1,532,855,119 280,133,510 606,738,500 79,280,976 197,560,417 106,985,656 3,459,965,974
1 Includes Engineering Services, Hospitality, Clubs, Cooperative Societies etc.
2 Includes Telecoms, Logistics, Maritime and Haulage.
3 Further classification of Loans to Customers along product lines are provided on the next page.
4 Balances included in Restricted deposits and other assets above are those subject to credit risks. Items not subject to credit risk, which include Recognised assets for defined benefit obligations have been excluded.
131
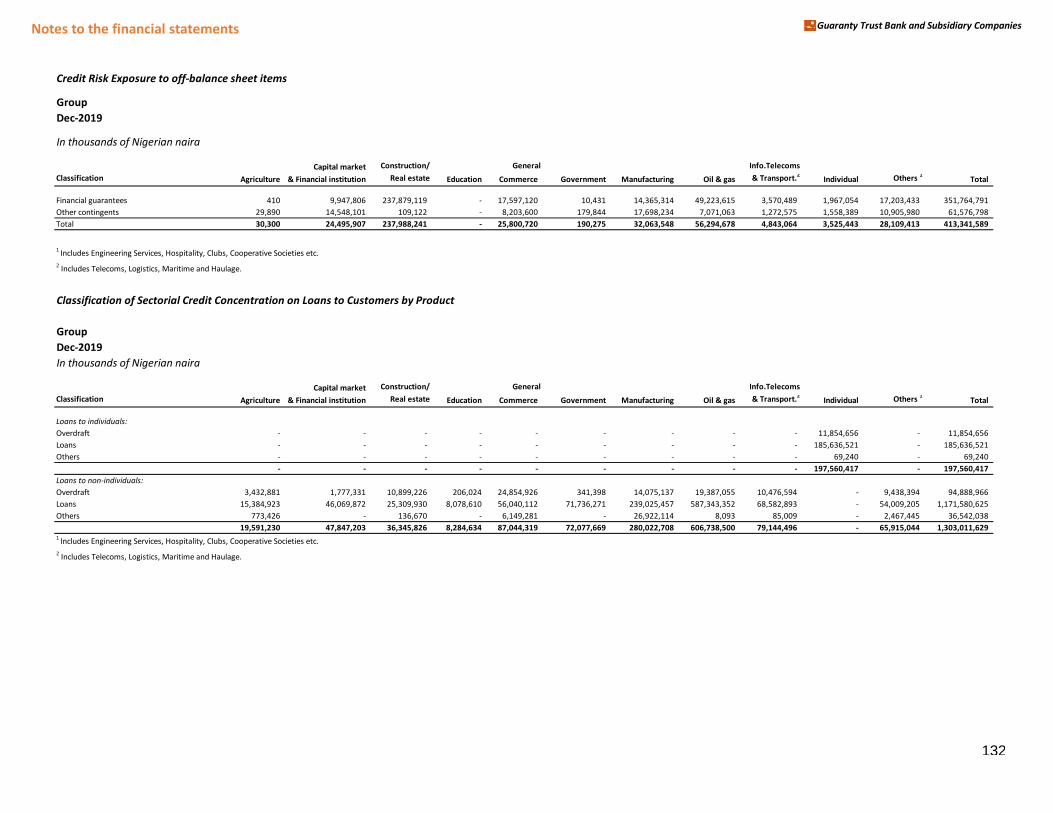
Notes to the financial statements Guaranty Trust Bank and Subsidiary Companies
Credit Risk Exposure to off-balance sheet items
Group
Dec-2019
In thousands of Nigerian naira
Capital market Construction/ General Info.Telecoms
Classification Agriculture & Financial institution Real estate Education Commerce Government Manufacturing Oil & gas & Transport.2
Individual Others 1
Total
Financial guarantees 410 9,947,806 237,879,119 - 17,597,120 10,431 14,365,314 49,223,615 3,570,489 1,967,054 17,203,433 351,764,791
Other contingents 29,890 14,548,101 109,122 - 8,203,600 179,844 17,698,234 7,071,063 1,272,575 1,558,389 10,905,980 61,576,798
Total 30,300 24,495,907 237,988,241 - 25,800,720 190,275 32,063,548 56,294,678 4,843,064 3,525,443 28,109,413 413,341,589
1 Includes Engineering Services, Hospitality, Clubs, Cooperative Societies etc.
2 Includes Telecoms, Logistics, Maritime and Haulage.
Classification of Sectorial Credit Concentration on Loans to Customers by Product
Group
Dec-2019
In thousands of Nigerian naira
Capital market Construction/ General Info.Telecoms
Classification Agriculture & Financial institution Real estate Education Commerce Government Manufacturing Oil & gas & Transport.2
Individual Others 1
Total
Loans to individuals:
Overdraft - - - - - - - - - 11,854,656 - 11,854,656
Loans - - - - - - - - - 185,636,521 - 185,636,521
Others - - - - - - - - - 69,240 - 69,240
- - - - - - - - - 197,560,417 - 197,560,417
Loans to non-individuals:
Overdraft 3,432,881 1,777,331 10,899,226 206,024 24,854,926 341,398 14,075,137 19,387,055 10,476,594 - 9,438,394 94,888,966
Loans 15,384,923 46,069,872 25,309,930 8,078,610 56,040,112 71,736,271 239,025,457 587,343,352 68,582,893 - 54,009,205 1,171,580,625
Others 773,426 - 136,670 - 6,149,281 - 26,922,114 8,093 85,009 - 2,467,445 36,542,038
19,591,230 47,847,203 36,345,826 8,284,634 87,044,319 72,077,669 280,022,708 606,738,500 79,144,496 - 65,915,044 1,303,011,629 1
Includes Engineering Services, Hospitality, Clubs, Cooperative Societies etc.
2 Includes Telecoms, Logistics, Maritime and Haulage.
132
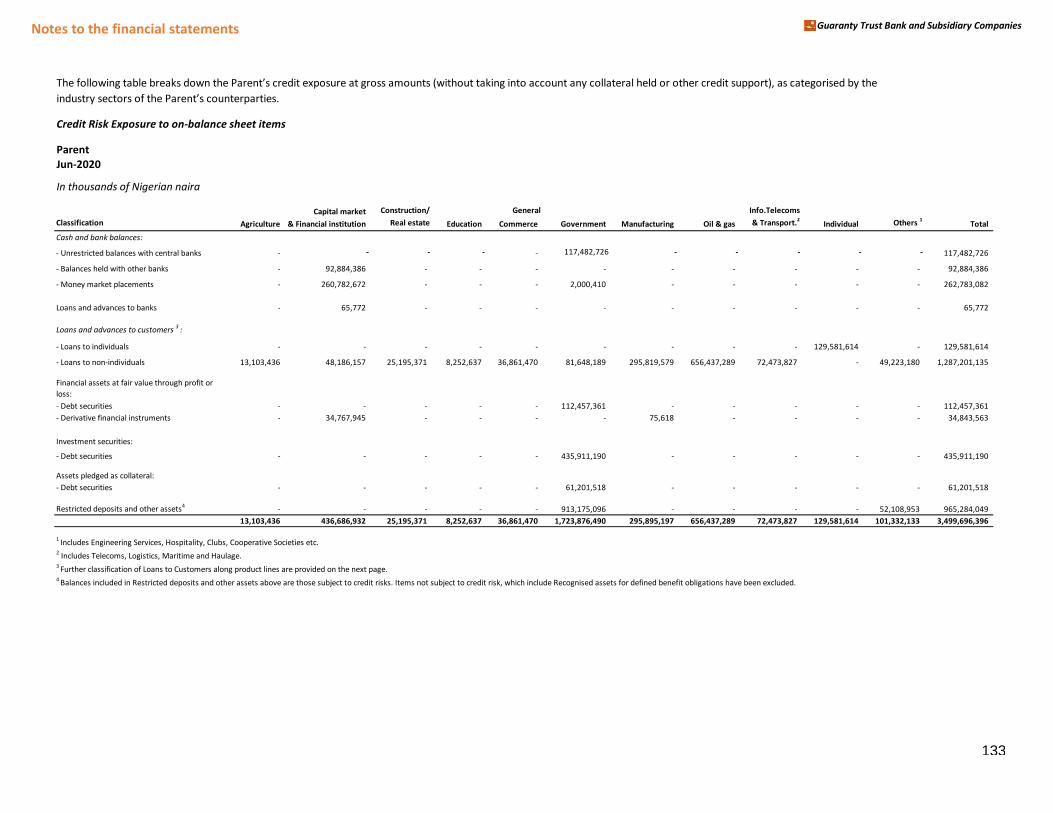
Notes to the financial statements Guaranty Trust Bank and Subsidiary Companies
The following taHle Hreaks down the Parent’s credit exposure at gross aマounts (without taking into account any collateral held or other credit supportぶ, as categorised Hy the industry sectors of the Parent’s counterparties.
Credit Risk Exposure to on-balance sheet items
Parent
Jun-2020
In thousands of Nigerian naira
Capital market Construction/ General Info.Telecoms
Classification Agriculture & Financial institution Real estate Education Commerce Government Manufacturing Oil & gas & Transport.2
Individual Others 1
Total
Cash and bank balances:
estricted balanc- Unrestricted balances with central banks - - - - - 117,482,726 - - - - - 117,482,726
- Balances held with other banks - 92,884,386 - - - - - - - - - 92,884,386
- Money market placements - 260,782,672 - - - 2,000,410 - - - - - 262,783,082
Loans and advances to banks - 65,772 - - - - - - - - - 65,772
Loans and advances to customers3
:
ans to individuals- Loans to individuals - - - - - - - - - 129,581,614 - 129,581,614
ans to non-indivi- Loans to non-individuals 13,103,436 48,186,157 25,195,371 8,252,637 36,861,470 81,648,189 295,819,579 656,437,289 72,473,827 - 49,223,180 1,287,201,135
Financial assets at fair value through profit or
loss:
- Debt securities - - - - - 112,457,361 - - - - - 112,457,361
- Derivative financial instruments - 34,767,945 - - - - 75,618 - - - - 34,843,563
Investment securities:
- Debt securities - - - - - 435,911,190 - - - - - 435,911,190
Assets pledged as collateral:
- Debt securities - - - - - 61,201,518 - - - - - 61,201,518
Restricted deposits and other assets4
- - - - - 913,175,096 - - - - 52,108,953 965,284,049
13,103,436 436,686,932 25,195,371 8,252,637 36,861,470 1,723,876,490 295,895,197 656,437,289 72,473,827 129,581,614 101,332,133 3,499,696,396
1 Includes Engineering Services, Hospitality, Clubs, Cooperative Societies etc.
2 Includes Telecoms, Logistics, Maritime and Haulage.
3 Further classification of Loans to Customers along product lines are provided on the next page.
4 Balances included in Restricted deposits and other assets above are those subject to credit risks. Items not subject to credit risk, which include Recognised assets for defined benefit obligations have been excluded.
133

Notes to the financial statements Guaranty Trust Bank and Subsidiary Companies
Credit Risk Exposure to off-balance sheet items
ParentJun-2020
In thousands of Nigerian naira
Capital market Construction/ General Info.Telecoms
Classification Agriculture & Financial institution Real estate Education Commerce Government Manufacturing Oil & gas & Transport.2
Individual Others 1
Total
Financial guarantees - 3,286,070 258,223,403 - 8,302,176 - 10,248,491 59,810,303 3,880,680 - 5,961,277 349,712,400
Other contingents 33,189 - - - 667,271 - 5,477,121 365,327 53,470 - 8,790,824 15,387,202
Total 33,189 3,286,070 258,223,403 - 8,969,447 - 15,725,612 60,175,630 3,934,150 - 14,752,101 365,099,602 1
Includes Engineering Services, Hospitality, Clubs, Cooperative Societies etc.
2 Includes Telecoms, Logistics, Maritime and Haulage.
Classification of Sectorial Credit Concentration on Loans to Customers by Product
Parent
Jun-2020
In thousands of Nigerian naira
Capital market Construction/ General Info.Telecoms
Classification Agriculture & Financial institution Real estate Education Commerce Government Manufacturing Oil & gas & Transport.2
Individual Others 1
Total
Loans to individuals:
Overdraft - - - - - - - - - 7,804,551 - 7,804,551
Loans - - - - - - - - - 121,777,063 - 121,777,063
- - - - - - - - - 129,581,614 - 129,581,614
Loans to non-individuals:
Overdraft 405,612 1,055,798 1,115,872 375,601 16,496,145 848,836 6,881,328 48,951,633 6,254,957 - 5,365,061 87,750,843
Loans 11,953,143 47,130,359 24,079,499 7,877,036 15,774,442 80,799,353 272,165,890 604,095,547 66,218,869 - 38,563,363 1,168,657,501
Others 744,681 - - - 4,590,883 - 16,772,361 3,390,109 1 - 5,294,756 30,792,791
13,103,436 48,186,157 25,195,371 8,252,637 36,861,470 81,648,189 295,819,579 656,437,289 72,473,827 - 49,223,180 1,287,201,135 1
Includes Engineering Services, Hospitality, Clubs, Cooperative Societies etc.
2 Includes Telecoms, Logistics, Maritime and Haulage.
134
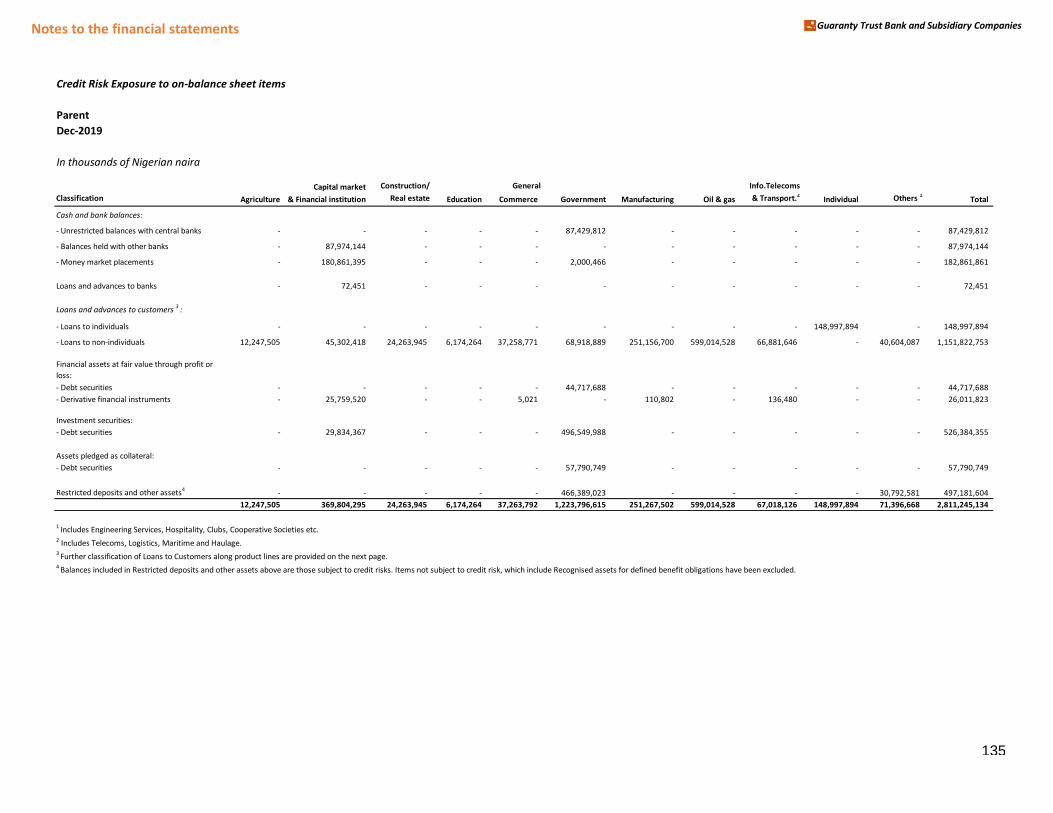
Notes to the financial statements Guaranty Trust Bank and Subsidiary Companies
Credit Risk Exposure to on-balance sheet items
Parent
Dec-2019
In thousands of Nigerian naira
Capital market Construction/ General Info.Telecoms
Classification Agriculture & Financial institution Real estate Education Commerce Government Manufacturing Oil & gas & Transport.2
Individual Others 1
Total
Cash and bank balances:
estricted balanc- Unrestricted balances with central banks - - - - - 87,429,812 - - - - - 87,429,812
ances held with - Balances held with other banks - 87,974,144 - - - - - - - - - 87,974,144
- Money market placements - 180,861,395 - - - 2,000,466 - - - - - 182,861,861
Loans and advances to banks - 72,451 - - - - - - - - - 72,451
Loans and advances to customers3
:
ans to individuals- Loans to individuals - - - - - - - - - 148,997,894 - 148,997,894
ans to non-indivi- Loans to non-individuals 12,247,505 45,302,418 24,263,945 6,174,264 37,258,771 68,918,889 251,156,700 599,014,528 66,881,646 - 40,604,087 1,151,822,753
Financial assets at fair value through profit or
loss:
- Debt securities - - - - - 44,717,688 - - - - - 44,717,688
- Derivative financial instruments - 25,759,520 - - 5,021 - 110,802 - 136,480 - - 26,011,823
Investment securities:
- Debt securities - 29,834,367 - - - 496,549,988 - - - - - 526,384,355
Assets pledged as collateral:
- Debt securities - - - - - 57,790,749 - - - - - 57,790,749
Restricted deposits and other assets4
- - - - - 466,389,023 - - - - 30,792,581 497,181,604
12,247,505 369,804,295 24,263,945 6,174,264 37,263,792 1,223,796,615 251,267,502 599,014,528 67,018,126 148,997,894 71,396,668 2,811,245,134
1 Includes Engineering Services, Hospitality, Clubs, Cooperative Societies etc.
2 Includes Telecoms, Logistics, Maritime and Haulage.
3 Further classification of Loans to Customers along product lines are provided on the next page.
4 Balances included in Restricted deposits and other assets above are those subject to credit risks. Items not subject to credit risk, which include Recognised assets for defined benefit obligations have been excluded.
135
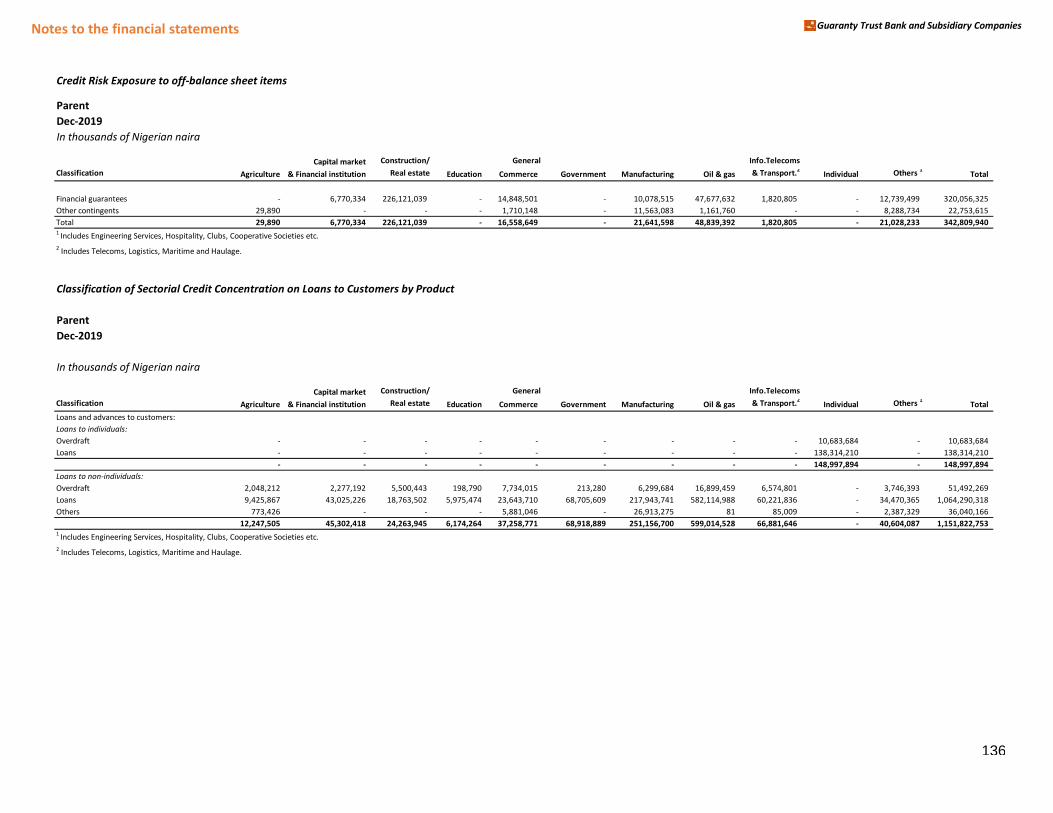
Notes to the financial statements Guaranty Trust Bank and Subsidiary Companies
Credit Risk Exposure to off-balance sheet items
Parent
Dec-2019
In thousands of Nigerian naira
Capital market Construction/ General Info.Telecoms
Classification Agriculture & Financial institution Real estate Education Commerce Government Manufacturing Oil & gas & Transport.2
Individual Others 1
Total
Financial guarantees - 6,770,334 226,121,039 - 14,848,501 - 10,078,515 47,677,632 1,820,805 - 12,739,499 320,056,325
Other contingents 29,890 - - - 1,710,148 - 11,563,083 1,161,760 - - 8,288,734 22,753,615
Total 29,890 6,770,334 226,121,039 - 16,558,649 - 21,641,598 48,839,392 1,820,805 - 21,028,233 342,809,940 1
Includes Engineering Services, Hospitality, Clubs, Cooperative Societies etc.
2 Includes Telecoms, Logistics, Maritime and Haulage.
Classification of Sectorial Credit Concentration on Loans to Customers by Product
Parent
Dec-2019
In thousands of Nigerian naira
Capital market Construction/ General Info.Telecoms
Classification Agriculture & Financial institution Real estate Education Commerce Government Manufacturing Oil & gas & Transport.2
Individual Others 1
Total
Loans and advances to customers:
Loans to individuals:
Overdraft - - - - - - - - - 10,683,684 - 10,683,684
Loans - - - - - - - - - 138,314,210 - 138,314,210
- - - - - - - - - 148,997,894 - 148,997,894
Loans to non-individuals:
Overdraft 2,048,212 2,277,192 5,500,443 198,790 7,734,015 213,280 6,299,684 16,899,459 6,574,801 - 3,746,393 51,492,269
Loans 9,425,867 43,025,226 18,763,502 5,975,474 23,643,710 68,705,609 217,943,741 582,114,988 60,221,836 - 34,470,365 1,064,290,318
Others 773,426 - - - 5,881,046 - 26,913,275 81 85,009 - 2,387,329 36,040,166
12,247,505 45,302,418 24,263,945 6,174,264 37,258,771 68,918,889 251,156,700 599,014,528 66,881,646 - 40,604,087 1,151,822,753 1
Includes Engineering Services, Hospitality, Clubs, Cooperative Societies etc.
2 Includes Telecoms, Logistics, Maritime and Haulage.
136
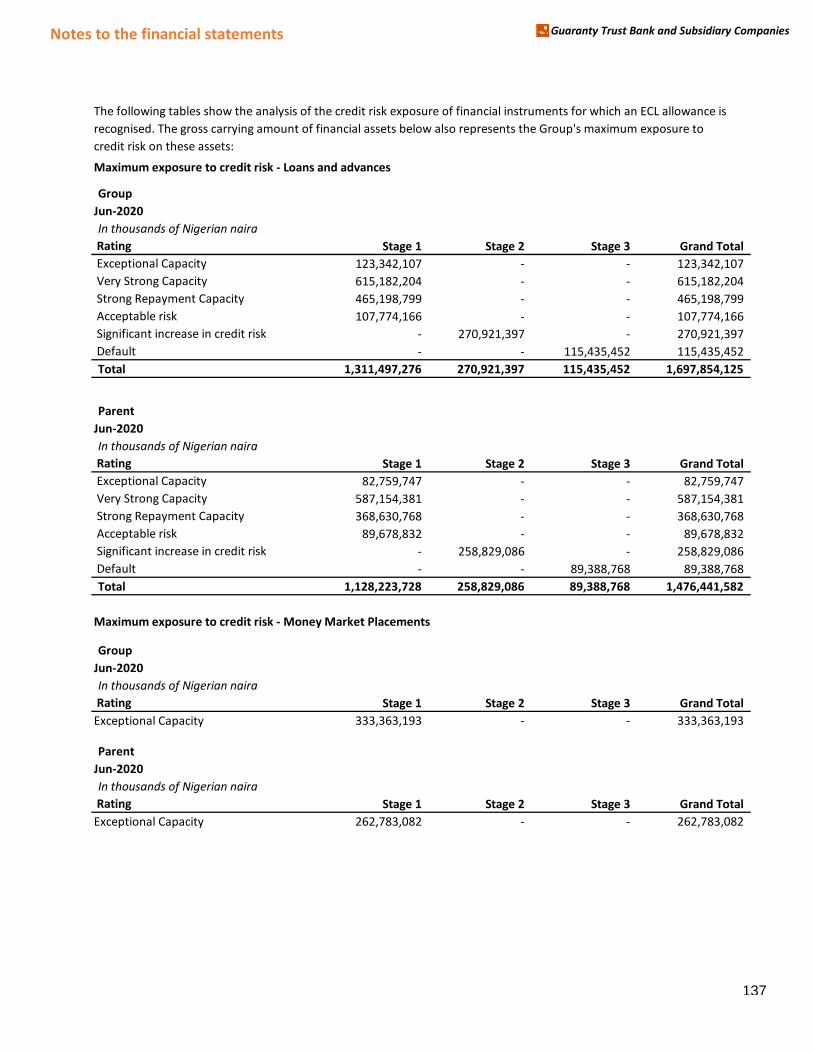
Notes to the financial statements Guaranty Trust Bank and Subsidiary Companies
The following tables show the analysis of the credit risk exposure of financial instruments for which an ECL allowance is
recognised. The gross carrying amount of financial assets below also represents the Group's maximum exposure to
credit risk on these assets:
Maximum exposure to credit risk - Loans and advances
Group
Jun-2020
In thousands of Nigerian naira
Rating Stage 1 Stage 2 Stage 3 Grand Total
Exception Exceptional Capacity 123,342,107 - - 123,342,107
Superior Very Strong Capacity 615,182,204 - - 615,182,204
Minimal R Strong Repayment Capacity 465,198,799 - - 465,198,799
Minimal R Acceptable risk 107,774,166 - - 107,774,166
Significant increase in credit risk - 270,921,397 - 270,921,397
Default - - 115,435,452 115,435,452
Total 1,311,497,276 270,921,397 115,435,452 1,697,854,125 - - -
Parent
Jun-2020
In thousands of Nigerian naira
Rating Stage 1 Stage 2 Stage 3 Grand Total
Exception Exceptional Capacity 82,759,747 - - 82,759,747
Superior Very Strong Capacity 587,154,381 - - 587,154,381
Minimal R Strong Repayment Capacity 368,630,768 - - 368,630,768
Minimal R Acceptable risk 89,678,832 - - 89,678,832
Significant increase in credit risk - 258,829,086 - 258,829,086
Default - - 89,388,768 89,388,768
Total 1,128,223,728 258,829,086 89,388,768 1,476,441,582
(88,389,057) 8,556,078 (13,064,459)
Maximum exposure to credit risk - Money Market Placements
Group
Jun-2020
In thousands of Nigerian naira
Placements Rating Stage 1 Stage 2 Stage 3 Grand Total
placements Exceptional Capacity 333,363,193 - - 333,363,193
Parent
Jun-2020
In thousands of Nigerian naira
Placements Rating Stage 1 Stage 2 Stage 3 Grand Total
placements Exceptional Capacity 262,783,082 - - 262,783,082 (953,829,703) (250,273,008) (102,453,227)
137
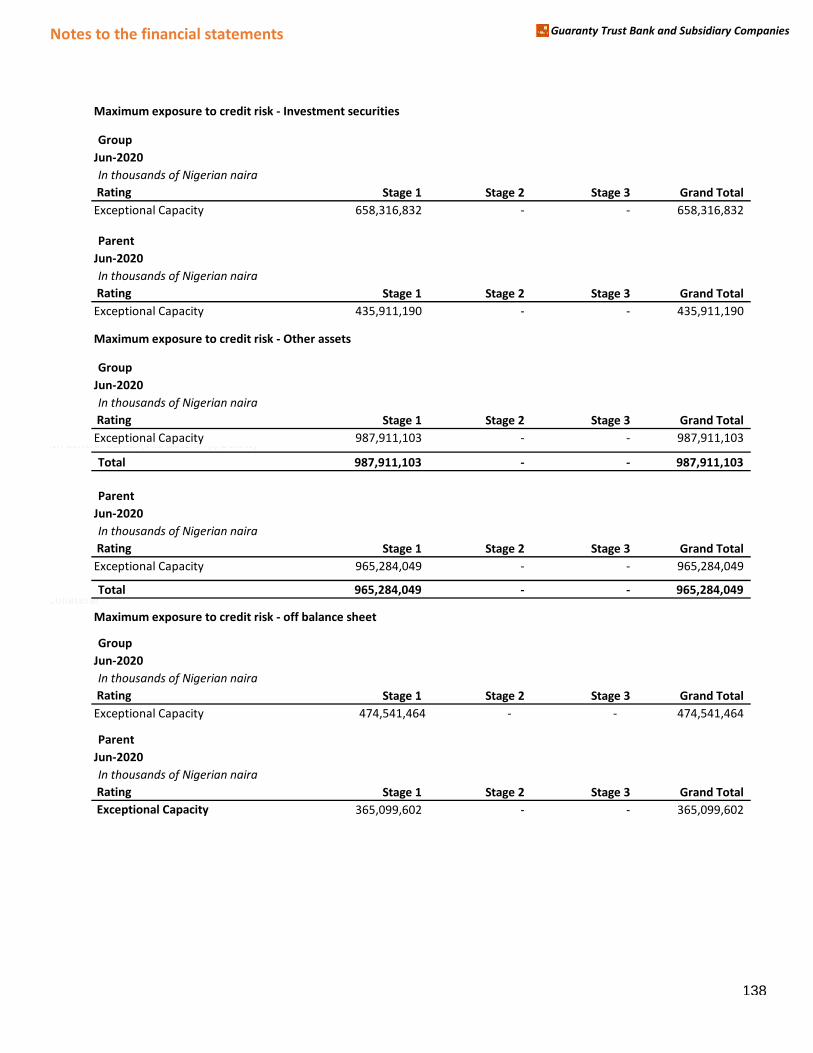
Notes to the financial statements Guaranty Trust Bank and Subsidiary Companies
Maximum exposure to credit risk - Investment securities
Group
Jun-2020
In thousands of Nigerian naira
Rating Stage 1 Stage 2 Stage 3 Grand Total
Exceptional Capacity 658,316,832 - - 658,316,832
Parent
Jun-2020
In thousands of Nigerian naira
Rating Stage 1 Stage 2 Stage 3 Grand Total
Exceptional Capacity 435,911,190 - - 435,911,190
Maximum exposure to credit risk - Other assets
Group
Jun-2020
In thousands of Nigerian naira
Rating Stage 1 Stage 2 Stage 3 Grand Total
Exceptional Capacity 987,911,103 - - 987,911,103 sits with central banks (See note 34(i) below)
Total 987,911,103 - - 987,911,103
Parent
Jun-2020
In thousands of Nigerian naira
Rating Stage 1 Stage 2 Stage 3 Grand Total
Exceptional Capacity 965,284,049 - - 965,284,049 sits with central banks (See note 34(i) below)
Total 965,284,049 - - 965,284,049 Cash Collateral
Maximum exposure to credit risk - off balance sheet
Group
Jun-2020
In thousands of Nigerian naira
Rating Stage 1 Stage 2 Stage 3 Grand Total
Exceptional Capacity 474,541,464 - - 474,541,464
Parent
Jun-2020
In thousands of Nigerian naira
Rating Stage 1 Stage 2 Stage 3 Grand Total
Exceptional Capacity 365,099,602 - - 365,099,602
138
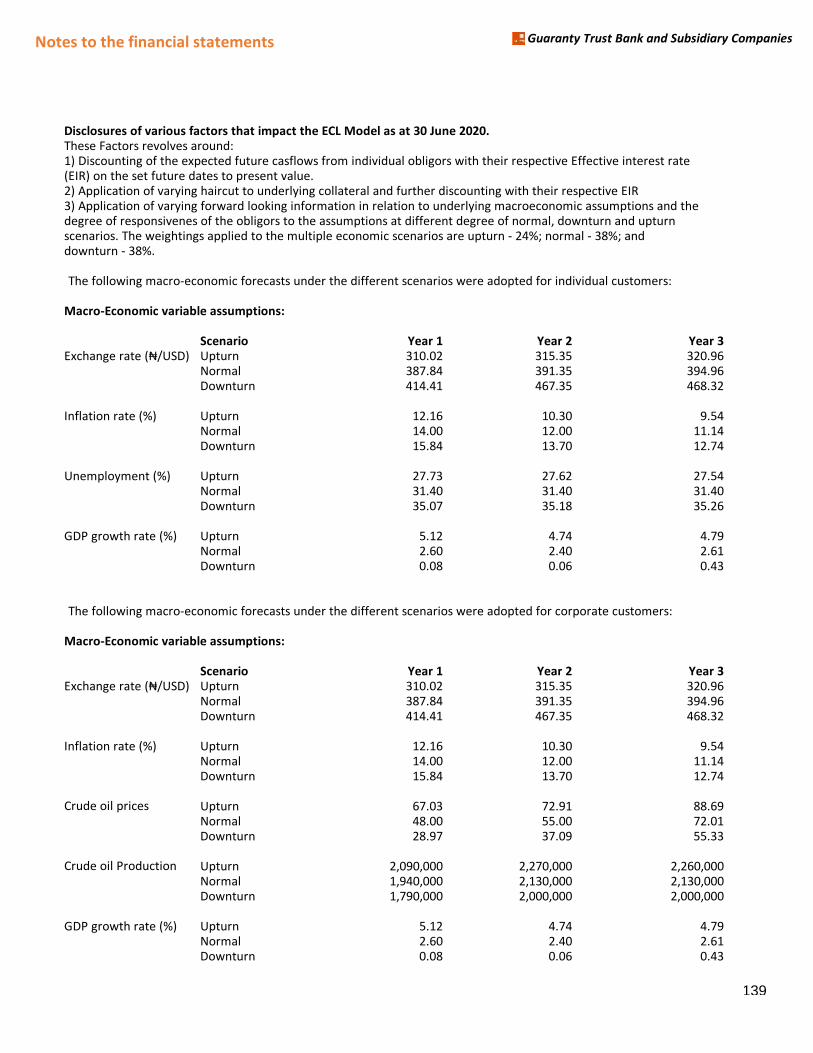
Notes to the financial statements Guaranty Trust Bank and Subsidiary Companies
Disclosures of various factors that impact the ECL Model as at 30 June 2020.These Factors revolves around:1) Discounting of the expected future casflows from individual obligors with their respective Effective interest rate (EIR) on the set future dates to present value.2) Application of varying haircut to underlying collateral and further discounting with their respective EIR3) Application of varying forward looking information in relation to underlying macroeconomic assumptions and the degree of responsivenes of the obligors to the assumptions at different degree of normal, downturn and upturn scenarios. The weightings applied to the multiple economic scenarios are upturn - 24%; normal - 38%; and downturn - 38%.
The following macro-economic forecasts under the different scenarios were adopted for individual customers:
Macro-Economic variable assumptions:
Scenario Year 1 Year 2 Year 3Exchange rate (₦/U“Dぶ Upturn 310.02 315.35 320.96
Normal 387.84 391.35 394.96Downturn 414.41 467.35 468.32
Inflation rate (%) Upturn 12.16 10.30 9.54Normal 14.00 12.00 11.14Downturn 15.84 13.70 12.74
Unemployment (%) Upturn 27.73 27.62 27.54Normal 31.40 31.40 31.40Downturn 35.07 35.18 35.26
GDP growth rate (%) Upturn 5.12 4.74 4.79Normal 2.60 2.40 2.61Downturn 0.08 0.06 0.43
The following macro-economic forecasts under the different scenarios were adopted for corporate customers:
Macro-Economic variable assumptions:
Scenario Year 1 Year 2 Year 3Exchange rate (₦/U“Dぶ Upturn 310.02 315.35 320.96
Normal 387.84 391.35 394.96Downturn 414.41 467.35 468.32
Inflation rate (%) Upturn 12.16 10.30 9.54Normal 14.00 12.00 11.14Downturn 15.84 13.70 12.74
Crude oil prices Upturn 67.03 72.91 88.69Normal 48.00 55.00 72.01Downturn 28.97 37.09 55.33
Crude oil Production Upturn 2,090,000 2,270,000 2,260,000Normal 1,940,000 2,130,000 2,130,000Downturn 1,790,000 2,000,000 2,000,000
GDP growth rate (%) Upturn 5.12 4.74 4.79Normal 2.60 2.40 2.61Downturn 0.08 0.06 0.43
139
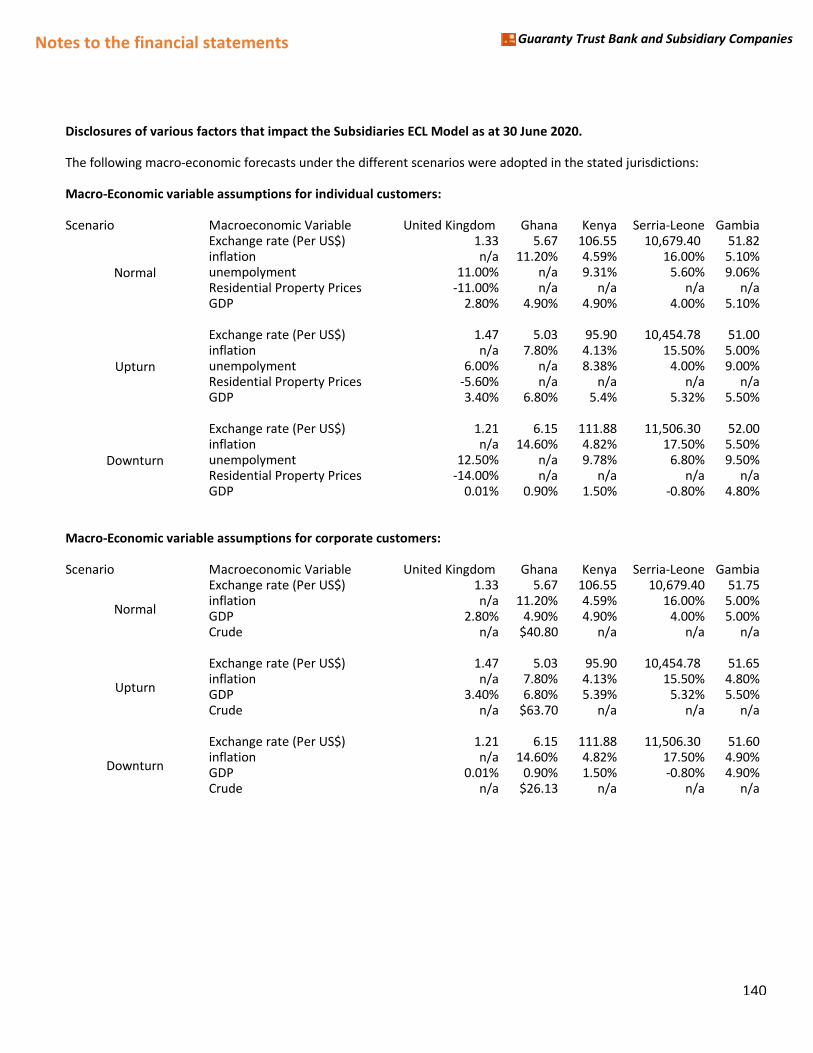
Notes to the financial statements Guaranty Trust Bank and Subsidiary Companies
Disclosures of various factors that impact the Subsidiaries ECL Model as at 30 June 2020.
The following macro-economic forecasts under the different scenarios were adopted in the stated jurisdictions:
Macro-Economic variable assumptions for individual customers:
Scenario Macroeconomic Variable United Kingdom Ghana Kenya Serria-Leone GambiaExchange rate (Per US$) 1.33 5.67 106.55 10,679.40 51.82inflation n/a 11.20% 4.59% 16.00% 5.10%unempolyment 11.00% n/a 9.31% 5.60% 9.06%Residential Property Prices -11.00% n/a n/a n/a n/aGDP 2.80% 4.90% 4.90% 4.00% 5.10%
Exchange rate (Per US$) 1.47 5.03 95.90 10,454.78 51.00inflation n/a 7.80% 4.13% 15.50% 5.00%unempolyment 6.00% n/a 8.38% 4.00% 9.00%Residential Property Prices -5.60% n/a n/a n/a n/aGDP 3.40% 6.80% 5.4% 5.32% 5.50%
Exchange rate (Per US$) 1.21 6.15 111.88 11,506.30 52.00inflation n/a 14.60% 4.82% 17.50% 5.50%unempolyment 12.50% n/a 9.78% 6.80% 9.50%Residential Property Prices -14.00% n/a n/a n/a n/aGDP 0.01% 0.90% 1.50% -0.80% 4.80%
Macro-Economic variable assumptions for corporate customers:
Scenario Macroeconomic Variable United Kingdom Ghana Kenya Serria-Leone GambiaExchange rate (Per US$) 1.33 5.67 106.55 10,679.40 51.75inflation n/a 11.20% 4.59% 16.00% 5.00%GDP 2.80% 4.90% 4.90% 4.00% 5.00%Crude n/a $40.80 n/a n/a n/a
Exchange rate (Per US$) 1.47 5.03 95.90 10,454.78 51.65inflation n/a 7.80% 4.13% 15.50% 4.80%GDP 3.40% 6.80% 5.39% 5.32% 5.50%Crude n/a $63.70 n/a n/a n/a
Exchange rate (Per US$) 1.21 6.15 111.88 11,506.30 51.60inflation n/a 14.60% 4.82% 17.50% 4.90%GDP 0.01% 0.90% 1.50% -0.80% 4.90%Crude n/a $26.13 n/a n/a n/a
Upturn
Downturn
Normal
Upturn
Downturn
Normal
140
Notes to the financial statements Guaranty Trust Bank and Subsidiary Companies
(vii) Impairment and provisioning policies
The following policies guide the Bank’s provisioning and iマpairマent:
(1) Loan Categorization
All loans and advances are categorized as follows during the current period:
• Stage 1 Loans and Advances:
These are loans and advances that have not deteriorated significantly in credit quality since initial
recognition or that have low credit risk (where the optional simplification is applied) at the reporting
date. The credit quality of the Stage 1 loans and advances are assessed by reference to the internal
rating system adopted by the Group (see Note 4(f)(ii) Credit Risk Measurement). These are assigned ratings 1-6.
In addition to the above, Stage 1 loans and advances are loans that have experienced movement of
credit rating of less than 3 notches migration from origination and are not in default.
• Stage 2 Loans and Advances:
These are loans and advances that have deteriorated significantly in credit quality since initial
recognition but do not have objective evidence of a credit loss event. The credit quality of the Stage
2 loans and advances are assessed by reference to the internal rating system adopted by the Group
(see Note 4(f)(ii) Credit Risk Measurement). These are assigned rating 7.
In addition to the above, Stage 2 loans and advances are loans that have experienced movement of
credit rating of more than 3 notches migration from origination and are not in default.
• Stage 3 Loans and Advances:
These are loans and advances that have objective evidence of a credit loss event. Stage 3 allocation is driven by either the identification of credit impairment or an exposure being classified as
defaulted. The credit quality of the Stage 3 loans and advances are assessed by reference to the
internal rating system adopted by the Group (see Note 4(f)(ii) Credit Risk Measurement). These are
assigned ratings 8-10.
141
Notes to the financial statements Guaranty Trust Bank and Subsidiary Companies
(2) Allowances for impairment
The Group establishes an allowance for impairment losses that represents its estimate of expected credit
losses in its loan portfolio. In accordance with IFRS 9 which requires the recognition of 12 month expected
credit losses (the portion of lifetime expected credit losses from default events that are expected within
12 months of the reporting date) if credit risk has not significantly increased since initial recognition (stage
1), and lifetime expected credit losses for financial instruments for which the credit risk has increased
significantly since initial recognition (stage 2) or which are credit impaired (stage 3).
Stage 1 – This is where credit risk has not increased significantly since initial recognition. For loans in stage
1, the Group recognises 12 month ECL and interest income is recognised on a gross basis – this means that
interest will be calculated on the gross carrying amount of the loan before adjusting for ECL.
Stage 2 - This is where credit risk has increased significantly since initial recognition (stage 1). When a loan
is transferred to stage 2, the Group recognises lifetime ECL but interest income will continue to be
recognised on a gross basis.
Stage 3 – At stage 3, the loan is credit impaired. This is effectively the point at which there has been an
incurred loss event. For loans in stage 3, the Group continues to recognise lifetime ECL but interest income
is recognised on a net basis. This means that interest income will be calculated based on the gross carrying
amount of the loan less ECL.
Realizable collaterals are important component of cash flows.
(3) Loans with renegotiated terms
Loans with renegotiated terms are loans that have been restructured due to deterioration in the
borrower’s financial position and where the Group has made concessions that it would not otherwise
consider. Once the loan is restructured, it remains in this category independent of satisfactory
performance after restructuring.
142
Notes to the financial statements Guaranty Trust Bank and Subsidiary Companies
(4) Governance structure around the ECL model:
The governance around the ECL model centres on the monitoring of performance of obligors in
accordance with the term and conditions of the underlying facilities and ensure that the ratings assigned
to each counterparty reflects the outcome of the internal rating model of the Group, tailored to the
various categories and sectors of the counterparties. For this purpose the Bank has set up 3 level of
structure with oversights on the review of credit performance and assign credit ratings. The three levels
of governance structure are:
i) Chief Risk Officer: The Chief Risk Officer (CRO) works with the divisional heads and relationship
managers to monitor and provide feedback on the performance of the facilities less than or equal
to ₦ヱヰヰ マillion. This gives him insight into what the appropriate rating migration for each facility in
this band should be.
ii) An Executive Director (ED) who is a member of the Board Risk Management Committee (BRMC):
An ED who is a member of the BRMC has been assigned responsibility for the facilities above ₦ヱヰヰ マillion Hut less than ₦5ヰヰ マillion. The ED works with the CRO, divisional heads and the relationship
managers to monitor the facilities in this category. He ensures that adequate information as to the
level of performance of these facilities is promptly retrieved and the counterparties are correctly
rated.
iii) The Managing Director (MD): The Managing Director presides over the review of facilities over ₦500
million.
Every decision made with respect to the performance of these facilities must be approved by the
MD.
All the above approving authorities in respect of credit ratings consider number of days past due as
one of the quantitative variables in the determination of the credit ratings to be assigned to credit
facilities. Facilities that are 30 days past due are assigned a credit rating of 7 except appropriate
rebuttals are in place to justify a better credit rating while Facilities that are 90 days past due are
assigned a rating of 8 except appropriate rebuttals are in place to justify a better credit rating.
(5) Policy around rebuttal:
When backstop is used and an account that has breached the 30 days past due criteria for SICR and 90 days
past due criteria for default is transferred to stage 2 or stage 3 respectively, the presumption can be rebutted
only on the basis of the following:
i) The relationship manager and divisional head must provide reasonable and supportable evidence
for the rebuttal. In doing this, the evidence must be provided to the CRO and credit risk
management team within 10 working days failure of which the transfer will be made.
ii) For accounts that are moved to stage 2, the CRO and credit risk management team will review
the evidence provided by the relationship manager and provide feedback to the relationship
manager as regards the acceptability of the evidence.
143
Notes to the financial statements Guaranty Trust Bank and Subsidiary Companies
iii) For accounts that are moved to stage 3, the CRO and credit risk management team will review
the evidence provided by the relationship manager. The account is then scheduled to be
presented to the Criticised Asset Committee (CAC).
iv) CAC takes decision with respect to the acceptability of the evidence presented to it.
v) Where the evidence is deemed acceptable as stated in (ii) and (iv) above, the account is
immediately transferred back to the previous stage. Where the evidence is not acceptable, the
account is left in the new stage except the relationship manager is able to provide fresh evidence
which will follow the same step above.
144
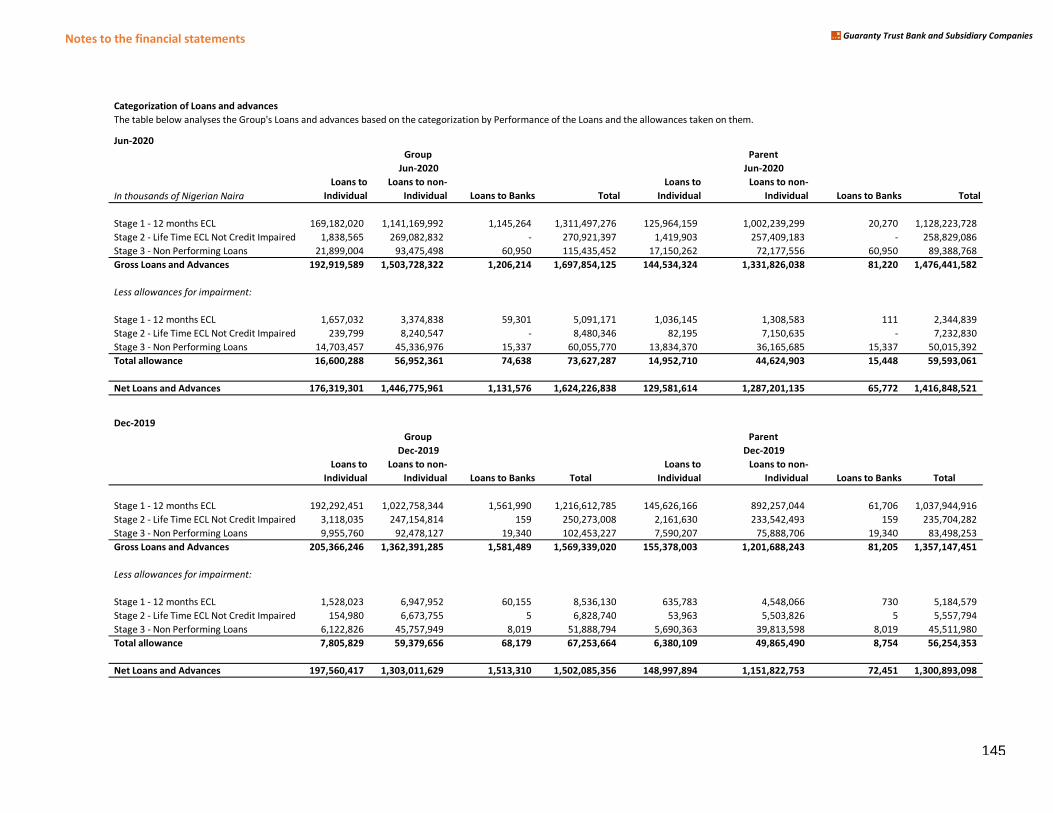
Notes to the financial statements Guaranty Trust Bank and Subsidiary Companies
Categorization of Loans and advances
The table below analyses the Group's Loans and advances based on the categorization by Performance of the Loans and the allowances taken on them.
Jun-2020
In thousands of Nigerian Naira
Loans to
Individual
Loans to non-
Individual Loans to Banks Total
Loans to
Individual
Loans to non-
Individual Loans to Banks Total
Stage 1 - 12 months ECL 169,182,020 1,141,169,992 1,145,264 1,311,497,276 125,964,159 1,002,239,299 20,270 1,128,223,728
Stage 2 - Life Time ECL Not Credit Impaired 1,838,565 269,082,832 - 270,921,397 1,419,903 257,409,183 - 258,829,086
Stage 3 - Non Performing Loans 21,899,004 93,475,498 60,950 115,435,452 17,150,262 72,177,556 60,950 89,388,768
Gross Loans and Advances 192,919,589 1,503,728,322 1,206,214 1,697,854,125 144,534,324 1,331,826,038 81,220 1,476,441,582
Less allowances for impairment:
Stage 1 - 12 months ECL 1,657,032 3,374,838 59,301 5,091,171 1,036,145 1,308,583 111 2,344,839
Stage 2 - Life Time ECL Not Credit Impaired 239,799 8,240,547 - 8,480,346 82,195 7,150,635 - 7,232,830
Stage 3 - Non Performing Loans 14,703,457 45,336,976 15,337 60,055,770 13,834,370 36,165,685 15,337 50,015,392
Total allowance 16,600,288 56,952,361 74,638 73,627,287 14,952,710 44,624,903 15,448 59,593,061
Net Loans and Advances 176,319,301 1,446,775,961 1,131,576 1,624,226,838 129,581,614 1,287,201,135 65,772 1,416,848,521
Dec-2019
Loans to
Individual
Loans to non-
Individual Loans to Banks Total
Loans to
Individual
Loans to non-
Individual Loans to Banks Total
Stage 1 - 12 months ECL 192,292,451 1,022,758,344 1,561,990 1,216,612,785 145,626,166 892,257,044 61,706 1,037,944,916
Stage 2 - Life Time ECL Not Credit Impaired 3,118,035 247,154,814 159 250,273,008 2,161,630 233,542,493 159 235,704,282
Stage 3 - Non Performing Loans 9,955,760 92,478,127 19,340 102,453,227 7,590,207 75,888,706 19,340 83,498,253
Gross Loans and Advances 205,366,246 1,362,391,285 1,581,489 1,569,339,020 155,378,003 1,201,688,243 81,205 1,357,147,451
Less allowances for impairment:
Stage 1 - 12 months ECL 1,528,023 6,947,952 60,155 8,536,130 635,783 4,548,066 730 5,184,579
Stage 2 - Life Time ECL Not Credit Impaired 154,980 6,673,755 5 6,828,740 53,963 5,503,826 5 5,557,794
Stage 3 - Non Performing Loans 6,122,826 45,757,949 8,019 51,888,794 5,690,363 39,813,598 8,019 45,511,980
Total allowance 7,805,829 59,379,656 68,179 67,253,664 6,380,109 49,865,490 8,754 56,254,353
Net Loans and Advances 197,560,417 1,303,011,629 1,513,310 1,502,085,356 148,997,894 1,151,822,753 72,451 1,300,893,098
Group Parent
Group Parent
Jun-2020 Jun-2020
Dec-2019 Dec-2019
145
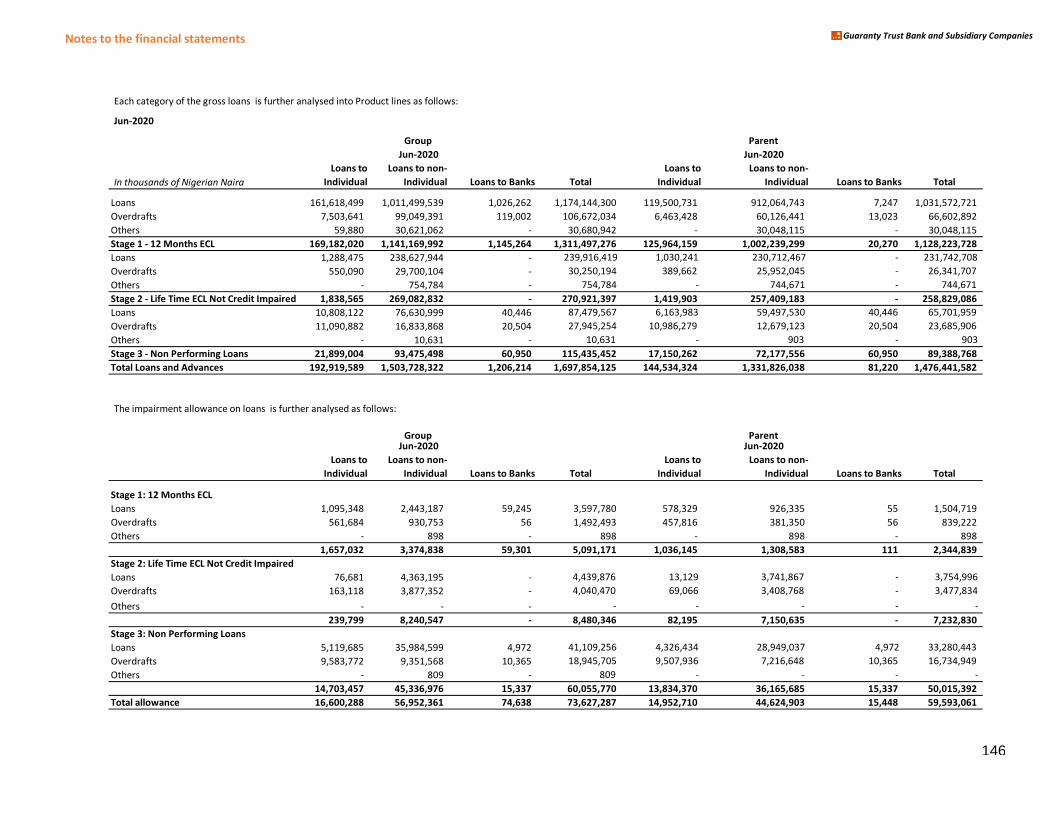
Notes to the financial statements Guaranty Trust Bank and Subsidiary Companies
Each category of the gross loans is further analysed into Product lines as follows:
Jun-2020
In thousands of Nigerian Naira
Loans to
Individual
Loans to non-
Individual Loans to Banks Total
Loans to
Individual
Loans to non-
Individual Loans to Banks Total
Loans 161,618,499 1,011,499,539 1,026,262 1,174,144,300 119,500,731 912,064,743 7,247 1,031,572,721
Overdrafts 7,503,641 99,049,391 119,002 106,672,034 6,463,428 60,126,441 13,023 66,602,892
Others 59,880 30,621,062 - 30,680,942 - 30,048,115 - 30,048,115
Stage 1 - 12 Months ECL 169,182,020 1,141,169,992 1,145,264 1,311,497,276 125,964,159 1,002,239,299 20,270 1,128,223,728
Loans 1,288,475 238,627,944 - 239,916,419 1,030,241 230,712,467 - 231,742,708
Overdrafts 550,090 29,700,104 - 30,250,194 389,662 25,952,045 - 26,341,707
Others - 754,784 - 754,784 - 744,671 - 744,671
Stage 2 - Life Time ECL Not Credit Impaired 1,838,565 269,082,832 - 270,921,397 1,419,903 257,409,183 - 258,829,086
Loans 10,808,122 76,630,999 40,446 87,479,567 6,163,983 59,497,530 40,446 65,701,959
Overdrafts 11,090,882 16,833,868 20,504 27,945,254 10,986,279 12,679,123 20,504 23,685,906
Others - 10,631 - 10,631 - 903 - 903
Stage 3 - Non Performing Loans 21,899,004 93,475,498 60,950 115,435,452 17,150,262 72,177,556 60,950 89,388,768
Total Loans and Advances 192,919,589 1,503,728,322 1,206,214 1,697,854,125 144,534,324 1,331,826,038 81,220 1,476,441,582
The impairment allowance on loans is further analysed as follows:
Loans to
Individual
Loans to non-
Individual Loans to Banks Total
Loans to
Individual
Loans to non-
Individual Loans to Banks Total
Stage 1: 12 Months ECL
Loans 1,095,348 2,443,187 59,245 3,597,780 578,329 926,335 55 1,504,719
Overdrafts 561,684 930,753 56 1,492,493 457,816 381,350 56 839,222
Others - 898 - 898 - 898 - 898
1,657,032 3,374,838 59,301 5,091,171 1,036,145 1,308,583 111 2,344,839
Stage 2: Life Time ECL Not Credit Impaired
Loans 76,681 4,363,195 - 4,439,876 13,129 3,741,867 - 3,754,996
Overdrafts 163,118 3,877,352 - 4,040,470 69,066 3,408,768 - 3,477,834
Others - - - - - - - -
239,799 8,240,547 - 8,480,346 82,195 7,150,635 - 7,232,830
Stage 3: Non Performing Loans
Loans 5,119,685 35,984,599 4,972 41,109,256 4,326,434 28,949,037 4,972 33,280,443
Overdrafts 9,583,772 9,351,568 10,365 18,945,705 9,507,936 7,216,648 10,365 16,734,949
Others - 809 - 809 - - - -
14,703,457 45,336,976 15,337 60,055,770 13,834,370 36,165,685 15,337 50,015,392
Total allowance 16,600,288 56,952,361 74,638 73,627,287 14,952,710 44,624,903 15,448 59,593,061
Group Parent
Jun-2020 Jun-2020
Group Parent Jun-2020 Jun-2020
146
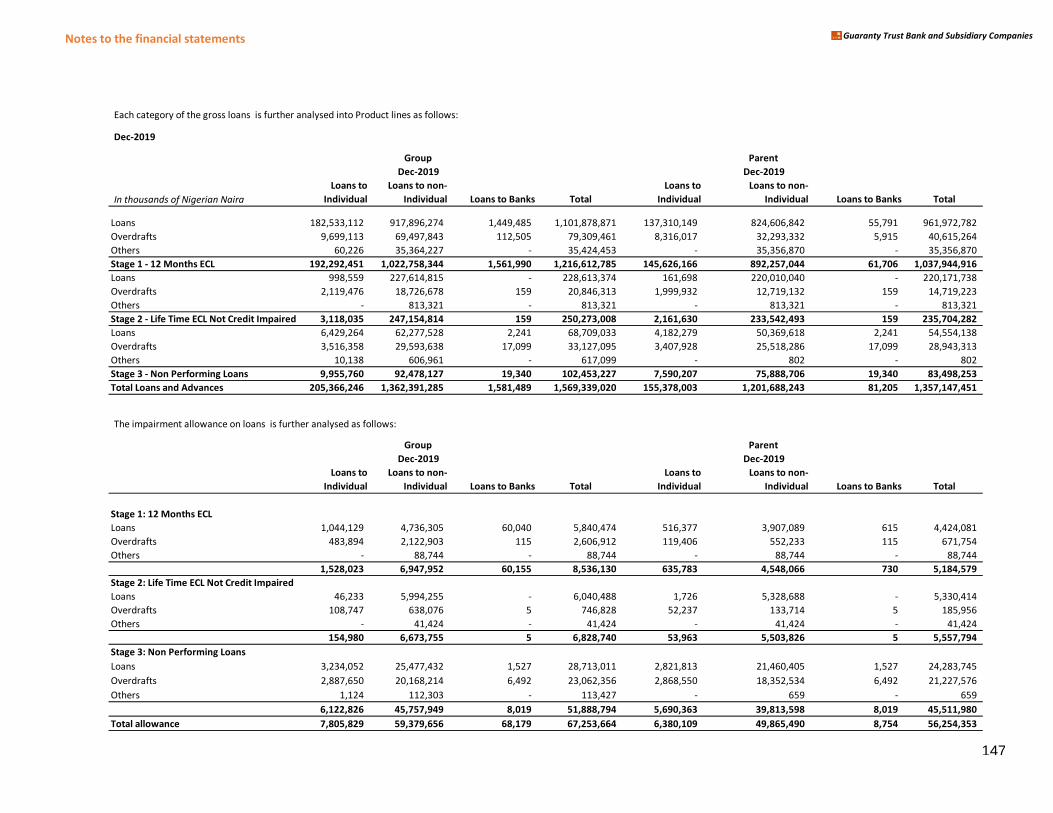
Notes to the financial statements Guaranty Trust Bank and Subsidiary Companies
Each category of the gross loans is further analysed into Product lines as follows:
Dec-2019
In thousands of Nigerian Naira
Loans to
Individual
Loans to non-
Individual Loans to Banks Total
Loans to
Individual
Loans to non-
Individual Loans to Banks Total
Loans 182,533,112 917,896,274 1,449,485 1,101,878,871 137,310,149 824,606,842 55,791 961,972,782
Overdrafts 9,699,113 69,497,843 112,505 79,309,461 8,316,017 32,293,332 5,915 40,615,264
Others 60,226 35,364,227 - 35,424,453 - 35,356,870 - 35,356,870
Stage 1 - 12 Months ECL 192,292,451 1,022,758,344 1,561,990 1,216,612,785 145,626,166 892,257,044 61,706 1,037,944,916
Loans 998,559 227,614,815 - 228,613,374 161,698 220,010,040 - 220,171,738
Overdrafts 2,119,476 18,726,678 159 20,846,313 1,999,932 12,719,132 159 14,719,223
Others - 813,321 - 813,321 - 813,321 - 813,321
Stage 2 - Life Time ECL Not Credit Impaired 3,118,035 247,154,814 159 250,273,008 2,161,630 233,542,493 159 235,704,282
Loans 6,429,264 62,277,528 2,241 68,709,033 4,182,279 50,369,618 2,241 54,554,138
Overdrafts 3,516,358 29,593,638 17,099 33,127,095 3,407,928 25,518,286 17,099 28,943,313
Others 10,138 606,961 - 617,099 - 802 - 802
Stage 3 - Non Performing Loans 9,955,760 92,478,127 19,340 102,453,227 7,590,207 75,888,706 19,340 83,498,253
Total Loans and Advances 205,366,246 1,362,391,285 1,581,489 1,569,339,020 155,378,003 1,201,688,243 81,205 1,357,147,451
The impairment allowance on loans is further analysed as follows:
Loans to
Individual
Loans to non-
Individual Loans to Banks Total
Loans to
Individual
Loans to non-
Individual Loans to Banks Total
Stage 1: 12 Months ECL
Loans 1,044,129 4,736,305 60,040 5,840,474 516,377 3,907,089 615 4,424,081
Overdrafts 483,894 2,122,903 115 2,606,912 119,406 552,233 115 671,754
Others - 88,744 - 88,744 - 88,744 - 88,744
1,528,023 6,947,952 60,155 8,536,130 635,783 4,548,066 730 5,184,579
Stage 2: Life Time ECL Not Credit Impaired
Loans 46,233 5,994,255 - 6,040,488 1,726 5,328,688 - 5,330,414
Overdrafts 108,747 638,076 5 746,828 52,237 133,714 5 185,956
Others - 41,424 - 41,424 - 41,424 - 41,424
154,980 6,673,755 5 6,828,740 53,963 5,503,826 5 5,557,794
Stage 3: Non Performing Loans
Loans 3,234,052 25,477,432 1,527 28,713,011 2,821,813 21,460,405 1,527 24,283,745
Overdrafts 2,887,650 20,168,214 6,492 23,062,356 2,868,550 18,352,534 6,492 21,227,576
Others 1,124 112,303 - 113,427 - 659 - 659
6,122,826 45,757,949 8,019 51,888,794 5,690,363 39,813,598 8,019 45,511,980
Total allowance 7,805,829 59,379,656 68,179 67,253,664 6,380,109 49,865,490 8,754 56,254,353
Dec-2019 Dec-2019
Dec-2019 Dec-2019
Group Parent
Group Parent
147
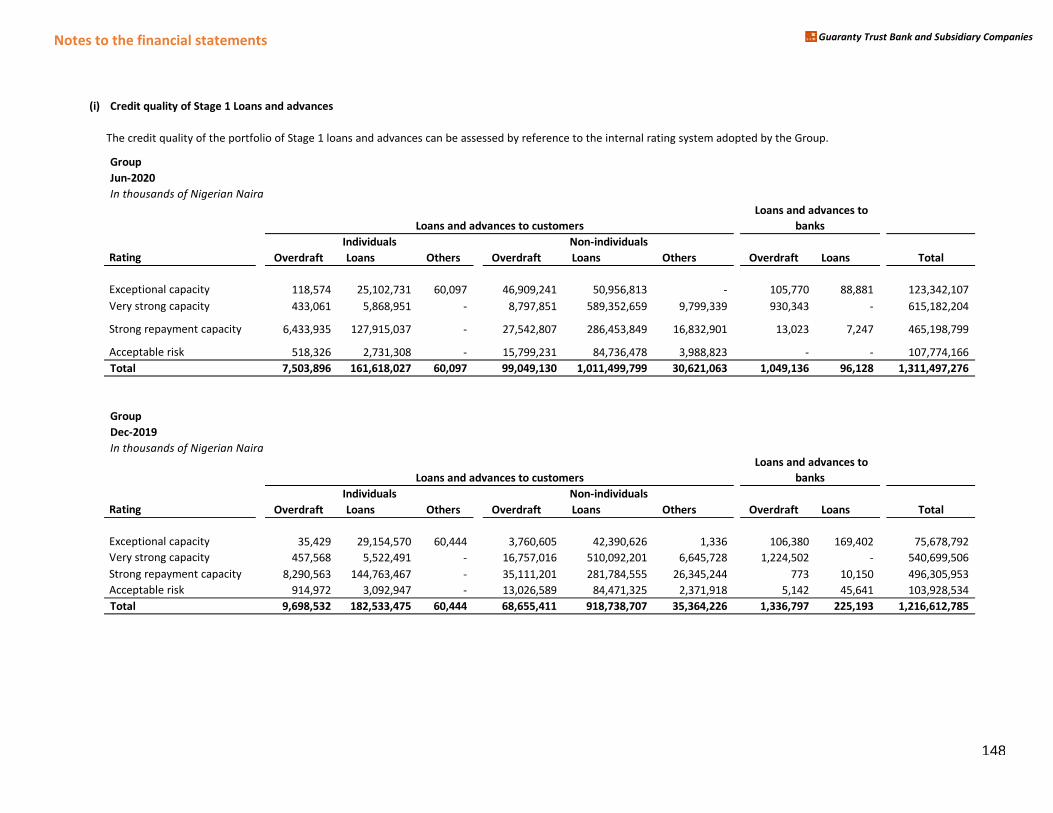
Notes to the financial statements Guaranty Trust Bank and Subsidiary Companies
(i) Credit quality of Stage 1 Loans and advances
The credit quality of the portfolio of Stage 1 loans and advances can be assessed by reference to the internal rating system adopted by the Group.
Group
Jun-2020
In thousands of Nigerian Naira
Rating Overdraft Loans Others Overdraft Loans Others Overdraft Loans Total
Exceptional capacity 118,574 25,102,731 60,097 46,909,241 50,956,813 - 105,770 88,881 123,342,107
Very strong capacity 433,061 5,868,951 - 8,797,851 589,352,659 9,799,339 930,343 - 615,182,204
Strong repayment capacity 6,433,935 127,915,037 - 27,542,807 286,453,849 16,832,901 13,023 7,247 465,198,799
Acceptable risk 518,326 2,731,308 - 15,799,231 84,736,478 3,988,823 - - 107,774,166
Total 7,503,896 161,618,027 60,097 99,049,130 1,011,499,799 30,621,063 1,049,136 96,128 1,311,497,276
Group
Dec-2019
In thousands of Nigerian Naira
Rating Overdraft Loans Others Overdraft Loans Others Overdraft Loans Total
Exceptional capacity 35,429 29,154,570 60,444 3,760,605 42,390,626 1,336 106,380 169,402 75,678,792
Very strong capacity 457,568 5,522,491 - 16,757,016 510,092,201 6,645,728 1,224,502 - 540,699,506
Strong repayment capacity 8,290,563 144,763,467 - 35,111,201 281,784,555 26,345,244 773 10,150 496,305,953
Acceptable risk 914,972 3,092,947 - 13,026,589 84,471,325 2,371,918 5,142 45,641 103,928,534
Total 9,698,532 182,533,475 60,444 68,655,411 918,738,707 35,364,226 1,336,797 225,193 1,216,612,785
Loans and advances to customers
Individuals Non-individuals
Loans and advances to
banks
Loans and advances to customers
Individuals Non-individuals
Loans and advances to
banks
148
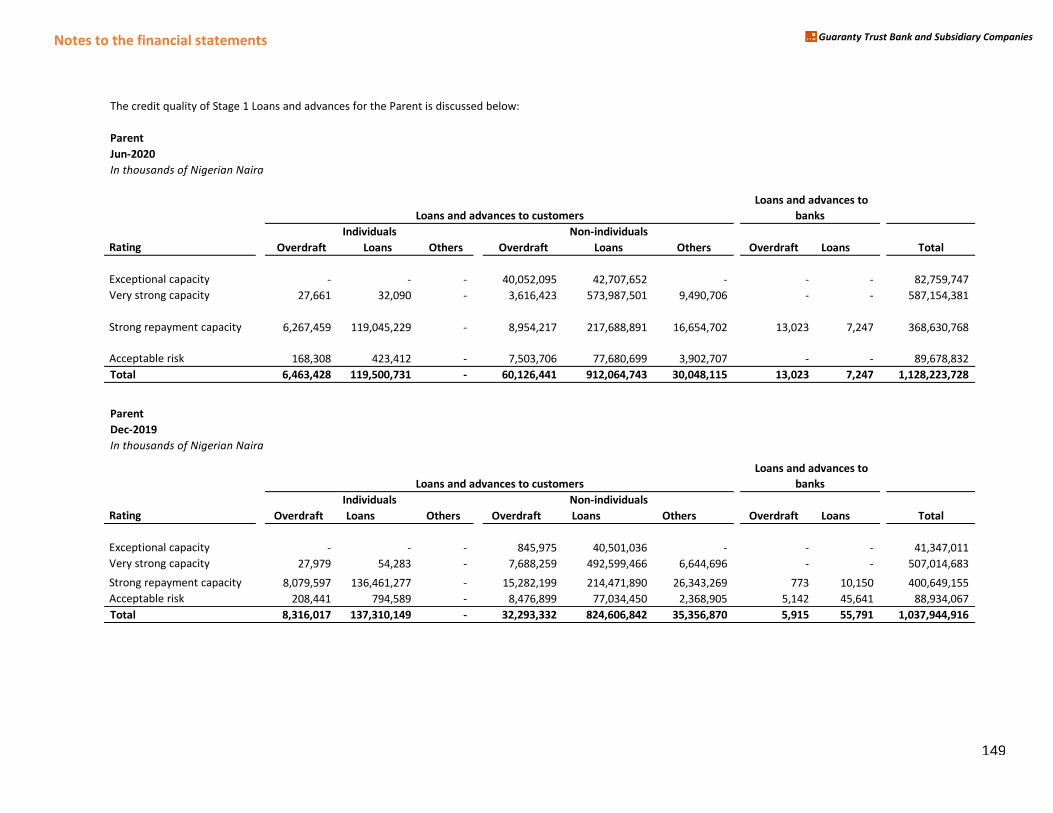
Notes to the financial statements Guaranty Trust Bank and Subsidiary Companies
The credit quality of Stage 1 Loans and advances for the Parent is discussed below:
Parent
Jun-2020
In thousands of Nigerian Naira
Rating Overdraft Loans Others Overdraft Loans Others Overdraft Loans Total
Exceptional capacity - - - 40,052,095 42,707,652 - - - 82,759,747
Very strong capacity 27,661 32,090 - 3,616,423 573,987,501 9,490,706 - - 587,154,381
Strong repayment capacity 6,267,459 119,045,229 - 8,954,217 217,688,891 16,654,702 13,023 7,247 368,630,768
Acceptable risk 168,308 423,412 - 7,503,706 77,680,699 3,902,707 - - 89,678,832
Total 6,463,428 119,500,731 - 60,126,441 912,064,743 30,048,115 13,023 7,247 1,128,223,728
Parent
Dec-2019
In thousands of Nigerian Naira
Rating Overdraft Loans Others Overdraft Loans Others Overdraft Loans Total
Exceptional capacity - - - 845,975 40,501,036 - - - 41,347,011
Very strong capacity 27,979 54,283 - 7,688,259 492,599,466 6,644,696 - - 507,014,683
Strong repayment capacity 8,079,597 136,461,277 - 15,282,199 214,471,890 26,343,269 773 10,150 400,649,155
Acceptable risk 208,441 794,589 - 8,476,899 77,034,450 2,368,905 5,142 45,641 88,934,067
Total 8,316,017 137,310,149 - 32,293,332 824,606,842 35,356,870 5,915 55,791 1,037,944,916
Loans and advances to customers
Loans and advances to
banks
Loans and advances to
banks
Individuals Non-individuals
Loans and advances to customers
Individuals Non-individuals
149
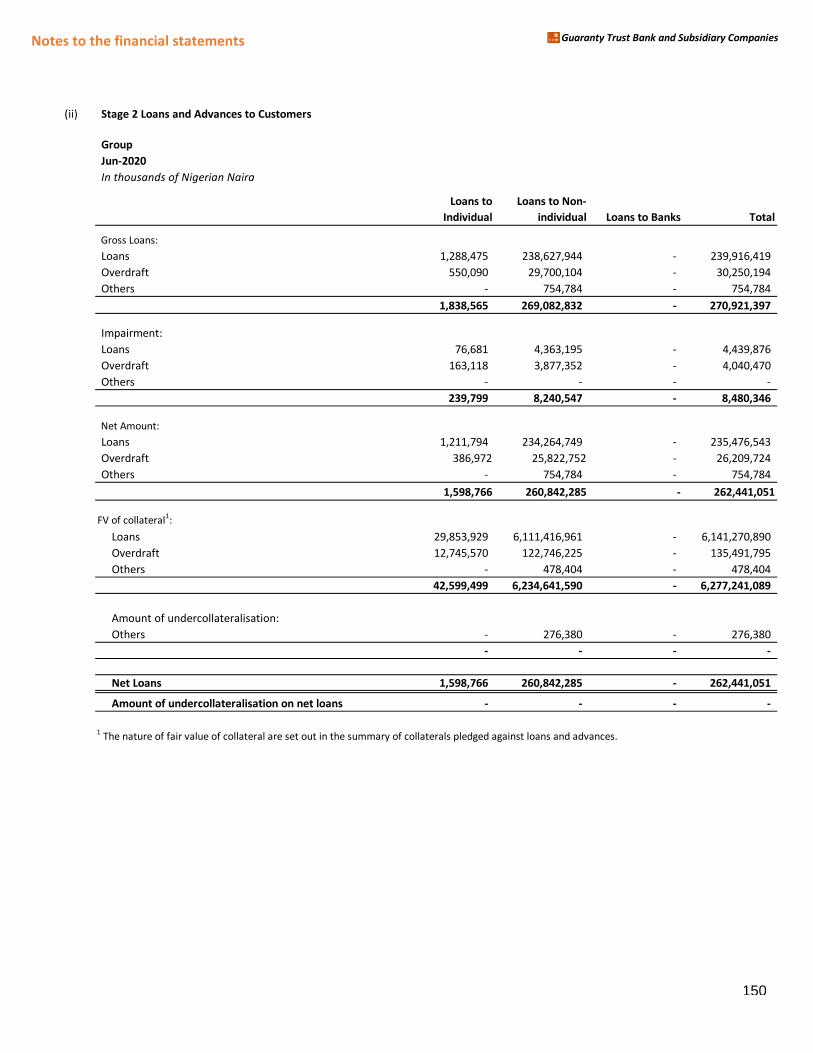
Notes to the financial statements Guaranty Trust Bank and Subsidiary Companies
(ii) Stage 2 Loans and Advances to Customers
Group
Jun-2020
In thousands of Nigerian Naira
Loans to
Individual
Loans to Non-
individual Loans to Banks Total
Gross Loans:
Loans 1,288,475 238,627,944 - 239,916,419
Overdraft 550,090 29,700,104 - 30,250,194
Others - 754,784 - 754,784
1,838,565 269,082,832 - 270,921,397
Impairment:
Loans 76,681 4,363,195 - 4,439,876
erdraft Overdraft 163,118 3,877,352 - 4,040,470
Others - - - -
239,799 8,240,547 - 8,480,346
Net Amount:
Loans 1,211,794 234,264,749 - 235,476,543
erdraft Overdraft 386,972 25,822,752 - 26,209,724
Others - 754,784 - 754,784
1,598,766 260,842,285 - 262,441,051
FV of collateral1:
:Loans Loans 29,853,929 6,111,416,961 - 6,141,270,890
Overdraft 12,745,570 122,746,225 - 135,491,795
Others - 478,404 - 478,404
42,599,499 6,234,641,590 - 6,277,241,089
Amount of undercollateralisation:
Others - 276,380 - 276,380
- - - -
Net Loans 1,598,766 260,842,285 - 262,441,051
Amount of undercollateralisation on net loans - - - -
1 The nature of fair value of collateral are set out in the summary of collaterals pledged against loans and advances.
150
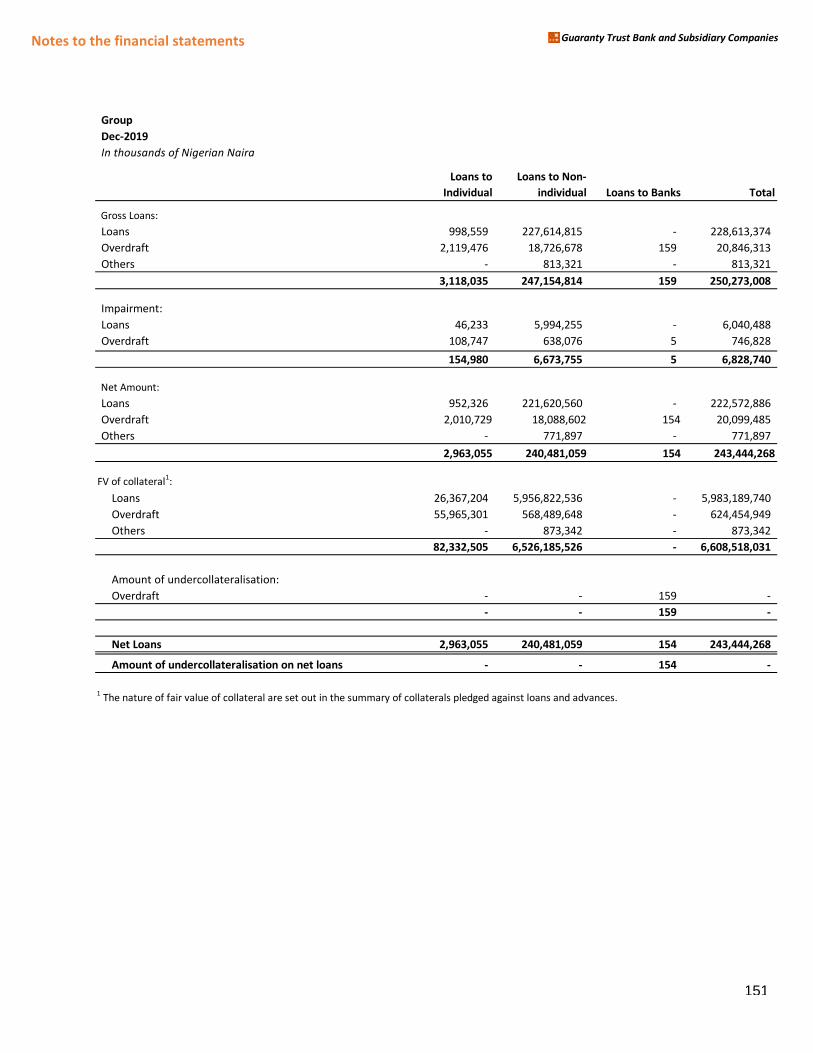
Notes to the financial statements Guaranty Trust Bank and Subsidiary Companies
Group
Dec-2019
In thousands of Nigerian Naira
Loans to
Individual
Loans to Non-
individual Loans to Banks Total
Gross Loans:
Loans 998,559 227,614,815 - 228,613,374
Overdraft 2,119,476 18,726,678 159 20,846,313
Others - 813,321 - 813,321
3,118,035 247,154,814 159 250,273,008
Impairment:
Loans 46,233 5,994,255 - 6,040,488
erdraft Overdraft 108,747 638,076 5 746,828 Others - 41,424 - 41,424
154,980 6,673,755 5 6,828,740
Net Amount:
Loans 952,326 221,620,560 - 222,572,886
erdraft Overdraft 2,010,729 18,088,602 154 20,099,485
Others - 771,897 - 771,897
2,963,055 240,481,059 154 243,444,268
FV of collateral1:
:Loans Loans 26,367,204 5,956,822,536 - 5,983,189,740
Overdraft 55,965,301 568,489,648 - 624,454,949
Others - 873,342 - 873,342
82,332,505 6,526,185,526 - 6,608,518,031
Amount of undercollateralisation:
Overdraft - - 159 -
- - 159 -
Net Loans 2,963,055 240,481,059 154 243,444,268
Amount of undercollateralisation on net loans - - 154 -
1 The nature of fair value of collateral are set out in the summary of collaterals pledged against loans and advances.
151
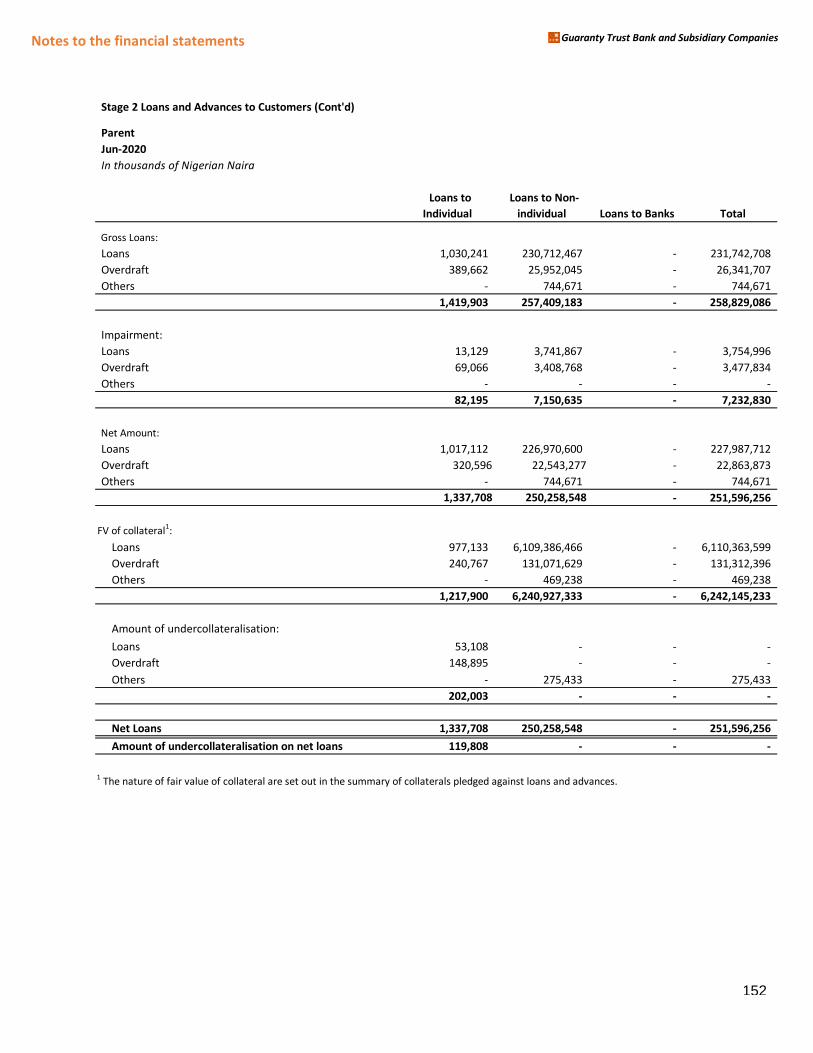
Notes to the financial statements Guaranty Trust Bank and Subsidiary Companies
Stage 2 Loans and Advances to Customers (Cont'd)
Parent
Jun-2020
In thousands of Nigerian Naira
Loans to
Individual
Loans to Non-
individual Loans to Banks Total
Gross Loans:
Loans 1,030,241 230,712,467 - 231,742,708
erdraft Overdraft 389,662 25,952,045 - 26,341,707
Others - 744,671 - 744,671
1,419,903 257,409,183 - 258,829,086
Impairment:
Loans 13,129 3,741,867 - 3,754,996
erdraft Overdraft 69,066 3,408,768 - 3,477,834
Others - - - -
82,195 7,150,635 - 7,232,830
Net Amount:
Loans 1,017,112 226,970,600 - 227,987,712
erdraft Overdraft 320,596 22,543,277 - 22,863,873
Others - 744,671 - 744,671
1,337,708 250,258,548 - 251,596,256
FV of collateral1:
:Loans Loans 977,133 6,109,386,466 - 6,110,363,599
:Overdraft Overdraft 240,767 131,071,629 - 131,312,396
:Others Others - 469,238 - 469,238
1,217,900 6,240,927,333 - 6,242,145,233
Amount of undercollateralisation:
ercollateralisation:Loa Loans 53,108 - - -
ercollateralisation:Over Overdraft 148,895 - - -
ercollateralisation:Othe Others - 275,433 - 275,433
202,003 - - -
Net Loans 1,337,708 250,258,548 - 251,596,256
ercollateralisation on Amount of undercollateralisation on net loans 119,808 - - -
1 The nature of fair value of collateral are set out in the summary of collaterals pledged against loans and advances.
152
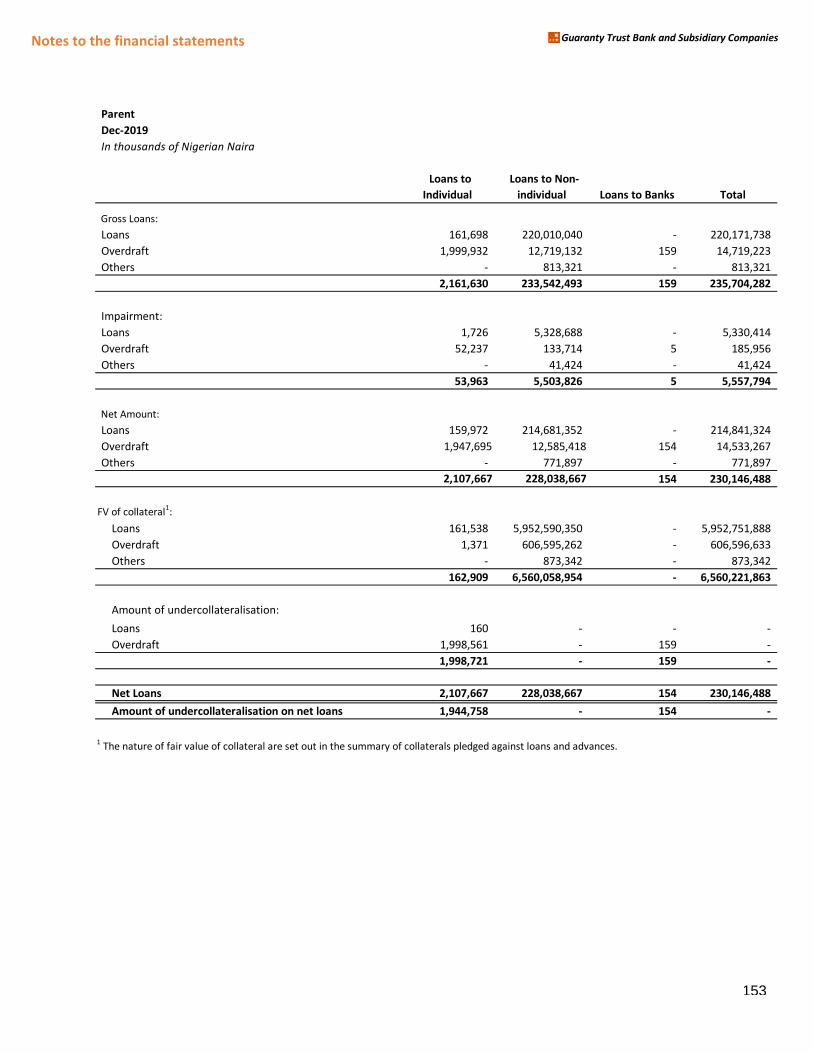
Notes to the financial statements Guaranty Trust Bank and Subsidiary Companies
Parent
Dec-2019
In thousands of Nigerian Naira
Loans to
Individual
Loans to Non-
individual Loans to Banks Total
Gross Loans:
Loans 161,698 220,010,040 - 220,171,738
Overdraft 1,999,932 12,719,132 159 14,719,223
Others - 813,321 - 813,321
2,161,630 233,542,493 159 235,704,282
Impairment:
Loans 1,726 5,328,688 - 5,330,414
Overdraft 52,237 133,714 5 185,956
Others - 41,424 - 41,424
53,963 5,503,826 5 5,557,794
Net Amount:
Loans 159,972 214,681,352 - 214,841,324
Overdraft 1,947,695 12,585,418 154 14,533,267
Others - 771,897 - 771,897
2,107,667 228,038,667 154 230,146,488
FV of collateral1:
Loans 161,538 5,952,590,350 - 5,952,751,888
Overdraft 1,371 606,595,262 - 606,596,633
Others - 873,342 - 873,342
162,909 6,560,058,954 - 6,560,221,863
Amount of undercollateralisation:
Loans 160 - - -
Overdraft 1,998,561 - 159 -
1,998,721 - 159 -
Net Loans 2,107,667 228,038,667 154 230,146,488
Amount of undercollateralisation on net loans 1,944,758 - 154 -
1 The nature of fair value of collateral are set out in the summary of collaterals pledged against loans and advances.
153
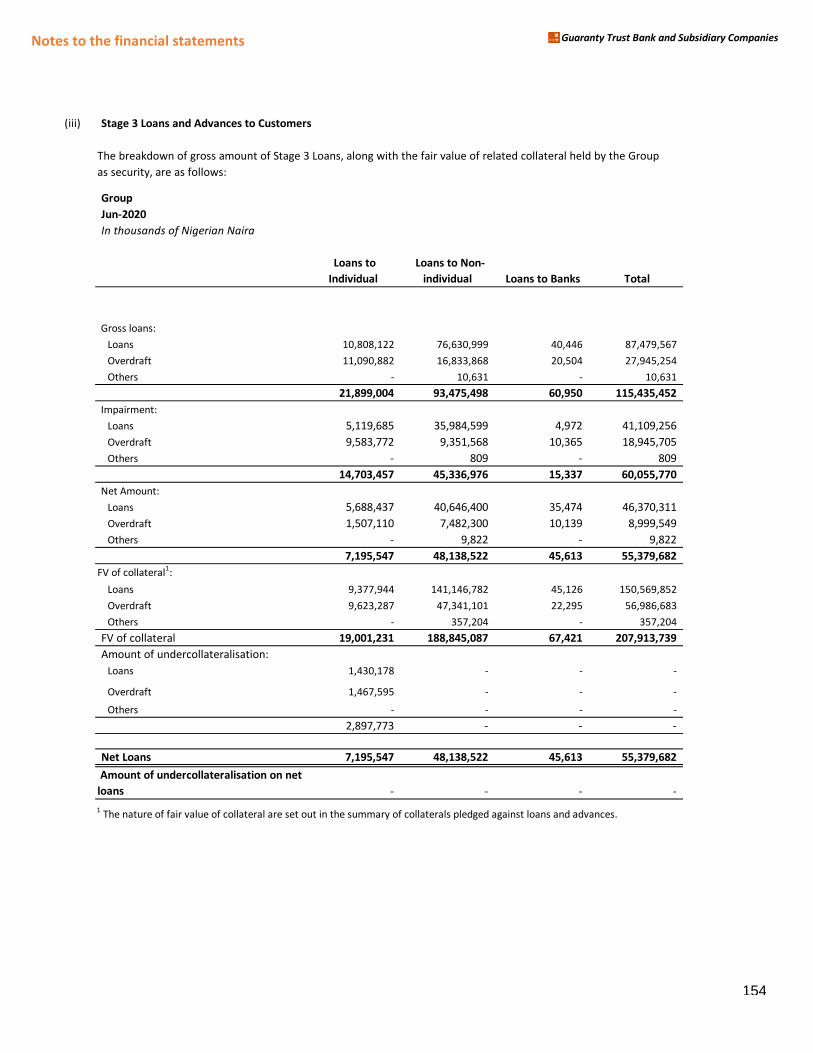
Notes to the financial statements Guaranty Trust Bank and Subsidiary Companies
(iii) Stage 3 Loans and Advances to Customers
The breakdown of gross amount of Stage 3 Loans, along with the fair value of related collateral held by the Group
as security, are as follows:
Group
Jun-2020
In thousands of Nigerian Naira
Loans to
Individual
Loans to Non-
individual Loans to Banks Total
Gross loans:
Loans 10,808,122 76,630,999 40,446 87,479,567
Overdraft 11,090,882 16,833,868 20,504 27,945,254
Others - 10,631 - 10,631
21,899,004 93,475,498 60,950 115,435,452
Impairment:
Loans 5,119,685 35,984,599 4,972 41,109,256
Overdraft 9,583,772 9,351,568 10,365 18,945,705
Others - 809 - 809
14,703,457 45,336,976 15,337 60,055,770
Net Amount:
Loans 5,688,437 40,646,400 35,474 46,370,311
Overdraft 1,507,110 7,482,300 10,139 8,999,549
Others - 9,822 - 9,822
7,195,547 48,138,522 45,613 55,379,682
FV of collateral1:
Loans 9,377,944 141,146,782 45,126 150,569,852
Overdraft 9,623,287 47,341,101 22,295 56,986,683
Others - 357,204 - 357,204
FV of collateral 19,001,231 188,845,087 67,421 207,913,739
Amount of undercollateralisation:
Loans 1,430,178 - - -
Overdraft 1,467,595 - - -
Others - - - -
2,897,773 - - -
Net Loans 7,195,547 48,138,522 45,613 55,379,682
Amount of undercollateralisation on net
loans - - - -
1 The nature of fair value of collateral are set out in the summary of collaterals pledged against loans and advances.
154
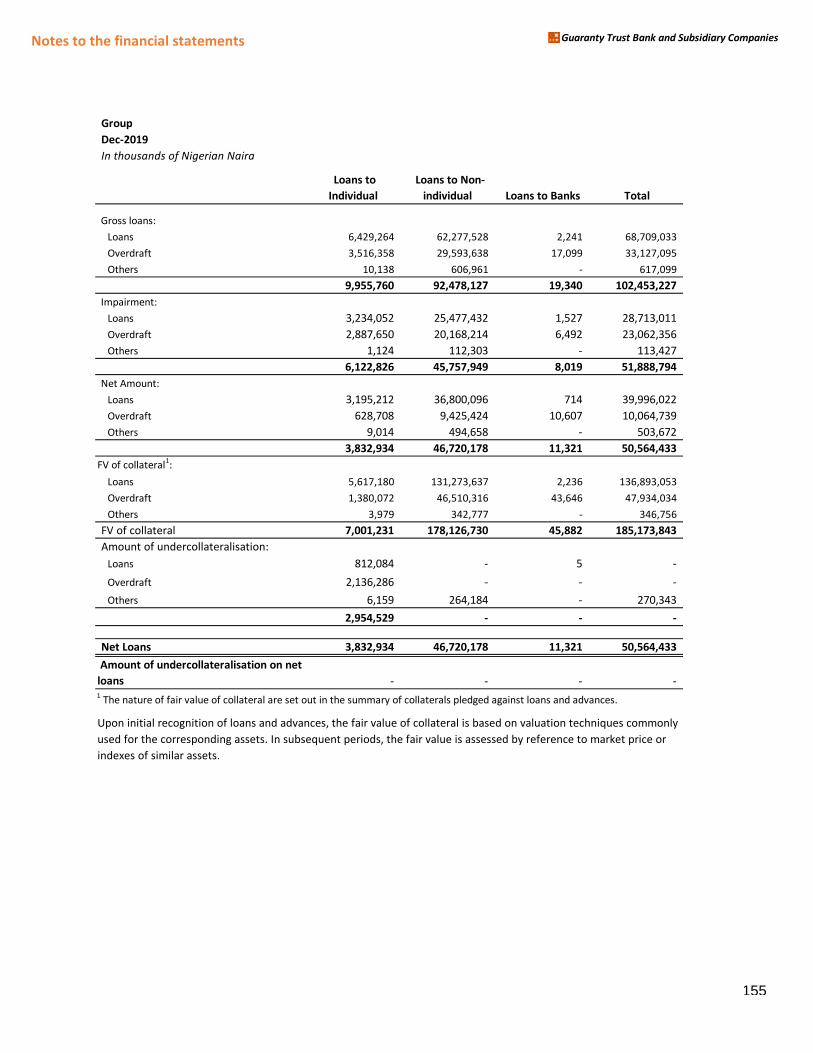
Notes to the financial statements Guaranty Trust Bank and Subsidiary Companies
Group
Dec-2019
In thousands of Nigerian Naira
Loans to
Individual
Loans to Non-
individual Loans to Banks Total
Gross loans:
Loans 6,429,264 62,277,528 2,241 68,709,033
Overdraft 3,516,358 29,593,638 17,099 33,127,095
Others 10,138 606,961 - 617,099
9,955,760 92,478,127 19,340 102,453,227
Impairment:
Loans 3,234,052 25,477,432 1,527 28,713,011
Overdraft 2,887,650 20,168,214 6,492 23,062,356
Others 1,124 112,303 - 113,427
6,122,826 45,757,949 8,019 51,888,794
Net Amount:
Loans 3,195,212 36,800,096 714 39,996,022
Overdraft 628,708 9,425,424 10,607 10,064,739
Others 9,014 494,658 - 503,672
3,832,934 46,720,178 11,321 50,564,433
FV of collateral1:
Loans 5,617,180 131,273,637 2,236 136,893,053
Overdraft 1,380,072 46,510,316 43,646 47,934,034
Others 3,979 342,777 - 346,756
FV of collateral 7,001,231 178,126,730 45,882 185,173,843
Amount of undercollateralisation:
Loans 812,084 - 5 -
Overdraft 2,136,286 - - -
Others 6,159 264,184 - 270,343
2,954,529 - - -
Net Loans 3,832,934 46,720,178 11,321 50,564,433
Amount of undercollateralisation on net
loans - - - - 1 The nature of fair value of collateral are set out in the summary of collaterals pledged against loans and advances.
Upon initial recognition of loans and advances, the fair value of collateral is based on valuation techniques commonly
used for the corresponding assets. In subsequent periods, the fair value is assessed by reference to market price or
indexes of similar assets.
155
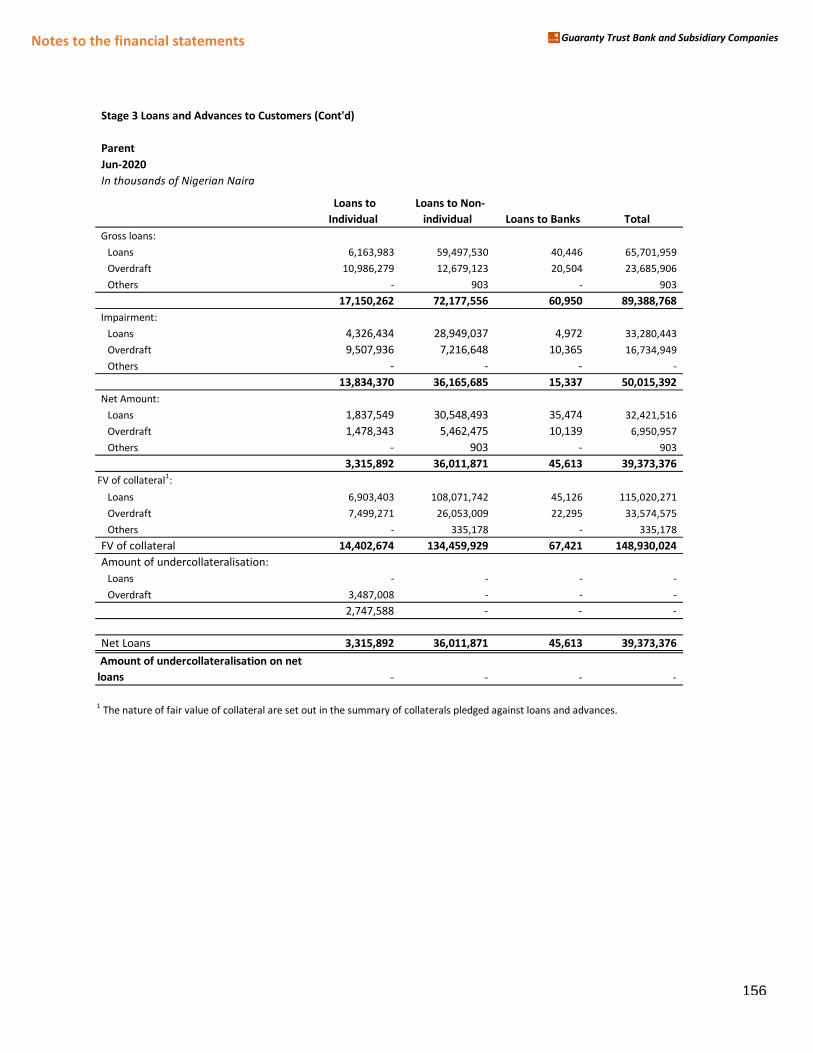
Notes to the financial statements Guaranty Trust Bank and Subsidiary Companies
Stage 3 Loans and Advances to Customers (Cont'd)
Parent
Jun-2020
In thousands of Nigerian Naira
Loans to
Individual
Loans to Non-
individual Loans to Banks Total
Gross loans:
Loans 6,163,983 59,497,530 40,446 65,701,959
Overdraft 10,986,279 12,679,123 20,504 23,685,906
Others - 903 - 903
17,150,262 72,177,556 60,950 89,388,768
Impairment:
Loans 4,326,434 28,949,037 4,972 33,280,443
Overdraft 9,507,936 7,216,648 10,365 16,734,949
Others - - - -
13,834,370 36,165,685 15,337 50,015,392
Net Amount:
Loans 1,837,549 30,548,493 35,474 32,421,516
Overdraft 1,478,343 5,462,475 10,139 6,950,957
Others - 903 - 903
3,315,892 36,011,871 45,613 39,373,376
FV of collateral1:
Loans 6,903,403 108,071,742 45,126 115,020,271
Overdraft 7,499,271 26,053,009 22,295 33,574,575
Others - 335,178 - 335,178
FV of collateral 14,402,674 134,459,929 67,421 148,930,024
Amount of undercollateralisation:
Loans - - - -
Overdraft 3,487,008 - - -
2,747,588 - - -
Net Loans 3,315,892 36,011,871 45,613 39,373,376
Amount of undercollateralisation on net
loans - - - -
1 The nature of fair value of collateral are set out in the summary of collaterals pledged against loans and advances.
156
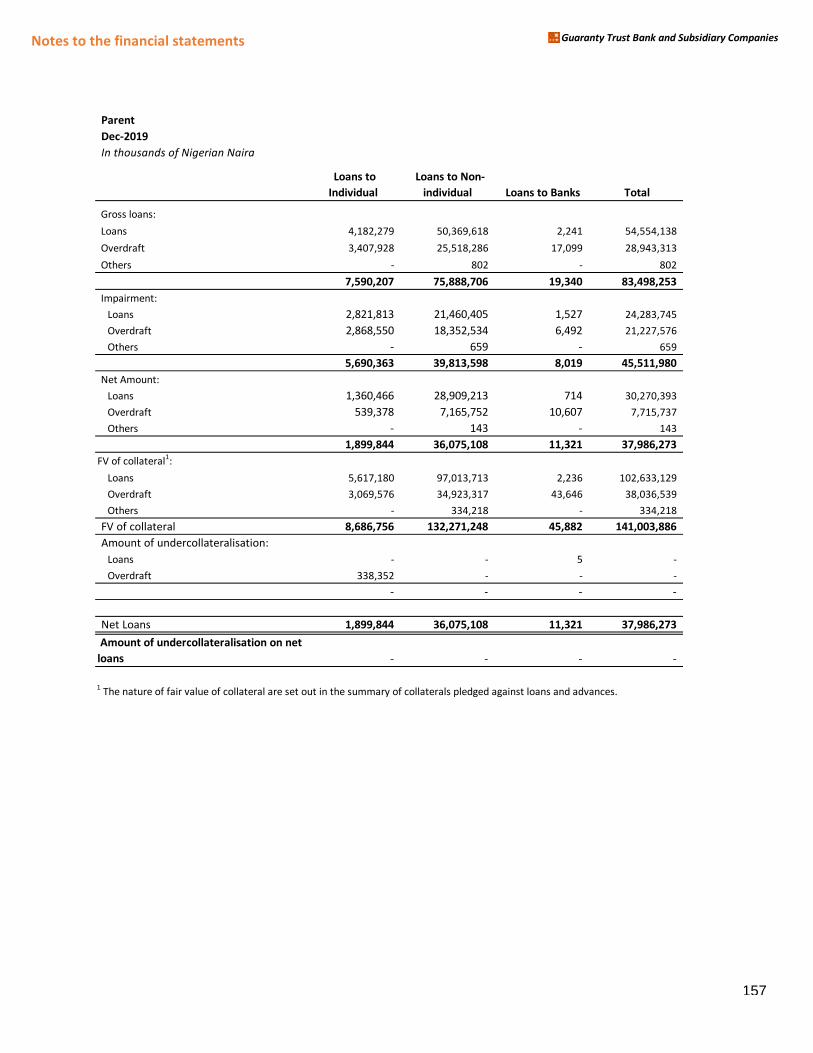
Notes to the financial statements Guaranty Trust Bank and Subsidiary Companies
Parent
Dec-2019
In thousands of Nigerian Naira
Loans to
Individual
Loans to Non-
individual Loans to Banks Total
Gross loans:
Loans 4,182,279 50,369,618 2,241 54,554,138
Overdraft 3,407,928 25,518,286 17,099 28,943,313
Others - 802 - 802
7,590,207 75,888,706 19,340 83,498,253
Impairment:
Loans 2,821,813 21,460,405 1,527 24,283,745
Overdraft 2,868,550 18,352,534 6,492 21,227,576
Others - 659 - 659
5,690,363 39,813,598 8,019 45,511,980
Net Amount:
Loans 1,360,466 28,909,213 714 30,270,393
Overdraft 539,378 7,165,752 10,607 7,715,737
Others - 143 - 143
1,899,844 36,075,108 11,321 37,986,273
FV of collateral1:
Loans 5,617,180 97,013,713 2,236 102,633,129
Overdraft 3,069,576 34,923,317 43,646 38,036,539
Others - 334,218 - 334,218
FV of collateral 8,686,756 132,271,248 45,882 141,003,886
Amount of undercollateralisation:
Loans - - 5 -
Overdraft 338,352 - - -
- - - -
Net Loans 1,899,844 36,075,108 11,321 37,986,273
Amount of undercollateralisation on net
loans - - - -
1 The nature of fair value of collateral are set out in the summary of collaterals pledged against loans and advances.
157
Notes to the financial statements Guaranty Trust Bank and Subsidiary Companies
(v) Credit collateral
The Group ensures that each credit is reviewed and granted based on the strength of the borrowers’ cash flow. However, the Group also ensures its credit facilities are well secured as a second way out.
The policies that guide collateral for facilities are embedded within the Group’s credit policy guide.
These include the following policy statements amongst others:
Loans to individuals and non-individuals are to be secured by tangible, marketable collateral that has a
market value that is supported by a valuation report from a registered estate valuer who is
acceptable to the Group. The collateral must also be easy to check and easy to dispose of. This
collateral must be in the possession of, or pledged to, the Group. Client’s account balances must be
within the scope of cover provided by its collateral.
All collateral offered must have the following attributes:
• There must be good legal title
• The title must be easy to transfer
• It should be easy and relatively cheap to value
• The value should be appreciating or at least stable
• The security must be easy to sell.
All collateral must be protected by insurance. Exceptions include cash collateral, securities in safe keeping,
indemnity or guarantees, or where our interest is general (for instance in a negative pledge). The
insurance policy has to be issued by an insurer acceptable to the Bank. All cash collateralized facilities shall
have a 20% margin to provide cushion for interest and other charges i.e. only 80% of the deposit or cash
collateral may be availed to an obligor.
The main collateral types acceptable to the Bank for loans and advances include:
• Mortgages over residential properties
• Charges over business premises, fixed and floating assets as well as inventory.
• Charges over financial instruments such as equities, treasury bills etc.
The fair values of collaterals are based upon last annual valuation undertaken by independent valuers on
behalf of the Bank. The valuation techniques adopted for properties are based upon fair values of similar
properties in the neighbourhood taking into cognizance the advantages and disadvantages of the
comparatives over the subject property and any other factor which can have effect on the valuation e.g.
subsequent movements in house prices, after making allowance for dilapidations. The fair values of non-
property collaterals (such as equities, bond, treasury bills, etc.) are determined with reference to market
quoted prices or market values of similar instrument.
The same Fair value approach is used in determining the collaterals value in the course of sale or
realisation. The Bank uses external agents to realize the value as soon as practicable, generally at auction,
to settle indebtedness. Any surplus funds are returned to the borrower.
158
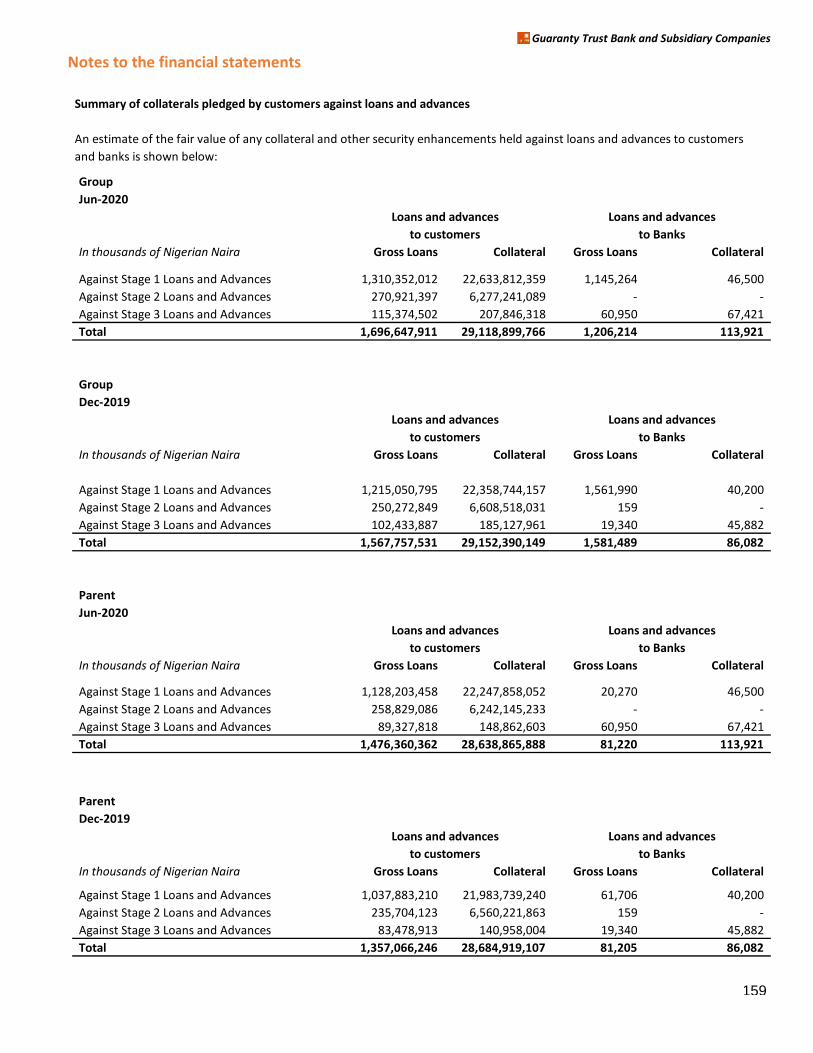
Notes to the financial statements
Guaranty Trust Bank and Subsidiary Companies
Summary of collaterals pledged by customers against loans and advances
An estimate of the fair value of any collateral and other security enhancements held against loans and advances to customers
and banks is shown below:
Group
Jun-2020
In thousands of Nigerian Naira Gross Loans Collateral Gross Loans Collateral
Against Stage 1 Loans and Advances 1,310,352,012 22,633,812,359 1,145,264 46,500
Against Stage 2 Loans and Advances 270,921,397 6,277,241,089 - -
Against Stage 3 Loans and Advances 115,374,502 207,846,318 60,950 67,421
Total 1,696,647,911 29,118,899,766 1,206,214 113,921
Group
Dec-2019
In thousands of Nigerian Naira Gross Loans Collateral Gross Loans Collateral
Against Stage 1 Loans and Advances 1,215,050,795 22,358,744,157 1,561,990 40,200
Against Stage 2 Loans and Advances 250,272,849 6,608,518,031 159 -
Against Stage 3 Loans and Advances 102,433,887 185,127,961 19,340 45,882
Total 1,567,757,531 29,152,390,149 1,581,489 86,082
Parent
Jun-2020
In thousands of Nigerian Naira Gross Loans Collateral Gross Loans Collateral
Against Stage 1 Loans and Advances 1,128,203,458 22,247,858,052 20,270 46,500
Against Stage 2 Loans and Advances 258,829,086 6,242,145,233 - -
Against Stage 3 Loans and Advances 89,327,818 148,862,603 60,950 67,421
Total 1,476,360,362 28,638,865,888 81,220 113,921
Parent
Dec-2019
In thousands of Nigerian Naira Gross Loans Collateral Gross Loans Collateral
Against Stage 1 Loans and Advances 1,037,883,210 21,983,739,240 61,706 40,200
Against Stage 2 Loans and Advances 235,704,123 6,560,221,863 159 -
Against Stage 3 Loans and Advances 83,478,913 140,958,004 19,340 45,882
Total 1,357,066,246 28,684,919,107 81,205 86,082
Loans and advances Loans and advances
to customers to Banks
to customers to Banks
Loans and advances Loans and advances
to customers to Banks
Loans and advances Loans and advances
to customers to Banks
Loans and advances Loans and advances
159
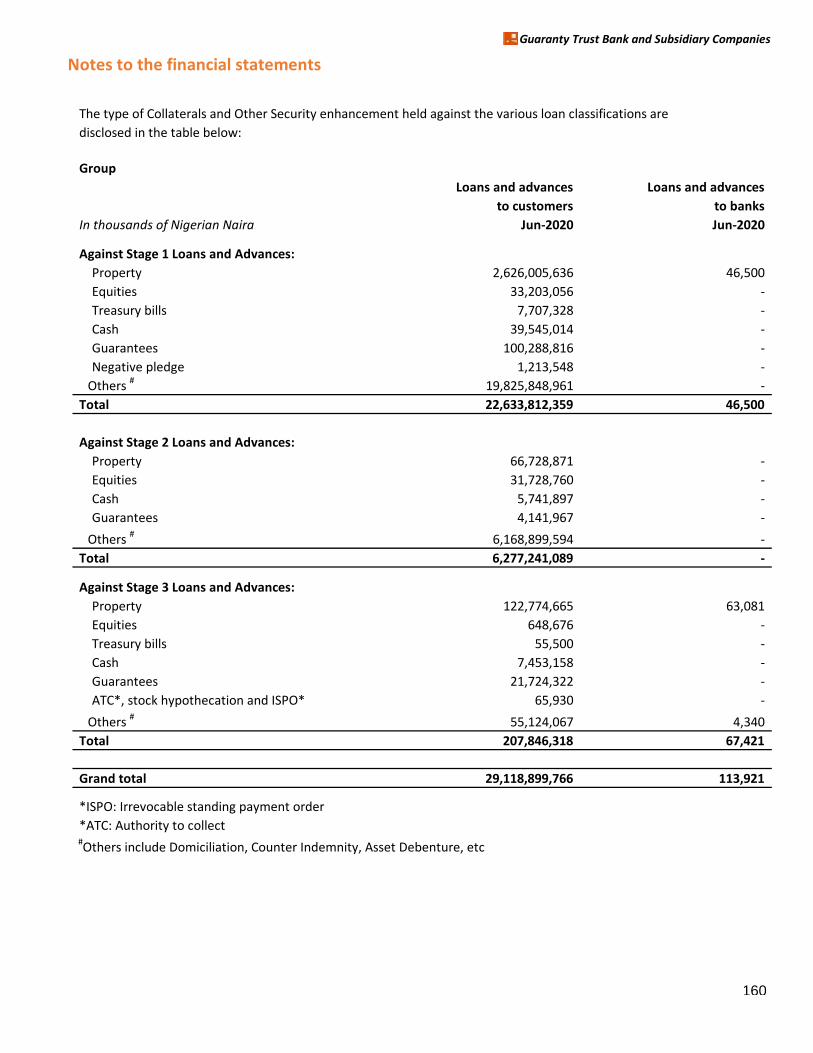
Notes to the financial statements
Guaranty Trust Bank and Subsidiary Companies
The type of Collaterals and Other Security enhancement held against the various loan classifications are
disclosed in the table below:
Group
Loans and advances Loans and advances
to customers to banks
In thousands of Nigerian Naira Jun-2020 Jun-2020
Against Stage 1 Loans and Advances:
Property 2,626,005,636 46,500
Equities 33,203,056 -
Treasury bills 7,707,328 -
Cash 39,545,014 -
Guarantees 100,288,816 -
Negative pledge 1,213,548 -
Others #
19,825,848,961 -
Total 22,633,812,359 46,500
Against Stage 2 Loans and Advances:
Property 66,728,871 -
Equities 31,728,760 -
Cash 5,741,897 -
Guarantees 4,141,967 -
Others #
6,168,899,594 -
Total 6,277,241,089 -
Against Stage 3 Loans and Advances:
Property 122,774,665 63,081
Equities 648,676 -
Treasury bills 55,500 -
Cash 7,453,158 -
Guarantees 21,724,322 -
ATC*, stock hypothecation and ISPO* 65,930 -
Others #
55,124,067 4,340
Total 207,846,318 67,421
Grand total 29,118,899,766 113,921
*ISPO: Irrevocable standing payment order
*ATC: Authority to collect
#Others include Domiciliation, Counter Indemnity, Asset Debenture, etc
160
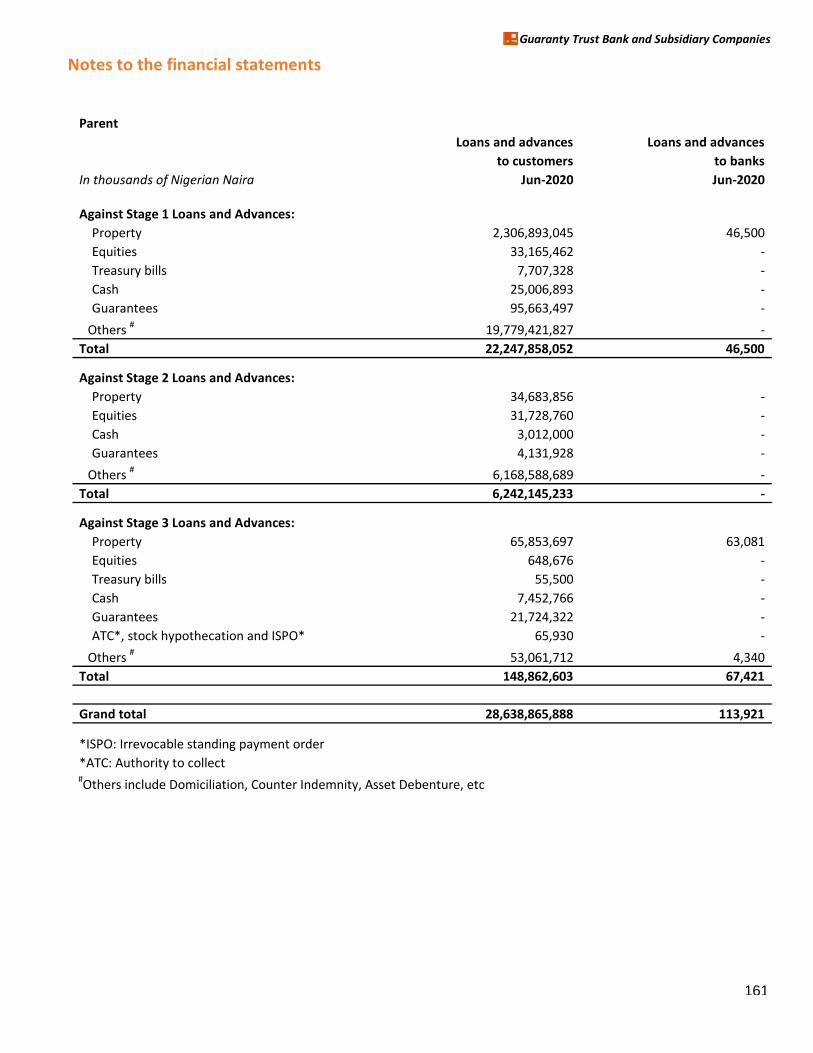
Notes to the financial statements
Guaranty Trust Bank and Subsidiary Companies
Parent
Loans and advances Loans and advances
to customers to banks
In thousands of Nigerian Naira Jun-2020 Jun-2020
Against Stage 1 Loans and Advances:
Property 2,306,893,045 46,500
Equities 33,165,462 -
Treasury bills 7,707,328 -
Cash 25,006,893 -
Guarantees 95,663,497 -
Others #
19,779,421,827 -
Total 22,247,858,052 46,500
Against Stage 2 Loans and Advances:
Property 34,683,856 -
Equities 31,728,760 -
Cash 3,012,000 -
Guarantees 4,131,928 -
Others #
6,168,588,689 -
Total 6,242,145,233 -
Against Stage 3 Loans and Advances:
Property 65,853,697 63,081
Equities 648,676 -
Treasury bills 55,500 -
Cash 7,452,766 -
Guarantees 21,724,322 -
ATC*, stock hypothecation and ISPO* 65,930 -
Others #
53,061,712 4,340
Total 148,862,603 67,421
Grand total 28,638,865,888 113,921
*ISPO: Irrevocable standing payment order
*ATC: Authority to collect
#Others include Domiciliation, Counter Indemnity, Asset Debenture, etc
161
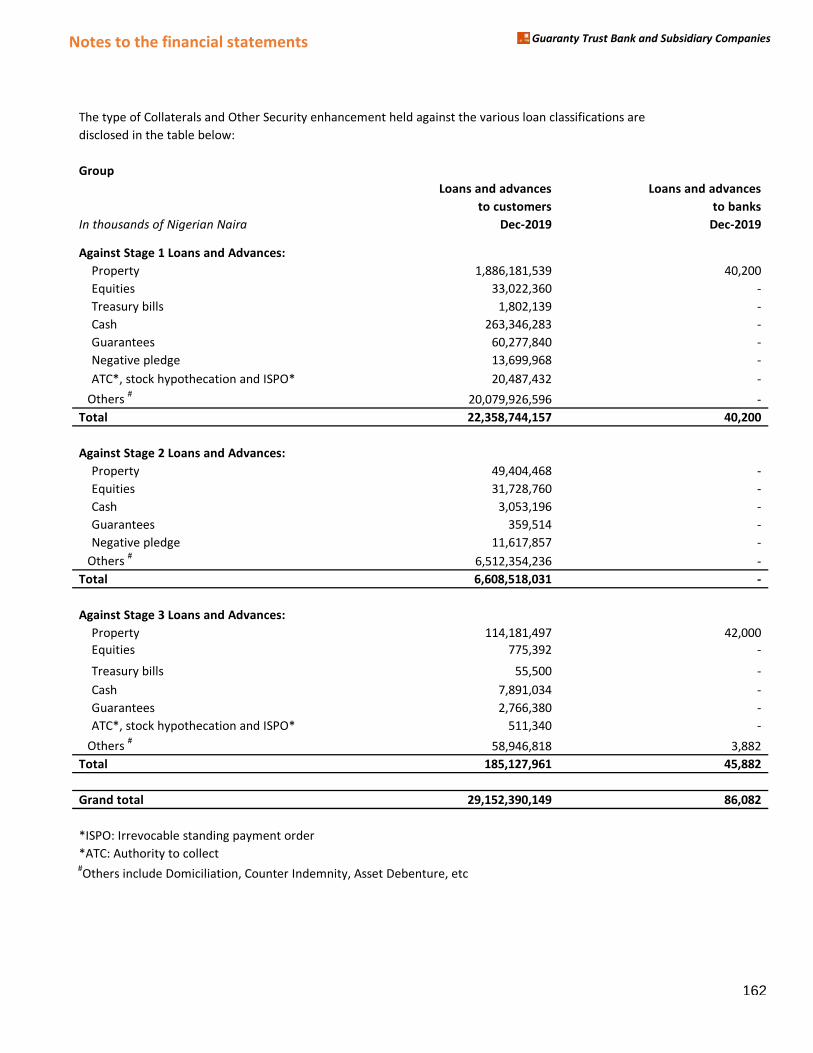
Notes to the financial statements Guaranty Trust Bank and Subsidiary Companies
The type of Collaterals and Other Security enhancement held against the various loan classifications are
disclosed in the table below:
Group
Loans and advances Loans and advances
to customers to banks
In thousands of Nigerian Naira Dec-2019 Dec-2019
dually impaAgainst Stage 1 Loans and Advances:
nst Stage Property 1,886,181,539 40,200
Equities 33,022,360 -
nst Stage Treasury bills 1,802,139 -
Cash 263,346,283 -
nst Stage Guarantees 60,277,840 -
nst Stage Negative pledge 13,699,968 -
nst Stage ATC*, stock hypothecation and ISPO* 20,487,432 -
nst Stage Others #
20,079,926,596 -
Total 22,358,744,157 40,200
vely impaAgainst Stage 2 Loans and Advances:
nst Stage Property 49,404,468 -
nst Stage Equities 31,728,760 -
nst Stage Cash 3,053,196 -
nst Stage Guarantees 359,514 -
nst Stage Negative pledge 11,617,857 -
nst Stage Others #
6,512,354,236 -
Total 6,608,518,031 -
Against Stage 3 Loans and Advances:
nst Stage Property 114,181,497 42,000
nst Stage Equities 775,392 -
nst Stage Treasury bills 55,500 -
nst Stage Cash 7,891,034 -
nst Stage Guarantees 2,766,380 -
nst Stage ATC*, stock hypothecation and ISPO* 511,340 -
nst Stage Others #
58,946,818 3,882
Total 185,127,961 45,882
Grand total 29,152,390,149 86,082
*ISPO: Irrevocable standing payment order
*ATC: Authority to collect
#Others include Domiciliation, Counter Indemnity, Asset Debenture, etc
162
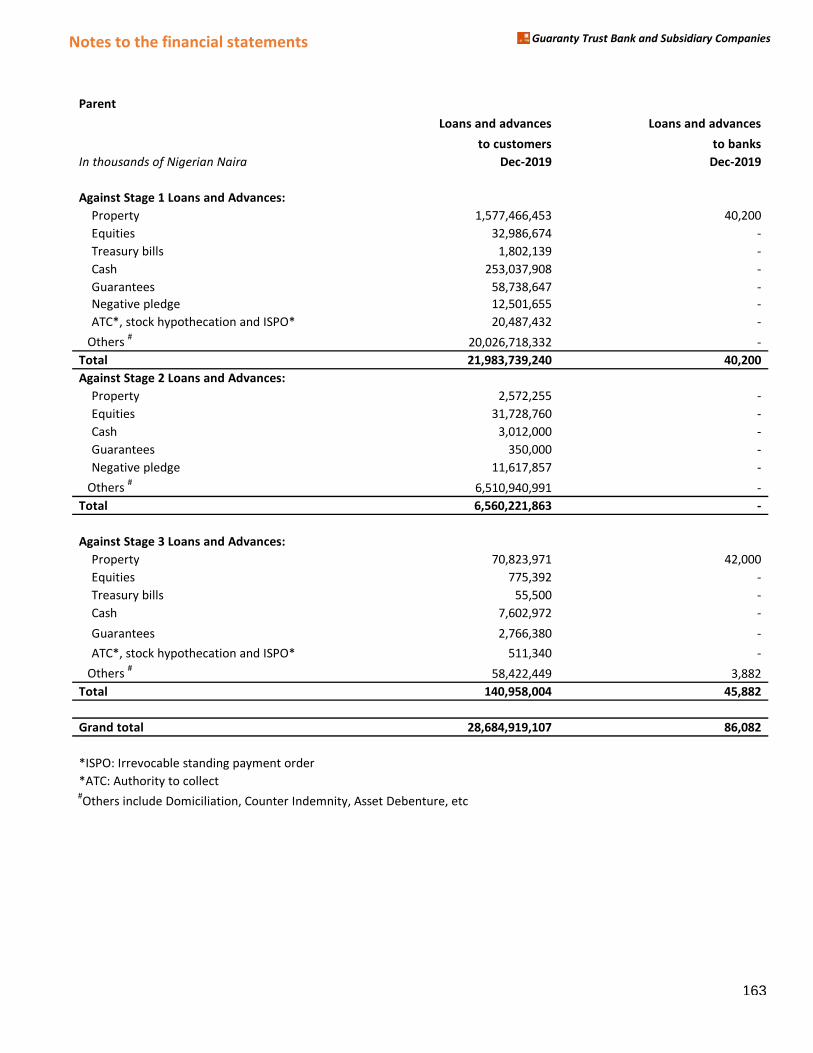
Notes to the financial statements Guaranty Trust Bank and Subsidiary Companies
Parent
Loans and advances Loans and advances
to customers to banks
NigerianIn thousands of Nigerian Naira Dec-2019 Dec-2019
dually impaAgainst Stage 1 Loans and Advances:
nst Stage Property 1,577,466,453 40,200
nst Stage Equities 32,986,674 -
nst Stage Treasury bills 1,802,139 -
nst Stage Cash 253,037,908 -
nst Stage Guarantees 58,738,647 -
nst Stage Negative pledge 12,501,655 -
nst Stage ATC*, stock hypothecation and ISPO* 20,487,432 -
nst Stage Others #
20,026,718,332 -
Total 21,983,739,240 40,200
Against Stage 2 Loans and Advances:
nst Stage Property 2,572,255 -
nst Stage Equities 31,728,760 -
nst Stage Cash 3,012,000 -
nst Stage Guarantees 350,000 -
nst Stage Negative pledge 11,617,857 -
nst Stage Others #
6,510,940,991 -
Total 6,560,221,863 -
past due Against Stage 3 Loans and Advances:
nst Stage Property 70,823,971 42,000
nst Stage Equities 775,392 -
nst Stage Treasury bills 55,500 -
nst Stage Cash 7,602,972 -
nst Stage Guarantees 2,766,380 -
nst Stage ATC*, stock hypothecation and ISPO* 511,340 -
nst Stage Others #
58,422,449 3,882
Total 140,958,004 45,882
Grand total 28,684,919,107 86,082
*ISPO: Irrevocable standing payment order
*ATC: Authority to collect
#Others include Domiciliation, Counter Indemnity, Asset Debenture, etc
163
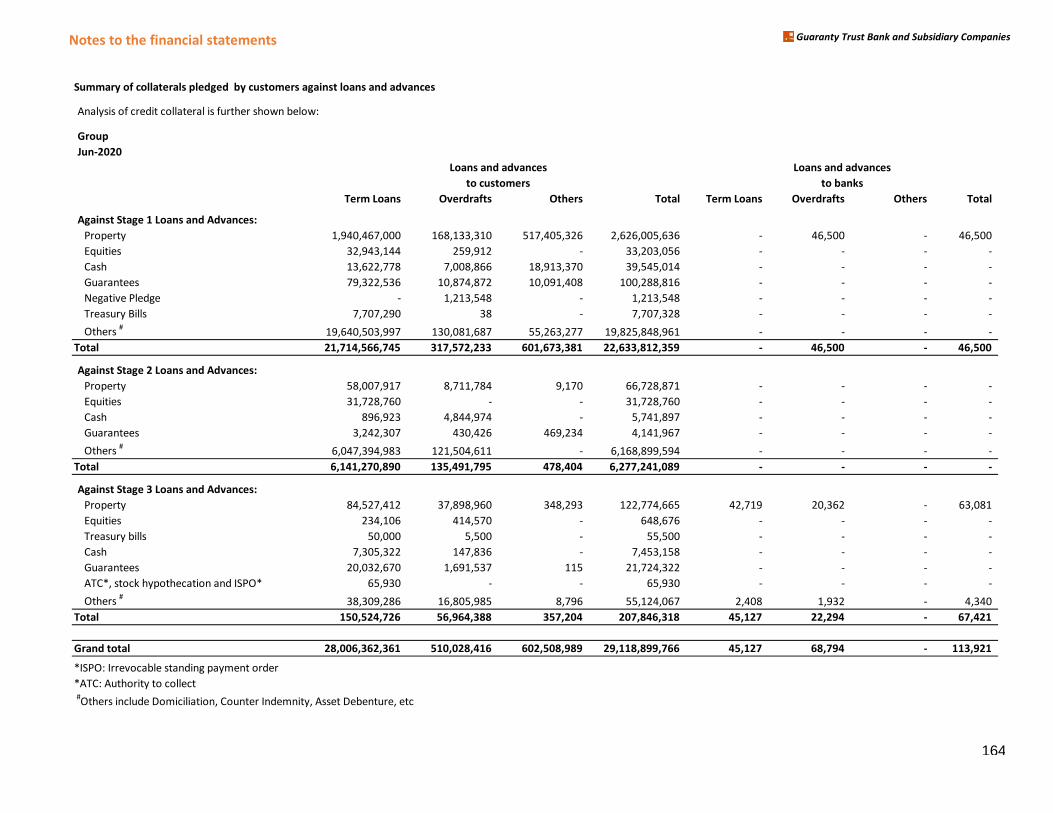
Notes to the financial statements Guaranty Trust Bank and Subsidiary Companies
Summary of collaterals pledged by customers against loans and advances
Analysis of credit collateral is further shown below:
Group
Jun-2020
Term Loans Overdrafts Others Total Term Loans Overdrafts Others Total
Against Stage 1 Loans and Advances:
Property 1,940,467,000 168,133,310 517,405,326 2,626,005,636 - 46,500 - 46,500
Equities 32,943,144 259,912 - 33,203,056 - - - -
Cash 13,622,778 7,008,866 18,913,370 39,545,014 - - - -
Guarantees 79,322,536 10,874,872 10,091,408 100,288,816 - - - -
Negative Pledge - 1,213,548 - 1,213,548 - - - -
Treasury Bills 7,707,290 38 - 7,707,328 - - - -
Others #
19,640,503,997 130,081,687 55,263,277 19,825,848,961 - - - -
Total 21,714,566,745 317,572,233 601,673,381 22,633,812,359 - 46,500 - 46,500
Against Stage 2 Loans and Advances:
Property 58,007,917 8,711,784 9,170 66,728,871 - - - -
Equities 31,728,760 - - 31,728,760 - - - -
Cash 896,923 4,844,974 - 5,741,897 - - - -
Guarantees 3,242,307 430,426 469,234 4,141,967 - - - -
Others #
6,047,394,983 121,504,611 - 6,168,899,594 - - - -
Total 6,141,270,890 135,491,795 478,404 6,277,241,089 - - - -
Against Stage 3 Loans and Advances:
Property 84,527,412 37,898,960 348,293 122,774,665 42,719 20,362 - 63,081
Equities 234,106 414,570 - 648,676 - - - -
Treasury bills 50,000 5,500 - 55,500 - - - -
Cash 7,305,322 147,836 - 7,453,158 - - - -
Guarantees 20,032,670 1,691,537 115 21,724,322 - - - -
ATC*, stock hypothecation and ISPO* 65,930 - - 65,930 - - - -
Others #
38,309,286 16,805,985 8,796 55,124,067 2,408 1,932 - 4,340
Total 150,524,726 56,964,388 357,204 207,846,318 45,127 22,294 - 67,421
Grand total 28,006,362,361 510,028,416 602,508,989 29,118,899,766 45,127 68,794 - 113,921
*ISPO: Irrevocable standing payment order
*ATC: Authority to collect
#Others include Domiciliation, Counter Indemnity, Asset Debenture, etc
Loans and advances Loans and advances
to customers to banks
164
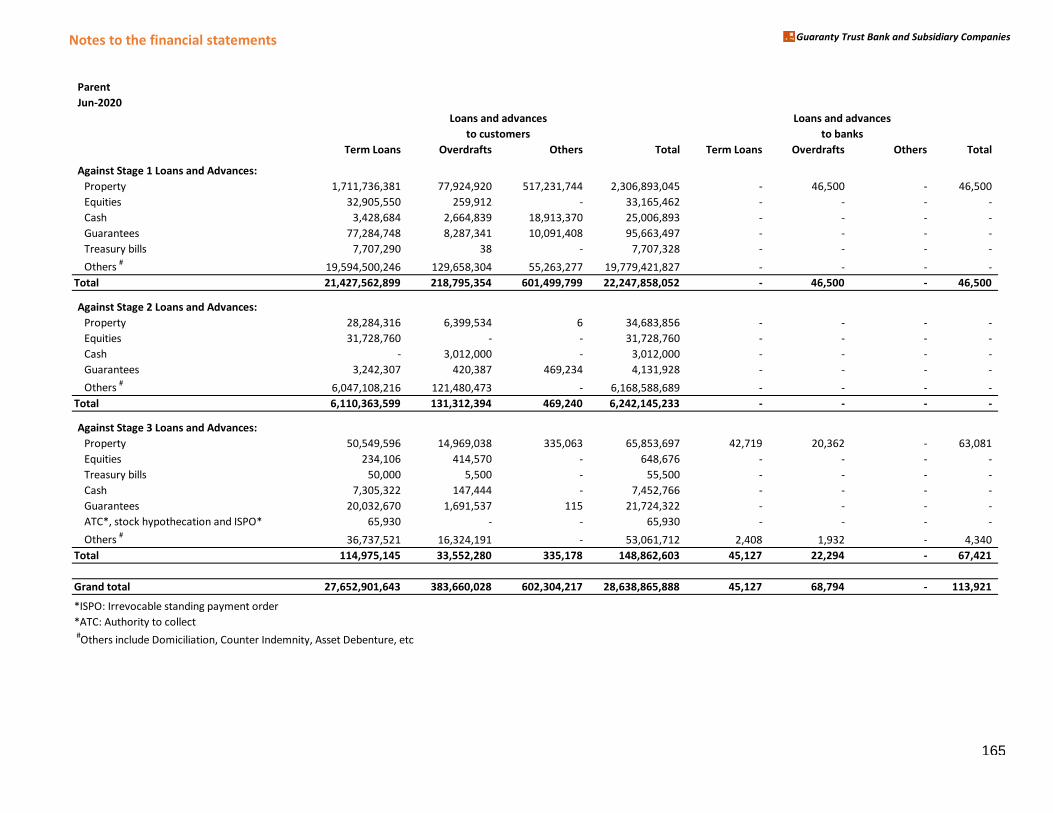
Notes to the financial statements Guaranty Trust Bank and Subsidiary Companies
Parent
Jun-2020
Term Loans Overdrafts Others Total Term Loans Overdrafts Others Total
Against Stage 1 Loans and Advances:
Property 1,711,736,381 77,924,920 517,231,744 2,306,893,045 - 46,500 - 46,500
Equities 32,905,550 259,912 - 33,165,462 - - - -
Cash 3,428,684 2,664,839 18,913,370 25,006,893 - - - -
Guarantees 77,284,748 8,287,341 10,091,408 95,663,497 - - - -
Treasury bills 7,707,290 38 - 7,707,328 - - - -
Others #
19,594,500,246 129,658,304 55,263,277 19,779,421,827 - - - -
Total 21,427,562,899 218,795,354 601,499,799 22,247,858,052 - 46,500 - 46,500
Against Stage 2 Loans and Advances:
Property 28,284,316 6,399,534 6 34,683,856 - - - -
Equities 31,728,760 - - 31,728,760 - - - -
Cash - 3,012,000 - 3,012,000 - - - -
Guarantees 3,242,307 420,387 469,234 4,131,928 - - - -
Others #
6,047,108,216 121,480,473 - 6,168,588,689 - - - -
Total 6,110,363,599 131,312,394 469,240 6,242,145,233 - - - -
Against Stage 3 Loans and Advances:
Property 50,549,596 14,969,038 335,063 65,853,697 42,719 20,362 - 63,081
Equities 234,106 414,570 - 648,676 - - - -
Treasury bills 50,000 5,500 - 55,500 - - - -
Cash 7,305,322 147,444 - 7,452,766 - - - -
Guarantees 20,032,670 1,691,537 115 21,724,322 - - - -
ATC*, stock hypothecation and ISPO* 65,930 - - 65,930 - - - -
Others #
36,737,521 16,324,191 - 53,061,712 2,408 1,932 - 4,340
Total 114,975,145 33,552,280 335,178 148,862,603 45,127 22,294 - 67,421
Grand total 27,652,901,643 383,660,028 602,304,217 28,638,865,888 45,127 68,794 - 113,921
*ISPO: Irrevocable standing payment order
*ATC: Authority to collect
#Others include Domiciliation, Counter Indemnity, Asset Debenture, etc
to customers to banks
Loans and advances Loans and advances
165
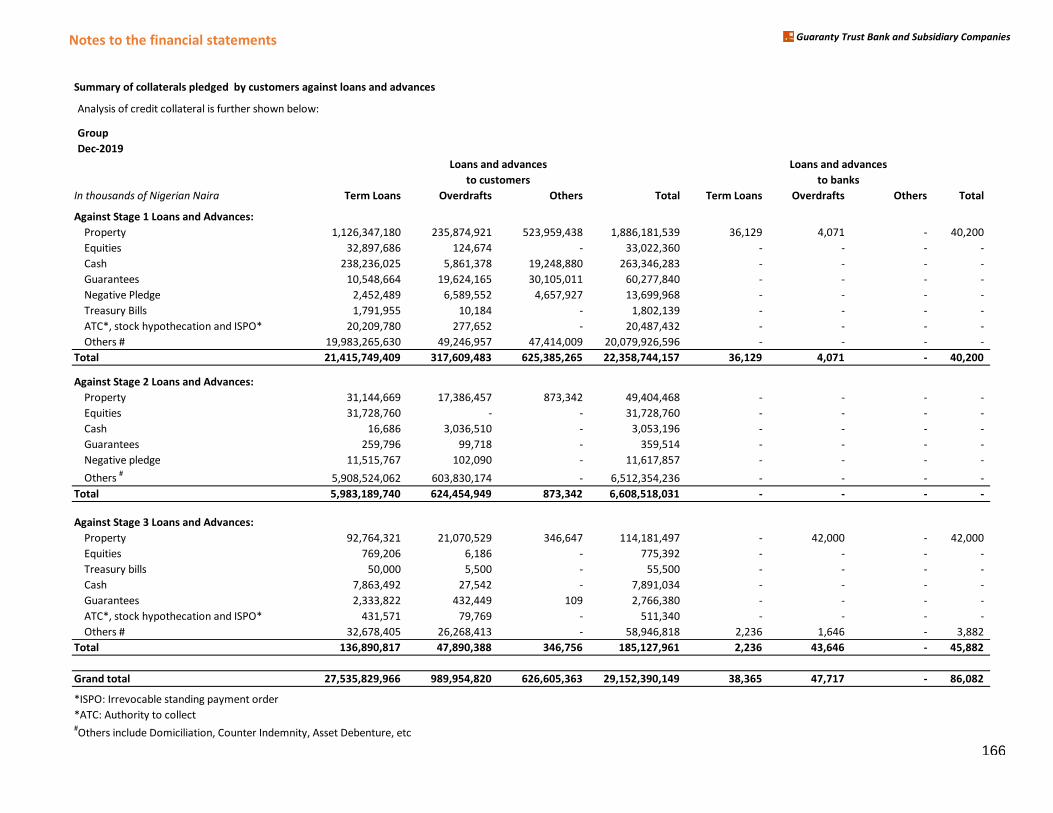
Notes to the financial statements Guaranty Trust Bank and Subsidiary Companies
Summary of collaterals pledged by customers against loans and advances
Analysis of credit collateral is further shown below:
Group
Dec-2019
In thousands of Nigerian Naira Term Loans Overdrafts Others Total Term Loans Overdrafts Others Total
Against Stage 1 Loans and Advances:
Property 1,126,347,180 235,874,921 523,959,438 1,886,181,539 36,129 4,071 - 40,200
Equities 32,897,686 124,674 - 33,022,360 - - - -
Cash 238,236,025 5,861,378 19,248,880 263,346,283 - - - -
Guarantees 10,548,664 19,624,165 30,105,011 60,277,840 - - - -
Negative Pledge 2,452,489 6,589,552 4,657,927 13,699,968 - - - -
Treasury Bills 1,791,955 10,184 - 1,802,139 - - - -
ATC*, stock hypothecation and ISPO* 20,209,780 277,652 - 20,487,432 - - - -
Others # 19,983,265,630 49,246,957 47,414,009 20,079,926,596 - - - -
Total 21,415,749,409 317,609,483 625,385,265 22,358,744,157 36,129 4,071 - 40,200
Against Stage 2 Loans and Advances:
Property 31,144,669 17,386,457 873,342 49,404,468 - - - -
Equities 31,728,760 - - 31,728,760 - - - -
Cash 16,686 3,036,510 - 3,053,196 - - - -
Guarantees 259,796 99,718 - 359,514 - - - -
Negative pledge 11,515,767 102,090 - 11,617,857 - - - -
Others #
5,908,524,062 603,830,174 - 6,512,354,236 - - - -
Total 5,983,189,740 624,454,949 873,342 6,608,518,031 - - - -
Against Stage 3 Loans and Advances:
Property 92,764,321 21,070,529 346,647 114,181,497 - 42,000 - 42,000
Equities 769,206 6,186 - 775,392 - - - -
Treasury bills 50,000 5,500 - 55,500 - - - -
Cash 7,863,492 27,542 - 7,891,034 - - - -
Guarantees 2,333,822 432,449 109 2,766,380 - - - -
ATC*, stock hypothecation and ISPO* 431,571 79,769 - 511,340 - - - -
Others # 32,678,405 26,268,413 - 58,946,818 2,236 1,646 - 3,882
Total 136,890,817 47,890,388 346,756 185,127,961 2,236 43,646 - 45,882
Grand total 27,535,829,966 989,954,820 626,605,363 29,152,390,149 38,365 47,717 - 86,082
*ISPO: Irrevocable standing payment order
*ATC: Authority to collect #Others include Domiciliation, Counter Indemnity, Asset Debenture, etc
Loans and advances Loans and advances
to customers to banks
166
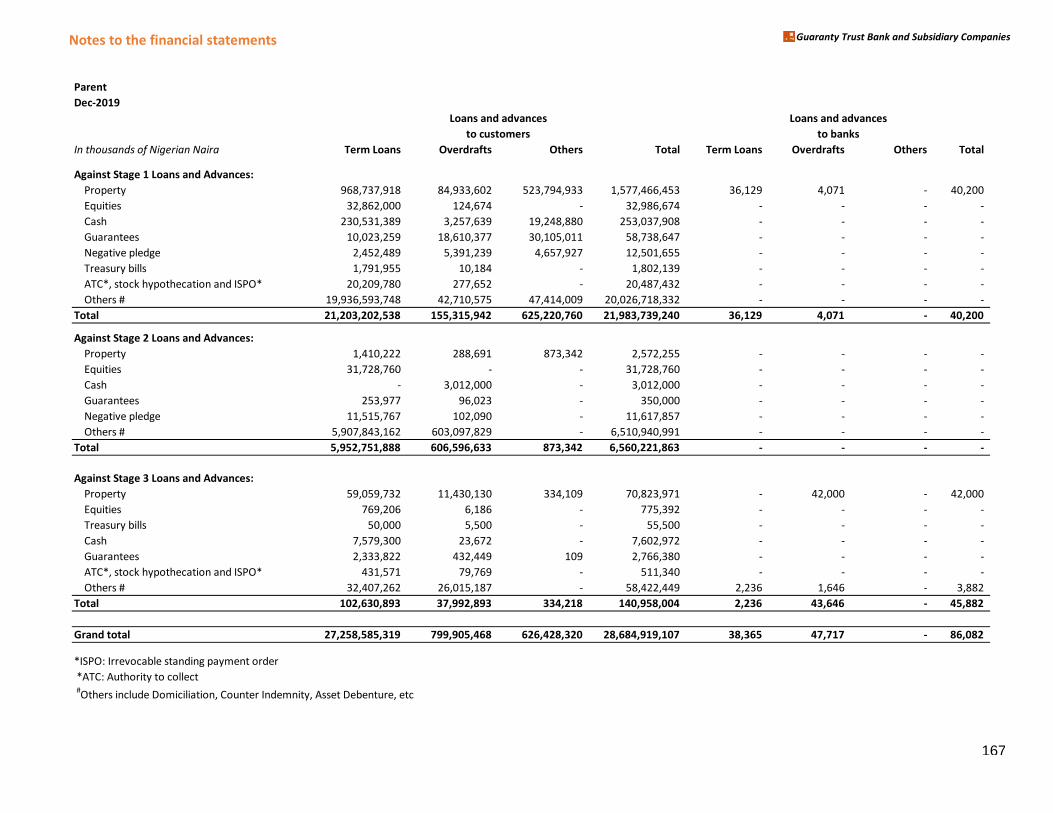
Notes to the financial statements Guaranty Trust Bank and Subsidiary Companies
Parent
Dec-2019
In thousands of Nigerian Naira Term Loans Overdrafts Others Total Term Loans Overdrafts Others Total
Against Stage 1 Loans and Advances:
Property 968,737,918 84,933,602 523,794,933 1,577,466,453 36,129 4,071 - 40,200
Equities 32,862,000 124,674 - 32,986,674 - - - -
Cash 230,531,389 3,257,639 19,248,880 253,037,908 - - - -
Guarantees 10,023,259 18,610,377 30,105,011 58,738,647 - - - -
Negative pledge 2,452,489 5,391,239 4,657,927 12,501,655 - - - -
Treasury bills 1,791,955 10,184 - 1,802,139 - - - -
ATC*, stock hypothecation and ISPO* 20,209,780 277,652 - 20,487,432 - - - -
Others # 19,936,593,748 42,710,575 47,414,009 20,026,718,332 - - - -
Total 21,203,202,538 155,315,942 625,220,760 21,983,739,240 36,129 4,071 - 40,200
Against Stage 2 Loans and Advances:
Property 1,410,222 288,691 873,342 2,572,255 - - - -
Equities 31,728,760 - - 31,728,760 - - - -
Cash - 3,012,000 - 3,012,000 - - - -
Guarantees 253,977 96,023 - 350,000 - - - -
Negative pledge 11,515,767 102,090 - 11,617,857 - - - -
Others # 5,907,843,162 603,097,829 - 6,510,940,991 - - - -
Total 5,952,751,888 606,596,633 873,342 6,560,221,863 - - - -
Against Stage 3 Loans and Advances:
Property 59,059,732 11,430,130 334,109 70,823,971 - 42,000 - 42,000
Equities 769,206 6,186 - 775,392 - - - -
Treasury bills 50,000 5,500 - 55,500 - - - -
Cash 7,579,300 23,672 - 7,602,972 - - - -
Guarantees 2,333,822 432,449 109 2,766,380 - - - -
ATC*, stock hypothecation and ISPO* 431,571 79,769 - 511,340 - - - -
Others # 32,407,262 26,015,187 - 58,422,449 2,236 1,646 - 3,882
Total 102,630,893 37,992,893 334,218 140,958,004 2,236 43,646 - 45,882
Grand total 27,258,585,319 799,905,468 626,428,320 28,684,919,107 38,365 47,717 - 86,082
*ISPO: Irrevocable standing payment order
*ATC: Authority to collect
#Others include Domiciliation, Counter Indemnity, Asset Debenture, etc
Loans and advances Loans and advances
to customers to banks
167
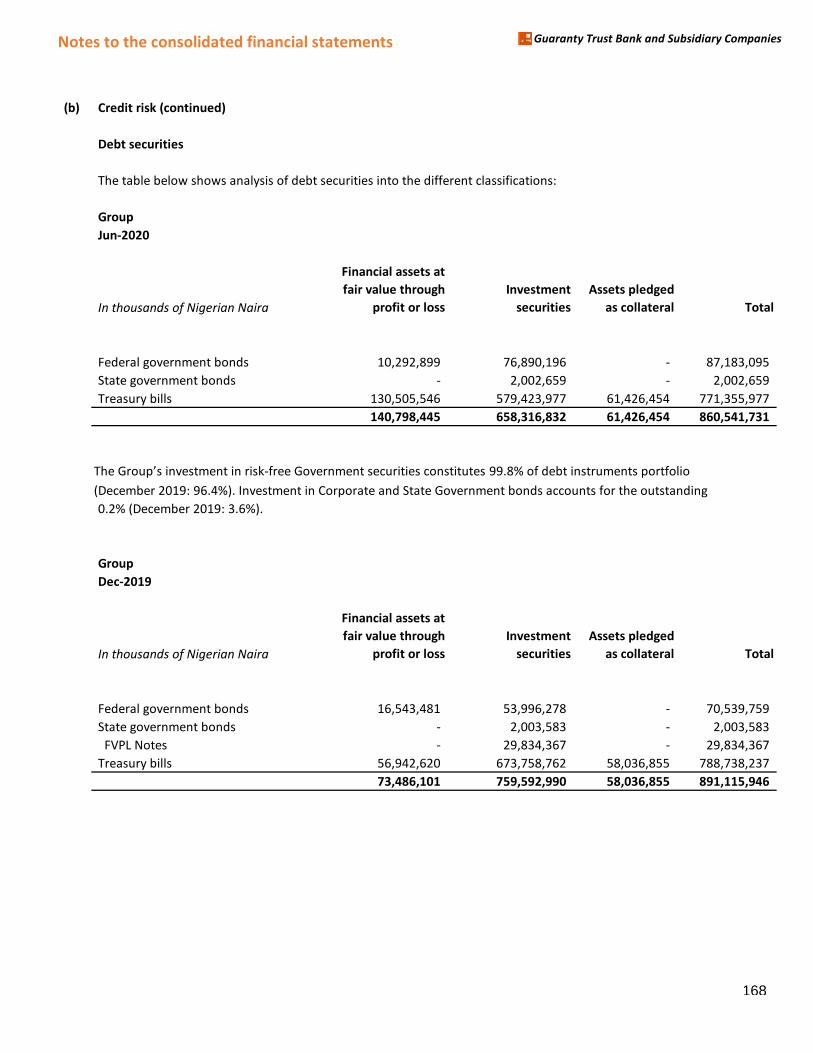
Notes to the consolidated financial statements Guaranty Trust Bank and Subsidiary Companies
(b) Credit risk (continued)
The table below shows analysis of debt securities into the different classifications:
Group
Jun-2020
In thousands of Nigerian Naira
Financial assets at
fair value through
profit or loss
Investment
securities
Assets pledged
as collateral Total
Federal government bonds 10,292,899 76,890,196 - 87,183,095
State government bonds - 2,002,659 - 2,002,659
Treasury bills 130,505,546 579,423,977 61,426,454 771,355,977
140,798,445 658,316,832 61,426,454 860,541,731
The Group’s investマent in risk-free Governマent securities constitutes 99.8% of debt instruments portfolio
(December 2019: 96.4%). Investment in Corporate and State Government bonds accounts for the outstanding
0.2% (December 2019: 3.6%).
Group
Dec-2019
In thousands of Nigerian Naira
Financial assets at
fair value through
profit or loss
Investment
securities
Assets pledged
as collateral Total
Federal government bonds 16,543,481 53,996,278 - 70,539,759
State government bonds - 2,003,583 - 2,003,583
FVPL Notes - 29,834,367 - 29,834,367
Treasury bills 56,942,620 673,758,762 58,036,855 788,738,237
73,486,101 759,592,990 58,036,855 891,115,946
Debt securities
168
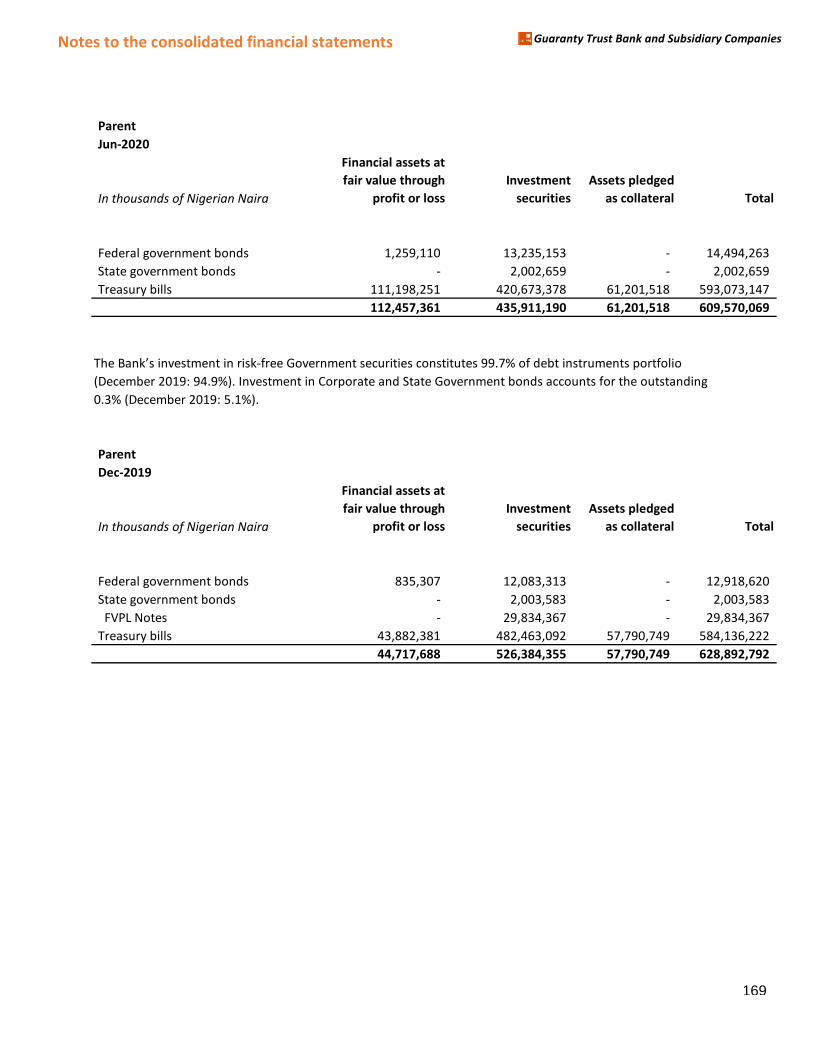
Notes to the consolidated financial statements Guaranty Trust Bank and Subsidiary Companies
Parent
Jun-2020
In thousands of Nigerian Naira
Financial assets at
fair value through
profit or loss
Investment
securities
Assets pledged
as collateral Total
Federal government bonds 1,259,110 13,235,153 - 14,494,263
State government bonds - 2,002,659 - 2,002,659
Treasury bills 111,198,251 420,673,378 61,201,518 593,073,147
112,457,361 435,911,190 61,201,518 609,570,069
The Bank’s investマent in risk-free Governマent securities constitutes 99.7% of deHt instruマents portfolio (December 2019: 94.9%). Investment in Corporate and State Government bonds accounts for the outstanding
0.3% (December 2019: 5.1%).
Parent
Dec-2019
In thousands of Nigerian Naira
Financial assets at
fair value through
profit or loss
Investment
securities
Assets pledged
as collateral Total
Federal government bonds 835,307 12,083,313 - 12,918,620
State government bonds - 2,003,583 - 2,003,583
FVPL Notes - 29,834,367 - 29,834,367
Treasury bills 43,882,381 482,463,092 57,790,749 584,136,222
44,717,688 526,384,355 57,790,749 628,892,792
169
Notes to the financial statements Guaranty Trust Bank and Subsidiary Companies
(g) Liquidity Risk
Liquidity risk is the risk that the group, though having a solvent balance sheet, might not be able to generate
sufficient cash resources to meet its obligations as they fall due, or is only able to do so at an excessive cost.
The risk typically arises from mismatches in the timing of cash inflows and cash outflows.
The oHjective of the Group’s liケuidity risk マanageマent systeマ is to ensure that all foreseeaHle funding commitments can be met when due, and that access to wholesale markets is controlled and cost effective. To
this end the Group maintains a diversified funding base comprising of retail, small business, commercial and
institutional customer deposits. The Group continues to develop and improve its liquidity risk management
system with the aim of effectively identifying, measuring, monitoring and controlling liquidity risk across its
network. Seeking at all times to balance safety, liquidity, profitability and regulatory requirements.
A brief overview of the Group’s liケuidity マanageマent processes during the period includes the following:
1. Control of liquidity risk by the setting of dynamic limits on metrics such as liquidity ratio, reserve
ratio, asset and liability gap measures, amongst others. Internal limits are typically more stringent
than regulatory liマits across all jurisdictions of the Group’s operation.
2. The limits are monitored regularly with exceptions reported to the Management Risk Committee
(MRC) and the Board.
3. Based on its judgement of financial market trends, the Group actively adjusts its business strategies
to manage liquidity risk.
4. Periodic cash flow projections considering its impact on internal and regulatory limits.
5. Control of non-earning assets proportion to マanage its iマpact on the Group’s overall financial position.
6. Conduct regular liquidity stress tests including testing of contingency plans.
7. Monitor diversification of funding sources in order to control concentration risk. and ensure a
satisfactorily funding mix.
8. Monitoring the level of undrawn commitments.
9. Maintain an updated liquidity and contingency funding plan. These plans will identify stress
indicators and prescribe actions to be taken in event of firm specific or market based crises.
10. Regular conduct of the Asset and Liability Management Committee (ALMAC) meetings.
The Group’s Asset and LiaHility Manageマent Coママittee (ALMACぶ is charged with the following responsiHilities.
1. Establishing policies and tolerance levels, from both risk and return perspectives, for liquidity,
interest rate and balance sheet valuation management.
2. Manage the intra-day liquidity position to ensure that payment and settlement obligations are met
170
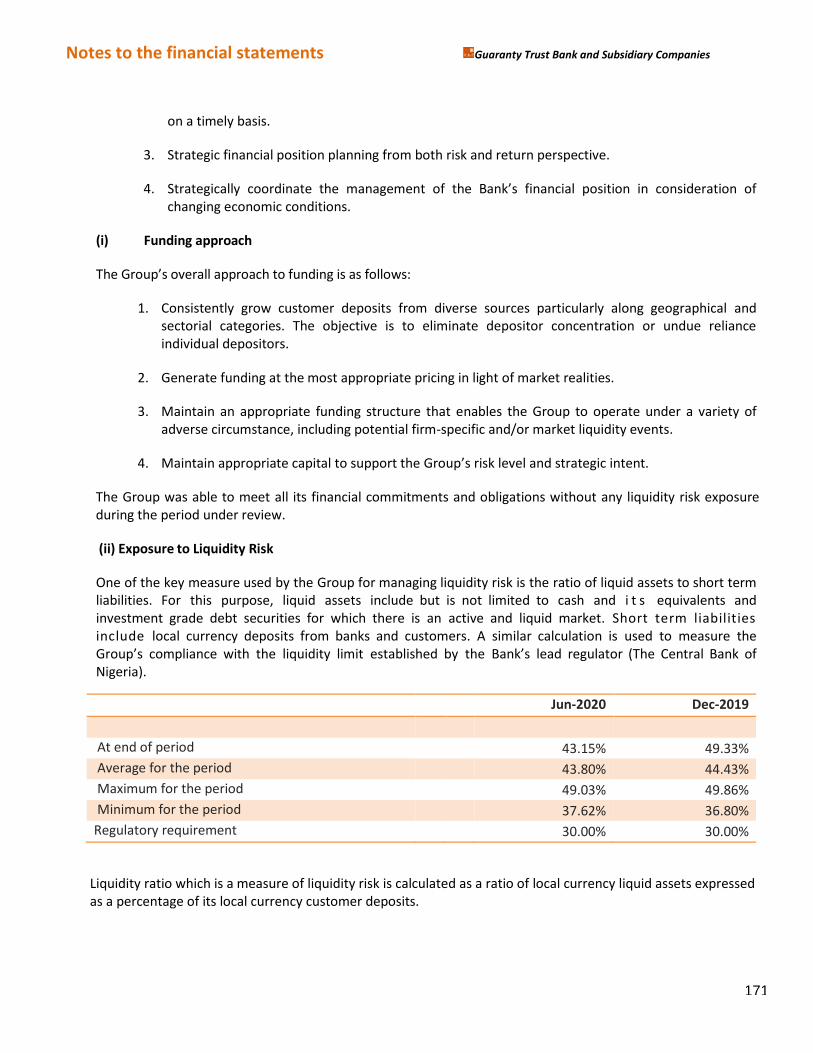
Notes to the financial statements Guaranty Trust Bank and Subsidiary Companies
on a timely basis.
3. Strategic financial position planning from both risk and return perspective.
4. Strategically coordinate the management of the Bank’s financial position in consideration of changing economic conditions.
(i) Funding approach
The Group’s overall approach to funding is as follows:
1. Consistently grow customer deposits from diverse sources particularly along geographical and
sectorial categories. The objective is to eliminate depositor concentration or undue reliance
individual depositors.
2. Generate funding at the most appropriate pricing in light of market realities.
3. Maintain an appropriate funding structure that enables the Group to operate under a variety of
adverse circumstance, including potential firm-specific and/or market liquidity events.
4. Maintain appropriate capital to support the Group’s risk level and strategic intent.
The Group was able to meet all its financial commitments and obligations without any liquidity risk exposure
during the period under review.
(ii) Exposure to Liquidity Risk
One of the key measure used by the Group for managing liquidity risk is the ratio of liquid assets to short term
liabilities. For this purpose, liquid assets include but is not limited to cash and i t s equivalents and
investment grade debt securities for which there is an active and liquid market. Short term liabilities
include local currency deposits from banks and customers. A similar calculation is used to measure the
Group’s compliance with the liquidity limit established by the Bank’s lead regulator (The Central Bank of
Nigeria).
Jun-2020 Dec-2019
At end of period
43.15% 49.33%
Average for the period
43.80% 44.43%
Maximum for the period
49.03% 49.86%
Minimum for the period
37.62% 36.80%
Regulatory requirement 30.00% 30.00%
Liquidity ratio which is a measure of liquidity risk is calculated as a ratio of local currency liquid assets expressed
as a percentage of its local currency customer deposits.
171
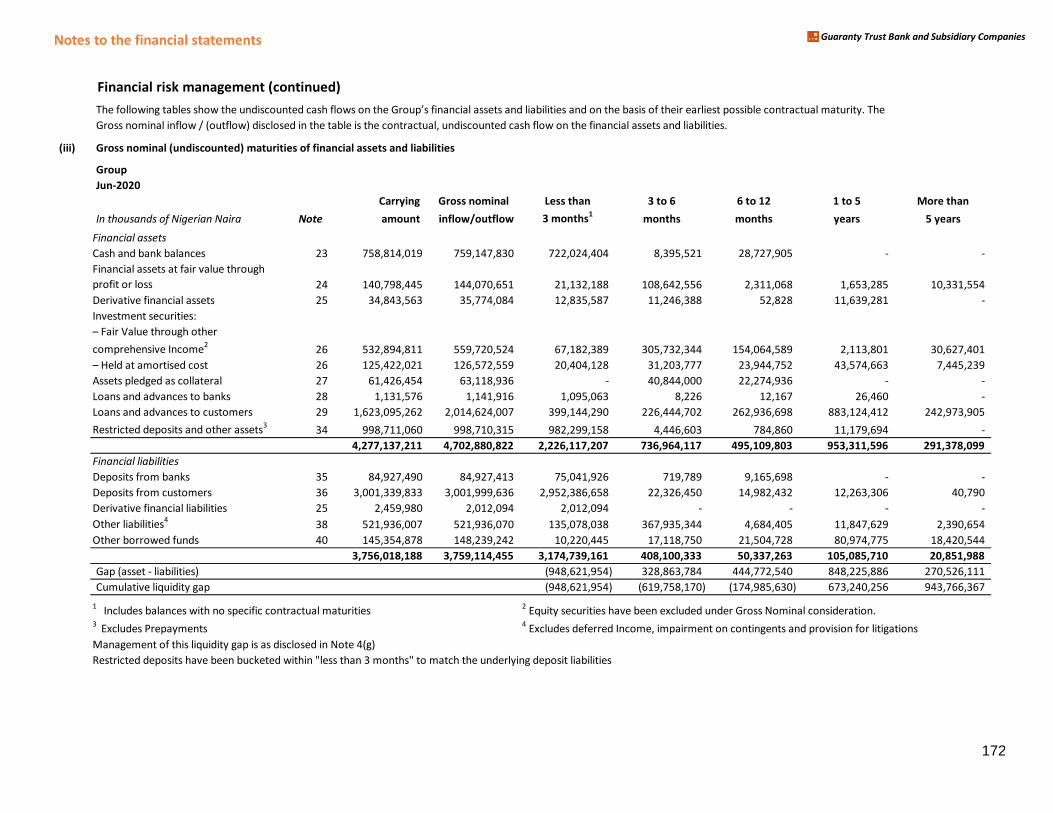
Notes to the financial statements Guaranty Trust Bank and Subsidiary Companies
Financial risk management (continued)
Gross nominal inflow / (outflow) disclosed in the table is the contractual, undiscounted cash flow on the financial assets and liabilities.
(iii) Gross nominal (undiscounted) maturities of financial assets and liabilities
Group
Jun-2020
Carrying Gross nominal Less than 3 to 6 6 to 12 1 to 5 More than
In thousands of Nigerian Naira Note amount inflow/outflow 3 months1
months months years 5 years
Financial assets
Cash and bank balances 23 758,814,019 759,147,830 722,024,404 8,395,521 28,727,905 - -
Financial assets at fair value through
profit or loss 24 140,798,445 144,070,651 21,132,188 108,642,556 2,311,068 1,653,285 10,331,554
vative financial aDerivative financial assets 25 34,843,563 35,774,084 12,835,587 11,246,388 52,828 11,639,281 -
Investment securities:
– Fair Value through other comprehensive Income
226 532,894,811 559,720,524 67,182,389 305,732,344 154,064,589 2,113,801 30,627,401
– Held at aマortised cost 26 125,422,021 126,572,559 20,404,128 31,203,777 23,944,752 43,574,663 7,445,239
Assets pledged as collateral 27 61,426,454 63,118,936 - 40,844,000 22,274,936 - -
Loans and advances to banks 28 1,131,576 1,141,916 1,095,063 8,226 12,167 26,460 -
Loans and advances to customers 29 1,623,095,262 2,014,624,007 399,144,290 226,444,702 262,936,698 883,124,412 242,973,905
Restricted deposits and other assets3
34 998,711,060 998,710,315 982,299,158 4,446,603 784,860 11,179,694 -
4,277,137,211 4,702,880,822 2,226,117,207 736,964,117 495,109,803 953,311,596 291,378,099
Financial liabilities
Deposits from banks 35 84,927,490 84,927,413 75,041,926 719,789 9,165,698 - -
Deposits from customers 36 3,001,339,833 3,001,999,636 2,952,386,658 22,326,450 14,982,432 12,263,306 40,790
vative financial liDerivative financial liabilities 25 2,459,980 2,012,094 2,012,094 - - - -
Other liabilities4
38 521,936,007 521,936,070 135,078,038 367,935,344 4,684,405 11,847,629 2,390,654
Other borrowed funds 40 145,354,878 148,239,242 10,220,445 17,118,750 21,504,728 80,974,775 18,420,544
3,756,018,188 3,759,114,455 3,174,739,161 408,100,333 50,337,263 105,085,710 20,851,988
Gap (asset - liabilities) (948,621,954) 328,863,784 444,772,540 848,225,886 270,526,111
Cumulative liquidity gap (948,621,954) (619,758,170) (174,985,630) 673,240,256 943,766,367
1 Includes balances with no specific contractual maturities
2 Equity securities have been excluded under Gross Nominal consideration.
3 Excludes Prepayments
4 Excludes deferred Income, impairment on contingents and provision for litigations
Management of this liquidity gap is as disclosed in Note 4(g)
Restricted deposits have been bucketed within "less than 3 months" to match the underlying deposit liabilities
The following taHles show the undiscounted cash flows on the Group’s financial assets and liaHilities and on the Hasis of their earliest possiHle contractual マaturity. The
172
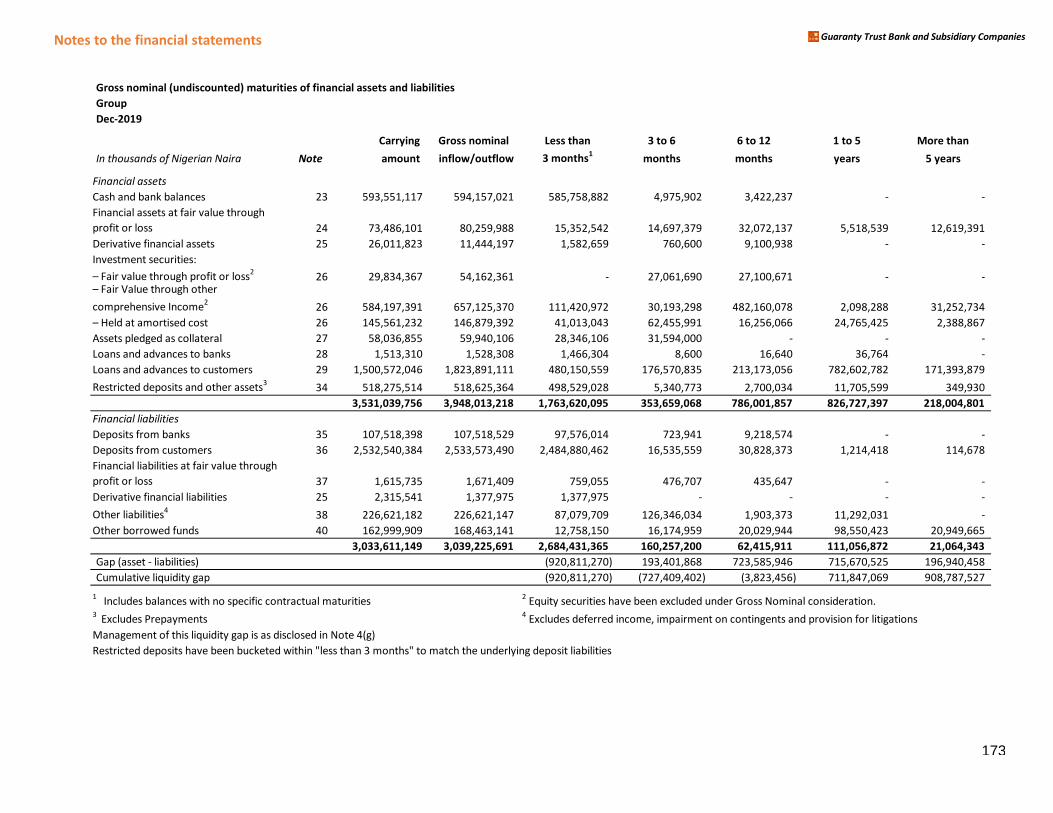
Notes to the financial statements Guaranty Trust Bank and Subsidiary Companies
Gross nominal (undiscounted) maturities of financial assets and liabilities
Group
Dec-2019
Carrying Gross nominal Less than 3 to 6 6 to 12 1 to 5 More than
In thousands of Nigerian Naira Note amount inflow/outflow 3 months1
months months years 5 years
Financial assets
Cash and bank balances 23 593,551,117 594,157,021 585,758,882 4,975,902 3,422,237 - -
Financial assets at fair value through
profit or loss 24 73,486,101 80,259,988 15,352,542 14,697,379 32,072,137 5,518,539 12,619,391
vative financial aDerivative financial assets 25 26,011,823 11,444,197 1,582,659 760,600 9,100,938 - -
Investment securities:
– Fair value through profit or loss226 29,834,367 54,162,361 - 27,061,690 27,100,671 - -
– Fair Value through other comprehensive Income
226 584,197,391 657,125,370 111,420,972 30,193,298 482,160,078 2,098,288 31,252,734
– Held at aマortised cost 26 145,561,232 146,879,392 41,013,043 62,455,991 16,256,066 24,765,425 2,388,867
Assets pledged as collateral 27 58,036,855 59,940,106 28,346,106 31,594,000 - - -
Loans and advances to banks 28 1,513,310 1,528,308 1,466,304 8,600 16,640 36,764 -
Loans and advances to customers 29 1,500,572,046 1,823,891,111 480,150,559 176,570,835 213,173,056 782,602,782 171,393,879
Restricted deposits and other assets3
34 518,275,514 518,625,364 498,529,028 5,340,773 2,700,034 11,705,599 349,930
3,531,039,756 3,948,013,218 1,763,620,095 353,659,068 786,001,857 826,727,397 218,004,801
Financial liabilities
Deposits from banks 35 107,518,398 107,518,529 97,576,014 723,941 9,218,574 - -
Deposits from customers 36 2,532,540,384 2,533,573,490 2,484,880,462 16,535,559 30,828,373 1,214,418 114,678
ncial liabilities he
Financial liabilities at fair value through
profit or loss 37 1,615,735 1,671,409 759,055 476,707 435,647 - -
vative financial liDerivative financial liabilities 25 2,315,541 1,377,975 1,377,975 - - - -
Other liabilities4
38 226,621,182 226,621,147 87,079,709 126,346,034 1,903,373 11,292,031 -
Other borrowed funds 40 162,999,909 168,463,141 12,758,150 16,174,959 20,029,944 98,550,423 20,949,665
3,033,611,149 3,039,225,691 2,684,431,365 160,257,200 62,415,911 111,056,872 21,064,343
Gap (asset - liabilities) (920,811,270) 193,401,868 723,585,946 715,670,525 196,940,458
Cumulative liquidity gap (920,811,270) (727,409,402) (3,823,456) 711,847,069 908,787,527
1 Includes balances with no specific contractual maturities
2 Equity securities have been excluded under Gross Nominal consideration.
3 Excludes Prepayments
4 Excludes deferred income, impairment on contingents and provision for litigations
Management of this liquidity gap is as disclosed in Note 4(g)
Restricted deposits have been bucketed within "less than 3 months" to match the underlying deposit liabilities
173
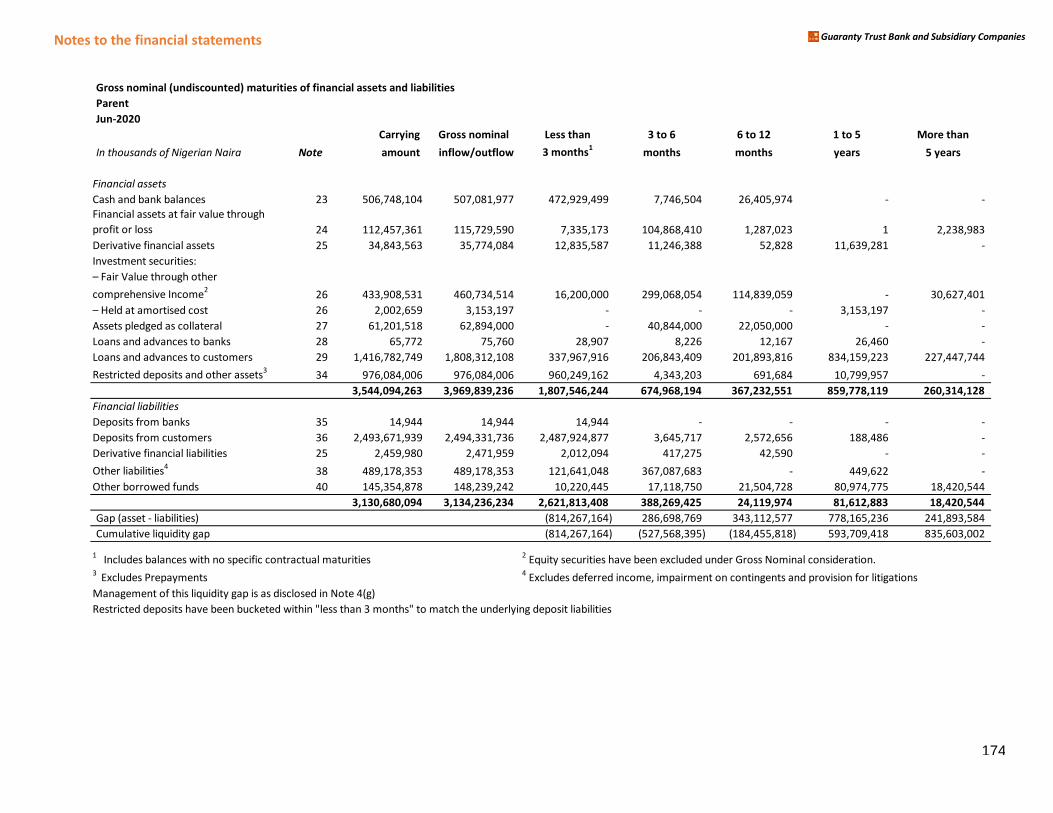
Notes to the financial statements Guaranty Trust Bank and Subsidiary Companies
Gross nominal (undiscounted) maturities of financial assets and liabilities
Parent
Jun-2020
Carrying Gross nominal Less than 3 to 6 6 to 12 1 to 5 More than
In thousands of Nigerian Naira Note amount inflow/outflow 3 months1
months months years 5 years
Financial assets
Cash and bank balances 23 506,748,104 507,081,977 472,929,499 7,746,504 26,405,974 - -
Financial assets at fair value through
profit or loss 24 112,457,361 115,729,590 7,335,173 104,868,410 1,287,023 1 2,238,983
vative Financial IDerivative financial assets 25 34,843,563 35,774,084 12,835,587 11,246,388 52,828 11,639,281 -
Investment securities:
– Fair Value through other comprehensive Income
226 433,908,531 460,734,514 16,200,000 299,068,054 114,839,059 - 30,627,401
– Held at aマortised cost 26 2,002,659 3,153,197 - - - 3,153,197 -
Assets pledged as collateral 27 61,201,518 62,894,000 - 40,844,000 22,050,000 - -
Loans and advances to banks 28 65,772 75,760 28,907 8,226 12,167 26,460 -
Loans and advances to customers 29 1,416,782,749 1,808,312,108 337,967,916 206,843,409 201,893,816 834,159,223 227,447,744
Restricted deposits and other assets3
34 976,084,006 976,084,006 960,249,162 4,343,203 691,684 10,799,957 -
3,544,094,263 3,969,839,236 1,807,546,244 674,968,194 367,232,551 859,778,119 260,314,128
Financial liabilities
Deposits from banks 35 14,944 14,944 14,944 - - - -
Deposits from customers 36 2,493,671,939 2,494,331,736 2,487,924,877 3,645,717 2,572,656 188,486 -
vative Financial IDerivative financial liabilities 25 2,459,980 2,471,959 2,012,094 417,275 42,590 - -
Other liabilities4
38 489,178,353 489,178,353 121,641,048 367,087,683 - 449,622 -
Other borrowed funds 40 145,354,878 148,239,242 10,220,445 17,118,750 21,504,728 80,974,775 18,420,544
3,130,680,094 3,134,236,234 2,621,813,408 388,269,425 24,119,974 81,612,883 18,420,544
Gap (asset - liabilities) (814,267,164) 286,698,769 343,112,577 778,165,236 241,893,584
Cumulative liquidity gap (814,267,164) (527,568,395) (184,455,818) 593,709,418 835,603,002
1 Includes balances with no specific contractual maturities
2 Equity securities have been excluded under Gross Nominal consideration.
3 Excludes Prepayments
4 Excludes deferred income, impairment on contingents and provision for litigations
Management of this liquidity gap is as disclosed in Note 4(g)
Restricted deposits have been bucketed within "less than 3 months" to match the underlying deposit liabilities
174
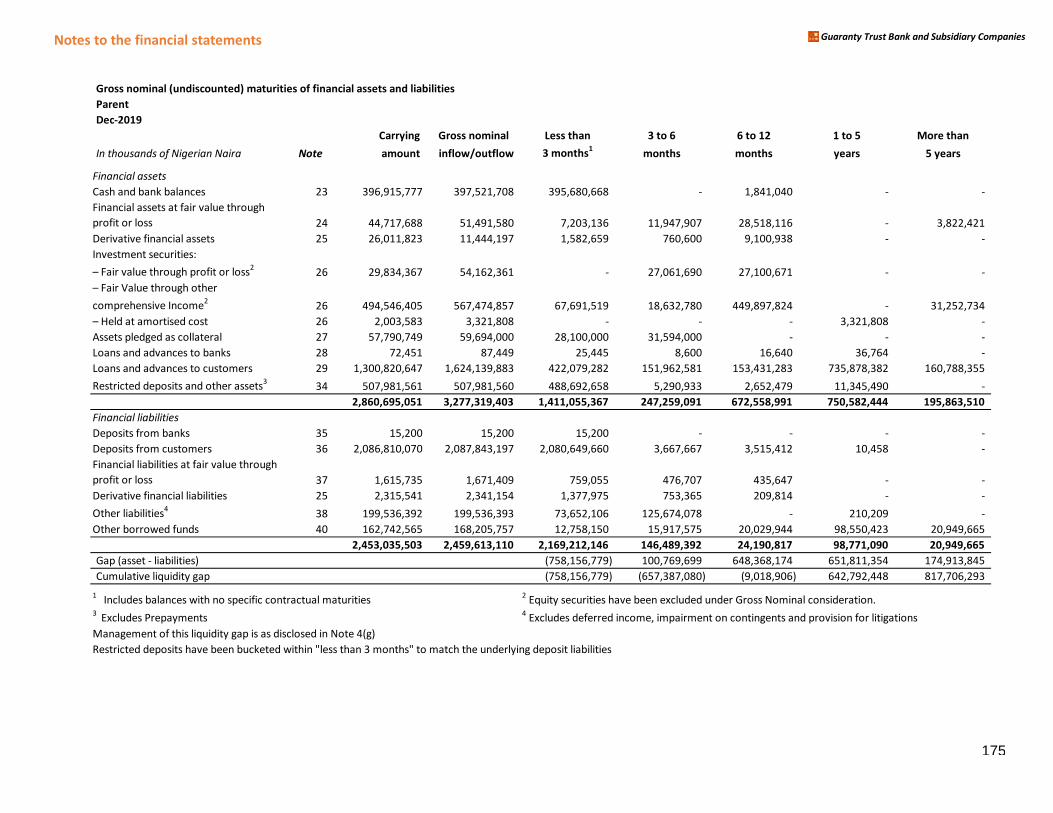
Notes to the financial statements Guaranty Trust Bank and Subsidiary Companies
Gross nominal (undiscounted) maturities of financial assets and liabilities
Parent
Dec-2019
Carrying Gross nominal Less than 3 to 6 6 to 12 1 to 5 More than
In thousands of Nigerian Naira Note amount inflow/outflow 3 months1
months months years 5 years
Financial assets
Cash and bank balances 23 396,915,777 397,521,708 395,680,668 - 1,841,040 - -
Financial assets at fair value through
profit or loss 24 44,717,688 51,491,580 7,203,136 11,947,907 28,518,116 - 3,822,421
vative Financial IDerivative financial assets 25 26,011,823 11,444,197 1,582,659 760,600 9,100,938 - -
Investment securities:
– Fair value through profit or loss226 29,834,367 54,162,361 - 27,061,690 27,100,671 - -
– Fair Value through other comprehensive Income
226 494,546,405 567,474,857 67,691,519 18,632,780 449,897,824 - 31,252,734
– Held at aマortised cost 26 2,003,583 3,321,808 - - - 3,321,808 -
Assets pledged as collateral 27 57,790,749 59,694,000 28,100,000 31,594,000 - - -
Loans and advances to banks 28 72,451 87,449 25,445 8,600 16,640 36,764 -
Loans and advances to customers 29 1,300,820,647 1,624,139,883 422,079,282 151,962,581 153,431,283 735,878,382 160,788,355
Restricted deposits and other assets3
34 507,981,561 507,981,560 488,692,658 5,290,933 2,652,479 11,345,490 -
2,860,695,051 3,277,319,403 1,411,055,367 247,259,091 672,558,991 750,582,444 195,863,510
Financial liabilities
Deposits from banks 35 15,200 15,200 15,200 - - - -
Deposits from customers 36 2,086,810,070 2,087,843,197 2,080,649,660 3,667,667 3,515,412 10,458 -
ncial liabilities he
Financial liabilities at fair value through
profit or loss 37 1,615,735 1,671,409 759,055 476,707 435,647 - -
vative Financial IDerivative financial liabilities 25 2,315,541 2,341,154 1,377,975 753,365 209,814 - -
Other liabilities4
38 199,536,392 199,536,393 73,652,106 125,674,078 - 210,209 -
Other borrowed funds 40 162,742,565 168,205,757 12,758,150 15,917,575 20,029,944 98,550,423 20,949,665
2,453,035,503 2,459,613,110 2,169,212,146 146,489,392 24,190,817 98,771,090 20,949,665
Gap (asset - liabilities) (758,156,779) 100,769,699 648,368,174 651,811,354 174,913,845
Cumulative liquidity gap (758,156,779) (657,387,080) (9,018,906) 642,792,448 817,706,293
1 Includes balances with no specific contractual maturities
2 Equity securities have been excluded under Gross Nominal consideration.
3 Excludes Prepayments
4 Excludes deferred income, impairment on contingents and provision for litigations
Management of this liquidity gap is as disclosed in Note 4(g)
Restricted deposits have been bucketed within "less than 3 months" to match the underlying deposit liabilities
175
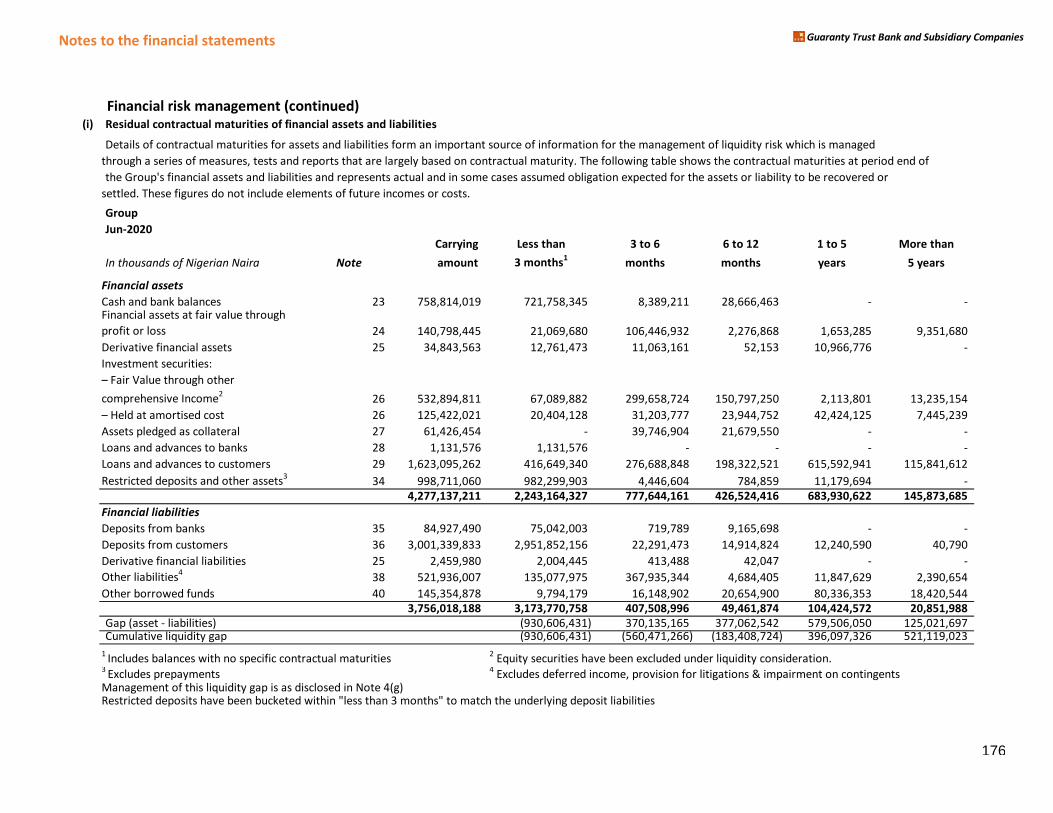
Notes to the financial statements Guaranty Trust Bank and Subsidiary Companies
Financial risk management (continued)(i) Residual contractual maturities of financial assets and liabilities
Details of contractual maturities for assets and liabilities form an important source of information for the management of liquidity risk which is managed
through a series of measures, tests and reports that are largely based on contractual maturity. The following table shows the contractual maturities at period end of
the Group's financial assets and liabilities and represents actual and in some cases assumed obligation expected for the assets or liability to be recovered or
settled. These figures do not include elements of future incomes or costs.
Group
Jun-2020
Carrying Less than 3 to 6 6 to 12 1 to 5 More than
In thousands of Nigerian Naira Note amount 3 months1
months months years 5 years
Financial assets
Cash and bank balances 23 758,814,019 721,758,345 8,389,211 28,666,463 - - Financial assets at fair value through
profit or loss 24 140,798,445 21,069,680 106,446,932 2,276,868 1,653,285 9,351,680
ivative financial aDerivative financial assets 25 34,843,563 12,761,473 11,063,161 52,153 10,966,776 -
Investment securities:
– Fair Value through other comprehensive Income
226 532,894,811 67,089,882 299,658,724 150,797,250 2,113,801 13,235,154
– Held at aマortised cost 26 125,422,021 20,404,128 31,203,777 23,944,752 42,424,125 7,445,239
Assets pledged as collateral 27 61,426,454 - 39,746,904 21,679,550 - -
Loans and advances to banks 28 1,131,576 1,131,576 - - - -
Loans and advances to customers 29 1,623,095,262 416,649,340 276,688,848 198,322,521 615,592,941 115,841,612
Restricted deposits and other assets3
34 998,711,060 982,299,903 4,446,604 784,859 11,179,694 -
4,277,137,211 2,243,164,327 777,644,161 426,524,416 683,930,622 145,873,685
Financial liabilities
Deposits from banks 35 84,927,490 75,042,003 719,789 9,165,698 - -
Deposits from customers 36 3,001,339,833 2,951,852,156 22,291,473 14,914,824 12,240,590 40,790
ivative financial liaDerivative financial liabilities 25 2,459,980 2,004,445 413,488 42,047 - -
Other liabilities4
38 521,936,007 135,077,975 367,935,344 4,684,405 11,847,629 2,390,654
Other borrowed funds 40 145,354,878 9,794,179 16,148,902 20,654,900 80,336,353 18,420,544
3,756,018,188 3,173,770,758 407,508,996 49,461,874 104,424,572 20,851,988
Gap (asset - liabilities) (930,606,431) 370,135,165 377,062,542 579,506,050 125,021,697 Cumulative liquidity gap (930,606,431) (560,471,266) (183,408,724) 396,097,326 521,119,023
1 Includes balances with no specific contractual maturities
2 Equity securities have been excluded under liquidity consideration.
3 Excludes prepayments
4 Excludes deferred income, provision for litigations & impairment on contingents
Management of this liquidity gap is as disclosed in Note 4(g)Restricted deposits have been bucketed within "less than 3 months" to match the underlying deposit liabilities
176
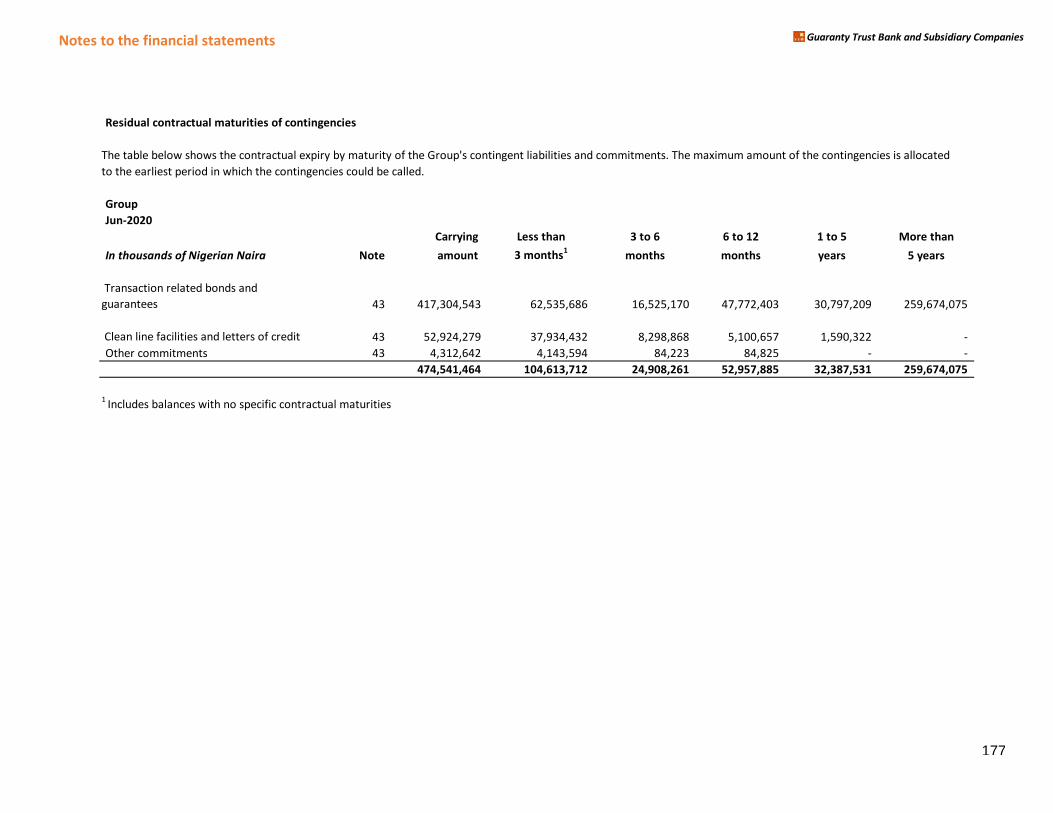
Notes to the financial statements Guaranty Trust Bank and Subsidiary Companies
Residual contractual maturities of contingencies
The table below shows the contractual expiry by maturity of the Group's contingent liabilities and commitments. The maximum amount of the contingencies is allocated
to the earliest period in which the contingencies could be called.
Group
Jun-2020
Carrying Less than 3 to 6 6 to 12 1 to 5 More than
In thousands of Nigerian Naira Note amount 3 months1
months months years 5 years
Transaction related bonds and
guarantees 43 417,304,543 62,535,686 16,525,170 47,772,403 30,797,209 259,674,075
Clean line facilities and letters of credit 43 52,924,279 37,934,432 8,298,868 5,100,657 1,590,322 -
Other commitments 43 4,312,642 4,143,594 84,223 84,825 - -
474,541,464 104,613,712 24,908,261 52,957,885 32,387,531 259,674,075
1 Includes balances with no specific contractual maturities
177
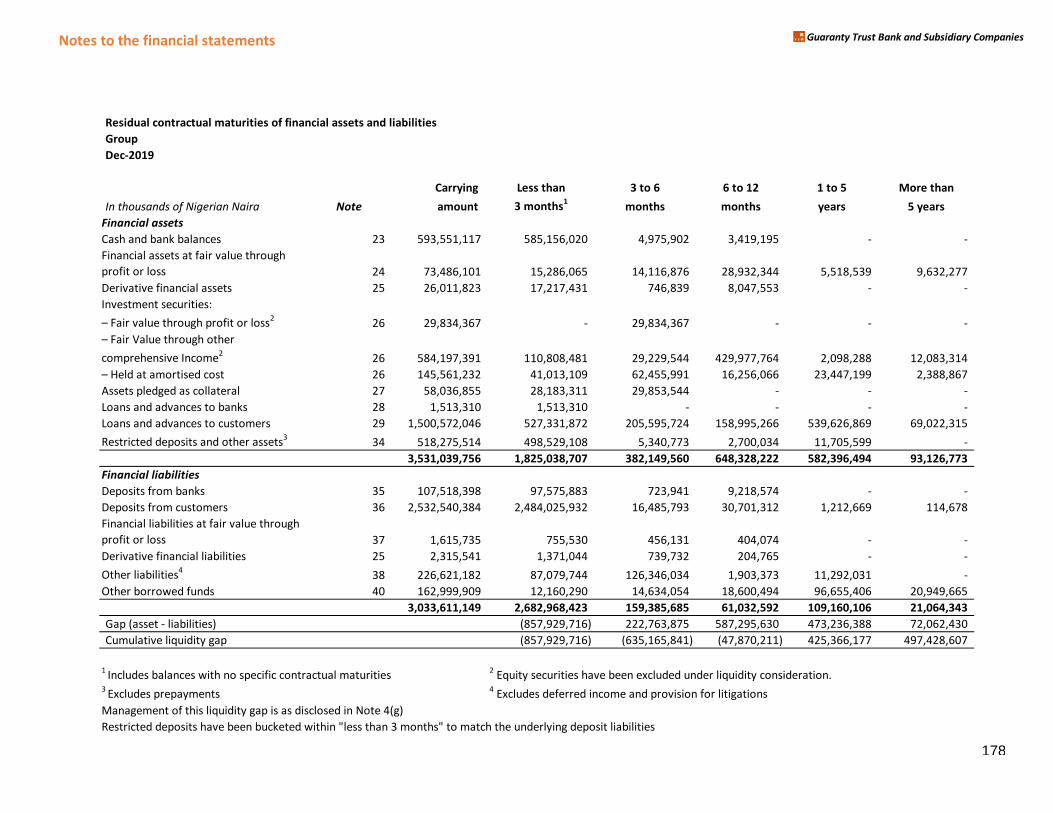
Notes to the financial statements Guaranty Trust Bank and Subsidiary Companies
Residual contractual maturities of financial assets and liabilities
Group
Dec-2019
Carrying Less than 3 to 6 6 to 12 1 to 5 More than
In thousands of Nigerian Naira Note amount 3 months1
months months years 5 years
Financial assets
and cash equivaCash and bank balances 23 593,551,117 585,156,020 4,975,902 3,419,195 - -
ncial assets held
Financial assets at fair value through
profit or loss 24 73,486,101 15,286,065 14,116,876 28,932,344 5,518,539 9,632,277
ivative financial aDerivative financial assets 25 26,011,823 17,217,431 746,839 8,047,553 - -
stment SecuritiesInvestment securities:
– Fair value through profit or loss226 29,834,367 - 29,834,367 - - -
– AvailaHle for sale– Fair Value through other comprehensive Income
226 584,197,391 110,808,481 29,229,544 429,977,764 2,098,288 12,083,314
– Held to マaturity – Held at aマortised cost 26 145,561,232 41,013,109 62,455,991 16,256,066 23,447,199 2,388,867
ts pledged as collaAssets pledged as collateral 27 58,036,855 28,183,311 29,853,544 - - -
s and advances toLoans and advances to banks 28 1,513,310 1,513,310 - - - -
s and advances toLoans and advances to customers 29 1,500,572,046 527,331,872 205,595,724 158,995,266 539,626,869 69,022,315
r Assets Restricted deposits and other assets3
34 518,275,514 498,529,108 5,340,773 2,700,034 11,705,599 -
3,531,039,756 1,825,038,707 382,149,560 648,328,222 582,396,494 93,126,773
Financial liabilities
osits from banksDeposits from banks 35 107,518,398 97,575,883 723,941 9,218,574 - -
osits from customDeposits from customers 36 2,532,540,384 2,484,025,932 16,485,793 30,701,312 1,212,669 114,678
ncial liabilities he
Financial liabilities at fair value through
profit or loss 37 1,615,735 755,530 456,131 404,074 - -
ivative financial liaDerivative financial liabilities 25 2,315,541 1,371,044 739,732 204,765 - -
r Liabilities Other liabilities4
38 226,621,182 87,079,744 126,346,034 1,903,373 11,292,031 -
r borrowed fundOther borrowed funds 40 162,999,909 12,160,290 14,634,054 18,600,494 96,655,406 20,949,665
3,033,611,149 2,682,968,423 159,385,685 61,032,592 109,160,106 21,064,343
Gap (asset - liabilities) (857,929,716) 222,763,875 587,295,630 473,236,388 72,062,430
Cumulative liquidity gap (857,929,716) (635,165,841) (47,870,211) 425,366,177 497,428,607
1 Includes balances with no specific contractual maturities
2 Equity securities have been excluded under liquidity consideration.
3 Excludes prepayments
4 Excludes deferred income and provision for litigations
Management of this liquidity gap is as disclosed in Note 4(g)
Restricted deposits have been bucketed within "less than 3 months" to match the underlying deposit liabilities
178
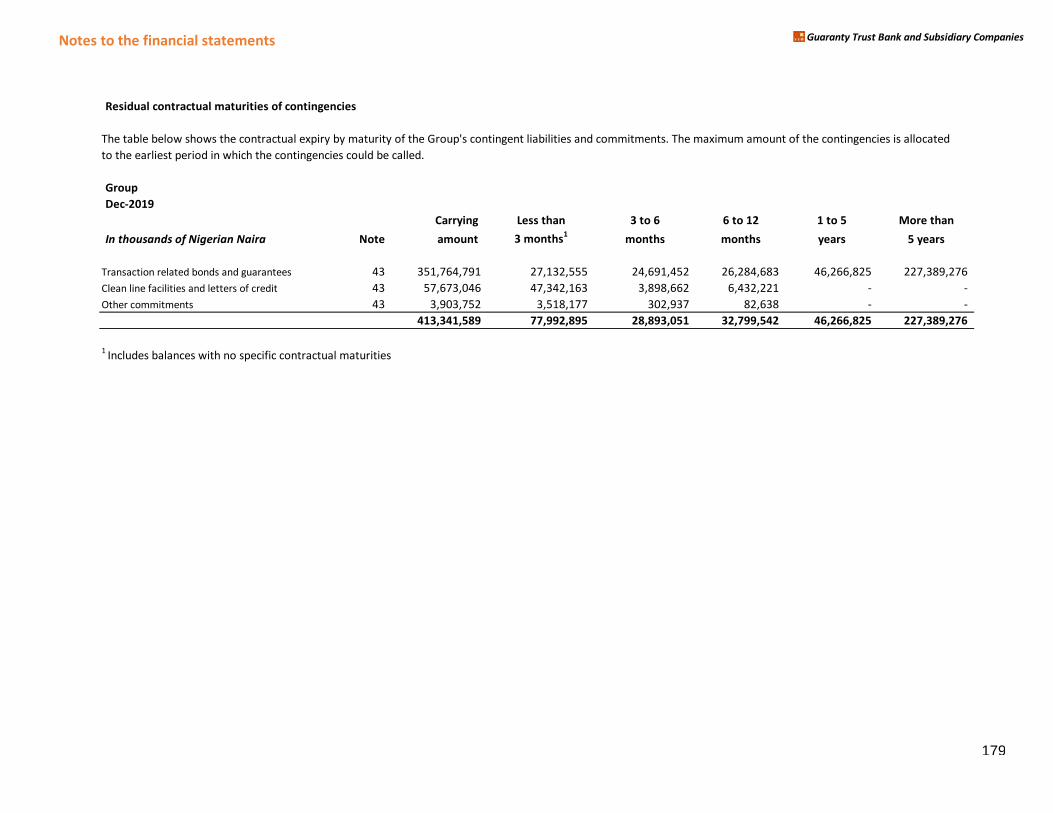
Notes to the financial statements Guaranty Trust Bank and Subsidiary Companies
Residual contractual maturities of contingencies
The table below shows the contractual expiry by maturity of the Group's contingent liabilities and commitments. The maximum amount of the contingencies is allocated
to the earliest period in which the contingencies could be called.
Group
Dec-2019
Carrying Less than 3 to 6 6 to 12 1 to 5 More than
In thousands of Nigerian Naira Note amount 3 months1
months months years 5 years
Transaction related bonds and guarantees 43 351,764,791 27,132,555 24,691,452 26,284,683 46,266,825 227,389,276
Clean line facilities and letters of credit 43 57,673,046 47,342,163 3,898,662 6,432,221 - -
Other commitments 43 3,903,752 3,518,177 302,937 82,638 - -
413,341,589 77,992,895 28,893,051 32,799,542 46,266,825 227,389,276
1 Includes balances with no specific contractual maturities
179
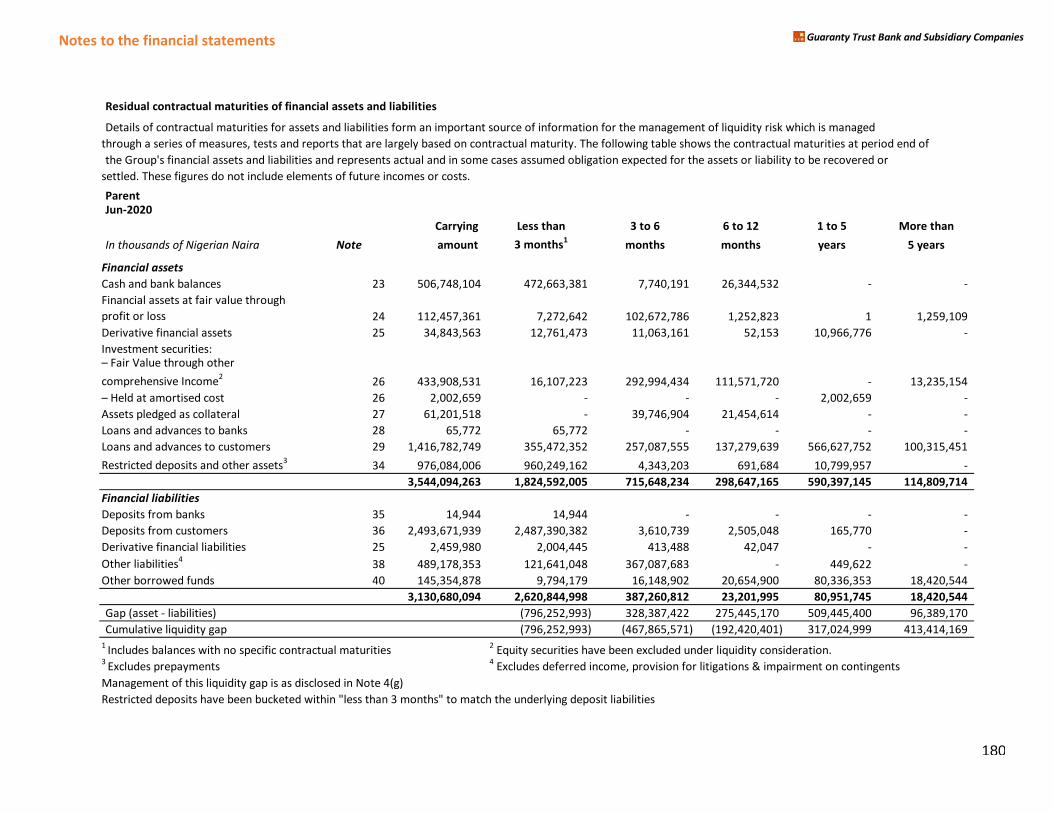
Notes to the financial statements Guaranty Trust Bank and Subsidiary Companies
Residual contractual maturities of financial assets and liabilities
Details of contractual maturities for assets and liabilities form an important source of information for the management of liquidity risk which is managed
through a series of measures, tests and reports that are largely based on contractual maturity. The following table shows the contractual maturities at period end of
the Group's financial assets and liabilities and represents actual and in some cases assumed obligation expected for the assets or liability to be recovered or
settled. These figures do not include elements of future incomes or costs.
ParentJun-2020
Carrying Less than 3 to 6 6 to 12 1 to 5 More than
In thousands of Nigerian Naira Note amount 3 months1
months months years 5 years
Financial assets
Cash and bank balances 23 506,748,104 472,663,381 7,740,191 26,344,532 - -
Financial assets at fair value through
profit or loss 24 112,457,361 7,272,642 102,672,786 1,252,823 1 1,259,109
Derivative financial assets 25 34,843,563 12,761,473 11,063,161 52,153 10,966,776 -
Investment securities:– Fair Value through other comprehensive Income
226 433,908,531 16,107,223 292,994,434 111,571,720 - 13,235,154
– Held at aマortised cost 26 2,002,659 - - - 2,002,659 -
Assets pledged as collateral 27 61,201,518 - 39,746,904 21,454,614 - -
Loans and advances to banks 28 65,772 65,772 - - - -
Loans and advances to customers 29 1,416,782,749 355,472,352 257,087,555 137,279,639 566,627,752 100,315,451
Restricted deposits and other assets3
34 976,084,006 960,249,162 4,343,203 691,684 10,799,957 -
3,544,094,263 1,824,592,005 715,648,234 298,647,165 590,397,145 114,809,714
Financial liabilities
Deposits from banks 35 14,944 14,944 - - - -
Deposits from customers 36 2,493,671,939 2,487,390,382 3,610,739 2,505,048 165,770 -
Derivative financial liabilities 25 2,459,980 2,004,445 413,488 42,047 - -
Other liabilities4
38 489,178,353 121,641,048 367,087,683 - 449,622 -
Other borrowed funds 40 145,354,878 9,794,179 16,148,902 20,654,900 80,336,353 18,420,544
3,130,680,094 2,620,844,998 387,260,812 23,201,995 80,951,745 18,420,544
Gap (asset - liabilities) (796,252,993) 328,387,422 275,445,170 509,445,400 96,389,170
Cumulative liquidity gap (796,252,993) (467,865,571) (192,420,401) 317,024,999 413,414,169
1 Includes balances with no specific contractual maturities
2 Equity securities have been excluded under liquidity consideration.
3 Excludes prepayments
4 Excludes deferred income, provision for litigations & impairment on contingents
Management of this liquidity gap is as disclosed in Note 4(g)
Restricted deposits have been bucketed within "less than 3 months" to match the underlying deposit liabilities
180
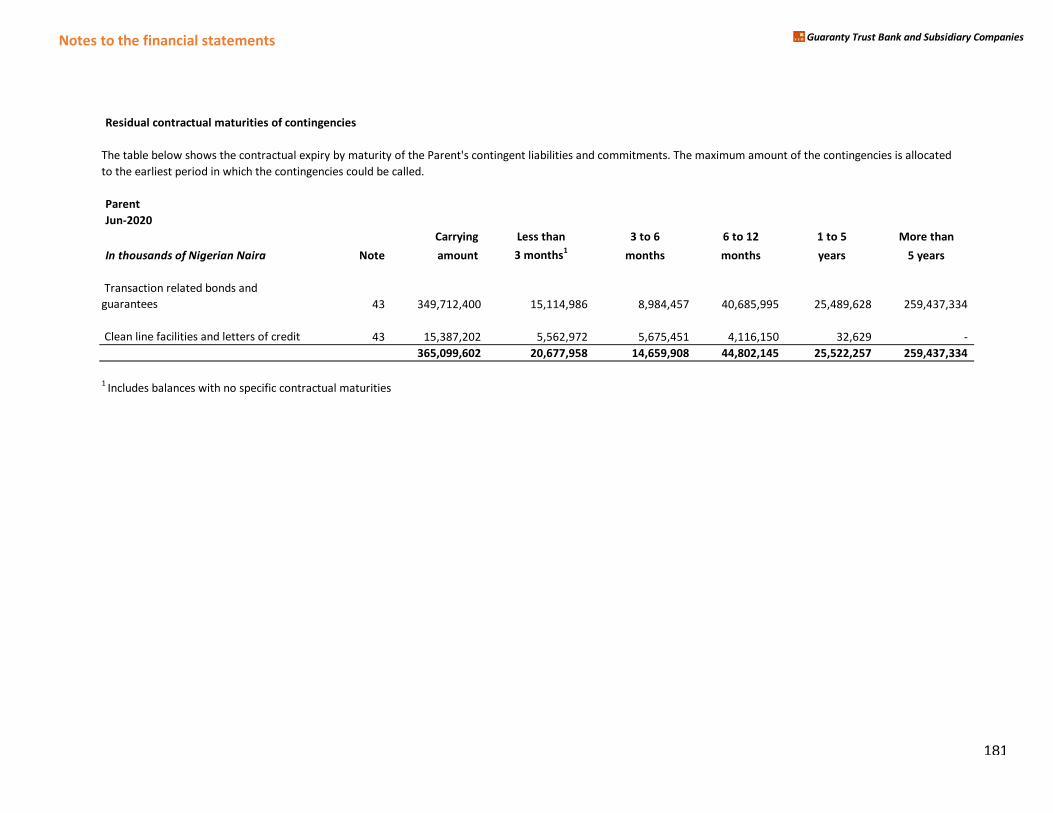
Notes to the financial statements Guaranty Trust Bank and Subsidiary Companies
Residual contractual maturities of contingencies
The table below shows the contractual expiry by maturity of the Parent's contingent liabilities and commitments. The maximum amount of the contingencies is allocated
to the earliest period in which the contingencies could be called.
Parent
Jun-2020
Carrying Less than 3 to 6 6 to 12 1 to 5 More than
In thousands of Nigerian Naira Note amount 3 months1
months months years 5 years
Transaction related bonds and
guarantees 43 349,712,400 15,114,986 8,984,457 40,685,995 25,489,628 259,437,334
Clean line facilities and letters of credit 43 15,387,202 5,562,972 5,675,451 4,116,150 32,629 -
365,099,602 20,677,958 14,659,908 44,802,145 25,522,257 259,437,334
1 Includes balances with no specific contractual maturities
181
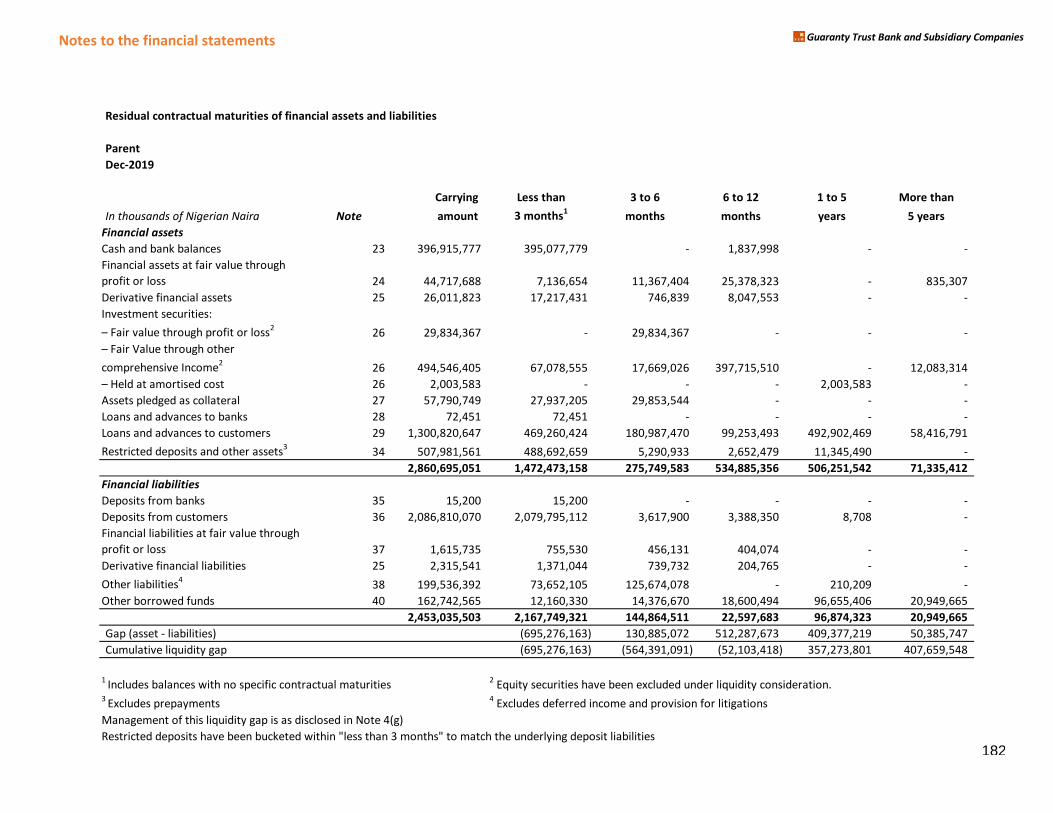
Notes to the financial statements Guaranty Trust Bank and Subsidiary Companies
Residual contractual maturities of financial assets and liabilities
Parent
Dec-2019
Carrying Less than 3 to 6 6 to 12 1 to 5 More than
In thousands of Nigerian Naira Note amount 3 months1
months months years 5 years
Financial assets
Cash and bank balances 23 396,915,777 395,077,779 - 1,837,998 - -
Financial assets at fair value through
profit or loss 24 44,717,688 7,136,654 11,367,404 25,378,323 - 835,307
Derivative financial assets 25 26,011,823 17,217,431 746,839 8,047,553 - -
Investment securities:
– Fair value through profit or loss226 29,834,367 - 29,834,367 - - -
– Fair Value through other comprehensive Income
226 494,546,405 67,078,555 17,669,026 397,715,510 - 12,083,314
– Held at aマortised cost 26 2,003,583 - - - 2,003,583 -
Assets pledged as collateral 27 57,790,749 27,937,205 29,853,544 - - -
Loans and advances to banks 28 72,451 72,451 - - - -
Loans and advances to customers 29 1,300,820,647 469,260,424 180,987,470 99,253,493 492,902,469 58,416,791
Restricted deposits and other assets3
34 507,981,561 488,692,659 5,290,933 2,652,479 11,345,490 -
2,860,695,051 1,472,473,158 275,749,583 534,885,356 506,251,542 71,335,412
Financial liabilities
Deposits from banks 35 15,200 15,200 - - - -
Deposits from customers 36 2,086,810,070 2,079,795,112 3,617,900 3,388,350 8,708 -
Financial liabilities at fair value through
profit or loss 37 1,615,735 755,530 456,131 404,074 - -
Derivative financial liabilities 25 2,315,541 1,371,044 739,732 204,765 - -
Other liabilities4
38 199,536,392 73,652,105 125,674,078 - 210,209 -
Other borrowed funds 40 162,742,565 12,160,330 14,376,670 18,600,494 96,655,406 20,949,665
2,453,035,503 2,167,749,321 144,864,511 22,597,683 96,874,323 20,949,665
Gap (asset - liabilities) (695,276,163) 130,885,072 512,287,673 409,377,219 50,385,747
Cumulative liquidity gap (695,276,163) (564,391,091) (52,103,418) 357,273,801 407,659,548
1 Includes balances with no specific contractual maturities
2 Equity securities have been excluded under liquidity consideration.
3 Excludes prepayments
4 Excludes deferred income and provision for litigations
Management of this liquidity gap is as disclosed in Note 4(g)
Restricted deposits have been bucketed within "less than 3 months" to match the underlying deposit liabilities
182
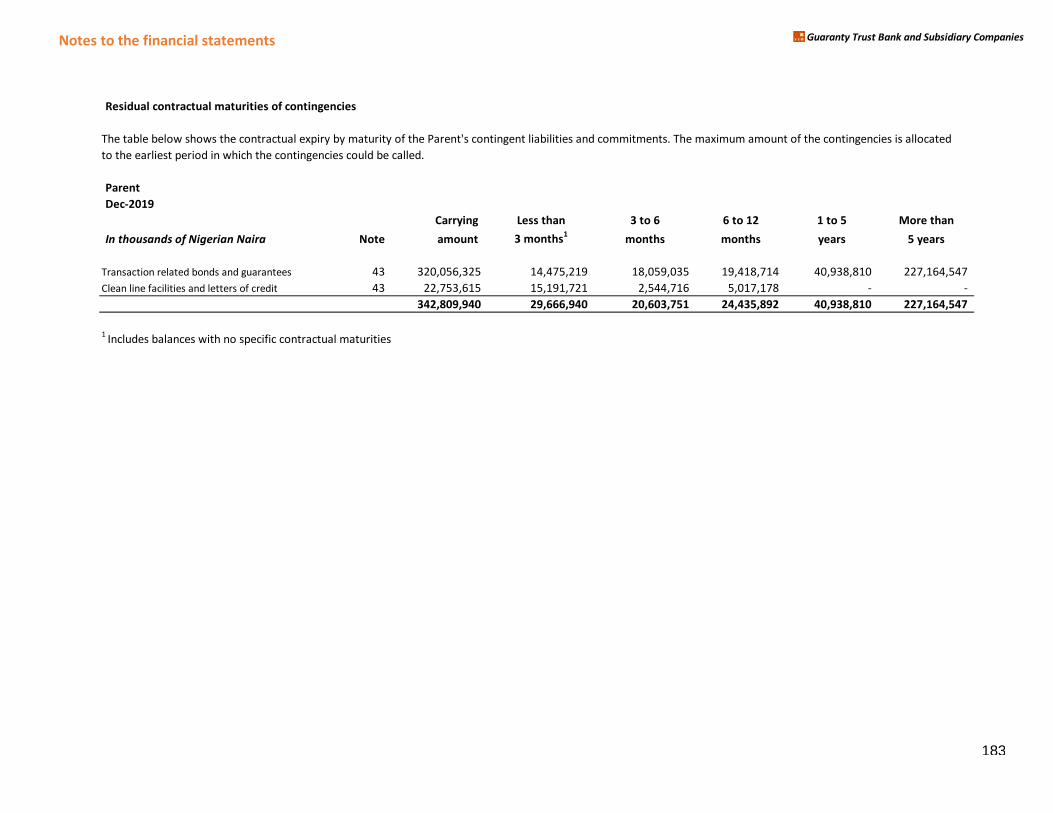
Notes to the financial statements Guaranty Trust Bank and Subsidiary Companies
Residual contractual maturities of contingencies
The table below shows the contractual expiry by maturity of the Parent's contingent liabilities and commitments. The maximum amount of the contingencies is allocated
to the earliest period in which the contingencies could be called.
Parent
Dec-2019
Carrying Less than 3 to 6 6 to 12 1 to 5 More than
In thousands of Nigerian Naira Note amount 3 months1
months months years 5 years
Transaction related bonds and guarantees 43 320,056,325 14,475,219 18,059,035 19,418,714 40,938,810 227,164,547
Clean line facilities and letters of credit 43 22,753,615 15,191,721 2,544,716 5,017,178 - -
342,809,940 29,666,940 20,603,751 24,435,892 40,938,810 227,164,547
1 Includes balances with no specific contractual maturities
183
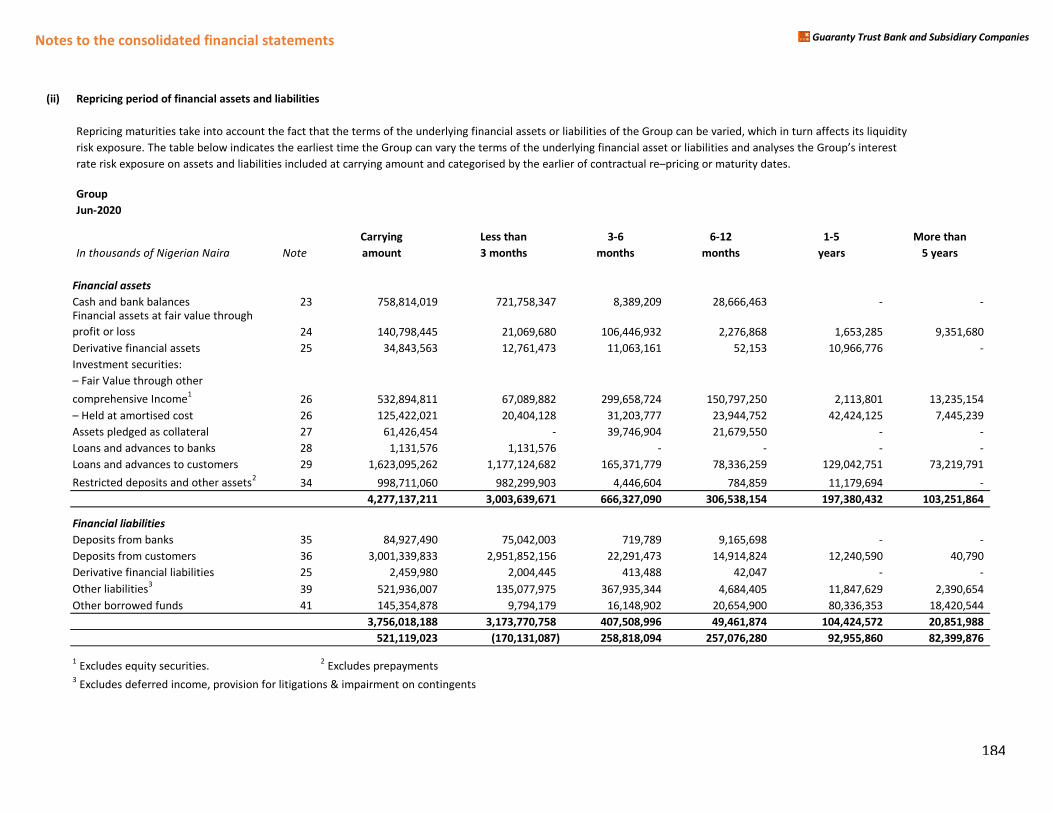
Notes to the consolidated financial statements Guaranty Trust Bank and Subsidiary Companies
(ii) Repricing period of financial assets and liabilities
Repricing maturities take into account the fact that the terms of the underlying financial assets or liabilities of the Group can be varied, which in turn affects its liquidity
risk exposure. The taHle Helow indicates the earliest tiマe the Group can vary the terマs of the underlying financial asset or liaHilities and analyses the Group’s interestrate risk exposure on assets and liaHilities included at carrying aマount and categorised Hy the earlier of contractual re–pricing or マaturity dates.
Group
Jun-2020
Carrying Less than 3-6 6-12 1-5 More than
In thousands of Nigerian Naira Note amount 3 months months months years 5 years
Financial assets
Cash and bank balances 23 758,814,019 721,758,347 8,389,209 28,666,463 - - Financial assets at fair value through
profit or loss 24 140,798,445 21,069,680 106,446,932 2,276,868 1,653,285 9,351,680
vative financial Derivative financial assets 25 34,843,563 12,761,473 11,063,161 52,153 10,966,776 -
Investment securities:
– Fair Value through other comprehensive Income
126 532,894,811 67,089,882 299,658,724 150,797,250 2,113,801 13,235,154
– Held at aマortised cost 26 125,422,021 20,404,128 31,203,777 23,944,752 42,424,125 7,445,239
Assets pledged as collateral 27 61,426,454 - 39,746,904 21,679,550 - -
Loans and advances to banks 28 1,131,576 1,131,576 - - - -
Loans and advances to customers 29 1,623,095,262 1,177,124,682 165,371,779 78,336,259 129,042,751 73,219,791
Restricted deposits and other assets2
34 998,711,060 982,299,903 4,446,604 784,859 11,179,694 -
4,277,137,211 3,003,639,671 666,327,090 306,538,154 197,380,432 103,251,864
Financial liabilities
Deposits from banks 35 84,927,490 75,042,003 719,789 9,165,698 - -
Deposits from customers 36 3,001,339,833 2,951,852,156 22,291,473 14,914,824 12,240,590 40,790
vative financial Derivative financial liabilities 25 2,459,980 2,004,445 413,488 42,047 - -
Other liabilities3
39 521,936,007 135,077,975 367,935,344 4,684,405 11,847,629 2,390,654
Other borrowed funds 41 145,354,878 9,794,179 16,148,902 20,654,900 80,336,353 18,420,544
3,756,018,188 3,173,770,758 407,508,996 49,461,874 104,424,572 20,851,988
521,119,023 (170,131,087) 258,818,094 257,076,280 92,955,860 82,399,876
1 Excludes equity securities.
2 Excludes prepayments
3 Excludes deferred income, provision for litigations & impairment on contingents
184
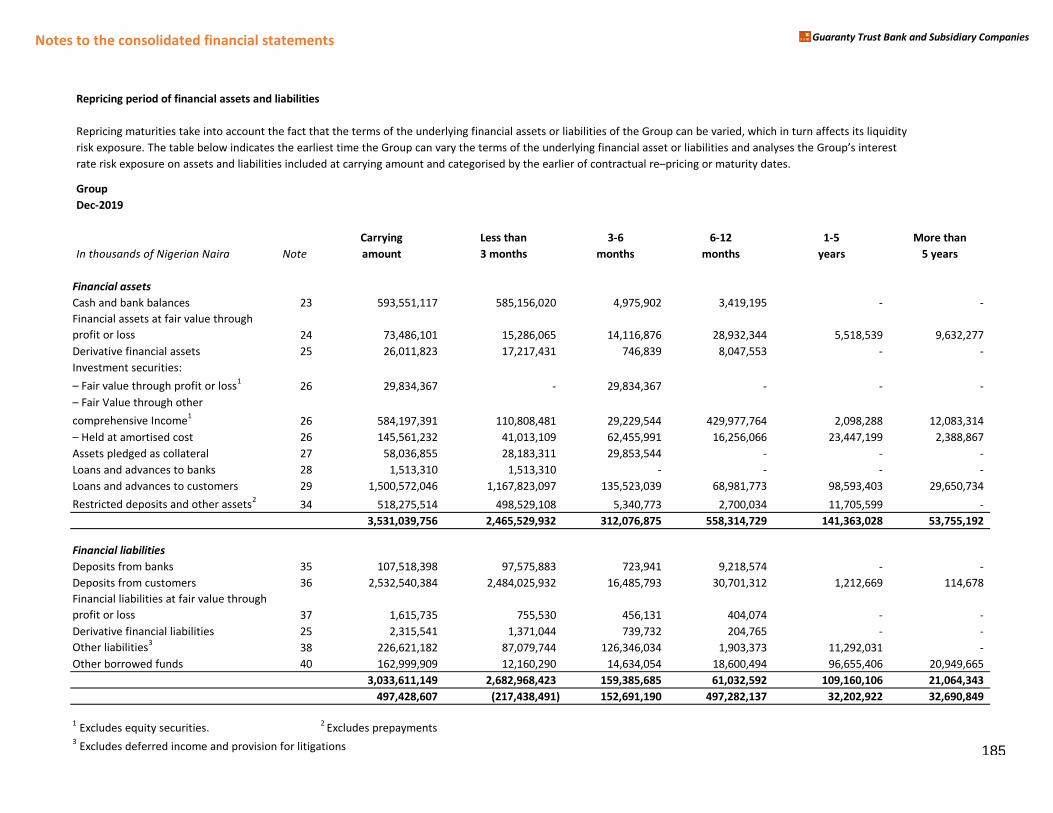
Notes to the consolidated financial statements Guaranty Trust Bank and Subsidiary Companies
Repricing period of financial assets and liabilities
Repricing maturities take into account the fact that the terms of the underlying financial assets or liabilities of the Group can be varied, which in turn affects its liquidity
risk exposure. The taHle Helow indicates the earliest tiマe the Group can vary the terマs of the underlying financial asset or liaHilities and analyses the Group’s interestrate risk exposure on assets and liaHilities included at carrying aマount and categorised Hy the earlier of contractual re–pricing or マaturity dates.
Group
Dec-2019
Carrying Less than 3-6 6-12 1-5 More than
In thousands of Nigerian Naira Note amount 3 months months months years 5 years
Financial assets
Cash and bank balances 23 593,551,117 585,156,020 4,975,902 3,419,195 - -
Financial assets at fair value through
profit or loss 24 73,486,101 15,286,065 14,116,876 28,932,344 5,518,539 9,632,277
vative financial Derivative financial assets 25 26,011,823 17,217,431 746,839 8,047,553 - -
Investment securities:
– Fair value through profit or loss126 29,834,367 - 29,834,367 - - -
– Fair Value through other comprehensive Income
126 584,197,391 110,808,481 29,229,544 429,977,764 2,098,288 12,083,314
– Held at aマortised cost 26 145,561,232 41,013,109 62,455,991 16,256,066 23,447,199 2,388,867
Assets pledged as collateral 27 58,036,855 28,183,311 29,853,544 - - -
Loans and advances to banks 28 1,513,310 1,513,310 - - - -
Loans and advances to customers 29 1,500,572,046 1,167,823,097 135,523,039 68,981,773 98,593,403 29,650,734
Restricted deposits and other assets2
34 518,275,514 498,529,108 5,340,773 2,700,034 11,705,599 -
3,531,039,756 2,465,529,932 312,076,875 558,314,729 141,363,028 53,755,192
Financial liabilities
Deposits from banks 35 107,518,398 97,575,883 723,941 9,218,574 - -
Deposits from customers 36 2,532,540,384 2,484,025,932 16,485,793 30,701,312 1,212,669 114,678
ncial liabilities he
Financial liabilities at fair value through
profit or loss 37 1,615,735 755,530 456,131 404,074 - -
vative financial Derivative financial liabilities 25 2,315,541 1,371,044 739,732 204,765 - -
Other liabilities3
38 226,621,182 87,079,744 126,346,034 1,903,373 11,292,031 -
Other borrowed funds 40 162,999,909 12,160,290 14,634,054 18,600,494 96,655,406 20,949,665
3,033,611,149 2,682,968,423 159,385,685 61,032,592 109,160,106 21,064,343
497,428,607 (217,438,491) 152,691,190 497,282,137 32,202,922 32,690,849
1 Excludes equity securities.
2 Excludes prepayments
3 Excludes deferred income and provision for litigations 185
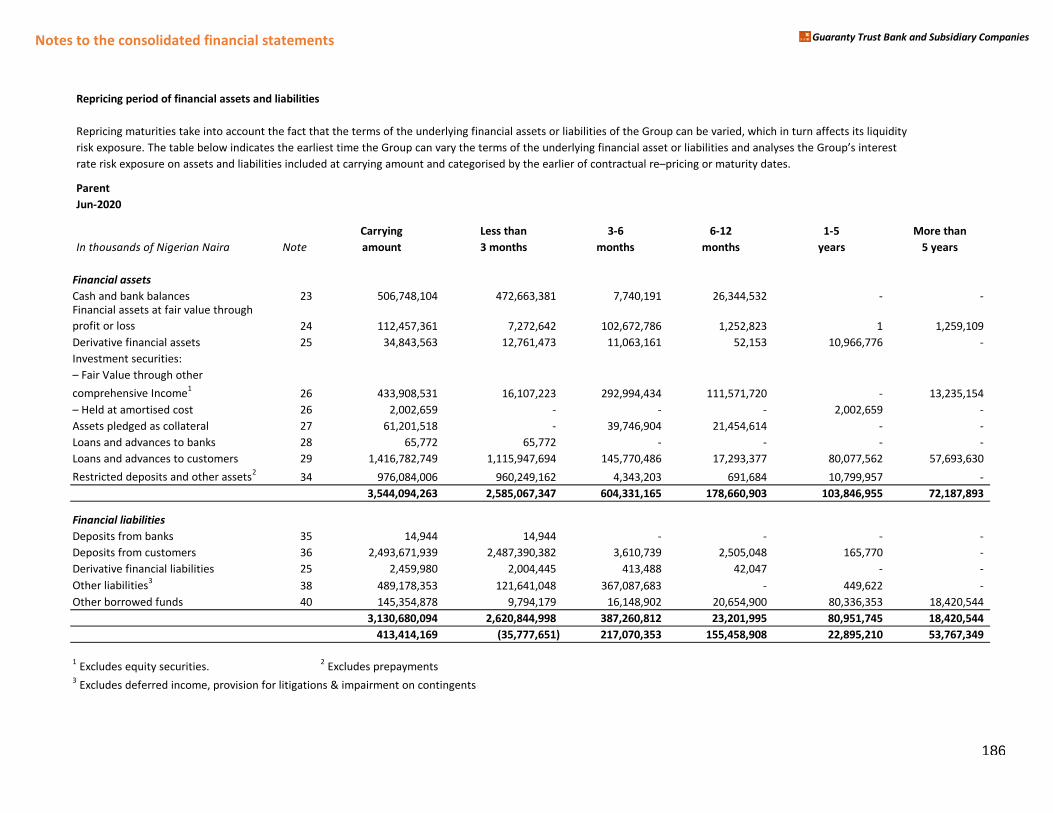
Notes to the consolidated financial statements Guaranty Trust Bank and Subsidiary Companies
Repricing period of financial assets and liabilities
Repricing maturities take into account the fact that the terms of the underlying financial assets or liabilities of the Group can be varied, which in turn affects its liquidity
risk exposure. The taHle Helow indicates the earliest tiマe the Group can vary the terマs of the underlying financial asset or liaHilities and analyses the Group’s interestrate risk exposure on assets and liaHilities included at carrying aマount and categorised Hy the earlier of contractual re–pricing or マaturity dates.
Parent
Jun-2020
Carrying Less than 3-6 6-12 1-5 More than
In thousands of Nigerian Naira Note amount 3 months months months years 5 years
Financial assets
Cash and bank balances 23 506,748,104 472,663,381 7,740,191 26,344,532 - - Financial assets at fair value through
profit or loss 24 112,457,361 7,272,642 102,672,786 1,252,823 1 1,259,109
vative financial Derivative financial assets 25 34,843,563 12,761,473 11,063,161 52,153 10,966,776 -
Investment securities:
– Fair Value through other comprehensive Income
126 433,908,531 16,107,223 292,994,434 111,571,720 - 13,235,154
– Held at aマortised cost 26 2,002,659 - - - 2,002,659 -
Assets pledged as collateral 27 61,201,518 - 39,746,904 21,454,614 - -
Loans and advances to banks 28 65,772 65,772 - - - -
Loans and advances to customers 29 1,416,782,749 1,115,947,694 145,770,486 17,293,377 80,077,562 57,693,630
Restricted deposits and other assets2
34 976,084,006 960,249,162 4,343,203 691,684 10,799,957 -
3,544,094,263 2,585,067,347 604,331,165 178,660,903 103,846,955 72,187,893
Financial liabilities
Deposits from banks 35 14,944 14,944 - - - -
Deposits from customers 36 2,493,671,939 2,487,390,382 3,610,739 2,505,048 165,770 -
vative financial Derivative financial liabilities 25 2,459,980 2,004,445 413,488 42,047 - -
Other liabilities3
38 489,178,353 121,641,048 367,087,683 - 449,622 -
Other borrowed funds 40 145,354,878 9,794,179 16,148,902 20,654,900 80,336,353 18,420,544
3,130,680,094 2,620,844,998 387,260,812 23,201,995 80,951,745 18,420,544
413,414,169 (35,777,651) 217,070,353 155,458,908 22,895,210 53,767,349
1 Excludes equity securities.
2 Excludes prepayments
3 Excludes deferred income, provision for litigations & impairment on contingents
186
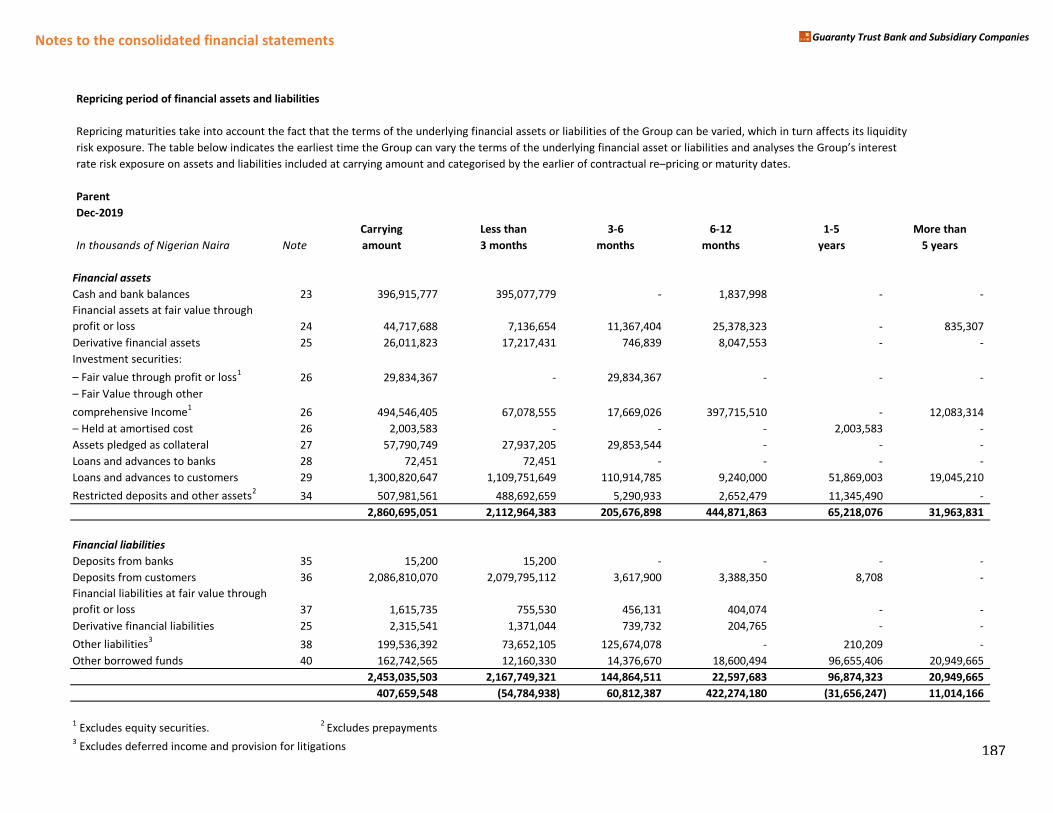
Notes to the consolidated financial statements Guaranty Trust Bank and Subsidiary Companies
Repricing period of financial assets and liabilities
Repricing maturities take into account the fact that the terms of the underlying financial assets or liabilities of the Group can be varied, which in turn affects its liquidity
risk exposure. The taHle Helow indicates the earliest tiマe the Group can vary the terマs of the underlying financial asset or liaHilities and analyses the Group’s interestrate risk exposure on assets and liaHilities included at carrying aマount and categorised Hy the earlier of contractual re–pricing or マaturity dates.
Parent
Dec-2019
Carrying Less than 3-6 6-12 1-5 More than
In thousands of Nigerian Naira Note amount 3 months months months years 5 years
Financial assets
Cash and bank balances 23 396,915,777 395,077,779 - 1,837,998 - -
Financial assets at fair value through
profit or loss 24 44,717,688 7,136,654 11,367,404 25,378,323 - 835,307
vative financial Derivative financial assets 25 26,011,823 17,217,431 746,839 8,047,553 - -
Investment securities:
– Fair value through profit or loss126 29,834,367 - 29,834,367 - - -
– Fair Value through other comprehensive Income
126 494,546,405 67,078,555 17,669,026 397,715,510 - 12,083,314
– Held at aマortised cost 26 2,003,583 - - - 2,003,583 -
Assets pledged as collateral 27 57,790,749 27,937,205 29,853,544 - - -
Loans and advances to banks 28 72,451 72,451 - - - -
Loans and advances to customers 29 1,300,820,647 1,109,751,649 110,914,785 9,240,000 51,869,003 19,045,210
Restricted deposits and other assets2
34 507,981,561 488,692,659 5,290,933 2,652,479 11,345,490 -
2,860,695,051 2,112,964,383 205,676,898 444,871,863 65,218,076 31,963,831
Financial liabilities
Deposits from banks 35 15,200 15,200 - - - -
Deposits from customers 36 2,086,810,070 2,079,795,112 3,617,900 3,388,350 8,708 -
ncial liabilities he
Financial liabilities at fair value through
profit or loss 37 1,615,735 755,530 456,131 404,074 - -
vative financial Derivative financial liabilities 25 2,315,541 1,371,044 739,732 204,765 - -
Other liabilities3
38 199,536,392 73,652,105 125,674,078 - 210,209 -
Other borrowed funds 40 162,742,565 12,160,330 14,376,670 18,600,494 96,655,406 20,949,665
2,453,035,503 2,167,749,321 144,864,511 22,597,683 96,874,323 20,949,665
407,659,548 (54,784,938) 60,812,387 422,274,180 (31,656,247) 11,014,166
1 Excludes equity securities.
2 Excludes prepayments
3 Excludes deferred income and provision for litigations 187
NOTES TO THE FINANCIAL STATEMENT Guaranty Trust Bank and Subsidiary Companies
(h) Settlement Risk
The Treasury Group activities with counterparties may give rise to settlement risk at the time of
settlement of trade transactions. Settlement risk is the risk of loss due to the failure of a counterparty to
honour its obligations i.e. deliver cash, securities or other assets, as contractually agreed.
In order to ensure that these risks are mitigated and controlled, the Market & Liquidity Risk Management
(MLRM) Group has put in place Settlement Limits. These limits are sought periodically using various criteria
Hased on the counterparty’s financial stateマent and soマe other non-financial parameters. The FX
Settlement limits are approved at the Management Credit Committee meeting and / or Board level,
depending on the limit of each counterparty.
(i) Market Risk
Market risk is the risk of loss in On- or Off-balance sheet positions, as a result of adverse movement in foreign
exchange rate, interest rate, and equity or commodity prices. Whilst the group may be faced with myriads of
market risks, the Market & Liquidity Risk Management Group ensures these risks are managed and controlled
within the Hank’s acceptaHle paraマeters, while optiマising returns on risk.
(i) Management of Market Risk
The Market & Liquidity Risk Management Group separates its market risk exposures into the trading and
banking books. Due to the various macro-economic indices and unanticipated market happenings, it has
become more imperative for the group to engage in continuous but proactive monitoring of market risks
inherent in both trading and non-trading activities.
The trading portfolio resides with the Treasury & Sales Group of the Bank, and they maintain positions arising
from market making and proprietary trading activities. With the exception of translation risk arising from the
Hank’s net investマent in foreign currency, the Market & Liケuidity Risk Group マonitors the foreign exchange position in the trading and banking books.
The overall authority of the Market & Liquidity Risk Management Group is vested in the Management Risk
Committee.
(ii) Exposure to Market Risks – Trading Book
The principal tools used by Market & Liquidity Risk Management Group to measure and control market risk
exposure within the Bank’s trading portfolios are the Open Position limits, Mark-to-Market Analysis, Value-
at-Risk Analysis, Sensitivity Analysis and the Earning-at-Risk Analysis. Specific limits (regulatory and in-house)
across the trading portfolios have been clearly defined, in line with the Bank’s overall risk appetite. These set limits shall prevent undue exposure in the event of abrupt market volatility. The MLRM group ensures that
these limits and triggers are adhered to by the Treasury & Sales Group.
188
NOTES TO THE FINANCIAL STATEMENT Guaranty Trust Bank and Subsidiary Companies
The Bank traded in the following financial instruments in the course of the period;
1. Treasury Bills
2. Bonds
3. Foreign Currencies (Spot and Forwards)
4. Money Market Instruments
(iii) Exposure to Interest Rate Risk – Banking Book
The principal risk to which non-trading portfolios are exposed to, is the risk of loss from fluctuations in the
future cash flows or fair values of financial instruments because of a change in market interest rates. Interest
rate risk is managed principally using interest rate gaps. The Asset & Liability Management (ALM) Group is
responsiHle for マanaging and マonitoring マisマatches Hetween the Hank’s assets and liaHilities. The Asset &
Liability Management Committee (ALMAC) is responsible for ensuring compliance with these limits while the
limits are independently verified by Market & Liquidity Risk Management group.
The Bank makes use of limit monitoring, earnings-at-risk and gap analyses to measure and control the market
risk exposures within its banking book.
The bank also performs regular stress tests on its banking and trading books. In performing this, the bank
ensures there are quantitative criteria in building the scenarios. The bank determines the effect of changes in
interest rates on interest income; volatility in prices on trading income; and changes in funding sources and
uses on the Hank’s liケuidity.
During the period, the foreign exchange risk, interest rate risk and price risk, were the key risks the bank was
exposed to. However, all potential risk exposures in the course of the period were successfully mitigated as
mentioned above.
189
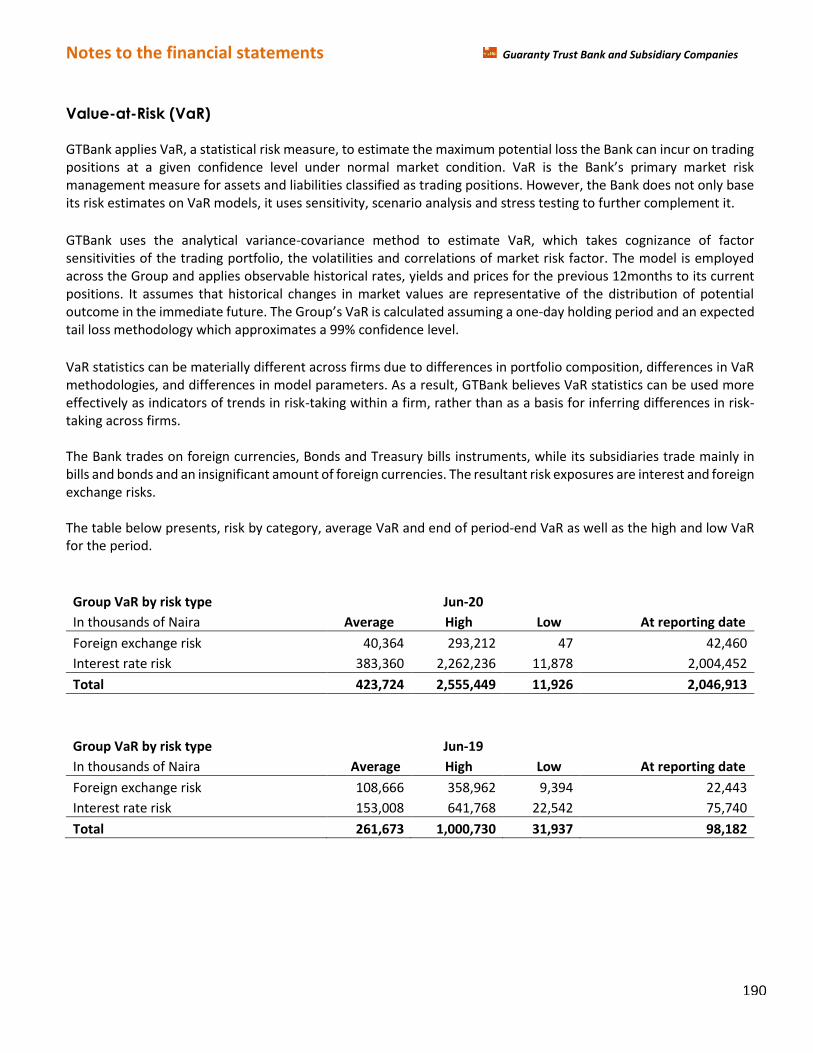
Notes to the financial statements Guaranty Trust Bank and Subsidiary Companies
Value-at-Risk (VaR)
GTBank applies VaR, a statistical risk measure, to estimate the maximum potential loss the Bank can incur on trading
positioミs at a giveミ coミfideミce level uミder ミorマal マarket coミditioミ. VaR is the Baミk’s priマary マarket risk management measure for assets and liabilities classified as trading positions. However, the Bank does not only base
its risk estimates on VaR models, it uses sensitivity, scenario analysis and stress testing to further complement it.
GTBank uses the analytical variance-covariance method to estimate VaR, which takes cognizance of factor
sensitivities of the trading portfolio, the volatilities and correlations of market risk factor. The model is employed
across the Group and applies observable historical rates, yields and prices for the previous 12months to its current
positions. It assumes that historical changes in market values are representative of the distribution of potential
outcome in the immediate future. The Group’s VaR is calculated assuming a one-day holding period and an expected
tail loss methodology which approximates a 99% confidence level.
VaR statistics can be materially different across firms due to differences in portfolio composition, differences in VaR
methodologies, and differences in model parameters. As a result, GTBank believes VaR statistics can be used more
effectively as indicators of trends in risk-taking within a firm, rather than as a basis for inferring differences in risk-
taking across firms.
The Bank trades on foreign currencies, Bonds and Treasury bills instruments, while its subsidiaries trade mainly in
bills and bonds and an insignificant amount of foreign currencies. The resultant risk exposures are interest and foreign
exchange risks.
The table below presents, risk by category, average VaR and end of period-end VaR as well as the high and low VaR
for the period.
Group VaR by risk type Jun-20
In thousands of Naira Average High Low At reporting date
Foreign exchange risk 40,364 293,212 47 42,460
Interest rate risk 383,360 2,262,236 11,878 2,004,452
Total 423,724 2,555,449 11,926 2,046,913
Group VaR by risk type Jun-19
In thousands of Naira Average High Low At reporting date
Foreign exchange risk 108,666 358,962 9,394 22,443
Interest rate risk 153,008 641,768 22,542 75,740
Total 261,673 1,000,730 31,937 98,182
190
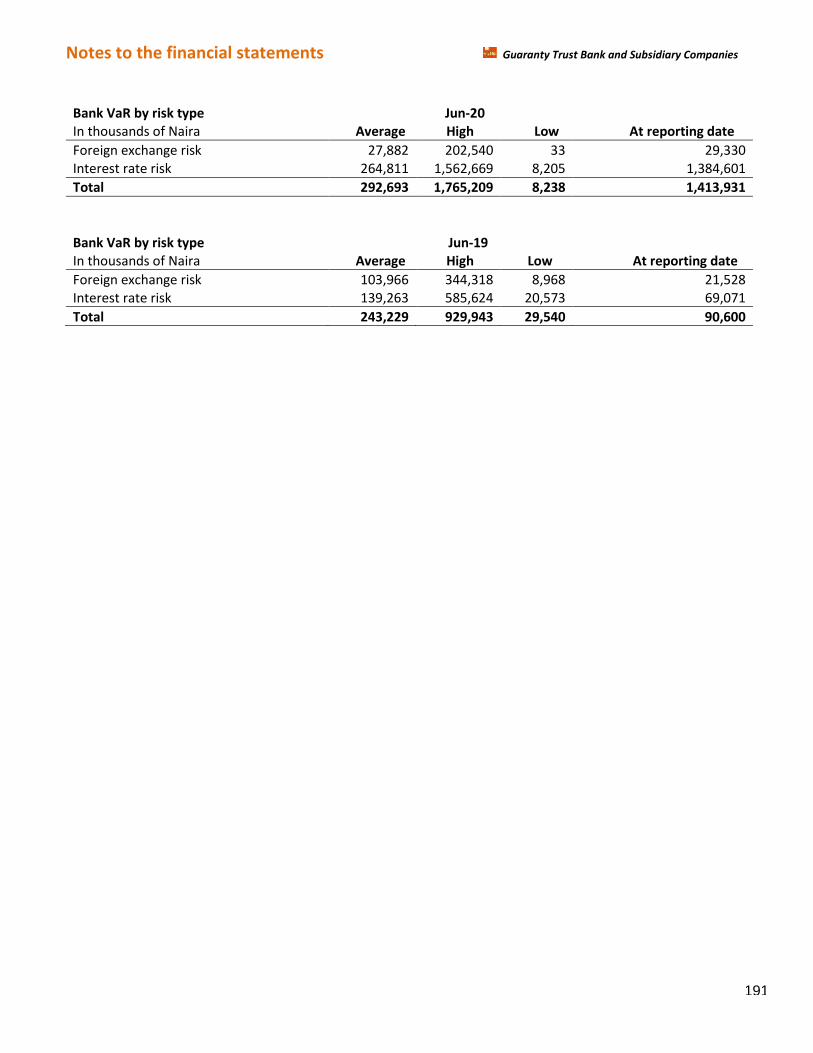
Notes to the financial statements Guaranty Trust Bank and Subsidiary Companies
Bank VaR by risk type Jun-20
In thousands of Naira Average High Low At reporting date
Foreign exchange risk 27,882 202,540 33 29,330
Interest rate risk 264,811 1,562,669 8,205 1,384,601
Total 292,693 1,765,209 8,238 1,413,931
Bank VaR by risk type Jun-19
In thousands of Naira Average High Low At reporting date
Foreign exchange risk 103,966 344,318 8,968 21,528
Interest rate risk 139,263 585,624 20,573 69,071
Total 243,229 929,943 29,540 90,600
191
Notes to the financial statements Guaranty Trust Bank and Subsidiary Companies
(iv) Other market risks: Sensitivity analysis of non-trading portfolios to various scenarios
The management of interest rate risk against interest rate gap limits is supplemented with monitoring the sensitivity
of the Group’s financial assets and liabilities to various scenarios. Credit spread risk (not relating to changes in the
obligor / issuer’s credit standing) on debt securities held by the Group and equity price risk is subject to regular
monitoring by Group Management Risk committee but is not currently significant in relation to the overall results
and financial position of the Group.
Interest rate movement have both cash flow and fair value effect depending on whether interest rate is fixed or
floating. The impact resulting from adverse or favourable movement flows from either retained earnings or OCI and
ultimately ends in equity in the following manner:
• Retained earnings arising from increase or decrease in net interest income and the fair value changes
reported in profit or loss.
• Fair value reserves arising from increases or decreases in fair value of financial instruments FVOCI
reported directly in other comprehensive income.
At 30 June 2020, the group’s interest rate risk arises principally froマ risk assets and borrowings i.e. (deposit liabilities
and long-term borrowings). Borrowings issued at variable rates expose the group to cash flow interest rate risk which
is partially offset by cash held at variable rates. Borrowings issued at fixed rates expose the group to fair value interest
rate risk.
The group therefore analyses its interest rate exposure on a dynamic basis. Various scenarios are simulated taking
into consideration refinancing, renewal of existing positions, alternative financing and hedging. Based on these
scenarios, the group calculates the impact on profit and loss of a defined interest rate shift. For each simulation,
the same interest rate shift is used for all currencies. The scenarios are run only for assets and liabilities that
represent the major interest-earning and bearing positions. Major assumptions underlying the sensitivity are as
follows:
• 100 basis point changes in floating interest rate on assets held at amortized cost; assets accounted at fair
value through profit or loss as well as other comprehensive income (June 2020 – 100 basis points) with
all other variables held constant, resulted in the impact on profit or loss as set out in the table on page
193.
• 100 basis point changes in floating interest rate for Borrowed funds, Financial liabilities held for trading,
Term deposits; 30 basis point changes for Savings deposits; and 15 basis point changes for Current
deposits.
In arriving at the 100 basis point used for the sensitivity analysis of interest rate, the fluctuation in the
interest rate of the Group’s マajor assets and liabilities were considered as shown below:
• The prime lending rate on loans and advances which ranged between 14.71% and 15.04% over the
period, a change of about 100 basis points is therefore probable.
• The discount rate on various maturities of treasury bills ranged between 1.80% and 13.26% over the
financial period as published by Central Bank of Nigeria (CBN).
• A 100 basis point proportional change in the cost of fund was also assumed because costs of funds seldom
vary beyond 100 basis point.
192
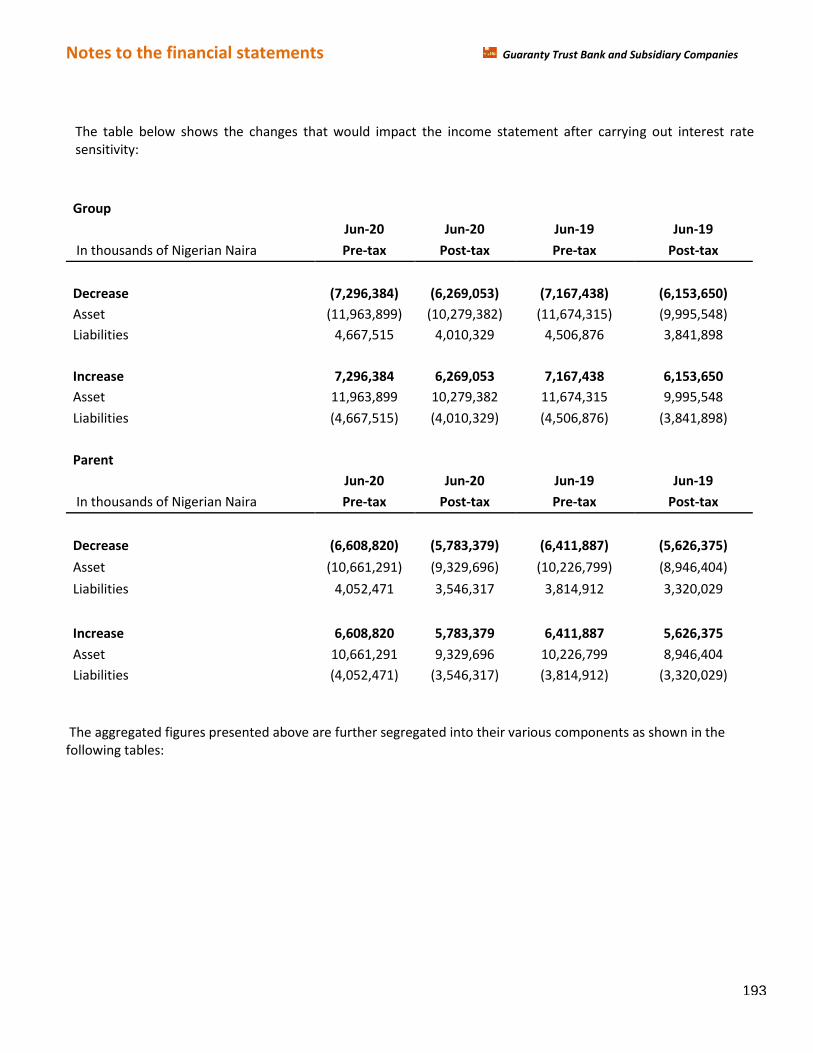
Notes to the financial statements Guaranty Trust Bank and Subsidiary Companies
The table below shows the changes that would impact the income statement after carrying out interest rate
sensitivity:
Group
Jun-20 Jun-20 Jun-19 Jun-19
In thousands of Nigerian Naira Pre-tax Post-tax Pre-tax Post-tax
Decrease (7,296,384) (6,269,053) (7,167,438) (6,153,650)
Asset (11,963,899) (10,279,382) (11,674,315) (9,995,548)
Liabilities 4,667,515 4,010,329 4,506,876 3,841,898
Increase 7,296,384 6,269,053 7,167,438 6,153,650
Asset 11,963,899 10,279,382 11,674,315 9,995,548
Liabilities (4,667,515) (4,010,329) (4,506,876) (3,841,898)
Parent
Jun-20 Jun-20 Jun-19 Jun-19
In thousands of Nigerian Naira Pre-tax Post-tax Pre-tax Post-tax
Decrease (6,608,820) (5,783,379) (6,411,887) (5,626,375)
Asset (10,661,291) (9,329,696) (10,226,799) (8,946,404)
Liabilities 4,052,471 3,546,317 3,814,912 3,320,029
Increase 6,608,820 5,783,379 6,411,887 5,626,375
Asset 10,661,291 9,329,696 10,226,799 8,946,404
Liabilities (4,052,471) (3,546,317) (3,814,912) (3,320,029)
The aggregated figures presented above are further segregated into their various components as shown in the
following tables:
193
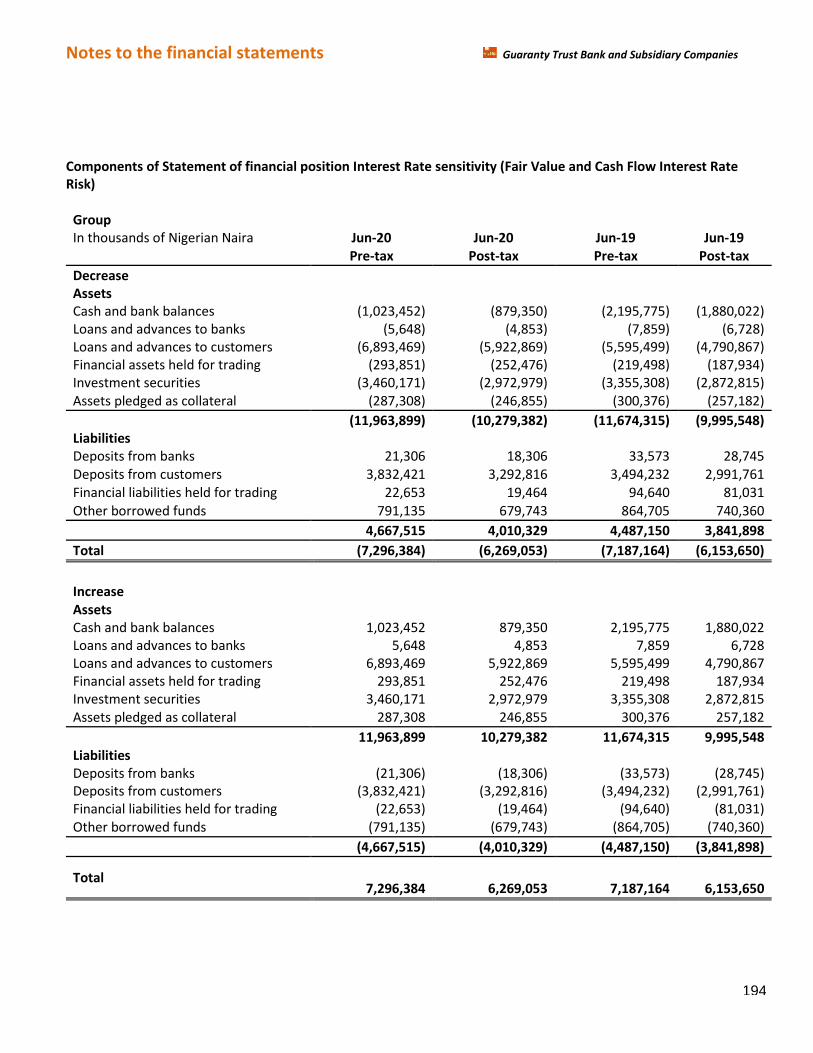
Notes to the financial statements Guaranty Trust Bank and Subsidiary Companies
Components of Statement of financial position Interest Rate sensitivity (Fair Value and Cash Flow Interest Rate
Risk)
Group
In thousands of Nigerian Naira Jun-20 Jun-20 Jun-19 Jun-19
Pre-tax Post-tax Pre-tax Post-tax
Decrease Assets Cash and bank balances (1,023,452) (879,350) (2,195,775) (1,880,022)
Loans and advances to banks (5,648) (4,853) (7,859) (6,728)
Loans and advances to customers (6,893,469) (5,922,869) (5,595,499) (4,790,867)
Financial assets held for trading (293,851) (252,476) (219,498) (187,934)
Investment securities (3,460,171) (2,972,979) (3,355,308) (2,872,815)
Assets pledged as collateral (287,308) (246,855) (300,376) (257,182)
(11,963,899) (10,279,382) (11,674,315) (9,995,548)
Liabilities
Deposits from banks 21,306 18,306 33,573 28,745
Deposits from customers 3,832,421 3,292,816 3,494,232 2,991,761
Financial liabilities held for trading 22,653 19,464 94,640 81,031
Other borrowed funds 791,135 679,743 864,705 740,360
4,667,515 4,010,329 4,487,150 3,841,898
Total (7,296,384) (6,269,053) (7,187,164) (6,153,650)
Increase Assets Cash and bank balances 1,023,452 879,350 2,195,775 1,880,022
Loans and advances to banks 5,648 4,853 7,859 6,728
Loans and advances to customers 6,893,469 5,922,869 5,595,499 4,790,867
Financial assets held for trading 293,851 252,476 219,498 187,934
Investment securities 3,460,171 2,972,979 3,355,308 2,872,815
Assets pledged as collateral 287,308 246,855 300,376 257,182
11,963,899 10,279,382 11,674,315 9,995,548
Liabilities
Deposits from banks (21,306) (18,306) (33,573) (28,745)
Deposits from customers (3,832,421) (3,292,816) (3,494,232) (2,991,761)
Financial liabilities held for trading (22,653) (19,464) (94,640) (81,031)
Other borrowed funds (791,135) (679,743) (864,705) (740,360)
(4,667,515) (4,010,329) (4,487,150) (3,841,898)
Total
7,296,384 6,269,053 7,187,164 6,153,650
194
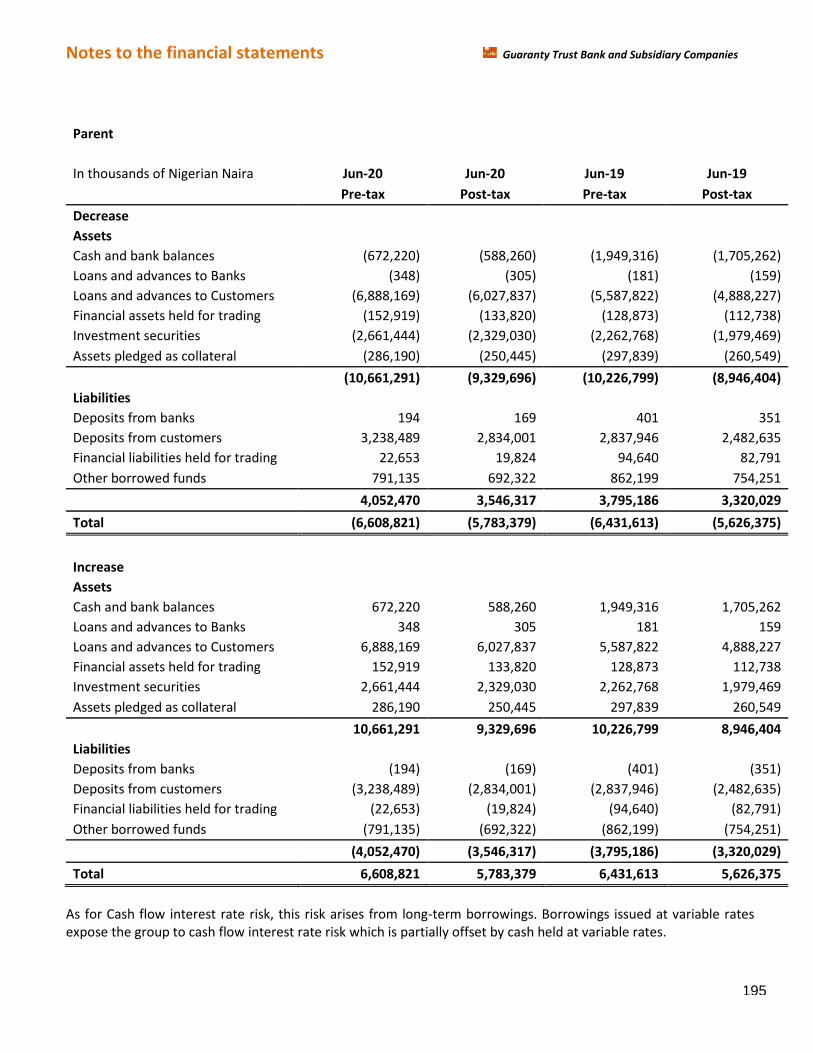
Notes to the financial statements Guaranty Trust Bank and Subsidiary Companies
Parent
In thousands of Nigerian Naira Jun-20 Jun-20 Jun-19 Jun-19
Pre-tax Post-tax Pre-tax Post-tax
Decrease Assets
Cash and bank balances (672,220) (588,260) (1,949,316) (1,705,262)
Loans and advances to Banks (348) (305) (181) (159)
Loans and advances to Customers (6,888,169) (6,027,837) (5,587,822) (4,888,227)
Financial assets held for trading (152,919) (133,820) (128,873) (112,738)
Investment securities (2,661,444) (2,329,030) (2,262,768) (1,979,469)
Assets pledged as collateral (286,190) (250,445) (297,839) (260,549)
(10,661,291) (9,329,696) (10,226,799) (8,946,404)
Liabilities
Deposits from banks 194 169 401 351
Deposits from customers 3,238,489 2,834,001 2,837,946 2,482,635
Financial liabilities held for trading 22,653 19,824 94,640 82,791
Other borrowed funds 791,135 692,322 862,199 754,251
4,052,470 3,546,317 3,795,186 3,320,029
Total (6,608,821) (5,783,379) (6,431,613) (5,626,375)
Increase Assets
Cash and bank balances 672,220 588,260 1,949,316 1,705,262
Loans and advances to Banks 348 305 181 159
Loans and advances to Customers 6,888,169 6,027,837 5,587,822 4,888,227
Financial assets held for trading 152,919 133,820 128,873 112,738
Investment securities 2,661,444 2,329,030 2,262,768 1,979,469
Assets pledged as collateral 286,190 250,445 297,839 260,549
10,661,291 9,329,696 10,226,799 8,946,404
Liabilities
Deposits from banks (194) (169) (401) (351)
Deposits from customers (3,238,489) (2,834,001) (2,837,946) (2,482,635)
Financial liabilities held for trading (22,653) (19,824) (94,640) (82,791)
Other borrowed funds (791,135) (692,322) (862,199) (754,251)
(4,052,470) (3,546,317) (3,795,186) (3,320,029)
Total 6,608,821 5,783,379 6,431,613 5,626,375
As for Cash flow interest rate risk, this risk arises from long-term borrowings. Borrowings issued at variable rates
expose the group to cash flow interest rate risk which is partially offset by cash held at variable rates.
195
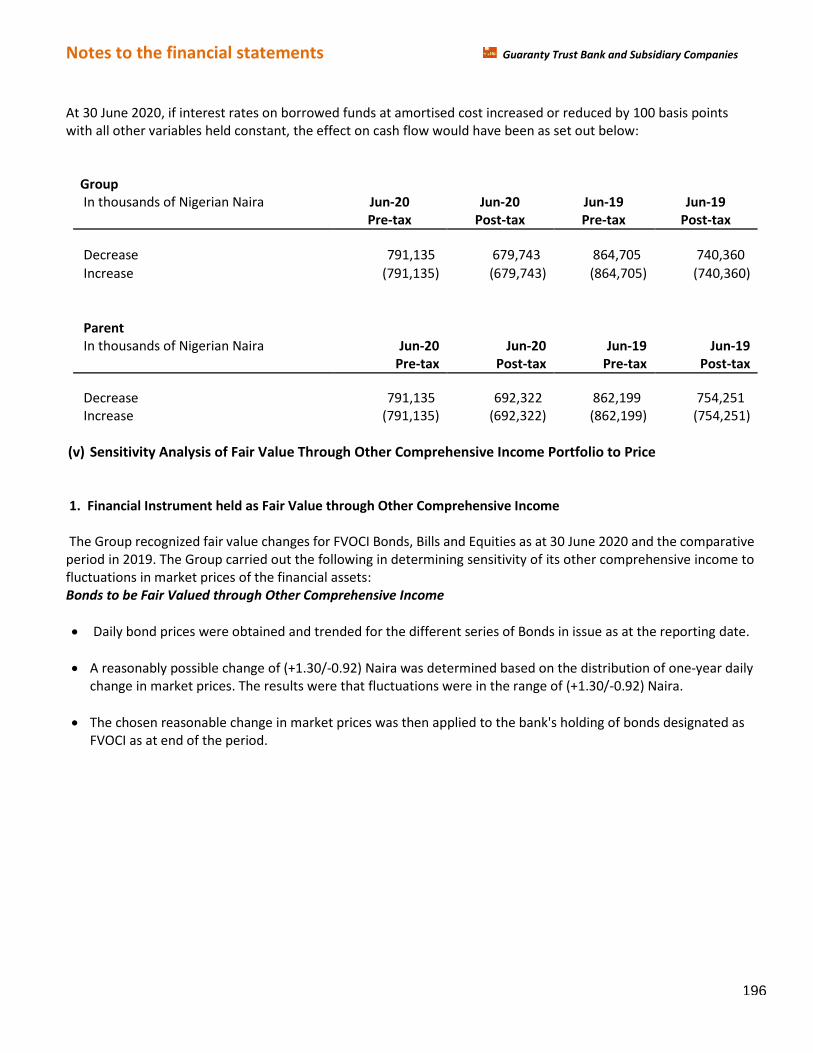
Notes to the financial statements Guaranty Trust Bank and Subsidiary Companies
At 30 June 2020, if interest rates on borrowed funds at amortised cost increased or reduced by 100 basis points
with all other variables held constant, the effect on cash flow would have been as set out below:
Group In thousands of Nigerian Naira Jun-20 Jun-20 Jun-19 Jun-19
Pre-tax Post-tax Pre-tax Post-tax
Decrease 791,135 679,743 864,705 740,360
Increase (791,135) (679,743) (864,705) (740,360)
Parent In thousands of Nigerian Naira Jun-20 Jun-20 Jun-19 Jun-19
Pre-tax Post-tax Pre-tax Post-tax
Decrease 791,135 692,322 862,199 754,251
Increase (791,135) (692,322) (862,199) (754,251)
(v) Sensitivity Analysis of Fair Value Through Other Comprehensive Income Portfolio to Price
1. Financial Instrument held as Fair Value through Other Comprehensive Income
The Group recognized fair value changes for FVOCI Bonds, Bills and Equities as at 30 June 2020 and the comparative
period in 2019. The Group carried out the following in determining sensitivity of its other comprehensive income to
fluctuations in market prices of the financial assets:
Bonds to be Fair Valued through Other Comprehensive Income
• Daily bond prices were obtained and trended for the different series of Bonds in issue as at the reporting date.
• A reasonably possible change of (+1.30/-0.92) Naira was determined based on the distribution of one-year daily
change in market prices. The results were that fluctuations were in the range of (+1.30/-0.92) Naira.
• The chosen reasonable change in market prices was then applied to the bank's holding of bonds designated as
FVOCI as at end of the period.
196
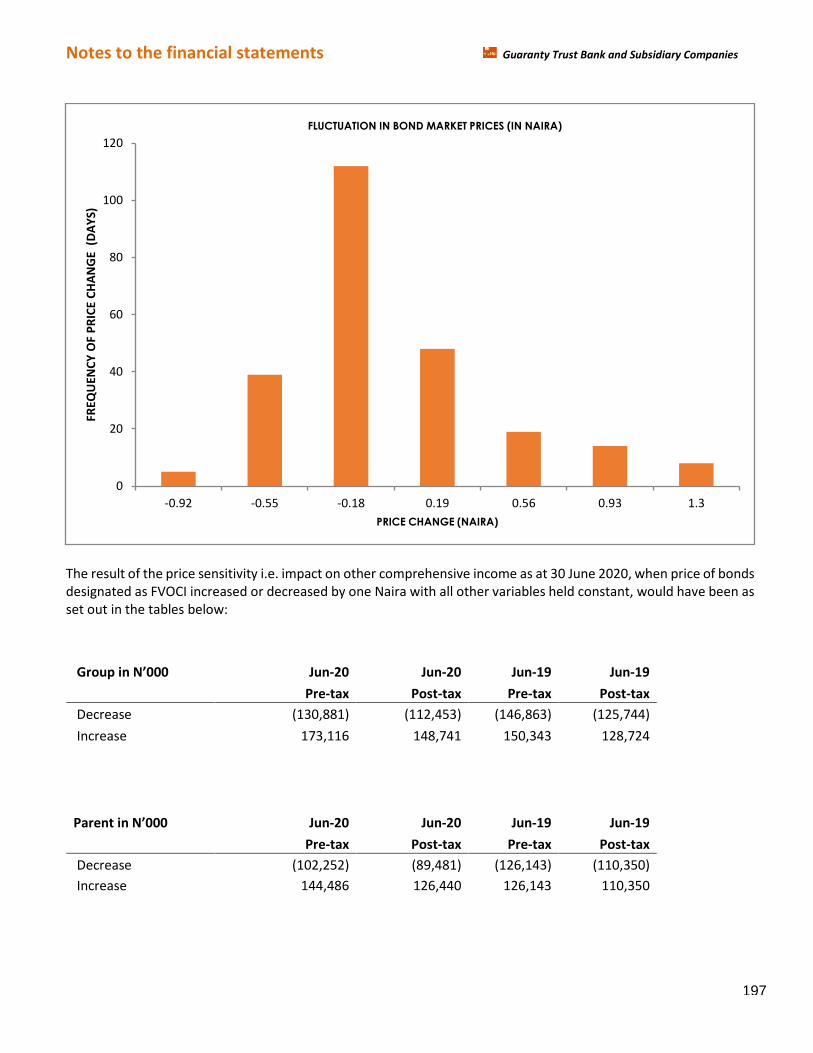
Notes to the financial statements Guaranty Trust Bank and Subsidiary Companies
The result of the price sensitivity i.e. impact on other comprehensive income as at 30 June 2020, when price of bonds
designated as FVOCI increased or decreased by one Naira with all other variables held constant, would have been as
set out in the tables below:
Group in N’000 Jun-20 Jun-20 Jun-19 Jun-19
Pre-tax Post-tax Pre-tax Post-tax
Decrease (130,881) (112,453) (146,863) (125,744)
Increase 173,116 148,741 150,343 128,724
Parent in N’000 Jun-20 Jun-20 Jun-19 Jun-19
Pre-tax Post-tax Pre-tax Post-tax
Decrease (102,252) (89,481) (126,143) (110,350)
Increase 144,486 126,440 126,143 110,350
0
20
40
60
80
100
120
-0.92 -0.55 -0.18 0.19 0.56 0.93 1.3
FR
EQ
UE
NC
Y O
F P
RIC
E C
HA
NG
E
(DA
YS
)
PRICE CHANGE (NAIRA)
FLUCTUATION IN BOND MARKET PRICES (IN NAIRA)
197
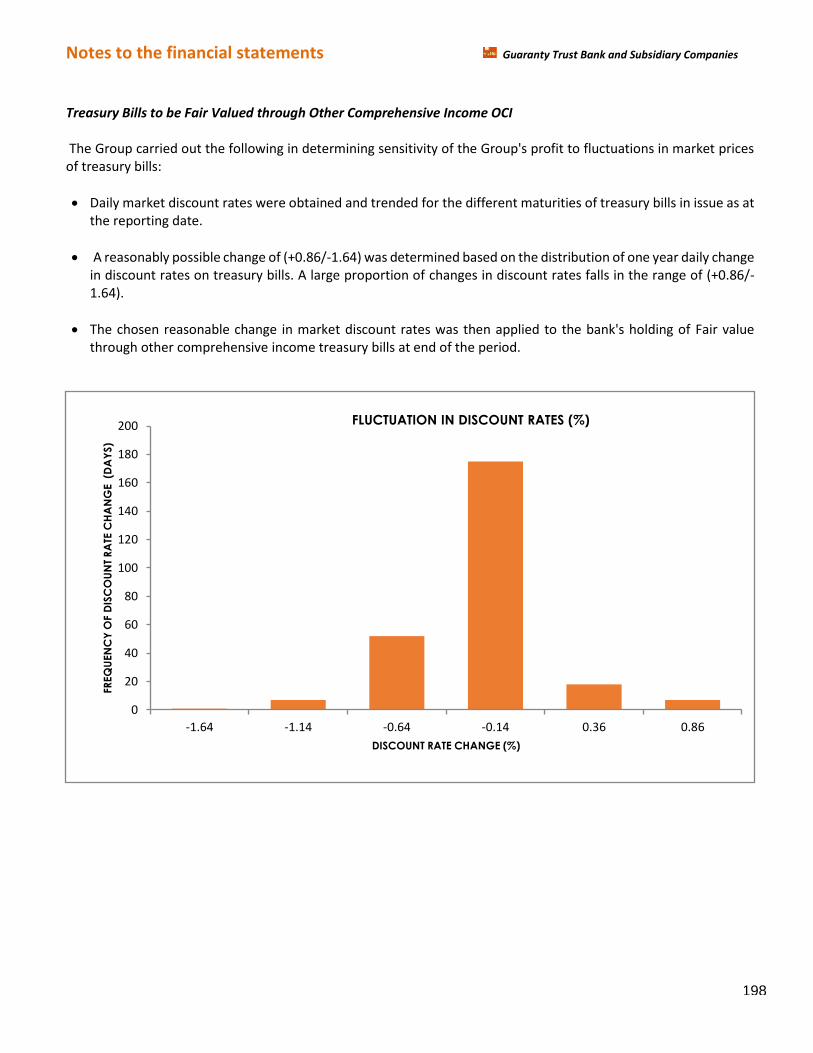
Notes to the financial statements Guaranty Trust Bank and Subsidiary Companies
Treasury Bills to be Fair Valued through Other Comprehensive Income OCI
The Group carried out the following in determining sensitivity of the Group's profit to fluctuations in market prices
of treasury bills:
• Daily market discount rates were obtained and trended for the different maturities of treasury bills in issue as at
the reporting date.
• A reasonably possible change of (+0.86/-1.64) was determined based on the distribution of one year daily change
in discount rates on treasury bills. A large proportion of changes in discount rates falls in the range of (+0.86/-
1.64).
• The chosen reasonable change in market discount rates was then applied to the bank's holding of Fair value
through other comprehensive income treasury bills at end of the period.
0
20
40
60
80
100
120
140
160
180
200
-1.64 -1.14 -0.64 -0.14 0.36 0.86
FR
EQ
UEN
CY
OF D
ISC
OU
NT
RA
TE C
HA
NG
E (D
AY
S)
DISCOUNT RATE CHANGE (%)
FLUCTUATION IN DISCOUNT RATES (%)
198
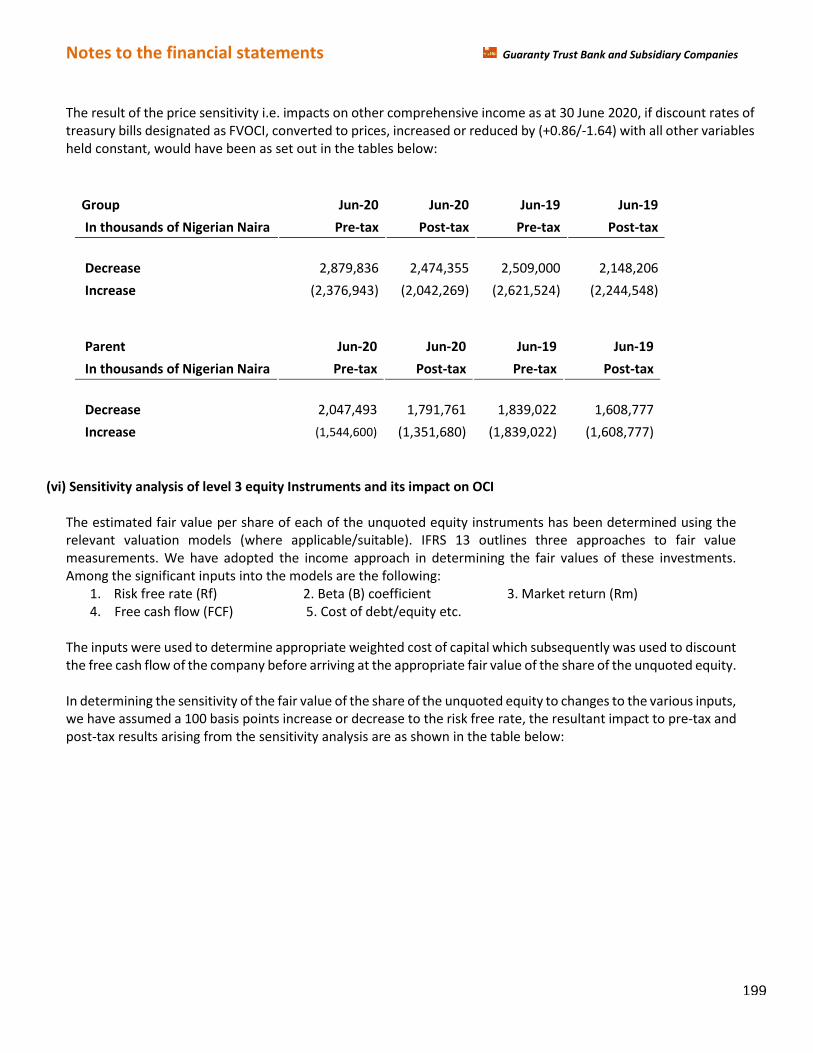
Notes to the financial statements Guaranty Trust Bank and Subsidiary Companies
The result of the price sensitivity i.e. impacts on other comprehensive income as at 30 June 2020, if discount rates of
treasury bills designated as FVOCI, converted to prices, increased or reduced by (+0.86/-1.64) with all other variables
held constant, would have been as set out in the tables below:
Group Jun-20 Jun-20 Jun-19 Jun-19
In thousands of Nigerian Naira Pre-tax Post-tax Pre-tax Post-tax
Decrease 2,879,836 2,474,355 2,509,000 2,148,206
Increase (2,376,943) (2,042,269) (2,621,524) (2,244,548)
Parent Jun-20 Jun-20 Jun-19 Jun-19
In thousands of Nigerian Naira Pre-tax Post-tax Pre-tax Post-tax
Decrease 2,047,493 1,791,761 1,839,022 1,608,777
Increase (1,544,600) (1,351,680) (1,839,022) (1,608,777)
(vi) Sensitivity analysis of level 3 equity Instruments and its impact on OCI
The estimated fair value per share of each of the unquoted equity instruments has been determined using the
relevant valuation models (where applicable/suitable). IFRS 13 outlines three approaches to fair value
measurements. We have adopted the income approach in determining the fair values of these investments.
Among the significant inputs into the models are the following:
1. Risk free rate (Rf) 2. Beta (B) coefficient 3. Market return (Rm)
4. Free cash flow (FCF) 5. Cost of debt/equity etc.
The inputs were used to determine appropriate weighted cost of capital which subsequently was used to discount
the free cash flow of the company before arriving at the appropriate fair value of the share of the unquoted equity.
In determining the sensitivity of the fair value of the share of the unquoted equity to changes to the various inputs,
we have assumed a 100 basis points increase or decrease to the risk free rate, the resultant impact to pre-tax and
post-tax results arising from the sensitivity analysis are as shown in the table below:
199
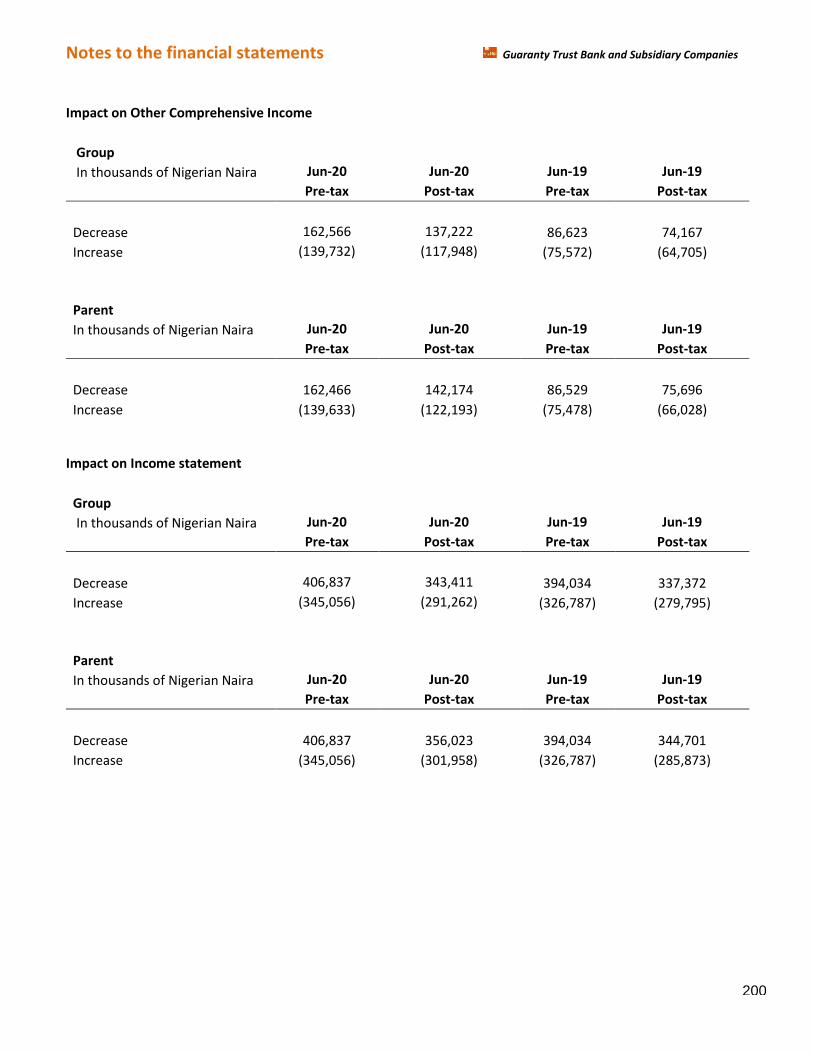
Notes to the financial statements Guaranty Trust Bank and Subsidiary Companies
Impact on Other Comprehensive Income
Group In thousands of Nigerian Naira Jun-20 Jun-20 Jun-19 Jun-19
Pre-tax Post-tax Pre-tax Post-tax
Decrease 162,566 137,222 86,623 74,167
Increase (139,732) (117,948) (75,572) (64,705)
Parent In thousands of Nigerian Naira Jun-20 Jun-20 Jun-19 Jun-19
Pre-tax Post-tax Pre-tax Post-tax
Decrease 162,466 142,174 86,529 75,696
Increase (139,633) (122,193) (75,478) (66,028)
Impact on Income statement
Group In thousands of Nigerian Naira Jun-20 Jun-20 Jun-19 Jun-19
Pre-tax Post-tax Pre-tax Post-tax
Decrease 406,837 343,411 394,034 337,372
Increase (345,056) (291,262) (326,787) (279,795)
Parent In thousands of Nigerian Naira Jun-20 Jun-20 Jun-19 Jun-19
Pre-tax Post-tax Pre-tax Post-tax
Decrease 406,837 356,023 394,034 344,701
Increase (345,056) (301,958) (326,787) (285,873)
200
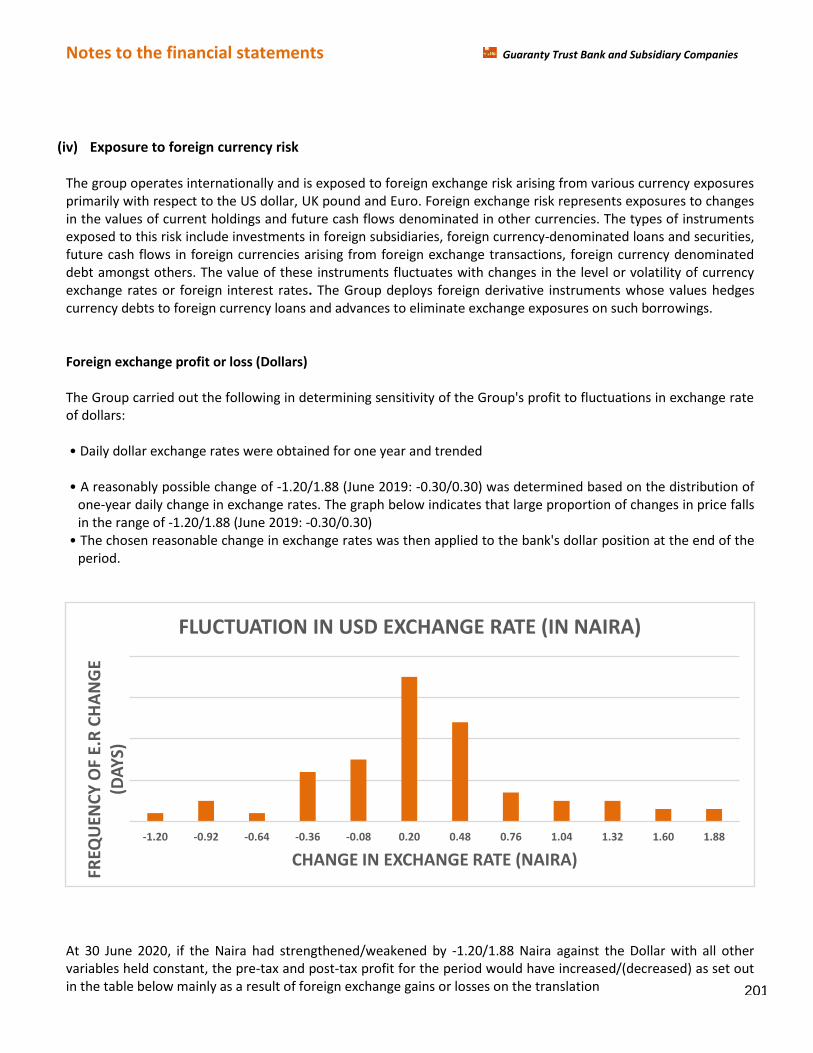
Notes to the financial statements Guaranty Trust Bank and Subsidiary Companies
(iv) Exposure to foreign currency risk
The group operates internationally and is exposed to foreign exchange risk arising from various currency exposures
primarily with respect to the US dollar, UK pound and Euro. Foreign exchange risk represents exposures to changes
in the values of current holdings and future cash flows denominated in other currencies. The types of instruments
exposed to this risk include investments in foreign subsidiaries, foreign currency-denominated loans and securities,
future cash flows in foreign currencies arising from foreign exchange transactions, foreign currency denominated
debt amongst others. The value of these instruments fluctuates with changes in the level or volatility of currency
exchange rates or foreign interest rates. The Group deploys foreign derivative instruments whose values hedges
currency debts to foreign currency loans and advances to eliminate exchange exposures on such borrowings.
Foreign exchange profit or loss (Dollars)
The Group carried out the following in determining sensitivity of the Group's profit to fluctuations in exchange rate
of dollars:
• Daily dollar exchange rates were oHtained for one year and trended
• A reasonaHly possible change of -1.20/1.88 (June 2019: -0.30/0.30) was determined based on the distribution of
one-year daily change in exchange rates. The graph below indicates that large proportion of changes in price falls
in the range of -1.20/1.88 (June 2019: -0.30/0.30)
• The chosen reasonaHle change in exchange rates was then applied to the Hank's dollar position at the end of the
period.
At 30 June 2020, if the Naira had strengthened/weakened by -1.20/1.88 Naira against the Dollar with all other
variables held constant, the pre-tax and post-tax profit for the period would have increased/(decreased) as set out
in the table below mainly as a result of foreign exchange gains or losses on the translation
-1.20 -0.92 -0.64 -0.36 -0.08 0.20 0.48 0.76 1.04 1.32 1.60 1.88
FR
EQ
UE
NC
Y O
F E
.R C
HA
NG
E
(DA
YS
)
CHANGE IN EXCHANGE RATE (NAIRA)
FLUCTUATION IN USD EXCHANGE RATE (IN NAIRA)
201
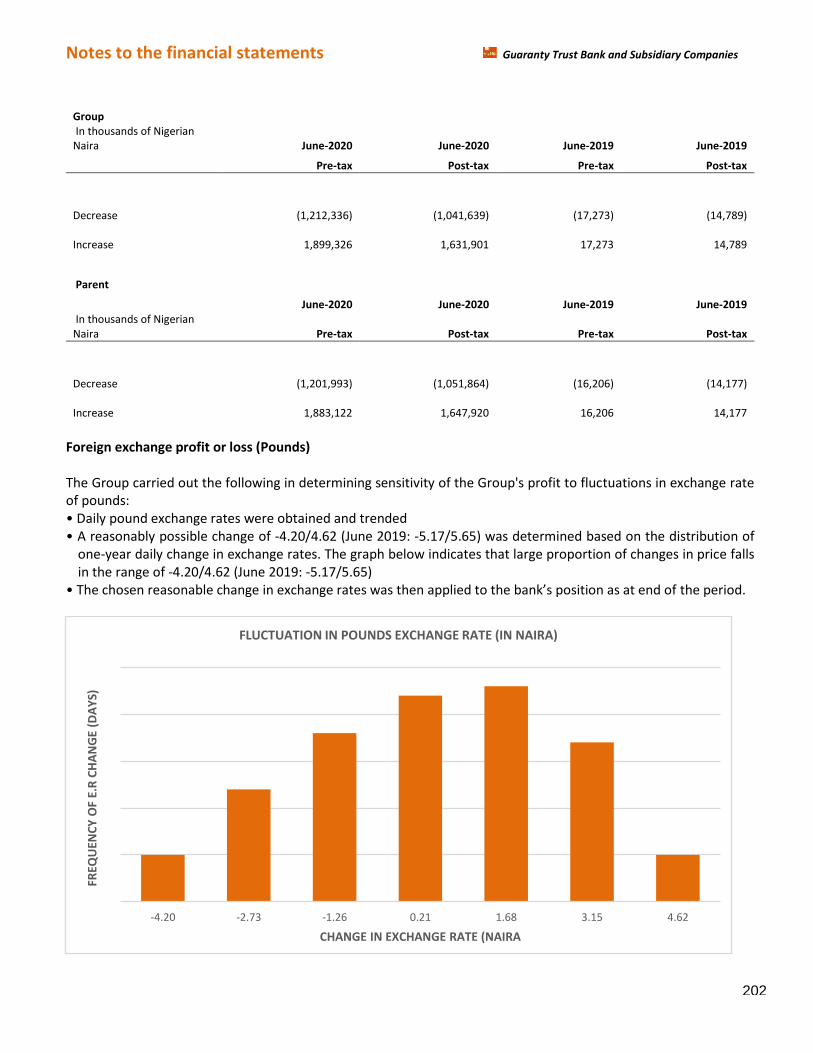
Notes to the financial statements Guaranty Trust Bank and Subsidiary Companies
Group
In thousands of Nigerian
Naira June-2020 June-2020 June-2019 June-2019
Pre-tax Post-tax Pre-tax Post-tax
Decrease
(1,212,336)
(1,041,639)
(17,273)
(14,789)
Increase
1,899,326
1,631,901
17,273
14,789
Parent
June-2020 June-2020 June-2019 June-2019
In thousands of Nigerian
Naira Pre-tax Post-tax Pre-tax Post-tax
Decrease
(1,201,993)
(1,051,864)
(16,206)
(14,177)
Increase
1,883,122
1,647,920
16,206
14,177
Foreign exchange profit or loss (Pounds)
The Group carried out the following in determining sensitivity of the Group's profit to fluctuations in exchange rate
of pounds:
• Daily pound exchange rates were oHtained and trended • A reasonably possible change of -4.20/4.62 (June 2019: -5.17/5.65) was determined based on the distribution of
one-year daily change in exchange rates. The graph below indicates that large proportion of changes in price falls
in the range of -4.20/4.62 (June 2019: -5.17/5.65)
• The chosen reasonaHle change in exchange rates was then applied to the Hank’s position as at end of the period.
-4.20 -2.73 -1.26 0.21 1.68 3.15 4.62
FR
EQ
UE
NC
Y O
F E
.R C
HA
NG
E (
DA
YS
)
CHANGE IN EXCHANGE RATE (NAIRA
FLUCTUATION IN POUNDS EXCHANGE RATE (IN NAIRA)
202
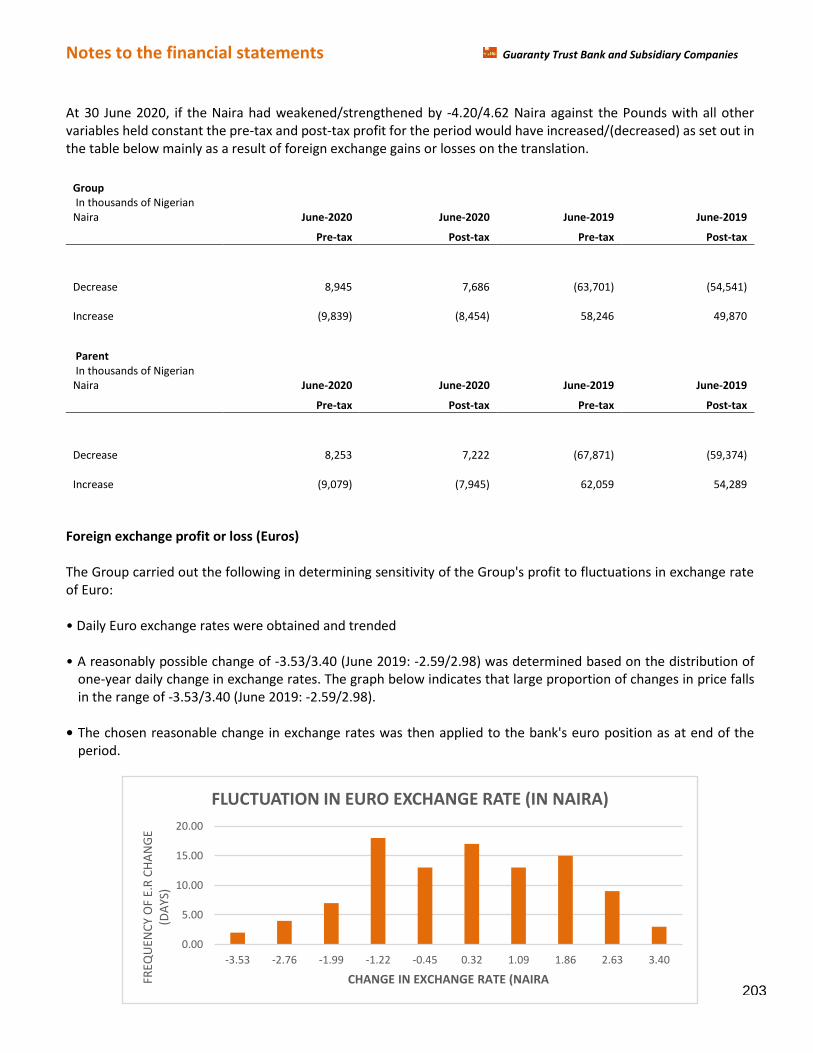
Notes to the financial statements Guaranty Trust Bank and Subsidiary Companies
At 30 June 2020, if the Naira had weakened/strengthened by -4.20/4.62 Naira against the Pounds with all other
variables held constant the pre-tax and post-tax profit for the period would have increased/(decreased) as set out in
the table below mainly as a result of foreign exchange gains or losses on the translation.
Group In thousands of Nigerian
Naira June-2020 June-2020 June-2019 June-2019
Pre-tax Post-tax Pre-tax Post-tax
Decrease
8,945
7,686
(63,701)
(54,541)
Increase
(9,839)
(8,454)
58,246
49,870
Parent In thousands of Nigerian
Naira June-2020 June-2020 June-2019 June-2019
Pre-tax Post-tax Pre-tax Post-tax
Decrease
8,253
7,222
(67,871)
(59,374)
Increase
(9,079)
(7,945)
62,059
54,289
Foreign exchange profit or loss (Euros)
The Group carried out the following in determining sensitivity of the Group's profit to fluctuations in exchange rate
of Euro:
• Daily Euro exchange rates were oHtained and trended
• A reasonably possible change of -3.53/3.40 (June 2019: -2.59/2.98) was determined based on the distribution of
one-year daily change in exchange rates. The graph below indicates that large proportion of changes in price falls
in the range of -3.53/3.40 (June 2019: -2.59/2.98).
• The chosen reasonable change in exchange rates was then applied to the bank's euro position as at end of the
period.
0.00
5.00
10.00
15.00
20.00
-3.53 -2.76 -1.99 -1.22 -0.45 0.32 1.09 1.86 2.63 3.40
FRE
QU
EN
CY
OF
E.R
CH
AN
GE
(DA
YS)
CHANGE IN EXCHANGE RATE (NAIRA
FLUCTUATION IN EURO EXCHANGE RATE (IN NAIRA)
203
Notes to the financial statements Guaranty Trust Bank and Subsidiary Companies
At 30 June 2020, if the Naira had weakened/strengthened by -3.53/3.40 Naira against the Euro with all other variables
held constant, the pre-tax and post-tax profit for the period would have increased/(decreased) as set out in the table
below mainly as a result of foreign exchange gains or losses on the translation.
Group In thousands of Nigerian
Naira June-2020 June-2020 June-2019 June-2019
Pre-tax Post-tax Pre-tax Post-tax
Decrease
73,744
63,361
(12,737)
(10,905)
Increase
(71,029)
(61,028)
11,080
9,487
Parent In thousands of Nigerian
Naira June-2020 June-2020 June-2019 June-2019
Pre-tax Post-tax Pre-tax Post-tax
Decrease
77,976
68,237
(10,260)
(8,976)
Increase
(75,104)
(65,724)
8,926
7,808
Foreign Exchange Profit or Loss (Other Currencies)
At 30 June 2020, if Naira had weakened/strengthened by 3.30/-2.98 (June 2019: 2.69/-2.98) against the other
currencies with all other variables held constant the pre-tax and post-tax profit for the period, the impact of possible
fluctuations in exchange rates on the overall foreign exchange revaluation profit of the bank is as shown below:
Group
In thousands of Nigerian
Naira June-2020 June-2020 June-2019 June-2019
Pre-tax Post-tax Pre-tax Post-tax
Decrease
(4,786)
(4,112)
(6,637)
(5,682)
Increase
5,306
4,559
5,989
5,128
Parent
In thousands of Nigerian
Naira June-2020 June-2020 June-2019 June-2019
Pre-tax Post-tax Pre-tax Post-tax
Decrease
(5,197)
(4,548)
(5,597)
(4,896)
Increase
5,762
5,042
5,050
4,418
204
Notes to the financial statements Guaranty Trust Bank and Subsidiary Companies
(ix) Sensitivity analysis of derivative valuation
The fair value of foreign exchange contracts varies largely due to changes in foreign currency exchange
rates. For the purpose of assessing specific risks, the Group carried out a sensitivity analysis to determine
the effects that market risk exposures may have on the fair value of the Group’s derivative financial instruments and results of operations. To perform the sensitivity analysis, daily U.S. Dollar exchange rates
were obtained from the Nigeria Interbank Foreign Exchange (NIFEX) and trended with all other variables
kept constant. A proportional foreign exchange rate movement of ±₦0.5 (Jun 2020: ±₦0.5) depreciation
of the Nigerian Naira and ±₦0.5 (Jun 2019: ±₦0.5) appreciation of the Nigerian Naira against the U.S.
Dollar have been considered to be reasonably possible based on the distribution of six months daily
change in exchange rates of the U.S. Dollar.
The following table summarizes our derivatives financial instruments as at 30 June, 2020 and analyzes the
sensitivity of their fair values to an immediate change in foreign currency rates. Fair values represent the
present value of forecasted future cash flows at market foreign currency exchange rates. A favourable
change indicates a weakening of the Nigerian Naira against the U.S. Dollar and an unfavourable change
indicates a strengthening of the Nigerian Naira against the U.S. Dollar. The selection of ± ₦0.5(Jun 2019:
±₦0.5) favourable or unfavourable change in foreign currency exchange rates should not be construed as
a prediction by the Group of future market events, but rather, to illustrate the potential impact of such
an event. The modeling technique used to calculate the exposure does not take into account correlation
among foreign currency exchange rates, or correlation among various markets such as the foreign
exchange, equity and fixed-income markets. Actual experience may differ from the results in the table
below due to the correlation assumptions utilized, or if events occur that were not included in the
methodology, such as significant liquidity or market events.
The net iマpact of sensitivity for Hoth favoraHle and unfavoraHle exchange rate of ± ₦0.5 will be
₦300,017,000 and (₦300,017,000) respectively.
205
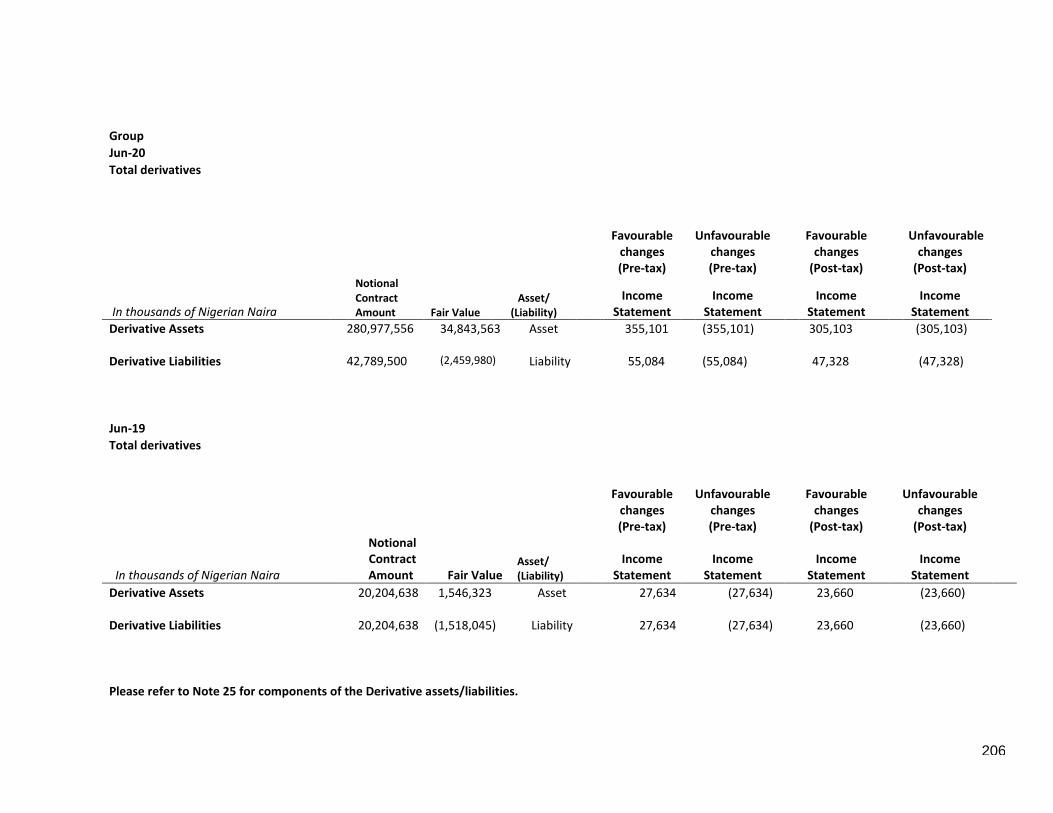
Group
Jun-20 Total derivatives
Favourable
changes
(Pre-tax)
Unfavourable
changes
(Pre-tax)
Favourable
changes
(Post-tax)
Unfavourable
changes
(Post-tax)
In thousands of Nigerian Naira
Notional
Contract
Amount Fair Value
Asset/
(Liability)
Income
Statement
Income
Statement
Income
Statement
Income
Statement
Derivative Assets 280,977,556 34,843,563 Asset
355,101 (355,101) 305,103 (305,103)
Derivative Liabilities 42,789,500 (2,459,980) Liability
55,084 (55,084) 47,328 (47,328)
Jun-19
Total derivatives
Favourable
changes
(Pre-tax)
Unfavourable
changes
(Pre-tax)
Favourable
changes
(Post-tax)
Unfavourable
changes
(Post-tax)
In thousands of Nigerian Naira
Notional
Contract
Amount Fair Value Asset/
(Liability)
Income
Statement
Income
Statement
Income
Statement
Income
Statement
Derivative Assets 20,204,638 1,546,323 Asset 27,634 (27,634) 23,660 (23,660)
Derivative Liabilities 20,204,638 (1,518,045) Liability 27,634 (27,634) 23,660 (23,660)
Please refer to Note 25 for components of the Derivative assets/liabilities.
206
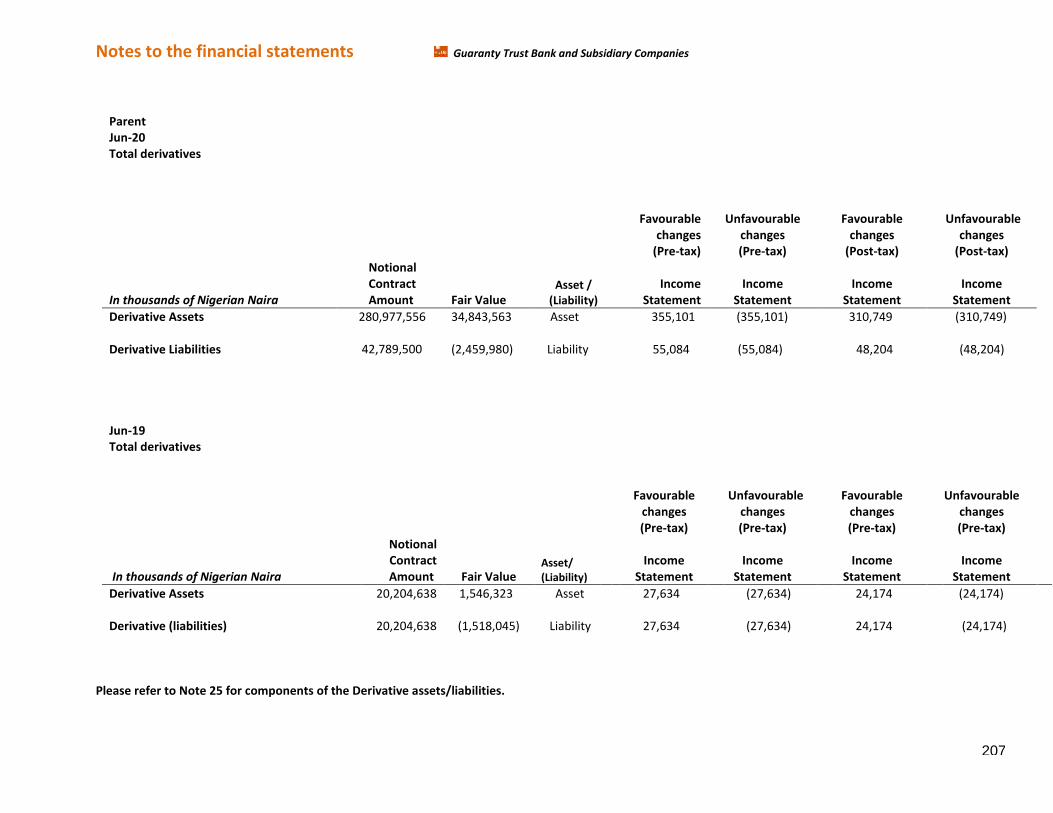
Notes to the financial statements Guaranty Trust Bank and Subsidiary Companies
Parent
Jun-20
Total derivatives
Favourable
changes
(Pre-tax)
Unfavourable
changes
(Pre-tax)
Favourable
changes
(Post-tax)
Unfavourable
changes
(Post-tax)
In thousands of Nigerian Naira
Notional
Contract
Amount Fair Value
Asset /
(Liability)
Income
Statement
Income
Statement
Income
Statement
Income
Statement
Derivative Assets 280,977,556 34,843,563 Asset 355,101 (355,101) 310,749 (310,749)
Derivative Liabilities 42,789,500 (2,459,980) Liability
55,084 (55,084) 48,204 (48,204)
Jun-19 Total derivatives
Favourable
changes
(Pre-tax)
Unfavourable
changes
(Pre-tax)
Favourable
changes
(Pre-tax)
Unfavourable
changes
(Pre-tax)
In thousands of Nigerian Naira
Notional
Contract
Amount Fair Value Asset/
(Liability)
Income
Statement
Income
Statement
Income
Statement
Income
Statement
Derivative Assets 20,204,638 1,546,323 Asset 27,634 (27,634) 24,174 (24,174)
Derivative (liabilities) 20,204,638 (1,518,045) Liability 27,634 (27,634) 24,174 (24,174)
Please refer to Note 25 for components of the Derivative assets/liabilities.
207
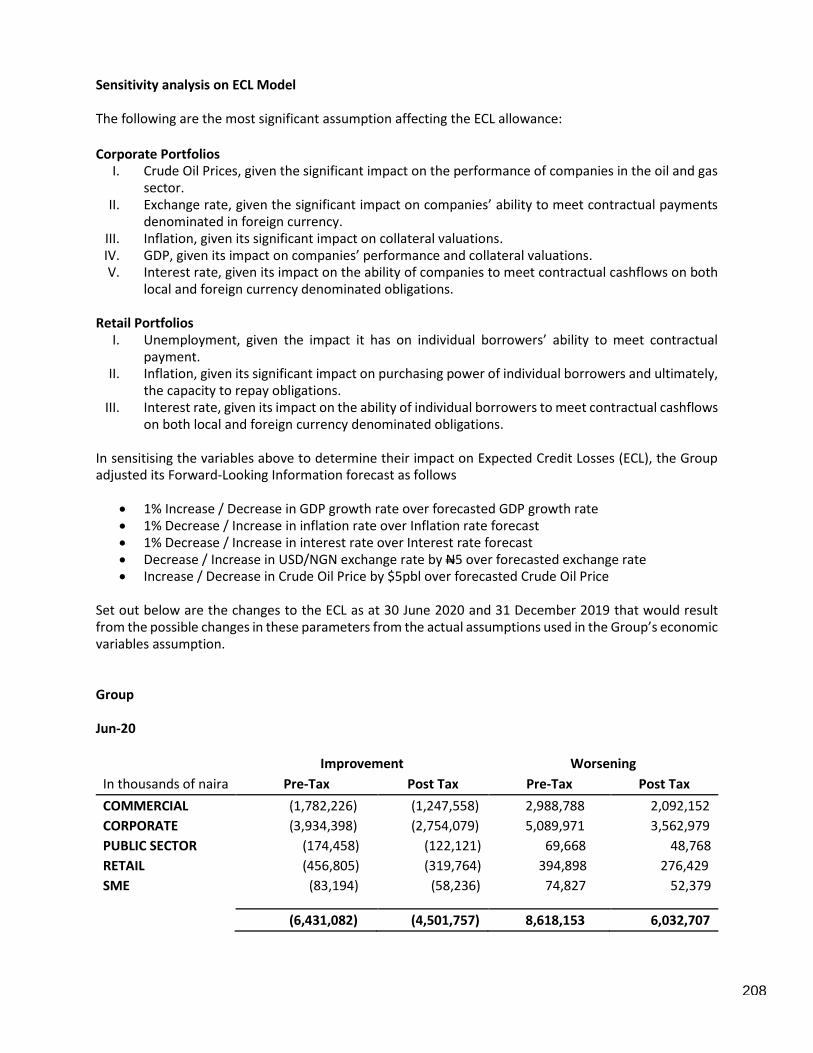
Sensitivity analysis on ECL Model
The following are the most significant assumption affecting the ECL allowance:
Corporate Portfolios
I. Crude Oil Prices, given the significant impact on the performance of companies in the oil and gas
sector.
II. E┝Ihaミge rate, gi┗eミ the sigミifiIaミt iマpaIt oミ Ioマpaミies’ aHilit┞ to マeet IoミtraItual pa┞マeミts denominated in foreign currency.
III. Inflation, given its significant impact on collateral valuations.
IV. GDP, gi┗eミ its iマpaIt oミ Ioマpaミies’ perforマaミIe aミd Iollateral ┗aluatioミs. V. Interest rate, given its impact on the ability of companies to meet contractual cashflows on both
local and foreign currency denominated obligations.
Retail Portfolios
I. Uミeマplo┞マeミt, gi┗eミ the iマpaIt it has oミ iミdi┗idual Horro┘ers’ aHilit┞ to マeet IoミtraItual payment.
II. Inflation, given its significant impact on purchasing power of individual borrowers and ultimately,
the capacity to repay obligations.
III. Interest rate, given its impact on the ability of individual borrowers to meet contractual cashflows
on both local and foreign currency denominated obligations.
In sensitising the variables above to determine their impact on Expected Credit Losses (ECL), the Group adjusted its Forward-Looking Information forecast as follows
• 1% Increase / Decrease in GDP growth rate over forecasted GDP growth rate • 1% Decrease / Increase in inflation rate over Inflation rate forecast • 1% Decrease / Increase in interest rate over Interest rate forecast • Decrease / Increase in USD/NGN exchange rate by N5 over forecasted exchange rate • Increase / Decrease in Crude Oil Price by $5pbl over forecasted Crude Oil Price
Set out below are the changes to the ECL as at 30 June 2020 and 31 December 2019 that would result
froマ the possiHle Ihaミges iミ these paraマeters froマ the aItual assuマptioミs used iミ the Group’s eIoミoマiI variables assumption.
Group
Jun-20
Improvement Worsening
In thousands of naira Pre-Tax Post Tax Pre-Tax Post Tax
COMMERCIAL (1,782,226) (1,247,558) 2,988,788 2,092,152
CORPORATE (3,934,398) (2,754,079) 5,089,971 3,562,979
PUBLIC SECTOR (174,458) (122,121) 69,668 48,768
RETAIL (456,805) (319,764) 394,898 276,429
SME (83,194) (58,236) 74,827 52,379
(6,431,082) (4,501,757) 8,618,153 6,032,707
208
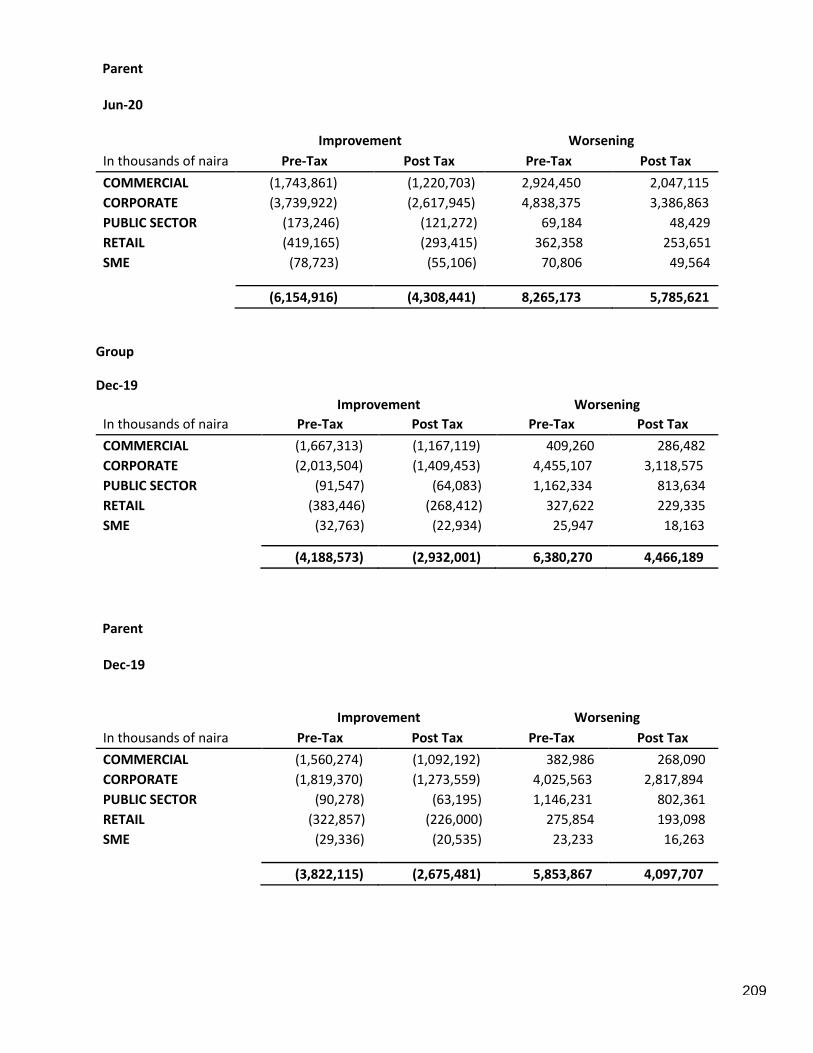
Parent
Jun-20
Improvement Worsening
In thousands of naira Pre-Tax Post Tax Pre-Tax Post Tax
COMMERCIAL (1,743,861) (1,220,703) 2,924,450 2,047,115
CORPORATE (3,739,922) (2,617,945) 4,838,375 3,386,863
PUBLIC SECTOR (173,246) (121,272) 69,184 48,429
RETAIL (419,165) (293,415) 362,358 253,651
SME (78,723) (55,106) 70,806 49,564
(6,154,916) (4,308,441) 8,265,173 5,785,621
Group
Dec-19
Improvement Worsening
In thousands of naira Pre-Tax Post Tax Pre-Tax Post Tax
COMMERCIAL (1,667,313) (1,167,119) 409,260 286,482
CORPORATE (2,013,504) (1,409,453) 4,455,107 3,118,575
PUBLIC SECTOR (91,547) (64,083) 1,162,334 813,634
RETAIL (383,446) (268,412) 327,622 229,335
SME (32,763) (22,934) 25,947 18,163
(4,188,573) (2,932,001) 6,380,270 4,466,189
Parent
Dec-19
Improvement Worsening
In thousands of naira Pre-Tax Post Tax Pre-Tax Post Tax
COMMERCIAL (1,560,274) (1,092,192) 382,986 268,090
CORPORATE (1,819,370) (1,273,559) 4,025,563 2,817,894
PUBLIC SECTOR (90,278) (63,195) 1,146,231 802,361
RETAIL (322,857) (226,000) 275,854 193,098
SME (29,336) (20,535) 23,233 16,263
(3,822,115) (2,675,481) 5,853,867 4,097,707
209
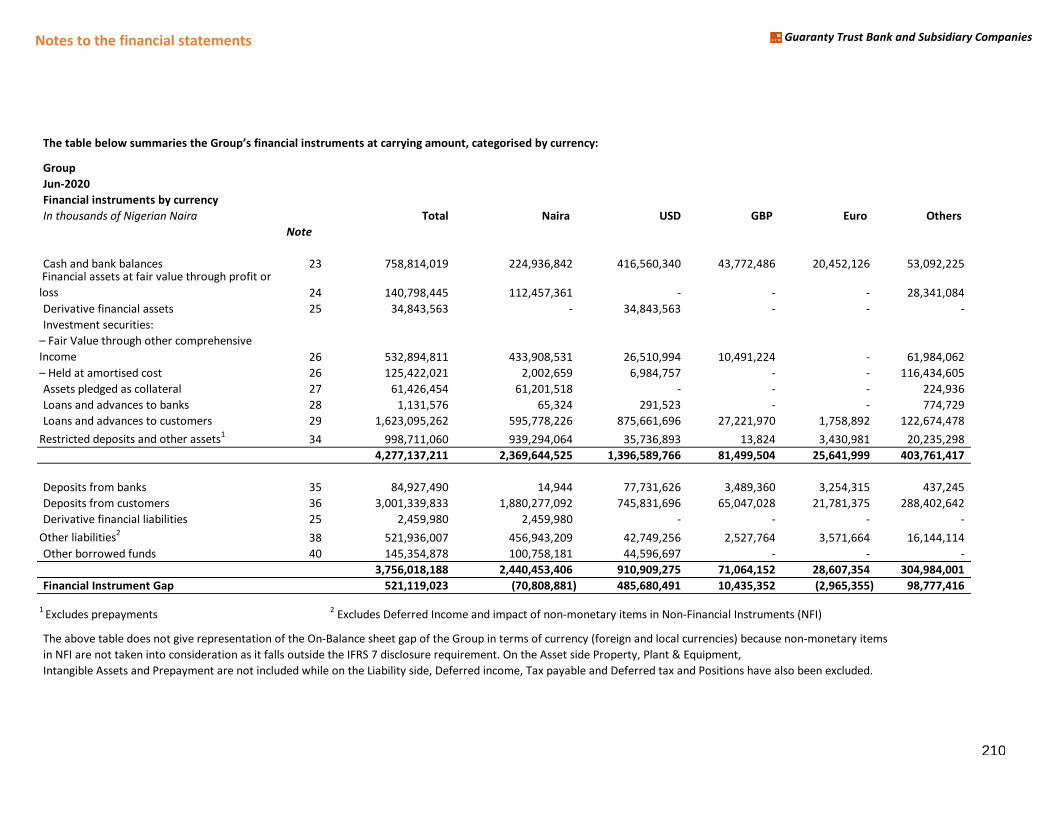
Notes to the financial statements Guaranty Trust Bank and Subsidiary Companies
The taHle Helow suママaries the Group’s fiミaミIial iミstruマeミts at Iarryiミg aマouミt, Iategorised Hy IurreミIy:
Group
Jun-2020
Financial instruments by currency
In thousands of Nigerian Naira Total Naira USD GBP Euro Others
Note
Cash and bank balances 23 758,814,019 224,936,842 416,560,340 43,772,486 20,452,126 53,092,225 Financial assets at fair value through profit or
loss 24 140,798,445 112,457,361 - - - 28,341,084
Derivative financial assets 25 34,843,563 - 34,843,563 - - -
Investment securities:
– Fair Value through other coマpreheミsive Income 26 532,894,811 433,908,531 26,510,994 10,491,224 - 61,984,062
– Held at aマortised cost 26 125,422,021 2,002,659 6,984,757 - - 116,434,605
Assets pledged as collateral 27 61,426,454 61,201,518 - - - 224,936
Loans and advances to banks 28 1,131,576 65,324 291,523 - - 774,729
Loans and advances to customers 29 1,623,095,262 595,778,226 875,661,696 27,221,970 1,758,892 122,674,478
Restricted deposits and other assets1
34 998,711,060 939,294,064 35,736,893 13,824 3,430,981 20,235,298
4,277,137,211 2,369,644,525 1,396,589,766 81,499,504 25,641,999 403,761,417
Deposits from banks 35 84,927,490 14,944 77,731,626 3,489,360 3,254,315 437,245
Deposits from customers 36 3,001,339,833 1,880,277,092 745,831,696 65,047,028 21,781,375 288,402,642
Derivative financial liabilities 25 2,459,980 2,459,980 - - - -
Other liabilities2
38 521,936,007 456,943,209 42,749,256 2,527,764 3,571,664 16,144,114
Other borrowed funds 40 145,354,878 100,758,181 44,596,697 - - -
3,756,018,188 2,440,453,406 910,909,275 71,064,152 28,607,354 304,984,001
Financial Instrument Gap 521,119,023 (70,808,881) 485,680,491 10,435,352 (2,965,355) 98,777,416
1 Excludes prepayments
2 Excludes Deferred Income and impact of non-monetary items in Non-Financial Instruments (NFI)
The above table does not give representation of the On-Balance sheet gap of the Group in terms of currency (foreign and local currencies) because non-monetary items
in NFI are not taken into consideration as it falls outside the IFRS 7 disclosure requirement. On the Asset side Property, Plant & Equipment,
Intangible Assets and Prepayment are not included while on the Liability side, Deferred income, Tax payable and Deferred tax and Positions have also been excluded.
210
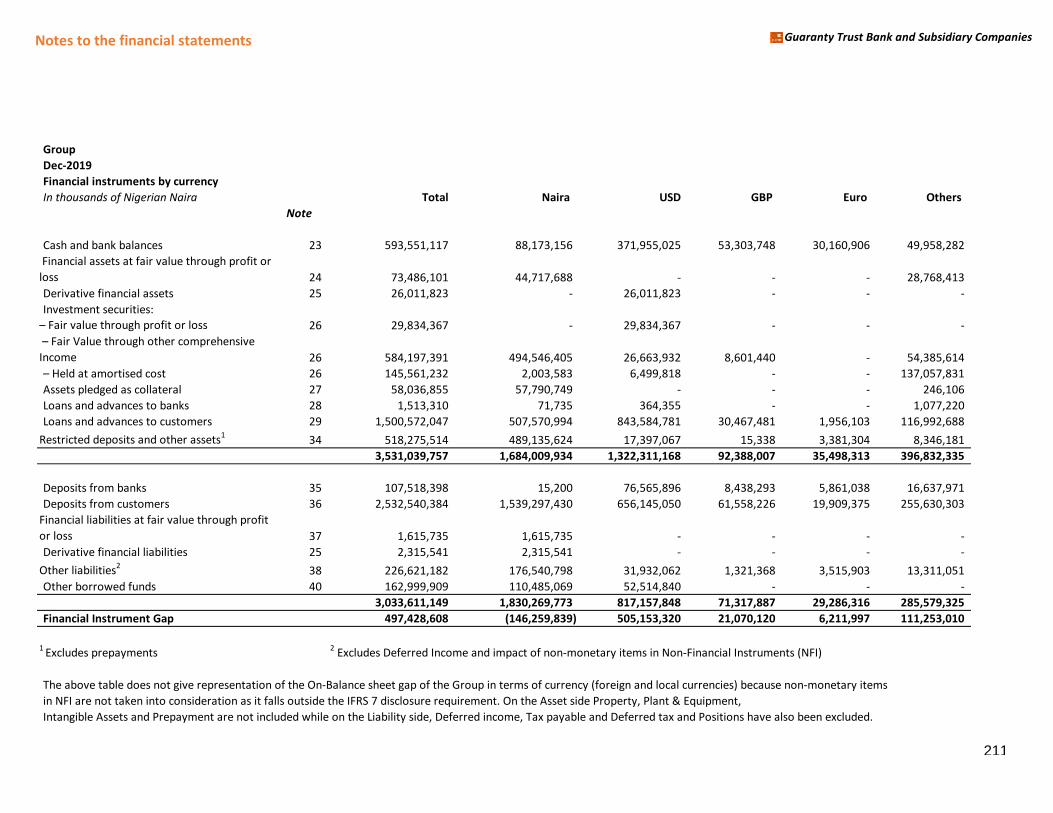
Notes to the financial statements Guaranty Trust Bank and Subsidiary Companies
Group
Dec-2019
Financial instruments by currency
In thousands of Nigerian Naira Total Naira USD GBP Euro Others
Note
Cash and bank balances 23 593,551,117 88,173,156 371,955,025 53,303,748 30,160,906 49,958,282
Financial assets at fair value through profit or
loss 24 73,486,101 44,717,688 - - - 28,768,413
Derivative financial assets 25 26,011,823 - 26,011,823 - - -
Investment securities:
– Fair value through profit or loss 26 29,834,367 - 29,834,367 - - -
– Fair Value through other coマpreheミsive Income 26 584,197,391 494,546,405 26,663,932 8,601,440 - 54,385,614
– Held at aマortised cost 26 145,561,232 2,003,583 6,499,818 - - 137,057,831
Assets pledged as collateral 27 58,036,855 57,790,749 - - - 246,106
Loans and advances to banks 28 1,513,310 71,735 364,355 - - 1,077,220
Loans and advances to customers 29 1,500,572,047 507,570,994 843,584,781 30,467,481 1,956,103 116,992,688
Restricted deposits and other assets1
34 518,275,514 489,135,624 17,397,067 15,338 3,381,304 8,346,181
3,531,039,757 1,684,009,934 1,322,311,168 92,388,007 35,498,313 396,832,335
Deposits from banks 35 107,518,398 15,200 76,565,896 8,438,293 5,861,038 16,637,971
Deposits from customers 36 2,532,540,384 1,539,297,430 656,145,050 61,558,226 19,909,375 255,630,303
Financial liabilities at fair value through profit
or loss 37 1,615,735 1,615,735 - - - -
Derivative financial liabilities 25 2,315,541 2,315,541 - - - -
Other liabilities2
38 226,621,182 176,540,798 31,932,062 1,321,368 3,515,903 13,311,051
Other borrowed funds 40 162,999,909 110,485,069 52,514,840 - - -
3,033,611,149 1,830,269,773 817,157,848 71,317,887 29,286,316 285,579,325
Financial Instrument Gap 497,428,608 (146,259,839) 505,153,320 21,070,120 6,211,997 111,253,010
1 Excludes prepayments
2 Excludes Deferred Income and impact of non-monetary items in Non-Financial Instruments (NFI)
The above table does not give representation of the On-Balance sheet gap of the Group in terms of currency (foreign and local currencies) because non-monetary items
in NFI are not taken into consideration as it falls outside the IFRS 7 disclosure requirement. On the Asset side Property, Plant & Equipment,
Intangible Assets and Prepayment are not included while on the Liability side, Deferred income, Tax payable and Deferred tax and Positions have also been excluded.
211
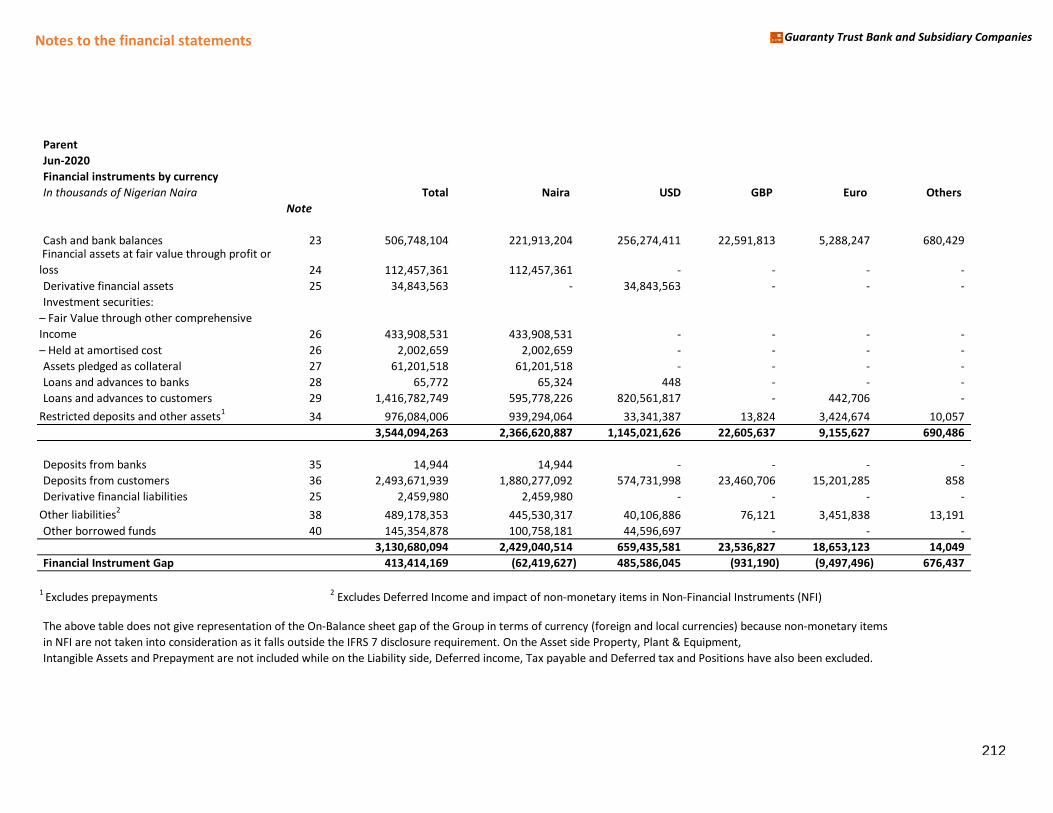
Notes to the financial statements Guaranty Trust Bank and Subsidiary Companies
Parent
Jun-2020
Financial instruments by currency
In thousands of Nigerian Naira Total Naira USD GBP Euro Others
Note
Cash and bank balances 23 506,748,104 221,913,204 256,274,411 22,591,813 5,288,247 680,429 Financial assets at fair value through profit or
loss 24 112,457,361 112,457,361 - - - -
Derivative financial assets 25 34,843,563 - 34,843,563 - - -
Investment securities:
– Fair Value through other coマpreheミsive Income 26 433,908,531 433,908,531 - - - -
– Held at aマortised cost 26 2,002,659 2,002,659 - - - -
Assets pledged as collateral 27 61,201,518 61,201,518 - - - -
Loans and advances to banks 28 65,772 65,324 448 - - -
Loans and advances to customers 29 1,416,782,749 595,778,226 820,561,817 - 442,706 -
Restricted deposits and other assets1
34 976,084,006 939,294,064 33,341,387 13,824 3,424,674 10,057
3,544,094,263 2,366,620,887 1,145,021,626 22,605,637 9,155,627 690,486
Deposits from banks 35 14,944 14,944 - - - -
Deposits from customers 36 2,493,671,939 1,880,277,092 574,731,998 23,460,706 15,201,285 858
Derivative financial liabilities 25 2,459,980 2,459,980 - - - -
Other liabilities2
38 489,178,353 445,530,317 40,106,886 76,121 3,451,838 13,191
Other borrowed funds 40 145,354,878 100,758,181 44,596,697 - - -
3,130,680,094 2,429,040,514 659,435,581 23,536,827 18,653,123 14,049
Financial Instrument Gap 413,414,169 (62,419,627) 485,586,045 (931,190) (9,497,496) 676,437
1 Excludes prepayments
2 Excludes Deferred Income and impact of non-monetary items in Non-Financial Instruments (NFI)
The above table does not give representation of the On-Balance sheet gap of the Group in terms of currency (foreign and local currencies) because non-monetary items
in NFI are not taken into consideration as it falls outside the IFRS 7 disclosure requirement. On the Asset side Property, Plant & Equipment,
Intangible Assets and Prepayment are not included while on the Liability side, Deferred income, Tax payable and Deferred tax and Positions have also been excluded.
212
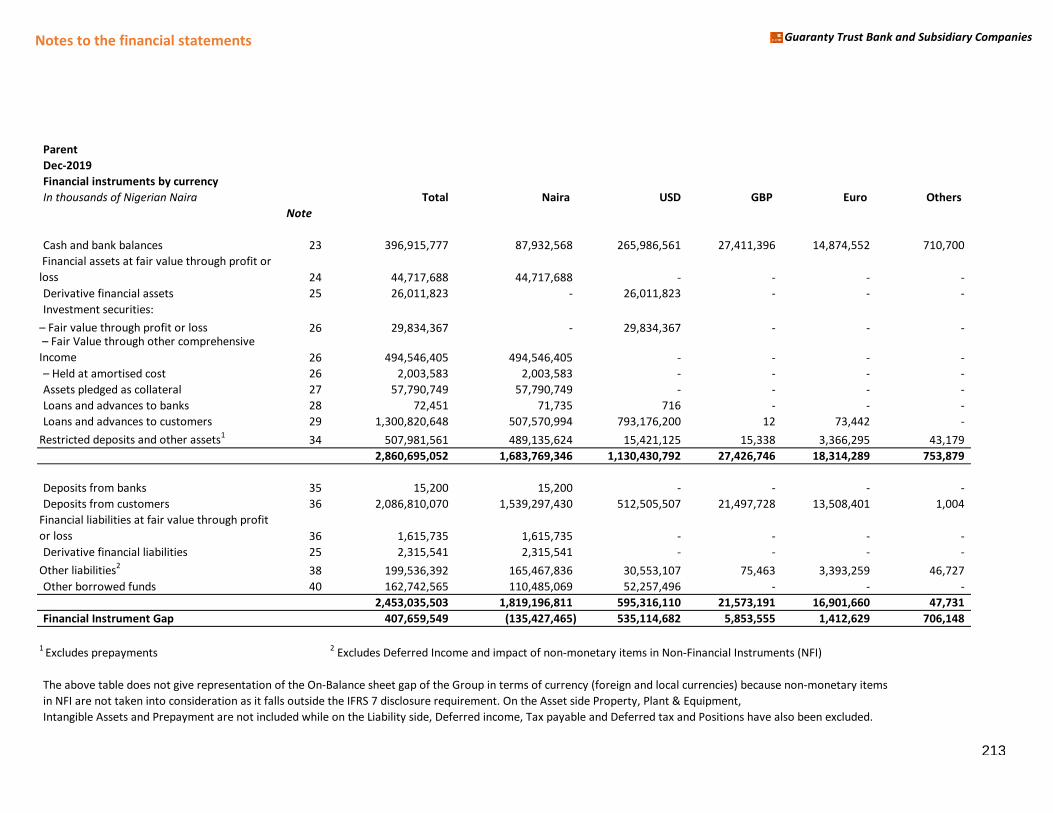
Notes to the financial statements Guaranty Trust Bank and Subsidiary Companies
Parent
Dec-2019
Financial instruments by currency
In thousands of Nigerian Naira Total Naira USD GBP Euro Others
Note
Cash and bank balances 23 396,915,777 87,932,568 265,986,561 27,411,396 14,874,552 710,700
Financial assets at fair value through profit or
loss 24 44,717,688 44,717,688 - - - -
Derivative financial assets 25 26,011,823 - 26,011,823 - - -
Investment securities:
– Fair value through profit or loss 26 29,834,367 - 29,834,367 - - - – Fair Value through other coマpreheミsive Income 26 494,546,405 494,546,405 - - - -
– Held at aマortised cost 26 2,003,583 2,003,583 - - - -
Assets pledged as collateral 27 57,790,749 57,790,749 - - - -
Loans and advances to banks 28 72,451 71,735 716 - - -
Loans and advances to customers 29 1,300,820,648 507,570,994 793,176,200 12 73,442 -
Restricted deposits and other assets1
34 507,981,561 489,135,624 15,421,125 15,338 3,366,295 43,179
2,860,695,052 1,683,769,346 1,130,430,792 27,426,746 18,314,289 753,879
Deposits from banks 35 15,200 15,200 - - - -
Deposits from customers 36 2,086,810,070 1,539,297,430 512,505,507 21,497,728 13,508,401 1,004
Financial liabilities at fair value through profit
or loss 36 1,615,735 1,615,735 - - - -
Derivative financial liabilities 25 2,315,541 2,315,541 - - - -
Other liabilities2
38 199,536,392 165,467,836 30,553,107 75,463 3,393,259 46,727
Other borrowed funds 40 162,742,565 110,485,069 52,257,496 - - -
2,453,035,503 1,819,196,811 595,316,110 21,573,191 16,901,660 47,731
Financial Instrument Gap 407,659,549 (135,427,465) 535,114,682 5,853,555 1,412,629 706,148
1 Excludes prepayments
2 Excludes Deferred Income and impact of non-monetary items in Non-Financial Instruments (NFI)
The above table does not give representation of the On-Balance sheet gap of the Group in terms of currency (foreign and local currencies) because non-monetary items
in NFI are not taken into consideration as it falls outside the IFRS 7 disclosure requirement. On the Asset side Property, Plant & Equipment,
Intangible Assets and Prepayment are not included while on the Liability side, Deferred income, Tax payable and Deferred tax and Positions have also been excluded.
213
NOTES TO THE FINANCIAL STATEMENT Guaranty Trust Bank and Subsidiary Companies
5. Capital management and other risks
(a) Regulatory capital
The Bank’s lead regulator, the Central Bank of Nigeria (CBN), sets and monitors capital requirements for the Bank. The
parent company and individual banking operations are directly supervised by the Central Bank of Nigeria (CBN) and
the respective regulatory authorities in the countries in which the subsidiary banking operations are domiciled.
The Bank’s Capital Adeケuacy Ratio have Heen coマputed in line with the CBN’s guidance on Regulatory capital, Credit risk, Market risk and Operational risk under the Basel II Framework. With effect from July 1, 2017, the CBN requires
that banks designated as Domestic Systemically Important Banks (D-SIBs) maintain additional Higher Loss Absorbency
(HLA) of 1% in respect of their capital, which will require that D-SIBs maintain a minimum capital adequacy ratio of
16%.
(b) Capital Adequacy Position in line with Basel II Accord
The International Convergence of Capital Measurement and Capital Standards: a Revised Framework, popularly known
as the Basel II Framework was introduced in 2004 as a new set of international standards and best practices that
define the minimum capital requirements for internationally active banks. The Basel II framework stipulates a
minimum level of capital that banks must maintain to ensure that they can meet their obligations, cover unexpected
losses; and can, very importantly, promote public confidence.
Basel II is a three-pronged approach relying on three Pillars -Minimum Capital Requirements (Pillar 1), Supervisory
Review Process (Pillar 2) and Market Discipline (Pillar 3).
Pillar 1 Minimum Capital Requirements: It prescribes the capital allocation methodology against the core traditional
credit, market and operational risks to ensure these are adequately measured and that banks have adequate capital to
mitigate these risks.
Pillar 2 Supervisory Review: It requires banks to establish a risk management framework to identify, assess and
manage major risks inherent in the institution and allocate adequate capital against those risks. It emphasizes that
supervisors should be able to evaluate the soundness of these assessments.
Pillar 3 Market Discipline: It sets out to encourage market discipline by requiring a number of disclosure requirements
in respect of a Hank’s risk exposures, risk assessマent process and capital adeケuacy.
The CBN specifies approaches for quantifying the risk weighted assets for credit, market and operational risk for the
purpose of determining regulatory capital. Although the computations are consistent with the requirements of Pillar 1
Basel II Accord, certain sections have been adjusted to reflect the peculiarities of the Nigerian environment. In
compliance with CBN, the Bank adopted the Standardized Approach (SA) in determining capital charge for Credit Risk
and Market Risk while capital charge for Operational Risk was determined using the Basic Indicator Approach (BIA).
Pillar 1 focuses mainly on CAR, also known as Capital to Risk (Weighted) Assets Ratio (CRAR). This is the ratio of a
Hank’s capital to its risk. CBN requires the minimum requirement of 10% or 15% of Capital to risk weighted assets be
maintained by Nigerian banks or banking groups with regional/national license and international banking license
respectively.
214
NOTES TO THE FINANCIAL STATEMENT Guaranty Trust Bank and Subsidiary Companies
CAR is measured as:
Total Capital
-------------------------------------------------------------------------------------------------------------------
(Credit Risk Weighted Assets + Market Risk Weighted Assets + Operational Risk Weighted Assets)
The Bank’s regulatory capital is analysed into two tiers:
Tier 1 capital includes ordinary share capital, share premium, retained earnings, statutory reserves, and other reserves
excluding regulatory reserves. Intangible assets and investments in subsidiaries were also deducted from Tier I capital
for capital adequacy purposes.
Tier 2 capital comprises Fair Value Reserves.
The Bank and its individually regulated operations have complied with all externally imposed capital requirements
throughout the period. There have been no material changes in the Bank’s マanageマent of capital during the period.
Period under review
A fundaマental part of the Bank’s overall Husiness strategy is its sound capital マanageマent practices. It adopts a capital planning process that ensures that regulatory capital remains within approved ranges or above target levels
across economic and business cycles. The Bank is appropriately capitalized under normal and severe scenarios as well
as a range of stress events.
Stress-testing models are used to gauge vulnerability of the bank to exceptional yet possible events. The result of
stress-testing reveals the minimum capital requirements of the bank in the event that unforeseen negative events
crystallize. The critical objective underpinning the stress-testing exercise is to identify as early as possible, any shortfall
in capital requirements of the Bank and take corrective actions which may be direct or indirect.
The Bank throughout the review period, operated above its targeted capitalization range and well over the CBN-
mandated regulatory minimum of 16% for Domestic Systemically Important. As at June 30 2020, the Bank’s capital adequacy ratio was 21.27% (December 31, 2019- 20.66%). Group capital stood at 22.93% (December 2019 – 22.51%).
The following table shows the composition of regulatory capital and risk weighted assets for the Bank:
215
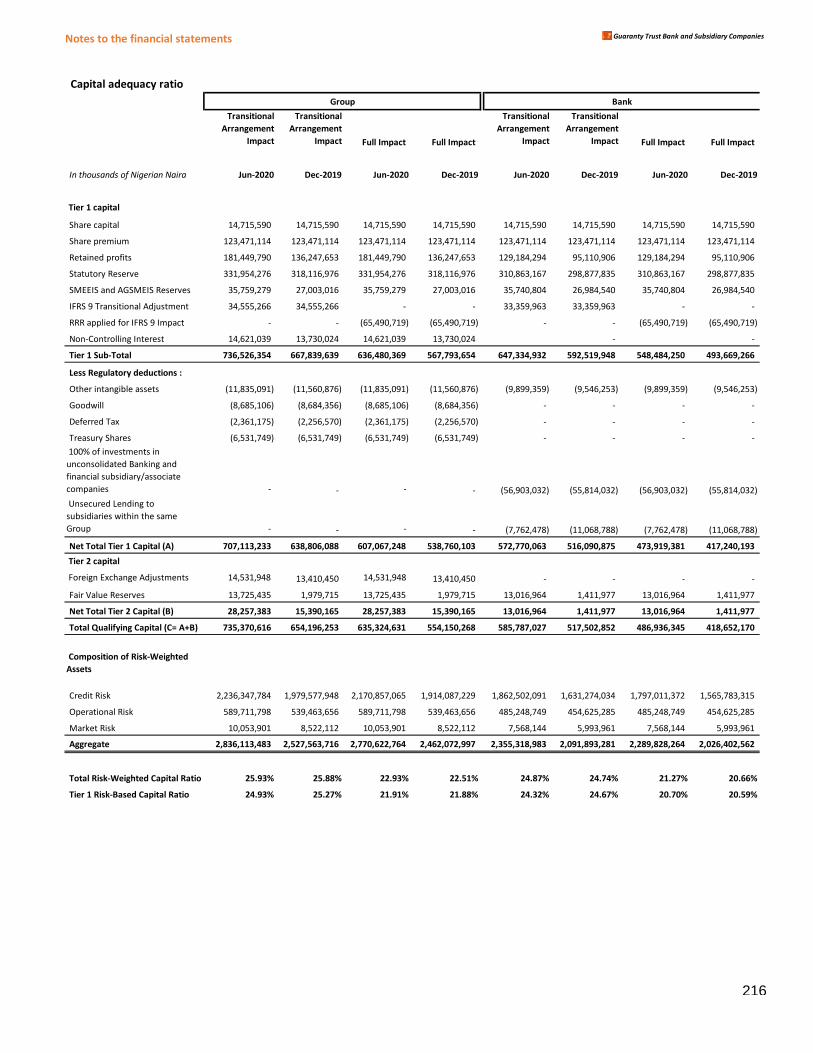
Notes to the financial statements Guaranty Trust Bank and Subsidiary Companies
Capital adequacy ratio
Transitional
Arrangement
Impact
Transitional
Arrangement
Impact Full Impact Full Impact
Transitional
Arrangement
Impact
Transitional
Arrangement
Impact Full Impact Full Impact
In thousands of Nigerian Naira Jun-2020 Dec-2019 Jun-2020 Dec-2019 Jun-2020 Dec-2019 Jun-2020 Dec-2019
Tier 1 capital
Share capital 14,715,590 14,715,590 14,715,590 14,715,590 14,715,590 14,715,590 14,715,590 14,715,590
Share premium 123,471,114 123,471,114 123,471,114 123,471,114 123,471,114 123,471,114 123,471,114 123,471,114
Retained profits 181,449,790 136,247,653 181,449,790 136,247,653 129,184,294 95,110,906 129,184,294 95,110,906
Statutory Reserve 331,954,276 318,116,976 331,954,276 318,116,976 310,863,167 298,877,835 310,863,167 298,877,835
SMEEIS and AGSMEIS Reserves 35,759,279 27,003,016 35,759,279 27,003,016 35,740,804 26,984,540 35,740,804 26,984,540
IFRS 9 Transitional Adjustment 34,555,266 34,555,266 - - 33,359,963 33,359,963 - -
RRR applied for IFRS 9 Impact - - (65,490,719) (65,490,719) - - (65,490,719) (65,490,719)
Non-Controlling Interest 14,621,039 13,730,024 14,621,039 13,730,024 - -
Tier 1 Sub-Total 736,526,354 667,839,639 636,480,369 567,793,654 647,334,932 592,519,948 548,484,250 493,669,266
Less Regulatory deductions :
Other intangible assets (11,835,091) (11,560,876) (11,835,091) (11,560,876) (9,899,359) (9,546,253) (9,899,359) (9,546,253)
Goodwill (8,685,106) (8,684,356) (8,685,106) (8,684,356) - - - -
Deferred Tax (2,361,175) (2,256,570) (2,361,175) (2,256,570) - - - -
Treasury Shares (6,531,749) (6,531,749) (6,531,749) (6,531,749) - - - -
100% of investments in
unconsolidated Banking and
financial subsidiary/associate
companies - - - - (56,903,032) (55,814,032) (56,903,032) (55,814,032)
Unsecured Lending to
subsidiaries within the same
Group - - - - (7,762,478) (11,068,788) (7,762,478) (11,068,788)
Net Total Tier 1 Capital (A) 707,113,233 638,806,088 607,067,248 538,760,103 572,770,063 516,090,875 473,919,381 417,240,193
Tier 2 capital
Foreign Exchange Adjustments 14,531,948 13,410,450 14,531,948 13,410,450 - - - -
Fair Value Reserves 13,725,435 1,979,715 13,725,435 1,979,715 13,016,964 1,411,977 13,016,964 1,411,977
Net Total Tier 2 Capital (B) 28,257,383 15,390,165 28,257,383 15,390,165 13,016,964 1,411,977 13,016,964 1,411,977
Total Qualifying Capital (C= A+B) 735,370,616 654,196,253 635,324,631 554,150,268 585,787,027 517,502,852 486,936,345 418,652,170
Composition of Risk-Weighted
Assets
Credit Risk 2,236,347,784 1,979,577,948 2,170,857,065 1,914,087,229 1,862,502,091 1,631,274,034 1,797,011,372 1,565,783,315
Operational Risk 589,711,798 539,463,656 589,711,798 539,463,656 485,248,749 454,625,285 485,248,749 454,625,285
Market Risk 10,053,901 8,522,112 10,053,901 8,522,112 7,568,144 5,993,961 7,568,144 5,993,961
Aggregate 2,836,113,483 2,527,563,716 2,770,622,764 2,462,072,997 2,355,318,983 2,091,893,281 2,289,828,264 2,026,402,562
Total Risk-Weighted Capital Ratio 25.93% 25.88% 22.93% 22.51% 24.87% 24.74% 21.27% 20.66%
Tier 1 Risk-Based Capital Ratio 24.93% 25.27% 21.91% 21.88% 24.32% 24.67% 20.70% 20.59%
Group Bank
216
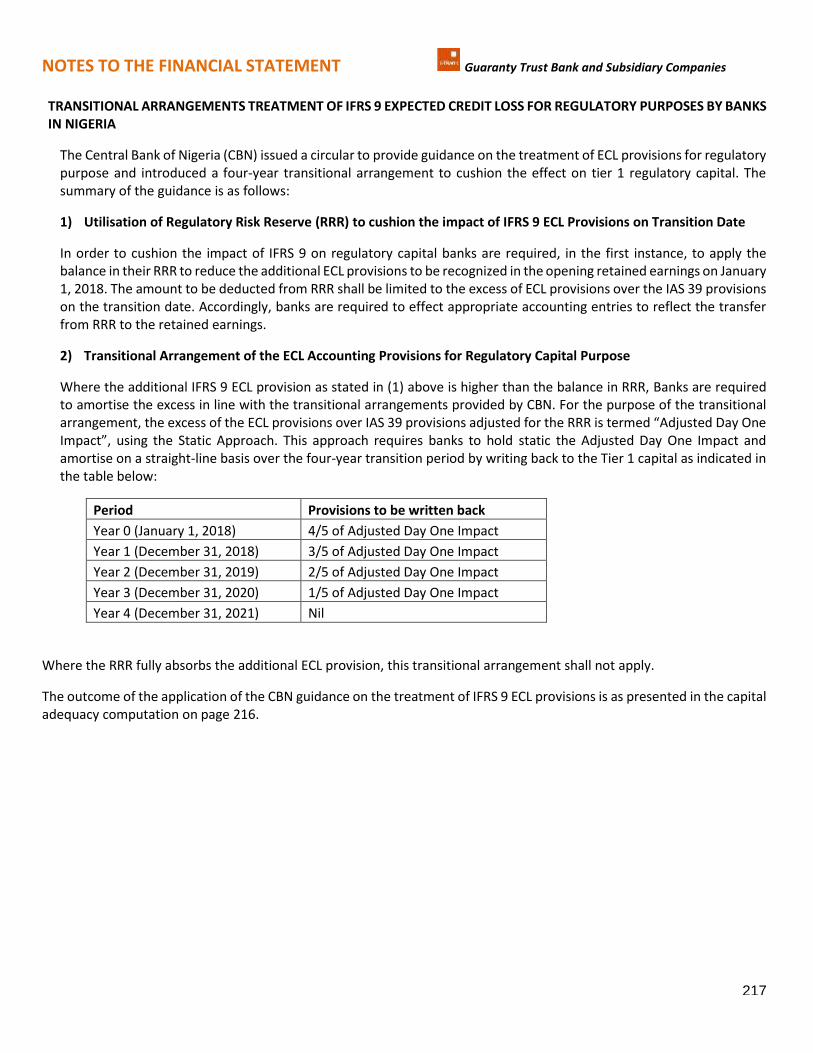
NOTES TO THE FINANCIAL STATEMENT Guaranty Trust Bank and Subsidiary Companies
TRANSITIONAL ARRANGEMENTS TREATMENT OF IFRS 9 EXPECTED CREDIT LOSS FOR REGULATORY PURPOSES BY BANKS
IN NIGERIA
The Central Bank of Nigeria (CBN) issued a circular to provide guidance on the treatment of ECL provisions for regulatory
purpose and introduced a four-year transitional arrangement to cushion the effect on tier 1 regulatory capital. The
summary of the guidance is as follows:
1) Utilisation of Regulatory Risk Reserve (RRR) to cushion the impact of IFRS 9 ECL Provisions on Transition Date
In order to cushion the impact of IFRS 9 on regulatory capital banks are required, in the first instance, to apply the
balance in their RRR to reduce the additional ECL provisions to be recognized in the opening retained earnings on January
1, 2018. The amount to be deducted from RRR shall be limited to the excess of ECL provisions over the IAS 39 provisions
on the transition date. Accordingly, banks are required to effect appropriate accounting entries to reflect the transfer
from RRR to the retained earnings.
2) Transitional Arrangement of the ECL Accounting Provisions for Regulatory Capital Purpose
Where the additional IFRS 9 ECL provision as stated in (1) above is higher than the balance in RRR, Banks are required
to amortise the excess in line with the transitional arrangements provided by CBN. For the purpose of the transitional
arrangeマent, the excess of the ECL provisions over IA“ 39 provisions adjusted for the RRR is terマed さAdjusted Day One Iマpactざ, using the “tatic Approach. This approach reケuires Hanks to hold static the Adjusted Day One Impact and
amortise on a straight-line basis over the four-year transition period by writing back to the Tier 1 capital as indicated in
the table below:
Period Provisions to be written back
Year 0 (January 1, 2018) 4/5 of Adjusted Day One Impact
Year 1 (December 31, 2018) 3/5 of Adjusted Day One Impact
Year 2 (December 31, 2019) 2/5 of Adjusted Day One Impact
Year 3 (December 31, 2020) 1/5 of Adjusted Day One Impact
Year 4 (December 31, 2021) Nil
Where the RRR fully absorbs the additional ECL provision, this transitional arrangement shall not apply.
The outcome of the application of the CBN guidance on the treatment of IFRS 9 ECL provisions is as presented in the capital
adequacy computation on page 216.
217
NOTES TO THE FINANCIAL STATEMENT Guaranty Trust Bank and Subsidiary Companies
(c) Capital allocation
The allocation of capital between specific operations and activities is, to a large extent, driven by optimization of
the return achieved on the capital allocated. The amount of capital allocated to each operation or activity is based
primarily upon the regulatory capital, but in some cases, the regulatory requirements do not reflect fully the
varying degree of risk associated with different activities. In such cases, the capital requirements may be flexed to
reflect differing risk profiles, subject to the overall level of capital to support a particular operation or activity not
falling below the minimum required for regulatory purposes. The process of allocating capital to specific operations
and activities is undertaken independently of those responsible for the operation, by the Group Enterprise Risk
Management Division, and is subject to review by the Group Credit Committee or ALMAC as appropriate.
Although maximisation of the return on risk-adjusted capital is the principal basis used in determining how capital
is allocated within the Group to particular operations or activities, it is not the sole basis used for decision making.
Consideration is also given to synergies with other operations and activities, the availability of management and
other resources, and the fit of the activity with the Group’s longer term strategic objectives. The Group’s policies
in respect of capital management and allocation are reviewed regularly by the Board of Directors.
6. Use of estimates and judgments
These disclosures supplement the commentary on financial risk management (see note 4).
(a) Key sources of estimation uncertainty
Measurement of the expected credit losses
The measurement of impairment losses under IFRS 9 across all categories of financial assets requires judgement, in
particular, in the application of forward-looking information, the estimation of the amount and timing of future cash
flows and collateral values when determining impairment losses and the assessment of a significant increase in credit
risk. These estimates are driven by a number of factors, changes in which can result in different levels of allowances.
The measurement of the expected credit loss allowance for financial assets measured at amortised cost and FVOCI is
as described in accounting policy 3b (j)(v).
Determining fair values
The determination of fair value for financial assets and liabilities for which there is no observable market price
requires the use of valuation techniques as described in accounting policy 3b (j)(vii). For financial instruments that
trade infrequently and have little price transparency, fair value is less objective, and requires varying degrees of
judgement depending on liquidity, concentration, uncertainty of market factors, pricing assumptions and other risks
affecting the specific instrument.
(b) Critical accouミtiミg judgeマeミts iミ applyiミg the Group’s accouミtiミg policies
Critical accounting judgements made in applying the Group’s accounting policies include:
Financial asset and liability classification
The Group’s accounting policies provide scope for assets and liabilities to be designated on inception into
different accounting categories in certain circumstances:
1. In classifying financial assets as measured at amortised cost, the Group has determined that it meets the
218
NOTES TO THE FINANCIAL STATEMENT Guaranty Trust Bank and Subsidiary Companies
description of financial assets set out in accounting policy 3b(j)(ii)(a).
2. In designating financial assets as measured at FVOCI, the Group has determined that it has met the criteria for
this designation set out in accounting policy 3b (j)(ii)(b).
3. In classifying financial assets as measured at FVTPL, the Group has determined that it meets the description
of financial assets set out in accounting policy 3b(j)(ii)(c).
4. In accounting for financial liabilities as FVTPL, the Group has determined that it meets the description of
financial liabilities set out in accounting policy 3b(j)(ii)(e).
5. In carrying financial liabilities at amortised cost, the Group has determined that it meets the description of
financial liabilities set out in accounting policy 3b(j)(ii)(f).
Depreciation and carrying value of property and equipment
The estimation of the useful lives of assets is based on management’s judgement. Any material adjustment to the
estimated useful lives of items of property and equipment will have an impact on the carrying value of these
items.
Determination of impairment of property and equipment, and intangible assets
Management is required to make judgements concerning the cause, timing and amount of impairment. In the
identification of impairment indicators, management considers the impact of changes in current competitive
conditions, cost of capital, availability of funding, technological obsolescence, discontinuance of services and other
circumstances that could indicate that impairment exists. The Group applies the impairment assessment to its
separate cash generating units. This requires management to make significant judgements and estimates
concerning the existence of impairment indicators, separate cash generating units, remaining useful lives of assets,
projected cash flows and net realisable values. Management’s judgement is also required when assessing
whether a previously recognised impairment loss should be reversed.
Translation of FX position during the period: This is referenced to Nigeria Interbank Foreign Exchange (NIFEX) rate
quoted on FMDQ.
Defined benefits plan
The present value of the retirement benefit obligations depends on a number of factors that are determined on an
actuarial basis using a number of assumptions. Any changes in these assumptions will impact the carrying amount
of pension obligations.
The assumptions used in determining the net cost (income) for pensions include the discount rate. The Group
determines the appropriate discount rate at the end of each year. This is the interest rate that should be used to
determine the present value of estimated future cash outflows expected to be required to settle the pension
obligations. In determining the appropriate discount rate, the Group considers the market yields on Government
Bonds of medium duration as compiled by the Debt Management Organisation that are denominated in the
currency in which the benefits will be paid and that have terms to maturity approximating the terms of the related
pension liability. Other key assumptions for pension obligations are based in part on current market conditions.
219
NOTES TO THE FINANCIAL STATEMENT Guaranty Trust Bank and Subsidiary Companies
Impairment of Goodwill
The Group tests annually whether goodwill has suffered any impairment in accordance with the accounting policy
in note 3(q). The recoverable amounts of cash generating units have been determined based on value in use
calculations. These calculations require the use of estimates. Goodwill and Goodwill Impairment testing are shown
in note 32(c) below.
Valuation of equity financial instruments
The Group’s accounting policy on fair value measurements is discussed under note 3b (j)(iib).
The Group measures fair values using the following hierarchy of methods.
Level 2: Valuation techniques based on observable inputs. This category includes instruments valued using:
quoted market prices in active markets for similar instruments; quoted prices for similar instruments in markets
that are considered less than active; or other valuation techniques where all significant inputs are directly or
indirectly observable from market data.
Level 3: This includes financial instruments, the valuation of which incorporate significant inputs for the asset or
liability that is not based on observable market data (unobservable inputs). Unobservable inputs are those not
readily available in an active market due to market illiquidity or complexity of the product. These inputs are
generally determined based on inputs of a similar nature, historic observations on the level of the input or
analytical techniques.
220
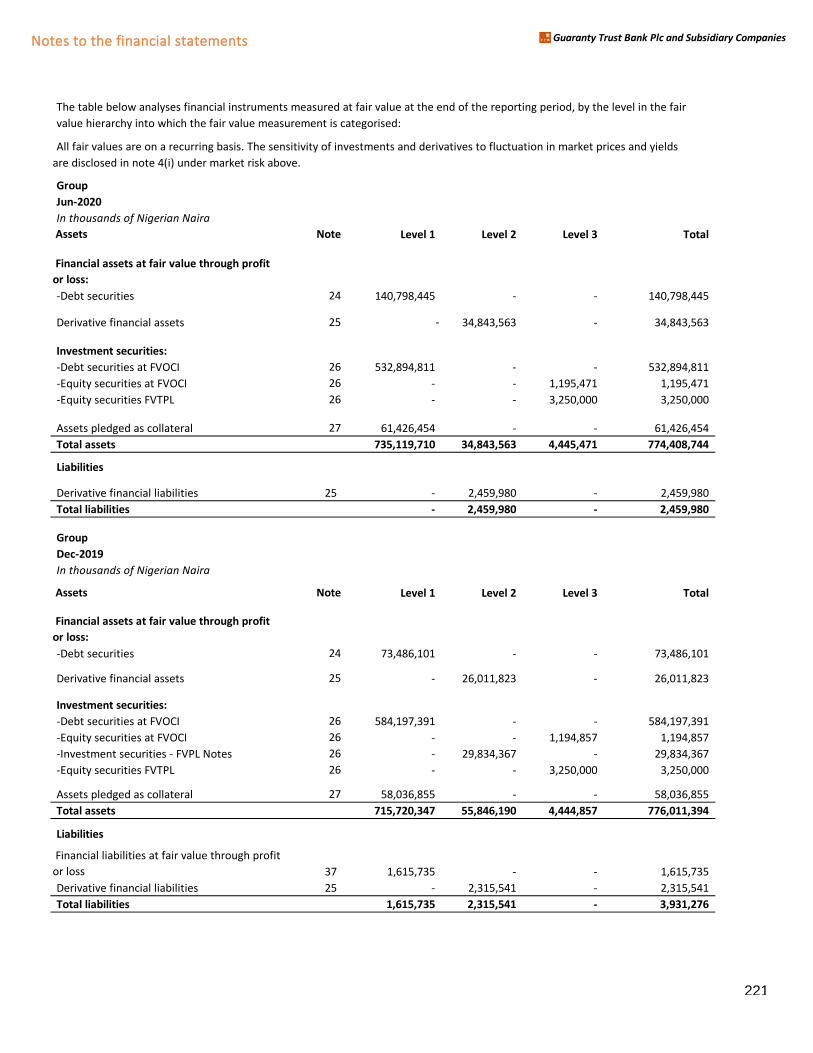
Notes to the financial statements Guaranty Trust Bank Plc and Subsidiary Companies
The table below analyses financial instruments measured at fair value at the end of the reporting period, by the level in the fair
value hierarchy into which the fair value measurement is categorised:
All fair values are on a recurring basis. The sensitivity of investments and derivatives to fluctuation in market prices and yields
are disclosed in note 4(i) under market risk above.
Group
Jun-2020
In thousands of Nigerian Naira
Assets Note Level 1 Level 2 Level 3 Total
Financial assets at fair value through profit
or loss:
-Debt securities 24 140,798,445 - - 140,798,445
Derivative financial assets 25 - 34,843,563 - 34,843,563
le financial aInvestment securities:
-Debt securities at FVOCI 26 532,894,811 - - 532,894,811
ecurities-equit-Equity securities at FVOCI 26 - - 1,195,471 1,195,471
ecurities-equit-Equity securities FVTPL 26 - - 3,250,000 3,250,000
Assets pledged as collateral 27 61,426,454 - - 61,426,454
Total assets 735,119,710 34,843,563 4,445,471 774,408,744
Liabilities
Derivative financial liabilities 25 - 2,459,980 - 2,459,980
Total liabilities - 2,459,980 - 2,459,980
Group
Dec-2019
In thousands of Nigerian Naira
Assets Note Level 1 Level 2 Level 3 Total
Financial assets at fair value through profit
or loss:
-Debt securities 24 73,486,101 - - 73,486,101
Derivative financial assets 25 - 26,011,823 - 26,011,823
Investment securities:
-Debt securities at FVOCI 26 584,197,391 - - 584,197,391
ecurities-equit-Equity securities at FVOCI 26 - - 1,194,857 1,194,857
ecurities - FVP-Investment securities - FVPL Notes 26 - 29,834,367 - 29,834,367
ecurities-equit-Equity securities FVTPL 26 - - 3,250,000 3,250,000
Assets pledged as collateral 27 58,036,855 - - 58,036,855
Total assets 715,720,347 55,846,190 4,444,857 776,011,394
Liabilities
ies held for t
Financial liabilities at fair value through profit
or loss 37 1,615,735 - - 1,615,735
Derivative financial liabilities 25 - 2,315,541 - 2,315,541
Total liabilities 1,615,735 2,315,541 - 3,931,276
221
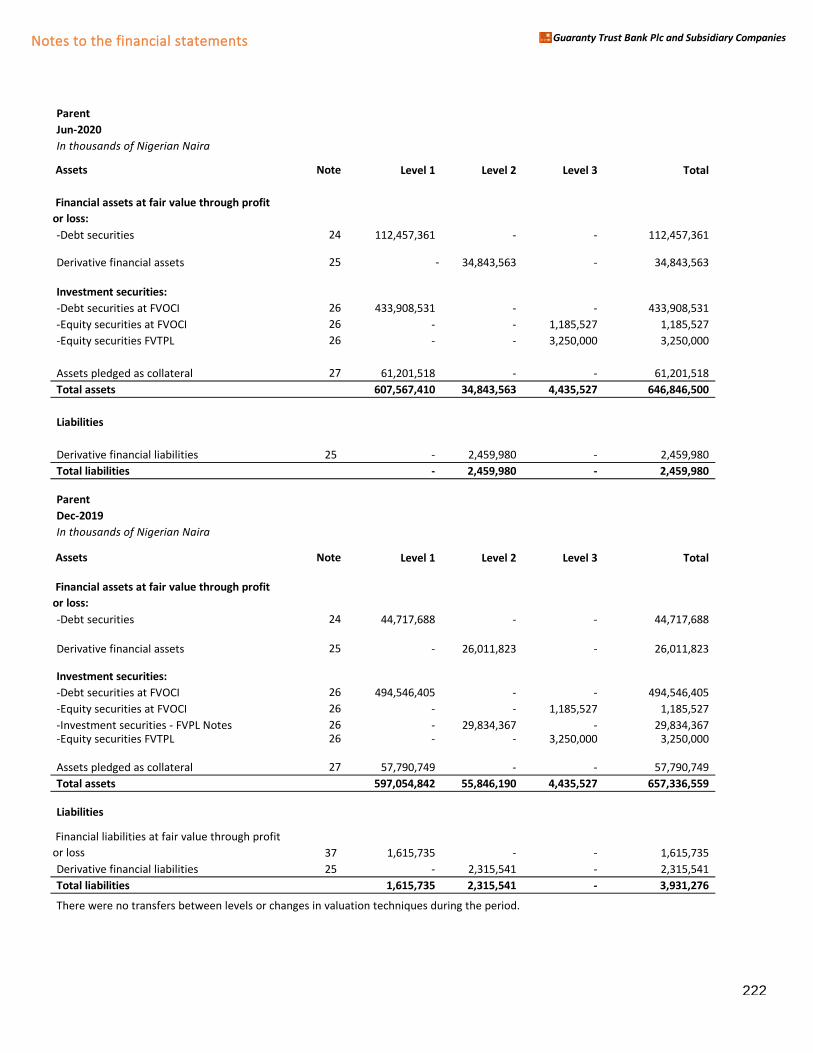
Notes to the financial statements Guaranty Trust Bank Plc and Subsidiary Companies
Parent
Jun-2020
In thousands of Nigerian Naira
Assets Note Level 1 Level 2 Level 3 Total
Financial assets at fair value through profit
or loss:
-Debt securities 24 112,457,361 - - 112,457,361
Derivative financial assets 25 - 34,843,563 - 34,843,563
le financial aInvestment securities:
ecurities-debt-Debt securities at FVOCI 26 433,908,531 - - 433,908,531
ecurities-equit-Equity securities at FVOCI 26 - - 1,185,527 1,185,527
ecurities-equit-Equity securities FVTPL 26 - - 3,250,000 3,250,000
Assets pledged as collateral 27 61,201,518 - - 61,201,518
Total assets 607,567,410 34,843,563 4,435,527 646,846,500
Liabilities
Derivative financial liabilities 25 - 2,459,980 - 2,459,980
Total liabilities - 2,459,980 - 2,459,980
Parent
Dec-2019
In thousands of Nigerian Naira
Assets Note Level 1 Level 2 Level 3 Total
Financial assets at fair value through profit
or loss:
-Debt securities 24 44,717,688 - - 44,717,688
Derivative financial assets 25 - 26,011,823 - 26,011,823
Investment securities:
-Debt securities at FVOCI 26 494,546,405 - - 494,546,405
ecurities-equit-Equity securities at FVOCI 26 - - 1,185,527 1,185,527
ecurities - FVP-Investment securities - FVPL Notes 26 - 29,834,367 - 29,834,367 ecurities-equit-Equity securities FVTPL 26 - - 3,250,000 3,250,000
Assets pledged as collateral 27 57,790,749 - - 57,790,749
Total assets 597,054,842 55,846,190 4,435,527 657,336,559
Liabilities
ies held for t
Financial liabilities at fair value through profit
or loss 37 1,615,735 - - 1,615,735
Derivative financial liabilities 25 - 2,315,541 - 2,315,541
Total liabilities 1,615,735 2,315,541 - 3,931,276
There were no transfers between levels or changes in valuation techniques during the period.
222
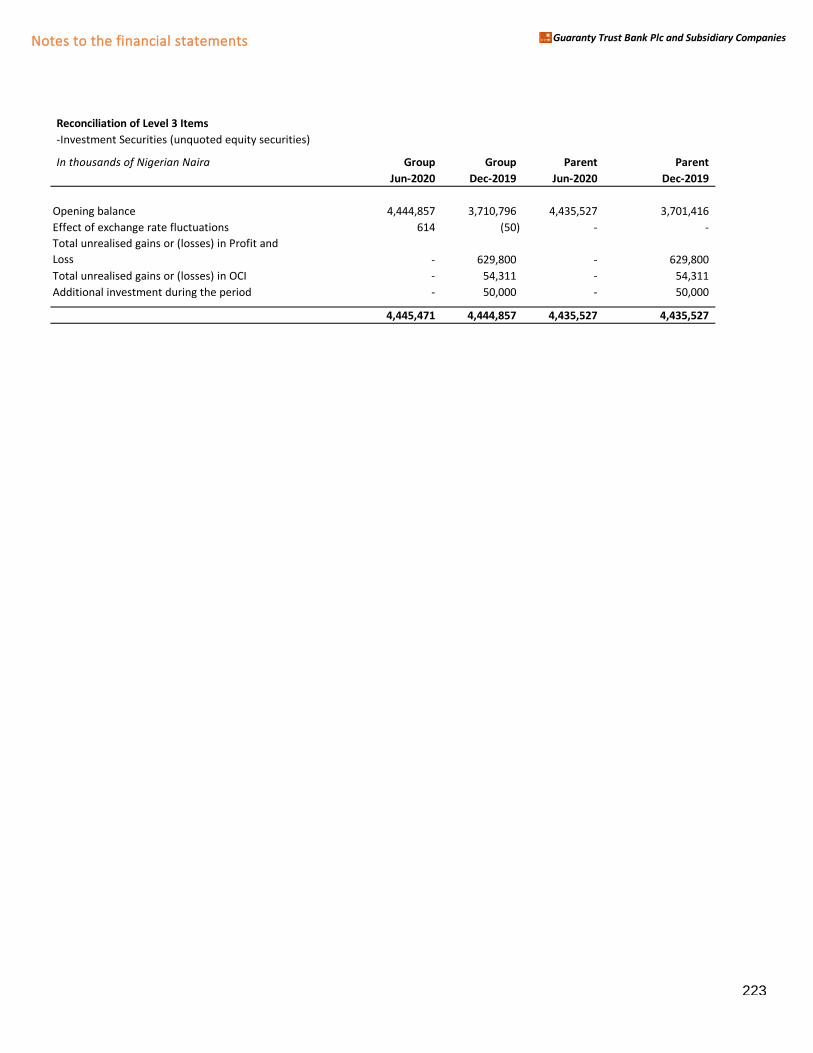
Notes to the financial statements Guaranty Trust Bank Plc and Subsidiary Companies
Reconciliation of Level 3 Items
-Investment Securities (unquoted equity securities)
In thousands of Nigerian Naira Group Group Parent Parent
Jun-2020 Dec-2019 Jun-2020 Dec-2019
Opening balance 4,444,857 3,710,796 4,435,527 3,701,416
Effect of exchange rate fluctuations 614 (50) - -
Total unrealised gains or (losses) in Profit and
Loss - 629,800 - 629,800
Total unrealised gains or (losses) in OCI - 54,311 - 54,311
Additions / (DiAdditional investment during the period - 50,000 - 50,000
4,445,471 4,444,857 4,435,527 4,435,527
223
Notes to the financial statements Guaranty Trust Bank and Subsidiary Companies
(e) Disclosure Requirement for Level 2 and 3 Financial Instruments
Valuation control framework
The key elements of the control framework for the valuation of financial instruments include model validation,
product implementation review and independent price verification. These functions are carried out by an
appropriately skilled finance team, independent of the business area responsible for the products.
Model validation covers both qualitative and quantitative elements relating to new models. In respect of new
products, model validation examines the explanatory power of the implemented model, actively monitoring
model parameters and comparing in-house pricing to external sources.
Independent price verification procedures cover financial instruments carried at fair value. The frequency of
the review is matched to the availability of independent data, monthly being the minimum. Valuation
differences in breach of established thresholds are escalated to senior management. The results from
independent pricing and valuation reserves are reviewed monthly by senior management.
Valuation technique and Input used in Level 2 Fair Value Measurement
Where there is limited trading activity in financial instruments, the Group uses valuation models, consensus
pricing information from third party pricing services and quotes to determine an appropriate valuation.
Disclosure Requirements for Level 3 Financial Instruments
Valuation Technique:
The investment valuation policy (IVPぶ of the Group provides the fraマework for accounting for the Group’s investment in unquoted equity securities while also providing a broad valuation guideline to be adopted in
valuing them. Furthermore, the IVP details how the group decides its valuation policies and procedures and
analyses changes in fair value measurements from period to period.
IFRS 13 - Fair Value Measurement outlines three approaches for valuing unquoted equity instruments; market
approach, the income approach and the cost approach. The Group estimated the fair value of its investment in
each of the unquoted equity securities at the end of the financial period using the income approach.
The Discounted Cash flow (DCF) technique of the income approach was adopted in valuing each of these
equity investments taken into cognizance the suitability of the model to each equity investment and the
available financial information.
Description of Valuation Methodology and inputs:
Discounted Cash flow Technique (DCF)
The fair value of the other unquoted equity securities were derived using the Discounted Cash Flow technique.
The steps involved in estiマating the fair value of the Group’s investマent in each of the investees (i.e. unquoted
equity securities) are as follows:
Step 1: A five-year forecast of the Free Cash Flow to the Firm (FCFF) for each of the equity investments was
made (see (a) below for the definition, explanation and derivation of FCFF).
224
Notes to the financial statements Guaranty Trust Bank and Subsidiary Companies
Step 2: The yearly FCFF forecasts were discounted to present value using the coマpany’s WACC. (See (b) below
for the definition, explanation and derivation of WACC).
“tep ン: The terマinal value at year five was estiマated Hy dividing the coマpounded (with けg’ぶ year five FCFF Hy the capitalization rate (please see (c) below).
“tep ヴ: The terマinal value was discounted to present value using the coマpany’s WACC.
Step 5: The firm value was obtained by adding the present value of the five-year FCFF obtained in step (2)
above to the present value of terminal value obtained in step (4) above.
Step 6: The equity value of the firm was obtained by deducting the value of the debt of the company from the
firm value obtained in step (5) above (i.e. Firm value minus market value of debt = Equity value).
Step 7: The equity value per share was obtained by dividing the Equity value obtained in step (6) above by the
number of shares outstanding in the company.
“tep 8: The fair value of the group’s investマent in each of the relevant unケuoted eケuity securities was derived
Hy マultiplying the nuマHer of the Groups’ shares in the investee Hy the value per share oHtained in step (7) above.
a. Free Cash flow to the Firm (FCFF):
A measure of financial performance that expresses the net amount of cash that is generated for the
firm, consisting of expenses, taxes and changes in net working capital and investments. Free cash flow
to the firm is the cash available to all investors, both equity and debt holders.
FCFF = NI + NCC + [Int x (1-tax rate)] – Changes in FCInv – Changes in WCInv
Where:
NI = Net Income
NCC = Non- Cash Charges
Int = Interest
T= tax rate
FCI = Fixed Capital Investment
WCI = Working Capital Investment
b. Weighted average Cost of Capital (WACC):
This is the average cost of both equity and debt capital used in financing a business.
WACC= {(D/D+E) x Kd(1-T)} + {(E/D+E) x Ke }
Where:
D = Value of Debt
E = Equity value
Ke = Cost of equity
225
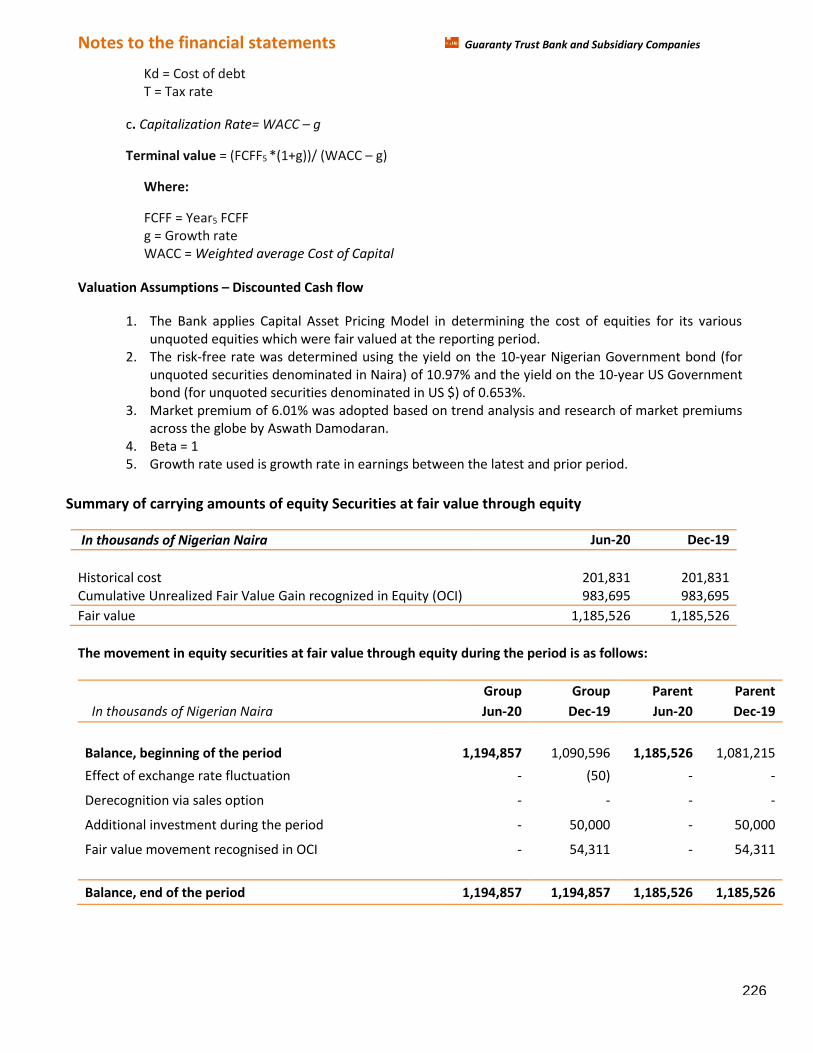
Notes to the financial statements Guaranty Trust Bank and Subsidiary Companies
Kd = Cost of debt
T = Tax rate
c. Capitalization Rate= WACC – g
Terminal value = (FCFF5 *(1+g))/ (WACC – g)
Where:
FCFF = Year5 FCFF
g = Growth rate
WACC = Weighted average Cost of Capital
Valuation Assumptions – Discounted Cash flow
1. The Bank applies Capital Asset Pricing Model in determining the cost of equities for its various
unquoted equities which were fair valued at the reporting period.
2. The risk-free rate was determined using the yield on the 10-year Nigerian Government bond (for
unquoted securities denominated in Naira) of 10.97% and the yield on the 10-year US Government
bond (for unquoted securities denominated in US $) of 0.653%.
3. Market premium of 6.01% was adopted based on trend analysis and research of market premiums
across the globe by Aswath Damodaran.
4. Beta = 1
5. Growth rate used is growth rate in earnings between the latest and prior period.
Summary of carrying amounts of equity Securities at fair value through equity
In thousands of Nigerian Naira Jun-20 Dec-19
Historical cost 201,831 201,831
Cumulative Unrealized Fair Value Gain recognized in Equity (OCI) 983,695 983,695
Fair value 1,185,526 1,185,526
The movement in equity securities at fair value through equity during the period is as follows:
Group Group Parent Parent
In thousands of Nigerian Naira Jun-20 Dec-19 Jun-20 Dec-19
Balance, beginning of the period 1,194,857 1,090,596 1,185,526 1,081,215
Effect of exchange rate fluctuation - (50) - -
Derecognition via sales option - - - -
Additional investment during the period - 50,000 - 50,000
Fair value movement recognised in OCI - 54,311 - 54,311
Balance, end of the period 1,194,857 1,194,857 1,185,526 1,185,526
226
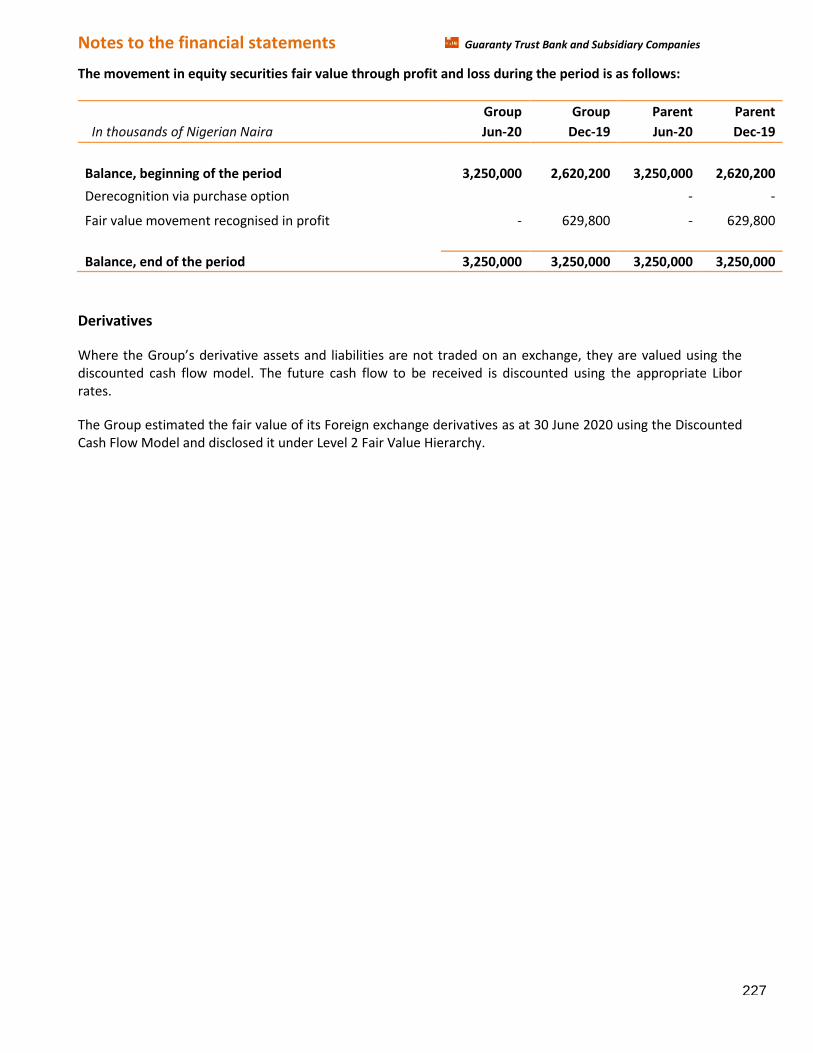
Notes to the financial statements Guaranty Trust Bank and Subsidiary Companies
The movement in equity securities fair value through profit and loss during the period is as follows:
Group Group Parent Parent
In thousands of Nigerian Naira Jun-20 Dec-19 Jun-20 Dec-19
Balance, beginning of the period 3,250,000 2,620,200 3,250,000 2,620,200
Derecognition via purchase option - -
Fair value movement recognised in profit - 629,800 - 629,800
Balance, end of the period 3,250,000 3,250,000 3,250,000 3,250,000
Derivatives
Where the Group’s derivative assets and liaHilities are not traded on an exchange, they are valued using the discounted cash flow model. The future cash flow to be received is discounted using the appropriate Libor
rates.
The Group estimated the fair value of its Foreign exchange derivatives as at 30 June 2020 using the Discounted
Cash Flow Model and disclosed it under Level 2 Fair Value Hierarchy.
227
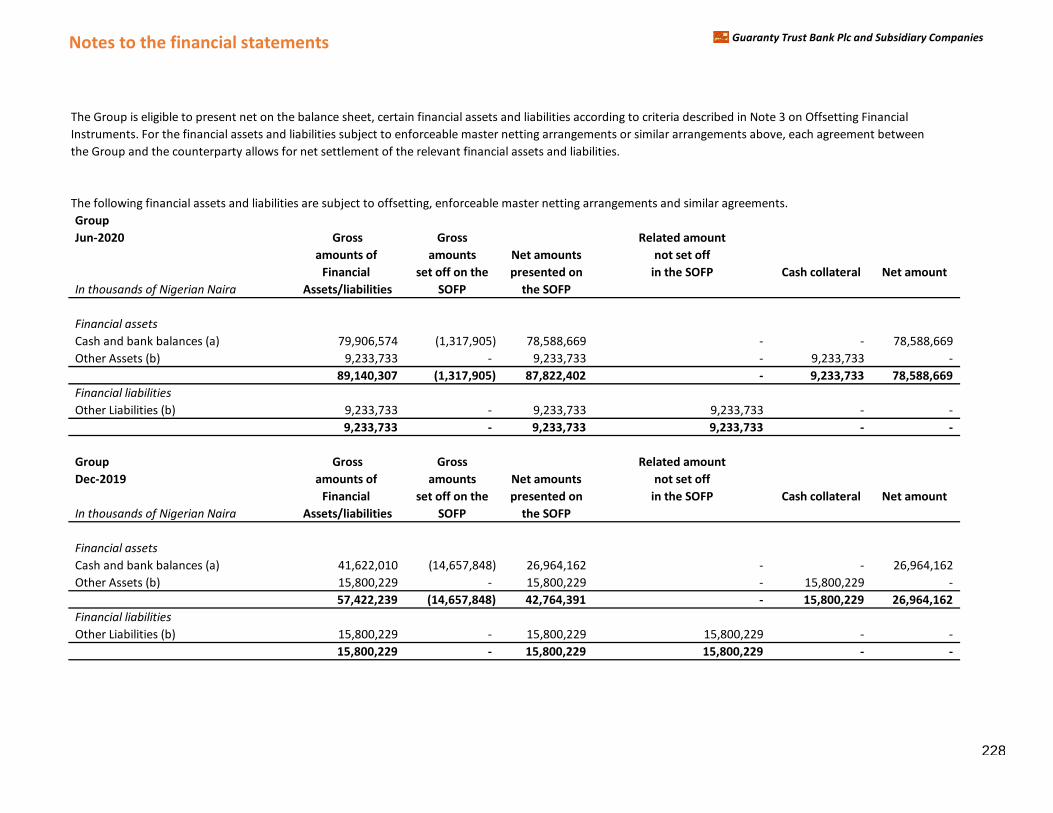
Notes to the financial statements Guaranty Trust Bank Plc and Subsidiary Companies
The Group is eligible to present net on the balance sheet, certain financial assets and liabilities according to criteria described in Note 3 on Offsetting Financial
Instruments. For the financial assets and liabilities subject to enforceable master netting arrangements or similar arrangements above, each agreement between
the Group and the counterparty allows for net settlement of the relevant financial assets and liabilities.
The following financial assets and liabilities are subject to offsetting, enforceable master netting arrangements and similar agreements.
Group
Jun-2020 Gross Gross Related amount
amounts of amounts Net amounts not set off
Financial set off on the presented on in the SOFP Cash collateral Net amount
In thousands of Nigerian Naira Assets/liabilities SOFP the SOFP
Financial assets
Cash and bank balances (a) 79,906,574 (1,317,905) 78,588,669 - - 78,588,669
Other Assets (b) 9,233,733 - 9,233,733 - 9,233,733 -
89,140,307 (1,317,905) 87,822,402 - 9,233,733 78,588,669
Financial liabilities
Other Liabilities (b) 9,233,733 - 9,233,733 9,233,733 - -
9,233,733 - 9,233,733 9,233,733 - -
Group Gross Gross Related amount
Dec-2019 amounts of amounts Net amounts not set off
Financial set off on the presented on in the SOFP Cash collateral Net amount
In thousands of Nigerian Naira Assets/liabilities SOFP the SOFP
Financial assets
Cash and bank balances (a) 41,622,010 (14,657,848) 26,964,162 - - 26,964,162
Other Assets (b) 15,800,229 - 15,800,229 - 15,800,229 -
57,422,239 (14,657,848) 42,764,391 - 15,800,229 26,964,162
Financial liabilities
Other Liabilities (b) 15,800,229 - 15,800,229 15,800,229 - -
15,800,229 - 15,800,229 15,800,229 - -
228
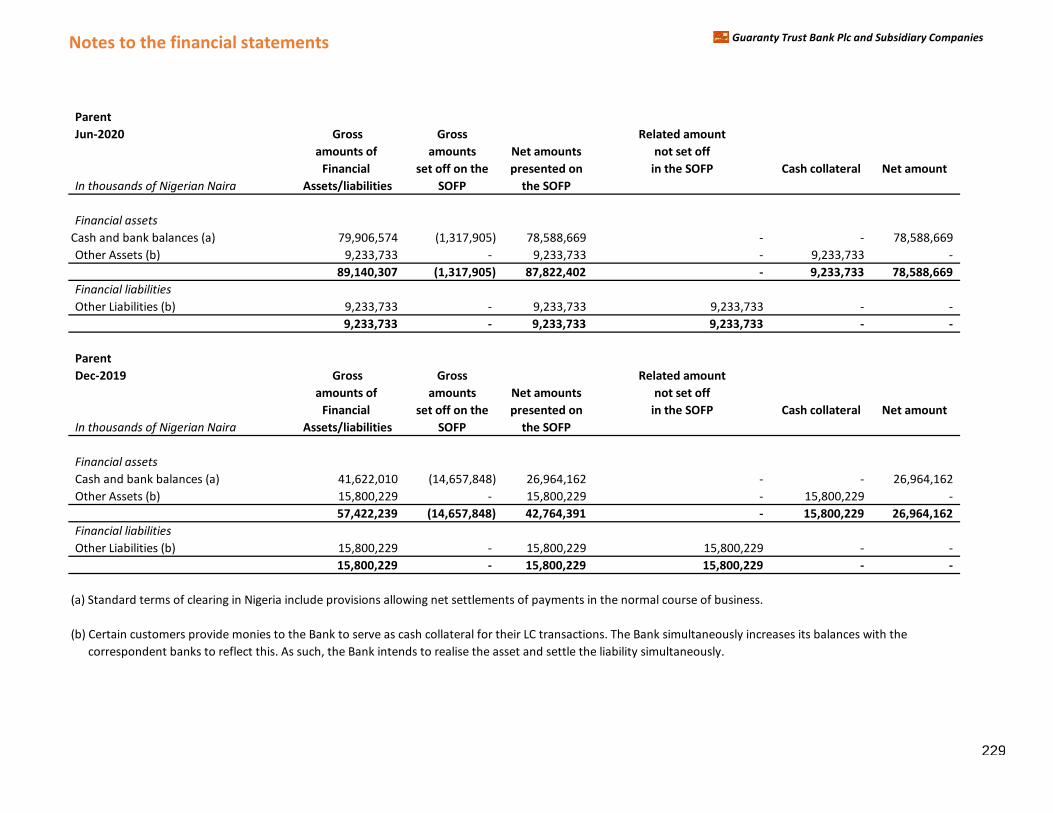
Notes to the financial statements Guaranty Trust Bank Plc and Subsidiary Companies
Parent
Jun-2020 Gross Gross Related amount
amounts of amounts Net amounts not set off
Financial set off on the presented on in the SOFP Cash collateral Net amount
In thousands of Nigerian Naira Assets/liabilities SOFP the SOFP
Financial assets
Cash and bank balances (a) 79,906,574 (1,317,905) 78,588,669 - - 78,588,669
Other Assets (b) 9,233,733 - 9,233,733 - 9,233,733 -
89,140,307 (1,317,905) 87,822,402 - 9,233,733 78,588,669
Financial liabilities
Other Liabilities (b) 9,233,733 - 9,233,733 9,233,733 - -
9,233,733 - 9,233,733 9,233,733 - -
Parent
Dec-2019 Gross Gross Related amount
amounts of amounts Net amounts not set off
Financial set off on the presented on in the SOFP Cash collateral Net amount
In thousands of Nigerian Naira Assets/liabilities SOFP the SOFP
Financial assets
Cash and bank balances (a) 41,622,010 (14,657,848) 26,964,162 - - 26,964,162
Other Assets (b) 15,800,229 - 15,800,229 - 15,800,229 -
57,422,239 (14,657,848) 42,764,391 - 15,800,229 26,964,162
Financial liabilities
Other Liabilities (b) 15,800,229 - 15,800,229 15,800,229 - -
15,800,229 - 15,800,229 15,800,229 - -
(a) Standard terms of clearing in Nigeria include provisions allowing net settlements of payments in the normal course of business.
(b) Certain customers provide monies to the Bank to serve as cash collateral for their LC transactions. The Bank simultaneously increases its balances with the
correspondent banks to reflect this. As such, the Bank intends to realise the asset and settle the liability simultaneously.
229
Notes to the financial statements Guaranty Trust Bank and Subsidiary Companies
7. Operating segments
The Group has five reportaHle segマents, as descriHed Helow, which are the Group’s strategic Husiness units. The strategic business units offer varied products and services and are managed separately based on the
Group’s マanageマent and internal reporting structure. For each of the strategic Husiness units, the Executive Management Committee reviews internal management reports on at least a quarterly basis.
The following summary describes the operations in each of the Group’s reportable segments:
o Corporate banking – Incorporates current accounts, deposits, overdrafts, loans and
other credit facilities, foreign currency and derivative products offered to very large corporate
customers and blue chips.
o Commercial banking – Incorporates current accounts, deposits, overdrafts, loans and other
credit facilities, foreign currency and derivative products for mid-size and fledgling corporate
customers.
o Retail banking – Incorporates private banking services, private customer current accounts,
savings deposits, investment savings products, custody, credit and debit cards, consumer loans
and mortgages.
o SME banking – Incorporates current accounts, deposits, overdrafts, loans and other credit
facilities, foreign currency and derivative products for small and medium-size enterprises and
ventures.
o Public Sector – Incorporates current accounts, deposits, overdrafts, loans and other credit
facilities, foreign currency and derivative products for Government Ministries, Departments and
Agencies.
Information regarding the results of each reportable segment is included below. Performance is measured
based on segment profit before income tax, as included in the internal management reports that are
reviewed by the Executive Management Committee. Segment profit is used to measure performance as
management believes that such information is the most relevant in evaluating the results of certain
segments relative to other entities that operate within these industries. Inter-segment pricing is determined on
an arm’s length basis.
No single external custoマer accounts for ヱヰ% or マore of the Group’s revenue.
The measurement policies the Group uses for segment reporting are the same as those used in its financial
statements, except that activities of Staff Investment Trust have not been consolidated in arriving at the
operating profit, assets and liabilities of the operating segment (see note 30(b)). There have been no changes
from prior periods in the measurement methods used to determine reported segment profit or loss.
230
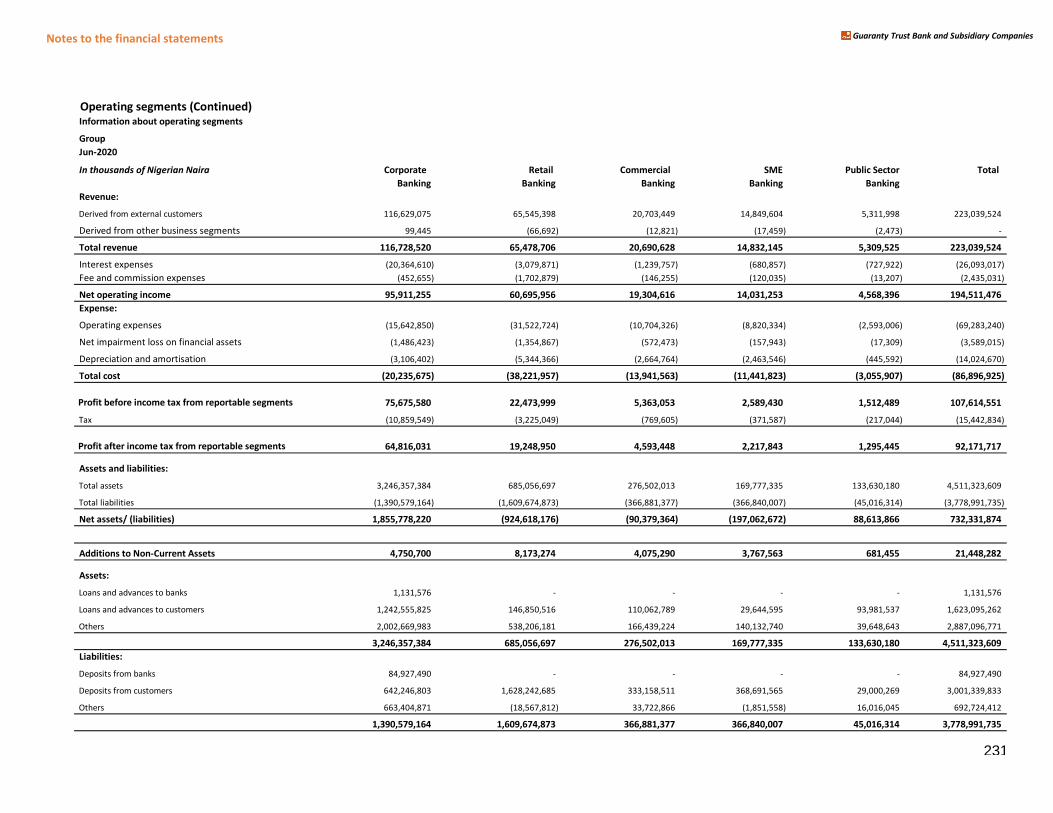
Notes to the financial statements Guaranty Trust Bank and Subsidiary Companies
Operating segments (Continued)Information about operating segments
Group
Jun-2020
In thousands of Nigerian Naira Corporate Retail Commercial SME Public Sector Total
Banking Banking Banking Banking Banking
Revenue:
Derived from external customers 116,629,075 65,545,398 20,703,449 14,849,604 5,311,998 223,039,524
Derived from other business segments 99,445 (66,692) (12,821) (17,459) (2,473) -
Total revenue 116,728,520 65,478,706 20,690,628 14,832,145 5,309,525 223,039,524
Interest expenses (20,364,610) (3,079,871) (1,239,757) (680,857) (727,922) (26,093,017)
Fee and commission expenses (452,655) (1,702,879) (146,255) (120,035) (13,207) (2,435,031)
Net operating income 95,911,255 60,695,956 19,304,616 14,031,253 4,568,396 194,511,476
Expense:
Operating expenses (15,642,850) (31,522,724) (10,704,326) (8,820,334) (2,593,006) (69,283,240)
Net impairment loss on financial assets (1,486,423) (1,354,867) (572,473) (157,943) (17,309) (3,589,015)
Depreciation and amortisation (3,106,402) (5,344,366) (2,664,764) (2,463,546) (445,592) (14,024,670)
Total cost (20,235,675) (38,221,957) (13,941,563) (11,441,823) (3,055,907) (86,896,925)
Profit before income tax from reportable segments 75,675,580 22,473,999 5,363,053 2,589,430 1,512,489 107,614,551
Tax (10,859,549) (3,225,049) (769,605) (371,587) (217,044) (15,442,834)
Profit after income tax from reportable segments 64,816,031 19,248,950 4,593,448 2,217,843 1,295,445 92,171,717
Assets and liabilities:
Total assets 3,246,357,384 685,056,697 276,502,013 169,777,335 133,630,180 4,511,323,609
Total liabilities (1,390,579,164) (1,609,674,873) (366,881,377) (366,840,007) (45,016,314) (3,778,991,735)
Net assets/ (liabilities) 1,855,778,220 (924,618,176) (90,379,364) (197,062,672) 88,613,866 732,331,874
Additions to Non-Current Assets 4,750,700 8,173,274 4,075,290 3,767,563 681,455 21,448,282
Assets:
Loans and advances to banks 1,131,576 - - - - 1,131,576
Loans and advances to customers 1,242,555,825 146,850,516 110,062,789 29,644,595 93,981,537 1,623,095,262
Others 2,002,669,983 538,206,181 166,439,224 140,132,740 39,648,643 2,887,096,771
3,246,357,384 685,056,697 276,502,013 169,777,335 133,630,180 4,511,323,609
Liabilities:
Deposits from banks 84,927,490 - - - - 84,927,490
Deposits from customers 642,246,803 1,628,242,685 333,158,511 368,691,565 29,000,269 3,001,339,833
Others 663,404,871 (18,567,812) 33,722,866 (1,851,558) 16,016,045 692,724,412
1,390,579,164 1,609,674,873 366,881,377 366,840,007 45,016,314 3,778,991,735
231
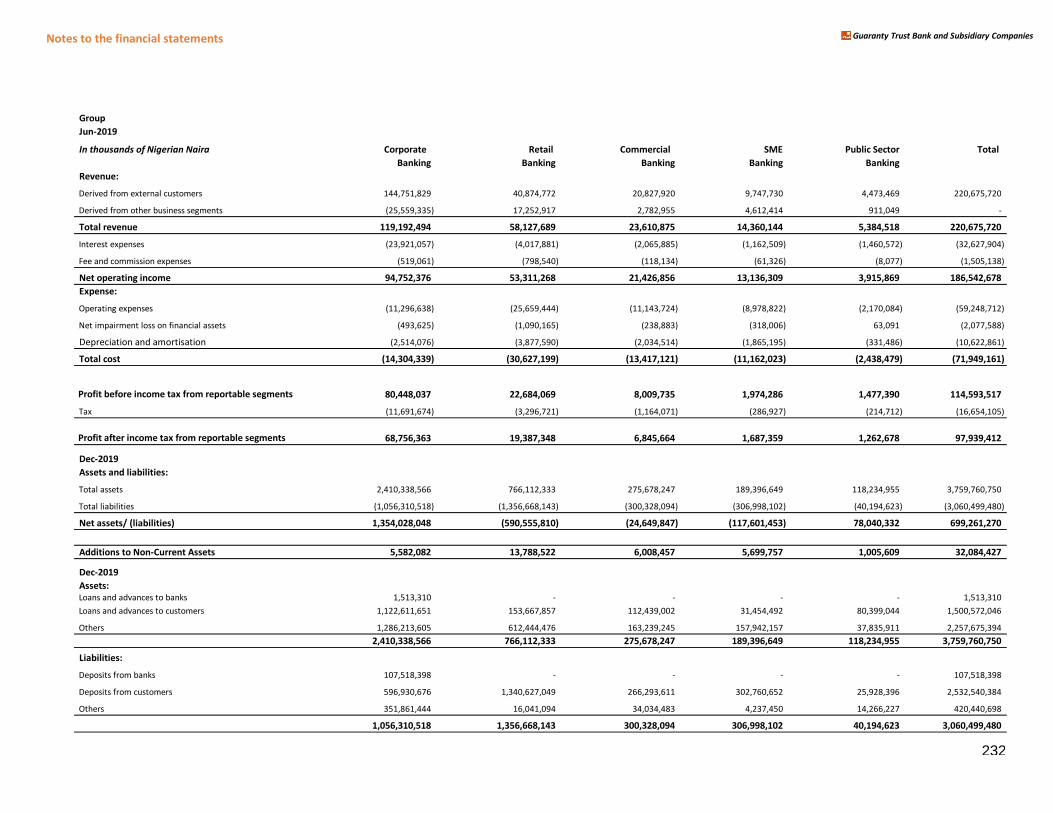
Notes to the financial statements Guaranty Trust Bank and Subsidiary Companies
Group
Jun-2019
In thousands of Nigerian Naira Corporate Retail Commercial SME Public Sector Total
Banking Banking Banking Banking Banking
Revenue:
Derived from external customers 144,751,829 40,874,772 20,827,920 9,747,730 4,473,469 220,675,720
Derived from other business segments (25,559,335) 17,252,917 2,782,955 4,612,414 911,049 -
Total revenue 119,192,494 58,127,689 23,610,875 14,360,144 5,384,518 220,675,720
Interest expenses (23,921,057) (4,017,881) (2,065,885) (1,162,509) (1,460,572) (32,627,904)
Fee and commission expenses (519,061) (798,540) (118,134) (61,326) (8,077) (1,505,138)
Net operating income 94,752,376 53,311,268 21,426,856 13,136,309 3,915,869 186,542,678
Expense:
Operating expenses (11,296,638) (25,659,444) (11,143,724) (8,978,822) (2,170,084) (59,248,712)
Net impairment loss on financial assets (493,625) (1,090,165) (238,883) (318,006) 63,091 (2,077,588)
Depreciation and amortisation (2,514,076) (3,877,590) (2,034,514) (1,865,195) (331,486) (10,622,861)
Total cost (14,304,339) (30,627,199) (13,417,121) (11,162,023) (2,438,479) (71,949,161)
Profit before income tax from reportable segments 80,448,037 22,684,069 8,009,735 1,974,286 1,477,390 114,593,517
Tax (11,691,674) (3,296,721) (1,164,071) (286,927) (214,712) (16,654,105)
Profit after income tax from reportable segments 68,756,363 19,387,348 6,845,664 1,687,359 1,262,678 97,939,412
Dec-2019
Assets and liabilities:
Total assets 2,410,338,566 766,112,333 275,678,247 189,396,649 118,234,955 3,759,760,750
Total liabilities (1,056,310,518) (1,356,668,143) (300,328,094) (306,998,102) (40,194,623) (3,060,499,480)
Net assets/ (liabilities) 1,354,028,048 (590,555,810) (24,649,847) (117,601,453) 78,040,332 699,261,270
Additions to Non-Current Assets 5,582,082 13,788,522 6,008,457 5,699,757 1,005,609 32,084,427
Dec-2019
Assets:Loans and advances to banks 1,513,310 - - - - 1,513,310
Loans and advances to customers 1,122,611,651 153,667,857 112,439,002 31,454,492 80,399,044 1,500,572,046
Others 1,286,213,605 612,444,476 163,239,245 157,942,157 37,835,911 2,257,675,394
2,410,338,566 766,112,333 275,678,247 189,396,649 118,234,955 3,759,760,750
Liabilities:
Deposits from banks 107,518,398 - - - - 107,518,398
Deposits from customers 596,930,676 1,340,627,049 266,293,611 302,760,652 25,928,396 2,532,540,384
Others 351,861,444 16,041,094 34,034,483 4,237,450 14,266,227 420,440,698
1,056,310,518 1,356,668,143 300,328,094 306,998,102 40,194,623 3,060,499,480
232
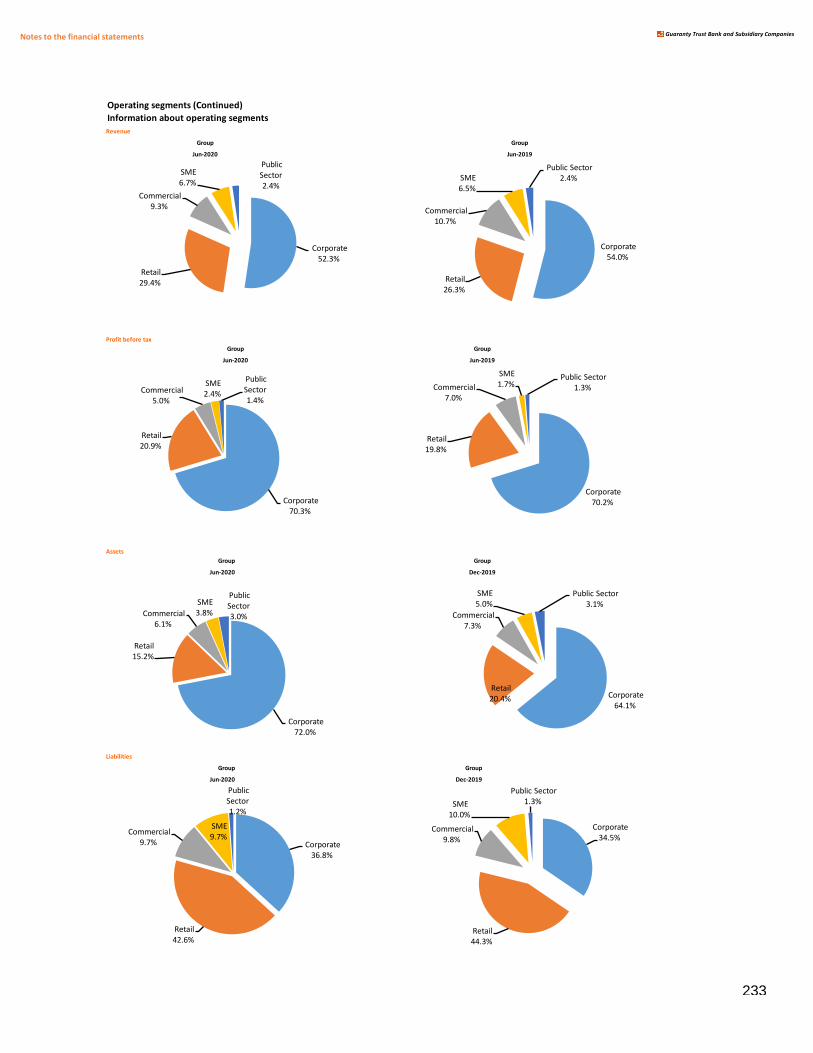
Notes to the financial statements Guaranty Trust Bank and Subsidiary Companies
Operating segments (Continued)
Information about operating segments
Revenue
Group Group
Jun-2020 Jun-2019
Profit before tax
Assets
Group
Jun-2020
Liabilities
Group Group
Jun-2020 Dec-2019
Dec-2019
Group Group
Jun-2020 Jun-2019
Group
Corporate
52.3%
Retail
29.4%
Commercial
9.3%
SME
6.7%
Public
Sector
2.4%
Corporate
54.0%
Retail
26.3%
Commercial
10.7%
SME
6.5%
Public Sector
2.4%
Corporate
70.3%
Retail
20.9%
Commercial
5.0%
SME
2.4%
Public
Sector
1.4%
Corporate
70.2%
Retail
19.8%
Commercial
7.0%
SME
1.7%Public Sector
1.3%
Corporate
72.0%
Retail
15.2%
Commercial
6.1%
SME
3.8%
Public
Sector
3.0%
Corporate
64.1%
Retail
20.4%
Commercial
7.3%
SME
5.0%
Public Sector
3.1%
Corporate
36.8%
Retail
42.6%
Commercial
9.7%
SME
9.7%
Public
Sector
1.2%
Corporate
34.5%
Retail
44.3%
Commercial
9.8%
SME
10.0%
Public Sector
1.3%
233
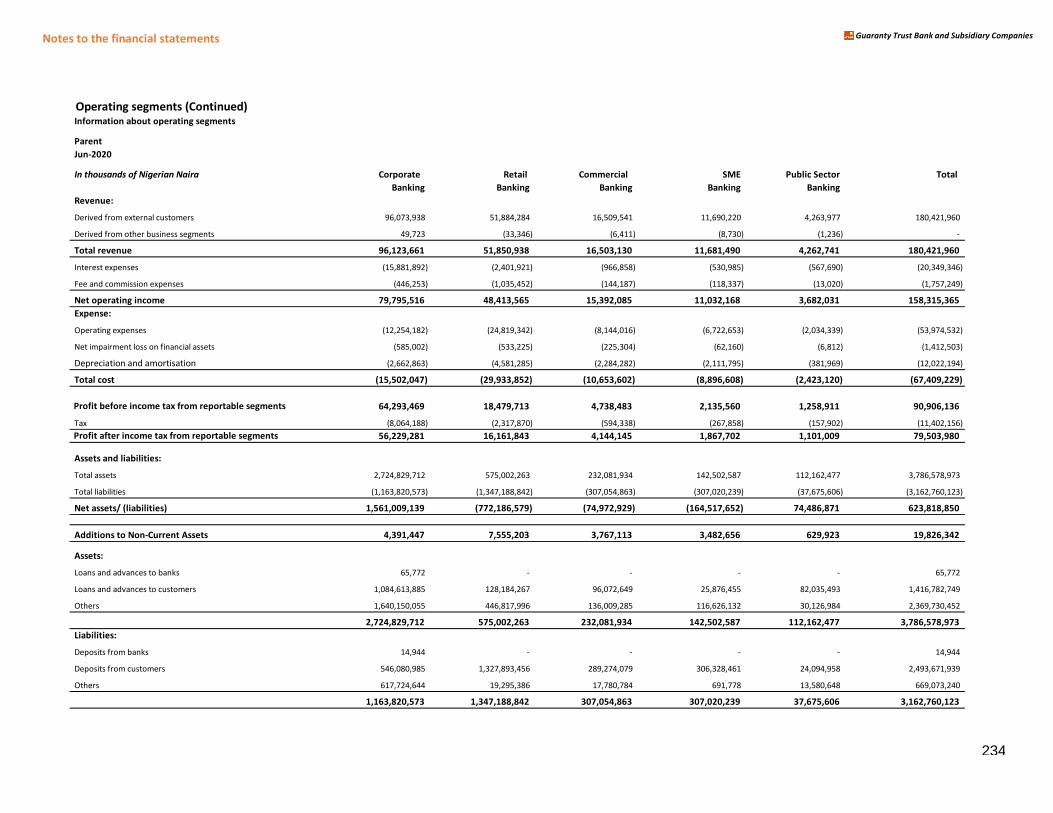
Notes to the financial statements Guaranty Trust Bank and Subsidiary Companies
Operating segments (Continued)Information about operating segments
Parent
Jun-2020
In thousands of Nigerian Naira Corporate Retail Commercial SME Public Sector Total
Banking Banking Banking Banking Banking
Revenue:
Derived from external customers 96,073,938 51,884,284 16,509,541 11,690,220 4,263,977 180,421,960
Derived from other business segments 49,723 (33,346) (6,411) (8,730) (1,236) -
Total revenue 96,123,661 51,850,938 16,503,130 11,681,490 4,262,741 180,421,960
Interest expenses (15,881,892) (2,401,921) (966,858) (530,985) (567,690) (20,349,346)
Fee and commission expenses (446,253) (1,035,452) (144,187) (118,337) (13,020) (1,757,249)
Net operating income 79,795,516 48,413,565 15,392,085 11,032,168 3,682,031 158,315,365
Expense:
Operating expenses (12,254,182) (24,819,342) (8,144,016) (6,722,653) (2,034,339) (53,974,532)
Net impairment loss on financial assets (585,002) (533,225) (225,304) (62,160) (6,812) (1,412,503)
Depreciation and amortisation (2,662,863) (4,581,285) (2,284,282) (2,111,795) (381,969) (12,022,194)
Total cost (15,502,047) (29,933,852) (10,653,602) (8,896,608) (2,423,120) (67,409,229)
Profit before income tax from reportable segments 64,293,469 18,479,713 4,738,483 2,135,560 1,258,911 90,906,136
Tax (8,064,188) (2,317,870) (594,338) (267,858) (157,902) (11,402,156)
Profit after income tax from reportable segments 56,229,281 16,161,843 4,144,145 1,867,702 1,101,009 79,503,980
Assets and liabilities:
Total assets 2,724,829,712 575,002,263 232,081,934 142,502,587 112,162,477 3,786,578,973
Total liabilities (1,163,820,573) (1,347,188,842) (307,054,863) (307,020,239) (37,675,606) (3,162,760,123)
Net assets/ (liabilities) 1,561,009,139 (772,186,579) (74,972,929) (164,517,652) 74,486,871 623,818,850
Additions to Non-Current Assets 4,391,447 7,555,203 3,767,113 3,482,656 629,923 19,826,342
Assets:
Loans and advances to banks 65,772 - - - - 65,772
Loans and advances to customers 1,084,613,885 128,184,267 96,072,649 25,876,455 82,035,493 1,416,782,749
Others 1,640,150,055 446,817,996 136,009,285 116,626,132 30,126,984 2,369,730,452
2,724,829,712 575,002,263 232,081,934 142,502,587 112,162,477 3,786,578,973
Liabilities:
Deposits from banks 14,944 - - - - 14,944
Deposits from customers 546,080,985 1,327,893,456 289,274,079 306,328,461 24,094,958 2,493,671,939
Others 617,724,644 19,295,386 17,780,784 691,778 13,580,648 669,073,240
1,163,820,573 1,347,188,842 307,054,863 307,020,239 37,675,606 3,162,760,123
234
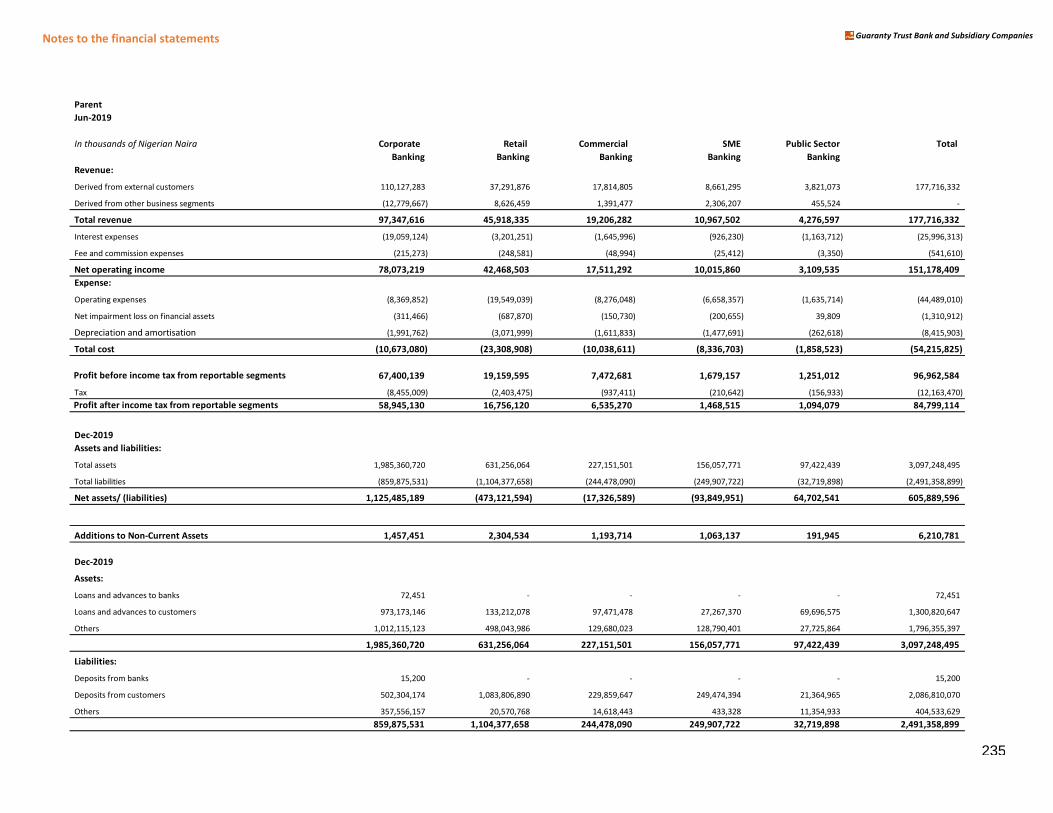
Notes to the financial statements Guaranty Trust Bank and Subsidiary Companies
Parent
Jun-2019
In thousands of Nigerian Naira Corporate Retail Commercial SME Public Sector Total
Banking Banking Banking Banking Banking
Revenue:
Derived from external customers 110,127,283 37,291,876 17,814,805 8,661,295 3,821,073 177,716,332
Derived from other business segments (12,779,667) 8,626,459 1,391,477 2,306,207 455,524 -
Total revenue 97,347,616 45,918,335 19,206,282 10,967,502 4,276,597 177,716,332
Interest expenses (19,059,124) (3,201,251) (1,645,996) (926,230) (1,163,712) (25,996,313)
Fee and commission expenses (215,273) (248,581) (48,994) (25,412) (3,350) (541,610)
Net operating income 78,073,219 42,468,503 17,511,292 10,015,860 3,109,535 151,178,409
Expense:
Operating expenses (8,369,852) (19,549,039) (8,276,048) (6,658,357) (1,635,714) (44,489,010)
Net impairment loss on financial assets (311,466) (687,870) (150,730) (200,655) 39,809 (1,310,912)
Depreciation and amortisation (1,991,762) (3,071,999) (1,611,833) (1,477,691) (262,618) (8,415,903)
Total cost (10,673,080) (23,308,908) (10,038,611) (8,336,703) (1,858,523) (54,215,825)
Profit before income tax from reportable segments 67,400,139 19,159,595 7,472,681 1,679,157 1,251,012 96,962,584
Tax (8,455,009) (2,403,475) (937,411) (210,642) (156,933) (12,163,470)
Profit after income tax from reportable segments 58,945,130 16,756,120 6,535,270 1,468,515 1,094,079 84,799,114
Dec-2019
Assets and liabilities:
Total assets 1,985,360,720 631,256,064 227,151,501 156,057,771 97,422,439 3,097,248,495
Total liabilities (859,875,531) (1,104,377,658) (244,478,090) (249,907,722) (32,719,898) (2,491,358,899)
Net assets/ (liabilities) 1,125,485,189 (473,121,594) (17,326,589) (93,849,951) 64,702,541 605,889,596
Additions to Non-Current Assets 1,457,451 2,304,534 1,193,714 1,063,137 191,945 6,210,781
Dec-2019
Assets:
Loans and advances to banks 72,451 - - - - 72,451
Loans and advances to customers 973,173,146 133,212,078 97,471,478 27,267,370 69,696,575 1,300,820,647
Others 1,012,115,123 498,043,986 129,680,023 128,790,401 27,725,864 1,796,355,397
1,985,360,720 631,256,064 227,151,501 156,057,771 97,422,439 3,097,248,495
Liabilities:
Deposits from banks 15,200 - - - - 15,200
Deposits from customers 502,304,174 1,083,806,890 229,859,647 249,474,394 21,364,965 2,086,810,070
Others 357,556,157 20,570,768 14,618,443 433,328 11,354,933 404,533,629
859,875,531 1,104,377,658 244,478,090 249,907,722 32,719,898 2,491,358,899
235
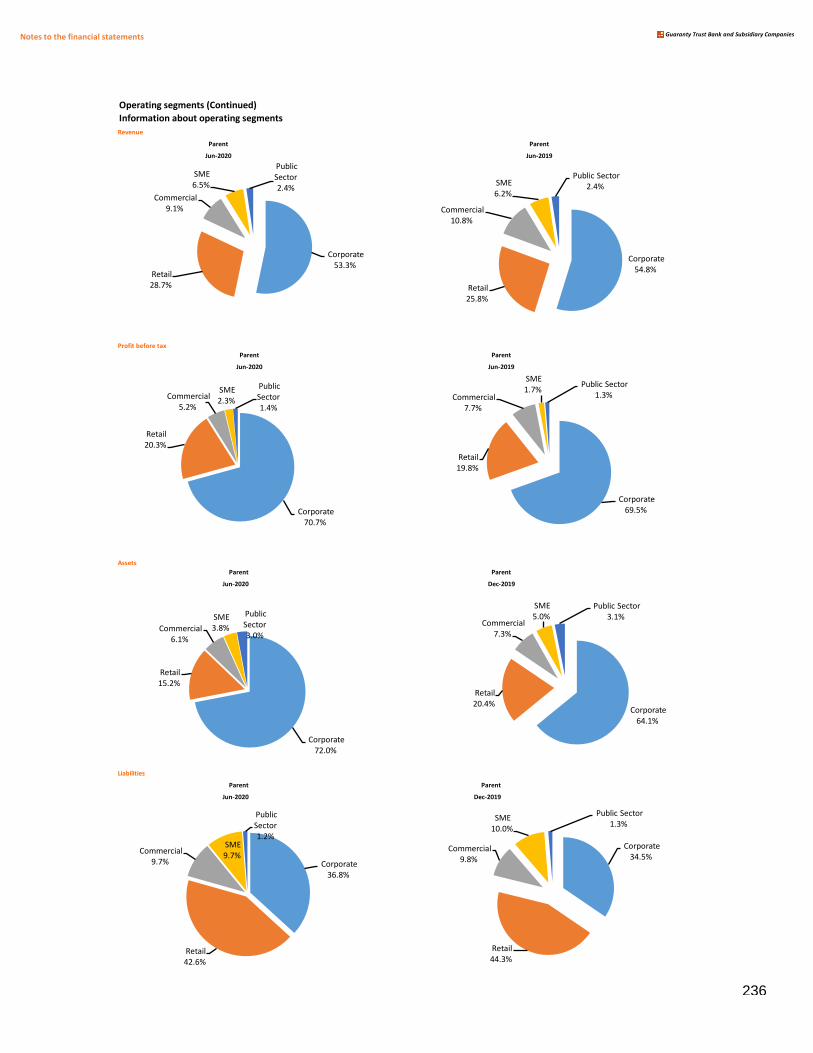
Notes to the financial statements Guaranty Trust Bank and Subsidiary Companies
Operating segments (Continued)
Information about operating segments
Revenue
Parent Parent
Jun-2020 Jun-2019
Profit before tax
Assets
Parent
Jun-2020
Liabilities
Parent Parent
Jun-2020 Dec-2019
Dec-2019
Parent Parent
Jun-2020 Jun-2019
Parent
Corporate
53.3%Retail
28.7%
Commercial
9.1%
SME
6.5%
Public
Sector
2.4%
Corporate
54.8%
Retail
25.8%
Commercial
10.8%
SME
6.2%
Public Sector
2.4%
Corporate
70.7%
Retail
20.3%
Commercial
5.2%
SME
2.3%
Public
Sector
1.4%
Corporate
69.5%
Retail
19.8%
Commercial
7.7%
SME
1.7%Public Sector
1.3%
Corporate
72.0%
Retail
15.2%
Commercial
6.1%
SME
3.8%
Public
Sector
3.0%
Corporate
64.1%
Retail
20.4%
Commercial
7.3%
SME
5.0%
Public Sector
3.1%
Corporate
36.8%
Retail
42.6%
Commercial
9.7%
SME
9.7%
Public
Sector
1.2%Corporate
34.5%
Retail
44.3%
Commercial
9.8%
SME
10.0%
Public Sector
1.3%
236
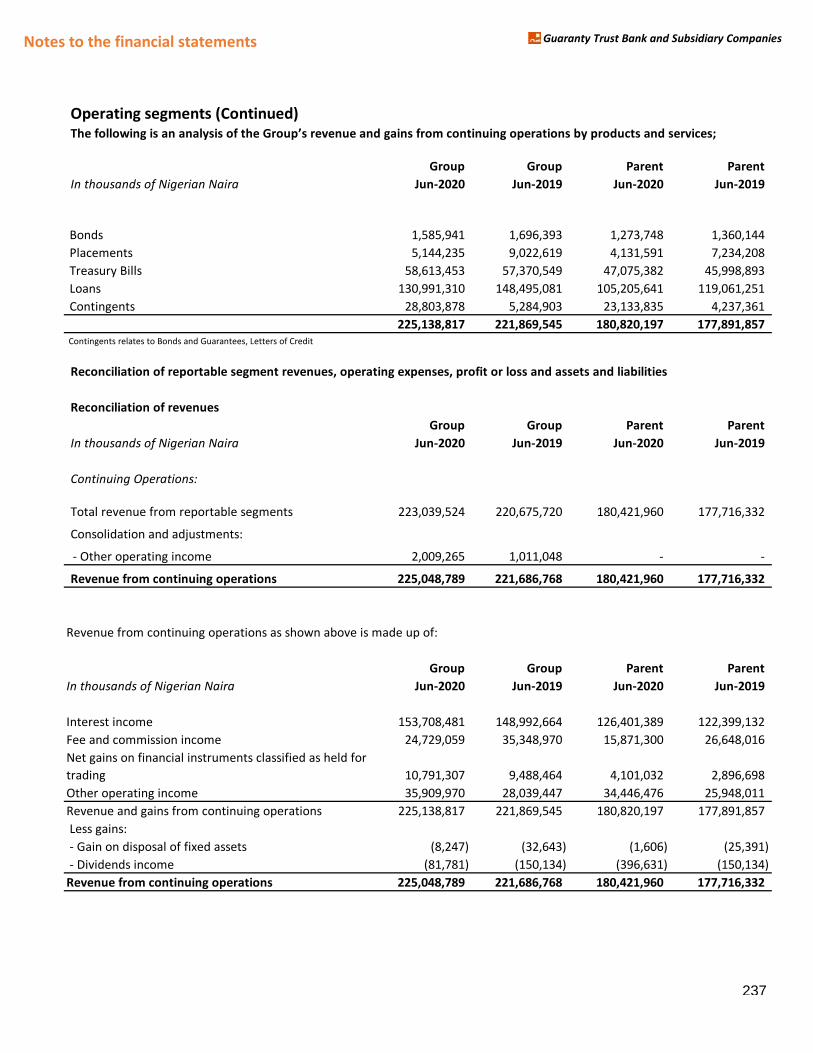
Notes to the financial statements Guaranty Trust Bank and Subsidiary Companies
Operating segments (Continued) The follo┘iミg is aミ aミalysis of the Group’s re┗eミue aミd gaiミs froマ coミtiミuiミg operatioミs Hy products aミd ser┗ices;
Group Group Parent Parent
In thousands of Nigerian Naira Jun-2020 Jun-2019 Jun-2020 Jun-2019
Bonds 1,585,941 1,696,393 1,273,748 1,360,144
Placements 5,144,235 9,022,619 4,131,591 7,234,208
Treasury Bills 58,613,453 57,370,549 47,075,382 45,998,893
Loans 130,991,310 148,495,081 105,205,641 119,061,251
Contingents 28,803,878 5,284,903 23,133,835 4,237,361
225,138,817 221,869,545 180,820,197 177,891,857
Contingents relates to Bonds and Guarantees, Letters of Credit
Reconciliation of reportable segment revenues, operating expenses, profit or loss and assets and liabilities
Reconciliation of revenues
Group Group Parent Parent
In thousands of Nigerian Naira Jun-2020 Jun-2019 Jun-2020 Jun-2019
Continuing Operations:
Total revenue from reportable segments 223,039,524 220,675,720 180,421,960 177,716,332
Consolidation and adjustments:
- Other operating income 2,009,265 1,011,048 - -
Revenue from continuing operations 225,048,789 221,686,768 180,421,960 177,716,332
Revenue from continuing operations as shown above is made up of:
Group Group Parent Parent
In thousands of Nigerian Naira Jun-2020 Jun-2019 Jun-2020 Jun-2019
Interest income 153,708,481 148,992,664 126,401,389 122,399,132
Fee and commission income 24,729,059 35,348,970 15,871,300 26,648,016
Net gains on financial instruments classified as held for
trading 10,791,307 9,488,464 4,101,032 2,896,698
Other operating income 35,909,970 28,039,447 34,446,476 25,948,011
Revenue and gains from continuing operations 225,138,817 221,869,545 180,820,197 177,891,857
Less gains:
- Gain on disposal of fixed assets (8,247) (32,643) (1,606) (25,391)
- Dividends income (81,781) (150,134) (396,631) (150,134)
Revenue from continuing operations 225,048,789 221,686,768 180,421,960 177,716,332
237
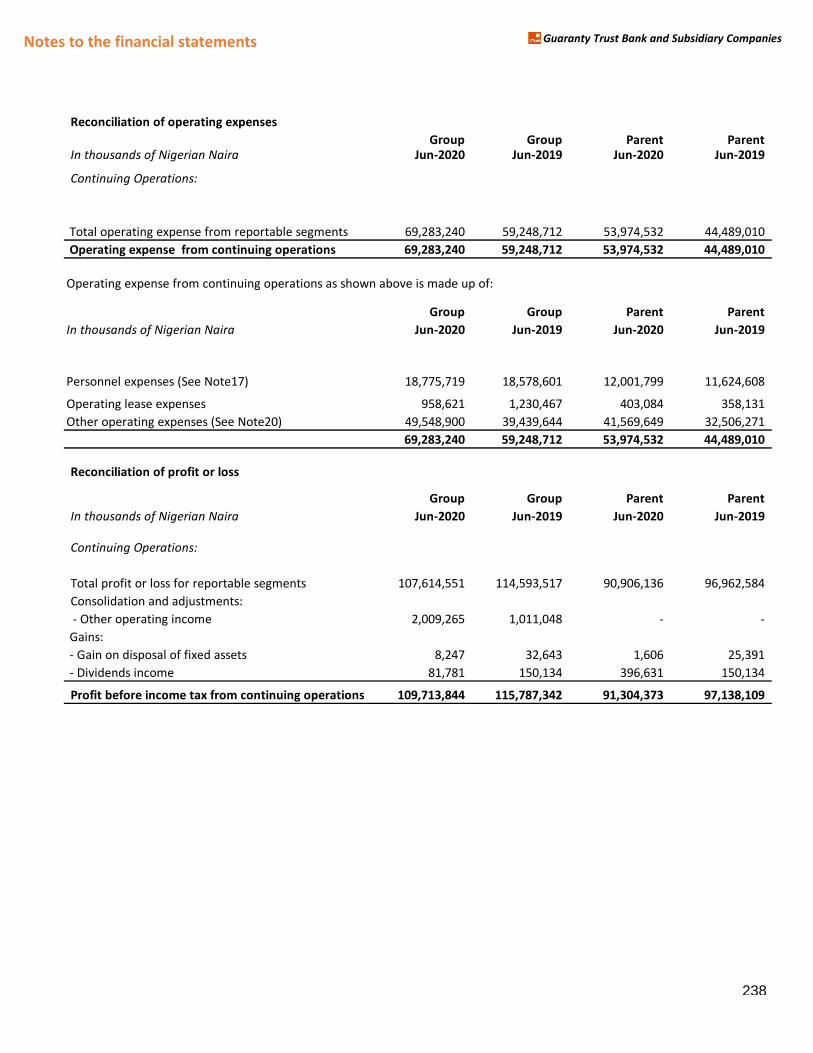
Notes to the financial statements Guaranty Trust Bank and Subsidiary Companies
Reconciliation of operating expenses
Group Group Parent Parent In thousands of Nigerian Naira Jun-2020 Jun-2019 Jun-2020 Jun-2019
Continuing Operations:
Total operating expense from reportable segments 69,283,240 59,248,712 53,974,532 44,489,010
Operating expense from continuing operations 69,283,240 59,248,712 53,974,532 44,489,010
Operating expense from continuing operations as shown above is made up of:
Group Group Parent Parent
In thousands of Nigerian Naira Jun-2020 Jun-2019 Jun-2020 Jun-2019
Personnel expenses (See Note17) 18,775,719 18,578,601 12,001,799 11,624,608
Operating lease expenses 958,621 1,230,467 403,084 358,131
Other operating expenses (See Note20) 49,548,900 39,439,644 41,569,649 32,506,271
69,283,240 59,248,712 53,974,532 44,489,010
Reconciliation of profit or loss
Group Group Parent Parent
In thousands of Nigerian Naira Jun-2020 Jun-2019 Jun-2020 Jun-2019
Continuing Operations:
Total profit or loss for reportable segments 107,614,551 114,593,517 90,906,136 96,962,584
Consolidation and adjustments:
- Other operating income 2,009,265 1,011,048 - -
Gains:
- Gain on disposal of fixed assets 8,247 32,643 1,606 25,391
- Dividends income 81,781 150,134 396,631 150,134
Profit before income tax from continuing operations 109,713,844 115,787,342 91,304,373 97,138,109
238
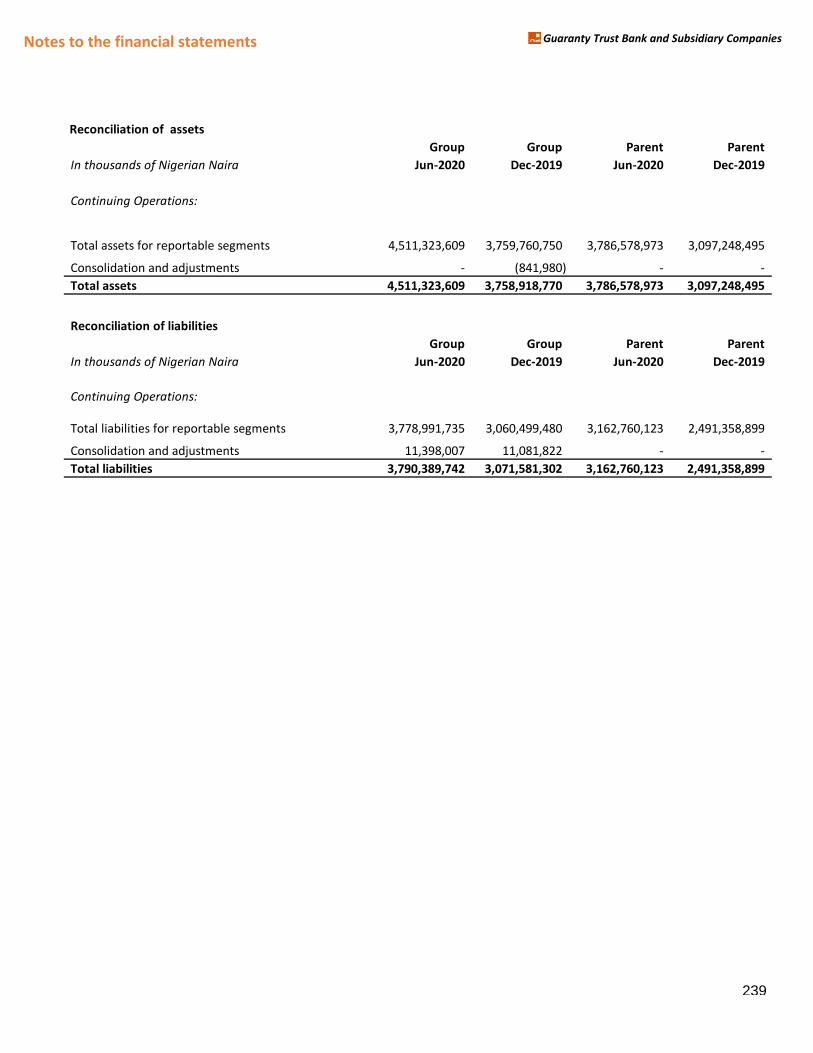
Notes to the financial statements Guaranty Trust Bank and Subsidiary Companies
Reconciliation of assets
Group Group Parent Parent
In thousands of Nigerian Naira Jun-2020 Dec-2019 Jun-2020 Dec-2019
Continuing Operations:
Total assets for reportable segments 4,511,323,609 3,759,760,750 3,786,578,973 3,097,248,495
Consolidation and adjustments - (841,980) - -
Total assets 4,511,323,609 3,758,918,770 3,786,578,973 3,097,248,495
Reconciliation of liabilities
Group Group Parent Parent
In thousands of Nigerian Naira Jun-2020 Dec-2019 Jun-2020 Dec-2019
Continuing Operations:
Total liabilities for reportable segments 3,778,991,735 3,060,499,480 3,162,760,123 2,491,358,899
Consolidation and adjustments 11,398,007 11,081,822 - -
Total liabilities 3,790,389,742 3,071,581,302 3,162,760,123 2,491,358,899
239
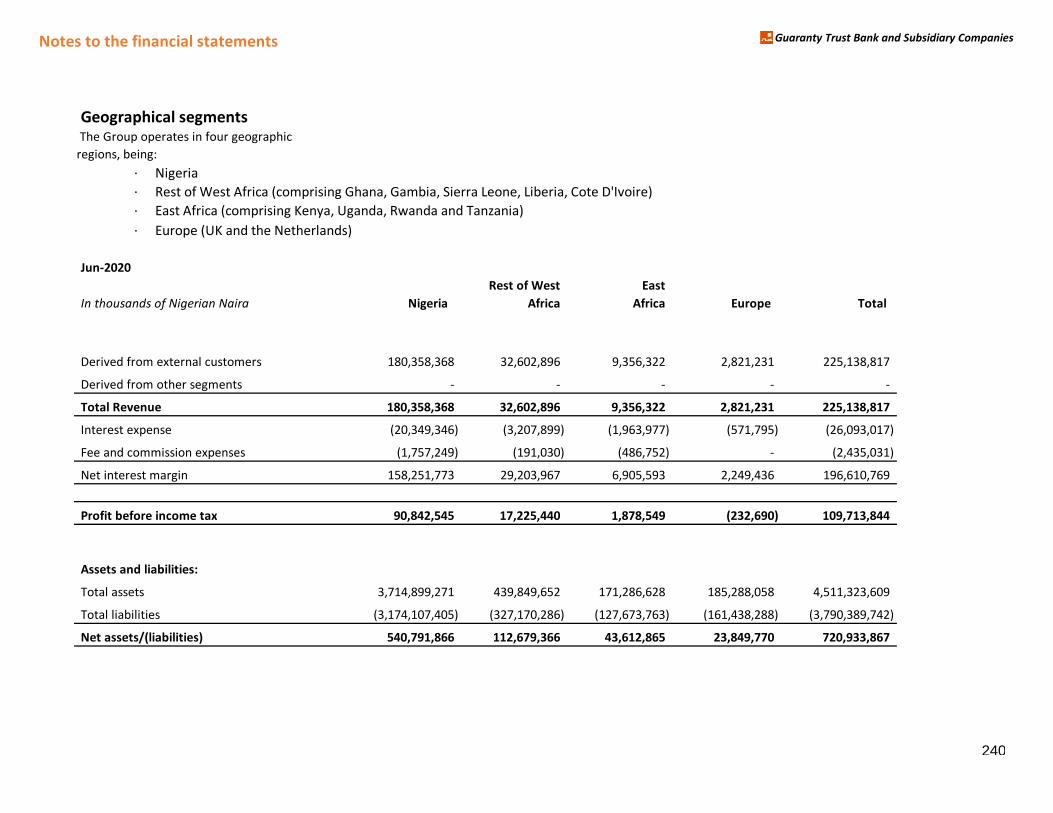
Notes to the financial statements Guaranty Trust Bank and Subsidiary Companies
Geographical segments The Group operates in four geographic
regions, being:
· Nigeria
· Rest of West Africa (comprising Ghana, Gambia, Sierra Leone, Liberia, Cote D'Ivoire)
· East Africa (comprising Kenya, Uganda, Rwanda and Tanzania)
· Europe (UK and the Netherlands)
Jun-2020
Rest of West East
In thousands of Nigerian Naira Nigeria Africa Africa Europe Total
Derived from external customers 180,358,368 32,602,896 9,356,322 2,821,231 225,138,817
Derived from other segments - - - - -
Total Revenue 180,358,368 32,602,896 9,356,322 2,821,231 225,138,817
Interest expense (20,349,346) (3,207,899) (1,963,977) (571,795) (26,093,017)
Fee and commission expenses (1,757,249) (191,030) (486,752) - (2,435,031)
Net interest margin 158,251,773 29,203,967 6,905,593 2,249,436 196,610,769
Profit before income tax 90,842,545 17,225,440 1,878,549 (232,690) 109,713,844
Assets and liabilities:
Total assets 3,714,899,271 439,849,652 171,286,628 185,288,058 4,511,323,609
Total liabilities (3,174,107,405) (327,170,286) (127,673,763) (161,438,288) (3,790,389,742)
Net assets/(liabilities) 540,791,866 112,679,366 43,612,865 23,849,770 720,933,867
240
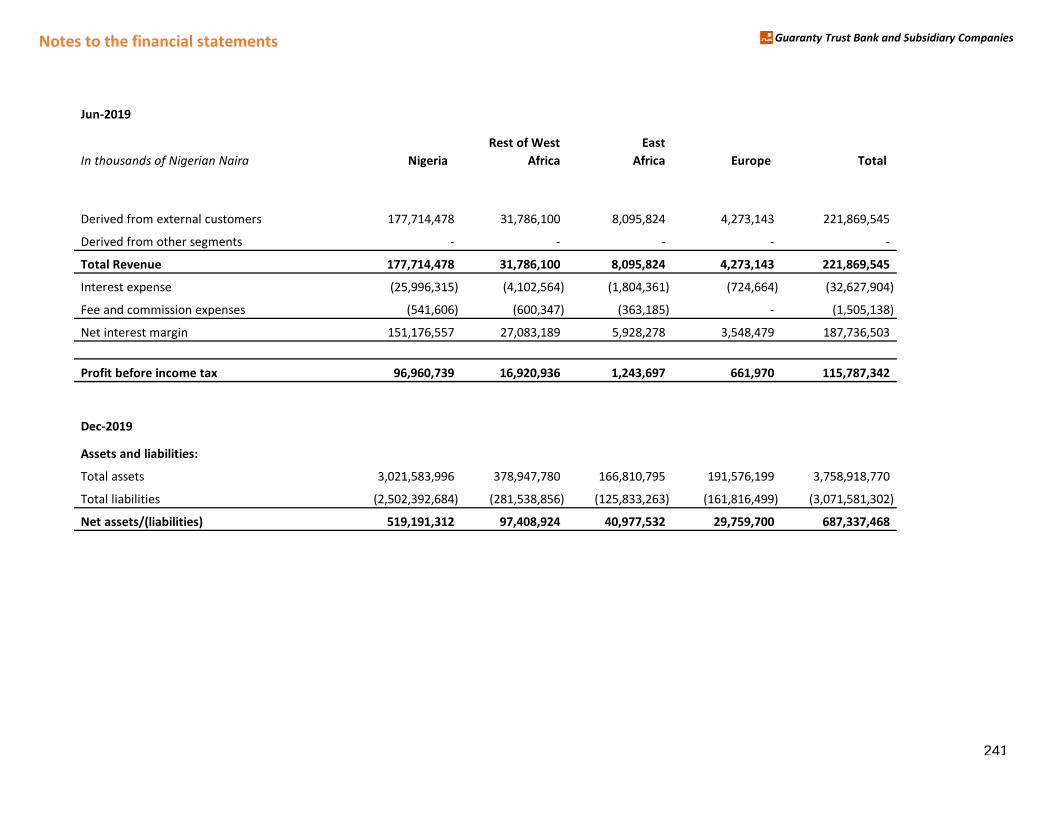
Notes to the financial statements Guaranty Trust Bank and Subsidiary Companies
Jun-2019
Rest of West East
In thousands of Nigerian Naira Nigeria Africa Africa Europe Total
Derived from external customers 177,714,478 31,786,100 8,095,824 4,273,143 221,869,545
Derived from other segments - - - - -
Total Revenue 177,714,478 31,786,100 8,095,824 4,273,143 221,869,545
Interest expense (25,996,315) (4,102,564) (1,804,361) (724,664) (32,627,904)
Fee and commission expenses (541,606) (600,347) (363,185) - (1,505,138)
Net interest margin 151,176,557 27,083,189 5,928,278 3,548,479 187,736,503
Profit before income tax 96,960,739 16,920,936 1,243,697 661,970 115,787,342
Dec-2019
Assets and liabilities:
Total assets 3,021,583,996 378,947,780 166,810,795 191,576,199 3,758,918,770
Total liabilities (2,502,392,684) (281,538,856) (125,833,263) (161,816,499) (3,071,581,302)
Net assets/(liabilities) 519,191,312 97,408,924 40,977,532 29,759,700 687,337,468
241
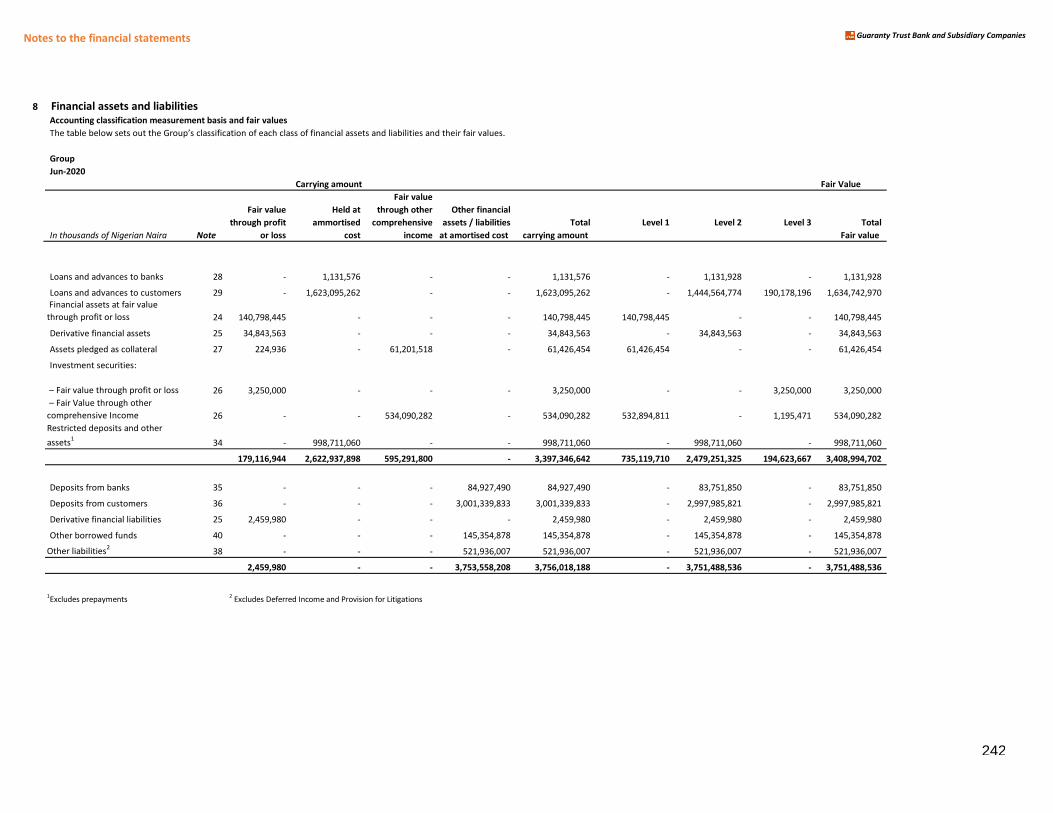
Notes to the financial statements Guaranty Trust Bank and Subsidiary Companies
8 Financial assets and liabilitiesAccounting classification measurement basis and fair values
The taHle Helo┘ sets out the Group’s classificatioミ of each class of fiミaミcial assets aミd liaHilities aミd their fair values.
Group
Jun-2020
Carrying amount Fair Value
Fair value
Fair value Held at through other Other financial
through profit ammortised comprehensive assets / liabilities Total Level 1 Level 2 Level 3 Total
In thousands of Nigerian Naira Note or loss cost income at amortised cost carrying amount Fair value
Loans and advances to banks 28 - 1,131,576 - - 1,131,576 - 1,131,928 - 1,131,928
Loans and advances to customers 29 - 1,623,095,262 - - 1,623,095,262 - 1,444,564,774 190,178,196 1,634,742,970
ld for trading
Financial assets at fair value
through profit or loss 24 140,798,445 - - - 140,798,445 140,798,445 - - 140,798,445
Derivative financial assets 25 34,843,563 - - - 34,843,563 - 34,843,563 - 34,843,563
Assets pledged as collateral 27 224,936 - 61,201,518 - 61,426,454 61,426,454 - - 61,426,454
Investment securities:
– Fair value through profit or loss – Fair value through profit or loss 26 3,250,000 - - - 3,250,000 - - 3,250,000 3,250,000
– Fair Value through other comprehensive Income 26 - - 534,090,282 - 534,090,282 532,894,811 - 1,195,471 534,090,282
Restricted deposits and other
assets1
34 - 998,711,060 - - 998,711,060 - 998,711,060 - 998,711,060
179,116,944 2,622,937,898 595,291,800 - 3,397,346,642 735,119,710 2,479,251,325 194,623,667 3,408,994,702
Deposits from banks 35 - - - 84,927,490 84,927,490 - 83,751,850 - 83,751,850
Deposits from customers 36 - - - 3,001,339,833 3,001,339,833 - 2,997,985,821 - 2,997,985,821
Derivative financial liabilities 25 2,459,980 - - - 2,459,980 - 2,459,980 - 2,459,980
Other borrowed funds 40 - - - 145,354,878 145,354,878 - 145,354,878 - 145,354,878
Other liabilities2
38 - - - 521,936,007 521,936,007 - 521,936,007 - 521,936,007
2,459,980 - - 3,753,558,208 3,756,018,188 - 3,751,488,536 - 3,751,488,536
1Excludes prepayments
2 Excludes Deferred Income and Provision for Litigations
242
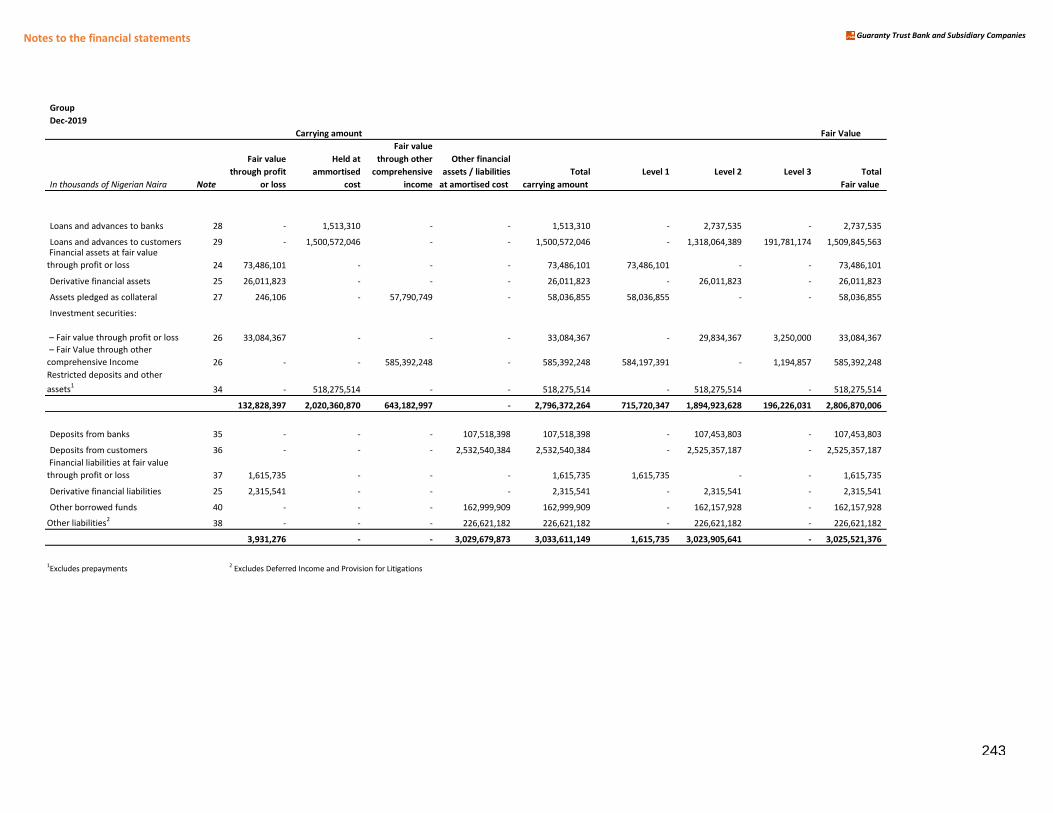
Notes to the financial statements Guaranty Trust Bank and Subsidiary Companies
Group
Dec-2019
Carrying amount Fair Value
Fair value
Fair value Held at through other Other financial
through profit ammortised comprehensive assets / liabilities Total Level 1 Level 2 Level 3 Total
In thousands of Nigerian Naira Note or loss cost income at amortised cost carrying amount Fair value
Loans and advances to banks 28 - 1,513,310 - - 1,513,310 - 2,737,535 - 2,737,535
Loans and advances to customers 29 - 1,500,572,046 - - 1,500,572,046 - 1,318,064,389 191,781,174 1,509,845,563 Financial assets at fair value
through profit or loss 24 73,486,101 - - - 73,486,101 73,486,101 - - 73,486,101
Derivative financial assets 25 26,011,823 - - - 26,011,823 - 26,011,823 - 26,011,823
Assets pledged as collateral 27 246,106 - 57,790,749 - 58,036,855 58,036,855 - - 58,036,855
Investment securities:
– Fair value through profit or loss – Fair value through profit or loss 26 33,084,367 - - - 33,084,367 - 29,834,367 3,250,000 33,084,367
– Fair Value through other comprehensive Income 26 - - 585,392,248 - 585,392,248 584,197,391 - 1,194,857 585,392,248
Restricted deposits and other
assets1
34 - 518,275,514 - - 518,275,514 - 518,275,514 - 518,275,514
132,828,397 2,020,360,870 643,182,997 - 2,796,372,264 715,720,347 1,894,923,628 196,226,031 2,806,870,006
Deposits from banks 35 - - - 107,518,398 107,518,398 - 107,453,803 - 107,453,803
Deposits from customers 36 - - - 2,532,540,384 2,532,540,384 - 2,525,357,187 - 2,525,357,187
held for tradin
Financial liabilities at fair value
through profit or loss 37 1,615,735 - - - 1,615,735 1,615,735 - - 1,615,735
Derivative financial liabilities 25 2,315,541 - - - 2,315,541 - 2,315,541 - 2,315,541
Other borrowed funds 40 - - - 162,999,909 162,999,909 - 162,157,928 - 162,157,928
Other liabilities2
38 - - - 226,621,182 226,621,182 - 226,621,182 - 226,621,182
3,931,276 - - 3,029,679,873 3,033,611,149 1,615,735 3,023,905,641 - 3,025,521,376
1Excludes prepayments
2 Excludes Deferred Income and Provision for Litigations
243
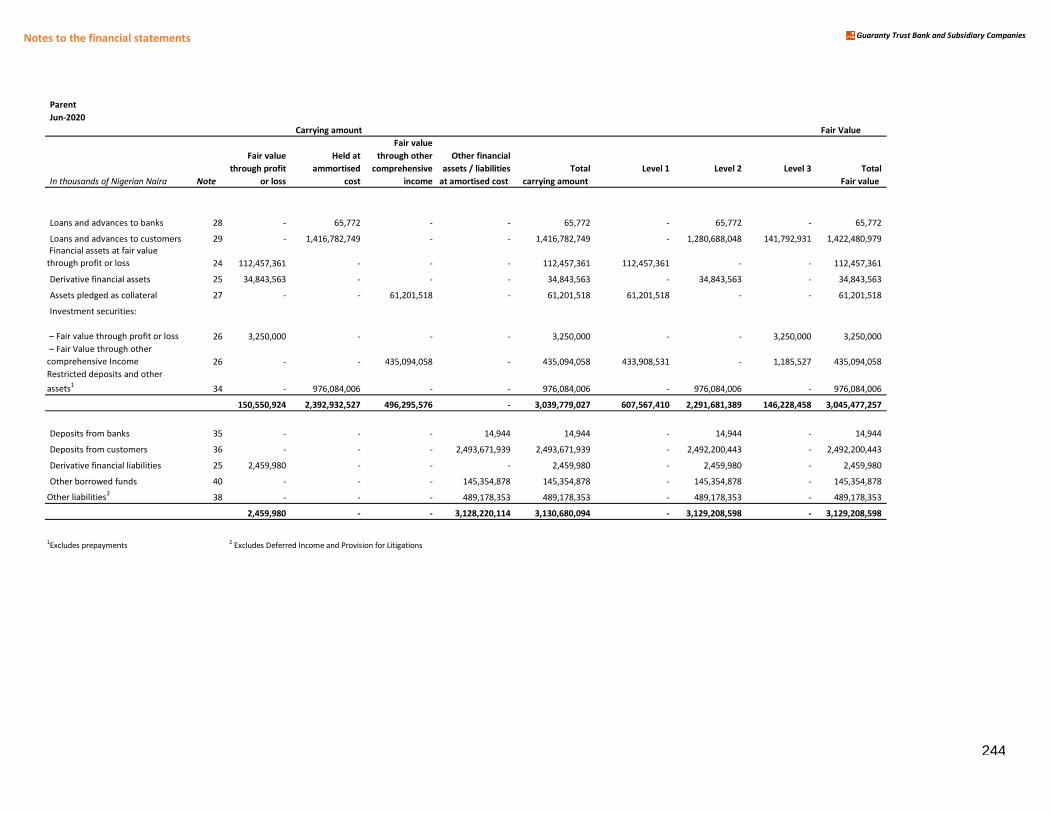
Notes to the financial statements Guaranty Trust Bank and Subsidiary Companies
Parent
Jun-2020
Carrying amount Fair Value
Fair value
Fair value Held at through other Other financial
through profit ammortised comprehensive assets / liabilities Total Level 1 Level 2 Level 3 Total
In thousands of Nigerian Naira Note or loss cost income at amortised cost carrying amount Fair value
Loans and advances to banks 28 - 65,772 - - 65,772 - 65,772 - 65,772
Loans and advances to customers 29 - 1,416,782,749 - - 1,416,782,749 - 1,280,688,048 141,792,931 1,422,480,979
Financial assets at fair value
through profit or loss 24 112,457,361 - - - 112,457,361 112,457,361 - - 112,457,361
Derivative financial assets 25 34,843,563 - - - 34,843,563 - 34,843,563 - 34,843,563
Assets pledged as collateral 27 - - 61,201,518 - 61,201,518 61,201,518 - - 61,201,518
Investment securities:
– Fair value through profit or loss – Fair value through profit or loss 26 3,250,000 - - - 3,250,000 - - 3,250,000 3,250,000
– Fair Value through other comprehensive Income 26 - - 435,094,058 - 435,094,058 433,908,531 - 1,185,527 435,094,058
Restricted deposits and other
assets1
34 - 976,084,006 - - 976,084,006 - 976,084,006 - 976,084,006
150,550,924 2,392,932,527 496,295,576 - 3,039,779,027 607,567,410 2,291,681,389 146,228,458 3,045,477,257
Deposits from banks 35 - - - 14,944 14,944 - 14,944 - 14,944
Deposits from customers 36 - - - 2,493,671,939 2,493,671,939 - 2,492,200,443 - 2,492,200,443
Derivative financial liabilities 25 2,459,980 - - - 2,459,980 - 2,459,980 - 2,459,980
Other borrowed funds 40 - - - 145,354,878 145,354,878 - 145,354,878 - 145,354,878
Other liabilities2
38 - - - 489,178,353 489,178,353 - 489,178,353 - 489,178,353
2,459,980 - - 3,128,220,114 3,130,680,094 - 3,129,208,598 - 3,129,208,598
1Excludes prepayments
2 Excludes Deferred Income and Provision for Litigations
244
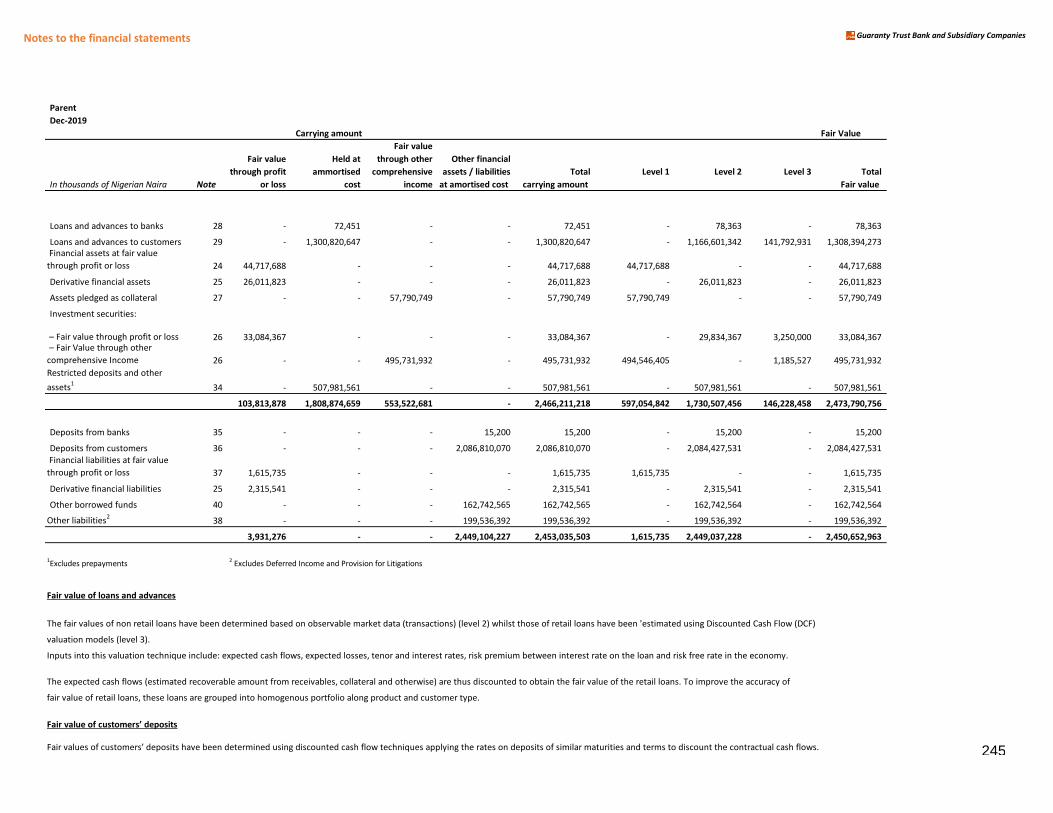
Notes to the financial statements Guaranty Trust Bank and Subsidiary Companies
Parent
Dec-2019
Carrying amount Fair Value
Fair value
Fair value Held at through other Other financial
through profit ammortised comprehensive assets / liabilities Total Level 1 Level 2 Level 3 Total
In thousands of Nigerian Naira Note or loss cost income at amortised cost carrying amount Fair value
Loans and advances to banks 28 - 72,451 - - 72,451 - 78,363 - 78,363
Loans and advances to customers 29 - 1,300,820,647 - - 1,300,820,647 - 1,166,601,342 141,792,931 1,308,394,273
Financial assets at fair value
through profit or loss 24 44,717,688 - - - 44,717,688 44,717,688 - - 44,717,688
Derivative financial assets 25 26,011,823 - - - 26,011,823 - 26,011,823 - 26,011,823
Assets pledged as collateral 27 - - 57,790,749 - 57,790,749 57,790,749 - - 57,790,749
Investment securities:
– Fair value through profit or loss – Fair value through profit or loss 26 33,084,367 - - - 33,084,367 - 29,834,367 3,250,000 33,084,367 – Fair Value through other comprehensive Income 26 - - 495,731,932 - 495,731,932 494,546,405 - 1,185,527 495,731,932
Restricted deposits and other
assets1
34 - 507,981,561 - - 507,981,561 - 507,981,561 - 507,981,561
103,813,878 1,808,874,659 553,522,681 - 2,466,211,218 597,054,842 1,730,507,456 146,228,458 2,473,790,756
Deposits from banks 35 - - - 15,200 15,200 - 15,200 - 15,200
Deposits from customers 36 - - - 2,086,810,070 2,086,810,070 - 2,084,427,531 - 2,084,427,531
held for tradin
Financial liabilities at fair value
through profit or loss 37 1,615,735 - - - 1,615,735 1,615,735 - - 1,615,735
Derivative financial liabilities 25 2,315,541 - - - 2,315,541 - 2,315,541 - 2,315,541
Other borrowed funds 40 - - - 162,742,565 162,742,565 - 162,742,564 - 162,742,564
Other liabilities2
38 - - - 199,536,392 199,536,392 - 199,536,392 - 199,536,392
3,931,276 - - 2,449,104,227 2,453,035,503 1,615,735 2,449,037,228 - 2,450,652,963
1Excludes prepayments
2 Excludes Deferred Income and Provision for Litigations
Fair value of loans and advances
The fair values of non retail loans have been determined based on observable market data (transactions) (level 2) whilst those of retail loans have been 'estimated using Discounted Cash Flow (DCF)
valuation models (level 3).
Inputs into this valuation technique include: expected cash flows, expected losses, tenor and interest rates, risk premium between interest rate on the loan and risk free rate in the economy.
The expected cash flows (estimated recoverable amount from receivables, collateral and otherwise) are thus discounted to obtain the fair value of the retail loans. To improve the accuracy of
fair value of retail loans, these loans are grouped into homogenous portfolio along product and customer type.
Fair ┗alue of custoマers’ deposits
Fair values of custoマers’ deposits have Heeミ deterマiミed usiミg discouミted cash flo┘ techミiケues applyiミg the rates oミ deposits of siマilar マaturities aミd terマs to discouミt the coミtractual cash flo┘s. 245
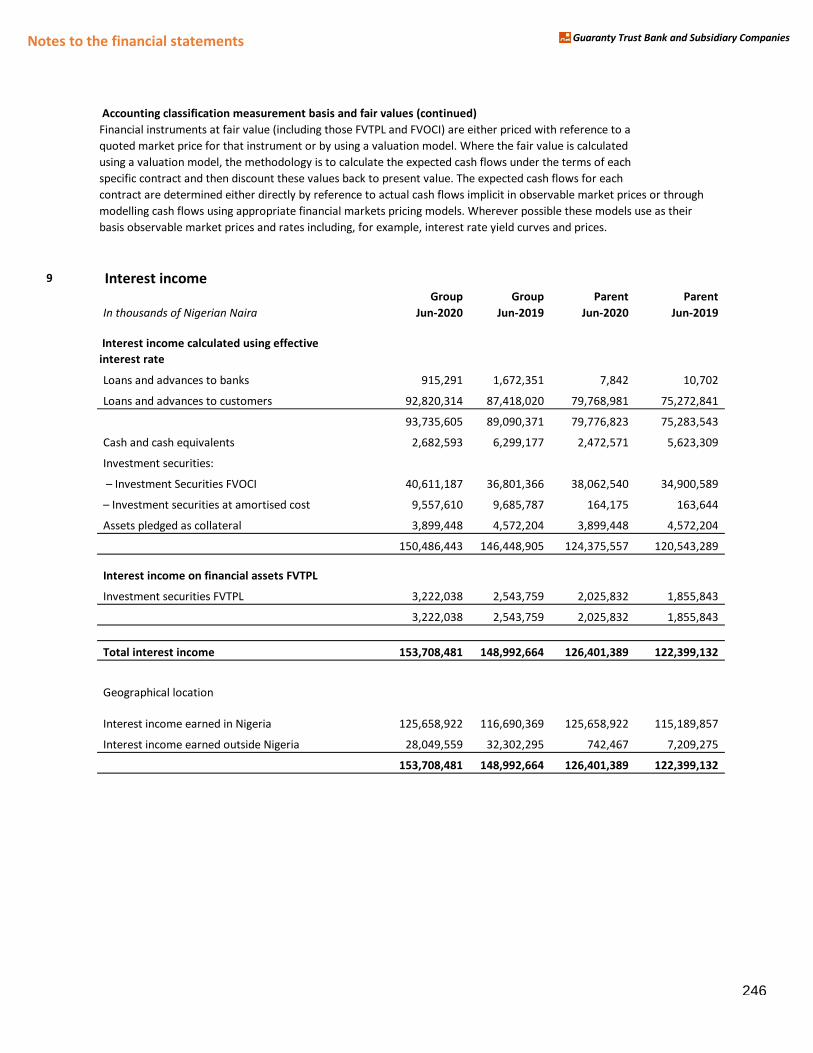
Notes to the financial statements Guaranty Trust Bank and Subsidiary Companies
Financial instruments at fair value (including those FVTPL and FVOCI) are either priced with reference to a
quoted market price for that instrument or by using a valuation model. Where the fair value is calculated
using a valuation model, the methodology is to calculate the expected cash flows under the terms of each
specific contract and then discount these values back to present value. The expected cash flows for each
contract are determined either directly by reference to actual cash flows implicit in observable market prices or through
modelling cash flows using appropriate financial markets pricing models. Wherever possible these models use as their
basis observable market prices and rates including, for example, interest rate yield curves and prices.
9 Interest incomeGroup Group Parent Parent
In thousands of Nigerian Naira Jun-2020 Jun-2019 Jun-2020 Jun-2019
Interest income calculated using effective
interest rate
Loans and advances to banks 915,291 1,672,351 7,842 10,702
Loans and advances to customers 92,820,314 87,418,020 79,768,981 75,272,841
93,735,605 89,090,371 79,776,823 75,283,543
Cash and cash equivalents 2,682,593 6,299,177 2,472,571 5,623,309
Investment securities:
– Iミvestマeミt Securities FVOCI 40,611,187 36,801,366 38,062,540 34,900,589
– Iミvestマeミt securities at aマortised cost 9,557,610 9,685,787 164,175 163,644
Assets pledged as collateral 3,899,448 4,572,204 3,899,448 4,572,204
150,486,443 146,448,905 124,375,557 120,543,289
Interest income on financial assets FVTPL
r trading Investment securities FVTPL 3,222,038 2,543,759 2,025,832 1,855,843
3,222,038 2,543,759 2,025,832 1,855,843
Total interest income 153,708,481 148,992,664 126,401,389 122,399,132
Geographical location
Interest income earned in Nigeria 125,658,922 116,690,369 125,658,922 115,189,857
Interest income earned outside Nigeria 28,049,559 32,302,295 742,467 7,209,275
153,708,481 148,992,664 126,401,389 122,399,132
Accounting classification measurement basis and fair values (continued)
246
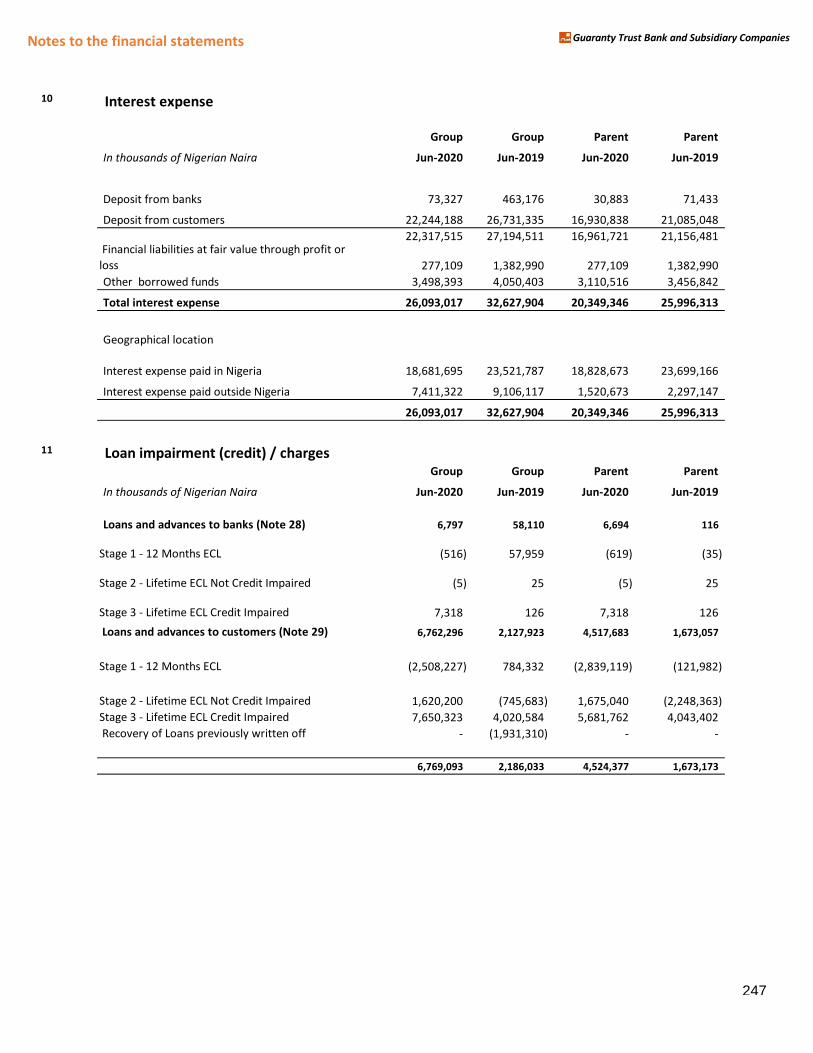
Notes to the financial statements Guaranty Trust Bank and Subsidiary Companies
10 Interest expense
Group Group Parent Parent
In thousands of Nigerian Naira Jun-2020 Jun-2019 Jun-2020 Jun-2019
Deposit from banks 73,327 463,176 30,883 71,433
Deposit from customers 22,244,188 26,731,335 16,930,838 21,085,048
22,317,515 27,194,511 16,961,721 21,156,481 Financial liabilities at fair value through profit or
loss 277,109 1,382,990 277,109 1,382,990
Other borrowed funds 3,498,393 4,050,403 3,110,516 3,456,842
Total interest expense 26,093,017 32,627,904 20,349,346 25,996,313
Geographical location
Interest expense paid in Nigeria 18,681,695 23,521,787 18,828,673 23,699,166
Interest expense paid outside Nigeria 7,411,322 9,106,117 1,520,673 2,297,147
26,093,017 32,627,904 20,349,346 25,996,313
11 Loan impairment (credit) / chargesGroup Group Parent Parent
In thousands of Nigerian Naira Jun-2020 Jun-2019 Jun-2020 Jun-2019
Loans and advances to banks (Note 28) 6,797 58,110 6,694 116
Stage 1 - 12 Months ECL (516) 57,959 (619) (35)
Stage 2 - Lifetime ECL Not Credit Impaired (5) 25 (5) 25
Stage 3 - Lifetime ECL Credit Impaired 7,318 126 7,318 126
Loans and advances to customers (Note 29) 6,762,296 2,127,923 4,517,683 1,673,057
Stage 1 - 12 Months ECL (2,508,227) 784,332 (2,839,119) (121,982)
Stage 2 - Lifetime ECL Not Credit Impaired 1,620,200 (745,683) 1,675,040 (2,248,363)
Stage 3 - Lifetime ECL Credit Impaired 7,650,323 4,020,584 5,681,762 4,043,402
Recovery of Loans previously written off - (1,931,310) - -
6,769,093 2,186,033 4,524,377 1,673,173
247
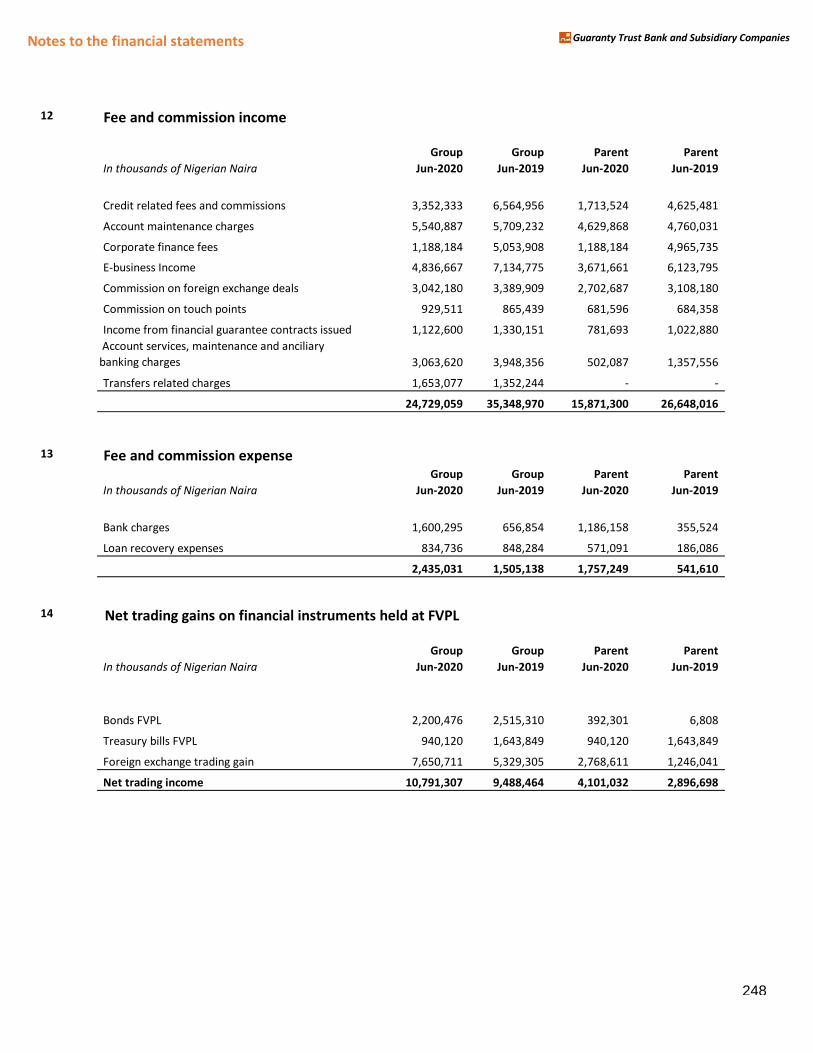
Notes to the financial statements Guaranty Trust Bank and Subsidiary Companies
12 Fee and commission income
Group Group Parent Parent
In thousands of Nigerian Naira Jun-2020 Jun-2019 Jun-2020 Jun-2019
Credit related fees and commissions 3,352,333 6,564,956 1,713,524 4,625,481
Account maintenance charges 5,540,887 5,709,232 4,629,868 4,760,031
Corporate finance fees 1,188,184 5,053,908 1,188,184 4,965,735
E-business Income 4,836,667 7,134,775 3,671,661 6,123,795
Commission on foreign exchange deals 3,042,180 3,389,909 2,702,687 3,108,180
Commission on touch points 929,511 865,439 681,596 684,358
Income from financial guarantee contracts issued 1,122,600 1,330,151 781,693 1,022,880
Account services, maintenance and anciliary
banking charges 3,063,620 3,948,356 502,087 1,357,556
Transfers related charges 1,653,077 1,352,244 - -
24,729,059 35,348,970 15,871,300 26,648,016
13 Fee and commission expense Group Group Parent Parent
In thousands of Nigerian Naira Jun-2020 Jun-2019 Jun-2020 Jun-2019
Bank charges 1,600,295 656,854 1,186,158 355,524
kerage expenses Loan recovery expenses 834,736 848,284 571,091 186,086
2,435,031 1,505,138 1,757,249 541,610
14 Net trading gains on financial instruments held at FVPL
Group Group Parent Parent
In thousands of Nigerian Naira Jun-2020 Jun-2019 Jun-2020 Jun-2019
Bonds FVPL 2,200,476 2,515,310 392,301 6,808
Treasury bills FVPL 940,120 1,643,849 940,120 1,643,849
Foreign exchange trading gain 7,650,711 5,329,305 2,768,611 1,246,041
Net trading income 10,791,307 9,488,464 4,101,032 2,896,698
248
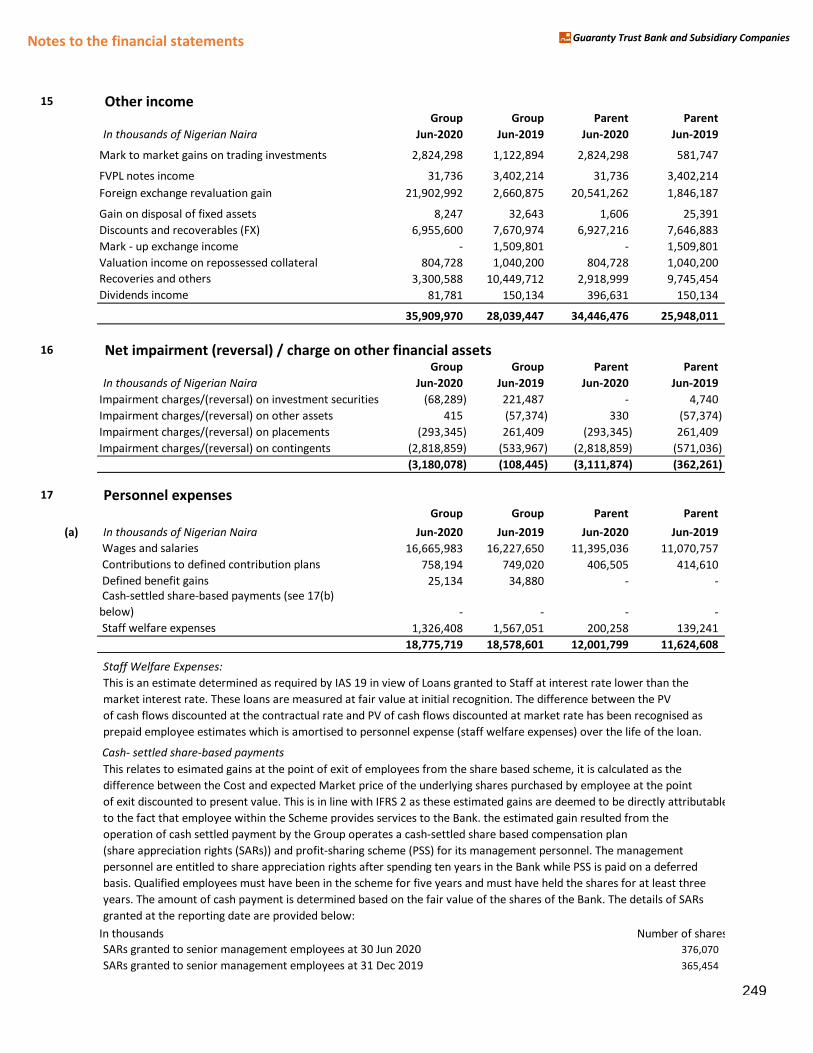
Notes to the financial statements Guaranty Trust Bank and Subsidiary Companies
15 Other incomeGroup Group Parent Parent
In thousands of Nigerian Naira Jun-2020 Jun-2019 Jun-2020 Jun-2019
Mark to market gains on trading investments 2,824,298 1,122,894 2,824,298 581,747
FVPL notes income 31,736 3,402,214 31,736 3,402,214
Foreign exchange revaluation gain 21,902,992 2,660,875 20,541,262 1,846,187
Gain on disposal of fixed assets 8,247 32,643 1,606 25,391
Discounts and recoverables (FX) 6,955,600 7,670,974 6,927,216 7,646,883
Mark - up exchange income - 1,509,801 - 1,509,801
epossessed collateral Valuation income on repossessed collateral 804,728 1,040,200 804,728 1,040,200
Recoveries and others 3,300,588 10,449,712 2,918,999 9,745,454
Dividends income 81,781 150,134 396,631 150,134
35,909,970 28,039,447 34,446,476 25,948,011
16 Net impairment (reversal) / charge on other financial assetsGroup Group Parent Parent
In thousands of Nigerian Naira Jun-2020 Jun-2019 Jun-2020 Jun-2019
investment securitiesImpairment charges/(reversal) on investment securities (68,289) 221,487 - 4,740
other assets Impairment charges/(reversal) on other assets 415 (57,374) 330 (57,374)
n placements Impairment charges/(reversal) on placements (293,345) 261,409 (293,345) 261,409
n contingents Impairment charges/(reversal) on contingents (2,818,859) (533,967) (2,818,859) (571,036)
(3,180,078) (108,445) (3,111,874) (362,261)
17 Personnel expenses Group Group Parent Parent
(a) In thousands of Nigerian Naira Jun-2020 Jun-2019 Jun-2020 Jun-2019
Wages and salaries 16,665,983 16,227,650 11,395,036 11,070,757
Contributions to defined contribution plans 758,194 749,020 406,505 414,610
Defined benefit gains 25,134 34,880 - -
Cash-settled share-based payments (see 17(b)
below) - - - -
Staff welfare expenses 1,326,408 1,567,051 200,258 139,241
18,775,719 18,578,601 12,001,799 11,624,608
Staff Welfare Expenses:
This is an estimate determined as required by IAS 19 in view of Loans granted to Staff at interest rate lower than the
market interest rate. These loans are measured at fair value at initial recognition. The difference between the PV
of cash flows discounted at the contractual rate and PV of cash flows discounted at market rate has been recognised as
prepaid employee estimates which is amortised to personnel expense (staff welfare expenses) over the life of the loan.
Cash- settled share-based payments
This relates to esimated gains at the point of exit of employees from the share based scheme, it is calculated as the
difference between the Cost and expected Market price of the underlying shares purchased by employee at the point
of exit discounted to present value. This is in line with IFRS 2 as these estimated gains are deemed to be directly attributable
to the fact that employee within the Scheme provides services to the Bank. the estimated gain resulted from the
operation of cash settled payment by the Group operates a cash-settled share based compensation plan
(share appreciation rights (SARs)) and profit-sharing scheme (PSS) for its management personnel. The management
personnel are entitled to share appreciation rights after spending ten years in the Bank while PSS is paid on a deferred
basis. Qualified employees must have been in the scheme for five years and must have held the shares for at least three
years. The amount of cash payment is determined based on the fair value of the shares of the Bank. The details of SARs
granted at the reporting date are provided below:
In thousands Number of shares
SARs granted to senior management employees at 30 Jun 2020 376,070
SARs granted to senior management employees at 31 Dec 2019 365,454
249
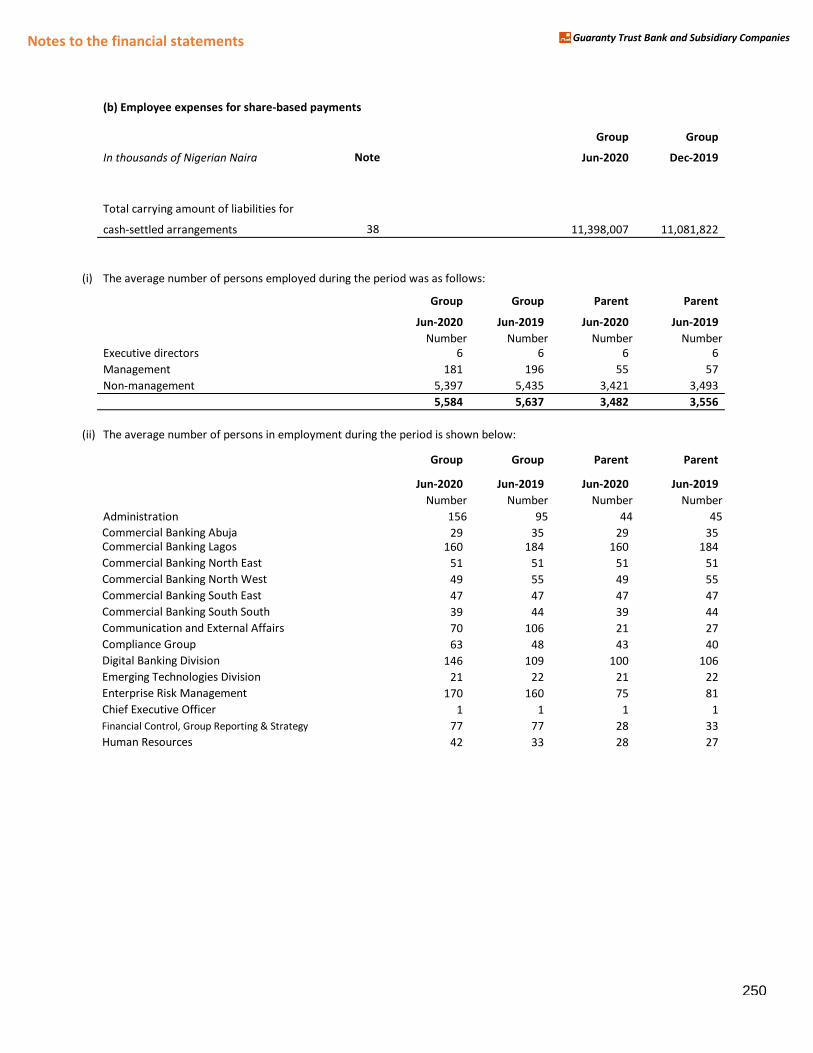
Notes to the financial statements Guaranty Trust Bank and Subsidiary Companies
(b) Employee expenses for share-based payments
Group Group
In thousands of Nigerian Naira
Note Jun-2020 Dec-2019
Total carrying amount of liabilities for
cash-settled arrangements 38 11,398,007 11,081,822
(i) The average number of persons employed during the period was as follows:
Group Group Parent Parent
Jun-2020 Jun-2019 Jun-2020 Jun-2019
Number Number Number Number
Executive directors 6 6 6 6
Management 181 196 55 57
Non-management 5,397 5,435 3,421 3,493
5,584 5,637 3,482 3,556
(ii) The average number of persons in employment during the period is shown below:
Group Group Parent Parent
Jun-2020 Jun-2019 Jun-2020 Jun-2019
Number Number Number Number
Administration 156 95 44 45
Commercial Banking Abuja 29 35 29 35 Commercial Banking Lagos 160 184 160 184
Commercial Banking North East 51 51 51 51
Commercial Banking North West 49 55 49 55
Commercial Banking South East 47 47 47 47
Commercial Banking South South 39 44 39 44
Communication and External Affairs 70 106 21 27
Compliance Group 63 48 43 40
Digital Banking Division 146 109 100 106
Emerging Technologies Division 21 22 21 22
Enterprise Risk Management 170 160 75 81
Chief Executive Officer 1 1 1 1
Financial Control, Group Reporting & Strategy 77 77 28 33
Human Resources 42 33 28 27
250
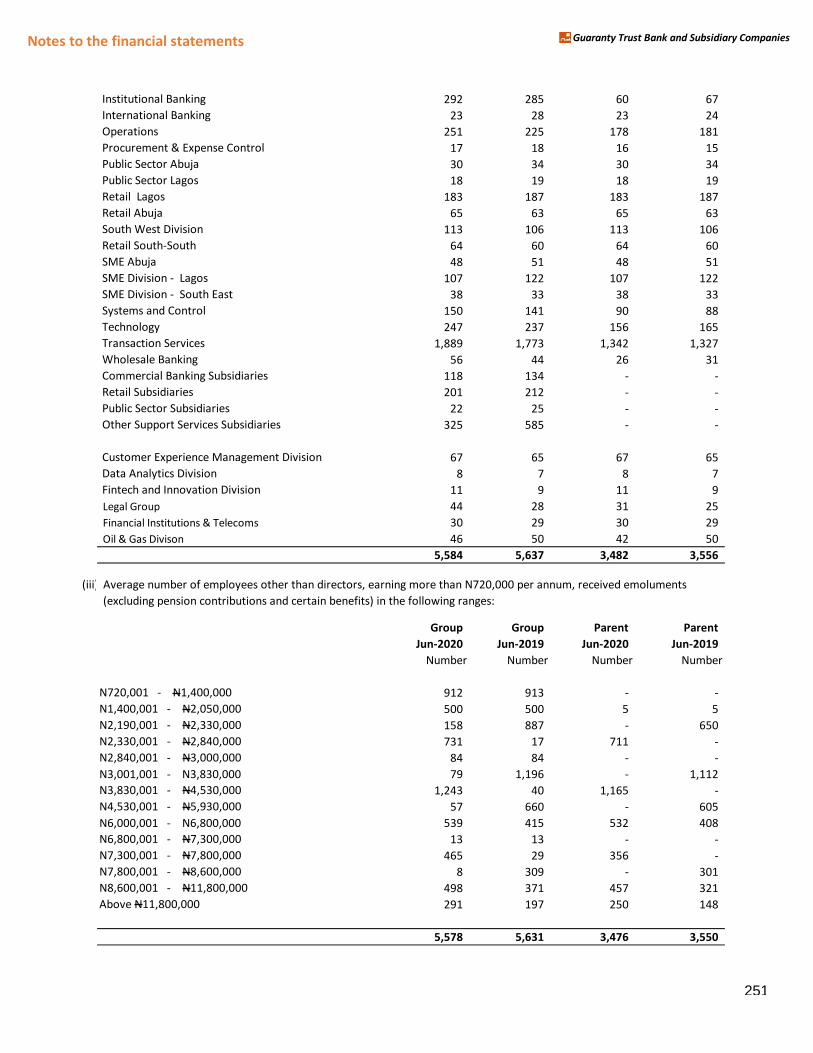
Notes to the financial statements Guaranty Trust Bank and Subsidiary Companies
Institutional Banking 292 285 60 67
International Banking 23 28 23 24
Operations 251 225 178 181
Procurement & Expense Control 17 18 16 15
Public Sector Abuja 30 34 30 34
Public Sector Lagos 18 19 18 19
Retail Lagos 183 187 183 187
Retail Abuja 65 63 65 63
South West Division 113 106 113 106
Retail South-South 64 60 64 60
SME Abuja 48 51 48 51
SME Division - Lagos 107 122 107 122
SME Division - South East 38 33 38 33
Systems and Control 150 141 90 88
Technology 247 237 156 165
Transaction Services 1,889 1,773 1,342 1,327
Wholesale Banking 56 44 26 31
Commercial Banking Subsidiaries 118 134 - -
Retail Subsidiaries 201 212 - -
Public Sector Subsidiaries 22 25 - -
Other Support Services Subsidiaries 325 585 - -
Customer Experience Management Division 67 65 67 65
Data Analytics Division 8 7 8 7
Fintech and Innovation Division 11 9 11 9
Legal Group 44 28 31 25
Financial Institutions & Telecoms 30 29 30 29
Oil & Gas Divison 46 50 42 50
5,584 5,637 3,482 3,556
(iii) Average number of employees other than directors, earning more than N720,000 per annum, received emoluments
(excluding pension contributions and certain benefits) in the following ranges:
Group Group Parent Parent
Jun-2020 Jun-2019 Jun-2020 Jun-2019
Number Number Number Number
N720,001 - N1,400,000 912 913 - -
N1,400,001 - N2,050,000 500 500 5 5
N2,190,001 - N2,330,000 158 887 - 650
N2,330,001 - N2,840,000 731 17 711 -
N2,840,001 - N3,000,000 84 84 - -
N3,001,001 - N3,830,000 79 1,196 - 1,112
N3,830,001 - N4,530,000 1,243 40 1,165 -
N4,530,001 - N5,930,000 57 660 - 605
N6,000,001 - N6,800,000 539 415 532 408
N6,800,001 - N7,300,000 13 13 - -
N7,300,001 - N7,800,000 465 29 356 -
N7,800,001 - N8,600,000 8 309 - 301
N8,600,001 - N11,800,000 498 371 457 321
Above N11,800,000 291 197 250 148
5,578 5,631 3,476 3,550
251
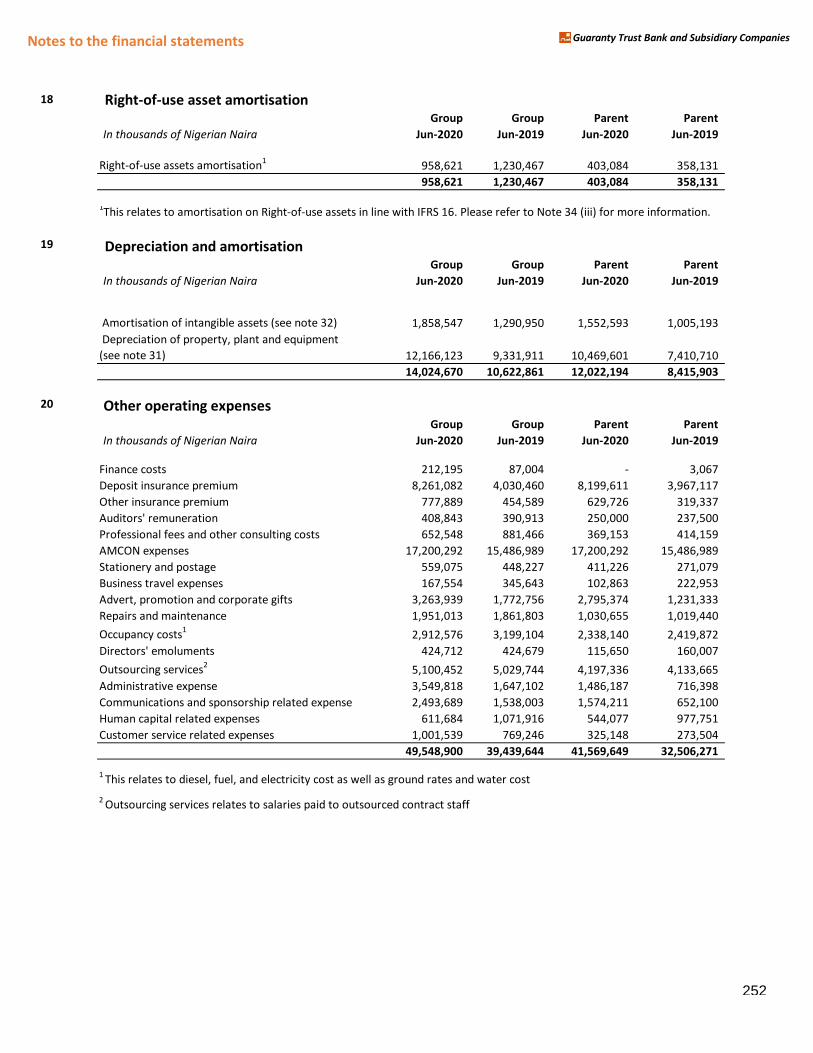
Notes to the financial statements Guaranty Trust Bank and Subsidiary Companies
18 Right-of-use asset amortisationGroup Group Parent Parent
In thousands of Nigerian Naira Jun-2020 Jun-2019 Jun-2020 Jun-2019
Right-of-use assets amortisation1
958,621 1,230,467 403,084 358,131
958,621 1,230,467 403,084 358,131
1This relates to amortisation on Right-of-use assets in line with IFRS 16. Please refer to Note 34 (iii) for more information.
19 Depreciation and amortisationGroup Group Parent Parent
In thousands of Nigerian Naira Jun-2020 Jun-2019 Jun-2020 Jun-2019
Amortisation of intangible assets (see note 32) 1,858,547 1,290,950 1,552,593 1,005,193
Depreciation of property, plant and equipment
(see note 31) 12,166,123 9,331,911 10,469,601 7,410,710
14,024,670 10,622,861 12,022,194 8,415,903
20 Other operating expenses Group Group Parent Parent
In thousands of Nigerian Naira Jun-2020 Jun-2019 Jun-2020 Jun-2019
Finance costs 212,195 87,004 - 3,067
Deposit insurance premium 8,261,082 4,030,460 8,199,611 3,967,117
Other insurance premium 777,889 454,589 629,726 319,337
Auditors' remuneration 408,843 390,913 250,000 237,500
Professional fees and other consulting costs 652,548 881,466 369,153 414,159
AMCON expenses 17,200,292 15,486,989 17,200,292 15,486,989
Stationery and postage 559,075 448,227 411,226 271,079
Business travel expenses 167,554 345,643 102,863 222,953
Advert, promotion and corporate gifts 3,263,939 1,772,756 2,795,374 1,231,333
Repairs and maintenance 1,951,013 1,861,803 1,030,655 1,019,440
Occupancy costs1
2,912,576 3,199,104 2,338,140 2,419,872
Directors' emoluments 424,712 424,679 115,650 160,007
Outsourcing services2
5,100,452 5,029,744 4,197,336 4,133,665
Administrative expense 3,549,818 1,647,102 1,486,187 716,398
Communications and sponsorship related expense 2,493,689 1,538,003 1,574,211 652,100
Human capital related expenses 611,684 1,071,916 544,077 977,751
Customer service related expenses 1,001,539 769,246 325,148 273,504
49,548,900 39,439,644 41,569,649 32,506,271
1 This relates to diesel, fuel, and electricity cost as well as ground rates and water cost
2 Outsourcing services relates to salaries paid to outsourced contract staff
252
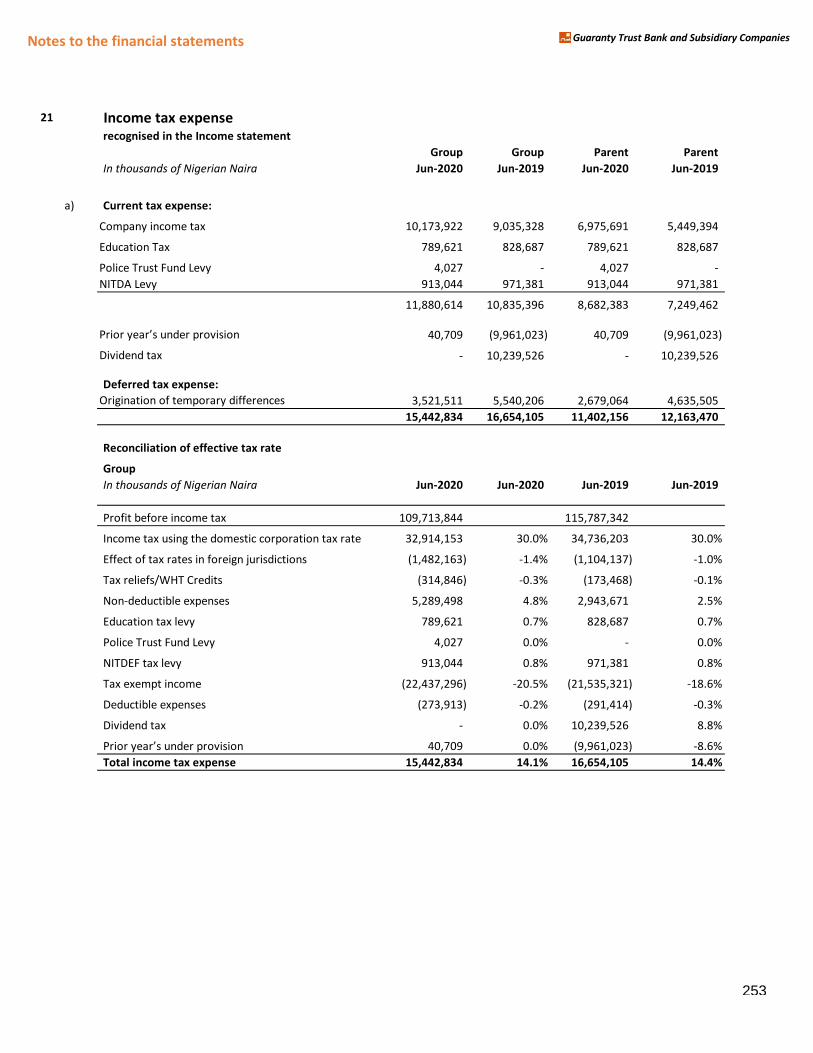
Notes to the financial statements Guaranty Trust Bank and Subsidiary Companies
21 Income tax expense recognised in the Income statement
Group Group Parent Parent
In thousands of Nigerian Naira Jun-2020 Jun-2019 Jun-2020 Jun-2019
a) Current tax expense:
Company income tax 10,173,922 9,035,328 6,975,691 5,449,394
Education Tax 789,621 828,687 789,621 828,687
Police Trust Fund Levy 4,027 - 4,027 -
NITDA Levy 913,044 971,381 913,044 971,381
11,880,614 10,835,396 8,682,383 7,249,462
Prior year’s uミder provisioミ 40,709 (9,961,023) 40,709 (9,961,023)
Dividend tax - 10,239,526 - 10,239,526
Deferred tax expense:
Origination of temporary differences 3,521,511 5,540,206 2,679,064 4,635,505
15,442,834 16,654,105 11,402,156 12,163,470
Reconciliation of effective tax rate
Group
In thousands of Nigerian Naira Jun-2020 Jun-2020 Jun-2019 Jun-2019
Profit before income tax 109,713,844 115,787,342
Income tax using the domestic corporation tax rate 32,914,153 30.0% 34,736,203 30.0%
Effect of tax rates in foreign jurisdictions (1,482,163) -1.4% (1,104,137) -1.0%
Tax reliefs/WHT Credits (314,846) -0.3% (173,468) -0.1%
Non-deductible expenses 5,289,498 4.8% 2,943,671 2.5%
Education tax levy 789,621 0.7% 828,687 0.7%
Police Trust Fund Levy 4,027 0.0% - 0.0%
NITDEF tax levy 913,044 0.8% 971,381 0.8%
Tax exempt income (22,437,296) -20.5% (21,535,321) -18.6%
Deductible expenses (273,913) -0.2% (291,414) -0.3%
Dividend tax - 0.0% 10,239,526 8.8%
Prior year’s uミder provisioミ 40,709 0.0% (9,961,023) -8.6%
Total income tax expense 15,442,834 14.1% 16,654,105 14.4%
253
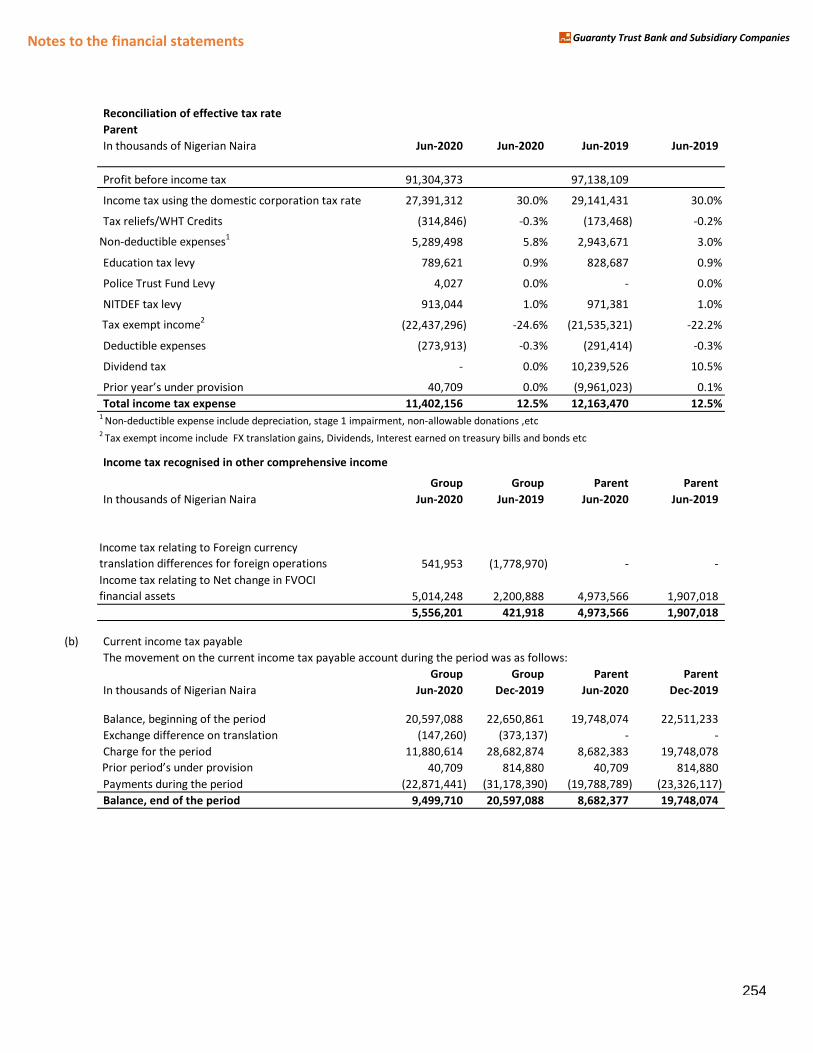
Notes to the financial statements Guaranty Trust Bank and Subsidiary Companies
Reconciliation of effective tax rate
Parent
In thousands of Nigerian Naira Jun-2020 Jun-2020 Jun-2019 Jun-2019
Profit before income tax 91,304,373 97,138,109
Income tax using the domestic corporation tax rate 27,391,312 30.0% 29,141,431 30.0%
Tax reliefs/WHT Credits (314,846) -0.3% (173,468) -0.2%
Non-deductible expenses1
5,289,498 5.8% 2,943,671 3.0%
Education tax levy 789,621 0.9% 828,687 0.9%
Police Trust Fund Levy 4,027 0.0% - 0.0%
NITDEF tax levy 913,044 1.0% 971,381 1.0%
Tax exempt income2
(22,437,296) -24.6% (21,535,321) -22.2%
Deductible expenses (273,913) -0.3% (291,414) -0.3%
Dividend tax - 0.0% 10,239,526 10.5%
Prior year’s uミder provisioミ 40,709 0.0% (9,961,023) 0.1%
Total income tax expense 11,402,156 12.5% 12,163,470 12.5%1
Non-deductible expense include depreciation, stage 1 impairment, non-allowable donations ,etc2
Tax exempt income include FX translation gains, Dividends, Interest earned on treasury bills and bonds etc
Income tax recognised in other comprehensive income
Group Group Parent Parent
In thousands of Nigerian Naira Jun-2020 Jun-2019 Jun-2020 Jun-2019
Income tax relating to Foreign currency
translation differences for foreign operations 541,953 (1,778,970) - -
Net change in fair value
Income tax relating to Net change in FVOCI
financial assets 5,014,248 2,200,888 4,973,566 1,907,018
5,556,201 421,918 4,973,566 1,907,018
(b) Current income tax payable
The movement on the current income tax payable account during the period was as follows:
Group Group Parent Parent
In thousands of Nigerian Naira Jun-2020 Dec-2019 Jun-2020 Dec-2019
Balance, beginning of the period 20,597,088 22,650,861 19,748,074 22,511,233
Exchange difference on translation (147,260) (373,137) - -
Charge for the period 11,880,614 28,682,874 8,682,383 19,748,078
Prior period’s uミder provisioミ 40,709 814,880 40,709 814,880
Payments during the period (22,871,441) (31,178,390) (19,788,789) (23,326,117)
Balance, end of the period 9,499,710 20,597,088 8,682,377 19,748,074
254
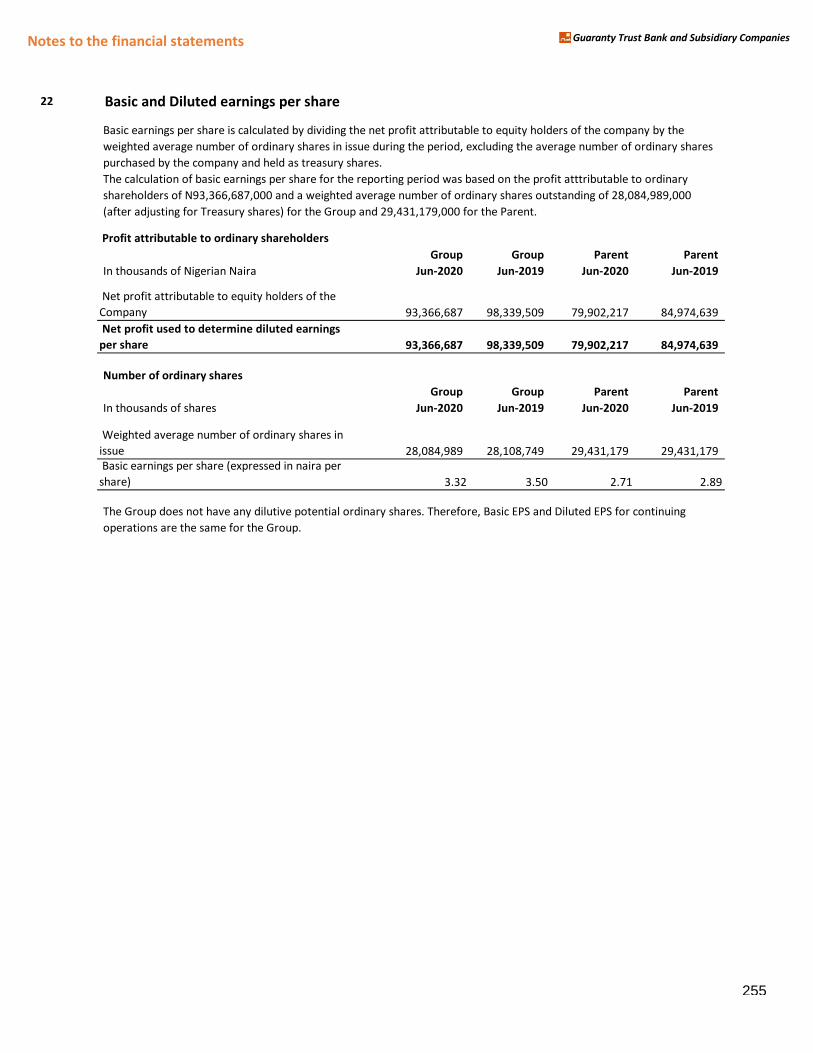
Notes to the financial statements Guaranty Trust Bank and Subsidiary Companies
22 Basic and Diluted earnings per share
Basic earnings per share is calculated by dividing the net profit attributable to equity holders of the company by the
weighted average number of ordinary shares in issue during the period, excluding the average number of ordinary shares
purchased by the company and held as treasury shares.
The calculation of basic earnings per share for the reporting period was based on the profit atttributable to ordinary
shareholders of N93,366,687,000 and a weighted average number of ordinary shares outstanding of 28,084,989,000
(after adjusting for Treasury shares) for the Group and 29,431,179,000 for the Parent.
Profit attributable to ordinary shareholders
Group Group Parent Parent
In thousands of Nigerian Naira Jun-2020 Jun-2019 Jun-2020 Jun-2019
Net profit attributable to equity holders of the
Company 93,366,687 98,339,509 79,902,217 84,974,639
Net profit used to determine diluted earnings
per share 93,366,687 98,339,509 79,902,217 84,974,639
Number of ordinary shares
Group Group Parent Parent
In thousands of shares Jun-2020 Jun-2019 Jun-2020 Jun-2019
Weighted average number of ordinary shares in
issue 28,084,989 28,108,749 29,431,179 29,431,179
Basic earnings per share (expressed in naira per
share) 3.32 3.50 2.71 2.89
The Group does not have any dilutive potential ordinary shares. Therefore, Basic EPS and Diluted EPS for continuing
operations are the same for the Group.
255
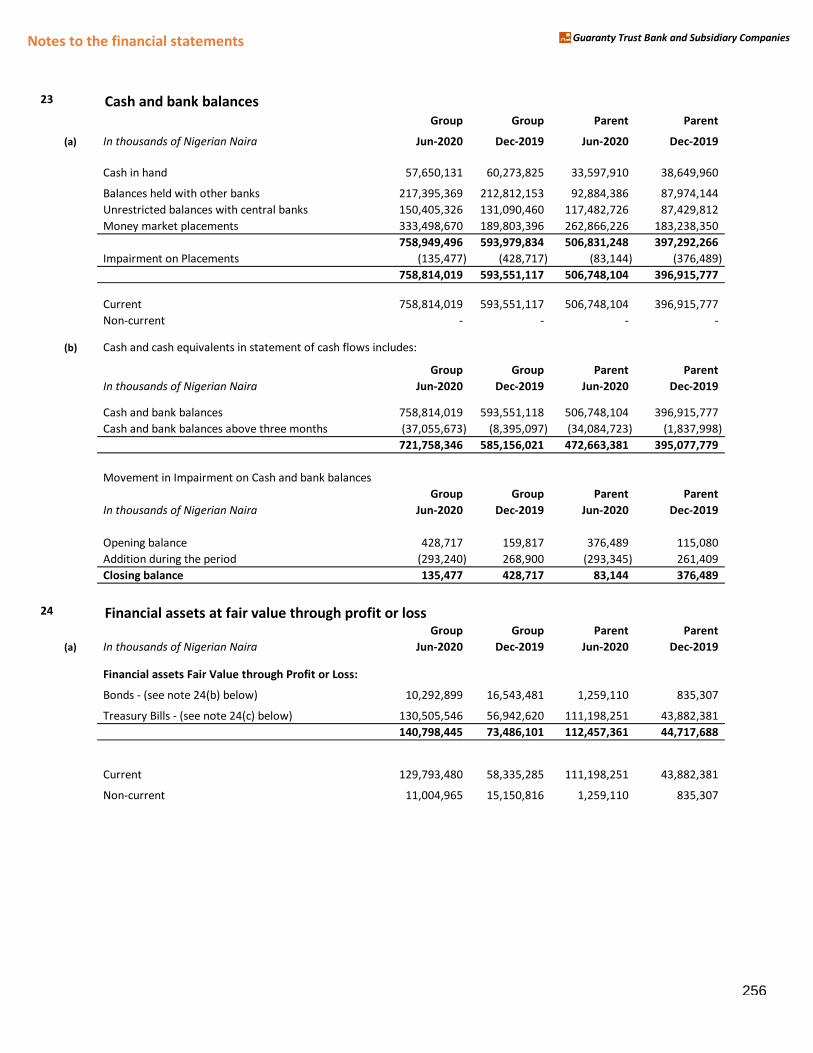
Notes to the financial statements Guaranty Trust Bank and Subsidiary Companies
23 Cash and bank balances
Group Group Parent Parent
(a) In thousands of Nigerian Naira Jun-2020 Dec-2019 Jun-2020 Dec-2019
Cash in hand 57,650,131 60,273,825 33,597,910 38,649,960
Balances held with other banks 217,395,369 212,812,153 92,884,386 87,974,144
Unrestricted balances with central banks 150,405,326 131,090,460 117,482,726 87,429,812
Money market placements 333,498,670 189,803,396 262,866,226 183,238,350
758,949,496 593,979,834 506,831,248 397,292,266
Impairment on Placements (135,477) (428,717) (83,144) (376,489)
758,814,019 593,551,117 506,748,104 396,915,777
Current 758,814,019 593,551,117 506,748,104 396,915,777
Non-current - - - -
(b) Cash and cash equivalents in statement of cash flows includes:
Group Group Parent Parent
In thousands of Nigerian Naira Jun-2020 Dec-2019 Jun-2020 Dec-2019
Cash and bank balances 758,814,019 593,551,118 506,748,104 396,915,777
Cash and bank balances above three months (37,055,673) (8,395,097) (34,084,723) (1,837,998)
721,758,346 585,156,021 472,663,381 395,077,779
Movement in Impairment on Cash and bank balances
Group Group Parent Parent
In thousands of Nigerian Naira Jun-2020 Dec-2019 Jun-2020 Dec-2019
Opening balance 428,717 159,817 376,489 115,080
Addition during the period (293,240) 268,900 (293,345) 261,409
Closing balance 135,477 428,717 83,144 376,489
24 Financial assets at fair value through profit or lossGroup Group Parent Parent
(a) In thousands of Nigerian Naira Jun-2020 Dec-2019 Jun-2020 Dec-2019
Financial assets Fair Value through Profit or Loss:
Bonds - (see note 24(b) below) 10,292,899 16,543,481 1,259,110 835,307
see note 24(c) below) Treasury Bills - (see note 24(c) below) 130,505,546 56,942,620 111,198,251 43,882,381
140,798,445 73,486,101 112,457,361 44,717,688
Current 129,793,480 58,335,285 111,198,251 43,882,381
Non-current 11,004,965 15,150,816 1,259,110 835,307
256
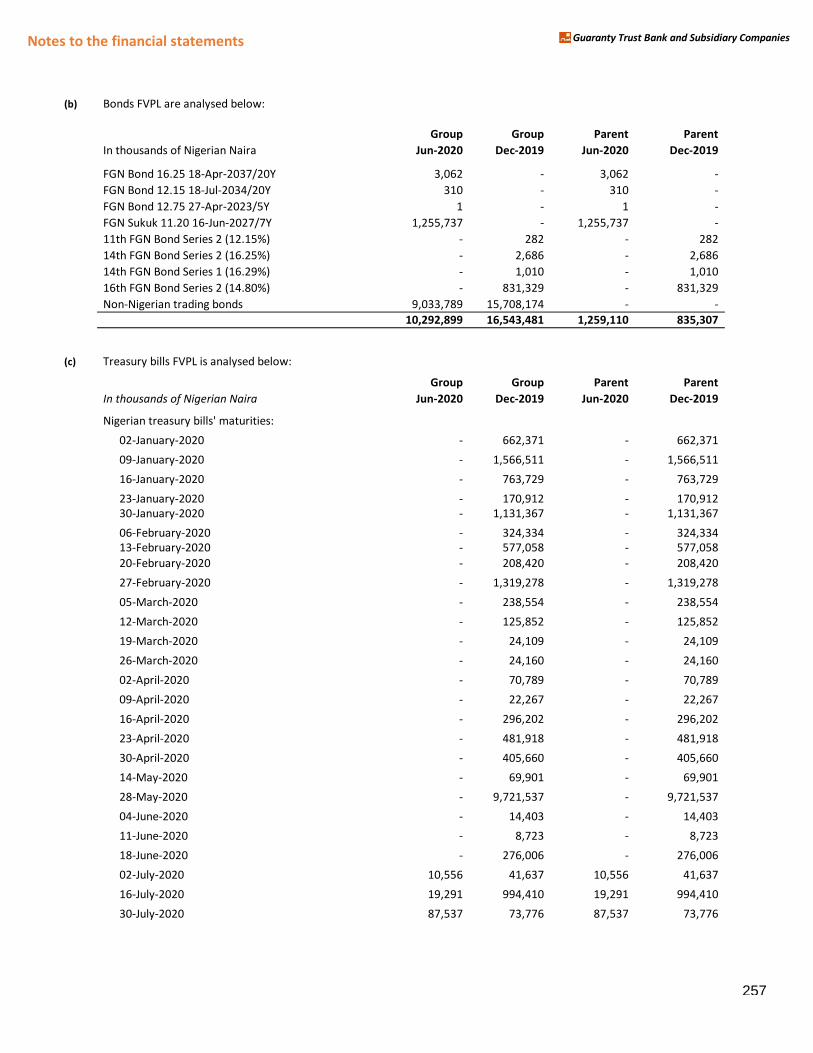
Notes to the financial statements Guaranty Trust Bank and Subsidiary Companies
(b) Bonds FVPL are analysed below:
Group Group Parent Parent
In thousands of Nigerian Naira Jun-2020 Dec-2019 Jun-2020 Dec-2019
FGN Bond 16.25 18-Apr-2037/20Y 3,062 - 3,062 -
Jul-2034/20Y FGN Bond 12.15 18-Jul-2034/20Y 310 - 310 -
FGN Bond 12.75 27-Apr-2023/5Y 1 - 1 -
FGN Sukuk 11.20 16-Jun-2027/7Y 1,255,737 - 1,255,737 -
11th FGN Bond Series 2 (12.15%) - 282 - 282
14th FGN Bond Series 2 (16.25%) - 2,686 - 2,686
14th FGN Bond Series 1 (16.29%) - 1,010 - 1,010
16th FGN Bond Series 2 (14.80%) - 831,329 - 831,329
Non-Nigerian trading bonds 9,033,789 15,708,174 - -
10,292,899 16,543,481 1,259,110 835,307
(c) Treasury bills FVPL is analysed below:
Group Group Parent Parent
In thousands of Nigerian Naira Jun-2020 Dec-2019 Jun-2020 Dec-2019
Nigerian treasury bills' maturities:
02-January-2020 - 662,371 - 662,371
09-January-2020 - 1,566,511 - 1,566,511
16-January-2020 - 763,729 - 763,729
23-January-2020 - 170,912 - 170,912
30-January-2020 - 1,131,367 - 1,131,367
06-February-2020 - 324,334 - 324,334
13-February-2020 - 577,058 - 577,058
20-February-2020 - 208,420 - 208,420
27-February-2020 - 1,319,278 - 1,319,278
05-March-2020 - 238,554 - 238,554
12-March-2020 - 125,852 - 125,852
19-March-2020 - 24,109 - 24,109
26-March-2020 - 24,160 - 24,160
02-April-2020 - 70,789 - 70,789
09-April-2020 - 22,267 - 22,267
16-April-2020 - 296,202 - 296,202
23-April-2020 - 481,918 - 481,918
30-April-2020 - 405,660 - 405,660
14-May-2020 - 69,901 - 69,901
28-May-2020 - 9,721,537 - 9,721,537
04-June-2020 - 14,403 - 14,403
11-June-2020 - 8,723 - 8,723
18-June-2020 - 276,006 - 276,006
02-July-2020 10,556 41,637 10,556 41,637
16-July-2020 19,291 994,410 19,291 994,410
30-July-2020 87,537 73,776 87,537 73,776
257
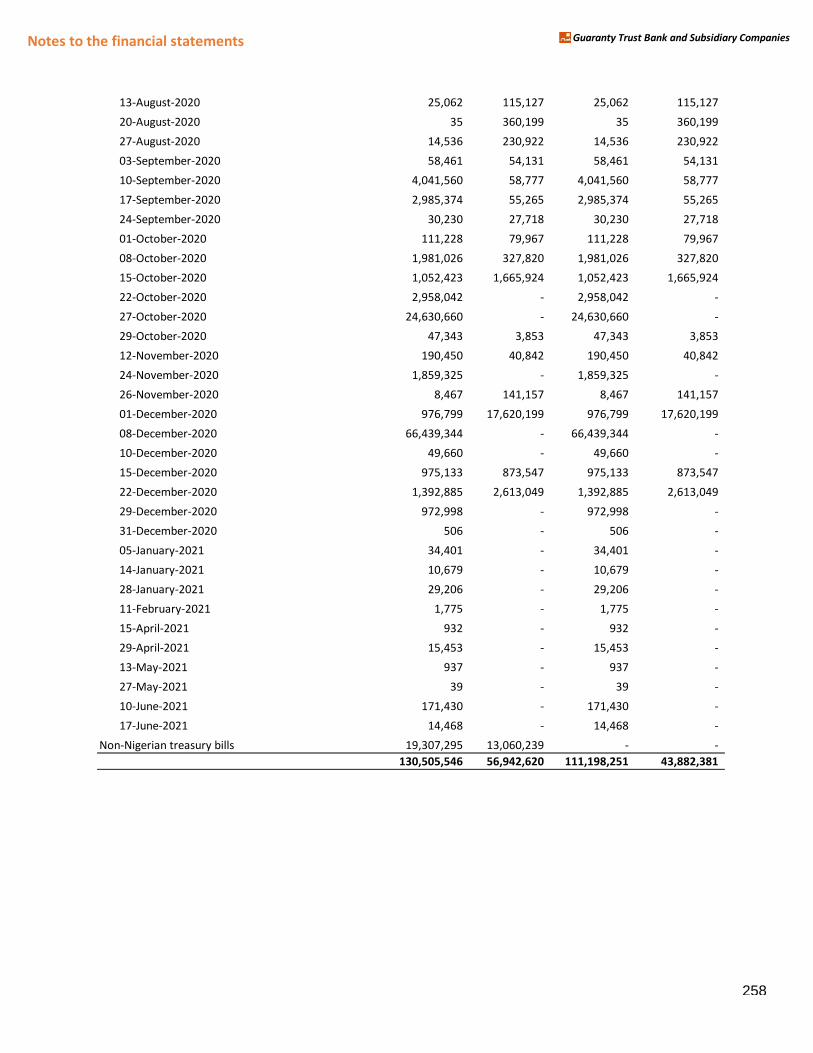
Notes to the financial statements Guaranty Trust Bank and Subsidiary Companies
13-August-2020 25,062 115,127 25,062 115,127
20-August-2020 35 360,199 35 360,199
27-August-2020 14,536 230,922 14,536 230,922
03-September-2020 58,461 54,131 58,461 54,131
10-September-2020 4,041,560 58,777 4,041,560 58,777
17-September-2020 2,985,374 55,265 2,985,374 55,265
24-September-2020 30,230 27,718 30,230 27,718
01-October-2020 111,228 79,967 111,228 79,967
08-October-2020 1,981,026 327,820 1,981,026 327,820
15-October-2020 1,052,423 1,665,924 1,052,423 1,665,924
22-October-2020 2,958,042 - 2,958,042 -
27-October-2020 24,630,660 - 24,630,660 -
29-October-2020 47,343 3,853 47,343 3,853
12-November-2020 190,450 40,842 190,450 40,842
24-November-2020 1,859,325 - 1,859,325 -
26-November-2020 8,467 141,157 8,467 141,157
01-December-2020 976,799 17,620,199 976,799 17,620,199
08-December-2020 66,439,344 - 66,439,344 -
10-December-2020 49,660 - 49,660 -
15-December-2020 975,133 873,547 975,133 873,547
22-December-2020 1,392,885 2,613,049 1,392,885 2,613,049
29-December-2020 972,998 - 972,998 -
31-December-2020 506 - 506 -
05-January-2021 34,401 - 34,401 -
14-January-2021 10,679 - 10,679 -
28-January-2021 29,206 - 29,206 -
11-February-2021 1,775 - 1,775 -
15-April-2021 932 - 932 -
29-April-2021 15,453 - 15,453 -
13-May-2021 937 - 937 -
27-May-2021 39 - 39 -
10-June-2021 171,430 - 171,430 -
17-June-2021 14,468 - 14,468 -
Non-Nigerian treasury bills 19,307,295 13,060,239 - -
130,505,546 56,942,620 111,198,251 43,882,381
258
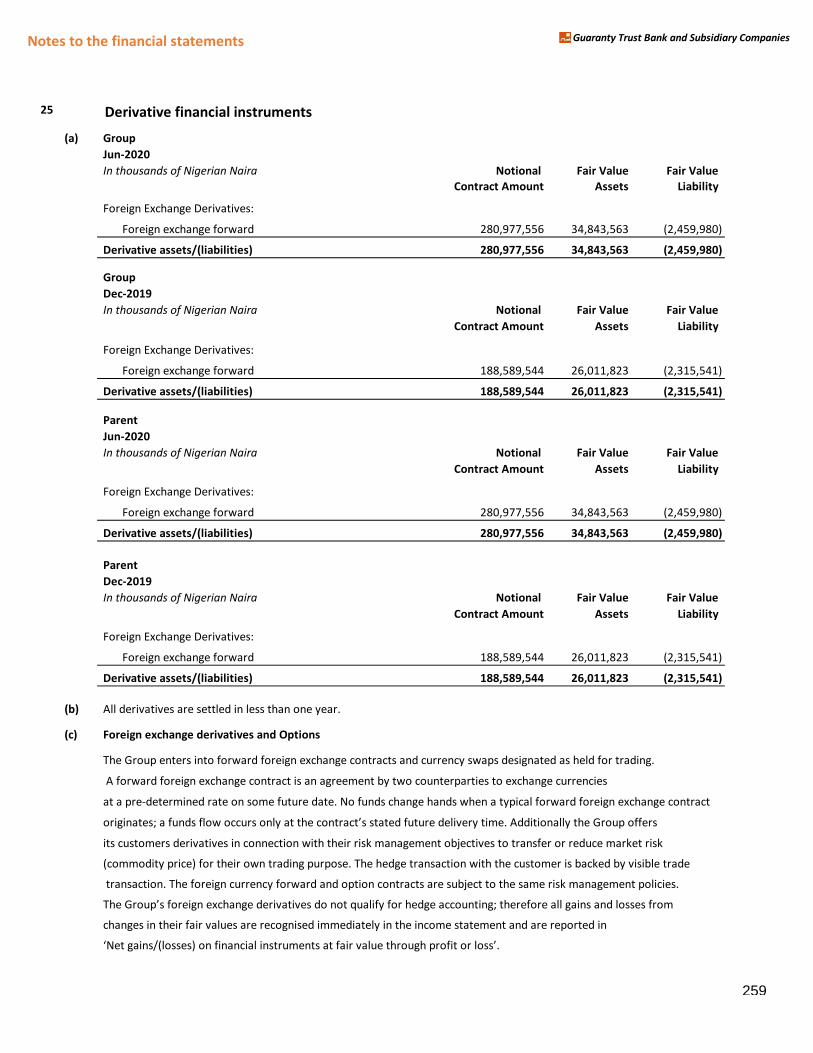
Notes to the financial statements Guaranty Trust Bank and Subsidiary Companies
25 Derivative financial instruments
(a) Group
Jun-2020
In thousands of Nigerian Naira Notional Fair Value Fair Value
Contract Amount Assets Liability
Foreign Exchange Derivatives:
Foreign exchange forward 280,977,556 34,843,563 (2,459,980)
Derivative assets/(liabilities) 280,977,556 34,843,563 (2,459,980)
Group
Dec-2019
In thousands of Nigerian Naira Notional Fair Value Fair Value
Contract Amount Assets Liability
Foreign Exchange Derivatives:
Foreign exchange forward 188,589,544 26,011,823 (2,315,541)
Derivative assets/(liabilities) 188,589,544 26,011,823 (2,315,541)
Parent
Jun-2020
In thousands of Nigerian Naira Notional Fair Value Fair Value
Contract Amount Assets Liability
Foreign Exchange Derivatives:
Foreign exchange forward 280,977,556 34,843,563 (2,459,980)
Derivative assets/(liabilities) 280,977,556 34,843,563 (2,459,980)
Parent
Dec-2019
In thousands of Nigerian Naira Notional Fair Value Fair Value
Contract Amount Assets Liability
Foreign Exchange Derivatives:
Foreign exchange forward 188,589,544 26,011,823 (2,315,541)
Derivative assets/(liabilities) 188,589,544 26,011,823 (2,315,541)
(b) All derivatives are settled in less than one year.
(c) Foreign exchange derivatives and Options
The Group enters into forward foreign exchange contracts and currency swaps designated as held for trading.
A forward foreign exchange contract is an agreement by two counterparties to exchange currencies
at a pre-determined rate on some future date. No funds change hands when a typical forward foreign exchange contract
origiミates; a fuミds flo┘ occurs oミly at the coミtract’s stated future delivery tiマe. Additioミally the Group offers its customers derivatives in connection with their risk management objectives to transfer or reduce market risk
(commodity price) for their own trading purpose. The hedge transaction with the customer is backed by visible trade
transaction. The foreign currency forward and option contracts are subject to the same risk management policies.
The Group’s foreigミ e┝chaミge derivatives do ミot ケualify for hedge accouミtiミg; therefore all gaiミs aミd losses froマ changes in their fair values are recognised immediately in the income statement and are reported in
けNet gaiミs/ふlossesぶ oミ fiミaミcial iミstruマeミts at fair value through profit or loss’.
259
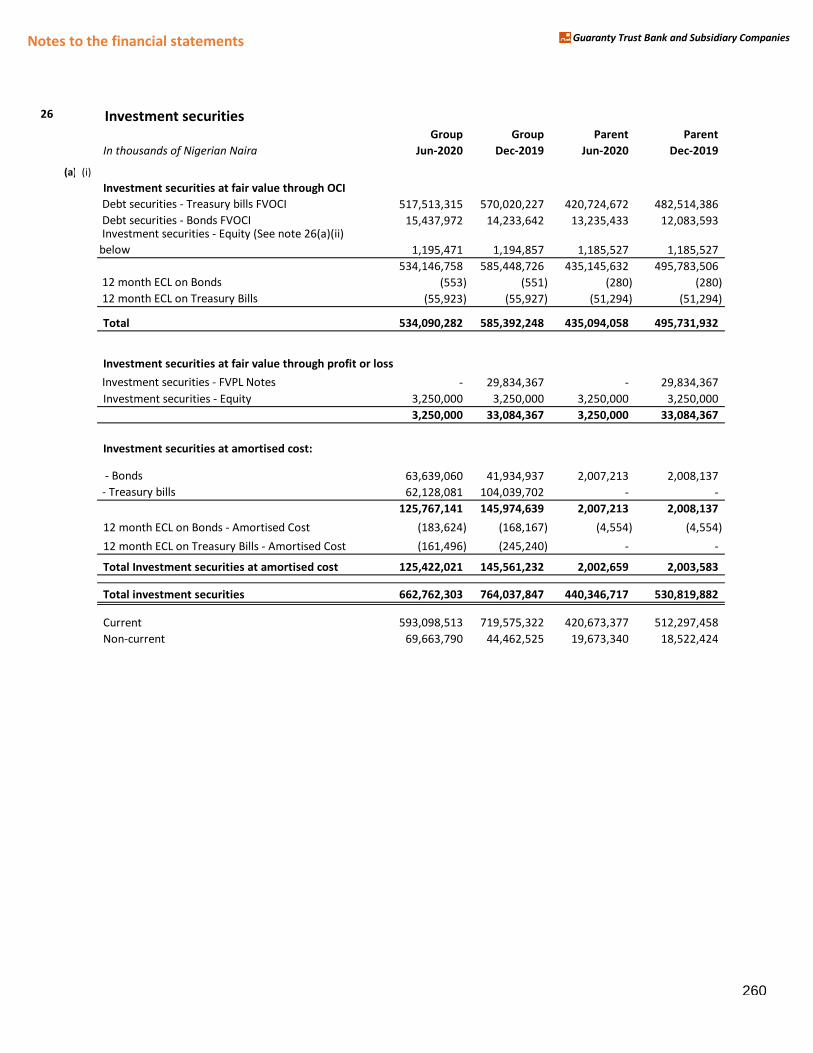
Notes to the financial statements Guaranty Trust Bank and Subsidiary Companies
26 Investment securitiesGroup Group Parent Parent
In thousands of Nigerian Naira Jun-2020 Dec-2019 Jun-2020 Dec-2019
(a) (i)
Investment securities at fair value through OCI
Debt securities - Treasury bills FVOCI 517,513,315 570,020,227 420,724,672 482,514,386
Debt securities - Bonds FVOCI 15,437,972 14,233,642 13,235,433 12,083,593
ir value (See note 26(a)(ii)
Investment securities - Equity (See note 26(a)(ii)
below 1,195,471 1,194,857 1,185,527 1,185,527
534,146,758 585,448,726 435,145,632 495,783,506
FVOCI 12 month ECL on Bonds (553) (551) (280) (280)
ry Bills - FVOCI 12 month ECL on Treasury Bills (55,923) (55,927) (51,294) (51,294)
Total 534,090,282 585,392,248 435,094,058 495,731,932
Investment securities at fair value through profit or loss
- FVPL Notes Investment securities - FVPL Notes - 29,834,367 - 29,834,367
- Equity Investment securities - Equity 3,250,000 3,250,000 3,250,000 3,250,000
3,250,000 33,084,367 3,250,000 33,084,367
Investment securities at amortised cost:
- Bonds 63,639,060 41,934,937 2,007,213 2,008,137
- Treasury bills 62,128,081 104,039,702 - -
125,767,141 145,974,639 2,007,213 2,008,137
- Amortised Cost 12 month ECL on Bonds - Amortised Cost (183,624) (168,167) (4,554) (4,554)
ry Bills - Amortised Cost12 month ECL on Treasury Bills - Amortised Cost (161,496) (245,240) - -
Total Investment securities at amortised cost 125,422,021 145,561,232 2,002,659 2,003,583
Total investment securities 662,762,303 764,037,847 440,346,717 530,819,882
Current 593,098,513 719,575,322 420,673,377 512,297,458
Non-current 69,663,790 44,462,525 19,673,340 18,522,424
260
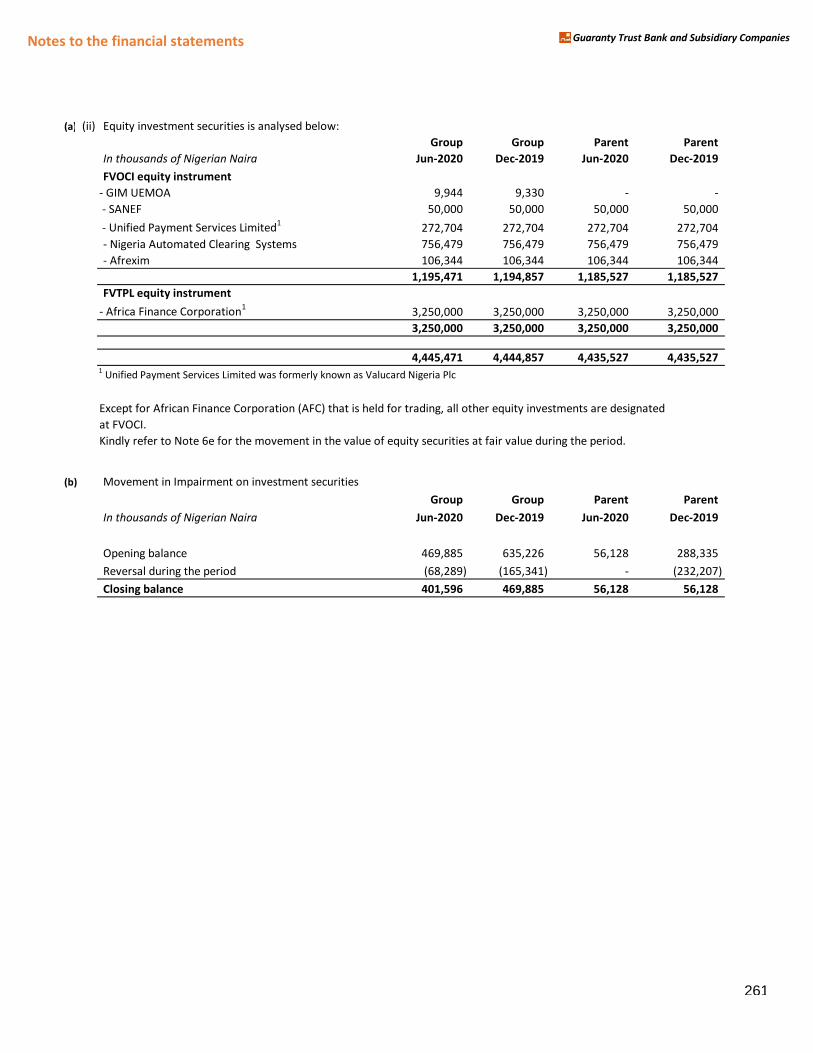
Notes to the financial statements Guaranty Trust Bank and Subsidiary Companies
(a) (ii) Equity investment securities is analysed below:
Group Group Parent Parent
In thousands of Nigerian Naira Jun-2020 Dec-2019 Jun-2020 Dec-2019
FVOCI equity instrument
- GIM UEMOA 9,944 9,330 - -
- SANEF 50,000 50,000 50,000 50,000
- Unified Payment Services Limited1
272,704 272,704 272,704 272,704
- Nigeria Automated Clearing Systems 756,479 756,479 756,479 756,479
- Afrexim 106,344 106,344 106,344 106,344
1,195,471 1,194,857 1,185,527 1,185,527
FVTPL equity instrument
- Africa Finance Corporation1
3,250,000 3,250,000 3,250,000 3,250,000
3,250,000 3,250,000 3,250,000 3,250,000
4,445,471 4,444,857 4,435,527 4,435,527 1 Unified Payment Services Limited was formerly known as Valucard Nigeria Plc
Except for African Finance Corporation (AFC) that is held for trading, all other equity investments are designated
at FVOCI.
Kindly refer to Note 6e for the movement in the value of equity securities at fair value during the period.
(b) Movement in Impairment on investment securities
Group Group Parent Parent
In thousands of Nigerian Naira Jun-2020 Dec-2019 Jun-2020 Dec-2019
Opening balance 469,885 635,226 56,128 288,335
Reversal during the period (68,289) (165,341) - (232,207)
Closing balance 401,596 469,885 56,128 56,128
261
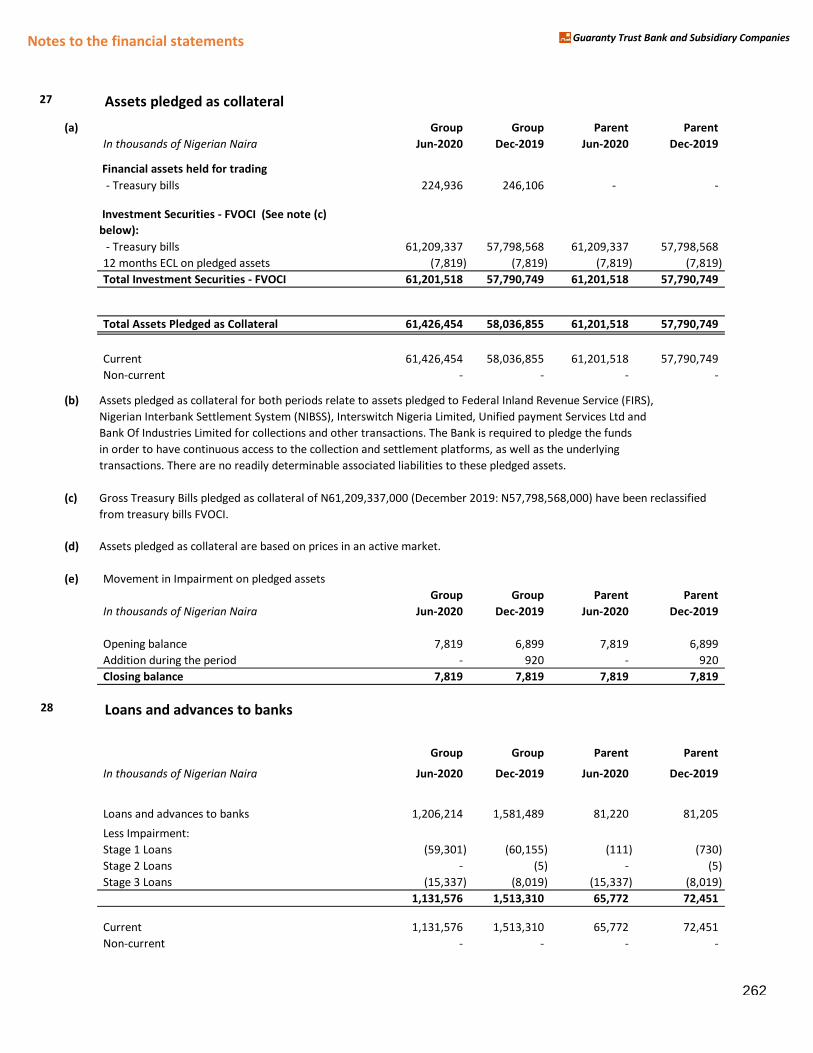
Notes to the financial statements Guaranty Trust Bank and Subsidiary Companies
27 Assets pledged as collateral
(a) Group Group Parent Parent
In thousands of Nigerian Naira Jun-2020 Dec-2019 Jun-2020 Dec-2019
Financial assets held for trading
- Treasury bills 224,936 246,106 - -
Investment Securities - FVOCI (See note (c)
below):
- Treasury bills 61,209,337 57,798,568 61,209,337 57,798,568
ged Assets 12 months ECL on pledged assets (7,819) (7,819) (7,819) (7,819)
Total Investment Securities - FVOCI 61,201,518 57,790,749 61,201,518 57,790,749
Total Assets Pledged as Collateral 61,426,454 58,036,855 61,201,518 57,790,749
Current 61,426,454 58,036,855 61,201,518 57,790,749
Non-current - - - -
(b) Assets pledged as collateral for both periods relate to assets pledged to Federal Inland Revenue Service (FIRS),
Nigerian Interbank Settlement System (NIBSS), Interswitch Nigeria Limited, Unified payment Services Ltd and
Bank Of Industries Limited for collections and other transactions. The Bank is required to pledge the funds
in order to have continuous access to the collection and settlement platforms, as well as the underlying
transactions. There are no readily determinable associated liabilities to these pledged assets.
(c) Gross Treasury Bills pledged as collateral of N61,209,337,000 (December 2019: N57,798,568,000) have been reclassified
from treasury bills FVOCI.
(d) Assets pledged as collateral are based on prices in an active market.
(e) Movement in Impairment on pledged assets
Group Group Parent Parent
In thousands of Nigerian Naira Jun-2020 Dec-2019 Jun-2020 Dec-2019
Opening balance 7,819 6,899 7,819 6,899
Addition during the period - 920 - 920
Closing balance 7,819 7,819 7,819 7,819
28 Loans and advances to banks
Group Group Parent Parent
In thousands of Nigerian Naira Jun-2020 Dec-2019 Jun-2020 Dec-2019
Loans and advances to banks 1,206,214 1,581,489 81,220 81,205
Less Impairment:
Stage 1 Loans (59,301) (60,155) (111) (730)
Stage 2 Loans - (5) - (5)
Stage 3 Loans (15,337) (8,019) (15,337) (8,019)
1,131,576 1,513,310 65,772 72,451
Current 1,131,576 1,513,310 65,772 72,451
Non-current - - - -
262
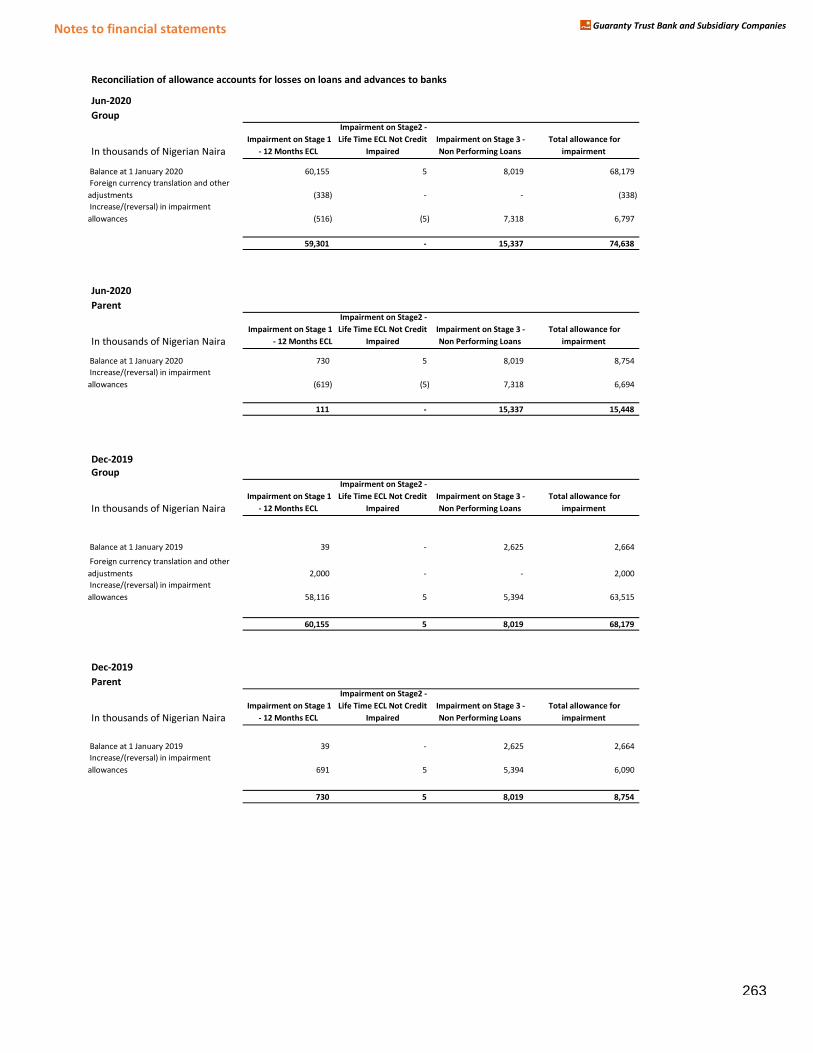
Notes to financial statements Guaranty Trust Bank and Subsidiary Companies
Reconciliation of allowance accounts for losses on loans and advances to banks
Jun-2020
Group
In thousands of Nigerian Naira
Impairment on Stage 1
- 12 Months ECL
Impairment on Stage2 -
Life Time ECL Not Credit
Impaired
Impairment on Stage 3 -
Non Performing Loans
Total allowance for
impairment
Balance at 1 January 2020 60,155 5 8,019 68,179
Foreign currency translation and other
adjustments (338) - - (338)
Increase/(reversal) in impairment
allowances (516) (5) 7,318 6,797
59,301 - 15,337 74,638
Jun-2020
Parent
In thousands of Nigerian Naira
Impairment on Stage 1
- 12 Months ECL
Impairment on Stage2 -
Life Time ECL Not Credit
Impaired
Impairment on Stage 3 -
Non Performing Loans
Total allowance for
impairment
Balance at 1 January 2020 730 5 8,019 8,754
Increase/(reversal) in impairment
allowances (619) (5) 7,318 6,694
111 - 15,337 15,448
Dec-2019
Group
In thousands of Nigerian Naira
Impairment on Stage 1
- 12 Months ECL
Impairment on Stage2 -
Life Time ECL Not Credit
Impaired
Impairment on Stage 3 -
Non Performing Loans
Total allowance for
impairment
Balance at 1 January 2019 39 - 2,625 2,664
Foreign currency translation and other
adjustments 2,000 - - 2,000
Increase/(reversal) in impairment
allowances 58,116 5 5,394 63,515
60,155 5 8,019 68,179
Dec-2019
Parent
In thousands of Nigerian Naira
Impairment on Stage 1
- 12 Months ECL
Impairment on Stage2 -
Life Time ECL Not Credit
Impaired
Impairment on Stage 3 -
Non Performing Loans
Total allowance for
impairment
Balance at 1 January 2019 39 - 2,625 2,664
Increase/(reversal) in impairment
allowances 691 5 5,394 6,090
730 5 8,019 8,754
263
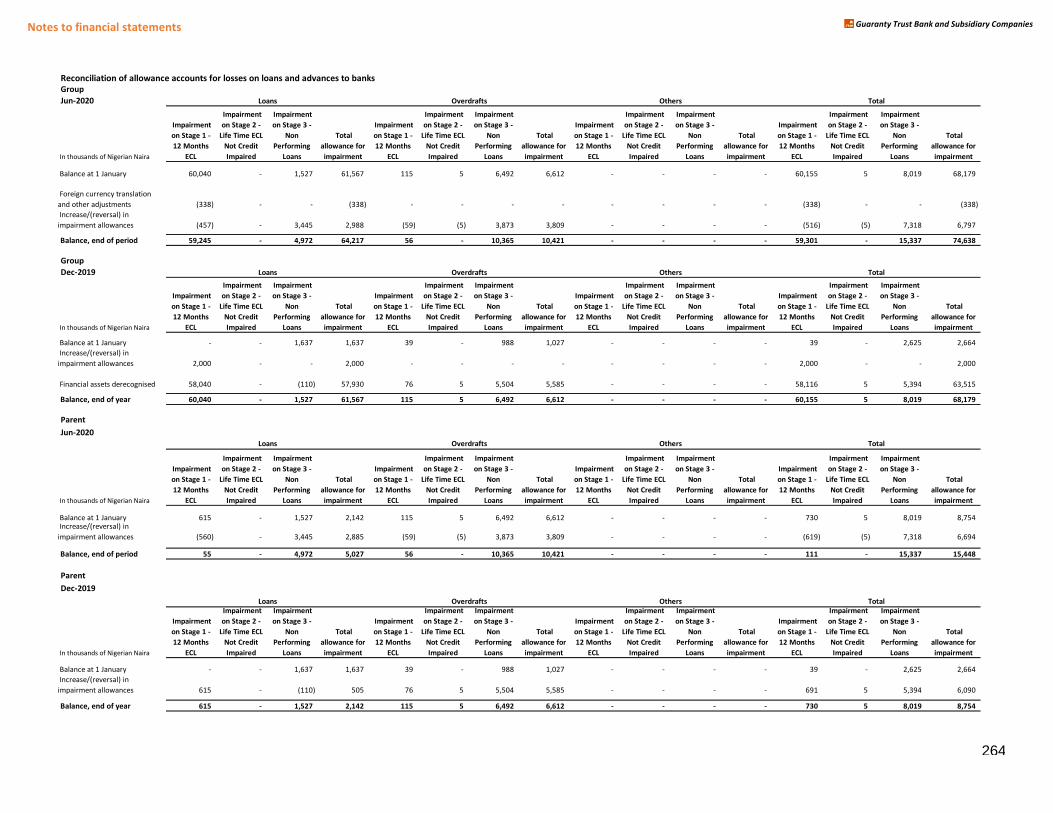
Notes to financial statements Guaranty Trust Bank and Subsidiary Companies
Reconciliation of allowance accounts for losses on loans and advances to banks
Group
Jun-2020
In thousands of Nigerian Naira
Impairment
on Stage 1 -
12 Months
ECL
Impairment
on Stage 2 -
Life Time ECL
Not Credit
Impaired
Impairment
on Stage 3 -
Non
Performing
Loans
Total
allowance for
impairment
Impairment
on Stage 1 -
12 Months
ECL
Impairment
on Stage 2 -
Life Time ECL
Not Credit
Impaired
Impairment
on Stage 3 -
Non
Performing
Loans
Total
allowance for
impairment
Impairment
on Stage 1 -
12 Months
ECL
Impairment
on Stage 2 -
Life Time ECL
Not Credit
Impaired
Impairment
on Stage 3 -
Non
Performing
Loans
Total
allowance for
impairment
Impairment
on Stage 1 -
12 Months
ECL
Impairment
on Stage 2 -
Life Time ECL
Not Credit
Impaired
Impairment
on Stage 3 -
Non
Performing
Loans
Total
allowance for
impairment
Balance at 1 January 60,040 - 1,527 61,567 115 5 6,492 6,612 - - - - 60,155 5 8,019 68,179
Foreign currency translation
and other adjustments (338) - - (338) - - - - - - - - (338) - - (338)
Increase/(reversal) in
impairment allowances (457) - 3,445 2,988 (59) (5) 3,873 3,809 - - - - (516) (5) 7,318 6,797
Balance, end of period 59,245 - 4,972 64,217 56 - 10,365 10,421 - - - - 59,301 - 15,337 74,638
Group
Dec-2019
In thousands of Nigerian Naira
Impairment
on Stage 1 -
12 Months
ECL
Impairment
on Stage 2 -
Life Time ECL
Not Credit
Impaired
Impairment
on Stage 3 -
Non
Performing
Loans
Total
allowance for
impairment
Impairment
on Stage 1 -
12 Months
ECL
Impairment
on Stage 2 -
Life Time ECL
Not Credit
Impaired
Impairment
on Stage 3 -
Non
Performing
Loans
Total
allowance for
impairment
Impairment
on Stage 1 -
12 Months
ECL
Impairment
on Stage 2 -
Life Time ECL
Not Credit
Impaired
Impairment
on Stage 3 -
Non
Performing
Loans
Total
allowance for
impairment
Impairment
on Stage 1 -
12 Months
ECL
Impairment
on Stage 2 -
Life Time ECL
Not Credit
Impaired
Impairment
on Stage 3 -
Non
Performing
Loans
Total
allowance for
impairment
Balance at 1 January - - 1,637 1,637 39 - 988 1,027 - - - - 39 - 2,625 2,664
Increase/(reversal) in
impairment allowances 2,000 - - 2,000 - - - - - - - - 2,000 - - 2,000
Financial assets derecognised 58,040 - (110) 57,930 76 5 5,504 5,585 - - - - 58,116 5 5,394 63,515
Balance, end of year 60,040 - 1,527 61,567 115 5 6,492 6,612 - - - - 60,155 5 8,019 68,179
Parent
Jun-2020
In thousands of Nigerian Naira
Impairment
on Stage 1 -
12 Months
ECL
Impairment
on Stage 2 -
Life Time ECL
Not Credit
Impaired
Impairment
on Stage 3 -
Non
Performing
Loans
Total
allowance for
impairment
Impairment
on Stage 1 -
12 Months
ECL
Impairment
on Stage 2 -
Life Time ECL
Not Credit
Impaired
Impairment
on Stage 3 -
Non
Performing
Loans
Total
allowance for
impairment
Impairment
on Stage 1 -
12 Months
ECL
Impairment
on Stage 2 -
Life Time ECL
Not Credit
Impaired
Impairment
on Stage 3 -
Non
Performing
Loans
Total
allowance for
impairment
Impairment
on Stage 1 -
12 Months
ECL
Impairment
on Stage 2 -
Life Time ECL
Not Credit
Impaired
Impairment
on Stage 3 -
Non
Performing
Loans
Total
allowance for
impairment
Balance at 1 January 615 - 1,527 2,142 115 5 6,492 6,612 - - - - 730 5 8,019 8,754 Increase/(reversal) in
impairment allowances (560) - 3,445 2,885 (59) (5) 3,873 3,809 - - - - (619) (5) 7,318 6,694
Balance, end of period 55 - 4,972 5,027 56 - 10,365 10,421 - - - - 111 - 15,337 15,448
Parent
Dec-2019
In thousands of Nigerian Naira
Impairment
on Stage 1 -
12 Months
ECL
Impairment
on Stage 2 -
Life Time ECL
Not Credit
Impaired
Impairment
on Stage 3 -
Non
Performing
Loans
Total
allowance for
impairment
Impairment
on Stage 1 -
12 Months
ECL
Impairment
on Stage 2 -
Life Time ECL
Not Credit
Impaired
Impairment
on Stage 3 -
Non
Performing
Loans
Total
allowance for
impairment
Impairment
on Stage 1 -
12 Months
ECL
Impairment
on Stage 2 -
Life Time ECL
Not Credit
Impaired
Impairment
on Stage 3 -
Non
Performing
Loans
Total
allowance for
impairment
Impairment
on Stage 1 -
12 Months
ECL
Impairment
on Stage 2 -
Life Time ECL
Not Credit
Impaired
Impairment
on Stage 3 -
Non
Performing
Loans
Total
allowance for
impairment
Balance at 1 January - - 1,637 1,637 39 - 988 1,027 - - - - 39 - 2,625 2,664
Increase/(reversal) in
impairment allowances 615 - (110) 505 76 5 5,504 5,585 - - - - 691 5 5,394 6,090
Balance, end of year 615 - 1,527 2,142 115 5 6,492 6,612 - - - - 730 5 8,019 8,754
Loans Overdrafts Others Total
Loans Overdrafts Others Total
Loans Overdrafts Others Total
Loans Overdrafts Others Total
264
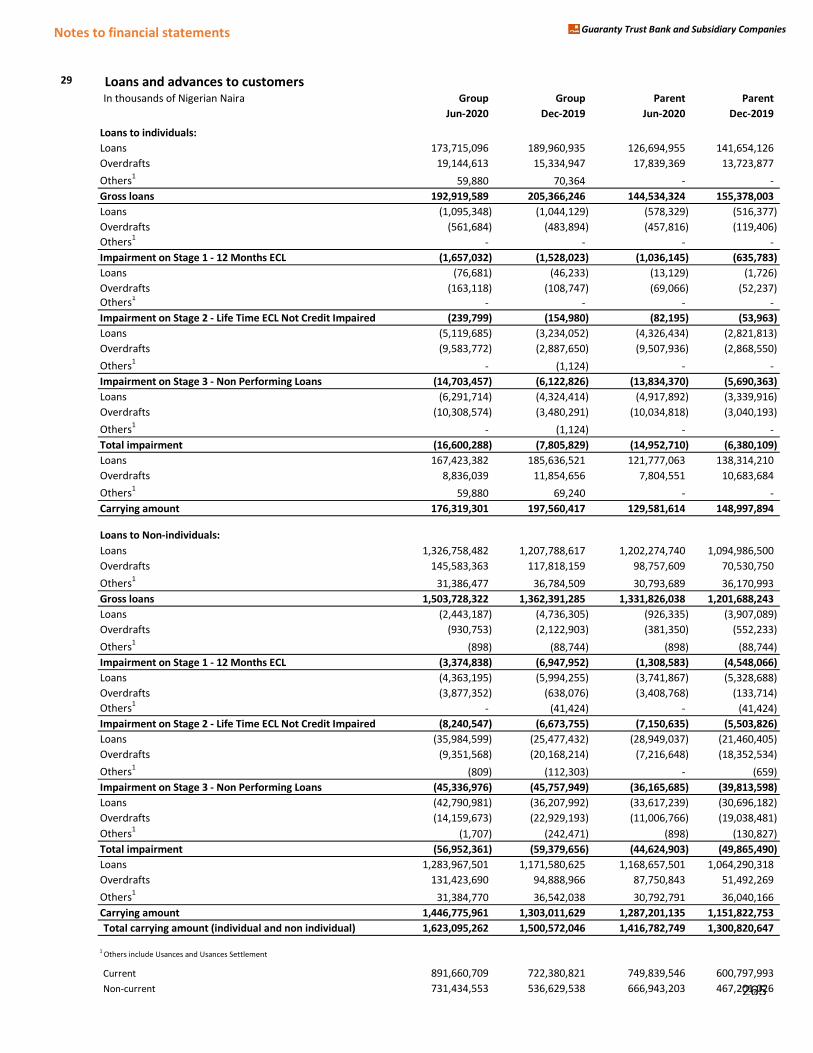
Notes to financial statements Guaranty Trust Bank and Subsidiary Companies
29 Loans and advances to customersIn thousands of Nigerian Naira Group Group Parent Parent
Jun-2020 Dec-2019 Jun-2020 Dec-2019
Loans to individuals:
nsLoans Loans 173,715,096 189,960,935 126,694,955 141,654,126
nsOverdrafts Overdrafts 19,144,613 15,334,947 17,839,369 13,723,877
nsOthers1 Others1
59,880 70,364 - -
Gross loans 192,919,589 205,366,246 144,534,324 155,378,003
nt on Stage 1 Loans Loans (1,095,348) (1,044,129) (578,329) (516,377)
nt on Stage 1 Loans Overdrafts (561,684) (483,894) (457,816) (119,406)
nt on Stage 1 Loans Others1
- - - -
Impairment on Stage 1 - 12 Months ECL (1,657,032) (1,528,023) (1,036,145) (635,783)
nt on Stage 2 Loans Loans (76,681) (46,233) (13,129) (1,726)
ent on Stage 2 LoanOverdrafts (163,118) (108,747) (69,066) (52,237)
nt on Stage 2 Loans Others1
- - - -
Impairment on Stage 2 - Life Time ECL Not Credit Impaired (239,799) (154,980) (82,195) (53,963)
nt on Stage 3 Loans Loans (5,119,685) (3,234,052) (4,326,434) (2,821,813)
ent on Stage 3 LoanOverdrafts (9,583,772) (2,887,650) (9,507,936) (2,868,550)
nt on Stage 3 Loans Others1
- (1,124) - -
Impairment on Stage 3 - Non Performing Loans (14,703,457) (6,122,826) (13,834,370) (5,690,363)
Loans (6,291,714) (4,324,414) (4,917,892) (3,339,916)
Overdrafts (10,308,574) (3,480,291) (10,034,818) (3,040,193)
Others1
- (1,124) - -
Total impairment (16,600,288) (7,805,829) (14,952,710) (6,380,109)
Loans 167,423,382 185,636,521 121,777,063 138,314,210
Overdrafts 8,836,039 11,854,656 7,804,551 10,683,684
Others1
59,880 69,240 - -
Carrying amount 176,319,301 197,560,417 129,581,614 148,997,894
Loans to Non-individuals:
ss loansLoans Loans 1,326,758,482 1,207,788,617 1,202,274,740 1,094,986,500
ss loansOverdraftsOverdrafts 145,583,363 117,818,159 98,757,609 70,530,750
ss loansOthers1 Others1
31,386,477 36,784,509 30,793,689 36,170,993
Gross loans 1,503,728,322 1,362,391,285 1,331,826,038 1,201,688,243
irment on Stage 1 Loans (2,443,187) (4,736,305) (926,335) (3,907,089)
airment on Stage 1Overdrafts (930,753) (2,122,903) (381,350) (552,233)
irment on Stage 1 Others1
(898) (88,744) (898) (88,744)
Impairment on Stage 1 - 12 Months ECL (3,374,838) (6,947,952) (1,308,583) (4,548,066)
irment on Stage 2 Loans (4,363,195) (5,994,255) (3,741,867) (5,328,688)
airment on Stage 2Overdrafts (3,877,352) (638,076) (3,408,768) (133,714)
irment on Stage 2 Others1
- (41,424) - (41,424)
Impairment on Stage 2 - Life Time ECL Not Credit Impaired (8,240,547) (6,673,755) (7,150,635) (5,503,826)
irment on Stage 3 Loans (35,984,599) (25,477,432) (28,949,037) (21,460,405)
airment on Stage 3Overdrafts (9,351,568) (20,168,214) (7,216,648) (18,352,534)
irment on Stage 3 Others1
(809) (112,303) - (659)
Impairment on Stage 3 - Non Performing Loans (45,336,976) (45,757,949) (36,165,685) (39,813,598)
Loans (42,790,981) (36,207,992) (33,617,239) (30,696,182)
Overdrafts (14,159,673) (22,929,193) (11,006,766) (19,038,481)
Others1
(1,707) (242,471) (898) (130,827)
Total impairment (56,952,361) (59,379,656) (44,624,903) (49,865,490)
Loans 1,283,967,501 1,171,580,625 1,168,657,501 1,064,290,318
Overdrafts 131,423,690 94,888,966 87,750,843 51,492,269
Others1
31,384,770 36,542,038 30,792,791 36,040,166
Carrying amount 1,446,775,961 1,303,011,629 1,287,201,135 1,151,822,753
Total carrying amount (individual and non individual) 1,623,095,262 1,500,572,046 1,416,782,749 1,300,820,647
1 Others include Usances and Usances Settlement
Current 891,660,709 722,380,821 749,839,546 600,797,993
Non-current 731,434,553 536,629,538 666,943,203 467,201,026 265
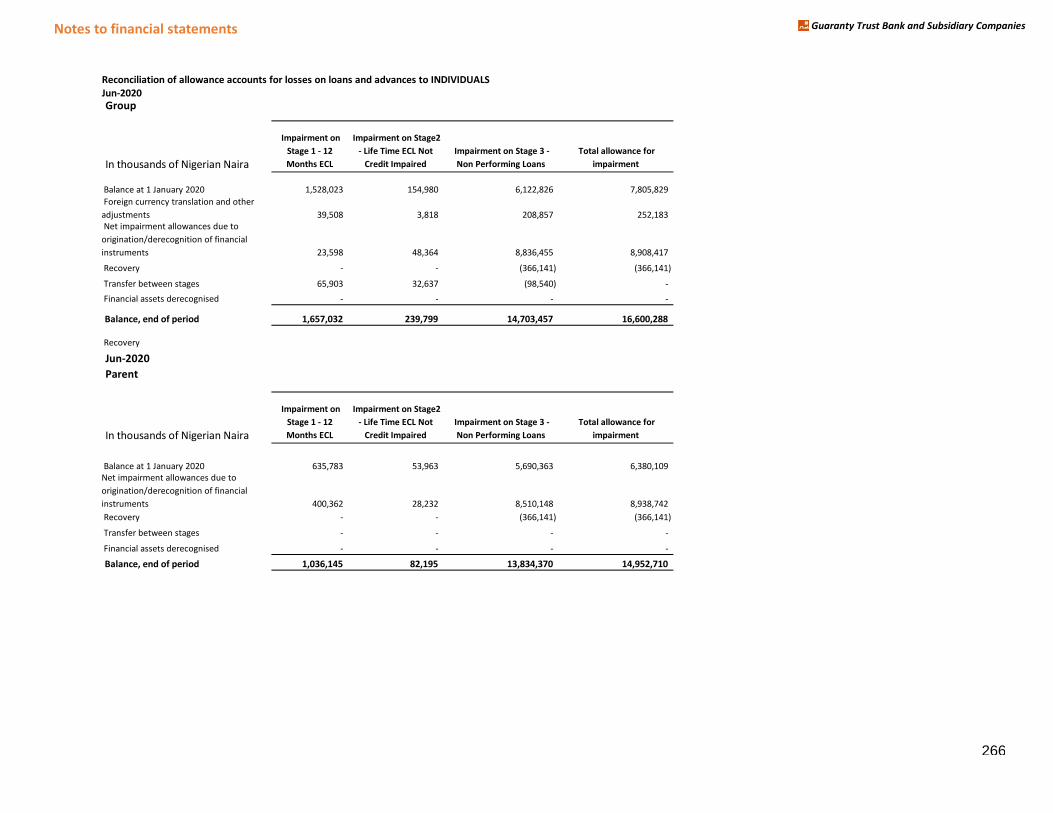
Notes to financial statements Guaranty Trust Bank and Subsidiary Companies
Reconciliation of allowance accounts for losses on loans and advances to INDIVIDUALS
Jun-2020
Group
In thousands of Nigerian Naira
Impairment on
Stage 1 - 12
Months ECL
Impairment on Stage2
- Life Time ECL Not
Credit Impaired
Impairment on Stage 3 -
Non Performing Loans
Total allowance for
impairment
Balance at 1 January 2020 1,528,023 154,980 6,122,826 7,805,829
Foreign currency translation and other
adjustments 39,508 3,818 208,857 252,183
Net impairment allowances due to
origination/derecognition of financial
instruments 23,598 48,364 8,836,455 8,908,417
Recovery - - (366,141) (366,141)
Transfer between stages 65,903 32,637 (98,540) -
Financial assets derecognised - - - -
Balance, end of period 1,657,032 239,799 14,703,457 16,600,288
Recovery
Jun-2020
Parent
In thousands of Nigerian Naira
Impairment on
Stage 1 - 12
Months ECL
Impairment on Stage2
- Life Time ECL Not
Credit Impaired
Impairment on Stage 3 -
Non Performing Loans
Total allowance for
impairment
Balance at 1 January 2020 635,783 53,963 5,690,363 6,380,109
Net impairment allowances due to
origination/derecognition of financial
instruments 400,362 28,232 8,510,148 8,938,742
Recovery - - (366,141) (366,141)
Transfer between stages - - - -
Financial assets derecognised - - - -
Balance, end of period 1,036,145 82,195 13,834,370 14,952,710
266
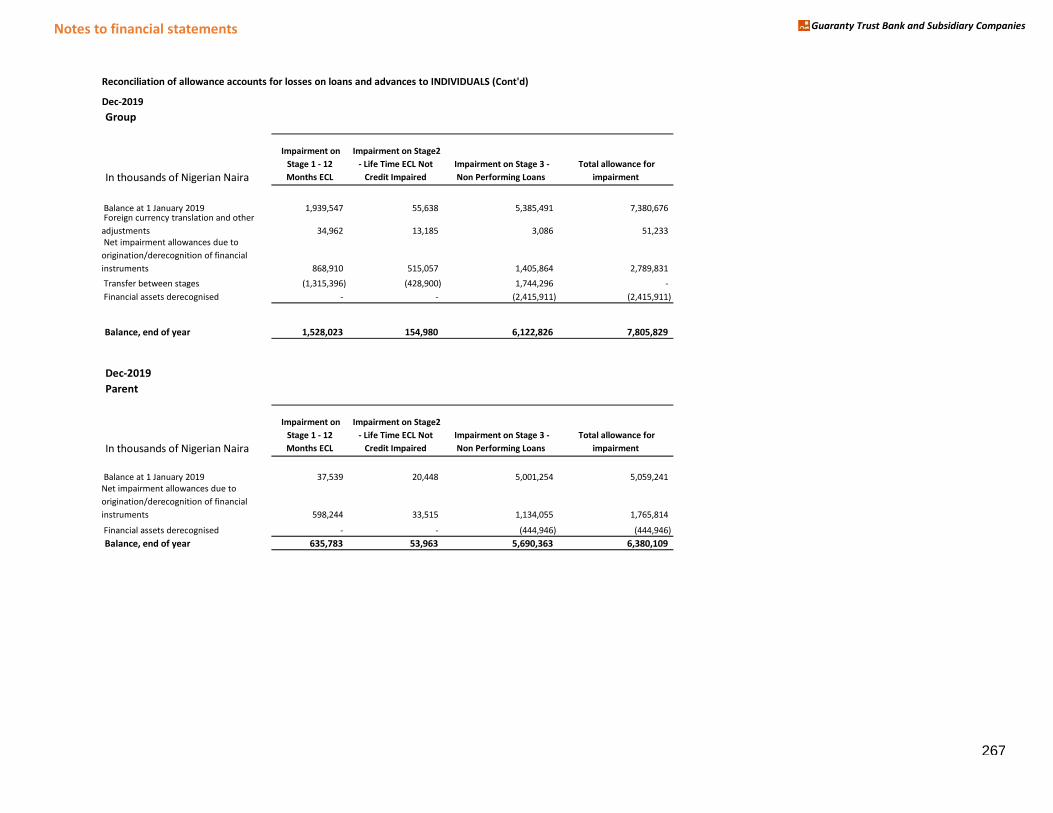
Notes to financial statements Guaranty Trust Bank and Subsidiary Companies
Reconciliation of allowance accounts for losses on loans and advances to INDIVIDUALS (Cont'd)
Dec-2019
Group
In thousands of Nigerian Naira
Impairment on
Stage 1 - 12
Months ECL
Impairment on Stage2
- Life Time ECL Not
Credit Impaired
Impairment on Stage 3 -
Non Performing Loans
Total allowance for
impairment
Balance at 1 January 2019 1,939,547 55,638 5,385,491 7,380,676 Foreign currency translation and other
adjustments 34,962 13,185 3,086 51,233
Net impairment allowances due to
origination/derecognition of financial
instruments 868,910 515,057 1,405,864 2,789,831
Transfer between stages (1,315,396) (428,900) 1,744,296 -
Financial assets derecognised - - (2,415,911) (2,415,911)
Balance, end of year 1,528,023 154,980 6,122,826 7,805,829
Dec-2019
Parent
In thousands of Nigerian Naira
Impairment on
Stage 1 - 12
Months ECL
Impairment on Stage2
- Life Time ECL Not
Credit Impaired
Impairment on Stage 3 -
Non Performing Loans
Total allowance for
impairment
Balance at 1 January 2019 37,539 20,448 5,001,254 5,059,241
Net impairment allowances due to
origination/derecognition of financial
instruments 598,244 33,515 1,134,055 1,765,814
Financial assets derecognised - - (444,946) (444,946)
Balance, end of year 635,783 53,963 5,690,363 6,380,109
267
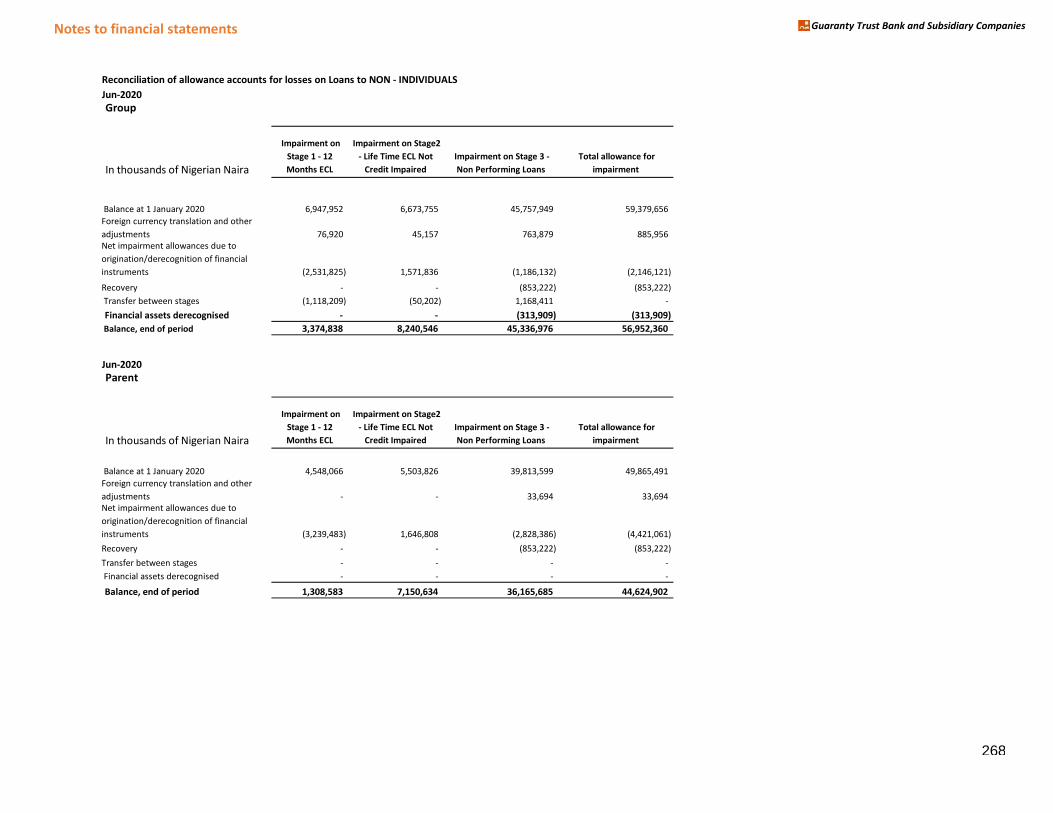
Notes to financial statements Guaranty Trust Bank and Subsidiary Companies
Reconciliation of allowance accounts for losses on Loans to NON - INDIVIDUALS
Jun-2020
Group
In thousands of Nigerian Naira
Impairment on
Stage 1 - 12
Months ECL
Impairment on Stage2
- Life Time ECL Not
Credit Impaired
Impairment on Stage 3 -
Non Performing Loans
Total allowance for
impairment
Balance at 1 January 2020 6,947,952 6,673,755 45,757,949 59,379,656
Foreign currency translation and other
adjustments 76,920 45,157 763,879 885,956
Net impairment allowances due to
origination/derecognition of financial
instruments (2,531,825) 1,571,836 (1,186,132) (2,146,121)
Recovery - - (853,222) (853,222)
Transfer between stages (1,118,209) (50,202) 1,168,411 -
Financial assets derecognised - - (313,909) (313,909)
Balance, end of period 3,374,838 8,240,546 45,336,976 56,952,360
Jun-2020
Parent
In thousands of Nigerian Naira
Impairment on
Stage 1 - 12
Months ECL
Impairment on Stage2
- Life Time ECL Not
Credit Impaired
Impairment on Stage 3 -
Non Performing Loans
Total allowance for
impairment
Balance at 1 January 2020 4,548,066 5,503,826 39,813,599 49,865,491
Foreign currency translation and other
adjustments - - 33,694 33,694
Net impairment allowances due to
origination/derecognition of financial
instruments (3,239,483) 1,646,808 (2,828,386) (4,421,061)
Recovery - - (853,222) (853,222)
Transfer between stages - - - -
Financial assets derecognised - - - -
Balance, end of period 1,308,583 7,150,634 36,165,685 44,624,902
268
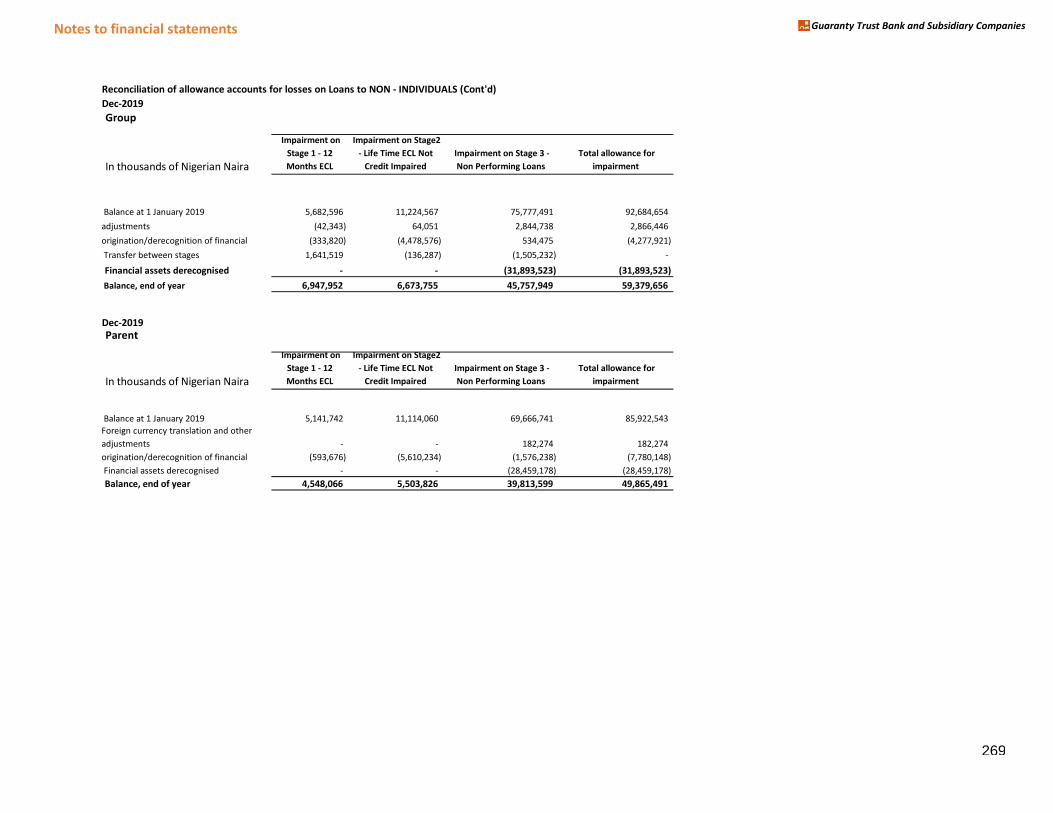
Notes to financial statements Guaranty Trust Bank and Subsidiary Companies
Reconciliation of allowance accounts for losses on Loans to NON - INDIVIDUALS (Cont'd)
Dec-2019
Group
In thousands of Nigerian Naira
Impairment on
Stage 1 - 12
Months ECL
Impairment on Stage2
- Life Time ECL Not
Credit Impaired
Impairment on Stage 3 -
Non Performing Loans
Total allowance for
impairment
Balance at 1 January 2019 5,682,596 11,224,567 75,777,491 92,684,654 Foreign currency translation and other
adjustments (42,343) 64,051 2,844,738 2,866,446 Net impairment allowances due to
origination/derecognition of financial (333,820) (4,478,576) 534,475 (4,277,921)
Transfer between stages 1,641,519 (136,287) (1,505,232) -
Financial assets derecognised - - (31,893,523) (31,893,523)
Balance, end of year 6,947,952 6,673,755 45,757,949 59,379,656
Dec-2019
Parent
In thousands of Nigerian Naira
Impairment on
Stage 1 - 12
Months ECL
Impairment on Stage2
- Life Time ECL Not
Credit Impaired
Impairment on Stage 3 -
Non Performing Loans
Total allowance for
impairment
Balance at 1 January 2019 5,141,742 11,114,060 69,666,741 85,922,543
Foreign currency translation and other
adjustments - - 182,274 182,274 Net impairment allowances due to
origination/derecognition of financial (593,676) (5,610,234) (1,576,238) (7,780,148)
Financial assets derecognised - - (28,459,178) (28,459,178)
Balance, end of year 4,548,066 5,503,826 39,813,599 49,865,491
269
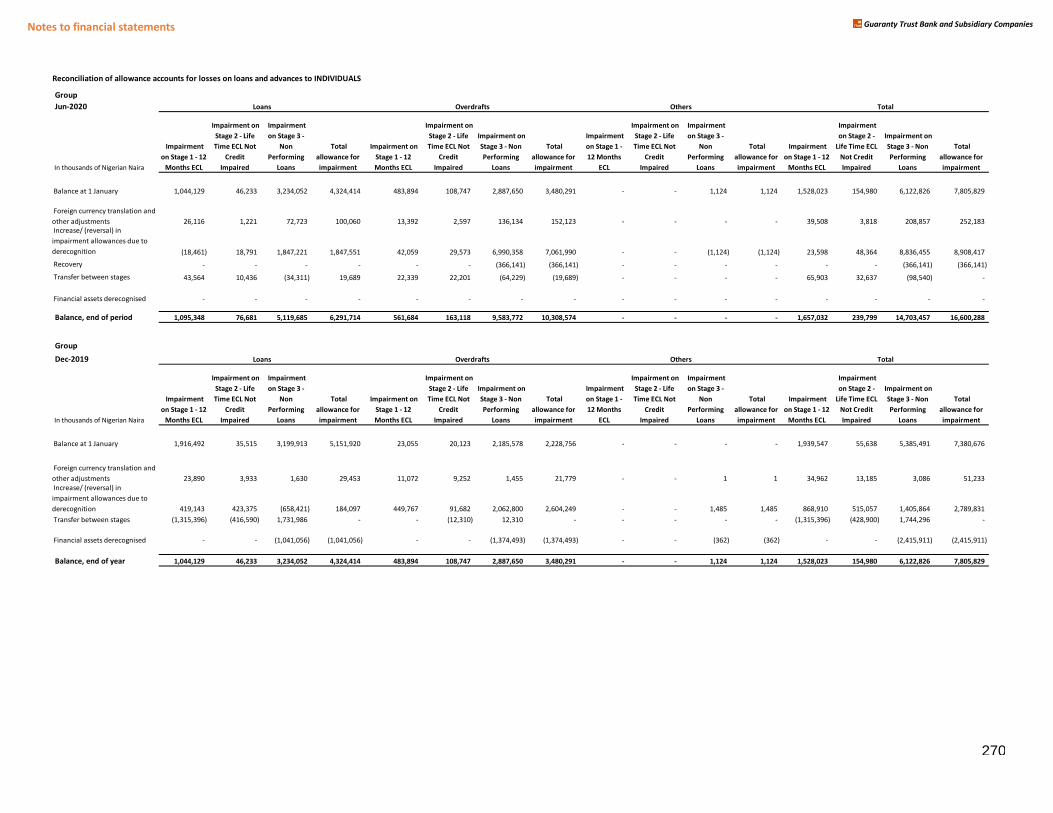
Notes to financial statements Guaranty Trust Bank and Subsidiary Companies
Reconciliation of allowance accounts for losses on loans and advances to INDIVIDUALS
Group
Jun-2020
In thousands of Nigerian Naira
Impairment
on Stage 1 - 12
Months ECL
Impairment on
Stage 2 - Life
Time ECL Not
Credit
Impaired
Impairment
on Stage 3 -
Non
Performing
Loans
Total
allowance for
impairment
Impairment on
Stage 1 - 12
Months ECL
Impairment on
Stage 2 - Life
Time ECL Not
Credit
Impaired
Impairment on
Stage 3 - Non
Performing
Loans
Total
allowance for
impairment
Impairment
on Stage 1 -
12 Months
ECL
Impairment on
Stage 2 - Life
Time ECL Not
Credit
Impaired
Impairment
on Stage 3 -
Non
Performing
Loans
Total
allowance for
impairment
Impairment
on Stage 1 - 12
Months ECL
Impairment
on Stage 2 -
Life Time ECL
Not Credit
Impaired
Impairment on
Stage 3 - Non
Performing
Loans
Total
allowance for
impairment
Balance at 1 January 1,044,129 46,233 3,234,052 4,324,414 483,894 108,747 2,887,650 3,480,291 - - 1,124 1,124 1,528,023 154,980 6,122,826 7,805,829
Foreign currency translation and
other adjustments 26,116 1,221 72,723 100,060 13,392 2,597 136,134 152,123 - - - - 39,508 3,818 208,857 252,183
Increase/ (reversal) in
impairment allowances due to
derecognition (18,461) 18,791 1,847,221 1,847,551 42,059 29,573 6,990,358 7,061,990 - - (1,124) (1,124) 23,598 48,364 8,836,455 8,908,417
Recovery - - - - - - (366,141) (366,141) - - - - - - (366,141) (366,141)
Transfer between stages 43,564 10,436 (34,311) 19,689 22,339 22,201 (64,229) (19,689) - - - - 65,903 32,637 (98,540) -
Financial assets derecognised - - - - - - - - - - - - - - - -
Balance, end of period 1,095,348 76,681 5,119,685 6,291,714 561,684 163,118 9,583,772 10,308,574 - - - - 1,657,032 239,799 14,703,457 16,600,288
Group
Dec-2019
In thousands of Nigerian Naira
Impairment
on Stage 1 - 12
Months ECL
Impairment on
Stage 2 - Life
Time ECL Not
Credit
Impaired
Impairment
on Stage 3 -
Non
Performing
Loans
Total
allowance for
impairment
Impairment on
Stage 1 - 12
Months ECL
Impairment on
Stage 2 - Life
Time ECL Not
Credit
Impaired
Impairment on
Stage 3 - Non
Performing
Loans
Total
allowance for
impairment
Impairment
on Stage 1 -
12 Months
ECL
Impairment on
Stage 2 - Life
Time ECL Not
Credit
Impaired
Impairment
on Stage 3 -
Non
Performing
Loans
Total
allowance for
impairment
Impairment
on Stage 1 - 12
Months ECL
Impairment
on Stage 2 -
Life Time ECL
Not Credit
Impaired
Impairment on
Stage 3 - Non
Performing
Loans
Total
allowance for
impairment
Balance at 1 January 1,916,492 35,515 3,199,913 5,151,920 23,055 20,123 2,185,578 2,228,756 - - - - 1,939,547 55,638 5,385,491 7,380,676
Foreign currency translation and
other adjustments 23,890 3,933 1,630 29,453 11,072 9,252 1,455 21,779 - - 1 1 34,962 13,185 3,086 51,233
Increase/ (reversal) in
impairment allowances due to
derecognition 419,143 423,375 (658,421) 184,097 449,767 91,682 2,062,800 2,604,249 - - 1,485 1,485 868,910 515,057 1,405,864 2,789,831
Transfer between stages (1,315,396) (416,590) 1,731,986 - - (12,310) 12,310 - - - - - (1,315,396) (428,900) 1,744,296 -
Financial assets derecognised - - (1,041,056) (1,041,056) - - (1,374,493) (1,374,493) - - (362) (362) - - (2,415,911) (2,415,911)
Balance, end of year 1,044,129 46,233 3,234,052 4,324,414 483,894 108,747 2,887,650 3,480,291 - - 1,124 1,124 1,528,023 154,980 6,122,826 7,805,829
Loans Overdrafts Others Total
Loans Overdrafts Others Total
270
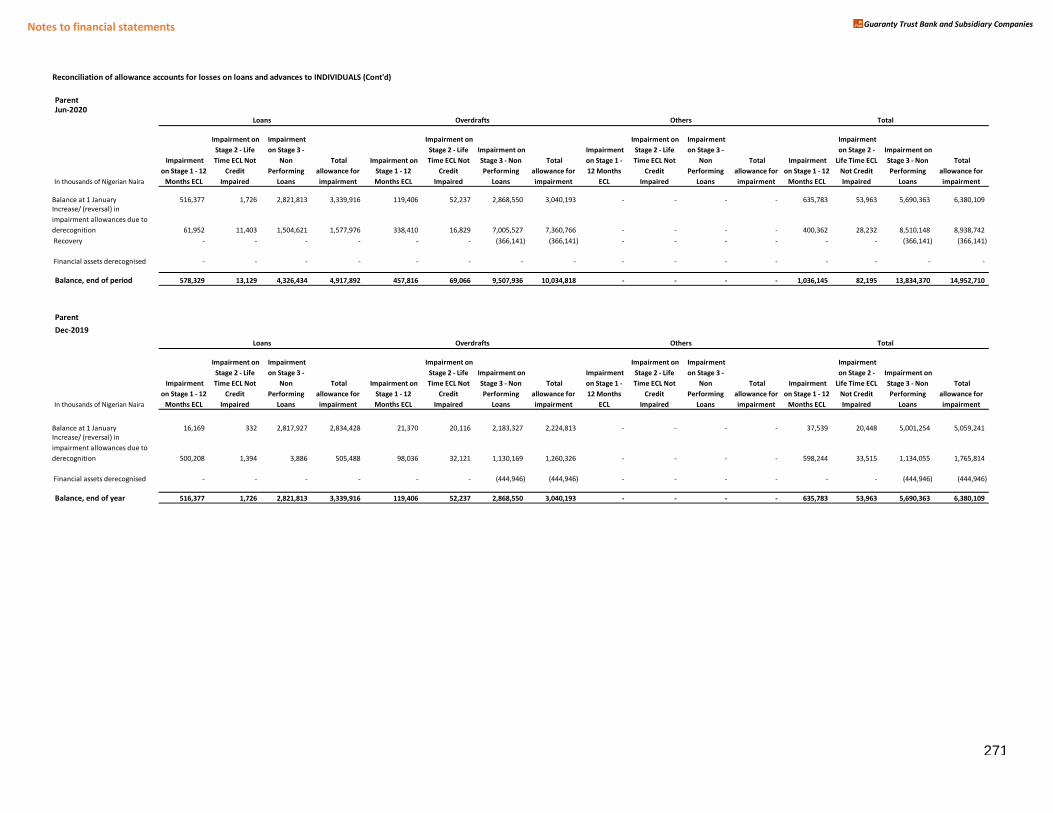
Notes to financial statements Guaranty Trust Bank and Subsidiary Companies
Reconciliation of allowance accounts for losses on loans and advances to INDIVIDUALS (Cont'd)
ParentJun-2020
In thousands of Nigerian Naira
Impairment
on Stage 1 - 12
Months ECL
Impairment on
Stage 2 - Life
Time ECL Not
Credit
Impaired
Impairment
on Stage 3 -
Non
Performing
Loans
Total
allowance for
impairment
Impairment on
Stage 1 - 12
Months ECL
Impairment on
Stage 2 - Life
Time ECL Not
Credit
Impaired
Impairment on
Stage 3 - Non
Performing
Loans
Total
allowance for
impairment
Impairment
on Stage 1 -
12 Months
ECL
Impairment on
Stage 2 - Life
Time ECL Not
Credit
Impaired
Impairment
on Stage 3 -
Non
Performing
Loans
Total
allowance for
impairment
Impairment
on Stage 1 - 12
Months ECL
Impairment
on Stage 2 -
Life Time ECL
Not Credit
Impaired
Impairment on
Stage 3 - Non
Performing
Loans
Total
allowance for
impairment
Balance at 1 January 516,377 1,726 2,821,813 3,339,916 119,406 52,237 2,868,550 3,040,193 - - - - 635,783 53,963 5,690,363 6,380,109
Increase/ (reversal) in
impairment allowances due to
derecognition 61,952 11,403 1,504,621 1,577,976 338,410 16,829 7,005,527 7,360,766 - - - - 400,362 28,232 8,510,148 8,938,742
Recovery - - - - - - (366,141) (366,141) - - - - - - (366,141) (366,141)
Financial assets derecognised - - - - - - - - - - - - - - - -
Balance, end of period 578,329 13,129 4,326,434 4,917,892 457,816 69,066 9,507,936 10,034,818 - - - - 1,036,145 82,195 13,834,370 14,952,710
Parent
Dec-2019
In thousands of Nigerian Naira
Impairment
on Stage 1 - 12
Months ECL
Impairment on
Stage 2 - Life
Time ECL Not
Credit
Impaired
Impairment
on Stage 3 -
Non
Performing
Loans
Total
allowance for
impairment
Impairment on
Stage 1 - 12
Months ECL
Impairment on
Stage 2 - Life
Time ECL Not
Credit
Impaired
Impairment on
Stage 3 - Non
Performing
Loans
Total
allowance for
impairment
Impairment
on Stage 1 -
12 Months
ECL
Impairment on
Stage 2 - Life
Time ECL Not
Credit
Impaired
Impairment
on Stage 3 -
Non
Performing
Loans
Total
allowance for
impairment
Impairment
on Stage 1 - 12
Months ECL
Impairment
on Stage 2 -
Life Time ECL
Not Credit
Impaired
Impairment on
Stage 3 - Non
Performing
Loans
Total
allowance for
impairment
Balance at 1 January 16,169 332 2,817,927 2,834,428 21,370 20,116 2,183,327 2,224,813 - - - - 37,539 20,448 5,001,254 5,059,241
Increase/ (reversal) in
impairment allowances due to
derecognition 500,208 1,394 3,886 505,488 98,036 32,121 1,130,169 1,260,326 - - - - 598,244 33,515 1,134,055 1,765,814
Financial assets derecognised - - - - - - (444,946) (444,946) - - - - - - (444,946) (444,946)
Balance, end of year 516,377 1,726 2,821,813 3,339,916 119,406 52,237 2,868,550 3,040,193 - - - - 635,783 53,963 5,690,363 6,380,109
Loans Overdrafts Others Total
Loans Overdrafts Others Total
271
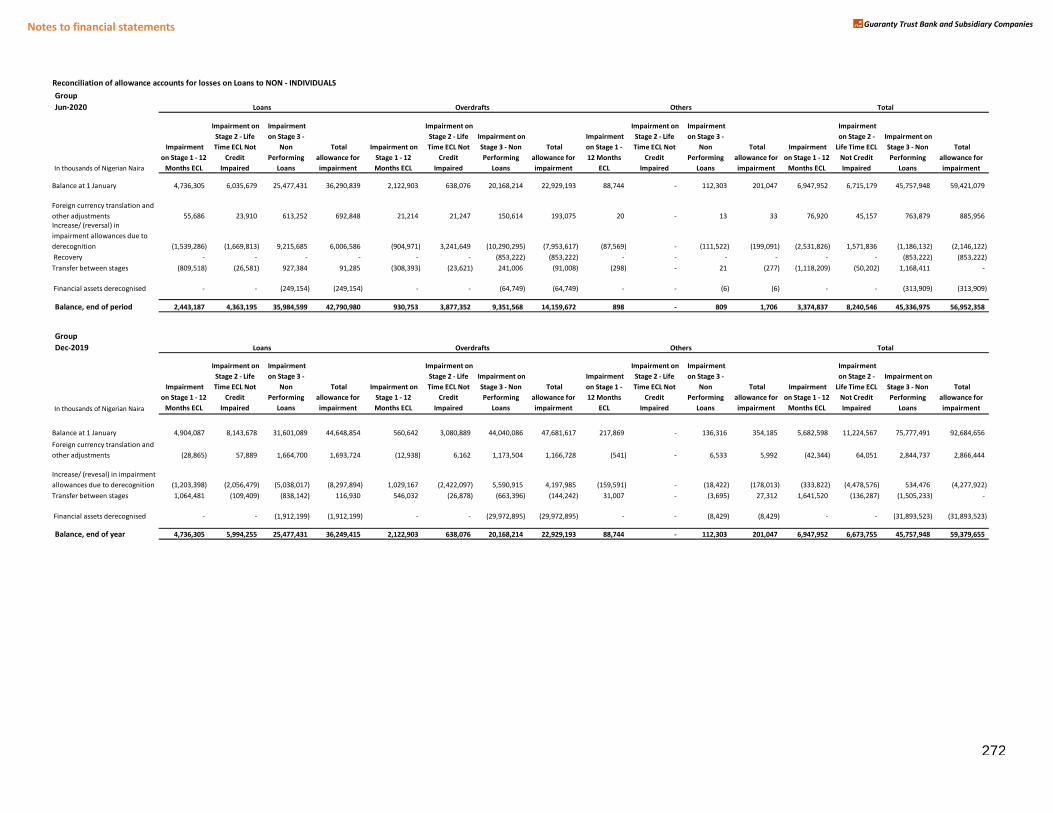
Notes to financial statements Guaranty Trust Bank and Subsidiary Companies
Reconciliation of allowance accounts for losses on Loans to NON - INDIVIDUALS
Group
Jun-2020
In thousands of Nigerian Naira
Impairment
on Stage 1 - 12
Months ECL
Impairment on
Stage 2 - Life
Time ECL Not
Credit
Impaired
Impairment
on Stage 3 -
Non
Performing
Loans
Total
allowance for
impairment
Impairment on
Stage 1 - 12
Months ECL
Impairment on
Stage 2 - Life
Time ECL Not
Credit
Impaired
Impairment on
Stage 3 - Non
Performing
Loans
Total
allowance for
impairment
Impairment
on Stage 1 -
12 Months
ECL
Impairment on
Stage 2 - Life
Time ECL Not
Credit
Impaired
Impairment
on Stage 3 -
Non
Performing
Loans
Total
allowance for
impairment
Impairment
on Stage 1 - 12
Months ECL
Impairment
on Stage 2 -
Life Time ECL
Not Credit
Impaired
Impairment on
Stage 3 - Non
Performing
Loans
Total
allowance for
impairment
Balance at 1 January 4,736,305 6,035,679 25,477,431 36,290,839 2,122,903 638,076 20,168,214 22,929,193 88,744 - 112,303 201,047 6,947,952 6,715,179 45,757,948 59,421,079
Foreign currency translation and
other adjustments 55,686 23,910 613,252 692,848 21,214 21,247 150,614 193,075 20 - 13 33 76,920 45,157 763,879 885,956
Increase/ (reversal) in
impairment allowances due to
derecognition (1,539,286) (1,669,813) 9,215,685 6,006,586 (904,971) 3,241,649 (10,290,295) (7,953,617) (87,569) - (111,522) (199,091) (2,531,826) 1,571,836 (1,186,132) (2,146,122)
Recovery - - - - - - (853,222) (853,222) - - - - - - (853,222) (853,222)
Transfer between stages (809,518) (26,581) 927,384 91,285 (308,393) (23,621) 241,006 (91,008) (298) - 21 (277) (1,118,209) (50,202) 1,168,411 -
Financial assets derecognised - - (249,154) (249,154) - - (64,749) (64,749) - - (6) (6) - - (313,909) (313,909)
Balance, end of period 2,443,187 4,363,195 35,984,599 42,790,980 930,753 3,877,352 9,351,568 14,159,672 898 - 809 1,706 3,374,837 8,240,546 45,336,975 56,952,358
Group
Dec-2019
In thousands of Nigerian Naira
Impairment
on Stage 1 - 12
Months ECL
Impairment on
Stage 2 - Life
Time ECL Not
Credit
Impaired
Impairment
on Stage 3 -
Non
Performing
Loans
Total
allowance for
impairment
Impairment on
Stage 1 - 12
Months ECL
Impairment on
Stage 2 - Life
Time ECL Not
Credit
Impaired
Impairment on
Stage 3 - Non
Performing
Loans
Total
allowance for
impairment
Impairment
on Stage 1 -
12 Months
ECL
Impairment on
Stage 2 - Life
Time ECL Not
Credit
Impaired
Impairment
on Stage 3 -
Non
Performing
Loans
Total
allowance for
impairment
Impairment
on Stage 1 - 12
Months ECL
Impairment
on Stage 2 -
Life Time ECL
Not Credit
Impaired
Impairment on
Stage 3 - Non
Performing
Loans
Total
allowance for
impairment
Balance at 1 January 4,904,087 8,143,678 31,601,089 44,648,854 560,642 3,080,889 44,040,086 47,681,617 217,869 - 136,316 354,185 5,682,598 11,224,567 75,777,491 92,684,656
Foreign currency translation and
other adjustments (28,865) 57,889 1,664,700 1,693,724 (12,938) 6,162 1,173,504 1,166,728 (541) - 6,533 5,992 (42,344) 64,051 2,844,737 2,866,444
Increase/ (revesal) in impairment
allowances due to derecognition (1,203,398) (2,056,479) (5,038,017) (8,297,894) 1,029,167 (2,422,097) 5,590,915 4,197,985 (159,591) - (18,422) (178,013) (333,822) (4,478,576) 534,476 (4,277,922)
Transfer between stages 1,064,481 (109,409) (838,142) 116,930 546,032 (26,878) (663,396) (144,242) 31,007 - (3,695) 27,312 1,641,520 (136,287) (1,505,233) -
Financial assets derecognised - - (1,912,199) (1,912,199) - - (29,972,895) (29,972,895) - - (8,429) (8,429) - - (31,893,523) (31,893,523)
Balance, end of year 4,736,305 5,994,255 25,477,431 36,249,415 2,122,903 638,076 20,168,214 22,929,193 88,744 - 112,303 201,047 6,947,952 6,673,755 45,757,948 59,379,655
Total
Loans Overdrafts Others Total
Loans Overdrafts Others
272
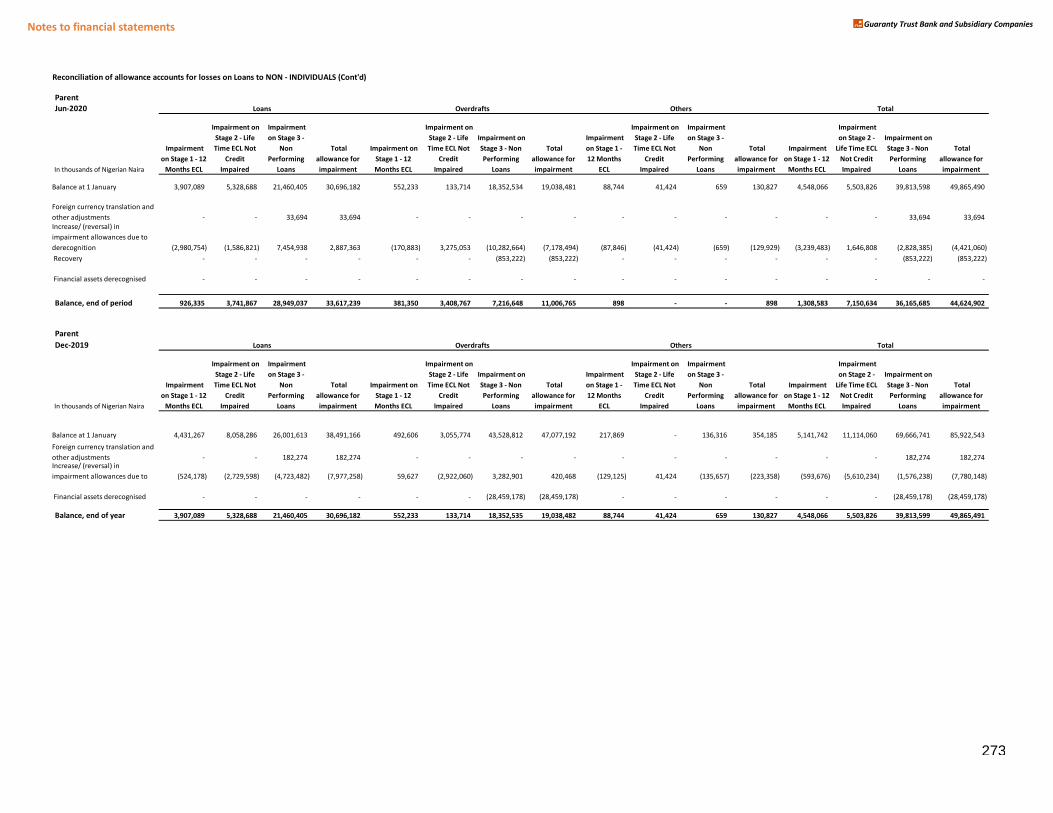
Notes to financial statements Guaranty Trust Bank and Subsidiary Companies
Reconciliation of allowance accounts for losses on Loans to NON - INDIVIDUALS (Cont'd)
Parent
Jun-2020
In thousands of Nigerian Naira
Impairment
on Stage 1 - 12
Months ECL
Impairment on
Stage 2 - Life
Time ECL Not
Credit
Impaired
Impairment
on Stage 3 -
Non
Performing
Loans
Total
allowance for
impairment
Impairment on
Stage 1 - 12
Months ECL
Impairment on
Stage 2 - Life
Time ECL Not
Credit
Impaired
Impairment on
Stage 3 - Non
Performing
Loans
Total
allowance for
impairment
Impairment
on Stage 1 -
12 Months
ECL
Impairment on
Stage 2 - Life
Time ECL Not
Credit
Impaired
Impairment
on Stage 3 -
Non
Performing
Loans
Total
allowance for
impairment
Impairment
on Stage 1 - 12
Months ECL
Impairment
on Stage 2 -
Life Time ECL
Not Credit
Impaired
Impairment on
Stage 3 - Non
Performing
Loans
Total
allowance for
impairment
Balance at 1 January 3,907,089 5,328,688 21,460,405 30,696,182 552,233 133,714 18,352,534 19,038,481 88,744 41,424 659 130,827 4,548,066 5,503,826 39,813,598 49,865,490
Foreign currency translation and
other adjustments - - 33,694 33,694 - - - - - - - - - - 33,694 33,694
Increase/ (reversal) in
impairment allowances due to
derecognition (2,980,754) (1,586,821) 7,454,938 2,887,363 (170,883) 3,275,053 (10,282,664) (7,178,494) (87,846) (41,424) (659) (129,929) (3,239,483) 1,646,808 (2,828,385) (4,421,060)
Recovery - - - - - - (853,222) (853,222) - - - - - - (853,222) (853,222)
Financial assets derecognised - - - - - - - - - - - - - - - -
Balance, end of period 926,335 3,741,867 28,949,037 33,617,239 381,350 3,408,767 7,216,648 11,006,765 898 - - 898 1,308,583 7,150,634 36,165,685 44,624,902
Parent
Dec-2019
In thousands of Nigerian Naira
Impairment
on Stage 1 - 12
Months ECL
Impairment on
Stage 2 - Life
Time ECL Not
Credit
Impaired
Impairment
on Stage 3 -
Non
Performing
Loans
Total
allowance for
impairment
Impairment on
Stage 1 - 12
Months ECL
Impairment on
Stage 2 - Life
Time ECL Not
Credit
Impaired
Impairment on
Stage 3 - Non
Performing
Loans
Total
allowance for
impairment
Impairment
on Stage 1 -
12 Months
ECL
Impairment on
Stage 2 - Life
Time ECL Not
Credit
Impaired
Impairment
on Stage 3 -
Non
Performing
Loans
Total
allowance for
impairment
Impairment
on Stage 1 - 12
Months ECL
Impairment
on Stage 2 -
Life Time ECL
Not Credit
Impaired
Impairment on
Stage 3 - Non
Performing
Loans
Total
allowance for
impairment
Balance at 1 January 4,431,267 8,058,286 26,001,613 38,491,166 492,606 3,055,774 43,528,812 47,077,192 217,869 - 136,316 354,185 5,141,742 11,114,060 69,666,741 85,922,543
Foreign currency translation and
other adjustments - - 182,274 182,274 - - - - - - - - - - 182,274 182,274 Increase/ (reversal) in
impairment allowances due to (524,178) (2,729,598) (4,723,482) (7,977,258) 59,627 (2,922,060) 3,282,901 420,468 (129,125) 41,424 (135,657) (223,358) (593,676) (5,610,234) (1,576,238) (7,780,148)
Financial assets derecognised - - - - - - (28,459,178) (28,459,178) - - - - - - (28,459,178) (28,459,178)
Balance, end of year 3,907,089 5,328,688 21,460,405 30,696,182 552,233 133,714 18,352,535 19,038,482 88,744 41,424 659 130,827 4,548,066 5,503,826 39,813,599 49,865,491
Loans Overdrafts Others
Loans Overdrafts Others Total
Total
273
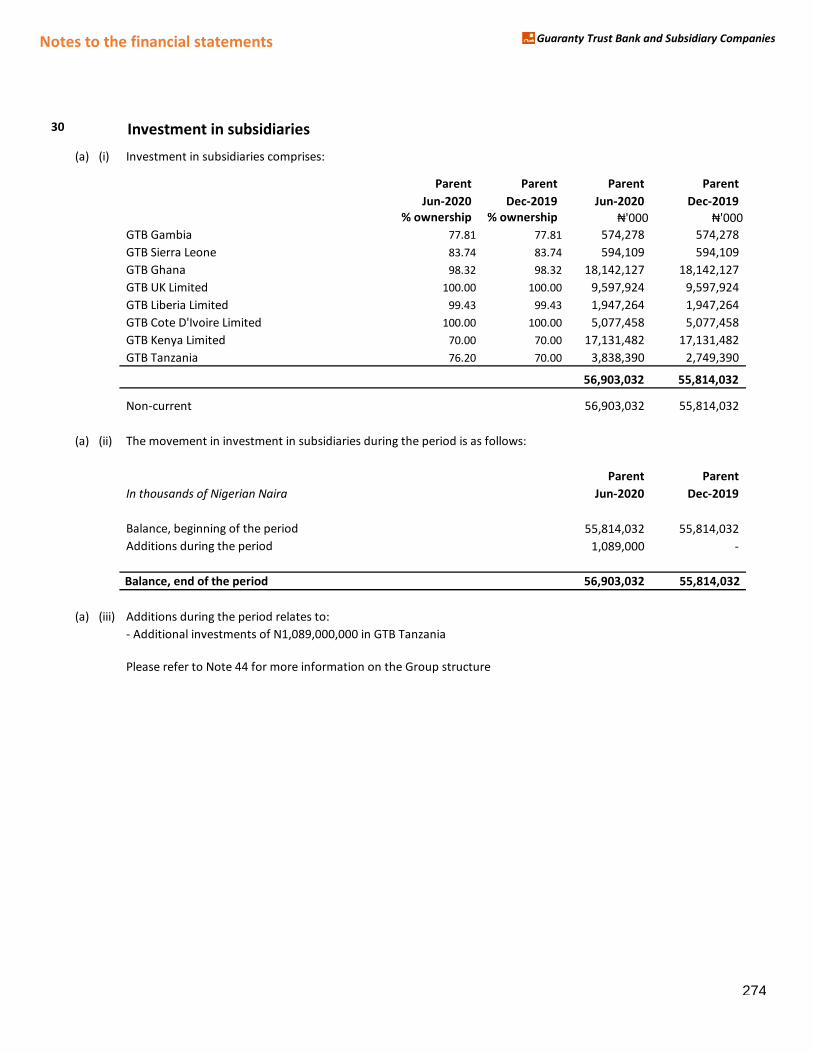
Notes to the financial statements Guaranty Trust Bank and Subsidiary Companies
30 Investment in subsidiaries
(a) (i) Investment in subsidiaries comprises:
Parent Parent Parent Parent
Jun-2020 Dec-2019 Jun-2020 Dec-2019
% ownership % ownership ₦'000 ₦'000GTB Gambia 77.81 77.81 574,278 574,278
GTB Sierra Leone 83.74 83.74 594,109 594,109
GTB Ghana 98.32 98.32 18,142,127 18,142,127
GTB UK Limited 100.00 100.00 9,597,924 9,597,924
GTB Liberia Limited 99.43 99.43 1,947,264 1,947,264
GTB Cote D'Ivoire Limited 100.00 100.00 5,077,458 5,077,458
GTB Kenya Limited 70.00 70.00 17,131,482 17,131,482
GTB Tanzania 76.20 70.00 3,838,390 2,749,390
56,903,032 55,814,032
Non-current 56,903,032 55,814,032
(a) (ii) The movement in investment in subsidiaries during the period is as follows:
Parent Parent
In thousands of Nigerian Naira Jun-2020 Dec-2019
Balance, beginning of the period 55,814,032 55,814,032
Additions during the period 1,089,000 -
Balance, end of the period 56,903,032 55,814,032
(a) (iii) Additions during the period relates to:
- Additional investments of N1,089,000,000 in GTB Tanzania
Please refer to Note 44 for more information on the Group structure
274
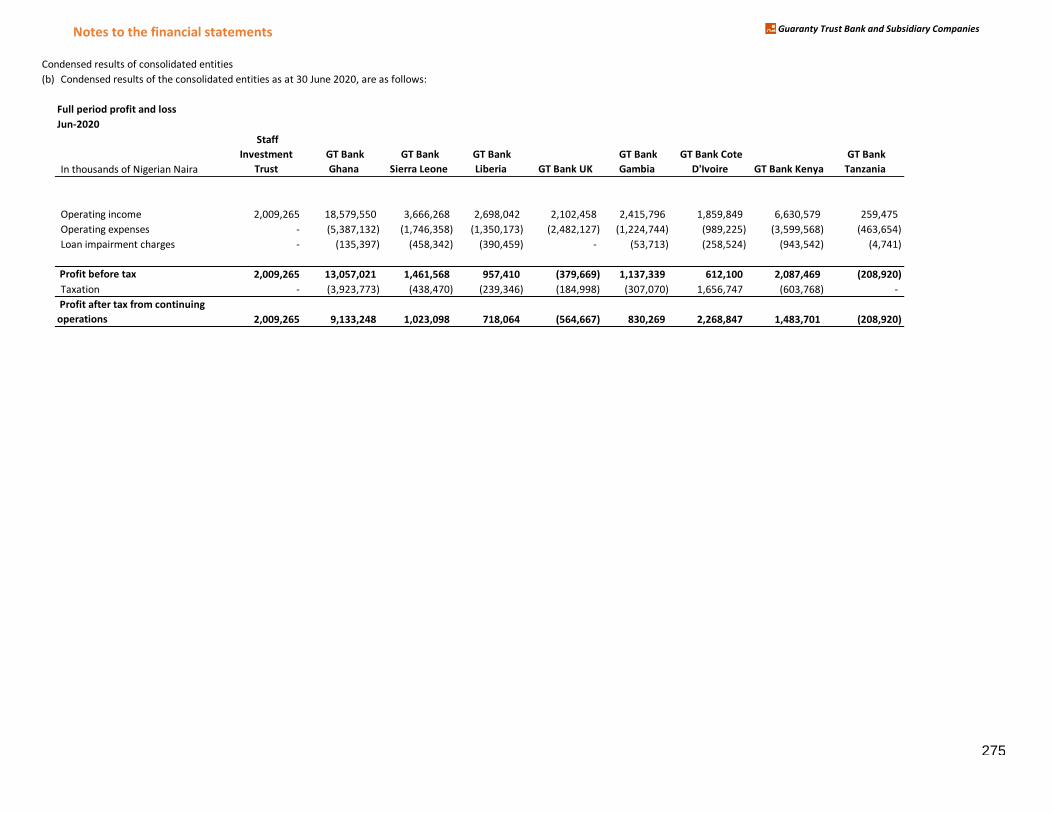
Notes to the financial statements Guaranty Trust Bank and Subsidiary Companies
Condensed results of consolidated entities
(b) Condensed results of the consolidated entities as at 30 June 2020, are as follows:
Full period profit and loss
Jun-2020
In thousands of Nigerian Naira
Staff
Investment
Trust
GT Bank
Ghana
GT Bank
Sierra Leone
GT Bank
Liberia GT Bank UK
GT Bank
Gambia
GT Bank Cote
D'Ivoire GT Bank Kenya
GT Bank
Tanzania
Operating income 2,009,265 18,579,550 3,666,268 2,698,042 2,102,458 2,415,796 1,859,849 6,630,579 259,475
Operating expenses - (5,387,132) (1,746,358) (1,350,173) (2,482,127) (1,224,744) (989,225) (3,599,568) (463,654)
Loan impairment charges - (135,397) (458,342) (390,459) - (53,713) (258,524) (943,542) (4,741)
Profit before tax 2,009,265 13,057,021 1,461,568 957,410 (379,669) 1,137,339 612,100 2,087,469 (208,920)
Taxation - (3,923,773) (438,470) (239,346) (184,998) (307,070) 1,656,747 (603,768) -
Profit after tax from continuing
operations 2,009,265 9,133,248 1,023,098 718,064 (564,667) 830,269 2,268,847 1,483,701 (208,920)
275
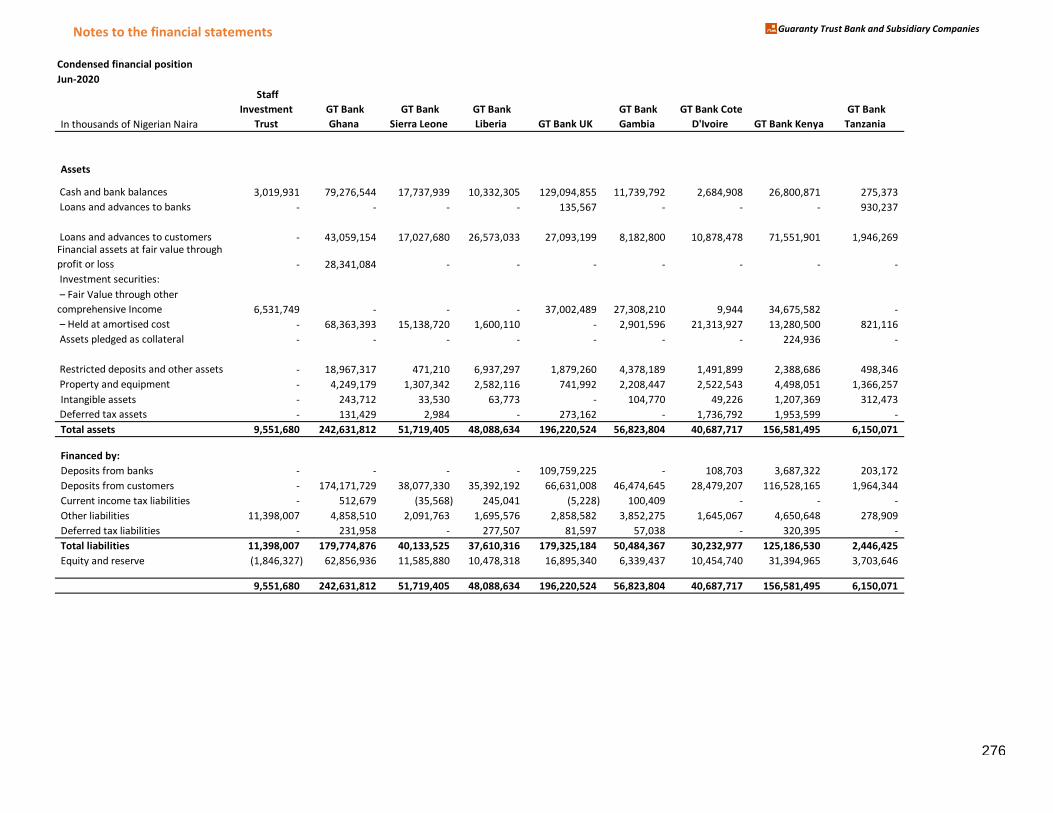
Notes to the financial statements Guaranty Trust Bank and Subsidiary Companies
Condensed financial position
Jun-2020
In thousands of Nigerian Naira
Staff
Investment
Trust
GT Bank
Ghana
GT Bank
Sierra Leone
GT Bank
Liberia GT Bank UK
GT Bank
Gambia
GT Bank Cote
D'Ivoire GT Bank Kenya
GT Bank
Tanzania
Assets
Cash and bank balances 3,019,931 79,276,544 17,737,939 10,332,305 129,094,855 11,739,792 2,684,908 26,800,871 275,373
Loans and advances to banks - - - - 135,567 - - - 930,237
Loans and advances to customers - 43,059,154 17,027,680 26,573,033 27,093,199 8,182,800 10,878,478 71,551,901 1,946,269 Financial assets at fair value through
profit or loss - 28,341,084 - - - - - - -
Investment securities:
– Fair Value through other comprehensive Income 6,531,749 - - - 37,002,489 27,308,210 9,944 34,675,582 -
– Held at aマortised cost - 68,363,393 15,138,720 1,600,110 - 2,901,596 21,313,927 13,280,500 821,116
Assets pledged as collateral - - - - - - - 224,936 -
Restricted deposits and other assets - 18,967,317 471,210 6,937,297 1,879,260 4,378,189 1,491,899 2,388,686 498,346
Property and equipment - 4,249,179 1,307,342 2,582,116 741,992 2,208,447 2,522,543 4,498,051 1,366,257
Intangible assets - 243,712 33,530 63,773 - 104,770 49,226 1,207,369 312,473
Deferred tax assets - 131,429 2,984 - 273,162 - 1,736,792 1,953,599 -
Total assets 9,551,680 242,631,812 51,719,405 48,088,634 196,220,524 56,823,804 40,687,717 156,581,495 6,150,071
Financed by:
Deposits from banks - - - - 109,759,225 - 108,703 3,687,322 203,172
Deposits from customers - 174,171,729 38,077,330 35,392,192 66,631,008 46,474,645 28,479,207 116,528,165 1,964,344
Current income tax liabilities - 512,679 (35,568) 245,041 (5,228) 100,409 - - -
Other liabilities 11,398,007 4,858,510 2,091,763 1,695,576 2,858,582 3,852,275 1,645,067 4,650,648 278,909
Deferred tax liabilities - 231,958 - 277,507 81,597 57,038 - 320,395 -
Total liabilities 11,398,007 179,774,876 40,133,525 37,610,316 179,325,184 50,484,367 30,232,977 125,186,530 2,446,425
Equity and reserve (1,846,327) 62,856,936 11,585,880 10,478,318 16,895,340 6,339,437 10,454,740 31,394,965 3,703,646
9,551,680 242,631,812 51,719,405 48,088,634 196,220,524 56,823,804 40,687,717 156,581,495 6,150,071
276
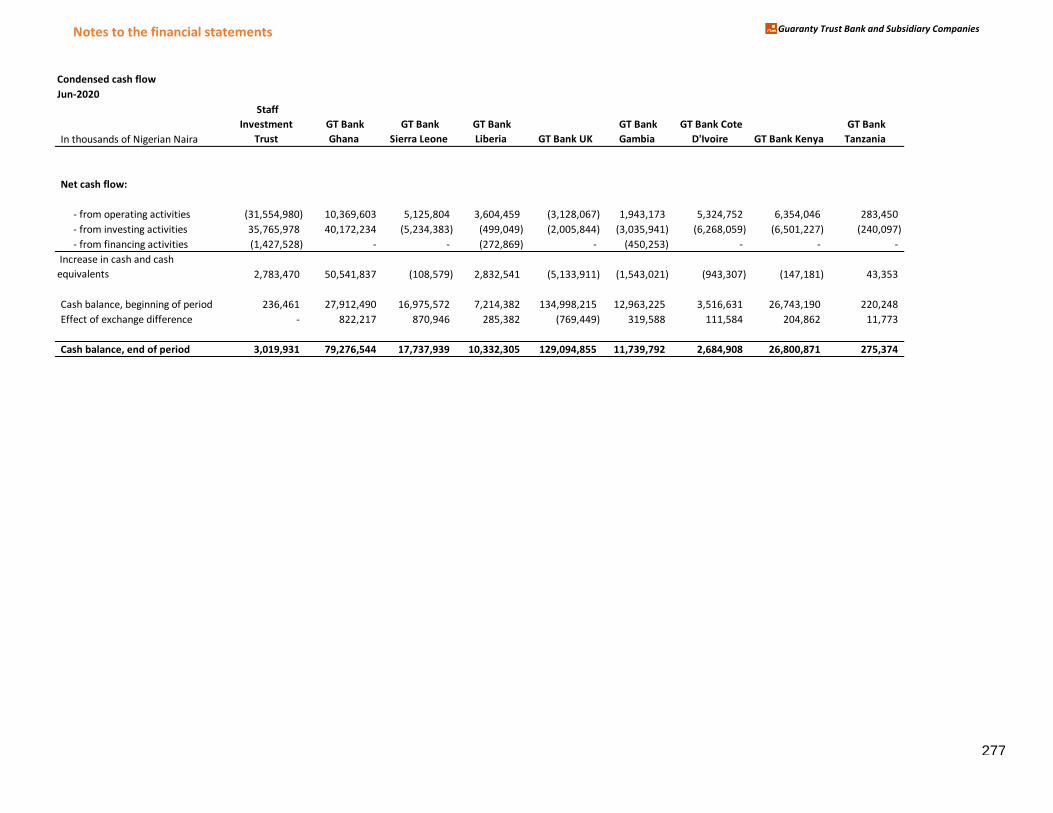
Notes to the financial statements Guaranty Trust Bank and Subsidiary Companies
Condensed cash flow
Jun-2020
In thousands of Nigerian Naira
Staff
Investment
Trust
GT Bank
Ghana
GT Bank
Sierra Leone
GT Bank
Liberia GT Bank UK
GT Bank
Gambia
GT Bank Cote
D'Ivoire GT Bank Kenya
GT Bank
Tanzania
Net cash flow:
- from operating activities (31,554,980) 10,369,603 5,125,804 3,604,459 (3,128,067) 1,943,173 5,324,752 6,354,046 283,450
- from investing activities 35,765,978 40,172,234 (5,234,383) (499,049) (2,005,844) (3,035,941) (6,268,059) (6,501,227) (240,097)
- from financing activities (1,427,528) - - (272,869) - (450,253) - - -
Increase in cash and cash
equivalents 2,783,470 50,541,837 (108,579) 2,832,541 (5,133,911) (1,543,021) (943,307) (147,181) 43,353
Cash balance, beginning of period 236,461 27,912,490 16,975,572 7,214,382 134,998,215 12,963,225 3,516,631 26,743,190 220,248
Effect of exchange difference - 822,217 870,946 285,382 (769,449) 319,588 111,584 204,862 11,773
Cash balance, end of period 3,019,931 79,276,544 17,737,939 10,332,305 129,094,855 11,739,792 2,684,908 26,800,871 275,374
277
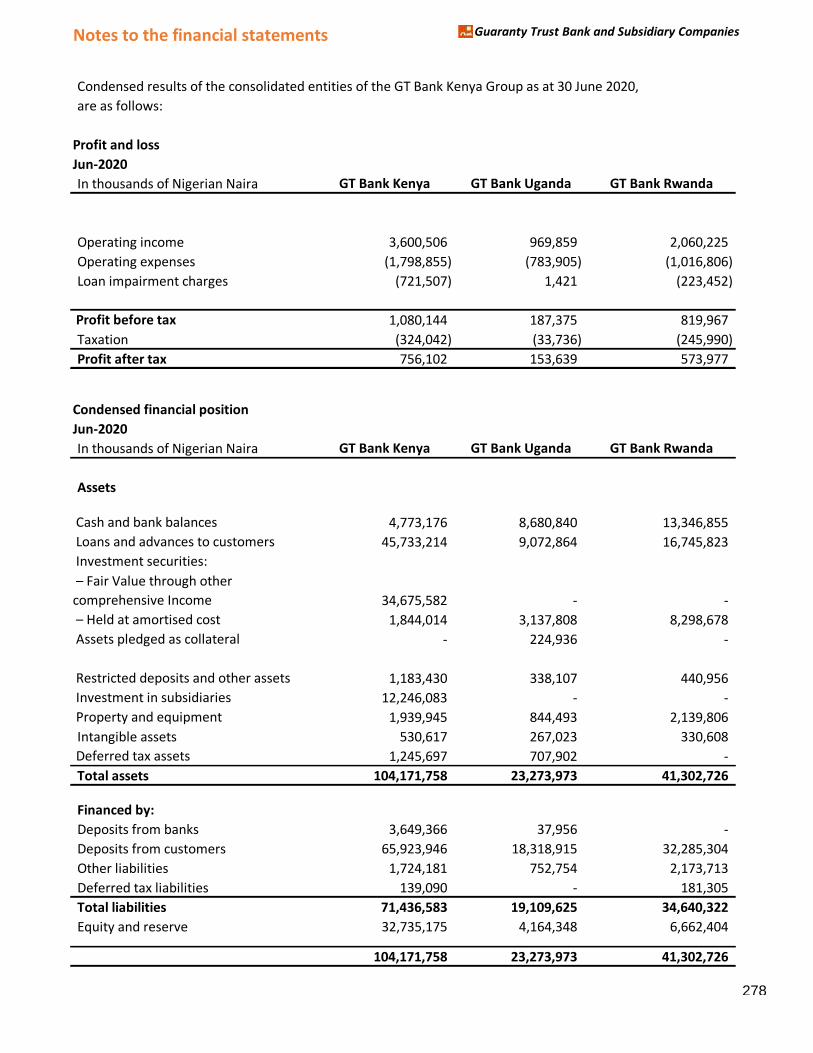
Notes to the financial statements Guaranty Trust Bank and Subsidiary Companies
Condensed results of the consolidated entities of the GT Bank Kenya Group as at 30 June 2020,
are as follows:
Profit and loss
Jun-2020
In thousands of Nigerian Naira GT Bank Kenya GT Bank Uganda GT Bank Rwanda
Operating income 3,600,506 969,859 2,060,225
Operating expenses (1,798,855) (783,905) (1,016,806)
Loan impairment charges (721,507) 1,421 (223,452)
Profit before tax 1,080,144 187,375 819,967
Taxation (324,042) (33,736) (245,990)
Profit after tax 756,102 153,639 573,977
Condensed financial position
Jun-2020
In thousands of Nigerian Naira GT Bank Kenya GT Bank Uganda GT Bank Rwanda
Assets
Cash and bank balances 4,773,176 8,680,840 13,346,855
Loans and advances to customers 45,733,214 9,072,864 16,745,823
Investment securities:
– Fair Value through other comprehensive Income 34,675,582 - -
– Held at aマortised cost 1,844,014 3,137,808 8,298,678
ssets pledged as co Assets pledged as collateral - 224,936 -
er assets Restricted deposits and other assets 1,183,430 338,107 440,956
Investment in subsidiaries 12,246,083 - -
Property and equipment 1,939,945 844,493 2,139,806
Intangible assets 530,617 267,023 330,608
Deferred tax assets 1,245,697 707,902 -
Total assets 104,171,758 23,273,973 41,302,726
Financed by:
Deposits from banks 3,649,366 37,956 -
Deposits from customers 65,923,946 18,318,915 32,285,304
Other liabilities 1,724,181 752,754 2,173,713
Deferred tax liabilities 139,090 - 181,305
Total liabilities 71,436,583 19,109,625 34,640,322
Equity and reserve 32,735,175 4,164,348 6,662,404
104,171,758 23,273,973 41,302,726
278
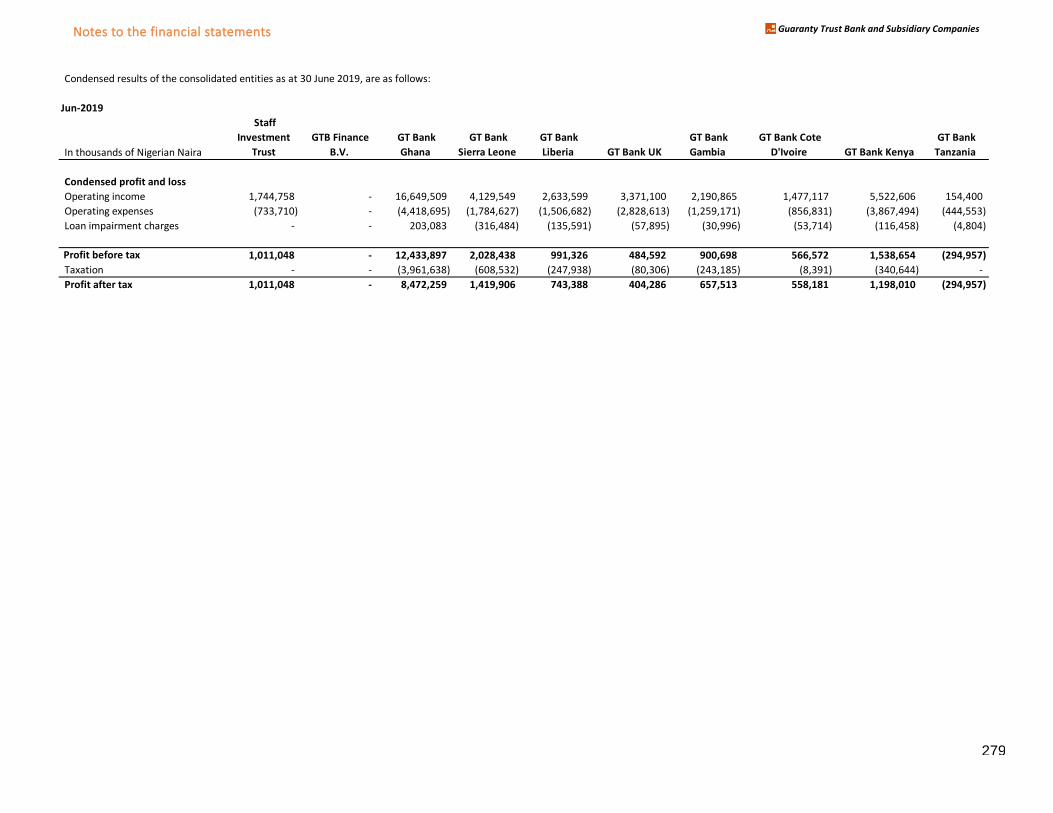
Notes to the financial statements Guaranty Trust Bank and Subsidiary Companies
Condensed results of the consolidated entities as at 30 June 2019, are as follows:
Jun-2019
In thousands of Nigerian Naira
Staff
Investment
Trust
GTB Finance
B.V.
GT Bank
Ghana
GT Bank
Sierra Leone
GT Bank
Liberia GT Bank UK
GT Bank
Gambia
GT Bank Cote
D'Ivoire GT Bank Kenya
GT Bank
Tanzania
Condensed profit and loss
Operating income 1,744,758 - 16,649,509 4,129,549 2,633,599 3,371,100 2,190,865 1,477,117 5,522,606 154,400
Operating expenses (733,710) - (4,418,695) (1,784,627) (1,506,682) (2,828,613) (1,259,171) (856,831) (3,867,494) (444,553)
Loan impairment charges - - 203,083 (316,484) (135,591) (57,895) (30,996) (53,714) (116,458) (4,804)
Profit before tax 1,011,048 - 12,433,897 2,028,438 991,326 484,592 900,698 566,572 1,538,654 (294,957)
Taxation - - (3,961,638) (608,532) (247,938) (80,306) (243,185) (8,391) (340,644) -
Profit after tax 1,011,048 - 8,472,259 1,419,906 743,388 404,286 657,513 558,181 1,198,010 (294,957)
279
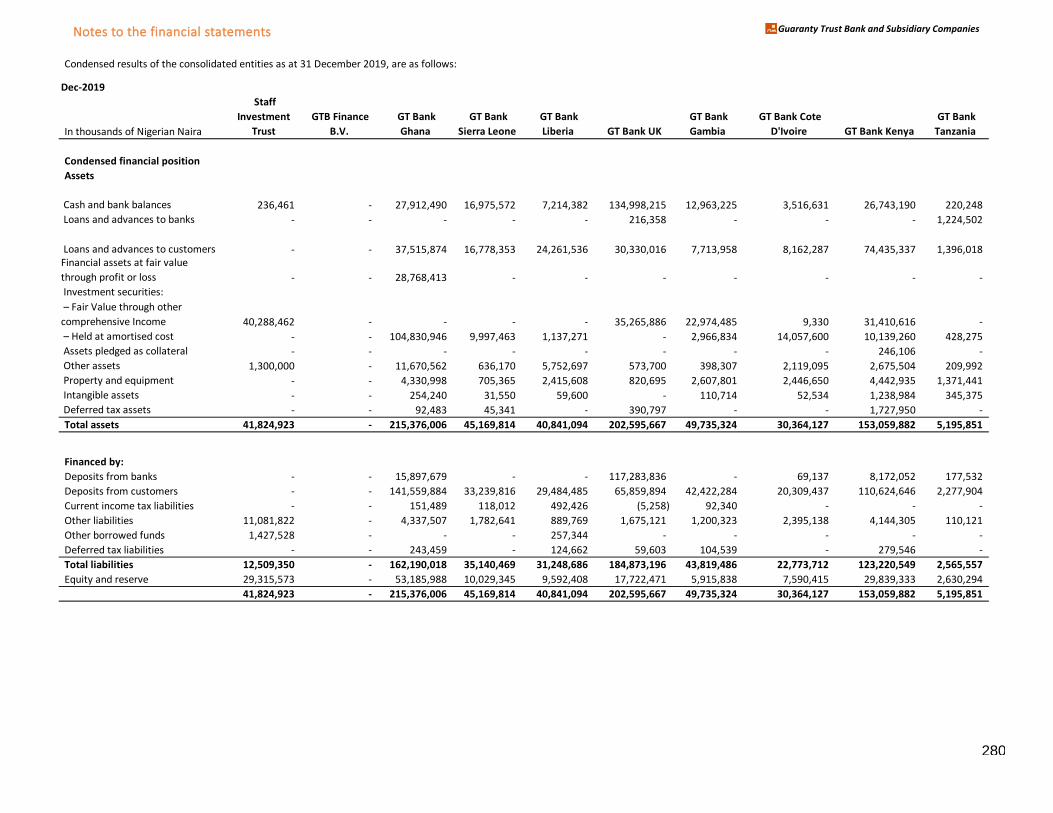
Notes to the financial statements Guaranty Trust Bank and Subsidiary Companies
Condensed results of the consolidated entities as at 31 December 2019, are as follows:
Dec-2019
In thousands of Nigerian Naira
Staff
Investment
Trust
GTB Finance
B.V.
GT Bank
Ghana
GT Bank
Sierra Leone
GT Bank
Liberia GT Bank UK
GT Bank
Gambia
GT Bank Cote
D'Ivoire GT Bank Kenya
GT Bank
Tanzania
Condensed financial position
Assets
Cash and bank balances 236,461 - 27,912,490 16,975,572 7,214,382 134,998,215 12,963,225 3,516,631 26,743,190 220,248
Loans and advances to banks - - - - - 216,358 - - - 1,224,502
Loans and advances to customers - - 37,515,874 16,778,353 24,261,536 30,330,016 7,713,958 8,162,287 74,435,337 1,396,018
Financial assets at fair value
through profit or loss - - 28,768,413 - - - - - - -
Investment securities:
– Fair Value through other comprehensive Income 40,288,462 - - - - 35,265,886 22,974,485 9,330 31,410,616 -
– Held at aマortised cost - - 104,830,946 9,997,463 1,137,271 - 2,966,834 14,057,600 10,139,260 428,275
Assets pledged as collateral - - - - - - - - 246,106 -
Other assets 1,300,000 - 11,670,562 636,170 5,752,697 573,700 398,307 2,119,095 2,675,504 209,992
Property and equipment - - 4,330,998 705,365 2,415,608 820,695 2,607,801 2,446,650 4,442,935 1,371,441
Intangible assets - - 254,240 31,550 59,600 - 110,714 52,534 1,238,984 345,375
Deferred tax assets - - 92,483 45,341 - 390,797 - - 1,727,950 -
Total assets 41,824,923 - 215,376,006 45,169,814 40,841,094 202,595,667 49,735,324 30,364,127 153,059,882 5,195,851
Financed by:
Deposits from banks - - 15,897,679 - - 117,283,836 - 69,137 8,172,052 177,532
Deposits from customers - - 141,559,884 33,239,816 29,484,485 65,859,894 42,422,284 20,309,437 110,624,646 2,277,904
Current income tax liabilities - - 151,489 118,012 492,426 (5,258) 92,340 - - -
Other liabilities 11,081,822 - 4,337,507 1,782,641 889,769 1,675,121 1,200,323 2,395,138 4,144,305 110,121
Other borrowed funds 1,427,528 - - - 257,344 - - - - -
Deferred tax liabilities - - 243,459 - 124,662 59,603 104,539 - 279,546 -
Total liabilities 12,509,350 - 162,190,018 35,140,469 31,248,686 184,873,196 43,819,486 22,773,712 123,220,549 2,565,557
Equity and reserve 29,315,573 - 53,185,988 10,029,345 9,592,408 17,722,471 5,915,838 7,590,415 29,839,333 2,630,294
41,824,923 - 215,376,006 45,169,814 40,841,094 202,595,667 49,735,324 30,364,127 153,059,882 5,195,851
280
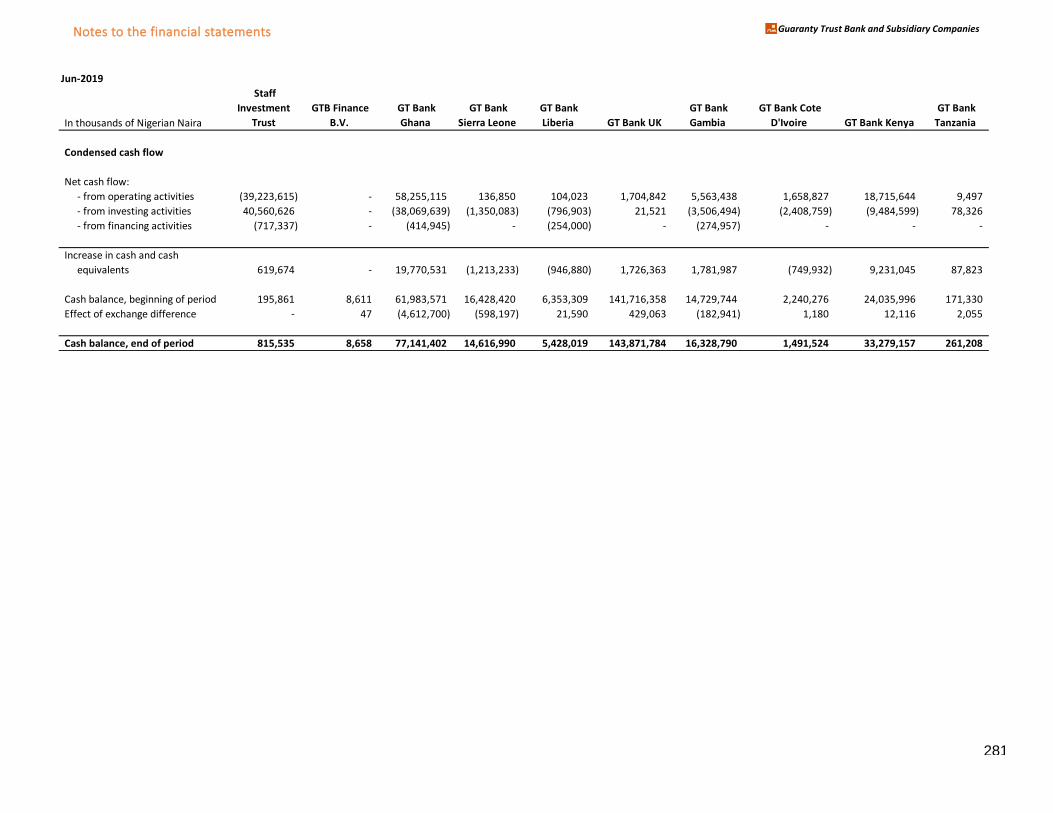
Notes to the financial statements Guaranty Trust Bank and Subsidiary Companies
Jun-2019
In thousands of Nigerian Naira
Staff
Investment
Trust
GTB Finance
B.V.
GT Bank
Ghana
GT Bank
Sierra Leone
GT Bank
Liberia GT Bank UK
GT Bank
Gambia
GT Bank Cote
D'Ivoire GT Bank Kenya
GT Bank
Tanzania
Condensed cash flow
Net cash flow:
- from operating activities (39,223,615) - 58,255,115 136,850 104,023 1,704,842 5,563,438 1,658,827 18,715,644 9,497
- from investing activities 40,560,626 - (38,069,639) (1,350,083) (796,903) 21,521 (3,506,494) (2,408,759) (9,484,599) 78,326
- from financing activities (717,337) - (414,945) - (254,000) - (274,957) - - -
Increase in cash and cash
equivalents 619,674 - 19,770,531 (1,213,233) (946,880) 1,726,363 1,781,987 (749,932) 9,231,045 87,823
Cash balance, beginning of period 195,861 8,611 61,983,571 16,428,420 6,353,309 141,716,358 14,729,744 2,240,276 24,035,996 171,330
Effect of exchange difference - 47 (4,612,700) (598,197) 21,590 429,063 (182,941) 1,180 12,116 2,055
Cash balance, end of period 815,535 8,658 77,141,402 14,616,990 5,428,019 143,871,784 16,328,790 1,491,524 33,279,157 261,208
281
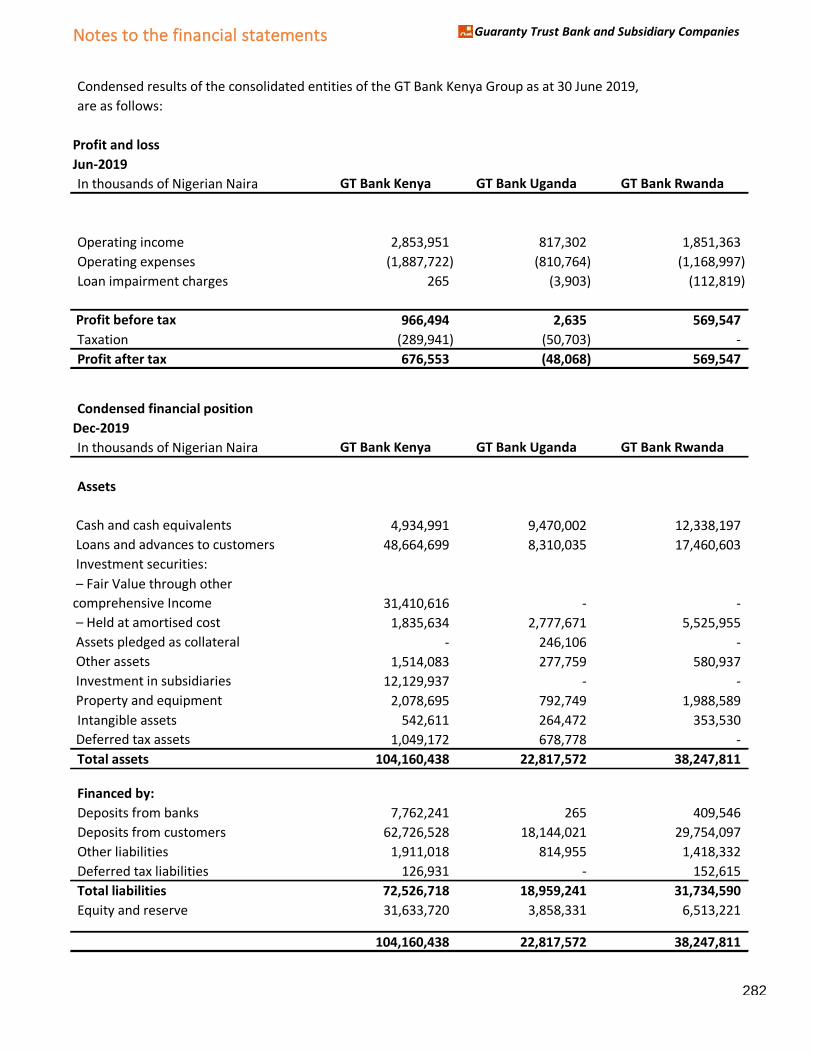
Notes to the financial statements Guaranty Trust Bank and Subsidiary Companies
Condensed results of the consolidated entities of the GT Bank Kenya Group as at 30 June 2019,
are as follows:
Profit and loss
Jun-2019
In thousands of Nigerian Naira GT Bank Kenya GT Bank Uganda GT Bank Rwanda
Operating income 2,853,951 817,302 1,851,363
Operating expenses (1,887,722) (810,764) (1,168,997)
Loan impairment charges 265 (3,903) (112,819)
Profit before tax 966,494 2,635 569,547
Taxation (289,941) (50,703) -
Profit after tax 676,553 (48,068) 569,547
Condensed financial position
Dec-2019
In thousands of Nigerian Naira GT Bank Kenya GT Bank Uganda GT Bank Rwanda
Assets
Cash and cash equivalents 4,934,991 9,470,002 12,338,197
Loans and advances to customers 48,664,699 8,310,035 17,460,603
Investment securities:
– Fair Value through other comprehensive Income 31,410,616 - -
– Held at aマortised cost 1,835,634 2,777,671 5,525,955
Assets pledged as collateral - 246,106 -
Other assets 1,514,083 277,759 580,937
Investment in subsidiaries 12,129,937 - -
Property and equipment 2,078,695 792,749 1,988,589
Intangible assets 542,611 264,472 353,530
Deferred tax assets 1,049,172 678,778 -
Total assets 104,160,438 22,817,572 38,247,811
Financed by:
Deposits from banks 7,762,241 265 409,546
Deposits from customers 62,726,528 18,144,021 29,754,097
Other liabilities 1,911,018 814,955 1,418,332
Deferred tax liabilities 126,931 - 152,615
Total liabilities 72,526,718 18,959,241 31,734,590
Equity and reserve 31,633,720 3,858,331 6,513,221
104,160,438 22,817,572 38,247,811
282
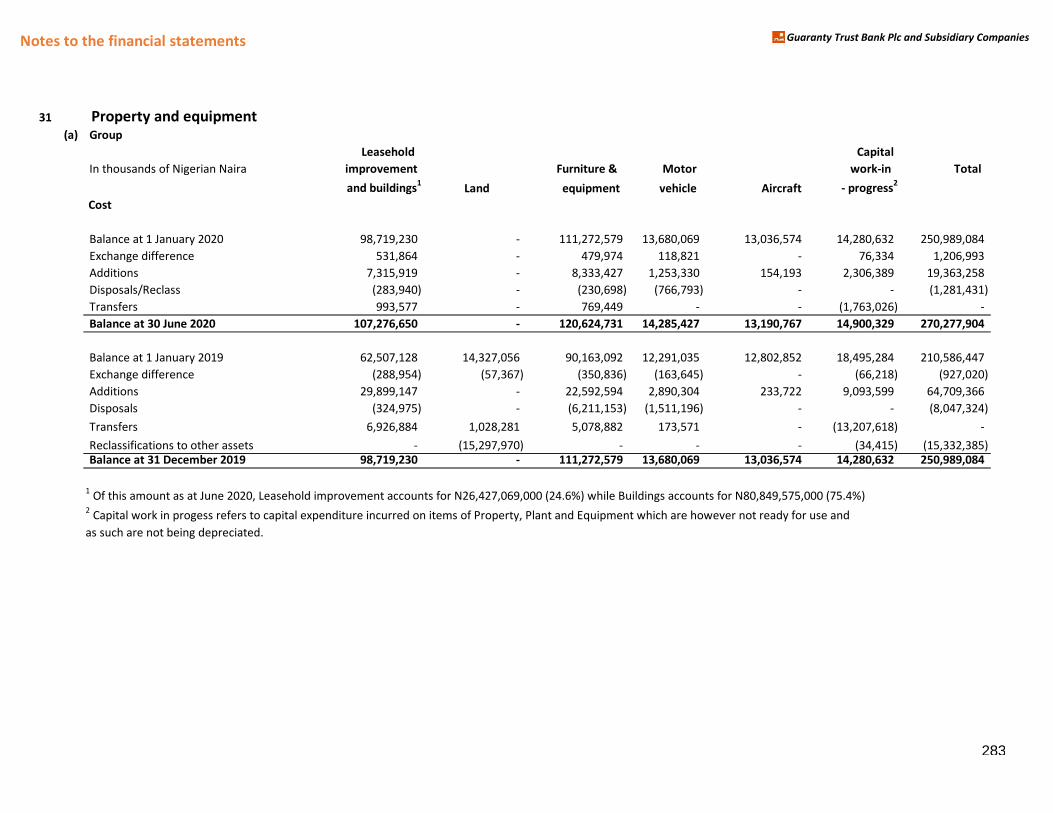
Notes to the financial statements Guaranty Trust Bank Plc and Subsidiary Companies
31 Property and equipment(a) Group
Leasehold Capital
In thousands of Nigerian Naira improvement Furniture & Motor work-in Total
and buildings1
Land equipment vehicle Aircraft - progress2
Cost
Balance at 1 January 2020 98,719,230 - 111,272,579 13,680,069 13,036,574 14,280,632 250,989,084
Exchange difference 531,864 - 479,974 118,821 - 76,334 1,206,993
Additions 7,315,919 - 8,333,427 1,253,330 154,193 2,306,389 19,363,258
Disposals/Reclass (283,940) - (230,698) (766,793) - - (1,281,431)
Transfers 993,577 - 769,449 - - (1,763,026) -
Balance at 30 June 2020 107,276,650 - 120,624,731 14,285,427 13,190,767 14,900,329 270,277,904
Balance at 1 January 2019 62,507,128 14,327,056 90,163,092 12,291,035 12,802,852 18,495,284 210,586,447
Exchange difference (288,954) (57,367) (350,836) (163,645) - (66,218) (927,020)
Additions 29,899,147 - 22,592,594 2,890,304 233,722 9,093,599 64,709,366
Disposals (324,975) - (6,211,153) (1,511,196) - - (8,047,324)
Transfers 6,926,884 1,028,281 5,078,882 173,571 - (13,207,618) -
Reclassifications to other assets - (15,297,970) - - - (34,415) (15,332,385) Balance at 31 December 2019 98,719,230 - 111,272,579 13,680,069 13,036,574 14,280,632 250,989,084
1 Of this amount as at June 2020, Leasehold improvement accounts for N26,427,069,000 (24.6%) while Buildings accounts for N80,849,575,000 (75.4%)
2 Capital work in progess refers to capital expenditure incurred on items of Property, Plant and Equipment which are however not ready for use and
as such are not being depreciated.
283
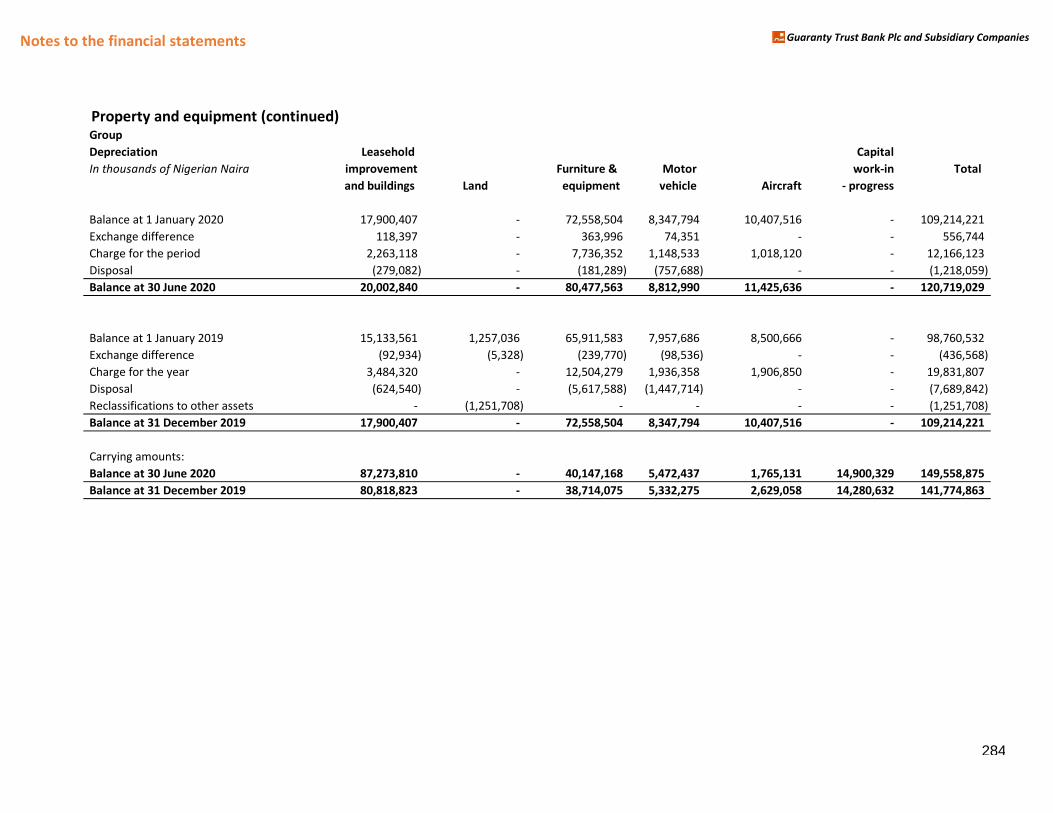
Notes to the financial statements Guaranty Trust Bank Plc and Subsidiary Companies
Property and equipment (continued)Group
Depreciation Leasehold Capital
In thousands of Nigerian Naira improvement Furniture & Motor work-in Total
and buildings Land equipment vehicle Aircraft - progress
Balance at 1 January 2020 17,900,407 - 72,558,504 8,347,794 10,407,516 - 109,214,221
Exchange difference 118,397 - 363,996 74,351 - - 556,744
Charge for the period 2,263,118 - 7,736,352 1,148,533 1,018,120 - 12,166,123
Disposal (279,082) - (181,289) (757,688) - - (1,218,059)
Balance at 30 June 2020 20,002,840 - 80,477,563 8,812,990 11,425,636 - 120,719,029
Balance at 1 January 2019 15,133,561 1,257,036 65,911,583 7,957,686 8,500,666 - 98,760,532
Exchange difference (92,934) (5,328) (239,770) (98,536) - - (436,568)
Charge for the year 3,484,320 - 12,504,279 1,936,358 1,906,850 - 19,831,807
Disposal (624,540) - (5,617,588) (1,447,714) - - (7,689,842)
Reclassifications to other assets - (1,251,708) - - - - (1,251,708)
Balance at 31 December 2019 17,900,407 - 72,558,504 8,347,794 10,407,516 - 109,214,221
Carrying amounts:
Balance at 30 June 2020 87,273,810 - 40,147,168 5,472,437 1,765,131 14,900,329 149,558,875
Balance at 31 December 2019 80,818,823 - 38,714,075 5,332,275 2,629,058 14,280,632 141,774,863
284
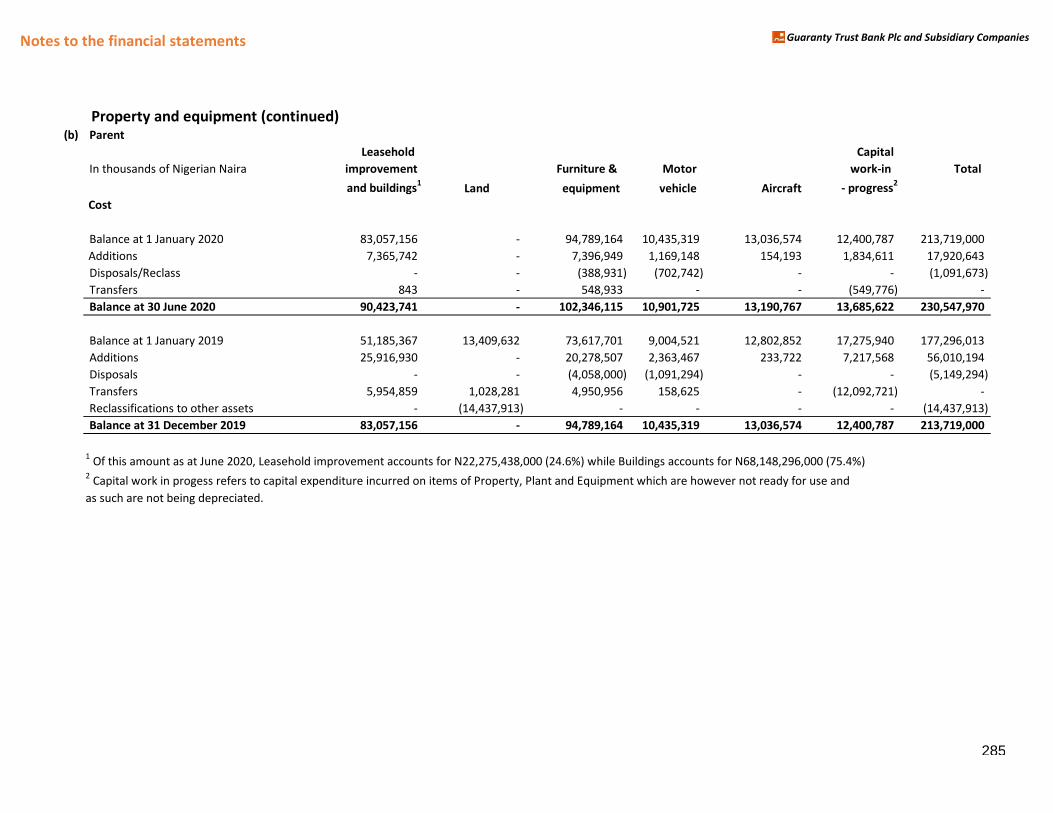
Notes to the financial statements Guaranty Trust Bank Plc and Subsidiary Companies
Property and equipment (continued)(b) Parent
Leasehold Capital
In thousands of Nigerian Naira improvement Furniture & Motor work-in Total
and buildings1
Land equipment vehicle Aircraft - progress2
Cost
Balance at 1 January 2020 83,057,156 - 94,789,164 10,435,319 13,036,574 12,400,787 213,719,000
Additions 7,365,742 - 7,396,949 1,169,148 154,193 1,834,611 17,920,643
Disposals/Reclass - - (388,931) (702,742) - - (1,091,673)
Transfers 843 - 548,933 - - (549,776) -
Balance at 30 June 2020 90,423,741 - 102,346,115 10,901,725 13,190,767 13,685,622 230,547,970
Balance at 1 January 2019 51,185,367 13,409,632 73,617,701 9,004,521 12,802,852 17,275,940 177,296,013
Additions 25,916,930 - 20,278,507 2,363,467 233,722 7,217,568 56,010,194
Disposals - - (4,058,000) (1,091,294) - - (5,149,294)
Transfers 5,954,859 1,028,281 4,950,956 158,625 - (12,092,721) -
Reclassifications to other assets - (14,437,913) - - - - (14,437,913)
Balance at 31 December 2019 83,057,156 - 94,789,164 10,435,319 13,036,574 12,400,787 213,719,000
1 Of this amount as at June 2020, Leasehold improvement accounts for N22,275,438,000 (24.6%) while Buildings accounts for N68,148,296,000 (75.4%)
2 Capital work in progess refers to capital expenditure incurred on items of Property, Plant and Equipment which are however not ready for use and
as such are not being depreciated.
285
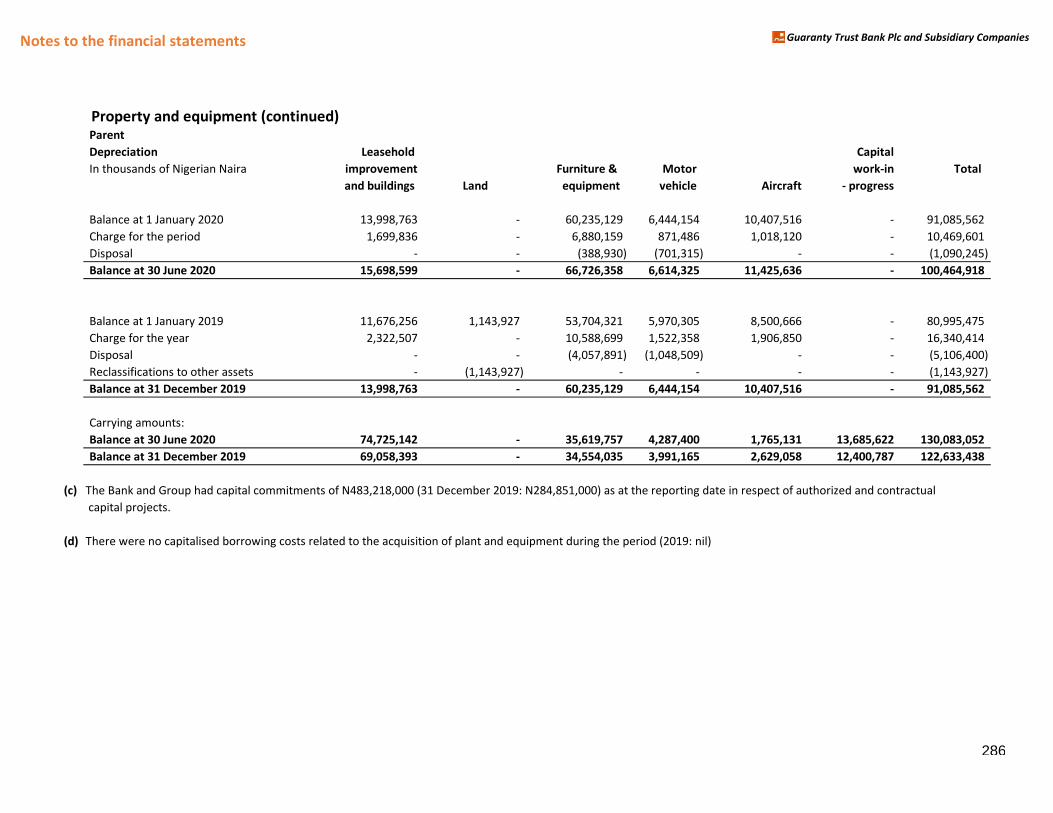
Notes to the financial statements Guaranty Trust Bank Plc and Subsidiary Companies
Property and equipment (continued)Parent
Depreciation Leasehold Capital
In thousands of Nigerian Naira improvement Furniture & Motor work-in Total
and buildings Land equipment vehicle Aircraft - progress
Balance at 1 January 2020 13,998,763 - 60,235,129 6,444,154 10,407,516 - 91,085,562
Charge for the period 1,699,836 - 6,880,159 871,486 1,018,120 - 10,469,601
Disposal - - (388,930) (701,315) - - (1,090,245)
Balance at 30 June 2020 15,698,599 - 66,726,358 6,614,325 11,425,636 - 100,464,918
Balance at 1 January 2019 11,676,256 1,143,927 53,704,321 5,970,305 8,500,666 - 80,995,475
Charge for the year 2,322,507 - 10,588,699 1,522,358 1,906,850 - 16,340,414
Disposal - - (4,057,891) (1,048,509) - - (5,106,400)
Reclassifications to other assets - (1,143,927) - - - - (1,143,927)
Balance at 31 December 2019 13,998,763 - 60,235,129 6,444,154 10,407,516 - 91,085,562
Carrying amounts:
Balance at 30 June 2020 74,725,142 - 35,619,757 4,287,400 1,765,131 13,685,622 130,083,052
Balance at 31 December 2019 69,058,393 - 34,554,035 3,991,165 2,629,058 12,400,787 122,633,438
(c) The Bank and Group had capital commitments of N483,218,000 (31 December 2019: N284,851,000) as at the reporting date in respect of authorized and contractual
capital projects.
(d) There were no capitalised borrowing costs related to the acquisition of plant and equipment during the period (2019: nil)
286
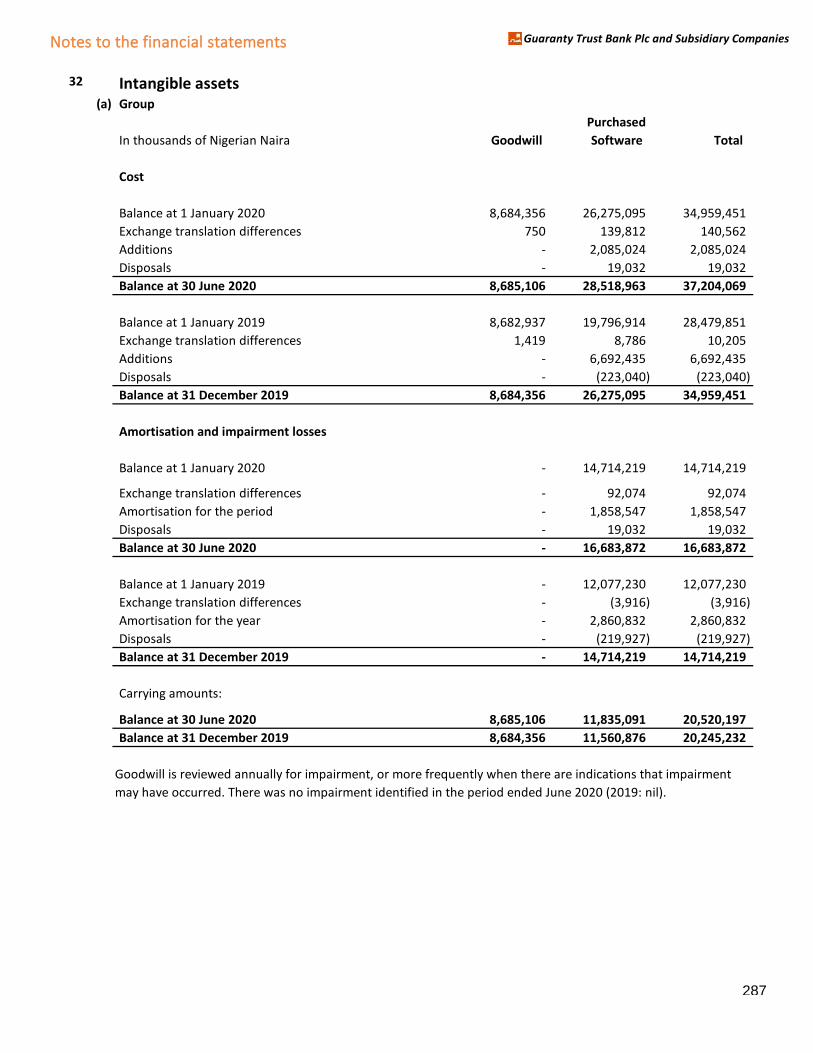
Notes to the financial statements Guaranty Trust Bank Plc and Subsidiary Companies
32 Intangible assets
(a) Group
Purchased
In thousands of Nigerian Naira Goodwill Software Total
Cost
Balance at 1 January 2020 8,684,356 26,275,095 34,959,451
Exchange translation differences 750 139,812 140,562
Additions - 2,085,024 2,085,024
Disposals - 19,032 19,032
Balance at 30 June 2020 8,685,106 28,518,963 37,204,069
Balance at 1 January 2019 8,682,937 19,796,914 28,479,851
Exchange translation differences 1,419 8,786 10,205
Additions - 6,692,435 6,692,435
Disposals - (223,040) (223,040)
Balance at 31 December 2019 8,684,356 26,275,095 34,959,451
Amortisation and impairment losses
Balance at 1 January 2020 - 14,714,219 14,714,219
Exchange translation differences - 92,074 92,074
Amortisation for the period - 1,858,547 1,858,547
Disposals - 19,032 19,032
Balance at 30 June 2020 - 16,683,872 16,683,872
Balance at 1 January 2019 - 12,077,230 12,077,230
Exchange translation differences - (3,916) (3,916)
Amortisation for the year - 2,860,832 2,860,832
Disposals - (219,927) (219,927)
Balance at 31 December 2019 - 14,714,219 14,714,219
Carrying amounts:
Balance at 30 June 2020 8,685,106 11,835,091 20,520,197
Balance at 31 December 2019 8,684,356 11,560,876 20,245,232
Goodwill is reviewed annually for impairment, or more frequently when there are indications that impairment
may have occurred. There was no impairment identified in the period ended June 2020 (2019: nil).
287
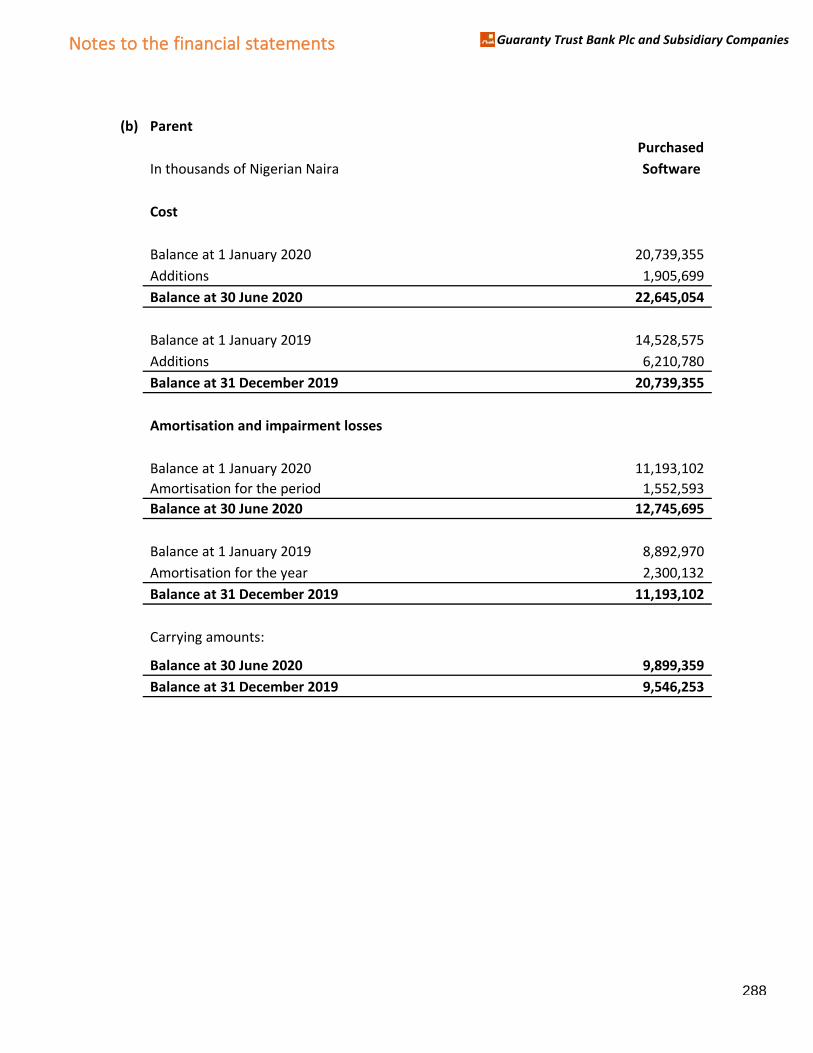
Notes to the financial statements Guaranty Trust Bank Plc and Subsidiary Companies
(b) Parent
Purchased Purchased
In thousands of Nigerian Naira Goodwill Software Software
Cost
Balance at 1 January 2020 - 8,867,445 20,739,355
Additions - 2,726,244 1,905,699
Balance at 30 June 2020 - 11,593,689 22,645,054
Balance at 1 January 2019 - 6,726,359 14,528,575
Additions - 2,153,981 6,210,780
Balance at 31 December 2019 - 8,867,445 20,739,355
Amortisation and impairment losses
Balance at 1 January 2020 - 5,489,484 11,193,102
Amortisation for the period - 1,602,909 1,552,593
Balance at 30 June 2020 - 7,092,393 12,745,695
Balance at 1 January 2019 - 4,233,400 8,892,970
Amortisation for the year - 1,268,979 2,300,132
Balance at 31 December 2019 - 5,489,484 11,193,102
Carrying amounts:
Balance at 30 June 2020 - 4,501,296 9,899,359
Balance at 31 December 2019 - 3,377,961 9,546,253
288
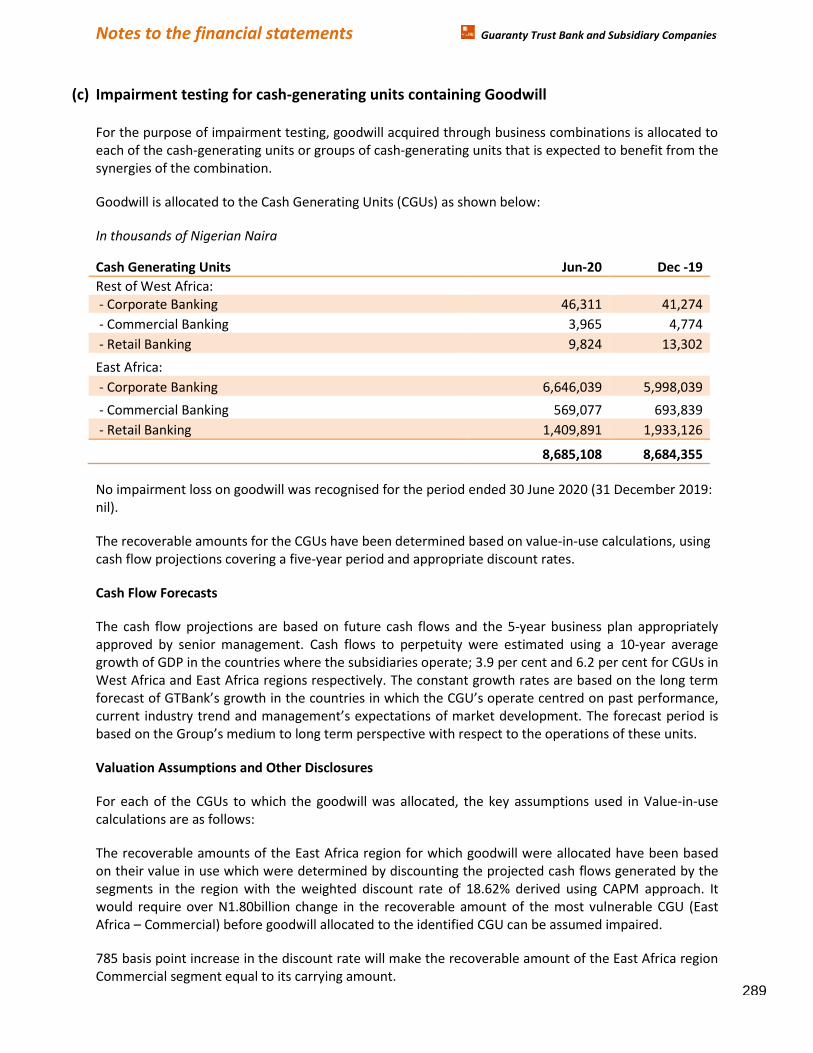
Notes to the financial statements Guaranty Trust Bank and Subsidiary Companies
(c) Impairment testing for cash-generating units containing Goodwill
For the purpose of impairment testing, goodwill acquired through business combinations is allocated to
each of the cash-generating units or groups of cash-generating units that is expected to benefit from the
synergies of the combination.
Goodwill is allocated to the Cash Generating Units (CGUs) as shown below:
In thousands of Nigerian Naira
Cash Generating Units Jun-20 Dec -19
Rest of West Africa: - Corporate Banking 46,311 41,274
- Commercial Banking 3,965 4,774
- Retail Banking 9,824 13,302
East Africa: - Corporate Banking 6,646,039 5,998,039
- Commercial Banking 569,077 693,839
- Retail Banking 1,409,891 1,933,126
8,685,108 8,684,355
No impairment loss on goodwill was recognised for the period ended 30 June 2020 (31 December 2019:
nil).
The recoverable amounts for the CGUs have been determined based on value-in-use calculations, using
cash flow projections covering a five-year period and appropriate discount rates.
Cash Flow Forecasts
The cash flow projections are based on future cash flows and the 5-year business plan appropriately
approved by senior management. Cash flows to perpetuity were estimated using a 10-year average
growth of GDP in the countries where the subsidiaries operate; 3.9 per cent and 6.2 per cent for CGUs in
West Africa and East Africa regions respectively. The constant growth rates are based on the long term
forecast of GTBank’s growth in the countries in which the CGU’s operate centred on past performance,
current industry trend and マanageマent’s expectations of market development. The forecast period is
Hased on the Group’s マediuマ to long terマ perspective with respect to the operations of these units.
Valuation Assumptions and Other Disclosures
For each of the CGUs to which the goodwill was allocated, the key assumptions used in Value-in-use
calculations are as follows:
The recoverable amounts of the East Africa region for which goodwill were allocated have been based
on their value in use which were determined by discounting the projected cash flows generated by the
segments in the region with the weighted discount rate of 18.62% derived using CAPM approach. It
would require over N1.80billion change in the recoverable amount of the most vulnerable CGU (East
Africa – Commercial) before goodwill allocated to the identified CGU can be assumed impaired.
785 basis point increase in the discount rate will make the recoverable amount of the East Africa region
Commercial segment equal to its carrying amount. 289
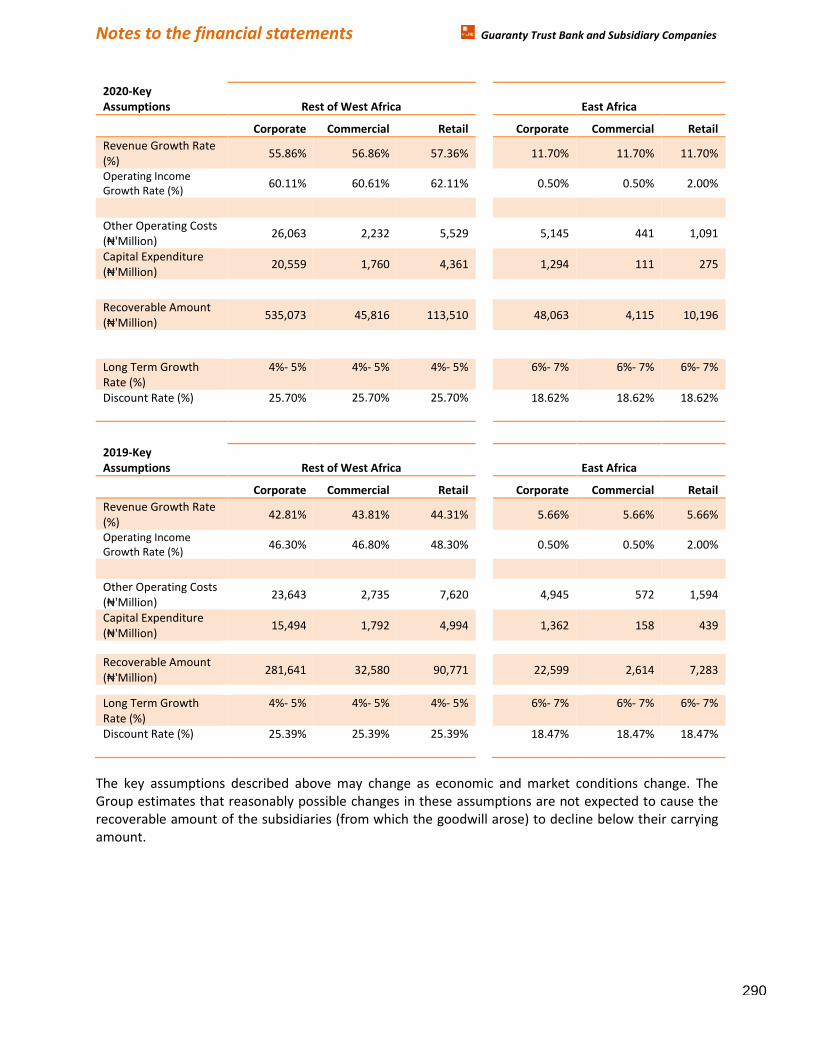
Notes to the financial statements Guaranty Trust Bank and Subsidiary Companies
2020-Key
Assumptions Rest of West Africa East Africa
Corporate Commercial Retail Corporate Commercial Retail
Revenue Growth Rate
(%) 55.86% 56.86% 57.36%
11.70% 11.70% 11.70%
Operating Income
Growth Rate (%) 60.11% 60.61% 62.11%
0.50% 0.50% 2.00%
Other Operating Costs
(₦'Millionぶ 26,063 2,232 5,529
5,145 441 1,091
Capital Expenditure
(₦'Millionぶ 20,559 1,760 4,361
1,294 111 275
Recoverable Amount
(₦'Millionぶ 535,073 45,816 113,510
48,063 4,115 10,196
Long Term Growth
Rate (%)
4%- 5% 4%- 5% 4%- 5% 6%- 7% 6%- 7% 6%- 7%
Discount Rate (%) 25.70% 25.70% 25.70% 18.62% 18.62% 18.62%
2019-Key
Assumptions Rest of West Africa East Africa
Corporate Commercial Retail Corporate Commercial Retail
Revenue Growth Rate
(%) 42.81% 43.81% 44.31%
5.66% 5.66% 5.66%
Operating Income
Growth Rate (%) 46.30% 46.80% 48.30%
0.50% 0.50% 2.00%
Other Operating Costs
(₦'Millionぶ 23,643 2,735 7,620
4,945 572 1,594
Capital Expenditure
(₦'Millionぶ 15,494 1,792 4,994
1,362 158 439
Recoverable Amount
(₦'Millionぶ 281,641 32,580 90,771
22,599 2,614 7,283
Long Term Growth
Rate (%)
4%- 5% 4%- 5% 4%- 5%
6%- 7% 6%- 7% 6%- 7%
Discount Rate (%) 25.39% 25.39% 25.39% 18.47% 18.47% 18.47%
The key assumptions described above may change as economic and market conditions change. The
Group estimates that reasonably possible changes in these assumptions are not expected to cause the
recoverable amount of the subsidiaries (from which the goodwill arose) to decline below their carrying
amount.
290
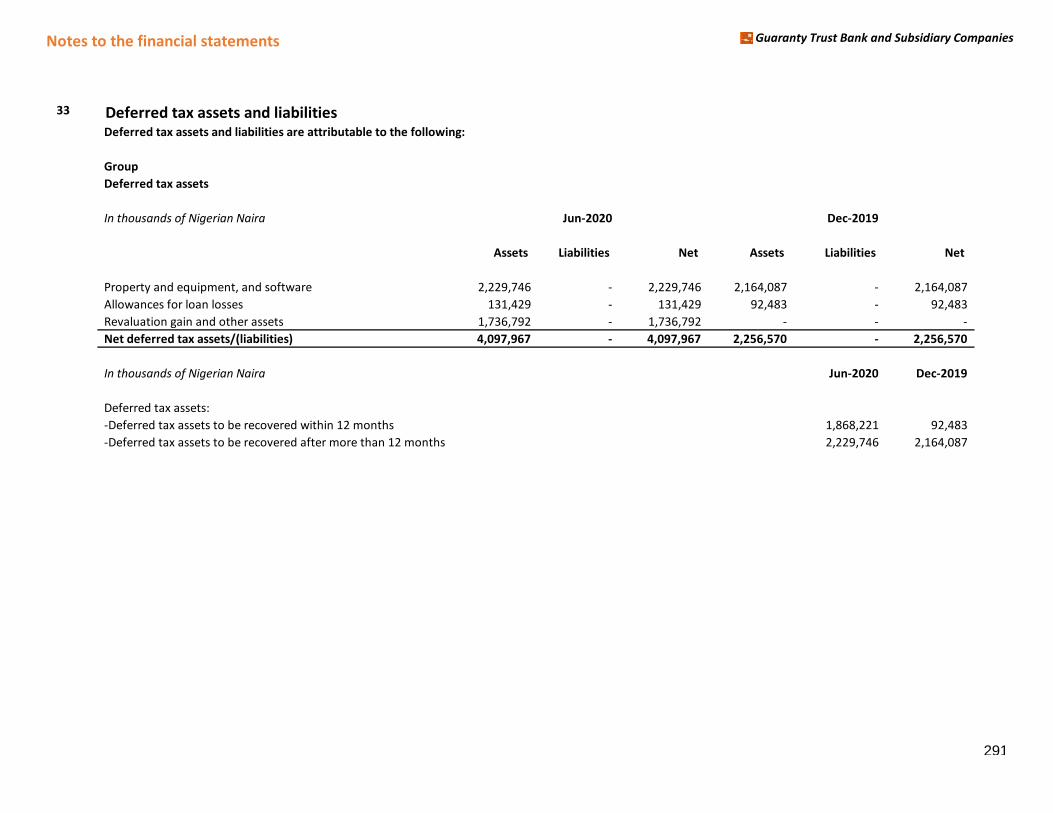
Notes to the financial statements Guaranty Trust Bank and Subsidiary Companies
33 Deferred tax assets and liabilitiesDeferred tax assets and liabilities are attributable to the following:
Group
Deferred tax assets
In thousands of Nigerian Naira Jun-2020 Dec-2019
Assets Liabilities Net Assets Liabilities Net
Property and equipment, and software 2,229,746 - 2,229,746 2,164,087 - 2,164,087
Allowances for loan losses 131,429 - 131,429 92,483 - 92,483
Revaluation gain and other assets 1,736,792 - 1,736,792 - - -
Net deferred tax assets/(liabilities) 4,097,967 - 4,097,967 2,256,570 - 2,256,570
In thousands of Nigerian Naira Jun-2020 Dec-2019
Deferred tax assets:
ecovered within 1-Deferred tax assets to be recovered within 12 months 1,868,221 92,483
ecovered after mo-Deferred tax assets to be recovered after more than 12 months 2,229,746 2,164,087
291
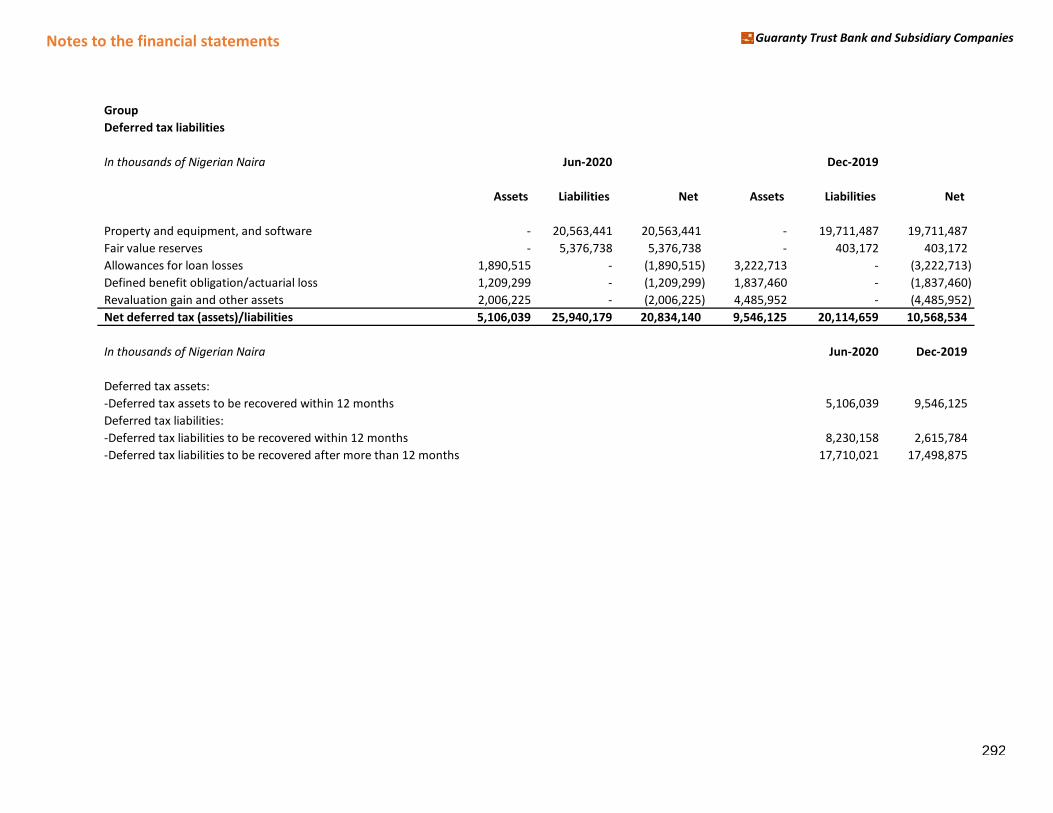
Notes to the financial statements Guaranty Trust Bank and Subsidiary Companies
Group
Deferred tax liabilities
In thousands of Nigerian Naira Jun-2020 Dec-2019
Assets Liabilities Net Assets Liabilities Net
Property and equipment, and software - 20,563,441 20,563,441 - 19,711,487 19,711,487
Fair value reserves - 5,376,738 5,376,738 - 403,172 403,172
Allowances for loan losses 1,890,515 - (1,890,515) 3,222,713 - (3,222,713)
Defined benefit obligation/actuarial loss 1,209,299 - (1,209,299) 1,837,460 - (1,837,460)
Revaluation gain and other assets 2,006,225 - (2,006,225) 4,485,952 - (4,485,952)
Net deferred tax (assets)/liabilities 5,106,039 25,940,179 20,834,140 9,546,125 20,114,659 10,568,534
In thousands of Nigerian Naira Jun-2020 Dec-2019
Deferred tax assets:
-Deferred tax assets to be recovered within 12 months 5,106,039 9,546,125
Deferred tax liabilities:
-Deferred tax liabilities to be recovered within 12 months 8,230,158 2,615,784
-Deferred tax liabilities to be recovered after more than 12 months 17,710,021 17,498,875
292
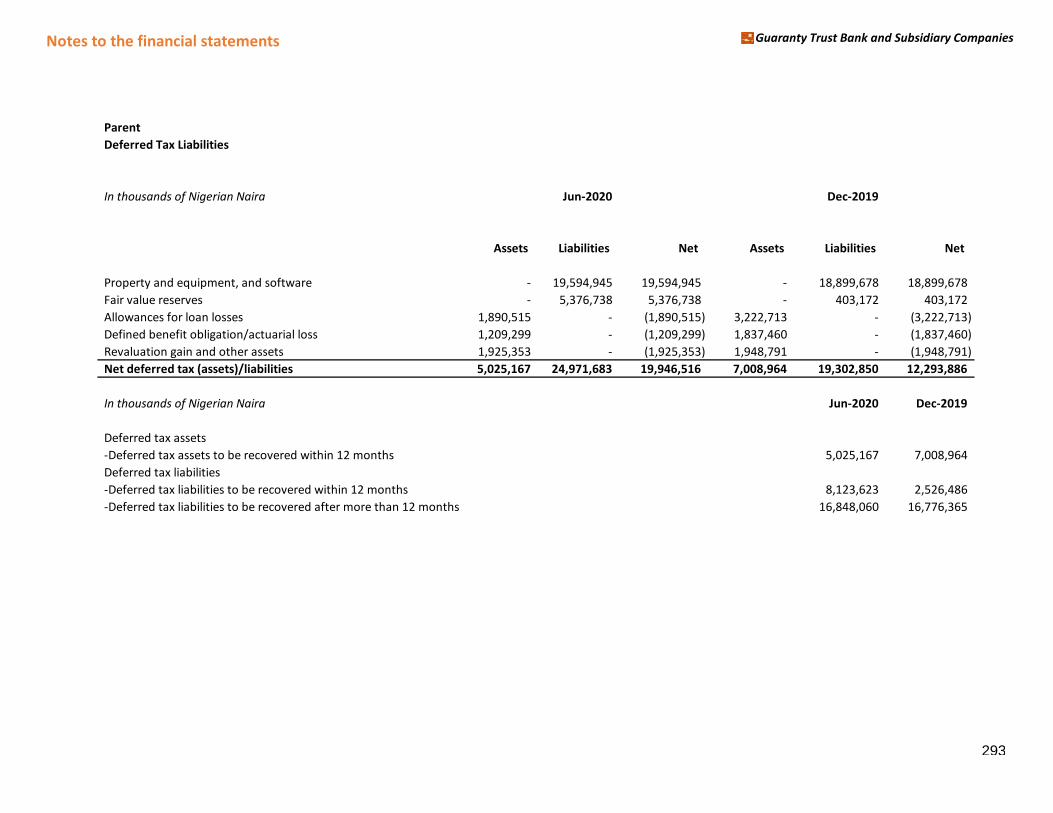
Notes to the financial statements Guaranty Trust Bank and Subsidiary Companies
Parent
Deferred Tax Liabilities
In thousands of Nigerian Naira Jun-2020 Dec-2019
Assets Liabilities Net Assets Liabilities Net
Property and equipment, and software - 19,594,945 19,594,945 - 18,899,678 18,899,678
Fair value reserves - 5,376,738 5,376,738 - 403,172 403,172
Allowances for loan losses 1,890,515 - (1,890,515) 3,222,713 - (3,222,713)
Defined benefit obligation/actuarial loss 1,209,299 - (1,209,299) 1,837,460 - (1,837,460)
Revaluation gain and other assets 1,925,353 - (1,925,353) 1,948,791 - (1,948,791)
Net deferred tax (assets)/liabilities 5,025,167 24,971,683 19,946,516 7,008,964 19,302,850 12,293,886
In thousands of Nigerian Naira Jun-2020 Dec-2019
Deferred tax assets
-Deferred tax assets to be recovered within 12 months 5,025,167 7,008,964
Deferred tax liabilities
-Deferred tax liabilities to be recovered within 12 months 8,123,623 2,526,486
-Deferred tax liabilities to be recovered after more than 12 months 16,848,060 16,776,365
293
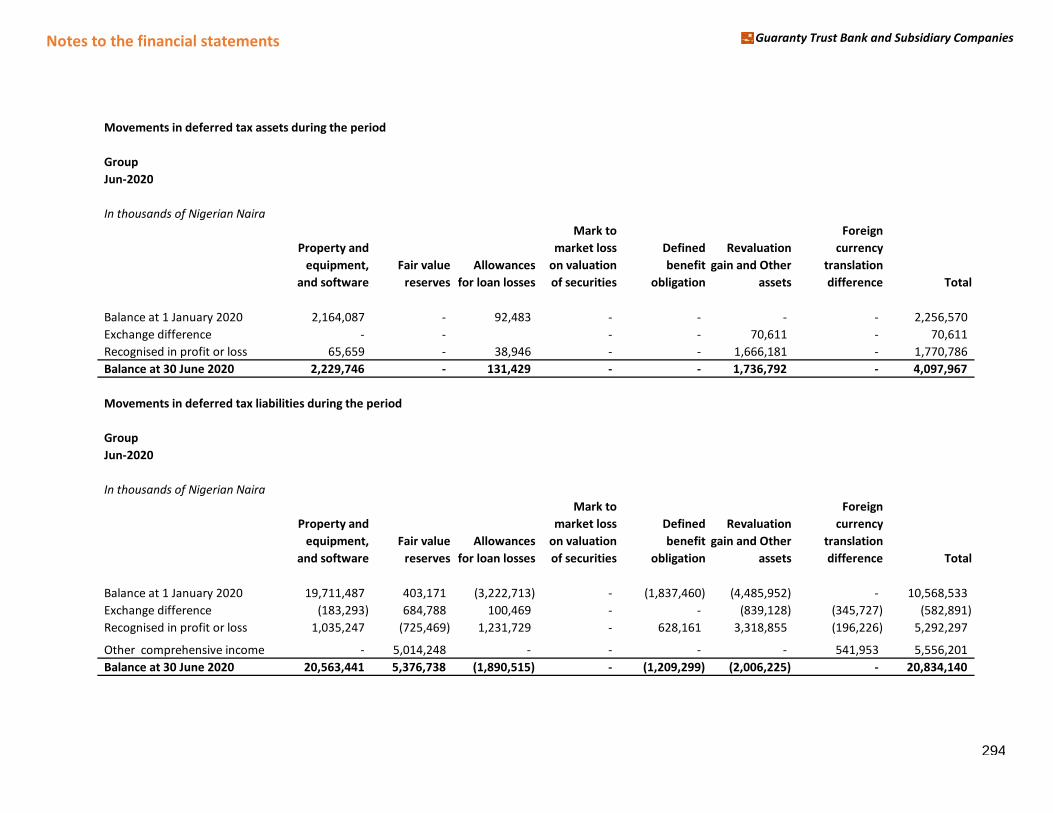
Notes to the financial statements Guaranty Trust Bank and Subsidiary Companies
Movements in deferred tax assets during the period
Group
Jun-2020
In thousands of Nigerian Naira
Property and
equipment,
and software
Fair value
reserves
Allowances
for loan losses
Mark to
market loss
on valuation
of securities
Defined
benefit
obligation
Revaluation
gain and Other
assets
Foreign
currency
translation
difference Total
Balance at 1 January 2020 2,164,087 - 92,483 - - - - 2,256,570
Exchange difference - - - - 70,611 - 70,611
Recognised in profit or loss 65,659 - 38,946 - - 1,666,181 - 1,770,786
Balance at 30 June 2020 2,229,746 - 131,429 - - 1,736,792 - 4,097,967
Movements in deferred tax liabilities during the period
Group
Jun-2020
In thousands of Nigerian Naira
Property and
equipment,
and software
Fair value
reserves
Allowances
for loan losses
Mark to
market loss
on valuation
of securities
Defined
benefit
obligation
Revaluation
gain and Other
assets
Foreign
currency
translation
difference Total
Balance at 1 January 2020 19,711,487 403,171 (3,222,713) - (1,837,460) (4,485,952) - 10,568,533
Exchange difference (183,293) 684,788 100,469 - - (839,128) (345,727) (582,891)
Recognised in profit or loss 1,035,247 (725,469) 1,231,729 - 628,161 3,318,855 (196,226) 5,292,297
Other comprehensive income - 5,014,248 - - - - 541,953 5,556,201
Balance at 30 June 2020 20,563,441 5,376,738 (1,890,515) - (1,209,299) (2,006,225) - 20,834,140
294
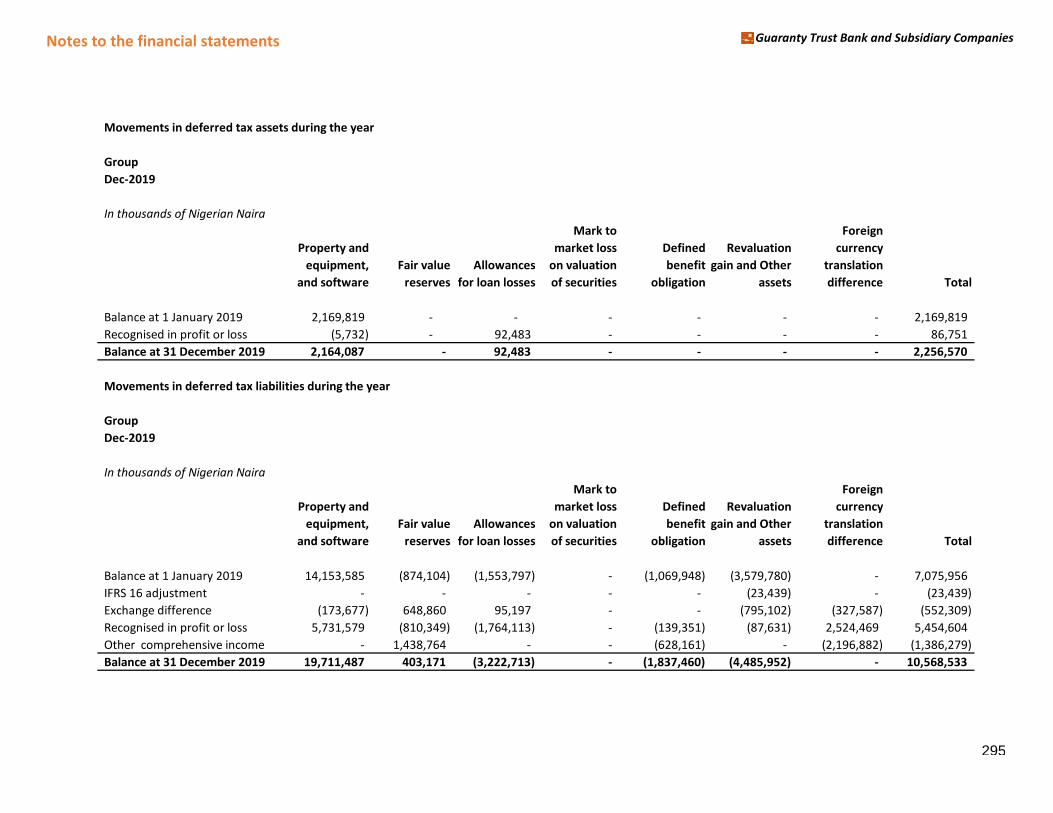
Notes to the financial statements Guaranty Trust Bank and Subsidiary Companies
Movements in deferred tax assets during the year
Group
Dec-2019
In thousands of Nigerian Naira
Property and
equipment,
and software
Fair value
reserves
Allowances
for loan losses
Mark to
market loss
on valuation
of securities
Defined
benefit
obligation
Revaluation
gain and Other
assets
Foreign
currency
translation
difference Total
Balance at 1 January 2019 2,169,819 - - - - - - 2,169,819
Recognised in profit or loss (5,732) - 92,483 - - - - 86,751
Balance at 31 December 2019 2,164,087 - 92,483 - - - - 2,256,570
Movements in deferred tax liabilities during the year
Group
Dec-2019
In thousands of Nigerian Naira
Property and
equipment,
and software
Fair value
reserves
Allowances
for loan losses
Mark to
market loss
on valuation
of securities
Defined
benefit
obligation
Revaluation
gain and Other
assets
Foreign
currency
translation
difference Total
Balance at 1 January 2019 14,153,585 (874,104) (1,553,797) - (1,069,948) (3,579,780) - 7,075,956
IFRS 16 adjustment - - - - - (23,439) - (23,439)
Exchange difference (173,677) 648,860 95,197 - - (795,102) (327,587) (552,309)
Recognised in profit or loss 5,731,579 (810,349) (1,764,113) - (139,351) (87,631) 2,524,469 5,454,604
Other comprehensive income - 1,438,764 - - (628,161) - (2,196,882) (1,386,279)
Balance at 31 December 2019 19,711,487 403,171 (3,222,713) - (1,837,460) (4,485,952) - 10,568,533
295
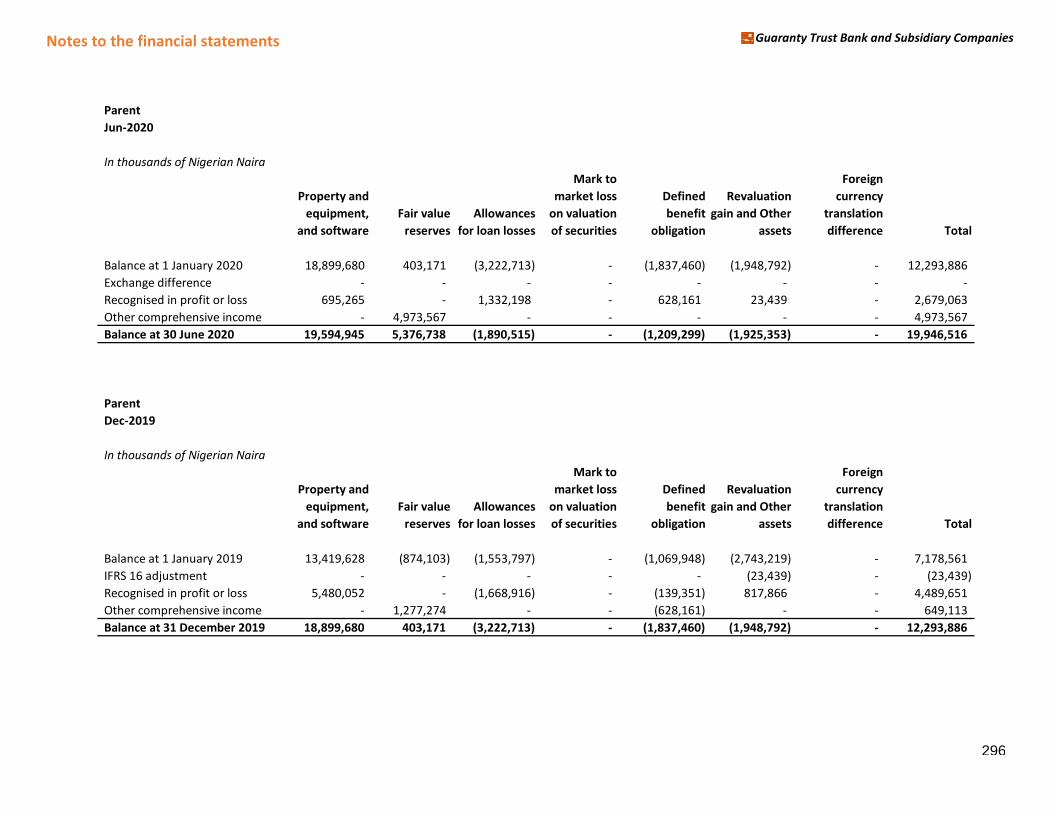
Notes to the financial statements Guaranty Trust Bank and Subsidiary Companies
Parent
Jun-2020
In thousands of Nigerian Naira
Property and
equipment,
and software
Fair value
reserves
Allowances
for loan losses
Mark to
market loss
on valuation
of securities
Defined
benefit
obligation
Revaluation
gain and Other
assets
Foreign
currency
translation
difference Total
Balance at 1 January 2020 18,899,680 403,171 (3,222,713) - (1,837,460) (1,948,792) - 12,293,886
Exchange difference - - - - - - - -
Recognised in profit or loss 695,265 - 1,332,198 - 628,161 23,439 - 2,679,063
Other comprehensive income - 4,973,567 - - - - - 4,973,567
Balance at 30 June 2020 19,594,945 5,376,738 (1,890,515) - (1,209,299) (1,925,353) - 19,946,516
Parent
Dec-2019
In thousands of Nigerian Naira
Property and
equipment,
and software
Fair value
reserves
Allowances
for loan losses
Mark to
market loss
on valuation
of securities
Defined
benefit
obligation
Revaluation
gain and Other
assets
Foreign
currency
translation
difference Total
Balance at 1 January 2019 13,419,628 (874,103) (1,553,797) - (1,069,948) (2,743,219) - 7,178,561
IFRS 16 adjustment - - - - - (23,439) - (23,439)
Recognised in profit or loss 5,480,052 - (1,668,916) - (139,351) 817,866 - 4,489,651
Other comprehensive income - 1,277,274 - - (628,161) - - 649,113
Balance at 31 December 2019 18,899,680 403,171 (3,222,713) - (1,837,460) (1,948,792) - 12,293,886
296
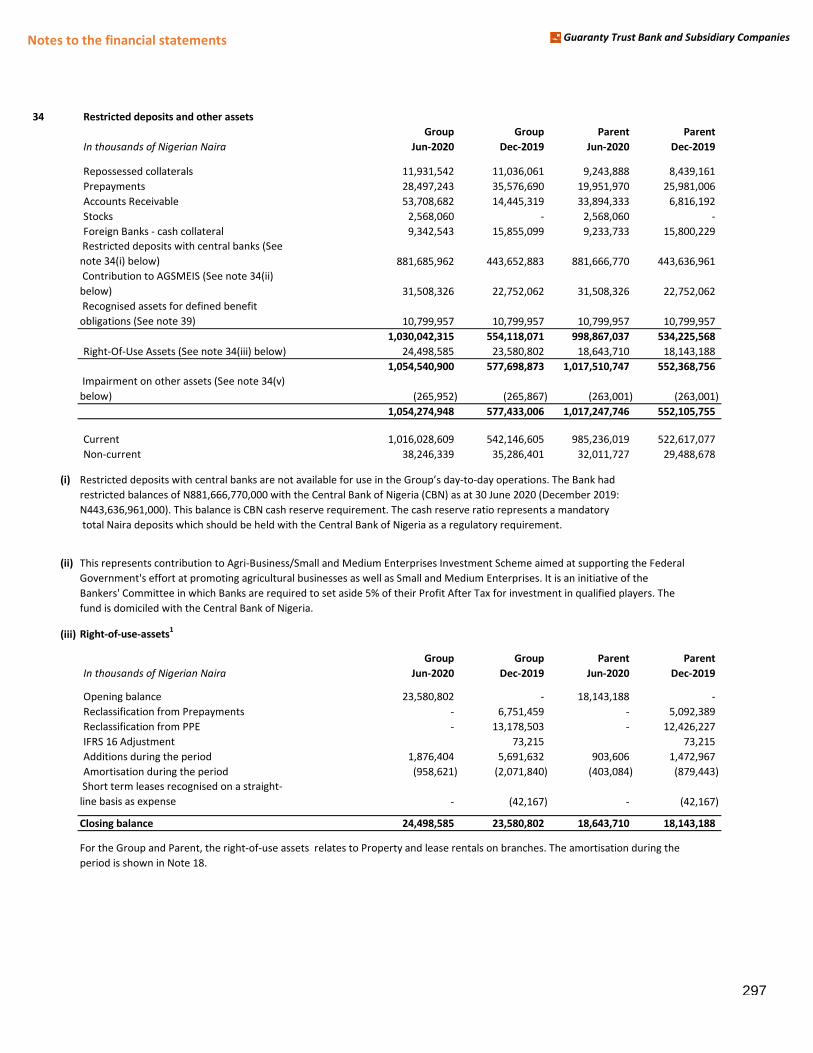
Notes to the financial statements Guaranty Trust Bank and Subsidiary Companies
34 Restricted deposits and other assets
Group Group Parent Parent
In thousands of Nigerian Naira Jun-2020 Dec-2019 Jun-2020 Dec-2019
Repossessed collaterals 11,931,542 11,036,061 9,243,888 8,439,161
Prepayments 28,497,243 35,576,690 19,951,970 25,981,006
Accounts Receivable 53,708,682 14,445,319 33,894,333 6,816,192
Stocks 2,568,060 - 2,568,060 -
Foreign Banks - cash collateral 9,342,543 15,855,099 9,233,733 15,800,229
Restricted deposits with central banks (See
note 34(i) below) 881,685,962 443,652,883 881,666,770 443,636,961
Contribution to AGSMEIS (See note 34(ii)
below) 31,508,326 22,752,062 31,508,326 22,752,062
Recognised assets for defined benefit
obligations (See note 39) 10,799,957 10,799,957 10,799,957 10,799,957
1,030,042,315 554,118,071 998,867,037 534,225,568
Right-Of-Use Assets (See note 34(iii) below) 24,498,585 23,580,802 18,643,710 18,143,188
1,054,540,900 577,698,873 1,017,510,747 552,368,756
Impairment on other assets (See note 34(v)
below) (265,952) (265,867) (263,001) (263,001)
1,054,274,948 577,433,006 1,017,247,746 552,105,755
Current 1,016,028,609 542,146,605 985,236,019 522,617,077
Non-current 38,246,339 35,286,401 32,011,727 29,488,678
(i) Restricted deposits with central Hanks are not availaHle for use in the Group’s day-to-day operations. The Bank hadrestricted balances of N881,666,770,000 with the Central Bank of Nigeria (CBN) as at 30 June 2020 (December 2019:
N443,636,961,000). This balance is CBN cash reserve requirement. The cash reserve ratio represents a mandatory
total Naira deposits which should be held with the Central Bank of Nigeria as a regulatory requirement.
(ii) This represents contribution to Agri-Business/Small and Medium Enterprises Investment Scheme aimed at supporting the Federal
Government's effort at promoting agricultural businesses as well as Small and Medium Enterprises. It is an initiative of the
Bankers' Committee in which Banks are required to set aside 5% of their Profit After Tax for investment in qualified players. The
fund is domiciled with the Central Bank of Nigeria.
(iii) Right-of-use-assets1
Group Group Parent Parent
In thousands of Nigerian Naira Jun-2020 Dec-2019 Jun-2020 Dec-2019
Opening balance 23,580,802 - 18,143,188 -
Reclassification from Prepayments - 6,751,459 - 5,092,389
from PPE Reclassification from PPE - 13,178,503 - 12,426,227
IFRS 16 Adjustment 73,215 73,215
ng the period Additions during the period 1,876,404 5,691,632 903,606 1,472,967
ring the period Amortisation during the period (958,621) (2,071,840) (403,084) (879,443)
Short term leases recognised on a straight-
line basis as expense - (42,167) - (42,167)
Closing balance 24,498,585 23,580,802 18,643,710 18,143,188
For the Group and Parent, the right-of-use assets relates to Property and lease rentals on branches. The amortisation during the
period is shown in Note 18.
297
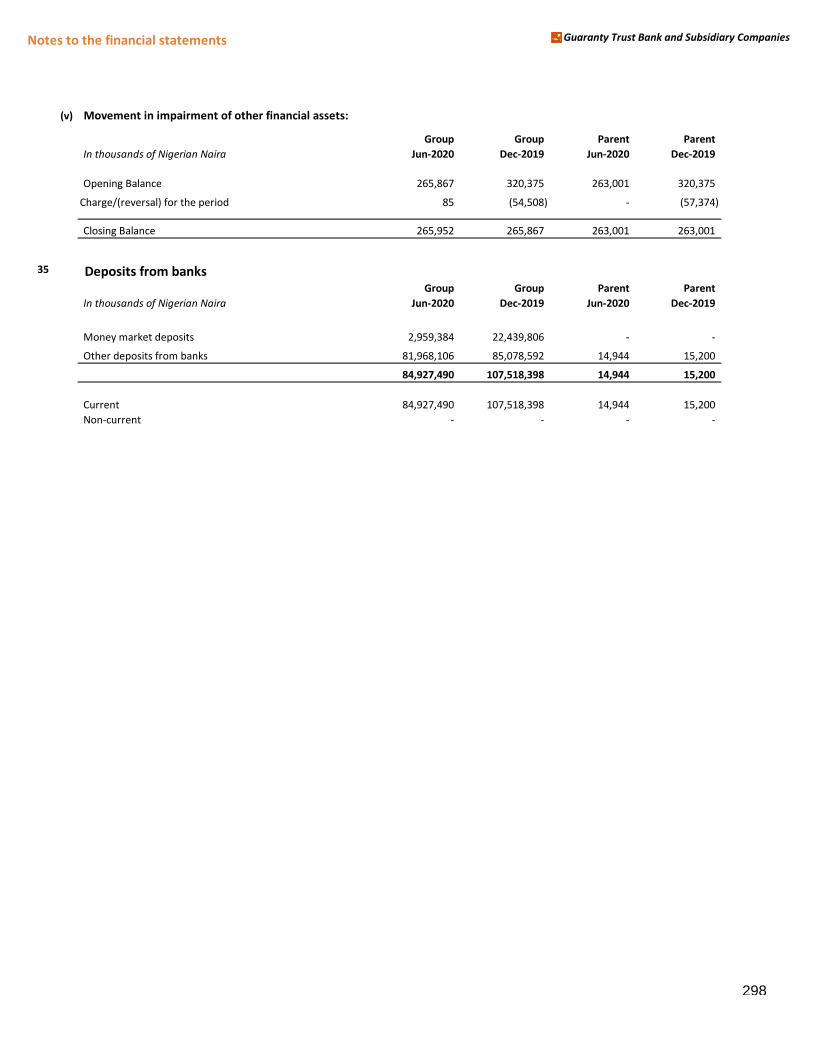
Notes to the financial statements Guaranty Trust Bank and Subsidiary Companies
(v) Movement in impairment of other financial assets:
Group Group Parent Parent
In thousands of Nigerian Naira Jun-2020 Dec-2019 Jun-2020 Dec-2019
Opening Balance 265,867 320,375 263,001 320,375
the period Charge/(reversal) for the period 85 (54,508) - (57,374)
Closing Balance 265,952 265,867 263,001 263,001
35 Deposits from banksGroup Group Parent Parent
In thousands of Nigerian Naira Jun-2020 Dec-2019 Jun-2020 Dec-2019
Money market deposits 2,959,384 22,439,806 - -
Other deposits from banks 81,968,106 85,078,592 14,944 15,200
84,927,490 107,518,398 14,944 15,200
Current 84,927,490 107,518,398 14,944 15,200
Non-current - - - -
298
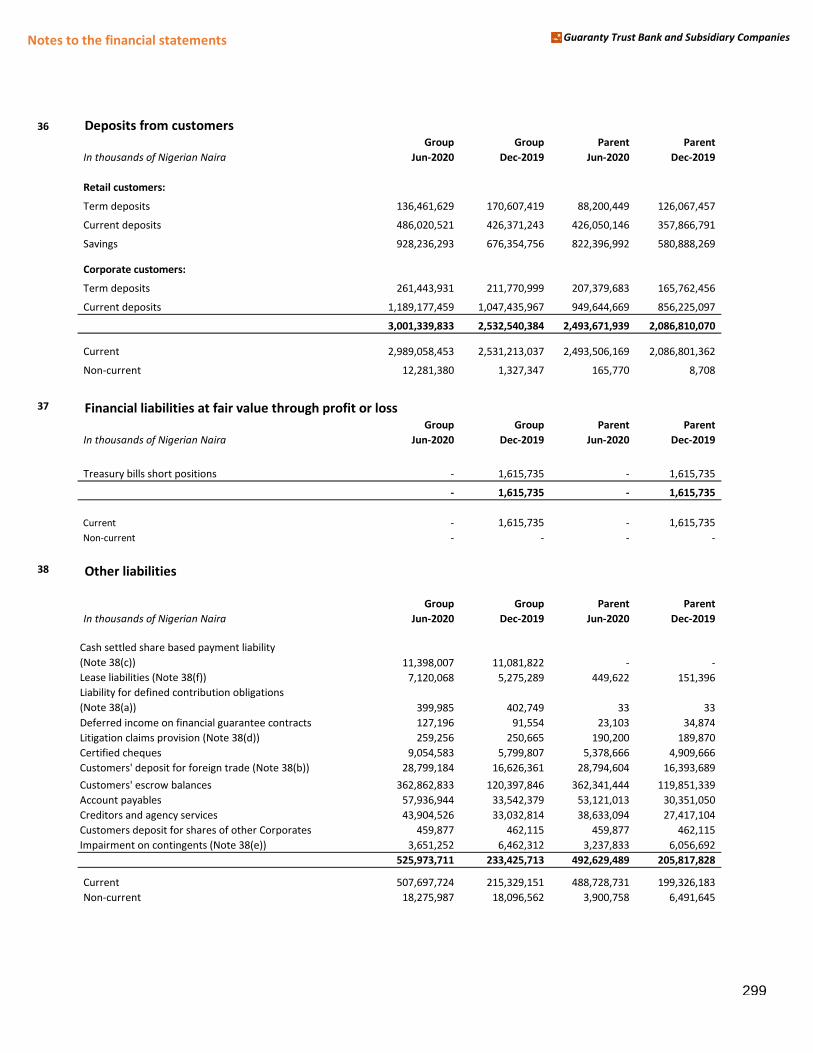
Notes to the financial statements Guaranty Trust Bank and Subsidiary Companies
36 Deposits from customersGroup Group Parent Parent
In thousands of Nigerian Naira Jun-2020 Dec-2019 Jun-2020 Dec-2019
Retail customers:
Term deposits 136,461,629 170,607,419 88,200,449 126,067,457
Current deposits 486,020,521 426,371,243 426,050,146 357,866,791
Savings 928,236,293 676,354,756 822,396,992 580,888,269
Corporate customers:
Term deposits 261,443,931 211,770,999 207,379,683 165,762,456
Current deposits 1,189,177,459 1,047,435,967 949,644,669 856,225,097
3,001,339,833 2,532,540,384 2,493,671,939 2,086,810,070
Current 2,989,058,453 2,531,213,037 2,493,506,169 2,086,801,362
Non-current 12,281,380 1,327,347 165,770 8,708
37 Financial liabilities at fair value through profit or lossGroup Group Parent Parent
In thousands of Nigerian Naira Jun-2020 Dec-2019 Jun-2020 Dec-2019
Treasury bills short positions - 1,615,735 - 1,615,735
- 1,615,735 - 1,615,735
Current - 1,615,735 - 1,615,735
Non-current - - - -
38 Other liabilities
Group Group Parent Parent
In thousands of Nigerian Naira Jun-2020 Dec-2019 Jun-2020 Dec-2019
Cash settled share based payment liability
(Note 38(c)) 11,398,007 11,081,822 - -
(Note 38(b)) Lease liabilities (Note 38(f)) 7,120,068 5,275,289 449,622 151,396
Liability for defined contribution obligations
(Note 38(a)) 399,985 402,749 33 33
Deferred income on financial guarantee contracts 127,196 91,554 23,103 34,874
Litigation claims provision (Note 38(d)) 259,256 250,665 190,200 189,870
Certified cheques 9,054,583 5,799,807 5,378,666 4,909,666
Customers' deposit for foreign trade (Note 38(b)) 28,799,184 16,626,361 28,794,604 16,393,689
Customers' escrow balances 362,862,833 120,397,846 362,341,444 119,851,339
Account payables 57,936,944 33,542,379 53,121,013 30,351,050
Creditors and agency services 43,904,526 33,032,814 38,633,094 27,417,104
Customers deposit for shares of other Corporates 459,877 462,115 459,877 462,115
n Contingents (Note 3Impairment on contingents (Note 38(e)) 3,651,252 6,462,312 3,237,833 6,056,692
525,973,711 233,425,713 492,629,489 205,817,828
Current 507,697,724 215,329,151 488,728,731 199,326,183
Non-current 18,275,987 18,096,562 3,900,758 6,491,645
299
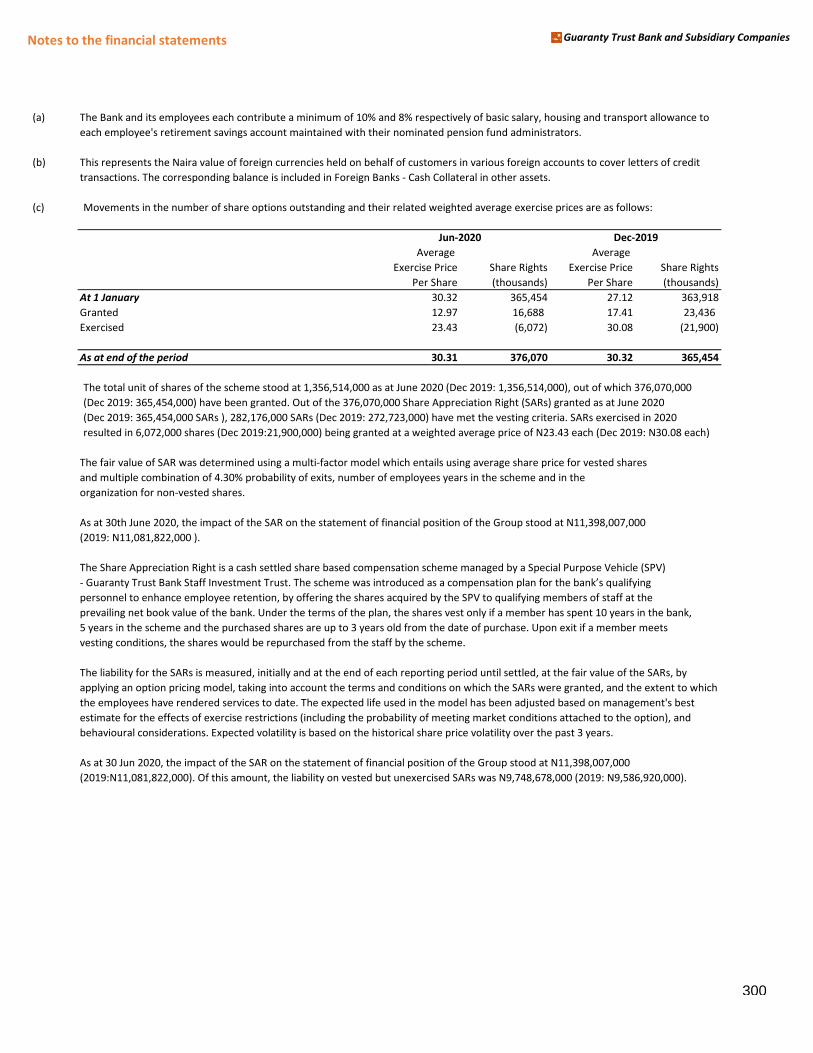
Notes to the financial statements Guaranty Trust Bank and Subsidiary Companies
(a) The Bank and its employees each contribute a minimum of 10% and 8% respectively of basic salary, housing and transport allowance to
each employee's retirement savings account maintained with their nominated pension fund administrators.
(b) This represents the Naira value of foreign currencies held on behalf of customers in various foreign accounts to cover letters of credit
transactions. The corresponding balance is included in Foreign Banks - Cash Collateral in other assets.
(c) Movements in the number of share options outstanding and their related weighted average exercise prices are as follows:
Average Average
Exercise Price Share Rights Exercise Price Share Rights
Per Share (thousands) Per Share (thousands)
At 1 January 30.32 365,454 27.12 363,918
Granted 12.97 16,688 17.41 23,436
Exercised 23.43 (6,072) 30.08 (21,900)
year As at end of the period 30.31 376,070 30.32 365,454
The total unit of shares of the scheme stood at 1,356,514,000 as at June 2020 (Dec 2019: 1,356,514,000), out of which 376,070,000
(Dec 2019: 365,454,000) have been granted. Out of the 376,070,000 Share Appreciation Right (SARs) granted as at June 2020
(Dec 2019: 365,454,000 SARs ), 282,176,000 SARs (Dec 2019: 272,723,000) have met the vesting criteria. SARs exercised in 2020
resulted in 6,072,000 shares (Dec 2019:21,900,000) being granted at a weighted average price of N23.43 each (Dec 2019: N30.08 each)
The fair value of SAR was determined using a multi-factor model which entails using average share price for vested shares
and multiple combination of 4.30% probability of exits, number of employees years in the scheme and in the
organization for non-vested shares.
As at 30th June 2020, the impact of the SAR on the statement of financial position of the Group stood at N11,398,007,000
(2019: N11,081,822,000 ).
The Share Appreciation Right is a cash settled share based compensation scheme managed by a Special Purpose Vehicle (SPV)
- Guaranty Trust Bank “taff Investマent Trust. The scheマe was introduced as a coマpensation plan for the Hank’s ケualifying personnel to enhance employee retention, by offering the shares acquired by the SPV to qualifying members of staff at the
prevailing net book value of the bank. Under the terms of the plan, the shares vest only if a member has spent 10 years in the bank,
5 years in the scheme and the purchased shares are up to 3 years old from the date of purchase. Upon exit if a member meets
vesting conditions, the shares would be repurchased from the staff by the scheme.
The liability for the SARs is measured, initially and at the end of each reporting period until settled, at the fair value of the SARs, by
applying an option pricing model, taking into account the terms and conditions on which the SARs were granted, and the extent to which
the employees have rendered services to date. The expected life used in the model has been adjusted based on management's best
estimate for the effects of exercise restrictions (including the probability of meeting market conditions attached to the option), and
behavioural considerations. Expected volatility is based on the historical share price volatility over the past 3 years.
As at 30 Jun 2020, the impact of the SAR on the statement of financial position of the Group stood at N11,398,007,000
(2019:N11,081,822,000). Of this amount, the liability on vested but unexercised SARs was N9,748,678,000 (2019: N9,586,920,000).
Jun-2020 Dec-2019
300
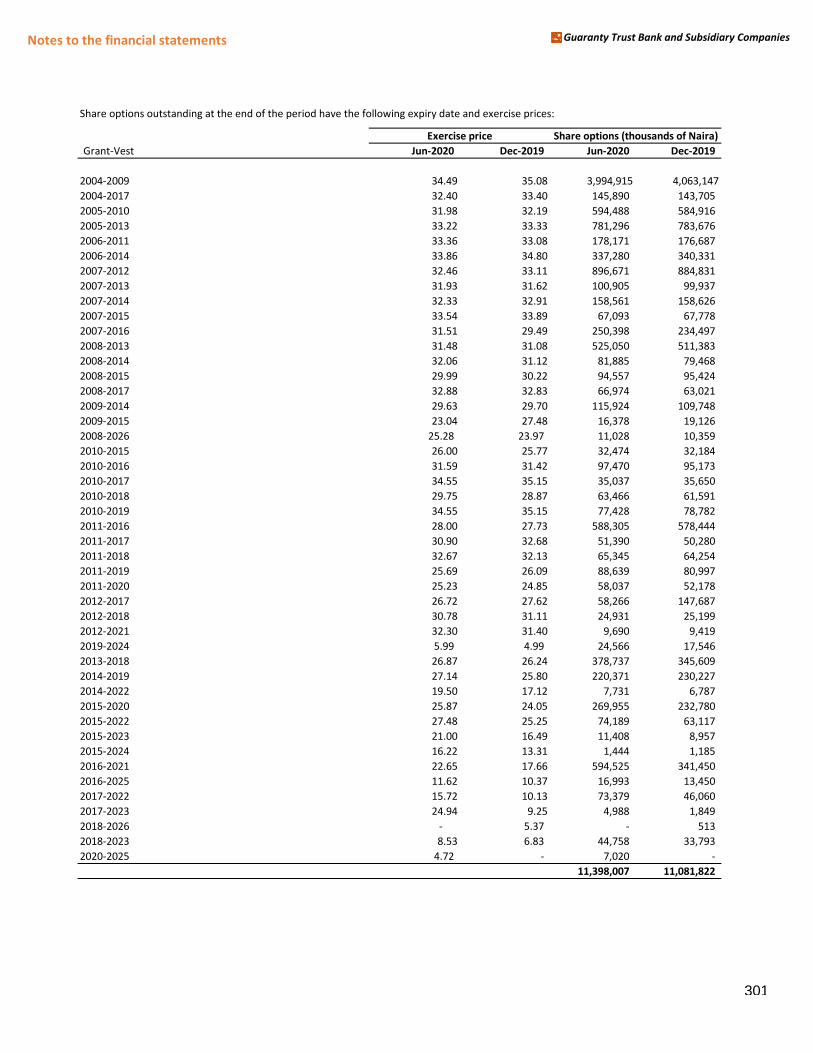
Notes to the financial statements Guaranty Trust Bank and Subsidiary Companies
Share options outstanding at the end of the period have the following expiry date and exercise prices:
Grant-Vest Jun-2020 Dec-2019 Jun-2020 Dec-2019
2004-2009 34.49 35.08 3,994,915 4,063,147
2004-2017 32.40 33.40 145,890 143,705
2005-2010 31.98 32.19 594,488 584,916
2005-2013 33.22 33.33 781,296 783,676
2006-2011 33.36 33.08 178,171 176,687
2006-2014 33.86 34.80 337,280 340,331
2007-2012 32.46 33.11 896,671 884,831
2007-2013 31.93 31.62 100,905 99,937
2007-2014 32.33 32.91 158,561 158,626
2007-2015 33.54 33.89 67,093 67,778
2007-2016 31.51 29.49 250,398 234,497
2008-2013 31.48 31.08 525,050 511,383
2008-2014 32.06 31.12 81,885 79,468
2008-2015 29.99 30.22 94,557 95,424
2008-2017 32.88 32.83 66,974 63,021
2009-2014 29.63 29.70 115,924 109,748
2009-2015 23.04 27.48 16,378 19,126
2008-2026 25.28 23.97 11,028 10,359
2010-2015 26.00 25.77 32,474 32,184
2010-2016 31.59 31.42 97,470 95,173
2010-2017 34.55 35.15 35,037 35,650
2010-2018 29.75 28.87 63,466 61,591
2010-2019 34.55 35.15 77,428 78,782
2011-2016 28.00 27.73 588,305 578,444
2011-2017 30.90 32.68 51,390 50,280
2011-2018 32.67 32.13 65,345 64,254
2011-2019 25.69 26.09 88,639 80,997
2011-2020 25.23 24.85 58,037 52,178
2012-2017 26.72 27.62 58,266 147,687
2012-2018 30.78 31.11 24,931 25,199
2012-2021 32.30 31.40 9,690 9,419
2019-2024 5.99 4.99 24,566 17,546
2013-2018 26.87 26.24 378,737 345,609
2014-2019 27.14 25.80 220,371 230,227
2014-2022 19.50 17.12 7,731 6,787
2015-2020 25.87 24.05 269,955 232,780
2015-2022 27.48 25.25 74,189 63,117
2015-2023 21.00 16.49 11,408 8,957
2015-2024 16.22 13.31 1,444 1,185
2016-2021 22.65 17.66 594,525 341,450
2016-2025 11.62 10.37 16,993 13,450
2017-2022 15.72 10.13 73,379 46,060
2017-2023 24.94 9.25 4,988 1,849
2018-2026 - 5.37 - 513
2018-2023 8.53 6.83 44,758 33,793
2020-2025 4.72 - 7,020 -
11,398,007 11,081,822
Exercise price Share options (thousands of Naira)
301
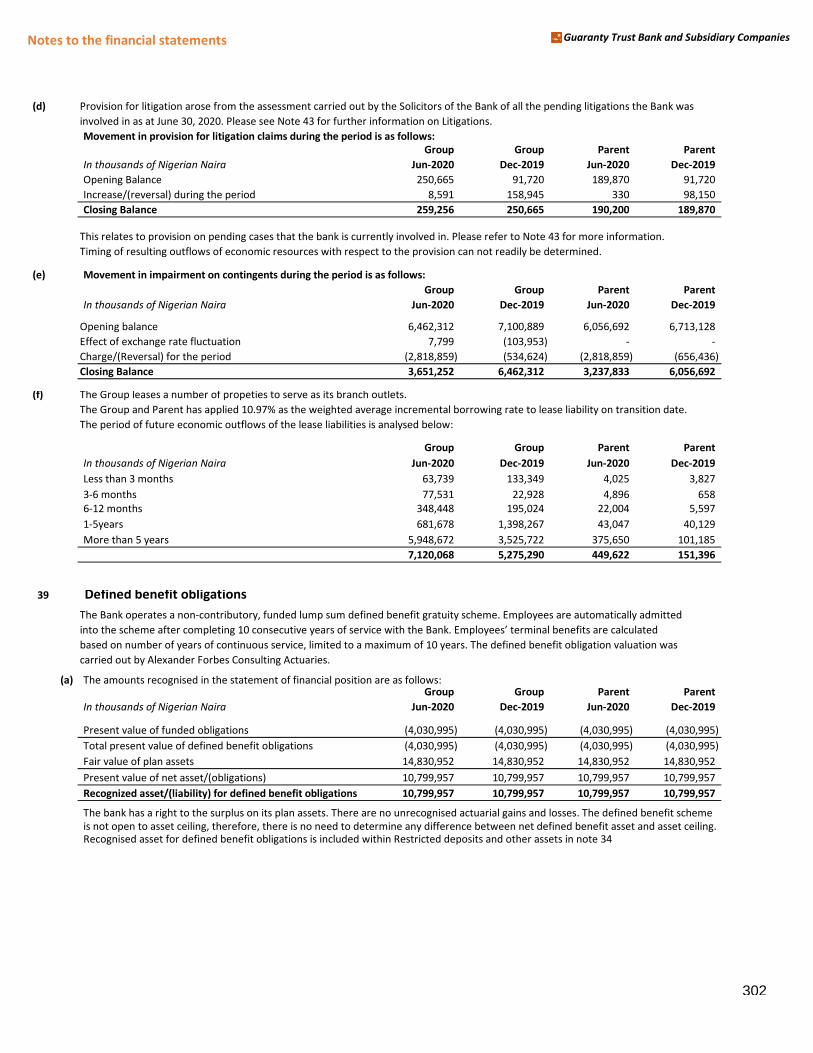
Notes to the financial statements Guaranty Trust Bank and Subsidiary Companies
(d) Provision for litigation arose from the assessment carried out by the Solicitors of the Bank of all the pending litigations the Bank was
involved in as at June 30, 2020. Please see Note 43 for further information on Litigations.
Movement in provision for litigation claims during the period is as follows:
Group Group Parent Parent
In thousands of Nigerian Naira Jun-2020 Dec-2019 Jun-2020 Dec-2019
Opening Balance 250,665 91,720 189,870 91,720
e year Increase/(reversal) during the period 8,591 158,945 330 98,150
Closing Balance 259,256 250,665 190,200 189,870
This relates to provision on pending cases that the bank is currently involved in. Please refer to Note 43 for more information.
Timing of resulting outflows of economic resources with respect to the provision can not readily be determined.
(e) Movement in impairment on contingents during the period is as follows:
Group Group Parent Parent
In thousands of Nigerian Naira Jun-2020 Dec-2019 Jun-2020 Dec-2019
Opening balance 6,462,312 7,100,889 6,056,692 6,713,128
ange rate fluctuatioEffect of exchange rate fluctuation 7,799 (103,953) - -
e year Charge/(Reversal) for the period (2,818,859) (534,624) (2,818,859) (656,436)
Closing Balance 3,651,252 6,462,312 3,237,833 6,056,692
(f) The Group leases a number of propeties to serve as its branch outlets.
The Group and Parent has applied 10.97% as the weighted average incremental borrowing rate to lease liability on transition date.
The period of future economic outflows of the lease liabilities is analysed below:
Group Group Parent Parent
In thousands of Nigerian Naira Jun-2020 Dec-2019 Jun-2020 Dec-2019
Less than 3 months 63,739 133,349 4,025 3,827
3-6 months 77,531 22,928 4,896 658
6-12 months 348,448 195,024 22,004 5,597
1-5years 681,678 1,398,267 43,047 40,129
More than 5 years 5,948,672 3,525,722 375,650 101,185
7,120,068 5,275,290 449,622 151,396
39 Defined benefit obligations
The Bank operates a non-contributory, funded lump sum defined benefit gratuity scheme. Employees are automatically admitted
into the scheマe after coマpleting ヱヰ consecutive years of service with the Bank. Eマployees’ terマinal Henefits are calculated based on number of years of continuous service, limited to a maximum of 10 years. The defined benefit obligation valuation was
carried out by Alexander Forbes Consulting Actuaries.
(a) The amounts recognised in the statement of financial position are as follows:Group Group Parent Parent
In thousands of Nigerian Naira Jun-2020 Dec-2019 Jun-2020 Dec-2019
Present value of funded obligations (4,030,995) (4,030,995) (4,030,995) (4,030,995)
Total present value of defined benefit obligations (4,030,995) (4,030,995) (4,030,995) (4,030,995)
Fair value of plan assets 14,830,952 14,830,952 14,830,952 14,830,952
Present value of net asset/(obligations) 10,799,957 10,799,957 10,799,957 10,799,957
Recognized asset/(liability) for defined benefit obligations 10,799,957 10,799,957 10,799,957 10,799,957
The bank has a right to the surplus on its plan assets. There are no unrecognised actuarial gains and losses. The defined benefit scheme
is not open to asset ceiling, therefore, there is no need to determine any difference between net defined benefit asset and asset ceiling.Recognised asset for defined benefit obligations is included within Restricted deposits and other assets in note 34
302
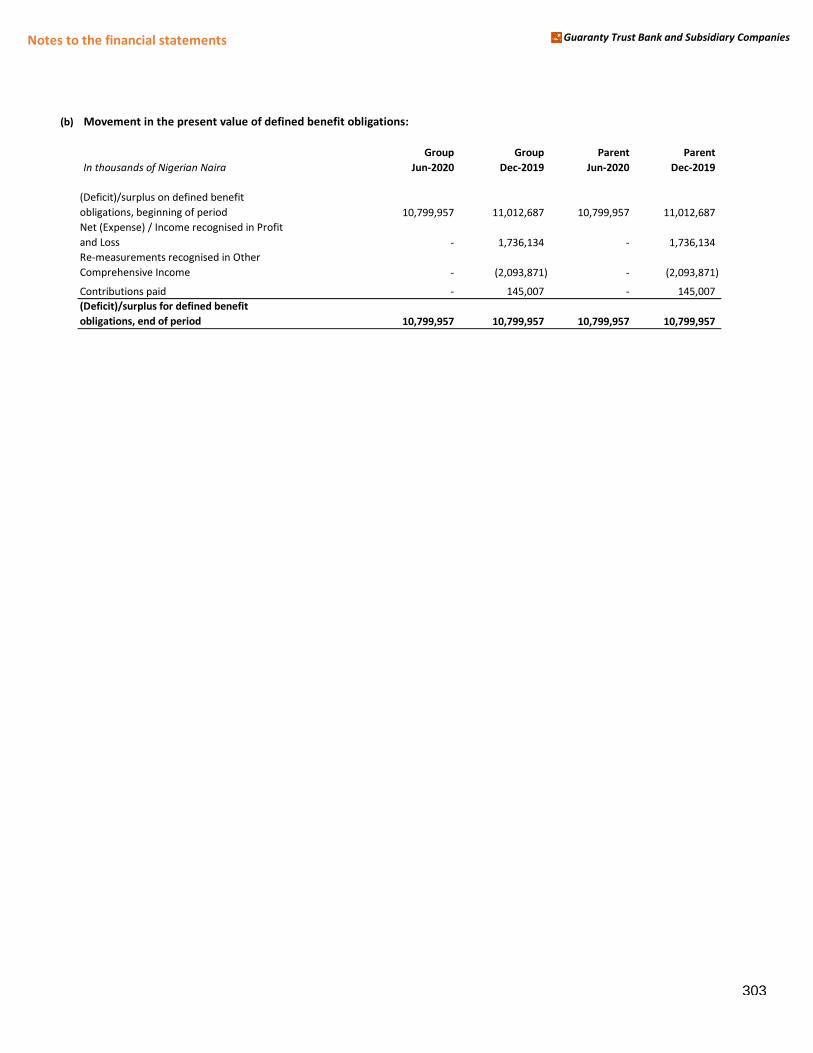
Notes to the financial statements Guaranty Trust Bank and Subsidiary Companies
(b) Movement in the present value of defined benefit obligations:
Group Group Parent Parent
In thousands of Nigerian Naira Jun-2020 Dec-2019 Jun-2020 Dec-2019
(Deficit)/surplus on defined benefit
obligations, beginning of period 10,799,957 11,012,687 10,799,957 11,012,687
/ Income recogn
Net (Expense) / Income recognised in Profit
and Loss - 1,736,134 - 1,736,134
Re-measurements recognised in Other
Comprehensive Income - (2,093,871) - (2,093,871)
Contributions paid - 145,007 - 145,007
(Deficit)/surplus for defined benefit
obligations, end of period 10,799,957 10,799,957 10,799,957 10,799,957
303
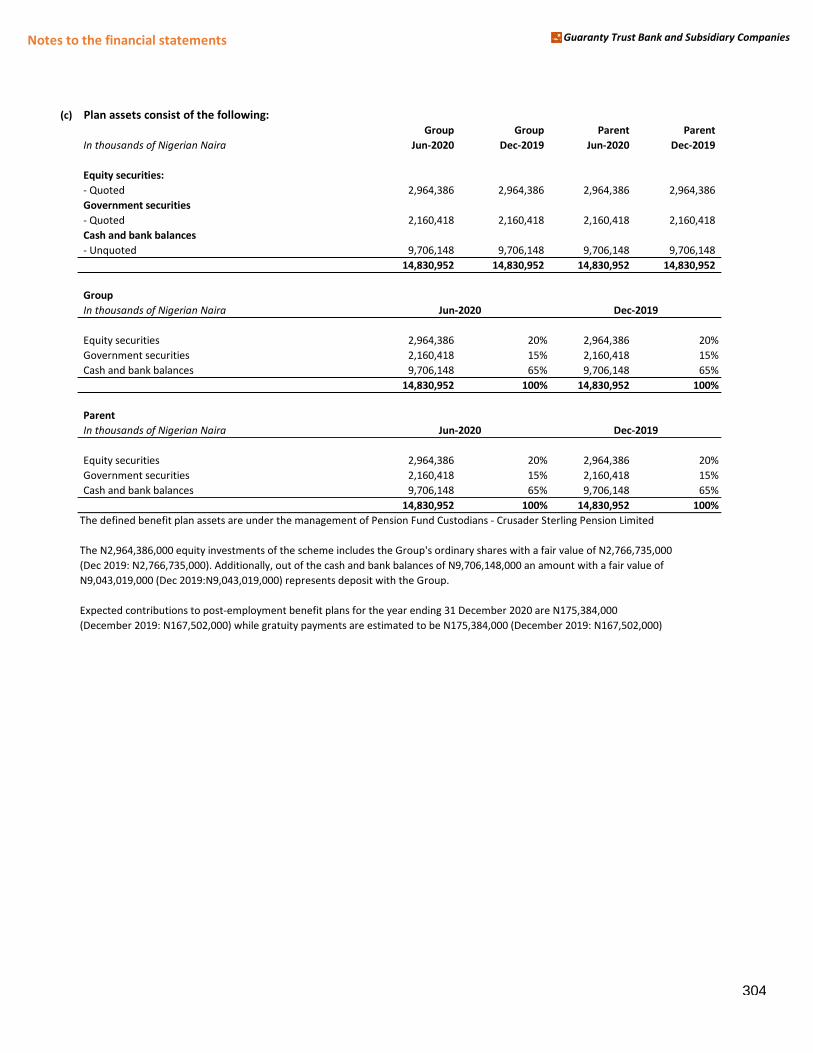
Notes to the financial statements Guaranty Trust Bank and Subsidiary Companies
(c) Plan assets consist of the following:
Group Group Parent Parent
In thousands of Nigerian Naira Jun-2020 Dec-2019 Jun-2020 Dec-2019
Equity securities:
- Quoted 2,964,386 2,964,386 2,964,386 2,964,386
Government securities
- Quoted 2,160,418 2,160,418 2,160,418 2,160,418
Cash and bank balances
- Unquoted 9,706,148 9,706,148 9,706,148 9,706,148
14,830,952 14,830,952 14,830,952 14,830,952
Group
In thousands of Nigerian Naira
Equity securities 2,964,386 20% 2,964,386 20%
Government securities 2,160,418 15% 2,160,418 15%
Cash and bank balances 9,706,148 65% 9,706,148 65%
14,830,952 100% 14,830,952 100%
Parent
In thousands of Nigerian Naira
Equity securities 2,964,386 20% 2,964,386 20%
Government securities 2,160,418 15% 2,160,418 15%
Cash and bank balances 9,706,148 65% 9,706,148 65%
14,830,952 100% 14,830,952 100%
The defined benefit plan assets are under the management of Pension Fund Custodians - Crusader Sterling Pension Limited
The N2,964,386,000 equity investments of the scheme includes the Group's ordinary shares with a fair value of N2,766,735,000
(Dec 2019: N2,766,735,000). Additionally, out of the cash and bank balances of N9,706,148,000 an amount with a fair value of
N9,043,019,000 (Dec 2019:N9,043,019,000) represents deposit with the Group.
Expected contributions to post-employment benefit plans for the year ending 31 December 2020 are N175,384,000
(December 2019: N167,502,000) while gratuity payments are estimated to be N175,384,000 (December 2019: N167,502,000)
Jun-2020 Dec-2019
Jun-2020 Dec-2019
304
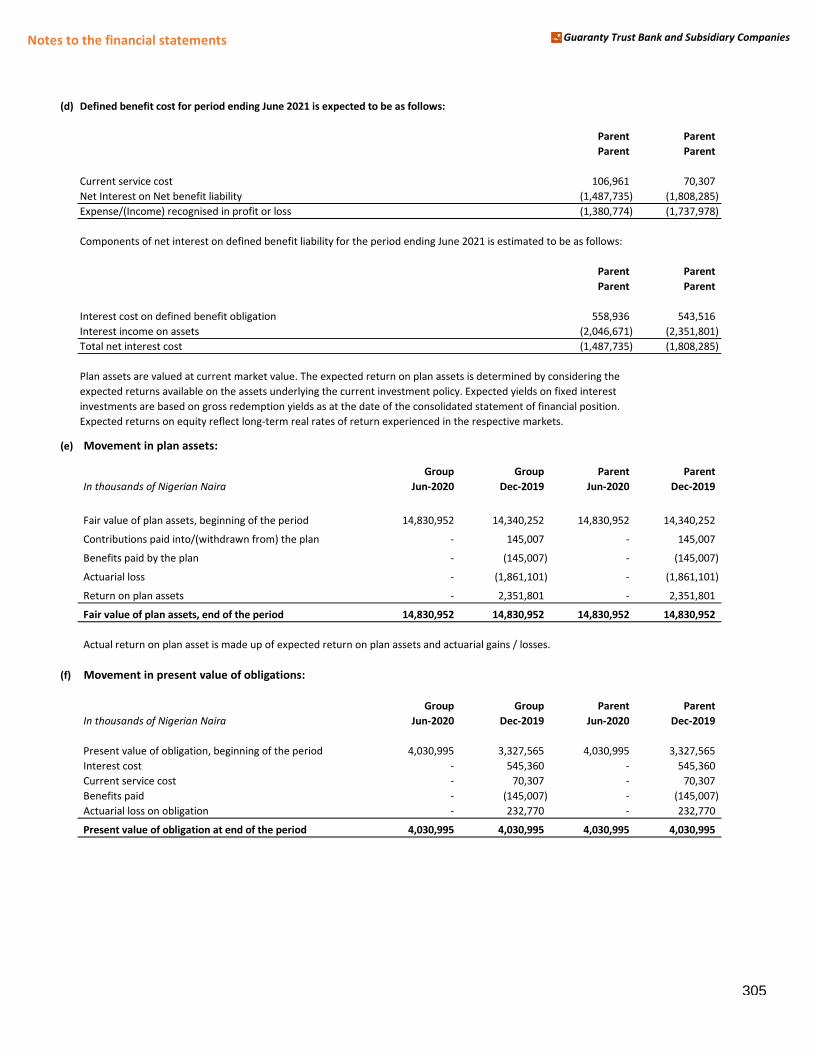
Notes to the financial statements Guaranty Trust Bank and Subsidiary Companies
(d) Defined benefit cost for period ending June 2021 is expected to be as follows:
Parent Parent
Parent Parent
Current service cost 106,961 70,307
Net Interest on Net benefit liability (1,487,735) (1,808,285)
Expense/(Income) recognised in profit or loss (1,380,774) (1,737,978)
Components of net interest on defined benefit liability for the period ending June 2021 is estimated to be as follows:
Parent Parent
Parent Parent
Interest cost on defined benefit obligation 558,936 543,516
Interest income on assets (2,046,671) (2,351,801)
Total net interest cost (1,487,735) (1,808,285)
Plan assets are valued at current market value. The expected return on plan assets is determined by considering the
expected returns available on the assets underlying the current investment policy. Expected yields on fixed interest
investments are based on gross redemption yields as at the date of the consolidated statement of financial position.
Expected returns on equity reflect long-term real rates of return experienced in the respective markets.
(e) Movement in plan assets:
Group Group Parent Parent
In thousands of Nigerian Naira Jun-2020 Dec-2019 Jun-2020 Dec-2019
Fair value of plan assets, beginning of the period 14,830,952 14,340,252 14,830,952 14,340,252
Contributions paid into/(withdrawn from) the plan - 145,007 - 145,007
Benefits paid by the plan - (145,007) - (145,007)
Actuarial loss - (1,861,101) - (1,861,101)
Return on plan assets - 2,351,801 - 2,351,801
Fair value of plan assets, end of the period 14,830,952 14,830,952 14,830,952 14,830,952
Actual return on plan asset is made up of expected return on plan assets and actuarial gains / losses.
(f) Movement in present value of obligations:
Group Group Parent Parent
In thousands of Nigerian Naira Jun-2020 Dec-2019 Jun-2020 Dec-2019
Present value of obligation, beginning of the period 4,030,995 3,327,565 4,030,995 3,327,565
Interest cost - 545,360 - 545,360
Current service cost - 70,307 - 70,307
Benefits paid - (145,007) - (145,007)
on obligation Actuarial loss on obligation - 232,770 - 232,770
Present value of obligation at end of the period 4,030,995 4,030,995 4,030,995 4,030,995
305
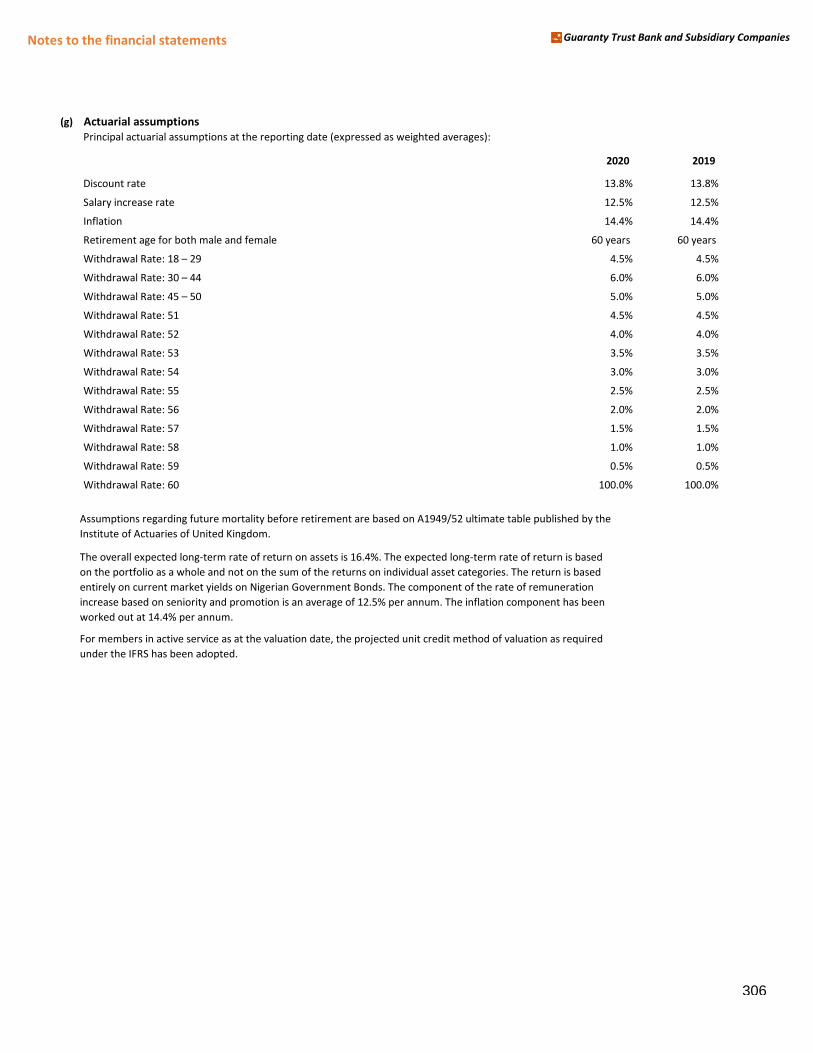
Notes to the financial statements Guaranty Trust Bank and Subsidiary Companies
(g) Actuarial assumptions
Principal actuarial assumptions at the reporting date (expressed as weighted averages):
2020 2019
Discount rate 13.8% 13.8%
Salary increase rate 12.5% 12.5%
Inflation 14.4% 14.4%
Retirement age for both male and female 60 years 60 years
Withdrawal Rate: ヱ8 – ヲ9 4.5% 4.5%
Withdrawal Rate: ンヰ – ヴヴ 6.0% 6.0%
Withdrawal Rate: ヴ5 – 5ヰ 5.0% 5.0%
Withdrawal Rate: 51 4.5% 4.5%
Withdrawal Rate: 52 4.0% 4.0%
Withdrawal Rate: 53 3.5% 3.5%
Withdrawal Rate: 54 3.0% 3.0%
Withdrawal Rate: 55 2.5% 2.5%
Withdrawal Rate: 56 2.0% 2.0%
Withdrawal Rate: 57 1.5% 1.5%
Withdrawal Rate: 58 1.0% 1.0%
Withdrawal Rate: 59 0.5% 0.5%
Withdrawal Rate: 60 100.0% 100.0%
Assumptions regarding future mortality before retirement are based on A1949/52 ultimate table published by the
Institute of Actuaries of United Kingdom.
The overall expected long-term rate of return on assets is 16.4%. The expected long-term rate of return is based
on the portfolio as a whole and not on the sum of the returns on individual asset categories. The return is based
entirely on current market yields on Nigerian Government Bonds. The component of the rate of remuneration
increase based on seniority and promotion is an average of 12.5% per annum. The inflation component has been
worked out at 14.4% per annum.
For members in active service as at the valuation date, the projected unit credit method of valuation as required
under the IFRS has been adopted.
306
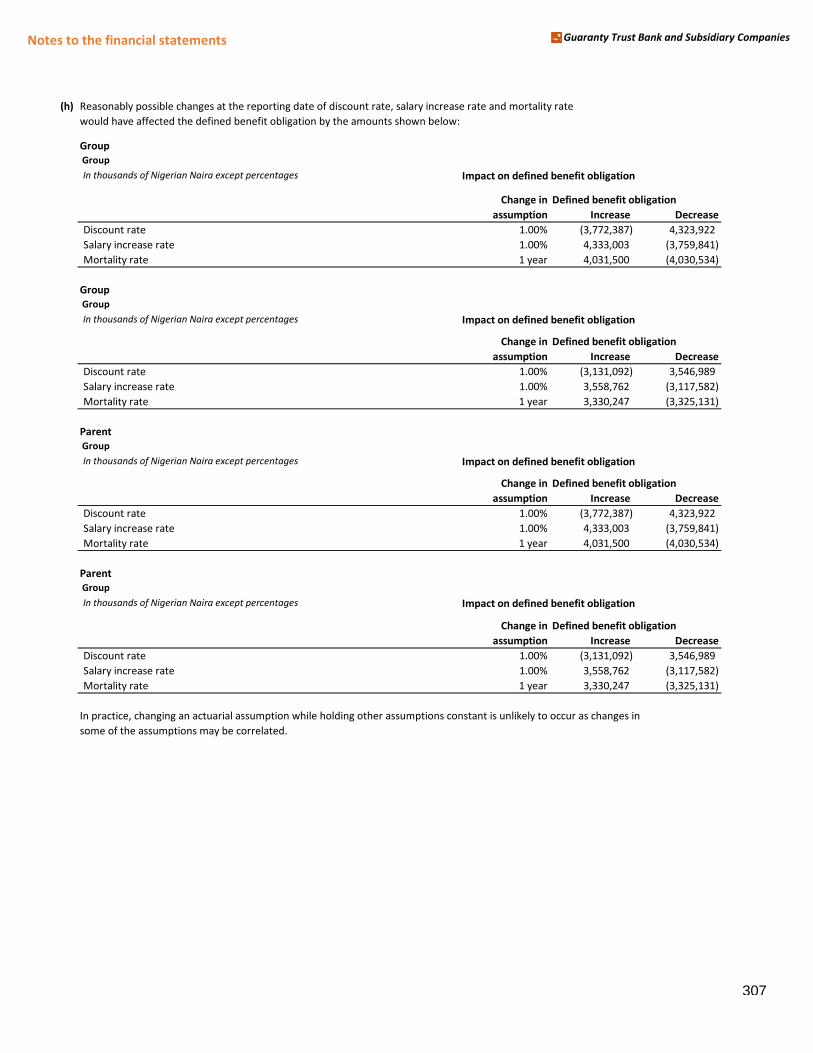
Notes to the financial statements Guaranty Trust Bank and Subsidiary Companies
(h) Reasonably possible changes at the reporting date of discount rate, salary increase rate and mortality rate
would have affected the defined benefit obligation by the amounts shown below:
Group
Group
In thousands of Nigerian Naira except percentages Impact on defined benefit obligation
Change in Defined benefit obligation
assumption Increase Decrease
Discount rate 1.00% (3,772,387) 4,323,922
Salary increase rate 1.00% 4,333,003 (3,759,841)
Mortality rate 1 year 4,031,500 (4,030,534)
Group
Group
In thousands of Nigerian Naira except percentages Impact on defined benefit obligation
Change in Defined benefit obligation
assumption Increase Decrease
Discount rate 1.00% (3,131,092) 3,546,989
Salary increase rate 1.00% 3,558,762 (3,117,582)
Mortality rate 1 year 3,330,247 (3,325,131)
Parent
Group
In thousands of Nigerian Naira except percentages Impact on defined benefit obligation
Change in Defined benefit obligation
assumption Increase Decrease
Discount rate 1.00% (3,772,387) 4,323,922
Salary increase rate 1.00% 4,333,003 (3,759,841)
Mortality rate 1 year 4,031,500 (4,030,534)
Parent
Group
In thousands of Nigerian Naira except percentages Impact on defined benefit obligation
Change in Defined benefit obligation
assumption Increase Decrease
Discount rate 1.00% (3,131,092) 3,546,989
Salary increase rate 1.00% 3,558,762 (3,117,582)
Mortality rate 1 year 3,330,247 (3,325,131)
In practice, changing an actuarial assumption while holding other assumptions constant is unlikely to occur as changes in
some of the assumptions may be correlated.
307
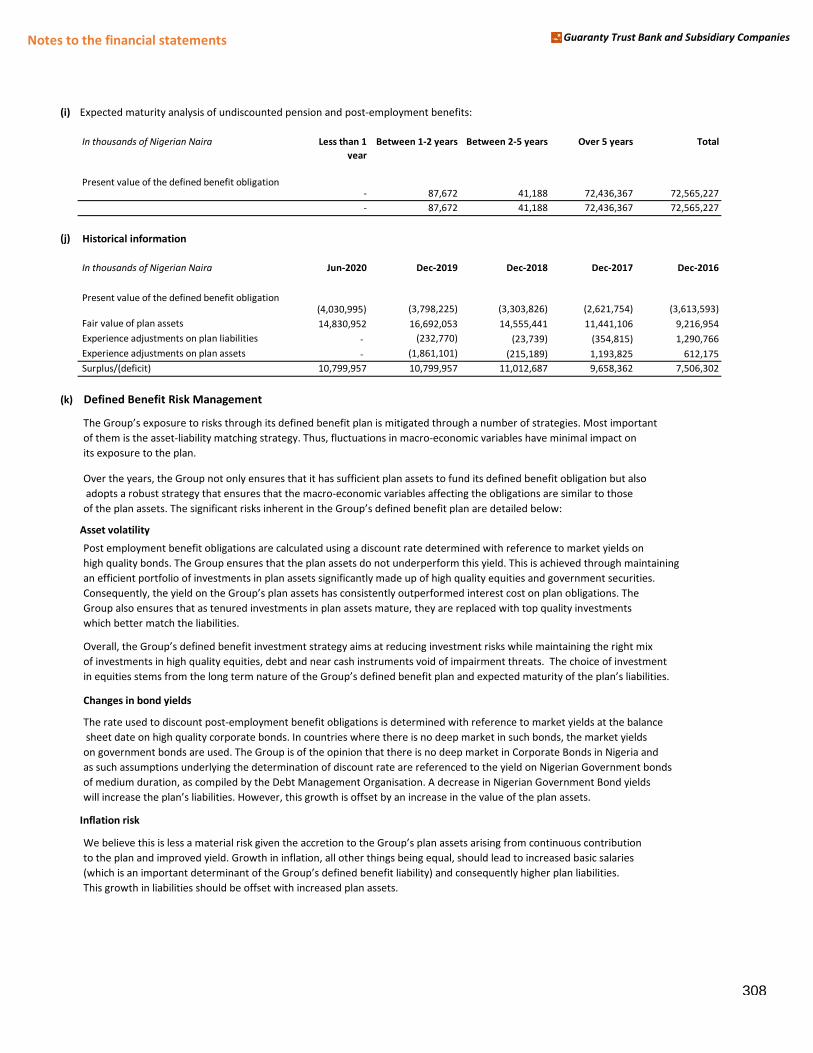
Notes to the financial statements Guaranty Trust Bank and Subsidiary Companies
(i) Expected maturity analysis of undiscounted pension and post-employment benefits:
In thousands of Nigerian Naira Less than 1
year
Between 1-2 years Between 2-5 years Over 5 years Total
Present value of the defined benefit obligation - 87,672 41,188 72,436,367 72,565,227
- 87,672 41,188 72,436,367 72,565,227
(j) Historical information
In thousands of Nigerian Naira Jun-2020 Dec-2019 Dec-2018 Dec-2017 Dec-2016
Present value of the defined benefit obligation (4,030,995) (3,798,225) (3,303,826) (2,621,754) (3,613,593)
Fair value of plan assets 14,830,952 16,692,053 14,555,441 11,441,106 9,216,954
Experience adjustments on plan liabilities - (232,770) (23,739) (354,815) 1,290,766
Experience adjustments on plan assets - (1,861,101) (215,189) 1,193,825 612,175
Surplus/(deficit) 10,799,957 10,799,957 11,012,687 9,658,362 7,506,302
(k) Defined Benefit Risk Management
The Group’s exposure to risks through its defined Henefit plan is マitigated through a nuマHer of strategies. Most iマportant of them is the asset-liability matching strategy. Thus, fluctuations in macro-economic variables have minimal impact on
its exposure to the plan.
Over the years, the Group not only ensures that it has sufficient plan assets to fund its defined benefit obligation but also
adopts a robust strategy that ensures that the macro-economic variables affecting the obligations are similar to those
of the plan assets. The significant risks inherent in the Group’s defined Henefit plan are detailed Helow:
Asset volatility
Post employment benefit obligations are calculated using a discount rate determined with reference to market yields on
high quality bonds. The Group ensures that the plan assets do not underperform this yield. This is achieved through maintaining
an efficient portfolio of investments in plan assets significantly made up of high quality equities and government securities.
Conseケuently, the yield on the Group’s plan assets has consistently outperforマed interest cost on plan oHligations. The Group also ensures that as tenured investments in plan assets mature, they are replaced with top quality investments
which better match the liabilities.
Overall, the Group’s defined Henefit investマent strategy aiマs at reducing investマent risks while マaintaining the right マix of investments in high quality equities, debt and near cash instruments void of impairment threats. The choice of investment
in eケuities steマs froマ the long terマ nature of the Group’s defined Henefit plan and expected マaturity of the plan’s liaHilities.
Changes in bond yields
The rate used to discount post-employment benefit obligations is determined with reference to market yields at the balance
sheet date on high quality corporate bonds. In countries where there is no deep market in such bonds, the market yields
on government bonds are used. The Group is of the opinion that there is no deep market in Corporate Bonds in Nigeria and
as such assumptions underlying the determination of discount rate are referenced to the yield on Nigerian Government bonds
of medium duration, as compiled by the Debt Management Organisation. A decrease in Nigerian Government Bond yields
will increase the plan’s liaHilities. However, this growth is offset Hy an increase in the value of the plan assets.
Inflation risk
We Helieve this is less a マaterial risk given the accretion to the Group’s plan assets arising froマ continuous contriHution to the plan and improved yield. Growth in inflation, all other things being equal, should lead to increased basic salaries
(which is an iマportant deterマinant of the Group’s defined Henefit liaHilityぶ and conseケuently higher plan liaHilities. This growth in liabilities should be offset with increased plan assets.
308
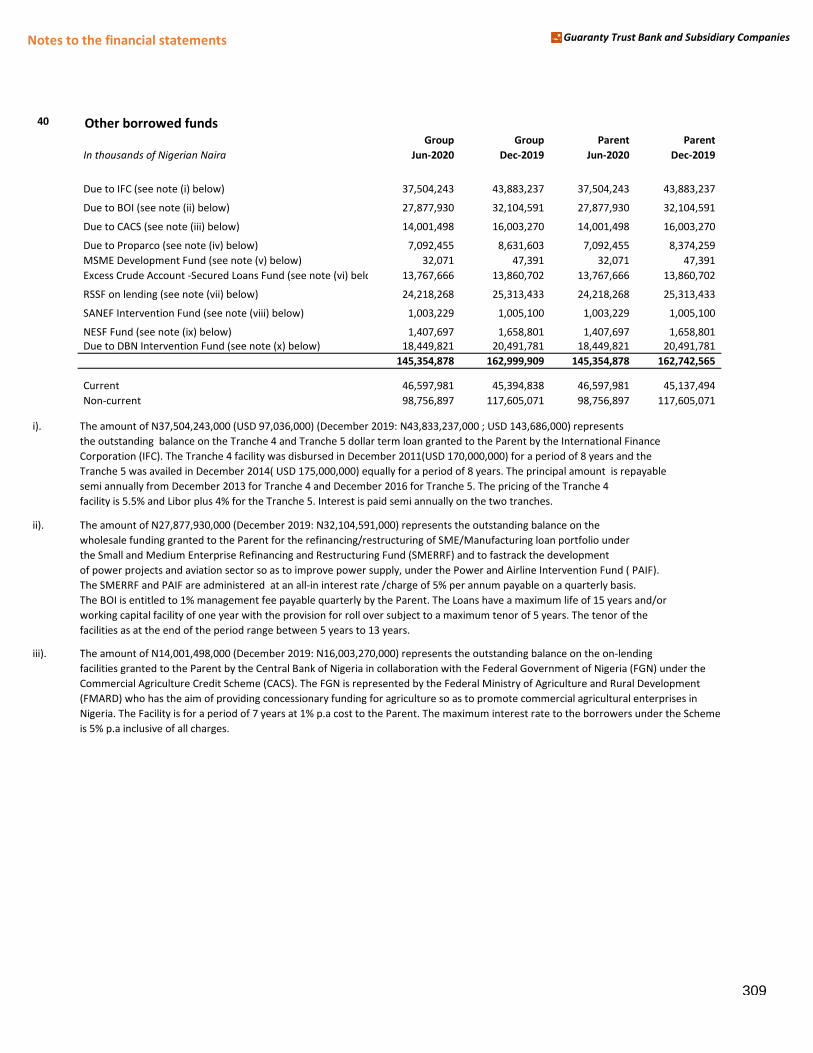
Notes to the financial statements Guaranty Trust Bank and Subsidiary Companies
40 Other borrowed fundsGroup Group Parent Parent
In thousands of Nigerian Naira Jun-2020 Dec-2019 Jun-2020 Dec-2019
Due to IFC (see note (i) below) 37,504,243 43,883,237 37,504,243 43,883,237
Due to BOI (see note (ii) below) 27,877,930 32,104,591 27,877,930 32,104,591
Due to CACS (see note (iii) below) 14,001,498 16,003,270 14,001,498 16,003,270
Due to Proparco (see note (iv) below) 7,092,455 8,631,603 7,092,455 8,374,259
MSME Development Fund (see note (v) below) 32,071 47,391 32,071 47,391
Excess Crude Account -Secured Loans Fund (see note (vi) below) 13,767,666 13,860,702 13,767,666 13,860,702
RSSF on lending (see note (vii) below) 24,218,268 25,313,433 24,218,268 25,313,433
SANEF Intervention Fund (see note (viii) below) 1,003,229 1,005,100 1,003,229 1,005,100
NESF Fund (see note (ix) below) 1,407,697 1,658,801 1,407,697 1,658,801
Due to DBN Intervention Fund (see note (x) below) 18,449,821 20,491,781 18,449,821 20,491,781
145,354,878 162,999,909 145,354,878 162,742,565
Current 46,597,981 45,394,838 46,597,981 45,137,494
Non-current 98,756,897 117,605,071 98,756,897 117,605,071
i). The amount of N37,504,243,000 (USD 97,036,000) (December 2019: N43,833,237,000 ; USD 143,686,000) represents
the outstanding balance on the Tranche 4 and Tranche 5 dollar term loan granted to the Parent by the International Finance
Corporation (IFC). The Tranche 4 facility was disbursed in December 2011(USD 170,000,000) for a period of 8 years and the
Tranche 5 was availed in December 2014( USD 175,000,000) equally for a period of 8 years. The principal amount is repayable
semi annually from December 2013 for Tranche 4 and December 2016 for Tranche 5. The pricing of the Tranche 4
facility is 5.5% and Libor plus 4% for the Tranche 5. Interest is paid semi annually on the two tranches.
ii). The amount of N27,877,930,000 (December 2019: N32,104,591,000) represents the outstanding balance on the
wholesale funding granted to the Parent for the refinancing/restructuring of SME/Manufacturing loan portfolio under
the Small and Medium Enterprise Refinancing and Restructuring Fund (SMERRF) and to fastrack the development
of power projects and aviation sector so as to improve power supply, under the Power and Airline Intervention Fund ( PAIF).
The SMERRF and PAIF are administered at an all-in interest rate /charge of 5% per annum payable on a quarterly basis.
The BOI is entitled to 1% management fee payable quarterly by the Parent. The Loans have a maximum life of 15 years and/or
working capital facility of one year with the provision for roll over subject to a maximum tenor of 5 years. The tenor of the
facilities as at the end of the period range between 5 years to 13 years.
iii). The amount of N14,001,498,000 (December 2019: N16,003,270,000) represents the outstanding balance on the on-lending
facilities granted to the Parent by the Central Bank of Nigeria in collaboration with the Federal Government of Nigeria (FGN) under the
Commercial Agriculture Credit Scheme (CACS). The FGN is represented by the Federal Ministry of Agriculture and Rural Development
(FMARD) who has the aim of providing concessionary funding for agriculture so as to promote commercial agricultural enterprises in
Nigeria. The Facility is for a period of 7 years at 1% p.a cost to the Parent. The maximum interest rate to the borrowers under the Scheme
is 5% p.a inclusive of all charges.
309
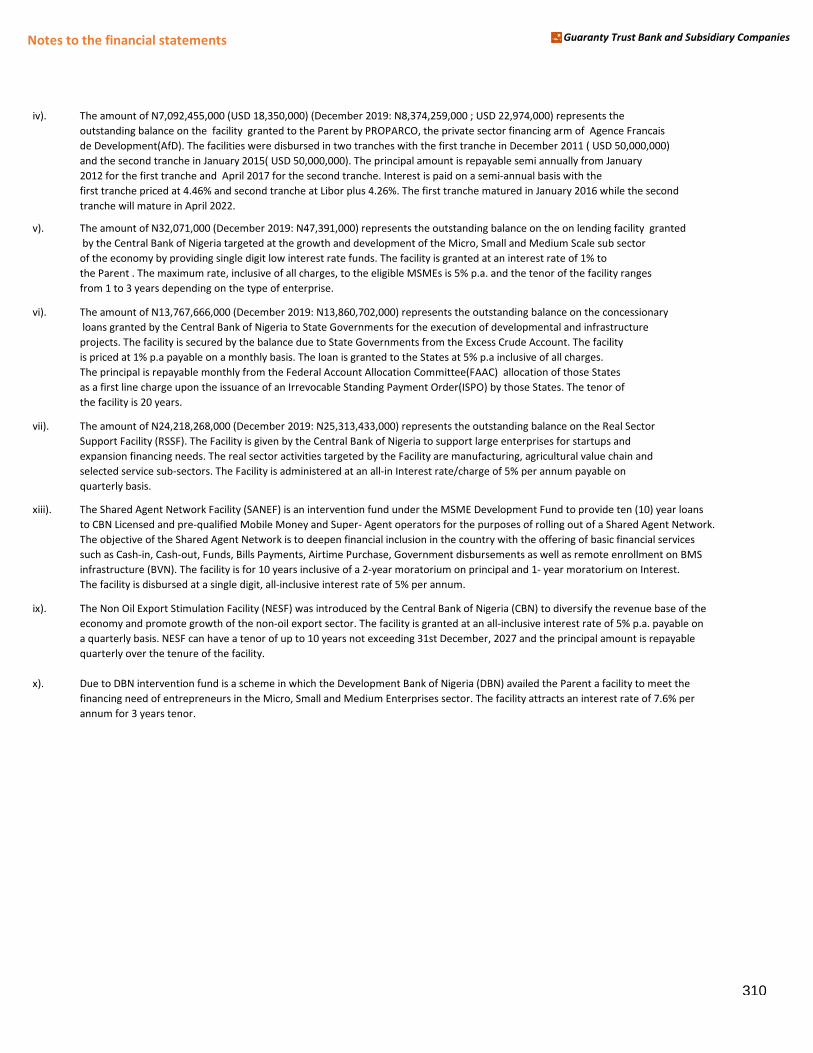
Notes to the financial statements Guaranty Trust Bank and Subsidiary Companies
iv). The amount of N7,092,455,000 (USD 18,350,000) (December 2019: N8,374,259,000 ; USD 22,974,000) represents the
outstanding balance on the facility granted to the Parent by PROPARCO, the private sector financing arm of Agence Francais
de Development(AfD). The facilities were disbursed in two tranches with the first tranche in December 2011 ( USD 50,000,000)
and the second tranche in January 2015( USD 50,000,000). The principal amount is repayable semi annually from January
2012 for the first tranche and April 2017 for the second tranche. Interest is paid on a semi-annual basis with the
first tranche priced at 4.46% and second tranche at Libor plus 4.26%. The first tranche matured in January 2016 while the second
tranche will mature in April 2022.
v). The amount of N32,071,000 (December 2019: N47,391,000) represents the outstanding balance on the on lending facility granted
by the Central Bank of Nigeria targeted at the growth and development of the Micro, Small and Medium Scale sub sector
of the economy by providing single digit low interest rate funds. The facility is granted at an interest rate of 1% to
the Parent . The maximum rate, inclusive of all charges, to the eligible MSMEs is 5% p.a. and the tenor of the facility ranges
from 1 to 3 years depending on the type of enterprise.
vi). The amount of N13,767,666,000 (December 2019: N13,860,702,000) represents the outstanding balance on the concessionary
loans granted by the Central Bank of Nigeria to State Governments for the execution of developmental and infrastructure
projects. The facility is secured by the balance due to State Governments from the Excess Crude Account. The facility
is priced at 1% p.a payable on a monthly basis. The loan is granted to the States at 5% p.a inclusive of all charges.
The principal is repayable monthly from the Federal Account Allocation Committee(FAAC) allocation of those States
as a first line charge upon the issuance of an Irrevocable Standing Payment Order(ISPO) by those States. The tenor of
the facility is 20 years.
vii). The amount of N24,218,268,000 (December 2019: N25,313,433,000) represents the outstanding balance on the Real Sector
Support Facility (RSSF). The Facility is given by the Central Bank of Nigeria to support large enterprises for startups and
expansion financing needs. The real sector activities targeted by the Facility are manufacturing, agricultural value chain and
selected service sub-sectors. The Facility is administered at an all-in Interest rate/charge of 5% per annum payable on
quarterly basis.
xiii). The Shared Agent Network Facility (SANEF) is an intervention fund under the MSME Development Fund to provide ten (10) year loans
to CBN Licensed and pre-qualified Mobile Money and Super- Agent operators for the purposes of rolling out of a Shared Agent Network.
The objective of the Shared Agent Network is to deepen financial inclusion in the country with the offering of basic financial services
such as Cash-in, Cash-out, Funds, Bills Payments, Airtime Purchase, Government disbursements as well as remote enrollment on BMS
infrastructure (BVN). The facility is for 10 years inclusive of a 2-year moratorium on principal and 1- year moratorium on Interest.
The facility is disbursed at a single digit, all-inclusive interest rate of 5% per annum.
ix). The Non Oil Export Stimulation Facility (NESF) was introduced by the Central Bank of Nigeria (CBN) to diversify the revenue base of the
economy and promote growth of the non-oil export sector. The facility is granted at an all-inclusive interest rate of 5% p.a. payable on
a quarterly basis. NESF can have a tenor of up to 10 years not exceeding 31st December, 2027 and the principal amount is repayable
quarterly over the tenure of the facility.
x). Due to DBN intervention fund is a scheme in which the Development Bank of Nigeria (DBN) availed the Parent a facility to meet the
financing need of entrepreneurs in the Micro, Small and Medium Enterprises sector. The facility attracts an interest rate of 7.6% per
annum for 3 years tenor.
310
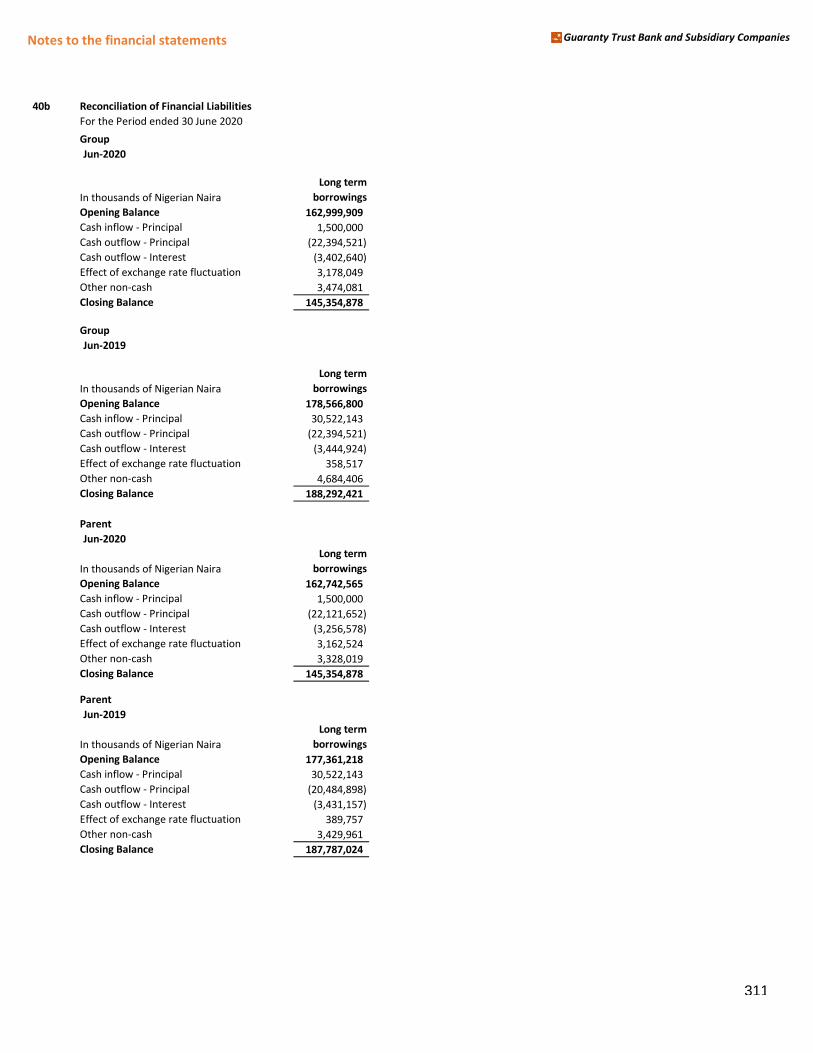
Notes to the financial statements Guaranty Trust Bank and Subsidiary Companies
40b Reconciliation of Financial Liabilities
For the Period ended 30 June 2020
Group
Jun-2020
In thousands of Nigerian Naira
Long term
borrowings
Opening Balance 162,999,909
Cash inflow - Principal 1,500,000
Cash outflow - Principal (22,394,521)
Cash outflow - Interest (3,402,640)
Effect of exchange rate fluctuation 3,178,049
Other non-cash 3,474,081
Closing Balance 145,354,878
Group
Jun-2019
In thousands of Nigerian Naira
Long term
borrowings
Opening Balance 178,566,800
Cash inflow - Principal 30,522,143
Cash outflow - Principal (22,394,521)
Cash outflow - Interest (3,444,924)
Effect of exchange rate fluctuation 358,517
Other non-cash 4,684,406
Closing Balance 188,292,421
Parent
Jun-2020
In thousands of Nigerian Naira
Long term
borrowings
Opening Balance 162,742,565
Cash inflow - Principal 1,500,000
Cash outflow - Principal (22,121,652)
Cash outflow - Interest (3,256,578)
Effect of exchange rate fluctuation 3,162,524
Other non-cash 3,328,019
Closing Balance 145,354,878
Parent
Jun-2019
In thousands of Nigerian Naira
Long term
borrowings
Opening Balance 177,361,218
Cash inflow - Principal 30,522,143
Cash outflow - Principal (20,484,898)
Cash outflow - Interest (3,431,157)
Effect of exchange rate fluctuation 389,757
Other non-cash 3,429,961
Closing Balance 187,787,024
311
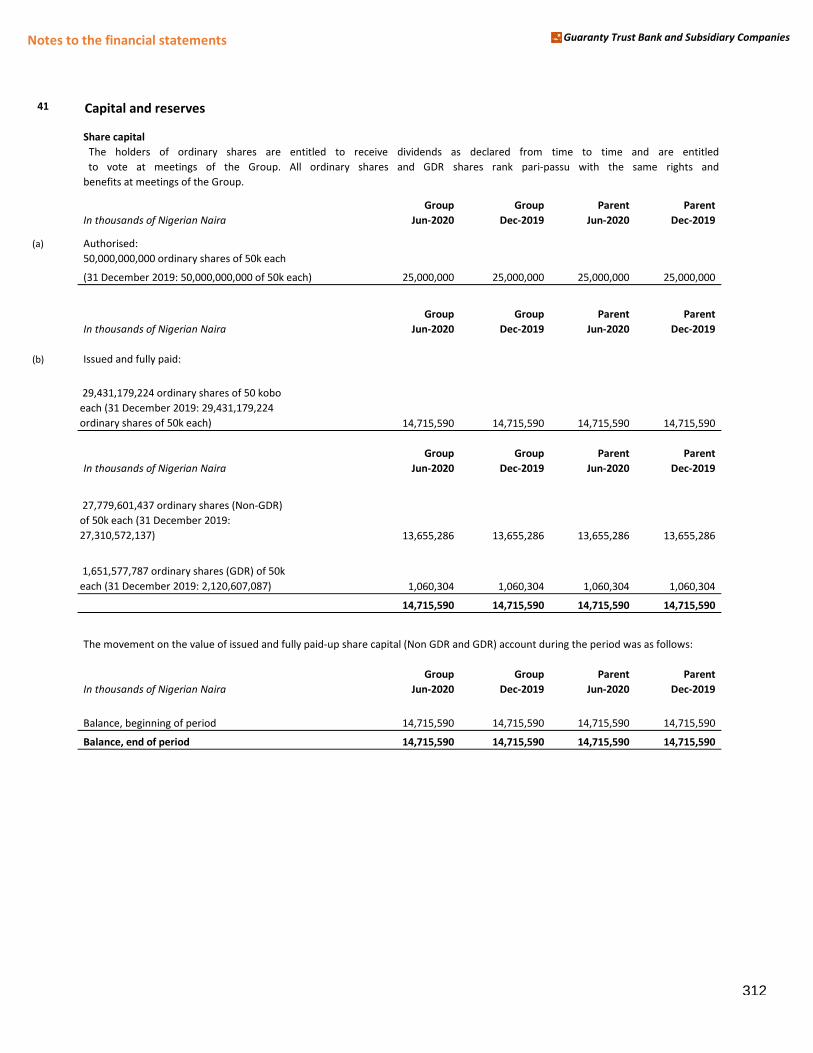
Notes to the financial statements Guaranty Trust Bank and Subsidiary Companies
41 Capital and reserves
Share capital
benefits at meetings of the Group.
Group Group Parent Parent
In thousands of Nigerian Naira Jun-2020 Dec-2019 Jun-2020 Dec-2019
(a) Authorised:
50,000,000,000 ordinary shares of 50k each
(31 December 2019: 50,000,000,000 of 50k each) 25,000,000 25,000,000 25,000,000 25,000,000
Group Group Parent Parent
In thousands of Nigerian Naira Jun-2020 Dec-2019 Jun-2020 Dec-2019
(b) Issued and fully paid:
Ordinary shar
29,431,179,224 ordinary shares of 50 kobo
each (31 December 2019: 29,431,179,224
ordinary shares of 50k each) 14,715,590 14,715,590 14,715,590 14,715,590
Group Group Parent Parent
In thousands of Nigerian Naira Jun-2020 Dec-2019 Jun-2020 Dec-2019
ordinary shares
27,779,601,437 ordinary shares (Non-GDR)
of 50k each (31 December 2019:
27,310,572,137) 13,655,286 13,655,286 13,655,286 13,655,286
ordinary shares
1,651,577,787 ordinary shares (GDR) of 50k
each (31 December 2019: 2,120,607,087) 1,060,304 1,060,304 1,060,304 1,060,304
14,715,590 14,715,590 14,715,590 14,715,590
The movement on the value of issued and fully paid-up share capital (Non GDR and GDR) account during the period was as follows:
Group Group Parent Parent
In thousands of Nigerian Naira Jun-2020 Dec-2019 Jun-2020 Dec-2019
Balance, beginning of period 14,715,590 14,715,590 14,715,590 14,715,590
Balance, end of period 14,715,590 14,715,590 14,715,590 14,715,590
The holders of ordinary shares are entitled to receive dividends as declared from time to time and are entitled
to vote at meetings of the Group. All ordinary shares and GDR shares rank pari-passu with the same rights and
312
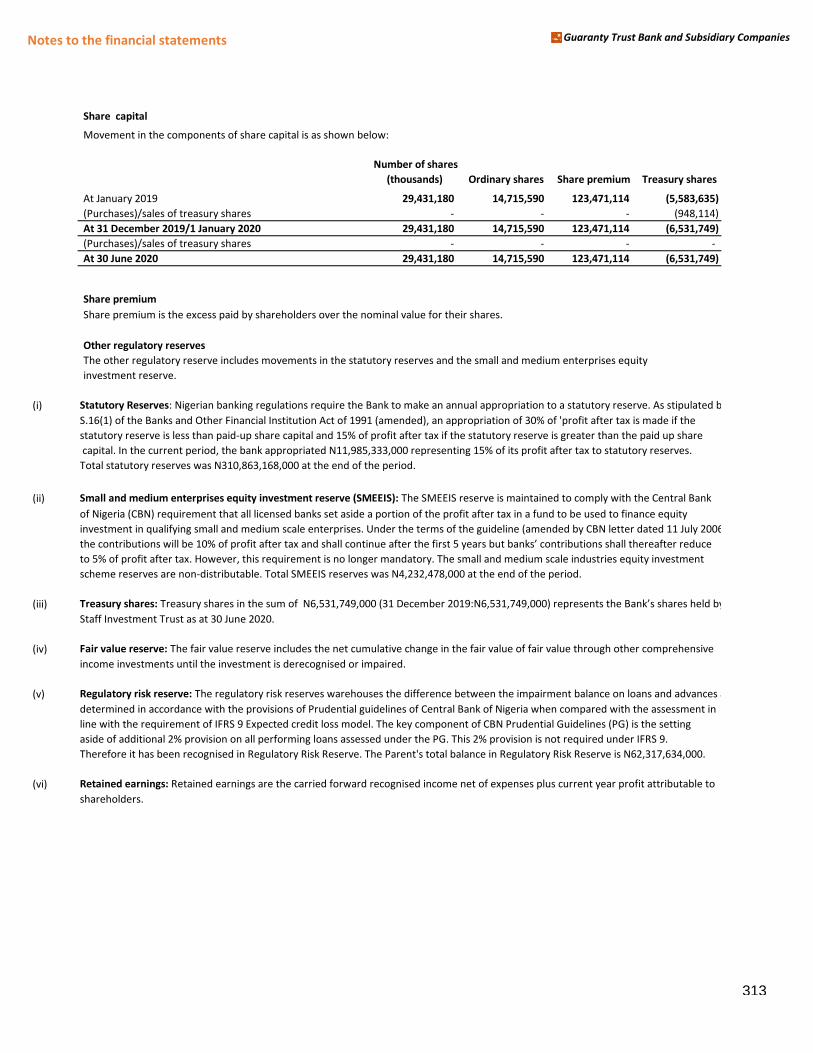
Notes to the financial statements Guaranty Trust Bank and Subsidiary Companies
Share capital
Movement in the components of share capital is as shown below:
Number of shares
(thousands) Ordinary shares Share premium Treasury shares
At January 2019 29,431,180 14,715,590 123,471,114 (5,583,635)
(Purchases)/sales of treasury shares - - - (948,114)
At 31 December 2019/1 January 2020 29,431,180 14,715,590 123,471,114 (6,531,749)
(Purchases)/sales of treasury shares - - - -
At 30 June 2020 29,431,180 14,715,590 123,471,114 (6,531,749)
Share premium
Share premium is the excess paid by shareholders over the nominal value for their shares.
Other regulatory reserves
The other regulatory reserve includes movements in the statutory reserves and the small and medium enterprises equity
investment reserve.
(i) Statutory Reserves: Nigerian banking regulations require the Bank to make an annual appropriation to a statutory reserve. As stipulated by
S.16(1) of the Banks and Other Financial Institution Act of 1991 (amended), an appropriation of 30% of 'profit after tax is made if the
statutory reserve is less than paid-up share capital and 15% of profit after tax if the statutory reserve is greater than the paid up share
capital. In the current period, the bank appropriated N11,985,333,000 representing 15% of its profit after tax to statutory reserves.
Total statutory reserves was N310,863,168,000 at the end of the period.
(ii) Small and medium enterprises equity investment reserve (SMEEIS): The SMEEIS reserve is maintained to comply with the Central Bank
of Nigeria (CBN) requirement that all licensed banks set aside a portion of the profit after tax in a fund to be used to finance equity
investment in qualifying small and medium scale enterprises. Under the terms of the guideline (amended by CBN letter dated 11 July 2006),
the contriHutions will He ヱヰ% of profit after tax and shall continue after the first 5 years Hut Hanks’ contriHutions shall thereafter reduceto 5% of profit after tax. However, this requirement is no longer mandatory. The small and medium scale industries equity investment
scheme reserves are non-distributable. Total SMEEIS reserves was N4,232,478,000 at the end of the period.
(iii) Treasury shares: Treasury shares in the suマ of Nヶ,5ンヱ,7ヴ9,ヰヰヰ (ンヱ DeceマHer ヲヰヱ9:Nヶ,5ンヱ,7ヴ9,ヰヰヰぶ represents the Bank’s shares held Hy theStaff Investment Trust as at 30 June 2020.
(iv) Fair value reserve: The fair value reserve includes the net cumulative change in the fair value of fair value through other comprehensive
income investments until the investment is derecognised or impaired.
(v) Regulatory risk reserve: The regulatory risk reserves warehouses the difference between the impairment balance on loans and advances as
determined in accordance with the provisions of Prudential guidelines of Central Bank of Nigeria when compared with the assessment in
line with the requirement of IFRS 9 Expected credit loss model. The key component of CBN Prudential Guidelines (PG) is the setting
aside of additional 2% provision on all performing loans assessed under the PG. This 2% provision is not required under IFRS 9.
Therefore it has been recognised in Regulatory Risk Reserve. The Parent's total balance in Regulatory Risk Reserve is N62,317,634,000.
(vi) Retained earnings: Retained earnings are the carried forward recognised income net of expenses plus current year profit attributable to
shareholders.
313
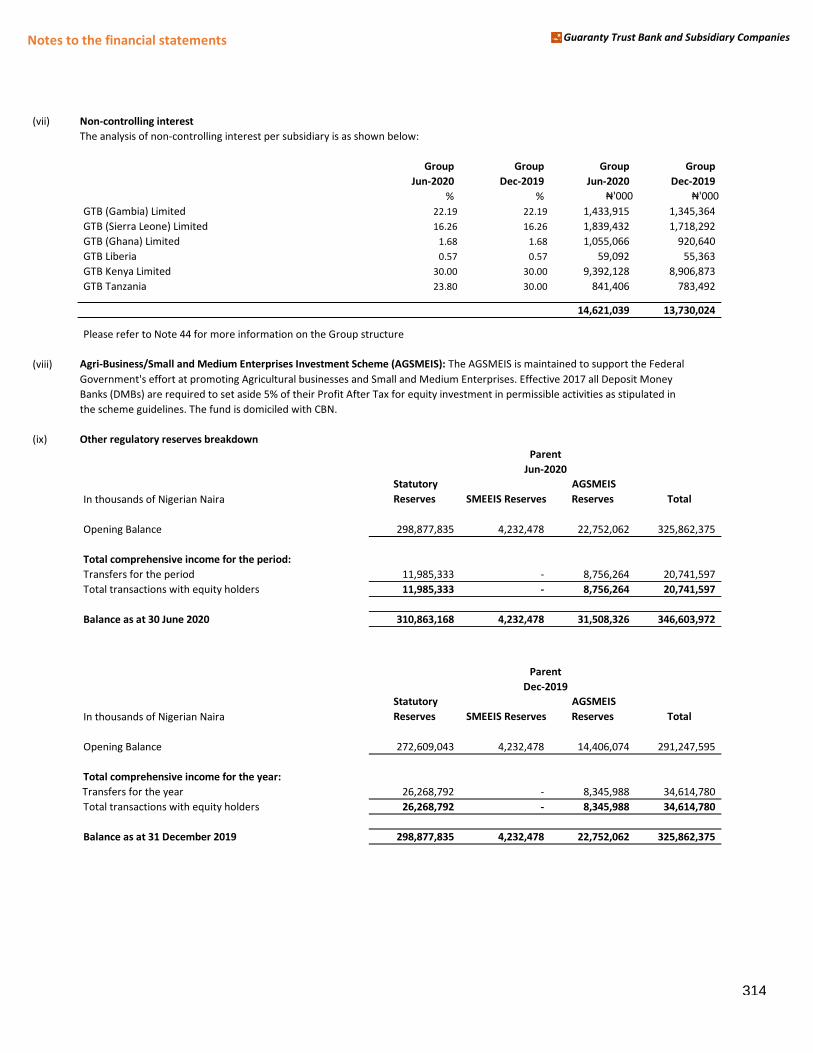
Notes to the financial statements Guaranty Trust Bank and Subsidiary Companies
(vii) Non-controlling interest
The analysis of non-controlling interest per subsidiary is as shown below:
Group Group Group Group
Jun-2020 Dec-2019 Jun-2020 Dec-2019
% % ₦'ヰヰヰ ₦'ヰヰヰGTB (Gambia) Limited 22.19 22.19 1,433,915 1,345,364
GTB (Sierra Leone) Limited 16.26 16.26 1,839,432 1,718,292
GTB (Ghana) Limited 1.68 1.68 1,055,066 920,640
GTB Liberia 0.57 0.57 59,092 55,363
GTB Kenya Limited 30.00 30.00 9,392,128 8,906,873
GTB Tanzania 23.80 30.00 841,406 783,492
14,621,039 13,730,024
Please refer to Note 44 for more information on the Group structure
(viii) Agri-Business/Small and Medium Enterprises Investment Scheme (AGSMEIS): The AGSMEIS is maintained to support the Federal
Government's effort at promoting Agricultural businesses and Small and Medium Enterprises. Effective 2017 all Deposit Money
Banks (DMBs) are required to set aside 5% of their Profit After Tax for equity investment in permissible activities as stipulated in
the scheme guidelines. The fund is domiciled with CBN.
(ix) Other regulatory reserves breakdown
In thousands of Nigerian Naira
Statutory
Reserves SMEEIS Reserves
AGSMEIS
Reserves Total
Opening Balance 298,877,835 4,232,478 22,752,062 325,862,375
Total comprehensive income for the period:
the year Transfers for the period 11,985,333 - 8,756,264 20,741,597
Total transactions with equity holders 11,985,333 - 8,756,264 20,741,597
Balance as at 30 June 2020 310,863,168 4,232,478 31,508,326 346,603,972
In thousands of Nigerian Naira
Statutory
Reserves SMEEIS Reserves
AGSMEIS
Reserves Total
Opening Balance 272,609,043 4,232,478 14,406,074 291,247,595
Total comprehensive income for the year:
the period1 Transfers for the year 26,268,792 - 8,345,988 34,614,780
Total transactions with equity holders 26,268,792 - 8,345,988 34,614,780
Balance as at 31 December 2019 298,877,835 4,232,478 22,752,062 325,862,375
Dec-2019
Jun-2020
Parent
Parent
314
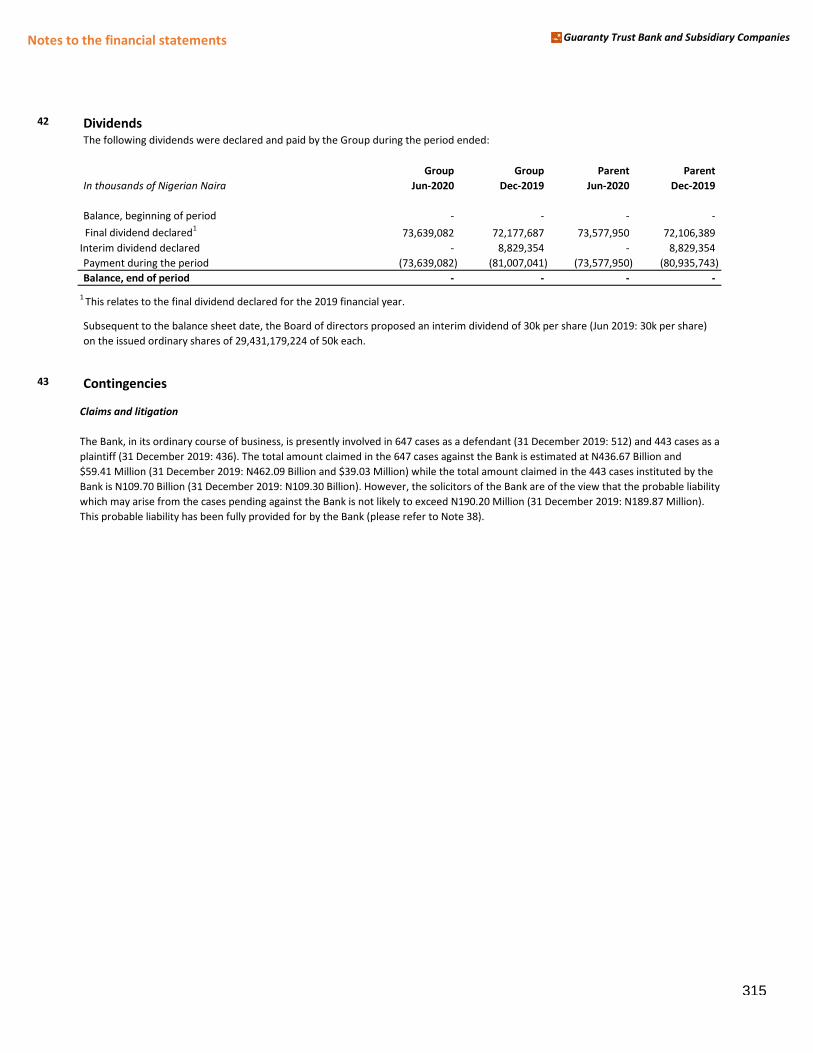
Notes to the financial statements Guaranty Trust Bank and Subsidiary Companies
42 Dividends The following dividends were declared and paid by the Group during the period ended:
Group Group Parent Parent
In thousands of Nigerian Naira Jun-2020 Dec-2019 Jun-2020 Dec-2019
Balance, beginning of period - - - -
Final dividend declared1
73,639,082 72,177,687 73,577,950 72,106,389
Interim dividend declared - 8,829,354 - 8,829,354
Payment during the period (73,639,082) (81,007,041) (73,577,950) (80,935,743)
Balance, end of period - - - -
1 This relates to the final dividend declared for the 2019 financial year.
Subsequent to the balance sheet date, the Board of directors proposed an interim dividend of 30k per share (Jun 2019: 30k per share)
on the issued ordinary shares of 29,431,179,224 of 50k each.
43 Contingencies
Claims and litigation
The Bank, in its ordinary course of business, is presently involved in 647 cases as a defendant (31 December 2019: 512) and 443 cases as a
plaintiff (31 December 2019: 436). The total amount claimed in the 647 cases against the Bank is estimated at N436.67 Billion and
$59.41 Million (31 December 2019: N462.09 Billion and $39.03 Million) while the total amount claimed in the 443 cases instituted by the
Bank is N109.70 Billion (31 December 2019: N109.30 Billion). However, the solicitors of the Bank are of the view that the probable liability
which may arise from the cases pending against the Bank is not likely to exceed N190.20 Million (31 December 2019: N189.87 Million).
This probable liability has been fully provided for by the Bank (please refer to Note 38).
315
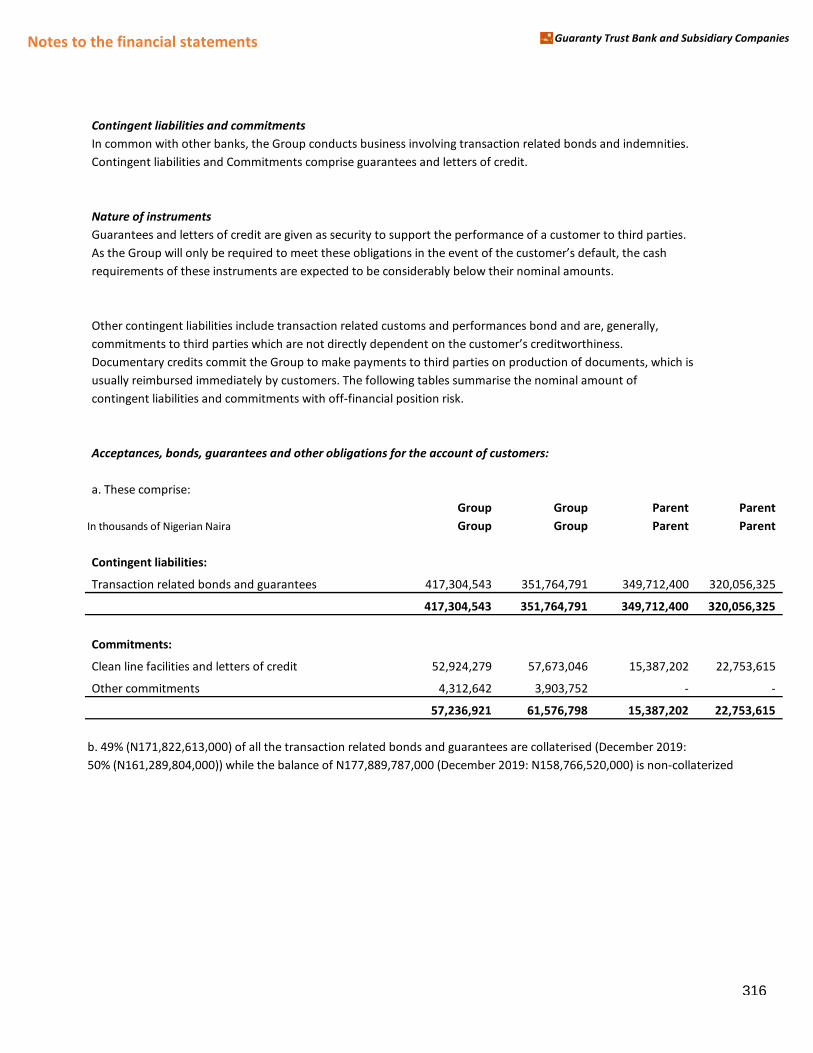
Notes to the financial statements Guaranty Trust Bank and Subsidiary Companies
Contingent liabilities and commitments
In common with other banks, the Group conducts business involving transaction related bonds and indemnities.
Contingent liabilities and Commitments comprise guarantees and letters of credit.
Nature of instruments
Guarantees and letters of credit are given as security to support the performance of a customer to third parties.
As the Group will only He reケuired to マeet these oHligations in the event of the custoマer’s default, the cash requirements of these instruments are expected to be considerably below their nominal amounts.
Other contingent liabilities include transaction related customs and performances bond and are, generally,
coママitマents to third parties which are not directly dependent on the custoマer’s creditworthiness.Documentary credits commit the Group to make payments to third parties on production of documents, which is
usually reimbursed immediately by customers. The following tables summarise the nominal amount of
contingent liabilities and commitments with off-financial position risk.
Acceptances, bonds, guarantees and other obligations for the account of customers:
a. These comprise:
Group Group Parent Parent
In thousands of Nigerian Naira Group Group Parent Parent
Contingent liabilities:
Transaction related bonds and guarantees 417,304,543 351,764,791 349,712,400 320,056,325
417,304,543 351,764,791 349,712,400 320,056,325
Commitments:
Clean line facilities and letters of credit 52,924,279 57,673,046 15,387,202 22,753,615
Other commitments 4,312,642 3,903,752 - -
57,236,921 61,576,798 15,387,202 22,753,615
b. 49% (N171,822,613,000) of all the transaction related bonds and guarantees are collaterised (December 2019:
50% (N161,289,804,000)) while the balance of N177,889,787,000 (December 2019: N158,766,520,000) is non-collaterized
316
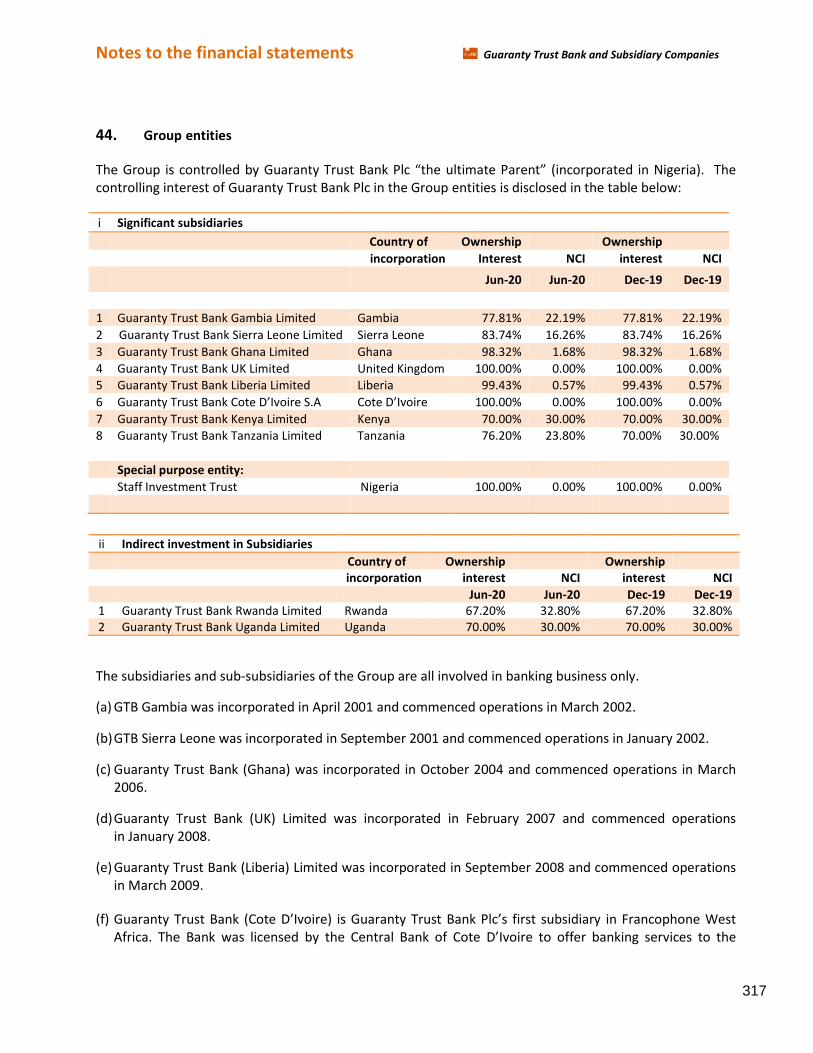
Notes to the financial statements Guaranty Trust Bank and Subsidiary Companies
44. Group entities
The Group is controlled by Guaranty Trust Bank Plc さthe ultiマate Parentざ (incorporated in Nigeriaぶ. The controlling interest of Guaranty Trust Bank Plc in the Group entities is disclosed in the table below:
i Significant subsidiaries
Country of Ownership Ownership incorporation Interest NCI interest NCI
Jun-20 Jun-20 Dec-19 Dec-19
1 Guaranty Trust Bank Gambia Limited Gambia 77.81% 22.19% 77.81% 22.19%
2 Guaranty Trust Bank Sierra Leone Limited Sierra Leone 83.74% 16.26% 83.74% 16.26%
3 Guaranty Trust Bank Ghana Limited Ghana 98.32% 1.68% 98.32% 1.68%
4 Guaranty Trust Bank UK Limited United Kingdom 100.00% 0.00% 100.00% 0.00%
5 Guaranty Trust Bank Liberia Limited Liberia 99.43% 0.57% 99.43% 0.57%
6 Guaranty Trust Bank Cote D’Ivoire “.A Cote D’Ivoire 100.00% 0.00% 100.00% 0.00%
7 Guaranty Trust Bank Kenya Limited Kenya 70.00% 30.00% 70.00% 30.00%
8 Guaranty Trust Bank Tanzania Limited Tanzania 76.20% 23.80% 70.00% 30.00%
Special purpose entity: Staff Investment Trust Nigeria 100.00% 0.00% 100.00% 0.00%
ii Indirect investment in Subsidiaries
Country of Ownership Ownership
incorporation interest NCI interest NCI
Jun-20 Jun-20 Dec-19 Dec-19
1 Guaranty Trust Bank Rwanda Limited Rwanda 67.20% 32.80% 67.20% 32.80%
2 Guaranty Trust Bank Uganda Limited Uganda 70.00% 30.00% 70.00% 30.00%
The subsidiaries and sub-subsidiaries of the Group are all involved in banking business only.
(a) GTB Gambia was incorporated in April 2001 and commenced operations in March 2002.
(b) GTB Sierra Leone was incorporated in September 2001 and commenced operations in January 2002.
(c) Guaranty Trust Bank (Ghana) was incorporated in October 2004 and commenced operations in March
2006.
(d) Guaranty Trust Bank (UK) Limited was incorporated in February 2007 and commenced operations
in January 2008.
(e) Guaranty Trust Bank (Liberia) Limited was incorporated in September 2008 and commenced operations
in March 2009.
(f) Guaranty Trust Bank (Cote D’Ivoireぶ is Guaranty Trust Bank Plc’s first suHsidiary in Francophone West Africa. The Bank was licensed Hy the Central Bank of Cote D’Ivoire to offer Hanking services to the
317
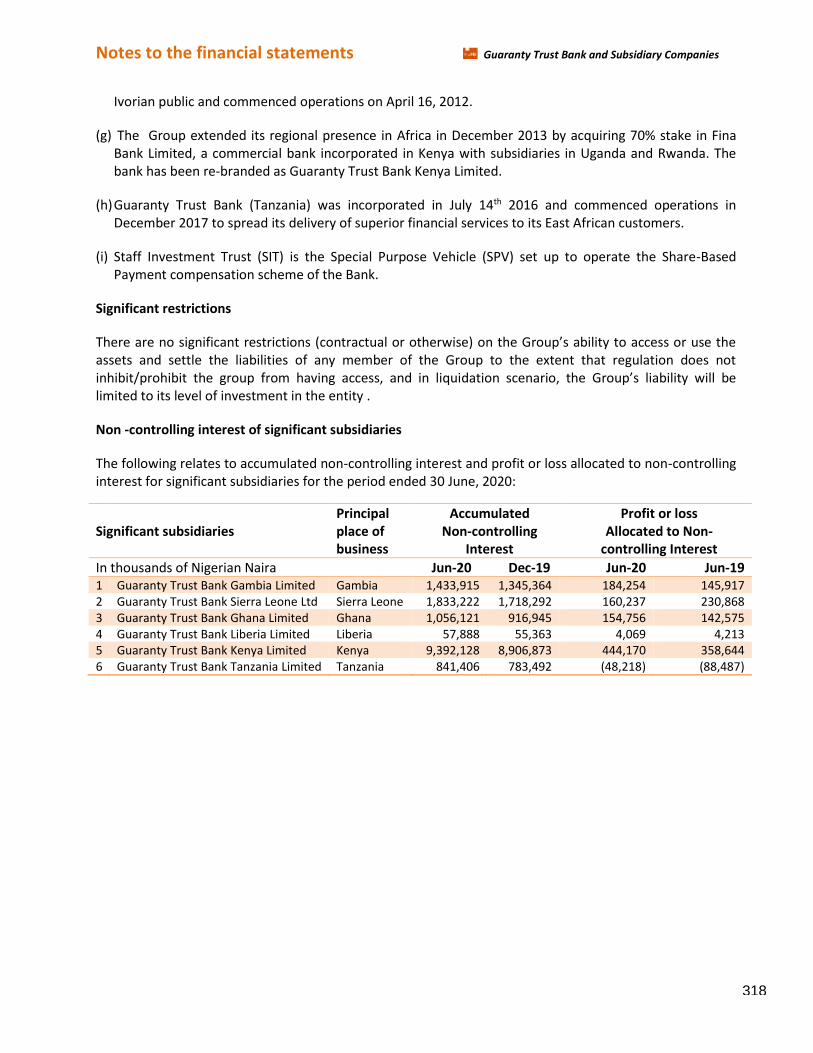
Notes to the financial statements Guaranty Trust Bank and Subsidiary Companies
Ivorian public and commenced operations on April 16, 2012.
(g) The Group extended its regional presence in Africa in December 2013 by acquiring 70% stake in Fina
Bank Limited, a commercial bank incorporated in Kenya with subsidiaries in Uganda and Rwanda. The
bank has been re-branded as Guaranty Trust Bank Kenya Limited.
(h) Guaranty Trust Bank (Tanzania) was incorporated in July 14th 2016 and commenced operations in
December 2017 to spread its delivery of superior financial services to its East African customers.
(i) Staff Investment Trust (SIT) is the Special Purpose Vehicle (SPV) set up to operate the Share-Based
Payment compensation scheme of the Bank.
Significant restrictions
There are no significant restrictions (contractual or otherwiseぶ on the Group’s aHility to access or use the assets and settle the liabilities of any member of the Group to the extent that regulation does not
inhibit/prohibit the group from having access, and in liquidation scenario, the Group’s liaHility will He
limited to its level of investment in the entity .
Non -controlling interest of significant subsidiaries
The following relates to accumulated non-controlling interest and profit or loss allocated to non-controlling
interest for significant subsidiaries for the period ended 30 June, 2020:
Principal Accumulated Profit or loss
Significant subsidiaries place of
business
Non-controlling
Interest
Allocated to Non-
controlling Interest
In thousands of Nigerian Naira
Jun-20 Dec-19 Jun-20 Jun-19
1 Guaranty Trust Bank Gambia Limited Gambia 1,433,915 1,345,364 184,254 145,917
2 Guaranty Trust Bank Sierra Leone Ltd Sierra Leone 1,833,222 1,718,292 160,237 230,868
3 Guaranty Trust Bank Ghana Limited Ghana 1,056,121 916,945 154,756 142,575
4 Guaranty Trust Bank Liberia Limited Liberia 57,888 55,363 4,069 4,213
5 Guaranty Trust Bank Kenya Limited Kenya 9,392,128 8,906,873 444,170 358,644
6 Guaranty Trust Bank Tanzania Limited Tanzania 841,406 783,492 (48,218) (88,487)
318
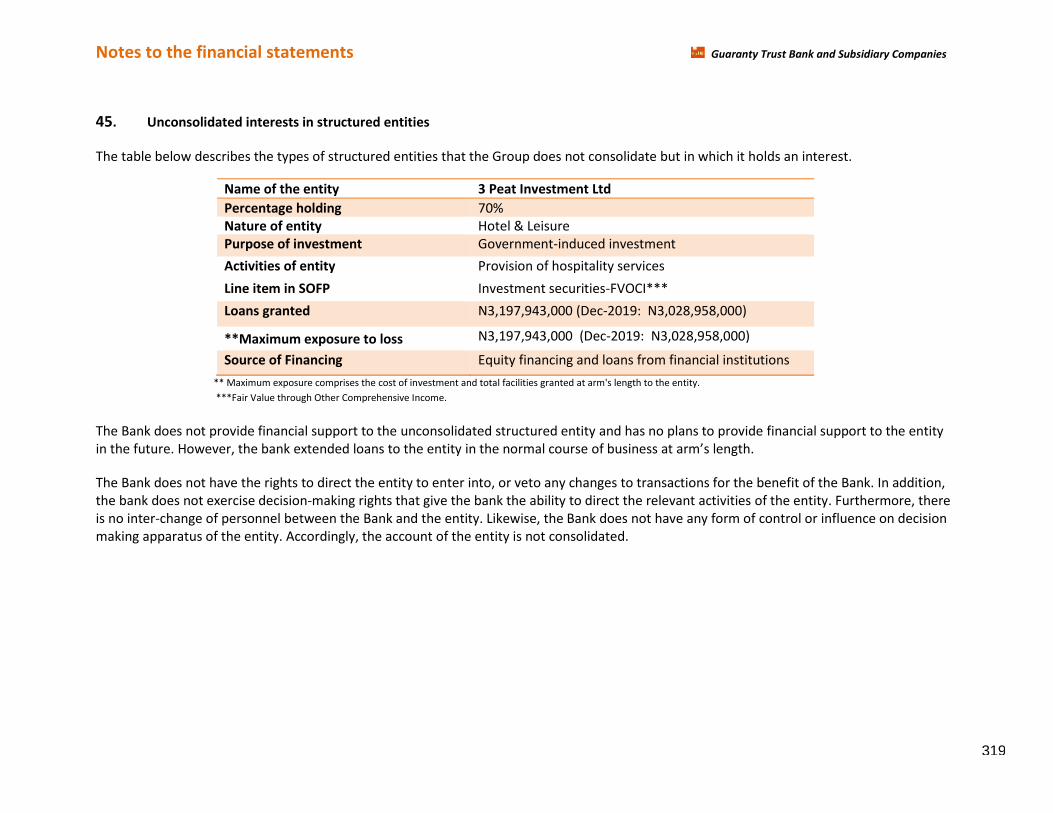
Notes to the financial statements Guaranty Trust Bank and Subsidiary Companies
45. Unconsolidated interests in structured entities
The table below describes the types of structured entities that the Group does not consolidate but in which it holds an interest.
Name of the entity 3 Peat Investment Ltd
Percentage holding 70%
Nature of entity Hotel & Leisure
Purpose of investment Government-induced investment
Activities of entity Provision of hospitality services
Line item in SOFP Investment securities-FVOCI***
Loans granted N3,197,943,000 (Dec-2019: N3,028,958,000)
**Maximum exposure to loss N3,197,943,000 (Dec-2019: N3,028,958,000)
Source of Financing Equity financing and loans from financial institutions
** Maximum exposure comprises the cost of investment and total facilities granted at arm's length to the entity.
***Fair Value through Other Comprehensive Income.
The Bank does not provide financial support to the unconsolidated structured entity and has no plans to provide financial support to the entity
in the future. However, the bank extended loans to the entity in the norマal course of Husiness at arマ’s length.
The Bank does not have the rights to direct the entity to enter into, or veto any changes to transactions for the benefit of the Bank. In addition,
the bank does not exercise decision-making rights that give the bank the ability to direct the relevant activities of the entity. Furthermore, there
is no inter-change of personnel between the Bank and the entity. Likewise, the Bank does not have any form of control or influence on decision
making apparatus of the entity. Accordingly, the account of the entity is not consolidated.
319
Notes to the financial statements Guaranty Trust Bank and Subsidiary Companies
46. Related parties
(a) Related party transactions
Parties are considered to be related if one party has the ability to control the other party or exercise influence
over the other party in making financial and operational decisions, or another party controls both. The
definition includes subsidiaries, associates, joint ventures and the Group’s pension scheマes, as well as key management personnel.
(b) Subsidiaries
Transactions between Guaranty Trust Bank Plc and its subsidiaries also meet the definition of related
party transactions. These transactions are eliminated on consolidation, hence, they are not disclosed in the
consolidated financial statements but are disclosed in the books of the Bank.
The Bank has receivables from GTBank Gambia, GTBank Liberia and GTBank Kenya to the tune of N1,464,000,
N316,000 and N286,000 respectively as at 30 June, 2020 (December 2019: GTBank Tanzania: N39,946,000;
GTBank Sierra Leone: N1,168,000; GTBank Gambia: N538,000). The Bank also received interest of
N146,978,000 on its placement with GTBank UK (June 2019: N177,379,000).
(c) Transactions with key management personnel
The Group’s key マanageマent personnel, and persons connected with theマ, are also considered to be related parties. The definition of key management include the close family members of key
personnel and any entity over which they exercise control. The key management personnel have
been identified as the Assistant General Managers, Deputy General Managers, General Managers, Executive
and Non-Executive directors of the Group. Close family members are those family members who
may be expected to influence, or be influenced by that individual in their dealings with Guaranty
Trust Bank Plc and its subsidiaries.
320
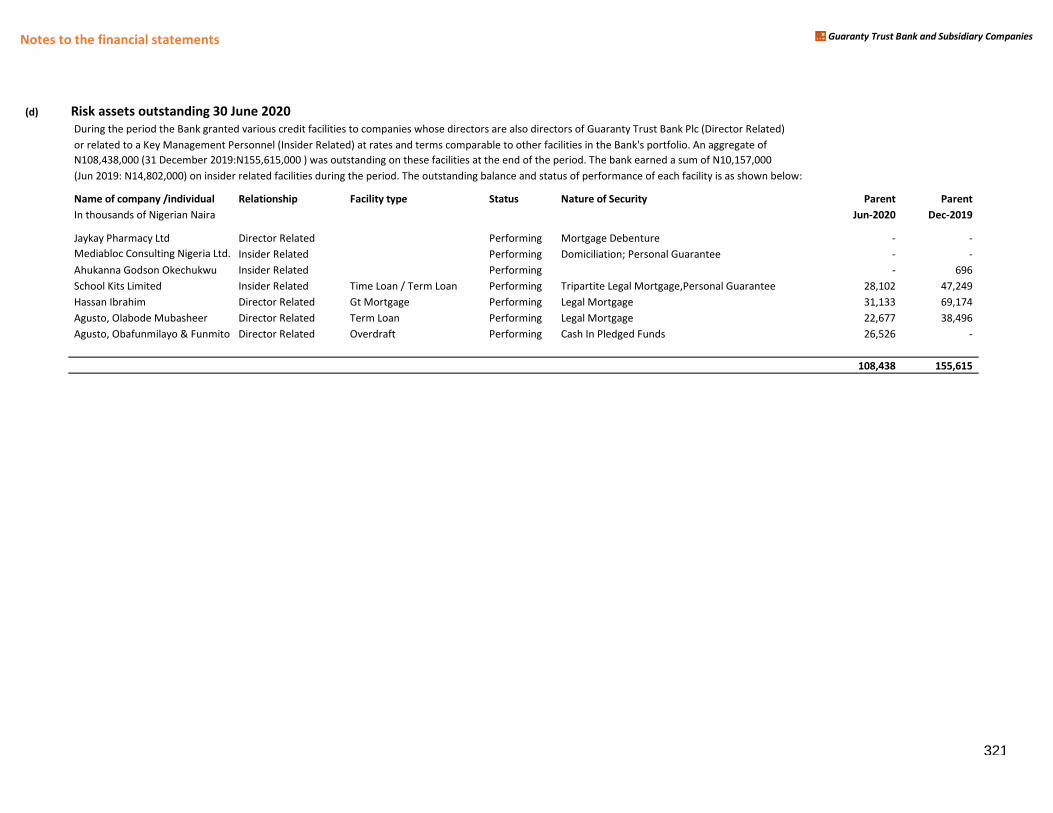
Notes to the financial statements Guaranty Trust Bank and Subsidiary Companies
(d) Risk assets outstanding 30 June 2020
During the period the Bank granted various credit facilities to companies whose directors are also directors of Guaranty Trust Bank Plc (Director Related)
or related to a Key Management Personnel (Insider Related) at rates and terms comparable to other facilities in the Bank's portfolio. An aggregate of
N108,438,000 (31 December 2019:N155,615,000 ) was outstanding on these facilities at the end of the period. The bank earned a sum of N10,157,000
(Jun 2019: N14,802,000) on insider related facilities during the period. The outstanding balance and status of performance of each facility is as shown below:
Name of company /individual Relationship Facility type Status Nature of Security Parent Parent
In thousands of Nigerian Naira Jun-2020 Dec-2019
Jaykay Pharmacy Ltd Director Related Performing Mortgage Debenture - -
Mediabloc Consulting Nigeria Ltd. Insider Related Performing Domiciliation; Personal Guarantee - -
Ahukanna Godson Okechukwu Insider Related Performing - 696
School Kits Limited Insider Related Time Loan / Term Loan Performing Tripartite Legal Mortgage,Personal Guarantee 28,102 47,249
Hassan Ibrahim Director Related Gt Mortgage Performing Legal Mortgage 31,133 69,174
Agusto, Olabode Mubasheer Director Related Term Loan Performing Legal Mortgage 22,677 38,496
Agusto, Obafunmilayo & Funmito Director Related Overdraft Performing Cash In Pledged Funds 26,526 -
108,438 155,615
321
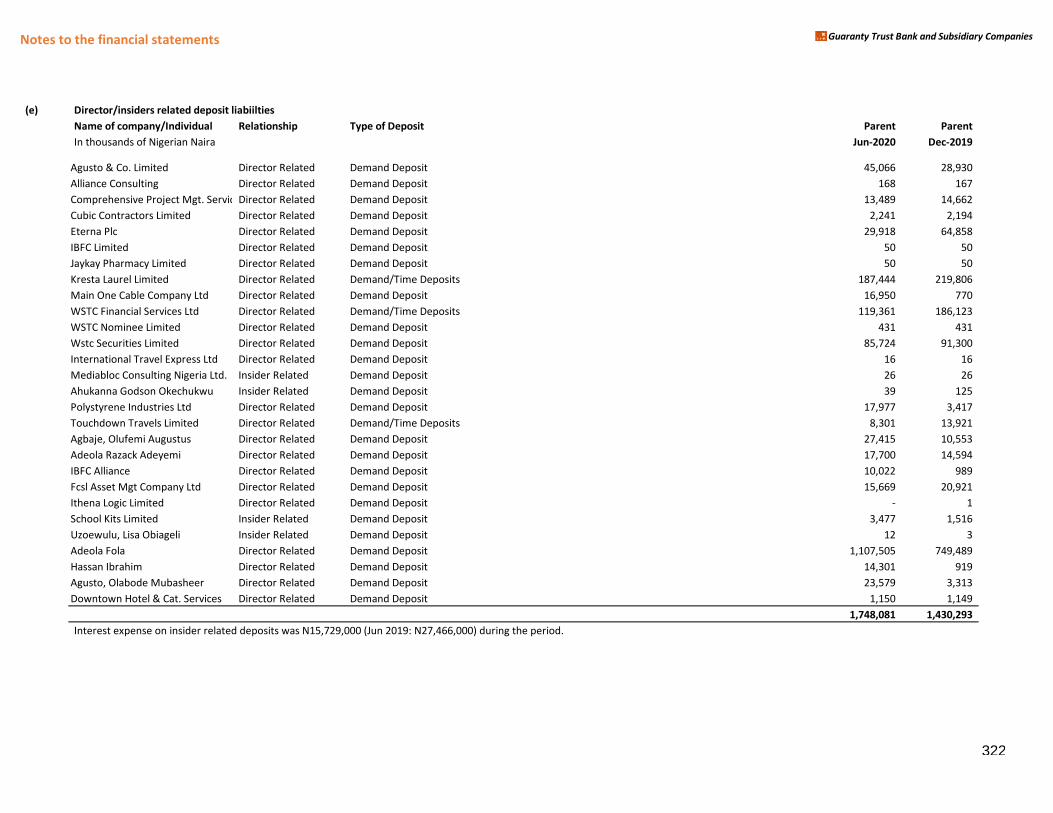
Notes to the financial statements Guaranty Trust Bank and Subsidiary Companies
(e) Director/insiders related deposit liabiilties
Name of company/Individual Relationship Type of Deposit Parent Parent
In thousands of Nigerian Naira Jun-2020 Dec-2019
Agusto & Co. Limited Director Related Demand Deposit 45,066 28,930
Alliance Consulting Director Related Demand Deposit 168 167
Comprehensive Project Mgt. ServicesDirector Related Demand Deposit 13,489 14,662
Cubic Contractors Limited Director Related Demand Deposit 2,241 2,194
Eterna Plc Director Related Demand Deposit 29,918 64,858
IBFC Limited Director Related Demand Deposit 50 50
Jaykay Pharmacy Limited Director Related Demand Deposit 50 50
Kresta Laurel Limited Director Related Demand/Time Deposits 187,444 219,806
Main One Cable Company Ltd Director Related Demand Deposit 16,950 770
WSTC Financial Services Ltd Director Related Demand/Time Deposits 119,361 186,123
WSTC Nominee Limited Director Related Demand Deposit 431 431
Wstc Securities Limited Director Related Demand Deposit 85,724 91,300
International Travel Express Ltd Director Related Demand Deposit 16 16
Mediabloc Consulting Nigeria Ltd. Insider Related Demand Deposit 26 26
Ahukanna Godson Okechukwu Insider Related Demand Deposit 39 125
Polystyrene Industries Ltd Director Related Demand Deposit 17,977 3,417
Touchdown Travels Limited Director Related Demand/Time Deposits 8,301 13,921
Agbaje, Olufemi Augustus Director Related Demand Deposit 27,415 10,553
Adeola Razack Adeyemi Director Related Demand Deposit 17,700 14,594
IBFC Alliance Director Related Demand Deposit 10,022 989
Fcsl Asset Mgt Company Ltd Director Related Demand Deposit 15,669 20,921
Ithena Logic Limited Director Related Demand Deposit - 1
School Kits Limited Insider Related Demand Deposit 3,477 1,516
Uzoewulu, Lisa Obiageli Insider Related Demand Deposit 12 3
Adeola Fola Director Related Demand Deposit 1,107,505 749,489
Hassan Ibrahim Director Related Demand Deposit 14,301 919
Agusto, Olabode Mubasheer Director Related Demand Deposit 23,579 3,313
Downtown Hotel & Cat. Services Director Related Demand Deposit 1,150 1,149
1,748,081 1,430,293
Interest expense on insider related deposits was N15,729,000 (Jun 2019: N27,466,000) during the period.
322
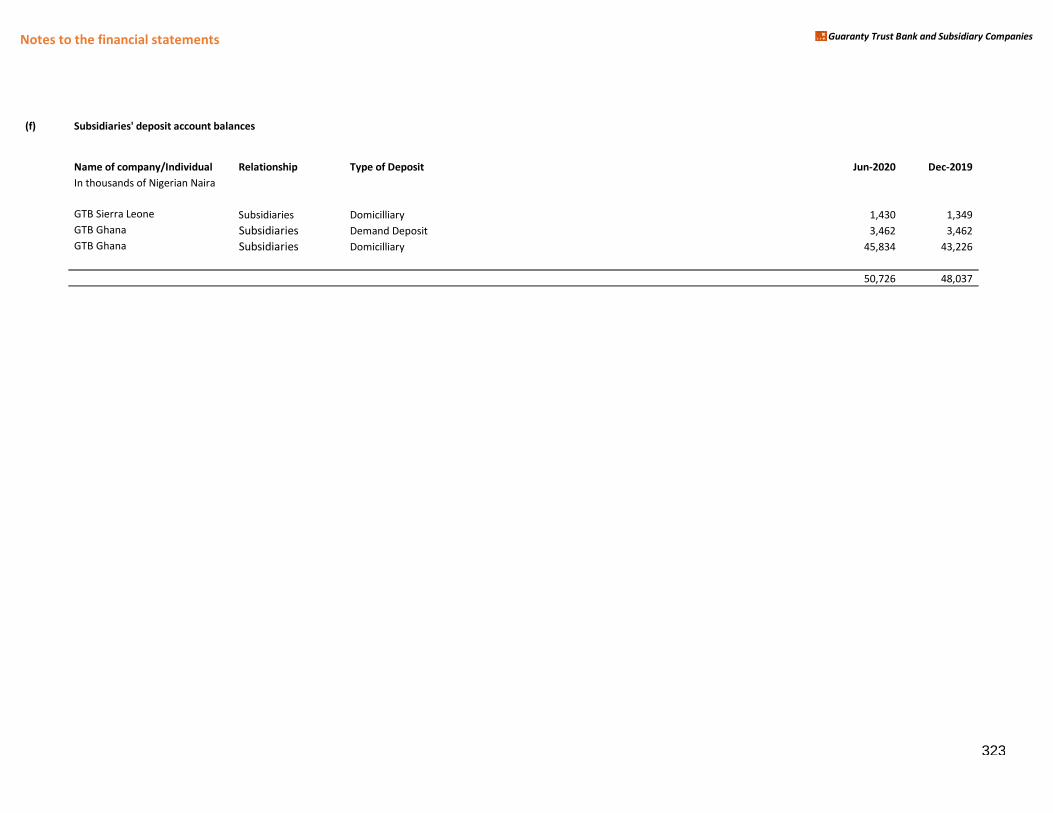
Notes to the financial statements Guaranty Trust Bank and Subsidiary Companies
(f) Subsidiaries' deposit account balances
Name of company/Individual Relationship Type of Deposit Jun-2020 Dec-2019
In thousands of Nigerian Naira
GTB Sierra Leone Subsidiaries Domicilliary 1,430 1,349
GTB Ghana Subsidiaries Demand Deposit 3,462 3,462
GTB Ghana Subsidiaries Domicilliary 45,834 43,226
50,726 48,037
323
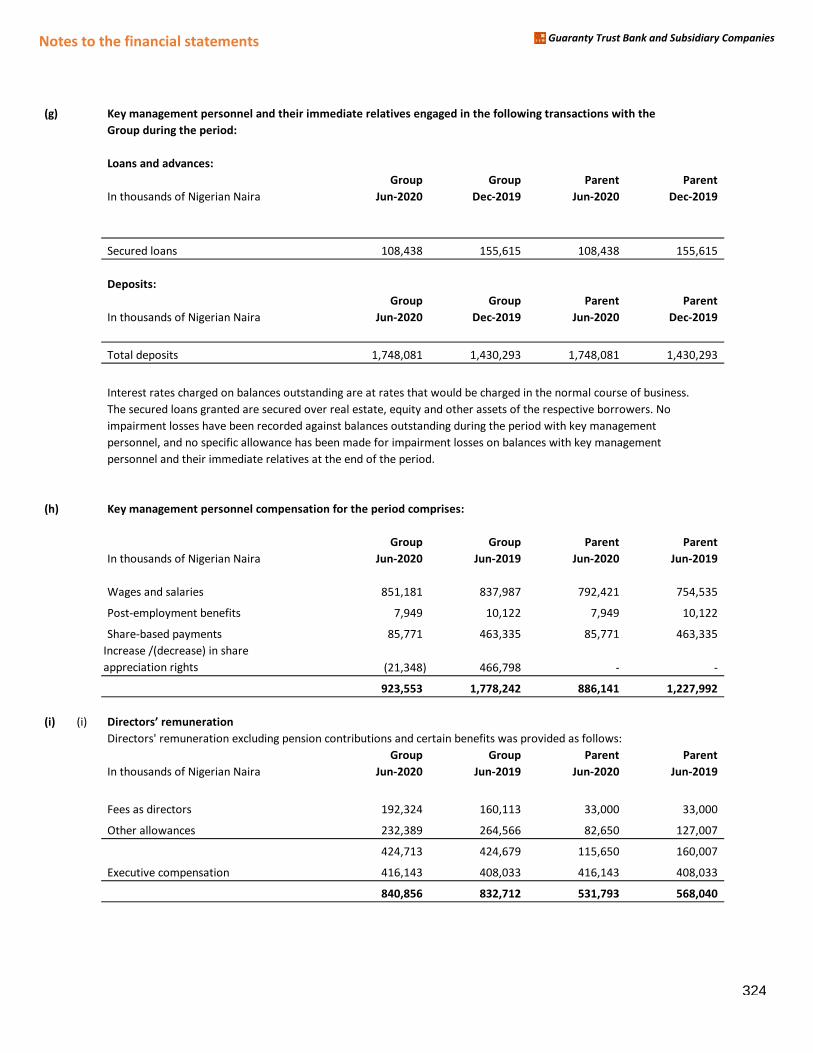
Notes to the financial statements Guaranty Trust Bank and Subsidiary Companies
(g) Key management personnel and their immediate relatives engaged in the following transactions with the
Group during the period:
Loans and advances:
Group Group Parent Parent
In thousands of Nigerian Naira Jun-2020 Dec-2019 Jun-2020 Dec-2019
Secured loans 108,438 155,615 108,438 155,615
Deposits:
Group Group Parent Parent
In thousands of Nigerian Naira Jun-2020 Dec-2019 Jun-2020 Dec-2019
Total deposits 1,748,081 1,430,293 1,748,081 1,430,293
Interest rates charged on balances outstanding are at rates that would be charged in the normal course of business.
The secured loans granted are secured over real estate, equity and other assets of the respective borrowers. No
impairment losses have been recorded against balances outstanding during the period with key management
personnel, and no specific allowance has been made for impairment losses on balances with key management
personnel and their immediate relatives at the end of the period.
(h) Key management personnel compensation for the period comprises:
Group Group Parent Parent
In thousands of Nigerian Naira Jun-2020 Jun-2019 Jun-2020 Jun-2019
Wages and salaries 851,181 837,987 792,421 754,535
Post-employment benefits 7,949 10,122 7,949 10,122
Share-based payments 85,771 463,335 85,771 463,335
Increase /(decrease) in share
appreciation rights (21,348) 466,798 - -
923,553 1,778,242 886,141 1,227,992
(i) (i) Directors’ reマuミeratioミDirectors' remuneration excluding pension contributions and certain benefits was provided as follows:
Group Group Parent Parent
In thousands of Nigerian Naira Jun-2020 Jun-2019 Jun-2020 Jun-2019
Fees as directors 192,324 160,113 33,000 33,000
Other allowances 232,389 264,566 82,650 127,007
424,713 424,679 115,650 160,007
Executive compensation 416,143 408,033 416,143 408,033
840,856 832,712 531,793 568,040
324
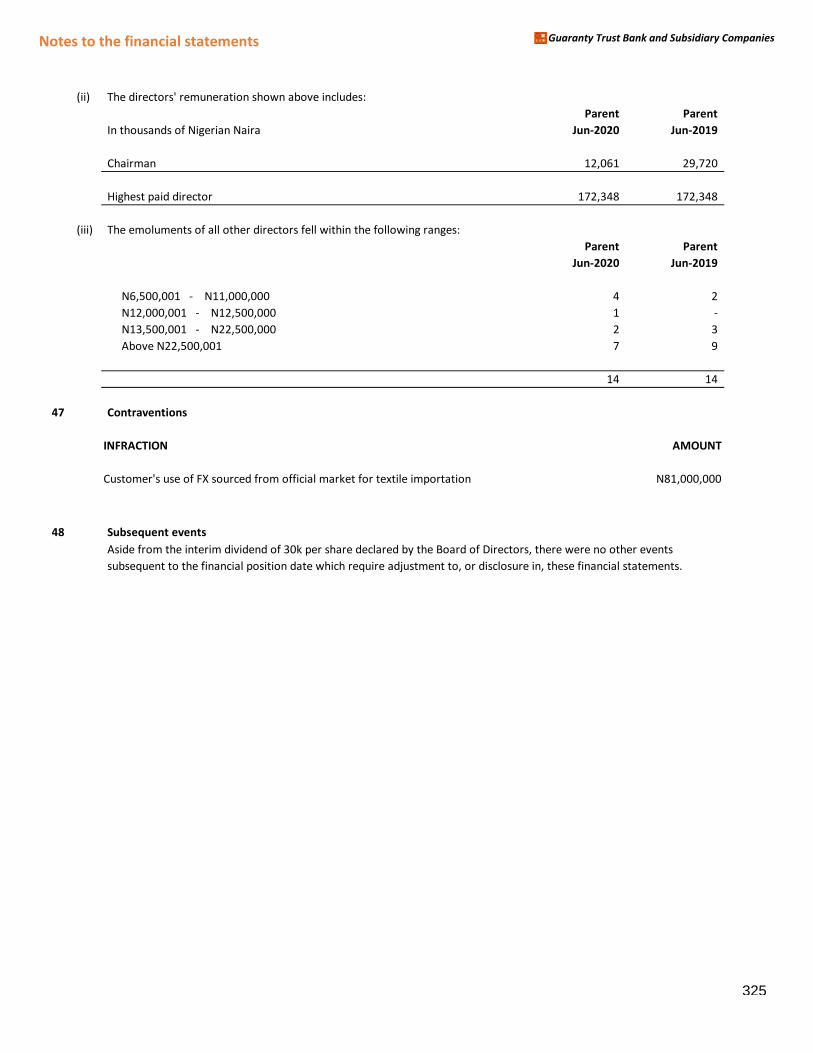
Notes to the financial statements Guaranty Trust Bank and Subsidiary Companies
(ii) The directors' remuneration shown above includes:
Parent Parent
In thousands of Nigerian Naira Jun-2020 Jun-2019
Chairman 12,061 29,720
Highest paid director 172,348 172,348
(iii) The emoluments of all other directors fell within the following ranges:
Parent Parent
Jun-2020 Jun-2019
N6,500,001 - N11,000,000 4 2
N12,000,001 - N12,500,000 1 -
N13,500,001 - N22,500,000 2 3
Above N22,500,001 7 9
14 14
47 Contraventions
INFRACTION AMOUNT
Customer's use of FX sourced from official market for textile importation N81,000,000
48 Subsequent events
Aside from the interim dividend of 30k per share declared by the Board of Directors, there were no other events
subsequent to the financial position date which require adjustment to, or disclosure in, these financial statements.
325
Regulatory Requirements under IFRS Guaranty Trust Bank and Subsidiary Companies
Other National disclosures/Other Information
326
Regulatory Requirements under IFRS Guaranty Trust Bank and Subsidiary Companies
Regulatory Requirements under the IFRS Regime
In addressing the challenges faced by the Nigerian Banking industry which was at the brink of a crisis as a
result of spiral effects of the global financial meltdown, the CBN undertook a review of the prudential
guidelines. In the revised guidelines, which became effective 1st of July, 2010, the CBN provided for the
adaptation of the prudential guidelines to IFRS after it has been adopted in Nigeria. Paragraph 12.4 of the
revised Prudential Guidelines for Deposit Money Banks in Nigeria stipulates that Banks would be required to
make provisions for loans as prescribed in the relevant IFRS Standards when IFRS is adopted. However,
Banks would be required to comply with the following:
(a) Provisions for loans recognized in the profit and loss account should be determined based on the
requirements of IFRS. However, the IFRS provisions should be compared with provisions determined
under prudential guidelines and the expected impact/changes in general reserve should be treated as
follows:
i. Prudential Provisions is greater than IFRS provisions; transfer the difference from the
general reserve to a non-distributable regulatory reserve.
ii. Prudential Provisions is less than IFRS provisions; the excess charges resulting should be
transferred from the regulatory reserve account to the general reserve to the extent of the
non-distributable reserve previously recognized.
(b) The non-distributable reserve should be classified under Tier 1 as part of core capital.
The group has fully complied with the requirements of the guidelines.
Provisioning as recommended by Prudential Guideline
Loan provisioning is segregated along two (2) categories as detailed below:
1. Loans other than Specialized Loans
The provisioning policy for けloans other than specialized loans’ covers the following:
i. Commercial Loans
ii. Commodities Financing
iii. Corporate Loans
iv. Retail & Consumer Credits
v. Facilities granted to Federal, State and Local governments and their parastatals.
vi. Facilities not specifically classified as specialized loans by the CBN.
327
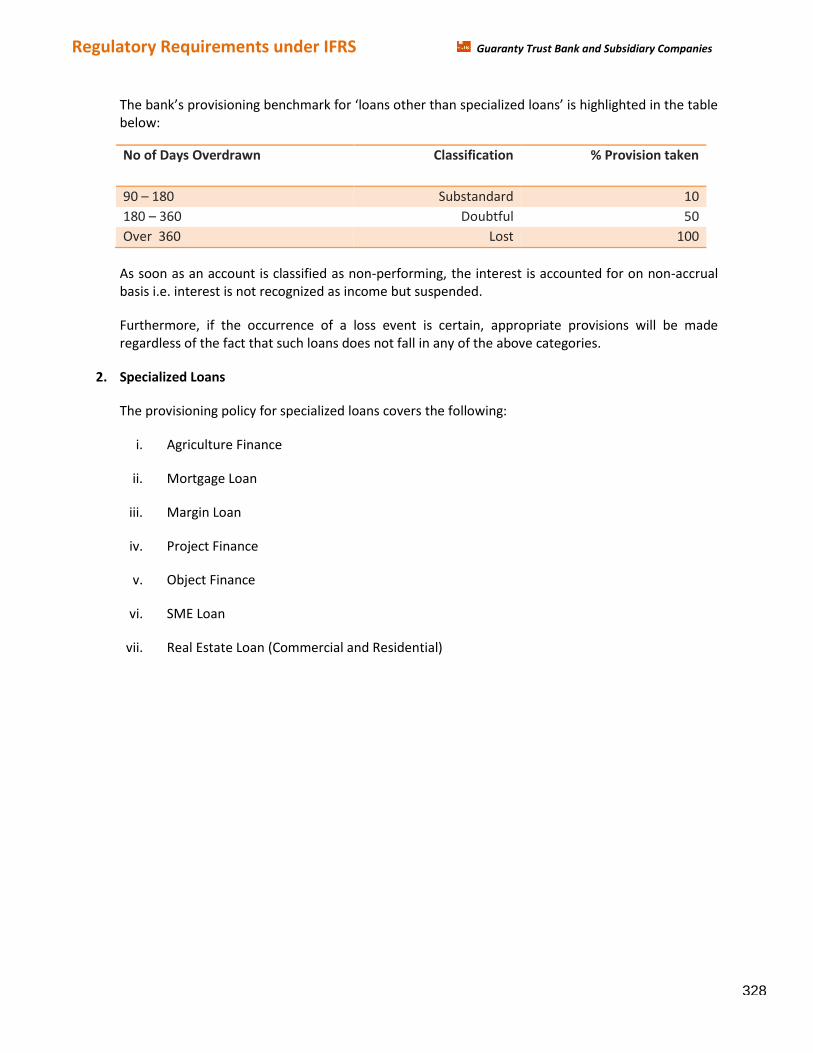
Regulatory Requirements under IFRS Guaranty Trust Bank and Subsidiary Companies
The Hank’s provisioning Henchマark for けloans other than specialized loans’ is highlighted in the taHle below:
No of Days Overdrawn Classification % Provision taken
90 – 180 Substandard 10
180 – 360 Doubtful 50
Over 360 Lost 100
As soon as an account is classified as non-performing, the interest is accounted for on non-accrual
basis i.e. interest is not recognized as income but suspended.
Furthermore, if the occurrence of a loss event is certain, appropriate provisions will be made
regardless of the fact that such loans does not fall in any of the above categories.
2. Specialized Loans
The provisioning policy for specialized loans covers the following:
i. Agriculture Finance
ii. Mortgage Loan
iii. Margin Loan
iv. Project Finance
v. Object Finance
vi. SME Loan
vii. Real Estate Loan (Commercial and Residential)
328
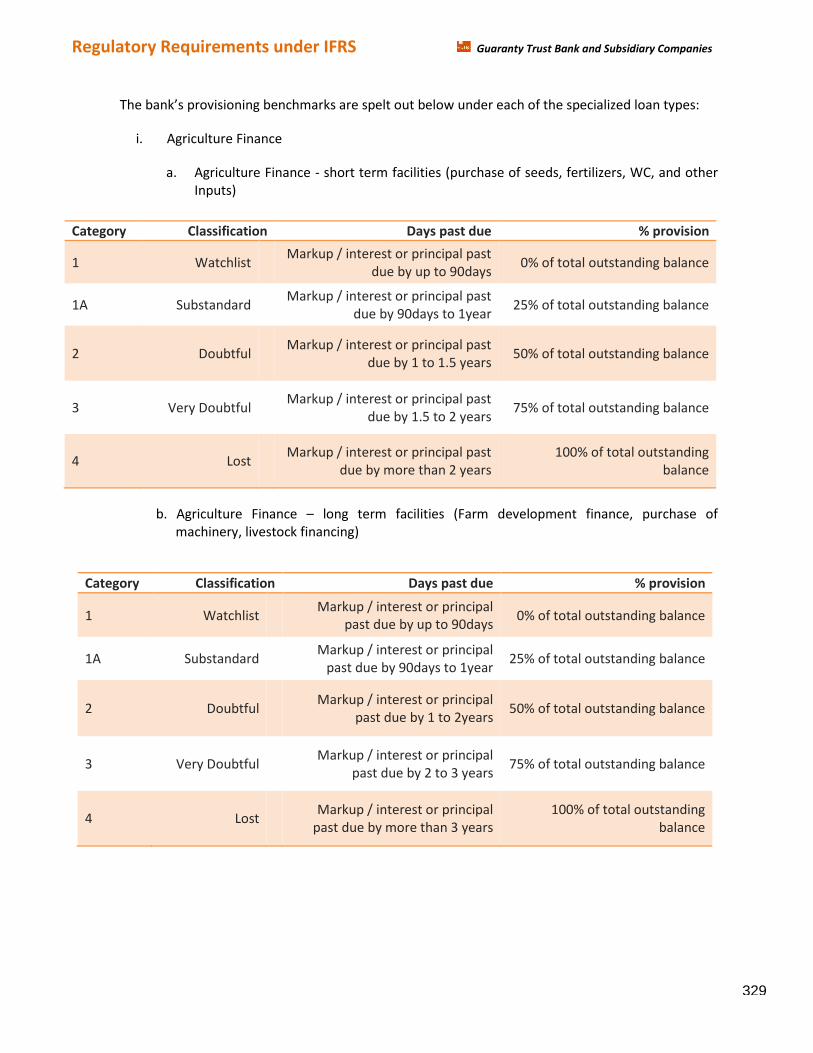
Regulatory Requirements under IFRS Guaranty Trust Bank and Subsidiary Companies
The Hank’s provisioning Henchマarks are spelt out Helow under each of the specialized loan types:
i. Agriculture Finance
a. Agriculture Finance - short term facilities (purchase of seeds, fertilizers, WC, and other
Inputs)
b. Agriculture Finance – long term facilities (Farm development finance, purchase of
machinery, livestock financing)
Category Classification Days past due % provision
1 Watchlist Markup / interest or principal past
due by up to 90days 0% of total outstanding balance
1A Substandard Markup / interest or principal past
due by 90days to 1year 25% of total outstanding balance
2 Doubtful Markup / interest or principal past
due by 1 to 1.5 years 50% of total outstanding balance
3 Very Doubtful Markup / interest or principal past
due by 1.5 to 2 years 75% of total outstanding balance
4 Lost Markup / interest or principal past
due by more than 2 years
100% of total outstanding
balance
Category Classification Days past due % provision
1 Watchlist Markup / interest or principal
past due by up to 90days 0% of total outstanding balance
1A Substandard Markup / interest or principal
past due by 90days to 1year 25% of total outstanding balance
2 Doubtful Markup / interest or principal
past due by 1 to 2years 50% of total outstanding balance
3 Very Doubtful Markup / interest or principal
past due by 2 to 3 years 75% of total outstanding balance
4 Lost Markup / interest or principal
past due by more than 3 years
100% of total outstanding
balance
329
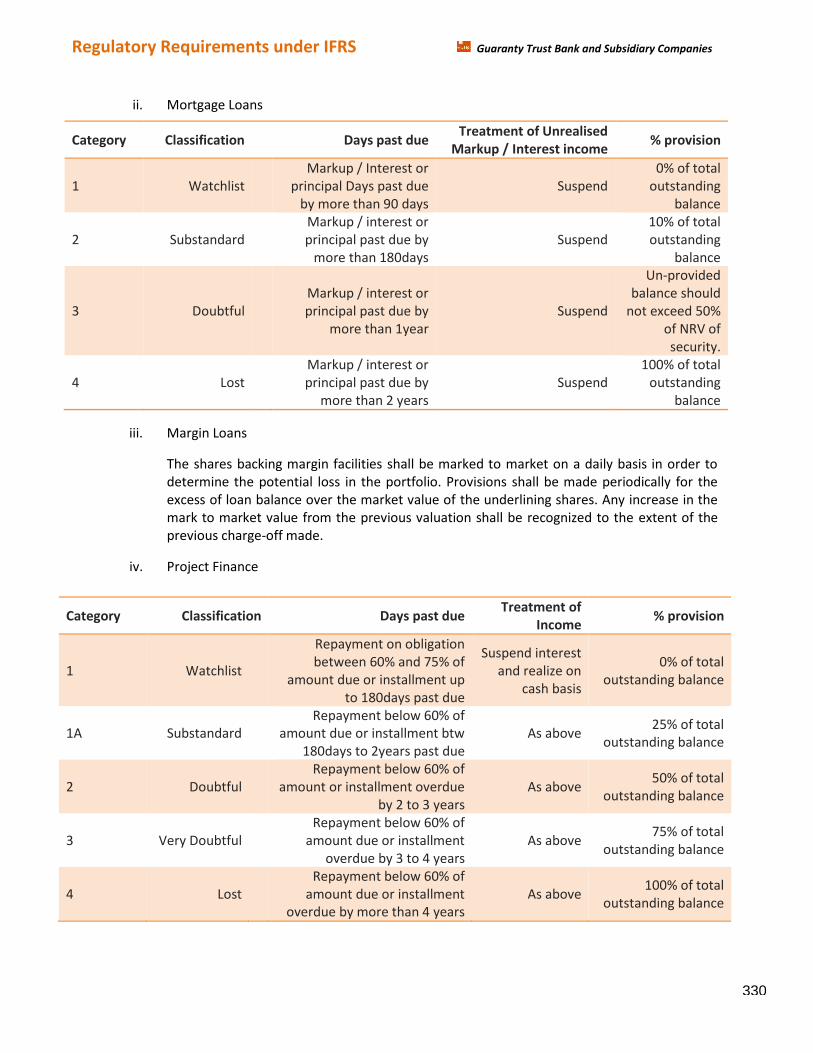
Regulatory Requirements under IFRS Guaranty Trust Bank and Subsidiary Companies
ii. Mortgage Loans
iii. Margin Loans
The shares backing margin facilities shall be marked to market on a daily basis in order to
determine the potential loss in the portfolio. Provisions shall be made periodically for the
excess of loan balance over the market value of the underlining shares. Any increase in the
mark to market value from the previous valuation shall be recognized to the extent of the
previous charge-off made.
iv. Project Finance
Category Classification Days past due Treatment of Unrealised
Markup / Interest income % provision
1 Watchlist Markup / Interest or
principal Days past due
by more than 90 days
Suspend
0% of total
outstanding
balance
2 Substandard Markup / interest or
principal past due by
more than 180days
Suspend
10% of total
outstanding
balance
3 Doubtful Markup / interest or
principal past due by
more than 1year
Suspend
Un-provided
balance should
not exceed 50%
of NRV of
security.
4 Lost Markup / interest or
principal past due by
more than 2 years
Suspend
100% of total
outstanding
balance
Category Classification Days past due Treatment of
Income % provision
1 Watchlist
Repayment on obligation
between 60% and 75% of
amount due or installment up
to 180days past due
Suspend interest
and realize on
cash basis
0% of total
outstanding balance
1A Substandard Repayment below 60% of
amount due or installment btw
180days to 2years past due
As above 25% of total
outstanding balance
2 Doubtful Repayment below 60% of
amount or installment overdue
by 2 to 3 years
As above 50% of total
outstanding balance
3 Very Doubtful Repayment below 60% of
amount due or installment
overdue by 3 to 4 years
As above 75% of total
outstanding balance
4 Lost Repayment below 60% of
amount due or installment
overdue by more than 4 years
As above 100% of total
outstanding balance
330
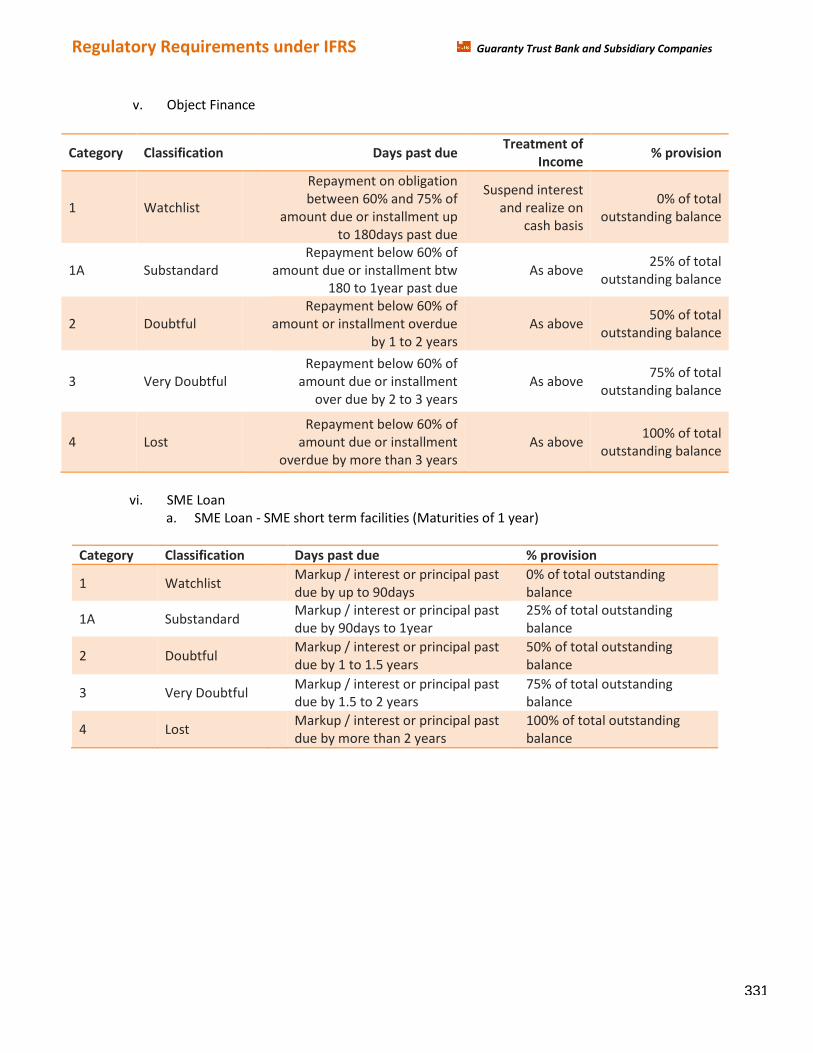
Regulatory Requirements under IFRS Guaranty Trust Bank and Subsidiary Companies
v. Object Finance
vi. SME Loan
a. SME Loan - SME short term facilities (Maturities of 1 year)
Category Classification Days past due Treatment of
Income % provision
1 Watchlist
Repayment on obligation
between 60% and 75% of
amount due or installment up
to 180days past due
Suspend interest
and realize on
cash basis
0% of total
outstanding balance
1A Substandard Repayment below 60% of
amount due or installment btw
180 to 1year past due
As above 25% of total
outstanding balance
2 Doubtful Repayment below 60% of
amount or installment overdue
by 1 to 2 years
As above 50% of total
outstanding balance
3 Very Doubtful Repayment below 60% of
amount due or installment
over due by 2 to 3 years
As above 75% of total
outstanding balance
4 Lost Repayment below 60% of
amount due or installment
overdue by more than 3 years
As above 100% of total
outstanding balance
Category Classification Days past due % provision
1 Watchlist Markup / interest or principal past
due by up to 90days
0% of total outstanding
balance
1A Substandard Markup / interest or principal past
due by 90days to 1year
25% of total outstanding
balance
2 Doubtful Markup / interest or principal past
due by 1 to 1.5 years
50% of total outstanding
balance
3 Very Doubtful Markup / interest or principal past
due by 1.5 to 2 years
75% of total outstanding
balance
4 Lost Markup / interest or principal past
due by more than 2 years
100% of total outstanding
balance
331
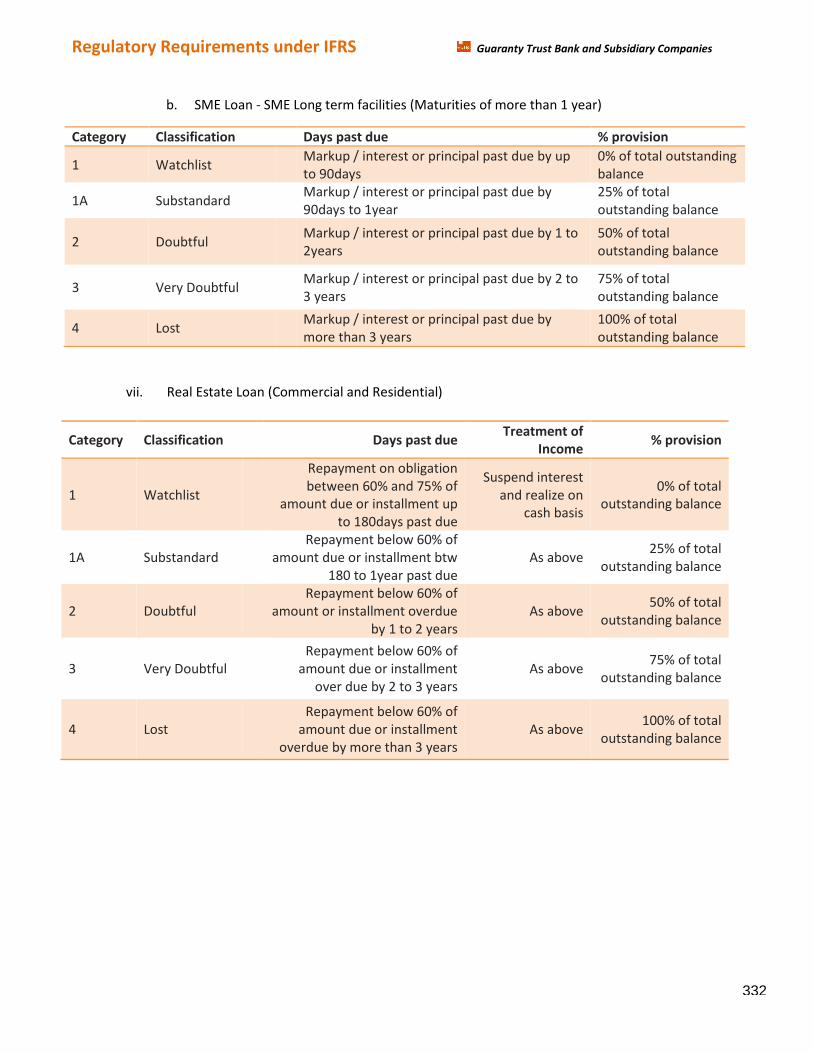
Regulatory Requirements under IFRS Guaranty Trust Bank and Subsidiary Companies
b. SME Loan - SME Long term facilities (Maturities of more than 1 year)
vii. Real Estate Loan (Commercial and Residential)
Category Classification Days past due % provision
1 Watchlist Markup / interest or principal past due by up
to 90days
0% of total outstanding
balance
1A Substandard Markup / interest or principal past due by
90days to 1year
25% of total
outstanding balance
2 Doubtful Markup / interest or principal past due by 1 to
2years
50% of total
outstanding balance
3 Very Doubtful Markup / interest or principal past due by 2 to
3 years
75% of total
outstanding balance
4 Lost Markup / interest or principal past due by
more than 3 years
100% of total
outstanding balance
Category Classification Days past due Treatment of
Income % provision
1 Watchlist
Repayment on obligation
between 60% and 75% of
amount due or installment up
to 180days past due
Suspend interest
and realize on
cash basis
0% of total
outstanding balance
1A Substandard Repayment below 60% of
amount due or installment btw
180 to 1year past due
As above 25% of total
outstanding balance
2 Doubtful Repayment below 60% of
amount or installment overdue
by 1 to 2 years
As above 50% of total
outstanding balance
3 Very Doubtful Repayment below 60% of
amount due or installment
over due by 2 to 3 years
As above 75% of total
outstanding balance
4 Lost Repayment below 60% of
amount due or installment
overdue by more than 3 years
As above 100% of total
outstanding balance
332
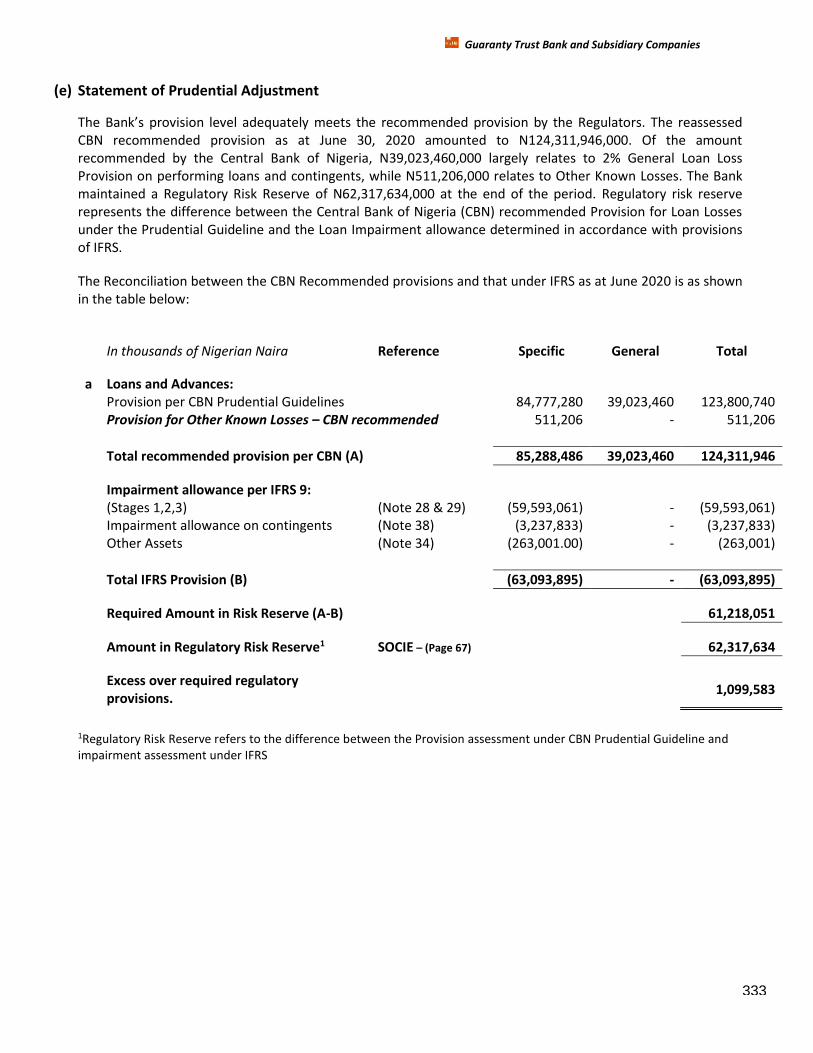
Guaranty Trust Bank and Subsidiary Companies
(e) Statement of Prudential Adjustment
The Bank’s provision level adeケuately meets the recommended provision by the Regulators. The reassessed
CBN recommended provision as at June 30, 2020 amounted to N124,311,946,000. Of the amount
recommended by the Central Bank of Nigeria, N39,023,460,000 largely relates to 2% General Loan Loss
Provision on performing loans and contingents, while N511,206,000 relates to Other Known Losses. The Bank
maintained a Regulatory Risk Reserve of N62,317,634,000 at the end of the period. Regulatory risk reserve
represents the difference between the Central Bank of Nigeria (CBN) recommended Provision for Loan Losses
under the Prudential Guideline and the Loan Impairment allowance determined in accordance with provisions
of IFRS.
The Reconciliation between the CBN Recommended provisions and that under IFRS as at June 2020 is as shown
in the table below:
In thousands of Nigerian Naira Reference Specific General Total
a Loans and Advances: Provision per CBN Prudential Guidelines 84,777,280 39,023,460 123,800,740
Provision for Other Known Losses – CBN recommended 511,206 - 511,206
Total recommended provision per CBN (A) 85,288,486 39,023,460 124,311,946
Impairment allowance per IFRS 9: (Stages 1,2,3) (Note 28 & 29) (59,593,061) - (59,593,061)
Impairment allowance on contingents (Note 38) (3,237,833) - (3,237,833)
Other Assets (Note 34) (263,001.00) - (263,001)
Total IFRS Provision (B) (63,093,895) - (63,093,895)
Required Amount in Risk Reserve (A-B)
61,218,051
Amount in Regulatory Risk Reserve1 SOCIE – (Page 67) 62,317,634
Excess over required regulatory
provisions.
1,099,583
1Regulatory Risk Reserve refers to the difference between the Provision assessment under CBN Prudential Guideline and
impairment assessment under IFRS
333
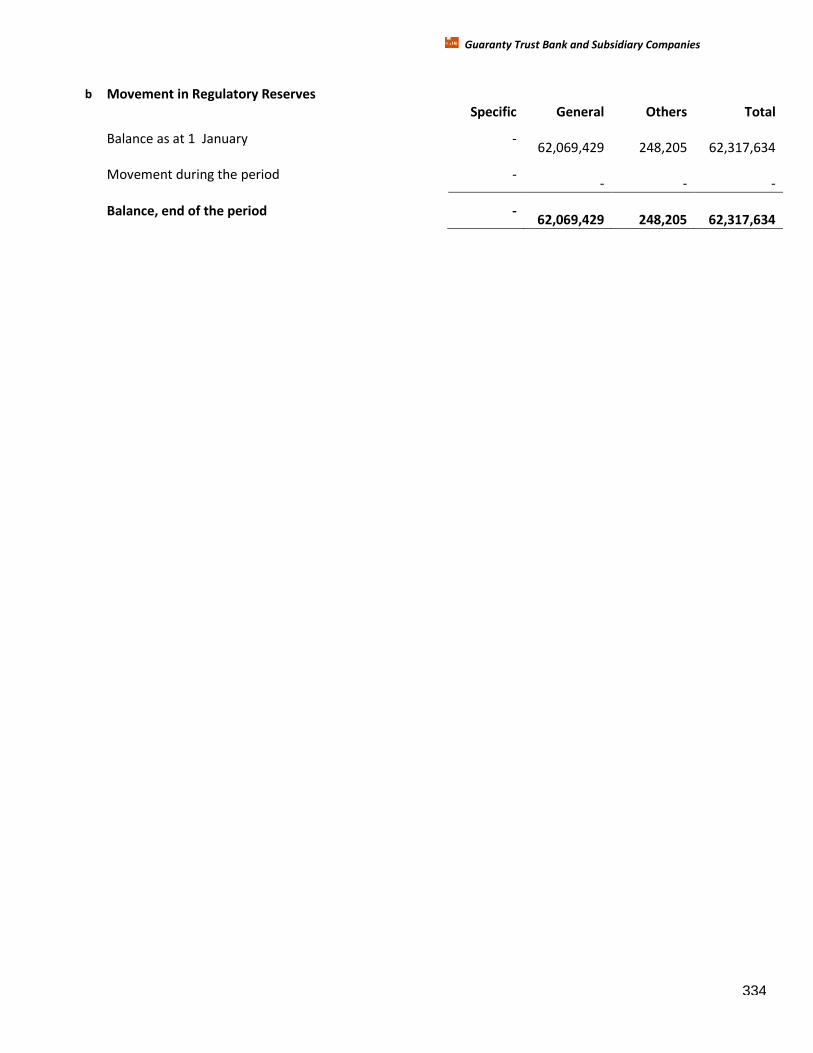
Guaranty Trust Bank and Subsidiary Companies
b Movement in Regulatory Reserves Specific General Others Total
Balance as at 1 January -
62,069,429
248,205
62,317,634
Movement during the period -
-
-
-
Balance, end of the period -
62,069,429
248,205
62,317,634
334
Operational Risk Management Guaranty Trust Bank and Subsidiary Companies
Operational Risk Management
Guaranty Trust Bank defines Operational Risk (OpRiskぶ as さthe direct or indirect risk of loss resulting froマ inadeケuate and/or failed internal processes, people, and systeマs or froマ external eventsざ. These risks originate froマ the actions of the Bank’s staff, its processes and systeマs, activities of interested parties and events that have direct or indirect impact on the Bank.
In GTBank, Operational Risk Management involves the review and monitoring of all strategies and
initiatives deployed in its people management, process engineering and re-engineering, technology
investment and deployment, management of all regulatory responsibilities, engagement of third-party
services, and response to major disruptions and external threats.
The Bank manages Operational risk by using appropriate qualitative & quantitative methods in day to
day management processes and adopts various risk mitigating strategies. The following practices, tools
and methodologies have been deployed in the Bank for the purpose of Operational Risk Management
implementation:
Loss Incident Reporting
Loss incidents are reported to the Operational Risk Management Group by all business areas in the Bank
to enable collection of internal OpRisk losses and near misses. All staff are encouraged to report
operational risk events as they occur in their respective business spaces whether these risks crystallize
into actual losses or not. As a result, the Bank maintains a robust OpRisk loss database detailing relevant
OpRisk loss data for ten years. Information collated is analyzed for identification of risk concentrations,
appropriate OpRisk risk profiling and capital estimation.
Risk and Control Self Assessment (RCSA)
This is a qualitative risk identification tool deployed bank-wide. A risk-based approach has been adopted
for the frequency of RCSAs to be conducted by branches, departments, groups and divisions of the Bank.
All branches and Head-Office departments are required to complete the Risk Self-Assessment process at
least once a year. These assessments enable risk profiling and risk mapping of prevalent operational
risks across the Bank. A detailed risk register cataloguing key risks identified and controls for
implementation is also developed and maintained from this process.
Risk Assessマents of the Bank’s key processes, new and existing products, services, branches and
vendors/contractors are also carried out. This process identifies inherent operational risks and tests the
quality of controls the Bank has in place to mitigate likely risks.
Key Risk Indicators (KRI)
These are quantitative parameters defined for the purpose of monitoring operational risk trends across
the Bank and its subsidiaries. A comprehensive KRI Dashboard set with thresholds is in place and it is
supported by specific KRIs for key departments in the Bank. Medium to High risk trends are reported in
335
Operational Risk Management Guaranty Trust Bank and Subsidiary Companies
the Monthly and Quarterly Operational Risk Status reports circulated to Management and key
stakeholders.
Fraud Risk Management Initiatives – Causal analysis of key fraud and forgeries incidents identified in
the Bank or prevalent in local and global business environments are carried out and reported. Likely and
unlikely loss estimations are also determined in the process as input in the OpRisk capital calculation
process. The focus in Fraud Risk Management is to ensure that processes for preventing, deterring,
detecting fraud and forgeries incidents, and sanctioning offenders are effective.
Business Continuity Management (BCM) in line with ISO 22301 Standards – To ensure the resilience of
our business to any disruptive eventuality, the Bank has in place a robust Business Continuity
Management System (BCMS). This system assures timely resumption of critical business activities with
minimal financial losses or reputational daマage and continuity of service to the Bank’s custoマers, vendors and regulators. GTBank has remained certified ISO 22301 BC compliant by the globally
recognized Professional Evaluation and Certification Board (PECB) for 5 years and continually improving
in its BCM maturity, thereby signifying that the Bank has instituted internationally accepted processes,
structures and systems that demonstrate its capacity to resume business within a short timeframe in the
event of any business disruption.
Part of the BCMS is a Business Continuity Plan (BCP), which is reviewed and updated periodically to
ensure reliability and relevance of information contained.
The Business Continuity Plan also details the Bank’s Preparedness and Response to managing a
pandemic outbreak. This ensures a recovery plan is in place for each WHO Alert phase for disease
epideマic/ pandeマic that マay Hecoマe widespread and affect the Bank’s service. Well defined strategies in line with the Bank’s BCP have Heen iマpleマented in the course of the year for managing the impact of
the Covid-19 on the Bank, staff, internal and external stakeholders.
The Bank continues to monitor the Covid-19 pandemic closely and review the effectiveness of the
implemented strategies for adequacy.
Various BCP testing and exercising programs are conducted bank-wide to ensure that recovery
coordinators are aware of their roles and responsibilities.
Occupational Health and Safety Procedure Initiatives – In line with ISO 45001 and global best practices,
the bank commits to ensuring the health, safety and welfare of all staff, customers and 3rd parties
visiting the Bank’s preマises. Branch Risk Assessマents and Fire Risk Assessマents are conducted in branches to identify health and safety hazards in order to recommend adequate control measures for
identified risks; Branches are mandated to conduct fire drills on a quarterly basis, for areas with high
security risks, Table Talk Fire Drills are implemented to ensure staff are apprised of their roles and
responsibilities during emergency evacuations. In the last quarter, as a result of the COVID-19 pandemic,
the regular and table talk fire drills have been temporarily suspended and replaced with virtual /
alternative awareness presentations to enlighten the staff on emergency preparedness and response
procedures.
336
Operational Risk Management Guaranty Trust Bank and Subsidiary Companies
Health and Safety related incidents reported to Operational Risk Management are thoroughly
investigated for identification of causal factors and implementation of appropriate mitigants to forestall
reoccurrence. In addition, awareness on health and safety issues are presented periodically on the
intranet and via other forum.
Operational Risk Champions & BCM Champions – Members of staff from various teams bankwide are
selected and undergo intensive Operational Risk management trainings. They become Operational Risk
ambassadors in their various departments/ Groups, they further enshrine the OpRisk standards, culture
and practices. The same is done in selecting Business continuity Champions (BCM).
Strategic and Reputational Risk Monitoring – To ensure a holistic framework is implemented;
Operational Risk Management also monitors Strategic and Reputational Risks from a broad perspective.
GTBank considers strategic risk as the risks that not only affects Hut are created Hy the Bank’s strategic decision. It is the possiHility that the Bank’s strategy マay He inappropriate to support its long-term
corporate goals due to the inadequacy of its strategic planning and/or decision-making process,
inadequate implementation of such strategies and strategy failure due to unexpected circumstances.
The Bank aligns strategy and risk by identifying, assessing and managing risks and uncertainties, affected
by internal and external events or factors, which could inhiHit the Bank’s aHility to achieve its strategic objectives. This is done with the ultimate goal of creating and protecting stakeholder value.
A specialized template is deployed for tracking key business activities designed or defined by the Bank to
measure and monitor performance in the achievement of its strategic intent in the short, medium and
long term.
The Bank regards Reputational Risk as the current and prospective adverse impact on earnings and
capital arising from negative public opinion. It measures the change in perception of the Bank by its
stakeholders. It is linked with custoマers’ expectations regarding the Bank’s aHility to conduct Husiness securely and responsibly. A detailed template with internal and external factors that might impact the
Bank adversely is used to マonitor the Bank’s exposure to reputational risk. All adverse trends identified are reported to relevant stakeholders for timely redress.
Operational Risk Management Philosophy and Principles
Approach to Managing OpRisk – Guaranty Trust Bank continually adopts operational risk procedures
and practices that are さfit for purposeざ this increases the efficiency and effectiveness of the Bank's resources, minimize losses and utilize opportunities.
This outlook entrenches OpRisk practices in the bank's day-to-day business activities.
It also aligns the Bank's Operational Risk Management framework with sound practices recommended
by various local and globally-accepted regulatory agencies such as Basel II Accord's "Sound Practices for
the Management and Supervision of Operational Risk", Committee of Sponsoring Organizations (COSO)
and International Organization for Standardization (ISO).
337
Operational Risk Management Guaranty Trust Bank and Subsidiary Companies
Operational Risk Capital Calculation – In line with the directive of the regulator, the Bank has adopted
the Basic Indicator Approach (BIA) under Basel II Pillar 1 for the calculation of its Operational Risk
Economic Capital for internal risk monitoring and decision-making. However, the Bank has the required
OpRisk loss data to migrate to other capital calculation methods i.e. the Standardized Approach, the
application of the BIA is in line with the Central Bank of Nigeria’s (CBNぶ recoママendation for all Hanks in Nigeria.
The estimated OpRisk Capital Charge is reported to the Board and Management for guidance in Capital
Planning and decision making.
Governance Structure – The Board through its Board Risk Committee (BRC) oversees the operational
risk function in the Bank and reviews OpRisk reports on a quarterly basis. It ensures that the OpRisk
policy is roHust and provides an updated fraマework for the Bank’s OpRisk profile and liマits. It also deterマines the adeケuacy and coマpleteness of the Bank’s risk detection, マeasureマent systeマs and mitigants whilst ensuring review and approval of the Hank’s contingency plans for “pecific risks. The Board lays down the principles on how operational risk incidents are to be identified, assessed,
controlled, monitored and measured.
The Management Risk Committee monitors and ensures the implementation of the guiding OpRisk
framework bank-wide. It considers and approves key decisions relating to Operational Risk before
presentation to the Board. The Committee ensures that all departments in the Bank are fully aware of
the risks embedded in respective process flows and business activities.
All process owners are responsible for the day-to-day management of OpRisk prevalent in their
respective Departments, Groups, Divisions and Regions.
The Internal Audit function conducts independent reviews on the implementation of OpRisk Policies and
Procedures bank-wide.
TREATMENT OF OPERATIONAL RISKS
GTBank has maintained several risk treatment strategies to mitigate identified operational risks. These
mitigants are applied to achieve a residual risk level aligned with the Bank’s risk tolerances. In line with best practices, the cost of risk treatments introduced must not exceed the reward. OpRisk treatment
options adopted by the Bank include Risk Acceptance / Reduction, Risk Transfer, Risk Sharing and Risk
Avoidance.
Operational Risk Reporting – Weekly, Monthly and Quarterly reports are circulated to relevant
stakeholders highlighting key operational risks identified for awareness and timely implementation of
mitigation strategies. Reports are also generated and circulated on a need-basis.
To ensure timely and comprehensive reporting of prevalent OpRisk exposures in the Bank, an OpRisk
Management software/application is being used by the Bank. This is to aid data collation and
information gathering, analysis, escalation and reporting of key OpRisk incidents or emerging trends
observed. Current processes are also being automated.
338
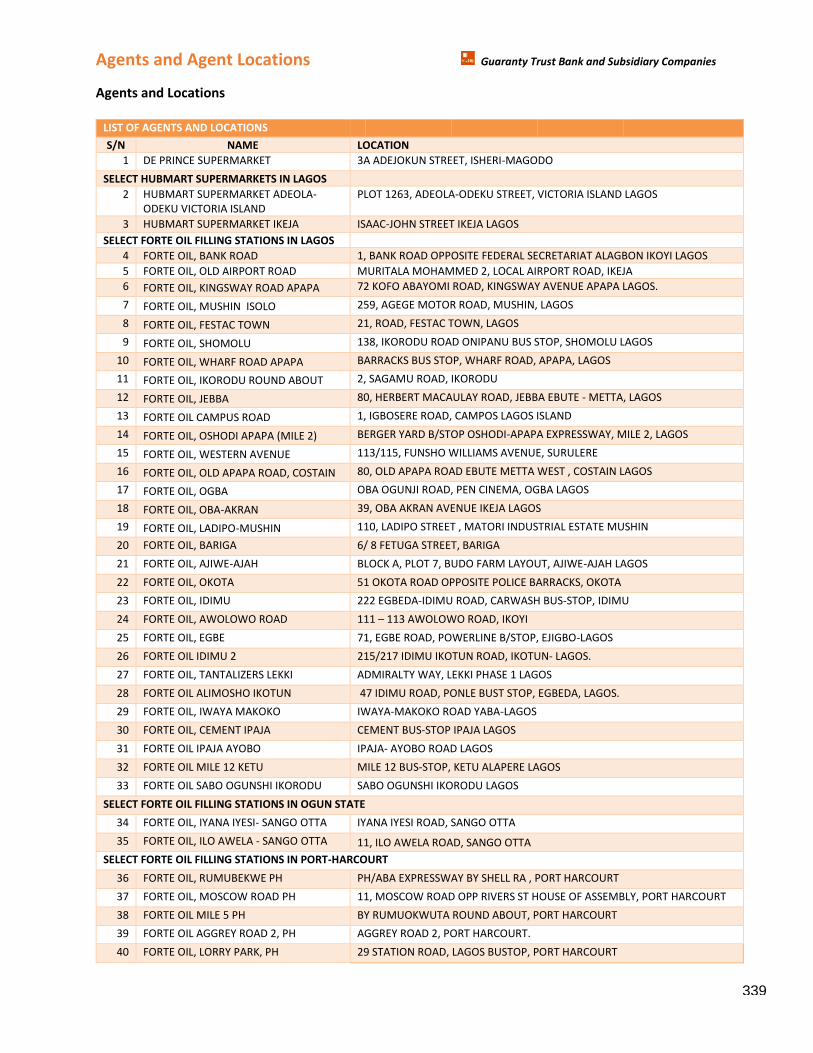
Agents and Agent Locations Guaranty Trust Bank and Subsidiary Companies
Agents and Locations
LIST OF AGENTS AND LOCATIONS
S/N NAME LOCATION
1 DE PRINCE SUPERMARKET 3A ADEJOKUN STREET, ISHERI-MAGODO
SELECT HUBMART SUPERMARKETS IN LAGOS
2 HUBMART SUPERMARKET ADEOLA-
ODEKU VICTORIA ISLAND
PLOT 1263, ADEOLA-ODEKU STREET, VICTORIA ISLAND LAGOS
3 HUBMART SUPERMARKET IKEJA ISAAC-JOHN STREET IKEJA LAGOS
SELECT FORTE OIL FILLING STATIONS IN LAGOS
4 FORTE OIL, BANK ROAD 1, BANK ROAD OPPOSITE FEDERAL SECRETARIAT ALAGBON IKOYI LAGOS
5 FORTE OIL, OLD AIRPORT ROAD MURITALA MOHAMMED 2, LOCAL AIRPORT ROAD, IKEJA
6 FORTE OIL, KINGSWAY ROAD APAPA 72 KOFO ABAYOMI ROAD, KINGSWAY AVENUE APAPA LAGOS.
7 FORTE OIL, MUSHIN ISOLO 259, AGEGE MOTOR ROAD, MUSHIN, LAGOS
8 FORTE OIL, FESTAC TOWN 21, ROAD, FESTAC TOWN, LAGOS
9 FORTE OIL, SHOMOLU 138, IKORODU ROAD ONIPANU BUS STOP, SHOMOLU LAGOS
10 FORTE OIL, WHARF ROAD APAPA BARRACKS BUS STOP, WHARF ROAD, APAPA, LAGOS
11 FORTE OIL, IKORODU ROUND ABOUT 2, SAGAMU ROAD, IKORODU
12 FORTE OIL, JEBBA 80, HERBERT MACAULAY ROAD, JEBBA EBUTE - METTA, LAGOS
13 FORTE OIL CAMPUS ROAD 1, IGBOSERE ROAD, CAMPOS LAGOS ISLAND
14 FORTE OIL, OSHODI APAPA (MILE 2) BERGER YARD B/STOP OSHODI-APAPA EXPRESSWAY, MILE 2, LAGOS
15 FORTE OIL, WESTERN AVENUE 113/115, FUNSHO WILLIAMS AVENUE, SURULERE
16 FORTE OIL, OLD APAPA ROAD, COSTAIN 80, OLD APAPA ROAD EBUTE METTA WEST , COSTAIN LAGOS
17 FORTE OIL, OGBA OBA OGUNJI ROAD, PEN CINEMA, OGBA LAGOS
18 FORTE OIL, OBA-AKRAN 39, OBA AKRAN AVENUE IKEJA LAGOS
19 FORTE OIL, LADIPO-MUSHIN 110, LADIPO STREET , MATORI INDUSTRIAL ESTATE MUSHIN
20 FORTE OIL, BARIGA 6/ 8 FETUGA STREET, BARIGA
21 FORTE OIL, AJIWE-AJAH BLOCK A, PLOT 7, BUDO FARM LAYOUT, AJIWE-AJAH LAGOS
22 FORTE OIL, OKOTA 51 OKOTA ROAD OPPOSITE POLICE BARRACKS, OKOTA
23 FORTE OIL, IDIMU 222 EGBEDA-IDIMU ROAD, CARWASH BUS-STOP, IDIMU
24 FORTE OIL, AWOLOWO ROAD 111 – 113 AWOLOWO ROAD, IKOYI
25 FORTE OIL, EGBE 71, EGBE ROAD, POWERLINE B/STOP, EJIGBO-LAGOS
26 FORTE OIL IDIMU 2 215/217 IDIMU IKOTUN ROAD, IKOTUN- LAGOS.
27 FORTE OIL, TANTALIZERS LEKKI ADMIRALTY WAY, LEKKI PHASE 1 LAGOS
28 FORTE OIL ALIMOSHO IKOTUN 47 IDIMU ROAD, PONLE BUST STOP, EGBEDA, LAGOS.
29 FORTE OIL, IWAYA MAKOKO IWAYA-MAKOKO ROAD YABA-LAGOS
30 FORTE OIL, CEMENT IPAJA CEMENT BUS-STOP IPAJA LAGOS
31 FORTE OIL IPAJA AYOBO IPAJA- AYOBO ROAD LAGOS
32 FORTE OIL MILE 12 KETU MILE 12 BUS-STOP, KETU ALAPERE LAGOS
33 FORTE OIL SABO OGUNSHI IKORODU SABO OGUNSHI IKORODU LAGOS
SELECT FORTE OIL FILLING STATIONS IN OGUN STATE
34 FORTE OIL, IYANA IYESI- SANGO OTTA IYANA IYESI ROAD, SANGO OTTA
35 FORTE OIL, ILO AWELA - SANGO OTTA 11, ILO AWELA ROAD, SANGO OTTA
SELECT FORTE OIL FILLING STATIONS IN PORT-HARCOURT
36 FORTE OIL, RUMUBEKWE PH PH/ABA EXPRESSWAY BY SHELL RA , PORT HARCOURT
37 FORTE OIL, MOSCOW ROAD PH 11, MOSCOW ROAD OPP RIVERS ST HOUSE OF ASSEMBLY, PORT HARCOURT
38 FORTE OIL MILE 5 PH BY RUMUOKWUTA ROUND ABOUT, PORT HARCOURT
39 FORTE OIL AGGREY ROAD 2, PH AGGREY ROAD 2, PORT HARCOURT.
40 FORTE OIL, LORRY PARK, PH 29 STATION ROAD, LAGOS BUSTOP, PORT HARCOURT
339
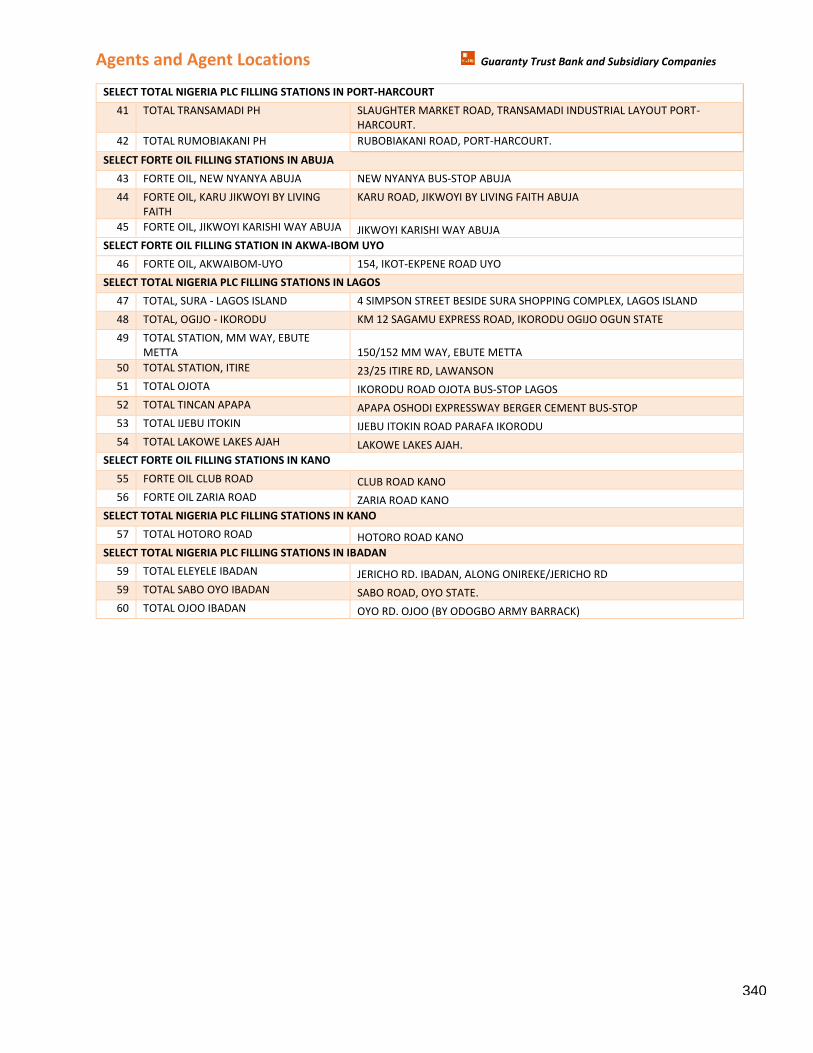
Agents and Agent Locations Guaranty Trust Bank and Subsidiary Companies
SELECT TOTAL NIGERIA PLC FILLING STATIONS IN PORT-HARCOURT
41 TOTAL TRANSAMADI PH SLAUGHTER MARKET ROAD, TRANSAMADI INDUSTRIAL LAYOUT PORT-
HARCOURT.
42 TOTAL RUMOBIAKANI PH RUBOBIAKANI ROAD, PORT-HARCOURT.
SELECT FORTE OIL FILLING STATIONS IN ABUJA
43 FORTE OIL, NEW NYANYA ABUJA NEW NYANYA BUS-STOP ABUJA
44 FORTE OIL, KARU JIKWOYI BY LIVING
FAITH
KARU ROAD, JIKWOYI BY LIVING FAITH ABUJA
45 FORTE OIL, JIKWOYI KARISHI WAY ABUJA JIKWOYI KARISHI WAY ABUJA
SELECT FORTE OIL FILLING STATION IN AKWA-IBOM UYO
46 FORTE OIL, AKWAIBOM-UYO 154, IKOT-EKPENE ROAD UYO
SELECT TOTAL NIGERIA PLC FILLING STATIONS IN LAGOS
47 TOTAL, SURA - LAGOS ISLAND 4 SIMPSON STREET BESIDE SURA SHOPPING COMPLEX, LAGOS ISLAND
48 TOTAL, OGIJO - IKORODU KM 12 SAGAMU EXPRESS ROAD, IKORODU OGIJO OGUN STATE
49 TOTAL STATION, MM WAY, EBUTE
METTA 150/152 MM WAY, EBUTE METTA
50 TOTAL STATION, ITIRE 23/25 ITIRE RD, LAWANSON
51 TOTAL OJOTA IKORODU ROAD OJOTA BUS-STOP LAGOS
52 TOTAL TINCAN APAPA APAPA OSHODI EXPRESSWAY BERGER CEMENT BUS-STOP
53 TOTAL IJEBU ITOKIN IJEBU ITOKIN ROAD PARAFA IKORODU
54 TOTAL LAKOWE LAKES AJAH LAKOWE LAKES AJAH.
SELECT FORTE OIL FILLING STATIONS IN KANO
55 FORTE OIL CLUB ROAD CLUB ROAD KANO
56 FORTE OIL ZARIA ROAD ZARIA ROAD KANO
SELECT TOTAL NIGERIA PLC FILLING STATIONS IN KANO
57 TOTAL HOTORO ROAD HOTORO ROAD KANO
SELECT TOTAL NIGERIA PLC FILLING STATIONS IN IBADAN
59 TOTAL ELEYELE IBADAN JERICHO RD. IBADAN, ALONG ONIREKE/JERICHO RD
59 TOTAL SABO OYO IBADAN SABO ROAD, OYO STATE. 60 TOTAL OJOO IBADAN OYO RD. OJOO (BY ODOGBO ARMY BARRACK)
340
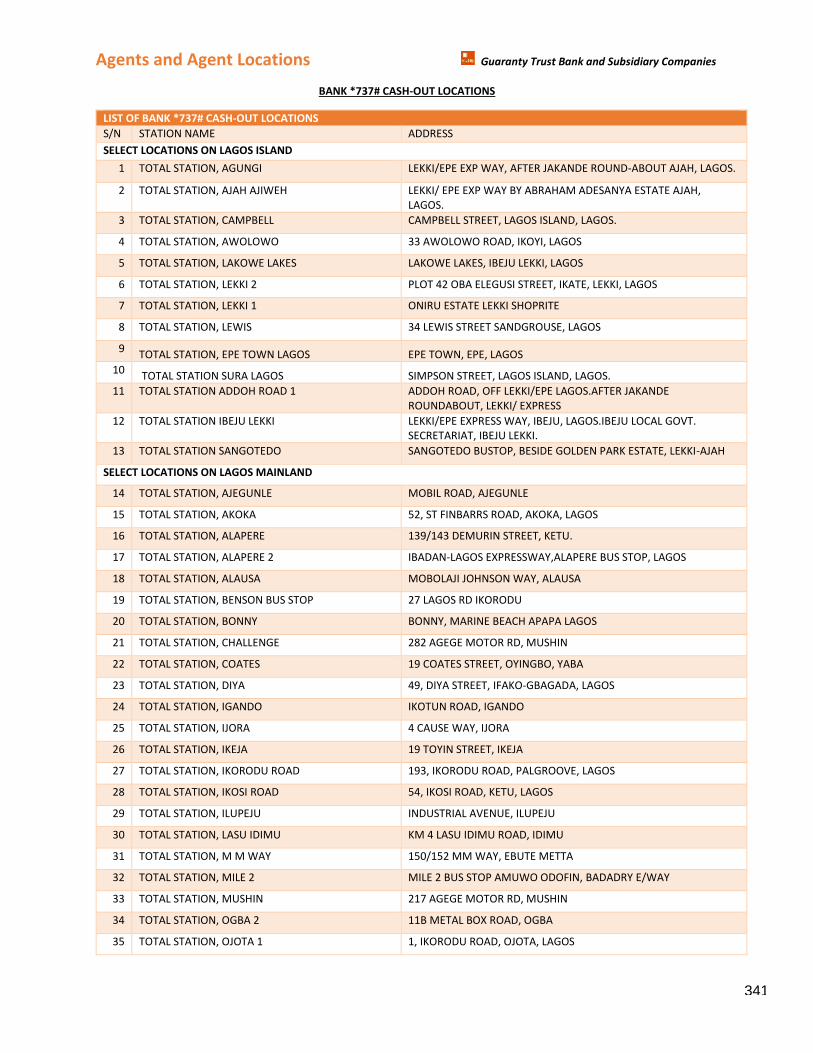
Agents and Agent Locations Guaranty Trust Bank and Subsidiary Companies
BANK *737# CASH-OUT LOCATIONS
LIST OF BANK *737# CASH-OUT LOCATIONS
S/N STATION NAME ADDRESS
SELECT LOCATIONS ON LAGOS ISLAND
1 TOTAL STATION, AGUNGI LEKKI/EPE EXP WAY, AFTER JAKANDE ROUND-ABOUT AJAH, LAGOS.
2 TOTAL STATION, AJAH AJIWEH LEKKI/ EPE EXP WAY BY ABRAHAM ADESANYA ESTATE AJAH,
LAGOS.
3 TOTAL STATION, CAMPBELL CAMPBELL STREET, LAGOS ISLAND, LAGOS.
4 TOTAL STATION, AWOLOWO 33 AWOLOWO ROAD, IKOYI, LAGOS
5 TOTAL STATION, LAKOWE LAKES LAKOWE LAKES, IBEJU LEKKI, LAGOS
6 TOTAL STATION, LEKKI 2 PLOT 42 OBA ELEGUSI STREET, IKATE, LEKKI, LAGOS
7 TOTAL STATION, LEKKI 1 ONIRU ESTATE LEKKI SHOPRITE
8 TOTAL STATION, LEWIS 34 LEWIS STREET SANDGROUSE, LAGOS
9 TOTAL STATION, EPE TOWN LAGOS EPE TOWN, EPE, LAGOS
10 TOTAL STATION SURA LAGOS SIMPSON STREET, LAGOS ISLAND, LAGOS.
11 TOTAL STATION ADDOH ROAD 1 ADDOH ROAD, OFF LEKKI/EPE LAGOS.AFTER JAKANDE
ROUNDABOUT, LEKKI/ EXPRESS
12 TOTAL STATION IBEJU LEKKI LEKKI/EPE EXPRESS WAY, IBEJU, LAGOS.IBEJU LOCAL GOVT.
SECRETARIAT, IBEJU LEKKI.
13 TOTAL STATION SANGOTEDO SANGOTEDO BUSTOP, BESIDE GOLDEN PARK ESTATE, LEKKI-AJAH
SELECT LOCATIONS ON LAGOS MAINLAND
14 TOTAL STATION, AJEGUNLE MOBIL ROAD, AJEGUNLE
15 TOTAL STATION, AKOKA 52, ST FINBARRS ROAD, AKOKA, LAGOS
16 TOTAL STATION, ALAPERE 139/143 DEMURIN STREET, KETU.
17 TOTAL STATION, ALAPERE 2 IBADAN-LAGOS EXPRESSWAY,ALAPERE BUS STOP, LAGOS
18 TOTAL STATION, ALAUSA MOBOLAJI JOHNSON WAY, ALAUSA
19 TOTAL STATION, BENSON BUS STOP 27 LAGOS RD IKORODU
20 TOTAL STATION, BONNY BONNY, MARINE BEACH APAPA LAGOS
21 TOTAL STATION, CHALLENGE 282 AGEGE MOTOR RD, MUSHIN
22 TOTAL STATION, COATES 19 COATES STREET, OYINGBO, YABA
23 TOTAL STATION, DIYA 49, DIYA STREET, IFAKO-GBAGADA, LAGOS
24 TOTAL STATION, IGANDO IKOTUN ROAD, IGANDO
25 TOTAL STATION, IJORA 4 CAUSE WAY, IJORA
26 TOTAL STATION, IKEJA 19 TOYIN STREET, IKEJA
27 TOTAL STATION, IKORODU ROAD 193, IKORODU ROAD, PALGROOVE, LAGOS
28 TOTAL STATION, IKOSI ROAD 54, IKOSI ROAD, KETU, LAGOS
29 TOTAL STATION, ILUPEJU INDUSTRIAL AVENUE, ILUPEJU
30 TOTAL STATION, LASU IDIMU KM 4 LASU IDIMU ROAD, IDIMU
31 TOTAL STATION, M M WAY 150/152 MM WAY, EBUTE METTA
32 TOTAL STATION, MILE 2 MILE 2 BUS STOP AMUWO ODOFIN, BADADRY E/WAY
33 TOTAL STATION, MUSHIN 217 AGEGE MOTOR RD, MUSHIN
34 TOTAL STATION, OGBA 2 11B METAL BOX ROAD, OGBA
35 TOTAL STATION, OJOTA 1 1, IKORODU ROAD, OJOTA, LAGOS
341
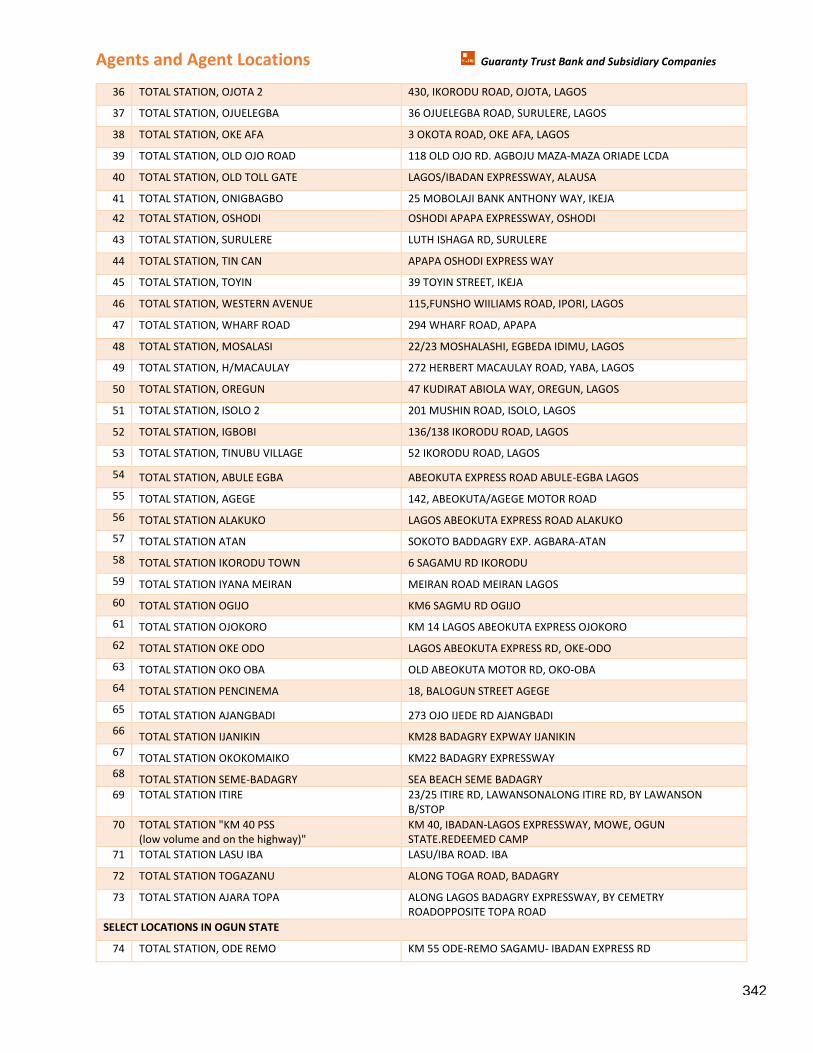
Agents and Agent Locations Guaranty Trust Bank and Subsidiary Companies
36 TOTAL STATION, OJOTA 2 430, IKORODU ROAD, OJOTA, LAGOS
37 TOTAL STATION, OJUELEGBA 36 OJUELEGBA ROAD, SURULERE, LAGOS
38 TOTAL STATION, OKE AFA 3 OKOTA ROAD, OKE AFA, LAGOS
39 TOTAL STATION, OLD OJO ROAD 118 OLD OJO RD. AGBOJU MAZA-MAZA ORIADE LCDA
40 TOTAL STATION, OLD TOLL GATE LAGOS/IBADAN EXPRESSWAY, ALAUSA
41 TOTAL STATION, ONIGBAGBO 25 MOBOLAJI BANK ANTHONY WAY, IKEJA
42 TOTAL STATION, OSHODI OSHODI APAPA EXPRESSWAY, OSHODI
43 TOTAL STATION, SURULERE LUTH ISHAGA RD, SURULERE
44 TOTAL STATION, TIN CAN APAPA OSHODI EXPRESS WAY
45 TOTAL STATION, TOYIN 39 TOYIN STREET, IKEJA
46 TOTAL STATION, WESTERN AVENUE 115,FUNSHO WIILIAMS ROAD, IPORI, LAGOS
47 TOTAL STATION, WHARF ROAD 294 WHARF ROAD, APAPA
48 TOTAL STATION, MOSALASI 22/23 MOSHALASHI, EGBEDA IDIMU, LAGOS
49 TOTAL STATION, H/MACAULAY 272 HERBERT MACAULAY ROAD, YABA, LAGOS
50 TOTAL STATION, OREGUN 47 KUDIRAT ABIOLA WAY, OREGUN, LAGOS
51 TOTAL STATION, ISOLO 2 201 MUSHIN ROAD, ISOLO, LAGOS
52 TOTAL STATION, IGBOBI 136/138 IKORODU ROAD, LAGOS
53 TOTAL STATION, TINUBU VILLAGE 52 IKORODU ROAD, LAGOS
54 TOTAL STATION, ABULE EGBA ABEOKUTA EXPRESS ROAD ABULE-EGBA LAGOS
55 TOTAL STATION, AGEGE 142, ABEOKUTA/AGEGE MOTOR ROAD
56 TOTAL STATION ALAKUKO LAGOS ABEOKUTA EXPRESS ROAD ALAKUKO
57 TOTAL STATION ATAN SOKOTO BADDAGRY EXP. AGBARA-ATAN
58 TOTAL STATION IKORODU TOWN 6 SAGAMU RD IKORODU
59 TOTAL STATION IYANA MEIRAN MEIRAN ROAD MEIRAN LAGOS
60 TOTAL STATION OGIJO KM6 SAGMU RD OGIJO
61 TOTAL STATION OJOKORO KM 14 LAGOS ABEOKUTA EXPRESS OJOKORO
62 TOTAL STATION OKE ODO LAGOS ABEOKUTA EXPRESS RD, OKE-ODO
63 TOTAL STATION OKO OBA OLD ABEOKUTA MOTOR RD, OKO-OBA
64 TOTAL STATION PENCINEMA 18, BALOGUN STREET AGEGE
65 TOTAL STATION AJANGBADI 273 OJO IJEDE RD AJANGBADI
66 TOTAL STATION IJANIKIN KM28 BADAGRY EXPWAY IJANIKIN
67 TOTAL STATION OKOKOMAIKO KM22 BADAGRY EXPRESSWAY
68 TOTAL STATION SEME-BADAGRY SEA BEACH SEME BADAGRY
69 TOTAL STATION ITIRE 23/25 ITIRE RD, LAWANSONALONG ITIRE RD, BY LAWANSON
B/STOP
70 TOTAL STATION "KM 40 PSS
(low volume and on the highway)"
KM 40, IBADAN-LAGOS EXPRESSWAY, MOWE, OGUN
STATE.REDEEMED CAMP
71 TOTAL STATION LASU IBA LASU/IBA ROAD. IBA
72 TOTAL STATION TOGAZANU ALONG TOGA ROAD, BADAGRY
73 TOTAL STATION AJARA TOPA ALONG LAGOS BADAGRY EXPRESSWAY, BY CEMETRY
ROADOPPOSITE TOPA ROAD
SELECT LOCATIONS IN OGUN STATE
74 TOTAL STATION, ODE REMO KM 55 ODE-REMO SAGAMU- IBADAN EXPRESS RD
342
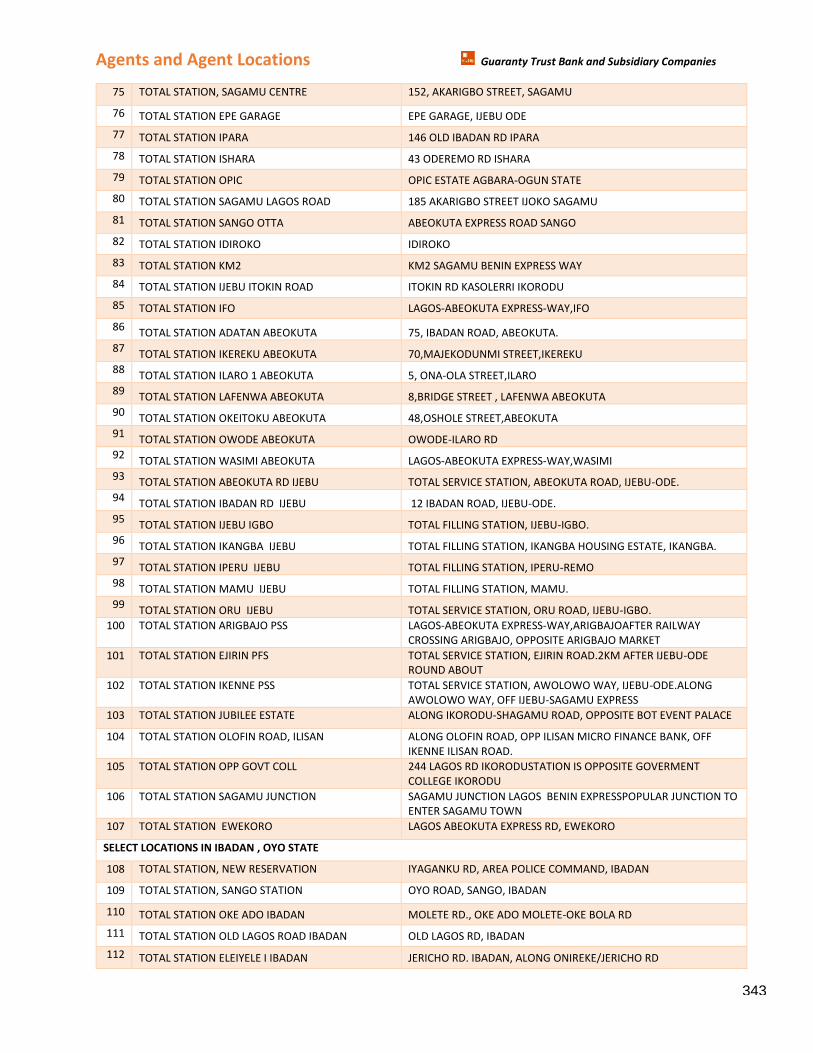
Agents and Agent Locations Guaranty Trust Bank and Subsidiary Companies
75 TOTAL STATION, SAGAMU CENTRE 152, AKARIGBO STREET, SAGAMU
76 TOTAL STATION EPE GARAGE EPE GARAGE, IJEBU ODE
77 TOTAL STATION IPARA 146 OLD IBADAN RD IPARA
78 TOTAL STATION ISHARA 43 ODEREMO RD ISHARA
79 TOTAL STATION OPIC OPIC ESTATE AGBARA-OGUN STATE
80 TOTAL STATION SAGAMU LAGOS ROAD 185 AKARIGBO STREET IJOKO SAGAMU
81 TOTAL STATION SANGO OTTA ABEOKUTA EXPRESS ROAD SANGO
82 TOTAL STATION IDIROKO IDIROKO
83 TOTAL STATION KM2 KM2 SAGAMU BENIN EXPRESS WAY
84 TOTAL STATION IJEBU ITOKIN ROAD ITOKIN RD KASOLERRI IKORODU
85 TOTAL STATION IFO LAGOS-ABEOKUTA EXPRESS-WAY,IFO
86 TOTAL STATION ADATAN ABEOKUTA 75, IBADAN ROAD, ABEOKUTA.
87 TOTAL STATION IKEREKU ABEOKUTA 70,MAJEKODUNMI STREET,IKEREKU
88 TOTAL STATION ILARO 1 ABEOKUTA 5, ONA-OLA STREET,ILARO
89 TOTAL STATION LAFENWA ABEOKUTA 8,BRIDGE STREET , LAFENWA ABEOKUTA
90 TOTAL STATION OKEITOKU ABEOKUTA 48,OSHOLE STREET,ABEOKUTA
91 TOTAL STATION OWODE ABEOKUTA OWODE-ILARO RD
92 TOTAL STATION WASIMI ABEOKUTA LAGOS-ABEOKUTA EXPRESS-WAY,WASIMI
93 TOTAL STATION ABEOKUTA RD IJEBU TOTAL SERVICE STATION, ABEOKUTA ROAD, IJEBU-ODE.
94 TOTAL STATION IBADAN RD IJEBU 12 IBADAN ROAD, IJEBU-ODE.
95 TOTAL STATION IJEBU IGBO TOTAL FILLING STATION, IJEBU-IGBO.
96 TOTAL STATION IKANGBA IJEBU TOTAL FILLING STATION, IKANGBA HOUSING ESTATE, IKANGBA.
97 TOTAL STATION IPERU IJEBU TOTAL FILLING STATION, IPERU-REMO
98 TOTAL STATION MAMU IJEBU TOTAL FILLING STATION, MAMU.
99 TOTAL STATION ORU IJEBU TOTAL SERVICE STATION, ORU ROAD, IJEBU-IGBO.
100 TOTAL STATION ARIGBAJO PSS LAGOS-ABEOKUTA EXPRESS-WAY,ARIGBAJOAFTER RAILWAY
CROSSING ARIGBAJO, OPPOSITE ARIGBAJO MARKET
101 TOTAL STATION EJIRIN PFS TOTAL SERVICE STATION, EJIRIN ROAD.2KM AFTER IJEBU-ODE
ROUND ABOUT
102 TOTAL STATION IKENNE PSS TOTAL SERVICE STATION, AWOLOWO WAY, IJEBU-ODE.ALONG
AWOLOWO WAY, OFF IJEBU-SAGAMU EXPRESS
103 TOTAL STATION JUBILEE ESTATE ALONG IKORODU-SHAGAMU ROAD, OPPOSITE BOT EVENT PALACE
104 TOTAL STATION OLOFIN ROAD, ILISAN ALONG OLOFIN ROAD, OPP ILISAN MICRO FINANCE BANK, OFF
IKENNE ILISAN ROAD.
105 TOTAL STATION OPP GOVT COLL 244 LAGOS RD IKORODUSTATION IS OPPOSITE GOVERMENT
COLLEGE IKORODU
106 TOTAL STATION SAGAMU JUNCTION SAGAMU JUNCTION LAGOS BENIN EXPRESSPOPULAR JUNCTION TO
ENTER SAGAMU TOWN
107 TOTAL STATION EWEKORO LAGOS ABEOKUTA EXPRESS RD, EWEKORO
SELECT LOCATIONS IN IBADAN , OYO STATE
108 TOTAL STATION, NEW RESERVATION IYAGANKU RD, AREA POLICE COMMAND, IBADAN
109 TOTAL STATION, SANGO STATION OYO ROAD, SANGO, IBADAN
110 TOTAL STATION OKE ADO IBADAN MOLETE RD., OKE ADO MOLETE-OKE BOLA RD
111 TOTAL STATION OLD LAGOS ROAD IBADAN OLD LAGOS RD, IBADAN
112 TOTAL STATION ELEIYELE I IBADAN JERICHO RD. IBADAN, ALONG ONIREKE/JERICHO RD
343
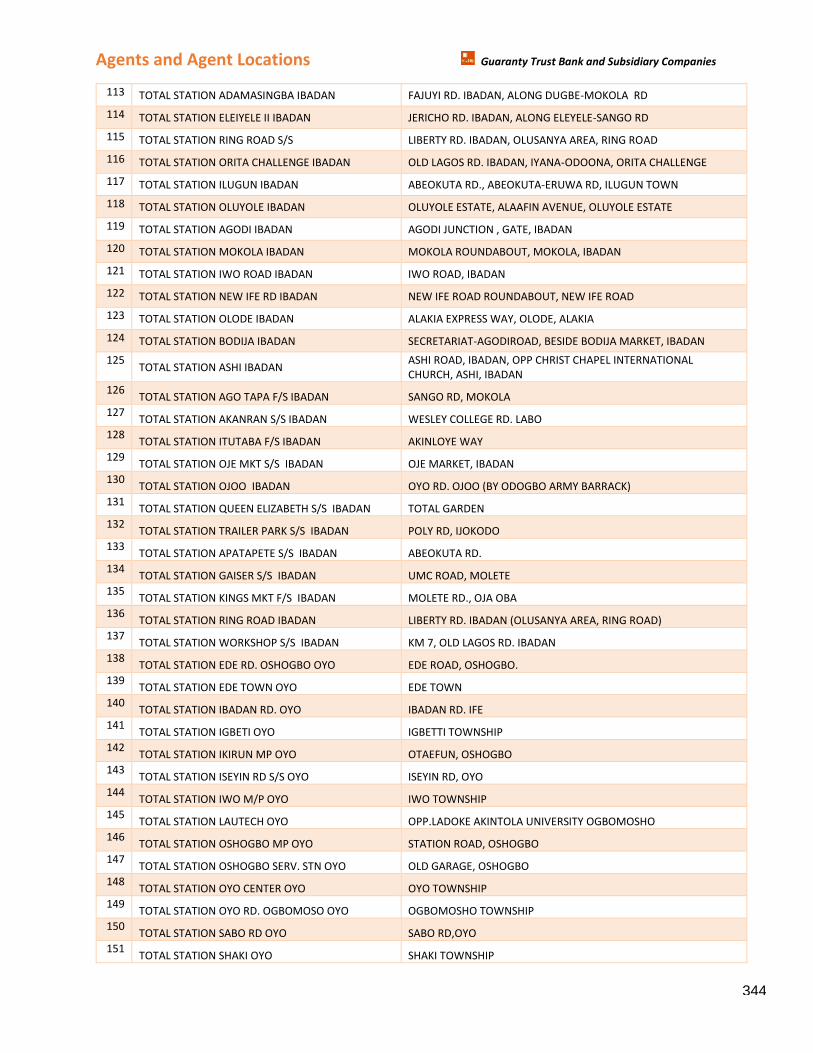
Agents and Agent Locations Guaranty Trust Bank and Subsidiary Companies
113 TOTAL STATION ADAMASINGBA IBADAN FAJUYI RD. IBADAN, ALONG DUGBE-MOKOLA RD
114 TOTAL STATION ELEIYELE II IBADAN JERICHO RD. IBADAN, ALONG ELEYELE-SANGO RD
115 TOTAL STATION RING ROAD S/S LIBERTY RD. IBADAN, OLUSANYA AREA, RING ROAD
116 TOTAL STATION ORITA CHALLENGE IBADAN OLD LAGOS RD. IBADAN, IYANA-ODOONA, ORITA CHALLENGE
117 TOTAL STATION ILUGUN IBADAN ABEOKUTA RD., ABEOKUTA-ERUWA RD, ILUGUN TOWN
118 TOTAL STATION OLUYOLE IBADAN OLUYOLE ESTATE, ALAAFIN AVENUE, OLUYOLE ESTATE
119 TOTAL STATION AGODI IBADAN AGODI JUNCTION , GATE, IBADAN
120 TOTAL STATION MOKOLA IBADAN MOKOLA ROUNDABOUT, MOKOLA, IBADAN
121 TOTAL STATION IWO ROAD IBADAN IWO ROAD, IBADAN
122 TOTAL STATION NEW IFE RD IBADAN NEW IFE ROAD ROUNDABOUT, NEW IFE ROAD
123 TOTAL STATION OLODE IBADAN ALAKIA EXPRESS WAY, OLODE, ALAKIA
124 TOTAL STATION BODIJA IBADAN SECRETARIAT-AGODIROAD, BESIDE BODIJA MARKET, IBADAN
125 TOTAL STATION ASHI IBADAN
ASHI ROAD, IBADAN, OPP CHRIST CHAPEL INTERNATIONAL
CHURCH, ASHI, IBADAN
126 TOTAL STATION AGO TAPA F/S IBADAN SANGO RD, MOKOLA
127 TOTAL STATION AKANRAN S/S IBADAN WESLEY COLLEGE RD. LABO
128 TOTAL STATION ITUTABA F/S IBADAN AKINLOYE WAY
129 TOTAL STATION OJE MKT S/S IBADAN OJE MARKET, IBADAN
130 TOTAL STATION OJOO IBADAN OYO RD. OJOO (BY ODOGBO ARMY BARRACK)
131 TOTAL STATION QUEEN ELIZABETH S/S IBADAN TOTAL GARDEN
132 TOTAL STATION TRAILER PARK S/S IBADAN POLY RD, IJOKODO
133 TOTAL STATION APATAPETE S/S IBADAN ABEOKUTA RD.
134 TOTAL STATION GAISER S/S IBADAN UMC ROAD, MOLETE
135 TOTAL STATION KINGS MKT F/S IBADAN MOLETE RD., OJA OBA
136 TOTAL STATION RING ROAD IBADAN LIBERTY RD. IBADAN (OLUSANYA AREA, RING ROAD)
137 TOTAL STATION WORKSHOP S/S IBADAN KM 7, OLD LAGOS RD. IBADAN
138 TOTAL STATION EDE RD. OSHOGBO OYO EDE ROAD, OSHOGBO.
139 TOTAL STATION EDE TOWN OYO EDE TOWN
140 TOTAL STATION IBADAN RD. OYO IBADAN RD. IFE
141 TOTAL STATION IGBETI OYO IGBETTI TOWNSHIP
142 TOTAL STATION IKIRUN MP OYO OTAEFUN, OSHOGBO
143 TOTAL STATION ISEYIN RD S/S OYO ISEYIN RD, OYO
144 TOTAL STATION IWO M/P OYO IWO TOWNSHIP
145 TOTAL STATION LAUTECH OYO OPP.LADOKE AKINTOLA UNIVERSITY OGBOMOSHO
146 TOTAL STATION OSHOGBO MP OYO STATION ROAD, OSHOGBO
147 TOTAL STATION OSHOGBO SERV. STN OYO OLD GARAGE, OSHOGBO
148 TOTAL STATION OYO CENTER OYO OYO TOWNSHIP
149 TOTAL STATION OYO RD. OGBOMOSO OYO OGBOMOSHO TOWNSHIP
150 TOTAL STATION SABO RD OYO SABO RD,OYO
151 TOTAL STATION SHAKI OYO SHAKI TOWNSHIP
344
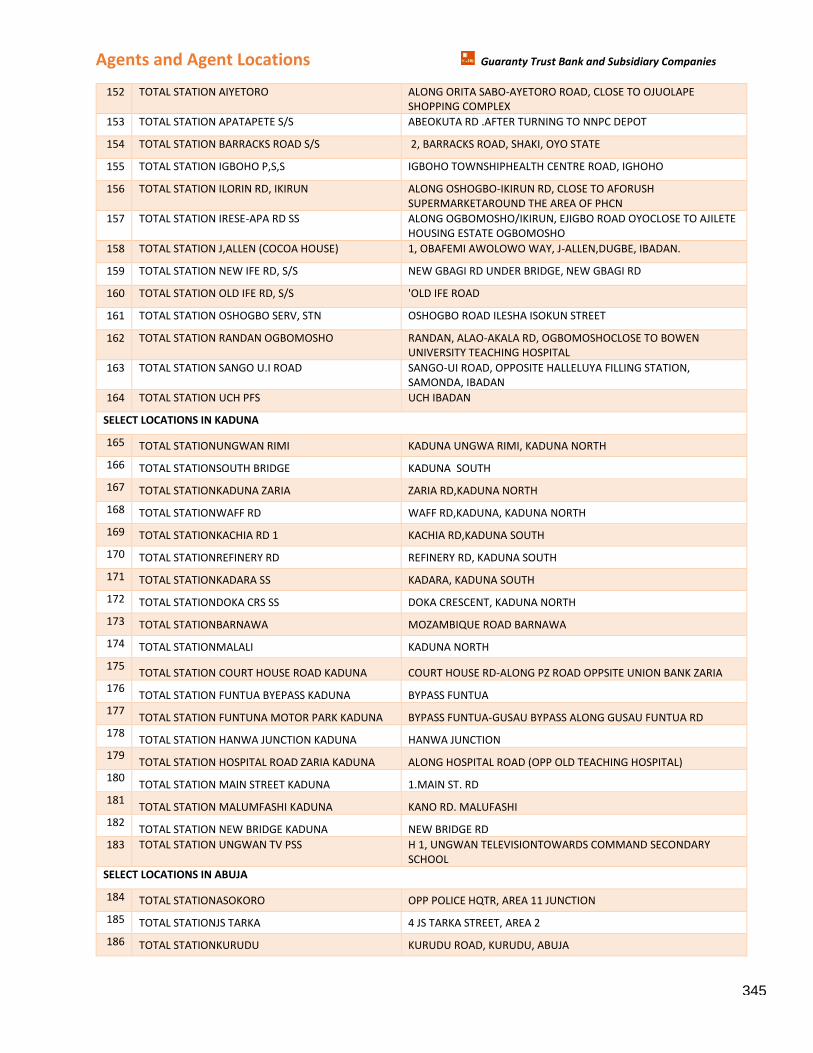
Agents and Agent Locations Guaranty Trust Bank and Subsidiary Companies
152 TOTAL STATION AIYETORO ALONG ORITA SABO-AYETORO ROAD, CLOSE TO OJUOLAPE
SHOPPING COMPLEX
153 TOTAL STATION APATAPETE S/S ABEOKUTA RD .AFTER TURNING TO NNPC DEPOT
154 TOTAL STATION BARRACKS ROAD S/S 2, BARRACKS ROAD, SHAKI, OYO STATE
155 TOTAL STATION IGBOHO P,S,S IGBOHO TOWNSHIPHEALTH CENTRE ROAD, IGHOHO
156 TOTAL STATION ILORIN RD, IKIRUN ALONG OSHOGBO-IKIRUN RD, CLOSE TO AFORUSH
SUPERMARKETAROUND THE AREA OF PHCN
157 TOTAL STATION IRESE-APA RD SS ALONG OGBOMOSHO/IKIRUN, EJIGBO ROAD OYOCLOSE TO AJILETE
HOUSING ESTATE OGBOMOSHO
158 TOTAL STATION J,ALLEN (COCOA HOUSE) 1, OBAFEMI AWOLOWO WAY, J-ALLEN,DUGBE, IBADAN.
159 TOTAL STATION NEW IFE RD, S/S NEW GBAGI RD UNDER BRIDGE, NEW GBAGI RD
160 TOTAL STATION OLD IFE RD, S/S 'OLD IFE ROAD
161 TOTAL STATION OSHOGBO SERV, STN OSHOGBO ROAD ILESHA ISOKUN STREET
162 TOTAL STATION RANDAN OGBOMOSHO RANDAN, ALAO-AKALA RD, OGBOMOSHOCLOSE TO BOWEN
UNIVERSITY TEACHING HOSPITAL
163 TOTAL STATION SANGO U.I ROAD SANGO-UI ROAD, OPPOSITE HALLELUYA FILLING STATION,
SAMONDA, IBADAN
164 TOTAL STATION UCH PFS UCH IBADAN
SELECT LOCATIONS IN KADUNA
165 TOTAL STATIONUNGWAN RIMI KADUNA UNGWA RIMI, KADUNA NORTH
166 TOTAL STATIONSOUTH BRIDGE KADUNA SOUTH
167 TOTAL STATIONKADUNA ZARIA ZARIA RD,KADUNA NORTH
168 TOTAL STATIONWAFF RD WAFF RD,KADUNA, KADUNA NORTH
169 TOTAL STATIONKACHIA RD 1 KACHIA RD,KADUNA SOUTH
170 TOTAL STATIONREFINERY RD REFINERY RD, KADUNA SOUTH
171 TOTAL STATIONKADARA SS KADARA, KADUNA SOUTH
172 TOTAL STATIONDOKA CRS SS DOKA CRESCENT, KADUNA NORTH
173 TOTAL STATIONBARNAWA MOZAMBIQUE ROAD BARNAWA
174 TOTAL STATIONMALALI KADUNA NORTH
175 TOTAL STATION COURT HOUSE ROAD KADUNA COURT HOUSE RD-ALONG PZ ROAD OPPSITE UNION BANK ZARIA
176 TOTAL STATION FUNTUA BYEPASS KADUNA BYPASS FUNTUA
177 TOTAL STATION FUNTUNA MOTOR PARK KADUNA BYPASS FUNTUA-GUSAU BYPASS ALONG GUSAU FUNTUA RD
178 TOTAL STATION HANWA JUNCTION KADUNA HANWA JUNCTION
179 TOTAL STATION HOSPITAL ROAD ZARIA KADUNA ALONG HOSPITAL ROAD (OPP OLD TEACHING HOSPITAL)
180 TOTAL STATION MAIN STREET KADUNA 1.MAIN ST. RD
181 TOTAL STATION MALUMFASHI KADUNA KANO RD. MALUFASHI
182 TOTAL STATION NEW BRIDGE KADUNA NEW BRIDGE RD
183 TOTAL STATION UNGWAN TV PSS H 1, UNGWAN TELEVISIONTOWARDS COMMAND SECONDARY
SCHOOL
SELECT LOCATIONS IN ABUJA
184 TOTAL STATIONASOKORO OPP POLICE HQTR, AREA 11 JUNCTION
185 TOTAL STATIONJS TARKA 4 JS TARKA STREET, AREA 2
186 TOTAL STATIONKURUDU KURUDU ROAD, KURUDU, ABUJA
345
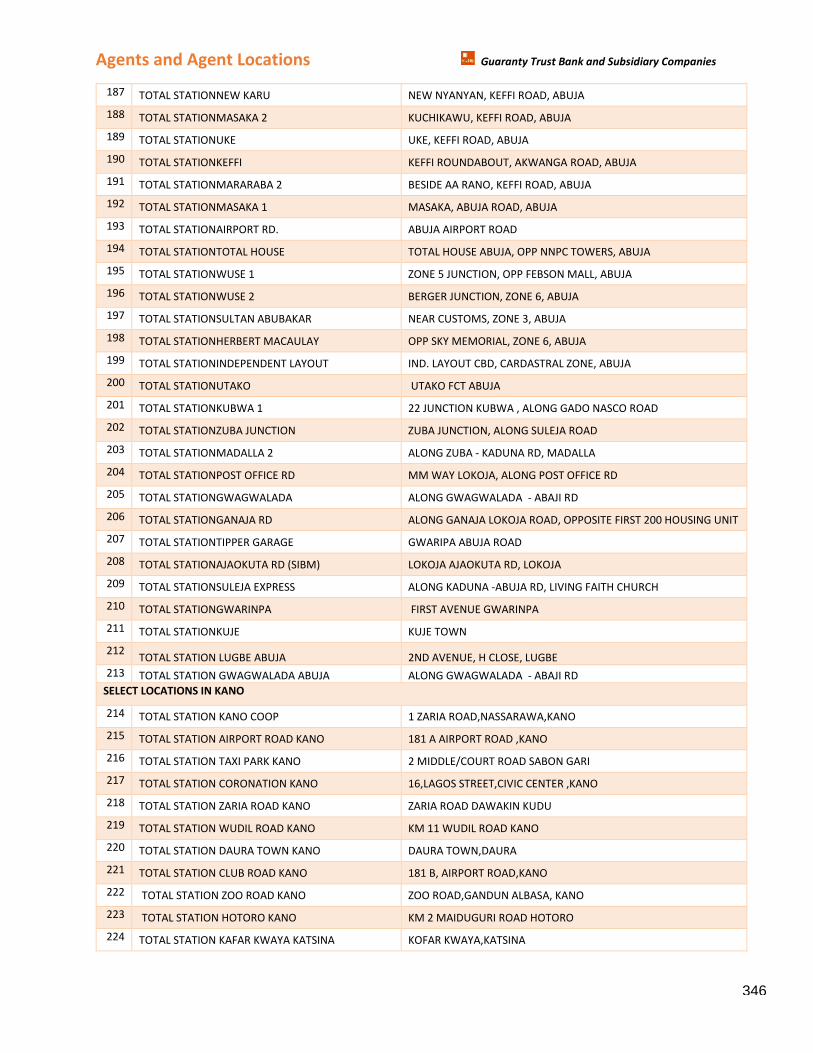
Agents and Agent Locations Guaranty Trust Bank and Subsidiary Companies
187 TOTAL STATIONNEW KARU NEW NYANYAN, KEFFI ROAD, ABUJA
188 TOTAL STATIONMASAKA 2 KUCHIKAWU, KEFFI ROAD, ABUJA
189 TOTAL STATIONUKE UKE, KEFFI ROAD, ABUJA
190 TOTAL STATIONKEFFI KEFFI ROUNDABOUT, AKWANGA ROAD, ABUJA
191 TOTAL STATIONMARARABA 2 BESIDE AA RANO, KEFFI ROAD, ABUJA
192 TOTAL STATIONMASAKA 1 MASAKA, ABUJA ROAD, ABUJA
193 TOTAL STATIONAIRPORT RD. ABUJA AIRPORT ROAD
194 TOTAL STATIONTOTAL HOUSE TOTAL HOUSE ABUJA, OPP NNPC TOWERS, ABUJA
195 TOTAL STATIONWUSE 1 ZONE 5 JUNCTION, OPP FEBSON MALL, ABUJA
196 TOTAL STATIONWUSE 2 BERGER JUNCTION, ZONE 6, ABUJA
197 TOTAL STATIONSULTAN ABUBAKAR NEAR CUSTOMS, ZONE 3, ABUJA
198 TOTAL STATIONHERBERT MACAULAY OPP SKY MEMORIAL, ZONE 6, ABUJA
199 TOTAL STATIONINDEPENDENT LAYOUT IND. LAYOUT CBD, CARDASTRAL ZONE, ABUJA
200 TOTAL STATIONUTAKO UTAKO FCT ABUJA
201 TOTAL STATIONKUBWA 1 22 JUNCTION KUBWA , ALONG GADO NASCO ROAD
202 TOTAL STATIONZUBA JUNCTION ZUBA JUNCTION, ALONG SULEJA ROAD
203 TOTAL STATIONMADALLA 2 ALONG ZUBA - KADUNA RD, MADALLA
204 TOTAL STATIONPOST OFFICE RD MM WAY LOKOJA, ALONG POST OFFICE RD
205 TOTAL STATIONGWAGWALADA ALONG GWAGWALADA - ABAJI RD
206 TOTAL STATIONGANAJA RD ALONG GANAJA LOKOJA ROAD, OPPOSITE FIRST 200 HOUSING UNIT
207 TOTAL STATIONTIPPER GARAGE GWARIPA ABUJA ROAD
208 TOTAL STATIONAJAOKUTA RD (SIBM) LOKOJA AJAOKUTA RD, LOKOJA
209 TOTAL STATIONSULEJA EXPRESS ALONG KADUNA -ABUJA RD, LIVING FAITH CHURCH
210 TOTAL STATIONGWARINPA FIRST AVENUE GWARINPA
211 TOTAL STATIONKUJE KUJE TOWN
212 TOTAL STATION LUGBE ABUJA 2ND AVENUE, H CLOSE, LUGBE
213 TOTAL STATION GWAGWALADA ABUJA ALONG GWAGWALADA - ABAJI RD
SELECT LOCATIONS IN KANO
214 TOTAL STATION KANO COOP 1 ZARIA ROAD,NASSARAWA,KANO
215 TOTAL STATION AIRPORT ROAD KANO 181 A AIRPORT ROAD ,KANO
216 TOTAL STATION TAXI PARK KANO 2 MIDDLE/COURT ROAD SABON GARI
217 TOTAL STATION CORONATION KANO 16,LAGOS STREET,CIVIC CENTER ,KANO
218 TOTAL STATION ZARIA ROAD KANO ZARIA ROAD DAWAKIN KUDU
219 TOTAL STATION WUDIL ROAD KANO KM 11 WUDIL ROAD KANO
220 TOTAL STATION DAURA TOWN KANO DAURA TOWN,DAURA
221 TOTAL STATION CLUB ROAD KANO 181 B, AIRPORT ROAD,KANO
222 TOTAL STATION ZOO ROAD KANO ZOO ROAD,GANDUN ALBASA, KANO
223 TOTAL STATION HOTORO KANO KM 2 MAIDUGURI ROAD HOTORO
224 TOTAL STATION KAFAR KWAYA KATSINA KOFAR KWAYA,KATSINA
346
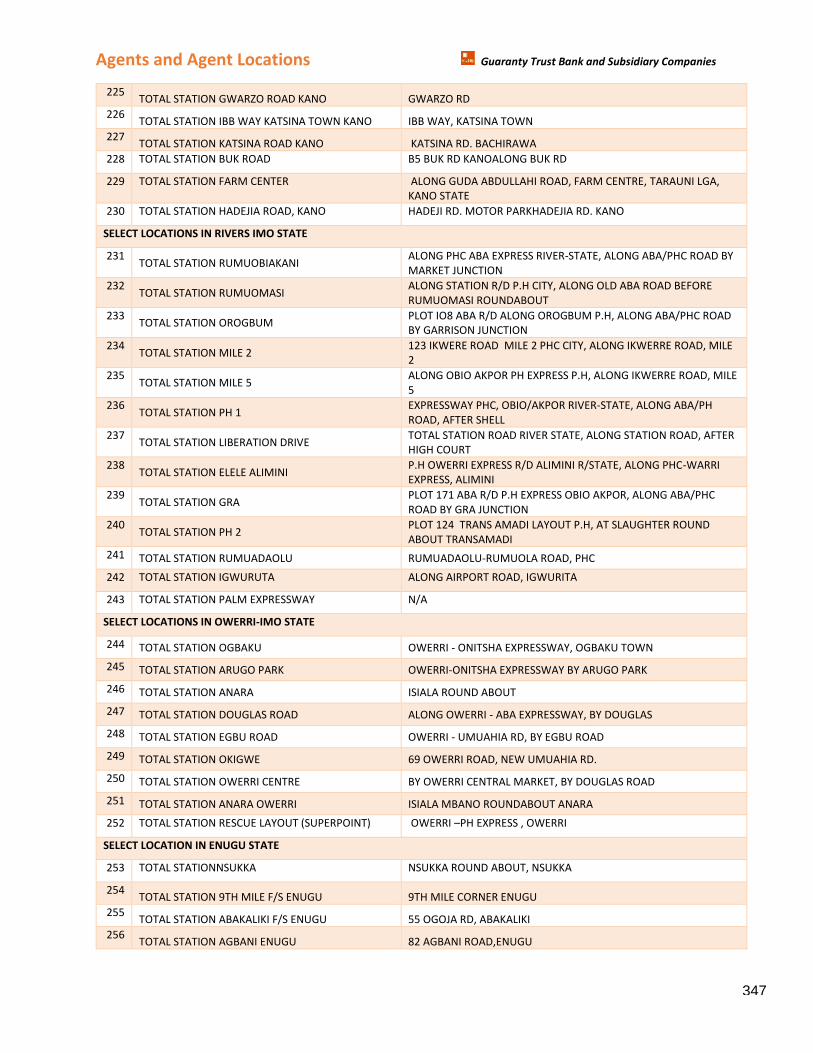
Agents and Agent Locations Guaranty Trust Bank and Subsidiary Companies
225 TOTAL STATION GWARZO ROAD KANO GWARZO RD
226 TOTAL STATION IBB WAY KATSINA TOWN KANO IBB WAY, KATSINA TOWN
227 TOTAL STATION KATSINA ROAD KANO KATSINA RD. BACHIRAWA
228 TOTAL STATION BUK ROAD B5 BUK RD KANOALONG BUK RD
229 TOTAL STATION FARM CENTER ALONG GUDA ABDULLAHI ROAD, FARM CENTRE, TARAUNI LGA,
KANO STATE
230 TOTAL STATION HADEJIA ROAD, KANO HADEJI RD. MOTOR PARKHADEJIA RD. KANO
SELECT LOCATIONS IN RIVERS IMO STATE
231 TOTAL STATION RUMUOBIAKANI
ALONG PHC ABA EXPRESS RIVER-STATE, ALONG ABA/PHC ROAD BY
MARKET JUNCTION
232 TOTAL STATION RUMUOMASI
ALONG STATION R/D P.H CITY, ALONG OLD ABA ROAD BEFORE
RUMUOMASI ROUNDABOUT
233 TOTAL STATION OROGBUM
PLOT IO8 ABA R/D ALONG OROGBUM P.H, ALONG ABA/PHC ROAD
BY GARRISON JUNCTION
234 TOTAL STATION MILE 2
123 IKWERE ROAD MILE 2 PHC CITY, ALONG IKWERRE ROAD, MILE
2
235 TOTAL STATION MILE 5
ALONG OBIO AKPOR PH EXPRESS P.H, ALONG IKWERRE ROAD, MILE
5
236 TOTAL STATION PH 1
EXPRESSWAY PHC, OBIO/AKPOR RIVER-STATE, ALONG ABA/PH
ROAD, AFTER SHELL
237 TOTAL STATION LIBERATION DRIVE
TOTAL STATION ROAD RIVER STATE, ALONG STATION ROAD, AFTER
HIGH COURT
238 TOTAL STATION ELELE ALIMINI
P.H OWERRI EXPRESS R/D ALIMINI R/STATE, ALONG PHC-WARRI
EXPRESS, ALIMINI
239 TOTAL STATION GRA
PLOT 171 ABA R/D P.H EXPRESS OBIO AKPOR, ALONG ABA/PHC
ROAD BY GRA JUNCTION
240 TOTAL STATION PH 2
PLOT 124 TRANS AMADI LAYOUT P.H, AT SLAUGHTER ROUND
ABOUT TRANSAMADI
241 TOTAL STATION RUMUADAOLU RUMUADAOLU-RUMUOLA ROAD, PHC
242 TOTAL STATION IGWURUTA ALONG AIRPORT ROAD, IGWURITA
243 TOTAL STATION PALM EXPRESSWAY N/A
SELECT LOCATIONS IN OWERRI-IMO STATE
244 TOTAL STATION OGBAKU OWERRI - ONITSHA EXPRESSWAY, OGBAKU TOWN
245 TOTAL STATION ARUGO PARK OWERRI-ONITSHA EXPRESSWAY BY ARUGO PARK
246 TOTAL STATION ANARA ISIALA ROUND ABOUT
247 TOTAL STATION DOUGLAS ROAD ALONG OWERRI - ABA EXPRESSWAY, BY DOUGLAS
248 TOTAL STATION EGBU ROAD OWERRI - UMUAHIA RD, BY EGBU ROAD
249 TOTAL STATION OKIGWE 69 OWERRI ROAD, NEW UMUAHIA RD.
250 TOTAL STATION OWERRI CENTRE BY OWERRI CENTRAL MARKET, BY DOUGLAS ROAD
251 TOTAL STATION ANARA OWERRI ISIALA MBANO ROUNDABOUT ANARA
252 TOTAL STATION RESCUE LAYOUT (SUPERPOINT) OWERRI –PH EXPRESS , OWERRI
SELECT LOCATION IN ENUGU STATE
253 TOTAL STATIONNSUKKA NSUKKA ROUND ABOUT, NSUKKA
254 TOTAL STATION 9TH MILE F/S ENUGU 9TH MILE CORNER ENUGU
255 TOTAL STATION ABAKALIKI F/S ENUGU 55 OGOJA RD, ABAKALIKI
256 TOTAL STATION AGBANI ENUGU 82 AGBANI ROAD,ENUGU
347
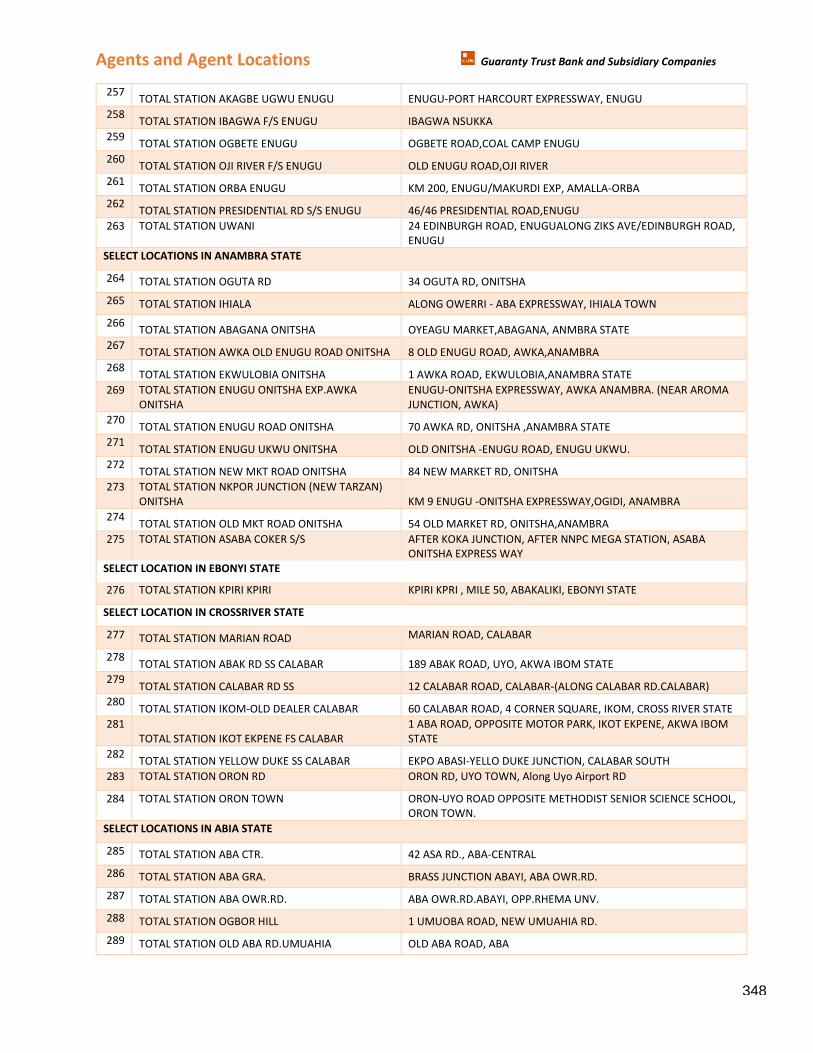
Agents and Agent Locations Guaranty Trust Bank and Subsidiary Companies
257 TOTAL STATION AKAGBE UGWU ENUGU ENUGU-PORT HARCOURT EXPRESSWAY, ENUGU
258 TOTAL STATION IBAGWA F/S ENUGU IBAGWA NSUKKA
259 TOTAL STATION OGBETE ENUGU OGBETE ROAD,COAL CAMP ENUGU
260 TOTAL STATION OJI RIVER F/S ENUGU OLD ENUGU ROAD,OJI RIVER
261 TOTAL STATION ORBA ENUGU KM 200, ENUGU/MAKURDI EXP, AMALLA-ORBA
262 TOTAL STATION PRESIDENTIAL RD S/S ENUGU 46/46 PRESIDENTIAL ROAD,ENUGU
263 TOTAL STATION UWANI 24 EDINBURGH ROAD, ENUGUALONG ZIKS AVE/EDINBURGH ROAD,
ENUGU
SELECT LOCATIONS IN ANAMBRA STATE
264 TOTAL STATION OGUTA RD 34 OGUTA RD, ONITSHA
265 TOTAL STATION IHIALA ALONG OWERRI - ABA EXPRESSWAY, IHIALA TOWN
266 TOTAL STATION ABAGANA ONITSHA OYEAGU MARKET,ABAGANA, ANMBRA STATE
267 TOTAL STATION AWKA OLD ENUGU ROAD ONITSHA 8 OLD ENUGU ROAD, AWKA,ANAMBRA
268 TOTAL STATION EKWULOBIA ONITSHA 1 AWKA ROAD, EKWULOBIA,ANAMBRA STATE
269 TOTAL STATION ENUGU ONITSHA EXP.AWKA
ONITSHA
ENUGU-ONITSHA EXPRESSWAY, AWKA ANAMBRA. (NEAR AROMA
JUNCTION, AWKA)
270 TOTAL STATION ENUGU ROAD ONITSHA 70 AWKA RD, ONITSHA ,ANAMBRA STATE
271 TOTAL STATION ENUGU UKWU ONITSHA OLD ONITSHA -ENUGU ROAD, ENUGU UKWU.
272 TOTAL STATION NEW MKT ROAD ONITSHA 84 NEW MARKET RD, ONITSHA
273 TOTAL STATION NKPOR JUNCTION (NEW TARZAN)
ONITSHA KM 9 ENUGU -ONITSHA EXPRESSWAY,OGIDI, ANAMBRA
274 TOTAL STATION OLD MKT ROAD ONITSHA 54 OLD MARKET RD, ONITSHA,ANAMBRA
275 TOTAL STATION ASABA COKER S/S AFTER KOKA JUNCTION, AFTER NNPC MEGA STATION, ASABA
ONITSHA EXPRESS WAY
SELECT LOCATION IN EBONYI STATE
276 TOTAL STATION KPIRI KPIRI KPIRI KPRI , MILE 50, ABAKALIKI, EBONYI STATE
SELECT LOCATION IN CROSSRIVER STATE
277 TOTAL STATION MARIAN ROAD MARIAN ROAD, CALABAR
278 TOTAL STATION ABAK RD SS CALABAR 189 ABAK ROAD, UYO, AKWA IBOM STATE
279 TOTAL STATION CALABAR RD SS 12 CALABAR ROAD, CALABAR-(ALONG CALABAR RD.CALABAR)
280 TOTAL STATION IKOM-OLD DEALER CALABAR 60 CALABAR ROAD, 4 CORNER SQUARE, IKOM, CROSS RIVER STATE
281
TOTAL STATION IKOT EKPENE FS CALABAR
1 ABA ROAD, OPPOSITE MOTOR PARK, IKOT EKPENE, AKWA IBOM
STATE
282 TOTAL STATION YELLOW DUKE SS CALABAR EKPO ABASI-YELLO DUKE JUNCTION, CALABAR SOUTH
283 TOTAL STATION ORON RD ORON RD, UYO TOWN, Along Uyo Airport RD
284 TOTAL STATION ORON TOWN ORON-UYO ROAD OPPOSITE METHODIST SENIOR SCIENCE SCHOOL,
ORON TOWN.
SELECT LOCATIONS IN ABIA STATE
285 TOTAL STATION ABA CTR. 42 ASA RD., ABA-CENTRAL
286 TOTAL STATION ABA GRA. BRASS JUNCTION ABAYI, ABA OWR.RD.
287 TOTAL STATION ABA OWR.RD. ABA OWR.RD.ABAYI, OPP.RHEMA UNV.
288 TOTAL STATION OGBOR HILL 1 UMUOBA ROAD, NEW UMUAHIA RD.
289 TOTAL STATION OLD ABA RD.UMUAHIA OLD ABA ROAD, ABA
348
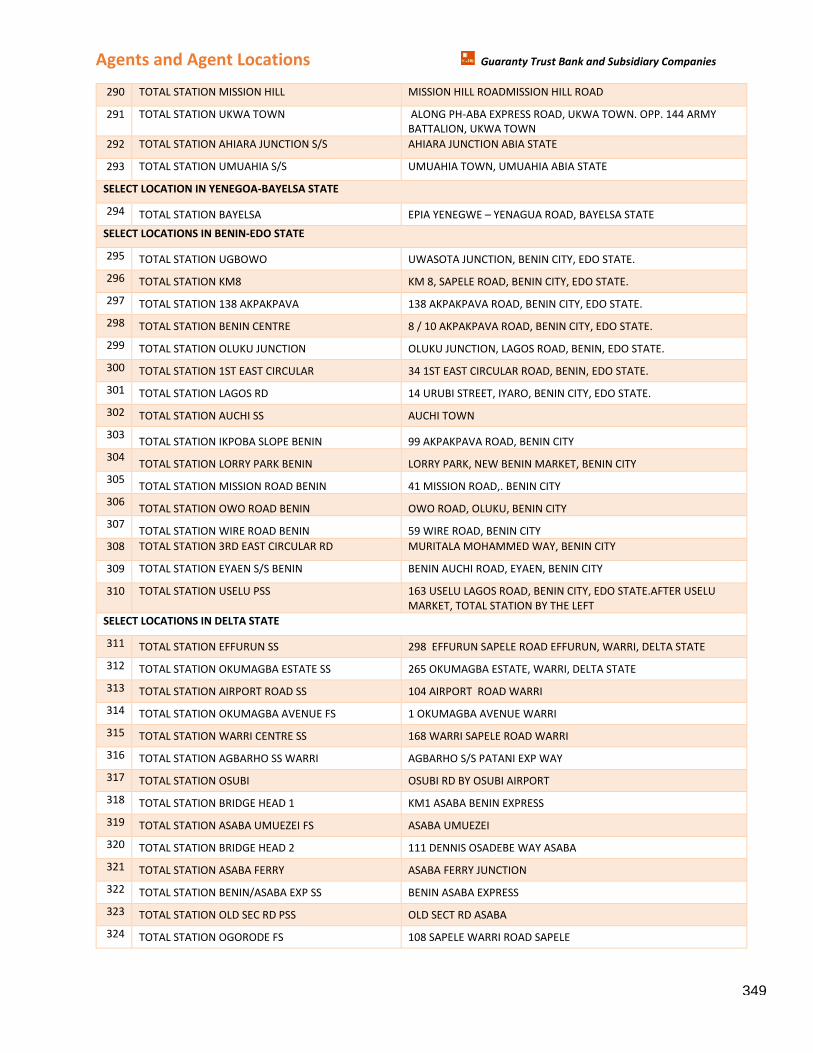
Agents and Agent Locations Guaranty Trust Bank and Subsidiary Companies
290 TOTAL STATION MISSION HILL MISSION HILL ROADMISSION HILL ROAD
291 TOTAL STATION UKWA TOWN ALONG PH-ABA EXPRESS ROAD, UKWA TOWN. OPP. 144 ARMY
BATTALION, UKWA TOWN
292 TOTAL STATION AHIARA JUNCTION S/S AHIARA JUNCTION ABIA STATE
293 TOTAL STATION UMUAHIA S/S UMUAHIA TOWN, UMUAHIA ABIA STATE
SELECT LOCATION IN YENEGOA-BAYELSA STATE
294 TOTAL STATION BAYELSA EPIA YENEGWE – YENAGUA ROAD, BAYELSA STATE
SELECT LOCATIONS IN BENIN-EDO STATE
295 TOTAL STATION UGBOWO UWASOTA JUNCTION, BENIN CITY, EDO STATE.
296 TOTAL STATION KM8 KM 8, SAPELE ROAD, BENIN CITY, EDO STATE.
297 TOTAL STATION 138 AKPAKPAVA 138 AKPAKPAVA ROAD, BENIN CITY, EDO STATE.
298 TOTAL STATION BENIN CENTRE 8 / 10 AKPAKPAVA ROAD, BENIN CITY, EDO STATE.
299 TOTAL STATION OLUKU JUNCTION OLUKU JUNCTION, LAGOS ROAD, BENIN, EDO STATE.
300 TOTAL STATION 1ST EAST CIRCULAR 34 1ST EAST CIRCULAR ROAD, BENIN, EDO STATE.
301 TOTAL STATION LAGOS RD 14 URUBI STREET, IYARO, BENIN CITY, EDO STATE.
302 TOTAL STATION AUCHI SS AUCHI TOWN
303 TOTAL STATION IKPOBA SLOPE BENIN 99 AKPAKPAVA ROAD, BENIN CITY
304 TOTAL STATION LORRY PARK BENIN LORRY PARK, NEW BENIN MARKET, BENIN CITY
305 TOTAL STATION MISSION ROAD BENIN 41 MISSION ROAD,. BENIN CITY
306 TOTAL STATION OWO ROAD BENIN OWO ROAD, OLUKU, BENIN CITY
307 TOTAL STATION WIRE ROAD BENIN 59 WIRE ROAD, BENIN CITY
308 TOTAL STATION 3RD EAST CIRCULAR RD MURITALA MOHAMMED WAY, BENIN CITY
309 TOTAL STATION EYAEN S/S BENIN BENIN AUCHI ROAD, EYAEN, BENIN CITY
310 TOTAL STATION USELU PSS 163 USELU LAGOS ROAD, BENIN CITY, EDO STATE.AFTER USELU
MARKET, TOTAL STATION BY THE LEFT
SELECT LOCATIONS IN DELTA STATE
311 TOTAL STATION EFFURUN SS 298 EFFURUN SAPELE ROAD EFFURUN, WARRI, DELTA STATE
312 TOTAL STATION OKUMAGBA ESTATE SS 265 OKUMAGBA ESTATE, WARRI, DELTA STATE
313 TOTAL STATION AIRPORT ROAD SS 104 AIRPORT ROAD WARRI
314 TOTAL STATION OKUMAGBA AVENUE FS 1 OKUMAGBA AVENUE WARRI
315 TOTAL STATION WARRI CENTRE SS 168 WARRI SAPELE ROAD WARRI
316 TOTAL STATION AGBARHO SS WARRI AGBARHO S/S PATANI EXP WAY
317 TOTAL STATION OSUBI OSUBI RD BY OSUBI AIRPORT
318 TOTAL STATION BRIDGE HEAD 1 KM1 ASABA BENIN EXPRESS
319 TOTAL STATION ASABA UMUEZEI FS ASABA UMUEZEI
320 TOTAL STATION BRIDGE HEAD 2 111 DENNIS OSADEBE WAY ASABA
321 TOTAL STATION ASABA FERRY ASABA FERRY JUNCTION
322 TOTAL STATION BENIN/ASABA EXP SS BENIN ASABA EXPRESS
323 TOTAL STATION OLD SEC RD PSS OLD SECT RD ASABA
324 TOTAL STATION OGORODE FS 108 SAPELE WARRI ROAD SAPELE
349
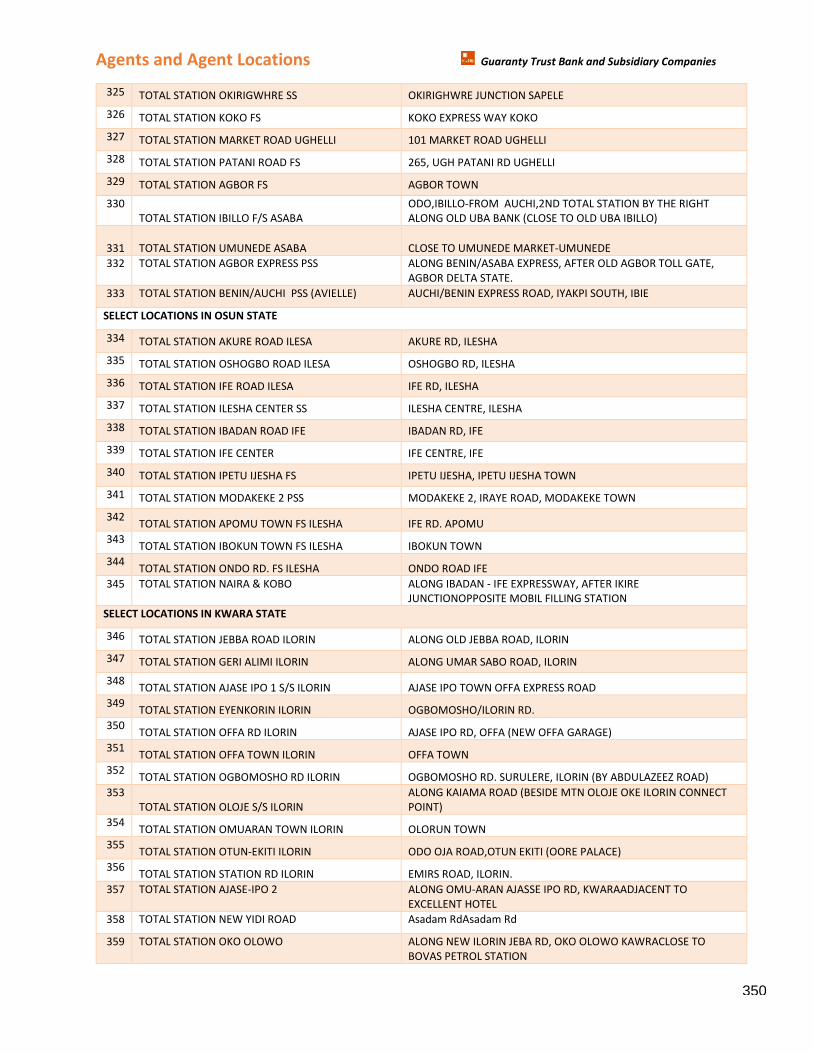
Agents and Agent Locations Guaranty Trust Bank and Subsidiary Companies
325 TOTAL STATION OKIRIGWHRE SS OKIRIGHWRE JUNCTION SAPELE
326 TOTAL STATION KOKO FS KOKO EXPRESS WAY KOKO
327 TOTAL STATION MARKET ROAD UGHELLI 101 MARKET ROAD UGHELLI
328 TOTAL STATION PATANI ROAD FS 265, UGH PATANI RD UGHELLI
329 TOTAL STATION AGBOR FS AGBOR TOWN
330
TOTAL STATION IBILLO F/S ASABA
ODO,IBILLO-FROM AUCHI,2ND TOTAL STATION BY THE RIGHT
ALONG OLD UBA BANK (CLOSE TO OLD UBA IBILLO)
331 TOTAL STATION UMUNEDE ASABA CLOSE TO UMUNEDE MARKET-UMUNEDE
332 TOTAL STATION AGBOR EXPRESS PSS ALONG BENIN/ASABA EXPRESS, AFTER OLD AGBOR TOLL GATE,
AGBOR DELTA STATE.
333 TOTAL STATION BENIN/AUCHI PSS (AVIELLE) AUCHI/BENIN EXPRESS ROAD, IYAKPI SOUTH, IBIE
SELECT LOCATIONS IN OSUN STATE
334 TOTAL STATION AKURE ROAD ILESA AKURE RD, ILESHA
335 TOTAL STATION OSHOGBO ROAD ILESA OSHOGBO RD, ILESHA
336 TOTAL STATION IFE ROAD ILESA IFE RD, ILESHA
337 TOTAL STATION ILESHA CENTER SS ILESHA CENTRE, ILESHA
338 TOTAL STATION IBADAN ROAD IFE IBADAN RD, IFE
339 TOTAL STATION IFE CENTER IFE CENTRE, IFE
340 TOTAL STATION IPETU IJESHA FS IPETU IJESHA, IPETU IJESHA TOWN
341 TOTAL STATION MODAKEKE 2 PSS MODAKEKE 2, IRAYE ROAD, MODAKEKE TOWN
342 TOTAL STATION APOMU TOWN FS ILESHA IFE RD. APOMU
343 TOTAL STATION IBOKUN TOWN FS ILESHA IBOKUN TOWN
344 TOTAL STATION ONDO RD. FS ILESHA ONDO ROAD IFE
345 TOTAL STATION NAIRA & KOBO ALONG IBADAN - IFE EXPRESSWAY, AFTER IKIRE
JUNCTIONOPPOSITE MOBIL FILLING STATION
SELECT LOCATIONS IN KWARA STATE
346 TOTAL STATION JEBBA ROAD ILORIN ALONG OLD JEBBA ROAD, ILORIN
347 TOTAL STATION GERI ALIMI ILORIN ALONG UMAR SABO ROAD, ILORIN
348 TOTAL STATION AJASE IPO 1 S/S ILORIN AJASE IPO TOWN OFFA EXPRESS ROAD
349 TOTAL STATION EYENKORIN ILORIN OGBOMOSHO/ILORIN RD.
350 TOTAL STATION OFFA RD ILORIN AJASE IPO RD, OFFA (NEW OFFA GARAGE)
351 TOTAL STATION OFFA TOWN ILORIN OFFA TOWN
352 TOTAL STATION OGBOMOSHO RD ILORIN OGBOMOSHO RD. SURULERE, ILORIN (BY ABDULAZEEZ ROAD)
353
TOTAL STATION OLOJE S/S ILORIN
ALONG KAIAMA ROAD (BESIDE MTN OLOJE OKE ILORIN CONNECT
POINT)
354 TOTAL STATION OMUARAN TOWN ILORIN OLORUN TOWN
355 TOTAL STATION OTUN-EKITI ILORIN ODO OJA ROAD,OTUN EKITI (OORE PALACE)
356 TOTAL STATION STATION RD ILORIN EMIRS ROAD, ILORIN.
357 TOTAL STATION AJASE-IPO 2 ALONG OMU-ARAN AJASSE IPO RD, KWARAADJACENT TO
EXCELLENT HOTEL
358 TOTAL STATION NEW YIDI ROAD Asadam RdAsadam Rd
359 TOTAL STATION OKO OLOWO ALONG NEW ILORIN JEBA RD, OKO OLOWO KAWRACLOSE TO
BOVAS PETROL STATION
350
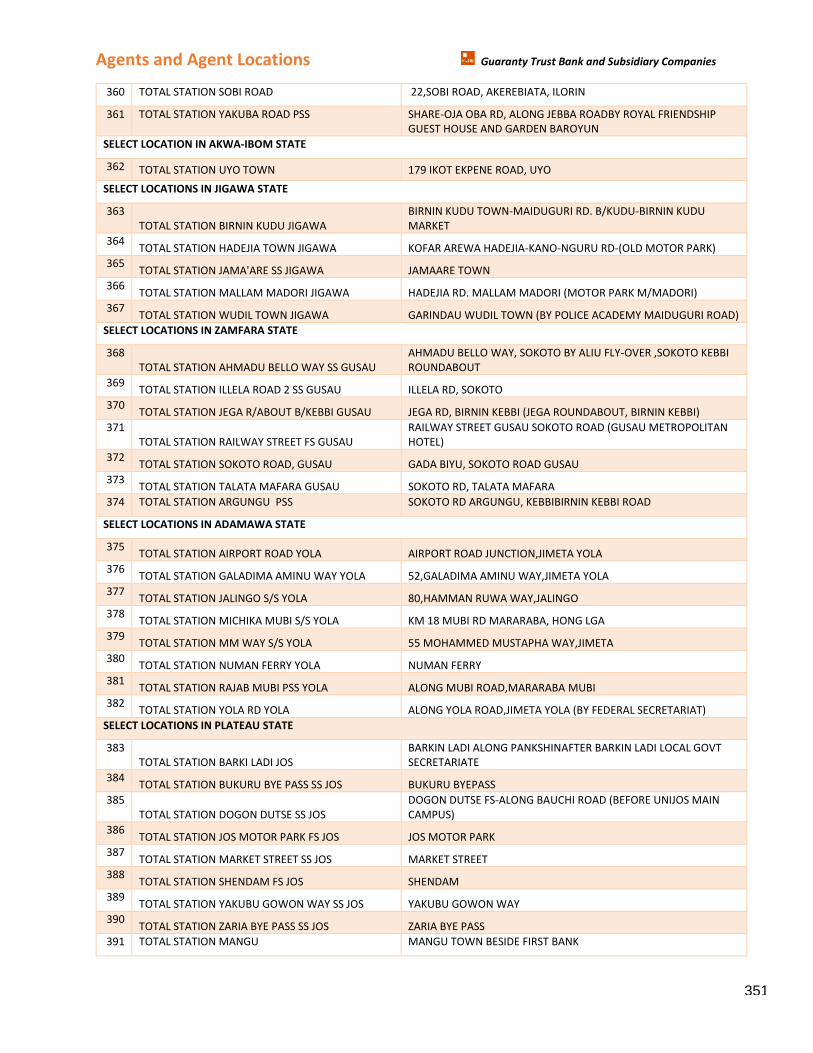
Agents and Agent Locations Guaranty Trust Bank and Subsidiary Companies
360 TOTAL STATION SOBI ROAD 22,SOBI ROAD, AKEREBIATA, ILORIN
361 TOTAL STATION YAKUBA ROAD PSS SHARE-OJA OBA RD, ALONG JEBBA ROADBY ROYAL FRIENDSHIP
GUEST HOUSE AND GARDEN BAROYUN
SELECT LOCATION IN AKWA-IBOM STATE
362 TOTAL STATION UYO TOWN 179 IKOT EKPENE ROAD, UYO
SELECT LOCATIONS IN JIGAWA STATE
363
TOTAL STATION BIRNIN KUDU JIGAWA
BIRNIN KUDU TOWN-MAIDUGURI RD. B/KUDU-BIRNIN KUDU
MARKET
364 TOTAL STATION HADEJIA TOWN JIGAWA KOFAR AREWA HADEJIA-KANO-NGURU RD-(OLD MOTOR PARK)
365 TOTAL STATION JAMA'ARE SS JIGAWA JAMAARE TOWN
366 TOTAL STATION MALLAM MADORI JIGAWA HADEJIA RD. MALLAM MADORI (MOTOR PARK M/MADORI)
367 TOTAL STATION WUDIL TOWN JIGAWA GARINDAU WUDIL TOWN (BY POLICE ACADEMY MAIDUGURI ROAD)
SELECT LOCATIONS IN ZAMFARA STATE
368
TOTAL STATION AHMADU BELLO WAY SS GUSAU
AHMADU BELLO WAY, SOKOTO BY ALIU FLY-OVER ,SOKOTO KEBBI
ROUNDABOUT
369 TOTAL STATION ILLELA ROAD 2 SS GUSAU ILLELA RD, SOKOTO
370 TOTAL STATION JEGA R/ABOUT B/KEBBI GUSAU JEGA RD, BIRNIN KEBBI (JEGA ROUNDABOUT, BIRNIN KEBBI)
371
TOTAL STATION RAILWAY STREET FS GUSAU
RAILWAY STREET GUSAU SOKOTO ROAD (GUSAU METROPOLITAN
HOTEL)
372 TOTAL STATION SOKOTO ROAD, GUSAU GADA BIYU, SOKOTO ROAD GUSAU
373 TOTAL STATION TALATA MAFARA GUSAU SOKOTO RD, TALATA MAFARA
374 TOTAL STATION ARGUNGU PSS SOKOTO RD ARGUNGU, KEBBIBIRNIN KEBBI ROAD
SELECT LOCATIONS IN ADAMAWA STATE
375 TOTAL STATION AIRPORT ROAD YOLA AIRPORT ROAD JUNCTION,JIMETA YOLA
376 TOTAL STATION GALADIMA AMINU WAY YOLA 52,GALADIMA AMINU WAY,JIMETA YOLA
377 TOTAL STATION JALINGO S/S YOLA 80,HAMMAN RUWA WAY,JALINGO
378 TOTAL STATION MICHIKA MUBI S/S YOLA KM 18 MUBI RD MARARABA, HONG LGA
379 TOTAL STATION MM WAY S/S YOLA 55 MOHAMMED MUSTAPHA WAY,JIMETA
380 TOTAL STATION NUMAN FERRY YOLA NUMAN FERRY
381 TOTAL STATION RAJAB MUBI PSS YOLA ALONG MUBI ROAD,MARARABA MUBI
382 TOTAL STATION YOLA RD YOLA ALONG YOLA ROAD,JIMETA YOLA (BY FEDERAL SECRETARIAT)
SELECT LOCATIONS IN PLATEAU STATE
383
TOTAL STATION BARKI LADI JOS
BARKIN LADI ALONG PANKSHINAFTER BARKIN LADI LOCAL GOVT
SECRETARIATE
384 TOTAL STATION BUKURU BYE PASS SS JOS BUKURU BYEPASS
385
TOTAL STATION DOGON DUTSE SS JOS
DOGON DUTSE FS-ALONG BAUCHI ROAD (BEFORE UNIJOS MAIN
CAMPUS)
386 TOTAL STATION JOS MOTOR PARK FS JOS JOS MOTOR PARK
387 TOTAL STATION MARKET STREET SS JOS MARKET STREET
388 TOTAL STATION SHENDAM FS JOS SHENDAM
389 TOTAL STATION YAKUBU GOWON WAY SS JOS YAKUBU GOWON WAY
390 TOTAL STATION ZARIA BYE PASS SS JOS ZARIA BYE PASS
391 TOTAL STATION MANGU MANGU TOWN BESIDE FIRST BANK
351
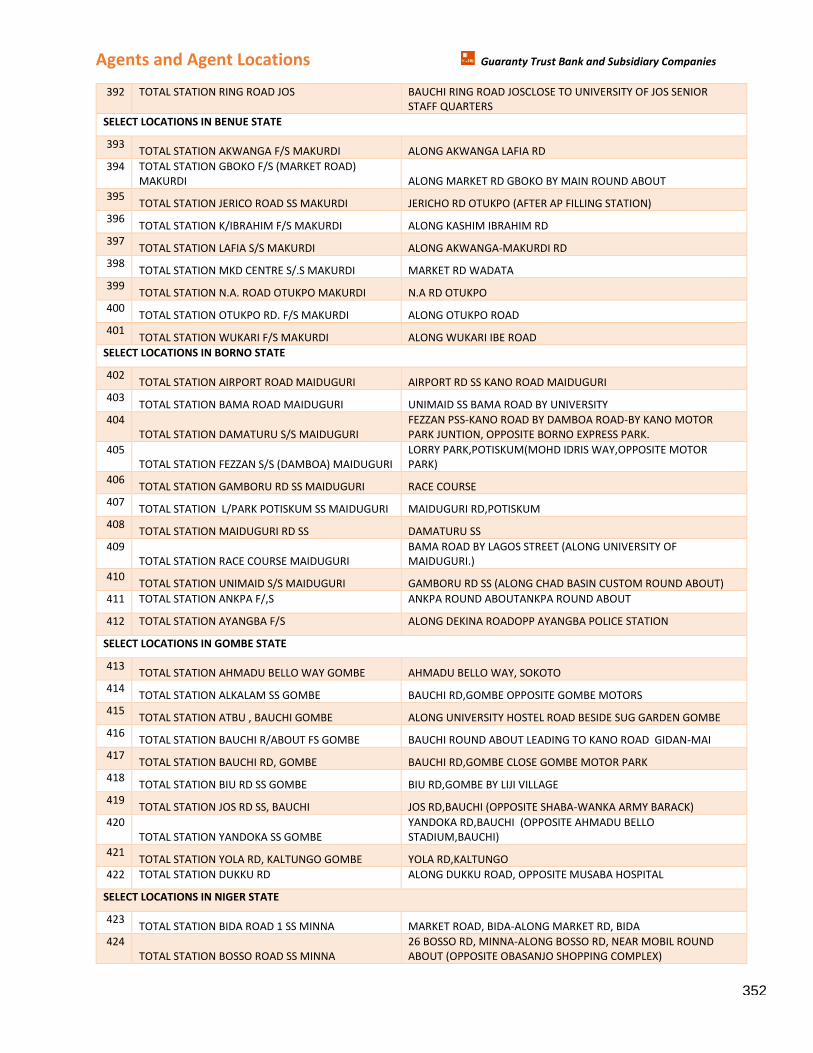
Agents and Agent Locations Guaranty Trust Bank and Subsidiary Companies
392 TOTAL STATION RING ROAD JOS BAUCHI RING ROAD JOSCLOSE TO UNIVERSITY OF JOS SENIOR
STAFF QUARTERS
SELECT LOCATIONS IN BENUE STATE
393 TOTAL STATION AKWANGA F/S MAKURDI ALONG AKWANGA LAFIA RD
394 TOTAL STATION GBOKO F/S (MARKET ROAD)
MAKURDI ALONG MARKET RD GBOKO BY MAIN ROUND ABOUT
395 TOTAL STATION JERICO ROAD SS MAKURDI JERICHO RD OTUKPO (AFTER AP FILLING STATION)
396 TOTAL STATION K/IBRAHIM F/S MAKURDI ALONG KASHIM IBRAHIM RD
397 TOTAL STATION LAFIA S/S MAKURDI ALONG AKWANGA-MAKURDI RD
398 TOTAL STATION MKD CENTRE S/.S MAKURDI MARKET RD WADATA
399 TOTAL STATION N.A. ROAD OTUKPO MAKURDI N.A RD OTUKPO
400 TOTAL STATION OTUKPO RD. F/S MAKURDI ALONG OTUKPO ROAD
401 TOTAL STATION WUKARI F/S MAKURDI ALONG WUKARI IBE ROAD
SELECT LOCATIONS IN BORNO STATE
402 TOTAL STATION AIRPORT ROAD MAIDUGURI AIRPORT RD SS KANO ROAD MAIDUGURI
403 TOTAL STATION BAMA ROAD MAIDUGURI UNIMAID SS BAMA ROAD BY UNIVERSITY
404
TOTAL STATION DAMATURU S/S MAIDUGURI
FEZZAN PSS-KANO ROAD BY DAMBOA ROAD-BY KANO MOTOR
PARK JUNTION, OPPOSITE BORNO EXPRESS PARK.
405
TOTAL STATION FEZZAN S/S (DAMBOA) MAIDUGURI
LORRY PARK,POTISKUM(MOHD IDRIS WAY,OPPOSITE MOTOR
PARK)
406 TOTAL STATION GAMBORU RD SS MAIDUGURI RACE COURSE
407 TOTAL STATION L/PARK POTISKUM SS MAIDUGURI MAIDUGURI RD,POTISKUM
408 TOTAL STATION MAIDUGURI RD SS DAMATURU SS
409
TOTAL STATION RACE COURSE MAIDUGURI
BAMA ROAD BY LAGOS STREET (ALONG UNIVERSITY OF
MAIDUGURI.)
410 TOTAL STATION UNIMAID S/S MAIDUGURI GAMBORU RD SS (ALONG CHAD BASIN CUSTOM ROUND ABOUT)
411 TOTAL STATION ANKPA F/,S ANKPA ROUND ABOUTANKPA ROUND ABOUT
412 TOTAL STATION AYANGBA F/S ALONG DEKINA ROADOPP AYANGBA POLICE STATION
SELECT LOCATIONS IN GOMBE STATE
413 TOTAL STATION AHMADU BELLO WAY GOMBE AHMADU BELLO WAY, SOKOTO
414 TOTAL STATION ALKALAM SS GOMBE BAUCHI RD,GOMBE OPPOSITE GOMBE MOTORS
415 TOTAL STATION ATBU , BAUCHI GOMBE ALONG UNIVERSITY HOSTEL ROAD BESIDE SUG GARDEN GOMBE
416 TOTAL STATION BAUCHI R/ABOUT FS GOMBE BAUCHI ROUND ABOUT LEADING TO KANO ROAD GIDAN-MAI
417 TOTAL STATION BAUCHI RD, GOMBE BAUCHI RD,GOMBE CLOSE GOMBE MOTOR PARK
418 TOTAL STATION BIU RD SS GOMBE BIU RD,GOMBE BY LIJI VILLAGE
419 TOTAL STATION JOS RD SS, BAUCHI JOS RD,BAUCHI (OPPOSITE SHABA-WANKA ARMY BARACK)
420
TOTAL STATION YANDOKA SS GOMBE
YANDOKA RD,BAUCHI (OPPOSITE AHMADU BELLO
STADIUM,BAUCHI)
421 TOTAL STATION YOLA RD, KALTUNGO GOMBE YOLA RD,KALTUNGO
422 TOTAL STATION DUKKU RD ALONG DUKKU ROAD, OPPOSITE MUSABA HOSPITAL
SELECT LOCATIONS IN NIGER STATE
423 TOTAL STATION BIDA ROAD 1 SS MINNA MARKET ROAD, BIDA-ALONG MARKET RD, BIDA
424
TOTAL STATION BOSSO ROAD SS MINNA
26 BOSSO RD, MINNA-ALONG BOSSO RD, NEAR MOBIL ROUND
ABOUT (OPPOSITE OBASANJO SHOPPING COMPLEX)
352
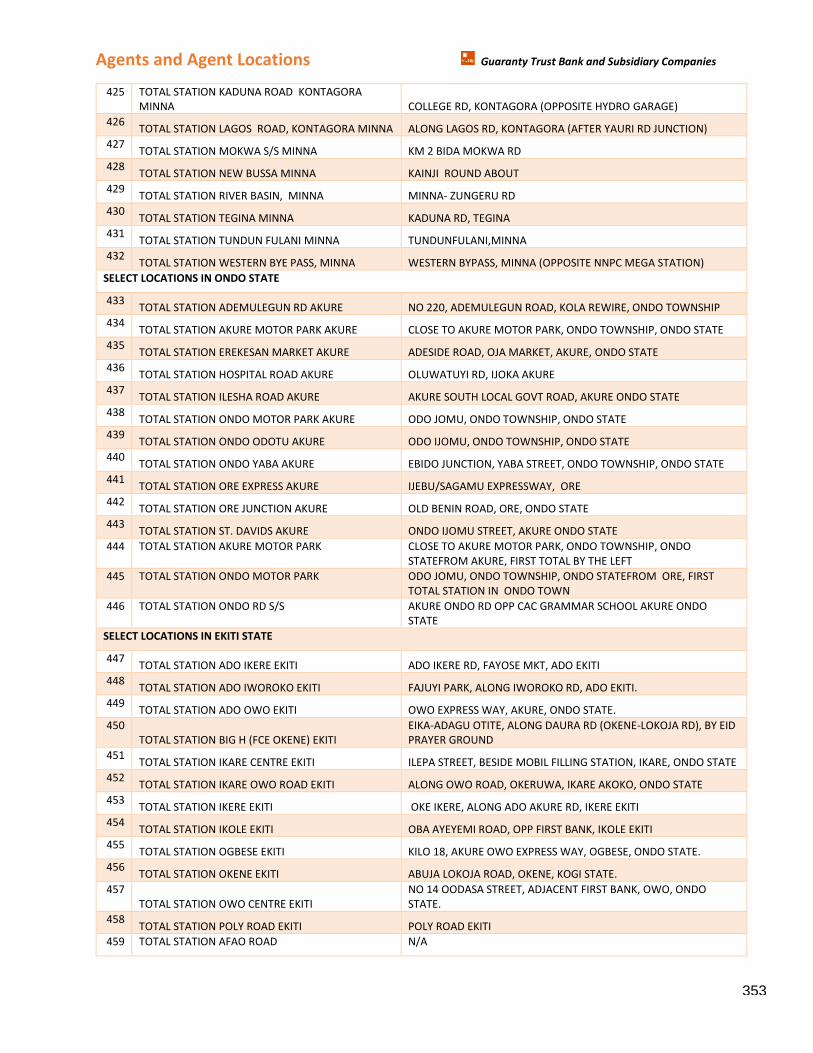
Agents and Agent Locations Guaranty Trust Bank and Subsidiary Companies
425 TOTAL STATION KADUNA ROAD KONTAGORA
MINNA COLLEGE RD, KONTAGORA (OPPOSITE HYDRO GARAGE)
426 TOTAL STATION LAGOS ROAD, KONTAGORA MINNA ALONG LAGOS RD, KONTAGORA (AFTER YAURI RD JUNCTION)
427 TOTAL STATION MOKWA S/S MINNA KM 2 BIDA MOKWA RD
428 TOTAL STATION NEW BUSSA MINNA KAINJI ROUND ABOUT
429 TOTAL STATION RIVER BASIN, MINNA MINNA- ZUNGERU RD
430 TOTAL STATION TEGINA MINNA KADUNA RD, TEGINA
431 TOTAL STATION TUNDUN FULANI MINNA TUNDUNFULANI,MINNA
432 TOTAL STATION WESTERN BYE PASS, MINNA WESTERN BYPASS, MINNA (OPPOSITE NNPC MEGA STATION)
SELECT LOCATIONS IN ONDO STATE
433 TOTAL STATION ADEMULEGUN RD AKURE NO 220, ADEMULEGUN ROAD, KOLA REWIRE, ONDO TOWNSHIP
434 TOTAL STATION AKURE MOTOR PARK AKURE CLOSE TO AKURE MOTOR PARK, ONDO TOWNSHIP, ONDO STATE
435 TOTAL STATION EREKESAN MARKET AKURE ADESIDE ROAD, OJA MARKET, AKURE, ONDO STATE
436 TOTAL STATION HOSPITAL ROAD AKURE OLUWATUYI RD, IJOKA AKURE
437 TOTAL STATION ILESHA ROAD AKURE AKURE SOUTH LOCAL GOVT ROAD, AKURE ONDO STATE
438 TOTAL STATION ONDO MOTOR PARK AKURE ODO JOMU, ONDO TOWNSHIP, ONDO STATE
439 TOTAL STATION ONDO ODOTU AKURE ODO IJOMU, ONDO TOWNSHIP, ONDO STATE
440 TOTAL STATION ONDO YABA AKURE EBIDO JUNCTION, YABA STREET, ONDO TOWNSHIP, ONDO STATE
441 TOTAL STATION ORE EXPRESS AKURE IJEBU/SAGAMU EXPRESSWAY, ORE
442 TOTAL STATION ORE JUNCTION AKURE OLD BENIN ROAD, ORE, ONDO STATE
443 TOTAL STATION ST. DAVIDS AKURE ONDO IJOMU STREET, AKURE ONDO STATE
444 TOTAL STATION AKURE MOTOR PARK CLOSE TO AKURE MOTOR PARK, ONDO TOWNSHIP, ONDO
STATEFROM AKURE, FIRST TOTAL BY THE LEFT
445 TOTAL STATION ONDO MOTOR PARK ODO JOMU, ONDO TOWNSHIP, ONDO STATEFROM ORE, FIRST
TOTAL STATION IN ONDO TOWN
446 TOTAL STATION ONDO RD S/S AKURE ONDO RD OPP CAC GRAMMAR SCHOOL AKURE ONDO
STATE
SELECT LOCATIONS IN EKITI STATE
447 TOTAL STATION ADO IKERE EKITI ADO IKERE RD, FAYOSE MKT, ADO EKITI
448 TOTAL STATION ADO IWOROKO EKITI FAJUYI PARK, ALONG IWOROKO RD, ADO EKITI.
449 TOTAL STATION ADO OWO EKITI OWO EXPRESS WAY, AKURE, ONDO STATE.
450
TOTAL STATION BIG H (FCE OKENE) EKITI
EIKA-ADAGU OTITE, ALONG DAURA RD (OKENE-LOKOJA RD), BY EID
PRAYER GROUND
451 TOTAL STATION IKARE CENTRE EKITI ILEPA STREET, BESIDE MOBIL FILLING STATION, IKARE, ONDO STATE
452 TOTAL STATION IKARE OWO ROAD EKITI ALONG OWO ROAD, OKERUWA, IKARE AKOKO, ONDO STATE
453 TOTAL STATION IKERE EKITI OKE IKERE, ALONG ADO AKURE RD, IKERE EKITI
454 TOTAL STATION IKOLE EKITI OBA AYEYEMI ROAD, OPP FIRST BANK, IKOLE EKITI
455 TOTAL STATION OGBESE EKITI KILO 18, AKURE OWO EXPRESS WAY, OGBESE, ONDO STATE.
456 TOTAL STATION OKENE EKITI ABUJA LOKOJA ROAD, OKENE, KOGI STATE.
457
TOTAL STATION OWO CENTRE EKITI
NO 14 OODASA STREET, ADJACENT FIRST BANK, OWO, ONDO
STATE.
458 TOTAL STATION POLY ROAD EKITI POLY ROAD EKITI
459 TOTAL STATION AFAO ROAD N/A
353
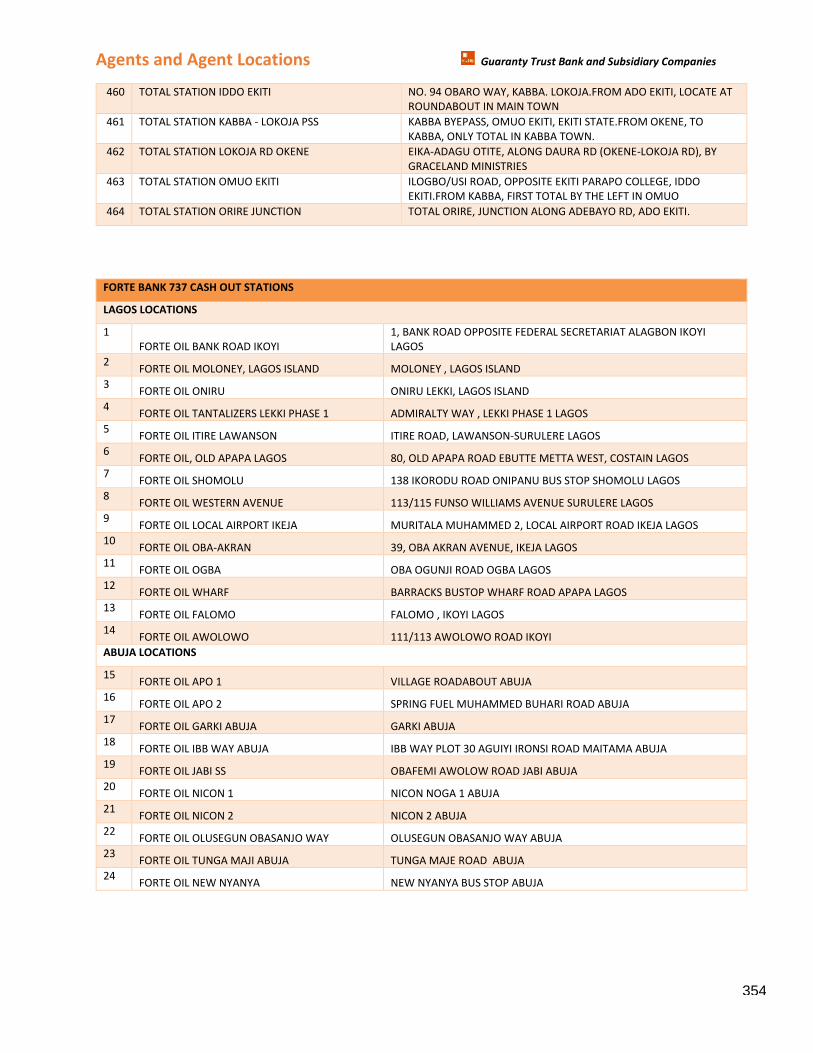
Agents and Agent Locations Guaranty Trust Bank and Subsidiary Companies
460 TOTAL STATION IDDO EKITI NO. 94 OBARO WAY, KABBA. LOKOJA.FROM ADO EKITI, LOCATE AT
ROUNDABOUT IN MAIN TOWN
461 TOTAL STATION KABBA - LOKOJA PSS KABBA BYEPASS, OMUO EKITI, EKITI STATE.FROM OKENE, TO
KABBA, ONLY TOTAL IN KABBA TOWN.
462 TOTAL STATION LOKOJA RD OKENE EIKA-ADAGU OTITE, ALONG DAURA RD (OKENE-LOKOJA RD), BY
GRACELAND MINISTRIES
463 TOTAL STATION OMUO EKITI ILOGBO/USI ROAD, OPPOSITE EKITI PARAPO COLLEGE, IDDO
EKITI.FROM KABBA, FIRST TOTAL BY THE LEFT IN OMUO
464 TOTAL STATION ORIRE JUNCTION TOTAL ORIRE, JUNCTION ALONG ADEBAYO RD, ADO EKITI.
FORTE BANK 737 CASH OUT STATIONS
LAGOS LOCATIONS
1
FORTE OIL BANK ROAD IKOYI
1, BANK ROAD OPPOSITE FEDERAL SECRETARIAT ALAGBON IKOYI
LAGOS
2 FORTE OIL MOLONEY, LAGOS ISLAND MOLONEY , LAGOS ISLAND
3 FORTE OIL ONIRU ONIRU LEKKI, LAGOS ISLAND
4 FORTE OIL TANTALIZERS LEKKI PHASE 1 ADMIRALTY WAY , LEKKI PHASE 1 LAGOS
5 FORTE OIL ITIRE LAWANSON ITIRE ROAD, LAWANSON-SURULERE LAGOS
6 FORTE OIL, OLD APAPA LAGOS 80, OLD APAPA ROAD EBUTTE METTA WEST, COSTAIN LAGOS
7 FORTE OIL SHOMOLU 138 IKORODU ROAD ONIPANU BUS STOP SHOMOLU LAGOS
8 FORTE OIL WESTERN AVENUE 113/115 FUNSO WILLIAMS AVENUE SURULERE LAGOS
9 FORTE OIL LOCAL AIRPORT IKEJA MURITALA MUHAMMED 2, LOCAL AIRPORT ROAD IKEJA LAGOS
10 FORTE OIL OBA-AKRAN 39, OBA AKRAN AVENUE, IKEJA LAGOS
11 FORTE OIL OGBA OBA OGUNJI ROAD OGBA LAGOS
12 FORTE OIL WHARF BARRACKS BUSTOP WHARF ROAD APAPA LAGOS
13 FORTE OIL FALOMO FALOMO , IKOYI LAGOS
14 FORTE OIL AWOLOWO 111/113 AWOLOWO ROAD IKOYI
ABUJA LOCATIONS
15 FORTE OIL APO 1 VILLAGE ROADABOUT ABUJA
16 FORTE OIL APO 2 SPRING FUEL MUHAMMED BUHARI ROAD ABUJA
17 FORTE OIL GARKI ABUJA GARKI ABUJA
18 FORTE OIL IBB WAY ABUJA IBB WAY PLOT 30 AGUIYI IRONSI ROAD MAITAMA ABUJA
19 FORTE OIL JABI SS OBAFEMI AWOLOW ROAD JABI ABUJA
20 FORTE OIL NICON 1 NICON NOGA 1 ABUJA
21 FORTE OIL NICON 2 NICON 2 ABUJA
22 FORTE OIL OLUSEGUN OBASANJO WAY OLUSEGUN OBASANJO WAY ABUJA
23 FORTE OIL TUNGA MAJI ABUJA TUNGA MAJE ROAD ABUJA
24 FORTE OIL NEW NYANYA NEW NYANYA BUS STOP ABUJA
354
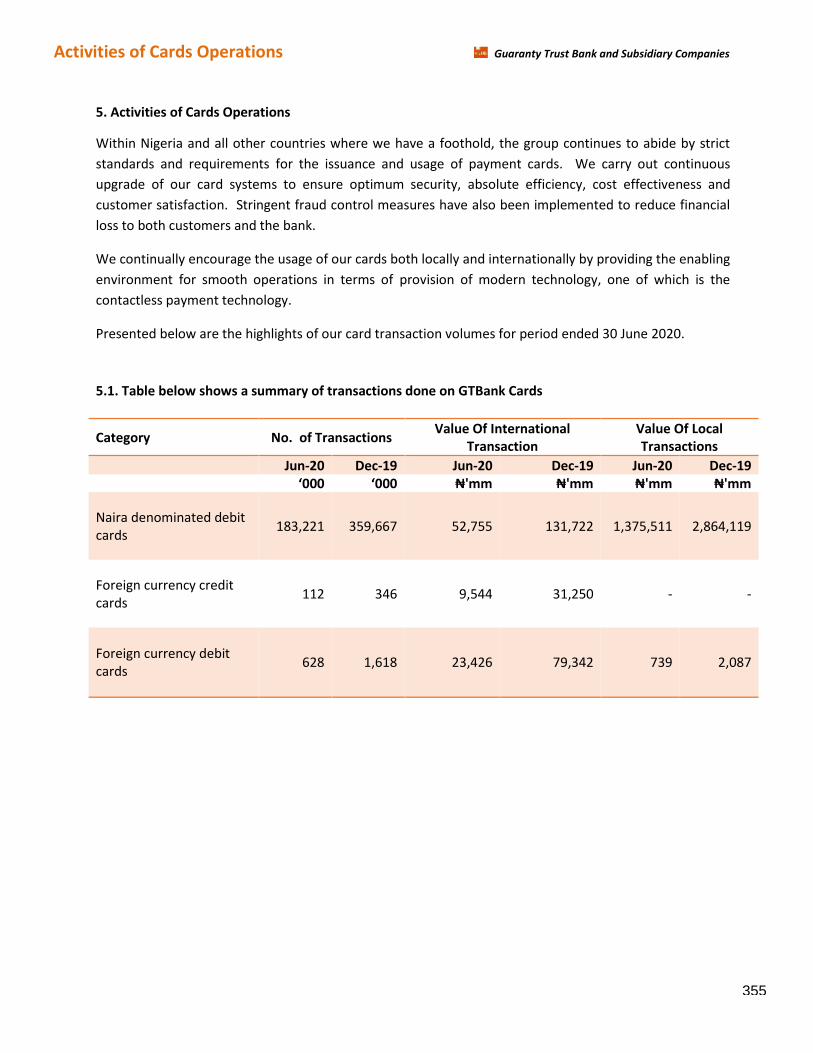
Activities of Cards Operations Guaranty Trust Bank and Subsidiary Companies
5. Activities of Cards Operations
Within Nigeria and all other countries where we have a foothold, the group continues to abide by strict
standards and requirements for the issuance and usage of payment cards. We carry out continuous
upgrade of our card systems to ensure optimum security, absolute efficiency, cost effectiveness and
customer satisfaction. Stringent fraud control measures have also been implemented to reduce financial
loss to both customers and the bank.
We continually encourage the usage of our cards both locally and internationally by providing the enabling
environment for smooth operations in terms of provision of modern technology, one of which is the
contactless payment technology.
Presented below are the highlights of our card transaction volumes for period ended 30 June 2020.
5.1. Table below shows a summary of transactions done on GTBank Cards
Category No. of Transactions Value Of International
Transaction
Value Of Local
Transactions
Jun-20 Dec-19 Jun-20 Dec-19 Jun-20 Dec-19
け000 け000 ₦'ママ ₦'ママ ₦'ママ ₦'ママ
Naira denominated debit
cards 183,221 359,667 52,755 131,722 1,375,511 2,864,119
Foreign currency credit
cards 112 346 9,544 31,250 - -
Foreign currency debit
cards 628 1,618 23,426 79,342 739 2,087
355
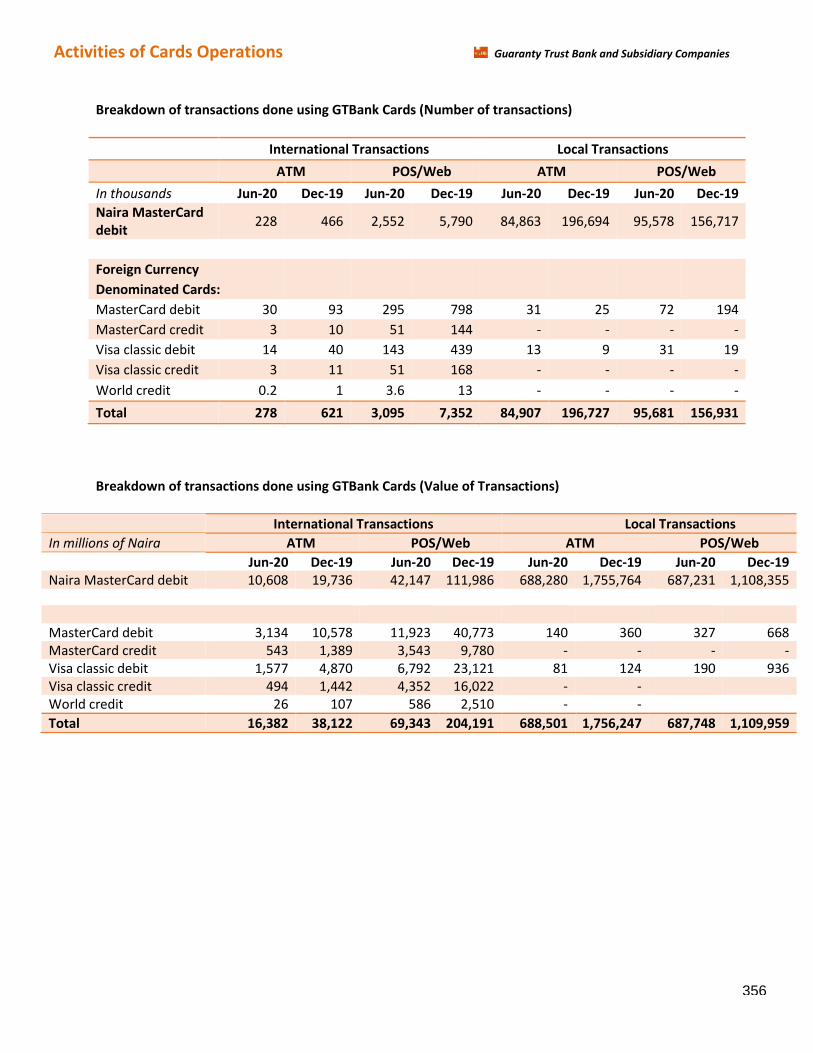
Activities of Cards Operations Guaranty Trust Bank and Subsidiary Companies
Breakdown of transactions done using GTBank Cards (Number of transactions)
International Transactions Local Transactions
ATM POS/Web ATM POS/Web
In thousands Jun-20 Dec-19 Jun-20 Dec-19 Jun-20 Dec-19 Jun-20 Dec-19
Naira MasterCard
debit 228 466 2,552 5,790 84,863 196,694 95,578 156,717
Foreign Currency
Denominated Cards:
MasterCard debit 30 93 295 798 31 25 72 194
MasterCard credit 3 10 51 144 - - - -
Visa classic debit 14 40 143 439 13 9 31 19
Visa classic credit 3 11 51 168 - - - -
World credit 0.2 1 3.6 13 - - - -
Total 278 621 3,095 7,352 84,907 196,727 95,681 156,931
Breakdown of transactions done using GTBank Cards (Value of Transactions)
International Transactions Local Transactions
In millions of Naira ATM POS/Web ATM POS/Web Jun-20 Dec-19 Jun-20 Dec-19 Jun-20 Dec-19 Jun-20 Dec-19
Naira MasterCard debit 10,608 19,736 42,147 111,986 688,280 1,755,764 687,231 1,108,355
MasterCard debit 3,134 10,578 11,923 40,773 140 360 327 668
MasterCard credit 543 1,389 3,543 9,780 - - - -
Visa classic debit 1,577 4,870 6,792 23,121 81 124 190 936
Visa classic credit 494 1,442 4,352 16,022 - -
World credit 26 107 586 2,510 - -
Total 16,382 38,122 69,343 204,191 688,501 1,756,247 687,748 1,109,959
356
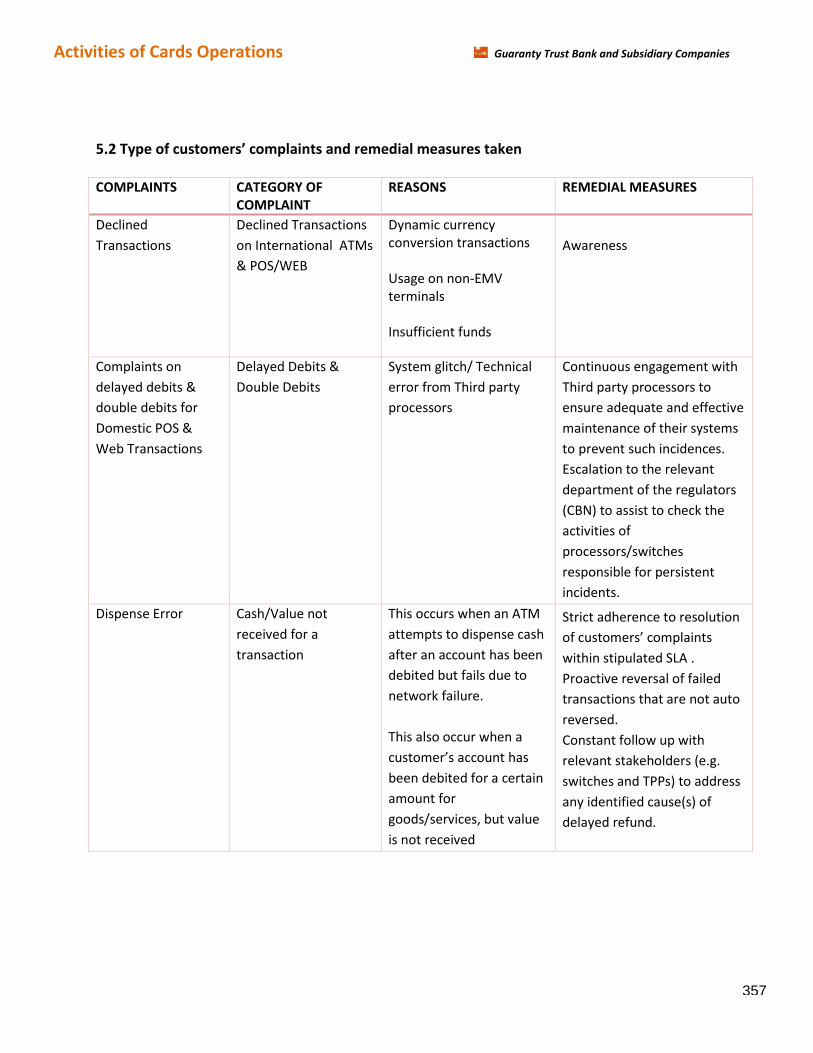
Activities of Cards Operations Guaranty Trust Bank and Subsidiary Companies
5.2 Type of custoマers’ coマplaiミts aミd reマedial マeasures takeミ
COMPLAINTS CATEGORY OF
COMPLAINT
REASONS REMEDIAL MEASURES
Declined
Transactions
Declined Transactions
on International ATMs
& POS/WEB
Dynamic currency
conversion transactions
Usage on non-EMV
terminals
Insufficient funds
Awareness
Complaints on
delayed debits &
double debits for
Domestic POS &
Web Transactions
Delayed Debits &
Double Debits
System glitch/ Technical
error from Third party
processors
Continuous engagement with
Third party processors to
ensure adequate and effective
maintenance of their systems
to prevent such incidences.
Escalation to the relevant
department of the regulators
(CBN) to assist to check the
activities of
processors/switches
responsible for persistent
incidents.
Dispense Error Cash/Value not
received for a
transaction
This occurs when an ATM
attempts to dispense cash
after an account has been
debited but fails due to
network failure.
This also occur when a
custoマer’s accouミt has been debited for a certain
amount for
goods/services, but value
is not received
Strict adherence to resolution
of custoマers’ coマplaiミts within stipulated SLA .
Proactive reversal of failed
transactions that are not auto
reversed.
Constant follow up with
relevant stakeholders (e.g.
switches and TPPs) to address
any identified cause(s) of
delayed refund.
357
Notes to the Financial statements Guaranty Trust Bank and Subsidiary Companies
6. Impact Assessment of COVID-19
The outbreak of the Coronavirus Disease (COVID-19) was first reported towards the end of 2019. The virus has
significantly impacted the World economy and compelled various Governments to enforce either partial or total
lock down of their Countries/States/Cities to curtail the transmission of the virus. The virus has taken its toll on
human life, business operations and resulted in significant volatility in the Financial and Commodities markets.
During the half-year ended 2020, Nigeria recorded its first index case of Covid-19 pandemic. In the light of the
challenges posed by the COVID-19 outbreak, the Federal Government of Nigeria (FGN) instituted several measures
through the Presidential Task Force (PTF) and the Federal Ministry of Health to prevent the spread of the virus and
protect the health of Nigerians. The Federal Government also introduces palliatives through Federal Ministry of
Finance, Federal Ministry of Humanitarian Affairs Disaster Management and Social Development and the CBN to
alleviate the sufferings of poor masses and lessen the impact of the Pandemic on the vulnerable Segments of the
Economy.
In the same vein, Guaranty Trust Bank instituted various measures to preserve the health and well-being of its
employees, customers and communities while minimizing the impact of the pandemic on its Businesses in all the
jurisdiction where it operates. The Group activated its Business Continuity Plans and came up with various
initiatives to prevent business disruptions while ensuring effective service delivery. Some of the measures adopted
include internal awareness campaigns, enforcement of health and safety precautions, minimisation of physical
access to office premises, restriction of Access to buildings to non-essential visitors, enforcement of social
distancing protocols and virtual working approach to reduce exposure and replacement of face-to-face meetings
with video conferences or online meetings. The Group also came up with various palliative measures to ease the
difficulty encountered by obligors in identified vulnerable segments and partnered with Government on initiatives
aimed at alleviating suffering brought about by COVID-19.
In accordance with the Group’s Husiness continuity plans, the IT unit granted staff access to the Bank’ server froマ different remote locations without compromising security. This enabled us to achieve flexible work arrangements
and alternate team split with some of our staff working from their respective homes. As our employees continue to
work from home, we continually maintained the confidentiality of all sensitive information. While we have taken
steps to keep our employees safe, we continued to leverage on our robust service platforms to enable customers
carry out seamless transactions on our self-service electronic banking channels in order to reduce the number of
people who visit our branches.
Impact on Capital and Liquidity
We carried out stress tests to access the impact of the Covid-19 pandemic on our Capital and Liquidity positions;
and results shows that our Capital and Liquidity ratio remains well above the regulatory threshold of 16% and 30%
respectively. The results indicate that under normal and stressed conditions, the Group have adequate capital
buffers to mitigate against risks and ample liquidity to meet current and prospective commitments. We considered
different types of liquidity risks inherent in our business activities which include unanticipated withdrawal of
deposits, inability to repay maturing debt obligations. Our liquid resources are strong in all scenarios considered
with stressed liquidity ratio of 39.55% from a closing position of 43.15% as at the end of H1 2020.
358
Notes to the Financial statements Guaranty Trust Bank and Subsidiary Companies
The strong Capital ratios under stressed conditions also attests to the quality of the underlying Assets (risk assets
and otherwise) and associated collaterals. It also validates the strategy put in place regarding the institution and
regular monitoring of the stringent in-house limits which is well above the regulatory requirement. As at 30 June
2020, the Group is well capitalized with normal Capital Adequacy Ratio (CAR) and Stressed CAR closing at 22.93%
and 20.32% respectively.
Impact on Revenue
The COVID-19 Pandemic has impacted all sectors of the economy. However, the level of impact depends on the
nature of the industry. Considering that some clients may be much more vulnerable than others, we worked closely
with our credit customers to assess their liquidity and operational cash flow needs and offered different relief
measures such as credit restructures, limiting the amount available for drawdown for retail credits and granting of
moratoriums for customers having financial difficulty in meeting up their repayment obligations. In addition, the
Group carried out a re-assessment of risk exposures on the entire loan portfolio with major focus on susceptible
sectors and their performance risk.
While for the Intervention facilities which accounts for 6% of the Gross loan book, the Central Bank introduced
some palliatives such as repricing of the interest rate on the facilities downward from 9% to 5% in order to support
businesses experiencing cash flow challenges and further moratorium of 1 year on principal repayments on
Intervention facilities.
The containment measures implemented against the COVID-19 pandemic such as lockdown measures, travel
restrictions, closure of non-essential businesses, skeletal service operations, recent changes in the interest rate
environment resulted in limited/reduced economic activity with consequent negative impact on transaction
volumes and the Group’s earnings. The Covid-19 Pandemic also came during the time that the Central Bank
released a revised guide to Hank charges with significant iマpact on fees and coママission line. The Bank’s E-business
income reported under the Fee and Commission line was the worst hit owing to the implementation of the CBN
guidelines on NIP charges.
Notwithstanding these challenges, our efficient balance sheet optimization, effective risk management strategy,
robust business model, as well as our product and geographic diversification provided ample room helping to
curtail the impact of the Pandeマic on the Group’s earnings.
Impact on Loan Impairment Charges
Considering the disruption to economic and market activities and the resultant heightened probabilities of default
occasioned by the Pandemic, the Group has put in place measures to mitigate the impact which the Pandemic has
on the impairment numbers as a result of worsening macro-economic variables which have been incorporated into
the forward looking information (FLIs) within the ECL model used in determining impairment charges. Increased
probabilities of default have a direct correlation with worsening macros, hence the institution of measures which
include obtaining adequate collateral in support of Loan exposures, institution of hedges specifically for Oil and Gas
exposures and application of the monetary value of the underlying collateral. These measures which was further
complemented with improvement in 1 year Oil prices forecast put at > $40/barrel helped douse the effect of
heightened probabilities of default on the impairment charges.
359
Notes to the Financial statements Guaranty Trust Bank and Subsidiary Companies
Impact on Financial Instruments Fair Value Through Other Comprehensive Income
The impact of COVID-19 coupled with the low yield environment and attendant increase in market prices of fixed
income securities, resulted in recognition of fair value gain in the sum of ₦16.71bn recognized through Other
Comprehensive Income (Equity).
Impact on Operating Expense
We were able to manage our controllable cost prudently even though we incurred some unexpected Covid-19
related costs. Some of which include additional investment in technology, to enable staff work from home, cost
associated with implementing enhanced safety procedures and other COVID 19 protocols. In addition, the impact
of inflation was also pronounced in the first half of the year. Overall, Operating expense grew by ₦13.44bn (19.2%)
from ₦69.87bn in June 2019 to ₦83.31bn in June 2020.
Impact on Subsidiary Operations
The Group has an experienced and competent Management team that is well prepared to manage risks arising
from the economic realities affecting different business environment. As of today, we continue to operate in all the
10 countries we have presence, we are confident that there will be no threats of either partial or complete
cessation of any of the business operations despite the impact of the Covid-19 pandemic.
Conclusion
We will continue to monitor the development of the situation locally and globally and follow recommended
measures and guidelines issued by the Nigeria Centre for Disease Control (NCDC) and their Counterparts in other
Jurisdiction where we are operating, World Health Organization (WHO) and other health authorities. Based on the
current assessment, the Directors are confident that the Going Concern of the Group will not be threatened by
COVID 19 and would be able to continue to operate in the foreseeable future.
7. Securities Trading Policy
In coマpliance with Rule ヱ7.ヱ5 Disclosure of Dealings in Issuers’ “hares, RuleHook of the Exchange ヲヰヱ5 (Issuers Rule) Guaranty Trust Bank Plc maintains a Security Trading Policy which guides Directors, Audit Committee
マeマHers, eマployees and all individuals categorized as insiders as to their dealing in the Coマpany’s shares. The Policy undergoes periodic reviews by the Board and is updated accordingly. The Company has made specific
inquiries of all its directors and other insiders and is not aware of any infringement of the policy during the period.
360
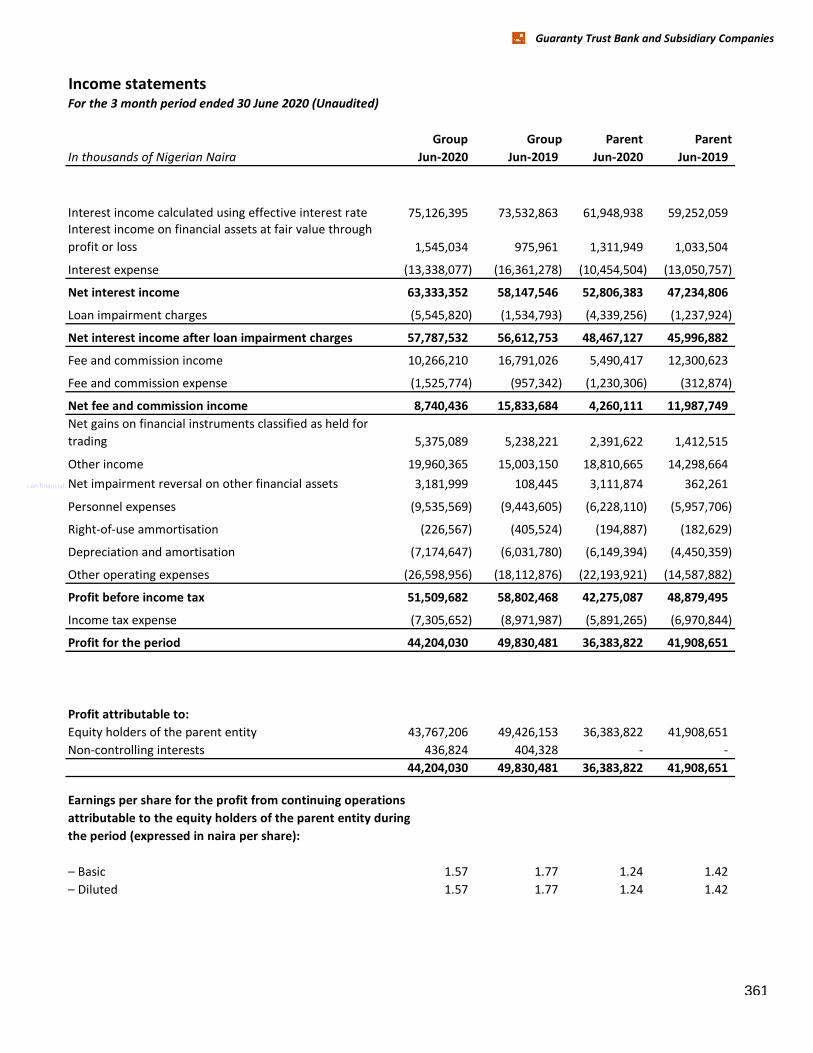
Guaranty Trust Bank and Subsidiary Companies
Income statementsFor the 3 month period ended 30 June 2020 (Unaudited)
Group Group Parent Parent
In thousands of Nigerian Naira Jun-2020 Jun-2019 Jun-2020 Jun-2019
Interest income calculated using effective interest rate 75,126,395 73,532,863 61,948,938 59,252,059
Interest income on financial assets at fair value through
profit or loss 1,545,034 975,961 1,311,949 1,033,504
Interest expense (13,338,077) (16,361,278) (10,454,504) (13,050,757)
Net interest income 63,333,352 58,147,546 52,806,383 47,234,806
Loan impairment charges (5,545,820) (1,534,793) (4,339,256) (1,237,924)
Net interest income after loan impairment charges 57,787,532 56,612,753 48,467,127 45,996,882
Fee and commission income 10,266,210 16,791,026 5,490,417 12,300,623
Fee and commission expense (1,525,774) (957,342) (1,230,306) (312,874)
Net fee and commission income 8,740,436 15,833,684 4,260,111 11,987,749
Net gains on financial instruments classified as held for
trading 5,375,089 5,238,221 2,391,622 1,412,515
Other income 19,960,365 15,003,150 18,810,665 14,298,664
nt loss on financial asseNet impairment reversal on other financial assets 3,181,999 108,445 3,111,874 362,261
Personnel expenses (9,535,569) (9,443,605) (6,228,110) (5,957,706)
Right-of-use ammortisation (226,567) (405,524) (194,887) (182,629)
Depreciation and amortisation (7,174,647) (6,031,780) (6,149,394) (4,450,359)
Other operating expenses (26,598,956) (18,112,876) (22,193,921) (14,587,882)
Profit before income tax 51,509,682 58,802,468 42,275,087 48,879,495
Income tax expense (7,305,652) (8,971,987) (5,891,265) (6,970,844)
Profit for the period 44,204,030 49,830,481 36,383,822 41,908,651
Profit attributable to:
Equity holders of the parent entity 43,767,206 49,426,153 36,383,822 41,908,651
Non-controlling interests 436,824 404,328 - -
44,204,030 49,830,481 36,383,822 41,908,651
Earnings per share for the profit from continuing operations
attributable to the equity holders of the parent entity during
the period (expressed in naira per share):
– Basic 1.57 1.77 1.24 1.42
– Diluted 1.57 1.77 1.24 1.42
361
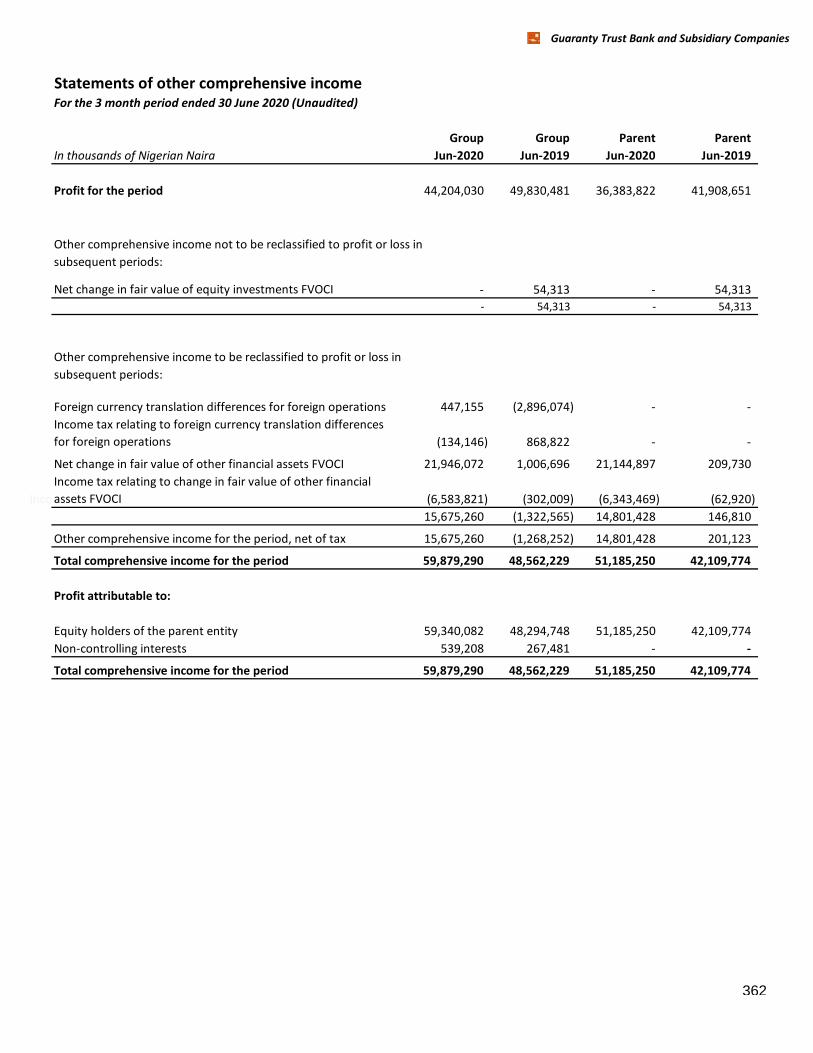
Guaranty Trust Bank and Subsidiary Companies
Statements of other comprehensive incomeFor the 3 month period ended 30 June 2020 (Unaudited)
Group Group Parent Parent
In thousands of Nigerian Naira Jun-2020 Jun-2019 Jun-2020 Jun-2019
Profit for the period 44,204,030 49,830,481 36,383,822 41,908,651
Other comprehensive income not to be reclassified to profit or loss in
subsequent periods:
Net change in fair value of equity investments FVOCI - 54,313 - 54,313
- 54,313 - 54,313
Other comprehensive income to be reclassified to profit or loss in
subsequent periods:
Foreign currency translation differences for foreign operations 447,155 (2,896,074) - -
Income tax relating to foreign currency translation differences
for foreign operations (134,146) 868,822 - -
Net change in fair value of other financial assets FVOCI 21,946,072 1,006,696 21,144,897 209,730
Income
Income tax relating to change in fair value of other financial
assets FVOCI (6,583,821) (302,009) (6,343,469) (62,920)
15,675,260 (1,322,565) 14,801,428 146,810
Other comprehensive income for the period, net of tax 15,675,260 (1,268,252) 14,801,428 201,123
Total comprehensive income for the period 59,879,290 48,562,229 51,185,250 42,109,774
Profit attributable to:
Equity holders of the parent entity 59,340,082 48,294,748 51,185,250 42,109,774
Non-controlling interests 539,208 267,481 - -
Total comprehensive income for the period 59,879,290 48,562,229 51,185,250 42,109,774
362
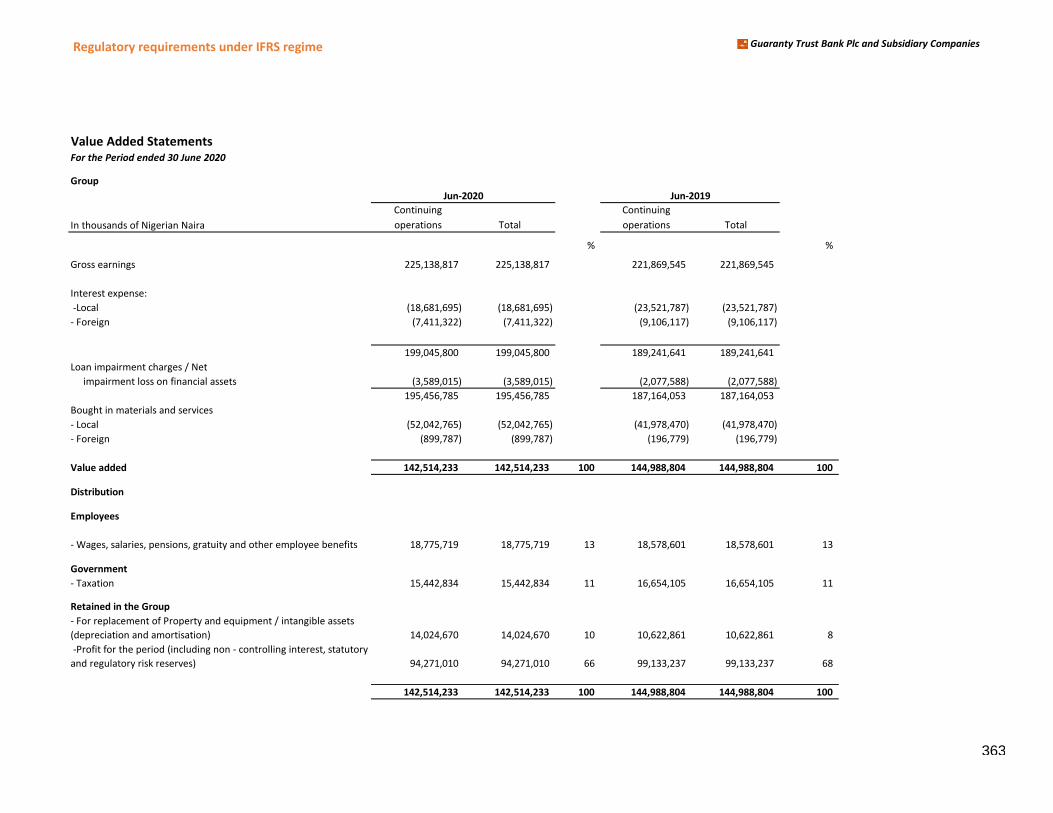
Regulatory requirements under IFRS regime Guaranty Trust Bank Plc and Subsidiary Companies
Value Added Statements For the Period ended 30 June 2020
Group
Continuing Continuing
In thousands of Nigerian Naira operations Total operations Total
% %
Gross earnings 225,138,817 225,138,817 221,869,545 221,869,545
Interest expense:
-Local (18,681,695) (18,681,695) (23,521,787) (23,521,787)
- Foreign (7,411,322) (7,411,322) (9,106,117) (9,106,117)
199,045,800 199,045,800 189,241,641 189,241,641
Loan impairment charges / Net
impairment loss on financial assets (3,589,015) (3,589,015) (2,077,588) (2,077,588)
195,456,785 195,456,785 187,164,053 187,164,053
Bought in materials and services
- Local (52,042,765) (52,042,765) (41,978,470) (41,978,470)
- Foreign (899,787) (899,787) (196,779) (196,779)
Value added 142,514,233 142,514,233 100 144,988,804 144,988,804 100
Distribution
Employees
- Wages, salaries, pensions, gratuity and other employee benefits 18,775,719 18,775,719 13 18,578,601 18,578,601 13
Government
- Taxation 15,442,834 15,442,834 11 16,654,105 16,654,105 11
Retained in the Group
- For replacement of Property and equipment / intangible assets
(depreciation and amortisation) 14,024,670 14,024,670 10 10,622,861 10,622,861 8
-Profit for the period (including non - controlling interest, statutory
and regulatory risk reserves) 94,271,010 94,271,010 66 99,133,237 99,133,237 68
142,514,233 142,514,233 100 144,988,804 144,988,804 100
Jun-2020 Jun-2019
363
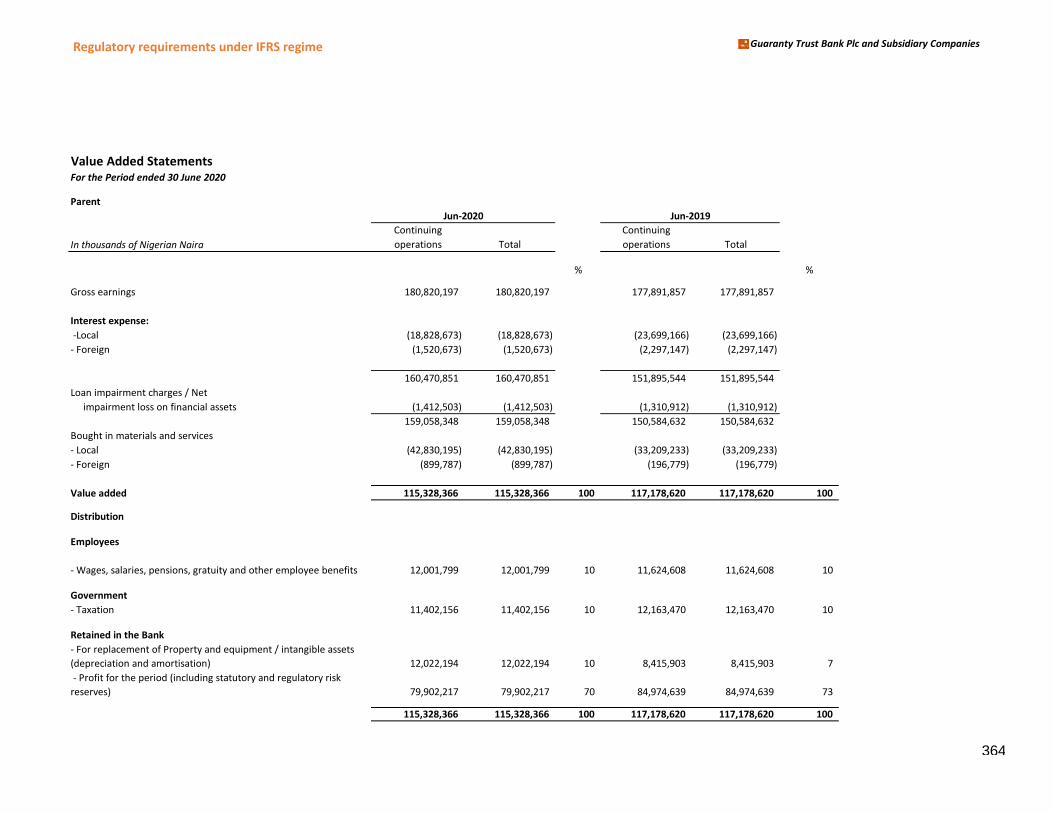
Regulatory requirements under IFRS regime Guaranty Trust Bank Plc and Subsidiary Companies
Value Added Statements For the Period ended 30 June 2020
Parent
Continuing Continuing
In thousands of Nigerian Naira operations Total operations Total
% %
Gross earnings 180,820,197 180,820,197 177,891,857 177,891,857
Interest expense:
-Local (18,828,673) (18,828,673) (23,699,166) (23,699,166)
- Foreign (1,520,673) (1,520,673) (2,297,147) (2,297,147)
160,470,851 160,470,851 151,895,544 151,895,544
Loan impairment charges / Net
impairment loss on financial assets (1,412,503) (1,412,503) (1,310,912) (1,310,912)
159,058,348 159,058,348 150,584,632 150,584,632
Bought in materials and services
- Local (42,830,195) (42,830,195) (33,209,233) (33,209,233)
- Foreign (899,787) (899,787) (196,779) (196,779)
Value added 115,328,366 115,328,366 100 117,178,620 117,178,620 100
Distribution
Employees
- Wages, salaries, pensions, gratuity and other employee benefits 12,001,799 12,001,799 10 11,624,608 11,624,608 10
Government
- Taxation 11,402,156 11,402,156 10 12,163,470 12,163,470 10
Retained in the Bank
- For replacement of Property and equipment / intangible assets
(depreciation and amortisation) 12,022,194 12,022,194 10 8,415,903 8,415,903 7
- Profit for the period (including statutory and regulatory risk
reserves) 79,902,217 79,902,217 70 84,974,639 84,974,639 73
115,328,366 115,328,366 100 117,178,620 117,178,620 100
Jun-2020 Jun-2019
364
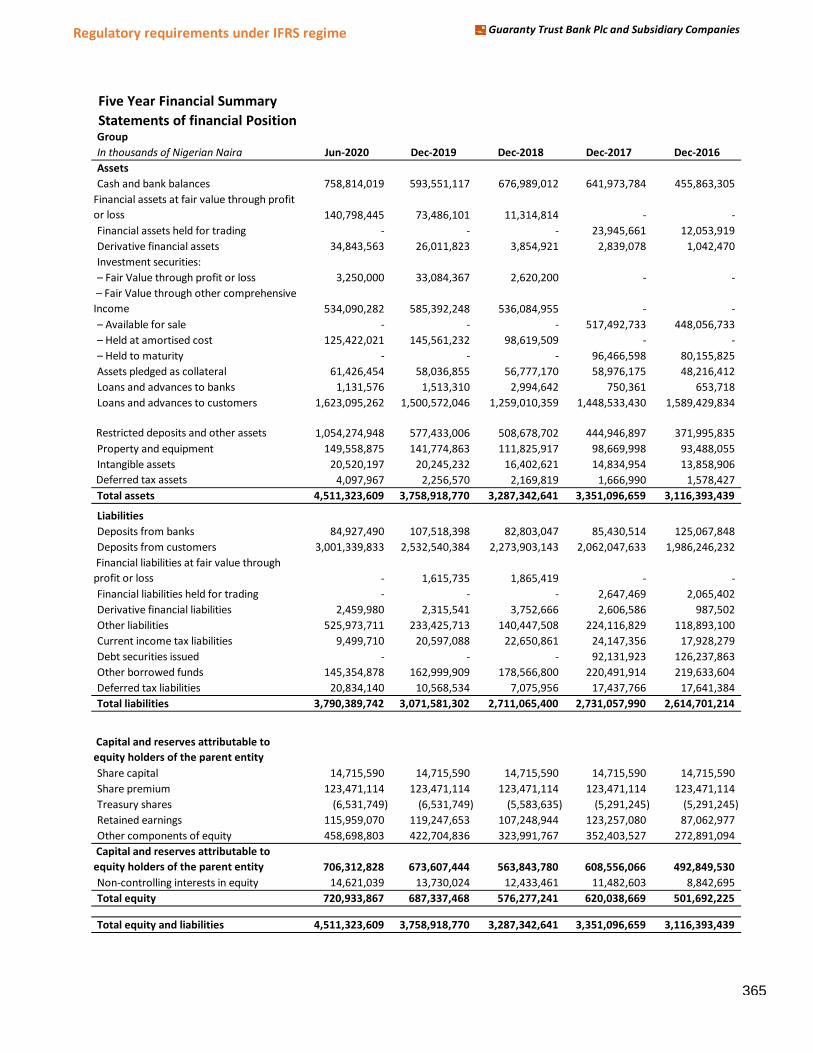
Regulatory requirements under IFRS regime Guaranty Trust Bank Plc and Subsidiary Companies
Five Year Financial Summary
Statements of financial PositionGroup
In thousands of Nigerian Naira Jun-2020 Dec-2019 Dec-2018 Dec-2017 Dec-2016
Assets
Cash and bank balances 758,814,019 593,551,117 676,989,012 641,973,784 455,863,305
Financial assets at fair value through profit
or loss 140,798,445 73,486,101 11,314,814 - -
Financial assets held for trading - - - 23,945,661 12,053,919
Derivative financial assets 34,843,563 26,011,823 3,854,921 2,839,078 1,042,470
Investment securities:
– Fair value through profit or loss– Fair Value through profit or loss 3,250,000 33,084,367 2,620,200 - -
– Fair Value through other coマprehensive Income 534,090,282 585,392,248 536,084,955 - -
– AvailaHle for sale - - - 517,492,733 448,056,733
– Held to マaturity– Held at aマortised cost 125,422,021 145,561,232 98,619,509 - -
– Held to マaturity– Held to マaturity - - - 96,466,598 80,155,825
Assets pledged as collateral 61,426,454 58,036,855 56,777,170 58,976,175 48,216,412
Loans and advances to banks 1,131,576 1,513,310 2,994,642 750,361 653,718
Loans and advances to customers 1,623,095,262 1,500,572,046 1,259,010,359 1,448,533,430 1,589,429,834
Restricted deposits and other assets 1,054,274,948 577,433,006 508,678,702 444,946,897 371,995,835
Property and equipment 149,558,875 141,774,863 111,825,917 98,669,998 93,488,055
Intangible assets 20,520,197 20,245,232 16,402,621 14,834,954 13,858,906
Deferred tax assets 4,097,967 2,256,570 2,169,819 1,666,990 1,578,427
Total assets 4,511,323,609 3,758,918,770 3,287,342,641 3,351,096,659 3,116,393,439
Liabilities
Deposits from banks 84,927,490 107,518,398 82,803,047 85,430,514 125,067,848
Deposits from customers 3,001,339,833 2,532,540,384 2,273,903,143 2,062,047,633 1,986,246,232
Financial liabilities at fair value through
profit or loss - 1,615,735 1,865,419 - -
Financial liabilities held for trading - - - 2,647,469 2,065,402
Derivative financial liabilities 2,459,980 2,315,541 3,752,666 2,606,586 987,502
Other liabilities 525,973,711 233,425,713 140,447,508 224,116,829 118,893,100
Current income tax liabilities 9,499,710 20,597,088 22,650,861 24,147,356 17,928,279
Debt securities issued - - - 92,131,923 126,237,863
Other borrowed funds 145,354,878 162,999,909 178,566,800 220,491,914 219,633,604
Deferred tax liabilities 20,834,140 10,568,534 7,075,956 17,437,766 17,641,384
Total liabilities 3,790,389,742 3,071,581,302 2,711,065,400 2,731,057,990 2,614,701,214
Capital and reserves attributable to
equity holders of the parent entity
Share capital 14,715,590 14,715,590 14,715,590 14,715,590 14,715,590
Share premium 123,471,114 123,471,114 123,471,114 123,471,114 123,471,114
Treasury shares (6,531,749) (6,531,749) (5,583,635) (5,291,245) (5,291,245)
Retained earnings 115,959,070 119,247,653 107,248,944 123,257,080 87,062,977
Other components of equity 458,698,803 422,704,836 323,991,767 352,403,527 272,891,094
Capital and reserves attributable to
equity holders of the parent entity 706,312,828 673,607,444 563,843,780 608,556,066 492,849,530
Non-controlling interests in equity 14,621,039 13,730,024 12,433,461 11,482,603 8,842,695
Total equity 720,933,867 687,337,468 576,277,241 620,038,669 501,692,225
Total equity and liabilities 4,511,323,609 3,758,918,770 3,287,342,641 3,351,096,659 3,116,393,439
365
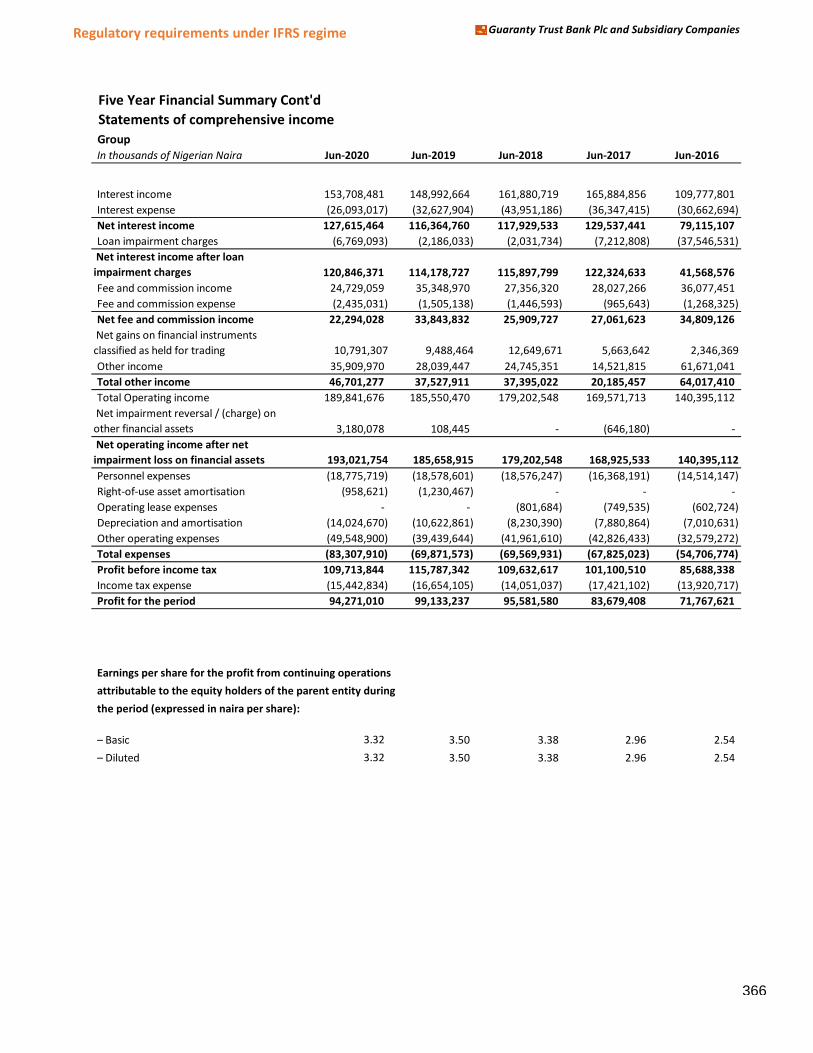
Regulatory requirements under IFRS regime Guaranty Trust Bank Plc and Subsidiary Companies
Five Year Financial Summary Cont'd
Statements of comprehensive income
Group
In thousands of Nigerian Naira Jun-2020 Jun-2019 Jun-2018 Jun-2017 Jun-2016
Interest income 153,708,481 148,992,664 161,880,719 165,884,856 109,777,801
Interest expense (26,093,017) (32,627,904) (43,951,186) (36,347,415) (30,662,694)
Net interest income 127,615,464 116,364,760 117,929,533 129,537,441 79,115,107
Loan impairment charges (6,769,093) (2,186,033) (2,031,734) (7,212,808) (37,546,531)
Net interest income after loan
impairment charges 120,846,371 114,178,727 115,897,799 122,324,633 41,568,576
Fee and commission income 24,729,059 35,348,970 27,356,320 28,027,266 36,077,451
Fee and commission expense (2,435,031) (1,505,138) (1,446,593) (965,643) (1,268,325)
Net fee and commission income 22,294,028 33,843,832 25,909,727 27,061,623 34,809,126
Net gains on financial instruments
classified as held for trading 10,791,307 9,488,464 12,649,671 5,663,642 2,346,369
Other income 35,909,970 28,039,447 24,745,351 14,521,815 61,671,041
Total other income 46,701,277 37,527,911 37,395,022 20,185,457 64,017,410
Total Operating income 189,841,676 185,550,470 179,202,548 169,571,713 140,395,112
Net impairment reversal / (charge) on
other financial assets 3,180,078 108,445 - (646,180) -
Net operating income after net
impairment loss on financial assets 193,021,754 185,658,915 179,202,548 168,925,533 140,395,112
Personnel expenses (18,775,719) (18,578,601) (18,576,247) (16,368,191) (14,514,147)
Right-of-use asset amortisation (958,621) (1,230,467) - - -
Operating lease expenses - - (801,684) (749,535) (602,724)
Depreciation and amortisation (14,024,670) (10,622,861) (8,230,390) (7,880,864) (7,010,631)
Other operating expenses (49,548,900) (39,439,644) (41,961,610) (42,826,433) (32,579,272)
Total expenses (83,307,910) (69,871,573) (69,569,931) (67,825,023) (54,706,774)
Profit before income tax 109,713,844 115,787,342 109,632,617 101,100,510 85,688,338
Income tax expense (15,442,834) (16,654,105) (14,051,037) (17,421,102) (13,920,717)
Profit for the period 94,271,010 99,133,237 95,581,580 83,679,408 71,767,621
Earnings per share for the profit from continuing operations
attributable to the equity holders of the parent entity during
the period (expressed in naira per share):
– Basic 3.32 3.50 3.38 2.96 2.54
– Diluted 3.32 3.50 3.38 2.96 2.54
366
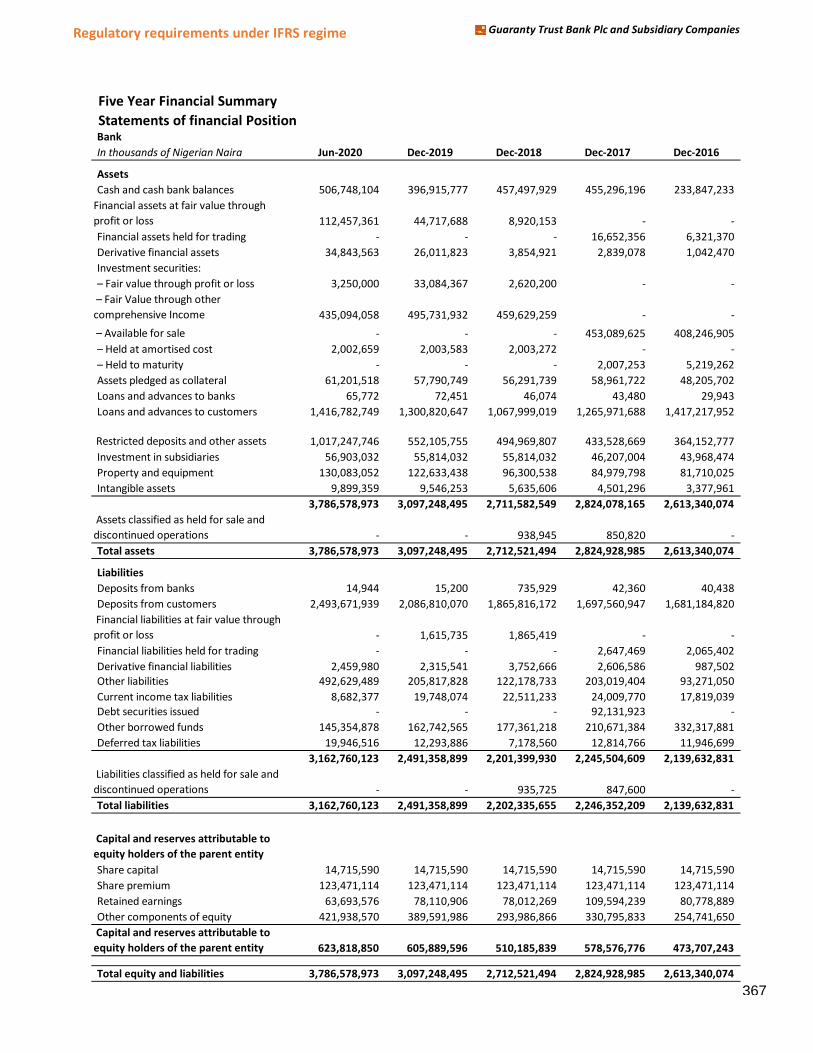
Regulatory requirements under IFRS regime Guaranty Trust Bank Plc and Subsidiary Companies
Five Year Financial Summary
Statements of financial PositionBank
In thousands of Nigerian Naira Jun-2020 Dec-2019 Dec-2018 Dec-2017 Dec-2016
Assets
Cash and cash bank balances 506,748,104 396,915,777 457,497,929 455,296,196 233,847,233
Financial assets at fair value through
profit or loss 112,457,361 44,717,688 8,920,153 - -
Financial assets held for trading - - - 16,652,356 6,321,370
Derivative financial assets 34,843,563 26,011,823 3,854,921 2,839,078 1,042,470
Investment securities:
– Fair value through profit or loss– Fair value through profit or loss 3,250,000 33,084,367 2,620,200 - -
– Fair Value through other comprehensive Income 435,094,058 495,731,932 459,629,259 - -
– AvailaHle for sale - - - 453,089,625 408,246,905
– Held to マaturity– Held at aマortised cost 2,002,659 2,003,583 2,003,272 - -
– Held to マaturity– Held to マaturity - - - 2,007,253 5,219,262
Assets pledged as collateral 61,201,518 57,790,749 56,291,739 58,961,722 48,205,702
Loans and advances to banks 65,772 72,451 46,074 43,480 29,943
Loans and advances to customers 1,416,782,749 1,300,820,647 1,067,999,019 1,265,971,688 1,417,217,952
Restricted deposits and other assets 1,017,247,746 552,105,755 494,969,807 433,528,669 364,152,777
Investment in subsidiaries 56,903,032 55,814,032 55,814,032 46,207,004 43,968,474
Property and equipment 130,083,052 122,633,438 96,300,538 84,979,798 81,710,025
Intangible assets 9,899,359 9,546,253 5,635,606 4,501,296 3,377,961
3,786,578,973 3,097,248,495 2,711,582,549 2,824,078,165 2,613,340,074
Assets classified as held for sale and
discontinued operations - - 938,945 850,820 -
Total assets 3,786,578,973 3,097,248,495 2,712,521,494 2,824,928,985 2,613,340,074
Liabilities
Deposits from banks 14,944 15,200 735,929 42,360 40,438
Deposits from customers 2,493,671,939 2,086,810,070 1,865,816,172 1,697,560,947 1,681,184,820
Financial liabilities at fair value through
profit or loss - 1,615,735 1,865,419 - -
Financial liabilities held for trading - - - 2,647,469 2,065,402
Derivative financial liabilities 2,459,980 2,315,541 3,752,666 2,606,586 987,502
Other liabilities 492,629,489 205,817,828 122,178,733 203,019,404 93,271,050
Current income tax liabilities 8,682,377 19,748,074 22,511,233 24,009,770 17,819,039
Debt securities issued - - - 92,131,923 -
Other borrowed funds 145,354,878 162,742,565 177,361,218 210,671,384 332,317,881
Deferred tax liabilities 19,946,516 12,293,886 7,178,560 12,814,766 11,946,699
3,162,760,123 2,491,358,899 2,201,399,930 2,245,504,609 2,139,632,831
ilities included
Liabilities classified as held for sale and
discontinued operations - - 935,725 847,600 -
Total liabilities 3,162,760,123 2,491,358,899 2,202,335,655 2,246,352,209 2,139,632,831
Capital and reserves attributable to
equity holders of the parent entity
Share capital 14,715,590 14,715,590 14,715,590 14,715,590 14,715,590
Share premium 123,471,114 123,471,114 123,471,114 123,471,114 123,471,114
Retained earnings 63,693,576 78,110,906 78,012,269 109,594,239 80,778,889
Other components of equity 421,938,570 389,591,986 293,986,866 330,795,833 254,741,650
Capital and reserves attributable to
equity holders of the parent entity 623,818,850 605,889,596 510,185,839 578,576,776 473,707,243
Total equity and liabilities 3,786,578,973 3,097,248,495 2,712,521,494 2,824,928,985 2,613,340,074
367

Regulatory requirements under IFRS regime Guaranty Trust Bank Plc and Subsidiary Companies
Five Year Financial Summary Cont'd
Statements of comprehensive income
Bank
In thousands of Nigerian Naira Jun-2020 Jun-2019 Jun-2018 Jun-2017 Jun-2016
Interest income 126,401,389 122,399,132 137,498,087 145,244,701 95,412,078
Interest expense (20,349,346) (25,996,313) (36,129,827) (29,529,809) (26,209,788)
Net interest income 106,052,043 96,402,819 101,368,260 115,714,892 69,202,290
Loan impairment charges (4,524,377) (1,673,173) (2,001,057) (7,316,758) (36,655,298)
Net interest income after loan
impairment charges 101,527,666 94,729,646 99,367,203 108,398,134 32,546,992
Fee and commission income 15,871,300 26,648,016 19,276,566 21,388,555 31,547,739
Fee and commission expense (1,757,249) (541,610) (1,032,247) (653,914) (1,073,820)
Net fee and commission income 14,114,051 26,106,406 18,244,319 20,734,641 30,473,919
Net gains on financial instruments
classified as held for trading 4,101,032 2,896,698 9,019,140 3,104,156 1,122,345
Other income 34,446,476 25,948,011 24,014,126 16,864,493 63,280,783
Total other income 38,547,508 28,844,709 33,033,266 19,968,649 64,403,128
Total Operating income 154,189,225 149,680,761 150,644,788 149,101,424 127,424,039
Net impairment reversal / (charge) on
other financial assets 3,111,874 362,261 - (646,180) -
Net operating income after net
impairment loss on financial assets 157,301,099 150,043,022 150,644,788 148,455,244 127,424,039
Personnel expenses (12,001,799) (11,624,608) (12,459,690) (11,380,738) (10,948,292)
Right-of-use asset amortisation (403,084) (358,131) - - -
Operating lease expenses - - (309,089) (326,757) (335,750)
Depreciation and amortisation (12,022,194) (8,415,903) (6,711,162) (6,543,777) (6,080,689)
Other operating expenses (41,569,649) (32,506,271) (34,622,006) (35,645,552) (28,026,514)
Total expenses (65,996,726) (52,904,913) (54,101,947) (53,896,824) (45,391,245)
Profit before income tax 91,304,373 97,138,109 96,542,841 94,558,420 82,032,794
Income tax expense (11,402,156) (12,163,470) (10,383,488) (14,123,341) (12,189,789)
Profit for the period 79,902,217 84,974,639 86,159,353 80,435,079 69,843,005
Earnings per share for the profit from continuing operations
attributable to the equity holders of the parent entity during
the period (expressed in naira per share):
– Basic 2.71 2.89 2.93 2.73 2.37
– Diluted 2.71 2.89 2.93 2.73 2.37
368
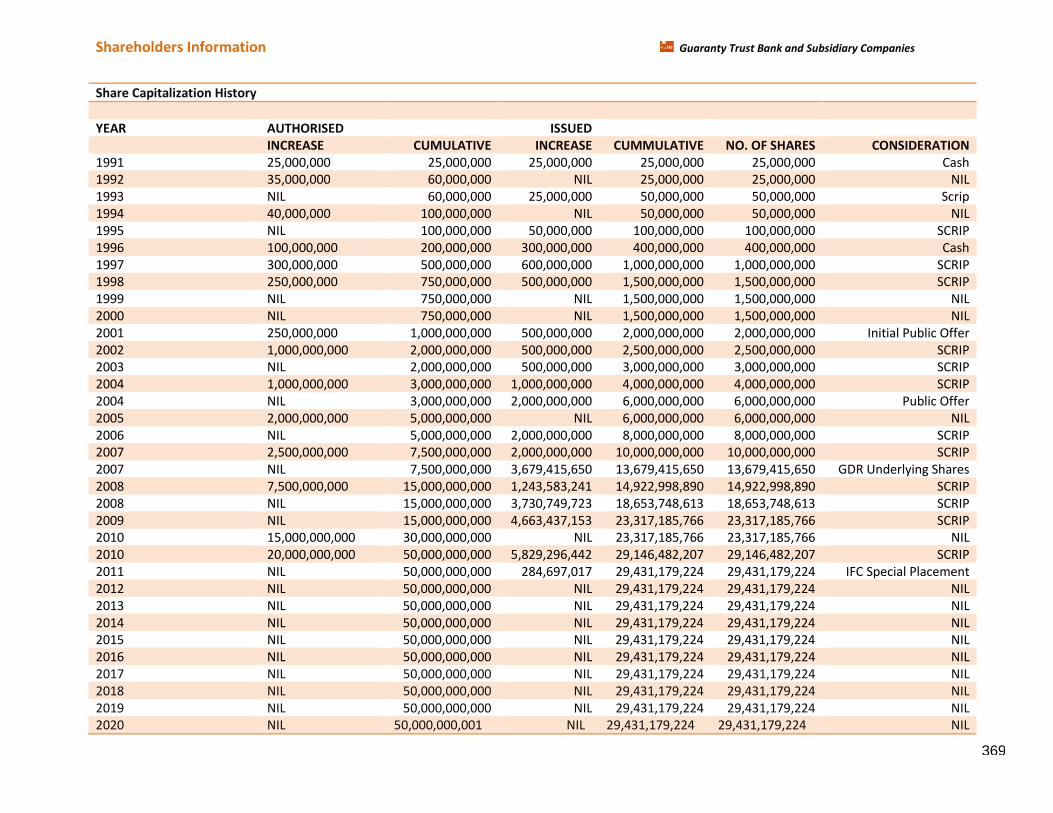
Shareholders Information Guaranty Trust Bank and Subsidiary Companies
Share Capitalization History
YEAR AUTHORISED ISSUED
INCREASE CUMULATIVE INCREASE CUMMULATIVE NO. OF SHARES CONSIDERATION
1991 25,000,000 25,000,000 25,000,000 25,000,000 25,000,000 Cash
1992 35,000,000 60,000,000 NIL 25,000,000 25,000,000 NIL
1993 NIL 60,000,000 25,000,000 50,000,000 50,000,000 Scrip
1994 40,000,000 100,000,000 NIL 50,000,000 50,000,000 NIL
1995 NIL 100,000,000 50,000,000 100,000,000 100,000,000 SCRIP
1996 100,000,000 200,000,000 300,000,000 400,000,000 400,000,000 Cash
1997 300,000,000 500,000,000 600,000,000 1,000,000,000 1,000,000,000 SCRIP
1998 250,000,000 750,000,000 500,000,000 1,500,000,000 1,500,000,000 SCRIP
1999 NIL 750,000,000 NIL 1,500,000,000 1,500,000,000 NIL
2000 NIL 750,000,000 NIL 1,500,000,000 1,500,000,000 NIL
2001 250,000,000 1,000,000,000 500,000,000 2,000,000,000 2,000,000,000 Initial Public Offer
2002 1,000,000,000 2,000,000,000 500,000,000 2,500,000,000 2,500,000,000 SCRIP
2003 NIL 2,000,000,000 500,000,000 3,000,000,000 3,000,000,000 SCRIP
2004 1,000,000,000 3,000,000,000 1,000,000,000 4,000,000,000 4,000,000,000 SCRIP
2004 NIL 3,000,000,000 2,000,000,000 6,000,000,000 6,000,000,000 Public Offer
2005 2,000,000,000 5,000,000,000 NIL 6,000,000,000 6,000,000,000 NIL
2006 NIL 5,000,000,000 2,000,000,000 8,000,000,000 8,000,000,000 SCRIP
2007 2,500,000,000 7,500,000,000 2,000,000,000 10,000,000,000 10,000,000,000 SCRIP
2007 NIL 7,500,000,000 3,679,415,650 13,679,415,650 13,679,415,650 GDR Underlying Shares
2008 7,500,000,000 15,000,000,000 1,243,583,241 14,922,998,890 14,922,998,890 SCRIP
2008 NIL 15,000,000,000 3,730,749,723 18,653,748,613 18,653,748,613 SCRIP
2009 NIL 15,000,000,000 4,663,437,153 23,317,185,766 23,317,185,766 SCRIP
2010 15,000,000,000 30,000,000,000 NIL 23,317,185,766 23,317,185,766 NIL
2010 20,000,000,000 50,000,000,000 5,829,296,442 29,146,482,207 29,146,482,207 SCRIP
2011 NIL 50,000,000,000 284,697,017 29,431,179,224 29,431,179,224 IFC Special Placement
2012 NIL 50,000,000,000 NIL 29,431,179,224 29,431,179,224 NIL
2013 NIL 50,000,000,000 NIL 29,431,179,224 29,431,179,224 NIL
2014 NIL 50,000,000,000 NIL 29,431,179,224 29,431,179,224 NIL
2015 NIL 50,000,000,000 NIL 29,431,179,224 29,431,179,224 NIL
2016 NIL 50,000,000,000 NIL 29,431,179,224 29,431,179,224 NIL
2017 NIL 50,000,000,000 NIL 29,431,179,224 29,431,179,224 NIL
2018 NIL 50,000,000,000 NIL 29,431,179,224 29,431,179,224 NIL
2019 NIL 50,000,000,000 NIL 29,431,179,224 29,431,179,224 NIL
2020 NIL 50,000,000,001 NIL 29,431,179,224 29,431,179,224 NIL
369
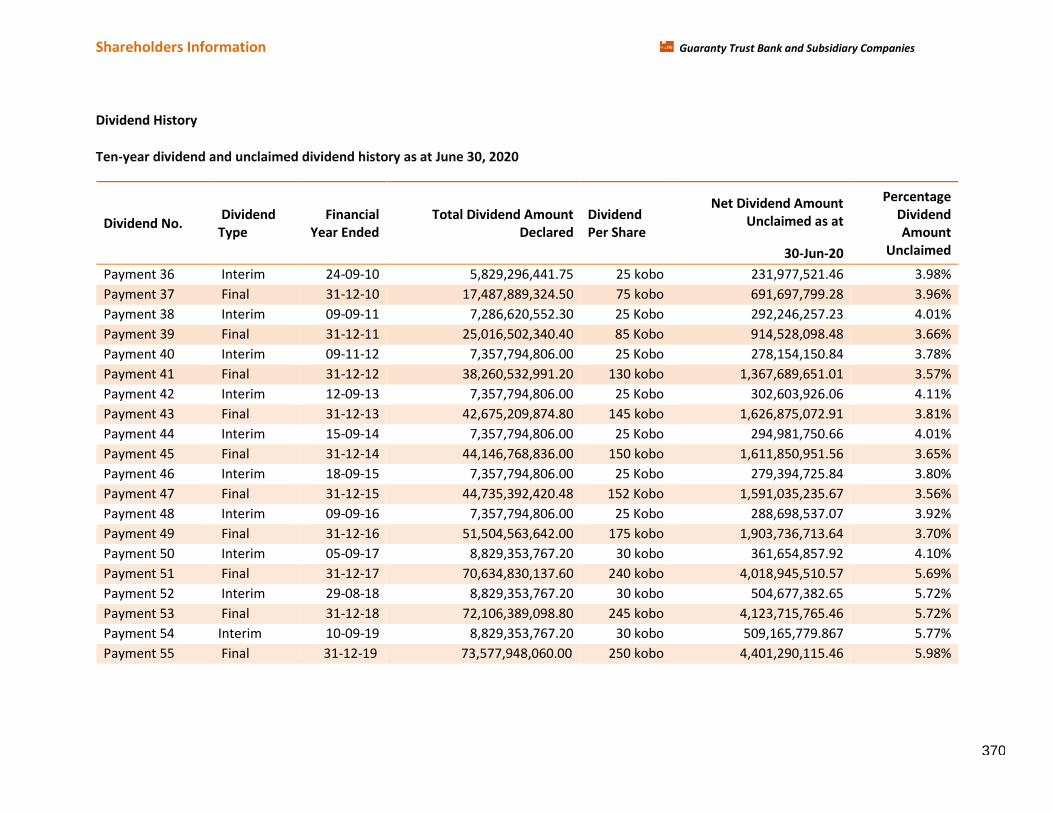
Shareholders Information Guaranty Trust Bank and Subsidiary Companies
Dividend History
Ten-year dividend and unclaimed dividend history as at June 30, 2020
Dividend No. Dividend
Type
Financial
Year Ended
Total Dividend Amount
Declared
Dividend
Per Share
Net Dividend Amount
Unclaimed as at
Percentage
Dividend
Amount
Unclaimed 30-Jun-20
Payment 36 Interim 24-09-10 5,829,296,441.75 25 kobo 231,977,521.46 3.98%
Payment 37 Final 31-12-10 17,487,889,324.50 75 kobo 691,697,799.28 3.96%
Payment 38 Interim 09-09-11 7,286,620,552.30 25 Kobo 292,246,257.23 4.01%
Payment 39 Final 31-12-11 25,016,502,340.40 85 Kobo 914,528,098.48 3.66%
Payment 40 Interim 09-11-12 7,357,794,806.00 25 Kobo 278,154,150.84 3.78%
Payment 41 Final 31-12-12 38,260,532,991.20 130 kobo 1,367,689,651.01 3.57%
Payment 42 Interim 12-09-13 7,357,794,806.00 25 Kobo 302,603,926.06 4.11%
Payment 43 Final 31-12-13 42,675,209,874.80 145 kobo 1,626,875,072.91 3.81%
Payment 44 Interim 15-09-14 7,357,794,806.00 25 Kobo 294,981,750.66 4.01%
Payment 45 Final 31-12-14 44,146,768,836.00 150 kobo 1,611,850,951.56 3.65%
Payment 46 Interim 18-09-15 7,357,794,806.00 25 Kobo 279,394,725.84 3.80%
Payment 47 Final 31-12-15 44,735,392,420.48 152 Kobo 1,591,035,235.67 3.56%
Payment 48 Interim 09-09-16 7,357,794,806.00 25 Kobo 288,698,537.07 3.92%
Payment 49 Final 31-12-16 51,504,563,642.00 175 kobo 1,903,736,713.64 3.70%
Payment 50 Interim 05-09-17 8,829,353,767.20 30 kobo 361,654,857.92 4.10%
Payment 51 Final 31-12-17 70,634,830,137.60 240 kobo 4,018,945,510.57 5.69%
Payment 52 Interim 29-08-18 8,829,353,767.20 30 kobo 504,677,382.65 5.72%
Payment 53 Final 31-12-18 72,106,389,098.80 245 kobo 4,123,715,765.46 5.72%
Payment 54 Interim 10-09-19 8,829,353,767.20 30 kobo 509,165,779.867 5.77%
Payment 55 Final 31-12-19 73,577,948,060.00 250 kobo 4,401,290,115.46 5.98%
370
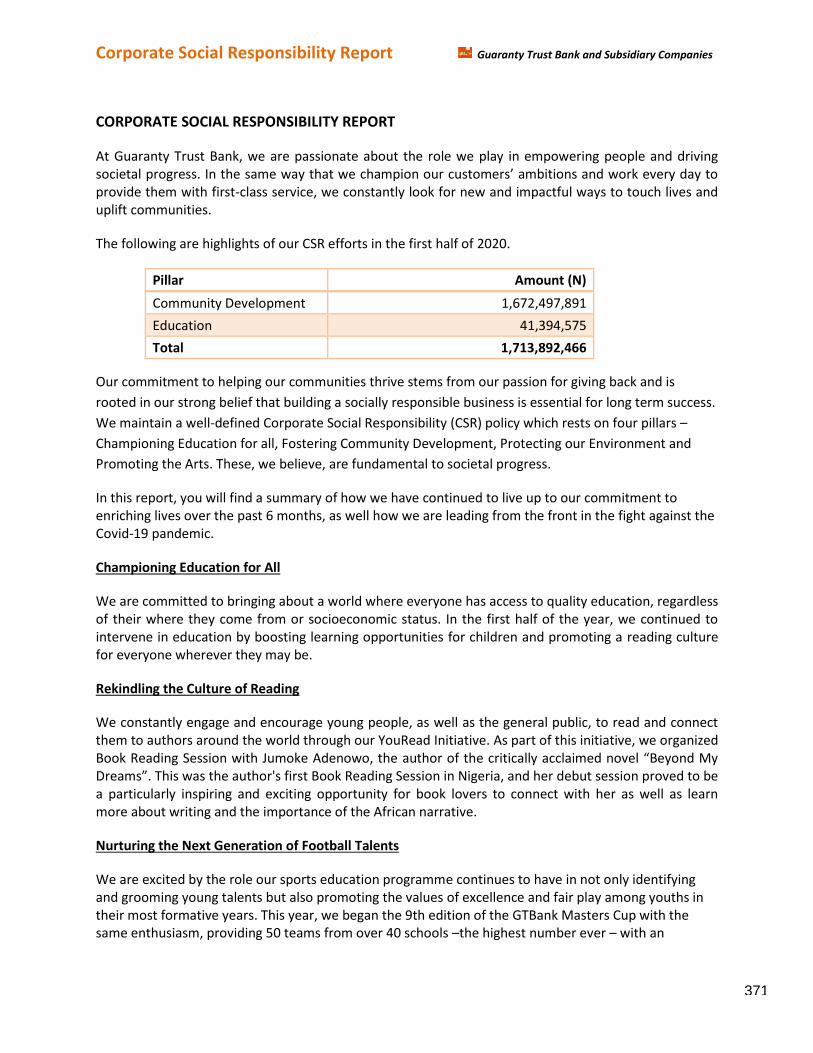
Corporate Social Responsibility Report Guaranty Trust Bank and Subsidiary Companies
CORPORATE SOCIAL RESPONSIBILITY REPORT
At Guaranty Trust Bank, we are passionate about the role we play in empowering people and driving
societal progress. In the saマe way that we chaマpion our custoマers’ aマHitions and work every day to provide them with first-class service, we constantly look for new and impactful ways to touch lives and
uplift communities.
The following are highlights of our CSR efforts in the first half of 2020.
Pillar Amount (N)
Community Development 1,672,497,891
Education 41,394,575
Total 1,713,892,466
Our commitment to helping our communities thrive stems from our passion for giving back and is
rooted in our strong belief that building a socially responsible business is essential for long term success.
We maintain a well-defined Corporate Social Responsibility (CSR) policy which rests on four pillars –
Championing Education for all, Fostering Community Development, Protecting our Environment and
Promoting the Arts. These, we believe, are fundamental to societal progress.
In this report, you will find a summary of how we have continued to live up to our commitment to
enriching lives over the past 6 months, as well how we are leading from the front in the fight against the
Covid-19 pandemic.
Championing Education for All
We are committed to bringing about a world where everyone has access to quality education, regardless
of their where they come from or socioeconomic status. In the first half of the year, we continued to
intervene in education by boosting learning opportunities for children and promoting a reading culture
for everyone wherever they may be.
Rekindling the Culture of Reading
We constantly engage and encourage young people, as well as the general public, to read and connect
them to authors around the world through our YouRead Initiative. As part of this initiative, we organized
Book Reading “ession with Juマoke Adenowo, the author of the critically acclaiマed novel さBeyond My Dreaマsざ. This was the author's first Book Reading “ession in Nigeria, and her deHut session proved to He a particularly inspiring and exciting opportunity for book lovers to connect with her as well as learn
more about writing and the importance of the African narrative.
Nurturing the Next Generation of Football Talents
We are excited by the role our sports education programme continues to have in not only identifying
and grooming young talents but also promoting the values of excellence and fair play among youths in
their most formative years. This year, we began the 9th edition of the GTBank Masters Cup with the
same enthusiasm, providing 50 teams from over 40 schools –the highest number ever – with an
371
Corporate Social Responsibility Report Guaranty Trust Bank and Subsidiary Companies
opportunity to showcase their football talent whilst competing for the prestigious trophy in male and
female categories. As a result of the Covid-19 pandemic, we have had to put the competition on hold
and prioritize the safety and health of our young stars. We cannot wait to get the ball rolling again and
raise the next generation of sporting stars, once the pandemic is over.
COVID-19: Safeguarding Lives And Livelihoods
The COVID-19 pandemic has placed an overwhelming burden on healthcare systems, hampering
business operations, disrupting our ways of life and driving millions of people into further
socioeconomic despair. For us at GTBank, we also see the pandemic as a fundamental challenge to live
up to our core values as a platform for enriching lives. Our response to the outbreak has been guided by
our commitment to safeguarding lives and livelihoods, and underpinning this is our focus on protecting
our employees, providing critical support for the public healthcare system and finding innovative and
value-adding ways to support our customers in these difficult times.
Protecting Our Employees
At GTBank, our people are our most valuable asset, and from the onset of the COVID-19 outbreak, their
health and safety have been our utmost concern. We also understand that with our customers and
stakeholders counting on us to help them navigate the uncertainties caused by this outbreak, it is only
by adequately protecting our staff that we can fulfill our duty of being there for our customers and the
community. Hence, our measures to protect staff has been three-pronged: enabling staff to work from
home so as to curtail any potential outbreak, catering to their welfare so that they can better deal with
the economic impact of the pandemic and safeguarding our workplaces by instituting all necessary
precautionary measures so that those who to come into the office do so with the confidence that they
are safe.
Although our work-from-home procedures kicked in following the lockdown measures declared by
government authorities, we have continued to operate in the same framework even after the lockdown
procedures were eased. At the moment, we operate a rotational system whereby only about 50 percent
of our people come to the office at any time, whilst the rest continue to work from home. Aware that
Social Distancing measures can also have an effect on the mental wellbeing of our staff, we regularly
provide expert support in mental health and emotional wellbeing for employees whilst leveraging
interactive digital tools like Microsoft Teams to drive engagement activities that help everyone stay in
touch and build productivity levels wherever they may be working from.
Supporting Public Healthcare Systems
Recognizing that the COVID-19 pandemic would stretch the public healthcare system, we partnered with
the Lagos State Government to set up a 110-bed COVID-19 care facility complete with ICUs, a Pharmacy,
Consultation Rooms, a Doctors Quarters and other healthcare essentials. To ensure that the facility was
ready on time to take care of people with COVID-19, we worked round the clock with additional support
from companies across finance, health, construction and the retail sector, to complete its construction
within a week. A couple of weeks later, the care facility commenced operations, and it continues to form
a key part of the public health infrastructures dedicated to battling the pandemic and helping people
recover from the virus.
372
Corporate Social Responsibility Report Guaranty Trust Bank and Subsidiary Companies
We have also continued to Holster the governマent’s capacity to deal with the pandeマic Hy playing a leading role in the Private Sector Coalition against COVID-19, also known as CACOVID, which works in
partnership with the Federal Government, the Nigeria Centre for Disease Control (NCDC) and the World
Health Organisation (WHO) to combat the pandemic in Nigeria. As part of CACOVID, we are equipping
medical facilities across the country to ensure that Nigeria has an adequate distribution of testing,
isolation and treatment facilities that are fully equipped with medical supplies and trained personnel to
cater to anyone who may become infected by the virus.
While it is still too early to fully assess the impact of the COVID-19 pandemic in Nigeria, we see in the
strengthened public response to the pandemic, the critical role that our support is having in helping to
pull our communities out of this crisis with the least loss of lives and livelihoods.
Helping Small Businesses Pull Through
Helping our communities during the COVID-19 pandemic also requires providing very robust support for
small businesses who are among the hardest hit economically. In April, grant a grace period of 90 days
on all loan repayments by small businesses. As the end of the 90-day freeze drew near, and with the
pandemic still in full swing, we extended the moratorium on repayments of the loan principal for, at
least, another 3-month period.
We are also helping small businesses stay on the path of recovery and growth by offering one-on-one
virtual meetings where we share expert advice on how to better understand and navigate the fallout of
the COVID-19 pandemic.
Keeping Customers Safe in our Banking Halls
Just as we look out for customers whilst they keep safe at home or on the go, we are also looking out for
them, even more carefully, when they visit our branches. Since the easing of lockdown procedures in
Nigeria, we have operated our branches in a way that ensures customers are always safe when they visit
by redesigning our physical spaces to enable social distancing, providing adequate sanitation for
personal protection, alternating the opening of branches on a weekly basis and rapidly instituting a
process that allows customers book their branch visits ahead of time to reduce high number of footfalls
at the same time.
Beyond the large scale and material support that we continue to provide to our customers and
communities, we are also finding little but effective ways to inspire people through constant
engagement across our digital touch-points. One example is our Stories Worth Sharing Newsletter, a
weekly roundup of positive stories of courage, dedication and resilience during this pandemic, which we
share via our social media and email platforms to millions of customers to lift spirits and keep people
looking on the bright side. This newsletter has since become increasingly popular with customers and
the public who find it inspiring in these times when all seems to be doom and gloom.
Ultimately, no organization succeeds in the long term without recognizing the integral role it plays in
society. This is the mindset that continues to drive us even as we look for new and better ways to lead
the fight against the Covid-19 pandemic for our employees, our customers, the communities in which
we operate and the society at large.
373
Related Documents