Economic overview: Recent developments in the South African economy June 2019 Department of Research and Information

Welcome message from author
This document is posted to help you gain knowledge. Please leave a comment to let me know what you think about it! Share it to your friends and learn new things together.
Transcript

Economic overview:
Recent developments in the South African economy
June 2019
Department of Research and Information
i
Economic overview
ic overview: Contents
Contents
Highlights ........................................................................................................................................................................................................ ii
Implications for South African businesses ......................................................................................................................................... iii
Introduction .................................................................................................................................................................................................... 1
Weak domestic demand amidst a crisis of confidence ................................................................................................................. 2
Export performance below potential .................................................................................................................................................... 5
Policy space and efforts to support the economy’s recovery ..................................................................................................... 9
Concluding remarks .................................................................................................................................................................................. 15
ii
Economic overview
ic overview: Contents
Highlights
• At the outset of his State of the Nation Address on June 20, 2019, President Cyril
Ramaphosa stated: “Our economy is not growing. Not enough jobs are being created.
This is the concern that rises above all others. It affects everyone.”
• The weakness of the South African economy in the opening quarter of the year was
much worse than anticipated. The sharp 3.2% contraction in real GDP, on a quarter-
on-quarter (q-o-q), seasonally adjusted and annualised (saar) basis, was the worst
quarterly performance since the 2009 recession.
• Almost all broad economic sectors recorded negative growth, particularly agriculture
(-13.2%), mining (-10.8%) and manufacturing (-8.8%). This was underpinned by weak
demand conditions domestically and a sharply lower export performance. Load-
shedding by Eskom later in the 1st quarter of 2019 impacted on production activity in
many sectors, affecting their export performance to some extent.
• Household consumption fell by 0.8% as domestic households continued struggling
with relatively high levels of indebtedness and debt-servicing costs, while disposable
incomes rose only marginally in real terms and labour market conditions remained
feeble. These factors are affecting the ability and willingness of households to spend.
• Fixed investment activity weakened in a difficult operating and trading environment.
Subdued demand and the associated spare production capacity in many industries,
alongside low business confidence and a cautious stance ahead of the national
elections, underscored the 9.8% drop in capital outlays by the private sector in real
terms. Overall fixed investment was 4.5% lower in the 1st quarter of 2019.
• South Africa’s open economy is highly reliant on economic developments globally.
After having made a positive contribution to economic growth in 2018, exports
tumbled by 26.4% (q-o-q, saar) in the 1st quarter of 2019 - the largest contributor to
the dismal GDP growth performance. The escalation of trade tensions between the
US and some of its major trading partners continues to rattle the multilateral trade
order and, through extensive transmission effects, is reinforcing the world economy’s
slowing momentum. The World Trade Organisation expects growth in the volume of
merchandise trade globally to slow to 2.6% in 2019, from 3% last year.
• A more growth-supportive monetary policy stance is likely in this difficult economic
climate, for inflation appears to be well anchored around the mid-point of the Reserve
Bank’s target band. The Monetary Policy Committee may thus cut the repo rate by 25
basis points in the 3rd quarter of the year. President Ramaphosa has unequivocally
confirmed the central bank’s constitutional mandate and independence.
• Fiscal limitations will be a constraining factor for general government, leaving it with
very limited room to raise expenditure to provide some stimulus to a fragile economy.
However, the impact of public sector spending on the economy can be significantly
enhanced through a more effective roll-out of its localisation strategies.
• Arresting and ultimately reversing the long-term decline in the economy’s growth
potential and the rising trend in government debt are deemed crucial by the credit
rating agencies. They are also highly concerned with the enormous burden that
financially-constrained state-owned companies, especially Eskom and South African
Airways, are placing on the fiscus.
• In the SONA, the President asserted government’s commitment to a confidence- and
investment-boosting macroeconomic and fiscal policy framework, underpinned by
“prudent borrowing and stringent expenditure management to stabilise our public
SA GDP growth in
Q1 2019:
-3.2% (q-o-q)
0.0% (y-o-y)
(Stats SA)
Growth in SA
exports in
Q1 2019:
-26.4% (q-o-q)
(Stats SA)
Growth in volume of
world merchandise
trade:
2.6% in 2019
3.0% in 2020
(WTO forecasts)
Business confidence
in SA in Q2 2019:
28 index points (unchanged from Q1)
(RMB/BER)
iii
Economic overview
ic overview: Contents
finances and lower the debt trajectory”. In the currently difficult environment, steps
are indeed being taken to restore confidence in South Africa’s future, for its economy
and people present enormous potential, but time is of the essence.
Implications for South African businesses
• The operating environment is likely to remain challenging for longer than previously
anticipated. Business enterprises whose activities are largely focused on the domestic
consumer market, particularly those operating in the durable and semi-durable goods
segments, are anticipated to continue facing difficult trading conditions over the
remainder of 2019. A gradual recovery should ensue in subsequent years.
• Slower world growth and the disruptive effects of increased protectionism on global
trade flows and investment activity may impact adversely on the performance of
several export-oriented business enterprises. However, export market development
opportunities may also emerge due to trade diversion effects. Industrial commodity
markets may be adversely affected by the slowing pace of expansion of the Chinese
economy, with implications for volume demand and prices.
• A potential reduction in interest rates as the South African Reserve Bank adopts a
more accommodative monetary policy stance should partly alleviate the hardship
faced by financially-constrained businesses and households. However, in the current
environment such a move is unlikely to stimulate investment activity or household
spending to a significant extent, at least in the short-term.
• Although limited financial resources will constrain public sector spending, both of a
capital and operational nature, the emphasis on localisation may mitigate the
negative impact to a considerable extent. Companies whose activities are closely
aligned to the investment cycle, or which could benefit from a more effective
application of product designations in public sector procurement, should stand ready
to tap into the associated business opportunities.
• In his State of the Nation Address, President Cyril Ramaphosa highlighted:
- The implementation of master plans developed by government in conjunction
with business and labour in industries such as clothing and textiles, chemicals
and plastics, gas, renewables, steel and metals fabrication;
- Support for key agricultural and agro-processing value chains, including new
market development and the pursuit of import replacement opportunities;
- Mining sector development through targeted minerals beneficiation, the
lowering of input costs and increased research and development;
- The imminent commencement of the spectrum licensing process, which will
open-up opportunities for business in the sector; and, among others,
- Spatial interventions such as the development of special economic zones, the
revitalisation of local industrial parks and the establishment of digital hubs.
• Business confidence in the South African economy should gradually improve as the
year unfolds, resulting in a relatively more conducive investment and business
environment.
Highlights
1
Economic overview
Introduction
Hopes of a relatively strong rebound in South Africa’s economic performance have been
dealt serious blows.
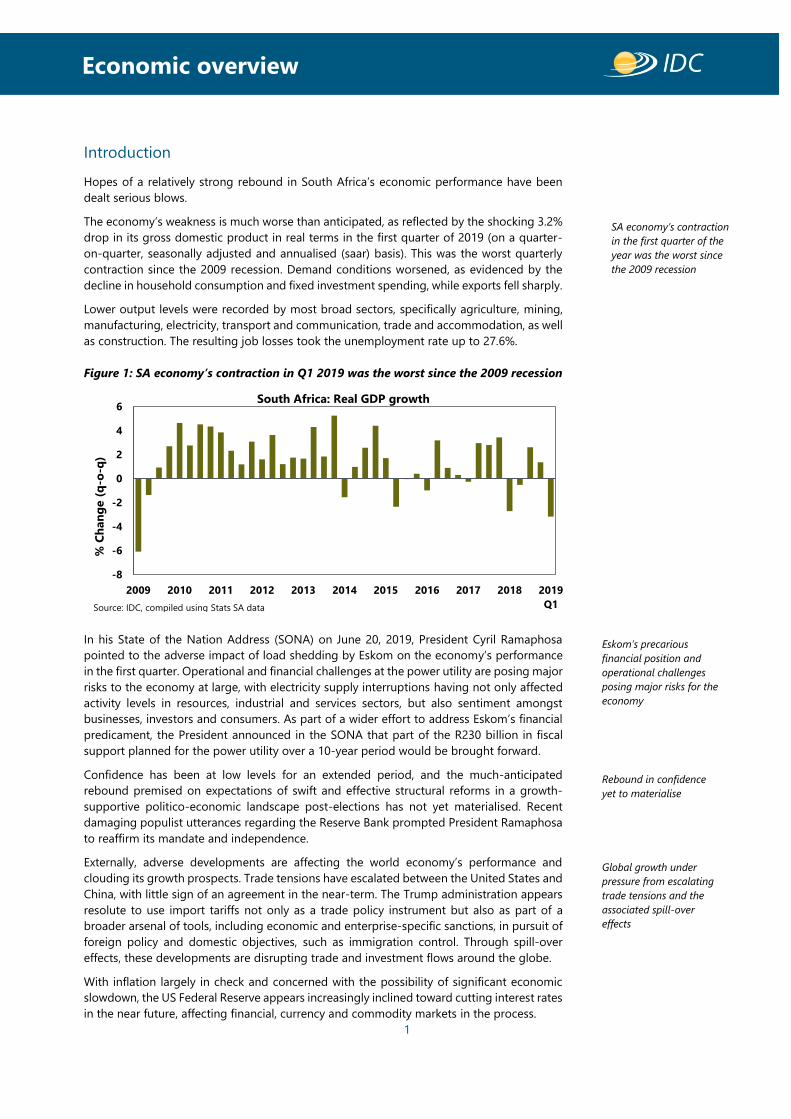
The economy’s weakness is much worse than anticipated, as reflected by the shocking 3.2%
drop in its gross domestic product in real terms in the first quarter of 2019 (on a quarter-
on-quarter, seasonally adjusted and annualised (saar) basis). This was the worst quarterly
contraction since the 2009 recession. Demand conditions worsened, as evidenced by the
decline in household consumption and fixed investment spending, while exports fell sharply.
Lower output levels were recorded by most broad sectors, specifically agriculture, mining,
manufacturing, electricity, transport and communication, trade and accommodation, as well
as construction. The resulting job losses took the unemployment rate up to 27.6%.
Figure 1: SA economy’s contraction in Q1 2019 was the worst since the 2009 recession
In his State of the Nation Address (SONA) on June 20, 2019, President Cyril Ramaphosa
pointed to the adverse impact of load shedding by Eskom on the economy’s performance
in the first quarter. Operational and financial challenges at the power utility are posing major
risks to the economy at large, with electricity supply interruptions having not only affected
activity levels in resources, industrial and services sectors, but also sentiment amongst
businesses, investors and consumers. As part of a wider effort to address Eskom’s financial
predicament, the President announced in the SONA that part of the R230 billion in fiscal
support planned for the power utility over a 10-year period would be brought forward.
Confidence has been at low levels for an extended period, and the much-anticipated
rebound premised on expectations of swift and effective structural reforms in a growth-
supportive politico-economic landscape post-elections has not yet materialised. Recent
damaging populist utterances regarding the Reserve Bank prompted President Ramaphosa
to reaffirm its mandate and independence.
Externally, adverse developments are affecting the world economy’s performance and
clouding its growth prospects. Trade tensions have escalated between the United States and
China, with little sign of an agreement in the near-term. The Trump administration appears
resolute to use import tariffs not only as a trade policy instrument but also as part of a
broader arsenal of tools, including economic and enterprise-specific sanctions, in pursuit of
foreign policy and domestic objectives, such as immigration control. Through spill-over
effects, these developments are disrupting trade and investment flows around the globe.
With inflation largely in check and concerned with the possibility of significant economic
slowdown, the US Federal Reserve appears increasingly inclined toward cutting interest rates
in the near future, affecting financial, currency and commodity markets in the process.
-8
-6
-4
-2
0
2
4
6
2009 2010 2011 2012 2013 2014 2015 2016 2017 2018 2019
Q1
% C
han
ge (
q-o
-q)
South Africa: Real GDP growth
Source: IDC, compiled using Stats SA data
SA economy’s contraction
in the first quarter of the
year was the worst since
the 2009 recession
Global growth under
pressure from escalating
trade tensions and the
associated spill-over
effects
Eskom’s precarious
financial position and
operational challenges
posing major risks for the
economy
Rebound in confidence
yet to materialise
Highlights
2
Economic overview
Weak domestic demand amidst a crisis of confidence
Struggling households holding back on spending
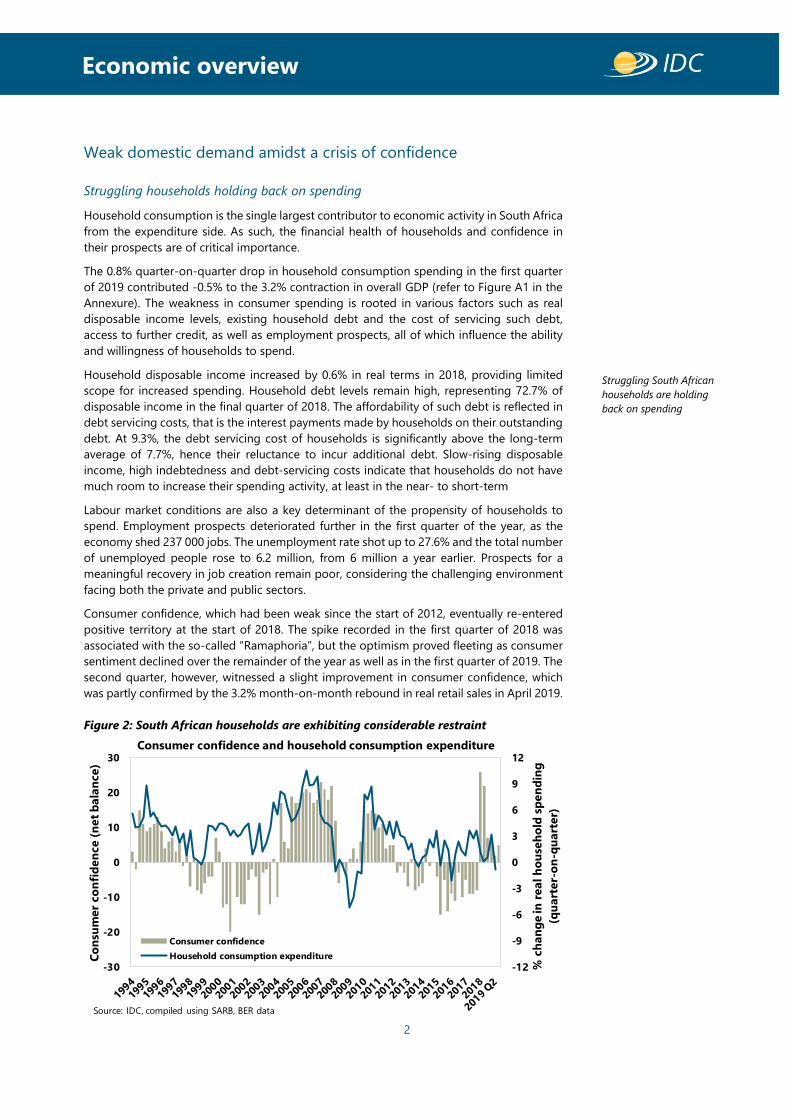
Household consumption is the single largest contributor to economic activity in South Africa
from the expenditure side. As such, the financial health of households and confidence in
their prospects are of critical importance.
The 0.8% quarter-on-quarter drop in household consumption spending in the first quarter
of 2019 contributed -0.5% to the 3.2% contraction in overall GDP (refer to Figure A1 in the
Annexure). The weakness in consumer spending is rooted in various factors such as real
disposable income levels, existing household debt and the cost of servicing such debt,
access to further credit, as well as employment prospects, all of which influence the ability
and willingness of households to spend.
Household disposable income increased by 0.6% in real terms in 2018, providing limited
scope for increased spending. Household debt levels remain high, representing 72.7% of
disposable income in the final quarter of 2018. The affordability of such debt is reflected in
debt servicing costs, that is the interest payments made by households on their outstanding
debt. At 9.3%, the debt servicing cost of households is significantly above the long-term
average of 7.7%, hence their reluctance to incur additional debt. Slow-rising disposable
income, high indebtedness and debt-servicing costs indicate that households do not have
much room to increase their spending activity, at least in the near- to short-term
Labour market conditions are also a key determinant of the propensity of households to
spend. Employment prospects deteriorated further in the first quarter of the year, as the
economy shed 237 000 jobs. The unemployment rate shot up to 27.6% and the total number
of unemployed people rose to 6.2 million, from 6 million a year earlier. Prospects for a
meaningful recovery in job creation remain poor, considering the challenging environment
facing both the private and public sectors.
Consumer confidence, which had been weak since the start of 2012, eventually re-entered
positive territory at the start of 2018. The spike recorded in the first quarter of 2018 was
associated with the so-called “Ramaphoria”, but the optimism proved fleeting as consumer
sentiment declined over the remainder of the year as well as in the first quarter of 2019. The
second quarter, however, witnessed a slight improvement in consumer confidence, which
was partly confirmed by the 3.2% month-on-month rebound in real retail sales in April 2019.
Figure 2: South African households are exhibiting considerable restraint
-12
-9
-6
-3
0
3
6
9
12
-30
-20
-10
0
10
20
30
% c
ha
ng
e in
re
al
ho
use
ho
ld s
pe
nd
ing
(qu
art
er-
on
-qu
art
er)
Co
nsu
me
r co
nfi
de
nce
(n
et
ba
lan
ce
)
Consumer confidence
Household consumption expenditure
Source: IDC, compiled using SARB, BER data
Consumer confidence and household consumption expenditure
Struggling South African
households are holding
back on spending
Highlights
3
Economic overview
Sharp fall in private sector fixed investment
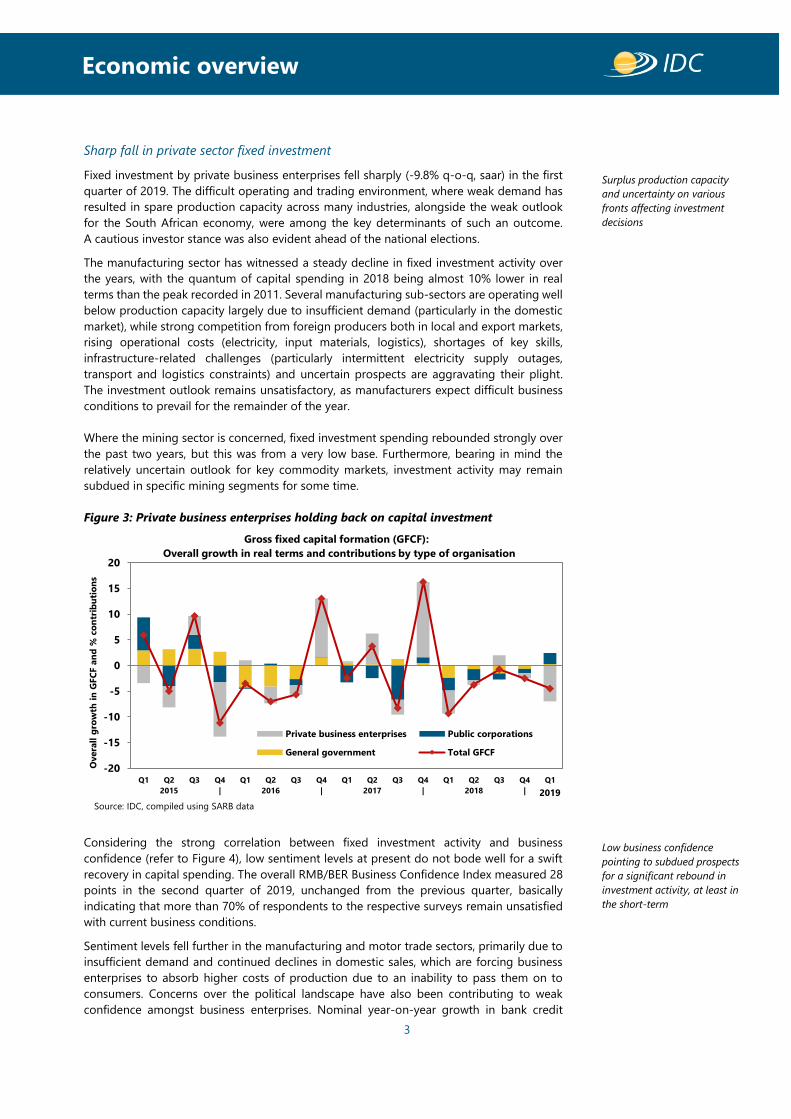
Fixed investment by private business enterprises fell sharply (-9.8% q-o-q, saar) in the first
quarter of 2019. The difficult operating and trading environment, where weak demand has
resulted in spare production capacity across many industries, alongside the weak outlook
for the South African economy, were among the key determinants of such an outcome.
A cautious investor stance was also evident ahead of the national elections.
The manufacturing sector has witnessed a steady decline in fixed investment activity over
the years, with the quantum of capital spending in 2018 being almost 10% lower in real
terms than the peak recorded in 2011. Several manufacturing sub-sectors are operating well
below production capacity largely due to insufficient demand (particularly in the domestic
market), while strong competition from foreign producers both in local and export markets,
rising operational costs (electricity, input materials, logistics), shortages of key skills,
infrastructure-related challenges (particularly intermittent electricity supply outages,
transport and logistics constraints) and uncertain prospects are aggravating their plight.
The investment outlook remains unsatisfactory, as manufacturers expect difficult business
conditions to prevail for the remainder of the year.
Where the mining sector is concerned, fixed investment spending rebounded strongly over
the past two years, but this was from a very low base. Furthermore, bearing in mind the
relatively uncertain outlook for key commodity markets, investment activity may remain
subdued in specific mining segments for some time.
Figure 3: Private business enterprises holding back on capital investment
Considering the strong correlation between fixed investment activity and business
confidence (refer to Figure 4), low sentiment levels at present do not bode well for a swift
recovery in capital spending. The overall RMB/BER Business Confidence Index measured 28
points in the second quarter of 2019, unchanged from the previous quarter, basically
indicating that more than 70% of respondents to the respective surveys remain unsatisfied
with current business conditions.
Sentiment levels fell further in the manufacturing and motor trade sectors, primarily due to
insufficient demand and continued declines in domestic sales, which are forcing business
enterprises to absorb higher costs of production due to an inability to pass them on to
consumers. Concerns over the political landscape have also been contributing to weak
confidence amongst business enterprises. Nominal year-on-year growth in bank credit
-20
-15
-10
-5
0
5
10
15
20
Q1 Q2
2015
Q3 Q4
|
Q1 Q2
2016
Q3 Q4
|
Q1 Q2
2017
Q3 Q4
|
Q1 Q2
2018
Q3 Q4
|
Q1
Overa
ll g
row
th i
n G
FC
F a
nd
% c
on
trib
uti
on
s
Private business enterprises Public corporations
General government Total GFCF
Gross fixed capital formation (GFCF):
Overall growth in real terms and contributions by type of organisation
Source: IDC, compiled using SARB data
2019
Surplus production capacity
and uncertainty on various
fronts affecting investment
decisions
Low business confidence
pointing to subdued prospects
for a significant rebound in
investment activity, at least in
the short-term
Highlights
4
Economic overview
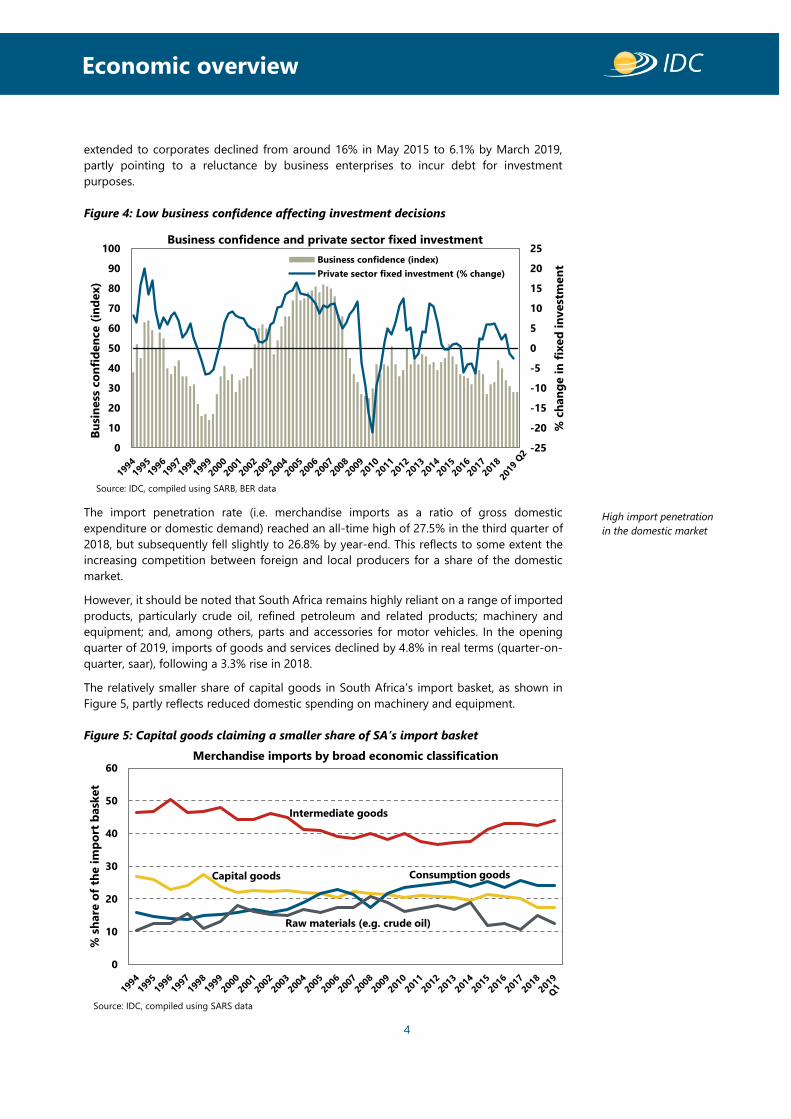
extended to corporates declined from around 16% in May 2015 to 6.1% by March 2019,
partly pointing to a reluctance by business enterprises to incur debt for investment
purposes.
Figure 4: Low business confidence affecting investment decisions
The import penetration rate (i.e. merchandise imports as a ratio of gross domestic
expenditure or domestic demand) reached an all-time high of 27.5% in the third quarter of
2018, but subsequently fell slightly to 26.8% by year-end. This reflects to some extent the
increasing competition between foreign and local producers for a share of the domestic
market.
However, it should be noted that South Africa remains highly reliant on a range of imported
products, particularly crude oil, refined petroleum and related products; machinery and
equipment; and, among others, parts and accessories for motor vehicles. In the opening
quarter of 2019, imports of goods and services declined by 4.8% in real terms (quarter-on-
quarter, saar), following a 3.3% rise in 2018.
The relatively smaller share of capital goods in South Africa’s import basket, as shown in
Figure 5, partly reflects reduced domestic spending on machinery and equipment.
Figure 5: Capital goods claiming a smaller share of SA’s import basket
-25
-20
-15
-10
-5
0
5
10
15
20
25
0
10
20
30
40
50
60
70
80
90
100
% c
han
ge i
n f
ixed
in
vest
men
t
Bu
sin
ess
co
nfi
den
ce (
ind
ex)
Business confidence (index)
Private sector fixed investment (% change)
Business confidence and private sector fixed investment
Source: IDC, compiled using SARB, BER data
0
10
20
30
40
50
60
% s
hare
of
the im
po
rt b
ask
et
Source: IDC, compiled using SARS data
Merchandise imports by broad economic classification
Consumption goods
Intermediate goods
Capital goods
Raw materials (e.g. crude oil)
High import penetration
in the domestic market
Highlights
5
Economic overview
Export performance below potential
Against the backdrop of persistently subdued demand conditions domestically, external
markets have provided some cushion for South African producers in recent years. With a
relatively open economy, the country has relied on exports to sustain production activity
and employment levels across many sectors. In 2018, exports of goods and services
accounted for 30% of GDP, contributing 0.8 percentage points to overall economic growth.
Several sectors of the economy have relatively high export propensities, implying a heavy
reliance on foreign markets for their performance. Besides the externally-oriented mining
sub-sectors, in recent years exports have accounted for close to 50% or more of total output
in sectors such as motor vehicles, parts and accessories; machinery and equipment; non-
ferrous metal products; as well as television, radio and other communication equipment.
A dismal export performance in the opening quarter of 2019
However, the first quarter of 2019 witnessed a massive 26.4% decline in exports (quarter-
on-quarter, saar) in real terms. Both domestic and external factors underpinned this dismal
export performance, which was the single largest detractor to national GDP during this
period, subtracting a massive 9 percentage points from overall economic growth (refer to
Figure A1 in the Annexure).
In nominal rand terms, South Africa’s exports declined by 14.2% (q-o-q) in the opening
quarter of the year. Exports of motor vehicles, parts and accessories fell by 20%, contributing
3 percentage points to the overall drop in exports. Other sectors that contributed
significantly to the weaker export performance in the first quarter of the year included the
mining of platinum group metals (-29.7% quarter-on-quarter); coal mining (-23.6%);
machinery and equipment (-22.4%); and paper and paper products (-56%).
Stage 4 load-shedding by Eskom towards the latter part of the first quarter of 2019 impacted
on production activity in many sectors, affecting their export performance to some extent.
The mining sector reduced its inventory holdings during this period, mitigating some of the
production losses due to electricity outages.
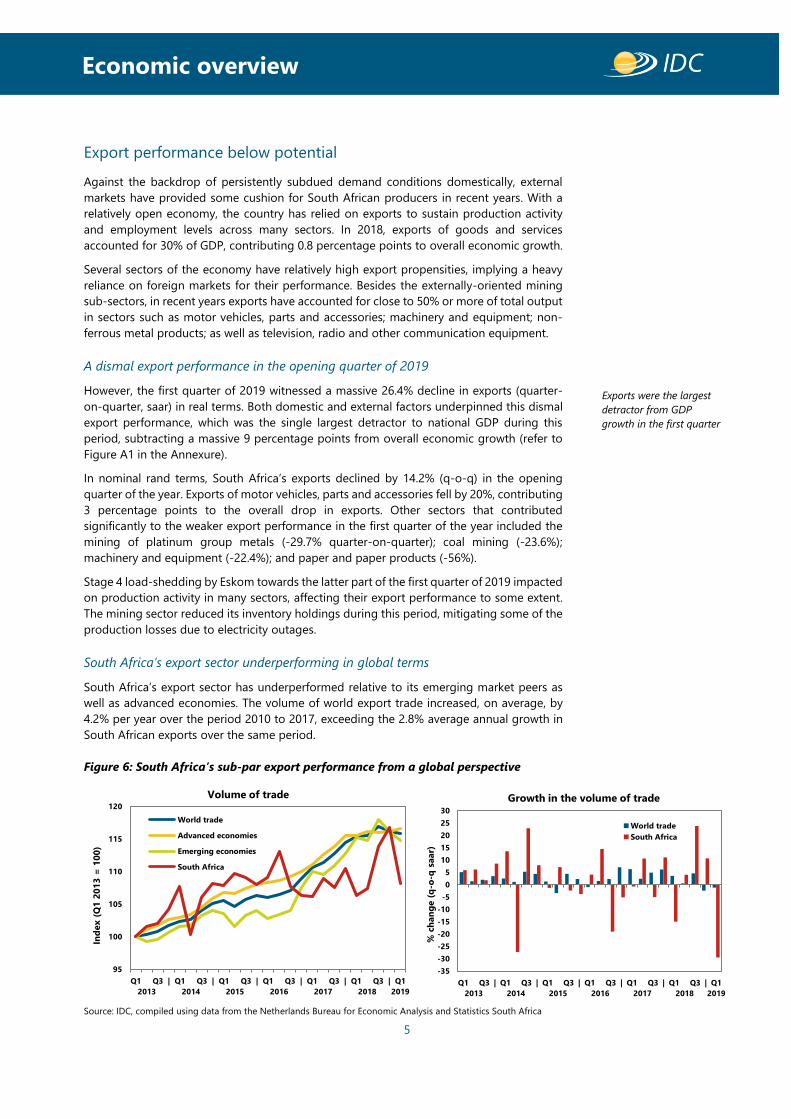
South Africa’s export sector underperforming in global terms
South Africa’s export sector has underperformed relative to its emerging market peers as
well as advanced economies. The volume of world export trade increased, on average, by
4.2% per year over the period 2010 to 2017, exceeding the 2.8% average annual growth in
South African exports over the same period.
Figure 6: South Africa’s sub-par export performance from a global perspective
Source: IDC, compiled using data from the Netherlands Bureau for Economic Analysis and Statistics South Africa
95
100
105
110
115
120
Q1
2013
Q3 | Q1
2014
Q3 | Q1
2015
Q3 | Q1
2016
Q3 | Q1
2017
Q3 | Q1
2018
Q3 | Q1
2019
Ind
ex (
Q1
20
13
= 1
00
)
Volume of trade
World trade
Advanced economies
Emerging economies
South Africa
-35
-30
-25
-20
-15
-10
-5
0
5
10
15
20
25
30
Q1
2013
Q3 | Q1
2014
Q3 | Q1
2015
Q3 | Q1
2016
Q3 | Q1
2017
Q3 | Q1
2018
Q3 | Q1
2019
% c
han
ge (
q-o
-q s
aar)
Growth in the volume of trade
World trade
South Africa
Exports were the largest
detractor from GDP
growth in the first quarter
Highlights
6
Economic overview
This sub-optimal performance is indicative of the fierce competition faced by South African
producers in global markets, calling for concerted efforts by the domestic private and public
sectors to enhance the competitiveness of export products in terms of price, quality and/or
service delivery. The infrastructure-related constraints that are hindering export
performance must be addressed, and external markets should be developed further through
effective marketing campaigns and by taking full advantage of preferential access
arrangements.
Developments in global markets bringing forth considerable downside risks
The escalation of trade tensions between the US and some of its major trading partners is
raising uncertainty in the global trading arena to levels not seen in many decades.
US protectionism continues to rattle the multilateral trade order and, through extensive
transmission effects, is reinforcing the world economy’s slowing momentum. Growth in the
volume of global trade weakened to 2.8% over the year to the end of the first quarter of
2019, and the prevailing uncertainty is elevating downside risks.
South Africa’s export sector is highly reliant on the economic performance and associated
import demand of the world’s two largest individual economies, the US and China, and, from
a regional standpoint, on prospects for the European Union and the African continent.
Collectively, these external markets accounted for 68% of South Africa’s overall merchandise
export basket over the period January to April 2019.
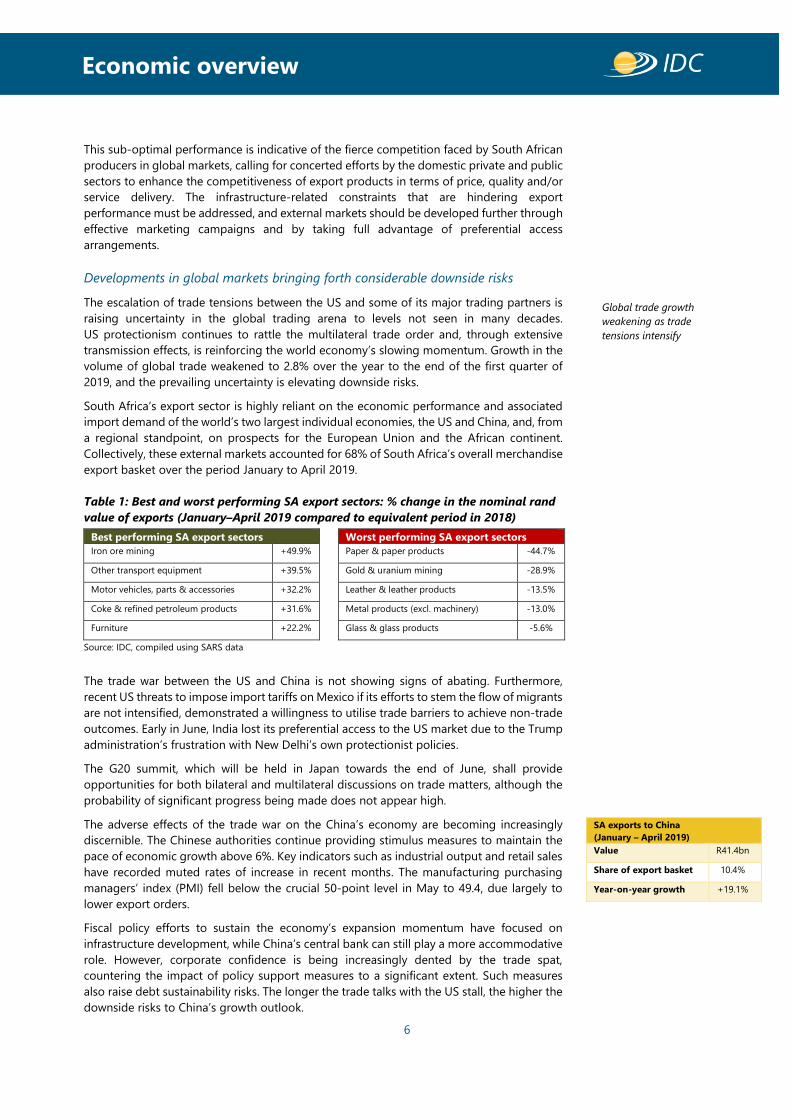
Table 1: Best and worst performing SA export sectors: % change in the nominal rand
value of exports (January–April 2019 compared to equivalent period in 2018)
Best performing SA export sectors Worst performing SA export sectors
Iron ore mining +49.9% Paper & paper products -44.7%
Other transport equipment +39.5% Gold & uranium mining -28.9%
Motor vehicles, parts & accessories +32.2% Leather & leather products -13.5%
Coke & refined petroleum products +31.6% Metal products (excl. machinery) -13.0%
Furniture +22.2% Glass & glass products -5.6%
Source: IDC, compiled using SARS data
The trade war between the US and China is not showing signs of abating. Furthermore,
recent US threats to impose import tariffs on Mexico if its efforts to stem the flow of migrants
are not intensified, demonstrated a willingness to utilise trade barriers to achieve non-trade
outcomes. Early in June, India lost its preferential access to the US market due to the Trump
administration’s frustration with New Delhi’s own protectionist policies.
The G20 summit, which will be held in Japan towards the end of June, shall provide
opportunities for both bilateral and multilateral discussions on trade matters, although the
probability of significant progress being made does not appear high.
The adverse effects of the trade war on the China’s economy are becoming increasingly
discernible. The Chinese authorities continue providing stimulus measures to maintain the
pace of economic growth above 6%. Key indicators such as industrial output and retail sales
have recorded muted rates of increase in recent months. The manufacturing purchasing
managers’ index (PMI) fell below the crucial 50-point level in May to 49.4, due largely to
lower export orders.
Fiscal policy efforts to sustain the economy’s expansion momentum have focused on
infrastructure development, while China’s central bank can still play a more accommodative
role. However, corporate confidence is being increasingly dented by the trade spat,
countering the impact of policy support measures to a significant extent. Such measures
also raise debt sustainability risks. The longer the trade talks with the US stall, the higher the
downside risks to China’s growth outlook.
SA exports to China
(January – April 2019)
Value R41.4bn
Share of export basket 10.4%
Year-on-year growth +19.1%
Global trade growth
weakening as trade
tensions intensify
Highlights
7
Economic overview
In the US, growth in private sector investment slowed to 2.3% (annualised rate) in the first
quarter of 2019, from an average of 7% last year, and business confidence is being clearly
affected by the lingering uncertainty around trade policy. The latest employment data
reported that 75 000 jobs were created in May, significantly below market expectations and
possibly confirming a slowing trend in economic activity. The latest National Association
for Business Economic Outlook Survey reported expectations of US growth decelerating
throughout 2019 and 2020, with the risk of a recession increasing from 15% in 2019 to 35%
in 2020. The US Federal Reserve also foresees a slowing US economy, but it does not expect
recessionary conditions to emerge. Having expressed concern over the potential impact of
trade tensions, the Fed stands ready to pre-emptively ease policy rates if so needed.
The European Union economy posted a fragile recovery earlier in the year, but risks abound
and growth is expected to moderate, even from the current low levels. The regional bloc is
feeling the impact of the US-China trade war, as both countries are important destinations
for EU exports of goods and services. Furthermore, the EU still faces the threat of US tariffs
on its auto exports. Uncertainty over the eventual form of Brexit continues to weigh on
consumer and business sentiment. In light of the weaker economic outlook for the
Eurozone, the European Central Bank indicated that interest rates will remain unchanged
until at least the first half of 2020, while it could consider reactivating its quantitative easing
programme. The impact, however, would likely be limited.
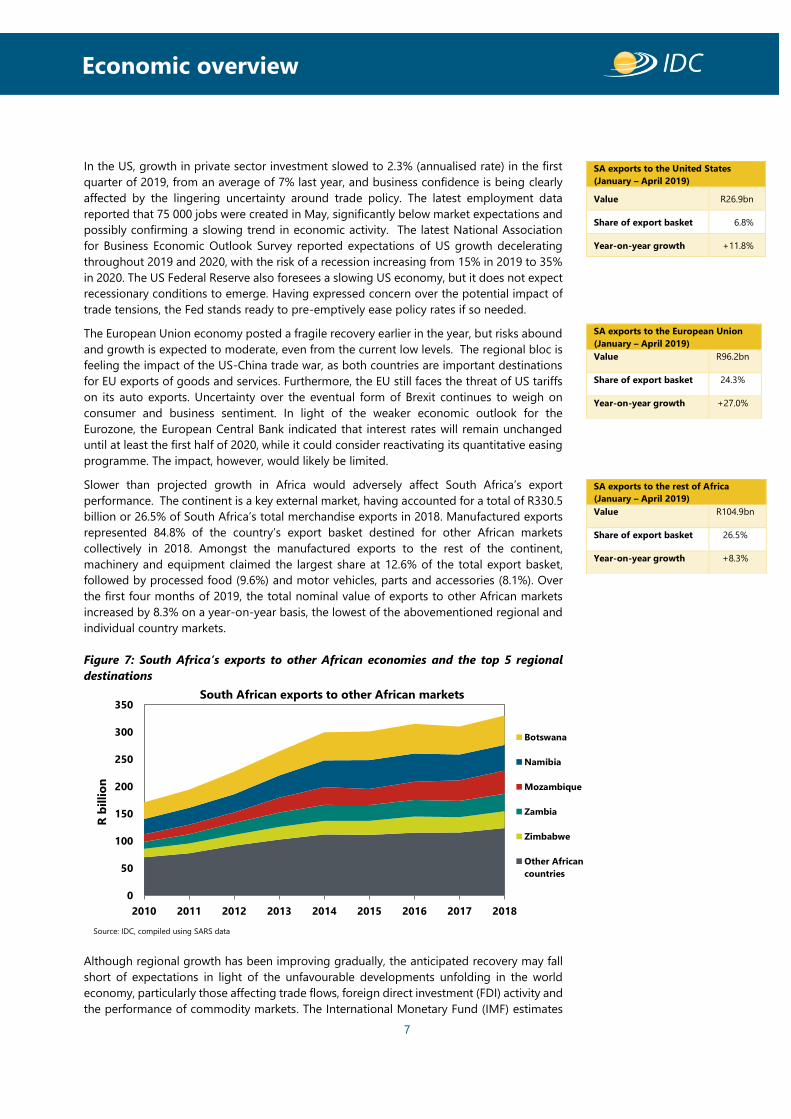
Slower than projected growth in Africa would adversely affect South Africa’s export
performance. The continent is a key external market, having accounted for a total of R330.5
billion or 26.5% of South Africa’s total merchandise exports in 2018. Manufactured exports
represented 84.8% of the country’s export basket destined for other African markets
collectively in 2018. Amongst the manufactured exports to the rest of the continent,
machinery and equipment claimed the largest share at 12.6% of the total export basket,
followed by processed food (9.6%) and motor vehicles, parts and accessories (8.1%). Over
the first four months of 2019, the total nominal value of exports to other African markets
increased by 8.3% on a year-on-year basis, the lowest of the abovementioned regional and
individual country markets.
Figure 7: South Africa’s exports to other African economies and the top 5 regional
destinations
Although regional growth has been improving gradually, the anticipated recovery may fall
short of expectations in light of the unfavourable developments unfolding in the world
economy, particularly those affecting trade flows, foreign direct investment (FDI) activity and
the performance of commodity markets. The International Monetary Fund (IMF) estimates
0
50
100
150
200
250
300
350
2010 2011 2012 2013 2014 2015 2016 2017 2018
R b
illi
on
South African exports to other African markets
Botswana
Namibia
Mozambique
Zambia
Zimbabwe
Other African
countries
Source: IDC, compiled using SARS data
SA exports to the United States
(January – April 2019)
Value R26.9bn
Share of export basket 6.8%
Year-on-year growth +11.8%
SA exports to the European Union (January – April 2019)
Value R96.2bn
Share of export basket 24.3%
Year-on-year growth +27.0%
SA exports to the rest of Africa
(January – April 2019)
Value R104.9bn
Share of export basket 26.5%
Year-on-year growth +8.3%
Highlights
8
Economic overview
that economic growth in Sub-Saharan Africa could be reduced by 2 percentage points in
2019 and by 1.5 percentage points in 2020 as a result.
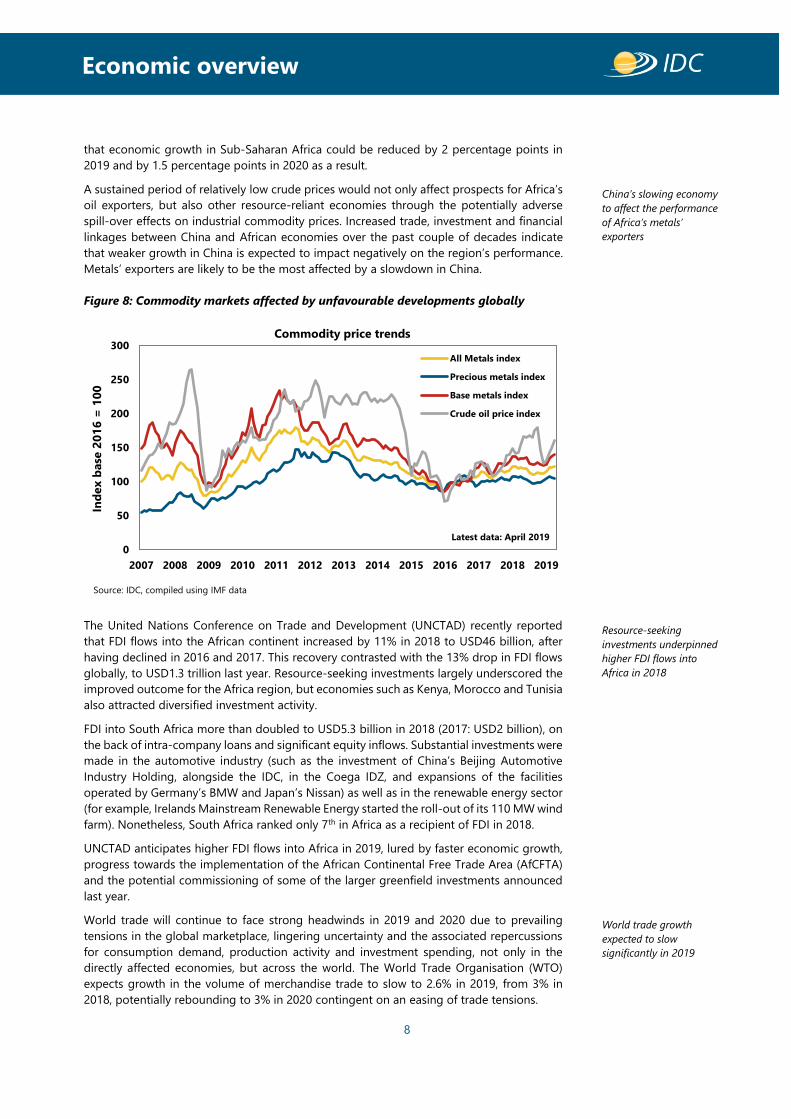
A sustained period of relatively low crude prices would not only affect prospects for Africa’s
oil exporters, but also other resource-reliant economies through the potentially adverse
spill-over effects on industrial commodity prices. Increased trade, investment and financial
linkages between China and African economies over the past couple of decades indicate
that weaker growth in China is expected to impact negatively on the region’s performance.
Metals’ exporters are likely to be the most affected by a slowdown in China.
Figure 8: Commodity markets affected by unfavourable developments globally
The United Nations Conference on Trade and Development (UNCTAD) recently reported
that FDI flows into the African continent increased by 11% in 2018 to USD46 billion, after
having declined in 2016 and 2017. This recovery contrasted with the 13% drop in FDI flows
globally, to USD1.3 trillion last year. Resource-seeking investments largely underscored the
improved outcome for the Africa region, but economies such as Kenya, Morocco and Tunisia
also attracted diversified investment activity.
FDI into South Africa more than doubled to USD5.3 billion in 2018 (2017: USD2 billion), on
the back of intra-company loans and significant equity inflows. Substantial investments were
made in the automotive industry (such as the investment of China’s Beijing Automotive
Industry Holding, alongside the IDC, in the Coega IDZ, and expansions of the facilities
operated by Germany’s BMW and Japan’s Nissan) as well as in the renewable energy sector
(for example, Irelands Mainstream Renewable Energy started the roll-out of its 110 MW wind
farm). Nonetheless, South Africa ranked only 7th in Africa as a recipient of FDI in 2018.
UNCTAD anticipates higher FDI flows into Africa in 2019, lured by faster economic growth,
progress towards the implementation of the African Continental Free Trade Area (AfCFTA)
and the potential commissioning of some of the larger greenfield investments announced
last year.
World trade will continue to face strong headwinds in 2019 and 2020 due to prevailing
tensions in the global marketplace, lingering uncertainty and the associated repercussions
for consumption demand, production activity and investment spending, not only in the
directly affected economies, but across the world. The World Trade Organisation (WTO)
expects growth in the volume of merchandise trade to slow to 2.6% in 2019, from 3% in
2018, potentially rebounding to 3% in 2020 contingent on an easing of trade tensions.
0
50
100
150
200
250
300
2007 2008 2009 2010 2011 2012 2013 2014 2015 2016 2017 2018 2019
All Metals index
Precious metals index
Base metals index
Crude oil price index
Commodity price trends
Ind
ex b
ase
20
16
= 1
00
Source: IDC, compiled using IMF data
Latest data: April 2019
China’s slowing economy
to affect the performance
of Africa’s metals’
exporters
Resource-seeking
investments underpinned
higher FDI flows into
Africa in 2018
World trade growth
expected to slow
significantly in 2019

Highlights
9
Economic overview
Policy space and efforts to support the economy’s recovery
The leader of the IMF mission which visited South Africa from May 27 to June 3, 2019 issued
the following statement upon its conclusion:
“Following President Ramaphosa’s election, there is a sense of cautious optimism about
economic prospects as the new government formulates its policy agenda. Amid challenging
global economic conditions, the growth outlook will depend critically on the pace of
implementation of reforms that address long-standing structural constraints.
If reform implementation accelerates sufficiently to lift business confidence and jump-start
private investment, growth would be reignited. However, if reforms are delayed, investment
would fail to pick up, economic growth would remain weak in the medium-term, and per
capita income would continue to decline.” (Ana Lucia Coronel, IMF, June 3, 2019)
Confidence plays an indispensable role in driving economic activity. Concerted and
consistent efforts across the higher echelons of government towards structural reform,
policy coherence and certainty, the eradication of corruption, and the restoration of trust in
the organs of state and parastatals are essential for the revival of confidence amongst
consumers, businesses and investors. Uniform, united and relentless messaging of such
commitments will reinforce the sense of purpose and direction towards a common and clear
vision. This is crucial for confidence-building and long-term investment decision-making by
business enterprises and the investor community, particularly in light of the very limited
fiscal resources and other forms of policy space for economic stimulation.
Monetary policy accommodation
The South African Reserve Bank’s cautious approach to monetary policy in recent years has
succeeded in keeping inflation largely under control, gravitating around the mid-point of its
3% to 6% target range. In so doing, the Monetary Policy Committee (MPC) has remained
cognisant of the economy’s poor performance, the fragility of its recovery and the plight of
millions of unemployed South Africans.
Figure 9: Headline consumer price inflation firmly within the target band
A more accommodative monetary policy stance could be justified considering the
economy’s weakness and moderate outlook for inflation. Inflationary pressures remain
contained and emanate mainly from the supply side, for there are hardly any demand-pull
forces at play in the current economic environment. Major upside risk factors include
- 2
0
2
4
6
8
10
12
14
16
-2
0
2
4
6
8
10
12
14
16
Inte
rest
rate
s: P
erc
en
tag
e
Head
lin
e C
PI
: %
ch
an
ge (
y-o
-y)
Inflation developments and the interest rate environment
Nominal prime lending rate (right-hand-side axis (Rhs))
Nominal repo rate (Rhs)
Real prime lending rate (Rhs)
Real repo rate (Rhs)
Headline consumer price inflation (left-hand-side axis)
Source: IDC, compiled using Stats SA and SARB data
Room for a more
accommodative monetary
policy stance
Structural reforms and
policy certainty are
essential to restore
confidence and revive
growth

Highlights
10
Economic overview
adverse movements in international oil prices and the rand exchange rate, as well as
escalations in domestic administered prices (e.g. electricity tariffs). Such price changes are
not interest rate sensitive, implying that monetary policy has limited impact in containing
inflationary pressures in the current environment. Interest rate changes may, however, affect
capital flows and, consequently, imported inflation outcomes via the associated exchange
rate movements. Furthermore, by anchoring inflation expectations, tight monetary policy
may persuade producers not to pass cost increases entirely on to consumers.
The recently announced 13.9% increase in electricity tariffs has added significant cost
pressures for businesses and households, with energy-intensive electricity users being the
hardest hit. Volatility in the rand exchange rate, in turn, could persist or even increase in a
global environment characterised by high levels of uncertainty, which can drive international
capital towards investment assets perceived to be safer.
The rand exchange rate is also likely to be influenced by changes in the policy rates of major
economies such as the US, Eurozone and Japan. Lower policy rates in the US or further
quantitative easing in the Eurozone, for instance, tend to be rand supportive and, by
implication, reduce imported inflation. Concerned with the sustainability of the US
economy’s expansion momentum in an increasingly challenging trading environment, the
US Federal Reserve recently affirmed its readiness to act in a supportive manner. As
illustrated in Figure 10, market expectations are that the Fed will cut rates by 50 to 75 basis
points (bps) over the remainder of 2019 (indicated in the chart by the highest probabilities
being associated with 2 to 3 rate cuts).
Figure 10: Market expectations tilted toward a lowering of US policy rates by 50-75 bps
In a seemingly pre-emptive move, the SARB’s MPC raised the repo rate by 25 basis points
in November 2018 as the inflation outlook deteriorated and in anticipation of a further
increase in the US policy rate by the Federal Reserve, which did not materialise. The SARB is
currently forecasting average inflation for 2019 at the target mid-point of 4.5%, increasing
to 5.1% in 2020.
Difficult economic conditions locally, as shown by the shocking GDP growth data for the
first quarter of the year, along with indications of a more accommodative monetary policy
stance in the US, may prompt the MPC to lower the repo rate by 25 basis points either in
July or September to support the domestic economic recovery, potentially followed by a
further 25 bps cut in November. However, on its own this will not be sufficient to re-ignite
growth in a domestic economic environment characterised by low business, investor and
consumer confidence due to a myriad of factors. Crucial amongst these are policy coherence
and certainty, and the independence of key institutions such as the SARB.
0
10
20
30
40
50
60
70
80
90
100
January-2019 February-2019 March-2019 April-2019 May-2019 June-2019
Pro
bab
ilit
y level
(%)
Market expectations of US Fed policy rate movements by the end of 2019
No Change (2.25-2.5)
1 cut
2 cuts
3 cuts
4cuts
Source: IDC, compiled using Bloomberg data
Federal Reserve now
expected to lower policy
rates to sustain the US
economy’s expansion
momentum
Reserve Bank’s Monetary
Policy Committee may
opt to reduce the repo
rate in a weak economic
environment
Highlights
11
Economic overview
The markets were recently perturbed by statements challenging the SARB’s mandate, its
approach to monetary policy and ownership status. Concerns thus resurfaced that the
central bank’s independence would be compromised, potentially leading to misguided and
risky monetary policy actions. Shortly thereafter, however, President Ramaphosa asserted
that “It is our desire for the South African Reserve Bank to be publicly owned. However, we
recognise that this will come at a cost, which, given our current economic and fiscal situation,
is simply not prudent.”
In his State of the Nation Address on June 20, the President confirmed the SARB’s mandate
as enshrined in the Constitution, specifically: “The primary object of the South African Reserve
Bank is to protect the value of the currency in the interest of balanced and sustainable
economic growth in the Republic”. Accordingly, the SARB “must pursue (this mandate)
independently, without fear, favour or prejudice”, stated the President. However, this must be
done in consultation with the Minister of Finance to ensure macroeconomic coordination,
as constitutionally mandated.
Highly constrained fiscal space, debt sustainability concerns
A persistently weak economic environment has been impacting negatively on government
finances. The space for counter-cyclical fiscal intervention in support of the economic
recovery has thus been drastically reduced.
During the 2018/19 fiscal year, total revenue collected amounted to R1.29 trillion, a shortfall
of R14.6 billion from the estimates published by National Treasury in the 2019 Budget.
Government expenditure, in turn, was reasonably in line with projections. The overall deficit
thus widened to R232.9 billion, taking the main budget deficit for 2018/19 to 4.9% of GDP,
significantly higher than the ratio of 4.4% estimated in the 2019 Budget.
A weaker than anticipated economic performance in 2019/20 is likely to result in a further
deterioration of the fiscal metrics beyond the projections published last February. The
possibility of a large fiscal stimulus being provided is thus basically ruled out, although
spending allocations could be somewhat reprioritised towards growth-inducing categories.
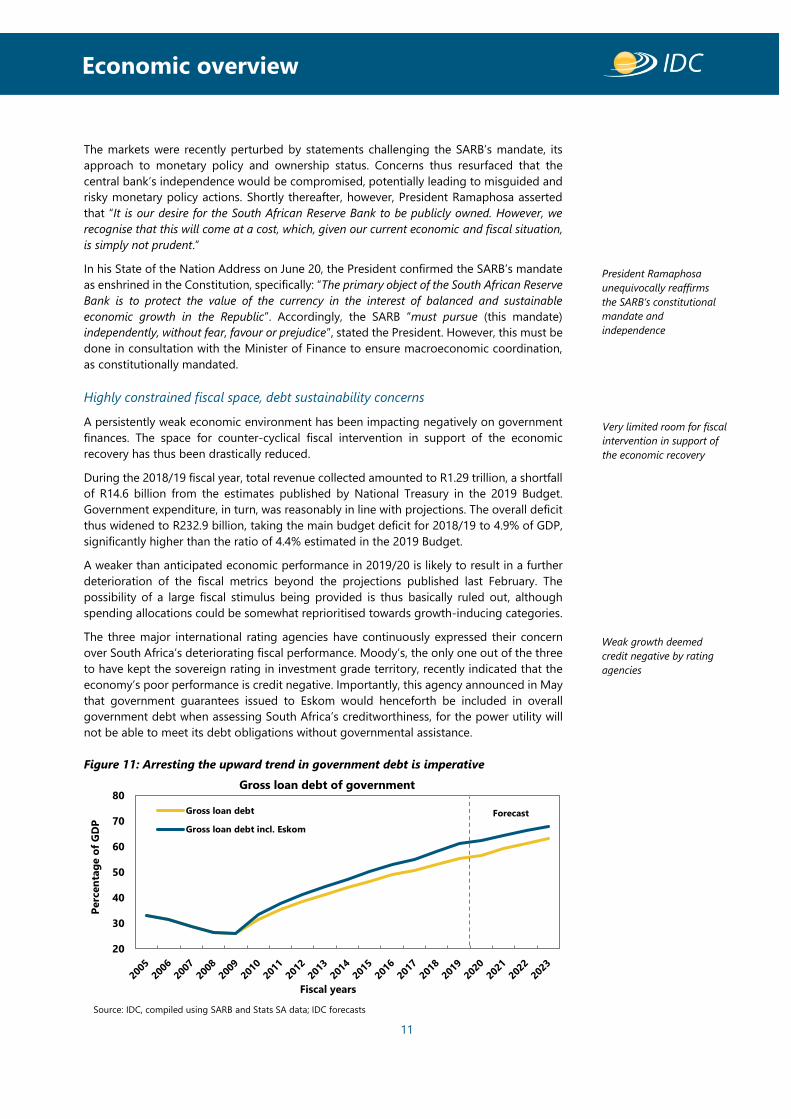
The three major international rating agencies have continuously expressed their concern
over South Africa’s deteriorating fiscal performance. Moody’s, the only one out of the three
to have kept the sovereign rating in investment grade territory, recently indicated that the
economy’s poor performance is credit negative. Importantly, this agency announced in May
that government guarantees issued to Eskom would henceforth be included in overall
government debt when assessing South Africa’s creditworthiness, for the power utility will
not be able to meet its debt obligations without governmental assistance.
Figure 11: Arresting the upward trend in government debt is imperative
20
30
40
50
60
70
80
Perc
en
tag
e o
f G
DP
Fiscal years
Gross loan debt of government
Gross loan debt
Gross loan debt incl. Eskom
Source: IDC, compiled using SARB and Stats SA data; IDC forecasts
Forecast
President Ramaphosa
unequivocally reaffirms
the SARB’s constitutional
mandate and
independence
Weak growth deemed
credit negative by rating
agencies
Very limited room for fiscal
intervention in support of
the economic recovery
Highlights
12
Economic overview
Recent developments thus raise the probability of Moody’s altering its outlook for South
Africa from “stable” to “negative”, possibly in November. In the absence of tangible progress
towards fiscal consolidation and debt sustainability, the possibility of a downgrade to sub-
investment will increase substantially.
According to Moody’s, arresting and ultimately reversing the long-term decline in the
economy’s growth potential and the rising debt trend, will be crucial. Other imperatives
include “(overcoming) spending pressures relating to interest and wages”, addressing the
tax collection challenges associated with a diminished institutional capacity at the South
African Revenue Services (SARS), as well as the financial sustainability of state-owned
companies (SOCs), especially Eskom, South African Airways (SAA) and Transnet.
In his State of the Nation Address (SONA), President Ramaphosa asserted government’s
commitment to a confidence- and investment-boosting macroeconomic and fiscal policy
framework, underpinned by “prudent borrowing and stringent expenditure management to
stabilise our public finances and lower the debt trajectory”.
Given the critical role played by Eskom in the economy at large, the President indicated that
a Special Appropriation Bill will be urgently tabled to frontload a significant portion of the
R230 billion in fiscal support planned for Eskom over the next 10 years, to alleviate the power
utility’s near- to medium-term financial constraints. This is likely to worsen government’s
debt ratios over the Medium-Term Expenditure Framework period. Besides indicating that
a chief restructuring officer will soon be appointed “to reposition Eskom financially with
careful attention to the mix between revenue, debt and cost structure of the company”, no
further detail was provided on its unbundling process. Moreover, no reference was made in
the SONA to SAA or the South African Broadcasting Corporation (SABC).
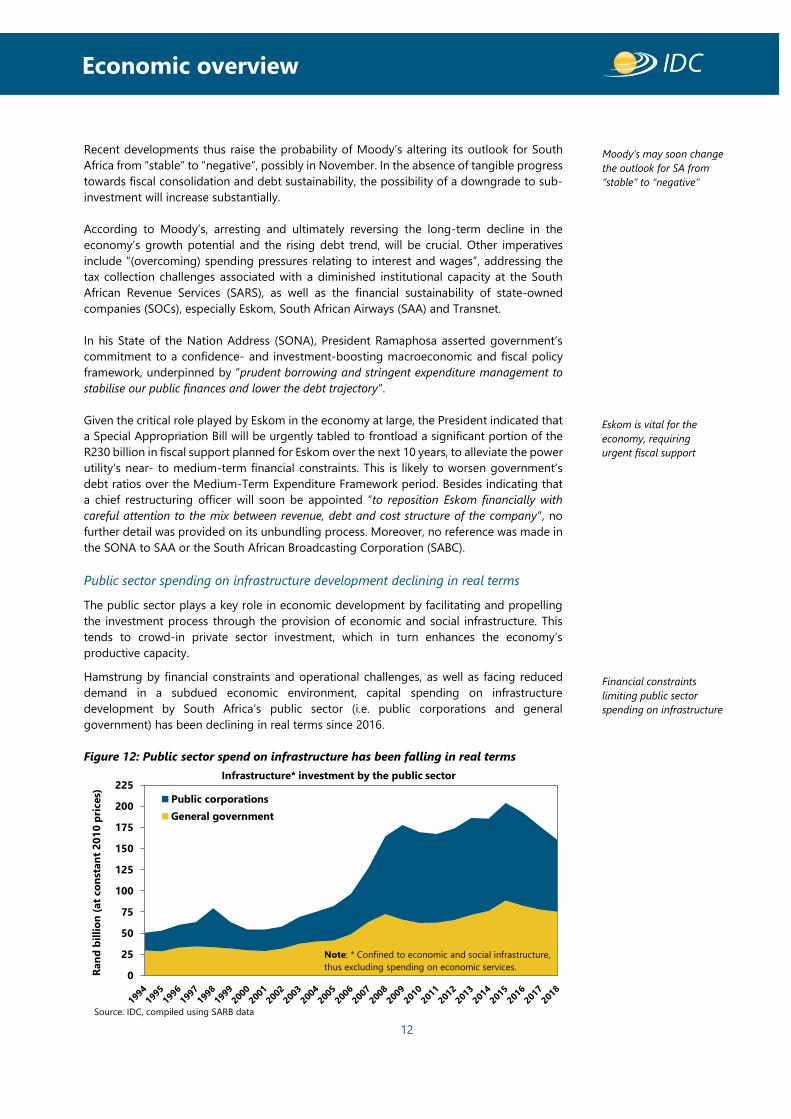
Public sector spending on infrastructure development declining in real terms
The public sector plays a key role in economic development by facilitating and propelling
the investment process through the provision of economic and social infrastructure. This
tends to crowd-in private sector investment, which in turn enhances the economy’s
productive capacity.
Hamstrung by financial constraints and operational challenges, as well as facing reduced
demand in a subdued economic environment, capital spending on infrastructure
development by South Africa’s public sector (i.e. public corporations and general
government) has been declining in real terms since 2016.
Figure 12: Public sector spend on infrastructure has been falling in real terms
0
25
50
75
100
125
150
175
200
225
Ran
d b
illi
on
(at
co
nst
an
t 2
01
0 p
rices) Public corporations
General government
Infrastructure* investment by the public sector
Source: IDC, compiled using SARB data
Note: * Confined to economic and social infrastructure,
thus excluding spending on economic services.
Moody’s may soon change
the outlook for SA from
“stable” to “negative”
Eskom is vital for the
economy, requiring
urgent fiscal support
Financial constraints
limiting public sector
spending on infrastructure

Highlights
13
Economic overview
Given the strong linkages between the public sector’s capital expenditure programmes and
many suppliers of goods and services across the economy, lower spending on infrastructure
development has far-reaching implications. Among the most affected are the construction
industry; manufacturers of key material inputs such as machinery and equipment, building
materials (e.g. fabricated steel, cement, bricks) and transport equipment (e.g. motor vehicles,
locomotives and rolling stock); as well as engineering, transport and business services.
According to National Treasury’s Budget Review 2019, public sector spending on
infrastructure development over the next three fiscal years (2019/20 to 2021/22) is projected
to total R865 billion at current prices. This translates into R248.3 billion per year, on average,
at constant 2017 prices. Our analysis of the potential impact of such expenditure revealed
the following developmental outcomes: the combined direct and indirect impact on GDP is
estimated at R258.7 billion per annum, again at constant 2017 prices, while almost 740 000
jobs could be created or maintained in the process.
However, in a scenario where such public sector expenditure on infrastructure is reduced by
5% in real terms relative to the above plan, the positive impact on GDP would be lowered
by almost R13 billion (at constant 2017 prices), on average per year, while 37 000 fewer jobs
would be created/maintained in the process.
Maximise localisation to counter the downward trend in infrastructure development
However, by ensuring a more effective implementation of their localisation strategies and
the product designations associated with public sector procurement, government and SOCs
can counter-act to a significant extent the adverse repercussions of reduced public sector
spend on infrastructure due to financial constraints.
In order to determine the potential impact of enhanced localisation efforts on the domestic
economy, specifically by procuring more from local suppliers instead of relying on imports,
our analysis assumed a 10% reduction in the import leakage associated with the public
sector spend over the fiscal years 2019/20 to 2021/22 as outlined in the Budget Review.
Should this be achieved, the positive impact on GDP is estimated to be about R4.5 billion
higher on an annual basis (refer to Table 2), while an additional 12 800 jobs could be either
created or sustained across several sectors of the economy. These outcomes pertain to both
direct and indirect impacts on GDP and employment through the multiplier effects
associated with increased spending on local goods and services, as opposed to imports.
Table 2: Estimated impact of enhanced localisation (reduced import leakage)
associated with public sector infrastructure expenditure on the South African economy
Economic variable 2019/20 2020/21 2021/22 Average over
MTEF period
Import leakage associated with
infrastructure spending Medium-term expenditure framework (MTEF)
Imports (at constant 2017 prices) 36.8 36.0 36.9 36.6
Reduced import leakage of 10%:
R billion (at constant 2017 prices) 3.7 3.6 3.7 3.7
Development impact: GDP in R billion (at constant 2017 prices)
4.5 4.4 4.5 4.5
Employment (number) 12 858 12 574 12 874 12 769
Source: IDC calculations, based on Budget Review 2019 data
An effective roll-out of localisation plans and proper monitoring of actual expenditure and
respective developmental outcomes would go a long way towards supporting several
supplier industries, including many small- to medium-sized enterprises whose activities are
highly reliant on the public sector’s procurement system.
Despite lower infrastructure
spend in real terms, its
economic impact can be
enhanced through localisation
Highlights
14
Economic overview
Crowding-in private sector funding for infrastructure development
The economic stimulus and recovery plan announced by President Ramaphosa in
September 2018 included the establishment of an Infrastructure Fund by means of which
government aimed to crowd-in other funders and investors for the expansion and
improvement of the country’s infrastructure.
The Infrastructure Fund would comprise a contribution from government of more than R400
billion over the next three years, which would be used to leverage funding from
developmental finance institutions, multilateral development banks, as well as private
lenders and investors.
To ensure that infrastructure projects are implemented in a swifter, more cost-effective and
developmental manner, particularly in terms of employment creation and localisation, the
fund would be supported by a strong technical team in the Presidency.
In the SONA on June 20, President Ramaphosa recalled that R100 billion had been set aside
by government as seed capital for the Infrastructure Fund. The President also indicated that
the consultative process towards the fund’s institutionalisation was proceeding with private
sector investors such as pension funds.
The fund will be managed by the Development Bank of Southern Africa, with oversight from
the reconfigured Department of Public Works and Infrastructure. However, private sector
investors may insist on playing some oversight role within the fund’s governing structure.
A clearly-defined project pipeline may also be a precondition for attracting long-term capital
investment commitments, ensuring alignment with private funders’ investment strategies
and risk appetite.
Revitalising the productive sectors of the economy and investment
With the aim of revitalising and expanding the productive sectors of the economy, boosting
private sector investment and creating a more inclusive economy, the SONA outlined several
initiatives.
These include the development of master plans in industries such as clothing and textiles,
chemicals and plastics, gas, renewables, steel and metals fabrication, as well as priority
attention on the development of agricultural and agro-processing value chains and targeted
minerals beneficiation.
Government will fulfil its role as an enabler by providing critical infrastructure and through
spatial interventions such as the development of special economic zones, the revitalisation
of local industrial parks and the establishment of digital hubs. SME development is also a
key focal point, while township and village enterprises will contribute to local economic
development.
Policy direction to initiate the spectrum licensing process will be issued by the Minister of
Communications to the Independent Communications Authority of South Africa (ICASA)
within a month. This long-awaited step, which will include measures to enhance competition
in the sector, transformation and universal access, is expected to reduce data costs in South
Africa.
The importance of the tourism sector was highlighted, with the aim being to attract more
than double the number international tourist arrivals by 2030. Introducing a world-class visa
system, revamping the country’s brand, making concerted efforts to attract more visitors
from China and India, and providing a safer environment for tourists form part of the plan
in this regard.
Substantially higher levels of fixed investment are required to elevate and sustain the
economy’s expansion momentum. By addressing bottlenecks hindering investment activity
Private sector funding can
be leveraged to augment
public sector investment in
infrastructure
SONA highlights several
priority sectors for
development

Highlights
15
Economic overview
and working towards a clear revival in business and investor sentiment, government aims to
attract substantial contributions from the private sector.
Improved efficiencies and better planning and implementation of the public sector’s
infrastructure build programme will be highly beneficial to the local construction sector,
which is under severe pressure at present. Furthermore, measures are to be put in place to
reduce the cost of doing business, including electricity prices, port and harbour charges, as
well as by ensuring a more affordable and efficient transport and logistics system.
Regional integration will be enhanced to expand trade and investment with the rest of the
African continent, with the African Continental Free Trade Area being key in this regard.
Particular focus will be paid to the development of select value chains within the SADC
region.
Concluding remarks
The outlook for the South African economy has dimmed significantly.
Households still find themselves in a difficult environment, which is affecting their ability
and willingness to spend, at least in the short-term.
Limited fiscal space in a low-growth environment will not only impact on government’s
consumption expenditure, but also on its investment in infrastructure. Financial and
operational challenges at key SOCs are expected to constrain their capital expenditure for
quite some time.
Capital outlays by the private sector, in turn, are likely to remain subdued in the shorter term
as weak demand, excess production capacity and a degree of policy uncertainty keep
business sentiment at low levels, weighing on investment decisions.
Globally, strong headwinds may result in a weaker than anticipated expansion momentum
for the world economy, with the deterioration in trade relations between the US and China
playing a key role in this regard. Lower economic growth in some of the principal external
markets for South Africa’s exports is a matter of concern, while FDI inflows may be also
affected in a more challenging global environment.
Against such a background, it is imperative that all social partners commit to and collaborate
in restoring confidence and investing in South Africa’s future, for its economy and people
present enormous potential. Steps are being taken in this direction, as highlighted by
President Ramaphosa in his State of the Nation Address, but time is of the essence.
Department of Research and Information
21 June 2019
Regional integration to
play a pivotal role

Highlights
16
Economic overview
Annexure
-15,0
-10,0
-5,0
0,0
5,0
10,0
15,0
Q1 Q2
2015
Q3 Q4
|
Q1 Q2
2016
Q3 Q4
|
Q1 Q2
2017
Q3 Q4
|
Q1 Q2
2018
Q3 Q4
|
Q1
GD
P g
row
th (
q-o
-q,
saar)
an
d %
co
ntr
ibu
tio
ns
Household consumption
Government consumption
Fixed investment
Change in inventories
Residual
Exports
Imports
Total GDP
Source: IDC, compiled using Stats SA data
Figure A1: Real GDP growth and contributions by expenditure item
-5,0
-4,0
-3,0
-2,0
-1,0
0,0
1,0
2,0
3,0
4,0
5,0
Q1 Q2
2015
Q3 Q4
|
Q1 Q2
2016
Q3 Q4
|
Q1 Q2
2017
Q3 Q4
|
Q1 Q2
2018
Q3 Q4
|
Q1
GD
P g
row
th (
q-o
-q,
saar)
an
d %
co
ntr
ibu
tio
ns
Agriculture, forestry and
fishing
Mining and quarrying
Manufacturing
Electricity, gas and water
Construction
Trade, catering and
accommodation
Transport, storage and
communication
Finance, real estate and
business services
General government
services
Personal services
Total GDP (Basic prices)
Source: IDC, compiled using Stats SA data
Figure A2: Real GDP growth and contributions by the broad economic sectors
Related Documents


![Estimating Road Segments Using Natural Point ...segments”-contest [6] was organized with the task of averaging segments of GPS trajectories to predict road segments while including](https://static.cupdf.com/doc/110x72/60cfe59c42219c07ae1490d1/estimating-road-segments-using-natural-point-segmentsa-contest-6-was-organized.jpg)