June 2014 TransAlta Investor Presentation

Welcome message from author
This document is posted to help you gain knowledge. Please leave a comment to let me know what you think about it! Share it to your friends and learn new things together.
Transcript
1
June 2014
TransAlta
Investor Presentation
2
Forward Looking Statements
This presentation may contain forward looking statements, including statements regarding the business and anticipated financial performance of
TransAlta Corporation in 2014, 2015 and subsequent years. All forward looking statements are based on our beliefs and assumptions based on
information available at the time the assumptions were made and on management’s experience and perception of historical trends, current conditions
and expected future developments, and other factors deemed appropriate in the circumstances. These statements are not guarantees of our future
performance and are subject to a number of risks and uncertainties that may cause actual results to differ materially from those contemplated by the
forward looking statements. In particular, this presentation contains forward looking statements pertaining to, among other things: expectations
relating to the timing of the completion and commissioning of projects under development and their attendant costs; our estimated spend on growth
and sustaining capital and productivity projects; expectations in terms of the cost of operations, capital spend and maintenance; expectations in
respect of future electricity prices and the impact of natural gas prices on electricity prices; the impact of certain hedges on future reported earnings
and cash flows; expectations related to future earnings, cash flow and funds from operations; expectations for demand for electricity in both the short-
term and the long-term and the resulting impact on electricity prices; expected impacts of load growth on electricity supply and the development of
additional generation; expectations in respect of generation availability, capacity and production; expected financing of our capital expenditures;
expected governmental regulatory regimes and legislation and their anticipated impact on us; our trading strategy and the expected results from our
trading activities; and expectations in respect to the global economic environment. Factors that may adversely impact our forward looking statements
include risks relating to, among other things: fluctuations in market prices and availability of fuel supplies required to generate electricity and in the
price of electricity; the regulatory and political environments in the jurisdictions in which we operate; environmental requirements and changes in, or
liabilities under, these requirements; changes in general economic conditions including interest rates; operational risks involving our facilities,
including unplanned outages at such facilities; disruptions in the transmission and distribution of electricity; effects of weather; disruptions in the
source of fuels, water, or wind required to operate our facilities; natural disasters; the threat of domestic terrorism and cyber-attacks; equipment
failure; energy trading risks; industry risk and competition; fluctuations in the value of foreign currencies and foreign political risks; the need for
additional financing counterparty credit risk; insurance coverage; reliance on key personnel; labour relations matters; and risks associated with
development projects and acquisitions. The foregoing risk factors, among others, are described in further detail in the Risk Management section of
our 2013 annual MD&A and under the heading “Risk Factors” in our 2014 Annual Information Form.
Except to the extent required by law, we assume no obligation to publicly update or revise any forward looking statements, whether as a result of new
information, future events or otherwise. All forward looking statements in this presentation are expressly qualified in their entirety by these cautionary
statements. For information on our risks please refer to our 2014 Annual Information Form which has been filed on SEDAR and can be accessed at
www.sedar.com.
Unless otherwise specified, all dollar amounts are expressed in Canadian dollars.
This presentation may contain references to comparable earnings comparable earnings per share, comparable EBITDA, funds from operations, and
funds from operations per share which are not defined under IFRS. Refer to the Non-IFRS financial measures section of TransAlta’s 2013 annual
MD&A for an explanation and, where applicable, reconciliations to net earnings attributable to common shareholders and cash flow from operating
activities. The presentation may also contain references to gross margin and operating income, which are Additional IFRS measures. Please refer to
the Additional IFRS measures section of the MD&A.
3
Strategic & Financial Objectives
4
Leading Diversified Power
Generation Company
Proven Track Record
Sound Financial and
Business Profile
Disciplined Growth
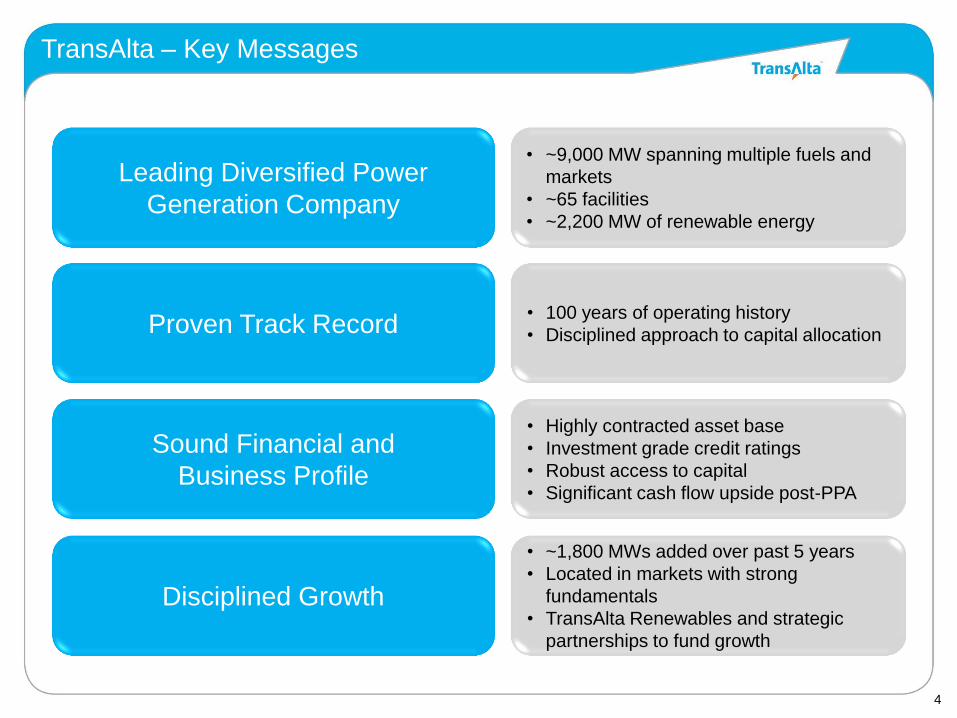
• ~9,000 MW spanning multiple fuels and
markets
• ~65 facilities
• ~2,200 MW of renewable energy
• 100 years of operating history
• Disciplined approach to capital allocation
• Highly contracted asset base
• Investment grade credit ratings
• Robust access to capital
• Significant cash flow upside post-PPA
• ~1,800 MWs added over past 5 years
• Located in markets with strong
fundamentals
• TransAlta Renewables and strategic
partnerships to fund growth
TransAlta – Key Messages

5
Our Business
Canada’s largest publicly traded wholesale power
generator & marketer with over 100 years of operating
experience
Diversified asset base with ~65 facilities strategically
positioned in Canada, Western U.S. and Western
Australia
Total fleet capacity of ~9,000 MWs
Our business lines:
• Coal
• Gas
• Renewable energy (Hydro and Wind)
• Energy trading, which optimizes our other
business lines
Sponsor and majority owner of TransAlta Renewables
Listed on Toronto and New York stock exchanges
Coal:
4,930 MW
Gas:
1,695 MW
Hydro:
914 MW1
Wind:
1,271MW1
1Includes 100% of TransAlta Renewables’ assets.
6
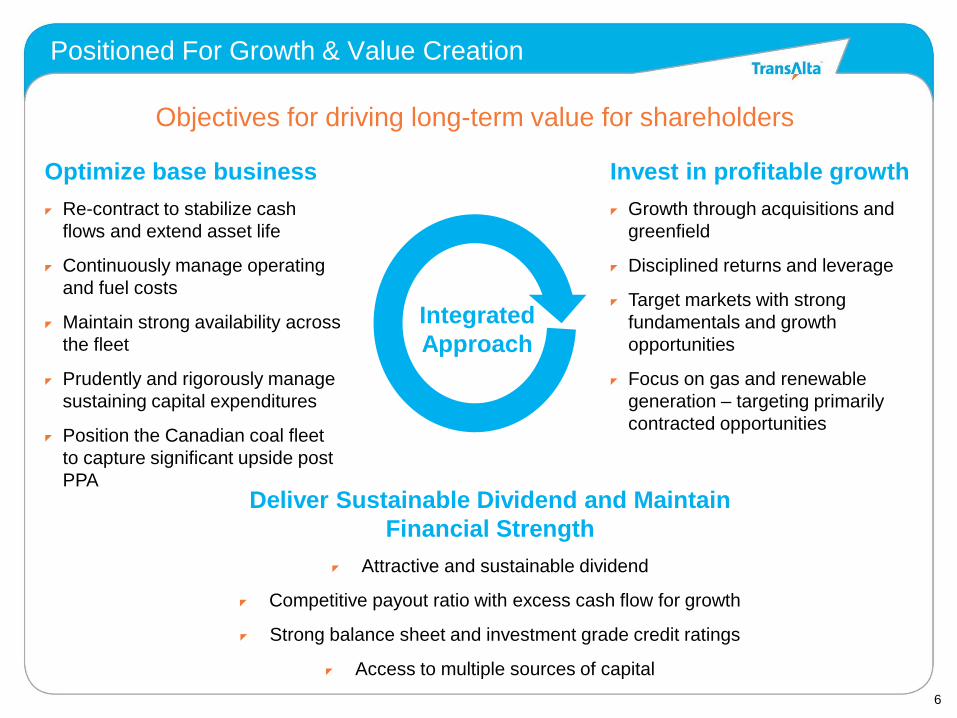
Objectives for driving long-term value for shareholders
Deliver Sustainable Dividend and Maintain
Financial Strength
Attractive and sustainable dividend
Competitive payout ratio with excess cash flow for growth
Strong balance sheet and investment grade credit ratings
Access to multiple sources of capital
Optimize base business
Re-contract to stabilize cash
flows and extend asset life
Continuously manage operating
and fuel costs
Maintain strong availability across
the fleet
Prudently and rigorously manage
sustaining capital expenditures
Position the Canadian coal fleet
to capture significant upside post
PPA
Invest in profitable growth
Growth through acquisitions and
greenfield
Disciplined returns and leverage
Target markets with strong
fundamentals and growth
opportunities
Focus on gas and renewable
generation – targeting primarily
contracted opportunities
Positioned For Growth & Value Creation
Integrated
Approach

7
20001
20141
Strategic Evolution of TransAlta
1Net Capacity Ownership Interest. Includes 100% of TransAlta Renewables’ assets.
Actively shifting our business
mix by growing renewables
8
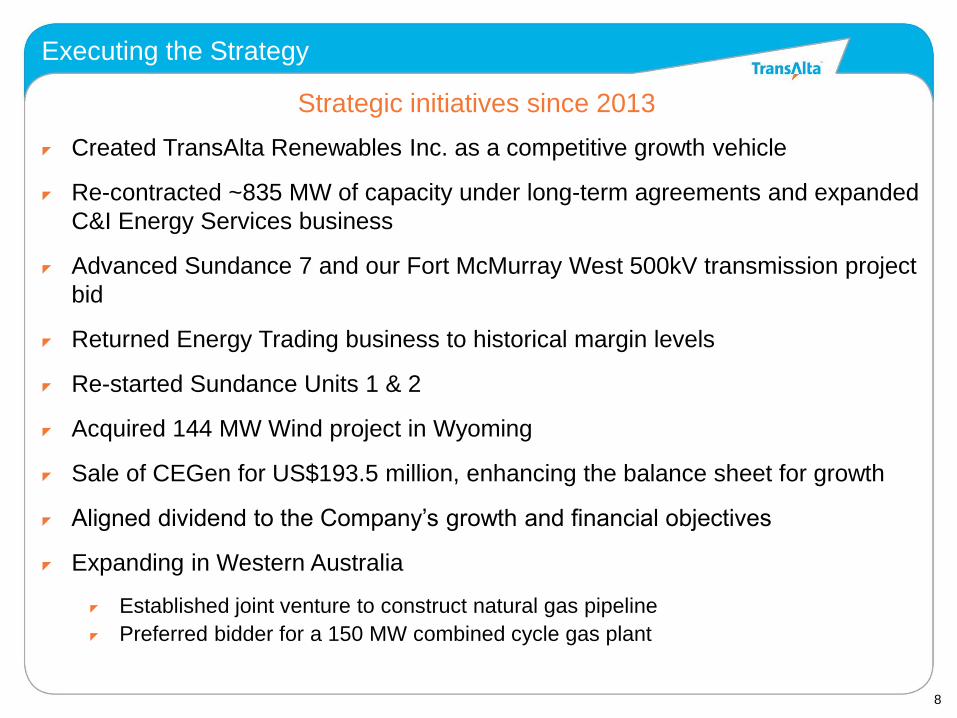
Executing the Strategy
Created TransAlta Renewables Inc. as a competitive growth vehicle
Re-contracted ~835 MW of capacity under long-term agreements and expanded
C&I Energy Services business
Advanced Sundance 7 and our Fort McMurray West 500kV transmission project
bid
Returned Energy Trading business to historical margin levels
Re-started Sundance Units 1 & 2
Acquired 144 MW Wind project in Wyoming
Sale of CEGen for US$193.5 million, enhancing the balance sheet for growth
Aligned dividend to the Company’s growth and financial objectives
Expanding in Western Australia
Established joint venture to construct natural gas pipeline
Preferred bidder for a 150 MW combined cycle gas plant
Strategic initiatives since 2013

9
2008 2009 2010
2011 2013 2012 2013
694 MW
Canadian Hydro
80 MW
Kent Hills 123 MW
Ardenville / Kent Hills 2 19 MW
Bone Creek
225 MW
Keephills 3
125 MW
Solomon
68 MW
New Richmond
2011
132 MW
Summerview 2 / Blue Trail
2010
144 MW
Wyoming Wind
Disciplined growth with a focus on contracted assets
TransAlta’s 5-Year Growth Track Record
~ 1,800 MW added in our core markets over 5 years1
150 MW
Western Australia Gas
Plant and Pipeline
¹Indicative illustration based on annualized EBITDA contributions. 2013 includes recent acquisition of 144 MW Wyoming Wind assuming full year pro-forma. Does not include natural gas
pipeline in Western Australia which will contribute EBITDA beginning in 2015. EBITDA does not include Port Hedland which will commission in early 2017.
2014

10
Creation of TransAlta Renewables
29 megawatts installed
generating capacity
1,255 billion total
market capitalization
$ 1.3 billion assets
$2.0 renewable power
generation facilities
One of the Largest Publicly-Traded Renewable Companies in Canada
British Columbia 4 hydro
77 MW
Alberta 4 hydro
21 MW
10 wind
417 MW
Ontario 4 hydro
7 MW
3 wind
398 MW
Quebec 1 wind
68 MW
New Brunswick 2 wind
125 MW
Bone Creek 19MW
Upper Mamquam 25MW
Pingston 23MW
Akolkolex 10MW
Summerview One 70MW
Sinnott 7MW
Castle River 44MW
Belly River 3MW
Waterton 3MW
Cowley North 20MW
Summerview Two 66MW
Macleod Flats 3MW Blue Trail 66MW
Soderglen 35MW Taylor Hydro 13MW
McBride Lake 38MW
Ardenville 69MW
St. Mary 2MW Misema 3MW
Moose Rapids 1MW
Appleton 1MW
Galetta 2MW
Wolfe Island 198MW
Melancthon One 68MW
Melancthon Two 132MW
New Richmond 68MW
Kent Hills One 80MW
Kent Hills Two 45MW
High Quality Diversified Portfolio 5 Operating Regions
11
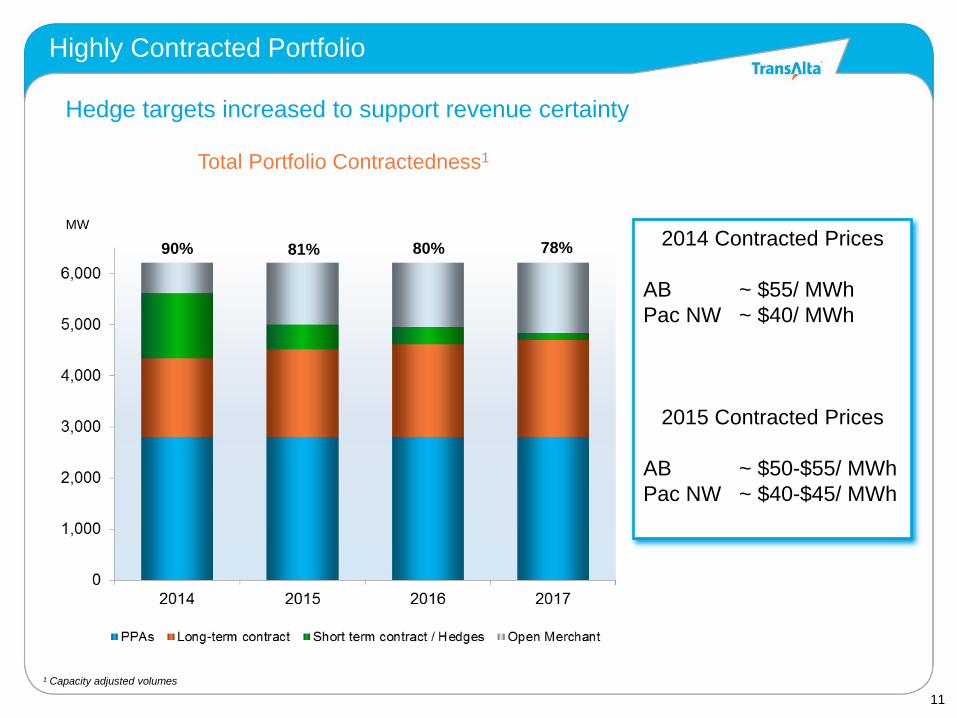
Total Portfolio Contractedness1
Hedge targets increased to support revenue certainty
2014 Contracted Prices
AB ~ $55/ MWh
Pac NW ~ $40/ MWh
2015 Contracted Prices
AB ~ $50-$55/ MWh
Pac NW ~ $40-$45/ MWh
Highly Contracted Portfolio
¹ Capacity adjusted volumes
MW
90% 81% 80% 78%

12
Financial Review & Outlook
13
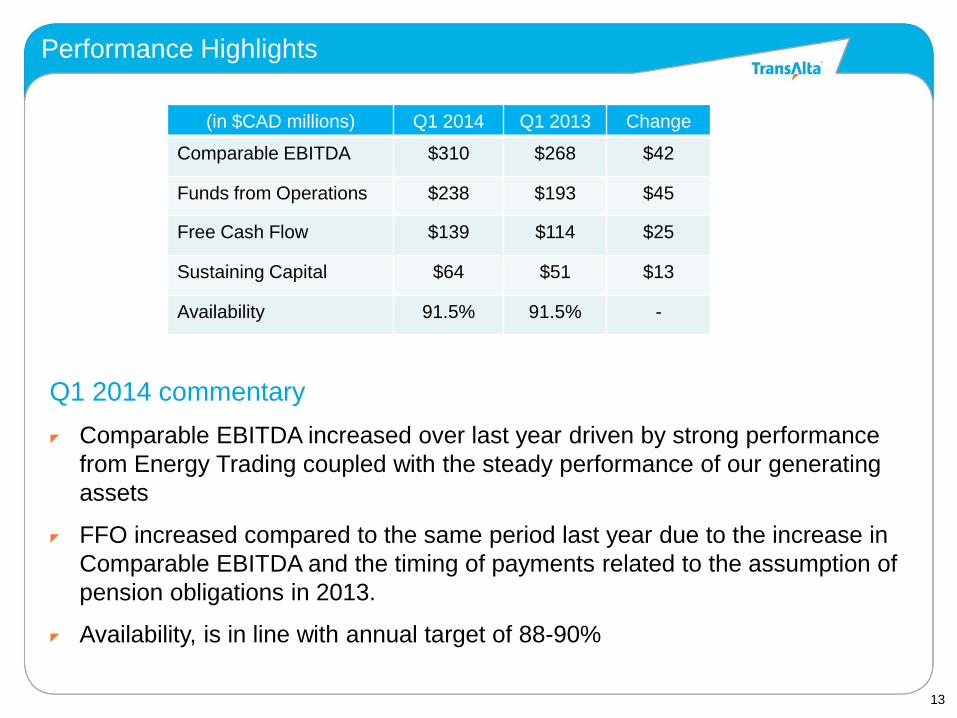
Performance Highlights
Q1 2014 commentary
Comparable EBITDA increased over last year driven by strong performance
from Energy Trading coupled with the steady performance of our generating
assets
FFO increased compared to the same period last year due to the increase in
Comparable EBITDA and the timing of payments related to the assumption of
pension obligations in 2013.
Availability, is in line with annual target of 88-90%
(in $CAD millions) Q1 2014 Q1 2013 Change
Comparable EBITDA $310 $268 $42
Funds from Operations $238 $193 $45
Free Cash Flow $139 $114 $25
Sustaining Capital $64 $51 $13
Availability 91.5% 91.5% -
14
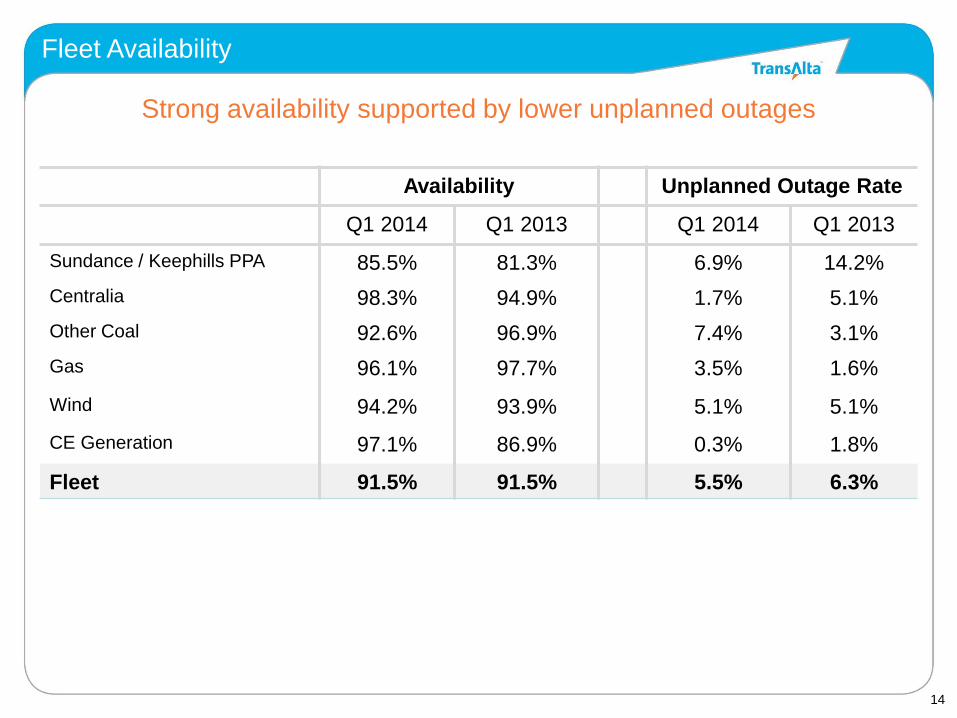
Fleet Availability
Availability Unplanned Outage Rate
Q1 2014 Q1 2013 Q1 2014 Q1 2013
Sundance / Keephills PPA 85.5% 81.3% 6.9% 14.2%
Centralia 98.3% 94.9% 1.7% 5.1%
Other Coal 92.6% 96.9% 7.4% 3.1%
Gas 96.1% 97.7% 3.5% 1.6%
Wind 94.2% 93.9% 5.1% 5.1%
CE Generation 97.1% 86.9% 0.3% 1.8%
Fleet 91.5% 91.5% 5.5% 6.3%
Strong availability supported by lower unplanned outages
15
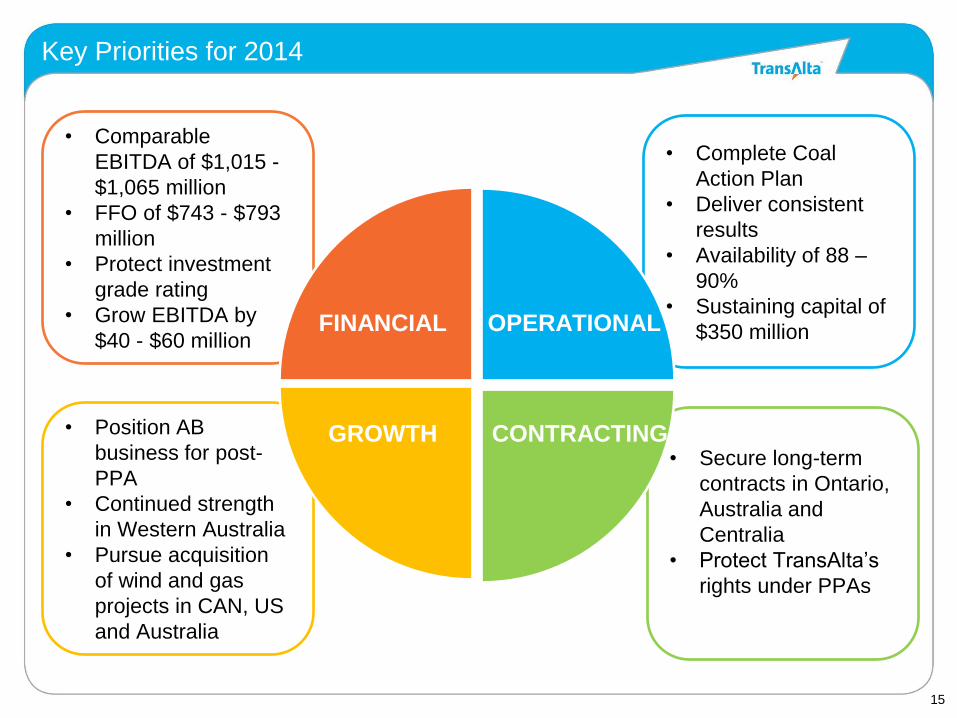
Key Priorities for 2014
• Secure long-term
contracts in Ontario,
Australia and
Centralia
• Protect TransAlta’s
rights under PPAs
• Complete Coal
Action Plan
• Deliver consistent
results
• Availability of 88 –
90%
• Sustaining capital of
$350 million
• Comparable
EBITDA of $1,015 -
$1,065 million
• FFO of $743 - $793
million
• Protect investment
grade rating
• Grow EBITDA by
$40 - $60 million
• Position AB
business for post-
PPA
• Continued strength
in Western Australia
• Pursue acquisition
of wind and gas
projects in CAN, US
and Australia
OPERATIONAL
CONTRACTING
FINANCIAL
GROWTH

16
Canadian Coal Improvements
New leadership with proven experience in similar vintage and type of assets:
Substantial cost reductions
Management of structural change across entire portfolios in response to
very challenging power market conditions
Implementation of Coal Action Plan focused on:
Organizational effectiveness
Reliability engineering
Major maintenance execution efficiencies
Operational Discipline
Focus on competitive operating model
Maintain daily focus on the competitiveness of the mining operation
Raising the bar at CDN Coal
17
Markets and Growth

18 ¹Per AESO
Markets where TransAlta is Positioned for Growth
Western U.S. Alberta
Ontario / B.C. Western Australia
GDP growth of 2 – 3% per year
6,000 MW of new generation by 20221
Cogen and combined cycle
Strong load growth
Coal generation retirement
~1.4% annual load growth over next ten years
California: 15,000 MW by 2020
WECC: 25,000-30,000 MW by 2020
Opportunity for gas-fired generation
GDP growth of 3 – 4% per year
Mining industry is largest driver of new opportunities
Ontario:
Near term conservation measures
Medium-term opportunity due to nuclear retirements/ refurbishments
B.C.:
~3% load growth to 2020
LNG development

19
Sundance 7
Continued development of Sundance 7 with the filing of
AUC permits and completing a Request for Interest from
engineering companies for the construction contract
TAMA Transmission
Successfully qualified to compete in the next phase of the
Fort McMurray West 500 KV Transmission Project
Western Australia Pipeline
Constructing a natural gas pipeline with joint venture
partner in Western Australia to serve customers in the
region to be operational in early 2015
Port Hedland
Named the successful bidder to build, own and operate a
150 MW combined cycle gas power station in South
Hedland, Western Australia. Full commissioning in 2017.
Recent Growth Progress
20
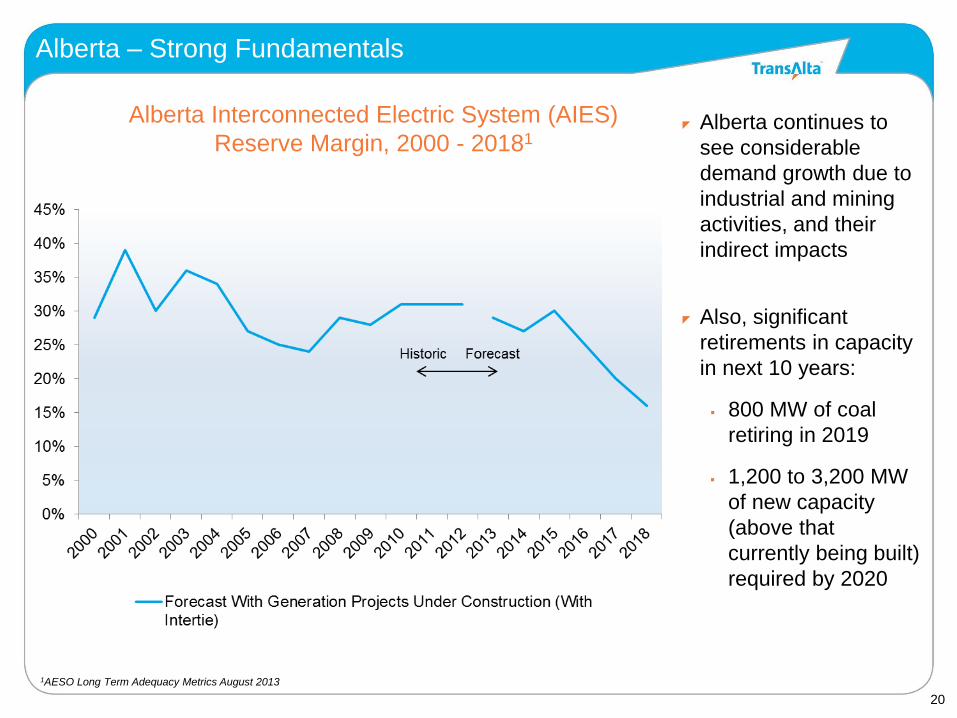
Alberta Interconnected Electric System (AIES)
Reserve Margin, 2000 - 20181
1AESO Long Term Adequacy Metrics August 2013
Alberta continues to
see considerable
demand growth due to
industrial and mining
activities, and their
indirect impacts
Also, significant
retirements in capacity
in next 10 years:
800 MW of coal
retiring in 2019
1,200 to 3,200 MW
of new capacity
(above that
currently being built)
required by 2020
Alberta – Strong Fundamentals

21
Since deregulation, AB Pool prices have averaged $65 / MWh
Source: AESO
Historical Power Prices in Alberta
22
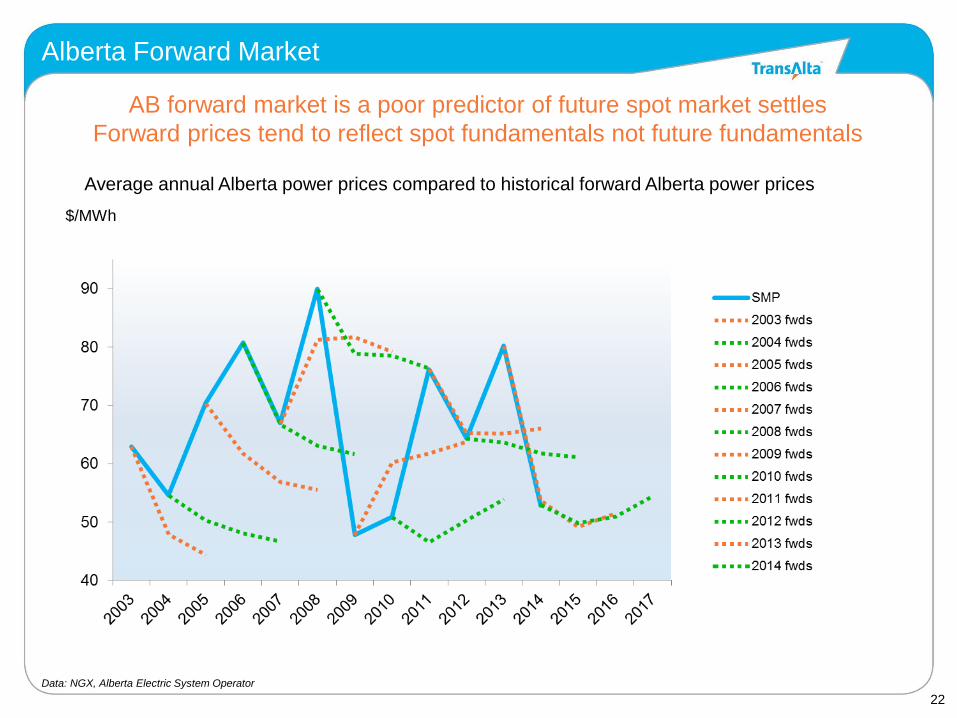
Data: NGX, Alberta Electric System Operator
AB forward market is a poor predictor of future spot market settles
Forward prices tend to reflect spot fundamentals not future fundamentals
$/MWh
Average annual Alberta power prices compared to historical forward Alberta power prices
Alberta Forward Market
23
Funding Growth & Credit Rating
$100 - $150 million annually in Free Cash Flow
Dividend re-investment proceeds
Secondary offering of TransAlta Renewables
Drop downs to TransAlta Renewables
Asset sales
Preferred shares
Debt
Growth will be funded supporting Investment Grade credit metrics
24
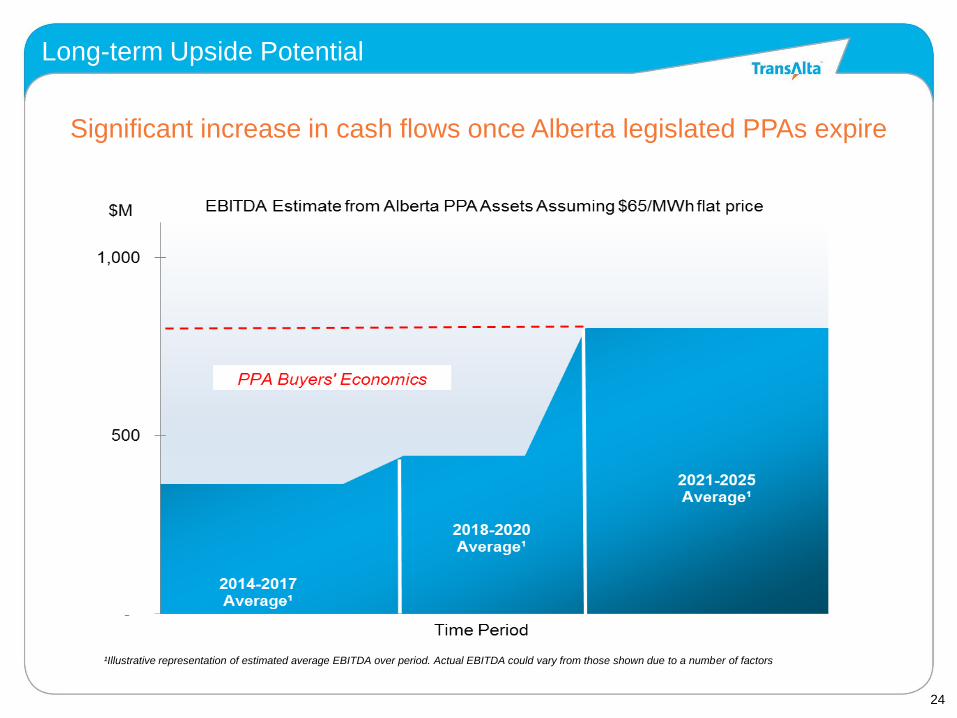
Long-term Upside Potential
Significant increase in cash flows once Alberta legislated PPAs expire
¹Illustrative representation of estimated average EBITDA over period. Actual EBITDA could vary from those shown due to a number of factors
25
Focused on Creating Value
Integrated approach to driving long-term shareholder value
Diversified and highly contracted portfolio
Attractive and sustainable dividend
Strong balance sheet and free cash flow
Well positioned for growth in markets with strong fundamentals
Significant upside post-PPA
Related Documents