03/25/22 1 ECONOMIC IMPLICATIONS OF LIQUID FUEL MITIGATION OPTIONS IN THE USA Presented at the “Time for Action: A Midnight Ride For Peak Oil” ASPO-USA World Oil Conference Boston, Massachusetts October 2006 Roger H. Bezdek. Ph.D. Management Information Services, Inc. www.misi-net.com

Jun-15 1 ECONOMIC IMPLICATIONS OF LIQUID FUEL MITIGATION OPTIONS IN THE USA Presented at the “Time for Action: A Midnight Ride For Peak Oil” ASPO-USA World.
Dec 21, 2015
Welcome message from author
This document is posted to help you gain knowledge. Please leave a comment to let me know what you think about it! Share it to your friends and learn new things together.
Transcript

04/18/23 1
ECONOMIC IMPLICATIONS OFLIQUID FUEL MITIGATION
OPTIONS IN THE USA
Presented at the “Time for Action:
A Midnight Ride For Peak Oil”
ASPO-USA World Oil Conference
Boston, Massachusetts
October 2006
Roger H. Bezdek. Ph.D.
Management Information Services, Inc.
www.misi-net.com

04/18/23 2
• Economic Implications of Peak Oil
• Summary of 2006 U.S. Peak Mitigation Study
• Recent U.S. Oil Import Reduction Study Results
• Findings and Conclusions
• Questions and Caveats
• U.S. Government Progress on Peaking
Views are the author’s, except where noted
THIS PRESENTATION

04/18/23 3
No, we’re facing a liquid fuels crisisNo, we’re facing a liquid fuels crisis

04/18/23 4
World is Consuming More Oiland Finding Less
Past discovery by ExxonMobil
0
10
20
30
40
50
60
1930 1950 1970 1990 2010 2030 2050
Bil
lio
ns
of
Ba
rrel
s
0
10
20
30
40
50
60
Past
Future
Production
“GrowingGap”

04/18/23 5
When Will Peaking Occur? Different Approximations Lead to Different Forecasts
Forecast Source
December 2005 Deffeyes (U.S.)
2006-2007 Bakhitari (Iran)
2006-2007 Simmons (U.S.)
2009 - 2010 Skrebowski (U.K.)
2010 Campbell (Ireland)
Before 2010 Goodstein (U.S.)
After 2010 World Energy Council
2012 Weng (China)
2016 Doug-Westwood (U.K.)After 2020 CERA (U.S.)
2030 or later EIA (U.S) / Exxon Mobil
5 years
5-15 years
> 20 years
Already

04/18/23 6
What Might Happen at Peaking?
WORLD OIL DEMAND
grows each year in a
healthy world economy
WORLD OIL PRODUCTION
reaches a maximum &
then declines
Supply cannot meet
demand
• PRICES INCREASE
• SHORTAGES DEVELOP
Time
04/18/23 7
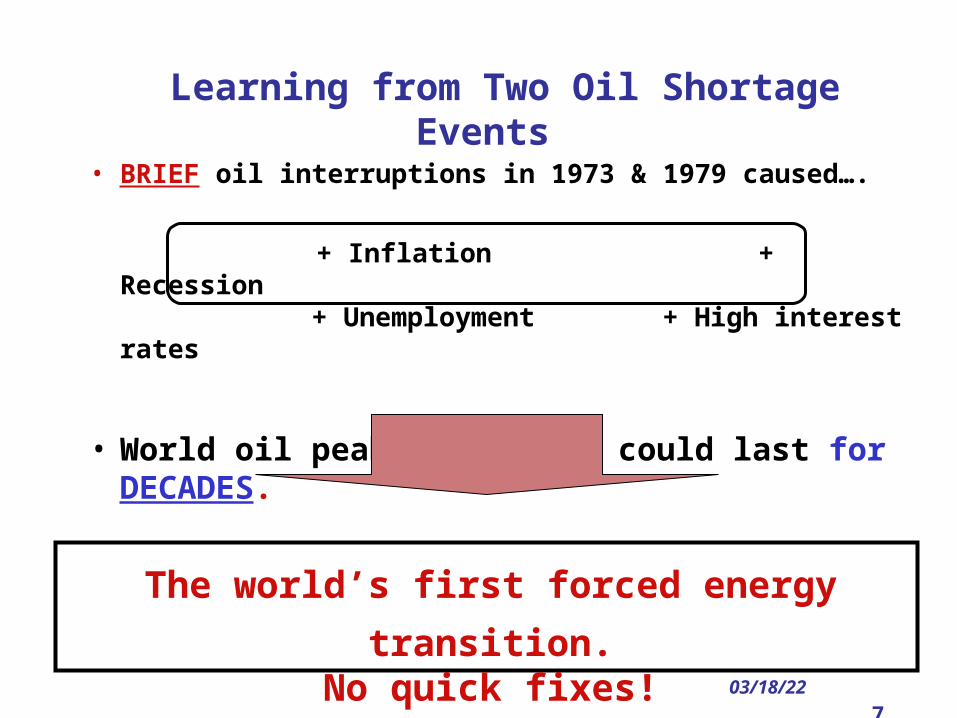
Learning from Two Oil Shortage Events
• BRIEF oil interruptions in 1973 & 1979 caused….
+ Inflation + Recession + Unemployment + High interest rates
• World oil peaking impacts could last for DECADES.
The world’s first forced energy transition.No quick fixes!
04/18/23 8
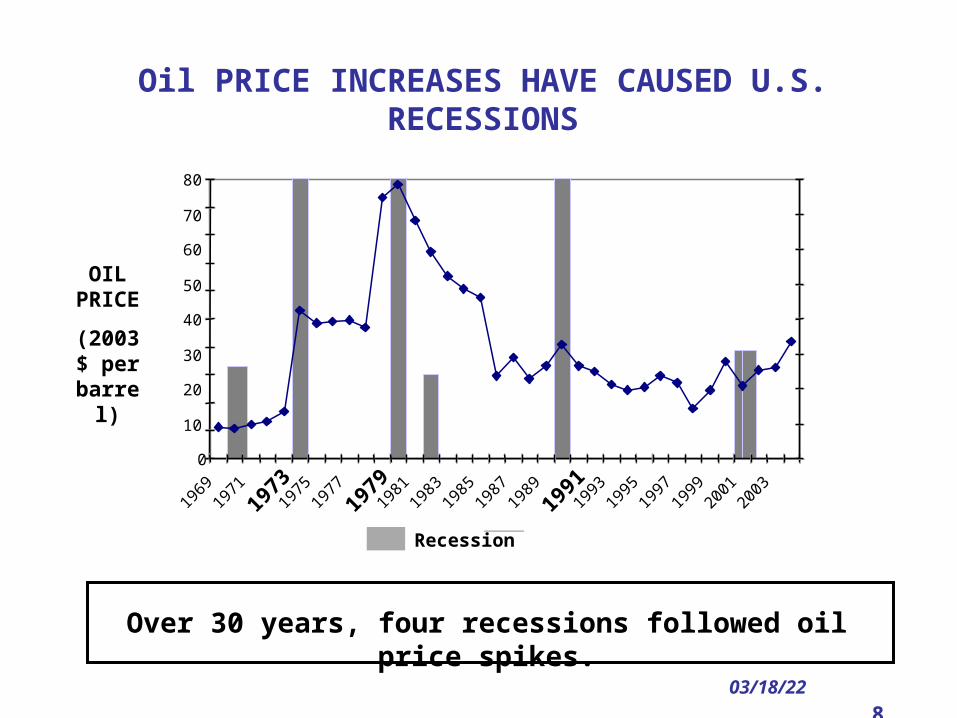
Oil PRICE INCREASES HAVE CAUSED U.S. RECESSIONS
0
0.1
0.2
0.3
0.4
0.5
0.6
0.7
0.8
0.9
1
1969
1971
1973
1975
1977
1979
1981
1983
1985
1987
1989
1991
1993
1995
1997
1999
2001
2003
0
10
20
30
40
50
60
70
80
Recession
OIL PRICE
(2003 $ per
barrel)
Over 30 years, four recessions followed oil price spikes.

04/18/23 9
_______________________________________________________________________________________________________________
Remember the 1970s?Remember the 1970s?Stagflation. . . recession. Stagflation. . . recession. That was only a short-term disruption.That was only a short-term disruption.

04/18/23 10
20.021.0
22.023.24.025.026.027.028.0
29.030.031.032.033.034.0
2002 2004 2006 2008 2010 2012 2014 2016 2018 2020 2022 2024 2026 2028 2030
’06
Tcf
/Yea
r
’02’03
’04
’05
0
Forecasting Oil & Gas Supply Is Difficult! DOE EIA Forecasts of N. American Natural Gas Supply to U.S.
Looks good
Trouble!
4 years
U.S. EIA says no world oil problem before 2030.
04/18/23 11
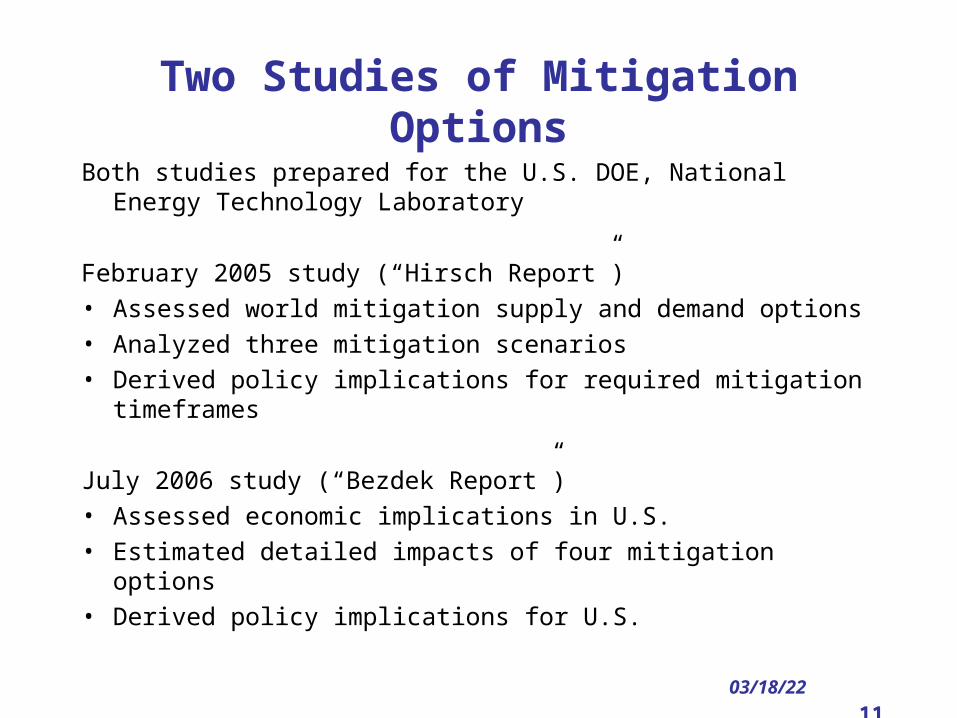
Two Studies of Mitigation Options
Both studies prepared for the U.S. DOE, National Energy Technology Laboratory
February 2005 study (“Hirsch Report”)• Assessed world mitigation supply and demand options• Analyzed three mitigation scenarios• Derived policy implications for required mitigation timeframes
July 2006 study (“Bezdek Report”)• Assessed economic implications in U.S.• Estimated detailed impacts of four mitigation options• Derived policy implications for U.S.

04/18/23 12
2006 Study Objective & Approach
• Explore imported oil reduction and/or peak oil mitigation -- U.S. only
+ Time required to save & produce liquid fuels
+ Costs
+ Economic, fiscal, tax, & jobs impacts.
• Assumed crash program implementation to define a
best case.
• Adopted an unspecified starting date – “t0.”

04/18/23 13
Option Worldwide Study
U.S. - Only Study
Vehicle Efficiency
Coal-To-Liquids
Enhanced Oil Recovery
Gas-To-Liquids
Shale Oil
Heavy Oil/Oil Sands
Not Ready
Assumed ready
Physical Mitigation Options & Their Applicability
Small
U.S. an Importer

04/18/23 14
Implementation AssumptionsMitigation Technology Previous Assumptions
for the WorldAssumptions for the
U.S. in This Study
Vehicle fuel efficiency Ramping up to a 50% increase in vehicle fuel efficiency after 8 years
Same
Coal-to-liquids Five (5) new 100,000 bpd plants/yr. 4 years to build
Three (3) new 100,000 bpd plants/yr. 4 years to build
Enhanced Oil Recovery
World oil production increased by 3 mbpd after 10 years / 5 year delay
175,000 bpd each year after 4 years construction delay
Oil Sands/Heavy Oil 2.5 MM bpd of incremental production achieved 13 years from a decision to accelerate
None
Gas-to-liquids 1 mbpd achieved in 5 years None
Oil Shale None 3 new 100,000 bpd plants/yr. 8 year delay

04/18/23 15
Methodological Approach & Databases
• Well-Established Models
+ MISI economic model & databases
+ U.S. Commerce Dept. models
+ Census Bureau/BLS industry/occupation data
• Labor force data within each industry for 800 occupations and skills
• State and regional data

04/18/23 16
____________________________________________________________________________________________________
Coal, Oil Shale, and Alternative Liquid Coal, Oil Shale, and Alternative Liquid Fuel PlantsFuel Plants

04/18/23 17
The Delayed Wedge Model
Prepare Produce
ImpactBarrels/ Day
0 10 20 30
Vehicle Fleet Fuel
Saved
Actual
Wedge Approximation
Time - Years

04/18/23 18
0
2
4
6
8
10
12
14
16
0 2 4 6 8 10 12 14 16 18 20
Mil
lio
ns
of
Bar
rels
Per
D
ay
Vehicle Fuel Efficiency
Coal Liquefaction
Oil Shale
EOR
Years after Crash Program Initiation
U.S. Crash Program to Cut Imports
Source: Roger H. Bezdek, Robert M. Wendling, and Robert L. Hirsch, Economic Impacts of U.S. Liquid Fuel Mitigation Options, DOE/NETL-2006/1237, July 8, 2006.

04/18/23 19
Mitigation Impacts if Initiated in 2006(forecasts based on EIA projections)
Domestic Production
VFE
EOR
CTL
OSBalance of U.S. Consumption
0
5
10
15
20
25
30
millio
n b
arr
els
per
day
Source: Roger H. Bezdek, Robert M. Wendling, and Robert L. Hirsch, Economic Impacts of U.S. Liquid Fuel Mitigation Options, DOE/NETL-2006/1237, July 8, 2006.
04/18/23 20
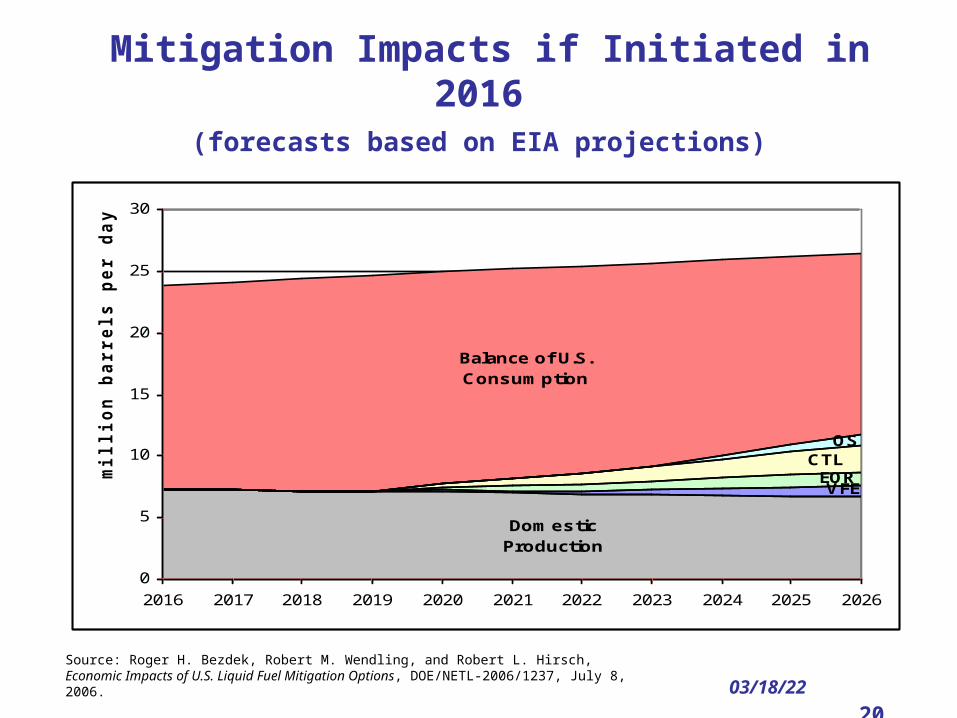
Mitigation Impacts if Initiated in 2016 (forecasts based on EIA projections)
Domestic Production
VFEEOR
CTLOS
Balance of U.S. Consumption
0
5
10
15
20
25
30
2016 2017 2018 2019 2020 2021 2022 2023 2024 2025 2026
millio
n b
arr
els
per
day
Source: Roger H. Bezdek, Robert M. Wendling, and Robert L. Hirsch, Economic Impacts of U.S. Liquid Fuel Mitigation Options, DOE/NETL-2006/1237, July 8, 2006.
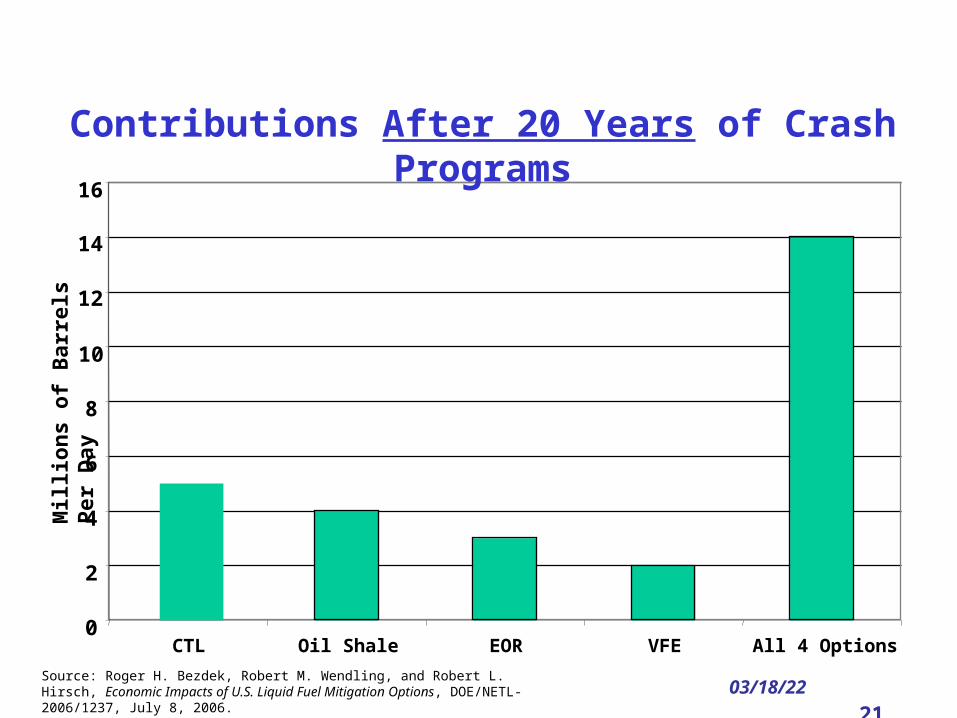
04/18/23 21
0
2
4
6
8
10
12
14
16
CTL Oil Shale EOR VFE All 4 Options
Mill
ion
s o
f B
arre
ls P
er D
ay
Contributions After 20 Years of Crash Programs
Source: Roger H. Bezdek, Robert M. Wendling, and Robert L. Hirsch, Economic Impacts of U.S. Liquid Fuel Mitigation Options, DOE/NETL-2006/1237, July 8, 2006.

04/18/23 22
CTL VFE EOR All
Jo
bs
- M
illio
ns
Jobs Created Annually in Year t0 + 20
Oil Shale
1.4
1.2
1.0
0.9
0.6
0.4
0.2
0
Source: Roger H. Bezdek, Robert M. Wendling, and Robert L. Hirsch, Economic Impacts of U.S. Liquid Fuel Mitigation Options, DOE/NETL-2006/1237, July 8, 2006.
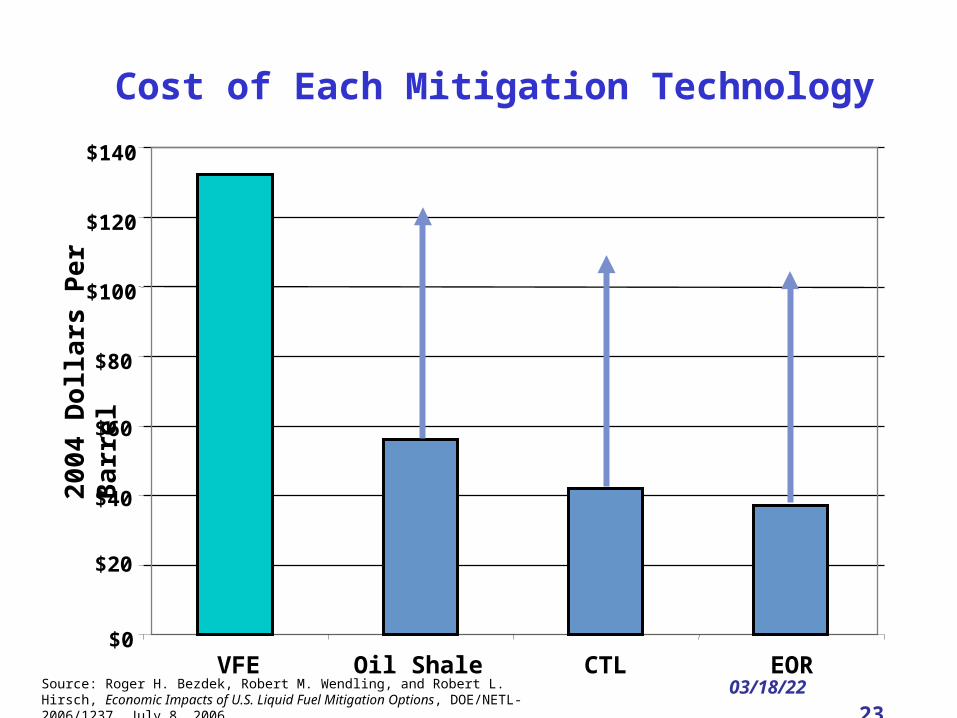
04/18/23 23
$0
$20
$40
$60
$80
$100
$120
$140
VFE Oil Shale CTL EOR
200
4 D
olla
rs P
er
Ba
rre
lCost of Each Mitigation Technology
Source: Roger H. Bezdek, Robert M. Wendling, and Robert L. Hirsch, Economic Impacts of U.S. Liquid Fuel Mitigation Options, DOE/NETL-2006/1237, July 8, 2006.

04/18/23 24
Crash Programs Will Escalate Liquid Fuel Production Costs
Possibility 1
Possibility 2
Possibility 3
U.S. 20 year capital costs based on N plants = $2.6 trillion
$4 - 6 Trillion Cost (20 years)
Likely Due to Cost Escalation
th

04/18/23 25
The Mitigation Initiatives Will Create $100’s of Billions of Sales For Industries
0
5
10
15
20
25
30
35
40
Bil
lio
ns
of
20
05
Do
lla
rs
Source: Roger H. Bezdek, Robert M. Wendling, and Robert L. Hirsch, Economic Impacts of U.S. Liquid Fuel Mitigation Options, DOE/NETL-2006/1237, July 8, 2006.

04/18/23 26
Occupational Jobs Created bythe Mitigation Options
2%
3%
3%
10%
18%2%
2%
8%
3%
3%
2%
3%
2%
0
5,000
10,000
15,000
20,000
job
s
3%
Source: Roger H. Bezdek, Robert M. Wendling, and Robert L. Hirsch, Economic Impacts of U.S. Liquid Fuel Mitigation Options, DOE/NETL-2006/1237, July 8, 2006.

04/18/23 27
The Mitigation Initiatives Will Create Billions of Tax Revenues
0
10
20
30
40
50
60
70
80
90
100
VehicleEfficiency
Coal toLiquids
Oil Shale Enahnced OilRecovery
Total
Bil
lio
ns
20
05
Do
lla
rs
Federal State & Local Total
Source: Roger H. Bezdek, Robert M. Wendling, and Robert L. Hirsch, Economic Impacts of U.S. Liquid Fuel Mitigation Options, DOE/NETL-2006/1237, July 8, 2006.

04/18/23 28
Benefits to a State of a Small (30,000 Barrels/Day) Coal Liquefaction Plant
• Development & construction expenditures: $2.5 billion
• Annual O&M expenditures: $400 million• Direct development & construction jobs: 2,000 +• Development & construction payroll: $100
million• Annual direct O&M jobs: 400• Annual O&M payroll: $25 million• Total new jobs annually: 1,000+• Annual state & local govt. tax revenues: $10 -
$20 millionSource: Roger H. Bezdek, Robert M. Wendling, and Robert L. Hirsch, Economic Impacts of U.S. Liquid Fuel Mitigation Options, DOE/NETL-2006/1237, July 8, 2006.

04/18/23 29
Findings (1)
• Mitigation options can contribute significantly to saving and production of U.S liquid fuels
• It will take decades for significant impact• Costs will be in the trillions of dollar range
Cumulative 20 year impact would be:• Savings and production of 44 billion barrels of liquid fuels• Requirement for over $2.6 trillion of investment (minimum
estimate)• Over 10 million employment years of jobs created• Total industry sales of over $3 trillion occurred• Over $125 billion of industry profits accrued• Over $500 billion in federal government tax revenues accrued• Nearly $300 billion in state & local government tax revenues
Source: Roger H. Bezdek, Robert M. Wendling, and Robert L. Hirsch, Economic Impacts of U.S. Liquid Fuel Mitigation Options, DOE/NETL-2006/1237, July 8, 2006.

04/18/23 30
Findings (2)
U.S. is endowed with needed geological resources, capital, labor, and management to undertake such an effort
Aggressive mitigation programs would have substantial benefits for U.S.:
• Enhanced energy security• Trillions of dollars of industry investment and sales• Hundreds of billions of dollars of industry profits• Rejuvenation of many U.S. manufacturing industries• Hundreds of billions of dollars of tax revenues• Millions of jobs• Elimination of most U.S. oil imports
Source: Roger H. Bezdek, Robert M. Wendling, and Robert L. Hirsch, Economic Impacts of U.S. Liquid Fuel Mitigation Options, DOE/NETL-2006/1237, July 8, 2006.

04/18/23 31
PRES. BUSH: “REDUCE OIL IMPORT DEPENDENCE”FIRST THING TO DO: STOP DIGGING!
(forecasts based on EIA projections)
Imports held at 2005
level
Projected Production
Supply Gap
0
5
10
15
20
25
30
millio
n b
arr
els
per
day
04/18/23 32
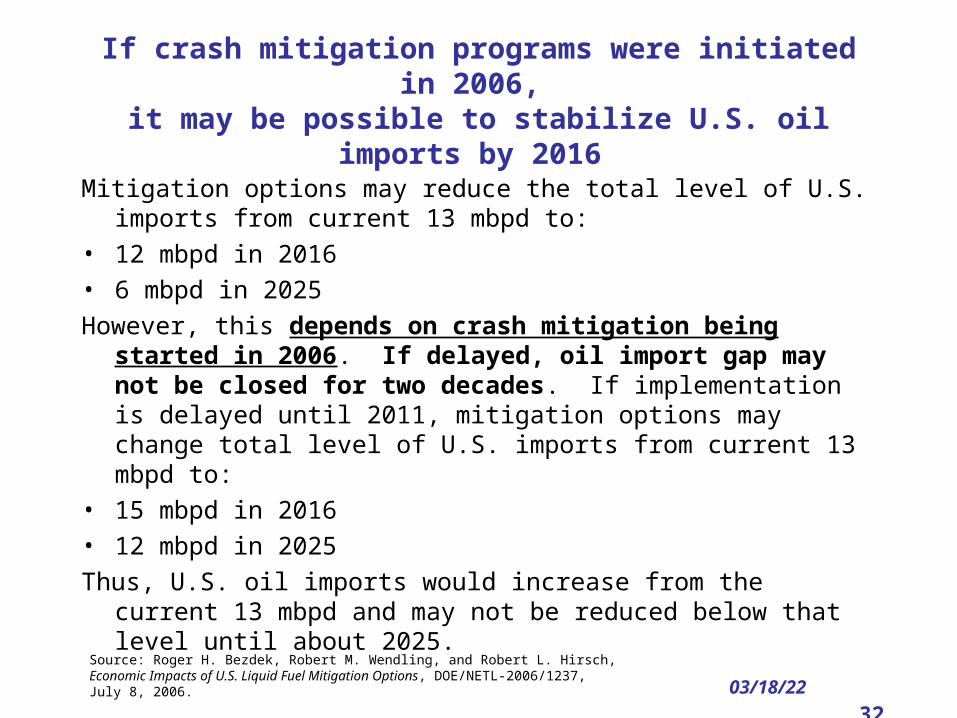
If crash mitigation programs were initiated in 2006, it may be possible to stabilize U.S. oil imports by 2016
Mitigation options may reduce the total level of U.S. imports from current 13 mbpd to:
• 12 mbpd in 2016• 6 mbpd in 2025
However, this depends on crash mitigation being started in 2006. If delayed, oil import gap may not be closed for two decades. If implementation is delayed until 2011, mitigation options may change total level of U.S. imports from current 13 mbpd to:
• 15 mbpd in 2016• 12 mbpd in 2025
Thus, U.S. oil imports would increase from the current 13 mbpd and may not be reduced below that level until about 2025.
Source: Roger H. Bezdek, Robert M. Wendling, and Robert L. Hirsch, Economic Impacts of U.S. Liquid Fuel Mitigation Options, DOE/NETL-2006/1237, July 8, 2006.

04/18/23 33
Interpretation of Study Findings
Controversy over interpretation; findings have various implications for ASPO and others:
• Costs and benefits of liquid fuel requirements• What is required to maintain “current energy regime”• Implications of maintaining “current energy regime”• What is required to change “current energy regime”• Time & $ required to transition to a “new energy regime”
How to get from “here” to “there – the new energy regime?” What is “there”? When is there: 2020? 2025? 2030?
Major finding: Problem is of enormous scale, will require decades to resolve, and will require $ trillions investment. No easy, “painless” solution

04/18/23 34
Growing Oil Shortages Will Induce Growing World “Demand Destruction”
Su
pp
ly
Supply & Demand in
Balance
Minimal Disruption
Recession Depression
Demand Destruction

04/18/23 35
What About “Demand Destruction”
• Is demand destruction the solution or the problem?
• It is always the “default solution:” Absent mitigation options, it will always equate oil supply with demand
• However, demand destruction is an euphemism for recession, depression, mass unemployment, etc.
• People – & governments – will not passively accept massive demand destruction and may opt for desperate alternatives
• Therefore, objective should be to use mitigation options to minimize and control demand destruction
04/18/23 36
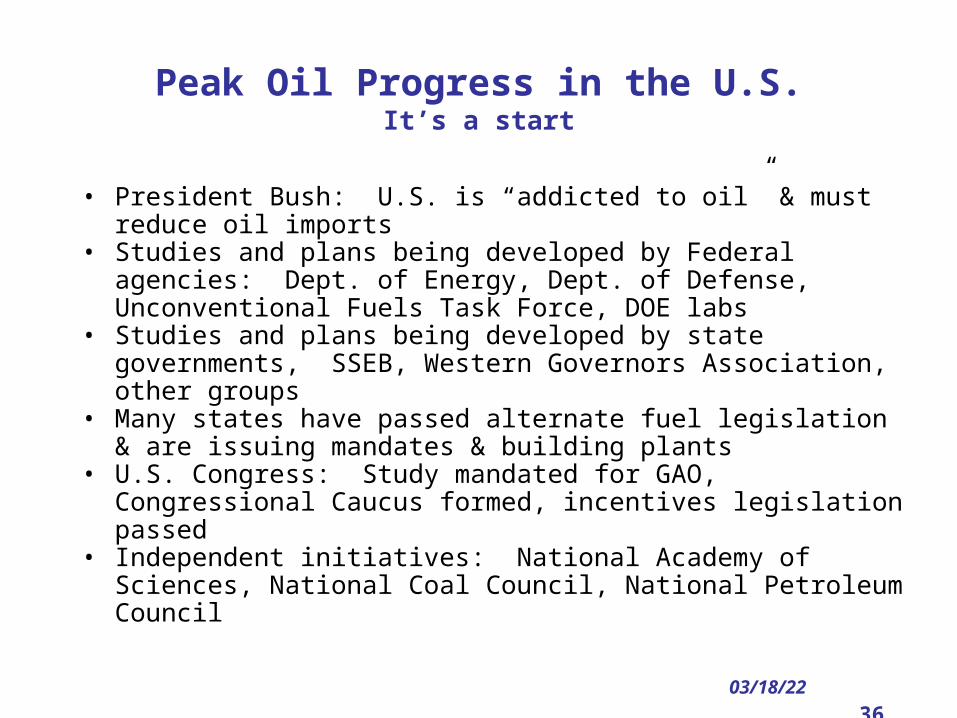
Peak Oil Progress in the U.S.It’s a start
• President Bush: U.S. is “addicted to oil” & must reduce oil imports
• Studies and plans being developed by Federal agencies: Dept. of Energy, Dept. of Defense, Unconventional Fuels Task Force, DOE labs
• Studies and plans being developed by state governments, SSEB, Western Governors Association, other groups
• Many states have passed alternate fuel legislation & are issuing mandates & building plants
• U.S. Congress: Study mandated for GAO, Congressional Caucus formed, incentives legislation passed
• Independent initiatives: National Academy of Sciences, National Coal Council, National Petroleum Council

04/18/23 37
Concluding Remarks
• Earlier (2005) world peak oil mitigation study has provided estimates and guidance
• Experience: Peaking could come with little warning & sharp declines.
• The new U.S.-only study provides time, cost, industry, job, & skill estimates: Scale is enormous & poorly recognized.
• Definition of “Peak Oil” needs to be clarified – some analysts keep expanding the definition of “oil.”
• The U.S. Energy Secretary has talked of peak oil, & some U.S. government activities are underway. It’s a start.
04/18/23 38
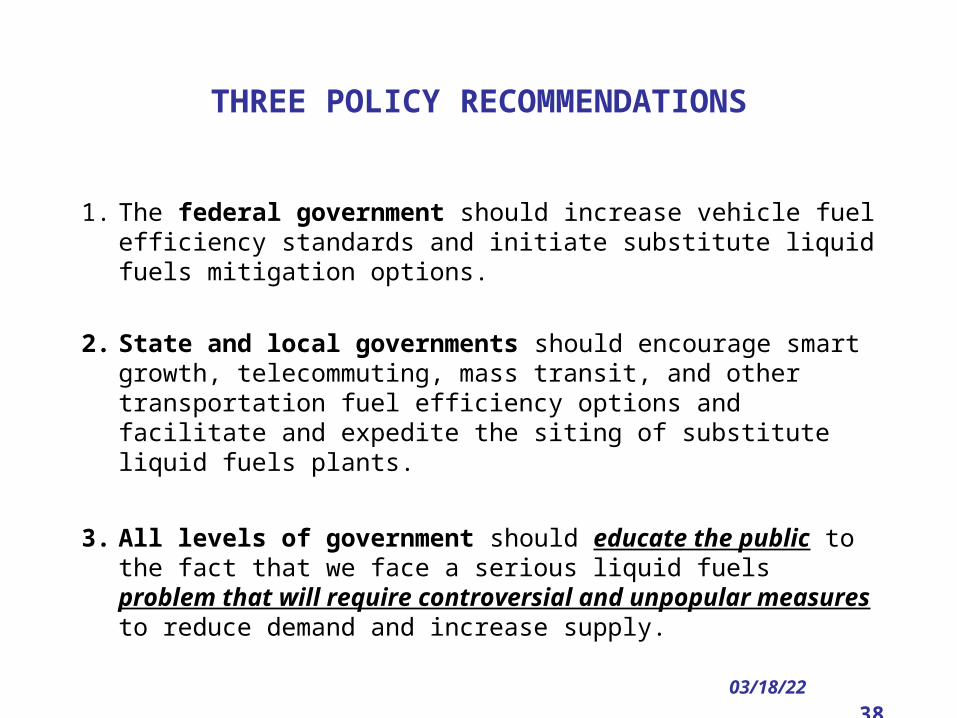
THREE POLICY RECOMMENDATIONS
1. The federal government should increase vehicle fuel efficiency standards and initiate substitute liquid fuels mitigation options.
2. State and local governments should encourage smart growth, telecommuting, mass transit, and other transportation fuel efficiency options and facilitate and expedite the siting of substitute liquid fuels plants.
3. All levels of government should educate the public to the fact that we face a serious liquid fuels problem that will require controversial and unpopular measures to reduce demand and increase supply.

04/18/23 39
It might happen again!

04/18/23 40
LOCAL CONTACT INFORMATION
While in Australia through July 6,
Dr. Bezdek can be contacted via ASPO Australia
Association for the Study of Peak Oil and Gas
www.ASPO-Australia.org.au
International Australia
Related Documents