July 2019 Mastercard Caixin BBD China New Economy Index Released: 10:00 am Beijing Time August-02-2019 Overview In July 2019, the Mastercard Caixin BBD New Economy Index (NEI) reading came in at 28.7, indicating that the New Economy accounted for 28.7% of overall economic input activities that month, down 1.3 ppts from June (Chart 1). The declining NEI was due to the decrease of capital input. New economy is defined as following: 1) human capital intensive, technology intensive and capital light, 2) sustainable rapid growth, and 3) in line with the strategic new industries defined by the government. Please refer to our previous reports (March 2016 and March 2017) for the list of NEI sectors. Primary Inputs The NEI includes labor, capital and technology inputs that account for 40%, 35% and 25% of the total weights of the index, respectively. The declining in the July NEI reading came from the decrease of capital input (Chart 2). Capital input fluctuated widely in the recent year, dropping to 32.0 this month, with 2.2 MoM decrease. Technology input index was on a downtrend since March 2019, coming in at 27.3 this month, with 1.8 MoM decrease. Labor input index declined moderately in the recent year, decreasing slightly to 26.6 this month, with 0.2 MoM decrease.

Welcome message from author
This document is posted to help you gain knowledge. Please leave a comment to let me know what you think about it! Share it to your friends and learn new things together.
Transcript

July 2019
Mastercard Caixin BBD China New Economy Index
Released: 10:00 am Beijing Time August-02-2019
Overview
In July 2019, the Mastercard Caixin BBD New Economy Index (NEI) reading came in at 28.7,
indicating that the New Economy accounted for 28.7% of overall economic input activities that
month, down 1.3 ppts from June (Chart 1). The declining NEI was due to the decrease of capital
input. New economy is defined as following: 1) human capital intensive, technology intensive and
capital light, 2) sustainable rapid growth, and 3) in line with the strategic new industries defined
by the government. Please refer to our previous reports (March 2016 and March 2017) for the list
of NEI sectors.
Primary Inputs
The NEI includes labor, capital and technology inputs that account for 40%, 35% and 25% of the
total weights of the index, respectively. The declining in the July NEI reading came from the
decrease of capital input (Chart 2). Capital input fluctuated widely in the recent year, dropping to
32.0 this month, with 2.2 MoM decrease. Technology input index was on a downtrend since
March 2019, coming in at 27.3 this month, with 1.8 MoM decrease. Labor input index declined
moderately in the recent year, decreasing slightly to 26.6 this month, with 0.2 MoM decrease.

Taking the weights into account, percentage changes in labor, capital and technology inputs were
-0.1, -0.8, and -0.5 ppts, respectively. The net NEI change was -1.3 ppts in total (Chart 3).
As for sectors, the New IT industry formed the largest proportion of the New Economy Index,
contributing 8.8 ppts to NEI. Biotech was the industry with fastest growth in July, contributing 3.7
ppts and ranking the third. Science Research and Hi-tech Services came fifth from second, the
biggest drop in ranking, contributing 3.4 ppts in July (Chart 4).

New Economy Employment
In July 2019, the average monthly entry-level salary of the New Economy was RMB 10,880,
increasing from last month’s level of RMB 10,867 (Chart 5). New Economy wage information is
compiled from online websites of career platforms and recruitment services including 51job and
Zhaopin, as well as other sites that list job openings.

The ratio of hiring in the New Economy sectors to that in total dropped by 0.2%. At the same time,
the compensation share of New Economy decreased by 0.1%. Accordingly, the average entry
salary level of New Economy increased compared to the whole economy. The entry-level salary
premium of the New Economy increased to 5.8% as compared to economy-wide counterparts
(Chart 6).
Economic Trend Based on Employment Data
In July, the NEI declined slightly, which were in part reflected in our micro data.
Chart 7 showed the employment of private enterprises since January 2017. In 2017 (January 2017
as base period), changes of employment were similar for three types of enterprises: small and
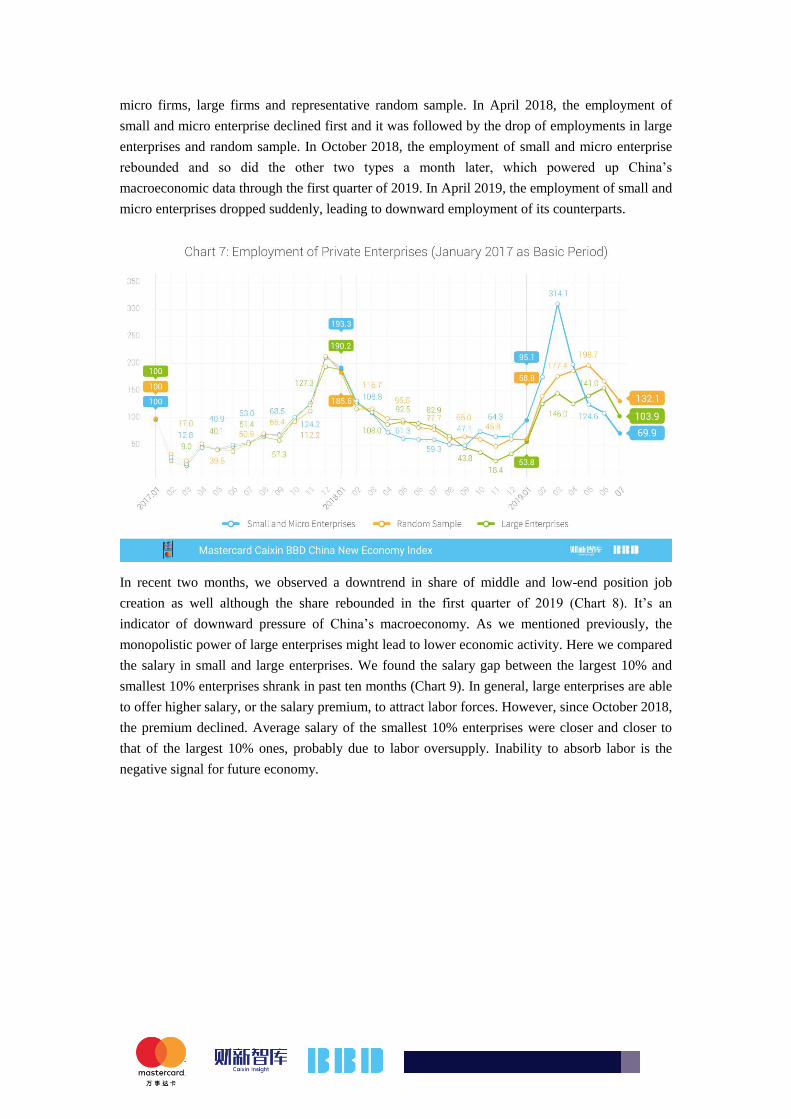
micro firms, large firms and representative random sample. In April 2018, the employment of
small and micro enterprise declined first and it was followed by the drop of employments in large
enterprises and random sample. In October 2018, the employment of small and micro enterprise
rebounded and so did the other two types a month later, which powered up China’s
macroeconomic data through the first quarter of 2019. In April 2019, the employment of small and
micro enterprises dropped suddenly, leading to downward employment of its counterparts.
In recent two months, we observed a downtrend in share of middle and low-end position job
creation as well although the share rebounded in the first quarter of 2019 (Chart 8). It’s an
indicator of downward pressure of China’s macroeconomy. As we mentioned previously, the
monopolistic power of large enterprises might lead to lower economic activity. Here we compared
the salary in small and large enterprises. We found the salary gap between the largest 10% and
smallest 10% enterprises shrank in past ten months (Chart 9). In general, large enterprises are able
to offer higher salary, or the salary premium, to attract labor forces. However, since October 2018,
the premium declined. Average salary of the smallest 10% enterprises were closer and closer to
that of the largest 10% ones, probably due to labor oversupply. Inability to absorb labor is the
negative signal for future economy.

City Rankings of the New Economy
Based on overall New Economy rankings, the top twenty cities were shown in Chart 10. The top
five cities were Beijing, Shanghai, Shenzhen, Guangzhou and Hangzhou. Rankings are based on a
weighted average of the percentile ranks of indicators for the city in the past six months.

Chart 11 showed the average NEI city rankings between January 2019 and July 2019. The top five
cities were Beijing, Hangzhou, Shanghai, Xiamen and Shenzhen.

In addition, we showed the city rankings adjusted by living cost by taking housing price,
minimum wage and disposable income per capita into account (Chart 12). After the adjustment,
the top five cities were Beijing, Chengdu, Shanghai, Chongqing and Shenzhen, following by
Nanjing, Hangzhou and Dongguan.

Historical Data
NEI NEI-labor NEI-capital NEI-technology Entry-level salary avg.
(yuan) Premium
Jul-19 28.7% 26.6% 32.0% 27.3% 10,880 105.8%
Jun-19 30.0% 26.8% 34.2% 29.1% 10,867 105.3%
May-19 28.0% 26.8% 29.1% 28.3% 10,776 105.0%
Apr-19 28.6% 26.8% 28.7% 31.1% 10,672 103.2%
Mar-19 28.3% 27.0% 28.5% 30.2% 10,533 102.8%
Feb-19 27.4% 26.7% 26.1% 30.4% 10,627 102.8%
Jan-19 28.8% 27.1% 31.4% 28.0% 10,541 102.6%
Dec-18 29.1% 27.5% 32.0% 27.6% 10,286 102.8%
Nov-18 31.3% 27.6% 37.1% 29.3% 10,212 103.1%
Oct-18 29.8% 27.1% 34.6% 27.4% 10,150 103.2%
Sep-18 31.3% 27.4% 39.1% 26.7% 10,161 103.8%
Aug-18 29.1% 27.3% 31.9% 28.1% 10,320 103.1%
Jul-18 30.6% 27.6% 36.8% 26.6% 10,357 103.6%
Jun-18 29.2% 27.8% 32.0% 27.4% 10,369 104.3%
May-18 29.6% 27.9% 31.0% 30.3% 10,444 104.0%
Apr-18 29.7% 27.9% 31.3% 30.6% 10,420 103.9%
Mar-18 31.3% 28.3% 33.1% 33.6% 10,265 104.2%
Feb-18 29.8% 28.2% 31.7% 29.7% 10,759 104.4%
Jan-18 31.3% 29.2% 31.5% 34.4% 10,481 104.8%

For further information please contact:
Mastercard
Mr. Wu Huanyu, Director, Communications
Tel:+86-10-8519-9304
Email:[email protected]
Caixin Insight Group
Dr. Wang Zhe, Senior Economist Ma Ling, Public Relations
Tel:+86-10-85905019 Tel:+86-10-8590-5204
Emails:[email protected] Email:[email protected]
BBD
Dr. Chen Qin, Chief Economist
Tel:+86-28-65290823
Emails:[email protected]
The Mastercard Caixin BBD China New Economy Index is the fruit of a research
partnership between Caixin Insight Group and BBD, in collaboration with the
National Development School, Peking University. The subject of a year of research,
the NEI was first publically released on March 2, 2016 and will be issued the 2nd of
every month at 10:00am China Standard Time.
About Caixin
Caixin Media is China's leading media group dedicated to providing financial and
business news through periodicals, online content, mobile applications, conferences,
books and TV/video programs. Caixin Media aims to blaze a trail that helps
traditional media prosper in the new media age through integrated multimedia
platforms. Caixin Insight Group is a high-end financial data and analysis platform.
For more information, please visitwww.caixin.com.
About Mastercard
Mastercard (NYSE: MA), www.mastercard.com, is a technology company in the
global payments industry. We operate the world’s fastest payments processing
network, connecting consumers, financial institutions, merchants, governments and
businesses in more than 210 countries and territories. Mastercard’s products and
solutions make everyday commerce activities – such as shopping, traveling, running a
business and managing finances – easier, more secure and more efficient for everyone.
Follow us on Twitter @MastercardAP and @MastercardNews, join the discussion
on the Beyond the Transaction Blog and subscribe for the latest news on the
Engagement Bureau.

About BBD (Business Big Data)
BBD is a leading Big Data and quantitative business analytics firm specializing in the
analysis of the high-growth industries emerging in Mainland China. Through dynamic
data tracking, credit analysis, risk pricing and economic index construction, BBD
provides its clients with a wide range of services at both the macro and micro level.
For more information, please visit http://www.bbdservice.com/.
Related Documents