Fracturing Fluids from Produced Water Trican Well Service, L.P. | 5825 N Sam Houston Pkwy W | Houston, TX 77086 | P 281.716.9152 | F 281.716.9211 | www.trican.us Frank Zamora, Sarkis Kakadjian, Joseph Thompson & Robert Torres July 2013

Welcome message from author
This document is posted to help you gain knowledge. Please leave a comment to let me know what you think about it! Share it to your friends and learn new things together.
Transcript

Fracturing Fluids from Produced Water
Trican Well Service, L.P. | 5825 N Sam Houston Pkwy W | Houston, TX 77086 | P 281.716.9152 | F 281.716.9211 | www.trican.us
Frank Zamora, Sarkis Kakadjian, Joseph Thompson & Robert Torres
July 2013

Public Disclosure (North America)
Tremendous growth in public
awareness related to shale
development in the past several
years
Public asked what we were doing
and we were not ready to answer
Media and the public have
focused on how harmful the
fracturing process can be

Public Disclosure (North America)
Misinformation:
Controversial drilling technique
We use water, sand and a lot
of chemicals
We use millions of gallons of
water and hundreds of tons of
chemicals
Cocktail of toxic and
carcinogenic chemicals
We blast fluid laced with
chemicals

Fast Facts
Fracture stimulation is a safe and proven technology
Used for more than 60 years in more than 1 million applications
Used to safely and effectively recover natural gas from hard-to-produce resources trapped in deep shale and other unconventional formations deep below ground
No confirmed cases of drinking water contamination
Fracture stimulation is KEY to
releasing America’s abundant
domestic supply of clean-burning
natural gas
Will be required for 60 to 80% of
wells drilled in the US during the
next decade

Public Disclosure
Only a relatively small volume of chemical additives are present in fracturing
fluids (0.79%) with water and sand making up around 99.2%
In addition to federal right to know laws, many states have passed laws
requiring full chemical disclosure
Even in states where reporting is not a state requirement, disclosure reports
are voluntarily provided by oil and natural gas operators
To date more than 42,000
chemical disclosure reports have
been filed on FracFocus for
hydraulically fractured wells

Goal of Presentation
Present the development of a new crosslinked gel system based in guar derivative that can be used in flowback or produced water
Show laboratory testing of the fluid characteristics in untreated produced water from the Bakken and the outcome of hybrid fluids, including field testing
Present new FR technology for untreated water.

Classification of Water Type Based on
Total Dissolved Solids (TDS) Concentration
(Downey and Armstrong, 1977)
Water Source TDS Concentration TDS Concentration (mg/L)
Fresh < 1,000
Slightly Saline 1,000-3,000
Moderately Saline 3,000-10,000
Saline 10,000-35,000
Sea Water > 35,000
Produced (Bakken Formation)
Williston Basin North Dakota 220,000-350,000

Water Handling Costs in the Bakken
Formation within the Williston Basin
Source: Evaluation of Brackish Ground Water Treatment for Use in Hydraulic Fracturing of the Bakken Play, North Dakota. Report 2011-
EEC-12-05, Energy and Environment Research Center University of North Dakota, Grand Forks, ND (December 2011)
Cost
$/bbl
Cost
$/1,000 gal
Acquisition Cost
Raw Water $0.25-$1.05 $5.95-$25.00
Transportation $0.63-$5.00 $15.00-$119.05
Disposal Cost
Transportation $0.63-$9.00 $15.00-$214.00
Deep Well Injection $0.50-$1.75 $11.90-$41.66
Total Cost $2.00-$16.80 $47.62-$400.00
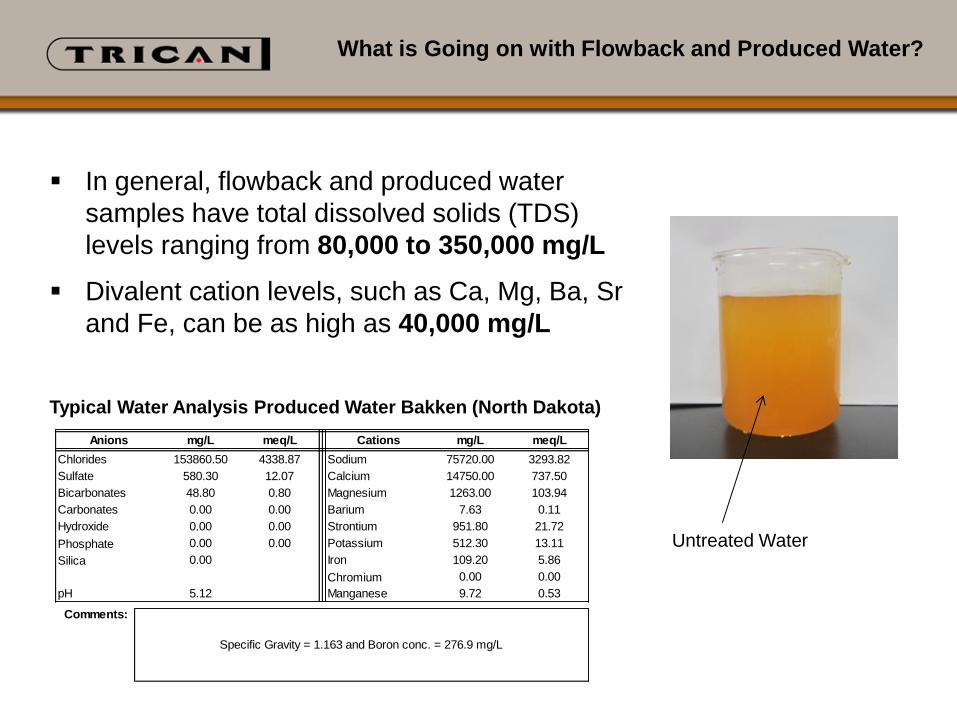
What is Going on with Flowback and Produced Water?
In general, flowback and produced water
samples have total dissolved solids (TDS)
levels ranging from 80,000 to 350,000 mg/L
Divalent cation levels, such as Ca, Mg, Ba, Sr
and Fe, can be as high as 40,000 mg/L Analysis Date:
Location: Analyst:
Formation: Sample Point:
BHT: Sample Date:
Well Type:
Phosphate
Silica
Chromium
Bakken Produced Water
5.12
Not PresentH2S
48.80
0.00
Iron
Manganese
meq/Lmg/L
21.72
75720.00
14750.00
1263.00
7.63
951.80
109.20
9.72
File:
pH
Hydroxide
Carbonates
Bicarbonates
0.00 0.00
Magnesium
Barium
Strontium
Potassium0.00
0.00
Sulfate
Chlorides 153860.50
580.30
Sodium
Calcium
mg/LAnions meq/L Cations
0.53
5.86
13.11512.30
0.11
103.94
737.50
3293.824338.87
12.07
0.80
0.00
0.00 0.00
0.00
Comments:
Specific Gravity = 1.163 and Boron conc. = 276.9 mg/L
Untreated Water
Typical Water Analysis Produced Water Bakken (North Dakota)

Trican’s New Crosslinked Gel System Based in Guar
Derivative in Produced Water from the Bakken – North Dakota
Produced water
Bakken ‒ North Dakota
Crosslinking Guar Derivative System
Untreated Produced Water
Bakken – North Dakota
Crosslinked Guar Derivative System
Untreated Produced Water
Bakken – North Dakota
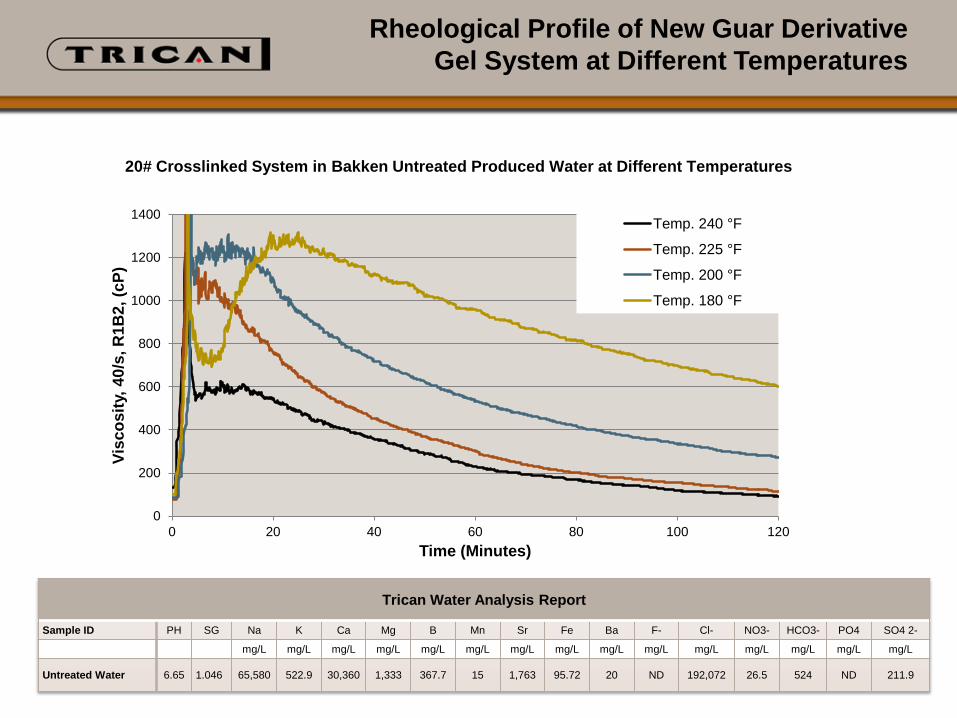
Rheological Profile of New Guar Derivative
Gel System at Different Temperatures
0
200
400
600
800
1000
1200
1400
0 20 40 60 80 100 120
Vis
co
sit
y, 4
0/s
, R
1B
2, (c
P)
Time (Minutes)
Temp. 240 °F
Temp. 225 °F
Temp. 200 °F
Temp. 180 °F
20# Crosslinked System in Bakken Untreated Produced Water at Different Temperatures
Trican Water Analysis Report
Sample ID PH SG Na K Ca Mg B Mn Sr Fe Ba F- Cl- NO3- HCO3- PO4 SO4 2-
mg/L mg/L mg/L mg/L mg/L mg/L mg/L mg/L mg/L mg/L mg/L mg/L mg/L mg/L mg/L
Untreated Water 6.65 1.046 65,580 522.9 30,360 1,333 367.7 15 1,763 95.72 20 ND 192,072 26.5 524 ND 211.9

Rheological Profile of New Guar Derivative Gel System @ 240°F
Previous Hydration at Different Temperatures (Box Time 9 min)
0
200
400
600
800
1000
1200
1400
1600
0 10 20 30 40 50 60
VIS
CO
SIT
Y, 4
0/S
, R
1B
2,
(cP
)
Time (Minutes)
9 Min. Box Time, 70°F hydration Temp.
9 Min. Box Time, 60°F hydration Temp.
9 Min. Box Time, 50°F hydration Temp.
9 Min. Box Time, 40°F hydration Temp.Temp
(°F)
Viscosity
Linear Gel @
9 min
Hydration
Time
40 25.3
50 27.9
60 25.1
70 23.0
25# Crosslinked System in Bakken Untreated Produced Water
Trican Water Analysis Report
Sample ID PH SG Na K Ca Mg B Mn Sr Fe Ba F- Cl- NO3- HCO3- PO4 SO4 2-
mg/L mg/L mg/L mg/L mg/L mg/L mg/L mg/L mg/L mg/L mg/L mg/L mg/L mg/L mg/L
Untreated Water 6.65 1.046 65,580 522.9 30,360 1,333 367.7 15 1,763 95.72 20 ND 192,072 26.5 524 ND 211.9

Rheological Profile of New Guar Derivative Gel System @ 240°F
Previous Hydration at Different Temperatures (Box Time 3 min)
0
200
400
600
800
1000
1200
1400
1600
0 10 20 30 40 50 60
VIS
CO
SIT
Y, 4
0/S
, R
1B
2,
(cP
)
Time (Minutes)
3 Min. Box Time, 70°F hydration Temp.
3 Min. Box Time, 60°F hydration Temp.
3 Min. Box time, 50°F hydration Temp.
3 Min. Box Time, 40°F hydration Temp.
25# Crosslinked System in Bakken Untreated Produced Water
Temp
(°F)
Viscosity
Linear Gel @
3 min
Hydration
Time
40 6.3
50 15.6
60 16.7
70 17.6
Trican Water Analysis Report
Sample ID PH SG Na K Ca Mg B Mn Sr Fe Ba F- Cl- NO3- HCO3- PO4 SO4 2-
mg/L mg/L mg/L mg/L mg/L mg/L mg/L mg/L mg/L mg/L mg/L mg/L mg/L mg/L mg/L
Untreated Water 6.65 1.046 65,580 522.9 30,360 1,333 367.7 15 1,763 95.72 20 ND 192,072 26.5 524 ND 211.9

Breaking Profile of New Guar
Derivative Gel System @ 250°F
0
50
100
150
200
250
300
0
200
400
600
800
1000
1200
1400
1600
0 10 20 30 40 50 60 70 80 90 100 110 120
Te
mp
era
ture
(°F
)
Vis
co
sit
y, 4
0/s
, R
1B
2, (c
P)
Time (Minutes)
30 lb/1000 gal Baseline
30 lb/1000 gal Baseline + 0.50 lb/1000 gal Breaker
Temperature
Trican Water Analysis Report
Sample ID PH SG Na K Ca Mg B Mn Sr Fe Ba F- Cl- NO3- HCO3- PO4 SO4 2-
mg/L mg/L mg/L mg/L mg/L mg/L mg/L mg/L mg/L mg/L mg/L mg/L mg/L mg/L mg/L
Untreated Water 6.65 1.046 65,580 522.9 30,360 1,333 367.7 15 1,763 95.72 20 ND 192,072 26.5 524 ND 211.9
30# Crosslinked System in Bakken Untreated Produced Water

Size of Colloids in Solution of Broken Guar Derivative Gels
in Produced Water vs. Broken Guar Gels in Fresh Water
20 lb/1,000gal
25 lb/1,000 gal
30 lb/1,000 gal
1 10 100 1000 10000size distribution (nm)
Size Distribution of Broken New Guar Derivative Gel Systems in Produced Water after aged for 16 hr @ 240°F
100%
4.2%
19.2%
92%
76.8%
95.7%
20lb/1000gallons
25lb/1000gallons
30lb/1000gallons
3.9%
4%
4.3%
1 10 100 1000 10000size distribution (nm)
Size Distribution of Broken of Guar Gel Systems in Fresh Water after aged for 16 hr @ 240°F

What We Look for with Slickwater Systems

Comparison of Enhanced Friction Reducers
in High Salinity Brine
Anionic FR
Anionic FR Plus
Cationic FR Plus
Cationic FR
Effect of 1 gpt Anionic FR, Cationic, Cationic w/ Enhancer
Friction Reduction in 3/8 in. Pipe @ 72°F and Re#=174,000 in Synthetic Brine with 251K ppm TDS (153K ppm Chloride, 20K ppm
Calcium and 78K ppm Sodium)

Field Testing of Crosslinked
System in the Bakken
A field test was performed on two wells with a total of 52 fracturing
stages using 100% produced water
Estimated BHST was 246°F and pump rates between 20 and 35 bbl/min
through 4.5-4.0 ID casing in openhole perforations with sliding sleeves
Polymer loading of the guar derivative gel system was varied between
20 and 30 lb/1,000 gal
Slickwater using 1 gal/1,000 gal of enhanced FR
Total pumped proppant:
352K lb 100 mesh sand
1.726 million lb 30/50 ‒ 20:40 sand
434K lb 30/50 CRC
Total volume of produced water used in both wells was close to 3
million gallons

Questions?
Thank you.
Related Documents


![Untitled-1 [] · isolation is necessary to prevent vertical migration of fluids or gases behind the casing; (4) All hydraulic fracturing fluids are directed into the zone(s) ... a](https://static.cupdf.com/doc/110x72/5af95cf27f8b9abd588cc6af/untitled-1-is-necessary-to-prevent-vertical-migration-of-fluids-or-gases-behind.jpg)


