MAGR GOVS MN 2000 MJSC-1958 Developments in the Egg and Poultry In United St:at:es-Minnesot:a (j) and Digest W. H. BANKERS, Extension Economist---Marketing F. L OLSON, Extension Marketing Assistant T. J. O'BRIEN, Extension Economics Assistant OJ: MINNESOTA ;t'q.A.lc.uttU11.4L &'X.tuuitm... U. S. D E P A R T M E NT 0 J: A G R I C U L T U R I July 1958 (

Welcome message from author
This document is posted to help you gain knowledge. Please leave a comment to let me know what you think about it! Share it to your friends and learn new things together.
Transcript
MAGR GOVS MN 2000 MJSC-1958 Developments
in the Egg and Poultry In
United St:at:es-Minnesot:a (j)
~andbook and Digest
W. H. BANKERS, Extension Economist---Marketing F. L OLSON, Extension Marketing Assistant
T. J. O'BRIEN, Extension Economics Assistant
~UNIVERSITY OJ: MINNESOTA ;t'q.A.lc.uttU11.4L &'X.tuuitm... ~e/UJU:,e,.., U. S. D E P A R T M E N T 0 J: A G R I C U L T U R I
July 1958
(

Developments in the Egg and Poultry Industry
Foreword
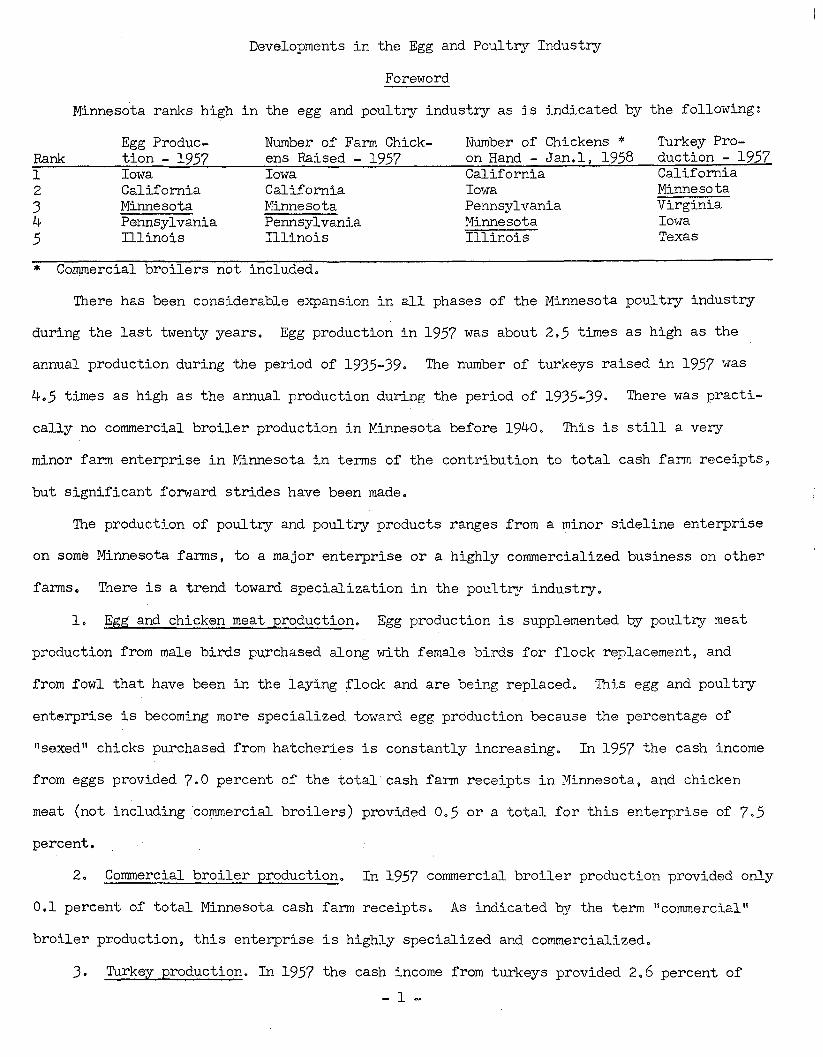
Minnesota ranks high in the egg and poultry industry as is indicated by the following:
Egg Produc- Number of Farm Chick- Number of Chickens * Turkey Pro-Rank tion - 1957 ens Raised - 1957 on Hand - Jan.l, 1958 duction - 1957 1 Iowa Iowa California California 2 California California Iowa Minnesota 3 Minnesota Minnesota Pennsylvania Virginia 4 Pennsylvania Pennsylvania Minnesota Iowa 5 Illinois Illinois Illinois Texas
* Commercial broilers not included.
There has been considerable expansion in all phases of the Minnesota poultry industry
during the last twenty years. Egg production in 1957 was about 2.5 times as high as the
annual production during the period of 1935-39. The number of turkeys raised in 1957 was
4.5 times as high as the annual production during the period of 1935-39. There was practi-
cally no commercial broiler production in Minnesota before 1940. This is still a very
minor farm enterprise in Minnesota in terms of the contribution to total cash farm receipts,
but significant forward strides have been made.
The production of poultry and poultry products ranges from a minor sideline enterprise
on some Minnesota farms, to a major enterprise or a highly commercialized business on other
farms. There is a trend toward specialization in the poult~r industry.
1. Egg and chicken meat production. Egg production is supplemented by poultry meat
production from male birds purchased along with female birds for flock replacement, and
from fowl that have been in the laying flock and are being replaced. This egg and poultry
enterprise is becoming more specialized toward egg production because the percentage of
"sexed 11 chicks purchased from hatcheries is constantly increasing. In 1957 the cash income
from eggs provided 7.0 percent of the total cash farm receipts in Minnesota, and chicken
meat (not including .commercial broilers) provided 0.5 or a total for this enterprise of 7.5
percent.
2. Commercial broiler production. In 1957 commercial broiler production provided only
0.1 percent of total Minnesota cash farm receipts. As indicated by the term 11 commercial 11
broiler production, this enterprise is highly specialized and commercialized.
3. Turkey production. In 1957 the cash income from turkeys provided 2.6 percent of
- 1 -

total cash farm receipts. This highly specialized and commercialized enterprise has in
recent years divided itself into three enterprises, namely the production of (a) Bronze,
(b) Heavy white turkeys, (dual purpose) and (c) Beltsville and other small turkeys which
are sold largely as turkey fryers and broilers. Some producers are active in both enter-
prises while others have preferred to specialize in one or the other.
All together the poult~J enterprises in Minnesota provided 10.2 percent of total cash
farm receipts in 1957. This was somewhat lower than in other recent years, when income
from poultry and poultry products provided from 12 to 13 percent of total cash farm receipts.
An example of increased efficiency in Minnesota 1 s poultry industry is the increase in
egg production per hen from an annual average of less than 90 eggs in the late twenties and
early thirties to 181 eggs in 1957 (based on the January l inventory of hens and pullets).
Egg production per hen in Minnesota is now considerably above the United States average.
Nearly 70 percent of the eggs produced in Minnesota are sold outside of the state. A
large proportion of Minnesota eggs move to the more distant markets of the East, West, and
South, so that Minnesota producers, handlers and others have a national interest in the poul-
try industry.
To assist in the analysis and study of the developments in the egg and poultry indus-
try, this handbook 9 and the poultry statistics included are presented as reference material.
An index precedes the statistical tables so that any section may be easily located. In
the "notes" which follow the different tables, attention is called to the "highlights"9
and to important items that can be observed from the tables.
The statistical information was obtained and calculated from egg and poultry reports
published by the various Divisions of the Agricultural Marketing Service and the Agric~
ultural Research Service in the United States Department of Agriculture, and the Minnesota
State-Federal Crop and Livestock Reporting Service.
Alyce Piepho, Senior Clerk, and Joanne Struss and Ellen Schwahn, Clerk~Typists, Agricultural Extension Marketing, assisted in the preparation of the material for this report.
- 2 -
I ~ 1
I I f,
Index
!he Poultry Industry
l I . I
I. Cash Receipts from Poultry Products and Percent of Total Farm Marketings • • • II. Red Meat and Poultry Meat Production and Human Population - u.s. • • • • • • •
III. Per Capita Consumption of Red Meat, Poultry Meat and Eggs - u.s. • •••••• IV. Breeds of Chickens ••• ~ • o •• o • o •••• o ••••• o •••• o • o •
V. Number of Chickens on Farms, January 1 - Not Including Commercial Broilers -u.s.
'~ VI. :1 VII. 1) VIII. I
~ I
rl
) I
l
IX. x.
XI. XIIo
XIII. XIV.
XV. XVI.
XVII. XVIII.
XIX.
1hickens ! 'I I i I
1 I I
i !
\
xx. XXI.
XXII. XXIII~.
XXIV. XXV.
! XXVI~ ~ XXVII ~ . r1
XXVIII.
!urkeys I XXIX I\ • l :i !) ,, 1 i
XXX. XXXI.
XXXII. \
I, XXXIIIo . XXXIV. j XXXV. 1 XXXVI. l XXXVII. FIII.
I I
Egg Production - United States • • • • o o • • • • • o o • • • • • • • • • o •
Egg Production - Minnesota • • o • • • • • • • • • • o • • o • • • • • • • • o
Monthly Egg Production and Percentage of Yearly Total - u.s. • •••••••• Monthly Egg Production and Percentage of Yearly Total Minnesota • • • o o • •
Egg Prices Received by Farmers - Mid-month Prices per Dozen - United States •• Egg Prices Received by Farmers - Mid-month Prices per Dozen - Minnesota • • • • Differences in Egg Prices Received by Farmers (A comparison of u.s. and Minnesota mid-month average prices as reported in Tables X and XI) o • • • • •
United States Retail Egg Prices - (AMS) •• o ••••••• o o ••••••••
Differences Between Average u.s. Retail Egg Prices and Egg Prices Received by Farmers in Minnesota. (A comparison of Tables XI and XIII) • • • • • o • • • •
Average Annual Farm Prices Received for Eggs and Percent of Parity - u.s. • • • The Manner and Form in which Eggs were Used - United States • • • • o • • •
Monthly Production of Liquid Egg - United States o • • • • u • o o • • • • • •
Monthly Utilization of Liquid Egg - United States • o • o • • • • • • o • •
Liquid Egg Products -· United States • • • o • • • o o o • .. • • • • • • • • o •
Chicks Hatched by Commercial Hatcheries - u.s. • ••••• o • o •••• o • o
Chicks Hatched by Comme:r-cial Hatcher·ies - Minnesota • • o o o • • • o • • o o o
Chicks Hatched for Laying Flock Replacement - United States o • o • o o • o • •
Death Loss of Layers - Unit.ed States n • • o o • • • o • • •. • • • • • • • • •
Chicken Meat Sold - United States and Minnesota o • • • o • • • o • • • • • o •
Live Weight of Birds and Prices Received - United States and Minnesota • • o •
Approximate Average Weights and Processing Shrinkages in Poultry o • • • • $ o
Farm Prices Received for Chickens - United States •••••• o o ••••• o •
Farm Prices Received for Chickens - Minnesota o •••••• o o • o • o ••••
Number of Turkey Breeder Hens on Farms~ January 1, Minnesota o o o ••••••
Types of Turkey Poults Hatched - Minnesota o • • o o • • • • o • • • o • • • o
Variations in Monthly Hatchings of Poults by Types of Turkeys Produced - u.s •• Variations in Monthly Hatchings of Poults by Types of Turkeys Produced -llinnesota • • • " • o .. Q o • o o • o • o o o ., o o o • ., o o o o G o o • .. o o
Turkeys Raised on Farms o • o • • o o o • • • o o • • o o • o o o • • o o o o ..
Death Loss of Turkeys o o o o • o o o o o o o o o o o • • o • o • • • o • o • o
Percent of the Turkey Crop Marketed each Month o o • • • o o • o o o o o o • o
Average Live Weight of •rurkeys Sold o o o o • o • o o • o • o o o o o o o • o •
Farm Prices Received for Turkeys - United States o .. o .•• o o • o ••• o ••
Farm Pri'ces Received for Turkeys -· Minnesota • o o • o o • • o • • • • o o • •
- 3 -
4 5 6 7 g
9 10 11 12 13 14
15 16
17 lS 19 20 21 22
23 24 25 25 26 26 27 2S 29
30 31 32-33
34-35 36 37 38 39 40 40

I~ Cash Recei_pt.,s from Poultr:v Products and Per>cent of Total Farm :Marketings
Year
19.35~39 avo 1940~44 avs 1945-49 avo 1950-54 avo
1955 1956 1957 1958
1935-39 19.40-44 1945~49 1950~54
1955 1956 1957 1958
1935-39 ave 1940~44 avo 1945-49 avo 1950~54 avo
1955 1956 1957 195S
1935-39 1940-44 1945-49 1950=54
1955 1956 1957
Eggs
Q 0
484 992
1~716 1,828
1,747 1,784 1,609
6ol 6.6 6e4 5Q8
5,.9 5o9 5.4
• • 19o0 58.6
111 .. 9 104o9
110.,0 104.4 89 • .3
5o7 9.2 6.6 8.4
7.0
Chickens
0 0 0 0 0 $ 0 . 210 431 5135 365
2213 1.89 137
2.6 2.9 2~2 L2
0.8 0 .. 6 0.5
0 0 0 • • $ • • lOvl 2269 30o8 15.5
12 .. 2 9.6 6.4
)ol )o6 1$8 1..2
Gash rElceipts Cornmerciay broilers a
Turkeys from all p~ltry products .b
United States 0 ~ Q Million dollars
39 63 161 135 353 252 702 326
844 325 838 .339 887 314
Percent of total .5 0.,8
L1 0 .. 9 L3 LO 2o3 lol
2o8 lol 2o8 lel 2.9 loO
Minnesota 0 0 • Million dollars
5.2 0.,6 12.0 1..4 24o5 2.4 30o5
L9 37.2 lo7 37.1 1.8 32 .. 6
Percent of total 1.6
0.1 lo9 0.1 1.5 OQ2 2.4
0 ~
0 •
• 0 • 796
1,719 2~906 3,221
3,144 3,150 2,947
10.0 11.5 10.9 10e4
10.6 10.4
9o8
• • 0
.34o:3 94.1
1613(}6 l53o3
16lo3 152.8 130.1
10.4 14.8 10 .. 0 12.2
1) .. 0 11.9 10.2
0 ~ 0
0 • •
Total cash receipts from farm marketings
G • • 0 ...
7,954 14,926 26,761 ;n~OO)
29,542 30,372 30,019
100.0 100o0 100.0 100.0
100~0 100.0 100o0
0 • • .. 0
.329 636
1,140 1,257
1,237 1~280 1,273
100.0 100 .. 0 100.0 100.0
~~------~~~~----~~~~~~-~----~~--------a./ Includes consumption of broiler meat in the household of producers, which is less than 1 percent of total production.
pJ Does not include ducks 9 geese, and "other P'>ultry" ·which is about 1 percent of :farm receipts for poultry0
Note~ 1~ Cash receipts from all poultry products in the United States and in Minnesota have been averaging 10 to 13 percent of the total cash receipts from farm marketings~ except during the World 't1lar II per:lod when i.t was nearly 15 perc.ent in Minneso'tao
2Q The 8gg enterprise is comparatively important in the Minnesota poultry industry~ Minnesota cash receipts from eggs constitute a higher percentage o.f total cash farm receipts than for the United StatE~s as a wholee
3Q Minnesota is also an important turkey state. Cash receipts from ·turkeys have in recent years ranged from 20 to 25 percent of cash receipts from all poultry· and ,poultry products o The cash receipts from turkeys constitute nearly 3 percent of total cash fa.rm receipts compared with about 1 percent for the U~ s. as a whole~
4., 'I'he M:ilmesota commercial broiler enterprise is contributing only a small amount to the total cash farm receipts in the stateo
- 4-

II. R d M eat and Po e ul try M d eat Pro :uction and Human Population ~ U. s. Lamb i Total 'Total Total of Human
Year Pork Beef Veal and I red Chicken Turkey 1poultry all red, popu-Mutton 1 meat 'meat and -poul- 1ation ~
I ' trY meat July 1 . . . . . . . . 0 e. 0 • . Million -pounds . . . . . . . . . . . . . . . 0 0 • • 0
1930-34 av. 8.755 6,500 915 859 I 1?,029 1~804 210 I 1,995 19,024 124 .. 8 1935-39 av. ?,337 6,937 1,038 870 t 16,-182 lp730 288 ' 2,018 18,200 12-9.0 1940--44 av., 11,478 8,357 . 1,215 994 t 22,043 2,480 397 I 2 1 841 24,884 -135.1 1945-49 av. 10,538 9,720 1,494 834 I 22,586 2,759 517 ' 3,229 25,815 144 .. 2 1950-54 av. 10,720 10,.678 1,330 646 ' 23.374 3,609 722 ' 4,331 27,705 157.0
I ' 1955 10,991 13,569 1,578 758 I 26,896 3,583 817 I 4 400 31,296 165.3 • 1956 11,221 14,462 1,632 741 I 28,056 4 0 256 958 t 5,214 33,270 I
168.2 1957 10,500 14,200 1,520 710 t 26,930 4eJ75 1,025 I 5,4oo 32,330 1?1.2 1958 10,900 13,800 1,4oO 675 I 26,?75 4,575 1 02 ' 600 2 1? .6 ' • 5 5. 3 .375 .3
Percent of all meat 1930-34 46.0 34.2 4.8 4.5 I 89.5 9.4 1.1 10.5 100.0 1935=39 4o.J 38.1 5.7 4.8 88.9 9.5 1.6 11.1 100.0 1940-44 46.1 33.6 4.9 4.0 88.6 10.,0 1.6 I 11.6 100.0 1945r-49 40.8 37.7 5.8 3.2 87.5 10.7 2.0 12.7 100.,0
I 1950-54 38.7 38.5 4.8 2.3 84.4 13.0 2.6 I 15.6 100.0
\.1'1
1955 35.1 43.4 5.0 2.4 85.9 1956 33.7 43.5 4.9 2.2 84.3 1957 32~5 43.9 4.7 2.2 83.3 1958 33-7 42.6 4.3 2.1 82.7
Index 1935-39 = 100 1930-34 av. 119 94 88 99 I 105 1935-39 av. 100 100 100 100 I 100 1940-44 av. 156 120 117 114 136 1945-49 av. 144 14o 144 96 14<) 1950-54 av. 146 154 128 74 144
1955 150 196 152 166 1956 153 208 157 173 1957 143 205 146 166 1 8 l 1 1 16
Including armed forces overseas
11.5 2.6- I
12.8 2.9 13.5 3.2 I
14.1 3.2
104 73 100 100 143 138 159 180 209 251
207 284 246 333 253 356 264 6
14.1 15.7 16.7 17.3
99 100 141 160 215
218 258 268 2
100.0 100.0 100.0 100.0
104 100 137 142 152
172 183 178 1 8
97 100 105 112 122
128 130 133 1
Note~ 1. Total meat production was at a low level during the 1935~39 period. This period included two drouth years. There was less feed available for livestock and there was less meat produced.
2. There has been a substantial increase in ~ meat produ~tion sinG~ 1935=39. Meat production has increased at a much more rapid rate than human population.
j. The largest percentage increase in meat product~on since 1935=39 was in poultry and especially in turkey meat production.
4. The production of lamb and mutton .has declined since the 1935~-39 period~ vMch is probably· a response to a decrease in demand for these meat~.

_!Y_:L_·--·------ Pe:r_ Capita Consumption of Red Meat,~ Poultry Meat and Eg,gs - Do s. w ' ' All meat - :1
Lamb ~ ' ~All red meat 'j Beef Veal and 'All red ~Chicken •rurkey llpoultrv and poul- Eggs '
'" ,j Year Pork
mutton Vmeat Y ~meat try meat '' ·---o -o --.-o-o --. -.-.-. - • ....:.:.::.:o:.=-:::o-=. - • ...:.::.;;~~Po_u_n~d:-s--. -.-.-. -. -.--.-. -=.~.::.:;_. ---~. '-. ....::.::. • ..&L......;• =::..::;...--H-N::::-um-:b-e-r ,j
i·l
1910-14 avo 1915-19 av& 1920-24 avq 1925-29 ave 1930-34 av. 1935-39 av. 1940-4.4 av. 1945-49 avo 1950-·54 av.
1955 1956 195'7 1958
1910-14 av~ 1915-19 av. 1920-2L~ avo 1925-29 avo 1930-3/+ avo 1935-39 avo 1940-44 avo. 1945-49 a.v. 1950-54 avo
1955 1956 1957 1958
66~0 63o9 68.4 6'7 o8 68.2 56oh '72of3 69.5 67.4
66.S 6?.4 61.5 61.0
11'7 11_3 121 120 121 100 129 123 120
118 120 109 108
65.8 62.0 58.6 511-o5 51.9 55.6 57.2 63 0 '7 6?.9
82.0 85~4. 84.5 ?8.0
118 112 105
98 93
100 103 115 122
J.LI-7 154 152 140
6.7 6.9 8.0 7.4 7.2 8.1 8.8 10~2
8~3
83 85 99 91 89
100 109 126 102
116 117 109
96
7o2 5~4 5o4 5.4 6o8 6.8 6.7 5o'7 4.2
4.6 4.4 4~2 3o9
106 79 79 79
100 100
99 84 62
68 65 62 57
Vl45o6 ~138o2
~140.5 fll35.2 q34.2 11 127~0 ~145o5 WI49o0 q47~7 v 'Yl6.2o8 ~166.7 q59oO ~151.0
15.0 13~8 14~0 15.1 14~9
13 ·'+ 18.1. 19o4 21.8
21.4 24.7 25.3 25.9
Index 1935-39 = 100
1.6 1.6 1.6 1.6 1.6 2.2 2.7 3.4 4o7
~ 16.6 1 15·4 v 15.6 ' 16.7 ~ 16.5 f 15.6 ~ 20.8 t' 21.8 ~ 26~5
5.0 ~ 26.4 5.2 It 2909 5.8 ~ 31.1 5.8 ~ 31.7
v
162~2 153.6 156$1 151.9 150.7 142.6 166.3 170.8 174.2
18902 196.6 190.1 182.7
309 r
296 t
313 I
334 1
1
312 '\
~~g :l 387 ;j 385 il
ll
3?1 1 369 i1 360 !1 348 ::J
I~ il l.l ·1
~ 115 II 112 73 ~ 106 11LJ. 103 I~ I! 109 It 103 73 w 99 108 99 i· ~ 111 ' 104 73 w 100 109 104 l·'.i
II 106 ': 11.3 73 II 107 107 111 .
~ ig~ : i~~ 16~ : ig~ ig~ ig~ i: ~ 115 v 135 123 t 132 117 110 !1
v 117 ' 145 155 ~ 140 120 129 l ' 116 ~ 163 214 g 170 122 128 l
11 f l1 iJ.~ W 128 '3 160 227 ~ 169 133 124 I~ 11 131 '3 184 236 ~ 192 138 123 ,j V 125 II 189 264 ~ 199 133 120 \' II 119 V 193 264 11 203 128 116 lj
--------------------~-____ v __________ ~ ---"------....1.1---___.!':j '-~
Note~ 1 o Loy,r production resulted in a low level of consumption of all meats of 1935-39.
d during the period'j
2. Per capita consumption of red meats has been i'airly uniform aver a long period of time, varying somewhat with employment and consumer purchasing power. It increased substantially in 1955 and 1956 because there was an abundant supply of beef and pork~ and prices to consumers were quite favorable.
3~ There has been a substantial increase in per capita consumption of poultry meat since the late ·thirties. The largest percentage increase in per capita consumption was in turkey meat.
4. Per capita cons·wmption of eggs reached an all time high in the post-war period when red Irl8ats were scarce and meat prices were comparatively high. During the last several yea:es there has been a decline in the per capita consumption of eggs~
Breeds of Chickens ~ {:Birds in the National PoultrY !:morovement Plan HatcherY SUpp)..y_ Flocks)
Total Percent of the total number of birds from each breed Number number New Rhode :Barred White 8
Year of states of birds Cross• Incross White Hampshire Island .Rocks Rocks Other 1 fotal .{July 1 - June 30) reporting: (million) mated mated Le.e:horn Red Red .Breeds 1 ,
United States I
1941-1945 38 16.1 5.1 - 25.6 20.1 9.,4 14.6 17.8 7.5 I 100.0 (4 year average). ' 1945-50 41 26.5 12.4 - 24.1 28.8 6.2 9.1 14.6 4.8 ' 100 0,0 (5 year average)· I
1950-55 47 35.7 17.5 _3.8 19.9 31.6 3.2 3.3 17.9 2.8 I 100.0 (5 year average) I
1955-.56 4? 34.9 34.0 9.1 18.9 6.7 2.3 lQ2 25.2 2.6 l·1oo.o 19.56-.57 47 .39.0 47.1 a.o 14.8 4.1 1.7 LO 21.0 2.3 i 100 .o
t
Minnesota 1941~45 - 1.1 9.6 - 68.6 4.2 .4 L2 11.6 4.4 J 100.0 (4 year average) I
1945-46 1.5 .
17.9 64o8 .5.3 .a .4 9.3 1..5 ' 100 .o - -{1 year average)
I
e 1950=1955 - 1.8 22.5 ?.4 5?.9 5.4 .? .1 4,0 2.0 100.0 (5 year average)
I
1955.,1956 - lo9 21.7 19.0 52.1 1.4 .4 .1 4.2 1.1 I 100.,0
195_6~1957 - 1.._2 l?e? 21.,~ 20 ~0 1~ ~l} .1 6.4 1~ I 100 o0 • There is some variation in re~o:rting the birds in crossmated flocks because some flocks are crossmated during a
portion of the year and are mated as purebreds another portion. Also in a number of states the birds in cross= mated flocks are reported under the respective purebred headings.
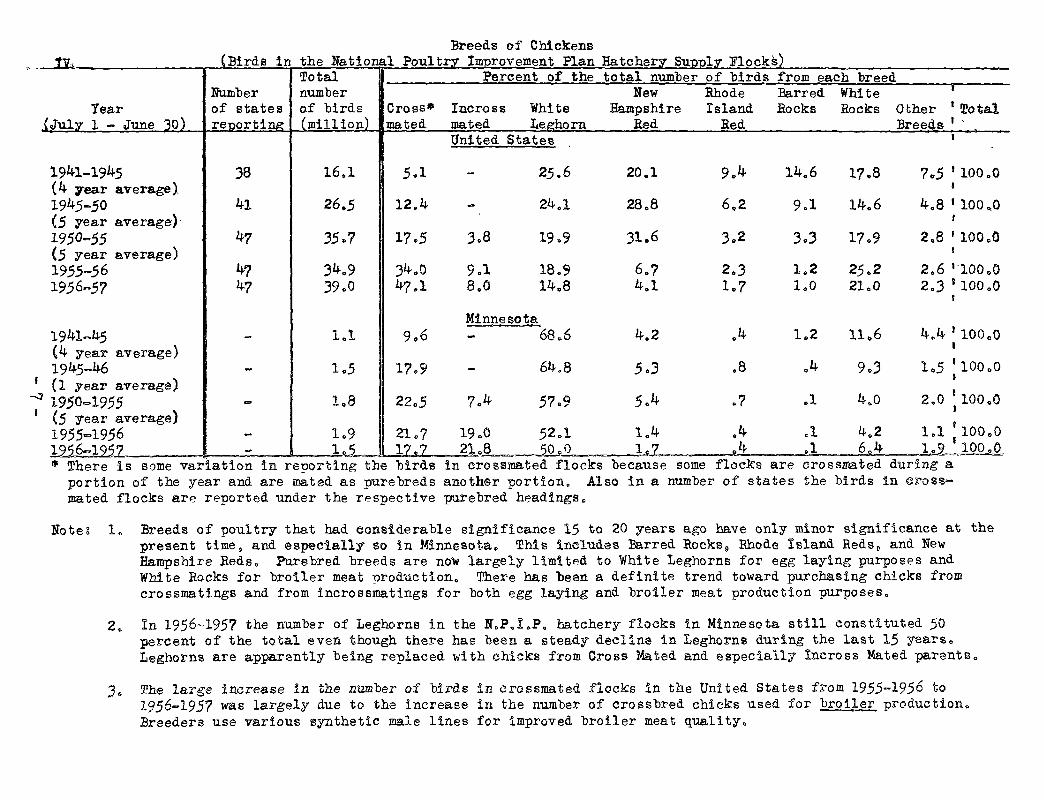
Note& 1. Breeds of poultry that had considerable significance 15 to 20 years ago have only minor significance at the present time 9 and especially so in Minnesota. This includes Barred Rocks 9 Rhode Island Reds 9 and New Hampshire Reds. Purebred breeds are now largely limited to White Leghorns for egg laying purposes and White Rocks for broiler meat production. There has been a definite trend toward purchasing chicks from crossmatings and from incrossmatings for both egg laying and broiler meat production purposes.
2~ In 1956-1957 the number of Leghorns in the N.PoYoPo hatchery flocks in Minnesota still constituted 50 percent of the total even though there has been a stead1 decline in Leghorns during the last 15 yearsc Leghorns are apparently being replaced with chicks from Cross Mated and especially Incross Mated parents.
J. The large increase in the number o£ birds in 0rossmated flocks in the United States from 1955-19.56 to 1956-1957 was largely due to the increase in the number of crossbred chicks used for broiler production, Breeders use various synthetic male lines for improved broiler meat qualityo
i t ! ' -"v--' _____ .:.;N:.=um:.:.:· b:::.e::;.:.r=---:o::.::f:.......;;C.:.:h.=.i::..:ck;.:..e:;.:nc;;;s;__::o~n'-F=-'a;:;.;r:;.:mr"s'-'.'---=-J·=a=nu=a::~r'-". y'"'=""l~--N':"-o"'-"~- Includina- Commercial Br._o_il~E___::_U. S. !!
I~ Pullets Othe:r ~ (Roos tors, :......::.~--~,1
Year Hens of laying not yet of Cockerels t Total ____ __.__ ...;.a...._g'-'-e__ ______ laY.ing age and Capons) ~
1930-34 av. 1935-39 av. 1940-44 avo 1945-49 av. 1950-54 av.
1955 1956 1957 1958
1930-34 1935-39 1940-44 1945-49 1950-54
1955 1956 195'7 1958
dl • • •
156,513 135,506 155,003 150,852 133,051
111,376 121,719 119.S1000 128,000
3500 33.5 31.5 31.6 31.6
28.5 31.? 30.5 34o6
• • • • • • • • • Thousand • • • • • • • • • • • • • " o v ~
192,754 ~/ 44,311 ~/ 49,874 '446,730 ~ '1·05,108 ~ ~~6:~~§ ~~;2~~ t~;J~~ '492,482 il
.247,532 40,635 38,473 ~ 477,492 :j :J 232,205 27,609 28,940 ~421,805 i.1
232,681 24,538 22,113 7390~708 ' 211,148 27,431 22y.548 v 382,846 :l 218 ,ooo 32,000 21~000 v 3909000 lj 193 '000 31' 000 18' 000 : 3 70 '000 ~~
Percent of total
• 0
4.6.1 46.8 51.8 55.1
59~6 55.1 55o9 52.1
0 53 .8 8 • • 10.3 11.6
8o5 6.5
6.3 ?.2 8.2 8.4
11.2 10.1 10.1 8.1 6e8
5.6 6.0 5.4 4.9
f
w
100.0 100.0 100.0 100.0 100.0
~ 100"0 ~ 100.,0 v 100"0 ? 100.0
'! ~
! :l
:§:/1931-34 -q
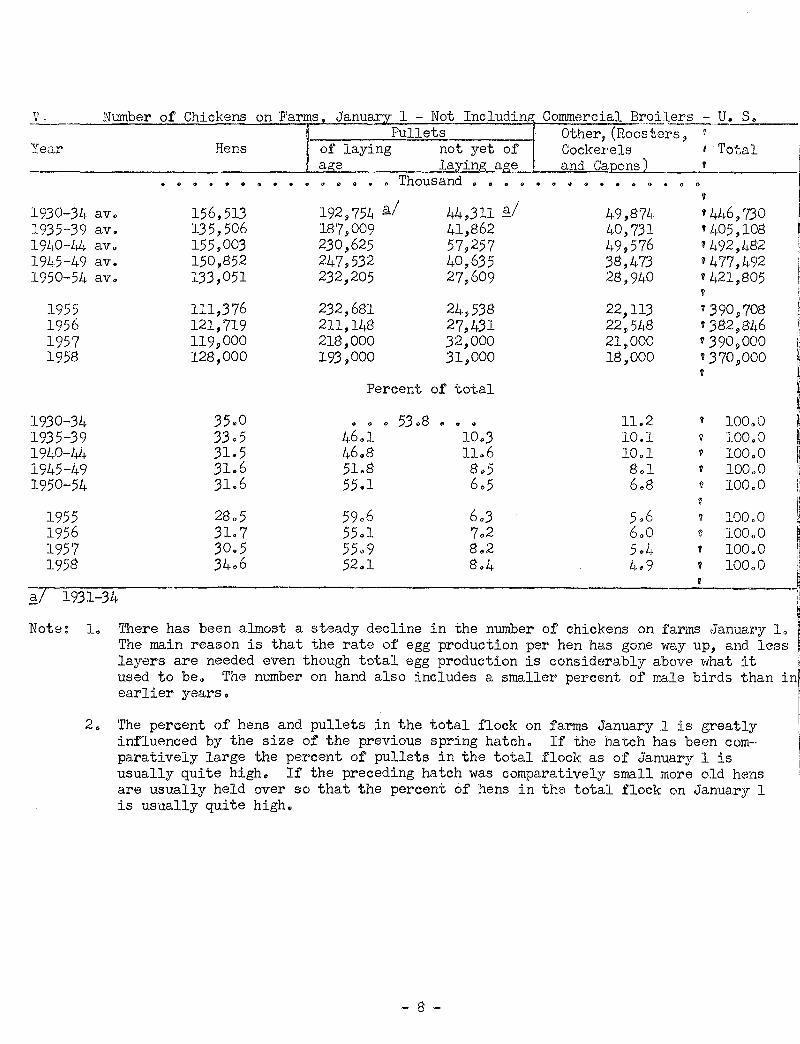
~ Note: 1. 'I'here has been almost a steady decline in the number of chickens on i'arms ,January L ~
The main reason is that the rate of egg production per hen has gone way up, and less ' layers are needed even though total egg production is considerably above vJhat it l, used to be. The number on hand also includes a smaller percent of male birds than in! earlier years. f
'rhe percent of hens and pullets in the total flock on farms January 1 is grea t.ly influenced by the size of the previous spring hatch. If the hatch has been com~ paratively large the percent of pullets in the total .flock as of January 1 is usually quite high. If the preceding hatch was comparatively small more old hens are usually held over so that the percent of hens in the total .flock on ,January 1 is usually quite high.
~ 8 -
I
I

• Total eggs
Egg Production -_United States_..__-=-------==-------Hens and pullets Average number of Eggs Eggs I
ear produce~ on
I farms §: . . • • •
f!9.25-29 av. 37,485 ~930-34 av. 36,768 F35-39 av. 36,381 940-44 av. 48,659
m945-49 av. 55,724 r0-54 av. 58,3S2
1955 .59,496 ) 1956 --60,877
on farms layers on farms Jamuary 1 Q/ during the year Q/
408 320 397 303 364 283 443 344 439 347 393 322
369 309 .360 311
• • • Million • • • • • • • • • • •
,. 1957 60,448 ! 19.58
369 305 352
Index - 1935-39 = 100
925-29 av. 103 111 113 930-34 av. 101 108 107
U935-39 av.. 100 U940-44 av. 134 ~945-49 av. 153
100 100 121 121 120 123 108 114 1950-54 av. 160
1 1955 16k 101 . 1956 167 99
109 110 108 1957 166 101
per .layer 9J
93 93
100 llO 127. 149
161 169 164
93 93
100 110 127 149
161 169 164
per layer .t;l
117 121 128 141 161 181
192 196 198
91 94
100 110 126 141
150 153 1.5.5
1958 97. ~I Non-farm egg production ( fl"om smal:~l---::f::-1-o-:ck:-s-n-o-:-t-a-c-=-tu-· a-:l:-:l:-y-o-n--=-fa_r_ms__,):-"-w-as-a-:b:-o-u-:t---:-l-::-0-pe-r-c-e-n-:-t-.;___
of farm production in the earlier years, and in the last several years has been about 8 percent. ·
/ This includes the pu~lets which are laying, and those not laying but which are kept for · egg production. il Calculated from monthly averages of layers in farm flocks. VI Based on the number of hens and pullets on farms January 1. ~ Based on the average number of layers on farms during the year.
ote: 1.
,.
I
i>l:.
I ll IJ
It
'1.·
I I I
2.
There has been a continuous increase in egg production in the United States. The percent increase in total egg production has been more than two times the percent increase in human population since the pre-war years of 1935-39.
In 1957 there were 66 percent more eggs produced than the average annual production for 1935-39, with only 1 percent more laying hens. This emphasizes the continuous increase in the number of eggs laid per hen, as indicated in the table.
- 9 -

~~·1~1~·----------------------- --------~E=~g~g~Pr~o~~uction - Minnesota Total eggs Hens and pullets Average number of Eggs Eggs
Year produced on on farms layers on farms per ~I per d/ -------=-fa=r::.:m::.:::l"'::..' ____ .:::.Ja=n:.:.u:::.:a==r'-"y'----=l=-§._l ____ ....:d::..:u=r--=i:.:..:n~g ... ~th:.:.e.:::-.y~...;.e::.;:a=r_E._/_---'l=a,yer .. ~ --=1=-ay"-e::..:r:..--_-__
1925-29 av. 1930-34 av. 1935-39 av. 1940-44 av. 1945-~9 av. 1950-54 av.
1955 1956 1957 1958
1925-:29 a.v. 1930-34 av. 1935-39 av. 19"0-44 av. 1945-49 av. l950-5LJ av.
1,424 1,457 1,599 2)86~. 3 j 764 3' 914
4,287 49169 4 0 024-
89 91
100 179 236 245
Million • c • • • • • • • •
16.2 16.9 16.6 24.1 27.0 24~0
24.5 23.1 23.1 2Ll
98 102 100 145 163 145
l2Q9 12.9 13.0 19.4 21.9 20.4
21.3 20.3 19.5
Index - 19.35-39 = 100
99 99
100 149 168 157
87 86 96
138 139 163
175 180 174
91 90
100 144 148 170
110 11.3 12.3 148 172 192
201 205 20'?
89 92
100 120 140 156
1955 268 148 164 182 163 1956 261 139 1.56 188 167 195 7 252 139 150 181 168 19)8 127
~/ This includes the pullets-w~h~i-c~h~a-r-e.-1-a-Yl-.~n-g-~--a-n.~d~th~o-s_e_n_o~t~l-a~ying but which are kept for egg production.
b/ Calculated from monthly averages of layers in farm flocks. g_/ Based on the number of hens and pullets on farms January 1. g/ Based on the av-erage nwnber of layers on farms during the year.
Note~ 1. There has been a great expansion in the egg enterprise in Minnesota since the pre-war years of 1935-39. During the last several years, total egg production has been more than .2~ times as large as the average annual production for 19.3 5-39. This was due to a very substantial increase in egg production per hen, and also to an increase in numbers of hens and pullets~ However, the increase in numbers of hens and pullets came before 1950. Since then there has been a considerable decrease"
2o To what extent the egg enterprise in Minnesota can remain on an expanded basis will depend on production, handling, transporting, marketing and distribution costs, compared with costs in other states and areas~ Most areas of Minnesota are in a favorable situation for low cost production because feeds are abundant and comparatively cheap. Much will depend on size of flocks, flock management, and marketing methods.
- 10 -
Year
1925-29 av. 1930-34 av. 1935~39- av. 1940-44 av. 1945--49 av. 19.50-54 av ..
1955 1956 1957 1958
1925-29 av. 1930;...34 av. 1935-39 av. 194o-44 av. 1945-49 av.
Jan.
1,874 2,_213 2,239 3,442 4,4?7 5t.l?6
5L234 5,_167 .5 ,}20 5,25-1
s.o 6.0 t>.2
Feb. Mar. .Apr. May June July Aug. Sept. • ·• • .o • • •· • • M.ill ions . . . Q • •• • •
2,175 4,_744 :5-.37'1- 5,099 -4~115 3,51'?- 2;988 2,4ol 3.,051 4,65"6 5,122_ 4,884- 3.866 .3;226 2.739 2,265 2,:790 4,375 4,897 4,_653 3.755 3,192" .2,?15 2.270 4,070 5,65.7 6,012 5~"808 4,75L 4,074 3,52? 3,048 4_,902- 6,345 6;362 6,032 5,0,50 "4,403 3.820- .J..a.:¥-.2. 5,156 fb,OO? 5, 788 5,593- 4,807 4,351 4,044 '.3,9441
Oct. Nov.
i,86j tr~J1{1 i,427 1,817 ~ 1,392; 1,536 1,.95.1 1 1,637 I 1~907 2,784 c2,523 1 2,963 3;450 ~_)..!~2_9 ~ 4, 011 4,282 4,404 4,830
37.485 36.768 36.381 48,659 55.724 58.382
I -- - l - l
- t I 4,896 5,73 5 .• 64-B 5,578 4,952 4,618 4,297 ~4,245j 5,153 5, 776 5,600 5 S64 4.966 4, 759 4,563 1 4,4391 4,983- 849 5,680 5,615 .5,000 4,752 4,569_ ;.E-~lfl.§f 4, 753 5,456 [5 .495{ 5,543
4,633 4,679 4,982 59,496 4~819 4,841 5,230 60,877 4. 6o2 4, 6o6 5,054 60,448
Percent Jllfrnthly production was of the 7.4 12.6 14 .. J 13.6 ll~O 9.4 8 • .3 12.7 13.9 13.3 10.5 8.8 7.7 12.0 13.4 12.8 10.3 8.8 8.4 11.6 12.3 11.9 9.8 8.4 8.8 11.4 - 11.4 10.8 9.1 7.9
l total egg production for
6:4 s.o .3.5 6.2 4.9 3.8 6.2 5.4 4.5 6.3 5.7 5.2 6.2 6.2 6.1
3,124 3.064 3,032
-4,055 4,644 4,865
4,958 5,073 5,037
8.3 8.3 8.3 8.3 8.3
1 1950-54 av. 8-.0 8.9 8.8 10.3 9.9 9.6 8.2 7.5
8.o 7.4 7.5 7.2 6.9 6.9 6~8 7.3 7.5
the year 3.8 4.2 5.2 6.1 7.2 8_.3
100.0 100.0 100.0 100.0 100.0 100.0
......
...... I 1955 8.8 8.2 9.4 8-.3 7.2
7.5 7.8 7•9 7.6
7.9 8.0 7.6
8.4 100.0 8.6 100.0 8.3 100.0
8.3 8.3 8.3
1956 8.5 8.5 8.8 . 8.2
9.1 8.1 1957 9.3 8~3 7 .. 6 1
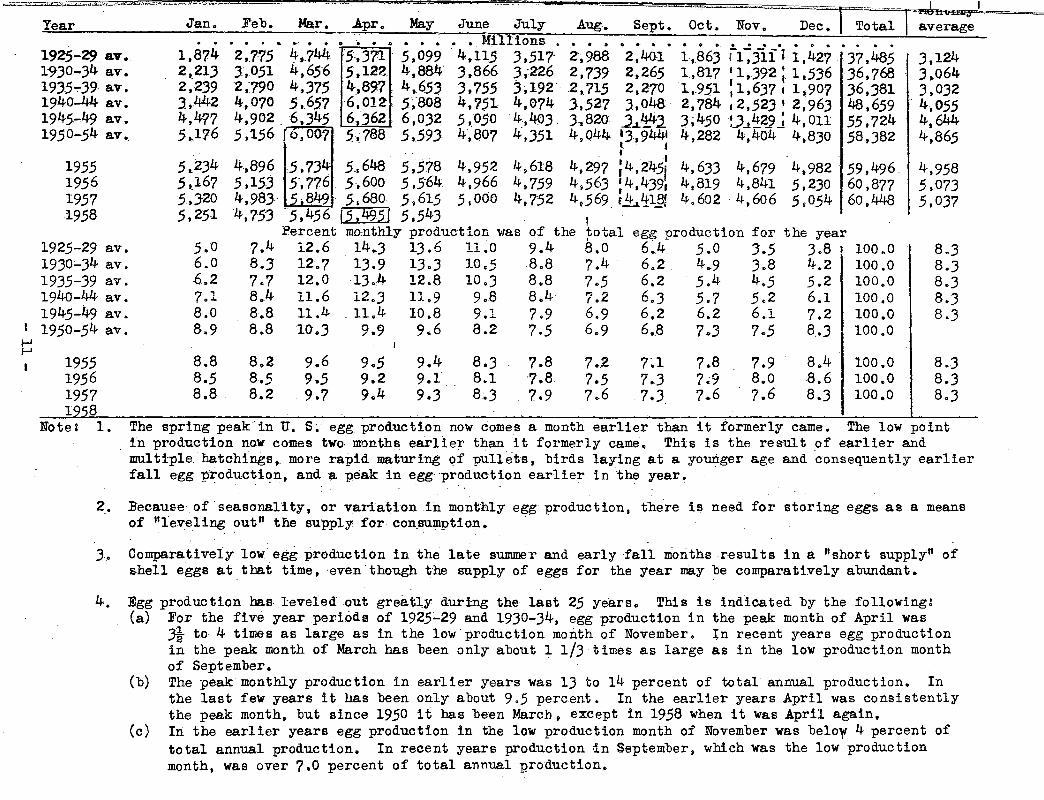
Note: 8 1. The spring peak-in U.S~ egg production now comes a month earlier than it formerly came. The low point
. in production now comes two. months earlier than it formerly came. This is the res-ult _of earlier and multiple hatchings, more rapid maturing of pullets, birds laying at a younger age and consequently earlier fall egg productiC?n, and a peak in egg production earlier in the year.
2. Eeca.use of seasonal1 ty, or variation in monthly egg production, there is need for storing eggs as a means of "leveling out 11 tile supPly for con_sumption. · ·
3. Comparatively low. egg production in the late summer and early fall nioriths r-esults in a 11 short supply" of shell eggs at that time, -even though the supply of eggs for the year may be comparatively abundant.
4. Egg production bas leveled out great],y during the last 25 years. This is indicated by the following: (a) For the five year periods of 1925~29 and 1930-34. egg production in the peak month of April was
Ji to 4 times as large as in the low-production month of November. ln recent years egg production in the peak month of March has been only about 1 1/3 times as large as in the low production month of September.
(b) The peak monthly production in earlier years was 13 to 14 percent of total annual production. In the last few years it llas bee-n only about 9.5 percent. In the earlier years April was consistently the peak month, but since 1950 it has been March, except in 1958 when it was April again.
(c) In the earlier years egg production in the low production month of November was belo~ 4 percent of total annual production. In recent years production dn September, which was the low production month, was over 7.0 percent of total annual production.

IX o MonthlY E Production and Percenta e of Yearl Total = Minnesota
~Y~sa~:r;;.,_ ___ ~~-w-~;;.;::n""'."----F~e;:;;..b~·~_:..;Ma~r-'<-• .......;:,A~p~r~i~l~_;Ma=Y~......;;,.JU!=n~~::..~--::.J..:::u:=.ly...___~~A:.:::u:~:>g_o2.,._...:,S~e::.t:p:..:;,gt. Octo Novo Dec. , Total Monthly ~verage _
• o o • o o • Millions oooeoeooeoo
1925~29 av. 1930-34 avo !935~39 av. 1940=44 av. 1945=49 aY. 1950-.54 s:v 0
59.8 76.4 88.2
221.4 ..J53.8 i 389.8' I
>-=~..,..,
83.0 1_58.8 212.6 21o. \ 1?4.2 146.6 123.0 100.8 17~.8 217.8 218.4 170.~ 13?.8 116.6 101.0 167.6 211.4 230.41 187.6 154.2 129.8 238.4 305o4 J37c8 ~48.61 290.4 246.6 212,2 343.o IJ99.4/ 394.6 388.8 J3B.a 298.2 263.6 356.4 384.6 360.8 356.8 313.4 28_5.4 261.6
96.o 6.5.4 ,- ho-.6-1 44.2 1,420.2 93.0 62.4 I 41.2 I ,50.4 1P4.56.6
106.2 ?8.6 ~ 6l.L~: 82.8 1 • .599.2 17.5o4 147.2 I l43JJ 1 l97o6 2.864oo 225.8 :-211--:,l.}; ,_ 2-:3.5.5 - 31L 6 3 p ?64. 0
- - - - - - - - -- I {2~_5.0: 26?.2 312.8 380.01 3.913.8
118.3 12104 l3JcJ 238.7 313.7 326.2
1955 19.56 1957 1958
1955 1956 1957 1958
Noteg "j ....
-'
1 ~18.0 404.0 40300 385.0
4.2 5.2 5.5 7.7 9.4
10.0
311.0 4ol.O 395.0 394.0 372.0 382.0 361.0 357.0 J60o0 392.0 369.0 370.0 342.0 371.0 346.0 334.0
352.0 329.0 302.0 321.0 309.0 295.0 321.0 294.0 2?0.0
Percent monthly production was 5.8 11.2 15.0 15.2 12.3 6.9 11.9 14.9 15.0 11.? 6.3 10.5 13.2 14.4 11.? 8.3 10.? 11.8 12.2 10.2 9.1 10.6 10.5 10.4 9.0 9.1 9.8 9.2 9.1 8.0
9.2 8.6 9.2
of the 10.3 9.4 9o7 8.6 7.9 7.3
?.7 7.4 ? • .3
total 8.7 8.0 8ol 7o4 ?.0 6.7
I
:285.0' 305.0 )40.0 389o0 4,28?.0 ,28;5oOI 318.0 )_56.0 [409.0) 4 9 169.0 1253.0: 287.0 327.0 3?8.0 4.024.0
production for 6.8 4o6 6.4 4o) 6.7 4.9 6.1 .5.1 6.0 5.6 6o3 6o8
the year 2.8 J.l 2.8 3 • .5 3.8 5.2 ,5.0 6.9 6.2 8.3 BoO 9.7
?.9 8.5 8.2
100.0 100.0 100.0 100.0 100.0 100.0
10000 100.0 100.0
357.3 34?o4 33.5 o)
8.3 8.3 8.3 8.3 8.3 8.3
8.3 8.3 8.3
In earlier years Minnesota egg production reached a peak in the month of May which was later in the year than for the United States. A large number of Minnesota pullets are now being brought into production in late summer and early fall& For this reason monthly egg production bas been at a ~eak in January and quite high for the period of January through Yarch& During the laying season of 19.56=57 monthly egg production was already at a peak in the month of Decembero ·
2o A larger percent of total annual egg production is obtained in the winter months of December. January. and February in Minnesota than in the United States as a wholeo
3o A smaller percent of total annual egg production is obtained in the summer months of July. August. September and October in Minnesota. than in the United States as a whole. If Minnesota ~roducers would get a higher percent of total annual production during these months. when the price is u~ually 19 seasona11y~ high. they would obtain a higher average annual price for eggs. and increase the returns froo their egg enterpriseo

If If lj J Egg Pric~ey Rc?c~Jtred by Farmers .... Mid-month Prices pet: Dozen - United States 11 Weighted ,, ~r Jan. Feb. Mar. Apr. May June July Augo Sept. Oct. No~. Dec. annual
avera e j Cents per dozen I
J !13-14 d.5-19 zo-24 ~5-29 ~0-34 ~5-39 140-44
27.3 23.2 20.0 16.2 16.6 17.0 17.0 18.4 22.0 24.8 29.8 32.4 40.6 32.9 25.0 25.9 27.0 26.1 27.2 29.0 32.8 37.9 43.2 48.9 44.1 34.9 26.6 23.6 23.9 23.7 25.2 28.3 33.7 40.2 50.0 52.1 38.6 30.9 24.0 23.0 27.7 23.9 25.4 27.4 31.5 36.7 43.4 45.5 23.3 17.1 14a6 D+o3 13.7 13o3 14~6 16.6 20.0 23.2 27.4 25.8 22.3 20.5 17.6 17.7 18.0 18.1 19.5 20.8 23.9 26.1 29.1 26.7 28.6 26.1 24.3 24.2 24.6 25.7 27.8 29.6 32.6 35.4 38.2 38.0 43.8 38.7 37.8 38.0 38.4 39.6 42.4 46.1 48.6 51.1 50.7 49.4 41.3 38.7 38.5 38.0 37.6 37.8 41.3 44.7 45.9 46.9 47.5 47.3
20.0 30.1 30.0 28.5 17.3 20.8 28.2 42.6 42.0
1~5-49 lp0-54 il 11955 13-956 ~~957 1!1..958 IJ I~ 11 11
I
mJ-14 ~l:L5-19 ~~0-24 ' 125-29 ~0-34 (35-39 'l+0-44 ~5-49 ~)50-54 [l 1)
:ll955 'b.956 ' 'P-957 h958 l
3~.2 39.6 39.8 35.9 33.8 33.8 35.2 39.5 43.8 43.0 43.4 47.2 46.6 40.2 39.6 38.5 37.6 36.4 36.6 36.9 38.6 38.1 37.2 37.1 33.2 32.8 30.6 30.8 29.0 29.0 32.1 36.3 40.0 43.0 45.3 44.0 38.9 36.6 40.8 37.4 35.5 33.9
136 135 147 135 135 107 101 103
98
83 120
94
Index of monthly prices - weighted annual average = 100
166 109 116 108
99 99 92 91 92
102 104
92
100 83 89 84 84 85 86 89 92
102 102 86
81 86 79 81 83 85 86 89 90
92 99 87
83 90 80 97 79 86 87 90 90
87 97 82
85 87 80 84 77 87 91 93 90
87 94 82
85 90 84 89 84 94 99 99 98
90 94 90
92 96 94 96 96
100 105 108 106
102 95
102
110 109 112 110 116 115 116 114 109
113 100 113
124 126 134 129 134 125 125 120 112
111 98
121
149 144 167 152 158 140 135 119 113
112 96
128
162 162 174 160 149 128 135 116 113
121 96
124
100 100 100 100 100 100 100 100 100
100 100 100
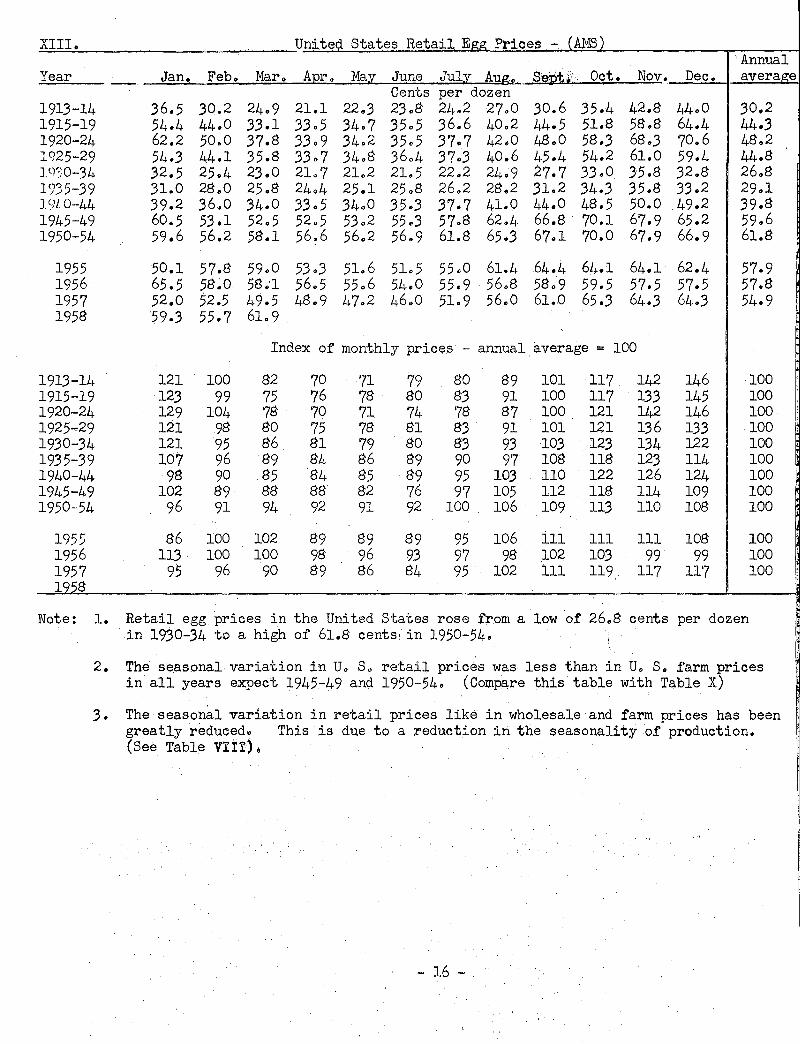
The degree of "seasonality" in egg prices has been les~.than in egg.production. Compare this table with Table VIII. This is because eggs produced in one season can be stored for a small cost and consumed in another season. The degree of seasonality in egg prices has be.en reduced continually from 1930-34 to 1950-54.
2. The lowest mid-month px·ices for eggs occur from about Februars or March through June, when monthly production of eggs is at or near the yearly peak. Compare this table with Table VIII.
3. The highest mid-month prices for eggs occur in the fa~l months when monthly production of ~ggs is at or near the year1y low point. Compare this table with Table V!!I. ·
4. P~oduce~s are getting their flocks into production earlier, namely in the late summer or early fall. Because more eggs are produced in the fall and winter months, egg prices in recent years already declined in the late fall, and rose .again. ~arlier in the next summer; compared with the earlier pet-iods. ·
5. Producers who get their flocks ~nto'production in late summer and early fall ha'IJ'e a decided advantage, and can 1'cash in" on highe~ egg prices.
- 13 -

XL E Prices Received b Farmers - Mid-month Prices er Dozen - Minnesota Weighted
Year Jano Feb. Mar. Apr. May June July Aug. Sept. Oct. Nov. Dec. annual rice
Cents per dozen 1913-14 26.0 23.5 19.5 16.0 15.0 16.0 16 .. 5 18.0 20.5 23.0 27.5 30.0 21.0*
! 1915-19 38.2 33 .. 0 25.2 25.8 26.6 25.6 26e2 27.8 30.0 35.0 40.0 46.6 31. 7'~" 1920-24 40.2 35.0 26.,0 2Jo2 22.9 22.2 23.2 25.9 30.4 37o0 44.0 49.0 31.. 6~!-1925-29 34o2 28.7 22.9 22.9 23.2 22.9 24.0 26.0 28.0 32o9 38.4 40o9 26.0 1930-34 20.0 15.0 14 .. 0 13.0 u.o 11.0 . 12 .. 0 14.0 16.0 20.0 24.0 2)o0 14.6 1935-39 19.0 18.0 16.0 16.0 17.0 16.0 17.0 18.0 20.0 24.0 25.0 23.0 18.1 1940-44 24.0 23.0 2Jo0 24.0 24.0 24~0 26.0 27 .. 0 29.0 31.0 33.0 32.0 25.8 1945-49 36.2 33.9 34.9 35.8 35.8 36.1 37.4 39.6 40.8 43.3 41.7 40.1 37.3 1950-54 32 .. 6 32.6 33.9 33o5 33.5 33·5 35.4 39.3. 39o4 40.6 . 39.9 36.7 35o3
1955 23.0 35.0 35o0 30.0 28.0 28.,0 28.0. 34.0 41.0 37.0 36.0 40.0 32.6 1956 37.0 32.0· 34.0 32.0 33.0 31.0 31.0 31.0 33.0 33.0 29.0 27.0 31.9 1957 24.0 24.0 24.0 25.0 22.0 23.0 26.0 32.0 32.0 37.0 41.0 36.0 28.3 1958 28.0 28.0 36.0 30.0 29.0 28 .. 0
Index of monthly prices - weighted annual price = 100 1913-14 124 112 93 76 71 76 79 86 98 110. 131 143 10~!-
1915-19 120 104 79 81 84 81 83 88 95 110 126 147 10~!-
1920-24 127 111 82 73 72 70 73 82 96 117 139 155 lOOl!-1925-29 132 110 88 88 89 88 92 100 108 126 148 157 100 1930-34 137 103 96 89 89 75 82 96 110 137 164 158 100 1935-39 105 99 88 88 94 88 94 99 110 133 138 127 100 1940-44 93 89 89 93 93 93 101 105 112 120 128 124 100 1945-49 97 91 94 96 96 97 100 106 109 116 112 108 100 1950-54 92 92 96 95 95 95 100 111 112 115 113 104 100
1955 71 107 107 92 86 86 86 104 126 113 110 123 100 1956 116 100 107 100 103 97 97 97 103 103 91 85 100 1957 85 85 85 88 78 81 92 113 113 131 145 127 100 1958
~~ Simple average
Note: 1. The prices for eggs were at a .low level in the depression years of the 30's., In some months they were less than one-third of the prices for the same months in recent years.
2. There is a wide range in egg prices from the low in late spring or early summer to the high in late summer and early fall.
. I Earlier chicks, good young flock
management, rapidly maturing pullets and late summer and fall egg production will help Minnesota producers increase their returns from the egg enterprise.
- 14 -

I • D~fferences in Egg Prices Received by Farmers I I, l_A_Q~mpari!3.QtL.Q.L.U.t. s. and Minnesota mid-month average J?rices as reported in Tables X and XI)
l~r Jan. Feb. Mar. Apr. May June July Aug. Sept. Oct. Nov. Dec. I I Cents per dozen - U. s. above Minnesota I
13-14 1.3 -0.3 0.5 0.2 1.6 1.0 0.5 0.4 1.5 1.8 2.3 2.4 ~~5-19 2.4 -0.1 -0.2 0.1 0.4 0.5 1.0 1.2 2.8 2.9 3.2 2.3 20-24 3.9 -0.1 0.6 0.4 1.0 1.5 2.0 2.4 3.3 3.2 6.0 3.1 '25-29 4.2 2.2 1.1 0.1 4.5 LO 1.4 1.4 3.5 3.8 5.0 7.1 ~0-34 3.3 2.1 0.6 1.3 0.7 2.3 2.6 2.6 4.0 3.2 3.4 2.8 p5-39 .3.3 2.5 1.6 1.7 1.0 2.1 2.5 2.8 3.9 2.1 4.1 3.7 40-44 4.6 3.1 1.3 0.2 0.6 1.7 1.8 2.6 3.6 4.4 5.2 6.0 45-49 7.6 4.8 2.9 2.2 2.6 3.5 5.0 6.5 7.8 7.8 9.0 9.3 ;:,0-54 8.7 6.1 4.6 4.5 4.1 4o3 5o9 5.4 6.5 6.3 7.6 10.6
1955 9.2 4.6 4.8 5.9 5.8 5.8 7.2 5.5 2.8 6.0 6.4 7.2 956 9.6 8.2 5.6 6.5 4.6 5.4 5.6 5.9 5.6 5.1 8.2 10.1
... 957 9.2 8.8 6 .. 6 5.8 7.0 6.0 6.1 4.3 8.0 6.0 4.3 8.0 ~958 10.9 8.6 4.8 7.4 6.5 5n9
Percent that Minnesota farm prices were of U. s. farm prices D-3--14 95 101 98 99 90 94 97 98 93 9.3 92 15-19 94 100 101 100 98 98 96 96 91 92 92 ~0-24 91 100 98 98 96 9£. 92 92 90 92 88 ~5-29 89 93 95 99 84 96 94 95 89 90 88 ~0-.34 '86 88 96 91 95 83 82 84 80 86 88 t35-39 85 88 91 90 94 88 87 87 84 92 86 40-44 84 88 95 99 98 93 94 91 89 88 86 r+5-49 83 88 92 94 93 91 88 86 84 85 82 ;:,0-54 79 84 88 8'8 89 89 86 88 86 87 84
~955 71 88 88 8~ 83 83 80 86 94 86 83 ~956 79 80 86 83 88 85 85 84 85 87 78
92 95 94 84 89 86 84 81 78
85 73 82 Q957 72 73 78 81 76 70 81 88 80 86 91
h-958 . 72 7? 88 80 82 ,_&_,'~'----------------·-. = Not available .
Weighted annual average
NA NA NA 2.5 2.7 2.7 2.4 5.3 6.7
6 • .3 6.8 7.2
NA NA NA 91 84 87 91 87 84
84 82 80
ve: 1. Since before World War I the prices recei·ved for eggs by farmers in Minnesota have become almost steadily less compared to the average prices received by farmers in the United States~ or stated differently the spread has increased. This can be accounted for by increases in packaging costs, transportation costs, labor costs, etc. Abbut 70 percent of the eggs produced in Minneso~a are sold out-of-state and mostly in distant markets such as New Yo;rk, Florida, California, and Washington. The farmer's price is the retail p~ice minus all costs in getting the eggs from the farmer to the retailer. Because of increased production of eggs in Minnesota a much higher percent of total production now moves to distant markets than in the earlier years. ·
2. Although the spread in the price per dozen was higher, Minnesota farm prices constituted as high a peroent of U. s. prices in 1950-54 and in 1955 as they did in the- e~rly thirties.
3. Minnesota egg prices ~eceived by farmers were nearly 90 percent and in some years over 90 per.eent, as high as the a~e~age u. s. egg prices ~eceived br farmers during the wa~ and early QOSt-war period. This was a period of strong demand for· eggs when red meats and some other substitute food products were in comparatively short supply. Because shell eggs were in strong demand there were lower storage and proceSsing costs for ~finnesota eggso
4. Abundant feed supplies and lower feed costs are to the advantage of the producer in Minnesota in holding his production costs down, which in turn makes it possible f6r him to sell at a lower price per dozen.
- 15 -
- 16 -
• Differences Between Average u.s. Retail Egg Prices and Egg Prices Received by Farmers in Minn. A com arisen of Tables XI and XIII
Annual r June Jul
I Cents per dozen - U., I I
6.7 .7~S 15 .. 4 9 .. 0 10.1 12.4 15.3 14.,0 9o2 3-14 10.5 5 .. 4 5ol 7o3 5-19 16.2 lLO 7o9 7o7 8 .. 1 9.9 10.4 12.4 14o5 16.S 18.8 17.S 12.6
·0-24 22.0 15 .. 0 ll.S 10.7 11.3 J3o3 l4o5 16.1 17.6 21.3 24.3 21.6 16.6 . 5-29 20.1 15.4 12 .. 9 lO.S 11.6 13.5 13.3 14.6 17.4 2l.3 22.6 1S.5 lS.S 0-34 12.5 i0.4 9o0 S.7 S.,2 10.5 10.2 10.9 11.7 13.0 ll.S 9.S 12.2 5-39 12.0 10.0 9oS So4 Sol 9oS 9o2 10.2 11.2 10.3 lO.S 10.2 10.9 0-44 15.2 13 .. 0 11.0 9.5 10~0 11.,3 11.7 14.0 15.0 17.5 17.0 17.2 14.0
I 5-49 24.3 19.2 17.6 16o7 l7o4 19.2 20.4 22.S 26.0 26.S 26.2 25.1 22.3 0-54 27.0 23.6 24.2 2.3.1 22.,7 2,3 o4 26.,4 26.0 27.7 26.4 28.0 .30.2 26.5
i 955 27.1 22.,S 24.,0 23 • .3 23o6 23o5 2'7 oO 27.,4 23.4 27.1 26.4 26.2 25 .. 3 i956 2S.5 23.0 24.1 24o5 22o6 23o0 24 .. 9 25.S 25.9 26.5 28.,5 29 .. 2 25 .. 9
957 2s.o 28.5 25.5 23.9 25o2 23.0 25.9 24.0 29.'0 2S.3 23.3 27.9 26.6 (8 31.3 27.7 25.9
Percent Minnesota farm prices were of U., s. retail prices
71 78 7S 76 67 67 6S 67 67 65 64 6S 70 ~-14 \5-19 70 75 76 77 77 72 72 69 67 6S 6S 72 72 0-24 65 70 69 68 . 67 62 62 62 63 63 64 69 66
r29 63 65 64 6S 67 63 64 64 62 61 63 69 5S 0-.34 62 59 61 60 61 51 54 56 58 61 67 70 54 5-39 61 64 62 66 68 62 65 64 64 70 70 69 62 0-44 61 64 6S 72 70 6S 69 66 66 64 66 65 65 5-49 60 64 66 68 67 65 65 63 61 62 61 62 63
~r0-54 55 58 58 59 60 59 57 . 60 59 58 59 55 57
46 60 56 64 56 64 56 t955 59 54 54 51 55 5S 956 56 55 58 57 59 57 55 54 56 55 50 47 55
~957 46 46 48 51 47 50 50 57 52 57 64 56 52 l 958 47 50 58
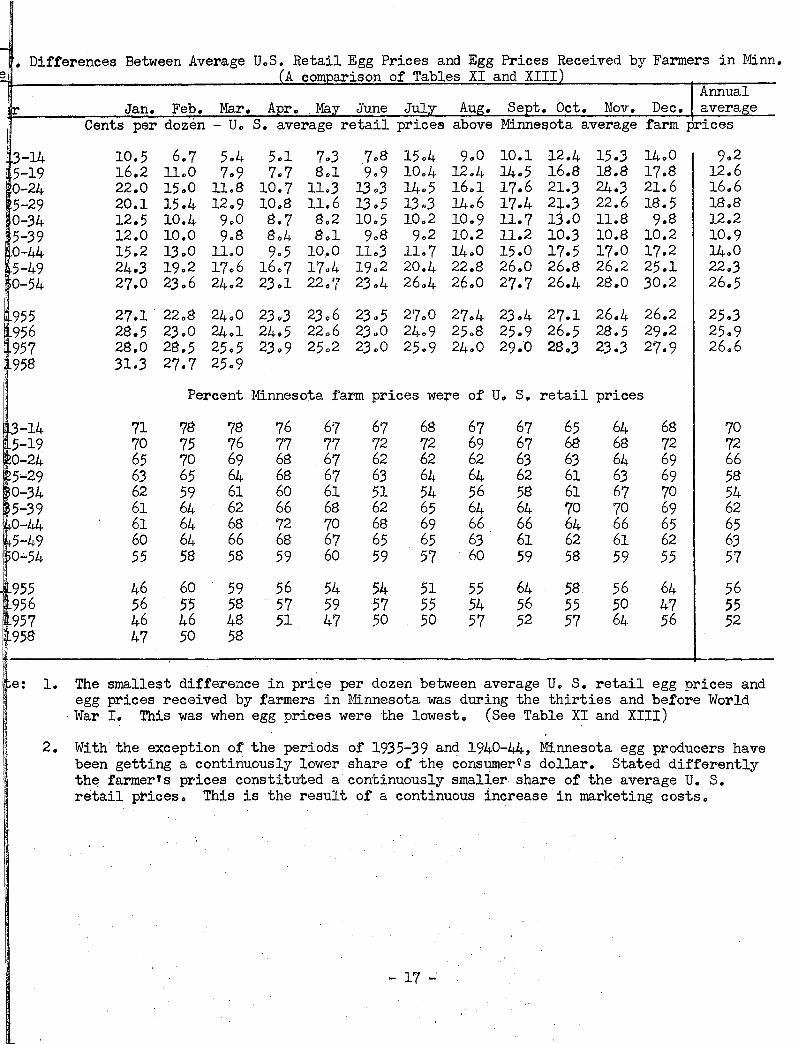
be: 1. The smallest difference in price per dozen between average u. s. retail egg prices and egg prices received by farmers in Minnesota was during the thirties and before World
·War I. This was when egg prices were the lowest. (See Table XI and XIII)
2. With the exception of the periods of' 1935-39 and 1940-44, Minnesota egg producers have been getting a continuously lower share of the consumer~s dollar. Stated differently 1;.he farmer's prices constituted a continuously smaller share of the average u. s. retail prices., This is the result of a continuous increase in marketing costs.
- 17 -

XV, Average Annual Farm Prices Received for Eggs, and Percent of Parity - u. s. Effective Percent farm
Year Farm price parity price was (Weighted) price of parity
1930-34 av. 1935-39 av. 1940-44 av. 1945-49 av. 1950-54 av.
1955 1956 1957
(cents per doz.) (cents per doz.)
17.3 29.2 20.8 28o9 28.2 31.8 42.6 47.0 42.0 49.7
38.9 46ol 38.6 46.4 35.5 49.7
59 72 89 91 85
84 83 71
Note: 1. The farm price of eggs was continually below 90 percent of parity before the World War II period. It has been below 90 percent of parity since then, except for the immediate post-war period when there was a definite shortage and a high price for red meats, and a resulting stro~g demand for eggs.
2. Much progress has been made in the poultry industry during the last 25 years in better breeding, feeding, and housing, and in reducing the rate of mortality. All this has greatly reduced the cost of production. This is one of the reasons why total egg production in the United States in 1957 was 70 percent above the 1935-39 annual average, and in Minnesota 160 percent above. This increase in production was achieved during a period when egg prices were usually less than 90 percent of parity. It is quite clear that egg production will continue at a comparatively high level even though egg prices are considerably below parity.
- 18 -

Pro-ar duced
B0-34 av. 35-39 av. f.t0-44 av. /-l-5-49 av. ~0-54 av.
1955 1956 1957
I 1958
on farms
. . . . ~0-34 av. 36,71$8 ·~5-39 av. )6, 381 ·~0-44 av. 48,659 ~5-49 av. 55,724 '~0-54 av. 58,38.2.
195.5 19.56
·J 199.5.57 il 8
~., ·0-34 3.5-39 0-44
f6~4
59,496. 6oj877· · 60,448
100.0 100.0 100.0 100.0 100.0
I
The Manner and Form in which Eggs were Used - United States On farm Off farm .! Total
Consumed 1 Used for hatchin_g_J Used 1 Used as liquid egg products b[' used in farm 1 Farm Comrner- I as 1 Frozen Dried For im- 1 Total off house- : cial 1 shell 1 ~/ ~/ mediate 1 farm hold . hatch-
1 eggs 1 consump- 1
1 eries a/ 1 1 tion '
• 0 • • 0
. 7 p 767 7,789 7,634 7,830 5, 9LJJ
5;534 5,514 5,468
21.1 21.4 1.5.7 14.1 10.2·
• . • • • Million nounds . • • • • ~ -- -.!!!.1 -- I 168 • 8 I -- -- --
1 201.6 I 321.8 543.1 22.6 1 887,5 I 364.8 265o5 18.1 1648.4 I 343.7 107.5 21.8 1473.0
I 341.5 I 349~1 Q 333.8
78.8 33.1 82.7 33.1
103.4 37 • .5
1453.4 1464.9 1474.7
Snell egg equivalents • . • Million eggs • • • • • • . 869 810 25,744 I NA 579 1,094 25,034 I NA 428 1,752 30,547 l 3.009 241J, 1 1 984 39,603 I 3,411 123 2,498 4.5,395 I 3,215
7.5 2,648 7.5 3,034 59 2,998
I
47,000 I 3,193 47 ,·907 I 3 ;264 47,484 I 3,121
. . . . . NA NA 5,078 2,483 l,Oo4
• • li[A NA 211 169 204
73.7 309 773 310 967 3.51
Percent of total egg produced on f?.rms 2.4 1.6 0.9 0.4 0.2
2.2 3.0 ).6 3.6 4.3
70.0 68.9 62.8 71.0 77.7
I NA . ~ NA
I 6.2 I 6.1
. I .5 ~5
NA NA NA NA 10 . .4 0.4 4 • .5 . 0.)
. 1.7 0.,4
o ·o 0 0 0 D 0 0 0
'(1,578) 28,132 1 (1,885) 28,013 I (8,298) 40,597 •(6,063) 47,650 1 (4,423) 52,316
I (4, 239) 53,887 1 (4,347) 55,288 I (4,439) 54,921 I
c ( 4.3) 76 • .5 I ( .5.1) 77 o0 1(17.0) 83.4 1 (10.9) 8.5 • .5 I ( 7.6) 89.6
19.5.5 · +Oo.o 9 • .) 0.1 4 • .5 79.0 1 .5.4- 1.2 0.,5. 1 ( 7.1) 90.6 19.56 100.0 . 9.1 0.1 .5.0 78.7 ' .5.3 1.3 0.5 t ( 7.1) 190.8 19.57 roo.b: · 9.0 o.l 5.o 78.6 • .5.1. 1.6 o.6 1 ( 7.3) 90.9 1 8 . ' 1 e number o eggs used for hatching was calculated on the .basis of th~ number of chicks
~ hatched at the rate of a. 10 percent hatch • . · The shell egg equivalents (n1ltnber of eggs) used in liquid egg .products was ootained by
dividing the number of pounds liquid by 38 .. .5 to obtain the number of cases of eggs used. This figure was in turn multiplied by 360 to obtain the. numb~r of individual eggs used. Does not include the liquid egg which was frozen and dried later. . . InclUC!,es the liquid egg which was frozen and dried laterw · The weight of the liquid egg before dryiTig. ·
,e: 1. ·A high percerit cf the t,otal number of eggs nrodu.c~d· and the' total number of eggs sold ··was. utilized as shell eggs. The shell egg market is all important.
2. 'nie liquid and dried egg industries became significant during the period of ltJorld War II as a means of simplifying overseas shipments. A substantial percent of the total number of eggs produced during that period was dried. Only about 1%- percent of the total nt1IIlber of e'ggs proouced have been d.ried during the last. several years 0
3. Th~ major portipri of the production of liquid egg is frozen, and is later used as liquid egg in baking and in processed food products.
4. .The liquid egg industry provides a good way of carrying over the excess supply of eggs in periods of heavy production to periods of low production~
- 19 ...

xvn. Monthly Production of Liquid Egg - United States
Year Jan. Feb. Mar. Apr. May June July Aug. Sept. Oct. Nov. Dec. Tota
1938-39 av. 1.5 1940-44 av. 31.8 1945-49 av. 24.5 1950-54 av. 2?.6
?.5 62.4 58.8 50.2
31.6 109.8 110.? 83.2
43.? 130.8 124.3 83.?
• , Million pounds ..
LJ4.? 140.6 121.0 86.0
33.5 12.3 122.4 88.9
88.6 50.? 61.2 30.0
,5.1 62.5 29.0 16.?
2.1 41.2 13.5 11.6
1.1 41.9 8.2 8.3
0.8 33.5 6.2 6.4
0.6 2.1.? 12.9 8.1
184.' 88?. 648. 4?3.
1955 1956 1957 1958
30.? 8.9
24.5 29.2
39.5 35.4 32.6 36.?
6?.8 62.6 59.2 32.?
80.0 ?8.5 ??.6 63.8
84.? 94.9 90.1
?2.1 36.~ 16.6 9.1 ?3.4 36.? 25.3 13.5 73.7 45.4 25.2 15.4.
?.2 13.5 12.6
5.3 4.2 453. 9.4 12.8 464. 8.0 10.4 4?4.
1938-39 1940-44 1945-49 1950-54
1955 1956 1957 1958
0.8 3.6 3.8 5.8
6.8 1.9 5.2
4.1 ?.0 9.1
10.6
8.? ?.6 6.9
Percent monthly production was of the total for the year
1?.1 12.4 1?.0 1?.6
14.9 13.5 12.5
23.6 14.8 19.1 17.7
1?.6 16.9 16.3
24.1 15.9 18.6 18.2
18.2 13.8 13.? 12.9
15.9 15.8 15.5
6.? 10.0 ?.8 6.3
2.8 7 .0. 4.5 3.5
8.0 3.7 ?.9 5.4 9.6 5.3
1.1 4.6 2.1 2.5
2.o· 2.9 3.2
0.6 4.? 1.3 1.8
1.6 2.9 2.?
0.5 3.8 1.0 1.4
1.2 2.0 1.7
0.4 2.4 2.0 1.7
0.9 2.8 2.2
Note: 1. The production of liquid egg perruits salvaging high quality eggs which are not sui table for the shell egg market, such as eggs with irregular shapes, cracke·d or otherwise abnormal shell conditions, and eggs which are too large or too small.
2. Over 2/3 of the volume of liquid egg is produced during the February-June period when production of eggs exceeds consumption. This makes tpe liquid egg industry especially significant in the rniddlewest from which a large proportion of the eggs are sold outside of the area.
- 20 -
100. 100. :J-00. 100.
100. 100. 100.
I Monthly Utilization of Liquid Egg - United States
Jan. Feb. Mar. Apr. May June JulJr Aug. Sept. Oct. Nov. Dec. Average
O-L14 -49
0-54
1955 1956 1957 1958
'0-l.!4 5-49 0-54
·1955 1956 1957 1958
O-L14 ~5-49 0-54
.1955 '1956 :1957 ,1958
12 • .3 .32. 9 72.9
65.9 77.0 57.6 72.9
8,3.8 57.4 19.6
24.6 15~6 .31.7 20.6
.3.9 9.7 7.5
9.5 7.4
10.7 6.5
25.4 5.3.8 74.5
69.7 7.3.5 61.7 69.8
70.9 42.9 18.6
21.-5 1.3.4 22.6 19.9
8.8 1.3.1 15.7 10 • .3
LJ4.8 60.4 79.8
81.7 78 • .3 76.8 77.2
52.1 .38 • .3 16.6
1.3 • .3 17.4 17.6 17 • .3
3.1 L2 ).6
5·0 4 . .3 5.6 5.5
48.6 65.4 78.1
81.2 ?8 • .3 76.9 79.7
49 • .3 3.3.2 18 • .3
15.2 17.9 19.0 17.0
Percent of total production • •
Frozen a/ 52.0 49.5 .3~0 19.4 66.9 56.0 40.7 ,36.2 72.8 67.1 59.5 61.7
81.1 73 • .3 71.4 60.4 79.2 77.1 74.0 69.2 7).6 70)1- 66.6 65.9
For dryi~ b/ 45.9 1+8.7 61.8 77.7 31.1 42 • .3 56.8 55 • .3 2).8 29.2 .36.7 28.9
12.6 15.7 2.3.7 29.6 15.0 12.7 17.9 2,3.6 19.3 20.7 25.5 26.5
For imm~.iate consumption
14.2 4.3.5 65.1
58.6 60.0 6).2
8.3.7 51.8 .30.4
29.7 .3L4 29.1
2.1 2.1 1.8 2.2 2.9 2.1 1.4 2.0 1.7 2.5 8.5 4.7 3.6 3.4 3.7 .3.8 9.4 4.5
3.6 3.8 4.1 ).)
6 • .3 ll. 0 5.8 10.2 ?.1 8.9
4.9 10.0 8.1 7.2 ?.9 ?.6
11.7 8.6 7.7
·Does not include the liquid egg which was frozen and dried later • . Includes the liquid egg which was frozen and dried later.
6.4 42 • .3 64.1
56.6 64.5 58.8
90.7 42.4 25.4
27.8 28.1 27.9
2.9 15 • .3 10.5
15.6 7.4
1.3 • .3
• •• • 0
5.4 4.6 .37.8 27.7 6).0 71.4
71.4 67.0 59.1 55.1 58.2 75.1
91.5 92.0 52.2 68.8 )0.6 22.9
• • 0 •
,36.2 56 • .3 72.7
75 • .3 75.1 70 • .3
12.2 18.1 17.4 28.9 .37.7 17.8 .31. 7 15.6 I 21.8
.3.1 ,3.4 10.0 .3.5 6.4 5.7
16.4 14.9 12.0 7.2 lO.l 9 • .3
2.6 2.8 4.6
7 . .3 7.1 7.9
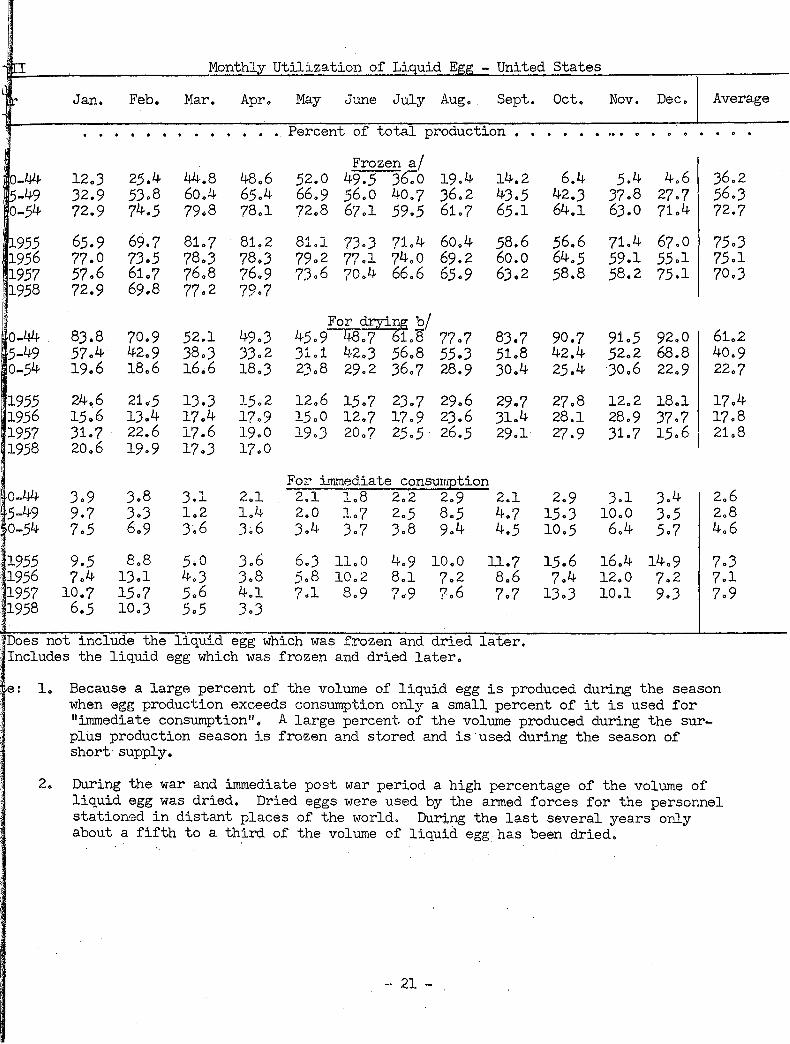
e: 1. Because a large percent of the volume of liquid egg is produced during the season when egg production exceeds consumption only a small percent of it is used for "immediate consumption11
"' A large percent of the volume produced during the surplus production season is frozen and stored and is·used during the season of short supply.
2. During the war and immediate post war period a high percentage of the volume of liquid egg was dried. Dried eggs were used by the armed forces for the personnel stationed in distant places of the world. During the last several years only about a fifth to a third of the volume of liquid egg has been dried •.
- 21 -
XIX.
Year
1940-44 av. 194.5-49 av. 19.50-54 av.
1955 1956 1957 1958
1940-44 1945-49 1950-.54
1955 1956 1957 1958
a - Plain yolks,
Whole egg
694.8 4)0.0 181.7
109.2 121.0 142.2
78.3 66.) )8.4
24.1 26.0 30.0
sugared yolks,
Liquid Egg Products - United States
Mixed Albumen Yolks! Total whole
e Million pounds . . . . . .
43.7 79.8 69.2 887.5 52.0 94.3 72.1 648.4 69.9 133.7 87.7 473.0
64.4 167.1 112.7 453.4 61.8 172.6 109.5 464.9 51.5 170.4 110.8 474.7
Percent of total
4.9 9.0 7.8 100.0 8.0 14.6 11.1 100.0
14.8 28.3 18.5 100.0
14.2 36.9 24.8 100.0 13.3 37.1 2).6 100.0 10.8 35.9 23.3 100.0
and yolk emulsion.
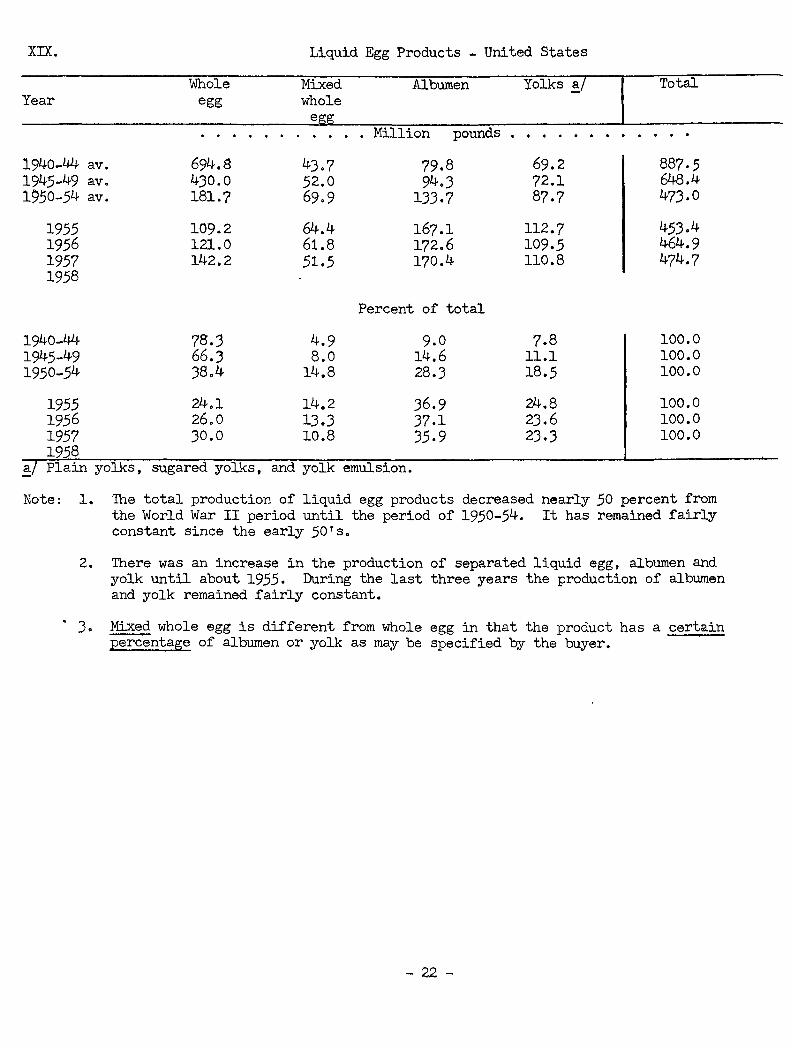
Note: 1. The total production of liquid egg products decreased nearly 50 percent from the World War II period until the period of 1950-54. It has remained fairly constant since the early .sors.
2. There was an increase in the production of separated liquid egg, albumen and yolk until about 1955. During the last three years the production of albumen and yolk remained fairly constant.
• 3. Mixed whole egg is different from whole egg in that the product has a certain percentage of albumen or yolk as may be specified qy the buyer.
- 22 -
Chicks Hatched b Commercial Hatcheries.~ U. s. Jan. Feb. .Mal". ~pr. ~y June July Aug. Sept. Oct. Nov. Dec.l Total
1 Chicks hatched for la~ng flock rep~acements • " 0 8 0 • • • • 0 0 0 ('I 0 • ~ () 0 Millions 0 0 0 • 0 • • • 0 • • • e 0 Q 0 " 0 0
'955 32.9 71.2 148.9 163.9 10?.9 32.6 1~ .• 9 12.6 14.1 16.6 956 39o3 84.0 149o5 159o4 108.8 J4o7 15.4 14o3 14.9 17.1
> 957 '30.5 56.3 109.4 129.1+ 90.8 27.9 11 .. 9 10.1 12.3 13.0 •958 34.4 61.9 114.6 135.8 111.6
6L>8o 6 668 .. 0 519.4
Percent the monthly hatch for laying flock replacement was of the total hatch for the year 955 5ol 11.0 22.9 25.J 16.6 5.0 2.3 1.9 2.2 2.6 2.4 2.7 10090 956 5.9 12.6 22.h 24.0 16.3 5.2 2.3 2.1 2.2 2.6 2.2 2.4 100.0 957 5.9 10.8 21.1 24.8 17.5 5.4 2.3 2.0 2.,4 2.5 2.3 3.0 100.0
I · (2) .QJ~s~.ks h.at.Qhed f9r broiler production I . . . . . Cll 0 0 0 0 0 ":) " 0 () 0 0 0 Millions • 0 (I • e () • • 0 • 0 tiJ 0 c 0 0 , 0 0 0
~955 81.2· 92.2 105.4 109.6 115.9 111.9 lll.O 98.9 86.8 93.4 95.9 102.7·1,204.9 956 110.9 114.9 132,4 13h·.9 142.6 137.9 128.5 123.1 106.8 107.2 107.9 108.8 1,455.9 957 128.6 122.4 139o3 141.3 lh?o? 1~.1.8 143o4 1.32.3 119o4 119.'7 116.4 126.5 1,5'78.8 958 138.6 136 .. 2 150.1 162.8 180.h
,i Percent the monthly hatch for broilc~r production ·was of the total hatch for the year ~~955 6.7 7.6 8.8 9o~ 9o6 9o~ 9o~ 8.2 7o2 7oS 8.0 8.5 :0 956 7.6 7.9 9ol 9.3 9o7 9.:; 8.8 8.5 7o3 7.4 7.4 7.5
100.0 100o0 100.0 .•. 957 8.1 7.8 .8.8 9o0 9o3 9o0 9.0 8.4 7.6 7.6 7o4 8o0
~ 8 .
: • • . • () ~ e o' 0 t) 0 0 0 0 0 0 0 Ct ., 0 1Yfilli ons 0 t' 0 o 0 • e • D 0 • o o o l. · · 3 Total chicks hatched by commercial hatcheries - (1) and (2) t1 o o o e
~ -347!- 13o5 51.8 ll9o6 16lol 142.,9 /+'7o5 8.4 2o2 2.7 4ol 4.9 , -3~!- 24.7 63.0 l44o~2 2llo6 175~2 65~9 19ol l2o0 11.7 12.4 13.0 ~ -4L~~~ 44.9 103.2 229o7 281.? 242o5 119.'( 5lo9 34.7 29o7 29o9 29.2 '-4~:· 59.3 117o9 253oh :3l5o3 ;;:~)+!+o2 110.1 60.5 46.3 43o0 48.1 48ol ' ·-54"!~ 114.0 170.8 282o 9 296.6 2J0 •. 2 126~0 94o 7 86o8 82o8 8'7 .2 87 o2
~ 955 . 956 t957 !i958
'-34 -39
'-44 : -49 ) -54
1.·.~955 'i956
957 8
11~:.1 150~2 159.1 173.0
2.4 3.2 3.? 4o3 6.5
6.2 7..1 7.6
163.4 251+.3 27},,5 223"8 144l,5 125.9 11L5 100.9 110.0 111.4 198o9 281.9 294.3 25L4. 1'7.<:. 6 143.9 13'7 .4 121.7 124.3 122.6 1'7Bo'7 248o7 2?0.? 238.5 169o? 155.3 142 .. 4 131.7 132 .. 7 128.5 198o1 264o'7 298'"6 292o0
Percent the· monthly total h3.tch was of. the .total hatch for the year 9~1 21..1 ~~8.4 25o2 8 ' L5 0.4 0.5 0.7 Oo9 o4 8~2 18o8 27o'/ 2.2o9 8o6 2o5 1 .. 6 1.5 1.6 1.7 8.'-1, 18~'7 2)o0 19.,8 9o8 I ,...,
I+,, ,t, 2 .. 8 2.4. 2.4 2$4 8~5 lfL2 22o'7 17a6 " 0 4e4 ~.,3 .361 3o4 3o5 I o /
9.$ 16o2 1'7.0 1.3 ~:z 1'1 ? 5.4 5o0 4.7 4o9 5 .. 0 I"'-·
s.s 1Jo7 14o8' 1~~.1 ?'oS 6 .. 8 6 .. 0 5.4 5.9 6.0 9.4 l3o3 lJ,.9 11.8' 8~1 6·o8 6o5 5.:7 5o9 5.8 $.5 11.9' 12.9 lL.4 S.l 7o4 6 .. 8 6.3 6 .. 3 6ol
8o4 567ol 13.2 ?66.0 29o2 1,226o3 43o4 l.ll388o6 90o6 1/748.4
120o2 1Jl853.5 124 .. 7 2,123 o9 142 .. 2 2~098o2
L5 100.0 1.7 100o0 2~4 100~0
3~1 100.0 5.2 100.0
6.5 100 .. 0 5.9 100.0 6~8 100.0
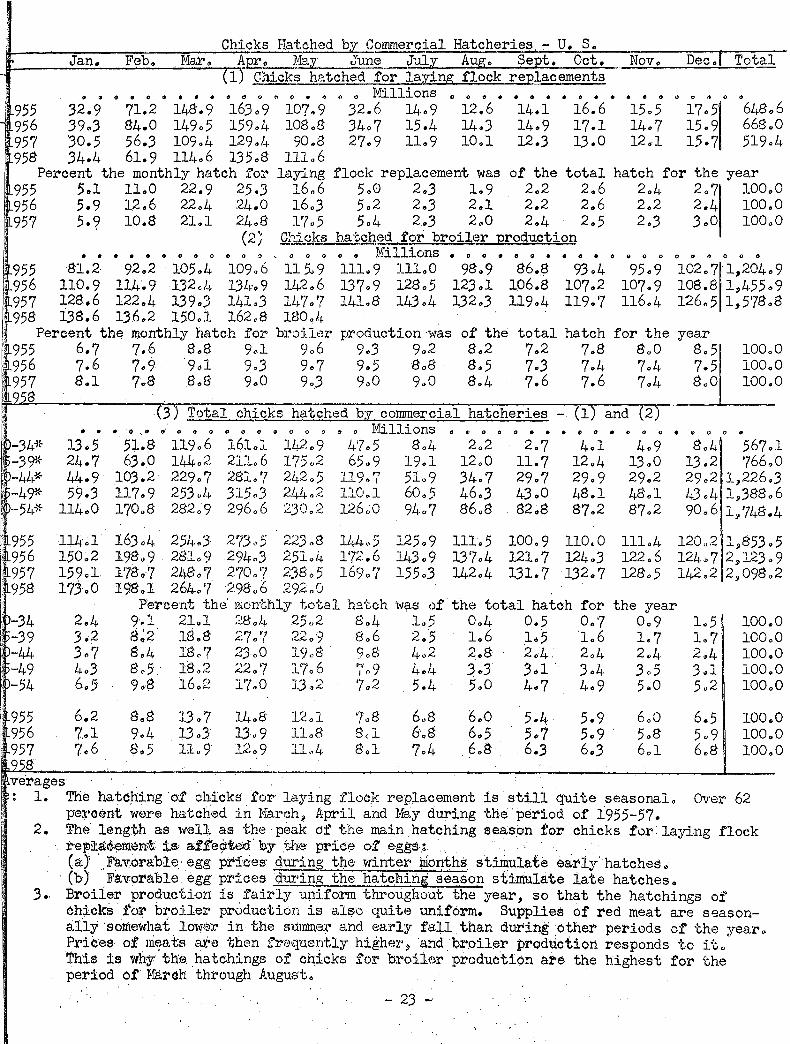
l. The hatc;hing of chicks for laying flock replacement is st:i..11 quite seasonal. Over 62 percent were hatc-hed in }'Iarch51 April and :rtay during the ·pe!"iod of l955-57.
2. The· length as well. as the·peak d:f' the main hatching season for chicks for.laying flock re!:'ita6-~ment i$1 aft'e¢:ted· by .the prict';;l o:l eggs} · .. . . · . (a:)' · .. Fav..orable. egg pri.ces· ~he winter 1J,tonths stirim1ate early· hatches~
· (h) .Fa:v9rable egg prices during the hatching. season stimulate 1ate hatcheso 3.. Broiler producf~iorr is i'airly u:piform throughout the year, so that the hatchings of
ch;ickS.:tol' b~oiler production is alf?O quite uniform. Supplies of red meat are seasonally ·s·ontewhat lowc~'r in the sunnne+' and early fall than dtl:I'ing other periods of the year~ Prices of ni€1ats are then frequently highF.lr, and broiler prodtictic;m responds to it.. This is why· th:e. hatchings of chicks for broile-r production are the highest for the period of March thx-ough Auguste

XXI.
Year
19.5.5 19.56 19.57 19.58
Chicks Hatched by Commercial Hatcheries - Minnesota
Jan. Feb. Mar. Apr. May June July Aug. Sept. Oct. Nov. Dec. To-t
: (l) Chicks ha~ched for laying flock replacement • • (I 0 0 0 0 0 0 o o o Thousands 0 • • 0 0
340 2,68.5 12»630 16,370 10,380 1,11.5 20 .5 .5 .5 .5 30 43, 46.5 4,.56.5 14,220 17,080 10,900 870 2.5 20 30 1.5 2.5 3.5 48, 39.5 2 ,39.5 99.5.5.5 13~760 9,720 910 110 20 55 55 70 80 37, 400 3,0.50 12,100 16,200 11,800
Percent the monthly hatch for laying flock replacement was of the total for the year 19.5.5 Oo8 6.2 29.0 37o.5 23.8 2.6 0.0. OoO OoO OoO OoO 0.1 100 19.56 1.0 9 • .5 29 • .5 3.5o4 22.6 lo8 Ool OoO 0.1 o.o Ool 0.1 100 19.57 lol 6.5 2.5.7 37.1 26.2 2 • .5 0.3 Ool 0.1 Ool Oo2 Oo2 100 19.58
19.5.5 19.56 19.57 195~
19.5.5 19.56 19.57 19.58
', (2) Chicks hatched for broiler production
0 • 0 0 0 0 0 0 0 Thousands o • • • 0
12.5 13.5 220 200 230 18.5 180 1.5.5 180 180 230 270 220 260 27.5 21.5 200 13.5 180 1.5.5 2.5.5 330 26.5 170 190 160 14.5 16.5 260 232 30.5 300
Percent the monthly hatch for broiler production was of the .5o9 6.4 10o3 9.4 10.8 8.7 8 • .5 7.3 8 • .5 7.4 9 • .5 11.1 9ol 10.7 11.4 8o9 8.3 .5o6 7.6 6 • .5 10.7 13.9 11.2 7.2 8.0 6o7 6.1
0 0 0 0 0 • 0
140 18.5 190 1.50 1.50 13.5 170 1.50 20.5
total for the year 6.6 8.7 8.9 6o2 6o2 .5o6 7.2 6.3 8.6
(3) Total of all chicks hatched qy commerci~1 hatcheries
1940-44 av. 192 194.5-49 av. .51 19.50-.54 ay. 493
19.5.5 19.56 19.57 19.58
1940-44 1945-49 1950-.54
19.5.5 19.56 19.57 1958
46.5 64.5 .57.5 60.5
0.3 0.1 Oo9
1.0 1.3 1..5
0 0 0 $
3,044 1,600 3,248
2,820 4.79.5 2».5.50 3,310
o • '• o o o • • o • o o Thousands ~ o o o o
12,170 19,170 17,413 7,134 296 --14,604 22,413 18,066 3,29.5 79 48 12,048 19,740. 14,04.5 1,613 19.5 , 199
12»8.50 16,.570 14,490 17,300
9»810 14,090 12,332 16,.50.5
10,610 1,300 200 160 11,160 1,14.5 240 220
9,985 1»080 300 180 12,100
0 0 0 0
4.5 164
18.5 ' 1.6.5 200
44 141
14.5 16.5 22.5
0 0 0
64 1,72
190 17.5 220
Percent the monthly total hatch was of the total for the year ,5.1 20 • .5 32.3 29.3 12.0 0 • .5 2.6 24.2 37.1 29.9 .5 • .5 0.1 0.1 Ool Ool 0.1 6.2 23.1 37.8 26.9 3.1 0.,4 0.4 0.3 0.3 0.3
" 6.2 28.1 36.2 23.2 2o8 0.4 0.4 0.4 0.,3 0.4 9 • .5 28.6 34.1 22.0 2.3 0.,.5 0.4 0.3 0.3 0.3 6 • .5 24.8 3.5.6 2.5.2 ' 2.7 0.8 0 • .5 0.".5 o'.6 0.6
• 0 0
64 1.58
220 170 28.5
0.1 0.3
0 • .5 0.3 0.7
2,1 2,4 2,3
100' 100 100·
.59' 60, .52 9
4.5" .50. 39,
100) 100 100.
100. 100. 100.
--·-:
Note: 1. Most of the chicks hatched in Minnesota are for laying flock replacement. This is the main reason why the Minnesota hatching business is ve~.seasonal. Between 8.5 and 90 percent of all chicks are hatched in March, April» and M~.
2. There is a tendency toward earlier hatching in Minnesota~in recent years. This is indicated by larger hatches in February and March» and smaller hatches in May and June, compared with the same months in earlier years.
3. The small increase in late summer and'"fall hatching reflects a slight increase in broiler production irt Minnesota.
- 24 =

XII. Chicks Hatched for Laying Flock Replacement - United States
Chicks hatched by commercial hatcheries For laying flock replacement
ear Total number of chicks hatched
Number ' Percent of the
Percent of the laying flock re~ placements purchased as "sexed" chicks.
• Millions
1 total number of 1 chicks hatched
• • Percent •
~42-44 av. ~45-49 av. :~50-54 av.
1,392.6 1,388.6 1,748.6
892.0 733.0 630.0
64.1 52.8 36.0
19 25 39
"•
1955 1956 1957 1958
l.
1,853.4 2,123.9 2,098.1
648.6 667.9 524.5
35.0 31.4 25.~
50 53 54
pte:
1 2.
The increase in the number of chicks hatched is the result of a substantial increase in broiler production.
There has been an overall decline ln the number of chlcks hatch€d for laylng flock replacement. Fewer laying hens are needed because egg production per hen has increased materially.
3. A much larger percent of the chicks purchased for laying flock replacement have been bought as sexed chicks in the last several years compared to earlier years.
XIII. Death L:ss of Layers - United States
ear
940-44 945-49 950-54
1955 1956 1957 1958
West North Central Region
19.6 17.0 18.3
18.4 20.1 19.9
East North North Central Atlantic Region Region
Death loss percentage of
19.1-~- 14.7 18.2 - 17.4 18.7 19.9
16.2 18.5 19.2 23.1 19 • .5 23.2
Southern Western United Region Region States Minnesota
chickens on hand January l
17.0 19.5 18.2 21.0 18.4 19.6 1?.9 16.4 20.8 ,22.1 19.7 17.2
19.3 23.6 18.8 19.0 24.7 27.1 22.5 21.0 24.6 25.0 22.2 21.0
ote: 1. About one out of every four or five layers was lost during the last several years with considerable variation between regions.
2. The North Atlantic region used to have the smallest death loss of layers, but in recent years the North Central Region had the smallest death loss.
3. The death loss of layers in Minnesota was far above the United States average and the West North Central Region average for the period of 1940-44. It is still above the average in the West North Central Region but is nov.r below the average in the United States.

XXIV.
Year
1935-39 av. 1940-44 av. 1945-49 av. 1950-54 av.
1955 1956 1957
1935-39 av. 1940-44 av. 1944-49 av. 1950-54 av.
1955 1956 1957
Note: l.
2.
Chicken Meat Sold - United States Total chicken Mature 1 % of Young meat sold chickens · 1 total chickens
(Million pounds) (Million
1,629 2,801 3,233 4,300
4,578 5,457 5,702
20.3 32.3
141.1 103.3
749 1,049 1,178
953
814 756 748
7.4 11.8 77.9 62.3
pounds) United States
t 46.0 ' 37.5 I 36,4 I 22.2
I 17.8 I 13.9 i 13.1
Minnesota u 36.5 I 36.5 I 55.2 I 60.3 I.
677 1,093
989 722
415 432 261
11.9 18.5 59.1 32.4
and Minnesota. 1 % of Commercial 1 total broilers
I 41.6 I 39,0 I 3d,6 I 16,8
I 9ol I 7o9 I 4.6
I 58.6 I 57,3 I 41,9 t• 31.4
(Million pounds)
203 659
1,066 2,625
3,349 4,269 4,693
1.0 2.0 4.1 8.6
% of total
12.4 23.5 33.0 61.0
73.1 78.2 82.3
4.9 6.2 2.9 8.3
86.9 59.6 I 68.6 19.9 I 22,9 7,4 t 8.5 86.5 54ol I 62.5 24.3 t 28,1 8.1 I 9.4 74.4 49.2 I 66,1 15.5 I 20,8 9o7 t 13.1
The percent of total chicken meat sold in the United States which comes from commercic broiler production has increased. The inc~ease has been comparatively rapid in the last several years and reached an all time high of over 82 percent of the total in 195 The commercial broiler ind~stry irt Minnesota supplies only a small percent of the total poultry meat sold in the state. However, considerable growth in the broiler industry is indicated.
3. Young chickens include cockerels purchased with pullet chicks for laying flock replace ment and cull young pullets, practically all of the egg laying breeds.
XXV.
Year
1935-39 av. 1940-44 av. 1945-49 av. 1950-54 av.
1955 1956 1957
11935-39 av. 1940-44 av. '1945-49 av. 1950-54 av.
1955 1956 1957
Live Weight of Birds and Prices Received - United States and Minnesota The averq,ge live weight of birds sold Price paid to producers Mature Young Commercial Chickens ~/ Broilers chickens chickens broilers • . . . . . . • • • Pounds . • ,. • . . • • •
Unit~d States 4.8 3.3 2.9 5.2 3.5 2.9 5.2 3.7 3.0 5.2 ).8 3.1
5.2 3.8 3.1 5.1 3.8 ).2 5.2 3.8 3.2
Minnesota 4.8 3.8 2.7 4.9 3.9 2.7 4.8 4.0 2.9 4.8 4.1 3.0
4.8 4.1 3.0 4.7 4.1 3.0 4.7 4.2 3.3
14.8 19.1 27.1 21.6
18.6 15.9 13.6
16.5 22.6 16.4
15.4 12.3 9.9
• • Cents •
19.6 23.2 31.7 26.9
25.2 19.6 18.9
26.6 34.6 27.2
25.3 21.2 19.1
.. ;
~/ The average price of all chickens sold from farm flocks, including mature and young chickens. ·
Note: l. The average we~ght of mature chickens.sold 1n Minnesota is lower than the U.s. average. This very likely is the result of a larger percent of Leghorn and other "egg laying" flocks in Minnesota compared with the United States.
- 26 -
XXVI. A ;:;;;;:..;;...:;;..;!:----AEEroximate average weights AEEroximate shrinkages
Kind and class
Chickens: Hens Roasters Broilers, fryers
All chickens
Turkeys: Hens and toms Hens and toms Hens and.toms Fryers
All turkeys
Ducks
Geese
Live
5o5 5.0 3.0
4.0
n.o lB.O 27.0 7.0
lB.5
6.0
14,0
Dressed 12/ Pounds
4.9 4.5 2.6
3.6
9.B 16.2 24.6 6.2
16.6
5.3
12.4
Ready to Live to Live to Dressed to cook dressed read to cook read to cook
Percent
3.7 10.5 32.5 25.0 3.4 10.5 33.0 25.0 1.9 11.5 36.0 2B.O
2.6 11.0 35.0 27.0
B.2 n.o 25.5 16.5 13.9 10.0 23.0 14.5 41.2 9.0 21.5 13.5
5.0 12.0 2B.O lB.O
13.9 10.0 25.0 16.5
4.2 11.0 30.5 22.0
10~2 ll.5 27.5 lB.O
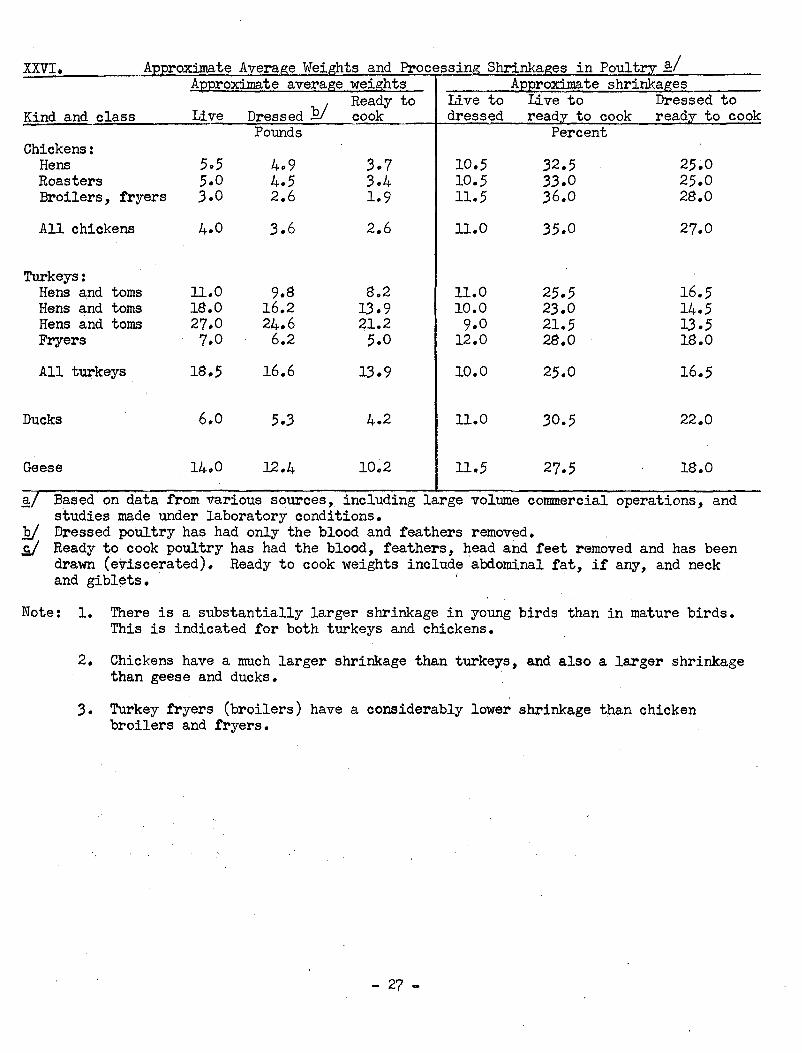
Based on data from various sources, including large vo1ume commercial operations, and studies made under laboratory conditions. Dressed poultry has had only the blood and feathers removed. Ready to cook poultry has had the blood, feathers, head and feet removed and has been drawn (eviscerated). Ready to cook weights include ·abdominal fat, if any, and neck and giblets. ' ·
Note: 1. There is a substantially larger shrinkage in young birds than in mature birds. This is indicated for both turkeys and chickens.
2. Chickens have a much larger shrinkage than turkeys, and also a larger shrinkage than geese and ducks. ·
3. Turkey fryers (broilers) have a considerably lower shrinkage than chicken broilers and fryers.
- 27 -
XXVII. Farm Prices Rec-eived for Chickens - United States
Weigh tee Year Jan. Feb. Mar. Apr. May Ju .. ne July Aug. Sept. Oct. Nov. Dec. average
1930-34 13.5 1935-39 14.6 1940-44 17.7 1945-49 27.0 1950-54 23.2
1955 15.4 1956 15.5 1957 13.9 1958 14.7
1940=44 22.2 1945-49 30.6 1950-54 25.7
1955 24.4 1956 20.6 1957 18.0 1958 19.9
13.5 14.8 18.0 26.8 23.8
18.6 16.5 14.1 15.3
22.6 28.2 27.0
25.4 21.4 19.5 20.3
13.8 15.1 18.5 27.8 24.9
20.9 16.0 14.6 16.7
23.2 30.6 26.0
29.7 21.9 19.5 21.5
Farm chickens ~] ~ cents per pound
14.3 15.6 19.1 28.2 24.3
20.:3 16.5 lLI-. 3 16.'?
1J.9 13.5 13.4 13.3 15.4 15.2 14.8 14.6 19.5 19.4 19.4 19.7 27.7 27.6 28.0 27.6 23.6 22.2 22.0 22.1
20.2 19.7 19.3 18.4 15.5 J..L~.5 lJ.O 13.5 1J.6 lJ.4 13.2 13.9 16.6 l6oO
13.5 15.1 19.8 27.3 21.1
18.8 11.0 13.7
Commercial broilers .. cents per pound
23.4 32.3 27.8
28.4 20.8 18.8 19.3
23.9 23.8 22.9 22.8 32.4 32.2 32.4 33.1 26.5 26.8 28.4 28.9
27 0 0 2(' .. 2 26 0 5 26 0 9 21.1 20.2 21.4 19.6 19.3 20.7 21.LJ. 20.7 20 01 2'i..(. 0
23.3 33.8 28.1
25.2 18.2 18.1
~I Does not include commercial broiiers
12.7 12.2 11.7 14.7 14.4 14.1 19.8 19.4 19.3 26.6 25.2 26.1 19.8 20.3 20.7
18.0 17.5 17.9 9.5 9.5 10.0
12.7 13.1 13.9
23.3 23.3 23.9 33.1 31.0 30.6 25.9 26.2 24.4
22.0 21.2 19.4 17.2 16.8 16.6 17.0 16.9 16.4
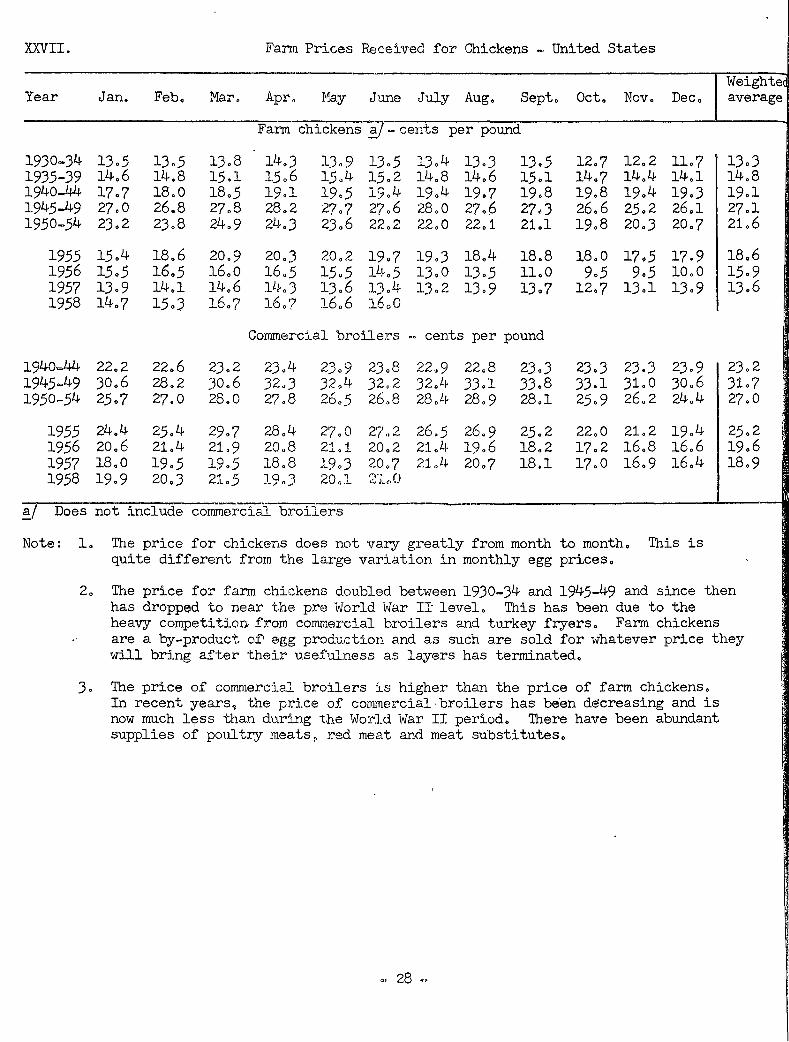
Note: l. The price for chickens does not vary greatly from month to month. This is quite different from the large variation in monthly egg prices.
13.3 14.8 19.1 27.1 21.6
18.6 15.9 13.6
23.2 31.7 27.0
25.2 19.6 18.9
2. The price for farm chickens doubled betvreen 1930-34 and 1945-49 and since then has dropped to near the pre World War II· level. This has been due to the heavy competition from commercial broilers and turkey fryers. Farm chickens are a by-product of• egg produ..-:tion and as such are sold for whatever price they will bring after their usefulness as layers has terminated.
3 o The price of conm1ercial broilers :is higher than the price of farm chickens o
In recent years~ the price of commercial· broilers has be'en decreasing and is now much lt?ss than during the World War II period. There have been abundant supplies of po1litry meats, red meat and meat substitutes.
=· 28 ..

III. Farm Prices Received for Chickens - Minnesota
·--· ___ .. _______
Weighted ear Jan. Feb. Mar. Apr. May June J"Luy Aug. Sept. Oct. Nov. Dec. average
Farm <:.:Eickens p-: cents per-po-und
940-44· 14.6 14.6 14.9 1.5.3 16.1 16.1 16.7 1'7.2 1?.4 16.5 16.0 16.5 16 • .5 945-49 21.4 20.9 21.0 2:l .• 3 21.6 21.8 23 • .5 23.5 23.2 22.7 21.1 20.9 22.6 950-54 16.7 17.4 1'?.8 18.2 17.8 16.5 16.8 17.6 16.9 15.3 15.0 15.3 16.4
1955 11.0 12.0 lLI .• O 15.0 15.0 16.0 1'7.0 15.0 16.0 16.0 14.5 14.5 15.4 1956 19.2 19.4 19.9 19.? 19.1 18.0 16.7 16.1 li.J..6 13.1 12.9 13.6 12.3 1957 10.9 9.0 8.5 9.0 9.0 9.0 9.0 10.5 11.0 10.0 10.0 10.5 9.9 1958 11,.0 11.5 12.5 13 .. 0 13.5 13~5
ComrnerGial broilers ~ cents per. pound 940-44 . 2lJ.. 8 25.4 27.0 28.2 28.8 27.0 26.0 25 .. 8. 26.0 26.4 26.6 27.4 26.6 945-L~9 32.6 32.6 )5.:~ 3?.2 37.3 36.8 36.::. 35.2 3/.j·. 6 32.7 32.2 32.1 34.6 950-54 27.3 28.4 28.3 28.4 28.2 27.4 27.2 27.2 27.2 26.0 25.7 25.4 27.2
1955 23.0 25.0 27.0 29.5 28.0 28.0 27.5 26.5 26.5 24.0 23.0 21.0 25.3 1956 24.0 23.0 23.0 23.0 2J,.O 22.0 21.0 21.0 21.0 20.0 19.0 17.0 21.1 1957 18.0 19.0 19.0 19.0 19.0 22.0 2).0 2:1..0 17.0 16.0 16.0 16.0 19.1 1958 20.0 19.5 22.0 20 .. 0 20.0 '21n0
Does not include cornmerciafbroilei'S--.. -·
ote: l. Minnesota chicken prices h<'lve been consistently low·er than the U. s. average. The chicken meat enterprise (ymmg and mature chickens) is lareely supplementary to the egg enterprise i.n Mj_nnesota. A J.are;e proport.J.on of the chicken meat comes from egg laying breeds and .strains.
2. Farm prices are the residual of prices paid by consumers, less the costs of trans~ portation and handling. A lower cost of produc1.J.on in JV:innesota ., especially a lower feed cost, compared with o·>:.her areas, :i.s one reason why Minnesota pro-~ ducers can market chickE::ns at lo'ftTer farm pr:l.ces than producers in some of the other are:;3.s.
). Minnesota broiler prices were consistently higher than the U. S. average in the earlier perjods. (see Table XXVII) This was the resQlt of limited production and special local market outlets. \iith increased broiler production in Minnesota. this spread in price has practieally disappeared. (Col11.pare Tables XXVII, XXVIII and also see Table XXI.)
XXIX.
Year
1949 1950 1951 1952 1953 1954
1955 1956 1957 1958
1951 1952 1953 1954
1955 1956 1957 1958
Note:
Number of Turkey Breeder Hens on Farms January 1 - Minnesota He a~
Light Heavy Other All Total White Hea._y:y_ Hea,vy . . . . . . . . • Thousands • . . . . . . . . .
125 165
31 13~ 170 50 171 221 43 158 201
101 144 245
50 70 135 20.5 255 35 121 142 263 298 32 138 182 320 352 79 97 19.5 292 371
Percent of total
18 82 100 23 77 100 21 79 100 41 59 ].00
20 27 53 80 100 12 41 47 88 100
9 39 52 91 100 21 26 53 79 100
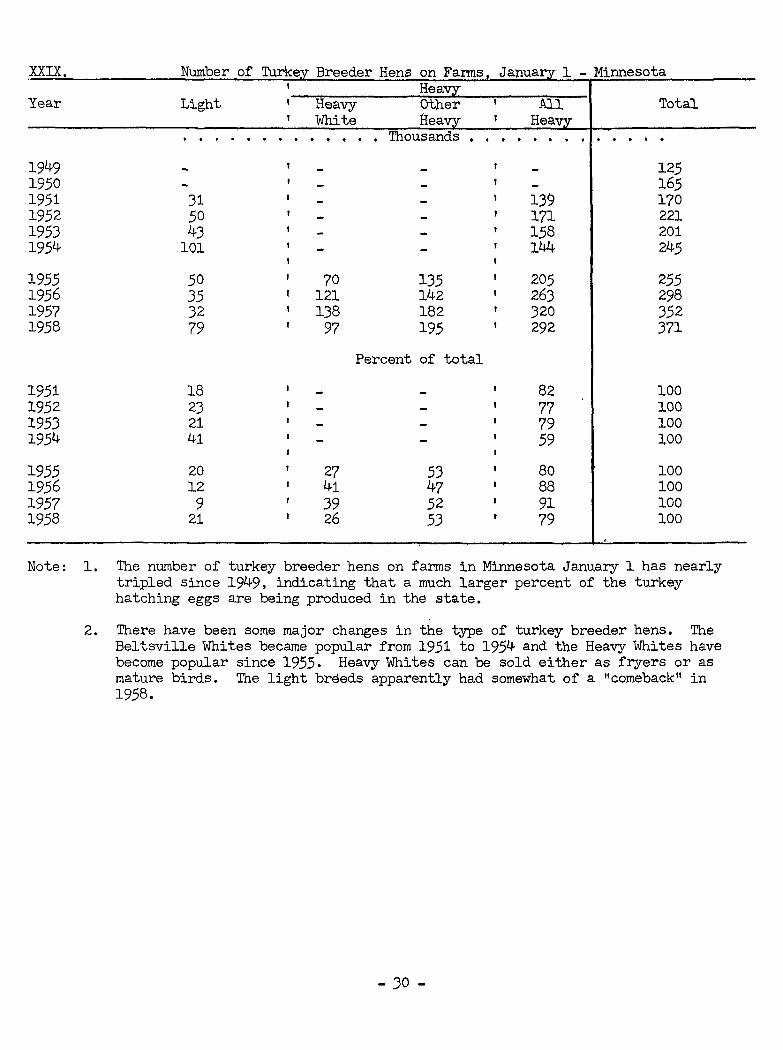
1. The number of turkey breeder hens on farms in Minnesota January 1 has nearly tripled since 1949, indicating that a much larger percent of the turkey hatching eggs are being produced in the state.
2. There have been some major changes in the type of turkey breeder hens. The Beltsville Whites became popular from 1951 to 1954 and the Heavy Whites have become popular since 1955. Heavy Whites can be sold either as fryers or as mature birds. The light breeds apparently had somewhat of a "comeback" in 1958.
- JO -
XXX. Types of Turkey Poults Hatched - Minnesota ~ HeaJQL
Light ' Heavy Other t Total Total ---------------- f whit~ hea__vy_ t heal[.y_
Index 1941_-50 = 100
1947-50 av. 1951-52 av. 1953-54 av.,
1955 1956 1957
1953-54
1955 1956 1957 1958
. . • • • • • • • Thousands • • • • • • • •
3,955
2,510 1,958 1,485
45()2
27.8 15.8 11.6
t'
II
11
17
11 2,560 v 5,463 ' 5,860 1t
'b
' " 28.4 'il 44.1 11 45.9 ' ~
' ~
11 4,789
' 3,944 ' 6,504 4,958 1! 10,421 5,433 11 11,293
' Percent of total
11 54o8 v
43~8 9 72o2 40.1 'il 84.2 42.5 'il 88.4
v 11
4,587 6,624 8,744
9,014 12,379 12,778
100.0
100.,0 100.0 100.0
• • • •
100 144 191
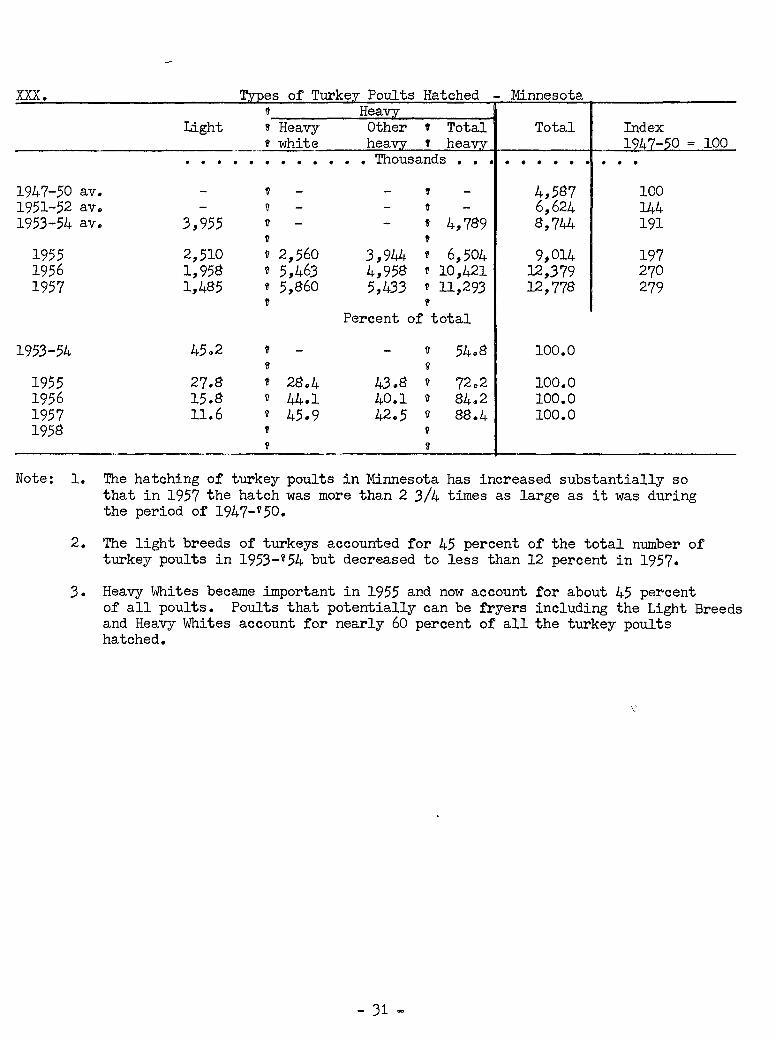
197 270 279
Note: 1. The hatching of turkey poults in Minnesota has increased substantially so that in 1957 the hatch was more than 2 3/4 times as large as it was during the period of 1947-1150.
2. The light breeds of turkeys accounted for 45 percent of the total number of turkey poults in 1953-V54 but decreased to less than 12 percent in 1957.
3. Heavy Whites became important in 1955 and now account for about 45 percent of all poults. Poults that potentially can be fryers including the Light Breeds and Heavy Whites account for nearly 60 percent of all the turkey poults hatched.
- 31 -

XXXI. Variations in Monthly Hatching of Poults by Types of •rurkeys Produced - U.S.
Year Jan. Feb. Mar. Apr. May June July Aug. Sept. Oct. Nov. Dec. Total 1. HeaYi£: Bronze
• . . . . . . . . . . . . • millions . . . . . . . . . . . . . 1956 1.1 3,7 9.5 13.3 13.5 8.2 1.5 o.o o.o o.o 0,2 1.1 I 52.1 1957 2.3 h.? 10.5 14.7 14.3 8.4 1.6 0.1 o.o 0.1 0.2 0.8 57.7 1958 1.7 3.6 9.3 13~5 13.5
Percent of total 1956 2,1 7.1 18.2 25.5 26.0 15.7 2.9 o.o o.o o.o o.u 2.1 i 100.0 1957 4.0 8.1 18.2 25.4 24.7 14.6 2.8 0.2 o.o 0.2 o.4 1.4 100.0 1958
2. Heavy Whites . . . . . millions . . . . . . . . .
l956 0.9 1.2 L.9 3.0 3 .. 7 2.8 1.6 0.7 0.3 o.u 0.6 0.9 I 18.0 1957 1.0 1.1 1.6 2.5 3.3 2.6 1.3 0.6 0.3 0.3 0.5 0.7 15.8 1958 0.8 0.9 1.3 2.1 2.8
Percent of total ~ 1956 5.0 6.? 10.6 16.6 20.5 15.6 8.9 3.9 1.7 2.2 3.3 5.0 I 100.0 l\) 1957 6.3 7.0 10.1 15.8 20.9 16.5 8.2 3.8 1.9 - Q 3.2 4.4 100.0 1._, I 1958
1t Ail Heayz Breeds - Tbtal 1 and 2 . . . . . . . . . • millions . . . . . . . . . . . . 1953-54 1.0 3.1 9.1 13.3 13.1 7.0 1.3 0.1 o.o o.o 0.1 0.4 48.5
1955 1.2 2.7 7.8 12.8 14.8 9.0 2.1 0.3 0.1 0.2 0.4 1.0 52.4 1956 2.0 4.9 11.4 16.3 17.2 11.0 3.1 0.7 0.3 0.4 0.8 2.0 70.1 1957 3.3 5.8 12.1 17.2 17.6 11.0 2.9 0.7 0.3 0.4 0.7 1.5 73.5 1958 2.5 4.5 10.6 15.6 16.3
Percent of total 1953-54 2.1 6.4 18.8 27.4 27.0 14.4 2.7 ·. 0.2 040 o.o 0.2 0.8 100.0
1955 2.3 5.2 14.9 24.4 28.1 17.2 4.0 o.6 0.2 0.4 0,8 1.9 100.0 1956 2.9 7.0 16.3 23~3 24.4 15.7 4.4 1.0 0.4 0 .. 6 1.1 2.9 100,0 1957 4.5 7.9 16.5 23.4 23.9 15.0 3.9 1.0 0.4 0""5 1.0 2.0 100.0 1958

19.53-54
1955 1956 195? 1958
1953-54
1955 1956 1957 1958
1953-54
1955 1956 19:57 .. 1958
1953-54.
1955 1956 19:57 1 8
. ~ . . 1.4 1.4
1.4· 1.1 0.9 . 0.8 1.0 0 ~8 0.-8 1.0
7.2
8.8 6.0 7.5
2.4
2.6 2.9 4.3 3.3
3.5
3.8 )..;4 5.0
7.2
6.9 5.3 ·6.0
4.5
3.8 5.7 6.? 5.:5
6.6
5.6 6.7 7.7
. . •- . . 1.?
1.1 1 •. o 1.1 1.1
8.7
6.9 6.7 8.3
10.8
8.9 12)1 13.2 11; 0 7
15.9
1.}.0 14.6 1_5.2
. . . 2.3
-1.8 1.6 1.6 1.5
11.8
11.3 10.7 12.;0
. . .3.1
2.4 2.4 2.4 2.1
4~ Light Breeds • • .. millions •••
2.8 2._1
2.6 2.5 2.3
2.2 2.2 "J- •. 9
·Pereent of total
1.2
1.2 1.1 0 ._9
15"'8 14.3 10 • .a 6.2·
1_5.).; 16.o 18.0
16.5 16.6 17.3
13.8 14.7 14.3
7.5 7.3 6.8
. . 0.6
o.-4 0._4 o •. 2
5. Total of all "Turkey Poults - total of 3 an~ 4 • 0 • • - • ; ~illi~ns • • o • •
15.6 16.2 9.8 ).4 1~3 0.6
14.6 17_. 9 18.8 17.1
22.9
21.4 21.0 21.7
17.2 19.6 20.0 18.4
11 •. 6 4.3 13._5 . 5.3 13.2 4.8
Percent of total
1~5 1.8 1.6
23.9 14.4 5.0 •1.9
25.2 23.1 2}.0
17.0 15.9 15.2
6.3 6.2 5.5
2.2 2.1 1.8
0.5 0.7 0.6
0.9
0.7 0.8 0.7
0.5
O.J O.J 0.2
i.9 2.0 1.5
0.5
0.5 0.7 0.5
0.7
0.7 0.8 0.6
. . . 0.9
0.5 0.7 o.3
4.6
3 •. 1 4.7 2.3
1.0
0.9 1.5 1.0
1.5
1.3 1.8 1.2
1 • .5
0.9 1.1 o.6
1.9
1.9 J.l 2.1
2.8
2.8 3.6 2.4
19 . .5
15.9 1_5.0 13.3
100.0
100.0 100.0 100.0
o a o 0 Cl
68.0
68.3 85.1 86.8
100.0
100.0 100.0 100.0
Note~ 1. The seasonality of hatching of turkey poults is greater in the U. S. than it is in Minnesota. This is because Minnesota has a larger proportion of Heavy Whi.tes which can be marketed at light or heavier weights depending
2.
· on the market through the year;
In 1957 the percent
Bronze Heavy Whites
'11otal all Light
Total Heavy
of the different u. s. 66.5 18.2
(84. ?) 15o3
100.0
types of poults hatched in the U. S, and Minnesota was as follows: Minnesota 42.5 45.9
(88 .4) 11.6
100.0

XXXII. Variations in Monthly Hatching of Poults by Types of Turkeys Produced -Minnesota
Jan. . Feb., Mar. Apr. May June July =A=ug=·~~S=ePb __ ~O~c~t~.--~N=o~v~·---=D~ec~·~~T~o~tal
19.5.5 19.56 1957 1958
14o 19.5 121
165 443 514 44o
909 1,2.55 1~418 1~422
D 0 0 G 0
1,322 1 ,.526 1,700 lp706
1. Heavy Bronze o. • 0 0 • Thousands . •
1,203 1,226 1,338 1,452
34.5 'l:i 368 ~ 268 ~
Percent o'f total
. . . v ~ ~/
3,944 4,958 5,433
i~;~ 2~8 ~:~ ~;:~ ~6:~ ~~:~ ~:4 - - - - - j- i~~:~ 19.57 3.6 9 • .5 26 .. 1 31.3 24.6 4.Q - 100.0
_____1.2,28 __________________ ---------- --- ----~----- ------ --- -- ------·------- ----------------·-- ----!!1 .A small number of bronze "Wer>!l included vli th heavy whites.
19.55 1956 1957 19.58
1955 19.56. 19.57 -19 8
206 312 399 366
8.0 .5.7 6.8
230 298 3.50 521 401 470 443 575
9.0 . 6)J-
6.8
lL6 9.5 8.0
318 71.5 571 712
12.4 13.1
9 '7 • I
340 861 80Z 922
13.4 15.8 13.6
2. Hea.yy Whites • • Tho us and s •
303 . 21.5iit 741 5?4ii!l 800 545"'
Percent of total 11.8 8.4 13.6 10.5 13.7 9~4
9F'' JJli-510
• This is a total of all heavy breeds.,
19.53~.54 av. 19.5.5 19.56 19.57 19.58
19.53-.54 . -. 19.5.5 19.56 19.57 1 8
102 206 4.52 .594 487
318 - c 39.5
793 915 883
6.6 6.1 7~6 8.1
1,190 1~207 1,776 lp888 1p997
24.8 18.6. 17.0 16.7
3. All Heavy Breeds = Total~.l and 2 • • • • • • • Thousands •
1~.56.5 1.30.5 2.55 18 1.640 1,.543 648 21.5 91 28241 2.087 1.109 574 334 2.271 2,14o 1.068 .548 510 2.418 2.374
32.7 2.5 .1 2L6 20.0
27.3 23.7 20c0 18.9
Percent 5.3
10.0 10~6 9 • .5
of total o.4 3.3 .5 • .5 4.9
li-9 208 Z98
L9 3.8
49 208 298
0.8 2.0 2.6
70 164 276* h·llt!< 209 227
279 345 437"'
70 209 279
1.1 2.0 2.5
6,4· 4.2 5.9
oooooo 0
36 164 276 227 411 34.5 437
2.5 2.2 J.l
o.8 4.2 4.0 3.9
2.560 5.463 59860
4,789 6 • .504
10.421 111<293
100.0 100.0· 100.0 100.0
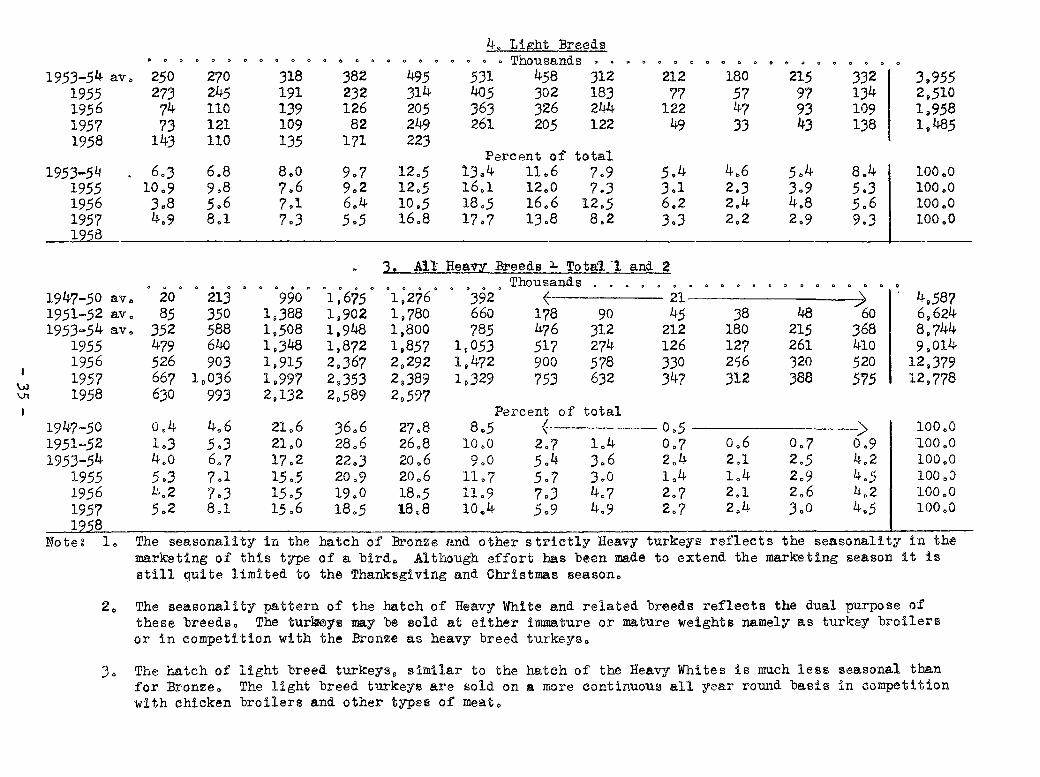
1953=54 av~ 1955 1956 1957 1958
1953-5ll 1955 1956 1957 19 8
1947-50 avo 1951-52 av. 19.53~.54 avo
195.5 19.56 19.57 19.58
1947~.50 19.51-.52 19.53=54
195.5 19.56 19.57 1958
250 273
74 73
143
6.3 10.,9 Jo8 4.9
20 8.5
3.52 479 .526 667 630
0.4 1.3 4.0 5.3 J.:,. 2 5.2
270 245 110 121 110
6.8 9.8 5.6 8.1
213 350 .588 640 903
1 9 036 993
4.6 5.3 6.7 ?.1 ?.3 8.1
000000000000
318 382 49.5 191 232 314 139 126 205 109 82 249 135 171 223
12.5 12.5 10.5 16.8
4. Light Breeds o • o Thousands .531 458 312 405 302 183 363 326 244 261 20.5 122
Percent of total 13.4 11.,6 7.9 16.1 12.0 7.3 18.5 16.6 12.5 17.7 13.8 8.2
212 77
122 49
o<~ooooooo
180 215 57 9? 4-7 93 33 43
332 134 109 138
8 .. 4 5.3 5.6 9.3
3.. All HeayY Breeds l. Tota1. ·1 and 2
990 1.388 1 0 508 la48 1~91.5 1$997 2 9 132
2lo6 21.0 17.2 15.5 15 • .5 1_5.6
.1:675 ~ 1p902 1,948 1,872 29367 2o353 29589
)6.6 28.6 22 • .3 20.9 19.0 18 • .5
\ ;2?6 • • lo780 1,800 1p857 29 292 2o389 2o.5??
27.8 26.8 20.6 20.,6 18.5 18~8
Thousands 0 0 0 0 .0
392 660 78.5
~------- 21--------~ 178 90 4.5 38 48 60 476 312 212 180 21.5 368
1 0 0.53 19472 1 0 329
.517 274 126 127 261 410 900 .578 330 2S6 320 520 753 632 347 312 388 5?5
Percent of total 8.5 \---------·---- o.s -------
10.0 2.( 1.4 0.7 9.0 5.4 3.6 2.4
11.7 5.7 J.O 1o4 11.9 7.3 4.7 2.7 10.4 )o9 4.9 2.?
o.6 2.1 1.4 2.1 2.4
0.7 2.5 2.9 2.6 ).0
-----> 0.9 4.2 4 . .5 4.2 4 • .5
399.5.5 29.510 1o958 19485
100.0 100.0 100.,0 100.0
49.587 69624 89744 9 9 014
12p379 12 9 778
100.0 1.00.0 100.0 100.,:) 100.0 100.0
Noteg L The seasonality in the batch of Bronze nnd other strictly Heavy turkeys reflects the seasonality in the marketing of this type of a bird. Although effort has been made to extend the marketing season it is still quite limited to the Thanksgiving and Christmas season.
2o The seasonality pattern of the hatch of Heavy White and related breeds reflects the dual purpose of these breedso The tur~ys may be sold at either immature or mature weights namely as turkey broilers or in competition with the Bronze as heavy breed turkeys.
). The hatch of light breed turkeys 9 similar to the hatch of the Heavy Whites is much less seasonal than for Bronzeo The light breed turkeys are sold on a more continuous all year round basis in competition with chicken broilers and other types of meat.

X)\XIII. 'r~ys Raised on Farms ---«-~- t ~\fest North East North North Southern I Yea.r Ivf..innesot.a United I Central Central Atlantic Region Western
States H.e ion Re ·ion Region a/ _Eegi.2!_1 --·· --·--· . 0 0 • & 0 & 0 n 0 • 0 • 0 Millions • • • • . 0 • . 0 • • • 0 • . . . 19.30--34 av. L7 20.6 5.5 1.5 0.9 8.1 4.6 19.35·-39 av. ':J ') ·-"- 2'7.0 8o2 2.2 1.6 8.1+ 6.6 1940-44 av. 3.1 33.2 10.3 3.0 2 ,, . .:. s.o 9.7 1945-/+ 9 av. 3.6 38o0 10.2 4.5 3.5 7.9 11.9 1950-54 av. 5.6 57.5 13.9 7.1 5.1 15.6 15.8
1955 8.0 65.6 17.4 9.0 5.1 17.6 16.5 1956 9.6 76.7 21.6 10.0 4.6 21.4 19.1 1957 9.9 81~2 22.5 11.0 3.9 22.7 21.1 1958
Percent of vl. N. ' Central 'i Percent of United States total Region ' 1930·-34 30.9 w 8c3 100o0 26.7 '7~3 4.4 39.3 22.3
1935-39 26.8 f 8.1 100.0 30.4 8.2 5.9 31.1 24.4 1940-44 30~1 'l 9.3 100.0 .31.0 9.1 6.6 24.1 29.2 1945-49 35.3 ? 9.5 100~0 26.9 11.8 9.2 20.8 31.3 1950-54 40~3 v 9.7 100.0 24~2 12.3 8.9 2?.1 27.5
~
1955 46.0 f 12.2 100.0 26.5 13.7 ?~8 26.8 25 .. 2 1956 44.4 f 12.5 100.0 28.2 13.0 6.0 2'7.9 2/+.9 1957 44.0 ' 12.2 100.0 27.7 13.5 4.8 28.0 26.0 1958 '
!d Includes South Atlantic and South Central Regions
:ITote: L The numbe:t• of turkeys raised in the United States has increased steadily since 19.30. The increase was shared by all regions but in varying degrees until 1955. Since then the North Atlantic Region has had a decrease.
•
1 J; '.:J
£;)
' ~ ~~ ~! ;~
:~'
'~] ,,
':~
:~ 1-", (.: ~ ,.,,
2. Minnesota is an important turkey state. During the last several years Minnesota turk, raisers have produced about 12 percent of the total number of turkeys in the ;! United States and over 40 percent of the total number of turkeys in the West North Central Regiono
~ 36-
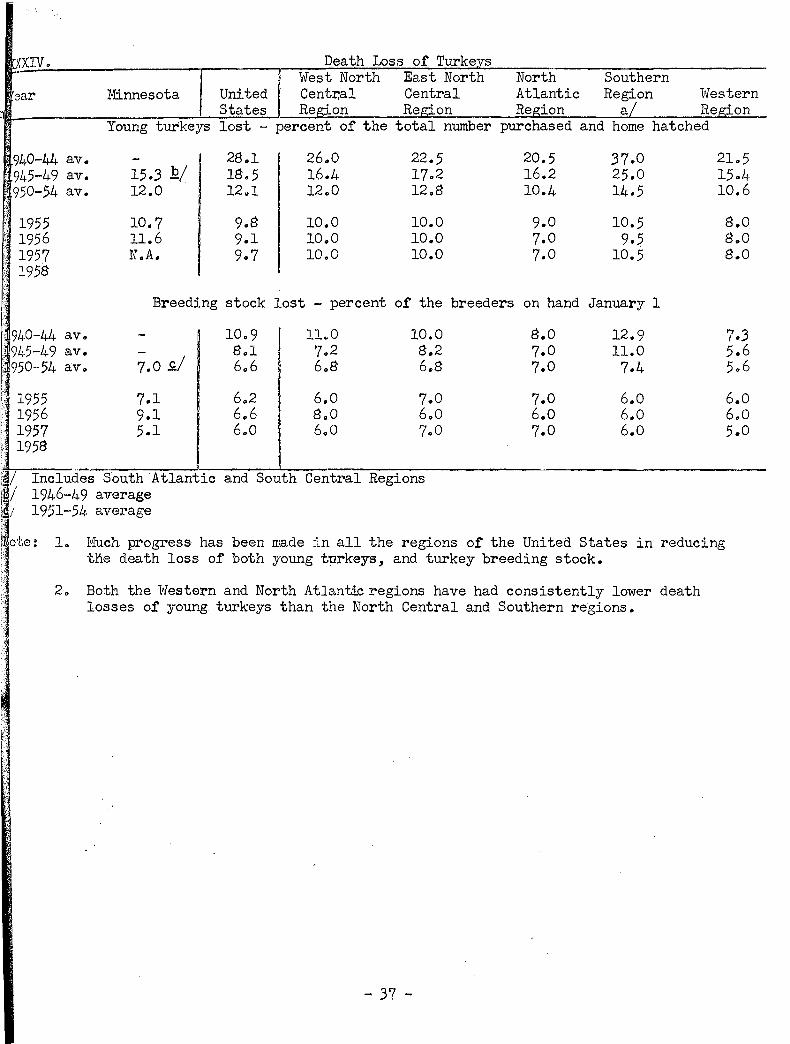
CJJ.D!. Death Loss of Turke~s West North East North North Southern
ear Minnesota United Centr.al Central Atlantic Region ~·[estern
n States Recion Region Region ~I Recion Young turkeys lost - percent of the total number purchased and horne hatched
940-44 av. 2S.l 26.0 22.5 20.5 37.0 21.5 1:945-49 av. 15.3 12/ 1S.5 16.4 17.2 16.2 25.0 15.4 ~ 950-54 av. 12.0 12 .. 1 12.0 12.S 10.4 14.5 10.6
1955 10.7 9.S 10.0 10.0 9.0 10.5 s.o 1956 11.6 9.1 10.0 10.0 7.0 9.5 8.0 1957 N.A. 9.7 10.0 10.0 7.0 10.5 s.o 195S
Breeding stock lost - percent of the breeders on hand January 1
··• 9/+0-44 a v. 10.9 lLO 10.0 s.o 12.9 7.3 j%5-49 av.
7.og./ 8.1 ?.2 S.2 7.0 11.0 5.6
·' 950-54 av. 6.6 6~S 6.S 7.0 7.4 5.6
1955 7.1 6.2 6.0 7 .. 0 7.0 6.0 6.0 1956 9.1 6.6 8.0 6.0 6.0 6.0 6.0
I~ 1957 5.1 6.0 6.0 ?.0 7.0 6.0 5.0 195S
'.•
f~Vrncludes South .Atlantic and South Central Regions l~·/ 1946-49 average ~ / 1951-5Lr. average L rl ote: lo Much progress has been rrade in all the regions of the United States in reducing
tl'l.e death loss of both young turkeys, and turkey breeding stock.
2. Both the 1;festern and North Atlantic regions have had consistently lower death losses of young turkeys than the North Central and Southern regions.
- 37 -

XXXV. Percent of the Turkey Crop Mc:Jrketed each Honth
Year Jan. Feb. Mar. Apr. May June July Aug. Sept. Oct. Nov. Dec. Total
Percent of total • • 0 ••
u. s.
1940-44 av. 194-5-49 av. 1950-54 av.*
2J.7 J1.6 47.7
40.7 J5.6 100.0 J8.4 JO,O 100.0 J1.1 21.2 100.0
1955 * J.l 1.2 1.6 2.5 2.2 1956 * J,O 0.7 0.7 1.4 1.6 1957 * 4.1 1.2 1.2 1.6 2.1 1958
1941-44 av. ---------------------- 6.9 1945-49 av. -------~-------------- 7.2 1950-54 av. ---------------------- 18.0
1955 J 2 4 5 5 1956 l l 2 2 4 1957 2 2 2 J 4
2.J J,4 6.6 2.2 J.7 8.0 J.2 4.7 8.J
Minnesota
----------------------------_,_ ___________
5 5 10 5 6 lJ 5 8 lJ
15.0 17.0 l6,J
11.0 lJ.2 15.4
14 18 18
22.5 2J.O 22.0
16.8 27.4 2J.8
18 21 21
24.7 14.9 100.0 2J.8 14.9 100.0 22.1 lJ.2 100.0
42.5 22.8 100.0 J5.6 16.6 100.0 29.4 lJ.4 100.0
19 10 100.0 18 9 100.0 16 6 100,0
* Based on hatchings with allow<'~nce for maturing and mc:trketin.-c: heavy poults in 6 months and light poults in 4 months. A 6 months allowance was made for all Heavy Whites.
Note: l. The figures for the monthly marketing of turkeys in the United States since 1954 are somewhat arbitra!"'J because the Heavy 1Alhi tes are included with the Bronze. As indicated in the footnote, the monthly marketings were based on the monthly hatches, allowing 6 months for maturing the Bronze and Heavy Whites and 4 months for maturing the Light breeds. Some of the Heavy Whites were no doubt marketed considerably before they were 6 months old.
2. The peak in marketing turkeys has shifted ahead during the last few years from November to October. This partly reflects the development in refrigeration facilities and in freezing. Turkey meat can now be stored for a longer period of time.
). The seasonality in marketing turkeys has been much greater in the United States in recent years than in Minnesota.
4. The marketing of turkeys in Minnesota is still highly seasonal, although it is much less seasonal than in the forties and early fifties. During the periods of 1941-44 and 1945-49 over 90 percent of the turkey crop was marketed during the four months period of September to December. During the period of 1950-54, it was 82.0 percent, During the period of 1955-57, it was 62.7 percent of the total.
- J8 -
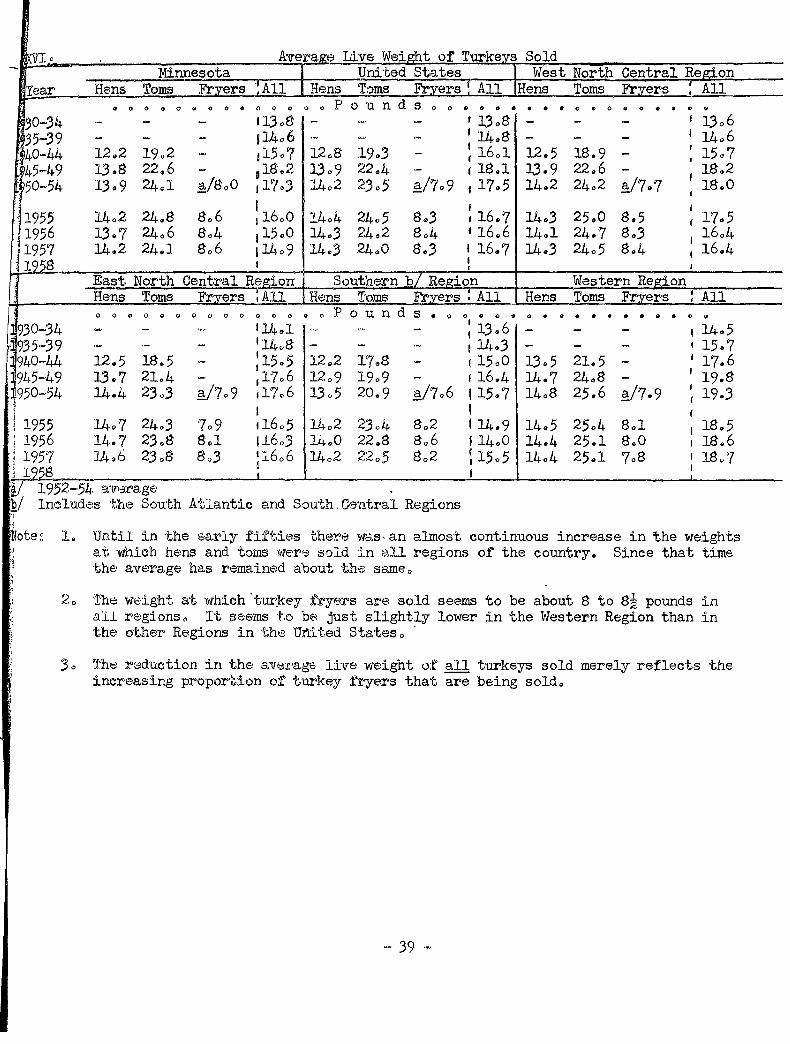
:NI o Average Live Weight of Turke:vs Sold -~.;:;..;.,_,....,._...:....----.:::Mi-.n-n_e_s-o7t_a __ _,:.:,, Uni:ted States West North Central Region
Year
~0-34 :~;5-39 ~40-44 ~P45-49 b50-54
1955 1956 1957 195S
Hens Toms Fryers · A 11 Hens Toms Fr:vers 1 All Hens Toms Fryers All " 0
0 0 0
12o2 19.2 13.8 22.6 13.,9 24ol
l4Q2 24.S 13.,7 24o6 14.2 24.1
".Pounds 0 0 • • • 0 CP 0 0 .. . .
East North Central Re_giorr Southex-n "Q/ Re,gion Western Re,gion Hens Toms Fr:vers • All Hens Toms Frxers : All Hens Toms Fr:vers ! All 0 0 ~ 0 Q Q 0 0 0 0 0 Q G 0 0 p 0 U n d S ~ 0 0 Q a e Q • <> 0 o 0 o 0 Q 0 0 0
930-34 - - ·- '14"1 ~ .u. - : 13 .. 6 - - - ' 14 .. 5 9)5·-39 ·- - - 114o8" - - - IJ.4o3 - - - I 15o7 940-44 12.5 1S.5 - :15 .. 5 12.,2 1'7 .. 8 - 115o0 13o5 21.5 - f 17.6 945-49 13~7 21o4 ~ ,17o6 12o9 19o9 - f 16.4 14.7 24o8 - I 19.8 950-54 14.4 23o3 ~/7o9 ,l7a6 l3o5 20.9 ~/7.6 I 15.7 14.S 25.6 a/7.9 ~ 19.3
J I I r J 1955 l4o7 24o3 7o9 116o5 J.4o2 2)o4 So2 I 14.9 l4o5 25o4 Sol I 1S.5 / 1956 14.7 23.8 Sol 116oJ 14.0 22.,8 So6 fl4o0 14.4 25.1 S.,O I 113.,6 J 1957 J.4o6 23o8 8o3 ~:i6o6 J..4o2 22o5 So2 : 15o5 14o4 25.,1 7oS I lS<.? I ~ a I
~4 a·111·:rrage 1
•
1
~/ Inc lud<21:s the South Atlantic and South. Central Regions l 1
·Note~ ,J
i 1 . '
l. Until in the early fifties ther8 Wds-an almost continuous increase in the weights at which hE:ms and toms wer'? sold in i'.l,ll regions of the country. Since that time ·~he average has remainc-'d about th6 same o
2 o Th~ wrc:ight at which · tur.key fryers a:rE~ sold seems to be about S to 13~ pounds in all regionso It seems to b8 just slightly lower in the Western Region than in the other Regions in tht: Utt:i ted States o ·
3 o ~ht~ l"<:lduction in the avt:>:t:'age live weight oi" all turkeys sold merely reflects the increasing propor·tion of turkey .fcyers that are being soldo
= 39 ~

XXXV ITo Farm Prices Received for Turkeys - United States Weight- Ind
Year Jan. Feb. Mar. Apr. May June July Aug. Sept. Oct. Nov. Dace; ed av- 193 erage = 1
Mid-month prices ~ cents per pound 193.5-39 17.7 17.2 17.0 16.7 1.5.9 1.5.1 1.5.0 14.8 1.5.8 16.6 17.6 17.9 17.4 100 1940-44 22.4 22.0 21.8 21.7 21.4 2Ll 21.2 21.8 22 •. 7 23.7 2.5.8 26.9 2.5.9 149 19lt.5-49 37.2 3.5~3 34.8 34.7 33.2 32.9 34.2 34.9 3.5.8 36.8 37.2 38.9 37.8 217 19.50-.54 34.1 33.9 33.8 33.3 31.7 32.0 31.8 32.4 32.6 32.1 33.3 34 • .5 33.2 191
19.5.5 27.4 29 • .5 30.4 29.7 28.9 29.4 29.6 29 • .5 31.0 31.2 29.8 30 • .5 30.2 174 19.56 30.6 31.0 31.3 30.8 30.6 29.1 28.6 28.3 26.7 .2.5. 9 2.5.9 27.8 27.2 1.5c 19.57 26.6 26.3 2.5 • .5 2.5.8 24.2 23.3 21.8 22.7 22.9 22.3 23 • .5 24 • .5 23.4 13~ 19.58 22.6 24.7 27.1 26 • .5 27.1 25~6
Index of monthly prices - weighted annual average = 100 193.5-39 102 99 98 96 91 87 86 8.5 91 9.5 . 101 103 100 1940-44 86 8.5 84 84 83 82 82 84 88 ~2 lbO 104 100 194.5-49 98 93 92 92 88 87 90 92 9.5 97 98 103 100 19.50-.54 103 102 102 100 9.5 96 96 98 98 97 90 92 100
19.5.5 91 98 101 98 96 97 98 98 103 103 99 101 100 19.56 102 114 11.5 113 113 107 10.5 104 98 9.5 9.5 102 100 19.57 19.58 .
114 108 110 110 103 100 93 97 98 95 100 10.5 100
Note: 1. Turkey prices were about twice as high in the late forties and early fifties .than in the pre World War II period 0 but in the last few years they have been only 1/3 to l/2 higher. . .
2. Like many other farm commodities the prices of turkeys are somewhat higher during the season of short supply. There are also some variations in the seasonal pattern of pri from one year to the next.
XXXItiilo Farm Prices Received for Tarkeys ~ Minnesota
Year Jan. Feb. Mar. Apr. May June July Aug. Sept. Oct. Nov. Dec~ Weighted average
Mid-month pr~ces - cents per pound
19.50-.54 3.5.4 3.5.0 33.8 3.5.2 31 • .5 32.2 32.0 33.4 33.1 31.2 31.8 33.6 32.3
19.5.5 28.0 29.0 30.0 27.0 28.0 29.0 29.0 29.0 32.0 32.0 26.0 29.0 29.0 19.56 30.0 29.0 31.0 29.0 30.0 28.0 27.0 28.0 2.5.0 2.5.0 2.5.0 27.0 26.2 19.57 24.0 23.0 24.0 24.0 23.0 22.0 21.0 22.0 22.0 21.0 23.0 24.0 22.2 19.58 24.0 26.0 30.0 26.0 28.0 27,0
Index of monthly prices = weighted annual average ~ 100 19.50-.54 110 108 10.5 109 98 100 99 103 102 97 98 104 100
19.5.5 96 99 103 92 96 99 99 99 110 110 89 99 100 .. 19.56 ll.5 lll 118 111 ll.5 107 103 i07 95 9.5 9.5 103 100 1957 108 104 108 108 104 99 9.5 99 99 9.5 104 108 100 19.58
Note: 1. Minnesota turkey prices are usually below the u.s. average during the heavy marketing season of October 0 November 0 and December. During this season a large proportion of the dressed turkeys are exported to other states. so that there are handling and tTah' portation costs involved 0 leaving a lower net price for the producer.
- 40 -


Related Documents