SAFETY ASSURANCE AND QUALITY ENHANCEMENT OF JUICES BY THE APPLICATION OF TRADITIONAL THERMAL TREATMENTS AND NONTHERMAL PROCESSES A Dissertation Presented to the Faculty of the Graduate School of Cornell University in Partial Fulfillment of the Requirement for the Degree of Doctor of Philosophy by Jessie Usaga Barrientos August 2014

Welcome message from author
This document is posted to help you gain knowledge. Please leave a comment to let me know what you think about it! Share it to your friends and learn new things together.
Transcript

SAFETY ASSURANCE AND QUALITY ENHANCEMENT OF JUICES BY THE
APPLICATION OF TRADITIONAL THERMAL TREATMENTS AND NONTHERMAL
PROCESSES
A Dissertation
Presented to the Faculty of the Graduate School
of Cornell University
in Partial Fulfillment of the Requirement for the Degree of
Doctor of Philosophy
by
Jessie Usaga Barrientos
August 2014

© 2014 Jessie Usaga Barrientos
SAFETY ASSURANCE AND QUALITY ENHANCEMENT OF JUICES BY THE
APPLICATION OF TRADITIONAL THERMAL TREATMENTS AND NONTHERMAL
PROCESSES
Jessie Usaga Barrientos, Ph.D.
Cornell University 2014
Outbreaks associated with the consumption of contaminated juices have stressed the
relevance of introducing a microbial killing step during processing of these products.
Nonetheless, some unanswered questions regarding the application of pasteurization
and nonthermal technologies, such as UV light, to ensure the safety of beverages with a
pH below 4.6 have been identified. Hence, this research project aimed to address some
of these existing gaps of information and therefore assist the food industry, regulatory
agencies and process authorities with the establishment of critical limits for the safe
thermal or UV processing of low-pH drinks. The thermal tolerance of E. coli O157:H7 in
apple-carrot juice blends, using different acids and at variable pH values was
determined. Then, the effect of different methodologies of acid adaptation and acid
shock on the thermal tolerance and survival of three Shiga toxin-producing E. coli
strains was assessed. Furthermore, the impact of the concentration of insoluble solids
and the darkening of juice after apple pressing, on the efficiency of UV treatments were
studied and, the influence of the addition of selected additives and preservatives on the
efficiency of the UV treatment of apple juice and the impact of UV radiation over those
compounds was additionally evaluated. This dissertation will provide the juice and
beverage industries with relevant information to meet some of the science-based rules
stated in current and new regulations, including the Food Safety Modernization Act.
iii
BIOGRAPHICAL SKETCH
A Costa Rican citizen, Jessie Usaga holds a BS degree in Food Technology from the
University of Costa Rica, where she has also carried out duties as assistant professor.
Jessie joined Cornell in 2011 thanks in part to a Fulbright-LASPAU scholarship and
partial funding from the University of Costa Rica, and as a graduate student, she held
Teaching (Product Development Course) and Extension (Northeast Center for Food
Entrepreneurship, Geneva NY) Assistantships. She also served as an officer of the
Student Association of the Geneva Experiment Station (SAGES). Jessie became
actively involved with the Institute of Food Technologists (IFT), representing Cornell
students at the Western New York Section (WNYIFT), and Latin American students at
the Nonthermal Processing Division (NPD).
Jessie presented seven posters at national conferences and won 2nd and 1st places in
the Graduate Research Paper Competitions (NPD) during IFT’s 2012 and 2013 Annual
Meetings. In 2013 she was selected finalist for the Developing Scientist Competition
organized by the International Association for Food Protection (IAFP). Jessie received
the WNYIFT Ph.D. Student Scholarship (2012), The Juice Products Association-Davis
Scholarship (2013), IFT Feeding Tomorrow Scholarship (2013), The Kosi Award in
Food Science (2014), and IAFP Student Travel Scholarship (2014). Jessie carried out
teaching, research and extension responsibilities at the University of Costa Rica and
upon completion of her Ph.D., she will resume her role as faculty member. She aspires
to promote food safety research initiatives and to continue supporting local food
companies by providing training and technical advice in food processing and safety.

iv
DEDICATION
In dedication to my best friend and favorite labmate and colleague, my husband Óscar,
who supported me even when this project was only a dream; and to my parents, the
most inspiring example of hard work and dedication and whose love, encouragement
and prayers accompanied me all the way through the end.

v
ACKNOWLEDGEMENTS
This work would not have been possible without the support, guidance and friendship of
my special committee. I would like to thank my major advisor Dr. Padilla-Zakour for this
enriching and rewarding academic and cultural experience. Her ability to provide the
right amount of structure yet allowing some flexibility and independence were
fundamental for this project. I am also appreciative for the opportunity to collaborate
with her at the Food Venture Center, experience that allowed me to develop a stronger
passion for extension and outreach activities. I also want to thank Dr. Worobo, a mentor
who has been an inspirational example due to his high-quality research and
involvement with the food industry. My experience in his laboratory will allow me to
accomplish many professional goals that I am pursuing in the field of food safety. I will
always be grateful for his support. I would also like to thank Dr. Moraru for serving as
my engineering minor advisor and for her kind guidance and advice. I want to thank as
well all the supportive people at NYSAES (Geneva, NY) who collaborated with this
project in many different ways: Tom Gibson, Herb Cooley, Elizabeth Sullivan, Dr. David
Manns, and current and past members of Dr. Padilla-Zakour’s and Dr. Worobo’s labs.
Special thanks to John Churey for sharing his knowledge and experience. His “tricks”
will facilitate my future professional endeavors. I would also like to acknowledge the
financial support of Fulbright-LASPAU and the University of Costa Rica (UCR) through
its Office of International Affairs and External Cooperation (OAICE), which allowed me
to complete my studies at Cornell. Finally, I want to thank my family and friends for their
love and encouragement and specially for helping me stay grounded and focused on
what really matters in life.

vi
TABLE OF CONTENTS
Biographical sketch………………………………………………………………………...…..iii
Dedication…………………………………………………………………………………….....iv
Acknowledgements……………………………………………………………………………..v
Table of contents………………………………………………………………………….……vi
List of figures…….……………………………………………………………………………..vii
List of tables…….……………………………………………………………………………....ix
List of abbreviations……………………………………………………………………………xi
1. Chapter 1: Introduction and Research Objectives…..………..……………………......1
2. Chapter 2: Thermal Resistance Parameters of Acid-Adapted and Unadapted E. coli
O157:H7 In Apple Carrot Juice Blends: Effect of Organic Acids and pH……………..9
3. Chapter 3: Effect of Acid Adaptation and Acid Shock on Thermal Tolerance and
Survival of Escherichia coli O157:H7 and O111 in Apple Juice……………………...34
4. Chapter 4: Time After Apple Pressing and Concentration of Insoluble Solids
Influence the Efficiency of the UV Treatment of Cloudy Apple Juice …...…………..63
5. Chapter 5: Effect of Ascorbic Acid and Selected Preservatives on the Efficiency of
Ultraviolet Treatment of Apple Juice at a Fixed UV Dose of 14 mJ·cm-2……..……..88
6. Chapter 6: Determination of the Validation Frequency for Commercial UV Juice-
Processing Units………………………………………………………………………....118
7. Chapter 7: Conclusions and Future Work………..…………………………………...136

vii
LIST OF FIGURES
Figure 1. Representative thermal death time curve for non-acid adapted E. coli O157:H7 C7927 in apple-carrot juice blend at 54°C, adjusted at three pH values by addition of acetic acid..……………………………………………………….……………….20 Figure 2. Representative thermal death time curves determined in apple juice (pH 3.6) at 56ºC for unadapted-control, acid-adapted, and acid-shocked (AS2) E. coli O157:H7 strain C7927………………………………………………………..…………………………..45 Figure 3. D-values of three E. coli strains at four physiological states, determined at 56ºC in apple juice (pH 3.6)..…………………………………………………………………46 Figure 4. D-values determined at 56ºC in apple juice (pH 3.6) of two E. coli O157:H7 strains subjected to acid shock (AS1) in TSB with a pH of 5, adjusted by the addition of hydrochloric, malic, and lactic acid………………………………………………………..…51 Figure 5. Survival curves for three E. coli strains at four physiological states: (A) unadapted-control, (B) acid-adapted, (C) acid-shocked (AS1), and (D) acid-shocked (AS2), determined in apple juice (pH 3.6) stored at room temperature (24 ± 2ºC)………………..…………………………………………….……………………….53 Figure 6. Survival curves for three E. coli strains at four physiological states: (A) unadapted-control, (B) acid-adapted, (C) acid-shocked (AS1), and (D) acid-shocked (AS2), determined in apple juice (pH 3.6) stored under refrigeration (1 ± 1ºC)…………………………………………………………………………..…………….54 Figure 7. Turbidity as a function of spin solids concentration in cloudy apple juice……74
Figure 8. Flow rate as a function of turbidity of model solutions with added apple solids with two different average particle diameters (895 µm and 199 µm), and treated at 7 mJ·cm-2 fixed UV dose……………………………………………………………………...78 Figure 9. Flow rate as a function of turbidity of model solutions with added apple solids with two different average particle diameters (895 µm and 199 µm), and treated at 7 mJ·cm-2 fixed UV dose……………………………………………………………………...80 Figure 10. Apparent absorption coefficient at 254 nm before and after UV treatment as a function of the concentrations of the selected additives……………………………….100

viii
Figure 11. Flow rate as a function of the concentration and the square root of the concentration of selected additives in apple juice, treated with a 14 mJ·cm-2 UV dose……………………………………………………………………………………………102 Figure 12. Effect of UV on the concentration of selected additives in apple juice……105 Figure 13. Representative HPLC chromatogram (260 nm) for apple juice containing potassium sorbate at 100 mg·kg-1 and treated at 14 mJ·cm-2 UV dose………………..108 Figure 14. Remaining concentration of potassium sorbate and the derivative UV product as a function of UV exposure……………….……………..……………………...109 Figure 15. Log reductions of E. coli ATCC 25922 in apple juice treated under fixed flow rate and fixed UV dose………………………………………………………………………110 Figure 16. Histogram of log reduction of E. coli ATCC 25922 in apple cider subjected to UV treatment at 14 mJ·cm–2 UV dose by using a commercial UV juice processing reactor, corresponding to validation trials (n=1200)………………………………………125

ix
LIST OF TABLES
Table 1. Total soluble solids content of samples used to determine the D and z-values of non-acid adapted E. coli O157:H7 C7927 in apple-carrot juice blend (average ± standard deviation for n = 3)………………………………………………………………….17 Table 2. D and z-values of non-acid adapted E. coli O157:H7 C7927 in apple-carrot juice blend (pH adjusted to 3.7 with malic acid) with three total soluble solids content (average ± standard deviation for n = 3)……………………………………………………18 Table 3. D and z-values of non-acid adapted E. coli O157:H7 C7927 in apple-carrot juice blend, acidified at three pH values with three organic acids (average ± standard deviation for n = 3)…………………………………………………………………………….19 Table 4. D and z-values of acid-adapted E. coli O157:H7 C7927 in apple-carrot juice blend, adjusted at four pH values with malic acid and NaOH (average ± standard deviation for n = 3)…………………………………………………………………………….24 Table 5. Initial counts in apple juice samples (pH 3.6) inoculated with E. coli O157:H7 strains C7927 and 43895, subjected to acid shock for (18 ± 2 h) in TSB acidified to pH 5 (AS1) by adding four different acids…………………………………………………………49 Table 6. Composition of the model solution used to assess the effects of concentration of SIS and SIS particle size…………………………………………………………………..68 Table 7. Physicochemical characterization of the liquid substrates used to evaluate the effect of SIS on the product flow rate and microbial inactivation of E. coli (mean ± standard deviations, n = 3)……………………………………………………………………76 Table 8. Physicochemical characterization of the apple solids used to evaluate the effect of SIS on the product flow rates and microbial inactivation of E. coli (mean ± standard deviations, n = 3)……………………………………………………………………76 Table 9. Average flow rates and log reductions of E. coli ATCC 25922 for low and high turbidity apple juices treated with UV (mean ± standard deviations, n = 3).…………….77 Table 10. Physicochemical characterization of the apple juices used to evaluate the effect of time after apple pressing on the flow rate and microbial inactivation of E. coli (mean ± standard deviations, n = 3)…………………………………………………………81
x
Table 11. Physicochemical characterization of reconstituted apple juices before the addition of additives (mean ± standard deviation, n = 3)……………………………….…81 Table 12. Apple juice color parameters in samples containing increasing concentrations of free sulfur dioxide before UV radiation at 14 mJ·cm-2 UV dose (mean ± standard deviation, n = 3)………………………………………………………………………………103 Table 13. Parameters estimates of the fixed effects included in the mixed-effects model used to analyze the initial validations of the quartz tubes with log reduction of E. coli ATCC 25922 as response…………………………………………………………………..126 Table 14. Variance components of the random effects included in the mixed-effects model used to analyze the initial validations of the quartz tubes with log reduction of E. coli ATCC 25922 as response…………………..………………………………………127 Table 15. Parameters estimates of the fixed effects included in the random coefficient model used to analyze the revalidations of the quartz tubes with log reduction of E. coli ATCC 25922 as response…………………………………………………………………..128 Table 16. Variance components of the random effects included in the random coefficient model used to analyze the revalidations of the quartz tubes with log reduction of E. coli ATCC 25922 as response………………………………………………………..129

xi
LIST OF ABBREVIATIONS
ANOVA: Analysis of variance
AS: Acid shock
ATCC: American Type Culture Collection
BPD: Butterfield’s buffer phosphate diluent
CFU: Colony forming unit
DHA: Dehydroascorbic acid
DTT: Dithiothreitol
FDA: U.S. Food and Drug Administration
FSMA: Food Safety Modernization Act
MPA: Metaphosphoric acid
HACCP: Hazard analysis and critical control points
HPLC: High performance liquid chromatography
NTU: Nephelometric turbidity units
RSIN: Reflectance-specular included
SIS: Suspended insoluble solids
TSA: Trypticase soy agar
TSB: Trypticase soy broth
US: United States
UV: Ultraviolet

1
CHAPTER 1
INTRODUCTION AND RESEARCH OBJECTIVES
Globally, the commercialization of juice-based beverages signifies an important source
of revenue for the food industry. In 2013, juices and juice drinks represented $15.5
billion of US sales and, in the past 5 years, the developing markets of Asia-Pacific and
Latin America have shown strong growth rates for these products (16). Furthermore, in
2013, juice innovation soared by 30% worldwide, led by efforts in Europe, and France in
particular (16). Unfortunately, outbreaks due to the consumption of contaminated and
unpasteurized juices have occurred in the United States and around the world (5). This
situation has prompted the establishment of more strict regulations to ensure the safe
and sanitary processing of these products (23).
In 1979, when the federal regulations governing acidified foods (21 Code of Federal
Regulations [CFR] part 114) were established in the United States, vegetative
pathogenic microorganisms were not considered a significant biological risk for acid and
acidified food products. Therefore, this regulation was primarily designed to prevent the
spore outgrowth and toxin production of Clostridium botulinum, which does not occur if
the pH is maintained at or below 4.6 (2). However, recent outbreaks involving the
consumption of acid and acidified food products (including some juices) contaminated
with foodborne pathogens such as Salmonella and Shiga toxin-producing Escherichia
coli, have stressed the importance of establishing a microbial killing step during
processing of these products. Moreover, studies have demonstrated that even though
these pathogenic microorganisms may not grow in acid and acidified products due to

2
the low pH (2), a gradual exposure of certain pathogens, for example E. coli O157:H7,
to moderate acidic environments may enhance their thermal tolerance and survival
ability when present in low-pH products (9, 13, 15, 18, 20, 21), which is the case of most
of fruit juices.
To prevent further outbreaks due to contaminated juices, the U.S. Food and Drug
Administration has established that processors must ensure a minimum of 5-log
reduction of the pertinent pathogen likely to occur in the product (FDA, 2001). This
reduction is achievable by the application of unit operations that have been specifically
designed and validated to kill disease-causing microorganisms. For example: a)
traditional heat treatments including pasteurization and sterilization, b) nonthermal
technologies such as ultraviolet (UV) light and high pressure processing or c) a
combination of both, thermal and nonthermal technologies. Nowadays, the thermal
treatments remain as an effective, recognized and the most commonly used approach
to prevent food safety issues (6, 14). However, little is known about the minimal
pasteurization regime (heating temperatures and processing times) required to
guarantee the safety of non-shelf stable liquid food products with a pH below or equal to
4.6 and commercialized under refrigerated conditions. Consequently, for some
beverages with these characteristics, the juice industry has been using overestimated
heat treatments that may have a negative effect on the quality and nutritional properties
of the products. Additionally, only a few studies have been published regarding the
thermal tolerance of enterohemorrhagic E. coli in acidic juices and similar liquid food
products such as sauces and dressings with a wide range of low pH values adjusted by
adding different acidulants. Likewise, information regarding the appropriate

3
methodology to conduct challenge microbiological studies in this type of products is
limited. Thus, the elucidation of this information is important not only for the juice and
beverages industries but also for regulatory agencies and process authorities.
Regarding the application of heat treatments, the major disadvantage of this traditional
approach is that, as previous research studies have shown, some adverse effects in
color, flavor, and nutritional content of juices may occur due to heat exposure (7, 17).
Changes in the quality of beverages represent a challenge for the food industry,
especially considering the increased consumer demand for more fresh-like products
with enhanced nutritional properties. Thus, the application of nonthermal affordable
treatments such as UV light has attracted the interest of the juice industry, especially for
small and medium sized juice producers in the United States. Since 2000, the FDA has
recognized UV light as a nonthermal-processing alternative to pasteurization (24). This
low-cost technology (4, 10) has been proven effective against pathogens (1, 8, 19), and
has been associated with limited changes in quality parameters (3, 22). However, its
application is restricted because, as reported in the literature, the colored compounds
and insoluble solids present in some juices may absorb UV light and therefore reduce
the antimicrobial capacity of the technology (11, 12). Worth noting, most of the research
that has been previously performed to address the effect of the concentration of solids
and colored compounds on the efficiency of the technology was executed using a
laboratory scale UV machine that operates under a laminar flow regime. Thus,
considering that the FDA has stated on the regulations that turbulent flow rate must be
ensured for the UV treatment of juices, it becomes relevant to evaluate these effects
while ensuring the recommended processing conditions.

4
This research project aims to address some of the mentioned unanswered questions
and existing gaps in the literature regarding the application of thermal pasteurization
and UV light treatments of low-pH juices. The goal of the study is to provide the juice
and beverage industries with relevant information to meet the science-based rules
stated on current and new regulations including the FDA Food Safety Modernization Act
(FSMA) and the Acidified Foods Draft Guidance (25). Hence, the following objectives
have been established:
Objective 1: Determine the effect of varying the pH of an apple-carrot juice blend, by
adding different organic acidulants, on the thermal tolerance parameters
of acid adapted and unadapted E. coli O157:H7 ATCC C7927.
Objective 2: Evaluate the effect of acid adaptation and acid shock on the thermal
tolerance and survival of E. coli O157:H7 (strains C7927 and ATCC
43895) and E. coli O111 in apple juice.
Objective 3: Determine the effects of the concentration of suspended insoluble solids
and time after apple pressing on the efficiency of UV treatment of cloudy
apple juice.
Objective 4: Assess the effect of the addition of ascorbic acid and selected
preservatives on the efficiency of the UV treatment of apple juice, and the
effect of the UV exposure over those compounds.
Objective 5: Determine the appropriate frequency of revalidation for a commercial UV
processing unit.

5
REFERENCES
1. Basaran N., A. Quintero-Ramos, M. M. Moake, J. J. Churey, and R. W. Worobo.
2004. Influence of apple cultivars on inactivation of different strains of Escherichia
coli O157:H7 in apple cider by UV irradiation. Appl. Environ. Microbiol. 70:6061-5.
2. Breidt, F., J. S. Hayes, J. A. Osborne, and R. F. McFeeters. 2005. Determination of
5-log pathogen reduction times for heat-processed, acidified vegetable brines.
J. Food Prot. 68:305-10.
3. Caminiti I. M., F. Noci, A. Munoz, P. Whyte, D. J. Morgan, D. A. Cronin, and J. G.
Lyng. 2011. Impact of selected combinations of non-thermal processing
technologies on the quality of an apple and cranberry juice blend. Food Chem.
124:1387-92.
4. Choi L., and S. Nielsen. 2005. The effects of thermal and nonthermal processing
methods on apple cider quality and consumer acceptability. J Food Qual. 28:13-29.
5. Danyluk M. D., R. M. Goodrich-Schneider, K. R. Schneider, L. J. Harris, and R. W.
Worobo. 2012. Outbreaks of Foodborne Disease Associated with Fruit and
Vegetable Juices, 1922-2010. Available at:
http://edis.ifas.ufl.edu/pdffiles/FS/FS18800.pdf. Accessed May 30, 2014.
6. Gabriel A. 2012. Influences of heating temperature, pH, and soluble solids on the
decimal reduction times of acid-adapted and non-adapted Escherichia coli O157:H7
(HCIPH 96055) in a defined liquid heating medium. Int. J Food Microbiol. 160:50-7.
7. Gabriel A. A., and H Nakano. 2009. Inactivation of Salmonella, E. coli and Listeria
monocytogenes in phosphate-buffered saline and apple juice by ultraviolet and heat
treatments. Food Control 20:443-6.

6
8. Hanes D. E., R. W. Worobo, P. A. Orlandi, D. H. Burr, M. D. Miliotis, M. G. Robl, J.
W. Bier, M. J. Arrowood, J. J. Churey and G. J. Jackson GJ. 2002. Inactivation of
Crytosporidium parvum oocysts in fresh apple cider using ultraviolet irradiation. Appl.
Environ. Microbiol. 68:4168-72.
9. Hsin-Yi, C., and C. C. Chou. 2001. Acid adaptation and temperature effect on the
survival of E. coli O157:H7 in acidic fruit juice and lactic fermented milk product.
Intern. J. Food Microbiol. 70:189-95.
10. Keyser M., I. A. Muller, F. P. Cilliers, W. Nel, and P. A. Gouws. 2008. Ultraviolet
radiation as a non-thermal treatment for the inactivation of microorganisms in fruit
juice. Innov. Food Sci. Emerg. Tech. 9:348-54.
11. Koutchma T. 2009. Advances in ultraviolet light technology for non-thermal
processing of liquid foods. Food Bioprocess Tech. 2:138-55.
12. Koutchma T, and B. Parisi. 2004. Biodosimetry of Escherichia coli UV inactivation in
model juices with regard to dose distribution in annular UV reactors. J Food Sci.
69:14-22.
13. Leyer, G. J., L. L. Wang, and E. A. Johnson. 1995. Acid adaptation of Escherichia
coli O157:H7 increases survival in acidic foods. Appl. Environ. Microbiol. 61:3752-5.
14. Lu, G., C. L. Li, P. Liu, H. B. Cui, Y. Xia, and J. F. Wang. 2010. Inactivation of
microorganisms in apple juice using an ultraviolet silica-fiber optical device. J
Photochem. Photobiol. B: Biol. 100:167-72.
15. Mazzota, A. S. 2001. Thermal inactivation of stationary-phase and acid-adapted
Escherichia coli O157:H7, Salmonella, and Listeria monocytogenes in fruit juices. J.
Food Prot. 64:315-20.

7
16. Mintel. 2014. Category Insight: Juice Drinks. London: UK. Available from:
http://www.gnpd.com/. Accessed May 30, 2014.
17. Oteiza J. M., L. Giannuzzi, and N. Zaritzky. 2010. Ultraviolet treatment of orange
juice to inactivate E. coli O157:H7 as affected by native microflora. Food Bioprocess.
Tech. 3:603-14.
18. Park, S. S., R. W. Worobo, and R. A. Durst. 2001. Escherichia coli O157:H7 as an
emerging foodborne pathogen: A literature review. Crit. Rev. Biotech. 21:27-48.
19. Quintero-Ramos A, J. J. Churey, P. Hartman, J. Barnard, and R. W. Worobo. 2004.
Modeling of Escherichia coli inactivation by UV irradiation at different pH values in
apple cider. J Food Prot. 67:1153-6.
20. Ryu, J. H., and L. R. Beuchat. 1998. Influence of acid tolerance responses on
survival, growth, and thermal cross-protection of Escherichia coli O157:H7 in
acidified media and fruit juices. Intern. J. Food Microbiol. 45:185-93.
21. Ryu, J. H., Y. Deng, and L. R. Beuchat. 1999. Behavior of acid-adapted and
unadapted Escherichia coli O157:H7 when exposed to reduced pH achieved with
various organic acids. J. Food Prot. 62:451-55.
22. Tran M. T. T., and M. Farid. 2004. Ultraviolet treatment of orange juice. Innov. Food
Sci. Emerg. Tech. 5:495-502.
23. U.S. Food and Drug Administration. 2001. Hazard Analysis and Critical Control
Points (HACCP): procedures for the safe and sanitary processing and importing of
juice. Federal Register 66:6137-202.
24. U.S. Food And Drug Administration (FDA). 2013a. Code of Federal Regulation
(CFR). Tittle 21. Chapter I. Subchapter B. Part 179. Section 179.39. Ultraviolet

8
radiation for the processing and treatment of food. Available at
http://www.accessdata.fda.gov/scripts/cdrh/cfdocs/cfcfr/CFRSearch.cfm?fr=179.39.
Accessed May 30, 2014.
25. U.S. Food and Drug Administration (FDA). 2013b. Overview of the FSMA proposed
rules on produce safety standards and preventive controls for human food. Available
at: http://www.fda.gov/Food/GuidanceRegulation/FSMA/ucm334120.htm. Accessed
May 30, 2013.

1Journal of Food Protection. 2014, 77(4): 567–573
9
CHAPTER 2
THERMAL RESISTANCE PARAMETERS OF ACID-ADAPTED AND UNADAPTED
ESCHERICHIA COLI O157:H7 IN APPLE CARROT JUICE BLENDS: EFFECT OF
ORGANIC ACIDS AND PH1
ABSTRACT
Numerous outbreaks involving fresh juices contaminated with Escherichia coli O157:H7
have occurred in the US and around the world, raising the concern for the safety of
these products. Until now only a few studies regarding the thermal tolerance of this
pathogen in acidic juices over a wide range of pH values have been published.
Therefore, the effect of varying the pH with different organic acids on the thermal
inactivation of non-acid adapted and acid-adapted E. coli O157:H7 (strain C7927) was
determined. The decimal reduction times (D-values) and the change in temperature
required for the thermal destruction curve to traverse one log cycle (z-values) were
calculated for non-acid adapted E. coli in an apple-carrot juice blend (80:20) adjusted to
three pH values (3.3, 3.5, and 3.7) by addition of lactic, malic, or acetic acid, and at a
pH of 4.5 adjusted with NaOH. Thermal parameters were also determined for acid-
adapted cells in juices acidified with malic acid. The effect of soluble solids content on
the thermal tolerance was studied in samples with a pH of 3.7 at 9.4 to 11.5°Brix. The
D-values were determined at 54, 56, and 58°C, and trials were conducted in triplicate.
Non-acid-adapted E. coli exhibited the highest thermal tolerance at pH 4.5 (D-value at
54°C [D54°C] of 20 ± 4 min and z-value of 6.2°C), although on average the D-values
increased significantly (P < 0.01) due to acid adaptation. In acidified juices, the highest
tolerance was observed in acid-adapted E. coli in samples adjusted to pH 3.7 with malic

10
acid (D54°C of 9 ± 2 min and z-value of 5.4°C), and the lowest in unadapted E. coli at pH
3.3 acidified with acetic acid (D58°C of 0.03 ± 0.01 min and z-value of 10.4°C). For juices
acidified to the same endpoint pH with different acids, E. coli was found more tolerant in
samples acidified with malic acid, followed by lactic, and acetic. Increasing the soluble
solids content from 9.4 to 11.5°Brix showed no significant effect on the thermal
tolerance of E. coli (P > 0.01). Data from this study will be useful for establishing critical
limits for safe thermal processing of pH controlled juices and similar products.
INTRODUCTION
Outbreaks involving the consumption of unpasteurized acidic juices such as apple juice
and cider contaminated with enterohemorrhagic Escherichia coli O157:H7 have been
reported (11). Consequently, juice safety represents a public health concern and has
prompted the establishment of regulations to ensure a safe and sanitary processing of
these products (35). The U.S. Food and Drug Administration has established that juice
processors must ensure a minimum of 5-log reduction of the most resistant pathogen
likely to occur in the product (35). Traditional thermal treatments remain an effective,
recognized and commonly used approach for fulfilling this requirement (16, 25).
However, thermal pasteurization is not sufficient for destroying heat resistant spores
and therefore, acidification has been commonly applied by the food industry as a pre-
treatment to pasteurization to inhibit spore germination and to allow milder time and
temperature conditions during heat treatments (12, 15).
Previous research has shown that the ability of E. coli O157:H7 to survive in acidified
food products is of concern because the resistance of this foodborne pathogen to

11
environmental stress increases when the microorganism is gradually exposed to
moderately acidic environments (18, 22). This represents a further challenge when a
safe thermal process needs to be established for pH-controlled products, including
acidic and acidified beverages.
Juices’ intrinsic and extrinsic properties, including the pH and organic acid composition,
soluble solids content, addition of preservatives and other ingredients with antimicrobial
properties, represent some of the variables that may play a predominant role in the heat
tolerance and survival response of E. coli O157:H7 (13, 28, 31, 34, 37). Limited studies
exist on the impact of varying pH and using organic acidulants on the heat resistance of
E. coli O157:H7 strains (particularly strains isolated from acid-juice-associated
outbreaks).
Prior to this study, Hsiao and Siebert (17) postulated a mathematical model to predict
the inhibitory effect of organic acids on bacterial growth. Their model was established
using non-pathogenic surrogates, including E. coli ATCC 25922, and its validation for
pathogenic strains has not been executed yet. Gabriel (16) also published a
comprehensive study that evaluated the influences of various combinations of process
and product parameters including heating temperature (53 to 62°C), pH (2.0 to 7.0) and
soluble solids content (1.4 to 69°Brix), on the thermal inactivation of non-acid-adapted
and acid-adapted E. coli O157:H7 (HCIPH 96055) in a liquid heating medium. A robust
model was developed and its validation was further performed using different fruit
juices. Nonetheless, since previous studies have revealed significant differences in the
heat tolerance among E. coli O157:H7 strains (14, 25, 33) as well as variations on the

12
survival response in acidic environments even within a single serotype (4), the use of
the suggested model might be limited for certain strains. Moreover, the validation of this
model using other enterohemorrhagic E. coli strains isolated from acid and acidified
food products should be performed.
The objective of this study was to evaluate the effect of pH variation by the addition of
different organic acidulants commonly used by the beverage industry on the thermal
inactivation of acid-adapted and unadapted E. coli O157:H7 (strain C7927) in an apple-
carrot juice blend, representing a turbid fruit juice blend with added nutrients and
suspended insoluble solids due to the 20% carrot juice formulation. Both apple and
carrot juices have been implicated in foodborne outbreaks (2, 6, 30).
MATERIALS AND METHODS
Juice blend extraction. An 80% apple and 20% carrot juice blend was prepared using
carrots purchased from a local supermarket and stock apples from controlled
atmosphere (8 to 12 months) storage at the New York State Agricultural Experiment
Station (Geneva, NY). Due to storage time, visually sound apples were hand-selected
from apples exhibiting mold and/or rot. Fruits and roots were hand washed in cold water
to remove visible soil and carrot top remnants. Unpeeled apples and carrots were
passed through a commercial food processor (Robot Coupe USA. Inc., Ridgeland, MS),
and pressed in a hydraulic rack-and-frame press (Loomis Engineering & MFG
Company, Caldwell, NJ) for juice extraction. The resulting juice blend was not sterilized
prior to inoculation to prevent heat precipitation of carrot solids and to represent the

13
microbial load of a fresh-pressed juice. To prevent fermentation, juice was stored at
-23°C until used.
Physicochemical characterization. pH was measured using a Thermo Scientific Orion
2 Star pH meter (Thermo Fisher Scientific, Beverly, MA). The soluble solids content
were estimated with a Leica Auto Abbe refractometer model 10500-802 (Leica Inc.,
Buffalo, NY). Total titratable acidity was determined using a G20 compact titrator
(Mettler Toledo, Schwerzenbach, Switzerland), and turbidity measurements were
performed with a HACH 2100P portable turbidimeter (Hach Company, Loveland, CO).
All physicochemical analyses were performed in triplicate.
Bacterial strains and media. A single isolated colony of E. coli O157:H7 (strain
C7927), obtained from the Food Microbiology Laboratory at the New York State
Agricultural Experiment Station (Geneva, NY) and originally isolated from a patient who
had consumed contaminated apple cider associated with an outbreak (34), was
transferred into 10 ml of Trypticase soy broth (TSB) (Difco, Becton Dickinson, Sparks,
MD) and incubated for 20 ± 2 h at 35 ± 2°C (to stationary-phase) on an Innova 2300
rotatory platform shaker (New Brunswick Scientific Co., Edison, NJ) at 250 rpm.
Acid-adaptation was conducted according to the protocol stated by Enache et al. (14),
where a loopful of stationary-phase E. coli was transferred to Trypticase soy broth (pH
adjusted at 5.0 with 1 N HCl) and incubated overnight (20 ± 2 h) at 35 ± 2°C. After
incubation, 1 ml of the culture was centrifuged and the pellet was resuspended in
refrigerated 0.1 M citrate buffer (pH 4.0) and stored at 4 ± 1°C for 18 h before use.

14
Heat tolerance determination. Thermal resistance parameters of E. coli O157:H7,
specifically decimal reduction times (D-values) and the increment in temperature
required to decrease the D-value in one log cycle (z-values), were determined following
the methodology reported by Splittstoesser et al. (34) with the exception that samples
were enumerated using the pour plate technique on Trypticase soy agar (TSA) (Difco,
BD) instead of plate count agar, and colonies were counted after 20 ± 2 h of incubation
at 35 ± 2°C, instead of 4 incubation days at 37°C. Amounts of 9 ml of the apple-carrot
juice blend were dispensed aseptically in a sterile centrifuged tube and inoculated with
1 ml of the E. coli O157:H7 culture resulting in an initial population of 107-108 CFU·ml-1.
Amounts of 20 µl of inoculated juice were injected into five replicate glass melting point
capillary tubes (1.5 to 1.8 by 100 mm; Kimble Chase, Vineland, NJ) using a 1 ml syringe
equipped with a repeater dispenser (Hamilton Co., Reno, NV). The capillary tubes were
flame sealed and immediately submerged in water test tubes contained in a stirred
water bath at temperatures and times selected to obtain thermal death time curves with
at least five sampling points, extended for over 4-log reductions, and showing a
coefficient of determination (r2) greater than 0.9. The range of time intervals differed
depending on the tested temperature, pH of samples, and acid-adaptation of the
culture. Nonheated controls were included, which corresponds to time zero in the
thermal death curves. After thermal treatment, capillaries were rapidly cooled in an ice
bath and then submerged in test tubes containing 70% cold ethanol to decontaminate
the exterior of the capillary tubes. The five capillaries were removed from the ethanol
solution, blotted to remove excess ethanol, and then transferred into a milk dilution
bottle containing 20 ml of 0.1% sterile peptone water, and crushed with a sterile glass
rod. Appropriate serial dilutions in sterile 0.1% peptone water were aseptically plated by

15
duplicate in petri dishes where 20 ml of TSA was pour plated and mixed thoroughly.
After agar solidification, petri dishes were incubated and colonies counted after 20 ± 2 h
of incubation at 35 ± 2°C. The D-values were calculated as the inverse negative value
of the slope obtained from plotting the log number of survivors against the sampling
time. The z-values were defined as the negative inverse slope of the linear regression
line for the log of the calculated D-values over the range of tested temperatures (54, 56
and 58°C).
Influence of pH, organic acid and soluble solids content on thermal tolerance. The
D-values for non-acid-adapted stationary-phase E. coli were determined in the model
apple-carrot juice blend following a complete factorial design, with three levels for
temperature (54, 56 and 58°C), three acids (malic, acetic, and lactic) and three pH
values (3.3, 3.5, and 3.7). The acids were purchased from Fisher Scientific (Fair Lawn,
NJ). The z-values were calculated accordingly. Heat inactivation tests were also carried
out in a juice sample with a pH of 4.5 adjusted by addition of 1 N NaOH. Thermal
resistance parameters were determined following the methodology indicated in “Heat
tolerance determination” above. The soluble solids content of all samples were
determined.
To examine whether the concentration of soluble solids had a significant influence on
the heat tolerance of the strain studied, heat inactivation tests were carried out for non-
acid-adapted E. coli in a juice sample with a pH of 3.7 adjusted by the addition of malic
acid at different concentrations. Thermal parameters were determined following a
factorial design with three levels for temperature (54, 56 and 58°C) and three levels for

16
ºBrix (11.5, 10.7, and 9.4). The pH and organic acid selected for this subsection of the
study correspond to the conditions that were expected to show the highest D-values on
the full factorial design proposed to asses the effect of pH and the acidulant on the heat
tolerance of this microorganism. All D-values were determined from three independent
experiments and z-values were calculated accordingly.
Influence of acid adaptation on thermal tolerance. Samples of the apple-carrot juice
blend were adjusted to pH of 3.7, 3.5, and 3.3 by the addition of malic acid at different
concentrations, and to pH of 4.5 with a solution of 1 N NaOH. Juices were inoculated
with acid-adapted E. coli O157:H7 C7927 and decimal reduction times were determined
from three independent experiments at 54, 56 and 58°C. z-values were additionally
calculated. D and z-values were determined following the methodology indicated in
“Heat tolerance determination” above.
To compare the heat tolerance (in terms of D-value) of non-acid-adapted and acid-
adapted E. coli, a factorial design with three levels for temperature (54, 56 and 58°C),
four levels for pH (3.7, 3.5, 3.3 and 4.5) and two levels for cell status (acid-adapted and
unadapted) was followed.
Statistical analyses. Two- and three-way analyses of variance (ANOVA) and Tukey’s
honestly significant difference (HSD) test for means comparison were performed using
JMP® version 10 (SAS Institute Inc., Cary, NC). Differences were considered significant
at P value of < 0.01.

17
RESULTS AND DISCUSSION
The model juice had a pH of 4.1, total soluble solids content of 12.2°Brix, total titratable
acidity of 0.33% (grams of malic acid per 100 grams of juice), and a turbidity value of
2230 nephelometric turbidity units, representing a turbid fruit-vegetable juice blend.
Influence of soluble solids content on thermal tolerance. As a result of pH
adjustment, the samples used to study the effect of varying pH by adding one of three
organic acids (malic, lactic and acetic) on the thermal tolerance of E. coli O157:H7
C7927 ranged between 9.05 and 12°Brix in the concentration of soluble solids. The
average values for total soluble solids content are given in Table 1.
Table 1. Total soluble solids content of samples used to determine the D and z values
of non-acid-adapted E. coli O157:H7 C7927 in apple-carrot juice blend.a
pH Total soluble solids content (°Brix)
Lactic acid Malic acid Acetic acid
3.7 9.07 ± 0.02 11 ± 2 10.7 ± 0.3
3.5 10.6 ± 0.3 10.5 ± 0.2 11 ± 1
3.3 10.6 ± 0.1 10.9 ± 0.3 11.6 ± 0.4 a Values are the average ± standard deviation (n = 3).
To examine whether the reported variation of soluble solids content had a significant
effect on the D-values of E. coli, the thermal parameters were determined in the apple-
carrot juice blend with a pH of 3.7 adjusted by the addition of malic acid. The D and z
values obtained are summarized in Table 2. After a natural log transformation of the D-
values, two-way ANOVA showed a nonsignificant interaction of temperature and soluble
solids content (P = 0.74). After removing the interaction term, an expected significant

18
effect of temperature on the D-values was observed (P < 0.0001), but soluble solids (in
the tested range) were shown not to have a significant effect on the D-values (P >
0.064). The resulting model presented a coefficient of determination (r2) of 84%. The
influence of temperature on D-values has been extensively reported in the literature and
is based on the alteration of microbial cell structures and denaturation of metabolic
enzymes that adversely affect several biological processes, leading to cell death (16,
19). The nonsignificant effect of soluble solids on thermal tolerance of this foodborne
pathogen has also been previously reported in similar food products and over the range
of soluble solids studied in this investigation. Sharma et al. (33) for example,
demonstrated a nonsignificant correlation between soluble solids content (ranging
between 7.6 and 13.2°Brix) and the thermal tolerance of E. coli O157:H7 (EO139 and
SEA 13B88) determined in cantaloupe and watermelon juices. Similarly, Splittstoesser
et al. (34) reported a nonsignificant alteration of the D-values of E. coli O157:H7 (same
strain used in this study) when soluble solids were augmented from 11.8 to 16.5ºBrix in
a single-strength Empire apple juice.
Table 2. D and z-values of non-acid-adapted E. coli O157:H7 C7927 in apple-carrot
juice blend (pH adjusted to 3.7 with malic acid) with three total soluble solids content.a
ºBrix D-value (min) at given temperature (°C)
z value (°C) 54 56 58
11.5 4.3 ± 0.7 3 ± 1 1.1 ± 0.3 6.6
10.7 6 ± 2 3.1 ± 0.3 1.4 ± 0.7 6.3
9.4 3.7 ± 0.4 2.7 ± 0.9 1.1 ± 0.4 7.7 a Values are the average ± standard deviation (n = 3).

19
Table 3. D and z-values of non-acid-adapted E. coli O157:H7 C7927 in apple-carrot juice blend, acidified at three pH values
with three organic acids (average ± standard deviation for n = 3).a
pH D-value (min) at 54°C D-value (min) at 56°C D-value (min) at 58°C z-value (°C)
Lactic Malic Acetic Lactic Malic Acetic Lactic Malic Acetic Lactic Malic Acetic
3.7 1.87 ± 0.03C 6 ± 1A 1.48 ± 0.05C 1.2 ± 0.3IJ 2.94 ± 0.02H 0.7 ± 0.1J 0.40 ± 0.07W 2.1 ± 0.3U 0.5 ± 0.1W 6.0 9.1 8.1
3.5 0.66 ± 0.04D 3.0 ± 0.3B 0.26 ± 0.01E 0.4 ± 0.1K 1.7 ± 0.4I 0.22 ± 0.05L 0.207 ± 0.001X 1.1 ± 0.1V 0.10 ± 0.01Y 8.0 9.2 9.2
3.3 0.134 ± 0.003F 1.9 ± 0.5C 0.08 ± 0.02G 0.086 ± 0.004M 1.0 ± 0.1J 0.049 ± 0.004N 0.08 ± 0.02Y 0.5 ± 0.1W 0.03 ± 0.01Z 16.7 6.9 10.4
a Values in the same temperature quadrant not sharing a common superscript letter represent significantly different values (P < 0.01) based on post hoc multiple comparisons with a Tukey correction following a two-way ANOVA run on a log transformed response.

20
Influence of varying pH and organic acid on thermal tolerance. The D and z-
values of stationary-phase (non-acid-adapted) E. coli O157:H7 C7927 are
presented in Table 3. Figure 1 shows a representative thermal death time curve
determined at 54°C for juice adjusted at three pH values (3.7, 3.5 and 3.3) by
addition of acetic acid. Similar curves were obtained for all conditions tested and
were used to calculate the D-values.
Figure 1. Representative thermal death time curve for non-acid adapted E. coli
O157:H7 C7927 in apple-carrot juice blend at 54°C, adjusted at three pH values
by addition of acetic acid. Error bars represent standard deviation for n = 3.
After a natural log transformation of the D-values, three-way ANOVA showed a
significant triple interaction between temperature, acid and pH (P = 0.0002).
Therefore, data was further analyzed by performing three independent two-way
ANOVAs for each temperature (54, 56 and 58°C) with two factors, acid and pH,
Figure 1
pH 3.7pH 3.5pH 3.3
r 2 = 0.99r 2 = 0.97
r 2 = 0.99Bac
teria
l cou
nt (l
og C
FU·m
l-1)
1
2
3
4
5
6
7
8
9
Time (min)0 1 2 3 4 5 6 7 8 9

21
at three levels each. The three resulting models showed coefficients of
determination (r2) of 99% and a consistent significant interaction between pH and
acid (P < 0.0001).
For samples acidified to the same endpoint pH and regardless of the tested
acidulant, E. coli was found more tolerant in juices acidified with malic acid,
followed by lactic, and acetic acids, except when the D-value was determined at
a pH of 3.7, the highest of the three acidified pH values, where no significant
differences were detected in samples acidified with lactic and acetic acids,
regardless of the tested temperature (P > 0.01). The toxicity of organic acids to
bacterial cells is attributed to a lowering cytoplasmic pH and intracellular
accumulation of acid anions (20), and the antimicrobial effect depends upon the
organic acid’s pKa value and the pH of the external medium. Theoretically, lactic
acid (pKa 3.86) is a stronger acid when compared to acetic (pKa 4.79) (1) and
malic acid (pKa1 3.40, pKa2 5.20) (17, 21). However, conflicting results regarding
the effect of different organic acidulants on bacterial inactivation have been
reported in the literature. For example, Buchanan and Edelson (4) found that at a
pH of 3.0 and at 37°C, lactic acid was the most deleterious acidulant for seven
enterohemorrhagic E. coli strains, in comparison with acetic and malic acids. In
agreement with this, Cheng et al. (8) found that lactic acid was more lethal than
acetic acid for acid-adapted and non-acid-adapted E. coli O157:H7 ATCC 43889
in a saline solution acidified to a pH of 3. Contradictorily, and in agreement with
our findings, Ryu et al. (32) stated that acetic acid was the most lethal acidulant

22
to E. coli O157:H7 (strain E0139), followed by lactic and malic acids, when tested
over a pH range from 3.9 to 5.4 and at 37°C. According to Bjornsdottir et al. (3),
the reported differences may result from variations in the experimental design
and methodologies used to assess effects of acidification. In addition, factors
such as temperature, pH, acid concentration and ionic strength, as well as the
bacterial strain and environmental features including growth phase and induced
acid resistance, may affect the antimicrobial activity of organic acids (3).
Regarding the effect of the pH within the same heating temperature, longer
exposure times were needed for inactivation of the test strain as pH increased.
This result agrees with findings reported by Chikthimmah (10), where increasing
the pH of cider (from 3.2 to 4.7) decreased the rate of destruction of E. coli
O157:H7 (SEA 13889).
The D-values were additionally determined for the same strain at a pH of 4.5,
obtaining a D-value at 54°C (D54°C) of 20 ± 4, a D56°C of 9 ± 2, and a D58°C of
4.5 ± 0.6 (with a z-value of 6.2°C), corresponding to the highest thermal
tolerance exhibited by the non-acid-adapted E. coli O157:H7 C7927 strain.
Concerning the z-values, no consistent trends were observed for the three
organic acids and pH values evaluated in this study. Published investigations
regarding the influence of pH on the z-values of different foodborne pathogens
and spoilage microorganisms have shown important differences and even
contradictory results (29). Accordingly, some authors have found higher z-values

23
when the pH was diminished while the opposite trend has also been reported (5,
7, 23, 26). Other researchers, ourselves included, have been unable to identify
the influence of pH over this thermal resistance parameter (24) and therefore,
further investigation is required to identify the sources of the reported differences.
Influence of acid adaptation on thermal tolerance. The D and z-values for
acid-adapted E. coli O157:H7 C7927 determined at pH values of 3.3, 3.5 and 3.7
(adjusted by the addition of malic acid), and at a pH of 4.5 (adjusted with 1 N
NaOH) are presented in Table 4. These values were compared to those obtained
from the non-acid-adapted cells (reported in the previous section and Table 3),
and after a natural log transformation of the D-values, three-way ANOVA showed
a nonsignificant interaction between temperature, pH and cell status (P = 0.03).
After removing the three-way interaction term, the three resulting two-way
interactions were deemed nonsignificant (P > 0.01). After removal of these
interactions from the model, it was found that, on average, acid adaptation of
E. coli O157:H7 C7927 significantly increased the D-values (P = 0.0003). As
expected, increments in pH (P < 0.0001) and reduction in the heating
temperature (P < 0.0001) lead to significantly greater D-values. After post hoc
multiple comparisons with a Tukey correction, these values were deemed
significantly different from each other at all tested temperatures and pH values
(P < 0.01). The model’s coefficient of determination (r2) was 92%. These latter
findings are consistent with the trends that we previously reported for the non-
acid-adapted E. coli subjected to the same experimental conditions.

24
Table 4. D and z-values of acid-adapted E. coli O157:H7 C7927 in apple-carrot
juice blend, adjusted at four pH values with malic acid and NaOH.a
pH D-value (min) at given temperature (°C)
z value (°C) 54 56 58
4.5 14 ± 4 8 ± 2 5 ± 2 8.6 3.7 9 ± 2 5 ± 1 1.7 ± 0.4 5.4 3.5 5.6 ± 0.6 2.6 ± 0.9 1.2 ± 0.1 5.9 3.3 3.1 ± 0.2 1.6 ± 0.9 0.8 ± 0.4 6.8 a Values are the average ± standard deviation (n = 3).
Previous studies have demonstrated that heat resistance of stationary-phase
cells of several Shiga toxin-producing E. coli strains is generally equal to or
higher than their acid adapted counterparts. This could be explained by a cross-
protection effect on cell membranes (9, 27) that potentially enhances bacterial
tolerance to different sources of stress such as heat, ionizing and non-ionizing
irradiation (4). Stationary phase and starvation induced protective proteins in
E. coli that are regulated by σs (rpoS) and impart resistance to chemical and
physical changes (9). It was previously suggested that these rpoS-regulated
proteins sustained acid tolerance of E. coli O157:H7 and enhanced the
pathogen’s tolerance and survival in fermented sausage (9).
Interestingly, despite the fact that our methodology for determination of D-values
differed from the protocol used by Enache et al. (14), and that this study was
performed on a juice blend rather than on a single-strength apple juice, we found
that at a pH of 3.7 and 56°C, the D-value obtained for acid-adapted E. coli
O157:H7 C7927 was not noticeably different from the value reported for E. coli

25
O157:H7 strain N-4073 (14). Moreover, the D-values obtained in this study were
consistently higher than D-values reported by Enache and co-workers (14) for
non-O157:H7 strains, including the serogroups O26, O45, O103, O111, O121
and O145.
When applying the predictive model proposed by Gabriel (16) to calculate the
expected D-values for acid adapted E. coli O157:H7 C7927 under all the
conditions tested in this experiment (pH, soluble solids content, temperature and
time combinations), the D-values predicted with that model were considerably
greater (ranging from 8 to 28 minutes) than the values obtained experimentally in
this study (Table 4). These differences can be attributed to variations within the
tested strains and liquid substrates but more likely to variations in the
methodology used to determine the thermal resistance parameters. Therefore, as
Gabriel (16) stated and based on the findings of this study, his model can be
safely used to establish a thermal process schedule for acid and acidified liquid
products. Unfortunately, due to the apparent overestimation observed in the
model, the predictive conditions might not be optimal for practical applications,
due to a potential detrimental effect of those processing conditions on
organoleptic and nutritional qualities of beverages, and due to increments in
production costs by increased processing time and energy consumption.
For apple-carrot juice blends with pH values under 4.5, our results confirmed that
the treatment recommended by Mazzota (27) and required by the U.S. Food and

26
Drug Administration of 3 s at 71.1°C is suitable for achieving a greater-than-5-log
reductions of the acid-adapted E. coli tested in this study. Therefore, the time and
temperature combination suggested by Mazzota (27) would guarantee the safe
thermal processing of this fruit juice blend, regardless of the organic acid used for
pH adjustment. Considering the results reported in our investigation and
specifically the D and z-values obtained at a pH of 3.7 for acid-adapted E. coli
(the combination that experimentally lead to the greater heat tolerance of this
pathogen in acidified samples), an example of a treatment that would reduce a
population of vegetative E. coli O157:H7 C7927 by 5 logs is represented by 2 s
at 71.1°C (z-value of 5.4°C). These processing conditions are based on the
extrapolation of results obtained between 54 and 58°C, and therefore, juice
processors and process authorities may want to generate specific data to
validate the effectiveness of the suggested treatment.
Furthermore, considering the D-values determined at the conditions that
triggered the greatest heat tolerance (non-acid-adapted E. coli, pH of 4.5 and
heating temperature of 54°C), a minimum treatment of 10 s at 71.1°C (z-value of
6.2°C) would be required to achieve a 5-log reduction of the tested strain. This
agrees with results obtained by Mazzota (27), who states that the heat tolerance
of pathogens likely to occur in juices including Salmonella, Listeria
monocytogenes and E. coli O157:H7, increases considerably above pH 4. Thus,
for the apple-carrot juice blend and similar liquid food products with a pH of 4.5
and above, process authorities and juice processors may want to generate

27
specific thermal inactivation data related to the most resistant pathogen likely to
occur in the product and to optimize the thermal process.
Data from our experiments confirmed that pH, heating temperature, type of
organic acidulant and acid adaptation dramatically influence the thermal
tolerance response of the E. coli O157:H7 C7927 strain studied. Therefore, for
the establishment of critical limits for the safe thermal processing of pH controlled
juices and similar food products, the process authorities or regulatory agencies
must give serious consideration to these parameters.
These results may help processors and process authorities establish the critical
limits for safe thermal processing of juices and similar pH controlled foods. The
authors also believe that this work will be useful to meet part of the new FDA
Food Safety and Modernization Act (FSMA) science-based rules to ensure the
safety of acidified and acid foods (36).
ACKNOWLEDGMENTS
Funding for this research was provided by the United States Department of
Agriculture, National Institute of Food and Agriculture (USDA-NIFA) grant
number 2009-51110-20147, the Fulbright International Exchange Program, and
Cornell University, College of Agriculture and Life Sciences. The authors thank
John Churey (New York State Agricultural Experiment Station, Cornell University)
for his technical assistance in the Food Microbiology Laboratory.

28
REFERENCES
1. Adams, M. R., and C. J. Hall. 1988. Growth inhibition of food-borne
pathogens by lactic and acetic acids and their mixtures. Int. J. Food Sci. and
Technol. 23:287-292.
2. Besser, R. E., S. M. Lett, J. T. Weber, M. P. Doyle, T. J. Barrett, J. G. Wells,
and P. M. Griffin. 1993. An outbreak of diarrhea and hemolytic uremic
syndrome from Escherichia coli O157:H7 in fresh-pressed apple cider. JAMA
269:2217-20.
3. Bjornsdottir, K., F. Breidt, Jr., and R. F. McFeeters. 2006. Protective effects of
organic acids on survival of Escherichia coli O157:H7 in acidic environments.
Appl. Environ. Microbiol. 72:660-4.
4. Buchanan, R. L., and S. G. Edelson. 1998. pH-dependent stationary-phase
acid resistance response of enterohemorrhagic Escherichia coli in the
presence of various acidulants. J. Food Prot. 62:211-8.
5. Cameron, M. S., S. J. Leonard, and E. L. Barret. 1980. Effect of moderately
acidic pH on heat resistance of Clostridium sporogenes spores in phosphate
buffer and in buffered pea puree. Appl. Environ. Microbiol. 39:943-9.
6. Centers for Disease Control and Prevention (CDC). 2006. Botulism
associated with commercial carrot juice - Georgia and Florida, September
2006. MMWR Morb. Mortal. Wkly. Rep. 55:1098-9.
7. Cerny, G. 1980. Dependence of thermal inactivation of microorganisms on
the pH-value of media. II. Bacteria and bacterial spores. Z. Lebensm. Unt.
Forsch. 170:180-6.

29
8. Cheng, H. Y., R.-C. Ye, and C.-C. Chou. 2003. Increased acid tolerance of
Escherichia coli O157:H7 by acid adaptation time and conditions of acid
challenge. Food Res. Int. 36:49-56.
9. Cheville, A. M., K. W. Arnold, C. Buchrieser, C.-M Cheng, and C. W. Kaspar.
1996. rpoS regulation of acid, heat, and salt tolerance in Escherichia coli
O157:H7. Appl. Environ. Microbiol. 62:1822-4.
10. Chikthimmah, N., L. F. Laborde, and R. B. Beelman. 2003. Critical factors
affecting the destruction of Escherichia coli O157:H7 in apple cider treated
with fumaric acid and sodium benzoate. J. Food Sci. 68:1438-42.
11. Danyluk M. D., R. M. Goodrich-Schneider, K. R. Schneider, L. J. Harris, and
R. W. Worobo. 2012. Outbreaks of Foodborne Disease Associated with Fruit
and Vegetable Juices, 1922-2010. Available at:
http://edis.ifas.ufl.edu/pdffiles/FS/FS18800.pdf. Accessed 7 September 2013.
12. Derossi, A., A. G. Fiore, T. De Pilli, and C. Severini. 2011. A Review on
acidifying treatments for vegetable canned food. Crit. Rev. Food Sci. Nutr.
51:955-64.
13. Enache, E., and Y. Chen. 2007. Survival of Escherichia coli O157:H7,
Salmonella, and Listeria monocytogenes in cranberry juice concentrates at
different °Brix levels. J. Food Prot. 70:2072-7.
14. Enache, E., E. C. Mathusa, P. H. Elliott, D. G. Black, Y. Chen, V. N. Scott,
and D. W. Schaffner. 2011. Thermal resistance parameters for Shiga toxin-
producing Escherichia coli in apple juice. J. Food Prot. 74:1231-7.
30
15. Fernández, A., J. Collado, L. M. Cunha, M. J. Ocio, and A. Martínez. 2002.
Empirical model building based on Weibull distribution to describe the joint
effect of pH and temperature on the thermal resistance of Bacillus cereus in
vegetable substrate. Int. J. Food Microbiol. 77:147-53.
16. Gabriel, A. 2012. Influences of heating temperature, pH, and soluble solids on
the decimal reduction times of acid-adapted and non-adapted Escherichia coli
O157:H7 (HCIPH 96055) in a defined liquid heating medium. Int. J. Food
Microbiol. 160:50-7.
17. Hsiao, C.-P., and K. J. Siebert. 1999. Modeling the inhibitory effects of
organic acids on bacteria. Int. J. Food Microbiol. 47:189-201.
18. Hsin-Y, C., and C.-C. Chou. 2001. Acid adaptation and temperature effect on
the survival of E. coli O157:H7 in acidic fruit juice and lactic fermented
product. Int. J. Food Microbiol. 70:189-95.
19. Jay, J. M. 2000. Modern food microbiology. Chapter 17: High-temperature
food preservation and characteristics of thermophilic microorganisms. 6th
edition. Aspen Publishers, Inc., Maryland.
20. Kreske, A. C., K. Bjornsdottir, F. Breidt, Jr., and H. Hassan. 2008. Effects of
pH, dissolved oxygen, and ionic strength on the survival of Escherichia coli
O157:H7 in organic acid solutions. J. Food Prot. 71:2404-9.
21. Lobit, P., M. Genard, P. Soing, and R. Habib. 2006. Modelling malic acid
accumulation in fruits: relationships with organic acids, potassium, and
temperature. J. Exp. Bot. 57:1471-83.
31
22. Leyer, G. J., L.-L. Wang, and E. Johnson. 1995. Acid adaptation of
Escherichia coli O157:H7 increases survival in acidic foods. Appl. Environ.
Microbiol. 61:3752-5.
23. López, M., I. González, S. Condón, and A. Bernardo. 1996. Effect of pH
heating medium on the thermal resistance of Bacillus stearothermophilus. Int.
J. Food Microbiol. 28:405-10.
24. Lowick, J. A. M., and P. J. Anema. 1972. Effect of pH on the heat resistance
of Cl. sporogenes in minced meat. J. Appl. Bacteriol. 35:119-21.
25. Mak, P. P., B. H. Ingham, and S. C. Ingham. 2001. Validation of apple cider
pasteurization treatment against Escherichia coli O157:H7, Salmonella, and
Listeria monocytogenes. J. Food Prot. 64:1679-89.
26. Mallidis, C. G., P. Frantzeskakis, G. Balatsouras, and C. Katsabotxakis. 1990.
Thermal treatment of aseptically processed tomato paste. Int. J. Food Sci.
Technol. 25:442-48.
27. Mazzota A. S. 2001. Thermal inactivation of stationary-phase and acid-
adapted Escherichia coli O157:H7, Salmonella, and Listeria
monocytogenes in fruit juices. J. Food Prot. 64:315-20.
28. Nogueira, M. C. L., O. M. Oyarzabal, and D. E. Gombas. 2003. Inactivation of
Escherichia coli O157:H7, Listeria monocytogenes, and Salmonella in
cranberry, lemon and lime juice concentrates. J. Food Prot. 66:1637-41.
29. Palop, A., J. Raso, R. Pagán, S. Condón, and F. J. Sala. 1999. Influence of
pH on heat resistance of spores of Bacillus coagulans in buffer and
homogenized foods. Int. J. Food Microbiol. 46:243-9.
32
30. Rangel, J. M., P. H. Sparling, C. Crowe, P. M. Griffin, and D. L. Swerdlow.
2005. Epidemiology of Escherichia coli O157:H7 outbreaks, United States,
1982–2002. Emerg. Infect. Dis. 11:603-9.
31. Reinders, R. D., S. Buensterveld, and P. G. H. Bijker. 2001. Survival of
Escherichia coli O157:H7 ATCC 43895 in a model apple juice medium with
different concentrations of proline and caffeic acid. Appl. Environ. Microbiol.
67:2863-6.
32. Ryu, J. H., Y. Deng, and L. R. Beuchat. 1999. Behavior of acid-adapted and
unadapted Escherichia coli O157:H7 when exposed to reduced pH achieved
with various organic acids. J. Food Prot. 62:451-5.
33. Sharma, M., B. B. Adler, M. D. Harrison, and L. R. Beuchat. 2005. Thermal
tolerance of acid-adapted and unadapted Salmonella, Escherichia coli
O157:H7 and Listeria monocytogenes in cantaloupe juice and watermelon
juice. Lett. Appl. Microbiol. 41:448-53.
34. Splittstoesser, D. F., M. R. McLellan, and J. J. Churey. 1995. Heat resistance
of Escherichia coli O157:H7 in apple juice. J. Food Prot. 59:226-9.
35. U.S. Food and Drug Administration (FDA). 2001. Hazard Analysis and Critical
Control Points (HACCP): procedures for the safe and sanitary processing and
importing of juice. Federal Register 66:6137-6202.
36. U.S. Food and Drug Administration (FDA). 2013. Overview of the FSMA
proposed rules on produce safety standards and preventive controls for
human food. Available at:

33
http://www.fda.gov/Food/GuidanceRegulation/FSMA/ucm334120.htm.
Accessed 7 September 2013.
37. Zhao, T., M. P. Doyle, and R. E. Besser. 1993. Fate of enterohemorrhagic
Escherichia coli O157:H7 in apple cider with and without preservatives. Appl.
Environ. Microbiol. 59:2526-2530.

1Journal of Food Protection. 2014. doi:10.4315/0362-028X. 34
CHAPTER 3
EFFECT OF ACID ADAPTATION AND ACID SHOCK ON THERMAL
TOLERANCE AND SURVIVAL OF ESCHERICHIA COLI O157:H7 AND O111
IN APPLE JUICE1
ABSTRACT
Gradual exposure to moderate acidic environments may enhance the thermal
tolerance and survival of Escherichia coli O157:H7 in acid and acidified foods.
Limited studies comparing methodologies to induce this phenomenon have been
performed. The effects of strain and physiological state on thermal tolerance and
survival of E. coli in apple juice were studied. The decimal reduction time (D-
value) at 56ºC [D56ºC] was determined for E. coli O157:H7 strains C7927 and
ATCC 43895, and E. coli O111 at four physiological states: unadapted, acid-
shocked (two methodologies used), and acid-adapted cells. The effect of
acidulant was also evaluated by determining the D56ºC for the O157:H7 strains
subjected to acid shock during 18 h in Trypticase soy broth (TSB) with pH 5
adjusted with hydrochloric, lactic, and malic acids. Survival of the three strains at
four physiological states was determined at 1 ± 1ºC and 24 ± 2ºC. Experiments
were performed in triplicate. For thermal inactivation, a significant interaction was
found between strain and physiological state (P < 0.0001). Highest thermal
tolerance was observed for the 43895 strain subjected to acid shock during 18 h
in TSB acidified with HCl (D56ºC of 3.0 ± 0.1 min), and the lowest for the acid-
shocked C7927 strain treated for 4 h in TSB acidified with HCl (D56ºC of

35
0.45 ± 0.06 min). Acidulants did not alter the heat tolerance of strain C7927
(D56ºC of 1.9 ± 0.1 min) (P > 0.05), but significantly affected strain 43895
(P < 0.05), showing the greatest tolerance when malic acid was used (D56ºC of
3.7 ± 0.3 min). A significant interaction between strain, storage temperature, and
physiological state was noted during the survival experiments (P < 0.05). E. coli
O111 was the most resistant strain, surviving 6 and 23 days at 24 and 1ºC,
respectively. Our findings may assist in designing challenge studies for juices
and other pH-controlled products, where Shiga toxin-producing E. coli represents
the pathogen of concern.
INTRODUCTION
Apple juice and cider contaminated with Escherichia coli O157:H7 and E. coli
O111 have been the cause of numerous foodborne outbreaks (7). Therefore,
these pathogens represent a safety concern for these, and other acidic and
acidified food products. Moreover, it has been demonstrated that a gradual
exposure of certain pathogens (including Shiga toxin-producing E. coli) to
moderate acidic environments, may enhance the thermal tolerance and survival
ability of these microorganisms when present in pH-controlled products (11, 14,
16, 19, 20, 21). Different methodologies to induce acid-enhanced responses,
including acid shock and acid adaptation protocols, have been developed and
applied in several microbial challenge studies. Nevertheless, limited studies have
been performed to compare these methodologies and their potential
differentiated effects on the thermal tolerance and survival of different E. coli

36
strains, which have shown significant variations even within a single serotype (5,
9, 11, 15, 23). Thus, the lack of comparative studies using different strains and
procedures complicates the selection of the most appropriate methodology to
conduct safety validations in acidic juices and similar food products.
Prior to this experiment, Ryu and Beuchat (20) performed a comprehensive study
to determine the survival and growth characteristics of acid-adapted, acid-
shocked, and unadapted cells of E. coli O157:H7 strain E0139 (venison jerky
isolate), inoculated into Trypticase soy broth (TSB) acidified with lactic and acetic
acids, and for three commercial brands of apple cider and orange juice. Acid-
adapted cells were reported more tolerant when compared to acid-shocked and
control cells, and the pathogen survived up to 42 days at 5 and 25ºC in both
juices. In this study, only one strain was evaluated. Hsin-Yi and Chou (11)
studied two E. coli O157:H7 strains (ATCC 43889 and ATCC 43895) subjected to
acid shock, but acidifying the TSB with HCl, and exposing the culture to the
acidified media for 4 h instead of the 2 h indicated by Ryu and Beuchat (20). In
this case, commercial mango juice, asparagus juice, Yakult, and low fat yogurt
were inoculated with acid-shocked and control cells, and survival was determined
at 25 and 7ºC. In this study, the 43895 strain survived longer than the 43889
strain in all products, and regardless of the storage temperature and
physiological state, the acid shock treatment and low storage temperature
increased the survival of both strains.

37
For the purpose of this study, and as previously stated by Ryu et al. (21), the acid
shock term was used for cells that have been exposed to an abrupt shift from
high to low pH, whereas acid-adapted cells were defined as those that have been
exposed to a gradual decrease in environmental pH. Acid adaptation is
considered a pre-treatment that more closely mimics what might take place in
fermented products in which acids are produced by naturally occurring microbiota
or added bacteria (8). However, an acid shock scenario is more likely to occur in
processing facilities where acidic products and organic acids are commonly used
with preservation purposes and to achieve desirable sensory qualities.
The objective of this study was to evaluate the combined effects of strain,
physiological state, and acidulant on the thermal tolerance and survival of
different pathogenic E. coli strains in apple juice. This product was chosen
because it is a highly consumed acidic product, and it has been reported that
Shiga toxin-producing E. coli has survived in this product and caused
hemorrhagic colitis outbreaks (7). This research aims to help juice processors
and process authorities to establish the most appropriate experimental conditions
for the execution of microbial challenge studies on pH-controlled juices and
similar liquid food products.
MATERIALS AND METHODS
Apple juice. Shelf-stable, preservative-free and single-strength 100% apple juice
was purchased at a local grocery store (Geneva, NY), and kept frozen at –23ºC

38
until used. After thawing, 9 ml of apple juice were dispensed aseptically in a
sterile test tube, pasteurized at 82ºC for 6 minutes, and immediately cooled. The
pasteurization step was performed to avoid the presence of any potential
unwanted microbiota that would interfere with the E. coli quantification during the
heat tolerance and survival determinations. To verify the absence of background
microbiota, three replicate samples of pasteurized apple juice were plated on
plate count agar (PCA), and acidified (pH 3.5) potato-dextrose agar (PDA) (Difco,
BD, Sparks, MD), and incubated at 35 ± 2ºC for 24 and 48 h, respectively, in
order to determine total plate, as well as molds and yeasts counts.
Physicochemical measurements. The juice’s pH was measured with a Thermo
Scientific Orion 2 Star pH meter (Thermo Fisher Scientific, Beverly, MA). The
soluble solids content were determined using a Leica Auto Abbe refractometer
model 10500-802 (Leica Inc., Buffalo, NY). Total titratable acidity was measured
with a G20 compact titrator (Mettler Toledo, Schwerzenbach, Switzerland), and
turbidity was determined using a HACH 2100P portable turbidimeter (Hach
Company, Loveland, CO). All physicochemical analyses were performed in
triplicate.
Bacterial strains and culture conditions. A single isolated colony of three
Shiga toxin-producing E. coli strains, E. coli O157:H7 (strains C7927 and ATCC
43895), and E. coli O111 (strain 04-11953), obtained from the Food Microbiology
Laboratory at the New York State Agricultural Experiment Station (Geneva, NY)

39
was transferred into 10 ml of TSB (Difco, BD, Sparks, MD), and incubated for
20 ± 2 h at 35 ± 2ºC (to stationary-phase) in an Innova 2300 rotatory platform
shaker (New Brunswick Scientific Co., Edison, NJ) at 250 rpm. These cultures
were used as the unadapted (control) strains and then subjected to the acid
adaptation and acid shock protocols described below. The E. coli O111 and
E. coli O157:H7 C7927 strains correspond to clinical isolates, whereas the E. coli
O157:H7 strain 43895 corresponds to a food isolate. The C7927 strain was
originally isolated from a patient who had consumed contaminated apple cider
that caused an outbreak (24), and the 43895 strain was originally isolated from
raw hamburger meat, also implicated in a hemorrhagic colitis outbreak (26).
Acid adaptation and acid shock induction. A total of four methods were used
for preparing cells at different physiological states including unadapted-control
(described above), acid-adapted, and acid-shocked (two methodologies used).
Acid adaptation was produced according to the protocol followed by Breidt et al.
(3), where one isolated colony of each strain was inoculated separately into 5 ml
of TSB supplemented with 1% glucose, purchased from Fisher Scientific (Fair
Lawn, NJ). Cultures were grown statically at 35 ± 2ºC for 16 ± 2 h to induce the
enhanced acid tolerance response by a gradual decrease of pH to an average
value of 4.71 ± 0.05. After incubation, cells were concentrated by centrifugation
at 2000 x g and 10ºC for 10 minutes using an Eppendorf 5417R microcentrifuge
(Hamburg, Germany), and resuspended in 1 ml of Butterfield’s buffer phosphate
diluent (BPD). As a modification to the original protocol (3), the Luria-Bertani

40
broth was substituted by TSB and the sterile saline solution (0.85% NaCl) was
replaced with BPD. Both changes were applied to prevent the inclusion of an
additional source of cell stress due to the presence of high concentrations of
sodium chloride, a compound that is not naturally found (at high concentrations)
in apple juice and other fruit juices.
The acid shock effect was induced on the three selected strains following two
different methodologies. For the first protocol, referred as AS1, as stated by
Enache et al. (9), a loopful of unadapted-control cells of E. coli (obtained as
indicated in Bacterial Strains and Culture Conditions above) was transferred into
5 ml of TSB with a pH of 5, adjusted by the addition of HCl 1 N (Fisher Scientific,
Fair Lawn, NJ), and incubated overnight (18 ± 2 h) at 35 ± 2ºC. After incubation,
1 ml of the acid-shocked culture was centrifuged at 8800 x g for 4 minutes in an
Eppendorf 5415C microcentrifuge (Hamburg, Germany), and the pellet was
resuspended in refrigerated 0.1 M citrate buffer (pH 4), and stored at 4 ± 1ºC for
18 h before use. The acid-shocked cells were also obtained following the
protocol reported by Hsin-Yi and Chou (11), and referred as AS2, in which a
volume of 1 ml of unadapted-control cells of E. coli was centrifuged at 8800 x g
for 12 minutes in an Eppendorf 5415C microcentrifuge. The cell pellets were
washed with BPD and resuspended in 1 ml of TSB with a pH adjusted to 5 by
adding HCl 6 N. Cultures were statically incubated at 35 ± 2ºC for 4 h before use.

41
Thermal tolerance determination. The decimal reduction times (D-values) were
determined according to the methodology described by Usaga et al. (25), where
9 ml of apple juice were inoculated with 1 ml of each culture, resulting in an initial
population of 107 to 108 CFU·ml–1. A volume of 20 µl of inoculated apple juice
was injected into five glass melting point capillary tubes (1.5 to 1.8 by 100 mm;
Kimble Chase, Vineland, NJ) using a 1 ml syringe and a repeater dispenser
(Hamilton Co., Reno, NV). After flame sealing, capillary tubes were heat treated
in water test tubes contained in a stirred water bath set at a temperature of 56ºC.
The selected sampling times differed depending on the strain and physiological
state, but all the thermal death time curves where characterized by at least 5
sampling points, 4-log reductions, and a coefficient of determination (r2) greater
than 0.9. Juice samples that represented the time zero in the thermal death
curves were considered the nonheated controls. After heating, capillary tubes
were cooled in an ice bath and, with the objective of decontaminating their
exterior and ending the thermal treatment, the tubes where immediately placed in
test tubes containing 70% cold ethanol contained in an ice water bath. The
excess of ethanol was removed by blotting the capillaries. The five capillary
tubes were crushed with a sterile glass rod in a milk dilution bottle containing
20 ml of 0.1% sterile peptone water. A minimum detection limit of 102 CFU·ml–1
was thus obtained. Appropriate serial dilutions in sterile 0.1% peptone water
were aseptically plated by duplicate in petri dishes where 20 ml of Trypticase soy
agar (TSA) (Difco, BD, Sparks, MD) was pour-plated. Petri dishes were
incubated for 20 ± 2 h at 35 ± 2ºC before counting colonies. The D-values were

42
calculated as the inverse negative slope of the linear regression line obtained
from plotting the log number of survivors against the sampling times.
Effect of acid adaptation and acid shock on the thermal tolerance of E. coli.
We evaluated the effect of the four physiological states on the D-values for each
of the three enterohemorrhagic E. coli strains. A total of three independent
biological replicates were performed of each treatment (physiological state ×
strain).
Effect of acidulants on the thermal tolerance of acid-shocked E. coli. We
studied the effect of the acidulant used in the acid shock protocol (AS1) on the D-
values for the two E.coli O157:H7 strains. Three organic acids 85% malic (6 M),
85% lactic (9 M) and 85% acetic (14 M) were used instead of HCl (1 M). Acids
were purchased from Fisher Scientific (Fair Lawn, NJ). A total of three
independent biological replicates were performed of each treatment (acidulant ×
strain).
Survival of E. coli in apple juice. We evaluated the effect of the four
physiological states on the survival for each of the three enterohemorrhagic
E. coli strains, at two storage temperatures: refrigeration (1 ± 1ºC), and room
temperature (24 ± 2ºC). A volume of 9 ml of pasteurized apple juice was
inoculated with 1 ml of the three tested E. coli strains at the four physiological
states. Initial E. coli counts were determined on day 0 by using the spread plate

43
techniques on TSA, and sampling intervals for subsequent counts depended on
the total bacterial population at each sampling time (spread or pour plate
techniques where used accordingly). Petri dishes were incubated for 20 ± 2 h at
35 ± 2ºC before enumeration. A total of three independent biological replicates
were performed for each treatment (physiological state × strain × storage
temperature).
Statistical Analysis. Two- and three-way analyses of variance (ANOVA),
Tukey’s honestly significant difference (HSD) and Student’s t tests for means
comparisons were performed using JMP® version 11 (SAS Institute Inc., Cary,
NC). Three values per treatment (from three independent replicates) were used
in each case. Differences were considered significant at a P value of < 0.05.

44
RESULTS AND DISCUSSION
Apple juice was characterized by a pH of 3.627 ± 0.006, 11.873 ± 0.006 ºBrix, a total
titratable acidity of 0.35 ± 0.01 % (grams of malic acid per 100 grams of juice) which is
equivalent to an average of 0.028 M of malic acid, and a turbidity of 1.35 ± 0.01
nephelometric turbidity units (NTU), representing a clear juice. The absence of
background microbiota was confirmed by negative results on the total plate count and
molds and yeasts count.
Effect of acid adaptation and acid shock on the thermal tolerance of E. coli. In
order to determine whether the tested methods had a significant effect on the thermal
tolerance of the E. coli strains, a full factorial design with three levels for strain (E. coli
O157:H7 C7927 and ATCC 43895, as well as E. coli O111), and four levels for
physiological state (unadapted-control, AS1, AS2, and acid-adapted cells) was built,
with the measured D-values at 56ºC as the response. Representative thermal death
time curves for E. coli O157:H7 strain C7927 are depicted in Figure 2. These curves
demonstrate that there were no deviations from the linear decline in the log number of
survivors over time. Similar curves were obtained for all experimental conditions and
used to calculate all the D-values reported on this study. A significant interaction
between strain and physiological state (P < 0.0001) was observed after performing a
two-way ANOVA, and the resulting model showed a coefficient of determination (r2) of
0.95. Post hoc multiple comparisons were performed using Student’s t test with a
Bonferroni correction, which allowed to compare mean values and determine significant

45
differences in physiological states within strains and in strains within physiological
states.
Figure 2. Representative thermal death time curves determined in apple juice (pH 3.6)
at 56ºC for unadapted-control, acid-adapted, and acid-shocked (AS2) E. coli O157:H7
strain C7927. Error bars represent standard deviations (n = 3).
As depicted in Figure 3, the greatest thermal tolerance was observed for acid-shocked
E. coli O157:H7 ATCC 43895 subjected to AS1 (3.0 ± 0.1 min), whereas the lowest was
obtained for E. coli O157:H7 strain C7927 subjected to AS2 (0.45 ± 0.06 min). For the
two O157:H7 strains tested, the thermal tolerance of the bacteria was found significantly
higher when subjected to AS1, as compared with the unadapted-control counterparts.
Moreover, the D-values for these strains were also consistently higher than those
obtained for acid-adapted cells (Figure 3). Worth noting, the thermal tolerance of these
O157:H7 strains was greatly influenced by the time of exposure of the culture to the
Figure 1
Unadapted-controlAcid-adaptedAS2
r 2 = 0.984r 2 = 0.975r 2 = 0.990Bac
teria
l cou
nt (l
og C
FU·m
l-1)
1
2
3
4
5
6
7
8
9
Time (min)0 1 2 3 4 5 6 7 8 9

46
acidic growing media (18 h in AS1 versus 4 h in AS2, which translated to lower D-
values in AS2 than in AS1), indicating that this time represents a critical factor that
influences the enhanced thermal tolerance response on the pathogenic E. coli strains
tested in this study. In a previous experiment conducted in our laboratory (25), we also
found that the D-values at 54, 56 and 58ºC for E. coli O157:H7 C7927 (one of the
strains evaluated on this study), determined in an apple-carrot juice blend acidified with
different acidulants and at different pH values, increased significantly due to the acid
shock treatment (AS1).
a D-values not sharing a common lowercase letter represent significantly different values (P < 0.05) when comparing physiological states within strains. D-values not sharing a common uppercase letter represent significantly different values (P < 0.05) when comparing strains within physiological states. Post hoc multiple comparisons were performed using Student’s t test with a Bonferroni correction, following a two-way ANOVA.
Figure 3. D-values of three E. coli strains at four physiological states, determined at
56ºC in apple juice (pH 3.6). Error bars represent standard deviations (n = 3).a
Figure 2
Unadapted-controlAS1
AS2Acid-adapted
Abc
Aa
ABc
Abc
!
!
Ba
AaC
aBa
!
!
Cb
Aa
Ba
Cb
D-v
alue
(min
)
0
0.5
1.0
1.5
2.0
2.5
3.0
3.5
4.0
E. coli strainO157:H7 (C7927) O157:H7 (43895) O111

47
It has been previously reported that during the acid shock many physiological changes
(responsible of an enhanced acid tolerance response) such as the production of
protective acid stress proteins that in E. coli are regulated by σs (rpoS), are occurring
(6). However, it is possible that during the application of AS2 these changes are not
completely developed and therefore, a cell damaging effect due to the abrupt exposure
to a low pH, is exceeding the expected protective effect induced by the acid shock
treatment. Consequently, it may be causing the adversely affected heat tolerance.
Previously, Ryu and Beuchat (20) found that the heat tolerance of E. coli O157:H7
(strain E0139) in apple cider can be substantially enhanced by acid adaptation
compared to acid shock. In that case, acid-shocked cells were obtained by adjusting a
16 h E. coli culture in TSB with a pH of 4.8 by adding lactic acid, and then incubating for
2 h at 37ºC. Differences in the conclusions from this and our study may result from
different times of acid exposure during the acid shock, differences on the acidulants
used to adjust the pH of the growing media, and natural and intrinsic variations among
the strains. Worth noting, and as indicated in the methodology section above, the
application of the AS1 treatment in contrast with AS2 includes additional cold and acid
shock treatments for 18 h at 4ºC on a citrate buffer (pH 4, 0.1 M) that may also influence
the E. coli thermal tolerance observed in this study. These differences in the methods,
besides variables such as the methodologies used to experimentally determine the D-
values, and the acid concentration and ionic strength might also explain the observed
disparities.
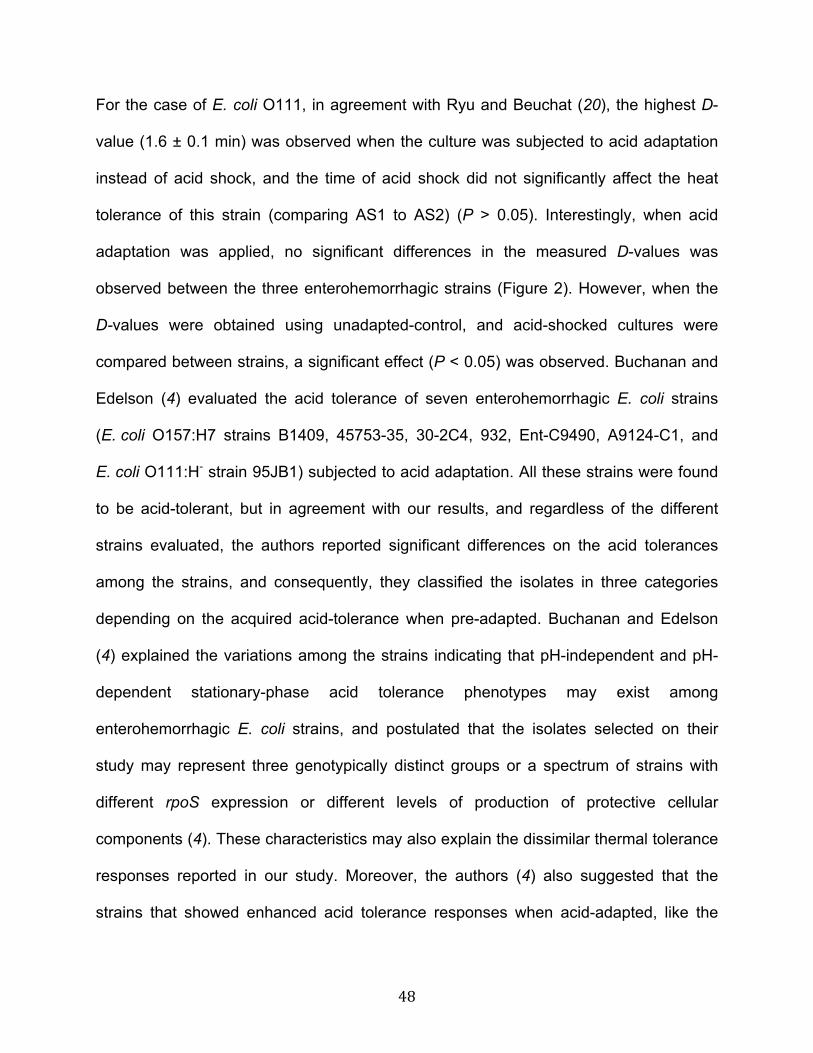
48
For the case of E. coli O111, in agreement with Ryu and Beuchat (20), the highest D-
value (1.6 ± 0.1 min) was observed when the culture was subjected to acid adaptation
instead of acid shock, and the time of acid shock did not significantly affect the heat
tolerance of this strain (comparing AS1 to AS2) (P > 0.05). Interestingly, when acid
adaptation was applied, no significant differences in the measured D-values was
observed between the three enterohemorrhagic strains (Figure 2). However, when the
D-values were obtained using unadapted-control, and acid-shocked cultures were
compared between strains, a significant effect (P < 0.05) was observed. Buchanan and
Edelson (4) evaluated the acid tolerance of seven enterohemorrhagic E. coli strains
(E. coli O157:H7 strains B1409, 45753-35, 30-2C4, 932, Ent-C9490, A9124-C1, and
E. coli O111:H- strain 95JB1) subjected to acid adaptation. All these strains were found
to be acid-tolerant, but in agreement with our results, and regardless of the different
strains evaluated, the authors reported significant differences on the acid tolerances
among the strains, and consequently, they classified the isolates in three categories
depending on the acquired acid-tolerance when pre-adapted. Buchanan and Edelson
(4) explained the variations among the strains indicating that pH-independent and pH-
dependent stationary-phase acid tolerance phenotypes may exist among
enterohemorrhagic E. coli strains, and postulated that the isolates selected on their
study may represent three genotypically distinct groups or a spectrum of strains with
different rpoS expression or different levels of production of protective cellular
components (4). These characteristics may also explain the dissimilar thermal tolerance
responses reported in our study. Moreover, the authors (4) also suggested that the
strains that showed enhanced acid tolerance responses when acid-adapted, like the

49
case of the three strains evaluated in our study, appear to resemble a pH-dependent
stationary-phase acid tolerance response previously reported for Salmonella
Typhimurium (4, 10, 13), whereas the strains that did not show an increased tolerance
could have a pH-independent acid resistance response instead.
Table 5. Initial counts in apple juice samples (pH 3.6) inoculated with E. coli O157:H7
strains C7927 and 43895, subjected to acid shock for (18 ± 2 h) in TSB acidified to pH 5
(AS1) by adding four different acids.a
Acid E.coli O157:H7 strain
43895 C7927
Hydrochloric 7.9 ± 0.6 7.0 ± 0.2
Malic 7.9 ± 0.1 6.0 ± 0.7
Lactic 7.4 ± 0.5 7.2 ± 0.2
Acetic 5.5 ± 0.2 5.59 ± 0.06
a Values are the average ± standard deviation (n = 3).
Effect of acidulants on the thermal tolerance of acid-shocked E. coli. Since the
greatest thermal tolerance response (highest D-values) was exhibited by the two acid-
shocked E.coli O157:H7 strains subjected to AS1, the effect of inducing this
phenomenon by acidifying the growing media with different organic acids (malic, lactic
and acetic) instead of HCl was studied. The E. coli counts of the nonheated controls are
indicated in Table 5. As observed, when the three strains where exposed to the acid
shock in media containing acetic acid, the population of E. coli was lower when
compared to counts of populations grown when other organic and inorganic acids where
used. This result agrees with Ryu et al. (21), who found that acetic acid was the most
lethal acidulant for E. coli O157:H7 (strain E0139), followed by lactic and malic acids,

50
when tested over a pH range from 3.9 to 5.4 and at 37ºC. Similarly, Deng et al. (8)
reported that three strains of E. coli O157:H7 (30-2C4, ENT-C9490, and SEA-13B88)
were markedly less tolerant to acetic acid than citric and malic acids when 18 h
stationary-phase cultures were surface-plated onto TSB acidified at six different pH
values (5.4, 5.1, 4.8, 4.5, 4.2, and 3.9), and incubated at 37ºC for at least 48 h. It is
important to note that comparisons of the antimicrobial effect of different organic acids
on Shiga toxin-producing E. coli should consider the relative effectiveness of the acid.
Therefore, comparisons at different pH values should be based on the concentration of
the effective form of the acids, information that in some publications has not been
provided or does not match with the conditions evaluated in the present study.
Considering the low initial counts obtained in the presence of acetic acid (Table 5), and
that the detection limit associated to the thermal inactivation methodology is
102 CFU·ml–1, it was deemed not feasible to perform the D-values determination on
these samples and still obtain a thermal death curve extended for at least 4-log
reductions, condition that was pre-established by the authors as a requirement to
calculate the D-values. Given this situation, and as a preliminary attempt to determine
the D-value of acid shocked E. coli in TSB acidified with acetic acid for one of the
O157:H7 strains (C7927), a higher concentration of initial inoculum (1 ml instead of a
loopfull) was subjected to AS1 using TSB acidified with this acid, and the D56ºC was
determined. However, the resulting D-value (1.1 ± 0.1 min) was not significantly
different (P > 0.05) than the value observed for the unadapted-control counterpart
(0.8 ± 0.2 min) and it was significantly lower (P < 0.05) than the values reported when
the other acidulants were used (Figure 4). This result suggests that AS1 does not
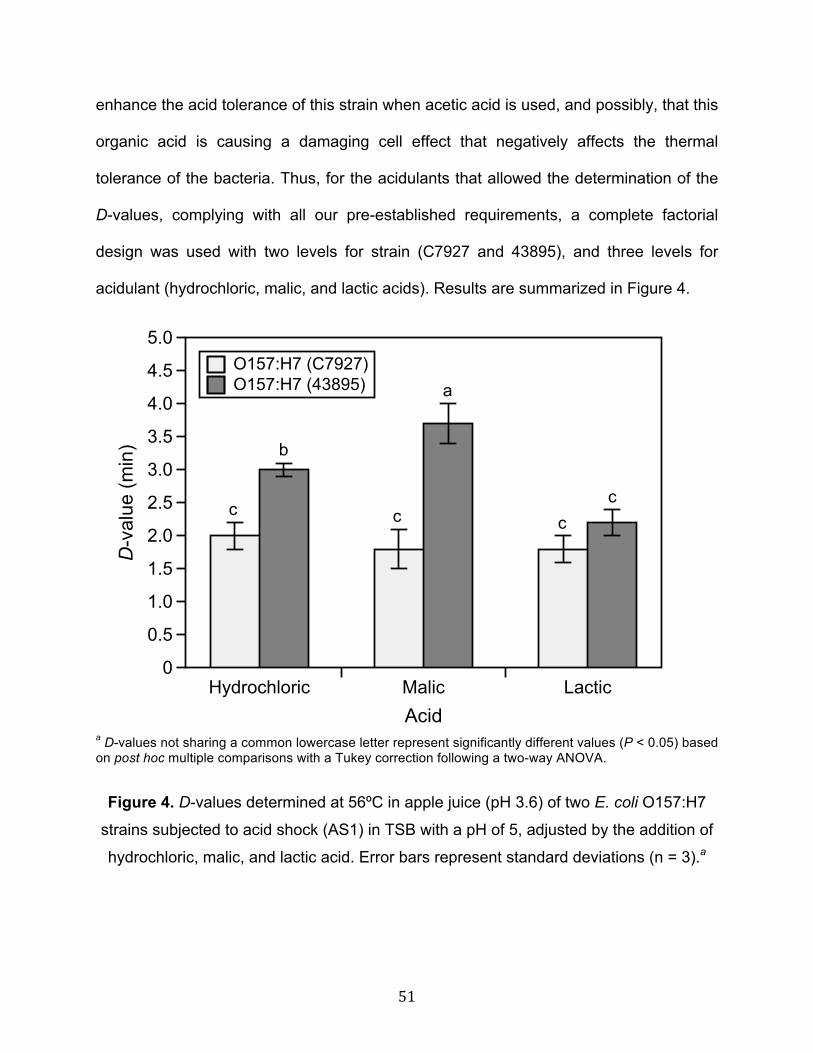
51
enhance the acid tolerance of this strain when acetic acid is used, and possibly, that this
organic acid is causing a damaging cell effect that negatively affects the thermal
tolerance of the bacteria. Thus, for the acidulants that allowed the determination of the
D-values, complying with all our pre-established requirements, a complete factorial
design was used with two levels for strain (C7927 and 43895), and three levels for
acidulant (hydrochloric, malic, and lactic acids). Results are summarized in Figure 4.
a D-values not sharing a common lowercase letter represent significantly different values (P < 0.05) based on post hoc multiple comparisons with a Tukey correction following a two-way ANOVA.
Figure 4. D-values determined at 56ºC in apple juice (pH 3.6) of two E. coli O157:H7
strains subjected to acid shock (AS1) in TSB with a pH of 5, adjusted by the addition of
hydrochloric, malic, and lactic acid. Error bars represent standard deviations (n = 3).a
Figure 3
O157:H7 (C7927)O157:H7 (43895)
!
!
c
b
c
a
cc
D-v
alue
(min
)
0
0.5
1.0
1.5
2.0
2.5
3.0
3.5
4.0
4.5
5.0
AcidHydrochloric Malic Lactic

52
A significant interaction (P = 0.0002) between strain and acidulant was observed after
performing a two-way ANOVA, and the resulting model showed a coefficient of
determination (r2) of 0.93. The acidulants did not alter the heat tolerance of the C7927
strain (P > 0.05) but significantly affected the 43895 strain (P < 0.05), which showed the
greatest tolerance when malic acid was used (Figure 4). Based on these results, and
considering that organic rather than inorganic acids are often used by the food industry,
and as previously recommended by Deng et al. (8), it seems that for studying the acid
tolerance of Shiga toxin-producing E. coli strains in acidic and acidified products, it
would be preferable to acidify the media by adding an organic acid with a lower strength
such as malic acid (pKa1 3.40 and pKa2 5.20), instead of an inorganic acid such as
hydrochloric acid or an organic acid with a higher pKa, for example lactic acid
(pKa1 3.86) and acetic acid (pKa 4.79), rather than malic acid.
Survival of E. coli in apple juice. The survival curves for the three Shiga toxin-
producing E. coli strains determined at room temperature and under refrigeration are
shown in Figure 5 and 6, respectively. A full factorial design was used to evaluate the
effect of strain, storage temperature, and physiological state on the survival of these
pathogenic strains in the apple juice. The experimental design included three levels for
strain: E. coli O157:H7 C7927 and ATCC 43895, as well as E. coli O111; two levels for
storage temperature: 24 ± 2ºC and 1 ± 1ºC; and four levels for physiological state:
unadapted-control, acid-shocked (induced by AS1 and AS2), and acid-adapted. The
survival response corresponds to the day when the E. coli count on each of the three
independent replicates and at each of the tested conditions, was zero. The three-way

53
ANOVA showed a significant triple interaction between strain, storage temperature, and
physiological state (P = 0.04). Therefore, the data were further analyzed by performing
two independent two-way ANOVAs for each temperature, each analysis with two
factors: strain and physiological state. The two resulting models showed coefficients of
determination (r2) of 0.89 for samples stored at room temperature, and 0.84 for the case
of refrigerated samples.
Figure 5. Survival curves for three E. coli strains at four physiological states: (A)
unadapted-control, (B) acid-adapted, (C) acid-shocked (AS1), and (D) acid-shocked
(AS2), determined in apple juice (pH 3.6) stored at room temperature (24 ± 2ºC). Error
bars represent standard deviations (n = 3).
Figure 4
E. coli O157:H7 C7927E. coli O157:H7 43895E. coli O111
A
Bac
teria
l cou
nt (l
og C
FU·m
l-1)
0123456789
Time (days)0 1 2 3 4 5 6
E. coli O157:H7 C7927E. coli O157:H7 43895E. coli O111
B
Bac
teria
l cou
nt (l
og C
FU·m
l-1)
0123456789
Time (days)0 1 2 3 4 5 6
E. coli O157:H7 C7927E. coli O157:H7 43895E. coli O111
C
Bac
teria
l cou
nt (l
og C
FU·m
l-1)
0123456789
Time (days)0 1 2 3 4 5 6
E. coli O157:H7 C7927E. coli O157:H7 43895E. coli O111
D
Bac
teria
l cou
nt (l
og C
FU·m
l-1)
0123456789
Time (days)0 1 2 3 4 5 6

54
In the case of samples stored at 24 ± 2ºC (Figure 5), a significant interaction between
strain and physiological state was found (P < 0.0001). Furthermore, the acid-shocked
E. coli O111 strain subjected to AS1 (Figure 5C) was the most resistant strain, and
survived for up to 6 days.
Figure 6. Survival curves for three E. coli strains at four physiological states: (A)
unadapted-control, (B) acid-adapted, (C) acid-shocked (AS1), and (D) acid-shocked
(AS2), determined in apple juice (pH 3.6) stored under refrigeration (1 ± 1ºC). Error bars
represent standard deviations (n = 3).
For refrigerated samples (Figure 6), the interaction between strain and physiological
state was deemed nonsignificant (P = 0.14). Thus, after removing the two-way
interaction term, results showed that both strain and physiological state had significant
Figure 5
E. coli O157:H7 C7927E. coli O157:H7 43895E. coli O111
A
Bac
teria
l cou
nt (l
og C
FU·m
l-1)
0123456789
Time (days)0 5 10 15 20 25
E. coli O157:H7 C7927E. coli O157:H7 43895E. coli O111
B
Bac
teria
l cou
nt (l
og C
FU·m
l-1)
0123456789
Time (days)0 5 10 15 20 25
E. coli O157:H7 C7927E. coli O157:H7 43895E. coli O111
C
Bac
teria
l cou
nt (l
og C
FU·m
l-1)
0123456789
Time (days)0 5 10 15 20 25
E. coli O157:H7 C7927E. coli O157:H7 43895E. coli O111
D
Bac
teria
l cou
nt (l
og C
FU·m
l-1)
0123456789
Time (days)0 5 10 15 20 25

55
effects on the survival response (P < 0.05). Furthermore, after post hoc multiple
comparisons with a Tukey correction, the E. coli O111 was found on average
significantly more resistant than the two E. coli O157:H7 strains (P < 0.05) surviving up
to 23 days, and no significant differences between the survival of both O157:H7 strains
were noted (P > 0.05) (on average, strain 43895 survived for 19 days and C7927 for 18
days). Moreover, no significant differences in the survival response were observed
between strains subjected to acid adaptation (Figure 6B) and acid shock by using the
protocol AS2 (Figure 6D). On average, the observed survival of the strains subjected to
these physiological states was significantly lower when compared with the observed
responses in the unadapted-control (Figure 6A) and acid-shocked cultures subjected to
AS1 (Figure 6C), which showed the highest survival responses.
Overall, the lowest temperature increased the survival response of the three tested
strains, confirming that as suggested by Lin et al. (12), and Miller and Caspar (17),
E. coli O157:H7 is acid tolerant and particularly tolerant at low temperatures. Previously,
Zhao et al. (27) studied the fate of unadapted E. coli O157:H7 strain C7927 (one of the
strains used on this study), and in agreement with our findings, the authors found a
significant effect of storage temperature on the survival of this pathogen in apple cider.
A survival of 10 to 31 days at 9ºC, and 2 to 3 days at 25ºC (pH 3.6 to 4.0) was
observed. However, in that study the physiological state was not included as a variable
in the experiment. In contrast, Ryu and Beuchat (20) reported a survival of E. coli
O157:H7 (E0139) in apple juice of up to 42 days at 5 and 25ºC but they did not find an
effect of the storage temperature or physiological state on the bacteria’s survival

56
response. Variations in the survival of Shiga toxin-producing E. coli strains are likely due
to differences among strains, physicochemical properties of juices (including its pH,
soluble solids, suspended insoluble solids, etc.) storage temperatures, as well as the
acid shock or acid adaptation methodology used to induce the enhanced tolerance
response to acidic environments.
Data from our study suggests that for this particular fruit juice and considering the test
strains, E. coli O157:H7 ATCC 43895 represents the most heat tolerant strain when
subjected to acid shock during 24 h in TSB acidified with malic acid, the most abundant
organic acid naturally present in apple juice. The heat treatment suggested by Mazzota
(16) and recognized by the U.S. Food and Drug Administration for acidic juices is based
on a D-value of 7 minutes at 56ºC which exceeds the greatest D-value obtained in this
experiment (D56ºC of 3.7 ± 0.3 min), thus confirming that the heat treatment currently
recommended of 3 s at 71.1ºC (z = 5.3ºC) is suitable to ensure a 5-log reduction of
E. coli O157:H7 ATCC 43895 in apple juice.
For survival studies, our results indicate that E. coli O111 should be used as the strain
of reference in apple juice, and that the survival of this pathogen is dramatically
enhanced when refrigerated conditions are used. This latter finding stresses the safety
concerns associated to acid and acidified products that are kept under refrigeration but
have not received a microbial killing step. In addition, we confirm that the variables
strain, physiological state, acidulant and time of exposure used to induce the acid shock
(main difference between AS1 and AS2 protocols) may dramatically influence the

57
thermal tolerance and survival responses of Shiga toxin-producing E. coli. Hence, for
the performance of challenge studies oriented to determine and validate critical limits for
safe processing of pH-controlled juices and similar products, process authorities and
regulatory agencies must carefully consider these experimental variables and their
potential interactions. Therefore, we recommend that the selected microorganism
should always represent the most resistant strain for the given product and under its
processing conditions. The use of three to five-strain cocktails is a practice that has
been widely extended in the design of validation studies involving E. coli and other
pathogens (1, 2, 18, 22) but for acidic and acidified products, we suggest that these
cocktails should forcefully include strains that have shown exceptional acid tolerance.
Likewise, it becomes relevant to study the effect of other variables, such as the pH of
the media used to induce the acid shock, the application of an additional cold and acid
shock treatment such as the applied in the case of AS1, as well as the concentrations of
soluble and insoluble solids in the juices, on the heat tolerance and fate of these and
other acid-tolerant pathogens.
The results reported in this study aim to facilitate the selection and standardization of
the most appropriate conditions required to performed safety validations in apple juice
and similar acidic fruit juices. This information may be used as a guideline for
determining the proper experimental conditions to conduct microbial challenge studies,
even with other food products in which different foodborne pathogens have shown
exceptional tolerance to adverse environmental conditions.

58
ACKNOWLEDGMENTS
Funding for this research was provided by the United States Department of Agriculture,
National Institute of Food and Agriculture (USDA-NIFA) grant #2009-51110-20147 and
Cornell University, College of Agriculture and Life Sciences. The authors thank John
Churey (New York State Agricultural Experiment Station, Cornell University) for his
technical assistance in the Food Microbiology Laboratory.
59
REFERENCES
1. Bjornsdottir, K., F. Breidt, Jr., and R. F. McFeeters. 2006. Protective effects of
organic acids on survival of Escherichia coli O157:H7 in acidic environments. Appl.
Environ. Microbiol. 72:660-664.
2. Breidt, F. Jr., J. Hayes, and R. F. Mcfeeters. 2007. Determination of 5-Log reduction
times for food pathogens in acidified cucumbers during storage at 10 and 25°C. J.
Food Prot. 70:2638-2641.
3. Breidt, F. Jr., K. Kay, J. Cook, J. Osborne, B. Ingham, and F. Arritt. 2013.
Determination of 5-log reduction times for Escherichia coli O157:H7, Salmonella
enterica, or Listeria monocytogenes in acidified foods with pH 3.5 or 3.8. J. Food
Prot. 76:1245–1249.
4. Buchanan, R. L., and S. G. Edelson. 1996. Culturing enterohemorrhagic Escherichia
coli in the presence and absence of glucose as a simple mean of evaluating the acid
tolerance of stationary-phase cells. Appl. Environment. Microbiol. 62:4009-4013.
5. Buchanan, R. L., and S. G. Edelson. 1998. pH-dependent stationary-phase acid
resistance response of enterohemorrhagic Escherichia coli in the presence of
various acidulants. J. Food Prot. 62:211-218.
6. Cheville, A. M., K. W. Arnold, C. Buchrieser, C.-M Cheng, and C. W. Kaspar. 1996.
rpoS regulation of acid, heat, and salt tolerance in Escherichia coli O157:H7. Appl.
Environ. Microbiol. 62:1822-1824.
7. Danyluk M. D., R. M. Goodrich-Schneider, K. R. Schneider, L. J. Harris, and R. W.
Worobo. 2012. Outbreaks of Foodborne Disease Associated with Fruit and
Vegetable Juices, 1922-2010. Available at:
60
http://edis.ifas.ufl.edu/pdffiles/FS/FS18800.pdf. Accessed 14 January 2014.
8. Deng Y., J. H. Ryu, and L. R. Beuchat. 1999. Tolerance of acid-adapted and non-
adapted Escherichia coli O157:H7 cells to reduced pH as affected by type of
acidulant. J. Appl. Microbiol. 86:203-210.
9. Enache, E., E. C. Mathusa, P. H. Elliott, D. G. Black, Y. Chen, V. N. Scott, and D. W.
Schaffner. 2011. Thermal resistance parameters for Shiga toxin-producing
Escherichia coli in apple juice. J. Food Prot. 74:1231-1237.
10. Foster, J. W. 1995. Low pH adaptation and the acid tolerance response of
Salmonella typhimurium. Crit. Rev. Microbiol. 21:215-237.
11. Hsin-Yi, C., and C-C. Chou. (2001). Acid adaptation and temperature effect on the
survival of E. coli O157:H7 in acidic fruit juice and lactic fermented milk products. Int.
J. Food Microbiol. 70:189-195.
12. Lin, J., M. P. Smith, K. C. Chapin, H. S. Baik, G. N. Bennett, and J. W. Foster. 1996.
Mechanisms of acid resistance in enterohemorrhagic Escherichia coli. Appl. Environ.
Microbiol. 62:3094–3100.
13. Lee, I. S., J. Lin, H. K. Hall, B. Bearson, and J. W. Foster.1995. The stationary-
phase sigma factor σS (Rpos) is required for a sustained acid tolerance response in
virulent Salmonella typhimurium. Mol. Microbiol. 17:155-167.
14. Leyer, G. J., L.-L. Wang, and E. Johnson. 1995. Acid adaptation of Escherichia coli
O157:H7 increases survival in acidic foods. Appl. Environ. Microbiol. 61:3752-3755.
15. Mak, P. P., B. H. Ingham, and S. C. Ingham. 2001. Validation of apple cider
pasteurization treatment against Escherichia coli O157:H7, Salmonella, and Listeria
monocytogenes. J. Food Prot. 64:1679-1689.

61
16. Mazzota A. S. 2001. Thermal inactivation of stationary-phase and acid-adapted
Escherichia coli O157:H7, Salmonella, and Listeria monocytogenes in fruit juices.
J. Food Prot. 64:315-320.
17. Miller, L. G., and C. W. Kaspar. 1994. Escherichia coli O157:H7 acid tolerance and
survival in apple cider. J. Food Prot. 57:460–464.
18. National Advisory Committee on Microbiological Criteria for Foods. 2010.
Parameters for determining inoculated pack/challenge study protocols. J. Food Prot.
73:140-202.
19. Park S., R. W. Worobo, and R. A. Durst. 2013. Escherichia coli O157:H7 as an
emerging foodborne pathogen: a literature review. Crit. Rev. Food Sc. Nutr. 39:481-
502.
20. Ryu, J. H. and L. R. Beuchat. 1998. Influence of acid tolerance responses on
survival, growth, and thermal cross-protection of Escherichia coli O157:H7 in
acidified media and fruit juices. Int. J. Food Microbiol. 45:185-193.
21. Ryu, J. H., Y. Deng, and L. R. Beuchat. 1999. Behavior of acid-adapted and
unadapted Escherichia coli O157:H7 when exposed to reduced pH achieved with
various organic acids. J. Food Prot. 62:451-455.
22. Schlesser, J. E. R. Gerdes, S. Ravishankar, K. Madsen, J. Mowbray, and A. Y. Teo.
2006. Survival of a five-strain cocktail of Escherichia coli O157:H7 during the 60-day
aging period of cheddar cheese made from unpasteurized milk. J. Food Prot.
69:990-998.
23. Sharma, M., B. B. Adler, M. D. Harrison, and L. R. Beuchat. 2005. Thermal tolerance
of acid-adapted and unadapted Salmonella, Escherichia coli O157:H7 and Listeria
62
monocytogenes in cantaloupe juice and watermelon juice. Lett. Appl. Microbiol.
41:448-453.
24. Splittstoesser, D. F., M. R. McLellan, and J. J. Churey. 1995. Heat resistance of
Escherichia coli O157:H7 in apple juice. J. Food Prot. 59:226-229.
25. Usaga, J., R. W. Worobo, and O. I. Padilla-Zakour. 2014. Thermal resistance
parameters of acid-adapted and unadapted Escherichia coli O157:H7 in Apple-
Carrot Juice Blends: Effect of Organic Acids and pH. J. Food Prot. 77:567–573.
26. Wells, J. G., B. R. Davis, I. K. Wachsmuth, L. W. Riley, R. S. Remis, R. Sokolow,
and G. K. Morris. 1983. Laboratory investigation of hemorrhagic colitis outbreak
associated with a rare Escherichia coli serotype. J. Clin. Microbiol. 18:512-520.
27. Zhao T., M. P. Doyle, and R. E. Besser. 1993. Fate of enterohemorrhagic
Escherichia coli O157:H7 in apple cider with and without preservatives. Appl.
Environment. Microbiol. 59:2526-2530.

63
CHAPTER 4
TIME AFTER APPLE PRESSING AND CONCENTRATION OF INSOLUBLE
SOLIDS INFLUENCE THE EFFICIENCY OF THE UV TREATMENT OF CLOUDY
APPLE JUICE
ABSTRACT
The effects of suspended insoluble solids (SIS) concentration and particle size, and the
time after apple pressing on the efficiency of UV treatment of cloudy apple juice were
evaluated. Clear model solutions (formulated to resemble physicochemical
characteristics of apple juice) and commercial apple juices, containing different solids
concentrations, were treated using a CiderSure 3500 reactor at 14 mJ·cm-2 UV dose.
Particle size effect was assessed on model solutions treated at UV dose of 7 mJ·cm-2.
The juice flow rate through the UV machine was determined. All samples were
inoculated with Escherichia coli ATCC 25922 (106 to 107 CFU·ml-1) and UV treated at a
fixed flow rate of 214.5 ml·s-1. Log reductions were calculated. SIS did not significantly
affect the juice flow rate (p > 0.05) but increasing SIS concentrations adversely affected
the inactivation of E. coli (p < 0.05). For solutions treated at 7 mJ·cm-2, a negative
linear relationship between SIS and flow rate was observed and particle size
significantly affected the flow rate (p < 0.05). A negative effect of time after apple
pressing on the juice flow rate was observed and this effect was found apple varietal-
dependent, thus better UV efficiency will be attained if time after pressing is minimized.

64
INTRODUCTION
Numerous outbreaks associated with the consumption of contaminated and
unpasteurized apple juice around the world (Cody et al. 1999; Danyluk et al. 2012;
Steele et al. 1982) have stressed the importance of including a microbial killing step
during the processing of these products.
In recent years, due to a global increased consumer demand for more fresh-like
beverages with enhanced nutritional properties, the application of ultraviolet (UV) light
technology, an affordable nonthermal treatment (Choi & Nielsen 2005; Keyser et al.
2008; Murakami et al. 2006), has attracted the interest of the juice and beverage
industries and in particular of small and medium size apple orchards interested in
producing clear and cloudy, refrigerated apple juices. Since 2000, the Food and Drug
Administration in the United States has recognized UV as an alternative to thermal
pasteurization of juices (FDA 2013). This treatment has been proven effective against
the pathogens of concern in apple juice including Escherichia coli O157:H7 and
Cryptosporidium parvum (Basaran et al. 2004; Hanes et al. 2002; Oteiza et al. 2005;
Quintero-Ramos et al. 2004). Moreover, the technology has shown some advantages in
comparison with traditional heat treatments including limited changes in physical,
chemical and nutritional properties of juices (Caminiti et al. 2011; Tran & Farid 2004)
and degradation of patulin in apple juice (Assatarakul et al. 2011; Dong et al. 2010).
Notwithstanding, the application of UV is restricted for certain beverages due to the
presence of compounds that increase the UV absorptivity of juices, such as colored
compounds and particulate matter, interfere with the UV light’s penetration and reduce
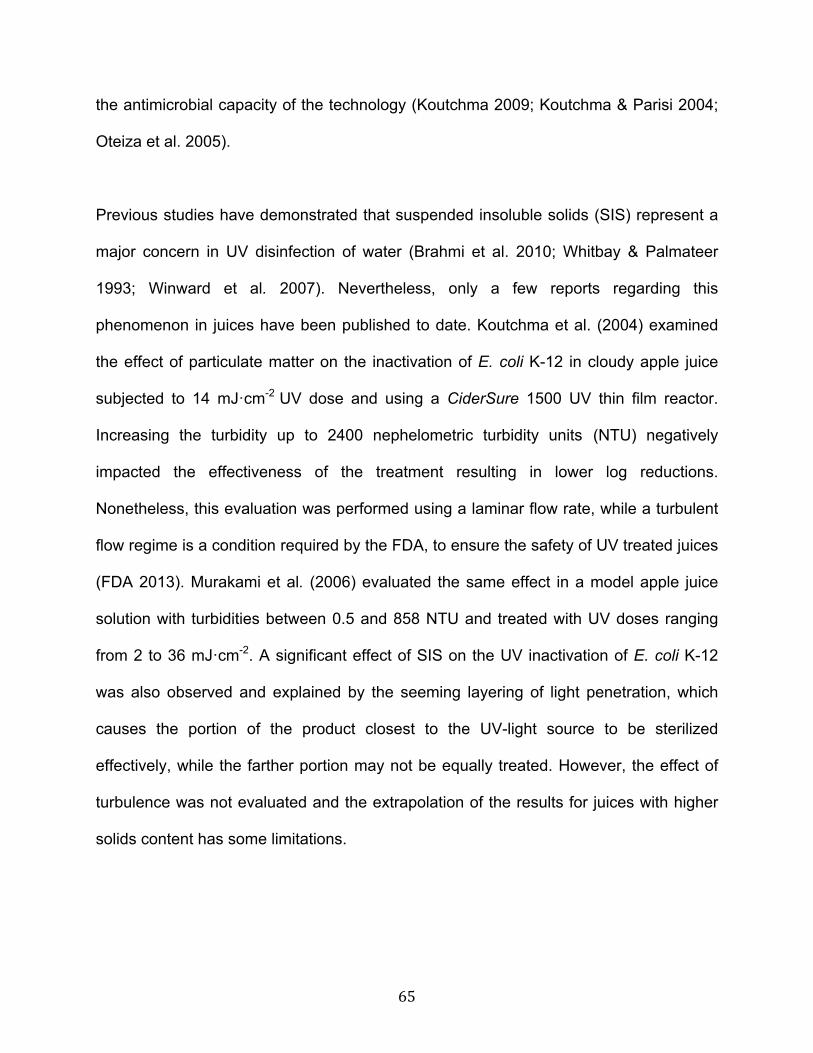
65
the antimicrobial capacity of the technology (Koutchma 2009; Koutchma & Parisi 2004;
Oteiza et al. 2005).
Previous studies have demonstrated that suspended insoluble solids (SIS) represent a
major concern in UV disinfection of water (Brahmi et al. 2010; Whitbay & Palmateer
1993; Winward et al. 2007). Nevertheless, only a few reports regarding this
phenomenon in juices have been published to date. Koutchma et al. (2004) examined
the effect of particulate matter on the inactivation of E. coli K-12 in cloudy apple juice
subjected to 14 mJ·cm-2 UV dose and using a CiderSure 1500 UV thin film reactor.
Increasing the turbidity up to 2400 nephelometric turbidity units (NTU) negatively
impacted the effectiveness of the treatment resulting in lower log reductions.
Nonetheless, this evaluation was performed using a laminar flow rate, while a turbulent
flow regime is a condition required by the FDA, to ensure the safety of UV treated juices
(FDA 2013). Murakami et al. (2006) evaluated the same effect in a model apple juice
solution with turbidities between 0.5 and 858 NTU and treated with UV doses ranging
from 2 to 36 mJ·cm-2. A significant effect of SIS on the UV inactivation of E. coli K-12
was also observed and explained by the seeming layering of light penetration, which
causes the portion of the product closest to the UV-light source to be sterilized
effectively, while the farther portion may not be equally treated. However, the effect of
turbulence was not evaluated and the extrapolation of the results for juices with higher
solids content has some limitations.
66
Similarly, very little information has been published regarding the change in color of
apple juice (browning) due to enzymatic reactions on the efficiency of UV light
treatments. Koutchma et al. (2004) studied this effect adding a colored compound to a
model solution and found that increasing the absorbance of the solution resulted in
lower inactivation levels of E. coli K-12. However, results were not related to the actual
time after apple pressing and corresponding color change during apple juice
manufacturing, and its impact on the productivity of the UV system was not assessed.
This study aims to address some of the existing gaps in the literature regarding the
influence of the presence of insoluble solids and the darkening of apple juice after apple
pressing on the effectiveness of the UV treatment of cloudy apple juice when using a
commercial-scale processing reactor. The elucidation of this information will contribute
to understand how these variables may affect the inactivation of E. coli and the
productivity of UV light systems when treating apple juice and similar liquid products.
MATERIALS AND METHODS
UV processing unit
UV treatments were carried out at a wavelength of 254 nm and at UV doses of
14 mJ·cm-2 or 7 mJ·cm-2 accordingly. Treatments were performed using a CiderSure
3500 commercial UV juice-processing unit (FPE Inc., Rochester, USA), which
comprises a stainless steel housing and an inner quartz tube. Beverages are pumped
through the system using a positive displacement pump and exposed to eight or four
low-pressure mercury lamps depending on the selected UV dose (Quintero-Ramos et

67
al. 2004). This machine has two settings: “fixed UV dose” and “fixed flow rate” and is
equipped with two UV light sensors (at the bottom and top of the outer cylinder) that
measure the UV transmittance through the juice every 50 ms. Based on those
measurements, when the apparatus is working under the “fixed UV dose” mode, it has
been programmed to automatically adjust the pump flow rate ensuring a constant UV
dose exposure of 14 mJ·cm-2 or 7 mJ·cm-2. For fluids with high UV absorption the flow
rate of the liquid through the system is automatically slowed down, while for products
with a lower absorption the flow rate is increased, so that the selected UV dose is
consistently delivered to the product. In compliance with FDA regulations (FDA 2013), a
turbulent flow regime (Re > 2200) was used at all tested conditions, and as an indicator
of productivity, the flow rate of the juice through the UV unit was measured as the time
required for processing a known volume of liquid.
Effect of SIS concentration
Two independent batches of freshly produced, non-pasteurized cloudy apple juice,
which did not contain any preservatives or other additives, were purchased locally
(Geneva, USA) and stored at 2 °C until used. Apple solids, as a slurry, were isolated
during the screening step from the same processing line that produced the apple juice,
and stored at 2 °C. Prior to use, apple solids were homogenized with a high shear mixer
(model HSM-100 LSK, Charles Ross & Son Company, Hauppauge, USA). Solids were
treated for 2 min with a disintegrating screen stator head, and 2 min with a slotted
screen rotor head, at the maximum agitation speed of 10000 rpm.

68
Homogenized apple solids were added to the first batch of juice at different
concentrations resulting in five solutions with turbidities from 1300 to 1700 NTU (refer
as low turbidity apple juice) and to the second batch of apple juice obtaining six different
solutions with turbidities from 1500 to 2800 NTU (refer as high turbidity apple juice).
A clear model solution was used to isolate the effect of the SIS concentration on the
flow rate from the effect of the sample UV absorption due to the presence of colored
compounds. Model solution was formulated considering the average chemical
composition and physicochemical properties of cloudy apple juice reported by
Markowski et al. (2009) and Piyasena et al. (2002). The composition of the solution is
given in Table 6.
Table 6. Composition of the model apple juice solution used to assess the effects of
concentration of SIS and SIS particle size on UV efficiency.
Component Content (%) Supplier
Distilled water 87.605 Available at the processing site
D-Fructose 6.147 Fisher Scientific (Fair Lawn, NJ)
Sucrose 3.242 Fisher Scientific (Fair Lawn, NJ)
D-Glucose 2.003 Fisher Scientific (Fair Lawn, NJ)
Malic acid 0.648 Presque Isle Wine Cellars (North East, PA)
Anhydrous sodium acetate 0.285 Mallinckrodt, Inc. (Paris, KY)
High methoxyl pectin 0.059 TIC Gums (Belcamp, NY)
Citric acid monohydrate 0.009 J.T. Baker Chemical Co. (Phillipsburg, NY)
Ascorbic acid 0.002 Growers Co-op Grape Juice Co. (Westfield, NY)

69
Apple solids added to the model solution were extracted at 1800 rpm using a turbo
extractor for cold processing of apples, series CX 5 (Bertocchi SRL, Parma, Italy),
equipped with a 1.5 mm screen, and immediately pasteurized at 96.6 °C for 6 minutes
to prevent enzymatic browning. Solids were added to model solution resulting in six
solutions with turbidities ranging from 3 to 1600 NTU. Apple juice and model solutions
were treated at room temperature at a fixed UV dose of 14 mJ·cm-2 and the flow rate
was determined. Processing trials were performed in triplicate.
To evaluate the effect of SIS on the inactivation of E. coli ATCC 25922, a non-
pathogenic surrogate that has shown similar UV sensitivity to E. coli O157:H7
(Quintero-Ramos et al. 2004), the apple juice and model solutions used to evaluate the
effect of SIS on flow rate were bottled and stored at 2 °C for up to 24 hours. Samples
were inoculated and analyzed as indicated in the microbiological analysis section.
Inoculated samples were UV treated using the “fixed flow rate” setting to avoid the
automatic flow rate adjustment, thus UV exposure was variable depending on the
sample’s UV absorptivity. A fixed flow rate of approximately 214.5 ml·s-1 was used as it
corresponds to the maximum pumping capacity of the CiderSure UV unit and therefore
the minimum time of UV exposure achievable on this machine.
Effect of SIS particle size
Since no significant effect of SIS on the flow rate was observed at 14 mJ·cm-2 UV dose,
the same effect was evaluated at a reduced dose of 7 mJ·cm-2 that still guarantees a
turbulent flow regime. A clear model solution (Table 6) and apple solids with two

70
different average particle sizes were used to assess the effects of SIS concentration
and particle size on the flow rate of the solution through the UV unit. Apple solids
(average diameter of 895 µm) were obtained using a turbo extractor, following the
procedure indicated above in the “Effect of SIS concentration” section. A second batch
of solids, with a smaller average diameter (199 µm), was obtained by the same method
but using a 0.4 mm screen. Solids were treated with steam at 99 ºC for 5 minutes, and a
second homogenization step was carried out for 2 minutes with a high shear mixer
model HSM-100 LSK (Charles Ross & Son Company, Hauppauge, USA) equipped with
a high shear rotor/stator attachment. Solids were treated for additional 2 minutes with a
fine screen stator head at 10000 rpm.
Apple solids, as slurries (with two different average particle sizes), were added to two
independent model solutions resulting in turbidities from 4 to 500 NTU. The flow rate of
the solution through the reactor was determined. After treated, samples were bottled
and stored at 2 °C for up to 24 hours. Model solutions were then inoculated with E. coli
ATCC 25922 and UV treated at a fixed flow rate of 214.5 ml·s-1. All treatments were
executed in triplicate. Inoculation and analysis were performed as indicated in the
microbiological analysis section.
Effect of time after apple pressing
Cloudy apple juice was prepared from three apple varietals: Jonagold, Golden Delicious
and Rhode Island Greening. Apples were washed and passed through a comminuting
machine (The W.J. Fitzpatrick Company, Chicago, USA), and immediately pressed in a

71
hydraulic rack-and-frame press for juice extraction. The resulting juice was treated at
14 mJ·cm-2 fixed UV dose after 0 to 120 min of apple pressing (10 to 20 min intervals).
The flow rate and color of the juice were measured at each sampling time. The juice
color was determined using the L’, a’ and b’ Hunter color parameters, and the total color
difference (ΔE) was calculated at each sampling time using the following equation:
Δ𝐸 = Δ𝐿!" − Δ𝑎!! + Δ𝑏′!
After 120 min of apple pressing, juices were inoculated with E. coli ATCC 25922 and
treated at 14 mJ·cm-2. Treatments were performed in triplicate.
Physicochemical analyses
pH was measured using an Accumet Basic AB15 pH meter (Fisher Scientific,
Pittsburgh, USA). Soluble solids content (degree Brix), were measured using a Leica
Auto Abbe refractometer model 10500-802 (Leica Inc., Buffalo, USA). Titratable acidity
(expressed as percentage of malic acid) was determined with a G20 compact titrator
(Mettler Toledo, Schwerzenbach, Switzerland). Particle size distribution of apple solids
was determined using a laser diffraction particle size analyzer Mastersizer 2000
(Malvern instruments, Worcestershire, UK). SIS concentration was estimated as
percentage spin solids (Vaillant et al. 2008) by centrifuging 10 ml of pre-weighed
homogenized sample at 2200 g for 15 min and draining the liquid.
Turbidity was measured using a HACH 2100P turbidimeter (Hach Company, Loveland,
USA). A Hunter UltraScan XE spectrocolorimeter (Hunter Lab Assoc., Reston, USA)
was used to measure color values L’, a’, and b’. The samples absorption coefficients (α)

72
were determined following the protocol reported by Koutchma et al. (2004), where α
corresponds to the slope of the absorbance against the path length. After a 10-fold
dilution in distilled water, samples absorbance was measured at 254 mm using a UV
1800 spectrophotometer (Shimadzu Scientific Instruments, Columbia, USA) equipped
with demountable fused quartz cuvettes (NSG Precision Cells, Inc., Farmingdale, USA)
of 0.1, 0.2, 0.5 and 1.0 mm path lengths. Moisture content of apple solids was
determined with a moisture analyzer model MX-50 (A&D Co. Ltd., Tokyo, Japan).
Microbiological analysis
Quantification of E. coli was performed as reported by Basaran et al. (2004). E. coli
ATCC 25922 (clinical isolate from the American Type Culture Collection) was obtained
from the Food Microbiology Laboratory at the New York State Agricultural Experimental
Station (Geneva, USA). A single isolated colony was transferred into 10 ml of Trypticase
soy broth (TSB) (Difco, Becton Dickinson, Sparks, USA) and incubated for 5 ± 1 h at
35 ± 2 °C. The inoculated TSB was transferred into 400 ml of TSB and incubated for
20 ± 2 h at 35 ± 2 °C (to stationary phase) on a rotary platform shaker, at 250 rpm. Prior
to UV treatment, approximately 1.8 l of each juice or model solution was inoculated with
a 20 ml aliquot of E. coli suspension, resulting in an initial population of 106 to
107 CFU·ml-1. Inoculated solutions were aseptically sampled before and after UV
processing and poured-plated by duplicate using Trypticase soy agar (TSA). After
incubation (20 ± 2 h at 35 ± 2 °C), colonies were counted and replicate counts were
averaged. Microbial reduction was calculated as log (N/No) where N refers to the after
treatment count and No to the initial count (CFU·ml-1).

73
Statistical analyses
Linear regression analysis was used to evaluate the relationships between turbidity and
spin solids and among the SIS concentration and flow rate of apple juice and model
solutions. Analysis of variance (ANOVA) was used to test differences between mean
flow rates and inactivation of E. coli within the five low turbidity apple juices, among the
six high turbidity juices and within the model solutions. The same statistical analysis
was used to compare the effect of turbidity level (low or high) on the juice flow rate and
inactivation of E. coli. Means were further compared using Tukey’s test. A multiple linear
regression analysis was applied to assess the effect of SIS concentration and particle
size on the flow rate of model solutions treated at 7 mJ·cm-2 UV dose. An interaction
term between average particle size and turbidity was included to identify the effect of
turbidity on the flow rate at different particle sizes. Statistical analyses were performed
using JMP® version 11 (SAS Institute, Cary, USA). Differences were considered
significant when p < 0.05.
RESULTS AND DISCUSSION
Relationship between turbidity and spin solids in cloudy apple juice
The SIS concentration was determined using two methods: turbidity and spin solids
estimation. For apple juices with turbidities ranging from 1300 to 3200 NTU, a linear
relationship (r2 = 0.93) between the two measurements was found (Figure 7). Vaillant et
al. (2008) reported that the relationship among these variables for different fruit juices
(banana, pineapple, and blackberry) is slightly non-linear and can be expressed by a
power law type equation. However, in that study the authors evaluated a wider range of

74
turbidities and reported equations with exponents lower than 1.5. Thus, considering the
selected range of turbidity in our study, which comprises the typical turbidity values for
commercial cloudy apple juice (Koutchma et al. 2004), the results obtained might
represent a linear section of the curvilinear trend mentioned above. Bearing in mind that
turbidity assessments allow getting immediate results, and that small variations in SIS
content result in much higher variation in turbidity values, which makes the turbidity
measurement more accurate in comparison with the spin solids estimation (Vaillant et
al. 2008), turbidity was chosen as the preferred method to express the SIS
concentration in the apple juice and model solutions for this study.
Figure 7. Turbidity as a function of spin solids concentration in cloudy apple juice.
!Spin solids (g·l-1)
0 100 200 300 400 500
Turb
idity
(NTU
)
0
1000
2000
3000
4000
Turbidity = 4.8 · Spin solids + 1251.2R2 = 0.9265

75
Effect of SIS concentration
Physicochemical characterization of apple juice, model solution and apple solids are
shown in Tables 7 and 8. When apple juice (six different juice samples with turbidities
ranging between 3.8 ± 0.3 to 1612 ± 121 NTU) were treated at a fixed UV dose of
14 mJ·cm-2, the SIS concentration, in terms of turbidity, did not show a significant effect
(p > 0.05) on the juice flow rate through the CiderSure (178 ± 13 ml·s-1). Moreover,
when the treatment was applied under a “fixed flow rate”, no significant differences
(p > 0.05) on the log reduction of E. coli were observed (mean log reduction of
6.7 ± 0.3). Likewise, turbidity did not significantly affect (p > 0.05) the juice flow rate and
inactivation of E. coli when the five low turbidity apple juices (from 1388 ± 12 to 1684 ±
45 NTU) were compared against each other, and within the six tested high turbidity
apple juices (from 1526 ± 106 to 2800 ± 45 NTU). Average flow rates and log reductions
in low and high turbidity apple juices are shown in Table 4. Nonetheless, when high and
low turbidity apple juices were compared against each other, even though nonsignificant
changes on the average flow rate were observed (p > 0.05), a significant difference in
the mean log reductions of E. coli was found (p < 0.05) (Table 9). These differences are
explained by the fact that, as reported by Parker & Darby (1995), higher concentrations
of particulate matter cause a shielding effect for microorganisms limiting the
effectiveness of the UV light technology. Moreover, solids could also absorb part of the
UV light energy applied to the product and therefore reduce the amount of energy
available for the inactivation of microorganisms (Murakami et al 2006).

76
Table 7. Physicochemical characterization of the liquid substrates used to evaluate the effect of SIS on the product flow
rate and microbial inactivation of E. coli using UV treatment (mean ± standard deviations, n = 3).
Sample pH Soluble solids
(ºBrix)
Titratable acidity
(g malic acid·100 g-1)
Color Turbidity
(NTU)
Absorption
coefficient
(mm-1) L’ a' b'
Apple juice (low turbidity) 3.79 ± 0.01 12.29 ± 0.01 0.360 ± 0.001 30.01 ± 0.01 0.6 ± 0.1 2.7 ± 0.1 1381 ± 12 2.14 ± 0.07
Apple juice (high turbidity) 3.84 ± 0.04 13.6 ± 0.2 0.320 ± 0.001 28.0 ± 0.2 0.8 ± 0.2 3.37 ± 0.08 1526 ± 106 2.19 ± 0.04
Model solution 3.56 ± 0.01 11.28 ± 0.01 0.649 ± 0.002 43.16 ± 0.06 -0.65 ± 0.01 0.28 ± 0.02 3.80 ± 0.03 0.08 ± 0.02
Table 8. Physicochemical characterization of the apple solids used to evaluate the effect of SIS on the product flow rates
and microbial inactivation of E. coli during UV treatment (mean ± standard deviations, n = 3).
Sample pH Soluble solids
(ºBrix)
Moisture
content (%)
Average particle
diameter (µm)
Apple solids (low turbidity apple juice) 3.85 ± 0.03 11.5 ± 0.3 85 ± 1 417 ± 7
Apple solids (high turbidity apple juice) 3.78 ± 0.03 13.80 ± 0.02 85.1 ± 0.3 325 ± 2
Apple solids (model solution) 3.81 ± 0.01 12.43 ± 0.01 85.8 ± 0.2 905 ± 9

77
Table 9. Average flow rates and log reductions of E. coli ATCC 25922 for low and high
turbidity apple juices treated with UV (mean ± standard deviations, n = 3).a
Sample Average flow rate (ml·s-1) Average log reduction
Apple juice (low turbidity) 64 ± 6a 5.55 ± 0.04b
Apple juice (high turbidity) 69 ± 7a 4.8 ± 0.7a
a Means with the same letter within the same column are not significantly different (Tukey’s test p > 0.05).
Expected differences between the mean flow rates of apple juice and model solutions
were observed and can be explained by the disparities in the apparent absorption
coefficients of the samples (Table 9), confirming that UV light transmission through
liquid food products decreases with increasing UV absorbance (Koutchma et al. 2004;
Sharma 1992; Sommer et al. 1995).
Effect of SIS particle size
In model solutions treated at 7 mJ·cm-2 UV dose, a negative linear relationship between
turbidity and flow rate was found (Figure 8). This effect was observed in the two
independent batches of model solutions, where apple solids with two different average
particle sizes were added. A significant interaction between average particle size and
turbidity was also observed (p < 0.05). Therefore, particle size has a significant effect on
the flow rate when turbidity changes. Furthermore, increments in turbidity due to the
addition of larger particles caused a more pronounced decrease on the flow rate as
compared to model solutions where smaller particles were added (Figure 8). For clear
solutions containing the larger solids (average particle diameter of 895 µm), increments

78
in the concentration of SIS explained about 98% of the total linear reduction in the flow
rate whereas for solutions containing smaller solids (average particle diameter of
199 µm) the coefficient of determination was 87%.
Figure 8. Flow rate as a function of turbidity of model solutions with added apple solids
with two different average particle diameters (895 µm and 199 µm), and treated at
7 mJ·cm-2 fixed UV dose.
Considering that the most adverse effect of solids on flow rate was observe in presence
of larger particles, the log inactivation of E. coli was tested in those samples and,
regardless of the solids concentration, a greater than 5-log reduction of E. coli was
achieved when the treatment was applied using the “fixed flow rate” mode. No
significant differences (p > 0.05) in the log reduction were found (average log reduction
of 6.4 ± 0.5). These results suggest that despite the presence of larger particles, the
turbulent flow regime used at all tested conditions (Reynolds numbers between 3000 to
!Turbidity (NTU)
0 100 200 300 400 500 600
Flow
rat
e (m
l·s-1
)
100
110
120
130
140
150
160
170
895 µm199 µm
Flow rate = -0.08 · Turbidity + 160.44R2 = 0.9805
Flow rate = -0.06 · Turbidity + 143.78R2 = 0.8743

79
4000) ensured a uniform distribution of the UV light during the application of the
treatment.
Effect of time after apple pressing
The characterization of apple juices used to evaluate the effect of time after apple
pressing is shown in Table 10. An attempt was made to record the absorption
coefficient (α) of juices at each sampling time but the method was slow enough that
samples were already browned when measured. Therefore, the total change in color
(ΔE) based on the Hunter color parameters was calculated (Table 11). For Jonagold
juice, an important reduction in the flow rate of about 17% (from 197 ± 6 ml·s-1 to
162 ± 7 ml·s-1) was found within the first 60 minutes after apple pressing. Afterwards, no
apparent differences were observed on the flow rate, which on average was
160 ± 6 ml·s-1 (Figure 9). A similar, but not as strong, effect was observed for the Rhode
Island Greening and Golden Delicious varietals (Figure 9).
A multiple linear regression analysis showed that a linear relationship between time
after pressing, after a natural log transformation, and flow rate was found for every
varietal. A significant interaction between varietal and time was also observed
(p < 0.05). The decreasing trend of the flow rate was more pronounced for Jonagold,
followed by Golden Delicious and less marked for the Rhode Island Greening varietal.
Moreover, the initial flow rates of each varietal differed significantly (p < 0.05) in the
same order: highest for Jonagold and lowest for Rhode Island Greening. These
differences can be explained by the observed disparities in the initial turbidity of the
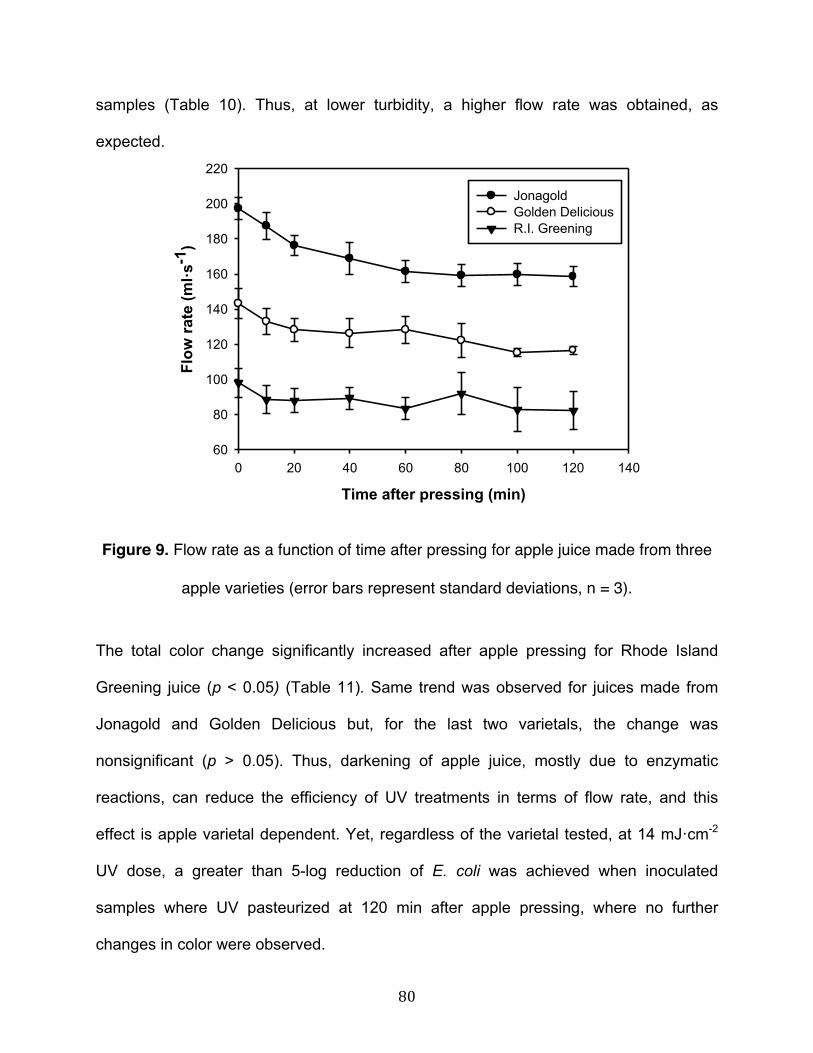
80
samples (Table 10). Thus, at lower turbidity, a higher flow rate was obtained, as
expected.
Figure 9. Flow rate as a function of time after pressing for apple juice made from three
apple varieties (error bars represent standard deviations, n = 3).
The total color change significantly increased after apple pressing for Rhode Island
Greening juice (p < 0.05) (Table 11). Same trend was observed for juices made from
Jonagold and Golden Delicious but, for the last two varietals, the change was
nonsignificant (p > 0.05). Thus, darkening of apple juice, mostly due to enzymatic
reactions, can reduce the efficiency of UV treatments in terms of flow rate, and this
effect is apple varietal dependent. Yet, regardless of the varietal tested, at 14 mJ·cm-2
UV dose, a greater than 5-log reduction of E. coli was achieved when inoculated
samples where UV pasteurized at 120 min after apple pressing, where no further
changes in color were observed.
!Time after pressing (min)
0 20 40 60 80 100 120 140
Flow
rat
e (m
l·s-1
)
60
80
100
120
140
160
180
200
220
JonagoldGolden DeliciousR.I. Greening

81
Table 10. Physicochemical characterization of the apple juices used to evaluate the effect of time after apple pressing on
the flow rate and microbial inactivation of E. coli by UV treatment (mean ± standard deviations, n = 3).
Apple variety pH Soluble solids
(°) Brix
Titratable acidity
(g malic acid/100 g)
Turbidity
(NTU)
Color
L’ a' b'
Jonagold 3.59 ± 0.07 11.7 ± 0.4 0.45 ± 0.02 628 ± 61 28.7 ± 0.2 0.0 ± 0.1 0.04 ± 0.08
Golden Delicious 3.39 ± 0.02 11.6 ± 0.4 0.24 ± 0.08 872 ± 53 29.3 ± 0.1 0.7 ± 0.6 1.4 ± 0.6
Rhode Island Greening 3.43 ± 0.05 12.6 ± 0.1 0.70 ± 0.04 1400 ± 90 29.4 ± 0.5 0.3 ± 0.1 1.1 ± 0.2
Table 11. Total change in color for the varietal apple juices used to evaluate the effect of time after apple pressing on the
juice flow rate through the UV unit (mean ± standard deviations, n = 3).
Time after pressing (min) Total change in color (ΔE)
Jonagold Golden Delicious Rhode Island Greening
10 2 ± 1 0.5 ± 0.7 1.05 ± 0.08
20 2 ± 1 0.6 ± 0.6 1.2 ± 0.08
40 2.0 ± 0.7 0.8 ± 0.6 1.4 ± 0.1
80 2.3 ± 0.3 0.9 ± 0.5 1.6 ± 0.2
80 2.3 ± 0.2 0.9 ± 0.5 1.8 ± 0.1
100 2.2 ± 0.3 0.9 ± 0.5 1.9 ± 0.08
120 2.2 ± 0.3 1.0 ± 0.5 1.9 ± 0.08

82
CONCLUSIONS
Although a greater than 5-log reduction of E. coli was achieved under all tested
conditions, considering the observed negative effects of increasing the SIS
concentration and particle size in UV-treated cloudy apple juice, special considerations
must be given to these variables when this nonthermal technology is used for treating
this and similar liquid food products. Furthermore, since increasing the time after apple
pressing was associated with lower juice flow rates; coupling the juice extraction system
with the UV reactor would be recommended to minimize this undesirable effect.
However factors such as the juice extraction system, production volume, and blend of
apple varieties should be considered before the implementation of this strategy.
The results obtained in this study will assist current producers of UV-treated apple juice
and similar liquid food products to understand how turbidity, particle size of SIS, and
time after apple pressing may influence the productivity of UV systems when using a
commercial-scale processing reactor such as the CiderSure. Our findings may also
assist process developers and researchers to optimize the application of this
nonthermal technology and to design new UV-based processes for products containing
an important amount of particulate matter and colored compounds.
ACKNOWLEDGEMENTS
This research was funded by the United States Department of Agriculture, National
Institute of Food and Agriculture (USDA-NIFA) grant # 2010-51110-21511, by Fulbright
International Exchange Program, and Cornell University, College of Agriculture and Life
Sciences.
83
REFERENCES
Assatarakul, K., Churey, J., Manns, D. & Worobo, R. (2011). Patulin reduction in apple
juice from concentrate by UV radiation and comparison of kinetic degradation models
between apple juice and apple cider. Journal of Food Protection, 75, 717-24.
Basaran, N., Quintero-Ramos, A., Moake, M. M., Churey, J. J. & Worobo, R.W. (2004).
Influence of apple cultivars on inactivation of different strains of Escherichia coli O157:
H7 in apple cider by UV irradiation. Applied Environmental Microbiology, 70, 6061-65.
Brahmi, M., Belhadi, N. H, Hamdi, H. & Hassen A. (2010). Modeling of secondary
treated wastewater disinfection by UV irradiation: effects of suspended solids content.
Journal of Environmental Science, 22, 1218-24.
Caminiti, I. M., Noci, F., Munoz, A., Whyte, P., Morgan, D. J., Cronin, D. A. & Lyng, J. G.
(2011). Impact of selected combinations of non-thermal processing technologies on the
quality of an apple and cranberry juice blend. Food Chemistry, 124, 1387-92.
Choi, L. & Nielsen, S. (2005). The effects of thermal and nonthermal processing
methods on apple cider quality and consumer acceptability. Journal of Food Quality, 28,
13–29.
Cody, S. H., Glynn, M. K., Farrar, J. A., Cairns, K. L., Griffin, P. M., Kobayashi, J., Fyfe,
M., Hoffman R., King, A. S., Lewis, J. H., Swaminathan, B., Bryant, R. G. & Vugia, D. J.

84
(1999). An outbreak of Escherichia coli O157:H7 infection from unpasteurized
commercial apple juice. Annals of Internal Medicine, 130, 202-9.
Danyluk, M. D., Goodrich-Schneider, R. M., Schneider, K. R., Harris, L. J., & Worobo R.
W. (2012). Outbreaks of Foodborne Disease Associated with Fruit and Vegetable
Juices, 1922-2010. Available at: http://edis.ifas.ufl.edu/pdffiles/FS/FS18800.pdf.
Accessed 2014 May 15.
Dong, Q. F., Manns, D. C., Feng, G. P., Yue, T. L., Churey, J. J. & Worobo, R. W.
(2010). Reduction of patulin in apple cider by UV radiation. Journal of Food Protection,
73, 69-74.
Hanes, D. E., Worobo, R. W., Orlandi, D. H., Burr, M. D., Miliotis, M. G., Robi, J. W.,
Bier, G. J., Arrowood, M. J., Churey, J. J. & Jackson, G. J. (2002). Inactivation of
Crytosporidium parvum oocysts in fresh apple cider using ultraviolet irradiation. Applied
Environmental Microbiology, 68, 4168–72.
Keyser, M., Muller, I. A., Cilliers, F. P., Nel, W., & Gouws, P.A. (2008). Ultraviolet
radiation as a non-thermal treatment for the inactivation of microorganisms in fruit juice.
Innovative Food Science and Emerging Technologies, 9, 348-54.
Koutchma, T. (2009). Advances in ultraviolet light technology for non-thermal
processing of liquid foods. Food and Bioprocess Technology, 2, 138-55.

85
Koutchma, T., Keller, S., Chirtel, S. & Parisi, B. (2004). Ultraviolet disinfection of juice
products in laminar and turbulent flow reactors. Innovative Food Science and Emerging
Technologies, 5, 179-89.
Koutchma, T. & Parisi, B. (2004). Biodosimetry of Escherichia coli UV inactivation in
model juices with regard to dose distribution in annular UV reactors. Journal of Food
Science, 69, 14-22.
Markowski, J., Baron, A., Mieszczakowska, M. & Płocharski, W. (2009). Chemical
composition of French and Polish cloudy apple juices. Journal of Horticultural Science
and Biotechnology, ISAFRUIT Special Issue, 68–74.
Murakami, E., Jackson, L., Madsen, K. & Schickedanz, B. (2006). Factors affecting the
ultraviolet inactivation of Escherichia coli K12 in apple juice and model system. Journal
of Food Processing Engineering, 29, 53-71.
Oteiza, J. M., Peltzer, M., Gannuzzi, L. & Zaritzky, N. (2005). Antimicrobial efficacy of
UV radiation on Escherichia coli O157: H7 (EDL 933) in fruit juices of different
absorptivities. Journal of Food Protection, 68, 49-58.
Parker, J. & Darby, J. (1995). Particle-associated coliform in secondary effluents:
shielding from ultraviolet light disinfection. Water Environment Research, 67, 1065-75.

86
Piyasena, P., Rayner, M., Bartlett, F. M., Lu, X. & McKellar, R. C. (2002).
Characterization of apples and apple cider produced by a Guelph area orchard.
LWT - Food Science and Technology, 35, 367–72.
Quintero-Ramos, A., Churey, J. J., Hartman, P., Barnard, J. & Worobo, R. W. (2004).
Modeling of Escherichia coli inactivation by UV irradiation at different pH values in apple
cider. Journal of Food Protection, 67, 1153-56.
Sharma, G. (1992). Ultraviolet irradiation apparatus for disinfecting liquids of high
ultraviolet absorptivities. Letters in Applied Microbiology, 15, 69-72.
Sommer, R., Cabaj, A., Schoenen, D., Gebel, J., Kolch, A., Havelaar, A. & Schets F.
(1995). Comparison of three laboratory devices for UV-inactivation of microorganism.
Water Science and Technology, 31, 147-56.
Steele, B. T., Murphy, N., Arbus, G. S., & Rance, C. P. (1982). An outbreak of hemolytic
uremic syndrome associated with ingestion of fresh apple juice. The Journal of
Pediatrics, 101, 963-65.
Tran, M. T. T. & Farid, M. (2004). Ultraviolet treatment of orange juice. Innovative Food
Science and Emerging Technologies, 5, 495-502.

87
U.S. Food And Drug Administration (FDA). (2013). Code of Federal Regulation (CFR).
Tittle 21. Chapter I. Subchapter B. Part 179. Section 179.39. Ultraviolet radiation for the
processing and treatment of food. Available at
http://www.accessdata.fda.gov/scripts/cdrh/cfdocs/cfcfr/CFRSearch.cfm?fr=179.39.
Accessed 2014 May 30.
Vaillant, F., Perez, A. M., Acosta, O. & Dornier, M. (2008). Turbidity of pulpy fruit juice: a
key factor for predicting cross-flow microfiltration performance. Journal of Membrane
Science, 325, 404-12.
Whitbay, G. E. & Palmateer, G. (1993). The effect of UV transmission, suspended
solids, and photoreaction on microorganism in wastewater treated with UV light. Water
Science and Technology, 27, 379-86.
Winward, G. P., Avery, L. M., Stephenson, T. & Jefferson, B. (2007). Ultraviolet (UV)
disinfection of grey water: particle size effects. Environmental Technology, 29, 235-44.

88
CHAPTER 5
EFFECT OF ASCORBIC ACID AND SELECTED PRESERVATIVES ON THE
EFFICIENCY OF ULTRAVIOLET TREATMENT OF APPLE JUICE AT A FIXED UV
DOSE OF 14 mJ·cm-2
ABSTRACT
The efficiency of UV pasteurization of apple juice containing selected additives was
evaluated. Ascorbic acid, total vitamin C, sodium benzoate, potassium sorbate, and
sulfur dioxide concentrations as well as juices’ absorption coefficients were measured
before and after UV at a fixed dose of 14 mJ·cm-2. The juice flow rate through the UV
reactor was determined. UV treated samples containing ascorbic acid and inoculated
with Escherichia coli ATCC 25922 (107 CFU·ml-1) were analyzed for microbial reduction.
Adding ascorbic acid, sorbate, and benzoate significantly increased juice absorption
coefficients and decreased flow rate (p < 0.05). UV showed no effect on total vitamin C
and benzoate concentrations (p > 0.05) but negatively affected sulfur dioxide, ascorbic
acid, and particularly sorbate levels (p < 0.05). Increases in ascorbic acid
concentrations decreased E. coli inactivation (p < 0.0001). Thus, additives that
adversely influence UV efficiency or are degraded should be added after treatment.
INTRODUCTION
Since the recognition of ultraviolet (UV) light treatment as an alternative for the thermal
pasteurization of beverages (FDA, 2013a), this technology has become a viable
nonthermal processing option for these products. The high efficiency of pathogen

89
reduction (Basaran et al., 2004; Hanes et al., 2002; Oteiza et al., 2005; Oteiza et al.,
2010; Quintero-Ramos et al., 2004), and the reduced loss of nutritional components
accompanied by fewer unwanted physical and chemical changes (Caminiti et al., 2010;
Tran and Farid, 2004) are some of the advantages that have attracted the attention of
consumers, producers, and researchers towards this technology. However, previous
studies have suggested that UV applications might be limited for treating selected
beverages due to the presence of compounds that strongly absorb UV light (Koutchma
et al., 2004; Koutchma et al., 2007; Oteiza et al., 2005).
Research has shown that vitamin C, a naturally occurring and commonly added nutrient
in juices, may dramatically decrease UV light effectiveness in different fruit juices by
diminishing the inactivation rates of certain microorganisms such as E. coli (Koutchma
et al., 2004; Koutchma, 2008; Oteiza et al., 2005). Furthermore, this light-sensitive
nutrient might be severely degraded during UV pasteurization. Koutchma et al. (2002)
reported a destruction of vitamin C ranging from 30 to 40% when apple juice was
exposed to a 600 mJ·cm-2 UV dose, and when exposed to a similar UV dosage, a
degradation of 18% and 25% in orange and carrot juices, respectively. Similarly, Tran
and Farid (2004) revealed a vitamin C concentration decline of 17% in orange juice
treated with a 100 mJ·cm-2 UV dose. Contradictorily, no significant difference in
ascorbic acid concentration was found when apple cider was treated for seven
consecutive passes (accumulative UV dose of 98 mJ·cm-2) using a commercial UV
apparatus, under a turbulent flow regime, and at a 14 mJ·cm-2 UV dose per pass
(Assatarakul et al., 2011; Dong et al., 2010).

90
The addition of other additives such as preservatives is also thought to increase the
absorptivity of beverages and consequently limit the performance of UV. Nevertheless,
no published information regarding this effect in juices is currently available.
Considering that UV treated beverages are not shelf-stable products, and that the
addition of preservatives represents a viable hurdle approach to preserve their quality
and ensure an extended shelf life, it becomes relevant to evaluate if these compounds
may adversely affect the efficiency of this treatment. Furthermore, in the particular case
of potassium sorbate, a preservative commonly used in juices and beverages, Cigić et
al. (2001) previously found that, in water, this additive isomerizes under UV radiation
after a 20 minute exposure to a 50 W high-pressure mercury lamp, and that the
resultant mixture of isomers had lower antimicrobial activity than the original trans-trans
isomer. However, this phenomenon has not been studied in UV treated juices or using
commercial UV juice processing units.
Considering the relevance of understanding the effect of certain food additives on the
productivity and efficiency of UV processing systems, and the potential influence of UV
radiation on the stability of those compounds, the present study sought to evaluate both
effects in apple juice containing ascorbic acid, as well as sodium benzoate, potassium
sorbate, and sulfur dioxide, the most common antimicrobials used for fresh juice
preservation (Basaran-Akgul et al., 2009).

91
2. MATERIALS AND METHODS
2.1 Reagents
1,4 dithiothreitol (DTT) was purchased from J.T. Baker (Center Valley, PA). L (+)
ascorbic acid, stabilized metaphosphoric acid (MPA), high performance liquid
chromatography (HPLC) grade acetonitrile, monobasic potassium phosphate,
phosphoric acid, sodium benzoate, potassium sorbate, and sulfuric acid were obtained
from Fisher Scientific (Fair Lawn, NJ). Trypticase soy broth (TSB) was purchased from
Difco, Becton Dickinson (Sparks, MD).
2.2 Apple juice
Locally purchased apple juice concentrate was reconstituted with distilled water to 12
°Brix, pasteurized at 73.9 °C for 6 seconds in an UHT/HTST Lab-25 HV tubular heat
exchanger (MicroThermics Inc., Raleigh, NC), and kept refrigerated at 4 °C for up to two
days and until used.
2.3 UV radiation processing unit
UV treatments were carried out in a commercial CiderSure 3500 UV juice processing
unit (FPE Inc., Macedon, NY) at a wavelength of 254 nm. This UV machine was
previously validated to ensure a greater than 5-log reduction of E. coli O157:H7 and
Cryptosporidium parvum in apple cider (Basaran et al., 2004; Hanes et al., 2002). The
CiderSure reactor comprises two UV light sensors that measure juice transmittance.
Based on the measurements, the machine automatically adjusts the flow rate,
guaranteeing a fixed UV dose of 14 mJ·cm-2. A thorough technical description of the

92
design and operation of this UV juice-processing units has been published by Basaran
et al. (2004).
2.4 Sample preparation and UV processing
Apple juice containing various concentrations of either ascorbic acid (0-600 mg·kg-1),
potassium sorbate (0-200 mg·kg-1), sodium benzoate (0-1000 mg·kg-1), or sulfur dioxide
(0-280 mg·kg-1, corresponding to a concentration of free sulfur dioxide ranging from 0-
160 mg·kg-1) were UV treated at 14 mJ·cm-2 fixed UV dose in a single-pass treatment.
All additives were added in concentrations that comply with the levels indicated by the
U.S. Food and Drug Administration (FDA, 2013b).
Flow rates were determined for all treatments using the bucket and stopwatch method,
where the time required for filling a known volume of UV treated juice was measured.
Samples before and after UV treatment were collected in amber high-density
polyethylene (HDPE) centrifuge tubes and, excluding ascorbic acid trials, and stored at
4 °C until the analyses were performed. Samples from trials involving ascorbic acid and
total vitamin C were analyzed via HPLC immediately after the addition of ascorbic acid
to the juice and the application of the UV treatment.
Total vitamin C, ascorbic acid, potassium sorbate, sodium benzoate, and free and total
sulfur dioxide concentrations as well as the apparent absorption coefficient of all juice
samples were determined before and after UV treatments.

93
In order to evaluate if the bleaching effect caused by the addition of sulfur dioxide, a
phenomenon previously reported in the literature (Joslyn and Braverman, 1954), has a
significant effect on the flow rate, the Hunter color parameters of the solutions
containing this preservative were measured before UV treatment.
To examine the potential degradative effect of UV exposure on potassium sorbate,
apple juice containing 100 mg·kg-1 of the additive was subjected to 5 consecutive
passes (a cumulative UV dose between 0 and 70 mJ·cm-2), and the residual sorbate
concentration was measured after each pass.
To assess the effect of ascorbic acid concentration on the log reduction of E. coli ATCC
25922, two independent batches of reconstituted apple juice containing ascorbic acid
between 0 and 600 mg·kg-1 were inoculated at 107 CFU·ml-1, and subjected to two
independent treatments: (1) fixed flow rate of 214.5 ml·s-1 which corresponds to the
maximum pumping capacity of the CiderSure and therefore the minimum time of UV
exposure in this UV unit, and (2) fixed UV dose of 14 mJ·cm-2 with automatic flow rate
adjustment. The E. coli counts, before and after treatment, were determined following
the protocol detailed in section 2.7. All trials were conducted in triplicate.
2.5 Total vitamin C and ascorbic acid determination
Ascorbic acid and total vitamin C concentration, defined as the sum of ascorbic acid and
its oxidized form dehydroascorbic acid (DHA), were determined via HPLC with a
modified version of the protocol described by Margolis et al. (1990). For total vitamin C

94
quantification, the DHA was reduced to ascorbic acid by the addition of dithiothreitol,
and eventually measured in conjunction with the native and residual ascorbic acid
present in the juice.
A 50 mmol potassium phosphate monobasic solution, adjusted to a pH of 2.8 by the
addition of phosphoric acid, was used as the mobile phase. For the standard curve
preparation, a stock solution of ascorbic acid at 5000 mg·kg-1 was used to prepare
standard solutions at 25, 100, 200, 300, 400, 500 and 600 mg·kg-1 in HPLC-grade
water. One ml of each standard solution was diluted by adding 400 µl of 5 mg·ml-1 DTT,
200 µl of 4% MPA, and 400 µl of HPLC-grade acetonitrile. Diluted standards were
filtered into amber autosampler vials with a nylon syringe filter (13 mm × 0.45 µm pore
size; Krackeler Scientific, Albany, NY), and analyzed by HPLC. The calibration standard
curve was performed in triplicate at the beginning of the experiment and eventually used
to determine the total vitamin C and ascorbic acid concentrations in samples.
Standard solutions and samples were injected onto a Thermo Scientific Aquasil C18
endcapped column (250 mm x 4 mm id, 5 µm particle size, 100 nm pore size; Thermo
Scientific, Waltham, MA) and resolved at a 1 ml·min-1 flow rate in an isocratic run for
20 min at ambient column temperature (22-25 ºC) and with a detection wavelength of
254 nm. One ml of each sample was diluted in a 2.2 ml vial with 400 µl of 5 mg·ml-1
DTT; vials were capped and vortex-mixed for 15 s. After 1 hour of storage at room
temperature in dark conditions, 200 µl of a 4% MPA solution and 400 µl of acetonitrile
were added. Samples were vortex-mixed and centrifuged at 1000 × g for 30 minutes at

95
4 ºC. The supernatant fluid was filtered as the standards and analyzed on an Agilent
1100 series HPLC (Santa Clara, CA).
The ascorbic acid quantification was performed following the same procedure indicated
for total vitamin C except that the addition of DTT and the incubation time after the
addition of the reagent were omitted.
2.6 Potassium sorbate and sodium benzoate determination
A 20% HPLC-grade acetonitrile in a 0.01 N sulfuric acid solution was used as the
mobile phase. For the calibration standard curve, a combined stock solution of
potassium sorbate and sodium benzoate at a concentration of 1000 mg·kg-1 of each
reagent were used for preparing standard solutions at 2, 5, 10, 20, 50 and 100 mg·kg-1
for each compound. Standards were filtered as the standards used for total vitamin C
quantification. The calibration standard curve was performed in triplicate.
A Bio-Rad Aminex HPX-87H column fitted with a micro-guard cation H refill cartridge
(Bio-Rad, Hercules, CA) was used at 0.6 ml·min-1 flow rate in an isocratic elution over
30 min at a column temperature of 60 °C. In the case of potassium sorbate
determination, a detection wavelength of 260 nm was used whereas 230 nm was
selected for sodium benzoate analyses. After a 10-fold dilution of the samples using
HPLC-grade water, juices were filtered as the standards and analyzed in an Agilent
1100 series HPLC.

96
2.7 Free and total sulfur dioxide determination
A multi-channel segmented-flow analyzer (FIA) was used for the automatic
determination of free and total sulfur dioxide. The system comprises a FIAstarTM 5000
(FOSS, Höganäs, Sweden) wine analyzer and an autosampler that operate by the
SoFIA software (service pack 3). This automatic system provides results for free and
total sulfur dioxide concentrations that are not significantly different from traditional
measurement methods (Barril et al., 2012). A sample of additive-free apple juice was
used as the blank and all measurements were performed in triplicate.
2.8 Microbiological analysis
E. coli ATCC 25922, a non-pathogenic surrogate with similar UV sensitivity than
pathogenic E. coli O157:H7 (Quintero-Ramos et al., 2004), was obtained from the Food
Microbiology Laboratory at the New York State Agricultural Experiment Station
(Geneva, NY). A single colony of the strain was transferred into 5 ml of TSB and grown
for 5 ± 1 h at 35 ± 2 ºC. The cell culture was then transferred into 500 ml of TSB and
incubated overnight for 20 ± 2 h at 35 ± 2 ºC on a rotatory platform shaker (New
Brunswick Scientific Co., Edison, NJ) at 250 rpm. Samples of approximately 1.8 L of
reconstituted and pasteurized apple juice were inoculated with 20 ml of the bacterial
solution resulting in an initial population of 107 CFU·ml-1. Apple juice was aseptically
sampled and analyzed before and after UV processing. Samples were subjected to
seven serial dilutions in 9 ml of sterile 0.1% peptone water and each dilution was plated
in duplicate. Petri dishes were pour-plated with Trypticase soy agar and incubated for

97
20 ± 2 h at 35 ± 2 °C. The log reduction of E. coli was calculated as the difference
between the log-transformed counts before and after the UV treatment.
2.9 Physicochemical characterization
The pH, total titratable acidity (expressed as grams of malic acid per 100 ml of apple
juice), soluble solids content (reported as degrees Brix), turbidity, color, and the
apparent absorption coefficient of the reconstituted juice samples were measured. The
pH was determined using a standard calibrated Accumet Basic AB15 pH meter (Fisher
Scientific, Pittsburgh, PA). Soluble solids contents were measured with a Leica Auto
Abbe refractometer model 10500-802 (Leica Inc., Buffalo, NY). Total titratable acidity
was estimated using a G20 compact titrator (Mettler Toledo, Schwerzenbach,
Switzerland). Turbidity measurements were performed in a HACH 2100P portable
turbidimeter (Hach Company, Loveland, CO). Hunter color parameters L’, a’, and b’
were determined using the reflectance-specular included (RSIN) mode in a Hunter
UltraScan XE spectrocolorimeter (Hunter Lab Assoc., Reston, VA). The juice apparent
absorption coefficient (α) was calculated following the protocol described by Koutchma
et al. (2004), where α corresponds to the slope obtained from plotting the sample
absorbance against the path length. After a 10-fold dilution in distilled water, the sample
absorbance was measured at 254 mm with a UV-1800 spectrophotometer (Shimadzu
Scientific Instruments, Columbia, MD) equipped with demountable fused quartz
cuvettes of 0.1, 0.2, 0.5 and 1.0 mm path length (NSG Precission Cells, INC.,
Farmingdale, NY). All physicochemical determinations were executed in triplicate.

98
2.10 Statistical analyses
Multiple linear regression analyses were used to assess the existent relationship
between the concentration of ascorbic acid, potassium sorbate, sodium benzoate, and
sulfur dioxide, and the juice apparent absorption coefficient, as well as the flow rate of
the juice through the UV machine during processing. This analysis was also used to
determine the effect of the UV treatment on the juice’s absorption coefficients and
concentrations of the additives tested.
The effect of adding sulfur dioxide on apple juice’s L’, a’, and b’ color attributes was
determined using analysis of variance (ANOVA). ANOVA was also used to determine
the effect of the UV dose on the stability of potassium sorbate in terms of concentration
of the additive, and the effect of ascorbic acid concentrations on the log reduction of
E. coli ATCC 25922. Means were further compared using Tukey’s honestly significant
difference (HSD) test at a significance level of 0.05. All statistical analyses were
performed using JMP® version 10 (SAS Institute, Cary, NC).
3. RESULTS AND DISCUSSION
3.1. Effect of additives on juice apparent absorption coefficient and flow rate
during UV processing
Table 11 shows the physicochemical characterization of apple juices used to determine
the effect of the selected additives on the juices’ apparent absorption coefficients and
the CiderSure flow rates, and to assess the impact of UV radiation on the stability of
those compounds.

99
Table 11. Physicochemical characterization of reconstituted apple juices before the addition of additives (mean ± standard
deviation, n = 3).
Additive pH Soluble solids (ºBrix) Titratable acidity (%) Color Turbidity
(NTU)
Apparent
absorption
coefficient (mm-1) L’ a' b'
Ascorbic acid 3.61 ± 0.03 12.8 ± 0.2 0.40 ± 0.02 31.1 ± 0.3 5.3 ± 0.3 6.7 ± 0.5 18 ± 3 1.5 ± 0.2
Potassium sorbate 3.67 ± 0.01 12.93 ± 0.02 0.40 ± 0.02 30.7 ± 0.1 5.5 ± 0.2 7.1 ± 0.1 18 ± 1 2.00 ± 0.06
Sodium benzoate 3.56 ± 0.01 12.89 ± 0.04 0.375 ± 0.002 30.713 ± 0.006 5.4 ± 0.1 7.1 ± 0.3 26.5 ± 0.7 1.94 ± 0.04
Sulfur dioxide 3.30 ± 0.01 12.37 ± 0.03 0.63 ± 0.04 55.1 ± 0.2 4.69 ± 0.05 36.8 ± 0.03 7.0 ± 0.1 0.81 ± 0.07

100
Linear relationships between ascorbic acid, potassium sorbate, and sodium benzoate
concentrations, and the juices’ apparent absorption coefficients were observed (Figure
10). Only in the case of potassium sorbate a significant effect of the UV treatment on
the relationship between concentration and measured absorption coefficient was
observed. This will be further discussed in section 3.2.
Figure 10. Apparent absorption coefficient at 254 nm, before and after UV treatment, as a function of the
concentrations of the selected additives (n = 3, error bars show standard deviation).
FIGURE 1
Before UVAfter UV
Abs. coeff. = 0.0037 · Conc. + 1.69r2 = 0.9083
Abs
orpt
ion
coef
ficie
nt (m
m-1
)
0
1
2
3
4
5
Ascorbic acid concentration (mg·kg-1)0 100 200 300 400 500 600
Before UVAfter UV
Abs. coeff. = 0.00068 · Conc. + 1.81r2 = 0.8009
Abs
orpt
ion
coef
ficie
nt (m
m-1
)
0
1
2
3
4
5
Sodium benzoate concentration (mg·kg-1)0 200 400 600 800 1000
Before UVAfter UV
Before UVAbs. coeff. = 0.012 · Conc. + 2.11
r2 = 0.9378
After UVAbs. coeff. = 0.017 · Conc. + 1.80
r2 = 0.9470
Abs
orpt
ion
coef
ficie
nt (m
m-1
)
0
1
2
3
4
5
6
Potassium sorbate concentration (mg·kg-1)0 50 100 150 200 250

101
Accordingly, an increase in the concentrations of these three additives resulted in a
negative effect on the flow rates measured during UV processing (Figure 11). The
reported changes in flow rate are explained by the fact that the CiderSure 3500 UV
reactor is equipped with two UV light sensors that measure the UV energy transmitted
through the treated liquid food product every 50 ms and, based on those
measurements, the UV apparatus has been programmed to automatically adjust the
pump flow rate ensuring a constant UV dose of 14 mJ·cm-2; this condition has been
proven effective in achieving a greater than 5-log reduction of E. coli O157:H7 and
C. parvum in apple cider (Basaran et al., 2004; Quintero-Ramos et al., 2004).
Therefore, for solutions with high UV absorption, the machine reduces the product flow
while for liquids with low absorption coefficients the pumped flow rate is increased. In
both cases, a constant UV exposure is guaranteed.
A multiple linear regression analysis of the effect of the square root of the concentration
of additives on the flow rate (Figure 11) showed that increases in concentrations of
potassium sorbate and ascorbic acid caused a more pronounced decrease in the flow
rate when compared to sodium benzoate. Moreover, no significant differences in flow
rate reduction were confirmed in samples containing increasing concentrations of
potassium sorbate and ascorbic acid (nonsignificant differences in their respective
slopes, p = 0.21). The resulting model presented a coefficient of determination (r2) of
96%.

102
Figure 11. Flow rate as a function of the concentration and the square root of the
concentration of selected additives in apple juice, treated with a 14 mJ·cm-2 UV dose
(n = 3, error bars show standard deviation).
FIGURE 2
Ascorbic acidSodium benzoatePotassium sorbate
Flow
rat
e (m
L·s-1
)
0
20
40
60
80
100
120
140
160
Concentration (mg·kg-1)0 100 200 300 400 500 600 700 800 900 1000
Ascorbic acidSodium benzoatePotassium sorbate
Flow = -3.0 · Conc.1/2 + 123.5r2 = 0.9193
Flow = -2.8 · Conc.1/2 + 144.7r2 = 0.9495
Flow = -1.4 · Conc.1/2 + 145.5r2 = 0.9595
Flow
rat
e (m
L·s-1
)
0
20
40
60
80
100
120
140
160
Concentration1/2 (mg1/2·kg-1/2)0 10 20 30 40

103
The juice’s apparent absorption coefficient was not significantly altered by the addition
of sulfur dioxide (p = 0.37) and therefore the flow rate (196 ± 4 ml·s-1) was not adversely
affected in samples containing increasing levels of this preservative (p = 0.66).
Table 12. Apple juice color parameters in samples containing increasing concentrations
of free sulfur dioxide measured before UV radiation at 14 mJ·cm-2 UV dose (mean ±
standard deviation, n = 3).a
Free sulfur dioxide – nominal
concentration (mg·kg-1) L’ a' b'
0 55.1c ± 0.2 4.69a ± 0.05 36.8b ± 1
60 56.5ab ± 0.3 3.60b ± 0.04 37.4ab ± 0.7
75 56.4b ± 0.1 3.50c ± 0.02 37.2ab ± 0.5
110 56.8ab ± 0.3 3.38d ± 0.03 37.5ab ± 1
130 57.3ab ± 0.4 3.37d ± 0.02 37.6ab ± 0.2
160 57.4a ± 0.4 3.27e ± 0.03 37.7a ± 1 a Means not followed by the same superscript within the columns are significantly different (p < 0.05).
Although the addition of sulfur dioxide did not affect the juice’s apparent absorption
coefficient, the evaluated concentrations of free sulfur dioxide (0 to 160 mg·kg-1) caused
a significant rise in lightness (p = 0.0001) and the b’ color parameter (p = 0.02). Also, a
significant detrimental effect on the a’ color parameter (p = 0.0001) was found
(Table 12). In agreement with our findings, Basaran-Akgul et al. (2009) previously
described a lightening phenomenon of apple cider due to the addition of sulfur dioxide.
Accordingly, Roberts and McWeeny (1972) postulated that these changes are explained
by a bleaching action of the preservative upon non-enzymatic browning pigments.
Despite the fact that sulfur dioxide leads to significant changes in color, the observed
variations in the visible spectrum did not impact the samples’ absorption coefficients,

104
explaining the reported nonsignificant changes on the flow rate when juices containing
this preservative were UV treated.
3.2. Effect of UV radiation on the stability of the selected additives
The apparent absorption coefficients of samples with increasing concentrations of
ascorbic acid, sodium benzoate (Figure 10), and sulfur dioxide were not significantly
affected by the single-pass UV process (p > 0.05). On the other hand, changes were
observed in juices containing potassium sorbate, where a marked effect of the UV
treatment on the juices’ apparent absorption coefficients was observed, depicted as a
significant increase (p = 0.0003) in the slope of the relationship between potassium
sorbate concentration and absorption coefficient after UV pasteurization (Figure 10).
As for the concentrations of the selected additives, total vitamin C and sodium benzoate
concentrations were not adversely affected by the UV treatment (p > 0.05). However,
the concentrations of free sulfur dioxide and ascorbic acid slightly decreased after UV
processing, as indicated by significant differences in the linear relationships between
nominal and measured concentrations before and after the UV (Figure 12). These
differences were characterized by significantly different intercepts for ascorbic acid (p =
0.0005); and intercepts (p = 0.0001) and slopes (p = 0.007) for the case of free sulfur
dioxide.

105
Figure 12. Effect of UV on the concentration of selected additives in apple juice.
FIGURE 3
Before UVAfter UV
Before UVConc. = 0.96 · Nominal Conc. - 3.6
r2 = 0.9983
After UVConc. = 0.95 · Nominal Conc. - 10.6
r2 = 0.9982
Asc
orbi
c ac
id c
once
ntra
tion
(mg·
kg-1
)
0
100
200
300
400
500
600
Ascorbic acid nominal concentration (mg·kg-1)0 100 200 300 400 500 600
Before UVAfter UV
Total Vit. C Conc. = 0.99 · Nominal AA Conc. - 12.6r2 = 0.9827
Tota
l vita
min
C c
once
ntra
tion
(mg·
kg-1
)
0
100
200
300
400
500
600
Ascorbic acid nominal concentration (mg·kg-1)0 100 200 300 400 500 600
Before UVAfter UV
Conc. = 0.99 · Nominal Conc. - 4.3r2 = 0.9973
Sod
ium
ben
zoat
e co
ncen
trat
ion
(mg·
kg-1
)
0
200
400
600
800
1000
Sodium benzoate nominal concentration (mg·kg-1)0 200 400 600 800 1000
Before UVAfter UV
Before UVConc. = 0.96 · Nominal Conc. - 4.6
r2 = 0.9922
After UVConc. = 0.79 · Nominal Conc. - 9.3
r2 = 0.9748
Pot
assi
um s
orba
te c
once
ntra
tion
(mg·
kg-1
)
0
50
100
150
200
250
300
Potassium sorbate nominal concentration (mg·kg-1)0 50 100 150 200 250 300
Before UVAfter UV
Before UVConc. = 0.98 · Nominal Conc. - 0.6
r2 = 0.9994
After UVConc. = 0.97 · Nominal Conc. - 0.7
r2 = 0.9992
Free
sul
fur
diox
ide
conc
entr
atio
n (m
g·kg
-1)
0
40
80
120
160
200
Free sulfur dioxide nominal concentration (mg·kg-1)0 40 80 120 160 200

106
Sulfur dioxide is used by the food industry as a preservative and antioxidant and it
occurs in two different forms in juices: free (inorganic forms including SO2 and HSO3)
and bound (fixed to organic compounds). Total SO2 represents the sum of all species of
free and bound SO2 (Bartroli et al., 1991; Čmelík et al., 2005). Considering that the free
sulfur dioxide corresponds to the active fraction in terms of preventing excessive
oxidation and microbial development (Santos et al., 2012), the effect of the UV
pasteurization over this preservative was reported in this study based on that form
(Figure 12). However, the total sulfur dioxide content was also determined and the
same trend reported for the free form was consistently observed (data not shown). Total
sulfur dioxide concentration slightly decreased after UV pasteurization when nominal
and measured concentrations were compared, showing significantly different slopes
(p = 0.046).
Chemical and biochemical degradation of ascorbic acid occurs through the pathway
from ascorbic acid to dehydroascorbic acid (DHA) to diketogulonic acid (the first
reaction being reversible and the second irreversible) (Margolis et al., 1990). Therefore,
the reported differences between total vitamin C and ascorbic acid concentrations
suggest that even though DHA is being produced via ascorbic acid degradation due to
UV exposure, as this reaction is reversible, no significant differences are detected in
terms of total vitamin C concentration. Contrarily, work published by Koutchma et al.
(2002), Tran and Farid (2004), and Tikekar et al. (2011) demonstrated that UV
irradiation induces vitamin C degradation in the range of 17 to 40%. Nevertheless, those
studies applied treatments using laboratory UV reactors at considerably higher UV
107
doses (600 mJ·cm-2, 100 mJ·cm-2, and 1.2-1.8 mW·cm-2, respectively), which may
cause vitamin C degradation due to heat exposure and other factors. Furthermore, the
total vitamin C concentration was considered equivalent to the ascorbic acid
concentration while the concentration of DHA was not estimated. In addition, as Tikekar
et al. (2011) indicated, the degradation rate of ascorbic acid can be also influenced by
other juice physicochemical factors such as pH, organic acid concentrations, and
absorbance. These factors help justify in part the differences between previously
reported results and the data shown in this study.
The most marked effect of the UV process was evidenced on the concentration of
potassium sorbate, characterized by significantly different slopes (p < 0.0001) and
intercepts (p = 0.0003) of the linear relationships between nominal and measured
concentrations before and after UV light treatment (Figure 12). As seen, an important
degradation of potassium sorbate was produced after the process. Moreover, as a
consequence of sorbate degradation, a derivative compound was found in the HPLC
chromatogram after UV radiation (Figure 13). This effect was UV-dose dependent
(Figure 14) and the presence of the UV-derivative was evidenced by the previously
described significant incremental effect of the UV treatment on the juice apparent
absorption coefficient (p = 0.0002) (Figure 10). Regarding this phenomenon, Cigić et al.
(2001) previously found that potassium sorbate isomerizes under UV radiation affecting
its antimicrobial activity. Hence, our particular finding demonstrated that this
phenomenon could be also observed when liquid food products such as apple juice are
exposed to UV even at milder intensities, under shorter exposure times, and using a

108
commercial UV juice-processing reactor. Nevertheless, further studies are needed to
confirm the nature of the derivative compound and the impact of this degradation on the
antimicrobial properties of the preservative, specifically in a juice matrix subjected to UV
pasteurization.
Figure 13. Representative HPLC chromatogram (260 nm) for apple juice containing
potassium sorbate at 100 mg·kg-1 and treated at 14 mJ·cm-2 UV dose.
3.3. Effect of ascorbic acid concentration on the log reduction of E. coli
Increments in the concentration of ascorbic acid led to a significant negative effect on
the log reduction of E. coli ATCC 25922 when UV was applied at a constant flow rate of
214.5 ml·s-1 (p < 0.0001) and at a fixed UV dose of 14 mJ·cm-2 (p < 0.0001).
Nevertheless, the observed trends varied depending on the conditions at which the
treatment was applied (Figure 15). When apple juice was UV treated at a fixed flow rate,
FIGURE 4
Before UV treatmentAfter UV treatment Potassium
Sorbate
UV-derivativecompound
Abs
orba
nce
(mA
U)
0
10
20
30
40
50
Retention time (min)0 5 10 15 20 25

109
results were in agreement with the findings previously reported by Koutchma et al.
(2004) where the inactivation rate of E. coli decreased as the solution absorbance
increased, and it was inversely proportional to the apparent absorption coefficient.
Figure 14. Remaining concentration of potassium sorbate and the derivative UV
product as a function of UV exposure. Means with the same lower or uppercase letter
are not significantly different (Tukey’s test p > 0.05) (n = 3, error bars show standard
deviation).
FIGURE 5
a
b
c
dd
d
D
C
BA A A
UV productPotassium sorbate
Con
cent
ratio
n (m
g·L-1
)
0
20
40
60
80
100
120
UV dose (mJ·cm-2)0 14 28 42 56 70

110
Figure 15. Log reductions of E. coli ATCC 25922 in apple juice treated under fixed flow
rate and fixed UV dose (n = 3, error bars show standard deviation).
Considering that the U.S. Food and Drug Administration (FDA, 2001) has mandated
that juice manufacturers achieve a greater that 5-log reduction of the pertinent
pathogen, our results suggest that UV treatments should not be applied under the
studied fixed flow rate, because at ascorbic acid concentrations higher than 100 mg·kg-1
the achieved reduction was lower than the required microbial inactivation. On the
contrary, when UV irradiation was performed at a fixed UV dose of 14 mJ·cm-2, the UV
treatment guaranteed a higher than 5-log reduction in samples contained between 0 to
300 mg·kg-1 of ascorbic acid. With concentrations exceeding 600 mg·kg-1 (for the tested
juice’s absorption coefficient) and due to the automatic flow rate adjustment, the pump
was not able to further reduce the flow rate and therefore the machine would stop
FIGURE 6
Fixed flow rate (214.5 mL·s-1)Fixed UV dose (14 mJ·cm-2)
Log
redu
ctio
n
0
2
4
6
8
10
Ascorbic acid concentration (mg·kg-1)0 100 200 300 400 500 600

111
processing the juice. Worth noting, under the fixed UV dose setting (which corresponds
to the only setting in a commercial CiderSure unit), this reactor has been programmed
to activate an alarm and stop the process when the validated UV dose of 14 mJ·cm-2 is
not achieved.
4. CONCLUSIONS
Although the addition of certain compounds represents a viable option to extend the
shelf life of UV treated beverages, our study demonstrated that ascorbic acid, sodium
benzoate, and potassium sorbate, additives commonly used by the juice industry,
increase the juice’s absorption coefficient and negatively interfere in the performance of
UV treatments. Furthermore, under the studied conditions the UV light application leads
to a degradation of ascorbic acid, sulfur dioxide and potassium sorbate, while the
addition of ascorbic acid impairs the inactivation of E. coli ATCC 25922. Therefore, it is
recommended that additives that increase the absorption coefficient of liquid food
products or are unfavorably affected by UV should be added after UV pasteurization.
ACKNOWLEDGEMENTS
This research was funded by the NIFSI-USDA grant No.2010-01394. Additional support
was given by the Fulbright International Exchange Program, and the Department of
Food Science at Cornell University, College of Agriculture and Life Sciences. We thank
Tom Gibson and John Churey (New York State Agricultural Experiment Station, Cornell
University) for their assistance in the operation of the UV processing unit.

112
REFERENCES
Assatarakul, K., Churey, J. J., Manns, D. C., & Worobo, R. W. (2011). Patulin reduction
in apple juice from concentrate by UV radiation and comparison of kinetic degradation
models between apple juice and apple cider. Journal of Food Protection, 75(4), 717–
724.
Barril, C., Clark, A. C., & Scollary, G. R. (2012). Chemistry of ascorbic acid and sulfur
dioxide as an antioxidant system relevant to white wine. Analytica Chimica Acta,
732,186–193.
Basaran, N., Quintero-Ramos, A., Moake, M. M., Churey, J. J., & Worobo, R. W. (2004).
Influence of apple cultivars on inactivation of different strains of Escherichia coli
O157:H7 in apple cider by UV irradiation. Applied Environmental Microbiology, 70(10),
6061-6065.
Basaran-Akgul, N., Churey, J. J., Basaran, P., & Worobo, R. W. (2009). Inactivation of
different strains of Escherichia coli O157:H7 in various apple ciders treated with
dimethyl dicarbonate (DMDC) and sulfur dioxide (SO2) as an alternative method. Food
Microbiology, 26(1), 8–15.
Bartroli, J., Escalada, M., Jimenez Jorquera C., & Alonso J. (1991). Determination of
total and free sulfur dioxide in wine by flow injection analysis and gas-diffusion using p-
113
aminoazobenzene as the colorimetric Reagent. Analytical Chemistry, 63(21), 2532-
2535.
Burleson, J. C. (1987). Method and apparatus for the generation and utilization of ozone
and singlet oxygen. US Patent 4,640,782.
Caminiti, I. M., Palgan, I., Muñoz, A., Noci, F., Whyte, P., Morgan, D. J., Cronin, D. A., &
Lyng, J. G. (2010). The effect of ultraviolet light on microbial inactivation and quality
attributes of apple juice. Food Bioprocess Technology, 5(2), 680-686.
Cigić, I. K., Plavec, J., Možinac, S. S., & Zupančič-Kralj, L. (2001). Characterisation of
sorbate geometrical isomers. Journal of Chromatography A, 905, 359-366.
Čmelík, J., Machát, J., & Niedobová, E. (2005). Determination of free and total sulfur
dioxide in wine samples by vapour-generation inductively coupled plasma–optical-
emission spectrometry. Analytical and Bioanalytical Chemistry, 383, 483–488.
Dong, Q., Manns, D. C., Feng, G., Yue, T., Churey, J. J., & Worobo, R. W. (2010).
Reduction of patulin in apple cider by UV radiation. Journal of Food Protection, 73(1),
69–74.

114
Falguera, V., Pagán, J., & Ibarz, A. (2011). Effect of UV irradiation on enzymatic
activities and physicochemical properties of apple juices from different varieties. Food
Science and Technology, 44(1), 115-119.
Guerrero-Beltrán, J. A., Welti-Chanes, J., & Barbosa-Cánovas, G. V. (2009). Ultraviolet-
C light processing of grape, cranberry and grapefruit juices to inactivate Saccharomyces
cerevisiae. Journal of Food Process Engineering, 32(6), 916–932.
Hanes, D. E., Worobo, R. W, Orlandi, P. A., Burr, D. H., Miliotis, M. D., Robl, M. G.,
Bier, J. W, Arrowood, J. J., Churey, J. J., & Jackson, G. J. (2002). Inactivation of
Cryptosporidium parvum oocysts in fresh apple cider using UV irradiation. Applied
Environmental Microbiology, 68(8), 4168–4172.
Koutchma, T. (2008). UV light for processing foods. Ozone: Science & Engineering,
30(1), 93-98.
Koutchma, T., Keller, S., Chirtel, S., & Parisi, B. (2004). Ultraviolet disinfection of juice
products in laminar and turbulent flow reactors. Innovative Food Science & Emerging
Technologies, 5(2), 179-189.
Koutchma, T., Parisi, B., & Patazca, E. (2007). Validation of UV coiled tube reactor for
fresh juices. Journal of Environmental Engineering Science, 6(3), 319-328.

115
Koutchma, T., & Shmalts, M. (2002). Degradation of vitamin C after alternative
treatments of juices. Paper presented at the Institute of Food Technologists Annual
Meeting, New Orleans. Available at:
http://ift.confex.com/ift/2002/techprogram/paper_12198.htm Accessed March 7, 2014.
Margolis, S. A., Paule, R. C., & Ziegler, R. G. (1990). Ascorbic acid and
dehydroascorbic acids measured in plasma preserved with dithiothreitol or
metaphosphoric acid. Clinical Chemistry, 36(10), 1750-1755.
Joslyn, M. A., & Braverman, J. B. S. (1954). The chemistry and technology of the
pretreatment and preservation of fruit and vegetables products with sulfur dioxide and
sulfites. Advances in Food Research, 5, 97-160.
Oteiza, J. M., Giannuzzi, L., & Zaritzky, N. (2010). Ultraviolet treatment of orange juice
to inactivate E. coli O157:H7 as affected by native microflora. Food Bioprocess
Technology, 3(4), 603-614.
Oteiza, J. M., Peltzer, M., Gannuzzi, L., & Zaritzky, N. (2005). Antimicrobial efficacy of
UV radiation on Escherichia coli O157:H7 (EDL 933) in fruit juices of different
absorptivities. Journal of Food Protection, 68(1), 49-58.

116
Quintero-Ramos, A., Churey, J. J., Hartman, P., Barnard, J., & Worobo, R. W. (2004).
Modeling of Escherichia coli inactivation by UV irradiation at different pH values in apple
cider. Journal of Food Protection, 67(6), 1153-1156.
Roberts, A. C., & McWeeny, D. J. (1972). The uses of sulphur dioxide in the food
industry. A review. International Journal of Food Science & Technology, 7(3), 221-238.
Santos M. C., Nunes, C., Saraiva, J. A., & Coimbra, M. A. (2012). Chemical and
physical methodologies for the replacement/reduction of sulfur dioxide use during
winemaking: review of their potentialities and limitations. European Food Research and
Technology, 234, 1–12.
Tikekar, R. V., Anantheswaran, R. C., & LaBorde, L. F. (2011). Ascorbic acid
degradation in a model apple juice system and in apple juice during ultraviolet
processing and storage. Journal of Food Science, 76(2), 62-71.
Tiwari, B. K., O’ Donnell, C. P., Brunton, N. P., & Cullen, P. J. (2009). Degradation
kinetics of tomato juice quality parameters by ozonation. International Journal of Food
Science & Technology, 44(6), 1199–1205.
Tran, M. T. T., & Farid, M. (2004). Ultraviolet treatment of orange juice. Innovative Food
Science & Emerging Technologies, 5(4), 495-502.
117
U.S. Food and Drug Administration (FDA). (2001). Hazard Analysis and Critical Control
Points (HACCP): procedures for the safe and sanitary processing and importing of juice.
Federal Register 66: 6137-6202.
U.S. Food And Drug Administration (FDA). (2013a). Code of Federal Regulation (CFR).
Tittle 21. Chapter I. Subchapter B. Part 179. Section 179.39. Ultraviolet radiation for the
processing and treatment of food. Available at
http://www.accessdata.fda.gov/scripts/cdrh/cfdocs/cfCFR/CFRSearch.cfm?fr=179.39.
Accessed March 7, 2014.
U.S. Food And Drug Administration (FDA). (2013b). Code of Federal Regulations
(CFR). Title 21. Chapter I. Subchapter B. Part 184. Direct food substances affirmed as
generally recognized as safe. Available at
http://www.accessdata.fda.gov/scripts/cdrh/cfdocs/cfCFR/CFRSearch.cfm?CFRPart=18
4&showFR=1. Accessed March 7, 2014.

118
CHAPTER 6
DETERMINATION OF THE VALIDATION FREQUENCY FOR COMMERCIAL UV
JUICE-PROCESSING UNITS
ABSTRACT
The CiderSure 3500 is one of the most commonly used UV juice-processing units in the
US for the nonthermal processing of apple cider, that fulfills the 5-log performance
standard established in the federal juice HACCP regulation. However, the appropriate
validation frequency of this machine’s quartz tubes is currently unknown by juice
processors and regulatory agencies. Presently, an annual validation is recommended
by the manufacturer. Historical validation data from 1998 to 2013 of commercially used
quartz tubes of the UV processing unit underwent comprehensive statistical analysis. A
total of 400 tubes were validated one time, and 212 of those units were revalidated at
least once over the evaluated timeframe. Validations were performed at 14 mJ·cm–2 UV
dose, and under turbulent flow conditions. Every validation showed a greater than 5-log
reduction of Escherichia coli ATCC 25922, a non-pathogenic surrogate for pathogenic
E. coli O157:H7, in each of three replicates. For initial validations, a mixed-effects model
with log reduction of E. coli as response was constructed (400 tubes analyzed in
triplicate). The model showed that the year of analysis and the initial inoculum level
significantly affected the log reduction of E. coli (P < 0.0001), which on average was
7.0 ± 0.7. A quadratic relationship between the year of analysis and the response was
found. Likewise, for revalidations (212 tubes analyzed in triplicate), the constructed
random coefficient model showed that the year of analysis, quadratic effect of year of

119
analysis and initial inoculum level significantly affected the log reduction of E. coli
(P < 0.0001). For this model, the major source of variance was explained by the year of
analysis. The models describe the UV reactor’s performance over time and suggest that
a validation frequency of every 3 years would be conservatively adequate during the
first eight years of use of the quartz tubes. After that and due to the reported quadratic
trend, a yearly validation would be recommended.
INTRODUCTION
In 2000, the U.S. Food and Drug Administration (FDA) recognized ultraviolet (UV) light
treatment as an alternative for thermal pasteurization of juices and beverages. The
requirements state in 21 CFR 179.39, that UV radiation may be safely used for the
processing of juice products when the treatment is provided by low-pressure mercury
lamps emitting 90% of the emission at a wavelength of 253.7 nanometers, and the juice
undergoes turbulent flow through tubes, with a minimum Reynolds number of 2,200
(25). Since then, and due to an increased consumer demand for more fresh-like
products with enhanced nutritional properties (2, 23), the applications of this affordable
nonthermal technology have augmented, with the advantage that UV light is
characterized by low energy requirements and reduced initial investment in comparison
with thermal pasteurization (4, 15, 18). Furthermore, with the intention of preventing
potentially negative effects, due the application of traditional heat treatments, on the
organoleptic properties of cider, and given that unpasteurized and contaminated apple
cider has caused several foodborne outbreaks (6, 21); many small- and medium-sized
cider producers have acquired a commercial UV juice processing unit to safely treat this

120
beverage. The CiderSure 3500 (FPE Inc., Rochester, NY) is one of the most commonly
used commercial UV processing machines in the US for the nonthermal processing of
apple cider. This machine has been proven effective to ensure more than 5-log
reductions of Escherichia coli O157:H7 and Cryptosporidium parvum in cider (1, 13),
microorganisms that represent the pertinent pathogens likely to occur in this juice.
Therefore, this technology fulfills the 5-log performance standard established in the
federal juice HACCP regulation (24).
Since 1998, the application of UV light treatments to juices has been actively
researched, and in a sixteen year period, a large number of individual quartz tubes used
on this UV apparatus have been validated. In the year 2000, 70 of these tubes were
subjected to a comprehensive statistical analysis, and the variability within and between
tubes, plus the distributions of the mean log reductions of E. coli ATCC 25922 and the
between-replicate variability were determined (9). However, until now, the appropriate
frequency of revalidation of these tubes is still unknown by juice processors and
regulatory agencies. Presently, an annual validation is recommended by the
manufacturer, due to the lack of knowledge regarding the tube variation over time in the
commercial use setting. Thus, considering that it is important for the UV-treated cider
industry and regulatory agencies to accurately identify the adequate frequency for
examining the performance of these quartz tubes, the availability of data corresponding
to a large quantity of validations and revalidations represents an exceptional opportunity
to determine this frequency, based on a comprehensive statistical approach. The
purpose of this study was to statistically analyze historical validation and revalidation

121
data from 1998 to 2013 of the quartz tubes from commercial UV processing units, with
the aim to describe the reactor’s performance and its variability over time. We hope that
our findings, and consequent recommendation of a validation frequency, will ultimately
assist regulatory agencies to establish the most appropriate frequency of revalidation for
the commercially available UV juice-processing machine unit used in this study.
MATERIALS AND METHODS
Microbiological analysis. Locally purchased (Geneva, NY) non-pasteurized apple cider,
which did not contain any preservatives or other additives, was inoculated with
Escherichia coli ATCC 25922, a clinical isolate from the American Type Culture
Collection, and a non-pathogenic surrogate that has shown similar UV sensitivity to
E. coli O157:H7 (20). A single isolated colony of E. coli grown on Trypticase soy agar
(TSA) (Difco, Becton Dickinson, Sparks, MD) was transferred in 10 ml of Trypticase soy
broth (TSB) (Difco, Becton Dickinson, Sparks, MD) and incubated for 5 ± 1 h at
35 ± 2ºC. The inoculum was then transferred into 400 ml of TSB and incubated for
20 ± 2 h at 35 ± 2ºC to stationary phase in an Innova 2300 rotary platform shaker (New
Brunswick Scientific Co., Edison, NJ) at 250 rpm. Prior to the validation of the quartz
tubes, approximately 1.8 l of cider was inoculated with a 20 ml aliquot of the E. coli
inoculum. An initial concentration of 6 to 7-log CFU·ml–1 of the surrogate was targeted.
Inoculated ciders were aseptically sampled before and after UV processing, and
analyzed immediately. For UV-treated samples, 1 ml of cider and two serial dilutions in
sterile 0.1% peptone water were aseptically plated (in duplicate) in Petri dishes, to
which approximately 20 ml of sterilized TSA (Difco, Becton Dickinson, Sparks, MD) was
122
pour-plated and mixed thoroughly. For untreated samples, six serial dilutions in sterile
0.1% peptone water were required. Petri dishes were incubated for 20 ± 2 h at 35 ± 2ºC
before enumeration, and the level of microbial reduction was calculated as log (N/No)
where N refers to the after treatment E. coli count, and No to the initial count, both in
CFU·ml–1. Each quartz tube was evaluated in triplicate.
UV juice-processing unit. Apple cider was run through a commercial CiderSure 3500
UV juice processing unit (FPE Inc., Rochester, NY) at a wavelength of 254 nm, and
guaranteeing a turbulent flow regime and a constant UV dose of 14 mJ·cm–2. The UV
processing unit is comprised of a stainless steel housing and an inner quartz tube. The
apple cider is pumped between the outer steel housing and inner quartz tube using a
positive displacement pump, and the product is exposed to eight germicidal low-
pressure mercury lamps placed concentrically within the interior of the quartz-stainless
steel cylinder (1). Two UV light sensors, located at the bottom and top of the outer
cylinder, measure the UV light transmittance through the cider every 50 ms. Based on
the product transmittance measurements, this machine has been programmed to
automatically adjust the pump flow rate ensuring a constant UV dose exposure
throughout the UV process (1, 20). This apparatus has been provided with an automatic
system designed to shut down the process if a UV light sensor fails or if the sensor
indicates that a minimum of 14 mJ·cm–2 UV dose, which represents the critical limit on
the application of this treatment, has not been met.

123
Validations and revalidations. Throughout sixteen consecutive years (from 1998 to
2013), a total of 400 quartz tubes were validated at least one time, and 212 of those
same tubes have been revalidated at least once. All quartz tubes were brought to the
Food Microbiology Laboratory at the New York State Agricultural Experiment Station
(Geneva, NY) and subjected to the standard validation procedure designed by this
laboratory and described above. During the evaluated timeframe, all quartz tubes were
validated and revalidated by the same analyst, and using the same UV juice-processing
unit, which was comprised of a pump, UV light sensors, software, and eight germicidal
UV lamps. Over the years, regular maintenance has been provided to the UV unit,
which includes repairs to the pump, and replacement of the UV light sensors and lamps.
Statistical analyses
The mixed-effects and random coefficient models were constructed and analyzed using
JMP® version 11 (SAS Institute Inc., Cary, NC). Effects were considered significant at
P < 0.05.
RESULTS AND DISCUSSION
Initial tube validations
All initial validations showed greater than 5-log reductions of E. coli ATCC 25922 in
each of the three replicates. This result is explained by the fact that if a tube failed to
achieve the minimum 5-log pathogen reduction during the first validation, that tube was
not sold to the cider industry, and therefore it was not considered for further statistical
analysis. Prior to this study, it was found that the risk of obtaining a less than 100,000-

124
fold reduction of E. coli, by using these UV light-processing tubes for treating apple
cider, occurs less than 0.2% of the time (9).
For the analysis of the initial validations, a mixed-effects model with log reduction of
E. coli as response was constructed. As stated by Wang et al. (26), a mixed-effects
model can specify a realistic model for the correlation existing between repeated
measurements, which in this case were represented by the logarithmic reduction of
E. coli due to the UV light exposure, measured in the same tube on three occasions.
The results associated with 400 tubes, analyzed in triplicate, and evaluated between
1998 and 2013 gave a total of 1200 observations. The variables of initial E. coli count,
year of analysis (with year zero corresponding to 1998), and a quadratic effect of year of
analysis were added to the model as continuous fixed effects, while the tube ID was
included as a random effect.
An average of 7.0 ± 0.7 log reductions of E. coli was obtained, and as observed in
Figure 16, the histogram of log reduction shows a skew to the left with a minimum value
of 5.01 log reduction, boundary at which the data set was artificially truncated when the
tubes that obtained a lower than 5-log reduction were not considered for further
analysis. Additionally, the upper limit was found at 8.29 log reduction. Worth noting, this
value may not reflect the maximum effectiveness of the apparatus. Instead, it suggests
that the efficacy of these UV processing quartz tubes could be limited, in part, by the
initial and targeted E. coli concentration in the test cider. Likewise, using a subset of this
data (70 tubes), Duffy et al. (9) previously reported high and low log reduction tails when

125
@RISK and Analytica simulations were used to model the data’s distribution, indicating
that those tails are probably an accurate reflection of the UV processing units’
performance rather than an artifact of simulation.
Figure 16. Histogram of log reduction of E. coli ATCC 25922 in apple cider
subjected to UV treatment at 14 mJ·cm–2 UV dose by using a commercial UV juice processing reactor, corresponding to validation trials (n=1200).
The constructed mixed-effects model showed that the effects of initial E. coli count and
year of analysis significantly affected the log reduction of E. coli (P < 0.0001) (Table 13),
and the relationship between the response variable and the year of analysis was found
to be quadratic, with an increasing and then diminishing effect over time. Moreover, the
model showed that the variance between the quartz tubes was considerably higher,
representing 70% of the total variance, in comparison with the variance observed within
tubes (Table 14).
FIGURE 1
Cou
nts
0
30
60
90
120
150
180
Log reduction5.0 5.5 6.0 6.5 7.0 7.5 8.0 8.5

126
Table 13. Parameters estimates of the fixed effects included in the mixed-effects model
used to analyze the initial validations of the quartz tubes with log reduction of E. coli
ATCC 25922 as response.
Term Estimate Standard
error P > |t|
Intercept 0.6 0.6 0.3542
Initial E. coli count 0.74 0.08 <0.0001
Year of analysis 0.22 0.03 <0.0001
(Year of analysis)*(Year of analysis) -0.011 0.002 <0.0001
Tube revalidations
With the objective of establishing the appropriate frequency of validation of the quartz
tubes, revalidation data from 1998 to 2013 underwent a comprehensive statistical
analysis. The results of 212 UV processing quartz tubes (each analyzed in triplicate)
and revalidated at least once (more than two validations were conducted) over the
selected timeframe (a total of 1740 observations), were used to construct a random
coefficient model with random intercept and log reduction of E. coli as response.
According to Cudeck and Harring (5), in the context of repeated measure studies, the
random coefficients models are based on the idea that the process of change is defined
for each unit of study, in this case each quartz tube, yet also is related to the population
mean trajectory over time. The variables of initial E. coli count, year of analysis (with
year zero corresponding to 1998), and a quadratic effect of year of analysis, were
considered as the fixed effects, while the tube ID, and the year of analysis (as a nominal
variable and nested within tube ID), were added as the random effects.

127
Table 14. Variance components of the random effects included in the mixed-effects
model used to analyze the initial validations of the quartz tubes with log reduction of
E. coli ATCC 25922 as response.
Random effect Variance component Percentage
Tube ID 0.30 70
Residual 0.13 30
Total 0.43 100
The parameters estimates of the constructed model are given in Table 15. As observed,
the initial E. coli count and year of analysis significantly affected the log reduction of
E. coli (P < 0.0001). Once again, a quadratic behavior of year of analysis with an
increasing and then diminishing effect on the log reduction of E. coli over time was
found. Considering the overall mean initial count of 7.57 logs of E. coli, it was found that
the maximum predicted value of E. coli reduction as a response, which corresponds to
8.00 logs, was observed at 8.86 years after the first validation. After this time, the
bacterial reduction levels begin to decrease. The residual unexplained variance within
tubes was 29%, whereas the variance between tubes caused only 5% of the total
variance. The rest –and most– of the variance was explained by the random effect of
year of analysis (Table 16). The higher level of variance caused by the year of analysis
is likely due to the expected and widely reported differences of the physicochemical
characteristics of the apple ciders used over the 16 year period. Although a slight
reduction of E. coli in the juices (without subjecting the beverage to the UV radiation) is
possible, the effect was not deemed substantial. The chemical and nutritional
composition of apple cider has been determined in several studies for different apple
varieties, and significant differences between apple cultivars have been consistently
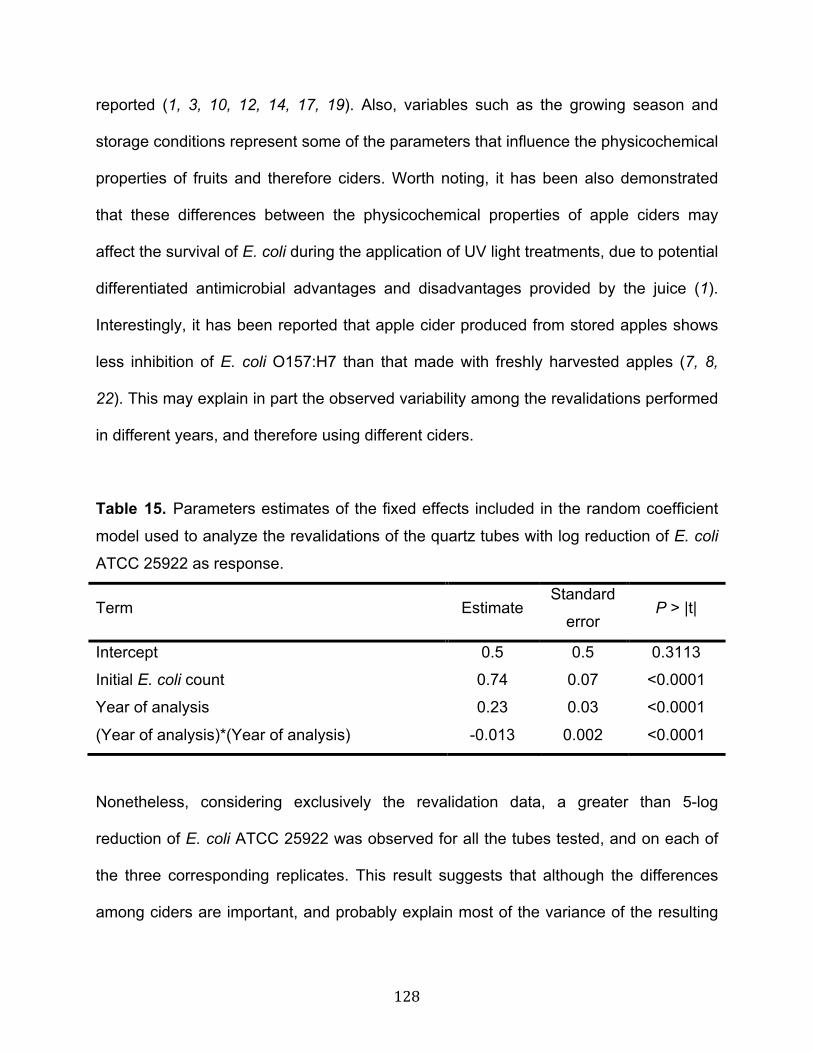
128
reported (1, 3, 10, 12, 14, 17, 19). Also, variables such as the growing season and
storage conditions represent some of the parameters that influence the physicochemical
properties of fruits and therefore ciders. Worth noting, it has been also demonstrated
that these differences between the physicochemical properties of apple ciders may
affect the survival of E. coli during the application of UV light treatments, due to potential
differentiated antimicrobial advantages and disadvantages provided by the juice (1).
Interestingly, it has been reported that apple cider produced from stored apples shows
less inhibition of E. coli O157:H7 than that made with freshly harvested apples (7, 8,
22). This may explain in part the observed variability among the revalidations performed
in different years, and therefore using different ciders.
Table 15. Parameters estimates of the fixed effects included in the random coefficient
model used to analyze the revalidations of the quartz tubes with log reduction of E. coli
ATCC 25922 as response.
Term Estimate Standard
error P > |t|
Intercept 0.5 0.5 0.3113
Initial E. coli count 0.74 0.07 <0.0001
Year of analysis 0.23 0.03 <0.0001
(Year of analysis)*(Year of analysis) -0.013 0.002 <0.0001
Nonetheless, considering exclusively the revalidation data, a greater than 5-log
reduction of E. coli ATCC 25922 was observed for all the tubes tested, and on each of
the three corresponding replicates. This result suggests that although the differences
among ciders are important, and probably explain most of the variance of the resulting

129
model, the inclusion of new apple varieties to produce cider, and the normal differences
between the physicochemical properties of the fruits did not compromise the
performance of the tubes during the studied timeframe. Therefore, it is the author’s
opinion that this source and magnitude of variability does not justify performing yearly
revalidations, as it is currently recommended by the manufacturer.
Table 16. Variance components of the random effects included in the random
coefficient model used to analyze the revalidations of the quartz tubes with log reduction
of E. coli ATCC 25922 as response.
Random effect Variance component Percentage
Tube ID 0.02 5
Year of analysis 0.28 66
Residual 0.12 29
Total 0.42 100
Different elements may explain the quadratic trend found with the random coefficient
model. A loss of the UV sensitivity of sensors, lamp degradation, and darkening of the
quartz caused by cider contact over the years, besides other changes in the quartz
tubes that have not been completely understood, could be the cause of the observed
results. For instance, if UV light sensors are not recalibrated, they may loose their UV
transmittance sensitivity over time, thus slowing the flow rate of cider through the
reactor and therefore causing extended times of UV light exposure that ultimately
translate into higher microbial reductions. A reduction of the germicidal capacity of the
UV lamps is also expected over time. The aging of lamps influences the emitted UV
energy intensity, and is primarily caused by two factors: solarization of the lamp wall
130
material, and blackening due to deposits of sputtered oxides from the electrodes (16).
The content within the lamps is continuously exposed to changes in pressure and
temperature, thus the electrodes inside decay and deposit material on the interior
quartz, reducing the lamps output. Moreover, the efficacy of the lamp is directly related
to the saturated mercury pressure inside the lamp and many parts on the UV lamps
such as the glass bulb, quartz bulb, electrode emitter, and metal parts consume
mercury during the lamp’s life and reduce its efficacy (11). Worth noting, these effects
are expected to be controlled to some extent by the UV light sensors and their effect on
the apparatus’ pump, which in turn affects the flow of cider through the quartz tubes.
The constructed models reported in this study describe the quartz tubes’ performance
over time, and as indicated by Duffy et al. (9), quantifying the variability of a food
process could be in extreme useful to formulate better predictive models and also to
separate the uncertainty from variables as much as possible. This study aims to help
regulatory agencies to establish the appropriate frequency of validation for the quartz
tubes of a commercial UV processing unit, and based on the constructed random
coefficient model, we recommend revalidating the quartz tubes every three years during
the first eight years of use. After that, and due to the reported quadratic trend –which
predicts the E. coli reduction to decrease after 8.86 years–, a yearly validation is
recommended instead. We also suggest that any changes in the UV juice processing
unit that may negatively compromise the performance of the reactor, and ultimately the
safety of the cider, such as changes in the computer and software, or replacement of
the pump, UV light sensors, and mercury lamps should be followed by the application of

131
the validation procedure of the quartz tubes, regardless of the time and results
associated to the last validation performed. Likewise, the use of this UV machine for
treating different juices or beverages, and changes in the formulation of already
validated liquid products, must be subjected to the validation protocol before launching
the beverage to market. Furthermore, it is important to clarify that the frequency of
validation suggested in this study does not substitute the regular verification
procedures, which include periodical maintenance of UV light sensors, pump and
computer, and the standard cleaning and sanitizing protocols of the UV unit
recommended by the manufacturer.
ACKNOWLEDGMENTS
Funding for this research was provided by USDA AFRI #2011-68003-30005, Federal
Formula Multistate Project – SDC-346, and Cornell University, College of Agriculture
and Life Sciences. The authors would like to thank Françoise M. Vermeylen of the
Cornell University Statistical Consulting Unit.
132
REFERENCES
1. Basaran N., A. Quintero-Ramos, M. M. Moake, J. J. Churey, and R. W. Worobo.
2004. Influence of apple cultivars on inactivation of different strains of Escherichia
coli O157:H7 in apple cider by UV irradiation. Appl. Environ. Microbiol. 70:6061-65.
2. Caminiti I. M., F. Noci, A. Muñoz, P. Whyte, D. J. Morgan, D. A. Cronin, and J. G.
Lyng. 2011. Impact of selected combinations of non-thermal processing
technologies on the quality of an apple and cranberry juice blend. Food Chem.
124:1387-92.
3. Cilliers, J. J. L., V. L. Singleton, and R. M. Lamuela-Raventos. 1990. Total
polyphenols in apples and ciders: correlation with chlorogenic acid. J. Food Sci.
55:1458-9.
4. Choi L. H., and S. S. Nielsen. 2005. The effects of thermal and nonthermal
processing methods on apple cider quality and consumer acceptability. J. Food
Qual. 28:13–29.
5. Cudeck, R., and J. R. Harring. 2007. Analysis of nonlinear patterns of change with
random coefficient models. Annu. Rev. Psychol. 58:615-37.
6. Danyluk M. D., R. M. Goodrich-Schneider, K. R. Schneider, L. J. Harris, and R. W.
Worobo. 2012. Outbreaks of Foodborne Disease Associated with Fruit and
Vegetable Juices, 1922-2010. Available at:
http://edis.ifas.ufl.edu/pdffiles/FS/FS18800.pdf. Accessed 23 March 2014.
7. Dingman, D. W. 1999. Prevalence of Escherichia coli in apple cider manufacturer in
Connecticut. J. Food Prot. 62:567-73.

133
8. Dingman, D. W. 2000. Growth of Escherichia coli O157:H7 in bruised apple (Malus
domestica) tissue as influenced by cultivar, date of harvest, and source. Appl.
Environ. Microbiol. 66:1077-83.
9. Duffy, S., J. Churey, R. W. Worobo, and D. W. Schaffner. 2000. Analysis and
modeling of the variability associated with UV inactivation of Escherichia coli in apple
cider. J. Food Prot. 63:1587-1590.
10. Fuleki, T., E. Pelayo, and R. B. Palabay. 1995. Carboxylic acid composition of
varietal juices produced from fresh and stored apples. J. Agric. Food Chem. 43:598-
607.
11. Giller H. F. J. I. 2000. A review of UV lamps. Proceed. Water Environ. Fed. 2:41-7.
12. Gökmen, V., A. Nevzat, J. Acar, N. Kahraman, and E. Poyrazoğlu. 2001. Effects of
various clarification treatments on patulin, phenolic compound and organic acid
compositions of apple juice. Eur. Food Res. Technol. 213:194-9.
13. Hanes D. E., R. W. Worobo, P. A. Orlandi, D. H. Burr, M. D. Miliotis, M. G. Robl, J.
W. Bier, M. J. Arrowood, J. J. Churey, and G. J. Jackson. 2002. Inactivation of
Crytosporidium parvum oocysts in fresh apple cider using ultraviolet irradiation. Appl.
Environ. Microbiol. 68:4168–72.
14. Hartmann, B. G., and F. Hilling. 1934. Acid constituents of food products. Special
reference to citric, malic and tartaric acids. J. Assoc. Off. Agric. Chem. 17:522-31.
15. Keyser M., I. A. Muller, F. P. Cilliers, W. Nel, and P. A. Gouws. 2008. Ultraviolet
radiation as a non-thermal treatment for the inactivation of microorganisms in fruit
juice. Innov. Food Sci. Emerg. Technol. 9:348-54.

134
16. Koutchma T., L. J. Forney, and C. I. Moraru. 2009. Ultraviolet Light in Food
Technology: Principles and Applications. CRC Press, Boca Raton, FL.
17. Mattick, L. R., and J. C. Moyer. 1983. Composition of apple juice. J. Assoc. Off.
Anal. Chem. 66:1251-5.
18. Murakami E. G., L. Jackson, K. Madsen, and B. Schickedanz. 2006. Factors
affecting the ultraviolet inactivation of Escherichia coli K12 in apple juice and model
system. J. Food Process. Eng. 29:53-71.
19. Lee, H. S., and R. E. Wrolstad. 1988. Apple juice composition: sugar, nonvolatile
acid, and phenolic profiles. J. Assoc. Off. Anal. Chem. 71:789-94.
20. Quintero-Ramos, A., J. J. Churey, P. Hartman, J. Barnard, and R. W. Worobo.
2004. Modeling of Escherichia coli inactivation by UV irradiation at different pH
values in apple cider. J. Food Prot. 67:1153-6.
21. Rangel, J. M., P. H. Sparling, C. Crowe, P. M. Griffin, and D. L. Swerdlow. 2005.
Epidemiology of Escherichia coli O157:H7 outbreaks, United States, 1982–2002.
Emerg. Infect. Dis. 11:603-9.
22. Reinders, R. D., S. Biesterveld, and P. G. H. Bijker. 2001. Survival of Escherichia
coli O157:H7 ATCC 43895 in a model apple juice medium with different
concentrations of proline and caffeic acid. Appl. Environ. Microbiol. 67:2863-2866.
23. Tran, M. T. T., and M. Farid. 2004. Ultraviolet treatment of orange juice. Innov.
Food Sci. Emerg. Techno. 5:495-502.
24. U.S. Food and Drug Administration. 2001. Hazard Analysis and Critical Control
Points (HACCP): procedures for the safe and sanitary processing and importing of
juice. Federal Register 66:6137-6202.

135
25. U.S. Food And Drug Administration. 2013. Code of Federal Regulations (CFR).
Tittle 21. Chapter I. Subchapter B. Part 179. Section 179.39. Ultraviolet radiation for
the processing and treatment of food. Available at
http://www.accessdata.fda.gov/scripts/cdrh/cfdocs/cfcfr/CFRSearch.cfm?fr=179.39.
Accessed 23 March, 2014.
26. Wang, H., C. A. Reitmeier, B. A. Glatz, and A. L. Carriquiry. 2003. Mixed model
analysis of sensory characteristics of irradiated apple cider. J. Food Sci. 68:1498-
1503.

136
CHAPTER 7
CONCLUSIONS AND FUTURE WORK
Thermal tolerance and survival of pathogenic microorganisms relevant to juices
Data from the study summarized in Chapter 2 will be useful as a reference for
establishing the critical limits for the safe thermal processing of pH controlled juices and
similar products. However, it is important to consider that the application of the
processing conditions (time and temperature of pasteurization) extrapolated from our
study, should be validated before their implementation in commercial applications.
These safety validations should be performed in terms of efficacy of the recommended
treatments against other pathogenic microorganisms of public health significance in
juices, such as Cryptosporidium parvum in apple juice, apple cider and apple-carrot
juice blends; and Salmonella in citrus juices. Moreover, it would be interesting to
evaluate if consumers prefer or can detect significant differences among juices and
beverages treated with a traditional flash pasteurization protocol (71ºC for 6 s) or
subjected to a milder heat treatment such as the recommended in Chapter 2.
The determination of the thermal tolerance parameters of E. coli O157:H7 described in
Chapter 2 was performed using only one strain (C7927) and, as demonstrated in
Chapter 3, significant differences on the thermal tolerance and survival among strains
are expected. Thus, further investigation is required to validate if the heat treatments
suggested in Chapter 2 will be sufficient against other O157:H7 strains. This can be

137
performed using a cocktail of at least five E. coli strains, as recommended in the third
chapter of this dissertation.
Additionally, the data reported in Chapter 2 would be useful for process authorities to
establish adequate thermal treatment protocols for refrigerated sauces, dressing, soups
and other liquid food products with a pH below 4.6 and acidified with different organic
acids. Nonetheless, the influence of other physicochemical properties of these products
including soluble solids, insoluble solids and fat content, as well as the presence of
natural antimicrobial compounds, on the thermal tolerance and survival responses of
the pathogens relevant to those products should be evaluated.
Thermal tolerance and survival enhanced responses of E. coli O157:H7 and O111
As demonstrated by the results reported in Chapters 2 and 3, inducing an acid shock or
acid adaptation in Shiga toxin-producing E. coli strains enhances the thermal tolerance
and survival of these pathogens in apple juice. Also, it has been reported in the
literature that this exposure to moderate acidic environment induces a cross-protection
against other environmental stresses that may be encountered during food processing,
including salt, activated lactoperoxidase system, surface-active agents, radiation, and
others (Leyer et al., 1995). Thus, considering the lack of evidence in the literature, it
would be interesting to investigate if the acid shock and acid adaptation have also a
significant effect on the UV tolerance and survival of Shiga toxin-producing E. coli in
juices when a UV treatment is applied under the conditions recommended by the FDA
(FDA, 2013) and using a commercial UV unit such as the CiderSure. Additionally,
138
further investigation is needed to elucidate if there is an effect of acid adaptation and
acid shock on the tolerance and survival of pathogens in juices treated with other
emergent technologies such as high pressure processing, pulse electric fields and
plasma. Also, it would be interesting to study if an enhanced tolerance response to
adverse environments would be observed for other foodborne pathogens including
Salmonella, and Listeria monocytogenes, and spoilage microorganisms subjected to
these emerging nonthermal technologies.
Additionally, is necessary to conduct research regarding the changes in gene
expression and membrane composition of Shiga toxin-producing E. coli when exposed
to acid adaptation and acid shock protocols. Microarrays, RNA sequencing, and
proteomics are some of the technological approaches that can be used for this purpose.
Application of UV light treatments to juices different than apple juice and cider
Further investigation into the effectiveness of this technological approach for the safe
treatment of juices (other than apple juice and cider) such as watermelon, pineapple,
white grape juices and coconut water is of interest to the juice industry. For this
purpose, microbial challenge studies oriented to evaluate the efficacy of UV light
technology against the pathogens of concern likely to occur in these juices should be
executed. If results indicate that the treatment is sufficient to ensure the safety of these
products, further work would be required to evaluate the shelf life of these beverages in
comparison with the shelf life of the heat pasteurized counterparts. Moreover, the
physicochemical and nutritional properties of the UV treated should be compared
139
against pasteurized juices, as well as consumers’ potential preference for the more
“fresh-like” versions.
Coupling of UV light with other thermal and nonthermal technologies
Considering that UV treated juices and juice drinks are not shelf stable products and
that some physicochemical properties of juices, such as those described in Chapter 4,
may negatively affect the performance of this technology, it would be important to
investigate the feasibility and advantages of coupling UV light with traditional
approaches such as heat treatments, as well as with other emerging nonthermal
technologies. This research should contemplate microbial validations to confirm that a
safe product would be obtained, as well as a comprehensive evaluation of other factors
relevant to the juice industry such as the cost of the hurdle treatment, changes in
nutritional and physicochemical properties and shelf life of the resulting juice. Although
some research efforts of coupling UV light with other technologies including pulsed
electric fields (PEF), radio frequency electric fields (RFEF), manothermosonication, and
high intensity ultrasound (HIU) have been executed and published in the last decade
(Gachovska et al., 2008; Martin-Belloso and Sobrino-Lopez, 2011; Noci et al., 2008;
Walkling-Ribeiro et al., 2008), further research is needed to optimize the combination of
these technologies and to offer efficient, sustainable, cost-effective and affordable
solutions to the food industry.
140
REFERENCES
U.S. Food And Drug Administration (FDA). 2013. Code of Federal Regulation (CFR).
Tittle 21. Chapter I. Subchapter B. Part 179. Section 179.39. Ultraviolet radiation for the
processing and treatment of food. Available at:
http://www.accessdata.fda.gov/scripts/cdrh/cfdocs/cfcfr/CFRSearch.cfm?fr=179.39.
Accessed June 7, 2014.
Gachovska, T. K., Kumar, S., Thippareddi, H., Subbiah, J., and Williams, F. 2008.
Ultraviolet and pulsed electric field treatments have additive effect on inactivation of
E. coli in apple juice. J. Food Sci. 7: 412-17.
Leyer, G. J., Wang L. L., and Johnson E. A. 1995. Acid adaptation of Escherichia coli
O157:H7 increases survival in acidic foods. Appl. Environ. Microbiol. 61:3752-5.
Martin-Belloso, O., and Sobrino-Lopez, A. 2011. Combination of pulsed electric fields
with other preservation techniques. Food Bioproces. Technol. 4: 1-15.
Noci, F., Riener, J., Walkling-Ribeiro, M., Cronin, D. A., Morgan, D. J., and Lyng, J. G.
2008. Ultraviolet irradiation and pulsed electric fields (PEF) in a hurdle strategy for the
preservation of fresh apple juice. J. Food Eng. 85: 141-6.
Walkling-Ribeiro, M., Noci, F., Cronin, D. A., Riener, J., Lyng, J. G., and Morgan, D. J.
2008. Reduction of Staphylococcus aureus and quality changes in apple juice
processed by ultraviolet irradiation, pre-heating and pulsed electric fields. J. Food Eng.,
89: 267-273.
Related Documents