JSCSEN 7 () (20 ) 11 6 9 1191 1338 – BELGRADE 2011 N 9 o VOLUME 76 Available on line at www.shd.org.rs/JSCS/ The full search of JSCS is available through www.doaj.org e lectronic ersion v

Welcome message from author
This document is posted to help you gain knowledge. Please leave a comment to let me know what you think about it! Share it to your friends and learn new things together.
Transcript
JSCSEN 7 ( ) (20 )116 9 1191 1338–
BELGR A D E 2011
N 9o
VOLUME 76Available on line at
www.shd.org.rs/JSCS/
The full search of JSCSis available through
www.doaj.org
electronic
ersionv

J. Serb. Chem. Soc. Vol. 76, No. 9 (2011)
CONTENTS
Organic Chemistry B. Karami and S. Khodabakhshi: A facile synthesis of phenazine and quinoxaline deri-
vatives using magnesium sulfate heptahydrate as a catalyst ....................................... 1191 R. B. Chaudhari and S. S. Rindhe: Synthesis and antimicrobial activities of novel 8-(1-
alkyl/alkylsulphonyl/alkoxycarbonyl-benzimidazol-2-ylmethoxy)-5-chloroquino-lines ................................................................................................................................... 1199
Biochemistry and Biotechnology D. Dekanski, S. Ristić, N. V. Radonjić, N. D. Petronijević, A. Dekanski and D. M. Mitro-
vić: Olive leaf extract modulates cold restraint stress-induced oxidative changes in rat liver ........................................................................................................................ 1207
N. Nikićević, M. Veličković, M. Jadranin, I. Vučković, M. Novaković, Lj. Vujisić, M. Stanković, I. Urošević and V. Tešević: The effects of the cherry variety on the chemical and sensorial characteristics of cherry brandy ............................................. 1219
M. Đ. Milisavljević, G. S. Timotijević, D. B. Nikolić, J. T. Samardžić and V. R. Maksi-mović: Cell wall localization of the aspartic proteinase from buckwheat (FeAPL1) over-expressed in tobacco BY-2 cells ......................................................................... 1229
Inorganic Chemistry V. N. Patange and B. R. Arbad: Synthesis, spectral, thermal and biological studies of
transition metal complexes of 4-hydroxy-3-[3-(4-hydroxyphenyl)-cryloyl]-6-me-thyl-2H-pyran-2-one ................................................................................................... 1237
Theoretical Chemistry M. Senćanski, M. D. Ivanović, S. Vučković and Lj. Došen-Mićović: Modeling the ligand
specific μ- and δ-opioid receptor conformations ........................................................ 1247 J. P. Barbosa, J. E. V. Ferreira, A. F. Figueiredo, R. C. O. Almeida, O. P. P. Silva, J. R.
C. Carvalho, M. D. G. G. Cristino, J. Ciríaco-Pinheiro, J. L. F. Vieira and R. T. A. Serra: Molecular modeling and chemometric study of anticancer derivatives of artemisinin .................................................................................................................. 1263
Physical Chemistry Lj. M. Kljajević, V. M. Jovanović, S. I. Stevanović, Ž. D. Bogdanov and B. V. Kalu-
djerović: Influence of chemical agents on the surface area and porosity of active carbon hollow fibers .................................................................................................... 1283
Electrochemistry H. A. Zamani, M. R. Ganjali and F. Faridbod: A novel platinum-based nanocatalyst at a
niobia-doped titania support for the hydrogen oxidation reaction ............................... 1295
Polymers K. Obradović-Djuričić, V. Medić, M. Radišić and M. Laušević: Correlation between the
degree of conversion and the elution of leachable components from dental resin-based cements ............................................................................................................. 1307
Environmental I. Kostić, T. Anđelković, R. Nikolić, A. Bojić, M. Purenović, S. Blagojević and D. Anđel-
ković: Copper(II) and lead(II) complexation by humic acid and humic-like ligands .. 1325
Book Review B. D. Djordjević: Interfacial Electrovicoelasticity and Electrophoresis, authors: Jyh-Ping
Hsu and Aleksandar M. Spasic ................................................................................... 1337
Published by the Serbian Chemical Society Karnegijeva 4/III, 11000 Belgrade, Serbia
Printed by the Faculty of Technology and Metallurgy Karnegijeva 4, P.O. Box 35-03, 11120 Belgrade, Serbia
_________________________________________________________________________________________________________________________
2011 Copyright (CC) SCS
Available online at www.shd.org.rs/JSCS/

J. Serb. Chem. Soc. 76 (9) 1191–1198 (2011) UDC 547.864+547.856+542.913:544.478 JSCS–4195 Original scientific paper
1191
A facile synthesis of phenazine and quinoxaline derivatives using magnesium sulfate heptahydrate as a catalyst
BAHADOR KARAMI* and SAEED KHODABAKHSHI
Department of Chemistry, Yasouj University, Yasouj, Zip Code: 75918-74831, P. O. Box 353, Iran
(Received 1 August, revised 29 November 2010)
Abstract: Convenient and simple procedures for the synthesis of phenazine and quinoxaline derivatives were developed via a reaction of o-phenylenediamines and 1,2-dicarbonyl compounds. In addition, the synthesis of two new 1,4-benzodiazine derivatives and the catalytic activity of magnesium sulfate heptahydrate (MgSO4·7H2O) in the room temperature condensation of o-phenylenediamines and 1,2-dicarbonyl compounds in ethanol as solvent are reported. This method has many appealing attributes, such as excellent yields, short reaction times, and simple work-up procedures.
Keywords: phenazine; quinoxaline; magnesium sulfate heptahydrate; catalyst.
INTRODUCTION
Nitrogen-containing heterocycles, which exhibit extensive biological proper-ties, are abundant in natural compounds.1 Phenazines and quinoxalines are im-portant classes of benzoheterocycles, which have significance in both chemistry and biology.2
Many phenazine compounds, which are produced by bacteria such as Pseu-domonas spp., Streptomyces spp. and Pantoea agglomerans, are found in nature These natural phenazine products have been implicated in the virulence and com-petitive fitness of the producing organisms.3,4 Quinoxaline and phenazine deriva-tives constitute the basis of some antitumor agents,5 bactericides,6 fungicides,7 herbicides,8 and insecticides (e.g., quinalphos).9 In addition, they are used in dyes,10 building blocks for the synthesis of organic semiconductors,11 chemically controllable switches,12 cavitands,13 DNA cleaving agents,14 dehydroannu-lenes,15 and electrical-photochemical materials.16–18
A number of synthetic strategies have been developed for the preparation of substituted quinoxalines.19 Many of the existing methods, however, suffer from
* Corresponding author. E-mail: [email protected] doi: 10.2298/JSC100801104K
_________________________________________________________________________________________________________________________
2011 Copyright (CC) SCS
Available online at www.shd.org.rs/JSCS/

1192 KARAMI and KHODABAKHSHI
disadvantages such as unsatisfactory product yields, harsh conditions, long reac-tions times, and critical product isolation procedures.
In recent years, heterogeneous catalysts have gained importance because of enviro-economic reasons. They have successfully been utilized in several organic transformations in order to minimize undesirable wastes which could pollute the environment.
Recently, the use of magnesium sulfate as an efficient and very cheap re-agent for the preparation of bis(indolyl)methanes was reported.20
RESULTS AND DISCUSSION
In connection with studies on the synthesis of organic compounds,21 it was now found that magnesium sulfate heptahydrate (MgSO4·7H2O) can be used as an efficient, safe and very cheap catalyst for the condensation of 1,2-dicarbonyl compounds 1–3 and o-phenylenediamine (4) at room temperature to afford phe-nazine and quinoxaline derivatives 5–9 in excellent yields (Scheme 1).
Scheme 1. The synthesis of quinoxaline and phenazine derivatives
using MgSO4·7H2O as a catalyst.
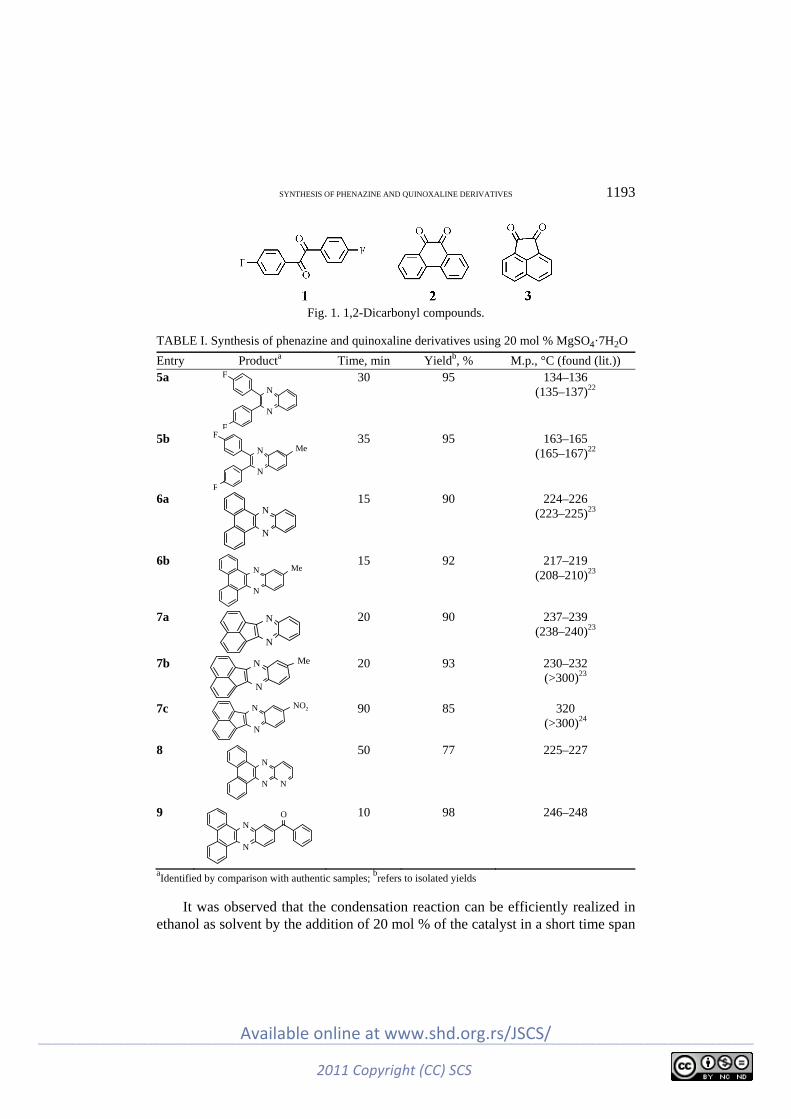
In this work, 4,4’-difluorobenzil (1), 9,10-phenanthrenequinone (2) and ace-naphthoquinone (3) were used as the 1,2-dicarbonyl compounds (Fig. 1).
To determine simple and suitable conditions for the preparation of quino-xaline and phenazine derivatives using MgSO4·7H2O as the Lewis acid catalyst, the treatment of 4,4’-difluoro-benzil (1) with o-phenylenediamine (4a) was chosen as the model reaction (Table I, Entry 5a).
_________________________________________________________________________________________________________________________
2011 Copyright (CC) SCS
Available online at www.shd.org.rs/JSCS/
SYNTHESIS OF PHENAZINE AND QUINOXALINE DERIVATIVES 1193
Fig. 1. 1,2-Dicarbonyl compounds.
TABLE I. Synthesis of phenazine and quinoxaline derivatives using 20 mol % MgSO4·7H2O
Entry Producta Time, min Yieldb, % M.p., °C (found (lit.)) 5a
N
N
F
F
30 95 134–136 (135–137)22
5b
N
N Me
F
F
35 95 163–165 (165–167)22
6a
N
N
15 90 224–226 (223–225)23
6b
N
N Me
15 92 217–219 (208–210)23
7a
N
N
20 90 237–239 (238–240)23
7b
N
N Me
20 93 230–232 (>300)23
7c N
N NO2
90 85 320 (>300)24
8
N
N
N
50 77 225–227
9
N
NO
10 98 246–248
aIdentified by comparison with authentic samples;
brefers to isolated yields
It was observed that the condensation reaction can be efficiently realized in ethanol as solvent by the addition of 20 mol % of the catalyst in a short time span
_________________________________________________________________________________________________________________________
2011 Copyright (CC) SCS
Available online at www.shd.org.rs/JSCS/
1194 KARAMI and KHODABAKHSHI
of 30 min. The use of excess amounts of the catalyst did not have a marked in-fluence on the product yield. The probable reason for this is the coordination of excessive catalyst to the diamine.
In order to prove the general applicability of this method, after optimizing the reaction conditions, different 1,2-dicarbonyl compounds were treated with o-phenylenediamines at room temperature in ethanol. The results are presented in Table I.
Although the generally mechanistic details of this reaction are not yet fully understood, a feasible pathway might involve the complexation of magnesium with the dicarbonyl, thereby acting as a Lewis acid, and also playing a complex role in promoting the dehydration steps.
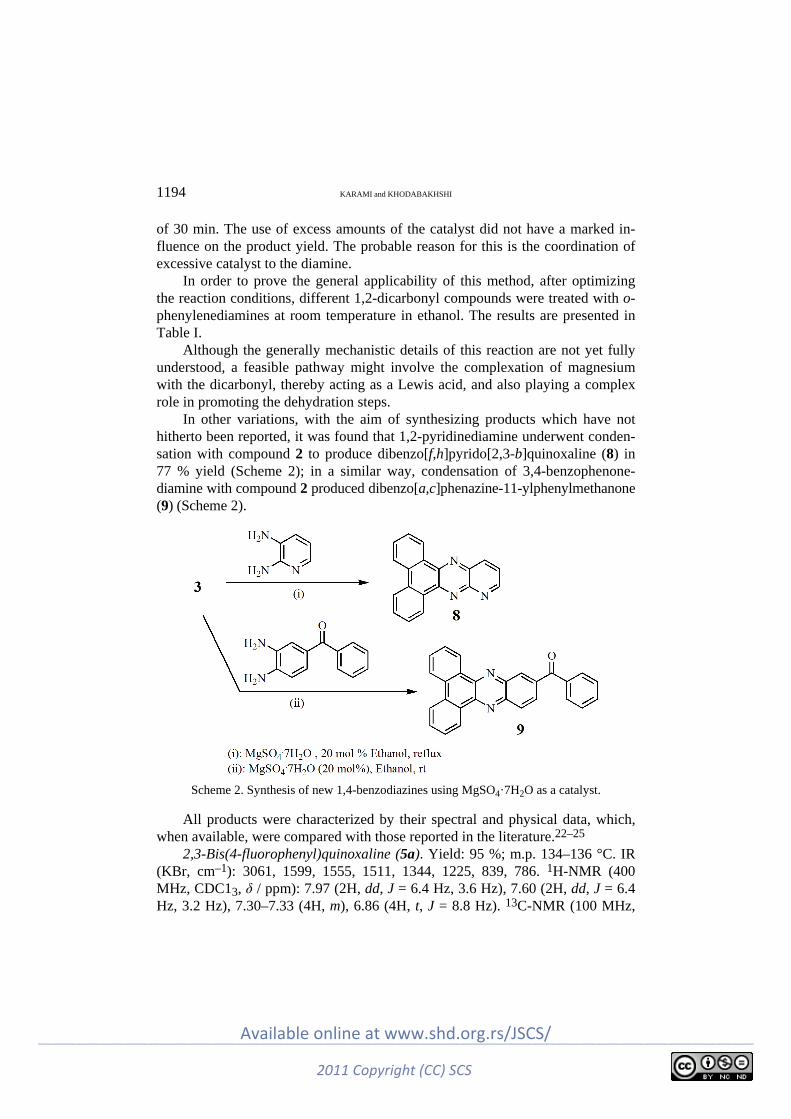
In other variations, with the aim of synthesizing products which have not hitherto been reported, it was found that 1,2-pyridinediamine underwent conden-sation with compound 2 to produce dibenzo[f,h]pyrido[2,3-b]quinoxaline (8) in 77 % yield (Scheme 2); in a similar way, condensation of 3,4-benzophenone-diamine with compound 2 produced dibenzo[a,c]phenazine-11-ylphenylmethanone (9) (Scheme 2).
Scheme 2. Synthesis of new 1,4-benzodiazines using MgSO4·7H2O as a catalyst.
All products were characterized by their spectral and physical data, which, when available, were compared with those reported in the literature.22–25
2,3-Bis(4-fluorophenyl)quinoxaline (5a). Yield: 95 %; m.p. 134–136 °C. IR (KBr, cm–1): 3061, 1599, 1555, 1511, 1344, 1225, 839, 786. 1H-NMR (400 MHz, CDC13, δ / ppm): 7.97 (2H, dd, J = 6.4 Hz, 3.6 Hz), 7.60 (2H, dd, J = 6.4 Hz, 3.2 Hz), 7.30–7.33 (4H, m), 6.86 (4H, t, J = 8.8 Hz). 13C-NMR (100 MHz,
_________________________________________________________________________________________________________________________
2011 Copyright (CC) SCS
Available online at www.shd.org.rs/JSCS/

SYNTHESIS OF PHENAZINE AND QUINOXALINE DERIVATIVES 1195
CDC13, δ / ppm): 161.99, 152.20, 141.23, 135.02, 131.82, 131.74, 130.23, 129.16, 115.65, 115.43.
2,3-Bis(4-fluorophenyl)-6-methylquinoxaline (5b). Yield: 95 %; m.p. 163– –165 °C. IR (KBr, cm–1): 2925, 2580, 1657, 1597, 1264, 1159, 833, 696. 1H- -NMR (400 MHz, CDC13, δ / ppm): 6.58 (4H, t, J = 8.8 Hz), 2.43 (3H, s), 7.85 (1H, d, J = 8.8 Hz), 7.73 (1H, s), 7.42 (1H, d, J = 8.8 Hz), 7.30 (4H, dd, J = 8.0 Hz, 5.2 Hz). 13C-NMR (100 MHz, CDC13, δ / ppm): 161.89, 152.05, 151.29, 141.28, 140.84, 139.69, 135.16, 135.13, 132.59, 131.77, 131.72, 131.69, 128.65, 127.96, 115.59, 115.37, 21.94.
Dibenzo[a,c]phenazine (6a). Yield: 90 %; m.p. 224–226 °C. IR (KBr, cm–1): 3055, 1600, 1490, 1350, 760, 720. 1H-NMR (400 MHz, CDC13, δ / ppm): 9.18 (2H, d, J = 7.6 Hz), 8.34 (2H, d, J = 8.0 Hz), 8.12 (2H, dd, J = 6.4, 3.6 Hz), 7.51– –7.66 (6H, m). 13C-NMR (100 MHz, CDC13, δ / ppm): 143.54, 143.28, 133.15, 131.42, 130.88, 130.57, 129.04, 127.38, 124.03.
11-Methyldibenzo[a,c]phenazine (6b). Yield: 92 %; m.p. 217–219 °C. IR (KBr, cm–1): 3055, 2910, 1620, 1500, 1350, 760, 720. 1H-NMR (400 MHz, CDC13, δ / ppm): 9.14 (2H, dd, J = 6.0 Hz, 1.6 Hz), 8.32 (2H, d, J = 8.0 Hz), 7.97 (1H, d, J = 8.4 Hz), 7.58 (1H, s), 7.52–7.53 (5H, m), 2.54 (3H, s). 13C-NMR (100 MHz, CDC13, δ / ppm): 143.29, 143.27, 142.72, 141.81, 141.41, 133.45, 133.06, 132.87, 131.49, 131.45, 131.20, 131.07, 130.01, 129.10, 128.92, 127.29, 127.15, 123.95, 23.20.
Acenaphtho[1,2-b]quinoxaline (7a). Yield: 90 %; m.p. 237–239 °C. IR (KBr, cm–1): 3050, 1610, 1430, 1300, 830, 760. 1H-NMR (400 MHz, CDC13, δ / / ppm): 8.21 (2H, d, J = 6.8 Hz), 8.02 (2H, dd, J = 6.2 Hz, 3.2 Hz), 7.90 (2H, d, J = 8.4 Hz), 7.65 (2H, t, J = 7.0 Hz), 7.57 (2H, dd, J = 6.4 Hz, 3.6 Hz). 13C-NMR (100 MHz, CDC13, δ / ppm): 155.19, 142.39, 137.60, 132.92, 131.10, 130.47, 130.59, 130.36, 129.78, 122.96.
9-Methylacenaphtho[1,2-b]quinoxaline (7b). Yield: 93 %; m.p. 230–232 °C. IR (KBr, cm–1): 3055, 2910, 1610, 1415, 1300, 810, 790. 1H-NMR (400 MHz, CDC13, δ / ppm): 8.21 (2H, t, J = 6.4 Hz), 7.90 (3H, dd, J = 8.2 Hz, 3.2 Hz), 7.79 (1H, s), 7.64 (2H, t, J = 7.4 Hz), 7.40 (1H, dd, J = 8.4 Hz, 1.6 Hz), 2.43 (3H, s). 13C-NMR (100 MHz, CDC13, δ / ppm): 155.15, 154.44, 142.38, 140.82, 140.71, 137.35, 133.08, 132.44, 131.06, 130.46, 130.31, 130.21, 129.89, 129.72, 122.83, 122.68, 22.94.
9-Nitroacenaphtho[1,2-b]quinoxaline (7c). Yield: 85 %; m.p. >300 °C. IR (KBr, cm–1): 3090, 1580, 1540, 1340, 1060, 680, 720. 1H-NMR (400 MHz, CDC13, δ / ppm): 8.97 (1H, d, J = 2.2 Hz), 8.51–8.53 (3H, m), 8.40 (3H, m), 8.00 (2H, t, J = 8.0 Hz).
Dibenzo[f,h]pyrido[2,3-b]quinoxaline (8). Yield: 70 %; m.p. 225–227 °C; Anal. Calcd. for C19H11N3: C, 81.12; H, 3.94; N, 14.94 %. Found: C, 81.68, H, 3.953, N, 15.00 %. IR (KBr, cm–1): 3056, 1566, 1525, 1384, 1220, 1161, 837.
_________________________________________________________________________________________________________________________
2011 Copyright (CC) SCS
Available online at www.shd.org.rs/JSCS/
1196 KARAMI and KHODABAKHSHI
1H-NMR (400 MHz, CDC13, δ / ppm): 9.35 (1H, d, J = 7.6 Hz), 9.04–9.15 (2H, m), 8.48 (1H, d, J = 8.0 Hz), 8.36 (2H, d, J = 8.4 Hz), 7.53–7.66 (5H, m). 13C- -NMR (100 MHz, CDC13, δ / ppm): 155.65, 150.92, 146.09, 144.70, 139.50, 138.45, 133.60, 133.38, 132.30, 131.99, 130.82, 130.60, 129.28, 129.16, 128.46, 127.58, 126.02, 124.12, 123.98. MS (m/z): 281.03, 280.04, 255.05, 175.99, 140, 86.90.
Dibenzo[a,c]phenazine-11-ylphenylmethanone (9). Yield: 96 %; m.p. 246– –248 °C; Anal. Calcd. for C27H16N2O: C, 84.36; H, 4.20; N, 7.29 %. Found: C, 84.48, H, 4.183, N, 7.375 %. IR (KBr, cm–1): 3050, 1650, 1600, 1445, 1320. 1H- -NMR (400 MHz CDC13, δ / ppm): 9.43 (1H, dd, J = 8.0 Hz, 1.2 Hz), 9.35 (1H, dd, J = 8.0 Hz, 1.2 Hz), 8.70 (1H, d, J = 1.6 Hz), 8.58 (2H, d, J = 8.0 Hz), 8.44 (1H, d, J = 8.8 Hz), 8.55 (1H, dd, J = 8.8 Hz, 2.0 Hz), 7.97–7.99 (2H, m), 7.68– –7.87 (5H, m), 7.60 (2H, t, J = 8.0 Hz). 13C-NMR (400 MHz, CDC13, δ / ppm): 196.00, 184.81, 153.70, 143.74, 143.45, 141.05, 137.92, 137.38, 132.95, 132.84, 132.48, 132.18, 130.99, 130.75, 130.23, 129.94, 129.40, 128.58, 128.12, 126.69, 126.36, 123.01; MS (m/z): 384.13, 307.06, 279.02, 104.88, 76.91.
EXPERIMENTAL
General
The commercial starting materials were purchased from Merck, Fluka and Aldrich. The reactions were monitored by TLC (silica-gel 60 F254, n-hexane:ethyl acetate). The IR spectra were recorded on a FTIR Shimadzu-470 spectrometer and the 1H-NMR spectra were obtained on a Bruker-Instrument DPX-400 and 500 MHz Avance 2 model. Mass spectra were recorded on an AMD 604 spectrometer in the EI-mode at 70 eV and FT-mode at 0.005 V. A Vario-El CHN instrument at the Isfahan Industrial University was used for the elemental analyses.
General procedure
A mixture of 1,2-dicarbonyl compound (1 mmol), o-phenylenediamine (1.1 mmol) and magnesium sulfate heptahydrate (20 mol %) in ethanol (5 mL) was stirred at room tempera-ture (except for entry 8 when reflux conditions were employed). The progress of the reaction was monitored by TLC. After completion of the reaction, the solid which separated was fil-tered and then recrystallized from ethanol to afford the pure product.
CONCLUSIONS
In summary, a new application of magnesium sulfate heptahydrate (MgSO4⋅7H2O) as an effective, very cheap and non-toxic catalyst for the syn-thesis of many phenazines and quinoxalines, based on the condensation of 1,2- -dicarbonyl compounds with o-phenylenediamines under mild reaction condi-tions, is presented. The most important point in this work is that new derivatives of phenazine and quinoxaline were also synthesized. This method is significant from an environmental viewpoint and economic considerations because it pro-duces little waste.
_________________________________________________________________________________________________________________________
2011 Copyright (CC) SCS
Available online at www.shd.org.rs/JSCS/
SYNTHESIS OF PHENAZINE AND QUINOXALINE DERIVATIVES 1197
The availability and stability of the catalyst, the simple work-up procedure and the high yields of products in short reaction times under mild reaction con-ditions make this method a valid contribution to the existing methodologies.
Acknowledgement. The authors gratefully acknowledge the partial support of this work by the Islamic Azad University, Gachsaran Branch, Iran.
И З В О Д
ЈЕДНОСТАВНА СИНТЕЗА ДЕРИВАТА ФЕНАЗИНА И КИНОКСАЛИНА (НОВИХ 1,4-БЕНЗОДИАЗИНА) ПОМОЋУ МАГНЕЗИЈУМ-СУЛФАТА ХЕПТАХИДРАТА
BAHADOR KARAMI и SAEED KHODABAKHSHI
Department of Chemistry, Yasouj University, Yasouj, Zip Code: 75918-74831, P. O. Box 353, Iran
Развијен је једноставан поступак за синтезу деривата феназина и хиноксалина, реак-цијом о-фенилендиамина и 1,2-дикарбонилних једињења. Синтетисана су два нова деривата 1,4-бензодиазина и описана је каталитичка активност магнезијум-сулфата хептахидрата (MgSO4·7H2O) у рекцији кондензације деривата о-фенилендиамина и 1,2-дикарбонилних једињења у етанолу на собној температури. Описани поступак има доста погодности, као што је одличан принос, кратко реакционо време и једноставна обрада реакционе смеше.
(Примљено 1. августа, ревидирано 29.новембра 2010)
REFERENCES
1. a) A. E. A. Porter, in Comprehensive Heterocyclic Chemistry: the Structure, Reactions, Synthesis and Uses of Heterocyclic Compounds, A. R. Katritzky, C. W. Rees, Eds., Pergamon Press, Oxford, U.K., 1984, p. 157; b) N. Sato, in Comprehensive Heterocyclic Chemistry II, Vol. 6, A. R. Katritzky, C. W. Rees, E. F. V. Scriven, Eds., Pergamon Press, Oxford, UK, 1996, p. 233
2. a) W. Zhu, M. Dai, Y. Xu, X. Qian, Bioorg. Med. Chem. 16 (2008) 3255; b) M. M. F. Ismail, Y. A. Ammar, M. K. H. Ibrahim, S. A. Elzahaby, S. S. Mahmoud, Arzneim.-Forsch. 55 (2006) 738; c) X. Hui, J. Desrivot, C. Bories, P. M. Loiseau, X. Franck, R. Hocquemiller, B. Figadere, Bioorg. Med. Chem. Lett. 16 (2006) 815; d) S. A. Kotharkar, D. B. J. Shinde, J. Iran. Chem. Soc. 3 (2006) 267
3. J. M. Turner, A. J. Messenger, Adv. Microb. Physiol. 27 (1986) 211 4. M. McDonald, D. V. Mavrodi, J. Am. Chem. Soc. 38 (2001) 9459 5. a) S. Nakaike, T. Yamagishi, K. Samata, K. Nishida, K. Inazuki, T. Ichihara, Y. Migita,
S. Otomo, H. Aihara, S. Tsukagoshi, Cancer Chemother. Pharmacol. 23 (1989) 135; b) P. Corona, A. Carta, M. Loriga, G. Vitale, G. Paglietti, Eur. J. Med. Chem. 44 (2009) 1579
6. a) M. L. Edwards, R. E. Bambury, H. K. Kim, J. Heterocycl. Chem. 13 (1976) 653; b) J. P. Dirlam, J. E. Presslitz, B. J. Williams, J. Med. Chem. 26 (1983) 1122
7. a) M. Patel, V. Hegde, A. C. Horan, V. P. Gullo, D. Loebenberg, J. A. Marquez, G. H. Miller, M. S. Puar, J. A. Waitz, J. Antibiot. (Tokyo) 37 (1984) 943; b) G. A. Carter, T. Clark, C. S. James, R. S. T. Loeffler, Pest. Manag. Sci. 14 (1983) 135
8. I. Starke, G. Sarodnick, V. V. Ovcharenko, K. Pihlaja, E. Kleinpeter, Tetrahedron 60 (2004) 6063
9. a) B. Cross, C. L. Dunn, D. H. Payne, J. D. Tipton, J. Sci. Food. Agr. 20 (1969) 340; b) P. Menon, M. Gopal, R. Prasad, J. Agric. Food. Chem. 52 (2004) 7370
_________________________________________________________________________________________________________________________
2011 Copyright (CC) SCS
Available online at www.shd.org.rs/JSCS/
1198 KARAMI and KHODABAKHSHI
10. a) A. Katoh, T. Yoshida, J. Ohkanda, J. Heterocycles 52 (2000) 911; b) D. M. Geller, J. Biol. Chem. 224 (1969) 971
11. S. Dailey, W. J. Feast, R. J. Peace, I. C. Sage, S. Till, E. L. Wood, J. Mater. Chem. 11 (2001) 2238
12. M. J. Crossley, L. A. Johnston, Chem. Commun. (2002) 1122 13. J. L. Sessler, H. Maeda, T. Mizuno, V. M. Lynch, H. Furuta, J. Am. Chem. Soc. 124
(2002) 13474 14. T. Yamaguchi, S. Matsumoto, K. Watanabe, Tetrahedron Lett. 39 (1998) 8311 15. O. Sascha, F. Rudiger, Synlett (2004) 1509 16. T. Yamamoto, K. Sugiyama, T. Kushida, T. Inoue, T. Kanbara, J. Am. Chem. Soc. 118
(1996) 3930 17. I. Nurulla, I. Yamaguchi, T. Yamamoto, Polym. Bull. 44 (2000) 231 18. T. Yamamoto, B. L. Lee, H. Kokubo, H. Kishida, K. Hirota, T. Wakabayashi, H.
Okamoto, Macromol. Rapid Commun. 24 (2003) 440 19. D. J. Brown, in: Quinoxalines: Supplement II, in The Chemistry of Heterocyclic Com-
pounds, E. C. Taylor, P. Wipf, Eds., Wiley, New Jersey, USA, 2004 20. A. Hasaninejad, A. Parhami Zare, A. A. Khalafi-Nezhad, A. Nasrolahi Shirazi, A. R.
Moosavi Zare, Pol. J. Chem. 82 (2008) 565 21. a) B. Karami, J. A. Damavandi, M. Bayat, M. Montazerozohori, J. Serb. Chem. Soc. 71
(2006) 27; b) B. Karami, M. Montazerozohori, M. H. Habibi, Bull. Korean Chem. Soc. 26 (2005) 1125; c) B. Karami, M. Montazerozohori, G. Karimipour, M. H. Habibi, Bull. Korean Chem. Soc. 26 (2005) 1431; d) B. Karami, M. Montazerozohori, M. H. Habibi, M. A. Zolfigol, Heterocyclic Commun. 11 (2005) 513; e) B. Karami, M. Montazero-zohori, M. H. Habibi, Phosphorus Sulfur Silicon Relat. Elem. 181 (2006) 2825; f) M. Montazerozohori, B. Karami, Helv. Chim. Acta 89 (2006) 2922; g) M. Montazerozohori, B. Karami, M. Aziz, Arkivoc (2007) 99; h) B. Karami, M. Montazerozohori, Molecules 11 (2006) 720
22. M. M. Heravi, M. H. Tehrani, K. Bakhtiari, N. M. Javadi, H. A. Oskooie, Arkivoc (2006) 16
23. K. Niknam, D. Saberi, M. Mohagheghnejad, Molecules 14 (2009) 1915 24. K. Niknam, M. A. Zolfigol, Z. Tavakoli, Z. J. Heydari, J. Chin. Chem. Soc. 55 (2008)
1373.
_________________________________________________________________________________________________________________________
2011 Copyright (CC) SCS
Available online at www.shd.org.rs/JSCS/
J. Serb. Chem. Soc. 76 (9) 1199–1206 (2011) UDC 547.7+547.53–327+547.831+ JSCS–4196 542.913:615.28–188 Original scientific paper
1199
Synthesis and antimicrobial activities of novel 8-(1-alkyl/ /alkylsulphonyl/alkoxycarbonyl-benzimidazol-2-
-ylmethoxy)-5-chloroquinolines RAJU B. CHAUDHARI* and SAHEBRAO S. RINDHE
PG Department of Chemistry; New Arts, Commerce and Science College, Ahmednagar-414003, Maharashtra, India
(Received 8 July 2010, revised 7 January 2011)
Abstract: The synthesis of a series of novel 8-(1-alkyl/alkylsulphonyl/al-koxycarbonyl-benzimidazol-2-ylmethoxy)-5-chloroquinoline derivatives is re-ported. These derivatives were prepared by the condensation of o-phenylene-diamine with [(5-chloroquinolin-8-yl)oxy]acetic acid, followed by substitution at nitrogen with different electrophilic reagents in presence of an appropriate base to give a series of nitrogen heterocycles containing the benzimidazole and quinoline nuclei. The structures of the compounds were confirmed based on 1H-NMR, 13C- -NMR, IR and mass spectral data. Almost all the compounds exhibited promising antibacterial activity against Salmonella typhimurium and Staphylococcus aureus. Some of the compounds showed good antifungal activities against Aspergillus niger but the antifungal activities against Candida albicans were disappointing.
Keywords: heterocyclic; benzimidazole; quinoline; antibacterial; antifungal.
INTRODUCTION
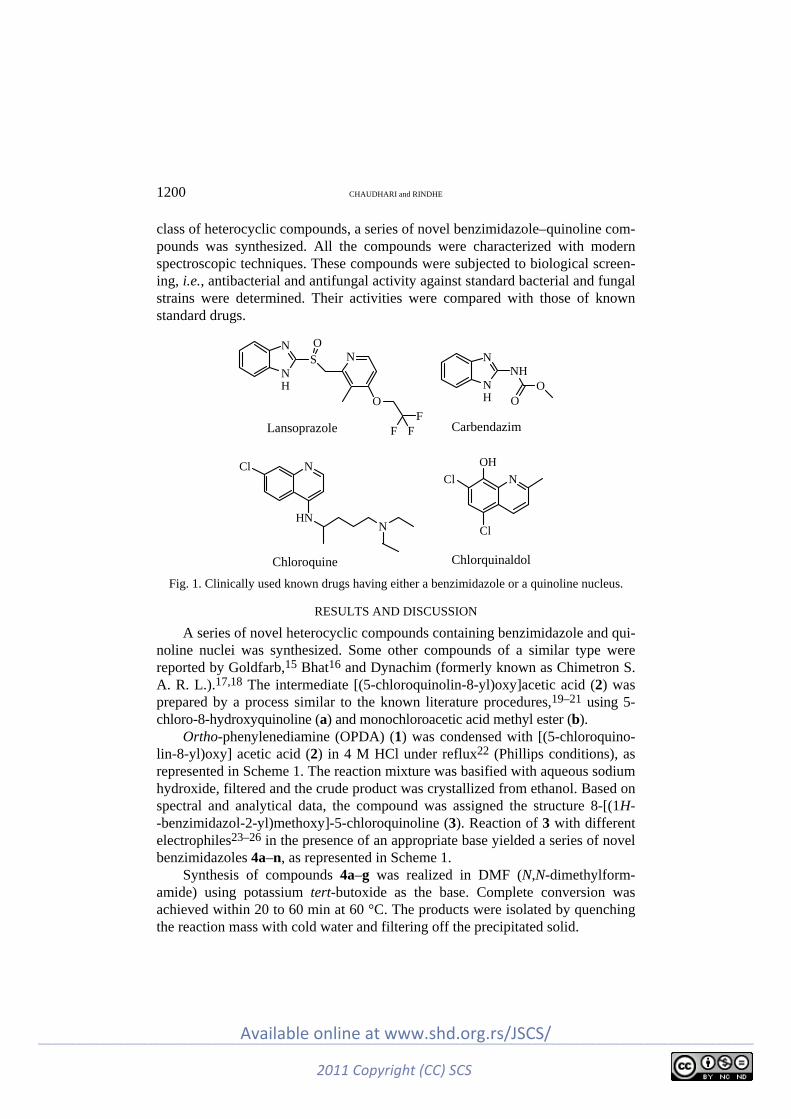
Heterocyclic compounds containing the benzimidazole nucleus are well re-cognized for their different therapeutic activities.1–6 Some of the important ex-amples are lansoprazole (anti-ulcer),7 carbendazim (fungicide),8 thiabendazole (ant-helmintic and fungicide),9 benperidol (antipsychotic), oxatomide (anti-allergic and anti-asthmatic),10 etc. Similarly, compounds containing the quinoline nuc-leus are also known for different therapeutic activities,11,12 such as chloroquine (antimalarial),13 chlorquinaldol (antibacterial and antifungal),14 etc. (Fig. 1).
Thus, substituted benzimidazoles and quinolines both have potential biolo-gical activities. Hence, molecules containing both benzimidazole and quinoline as building blocks of their chemical structure have increased probability of pos-sessing still better biological activities. In an attempt to extend the study of this
* Corresponding author. E-mail: [email protected] doi: 10.2298/JSC100817105C
_________________________________________________________________________________________________________________________
2011 Copyright (CC) SCS
Available online at www.shd.org.rs/JSCS/
1200 CHAUDHARI and RINDHE
class of heterocyclic compounds, a series of novel benzimidazole–quinoline com-pounds was synthesized. All the compounds were characterized with modern spectroscopic techniques. These compounds were subjected to biological screen-ing, i.e., antibacterial and antifungal activity against standard bacterial and fungal strains were determined. Their activities were compared with those of known standard drugs.
NH
NSO
N
O
FF
F
NH
NNH
OO
NCl
HNN
NCl
OH
Cl
Lansoprazole Carbendazim
Chloroquine Chlorquinaldol Fig. 1. Clinically used known drugs having either a benzimidazole or a quinoline nucleus.
RESULTS AND DISCUSSION
A series of novel heterocyclic compounds containing benzimidazole and qui-noline nuclei was synthesized. Some other compounds of a similar type were reported by Goldfarb,15 Bhat16 and Dynachim (formerly known as Chimetron S. A. R. L.).17,18 The intermediate [(5-chloroquinolin-8-yl)oxy]acetic acid (2) was prepared by a process similar to the known literature procedures,19–21 using 5-chloro-8-hydroxyquinoline (a) and monochloroacetic acid methyl ester (b).
Ortho-phenylenediamine (OPDA) (1) was condensed with [(5-chloroquino-lin-8-yl)oxy] acetic acid (2) in 4 M HCl under reflux22 (Phillips conditions), as represented in Scheme 1. The reaction mixture was basified with aqueous sodium hydroxide, filtered and the crude product was crystallized from ethanol. Based on spectral and analytical data, the compound was assigned the structure 8-[(1H- -benzimidazol-2-yl)methoxy]-5-chloroquinoline (3). Reaction of 3 with different electrophiles23–26 in the presence of an appropriate base yielded a series of novel benzimidazoles 4a–n, as represented in Scheme 1.
Synthesis of compounds 4a–g was realized in DMF (N,N-dimethylform-amide) using potassium tert-butoxide as the base. Complete conversion was achieved within 20 to 60 min at 60 °C. The products were isolated by quenching the reaction mass with cold water and filtering off the precipitated solid.
_________________________________________________________________________________________________________________________
2011 Copyright (CC) SCS
Available online at www.shd.org.rs/JSCS/

SYNTHESIS AND ANTIMICROBIAL ACTIVITIES OF NOVEL BENZIMIDAZOLES 1201
O
O ClN
O Cl
O
HO
(a) (b) (2)
A.
NH2
NH2
N
O Cl
O
HO
(2)
N
O ClNH
N
(3)
N
O ClNH
N
(3)
(4a-4n)
(1)
R-X
Electrophile
Base / Solvent
4 M HCl
Ref lux
(i) K2CO3 / KI
Xylene Reflux
(ii) 4 M HCl Ref lux
B.
C.
N
HO Cl
N
N
O
N
Cl
R
+
+
Where, X = Halogen;(4a, R = Methyl), (4b, R = Ethyl), (4c, R = Propyl), (4d, R = Butyl), (4e, R = Pentyl),(4f, R =Benzyl), (4g, R =p-Bromobenzyl), (4h, R =methylsulfonyl), (4i, R =Phenylsulfonyl),(4j, R = p-Toluenesulfonyl), (4k = R = Methoxycarbonyl), (4l, R = Ethoxycarbonyl),(4m, R = Benzyloxycarbonyl), (4n, R = 2,2,2-Trichloroethoxycarbonyl).
Scheme 1. Synthetic route to compounds 4a–n.
Preparation of derivatives 4h–n from 3 was performed in pyridine as both the base and solvent using the corresponding alkyl/aryl sulphonyl chlorides or alkyl/aralkyl chloroformates. Reactions were fast and complete conversion could be achieved in 30 to 40 min at room temperature. Reaction mass was then quenched with water, neutralized with dilute hydrochloric acid and the product was extracted with ethyl acetate. Partial concentration of the organic layer and addition of diethyl ether into the concentrated mass resulted in precipitation of the required product, which was collected by filtration. The crude products were purified with a hot acetone–water mixture.
The compounds were characterized by 1H-NMR, mass, FTIR and 13C-NMR of some representative derivatives. Yields and reaction conditions are given in Table I. The melting points and spectral data are in the supplementary material to this paper.
Antimicrobial activity
All the synthesized compounds were subjected to in vitro antibacterial and antifungal activity determination.
_________________________________________________________________________________________________________________________
2011 Copyright (CC) SCS
Available online at www.shd.org.rs/JSCS/

1202 CHAUDHARI and RINDHE
Most of the compounds showed very good antibacterial activities against Sta-phylococcus aureus (Gram-positive) and Salmonella typhimurium, and were almost competitive with the standard drugs, chloramphenicol and ciprofloxacin. The re-sults of the determination of the antibacterial activities are summarized in Table II.
TABLE I. Yields and reaction conditions of the synthesized compounds
Electrophile Conditions Substituent ‘R’ Compd. Yield, % Methyl iodide t-BuOK/DMF/60 °C Methyl 4a 83 Ethyl iodide t-BuOK/DMF/60 °C Ethyl 4b 78 n-Propyl bromide t-BuOK/DMF/60 °C n-Propyl 4c 73 n-Butyl bromide t-BuOK/DMF/60 °C n-Butyl 4d 68 n-Pentyl bromide t-BuOK/DMF/60 °C n-Pentyl 4e 61 Benzyl bromide t-BuOK/DMF/60 °C Benzyl 4f 85 4-Bromobenzyl bromide t-BuOK/DMF/60 °C 4-Bromobenzyl 4g 81 Methanesulphonyl chloride Pyridine/RT Methylsulphonyl 4h 62 Benzenesulphonyl chloride Pyridine/RT Phenylsulphonyl 4i 60 p-Toluenesulphonyl chloride
Pyridine/RT 4-Methylphenyl-sulphonyl
4j 52
Methyl chloroformate Pyridine/RT Methoxycarbonyl 4k 50 Ethyl chloroformate Pyridine/RT Ethoxycarbonyl 4l 68 Benzyl chloroformate Pyridine/RT Benzyloxycarbonyl 4m 55 2,2,2-Trichloroethyl chloroformate
Pyridine/RT 2,2,2-Trichloroethoxy-carbonyl
4n 67
TABLE II. Antibacterial activities of the novel benzimidazole derivatives and standard anti-bacterial drugs (zone of inhibition in mm)
Compound S. aureus MTCC-96 S. typhimurium MTCC-98
Concentration, μg mL-1 25 50 100 250 25 50 100 250
3 11 15 18 20 12 16 18 21 4a 10 14 17 18 13 14 15 16 4b 11 12 13 15 11 14 17 19 4c 14 16 17 19 15 17 18 18 4d 11 13 18 20 12 15 19 23 4e 10 12 16 17 15 15 18 19 4f 10 12 15 19 14 16 18 21 4g 10 11 13 14 15 16 18 20 4h 12 14 17 19 12 15 19 21 4i 13 15 16 18 12 12 15 18 4j 10 11 14 15 15 17 20 21 4k 13 15 18 19 12 13 17 19 4l 11 12 13 15 14 16 17 21 4m 11 14 16 17 12 13 15 17 4n 15 17 19 22 15 17 18 20 Chloramphenicol 14 19 20 21 12 18 19 21 Ciprofloxacin 19 21 22 22 18 19 20 21
_________________________________________________________________________________________________________________________
2011 Copyright (CC) SCS
Available online at www.shd.org.rs/JSCS/
SYNTHESIS AND ANTIMICROBIAL ACTIVITIES OF NOVEL BENZIMIDAZOLES 1203
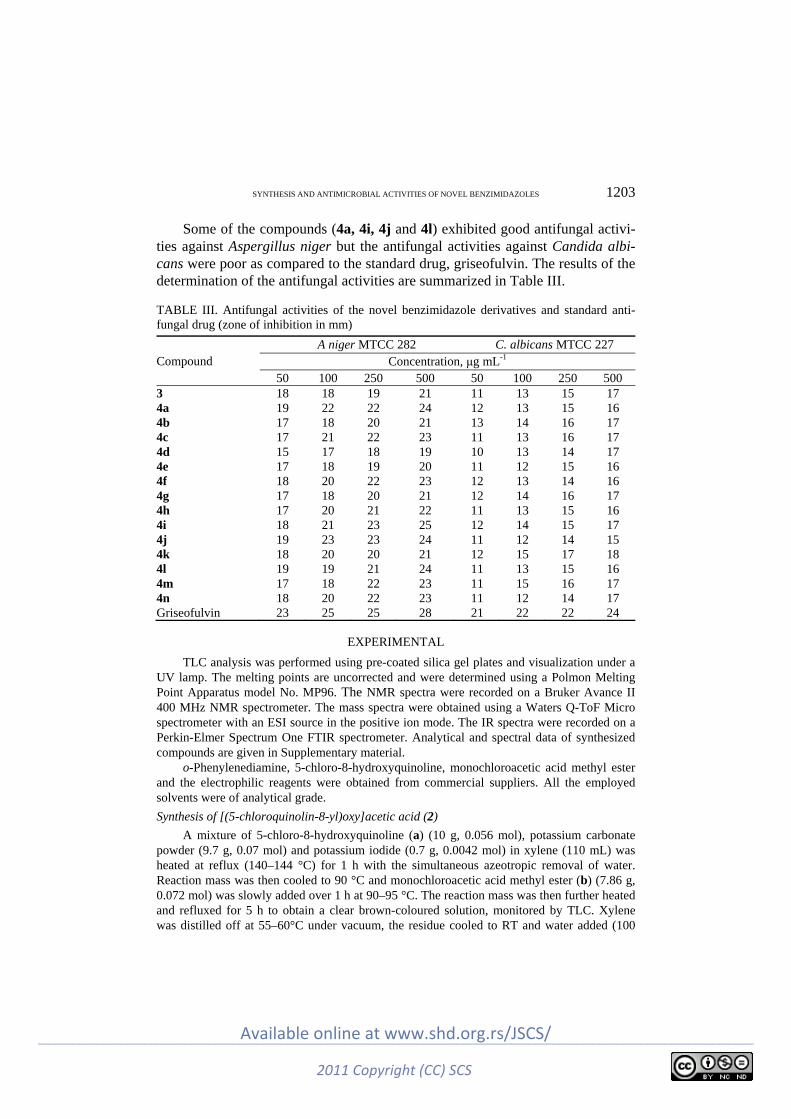
Some of the compounds (4a, 4i, 4j and 4l) exhibited good antifungal activi-ties against Aspergillus niger but the antifungal activities against Candida albi-cans were poor as compared to the standard drug, griseofulvin. The results of the determination of the antifungal activities are summarized in Table III.
TABLE III. Antifungal activities of the novel benzimidazole derivatives and standard anti-fungal drug (zone of inhibition in mm)
Compound A niger MTCC 282 C. albicans MTCC 227
Concentration, μg mL-1 50 100 250 500 50 100 250 500
3 18 18 19 21 11 13 15 17 4a 19 22 22 24 12 13 15 16 4b 17 18 20 21 13 14 16 17 4c 17 21 22 23 11 13 16 17 4d 15 17 18 19 10 13 14 17 4e 17 18 19 20 11 12 15 16 4f 18 20 22 23 12 13 14 16 4g 17 18 20 21 12 14 16 17 4h 17 20 21 22 11 13 15 16 4i 18 21 23 25 12 14 15 17 4j 19 23 23 24 11 12 14 15 4k 18 20 20 21 12 15 17 18 4l 19 19 21 24 11 13 15 16 4m 17 18 22 23 11 15 16 17 4n 18 20 22 23 11 12 14 17 Griseofulvin 23 25 25 28 21 22 22 24
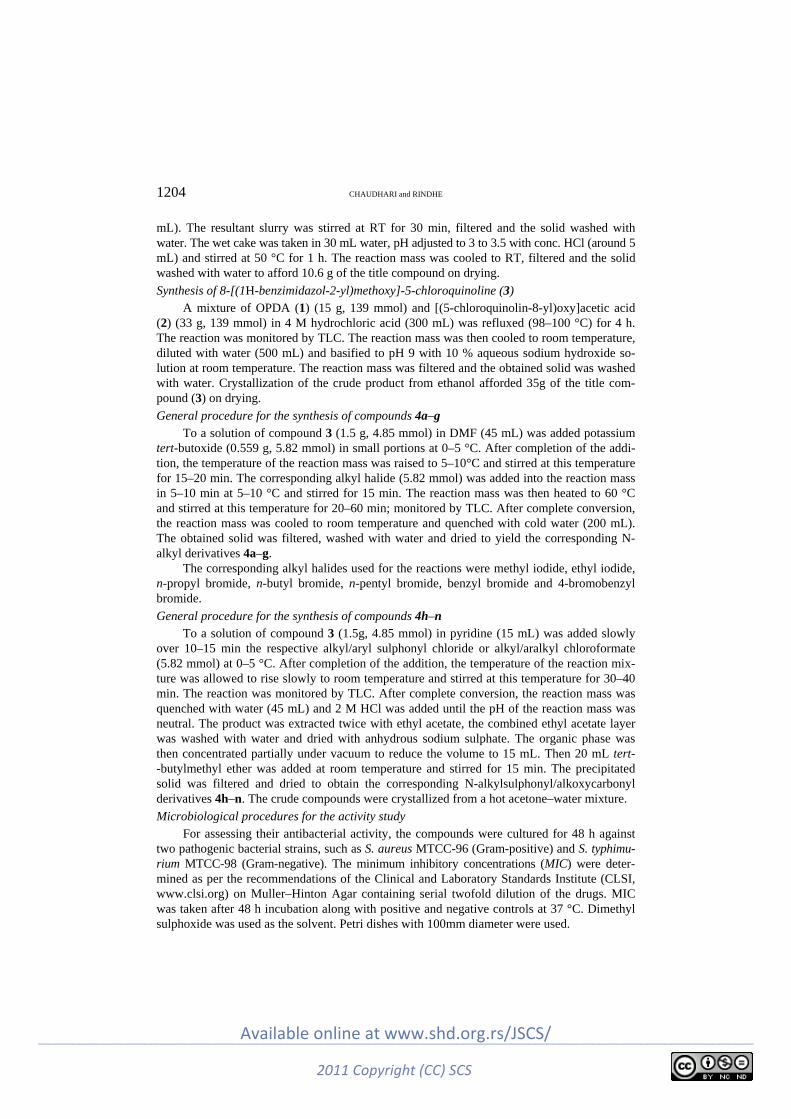
EXPERIMENTAL
TLC analysis was performed using pre-coated silica gel plates and visualization under a UV lamp. The melting points are uncorrected and were determined using a Polmon Melting Point Apparatus model No. MP96. The NMR spectra were recorded on a Bruker Avance II 400 MHz NMR spectrometer. The mass spectra were obtained using a Waters Q-ToF Micro spectrometer with an ESI source in the positive ion mode. The IR spectra were recorded on a Perkin-Elmer Spectrum One FTIR spectrometer. Analytical and spectral data of synthesized compounds are given in Supplementary material.
o-Phenylenediamine, 5-chloro-8-hydroxyquinoline, monochloroacetic acid methyl ester and the electrophilic reagents were obtained from commercial suppliers. All the employed solvents were of analytical grade.
Synthesis of [(5-chloroquinolin-8-yl)oxy]acetic acid (2)
A mixture of 5-chloro-8-hydroxyquinoline (a) (10 g, 0.056 mol), potassium carbonate powder (9.7 g, 0.07 mol) and potassium iodide (0.7 g, 0.0042 mol) in xylene (110 mL) was heated at reflux (140–144 °C) for 1 h with the simultaneous azeotropic removal of water. Reaction mass was then cooled to 90 °C and monochloroacetic acid methyl ester (b) (7.86 g, 0.072 mol) was slowly added over 1 h at 90–95 °C. The reaction mass was then further heated and refluxed for 5 h to obtain a clear brown-coloured solution, monitored by TLC. Xylene was distilled off at 55–60°C under vacuum, the residue cooled to RT and water added (100
_________________________________________________________________________________________________________________________
2011 Copyright (CC) SCS
Available online at www.shd.org.rs/JSCS/
1204 CHAUDHARI and RINDHE
mL). The resultant slurry was stirred at RT for 30 min, filtered and the solid washed with water. The wet cake was taken in 30 mL water, pH adjusted to 3 to 3.5 with conc. HCl (around 5 mL) and stirred at 50 °C for 1 h. The reaction mass was cooled to RT, filtered and the solid washed with water to afford 10.6 g of the title compound on drying.
Synthesis of 8-[(1H-benzimidazol-2-yl)methoxy]-5-chloroquinoline (3) A mixture of OPDA (1) (15 g, 139 mmol) and [(5-chloroquinolin-8-yl)oxy]acetic acid
(2) (33 g, 139 mmol) in 4 M hydrochloric acid (300 mL) was refluxed (98–100 °C) for 4 h. The reaction was monitored by TLC. The reaction mass was then cooled to room temperature, diluted with water (500 mL) and basified to pH 9 with 10 % aqueous sodium hydroxide so-lution at room temperature. The reaction mass was filtered and the obtained solid was washed with water. Crystallization of the crude product from ethanol afforded 35g of the title com-pound (3) on drying.
General procedure for the synthesis of compounds 4a–g To a solution of compound 3 (1.5 g, 4.85 mmol) in DMF (45 mL) was added potassium
tert-butoxide (0.559 g, 5.82 mmol) in small portions at 0–5 °C. After completion of the addi-tion, the temperature of the reaction mass was raised to 5–10°C and stirred at this temperature for 15–20 min. The corresponding alkyl halide (5.82 mmol) was added into the reaction mass in 5–10 min at 5–10 °C and stirred for 15 min. The reaction mass was then heated to 60 °C and stirred at this temperature for 20–60 min; monitored by TLC. After complete conversion, the reaction mass was cooled to room temperature and quenched with cold water (200 mL). The obtained solid was filtered, washed with water and dried to yield the corresponding N-alkyl derivatives 4a–g.
The corresponding alkyl halides used for the reactions were methyl iodide, ethyl iodide, n-propyl bromide, n-butyl bromide, n-pentyl bromide, benzyl bromide and 4-bromobenzyl bromide.
General procedure for the synthesis of compounds 4h–n To a solution of compound 3 (1.5g, 4.85 mmol) in pyridine (15 mL) was added slowly
over 10–15 min the respective alkyl/aryl sulphonyl chloride or alkyl/aralkyl chloroformate (5.82 mmol) at 0–5 °C. After completion of the addition, the temperature of the reaction mix-ture was allowed to rise slowly to room temperature and stirred at this temperature for 30–40 min. The reaction was monitored by TLC. After complete conversion, the reaction mass was quenched with water (45 mL) and 2 M HCl was added until the pH of the reaction mass was neutral. The product was extracted twice with ethyl acetate, the combined ethyl acetate layer was washed with water and dried with anhydrous sodium sulphate. The organic phase was then concentrated partially under vacuum to reduce the volume to 15 mL. Then 20 mL tert- -butylmethyl ether was added at room temperature and stirred for 15 min. The precipitated solid was filtered and dried to obtain the corresponding N-alkylsulphonyl/alkoxycarbonyl derivatives 4h–n. The crude compounds were crystallized from a hot acetone–water mixture.
Microbiological procedures for the activity study For assessing their antibacterial activity, the compounds were cultured for 48 h against
two pathogenic bacterial strains, such as S. aureus MTCC-96 (Gram-positive) and S. typhimu-rium MTCC-98 (Gram-negative). The minimum inhibitory concentrations (MIC) were deter-mined as per the recommendations of the Clinical and Laboratory Standards Institute (CLSI, www.clsi.org) on Muller–Hinton Agar containing serial twofold dilution of the drugs. MIC was taken after 48 h incubation along with positive and negative controls at 37 °C. Dimethyl sulphoxide was used as the solvent. Petri dishes with 100mm diameter were used.
_________________________________________________________________________________________________________________________
2011 Copyright (CC) SCS
Available online at www.shd.org.rs/JSCS/
SYNTHESIS AND ANTIMICROBIAL ACTIVITIES OF NOVEL BENZIMIDAZOLES 1205
For the antifungal activity, all the compounds were tested with a similar procedure as above against two different fungi: A. niger and C. albicans.
CONCLUSIONS
A series of novel substituted benzimidazole–quinoline derivatives was syn-thesized by condensation of o-phenylenediamine with [(5-chloroquinolin-8-yl)-oxy]acetic acid, followed by subsequent reactions of this compound with diffe-rent electrophiles. All the compounds were subjected to biological screening and they showed promising antibacterial activity against S. aureus (Gram-positive) and S. typhimurium (Gram-negative), which were comparable to the activity of known standard drugs. This proves the high therapeutic value of these com-pounds and encourages further study to explore their biological potential. Some of the compounds (4a, 4i, 4j and 4l) also exhibited good antifungal activity against A. niger but the antifungal activities against C. albicans were disappointing.
SUPPLEMENTARY MATERIAL
Analytical and spectral data of the synthesized compounds are available electronically at http://www.shd.org.rs/JSCS/, or from the corresponding author on request.
Acknowledgements. One of the authors (R. B. Chaudhari) is thankful to Alchem Synthon (P) Ltd., Ambernath, Mumbai (India) for providing the chemicals required for the research work and The Principal, New Arts, Commerce and Science College, Ahmednagar, Maharash-tra (India) for the use of the laboratory facilities. Thanks go to the Sophisticated Analytical Instrumentation Facility (SAIF), Punjab University, Chandigarh for providing spectral ana-lysis and the Microcare Laboratory Surat, Gujarat (An ISO 9001:2000 certified Lab) for the biological screening of the compounds.
И З В О Д
СИНТЕЗА И АНТИБИКРОБНА АКТИВНОСТ НОВИХ N-СУПСТИТУИСАНИХ 8-(1-АЛКИЛ/АЛКИЛСУЛФОНИЛ/АЛКОКСИКАРБОНИЛ-БЕНЗИМИДАЗОЛ-2-
-ИЛМЕТОКСИ)-5-ХЛОРХИНОЛИНА
RAJU B. CHAUDHARI и SAHEBRAO S. RINDHE
PG Department of Chemistry; New Arts, Commerce and Science College, Ahmednagar-414003, Maharashtra, India
У раду је приказана синтеза серије нових деривата 8-(1-алкил/алкилсулфонил/ал-коксикарбонил-бензимидазол-2-илметокси)-5-хлорхинолина. Једињења су добијена конден-зацијом о-фенилендиамина и [(5-хлорхинолин-8-ил)окси]сирћетне киселине, после чега је уследила супституција на азоту различитим електрофилним реагенсима у присуству одгова-рајуће базе чиме је добијена серија хетероцикличних једињења која садрже бензимидазолско и хинолинско језгро. Структуре једињења потврђене су спектралним подацима – 1H-NMR, 13C-NMR, IC и масеним спектрима. Готово сва једињења показују значајну антибактеријску активност према Salmonella typhimurium и Staphylococcus aureus. Нека од њих показују добру антифунгалну активност према Aspergillus niger, али је антифунгална активност према Candida albicans веома слаба.
(Примљено 8. јула 2010, ревидирано 7. јануара 2011)
_________________________________________________________________________________________________________________________
2011 Copyright (CC) SCS
Available online at www.shd.org.rs/JSCS/
1206 CHAUDHARI and RINDHE
REFERENCES
1. G. Coban, S. Zencir, I. Zupko, B. Rethy, H. S. Gunes, Z. Topcu, Eur. J. Med. Chem. 44 (2009) 2280
2. M. Amari, M. Fodili, B. Nedjar-Kolli, J. Heterocycl. Chem. 39 (2002) 811 3. A. Kozo, A. Kazuhiro, K. Masayuki, Y. Yongzhe (Fuji Photo Film Co. Ltd.), US
6815455 (2001) 4. J. A. Robl, R. Sulsky, C. Q. Sun, L. M. Simpkins, T. Wang, J. K. Dickson Jr., Y. Chen,
D. R. Magnin, P. Taunk, W. A. Slusarchyk, S. A. Biller, S. J. Lan, F. Connolly, L. K. Kunselman, T. Sabrah, H. Jamil, D. Gordon, T. W. Harrity, J. R. Wetterau, J. Med. Chem. 44 (2001) 851
5. S. K. Katiyar, V. R. Gordon, G. L. McLaughlin, T. D. Edlind, Antimicrob. Agents Chemother. 38 (1994) 2086
6. H. D. Langtry, M. I. Wilde, Drugs 56 (1998) 447 7. K. Nagata, N. Sone, T. Tamura, Antimicrob. Agents Chemother. 45 (2001) 1522 8. P. C. Garcia, R. M. Rivero, L. R. Lopez-Lefebre, E. Sanchez, J. M. Ruiz, L. Romero, J.
Agric. Food Chem. 49 (2001) 131 9. L. Crocetti, A. Maresca, C. Temperini, R. A. Hall, A. Scozzafava, F. A. Muhlschlegel, C.
T. Supuran, Bioorg. Med. Chem. Lett. 19 (2009) 1371 10. F. Awouters, C. J. E. Niemegeers, J. V. Berk, J. M. V. Nueten, F. M. Lenaerts, M.
Borgers, K. H. L. Schellekens, A. Broeckaert, J. D. Cree, P. A. J. Janssen, Cell. Mol. Life Sci. 33 (1977) 1657
11. P. R. Graves, J. J. Kwiek, P. Fadden, R. Ray, K. Hardeman, A. M. Coley, M. Foley, T. A. J. Haystead, Mol. Pharmacol. 62 (2002) 1364
12. L. W. Scheibel, A. Adler, Mol. Pharmacol. 20 (1981) 218 13. H. Andersag, S. Breitner, H. Jung (Winthrop Chem. Co. Inc.), US 2233970 (1941) 14. E. Senn (J. R. Geigy A. G.), US 2411670 (1946) 15. D. S. Goldfarb (University of Rochester), US 2009/0163545A1 (2009) 16. C. Bhat, Indian J. Heterocycl. Chem. 5 (1995) 111 17. Dynachim (Chimetron S. A. R. L.), FR 1504627 (1967) 18. Dynachim (Chimetron S. A. R. L.), BE 696711 (1967) 19. A. Hubele (Ciba-Geigy Corporation), US 4902340 (1990) 20. G. Hynd, J. G. Montana, H. Finch, S. Ahmed, M. Domostoj, J. Moise, R. Arienzo (Ar-
genta Discovery Ltd.), WO 2009/060209A1 (2009) 21. D. S. Rane, P. D. Joshi, IN 1126/MUM/2006A 22. M. A. Phillips, J. Chem. Soc. (1928) 2393 23. W. C. Guida, D. J. Mathre, J. Org. Chem. 45 (1980) 3172 24. I. A. Potapova, Pharm. Chem. J. 35 (2001) 588 25. P. R. Kumar, Indian J. Chem., B 25 (1986) 1273 26. K. Nagata, T. Itoh, M. Okada, A. Ohsawa, Tetrahedron 52 (1996) 6569.
_________________________________________________________________________________________________________________________
2011 Copyright (CC) SCS
Available online at www.shd.org.rs/JSCS/

J. Serb. Chem. Soc. 76 (9) S1–S5 (2011) Supplementary material
S1
SUPPLEMENTARY MATERIAL TO
Synthesis and antimicrobial activities of novel N-substituted 8-(1-alkyl/alkylsulphonyl/alkoxycarbonyl-benzimidazol-2-
-ylmethoxy)-5-chloroquinolines RAJU B. CHAUDHARI* and SAHEBRAO S. RINDHE
PG Department of Chemistry, New Arts, Commerce and Science College, Ahmednagar-414003, Maharashtra, India
J. Serb. Chem. Soc. 76 (9) (2011) 1199–1206
SPECTRAL CHARACTERIZATION OF THE SYNTHESIZED COMPOUNDS
[(5-Chloroquinolin-8-yl)oxy]acetic acid (2). Yield: 80 %; m. p. 222–225 °C. IR (KBr, cm–1): 2799 (O–H stretching), 3068 (C–H stretching of aromatic ring), 1279 and 1257 (C–O–C stretching), 1107 (C–Cl stretching). 1H-NMR (400 MHz, DMSO-d6, δ / ppm): 4.95 (2H, s, –OCH2), 7.13 (1H, d, aromatic, J = 8.0 Hz), 7.67 (1H, d, J = 8.8 Hz, aromatic), 7.71–7.74 (1H, m, aromatic), 8.50 (1H, d, J = = 8.0 Hz, aromatic), 8.96–8.97 (1H, m, aromatic), 13.08 (1H, bs, –COOH). 13C- -NMR (100 MHz, DMSO-d6, δ / ppm): 66.2 (O–CH2), 110.92, 122.33, 124.02, 127.09, 127.50, 133.31, 140.64, 150.70, 153.57 (aromatic), 170.69 (–COOH). MS (m/z): 238.1 (M+).
8-[(1H-Benzimidazol-2-yl)methoxy]-5-chloroquinoline (3). Yield: 81 %; M. p. 214–217 °C. IR (KBr, cm–1): 3340 (N–H stretching), 3048 (C–H stretching of aromatic ring), 1273 and 1257 (C–O–C stretching), 1101 (C–Cl stretching). 1H- -NMR (400 MHz, DMSO-d6, δ / ppm): 5.65 (2H, s, –OCH2), 7.22–7.25 (3H, m, aromatic), 7.54 (1H, d, J = 8.4 Hz, aromatic), 7.59–7.63 (3H, m, aromatic), 8.56 (1H, d, J = 8.6 Hz and J = 1.6 Hz, aromatic), 8.92 (1H, bs, aromatic), 12.8 (1H, bs, N–H). 13C-NMR (100 MHz, DMSO-d6, δ / ppm): 65.05 (O–CH2), 110.38, 115.09, 121.82, 122.25, 122.50, 126.30, 126.41, 132.41, 140.20, 149.30, 149.36, 152.93 (aromatic). MS (m/z): 310.1 (M+).
5-Chloro-8-[(1-methyl-1H-benzimidazol-2-yl)methoxy]quinoline (4a). M. p. 215–220 °C. IR (KBr, cm–1): 3049 (C–H stretching of aromatic ring), 1254 and 1241 (C–O–C stretching), 1092 (C–Cl stretching). 1H-NMR (400 MHz, CDCl3, δ / ppm): 3.98 (3H, s, –NCH3), 5.75 (2H, s, –OCH2), 7.27–7.31 (3H, m, aro-matic), 7.43–7.49 (2H, m, aromatic), 7.54–7.56 (1H, m, aromatic), 7.78–7.79
* Corresponding author. E-mail: [email protected]
_________________________________________________________________________________________________________________________
2011 Copyright (CC) SCS
Available online at www.shd.org.rs/JSCS/
S2 CHAUDHARI and RINDHE
(1H, m, aromatic), 8.52 (1H, d, J = 8.3 Hz, aromatic), 8.99 (1H, bs, aromatic). 13C-NMR (100 MHz, CDCl3, δ / ppm): 29.46 (CH3 of N–methyl), 63.76 (O–CH2), 108.77, 110.04, 118.81, 121.27, 121.65, 122.29, 122.37, 125.45, 126.09, 132.00, 135.40, 139.89, 141.08, 148.00, 148.99, 151.79 (aromatic). MS (m/z): 324.1 (M+).
5-Chloro-8-[(1-ethyl-1H-benzimidazol-2-yl)methoxy]quinoline (4b). M. p. 225–228 °C. IR (KBr, cm–1): 3049 (C–H stretching of aromatic ring), 1255 and 1242 (C–O–C stretching), 1095 (C–Cl stretching). 1H-NMR (400 MHz, CDCl3, δ / ppm): 1.40 (3H, t, J = 6.8 Hz, –CH3), 4.51 (2H, q, J = 6.8 Hz, –NCH2), 5.76 (2H, s, –OCH2), 7.27–7.36 (3H, m, aromatic), 7.48–7.54 (3H, m, aromatic), 7.80–7.81 (1H, m, aromatic), 8.53 (1H, d, J = 8.2 Hz, aromatic), 8.98 (1H, bs, aromatic). 13C-NMR (100 MHz, CDCl3, δ / ppm): 15.19 (CH3 of N-ethyl), 39.36 (N–CH2), 64.64 (O–CH2), 109.74, 110.93, 120.17, 122.32, 122.37, 123.26, 123.40, 126.50, 127.14, 133.06, 135.24, 140.82, 142.38, 148.49, 149.81, 152.71 (aromatic). MS (m/z): 338.1 (M+).
5-Chloro-8-[(1-propyl-1H-benzimidazol-2-yl)methoxy] quinoline (4c). M. p. 178–180 °C. IR (KBr, cm–1): 3049 (C–H stretching of aromatic ring), 1254 and 1241 (C–O–C stretching), 1093 (C–Cl stretching). 1H-NMR (400 MHz, CDCl3, δ / ppm): 0.92 (3H, t, J = 7.2 Hz, –CH3), 1.81–1.86 (2H, m, –CH2 of N-propyl), 4.41 (2H, t, J = 7.3 Hz, –NCH2), 5.76 (2H, s, –OCH2), 7.27–7.30 (3H, m, aro-matic), 7.47–7.56 (3H, m, aromatic), 7.80–7.81 (1H, m, aromatic), 8.53 (1H, d, J = 8.3 Hz, aromatic), 8.98 (1H, bs, aromatic). 13C-NMR (100 MHz, CDCl3, δ / / ppm): 11.30 (CH3 of N-propyl), 23.22 (CH2 of N-propyl), 46.03 (N–CH2), 64.83 (O–CH2), 110.03, 111.10, 120.12, 122.29, 122.37, 123.20, 123.44, 126.50, 127.13, 133.05, 135.63, 140.88, 142.29, 148.76, 149.79, 152.75 (aromatic). MS (m/z): 352.1 (M+).
8-[(1-Butyl-1H-benzimidazol-2-yl)methoxy]-5-chloroquinoline (4d). M. p. 174–178 °C. IR (KBr, cm–1): 3050 (C–H stretching of aromatic ring), 1254 and 1241 (C–O–C stretching), 1093 (C–Cl stretching). 1H-NMR (400 MHz, CDCl3, δ / ppm): 0.81 (3H, t, J = 6.7 Hz, –CH3 of N-butyl), 1.32–1.41 (2H, m, –CH2 of N-butyl), 1.71–1.79 (2H, m, –CH2 of N-butyl), 4.42 (2H, t, J = 6.7 Hz, –NCH2), 5.75 (2H, s, –OCH2), 7.27–7.34 (3H, m, aromatic), 7.49–7.54 (3H, m, aromatic), 7.78–7.79 (1H, m, aromatic), 8.52 (1H, d, J = 7.7 Hz, aromatic), 8.98 (1H, bs, aromatic). 13C-NMR (100 MHz, CDCl3, δ / ppm): 13.70 (CH3 of N-butyl), 20.22 (CH2 of N-butyl), 32.07 (CH2 of N-butyl), 44.48 (N–CH2), 64.73 (O–CH2), 109.97, 110.96, 120.12, 122.28, 122.38, 123.20, 123.41, 126.51, 127.13, 133.06, 135.62, 140.86, 142.29, 148.66, 149.77, 152.70 (aromatic). MS (m/z): 366.2 (M+).
5-Chloro-8-[(1-pentyl-1H-benzimidazol-2-yl)methoxy]quinoline (4e). M. p. 147–150 °C. IR (KBr, cm–1): 3054 (C–H stretching of aromatic ring), 1254 and 1240 (C–O–C stretching), 1093 (C–Cl stretching). 1H-NMR (400 MHz, CDCl3, δ / ppm): 0.73 (3H, t, J = 7.2 Hz, –CH3 of N-pentyl), 1.13–1.22 (2H, m, –CH2 of
_________________________________________________________________________________________________________________________
2011 Copyright (CC) SCS
Available online at www.shd.org.rs/JSCS/
SUPPLEMENTARY MATERIAL S3
N-pentyl), 1.27–1.34 (2H, m, –CH2 of N-pentyl), 1.72–1.80 (2H, m, –CH2 of N- -pentyl), 4.42 (2H, t, J =7.7 Hz, –NCH2), 5.76 (2H, s, –OCH2), 7.28–7.32 (2H, m, aromatic), 7.33–7.37 (1H, m, aromatic), 7.47–7.56 (3H, m, aromatic), 7.78– –7.81 (1H, m, aromatic), 8.52 (1H, dd, J = 8.6 Hz and 1.6 Hz, aromatic), 8.98 (1H, bs, aromatic). 13C-NMR (100 MHz, CDCl3, δ / ppm): 13.77 (CH3 of N- -pentyl), 22.32 (CH2 of N-pentyl), 29.01 (CH2 of N-pentyl), 29.71 (CH2 of N- -pentyl), 44.68 (N–CH2), 64.73 (O–CH2), 109.99, 110.93, 120.11, 122.28, 122.36, 123.20, 123.37, 126.50, 127.12, 133.05, 135.59, 140.84, 142.29, 148.68, 149.74, 152.70 (aromatic). MS (m/z): 380.2 (M+).
8-[(1-Benzyl-1H-benzimidazol-2-yl)methoxy]-5-chloroquinoline (4f). M. p. 208–210 °C. IR (KBr, cm–1): 3061 (C–H stretching of aromatic ring), 1252 and 1239 (C–O–C stretching), 1093 (C–Cl stretching). 1H-NMR (400 MHz, CDCl3, δ / ppm): 5.68 (2H, s, –NCH2), 5.70 (2H, s, –OCH2), 6.92–6.93 (2H, m, aroma-tic), 7.0–7.1 (3H, m, aromatic), 7.23–7.38 (3H, m, aromatic), 7.36–7.38 (1H, m, aromatic), 7.44–7.51 (2H, m, aromatic), 7.82 (1H, d, J = 7.7 Hz, aromatic), 8.47 (1H, d, J = 8.3 Hz, aromatic), 8.88 (1H, bs, aromatic). 13C-NMR (100 MHz, CDCl3, δ / ppm): 47.61 (N–CH2), 64.91 (O–CH2), 110.21, 110.90, 120.18, 122.31, 122.56, 123.48, 123.58, 126.30, 126.33, 127.07, 127.46, 128.50, 132.91, 135.73, 136.04, 140.83, 142.29, 149.12, 149.73, 152.61 (aromatic). MS (m/z): 400.2 (M+).
8-[1-(4-Bromobenzyl)-1H-benzimidazol-2-yl]methoxy-5-chloroquinoline (4g). M. p. 244–248 °C. IR (KBr, cm–1): 3060 (C–H stretching of aromatic ring), 1254 and 1241 (C–O–C stretching), 1091 (C–Cl stretching). 1H-NMR (400 MHz, CDCl3, δ / ppm): 5.68 (2H, s, –NCH2), 5.71 (2H, s, –OCH2), 6.78 (2H, d, J = 8.3 Hz, aromatic), 7.09 (2H, d, J = 8.3 Hz, aromatic), 7.25–7.31 (3H, m, aromatic), 7.35 (1H, d, J = 8.4 Hz, aromatic), 7.47 (1H, d, J = 8.4 Hz, aromatic), 7.55–7.58 (1H, m, aromatic), 7.80 (1H, d, J = 7.7 Hz, aromatic), 8.50 (1H, d, J = 8.5 Hz, aromatic), 8.84 (1H, bs, aromatic). MS (m/z): 480.1 (M+).
5-Chloro-8-[1-(methylsulphonyl)-1H-benzimidazol-2-yl]methoxyquinoline (4h). M. p. 183–186 °C. IR (KBr, cm–1): 3055 (C–H stretching of aromatic ring), 1249 and 1237 (C–O–C stretching), 1165 (S=O stretching), 1096 (C–Cl stretch-ing). 1H-NMR (400 MHz, CDCl3, δ / ppm): 3.81 (3H, s, –SO2CH3), 5.70 (2H, s, –OCH2), 7.21 (1H, d, J = 8.4 Hz aromatic), 7.40–7.48 (2H, m, aromatic), 7.52– –7.56 (1H, m, aromatic), 7.60 (1H, d, J = 8.4 Hz, aromatic), 7.82 (1H, d, J = 7.2 Hz, aromatic), 7.97 (1H, d, J = 8.3 Hz, aromatic), 8.56 (1H, dd, J = 8.5 Hz and 1.5 Hz, aromatic), 8.82 (1H, dd, J = 8.3 Hz and 1.56 Hz, aromatic). 13C-NMR (100 MHz, CDCl3, δ / ppm): 38.00 (SO2–CH3), 59.84 (O–CH2), 104.23, 108.52, 116.25, 117.80, 118.71, 120.26, 121.40, 121.76, 122.53, 128.46, 128.76, 135.73, 136.52, 143.24, 144.73, 147.93 (aromatic). MS (m/z): 388.1 (M+).
5-Chloro-8-[1-(phenylsulphonyl)-1H-benzimidazol-2-yl] methoxyquinoline (4i). M. p. 173–177 °C. IR (KBr, cm–1): 3059 (C–H stretching of aromatic ring),
_________________________________________________________________________________________________________________________
2011 Copyright (CC) SCS
Available online at www.shd.org.rs/JSCS/

S4 CHAUDHARI and RINDHE
1248 and 1235 (C–O–C stretching), 1178 (S=O stretching), 1093 (C–Cl stretch-ing). 1H-NMR (400 MHz, CDCl3, δ / ppm): 5.89 (2H, s, –OCH2), 7.25 (1H, d, J = 8.4 Hz, aromatic), 7.33–7.42 (4H, m, aromatic), 7.52–7.59 (3H, m, aromatic), 7.75 (1H, d, J = 7.5 Hz, aromatic), 7.95 (1H, d, J = 7.4 Hz, aromatic), 8.36 (2H, dd, J = 8.4 Hz and 2.8 Hz, aromatic), 8.55 (1H, dd, J = 8.5 Hz and 1.6 Hz, aromatic), 9.01 (1H, dd, J = 8.3 Hz and 1.7 Hz, aromatic). 13C-NMR (100 MHz, CDCl3, δ / ppm): 64.93 (O–CH2), 110.13, 113.39, 121.02, 122.44, 123.49, 124.94, 125.94, 126.46, 127.26, 128.12, 129.40, 132.87, 133.07, 134.64, 137.61, 140.81, 141.66, 148.26, 149.74, 153.08 (aromatic). MS (m/z): 450.2 (M+).
5-Chloro-8-[1-(4-methylphenylsulphonyl)-1H-benzimidazol-2-yl]methoxy-quinoline (4j). M. p. 181–184 °C. IR (KBr, cm–1): 3057 (C–H stretching of aro-matic ring), 1256 and 1240 (C–O–C stretching), 1175 (S=O stretching), 1092 (C–Cl stretching). 1H-NMR (400 MHz, CDCl3, δ / ppm): 2.33 (3H, s, –CH3), 5.88 (2H, s, –OCH2), 7.17 (2H, d, J = 8.4 Hz, aromatic), 7.25 (1H, d, J = 8.4 Hz, aromatic), 7.33–7.44 (2H, m, aromatic), 7.54 (1H, d, J = 7.4 Hz, aromatic), 7.57–7.60 (1H, m, aromatic), 7.75 (1H, d, J = 7.5 Hz, aromatic), 7.95 (1H, d, J = 8.1 Hz, aro-matic), 8.20 (2H, d, J = 8.4 Hz, aromatic), 8.57 (1H, dd, J = 8.5 Hz and 1.6 Hz, aromatic), 9.02 (1H, bs, aromatic). 13C-NMR (100 MHz, CDCl3, δ / ppm): 21.69 (CH3), 64.95 (O–CH2), 110.12, 113.40, 120.96, 122.43, 123.43, 124.84, 125.82, 126.46, 127.24, 128.11, 130.02, 132.89, 133.05, 134.66, 140.81, 141.69, 145.98, 148.25, 149.72, 153.13 (aromatic). MS (m/z): 464 (M+).
Methyl 2-[(5-chloroquinolin-8-yl)oxy]methyl-1H-benzimidazole-1-carbo-xylate (4k). M. p. 140–144 °C. IR (KBr, cm–1): 3060 (C–H stretching of aromatic ring), 1758 (C=O stretching), 1255 and 1233 (C–O–C stretching), 1093 (C–Cl stretching). 1H-NMR (400 MHz, CDCl3, δ / ppm): 4.08 (3H, s, –OCH3), 5.83 (2H, s, –OCH2), 7.17 (1H, d, J = 8.4 Hz, aromatic), 7.36–7.40 (2H, m, aromatic), 7.52–7.57 (2H, m, aromatic), 7.77 (1H, d, J = 7.4 Hz, aromatic), 7.95 (1H, dd, J = = 7.1 Hz and 1.6 Hz, aromatic), 8.55 (1H, dd, J = 8.5 Hz and 1.6 Hz, aromatic), 8.99 (1H, bs, aromatic). MS (m/z): 368.1 (M+).
Ethyl 2-[(5-chloroquinolin-8-yl)oxy]methyl-1H-benzimidazole-1-carboxy-late (4l). M. p. 134–138 °C. IR (KBr, cm–1): 3063 (C–H stretching of aromatic ring), 1758 (C=O stretching), 1259 and 1230 (C–O–C stretching), 1090 (C–Cl stretching). 1H-NMR (400 MHz, CDCl3, δ / ppm): 1.43 (3H, t, J = 7.1 Hz, –CH3), 4.53 (2H, q, J = 7.1 Hz, –COOCH2), 5.82 (2H, s, –OCH2), 7.17 (1H, d, J = 8.4 Hz, aromatic), 7.34–7.41 (2H, m, aromatic), 7.52–7.58 (2H, m, aromatic), 7.77 (1H, d, J = 8.2 Hz, aromatic), 7.97 (1H, d, J = 8.5 Hz, aromatic), 8.56 (1H, d, J = = 8.4 Hz, aromatic), 9.0 (1H, bs, aromatic). 13C-NMR (100 MHz, CDCl3, δ / ppm): 14.10 (–CH3), 64.54 (COO–CH2), 66.26 (O–CH2), 110.08, 114.92, 120.54, 122.40, 123.25, 124.67, 125.48, 126.29, 127.13, 132.88, 133.01, 140.70, 142.08, 149.81, 150.02, 150.08, 153.38 (aromatic). MS (m/z): 382.2 (M+).
_________________________________________________________________________________________________________________________
2011 Copyright (CC) SCS
Available online at www.shd.org.rs/JSCS/
SUPPLEMENTARY MATERIAL S5
Benzyl 2-[(5-chloroquinolin-8-yl)oxy]methyl-1H-benzimidazole-1-carbo-xylate (4m). M. p. 167–170 °C. IR (KBr, cm–1): 3060 (C–H stretching of aro-matic ring), 1759 (C=O stretching), 1254 and 1238 (C–O–C stretching), 1098 (C–Cl stretching). 1H-NMR (400 MHz, CDCl3, δ / ppm): 5.36 (2H, m, –COOCH2), 5.66 (2H, s, –OCH2), 6.94 (1H, d, J = 8.4 Hz, aromatic), 7.17–7.31 (7H, m, aromatic), 7.38 (1H, d, J = 8.4 Hz, aromatic), 7.47–7.50 (1H, m, aromatic), 7.67–7.70 (1H, m, aromatic), 7.89–7.91 (1H, m, aromatic), 8.47 (1H, d, J = 8.4 Hz, aromatic), 8.92 (1H, bs, aromatic). 13C-NMR (100 MHz, CDCl3, δ / ppm): 66.24 (O–CH2), 70.14 (COO–CH2), 109.94, 114.98, 120.61, 122.37, 123.19, 124.74, 125.65, 126.27, 127.13, 128.73, 128.86, 129.03, 132.91, 133.10, 133.74, 140.77, 142.12, 149.72, 149.84, 149.88, 153.35 (aromatic). MS (m/z): 466.2 (M+).
2,2,2-Trichloroethyl 2-[(5-chloroquinolin-8-yl)oxy]methyl-1H-benzimida-zole-1-carboxylate (4n). M. p. 121–125 °C. IR (KBr, cm–1): 3064 (C–H stretch-ing of aromatic ring), 1759 (C=O stretching), 1253 and 1230 (C–O–C stretching), 1099 (C–Cl stretching). 1H-NMR (400 MHz, CDCl3, δ / ppm): 5.10 (2H, s, –COOCH2), 5.66 (2H, s, –OCH2), 7.16 (1H, d, J = 8.4 Hz, aromatic), 7.37–7.45 (2H, m, aromatic), 7.51–7.56 (2H, m, aromatic), 7.79 (1H, dd, J = 7.2 Hz and 2.0 Hz, aromatic), 8.10 (1H, dd, J = 7.0 Hz and 1.3 Hz, aromatic), 8.54 (1H, dd, J = = 8.5 Hz and 1.6 Hz, aromatic), 8.97 (1H, bs, aromatic). MS (m/z): 486.1 (M+).
_________________________________________________________________________________________________________________________
2011 Copyright (CC) SCS
Available online at www.shd.org.rs/JSCS/

J. Serb. Chem. Soc. 76 (9) 1207–1218 (2011) UDC 633.852.73+581.45+66.094.3+ JSCS–4197 591.4:611.33/.36 Original scientific paper
1207
Olive leaf extract modulates cold restraint stress-induced oxidative changes in rat liver
DRAGANA DEKANSKI1*, SLAVICA RISTIĆ1, NEVENA V. RADONJIĆ2, NATAŠA D. PETRONIJEVIĆ2, ALEKSANDAR DEKANSKI3# and DUŠAN M. MITROVIĆ4
1Biomedical Research, R&D Institute, Galenika a.d., Belgrade, 2Institute for Medical and Clinical Biochemistry, School of Medicine, University of Belgrade, 3Institute of Chemistry, Technology and Metallurgy, Department of Electrochemistry, University of Belgrade and
4Institute for Medical Physiology “Richard Burian”, School of Medicine, University of Belgrade, Serbia
(Received 4 February, revised 18 March 2011)
Abstract: Recently, the beneficial effects of different single doses of standardized dry olive (Olea europaea L.) leaf extract (OLE) in cold restraint stress (CRS)-in-duced gastric lesions in rats and its influence on oxidative parameters in gastric mucosa were demonstrated. The present study was undertaken to investigate the long-term pretreatment efficacy of OLE and its potential in the modulation of CRS-induced oxidative changes at the liver level. The experimental animals were divided into four groups, i.e., control, OLE-treated, CRS non-treated and CRS treated with OLE (CRS+OLE) groups. CRS caused severe gastric lesions in all non-pretreated animals and two-week pretreatment with OLE (80 mg per kg of body weight) attenuated stress-induced gastric lesions significantly. The malondialdehyde (MDA) level as an index of lipid peroxidation, superoxide dismutase (SOD) and catalase (CAT) activities were measured spectrophotometrically in liver tissue homogenates. The MDA level was increased in the CRS group and significantly decreased in the CRS+OLE group. The SOD and CAT activities were significantly decreased in the CRS group. In the CRS+OLE group, the activities of these two enzymes were significantly increased in comparison with the CRS group. The results obtained indicate that long-term supplementation with OLE provides oxidant/antioxidant balance in liver during stress condition.
Keywords: olive leaf; cold restraint stress; oxidative stress; liver.
INTRODUCTION
Stress, a condition in an organism that results from the action of several stressors, has been reported to affect the progression and severity of different di-seases. Environmental stress has been shown to be associated with altered ho-
* Corresponding author. E-mail: [email protected] # Serbian Chemical Society member. doi: 10.2298/JSC110204107D
_________________________________________________________________________________________________________________________
2011 Copyright (CC) SCS
Available online at www.shd.org.rs/JSCS/

1208 DEKANSKI et al.
meostasis that may lead to oxidant–antioxidant imbalance. Under normal condi-tions, antioxidant systems of the cell minimize the perturbations caused by free radicals. When free radicals generation is increased to an extent that overcomes the cellular antioxidants, the result is oxidative stress.
It is known that immobilization stress accelerated by cold (a combination of two potent stressors) can disrupt the balance in an oxidant/antioxidant system and cause oxidative damage to several tissues by altering the enzymatic and non-en-zymatic antioxidant status, protein oxidation and lipid peroxidation.1
As a new strategy for alleviating oxidative damage, interest has been grow-ing in the usage of natural antioxidants. It was suggested that many of the nega-tive effects of oxidative stress are diminished upon supplementation with certain dietary antioxidants, such as vitamins and other non-nutrient antioxidants, e.g., plant flavonoids.2,3 There is an increasing interest in total medicinal plant ex-tracts, the greatest value of which may be due to the constituents that contribute to the modulation of the oxidative balance in vivo. Additionally, the obvious ad-vantage of total plant extracts is that they are easily attainable products, without purification of any of the fractions needed in order to apply them in possible pre-vention/treatment of diseases.2 Reasonably, the application of large quantities of plant extracts as dietary supplements is not to be recommends before assessment of important health issues regarding use of plant phenolics in general, and plant flavonoids in particular.3
Olive tree (Olea europaea L.) leaf has been used in traditional, folk medi-cine, in Mediterranean countries, particularly as an antimicrobial and cardiopro-tective agent.4 Recently, experimental animal studies demonstrated its antihyper-tensive, anti-atherogenic, anti-inflammatory, hypoglycemic and hypocholestero-lemic effects; all of these positive effects were at least partly related to its anti-oxidative action.5 Moreover, its antihypertensive effect in patients with stage-1 hypertension was confirmed in a double-blind, randomized, parallel and active-controlled clinical study.6
The main constituent of olive leaf is oleuropein, one of the iridoide monoter-penes, which is thought to be responsible for its pharmacological effects. In addi-tion, olive leaf contains triterpenes (important amounts of oleanolic and maslinic acid followed by minor concentrations of ursolic acid, erythrodiol, and uvaol), flavonoids (luteolin, apigenine, rutin, etc.), chalcones (olivin, olivine diglucoside) and tannins.4,7–9 It is its chemical content that makes olive leaf one of the most potent natural antioxidants. Oleuropein has remarkable antioxidant activity in vi-tro, comparable to a hydrosoluble analog of tocopherol10, as do other consti-tuents of olive leaf.11 Literature data on olive phenolics is mainly concerned with purified compounds, while the antioxidant properties of total extract have been poorly investigated. Being a complex mixture of compounds, the study of the protective effect of the total extract could be more representative than those of
_________________________________________________________________________________________________________________________
2011 Copyright (CC) SCS
Available online at www.shd.org.rs/JSCS/

OLIVE LEAF MODULATES HEPATIC OXIDATIVE STRESS 1209
single components. It was shown that a total olive leaf extract had an antioxidant activity higher than those of vitamin C and vitamin E, due to the synergy be-tween flavonoids, oleuropeosides and substituted phenols.12
The beneficial properties of olive leaf are further enhanced by the good ab-sorption of its phenolic constituents and their significant levels in the circula-tion.13,14
Although several studies have investigated the effects of cold-restraint stress on the antioxidant system and induction of lipid peroxidation in several tissues, to date, no information is available regarding the antioxidant effect of total dry olive leaf extract (OLE) on cold restraint stress (CRS)-induced hepatic oxidative stress. The influence of stress on the liver is also of interest from the clinical point of view, because stress plays a potential role in aggravating liver diseases in general and hepatic inflammation in particular, probably through the generation of reactive oxygen species (ROS). Thus, in this preclinical investigation, the ef-fect of CRS on oxidative stress and antioxidant defense system and the possible protective effect of OLE in rat liver tissue were investigated.
EXPERIMENTAL
Materials
Olive leaf extract EFLA® 943, standardized to 18–26 % of oleuropein, was purchased from Frutarom Switzerland Ltd. (Wadenswil, Switzerland). The extract was manufactured from the dried leaves of Olea europaea L., applying an ethanol (80 % m/m) extraction proce-dure. After a patented filtration process (EFLA® Hyperpure), the crude extract was dried. The stability and microbiological purity were confirmed by the manufacturer. Further compre-hensive phytochemical analysis of the extract was previously realized and it was found to contain oleuropein (19.8 %), total flavonoids (0.29 %), including luteolin-7-O-glucoside (0.04 %), apigenine-7-O-glucoside (0.07 %) and quercetin (0.04 %), as well as caffeic acid (0.02 %), and tannins (0.52 %).15 The same batch of EFLA® 943 was used in the present study. Hydro-gen peroxide and thiobarbituric acid (TBA) were purchased from Sigma-Aldrich (Schnelldorf, Germany). All other reagents used in biochemical analysis were obtained from Merck (Darm-stadt, Germany).
Animals, stress induction and stomach evaluation
Twenty-four male Wistar rats from the Biomedical Research Center, R&D Institute, Ga-lenika a.d. (Belgrade, Serbia), weighing 250±20 g, were used. The rats were housed 3 per cage under constant environmental conditions (20–24 °C; 12 h light/dark cycle), and were given ad libitum access to standard pelleted food and water. This study was approved by the Ethical Committee of the Medical School, University of Belgrade, and run in accordance to the state-ments of the European Union regarding the handling of experimental animals (86/609/EEC).
The animals were randomly divided into 4 groups each consisting of 6 rats: control, OLE, CRS, and CRS+OLE.
The first, control group received 1 ml of distilled water intragastrically (i.g.) using a me-tal tube for gavage for 14 days. This was the group of normal, healthy animals without any drug pretreatment or stress induction.
The OLE group received olive leaf extract (80 mg kg-1 daily, i.g.) dissolved in distilled water for 14 days.
_________________________________________________________________________________________________________________________
2011 Copyright (CC) SCS
Available online at www.shd.org.rs/JSCS/
1210 DEKANSKI et al.
The CRS group received distilled water i.g. for 14 days, and it was the group exposed to cold restraint stress on the last day of the experiment.
The CRS+OLE group received OLE (80 mg kg-1, daily, i.g.) dissolved in distilled water for 14 days. The last dose was administrated 120 min prior to CRS induction.
Day before the stress induction all experimental animals were placed in individual meta-bolic cages and were fasted for 24 h, but had free access to water. The rats from CRS and CRS+OLE group were immobilized in individual restraint boxes without the possibility of visual contact16 and subjected to cold (4 ±1 °C) stress for 3.5 h. This regimen of cold-restraint stress was reported to produce gastric ulcers in food-deprived rats,17,18 as well as plasma and hepatic tissue lipid peroxidation.19
At the end of this period, the animals were sacrificed under ether anesthesia, the ab-domen was opened by midline incision and the liver and the stomach were removed. The sto-mach was opened along the greater curvature, rinsed gently with water and pinned open for macroscopic examination. The number and severity of gastric lesions were evaluated accord-ing to the following rating scale:20 0 – no lesion; 1 – mucosal edema and petechiae; 2 – from 1 to 5 small lesions (1–2 mm); 3 – more than 5 small lesions or 1 intermediate lesion (3–4 mm); 4 – 2 or more intermediate lesions or 1 large lesion (greater than 4 mm); 5 – perforated ulcers. The sum of the total scores divided by the number of animals in the group was expressed as the ulcer index (UI)±standard deviation (SD). The percent inhibition of UI in relation to the CRS group was estimated from formula:
% Inhibition = (1–(UIOLE+CRS/UICRS))×100
Biochemical examination of liver
The liver from each animal was weighed, transferred to the ice-cooled test tube and homogenized by Ultra-Turrax T25 (Janke & Kunkel GmbH. & Co., IKA®-Labortechnik, Staufen, Germany) in 20 mmol l-1 Tris buffer, pH 7.4, containing 5 mmol butylated hydroxy-toluene to prevent new lipid peroxidation that could occur during the homogenization. The homogenate was then centrifuged at 12000 rpm at 4 °C (Megafuge 2.0.R, Heraeus, Germany) for 10 min. The supernatant was aliquoted and stored at –80 °C until determination of the total protein, malondialdehyde (MDA), superoxide dismutase (SOD) and catalase (CAT).
The biochemical parameters were determined spectrophotometrically (UV–Vis spectro-photometer HP 8453, Agilent Technologies, Santa Clara, CA).
The protein content of the liver tissue samples was estimated by the method of Lowry et al.21 using bovine serum albumin as the standard.
Lipid peroxidation was determined at 533 nm and the MDA level was measured by the thiobarbituric acid (TBA) test according to the method suggested by Buege and Aust.22
The SOD activity in the liver was determined by measuring the inhibition of auto-oxida-tion of adrenaline at pH 10.2 at 30 °C by the method of Misra and Fridovich.23 One unit of SOD activity represented the amount of SOD which was necessary to cause a 50 % inhibition of adrenaline auto-oxidation.
Activity of catalase in liver was determined according to the procedure of Goth24 by fol-lowing the absorbance of hydrogen peroxide at 230 nm and pH 7.0.
Statistical analysis
All results are expressed as means±SD. Statistical analysis was realized using one-way ANOVA and the post hoc Tukey test. Values of P less than 0.05 were considered as signi-ficant.
_________________________________________________________________________________________________________________________
2011 Copyright (CC) SCS
Available online at www.shd.org.rs/JSCS/
OLIVE LEAF MODULATES HEPATIC OXIDATIVE STRESS 1211
RESULTS
Effect of OLE on gastric lesions induced by cold restraint stress
Cold restraint stress produced visible gastric lesions in all animals in the CRS group. They were located mostly in the corpus. No visible lesions deve-loped in the non-secretary part of the rat stomach, which is a well-known res-ponse to CRS. Moreover, after opening, hemorrhagic content was found in sto-mach lumens. Following 3.5 h of cold-restraint stress, the average ulcer score in the non-pretreated group was very high (4.33±0.85). OLE (80 mg kg–1) signi-ficantly prevented the gastric mucosal lesions induced by cold-restraint stress. Ulcer index (UI) was 1.33±0.52. The percent of inhibition in UI was 70 %. Only gastric mucosal edema and petechiae were seen in almost all (5 of 6) animals in this experimental group. No visible sign of ulceration was observed in the control animals or in OLE group of animals.
Effect of OLE pretreatment on lipid peroxidation and the activity of antioxidative enzymes in the liver
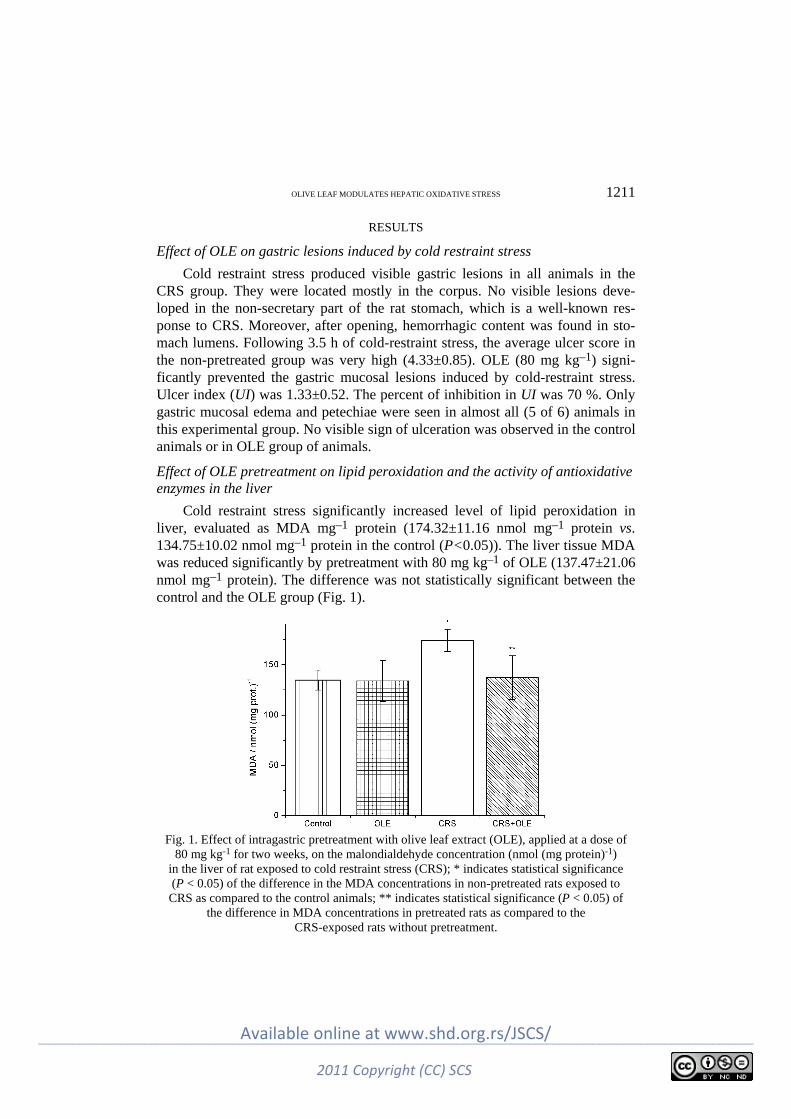
Cold restraint stress significantly increased level of lipid peroxidation in liver, evaluated as MDA mg–1 protein (174.32±11.16 nmol mg–1 protein vs. 134.75±10.02 nmol mg–1 protein in the control (P<0.05)). The liver tissue MDA was reduced significantly by pretreatment with 80 mg kg–1 of OLE (137.47±21.06 nmol mg–1 protein). The difference was not statistically significant between the control and the OLE group (Fig. 1).
Fig. 1. Effect of intragastric pretreatment with olive leaf extract (OLE), applied at a dose of
80 mg kg-1 for two weeks, on the malondialdehyde concentration (nmol (mg protein)-1) in the liver of rat exposed to cold restraint stress (CRS); * indicates statistical significance (P < 0.05) of the difference in the MDA concentrations in non-pretreated rats exposed to CRS as compared to the control animals; ** indicates statistical significance (P < 0.05) of
the difference in MDA concentrations in pretreated rats as compared to the CRS-exposed rats without pretreatment.
_________________________________________________________________________________________________________________________
2011 Copyright (CC) SCS
Available online at www.shd.org.rs/JSCS/
1212 DEKANSKI et al.
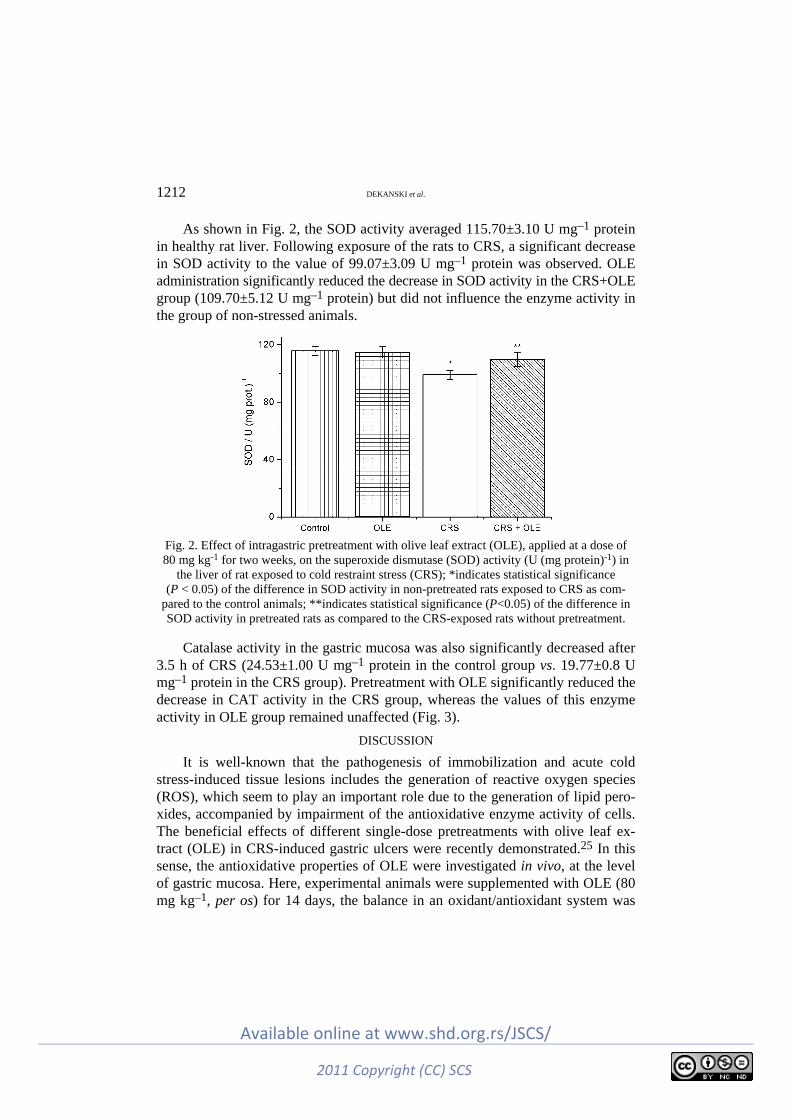
As shown in Fig. 2, the SOD activity averaged 115.70±3.10 U mg–1 protein in healthy rat liver. Following exposure of the rats to CRS, a significant decrease in SOD activity to the value of 99.07±3.09 U mg–1 protein was observed. OLE administration significantly reduced the decrease in SOD activity in the CRS+OLE group (109.70±5.12 U mg–1 protein) but did not influence the enzyme activity in the group of non-stressed animals.
Fig. 2. Effect of intragastric pretreatment with olive leaf extract (OLE), applied at a dose of 80 mg kg-1 for two weeks, on the superoxide dismutase (SOD) activity (U (mg protein)-1) in
the liver of rat exposed to cold restraint stress (CRS); *indicates statistical significance (P < 0.05) of the difference in SOD activity in non-pretreated rats exposed to CRS as com-
pared to the control animals; **indicates statistical significance (P<0.05) of the difference in SOD activity in pretreated rats as compared to the CRS-exposed rats without pretreatment.
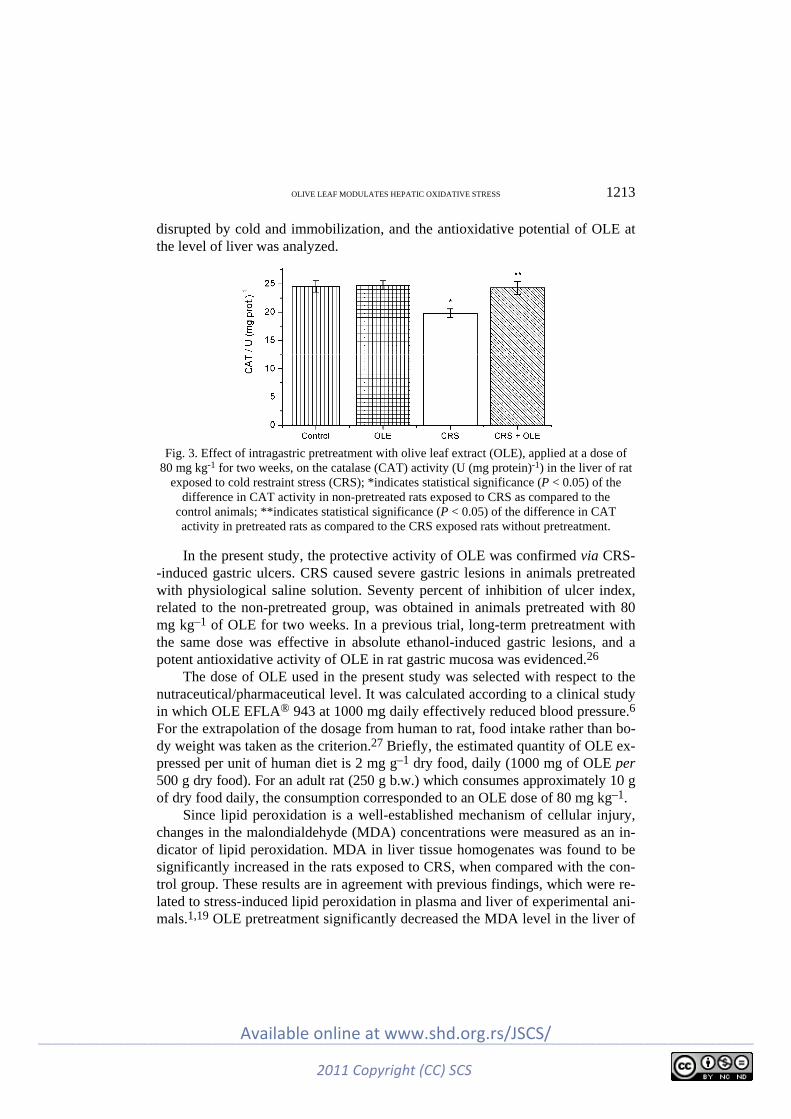
Catalase activity in the gastric mucosa was also significantly decreased after 3.5 h of CRS (24.53±1.00 U mg–1 protein in the control group vs. 19.77±0.8 U mg–1 protein in the CRS group). Pretreatment with OLE significantly reduced the decrease in CAT activity in the CRS group, whereas the values of this enzyme activity in OLE group remained unaffected (Fig. 3).
DISCUSSION
It is well-known that the pathogenesis of immobilization and acute cold stress-induced tissue lesions includes the generation of reactive oxygen species (ROS), which seem to play an important role due to the generation of lipid pero-xides, accompanied by impairment of the antioxidative enzyme activity of cells. The beneficial effects of different single-dose pretreatments with olive leaf ex-tract (OLE) in CRS-induced gastric ulcers were recently demonstrated.25 In this sense, the antioxidative properties of OLE were investigated in vivo, at the level of gastric mucosa. Here, experimental animals were supplemented with OLE (80 mg kg–1, per os) for 14 days, the balance in an oxidant/antioxidant system was
_________________________________________________________________________________________________________________________
2011 Copyright (CC) SCS
Available online at www.shd.org.rs/JSCS/
OLIVE LEAF MODULATES HEPATIC OXIDATIVE STRESS 1213
disrupted by cold and immobilization, and the antioxidative potential of OLE at the level of liver was analyzed.
Fig. 3. Effect of intragastric pretreatment with olive leaf extract (OLE), applied at a dose of
80 mg kg-1 for two weeks, on the catalase (CAT) activity (U (mg protein)-1) in the liver of rat exposed to cold restraint stress (CRS); *indicates statistical significance (P < 0.05) of the
difference in CAT activity in non-pretreated rats exposed to CRS as compared to the control animals; **indicates statistical significance (P < 0.05) of the difference in CAT activity in pretreated rats as compared to the CRS exposed rats without pretreatment.
In the present study, the protective activity of OLE was confirmed via CRS- -induced gastric ulcers. CRS caused severe gastric lesions in animals pretreated with physiological saline solution. Seventy percent of inhibition of ulcer index, related to the non-pretreated group, was obtained in animals pretreated with 80 mg kg–1 of OLE for two weeks. In a previous trial, long-term pretreatment with the same dose was effective in absolute ethanol-induced gastric lesions, and a potent antioxidative activity of OLE in rat gastric mucosa was evidenced.26
The dose of OLE used in the present study was selected with respect to the nutraceutical/pharmaceutical level. It was calculated according to a clinical study in which OLE EFLA® 943 at 1000 mg daily effectively reduced blood pressure.6 For the extrapolation of the dosage from human to rat, food intake rather than bo-dy weight was taken as the criterion.27 Briefly, the estimated quantity of OLE ex-pressed per unit of human diet is 2 mg g–1 dry food, daily (1000 mg of OLE per 500 g dry food). For an adult rat (250 g b.w.) which consumes approximately 10 g of dry food daily, the consumption corresponded to an OLE dose of 80 mg kg–1.
Since lipid peroxidation is a well-established mechanism of cellular injury, changes in the malondialdehyde (MDA) concentrations were measured as an in-dicator of lipid peroxidation. MDA in liver tissue homogenates was found to be significantly increased in the rats exposed to CRS, when compared with the con-trol group. These results are in agreement with previous findings, which were re-lated to stress-induced lipid peroxidation in plasma and liver of experimental ani-mals.1,19 OLE pretreatment significantly decreased the MDA level in the liver of
_________________________________________________________________________________________________________________________
2011 Copyright (CC) SCS
Available online at www.shd.org.rs/JSCS/

1214 DEKANSKI et al.
CRS rats. Recent reports showed antioxidant properties of the main phenolics present in olive extracts, i.e., oleuropein and hydroxytyrosol (the main metabolite of oleuropein). Thus, both phenolics showed a substantial degree of inhibition of lipid peroxidation in vivo in rat liver microsomes28 and in oxidative stress in-duced by hydrogen peroxide or xanthine oxidase in vitro.29 The OLE used in the present study contained 19.8 % of oleuropein. Therefore, ≈ 16 mg kg–1 of oleu-ropein was administered daily per rat. It is interesting that this dose of oleuropein was the effective dose in attenuation of hepatic oxidative damage (thiobarbituric acid-reactive substances (TBARS) reduction) in alloxan-diabetic rats. The admi-nistration of oleuropein- and hydroxytyrosol-rich extracts for 4 weeks signifi-cantly decreased the serum glucose and cholesterols levels and restored the anti-oxidant perturbations in liver.30 The present results showed that the antioxidant system in liver was also affected by CRS. It was previously reported that CRS caused the inhibition of the activity of antioxidant enzymes in the liver and in the other tissues in rat.1,31 Six hours of immobilization stress caused a decrease in the liver levels of SOD, CAT and glutathione, while the level of MDA was in-creased, compared with non-stressed control rats.32 Cold stress (CS) alone also alters homeostasis, resulting in the creation of reactive oxygen species which lead to alterations in the antioxidant defense system. The MDA levels were increased, whereas the SOD, CAT and glutathione peroxidase activities and total gluta-thione level were significantly decreased in the CS group.33 In the present study, OLE administered to rats prior to stress induction attenuated the inhibition of SOD and CAT activity and, thus, additionally implicated its role in the modu-lation of the oxidative balance in liver. Jemai et al.34 reported that hydroxytyro-sol purified from olive tree leaves increased the SOD and CAT activities in the liver of Wistar rats fed a cholesterol-rich diet. In addition, in the same study, the content of TBARS in liver, heart, kidney, and aorta decreased significantly when hydroxytyrosol was orally administered. The antioxidative effect of the total OLE most probably resulted from the ability of its constituents to scavenge re-active oxygen species produced in CRS, which initiate lipid peroxidation. The performed phytochemical analysis of OLE EFLA® 943 showed a high oleuropein content together with other important constituents, i.e., apigenine-7-O-glucoside, luteolin-7-O-glucoside, quercetin and caffeic acid, as well as low concentration of tannins.15 The radical scavenging abilities of tannins, oleuropein and its me-tabolites, apigenine-7-O-glucoside, luteolin-7-O-glucoside, caffeic acid, and for total olive leaf extract were already reported.12 Furthermore, quercetin, luteolin-7-glucoside and caffeic acid showed protective potential against oxidative dama-ges induced by tert-butyl hydroperoxide (t-BHP) in HepG2 cells. All the tested phenolic compounds were found to significantly decrease lipid peroxidation and prevent glutathione depletion induced by t-BHP; quercetin also significantly de-creased DNA damage.35
_________________________________________________________________________________________________________________________
2011 Copyright (CC) SCS
Available online at www.shd.org.rs/JSCS/

OLIVE LEAF MODULATES HEPATIC OXIDATIVE STRESS 1215
Antioxidants are substances that delay or prevent the oxidation of cellular oxidizable substrates. The various antioxidants exert their effect by scavenging superoxide, or by activation of a battery of detoxifying/defensive proteins.36 The present finding that orally applied OLE had a significant protective effect in he-patic oxidative stress is very important. The phenolic compounds from OLE are food constituents, thus ingestion is the natural route for their intake. The potential of other antioxidant nutrients, such as vitamins A (retinol), E (tocopherol) and C (ascorbic acid) individually and in combination (vitamin E + C) to modulate res-traint stress-induced oxidative changes in liver was investigated, and the vitamin post-stress treatment was found to be effective in combating hepatic oxidative stress.32 In the present study, the additional intake of OLE influenced neither lipid peroxidation nor the activity of the investigated antioxidative enzyme in healthy animals. It was recently reported that supplementation of vitamin E under non-stress condition decreased liver SOD, however the hydrogen peroxide con-tent (as the subsequent product of SOD activity) and catalase activity remained unchanged.37 The results obtained in the present study are partly in agreement with these. Not only is the liver the main target for nutrient antioxidants once ab-sorbed from the gastrointestinal tract, but it is also the major place for their me-tabolism. Therefore, studies dealing with the metabolism of OLE constituents in liver should be given priority.
Several studies showed that phenolic substances increased the expression of SOD and CAT enzymes at the transcriptional level.38 Recently, some individual and combined olive leaf phenolics exhibited SOD-like activity in vitro.39 Fur-thermore, it was reported that oleuropein reduced the expression of a number of hepatic genes involved in oxidative stress responses and detoxification of lipid peroxidation products and pro-inflammatory cytokine genes.40 According to the biochemical parameters, the first step has been made in that it was shown that OLE synchronized antioxidant enzymes and inhibited lipid peroxidation in liver. Thus, this effect is worthy of further investigation of its potential in the regu-lation of cellular signaling, gene expression and protein synthesis; in one word, investigation at the molecular level.
CONCLUSIONS
Bearing in mind the significance of stress and its potential role in the aggra-vation of liver diseases, natural hepatoprotective antioxidants are of great impor-tance. A standardized olive leaf extract decreased lipid peroxidation in the liver of rats exposed to cold restraint stress. Superoxide dismutase and catalase en-zyme activity were increased in liver tissue homogenates. The obtained results indicate that olive leaf exhibits a potent antioxidative activity at the level of liver.
_________________________________________________________________________________________________________________________
2011 Copyright (CC) SCS
Available online at www.shd.org.rs/JSCS/
1216 DEKANSKI et al.
ABBREVIATIONS
CAT – Catalase; CRS – Cold restraint stress; MDA – Malondialdehyde; OLE – Olive leaf extract; ROS – Reactive oxygen species; SOD – Superoxide dismutase; TBA – Thiobarbituric acid.
Acknowledgements. This study was supported by the Ministry of Science and Technological Development of the Republic of Serbia (Grant No.175096).
И З В О Д
ЕКСТРАКТ ЛИСТА МАСЛИНЕ МОДУЛИШЕ ОКСИДАТИВНЕ ПРОМЕНЕ ИНДУКОВАНЕ ИМОБИЛИЗАЦИОНИМ СТРЕСОМ УБРЗАНИМ
ХЛАДНОЋОМ У ЈЕТРИ ПАЦОВА
ДРАГАНА ДЕКАНСКИ1, СЛАВИЦА РИСТИЋ1, НЕВЕНА В. РАДОЊИЋ2, НАТАША Д. ПЕТРОНИЈЕВИЋ2,
АЛЕКСАНДАР ДЕКАНСКИ3 и ДУШАН М. МИТРОВИЋ4
1Biomedicinska ispitivawa, Institut za istra`ivawe i razvoj, Galenika a.d., Pasterova 2, 11000
Beograd, 2Institut za medicinsku i klini~ku biohemiju, Medicinski fakultet, Univerzitet u
Beogradu, Pasterova 2, 11000 Beograd, 3Institut za hemiju, tehnologiju i metalurgiju, Centar za
elektrohemiju, Wegoeva 12, 11000 Beograd i 4Institut za medicinsku fiziologiju “Rihard Burijan”,
Medicinski fakultet, Univerzitet u Beogradu, Viegradska 26, 11 000 Beograd
Недавно су показани повољни ефекти различитих појединачних доза стандардизованог екстракта листа маслине (Olea europaea L.) на желудачне лезије пацова индуковане имо-билизационим стресом убрзаним хладноћом (CRS) и његов утицај на параметре оксида-тивног стреса у желудачној слузници. У овој студији испитиван је ефекат дуготрајног пре-третмана листом маслине и његов потенцијал у модулацији CRS-ом индукованих оксида-тивних промена на нивоу јетре. Експерименталне животиње су подељене у четири групе: контролна, третирана екстрактом листа маслине (OLE), CRS и група код које је CRS тре-тиран екстрактом (CRS+OLE). CRS је проузроковао озбиљна оштећења желуца код свих непретретираних животиња, а двонедељни претретман са OLE (80 mg kg-1 т.т.) значајно је смањио стресом индуковане желудачне лезије. Малондиалдехид (MDA), као показатељ липидне пероксидације, активности супероксид-дисмутазе (SOD) и каталазе (CAT) мерени су спектрофотометријски у хомогенатима ткива јетре. Ниво MDA се значајно повећао у CRS групи, а потом значајно смањио у CRS+OLE групи. Активности SOD и CAT биле су зна-чајно смањене у CRS групи, док је у CRS+OLE групи животиња активност ова два ензима знатно повећана у поређењу са CRS групом. Добијени резултати указују на то да дуготрајно прехрањивање екстрактом листа маслине помаже успостављање оксидативне–антиокси-дативне равнотеже у јетри током стреса.
(Примљено 4. фебруара, ревидирано 18. марта 2011)
REFERENCES
1. E. Sahin, S. Gümüşlü, Clin. Exp. Pharmacol. Physiol. 34 (2007) 425 2. B. Dimitrios, Trends Food Sci. Technol. 17 (2006) 505 3. B. Halliwell, Cardiovasc. Res. 73 (2007) 341
_________________________________________________________________________________________________________________________
2011 Copyright (CC) SCS
Available online at www.shd.org.rs/JSCS/

OLIVE LEAF MODULATES HEPATIC OXIDATIVE STRESS 1217
4. Physician’s Desk References for Herbal Medicine, Medical Economics Company, Mont-vale, NJ, 2000, p. 556
5. S. N. El, S. Karakaya, Nutr. Rev. 67 (2009) 632 6. E. Susalit, N. Agus, I. Effendi, R. R. Tjandrawinata, D. Nofiarny, T. Perrinjaquet-Moc-
cetti, M. Verbruggen, Phytomedicine 18 (2011) 251 7. J. Meirinhos, B. M. Silva, P. Valentao, R. M. Seabra, J. A. Pereira, A. Dias, P. B. And-
rade, F. Ferreres, Nat. Prod. Res. 68 (2005) 189 8. A. P. Pereira, I. C. Ferreira, F. Marcelino, P. Valentao, P. B. Andrade, R. Seabra, L. Este-
vinho, A. Bento, J. A. Pereira, Molecules 12 (2007) 1153 9. A. Guinda, M. Rada, T. Delgado, P. Gutiérrez-Adánez, J. M. Castellano, J. Agric. Food.
Chem. 58 (2010) 9685 10. E. Speroni, M. C. Guerra, A. Minghetti, N. Crespi-Perellino, P. Pasini, F. Piazza, Phyto-
ther. Res. 12 (1998) S98 11. R. Briante, M. Paturni, S. Terenziani, E. Bismuto, F. Febbraio, R. Nucci, J. Agric. Food
Chem. 50 (2002) 4934 12. O. Benavente-Garcia, J. Castillo, J. Lorente, A. Ortuno, J. A. Del Rio, Food Chem. 68
(2000) 457 13. F. Visioli, C. Galli, F. Bornet, A. Mattei, R. Patelli, G. Galli, D. Caruso, FEBS Lett. 468
(2000) 159 14. M. N. Vissers, P. L Zock, A. J. C. Roodenburg, R. Leenen, M. B. Katan, J. Nutr. 132
(2002) 409 15. D. Dekanski, S. Janićijević-Hudomal, V. Tadić, G. Marković, I. Arsić, D. M. Mitrović, J.
Serb. Chem. Soc. 74 (2009) 367 16. M. Popović, N. Popović, D. Bokonjić, S. Dobrić, Int. J. Neurosci. 91 (1997) 1 17. E. C. Senay, R. J. Levine, Proc. Soc. Exp. Biol. Med. 124 (1967) 1221 18. D. Das, R. K. Banerjee, Mol. Cell. Biochem. 125 (1993) 115 19. C. Özer, S. Ercan, A. Babül, Z. S. Ercan, Turk. J. Biochem. 34 (2009) 32 20. N. I. Büyükcoşkun, G. Güleç, B. C. Etöz, K. Ozlük, Turk. J. Gastroenterol. 18 (2007) 150 21. O. H. Lowry, N. J. Rosenbrough, A. L. Farr, R. J. Randall, J. Biol. Chem. 193 (1951) 265 22. J. A. Buege, S. D. Aust, Methods Enzymol. 52 (1978) 302 23. H. P. Misra, I. Fridovich, J. Biol. Chem. 247 (1972) 3170 24. L. Goth, Clin. Chim. Acta 196 (1991) 143 25. D. Dekanski, S. Janićijević-Hudomal, S. Ristić, N. V. Radonjić, N. D. Petronijević, V.
Piperski, D. M. Mitrović, Gen. Physiol. Biophys. 28 (2009) 135 26. D. Dekanski, S. Ristić, D. M. Mitrović, Mediterr. J. Nutr. Metab. 2 (2009) 205 27. R. Rucker, D. Storms, J. Nutr. 132 (2002) 2999 28. V. R. Gutierrez, R. de la Puerta, A. Catalá, Mol Cell Biochem. 217 (2001) 35 29. C. Manna, P. Galletti, V. Cucciolla, O. Moltedo, A. Leone, V. Zappia, J. Nutr. 127 (1997)
286 30. H. Jemai, A. El Feki, S. Sayadi, J. Agric. Food Chem. 57 (2009) 8798 31. T. A. Shustanova, T. I. Bondarenko, N. P. Miliutina, Ross. Fiziol. Zh. Im. I M Sechenova
90 (2004) 73 (in Russian) 32. S. M. Zaidi, T. M. Al-Qirim, N. Banu, Drugs R D 6 (2005) 157 33. B. Ates, M. I. Dogru, M. Gul, A. Erdogan, A. K. Dogru, I. Yilmaz, M. Yurekli, M.
Esrefoglu, Fundam. Clin. Pharmacol. 20 (2006) 283
_________________________________________________________________________________________________________________________
2011 Copyright (CC) SCS
Available online at www.shd.org.rs/JSCS/

1218 DEKANSKI et al.
34. H. Jemai, I. Fki, M. Bouaziz, Z. Bouallagui, A. El Feki, H. Isoda, S. Sayadi. J. Agric. Food Chem. 56 (2008) 2630
35. C. F. Lima, M. Fernandes-Ferreira, C. Pereira-Wilson, Life Sci. 79 (2006) 2056 36. J. M. Matés, Toxicology 153 (2000) 83 37. S. F. Đurašević, J. Đorđević, N. Jasnić, I. Đorđević, P. Vujović, G. Cvijić, Arch. Biol. Sci.
Belgrade 62 (2010) 679 38. J. Vina, C. Borras, M. C. Gomez-Cabrera, W. C. Orr, Free Radic. Res. 40 (2006) 111 39. O. H. Lee, B. Y. Lee, Bioresour. Technol. 101 (2010) 3751 40. Y. Kim, Y. Choi, T. Park, Biotechnol. J. 5 (2010) 950.
_________________________________________________________________________________________________________________________
2011 Copyright (CC) SCS
Available online at www.shd.org.rs/JSCS/

J. Serb. Chem. Soc. 76 (9) 1219–1228 (2011) UDC 663.551.5:634.23+543.544.3+ JSCS–4198 543.51:54.004.12 Original scientific paper
1219
The effects of the cherry variety on the chemical and sensorial characteristics of cherry brandy
NINOSLAV NIKIĆEVIĆ1, MILOVAN VELIČKOVIĆ1, MILKA JADRANIN2, IVAN VUČKOVIĆ3, MIROSLAV NOVAKOVIĆ2, LJUBODRAG VUJISIĆ3, MIROSLAVA
STANKOVIĆ2, IVAN UROŠEVIĆ1 and VELE TEŠEVIĆ3*
1Faculty of Agriculture, University of Belgrade, Nemanjina 6, 11080 Zemun, 2Institute of Chemistry, Technology and Metallurgy, University of Belgrade, Njegoševa 12,
11000 Belgrade and 3Faculty of Chemistry, University of Belgrade, Studentski trg 16, 11000 Belgrade, Serbia
(Received 1 December 2010, revised 24 February 2011)
Abstract: The chemical and sensorial characteristics of cherry brandy produced from five cherry varieties (Oblacinska, Celery’s 16, Rexle, Heiman’s Ruby and Heiman’s Conserve) grown in Serbia were studied. Gas chromatography and gas chromatography–mass spectrometry analysis of these distillates led to the identifi-cation of 32 components, including 20 esters, benzaldehyde, 6 terpenes and 5 acids. The ethyl esters of C8–C18 acids were the most abundant in all samples. The benz-aldehyde content was quantified by high performance liquid chromatography with UV detection. The average benzaldehyde concentration in the samples ranged between 2.1 and 24.1 mg L-1. The total sensory scores of the cherry brandies ranged between 17.30 to 18.05, with the cherry brandy produced from the Celery’s 16 variety receiving the highest score (18.05).
Keywords: aroma; benzaldehyde; cherry brandy; GC/MS; cherry varieties.
INTRODUCTION
Cherries are divided into sweet cherries (Prunus avium) and sour cherries (P. ceresus). There is archaeological evidence of sweet cherry about 5000 to 4000 BC in Switzerland, France, Italy, Hungary, Germany and England. The first des-cription of sweet cherry was by Theophrastus (ca. 300 BC), who named it kera-sos, after the town Kerasun in ancient Pontus on the Black Sea, but the town may have been named after the fruit. By Roman times, cherries were a common fruit and were described by Pliny and Virgil, but generally as wild trees.1
Sour cherry fruits contain many volatile compounds and a number of these compounds, including benzaldehyde, linalool, hexanal, (2E)-hexenal, (2E), (6Z)-
* Corresponding author. E-mail: [email protected] doi: 10.2298/JSC101201109N
_________________________________________________________________________________________________________________________
2011 Copyright (CC) SCS
Available online at www.shd.org.rs/JSCS/

1220 NIKIĆEVIĆ et al.
-nonadienal, phenylacetaldehyde and eugenol, contribute to the fruit flavour and aroma.2 The majority of the quantitative and qualitative changes in volatile pro-duction occur during fruit development and ripening.3
The typical flavour of sour cherries is produced during processing into wine, liquor, juice, jam or fruit sauce. Benzaldehyde was determined to be the most important aroma compound in sour cherries,4 but benzyl alcohol, eugenol and va-nillin are also important.5
Distilled spirits are produced from stone fruits such as cherry (Kirschwasser, Cherry, Kirsch), plum (Zwetschgenwasser, Slivovitz), yellow plum, and apricots not only in many regions of Europe, but also in many other parts of the world. The flavour of stone fruit spirits is mostly affected by the aroma compound benz-aldehyde, which originates from the enzymatic degradation of amygdalin in the stones of the fruits, passing into the mash during fermentation and later into the distillate at rather high levels.
Kirschwasser is mainly produced in southern Germany, France and Switzer-land by crushing different kinds of sweet cherries, and leaving the mashed mass to ferment for several weeks. The fermented mash is then distilled in copper stills on open fire or vapour, whereby the first running and the tailings are removed. The resulting distillate has an alcohol content of approx. 60 vol. % and more and is marked as a clear, colourless fruit spirit with an alcohol content of 40–50 vol. %. Kirschwasser is also used as an additive for different liqueurs (e.g., Curacao, Cherry Brandy, Maraschino etc.).
Aroma compounds, their levels, odour attributes and thresholds are most im-portant for quality and authenticity of distilled spirits and liqueurs. The compo-sition of the volatile aroma compounds in distilled spirits has been widely inves-tigated using gas chromatography and mass spectrometry.6 By direct injection of an alcoholic distillate, it is possible to determine more than 50 components within levels between 0.1 and 1.0 mg L–1; special methods of extraction can be used to increase this number up to more than 1000 volatile substances. However, sensory analysis is still indispensable to describe and evaluate spirit drinks.7
The production of unique fruit brandies, the prominent place belonging to a sour cherry brandy, has a long tradition in Serbia. Favourable microclimatic con-ditions and pedological properties of Serbian soil resulted in Serbia holding fourth place in Europe for the production of this fruit. Sour cherry accounts for 9 % of the total fruit production in Serbia. For its importance in Serbia, sour cherry ranks third, following plum and apple. The annual production is of 89.814 t or 11.25 kg per capita.
In addition to production factors (alcoholic fermentation, distillation, distil-late aging), the choice of the appropriate cultivar is of critical importance for the end quality of sour cherry brandy.
_________________________________________________________________________________________________________________________
2011 Copyright (CC) SCS
Available online at www.shd.org.rs/JSCS/

CHEMICAL AND SENSORIAL CHARACTERISTICS OF CHERRY BRANDY 1221
The aim of this study was to compare the influence of the cherry variety (Oblačinska, Celery’s 16, Rexle, Heiman’s Ruby, and Heiman’s Conserve) on the composition of the volatile compounds in alcoholic distillates and on the sen-sorial characteristics.
EXPERIMENTAL
Materials and methods
Chemicals and reagents. Ethanol, NaCl, anhydrous sodium sulphate and dichloro-methane were purchased from Merck (Darmstadt, Germany).
Samples. In the present study, the fruits of five sour cherry cultivars that had been grown near Belgrade (the experimental orchard of Radmilovac, property of the Faculty of Agricul-ture, University of Belgrade) were used. Healthy and technically mature fruit of the following cherry cultivars was used in the experiments: Oblačinska, Celery’s 16, Rexle, Heiman’s Ruby and Heiman’s Conserve.
Fermentation was performed with the autochthonous micro flora over a period of 10 to 15 days. The distillation was performed with a traditional copper alembics of 80 L, which is a simplified type of the Charentais-type distiller. The fermented raw material was transferred to the vessel up to 3/4 of its capacity. Before the beginning of heating, the alembic was herme-tically closed with dough in order to prevent any vapour leakage. The first distillation of the fermented mash was performed without separation of a head. Redestillation was realised using the same distiller, but now with separation of 1 % of head, the heart (when average alcoholic strength of the heart was 60 % v/v) and a tail. The heart, containing 60 % v/v of ethanol was diluted with distilled water down to a strength of 45 % v/v. All samples were filled into glass bottles and stored in the dark at 4 °C until analysis. All the tested samples were distinguished by a characteristic aroma and flavour and were colourless.
Alcoholic strength
The ethanol content in the distillates was determined using a pycnometric method ac-cording to European Union regulations.8
GC and GC/MS analysis volatile compounds
For a typical experiment, a 100-mL aliquot of each beverage was mixed with 50 mL of dichloromethane and continuously extracted (2 h). Then the extract was dried (2 h) over anhydrous sodium sulphate, and concentrated to 1.0 mL under nitrogen.
Gas chromatographic analysis was performed using an HP 5890 gas chromatograph equipped with a flame ionization detector (FID) and a split/splitless injector. The separation was achieved using an HP-5 (5 % diphenyl and 95 % dimethylpolysiloxane) fused silica capil-lary column, 30 m×0.25 mm i.d., 0.25 μm film thickness. The temperature of the GC oven was programmed from 50 °C (6 min) to 285 °C at a rate of 4.3 °C min-1. Hydrogen was used as the carrier gas; flow rate: 1.6 mL min-1 at 45 °C. The injector and detector temperatures were 250 and 280 °C, respectively. Injection mode: splitless delay, 1 min. The injection volume of the beverage extract was 1.0 μL.
Gas chromatographic–mass spectrometric analysis (EI) was performed using an Agilent 5973 Network chromatograph coupled to an Agilent 5973 MSD spectrometer. The separation was achieved on an Agilent 19091S-433 HP-5MS fused silica capillary column, 30 m×0.25 mm i.d., 0.25 µm film thickness. The temperature of the GC oven was programmed from 60 °C to 285 °C at a rate of 4.3 °C min-1. Helium of grade 5.0 was used as the carrier gas; the inlet pressure was 25 kPa; the column flow: 1 mL min-1 at 210 °C. The injector temperature
_________________________________________________________________________________________________________________________
2011 Copyright (CC) SCS
Available online at www.shd.org.rs/JSCS/
1222 NIKIĆEVIĆ et al.
was 250 °C. The splitless injection mode was employed with a delay of 1 min. MS conditions: source temperature, 200 °C; interface temperature, 250 °C; E energy, 70 eV; mass scan range, 40–350 amu; scan speed, 1.1 scan s-1. Identification of the components was based on the retention indices and comparison with reference spectra (Wiley 07 & NIST 05). Percentage (relative) of the identified compounds was computed from the GC peak area. All analyses were performed in triplicate and the data are presented as mean±error (95 % confidence level, F = 4, n = 3).
HPLC analysis and benzaldehyde content The samples were filtered through a 0.45 µm nylon membrane and 10 µL directly in-
jected into the chromatographic system. Benzaldehyde identity was confirmed by retention time and by spiking the sample with the standard.
The separation was performed with an HPLC apparatus (1100 Series Agilent Techno-logies) comprising an on-line degasser, binary pump, auto injector, column oven and photodiode array (PDA) detector, equipped with a Zorbax Eclipse XDB-C8 column (Ana-lytical, 150×4.6 mm2, 5 μm ID) maintained at 25 °C. The mobile phase was a mixture of solvent A (water) and solvent B (methanol) according to a combination of gradient and iso-cratic modes: 95 % A, 0 min; 90 % A, 4 min; 85 % A, 8 min; 80 % A, 12 min; 60 % A, 16 min; 0 % A, 20–25 min and 0–95 % A, 25–26 min (26 min stop time and 5 min post time), at a flow-rate of 1.0 mL min-1 Detection was accomplished using a diode array detection system, storing the signals over the spectral range 190–400 nm. To obtain quantitative data, the primary detection wavelength used was 254 nm. A personal computer system running Agilent ChemStation software was used for data acquisition and processing. Quantifications were realised by the external standard method and calibration curves were constructed through linear regression of the data obtained for the mean peak area after triplicate injection of solutions containing 1.5, 5, 10, 15, 20 and 30 µg mL-1 benzaldehyde. The constructed cali-bration curve showed excellent linearity (correlation coefficient: 0.99954). All analyses were performed in triplicate and the data are presented as mean ± error (95 % confidence level, F = 4, n = 3).
Sensory analysis Sensory assessment of cherry brandy samples was performed using a modified Buxbaum
model of positive ranking. This model is based on five sensorial experiences rated by a ma-ximum of 20 points. The samples of cherry brandies were subjected to sensory evaluation by a panel comprising five qualified testers, all of them highly experienced in sensory testing.
Statistical analysis The statistical significance of difference between the analyzed samples was evaluated by
analysis of variance (one-way ANOVA) followed by the Tukey test.
RESULTS AND DISCUSSION
The volatile compounds identified in the five cherry spirits are presented in Table I. In total, 32 aroma compounds were identified, including esters, acids, benzaldehyde and the monoterpene linalool.
Numerically, esters were the main group in all the distillates. Fatty acid ethyl esters were by far the most abundant. Esters are mostly formed from esterifi-cation of fatty acids with alcohols during the fermentation and ageing process. Ester formation can be influenced by many factors, such as fermentation tempe-
_________________________________________________________________________________________________________________________
2011 Copyright (CC) SCS
Available online at www.shd.org.rs/JSCS/
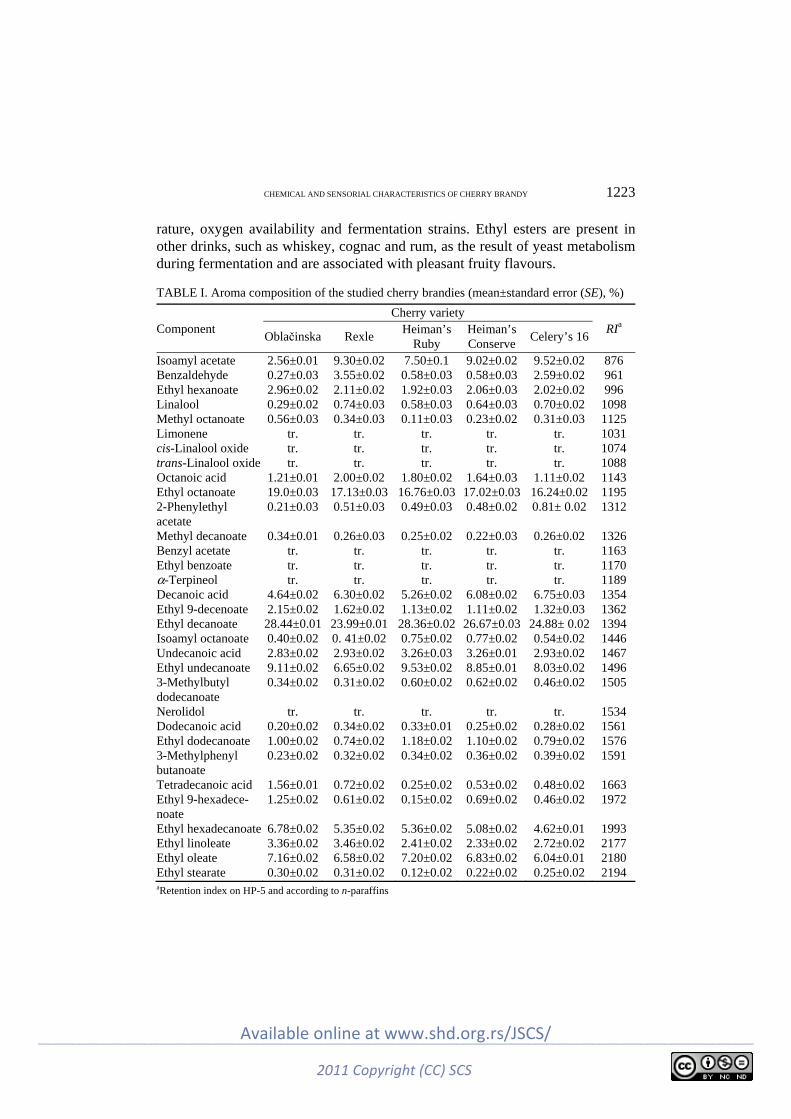
CHEMICAL AND SENSORIAL CHARACTERISTICS OF CHERRY BRANDY 1223
rature, oxygen availability and fermentation strains. Ethyl esters are present in other drinks, such as whiskey, cognac and rum, as the result of yeast metabolism during fermentation and are associated with pleasant fruity flavours.
TABLE I. Aroma composition of the studied cherry brandies (mean±standard error (SE), %)
Component Cherry variety
RIa Oblačinska Rexle
Heiman’s Ruby
Heiman’s Conserve
Celery’s 16
Isoamyl acetate 2.56±0.01 9.30±0.02 7.50±0.1 9.02±0.02 9.52±0.02 876 Benzaldehyde 0.27±0.03 3.55±0.02 0.58±0.03 0.58±0.03 2.59±0.02 961 Ethyl hexanoate 2.96±0.02 2.11±0.02 1.92±0.03 2.06±0.03 2.02±0.02 996 Linalool 0.29±0.02 0.74±0.03 0.58±0.03 0.64±0.03 0.70±0.02 1098 Methyl octanoate 0.56±0.03 0.34±0.03 0.11±0.03 0.23±0.02 0.31±0.03 1125 Limonene tr. tr. tr. tr. tr. 1031 cis-Linalool oxide tr. tr. tr. tr. tr. 1074 trans-Linalool oxide tr. tr. tr. tr. tr. 1088 Octanoic acid 1.21±0.01 2.00±0.02 1.80±0.02 1.64±0.03 1.11±0.02 1143 Ethyl octanoate 19.0±0.03 17.13±0.03 16.76±0.03 17.02±0.03 16.24±0.02 1195 2-Phenylethyl acetate
0.21±0.03 0.51±0.03 0.49±0.03 0.48±0.02 0.81± 0.02 1312
Methyl decanoate 0.34±0.01 0.26±0.03 0.25±0.02 0.22±0.03 0.26±0.02 1326 Benzyl acetate tr. tr. tr. tr. tr. 1163 Ethyl benzoate tr. tr. tr. tr. tr. 1170 α-Terpineol tr. tr. tr. tr. tr. 1189 Decanoic acid 4.64±0.02 6.30±0.02 5.26±0.02 6.08±0.02 6.75±0.03 1354 Ethyl 9-decenoate 2.15±0.02 1.62±0.02 1.13±0.02 1.11±0.02 1.32±0.03 1362 Ethyl decanoate 28.44±0.01 23.99±0.01 28.36±0.02 26.67±0.03 24.88± 0.02 1394 Isoamyl octanoate 0.40±0.02 0. 41±0.02 0.75±0.02 0.77±0.02 0.54±0.02 1446 Undecanoic acid 2.83±0.02 2.93±0.02 3.26±0.03 3.26±0.01 2.93±0.02 1467 Ethyl undecanoate 9.11±0.02 6.65±0.02 9.53±0.02 8.85±0.01 8.03±0.02 1496 3-Methylbutyl dodecanoate
0.34±0.02 0.31±0.02 0.60±0.02 0.62±0.02 0.46±0.02 1505
Nerolidol tr. tr. tr. tr. tr. 1534 Dodecanoic acid 0.20±0.02 0.34±0.02 0.33±0.01 0.25±0.02 0.28±0.02 1561 Ethyl dodecanoate 1.00±0.02 0.74±0.02 1.18±0.02 1.10±0.02 0.79±0.02 1576 3-Methylphenyl butanoate
0.23±0.02 0.32±0.02 0.34±0.02 0.36±0.02 0.39±0.02 1591
Tetradecanoic acid 1.56±0.01 0.72±0.02 0.25±0.02 0.53±0.02 0.48±0.02 1663 Ethyl 9-hexadece-noate
1.25±0.02 0.61±0.02 0.15±0.02 0.69±0.02 0.46±0.02 1972
Ethyl hexadecanoate 6.78±0.02 5.35±0.02 5.36±0.02 5.08±0.02 4.62±0.01 1993 Ethyl linoleate 3.36±0.02 3.46±0.02 2.41±0.02 2.33±0.02 2.72±0.02 2177 Ethyl oleate 7.16±0.02 6.58±0.02 7.20±0.02 6.83±0.02 6.04±0.01 2180 Ethyl stearate 0.30±0.02 0.31±0.02 0.12±0.02 0.22±0.02 0.25±0.02 2194 aRetention index on HP-5 and according to n-paraffins
_________________________________________________________________________________________________________________________
2011 Copyright (CC) SCS
Available online at www.shd.org.rs/JSCS/

1224 NIKIĆEVIĆ et al.
The concentrations of long chain acid ethyl esters (C8–C18) in the investi-gated distillates were similar. Ethyl octanoate and ethyl decanoate, which are considered important contributors to the aroma of alcoholic distillates, were found in the highest concentrations. Distillates obtained from Oblačinska and Heiman’s Ruby cherry varieties (cv) had the highest content of these compounds (≈28 %).
They were also reported as important aroma constituents in several fruit species. For example, ethyl hexanoate, ethyl octanoate and ethyl decanoate, were identified as odour active compounds in apple and apricot distillates.9
Salo et al.10 identified ethyl esters of fatty acids with even numbers of car-bons, between 6 and 12, as the major contributors to whisky flavour. Jounela- -Eriksson11 reported that if ethyl esters were added or removed from the spirits, a negative effect on the overall odour intensity resulted. Postel and Adam12 and Schreier et al.13 also showed that ethyl esters could be used to analytically diffe-rentiate between cognacs and other groups of grape brandies.
The most significant acetate esters present in cherry distillates are isoamyl acetate and 2-phenylethyl acetate. These esters are present in plum,14 apricot,9 apple9 and cornelian cherry14 brandy and are mainly responsible for the floral and fruity aroma of the distillates.15
The isoamyl acetate concentrations in the present samples ranged between 2.56 % (Oblačinska cv) and 9.52 % for distillate obtained from Celery’s 16 cv Highest content of 2-phenylethyl acetate (0.81 %) was found in the distillate ob-tained from Celery’s 16 cv
Free fatty acids are normal components of distilled alcoholic beverages and are mainly produced via yeast metabolism of carbohydrates. Long chain fatty acids, octanoic, nonanoic, dodecanoic, tetradecanoic and hexadecanoic acid, have a smaller effect on the flavour distillates.16 Five fatty carboxylic acids were iden-tified in the analyzed samples.
Table I shows that decanoic acid has the highest mean value of all these acids, followed by undecanoic acid, octanoic acid, tetradecanoic acid and dode-canoic acid.
Terpenoids in distillates are formed in the fruits during the fermentation pe-riod, and pass into the distillate during distillation.17
In the present study, only six terpenes, i.e., limonene, cis/trans-linalool oxide, linalool, α-terpineol and nerolidol, were detected. Despite the low con-centration of these compounds, their presence is relevant because they harmoni-cally synergize to produce the characteristic cherry aroma.
Linalool is a naturally-occurring terpene alcohol found in many flowers and spice plants with many commercial applications, the majority of which are based on its pleasant scent (floral, with a touch of spiciness). Linalool was previously reported as a constituent of the endogenous fruit aroma of sour cherry fruits. Li-
_________________________________________________________________________________________________________________________
2011 Copyright (CC) SCS
Available online at www.shd.org.rs/JSCS/

CHEMICAL AND SENSORIAL CHARACTERISTICS OF CHERRY BRANDY 1225
nalool has an aroma with a sweet, floral alcoholic note and its aroma threshold is in the range of 4–10 ppb.18
The linalool content of the analyzed samples was in the range of 0.29–0.74 %. The highest content was found in the Rexle cv distillate (0.74 %), and then in the Celery’s 16 cv distillate (0.70 %). In contrast, the Oblačinska cv distillate, rated the lowest (17.30 %) of all the investigated distillates, had the lowest content of linalool.
Products of cyanogenic glycoside decomposition are important components of the aroma of some alcoholic beverages. These constituents occur mainly in fruit brandies produced from stone fruits, lending them the characteristic aroma of bitter almonds. The fruits of Prunus genus plants (plums, sour cherries, sweet cherries, apricots, peaches, etc.) contain amygdalin in the stones and prunasin mainly in the vegetative parts of the plants. Through enzymatic hydrolysis with the participation of β-glucanase and hydroxynitrilase or at elevated acidity, amygdalin is decomposed to form benzaldehyde, HCN and two glucose mole-cules.2,19,20
The aroma of sour cherries was studied by Schmid and Grosch,2 Poll and Lewis21 and, more recently, by Schwab and Schreier4 who studied the glycol-sidically bound aroma components. Benzaldehyde was found to be the most im-portant aroma compound in sour cherries.21
Benzaldehyde content of the analyzed samples was in the range of 2.1–24.1 mg L–1 (Table II). The highest benzaldehyde content was found in the Rexle cv distillate (24.1 mg L–1), followed by the Celery’s 16 cv distillate.
TABLE II. The content of alcohol and benzaldehyde in the investigated cherry brandies
Sample Alcohol content, vol.% Concentration of benzaldehyde, mg L-1 Oblačinska 41.5 2.1±0.5 Rexle 42.0 24.1±1.5 Heiman’s Ruby 41.0 3.6±0.6 Heiman’s Conserve 42.0 3.7±0.7 Celery’s 16 42.5 14.6±1.1
Analysis of variance at the 0.05 level shows the population means were not significantly different (Table III).
TABLE III. Statistical significance of the difference between the data pairs evaluated by analysis of the variance (one-way ANOVA) followed by the Tukey test. Analysis of variance followed by the least significance at p < 0.01
Sample Rexle Heiman’s Ruby Heiman’s Conserve Celery’s16 Oblačinska p < 0.01 p < 0.01 p < 0.05 p < 0.01 Rexle p < 0.01 p < 0.01 p < 0.01 Heiman’s Ruby No statistical significance p < 0.01 Heiman’s Conserve p < 0.01
_________________________________________________________________________________________________________________________
2011 Copyright (CC) SCS
Available online at www.shd.org.rs/JSCS/

1226 NIKIĆEVIĆ et al.
Sensory evaluation
Total sensory quality of cherry brandies was between 17.30 and 18.05, which are very high scores (Table IV). According to the results of the performed sensory ranking, the best-rated brandy was the sample produced from Celery’s 16, which was rated with a very high score by the five examiners (total sensory characteristics 18.05). It had the highest content of benzaldehyde and linalool as well as the most harmonious proportion of these two compounds to other aro-matic components.
TABLE IV. Sensory analyses of the cherry brandies
Cherry brandy sample
Assessment characteristics Colour
(max 1 pt.) Clearness
(max 1 pt.)Typicality
(max 2 pts.)Odour
(max 6 pts.)Taste
(max. 10 pts.) Total
(max 20 pts.) Oblačinska 1 1 2 5.10 8.20 17.30 Celery’s 16 1 1 2 5.50 8.55 18.05 Rexle 1 1 2 5.40 8.50 17.90 Heiman’s Ruby
1 1 2 5.30 8.20 17.50
Heiman’s Conserve
1 1 2 5.20 8.20 17.40
CONCLUSIONS
All the investigated cultivars yielded brandies of very good to excellent quality. The dominant content of benzaldehyde, the significant amount of aro-matic organic acids, as well as the harmonious proportion of the two characte-ristic and the most aromatic compounds, benzaldehyde and linalool, together with other compounds, esters and organic acids, are the main reasons why the sour cherry cultivars Celery’s 16 and Rexle were rated best compared to the dis-tillates from the other investigated cultivars.
The aromatic ester ethyl decanoate was present in the highest percent of all aromatic compounds found in the investigated distillates. Its content in some distillates (Oblačinska cv and Heiman’s Ruby cv) accounted for nearly 1/3 of all the aromatic compounds. In addition, it is interesting to note that the Oblačinska cv distillate had the highest content of the aromatic esters ethyl octanoate and ethyl hexadecanoate. However, the presence of these esters is not followed by the presence of two key compounds benzaldehyde and linalool; hence, this might be the reason for the lower sensory rating of this distillate compared to others.
Acknowledgments. The authors are grateful to the Ministry of Education and Science of the Republic of Serbia for financial support, Grant No. 172053.
_________________________________________________________________________________________________________________________
2011 Copyright (CC) SCS
Available online at www.shd.org.rs/JSCS/
CHEMICAL AND SENSORIAL CHARACTERISTICS OF CHERRY BRANDY 1227
И З В О Д
УТИЦАЈ ВАРИЈЕТЕТА ВИШЊЕ НА ХЕМИЈСКЕ И СЕНЗОРНЕ КАРАКТЕРИСТИКЕ РАКИЈЕ ВИШЊЕВАЧЕ
НИНОСЛАВ НИКИЋЕВИЋ1, МИЛОВАН ВЕЛИЧКОВИЋ1, МИЛКА ЈАДРАНИН2, ИВАН ВУЧКОВИЋ3,
МИРОСЛАВ НОВАКОВИЋ2, ЉУБОДРАГ ВУЈИСИЋ3, МИРОСЛАВА СТАНКОВИЋ2,
ИВАН УРОШЕВИЋ1 и ВЕЛЕ ТЕШЕВИЋ3
1Poqoprivredni fakultet, Univerzitet u Beogradu, Nemawina 6, 11080 Zemun, 2Institut za hemiju,
tehnologiju i metalurgiju, Univerzitet u Beogradu, Wegoeva 12 11000 Beograd i 3Hemijski fakultet,
Univerzitet u Beogradu, Studentskii trg 16, 11000 Beograd
Испитиване су хемијске и сензорске карактеристике ракије вишњеваче произведене из пет варијетета вишње (Облачинска, Celery’s 16, Rexle, Heiman’s Ruby и Heiman’s Conserve) гајених у Србији. Методама гасне хроматографије и комбинацијом гасне хроматографије и масене спектрометрије у екстракатима идентификована су 32 једињења, 20 естaрa, бензал-дехид, 6 терпенa и 5 киселина. Етил-естри C8–C18 киселина су најобилнији у свим узорцима. Садржај бензалдехида је одређиван методом течне хроматографије уз UV детекцију. Просечна количина бензалдехида у испитиваним узорцима била је између 2,1 и 24,1 mg L-1. Оцене сензорског испитивања ракија вишњевача су у распону од 17,30 до 18,05, док је најбоље оцењена (18,05) ракија произведена од варијетета Celery’s 16.
(Примљено 1. децембра 2010, ревидирано 24. фебруара 2011)
REFERENCES
1. M. Faust, D. Surányi, Origin and dissemination of cherry. Horticultural Reviews, Wiley, New York, USA, 1997, p. 263
2. W. Schmid, W. Grosch, Z. Lebensm. Unters. Forsch., A 183 (1986) 39 3. J. P. Mattheis, D. A. Buchanan, J. K. Fellman, J. Agric. Food. Chem. 40 (1992) 471 4. W. Schwab, P. Schreier, Z. Lebensm. Unters. Forsch., A 190 (1990) 228 5. M. B. Petersen, L. Poll, Eur. Food Res. Technol. 209 (1999) 251 6. L. Nykänen, I. Nykänen, in Volatile Compounds in Foods and Beverages, H. Maarse, Ed.,
Dekker, New York, USA, 1991, p. 547 7. C. Norbert, C. C. Bauer, in Flavours and Fragrances Chemistry, Bioprocessing and
Sustainability, Springer-Verlag, Berlin, Heidelberg, Germany, 2007, p. 219 8. EEC, Council Regulation 2870/00 laying down Community reference methods for the
analysis of spirit drinks, Off. J. Eur. Comm. L333 (2000) 9. A. Genovese, M. Ugliano, R. Pessina, A. Gambuti, P. Piombino, L. Moio, Ital. J. Food
Sci. 16 (2004) 185 10. P. Salo, L. Nykanen, H. Soumalainen, J. Food Sci. 37 (1972) 394 11. P. Jounela-Eriksson, in Flavour ‘81, P. Schreier, Ed., Walter de Gruyter, Berlin, Ger-
many, 1981, p. 145 12. W. Postel, L. Adam, Branntweinwirtschaft 120 (1980) 154 13. P. Scheirer, L. Reiner, J. Sci. Food. Agric. 30 (1979) 319 14. V. Ferreira, P. Hernandez-Orte, A. Escudero, R. Lopez, J. Cacho, J. Chromatogr., A 864
(1999) 77 15. V. Tešević, N. Nikićević, A. Jovanović, D. Djoković, Lj. Vujisić, I. Vučković, M Bonić,
Food Technol. Biotechnol. 43 (2005) 367
_________________________________________________________________________________________________________________________
2011 Copyright (CC) SCS
Available online at www.shd.org.rs/JSCS/

1228 NIKIĆEVIĆ et al.
16. V. Tešević, N. Nikičević, S. Milosavljević, D. Bajić, V. Vajs., I. Vučković, Lj. Vujisić, I. Djordjević, M. Stanković, M. Veličković, J. Serb. Chem. Soc. 74 (2009) 117
17. I. A. Egorov, A. K. Rodopulo, Appl. Biochem. Microbiol. 30 (1994) 4 18. G. Fenaroli, in Handbook of Flavor Ingredients, 4th ed., G. A. Burdock, Ed., CRC Press,
Florida, USA, 2002, p. 972 19. M. Ljekočević, Review of Research Work at the Faculty of Agriculture 38 (1993) 119 (in
Serbian) 20. M. R. Haque, J. H. Bradbury, Food Chem. 77 (2002) 107 21. L. Poll, M. J. Lewis, in Flavour science and technology, 5th ed., Weurman Flavour
Research Symposium, Chichester, UK, 1987, p. 63.
_________________________________________________________________________________________________________________________
2011 Copyright (CC) SCS
Available online at www.shd.org.rs/JSCS/

J. Serb. Chem. Soc. 76 (9) 1229–1236 (2011) UDC 577.112.384:633.71+633.12:576 JSCS–4199 Original scientific paper
1229
Cell wall localization of the aspartic proteinase from buckwheat (FeAPL1) over-expressed in tobacco BY-2 cells
MIRA Đ. MILISAVLJEVIĆ*, GORDANA S. TIMOTIJEVIĆ, DRAGANA B. NIKOLIĆ, JELENA T. SAMARDŽIĆ and VESNA R. MAKSIMOVIĆ
Institute of Molecular Genetics and Genetic Engineering, University of Belgrade, Vojvode Stepe 444a, P. O. Box 23, 11010 Belgrade, Serbia
(Received 20 January, revised 24 March 2011)
Abstract: The recombinant aspartic proteinase-like protein (FeAPL1-His6) was overexpressed in the tobacco BY-2 cell line and the expected pepstatin A-sensitive enzymatic activity was confirmed at pH 3.0. Immunocytochemistry and protein gel blot analysis of the transformed BY-2 cells and their protoplasts showed extra-cellular localization of rFeAPL1-His6 in the cell wall. Based on the obtained re-sults, potential functions of FeAPL1 are discussed.
Keywords: aspartic proteinase; buckwheat; BY-2 cells; cell wall.
INTRODUCTION
Aspartic proteases (APs) are one of the major classes of proteolytic enzymes and are widely distributed in the whole living world. According to the MEROPS database (http://merops.sanger.ac.uk/), most plant APs belong to the A1 family, together with pepsin-like enzymes from many origins. They are most active at acidic pH values, are specifically inhibited by pepstatin A and contain two cata-lytic aspartic acid residues. The majority of plant APs are characterized by the presence of the plant specific insert (PSI) sequence, which is removed from most mature APs together with the signal peptide and the autoinhibitory PRO seg-ment.1 The recently identified new class of plant APs without PSI (AP-like) is represented by only seven members.2–7 One of those is FeAPL1 (AY536047), the cDNA of which was isolated from mid maturation buckwheat seed.7
The biological functions are still hypothetical for most plant APs, including AP-like, and data are generally derived from the analysis of expression in diffe-rent tissues or under specific conditions, and from co-localization studies with putative substrates. For example, CDR1 is an apoplastic aspartic proteinase, the overexpression of which causes resistance to virulent Pseudomonas syringae by
* Corresponding author. E-mail: [email protected] doi: 10.2298/JSC110120106M
_________________________________________________________________________________________________________________________
2011 Copyright (CC) SCS
Available online at www.shd.org.rs/JSCS/

1230 MILISAVLJEVIĆ et al.
activating inducible resistance mechanisms.3 CND41 is the only DNA-binding aspartic proteinase found in chloroplasts and is involved in the degradation of ru-bisco during leaf senescence.5,8–10 Extracellular nepenthesins play a role in prey digestion,4 while barley nucellin may be involved in nucellar cell death.2
Most APs are localized in vacuoles but there are several known to be extra-cellular.3,4,11,12 The roles of apoplastic proteins in general are unexplored due to technically complicated extraction procedures.13 In addition, investigation of APs is especially complicated because this class of proteases is a large family comprising more than 70 members most of which are quantitatively underrepre-sented and with similar biochemical characteristics, which make their separation and detailed characterization difficult.
Therefore, in this study, recombinant FeAPL1 was produced in the BY-2 cell line in order to identify its cellular localization and protease activity, which are the first steps towards elucidation of its physiological role.
EXPERIMENTAL
Preparation of the expression construct FeAPL1-His6
The binary vector pBINAR-EGFP was linearized by double digestion using KpnI/SalI restriction enzymes (Fermentas), which excised the EGFP sequence.
The coding sequence of the FeAPL1 gene was amplified from the FeAPL1 cDNA clone (AY536047)7 using forward P9 (5’-ggtaccatgcccacttctctc-3’) and P10 (5’-gtcgacttagtgatggtgatggtgatgatttttggatcg-3’) pri-mers containing KpnI and SalI restriction sites, respectively. The polymerase chain reaction was cycled five times for 30 s at 94 °C, 30 s at 33 °C and 90 s at 68 °C and then twenty times for 30 s at 94 °C, 30 s at 62 °C and 1.5 min at 68 °C. The amplification product was cloned into the pGEM-TEasy vector (Promega), excised by KpnI and SalI restriction enzymes, gel extracted and subcloned into an opened pBINAR-EGFP vector under control of the cauli-flower mosaic virus (CaMV) 35S promoter.
The EHA105 strain of Agrobacterium tumefaciens was transformed by electroporation (25 µF, 200 Ω, 2.5 kV) on a BIO RAD Gene pulser. The bacterial cells were grown on LB or LA medium14 containing kanamycin (25 µg ml-1) and rifampicin (10 µg ml-1).
DNA and RNA isolation and cDNA synthesis
RNA was isolated using an RNeasy Plant Mini Kit (QIAGEN) according to the manu-facturer’s instructions. DNA was removed with the DNA-free DNase Treatment and Removal Kit (Ambion) according to the manufacturer’s instructions.
Using oligohexamers (Applied Biosystems), cDNA was synthesized according to Chen-chik et al.15 with some modifications.16
The DNeasy Plant Mini Kit (QIAGEN) was used to isolate genomic DNA according to the manufacturer’s instructions.
PCR and RT-PCR were performed employing the primers rtAPL1f (5’-ccaaggagattgaggacagttcg-3’) and rtAPL1r (5’-tcggtgacaagtgagaaataatcg-3’). The polymerase chain reactions were cycled 25 times for 30 s at 94 °C, 30 s at 60 °C and 30 s at 72 °C.
_________________________________________________________________________________________________________________________
2011 Copyright (CC) SCS
Available online at www.shd.org.rs/JSCS/
BUCKWHEAT ASPARTIC PROTEINASE-LIKE PROTEIN LOCALIZATION 1231
Transformation of BY-2 cells
The tobacco BY-2 cell line was cultured in TSC (Tobacco Suspension Cell) medium in the dark at 26 °C in a 130-rpm shaker.17 The cells were subcultured once a week by trans-ferring 2.5 ml of the old culture to 25 ml of fresh TSC medium.
The BY-2 cells were transformed according to Gynheung18 with some modifications. Thus, BY-2 cells were cultured in modified TSC medium, pH 5.3 containing one-tenth the vi-tamin concentration prior to transformation. The pellet from an overnight culture of A. tume-faciens (OD600 1.1–1.2) was resuspended in 5 % sucrose. Four ml of a 3-day old BY-2 cell suspension was inoculated with resuspended bacterial cells in the presence of 300 µM ace-tosyringone in a Petri dish and incubated at 26 °C for 48 h without shaking. The BY-2 cells were washed twice with fresh TSC medium and once with TSC medium containing kana-mycin (100 mg L-1), carbenicilin (500 mg L-1) and cefotaxime (500 mg L-1). The BY-2 cells were plated on TSC agar plates containing kanamycin (200 mg L-1), carbenicilin (250 mg L-1) and cefotaxime (250 mg L-1).
Preparation of BY-2 protoplasts
BY-2 protoplasts were prepared as described in Stoeckel and Takeda19 with some modi-fications. A 4-day old BY-2 cell culture was transferred to fresh TSC medium and grown for 3 days. The 3-day old BY-2 cell suspension (2 ml) was then mixed with 6 ml of digestive medium (1 % cellulase “Onozuka R-10”, 0.2 % macerozyme R-10, 0.1 % pectolyase Y-23 (Zakult Pharmaceutical Ind. Co., Ltd.) in 0.45 M mannitol, 25 mM 2-(N-morpholino)etha-nesulfonic acid (MES), 8 mM CaCl2, pH 5.6) and incubated in the dark at 30 °C for 90 min with agitation at 39 rpm. After centrifugation at 80 g for 7 min, the pellet was gently resus-pended in 0.35 M sucrose and 5 mM CaCl2 (2 ml) and gently laid over approximately 6 ml of the same solution. After centrifugation at 80 g for 10 min, the purified protoplasts formed a thick layer on the surface. After two washings with 0.5 M mannitol, 20 mM CaCl2, 0.1 % MES, pH 5.8, the protoplasts were ready for protein extraction.
Preparation of protein extracts
Ground buckwheat seeds, pellets of BY-2 cells and protoplasts were resuspended in acidic buffer (1 M NaCl, 1 % Triton X-100, 3 mM NaHSO3) and sonicated on ice three times for 10 s. Concentrated HCl was added until the extracts reached pH 4.0. After centrifugation at 14000 rpm for 15 min at +4 °C, the supernatants were used for further analyses. Protein concentration was determined according to the method of Bradford.20
Immunodetection
Polyclonal anti-FeAPL1 antibodies were raised in rabbits against two peptides corres-ponding to the FeAPL1 sequences: C-IPIYARNKSSTVQS (amino acids 124 to 137) and CLVSHRFDDTPQSGD (amino acids 230 to 244). The affinity-purified antibodies were ob-tained from the commercial service, BioGenes, Customized Polyclonal Antisera/Antibodies, Berlin, Germany.
Crude seed, BY-2 and protoplast protein extracts were electrophoresed and transferred to polyvinylidene fluoride (PVDF) membranes (Millipore) in a Fastblot B43 transfer system (Biometra) according to the manufacturer’s instructions.
After transfer, the membranes were washed in PBS-T buffer (80 mM Na2HPO4, 20 mM NaH2PO4, 100 mM NaCl, and 0.1 % Tween-20, pH 7.5) and incubated in blocking buffer (5 % non-fat dry milk in PBS-T buffer) overnight at +4 °C. The further immunodetection steps were performed at room temperature. The membranes were incubated with anti-FeAPL1 anti-bodies (1:100 dilution) in PBS-T buffer for 1 h. After washing with PBS-T buffer three times
_________________________________________________________________________________________________________________________
2011 Copyright (CC) SCS
Available online at www.shd.org.rs/JSCS/
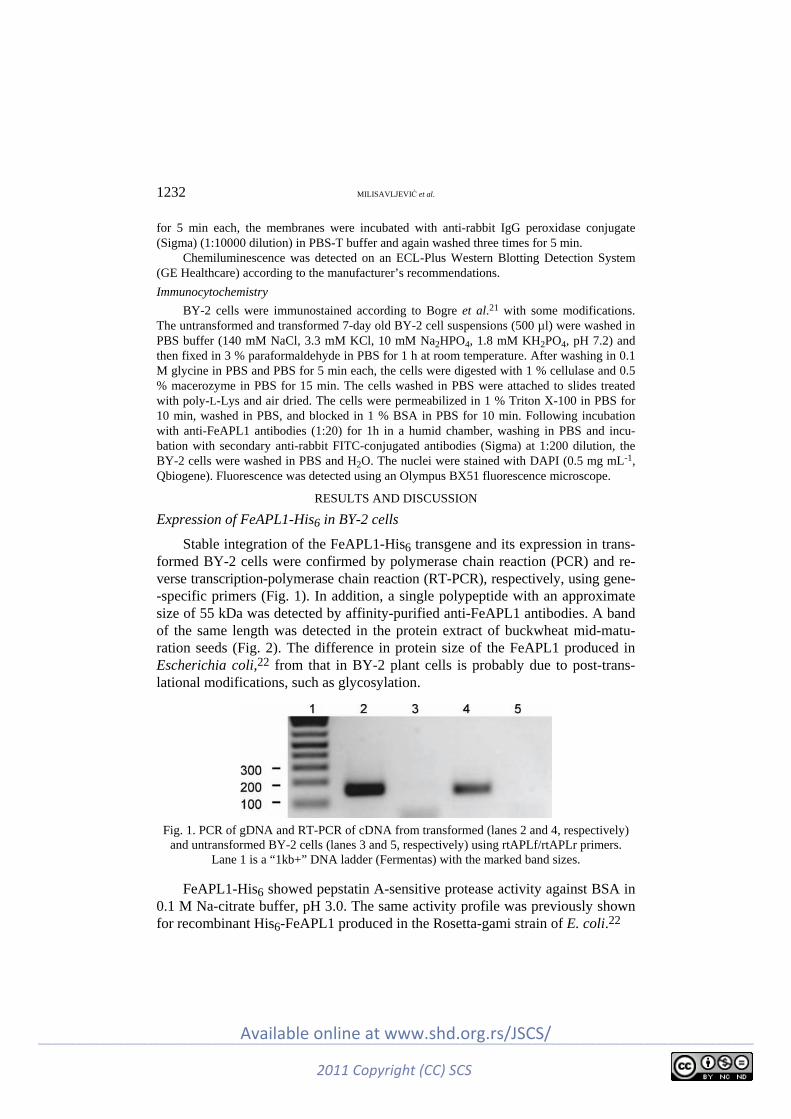
1232 MILISAVLJEVIĆ et al.
for 5 min each, the membranes were incubated with anti-rabbit IgG peroxidase conjugate (Sigma) (1:10000 dilution) in PBS-T buffer and again washed three times for 5 min.
Chemiluminescence was detected on an ECL-Plus Western Blotting Detection System (GE Healthcare) according to the manufacturer’s recommendations.
Immunocytochemistry
BY-2 cells were immunostained according to Bogre et al.21 with some modifications. The untransformed and transformed 7-day old BY-2 cell suspensions (500 µl) were washed in PBS buffer (140 mM NaCl, 3.3 mM KCl, 10 mM Na2HPO4, 1.8 mM KH2PO4, pH 7.2) and then fixed in 3 % paraformaldehyde in PBS for 1 h at room temperature. After washing in 0.1 M glycine in PBS and PBS for 5 min each, the cells were digested with 1 % cellulase and 0.5 % macerozyme in PBS for 15 min. The cells washed in PBS were attached to slides treated with poly-L-Lys and air dried. The cells were permeabilized in 1 % Triton X-100 in PBS for 10 min, washed in PBS, and blocked in 1 % BSA in PBS for 10 min. Following incubation with anti-FeAPL1 antibodies (1:20) for 1h in a humid chamber, washing in PBS and incu-bation with secondary anti-rabbit FITC-conjugated antibodies (Sigma) at 1:200 dilution, the BY-2 cells were washed in PBS and H2O. The nuclei were stained with DAPI (0.5 mg mL-1, Qbiogene). Fluorescence was detected using an Olympus BX51 fluorescence microscope.
RESULTS AND DISCUSSION
Expression of FeAPL1-His6 in BY-2 cells
Stable integration of the FeAPL1-His6 transgene and its expression in trans-formed BY-2 cells were confirmed by polymerase chain reaction (PCR) and re-verse transcription-polymerase chain reaction (RT-PCR), respectively, using gene- -specific primers (Fig. 1). In addition, a single polypeptide with an approximate size of 55 kDa was detected by affinity-purified anti-FeAPL1 antibodies. A band of the same length was detected in the protein extract of buckwheat mid-matu-ration seeds (Fig. 2). The difference in protein size of the FeAPL1 produced in Escherichia coli,22 from that in BY-2 plant cells is probably due to post-trans-lational modifications, such as glycosylation.
Fig. 1. PCR of gDNA and RT-PCR of cDNA from transformed (lanes 2 and 4, respectively)
and untransformed BY-2 cells (lanes 3 and 5, respectively) using rtAPLf/rtAPLr primers. Lane 1 is a “1kb+” DNA ladder (Fermentas) with the marked band sizes.
FeAPL1-His6 showed pepstatin A-sensitive protease activity against BSA in 0.1 M Na-citrate buffer, pH 3.0. The same activity profile was previously shown for recombinant His6-FeAPL1 produced in the Rosetta-gami strain of E. coli.22
_________________________________________________________________________________________________________________________
2011 Copyright (CC) SCS
Available online at www.shd.org.rs/JSCS/
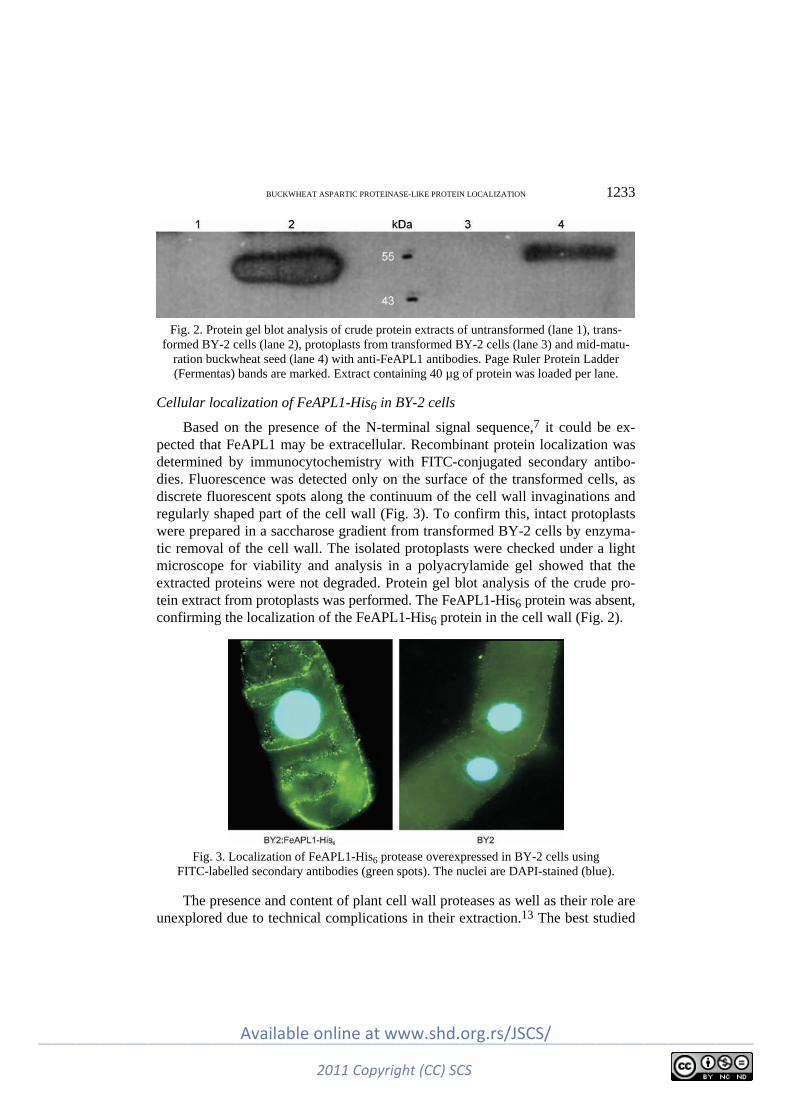
BUCKWHEAT ASPARTIC PROTEINASE-LIKE PROTEIN LOCALIZATION 1233
Fig. 2. Protein gel blot analysis of crude protein extracts of untransformed (lane 1), trans-
formed BY-2 cells (lane 2), protoplasts from transformed BY-2 cells (lane 3) and mid-matu-ration buckwheat seed (lane 4) with anti-FeAPL1 antibodies. Page Ruler Protein Ladder (Fermentas) bands are marked. Extract containing 40 µg of protein was loaded per lane.
Cellular localization of FeAPL1-His6 in BY-2 cells
Based on the presence of the N-terminal signal sequence,7 it could be ex-pected that FeAPL1 may be extracellular. Recombinant protein localization was determined by immunocytochemistry with FITC-conjugated secondary antibo-dies. Fluorescence was detected only on the surface of the transformed cells, as discrete fluorescent spots along the continuum of the cell wall invaginations and regularly shaped part of the cell wall (Fig. 3). To confirm this, intact protoplasts were prepared in a saccharose gradient from transformed BY-2 cells by enzyma-tic removal of the cell wall. The isolated protoplasts were checked under a light microscope for viability and analysis in a polyacrylamide gel showed that the extracted proteins were not degraded. Protein gel blot analysis of the crude pro-tein extract from protoplasts was performed. The FeAPL1-His6 protein was absent, confirming the localization of the FeAPL1-His6 protein in the cell wall (Fig. 2).
Fig. 3. Localization of FeAPL1-His6 protease overexpressed in BY-2 cells using
FITC-labelled secondary antibodies (green spots). The nuclei are DAPI-stained (blue).
The presence and content of plant cell wall proteases as well as their role are unexplored due to technical complications in their extraction.13 The best studied
_________________________________________________________________________________________________________________________
2011 Copyright (CC) SCS
Available online at www.shd.org.rs/JSCS/
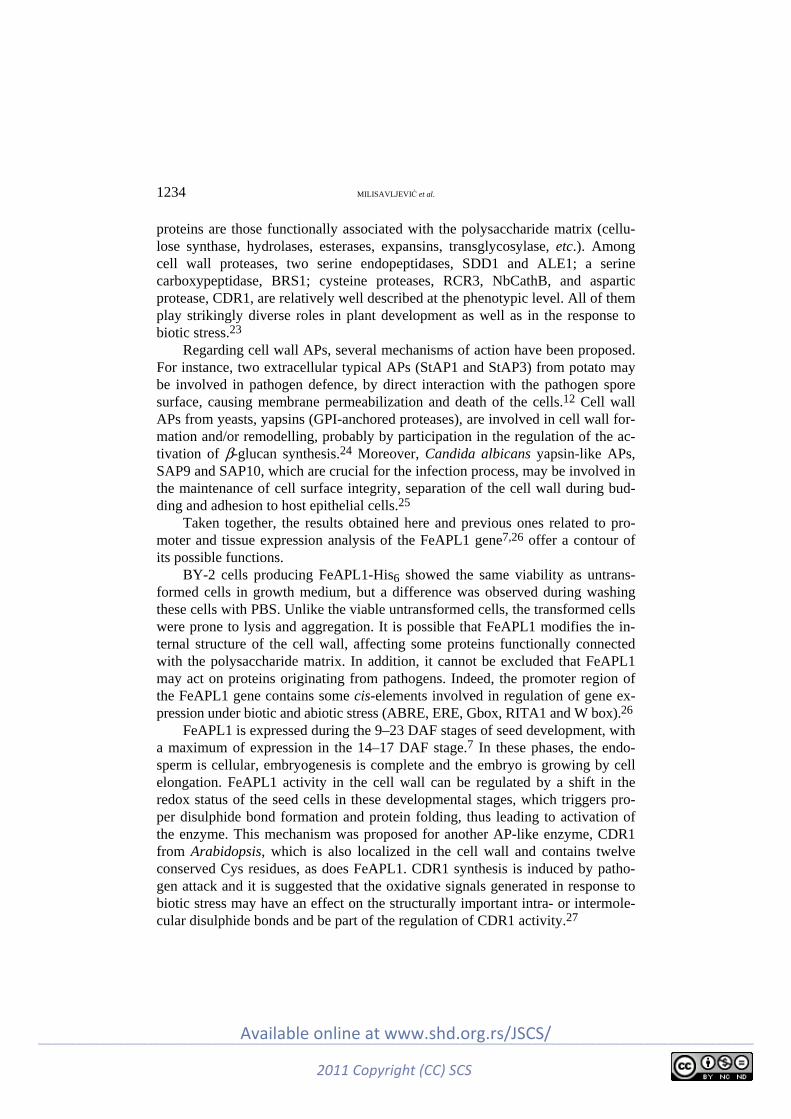
1234 MILISAVLJEVIĆ et al.
proteins are those functionally associated with the polysaccharide matrix (cellu-lose synthase, hydrolases, esterases, expansins, transglycosylase, etc.). Among cell wall proteases, two serine endopeptidases, SDD1 and ALE1; a serine carboxypeptidase, BRS1; cysteine proteases, RCR3, NbCathB, and aspartic protease, CDR1, are relatively well described at the phenotypic level. All of them play strikingly diverse roles in plant development as well as in the response to biotic stress.23
Regarding cell wall APs, several mechanisms of action have been proposed. For instance, two extracellular typical APs (StAP1 and StAP3) from potato may be involved in pathogen defence, by direct interaction with the pathogen spore surface, causing membrane permeabilization and death of the cells.12 Cell wall APs from yeasts, yapsins (GPI-anchored proteases), are involved in cell wall for-mation and/or remodelling, probably by participation in the regulation of the ac-tivation of β-glucan synthesis.24 Moreover, Candida albicans yapsin-like APs, SAP9 and SAP10, which are crucial for the infection process, may be involved in the maintenance of cell surface integrity, separation of the cell wall during bud-ding and adhesion to host epithelial cells.25
Taken together, the results obtained here and previous ones related to pro-moter and tissue expression analysis of the FeAPL1 gene7,26 offer a contour of its possible functions.
BY-2 cells producing FeAPL1-His6 showed the same viability as untrans-formed cells in growth medium, but a difference was observed during washing these cells with PBS. Unlike the viable untransformed cells, the transformed cells were prone to lysis and aggregation. It is possible that FeAPL1 modifies the in-ternal structure of the cell wall, affecting some proteins functionally connected with the polysaccharide matrix. In addition, it cannot be excluded that FeAPL1 may act on proteins originating from pathogens. Indeed, the promoter region of the FeAPL1 gene contains some cis-elements involved in regulation of gene ex-pression under biotic and abiotic stress (ABRE, ERE, Gbox, RITA1 and W box).26
FeAPL1 is expressed during the 9–23 DAF stages of seed development, with a maximum of expression in the 14–17 DAF stage.7 In these phases, the endo-sperm is cellular, embryogenesis is complete and the embryo is growing by cell elongation. FeAPL1 activity in the cell wall can be regulated by a shift in the redox status of the seed cells in these developmental stages, which triggers pro-per disulphide bond formation and protein folding, thus leading to activation of the enzyme. This mechanism was proposed for another AP-like enzyme, CDR1 from Arabidopsis, which is also localized in the cell wall and contains twelve conserved Cys residues, as does FeAPL1. CDR1 synthesis is induced by patho-gen attack and it is suggested that the oxidative signals generated in response to biotic stress may have an effect on the structurally important intra- or intermole-cular disulphide bonds and be part of the regulation of CDR1 activity.27
_________________________________________________________________________________________________________________________
2011 Copyright (CC) SCS
Available online at www.shd.org.rs/JSCS/
BUCKWHEAT ASPARTIC PROTEINASE-LIKE PROTEIN LOCALIZATION 1235
For elucidating the function of FeAPL1, it would be crucial to determine tis-sue localization as well as to confirm cell wall localization in the buckwheat seeds, which will be the subject of future work.
CONCLUSIONS
Production of proteins in the BY-2 cell line enables the investigation of those that are very difficult to purify in sufficient amounts from plant tissue. In ad-dition, the BY-2 cell line is a more “natural” host for plant proteins than hete-rologous systems such as bacterial, yeast and insect cells. Production of FeAPL1 in BY-2 cells enabled the determination of its cellular localization – in the cell wall, as well as the confirmation that it retains its pepstatin-A sensitive proteo-lytic activity at acidic pH values in this biological system, supporting previous findings with recombinant FeAPL1 from E. coli.
These results, together with analyses of seed tissue expression, as well as ex-pression under different environmental stress conditions are necessary for re-vealing the physiological function of FeAPL1. Bearing in mind that the functions of plant aspartic proteases are elusive, this is a significant contribution to re-search efforts to solve this biological puzzle.
ABBREVIATIONS
ALE1, abnormal leaf shape 1; AP, aspartic proteinase; BRS1, Bri1 suppressor; BSA, bo-vine serum albumin; BY-2, Bright Yellow; CaMV, cauliflower mosaic virus; CDR1, consti-tutive disease resistance; DAF, days after flowering; DAPI, 4’,6-diamidino-2-phenylindole; FITC, fluorescein isothiocyanate; NbCathB, Nicotiana benthamiana cathepsin B; PCR, polymerase chain reaction; PSI, plant-specific insert; RCR3, required for Cladosporium resistance 3; SDD1, stomata density and distribution 1.
Acknowledgments. This work was supported by the Ministry of Education and Science of the Republic of Serbia, Research Grant 173005.
И З В О Д
ЋЕЛИЈСКА ЛОКАЛИЗАЦИЈА НОВОГ ТИПА АСПАРТАТНЕ ПРОТЕИНАЗЕ ХЕЉДЕ (FEAPL1) У ТРАНСФОРМИСАНИМ BY-2 ЋЕЛИЈАМА ДУВАНА
МИРА Ђ. МИЛИСАВЉЕВИЋ, ГОРДАНА С. ТИМОТИЈЕВИЋ, ДРАГАНА Б. НИКОЛИЋ, ЈЕЛЕНА Т. САМАРЏИЋ
и ВЕСНА Р. МАКСИМОВИЋ
Institut za molekularnu genetiku i geneti~ko in`ewerstvo, Univerzitet u Beogradu,
Vojvode Stepe 444a, p. pr. 23, 11010 Beograd
BY-2, ћелијска линија дувана, употребљена је за продукцију новог типа аспартатне протеиназе хељде – FeAPL1-His6. Потврђена је очекивана пепстатин-А сензитивна ензимска активност овог протеина на pH 3,0. Локализација протеина FeAPL1-His6 је одређена иму-ноцитохемијски и упоредном анализом Western blot трансформисаних ћелија BY-2 и њи-хових протопласта. Овим методама је утврђено да испитивани протеин има екстрацелуларну локализацију у ћелијском зиду. На основу добијених резултата разматрана је потенцијална функција протеазе FeAPL1.
(Примљено 20. јануара, ревидирано 24. марта 2011)
_________________________________________________________________________________________________________________________
2011 Copyright (CC) SCS
Available online at www.shd.org.rs/JSCS/
1236 MILISAVLJEVIĆ et al.
REFERENCES
1. I. Simoes, C. Faro, Eur. J. Biochem. 271 (2004) 2067 2. F. Chen, M. Foolad, Plant Mol. Biol. 35 (1997) 821 3. Y. Xia, H. Suzuki, J. Borevitz, J. Blount, Z. Guo, K. Patel, R. A. Dixon, C. Lamb, EMBO
J. 23 (2004) 980 4. S. Athauda, K. Matsumoto, S. Rajapakshe, M. Kuribayashi, M. Kojima, N. Kubomura, A.
Iwamatsu, C. Shibata, H. Inoue, K. Takahashi, Biochem. J. 381 (2004) 295 5. Y. Kato, S. Murakami, Y. Yamamoto, H. Chatani, Y. Kondo, T. Nakano, A. Yokota, F.
Sato, Planta 220 (2004) 97 6. X. Bi, G. Khush, J. Bennett, Plant Cell Physiol. 46 (2005) 87 7. M. Milisavljević, G. Timotijević, S. Radović, M. Konstantinović, V. Maksimović, J.
Plant Physiol. 165 (2008) 983 8. T. Nakano, S. Murakami, T. Shoji, S. Yoshida, Y. Yamada, F. Sato, Plant Cell 9 (1997)
1673 9. S. Murakami, Y. Kondo, T. Nakano, F. Sato, FEBS Lett. 468 (2000) 15
10. Y. Kato, Y. Yamamoto, S. Murakami, F. Sato, Planta 222 (2005) 643 11. M. Vieira, J. Pissara, P. Verissimo, P. Castanheira, Y. Costa, E. Pires, C. Faro, Plant Mol.
Biol. 45 (2001) 529 12. J. Mendieta, M. Pagano, F. Munoz, G. Daleo, M. G. Guevara, Microbiology 152 (2006)
2039 13. E. Jamet, H. Canut, G. Boudart, R. F. Pont-Lezica, Trends Plant Sci. 11 (2006) 33 14. 14. J. Sambrook, E. F. Fritsch, T. Maniatis, Molecular cloning. A laboratory manual, 2nd
ed., Cold Spring Harbor Laboratory Press, New York, 1989 15. A. Chenchik, F. Moqadam, P. Siebert, CLONTECHniques 10 (1995) 5 16. J. Samardzić, M. Milisavljević, J. Brkljacić, M. Konstantinović, V. Maksimović, Plant
Physiol. Biochem. 42 (2004) 157 17. T. Nagata, Y. Nemoto, S. Hasezawa, Int. Rev. Cytol. 132 (1992) 1 18. A. Gynheung, Plant Physiol. 79 (1985) 568 19. H. Stoeckel, K. Takeda, Protoplasma 220 (2002) 79 20. M. N. A. Bradford, Anal. Biochem. 72 (1976) 248 21. L. Bogre, K. Zwerger, I. Meskiene, P. Binarova, V. Csizmadia, C. Planck, E. Wagner, H.
Hirt, E. Heberle-Bors, Plant Physiol. 113 (1997) 841 22. M. Milisavljević, D. Papić, G. Timotijević, V. Maksimović, J. Serb. Chem. Soc. 74
(2009) 607 23. R. A. van der Hoorn, Annu. Rev. Plant Biol. 59 (2008) 191 24. I. Gagnon-Arsenault, J. Tremblay, Y. Bourbonnais, FEMS Yeast Res. 6 (2006) 966 25. A. Albrecht, A. Felk, I. Pichova, J. Naglik, M. Schaller, P. de Groot, D. MacCallum, F. C.
Odds, W. Schäfer, F. Klis, M. Monod, B. Hube, J. Biol. Chem. 281 (2006) 688 26. M. Milisavljević, G. Timotijević, S. Radović, M. Konstantinović, V. Maksimović, Arch.
Biol. Sci. 59 (2007) 119 27. I. Simões, R. Faro, D. Bur, C. Faro, J. Biol. Chem. 282 (2007) 31358.
_________________________________________________________________________________________________________________________
2011 Copyright (CC) SCS
Available online at www.shd.org.rs/JSCS/

J. Serb. Chem. Soc. 76 (9) 1237–1246 (2011) UDC 547.484.7:57–188:546.302 JSCS–4200 Original scientific paper
1237
Synthesis, spectral, thermal and biological studies of transition metal complexes of 4-hydroxy-3-[3-(4-hydroxyphenyl)-
acryloyl]-6-methyl-2H-pyran-2-one VAIBHAV N. PATANGE1* and BALASAHEB R. ARBAD2
1Department of Chemistry, Research and P. G. Center, Shri Chhatrapati Shivaji College, Omerga, Dist-Osmanabad-413606, Maharashtra and 2Department of Chemistry, Dr.
Babasaheb Ambedkar Marathwada University, Aurangabad-431004, Maharashtra, India
(Received 31 May 2010, revised 4 March 2011)
Abstract: The solid complexes of Mn(II), Fe(III), Co(II), Ni(II), and Cu(II) with 4-hydroxy-3-[(2E)-3-(4-hydroxyphenyl)prop-2-enoyl]-6-methyl-2H-pyran-2-one, derived from 3-acetyl-6-methyl-2H-pyran-2,4(3H)-dione (dehydroacetic acid) and 4-hydroxybenzaldehyde, were synthesized and characterized by elemental analysis, conductometry, thermal analysis, magnetic measurements, IR, 1H-NMR and UV– –Vis spectroscopy and a biological study. From the analytical and spectral data, the stoichiometry of the complexes was found to be 1:2 (metal:ligand). The physico– –chemical data suggest a distorted octahedral geometry for the Cu(II) complexes and an octahedral geometry for all the other complexes. The thermal decomposition of all the complexes was studied by the TG–DTA method. The synthesized ligand and its metal complexes were screened for their in vitro antibacterial activity against Gram-negative (Escherichia coli) and Gram-positive (Staphylococcus aureus) bacterial strains and for in vitro antifungal activity against Aspergillus flavus, Curvularia lunata and Penicillium notatum. The results of these studies showed the metal complexes to be more antibacterial/antifungal against one or more species as compared with the non-complexed ligand.
Keywords: dehydroacetic acid; biological activity; transition metal complexes.
INTRODUCTION
The multifarious role of transition metal complexes in biochemistry has been directing the development of new chemistry with metal ligand systems. This has stimulated enormous interest in the synthesis of transition metal complexes with oxygen and nitrogen donor groups, due to the wide range of pharmacological ac-tivities of such compounds. In recent years, there has been a growing interest in compounds containing a carbonyl group directly linked to an α,β-unsaturated system (chalcones) and their presumed role in the prevention of various degene-
* Corresponding author. E-mail: [email protected] doi: 10.2298/JSC100531108P
_________________________________________________________________________________________________________________________
2011 Copyright (CC) SCS
Available online at www.shd.org.rs/JSCS/
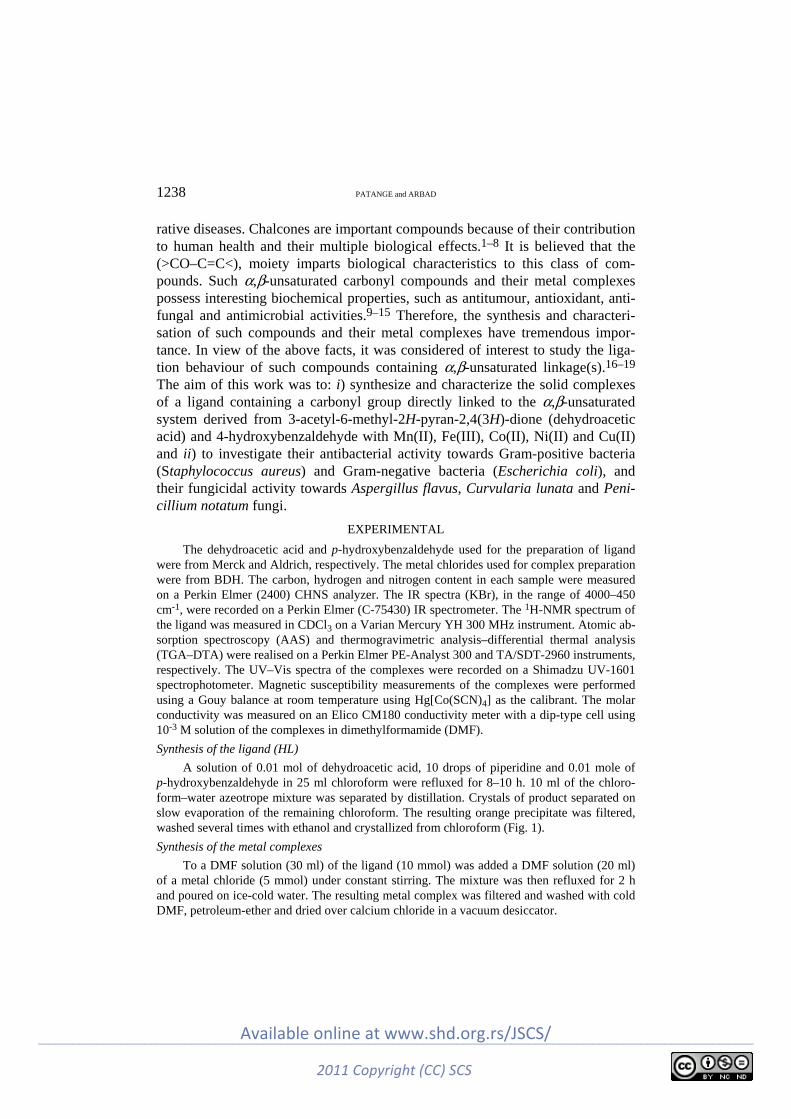
1238 PATANGE and ARBAD
rative diseases. Chalcones are important compounds because of their contribution to human health and their multiple biological effects.1–8 It is believed that the (>CO–C=C<), moiety imparts biological characteristics to this class of com-pounds. Such α,β-unsaturated carbonyl compounds and their metal complexes possess interesting biochemical properties, such as antitumour, antioxidant, anti-fungal and antimicrobial activities.9–15 Therefore, the synthesis and characteri-sation of such compounds and their metal complexes have tremendous impor-tance. In view of the above facts, it was considered of interest to study the liga-tion behaviour of such compounds containing α,β-unsaturated linkage(s).16–19 The aim of this work was to: i) synthesize and characterize the solid complexes of a ligand containing a carbonyl group directly linked to the α,β-unsaturated system derived from 3-acetyl-6-methyl-2H-pyran-2,4(3H)-dione (dehydroacetic acid) and 4-hydroxybenzaldehyde with Mn(II), Fe(III), Co(II), Ni(II) and Cu(II) and ii) to investigate their antibacterial activity towards Gram-positive bacteria (Staphylococcus aureus) and Gram-negative bacteria (Escherichia coli), and their fungicidal activity towards Aspergillus flavus, Curvularia lunata and Peni-cillium notatum fungi.
EXPERIMENTAL
The dehydroacetic acid and p-hydroxybenzaldehyde used for the preparation of ligand were from Merck and Aldrich, respectively. The metal chlorides used for complex preparation were from BDH. The carbon, hydrogen and nitrogen content in each sample were measured on a Perkin Elmer (2400) CHNS analyzer. The IR spectra (KBr), in the range of 4000–450 cm-1, were recorded on a Perkin Elmer (C-75430) IR spectrometer. The 1H-NMR spectrum of the ligand was measured in CDCl3 on a Varian Mercury YH 300 MHz instrument. Atomic ab-sorption spectroscopy (AAS) and thermogravimetric analysis–differential thermal analysis (TGA–DTA) were realised on a Perkin Elmer PE-Analyst 300 and TA/SDT-2960 instruments, respectively. The UV–Vis spectra of the complexes were recorded on a Shimadzu UV-1601 spectrophotometer. Magnetic susceptibility measurements of the complexes were performed using a Gouy balance at room temperature using Hg[Co(SCN)4] as the calibrant. The molar conductivity was measured on an Elico CM180 conductivity meter with a dip-type cell using 10-3 M solution of the complexes in dimethylformamide (DMF).
Synthesis of the ligand (HL)
A solution of 0.01 mol of dehydroacetic acid, 10 drops of piperidine and 0.01 mole of p-hydroxybenzaldehyde in 25 ml chloroform were refluxed for 8–10 h. 10 ml of the chloro-form–water azeotrope mixture was separated by distillation. Crystals of product separated on slow evaporation of the remaining chloroform. The resulting orange precipitate was filtered, washed several times with ethanol and crystallized from chloroform (Fig. 1).
Synthesis of the metal complexes
To a DMF solution (30 ml) of the ligand (10 mmol) was added a DMF solution (20 ml) of a metal chloride (5 mmol) under constant stirring. The mixture was then refluxed for 2 h and poured on ice-cold water. The resulting metal complex was filtered and washed with cold DMF, petroleum-ether and dried over calcium chloride in a vacuum desiccator.
_________________________________________________________________________________________________________________________
2011 Copyright (CC) SCS
Available online at www.shd.org.rs/JSCS/
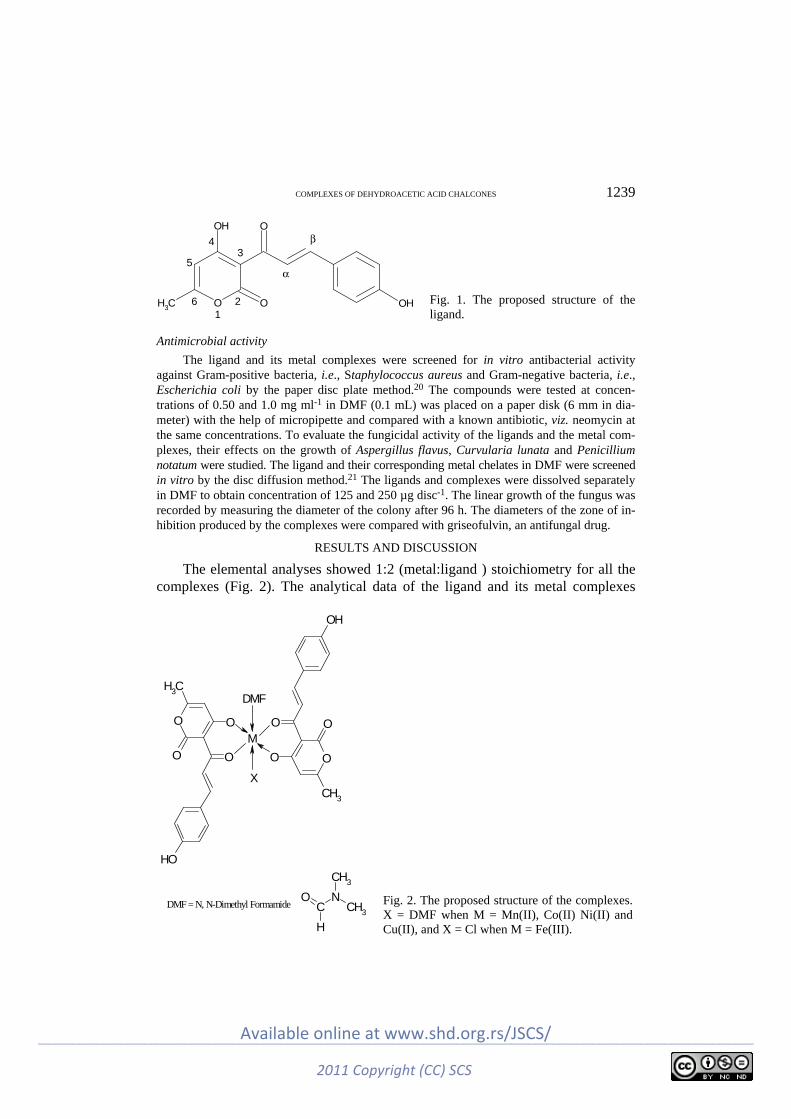
COMPLEXES OF DEHYDROACETIC ACID CHALCONES 1239
OCH3 O
OH O
OH1
2
34
5
6
α
β
Fig. 1. The proposed structure of the ligand.
Antimicrobial activity
The ligand and its metal complexes were screened for in vitro antibacterial activity against Gram-positive bacteria, i.e., Staphylococcus aureus and Gram-negative bacteria, i.e., Escherichia coli by the paper disc plate method.20 The compounds were tested at concen-trations of 0.50 and 1.0 mg ml-1 in DMF (0.1 mL) was placed on a paper disk (6 mm in dia-meter) with the help of micropipette and compared with a known antibiotic, viz. neomycin at the same concentrations. To evaluate the fungicidal activity of the ligands and the metal com-plexes, their effects on the growth of Aspergillus flavus, Curvularia lunata and Penicillium notatum were studied. The ligand and their corresponding metal chelates in DMF were screened in vitro by the disc diffusion method.21 The ligands and complexes were dissolved separately in DMF to obtain concentration of 125 and 250 µg disc-1. The linear growth of the fungus was recorded by measuring the diameter of the colony after 96 h. The diameters of the zone of in-hibition produced by the complexes were compared with griseofulvin, an antifungal drug.
RESULTS AND DISCUSSION
The elemental analyses showed 1:2 (metal:ligand ) stoichiometry for all the complexes (Fig. 2). The analytical data of the ligand and its metal complexes
O
CH3
O
O
O
OH
O
CH3
O
O
O
OH
M
DMF
X
CNO
HCH3
CH3
DMF = N, N-Dimethyl Formamide Fig. 2. The proposed structure of the complexes. X = DMF when M = Mn(II), Co(II) Ni(II) and Cu(II), and X = Cl when M = Fe(III).
_________________________________________________________________________________________________________________________
2011 Copyright (CC) SCS
Available online at www.shd.org.rs/JSCS/
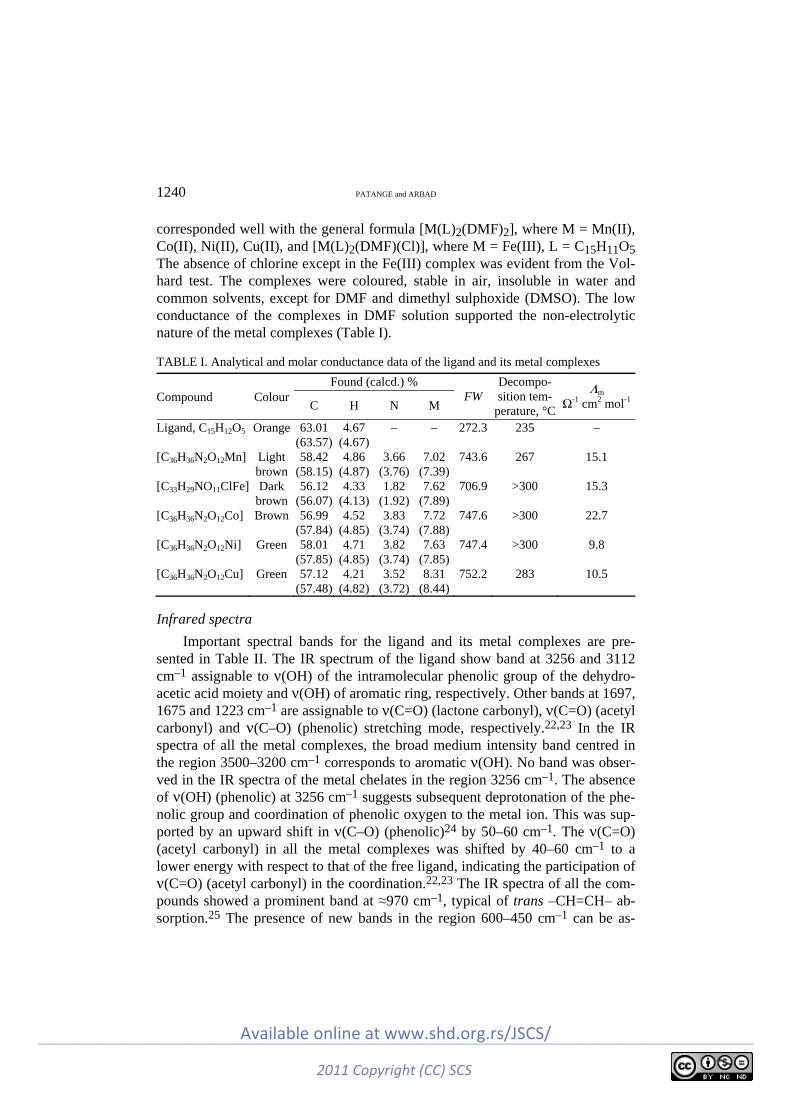
1240 PATANGE and ARBAD
corresponded well with the general formula [M(L)2(DMF)2], where M = Mn(II), Co(II), Ni(II), Cu(II), and [M(L)2(DMF)(Cl)], where M = Fe(III), L = C15H11O5 The absence of chlorine except in the Fe(III) complex was evident from the Vol-hard test. The complexes were coloured, stable in air, insoluble in water and common solvents, except for DMF and dimethyl sulphoxide (DMSO). The low conductance of the complexes in DMF solution supported the non-electrolytic nature of the metal complexes (Table I).
TABLE I. Analytical and molar conductance data of the ligand and its metal complexes
Compound Colour Found (calcd.) %
FW Decompo-sition tem-
perature, °C
Λm Ω-1 cm2 mol-1 C H N M
Ligand, C15H12O5 Orange 63.01 (63.57)
4.67 (4.67)
– – 272.3 235 –
[C36H36N2O12Mn] Light brown
58.42 (58.15)
4.86 (4.87)
3.66 (3.76)
7.02 (7.39)
743.6 267 15.1
[C33H29NO11ClFe] Dark brown
56.12 (56.07)
4.33 (4.13)
1.82 (1.92)
7.62 (7.89)
706.9 >300 15.3
[C36H36N2O12Co] Brown 56.99 (57.84)
4.52 (4.85)
3.83 (3.74)
7.72 (7.88)
747.6 >300 22.7
[C36H36N2O12Ni] Green 58.01 (57.85)
4.71 (4.85)
3.82 (3.74)
7.63 (7.85)
747.4 >300 9.8
[C36H36N2O12Cu] Green 57.12 (57.48)
4.21 (4.82)
3.52 (3.72)
8.31 (8.44)
752.2 283 10.5
Infrared spectra
Important spectral bands for the ligand and its metal complexes are pre-sented in Table II. The IR spectrum of the ligand show band at 3256 and 3112 cm–1 assignable to ν(OH) of the intramolecular phenolic group of the dehydro-acetic acid moiety and ν(OH) of aromatic ring, respectively. Other bands at 1697, 1675 and 1223 cm–1 are assignable to ν(C=O) (lactone carbonyl), ν(C=O) (acetyl carbonyl) and ν(C–O) (phenolic) stretching mode, respectively.22,23 In the IR spectra of all the metal complexes, the broad medium intensity band centred in the region 3500–3200 cm–1 corresponds to aromatic ν(OH). No band was obser-ved in the IR spectra of the metal chelates in the region 3256 cm–1. The absence of ν(OH) (phenolic) at 3256 cm–1 suggests subsequent deprotonation of the phe-nolic group and coordination of phenolic oxygen to the metal ion. This was sup-ported by an upward shift in ν(C–O) (phenolic)24 by 50–60 cm–1. The ν(C=O) (acetyl carbonyl) in all the metal complexes was shifted by 40–60 cm–1 to a lower energy with respect to that of the free ligand, indicating the participation of ν(C=O) (acetyl carbonyl) in the coordination.22,23 The IR spectra of all the com-pounds showed a prominent band at ≈970 cm–1, typical of trans –CH=CH– ab-sorption.25 The presence of new bands in the region 600–450 cm–1 can be as-
_________________________________________________________________________________________________________________________
2011 Copyright (CC) SCS
Available online at www.shd.org.rs/JSCS/

COMPLEXES OF DEHYDROACETIC ACID CHALCONES 1241
signed to ν(M–O) vibrations.26 According to the above-mentioned data, the ligand behaved as monodeprotonated bidentate and the coordination occurred via the acetyl and phenolic oxygen of the dehydroacetic acid moiety, as shown in Fig. 1.
TABLE II. Characteristic IR frequencies (cm-1) of the ligand and its metal complexes
Compound ν(OH)
(aromatic ring)
ν(OH) (dehyd-roacetic acid
moiety)
ν(C=O) (lactone)
ν(C=O) (acetyl
carbonyl)
ν(C–O) (phenolic)
ν(C=C) (trans)
ν(M–O)
Ligand, C15H12O5 3256 (s) 3112 (s) 1697 (m) 1675 (m) 1223 (m) 980 (m) – [C36H36N2O12Mn] 3251 (s) – 1678 (m) 1603 (m) 1280 (m) 975 (m) 560 (m)
462 (m) [C33H29NO11ClFe] 3257 (s) – 1680 (s) 1621 (m) 1280 (m) 975 (m) 530 (w)
488 (m) [C36H36N2O12Co] 3252 (s) – 1683 (w) 1620 (m) 1277 (m) 970 (m) 531(w)
476(m) [C36H36N2O12Ni] 3256 (s) – 1680 (w) 1622 (w) 1277 (m) 988 (m) 551 (m)
531 (w) [C36H36N2O12Cu] 3251 (s) – 1686 (m) 1628 (m) 1280 (m) 967 (m) 560 (w)
480 (m)
1H-NMR spectrum of the ligand
The 1H-NMR spectrum of the ligand in CDCl3 with TMS as an internal stan-dard showed a singlet at 2.27 ppm for the 3 hydrogens of the methyl group attached to C6 (Fig. 1), a singlet at 5.39 ppm for the one hydrogen of C5, a singlet at 6.33 ppm for the one hydrogen of the aromatic OH, a multiplet at 6.8–7.6 ppm for the four hydrogens of the aromatic ring, a doublet at 7.9–8.19 ppm for the two olefinic protons (J = 14 Hz) and a singlet at 18.16 ppm for the one hydrogen of C4 (phenolic hydrogen).
Magnetic moment and UV–Vis Spectra
The electronic spectra of all the complexes were recorded in DMF solution. The electronic spectrum of the Mn(II) complex exhibited three bands at 18345 cm–1 (ε = 26 dm3 mol–1 cm–1), 19763 cm–1 (ε = 16 dm3 mol–1 cm–1) and 23154 cm–1 (ε = 28 dm3 mol–1 cm–1), which are assigned to 6A1g → 4T1g(G), 6A1g → → 4T2g(G) and 6A1g → 4A1g, 4E1g(4G) transitions, respectively, indicating an octahedral configuration27,28 around the Mn(II) ion. The octahedral geometry of Mn(II) was further confirmed by the value of the magnetic moment (5.84 μB).
Three electronic transitions were observed in the electronic spectrum of the Fe(III) complex, at 14472 cm–1 (ε = 22 dm3 mol–1 cm–1), 21322 cm–1 (ε = 26 dm3 mol–1 cm–1) and 24272 cm–1 (ε = 32 dm3 mol–1 cm–1), which are assigned to 6A1g → 4T1g(G), 6A1g → 4T2g(G) and 6A1g → 4Eg(G), respectively, sug-
_________________________________________________________________________________________________________________________
2011 Copyright (CC) SCS
Available online at www.shd.org.rs/JSCS/

1242 PATANGE and ARBAD
gesting an octahedral complex of Fe(III), which was confirmed by the value of magnetic moment (5.93 μB).28
The electronic spectrum of the Co(II) complex exhibited three bands at 9487 cm–1 (ε = 17 dm3 mol–1 cm–1), 18656 cm–1 (ε = 59 dm3 mol–1 cm–1) and 21551 cm–1 (ε = 98 dm3 mol–1 cm–1), which are assigned to 4T1g(F) → 4T2g(F), 4T1g(F) → 4A2g(F) and 4T1g(F) → 4T1g(P), respectively, indicating octahedral configuration around the Co(II) ion. The magnetic moment of the Co(II) complex was 4.54 μB. The calculated spectral parameters ν2/ν1, 10Dq, B, β and the ligand field stabilizing energy (LFSE) have the values 1.96, 9169 cm–1, 783.1 cm–1, 0.81 and 26.20 kcal mol–1, respectively, which are in good agreement with the reported values of an octahedral Co(II) complex.28
The electronic spectrum of the Ni(II) complex exhibited three bands at 9345 cm–1 (ε = 34 dm3 mol–1 cm–1), 15698 cm–1 (ε = 67 dm3 mol–1 cm–1) and 22471 cm–1 (ε = 188 dm3 mol–1 cm–1), which are assigned to 3A2g → 3T2g(F), 3A2g → → 3T1g(F) and 3A2g → 3T1g(P), respectively. The ligand field parameters ν2/ν1, 10Dq, B, β and the LFSE have the values 1.68, 9345 cm–1, 675.6 cm–1, 0.65 and 26.69 kcal mol–1, respectively. These values, as well as the magnetic moment value (3.13 μB), support an octahedral geometry of the Ni(II) complex.28
The spectrum of the Cu(II) complex consisted of a broad band at 14225 cm–1 (ε = 94 dm3 mol–1 cm–1), assigned to the 2Eg → 2T2g transition of a distorted octahedral geometry.29 In addition to this band, the band observed at 25316 cm–1
(ε = 1143 dm3 mol–1 cm–1) arises from intra ligand charge transfer. The LFSE value of the Cu(II) complex is 42.64 kcal mol–1. The obtained values of LFSE determine the stability of the complexes and follows the order in terms of metal ions Cu(II)>Ni(II)>Co(II).
Thermal analysis
All the complexes showed high thermal stability and decomposed above 250 °C, indicating the absence of any lattice or coordinated water molecules. The TG curve of the Mn(II) complex showed a rapid first step decomposition between 240–350 °C with 48 % mass loss (calcd. 48.14 %), associated with an exothermic peak on the DTA curve (∆Tmax = 247.38 °C ), indicating the loss of two coordinated DMF molecules and the non-coordinated part of the complex, i.e., the aromatic ring with a beta carbon.30 The complex did not remain stable at higher temperatures and exhibited a slow second step decomposition in the tem-perature range 360–950 °C with a mass loss of 42 % (calcd. 42.22 %). The broad endothermic peak for this step on the DTA curve corresponds to the oxidative degradation of the coordinated part of the ligand. The decomposition was com-pleted at ≈950 °C leading to the formation of the stable metal oxide MnO (ob-served 10 %, calcd. 9.54 %). The thermal study of the Fe(III) complex shows sta-bility up to 325 °C. The first step showed a rapid decomposition between 340– –400 °C with a 45 % mass loss (calcd. 45.3 %). A broad exotherm was observed
_________________________________________________________________________________________________________________________
2011 Copyright (CC) SCS
Available online at www.shd.org.rs/JSCS/
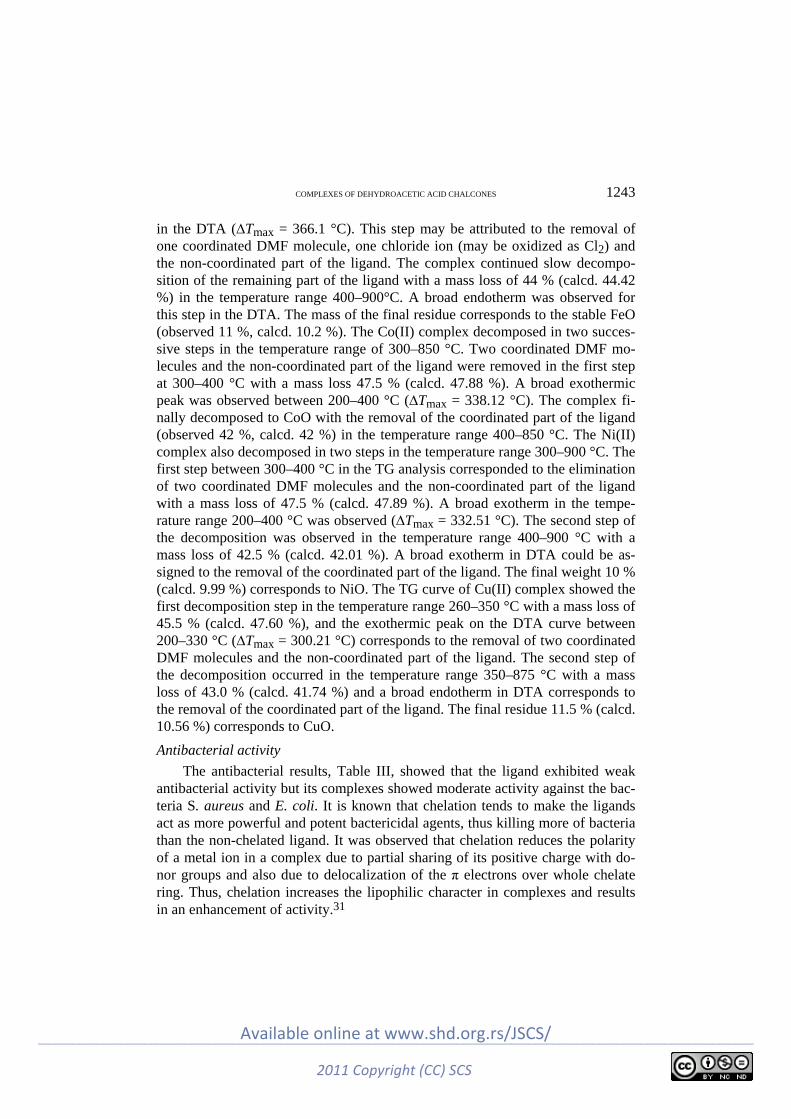
COMPLEXES OF DEHYDROACETIC ACID CHALCONES 1243
in the DTA (∆Tmax = 366.1 °C). This step may be attributed to the removal of one coordinated DMF molecule, one chloride ion (may be oxidized as Cl2) and the non-coordinated part of the ligand. The complex continued slow decompo-sition of the remaining part of the ligand with a mass loss of 44 % (calcd. 44.42 %) in the temperature range 400–900°C. A broad endotherm was observed for this step in the DTA. The mass of the final residue corresponds to the stable FeO (observed 11 %, calcd. 10.2 %). The Co(II) complex decomposed in two succes-sive steps in the temperature range of 300–850 °C. Two coordinated DMF mo-lecules and the non-coordinated part of the ligand were removed in the first step at 300–400 °C with a mass loss 47.5 % (calcd. 47.88 %). A broad exothermic peak was observed between 200–400 °C (∆Tmax = 338.12 °C). The complex fi-nally decomposed to CoO with the removal of the coordinated part of the ligand (observed 42 %, calcd. 42 %) in the temperature range 400–850 °C. The Ni(II) complex also decomposed in two steps in the temperature range 300–900 °C. The first step between 300–400 °C in the TG analysis corresponded to the elimination of two coordinated DMF molecules and the non-coordinated part of the ligand with a mass loss of 47.5 % (calcd. 47.89 %). A broad exotherm in the tempe-rature range 200–400 °C was observed (∆Tmax = 332.51 °C). The second step of the decomposition was observed in the temperature range 400–900 °C with a mass loss of 42.5 % (calcd. 42.01 %). A broad exotherm in DTA could be as-signed to the removal of the coordinated part of the ligand. The final weight 10 % (calcd. 9.99 %) corresponds to NiO. The TG curve of Cu(II) complex showed the first decomposition step in the temperature range 260–350 °C with a mass loss of 45.5 % (calcd. 47.60 %), and the exothermic peak on the DTA curve between 200–330 °C (∆Tmax = 300.21 °C) corresponds to the removal of two coordinated DMF molecules and the non-coordinated part of the ligand. The second step of the decomposition occurred in the temperature range 350–875 °C with a mass loss of 43.0 % (calcd. 41.74 %) and a broad endotherm in DTA corresponds to the removal of the coordinated part of the ligand. The final residue 11.5 % (calcd. 10.56 %) corresponds to CuO.
Antibacterial activity
The antibacterial results, Table III, showed that the ligand exhibited weak antibacterial activity but its complexes showed moderate activity against the bac-teria S. aureus and E. coli. It is known that chelation tends to make the ligands act as more powerful and potent bactericidal agents, thus killing more of bacteria than the non-chelated ligand. It was observed that chelation reduces the polarity of a metal ion in a complex due to partial sharing of its positive charge with do-nor groups and also due to delocalization of the π electrons over whole chelate ring. Thus, chelation increases the lipophilic character in complexes and results in an enhancement of activity.31
_________________________________________________________________________________________________________________________
2011 Copyright (CC) SCS
Available online at www.shd.org.rs/JSCS/
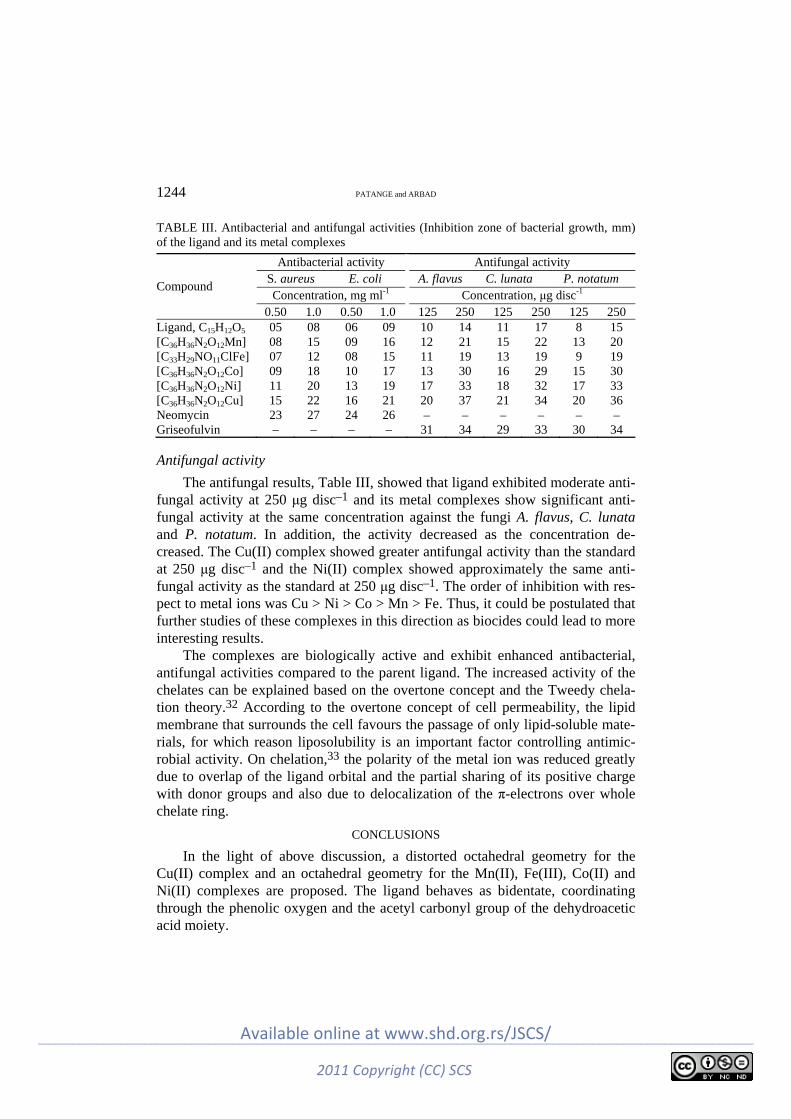
1244 PATANGE and ARBAD
TABLE III. Antibacterial and antifungal activities (Inhibition zone of bacterial growth, mm) of the ligand and its metal complexes
Compound
Antibacterial activity Antifungal activity S. aureus E. coli A. flavus C. lunata P. notatum Concentration, mg ml-1 Concentration, μg disc-1
0.50 1.0 0.50 1.0 125 250 125 250 125 250 Ligand, C15H12O5 05 08 06 09 10 14 11 17 8 15 [C36H36N2O12Mn] 08 15 09 16 12 21 15 22 13 20 [C33H29NO11ClFe] 07 12 08 15 11 19 13 19 9 19 [C36H36N2O12Co] 09 18 10 17 13 30 16 29 15 30 [C36H36N2O12Ni] 11 20 13 19 17 33 18 32 17 33 [C36H36N2O12Cu] 15 22 16 21 20 37 21 34 20 36 Neomycin 23 27 24 26 – – – – – – Griseofulvin – – – – 31 34 29 33 30 34
Antifungal activity
The antifungal results, Table III, showed that ligand exhibited moderate anti-fungal activity at 250 μg disc–1 and its metal complexes show significant anti-fungal activity at the same concentration against the fungi A. flavus, C. lunata and P. notatum. In addition, the activity decreased as the concentration de-creased. The Cu(II) complex showed greater antifungal activity than the standard at 250 μg disc–1 and the Ni(II) complex showed approximately the same anti-fungal activity as the standard at 250 μg disc–1. The order of inhibition with res-pect to metal ions was Cu > Ni > Co > Mn > Fe. Thus, it could be postulated that further studies of these complexes in this direction as biocides could lead to more interesting results.
The complexes are biologically active and exhibit enhanced antibacterial, antifungal activities compared to the parent ligand. The increased activity of the chelates can be explained based on the overtone concept and the Tweedy chela-tion theory.32 According to the overtone concept of cell permeability, the lipid membrane that surrounds the cell favours the passage of only lipid-soluble mate-rials, for which reason liposolubility is an important factor controlling antimic-robial activity. On chelation,33 the polarity of the metal ion was reduced greatly due to overlap of the ligand orbital and the partial sharing of its positive charge with donor groups and also due to delocalization of the π-electrons over whole chelate ring.
CONCLUSIONS
In the light of above discussion, a distorted octahedral geometry for the Cu(II) complex and an octahedral geometry for the Mn(II), Fe(III), Co(II) and Ni(II) complexes are proposed. The ligand behaves as bidentate, coordinating through the phenolic oxygen and the acetyl carbonyl group of the dehydroacetic acid moiety.
_________________________________________________________________________________________________________________________
2011 Copyright (CC) SCS
Available online at www.shd.org.rs/JSCS/
COMPLEXES OF DEHYDROACETIC ACID CHALCONES 1245
Acknowledgements. The authors are thankful to Dr. A. A. Chavan, Department of Bota-ny, Dr. Babasaheb Ambedkar Marathwada University, Aurangabad, Maharashtra, India, for valuable suggestions.
И З В О Д
СИНТЕЗА, СПЕКТРАЛНА, ТЕРМАЛНА И БИОЛОШКА ИСПИТИВАЊА КОМПЛЕКСА ПРЕЛАЗНИХ МЕТАЛА СА 4-ХИДРОКСИ-3-[3-(4-ХИДРОКСИФЕНИЛ)-АКРИЛОИЛ]-6-
-МЕТИЛ-2H-ПИРАН-2-ОНОМ КАО ЛИГАНДОМ
VAIBHAV N. PATANGE1 и BALASAHEB R. ARBAD2
1Department of Chemistry, Research and P. G. Center, Shri Chhatrapati Shivaji College, Omerga, Dist-Osmanabad-413606, Maharashtra и 2Department of Chemistry, Dr. Babasaheb Ambedkar
Marathwada University, Aurangabad-431004, Maharashtra, India
Синтетизовани су комплекси Mn(II), Fe(III), Co(II), Ni(II) и Cu(II) са 4-хидрокси-3- -[(2E)-3-(4-хидроксифенил)проп-2-еноил]-6-метил-2H-пиран-2-оном као лигандом, који је добијен из 3-ацетил-6-метил-2H-пиран-2,4(3H)-диона (дехидросирћетне киселине) и 4-хидроксибензалдехида. За карактеризацију ових комплекса употребљени су елементална микроанализа, термална, кондуктометријска, магнетна, IR, 1H-NMR и UV–Vis мерења. Такође, испитана је антибактеријска и антифунгална активност изолованих комплекса. На основу аналитичких и спектралних података нађено је да су одговарајући јон метала и лиганд у овим комплексима координовани у 1:2 молском односу. На основу физичко–хе-мијских података закључено је да комплекси Cu(II) имају дисторговану октаедарску гео-метрију, док остали испитивани комплекси имају октаедарску геометрију. Термална анализа ових комплекса одређена је помоћу TG–DTA методе. Испитивана је in vitro антибактеријска активност синтетизованог лиганда и одговарајућих комплекса на грам-негативне (Esche-richia coli) и грам-позитивне (Staphylococcus aureus) бактерије, као и in vitro антифунгална активност на сојевима Aspergillus flavus, Curvularia lunata и Penicillium notatum. Добијени резултати ових испитивања су показали да комплекси наведених јона метала имају већу антибактеријску/антифунгалну активност у односу на некоординовани лиганд.
(Примљено 31. маја 2010, ревидирано 4. марта 2011)
REFERENCES
1. S. S. Lim, H. S. Kim, D. U. Lee, Bull. Korean Chem. Soc. 28 (2007) 2495 2. M. S. Ponnurengam, S. Malliappan, K. G. Sethu, M. Doble, Chem. Pharm. Bull. 55
(2007) 44 3. M. L. Go, M. Liu, P. Wilairat, P. J. Rosenthal, K. L. Saliba, K. Kirk, Antimicrob. Agents
Chemother. 48 (2004) 3241 4. L. Zhai, M. Chen, J. Blom, T. G. Theander, S. B. Christensen, A. Kharazmi, J. Antimic-
rob. Chemother. 43 (1999) 793 5. A. O. Oyedapo, V. O. Makanju, C. O. Adewunmi, E. O. Iwalewa, K. Adenowo, Afr. J.
Trad. CAM 1 (2004) 55 6. S. J. Won, C. T. Liu, L. T. Tsao, J. R. Weng, H. H. Ko, J. P. Wang, C. N. Lin, Eur. J.
Med. Chem. 40 (2005) 103 7. L. Miranda, J. F. Cristobal, J. F. Stevens, V. Ivanov, M. McCall, B. Feri, M. L. Deinzer,
D. R. Buhler, J. Agric. Food. Chem. 48 (2000) 3876 8. G. S. B. Viana, M. A. M. Bandeira, F. J. A. Matos, Phytomedicine 10 (2003) 189 9. K. Krishanankutty, V. D. John, Synth. React. Inorg., Met.-Org. Chem. 28 (2003) 343
_________________________________________________________________________________________________________________________
2011 Copyright (CC) SCS
Available online at www.shd.org.rs/JSCS/

1246 PATANGE and ARBAD
10. H. J. J. Pabon, Recl. Trav. Chim. Pays-Bas 83 (1964) 237 11. R. C. Srimal, B. N. Dhawan, J. Pharm. Pharmacol. 25 (1973) 447 12. K. K. Soudamani, R. Kuttan, Ethnopharmacology 27 (1989) 227 13. T. S. Rao, N. Basu, H. H. Siddique, Indian J. Med. Res. 75 (1982) 574 14. J. D. Lasken, A. H. Conney, Carcinogenesis 13 (1992) 2183 15. R. J. Anto, K. N. Dinesh Babu, R. Kuttan, Cancer Lett. 95 (1995) 221 16. V. N. Patange, B. R. Arbad, V. G. Mane, S. D. Salunke, Transition Met. Chem. 32 (2007)
944 17. V. N. Patange, B. R. Arbad, J. Indian Chem. Soc. 84 (2007) 1096 18. V. G. Mane, V. N. Patange, B. R. Arbad, J. Indian Chem. Soc. 84 (2007) 1086 19. V. N. Patange, R. K. Pardeshi, B. R. Arbad, J. Serb. Chem. Soc. 73 (2008) 1073 20. H. H. Thornberry, Phytopathology 40 (1950) 419 21. A. W. Bauer, W. M. M. Kirby, J. C. Shesies, M. Turck, Am. J. Clin. Pathol. 44 (1966) 93 22. N. Ramarao, V. P. Rao, V. J. Tyaga Raju, M. C. Ganorkar, Indian J. Chem., A 24 (1985)
877 23. O. Carugo, C. B. Castellani, M. Rizzi, Polyhedron 9 (1990) 2061 24. A. S. El-Tabl, T. L. Kashar, R. M. El-Bahnasawy, A. El-Monsef Ibrahim, Pol. J. Chem.
73 (1999) 245 25. K. Krishnankutty, M. B. Ummathur, J. Indian Chem. Soc. 83 (2006) 639 26. K. Nakamoto, Infrared Spectra of Inorganic and Coordination Compounds, Wiley
Interscience, New York, 1970, pp. 159, 167, 214 27. K. A. H. Afkar, Indian J. Chem., A 33 (1994) 879 28. A. B. P. Lever, Inorganic electronic spectroscopy, Elsevier, Amsterdam, 1968 29. G. L. Eichhorn, J. C. Bailar, J. Am. Chem. Soc. 75 (1953) 2905 30. V. N. Patange, P. S. Mane, V. G. Mane, B. R. Arbad, J. Indian Chem. Soc. 85 (2008) 792 31. R. S. Shrivastava, Inorg. Chim. Acta 56 (1981) 165 32. N. Raman, A. Kulandaisamy, C. Tungaraja, P. Manishankar, S. Viswanthan, C. Vedhi,
Transition Met. Chem. 29 (2004) 129 33. Z. H. Chohan, M. Arif, M. Sarfaz, Appl. Organomet. Chem. 21 (2007) 294.
_________________________________________________________________________________________________________________________
2011 Copyright (CC) SCS
Available online at www.shd.org.rs/JSCS/
J. Serb. Chem. Soc. 76 (9) 1247–1262 (2011) UDC 66.011:663.991+577.354.3:543.544.164 JSCS–4201 Original scientific paper
1247
Modeling the ligand specific μ- and δ-opioid receptor conformations
MILAN SENĆANSKI1#, MILOVAN D. IVANOVIĆ2, SONJA VUČKOVIĆ3 and LJILJANA DOŠEN-MIĆOVIĆ2*
1Innovation Center of the Faculty of Chemistry, University of Belgrade, 2Faculty of Chemistry, University of Belgrade and Center for Chemistry, ICTM, Studentski trg 12–16, P. O. Box 51, 11158 Belgrade and 3Department of Pharmacology, Clinical Pharmacology
and Toxicology, School of Medicine, University of Belgrade, Belgrade, Serbia
(Received 20 January 2011)
Abstract: An automated docking procedure was applied to study the binding of a series of μ- and δ-selective ligands to ligand-specific μ- and δ-opioid receptor mo-dels. Short-time molecular dynamic simulations were used to obtain ligand-specific μ- and δ-opioid receptors from arbitrarily chosen models of the active form of these receptors. The quality of receptor model depended on the molecular volume of the ligand in the receptor–ligand complex used in the molecular dynamic simulations. Within a series of ligands of similar size (volume), the results of ligand docking to the obtained ligand–specific receptor conformation were in agreement with point mutation studies. The correlation of the calculated and the experimentally deter-mined binding energies was improved in relation to the initial receptor confor-mation.
Keywords: molecular modeling; opioid receptor; ligand–receptor interactions; dock-ing simulation.
INTRODUCTION
Three types of opioid receptors: μ, δ and κ (or MOR, DOR and KOR, res-pectively), are involved in pain regulation by inhibiting neuronal adenylyl cyc-lase activity, but they also participate in the regulation of multiple other effec-tors.1 There are also studies indicating that the δ-opioid receptor and/or its speci-fic ligands are involved in cardioprotection.2 Based on the results of pharmaco-logical investigations,3 opioid receptors have been subdivided into receptor sub-types, but the molecular basis of these subtypes remains to be resolved. Both, MOR and DOR have been cloned.4–6 A hypothesis was made7 that selective ligands might bind the same receptor but at different binding sites. The ability of
* Corresponding author. E-mail: [email protected] # Serbian Chemical Society member. doi: 10.2298/JSC110120110S
_________________________________________________________________________________________________________________________
2011 Copyright (CC) SCS
Available online at www.shd.org.rs/JSCS/

1248 SENĆANSKI et al.
the selective ligands to bind their respective binding site would depend on the conformational state of the opioid receptor.7,8
The regions of MOR and DOR involved in ligand binding and mediation of receptor function have been identified: a) by the construction of chimeric recep-tors containing sequences of MOR or DOR receptors,9–14 b) by site-directed mutagenesis of specific amino acid residues15–21 and c) by the construction of truncated mutant receptors.22–26
In the case of DOR, it was found by point-mutation experiments21 that Asp95Asn mutation reduced the affinity of many DOR-selective peptidic and non-peptidic agonists for DOR. Studies5 on chimeric and site-mutagenized DOR established the importance of the third extracellular loop (EC3) arginine amino acids for the binding of peptidic ligands while non-peptidic ligands were unaf-fected. Site-directed mutagenesis experiments showed16 that Asp128 contributes to the stabilization of the binding pocket. Mutations of amino acids Tyr129Phe, Trp274Ala and Tyr308Phe suggested that these aromatic residues might be a part of an opioid binding domain. Chimeric receptors and the alanine scan method were used11 to show that Leu295, Val296, Val297 and Ala298 of the EC3 loop are important for the binding of DOR-selective ligands. The amino acids Trp284 (TM6) and Ser312 (TM7) are important but to a lesser degree. It was also found12 that modifications of the second extracellular loop (EC2) had no effect on ligand binding. Other chimeric receptor studies13 demonstrated that the sixth transmem-brane domain (TM6) and the third extracellular loop (EC3) are absolutely critical for δ-opioid receptor selectivity. Point mutations emphasized the importance of Leu300, Ala298, Ala299 amino acids, and the unimportance of Arg291 for ligand binding. Val281 had moderate effect on ligand binding.13 It was suggested18 that interactions [Asp128(TM3)–Tyr308 (TM7) and Tyr129 (TM3)–His278(TM6)] maintain the δ-receptor in an inactive conformation. Point-mutation experi-ments19 confirmed that Trp284 (TM6) is important for the binding of ligands to the DOR, and that amino acids at the extracellular end of TM6 and TM7 are key residues for δ-ligand selectivity. Binding studies27 on a series of non-peptidic DOR ligands revealed that the binding site of these ligands is between TM5 and TM7 of the DOR. The binding pocket for most DOR-selective ligands is located close to the EC3 loop and between the transmembrane helices TM3, TM6 and TM7.
It was found by chimeric receptor studies9 that the major determinant for the binding of MOR-selective alkaloids exists in the region spanning the transmem-brane segments TM5 to TM7 of the MOR. Segments TM6 and TM7, as well as the third extra-cellular (E3) loop of the μ-receptor, were important28 for the bind-ing of agonists, such as morphine and fentanyl analogs, while the first extra-cel-lular loop (E1) was not important for MOR-selective non-peptide ligands. Site directed mutagenesis studies15 indicated that Asp147 is the primary binding site in the MOR, as the counter ion for the protonated nitrogen of opioid ligands. The
_________________________________________________________________________________________________________________________
2011 Copyright (CC) SCS
Available online at www.shd.org.rs/JSCS/
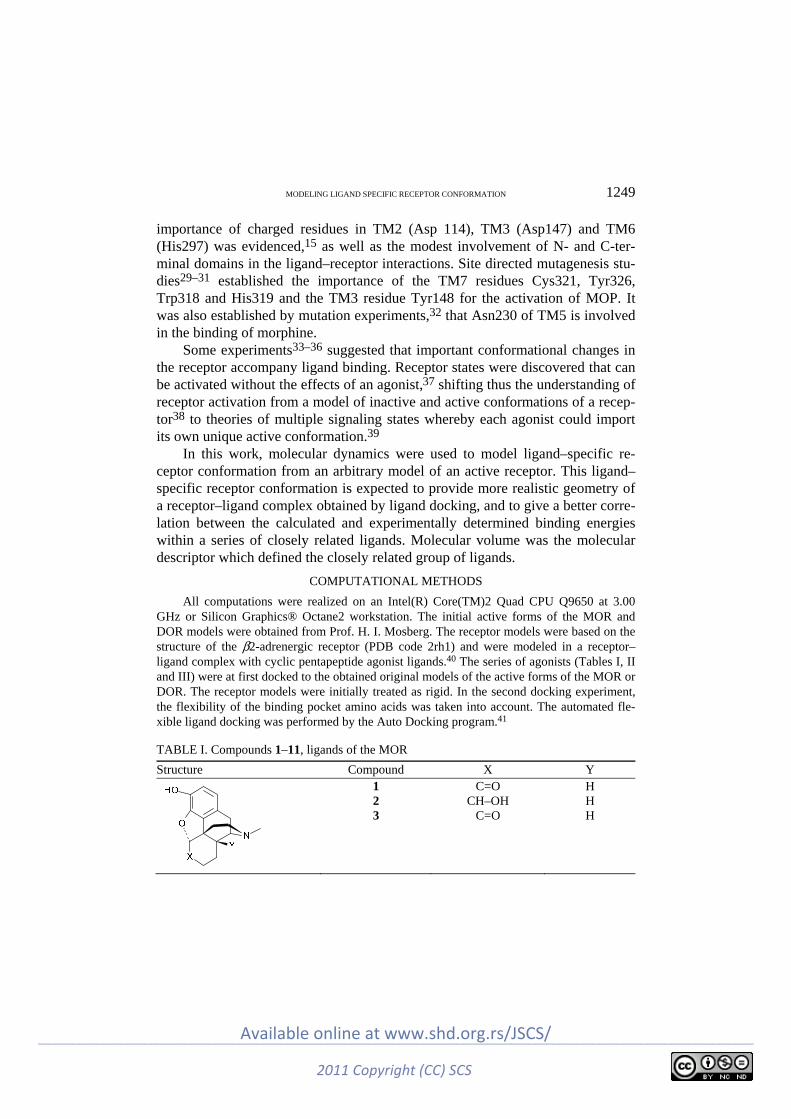
MODELING LIGAND SPECIFIC RECEPTOR CONFORMATION 1249
importance of charged residues in TM2 (Asp 114), TM3 (Asp147) and TM6 (His297) was evidenced,15 as well as the modest involvement of N- and C-ter-minal domains in the ligand–receptor interactions. Site directed mutagenesis stu-dies29–31 established the importance of the TM7 residues Cys321, Tyr326, Trp318 and His319 and the TM3 residue Tyr148 for the activation of MOP. It was also established by mutation experiments,32 that Asn230 of TM5 is involved in the binding of morphine.
Some experiments33–36 suggested that important conformational changes in the receptor accompany ligand binding. Receptor states were discovered that can be activated without the effects of an agonist,37 shifting thus the understanding of receptor activation from a model of inactive and active conformations of a recep-tor38 to theories of multiple signaling states whereby each agonist could import its own unique active conformation.39
In this work, molecular dynamics were used to model ligand–specific re-ceptor conformation from an arbitrary model of an active receptor. This ligand–specific receptor conformation is expected to provide more realistic geometry of a receptor–ligand complex obtained by ligand docking, and to give a better corre-lation between the calculated and experimentally determined binding energies within a series of closely related ligands. Molecular volume was the molecular descriptor which defined the closely related group of ligands.
COMPUTATIONAL METHODS
All computations were realized on an Intel(R) Core(TM)2 Quad CPU Q9650 at 3.00 GHz or Silicon Graphics® Octane2 workstation. The initial active forms of the MOR and DOR models were obtained from Prof. H. I. Mosberg. The receptor models were based on the structure of the β2-adrenergic receptor (PDB code 2rh1) and were modeled in a receptor–ligand complex with cyclic pentapeptide agonist ligands.40 The series of agonists (Tables I, II and III) were at first docked to the obtained original models of the active forms of the MOR or DOR. The receptor models were initially treated as rigid. In the second docking experiment, the flexibility of the binding pocket amino acids was taken into account. The automated fle-xible ligand docking was performed by the Auto Docking program.41
TABLE I. Compounds 1–11, ligands of the MOR
Structure Compound X Y
1 2 3
C=O CH–OH
C=O
H H H
_________________________________________________________________________________________________________________________
2011 Copyright (CC) SCS
Available online at www.shd.org.rs/JSCS/
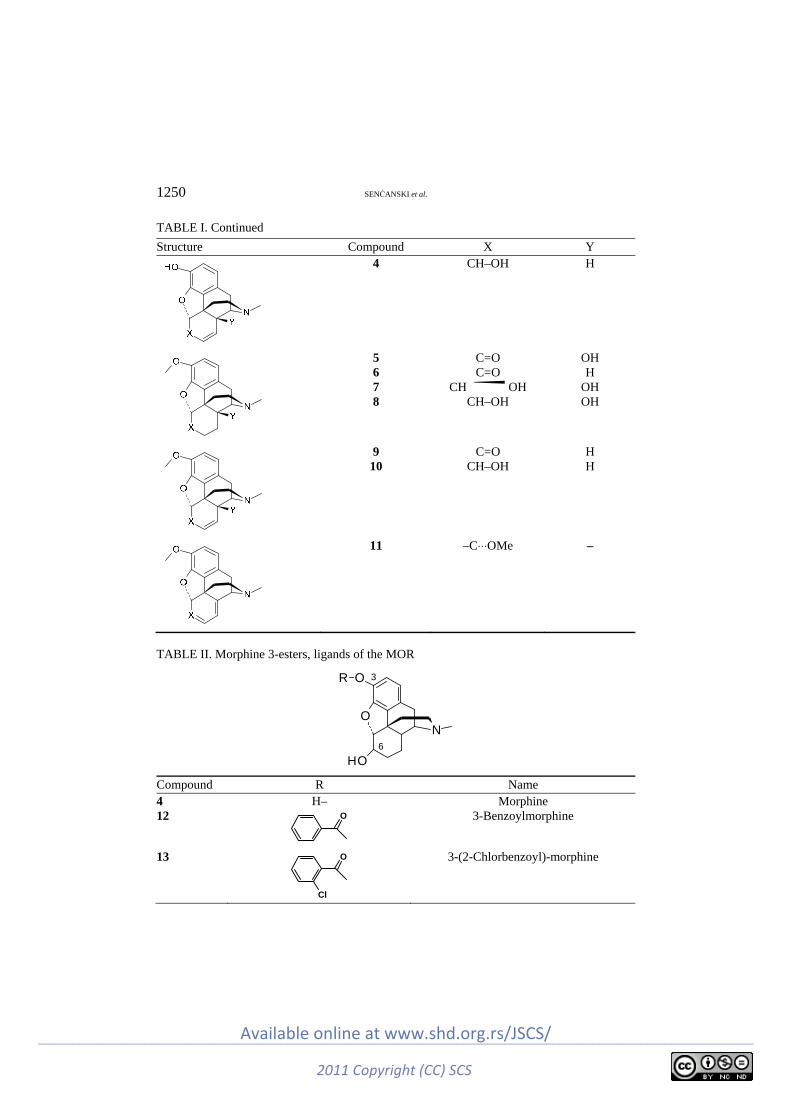
1250 SENĆANSKI et al.
TABLE I. Continued
Structure Compound X Y
4 CH–OH H
5 6 7 8
C=O C=O
CH OH CH–OH
OH H
OH OH
9 10
C=O CH–OH
H H
11 –C⋅⋅⋅OMe –
TABLE II. Morphine 3-esters, ligands of the MOR
3
6
ON
OR
OH
Compound R Name 4 H– Morphine 12 O 3-Benzoylmorphine
13 O
Cl
3-(2-Chlorbenzoyl)-morphine
_________________________________________________________________________________________________________________________
2011 Copyright (CC) SCS
Available online at www.shd.org.rs/JSCS/

MODELING LIGAND SPECIFIC RECEPTOR CONFORMATION 1251
TABLE II. Continued
Compound R Name 14
O
Cl
Cl 3-(2,6-Chlorbenzoyl)-morphine
15 O
Me
3-(2-Methylbenzoyl)-morphine
16 O
Me
Me 3-(2,6-Dimethylbenzoyl)-morphine
17 O
OMe
OMe
3-(2,6-Dimethoxybenzoyl)-morphine
18 O 3-(2-Phenylbenzoyl)-morphine
19 O 3-(α-Methylcinnamoyl)-morphine
20 O 3-Pivaloylmorphine
21
O
3-(2,2-Diphenylpropionyl)-morphine
In the subsequent docking experiments, the receptor models were optimized as follows. The selected ligands were manually docked to the original (obtained) receptor models using Accelrys Discovery Studio® (DS 2.5.5) visualizer. The orientation of the ligand inside the binding pocket was such as to: 1) provide interactions between the protonated nitrogen of the ligand and the important receptor residues (Asp 147 of TM3) in the MOR, or the corres-ponding Asp128 in the DOR; 2) form a hydrogen bond between the OH group of the ligand and the His297 residue of TM6 in the MOR (or His 278 in the DOR) and 3) provide close interactions with Trp318 of TM7 in the MOR (or Leu300 in the DOR). The resulting complex structure was refined by molecular mechanics with a conjugated gradient algorithm in vacuum
_________________________________________________________________________________________________________________________
2011 Copyright (CC) SCS
Available online at www.shd.org.rs/JSCS/
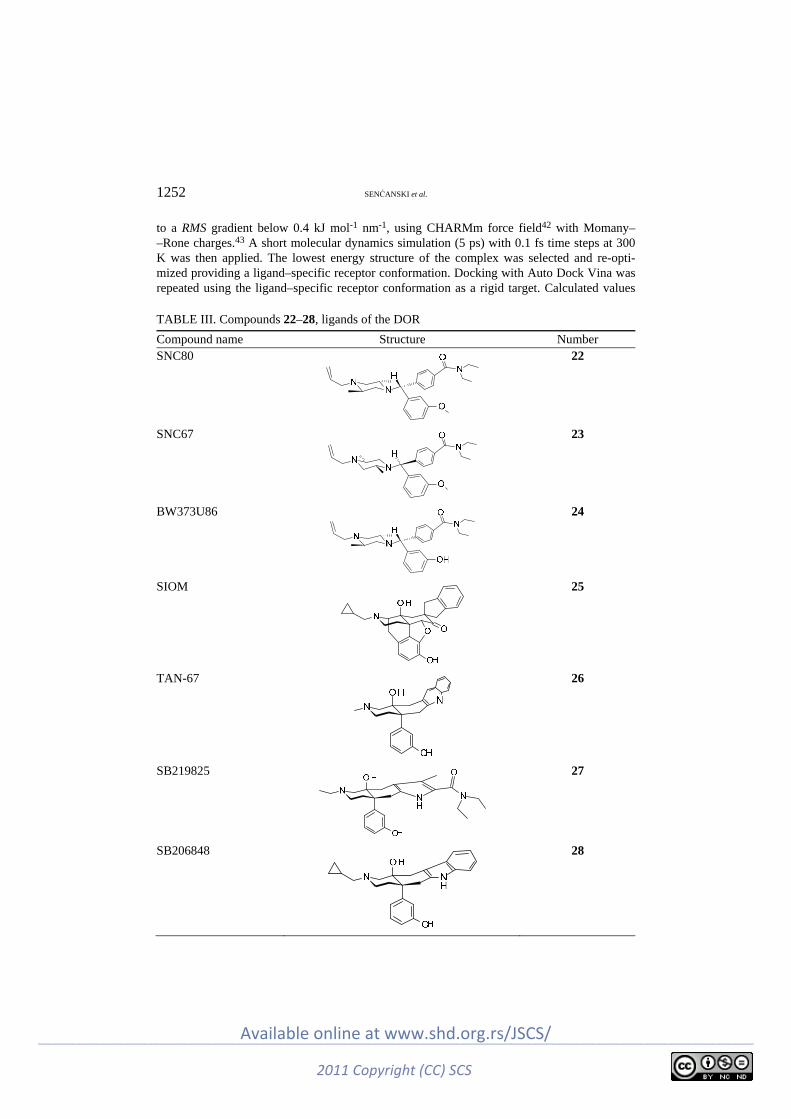
1252 SENĆANSKI et al.
to a RMS gradient below 0.4 kJ mol-1 nm-1, using CHARMm force field42 with Momany– –Rone charges.43 A short molecular dynamics simulation (5 ps) with 0.1 fs time steps at 300 K was then applied. The lowest energy structure of the complex was selected and re-opti-mized providing a ligand–specific receptor conformation. Docking with Auto Dock Vina was repeated using the ligand–specific receptor conformation as a rigid target. Calculated values
TABLE III. Compounds 22–28, ligands of the DOR
Compound name Structure Number SNC80 22
SNC67 23
BW373U86 24
SIOM 25
TAN-67 26
SB219825 27
SB206848 28
_________________________________________________________________________________________________________________________
2011 Copyright (CC) SCS
Available online at www.shd.org.rs/JSCS/
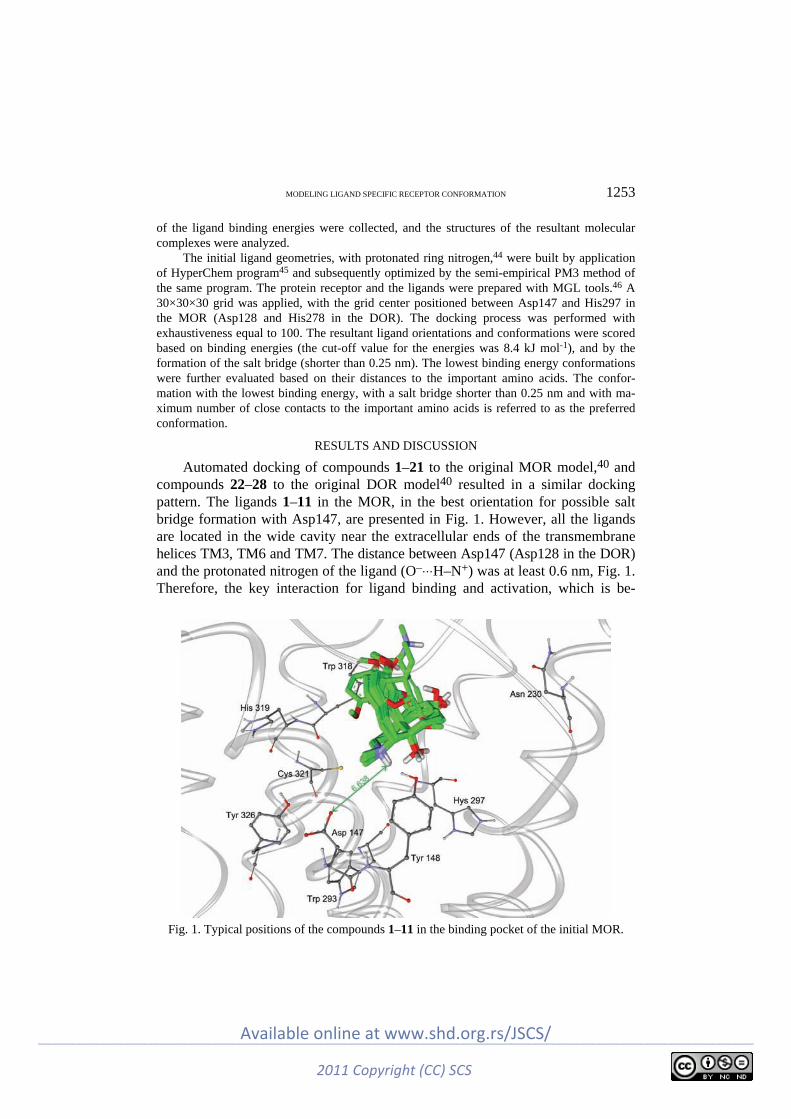
MODELING LIGAND SPECIFIC RECEPTOR CONFORMATION 1253
of the ligand binding energies were collected, and the structures of the resultant molecular complexes were analyzed.
The initial ligand geometries, with protonated ring nitrogen,44 were built by application of HyperChem program45 and subsequently optimized by the semi-empirical PM3 method of the same program. The protein receptor and the ligands were prepared with MGL tools.46 A 30×30×30 grid was applied, with the grid center positioned between Asp147 and His297 in the MOR (Asp128 and His278 in the DOR). The docking process was performed with exhaustiveness equal to 100. The resultant ligand orientations and conformations were scored based on binding energies (the cut-off value for the energies was 8.4 kJ mol-1), and by the formation of the salt bridge (shorter than 0.25 nm). The lowest binding energy conformations were further evaluated based on their distances to the important amino acids. The confor-mation with the lowest binding energy, with a salt bridge shorter than 0.25 nm and with ma-ximum number of close contacts to the important amino acids is referred to as the preferred conformation.
RESULTS AND DISCUSSION
Automated docking of compounds 1–21 to the original MOR model,40 and compounds 22–28 to the original DOR model40 resulted in a similar docking pattern. The ligands 1–11 in the MOR, in the best orientation for possible salt bridge formation with Asp147, are presented in Fig. 1. However, all the ligands are located in the wide cavity near the extracellular ends of the transmembrane helices TM3, TM6 and TM7. The distance between Asp147 (Asp128 in the DOR) and the protonated nitrogen of the ligand (O–⋅⋅⋅H–N+) was at least 0.6 nm, Fig. 1. Therefore, the key interaction for ligand binding and activation, which is be-
Fig. 1. Typical positions of the compounds 1–11 in the binding pocket of the initial MOR.
_________________________________________________________________________________________________________________________
2011 Copyright (CC) SCS
Available online at www.shd.org.rs/JSCS/

1254 SENĆANSKI et al.
lieved to be the salt bridge formation, was not predicted by the model. The same was true for MOR ligands 12–21 and DOR ligands 22–28. The area in the ori-ginal receptors, around Asp147 (Asp128 in the DOR) was too narrow to accom-modate even small ligands and to allow the formation of the salt bridge. The use of receptors with flexible amino acids within the binding pocket did not improve the model. Moreover, the correlation of the calculated binding energies to the experimentally determined ones was poor, the correlation coefficient being –0.36 for the compounds 1–11, Table IV. The experimentally determined and the cal-culated binding energies had opposite trends, Fig. 2.
This was expected since the original active receptors used in this work were modeled with voluminous molecules, i.e., naphthylalanine-substituted cyclic pentapeptide40 ligands. This is also in agreement with earlier results47 which suggested that ligands bind to their ligand–specific receptor conformations.
TABLE IV. The studied MOR receptor agonist: molecular volume, experimentally deter-mined Ki, binding energies, Eb(exp), and the binding energies calculated by Vina, Eb(calcd), for the initial MOR receptor, and the correlation coefficient between experimentally deter-mined and calculated Eb values
No. Ligand name Molecular volume
nm3 Ki(exp)
nM Eb(exp)a
kJ mol-1 Eb(calcd) kJ mol-1
1 Hydromorphone 0.754 0.26b –54.7 –34.3 2 Dihydromorphine 0.758 0.39b –53.7 –34.3 3 Oxymorphone 0.765 0.36c –53.9 –33.9 4 Morphine 0.765 1.8d –49.9 –33.5 5 Oxycodone 0.811 16e –44.5 –34.7 6 Hydrocodone 0.801 19.8c –44.0 –34.7 7 β-Oxycodol 0.829 33.7c –42.6 –33.1 8 α-Oxycodol 0.814 187c –38.4 –35.2 9 Codeinone 0.790 459f –36.2 –33.9 10 Codeine 0.811 6300f –29.7 –34.7 11 Thebaine 0.847 7400f –29.3 –34.7 Correlation coefficient R (R2) – – –0.36 (0.13) – aEb(exp) = 2.48 ln (10-9Ki);
bref. 48; cref. 49; dref. 50; eref. 51; fref. 52
An effort was made to find the ligand specific receptor conformations of the MOR and DOR for ligands 1–28 by short molecular dynamics simulation of the complex obtained by manual docking of a specific ligand to the original receptor model.40 Since Auto Dock Vina does not take into account receptor flexibility, a unique receptor had to be modeled for a set of ligands of similar size. Therefore the MOR ligands were divided into two groups (group 1–11, Table I, and group 12–21, Table II) based on their molecular volume, and the DOR ligands formed the third group, Table III. At least one representative molecule of small volume in each group was manually docked to the original receptor in such an orientation that a salt bridge was formed between the protonated nitrogen of the ligand and
_________________________________________________________________________________________________________________________
2011 Copyright (CC) SCS
Available online at www.shd.org.rs/JSCS/

MODELING LIGAND SPECIFIC RECEPTOR CONFORMATION 1255
Fig. 2. Trends in the binding energies, Eb, of ligands 1–11 with different receptor models.
Original MOR – , MOR optimized with ligand 4 – , MOR optimized with ligand 2 – and MOR optimized with ligand 3 – .
the Asp147 (Asp 128) of the receptor, and hydrogen bond formation was enabled between the phenolic hydroxyl group and the His297 (His278) of the receptor. The structure of a complex was optimized and subsequently submitted to the short molecular dynamics run. The lowest energy conformation of the complex found by molecular dynamics was isolated and re-optimized. The ligand was re-moved and the optimized receptor model was used for docking. The collected binding energies Eb, and the resulting docking structures are presented in Table V, and Fig. 3, for the series 1–11. In this group of ligands, compounds 1–6 and 10 were used for receptor optimization and docking in order to investigate the effect of ligand size on the quality of the receptor model. It can be seen in Table V and Fig. 2 that all ligands (1–4) with a small molecular volume improved the receptor model. This is illustrated by the increase of binding energy correlation coefficient from –0.36, for the initial MOR, to 0.83 for the receptor optimized with morphine (4) as the ligand. Only compound 1 insignificantly improved the correlation coefficient, just to a value of 0.22. The correlation coefficient for the larger molecules 5, 6 and 10 were either close to zero or had negative value. The best correlation of Eb was achieved with compounds 3 and 4 which, besides low molecular volume, had maximum number of hydrogen bond donors and accep-tors. In addition, in the morphine (4) optimized receptor, the preferred ligand conformation was always the lowest energy conformation for ligands 1–10, Fig. 3. Only thebaine (11) had no conformation with a salt bridge; it was in fact too big to enter the binding site created by the receptor optimization, which might be
_________________________________________________________________________________________________________________________
2011 Copyright (CC) SCS
Available online at www.shd.org.rs/JSCS/
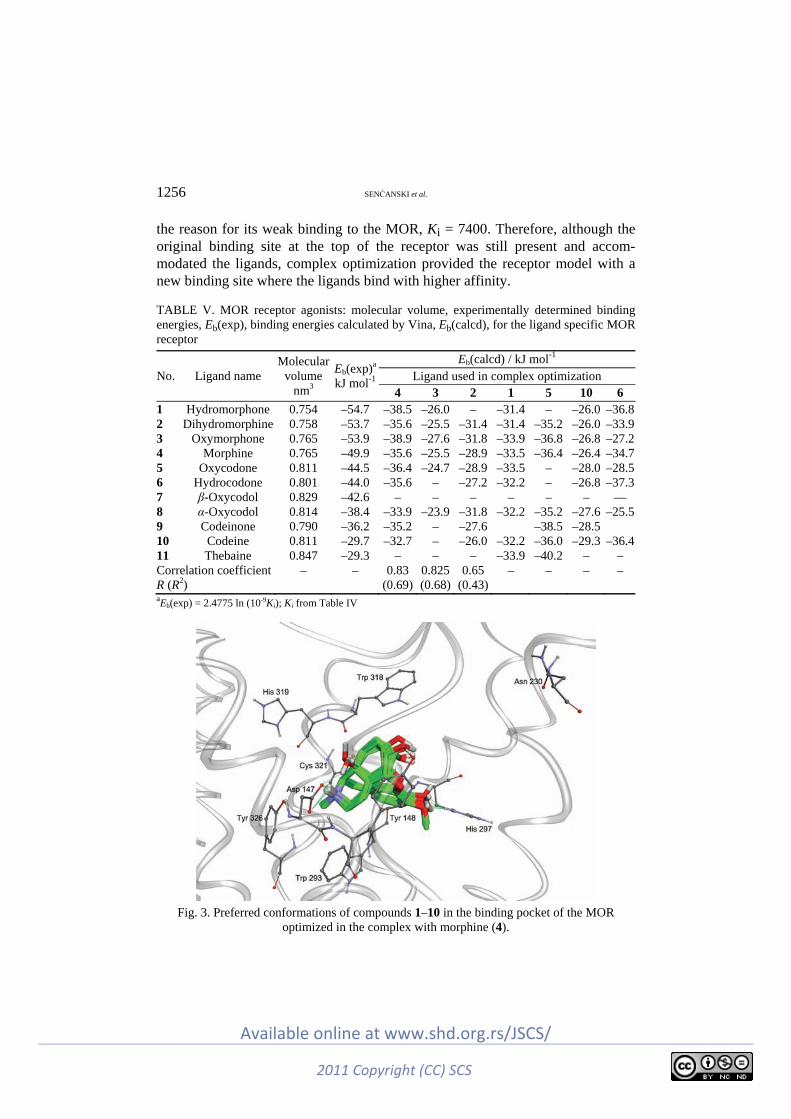
1256 SENĆANSKI et al.
the reason for its weak binding to the MOR, Ki = 7400. Therefore, although the original binding site at the top of the receptor was still present and accom-modated the ligands, complex optimization provided the receptor model with a new binding site where the ligands bind with higher affinity.
TABLE V. MOR receptor agonists: molecular volume, experimentally determined binding energies, Eb(exp), binding energies calculated by Vina, Eb(calcd), for the ligand specific MOR receptor
No. Ligand name Molecular
volume nm3
Eb(exp)a
kJ mol-1
Eb(calcd) / kJ mol-1 Ligand used in complex optimization
4 3 2 1 5 10 6 1 Hydromorphone 0.754 –54.7 –38.5 –26.0 – –31.4 – –26.0 –36.8 2 Dihydromorphine 0.758 –53.7 –35.6 –25.5 –31.4 –31.4 –35.2 –26.0 –33.9 3 Oxymorphone 0.765 –53.9 –38.9 –27.6 –31.8 –33.9 –36.8 –26.8 –27.2 4 Morphine 0.765 –49.9 –35.6 –25.5 –28.9 –33.5 –36.4 –26.4 –34.7 5 Oxycodone 0.811 –44.5 –36.4 –24.7 –28.9 –33.5 – –28.0 –28.5 6 Hydrocodone 0.801 –44.0 –35.6 – –27.2 –32.2 – –26.8 –37.3 7 β-Oxycodol 0.829 –42.6 – – – – – – –– 8 α-Oxycodol 0.814 –38.4 –33.9 –23.9 –31.8 –32.2 –35.2 –27.6 –25.5 9 Codeinone 0.790 –36.2 –35.2 – –27.6 –38.5 –28.5 10 Codeine 0.811 –29.7 –32.7 – –26.0 –32.2 –36.0 –29.3 –36.4 11 Thebaine 0.847 –29.3 – – – –33.9 –40.2 – – Correlation coefficient R (R2)
– – 0.83 (0.69)
0.825 (0.68)
0.65 (0.43)
– – – –
aEb(exp) = 2.4775 ln (10-9Ki); Ki from Table IV
Fig. 3. Preferred conformations of compounds 1–10 in the binding pocket of the MOR
optimized in the complex with morphine (4).
_________________________________________________________________________________________________________________________
2011 Copyright (CC) SCS
Available online at www.shd.org.rs/JSCS/
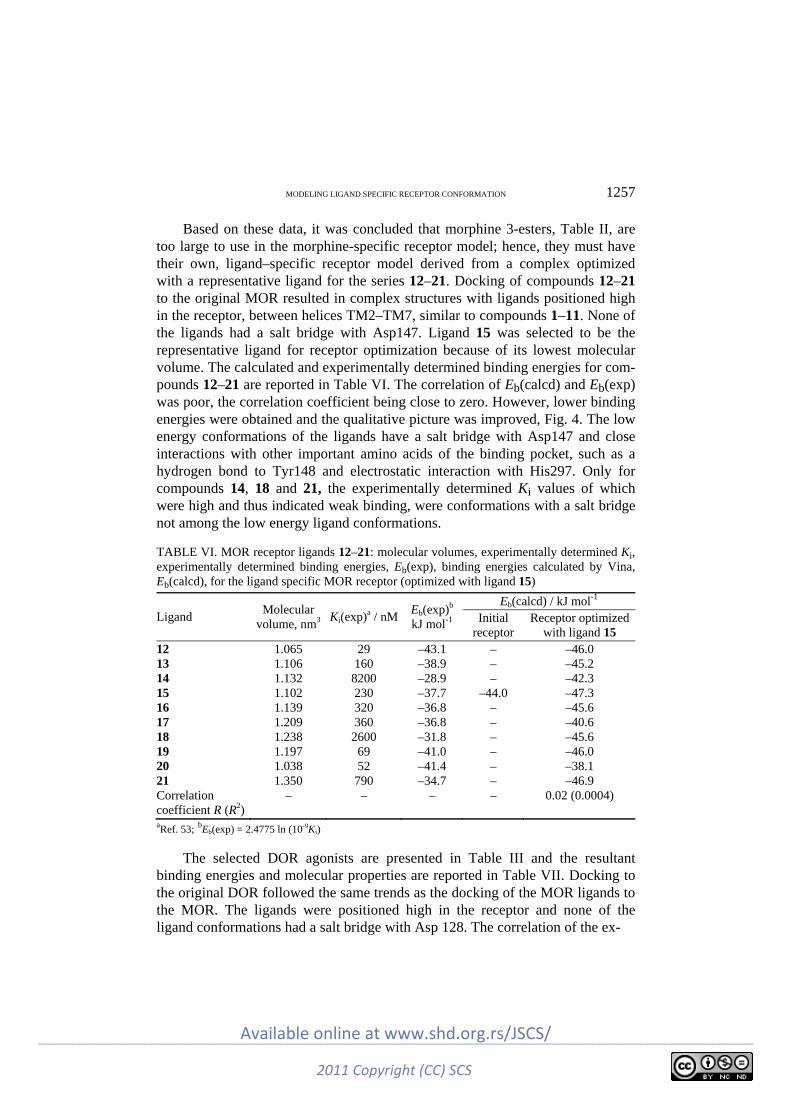
MODELING LIGAND SPECIFIC RECEPTOR CONFORMATION 1257
Based on these data, it was concluded that morphine 3-esters, Table II, are too large to use in the morphine-specific receptor model; hence, they must have their own, ligand–specific receptor model derived from a complex optimized with a representative ligand for the series 12–21. Docking of compounds 12–21 to the original MOR resulted in complex structures with ligands positioned high in the receptor, between helices TM2–TM7, similar to compounds 1–11. None of the ligands had a salt bridge with Asp147. Ligand 15 was selected to be the representative ligand for receptor optimization because of its lowest molecular volume. The calculated and experimentally determined binding energies for com-pounds 12–21 are reported in Table VI. The correlation of Eb(calcd) and Eb(exp) was poor, the correlation coefficient being close to zero. However, lower binding energies were obtained and the qualitative picture was improved, Fig. 4. The low energy conformations of the ligands have a salt bridge with Asp147 and close interactions with other important amino acids of the binding pocket, such as a hydrogen bond to Tyr148 and electrostatic interaction with His297. Only for compounds 14, 18 and 21, the experimentally determined Ki values of which were high and thus indicated weak binding, were conformations with a salt bridge not among the low energy ligand conformations.
TABLE VI. MOR receptor ligands 12–21: molecular volumes, experimentally determined Ki, experimentally determined binding energies, Eb(exp), binding energies calculated by Vina, Eb(calcd), for the ligand specific MOR receptor (optimized with ligand 15)
Ligand Molecular
volume, nm3 Ki(exp)a / nM
Eb(exp)b
kJ mol-1
Eb(calcd) / kJ mol-1 Initial
receptor Receptor optimized
with ligand 15 12 1.065 29 –43.1 – –46.0 13 1.106 160 –38.9 – –45.2 14 1.132 8200 –28.9 – –42.3 15 1.102 230 –37.7 –44.0 –47.3 16 1.139 320 –36.8 – –45.6 17 1.209 360 –36.8 – –40.6 18 1.238 2600 –31.8 – –45.6 19 1.197 69 –41.0 – –46.0 20 1.038 52 –41.4 – –38.1 21 1.350 790 –34.7 – –46.9 Correlation coefficient R (R2)
– – – – 0.02 (0.0004)
aRef. 53; bEb(exp) = 2.4775 ln (10-9Ki)
The selected DOR agonists are presented in Table III and the resultant binding energies and molecular properties are reported in Table VII. Docking to the original DOR followed the same trends as the docking of the MOR ligands to the MOR. The ligands were positioned high in the receptor and none of the ligand conformations had a salt bridge with Asp 128. The correlation of the ex-
_________________________________________________________________________________________________________________________
2011 Copyright (CC) SCS
Available online at www.shd.org.rs/JSCS/

1258 SENĆANSKI et al.
Fig. 4. Preferred conformations of compounds 13 and 21 in the
binding pocket of the MOR optimized with ligand 15.
TABLE VII. DOR receptor ligands 22–28: molecular volumes, experimentally determined Ki, experimentally determined binding energies, Eb(exp), binding energies calculated by Vina, Eb(calcd), for the initial receptor, and for the ligand specific DOR (optimized with ligand 26)
Ligand Molecular
volume, nm3 Ki(exp)a / nM
Eb(exp)b
kJ mol-1
Eb(calcd) / kJ mol-1 Initial
receptor Receptor optimized
with ligand 26 22 1.377 0.818 –51.9 –33.1 –38.9 23 1.378 218 –38.1 –35.6 –33.1 24 1.319 0.086 –57.3 –34.3 –38.1 25 1.155 4.1 –47.7 –49.4 –38.1 26 1.000 0.649 –52.3 –36.8 –39.3 27 1.213 0.6 –52.7 –34.3 –33.5 28 1.096 1.7 –49.8 –39.3 –36.8 Correlation coefficient R (R2)
– – – 0.23 (0.053)
0.56 0.32)
aRef. 47 and references therein; bEb(exp) = 2.4775 ln (10-9Ki)
perimentally determined Eb values and the calculated ones was low, close to zero, Fig. 5. Ligand 26 with its low molecular volume was used for optimization of the receptor to its ligand specific conformation. The docking results with the optimized receptor are also reported in Table VII. The ligand preferred confor-mations whose binding energies are reported, are the ones with low binding ener-gies (within 8.4 kJ mol–1 above the global minimum), with a salt bridge shorter than 0.25 nm and the maximum number of interactions with other important amino acids of the binding pocket, Fig. 6. The trend of the binding energies for
_________________________________________________________________________________________________________________________
2011 Copyright (CC) SCS
Available online at www.shd.org.rs/JSCS/
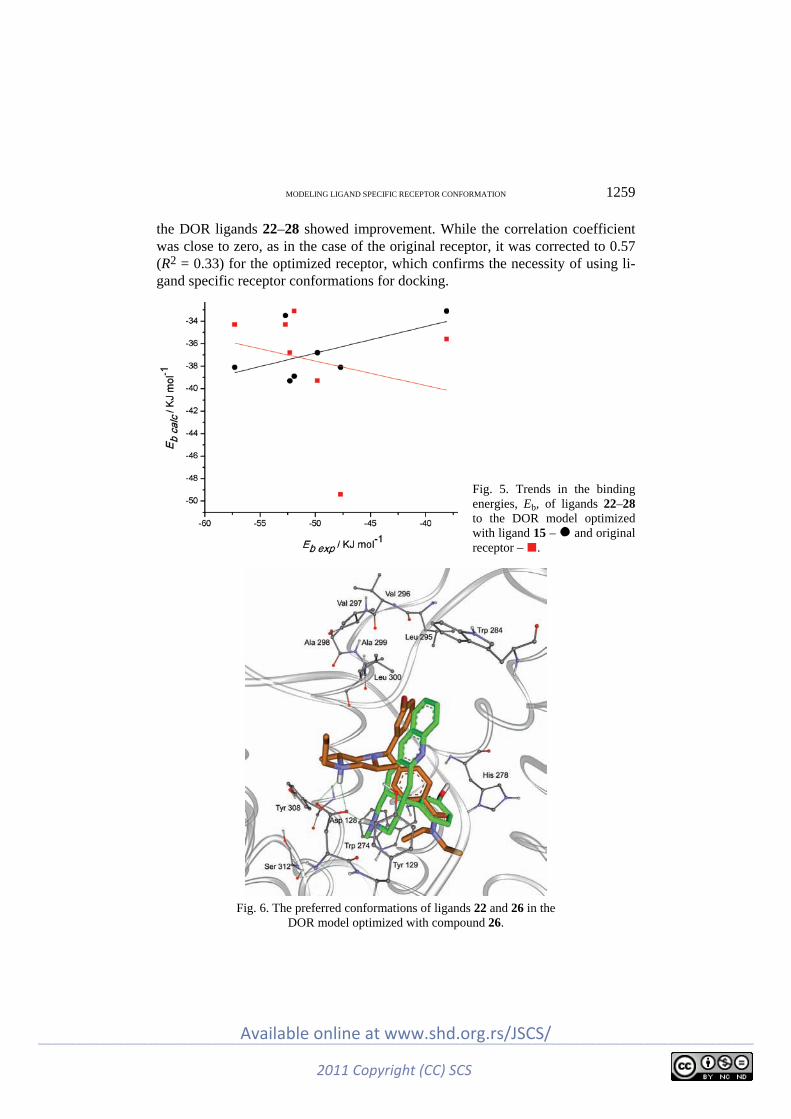
MODELING LIGAND SPECIFIC RECEPTOR CONFORMATION 1259
the DOR ligands 22–28 showed improvement. While the correlation coefficient was close to zero, as in the case of the original receptor, it was corrected to 0.57 (R2 = 0.33) for the optimized receptor, which confirms the necessity of using li-gand specific receptor conformations for docking.
Fig. 5. Trends in the binding energies, Eb, of ligands 22–28 to the DOR model optimized with ligand 15 – and original receptor – .
Fig. 6. The preferred conformations of ligands 22 and 26 in the
DOR model optimized with compound 26.
_________________________________________________________________________________________________________________________
2011 Copyright (CC) SCS
Available online at www.shd.org.rs/JSCS/

1260 SENĆANSKI et al.
CONCLUSIONS
An automated docking procedure, combined with a short molecular dyna-mics simulation, was applied in order to determine ligand specific receptor con-formations for MOR and DOR receptors. It was established that one receptor conformation cannot reproduce correctly the binding of different ligands. Instead, a method is proposed to model a ligand specific receptor conformation for a se-ries of ligands of similar size. The method consists of using an arbitrary model of an active receptor, manually docking a ligand representative of a series of ligands of similar size to the receptor, following the existing knowledge of key ligand–receptor interactions; optimizing the receptor–ligand complex; allowing the re-ceptor and the ligand to adjust their conformations in a short molecular dynamics run; extracting the most stable receptor–ligand complex structure and re-optimi-zing its geometry. The receptor models obtained in this way were used for dock-ing of different MOR and DOR ligands. They improved the resulting receptor ligand complexes both qualitatively (increased number of close interactions with amino acids important for binding, as found by point mutation studies) and quan-titatively (improved correlation between the experimentally measured and calcu-lated binding energies).
Acknowledgment. This work was supported by the Ministry of Education and Science of the Republic of Serbia.
И З В О Д
МОДЕЛОВАЊЕ КОНФОРМАЦИЈА μ- И δ-ОПИОИДНИХ РЕЦЕПТОРА СПЕЦИФИЧНИХ ЗА ПОЈЕДИНЕ ЛИГАНДЕ
МИЛАН СЕНЋАНСКИ1, МИЛОВАН Д. ИВАНОВИЋ2, СОЊА ВУЧКОВИЋ3 и ЉИЉАНА ДОШЕН-МИЋОВИЋ2
1Inovacioni centar Hemijskog fakulteta, Univerzitet u Beogradu, 2Hemijski fakultet, Univerzitet u
Beogradu i Centar za hemiju, IHTM, Studentski trg 12–16, p. pr. 51, 11158 Beograd i 3Institut za
farmakologiju, klini~ku farmakologiju i toksikologiju, Medicinski fakultet, Univerzitet u Beogradu
Рачунска метода аутоматизованог докирања примењена је на везивање серије лиганада, специфичних за μ- и δ-рецепторе, за моделе ових рецептора. Краткотрајна молекулско дина-мичка симулација је коришћена за добијање конформација ових рецептора које су специ-фичне за поједине лиганде, полазећи од случајно изабраног модела активираног рецептора. Квалитет овако добијеног модела рецептора зависи од молекулске запремине лиганда у ли-ганд–рецептор комплексу коришћеног у молекулско-динамичкој симулацији. За серију ли-ганда сличне запремине резултати докирања су у складу са експерименталним резлтатима мутација аминокиселина у рецептору. Корелација израчунатих и мерених енергија везивања је побољшана у односу на резултате добијене са полазном конформацијом рецептора.
(Примљено 20. јануара 2011)
REFERENCES
1. P. Y. Law, Y. H. Wong, H. H. Loh, Biopolymers 51 (1999) 440 2. a) S. Wu, M. C. Y. Wong, M. Chen, C. H. Cho, T. M. Wong, J. Biomed. Sci. 11 (2004)
726; b) K. Forster, A. Kuno, N. Solenkova, S. B. Felix, T. Krieg, Am. J. Physiol. Heart. Circ. Physiol. 293 (2007) H1604
_________________________________________________________________________________________________________________________
2011 Copyright (CC) SCS
Available online at www.shd.org.rs/JSCS/

MODELING LIGAND SPECIFIC RECEPTOR CONFORMATION 1261
3. M. Satoh, M. Minami, Pharmacol. Ther. 68 (1995) 343 4. Y. Chen, A. Mestek, J. Liu, J. A. Hurley, L. Yu, Mol. Pharmacol. 44 (1993) 8 5. R. M. Quock, T. H. Burkey, E. Verga, Y. Hosohata, K. Hosohata, S. Cowell, C. Slate, F.
J. Ehlert, W. R. Roeske, H. I. Yamamura, Pharmacol. Rev. 53 (1999) 503 6. K. Yasuda, K. Raynor, H. Kong, C. D. Breder, J. Takeda, T. Reisine, G. I. Bell, Proc.
Natl. Acad. Sci. USA 90 (1993) 6736 7. S. Allouche, A. Hasbi, V. Ferey, B. Sola, P. Jauzac, J. Polastron, Biochem. Pharmacol. 59
(2000) 915 8. C. A. Maggi, T. W. Schwartz, Trends Pharmacol. Sci. 18 (1997)351 9. K. Fukudo, S. Kato, K. Mori, J. Biol. Chem. 270 (1995) 6702
10. M.-C. Pepin, S. Y. Yue, E. Roberts, C. Wahlestedt, P. Walker, J. Biol. Chem. 272 (1997) 9260
11. M. Valiquette, K. H. Vu, S. Y. Yue, C. Wahlestedt, P. Walker, J. Biol. Chem. 271 (1996) 18789
12. X. Li, E. V. Varga, D. Stropova, T. Zalewski, E. Malatynska, R. J. Knap, W. R. Roeske, H. I. Yamamura, Eur. J. Pharmacol. 300 (1996) R1–R2
13. F. Meng, Y. Ueda, M. T. Hoversten, R. C. Thompson, L. Taylor, S. J. Watson, H. Akil, Eur. J. Pharmacol. 311 (1996) 285
14. J. Zhu, J. Yin, P.-Y. Law, P A. Claude, K. C. Rice, C. J. Evans, C. Chen, L. Yu, L.-Y. Liu-Chen, J. Biol. Chem. 271 (1996) 1430
15. C. K. Surratt, P. S. Johnson, A. Moriwaki, B. K. Seidleck, C. J. Blaschak, J. B. Wang, G. R. Uhl, J. Biol. Chem. 269 (1994) 20548
16. K. Befort, L. Tabbara, S. Bausch, C. Chavkin, C. Evans, B. Keiffer, Mol. Pharmacol. 49 (1996) 216
17. K. Befort, L. Tabbara, D. Kling, B. Maigret, B. L. Kieffer, J. Biol. Chem. 271 (1996) 10161
18. K. Befort, C. Zilliox, D. Filliol, S. Y. Yue, B. L. Keiffer, J. Biol. Chem. 274 (1999) 18574 19. T. G. Metzger, M. G. Paterlini, D. M. Ferguson, P. S. Portoghese, J. Med. Chem. 44
(2001) 857 20. G. Bonner, F. Meng, H. Akil, Eur. J. Pharmacol. 403 (2000) 37 21. H. Kong, K. Raynor, K. Yasuda, S. T. Moe, P. S. Portoghese, J. Biol. Chem. 268 (1993)
23055 22. X. Zhu, W. Chunhe, Z. Cheng, Y. Wu, D. Zhou, G. Pei, Biochem. Biophys. Res.
Commun. 232 (1997) 513 23. S. Cvejic, N. Trapaidze, C. Cyr, V. A. Devi, J. Biol. Chem. 271 (1996) 4073 24. C. H. Wang, D. H. Zhou, J. Chen, G. E. Li, G. Pei, Z. Q. Chi, Acta Pharmacol. Sin. 18
(1997) 337 25. C. Wang, Z. Cheng, Q. Wei, J. Chen, G. Li, G. Pei, Z. Chi, Biochem. Biophys. Res.
Commun. 249 (1998) 321 26. R. A. Hirst, D. Smart, L.A. Devi, D. G. Lambert, J. Neurochem. 70 (1998) 2273 27. K. Cheturvedi, X. Jiang, K. H. Christoffers, N. Chinen, P. Bandari, L. F. Raveglia, S.
Rozoni, G. Dondio, R. D. Howells, Mol. Brain. Res. 80 (2000) 166 28. J. Zhu, J. C. Xue, P. Y. Law, P. A. Claude, L. Y. Luo, J. L. Yin, C. G. Chen, L. Y. Liu-
Chen, FEBS Lett. 384 (1996) 198 29. A. Mansour, L. P. Taylor, J. L. Fine, R. Thompson, M. T. Hoversten, H. I. Mosberg, S. J.
Watson, H. Akil, J. Neurochem. 68 (1997) 344
_________________________________________________________________________________________________________________________
2011 Copyright (CC) SCS
Available online at www.shd.org.rs/JSCS/
1262 SENĆANSKI et al.
30. H. Xu, X. F. Lu, J. S. Pertilla, Q. X. Zheng, J. B. Wang, G. A. Brine, F. I. Carroll, K. C. Rice, K. X. Chen, Z. Q. Chi, R. B. Rothman, Synapse 32 (1999) 23
31. W. Xu, C. Chen, P. Huang, J. Li, J. K. de Riel, J. A. Javitch, L. Y. Liu-Chen, Biochemistry 39 (2000) 13904
32. a) J. Pil, J. Tytgat Br. J. Pharmacol. 134 (2001) 496; b) J. Pil, J. Tytgat, J Pharmacol. Exp. Ther. 304 (2003) 924
33. G. Pineyro, E. Archer-Lahlou, Cell Signalling 19 (2007) 8 34. I. Fadhil, R. Schmidt, C. Walpole, K. A. Carpenter, J. Biol. Chem. 279 (2004) 21069 35. S. Alloche, A. Hasbi, V. Ferey, B. Sola, P. Jauzac, J. Polastron, Biochem. Pharmacol. 59
(2000) 915 36. Z. Salamon, V. J. Hruby, G. Tollin, S. Cowell, J. Pept. Res. 60 (2000) 322 37. P. Samama, S. Cotecchia, T. Costa, R. J. Lefkowitz, J. Biol. Chem. 268 (1993) 4625 38. A. DeLean, J. M. Stadel, R. J. Lefkowitz, J. Biol. Chem. 255 (1980) 7108 39. D. M. Perez, S. S. Karnik, Pharmacol. Rev. 57 (2005) 147 40. L. C. Purington, I. D. Pogozheva, J. R. Traynor, H. I. Mosberg, J. Med. Chem. 52 (2009)
7724 41. O. Trott, A. J. Olson, J. Comput. Chem. 31 (2010) 455 42. B. R. Brooks, R. E. Bruccoleri, B. D. Olafson, D. J. States, S. Swaminathan, M. Karplus,
J. Comp. Chem. 4 (1983) 187 43. F. A. Momany, R. Rone, J. Comp. Chem. 13 (1992) 888 44. Y. Peng, S. M. Keenan, Q. Zhang, W. J. Welsh J. Mol. Graph. Model. 24 (2005) 25 45. Hypercybe, Inc. 419 Phillip St., Waterloo, ON N2L 3X2, Canada 46. MGLTools, http://mgltools.scripps.edu/ (accessed January, 2011) 47. V. Micovic, M. D. Ivanovic, L. Dosen-Micovic, J. Mol. Mod. 15 (2009) 267 48. F. Geo, J. Miotto, (2004) United States, Euro-Celtique, S.A. (LU), 6740641, http://
//www.freepatentsonline.com/6740641.html (accessed January, 2011) 49. B. Lalovic, E. Kharasch, C. Hofer, L. Risler, L. Y. Liu Chen, D. D. Shen, Clin.
Pharmacol. Ther. 79 (2006) 461 50. M. Filizola, H. O. Villar, G. H. Loew, Bioorg. Med. Chem. 9 (2001) 69 51. Z. R. Chen, R. J. Irvine, A. A. Somogyi, F. Bochner, Life Sci. 48 (1991) 2165 52. V. O. Nikolaev, C. Boettcher, C. Dees, M. Bunemann, M. J. Lohse, M. H. Zenk, J. Biol.
Chem. 282 (2007) 27126 53. C. Mignat, D. Heber, H. Schlicht, A. Ziegler, J. Pharm. Sci. 85 (1996) 690.
_________________________________________________________________________________________________________________________
2011 Copyright (CC) SCS
Available online at www.shd.org.rs/JSCS/

J. Serb. Chem. Soc. 76 (9) 1263–1282 (2011) UDC 66.011+54.061/.062:635.71:615.277 JSCS–4202 Original scientific paper
1263
Molecular modeling and chemometric study of anticancer derivatives of artemisinin
JARDEL P. BARBOSA1*, JOÃO E. V. FERREIRA1, ANTONIO F. FIGUEIREDO1, RUTH C. O. ALMEIDA1, OSMARINA P. P. SILVA1, JOSÉ R. C. CARVALHO1,
MARIA DA G. G. CRISTINO1, JOSE CIRÍACO-PINHEIRO1, JOSÉ L. F. VIEIRA2 and RAYMONY T. A. SERRA3
1Laboratório de Química Teórica e Computacional, Faculdade de Química, Instituto de Ciências Exatas e Naturais, Universidade Federal do Pará, CP 101101, CEP 66075-110
Belém, PA, Amazônia, 2Faculdade de Farmácia, Instituto de Ciências da Saúde, Universidade Federal do Pará, CP 101101, CEP 66075-110 Belém, PA and 3Centro de Ciências Biológicas
e da Saúde, Universidade Federal do Maranhão, CEP 65085-580 São Luis, MA, Brasil
(Received 27 December 2010)
Abstract: In this work, a molecular modeling and multivariate study involving artemisinin and 28 derivatives with activity against human hepatocellular carci-noma HepG2 is reported. The studied calculations of the compounds were per-formed at the B3LYP/6-31G level. MEP maps were used in an attempt to iden-tify key structural features of artemisinin and its derivatives that are necessary for their activities, and to investigate their interaction with the transferrin. The chemo-metrics methods PCA, HCA, KNN, SIMCA and SDA were employed in order to reduce dimensionality and to investigate which subset of variables could be more effective for classification of the compounds according to their degree of anticancer activity. Chemometric studies revealed that the ALOGPS_logs, Mor29m, IC5 and the gap energy descriptors are responsible for the separation into more active and less active compounds. In addition, molecular docking was used to investigate the interaction between ligands and receptor. The results showed that the ligands approached the receptor through the endoperoxide bond.
Keywords: artemisinin; HepG2; MEP maps; chemometrics; molecular docking.
INTRODUCTION
Cancer, malignant neoplasia and malignant tumor are synonymous words for the disease characterized by uncontrolled growth of abnormal cells of an orga-nism. The presence of some characteristics in these cells indicates alteration in genes owing to mutation in DNA.1
* Corresponding author. E-mail: [email protected] doi: 10.2298/JSC111227111B
_________________________________________________________________________________________________________________________
2011 Copyright (CC) SCS
Available online at www.shd.org.rs/JSCS/

1264 BARBOSA et al.
According to the WHO, in 2008, the total number of new cases of cancer would reach 12.3 million people, with 7.6 million deaths. The least developed regions are more affected, considering both incidence (56 %) and mortality (63 %).2 Most deaths are due to lung cancer (≈18.2 %), stomach cancer (≈9.7 %) and liver cancer (≈9.2 %). It is important to state that among the malignant tumors in the liver, the most common and dangerous one is the hepatocellular carcinoma.2 Thus, it is essential to discover new efficient strategies to treat the disease and to avoid new cases.
Artemisia annua L. (qinghao) is one of the plants that have shown anticancer properties. It contains the active ingredient artemisinin, which is used as an anti-malarial, mainly against falciparum and vivax malaria.3–6 Lately, the sensitivity to artemisinin and its first generation derivatives artesunate, artemether, arteether and artelinate has been evaluated in some tumoral cells. It was verified that arte-misinin and its derivatives exhibit cytotoxicity to mammary cell in nanomolar and micromolar concentrations.7 Moreover, low concentrations of these com-pounds show cytotoxicity to leukemia cells, colon cancer, lung cancer, kidney cancer,8 thyroid cancer,9 cervical cancer, uterine cancer and ovarian cancer.10
Another aspect that has intensified research with artemisinin and its deri-vatives in anticancer treatment is the lack of resistance that tumoral cells show to these compounds. As a strategy to preserve natural sources of Artemisia annua L., endoperoxides similar to artemisinin were synthesized.11 Some of these second generation compounds showed considerable cytotoxicity to tumoral cells.12–16
In this report, a molecular modeling and chemometric study of 29 artemisi-nins (artemisinin and its derivatives) with different degrees of cytotoxicities against human hepatocellular carcinoma HepG2 is presented.17 The employed strategy was based on the knowledge that the endoperoxide group presented in artemisinin and its derivatives is responsible for their antimalarial and anticancer activities. Calculations of the studied molecules were performed by the B3LYP/6-31G method as implemented in the Gaussian 98 program.18 MEP maps were used in an attempt to identify key structural features of the artemisinin and the derivatives that are necessary for their activities and to investigate the in-teraction with a molecular receptor (transferrin). PC and HC analyses, KNN and SIMCA methods19 and SD analysis20,21 were employed in order to reduce di-mensionality and to investigate which subset of variables could be more effective at classifying the compounds according to their degree of anticancer activity. Molecular docking studies were used to investigate the interaction between the ligands and receptor (transferrin). The developed studies could provide valuable insight into the experimental process of syntheses and biological evaluation of new artemisinin derivatives with activity against cancer HepG2.
_________________________________________________________________________________________________________________________
2011 Copyright (CC) SCS
Available online at www.shd.org.rs/JSCS/
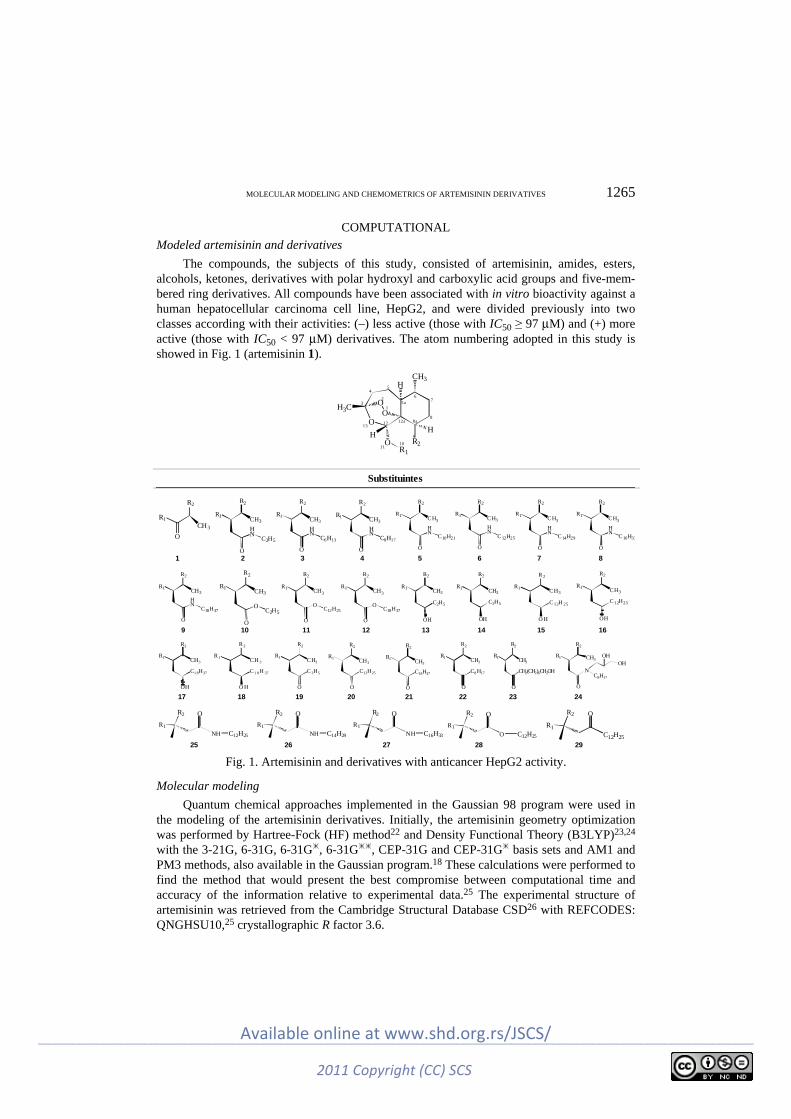
MOLECULAR MODELING AND CHEMOMETRICS OF ARTEMISININ DERIVATIVES 1265
COMPUTATIONAL
Modeled artemisinin and derivatives
The compounds, the subjects of this study, consisted of artemisinin, amides, esters, alcohols, ketones, derivatives with polar hydroxyl and carboxylic acid groups and five-mem-bered ring derivatives. All compounds have been associated with in vitro bioactivity against a human hepatocellular carcinoma cell line, HepG2, and were divided previously into two classes according with their activities: (–) less active (those with IC50 ≥ 97 μM) and (+) more active (those with IC50 < 97 μM) derivatives. The atom numbering adopted in this study is showed in Fig. 1 (artemisinin 1).
R2
R1 CH3
O
HN
C 16H33
R2
R1 CH3
O
HN
C18H37
R2
R1CH3
O
OC2H5
R2
R1 CH3
O
OC12H25
R2
R1 CH3
O
OC18H37
R2
R1 CH3
OH
C2H5
R2
R1 CH3
OH
C2H5
R2
R1 CH3
O H
C 12H 25
R2
R1 CH3
OH
C12H25
R2
R1 CH3
OH
C1 8H37
R 2
R 1 CH 3
O H
C 1 8 H 37
R2
R1 CH3
O
C 2H5
R2
R1 CH3
O
C12H25
R2
R1 CH3
O
C18H37
R2
R1 CH3
O
C8 H17
R2
R1 CH3
O
CH2(CH2)6CH2OH
R2
R1 CH3
O
NC8H17
OHOH
R2
R1
NH
O
C12H25
R2
R1
NH
O
C14H29
R2
R1
NH
O
C16H33
R2
R1
O
O
C12H25
R2
R1C12H25
O
R2
R1CH3
O
HN
C2H5
R2
R1CH3
O
HN
C6H13
R2
R1 CH3
O
HN
C8H17
R2
R1 CH3
O
HN
C10H21
R2
R1 CH3
O
HN
C 12H25
R2
R1 CH3
O
HN
C14H29
R2
R1CH3
O
1 2 3 4 5 6 7 8
9 10 11 12 13 14 15 16
17 18 19 20 21 22 23 24
25 26 27 28 29
O
O R2R1
H
H3C
HCH3
H
OO
1
23
45
1312 12a
5a
8a8
76
9
1011
Substituintes
Fig. 1. Artemisinin and derivatives with anticancer HepG2 activity.
Molecular modeling
Quantum chemical approaches implemented in the Gaussian 98 program were used in the modeling of the artemisinin derivatives. Initially, the artemisinin geometry optimization was performed by Hartree-Fock (HF) method22 and Density Functional Theory (B3LYP)23,24 with the 3-21G, 6-31G, 6-31G, 6-31G, CEP-31G and CEP-31G basis sets and AM1 and PM3 methods, also available in the Gaussian program.18 These calculations were performed to find the method that would present the best compromise between computational time and accuracy of the information relative to experimental data.25 The experimental structure of artemisinin was retrieved from the Cambridge Structural Database CSD26 with REFCODES: QNGHSU10,25 crystallographic R factor 3.6.
_________________________________________________________________________________________________________________________
2011 Copyright (CC) SCS
Available online at www.shd.org.rs/JSCS/

1266 BARBOSA et al.
Chemometric methods implemented in the Pirouette program,27 PCA and HCA, were used to compare the optimized structures by different approaches with the experimental struc-ture of artemisinin QNGHSU to identify the appropriate method and the basis set for further calculations. The analyses were performed on an autoscaled data matrix with dimension 15×18, where each row was related to 14 computed and 1 experimental geometries and each column represented one of 18 geometrical parameters of the 1,2,4-trioxane ring (bond lengths, bond angles and torsion angles). In order to optimize all structures and to perform calculations to obtain the molecular properties, the B3LYP/6-31G method was also selected.
Molecular descriptors The descriptors were computed to represent electronic, steric as well as hydrophilic and
hydrophobic features, and to allow for quantification of their influence on the biological activity of the studied molecules. The electronic descriptors employed were: total energy, HOMO, HOMO–1, LUMO, LUMO+1 energies, LUMO–HOMO gap energy, Mulliken’s electronegativity, and molecular hardness and softness; the steric descriptors were: O1–O2 bond length, C12a–O1–O2–C3 torsion angle, superficial area, molecular volume, Mor29m and IC5; the hydrophilic descriptors were: HYF, ALOGPS_logs and the hydrophobic descriptor was the log P value. The computation of the descriptors was performed employing the Gaussian 98 program, the e-Dragon program28 and the HyperChem 6.02. program.29
Molecular electrostatic potential maps The MEP is related to the electronic density and it is a very useful descriptor to under-
stand sites for electrophilic attack and nucleophilic reactions as well as for hydrogen bonding interactions.30–33 The electrostatic potential, V(r), is also well-suited for analyzing processes based on the “recognition” of one molecule by another, as in drug–receptor, and enzyme– –substrate interactions, because it is through their potentials that the two species first “see” each other.34,35 Being a real physical property, V(r) can be determined experimentally by diffraction or by computational methods.36 To investigate the reactive sites of artemisinin and its derivatives, the MEP was evaluated using the B3LYP/6-31G method. The MEP at a given point (x,y,z) in the vicinity of a molecule is defined in terms of the interaction energy between the electrical charge generated from the molecule’s electrons and nuclei and a posi-tive test charge (a proton) located at r. For the studied compounds, the V(r) values were calculated as described previously using Eq. (1).37
A
A
( ')( ) d
ρ= − − −rZV r r'
r r' rRA (1)
where ZA is the charge of nucleus A, located at RA, ρ(r') is the electronic density function of the molecular, and r' is the dummy integration variable.
The MEP was realized by the Molekel program.38
Chemometrics
Principal component analysis (PCA). Given the great number of multivariate computed data, an exploratory tool is recommended to uncover unknown trends in the data and to reduce them. The central idea of PCA19 is to reduce the dimensionality of a data set consisting of large number of interrelated variables, while retaining, as much as possible, the variation present in the data set. This is achieved by transforming them into a new set of variables, the principle components (PCs), which are uncorrelated and ordered so that the first few retain most of the variation present in all of the original variables. The final result of PCA is the selection of a small number of descriptors (molecular properties) that are believed to be best related to the dependent variable, in this case, anticancer activity against HepG2-strains.
_________________________________________________________________________________________________________________________
2011 Copyright (CC) SCS
Available online at www.shd.org.rs/JSCS/
MOLECULAR MODELING AND CHEMOMETRICS OF ARTEMISININ DERIVATIVES 1267
Hierarchical cluster analysis (HCA). The statistical analysis required in this study should group compounds of a similar kind into respective categories. HCA19 is a statistical method developed for this purpose. It is represented by a two dimensional diagram known as den-drogram which illustrates the fusions or divisions made at each successive stage of the ana-lysis. The single samples (compounds) are represented by the branches on the bottom of the dendrogram. The similarity among the clusters is given by the length of their branches so that compounds presenting low similarity have long branches whereas compounds of high simi-larity have short branches.
K-Nearest neighbor (KNN) method. The statistical technique KNN19 categorizes an un-known object based on its proximity to samples already placed into categories. Specifically, the predicted class of an unknown object depends on the class of its K nearest neighbors, which accounts for the name of the technique. Classification with KNN is related to the compared distance among samples. Multivariate Euclidean distances between every pair of training samples are computed. After the model is built, a test set has its predicted class taking into account the multivariate distance of this sample with respect to the K samples in the training set.
Soft independent modeling of class analogy (SIMCA) method. This method develops principal component models for each training set category. The main goal of SIMCA19 is the reliable classification of new samples. When a prediction is made in SIMCA, new samples insufficiently close to the PC space of a class are considered non-members. Additionally, the method requires that each training sample be pre-assigned to one of Q different categories, where Q is typically greater than one. It provides three possible outcome predictions: the sample fits only one pre-defined category, the sample does not fit any of the pre-defined categories and the sample fits into more than one pre-defined category.
Stepwise discriminant analysis (SDA). SDA20,21 is also a multivariate method that at-tempts to maximize the probability of correct allocation. This method has two main objec-tives, which are to separate objects from distinct populations and to allocate new objects into populations previously defined. A stepwise procedure is used in this program, i.e., in each step, the most powerful variable is entered into the discriminant function. The criterion func-tion for selecting the next variable depends on the number of specified groups.
The SDA is a method based on the F-test for the significance of the variables. In each step, one variable is selected based on its significance and, after several steps, the more sig-nificant variables are extracted from the whole set in question.
Molecular Docking
The geometry of the molecules 1–29 was optimized by the B3LYP/6-31G method while the geometry of the protein receptor was obtained from the Protein Data Bank (PDB) RCSB, identified by the code 1A8E,39 and optimized by the ROB3LYP/6-31G method. In order to better describe the biological environment involving the ligand/receptor interaction, only the protein fragment (iron atom and the amino acids bound to it: two tyrosines, one histidine, and one aspartic acid) of the transferrin was considered. The geometry of the complex was optimized through the molecular mechanics method with the force field MM+ implemented in the HyperChem 6.02 program and Polak Ribiere algorithms with a gradient of 0.1 kcal Å-1 mol-1*. Flexible docking40 calculations were performed into a box. When using artemisinin (1), the dimensions of the box were x =18 Å, y =18 Å and z=18 Å and the number of molecules of water was 193, while for the other compounds (2–29) the dimensions were
* 1 kcal = 4.184 kJ
_________________________________________________________________________________________________________________________
2011 Copyright (CC) SCS
Available online at www.shd.org.rs/JSCS/
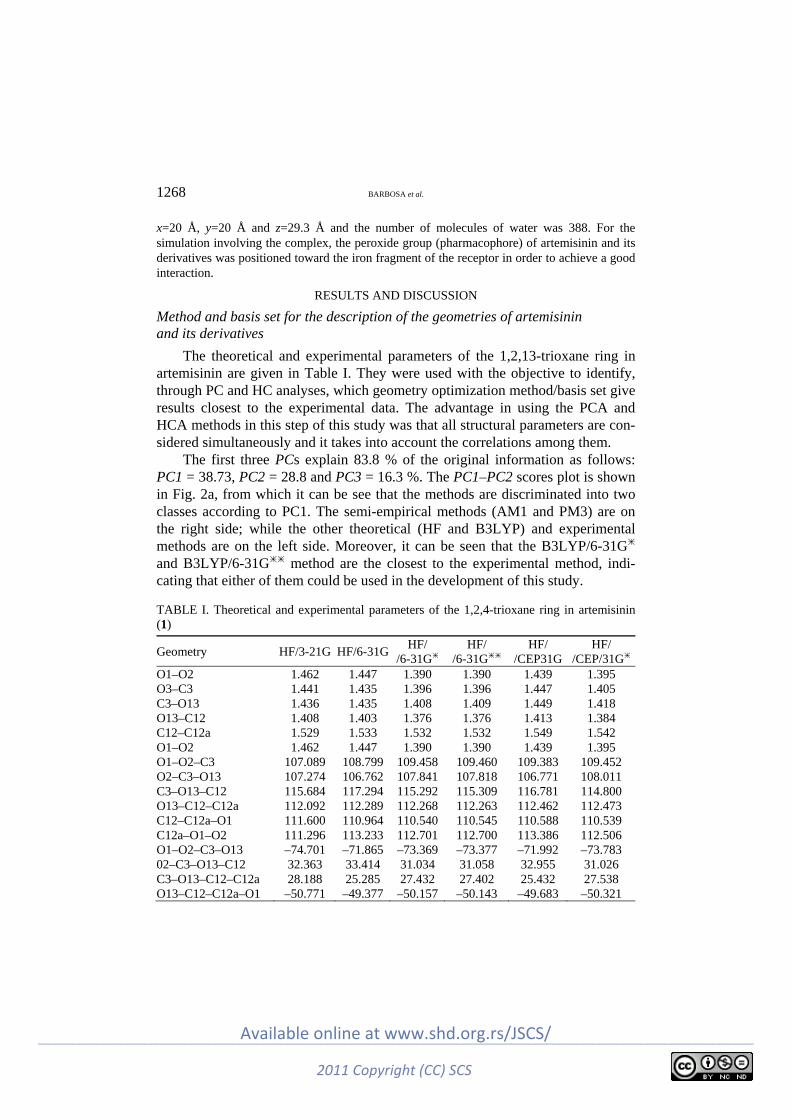
1268 BARBOSA et al.
x=20 Å, y=20 Å and z=29.3 Å and the number of molecules of water was 388. For the simulation involving the complex, the peroxide group (pharmacophore) of artemisinin and its derivatives was positioned toward the iron fragment of the receptor in order to achieve a good interaction.
RESULTS AND DISCUSSION
Method and basis set for the description of the geometries of artemisinin and its derivatives
The theoretical and experimental parameters of the 1,2,13-trioxane ring in artemisinin are given in Table I. They were used with the objective to identify, through PC and HC analyses, which geometry optimization method/basis set give results closest to the experimental data. The advantage in using the PCA and HCA methods in this step of this study was that all structural parameters are con-sidered simultaneously and it takes into account the correlations among them.
The first three PCs explain 83.8 % of the original information as follows: PC1 = 38.73, PC2 = 28.8 and PC3 = 16.3 %. The PC1–PC2 scores plot is shown in Fig. 2a, from which it can be see that the methods are discriminated into two classes according to PC1. The semi-empirical methods (AM1 and PM3) are on the right side; while the other theoretical (HF and B3LYP) and experimental methods are on the left side. Moreover, it can be seen that the B3LYP/6-31G and B3LYP/6-31G method are the closest to the experimental method, indi-cating that either of them could be used in the development of this study.
TABLE I. Theoretical and experimental parameters of the 1,2,4-trioxane ring in artemisinin (1)
Geometry HF/3-21G HF/6-31GHF/
/6-31GHF/
/6-31G HF/
/CEP31G HF/
/CEP/31G O1–O2 1.462 1.447 1.390 1.390 1.439 1.395 O3–C3 1.441 1.435 1.396 1.396 1.447 1.405 C3–O13 1.436 1.435 1.408 1.409 1.449 1.418 O13–C12 1.408 1.403 1.376 1.376 1.413 1.384 C12–C12a 1.529 1.533 1.532 1.532 1.549 1.542 O1–O2 1.462 1.447 1.390 1.390 1.439 1.395 O1–O2–C3 107.089 108.799 109.458 109.460 109.383 109.452 O2–C3–O13 107.274 106.762 107.841 107.818 106.771 108.011 C3–O13–C12 115.684 117.294 115.292 115.309 116.781 114.800 O13–C12–C12a 112.092 112.289 112.268 112.263 112.462 112.473 C12–C12a–O1 111.600 110.964 110.540 110.545 110.588 110.539 C12a–O1–O2 111.296 113.233 112.701 112.700 113.386 112.506 O1–O2–C3–O13 –74.701 –71.865 –73.369 –73.377 –71.992 –73.783 02–C3–O13–C12 32.363 33.414 31.034 31.058 32.955 31.026 C3–O13–C12–C12a 28.188 25.285 27.432 27.402 25.432 27.538 O13–C12–C12a–O1 –50.771 –49.377 –50.157 –50.143 –49.683 –50.321
_________________________________________________________________________________________________________________________
2011 Copyright (CC) SCS
Available online at www.shd.org.rs/JSCS/
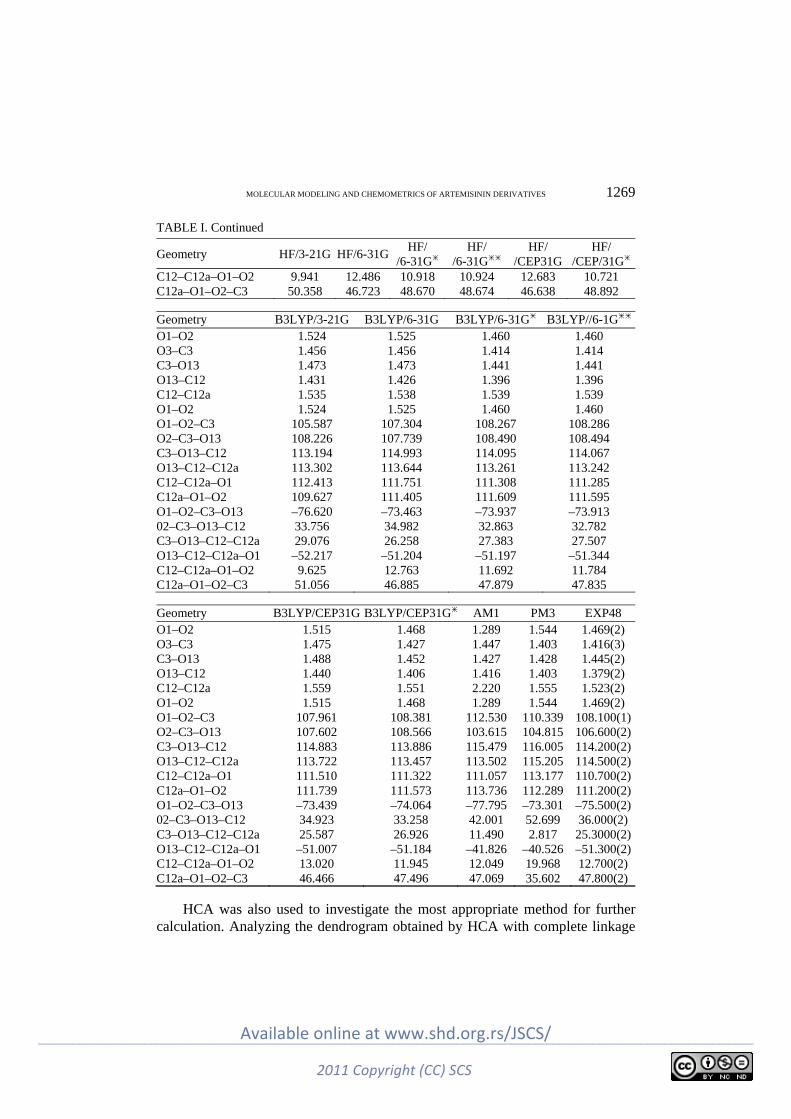
MOLECULAR MODELING AND CHEMOMETRICS OF ARTEMISININ DERIVATIVES 1269
TABLE I. Continued
Geometry HF/3-21G HF/6-31GHF/
/6-31GHF/
/6-31G HF/
/CEP31G HF/
/CEP/31G C12–C12a–O1–O2 9.941 12.486 10.918 10.924 12.683 10.721 C12a–O1–O2–C3 50.358 46.723 48.670 48.674 46.638 48.892
Geometry B3LYP/3-21G B3LYP/6-31G B3LYP/6-31G B3LYP//6-1G O1–O2 1.524 1.525 1.460 1.460 O3–C3 1.456 1.456 1.414 1.414 C3–O13 1.473 1.473 1.441 1.441 O13–C12 1.431 1.426 1.396 1.396 C12–C12a 1.535 1.538 1.539 1.539 O1–O2 1.524 1.525 1.460 1.460 O1–O2–C3 105.587 107.304 108.267 108.286 O2–C3–O13 108.226 107.739 108.490 108.494 C3–O13–C12 113.194 114.993 114.095 114.067 O13–C12–C12a 113.302 113.644 113.261 113.242 C12–C12a–O1 112.413 111.751 111.308 111.285 C12a–O1–O2 109.627 111.405 111.609 111.595 O1–O2–C3–O13 –76.620 –73.463 –73.937 –73.913 02–C3–O13–C12 33.756 34.982 32.863 32.782 C3–O13–C12–C12a 29.076 26.258 27.383 27.507 O13–C12–C12a–O1 –52.217 –51.204 –51.197 –51.344 C12–C12a–O1–O2 9.625 12.763 11.692 11.784 C12a–O1–O2–C3 51.056 46.885 47.879 47.835
Geometry B3LYP/CEP31G B3LYP/CEP31G AM1 PM3 EXP48 O1–O2 1.515 1.468 1.289 1.544 1.469(2) O3–C3 1.475 1.427 1.447 1.403 1.416(3) C3–O13 1.488 1.452 1.427 1.428 1.445(2) O13–C12 1.440 1.406 1.416 1.403 1.379(2) C12–C12a 1.559 1.551 2.220 1.555 1.523(2) O1–O2 1.515 1.468 1.289 1.544 1.469(2) O1–O2–C3 107.961 108.381 112.530 110.339 108.100(1) O2–C3–O13 107.602 108.566 103.615 104.815 106.600(2) C3–O13–C12 114.883 113.886 115.479 116.005 114.200(2) O13–C12–C12a 113.722 113.457 113.502 115.205 114.500(2) C12–C12a–O1 111.510 111.322 111.057 113.177 110.700(2) C12a–O1–O2 111.739 111.573 113.736 112.289 111.200(2) O1–O2–C3–O13 –73.439 –74.064 –77.795 –73.301 –75.500(2) 02–C3–O13–C12 34.923 33.258 42.001 52.699 36.000(2) C3–O13–C12–C12a 25.587 26.926 11.490 2.817 25.3000(2) O13–C12–C12a–O1 –51.007 –51.184 –41.826 –40.526 –51.300(2) C12–C12a–O1–O2 13.020 11.945 12.049 19.968 12.700(2) C12a–O1–O2–C3 46.466 47.496 47.069 35.602 47.800(2)
HCA was also used to investigate the most appropriate method for further calculation. Analyzing the dendrogram obtained by HCA with complete linkage
_________________________________________________________________________________________________________________________
2011 Copyright (CC) SCS
Available online at www.shd.org.rs/JSCS/

1270 BARBOSA et al.
method in Fig. 2b, it can concluded that the theoretical methods are distributed in a similar way as in PCA, i.e., HC analysis confirmed the PC analysis results. Therefore, according to the obtained results, the B3LYP in combination with either of the 6-31G and 6-31G basis sets can be used to model the molecular struc-ture of the studied compounds. In this study, the B3LYP/6-31G method was used.
Fig. 2. PC1–PC2 scores plot (a) and dendrogram (b) of the fourteen theoretical and
experimental methods used in the geometry optimization of artemisinin.
Molecular electrostatic potential maps
The MEP maps for artemisinin and the derivatives given in Fig. 1 were simi-lar (Fig. 3). They display contour surfaces close to that of the 1,2,13-trioxane ring, which is characterized by negative electrostatic potentials (red and green co-lors), on which the lowest value for the charge was about –0.11 a.u. (red color).
_________________________________________________________________________________________________________________________
2011 Copyright (CC) SCS
Available online at www.shd.org.rs/JSCS/
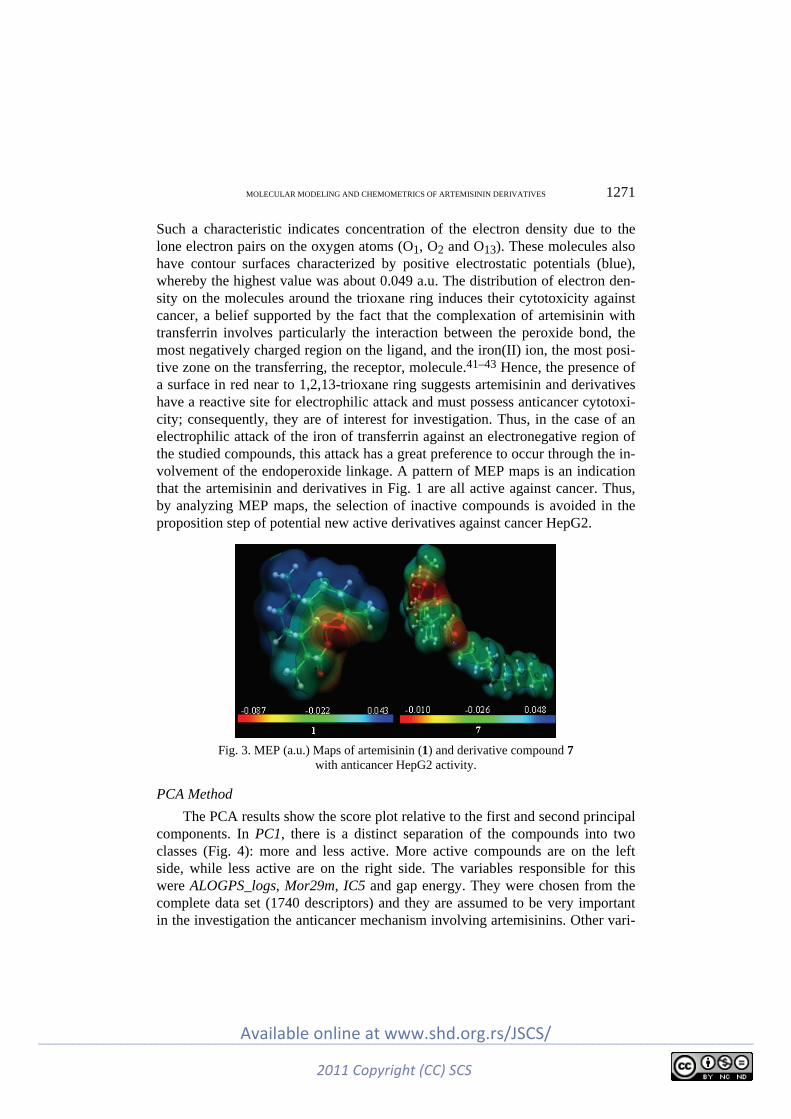
MOLECULAR MODELING AND CHEMOMETRICS OF ARTEMISININ DERIVATIVES 1271
Such a characteristic indicates concentration of the electron density due to the lone electron pairs on the oxygen atoms (O1, O2 and O13). These molecules also have contour surfaces characterized by positive electrostatic potentials (blue), whereby the highest value was about 0.049 a.u. The distribution of electron den-sity on the molecules around the trioxane ring induces their cytotoxicity against cancer, a belief supported by the fact that the complexation of artemisinin with transferrin involves particularly the interaction between the peroxide bond, the most negatively charged region on the ligand, and the iron(II) ion, the most posi-tive zone on the transferring, the receptor, molecule.41–43 Hence, the presence of a surface in red near to 1,2,13-trioxane ring suggests artemisinin and derivatives have a reactive site for electrophilic attack and must possess anticancer cytotoxi-city; consequently, they are of interest for investigation. Thus, in the case of an electrophilic attack of the iron of transferrin against an electronegative region of the studied compounds, this attack has a great preference to occur through the in-volvement of the endoperoxide linkage. A pattern of MEP maps is an indication that the artemisinin and derivatives in Fig. 1 are all active against cancer. Thus, by analyzing MEP maps, the selection of inactive compounds is avoided in the proposition step of potential new active derivatives against cancer HepG2.
Fig. 3. MEP (a.u.) Maps of artemisinin (1) and derivative compound 7
with anticancer HepG2 activity.
PCA Method
The PCA results show the score plot relative to the first and second principal components. In PC1, there is a distinct separation of the compounds into two classes (Fig. 4): more and less active. More active compounds are on the left side, while less active are on the right side. The variables responsible for this were ALOGPS_logs, Mor29m, IC5 and gap energy. They were chosen from the complete data set (1740 descriptors) and they are assumed to be very important in the investigation the anticancer mechanism involving artemisinins. Other vari-
_________________________________________________________________________________________________________________________
2011 Copyright (CC) SCS
Available online at www.shd.org.rs/JSCS/
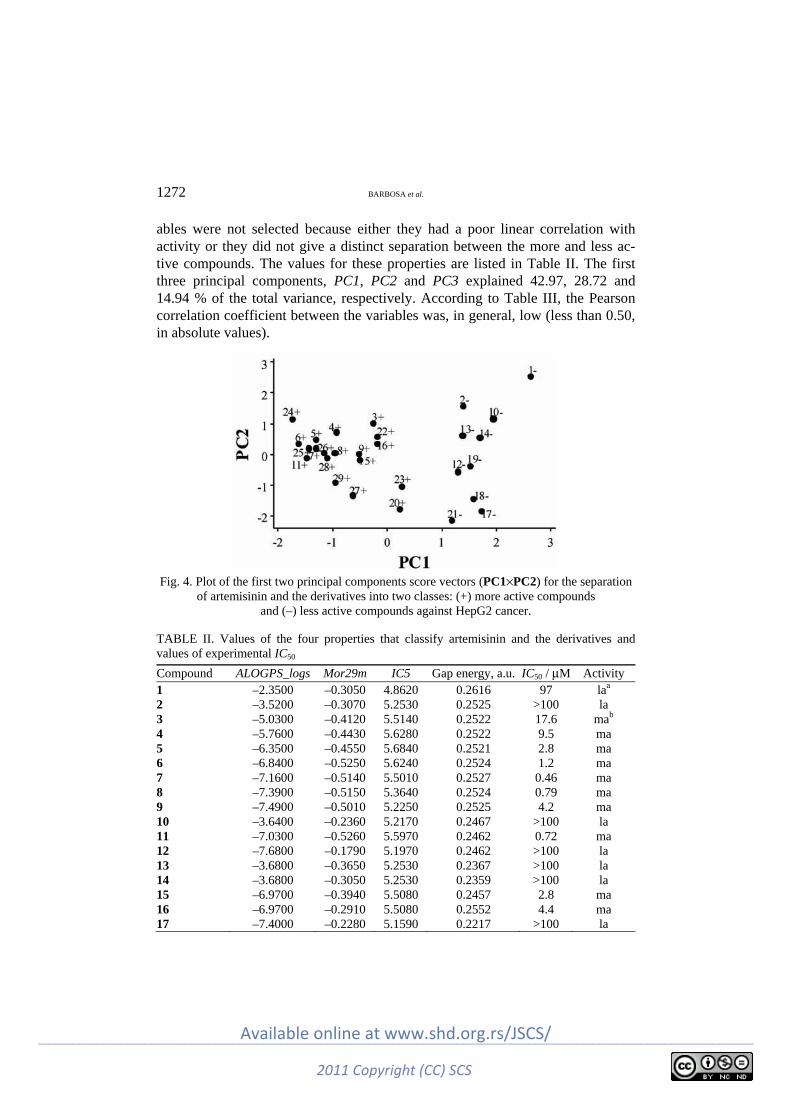
1272 BARBOSA et al.
ables were not selected because either they had a poor linear correlation with activity or they did not give a distinct separation between the more and less ac-tive compounds. The values for these properties are listed in Table II. The first three principal components, PC1, PC2 and PC3 explained 42.97, 28.72 and 14.94 % of the total variance, respectively. According to Table III, the Pearson correlation coefficient between the variables was, in general, low (less than 0.50, in absolute values).
Fig. 4. Plot of the first two principal components score vectors (PC1×PC2) for the separation
of artemisinin and the derivatives into two classes: (+) more active compounds and (–) less active compounds against HepG2 cancer.
TABLE II. Values of the four properties that classify artemisinin and the derivatives and values of experimental IC50
Compound ALOGPS_logs Mor29m IC5 Gap energy, a.u. IC50 / μM Activity
1 –2.3500 –0.3050 4.8620 0.2616 97 laa 2 –3.5200 –0.3070 5.2530 0.2525 >100 la 3 –5.0300 –0.4120 5.5140 0.2522 17.6 mab 4 –5.7600 –0.4430 5.6280 0.2522 9.5 ma 5 –6.3500 –0.4550 5.6840 0.2521 2.8 ma 6 –6.8400 –0.5250 5.6240 0.2524 1.2 ma 7 –7.1600 –0.5140 5.5010 0.2527 0.46 ma 8 –7.3900 –0.5150 5.3640 0.2524 0.79 ma 9 –7.4900 –0.5010 5.2250 0.2525 4.2 ma 10 –3.6400 –0.2360 5.2170 0.2467 >100 la 11 –7.0300 –0.5260 5.5970 0.2462 0.72 ma 12 –7.6800 –0.1790 5.1970 0.2462 >100 la 13 –3.6800 –0.3650 5.2530 0.2367 >100 la 14 –3.6800 –0.3050 5.2530 0.2359 >100 la 15 –6.9700 –0.3940 5.5080 0.2457 2.8 ma 16 –6.9700 –0.2910 5.5080 0.2552 4.4 ma 17 –7.4000 –0.2280 5.1590 0.2217 >100 la
_________________________________________________________________________________________________________________________
2011 Copyright (CC) SCS
Available online at www.shd.org.rs/JSCS/

MOLECULAR MODELING AND CHEMOMETRICS OF ARTEMISININ DERIVATIVES 1273
TABLE II. Continued
Compound ALOGPS_logs Mor29m IC5 Gap energy, a.u. IC50 / μM Activity
18 –7.4000 –0.2280 5.1590 0.2287 >100 la 19 –3.7500 –0.4430 5.1800 0.2194 >100 la 20 –7.1401 –0.3051 5.5711 0.2197 1.4 ma 21 –7.6100 –0.3330 5.1680 0.2177 >100 la 22 –6.0300 –0.3110 5.5720 0.2524 1.8 ma 23 –5.4900 –0.3470 5.6380 0.2199 42.3 ma 24 –4.8200 –0.5180 5.8560 0.2517 3.5 ma 25 –6.7200 –0.5520 5.5430 0.2491 1.3 ma 26 –7.0600 –0.5520 5.4190 0.2492 0.77 ma 27 –7.3500 –0.6010 5.2800 0.2276 0.74 ma 28 –6.8400 –0.5150 5.5160 0.2449 3.7 ma 29 –7.0100 –0.5430 5.4880 0.2323 0.47 ma aThe less active compound; bThe more active compound
TABLE III. Correlation matrix for the descriptors
ALOGPS_logs Mor29m IC5 Mor29m 0.251 – – IC5 –0.269 –0.464 – Gap energy 0.152 –0.207 0.203
The loading plot relative to the first and second principal components can be seen in Fig. 5. PC1 is expressed in Eq. (2) as a function of the four selected descriptors. Thus, it is a quantitative variable that provides the overall predictive ability of the different sets of molecular descriptors for all the selected properties. The loadings of ALOGPS_logs and Mor29m are positive whereas they are nega-tive for IC5 and gap energy. Incidentally, gap energy is the least important pro-
Fig. 5. Plot of the first two principal components loadings vectors (PC1×PC2) for the four
descriptors responsible for the separation of the artemisinin and the derivatives into two classes: (+) more active compounds and (–) less active compounds against HepG2 cancer.
_________________________________________________________________________________________________________________________
2011 Copyright (CC) SCS
Available online at www.shd.org.rs/JSCS/

1274 BARBOSA et al.
perty contributing to PC1, as its coefficient (–0.272) is lower in comparison to those of the others. For a compound to be more active against cancer, it must ge-nerally have a combination of these properties, i.e., more negative values for ALOGPS_logs and Mor29m but more positive values for Gap energy and IC5.
PC1 = 0.393ALOGPS_logs + 0.619Mor29m – 0.624 IC5 – 0.272Gap energy (2)
HCA Method
The HCA method that better classified the compounds into two classes (more and less active compounds) was the complete method. In the complete linkage, the distance between two clusters is the maximum distance between a variable in one cluster and a variable in the other cluster. The descriptors em-ployed to perform HCA were the same as for PCA, i.e., ALOGPS_logs, Mor29m, IC5 and gap energy. The dendrogram (Fig. 6) shows HCA graphic as well as the compounds separated into two main classes. The scale of similarity varies from 0 for samples with no similarity to 100 for samples with identical similarity. By analyzing the dendrogram, some conclusions can be made even though the compounds present some structural diversity.
Fig. 6. HCA Dendrogram for artemisinin and the derivatives with anti-HepG2 cancer activity.
The more active analogs are distributed into clusters a and b. They have both a six-membered ring artemisinin and a five-membered ring artemisinin analogs and substituents with a greater number of carbon atoms. The number of amides in clusters a and b (more active analogues) is eleven, while in clusters c and d (less active analogues), it is only one. The values for IC5 are the highest (IC5 > 5.20) and for Mor29m they are the most negative. The variation in activity is the great-est in cluster a (IC50 = 0.47 μM, for 29, and IC50 = 42.3 μM, for 23). This cluster also presents the lowest values for gap energy among the most active com-pounds.
_________________________________________________________________________________________________________________________
2011 Copyright (CC) SCS
Available online at www.shd.org.rs/JSCS/

MOLECULAR MODELING AND CHEMOMETRICS OF ARTEMISININ DERIVATIVES 1275
The less active class was divided into two main clusters (c and d). All samp-les, excluding 1, present a six-membered ring artemisinin. These two clusters have a clear difference involving values for ALOGPS_logs (cluster c, –7.40 to –7.68; cluster d, –2.35 to –3.75) and Mor29m (cluster c, –0.179 to 0.333, which are the lowest of all compounds; cluster d, –0.236 to –0.443). Since artemisinin (1) is found to bear different substitution from the others structures, it was clas-sified alone. It shows the lowest negative value for ALOGPS_logs and the lowest positive value for IC5 (–2.35). Cluster c contains ester 12, alcohols 17 and 18 (isomers), and ketone 21. These compounds bear a long carbon chain of C18H37. Samples in cluster d are amide 2, ester 10, alcohols 13 and 14 (isomers), and ketone 19. They bear a short carbon chain, C2H5 (the exception is 1).
Interestingly, alcohols with a C12H25 carbon chain developed cytotoxicities much higher than alcohols with a short C2H5 carbon chain or with a long C18H37 carbon chain. Moreover, ketones with C8H17 and C12H25 carbon chains were much more active than ketones with a short C2H5 carbon chain or a long C18H37 carbon chain. Moreover, as the length of the carbon chain of the six-membered ring amides increased, the activity increased from 2 (C2H5, IC50 = 100 μM) through 3 (C6H13, IC50 = 17.6 μM), 4 (C8H17, IC50 = 9.5 μM), 5 (C10H21, IC50 = 2.8 μM), 6 (C12H25, IC50 = 1.2 μM) to 7 (C14H29, IC50 = 0.46 μM). Further in-creases in the carbon chain length resulted in slight drops in the cytotoxicity as can be noted for 8 (C16H33, IC50 = 0.79 μM) and 9 (C18H37, IC50 = 4.2 μM). For the five-membered ring amides, as the length of carbon chains increased, the activity increased slightly from 25 (C12H25, IC50 = 1.3 μM), 26 (C14H29, IC50 = = 0.77 μM) to 27 (C16H33, IC50 = 0.74 μM).
KNN Method
The results obtained with the KNN method using one to eight (K = 1 to K = = 8) nearest neighbors are given in Table IV and the same was used for vali-dation of the initial set (Fig. 1). For K = 1, 2, 4, 6 and 8, the percentage correct information was 100 % but 8NN was used because the higher the number of nearest neighbors, the better the reliability of the method in question.
TABLE IV. Classification obtained with the KNN method
Category Number of compounds
Compounds incorrectly classified 1NN 2NN 3NN 4NN 5NN 6NN 7NN 8NN
Class: more active 19 0 0 1 0 1 0 0 0 Class: less active 10 0 0 0 0 0 0 1 0 Total 29 0 0 1 0 1 0 1 0 % Correct information – 100 100 96.36 100 96.36 100 96.36 100
_________________________________________________________________________________________________________________________
2011 Copyright (CC) SCS
Available online at www.shd.org.rs/JSCS/
1276 BARBOSA et al.
SIMCA Method
The results obtained with the SIMCA method are given in Table V. The me-thod was also used for validation of the initial set (Fig. 1). For the 19 more active compounds, one was incorrectly classified. The model was built with three PCs for the more active class and two PCs for the less active class.
TABLE V. Classification obtained by using SIMCA method
Category Number of compounds Correct classification Class: more active 19 18 Class: less active 10 10 Total 29 29 % Correct information – 96.5
SD Analysis
From the two-discrimination function obtained with the SDA study, it can see that the variables ALOGPS_logs, MOR29m, IC5 and Gap energy have a large contribution in the classification methodology. According to the results using PCA, HCA, KNN, SIMCA and SDA, it can also be seen that the descriptors are key properties for explaining the anticancer HepG2 activity of the derivatives compounds artemisinin (Fig. 1).
The discrimination functions for the more active and less active groups are given, respectively, by Eqs. (3a) and (3b).
Group more active:
–1.28–1.18ALOGPS_logs – 1.45Mor29m + 2.27IC5 + 0.772Gap energy (3a)
Group less active:
–4.64 + 2.23ALOGPS_logs + 2.75Mor29m – 4.32IC5 – 1.47Gap energy (3b)
Through the discrimination functions and the value of each variable for the compounds and using all compounds of the training set, the classification is ob-tained (Table VI). The classification error rate was 0 %, resulting in a satisfactory separation of the more and less active compounds. The allocation rule derived from the SDA results, when the activity against cancer of new artemisinin deri-vative is investigated, is: a) initially, for the new derivatives, calculate the value of the more important variables obtained in the construction of the SDA model (descriptors); b) substitute these values in the two discrimination functions per-formed in this work; c) check which discrimination function (group more active compounds or group less active compounds) presents the higher value. The new derivative is more active if it is related to the discrimination function of the more active group and vice versa.
To determine if the model obtained is reliable, a cross-validation test which uses the leave-one-out technique was employed. In this procedure, one com-
_________________________________________________________________________________________________________________________
2011 Copyright (CC) SCS
Available online at www.shd.org.rs/JSCS/
MOLECULAR MODELING AND CHEMOMETRICS OF ARTEMISININ DERIVATIVES 1277
pound is omitted from the data set and the classification functions are built based on the remaining compounds.
TABLE VI. Classification matrix obtained using SDA
Classification group or class Number of compounds True group
More active Less active Group (Class): more active 19 19 0 Group (Class): less active 10 0 10 Total 29 – – % Correct information – 100 100
Afterwards, the omitted compound is classified according to the classifica-tion functions generated. In the next step, the omitted compound is included and a new compound is removed, and the procedure continues until the last com-pound is removed. The obtained results with the cross-validation methodology are summarized in Table VII.
TABLE VII. Classification matrix obtained by using SDA with cross validation
Classification group or class Number of compounds True group
More active Less active Group (Class): more active 19 19 0 Group (Class): less active 10 0 10 Total 29 – – % Correct information – 100 100
In the application of the chemometric step in this study, it was verified that the most important properties to describe the anticancer activity are: ALOGPS_logs, Mor29m, IC5 and gap energy. Thus, some considerations on the most important variables can be drawn for activity from molecules. The ALOGPS_logs indicates that drug solubility is one of the important factors, which affect the movement of a drug from the site of administration into the blood. Knowledge of drug solubility is important. It is well-known that insuf-ficient solubility of a drug can lead to poor absorption.44 From Table II, it can be seen that aqueous solubility is lower for the more active compounds than for the less inactive ones. This is an indication that the lipophilic carbon chain plays an important role in determining the cytotoxicities of the more active compounds.
The Mor29m is the 3D-MORSE (Molecule representation of structures based on electron diffraction) code of signal 29, weighted with atomic masses. It is cal-culated by summing atom weights viewed by a different angular scattering func-tion. The 3D-MORSE code allows the representation of the three dimensional structure of a molecule by a fixed number of values.45 This fact indicates the importance of atomic mass, a steric property, and gives the basic idea that the larger the molecule is, the higher is the activity, because the activity also in-
_________________________________________________________________________________________________________________________
2011 Copyright (CC) SCS
Available online at www.shd.org.rs/JSCS/

1278 BARBOSA et al.
creases with decreasing value of Mor29m. In fact, the less active compounds (Table II), 12, 17 and 18, have Mor29m values of –0.1790 and –0.2280, respectively, and the more active compounds, 7, 8, 11, 26, 27 and 29, present va-lues of –0.5140, –0.5150, –0.5260, –0.5520, –0.6010 and –0.5430, respectively. It seems clear that larger compounds present a bigger steric effect, augmenting the anticancer activity as consequence of the augmented lipophilicity.
The information content index is calculated based on the pair-wise equiva-lence atoms in a hydrogen-filled molecule.46 In Table III, in general, compounds with higher values for IC5 are more active. These compounds are the same that have a lipophilic carbon chain.
The gap energy is the energy separation between the LUMO and HOMO energies.47 This property gives information associated to the electronic structure of a molecule and is the measure of the stability of a molecule. A smaller gap energy shows that a molecule is more reactive. In TABLE III, as can be seen, when the gap energy values of the more active and less active compounds are compared, it is not possible to verify a clear tendency for their distinction. This can be associated to the smaller contribution of this property in PC1 (Eq. (2)). It is possible that the main contribution to a higher anticancer activity against HepG2 developed by a compound is due to its lipophilicity.
Molecular docking
Docking calculations for the compounds from Fig. 1 show that the polar region of the ligands close to the peroxide linkage is directed toward the iron ion of the receptor. The results achieved for the interaction of artemisinin (1) and compound 7 with the receptor are presented in Fig. 9. For artemisinin, the Fe–O1
(7)
(1)
Fig. 9. Docking formed for artemisinin (1) and the molecule receptor and derivative 7 and the molecule receptor (transferrin).
_________________________________________________________________________________________________________________________
2011 Copyright (CC) SCS
Available online at www.shd.org.rs/JSCS/

MOLECULAR MODELING AND CHEMOMETRICS OF ARTEMISININ DERIVATIVES 1279
and Fe–O2 distances are 2.52 and 2.74 Å, respectively. However, for 7, they are 2.85 e 3.48Å, respectively. The explanation for a closer approximation of the artemisinin to the iron ion (Fe2+) is probably due to the greater number of bulky substituents in the artemisinin derivative, which makes it difficult to approach the transferrin. Another point to emphasize is that the anticancer activity of the derivatives is probably also related to lipophilicity owing to the great number of carbon atoms present in the molecule, besides the endoperoxide group.48 The histidine unity in transferrin is usually coordinated to the iron ion through its sp2 the nitrogen atom. This allows for the iron ion to acquire a hexacoordinated octahedral arrangement after binding to the artemisinin and the derivatives.49
CONCLUSIONS
In this work, the use PCA and HCA in the selection step of the method and the basis set for the molecular modeling and development of quantum chemistry calculations revealed that the B3LYP/6-31G and B3LYP/6-31G theory were the most adequate. The use of MEP maps to identify key structural features of the artemisinin and its derivatives necessary for their activities and to investigate the interaction with the molecular receptor (transferrin) showed that the presence of a red surface near to the 1,2,13-trioxane ring suggested that these compounds have a reactive site for electrophilic attack and they must possess anticancer cytoto-xicity and which in the case of the an electrophilic attack of the ion of tranferrin against an electronegative region of the studied compounds, this attack has a great preference to occur through the involvement of the endoperoxide linkage. Principal component analysis (PCA), hierarchical cluster analysis (HCA), the K-nearest neighbor method (KNN), soft independent modeling of class analogy method (SIMCA) and the stepwise discriminant analysis showed that the studied artemisinin and derivatives can be classified into two classes or group: more ac-tive and less active according to their degree of anticancer HepG2 activity. The properties ALOGPS_logs, Mor29m, IC5 and gap energy are responsible for the separation into the more active and less active studied molecules and it is inte-resting to notice that these properties represent three distinct classes of interac-tions between the molecules and the transferring receptor: electronic (gap ener-gy), steric (Mor29m and IC5) and hydrophilic (ALOGPS_logs). The molecular docking study showed that the ligands approached the receptor (transferrin) through the endoperoxide bond. The developed studies with MEP maps, PCA, HCA, KNN, SIMCA and SDA and molecular docking can provide valuable insight into the experimental process of syntheses and biological evaluation of new artemisinin derivatives with activity against cancer HepG2.
Acknowledgements. We acknowledge the financial support of the Brazilian agency Con-selho Nacional de Desenvolvimento Científico e Tecnológico. We also thank the Instituto de Química-Araraquara for the use of the GaussView software and the Swiss Center for Scien-
_________________________________________________________________________________________________________________________
2011 Copyright (CC) SCS
Available online at www.shd.org.rs/JSCS/
1280 BARBOSA et al.
tific Computing for the use of the Molekel software and the Laboratório de Química Teórica e Computacional, Universidade Federal do Pará.
И З В О Д
МОЛЕКУЛСКО МОДЕЛОВАЊЕ И ХЕМОМЕТРИЈСКЕ СТУДИЈЕ АНТИКАНЦЕР ДЕРИВАТА АРТЕМИЗИНИНА
JARDEL P. BARBOSA1, JOÃO E. V. FERREIRA1, ANTONIO F. FIGUEIREDO1, RUTH C. O. ALMEIDA1,
OSMARINA P. P. SILVA1, JOSÉ R. C. CARVALHO1, MARIA DA G. G. CRISTINO1, JOSE CIRÍACO-PINHEIRO1,
JOSÉ L. F. VIEIRA2 и RAYMONY T. A. SERRA3
1Laboratório de Química Teórica e Computacional, Faculdade de Química, Instituto de Ciências Exatas e Naturais, Universidade Federal do Pará, CP 101101, CEP 66075-110 Belém, PA, Amazônia, 2Faculdade de
Farmácia, Instituto de Ciências da Saúde, Universidade Federal do Pará, CP 101101, CEP 66075-110 Belém, PA и 3Centro de Ciências Biológicas e da Saúde, Universidade Federal do Maranhão,
CEP 65085-580 São Luis, MA, Brasil
Изложени су резултати молекулског моделовања и мултиваријантне студије која обу-хвата артемизинин и 28 његових деривата, који делују против хуманог хепатоцелуларног карцинома HepG2. Израчунавања су вршена на нивоу теорије B3LYP/6-31G. Коришћене су MEP мапе да би се идентификовали структурни детаљи у артемизинину и његовим дери-ватима, неопходни за њихову активност. Примењене су хемометријске методе PCA, HCA, KNN, SIMCA и SDA да би се установило који подскуп варијабли највише одговара за пред-виђање антиканцерогене активиности. Хемометријска разматрања су показала да су LOGPS_logs, Mor29m, IC5 и gap energy дескриптори одговорни за разликовање између ак-тивних и мање активних једињења. Такође је примењено молекулско доковање да би се ис-тражила интеракција између лиганда и рецептора. Резултати показују да се лиганд везује за рецептор преко ендопероксидне везе.
(Примљено 27. децембра 2010)
REFERENCES
1. S. A. Rosenberg, Nature 411 (2001) 380 2. Word Health Organization – International Agency for Research on Cancer, Geneva,
Switzerland, http://globocan.iarc.fr (accessed August 2010) 3. R. Price, M. van Vugt, F. Nosten, C. Luxemburger, A. Brockman, L. Phaipun, T. Chon-
gsuphajaisiddhi, N. White, Am. J. Trop. Med. Hyg. 59 (1998) 883 4. D. M. Opsenica, B. A. Šolaja, J. Serb. Chem. Soc. 74 (2009) 1155 5. A. K. Bhattacharjee, K. A. Carvalho, D. Opsenica, B. A. Solaja, J. Serb. Chem. Soc. 70
(2005) 329 6. J. E. V. Ferreira, A. F. Figueiredo, J. P. Barbosa, M. G. G. Crispino, W. J. C. Macedo, O.
P. P. Silva, B. V. Malheiros, R. T. A. Serra, J. C. Pinheiro. J. Serb. Chem. Soc. 75 (2010) 1533
7. A. C. Beekman, H. J. Woerdenbag, W. van Uden, N. Pras, A. W. Konings, H. V. Wiks-trom, J. Pharm. Pharmacol. 49 (1997) 1254
8. T. Efferth, H. Duntan, A. Sauerbrey, H. Miyachi, C. R. Chitambar, Int. J. Oncol. 18 (2001) 767
9. B. Rinner, V. Siegl, P. Purstner, T. Efferth, B. Brem, H. Greger, R. Pfragner, Anticancer 24 (2004) 495
10. H. H. Chen, H. J. Zhou, X. Fang, Pharmacol. 48 (2003) 231
_________________________________________________________________________________________________________________________
2011 Copyright (CC) SCS
Available online at www.shd.org.rs/JSCS/
MOLECULAR MODELING AND CHEMOMETRICS OF ARTEMISININ DERIVATIVES 1281
11. W. Hofheinz, H. Burgin, E. Gocke, C. Jaquet, R. Masciadri, G. Schmid, H. Stohler, H. Urwyler, Trop. Med. Parasitol. 45 (1994) 261
12. G. H. Posner, J. Northrop, I. H. Paik, K. Borstnik, P. Dolan, T. W. Kensler, S. Xie, T. A. Shapiro, Bioorg. Med. Chem. 10 (2002) 227
13. G. H. Posner, A. J. McRiner, I. H. Paik, S. Sur, K. Borstnik, S. Xie, T. A. Shapiro, A. Alagbala, B. Foster, J. Med. Chem. 47 (2004) 1299
14. A. M. Galal, S. A. Ross, M. A. El-Sohly, F. S. El-Feraly, M. S. Ahmed, A. T. McPhail, J. Nat. Prod. 65 (2002) 184
15. Y. Li, J. M. Wu, F. Shan, G. S. Wu, J. Ding, D. Xiao, J. X. Han, G. Atassi, S. Leonce, D. H. Caignard, P. Renard, Bioorg. Med. Chem. 11 (2003) 1391
16. J. P. Jeyadevan, P. G. Bray, J. Chadwick, A. E. Mercer, A. Bayme, S. A. Ward, B. K. Park, D. P. Williams, R. Cosstick, J. Davies, A. P. Higson, E. Irving, G. H. Posner, P. M. O’Neill, J. Med. Chem. 47 (2004) 1290
17. Y. Liu, V. K.-W. Wong, B. C.-B. Ho, M.-K. Woang, C.-M. Che, Org. Lett. 7 (2005) 1561 18. Gaussian 98, revision A.7, Gaussian, Inc., Pittsburgh, PA, 1998 19. K. R. Beebe, R. J. Pell, M. B. Seashottz, Chemometrics: A Practical Guide, Wiley, New
York, 1998, p. 81 20. R. A. Johnson, D. W. Wichem, Applied Multivariate Statistical Analysis, Prentice-Hall,
Englewood Cliffs, NJ, USA, 1992 21. K. V. Mardia, J. T. Kent, J. M. Bibbly, Multivariate Analysis, Academic Press, New
York, 1979 22. C. C. Roothaan, Rev. Mod. Phys. 23 (1951) 69 23. A. D. Becke, J. Chem. Phys. 98 (1993) 5648 24. C. Lee, W. Yang, R. G. Parr, Phys. Rev., B 37 (1988) 785 25. J. N. Lisgarten, B. S. Potter, C. Bantuzeko, R. A. Palmer, J. Chem. Cryst. 28 (1998) 539 26. F. H. Allen, Acta Cryst., B 58 (2002) 380 27. Pirouette 3.01, Informetrix, Inc., Woodinville, WA, 2001 28. Virtual Computational Laboratory, VCCLAB 2005, http://www.vcclab.org (accessed
February 2010) 29. ChemPlus, Modular Extensions to HyperChem Release 6.02, Molecular Modeling for
Windows, Hyper, Inc., Gainesville, FL, 2000 30. H. Tanak, J. Mol. Struct. THEOCHEM 5 (2010) 950 31. E. Scrocco, J. Tomasi, Adv. Quantum Chem. 11 (1979) 115 32. F. J. Luque, J. M. Lopz, M. Orozco, Theor. Chem. Acc. 103 (2000) 343 33. N. Okulik, A. H. Jubert, Int. Electron J. Mol. Des. 4 (2005) 17 34. P. Politzer, P. R. Laurence, K. Jayasuriya, J. McKinney, Environ. Health Perspect. 61
(1985) 191 35. E. Scrocco, J. Tomasi, Top. Curr. Chem. 42 (1973) 45 36. P. Politzer, D. G. Truhlar, Chemical Applications of Atomic and Molecular Electrostatic
Potentials, Plenum, New York, 1981, p. 1 37. P. Politzer, J. S. Murray, Theor. Chem. Acc. 108 (2002) 134 38. Molekel 4.3, Swiss Center for Scientific Computing, Manno, Switzerland, 2000 39. R. T. A. MacGillivray, S. A. Moore, J. Chen, B. F. Anderson, H. Baker, Y. Luo, M. Bew-
ley, C. A. Smith, M. E. P. Murphy, Y. Wang, A. B. Mason, R. C. Woodworth, G. D. Brayer, E. N. Baker, Biochemistry 37 (1998) 1719
40. D. E. Koshland, G. Nemethy, D. Filmer, Biochemistry 5 (1996) 365
_________________________________________________________________________________________________________________________
2011 Copyright (CC) SCS
Available online at www.shd.org.rs/JSCS/
1282 BARBOSA et al.
41. H. C. Lai, T. Sasaki, N. P. Singh, (University of Washington), US2004/0067875A1 (2004)
42. T. Sasaki, H. C.-Y. Lai, N. P. Singh, S. J. Oh, (University of Washington) US2007/ /0231300A1 (2007)
43. P. M. O’Neill, V. E. Barton, S. A. Ward, Molec. 15 (2010) 1705 44. V. Tetko, V. I. Tanchuk, T. N. Kasheva, A. E. Villa, J. Chem. Inf. Comput. Sci. 41 (2001)
1488 45. B. F. Rasulev, N. D. Abdullaev, V. N. Syrov, J. Leszczynski, QSAR Comb. Chem. 24
(2005) 1056 46. V. R. Magnuson, D. K. Harriss, S. C. Basak, Studies in Physical and Theoretical
Chemistry, Elsevier, Amsterdam, 1983, p. 178 47. M. Karelson, V. S. Labanov, A. R. Katritzky, Chem. Rev. 96 (1999) 1027 48. M. S. Costa, R. Kiralj, M. M. C. Ferreira, Quím. Nova 30 (2007) 25 49. R. K. Haynes, S. C. Vonwiller, Tetrahedron Lett. 37 (1996) 253.
_________________________________________________________________________________________________________________________
2011 Copyright (CC) SCS
Available online at www.shd.org.rs/JSCS/

J. Serb. Chem. Soc. 76 (9) 1283–1294 (2011) UDC 546.26–037:54–188:544.723.2:543.552 JSCS–4203 Original scientific paper
1283
Influence of chemical agents on the surface area and porosity of active carbon hollow fibers
LJILJANA M. KLJAJEVIĆ1*, VLADISLAVA M. JOVANOVIĆ2#, SANJA I. STEVANOVIĆ2#, ŽARKO D. BOGDANOV1 and BRANKA V. KALUDJEROVIĆ1
1University of Belgrade, Vinča Institute of Nuclear Sciences, P. O. Box 522, 11001 Belgrade and 2ICTM – Institute of Electrochemistry, University of Belgrade, P. O. Box 473,
11000 Belgrade, Serbia
(Received 26 February 2010, revised 31 May 2011)
Abstract: Active carbon hollow fibers were prepared from regenerated polysulfone hollow fibers by chemical activation using: disodium hydrogen phosphate 2-hyd-rate, disodium tetraborate 10-hydrate, hydrogen peroxide, and diammonium hyd-rogen phosphate. After chemical activation fibers were carbonized in an inert atmosphere. The specific surface area and porosity of obtained carbons were stu-died by nitrogen adsorption–desorption isotherms at 77 K, while the structures were examined with scanning electron microscopy and X-ray diffraction. The activation process increases these adsorption properties of fibers being more pronounced for active carbon fibers obtained with disodium tetraborate 10-hydrate and hydrogen peroxide as activator. The obtained active hollow carbons are microporous with dif-ferent pore size distribution. Chemical activation with phosphates produces active carbon material with small surface area but with both mesopores and micropores. X-ray diffraction shows that besides turbostratic structure typical for carbon ma-terials, there are some peaks which indicate some intermediate reaction products when sodium salts were used as activating agent. Based on data from the electro-chemical measurements the activity and porosity of the active fibers depend strongly on the oxidizing agent applied.
Keywords: carbon hollow fibers; chemical activation; adsorption; cyclic voltam-metry.
INTRODUCTION
Various kinds of porous carbon materials with a wide range of structures, compositions and properties are widely produced and they can be used as ad-sorbents, catalytic supports, etc.1 In order to obtain a high surface area, physical or/and chemical activation processes of material have usually been employed. Chemical activation offers some advantages over physical activation, such as: the
* Corresponding author. E-mail: [email protected] # Serbian Chemical Society member. doi: 10.2298/JSC100226112K
_________________________________________________________________________________________________________________________
2011 Copyright (CC) SCS
Available online at www.shd.org.rs/JSCS/

1284 KLJAJEVIĆ et al.
use of lower temperatures and heat treatment times, usually it consists of one stage and the obtained carbon yields are generally higher. The disadvantages are the need for a washing step of the activated material to remove the chemical agent and the inorganic reaction products, as well as the more corrosive nature of the chemical agents used in comparison to CO2 or steam.
Through the activation process, depending on the nature of the organic pre-cursor and process parameters, various active carbons have been prepared and various applications developed. In addition to classical granular or powder active carbon forms, there are new forms of active carbons: fibers and textiles, carbon molecular sieves, porous carbon membranes, carbon aerogels or cryogels, and carbon hollow fibers (CHF).1–3
Carbon membranes with useful characteristics and numerous advantages have great potential to be widely used in gas separation processes, especially carbon hollow fiber membranes 4. There are numerous applications of hollow fi-ber technology for the separation and purification in both industry and medicine, including the preparation of drinkable, high quality water, for the pharmaceutical industry (hemodialyzers), gas separation for industrial application, etc.
Hollow fibers can be used to prepare microcapillary catalytic reactor ele-ments. These reactors could be prepared in the form of composites with glassy carbon as the matrix5 or with a porous carbon matrix.6 Considering flows, mass and energy balances for an exothermic reaction inside a single fiber, better heat transport, shorter diffusion lengths and small axial dispersion were obtained when compared to classic catalytic tube reactors.5
Hollow-fiber carbon membranes were prepared and used as the support me-dia for a platinum catalyst.7
Amongst the precursors applied for the preparation of carbon hollow fibers are polysulfone (PSF),8,9,10 cellulose,10,11 mesophase pitch,12 polyacrylonitrile (PAN),3,13 polyetherimides14 and polyimides.15
Active carbon hollow fibers compared to classic active carbon possess higher geometric area to volume ratios, which improves the heat and a mass transport.
Studies of active carbon hollow fibers (ACHF) formation are, however, quite scarce. Some research was realized with PAN as the precursor,3 and others by filling or impregnating hollow fibers with active carbon.8,9 ACHF were obtained when PAN hollow fibers were pretreated with diammonium hydrogen phosphate and then further oxidized in air, carbonized in nitrogen, and activated with carbon dioxide.3
Generally, in the literature, there are several activating agents used for the chemical activation of carbon precursor material, such as phosphoric acid,16 zinc chloride,17 alkaline carbonates18,19 and more recently alkaline hydroxides.20
This present work investigates the effect of different chemical agents on the formation of microporous and mesoporous structures of the obtained active
_________________________________________________________________________________________________________________________
2011 Copyright (CC) SCS
Available online at www.shd.org.rs/JSCS/

ACTIVE CARBON HOLLOW FIB 1285
carbon hollow fibers through measurement of their microstructure, adsorption and electrochemical characteristics.
EXPERIMENTAL
The polysulfone hollow fibers used as the raw material in this study were taken from a hollow fiber dialyzer supplied by Hemofarm AD, Vršac in cooperation with Fresenius, Bad Homburg, Germany. The hollow fibers were roughly cut to about 1 cm long fibers. The appro-ximately same mass of cut fibers were soaked in 15 % aqueous solutions of Na2HPO4⋅2H2O (1), Na2B4O7⋅10H2O (2), H2O2 (3), or (NH4)2HPO4 (4) for one hour.
The ratio of the mass of the chemical agents in solution to the mass of the used hollow fibers was about 5. The mixtures were then filtered and the remaining wet fibers were dried at 353 K for about 6 h. The impregnation yield was calculated as the ratio of the mass difference of the hollow fibers after and before drying and the mass of the hollow fibers before drying.
These fibers were carbonized in a horizontal tubular furnace under an Ar flow up to 1173 K at a heating rate of 5 K min-1 and maintained at the final temperature for 1 h. After cooling under an Ar flow, the ACHF samples were washed with distilled water. The final wash was at elevated temperature (333 K) for 1 h. After filtration, the wet fibers were dried in an oven at 353 K for about 6 h.
The samples are designated ACHF1 ACHF2, ACHF3 and ACHF4, according to the ordinal number of the used chemical agent (number in parentheses, next to chemical agent).
The adsorption characteristics of ACHF were experimentally and numerically charac-terized according to their surface area, pore volume and pore sizes. The crystalline structure was examined by X-ray diffraction analysis (XRD) and morphology investigated by scanning electron microscopy (SEM).
The adsorption characteristics were determined from N2 adsorption/desorption isotherms at 77 K using the gravimetric McBain balance method. Before obtaining adsorption isotherms, the ACHF samples were degassed at a temperature of 523 K to remove any contaminants that may be present on their surface. The values of specific surface area (SBET) were calculated from the adsorption data applying the standard Brunauer–Emmet–Teller (BET) Equation.21 The BET surface areas were assessed by applying relative pressures ranging from 0.01 to 0.15. The total pore volume Vtot was estimated by the Gurwitsch Rule21 using the quantity adsorbed close to saturation, i.e., the liquid volumes of N2 at a relative pressure p/p0 = 0.95.
The micropores volume (VDR) and characteristic adsorption energy (E0) were calculated by application of the Dubinin–Radushkevich (D–R) Equation.22
Using the Stoeckli Formulas based on the D–R Equation, the average width of the slit- -shaped pores (L0) was calculated. This pore width was used to calculate the surface area of the micropores (SL).23
The average micropore width (Wm) was also calculated from the McEnaney Equation using the parameter of the D–R isotherm (E0),24 followed by the calculation of the surface area of the micropores (SW).
The high resolution αs-plot and the method proposed by Kaneko et al.25 were used to calculate the micropore volume (Vαs) and the external surface area (Sext) as well as the total surface area (Stot). Non-graphitized carbon black BP 280 (SBET = 40.2 m2 g-1) was used as the reference adsorbent. The micropore surface (Smic) for the mesoporous materials were calcu-lated by subtracting Sext from Stot.
The effective pore size distribution (L) was calculated according to the Horvath and Kawazoe (HK) method. This function gives the effective pore size for micropores, the values
_________________________________________________________________________________________________________________________
2011 Copyright (CC) SCS
Available online at www.shd.org.rs/JSCS/
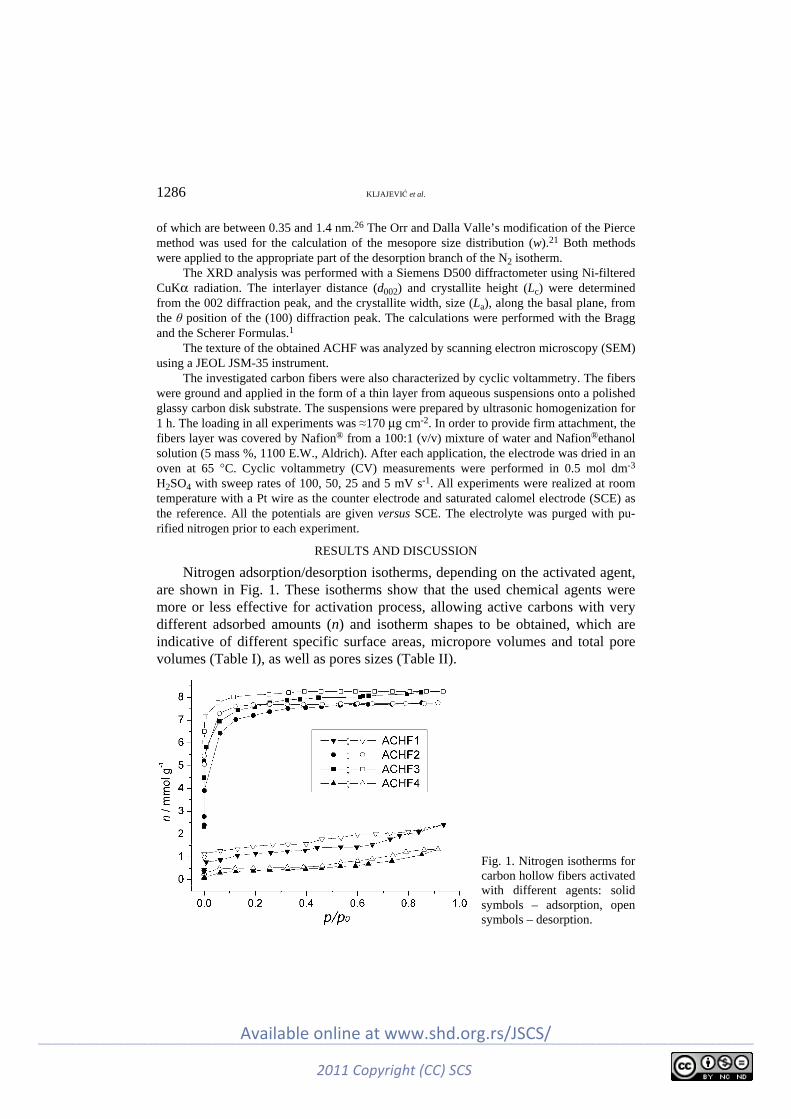
1286 KLJAJEVIĆ et al.
of which are between 0.35 and 1.4 nm.26 The Orr and Dalla Valle’s modification of the Pierce method was used for the calculation of the mesopore size distribution (w).21 Both methods were applied to the appropriate part of the desorption branch of the N2 isotherm.
The XRD analysis was performed with a Siemens D500 diffractometer using Ni-filtered CuKα radiation. The interlayer distance (d002) and crystallite height (Lc) were determined from the 002 diffraction peak, and the crystallite width, size (La), along the basal plane, from the θ position of the (100) diffraction peak. The calculations were performed with the Bragg and the Scherer Formulas.1
The texture of the obtained ACHF was analyzed by scanning electron microscopy (SEM) using a JEOL JSM-35 instrument.
The investigated carbon fibers were also characterized by cyclic voltammetry. The fibers were ground and applied in the form of a thin layer from aqueous suspensions onto a polished glassy carbon disk substrate. The suspensions were prepared by ultrasonic homogenization for 1 h. The loading in all experiments was ≈170 μg cm-2. In order to provide firm attachment, the fibers layer was covered by Nafion® from a 100:1 (v/v) mixture of water and Nafion®ethanol solution (5 mass %, 1100 E.W., Aldrich). After each application, the electrode was dried in an oven at 65 °C. Cyclic voltammetry (CV) measurements were performed in 0.5 mol dm-3 H2SO4 with sweep rates of 100, 50, 25 and 5 mV s-1. All experiments were realized at room temperature with a Pt wire as the counter electrode and saturated calomel electrode (SCE) as the reference. All the potentials are given versus SCE. The electrolyte was purged with pu-rified nitrogen prior to each experiment.
RESULTS AND DISCUSSION
Nitrogen adsorption/desorption isotherms, depending on the activated agent, are shown in Fig. 1. These isotherms show that the used chemical agents were more or less effective for activation process, allowing active carbons with very different adsorbed amounts (n) and isotherm shapes to be obtained, which are indicative of different specific surface areas, micropore volumes and total pore volumes (Table I), as well as pores sizes (Table II).
Fig. 1. Nitrogen isotherms for carbon hollow fibers activated with different agents: solid symbols – adsorption, open symbols – desorption.
_________________________________________________________________________________________________________________________
2011 Copyright (CC) SCS
Available online at www.shd.org.rs/JSCS/

ACTIVE CARBON HOLLOW FIB 1287
TABLE I. Adsorption characteristics of carbon hollow fibers activated with different agents
Sample SBET
m2 g-1 Vtot
cm3 g-1 VDR
cm3 g-1 Smic
m2 g-1 Vαs
cm3 g-1 Sext
m2 g-1 Stot
m2 g-1 ACHF1 88 0.084 0.033 43 0.041 41 84 ACHF2 600 0.269 0.238 558 0.262 6 564 ACHF3 632 0.286 0.245 613 0.271 12 625 ACHF4 32 0.046 0.014 16 0.005 11 27
TABLE II. Values for micropore sizes and surface area of the micropores calculated using the DR characteristic adsorption energy
Sample E0 / kJ mol-1 L0 / nm SL / m2 g-1 Wm / cm3 g-1 SW / m2 g-1 ACHF1 19.44 1.40 47 1.28 51 ACHF2 22.35 1.08 439 1.06 449 ACHF3 25.11 0.89 550 0.88 555 ACHF4 16.61 1.98 14 1.55 18
Two types of isotherms were clearly observed. Carbons ACHF1 and ACHF4 activated by phosphate salts (Na2HPO4⋅2H2O and (NH4)2HPO4, respectively) exhibit type IV isotherms, according to the IUPAC classification and indicate the occurrence of capillary condensation in the pores. The limiting uptake over the range of high relative pressures p/p0 resulted in a plateau on the isotherm (Fig. 1), which indicates complete pore filling. The hysteresis loops in both cases are Type H4, according to the IUPAC classification and indicate the presence of me-sopores and slit-shaped pores, but the pore size distribution is mainly in the range of micropores.21 This was confirmed by further analysis and will be discussed later.
The carbons ACHF2 and ACHF3 activated by Na2B4O7⋅10H2O and H2O2, respectively, exhibited type I isotherms, according to the IUPAC classification, which indicate microporous materials.1,21 These isotherms exhibit low-pressure hysteresis, attributed to the irreversible uptake of adsorptive molecules in pores of about the same width as that of the adsorbate molecules, and/or swelling of non-rigid pore walls.21 Micropore filling and high uptakes were observed at rela-tively low pressures (Fig. 1), because of the narrow pore width which induced high adsorption potential. The knee of the nitrogen adsorption isotherm at 77 K for the ACHF3 sample is sharper than that for the ACHF2 sample, which means that the net heat of adsorption is higher and the micropores are narrower for ACHF3 (Table II and Fig. 2).
Chemical activation increased the specific surface area significantly from SBET = 3.2 m2 g–1 obtained for the carbon hollow fibers (CHF) to SBET = 632 m2 g–1 obtained for the activated carbon hollow fibers ACHF3, (Table I). The pre-sence of microporosity increases the specific surface area of an active material. Thus, the specific surface area of the microporous materials ACHF2 and ACHF3
_________________________________________________________________________________________________________________________
2011 Copyright (CC) SCS
Available online at www.shd.org.rs/JSCS/

1288 KLJAJEVIĆ et al.
was greatly enhanced when compared with those of the mesoporous materials ACHF1 and ACHF4 (Table I).
Fig. 2. Effective pore size distri-bution of the activated CHF cal-culated by the HK method.
The usage of disodium tetraborate 10-hydrate (ACHF2) and hydrogen pe-roxide (ACHF3) as the activating agent induced significant increases of the spe-cific surface area and especially of the total and micropore volume. Remarkably higher micropore volume for these samples in comparison with ACHF1 and ACHF4 (Table I), was confirmed by both calculation methods αs (Vαs) and D–R (VD–R). The values of Vmic obtained from these two methods are in disagree-ment, which was more pronounced for the mesoporous samples, especially for ACHF4. This was to be expected because the D–R method is proposed for mic-roporous materials. The mesoporous structure of these two materials is presented by the pore size distribution in Fig. 3. However, Vmic for the microporous ma-
Fig. 3. Pore size distribu-tion of activated CHF cal-culated using the Orr and Dalla Valle modification of the Pierce method.
_________________________________________________________________________________________________________________________
2011 Copyright (CC) SCS
Available online at www.shd.org.rs/JSCS/

ACTIVE CARBON HOLLOW FIB 1289
terials ACHF2 and ACHF3 calculated using the D–R method was lower by about 9 % than when they are calculated using the αs method. The reason for this could lie in the broad micropore size distribution (Fig. 2). Additionally, the fact that the αs method is based on the standard isotherm affects that the Vαs values are expected to be more accurate than the VD–R values for the micropore volume.
Average width of the slit-shaped pores calculated using the parameters of D–R Equation L0 and Wm have different values depending on the employed calcula-tion method (Table II). The values for the micropore width obtained using the McEnaney Equation (Wm) were lower than L0 (Stoeckli Formulas), espe-cially for the mesoporous materials ACHF1 and ACHF4 as well as the corres-ponding surface area of the micropores. Of these two mesoporous materials, ACHF1 had a higher micropore surface area according to the smaller micropore size of this material (Fig. 2). The wider the micropore size is, the smaller is the micropore surface area. The activation with phosphoric salts, besides developing mesoporosity, induced wider micropore size and accordingly a low surface area of the micropores. Although the D–R Equation is more appropriate for micro-porous materials, the values of SL for the mesoporous materials were in a good agreement with the values obtained by the αs method (Tables I and II). However, the values of SL and SW for the microporous materials ACHF2 and ACHF3 were lower than the values obtained by the αs method. The values SL and SW were calculated using the mean pore width but these materials had a broad micropore size distribution (Fig. 2).
External surface area, which presents the mesopores and the macropores sur-face area, was greater in the materials ACHF1 and ACHF4 than in the micropo-rous materials ACHF2 and ACHF3, Table I. Even the presence of macropores on the surface of ACHF1 could be seen in the SEM analysis, see Fig. 4. Moreover,
Fig. 4. SEM Micrograph for car-bon hollow fibers activated by Na2HPO4⋅2H2O – ACHF1.
_________________________________________________________________________________________________________________________
2011 Copyright (CC) SCS
Available online at www.shd.org.rs/JSCS/
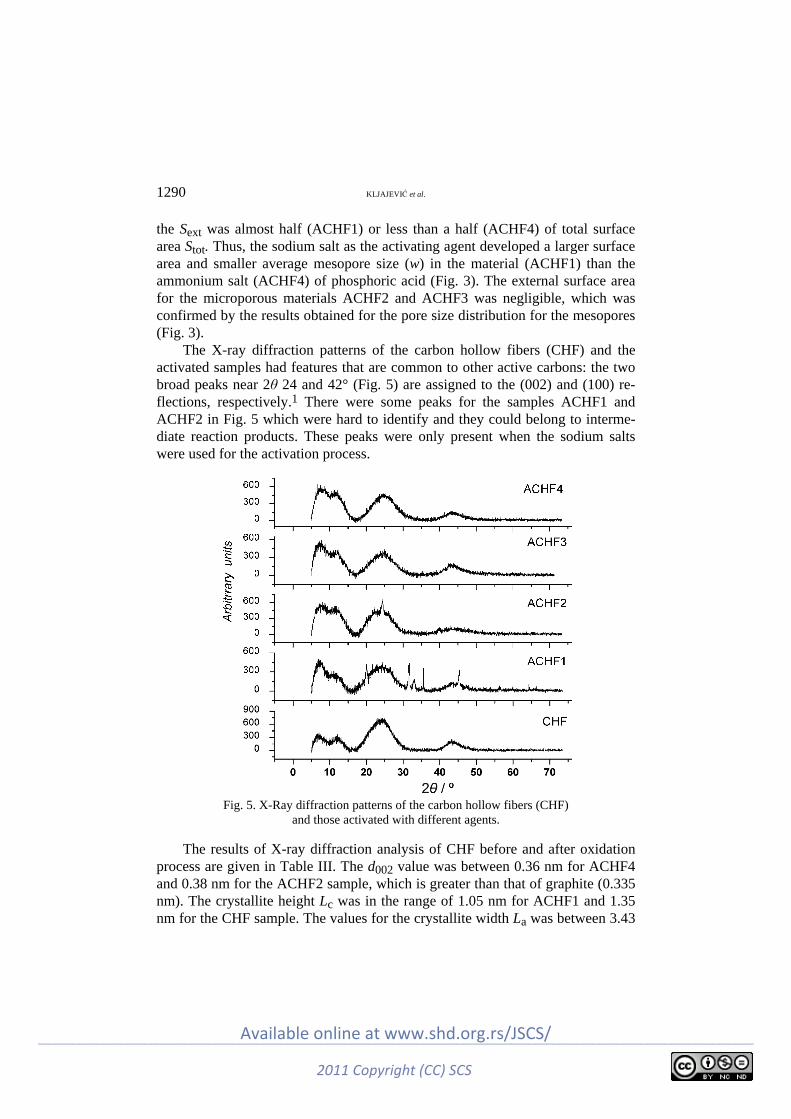
1290 KLJAJEVIĆ et al.
the Sext was almost half (ACHF1) or less than a half (ACHF4) of total surface area Stot. Thus, the sodium salt as the activating agent developed a larger surface area and smaller average mesopore size (w) in the material (ACHF1) than the ammonium salt (ACHF4) of phosphoric acid (Fig. 3). The external surface area for the microporous materials ACHF2 and ACHF3 was negligible, which was confirmed by the results obtained for the pore size distribution for the mesopores (Fig. 3).
The X-ray diffraction patterns of the carbon hollow fibers (CHF) and the activated samples had features that are common to other active carbons: the two broad peaks near 2θ 24 and 42° (Fig. 5) are assigned to the (002) and (100) re-flections, respectively.1 There were some peaks for the samples ACHF1 and ACHF2 in Fig. 5 which were hard to identify and they could belong to interme-diate reaction products. These peaks were only present when the sodium salts were used for the activation process.
Fig. 5. X-Ray diffraction patterns of the carbon hollow fibers (CHF)
and those activated with different agents.
The results of X-ray diffraction analysis of CHF before and after oxidation process are given in Table III. The d002 value was between 0.36 nm for ACHF4 and 0.38 nm for the ACHF2 sample, which is greater than that of graphite (0.335 nm). The crystallite height Lc was in the range of 1.05 nm for ACHF1 and 1.35 nm for the CHF sample. The values for the crystallite width La was between 3.43
_________________________________________________________________________________________________________________________
2011 Copyright (CC) SCS
Available online at www.shd.org.rs/JSCS/

ACTIVE CARBON HOLLOW FIB 1291
nm for the ACHF3 and 4.57 nm for the CHF samples. Therefore, these materials had a turbostratic structure similar to that of active carbon, as well as the majority of carbonaceous materials. However, the chemical agents introduced defects in the structure of the carbon material which led to the formation of the porosity. The changes in the structure of the carbon hollow fibers that occurred on activation mainly decreased the interlayer spacing and crystallites size.
TABLE III. Results of the X-ray diffraction analysis of carbon hollow fibers (CHF) and car-bon hollow fibers activated with different agents
Sample CHF ACHF1 ACHF2 ACHF3 ACHF4 d002 / nm 0.372 0.365 0.376 0.364 0.359 Lc / nm 1.35 1.25 1.11 1.10 1.07 La / nm 4.57 3.27 2.03 3.29 3.31 Lc/d002 3.6 3.4 2.9 3 3.0
The influence of oxidizing agent used for activation of the raw hollow fibers was also analyzed by cyclic voltammetry. The steady state CVs recorded in 0.5 M H2SO4 of all the studied fibers are shown in Fig. 6. None of the ACHF fibers exhibited pure double layer properties. The voltammograms for ACHF1 and
Fig. 6. Cyclic voltammograms for the carbon hollow fibers (CHF) – dashed line, and activated
with different agents – solid line.
_________________________________________________________________________________________________________________________
2011 Copyright (CC) SCS
Available online at www.shd.org.rs/JSCS/

1292 KLJAJEVIĆ et al.
ACHF2 had a more or less defined redox peak at around 0.4 V vs. SCE, de-signating a redox reaction of carbon functional groups (mostly quinone/hydro-quinone) that is characteristic for carbon materials in acidic solution.27–30 How-ever, the voltammograms for ACHF3 and ACHF4, although recorded in acid, were more similar to the CVs for carbon materials in alkaline solution.31 The charge calculated from the CVs for the activated fibers ACHF1–4 was from 2 to 8 times larger in comparison to that for the raw fibers CHF. In addition, the in-crease in charge at the slower sweep rate, as an indication of porosity, was higher for the activated fibers. Moreover, both the increase of charge, which could be considered as a measure of activity, and the increase of the porosity of the active fibers depended on the applied oxidizing agent. Based on data from the elec-trochemical measurements, the activity and porosity of the active fibers was in the order ACHF1 > ACHF3 > ACHF2 ≥ ACHF4. According to the results ob-tained from the N2 adsorption analysis, it seems that the external surface area Sext (Table I) had a great influence on the electrochemical characteristics.
CONCLUSIONS
In conclusion, it can be stated that the chemical activation of polysulfone hollow fibers increased their specific surface area after the carbonization process. This is in dependence on which chemical agent was used. Phosphates such as disodium hydrogen phosphate 2-hydrate more and diammonium hydrogen phos-phate less, have a significant influence on the formation of a mesoporous struc-ture of the active hollow carbon fibers. It is presumed this could influence the electrochemical characteristics of these materials. Microporous active carbon hollow fibers can be obtained using hydrogen peroxide or disodium tetraborate 10-hydrate.
In the future work, it would be interesting to investigate the effects of other activation methods on the adsorption characteristics of these materials, as well as their possible application for the adsorption of various contaminants from fluids, and as catalytic supports.
Acknowledgements. This paper was financially supported by the Ministry of Education and Science of the Republic of Serbia, Contracts No. 45005 and 45012.
И З В О Д
УТИЦАЈ ХЕМИЈСКИХ АГЕНАСА НА СПЕЦИФИЧНУ ПОВРШИНУ И ПОРОЗНОСТ АКТИВНИХ УГЉЕНИЧНИХ ШУПЉИХ ВЛАКАНА
ЉИЉАНА М. КЉАЈЕВИЋ1, ВЛАДИСЛАВА М. ЈОВАНОВИЋ2, САЊА И. СТЕВАНОВИЋ2,
ЖАРКО Д. БОГДАНОВ1 и БРАНКА В. КАЛУЂЕРОВИЋ1
1Institut za nuklearne nauke “Vin~a”, p. pr. 522 ,11001 Beograd i 2IHTM – Institut za elektrohemiju,
p. pr. 473, 11000 Beograd
Активна угљенична шупља влакна су добијена хемијском активацијом полисулфонских шупљих влакана помоћу раствора динатријум-водоник-фосфата-2-хидрата, динатријум-тет-
_________________________________________________________________________________________________________________________
2011 Copyright (CC) SCS
Available online at www.shd.org.rs/JSCS/
ACTIVE CARBON HOLLOW FIB 1293
рабората 10-хидрата, водоник-пероксида и диамонијум-водоник-фосфата. Након хемијске активације, влакна су карбонизована у инертној атмосфери. Специфична површина и по-розност добијених влакана су испитивана преко изотерми адсорпије–десорпције азота на 77 К, док је структура испитивана скенирајућом електронском микроскопијом и рендгенском дифракцијом. Процес активације побољшава адсорпциона својства влакана, што је нарочито изражено код активних шупљих влакана активираних помоћу динатријум-тетрабората- -10-хидрата и водоник-пероксида. Активна угљенична шупља влакна су микропорозна са различитом расподелом величине пора. Хемијском активацијом фосфатима добија се акти-ван карбонски материјал мале специфичне површине, али са мезопорозном и микропороз-ном структуром. Рендгено-структурна анализа, поред турбостратичне структуре, типичне за угљеничне материјале, указује на присуство неких интермедијарних једињења насталих у току процеса активације солима натријума. На основу електрохемијских мерења може се закључити да активност и порозност активних влакана строго зависе од примењеног актива-ционог агенса.
(Примљено 26. фебруара 2010, ревидирано 31. маја 2011)
REFERENCES
1. T. J. Bandosz, M. J. Biggs, K. E. Gubbins, Y. Hattori, T. Iiyama, K. Kaneko, J. Pikunic, K. T. Thomson, in Chemistry and Physics of Carbon, Vol. 28, L. R. Radovic, Ed., Marcel Dekker, New York, 2003, p. 41
2. M. Inagaki, L. R. Radovic, Carbon 40 (2002) 2279 3. J. Sun, G. Wu, Q. Wang, J. Appl. Poly. Sci. 93 (2004) 602 4. A. F. Ismail, L. I. B. David, J. Membr. Sci. 193 (2001) 1 5. M. Mitrović, Z. Laušević, M. Petkovska, B. Kaludjerović, M. Laušević, in The role of
theory in the development of industrial catalysis, P. Putanov, Ed., Academy of Sciences and Arts of Vojvodina, Novi Sad, Serbia, 1992, p. 21
6. B. V. Kaludjerović, V. M. Jovanović, B. M. Babić, S. Terzić, Ž. Bogdanov, J. Opto-electron. Adv. Mater. 10 (2008) 2708
7. R. D. Sanderson, E. R. Sadiku, J. Appl. Polym. Sci. 87 (2003) 1051 8. L. Y. Jiang, T.-S. Chung, R. Rajagopalan, Carbon 45 (2007) 166 9. Y. Li, K.-C. Loh, J. Membr. Sci. 276 (2006) 81
10. B. V. Kaluđerović, Lj. Kljajević, D. Sekulić, J. Stašić, Ž. Bogdanov, Chem Ind. Chem. Eng. Q. 15 (2009) 29
11. C. Y. Wang, M. W. Li, Y. L. Wu, C. T. Guo, Carbon 36 (1998) 1749 12. G. Zhu, T.-S. Chung, K.-C. Loh, J. Appl. Polym. Sci. 76 (2000) 695 13. S. M. Saufi, A. F. Ismail, Membr. Sci. Tech. 24 (Suppl.) (2002) 843 14. E. Barbosa-Coutinho, V. M. M. Salim, C. Piacsek Borges, Carbon 41 (2003) 1707 15. N. Tanihara, H. Shimazaki, Y. Hirayama, S. Nakanishi, T. Yoshinaga, Y. Kusuki, J.
Membr. Sci. 160 (1999) 179 16. F. Suarez-Garcia, A. Martinez-Alonso, J. M. D. Tascon, Microporous Mesoporous Mater.
75 (2004) 73 17. F. Rodriguez-Reinoso, M. Molina-Sabio, Carbon 30 (1992) 1111 18. A. P. Carvalho, M. Gomes, A. S. Mestre, J. Pires, M. B. de Carvalho, Carbon 42 (2004)
672 19. J. Hayashi, M. Uchibayashi, T. Horikawa, K. Muroyama, V. G. Gomes, Carbon 40
(2002) 274
_________________________________________________________________________________________________________________________
2011 Copyright (CC) SCS
Available online at www.shd.org.rs/JSCS/

1294 KLJAJEVIĆ et al.
20. A. Linares-Solano, D. Lozano-Castello, M.A. Lillo-Rodenas, D. Cazorla-Amoros, in Chemistry and Physics of Carbon, Vol. 30, L. R. Radovic, Ed., Marcel Dekker, New York, 2008, p. 1
21. F. Rouquerol, J. Rouquerol, K. Sing, Adsorption by Powders and Porous Solids, Aca-demic Press, London, 1999, p. 197
22. M. M. Dubinin, in Chemistry and Physics of Carbon Vol. 2, P. L. Walker Jr., Ed., Marcel Dekker, New York, 1996, p. 51
23. F. Stoeckli, M. V. López-Ramón, D. Hugi-Cleary, A. Guillot, Carbon 39 (2001) 1115 24. B. McEnaney, Carbon 26 (1988) 267 25. K. Kaneko, C. Ishii, H. Kanoh, Y. Hanzawa, N. Setoyama, T. Suzuki, Adv. Colloid
Interface Sci. 76–77 (1998) 295 26. G. Horwat, K. Kawazoe, J. Chem. Eng. Jpn. 16 (1983) 470 27. K. Kinoshita, J. A. S. Bett, Carbon 12 (1974) 525 28. A. Dekanski, J. Stevanović, R. Stevanović, B. Ž. Nikolić, V. M. Jovanović, Carbon 39
(2001) 1195 29. A. B. Dekanski, V. V. Panić, V. M. Jovanović, R. M. Stevanović, J. Power Sources 181
(2008) 186 30. M. D. Obradović, G. D. Vuković, S. I. Stevanović, V. V. Panić, P. S. Uskoković, A.
Kowal, S. Lj. Gojković, J. Electroanal. Chem. 634 (2009) 22 31. V. Jovanović, R. Atanasoski, B. Nikolić, J. Serb. Chem. Soc. 51 (1986) 611.
_________________________________________________________________________________________________________________________
2011 Copyright (CC) SCS
Available online at www.shd.org.rs/JSCS/

J. Serb. Chem. Soc. 76 (9) 1295–1305 (2011) UDC 543.554+681.586.74:544.6.076.32– JSCS–4204 034.669+66.081 Original scientific paper
1295
A lutetium PVC membrane sensor based on (2-oxo-1,2- -diphenylethylidene)-N-phenylhydrazinecarbothioamide
HASSAN ALI ZAMANI1*, MOHAMMAD REZA GANJALI2 and FARNOUSH FARIDBOD3
1Department of Applied Chemistry, Quchan Branch, Islamic Azad University, Quchan, 2Center of Excellence in Electrochemistry, Faculty of Chemistry, University of Tehran,
Tehran and 3Endocrinology & Metabolism Research Center, Tehran University of Medical Sciences, Tehran, Iran
(Received 26 August, revised 18 November 2010)
Abstract: Based on the former experience on the design and construction of metal ions sensors, especially those of high sensitivity for lanthanides, (2-oxo-1,2-diphe-nylethylidene)-N-phenylhydrazinecarbothioamide (PHCT) was used to construct a Lu3+ PVC sensor exhibiting a Nernstian slope of 19.8±0.3 mV dec-1. The sensor was found to function well over a concentration range of 1.0×10⁻² and 1.0×10⁻⁶ mol L-1 of the target ion with a detection limit of 6.8×10⁻⁷ mol L-1. The sensor selec-tivity against many common alkaline, alkaline earth, transition, heavy metals and specially lanthanide ions was very good and it functioned well in the pH range 2.5– –8.7. Having a lifetime of at least 2 months and a short response time of ≈ 5 s, the sensor was successfully used as an indicator electrode in the potentiometric titration of Lu3+.
Keywords: potentiometry; sensor; PVC membrane; ion-selective electrode.
INTRODUCTION
The fact that lanthanides have similar chemical and physical properties, makes their analyses an extremely time consuming and complicated procedure, especially in case when other similar ions are present in the sample solution.1 Lutetium is a very rare element commonly used as a fluorescent and magnetic material, the uses of which are growing, due to its applicability in the production of catalysts used in oil and gas technologies and glass polish. The element is hence dumped in the environment, mainly from petrol-producing industries.2 Thus, finding a method for its determination would be useful.
Such methods are inductively couple plasma mass spectrometry (ICP–MS), inductively couple plasma atomic emission spectrometry (ICP–AES), mass spec-
* Corresponding author. E-mail: [email protected] doi: 10.2298/JSC100826114A
_________________________________________________________________________________________________________________________
2011 Copyright (CC) SCS
Available online at www.shd.org.rs/JSCS/

1296 ALI ZAMANI, REZA GANJALI and FARIDBOD
trometry (MS), Isotope dilution mass spectrometry, X-ray fluorescence spectro-metry, etc. Almost all of the mentioned methods are expensive and time con-suming, as compared to the application of ion selective electrodes (ISEs). ISEs are among the most popular electrochemical devices that usually show fast and selective responses in addition to their low cost and ease of preparation and use
Since there are some reports on lutetium sensors based on different iono-phores3–6 and also recent experience on the development of highly selective and sensitive PVC-membrane ISEs,7–20 it was decided to assess the possibility of constructing a novel Lu3+ sensor by testing (2-oxo-1,2-diphenylethylidene)-N- -phenylhydrazinecarbothioamide (PHCT) (Fig. 1) as a neutral ion carrier.
Fig. 1. Chemical structure of PHCT.
EXPERIMENTAL
Reagents
Nitrate and chloride salts of all cations, as well as reagent grade dibutyl phthalate (DBP), benzyl acetate (BA), acetophenone (AP), nitrobenzene (NB), sodium tetraphenyl borate (NaTPB), tetrahydrofuran (THF) and high relative molecular weight PVC of the highest purity available were procured from Merck and Aldrich and used without any further treatments, except for the vacuum drying of the salts over P2O5. Doubly distilled water was used in all experiments.
Synthesis of PHCT
To prepare (2-oxo-1,2-diphenylethylidene)-N-phenylhydrazinecarbothioamide, 1 mmol (0.21 g) of benzil was dissolved in hot ethanol, and then 1 mmol (0.167 g) of N-phenyl hydrazinecarbothioamide and a catalytic amount of acetic acid were added to the benzyl so-lution. The reaction mixture was next refluxed for an hour, before crystallizing the solid product from a solution of acetone and ethanol (1:1).
EMF Measurements
The cell assembly used in all experiments was as follows: Ag/AgCl | 1.0×10⁻³ mol L-1 LuCl3 | PVC membrane: test solution| Hg/Hg2Cl2, KCl (satd.).
The potential measurements were made using a Corning ion analyzer 250 pH/mV meter. The measurements were performed at room temperature (25.0 °C) and the activities of the species were calculated according to the Debye–Hückel procedure.21 The pH was adjusted to 4 using sodium acetate buffer.
_________________________________________________________________________________________________________________________
2011 Copyright (CC) SCS
Available online at www.shd.org.rs/JSCS/

LUTETIUM PVC MEMBRANE SENSOR 1297
Electrode preparation
In general, the desired amount of the components, i.e., powdered PVC, the plasticizer, the ionic additive and the ionophore (PHCT), were completely dissolved in 5 mL of THF in a glass dish of 2 cm in diameter and then some of the THF was allowed to evaporate to yield a rather viscose solution that was used for forming a layer of the membrane on the tip of Pyrex tubes of 3–5 mm o.d. To do this, the tips of the tubes were dipped into the mixture for a short time. 22-34 The tube, now having a layer of the membrane on the tip were next kept at room temperature for 12 h before being filled with an internal filling solution (1.0×10⁻³ mol L-1 of the target ion) and conditioned for 24 h in a 1.0×10⁻² mol L-1 solution of the target ion. The electrodes were furnished with an internal reference silver/silver chloride coated wire.
RESULTS AND DISCUSSION
The response behavior of the sensors
Having four medium to soft base donating nitrogen and sulfur atoms in PHCT structure, it was expected to form stable complexes with transition metal ions. Therefore, in the initial tests to check the suitability of PHCT as an iono-phore for different metal ions, PHCT complexation with a number of metal ions including mono-, di- and tri-valent cations was investigated by conductometric method in acetonitrile solution (1.0×10⁻⁴ mol L–1 of cation solution and 1.0×10⁻² mol L–1 of ligand solution) at 25±0.1 °C.29–31 Then, 25 mL of each ion solution was titrated with 0.01 mol L–1 of PHCT solution. The conductance of the solu-tion was measured after each addition. Ligand addition was continued until the desired ligand-to-cation mole ratio was achieved. The 1:1 binding of the cations with ligands can be expressed by the following equilibrium:
fn nM L MLK+ ++ ←⎯⎯→ (1)
The formation constant of the equilibrium, Kf, is given by:
+
+
+ (ML )f +
(L)(M )
[ML ]
[M ][L]=
n
n
n
n
fK
f f (2)
where [MLn+], [Mn+], [L] and f represent the equilibrium molar concentration of complex, free cation, free ligand, and the activity coefficient of the species in-dicated, respectively. The activity coefficient of the unchanged ligand, f(L) can be assumed as unity in diluted solutions. The Debye–Hückel limiting law of 1:1 ele-ctrolytes leads to activity coefficient in Eq. (2) being canceled. Hence, the com-plex formation constant in term of molar conductance can be expressed as:
+
M obsf +
obs ML
[ML ] ( )
[M ][L] ( )[L]
Λ ΛΛ Λ
= =n
n
–K
– (3)
where:
M M obsf L
obs ML
( )=
( )
Λ ΛΛ Λ
c –K c –
– (4)
_________________________________________________________________________________________________________________________
2011 Copyright (CC) SCS
Available online at www.shd.org.rs/JSCS/
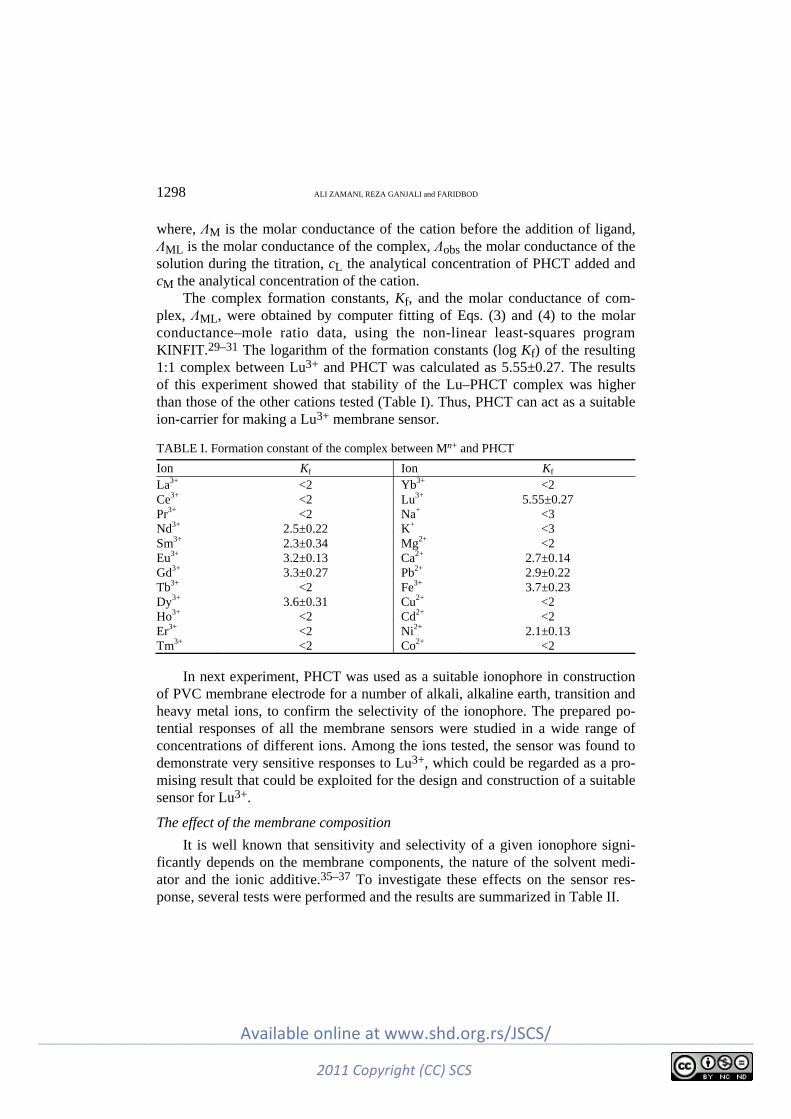
1298 ALI ZAMANI, REZA GANJALI and FARIDBOD
where, ΛM is the molar conductance of the cation before the addition of ligand, ΛML is the molar conductance of the complex, Λobs the molar conductance of the solution during the titration, cL the analytical concentration of PHCT added and cM the analytical concentration of the cation.
The complex formation constants, Kf, and the molar conductance of com-plex, ΛML, were obtained by computer fitting of Eqs. (3) and (4) to the molar conductance–mole ratio data, using the non-linear least-squares program KINFIT.29–31 The logarithm of the formation constants (log Kf) of the resulting 1:1 complex between Lu3+ and PHCT was calculated as 5.55±0.27. The results of this experiment showed that stability of the Lu–PHCT complex was higher than those of the other cations tested (Table I). Thus, PHCT can act as a suitable ion-carrier for making a Lu3+ membrane sensor.
TABLE I. Formation constant of the complex between Mn+ and PHCT
Ion Kf Ion Kf La3+ <2 Yb3+ <2 Ce3+ <2 Lu3+ 5.55±0.27 Pr3+ <2 Na+ <3 Nd3+ 2.5±0.22 K+ <3 Sm3+ 2.3±0.34 Mg2+ <2 Eu3+ 3.2±0.13 Ca2+ 2.7±0.14 Gd3+ 3.3±0.27 Pb2+ 2.9±0.22 Tb3+ <2 Fe3+ 3.7±0.23 Dy3+ 3.6±0.31 Cu2+ <2 Ho3+ <2 Cd2+ <2 Er3+ <2 Ni2+ 2.1±0.13 Tm3+ <2 Co2+ <2
In next experiment, PHCT was used as a suitable ionophore in construction of PVC membrane electrode for a number of alkali, alkaline earth, transition and heavy metal ions, to confirm the selectivity of the ionophore. The prepared po-tential responses of all the membrane sensors were studied in a wide range of concentrations of different ions. Among the ions tested, the sensor was found to demonstrate very sensitive responses to Lu3+, which could be regarded as a pro-mising result that could be exploited for the design and construction of a suitable sensor for Lu3+.
The effect of the membrane composition
It is well known that sensitivity and selectivity of a given ionophore signi-ficantly depends on the membrane components, the nature of the solvent medi-ator and the ionic additive.35–37 To investigate these effects on the sensor res-ponse, several tests were performed and the results are summarized in Table II.
_________________________________________________________________________________________________________________________
2011 Copyright (CC) SCS
Available online at www.shd.org.rs/JSCS/

LUTETIUM PVC MEMBRANE SENSOR 1299
TABLE II. Optimization of the membrane components (dynamic linear range: 1.0×10⁻²– –1.0×10⁻⁶ mol L-1)
Sensor No. Composition of the membrane, mass% (PVC content: 30 mass%) Slope
mV dec-1 Plasticizer PHCT NaTPB 1 2 3
NB, 66 AP, 66 BA, 66
2 2 2
2 2 2
15.8±0.3 16.1±0.5 16.5±0.2
4 DBP, 66 2 2 18.4±0.3 5 DBP, 67 1 2 14.3±0.6 6 DBP, 65 3 2 19.8±0.3 7 DBP, 67 3 0 11.7±0.4 8 DBP, 66 3 1 13.5±0.5 9 DBP, 64 3 3 18.3±0.2
The initial composition (No. 7, Table II), prepared based on previous ex-perience gained on other sensors for similar ions,4–20 of 66 mg of DBP, 30 mg of PVC powder and 2 mg of the ionophore (in the absence of an ionic additive) showed a selective response toward Lu3+, but the slope of 11.7±0.4 mV dec–1 of the calibration curve showed its low sensitivity which could be caused by the high ohmic resistance of the membrane, as well as the co-extraction of the cat-ions in the solutions together with the ions present therein. Hence, in the next experiments, 1, 2, and even 3 mg of an appropriate ionic additive (NaTPB) was added to the membrane composition (Nos. 8, 4 and 9, respectively, Table II). Changes of the slopes from 13.5±0.5 to 18.4±0.3, and finally to 18.3±0.2 mV dec–1 resulting from changes in the amount of ionic additive in the membrane, showed that 2 mg of the ionic additive could be regarded as the optimum amount.
To find the best plasticizer for the membrane, four common plasticizers na-mely NB, AP, BA, and DBP were used in an amount of 66 mg (Nos. 1–4, Table II). NB showed the lowest response of 15.8±0.3 mV dec–1, while AP and BA had better and rather identical responses of 16.1±0.5 and 16.5±0.2 mV dec–1, respec-tively. The best response was, however, observed in the case of DBP with a response of 18.4±0.3 mV dec–1.
To assess the optimal amount of the ionophore for the membrane compo-sition, two more compositions were prepared and compared with composition 4. The results (Nos. 5 and 6, Table II) showed that decreasing the amount of the ionophore in the membrane to 1 mg considerably decreased the potential slope. While increasing the amount up to a value of 3 mg increased the potential response to the optimum Nernstian value of 19.8±0.3 mV dec–1. Hence, this composition was chosen as the optimum one and used for the further experi-ments.
_________________________________________________________________________________________________________________________
2011 Copyright (CC) SCS
Available online at www.shd.org.rs/JSCS/
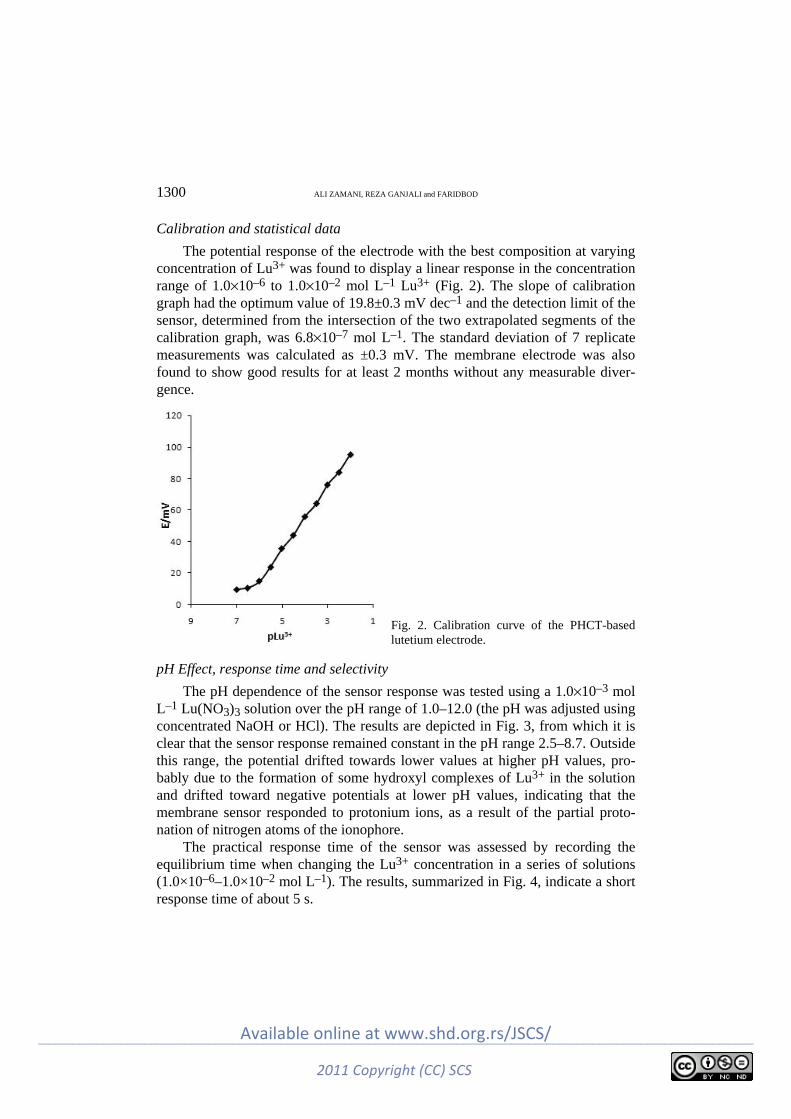
1300 ALI ZAMANI, REZA GANJALI and FARIDBOD
Calibration and statistical data
The potential response of the electrode with the best composition at varying concentration of Lu3+ was found to display a linear response in the concentration range of 1.0×10⁻⁶ to 1.0×10⁻² mol L–1 Lu3+ (Fig. 2). The slope of calibration graph had the optimum value of 19.8±0.3 mV dec–1 and the detection limit of the sensor, determined from the intersection of the two extrapolated segments of the calibration graph, was 6.8×10⁻⁷ mol L–1. The standard deviation of 7 replicate measurements was calculated as ±0.3 mV. The membrane electrode was also found to show good results for at least 2 months without any measurable diver-gence.
Fig. 2. Calibration curve of the PHCT-based lutetium electrode.
pH Effect, response time and selectivity
The pH dependence of the sensor response was tested using a 1.0×10⁻³ mol L–1 Lu(NO3)3 solution over the pH range of 1.0–12.0 (the pH was adjusted using concentrated NaOH or HCl). The results are depicted in Fig. 3, from which it is clear that the sensor response remained constant in the pH range 2.5–8.7. Outside this range, the potential drifted towards lower values at higher pH values, pro-bably due to the formation of some hydroxyl complexes of Lu3+ in the solution and drifted toward negative potentials at lower pH values, indicating that the membrane sensor responded to protonium ions, as a result of the partial proto-nation of nitrogen atoms of the ionophore.
The practical response time of the sensor was assessed by recording the equilibrium time when changing the Lu3+ concentration in a series of solutions (1.0×10⁻⁶–1.0×10⁻² mol L–1). The results, summarized in Fig. 4, indicate a short response time of about 5 s.
_________________________________________________________________________________________________________________________
2011 Copyright (CC) SCS
Available online at www.shd.org.rs/JSCS/
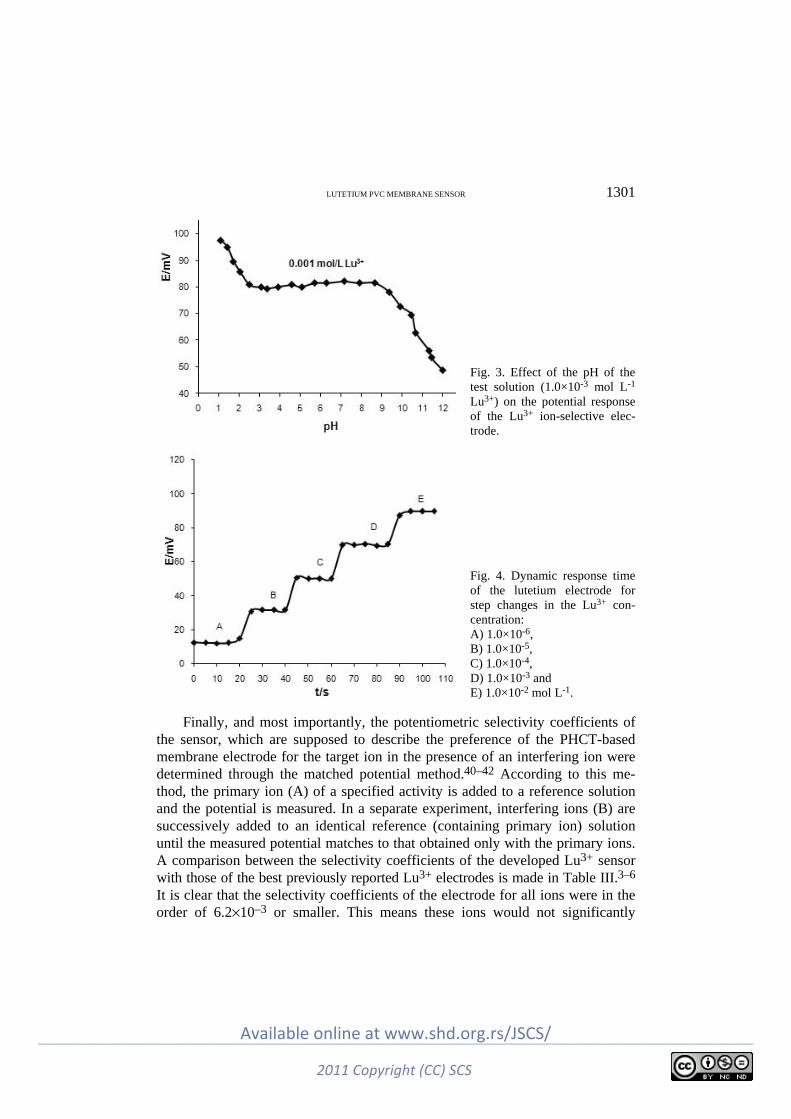
LUTETIUM PVC MEMBRANE SENSOR 1301
Fig. 3. Effect of the pH of the test solution (1.0×10⁻³ mol L-1 Lu3+) on the potential response of the Lu3+ ion-selective elec-trode.
Fig. 4. Dynamic response time of the lutetium electrode for step changes in the Lu3+ con-centration: A) 1.0×10⁻⁶, B) 1.0×10⁻⁵, C) 1.0×10⁻⁴, D) 1.0×10⁻³ and E) 1.0×10⁻² mol L-1.
Finally, and most importantly, the potentiometric selectivity coefficients of the sensor, which are supposed to describe the preference of the PHCT-based membrane electrode for the target ion in the presence of an interfering ion were determined through the matched potential method.40–42 According to this me-thod, the primary ion (A) of a specified activity is added to a reference solution and the potential is measured. In a separate experiment, interfering ions (B) are successively added to an identical reference (containing primary ion) solution until the measured potential matches to that obtained only with the primary ions. A comparison between the selectivity coefficients of the developed Lu3+ sensor with those of the best previously reported Lu3+ electrodes is made in Table III.3–6 It is clear that the selectivity coefficients of the electrode for all ions were in the order of 6.2×10⁻³ or smaller. This means these ions would not significantly
_________________________________________________________________________________________________________________________
2011 Copyright (CC) SCS
Available online at www.shd.org.rs/JSCS/

1302 ALI ZAMANI, REZA GANJALI and FARIDBOD
disturb the response of the Lu3+ selective membrane sensor, especially if their concentrations were low in the test solution. A comparison made of the detection range, the response time, the detection limit and the selectivity coefficients of the sensor with those existing in the literature is evidence enough for the comparative superiority of the sensor investigated in the present study.
TABLE III. Comparison of the selectivity coefficient, MPM×104, linearity range, detection limit and response time of the developed Lu3+ electrode and previously reported Lu3+ PVC-membrane sensors
Element Reference
3 4 5 6 This work Nd3+ 200 0.10 65 – 3.6 Eu3+ – 3.0 21 2.0 7.2 Gd3+ 63 1.0 47 1.7 6.8 Dy3+ 80 1.0 62 80 7.7 Sm3+ 2.5 2.0 8.5 50 7.5 Cr3+ – – 8.6 – 57 Fe3+ – – 10 – 22 Pb2+ 7.9 0.20 – 1.0 62 Ni2+ – – – – 2.7 Co2+ – – – – 5.9 Ca2+ 1.6 1.0 – 8.0 1.8 Na+ 3.2 2.5 8.7 2.5 6.3 K+ 6.3 8.0 21 9.0 8.4 Response time, s <10 ≈5 <10 ≈5 ≈5 Linearity range, mol L-1
1.0×1-6– 1.0×10⁻²
1.0×1-6–0.10 1.0×1-6– 1.0×1-2
1.0×1-6–0.10 1.0×1-6– 1.0×10⁻²
Limit of detection, mol L-1
8.0 × 10⁻⁷ 6.3 × 10⁻⁷ 7.2 × 10⁻⁷ 6.0 × 10⁻⁷ 6.8 × 10⁻⁷
pH Range 4.5–8.0 3–7.5 2.7–10.6 4–9 2.5–8.7
Analytical accuracy
The electrode was found to function well under laboratory conditions and the sensor was used as an indicator electrode in the titration of a 1.0×10⁻⁴ mol L–1 lutetium ion solution with a standard 1.0×10⁻² mol/L EDTA solution. The re-sulting titration curve is shown in Fig. 5, which indicates that the sensor was capable of monitoring the amounts of lutetium ions in such measurements.
The proposed sensor was also applied to Lu3+ determination in a certified reference material (CRM), called coal and fuel ash (FFA 1 fly ash). According to Table IV, where the CRM analysis is summarized, the Lu3+ concentration was 0.658 mg kg–1. Employing the calibration method a Lu3+ concentration value of 0.669±0.5 mg kg–1 was obtained.
These experimental data reveal that the proposed electrode performed a trustworthy detection of Lu3+, despite the presence of other rare earth elements.
_________________________________________________________________________________________________________________________
2011 Copyright (CC) SCS
Available online at www.shd.org.rs/JSCS/
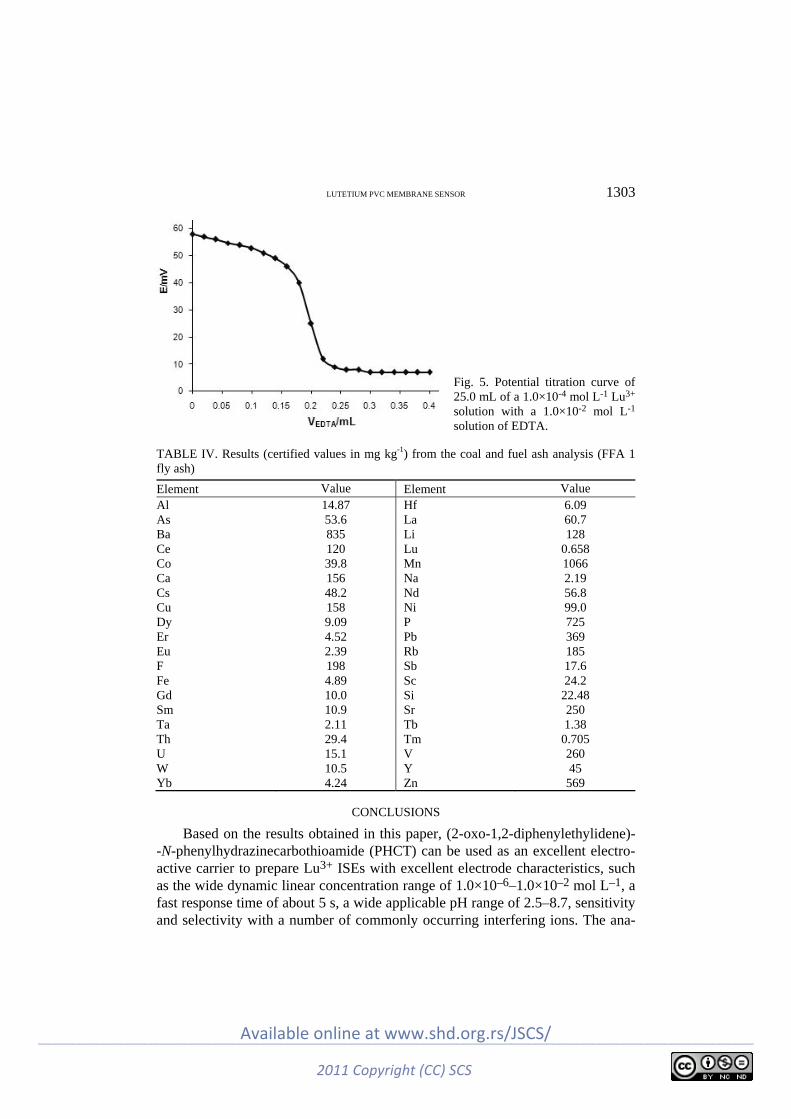
LUTETIUM PVC MEMBRANE SENSOR 1303
Fig. 5. Potential titration curve of 25.0 mL of a 1.0×10⁻⁴ mol L-1 Lu3+ solution with a 1.0×10⁻² mol L-1 solution of EDTA.
TABLE IV. Results (certified values in mg kg-1) from the coal and fuel ash analysis (FFA 1 fly ash)
Element Value Element Value Al 14.87 Hf 6.09 As 53.6 La 60.7 Ba 835 Li 128 Ce 120 Lu 0.658 Co 39.8 Mn 1066 Ca 156 Na 2.19 Cs 48.2 Nd 56.8 Cu 158 Ni 99.0 Dy 9.09 P 725 Er 4.52 Pb 369 Eu 2.39 Rb 185 F 198 Sb 17.6 Fe 4.89 Sc 24.2 Gd 10.0 Si 22.48 Sm 10.9 Sr 250 Ta 2.11 Tb 1.38 Th 29.4 Tm 0.705 U 15.1 V 260 W 10.5 Y 45 Yb 4.24 Zn 569
CONCLUSIONS
Based on the results obtained in this paper, (2-oxo-1,2-diphenylethylidene)- -N-phenylhydrazinecarbothioamide (PHCT) can be used as an excellent electro-active carrier to prepare Lu3+ ISEs with excellent electrode characteristics, such as the wide dynamic linear concentration range of 1.0×10⁻⁶–1.0×10⁻² mol L–1, a fast response time of about 5 s, a wide applicable pH range of 2.5–8.7, sensitivity and selectivity with a number of commonly occurring interfering ions. The ana-
_________________________________________________________________________________________________________________________
2011 Copyright (CC) SCS
Available online at www.shd.org.rs/JSCS/

1304 ALI ZAMANI, REZA GANJALI and FARIDBOD
lysis of a certified reference material showed the accuracy of the sensor for appli-cation in real samples.
Acknowledgements. The authors are grateful to the Research Council of the Quchan Isla-mic Azad University for the financial support of this research.
И З В О Д
СЕНЗОР ЗА ЛУТЕЦИЈУМ НА БАЗИ (2-ОКСО-1,2-ДИФЕНИЛЕТИЛИДЕН)-N- -ФЕНИЛХИДРАЗИНКАРБОТИОАМИДА У PVC МАТРИЦИ
HASSAN ALI ZAMANI1, MOHAMMAD REZA GANJALI2 и FARNOUSH FARIDBOD3
1Department of Applied Chemistry, Quchan branch, Islamic Azad University, Quchan, 2Center of Excellence in Electrochemistry, Faculty of Chemistry, University of Tehran, Tehran и 3Endocrinology and Metabolism
Research Center, Tehran University of Medical Sciences, Tehran, Iran
На основу ранијег искукства у дизајну и конструкцији сензора за јоне метала, посебно оних високе осетљивости за лантаноиде, направљен је сензор за Lu3+ на бази (2-оксо-1,2-дифенилетилиден)-N-фенилхидразинкарботиоамид (PHCT) у PVC матрици, који је показао Нернстов нагиб од 19,8±0,3 mV deк-1. Показано је да сензор ради добро у опсегу концентра-ција Lu3+ од 1,0×10⁻² до 1,0×10⁻⁶ mol L-1 и да му је граница осетљивости 6,8×10⁻⁷ mol L-1. Селективност сензора према многим уобичајеним алкалним, земноалкалним, прелазним и тешким металима, а посебно према јонима лантаноида је веома добра и може се употребља-вати у опсегу pH 2,5–8,7. Са периодом употребе од најмање 2 месеца и кратким временом одзива од ≈5 s, сензор је успешно коришћен као индикатроска електрода у потенциомет-ријској титрацији Lu3+.
(Примљено 26. августа, ревидирано 18. новембра 2010)
REFERENCES
1. J. G. S. Gupta, J. Anal. At. Spectrom. 8 (1993) 93 2. C. Bariain, I. R. Matias, C. Fernandez-Valdivielso, F. J. Arregui, M. L. Rodriguez-Men-
dezb, J. A. de Saja, Sens. Actuators, B 93 (2003) 153 3. M. R. Ganjali, A. Tamaddon, P. Norouzi, M. Adib, Sens. Actuators, B 120 (2006) 194 4. M. R. Ganjali, P. Norouzi, F. Faridbod, N. Hajiabdollah, R. Dinarvand, S. Meghdadi,
Anal. Lett. 41 (2008) 3 5. H. A. Zamani, M. Rohani, A. Zangeneh-Asadabadi, M. S. Zabihi, M. R. Ganjali, M.
Salavati-Niasari, Mater. Sci. Eng., C 30 (2010) 917 6. M. R. Ganjali, P. Norouzi, A. Atrian, F. Faridbod, S. Meghdadi, M. Giahi, Mater. Sci.
Eng., C 29 (2009) 205 7. M. Mohammadhossieni, H. A. Zamani, M. Nekoei, Anal. Lett. 42 (2009) 298 8. K. Gupta, M. K. Pal, A. K. Singh, Talanta 79 (2009) 528 9. V. K. Gupta, R. N. Goyal, M. K. Pal, R. A. Sharma, Anal. Chim. Acta 653 (2009) 161
10. H. A. Zamani, M. R. Ganjali, P. Norouzi, M. Adib, Mater. Sci. Eng., C 28 (2008) 157 11. H. Behmadi, H. A. Zamani, M. R. Ganjali, P. Norouzi, Electrochim. Acta 53 (2007) 1870 12. A. K. Singh, V. K. Gupta, B. Gupta, Anal. Chim. Acta 585 (2007) 171 13. F. Faridbod, M. R. Ganjali, S. Labbafi, P. Norouzi, Anal. Lett. 41 (2008) 2972 14. H. A. Zamani, M. Masrournia, S. Sahebnasagh, M. R. Ganjali, Anal. Lett. 42 (2009) 555 15. M. B. Saleh, A. A. Abdel-Gaber, M. M. R. Khalaf, A. M. Tawfeek, Anal. Lett. 39 (2006) 17
_________________________________________________________________________________________________________________________
2011 Copyright (CC) SCS
Available online at www.shd.org.rs/JSCS/
LUTETIUM PVC MEMBRANE SENSOR 1305
16. M. R. Ganjali, P. Norouzi, F. Faridbod, M. Ghorbani, M. Adib, Anal. Chim. Acta 569 (2008) 35
17. H. A. Zamani, J. Abedini-Torghabeh, M. R. Ganjali, Electroanalysis 18 (2006) 888 18. M. Nekoei, H. A. Zamani, M. Mohammadhossieni, Anal. Lett. 42 (2009) 284 19. F. Faridbod, M. R. Ganjali, B. Larijani, P. Norouzi, Electrochim. Acta 55 (2009) 234 20. H. A. Zamani, M. R. Ganjali, P. Norouzi, A. Tadjarodi, E. Shahsavani, Mater. Sci. Eng.,
C 28 (2008) 1489 21. S. Kamata, A. Bhale, Y. Fukunaga, A. Murata, Anal. Chem. 60 (1988) 2464 22. L. Liu, L. Wang, H. Yin, Y. Li, X. He, Anal. Lett. 39 (2006) 879 23. H. A. Zamani, M. T. Hamed-Mosavian, E. Aminzadeh, M. R. Ganjali, M. Ghaemy, H.
Behmadi, F. Faridbod, Desalination 250 (2010) 56 24. H. A. Zamani, M. T. Hamed-Mosavian, E. Hamidfar, M. R. Ganjali, P. Norouzi, Mater.
Sci. Eng., C 28 (2008) 1551 25. E. P. Luo, Y. Q. Chai, R. Yuan, Anal. Lett. 40 (2007) 369 26. H. A. Zamani, M. R. Ganjali, M. Salavati-Niasari, Transition Met. Chem. 33 (2008) 995 27. A. Shokrollahi, M. Ghaedi, M. Montazerozohori, O. Hosaini, H. Ghaedi, Anal. Lett. 40
(2007) 1714 28. R. Prasad, V. K. Gupta, A. Kumar, Anal. Chim. Acta 508 (2004) 61 29. H. A. Zamani, G. Rajabzadeh, M. Masrornia, A. Dejbord, M. R. Ganjali, N. Seifi,
Desalination 249 (2009) 560 30. H. A. Zamani, G. Rajabzadeh, M. R. Ganjali, Sens. Actuators, B 119 (2006) 41 31. M. R. Abedi, H. A. Zamani, M. R. Ganjali, P. Norouzi, Sensor Lett. 5 (2007) 516 32. M. B. Saleh, E. M. Soliman, A. A. Abdel Gaber, S. A. Ahmed, Anal. Lett. 39 (2006) 659 33. H. A. Zamani, M. Masrournia, M. Rostame-Faroge, M. R. Ganjali, H. Behmadi, Sensor
Lett. 6 (2008) 759 34. E. Naddaf, H. A. Zamani, Anal. Lett. 42 (2009) 2838 35. T. Rosatzin, E. Bakker, Y. Suzuki, W. Simon, Anal. Chim. Acta 280 (1993) 197 36. K. Jain, V. K. Gupta, L. P. Singh, U. Khurana, Analyst 122 (1997) 583 37. E. Ammann, E. Pretsch, W. Simon, E. Lindner, A. Bezegh, E. Pungor, Anal. Chim. Acta
171 (1985) 119 38. M. Huster, P. M. Gehring, W. E. Morf, W. Simon, Anal. Chem. 63 (1990) 1330 39. H. A. Zamani, M. R. Ganjali, P. Norouzi, M. Adib, Sensor Lett. 5 (2007) 522 40. F. Faridbod, M. R. Ganjali, R. Dinarvand, P. Norouzi, Comb. Chem. High Throughput
Screening 10 (2007) 527 41. Y. Umezawa, K. Umezawa, H. Sato, Pure Appl. Chem. 67 (1995) 507 42. M. R. Ganjali, F. Memari, F. Faridbod, R. Dinarvand, P. Norouzi, Electroanalysis 20
(2008) 2663.
_________________________________________________________________________________________________________________________
2011 Copyright (CC) SCS
Available online at www.shd.org.rs/JSCS/


J. Serb. Chem. Soc. 76 (9) 1307–1323 (2011) UDC 615.463+615.464:543.544.5.068.7+ JSCS–4205 543.21:616.314 Original scientific paper
1307
Correlation between the degree of conversion and the elution of leachable components from dental resin-based cements
KOSOVKA OBRADOVIĆ-DJURIČIĆ1*, VESNA MEDIĆ1, MARINA RADIŠIĆ2# and MILA LAUŠEVIĆ2#
1Clinic for Prosthetic Dentistry, Faculty of Dentistry, University of Belgrade, Rankeova 4, 11000 Belgrade and 2Department of Analytical Chemistry, Faculty of Technology and
Metallurgy, University of Belgrade, Karnegijeva 4, 11120 Belgrade, Serbia
(Received 10 June 2010, revised 20 February 2011)
Abstract: This study examined the possible correlation between the degree of con-version (DC) and the amount of substances eluted from three commercial cured resin-based cements. The DC of the various resin-based cements was measured by Raman spectroscopy, while the quantity of unreacted monomers released from the cement matrix (triethylene glycol dimethacrylate, TEGDMA, urethane dimetha-crylate, UDMA, 2-hydroxyethyl methacrylate, HEMA and bisphenol A) was deter-mined by high pressure liquid chromatography (HPLC). The obtained results, after multiple statistical evaluation (one way ANOVA, LSD post hoc test), showed no significant differences in the DC values between the resin cements. On the contrary, the results of the HPLC analysis depicted statistically significant differences be-tween the three materials with respect to the amount of leached monomers. In ad-dition, no correlation between the DC and the amount of eluted substances from the tested cured composite cements was found.
Keywords: dental resin-based cement; degree of conversion; eluted monomer.
INTRODUCTION
Contemporary prosthodontics promotes new all-ceramic systems and diffe-rent resin-based luting cements. Adhesive composite cements belong to a rela-tively small but specific group of dental composite materials. They are highly responsible for the final appearance and functional capacity of cemented ceramic crowns in the mouth environment.1,2
Although, the composition of luting resin-based dental composites is basi-cally identical to other composite materials (filling composite and core build-up materials), there are some differences. Resin-based cements must provide the
* Corresponding author. E-mail: [email protected] # Serbian Chemical Society member. doi: 10.2298/JSC100610113O
_________________________________________________________________________________________________________________________
2011 Copyright (CC) SCS
Available online at www.shd.org.rs/JSCS/
1308 OBRADOVIĆ-DJURIČIĆ et al.
practitioners with optimum handling features. Therefore they have modified rheo-logical properties (higher flow capacity and lower viscosity) resulting from a reduced filler content (fine particle hybrid type). In addition, the different poly-merization initiation system of resin cements is responsible for the participation of additional components: chemical polymerization or/and light-curing initiators. Newer self-adhesive resin cements contain acidic monomers with several metha-crylate and phosphate groups.3
The setting of resin-based cements belongs to a radical-chain type of poly-merization. Most frequently, a material sets through the light or chemical ini-tiated polymerization of matrix monomers by the opening of double bonds at both methacrylate residues of the monomers and the resulting cross-linking process. Ideally, dental resins would have all their monomers converted to polymer during the polymerization process. However, all dimethacrylate monomers exhibit re-sidual unsaturation in the final product, mainly in the form of pendant metha-crylate groups, due to steric hindrance.4,5 The percentage of reacted C=C bonds is defined as the degree of conversion (DC). This value, which varies between 35 and 77 % (88 %) among different composite materials, affects many properties including mechanical features, solubility, dimensional stability and biocompati-bility of resin-based materials.6–8 The degree of conversion may be assessed di-rectly or indirectly. Micro-Raman spectroscopy and Fourier transform infrared micromultiple internal reflectance spectroscopy (FT-IR) are the available direct methods frequently used for measuring the DC values of the composites. Infrared spectroscopy is the most sensitive as it detects the C=C stretching vibrations di-rectly before and after curing of the material, but it is a time consuming and costly method.9 On the other hand, FT-Raman spectroscopy is a nondestructive tech-nique which provides for investigation of samples of any thickness and geometry. Physical property test such as hardness, flexural strength and modulus of elas-ticity are indirect methods used to evaluate the conversion of double bonds in a composite.9–11
The elutable residual monomer content must be differentiated from the de-gree of conversion. Residual monomers are those components that are released from the resin into various media. The results concerning the correlation between DC and eluted residual monomers in water are strongly controversial.8,12 Appro-ximately, one tenth of the non-reacted methacrylate groups exist as residual mo-nomers,8 or 0.2–3 mass% is the measured elution of monomer from the polymer matrix of various resin composites.13,14 The main analytical methods used for the determination of substances eluted from cured composite materials are gas chro-matography (GC) and high performance liquid chromatography (HPLC). If ne-cessary, they are combined with mass spectroscopy (MS), whereby different forms and masses of the eluted species can be identified.15–17
_________________________________________________________________________________________________________________________
2011 Copyright (CC) SCS
Available online at www.shd.org.rs/JSCS/
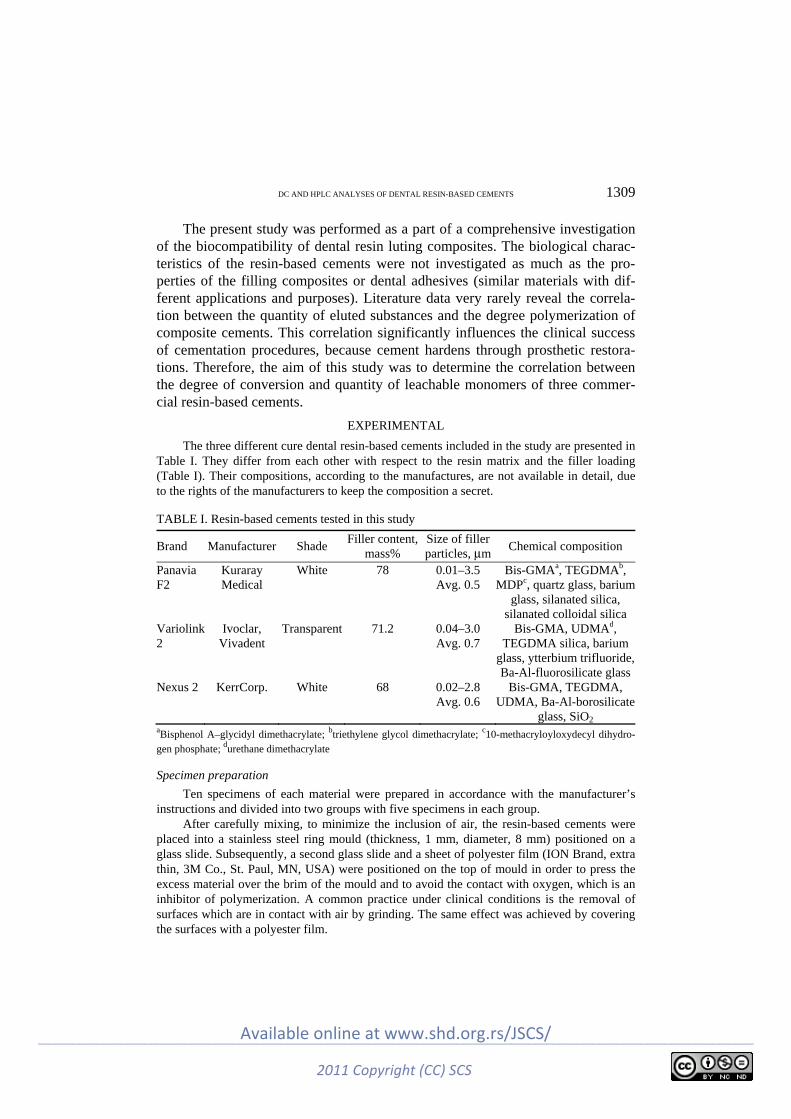
DC AND HPLC ANALYSES OF DENTAL RESIN-BASED CEMENTS 1309
The present study was performed as a part of a comprehensive investigation of the biocompatibility of dental resin luting composites. The biological charac-teristics of the resin-based cements were not investigated as much as the pro-perties of the filling composites or dental adhesives (similar materials with dif-ferent applications and purposes). Literature data very rarely reveal the correla-tion between the quantity of eluted substances and the degree polymerization of composite cements. This correlation significantly influences the clinical success of cementation procedures, because cement hardens through prosthetic restora-tions. Therefore, the aim of this study was to determine the correlation between the degree of conversion and quantity of leachable monomers of three commer-cial resin-based cements.
EXPERIMENTAL
The three different cure dental resin-based cements included in the study are presented in Table I. They differ from each other with respect to the resin matrix and the filler loading (Table I). Their compositions, according to the manufactures, are not available in detail, due to the rights of the manufacturers to keep the composition a secret.
TABLE I. Resin-based cements tested in this study
Brand Manufacturer Shade Filler content,
mass% Size of filler particles, μm
Chemical composition
Panavia F2
Kuraray Medical
White 78 0.01–3.5 Avg. 0.5
Bis-GMAa, TEGDMAb, MDPc, quartz glass, barium
glass, silanated silica, silanated colloidal silica
Variolink 2
Ivoclar, Vivadent
Transparent 71.2 0.04–3.0 Avg. 0.7
Bis-GMA, UDMAd, TEGDMA silica, barium
glass, ytterbium trifluoride, Ba-Al-fluorosilicate glass
Nexus 2 KerrCorp. White 68 0.02–2.8 Avg. 0.6
Bis-GMA, TEGDMA, UDMA, Ba-Al-borosilicate
glass, SiO2 aBisphenol A–glycidyl dimethacrylate; btriethylene glycol dimethacrylate; c10-methacryloyloxydecyl dihydro-gen phosphate; durethane dimethacrylate
Specimen preparation
Ten specimens of each material were prepared in accordance with the manufacturer’s instructions and divided into two groups with five specimens in each group.
After carefully mixing, to minimize the inclusion of air, the resin-based cements were placed into a stainless steel ring mould (thickness, 1 mm, diameter, 8 mm) positioned on a glass slide. Subsequently, a second glass slide and a sheet of polyester film (ION Brand, extra thin, 3M Co., St. Paul, MN, USA) were positioned on the top of mould in order to press the excess material over the brim of the mould and to avoid the contact with oxygen, which is an inhibitor of polymerization. A common practice under clinical conditions is the removal of surfaces which are in contact with air by grinding. The same effect was achieved by covering the surfaces with a polyester film.
_________________________________________________________________________________________________________________________
2011 Copyright (CC) SCS
Available online at www.shd.org.rs/JSCS/
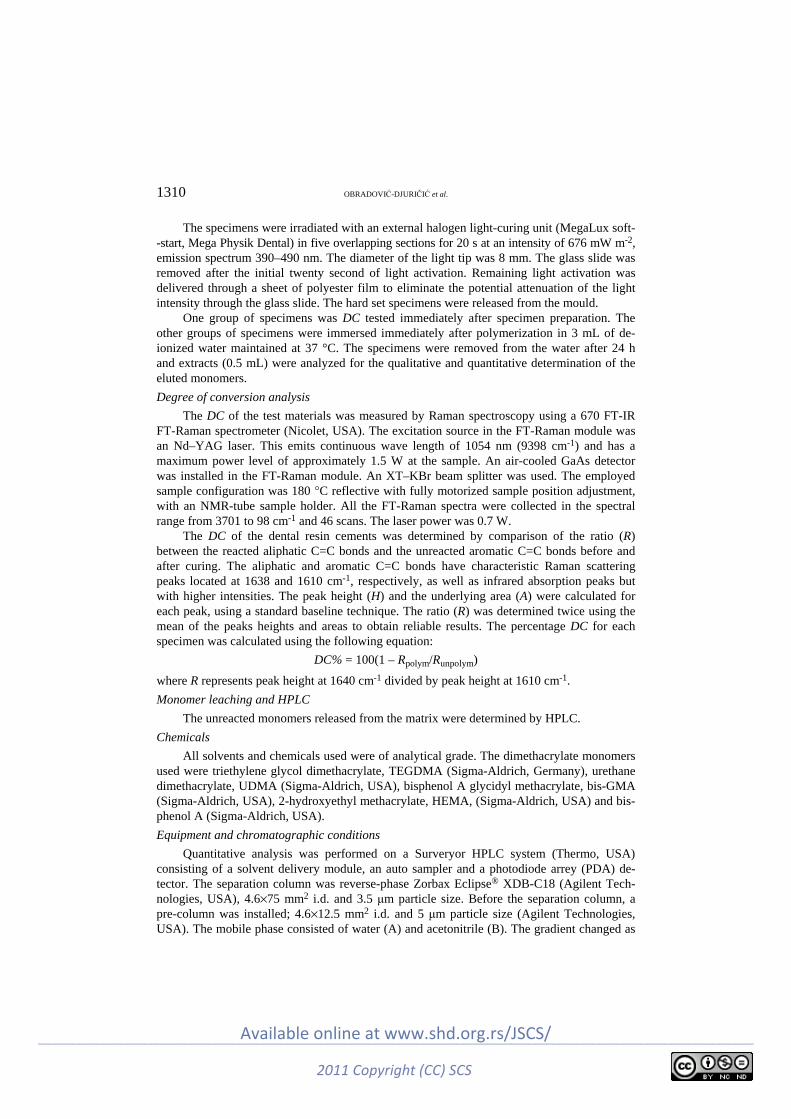
1310 OBRADOVIĆ-DJURIČIĆ et al.
The specimens were irradiated with an external halogen light-curing unit (MegaLux soft- -start, Mega Physik Dental) in five overlapping sections for 20 s at an intensity of 676 mW m-2, emission spectrum 390–490 nm. The diameter of the light tip was 8 mm. The glass slide was removed after the initial twenty second of light activation. Remaining light activation was delivered through a sheet of polyester film to eliminate the potential attenuation of the light intensity through the glass slide. The hard set specimens were released from the mould.
One group of specimens was DC tested immediately after specimen preparation. The other groups of specimens were immersed immediately after polymerization in 3 mL of de-ionized water maintained at 37 °C. The specimens were removed from the water after 24 h and extracts (0.5 mL) were analyzed for the qualitative and quantitative determination of the eluted monomers.
Degree of conversion analysis
The DC of the test materials was measured by Raman spectroscopy using a 670 FT-IR FT-Raman spectrometer (Nicolet, USA). The excitation source in the FT-Raman module was an Nd–YAG laser. This emits continuous wave length of 1054 nm (9398 cm-1) and has a maximum power level of approximately 1.5 W at the sample. An air-cooled GaAs detector was installed in the FT-Raman module. An XT–KBr beam splitter was used. The employed sample configuration was 180 °C reflective with fully motorized sample position adjustment, with an NMR-tube sample holder. All the FT-Raman spectra were collected in the spectral range from 3701 to 98 cm-1 and 46 scans. The laser power was 0.7 W.
The DC of the dental resin cements was determined by comparison of the ratio (R) between the reacted aliphatic C=C bonds and the unreacted aromatic C=C bonds before and after curing. The aliphatic and aromatic C=C bonds have characteristic Raman scattering peaks located at 1638 and 1610 cm-1, respectively, as well as infrared absorption peaks but with higher intensities. The peak height (H) and the underlying area (A) were calculated for each peak, using a standard baseline technique. The ratio (R) was determined twice using the mean of the peaks heights and areas to obtain reliable results. The percentage DC for each specimen was calculated using the following equation:
DC% = 100(1 – Rpolym/Runpolym)
where R represents peak height at 1640 cm-1 divided by peak height at 1610 cm-1.
Monomer leaching and HPLC
The unreacted monomers released from the matrix were determined by HPLC.
Chemicals
All solvents and chemicals used were of analytical grade. The dimethacrylate monomers used were triethylene glycol dimethacrylate, TEGDMA (Sigma-Aldrich, Germany), urethane dimethacrylate, UDMA (Sigma-Aldrich, USA), bisphenol A glycidyl methacrylate, bis-GMA (Sigma-Aldrich, USA), 2-hydroxyethyl methacrylate, HEMA, (Sigma-Aldrich, USA) and bis-phenol A (Sigma-Aldrich, USA).
Equipment and chromatographic conditions
Quantitative analysis was performed on a Surveryor HPLC system (Thermo, USA) consisting of a solvent delivery module, an auto sampler and a photodiode arrey (PDA) de-tector. The separation column was reverse-phase Zorbax Eclipse® XDB-C18 (Agilent Tech-nologies, USA), 4.6×75 mm2 i.d. and 3.5 μm particle size. Before the separation column, a pre-column was installed; 4.6×12.5 mm2 i.d. and 5 μm particle size (Agilent Technologies, USA). The mobile phase consisted of water (A) and acetonitrile (B). The gradient changed as
_________________________________________________________________________________________________________________________
2011 Copyright (CC) SCS
Available online at www.shd.org.rs/JSCS/

DC AND HPLC ANALYSES OF DENTAL RESIN-BASED CEMENTS 1311
follows: 0 min, B 20 %; 15 min, B 70 %; 17 min, B 70 %; 20 min, B 100 %. The initial con-ditions were re-established and held for 9 min to ensure minimal carry-over between injec-tions. The flow rate was 0.5 mL min-1 and the injector volume was 10 μL. UV detection was performed at 205 and 275 nm simultaneously. The components were identified by comparing the elution time with that of reference compounds and by their UV spectra. Simultaneously, additional conformation for TEGDMA, UDMA and Bis-GMA was performed using a quad-ruple ion trap mass selective detector (LCQ Advantage Thermo, USA). Samples were ana-lyzed using the electrospray ionization technique in the positive mode. The optimal source working parameters for monitoring all ions were as follows: source voltage (4.5 kV), sheath gas (25 a.u.), auxiliary gas (4 a.u.) and capillary temperature (220 °C). Detection of the analytes was based on the isolation of the ammonia adduct [M+NH4]+, for TEGDMA and bis- -GMA and the sodium adduct [M+Na]+ for UDMA. Subsequent MS2 and MS3 fragmentations of the isolated ions were performed using the parameters listed in Table II. Selected reaction monitoring (SRM) or consecutive reaction modes (CRM) were used for identification of all the mentioned monomers.
TABLE II. Calibration equations, regression correlation coefficients and retention times for the reference compounds at 205 nm
Analyte Regression equation R2 Retention time, min HEMA Y = 167028x + 205716 0.9918 4.05 Bisphenol A Y = 244316x + 11111 0.9997 13.48 TEGDMA Y =274101x + 12000 0.9983 15.18 Ya = 159927x + 2000000 0.9992 UDMA Y= 79274x + 12473 0.9992 18.58 Bis-GMA Y = 174038x + 67260 0.9992 20.10 aCalibration equation for the concentration range from 20 to 50 μg mL-1
Calibration procedure
Stock solutions of reference standards (100 μg mL-1) were prepared in methanol. These solutions were stored at 4 °C. Working standards of the analytes were obtained by dilution with methanol to final concentrations at 0.5, 1.0, 5.0, 10.0 and 20.0 μg mL-1. For TEGDMA and HEMA, working standards at 30.0 and 50.0 μg mL-1 were also made. Calibration plots were produced using the standard solutions described above. Calibration curves were obtained by plotting the peak area vs. concentration using linear regression analysis.
Optimization of the HPLC and HPLC/MS analysis
Detection and quantification was performed at a wavelength of 205 nm for all the ana-lytes because they exhibit significant absorption. The second wavelength of 275 nm for bis- -GMA and bisphenol A detection was used based on their UV spectra. The linearity of the analytes response was established with five concentration levels. The equations obtained, as well as the retention times for reference compounds are also reported in the Table II.
For additional confirmation purposes, the HPLC/MS method was also optimized. In a search for the most appropriate conditions to optimize the mass spectrometric system for analysis, different ionization techniques were examined. The responses of analytes using atmospheric pressure chemical ionization (APCI) and electrospray ionization (ESI) were com-pared. Tuning of the instrument, with both ionization techniques, was performed for each tested compound using standard solution prepared at 10 μg ml-1. All standard solutions were infused with the syringe pump at 5 μl min-1 to the mobile phase consisting of 50/50, aceto-
_________________________________________________________________________________________________________________________
2011 Copyright (CC) SCS
Available online at www.shd.org.rs/JSCS/

1312 OBRADOVIĆ-DJURIČIĆ et al.
nitrile/water at a flow rate of 0.5 ml min-1. Identification of the characteristic ions as well as the choice of the ionization mode for each analyte were performed in the full scan mode by recording mass spectra from m/z 60 to 700 in both the positive and negative mode. For HEMA and bisphenol A, it was not possible to obtain reliable MS spectra with either of ionization sources. The most abundant ions for the remaining three analytes were: ammonia adducts for TEGDMA and bis-GMA and the sodium adduct for UDMA. The response using the ESI technique was 10 times higher than that using the APCI technique. Positive ESI mode was chosen for further analysis.
Furthermore, for TEGDMA, UDMA and bis-GMA, optimization of the isolation width of the chosen parent ion, selection of the optimal collision energy and identification of the most abundant daughter ion were performed in the selected reaction and consecutive reaction modes. The optimized parameters for MS acquisition are given in Table III. The linearity of calibration curves was rather poor, suggesting that MS analysis could not be used for quanti-fication purposes but rather as an additional identification tool for TEDMA, UDMA and bis- -GMA. Sample analyses were performed using the same chromatographic conditions as for the standards.
TABLE III. Optimized MS, MS2 and MS3 parameters for TEDMA, UDMA and bis-GMA identification
Analyte MS Isolation
width Collision energy
MS2 Isolation
width Collision energy
MS3
TEGDMA 303.9 [M+NH4]+ 2.0 25 286.7 2.0 – –
303.9 [M+NH4]+ 2.0 25 286.7 3.0 20 113.0
UDMA 493.2 [M+Na]+ 1.0 42 407.1 1.0 – – 493.2 [M+Na]+ 1.0 42 449.6 1.0 – – Bis-GMA 512.8 [M+NH4]
+ 2.0 25 512.8 2.0 – – 512.8 [M+NH4]
+ 2.0 25 494.7 2.0 – –
Statistical analysis
The data were expressed as mean values with standard deviations. Differences in the continuous variables between the materials (Panavia F2, Variolink 2, Nexus 2) were compared with the parametric one way ANOVA with the LSD post hoc test for multiple comparisons.
Correlation (measured as a correlation coefficient, r) indicates the strength and direction of a linear relationship between two random variables. Differences were considered signi-ficant at p < 0.05 level.
RESULTS
Degree of conversion analysis
Typical FT-Raman spectra recorded for the resin cements are shown in Figs. 1 and 2. The spectra reveals a scattering Raman peak at 1638 cm–1 corresponding to the reacting aliphatic C=C stretching of the vinyl group in the acrylates and methacrylates. The scattering peak at 1610 cm–1, arising from unreacted aromatic rings in the bis-GMA molecule, is commonly used as an internal reference for precise quantitative analysis.1 For more reliable data, the ratio of the peaks 1638 to 1610 cm–1 (R) was calculated twice, using the means of peaks height and peaks area.
_________________________________________________________________________________________________________________________
2011 Copyright (CC) SCS
Available online at www.shd.org.rs/JSCS/

DC AND HPLC ANALYSES OF DENTAL RESIN-BASED CEMENTS 1313
Fig. 1. Typical FT-Raman spectrum of the cured resin cement Variolink 2.
Fig. 2. Magnified section from the FT-Raman spectrum of the cured resin cement Variolink 2.
According to the results of statistical analysis, Variolink 2 showed the high-est degree of conversion, whereas Panavia F2 showed the lowest (Table IV). The ANOVA revealed no significant differences in the DC between the tested luting resin cements (F = 1.925; p > 0.05).
Monomer leaching and HPLC
Concentrations of detected monomers are presented in Table V (means and standard deviation). There was a statistically significant difference between the three materials with respect to the amount of leached monomers (p < 0.001) (Table VI).
_________________________________________________________________________________________________________________________
2011 Copyright (CC) SCS
Available online at www.shd.org.rs/JSCS/
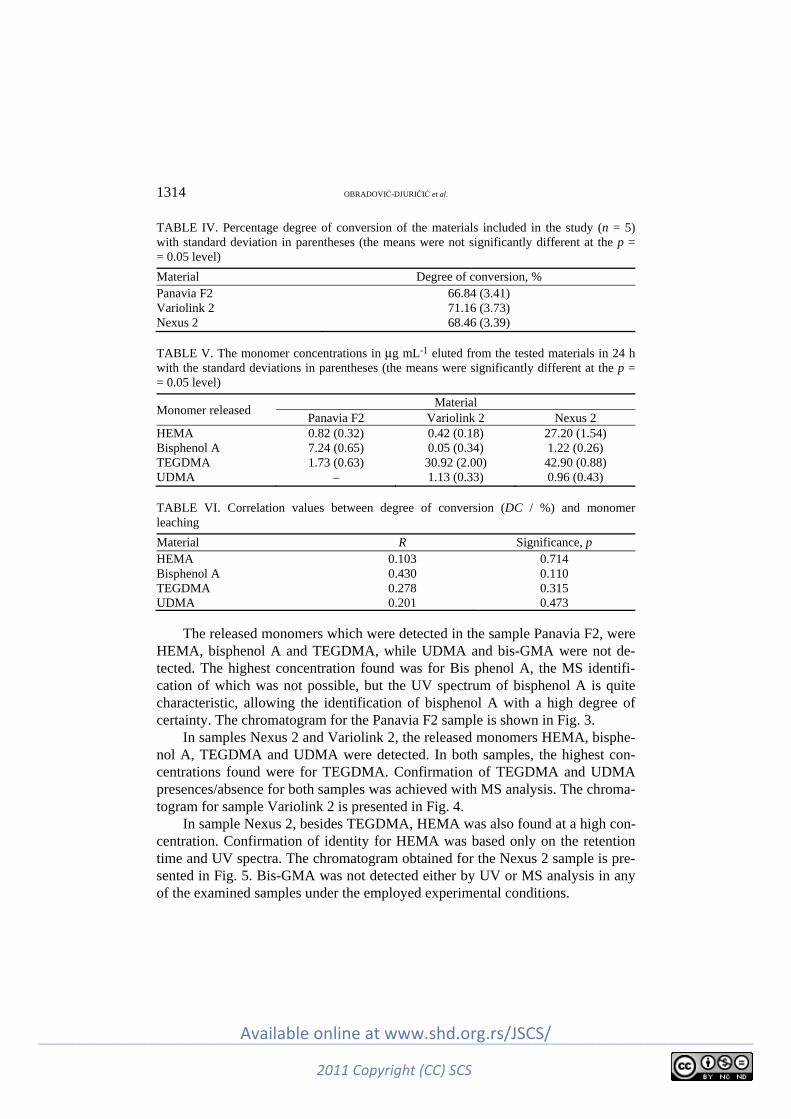
1314 OBRADOVIĆ-DJURIČIĆ et al.
TABLE IV. Percentage degree of conversion of the materials included in the study (n = 5) with standard deviation in parentheses (the means were not significantly different at the p = = 0.05 level)
Material Degree of conversion, % Panavia F2 66.84 (3.41)Variolink 2 71.16 (3.73)Nexus 2 68.46 (3.39)
TABLE V. The monomer concentrations in μg mL-1 eluted from the tested materials in 24 h with the standard deviations in parentheses (the means were significantly different at the p = = 0.05 level)
Monomer released Material
Panavia F2 Variolink 2 Nexus 2 HEMA 0.82 (0.32) 0.42 (0.18) 27.20 (1.54) Bisphenol A 7.24 (0.65) 0.05 (0.34) 1.22 (0.26) TEGDMA 1.73 (0.63) 30.92 (2.00) 42.90 (0.88) UDMA – 1.13 (0.33) 0.96 (0.43)
TABLE VI. Correlation values between degree of conversion (DC / %) and monomer leaching
Material R Significance, p HEMA 0.103 0.714 Bisphenol A 0.430 0.110 TEGDMA 0.278 0.315 UDMA 0.201 0.473
The released monomers which were detected in the sample Panavia F2, were HEMA, bisphenol A and TEGDMA, while UDMA and bis-GMA were not de-tected. The highest concentration found was for Bis phenol A, the MS identifi-cation of which was not possible, but the UV spectrum of bisphenol A is quite characteristic, allowing the identification of bisphenol A with a high degree of certainty. The chromatogram for the Panavia F2 sample is shown in Fig. 3.
In samples Nexus 2 and Variolink 2, the released monomers HEMA, bisphe-nol A, TEGDMA and UDMA were detected. In both samples, the highest con-centrations found were for TEGDMA. Confirmation of TEGDMA and UDMA presences/absence for both samples was achieved with MS analysis. The chroma-togram for sample Variolink 2 is presented in Fig. 4.
In sample Nexus 2, besides TEGDMA, HEMA was also found at a high con-centration. Confirmation of identity for HEMA was based only on the retention time and UV spectra. The chromatogram obtained for the Nexus 2 sample is pre-sented in Fig. 5. Bis-GMA was not detected either by UV or MS analysis in any of the examined samples under the employed experimental conditions.
_________________________________________________________________________________________________________________________
2011 Copyright (CC) SCS
Available online at www.shd.org.rs/JSCS/

DC AND HPLC ANALYSES OF DENTAL RESIN-BASED CEMENTS 1315
Fig. 3. Chromatogram obtained for Panavia F2 sample at 205 nm.
Obtained results indicate that the percentage of conversion is a rather poor predictor for monomer leaching, as Fig. 6 illustrates.
DISCUSSION
The materials used in the present study were chosen for their differences in particle size, and types and weight fractions of filler additives. It is known that the transmission of the curing light is determined by the material and by the size of the filler particles. Different filler particles have different refractive indexes, causing different transmission properties of the composites with respective to wavelength. This fact is probably responsible for the differences in the DC of the tested resin-based cements and may lead to different releasing rates of unreacted toxic components.
It is hard to obtain the exact composition of the materials because the manu-facturers guard them as company secrets.
The degree of polymerization is one of the important factors which affect the clinical performance of resin cements. Among the methods which determine the degree of conversion (DC) of resin materials, Raman spectroscopy has mostly been used. This method relies on the scattering of the IR signal at the surface of a
_________________________________________________________________________________________________________________________
2011 Copyright (CC) SCS
Available online at www.shd.org.rs/JSCS/
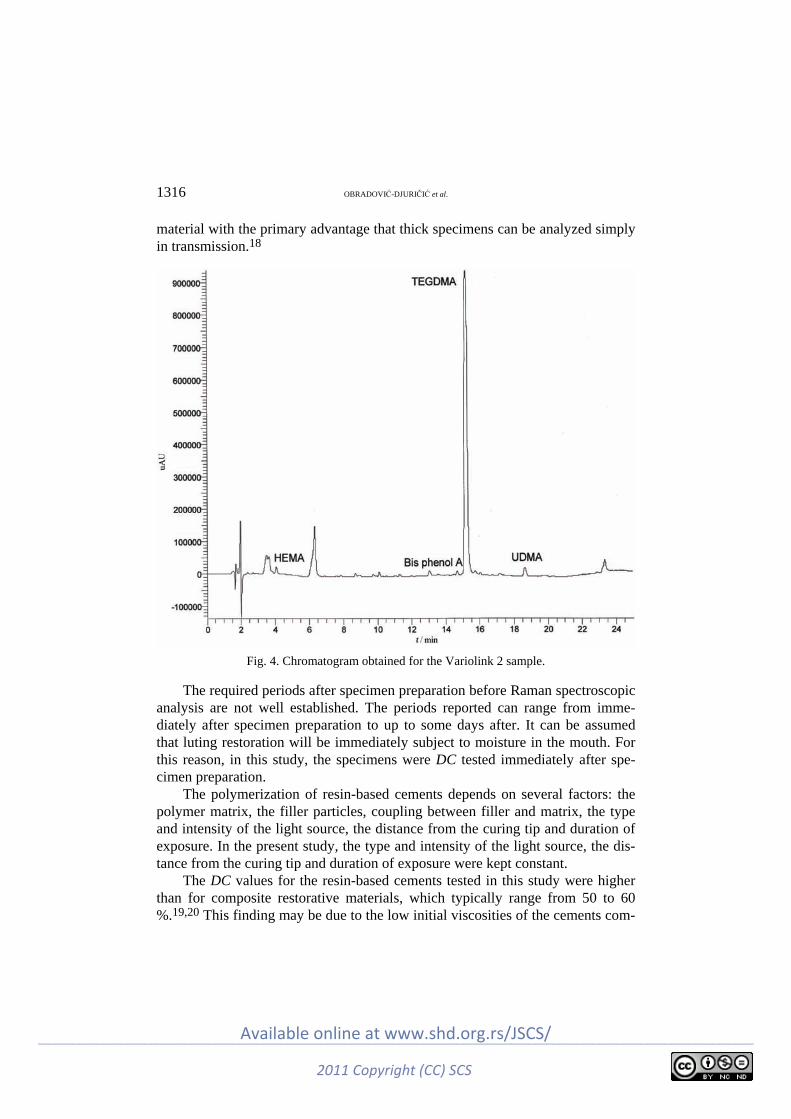
1316 OBRADOVIĆ-DJURIČIĆ et al.
material with the primary advantage that thick specimens can be analyzed simply in transmission.18
Fig. 4. Chromatogram obtained for the Variolink 2 sample.
The required periods after specimen preparation before Raman spectroscopic analysis are not well established. The periods reported can range from imme-diately after specimen preparation to up to some days after. It can be assumed that luting restoration will be immediately subject to moisture in the mouth. For this reason, in this study, the specimens were DC tested immediately after spe-cimen preparation.
The polymerization of resin-based cements depends on several factors: the polymer matrix, the filler particles, coupling between filler and matrix, the type and intensity of the light source, the distance from the curing tip and duration of exposure. In the present study, the type and intensity of the light source, the dis-tance from the curing tip and duration of exposure were kept constant.
The DC values for the resin-based cements tested in this study were higher than for composite restorative materials, which typically range from 50 to 60 %.19,20 This finding may be due to the low initial viscosities of the cements com-
_________________________________________________________________________________________________________________________
2011 Copyright (CC) SCS
Available online at www.shd.org.rs/JSCS/

DC AND HPLC ANALYSES OF DENTAL RESIN-BASED CEMENTS 1317
pared with those composite restorative materials. The lower viscosity would al-low for greater diffusion of free radicals in the polymerization process and for a higher conversion potential.21
Fig. 5. Chromatogram obtained for the Nexus 2 sample at 205 nm.
However, little has been published about the polymerization of resin-based cements. The results of the present study, mostly agree with those in the litera-ture.22–24
In the present study, Variolink 2 showed the highest degree of conversion. This may be due to the content of urethane dimethacrylate (UEDMA), which is known to be a more flexible molecule than Bis GMA because of its urethane linkages. It also has a lower viscosity, which facilitates the migration of free radicals. It is well known that degree of conversion of methacrylate monomers depends on the nature of the polymerizing monomers, more flexible monomer molecules increase the conversion.25
However, Nexus 2, with similar chemical composition and filler loading showed a lower degree of conversion than Variolink 2. The general difference between resin-based cements is very difficult to deduce from existing in vitro stu-dies because the materials differ in many aspects. A conversion decrease can be
_________________________________________________________________________________________________________________________
2011 Copyright (CC) SCS
Available online at www.shd.org.rs/JSCS/

1318 OBRADOVIĆ-DJURIČIĆ et al.
considered from factors that impair the mobility of the reactants. The limited conversion found in many network polymers is due to restricted mobility of the radical chain ends, pendant methacrylate groups and monomer at high cross-link densities.26
Fig. 6. Monomer leached out as a function of conversion.
On the other hand, Panavia F2 showed the lowest degree of conversion of the studied materials. Furthermore, the relatively higher filler loading of Panavia F2 might contribute to the low DC obtained in this study. Incorporation of filler into polymerizable resins was shown to also decrease molecular mobility within the boundary regions extending from the interface of the filler.27
The analytical HPLC method used in this study was able to detect monomers that leach out from the investigated resin-based cements (within the limits of the detection system). In this study, the elution of HEMA, bisphenol A, TEGDMA, UDMA and bis-GMA from Panavia F2, Nexus 2 and Variolink 2 into water was followed.
_________________________________________________________________________________________________________________________
2011 Copyright (CC) SCS
Available online at www.shd.org.rs/JSCS/
DC AND HPLC ANALYSES OF DENTAL RESIN-BASED CEMENTS 1319
The results showed that bisphenol A was eluted from Panavia F2 in a higher amount than from Nexus 2 and Variolink 2 (p < 0.001). Bisphenol A is not an original component of dental composites but a contaminant which could always be expected in resin-based materials containing bis-GMA.28 Several researchers have studied whether bisphenol A leaches from cured dental restorative or resin- -based cements. Many investigations indicated the presence of the residual bis-phenol A in some dental products based on bis-GMA.28–31 However, in some studies bisphenol A was not detected.14 The lack of detection of bisphenol A in this and similar studies may be due to several reasons: the concentration of BPA was too low to be detected, the detection method was not suitable, or the tested products were not contaminated with residual BPA.
It is possible that the number of polymerized bis-GMA monomers were smaller in Panavia F2 (compared to the other two cements) and some of them were degraded to bisphenol A (bis-GMA monomer precursor), which was detec-ted.14 Bis-GMA was not found as an eluted substance from any of the tested ce-ments, mostly due to its low solubility in water. Bis-GMA is soluble only in alka-line or acidic aqueous solutions under vigorous conditions, when hydrolysis oc-curs (100 °C).15 This process results in the formation of the individual compo-nents, i.e., bisphenol A, methacrylic acid and glycerol. The fact that this experi-ment was performed under ambient conditions and in water leads to the logical conclusion that the bisphenol A in Panavia F2 could be rather an impurity not a degradation product of bis-GMA. Hence, in the case of Panavia F2, the possible explanation for the found concentration of bisphenol A was probably the poor quality of bis-GMA. Bisphenol A exhibits estrogenicity, acts as a steroid hor-mone and bonds to hormone binding sites. Hence, the biocompatibility of Pana-via F2 may be questionable and critical, especially if it is used for the cemen-tation of long span fixed restorations and orthodontic appliances.32–34
Small, mobile resin monomers, such as TEGDMA, were primarily eluted from Nexus 2 and Variolink 2 in higher quantity compared to Panavia F2 (p < < 0.001). Due to the low viscosity, relatively high hydrophilicity as well as good water solubility, TEGDMA was always found to leach from polymerized compo-site, even into aqueous solution.35 TEGDMA elution depends on the mode of polymerization (an oxygen inhibition layer increases the elution); it easily hydro-lyzes at low pH to methacrylic acid, which would be detect as a reaction pro-duct.14
There are reports which illustrate higher water uptake in composite materials with low filler contents (resin cements are such) compared with materials with a higher filler content. The results of the present study, which are in line with these reports, showed a greater TEGDMA elution from Nexus 2 and Variolink 2, the cements with lower initial filler contents compared to Panavia F2 luting re-
_________________________________________________________________________________________________________________________
2011 Copyright (CC) SCS
Available online at www.shd.org.rs/JSCS/

1320 OBRADOVIĆ-DJURIČIĆ et al.
sin.14,36,37 This leads to the conclusion that the elution mechanism is complex and cannot be explained only by the absorption process.
Concerning the clinical significance of eluted TEGDMA, it is clear that it may be released either through dentin tubules into pulp, or through the surface of a restoration into the oral cavity (mostly TEGDMA from the filling materials). For the first pathway of release, dentin adhesives may be the prime issue of con-cern, since these materials consist of monomers that are more hydrophilic than monomers typically contained in resin composites. Recent results showed that release of TEGDMA through dentine was 60 % of the direct release; therefore dentin appears to exert its protective effects principally by retarding or “damp-ing” the initial high release of TEGDMA to a substantial degree.38
The second pathway of release enables components to be eluted into salivary fluids and brought into contact with mucosal tissues. Depending on the level of irradiation and curing duration, this could play a significant role in the elution action.39,7
In addition, there are results of the synthesis of a reliable chemical inhibitor (CI) which can prevent the adverse effects mediated by TEGMA, HEMA and bleaching agents (cells death inhibition, increasing cell viability and function).40
The elution of HEMA (2-hydroxyethyl methacrylate) was the highest from Nexus 2 compared to the other two tested cements (p < 0.001). It is known that HEMA mediates apoptotic cell death by inducing changes in the cell-surface composition and by activating many critical genes to apoptosis these, in turn, activate endonucleases that cause DNA fragmentation. Additionally, HEMA seems to be a more potent inhibitor of cellular function than TEGDMA.41
Urethane acrylates monomer UEDMA was released in small quantities from Nexus 2 and Variolink 2 due to its “hydrophobic” nature and dimensions (bulky and large substance). The main role of UDMA in resin composite materials is to improve their resistance to wear and to reduce water absorption. However, it must be emphasized that particular base monomer, such as UDMA, are more to-xic in general when tested individually, compared with TEGDMA co-monomer. However, the elution rate of UDMA was low and only trace amounts leach out into the aqueous media. Some results suggested synergistic cytotoxic effects of TEGDMA and UDMA in combination, while other studies confirmed UDMA as a sensitizing agent.42 The total replacement of TEGDMA by UEDMA in a resin composition would change the mechanical properties significantly, leading to a decrease in the elasticity modulus, and in the flexure and tensile strength. This is associated with the capacity of urethane acrylate resins to form hydrogen–ionic links with copolymers and thus restrict the mobility of the polymers.43,44
The present study shows that it is not possible to predict the elution of mo-nomers based on the manufacture’s declaration. A comparison of the composites investigated showed that, although several compounds were extractable from
_________________________________________________________________________________________________________________________
2011 Copyright (CC) SCS
Available online at www.shd.org.rs/JSCS/
DC AND HPLC ANALYSES OF DENTAL RESIN-BASED CEMENTS 1321
each material, the quantities differed between the resin cements, even when they had a similar DC. The water extracts of resin cement Nexus 2, especially, re-vealed a considerable concentration of both TEGDMA and HEMA, but a minor concentration of UDMA. In contrast to Nexsus 2, cement Panavia F2 revealed a considerable concentration of bisphenol A, with minor concentrations of HEMA and TEGDMA found. Only, the elution from Variolink 2 was to some extent as expected according to the declared composition. The detected concentration of bisphenol A was negligibly low and concentrations of both HEMA and UDMA were minor. The only eluted monomer found in a considerably high concen-tration was TEGDMA.
For the particular resin system or composite, the percentage elution can be correlated with the degree of conversion. However, due to differences in mono-mer composition, type and concentration of adhesive promoters, and the cross- -link density of polymer networks, it is not possible to predict accurately the elu-tion for different composites based on their relative degree of conversion.7 The results in this study are in line with these statements, showing no correlation between the DC and the percent of monomers eluted from resin-based composite cements. The great importance of composite cements in every day practice actua-lizes the existence of controversial opinions in the literature (inverse correlation between the DC and the percent elution), confirming that this subject will still be a topic of interest in the future.12,45
CONCLUSIONS
Within the limitation of the current study, it can be concluded that resin- -based cements may show different DC depending on their composition, but without significant differences. All the tested luting resin cements resulted in ac-ceptable levels of the degree of conversion with the same polymerization condi-tions. These results cannot be unreservedly extrapolated across other brands of related materials because of the possibility of minor changes in chemistry and the polymerization conditions causing significantly different responses. It can also be assumed that quantity of eluted monomers from composite cements depends on various factors (the composition and solubility parameters of the solvent-tested media, condition used for light curing, size and chemical characteristics of leach-able substances). This research did not confirm a direct correlation between the degree of conversion and elution of monomers among the different commercial resin-based cements.
_________________________________________________________________________________________________________________________
2011 Copyright (CC) SCS
Available online at www.shd.org.rs/JSCS/

1322 OBRADOVIĆ-DJURIČIĆ et al.
И З В О Д
КОРЕЛАЦИЈА СТЕПЕНА КОНВЕРЗИЈЕ И КОЛИЧИНЕ ОСЛОБОЂЕНИХ СУПСТАНЦИ ИЗ ДЕНТАЛНИХ КОМПОЗИТНИХ ЦЕМЕНАТА
КОСОВКА ОБРАДОВИЋ-ЂУРИЧИЋ1, ВЕСНА МЕДИЋ1, МАРИНА РАДИШИЋ2 и МИЛА ЛАУШЕВИЋ2
1Klinika za stomatoloku protetiku, Stomatoloki fakultet, Univerzitet u Beogradu, Rankeova 4,
11000 Beograd i 2Katedra za analiti~ku hemiju, Tehnoloko–metalurki fakultet,
Univerzitet u Beogradu, Karnegijeva 4, 11120 Beograd
Рад истражује могућу корелацију степена конверзије (DC) и количине ослобођених мономерних супстанци из три комерцијална препарата композитних денталних цемената. Степен конверзије композитних цемената одређен је методом Раман спектроскопије, док је количина неизреаговалих и ослобођених мономера из цементног матрикса детектована по-моћу HPLC методе. Резултати добијени након вишеструке статистичке евалуације (оne way ANOVA, LSD past hoc test) не показују значајне разлике у степену конверзије различитих препарата композитних цемената. Насупрот томе, резултати HPLC анализе бележе значајне разлике у количини и врсти мономерних супстанци отпуштених из композитних цемената. Такође, статистичка анализа у оквиру ове студије није показала корелацију степена конвер-зије испитиваних композитних денталних цемената и количине ослобођених супстанци из ових материјала.
(Примљено 10. јуна 2010, ревидирано 20. фебруара 2011)
REFERENCES
1. G. Schmalz, in Resin-based composites. Biocompatibility of dental materials, G. Schmalz, D. Arenholt-Bindslev, Eds., Springer, Berlin, Germany, 2009, p.p. 99–138
2. K. Obradović-Đuričić, Ž. Martinović, Stomatol. Protet. 3 (2004) 3 (in Serbian) 3. S. Mitra, in Zinc-polycarboxylate, glass ionomer and resin cements. Contemporary dental
materials, B. V. Dhuru, Ed., Oxford University Press, New Delhi, India, 2004, p.p. 173– –182
4. N Silikas, G. Eliades, D. C. Watts, Dent. Mater. 16 (2000) 292 5. L. Correr Sobrinho, M. F. de Goes, S. Consani, M. A. C. Sinhoreti, J. C. Knowles, J.
Mater. Sci. Mater. Med. 11 (2000) 361 6. E. Asmussen, Scand. J. Dent. Res. 90 (1982) 490 7. J. L. Ferracane, J. Oral. Rehabil. 21 (1994) 441 8. J. L. Ferracane, Crit. Rev. Oral. Biol. Med. 6 (1995) 302 9. K. Tanaka, M. Taira, H. Shintani, K. Wakasa, M. Yamaki, J. Oral. Rehabil. 18 (1991)
353 10. E. C. Munksgaard, A. Peutzfeldt, E. Asmussen, Eur. J. Oral. Sci. 108 (2000) 341 11. W. Geurtsen, Eur. J. Oral. Sci. 106 (1998) 687 12. I. E. Ruyter, H. Oysaed, Crit. Rev. Biocompat. 4 (1988) 247 13. I. E. Ruyter, Adv. Dent. Res. 9 (1995) 344 14. U Ortengren, H. Wellendorf, S. Karlsson, I. E. Ruyter, J. Oral. Rehabil. 28 (2001) 1106 15. N. Olea, R. Pulgar, P. Pérez, F. Olea-Serrano, A. Rivas, A. Novillo-Fertrell, V. Pedraza,
A. M. Soto, C. Sonnenschein, Environ. Health Perspect. 104 (1996) 298 16. I. E. Ruyter, I. J. Sjøvik, Acta Odontol. Scand. 39 (1981) 133 17. I. E. Ruyter, H. Oysaed, Crit. Rev. Biocompat. 4 (1988) 247
_________________________________________________________________________________________________________________________
2011 Copyright (CC) SCS
Available online at www.shd.org.rs/JSCS/

DC AND HPLC ANALYSES OF DENTAL RESIN-BASED CEMENTS 1323
18. J. W. Stansbury, M. Trujillo-Lemon, H. Lu, X. Ding, Y. Lin, J. Ge, Dent. Mater. 21 (2005) 56
19. A. Peutzfeldt, A. Sahafi, E. Asmussen, Dent. Mater. 16 (2000) 330 20. S. Imazato, J. F. McCabe, H. Tarumi, A. Ehara, S. Ebisu, Dent. Mater. 17 (2001) 178 21. J. E. Elliott, L. G. Lovell, C. N. Bowman, Dent. Mater. 17 (2001) 221 22. W. F. Caughman, D. C. N. Chan, F. A. Rueggeberg, J. Prosthet. Dent. 85 (2001) 479 23. I. B. Lee, C. M. Um, J. Oral. Rehabil. 28 (2001) 186 24. A. Tezvergil-Mutluay, L. V. J. Lassila, P. K. Vallittu, Acta Odontol. Scand. 65 (2007) 201 25. E. Asmussen, A. Peutzfeldt, Dent. Mater. 14 (1998) 51 26. L. G. Lovell, J. W. Stansbury, D. C. Syrpes, C. N. Bowman, Macromolecules 32 (1999)
3913 27. R. H. Halvorson, R. L. Erickson, C. L. Davidson, Dent. Mater. 19 (2003) 327 28. M. Nada, H. Komatsu, H. Sano, J. Biomed Mater. Res. A. 47 (1999) 374 29. O. Olla, R. Pulgar, P. Perez, F. Olean-Serrano, A. Rivas, A. Novillo-Fertell, V. Pedraza,
A. M. Soto, C. Sonnenschein, Environ. Health. Persp. 104 (1996) 298 30. D. Arenholt-Bindslev, V. Breinholt, G. Schmalz, A. Preiss, J. Dent. Res. B 77 (1998) 692 31. E. Y. K. Fung, N. O. Ewoldsen, H. S. St. German Jr., D. B. Marx, C. Miaw, C. Siew, H.
Chou, S. E. Grunniger, D. M. Mayer, J. Am. Dent. Assoc. 131 (2000) 51 32. V. Medić, PhD Thesis, Faculty of Dentistry, University of Belgrade, Belgrade, Serbia,
2006, p. 172 (in Serbian) 33. T. Eliades, G. Eliades, T. G. Bradley, D. C. Watts, Eur. J. Orthod. 22 (2000) 395 34. K. J. Söderholm, in Degradation Mechanisms of Dental Resin Composites. Dental
Materials in Vivo: Aging and Related Phenomena, G. Eliades, T. Eliades, W. A. Brant-ley, D. C. Watts, Eds., Quintessence Pub., Chicago, IL, 2003, p. 296
35. M. Pelka, W. Distler, A. Petschelt, Clin. Oral. Invest. 3 (1999) 194 36. M. Braden, R. L. Clarke, Biomaterials 5 (1984) 369 37. M. Braden, K. W. M. Davy, Biomaterials 7 (1986) 474 38. N. Hofmann, J. Renner, B. Hugo, B. Klaiber, J. Dent. 30 (2002) 223 39. T. M. Gerzina, W. R. Hume, J. Oral. Rehabil. 21 (1994) 463 40. A. Jewett, A. Paranipe, WO 2007/112134 (2007) 41. A. Paranjpe, L. C. F. Bordador, M. Wang, W. R. Hume, A. Jewett, J. Dent. Res. 84
(2005) 172 42. B. Bjorkner, Contact Derm. 11 (1984) 115 43. E. Asmussen, A. Peutzfeldt, Eur. J. Oral. Sci. 109 (2001) 282 44. H. Nagem Filho, H. D. Nagem, P. A. S. Francisconi, E. B. Franco, R. F. L. Mondelli, K.
Q. Coutinho, J. Appl. Oral. Sci. 15 (2007) 448 45. F. A. Rueggeberg, R. G. Craig, J. Dent. Res. 67 (1988) 932.
_________________________________________________________________________________________________________________________
2011 Copyright (CC) SCS
Available online at www.shd.org.rs/JSCS/


J. Serb. Chem. Soc. 76 (9) 1325–1336 (2011) UDC 546.562+546.817+547.581.2+ JSCS–4206 547.587.11+547.992:544.726 Original scientific paper
1325
Copper(II) and lead(II) complexation by humic acid and humic-like ligands
IVANA KOSTIĆ1*#, TATJANA ANĐELKOVIĆ1#, RUŽICA NIKOLIĆ1#, ALEKSANDAR BOJIĆ1#, MILOVAN PURENOVIĆ1, SRĐAN BLAGOJEVIĆ2#
and DARKO ANĐELKOVIĆ3
1Department of Chemistry, Faculty of Sciences and Mathematics, University of Niš, Višegradska 33, 18000 Niš, 2Faculty of Agriculture, University of Belgrade,
Nemanjina 6, 11080 Zemun and 3Water Work Association “Naissus”, Kneginje Ljubice 1/1, 18000 Niš, Serbia
(Received 10 March, revised 2 July 2011)
Abstract: The stability of metal–humate complexes is an important factor deter-mining and predicting speciation, mobility and bioavailability of heavy metals in the environment. A comparative investigation of the complexation of Cu(II) and Pb(II) with humic acid and humic-like ligands, such as benzoic and salicylic acid, was performed. The analysis was realized at pH 4.0, a temperature of 25 °C and at an ionic strength of 0.01 mol dm-3 (NaCl) using the Schubert ion-exchange method and its modified form. The stability constants were calculated from the experi-mental data by the Schubert method for complexes with benzoic and humic acid. A modified Schubert method was used for the determination of the stability constants of the complexes with salicylic acid. It was found that Cu(II) and Pb(II) form mo-nonuclear complexes with benzoic and humic acid while with salicylic acid both metals form polynuclear complexes. The results indicate that Pb(II) has a higher binding ability than Cu(II) to all the investigated ligands. The Cu(II)–salicylate and Pb(II)–salicylate complexes showed noticeable higher stability constants compared with their complexes with humic acid, while the stabilities of the complexes with benzoic acid differed less. Salicylic and benzoic acids as humic-like ligands can be used for setting the range of stability constants of humic complexes with Cu(II) and Pb(II).
Keywords: copper; lead; benzoic acid; salicylic acid; humic acid; Schubert’s method.
INTRODUCTION
Heavy metals introduced into soil and natural waters are involved in a num-ber of chemical, physical, and biological processes that determine their concen-
* Corresponding author. E-mail: [email protected] # Serbian Chemical Society member. doi: 10.2298/JSC110310115K
_________________________________________________________________________________________________________________________
2011 Copyright (CC) SCS
Available online at www.shd.org.rs/JSCS/

1326 KOSTIĆ et al.
trations. The bioavailability of a metal depends on its chemical form, which is strongly affected by the presence of natural and anthropogenic ligands. The com-plexation of metals with ligands can drastically change the physico–chemical and biological properties of the metal species.1
The binding or complexing of metal ions by humic substances (HS), as wi-dely distributed natural ligands in soil and natural waters, is an important factor determining metal toxicity, bioavailability and transport.2–4 Humic and fulvic acids, as fractions of humic substances, are the most important HS components that, due to their high structural complexity, contribute to the overall fate of trace metal cations, such as Pb(II), Cu(II), Zn(II) and Cd(II), in environment.5–7 They contain a variety of functional groups which may react with metal ions. Humic acid (HA) with its hydroxyl, phenoxyl and carboxyl reactive groups can form co-ordination compounds with metals. The large number of ionizable sites in the hu-mic acid molecule, mainly phenolic and carboxylic groups, provide the appre-ciable ability to form stable complexes and chelates with heavy metal cations (Pb(II), Cu(II), Zn(II) and Cd(II)).8
The mobility of humic–metal complexes in soils and aquifers strongly de-pends on their charging behavior which is influenced by the ambient pH value.2 Metal ion binding to HA depends on the competition between metal ions and protons for the available binding sites and the electric charge of the humic mac-romolecule.9,10 As the pH increases, the macromolecule becomes increasingly negatively charged attracting the positively charged metal ions and protons. Thus, in defining the ion binding process of humic substances, it is necessary to specify the pH value of the system.11
The study of Cu(II) and Pb(II) interactions with HS is of great interest in terms of the environmental impact of metals due to the ability of HS to immo-bilize these ions by sorption processes.12,13 Humic matter–metal ion stability constants have been determined by a variety of different analytical techniques,14 such as potentiometric titration,15 equilibrium dialysis,16 ion selective electrode (ISE) techniques,17 scanned stripping voltammetry and dynamic light scattering techniques.18 The Schubert ion-exchange method is a popular method for deter-mining the stability constants of metal ions and humic acid.19,20 This method is based on the competition of a metal to bind to a ligand or resin, which lead to its distribution between solution and solid phase. The concentration of metal is measured in the presence and absence of a dissolved ligand.21
In this study, benzoic and salicylic acid were used, as discrete ligand models, for the study of complexation properties of humic acid. Their structure is a sim-plified form of the humic structure, which can be seen in Fig. 1.
The understanding of complexation process is hindered by the fact that hu-mic acids are assemblage of large polyfunctional molecules, such as lipids, car-bohydrates, aromatics, etc. having a great variety of functional groups and metal
_________________________________________________________________________________________________________________________
2011 Copyright (CC) SCS
Available online at www.shd.org.rs/JSCS/
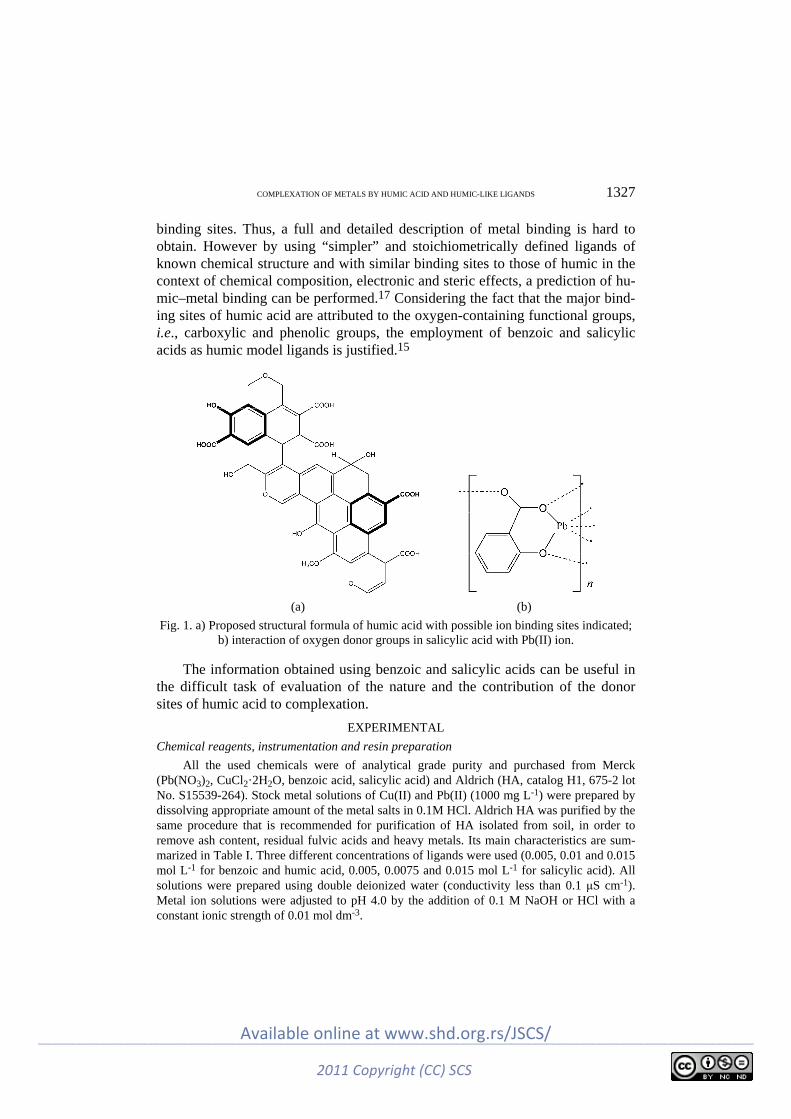
COMPLEXATION OF METALS BY HUMIC ACID AND HUMIC-LIKE LIGANDS 1327
binding sites. Thus, a full and detailed description of metal binding is hard to obtain. However by using “simpler” and stoichiometrically defined ligands of known chemical structure and with similar binding sites to those of humic in the context of chemical composition, electronic and steric effects, a prediction of hu-mic–metal binding can be performed.17 Considering the fact that the major bind-ing sites of humic acid are attributed to the oxygen-containing functional groups, i.e., carboxylic and phenolic groups, the employment of benzoic and salicylic acids as humic model ligands is justified.15
(a) (b)
Fig. 1. a) Proposed structural formula of humic acid with possible ion binding sites indicated; b) interaction of oxygen donor groups in salicylic acid with Pb(II) ion.
The information obtained using benzoic and salicylic acids can be useful in the difficult task of evaluation of the nature and the contribution of the donor sites of humic acid to complexation.
EXPERIMENTAL
Chemical reagents, instrumentation and resin preparation
All the used chemicals were of analytical grade purity and purchased from Merck (Pb(NO3)2, CuCl2·2H2O, benzoic acid, salicylic acid) and Aldrich (HA, catalog H1, 675-2 lot No. S15539-264). Stock metal solutions of Cu(II) and Pb(II) (1000 mg L-1) were prepared by dissolving appropriate amount of the metal salts in 0.1M HCl. Aldrich HA was purified by the same procedure that is recommended for purification of HA isolated from soil, in order to remove ash content, residual fulvic acids and heavy metals. Its main characteristics are sum-marized in Table I. Three different concentrations of ligands were used (0.005, 0.01 and 0.015 mol L-1 for benzoic and humic acid, 0.005, 0.0075 and 0.015 mol L-1 for salicylic acid). All solutions were prepared using double deionized water (conductivity less than 0.1 μS cm-1). Metal ion solutions were adjusted to pH 4.0 by the addition of 0.1 M NaOH or HCl with a constant ionic strength of 0.01 mol dm-3.
_________________________________________________________________________________________________________________________
2011 Copyright (CC) SCS
Available online at www.shd.org.rs/JSCS/

1328 KOSTIĆ et al.
Measurements of pH were made with a Hach Sension 3 pH-meter (precision 0.1 mV or 0.001 units of pH) using a Hach gel-filled combination glass electrode (51935-00). All experi-ments were performed at 25±1 °C.
TABLE I. Main characteristics of the humic acids used in this study
Elementary analysis Content, % Functional group Concentration, mmol g-1 C 54.47 Total acidity 6.48 H 3.82 COOH 3.94 N 0.75 Phenolic OH 2.54 S 3.80 – – O 29.26 – – Ash content Moisture content
3.7 4.2
– –
– –
The prepared solutions were analyzed by flame atomic absorption spectroscopy (AAS) using an AAnalyst 300 (Perkin Elmer) instrument.
For each experiment, Dowex 50WX8, 100–200 mesh, Na-form cation exchange resin was used. Approximately 50 g of the resin was stirred with deionized water. Fine particles were decanted off and the resin was transferred to glass column containing deionized water. Then, the resin was rinsed with 2 L of deionized water, followed by 2 L of 2 M HCl, 2 L of 2 M NaOH, and rinsed with 2 L of deionized water. The resin was converted into the Na-form by passing 2 L of 2 M NaCl, followed by a 2 L rinse with deionized water. The resin was air-dried for 24 h, and then stored in an air-tight polyethylene container.
The time to attain equilibrium was investigated for both metal ions by taking an accu-rately known amount of Na-saturated cation exchange resin and 50.0 ml of metal ion solution. Samples were shaken and period to attain equilibrium was determined by measuring the concentration of the respective metal ions in the supernatant. Equilibrium was achieved after 1 h.
Experimental procedure for establishing metal/ion-exchange isotherms (D0)
Ion-exchange isotherms were measured at pH 4.0 for each metal Cu(II) and Pb(II). For each measurement, metal solutions were prepared by adding different volumes of metal stock solutions to 50.0 mL volumetric flask together with 0.01 M NaCl, and the pH was adjusted by the addition of 0.1 M NaOH and/or 0.1 M HCl. Accurately weighed, 100.0 mg of cleaned, Na-saturated cation exchange resin was added to 50.0 mL of the prepared metal solutions. All samples were shaken at constant temperature for 2 h at 25 °C.
Experimental procedure for the determination of the conditional stability constant of the metal–ligand complexes (D)
The ion-exchange procedure used to determine stability constants for ligands and di-valent metal ion was similar to the procedure used to establish the distribution coefficient, D0, with difference that the solution contained ligand.22
Each solution contained variable concentration of metal ions, from 5 to 20 mg L-1 for Cu(II) and Pb(II), and a concentration of organic acid (benzoic, salicylic or humic acid), from 5 to 15 mol L-1, at pH 4.0, with 100 mg of Dowex 50WX8 (100–200 mesh) resin in the Na- -form and was shaken for 2 h at 25 °C. The total concentration of free metal ion and com-plexed metal ion remaining in the equilibrium solution was determined in the supernatant by flame AAS.
_________________________________________________________________________________________________________________________
2011 Copyright (CC) SCS
Available online at www.shd.org.rs/JSCS/
COMPLEXATION OF METALS BY HUMIC ACID AND HUMIC-LIKE LIGANDS 1329
RESULTS AND DISCUSSION
The isotherms for both metal ions at 25 °C temperature and pH 4.0 were investigated. The experiments were performed at pH 4.0 to avoid hydrolysis of the metal ions and carbonate formation. The linear range was obtained from each isotherm curve to estimate the D0 in order to choose the appropriate concentra-tions for both metal ions to avoid the effect of metal loading.
The distribution coefficient, D0, between the resin and solution phase for metal ion in the absence of ligand and the distribution coefficient, D, between resin and solution phase for metal ion in presence of ligand was calculated from the equilibrium ratio:
( )0
00 r100
VD
m
αα
=−
(1)
where α0 is percentage of total metal bound to the exchange resin; (100 – α0) is percentage of the total metal remaining in solution; V is volume of solution (mL) and mr is mass of the exchange resin (g).
The number of equivalents of complexing agent, n, combined with a particu-lar metal ion was found from the slope of the linear function:
0Llog 1 log logβ − = +
mn
Dn c
D (2)
where cL is the concentration of ligand (mol L-1). Equation (2) was used to determine conditional stability constants for the
mononuclear complexes. Possible problems with the Schubert method can occur when the complex, MmLn, is not mononuclear (m ≠ 1). Equation (3) presents the equation for the modified Schubert method, which was used to eliminate this source of error and presents the modified method of data treatment and analysis:
( )0Llog log 1 log log 1 log logβ = − = + + − +
c mn
DM m m M n c
D (3)
Equation (3) was used to calculate log βmn for polynuclear complexes.22–25 Equation (2) is a reduced form of Eq. (3) for the case of m = 1, when a mono-nuclear complex is present. The metal–ligand ratios were obtained from the slo-pes of the curves log (D0/D–1) vs. log cL (Fig. 2) according to the Schubert me-thod, and log MC vs. log cL (Fig. 3) according to the modified Schubert method. The slopes of these plots give the composition of the complexes, which when close to unity indicate a 1:1 metal:ligand ratio. Values of n near 1.5 indicate that the stoichiometry of the complexes is 2:3.
The percentage of total metal bound to the exchange resin, α0, the values of the slope, n, and stability constants, log βmn, obtained for Cu(II) complexes (at 5
_________________________________________________________________________________________________________________________
2011 Copyright (CC) SCS
Available online at www.shd.org.rs/JSCS/

1330 KOSTIĆ et al.
mg L–1 Cu(II) concentration) with the investigated ligands, at pH 4.0 are sum-marized in Table II.
(a) (b)
(c) (d)
Fig. 2. Plots of log (D0/D–1) vs. log cL for a) Cu(II)–benzoic acid; b) Cu(II)–humic acid; c) Pb(II)–benzoic acid and d) Pb(II)–humic acid, obtained by the Schubert method.
These results show that percentage of total metal bound to the exchange resin, α0, for Cu(II)–salicylate was 54.76 %, which was the highest when com-pared to the percentage for Cu(II)–humate (49.28 %) and Cu(II)–benzoate (53.70 %). This trend was even more pronounced in the presence of higher humic acid concentrations, that is, more metal was in the solution phase than on the resin, confirming the stronger and multi-site binding and multifunctional characteristics of the humate ligand.
_________________________________________________________________________________________________________________________
2011 Copyright (CC) SCS
Available online at www.shd.org.rs/JSCS/
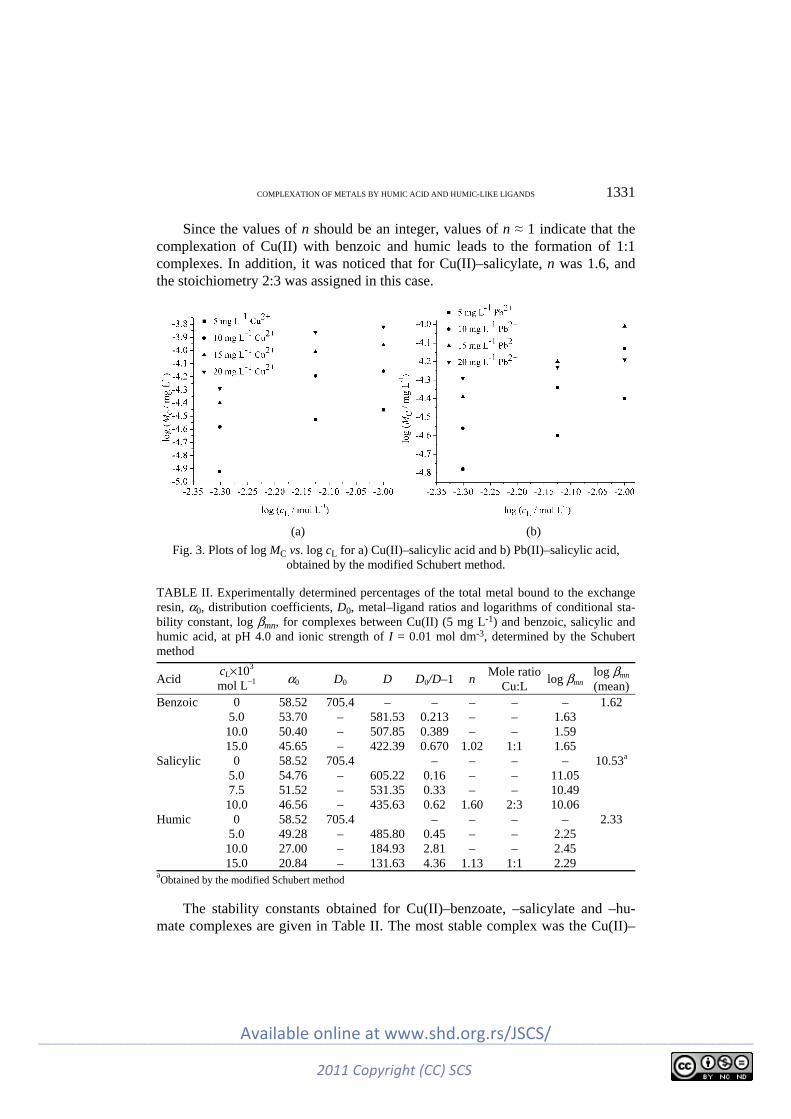
COMPLEXATION OF METALS BY HUMIC ACID AND HUMIC-LIKE LIGANDS 1331
Since the values of n should be an integer, values of n ≈ 1 indicate that the complexation of Cu(II) with benzoic and humic leads to the formation of 1:1 complexes. In addition, it was noticed that for Cu(II)–salicylate, n was 1.6, and the stoichiometry 2:3 was assigned in this case.
(a) (b)
Fig. 3. Plots of log MC vs. log cL for a) Cu(II)–salicylic acid and b) Pb(II)–salicylic acid, obtained by the modified Schubert method.
TABLE II. Experimentally determined percentages of the total metal bound to the exchange resin, α0, distribution coefficients, D0, metal–ligand ratios and logarithms of conditional sta-bility constant, log βmn, for complexes between Cu(II) (5 mg L-1) and benzoic, salicylic and humic acid, at pH 4.0 and ionic strength of I = 0.01 mol dm-3, determined by the Schubert method
Acid cL×103 mol L–1 α0 D0 D D0/D–1 n
Mole ratioCu:L
log βmn log βmn (mean)
Benzoic 0 58.52 705.4 – – – – – 1.62 5.0 53.70 – 581.53 0.213 – – 1.63 10.0 50.40 – 507.85 0.389 – – 1.59 15.0 45.65 – 422.39 0.670 1.02 1:1 1.65
Salicylic 0 58.52 705.4 – – – – 10.53a 5.0 54.76 – 605.22 0.16 – – 11.05 7.5 51.52 – 531.35 0.33 – – 10.49 10.0 46.56 – 435.63 0.62 1.60 2:3 10.06
Humic 0 58.52 705.4 – – – – 2.33 5.0 49.28 – 485.80 0.45 – – 2.25 10.0 27.00 – 184.93 2.81 – – 2.45 15.0 20.84 – 131.63 4.36 1.13 1:1 2.29
aObtained by the modified Schubert method
The stability constants obtained for Cu(II)–benzoate, –salicylate and –hu-mate complexes are given in Table II. The most stable complex was the Cu(II)–
_________________________________________________________________________________________________________________________
2011 Copyright (CC) SCS
Available online at www.shd.org.rs/JSCS/
1332 KOSTIĆ et al.
–salicylate complex with log βmn 10.53, which corresponds to literature data.26 For determination of these stability constants, the modified Schubert method was applied. The stability constant of the Cu(II)–humate complex was between the stabilities of Cu(II)–salicylate and –benzoate complexes. Stability constants of Cu(II)–humate complexes can differ because of the origin of the humic ligand, but the obtained values were similar and comparable. Variation of stability cons-tants values in humic complexation studies is not uncommon due to differences in the elemental composition of the humics, their chemical structure and period of genesis during the humification process.27
The percentage of total metal bound to the exchange resin, α0, the slope values, n, and stability constants, log βmn, obtained for the Pb(II) complexes (at a 5 mg L–1 Pb(II) concentration) with the investigated ligands, at pH 4.0 and 25 °C, are presented in Table III. It was found that percentage of total metal bound to the exchange resin for Pb(II)–benzoate was higher than for Cu(II)–salicylate and Cu(II)–humate in the total metal and ligand concentration range. This is in accordance with the number of binding sites in the ligands. In addition, the dif-ferences between the percentages of the total metal bound to the resin for same ligand were greater with increasing concentration of ligand. The values of stabi-lity constants presented in Table III show that stability constant of Pb(II)–humate complex was higher than that of the Pb(II)–benzoate complex. Moreover, the Pb(II)–salicylate complex was the most stable, with a value of 10.90 for log βmn.
TABLE III. Experimentally determined percentages of the total metal bound to the exchange resin, α0, distribution coefficients, D0, metal–ligand ratios and logarithms of conditional sta-bility constant, log βmn, for complexes between Pb(II) (5 mg L-1) and benzoic, salicylic and humic acid, at pH 4.0 and ionic strength of I = 0.01 mol dm-3, determined by the Schubert’s method
Acid cL×103 mol L–1 α0 D0 D D0/D–1 n
Mole ratioPb:L
log βmn log βmn (mean)
Benzoic 0 52.56 553.96 – – – – – 1.97 5.0 42.80 – 374.12 0.48 – – 1.98 10.0 37.80 – 303.86 0.82 – – 1.92 15.0 30.00 – 214.29 1.58 1.05 1:1 2.02
Salicylic 0 52.56 553.96 – – – – – 10.90a 5.0 34.96 – 268.76 1.06 – – 11.41 7.5 30.76 – 222.13 1.49 – – 10.85 10.0 25.60 – 172.04 2.21 1.24 2:3 10.44
Humic 0 52.56 553.96 – – – – – 2.50 5.0 29.40 – 208.21 1.66 – – 2.52 10.0 24.20 – 159.63 2.47 – – 2.39 15.0 14.00 – 81.39 5.81 1.07 1:1 2.59
aObtained by the modified Schubert method
_________________________________________________________________________________________________________________________
2011 Copyright (CC) SCS
Available online at www.shd.org.rs/JSCS/
COMPLEXATION OF METALS BY HUMIC ACID AND HUMIC-LIKE LIGANDS 1333
According to Table II and III, the results show that the system Cu(II) without ligand had higher value of the percentage of total metal bound to exchange resin than the Pb(II) system.
The stability constants, log βmn, and the metal–ligand ratio for the Cu(II) and Pb(II) complexes with all the investigated ligands, shown in Figs. 1 and 2, are summarized in Table IV.
Table IV. Stability constants, log βmn, and metal–ligand ratios for complexes between Cu(II) and Pb(II) with benzoic, salicylic and humic acid, at pH 4.0 and ionic strength I = 0.01 mol dm-3, determined by the Schubert method
Acid Cu Pb
c mg L-1 M:L log βmn
log βmn
(mean)Literature
valueref c
mg L-1 M:L log βmnlog βmn (mean)
Literature valueref
Benzoic 5 1:1 1.62 1.65 1.6028 5 1:1 1.97 1.96 2.0028 10 1:1 1.63 10 1:1 1.90 15 1:1 1.65 15 1:1 2.01 20 1:1 1.71 20 1:1 1.95
Salicylic 5 2:3 10.53 10.34a 10.6026 5 2:3 10.90 10.51a – 10 2:3 10.22 10 2:3 10.6015 2:3 10.10 15 2:3 10.4420 2:3 10.49 20 3:1 10.12
Humic 5 1:1 2.33 2.35 1.9512 3.7022 5.2821
5 1:1 2.50 2.58 2.7612
3.6621 4.7824
10 1:1 2.42 10 1:1 2.57 15 1:1 2.32 15 1:1 2.64 20 1:1 2.34 20 1:1 2.60
aObtained by the modified Schubert method
A comparison of the obtained results for the stability constants and stoichio-metry of Cu(II) with benzoic and salicylic acid with literature data indicate that values were approximately the same. The obtained values of the stability cons-tants for the Pb(II)–benzoate complexes were similar with literature data,28 while the values of the stability constant for Pb(II)–salicylate complexes are not avail-able in the literature.
The obtained results, which were derived using the Schubert method and its modified form, indicate that the conditional stability constant, log βmn, for the Pb(II)–humate complex was greater than that of Cu(II)–humate at pH 4.0. Pb(II) was found to form the most stable complex with the oxygen-carrying donor groups of humic acid. An explanation for the established stabilities of the Pb(II)– and Cu(II)–humate complexes can be given within the concept of hard/soft acids and bases. Since oxygen, as the donor atom in carboxylic and phenolic groups, exhi-bits hard base properties (a highly electronegative atom), a strong bond will be formed with hard acids (Pearson’s rule). Bearing in mind that the electronic con-figuration of the Pb(II) ion 18(n–1)e– + 2ne– classifies it in the borderline metal acids, while Cu(II) ion, the electronic configuration (n–1)d9, classifies it as a soft
_________________________________________________________________________________________________________________________
2011 Copyright (CC) SCS
Available online at www.shd.org.rs/JSCS/

1334 KOSTIĆ et al.
metal acid, the greater stability of the Pb(II)–humate complex compared to the complexes with copper can be expected.
The established trend of the stabilities of the metal–humate complexes can be used for predicting the strength of interaction between the donor atoms and the metal ions, as well as to predict their competition in binding to humate ligand. The obtained results indicate that there may be competition between Pb(II) ions and Cu(II) ions in the binding for carboxyl and phenolic binding sites of humate macromolecules. Therefore, under conditions of increased concentrations of Pb(II) ions in the natural environment, Pb(II) may displace Cu(II) ions, which can lead to increasing mobility and bioavailability of copper.
The present results provide important information on the interaction of Cu(II) and Pb(II) with benzoic, salicylic and humic acid, and demonstrate that not only are carboxyl groups involved in metal binding, but also other groups, like pheno-lic groups, must be involved.
CONCLUSIONS
The Schubert ion-exchange method is applicable for the determination of conditional stability constants of mononuclear complexes while for polynuclear complexes, a modified Schubert ion-exchange method should be applied. The ob-tained stoichiometry values indicate that humic and benzoic acid form mononuc-lear complexes with Cu(II) and Pb(II), while salicylic acid forms polynuclear complexes with both metals.
Phenolic acids comprise a significant part of the chemical structure of humic substances showing an important role in complexation properties of HA. Sali-cylic and benzoic acids, as humic-like ligands, can be used for setting the range of stability constants of humic complexes with Cu(II) and Pb(II). The binding of Pb(II) by HA is stronger than that for Cu(II). The results of this study are impor-tant for understanding the mobility and fate of Cu(II) and Pb(II) in the environ-ment.
Acknowledgements. This study was supported by the Ministry of Science and Techno-logical Development of the Republic of Serbia and was performed as a part of Project III41018.
И З В О Д
КОМПЛЕКСИРАЊЕ БАКАР(II) И ОЛОВО(II) ЈОНА ХУМИНСКОМ КИСЕЛИНОМ И МОДЕЛОМ ХУМИНСКОГ ЛИГАНДА
ИВАНА КОСТИЋ1, ТАТЈАНА АНЂЕЛКОВИЋ1, РУЖИЦА НИКОЛИЋ1, АЛЕКСАНДАР БОЈИЋ1,
МИЛОВАН ПУРЕНОВИЋ1, СРЂАН БЛАГОЈЕВИЋ2 и ДАРКО АНЂЕЛКОВИЋ3
1Odsek za hemiju, Prirodno–matemati~ki fakultet,Univerzitet u Niu, Viegradska 33,
18000 Ni, 2Poqoprivredni fakultet, Univerzitet u Beogradu, Nemawina 6,
11080 Zemun i 3JKP “Naissus”, Knegiwe Qubice 1/1, 18000 Ni
Стабилност метал–хуматног комплекса представља важан фактор у одређивању и пред-виђању специјације, мобилности и биорасположивости тешких метала у животној средини.
_________________________________________________________________________________________________________________________
2011 Copyright (CC) SCS
Available online at www.shd.org.rs/JSCS/

COMPLEXATION OF METALS BY HUMIC ACID AND HUMIC-LIKE LIGANDS 1335
У овом раду вршена су упоредна испитивања комплекса Cu(II) и Pb(II) са хуминском кисе-лином и моделом хуминског лиганда, као што су бензоева и салицилна киселина. Испити-вања су вршена на pH 4,0 и температури од 25 °C и при јонској јачини од 0,01 mol dm-3 (NaCl), помоћу класичне и модификоване Шубертове јоноизмењивачке методе. Константе стабилности за комплексе са бензоевом и хуминском киселином израчунате су помоћу екс-перименталних података добијених класичном Шубертовом методом. Модификована Шу-бертова метода је коришћена за одређивање константе стабилности комплекса са салицил-ном киселином. Утврђено је да Cu(II) и Pb(II) јони формирају мононуклеарне комплексе са бензоевом и хуминском киселином. Такође, утврђено је и да оба метала формирају полину-клеарне комплексе са салицилном киселином. Резултати указују на то да Pb(II) јон има већу способност везивања од Cu(II) јона са свим испитиваним лигандима. Олово и бакар салици-латни комплекси показују већу константу стабилности у поређењу са хуматним комплек-сима, док се стабилности ових комплекса мање разликују од стабилности комплекса са бен-зоевом киселином. Салицилна и бензоева киселина се могу користити као модели хуминског лиганда за одређивање опсега константи стабилности комплекса Cu(II) и Pb(II) јона са ху-минском киселином.
(Примљено 10. марта, ревидирано 2. јула 2011)
REFERENCES
1. K. Gao, J. Pearce, J. Jones, C. Taylor, Environ. Geochem. Health 21 (1999) 13 2. M. Schizer, S. U. Kahn, Humic substances in the Environment, Dekker, New York, 1972 3. T. Andjelkovic, J. Perovic, M. Purenovic, S. Blagojevic, R. Nikolic, D. Andjelkovic, A.
Bojic, Anal. Sci. 22 (2006) 1553 4. T. Anđelković, R. Nikolić, A. Bojić, D. Anđelković, G. Nikolić, Macedonian J. Chem.
Chem. Eng. 29 (2010) 215 5. E. Giannakopoulos, K. C. Christoforidis, A. Tsipis, M. Jerzykiewicz, Y. Deligiannakis, J.
Phys. Chem., A 109 (2005) 2223 6. J. P. Gustafsson, P. Pechova, Environ. Sci. Technol. 37 (2003) 2767 7. M. Fukushima, S. Tanaka, H. Nakamura, S. Ito, Talanta 43 (1996) 383 8. T. Andjelković, J. Perović, M. Purenović, D. Andjelković, Facta Universitatis 3 (2004)
79 9. G. Abate, J. Masini, J. Braz. Chem. Soc. 12 (2001) 109
10. J. Buffle, Metal Ions in Biological Systems, Dekker, New York, p.p. 165–221 11. L. J. Evans, B. Sengdy, D. G. Lumsdon, D. A. Stanbury, Chem. Speciation Bioavail-
ability 15 (2003) 4 12. E. M. Logan, I. D. Pulford, G. T. Cook, A. B. Mackenzie, Eur. J. Soil Sci. 48 (1997) 685 13. J. Čežikova, J. Kozler, L. Madronova, J. Novak, P. Janoš, React. Funct. Polym. 47 (2001)
111 14. M. Pesavento, G. Alberti, R. Biesuz, Anal. Chim. Acta 631 (2009) 129 15. F. Borges, C. Guimaraes, J. L. F. C. Lima, I. Pinto, S. Reis, Talanta 66 (2005) 670 16. M. A. Glaus, W. Hummel, L. R. van Loon, Appl. Geochem.15 (2000) 953 17. D. Gondar, S. Fiol, R. Lopez, M. Ramos, J. M. Antelo, F. Arce, Chem. Speciation Bio-
availability 12 (2000) 3 18. P. Chakraborty, Anal. Chim. Acta 659 (2010) 137 19. J. Schubert, Theoret. J. Phys. Chem. 52 (1947) 340 20. J. Schubert, J. W. Richter, Theoret. J. Phys. Chem. 52 (1947) 350
_________________________________________________________________________________________________________________________
2011 Copyright (CC) SCS
Available online at www.shd.org.rs/JSCS/

1336 KOSTIĆ et al.
21. K. Pandey, S. D. Pandey, V. Misra, Ecotoxicol. Environ. Saf. 47 (2000) 195 22. H. Baker, F. Khalili, Anal. Chim. Acta 497 (2003) 235 23. H. Baker, F. Khalili, Anal. Chim. Acta 542 (2005) 240 24. H. Baker, F. Khalili, Ann. Environ. Sci. 1 (2007) 35 25. G. K. Brown, P. MacCarthy, J. A. Leenheer, Anal. Chim. Acta 402 (1999) 169 26. J. Dean, Lange’s Handbook of Chemistry, 14th Edition, McGraw-Hill, New York, USA,
1992. 27. H. Itabashi, Y. Kamata, D. Kawaguchi, H. Kawamoto, Anal. Sci. 19 (2003) 1277 28. M. Yasuda, K. Yamasaki, H. Ohtaki, Bull. Chem. Soc. Jpn. 33 (1960) 1067.
_________________________________________________________________________________________________________________________
2011 Copyright (CC) SCS
Available online at www.shd.org.rs/JSCS/
J. Serb. Chem. Soc. 76 (9) 1337–1338 (2011) UDC 537.363+539.196:532+536.7 JSCS–4207 Book review
1337
BOOK REVIEW
Interfacial electrovicoelasticity and electrophoresis Authors: JYH-PING HSU and ALEKSANDAR M. SPASIC
Published by CRC Press Taylor & Francis Group, 6000 Broken Sound Parkway NW, Suite 300, Boca Raton, FL 33487-2742
In contemporary hydrodynamic, electrodynamic and thermodynamic instabi-lities that occur at interfaces, it is important wisdom to believe that interfacial electroviscoelasticity and electrophoresis are a new science with adequate use in modern technology. They are connected with the interfaces of rigid and defor-mable particles in homo- and hetero-aggregate dispersed systems, such as emul-sions, dispersoides, suspensions, nanopowders, foams, fluosols, polymer mem-branes, biocolloids and plasmas.
This book is published on 176 pages with 57 Figures, 5 Tables and 232 References, 147 for the first 5 Chapters and 85 for the 6th. The book also has an Author Index and a Subject Index.
The authors have collected six chapters that show the development of the theory of electroviscoelasticity and electrophoresis and the motivation for deve-loping this theory. These chapters cover a wide range including: Classifications of Finely Dispersed Systems, Historical Review and Motivation, Theory of Elec-troviscoelasticity, Measurements, Implications and Electrophoresis.
Classifications (Chapter 1) are based on various phenomenological notions: the scales, geometry, and the origin of forces, physical-chemical processes and entities.
Historical Review and Motivation (Chapter 2) describe the pilot plant of uranium extraction from wet phosphoric acid. There are also subsections related to entrainment problems in solvent extraction, underlining the performance of de-mulsions, Marangoni instabilities and possible electrical analogies, and various constitutive models of liquids. Finally, authors introduced the terms “electro-viscosity” and “electroviscoelasticity” of liquid–liquid interfaces.
Theory of electroviscoelasticity (Chapter 3) includes: previous work, struc-ture: electrified interfaces – a new constitutive model of liquids and dynamics: physical formalism. Mathematical formalisms are also presented by the stretch-ing tensor model and the van der Pol derivative model: the fractional approach.
_________________________________________________________________________________________________________________________
2011 Copyright (CC) SCS
Available online at www.shd.org.rs/JSCS/
1338 DJORDJEVIĆ
Experiments (Chapter 4) confirm the theoretical predictions describing sys-tems which include the generation of the physical model, measuring changes of electrical interfacial potential at interfaces and measuring the characteristic frequencies of the system. The results and discussion of the subsections and as-sembled measured, calculated and estimated data are given.
The implication and applications to the first and second philosophical break-points (Chapter 5) are discussed (particular entrainment problem is solvent ex-traction: breaking of emulsions).
Electrophoresis (Chapter 6), as very important electrokinetic phenomena, presents analytical tools for the characterization of the surface properties of col-loid-sized particles as well as for separation and purification process in both labo-ratory and industrial investigations.
This welcome collection concerning electroviscoelasticity and electropho-resis provides an important survey of how and where interfacial and colloidal phenomena serve to advance the frontiers of numerous chemical manufacturing processes at the micro-, nano- and atto-scales, in one word to solve problems in solvent extraction operations and processes, colloid and interface science, chemi-cal and biological sensors, electroanalytical methods and /or biology/biomedicine (hematology, genetics and electroneurophysiology). In addition, the second philosophical breakpoint could be applied in elucidation and research of spin-tronics, decoherence sensitivity, quantum particles entanglement, ionics, fractio-nal-quantum Hall Effect, fluids, etc.
This book is aimed not only at those working in a specific area related to the considered phenomena, but also at general chemists, prospective researchers and graduate students with a basic knowledge of physical chemistry, electromag-netism, fluid mechanics, quantum mechanics and wave mechanics.
Bojan D. Djordjević*#
Faculty of Technology and Metallurgy University of Belgrade
* E-mail: [email protected] # Serbian Chemical Society member.
_________________________________________________________________________________________________________________________
2011 Copyright (CC) SCS
Available online at www.shd.org.rs/JSCS/
Related Documents