IMPROVIZATION OF PRODUCTIVITY THROUGH LAYOUT OPTIMIZATION IN PUMP INDUSTRY Karthik .T * Assistant Professor, Department Of Mechanical Engineering, PSG College of Technology Tamilnadu, Coimbatore, India. [email protected] Senthilkumar.M PSG College of Technology, Coimbatore, Tamilnadu, India A B S T R A C T K E Y W O R D S A R T I C L E I N F O Productivity, Layout, Manpower Received 03 July 2012 Accepted 06 September 2012 Available online 01 October 2012 This paper focuses on meeting the customer demand by improving the man power utilization, enhancing the machining capacity and improving material flow .The productivity improvement is made through modification of shop floor layout which supports the multi machine manning and streamlining the material flow in between the machines. The cycle time analysis and part flow analysis is carried out to group the machines which look more in detail on bottleneck processes. The machines are low cost automated hence, the operator only has to perform the set up and the machine does the rest of the process automatically. Thus the operators are less of loaded with work content, effective utilization of manpower becomes more important and critical to bring up the productivity. The analysis on machine utilization and layout of machinery is made to enhance the machining capacity of the shop floor. ________________________________ * Corresponding Author 1. Introduction and literature survey One of the major roles of lean manufacturing in a factory is to perform space planning according to the expansion plans for new machines to add capacity to the plant. More often than not, the Industrial Engineer can be challenged when there is a limitation to the space on a production floor. Particularly for cases where a certain production floor or area is designated for a specific product, space becomes an issue of greater concern when the product volume expands beyond the designated area. When there is a mismatch between demand and capacity from the planning systems, it is time for the Industrial Engineer to seek actions needed for productivity improvement to close the capacity gaps in order to meet the demand of customers in a timely manner. By understanding the factors contributing to productivity losses, an Industrial Engineer can then work with the operations and engineering teams to identify the opportunities based on existing problems on the production floor and efficiency of the material handling equipment.

Welcome message from author
This document is posted to help you gain knowledge. Please leave a comment to let me know what you think about it! Share it to your friends and learn new things together.
Transcript
International Journal of Lean Thinking Volume 3, Issue 2 (December 2012)
Lean Thinkingjournal homepage: www.thinkinglean.com/ijlt
IMPROVIZATION OF PRODUCTIVITY THROUGH LAYOUT OPTIMIZATION IN PUMP INDUSTRY
Karthik .T * Assistant Professor, Department Of
Mechanical Engineering, PSG College of Technology Tamilnadu, Coimbatore, India.
Senthilkumar.M PSG College of Technology, Coimbatore, Tamilnadu, India
A B S T R A C T
K E Y W O R D S
A R T I C L E I N F O
Productivity,
Layout,
Manpower
Received 03 July 2012
Accepted 06 September 2012
Available online 01 October 2012
This paper focuses on meeting the customer demand by
improving the man power utilization, enhancing the machining
capacity and improving material flow .The productivity
improvement is made through modification of shop floor layout
which supports the multi machine manning and streamlining the
material flow in between the machines. The cycle time analysis and
part flow analysis is carried out to group the machines which look
more in detail on bottleneck processes. The machines are low cost
automated hence, the operator only has to perform the set up and
the machine does the rest of the process automatically. Thus the
operators are less of loaded with work content, effective utilization
of manpower becomes more important and critical to bring up the
productivity. The analysis on machine utilization and layout of
machinery is made to enhance the machining capacity of the shop
floor.
________________________________
* Corresponding Author
1. Introduction and literature survey
One of the major roles of lean manufacturing in a factory is to perform space planning
according to the expansion plans for new machines to add capacity to the plant. More often
than not, the Industrial Engineer can be challenged when there is a limitation to the space on a
production floor. Particularly for cases where a certain production floor or area is designated
for a specific product, space becomes an issue of greater concern when the product volume
expands beyond the designated area.
When there is a mismatch between demand and capacity from the planning systems, it
is time for the Industrial Engineer to seek actions needed for productivity improvement to
close the capacity gaps in order to meet the demand of customers in a timely manner. By
understanding the factors contributing to productivity losses, an Industrial Engineer can then
work with the operations and engineering teams to identify the opportunities based on existing
problems on the production floor and efficiency of the material handling equipment.
KARTHIK, SENTHİLKUMAR / International Journal of Lean Thinking Volume 3, Issue 2(December 2012)
91
II. LITERATURE REVIEW
One-operator – two machine flow shop so as to minimize the make span. Confining our attention to
cyclic-movement schedules, we have first identified the relevant cyclic-movement schedules for the
separable and no separable setup and dismounting problems, respectively [1]
the user has to rebuild the model based on the number of jobs and machines given in the problem.
The result obtained from the simulation output helps managers to evaluate the performance of the system
by knowing machines utilization and other resources, average waiting time of jobs, and average idle time
for each machine[2]
where each worker has skills to operate two machines, and where the operator busy time is
considered the same as the machine busy time, worker level was found to be the best. Under these
conditions, increasing the worker level. results in a marginal gain for which the return on investment does
not justify the increase in worker cost. [3]
The proposed model should be extended to examine other performance measures that are critical to
the efficient operation of cellular systems such as work in process inventories and production lead times.
The selection of the best labour allocation strategies should simultaneously consider production output,
lead times, and the amount of work in process inventories in the system.[4]
III. PROBLEM DEFINITION
The problem identified here is that the demand is not met, due to improper material flow under
utilization of machines and man power not sufficient
IV.METHODOLOGY
These problems can be solved by following lean concepts. The approach is bas explained in the
following fig.1
Fig. 1 Flowchart of systematic approach

KARTHIK, SENTHİLKUMAR / International Journal of Lean Thinking Volume 3, Issue 2(December 2012)
92
V .THE CURRENT PROCESS
The parts like top bearing block, Bottom bearing block, Pump adopter, Out let casing, Outlet
casing, Thrust bearing housing required for the pumps are casted from the vendors and brought into the
shops for machining process. Here these parts are first turned in the semi automated lathes. These lathes
are arranged based on product, so each part is turned in their specific cells. After turning operations like
drilling, tapping, grooving is performed in respective machines which are arranged in traditional layout.
The layout of these machines is as shown in fig.2 below
Fig.2 Lay out of machines in the pump industry
The top bearing block undergoes several operations which are as shown in fig 3 below.
Fig.3 Flow chart of Top bearing blocks process.
KARTHIK, SENTHİLKUMAR / International Journal of Lean Thinking Volume 3, Issue 2(December 2012)
93
Similar operations are performed in other parts also
A. Problems In Current Layout:
The following are the problems faced in the current layout
Some machines remain ideal due to lack of man power.
Distance between machines are high, wich increases the transportation.
High Lead time of the product.
Customer demand cannot be satisfied.
B. Data Collection
Takt Time
Working shift per day = 2
Working hours per shift = 12 hours
Available time per shift = 720 minutes
Tea break per shift = 2breaks * 15 minutes
= 30 minutes
Lunch break per shift = 60 minutes
Down time per shift = 0
Net working time per shift = [ available time-(breaks +break down)]
= 720-90
= 630 minutes
= 37800 seconds
Net working time per day = 75600 seconds
Customer demand per day = 500 pieces
Takt time = Net working time per day/ Customer demand per day
= 75600/500
Takt time = 151.12 seconds
The Takt time required to meet the customer demand is calculated & found to be 151.2 seconds
The daily demand for each parts & the cycle time for every machine is noted. Then the productions of
each machine are calculated. These are tabulated in table I.

KARTHIK, SENTHİLKUMAR / International Journal of Lean Thinking Volume 3, Issue 2(December 2012)
94
TABLE I
S.NO MACHINE CYCLE TIME CAPACITY REQUIRED
1 MACHINE001 4 315.0 500
2 MACHINE002 3.32 379.5 500
3 MACHINE003 3 420.0 500
4 MACHINE004 3.3 0.0 0
5 MACHINE005 3.3 381.8 500
6 MACHINE006 5 252.0 500
7 MACHINE007 3.5 360.0 500
8 MACHINE008 2.3 547.8 500
9 MACHINE009 3.27 385.3 500
10 MACHINE010 3.27 0.0 0
11 MACHINE011 2.41 0.0 500
12 MACHINE012 5.2 0.0 0
13 MACHINE013 5.2 0.0 500
14 MACHINE014 2.3 0.0 500
15 MACHINE015 3.27 0.0 500
16 MACHINE016 3.27 0.0 0
C. Current States
We found that many machines are not used, kept idle due to unavailable of skilled man power. So
as the result the operations to be performed are done by vendors outside the premises. The following fig.4
shows the current process simulation models.
Fig.4 simulation models the current process

KARTHIK, SENTHİLKUMAR / International Journal of Lean Thinking Volume 3, Issue 2(December 2012)
95
The following are the results of the simulated model. The man power utilization is tabulated in table II.
TABLE II
DESCRIPTION
%
BUSY
%
IDLE QUANTITY
NO.
STARTED
NO.
ENDED
NO.
NOW
Labor001 19.31 80.69 1 244 243 1
Labor002 19.23 80.77 1 243 242 1
Labor003 23.25 76.75 1 293 293 0
Labor004 23.18 76.83 1 292 292 0
Labor005 30.41 69.59 1 384 383 1
Labor006 22.38 77.62 1 282 282 0
Labor007 20.08 79.92 1 253 253 0
Labor008 20.00 80.00 1 252 252 0
The machine utility is tabulated in table III
TABLE III
DESCRIPTION % IDLE % SETUP
NO. OF
OPER % BUSY
Machine001 0 19.312 244 80.688
Machine002 16.481 19.233 243 64.286
Machine003 0 23.254 293 76.746
Machine004 100 0 0 0
Machine005 0.341 23.175 292 76.484
Machine006 0 30.413 384 69.587
Machine007 100 0 0 0
Machine008 0.181 22.381 282 77.438
Machine009 100 0 0 0
Machine010 100 0 0 0
Machine011 100 0 0 0
Machine012 100 0 0 0
Machine013 100 0 0 0
Machine014 100 0 0 0
Machine015 0 20.079 253 79.921
Machine016 20.097 20 253 59.903

KARTHIK, SENTHİLKUMAR / International Journal of Lean Thinking Volume 3, Issue 2(December 2012)
96
Parts output from simulation is tabulated in table IV
TABLE IV DESCRIPTION NO. ENTERED NO. SHIPPED W.I.P.
BTTOMBONOT 600 253 347
HOUSING 0 0 0
OUTLETCASING125 600 282 318
PUMPADOPTER 600 243 357
TOPBEARING 600 292 308
VI.MODIFIED LAYOUT
With the help of modified layout the available operators can be used effectively. Through this layout
the non utilized machine can also be used. One operator will be used in running two machines. This will
help in utilization on the worker as shown in fig 5.Tthe modified shop floor layout
Fig.5 Modified layout
KARTHIK, SENTHİLKUMAR / International Journal of Lean Thinking Volume 3, Issue 2(December 2012)
97
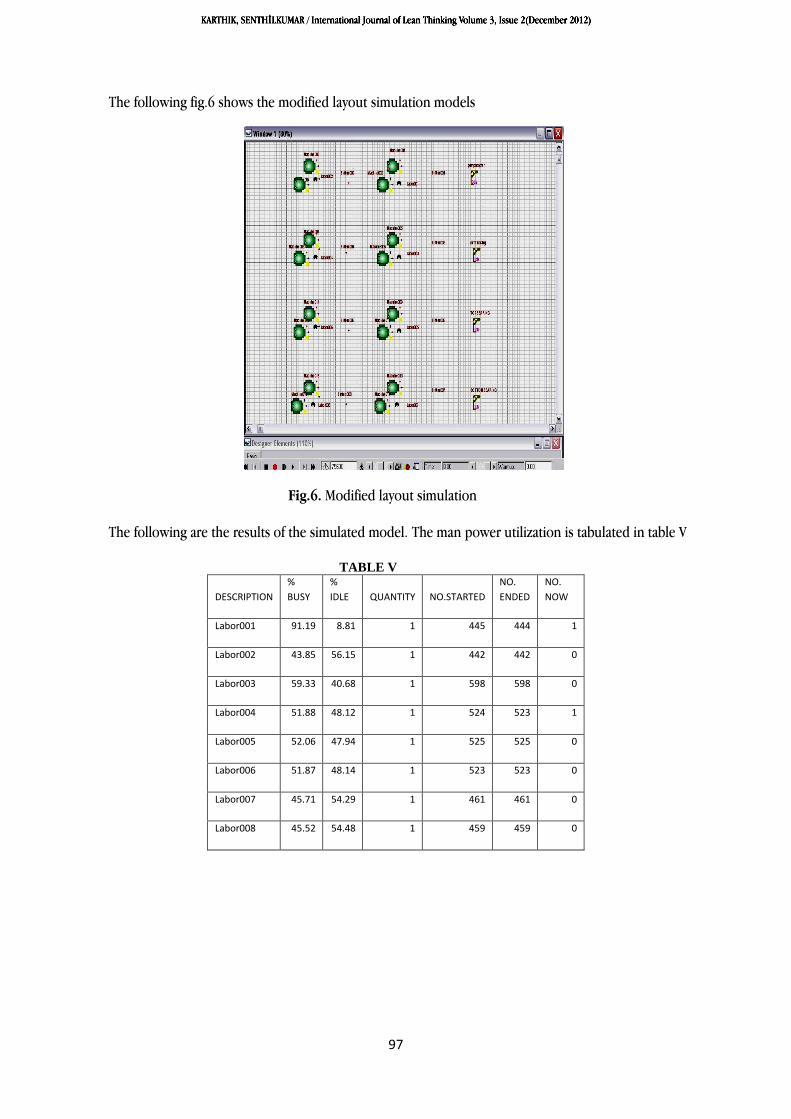
The following fig.6 shows the modified layout simulation models
Fig.6. Modified layout simulation
The following are the results of the simulated model. The man power utilization is tabulated in table V
TABLE V
DESCRIPTION
%
BUSY
%
IDLE QUANTITY NO.STARTED
NO.
ENDED
NO.
NOW
Labor001 91.19 8.81 1 445 444 1
Labor002 43.85 56.15 1 442 442 0
Labor003 59.33 40.68 1 598 598 0
Labor004 51.88 48.12 1 524 523 1
Labor005 52.06 47.94 1 525 525 0
Labor006 51.87 48.14 1 523 523 0
Labor007 45.71 54.29 1 461 461 0
Labor008 45.52 54.48 1 459 459 0
KARTHIK, SENTHİLKUMAR / International Journal of Lean Thinking Volume 3, Issue 2(December 2012)
98
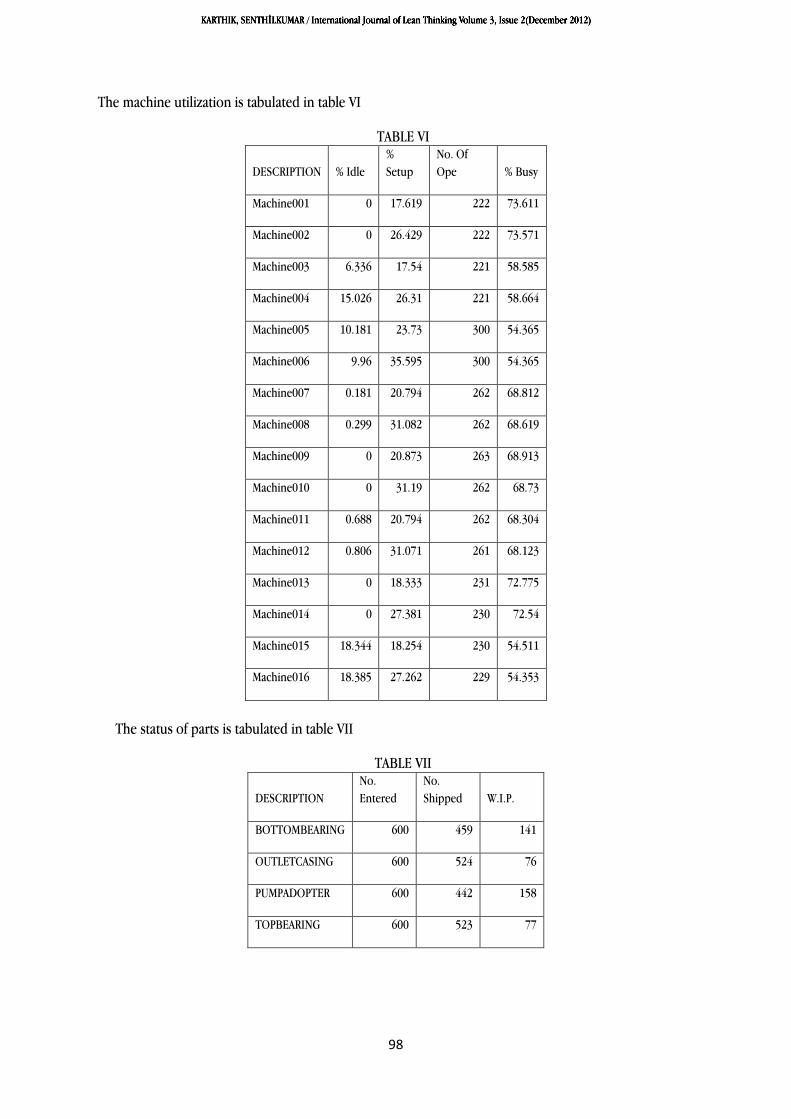
The machine utilization is tabulated in table VI
TABLE VI
DESCRIPTION % Idle
%
Setup
No. Of
Ope % Busy
Machine001 0 17.619 222 73.611
Machine002 0 26.429 222 73.571
Machine003 6.336 17.54 221 58.585
Machine004 15.026 26.31 221 58.664
Machine005 10.181 23.73 300 54.365
Machine006 9.96 35.595 300 54.365
Machine007 0.181 20.794 262 68.812
Machine008 0.299 31.082 262 68.619
Machine009 0 20.873 263 68.913
Machine010 0 31.19 262 68.73
Machine011 0.688 20.794 262 68.304
Machine012 0.806 31.071 261 68.123
Machine013 0 18.333 231 72.775
Machine014 0 27.381 230 72.54
Machine015 18.344 18.254 230 54.511
Machine016 18.385 27.262 229 54.353
The status of parts is tabulated in table VII
TABLE VII
DESCRIPTION
No.
Entered
No.
Shipped W.I.P.
BOTTOMBEARING 600 459 141
OUTLETCASING 600 524 76
PUMPADOPTER 600 442 158
TOPBEARING 600 523 77
KARTHIK, SENTHİLKUMAR / International Journal of Lean Thinking Volume 3, Issue 2(December 2012)
99
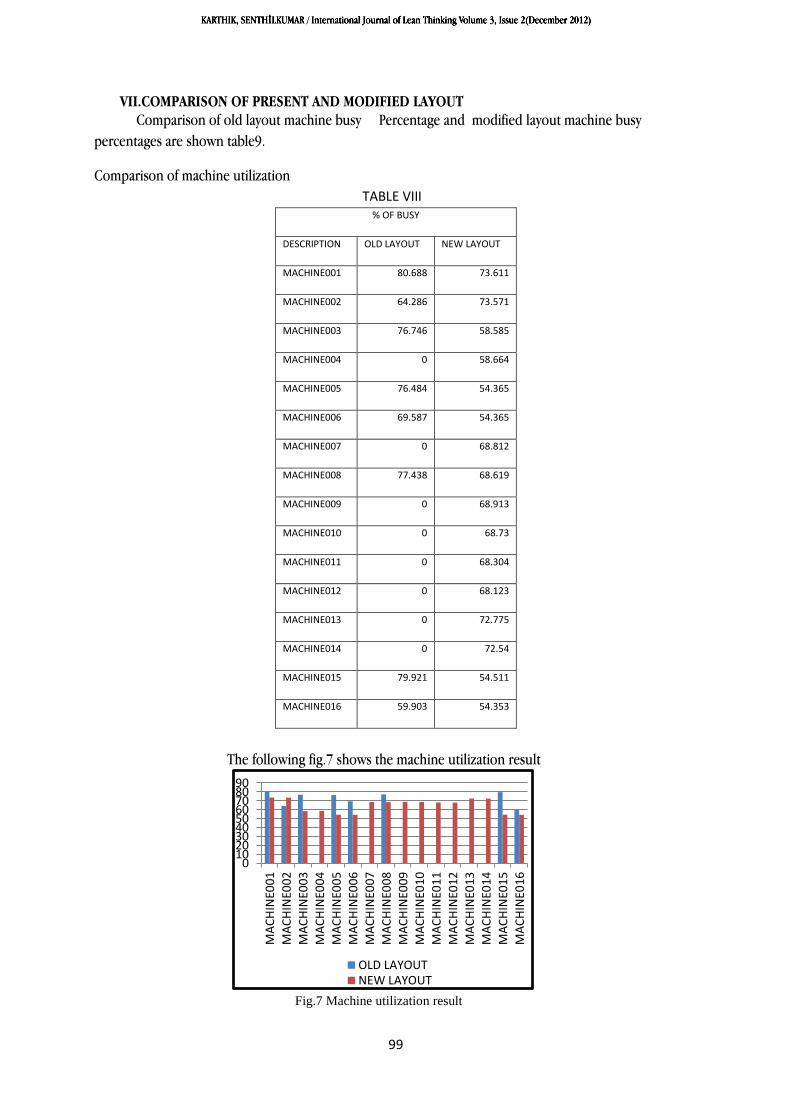
VII.COMPARISON OF PRESENT AND MODIFIED LAYOUT
Comparison of old layout machine busy Percentage and modified layout machine busy
percentages are shown table9.
Comparison of machine utilization
TABLE VIII % OF BUSY
DESCRIPTION OLD LAYOUT NEW LAYOUT
MACHINE001 80.688 73.611
MACHINE002 64.286 73.571
MACHINE003 76.746 58.585
MACHINE004 0 58.664
MACHINE005 76.484 54.365
MACHINE006 69.587 54.365
MACHINE007 0 68.812
MACHINE008 77.438 68.619
MACHINE009 0 68.913
MACHINE010 0 68.73
MACHINE011 0 68.304
MACHINE012 0 68.123
MACHINE013 0 72.775
MACHINE014 0 72.54
MACHINE015 79.921 54.511
MACHINE016 59.903 54.353
The following fig.7 shows the machine utilization result
Fig.7 Machine utilization result
0102030405060708090
MA
CH
INE0
01
MA
CH
INE0
02
MA
CH
INE0
03
MA
CH
INE0
04
MA
CH
INE0
05
MA
CH
INE0
06
MA
CH
INE0
07
MA
CH
INE0
08
MA
CH
INE0
09
MA
CH
INE0
10
MA
CH
INE0
11
MA
CH
INE0
12
MA
CH
INE0
13
MA
CH
INE0
14
MA
CH
INE0
15
MA
CH
INE0
16
OLD LAYOUTNEW LAYOUT
KARTHIK, SENTHİLKUMAR / International Journal of Lean Thinking Volume 3, Issue 2(December 2012)
100
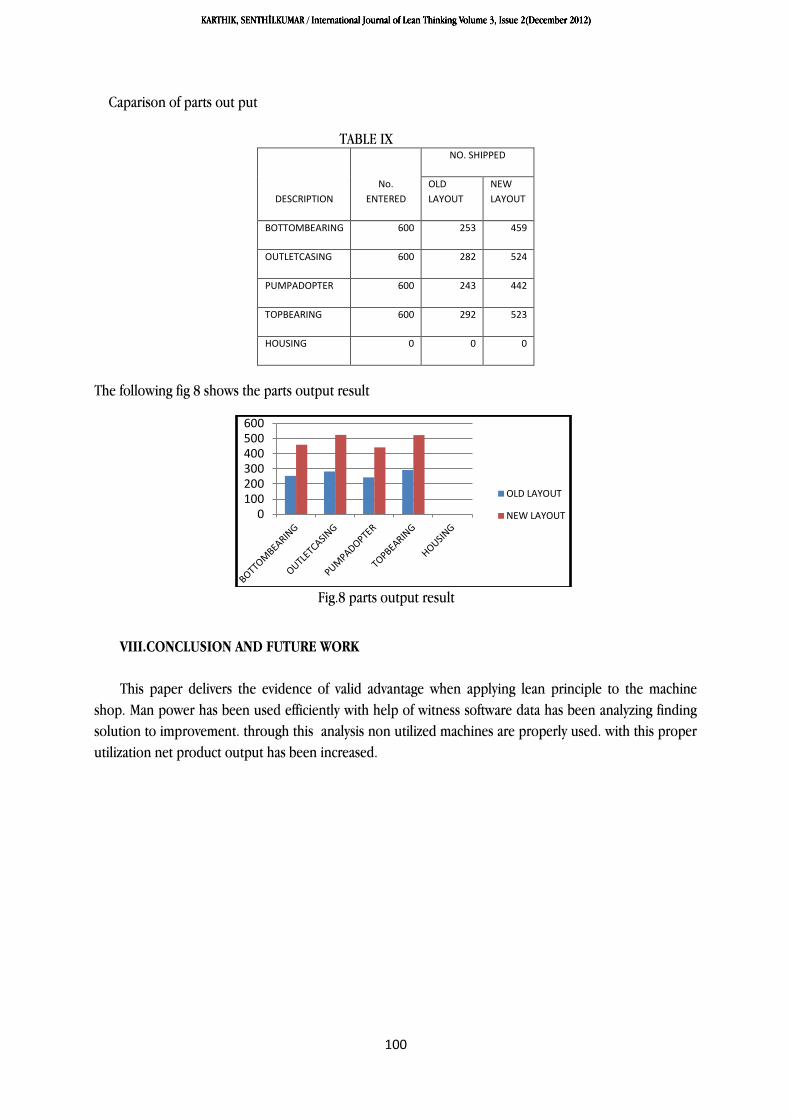
Caparison of parts out put
TABLE IX
DESCRIPTION
No.
ENTERED
NO. SHIPPED
OLD
LAYOUT
NEW
LAYOUT
BOTTOMBEARING 600 253 459
OUTLETCASING 600 282 524
PUMPADOPTER 600 243 442
TOPBEARING 600 292 523
HOUSING 0 0 0
The following fig 8 shows the parts output result
Fig.8 parts output result
VIII.CONCLUSION AND FUTURE WORK
This paper delivers the evidence of valid advantage when applying lean principle to the machine
shop. Man power has been used efficiently with help of witness software data has been analyzing finding
solution to improvement. through this analysis non utilized machines are properly used. with this proper
utilization net product output has been increased.
0100200300400500600
OLD LAYOUT
NEW LAYOUT

KARTHIK, SENTHİLKUMAR / International Journal of Lean Thinking Volume 3, Issue 2(December 2012)
101
IX.REFERENCES
Cheng TCE, Podolsky S. Just-in-time manufacturing: an introduction, 2/e. London: Chapman & Hall,
1996.
Krajeswski LJ, Ritzman LP. Operations management: strategy and analysis. Reading, MA: Addison-Wesley,
1987.
East N. A human guide to robots. UK: Alpin Press, 1983.
Su Q, Chen FE. Optimal sequencing of double-gripper gantry robot moves in tightly-coupled serial
production systems. IEEE Transactions on Robotics and Automation 1996;12:22— 30.
Graham RL, Lawler EL, Lenstra JK, Rinnooy Kan AHG. Optimization and approximation in
deterministic sequencing and scheduling: a survey. Annals of Discrete Mathematics 1979;5:287— 326.
Dudek RA, Panwalker SS, Smith ML. The lessons of flowshop scheduling research. Operations
Research 1992;40:7— 13.
Lawler EL, Lenstra JK, Rinnooy Kan AHG, Shmoys DB. Sequencing and scheduling: algorithms and
complexity. In: Nemhauser GL, Rinnooy Kan AHG (editors), Logistics of production and inventory.
Amsterdam: North- Holland, 1993.
Hall NG, Sriskandarajah C. A survey of machine scheduling problems with blocking and no-wait in
process.Operations Ressearch 1996;44:510— 24.
Crama Y, van de Klundert J. Cyclic scheduling of identical parts in a robotic cell. Operations
Research 1997;45:952— 6.
Levner E, Kats V, Levit VE. An improved algorithm for the cyclic flowshop scheduling in a robotic cell.
European Journal of Operational Research 1997;97:500 — 8.
Kise H, Shioyama T, Ibaraki T. Automated two-machine flowshop scheduling: a solvable case. IIE
Transactions 1991;23:10— 6.
Sethi SP, Sriskandarajah C, Sorger G, Blazewicz J, Kubiak W. Sequencing of parts and robot moves in a
robotic cell. International Journal of Flexible Manufacturing Systems 1992;4:331 — 58.
Related Documents