www.jpmorganmarkets.com Europe Economic Research 03 February 2014 Euro area slack: there is much more than you think Economic and Policy Research David Mackie (44-20) 7134-8325 [email protected] Malcolm Barr (44-20) 7134-8326 [email protected] Greg Fuzesi (44-20) 7134-8310 [email protected] Marco Protopapa (44-20) 7742 -7644 [email protected] Raphael Brun-Aguerre (44-20) 7134-8308 [email protected] JPMorgan Chase Bank N.A, London Branch See page 24 for analyst certification and important disclosures. Estimating the amount of slack in the Euro area economy, and gauging how it will evolve over time, are of critical importance. Judgments about the amount of slack and its evolution determine the appropriate stance of monetary policy and the appropriate degree of fiscal consolidation. Misjudgments about slack can not only lead to weak growth, high unemployment and inflation that is too low, but can also turn cyclical weakness into structural weakness through hysteresis. Since the beginning of 2008, the Euro area unemployment rate has risen by 4.7%-pts to reach the current level of 12%. This is the highest level seen since the 1930s. At first blush, this would suggest a huge amount of slack. However, official institutions in the Euro area—the European Central Bank and the European Commission—do not believe this to be the case. They look at both the rise in long-term unemployment, and the disconnect between unemployment and other measures of labor market slack (such as skill shortages and vacancies), and assume that much of the rise in unemployment is structural in nature. This leaves them thinking that the output gap is only modest, despite the fact that the level of GDP is still 3% lower than the last cyclical peak at the beginning of 2008. We disagree with this judgment. As the last business cycle showed, solid growth can reduce long-term unemployment with very little upward pressure on wages. This means that the long-term unemployed are not necessarily structurally unemployed. Moreover, because of the experience of the back- to-back deep recessions in the periphery, some indicators of labor market slack have been at their lower bound for a while. The proportion of firms reporting labor as a constraint on production cannot go below zero; nor can the vacancy rate. Across the periphery, these indicators reached their lower bound after the first recession in 2008/9, so they couldn’t fall further in the second recession that began in 2011. This means the additional rise in unemployment in the 2011/12 recession could not be matched by a decline in skill shortages and vacancies. As a consequence, we believe there is likely much more slack in the region than the ECB and EC assume. This means that the monetary stance should be much easier and that the degree of fiscal consolidation should be less. If our assessment is correct, then growth is likely to remain lackluster and inflation will remain very low for a very long time. This means that the ECB policy rate is likely to remain at the current level or lower for much longer than the central bank anticipates, and the ECB will remain under persistent pressure to do more. A misjudgment about the amount of slack in the economy not only condemns the region to sub-par performance for many years to come, but it also adds to the likelihood that cyclical weakness turns into structural weakness through weak capital formation and hysteresis in the labor market.

Welcome message from author
This document is posted to help you gain knowledge. Please leave a comment to let me know what you think about it! Share it to your friends and learn new things together.
Transcript

www.jpmorganmarkets.com
Europe Economic Research03 February 2014
Euro area slack: there is much more than you think
Economic and Policy Research
David Mackie
(44-20) 7134-8325
Malcolm Barr
(44-20) 7134-8326
Greg Fuzesi
(44-20) 7134-8310
Marco Protopapa
(44-20) 7742 -7644
Raphael Brun-Aguerre
(44-20) 7134-8308
JPMorgan Chase Bank N.A, London Branch
See page 24 for analyst certification and important disclosures.
Estimating the amount of slack in the Euro area economy, and gauging how it will evolve over time, are of critical importance. Judgments about the amount of slack and its evolution determine the appropriate stance of monetary policy and the appropriate degree of fiscal consolidation. Misjudgments about slack can not only lead to weak growth, high unemployment and inflation that is too low, but can also turn cyclical weakness into structural weakness through hysteresis.
Since the beginning of 2008, the Euro area unemployment rate has risen by 4.7%-pts to reach the current level of 12%. This is the highest level seen since the 1930s. At first blush, this would suggest a huge amount of slack.
However, official institutions in the Euro area—the European Central Bank and the European Commission—do not believe this to be the case. They look at both the rise in long-term unemployment, and the disconnectbetween unemployment and other measures of labor market slack (such as skill shortages and vacancies), and assume that much of the rise in unemployment is structural in nature. This leaves them thinking that the output gap is only modest, despite the fact that the level of GDP is still 3% lower than the last cyclical peak at the beginning of 2008.
We disagree with this judgment. As the last business cycle showed, solid growth can reduce long-term unemployment with very little upward pressure on wages. This means that the long-term unemployed are not necessarily structurally unemployed. Moreover, because of the experience of the back-to-back deep recessions in the periphery, some indicators of labor market slack have been at their lower bound for a while. The proportion of firms reporting labor as a constraint on production cannot go below zero; nor can the vacancy rate. Across the periphery, these indicators reached their lower bound after the first recession in 2008/9, so they couldn’t fall further in the second recession that began in 2011. This means the additional rise in unemployment in the 2011/12 recession could not be matched by a decline in skill shortages and vacancies.
As a consequence, we believe there is likely much more slack in the region than the ECB and EC assume. This means that the monetary stance should be much easier and that the degree of fiscal consolidation should be less.
If our assessment is correct, then growth is likely to remain lackluster and inflation will remain very low for a very long time. This means that the ECB policy rate is likely to remain at the current level or lower for much longer than the central bank anticipates, and the ECB will remain under persistent pressure to do more.
A misjudgment about the amount of slack in the economy not only condemns the region to sub-par performance for many years to come, but it also adds to the likelihood that cyclical weakness turns into structural weakness through weak capital formation and hysteresis in the labor market.

2
Europe Economic ResearchEuro area slack: there is much more than you think
03 February 2014
David Mackie(44-20) [email protected]
Introduction and overview
When thinking about the amount of slack in the Euro area, and how it will evolve over time, two critical judgments need to be made. First, the current magnitude of the output gap needs to be gauged. This sets the starting point for thinking about the evolution of slack. And second, the development of the supply side of the economy—labor supply and labor productivity— needs to be determined. This influences the pace at which slack diminishes for any given path of demand. Getting these judgments right is of huge importance. Judgments about the magnitude of the output gap and its evolution over time play a critical role in determining the appropriate stance of monetary policy. And they play a critical role in determining the appropriate degree of fiscal adjustment. Policy settings will then influence the evolution of both demand and supply in the economy.
It is clear that policymakers in the Euro area (at the European Commission and the European Central Bank) have had a very pessimistic view of supply side developments in recent years. They have assumed that much of the decline in output since 2008 represents a permanent loss, which would mean the current output gap is modest. Moreover, the EC and the ECB both assume relatively lackluster growth potential in the coming years, which would mean the output gap closing relatively quickly even with fairly modest increases in demand. Although there is some acknowledgement that the supply side of the economy is influenced by the business cycle, these institutions stress the importance of structural reform as the key means of improving the supply side.
In contrast, we have a more constructive view of the Euro area supply side. Although developments in recent years have likely contributed to a permanent loss of output, our inclination is to think that the output gap is currently much larger than the ECB and EC assume. Moreover, our inclination is to think that the supply side issomewhat endogenous to developments in demand, although an improvement in the supply side may require strong demand and tightening labor markets.
Views on the supply side have enormous implications for monetary and fiscal policy. Our judgment is that the ECB’s monetary stance is around 200 basis points tighter than it should be, given the macro landscape. This gap exists partly due to the ECB’s more pessimistic view on the supply side and partly due to the challenge ofovercoming the zero nominal bound. Meanwhile, the European Commission’s
Contents
Introduction and overview .......................................... 2
Starting to think about the output gap ......................... 3
Official estimates of the Euro area output gap............. 5
The utilization of labor................................................ 6
The utilization of capital ........................................... 10
The behavior of inflation........................................... 12
Putting it all together ................................................ 13
The output gap and the monetary stance.................. 15
The output gap and the fiscal stance ........................ 17
Consequences and tracking..................................... 17
Annex 1: The zero nominal bound in skill shortages and vacancies in the periphery ....................................... 19
Annex 2: The relationship between skill shortages and unemployment in the core........................................ 21
Annex 3: Estimates of structural unemployment at the country level ............................................................ 22
Recent J.P. Morgan Global Issues ........................... 23
Euro area employment, unemployment, underemployment and inactivity
Level millions and % of labor force, 15-74
2008Q3 2013Q3 Difference millions Difference %-pts
Full time employed +part time employed not seeking additional work (1) 140.1 (89.4) 133.3 (84.3) -6.8 -5.1
Underemployed part time workers (2) 5.2 (3.3) 6.6 (4.2) 1.4 0.9
Employed persons (1+2) 145.2 (92.7) 139.9 (88.5) -5.3 -4.2
Unemployed persons (3) 11.4 (7.3) 18.2 (11.5) 6.8 4.2
Active persons (1+2+3) 156.6 (100.0) 158.1 (100.0) 1.5 0.0
Persons seeking work but not immediately available (4) 1.8 (1.2) 1.6 (1.0) -0.2 -0.2
Persons available to work but not seeking work (5) 5.3 (3.4) 7.1 (4.5) 1.8 1.1
Potential additional labor force (4+5) 7.1 (4.6) 8.6 (5.5) 1.5 0.9
Other inactive (6) 83.9 (53.6) 81.4 (51.5) -2.5 -2.1
Inactive (4+5+6) 91.1 (58.2) 90.0 (56.9) -1.1 -1.3
Total population (1+2+3+4+5+6) 247.6 (158.2) 248.1 (156.9) 0.5 -1.3
Source: Eurostat

3
Europe Economic ResearchEuro area slack: there is much more than you think
03 February 2014
David Mackie(44-20) [email protected]
pessimistic view on the supply side is generating pressure for a greater degree of fiscal consolidation than we think appropriate. Fiscal governance now focuses on structural budget positions rather than headline positions, with the fiscal pact requiring that governments move toward balancing their structural budgets. While this might sound reasonable, the size of the structural budget position is determined by the magnitude of the output gap. A pessimistic view on the supply side attributes more of the overall deficit to the structural position, rather than to cyclical influences, which means more fiscal austerity in the short term.
The macro consequences of misjudging the output gap are clear: growth will remain lackluster, unemployment will remain elevated, inflation will remain well below the ECB’s inflation objective, cyclical unemployment will turn into structural unemployment, and the erosion of growth potential will be sustained. While the first three consequences can be observed, the last two cannot be. This means that the judgments made by policy makers are of critical importance. It is true that we have to recognize the considerable uncertainty in estimating output gaps in real time. This means there are risks of policymakers doing either too much or too little. With inflation currently very low, with the real possibility of deflation and hysteresis, and with social and political stress already very elevated, we consider the onus to be on policy makers is to err on the side of doing too much. In our view, the ECB is currently positioned to do too little.
Normally, the passage of time helps us to choose between competing hypotheses. Unfortunately, this may not be true in this situation. To the extent that there is some endogeneity between the supply side and the demand side, ex ante judgments about this endogeneity will significantly influence ex post realizations. For example, if the supply side is stronger in the face of better demand conditions, then an ex ante judgment by policy makers that this will happen will ensure that the economy achieves an equilibrium path with a better profile for both demand and supply. But, if the ex ante judgment by policy makers is that the supply side is not related to demand, then, even if that judgment is incorrect, policy will be set in a manner that makes it likely that the economy will achieve a different equilibrium path with a worse profile for both demand and supply. Ex post it will not be possible to determine, which ex ante view was correct. This means that policymakers—central bankers in particular—need to run an experiment. This is something that the Federal Reserve and Bank of England are willing to do, but the ECB is not. Over time, Euro area policy makers may claim victory for their pessimistic view of the supply side. But it would be a pyrrhic one, in our view.
Starting to think about the output gap
One starting point for thinking about the output gap is to extend the level of real GDP from the prior cyclical peak (1Q08) at the same potential pace of growth as that seen in the last business cycle. This is done in the chart below with the potential pace of growth defined as the level consistent with a stable unemployment rate in the last cycle (i.e., a pace of growth of 1.6%). This exercise suggests that the current level of output is 11.1% below where it would have been had it continued to grow beyond the last cyclical peak at the same potential pace of growth as that seen in the last business cycle. This can be viewed as an estimate of the output gap.
This estimate of the output gap is very substantial. Importantly, two very strong assumptions are being made in the calculation. First, that the economy was in an equilibrium in the first quarter of 2008: essentially that the output gap was zero. Andsecond, that the growth of potential since then has been the same as in the last business cycle. Neither of these assumptions are likely to be true.

4
Europe Economic ResearchEuro area slack: there is much more than you think
03 February 2014
David Mackie(44-20) [email protected]
In terms of judging how close the economy was to an equilibrium at the peak of the last business cycle, we can look at inflation developments and direct measures of resource utilization. It is commonplace to assume that the economy is in equilibrium when inflation pressures are absent. In most specifications of the Phillips curve, with some anchoring of inflation expectations at the central bank’s objective, inflation pressures are absent when inflation is in line with the central bank’s objective. In this regard, we can look at peak levels of two different measures of inflation. Core CPI inflation peaked at 1.9% in mid-2007, which at first blush would point to resource utilization rates at their equilibrium (essentially a zero output gap). But the GDP deflator peaked at 2.5% at the end of 2007, which would point to resource utilization rates above their equilibrium (essentially a positive output gap). Direct survey measures of capacity utilization, labor shortages, and equipment shortages were all close to prior cyclical peaks, which would suggest an above-equilibrium level of resource utilization. Our inclination is to assume a positive output gap at the start of 2008 of around 1.5%.
Meanwhile, growth potential appears to have slowed relative to the last business cycle given labor market developments. In the first quarter of 2008, the unemployment rate hit a trough of 7.3%. It now stands at 12%. With an Okun coefficient of around 0.5, which was the experience of the last business cycle, a rise in the unemployment rate of 4.7%-pts would suggest an increase in the output gap ofaround 9.5%.With the level of GDP currently 3% lower than the last cyclical peak, this suggests an increase in the level of potential output of around 6.5%. This wouldimply an annualized quarterly pace of growth of potential of around 1.2% since 2007, somewhat lower than the 1.6% estimate from the last business cycle.Interestingly, this 1.2% estimate of growth potential is almost identical to our analysis of what growth potential might be in the current business cycle ignoring anypersistent structural effects of the financial crisis and recession (see: The long slide in Euro area growth potential is likely to continue, Special Report, March 25, 2010).
If we assume a positive output gap at the start of 2008 of 1.5% (consistent with a natural rate of unemployment—NAIRU—of 8%) and growth in potential of around 1.2% since then, this would put the output gap currently at around 8%. This is smaller than the initial estimate but much larger than any official estimates. However, this estimate assumes that all of the rise in unemployment since 2008 is cyclical: essentially that the NAIRU has remained constant at 8%. To the extent that
1900
2000
2100
2200
2300
2400
2500
03 05 07 09 11 13
€bn
Euro area GDP
Source: Eurostat and J.P. Morgan
Actual
Extrapolated
5
Europe Economic ResearchEuro area slack: there is much more than you think
03 February 2014
David Mackie(44-20) [email protected]
some of the rise in unemployment is structural, then the increase in potential output in recent years will have been less than these calculations suggest and the current output gap will be correspondingly smaller. Deciding how much of the rise in unemployment is structural, and how the supply side will evolve as demand recovers, is of crucial importance in gauging the magnitude of the output gap and its likely evolution.
Official estimates of the Euro area output gap
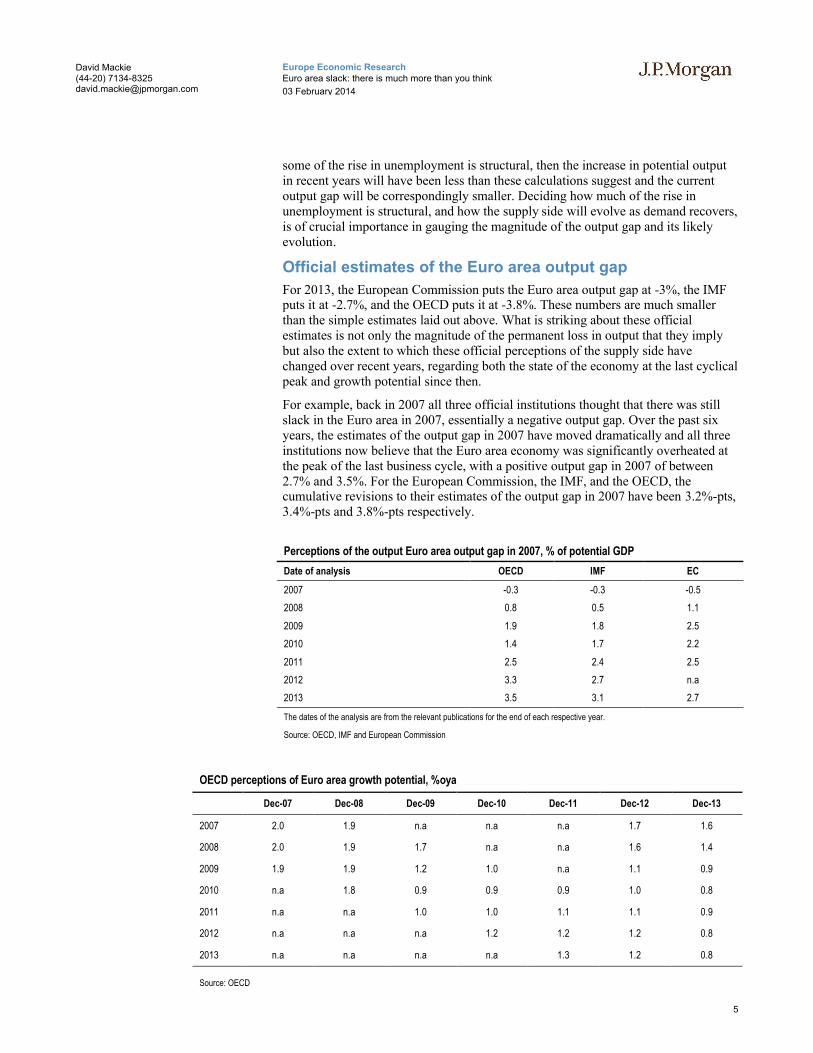
For 2013, the European Commission puts the Euro area output gap at -3%, the IMF puts it at -2.7%, and the OECD puts it at -3.8%. These numbers are much smaller than the simple estimates laid out above. What is striking about these official estimates is not only the magnitude of the permanent loss in output that they implybut also the extent to which these official perceptions of the supply side have changed over recent years, regarding both the state of the economy at the last cyclical peak and growth potential since then.
For example, back in 2007 all three official institutions thought that there was still slack in the Euro area in 2007, essentially a negative output gap. Over the past six years, the estimates of the output gap in 2007 have moved dramatically and all three institutions now believe that the Euro area economy was significantly overheated at the peak of the last business cycle, with a positive output gap in 2007 of between 2.7% and 3.5%. For the European Commission, the IMF, and the OECD, the cumulative revisions to their estimates of the output gap in 2007 have been 3.2%-pts, 3.4%-pts and 3.8%-pts respectively.
Perceptions of the output Euro area output gap in 2007, % of potential GDP
Date of analysis OECD IMF EC
2007 -0.3 -0.3 -0.5
2008 0.8 0.5 1.1
2009 1.9 1.8 2.5
2010 1.4 1.7 2.2
2011 2.5 2.4 2.5
2012 3.3 2.7 n.a
2013 3.5 3.1 2.7
The dates of the analysis are from the relevant publications for the end of each respective year.
Source: OECD, IMF and European Commission
OECD perceptions of Euro area growth potential, %oya
Dec-07 Dec-08 Dec-09 Dec-10 Dec-11 Dec-12 Dec-13
2007 2.0 1.9 n.a n.a n.a 1.7 1.6
2008 2.0 1.9 1.7 n.a n.a 1.6 1.4
2009 1.9 1.9 1.2 1.0 n.a 1.1 0.9
2010 n.a 1.8 0.9 0.9 0.9 1.0 0.8
2011 n.a n.a 1.0 1.0 1.1 1.1 0.9
2012 n.a n.a n.a 1.2 1.2 1.2 0.8
2013 n.a n.a n.a n.a 1.3 1.2 0.8
Source: OECD

6
Europe Economic ResearchEuro area slack: there is much more than you think
03 February 2014
David Mackie(44-20) [email protected]
It is also clear that these institutions have revised their views of growth potentialsince 2007 to a significant extent. For example, back in 2007, the OECD thought that growth potential in the Euro area in the period 2008-2009 would average close to 2%. Now the OECD’s estimate of growth potential in those two years is 1.2%. It is not possible to say what the OECD’s estimate of growth potential for the period 2008-2013 was back in 2007. But, we know that their latest estimate is an average of 0.9%. The European Commission’s latest estimate of Euro area growth potential in the period 2008-2013 is 0.7%. The lower estimate from the Commission contributes to their smaller estimate of the current output gap.
Since 2009, official institutions have made substantial changes to their views of the Euro area supply side, regarding both the position of the economy at the last cyclical peak and the pace of growth of potential output since then. These changes have been based on the idea that severe financial crises tend to generate permanent losses in output, reflecting reduced capital spending, fewer firm births and deaths, premature scrapping of the capital stock and higher natural rates of unemployment.
Given the importance of having an accurate assessment of the output gap, we think itworth looking at the evolution of direct measures of the supply side since 2007. Mostof these relate to the labor market, and are therefore linked to the natural rate of unemployment. This is helpful given the relationship between the output gap and the gap between actual unemployment and the natural rate of unemployment. A reasonable rule of thumb is that the output gap is twice the size of the gap between actual unemployment and the natural rate. Direct measures of the evolution of the supply side in the labor market are skill shortages, the Beveridge curve, and longterm unemployment. Other direct measures of the supply side come from capacity utilization and survey measures of equipment shortages. It is also worth considering to what extent inflation dynamics can guide our views on the supply side.
The utilization of labor
From the peak in 2008 to the autumn of 2013, employment in the Euro area fell by 5.3 million. Over this period, the number of unemployed increased by 6.8 million. This means that the participation rate—the share of employed and unemployed in the population of working age—increased slightly from 63.2% to 63.7%.
0.0
0.5
1.0
1.5
2.0
2.5
98 00 02 04 06 08 10 12 14 16
%oya
European Commission estimate of Euro area growth potential
Source: European Commission

7
Europe Economic ResearchEuro area slack: there is much more than you think
03 February 2014
David Mackie(44-20) [email protected]
To be defined as unemployed an individual has to be without a job, to be available to work within the next two weeks, and to have actively sought work in the past four weeks. The critical question is not whether the unemployed are available and lookingfor work —they are by definition—but whether they have the right skills or are in the right geographic location to fill the available vacancies. To the extent that there is a mismatch between the unemployed and the available vacancies, either because theydo not have the right skills or are unwilling or unable to move to the right location, it is generally assumed that the unemployment is of a structural nature.
The simplest way of gauging the extent to which the rise in unemployment since the start of 2008 is structural is to look at the duration of unemployment. This is based on the idea of hysteresis: individuals who have been out of work for an extended period of time tend to experience an erosion of their human capital.
Indeed, this was the methodology used by the OECD in 2009 to estimate the impact of the crisis on structural unemployment rates (NAIRUs). The OECD estimated the evolution of long-term unemployment (defined as unemployment lasting more than twelve months) on the basis of projections of total unemployment. In the Euro area, it was assumed that around 70% of the unemployed eventually become long-term unemployed. It was then assumed that two-thirds of the rise in long-term unemployment in the Euro area would translate into a rise in the NAIRU. This methodology made it inevitable that those countries which have seen the largest rises in total unemployment would see the largest increases in the OECD’s estimates of structural unemployment.
More recently the OECD has reverted to its traditional approach to estimating NAIRUs—Kalman filter estimates of time varying NAIRUs in a Phillips curve framework. The OECD has argued that the updated Kalman filter approach generates similar profiles for the NAIRU as the simpler methodology based on long-term unemployment. Thus, the tight relationship between the evolution of actual unemployment and the evolution of the OECD’s estimate of the NAIRU remains.
It is clear from this discussion that gauging the evolution of the NAIRU—and thus the output gap—is very judgmental. It seems clear from the last business cycle that long-term unemployment is sensitive to actual growth. In Spain, for example, the long-term unemployment rate fell from 5% in 2000 to 1.7% in 2007. To some extent this may have reflected the widespread availability of low-skilled jobs in the construction sector. But, in Italy, which did not experience a construction boom, the
-6
-4
-2
0
2
4
6
8
10
127
8
9
10
11
12
1385 90 95 00 05 10
Euro area skill shortages in manufacturing and unemployment
Source: European Commission and Eurostat
Skill shortages
Unemployment rate

8
Europe Economic ResearchEuro area slack: there is much more than you think
03 February 2014
David Mackie(44-20) [email protected]
long-term unemployment rate fell from 6.2% in 2000 to 2.9% in 2007. These declines were accompanied by very little wage pressure. Spanish and Italian labor market reforms at the time may have helped these declines. The more recent labor market reforms in Spain are much more substantial, raising the likelihood that long-term unemployment could fall significantly in the coming years. Moreover, the OECD's methodology for estimating time varying NAIRUs is problematic, in our view. Many of the equations for Euro area countries have estimation periods starting in the 1970s. Given that the level of inflation has fallen significantly over recent decades, globalization has increased dramatically, and central banks have become more independent, it is unlikely that the shape of the Phillips curve has been stable over this period. Nominal rigidities are likely to be greater at lower levels of inflation, the impact of external developments has likely risen over time due to globalization, and inflation expectations are likely better anchored than in the past due to central bank independence. All of these would contribute to a flattening of the Phillips curve, which would make it hard to back out a reliable estimate of the NAIRU.
Given that structural unemployment is closely related to the idea of a mismatch between the unemployed and the available vacancies, there are other ways we can consider how the NAIRU may have evolved in recent years.
The issue of skill shortages can easily be illustrated by looking at the relationship between the European Commission’s survey on factors limiting output and the actual unemployment rate. Prior to 2011, there was a reasonably close relationship between the EC survey measure of skill shortages and unemployment. Since 2011, this relationship has broken down. The current level of skill shortages would normally be consistent with an unemployment rate of around 9%. At first blush, this would suggest a significant rise in the natural rate of unemployment given that the current unemployment rate is 12%.
What is striking about the relationship between skill shortages and unemployment isthat the break occurred in 2011. The rise in unemployment in the recession of 2008-2009 was matched by a decline in skill shortages broadly in line with the historicalpattern. Only since the recession prompted by the sovereign crisis has the subsequent rise in unemployment not been matched by a corresponding movement in skill shortages.
-2
0
2
4
6
8
10
12
147
8
9
10
11
12
1303 05 07 09 11 13
Euro area skill shortages in services and unemployment
%, bal
Source: European Commission and Eurostat
Skill shortages
Unemployment rate
% , scale inverted
9
Europe Economic ResearchEuro area slack: there is much more than you think
03 February 2014
David Mackie(44-20) [email protected]
We believe that the explanation for this can be found in the nature of the question in the EC survey. Firms are asked to identify factors that are limiting production. Clearly there is a zero lower bound to the answers to this question: the proportion of firms saying that labor is a constraint on their production cannot fall below zero. Spain approached this zero bound in the spring of 2009 and the survey has held at that level despite the fact that the unemployment rate has risen by almost 10%-pts since then. Similarly, Italy approached the zero bound in early 2009 and has held at that level since then, even though the unemployment rate has risen by 5%-pts (see Annex 1 for some relevant charts).
The existence of the zero bound makes it hard to use the EC survey to evaluate the degree of structural deterioration in Euro area labor markets. If we exclude those countries that are at the zero bound in the proportion of firms reporting labor shortages as a factor limiting production—Italy, Spain and Portugal—then there is limited evidence of structural deterioration elsewhere in the Euro area. But, this doesn’t help much given that the rise in the European Commission and OECDestimates of the NAIRU for the region as a whole is dominated by developments in these three countries.
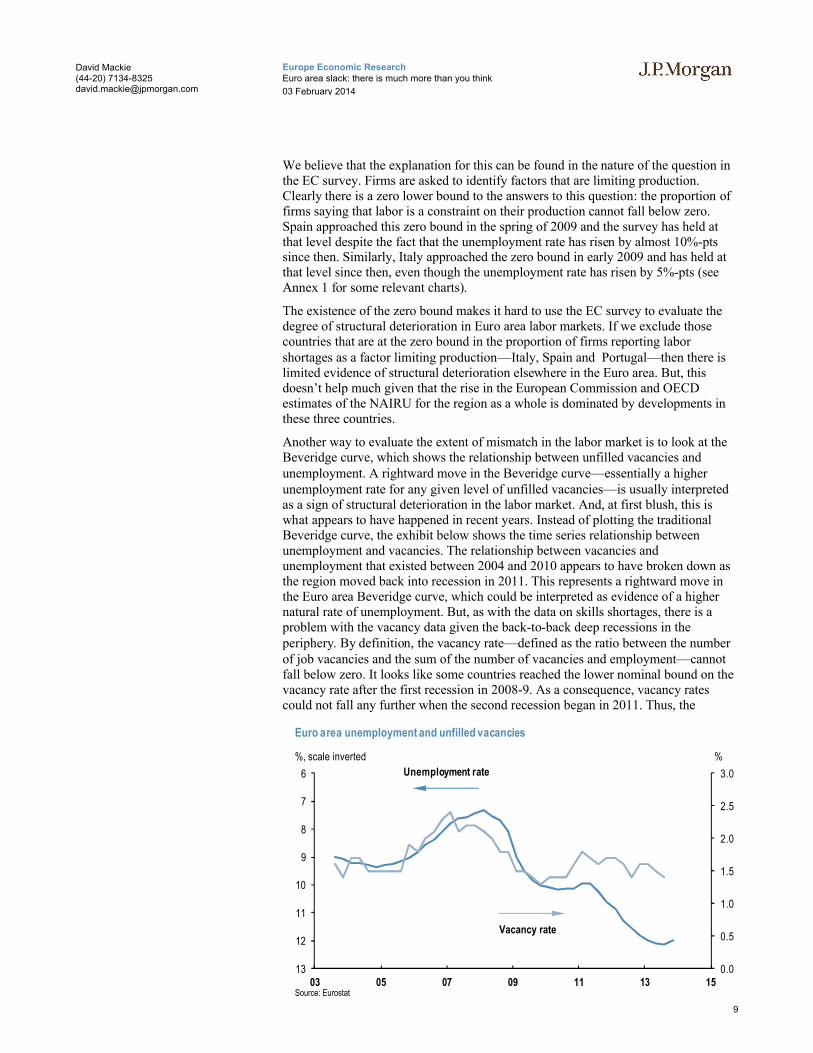
Another way to evaluate the extent of mismatch in the labor market is to look at the Beveridge curve, which shows the relationship between unfilled vacancies and unemployment. A rightward move in the Beveridge curve—essentially a higher unemployment rate for any given level of unfilled vacancies—is usually interpreted as a sign of structural deterioration in the labor market. And, at first blush, this is what appears to have happened in recent years. Instead of plotting the traditional Beveridge curve, the exhibit below shows the time series relationship between unemployment and vacancies. The relationship between vacancies and unemployment that existed between 2004 and 2010 appears to have broken down as the region moved back into recession in 2011. This represents a rightward move in the Euro area Beveridge curve, which could be interpreted as evidence of a higher natural rate of unemployment. But, as with the data on skills shortages, there is a problem with the vacancy data given the back-to-back deep recessions in the periphery. By definition, the vacancy rate—defined as the ratio between the number of job vacancies and the sum of the number of vacancies and employment—cannot fall below zero. It looks like some countries reached the lower nominal bound on the vacancy rate after the first recession in 2008-9. As a consequence, vacancy rates could not fall any further when the second recession began in 2011. Thus, the
0.0
0.5
1.0
1.5
2.0
2.5
3.06
7
8
9
10
11
12
1303 05 07 09 11 13 15
%, scale inverted %
Source: Eurostat
Unemployment rate
Vacancy rate
Euro area unemployment and unfilled vacancies

10
Europe Economic ResearchEuro area slack: there is much more than you think
03 February 2014
David Mackie(44-20) [email protected]
rightward move in the Beveridge curve may be more a reflection of the way the data are constructed rather than a genuine deterioration in labor market mismatch.
Regarding mismatch, we have focused thus far on the issue of skills. There is also the issue of geographic mismatch. A combination of large cross-country divergences in labor market conditions, unemployed individuals who are either unwilling or unable to move and asymmetries in wage developments would represent a de facto increase in the Euro area natural rate of unemployment, even if there were no increase in any individual country NAIRU. It is certainly true that the dispersion of unemploymentacross countries has increased sharply since 2008. Whether this represents a de facto rise in the regional NAIRU depends on how asymmetric wage developments are between the core and the periphery.
Aside from the question of unemployment, and whether the unemployed have the right skills or are in the right location, there is also the issue of the underutilization of either the employed or the economically inactive. Eurostat now provide data to examine these issues. Unfortunately, the data only go back to 2008, so it is not possible to examine the behavior of the labor market in the last business cycle.
One measure of underutilization concerns part-time workers who would like to work more hours or who would like to work full time. Since 2008, there has been a1.4 million increase in the number of individuals who would classify themselves in this way. This increase is worth 0.9%-pts of the labor force. To the extent that these individuals are working shorter hours within the same firm, this indicates a capacityfor output to grow without tightening the labor market.
Other measures of underutilization concern individuals who are currently classified as inactive, but are either seeking work but not immediately available to take up work or are immediately available to take up work but are not seeking work. The latter would include discouraged workers. According to the Eurostat data, the number of individuals who are classified as economically inactive but are close to joining the labor force has increased by around 1.5 million since 2008. This increase is worth 0.9%-pts of the labor force.
The utilization of capital
The European Commission survey also provides information on the utilization of capital: capacity utilization in manufacturing and the number of firms reporting that equipment shortages are limiting production in both manufacturing and services.
During the 2008-9 recession, capacity utilization in manufacturing fell 14.2%-pts reflecting the 21% decline in manufacturing output. It then rebounded by 12.1%-pts from the autumn of 2009 to the middle of 2011 as the level of manufacturing output recovered by 15.3%. Capacity utilization then fell again as the economy went back into recession, and has been recovering in recent quarters as output has risen. Capacity utilization does look elevated relative to the level of unemployment, but that reflects developments in manufacturing output relative to developments in GDP. The key issue is the extent to which capacity utilization is high relative to the level of manufacturing output. It is to some extent. A simple model estimated over the period 1985-2009 does suggest that the rebound in capacity utilization in 2010-11 was stronger than previous experience would have suggested. In addition, the current level of capacity utilization is a bit higher than the model would predict. These developments imply some degree of structural deterioration. But, in terms of the level, the latest reading of 80.0 is still below the average of 81.8 seen from 1985-2007.
Meanwhile, the number of firms in manufacturing reporting that equipment is a constraint on production stands at a low level, although it has been rising in the past

11
Europe Economic ResearchEuro area slack: there is much more than you think
03 February 2014
David Mackie(44-20) [email protected]
few quarters. It is also noticeable that the low level of equipment shortages in manufacturing is relatively broad based across countries, even in Germany where output gains in manufacturing have been much stronger than in the rest of the region.
In the service sector, the number of firms reporting equipment or space shortages as a constraint on production is very low, although there is much less history to these data. In contrast to the situation in manufacturing, there is more heterogeneity in services. In Germany, shortages look high relative to the short history of the data. Elsewhere, with the exception of France and the Netherlands, these data have moved close to the zero nominal bound where very few firms in the services sector are reporting equipment and space shortages as a constraint on production. As with labor shortages, this means that these data are not a reliable guide to the amount of slack in the economy.
An important issue with both capacity utilization and equipment shortages concerns mothballed production facilities, which may be substantial after a deep recession. To the extent that these are slow to be brought back on stream, this can cause a spike in measures of resource utilization if demand recovers sharply. This may explain the spike in equipment shortages in manufacturing in late 2010. Assuming that mothballed production facilities can eventually be brought back on stream, short-term movements in these measures of the utilization of capital may be misleading.
-6
-1
4
9
14
7
8
9
10
11
12
1395 00 05 10 15
%, scale inverted
Euro area equipment shortages in manufacturing and unemployment
%, bal
Source: Eurostat and European Commission
Equipment shortages
Unemployment rate
0
0.5
1
1.5
2
2.57
8
9
10
11
12
1303 05 07 09 11 13 15
%, scale inverted
Euro area equipment shortages in services and unemployment
%, bal
Source: Eurostat and European Commission
Equipment shortages
Unemployment rate

12
Europe Economic ResearchEuro area slack: there is much more than you think
03 February 2014
David Mackie(44-20) [email protected]
The behavior of inflation
Given that, in the long run, inflation is the final arbiter of an economy’s supply side performance, it is natural to look at the behavior of inflation as a guide to developments on the supply side. Over the past few years, Euro area core inflation ex taxes has been very choppy. It fell from a peak of around 2% in 2008 to below 1% after the first recession in 2008-9, only to rise back up to 1.5% in the recovery from mid 2009 to mid 2011. This pick-up supported views of significant structural deterioration. Indeed the European Commission puts the output gap in 2011 at only -1.1%, even though the level of GDP in that year was still 1% lower than in 2008.Core inflation ex taxes has more recently fallen to below 1%. Official institutions like to use a Kalman filter methodology to derive time varying NAIRUs as a key input into their assessment of supply side performance. Essentially, if a given rise in unemployment delivers less disinflation than in the past, this methodology suggests that the natural rate of unemployment has risen.
Unfortunately, this approach is fraught with problems, which can be illustrated using the simple equation on the adjacent page. In most Phillips curves, inflation is determined by some combination of past inflation, inflation expectations, the output gap, and external developments. External developments cover the currency, imported goods prices, and commodity prices. Using the Kalman filter to estimate a time varying NAIRU essentially assumes that all the other features of the Phillips curve are unchanged over time. This is unlikely to be true. Increased central bank independence has likely increased the coefficient on inflation expectations (anchored at the central bank’s inflation objective) and reduced the coefficient on past inflation. Greater nominal rigidities at lower inflation rates have likely reduced the coefficient on the output gap as the level of inflation has declined dramatically over recent decades. The coefficient on the output gap has likely been depressed further by globalization effects as increased trade and capital mobility has limited the pricing power of domestic firms and the bargaining power of domestic labor.
The impact of changing the shape of the Phillips curve can be illustrated in the calculations in the following table. Let’s imagine a simple Phillips curve with some weight on past inflation, some weight on inflation expectations anchored at the central bank’s objective and some weight on the output gap. Scenario 1 shows the impact of a 2%-pt shock to the output gap when past inflation and inflationexpectations have an equal weight of 0.5 and the coefficient on the output gap is 0.2. In this situation, inflation declines to 1.2% and will remain there until the output gap shock fades. Now imagine a change in the world where central bank credibility
0.5
1.0
1.5
2.0
2.5
04 06 08 10 12 14
% oya
Euro area core inflation ex taxes
Source: Eurostat

13
Europe Economic ResearchEuro area slack: there is much more than you think
03 February 2014
David Mackie(44-20) [email protected]
increases the coefficient on inflation expectations (to 0.75) and where nominal rigidities and globalization reduce the coefficient on the output gap (to 0.1). In this scenario, inflation will fall to 1.7%. A Kalman filtering approach which fails to recognize the change in the structure of the Phillips curve will assume that the shock to the output gap was only 0.6%-pt, because it will assume that the more moderate decline in inflation is due to a structural deterioration in the labor market (scenario 3). But, of course, we know that the actual shock to the output gap was 2%-pt all along. Thus, when the structure of the Phillips curve is evolving, inflation developments over the short term cannot be used as a good guide to the structural state of the economy, in our view.
Putting it all together
Calibrating the state of the supply side in real time is very difficult. The European Commission estimates that the natural rate of unemployment has risen by 2.2%-pts since 2007. Our judgment is that the rise has been smaller than that, for four reasons. First, the experience of the last business cycle indicates that the long-term unemployed can be absorbed back into employment with little wage pressure. This suggests that it is incorrect to assume that the majority of the long-tem unemployed are structurally unemployed. Second, that at a time of structural change the use of the Kalman filter to estimate a Phillips curve with a time varying NAIRU is likely to overestimate the extent of the rise in the NAIRU. Third, the problem with the zero nominal bound means that the breakdown in the relationships between unemployment on one hand and skills shortages and vacancies on the other hand may be more apparent than real. And fourth, structural reform over recent years is likely to have contributed to better functioning labor markets.
While recognizing the difficulties highlighted above, we have also estimated Phillips curves with time-varying NAIRUs in order to help our understanding of what is going on (see: Explaining the stickiness of Euro area core inflation, Global Datawatch, April 26, 2013). If the NAIRU is allowed to vary and all the other coefficients are held constant, then indeed the model wants to predict a rise in the NAIRU over the last five years. Our model points to an increase of around 1.5%-pts, albeit from a higher level than we are assuming here. But, it also possible to estimate a model where the NAIRU is held constant and the coefficient on the unemployment
Scenarios using simple Phillips curves
Coefficient on past inflation 0.5 0.25 0.5
Coefficient on inflation expectations 0.5 0.75 0.5
Coefficient on output gap 0.2 0.1 0.2
Years Inflation expectations Output gap Scenario 1 Scenario 2 Output gap Scenario 3
0 2.00 0.00 2.00 2.00 0.00 2.00
1 2.00 -2.00 1.60 1.80 -0.60 1.88
2 2.00 -2.00 1.40 1.75 -0.60 1.82
3 2.00 -2.00 1.30 1.74 -0.60 1.79
4 2.00 -2.00 1.25 1.73 -0.60 1.78
5 2.00 -2.00 1.23 1.73 -0.60 1.77
6 2.00 -2.00 1.21 1.73 -0.60 1.76
7 2.00 -2.00 1.21 1.73 -0.60 1.76
8 2.00 -2.00 1.20 1.73 -0.60 1.76
9 2.00 -2.00 1.20 1.73 -0.60 1.76
10 2.00 -2.00 1.20 1.73 -0.60 1.76
Source: J.P. Morgan
14
Europe Economic ResearchEuro area slack: there is much more than you think
03 February 2014
David Mackie(44-20) [email protected]
gap (the difference between unemployment and the NAIRU) is allowed to vary. In this model, the coefficient on the unemployment gap would decline by between a quarter and a half. This is a plausible estimate of the possible change in the shape of the Phillips curve over recent years. Most likely the truth is somewhere in between: some rise in the NAIRU and some flattening in the shape of the Phillips curve.
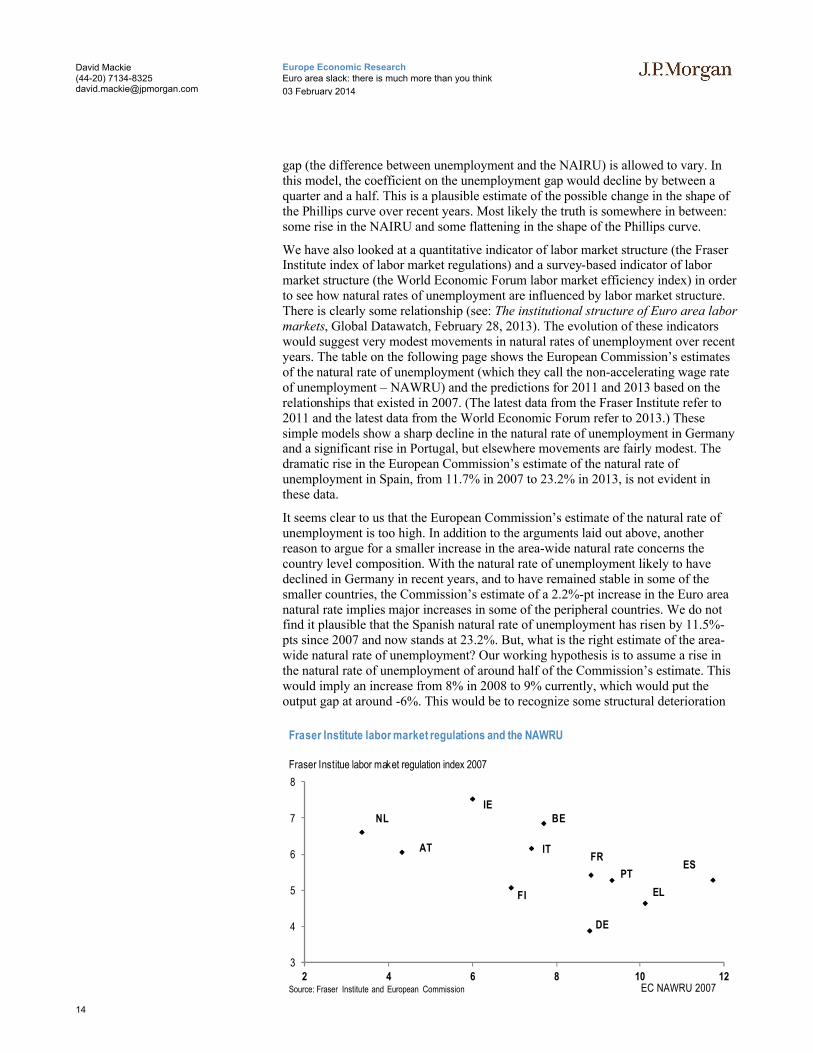
We have also looked at a quantitative indicator of labor market structure (the Fraser Institute index of labor market regulations) and a survey-based indicator of labor market structure (the World Economic Forum labor market efficiency index) in order to see how natural rates of unemployment are influenced by labor market structure. There is clearly some relationship (see: The institutional structure of Euro area labor markets, Global Datawatch, February 28, 2013). The evolution of these indicators would suggest very modest movements in natural rates of unemployment over recent years. The table on the following page shows the European Commission’s estimates of the natural rate of unemployment (which they call the non-accelerating wage rate of unemployment – NAWRU) and the predictions for 2011 and 2013 based on the relationships that existed in 2007. (The latest data from the Fraser Institute refer to 2011 and the latest data from the World Economic Forum refer to 2013.) These simple models show a sharp decline in the natural rate of unemployment in Germany and a significant rise in Portugal, but elsewhere movements are fairly modest. The dramatic rise in the European Commission’s estimate of the natural rate of unemployment in Spain, from 11.7% in 2007 to 23.2% in 2013, is not evident in these data.
It seems clear to us that the European Commission’s estimate of the natural rate of unemployment is too high. In addition to the arguments laid out above, another reason to argue for a smaller increase in the area-wide natural rate concerns the country level composition. With the natural rate of unemployment likely to have declined in Germany in recent years, and to have remained stable in some of the smaller countries, the Commission’s estimate of a 2.2%-pt increase in the Euro area natural rate implies major increases in some of the peripheral countries. We do not find it plausible that the Spanish natural rate of unemployment has risen by 11.5%-pts since 2007 and now stands at 23.2%. But, what is the right estimate of the area-wide natural rate of unemployment? Our working hypothesis is to assume a rise in the natural rate of unemployment of around half of the Commission’s estimate. This would imply an increase from 8% in 2008 to 9% currently, which would put the output gap at around -6%. This would be to recognize some structural deterioration
3
4
5
6
7
8
2 4 6 8 10 12EC NAWRU 2007
Fraser Institue labor maket regulation index 2007
Fraser Institute labor market regulations and the NAWRU
Source: Fraser Institute and European Commission
DE
FRIT
NL
ES
BE
AT
ELFI
IE
PT

15
Europe Economic ResearchEuro area slack: there is much more than you think
03 February 2014
David Mackie(44-20) [email protected]
where the adjustments in the periphery may be causing an increase in mismatch, especially in Spain and Ireland, where construction booms are deflating. It would also take some account of improvements in the structure of labor markets.
Our view of the natural rate of unemployment can also be recast in terms of growth potential. A 1% rise in the NAIRU since 2008 suggests that potential output has grown by around 0.9% a year since then. This is higher than the European Commission’s estimate. In our earlier work on growth potential, we decomposed potential growth into three main components: the growth of labor productivity (GDP divided by hours worked); the change in labor utilization (hours worked divided by the working age population); and the contribution from demographics (the growth in the working age population). (For a discussion of this work see: The long slide in Euro area growth potential is likely to continue, Special Report, March 25, 2010.)
It is not possible to fully implement this approach to the past few years, because we defined growth potential as the move in GDP between two periods with similar utilization rates for labor and capital. Clearly, utilization rates are currently far away from where they were at the last cyclical peak. Nevertheless, the table on the next page shows a decomposition of how we might understand what is going on. The first column shows the expectations of our original analysis for the current business cycle as a whole. The second column shows the actual outturns in recent years. The third column shows a way of explaining the European Commission’s view of growth potential in recent years. The fourth column shows a way of explaining our view of growth potential in recent years. As is evident in the table, the entire difference between the Commission's view and our view relates to the natural rate of unemployment. In this decomposition, a negative sign on the unemployment rate shows less labor supply coming from a higher natural rate of unemployment.
The output gap and the monetary stance
In general, a commitment by a central bank to keep inflation in line with its objective is equivalent to a commitment to ensuring a zero output gap. This means that calibrating the output gap correctly is of major importance in determining the appropriate monetary stance.
Implications of indicators of labor market structure
EC NAWRU Predictions
From Fraser Institute From World Economic Forum
2007 2011 2013 2007 2011 2007 2013
Germany 8.8 6.9 5.8 10.2 6.8 7.2 6.4
France 8.8 9.6 10.2 8.1 7.5 8.2 7.4
Italy 7.4 8.5 10.3 7.1 6.0 10.0 10.3
Spain 11.7 19.0 23.2 8.3 8.1 8.4 8.7
Netherlands 3.4 4.6 5.8 6.5 6.3 6.2 5.5
Belgium 7.7 7.7 7.9 6.1 5.4 8.4 7.3
Austria 4.3 4.4 4.5 7.2 6.9 6.8 6.5
Greece 10.1 15.4 19.3 9.1 9.6 9.7 9.3
Finland 6.9 6.9 7.1 8.5 7.9 6.0 5.5
Ireland 6.0 11.7 12.9 5.2 4.4 5.4 5.2
Portugal 9.3 12.7 15.2 8.3 8.7 8.0 9.2
Source: European Commission, Fraser Institute, World Economic Forum and J.P. Morgan

16
Europe Economic ResearchEuro area slack: there is much more than you think
03 February 2014
David Mackie(44-20) [email protected]
The Taylor rule has proven to be an efficient and robust reaction function for inflation targeting central banks, so it provides a useful starting point for thinking about the appropriate monetary stance. If we assume that core inflation settles at around 0.8%, that the output gap is -6% and that the equilibrium neutral policy rate is 3%, then the original Taylor rule (with a coefficient of 0.5 on the output gap) would suggest that the appropriate policy rate in the Euro area is -1.8%. If we take a more standard Taylor rule (with a coefficient of 1.0 on the output gap) then the appropriate policy rate is -4.8%. Perhaps we should take something in between these estimates. We also need to give some credit for the larger-than-normal balance sheet and the OMT. Overall, it could be argued that the ECB’s monetary policy stance is around 200 basis points too tight, in our view.
The implications of the more pessimistic view of the supply side can be seen from putting the European Commission’s estimate of the output gap into a Taylor rule. A 3% output gap would point to an appropriate policy rate of -0.3% (in the original Taylor rule) or -1.8% (in the more standard Taylor rule). Depending on the contribution from the balance sheet and the OMT, the ECB's policy stance may still be too tight but to a much lesser extent than our estimate of the output gap would suggest.
GDP decomposition%
Expectations of previous
analysis – full cycle
Actual outturn – 2009-2012
Possible explanation of Commission's
estimate of potential –2009-2012
Possible explanation of JP Morgan's estimate of potential –2009-2012
Gross domestic product 1.2 -0.4 0.6 0.9
Labor productivity 0.9 0.6 1.0 1.0
Labor utilization 0.2 -1.0 -0.4 -0.1
Hours worked per employed -0.3 -0.4 -0.3 -0.3
Unemployment rate 0.1 -1.0 -0.5 -0.2
Participation rate 0.4 0.4 0.4 0.4
Demographics 0.1 0.0 0.0 0.0
Age structure -0.3 -0.3 -0.3 -0.3
Total population 0.4 0.3 0.3 0.3Source: The Conference Board, European Commission, OECD and JP Morgan
Box: Explaining the decomposition
� =�
�∙
�
���∙ ��� GDP growth
�
���=
�
�∙
�
�∙
�
���Labor utilization
��� =���
����∙ ���� Demographics
Y is GDP, H is hours worked, PWA is the population of working age, E is employment, N is the labor force and PTOT
is the total population.
17
Europe Economic ResearchEuro area slack: there is much more than you think
03 February 2014
David Mackie(44-20) [email protected]
We have to recognize the importance of uncertainty in measuring the output gap in real time, and that this creates a challenge for central banks in setting the appropriate monetary stance. Clearly, uncertainty means that central banks may end up doingeither too much or too little. Given the already low level of inflation, the risk of hysteresis, and the risk of inflation expectations sliding, we believe the onus is on the ECB to err on the side of doing too much. This is essentially what the Federal Reserve and the Bank of England are doing: they are setting policy stances that are easy relative to pre-crisis norms in order to limit hysteresis effects and the risk of deflation. In contrast, the ECB is setting a policy stance in a way that looks to us too tight relative to pre-crisis norms. We believe this is partly due to the ECB’s pessimistic view of the supply side and partly due to the challenge of overcoming the zero nominal bound. Some options at the zero nominal bound involve taking more balance sheet risk (LTROs, asset purchases), while others involve taking on more inflation risk (aggressive forward guidance). The ECB is reluctant to take on any more risk, primarily due to concerns about moral hazard.
The output gap and the fiscal stance
Medium-term fiscal policy in the Euro area is now calibrated according to an objective for the structural budget position, constrained to be a deficit of no more than 0.5% of GDP. While we think it appropriate to focus on the structural budget position, this does require an accurate estimate of the output gap. In its last set of projections, the European Commission put the overall budget deficit estimate for 2013 at -3.1%. A -3% output gap estimate then put the structural deficit at -1.5%. This means that austerity worth 1% of GDP is required to meet the medium-term fiscal objective. If, instead, the output gap is actually -6%, this would reduce the required fiscal austerity to nothing: essentially, the journey toward the structural fiscal objective has already been reached for the region as a whole. This difference is obviously noticeable in aggregate, but it is particularly important for some of the individual peripheral countries. The Commission’s estimate for the Spanish output gap of -5.2% puts the estimate of Spain’s structural budget deficit at -4.1% of GDP. Assuming an Okun coefficient of 0.5, this would put the natural rate of unemployment in Spain at around 24%. This impression is reinforced by the projections that the Commission publishes, which put the Spanish output gap in 2015 at -0.7% of GDP when the unemployment rate is still expected to be 25.3%. This very pessimistic view of the structural deterioration in Spain in recent years means that Spain is being asked to do much more fiscal tightening than is appropriate, in our view.
Consequences and tracking
A monetary stance that is too tight relative to a standard Taylor rule, and a degree of fiscal consolidation that is greater than it need be, does not mean that the economy cannot grow. And indeed the region has returned to growth over recent months. Policy stances that are too tight relative to reaction functions like the Taylor rulemean that the economy will not grow at a pace that will ensure that inflation returns to the central bank’s objective over a two to three year horizon. Essentially, the ECB is, in our view, tolerating a very slow journey back to price stability, something which the central bank seems to recognize. This is evident in the extended-period rhetoric and also in the financial markets. According to the inflation swaps market, Euro area inflation will not return to 2% until 2020. With a very slow journey back to price stability, unemployment will remain very elevated with all the attendant risks of hysteresis.
Given the importance of gauging the path of slack accurately, it is reasonable to ask how we can track different views. Unfortunately, this is easier said than done.

18
Europe Economic ResearchEuro area slack: there is much more than you think
03 February 2014
David Mackie(44-20) [email protected]
It might seem reasonable to look at inflation as a guide to the size of the output gap, given the role of the supply-demand balance in influencing inflation in the long run. And indeed, at first blush it would be reasonable to argue that if inflation remains at a very low level for an extended period and then moves back toward the ECB’s price stability target very gradually, this would suggest a greater output gap than the ECB and EC are assuming. But, there are other influences on inflation that may muddy the waters in the short term, which means that inflation is not a perfect guide to the supply side over short periods of time. Nevertheless, if out view regarding the output gap is correct, then the journey back to the ECB’s price stability objective will take much longer than the central bank currently expects.
If our judgment about the size of the output gap is correct then it should take a long while before measures of labor shortages and vacancies start moving across the periphery. If the zero nominal bound has been important in these variables, then presumably the labor market can improve considerably before any labor shortages and any vacancies are registered. The gap between the unemployment rate and these other measures of labor utilization should then gradually close. Essentially, the apparent rightward move in the Beveridge curve should be partially reversed in the coming years.
Normally, the passage of time helps us to choose between competing hypotheses. Unfortunately, this may not be true in this situation. To the extent that there is some endogeneity between the supply side and the demand side, ex ante judgments about this endogeneity will significantly influence ex post realizations. For example, if the supply side is stronger in the face of better demand conditions, then an ex ante judgment by policy makers that this will happen will ensure that the economy achieves an equilibrium path with a better profile for both demand and supply. But, if the ex ante judgment by policy makers is that the supply side is not related to demand, then, even if that judgment is incorrect, policy will be set in a manner that makes it likely that the economy will achieve a different equilibrium path with a worse profile for both demand and supply. Ex post it will not be possible to determine which ex ante view was correct.

19
Europe Economic ResearchEuro area slack: there is much more than you think
03 February 2014
David Mackie(44-20) [email protected]
Annex 1: The zero nominal bound in skill shortages and vacancies in the periphery
-4
-2
0
2
4
6
8
10
124
6
8
10
12
1485 90 95 00 05 10
%, scale inverted
Italy skill shortages in manufacturing and unemployment
%, bal
Source: European Commission and Eurostat
Unemployment
Skill shortages
-4
-2
0
2
4
6
8
10
124
6
8
10
12
1403 05 07 09 11 13
%, scale inverted
Italy skill shortages in services and unemployment
%, bal
Source: European Commission and Eurostat
Unemployment
Skill shortages
-1
0
1
2
3
4
55
10
15
20
25
3095 97 99 01 03 05 07 09 11 13
%, scale inverted
Spain skill shortages in manufacturing and unemployment
%, bal
Source: European Commission and Eurostat
Skill shortages
Unemployment
-1
0
1
2
3
4
5
610
15
20
25
302008 2009 2010 2011 2012 2013 2014
%, scale inverted
Spain skill shortages in services and unemployment
%, bal
Source: European Commission and Eurostat
Unemployment
Skill shortages

20
Europe Economic ResearchEuro area slack: there is much more than you think
03 February 2014
David Mackie(44-20) [email protected]
0
5
10
150
5
10
15
2090 95 00 05 10
%, scale inverted
Portugal skill shortages in manufacturing and unemployment
%, bal
Source: European Commission and Eurostat
Skill shortages
Unemployment
0.0
0.2
0.4
0.6
0.8
1.0
1.2
1.4
1.615
20
25
302009 2010 2011 2012 2013 2014
%, scale inverted
Spain vacancy rate and unemployment
%
Source: Eurostat
Vacancy rate
Unemployment
0.0
0.1
0.2
0.3
0.4
0.5
0.6
0.7
0.80
2
4
6
8
10
12
14
16
18
2001 03 05 07 09 11 13 15
%, scale inverted
Portugal vacancy rate and unemployment
%
Source: Eurostat
Vacancy rate
Unemployment
0.0
0.2
0.4
0.6
0.8
1.0
1.2
1.45
6
7
8
9
10
11
12
1304 06 08 10 12 14
%, scale inverted
Italy vacancy rate and unemployment
%
Source: Eurostat and Istat
Vacancy rate
Unemployment

21
Europe Economic ResearchEuro area slack: there is much more than you think
03 February 2014
David Mackie(44-20) [email protected]
Annex 2: The relationship between skill shortages and unemployment in the core
-5
0
5
10
15
20
254
6
8
10
1203 05 07 09 11 13
%, scale inverted
Germany skill shortages in services and unemployment
%, bal
Source: European Commission and Eurostat
Skill shortages
Unemployment
-2
0
2
4
6
8
10
12
14
166
7
8
9
10
1185 90 95 00 05 10
%, inverted scale
Belgium skill shortages in manufacturing and unemployment
%, bal
Source:European Commission and Eurostat
Skill shortages
Unemployment
-5
0
5
10
15
207
8
9
10
11
1203 05 07 09 11 13
%, scale inverted
France skill shortages in services and unemployment
%, bal
Source: European Commission and Eurostat
Skill shortages
Unemployment
-4
-2
0
2
4
6
8
10
12
142
3
4
5
6
7
885 90 95 00 05 10
%, scale inverted
Netherlands skill shortages in manufacturing and unemployment
%, bal
Source: European Commission and Eurostat
Unemployment
Skill shortages
22
Europe Economic ResearchEuro area slack: there is much more than you think
03 February 2014
David Mackie(44-20) [email protected]
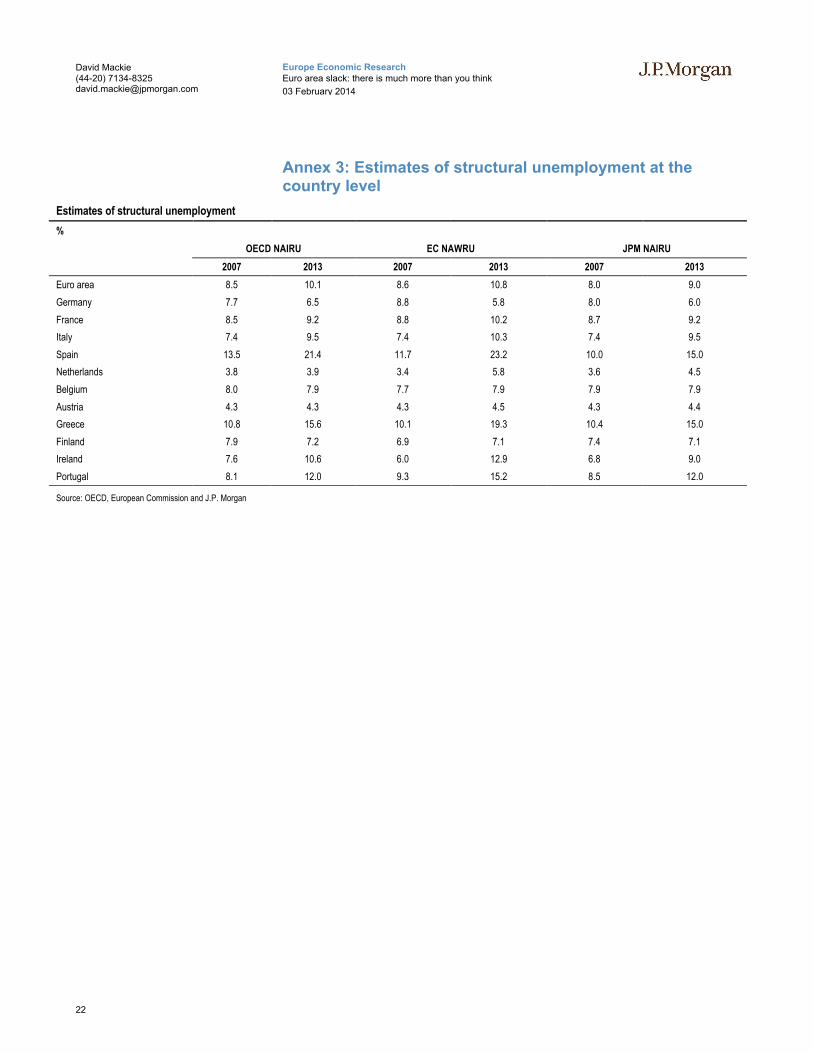
Annex 3: Estimates of structural unemployment at the country level
Estimates of structural unemployment
%
OECD NAIRU EC NAWRU JPM NAIRU
2007 2013 2007 2013 2007 2013
Euro area 8.5 10.1 8.6 10.8 8.0 9.0
Germany 7.7 6.5 8.8 5.8 8.0 6.0
France 8.5 9.2 8.8 10.2 8.7 9.2
Italy 7.4 9.5 7.4 10.3 7.4 9.5
Spain 13.5 21.4 11.7 23.2 10.0 15.0
Netherlands 3.8 3.9 3.4 5.8 3.6 4.5
Belgium 8.0 7.9 7.7 7.9 7.9 7.9
Austria 4.3 4.3 4.3 4.5 4.3 4.4
Greece 10.8 15.6 10.1 19.3 10.4 15.0
Finland 7.9 7.2 6.9 7.1 7.4 7.1
Ireland 7.6 10.6 6.0 12.9 6.8 9.0
Portugal 8.1 12.0 9.3 15.2 8.5 12.0
Source: OECD, European Commission and J.P. Morgan
23
Europe Economic ResearchEuro area slack: there is much more than you think
03 February 2014
David Mackie(44-20) [email protected]
Recent J.P. Morgan Global Issues
India in 2014: five questions that keep us awake, Sajjid Chinoy, Toshi Jain, January 2014
We will grow, but can we heal? 2014 global economic outlook, Bruce Kasman, David Hensley, Joseph Lupton, December 2013
Ten questions about China, Haibin Zhu, Grace Ng Lu Jiang, December 2013
Enjoying the interval in the Euro area drama, Mackie et al, October 2013
US future isn’t what it used to be: potential falls below 2%, Michael Feroli, Robert Mellman , August 2013
Job gains to lag global growth lift, Bruce Kasman, Joseph Lupton, David Hensley, July 2013
BoJ to succeed by failing to hit its inflation goal, Masaaki Kanno, Masamichi Adachi, Tohru Sasaki, July 2013
China’s financial sector: Concerns about mounting risks, Haibin Zhu, Grace Ng, Lu Jiang, July 2013
The challenge of very low inflation in the Euro area, Brun-Aguerre, et al, July 2013
The Euro area adjustment: about halfway there, Mackie, et al, May 2013
Beyond “whatever it takes”: ECB policy changes in the year ahead, Mackie, Barr, Fuzesi, Feb 2013
More growth, less fear: 2013 global economic outlook, Kasman, Hensley, Lupton, Jan 2013
The time is always now: introducing J.P. Morgan’s global nowcaster, Lupton, Hensley, Kasman, Brun-Aguerre, September 2012Moving towards a much larger ECB balance sheet, Mackie, Wadhwa, Normand, July 2012
Global impact of the Euro area crisis, Kasman, Hensley, Lupton, June 2012
Global manufacturing puts in overtime as other sectors dawdle, Kasman, Hensley, Lupton, May 2012
The Euro area’s painful path to Eurobonds, David Mackie, Malcolm Barr, Nicola Mai, February 2012
Global economic outlook 2012: let’s get cyclical, Bruce Kasman, Joseph Lupton, David Hensley, Jan 2012
Japan well on its way to becoming a capital importer, Masaaki Kanno, January 2012
Nowhere to hide: EM decelerating alongside US and Euro area, Joseph Lupton, David Hensley, Luis Oganes October 2011
Wagging the dog: powerful swings in EM inflation spill over to DM, J. Lupton, D. Hensley, July 2011
Global repercussions from the Japanese earthquake, Joseph Lupton, David Hensley, March 2011
A way out of the EMU fiscal crisis, Joseph Lupton, David Mackie, December 2010
Stuck in a low inflation rut, Joseph Lupton, David Hensley, October 2010

24
Europe Economic ResearchEuro area slack: there is much more than you think
03 February 2014
David Mackie(44-20) [email protected]
Analysts' Compensation: The research analysts responsible for the preparation of this report receive compensation based upon various factors, including the quality and accuracy of research, client feedback, competitive factors, and overall firm revenues. Principal Trading: JPMorgan and/or its affiliates normally make a market and trade as principal in fixed income securities discussed in this report. Legal Entities: J.P. Morgan is the global brand name for J.P. Morgan Securities LLC (JPMS) and its non-US affiliates worldwide. J.P. Morgan Cazenove is a brand name for equity research produced by J.P. Morgan Securities plc; J.P. Morgan Equities South Africa Proprietary Limited; JPMorgan Chase Bank, N.A., Dubai Branch; and J.P. Morgan Bank International LLC. J.P.Morgan Securities Inc. is a member of NYSE and SIPC. JPMorgan Chase Bank, N.A. is a member of FDIC. U.K.: JPMorgan Chase N.A., London Branch, is authorised by the Prudential Regulation Authority and is subject to regulation by the Financial Conduct Authority and to limited regulation by the Prudential Regulation Authority. Details about the extent of our regulation by the Prudential Regulation Authority are available from J.P. Morgan on request. J.P. Morgan Securities plc (JPMS plc) is a member of the London Stock Exchange and is authorised by the Prudential Regulation Authority and regulated by the Financial Conduct Authority and the Prudential Regulation Authority. J.P. Morgan Equities South Africa Proprietary Limited is a member of the Johannesburg Securities Exchange and is regulated by the Financial Services Board. J.P. Morgan Securities (Asia Pacific) Limited (CE number AAJ321) is regulated by the Hong Kong Monetary Authority. JPMorgan Chase Bank, N.A., Singapore branch and J.P. Morgan Securities Singapore Private Limited are regulated by the Monetary Authority of Singapore. JPMorgan Securities Japan Co., Ltd. is regulated by the Financial Services Agency in Japan. J.P. Morgan Australia Limited (JPMAL) (ABN 52 002 888 011/AFS Licence No: 238188) is regulated by ASIC and J.P. Morgan Securities Australia Limited (JPMSAL) (ABN 61 003 245 234/AFS Licence No: 238066) is regulated by ASIC and is a Market, Clearing and Settlement Participant of ASX Limited and CHI-X. J.P.Morgan Saudi Arabia Ltd. is authorized by the Capital Market Authority of the Kingdom of Saudi Arabia (CMA), licence number 35-07079. General: Information has been obtained from sources believed to be reliable but JPMorgan does not warrant its completeness or accuracy except with respect to disclosures relative to JPMS and/or its affiliates and the analyst’s involvement with the issuer. Opinions and estimates constitute our judgment at the date of this material and are subject to change without notice. Past performance is not indicative of future results. The investments and strategies discussed may not be suitable for all investors; if you have any doubts you should consult your investment advisor. The investments discussed may fluctuate in price or value. Changes in rates of exchange may have an adverse effect on the value of investments. This material is not intended as an offer or solicitation for the purchase or sale of any financial instrument. JPMorgan and/or its affiliates and employees may act as placement agent, advisor or lender with respect to securities or issuers referenced in this report.. Clients should contact analysts at and execute transactions through a JPMorgan entity in their home jurisdiction unless governing law permits otherwise. This report should not be distributed to others or replicated in any form without prior consent of JPMorgan. U.K. and European Economic Area (EEA): Investment research issued by JPMS plc has been prepared in accordance with JPMS plc’s Policies for Managing Conflicts of Interest in Connection with Investment Research. This report has been issued in the U.K. only to persons of a kind described in Article 19 (5), 38, 47 and 49 of the Financial Services and Markets Act 2000 (Financial Promotion) Order 2001 (all such persons being referred to as “relevant persons”). This document must not be acted on or relied on by persons who are not relevant. Any investment or investment activity to which this document relates is only available to relevant persons and will be engaged in only with these persons. In other EEA countries, the report has been issued to persons regarded as professional investors (or equivalent) in their home jurisdiction. Japan: There is a risk that a loss may occur due to a change in the price of the shares in the case of share trading, and that a loss may occur due to the exchange rate in the case of foreign share trading. In the case of share trading, JPMorgan Securities Japan Co., Ltd., will be receiving a brokerage fee and consumption tax (shouhizei) calculated by multiplying the executed price by the commission rate which was individually agreed between JPMorgan Securities Japan Co., Ltd., and the customer in advance. Financial Instruments Firms: JPMorgan Securities Japan Co., Ltd., Kanto Local Finance Bureau (kinsho) No. 82 Participating Association / Japan Securities Dealers Association, The Financial Futures Association of Japan, Type II Financial Instruments Firms Association and Japan Investment Advisers Association. Australia: This material is issued and distributed by JPMSAL in Australia to “wholesale clients” only. This material does not take into account the specific investment objectives, financial situation or particular needs of the recipient. The recipient of this material must not distribute it to any third party or outside Australia without the prior written consent of JPMSAL. For the purposes of this paragraph the term “wholesale client” has the meaning given in section 761G of the Corporations Act 2001. New Zealand: This material is issued and distributed by JPMSAL in New Zealand only to persons whose principal business is the investment of money or who, in the course of and for the purposes of their business, habitually invest money. JPMSAL does not issue or distribute this material to members of "the public" as determined in accordance with section 3 of the Securities Act 1978. The recipient of this material must not distribute it to any third party or outside New Zealand without the prior written consent of JPMSAL. Canada: The information contained herein is not, and under no circumstances is to be construed as, a prospectus, an advertisement, a public offering, an offer to sell securities described herein, or solicitation of an offer to buy securities described herein, in Canada or any province or territory thereof. Any offer or sale of the securities described herein in Canada will be made only under an exemption from the requirements to file a prospectus with the relevant Canadian securities regulators and only by a dealer properly registered under applicable securities laws or, alternatively, pursuant to an exemption from the dealer registration requirement in the relevant province or territory of Canada in which such offer or sale is made. The information contained herein is under no circumstances to be construed as investment advice in any province or territory of Canada and is not tailored to the needs of the recipient. To the extent that the information contained herein references securities of an issuer incorporated, formed or created under the laws of Canada or a province or territory of Canada, any trades in such securities must be conducted through a dealer registered in Canada. No securities commission or similar regulatory authority in Canada has reviewed or in any way passed judgment upon these materials, the information contained hereinor the merits of the securities described herein, and any representation to the contrary is an offense. Korea: This report may have been edited or contributed to from time to time by affiliates of J.P. Morgan Securities (Far East) Ltd, Seoul branch. Brazil: Ombudsman J.P. Morgan: 0800-7700847 / [email protected]. Revised December 7, 2013. Copyright 2014 JPMorgan Chase Co. All rights reserved. Additional information available upon request.
Related Documents