JOURNAL OF SOCIAL SCIENCES AND HUMANITIES VOLUME 26 NUMBER 1 SPRING 2018 Editor Prof. Dr. Samina Awan Assistant Editors Fozia Umar Mehmood ul Hassan FACULTY OF SOCIAL SCIENCES AND HUMANITIES ALLAMA IQBAL OPEN UNIVERSITY, ISLAMABAD, PAKISTAN

Welcome message from author
This document is posted to help you gain knowledge. Please leave a comment to let me know what you think about it! Share it to your friends and learn new things together.
Transcript
JOURNALOF
SOCIAL
SCIENCESAND
HUMANITIES VOLUME 26 NUMBER 1 SPRING 2018
Editor
Prof. Dr. Samina Awan
Assistant Editors
Fozia Umar
Mehmood ul Hassan
FACULTY OF SOCIAL SCIENCES AND HUMANITIES
ALLAMA IQBAL OPEN UNIVERSITY, ISLAMABAD, PAKISTAN

Published by Faculty of Social Sciences and Humanities
Allama Iqbal Open University
Islamabad, Pakistan
Spring 2018
© Journal of Social Sciences and Humanities 2018
All rights reserved. No part of this journal may be reproduced with any form or by
any electronic or mechanical means including information storage and retrieval
systems without prior permission in writing from the Editor, JSSH.
“Y” Category by HEC
ISSN 1994-7046
Cover design by Hameed Zahid
Layout by Muhammad Javed
Printed and bound by AIOU-Printing Press, Islamabad, Pakistan
EDITORIAL BOARD
Editor Prof. Dr. Samina Awan
Chairperson, Department of History/Dean Faculty of Social
Sciences & Humanities, AIOU
Assistant Editors Fozia Umar
Lecturer, Department of History, AIOU
Mehmood ul Hassan
Lecturer, Department of Business Administration, AIOU
Advisory Board Prof. Dr. David J. Corner
Advisor to the Principal, University of St. Andrews, College Gate
North Street, St. Andrews, Fite, KY16 9AJ, Scotland, UK
Prof. Dr. Mushtaq A. Sajid
Dean, Faculty of Management Sciences, University of
Management Science and Information Technology, Kotli (AJK)
Prof. Dr. Mughees Ud did Sheikh
Dean of School of Media and Communication Studies,
University of Central Punjab, Lahore
Prof. Dr. Robert Nichols
The Richard Stockton College of NJ, USA
Prof. Dr. Rafique Afzal
Department of History, Quaid-i-Azam University, Islamabad,
Pakistan
Prof. Dr. Gita Dharampal-Frick
Director, South Asian Institute University of Heidelberg
Im Neuenhemer Feld 330, D-69120
Heidelberg, Germany
Prof. Dr. Samina Amin Qadir
Vice Chancellor, Fatima Jinnah Women University, Rawalpindi,
Pakistan
Dr. Usman Ghani
Joint Director
Institute of Management Sciences
Peshawar, Pakistan
Yahya R. Kamalipour
Professor and Head, Department of Communication & Creative
Arts, Director Center for Global Studies, Purdue University
Calumet, 2200 169th Street Hammond, IN 46323-2094, USA

CONTENTS
1 Metacognition and Reading in Children: A State
of the Art Review
Bushra Ahmed Khurram
25 An Investigation of Pakistan’s Manufacturing
Sector Corporate Investment Under Financial
Liberalization
Salman Ali Qureshi, Syed Muhammad Amir
Shah & Syed Hassan Raza
77 The Impact of Consumer Beliefs on Consumers’
Attitude: A Social Media Advertising Perspective
Qazi Mohammed Ahmed, Muhammad
Mustafa Raziq, Abeera Babar Goreja
105 A Meta-functional Analysisof Baba Bulleh
Shah’s Kaafi: Ranjha Ranjha Kardi Hun Mein
Apey Ranjha Hoi
Priya Avais, Muhammad Shaban &
Nadia Anwar
141 The Impact of GDP, Inflation, Exchange Rate,
Unemployment and Tax Rate on the Non
Performing Loans of Banks: Evidence From
Pakistani Commercial Banks
Ihtesham Khan, Adnan Ahmad, Muhammad
Tahir Khan & Muhammad Ilyas
165 Critical Boundaries of Activism in Public
Relations in Pakistan: A Comparative Analysis
of Effects of Professional Practices
Mudassir Mukhtar, Noshina Saleem &
Stephen D. McDowell

Bushra Ahmed Khurram*
Metacognition and Reading in
Children: A State of the Art Review
ABSTRACT
The aim of this paper is to provide a review and synthesis of
the literature on metacognition and reading in children. The
paper begins with a brief discussion of what metacognition is
and presents the components of metacognition. It then reviews
the key studies that have been conducted on metacognition
and reading in children. The first part of the review discusses
the empirical studies which examine children’s metacognitive
knowledge. The second part considers the research concerned
with children’s monitoring of comprehension. The final part
discusses the studies conducted on training of metacognition
about reading in children. The paper concludes by reviewing
the current research on metacognition.
Keywords: Metacognition, Reading, Metacognitive Awareness,
Monitoring of Comprehension, Metacognitive Training.
Introduction
Good readers bring metacognition-in-action to the act of
reading by planning, monitoring and evaluating their own
cognitive processes (Baker, 2002). Research indicates that
metacognitive acts promote reading comprehension as they
* Department of English, University of Karachi, Karachi
Journal of Social Sciences and Humanities: Volume 26, Number 1, Spring 2018
2
guide and coordinate thinking (Baker & Brown, 1984). A
number of research studies establishe the centrality of the
construct of metacognition in reading (e.g. Brown, 1987;
Alexander & Murphy 1998). The importance of
metacognition is therefore ‘now firmly established in theories
of learning and reading' (Baker, 2002, p.77).
Definition of Metacognition
Metacognition has been defined by a number of theorist.
Armbruster, Echols and Brown (1983) has defined
metacognition as the knowledge and control a reader has over
his or her reading processes. Along similar lines, Mokhtari and
Reichard (2002, p. 249) have defined metacognition as ‘the
knowledge of the reader’s cognition about reading and the
self-control mechanisms he/she exercises when monitoring and
regulating text comprehension.’ In other words, metacognition
makes readers aware of their reading processes,
comprehension break down and the strategies they could use
to read successfully. This is why, the literature stresses that
‘students without metacognitive approaches are essentially
learners without direction or opportunity to review their
progress, accomplishments, and future directions’ (O’ Malley et
al. 1985, p. 561).
Components of Metacognition
Metacognition is usually conceptualized as having two
fundamental components: 1) metacognitive knowledge and
2) regulation of cognition (Harris, Santangelo & Graham,
2010; Schraw & Moshman, 1995). Researchers are of the
opinion that these two components are distinct but not
Bushra Ahmed Khurram
3
independent of one another (Griffith & Ruan, 2005; Schraw
& Moshman, 1995).
The first component of metacognition, metacognitive
knowledge, is 'that portion of the total knowledge base that
pertains to a given area of cognitive activity' (Flavell 1985,
quoted by Garner,1987). Flavell (1987) proposed that
metacognitive knowledge includes knowledge we have
about ourselves, the tasks we face and the strategies we
employ in specific cognitive domains. In the cognitive
domain of reading, research has indicated a casual role of
metacognitive knowledge in reading comprehension
(Pressley, El-Dinary, Gaskins, Schuder, Bergman, Almasi, &
Brown, 1992).
The second major component of metacognition,
regulation of cognition, refers to metacognitive activities that
help control one’s thinking or learning (Schraw & Moshman,
1995). Baker & Brown (1984b) indicate that regulation of
cognition involves the ability to use the self-regulatory
mechanisms such as checking, planning, evaluating, revising
to ensure successful completion of the task.
Research on Metacognition in Reading
In the 1970s a number of studies was conducted related
to metacognition and reading (e.g., Anderson, 1991; Carrell,
1989; Knight, Pardon, & Waxman, 1985). Although some of
these studies had adults as subjects, most of the early
research on metacognition and reading was carried out on
children (El-Hindi & Amelia, 1993). This section reviews the
empirical studies which examine children’s metacognitive
knowledge, monitoring of comprehension and training of
metacognition about reading in children.

Journal of Social Sciences and Humanities: Volume 26, Number 1, Spring 2018
4
Studies of Metacognitive Knowledge
The early research in the area of metacognition and
reading in 1970s was primarily of a descriptive and
correlational nature (Baker, 2008). An early landmark study of
metacognition and comprehension in young readers was
carried out by Myers and Paris (1978) who assessed the
knowledge of the person variable, task variable and strategy
variable involved in reading of the children of the second
and sixth grades. The results of their study showed that
younger children had less understanding of reading: they
took reading as a process of decoding text rather than
meaning-making. In addition, the study showed that the
older children were more cognizant of the reading strategies
that are used to determine meaning of words or sentences,
such as rereading to deduce the meaning from context,
using a dictionary or asking for help from a knowledgeable
other. Older children were also aware of the purposes of
reading strategies as compared to the young children. A little
later, researchers in the area of metacognition and reading
started to investigate individual differences in students'
metacognitive knowledge. A significant study that was
carried out by Garner and Kraus (1981-82) investigated
individual differences in the metacognitive knowledge of
better and poorer readers. The results of the study
demonstrated that as compared to the poor readers, better
readers had more awareness and control of reading. It is
noteworthy that the findings of these two early studies have
been held up over time: older and successful readers show
higher levels of metacognitive knowledge and more skilled
regulation of reading (Baker and Beall, 2009, p 373).

Bushra Ahmed Khurram
5
The research outcomes of recent L2 studies look
remarkably similar to earlier studies. This can be seen in the
study by Eme, Puustinen, and Coutlet (2006) with third and
fifth grade students in France. Their study showed that fifth
graders as compared to third graders were more likely to
consider understanding as a characteristic of a good reader.
For third graders, a skilled reader was the one who read the
text quickly without making any mistake.
Most of the research on developmental changes in
metacognition is cross-sectional. However, the literature
indicates that longitudinal studies replicate the results of
earlier studies on metacognitive knowledge. For instance,
Annevirta & Vauras (2001) undertook a longitudinal study to
examine the metacognitive knowledge of Finnish children
from preschool through the third grade. Interviews were
conducted to tap knowledge about memory, learning and
comprehension. Results of the study showed that children
had understanding of memory processes even at the
preschool level. By the first grade children recognized the
active role of the self in learning. However, metacognitive
understanding of comprehension was not evidenced before
the second or third grade. And it was not until the third
grade that students described evaluating and monitoring
their understanding. In sum, when children were younger
they did not show understanding of reading as a meaning-
getting process.
Recently, researchers have started investigating if there is
stability in metacognitive knowledge over time and if the
relations between reading comprehension and metacognition
are consistent over time. For example, Roesch-Heils,
Schneider, and van Kraayenoord (2003) followed up children
who had participated in a study conducted earlier by van
Journal of Social Sciences and Humanities: Volume 26, Number 1, Spring 2018
6
Kraayenoord & Schneider (1999). In the study the researchers
reassessed metacognitive knowledge of Grade 7 or 8 German
children in relation to reading comprehension and reading
motivation that was first examined in Grades 3 or 4. Results of
the study showed that students who scored higher on
assessment of metacognitive knowledge in Grades 3 or 4
continued to score higher in Grades 7 or 8. The study also
indicated important links among reading interest, motivation
and metacognition at both time points. Children who were
more interested in reading had better metacognitive skills and
performed better on reading assessments in Grades 3 or 4
and in Grades 7 or 8. Moreover, metacognitive knowledge
was a significant predictor of reading comprehension in
Grades 3 and 4 as well as in Grades 7 and 8. Similarly,
Bouchard (1998) conducted a longitudinal study that focused
on similar questions. She examined interrelations between
self-system, reading achievement and metacognitive
knowledge when children were in the fourth grade and then
when they were in grade 6. Results indicate that there was a
correlation between self-system and reading measures at
each time point. In addition, the patterns of relations were
similar over time.
Research conducted in the area of metacognitive
knowledge indicates that metacognitive knowledge precedes
metacognitive control (Baker & Brown, 1984a). This implies
that students need to have ‘a sufficient level of internalized
metacognitive knowledge before they can use it effectively
to guide their own learning’ (Baker, 2008a). However, the
literature also indicates that it is not sufficient for students to
only have metacognitive knowledge to regulate their
cognition. For instance, Annevirta & Vaurus (2006) in their
longitudinal study discussed previously Annevirta & Vaurus
Bushra Ahmed Khurram
7
(2001) studied metacognitive skills of a subset of sample for
three years, preschool, first grade and second grade. For this
purpose, they selected three groups of children representing
low, intermediate and high levels of metacognitive
knowledge. The results indicate that low or average
metacognitive knowledge group did not demonstrate
comprehension monitoring at any grade over three years. On
the other hand, out of the sample a few children whose
metacognitive knowledge was demonstrated comprehension
monitoring in preschool and first year. However, more
demonstrated comprehension monitoring in second year. In
addition, children with high metacognitive knowledge
showed considerable growth in metacognitive control. In
contrast, children with low metacognitive knowledge showed
very little growth in metacognitive control. Furthermore,
whereas no children with low metacognitive knowledge
showed good metacognitive control, some children with
high metacognitive knowledge did not demonstrate
metacognitive control either. Similarly, Hacker’s (1997) study
with adolescents in grades 7, 9 and 11 also indicates that
although some students in his study have the necessary
knowledge to monitor their understanding of the text, they
did not use that knowledge. Baker (2008a) indicates that
these studies illustrate the ‘importance of will in addition to
skill’ for metacognitive monitoring (p. 32, emphasis in
original)
Studies on Monitoring of Comprehension
In the 1970s researchers also started documenting
developmental and individual differences in students’
comprehension monitoring abilities (Baker, 2008b). For this
Journal of Social Sciences and Humanities: Volume 26, Number 1, Spring 2018
8
purpose, researchers studied self-correction, an evidence of
comprehension monitoring (Baker & Brown, 1984a), made by
readers in an attempt to understand the reading process.
The findings from these studies showed that when good
readers, whether first graders or adults, made an error that
distorted meaning they corrected themselves. However, poor
and average readers did not correct themselves even if the
errors distort meaning.
Researchers in the early 1980 studies started using an
error detection paradigm to study comprehension
monitoring while reading rather than waiting for readers to
make and correct their reading errors. In this paradigm errors
or problem are introduced in the text. Researchers use
various indices such as asking readers to underline or report
detected errors to find out whether readers noticed the
problem and made attempt to resolve them. An early study
that used the error detection paradigm was conducted by
Baker (1979). This study investigated college students’
comprehension monitoring. The results of the study showed
that the college students do not consistently monitor their
comprehension. On the other hand, the study by Baker
(1984) on children's comprehension monitoring using the
same paradigm showed that many children of the fourth and
sixth grades who were given specific instructions regarding
the type of problem identified more problems overall as
compared to those who were not given such instructions.
However, the problems that were identified were at the word
level only. This finding confirmed the results of Myers and
Paris's (1978) study that showed that children regard reading
as a decoding process. Interestingly, contemporary advances
in cognitive development work have informed us that such
children are called 'word callers' (Cartwright, 2009). It is now
Bushra Ahmed Khurram
9
known that beginning and struggling readers are less flexible
and they consider only one aspect of print, usually
graphophonological information and do not consider other
important aspects of print, like meaning (Pressley, 2002c).
Other early important studies on comprehension monitoring
by Harris, Kruithof, Terwogt, and Visser (1981), Paris and
Myers (1981), Winograd and Johnson (1982), and August,
Flavell and Clift (1984) showed that more skilled and older
readers demonstrated better monitoring of comprehension
as compared to less skilled and younger readers. However,
these studies did not show that there is a casual link between
ineffective monitoring and poor comprehension (Baker and
Brown, 1984a). A study that showed such a link was carried
out by Bereiter and Bird (1985) which will be discussed later.
Another approach used in early research and continued
through the present is to ask readers to reflect on their
reading process either during or after reading. Several
studies used this approach. For instance, Collins et al (1980)
used protocol analyses to understand how adult readers
processed a short, difficult-to-understand passage he gave
them. The study findings showed that adult readers used
complex processes such as evaluating text for completeness
and interconnectedness to understand it.
Research in students’ comprehension monitoring abilities
continues today. However, researchers in their studies now
examine other contributors to reading comprehension along
with comprehension monitoring. For instance, recently Zinar
(2000) carried out a study to examine the contribution of the
skill of word-identification and strategies used for monitoring
reading comprehension. He used error detection paradigm to
measure fourth grade children’s online comprehension
monitoring. Results showed that word identification was the
Journal of Social Sciences and Humanities: Volume 26, Number 1, Spring 2018
10
strongest predictor of reading comprehension. However,
comprehension monitoring behaviour was the significant
additional variable in reading comprehension and can be
used to compensate for weakness in word-identification
skills.
Researchers have also examined the contribution of
comprehension monitoring along with working memory and
other contributors of reading comprehension. For instance,
Cain, Oakhill, and Bryant (2004) examined the contribution of
comprehension monitoring to comprehension along with
working memory and inference making. In their study they
assessed the comprehension monitoring of English children
ages 8-11 with error detection tasks. Results of the study
showed that comprehension monitoring and working
memory were significant predictors of text comprehension.
In addition, the results showed that comprehension
monitoring accounted for unique variance after controlling
working memory and other background variables. Other
studies also showed link between comprehension
monitoring and working memory. For instance, Oakhill, Hartt
and Samols’s (2005) study showed that working memory
limitations were responsible for students’ difficulties in
identifying inconsistencies in text. Another study by Walczyk,
Marsiglia, Johns, & Bryan (2004) indicate that young readers
can compensate for limited processing abilities by pausing to
understand a phrase or sentence, rereading and looking
back to reprocess the text more often than efficient readers.
Studies on Training of Metacognition
The early descriptive studies that demonstrated
differences in metacognitive knowledge and control led to
Bushra Ahmed Khurram
11
the design and implementation of training studies since ‘they
stimulated interest in the possibility that metacognitive skills
might be deliberately fostered’ (Baker, 2008b, p. 67). In these
studies, students were divided into groups that received or
did not receive instruction to promote metacognitive
knowledge and/or control. Results of these studies quite
consistently showed that students did become cognizant of
their reading processes and improved their comprehension
monitoring ability. For instance, a study conducted by
Bereiter and Bird (1985) taught a set of strategies to seventh-
grade students. The results of the study showed that
students increased their use of strategies through training.
More importantly, it showed that students’ reading
comprehension also improved.
Other than Bereiter and Bird's (1985) study, several training studies that incorporated metacognitively-oriented instruction were implemented in reading classrooms in 1980s. The goal of these studies was to enhance metacognitive knowledge and comprehension monitoring skills of skilled and unskilled readers. For instance, Paris, Cross and Lipson (1984), trained third and fifth grade children to use various comprehension and comprehension monitoring strategies over a period of 12 weeks. In this study students learnt about reading strategies and how and when to use them. The findings of the study showed that metacognitive-oriented instructions promoted metacognitive knowledge about reading and comprehension monitoring successfully. However, it did not yield gains on reading comprehension test. Another illustrative study that was conducted by Palinscar and Brown (1984) using reciprocal teaching approach showed that strategy use and comprehension monitoring can be promoted in students by making them aware of comprehension monitoring processes. The general conclusion that emerged from these and other early studies of the relationship between metacognition and
Journal of Social Sciences and Humanities: Volume 26, Number 1, Spring 2018
12
reading (e.g. Baker and Zimlin, 1989; Bereiter and Bird, 1985; Miller, 1985, 1987) was that metacognitive knowledge and regulation of reading could be fostered. The literature also indicates that providing explicit metacognitive information about strategies increases their use (Pressley, Borkowski, & O’Sullivan, 1984, 1985; Pressley and Gaskin, 2006). However, research also indicates that the transfer of metacognitive understandings about strategies depends on providing students guided practice on the use of strategies, and encouraging student reflection on the application of strategies (e.g., Fogarty, Perkins, & Barell, 1992, cited in Pressley and Gaskin, 2006, p. 104). In sum, it can be seen from the above review that metacognitive knowledge and regulation of reading strategies could be fostered in children. Despite this, Pakistani children have not been afforded metacognitive reading strategies instruction to date since no published paper has reported implementing such instructions at the school level in Pakistan. Hence, teachers and researchers need to carry out research to understand the teaching practices that could be applied to Pakistani classrooms to foster metacognition about reading in children. Put another way, practitioners in Pakistan need to understand how they could promote metacognition about reading in children since metacognitive reading instructions are ‘new’ to Pakistani context (Edge & Mann, 2013).
Current Research on Metacognition
The current literature on metacognition recognizes the
importance of motivation, self-efficacy, and peer
collaboration. Some researchers assert that the 'self-system'
underlies the development of metacognitive system (e.g.,
Borkowski, Carr, Rellinger, & Pressley, 1990, cited in Baker
and Beall, 2009). Researchers have also examined the role
motivation and attributional beliefs play in the deployment
Bushra Ahmed Khurram
13
of metacognitive strategies (Borokwski, Chan, &
Muthukrishna 2000). For instance, De Sousa & Oakhill (1996)
demonstrated that level of interest plays a role in
comprehension monitoring. To elaborate, in their study of 8-
9 years’ old who had similar vocabulary and single-word
reading skills but different comprehension skills were asked
to participate in two tasks. To perform these tasks children
had to read short passages to identify embedded problems
in them. One of these two tasks was a typical school-like
reading task, whereas the other was a more game like task
that children later rated as more interesting. Results of the
study showed that children who were poor in
comprehension performed significantly better on the task
they found interesting as compared to the school-like
traditional task. On the other hand, performance of good
comprehenders remained same across tasks. This study has
important implications for research and practice since it
suggests that poor comprehenders can show higher levels of
ability than they otherwise would provided they are
sufficiently motivated. Other previously discussed studies by
Roeschl-Heils et al (2003) and Bouchard (1998) also point
towards strong and stable correlations among
metacognition, comprehension and motivation. Therefore,
some researchers consider metacognition and motivation to
read to be directly linked with each other (Dunlosky &
Metcalfe, 2009; Guthrie et al., 2004).
Conclusion
The review of the literature reveals an overwhelming
amount of information on metacognition and reading in
children. Some trends in this literature are apparent. The first
Journal of Social Sciences and Humanities: Volume 26, Number 1, Spring 2018
14
trend emerging from this body of literature is that older and
successful readers show higher levels of metacognitive
knowledge and more skilled regulation of reading (Baker and
Beall, 2009, p 373). To elaborate, it appears from studies that
when children were younger they did not show
understanding of reading as a meaning-getting process.
Second, the literature indicates that students who scored
higher on assessment of metacognitive knowledge in earlier
grades continued to score higher in later grades. Third, the
literature also shows important links among reading interest,
motivation and metacognition. Children who were more
interested in reading had better metacognitive skills and
performed better on reading assessments in earlier grades as
well as in later grades. Lastly, it also appears from the
literature that the research has yet not determined how to
help students apply strategies independently to texts 'in
millions of diverse classrooms around the world' (Block &
Duffy, 2008). For instance, as mentioned earlier, no research
has yet been carried out to foster metacognition of reading
strategies in Pakistani children. Perhaps this is why research
still shows 'familiar student limitations in metacognitive
knowledge and control that were characteristic of students
studied 30 years ago' (Baker, 2008b, p. 76). Hence, the review
of the literature would suggest that there is a need for
further research on training of metacognition about reading
in children in different context, including that of Pakistan.
Bushra Ahmed Khurram
15
References
Alexander, P. A., & Murphy, P. K. (1998). The research base
for APA’s Learner-Centered Psychological Principles. In N.
M. Lambert & B. L. McCombs (Eds.), How students learn:
Reforming Schools Through Learner-centered Education
(pp. 25-60). Washington, CC: American Psychological
Association.
Anderson, N. J. (1991). Individual Differences in Strategy Use
in Second Language Reading and Testing. Modern
Language Journal, 75, 460-472.
Annevirta, T., & Vauras, M. (2001). Development of
Metacognitive Knowledge in Primary Grades. European
Journal of Educational Psychology, 16, 257-282.
Annevirta, T., & Vauras, M. (2006). Developmental Changes
of Metacognitive Skills in Elementary School Children. The
Journal of Experimental Education, 74, 197-225.
Armbruster, B. B., Echols, C. H., & Brown, A. L. (1983). The
Role of Metacognition in Reading to Learn: A
Developmental Perspective (Reading Education Report
No. 40). Urbana, IL: University of Illinois, Center for the
Study of Reading.
August, D.L., Flavell, J. H., & Clift, R. (1984). Comparison of
Comprehension Monitoring of Skilled and Less Skilled
Readers. Reading Research Quarterly, 20 (1), pp. 39-53.
Journal of Social Sciences and Humanities: Volume 26, Number 1, Spring 2018
16
Baker, L. (1979). Comprehension Monitoring Identifying and
Coping with Text Confusions. Journal of Reading Behavior,
11, 366-374.
Baker, L. (1984). Spontaneous Versus Instructed Use of
Multiple Standards for Evaluating Comprehension: Effects
of Age, Reading Proficiency, and Type of Standard.
Journal of Experiemental Child Psychology, 38, 289-311.
Baker, L. (2002). Metacognition in Comprehension
Instruction. In C. Block and M. Pressley (eds)
Comprehension Instruction: Research-based Best Practices
(pp. 77-95). New York: The Guilford Press.
Baker, L. (2008a). Metacognitive Development in Reading:
Contributors and Consequences. In K. Mokhatari & R.
Sheorey (Eds.), Reading Strategies of First and Second
Language Learners: See How They Read (pp. 25-42).
Norwood, MA: Christopher Gordon.
Baker, L. (2008b). Metacognition in Comprehension Instruction:
What We've Learned Since NRP. In C. Block, S. Parris (Eds.).
Comprehension Instruction: Research-Based Best Practices.
(pp. 65-79). NY: The Guildford Press.
Baker, L. and Brown, A. L. (1984). Metacognitive Skills and
Reading. In. P. D. Pearson (ed.) Handbook of Reading
Research (pp. 353-394). White Plains, NY: Longman.
Baker, L., & Beall, L.C. (2009). Metacognitive Processes and
Reading Comprehension. In Israel, S.E. Israel & G.G. Duffy
Bushra Ahmed Khurram
17
(Eds.). Handbook of Research on Reading Comprehension.
(pp. 373-388). New York: Routledge.
Baker, L., & Zimlin, L. (1989). Instructional Effects on
Children's Use of Two Levels of Standards for Evaluating
Their Comprehension. Journal of Educational Psychology.
81. 340-346.
Bereiter, C., & Bird, M. (1985). Use of Thinking Aloud in
Identification and Teaching of Reading Comprehension
Strategies. Cognition and Instruction, 2, 131-156.
Block, C. C., & Duffy, G. G. (2008). Research on Teaching
Comprehension: Where We’ve been and Where We’re
Going. In C. Block & S. Parris (Eds.), Comprehension
Instruction: Research-based Best Practices (pp. 19-37). NY:
The Guildford Press.
Borkowski, J. G., Carr, M., Rellinger, E., & Pressley, M. (1990).
Self-regulated Cognition: Interdependence of
Metacognition, Attributions, and Self-esteem. In B. F.
Jones & L. Idol (Eds.), Dimensions of Thinking and
Cognitive Instruction (pp. 53-92). Hillsdale, NJ: Erlbaum.
Borkowski, J.G., Chan, L.K.S., & Muthukrishna, N. (2000). A
Process-oriented Model of Metacognition: Links Between
Motivation and Executive Functioning. In G. Schrwa & J.
Impara (eds), Issues in the Measurement of Metacognition.
Lincoln, NE: Buros Institute of Mental Measurements,
University of Nebraska.

Journal of Social Sciences and Humanities: Volume 26, Number 1, Spring 2018
18
Bouchard, D. (1998). The Distribution and Interpretation of
Adjectives in French: A Consequence of Bare Phrase
Structure. Probus, 10, 324-336.
Brown, A. (1987). Metacognition, Executive Control, Self-
Regulation and other More Mysterious Mechanisms. In F.
E. Weinert and R. H. Kluwe (Eds.), Metacognition,
Motivation, and Understanding (pp. 65-116). Hillsdale, NJ:
Erlbaum.
Burton, C., & Daneman, M. (2007). Compensating for a
Limited Working Memory Capacity During Reading:
Evidence from Eye Movement. Reading Psychology, 28,
163-186.
Cain, K., Oakhill, J., & Bryant, P. (2004). Children's Reading
Comprehension Ability: Concurrent Prediction by
Working Memory, Verbal Ability, and Component Skills.
Journal of Educational Psychology, 96, 31-42.
Carrell, P. L. (1989). Metacognitive Awareness and Second
Language Reading. Modern Language Journal, 73, 121-
133.
Cartwright, K. B. (2009). The Role of Cognitive Flexibility in
Reading Comprehension: Past, Present and Future. In
Israel, S.E. Israel & G.G. Duffy (Eds.). Handbook of Research
on Reading Comprehension. (pp. 115-139). New York:
Routledge.
Collins, A., Brown, J. S., & Larkin, K. M. (1980). Inference in
Text Understanding. In R. J. Spiro, B. C. Bruce, & W. F.
Bushra Ahmed Khurram
19
Brewer (Eds.), Theoretical Issues in Reading
Comprehension (pp 385-410). Hillsdale, NJ: Lawrence
Erlbaum.
De Sousa, I., & Oakhill, J. (1996). Do Levels of Interest have an
Effect on Children's Comprehension Monitoring
Performance? British Journal of Educational Psychology,
66, 471-482.
Dunlosky J. & Metcalfe, J. (2009). Metacognition. Thousand
Oaks, CA: Sage Publications, Inc.
Edge, J. and Mann, S. (2013) Innovations in Pre-service
Education and Training for English Language Teachers.
London: British Council.
El-Hindi & Amelia (1993). Supporting College Learners:
Metacognition, Locus of Control, Reading
Comprehension and Writing Performance. ERIC
Document Reproduction Service ED 364852.
Eme, E., Puustinen, M., & Coutlet, B. (2006). Individual and
Developmental Differences in Reading Monitoring: When
and How do Children Evaluate their Comprehension?
European Journal of Psychology of Education, 21, 91-115.
Flavell, J. H. (1985). Cognitive Development (2nd ed).
Englewood Cliffs, NJ: Prentice Hall.
Garner, R. (1987). Metacognition and Reading
Comprehension. New Jersey: Ablex Publishing
Corporation.
Journal of Social Sciences and Humanities: Volume 26, Number 1, Spring 2018
20
Flavell, J, H. (1987). Speculation about The Nature and
Development of Metacognition. In F. E. Weinert & R. H.
Kluwe (Eds.), Metacognition, Motivation and
Understanding (pp. 21-29). Hillsdale, NJ: Erlbaum.
Garner, R., & Kraus, C. (1981-1982). Good and poor
Comprehender Differences in Knowing and Regulating
Reading Behaviours. Educational Research Quarterly, 6, 5-
12.
Griffith, P. L. & Ruan, J. (2005). What is Metacognition and
What Should be its Role in Literacy Instruction? In S.
Isreal, C. Block, K. Bauserman, K. Kinnucan-Welsch (Eds.)
Metacognition in Literacy Learning: Theory, Assessment,
Instruction and Professional Development (pp. 3-18).
Hillsdale, NJ: Lawrence Erlbaum Associates.
Guthrie, J., Wigfield, A., Barbosa, P., Perencevich, K., Taboada,
A., Davis, M., Scafiddi, N. & Tonks, S. (2004). Increased
Reading Comprehension and Engagement Through
Concept-oriented Reading Instruction. Journal of
Educational Psychology, 96(3), 403-423.
Hacker, D. J. (1997). Comprehension Monitoring of Written
Discourse Across early-to Middle Adolescence. Reading
and Writing, 9, 207-240.
Harris, K. R., Santangelo, T., & Graham, S. (2010).
Metacognition and Strategies Instruction in Writing. In H.
R. Waters & W, Schneider (eds). Metacognition, Strategy
Use and Instruction. London: The Guilford Press.

Bushra Ahmed Khurram
21
Harris, P.L., Kruithof, A., Terwogt, W., & Visser, T. (1981).
Children's Detection and Awareness of Textual Anomaly.
Journal of Experimental Child Psychology, 31, 212-230.
Jacobs, J. E., & Paris, S. G. (1987). Children's metacognition
about reading: Issues in definition, measurement, and
instruction. Educational Psychologist, 22(3-4), 255-278.
Knight, S. L., Padron, Y. N., and Waxman, H. C. (1985). The
cognitive reading strategies of ESL students. TESOL
Quarterly, 19, 789-792.
Miller, G. (1985). The effects of general and specific self-
instruction training on children's comprehension
monitoring performances during reading. Reading
Research Quarterly, 20, 616-628.
Miller, G. (1987). The Influence Of Self-Instruction On The
Comprehension Monitoring Performance of Average and
Above Average Readers. Journal of Reading Behaviour, 19,
303-317.
Mokhtari, K., & Reichard, C. A. (2002). Assessing Students’
Metacognitive Awareness of Reading Strategies. Journal
of Educational Psychology, 94(2), 249–259.
Myers, M., & Paris, S. (1978). Children's Metacognitive
Knowledge about Reading. Journal of Educational
Psychology, 70, 680-690.
Oakhill, J., Hartt, J., & Samols, D. (2005). Levels of
Comprehension Monitoring and Working Memory in

Journal of Social Sciences and Humanities: Volume 26, Number 1, Spring 2018
22
Good and Poor Comprehenders. Reading and Writing, 18,
657-686.
Palinscar, A. S. and Brown, A. L. (1984). Reciprocal Teaching
of Comprehension-Fostering and Comprehension-
Monitoring Activities. Cognition and Instruction 1 (2), 117-
175.
Paris, S. G., & Myers, M. (1981). Comprehension Monitoring,
Memory, and Study Strategies of Good and Poor Readers.
Journal of Reading Behaviour, 13, 5-22.
Paris, S. G., Cross, D., & Lipson, M. (1984). Informed
Strategies for Learning: A Program to Improve Children's
Reading Awareness and Comprehension. Journal of
Educational Psychology, 76, 1239-1252.
Paris, S. G., Lipson, M. Y., & Wixon, K. K. (1983). Becoming a
Strategic Reader. Contemporary Educational Psychology,
8, 293-316.
Pintrich, P. R; Wolfers, C.A. & Baxter, G. P. (2000). Assessing
Metacognition and Self-regulated Learning. In Schraw, G.,
& Impara, J.C. (Eds.), Issues in the Measurement of
Metacognition, p. 43-97. Buros Institute of Mental
Measurement.
Pressley, M. (2002). Reading Instruction that Works: The Case
for Balanced Teaching (2nd ed.). New York: The Guilford
Press.
Pressley, M., & Gaskins, I. W. (2006). Metacognitively
Competent Reading Comprehension is Constructively

Bushra Ahmed Khurram
23
Responsive Reading: How can such Reading be
Developed in Students? Metacognition and Learning, 7(1),
99-113.
Pressley, M., Borkowski, J. G., & O’Sullivan, J. T. (1984).
Memory Strategy Instruction is Made of This:
Metamemory and Durable Strategy Use. Educational
Psychologist, 19, 94–107.
Pressley, M., Borkowski, J. G., & O’Sullivan, J. T. (1985).
Children’s Metamemory and The Teaching of Strategies. In
D. L. Forrest-Pressley, G. E. MacKinnon, & T. G. Waller
(Eds.), Metacognition, Cognition, and Human Performance
(pp. 111–153). Orlando, FL: Academic Press.
Pressley, M., El-Dinary, P., Gaskins, I., Schuder, T., Bergman, J.,
Almasi, L., et al (1992). Beyond Direct Explanation:
Transactional Instruction of Reading Comprehension
Strategies. Elementary School Journal, 92, 511-554.
Roesch-Heils, A., Schneider, W., & Van Kraayenoord, C. E.
(2003). Reading, Metacognition, and Motivation: A
Follow-up Study of German Students 7 and 8. European
Journal of Psychology of Education, 18, 75-86.
Schmitt, M. C. (2005). Measuring Students' Awareness and
Control of Strategic Processes. In S. E. Israel, C. C. Block, K.
L. Bauserman, & K. Kinnucan-Welsch (Eds.), Metacognition
in Literacy Learning: Theory, Assessment, Instruction, and
Professional Development (pp. 101-119). Mahwah, NJ:
Lawrence Erlbaum Associates.

Journal of Social Sciences and Humanities: Volume 26, Number 1, Spring 2018
24
Schraw, G. & Moshman, D. (1995). Metacognitive Theories.
Educational Psychology Review, 7, 4, pp. 351–371.
Sheorey, R., & Mokhtari, K. (2001). Differences in the
Metacognitive Awareness of Reading Strategies Among
Native and Non-native Readers, System, 29, 431-449.
Van Kraayenoord, C. E., & Schneider, W. E. (1999). Reading
Achievement, Metacognition, Reading Self-concept, and
Interest: A Study of German Students in Grades 3 and 4.
European Journal of Psychology of Education, 14, 305-324.
Walczyk, J.J., Marsiglia, C.S., Johns, A. K., & Bryan, K. S. (2004).
Children's Compensations for Poorly Automated Reading
Skills. Discourse Processes, 37, 47-66.
Winograd, P., & Johnson, P. (1982). Comprehension
Monitoring and the Error Detection Paradigm. Journal of
Reading Behaviour, 14, 61-74.
Zinar, S. (2000). The Relative Contributions of Word
Identification Skill and Comprehension-Monitoring
Behaviour to Reading Comprehension Ability.
Contemporary Educational Psychology, 25, 363-377.
Salman Ali Qureshi*
Syed Muhammad Amir Shah**
Syed Hassan Raza***
An Investigation of Pakistan’s Manufacturing
Sector Corporate Investment Under Financial
Liberalization ABSTRACT
Previous studies at macro level resultantly favor the financial
liberalization and growth of a country. On the other side the
studies conducted at the micro level show mixed results and
there is a dearth of literature for accepting/rejecting the
notion of financial liberalization at the micro level. The
present study examines the impact of Financial Sector Reforms
on the Investment of Manufacturing Sector listed at Pakistan
Stock Exchange. A unique index for measuring the Financial
Liberalization is developed obtaining the data from Financial
Sector Assessment Progress Review Report (1991-2004) and
Economic Survey of Pakistan (2005-2014). The data for
manufacturing firms is extracted from Balance Sheet Analysis
published by State Bank of Pakistan. The sample includes the
companies that remained listed at Pakistan Stock Exchange
from 1993 to 2014 in sample. Separate analyses were made
on different manufacturing sectors that includes Textiles,
* Assistant Professor, Department of Business Administration, Allama
Iqbal Open University, Islamabad **
Professor, Department of Commerce, Allama Iqbal Open University,
Islamabad ***
Professor, Department of Business Administration, Allama Iqbal Open
University, Islamabad
Journal of Social Sciences and Humanities: Volume 26, Number 1, Spring 2018
26
Food, Chemicals, Other manufacturing, Motor Vehicle, Fuel &
Energy, Communication, Refined Petroleum, Paperboard, and
Electrical Machinery. The study utilized descriptive analysis
and fixed effect model on the panel data of two hundred and
ninety four (294) firms in GRATEL. Amongst different
industries the investment level of textile sector is increased
whereas, food and non metallic minerals do not improve
much. Furthermore, upon the basis of results the
communication and transport sector require attention towards
liquidity, risk, and growth to achieve benefits for improving
their investment function.
Keywords: Financial Liberalization, Firm Level Investment,
Profitability, Tangibility, Liquidity, Risk, and Growth.
Introduction
The growth of an economy relies upon the well functioning
of financial system because it assists to mobilize the financial
resources, improves managing risks, and allocate financial
resources to the efficient projects. The effective financial
structure provides mechanism for payment arrangement and
encourages trade among participants, which leads to the
financial development (Levine, 1997). Bagehot (1873) coined
the importance of financial development for the maturation
of any economic system. The developments in the financial
system are triggered by the financial reforms. Several
countries introduced financial reforms in both domestic and
international perspective in the last two decades (Hermes &
Lansing, 2005).
During 1970’s and 1980’s government led developments,
nationalist policies, and economic subversion were observed
Salman Ali Qureshi, Syed Muhammad Amir Shah & Syed Hassan Raza
27
in transition and developing countries. Therefore, the
financial system was believed as an instrument of treasuries
by the governments for monetary and fiscal policies, interest
rates, and distribution of financial resources. The resources
were addressed to the favored sectors through various
channels in the financial mechanism. The banks were
instructed to direct the credit to the favored sectors rather
than abiding by the prudential regulations (Guermazi, 2014).
The interest rates to depositors were low to maintain the
cost of capital low for improving the distribution of cash in
hand and generating extra demand for credit (Lenuta, 2012).
The capital was not controlled by the governments for
national saving in fact; it was to control the interest rates and
economic volatility. The dominance of capital was a revenue
enhancement for those unwilling to avoid such taxes, which
ultimately encouraged corruption (Hanson, 1994). Ultimately
changes lead to the repressed financial mechanism. The
financial repression is a set of policies, laws, formal
regulations and informal control of diverse financial
operations of the country. It includes fixing interest rates,
prices, exchange rates, and flow of funds within and outside the
country. Importantly, financial repression inhibits the
operations of the financial intermediaries at their total potential
(Denizer et al, 1988).. The political pressure and corruption
added to the repressed financial system and the recovery of
loans was insufficient. The borrowers treated loan as just a
transfer from the financial institutions (Schmukler, 2004).
To break away from the state of repressed financial
system and accomplish the financial objectives of a country;
the world financial systems are integrated with a series of
reforms & policies aiming to liberalize their financial sectors.
Financial liberalization reforms consist mainly of the removal
Journal of Social Sciences and Humanities: Volume 26, Number 1, Spring 2018
28
of administrative controls on interest rates and the scaling
down of direct credit programs (Leaven, 2003 & Schmukler,
2004).
Financial liberalization is a steady and multifold process
that tries to reduce the control on the financial sector of a
country. Financial liberalization attempts to attain
development and stability through dismantling the
restrictions on the domestic interest rate, financial markets,
and control of capital flows. Liberalization of financial system
comprises of establishing the price control mechanism which
works by deregulating credits, interest rates, privatizing
domestic financial institutions, diminishing entry barriers for
international financial corporations, and supporting foreign
financial transactions. It also refers to the measures which
aim at reducing the regulatory controls imposed on the
institutional structures, official documents and activities of
agents in the different segments of the financial sector
(Chandrasekhar, 2004 & Ghosh, 2005).
Most by developing countries have initiated financial
liberalization process in the past decades. Financial
liberalization has been implemented in both domestic and
international scopes. The former includes deregulation of
interest rates and a reduction of directed credit while the
latter involves the opening of equity and bond markets.
The effects of liberalization in financial markets on
economic growth have received considerable attention in the
literature. McKinnon (1973) and Shaw (1973) propose that
liberalization can promote economic growth. More recently,
financial endogenous growth models emphasize the role of
financial development for growth. Among others, Bekaert,
Harvey, and Lundblad (2001) empirically show that equity
market opening leads to an increase in economic growth.
Salman Ali Qureshi, Syed Muhammad Amir Shah & Syed Hassan Raza
29
The theoretical and empirical studies cover the subject of
financial liberalization with respect to both dimensions i.e.
negative and positive. It is true that financial liberalization at
different levels may malfunction but one should not forget
that it may be beneficial on other levels of saving and
investment. A large body of literature emphasizes on the
positive link between financial markets and the growth of the
country. The literature on the arena of financial liberalization
focus on the macroeconomic impact of financial market
deregulation and test the predictions on the aggregate
economic data leaving the empirical research on the effects
of such reforms on the firm level data (Gelos & Werner,
2002; Leaven, 2003; Koo & Maeng, 2004; Koo & Shin 2005;
Bhaduri, 2005; Kose et al., 2006; Carreira et al., 2010 and Ziad
& Gharaibeh, 2011).
In an imperfect market condition, the subject of firm-level
investment never dies. Researchers have applied different
methodologies to see whether financial reforms helped to
improve investment of firms or not? The research work
conducted in Indonesia by Harris et al., (1994), Guncavdi et
al., (1998) for Turkey, Gelos & Werner (2002) for Mexico,
Wang (2003) for Taiwan, Koo & Maeng (2004) for South
Korea, Bhaduri (2005) and Ghosh (2006) for India. Broadly, it
is observed that liberalization reforms delivered beneficial
results. However, the work of Gelos & Warner (2002) and
Wang (2003), and Bhaduri (2005) show conflicting results.
Gelos & Warner (2002) and Wang (2003) argue that
liberalization of financial sector supported small size
corporations and large firms did not benefited much from it.
Bhaduri (2005) argued that financial liberalization reforms
were unfavorable for young and small sized firms in India.
However, after the careful review of the literature the general
Journal of Social Sciences and Humanities: Volume 26, Number 1, Spring 2018
30
impression that emerges from the review of literature is that
the evidence remains inconclusive.
Due to this differential outcomes and literary support
from prior literature it guides the present study to
investigate the possible influence of financial liberalization
on firm level investment in different manufacturing sectors of
Pakistan. For this reason the study utilized sample of 294
firms from 12 different sectors from 1993-2014 that includes
Textile, Food, Chemical Products, Other Manufacturing, Non
Metallic Minerals, Motor Vehicle, Fuel and Energy,
Communication, Refined Petroleum, Paper and Cardboard,
Electric Machinery, and others.
Literature Review
Investment of Firms in Imperfect Markets
According to Modigliani & Miller (1958), a firm’s investment
depends entirely on the profitability of its investment
opportunities. A developing body of literature, however, has
found that the firms’ investment depends on the availability of
internal finances. Two streams of literature investigate why
investment is sensitive to internal funds in imperfect financial
markets. The first focuses on a non-negligible premium for
external finance that firms should pay. Myers & Majluf (1984)
and Stiglitz & Weiss (1981) prove that the monetary value of
external funds is more eminent than that of internal funds
because of the asymmetry of information between borrowers
and lenders. Firms face a constraint in financial markets
because of a wedge between costs of internal and external
funds. Under such a financial constraint, firms tend to rely on
internal funds to finance investment. The second stream of
Salman Ali Qureshi, Syed Muhammad Amir Shah & Syed Hassan Raza
31
literature attributes the importance of internal funds for
investment to managerial agency problems. As noted by
Jensen & Meckling (1979), managers who are not owners may
follow their own interests, not the stockholders’ interest. Jensen
(1986) argues that managerial discretion is likely to induce
managers to spend all available funds on investment projects.
A great body of literature has empirically examined
whether imperfections in financial markets influence firms’
investments. Most studies interpret the cash-flow effect on
investment as resulting from financial constraints. Fazzari et
al., (1988) initially show that, utilizing the dividend–payout
ratio as a measure of the financial constraints faced by firms,
investments of more financially constrained firms are more
sensitive to changes in cash flow. The existing empirical
studies have used various segmenting variables to identify
unobservable degree of financial constraints, for example:
group affiliation in Hoshi et al., (1991); firm size and age in
Devereux & Schiantarelli (1990); issuing commercial paper
and bond ratings in Whited (1992); exchange listing in Oliner
& Rudebusch (1992); ownership structure and country
characteristics in Bond et al., (2003).
The studies argue that financial liberalization causes the
variations over time in the responsiveness of investment.
Financial liberalization influences asymmetric information
and agency conflicts between managers and shareholders. In
particular, various liberalization policies play the role in
reducing asymmetric information problems in financial
markets. The managerial agency problems are attenuated
because financial institutions tend to monitor managers’
behaviour more intensively.
Developments in security markets and financial market
opening also result in a reduction of the cost of external
Journal of Social Sciences and Humanities: Volume 26, Number 1, Spring 2018
32
financing. The financial liberalization reduces the wedge
between the costs of external and internal funds and thereby
decreases the cash-flow effect on investment of financially
constrained firms. Although an increased availability of credit
with the financial liberalization should have led to a
reduction of liquidity constraints, there’s no cause to believe
that informational and enforcement problems that motivate
the usage of collateral diminished after the liberalization of
the financial sector.
There is, yet, mixed empirical evidence for the consequence
of financial liberalization on firms’ investment. Examining panel
data of firms Laeven (2003) concludes that financial
liberalization relaxes financing constraints on firms, specially
small ones. Various studies report that financial reform made a
decrease in financial constraints using an individual country
data, for instance: Harris et al., (1994) for Indonesia; Gelos &
Werner (2002) for Mexico; Guncavdiet al., (1998) for Turkey;
and Koo & Shin (2005) for Korea. Forbes (2003) demonstrates
that the Chilean capital controls increased financial constraints
for small firms. Jaramillo et al., (1996), nevertheless, neglect to
offer evidence that fiscal reform in Ecuador served to ease
financial constraints on small firms. Using Chilean data, Hermes
& Lansing (1998) also describe that the reforms did not
improve access of small and young firms to external finance. In
light of mixed empirical findings, it is important to further look
into the issue of financial liberalization on firms’ capital
structure and investment.
These reforms were directed toward institutional
development to advance the economic growth in the country
(Waliullah & Nishat. (2008). Several researchers (Myers &
Majluf, 1984; Love, 2000; Laeven, 2000; Harris, et al, 1994;
Gelos & Werner, 2002; Guncavdi, et al, 1998) have shown that
Salman Ali Qureshi, Syed Muhammad Amir Shah & Syed Hassan Raza
33
financial development eases out financial constraints thus
providing the firms with the opportunity to easily access
funds. So reform is required to experience mixed relationship
with leverage and investment of the firm (Ziad & Gharaibeh,
2011; Koo & Shin, 2005; Galindo et al, 2007; Carreira et al.,
2010; Yan et al., 2011; and Guermazi, 2014).
Firm Investment Under Financial Liberalization
Many studies argue that financial liberalization causes the
variations over time in the responsiveness of investment to
internal fund. Financial liberalization influence asymmetric
information and agency conflicts between managers and
stockholders. In particular, various liberalization policies play
the role of reducing asymmetric information problems in
financial markets by improving banks’ screening ability. Also,
managerial agency problems are attenuated because
financial institutions tend to monitor managers’ behavior
more intensively. Developments in security markets and
financial market opening also result in a reduction of the
cost of external financing. We thus expect that financial
liberalization reduces the wedge between the costs of
external and internal funds and thereby decreases the cash-
flow effect on investment of financially constrained firms.
There are, however, mixed empirical evidence for the
effect of financial liberalization on firms’ investment.
Examining panel data of a large number of firms in 13
developing countries, Laeven (2003) concludes that financial
liberalization relaxes financing constraints on firms, especially
small ones. Several studies report that financial reform
caused a reduction in financial constraints using an individual
country data, for instance: Harris, Schiantarelli, and Siregar
Journal of Social Sciences and Humanities: Volume 26, Number 1, Spring 2018
34
(1994) for Indonesia; Gelos and Werner (2002) for Mexico;
Guncavdi, Bleaney, and McKay (1998) for Turkey; and Koo
and Shin (2004) for Korea. Forbes (2003) recently shows that
the Chilean capital controls increased financial constraints for
small firms. Jaramillo, Schiantarelli, and Weiss (1996),
however, fail to provide evidence that financial reform in
Equador served to ease financial constraints on small firms.
Using Chilean data, Hermes and Lensink (1998) also report
that reforms did not improve access of small and young
firms to outside finance. In light of mixed empirical findings,
we need to further investigate the effect of financial
liberalization on firms’ investment.
Firm Specific Factors and Investment under Financial
Liberalization
Firm enhance their production by investing in fixed assets
like plant, machinery, motor vehicles, land and building. It is
inevitable for organization to sustain without investment in
fixed assets. A firm can achieve long term profitability by
investing in long term assets. In determining profit ratio
efficiency assets play pivotal role. The future is unpredictable
by the companies and it has possible implications on the
investment decisions. Investment includes purchase of
equipment of production with durable life like machines and
production equipment. Fixed assets expenditure attained the
attention of researchers’ worldwide (Dayaratne et al., 2015).
Firm size may be determined by various techniques.
Previous literature sheds light to utilize log of assets, revenues,
and employees working in the organization. However, the
measurement of firm size depends upon the available
information from authentic sources. Size is an important
Salman Ali Qureshi, Syed Muhammad Amir Shah & Syed Hassan Raza
35
determinant of a firm’s investment and previous studies
managed to find out the possible association and identified
inverse relationship between size and investment level of firms
Bokpin & Onumah (2009). Contradictory results were
mentioned in the studies of Adelegan and Ariyo (2008), Jangili
and Kumar (2010), Li et al. (2010), and Porras and Lopez (2011)
that there is a positive relationship among size of the firm and
level of investment. Because large companies have better
information and access to external sources of capital that
small firms and hold consistent cash flows. On the basis of
above discussion the size of the firm is expected to have mix
relationship with the dependent variable, investment.
The overall objective of the firm is to increase the
profitability. Profitability is simply the capacity to make a profit,
and a profit is what is left over from income earned after you
have deducted all costs and expenses related to earning.
Profitability is measured as return on equity and return on
assets. Theoretically, increase in profitability leads to increase in
fixed assets investment. Deepankar and Das (2015) find out
positive relationship between profitability and investment.
Firms with more tangibility are able to sustain more and
gain financing from external environment. One of the
important reasons that tangibility helps to mitigate
contractibility problem and increases the value of the firm
which can be recaptured in case of default (Xu et al., 2013).
However, study show that investment sensitivity is increasing
with the increase in firm asset tangibility. On the basis of this
assumption an empirical analysis is important for the Pakistani
manufacturing firms. Earlier studies attempt to capture the
financing friction and investment of corporate sector listed
firms under various financial regimes. Corporation that invest
Journal of Social Sciences and Humanities: Volume 26, Number 1, Spring 2018
36
more in tangible assets tend to have more borrowing capacity
and the change is level of investment is proportionally
enhanced. The possible argument could be that credited
multiplier is expected to be higher due to greater tangibility.
Therefore, theory suggested that tangibility increases
investment (Sheikh & Wang, 2011).
Liquidity of the firm maintains relationship with various
other factors like financing patterns and performance of the
firm. It is also observed that liquidity creates a positive
relationship with investment (Manova et al., 2015) because
higher liquidity helps to improve the financing for investment.
Studies have shown that firms with financial constraints are
more sensitive to the available liquidity. The relationship gets
stronger in firms with greater opportunities for investment. Past
literature also sheds considerable light and provides evidences
that investment opportunities are sensitive to the liquidity
position of the firm and market conditions (Jorion and Zhang,
2007). So liquidity of the firm should help as a catalyst for
making investment decisions. The results show that the effect
of liquidity is higher in firms with greater investment
opportunities, which was tested including interaction between
liquidity and a dummy that identifies whether the firm has
greater investment opportunities.
Risk and investment decisions at firm level have been
analyzed in several economic and financial literatures. The
irreversible investment model is off the notion that increased
uncertainty reduces investment of the firm (McDonald & Siegel,
1986; Pindyck, 1988; Dixit & Pindyck, 1994). Firm pertains the
capacity to wait for the uncertain situation to be resolved and
then invest. Informational asymmetries between borrowers and
Salman Ali Qureshi, Syed Muhammad Amir Shah & Syed Hassan Raza
37
lenders may create financing constraints for certain types of
borrowers (Greenwald et al., 1984; Myres and Majluf, 1984 and
Greenwald & Stiglitz, 1990). Increased uncertainty about future
profitability increases the risk of bankruptcy, and hence, implies
that some firms may have to rely on internal funds for
investment activities, whereas others may have access to
efficient external financing. Resulting in low investment practices
due to increased risk to external constraints of financing.
According to Hartman (1972), firms with more risk averse
behavior tend to invest low. The model of asset pricing (CAPM)
explains that a covariance is observed between the increase in
risk (uncertainty) and returns on the investment project due to
market returns. Whereas, previous studies in the field provide
inconclusive results and tend to tilt on the negative relationship
of the variables. For example, the findings of Leahy and Whited
(1996), Minton and Schrand (1999), Ghosal and Loungani (2000),
and Bulan (2001) lend support to a negative relation between
uncertainty and investment.
Since the important contribution of Kuh (1963) towards
the investment determinants in business environment much
of the work is published in theoretical and empirical
dimension. A few years ago the major issues seemed
resolved, concerning both the relative importance of
explanatory variables and the time pattern of investment.
The growth of a firm is measured as annual percentage
change in total sales (Fazzari et al., 1988). Bilsborrow (1977)
examined the determinants of fixed investment of
Colombian firms and included sales growth as an
explanatory variable. The results provide evidence that
growth has positive relationship with investment of firm. The
Journal of Social Sciences and Humanities: Volume 26, Number 1, Spring 2018
38
findings were further supported by Lang et al., (1996).
Therefore, the present study hypothesizes:
H1 = Financial Liberalization has significant affect on the
Investment of the firms.
H1.1 = The interaction of Firm Size with Financial
Liberalization has significant positive effect on the
Investment of the manufacturing firms.
H1.2 = The interaction of Firm Profitability with Financial
Liberalization has significant positive effect on the
Investment of the manufacturing firms.
H1.3 = The interaction of Asset Tangibility with Financial
Liberalization has significant positive effect on the
Investment of the manufacturing firms
H1.4 = The interaction of Firm Liquidity with Financial
Liberalization has significant negative effect on the
Investment of the manufacturing firms
H1.5 = The interaction of Financial Risk with Financial
Liberalization has significant negative effect on the
Investment of the manufacturing firms
H1.6 = The interaction of Firm Growth with Financial
Liberalization has significant positive effect on the
Investment of the manufacturing firms.
Financial Reforms in Pakistan
In Pakistan, State bank and commercial banks were
nationalized in 1974 aimed to achieve socio economic benefits;
however it could not achieve the desired results (Mujahid,
Hashmi, & Abbas, 2014). Multifarious financial deficiencies like
wretched private investment, low range of financial products in
the money and capital market, insufficient financing options,
Salman Ali Qureshi, Syed Muhammad Amir Shah & Syed Hassan Raza
39
high risk exposure to investor, holding of financial assets by
state owned institutions, deficient liquidity, limited arbitrage
options, high transaction cost, low response to monetary and
fiscal incentives, and vulnerable stock market capitalization
were encountered by the financial markets in Pakistan (Goyal,
2014). The economic growth was slowed due to these
deficiencies. Consistent and efficient financial mechanism is
important for reducing the distortion in financial markets that
shall amplify economic growth.
Therefore to overcome the financial sector deficiencies
Government of Pakistan initiated diverse financial reform in
early 1990s under structural adjustment programs (SAP).
During initial phase notable reforms include privatization of
state owned banks, recovery of bank loans, and
implementation of international accounting standards.
Afterwards from several reforms related to financial markets
for instance minimum capital requirements for the banks,
permission to start subsidiaries (mutual funds), venture
capitalist financing, foreign exchange and asset management
firms, etc. Consumer financing was also introduced in the
same time period to support middle and lower level income
sector (Munir, et al., 2013).
The process of financial liberalization commenced in year
1990 in Pakistan under manifolds. The reforms from 1990-2014
are categorized by State Bank of Pakistan as Privatization
Reforms, Institutional Strengthening, Nonperforming Loan,
Debt Management, Monetary Management Measures,
Exchange Payment, Capital Market Reforms, Banking Reforms,
and Prudential Regulations.
The aim of implementing financial reforms was to widen
and deepen the financial sector of the country. Few policy
measures were targeted to increase the competition in the
Journal of Social Sciences and Humanities: Volume 26, Number 1, Spring 2018
40
country and some focused for improving the efficiency of the
financial sector (Amel et al., 2004). Such as removal of entry
barrier for foreign banks and restructuring of state owned
banks. The reforms also include the interest rate deregulation
and reserve requirement of banks. Similarly introduction to
prudential regulations and strengthening the capital markets
were the target of financial reforms. The target of these policy
measures was to strengthen financial markets for attaining
efficiency and stability in the country (Ataullah, Cockerill, & Le,
2004). The present study incorporates the categorization by
the State Bank of Pakistan regarding data of financial reforms
for the period (1990-2014) for development of financial
liberalization index for Pakistan.
Data, Methodology and Financial Liberalization
Index
Financial Liberalization Index
Financial Liberalization Index was constructed in order to
study the degree of financial liberalization process in
Pakistan over the time. Financial liberalization is a procedure
that includes various changes, amendments on existing
policies related to financial matters and launching of new
policies to support various sectors of the economic system.
The present study implies principal component method as
proposed by Bandiea et al. (2000), Leaven (2003),
Laurenceson and Chai (2003), Shrestha (2005), and Amaira &
Amaira (2014).
This study used the major policy components of financial
liberalization, which could influence the capital structure,
investment, and the cost of debt of the manufacturing firms
Salman Ali Qureshi, Syed Muhammad Amir Shah & Syed Hassan Raza
41
in Pakistan. The present study included Privatization (PRV),
Institutional Strengthening (IS), Non Performing Loans (NPL),
Debt Management Reforms (DMR), Monetary Management
Measures (MMM), Exchange and Payment Reforms (EPR),
Capital Market Reforms (CMR), Banking Reforms (BR), and
Prudential Regulations (PR) nine (09) components having
about three hundred and fifty one (351) reforms in the above
mentioned categories for the construction of financial
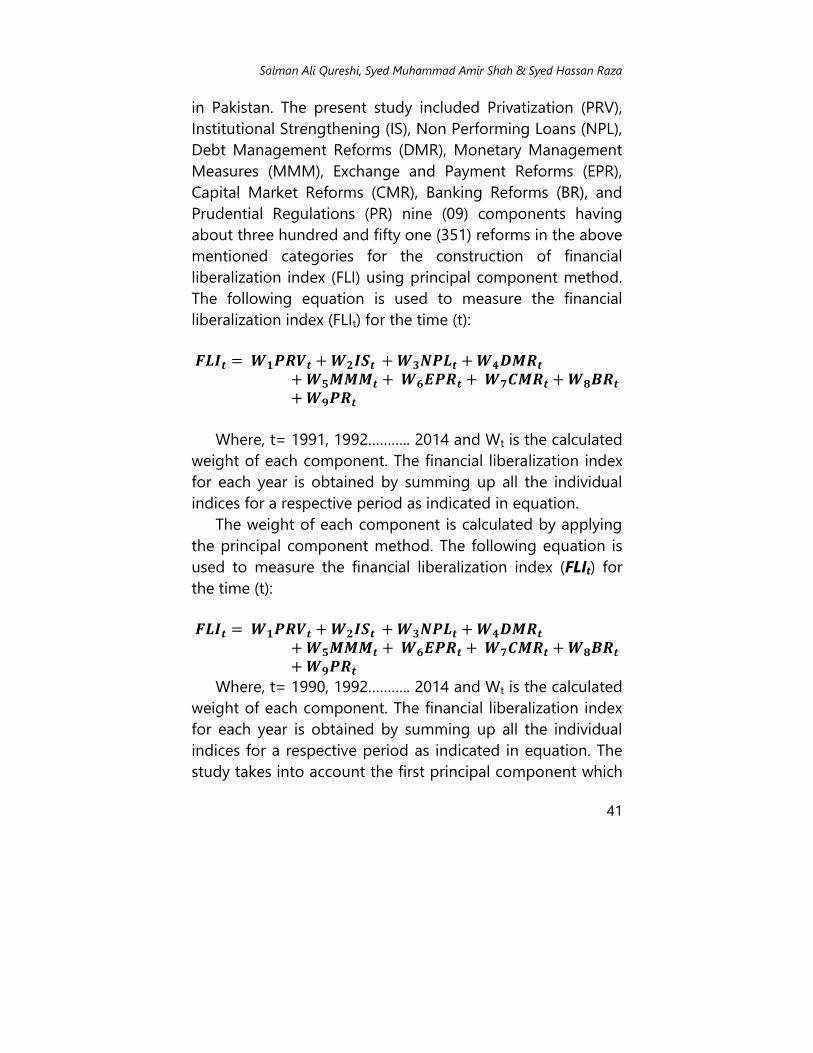
liberalization index (FLI) using principal component method.
The following equation is used to measure the financial
liberalization index (FLIt) for the time (t):
Where, t= 1991, 1992……….. 2014 and Wt is the calculated
weight of each component. The financial liberalization index
for each year is obtained by summing up all the individual
indices for a respective period as indicated in equation.
The weight of each component is calculated by applying
the principal component method. The following equation is
used to measure the financial liberalization index (FLIt) for
the time (t):
Where, t= 1990, 1992……….. 2014 and Wt is the calculated
weight of each component. The financial liberalization index
for each year is obtained by summing up all the individual
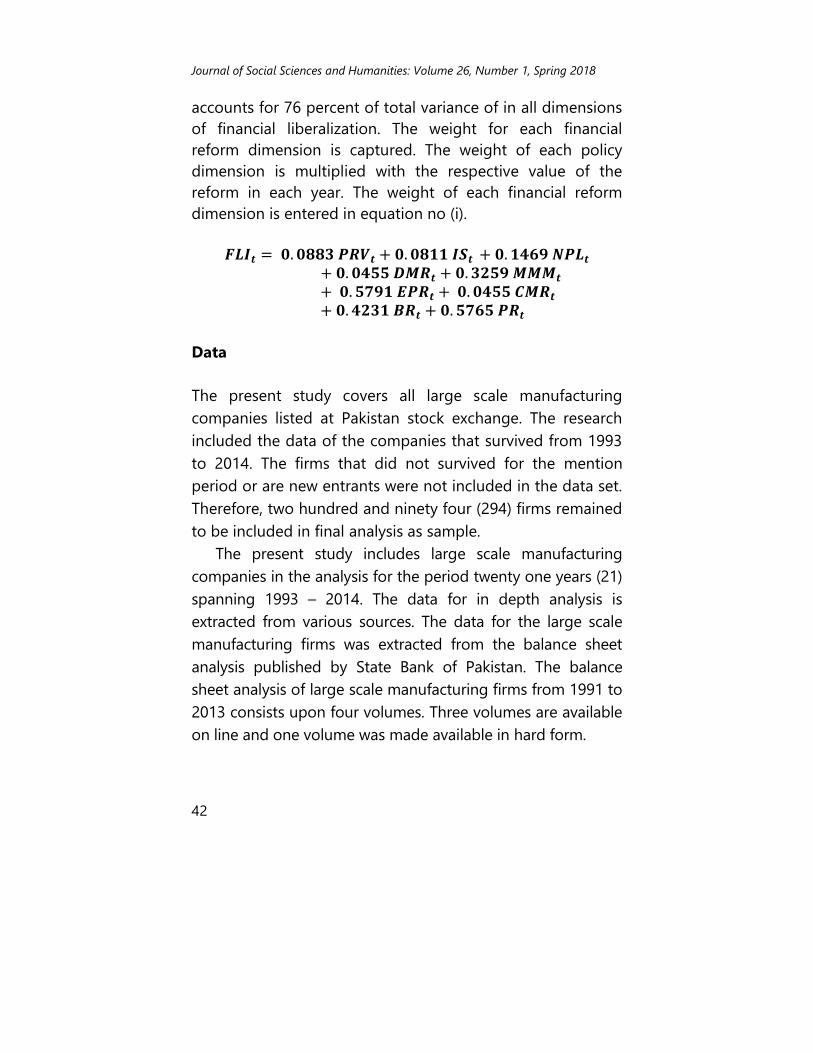
indices for a respective period as indicated in equation. The
study takes into account the first principal component which
Journal of Social Sciences and Humanities: Volume 26, Number 1, Spring 2018
42
accounts for 76 percent of total variance of in all dimensions
of financial liberalization. The weight for each financial
reform dimension is captured. The weight of each policy
dimension is multiplied with the respective value of the
reform in each year. The weight of each financial reform
dimension is entered in equation no (i).
Data
The present study covers all large scale manufacturing
companies listed at Pakistan stock exchange. The research
included the data of the companies that survived from 1993
to 2014. The firms that did not survived for the mention
period or are new entrants were not included in the data set.
Therefore, two hundred and ninety four (294) firms remained
to be included in final analysis as sample.
The present study includes large scale manufacturing
companies in the analysis for the period twenty one years (21)
spanning 1993 – 2014. The data for in depth analysis is
extracted from various sources. The data for the large scale
manufacturing firms was extracted from the balance sheet
analysis published by State Bank of Pakistan. The balance
sheet analysis of large scale manufacturing firms from 1991 to
2013 consists upon four volumes. Three volumes are available
on line and one volume was made available in hard form.
Salman Ali Qureshi, Syed Muhammad Amir Shah & Syed Hassan Raza
43
Balance sheet analysis volume from 1991 to 1998 was in
hard form, 1999 to 2004, 2005 to 2008, and 2008 to 2013 were
in soft form. Balance sheet analysis from 1991 to 1998 contains
information about 514 listed firms. Whereas, Balance sheet
analysis from 1999 to 2004, 2005 to 2008, and 2008 to 2013
contains data of 451, 436, and 396 listed firms respectively.
Hard form data was transformed in soft form. Data from all the
balance sheet analysis was extracted using MS Excel.
The data for all the sectors was segregated under each
industry head based on the categories mentioned in Balance
sheet analysis volume 2008 to 2013. The data of the
companies that sustained throughout the analysis period i.e.,
1993 to 2014 was extracted cautiously. However, the data
for the year 2014 was not available in Balance sheet analysis
of State Bank of Pakistan therefore the data for year 2014
was extracted from the website of individual company.
Measurement of Variables
The aim of the present study is to investigate the possible
influence of financial liberalization on firm level investment in
different manufacturing sectors of Pakistan. For this reason
the study also included firm size, profitability, tangibility,
liquidity, risk, and growth. The investment is defined as the
purchase of an asset or item with the hope that it will
generate income or appreciate cash flows in the future. Firms
make investment in different type of assets. Table 3.1
explains the measures of variables with literature support:
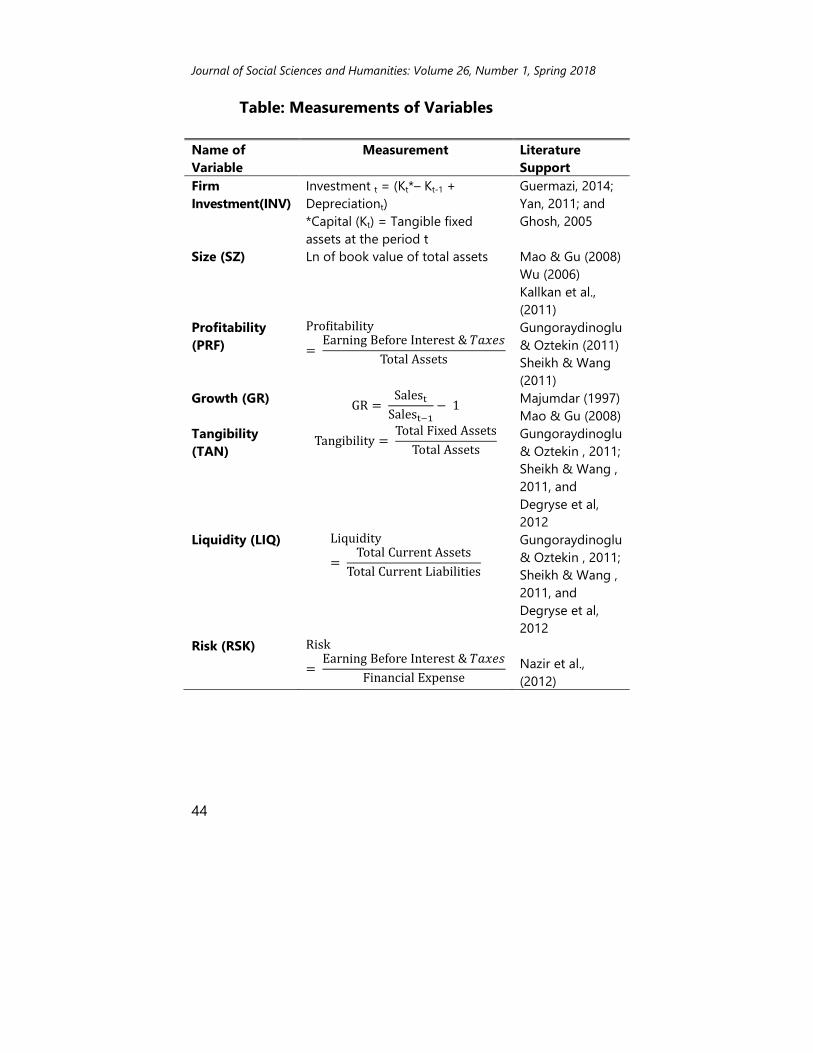
Journal of Social Sciences and Humanities: Volume 26, Number 1, Spring 2018
44
Table: Measurements of Variables
Name of
Variable
Measurement Literature
Support
Firm
Investment(INV)
Investment t = (Kt*– Kt-1 +
Depreciationt)
*Capital (Kt) = Tangible fixed
assets at the period t
Guermazi, 2014;
Yan, 2011; and
Ghosh, 2005
Size (SZ) Ln of book value of total assets Mao & Gu (2008)
Wu (2006)
Kallkan et al.,
(2011)
Profitability
(PRF)
Gungoraydinoglu
& Oztekin (2011)
Sheikh & Wang
(2011)
Growth (GR)
Majumdar (1997)
Mao & Gu (2008)
Tangibility
(TAN)
Gungoraydinoglu
& Oztekin , 2011;
Sheikh & Wang ,
2011, and
Degryse et al,
2012
Liquidity (LIQ)
Gungoraydinoglu
& Oztekin , 2011;
Sheikh & Wang ,
2011, and
Degryse et al,
2012
Risk (RSK)
Nazir et al.,
(2012)
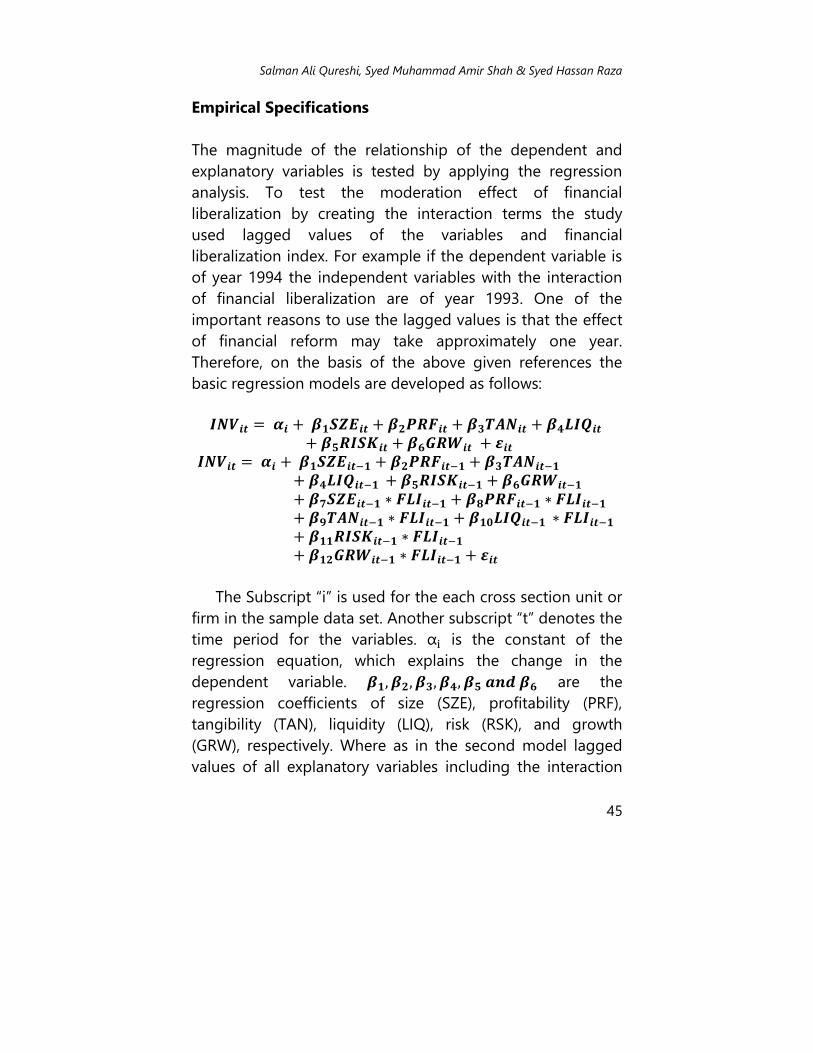
Salman Ali Qureshi, Syed Muhammad Amir Shah & Syed Hassan Raza
45
Empirical Specifications
The magnitude of the relationship of the dependent and
explanatory variables is tested by applying the regression
analysis. To test the moderation effect of financial
liberalization by creating the interaction terms the study
used lagged values of the variables and financial
liberalization index. For example if the dependent variable is
of year 1994 the independent variables with the interaction
of financial liberalization are of year 1993. One of the
important reasons to use the lagged values is that the effect
of financial reform may take approximately one year.
Therefore, on the basis of the above given references the
basic regression models are developed as follows:
The Subscript “i” is used for the each cross section unit or
firm in the sample data set. Another subscript “t” denotes the
time period for the variables. is the constant of the
regression equation, which explains the change in the
dependent variable. are the
regression coefficients of size (SZE), profitability (PRF),
tangibility (TAN), liquidity (LIQ), risk (RSK), and growth
(GRW), respectively. Where as in the second model lagged
values of all explanatory variables including the interaction
Journal of Social Sciences and Humanities: Volume 26, Number 1, Spring 2018
46
terms with financial liberalization index are regressed on the
investment of firms.
Data Analysis Technique
For the data analysis purpose, different techniques are used
in this study including the Descriptive statistics, Correlation
analysis and Regression Analysis etc. Panel data is used for
the analysis purposes in this study which contains n units
(firms) each of them includes T observations at 1 through t
time period. So the total numbers of observations in panel
data are calculated as nT. That panel data which contains
many units (firms) and small time period is known as short
panel data. But if there are less firms and large time periods,
it is known as long panel data (Cameron & Trivedi, 2005).
Several type of models may be used to analyze the panel or
longitudinal data, which include the; Pooled OLS, Fixed Effect
Model and Random Effect Model.
Results and Discussion
The results and discussion section explains the descriptive stats
of the data. It further elucidates the relationship among the
explanatory and dependent variable using correlation analysis.
Essentially this section highlights the results of regression
models on the each manufacturing sector of Pakistan.
Descriptive Statistics
Descriptive statistics are implied to observe the behavior of
the data. It can be viewed by calculating the mean, median,
standard deviation, range, minimum and maximum value of
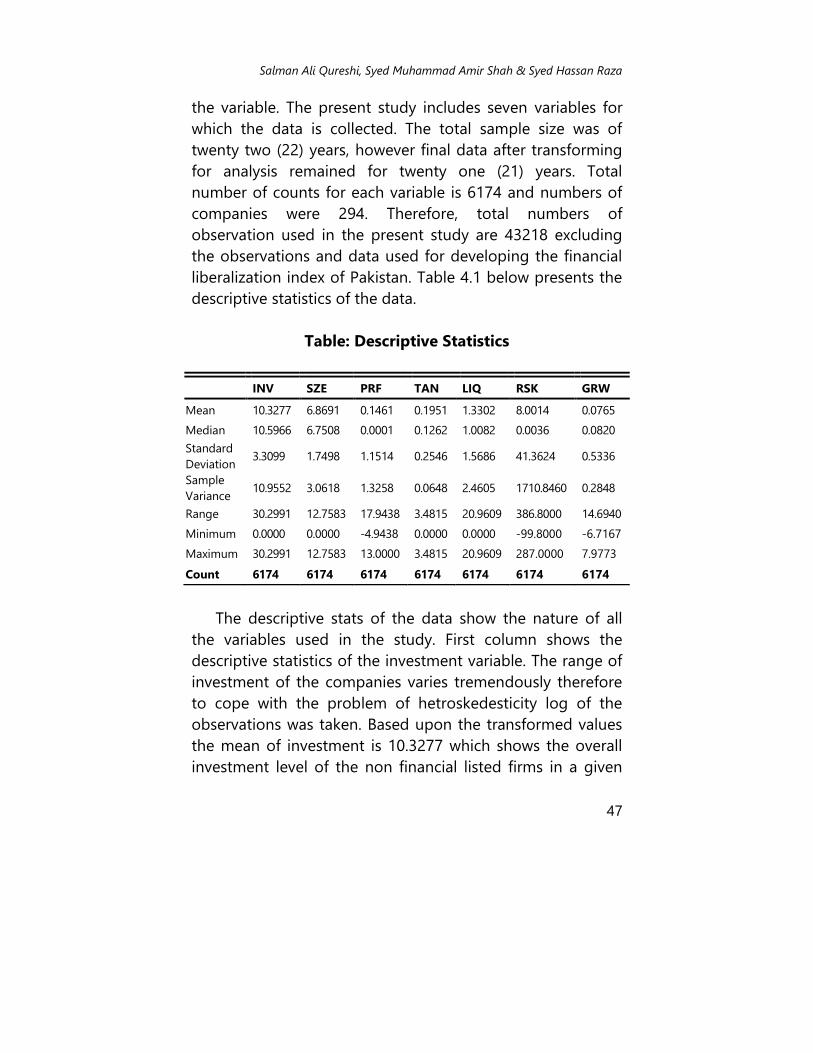
Salman Ali Qureshi, Syed Muhammad Amir Shah & Syed Hassan Raza
47
the variable. The present study includes seven variables for
which the data is collected. The total sample size was of
twenty two (22) years, however final data after transforming
for analysis remained for twenty one (21) years. Total
number of counts for each variable is 6174 and numbers of
companies were 294. Therefore, total numbers of
observation used in the present study are 43218 excluding
the observations and data used for developing the financial
liberalization index of Pakistan. Table 4.1 below presents the
descriptive statistics of the data.
Table: Descriptive Statistics
INV SZE PRF TAN LIQ RSK GRW
Mean 10.3277 6.8691 0.1461 0.1951 1.3302 8.0014 0.0765
Median 10.5966 6.7508 0.0001 0.1262 1.0082 0.0036 0.0820
Standard
Deviation 3.3099 1.7498 1.1514 0.2546 1.5686 41.3624 0.5336
Sample
Variance 10.9552 3.0618 1.3258 0.0648 2.4605 1710.8460 0.2848
Range 30.2991 12.7583 17.9438 3.4815 20.9609 386.8000 14.6940
Minimum 0.0000 0.0000 -4.9438 0.0000 0.0000 -99.8000 -6.7167
Maximum 30.2991 12.7583 13.0000 3.4815 20.9609 287.0000 7.9773
Count 6174 6174 6174 6174 6174 6174 6174
The descriptive stats of the data show the nature of all
the variables used in the study. First column shows the
descriptive statistics of the investment variable. The range of
investment of the companies varies tremendously therefore
to cope with the problem of hetroskedesticity log of the
observations was taken. Based upon the transformed values
the mean of investment is 10.3277 which shows the overall
investment level of the non financial listed firms in a given

Journal of Social Sciences and Humanities: Volume 26, Number 1, Spring 2018
48
time period. The standard deviation of the investment is
3.3099 which describe the deviation of the data from mean
value. The minimum value is 0.0000 and maximum value is
30.2991 and it shows that there are firm in the sample period
that did not make any investment and firms that make large
investments.
Size of the firms is proxied by taking the natural log of
total assets of the firms in the data. The mean value is 6.8691
which shows the average size of the large scale
manufacturing listed firms in a given time period. The
standard deviation of the investment is 1.7498 which
describes the deviation of the data from mean value. The
minimum value is 0.0000 and maximum value is 12.7583.
The profitability of the firm is measure by Return on
Assets. The mean value is 14.61% which explains the average
accounting performance of the firms. Median explains the
central value in the data with a value of 0.0001. The standard
deviation of this variable is 1.1514 which shows the deviation
from the average value. This variable has – 4.9438 and
13.0000 as minimum and maximum values, respectively. The
minimum and maximum values show that in the sample
there are all types of firms, which are facing huge losses and
those that are enjoying the maximum profit.
Tangibility of the firms is determined by taking the
percentage of fixed assets to total assets. The mean value of
this variable is 0.1951which shows the percentage of fixed to
total assets. The median of this variable is 0.1262 which is the
central value in the data. The variation in the data is found
25.46% as described by standard deviation. The minimum
and maximum values of this variable are 0.0000 and 3.4815,
respectively.

Salman Ali Qureshi, Syed Muhammad Amir Shah & Syed Hassan Raza
49
Liquidity is the ability to meet firm’s obligations as they
come due. In this data set on average firms have 1.3302
times assets available to meet the short term liabilities. The
median of the data set of this variable is 1.0082. The
standard deviation describes the deviation of the data from
its average value by 1.5686. Minimum and maximum values
are 0.0000 and 20.9609. The maximum value explains that
there are firms in the data which have twenty times more
current assets to meet short term obligations.
Risk is measured by dividing the Earnings before Interest
and Taxes to financial expenses and its average value 8.0014
describes that companies have eight times more earnings
than their financial expenses. The median of this variable is
0.0036 and standard deviation is 41.3624. The minimum
value of this variable is -99.8000 and maximum 287.0000. It
explains that there are firms which have negative profits and
are unable to bear the financial costs. Whereas, some firms
are financially sound having 287 times more earnings
available to meet their financial obligations.
Growth is denoted in decimal points. The average value
of the growth is 0.0765 which describes that the average
growth of all firms in sample data is 7.6%. The median value
is 0.0820 which is more than the mean and shows that the
growth of majority firms is not only high but also the positive
growth. The deviation in the data is 0.5336 reported.
Minimum value of the growth is -6.716 which shows the
negative growth of the firms, that firms are declining
gradually instead of growing. The maximum value is 7.9773,
which shows that there are some firms which grow drastically
by more than seven times.
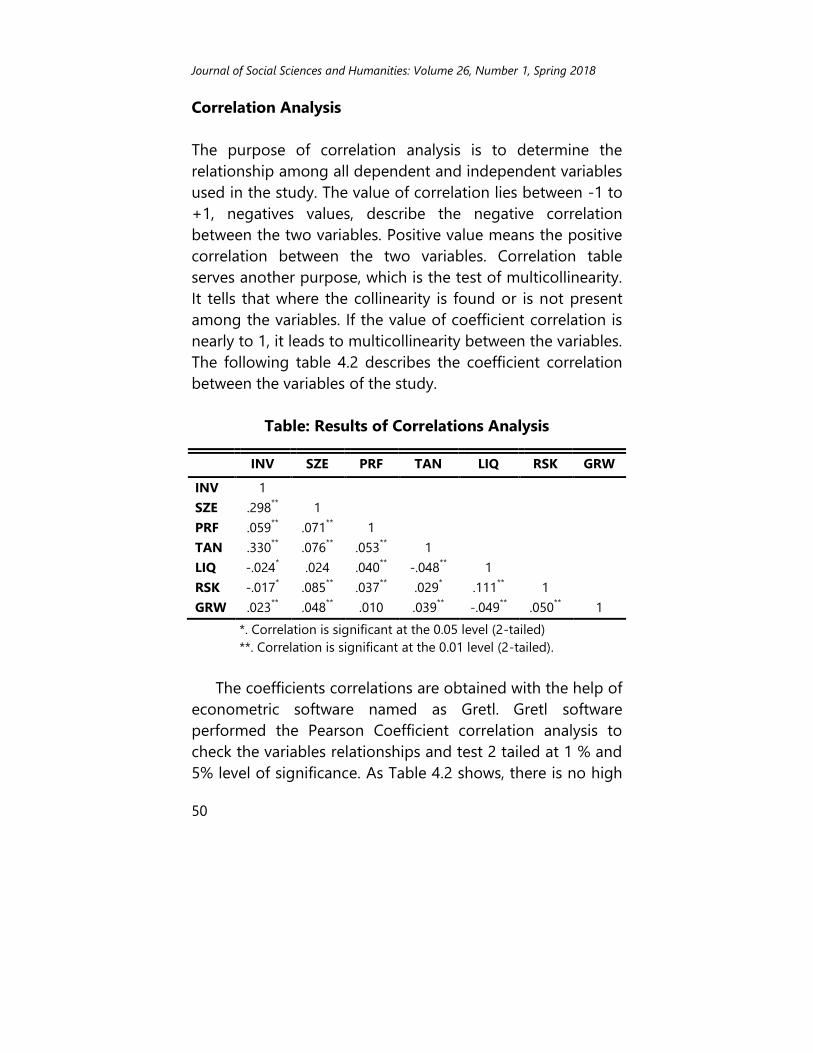
Journal of Social Sciences and Humanities: Volume 26, Number 1, Spring 2018
50
Correlation Analysis
The purpose of correlation analysis is to determine the
relationship among all dependent and independent variables
used in the study. The value of correlation lies between -1 to
+1, negatives values, describe the negative correlation
between the two variables. Positive value means the positive
correlation between the two variables. Correlation table
serves another purpose, which is the test of multicollinearity.
It tells that where the collinearity is found or is not present
among the variables. If the value of coefficient correlation is
nearly to 1, it leads to multicollinearity between the variables.
The following table 4.2 describes the coefficient correlation
between the variables of the study.
Table: Results of Correlations Analysis
*. Correlation is significant at the 0.05 level (2-tailed)
**. Correlation is significant at the 0.01 level (2-tailed).
The coefficients correlations are obtained with the help of
econometric software named as Gretl. Gretl software
performed the Pearson Coefficient correlation analysis to
check the variables relationships and test 2 tailed at 1 % and
5% level of significance. As Table 4.2 shows, there is no high
INV SZE PRF TAN LIQ RSK GRW
INV 1
SZE .298** 1
PRF .059** .071
** 1
TAN .330** .076
** .053
** 1
LIQ -.024* .024 .040
** -.048
** 1
RSK -.017* .085
** .037
** .029
* .111
** 1
GRW .023** .048
** .010 .039
** -.049
** .050
** 1
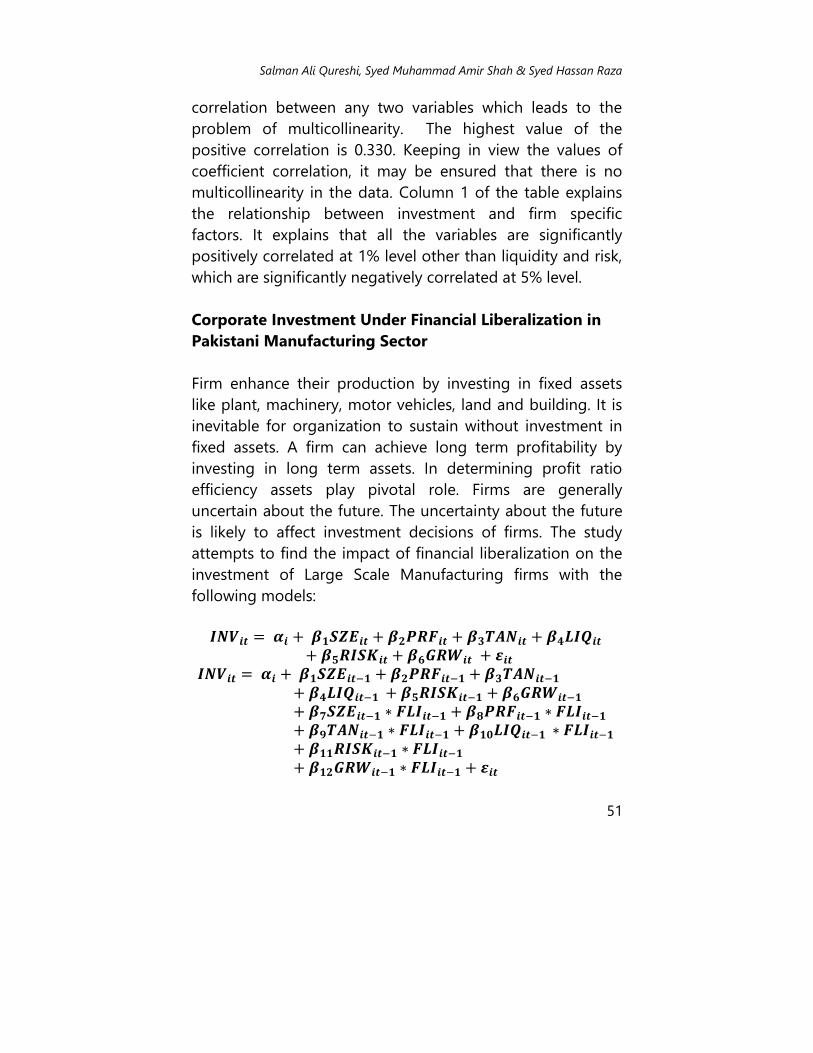
Salman Ali Qureshi, Syed Muhammad Amir Shah & Syed Hassan Raza
51
correlation between any two variables which leads to the
problem of multicollinearity. The highest value of the
positive correlation is 0.330. Keeping in view the values of
coefficient correlation, it may be ensured that there is no
multicollinearity in the data. Column 1 of the table explains
the relationship between investment and firm specific
factors. It explains that all the variables are significantly
positively correlated at 1% level other than liquidity and risk,
which are significantly negatively correlated at 5% level.
Corporate Investment Under Financial Liberalization in
Pakistani Manufacturing Sector
Firm enhance their production by investing in fixed assets
like plant, machinery, motor vehicles, land and building. It is
inevitable for organization to sustain without investment in
fixed assets. A firm can achieve long term profitability by
investing in long term assets. In determining profit ratio
efficiency assets play pivotal role. Firms are generally
uncertain about the future. The uncertainty about the future
is likely to affect investment decisions of firms. The study
attempts to find the impact of financial liberalization on the
investment of Large Scale Manufacturing firms with the
following models:
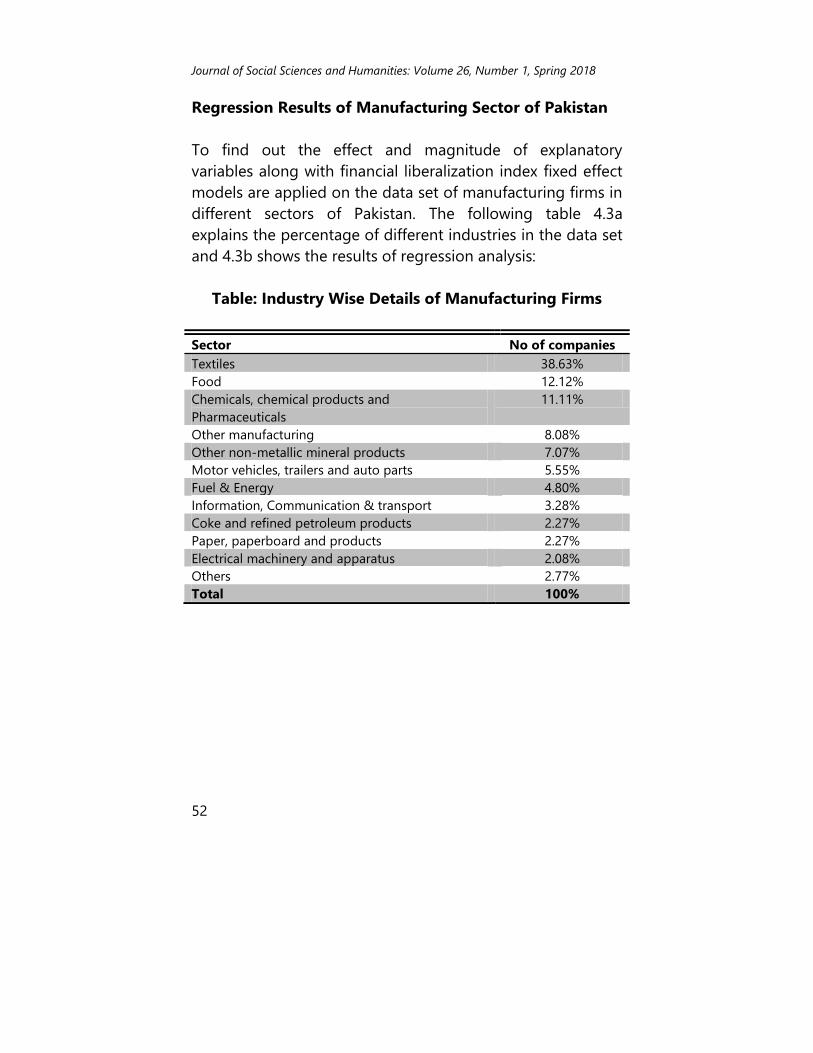
Journal of Social Sciences and Humanities: Volume 26, Number 1, Spring 2018
52
Regression Results of Manufacturing Sector of Pakistan
To find out the effect and magnitude of explanatory
variables along with financial liberalization index fixed effect
models are applied on the data set of manufacturing firms in
different sectors of Pakistan. The following table 4.3a
explains the percentage of different industries in the data set
and 4.3b shows the results of regression analysis:
Table: Industry Wise Details of Manufacturing Firms
Sector No of companies
Textiles 38.63%
Food 12.12%
Chemicals, chemical products and
Pharmaceuticals
11.11%
Other manufacturing 8.08%
Other non-metallic mineral products 7.07%
Motor vehicles, trailers and auto parts 5.55%
Fuel & Energy 4.80%
Information, Communication & transport 3.28%
Coke and refined petroleum products 2.27%
Paper, paperboard and products 2.27%
Electrical machinery and apparatus 2.08%
Others 2.77%
Total 100%
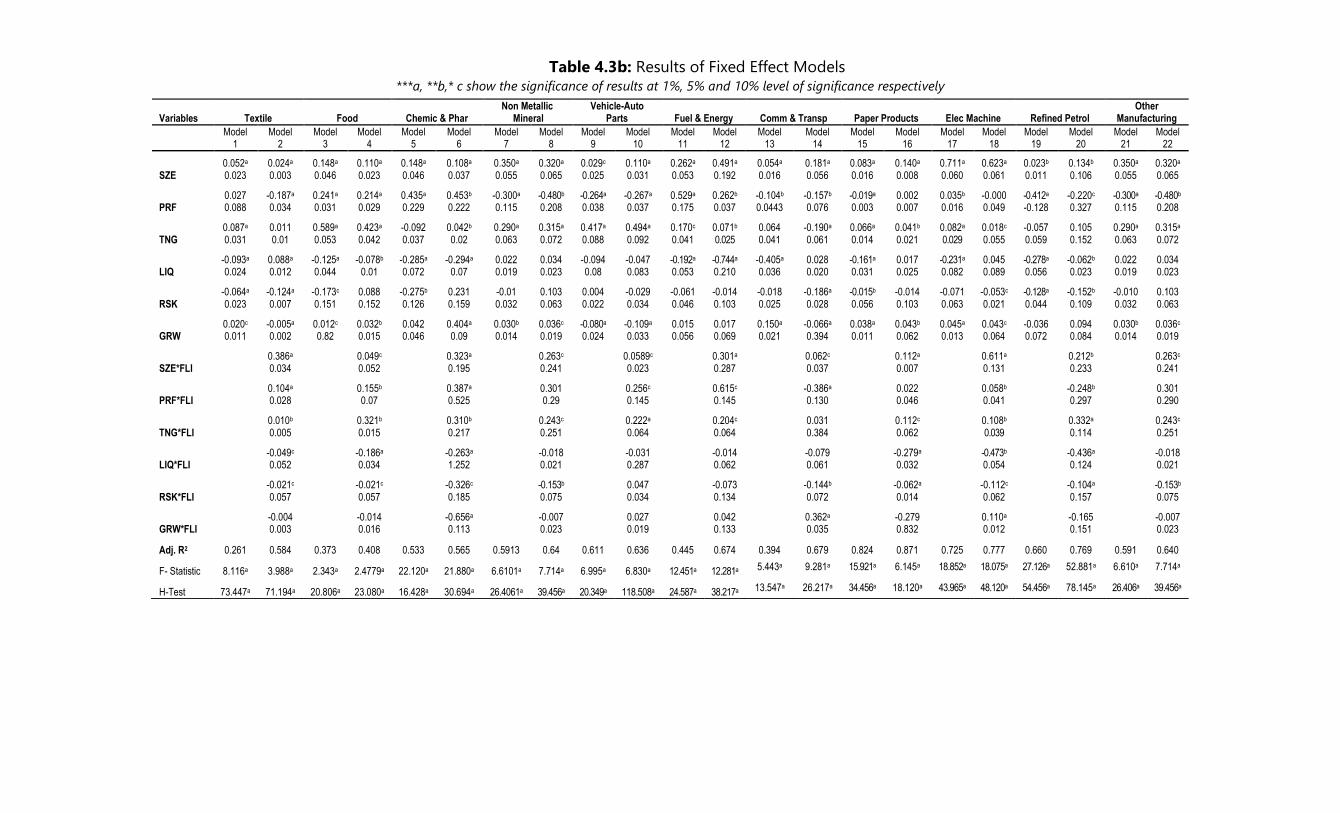
Table 4.3b: Results of Fixed Effect Models ***a, **b,* c show the significance of results at 1%, 5% and 10% level of significance respectively
Variables Textile Food Chemic & Phar Non Metallic
Mineral Vehicle-Auto
Parts Fuel & Energy Comm & Transp Paper Products Elec Machine Refined Petrol Other
Manufacturing
Model 1
Model 2
Model 3
Model 4
Model 5
Model 6
Model 7
Model 8
Model 9
Model 10
Model 11
Model 12
Model 13
Model 14
Model 15
Model 16
Model 17
Model 18
Model 19
Model 20
Model 21
Model 22
SZE 0.052a 0.024a 0.148a 0.110a 0.148a 0.108a 0.350a 0.320a 0.029c 0.110a 0.262a 0.491a 0.054a 0.181a 0.083a 0.140a 0.711a 0.623a 0.023b 0.134b 0.350a 0.320a 0.023 0.003 0.046 0.023 0.046 0.037 0.055 0.065 0.025 0.031 0.053 0.192 0.016 0.056 0.016 0.008 0.060 0.061 0.011 0.106 0.055 0.065
PRF 0.027 -0.187a 0.241a 0.214a 0.435a 0.453b -0.300a -0.480b -0.264a -0.267a 0.529a 0.262b -0.104b -0.157b -0.019a 0.002 0.035b -0.000 -0.412a -0.220c -0.300a -0.480b 0.088 0.034 0.031 0.029 0.229 0.222 0.115 0.208 0.038 0.037 0.175 0.037 0.0443 0.076 0.003 0.007 0.016 0.049 -0.128 0.327 0.115 0.208
TNG 0.087a 0.011 0.589a 0.423a -0.092 0.042b 0.290a 0.315a 0.417a 0.494a 0.170c 0.071b 0.064 -0.190a 0.066a 0.041b 0.082a 0.018c -0.057 0.105 0.290a 0.315a 0.031 0.01 0.053 0.042 0.037 0.02 0.063 0.072 0.088 0.092 0.041 0.025 0.041 0.061 0.014 0.021 0.029 0.055 0.059 0.152 0.063 0.072
LIQ -0.093a 0.088a -0.125a -0.078b -0.285a -0.294a 0.022 0.034 -0.094 -0.047 -0.192a -0.744a -0.405a 0.028 -0.161a 0.017 -0.231a 0.045 -0.278a -0.062b 0.022 0.034 0.024 0.012 0.044 0.01 0.072 0.07 0.019 0.023 0.08 0.083 0.053 0.210 0.036 0.020 0.031 0.025 0.082 0.089 0.056 0.023 0.019 0.023
RSK -0.064a -0.124a -0.173c 0.088 -0.275b 0.231 -0.01 0.103 0.004 -0.029 -0.061 -0.014 -0.018 -0.186a -0.015b -0.014 -0.071 -0.053c -0.128a -0.152b -0.010 0.103 0.023 0.007 0.151 0.152 0.126 0.159 0.032 0.063 0.022 0.034 0.046 0.103 0.025 0.028 0.056 0.103 0.063 0.021 0.044 0.109 0.032 0.063
GRW 0.020c -0.005a 0.012c 0.032b 0.042 0.404a 0.030b 0.036c -0.080a -0.109a 0.015 0.017 0.150a -0.066a 0.038a 0.043b 0.045a 0.043c -0.036 0.094 0.030b 0.036c 0.011 0.002 0.82 0.015 0.046 0.09 0.014 0.019 0.024 0.033 0.056 0.069 0.021 0.394 0.011 0.062 0.013 0.064 0.072 0.084 0.014 0.019
SZE*FLI 0.386a
0.049c
0.323a
0.263c
0.0589c
0.301a
0.062c
0.112a
0.611a
0.212b
0.263c 0.034 0.052 0.195 0.241 0.023 0.287 0.037 0.007 0.131 0.233 0.241
PRF*FLI 0.104a
0.155b
0.387a
0.301
0.256c
0.615c
-0.386a
0.022
0.058b
-0.248b
0.301 0.028 0.07 0.525 0.29 0.145 0.145 0.130 0.046 0.041 0.297 0.290
TNG*FLI 0.010b
0.321b
0.310b
0.243c
0.222a
0.204c
0.031
0.112c
0.108b
0.332a
0.243c 0.005 0.015 0.217 0.251 0.064 0.064 0.384 0.062 0.039 0.114 0.251
LIQ*FLI -0.049c
-0.186a
-0.263a
-0.018
-0.031
-0.014
-0.079
-0.279a
-0.473b
-0.436a
-0.018 0.052 0.034 1.252 0.021 0.287 0.062 0.061 0.032 0.054 0.124 0.021
RSK*FLI -0.021c
-0.021c
-0.326c
-0.153b
0.047
-0.073
-0.144b
-0.062a
-0.112c
-0.104a
-0.153b 0.057 0.057 0.185 0.075 0.034 0.134 0.072 0.014 0.062 0.157 0.075
GRW*FLI -0.004
-0.014
-0.656a
-0.007
0.027
0.042
0.362a
-0.279
0.110a
-0.165
-0.007 0.003 0.016 0.113 0.023 0.019 0.133 0.035 0.832 0.012 0.151 0.023
Adj. R2 0.261 0.584 0.373 0.408 0.533 0.565 0.5913 0.64 0.611 0.636 0.445 0.674 0.394 0.679 0.824 0.871 0.725 0.777 0.660 0.769 0.591 0.640
F- Statistic 8.116a 3.988a 2.343a 2.4779a 22.120a 21.880a 6.6101a 7.714a 6.995a 6.830a 12.451a 12.281a 5.443a 9.281a 15.921a 6.145a 18.852a 18.075a 27.126a 52.881a 6.610a 7.714a
H-Test 73.447a 71.194a 20.806a 23.080a 16.428a 30.694a 26.4061a 39.456a 20.349a 118.508a 24.587a 38.217a 13.547a 26.217a 34.456a 18.120a 43.965a 48.120a 54.456a 78.145a 26.406a 39.456a
Journal of Social Sciences and Humanities: Volume 26, Number 1, Spring 2018
54
The results in the table 4.3b are based on two model
applied on each of the industry. One model is applied only
on the explanatory variables, whereas, the second model
utilized the interaction terms of explanatory variables and
financial liberalization index for Pakistan. The value of the F-
Test in all the models describes the acceptance or rejection
of the hypothesis of common constant. Significance of F
value rejects the null hypothesis that the constants are
common and the significance of H-Test Value confirms the
validity and application of Fixed Effect Method for this panel
data analysis in each of the manufacturing sector in Pakistan.
The analysis reveals that the exogenous variables explain
the change in endogenous variable by 0.2615 as described
by adjusted R-square in Model no 1 of the Textile sector of
Pakistan. Coefficient of size is 0.0522 which describes the
positive impact on investment of firms and beta coefficient
of interaction term of size and financial liberalization is
0.3861 which means that financial reforms increased the
investment as the size of the firm increases. Financial
Liberalization has significant positive effect on the
investment of the firms at 1% level of significance
respectively. Beta coefficients of profitability without financial
liberalization index show insignificant results, whereas, the
interaction of profitability and index is positive. This shows
that after liberalization the profitability of firms help to make
investments by firms in the textile sector of Pakistan. The
results in the table show 0.0871 for tangibility and the result
of interaction of liberalization index with tangibility is 0.0105.
It means that financial reforms have reduced the reliance on
the asset tangibility for the acquisition of financial resources.
Beta coefficient of liquidity is -0.0935 and risk is -0.0649.
There is inverse relationship between the independent and
dependent variable. It explains that one unit change in these
variables will account for 9.35% and 6.49% negatively.
Salman Ali Qureshi, Syed Muhammad Amir Shah & Syed Hassan Raza
55
However, the interaction term of liquidity and risk is
significant at 10%. It implies that financial liberalization have
minimized the risk of investment. The interaction term of
growth and index is insignificant.
The results of the fixed effect models no 03 and 04 of the
food sector of Pakistan indicates that the exogenous
variables explain the change in endogenous variable by
37.38% as described by adjusted R-square. Coefficient of size
is 0.1489 which describes the positive impact on investment
of firms and beta coefficient of interaction term of size and
financial liberalization is 0.0491 which means that financial
reforms decreased the investment of food related
companies. Beta coefficients of profitability without financial
liberalization index is 0.2412, whereas, the interaction of
profitability and index is positive. This shows that after
liberalization the investment of the firms is reduced on the
basis of profitability in the food sector of Pakistan. The
results in the table show 0.5895 for tangibility and the result
of interaction of liberalization index with tangibility is 0.3218.
It means that financial reforms have reduced the reliance on
the asset tangibility for the investment in food sector of
Pakistan. Beta coefficient of liquidity is -0.1255 and risk is -
0.1734. There is inverse relationship between the
independent and dependent variable. It explains that one
unit change in these variables will account for 12.55% and
17.34% negatively. However, the interaction term of liquidity
and risk is significant at 10%. It implies that financial
liberalization have minimized the risk of investment. The
interaction term of growth and index is insignificant.
The results of chemical and pharmaceutical sector
highlight that independent variables bring the change in the
investment of the firm by 0.5333 as described by adjusted R-
square. Coefficient of size is 0.1489 which describes the
positive impact on investment of firms and beta coefficient
Journal of Social Sciences and Humanities: Volume 26, Number 1, Spring 2018
56
of interaction term of size and financial liberalization is
0.3236 which means that financial reforms increased the
investment as the size of the firm increases. Financial
Liberalization has significant positive effect on the
investment of the firms at 1% level of significance
respectively. Beta coefficients of profitability without and
with financial liberalization index show positive results and
the values are 0.4357 and 0.3875. Tangibility is insignificant
whereas, the result for tangibility after interaction of
liberalization index is 0.3102. It means that financial reforms
have increased the requirement of tangible assets for making
investments in chemical and pharmaceutical industry of
Pakistan. Beta coefficient of liquidity is -0.2853 and risk is -
0.2755. There is inverse relationship between the
independent and dependent variable. It explains that one
unit change in these variables will account for 28.53% and
27.55% negatively. However, the interaction term of liquidity
is significant at 1% and risk is significant at 10%. It implies
that financial liberalization have minimized the risk of
investment. The interaction term of growth and index is
significant at 1% level.
The results of fixed effect models of Non Metallic mineral
sector foreshadow that all variables will bring about 0.5913
as described by adjusted R-square. Coefficient of size is
0.3506 which describes the positive impact on investment of
firms and beta coefficient of interaction term of size and
financial liberalization is 0.2630 which means that financial
reforms increased the investment as the size of the firm
increases. Financial Liberalization has significant positive
effect on the investment of the firms at 10% level of
significance respectively. Beta coefficients of profitability
without financial liberalization index show negative results,
whereas, the interaction of profitability and index is
insignificant. This shows that after liberalization the
Salman Ali Qureshi, Syed Muhammad Amir Shah & Syed Hassan Raza
57
profitability of firms is not the determinant of investment in
Non Metallic Manufacturing sector of Pakistan. The results in
the table show 0.2904 for tangibility and the result of
interaction of liberalization index with tangibility is 0.2439. It
means that financial reforms have reduced the reliance on
the asset tangibility for the acquisition of financial resources.
Beta coefficients of liquidity and risk are insignificant without
interaction of liberalization. The beta coefficient of risk and
liberalization is -0.1538 which means that after financial
liberalization risk of other manufacturing firms have inverse
relationship. If risk is higher the investment is reduced by
15.28% in this sector. However, the interaction term of
liquidity and risk is insignificant. It implies that financial
liberalization have minimized the risk of investment. The
interaction term of growth and index is insignificant.
The results of motor vehicle auto parts sector explain the
change in endogenous variable by 0.6117 as described by
adjusted R-square. Coefficient of size is 0.0290 which
describes the positive impact on investment of firms and
beta coefficient of interaction term of size and financial
liberalization is 0.0589 which means that financial reforms
increased the investment as the size of the firm increases.
Financial Liberalization has significant positive effect on the
investment of the firms at 10% level of significance
respectively. Beta coefficients of profitability without financial
liberalization index show negative results, whereas, the
interaction of profitability and index is positive. This shows
that after liberalization the profitability of firms help to make
investments by firms in the motor vehicle and auto parts
sector of Pakistan. The results in the table show 0.4171 for
tangibility and the result of interaction of liberalization index
with tangibility is 0.2227. It means that financial reforms have
reduced the reliance on the asset tangibility for the
investment and firms are investing in financial assets rather
Journal of Social Sciences and Humanities: Volume 26, Number 1, Spring 2018
58
that fixed assets. Beta coefficient of liquidity and risk are
insignificant, whereas the interaction terms of both the
variables with liberalization index are also insignificant. It
means that in motor vehicle and auto parts sector risk and
liquidity are not the determinants of investment even after
financial liberalization. The interaction term of growth and
index is insignificant.
The fuel and energy sector show a change in adjusted R
square of 0.4455. It means that all the independent variables
will bring about 44 percent change in the investment of the
any firm in this sector of Pakistan. Coefficient of size is
0.2625 which describes the positive impact on investment of
firms and beta coefficient of interaction term of size and
financial liberalization is 0.3011 which means that financial
reforms increased the investment as the size of the firm
increases. Financial Liberalization has significant positive
effect on the investment of the firms at 1% level of
significance respectively. Beta coefficient of profitability
without financial liberalization index is 0.5291 and is
significant at 1% level, whereas, the interaction of
profitability and index is positive with beta value 0.6151. This
shows that after liberalization the profitability of firms help
to make investments by firms in the fuel and energy sector
of Pakistan. The results in the table show 0.1702 for
tangibility and the result of interaction of liberalization index
with tangibility is 0.2042. It means that financial reforms have
increased the effect of asset tangibility on the investment of
firms in fuel & energy sector. Beta coefficient of liquidity is -
0.1921 and risk is insignificant. There is inverse relationship
between the liquidity and investment. It explains that one
unit change in this variable will account for 19.21%
negatively. However, the interaction term of liquidity, risk
and growth are insignificant.
Salman Ali Qureshi, Syed Muhammad Amir Shah & Syed Hassan Raza
59
However, in communication and transport sector analysis
indicates that independent variables explain the change in
dependent variable by 39.5% in model 75 whereas Adjusted
R-square of model 76 is higher which has the explanatory
power 67.93% in explaining the dependent variable.
Coefficient of size describes that 1% change in size would
cause the change in investment by 5.46% whereas the
liberalization lever up this relation to 6.24%. Profitability has
the negative impact on the investment which shows that in
communication and transport section firms are distributing
the major portion of profit among shareholders and not
making investment to expand its operation. The coefficients of
the tangibility in both models are insignificant. The beta
coefficient of liquidity is -.4054 which means that 1% increase
in liquidity will bring the negative change in investment by
40.54%, these results describe the tradeoff between liquidity
and investment. Risk is insignificant in model 75 whereas the
beta coefficient of Risk in Model 76 is -0.1448, which shows
that 1% increase in Risk would impact negatively on
investment by 14.48%. Financial liberalization pushes up the
level of investment in this sector which may be verified from
the coefficients of growth. Without interaction term of
financial liberalization growth has impact by 15.09% whereas
in model 76 this impact is increased to 36.28%.
The analysis indicates that independent variables explain
the change in dependent variable by 82.49% in model
15whereas Adjusted R-square of model 16 is higher which
has the explanatory power 87.12% in explaining the
dependent variable in Paper Products Sector in Pakistan.
Coefficient of size describes that 1% change in size would
cause the change in investment by 8.32% whereas the
liberalization lever up this relation up to 11.25%. Profitability
has the negative impact on the investment which shows that
in paper product sector firms are distributing the major
Journal of Social Sciences and Humanities: Volume 26, Number 1, Spring 2018
60
portion of profit among shareholders and not making
investment to expand its operation. The coefficients of the
tangibility in both models are positive and significant. The
interaction of tangibility and liberalization index increased
the effect of tangibility on investment by 11.28%. The beta
coefficient of liquidity is -0.1610 which means that 1%
increase in liquidity will bring the negative change in
investment by 16.10%, these results describe the tradeoff
between liquidity and investment. Risk in both the models is
significant at 5% and 1% level of significance, whereas the
beta coefficient of Risk and liberalization index is -0.0624,
which shows that 1% increase in Risk would impact
investment negatively by 6.24%. Financial liberalization did
not help to increase the level of investment in this sector
which is evident from the values of growth.
The electrical machinery sector of Pakistan shows that the
explanatory variables can bring about 72.59% change in
dependent variable without interaction of financial
liberalization whereas Adjusted R-square of model 18 is
higher which has the explanatory power 77.78% in explaining
the dependent variable. Coefficient of size describes that 1%
change in size would cause the change in investment by
71.12% whereas the liberalization reduced this relation up to
61.12%. Profitability has the positive impact on the
investment which shows that in electrical machinery section
firms are retaining the profits for future projects and
expansion. The coefficients of the tangibility in both models
are significant. Financial liberalization increased the
requirement of asset tangibility for investment in this sector
which is evident from the beta value 0.1082. The beta
coefficient of liquidity is -0.2313 which means that 1%
increase in liquidity will bring the negative change in
investment by 23.13%, these results describe the tradeoff
between liquidity and investment. Risk is insignificant in
Salman Ali Qureshi, Syed Muhammad Amir Shah & Syed Hassan Raza
61
model 87 whereas the beta coefficient of Risk in model 88 is
-0.1128, which shows that 1% increase in Risk would
negatively impact on investment by 11.28%. Financial
liberalization pushes up the level of investment in this sector
which may be verified from the coefficients of growth.
Without interaction term of financial liberalization growth
has impact by 4.50% whereas in model 88 this impact is
increased up to 11.02%.
The analysis of refined petroleum products show that the
exogenous variables explain the change in endogenous
variable by 0.6603 as described by adjusted R-square.
Coefficient of size is 0.0238which describes the positive
impact on investment of firms and beta coefficient of
interaction term of size and financial liberalization is 0.2124
which means that financial reforms increased the investment
as the size of the firm increases. Financial Liberalization has
significant positive effect on the investment of the firms at 5%
level of significance. Beta coefficients of profitability without
and financial liberalization index show negative results. It
means that firm in this sector are not making investments in
real assets they may be investing in financial assets. The
results in the table show insignificant results for tangibility
without interaction of liberalization. However, after interaction
of index and tangibility it shows positive relationship with the
beta value of 0.3321. Beta coefficient of liquidity is -0.2781
and risk is -0.1289. There is inverse relationship between the
independent and dependent variable. It explains that one unit
change in these variables will account for 27.81% and 12.89%
negatively. However, the interaction term of liquidity and risk
is significant at 1%. It implies that financial liberalization have
minimized the risk of investment. The interaction term of
growth and index is insignificant.
The analysis of other manufacturing sector indicates that
the exogenous variables explain the change in endogenous
Journal of Social Sciences and Humanities: Volume 26, Number 1, Spring 2018
62
variable by 0.5913 as described by adjusted R-square.
Coefficient of size is 0.3506 which describes the positive
impact on investment of firms and beta coefficient of
interaction term of size and financial liberalization is 0.2630
which means that financial reforms increased the investment
as the size of the firm increases. Financial Liberalization has
significant positive effect on the investment of the firms at
10% level of significance respectively. Beta coefficients of
profitability without financial liberalization index show
negative results, whereas, the interaction of profitability and
index is insignificant. This shows that after liberalization the
profitability of firms is not the determinant of investment in
the other manufacturing sector of Pakistan. The results in the
table show 0.2904 for tangibility and the result of interaction
of liberalization index with tangibility is 0.2439. It means that
financial reforms have reduced the reliance on the asset
tangibility for the acquisition of financial resources. Beta
coefficients of liquidity and risk are insignificant without
interaction of liberalization. The beta coefficient of risk and
liberalization is -0.1538 which means that after financial
liberalization risk of other manufacturing firms have inverse
relationship. If risk is higher the investment is reduced by
15.28% in this sector. However, the interaction term of
liquidity and risk is insignificant. It implies that financial
liberalization have minimized the risk of investment. The
interaction term of growth and index is insignificant.
Discussion
The present research is conducted to find out the impact of
financial liberalization reforms along with firm-specific factors
(size, profitability, tangibility, liquidity, risk, and growth) on the
investment of manufacturing listed firms in Pakistan Stock
Salman Ali Qureshi, Syed Muhammad Amir Shah & Syed Hassan Raza
63
Exchange. To investigate, the study developed financial
liberalization index based on the reforms from 1991 to 2014.
The reforms were subdivided into nine categories as per the
financial sector progress review report of State Bank of
Pakistan. To meet the objectives of the study analyses were
brought down to various sectors of manufacturing firms that
include Textiles, Food, Chemicals, Other manufacturing, Motor
Vehicle, Fuel & Energy, Communication, Refined Petroleum,
Paperboard, and Electrical Machinery. Panel data regression
analyses were performed and fixed effect models were applied
on the data set.
In nutshell, on the basis of firm-level factors and their
interaction with liberalization index, the results highlight the
favorable impact of financial reforms on the investment of
Manufacturing listed in Pakistan Stock Exchange. However,
results which have been extracted from the analyses show
that there is significantly different impact of financial
liberalization on the level of investment among sectors.
Results show that textile sector is benefited at the most from
the financial liberalization in terms of increase in investment
and it is evident from the interaction coefficients of firm
specific factors and financial liberalization. The coefficient
values of size, profitability, liquidity, and risk favorably affect
investment level of the firm after liberalization of the
financial system in Pakistan. The coefficient of index and size
is 0.3861, profitability is 0.1041, liquidity is -0.0491, and risk is
-0.0214. Among other sectors, financial liberalization has also
helped to increase the investment in refined petroleum
products, electrical machinery, and chemical and
pharmaceutical sectors. This is also evident from the analyses
Journal of Social Sciences and Humanities: Volume 26, Number 1, Spring 2018
64
that the interaction of profitability, risk, and tangibility
affected favorably on the level of firm investment in these
sectors. On the other side, investment level of food, non-
metallic minerals, other manufacturing, and paper products
did not improve much from financial liberalization reforms in
Pakistan. Some sectors provided evidence of mixed results
which includes fuel & energy sector and motor vehicle &
auto parts sector. The results of this research are in
consonance with the work of Koo & Shin (2004), Galindo et
al., (2005), Ghosal & Nair (2009) and Onwuka (2014) that
financial liberalization has divergent effects on the firm-level
investment in listed large scale manufacturing firms.
Policy Implications and Future Research Directions
The results of the present study suggest that there is still
room for improvement. On the basis of the findings the
following recommendations can be drawn. It is proved that
financial liberalization has an impact on the investment of
manufacturing sector in Pakistan. Therefore, policy makers
should keep an eye on improving financial system so that
benefits of financial liberalization become constant
phenomena for the manufacturing sector. The results further
show that the effect of financial liberalization is not uniform
across various sectors. Therefore, sector specific reforms may
be introduced in refined petroleum products, non metallic
minerals, and food sectors considering their special needs.
The study also recommends that Food sector needs focus in
terms of investment to get benefit of financial liberalization.
Salman Ali Qureshi, Syed Muhammad Amir Shah & Syed Hassan Raza
65
Communication and transport sector requires attention
towards liquidity, risk, and growth to achieve benefit in terms
of improving their investment function.
Future Research Directors
Research open up avenues to conduct future research and
none of the research is ultimate. Future research may be
directed to find out more insight of financial liberalization
hypothesis by conducting extensive interviews from the
financial manager or chief executive officer of the
manufacturing sector firms. The interviews may be targeted
to know better perceptions of the finance manager/chief
financial officer and CEO views about the benefits and
drawbacks of three levels of financial liberalization i.e., capital
account, stock market, and bank liberalization.
Future research may also segregate the data on the basis
of firms having affiliation with large business groups and non
business group. The analysis may be conducted to explore,
whether firms with business group affiliate have better
access to funds or non business group affiliated firms.
Another dimension for future research could be to
categorize firms on the basis of political connection of
CEO/Finance Manager/Senior Management. This may unveil
some more truths about the level of firm investment.
Journal of Social Sciences and Humanities: Volume 26, Number 1, Spring 2018
66
References
Adelegan, O. J., & Ariyo, A. (2008). Capital Market
Imperfections and Corporate Investment Behavior: A
Switching Regression Approach Using Panel Data for
Nigerian Manufacturing Firms. Journal of Money,
Investment and Banking, 2, 16-38.
Ahmed Sheikh, N., & Wang, Z. (2011). Determinants of
Capital Structure: An Empirical Study of Firms in
Manufacturing Industry of Pakistan. Managerial
Finance, 37(2), 117-133.
Alrabadi, D. W., AL-Gharaibeh, M. A., & Ziad, M. Z. (2011).
What Makes Investors Overconfident? Evidence from
Amman Stock Exchange. European Journal of Economics,
Finance and Administrative Sciences, 43.
Amaira, B. and Amaira, R. (2014). Financial liberalization Index
of Tunisia: Factorial Method Approach. International
Journal of Economics, Finance and Management Sciences,
2014; 2(3): 206-211.
Amel, D., C. Barnes, F. Panetta and C. Salleo (2004):
“Consolidation and Efficiency in the Financial Sector: A
Review of the International Evidence,” Journal of Banking
and Finance, 28, 2493-2519.
Ataullah, A., Cockerill, T., & Le, H. (2004). Financial
Liberalization and Bank Efficiency: a Comparative Analysis
of India and Pakistan. Applied Economics, 36(17), 1915-
1924
Bagehot, W. (1873). Lombard Street. Homewood, IL: Irwin.
Salman Ali Qureshi, Syed Muhammad Amir Shah & Syed Hassan Raza
67
Bandiera, O., Caprio, G., Honohan, P., & Schiantarelli, F. (2000).
Does Financial Reform Raise or Reduce Saving?. Review of
Economics and Statistics, 82(2), 239-263.
Bekaert, G., Harvey, C. R., & Lundblad, C. (2001). Emerging
Equity Markets and Economic Development. Journal of
Development Economics, 66(2), 465-504.
Bhaduri, S. N. (2005). Investment, Financial Constraints and
Financial Liberalization: Some Stylized Facts from a
Developing Economy, India. Journal of Asian
Economics, 16(4), 704-718.
Bilsborrow, R. E. (1977). The Determinants of Fixed
Investment by Manufacturing firms in a Developing
Country. International Economic Review, 697-717
Bond, S., Elston, J. A., Mairesse, J., & Mulkay, B. (2003).
Financial Factors and Investment in Belgium, France,
Germany, and the United Kingdom: a Comparison Using
Company Panel Data. Review of Economics and Statistics,
85(1), 153-165.
Bulan, L. (2001). Firm Investment Behavior in a Real Options
Framework: Empirical Evidence (Doctoral Dissertation,
Columbia University).
Carreira, C., & Silva, F. (2010). NO DEEP POCKETS: SOME
STYLIZED EMPIRICAL RESULTS ON FIRMS’FINANCIAL
CONSTRAINTS. Journal of Economic Surveys, 24(4), 731-
753.
Chandrasekhar, C. P. (2004). Financial Liberalization and the
Macroeconomics of Poverty Reduction. Draft Thematic
Journal of Social Sciences and Humanities: Volume 26, Number 1, Spring 2018
68
Summary on Financial Liberalization for the Asia-Pacific
Programme on the Macroeconomics of Poverty Reduction,
May.
Dayaratne, S. P., Wickremathillake, G. K., & Gunawardana, K.
D. (2015). Impact of Green Reporting for Business
Valuation Study of Rubber Manufacturing SME in Sri
Lanka. Sri Lanka Journal of Real Estate, (8).
Deepankar, B., & Das, D. (2015). Profitability in India's
Organized Manufacturing Sector: The Role of Technology,
Distribution, and Demand (No. 2015-04). Working Paper,
University of Massachusetts, Department of Economics.
Degryse, H., de Goeij, P., & Kappert, P. (2012). The Impact of
Firm and Industry Characteristics on Small Firms’ Capital
Structure. Small Business Economics, 38(4), 431-447.
Denizer, C., Desai, R. M., & Gueorguiev, N. (1988). The
Political Economy of Financial Repression in Transition
Economies.
Devereux, M., & Schiantarelli, F. (1990). Investment, Financial
factors, and cash flow: Evidence from UK Panel Data.
In Asymmetric Information, Corporate Finance, and
Investment (pp. 279-306). University of Chicago Press,
1990.
Dixit, A. K., & Pindyck, R. S. (1994). Investment Under
Uncertainty. Princeton University Press.
Fazzari, S. M., Hubbard, R. G., Petersen, B. C., Blinder, A. S., &
Poterba, J. M. (1988). Financing Constraints and
Salman Ali Qureshi, Syed Muhammad Amir Shah & Syed Hassan Raza
69
Corporate Investment. Brookings Papers on Economic
Activity, 1988(1), 141-206.
Forbes, K. J. (2003). One cost of the Chilean Capital Controls:
Increased Financial Constraints for Smaller Trade Firms.
NBER Working Paper 977
Galindo, A., Schiantarelli, F., & Weiss, A. (2007). Does
Financial Liberalization Improve the Allocation of
Investment?: Micro-Evidence from Developing Countries.
Journal of Development Economics, 83(2), 562-587.
Gelos, R. G., & Werner, A. M. (2002). Financial Liberalization,
Credit Constraints, and Collateral: Investment in the
Mexican Manufacturing Sector. Journal of Development
Economics, 67(1), 1-27.
Ghosal, V., & Loungani, P. (2000). The Differential Impact of
Uncertainty on Investment in Small and Large Businesses.
Review of Economics and Statistics, 82(2), 338-343.
Ghosh, J. (2005). The Economic and Social Effects of Financial
Liberalization: A Primer for Developing Countries. UN.
Goyal, A. (2014). Banks, Policy, and Risks: How Emerging
Markets Differ. International Journal of Public Policy, 10(1-
3), 4-26
Greenwald, B., Stiglitz, J. E., & Weiss, A. (January 01,
1984).Informational Imperfections in the Capital Market
and Macroeconomic Fluctuations. The American Economic
Review, 74(2), 194-199.
Journal of Social Sciences and Humanities: Volume 26, Number 1, Spring 2018
70
Guermazi, A. (2014). Financial Liberalization, Credit
Constraints and Collateral: The Case of Manufacturing
Industry in Tunisia. Procedia Economics and Finance, 13,
82-100.
Guncavdi, O., M. Bleaney & A. McKay. (1998). Financial
Liberalization and Private Investment: Evidence from Turkey.
Journal of Development Economics, 57(2), 443-55.
Gungoraydinoglu, A., & Öztekin, Ö. (2011). Firm-and
Country-Level Determinants of Corporate Leverage: Some
New International Evidence. Journal of Corporate
Finance, 17(5), 1457-1474.
Hanson, J. D. (1994). Toward Unlocking Lockups. Yale Law
Journal, 1739-1834. Hanson, J., & Ramachandran, S.
(1990). Financial Liberalization: What Went Right, What
Went Wrong?. World Bank, Economic Growth in the.
Harris, J. R., Schiantarelli, F., & Siregar, M. G. (1994). The
Effect of Financial Liberalization on the Capital Structure
and Investment Decisions of Indonesian Manufacturing
Establishments. The World Bank Economic Review, 8(1),
17-47.
Hartman, R. (1972). The Effects of Price and Cost Uncertainty
on Investment. Journal of Economic Theory, 5(2), 258-266.
Hermes, N., & Lensink, R. (2005). Does Financial Liberalization
Influence Saving, Investment and Economic Growth?
Evidence from 25 Emerging Market Economies, 1973-
96 (No. 2005/69). Research Paper, UNU-WIDER, United
Nations University (UNU).
Salman Ali Qureshi, Syed Muhammad Amir Shah & Syed Hassan Raza
71
Hoshi, T., Kashyap, A., & Scharfstein, D. (1991). Corporate
Structure, Liquidity, and Investment: Evidence from
Japanese Industrial Groups. The Quarterly Journal of
Economics, 33-60.
Isshaq, Z., Bokpin, G. A., & Mensah Onumah, J. (2009).
Corporate Governance, Ownership Structure, Cash
Holdings, and Firm Value on the Ghana Stock
Exchange. The Journal of Risk Finance, 10(5), 488-499.
Jangili, R., & Kumar, S. (2010). Determinants of Private
Corporate Sector Investment in India.
Jaramillo, F., F. Schiantarelli and A.Weiss.(1996). Capital
Market Imperfections before and After Financial
Liberalization: An Euler Equation Approach to Panel Data
for Ecuadorian Firms. Journal of Development Economics,
51, 367–386.
Jensen, M. C. (1986). Agency Costs of Free Cash Flow,
Corporate Finance, and Takeovers. The American
Economic Review, 76(2), 323-329
Jensen, M. C. and Meckling, W, H. (1979). Rights and Production
Functions: An Application to Labor-managed Firms and
Codetermination, Journal of Business, 52, 469-506.
Jorion, P., & Zhang, G. (2007). Good and Bad Credit
Contagion: Evidence from Credit Default Swaps. Journal
of Financial Economics, 84(3), 860-883.
Kalkan, A., Erdil, O., & Çetinkaya, Ö. (2011). The Relationships
Between Firm Size, Prospector Strategy, Architecture of
Journal of Social Sciences and Humanities: Volume 26, Number 1, Spring 2018
72
Information Technology and Firm Performance. Procedia-
Social and Behavioral Sciences, 24, 854-869.
Khan, A., Kaleem, A., & Nazir, M. S. (2012). Impact of Financial
Leverage on Agency Cost of Free Cash Flow: Evidence
from the Manufacturing Sector of Pakistan. Journal of
Basic and Applied Scientific Research, 2(7), 6694-6700.
Koo, J., & Maeng, K. (2005). The Effect of Financial
Liberalization on Firms’ Investments in Korea. Journal of
Asian Economics, 16(2), 281-297.
Koo, J., & Shin, S. (2004). Financial Liberalization and
Corporate Investments: Evidence from Korean Firm
Data. Asian Economic Journal, 18(3), 277-292.
Kose, M. A., Prasad, E., Rogoff, K. S., & Wei, S. J.
(2006). Financial Globalization: a Reappraisal (No.
w12484). National Bureau of Economic Research.
Kuh, E. (1963). Theory and Institutions in the Study of
Investment Behavior. The American Economic
Review, 53(2), 260-268.
Lang, L., Ofek, E., & Stulz, R. (1996). Leverage, Investment, and
Firm Growth. Journal of Financial Economics, 40(1), 3-29.
Laurenceson, J., & Chai, J. C. (2003). Financial Reform and
Economic Development in China. Edward Elgar Publishing.
Leahy, J. V., & Whited, T. M. (1995). The Effect of Uncertainty
on Investment: Some Stylized Facts (No. w4986). National
Bureau of Economic Research.
Salman Ali Qureshi, Syed Muhammad Amir Shah & Syed Hassan Raza
73
Leaven, L. (2003). Does Financial Liberalization Reduce
Financing Constraints?.Financial Management, 5-34.
Levine, R. (1997). ‘Financial Development and Economic
Growth: Views and Agenda’. Journal of Economic
Literature, 35 (2): 688-726.
Li, J., & Tang, Y. I. (2010). CEO Hubris and Firm Risk Taking in
China: The Moderating Role of Managerial
Discretion. Academy of Management Journal, 53(1), 45-68.
Love, I. (2003). Financial Development and Financing
Constraints: International Evidence from the Structural
Investment Model. Review of Financial studies, 16(3), 765-
791.
Majumdar, S. K. (1997). The impact of Size and age on Firm-
level Performance: Some Evidence from India. Review of
Industrial Organization, 12(2), 231-241.
Manova, K., Wei, S. J., & Zhang, Z. (2015). Firm Exports and
Multinational Activity Under Credit Constraints. Review of
Economics and Statistics, 97(3), 574-588.
Mao, Z., & Gu, Z. (2008). The Relationship Between Financial
Factors and Firm Performance: Empirical Evidence from
US Restaurant Firms. Journal of Foodservice Business
Research, 11(2), 138-159.
McDonald, R. L., & Siegel, D. R. (1985). Investment and the
Valuation of Firms When There is an Option to Shut
Down. International Economic Review, 331-349.
Journal of Social Sciences and Humanities: Volume 26, Number 1, Spring 2018
74
McKinnon, R. I. (1973). Money and Capital in Economic
Development (Washington, DC: Brookings Institution,
1973). McKinnonMoney and Capital in Economic
Development1973.
Minton, B. A., & Schrand, C. (1999). The Impact of Cash Flow
Volatility on Discretionary Investment and the Costs of
Debt and Equity Financing. Journal of Financial
Economics, 54(3), 423-460.
Modigliani, F. and M. H. Miller (1958). The Cost of Capital,
Corporation Finance, and the Theory of Investment.
American Economic Review, 48, 261–297.
Mujahid, M., Hashmi, F. K. H., & Abbas, M. D. (2014). Impact
of Privatization of Banks on Profitability of Banking Sector
in Pakistan. Journal of Economics and Sustainable
Development, 5(24), 101-110.
Munir, S., Chaudhry, I. S., & Akhtar, M. H. (2013). Financial
Liberalization and Economic Growth in Pakistan: Empirical
Evidence from Co-integration Analysis.Pakistan Journal of
Social Sciences (PJSS), 33(2), 227-241.
Myers, S. C. & N. S. Majluf. (1984). Corporate Financing and
Investment Decisions When Firms Have Information That
Investors Do Not Have. Journal of Financial Economics,
13, 187-221.
Oliner, S. D. and G. D. Rudebusch. (1992). Sources of the
Financing Hierarchy for Business Investment. Review of
Economics and Statistics, 74, 643–654.
Pindyck, R. S. (1986). Irreversible investment, capacity choice,
and the Value of the Firm.
Salman Ali Qureshi, Syed Muhammad Amir Shah & Syed Hassan Raza
75
Ruiz-Porras, A., & Lopez-Mateo, C. (2011). Corporate
Governance, Market Competition and Investment
Decisions in Mexican Manufacturing Firms.
Schmukler, S. L. (2004). Financial Globalization: Gain and Pain
for Developing countries. Federal Reserve Bank of Atlanta
Economic Review, 89(2), 39-66.
Shaw, E, S. (1973). Financial Deepening in Economic
Development. New York: Oxford University Press.
Shrestha, M. B., & Chowdhury, K. (2006). Financial Liberalization
Index for Nepal.International Journal of Applied
Econometrics and Quantitative Studies, 3(1), 41-54.
Stiglitz, J. E. (1969). A re-examination of the Modigliani-Miller
Theorem. The American Economic Review, 59(5), 784-793.
Ulici, Maria-Lenuta (2012) Financial Liberalization and the Impact
on Financial Market. Faculty of Economics and Business
Administration, Finance Department, PHD. Thesis.
Waliullah and M. Nishat. (2008). “Capital Structure Choice in
an Emerging Market: Evidence from Listed Firms in
Pakistan”, Paper Presented in 21st Australasian Finance
and Banking Conference.
Wang, H-J. (2003). A Stochastic Frontier Analysis of Financing
Constraints on Investment: The case of Financial
Liberalization in Taiwan, Journal of Business and Economic
Statistics, 21, 406-419.
Journal of Social Sciences and Humanities: Volume 26, Number 1, Spring 2018
76
Whited, T. M. (1992). Debt, Liquidity Constraints, and
Corporate Investment: Evidence from Panel Data, Journal
of Finance, 47(1), 425–1460.
Wu, M. L. (2006). Corporate Social Performance, Corporate
Financial Performance, and Firm Size: A Meta-
analysis. Journal of American Academy of Business, 8(1), 163-
171
Xu, N., Xu, X., & Yuan, Q. (2013). Political Connections,
Financing Friction, and Corporate Investment: Evidence
from Chinese Listed Family Firms. European Financial
Management, 19(4), 675-702.
Yan, I. K., Chan, K. S., & Dang, V. Q. (2011). Financial
Liberalization and Financing Constraints: Some Evidence
from Panel data of Listed Chinese Firms, MPRA Paper No.
35227.
Qazi Mohammad Ahmed*
Muhammad Mustafa Raziq**
Abeera Babar Goreja***
The Impact of Consumer Beliefs on
Consumers’ Attitude: A Social Media
Advertising Perspective
ABSTRACT
This study examines the role of consumer beliefs on the consumers’ attitude towards social media advertising. The rationale behind this research is to learn how different consumers’ beliefs influence the consumers’ attitudes towards social media advertising and the virtual audience in the development of their behaviors towards the online content available. In this study, the consumer belief is reflected by: infotainment, intrusiveness and integrity. Data is collected through an online survey developed in Google Docs. The target population comprises of 350 college and university level students. Data are analyzed through multiple regression technique using the SPSS tool. Results show that infotainment and integrity have a significant positive impact on consumer attitudes while intrusiveness has no significant impact on the consumer’s attitudes. The results are discussed and implications for the management practice and policy-makers are made.
Keywords: Social Media Advertising, Consumer Beliefs,
Attitudes, Infotainment, Intrusiveness, Integrity.
* PhD Scholar, COMSATS Institute of Information Technology (CIIT),
Senior Lecturer, Department of Management Sciences, Bahria
University, Islamabad Campus **
Assistant Professor, COMSATS Institute of Information Technology
(CIIT), Department of Management Sciences, Islamabad ***
MBA Student, Department of Management Sciences, Bahria
University, Islamabad
Journal of Social Sciences and Humanities: Volume 26, Number 1, Spring 2018
78
Introduction
The recent expansions in the field of internet-based
technologies have generated a far-reaching impact on the
psycho-demographic & socio-economic nature of businesses,
the content generated and the engagement of participants on
the internet. The new jargon named ‘Social Media’ has
received an overwhelming acceptance since the day of its
inception. Kaplan and Haenlein (2010)define it as a group of
internet based applications that have emerged from the
ideological and technological foundations of Web 2.0, serving
as a medium for the formation and interchange of User
Generated Content (UGC).
A leading social media platform is Facebook with more
than a billion monthly active users (Statista, 2016). YouTube
estimates a billion monthly active users with over a 4 billion
videos watched a day (Hub Spot & Social Bakers, 2016).
Twitter has a customer base of 320 million monthly active
users with around 500 million Tweets sent per day. WhatsApp
and Instagram have an active user-base of 900 million and
400 million respectively (Social Bakers, 2016). Instagram’s
active consumer base has crossed both Twitter and Pinterest,
recording more than 80 million photos and 3.5 billion posts
per day. Moreover, LinkedIn (100 million), Snap Chat (200
million) and Google+ (400 million) active users are also well
recognized social media platforms (Mawhinney, 2017).
Google, the search engine giant approximately earns US$ 20
Billion a year from advertising. This is much greater than the
prime time revenues of the renowned channel networks of
NBC, CBS, ABC and FOX combined (Social Bakers, 2016). It is
expected that the digital ad spending would effortlessly
Qazi Mohammed Ahmed, Muhammad Mustafa Raziq & Abeera Babar Goreja
79
surpass the TV ad spending by 2017 due to an ever increasing
consumer base on a daily basis (eMarketer, 2016).
Despite the massive and incredibly increasing customer
base of these businesses, some critical questions remain
unexplored. For example, it is less known as to what
determines the attitude of the online users towards social
media. Social media has become perhaps the most popular
mode of communication in the past few years, especially
among the youth. Research work on social networking
advertising (SNA) not only needs to be conceptually
evaluated but empirically tested. Knoll (2015), for example,
identifies seven emerging research areas for social media
advertising research, and from amongst the seven themes,
the top two are: Use of advertising in social media and, the
consumers’ attitudes towards and exposure to advertising.
Studies on social media and online advertising in general
show that the dimension, consumers’ attitude towards social
media advertising (CATSMA), is an essential determinant of
the social media effectiveness (Chu, Kamal, & Kim, 2013;
Ducoffe, 1996; Ducoffe & Curlo, 2000; Pollay & Mittal, 1993).
Consumers with positive attitudes towards advertising show
a favorable response to the advertisements, while those with
negative attitudes show an unfavorable response (Pollay &
Mittal, 1993; Wang & Sun, 2010a, 2010b; Wolin, Korgaonkar,
& Lund, 2002). Based on this notion, we examine the role of
consumers’ beliefs based on their attitudes towards
advertising and through a social media lens extend the
existing debate on consumers’ beliefs and attitudes.
In the subsequent sections, we provide an overview of
the literature on consumer’s attitudes and their belief
constructs. This is followed by conceptual development,
where we link the concepts, develop hypotheses and finally
Journal of Social Sciences and Humanities: Volume 26, Number 1, Spring 2018
80
present a theoretical model for empirical testing. We then
present the methodology section followed by the results
section. Finally, discussion& implications, limitations & future
directions and conclusions from the study are presented.
Literature Review
Consumer Attitudes:
A belief is a descriptive thought that a person holds about
something. An attitude is a person’s enduring favorable or
unfavorable emotional feeling, evaluation and action
tendencies(Kotler & Keller, 2009). Reviewing it, the beliefs
that are generated about social media advertising highlight
its attributes like social media advertising is informative.
Adding on to it, attitudes towards social media advertising
are evaluations that reflect its perceived benefits (e.g. In
general, I consider social media advertising to be a good
thing). This viewpoint has also been effectively applied by
Chi (2011); Jung, Shim, and Jin (2015) Wang and Sun (2010a)
for online and social media advertising.
Over the period of time, as consumer awareness rose up,
Shavitt, Lowrey, and Haefner (1998) reported that public
attitudes towards advertising turned out be highly favorable.
The successive works of Mehta (2000); Pyun and James
(2011) Jin and Lutz (2013)seconded the favorable consumer
attitudes towards different forms and mediums of
advertising. The study of social media advertising is still in
the iterative stage(Taylor, Lewin, & Strutton, 2011) and there
is a dire need of a sound pragmatic investigation into
consumer attitudes towards social media advertising(Knoll,
2015; Nevarez & Torres, 2015).
Qazi Mohammed Ahmed, Muhammad Mustafa Raziq & Abeera Babar Goreja
81
Consumer Beliefs
They are a measure of a consumer’s cognitions and
attributes about a specific entity or a brand(Solomon,
2014).The attitudes emerge from beliefs and they exist at
different cognitive levels. In this manner, a consumer’s belief
about advertising is an antecedent of his attitude towards
advertising(Brackett & Carr, 2001; Ducoffe, 1996; Ducoffe &
Curlo, 2000; Pollay & Mittal, 1993).The research study
investigates three consumer beliefs i.e. Infotainment,
Intrusiveness & Integrity showing an impact on consumer
attitudes towards social media advertising. It extends the
model proposed by Pollay and Mittal (1993) and tests it
within the social media advertising context. So, applying
Pollay & Mittal’s (1993) framework, we investigate the
relationship between consumer beliefs and their underlying
attitudes. These three constructs have been considered as
the most significant and robust dimensions in evaluating
consumer’s motives, values and attitudes(Eighmey &
McCord, 1998; Liu, Sinkovics, Pezderka, & Haghirian, 2012;
Luo & Xueming, 2002; Okazaki, 2004).
Infotainment: Product Information describes the role of
advertising as an information reflector and a significant
indicator in portraying market efficiencies (Wang & Sun,
2010a). In simple terms, product information is a personal
belief factor which shapes consumer opinions about the
instructive, educational and informative character of
advertising(Pollay & Mittal, 1993; Wang & Sun, 2010a). The
higher degree of product information depicted through
advertising in general also results in enriched and effective
decision making(Alwitt & Prabhaker, 1992; Pyun & James,
2011). Additionally, most of the other researchers also
Journal of Social Sciences and Humanities: Volume 26, Number 1, Spring 2018
82
validated advertising as a valuable source of product
information and found it as a major predictor of forming
attitudes towards advertising (Korgaonkar, Karson, & Akaah,
1997; Pollay & Mittal, 1993; Schlosser, Shavitt, & Kanfer,
1999). It was also considered as a significant consumer value,
motive and a belief construct when evaluating consumer
attitudes towards online and social media advertising(Dao,
Le, Cheng, & Chen, 2014; Jung et al., 2015; Taylor et al., 2011;
Wolin et al., 2002).
The second portion of Infotainment referred to as
Entertainment states advertising becoming a source of
pleasure or joy upon exposure. Also referred to as hedonism,
there is no doubt that advertisements can touch our
emotions, look quite appealing, portray funny events, fosters
likeability and be amusing and nostalgic by nature (Greyser
& Bauer, 1966; Pollay & Mittal, 1993; Pyun & James, 2011).
Entertainment has been studied as a belief construct in
evaluating consumer attitudes towards advertising in general
(Greyser & Bauer, 1966; Shavitt et al., 1998), television
advertising (Alwitt & Prabhaker, 1992; Mittal, 1994), sports
advertising (Pyun & James, 2011) and online advertising
(Wang & Sun, 2010a; Wolin et al., 2002). Moreover, it has
also been tested as a significant belief, motive and a value
construct when examining consumer attitudes towards social
networking advertising(Dao et al., 2014; Jung et al., 2015;
Taylor et al., 2011). Based on the extant literature evaluated,
it is hypothesized that:
H1: There is a significant positive relationship between
infotainment and consumers’ attitude towards social media
advertising (CATSMA)
Qazi Mohammed Ahmed, Muhammad Mustafa Raziq & Abeera Babar Goreja
83
Invasiveness:
This belief dimension was referred to as annoyance/ irritation
(Bauer & Greyser, 1968). They classically defined annoying
ads as “...ads that irritate you. They may be annoying because
of what they say or how they say it. They may annoy you
because they are around so much, or because of when and
where they appear. They may be other reasons for ads to be
annoying – the main thing is that they bother or irritate
you”(Bauer & Greyser, 1968, p. 182).
A series of empirical research studies have been
conducted to test the impact of invasiveness as a belief
construct influencing consumer attitudes towards advertising
in general. The findings have clearly reflected that the
existence of invasiveness has been one of the significant
predictors of negative attitudes towards advertising (Aaker &
Bruzzone, 1981, 1985; Alwitt & Prabhaker, 1992; Ducoffe,
1996; James & Kover, 1992; Mittal, 1994). Further Pyun and
James (2011) has considered irritation as an important belief
dimension with a negative impact on consumer attitudes
towards sports advertising. In the concrete research studies
conducted byJung et al. (2015)and Taylor et al. (2011)on
social networking advertising (SNA), an add was considered
invasive when it interfered with their goal oriented behavior
and resulted in negative attitudes and perceptions. Under
the light of the academic literature discussed above, the
proposed study hypothesizes that:
H2: There is a significant negative relationship between
invasiveness and consumer’s attitude towards social media
advertising (CATSMA)
Journal of Social Sciences and Humanities: Volume 26, Number 1, Spring 2018
84
Integrity:
Advertising in general can also be perceived to be
intentionally misleading, confusing, trivial or lacking adequate
information. This belief dimension has been derived as
Falsity/No Sense (Pollay & Mittal, 1993; Pyun & James,
2011)and Credibility (Wang & Sun, 2010a)in the renowned
research literature. The notion that advertising can turn out
to be deceptive and skeptical has been studied in relation to
the attitudes that develop towards various media tools and
in general too (Alwitt & Prabhaker, 1992; Greyser & Bauer,
1966; Larkin, 1977; Pollay & Mittal, 1993; Schlosser et al.,
1999; Shavitt et al., 1998). On the other hand, Pollay and
Mittal (1993)also found a highly significant and negative
relationship between Falsity/No Sense and attitude towards
advertising in general (b= -0.15 for collegians and b= -0.36
for householders).
Later in the research study conducted by Wang and Sun
(2010a), Credibility was observed as the second most
important predictor in defining consumer attitudes towards
online advertising. Generally, when people regard online
advertising as trustworthy, they tend to develop more
positive attitudes towards it. This result is again consistent
with Wolin et al. (2002), that Falsity/No Sense has a negative
impact on attitude towards online advertising. The element
of relevance and credibility in an advertisement is considered
vital when consumers have to make decisions on the basis of
uncertain information(Okazaki, Katsukura, & Nishiyama,
2007). Based on the literature evaluated, the study
hypothesis that:
H3:There is a significant positive relationship between
credibility and consumers’ attitude towards social media
advertising (CATSMA).
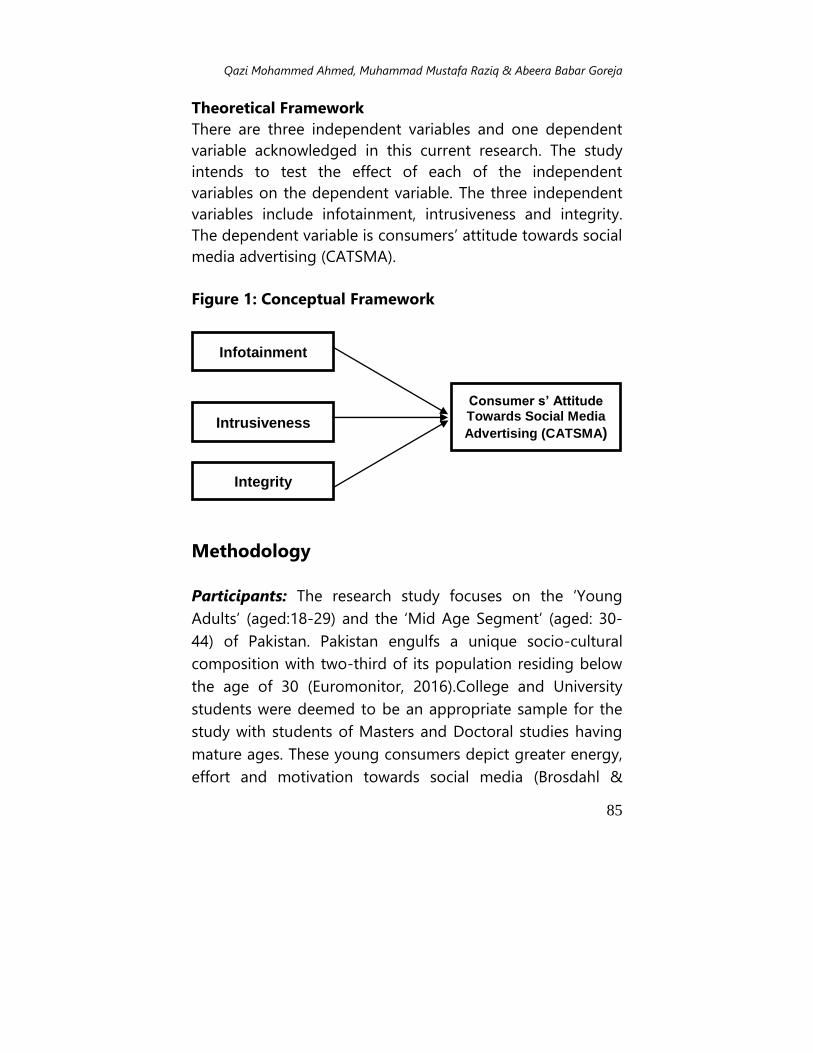
Qazi Mohammed Ahmed, Muhammad Mustafa Raziq & Abeera Babar Goreja
85
Theoretical Framework
There are three independent variables and one dependent
variable acknowledged in this current research. The study
intends to test the effect of each of the independent
variables on the dependent variable. The three independent
variables include infotainment, intrusiveness and integrity.
The dependent variable is consumers’ attitude towards social
media advertising (CATSMA).
Figure 1: Conceptual Framework
Methodology
Participants: The research study focuses on the ‘Young
Adults’ (aged:18-29) and the ‘Mid Age Segment’ (aged: 30-
44) of Pakistan. Pakistan engulfs a unique socio-cultural
composition with two-third of its population residing below
the age of 30 (Euromonitor, 2016).College and University
students were deemed to be an appropriate sample for the
study with students of Masters and Doctoral studies having
mature ages. These young consumers depict greater energy,
effort and motivation towards social media (Brosdahl &
Infotainment
Intrusiveness
Integrity
Consumer s’ Attitude Towards Social Media
Advertising (CATSMA)
Journal of Social Sciences and Humanities: Volume 26, Number 1, Spring 2018
86
Carpenter, 2011). They are also considered amidst the first
generations to have truly tasted the digital environment and
the role of information technology has encircled their
personal and working lives (Wesner & Miller, 2008). Earlier
studies on social media have also taken university/college
students as their sampling frame when evaluating consumer
behavior(Dao et al., 2014; Jung, Shim, Jin, & Khang, 2016;
Nevarez & Torres, 2015).
Sampling Technique: The study has applied Convenience
Sampling in selecting its target subjects/audience. Under the
umbrella of this sampling technique, Kardes (1996)and Lucas
(2003) have argued that taking college students would not
result in biased results if the theory tested is based on
human psychology (Polly and Mittal’s model is based on
consumer beliefs and attitudes). Earlier, Berkowitz and
Donnerstein (1982) also propagated that it would also add to
the generalizability of the outcomes for the non-student
populations. Moreover, convenience sampling has been
considered as a highly popular sampling technique when
evaluating consumer responses towards social media
advertising (Lee & Hong, 2016; Muk, Chung, & Kim, 2014;
Zhang & Mao, 2016).
Questionnaire Design: A self-administered questionnaire
was used to collect the data. The questionnaires were
distributed electronically (emailed) in the major colleges
&universities of the capital city, named Bahria College, Bahria
University, Comsats Institute of Information Technology
(CIIT) and OPF College. Google Docs was used as a tool for
Qazi Mohammed Ahmed, Muhammad Mustafa Raziq & Abeera Babar Goreja
87
the online survey. A total of 340 students took part and 288
usable responses were employed in the data analysis after
eliminating the incomplete responses.
Measures: The scale for the first construct (infotainment) was
adopted from the work of Ducoffe (1996)&Liu et al. (2012).
The scale for the second construct (instrusiveness) was
adopted from the research works of Liu et al. (2012)&Taylor
et al. (2011).The third construct (Integrity) was measured
through the scales adopted fromDao et al. (2014), Mackenzie
and Lutz (1989)&Taylor et al. (2011). The fourth construct i.e.
consumers’ attitude towards social media advertising
(CATSMA) was measured from the scales adopted from
(Nevarez & Torres, 2015) &Taylor et al. (2011). All the
constructs were measured on a 5-Point Likert scale ranging
from (1= ‘Strongly Disagree’ and 5= ‘Strongly Agree’). The 5-
Point Likert scale has been extensively applied by Wang and
Sun (2010a), Taylor et al. (2011) and Chu, Kamal, & Kim
(2013)in evaluating consumer responses towards online and
social media advertising.
Data Analysis: The proposed study would incorporate
Statistical Package for the Social Science (SPSS) v. 23 to
perform thorough reliability tests for the associated items of
measurement. To evaluate the hypothesized relationships
amidst the constructs, Pearson correlation analysis has been
carried out accompanied by a multi-collinearity test. Finally, a
Regression analysis has also been undertaken for confirming
the extent of effects of infotainment, intrusiveness and
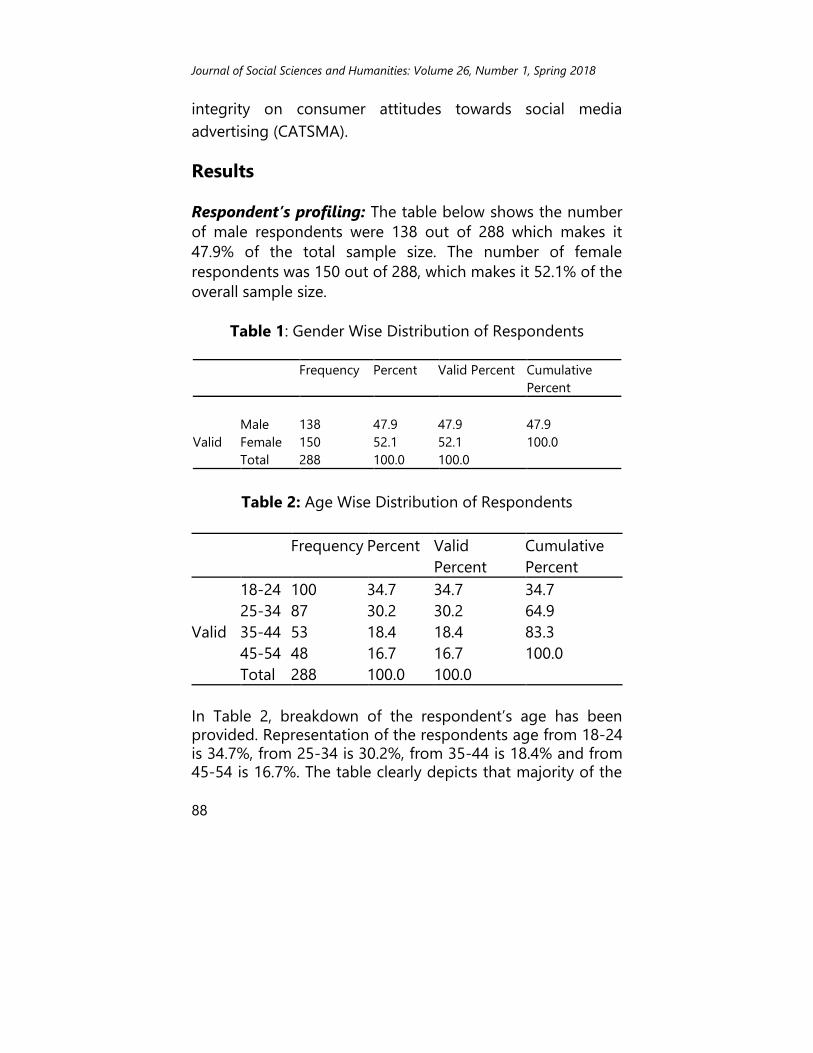
Journal of Social Sciences and Humanities: Volume 26, Number 1, Spring 2018
88
integrity on consumer attitudes towards social media
advertising (CATSMA).
Results
Respondent’s profiling: The table below shows the number
of male respondents were 138 out of 288 which makes it
47.9% of the total sample size. The number of female
respondents was 150 out of 288, which makes it 52.1% of the
overall sample size.
Table 1: Gender Wise Distribution of Respondents
Frequency Percent Valid Percent Cumulative
Percent
Valid
Male 138 47.9 47.9 47.9
Female 150 52.1 52.1 100.0
Total 288 100.0 100.0
Table 2: Age Wise Distribution of Respondents
Frequency Percent Valid
Percent
Cumulative
Percent
Valid
18-24 100 34.7 34.7 34.7
25-34 87 30.2 30.2 64.9
35-44 53 18.4 18.4 83.3
45-54 48 16.7 16.7 100.0
Total 288 100.0 100.0
In Table 2, breakdown of the respondent’s age has been provided. Representation of the respondents age from 18-24 is 34.7%, from 25-34 is 30.2%, from 35-44 is 18.4% and from 45-54 is 16.7%. The table clearly depicts that majority of the
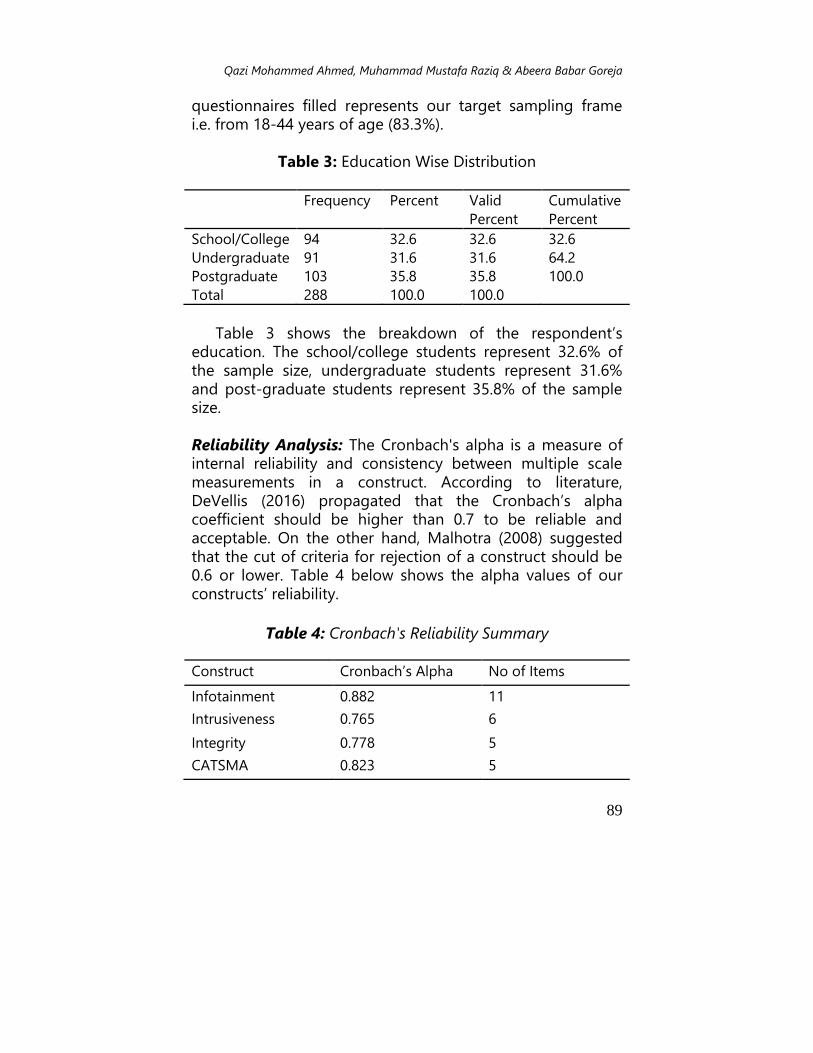
Qazi Mohammed Ahmed, Muhammad Mustafa Raziq & Abeera Babar Goreja
89
questionnaires filled represents our target sampling frame i.e. from 18-44 years of age (83.3%).
Table 3: Education Wise Distribution
Frequency Percent Valid
Percent
Cumulative
Percent
School/College 94 32.6 32.6 32.6
Undergraduate 91 31.6 31.6 64.2
Postgraduate 103 35.8 35.8 100.0
Total 288 100.0 100.0
Table 3 shows the breakdown of the respondent’s education. The school/college students represent 32.6% of the sample size, undergraduate students represent 31.6% and post-graduate students represent 35.8% of the sample size.
Reliability Analysis: The Cronbach's alpha is a measure of internal reliability and consistency between multiple scale measurements in a construct. According to literature, DeVellis (2016) propagated that the Cronbach’s alpha coefficient should be higher than 0.7 to be reliable and acceptable. On the other hand, Malhotra (2008) suggested that the cut of criteria for rejection of a construct should be 0.6 or lower. Table 4 below shows the alpha values of our constructs’ reliability.
Table 4: Cronbach's Reliability Summary
Construct Cronbach’s Alpha No of Items
Infotainment 0.882 11
Intrusiveness 0.765 6
Integrity 0.778 5
CATSMA 0.823 5
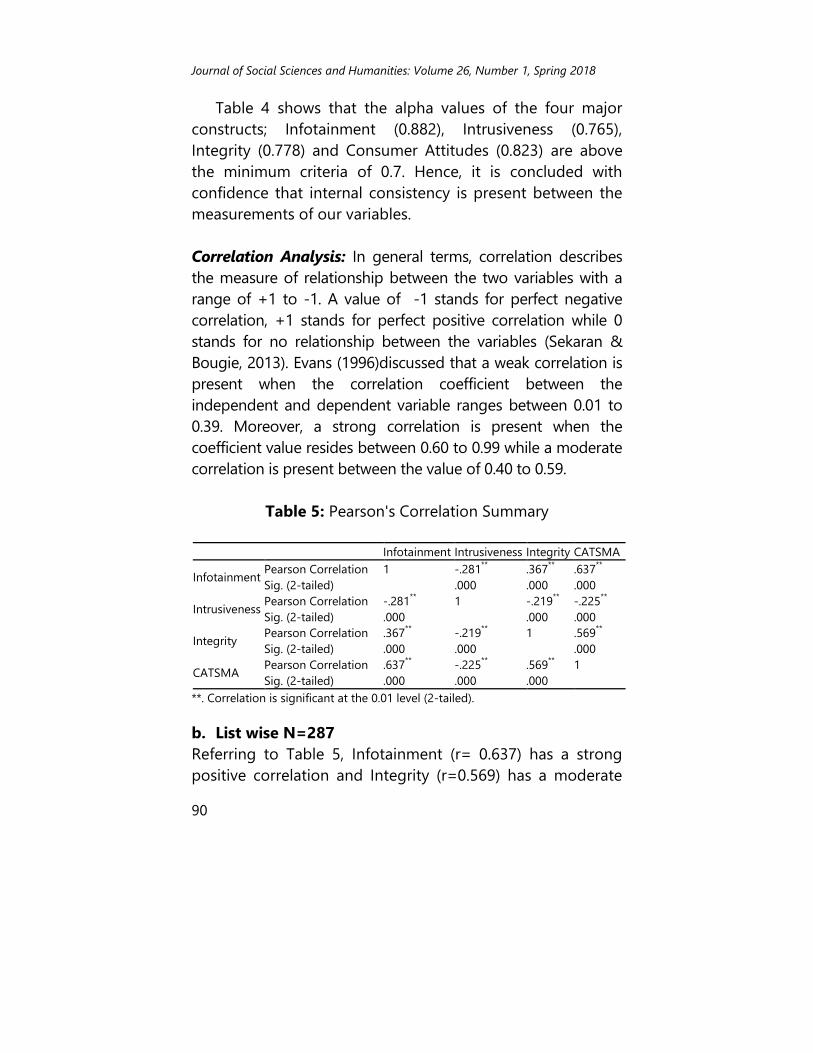
Journal of Social Sciences and Humanities: Volume 26, Number 1, Spring 2018
90
Table 4 shows that the alpha values of the four major
constructs; Infotainment (0.882), Intrusiveness (0.765),
Integrity (0.778) and Consumer Attitudes (0.823) are above
the minimum criteria of 0.7. Hence, it is concluded with
confidence that internal consistency is present between the
measurements of our variables.
Correlation Analysis: In general terms, correlation describes
the measure of relationship between the two variables with a
range of +1 to -1. A value of -1 stands for perfect negative
correlation, +1 stands for perfect positive correlation while 0
stands for no relationship between the variables (Sekaran &
Bougie, 2013). Evans (1996)discussed that a weak correlation is
present when the correlation coefficient between the
independent and dependent variable ranges between 0.01 to
0.39. Moreover, a strong correlation is present when the
coefficient value resides between 0.60 to 0.99 while a moderate
correlation is present between the value of 0.40 to 0.59.
Table 5: Pearson's Correlation Summary
Infotainment Intrusiveness Integrity CATSMA
Infotainment Pearson Correlation 1 -.281
** .367
** .637
**
Sig. (2-tailed) .000 .000 .000
Intrusiveness Pearson Correlation -.281
** 1 -.219
** -.225
**
Sig. (2-tailed) .000 .000 .000
Integrity Pearson Correlation .367
** -.219
** 1 .569
**
Sig. (2-tailed) .000 .000 .000
CATSMA Pearson Correlation .637
** -.225
** .569
** 1
Sig. (2-tailed) .000 .000 .000
**. Correlation is significant at the 0.01 level (2-tailed).
b. List wise N=287
Referring to Table 5, Infotainment (r= 0.637) has a strong
positive correlation and Integrity (r=0.569) has a moderate
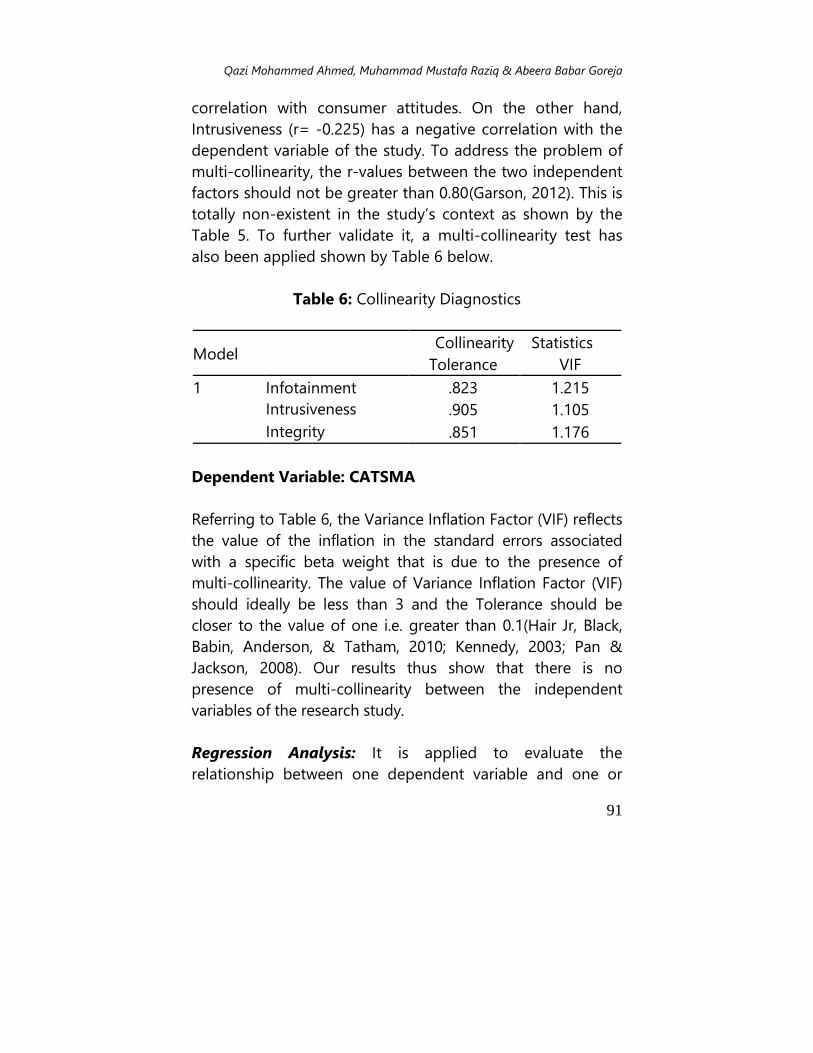
Qazi Mohammed Ahmed, Muhammad Mustafa Raziq & Abeera Babar Goreja
91
correlation with consumer attitudes. On the other hand,
Intrusiveness (r= -0.225) has a negative correlation with the
dependent variable of the study. To address the problem of
multi-collinearity, the r-values between the two independent
factors should not be greater than 0.80(Garson, 2012). This is
totally non-existent in the study’s context as shown by the
Table 5. To further validate it, a multi-collinearity test has
also been applied shown by Table 6 below.
Table 6: Collinearity Diagnostics
Model Collinearity Statistics
Tolerance VIF
1 Infotainment .823 1.215
Intrusiveness .905 1.105
Integrity .851 1.176
Dependent Variable: CATSMA
Referring to Table 6, the Variance Inflation Factor (VIF) reflects
the value of the inflation in the standard errors associated
with a specific beta weight that is due to the presence of
multi-collinearity. The value of Variance Inflation Factor (VIF)
should ideally be less than 3 and the Tolerance should be
closer to the value of one i.e. greater than 0.1(Hair Jr, Black,
Babin, Anderson, & Tatham, 2010; Kennedy, 2003; Pan &
Jackson, 2008). Our results thus show that there is no
presence of multi-collinearity between the independent
variables of the research study.
Regression Analysis: It is applied to evaluate the
relationship between one dependent variable and one or
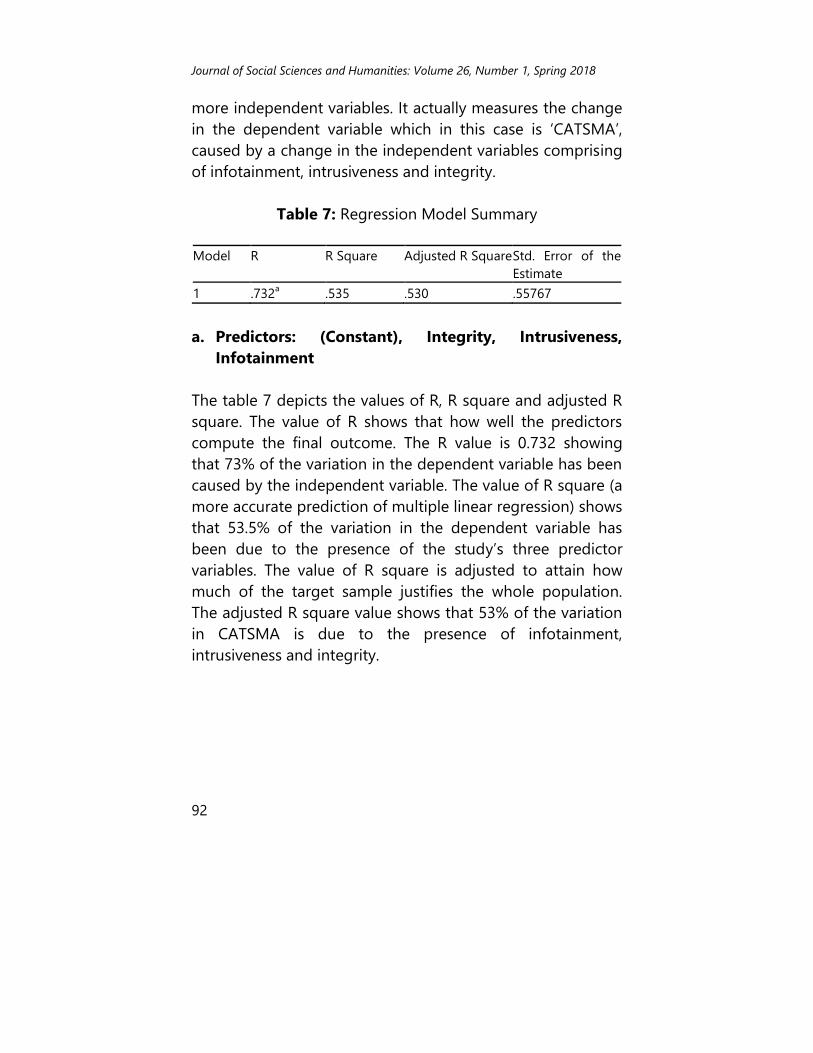
Journal of Social Sciences and Humanities: Volume 26, Number 1, Spring 2018
92
more independent variables. It actually measures the change
in the dependent variable which in this case is ‘CATSMA’,
caused by a change in the independent variables comprising
of infotainment, intrusiveness and integrity.
Table 7: Regression Model Summary
Model R R Square Adjusted R Square Std. Error of the
Estimate
1 .732a .535 .530 .55767
a. Predictors: (Constant), Integrity, Intrusiveness,
Infotainment
The table 7 depicts the values of R, R square and adjusted R
square. The value of R shows that how well the predictors
compute the final outcome. The R value is 0.732 showing
that 73% of the variation in the dependent variable has been
caused by the independent variable. The value of R square (a
more accurate prediction of multiple linear regression) shows
that 53.5% of the variation in the dependent variable has
been due to the presence of the study’s three predictor
variables. The value of R square is adjusted to attain how
much of the target sample justifies the whole population.
The adjusted R square value shows that 53% of the variation
in CATSMA is due to the presence of infotainment,
intrusiveness and integrity.
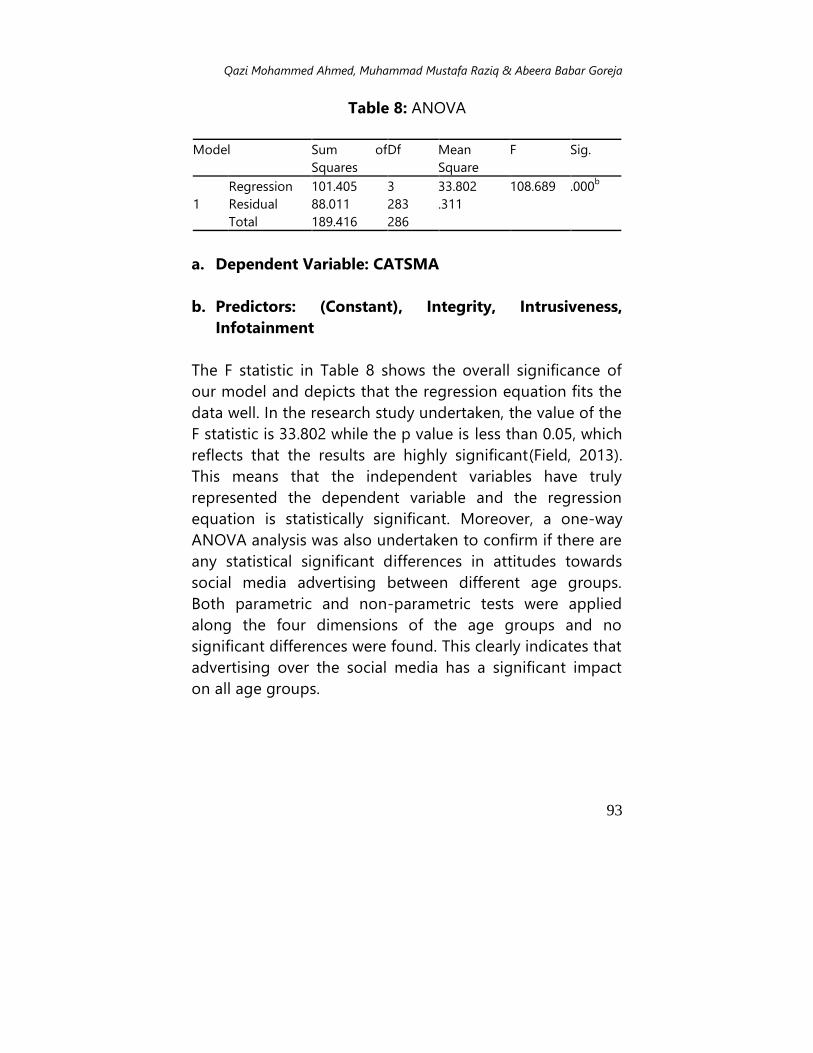
Qazi Mohammed Ahmed, Muhammad Mustafa Raziq & Abeera Babar Goreja
93
Table 8: ANOVA
Model Sum of
Squares
Df Mean
Square
F Sig.
1
Regression 101.405 3 33.802 108.689 .000b
Residual 88.011 283 .311
Total 189.416 286
a. Dependent Variable: CATSMA
b. Predictors: (Constant), Integrity, Intrusiveness,
Infotainment
The F statistic in Table 8 shows the overall significance of
our model and depicts that the regression equation fits the
data well. In the research study undertaken, the value of the
F statistic is 33.802 while the p value is less than 0.05, which
reflects that the results are highly significant(Field, 2013).
This means that the independent variables have truly
represented the dependent variable and the regression
equation is statistically significant. Moreover, a one-way
ANOVA analysis was also undertaken to confirm if there are
any statistical significant differences in attitudes towards
social media advertising between different age groups.
Both parametric and non-parametric tests were applied
along the four dimensions of the age groups and no
significant differences were found. This clearly indicates that
advertising over the social media has a significant impact
on all age groups.
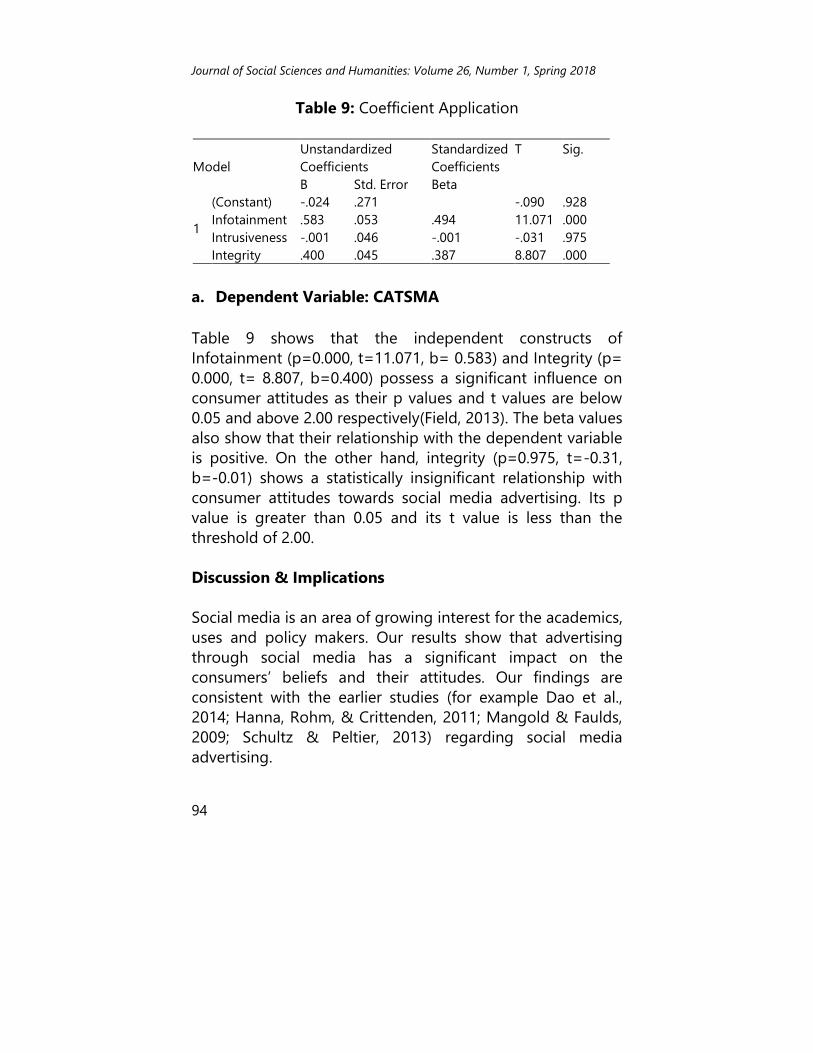
Journal of Social Sciences and Humanities: Volume 26, Number 1, Spring 2018
94
Table 9: Coefficient Application
Model
Unstandardized
Coefficients
Standardized
Coefficients
T Sig.
B Std. Error Beta
1
(Constant) -.024 .271 -.090 .928
Infotainment .583 .053 .494 11.071 .000
Intrusiveness -.001 .046 -.001 -.031 .975
Integrity .400 .045 .387 8.807 .000
a. Dependent Variable: CATSMA
Table 9 shows that the independent constructs of
Infotainment (p=0.000, t=11.071, b= 0.583) and Integrity (p=
0.000, t= 8.807, b=0.400) possess a significant influence on
consumer attitudes as their p values and t values are below
0.05 and above 2.00 respectively(Field, 2013). The beta values
also show that their relationship with the dependent variable
is positive. On the other hand, integrity (p=0.975, t=-0.31,
b=-0.01) shows a statistically insignificant relationship with
consumer attitudes towards social media advertising. Its p
value is greater than 0.05 and its t value is less than the
threshold of 2.00.
Discussion & Implications
Social media is an area of growing interest for the academics,
uses and policy makers. Our results show that advertising
through social media has a significant impact on the
consumers’ beliefs and their attitudes. Our findings are
consistent with the earlier studies (for example Dao et al.,
2014; Hanna, Rohm, & Crittenden, 2011; Mangold & Faulds,
2009; Schultz & Peltier, 2013) regarding social media
advertising.
Qazi Mohammed Ahmed, Muhammad Mustafa Raziq & Abeera Babar Goreja
95
Our results provide further support to former studies. For
example, the internal consistency of the items was similar
with the study of Liu et al. (2012)on the role of consumer
beliefs on attitudes towards mobile advertising. The
relationships of infotainment, integrity, and invasiveness with
regards to CATMSA show consistency with Dao et al. (2014),
Muk et al. (2014) andTaylor et al. (2011). Regarding
significance of the hypothesized relationships, both
infotainment and integrity had a significant positive impact
on CATMSA showing similar results asChu et al. (2013).
However, with intrusiveness, the non-significant impact on
consumer attitudes contrasts the findings of Taylor et al.
(2011). This adds to the contribution of our study within the
Pakistani context. It shows that the element of invasiveness/
irritation does not interfere with the goal oriented behaviors
of the young & mid age Pakistani consumers and does not
result in negative attitudes towards social media advertising.
In the light of practical insights of the research study, it
would benefit the multinationals which have plans to
advertise and sell their products through the social media in
Pakistan. It would also assist the policy makers and
advertising mangers to understand the emerging needs,
dynamic desires and volatile expectations of the young
consumers which reside within traditional and plural cultures.
Moreover, the businesses would also be able to approach
their target segment through personalized communications
on the social media which will not only be cost effective but
more sustainable.
Limitations and Future Research Directions
As like all other researches, this study is not free from
limitation. As the sample drawn is based on convenience,
there are always issues pertaining to the generalizations one
Journal of Social Sciences and Humanities: Volume 26, Number 1, Spring 2018
96
is making from the sample to the population under study.
Moreover, consumer behavior over the social media is still in
an iterative phase, a cross-sectional design is not enough to
capture the true change or evolution. For attaining greater
precision, a longitudinal study may provide better results
into emerging consumer responses and their perceptions
online. Futuristic studies also need to incorporate context
based variables, such as aesthetics & functionality of virtual
communities and user based variables, such as need for
creativity & self-efficacy to attain useful insights about a
virtual user. Additional moderating variables could also be
added like age and gender to attain demographic
comparisons within the sampling frame.
Conclusion
This paper examined the role of consumers’ beliefs and
attitudes by extending the model of Pollay and Mittal (1993)
within the context of social media advertising. Specifically, it
evaluated the role of infotainment, intrusiveness and
integrity on consumers’ attitude towards social media
advertising. The results showed that both infotainment and
integrity had a significant influence on consumers’ attitude
while intrusiveness depicted statistically insignificant results.
The research contributions thus reflected that the young and
middle age segment of Pakistan seeks greater information,
better entertainment and enhanced credibility on the social
networking sites. Moreover, intrusiveness is not a significant
predictor of their attitudes and does not inhibit their goal
oriented behaviors. This research paper provides strategic
guidelines to the policy makers and marketing managers
over how they can build engaging promotional content
through social media.
Qazi Mohammed Ahmed, Muhammad Mustafa Raziq & Abeera Babar Goreja
97
References
Aaker, & Bruzzone. (1981). Viewer Perceptions of Prime-time
Television Advertising. Journal of Advertising Research,
21(5), 15-23.
Aaker, & Bruzzone. (1985). Causes of Irritation in Advertising.
Journal of Marketing, 49(2), 47-57. doi: 10.2307/1251564
Alwitt, L. F., & Prabhaker, P. R. (1992). Functional and Belief
Dimensions of Attitudes to Television Advertising:
Implications for Copytesting. Journal of Advertising
Research (September/October), 30-42.
Bauer, R., & Greyser, S. (1968). Advertising in America: The
Consumer View. Boston, MA.: Harvard University Press.
Berkowitz, L., & Donnerstein, E. (1982). External Validity is
More Than Skin Deep: Some Answers to Criticisms of
Laboratory Experiments. American Psychologist, 37(3),
245.
Brackett, L. K., & Carr, B. N. (2001). Cyberspace Advertising vs.
Other Media: Consumer vs. Mature Student Attitudes.
Journal of Advertising Research, 41(5), 23-32.
Brosdahl, D. J. C., & Carpenter, J. M. (2011). Shopping
Orientations of US Males: A Generational Cohort
Comparison. Journal of Retailing and Consumer Services,
18(6), 548-554. doi: 10.1016/j.jretconser.2011.07.005
Chi, H.-h. (2011). Interactive Digital Advertising vs. Virtual
Brand Community: Exploratory Study of User Motivation
and Social Media Marketing Responses in Taiwan. Journal
Journal of Social Sciences and Humanities: Volume 26, Number 1, Spring 2018
98
of Interactive Advertising, 12(1), 44-61. doi:
10.1046/j.1365-2958.2003.03368.x
Chu, S., Kamal, S., & Kim, Y. (2013). Understanding
Consumers' Responses toward Social Media Advertising
and Purchase Intention Toward Luxury Products. Journal
of Global Fashion Marketing, 4(3), 158-174. doi:
10.1080/20932685.2013.790709
Dao, W. V. T., Le, A. N. H., Cheng, J. M. S., & Chen, D. C. (2014).
Social Media Advertising Value: The Case of Transitional
Economies in Southeast Asia. International journal of
Advertising, 33(2). doi: 10.2501/IJA-33-2-271-294
DeVellis, R. F. (2016). Scale Development: Theory and
Applications (Vol. 26): Sage Publications.
Ducoffe, R. H. (1996). Advertising Value and Advertising on
the Web. Journal of Advertising Research, 36(5), 21-35.
doi: 10.1080/135272600750036364
Ducoffe, R. H., & Curlo, E. (2000). Advertising Value and
Advertising Processing. Journal of Marketing
Communications, 6(4), 247-262. doi: 10.1080/
135272600750036364
Eighmey, & McCord, L. (1998). Adding Value in the
Information Age: Uses and Gratifications of Sites on the
World Wide Web. Journal of Business Research, 41(3),
187-194. doi: 10.1016/S0148-2963(97)00061-1
Euromonitor. (2016). Consumer Lifestyles in Pakistan (pp. 1-23).
Qazi Mohammed Ahmed, Muhammad Mustafa Raziq & Abeera Babar Goreja
99
Evans, J. D. (1996). Straightforward Statistics for the Behavioral
Sciences: Brooks/Cole.
Field, A. (2013). Discovering statistics using IBM SPSS
Statistics: Sage.
Garson, G. D. (2012). Hierarchical Linear Modeling: Guide and
applications: Sage.
Greyser, S. A., & Bauer, R. A. (1966). Americans and
Advertising: Thirty Years of Public Opinion. Public Opinion
Quarterly, 30, 69-69. doi: 10.1086/267382
Hair Jr, J., Black, W., Babin, B., Anderson, R., & Tatham, R.
(2010). SEM: An introduction. Multivariate Data Analysis:
A global perspective, 629-686.
Hanna, R., Rohm, A., & Crittenden, V. L. (2011). We're all
Connected: The Power of the Social Media Ecosystem.
Business Horizons, 54(3), 265-273. doi:
10.1016/j.bushor.2011.01.007
HubSpot, & SocialBakers. (2016). The Future of Facebook and
Instagram Advertising (pp. 1-36).
James, W., & Kover, A. (1992). Observations: Do Overall
Attitudes Toward Advertising Affect Involvement with
Specific Advertisements? Journal of Advertising Research,
32(5), 78-83.
Jin, H. S., & Lutz, R. J. (2013). The Typicality and Accessibility
of Consumer Attitudes Toward Television Advertising:
Implications for the Measurement of Attitudes Toward
Journal of Social Sciences and Humanities: Volume 26, Number 1, Spring 2018
100
Advertising in General. Journal of Advertising, 42(4), 343-
357. doi: 10.1080/00913367.2013.803184
Jung, J., Shim, S. W., & Jin, H. S. (2015). The Review of
Marketing Communications Factors Affecting Attitudes
and Behavioural Intention Towards Social Networking
Advertising : A Case of Facebook Users in South Korea.
International journal of Advertising, 0487(March), 37-41.
doi: 10.1080/02650487.2015.1014777
Jung, J., Shim, S. W., Jin, H. S., & Khang, H. (2016). Factors
Affecting Attitudes and Behavioural Intention Towards
Social Networking Advertising: A case of Facebook Users
in South Korea. International journal of Advertising, 35(2),
248-265. doi: 10.1080/02650487.2015.1014777
Kaplan, A. M., & Haenlein, M. (2010). Users of the World,
Unite! The challenges and opportunities of Social Media.
Business Horizons, 53(1), 59-68. doi:
10.1016/j.Bushor.2009.09.003
Kardes, F. R. (1996). In Defense of Experimental Consumer
Psychology. Journal of Consumer Psychology, 5(3), 279-296.
Kennedy, P. (2003). A Guide to Econometrics: MIT Press.
Knoll, J. (2015). Advertising in Social Media: a Review of
Empirical Evidence. International journal of Advertising,
0(0), 1-35. doi: 10.1080/02650487.2015.1021898
Korgaonkar, Karson, & Akaah. (1997). Direct Marketing
Advertising: The Assents, the Dissents, and the
Ambivalents. Journal of Advertising Research, 37(5), 41-55.
Qazi Mohammed Ahmed, Muhammad Mustafa Raziq & Abeera Babar Goreja
101
Kotler, P., & Keller, K. L. (2009). Marketing Management (Vol. 22).
Larkin, E. F. (1977). A Factor Analysis of College Students
Attitudes Toward Advertising. Journal of Advertising, 6,
42-46.
Lee, J., & Hong, I. B. (2016). Predicting Positive User
Responses to Social Media Advertising: The Roles of
Emotional Appeal, Informativeness, and Creativity.
International Journal of Information Management, 36(3),
360-373. doi: 10.1016/j.ijinfomgt.2016.01.001
Liu, C. L. E., Sinkovics, R. R., Pezderka, N., & Haghirian, P.
(2012). Determinants of Consumer Perceptions Toward
Mobile Advertising - A Comparison between Japan and
Austria. Journal of Interactive Marketing, 26(1), 21-32. doi:
10.1016/j.intmar.2011.07.002
Lucas, J. W. (2003). Theory‐testing, Generalization, and the
Problem of External Validity. Sociological Theory, 21(3),
236-253.
Luo, & Xueming. (2002). Uses and Gratifications Theory and
E-Consumer Behaviors: A Structural Equation Modelling
Study. Journal of Interactive Advertising, 2(2), 34-41.
Mackenzie, S. B., & Lutz, R. J. (1989). An Empirical
Examination of the Structural Antecedents of Attitude
Toward the Ad in an Advertising Pretesting Context.
Source: Journal of Marketing, 5321127(2), 48-65. doi:
10.2307/1251413
Malhotra, N. K. (2008). Marketing research: An applied
orientation, 5/e: Pearson Education India.
Journal of Social Sciences and Humanities: Volume 26, Number 1, Spring 2018
102
Mangold, W. G., & Faulds, D. J. (2009). Social Media: The new
Hybrid Element of the Npromotion mix. Business
Horizons, 52(4), 357-365. doi:
10.1016/j.bushor.2009.03.002
Mawhinney, J. (2017). Visual Content Marketing Statistics You
Should Know in 2017. Hubspot. Retrieved April 11th.
Mehta, A. (2000). Advertising Attitudes and Advertising
Effectiveness. Journal of Advertising Research, 40(3), 67-72.
Mittal, B. (1994). Public Assessment of Tv Advertising: Faint
Praise and Harsh Criticism. Journal of Advertising
Research, 34(1), 35-53.
Muk, A., Chung, C., & Kim, J. (2014). "Korean Consumer
Perspectives on Social Media Advertising and Intention to
Join Brand Pages". Journal of Global Scholars of Marketing
Science, Vol.24(January), 384-394. doi:
10.1080/21639159.2014.949371
Nevarez, C., & Torres, I. M. (2015). Consumer Attitudes
Toward Social Network Advertising. Journal of Current
Issues & Research in Advertising, 36(1), 1-19. doi:
10.1080/10641734.2014.912595
Okazaki, S. (2004). How do Japanese Consumers Perceive
Wireless ads ? A Multivariate Analysis. International
journal of Advertising, 429-454. doi:
10.1080/02650487.2004. 11072894
Okazaki, S., Katsukura, A., & Nishiyama, M. (2007). How
Mobile Advertising Works: The Role of Trust in Improving
Qazi Mohammed Ahmed, Muhammad Mustafa Raziq & Abeera Babar Goreja
103
Attitudes and Recall. Journal of Advertising Research,
47(2), 165-178. doi: 10.2501/S0021849907070195
Pan, Y., & Jackson, R. T. (2008). Ethnic Difference in the Relationship Between Acute Inflammation and Serum Ferritin in US Adult Males. Epidemiology & Infection, 136(3), 421-431.
Pollay, R. W., & Mittal, B. (1993). Here's the Beef: Factors,
Determinants, and Segments in Consumer Criticism of Advertising. Journal of Marketing, 57(3), 99-114. doi: 10.2307/1251857
Pyun, D. Y., & James, J. D. (2011). Attitude Toward
Advertising Through Sport: A Theoretical Framework. Sport Management Review, 14(1), 33-41. doi: 10.1016/j.smr.2009.12.002
Schlosser, A. E., Shavitt, S., & Kanfer, A. (1999). Survey of
Internet Users’ Attitudes Toward Internet Advertising. Journal of Interactive Marketing, 13(3), 34-54. doi: 10.1002/(SICI)1520-6653(199922)13:3<34::AID-DIR3>3.0.CO;2-R
Schultz, D. E., & Peltier, J. (2013). Social Media's Slippery
Slope: Challenges, Opportunities and Future Research Directions. Journal of Research in Interactive Marketing, 7(2), 86-99. doi: http://dx.doi.org/10.1108/JRIM-12-2012-0054
Sekaran, U., & Bougie, R. (2013). Research Methods for
business: A skill-Building Approach, Fourth Edition. Shavitt, S., Lowrey, P., & Haefner, J. (1998). Public Attitudes
Toward Advertising: More Favorable Than you Might Think. Journal of Advertising Research, 38(4), 7-22.
SocialBakers (2016). [Social Bakers].
Journal of Social Sciences and Humanities: Volume 26, Number 1, Spring 2018
104
Solomon, M. R. (2014). Consumer Behavior: Buying, Having,
and Being (Vol. 10): Prentice Hall Upper Saddle River, NJ. Statista (2016). [Statista]. Taylor, D. G., Lewin, J. E., & Strutton, D. (2011). Friends, Fans,
and Followers: Do ads Work on Social Networks? How Gender and age Shape Receptivity. Journal of Advertising Research, 51(1). doi: 10.2501/JAR-51-1-258-275
Wang, Y., & Sun, S. (2010a). Assessing Beliefs , Attitudes , and
Behavioral Responses Toward Online Advertising in Three Countries. International Business Review, 19(4), 333-344. doi: 10.1016/j.ibusrev.2010.01.004
Wang, Y., & Sun, S. (2010b). Examining the Role of Beliefs
and Attitudes in Online Advertising: A Comparison Between the USA and Romania. International Marketing Review, 27(1), 87-107.
Wesner, M. S., & Miller, T. (2008). Boomers and Millennials
Have Much in Common. Organization Development Journal, 26(3), 89-96.
Wolin, L. D., Korgaonkar, P., & Lund, D. (2002). Beliefs,
Attitudes and Behaviour Towards Web Advertising. International Journal of Advertising, 21(1), 87-113. doi: 10.1080/02650487.2002.11104918
Zhang, J., & Mao, E. (2016). From Online Motivations to Ad
Clicks and to Behavioral Intentions: An Empirical Study of Consumer Response to Social Media Advertising. Psychology and Marketing, 33(3), 155-164. doi: 10.1002/mar.20862
Priya Avais*
Muhammad Shaban**
Nadia Anwar***
A Meta-functional Analysis of Baba
Bulleh Shah’s Kaafi:
Ranjha Ranjha Kardi Hun Mein Apey
Ranjha Hoi
ABSTRACT
This study undertakes a thematic analysis of Bulleh Shah’s
seminal kaafi which is a genre of poetry. Kaafi is a poem on
devine attribution and sometimes mystic beliefs. This name
kaafi is borrowed from the Persian word called Kafaya
meaning rhyme. This kaafi, Ranjha Ranjha kardi hun main
apey Ranjha hoi will be studied through the three meta-
functionsie ideational, interpersonal and textual developed
within the theoretical parameters of Systemic Functional
Grammar.
This study reveals that each clause of the kaafiis enriched
with one of the meta-functions offering multiple meanings for
interpretation. The selected kaafi expresses spiritual
connections through emerging themes such as poetic voice,
self reliance, universality, transformation and displacement.
* Assistant Professor, Applied Linguistics Department Kinnaird College
for Women. Lahore **
Associate Professor, Department of English Language and Literature
UMT Lahore. ***
Assistant Professor ,Department of English Languages, UMT Lahore.
Journal of Social Sciences and Humanities: Volume 26, Number 1, Spring 2018
106
Hence the study supplements the meta functional analysis
with a scientific account of textual and clausal analyses.
Keywords: Meta Functions, Systemic Functional Grammar,
Ideational, Interpersonal and Textual Functions, Kaafi, Baba
Bulleh Shah, Loi, Chaddar, Language Functions, Multiple
meanings.
Introduction
To date only a few researchers (e.g. Bilal 2012 and Olusanya
2013)have conducted studies on meta-functions of language
with reference to literary and media texts. According to
Fontaine (2013),explicates that a poetic narrative focuses on
defining human experiences and revolves around certain
social relations essential for a shared sense of human
activity. And unless the mythographer has imitated studio
technicians, producing a decontextualized voice that is in
some ways the auditory equivalent of a carefully edited and
printed text on a clean white page, the information on the
tape is not limited to what that voice sounded like at the
moment it left the lips. In this way it enables a reader to
excavate not only the realities of his/her mundane existence
but also those phenomena which reside at the level of super-
consciousness (according to Yogi 2009), super consciousness
means a state of heightened awareness. The multi-
dimensional aspects of meanings in the Sufi narratives of
Bulleh Shah are also characterized by the impulse he
achieved through divine intervention to discover the
meanings of life. In this paper an attempt has been made to
explore Bulleh Shah’s kaafi Ranjha Ranjha kardi hun mein
apey ranjha hoi in order to understand both the social
Priya Avais, Muhammad Shaban & Nadia Anwar
107
relations and spiritual experiences involved through the
metafunctions.
Bulleh Shah is one of the most time honored sufi poets
of the eighteenth century (1680-1758). According to Sheik
(2004) Bulleh Shah devoted his entire life to producing sufi
poetry which has often been a subject of investigation e.g.
authors like Nasir (1916) Thomas (2008), Waldo (2008), and
Ivan, (2009) has challenged Bulleh Shah’s religious identity
with reference through historic records. On the other hand,
many researchers such as Chopra (1999), Peterson (2013),
and Bhatti (2015) believe that supposedly simple words like
dheedo (reflection), loi (cape), chaddar (sheet), dagh (stain),
Heer and Ranjha (the protagonists) and kuriyae (girl) connect
the reader with mundane as well as spiritual experience, i.e
they are metaphorical and intended to convey double
meanings.
Bulleh Shah was preceded by prominent poets such as
Baba Ghulam Farid 12-13th century A.D, Guru Nanak 15th -
16th century, Sultan Bahoo 16th century, and Shah Inayat 16th
-17th centuries A.D. under the guidance of his mentor and
teacher Shah Inayat Hussein, Bulleh Shah produced sufi
narratives to connect people to divinity. The narratives of
Bulleh Shah address all people irrespective of their religious
affiliations, racial or ethnic backgrounds. His narratives when
read or sung not only envelope their readers in ecstasy but
also give directions to the righteous path on which lie their
worldly and spiritual success.
Purpose of the Study
The purpose of this study is to discover the extent to which
Michael Alexander Kirkwood Halliday’s (1985) meta-
Journal of Social Sciences and Humanities: Volume 26, Number 1, Spring 2018
108
functions can be used to analyse linguistic elements i.e.
(nominal and verbal groups) present in Bulleh Shah’s kaafi,
Ranjha Ranjha. This article also includes Dennis Teadlock’s
(1983) account on the authenticity of oral literature from his
book The Spoken Word and the work of interpretation. Dennis
Teadlock talks about oral literature as a repository of forms
and images. The researchers in this context aim to link for
example, sufi narratives and in the present context it is the
genre of kaafi which may be seen as a complex ceremony
from the oral to written medium. The kaafi may be seen as a
miniature form of the entire sufi experience. According to
Dennis Teadlock the narrators or poets in a poetic
experience can either be poets or they may sometimes
behave as narrators to punctuate their visible texts according
to the rise ,falls and contours of their oratical texts.
Oral delivery and syntax move together in a synchronic
manner, while the audible texts will be studied in a correct
manner to carry out this particular metafunctional analysis of
the kaafi. A kaafi is that form of oral literature which
according to Teadlock means a hypothetical reconstruction
of delivery regarding a dedicated sufi text. Major shifts the
wording of syntax can contribute to the metafunctional
structure while dealing with a genre like a kaafi.
According to Halliday, the role of a practical poet is to
extend his very own poetics into the reigons of linguistics
and to experiment effectively with tools like the meta-
functions. In the realm of kaafi chosen as a poetic genre the
present researcher is able to understand and integrate a
term“ A performable text” used quite essentially coined by
Teadlock (1983) . The secondary function of such linguistic
analyses would meant represent new dimensions and subtel
effects created by the language metafunctions. In addition
Priya Avais, Muhammad Shaban & Nadia Anwar
109
the researcher has used ideas presented by ,Dennis Tedlock
who has demonstrated some basic methods for transcribing,
translating, and interpreting oral performances or similar
such techniques which carry a wide range of implications for
areas in speech acts. How ever this present research does not
involve transcribing and translating but at present the
researcher will use and consider the interpretative techniques
by Teadlock. Teadlock as he, himself mentions in his oral
interpretations has at his best been able to reveal the
categories and concepts of poetic and hermeneutic
interpretations used for some Western literary traditions. He
narrates that these techniques cannot exactly be carried out
in its entirety for the sake of interpretive art of oral narratives
of other languages however they may be applied after
extensive re-evaluation.
The researcher through this research article aims to
investigate both the nominal and verbal groups in the kaafi.
Throughthe metafunctions of persons and their
modifications for the nominal group, the naming elements
are used however the verbal group will include tense and
modality explained through the textual functions which are
immanent in this kaafi Ranjha Ranjha Kardi... By
understanding the nominal and verbal groups meta-
functionally, the researchers are able to discover underlying
themes that create an essence for the kaafi, for example, the
poetic voice and the reader’s voice. This research article is
going to unfold the duality of clauses through meta-
functional meanings and this article will also reveal ways to
investigate ideational, textual and interpersonal functions
which will be used as a linguistic tool box to break down the
complex structures present in this chosen kaafi into simpler
forms. One of the differences in Halliday’s and Dennis’s way
Journal of Social Sciences and Humanities: Volume 26, Number 1, Spring 2018
110
of dealing with meta-functions is that in the present context
of the research, Teadlock (2013) uses the word
mythographer who breaks down meanings through
metafunctions and Halliday uses the term narrator who deals
with matafunctions without the distinction between mystic or
other types of analyses. The challenge for the present
researcher is to mould this analysis in the context of
interpreting sufi narrative i.e the genre of kaafi.
Significance of the Study
This study aims to contribute towards revealing the meta-
functions of the kaafi under discussion. Previously, meta-
functional analyses have been carried out on different poetic
narratives and literary texts written in the English language. This
study is first of its kind to deal with clausal analyses in the
domain of Punjabi language via meta-functional exegesis of
sufi poetry in Punjabi. This study will help the readers to
understand how well the earthly and unassuming vocabulary of
this chosen kaafi distinguishes between godly and earthly love.
Duality of clauses, examined by Teadlock (1983) means
the presence of two opposing ideas in the same clause. For
this purpose, Teadlock gives examples like the conflict
between the benevolent(kind) and the malevolent(hostile).
As Teadlock implies the benevolent and malevolent
antonymy, it simply means the co-existence of two moral
opposites at work. The moral opposites might, for example,
exist in a “worldview” which has one God, or perhaps more
than one gods, or none. Teadlock also relates to the fusions
of centers or the fusions of intimacies during which one act
or phenomena meets or fuses with another similar or
opposite act or phenomena. The same phenomena of duality
Priya Avais, Muhammad Shaban & Nadia Anwar
111
is expressed by Halliday by the name of ideational function.
In the context of Bulleh Shah’s kaafis the moral and dualistic
philosophies of Bulleh Shah can be compared with
Teadlock’s interpretations about oral literature. However
holistically, Halliday’s metafunctions will be used as an
analytical tool. In the present kaafi the use of
common/words like loi (cape), chaddar (sheet), dagh (stain),
and participants like Heer, Ranjha, kuriyae (girl) and unho
(them) etc. eventually relates meanings with spiritual and
earthly love.
Research Questions
1. What are the linguistic elements in the selected kaafi
which represents the meta-functions?
2. To what extent can meta-functions break down the
structures of the kaafi into simpler forms?
3. How does the present meta-functional analysis of the
kaafi reveal multiple layers of meanings?
Methods and Materials
The sample for this research has been chosen from among
one of the famous kaafis which Bulleh Shah wrote in 1710.
The method currently used for this research is firstly the
thematic analysis followed by a detailed metafunctional
analysis of the given text. The data comprising clauses of the
kaafi are analyzed by the aforementioned method for
metafunctions. Thematic analysis, according to Braun and
Clarke(2006),is widely used as a qualitative research technique
in which excerpts of texts from poetry or novel are coded or
broken down into further manageable categories at different

Journal of Social Sciences and Humanities: Volume 26, Number 1, Spring 2018
112
levels: sentence, phrase, word, theme and so on. Similarly an
initial thematic analysis is done in this article, under the
broader parameters of qualitative research methods which
aim to indicate epistemological themes and pattern.
Theoretical Frameworks
Halliday’s meta-functional theory has been used as a
theoretical framework for this research. Webster (1999),
Benson (1985), Johnathan and James (1968),have applied
meta-functional methods for interpreting literary texts
including mystic ideas in order to convey systemic
functional grammar rules.
According to Webster (2012), the first meta-function .i.e.
Ideational construes experiences and meanings about the
outer and inner worlds, it is also known as the field. The
second meta-function is labeled as the interpersonal
function or tenor which involves social relations, i.e.
meanings concerned with communal relations, while the
third meta-function called textual or mode weaves together
the first two meta-functions in order to shape up an
accumulative text.
The above mentioned mechanism, has been used
originally by Matthiessesn and Bateman(1991) which is
mapped out onto the structure of the clause for the chosen
kaafi. Each meta-function will be discussed in detail with
examples from the kaafi to explicate a multi layered clausal
analysis.
Secondly this research revolves around the methodology
of Dennis Teadlock which considers the thought processes
and violations regarding integrity of the written and spoken
Priya Avais, Muhammad Shaban & Nadia Anwar
113
codes. Since kaafi is widely used in the oral form Teadlock
(1993)’s variation has been applied.
Ideational Function or Field
The ideational functionalists language users make meaning
out of reality. Halliday (1925) further divides the ideational
function into logical and experiential parts. The experiential
part according to Halliday (1925), is represented by the
presence of an actor, who in the given context of the kaafi is
represented by the protagonist named Ranjha. In this
research article a link has been created between the chosen
kaafi and the ideational meta function in such a way that the
grammatical resources at the initial clausal level interpret the
inner and outer experiences of the poet expressed through
“words” as domains of functions and meanings of our worlds
through the systems of transitivity.
According to Sinclair (1985), “logical part of the ideational
function refers to the grammatical resources present in the
fabric of language for building grammatical units into
complex structures”. For instance, in the present context of
this kaafi, by combining two or more clauses in a clause
complex sadhu main udheedo ranjha, sadhoo, i.e. sadhu
meaning “call” sets predication at the initial level. Here the
researcher links the grammatical aspect of ideational
function within the framework of the given kaafi. In this way
the logical part of the ideational function also looks after the
process of creating meanings between clause and clause
complexes. In the given kaafi the ideational function of
language through the “process” part of meaning making
process means as Hamzic (2012) puts it, a unique semantic
verb, i.e. a verb which is related to doing, happening, feeling,
sensing, behaving and existinge.g in the kaafi these are :
sadhoo (bring), diljoi (empathy), wassey (exists), pehan (wear).
Journal of Social Sciences and Humanities: Volume 26, Number 1, Spring 2018
114
According to Halliday (1976), “The semantic verb may
express an event, i.e. relational, physical, mental or emotional
states when sorted into the semantic system of the clause.”
This idea is quite similar to the context of oral literature of
Zuni language , a little different yet thematically similar idea
presented by Teadlock (1983) i.e the occurrence of stress
and pitch patterns to control the pace and quality of
narratives in the Zuni language.
The experiential section in the ideational meta-function
organizes the language user’s or reader’s experiences and
understandings about the world and it also deals with the
concept of transitivity as in the verb kardi (‘she does’) used in
the kaafi. Halliday (1991), explains the experiential meta-
function as a transitivity function developed via the concept
of transitive and intransitive verbs, i.e. whether a verb takes
an object or not. In Halladian meta-function, transitivity is a
major component of experiential part in a clause which deals
with the transmission of ideas representing experiences.
According to Fowler (1986),transitivity depends upon
participants. Meta-functionally speaking the participants in
subject or object positions of a clause represent different
labels such as actors, sensors, processors and carriers. The
experiential meta-function includes sub-functions like
manner and circumstance which includes cause and location,
while the presence of locative case indicates location, e.g.
prepositions including in, on, upon.
The Interpersonal Function or Tenor
The second meta-function is labelled as the interpersonal
function and it is also known as tenor. “The interpersonal
function is the participatory function for language”. (Halliday
2007). Halliday further explains meanings in language from
the point of view of social interaction. This meta-function
Priya Avais, Muhammad Shaban & Nadia Anwar
115
allows the expressions of interpersonal setups between text
producers, i.e. writers and text consumers or readers. In this
article the interpersonal meta-function is revealed step wise
by breaking down the given kaafi into clause levels. The
clauses are analyzed from the perspectives of two elements,
i.e. mood and residue. The mood aspect throughout this
kaafi is predominantly interpersonal and conversational as
Baba Bulleh Shah expresses love towards his mentor Shah
Inayat Hussein using the persona of Ranjha and reveals this
emotion of love to the reader through this kaafi who acts as
an observer. The element of mood is further categorized into
subject and finite verb, while the remaining part of that
sentence is called the residue. The sentence pattern followed
for expressing declarative sentences through interpersonal
meta-functions is subject + finite verb word order. Those
sentences of the kaafi in which structures, for example, finite
verb + subject word order are present, the interrogative
mood prevails.
While dealing with finite verbs ,subjects or tense choices,
the interpersonal meta-function of language helps to express
speech functions such as persuading, demanding,
recommending, confirming, persisting, and denying. These
verbal functions of mood and clause are expressed through
the words like hoi (to become), naakho (do not say), karay &
kar (to do), wasey (to reside), lagaya (to bond). According to
Teadlock (1983) different texts serve to be evident of
contemporary performances to elucidate patterns exhibited
by different texts. Teadlock (1983) says that old texts can be
written recently in order to advance the analysis of oral
narratives.
The interpersonal function on the whole indicates the
presence of a vocative case. According to Holton (1997), the
Journal of Social Sciences and Humanities: Volume 26, Number 1, Spring 2018
116
vocative case means inclusion of a noun that identifies a
person or an object being addressed. The verbs present in
this kaafi support the nouns of the kaaf ii.e these verbs
reflect the vocative case. Bulleh Shah has addressed the
reader by using a plural pronoun aakho and later towards
the end he uses the vocative case for himself, i.e. “le chal
Bulleya” (‘take me to my own being’). A vocative expression
according to David (1997) is an expression of direct address
where the identity of the party spoken to is set forth
expressively within a sentence.
The Textual Function or Mode
The third meta-function of language is textual or mode.
Exploring thematic structures through the textual functions
involve clausal analyses. The textual function has two sub-
parts called theme and rheme.The theme part sets up a local
context for each clause and the rheme, initiates when the
subject has been set up by the theme. In kaafi: Ranjha
Ranjha the primary theme is the poetic voice and the rest is
called rheme also known as residue in Hallidian terms. From
the very first line the theme is related to the given
information about the poet where he has portrayed himself
as a feminine pronoun in order to establish his subjugation
through his poetic persona. Rheme or residue is related to
new information present in a clause which, in this context, is
as important as theme. Martin (1992), elaborates that
“Theme is equated with what the speaker or author is all
about while rheme is that structure which is either listener-
or reader-oriented.”
The textual meta-function helps the reader to understand
how ideology can be embedded in a text, sometimes below
the level of conscious notice. For example, in the chosen

Priya Avais, Muhammad Shaban & Nadia Anwar
117
kaafi ideology pertains to creation of an analogy made
between Shah Inayat Hussein and Ranjha who is Baba Bulleh
Shah’s mentor. This textual meta-function is used for the
purpose of persuasion. The textual meta-function is further
used in texts for negotiations of conflicts and disagreements.
The textual function, of this kaafi, has the following
properties:
It creates a discourse and dialogue among different
participants, e.g. lover (Heer),beloved (Ranjha),
mentor(God), and disciple (Bulleya).
Textually, the clause functions as a message. For example,
“Chitti chaddar laasutt kuriyaey pehan faqir di loi. Chitti
chaddar dagh lage siloidaghna koi. (The white sheets will
show the stains but the red cape will hide your sins and
stains.). There are vivid messages through simple
vocabulary about the reality of virtue and sin presented
within the structure of the kaafi.
The textual functions serve as linguistic expressions for
ideational and interpersonal functions.
Each of the above mentioned meta-functions have
principal systems or functions in the network of clauses.
These principal systems or meta-functional layering is shown
by a model developed by Matthiessen and Bateman (1991).
This model (already shown in the research methodology) has
been applied to this research article directly for the clausal
analysis of the chosen kaafi.
Rationale for Choosing the Text
Ranjha Ranjha Kardi hun mei apey Ranjha hoi is a famous kaafi
of Baba Bulleh Shah written during the year 1710. The first line
of this famous kaafi has become a proverbial in Punjabi

Journal of Social Sciences and Humanities: Volume 26, Number 1, Spring 2018
118
language with the variation between hun mein (‘now’ and ‘I’)
and way mein (hey! It’s I ).Punjabi speakers in general are able
to relate to this kaafi because of its popularity. As an example
this kaafi provides a broad spectrum of deep and surface
meanings within each clause. Choosing this kaafi for meta-
functional analysis can be justified on the grounds which
provides a blue print for the application of the three meta-
functions of language. This kaafi reflects the personal
experiences of the poet as the poet Baba Bulleh Shah wishes to
be personified as his mentor or beloved referred to as Ranjha.
The interpersonal function is not only reflected through the
communication between the protagonists (Ranjha and
Heer),but also through the metaphoric presence of a dialogue
between God and his disciple or Mentor and his disciple.
Ranjha and Heer, who are popular characters originally created
by Warris Shah,( a predecessor of Baba Bulleh Shah). These two
characters are popular metaphors of love in Punjabi folk poetry
just like Romeo and Juliet by Shakespear. In the context of this
poem the characters are referred to as the mentor (Ranjha) and
as the disciple (Heer), respectively.
The poet Baba Bulleh Shah, uses female pronouns and
implores the company of his mentor. He wishes to surrender
himself in the hands of divine authority i.e God. While making
choices the poet derives information about the participants of
a speech utterance which are units of speech and are
bounded by silence, which are supporting the speech act with
a set of personal and other pronouns: mai, mainu, sadey,
unho, etc.(‘me’, ‘mine’, ‘ours’, ‘theirs’). It may be noted that a
personal pronoun is the one which refers to a particular
person, group, or thing. Like all other pronouns, personal
pronouns can take the place of nouns and noun phrases.
There are six verses or lines used in this kaafi for which
personal pronouns have been used in order to signify
meanings. The presence of these personal pronouns help to

Priya Avais, Muhammad Shaban & Nadia Anwar
119
develop an overall impact of this poem on the readers. Six
different references of the pronoun I and mine (mai and
mera) and its variant forms has created the inner voice in the
kaafi subsequent to the poet discovering his identity in the
middle of the poem. The poet also involves some other
participants in the poem, i.e. the people around him. He says
Heer na aakho koi, i.e. “O people! Do not call me Heer”. The
distribution of personal and other pronouns in the kaafi
maintain the interpersonal tone of the poem.
Another major participant in the poem is kuriyae, (girl) a
common noun used for a maiden. Here kuriyae is a maiden
who is in love, either in the ishq-e majazi (infatuation/human
love) or in ishq-e haqiqi (real/or divine love). Bulleh Shah
himself provides his readers with interpersonal experiences
offering the best interpretations to understand the gravity of
this love. Kuriyae acts as a passive recipient, which means
that passive subjects are indirectly affected by the action of
the main verb. Moreover, clothing items such as chaddar
followed by a verb desindi (shows) represents the
relationship of passive recipient and its main verb. mun-i.e
(heart) has been mentioned and is used as a personification
of a place to reside (Ranjha resides in my heart).Nouns like
kuriyae, etc. are used to express the voice of the poet Bulleh
Shah. The above mentioned examples infused with symbolic
imagery call for a special thematic analysis of the kaafi
through meta-functional linguistic tools.
Commonly Emerging Patterns and Themes in the Text
The original Punjabi version of the kaafi will be analyzed
meta-functionalyin order to identify some consistently
emerging themes. All the verses of the kaafi are placed in
chronological order and all three meta-functions are
discovered in each clause. Each clause will be re-written in

Journal of Social Sciences and Humanities: Volume 26, Number 1, Spring 2018
120
Roman script for clear understanding. It may be noted that
the three meta-functions are used as tools to justify
commonly emerging themes, e.g. poetic voice, reader’s seat,
displacement and unity, etc.
Poetic Voice
رانجھا رانجھا کردی ھن میں آپے رانجھا ھوئی
Ranjha Ranjha kardi hun mein apey Ranjha hoi
In the love of Ranjha I myself have become Ranjha.
This textual analysis will commence by using a-meta
functional model originally created by Halliday and later
adapted by Matthiessesn and Bateman (1991). It may be
noted that the same analysis will be applied at the end of the
kaafi where the same line has been used as a refrain.
Ranjha Ranjha Kardi hunmein Apey Ranjha Hoi Clause
Theme Rheme Textual
Vocative Mood
(finite)
Subject
(vocative)
Finite
(verb)
Interperso
nal
Process (transi
tivity)
Manner +Actor
(participant)
Process
(transitivity)
Ideational
Table.1: Poetic Persona in the kaafi
The above tables starts with the ideational function. This
model starts from below and follows a bottoms up approach.
The reason for this inverse approach is that the ideational
function lies at the core of the clause and develops upwards
to unfold interpersonal and textual metafunctions. Within the
interpretation of the kaafi there searchers discover that the
Priya Avais, Muhammad Shaban & Nadia Anwar
121
ideational function as per Matthiessesn and Bateman model
is like a tree trunk from which the branches of interpersonal
and textual metafunctions grow. The Ideational meta
functional analysis, of the above clause shows the presence
of an actor as a participant. The process part of this clause
starts with an utterance Ranjha Ranjha and the verb such as
kardi (doing) is associated with the actor or subject mein, i.e.
“I” there is an additional adverb of manner hun (now)
attached to it whereas, Mein + Apey is the subject. Over here
there are two participants one is an actor mein (me) and the
second is a processer the word Ranjha (proper noun).
According to Halliday it is the logical part of the ideational
function which expresses Ranjha as a protagonist through
the available linguistic resources.
On the other hand, the experiential part organizes our
experiences about the presence of Bulleh Shah’s inner voice.
As a unique technique the poet uses a feminine voice which
reveals the presence of an experiential metafunction. The
personal experience involves a dialogue between Bulleh
Shah and his mentor (the Supreme Being or God) to the
extent which satisfies him to maintain a subordinate feminine
pronoun. On the whole the experiential function explained
earlier of this clause expresses the process of uttering the
word Ranjha Ranjha.
The interpersonal meta function exists in the subject
(Ranjha) + finite verb (kardi) order hence reflecting a
declarative tone. The vocative noun is also presented in the
word Ranjha. Here the poet declares his love for Ranjha.

Journal of Social Sciences and Humanities: Volume 26, Number 1, Spring 2018
122
The analysis of textual function begins with the theme
part. As mentioned in the section on theoretical
underpinning the theme expresses ideology behind
meanings and above the conscious level. The clause begins
with the protagonist of the poem Ranjha which is used as a
noun for God or Godly love. The rheme part of this verse
deals with the spiritual development of which the poet talks
about. It is that process through which (in the love of Ranjha)
the poet says that he, himself becomes Ranjha. Ranjha is the
theme or the given information in textual analyses and the
rest, i.e rheme consists of some new information present
after the theme.
According to Sheikh(2009),the theme part in Punjabi
poetry and Punjabi language is not subject oriented but
process oriented, i.e it presents a set of axiomated ideas to
deal with resolution. This means that in Punjabi language
process leads to thematic content of the kaafi not only for
the purpose of meta functions but otherwise as well.
According to Halliday 1994,The theme in the textual function
is followed by a participle in an utterance form. Participle is a
word created from a verb. This is similar to the structure
found in the above mentioned clausal analysis under the
theme of poetic persona. For example hoi ( to become)is a
past participle which has been followed by kardi ( to utter/to
do) which is a simple present tense.
The textual meta functional analysis of the above line has
emerged as an overlap between interpersonal and ideational
meta functions. The textual function is split into theme and
rheme. It also determines the mode or style of the message
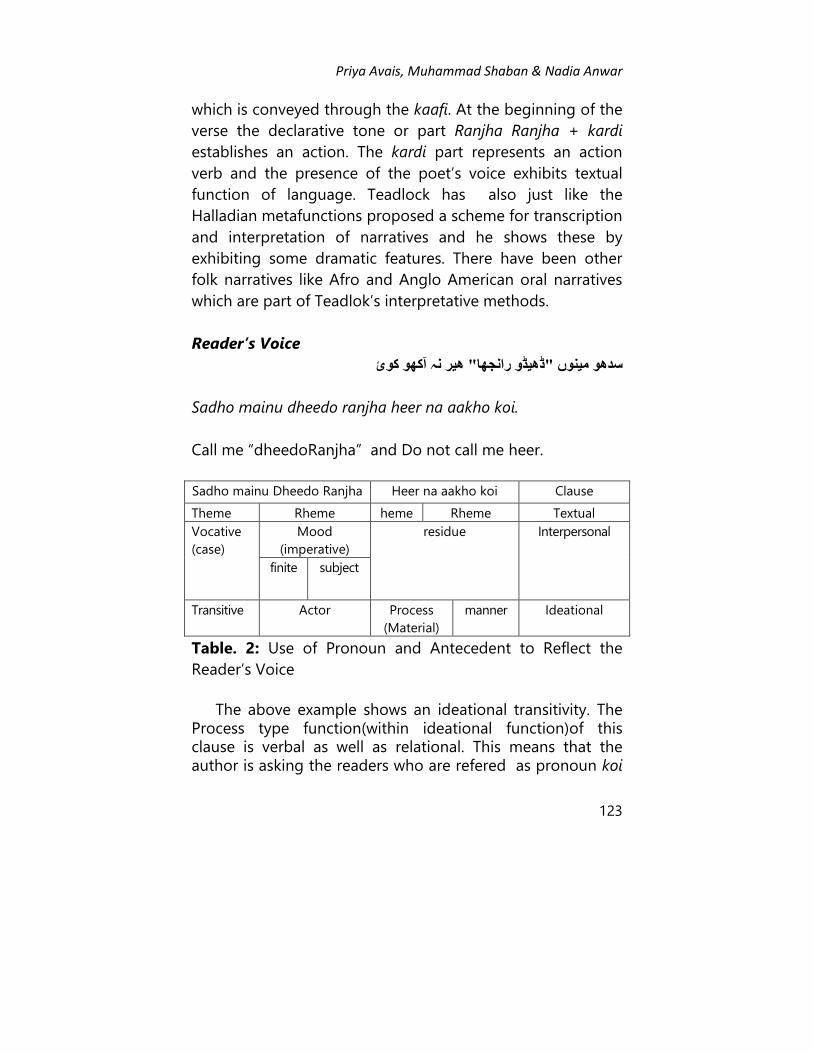
Priya Avais, Muhammad Shaban & Nadia Anwar
123
which is conveyed through the kaafi. At the beginning of the
verse the declarative tone or part Ranjha Ranjha + kardi
establishes an action. The kardi part represents an action
verb and the presence of the poet’s voice exhibits textual
function of language. Teadlock has also just like the
Halladian metafunctions proposed a scheme for transcription
and interpretation of narratives and he shows these by
exhibiting some dramatic features. There have been other
folk narratives like Afro and Anglo American oral narratives
which are part of Teadlok’s interpretative methods.
Reader’s Voice
ھیر نہ آکھو کوئ "ڈھیڈو رانجھا"سدھو مینوں
Sadho mainu dheedo ranjha heer na aakho koi.
Call me “dheedoRanjha” and Do not call me heer.
Sadho mainu Dheedo Ranjha Heer na aakho koi Clause
Theme Rheme heme Rheme Textual
Vocative
(case)
Mood
(imperative)
residue
Interpersonal
finite subject
Transitive Actor Process
(Material)
manner Ideational
Table. 2: Use of Pronoun and Antecedent to Reflect the
Reader’s Voice
The above example shows an ideational transitivity. The Process type function(within ideational function)of this clause is verbal as well as relational. This means that the author is asking the readers who are refered as pronoun koi
Journal of Social Sciences and Humanities: Volume 26, Number 1, Spring 2018
124
(someone).The process type is also relational in nature since there is a synchrony among the nouns dheedo, Ranjha, mainu, Heer and koi. Interpersonally, the mood type is imperative as the author’s voice uses naakho (don’t call).Also the clause begins with a verb followed by a subject (as per sentence conventions of Punjabi language) therefore this verb and subject combination results in an imperative case. In terms of textual function the theme provides some new information within the marked theme part and the remaining information is called rheme. “Dheedo Ranjha” here means the reflection or manifestation of Ranjha. At this point in the kaafi the requirements of meta functions being above, below and around the text are fulfilled and the meaning making process is enhanced. There are two clauses in the verse/ line under consideration and both contain nouns (nominal groups) in combination with a verb, i.e. finite +subject in the first clause, and subject + finite combination in the second clause. Therefore both the clauses in binary forms show imperative functions. As mentioned earlier the subject is also known as an agent or the doer of the action in metafunctional terms. It means that the agent here is the carrier of interpersonal information, i.e what the author expects from the readers. The author says, “O people call me Ranjha”, where the word “people” stays as a hidden subject. The presence of pronouns reveals the reader’s voice. The interpersonal metafunction of language in the above clause is evident with the presence of grammatical categories like subject and verb.
Spiritual Oneness
رانجھا من وچ من رانجھے وچ غیر خیال نہ کوئی
Ranjha mun wich mun ranjhey wich ghair khiyal na koi
Ranjha resides in my heart and my heart resides in Ranjha.
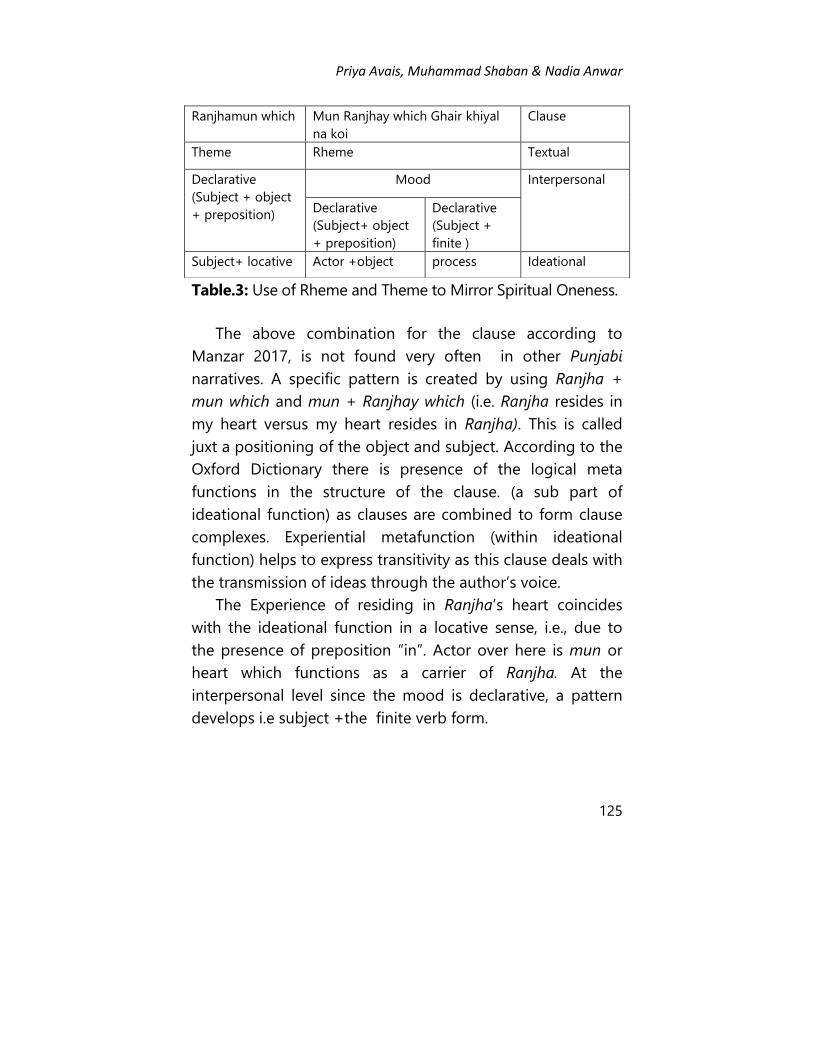
Priya Avais, Muhammad Shaban & Nadia Anwar
125
Table.3: Use of Rheme and Theme to Mirror Spiritual Oneness.
The above combination for the clause according to
Manzar 2017, is not found very often in other Punjabi
narratives. A specific pattern is created by using Ranjha +
mun which and mun + Ranjhay which (i.e. Ranjha resides in
my heart versus my heart resides in Ranjha). This is called
juxt a positioning of the object and subject. According to the
Oxford Dictionary there is presence of the logical meta
functions in the structure of the clause. (a sub part of
ideational function) as clauses are combined to form clause
complexes. Experiential metafunction (within ideational
function) helps to express transitivity as this clause deals with
the transmission of ideas through the author’s voice.
The Experience of residing in Ranjha’s heart coincides
with the ideational function in a locative sense, i.e., due to
the presence of preposition “in”. Actor over here is mun or
heart which functions as a carrier of Ranjha. At the
interpersonal level since the mood is declarative, a pattern
develops i.e subject +the finite verb form.
Ranjhamun which Mun Ranjhay which Ghair khiyal
na koi
Clause
Theme Rheme Textual
Declarative
(Subject + object
+ preposition)
Mood Interpersonal
Declarative
(Subject+ object
+ preposition)
Declarative
(Subject +
finite )
Subject+ locative Actor +object process Ideational
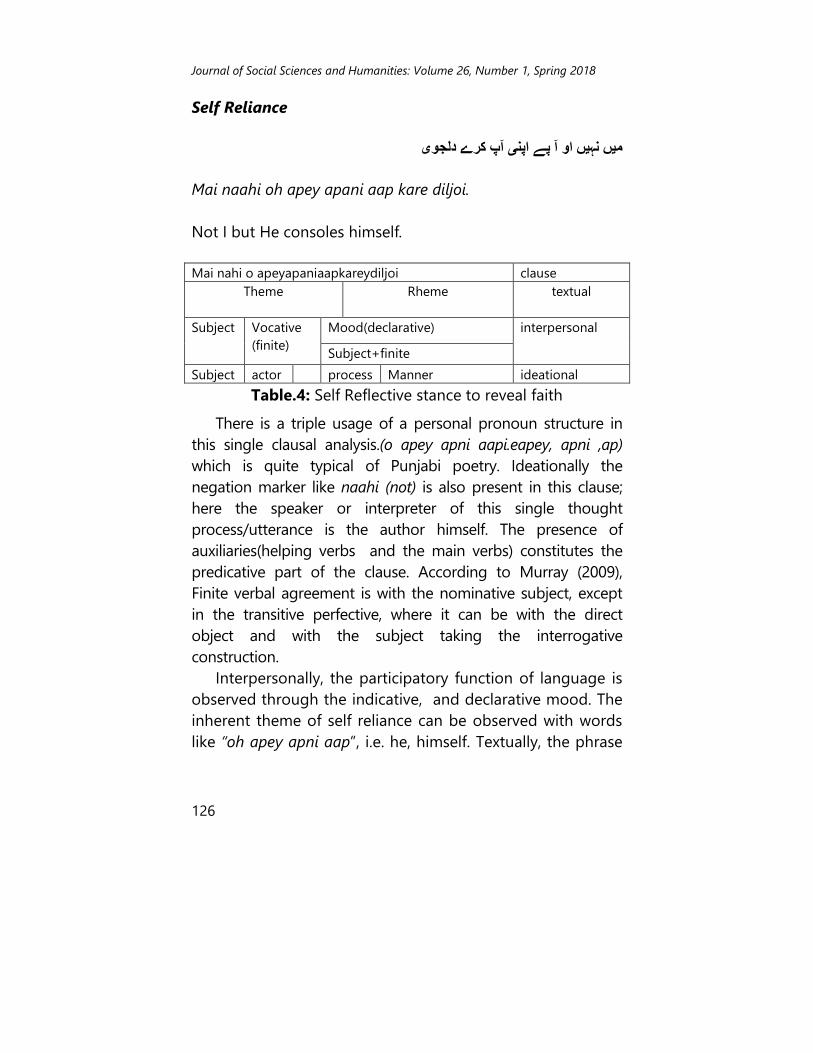
Journal of Social Sciences and Humanities: Volume 26, Number 1, Spring 2018
126
Self Reliance
ویے دلجمیں نہیں او آ پے اپنی آپ کر
Mai naahi oh apey apani aap kare diljoi.
Not I but He consoles himself.
Mai nahi o apeyapaniaapkareydiljoi clause
Theme Rheme
textual
Subject Vocative
(finite)
Mood(declarative) interpersonal
Subject+finite
Subject actor process Manner ideational
Table.4: Self Reflective stance to reveal faith
There is a triple usage of a personal pronoun structure in
this single clausal analysis.(o apey apni aapi.eapey, apni ,ap)
which is quite typical of Punjabi poetry. Ideationally the
negation marker like naahi (not) is also present in this clause;
here the speaker or interpreter of this single thought
process/utterance is the author himself. The presence of
auxiliaries(helping verbs and the main verbs) constitutes the
predicative part of the clause. According to Murray (2009),
Finite verbal agreement is with the nominative subject, except
in the transitive perfective, where it can be with the direct
object and with the subject taking the interrogative
construction.
Interpersonally, the participatory function of language is
observed through the indicative, and declarative mood. The
inherent theme of self reliance can be observed with words
like “oh apey apni aap”, i.e. he, himself. Textually, the phrase
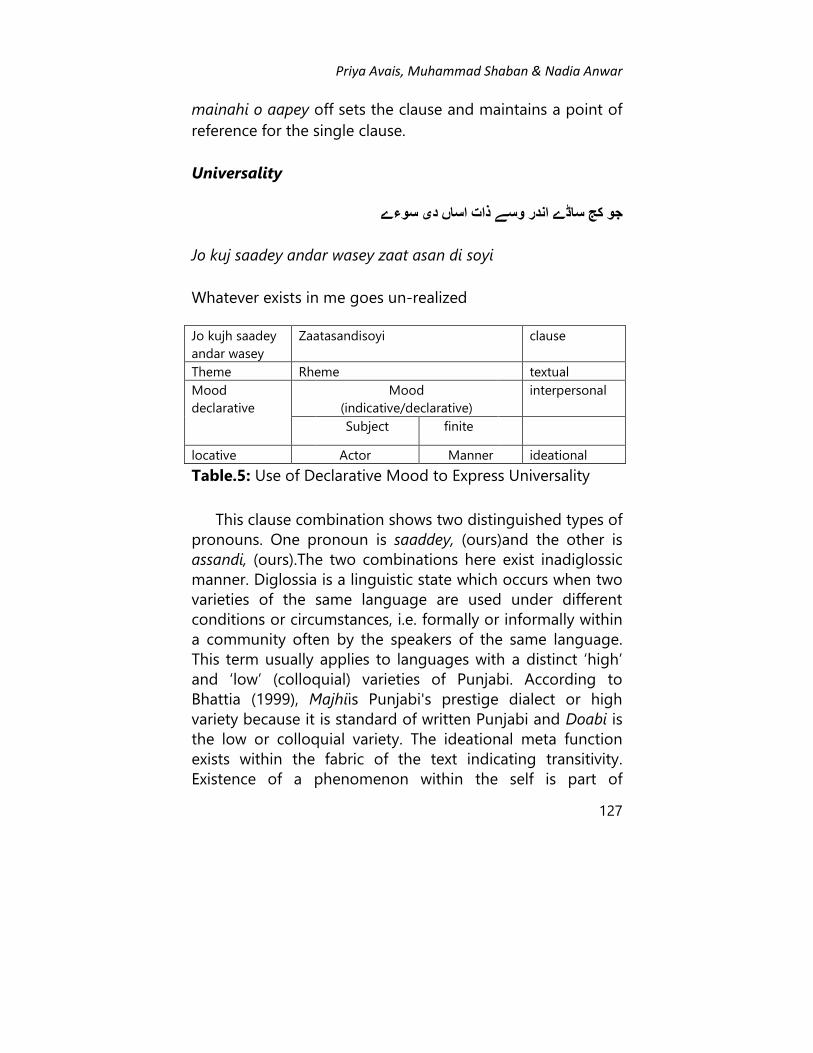
Priya Avais, Muhammad Shaban & Nadia Anwar
127
mainahi o aapey off sets the clause and maintains a point of
reference for the single clause.
Universality
جو کج ساڈے اندر وسے ذات اساں دی سوءے
Jo kuj saadey andar wasey zaat asan di soyi
Whatever exists in me goes un-realized
Jo kujh saadey
andar wasey
Zaatasandisoyi clause
Theme Rheme textual
Mood
declarative
Mood
(indicative/declarative)
interpersonal
Subject finite
locative Actor Manner ideational
Table.5: Use of Declarative Mood to Express Universality
This clause combination shows two distinguished types of
pronouns. One pronoun is saaddey, (ours)and the other is
assandi, (ours).The two combinations here exist inadiglossic
manner. Diglossia is a linguistic state which occurs when two
varieties of the same language are used under different
conditions or circumstances, i.e. formally or informally within
a community often by the speakers of the same language.
This term usually applies to languages with a distinct ‘high’
and ‘low’ (colloquial) varieties of Punjabi. According to
Bhattia (1999), Majhiis Punjabi's prestige dialect or high
variety because it is standard of written Punjabi and Doabi is
the low or colloquial variety. The ideational meta function
exists within the fabric of the text indicating transitivity.
Existence of a phenomenon within the self is part of
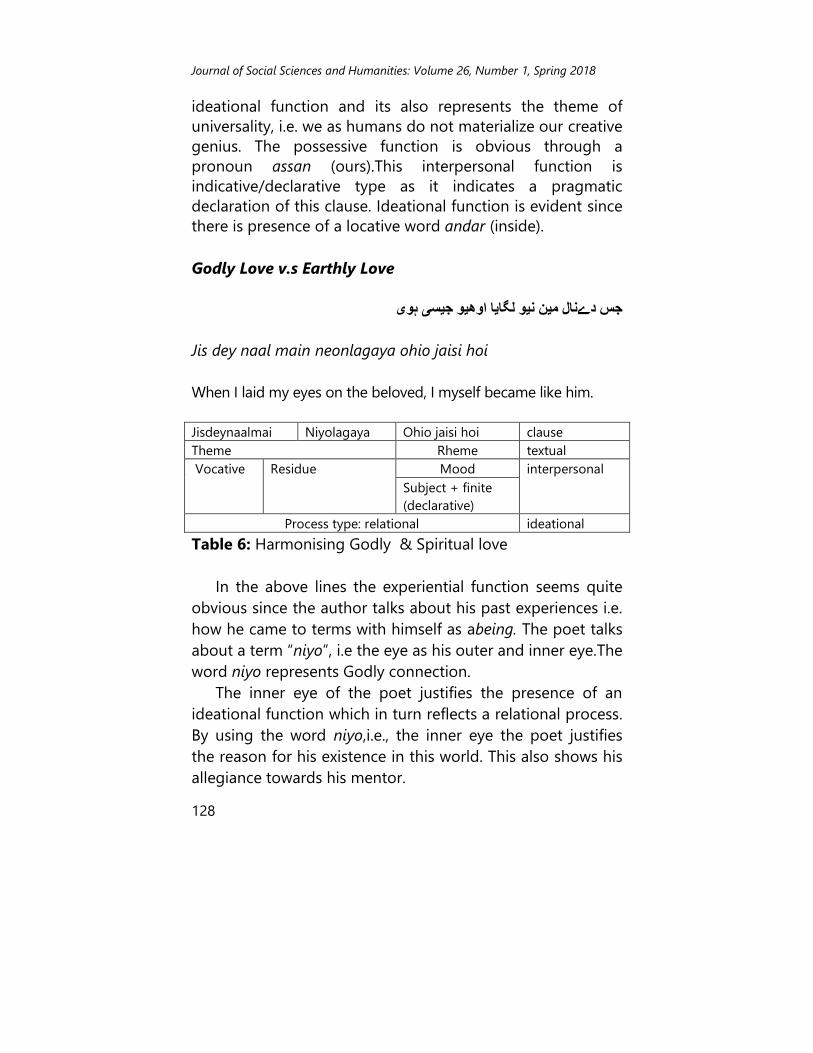
Journal of Social Sciences and Humanities: Volume 26, Number 1, Spring 2018
128
ideational function and its also represents the theme of
universality, i.e. we as humans do not materialize our creative
genius. The possessive function is obvious through a
pronoun assan (ours).This interpersonal function is
indicative/declarative type as it indicates a pragmatic
declaration of this clause. Ideational function is evident since
there is presence of a locative word andar (inside).
Godly Love v.s Earthly Love
جس دےنال مین نیو لگایا اوھیو جیسی ہوی
Jis dey naal main neonlagaya ohio jaisi hoi
When I laid my eyes on the beloved, I myself became like him.
Jisdeynaalmai Niyolagaya Ohio jaisi hoi clause
Theme Rheme textual
Vocative Residue Mood interpersonal
Subject + finite
(declarative)
Process type: relational ideational
Table 6: Harmonising Godly & Spiritual love
In the above lines the experiential function seems quite
obvious since the author talks about his past experiences i.e.
how he came to terms with himself as abeing. The poet talks
about a term “niyo”, i.e the eye as his outer and inner eye.The
word niyo represents Godly connection.
The inner eye of the poet justifies the presence of an
ideational function which in turn reflects a relational process.
By using the word niyo,i.e., the inner eye the poet justifies
the reason for his existence in this world. This also shows his
allegiance towards his mentor.
Priya Avais, Muhammad Shaban & Nadia Anwar
129
Interpersonally speaking the pronoun “Jis” (with whom)
reflects the vocative function of the pronoun and in the
second half we see a subject and finite relation expressing a
declarative mode. Arelational process states the things which
exist in relation to other worldly things. Here, the pronoun
“Jis” (whom) and “Oho” (that) creates a bond within the
structure of the clause. The earthly love is depicted with the
phrase ohio jaise hoi, i.e. the poet finds his own reflection in
the beloved, i.e. God or Godly love.
This clausal analysis shows the presence of an
independent clause with a relative clause. Both the clauses
show a clear grammatical inclination. As with other
dimensions of the metafunctional theory, Halliday (1996),
describes the relation of grammar with lexis(for example in
the above clause most of the agents are connected to a verb,
e.g. Mai (I), jaisi (like me) and hoi(to be). Halliday describes
these semantic verbs as one of a cline and therefore one of
delicacy. In 1961, he wrote that, “The grammarian’s dream
is...to turn the whole of linguistic form into grammar, hoping
to show that lexis can be defined as most delicate grammar”
which according to Willcock, (2001) is analysed into process
and participant already discussed in section 1.6.1. Similar
pattering technique is evident in the analysis of the above
mentioned line, i.e., niyolagaya, “laid my eyes”.
Transformation
چٹی چدر ال سٹ کڑئیے پہن فقیردی لوئ
Chitti chaddar La sut kuriya Pehan faqeer di loi
Take off the white sheet o girl and wear the saint’s cape.
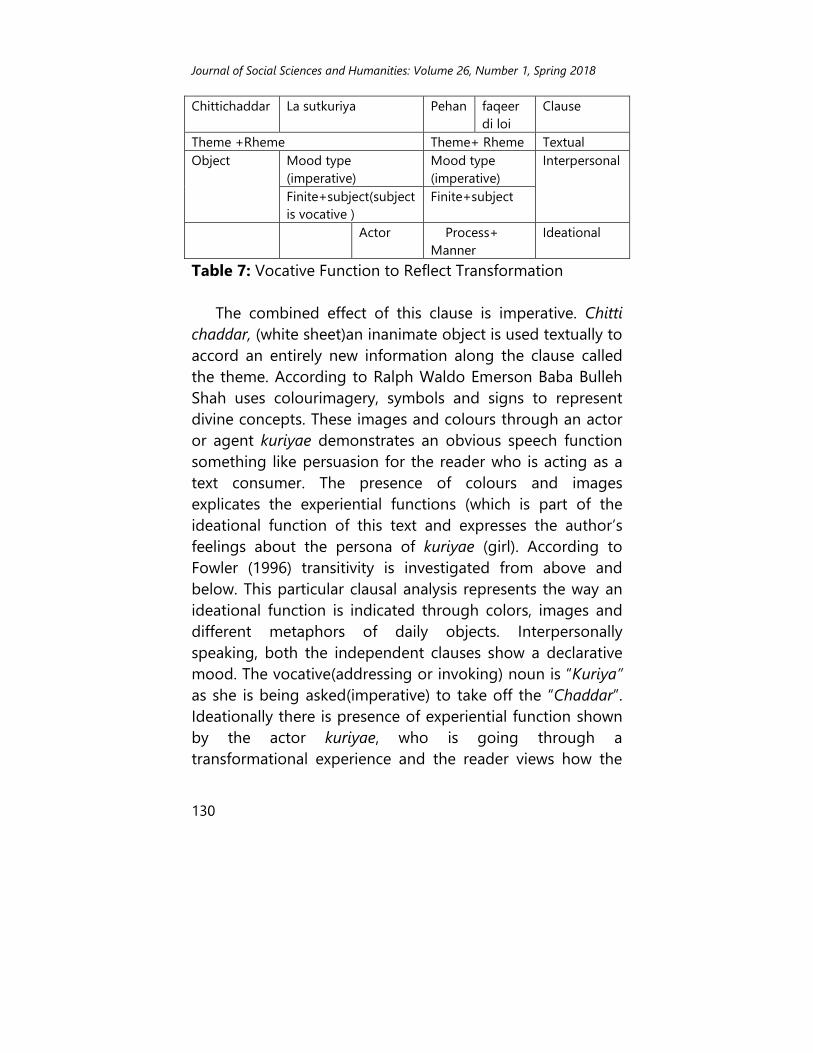
Journal of Social Sciences and Humanities: Volume 26, Number 1, Spring 2018
130
Chittichaddar La sutkuriya Pehan faqeer
di loi
Clause
Theme +Rheme Theme+ Rheme Textual
Object Mood type
(imperative)
Mood type
(imperative)
Interpersonal
Finite+subject(subject
is vocative )
Finite+subject
Actor Process+
Manner
Ideational
Table 7: Vocative Function to Reflect Transformation
The combined effect of this clause is imperative. Chitti
chaddar, (white sheet)an inanimate object is used textually to
accord an entirely new information along the clause called
the theme. According to Ralph Waldo Emerson Baba Bulleh
Shah uses colourimagery, symbols and signs to represent
divine concepts. These images and colours through an actor
or agent kuriyae demonstrates an obvious speech function
something like persuasion for the reader who is acting as a
text consumer. The presence of colours and images
explicates the experiential functions (which is part of the
ideational function of this text and expresses the author’s
feelings about the persona of kuriyae (girl). According to
Fowler (1996) transitivity is investigated from above and
below. This particular clausal analysis represents the way an
ideational function is indicated through colors, images and
different metaphors of daily objects. Interpersonally
speaking, both the independent clauses show a declarative
mood. The vocative(addressing or invoking) noun is “Kuriya”
as she is being asked(imperative) to take off the “Chaddar”.
Ideationally there is presence of experiential function shown
by the actor kuriyae, who is going through a
transformational experience and the reader views how the

Priya Avais, Muhammad Shaban & Nadia Anwar
131
climax of the poem is achieved. Textually there are only two
themes and rhemes as two independent clauses are present.
Sin Vs Virtue
داغ لگیسی لوئی داغ نہ کوئی ررچٹی چ
Chitti chaddar dagh lagesi loi dagh na koi
The white sheet will show stains while the red cape will hide
your stains.
Chitti Chaddar dagh
lagesi
Loyi Daghna koi clause
theme rheme Theme rehme textual
Mood Mood interpersonal
Subject finite Subject finite
Actor+processor Actor + processor ideational
Table 8: Representation of Sin and Virtue Through Inanimate
Objects
The metafunctional analysis of the above line is carried out in a dual manner as both the clauses are independent. At an ideational level the actor part in both the clauses is played by two very common inanimate actors or objects e.g. chaddar (sheet) and loi (cape). Ideationally this refers to the poet’s experiential account(experiences) about the connotations of the white sheet and red cape respectively. This experiential function orients the readers to create their own analogies of the text. The “going ons” about the functions of the word (as discussed in the theoretical framework) is obvious at clause level for both of the above independent clauses of this verse. Interpersonally the mood is declarative and vocative case is not quite evident. Textually both the clauses send a very strong message by balancing

Journal of Social Sciences and Humanities: Volume 26, Number 1, Spring 2018
132
out the rheme and theme in a way that in each clause the subject part establishes the textual theme.
Displacement
کوئرہ لے چل بلھیا سالین ملے نہ تخت ھزا
Takht Hazara Le chal bulleya Salein miley na koi
Take me to takht hazara I haven’t been there since long.
Takht Hazara Lechal bulleya Salein miley na koi Clause
Mood(imperative) Mood (declarative) Interpersonal
Ideational
Object+Finite+ subject Object +finite+
subject
locative Transitivity +
actor
Process (manner)
+ actor
Textual
Table 16: Revisiting the holy places in the context of the
kaafi to show Displacement.
As a final note the above line presents a combination of
two clauses, where the poet goes back in time and engages
himself and the readers in a monologue to visit his beloved
place called, takht hazara. Interpersonally the mood in these
clauses is both imperative and declarative in nature. He uses
the imperative manner to urge his visit to the beloved place,
while in the second half he assumes a declarative tone.
According to the process type at a relational level
(ideationally), he relates his transitivity with a visit to the
place takht hazara. The two functions, i.e. Ideational and
interpersonal intertwine with the concept of displacement to
create a collaborative effect of textually with displacement at
Priya Avais, Muhammad Shaban & Nadia Anwar
133
the heart of clause. These functions blend with displacement
to portray the image of takht hazara as a beloved place.
Discussion and Conclusion:
This study investigates, the unique nuances of language
contributing to the meaning potentials of the kaafi, Ranjha
Ranjha Kardi hun mein apey Ranjha hoi through Systemic
Functional Grammar. This may not be an ultimate framework
used to interpret meanings and take the readers (just like the
shrine attendees) to an exotic trance. The most interesting
aspect of communication in this kaafi is the poet’s vision to
transcend the limitations of ordinary language. Bulleh Shah
makes use of different analogies to analyse the relationship
with his mentor. The three meta functions: Ideational,
interpersonal and textual are present significantly throughout
the kaafi. The poet successfully manages to keep himself in
place and praises the attributes of the mentor in this
connection.
While investigating the interplay of the meta functions in
the kaafi it was found that Bulleh Shah unfolds different
phases of its meaning; with ideational function placed at the
initial position and interpersonal situated at the final level. The
distribution of the processes among the participants or actors
demonstrates that the character of Ranjha, dominates the
scenario of the poem. The poet is addressing in a humble
tone about his feelings towards the mentor which reflects the
experiential function. All the three participants throughout the
Journal of Social Sciences and Humanities: Volume 26, Number 1, Spring 2018
134
kaafi differ from one another linguistically. Kuriyai, Ranjha,
Heer and Bulleya have different transitive roles.
Interpersonal and textual reference in addition to the
logic in the structure of the kaafi proves how clauses relate
to each other, and add to the semantic understanding of the
poetry. This attempt to carry out a systemic functional
analysis shows that this model can help the researchers
acquire a comprehensive vision of the literary messages
embedded in the narratives of Bulleh Shah. The structural
analysis provides contemplation of linguistic structures on
which the kaafi is developed. This intensifies the overall
understanding of the reader and deeper understanding of
the linguistic dimensions. The translation of each verse in
English provides a broad spectrum of meta functional
versatility and in fact leaves ideas for future researchers in
the area of comparisons, i.e., of original text (Punjabi) and
translated (English) text. The overall targets achieved through
this metafunctional analysis are the reader’s understanding
of textual meta function as a foundation for the
development of interpersonal and ideational functions in the
kaafi. These metafunctions as linguistic tools unfold the
multilayered meanings inherent in the kaafi.

Priya Avais, Muhammad Shaban & Nadia Anwar
135
Appendices: Sample Text رانجھا رانجھا کردی ھن میں آپے رانجھا ھوئی
Ranjha Ranjha kardi hun mai apey ranjha hoi
In the love of Ranjha I myself have become Ranjha
سدھو مینوں ڈھیڈو رانجھا ھیر نہ آکھو کوئی
Saddo mainu dheedo Ranjha heer na akho koi
Call me only Ranjha and do not call me heer
رانجھا من وچ من رانجھے وچ غیر خیال نہ کوئی
Ranjha mun which mun Ranjhay wich ghair khayal na koi.
Ranjha resides in my heart and my heart resides in Ranjha
(no one else can enter the realm of my heart.)
میں نہیں او آپے آپنی آپ کرے دل جوئی
Mai naahi oh apey apani aap kare diljoi
He himself tends to his heart
(me and Ranjha are one and we are in-separable)
جو کج ساڈے اندر وسے ذات اساں دی سوئے
Whatever resides in me is not appreciated
(later on we realize its significance)
Jo kujh saadey andar wasey zaat asan di soyi
جس دے نال میں نیوں لگایا اوھئیو جیسی ہوئی
Jis dey naal main niyo lagaya oho jaisi hoi.
Whomsoever I laid my eyes on
(i.e.Ranjha) I myself became like him
چٹی چادر ال سٹ کڑئیےپہن فقیر دی لوئی
Chitti chaddar la sutt kuriya pehan faqeeran di loyi
Take off the white cape o girl and wear the saint’s dress

Journal of Social Sciences and Humanities: Volume 26, Number 1, Spring 2018
136
نہ کوئیچٹی چادر داغ لگیسی لوئی داغ
Chitti chaddar dagh lageysi loyi daag na koi
The white sheet will show stains while the red cape will hide
your stains
تخت ھزارہ لے چل بلھیا سالین ملے نہ کوئی
Takht hazara le chal bulleya sayaalen mile na dhoyi
Take me to my beloved place called Takht Hazara (A sacred
place which otherwise is not in my naseeb (fate)) Takht
Hazara is my beloved place and I will not be able to be there
for long).
رانجھا رانجھاکردی میں ہن آپے رانجھا ہوئی
Ranjha Ranjha kardi main hun Apey Ranjha hoyi
Priya Avais, Muhammad Shaban & Nadia Anwar
137
References
Books with One Author:
Babbie, E. (1992).The Practice of Social Research. Berkely Books. Benelson, B. (1952).Content Analysis in Communicative
Research. Routledge. Chopra,R. (1999).The Great Sufis of Punjab. Ferozsons. Christian, M.A.K Halliday. (1997). Systemic Functional
Grammar: A First Step into the Theory. Maple Leaf Publications Coffin,C. (2006).The Heer Ranjha Dichotomy. Canada. Faber&
Faber Dachev, T.(2007).The Convention of Coloureme. Deakin
University Press. David,R. (2014). Artisians,Sufis and Shrines: Colonial
Architecture. Dover Publications. David,R. (2003).Working with Discourse: Meanings Beyond the
Clause. G. P.Putman’s Sons. Duggal,K. (2009). Sain Bulleh Shah: Transcreated by Kartar
Singh Duggal. New Delhi: National Book Trust. Eggins,S.(1994). An introduction to Systemic Functional
Linguistics. London. Printer Publishers Emerson, W.(2009).Reconciling religion: Bulleh Shah and
Ralph Waldo Emerson. Kindle Edition
Journal of Social Sciences and Humanities: Volume 26, Number 1, Spring 2018
138
Fontaine, (2012). Analysing English Grammar. Paris. Jean de La Fontaine's Books.
Fontaine, (2013). Analysing English Grammar: A Systemic
Functional Introduction. Paris. Jean de La Fontaine's Books Fowler, R.(1996), On Critical Linguistic Texts and Practices
Readings in Critical Discourse Analysis. Pittsberg Pennsylvania. Dorrancepublishing.com
Fowler, J1996, Faithful Change: The Personal and Public
Challenges of Postmodern life. London. Longman Genette, G. (1998), Developing Narratology. Ithaca. New York.
Cornell University Press. Gleech, (1999),Consistency and Accuracy in Correcting
Automatically Tagged Data. London Longman. Halliday,M. (1994). Functional Grammar.2nd Edition. Shffield.
London. Equinox. Halliday, M. (1994).Language as a Social Semiotic. Cambridge.
Cambridge University Press. Halliday, M. (2003).An Introduction On the Architecture of
human languages. New York. Continuum International Publishing.
Halliday, (2004).Spoken and Written modes of Meanings.
Washington, D.C. Georgetown University Press. Hassan, R. (2009).Wanted; a Theory for Integrated
Sociolinguistics. Oxford. Wiley-Blackwell. Jhonathan.J The Spirit of Islamic Calligraphy. London.
Permalink.
Priya Avais, Muhammad Shaban & Nadia Anwar
139
Kress,G. (1985).Linguistic Process in Sociocultural Practice. Geelong. Australia. Deakin
University Press. Kress,G. (2002), Multimodal Discourse. Geelong. Australia.
Deakin University Press. Leckie,T.H. (1993).The Specification of a Text: Register Genre &
Language Teaching. Ghadessy. Bloomsbury. Publishing. Leech, G. (1969).A Linguistic Guide to English Poetry. London.
Longman Matthiessen, (1995). Lexicogarmmatical Cantography.
Elsevier. Amsterdam International Language Sciences Publishers.
Mathinessen, (2004).An Introduction to Functional Grammar, 33rd Edition London. Edward Elgar Publishing.
Micheler,J. (2009).Novels, Sweep Through the History Places.
New York Times, November 5th 2009. Peterson.B,(2013).Literary Tribute: Kar Key Thaiya Thaiya.
London. Longman. Teadlock.D,(1983).The Spoken Word and the Work of
Interpretation. Westminister. London. Penguin. Teadlock.D,(1993).Breath on the Mirror: Mystic Voices and
Visions of the Living. Mayan. Mexico. Amazon. Teadlock.D,(1996).The Definitive Edition of the Mayan Book of
the Dawn of life. Mexico. Amazon. Teadlock.D, (1999). Finding the Centre:The Art of the Zuni
Stroryteller. Georgia.Better world Books.
Journal of Social Sciences and Humanities: Volume 26, Number 1, Spring 2018
140
Thompson.G,(2004) Introducing Functional Grammar.2nd Edition. London. Edward Arnold.
Webster .M,Encyclopedia of World Religions .Cambridge.
University Press Wilcock,G. (2001).Synthesis Lecture on Human Language
Technologies. San Rfael. California. Morgan& Claypool Press. Research Papers: Bhatti, I. (2015) http://en,org/Iryati.lums.edu.pk. Books with Two Authors: Sylva.D, &Joyec .H.(1999) .Focus on Grammar. Sydney. Opera
Publications. David, R. (2003).Working with Discourse: Meanings Beyond
the Clause. Cambridge. Cambridge University Press. Downing. A & Phillip.L (2002). A University Course in English
Grammar. London. Routledge Halliday, M. & Matthiessen, I. (2004) Introduction to
Functional Grammar. Oxford. Oxford University Press. Newsletter: Ghassan. J. Sufi Chivilary. January 2017. Muhammad Badar Alam-How to Read Bulleh Shah. Updated 2017. https://books.google.com.pk/books?hl=en&lr=&id=nigKYe5It9IC&oi=fnd&pg=PP2&dq=Tedlock+on+interpretation&ots=ShQwbggW14&sig=VIJVoe88_Bp1JiqmOUZGS7xVKPQ#v=onepage&q=Tedlock%20on%20interpretation&f=true
Ihtesham Khan*
Adnan Ahmad**
Muhammad Tahir Khan***
Muhammad Ilyas****
The Impact of GDP, Inflation,
Exchange Rate, Unemployment and
Tax Rate on the Non Performing
Loans of Banks: Evidence From
Pakistani Commercial Banks
ABSTRACT
One of the important determinants of the banking sector
performance are the loans advanced for the purpose of profit.
Thus, banks take loans and repayment as a yardstick.
Specifically, banks take a serious note of its repayments and
those loans, which either default or declared as Non-
Performing Loan (NPL). Many factors play an important role in
the repayment of loan advances as well as those that are
declared as NPLs. Such factors include but are not limited to
regulatory and institutional environment, bank-based micro
* PHD Scholar, Institute of Business Studies and Leader, Abdul Wali
Khan University, Mardan ** Assistant Professor, Institute of Business Studies and Leader, Abdul
Wali Khan University, Mardan *** Lecturer, Institute of Business Studies and Leader, Abdul Wali Khan
University, Mardan **** Lecturer, Institute of Business Studies and Leader, Abdul Wali Khan
University, Mardan
Journal of Social Sciences and Humanities: Volume 26, Number 1, Spring 2018
142
economic indicators and macroeconomic determinants. Thus,
the main purpose of this paper is to assess the macroeconomic
factors such as GDP growth rate, exchange rate, inflation,
unemployment and tax rate as determinants of NPL.
Secondary data of NPL is taken from the respective banks’
annual reports and the macroeconomic data from the World
Bank for the period 2006-2016. Using a panel data, both Uni-
variate and Bi-Variate analyses are used to investigate the
relationship of NPL with these macroeconomic variables. The
results show that GDP growth rate, exchange rate, tax rate,
inflation, and unemployment effect NPL in a respectively
different manner. The study conclude that macroeconomic
activities of a particular country are important indicators of a
sound financial institutional system.
Keywords: Macroeconomic Factors, Non Performing Loans
(NPL), Fixed Effect and Random Effect Least Square Regression
Analysis Techniques
Introduction
Financial institutions play the role of a back bone in an economy. Every sound economic system posess a strong financial system that has got the ability to absorb the financial crises (Dash & Kobra, 2012). The Central bank or the State bank of each country has the key role to play in this regard to prepare the financial institutions for such financial jolts. The economic sustainability of the economy largely depends upon the sound banking system. In sound economies it is the responsibility of the central banks to develop regulations and policies regarding the operational activities within a country. At the same time it is the responsibility of the banks to follow and implement those regulations and policies in their banks and report to state bank accordingly (Fofack, 2005). All the commercial
Ihtesham Khan, Adnan Ahmad, Muhammad Tahir Khan & Muhammad Ilyas
143
banks mostly adopt the basic rules by receiving money from the customers in shape of deposit and then disburse it to the customers in shape of advances, credit or loans. At the same time the banks give a certain percentage on the deposit to the depositors while receive profit on the advances disbursed to the creditors. Earning spread is a term that is being used as the difference between the borrower’s rate and depositor’s rate. The earning spread is the actual earnings of the banks. At times creditor fail to repay the advances along with its credit rate. This failure is being reported in the annual reports as Non Performing Loan (NPL). The higher the level of NPL rises the weaker will the banks’ ability to maintain a balance between the deposit and
advances ratio and it may lead to bankruptcy. Thus it has a strong effect on the financial system of an economy (Saba, Kouser & Azeem, 2012). That’s why NPL should be considered as tool to measure the sustainability of the banking system within an economy (Nkusu, 2011). There is no single way to measure or report the NPL levels in banks annual reports, it varies from region to region. Basel Committee (2001) defines NPL as the advances or loans that are not being paid for ninety days and more. Banks performance can be badly damaged by the increasing level of NPLs (DeYoung & Whalen, 1994). In USA the increasing level of NPLs in banks caused the financial crises (Sinkey & Greewalt, 1991). Fofack (2005) argues that in
African countries the main source of economic crises was the
rising levels of NPL. Both the developing and developed countries
showed that NPLs has an adverse effect on the financial sector of a
country. Dash and Kobra (2012) checks the relationship between macroeconomic variables and NPLs. There results showed that the high risk banks had greater chance towards defaulted loans.
In Pakistan same problem exists, the State bank of
Pakistan (SBP) has been trying hard in terms of keeping NPL
limits within control but for the last 25 years the NPLs figure
has not fallen below double digit (SBP, 2016). If we give a look
Journal of Social Sciences and Humanities: Volume 26, Number 1, Spring 2018
144
at the NPL levels in Pakistan the average level is 14.87% from
1995 till 2016. Currently Pakistan has been 24th in terms of
high levels of NPL countries (SBP, 2016).
Keeton and Morris (1987) were the pioneers, who
investigated the relationship between the macro-economic
variables and banks’ loan-quality. Their sample range contained
over 2400 commercial U.S. banks between 1979 and 1985, and
the study had nexuses the bank loan losses with the macro-
economic variables of the respective country. Pesola (2005)
investigating the banking vulnerabilities in Northern-Europe,
validated the connection between the macro level factors and
debt insolvencies. Now the question arises that do macroeconomic
variables have also the same effect on Pakistani banks performance
in shape of NPLs?
Research Question
The impact of macroeconomic factors on NPLs in commercial
banks of Pakistan. Review of Literature
NPL definition varies from country to country. NPLs are the bad loans that are due to be paid for 90 days or more (IMF, 2005). The State bank of Pakistan (2010) has also classified loans that are overdue for a specific period into different categories. The basic categories are three, i.e Substandard, doubtful and loss. If the loan installment is due by ninety days or more and is not being repaid will be termed as substandard loan. 25% provisioning will be done on the outstanding loan and will be termed as NPL. If the installment is overdue by 180 days or more will be termed as doubtful. 50% provision will be done on the outstanding loans. If the installment is overdue by one year or more their it will be
Ihtesham Khan, Adnan Ahmad, Muhammad Tahir Khan & Muhammad Ilyas
145
termed as loss and 100% provisioning will be done to the outstanding loan (SBP, 2016). Keeton and Morris (1987) are being considered as the pioneer in terms of establishment of relationship between the NPLs and macroeconomic factors of the country. They also concluded that one main reason behind high NPL levels are the bad position of the macroeconomic condition of the country. It was also being observed and analyzed that NPLs are not the direct contributor to the economy but it has an indirect effect of the whole economy (Drees & Pazrbasioglu, 1998). Now if remedial and timely measures are not being taken it may lead to financial crises in the economy. Adebola, Wan Yousaff and Dahalan (2011) are of the view
that a country owning macroeconomic factors has an impact on the financial performance of the banking sector. Initially the macro-economic variables will be elucidated, that might have an influence on the Non-Performing-loans and the macro-economic variables tend to yearly change in GDP, unemployment rate, Real exchange rate, Tax rate and Inflation rate. Although, the extant of Literature that had investigated the relationship between macroeconomic variables and NPL, and the findings had established only theoretical models rather than giving an empirical evidence. A negative relation exists between NPL and growth in GDP (Jimenez and Saurina, 2009). It is obvious that the growth in the income level of the people within an economy increases loan repayment capacity of the borrower. That at the end reduces the level of NPL in the banking sector of that economy (Khemraj and Pasha, 2009). Khemraj and Pasha (2009) had analyzed the relationship between the inflation rate and the NPL’s strength, they founded that a direct relationship exists between them. Although, on the contrary, Nkusu (2011) carried out a study and founded that the natural connection between non-performing loan and inflation rate can either be direct or inverse. Rationally, the increasing inflation rate will cause increase in the borrowers’ incomes while the physical value
Journal of Social Sciences and Humanities: Volume 26, Number 1, Spring 2018
146
of the credit will mitigate, thus the raising inflation rate will enhance the borrowers credit paying ability. Jimenez and Saurina (2005) had investigated the Spanish banking area and the data range was from 1984 to 2003, and they founded that a surge in NPLs is caused by the slow GDP growth, immense real interest charges and the expanded credit environment due to the easy credit conditions. Nkusu (2011) carried out a study and founded that the natural connection between non-performing loan and inflation rate can either be direct or inverse. A positive relationship exist between NPL and unemployment in an economy of the country (Gambera, 2000). But on the other hand theoretical back ground of this relationship shows that a negative
relationship exists between NPL and unemployment. If a person has availed loan from a bank and that person is an employed person. Suddenly he/she losses his/her job then how he/she will repay that loan so in that case NPL increases. In the same way if a business unit has availed loan facility from a bank and suddenly unemployment has hit the economy of the country this may reduce the demand level in that country because of the low purchasing power of the people then the repayment capacity of the borrower will be reduced. That at the end induces increase in the level of NPL in the country ( Louzis, Vouldis and Metaxas, 2012). Different researchers are of different views about the relation of exchange rate with NPL. Khemraj and Pasha (2009) are of the view that a positive relation exists between NPL and Real effective exchange rate. An increase in the exchange rate may effect the loan payment capacity of the borrower (Fofack, 2005) or on the other hand those borrowers who borrow loan in foreign currency then increase in exchange rate will have a positive relation. Interest is the sole income of banks from which the depositor’s rate, tax and other expenses are paid. Now, the banks strategically shift the tax expenses in their credit portfolios to the corporate sector or cleverly reduces the depositor’s rate (Albertazzi & Gambacorta, 2006). Hence, the
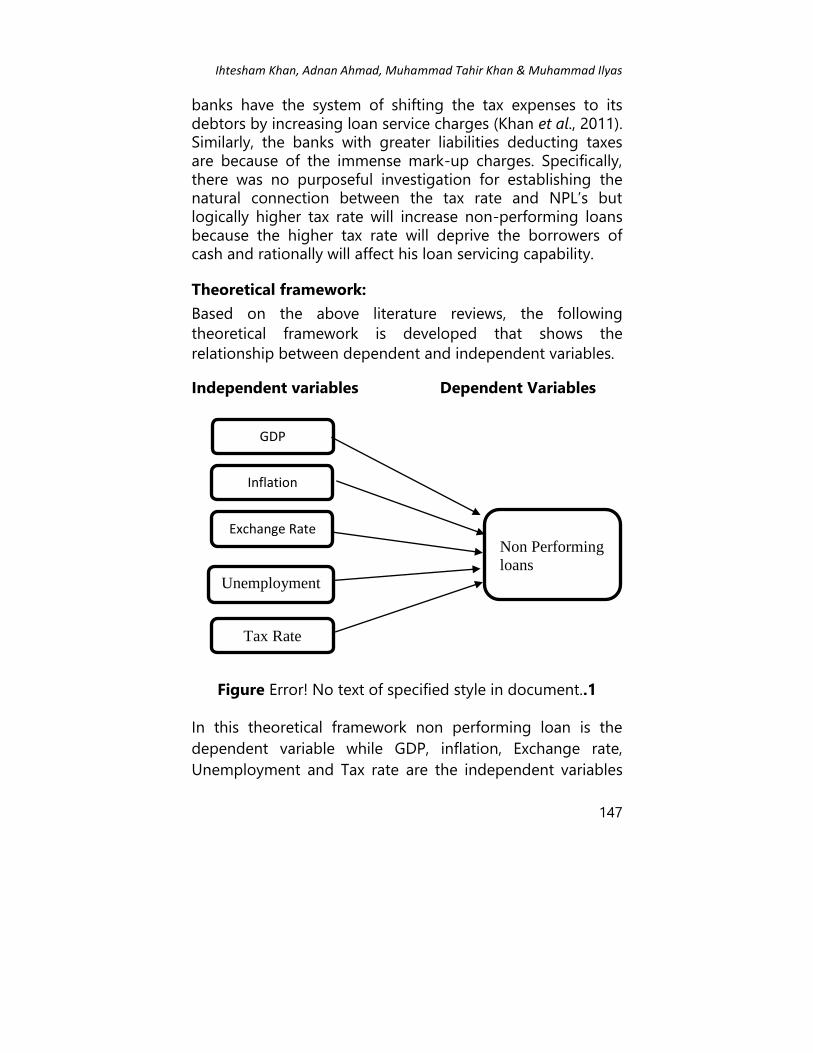
Ihtesham Khan, Adnan Ahmad, Muhammad Tahir Khan & Muhammad Ilyas
147
banks have the system of shifting the tax expenses to its debtors by increasing loan service charges (Khan et al., 2011). Similarly, the banks with greater liabilities deducting taxes are because of the immense mark-up charges. Specifically, there was no purposeful investigation for establishing the natural connection between the tax rate and NPL’s but logically higher tax rate will increase non-performing loans because the higher tax rate will deprive the borrowers of cash and rationally will affect his loan servicing capability.
Theoretical framework:
Based on the above literature reviews, the following
theoretical framework is developed that shows the
relationship between dependent and independent variables.
Independent variables Dependent Variables
Figure Error! No text of specified style in document..1
In this theoretical framework non performing loan is the
dependent variable while GDP, inflation, Exchange rate,
Unemployment and Tax rate are the independent variables
Unemployment
Tax Rate
Non Performing
loans
GDP
Inflation
Exchange Rate
Journal of Social Sciences and Humanities: Volume 26, Number 1, Spring 2018
148
that has an influence on Dependent variable either positive
or negative.
Data and Methodology
Data
The main purpose of this investigation is to get impact of GDP,
inflation, exchange rate, unemployment and tax rate on NPLs.
The selected sample time period is from 2006 to 2016. Total of
20 sample banks were selected based on the criteria their
operation started before 2006 and had not merged till 2016, so
that homogeneity can be created in the data set.
Methodology
Since this investigation was spawned to examine the
association between the non-performing loans and
macroeconomic elements, a rational analysis is carried by
following the deductive approach. A Deductive-analysis
mechanically causes the laws or principles to generalize
specific instance and the underlying study is pure-objective
in nature. Thus, quantitative-study technique is used to
analyze the outcome on the recognized causers of non-
performing loans.
Variables Used
Based on the above discussion the following variables are
being used mentioned in Table 1.

Ihtesham Khan, Adnan Ahmad, Muhammad Tahir Khan & Muhammad Ilyas
149
Table 1. Variables Description Variables Definition Sources
Non Performing
Loan (NPL)
GDP Growth Rate
Inflation Rate
Exchange Rate
Unemployment
Rate
Tax Rate
Non performing loans to total loans
Annual percentage growth rate of GDP at market
prices based on constant local currency.
Inflation as measured by the consumer price
index reflects the annual percentage change in
the cost to the average consumer of acquiring a
basket of goods and services that may be fixed or
changed at specified intervals, such as yearly.
Real effective exchange rate is the nominal
effective exchange rate divided by a price
deflator or index of costs.
Unemployment refers to the share of the labor
force and educated force that is without work but
available for and seeking employment.
Total tax rate measures the amount of taxes and
mandatory contributions payable by business
after accounting for allowable deductions and
exemptions as a share of commercial profits.
Banks Annual Reports
World Bank Database
World Bank Database
World Bank Database
World Bank Database
World Bank Database
Empirical Model
In order to assess the macroeconomic impact on the NPL the
following model is used.
NPLit= α + β1 GDP_GRRATEt + β2 INFLATt + β3 REERt + β4 UNEMPLt
+ + β5TAXRATEt+ it
Where:
NPL=Non Performing Loan
GDP_GRRATE= GDP Growth rate
INFLAT= Inflation Rate
REER=Real Exchange Rate
UNEMPL=Unemployment Rate
TAXRATE= TAX RATE
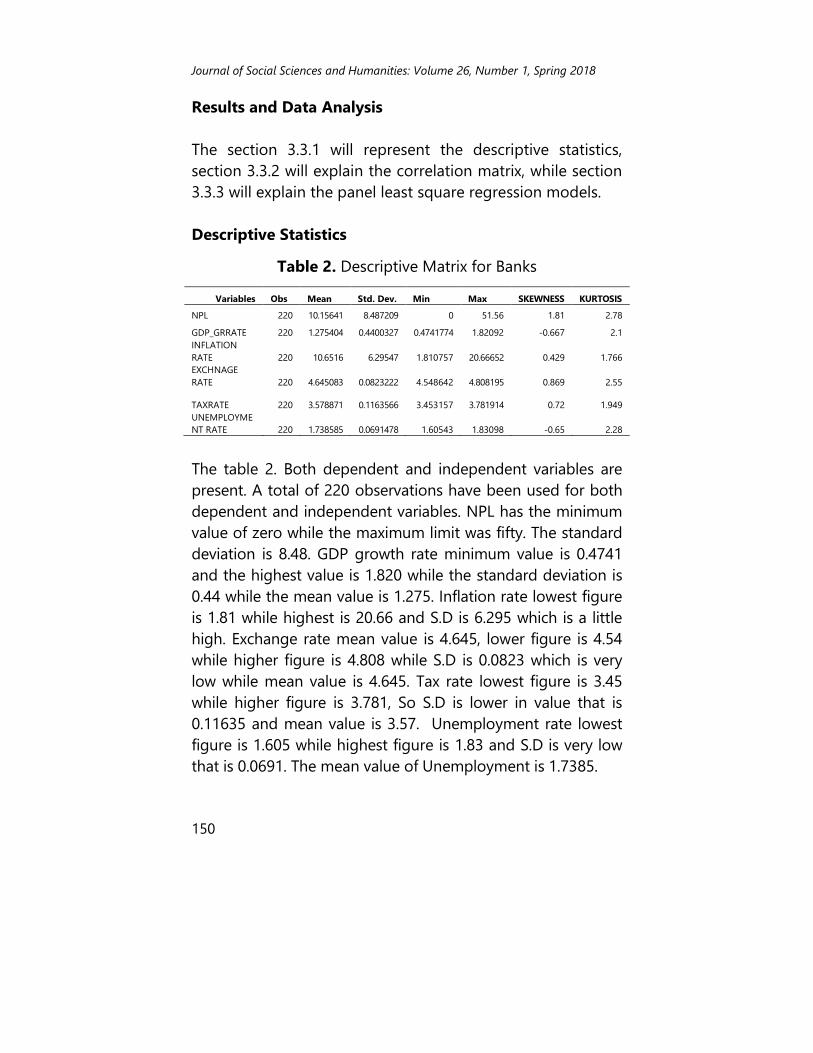
Journal of Social Sciences and Humanities: Volume 26, Number 1, Spring 2018
150
Results and Data Analysis
The section 3.3.1 will represent the descriptive statistics,
section 3.3.2 will explain the correlation matrix, while section
3.3.3 will explain the panel least square regression models.
Descriptive Statistics
Table 2. Descriptive Matrix for Banks
Variables Obs Mean Std. Dev. Min Max SKEWNESS KURTOSIS
NPL 220 10.15641 8.487209 0 51.56 1.81 2.78
GDP_GRRATE 220 1.275404 0.4400327 0.4741774 1.82092 -0.667 2.1
INFLATION
RATE 220 10.6516 6.29547 1.810757 20.66652 0.429 1.766
EXCHNAGE
RATE 220 4.645083 0.0823222 4.548642 4.808195 0.869 2.55
TAXRATE 220 3.578871 0.1163566 3.453157 3.781914 0.72 1.949
UNEMPLOYME
NT RATE 220 1.738585 0.0691478 1.60543 1.83098 -0.65 2.28
The table 2. Both dependent and independent variables are
present. A total of 220 observations have been used for both
dependent and independent variables. NPL has the minimum
value of zero while the maximum limit was fifty. The standard
deviation is 8.48. GDP growth rate minimum value is 0.4741
and the highest value is 1.820 while the standard deviation is
0.44 while the mean value is 1.275. Inflation rate lowest figure
is 1.81 while highest is 20.66 and S.D is 6.295 which is a little
high. Exchange rate mean value is 4.645, lower figure is 4.54
while higher figure is 4.808 while S.D is 0.0823 which is very
low while mean value is 4.645. Tax rate lowest figure is 3.45
while higher figure is 3.781, So S.D is lower in value that is
0.11635 and mean value is 3.57. Unemployment rate lowest
figure is 1.605 while highest figure is 1.83 and S.D is very low
that is 0.0691. The mean value of Unemployment is 1.7385.
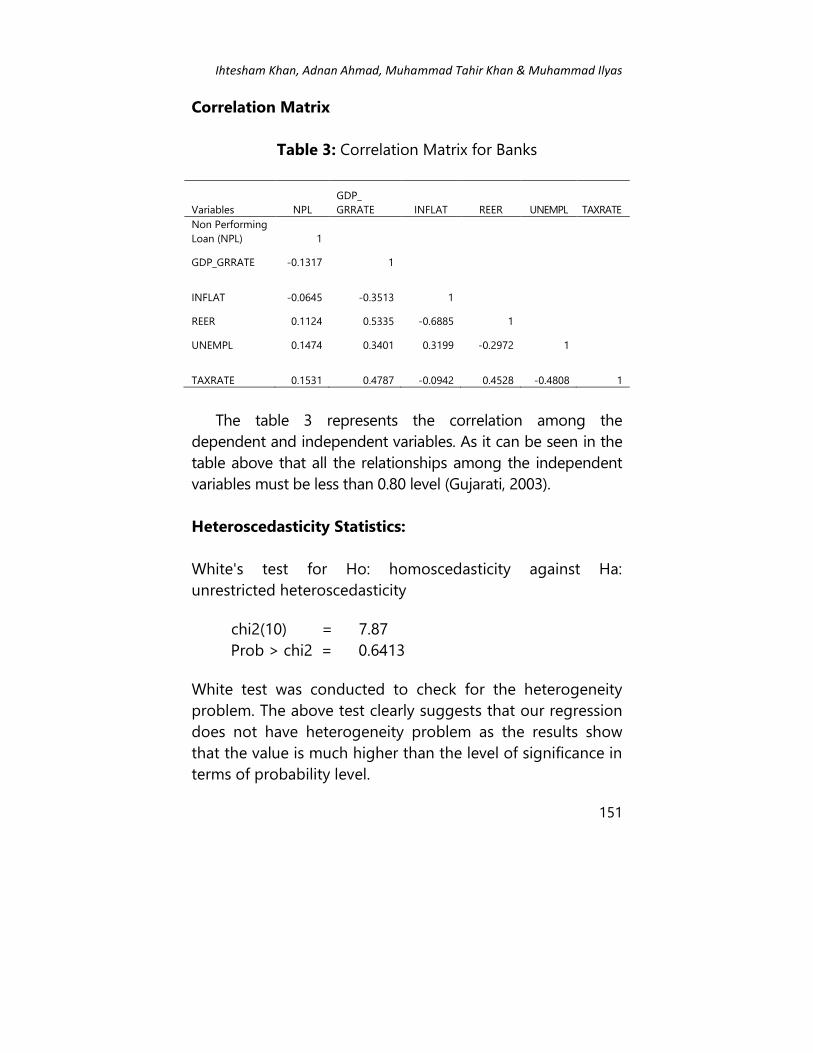
Ihtesham Khan, Adnan Ahmad, Muhammad Tahir Khan & Muhammad Ilyas
151
Correlation Matrix
Table 3: Correlation Matrix for Banks
Variables NPL
GDP_
GRRATE INFLAT REER UNEMPL TAXRATE
Non Performing
Loan (NPL) 1
GDP_GRRATE -0.1317 1
INFLAT -0.0645 -0.3513 1
REER 0.1124 0.5335 -0.6885 1
UNEMPL 0.1474 0.3401 0.3199 -0.2972 1
TAXRATE 0.1531 0.4787 -0.0942 0.4528 -0.4808 1
The table 3 represents the correlation among the
dependent and independent variables. As it can be seen in the
table above that all the relationships among the independent
variables must be less than 0.80 level (Gujarati, 2003).
Heteroscedasticity Statistics:
White's test for Ho: homoscedasticity against Ha:
unrestricted heteroscedasticity
chi2(10) = 7.87
Prob > chi2 = 0.6413
White test was conducted to check for the heterogeneity
problem. The above test clearly suggests that our regression
does not have heterogeneity problem as the results show
that the value is much higher than the level of significance in
terms of probability level.
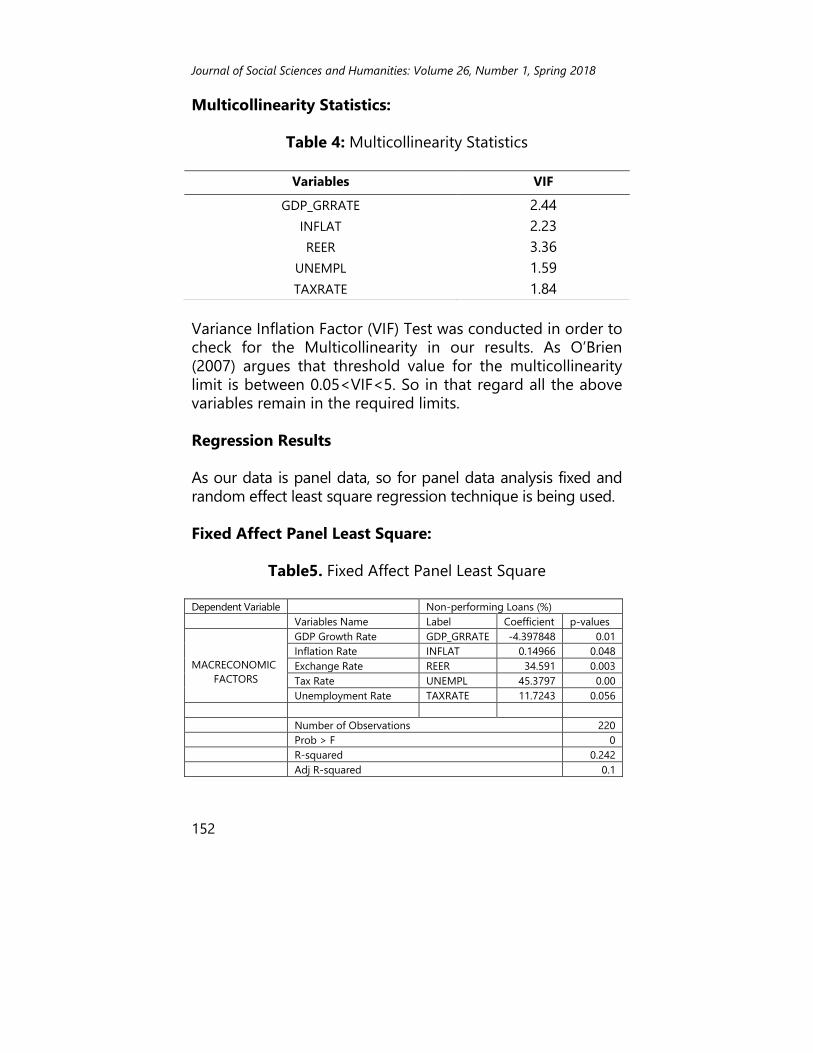
Journal of Social Sciences and Humanities: Volume 26, Number 1, Spring 2018
152
Multicollinearity Statistics:
Table 4: Multicollinearity Statistics
Variance Inflation Factor (VIF) Test was conducted in order to check for the Multicollinearity in our results. As O’Brien (2007) argues that threshold value for the multicollinearity limit is between 0.05<VIF<5. So in that regard all the above variables remain in the required limits. Regression Results As our data is panel data, so for panel data analysis fixed and random effect least square regression technique is being used. Fixed Affect Panel Least Square:
Table5. Fixed Affect Panel Least Square
Dependent Variable Non-performing Loans (%)
Variables Name Label Coefficient p-values
MACRECONOMIC
FACTORS
GDP Growth Rate GDP_GRRATE -4.397848 0.01
Inflation Rate INFLAT 0.14966 0.048
Exchange Rate REER 34.591 0.003
Tax Rate UNEMPL 45.3797 0.00
Unemployment Rate TAXRATE 11.7243 0.056
Number of Observations 220
Prob > F 0
R-squared 0.242
Adj R-squared 0.1
Variables VIF
GDP_GRRATE 2.44
INFLAT 2.23
REER 3.36
UNEMPL 1.59
TAXRATE 1.84
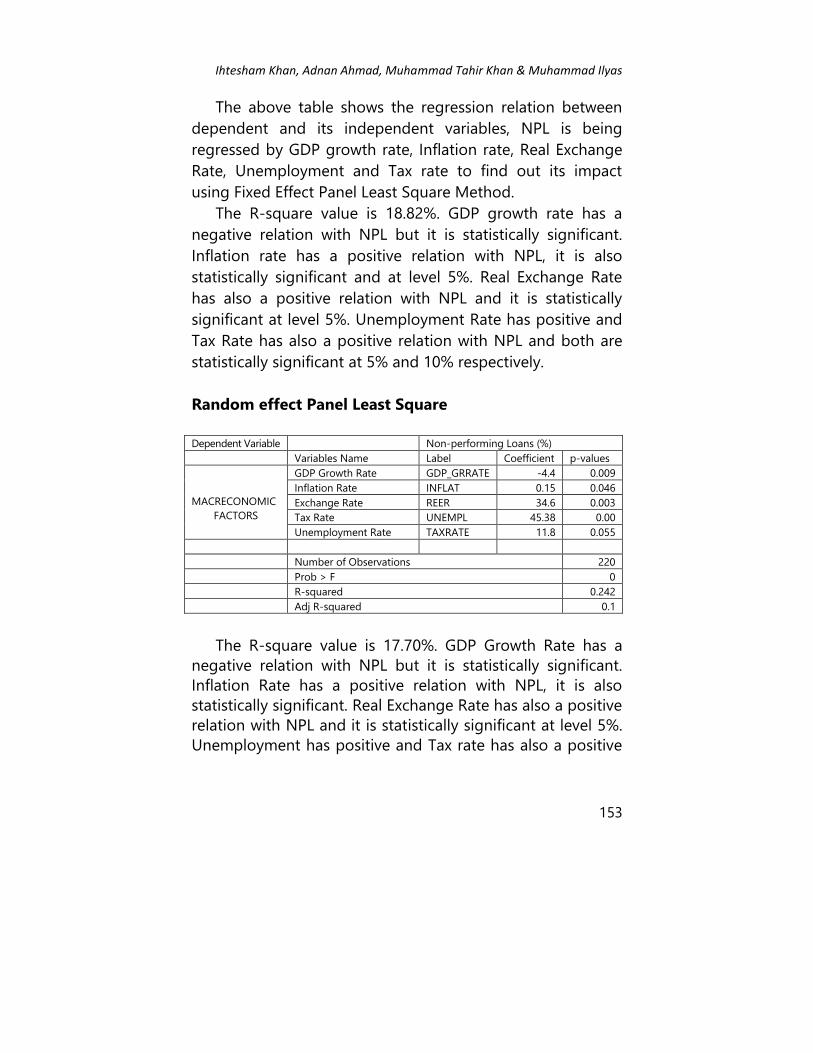
Ihtesham Khan, Adnan Ahmad, Muhammad Tahir Khan & Muhammad Ilyas
153
The above table shows the regression relation between
dependent and its independent variables, NPL is being
regressed by GDP growth rate, Inflation rate, Real Exchange
Rate, Unemployment and Tax rate to find out its impact
using Fixed Effect Panel Least Square Method.
The R-square value is 18.82%. GDP growth rate has a
negative relation with NPL but it is statistically significant.
Inflation rate has a positive relation with NPL, it is also
statistically significant and at level 5%. Real Exchange Rate
has also a positive relation with NPL and it is statistically
significant at level 5%. Unemployment Rate has positive and
Tax Rate has also a positive relation with NPL and both are
statistically significant at 5% and 10% respectively.
Random effect Panel Least Square
Dependent Variable Non-performing Loans (%)
Variables Name Label Coefficient p-values
MACRECONOMIC
FACTORS
GDP Growth Rate GDP_GRRATE -4.4 0.009
Inflation Rate INFLAT 0.15 0.046
Exchange Rate REER 34.6 0.003
Tax Rate UNEMPL 45.38 0.00
Unemployment Rate TAXRATE 11.8 0.055
Number of Observations 220
Prob > F 0
R-squared 0.242
Adj R-squared 0.1
The R-square value is 17.70%. GDP Growth Rate has a
negative relation with NPL but it is statistically significant.
Inflation Rate has a positive relation with NPL, it is also
statistically significant. Real Exchange Rate has also a positive
relation with NPL and it is statistically significant at level 5%.
Unemployment has positive and Tax rate has also a positive
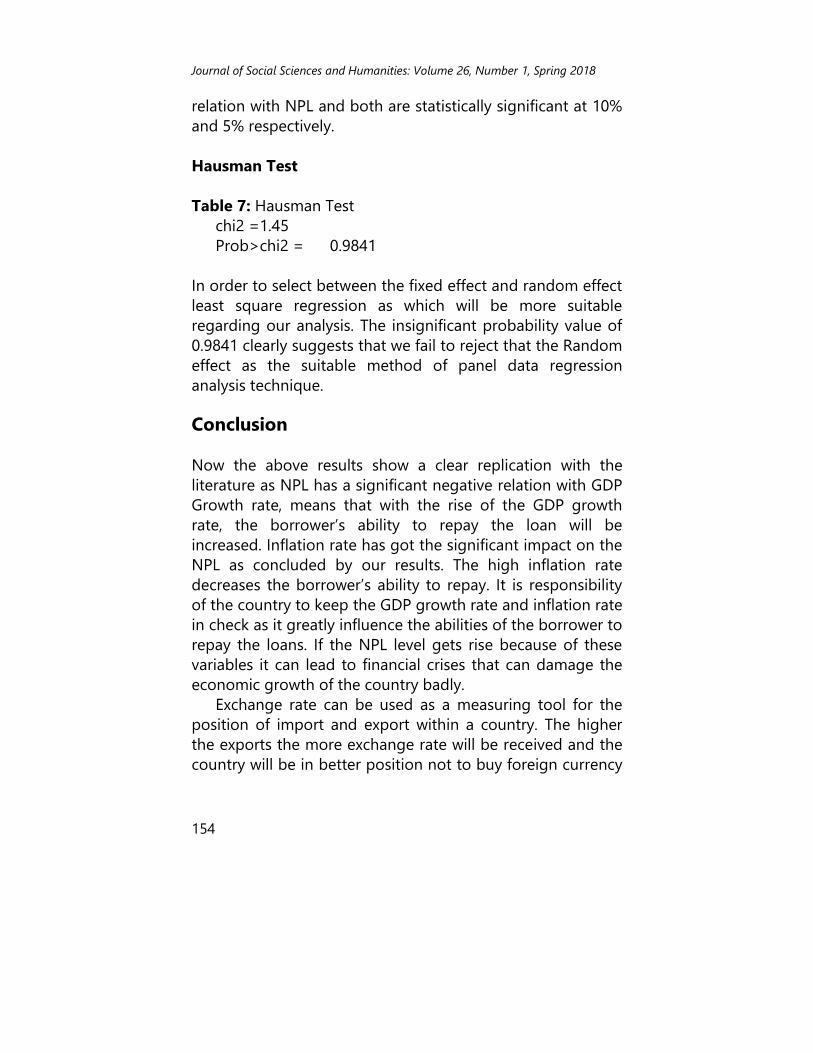
Journal of Social Sciences and Humanities: Volume 26, Number 1, Spring 2018
154
relation with NPL and both are statistically significant at 10%
and 5% respectively.
Hausman Test
Table 7: Hausman Test
chi2 =1.45
Prob>chi2 = 0.9841
In order to select between the fixed effect and random effect
least square regression as which will be more suitable
regarding our analysis. The insignificant probability value of
0.9841 clearly suggests that we fail to reject that the Random
effect as the suitable method of panel data regression
analysis technique.
Conclusion
Now the above results show a clear replication with the
literature as NPL has a significant negative relation with GDP
Growth rate, means that with the rise of the GDP growth
rate, the borrower’s ability to repay the loan will be
increased. Inflation rate has got the significant impact on the
NPL as concluded by our results. The high inflation rate
decreases the borrower’s ability to repay. It is responsibility
of the country to keep the GDP growth rate and inflation rate
in check as it greatly influence the abilities of the borrower to
repay the loans. If the NPL level gets rise because of these
variables it can lead to financial crises that can damage the
economic growth of the country badly.
Exchange rate can be used as a measuring tool for the
position of import and export within a country. The higher
the exports the more exchange rate will be received and the
country will be in better position not to buy foreign currency
Ihtesham Khan, Adnan Ahmad, Muhammad Tahir Khan & Muhammad Ilyas
155
for payment of the imports. In this process exchange rate is
considered as the tool to check the levels of the exports and
imports. The exchange rate has a positive relation with NPL.
The higher the level of exchange rate the higher will be the
level of NPL.
The global financial crises in 2008 has been triggered
mostly because of the crises in mortgage banking (Makri,
2015). The reason was the rise of the unemployment levels in
USA, most of the mortgage holders got unemployed
because of that they were unable to repay the mortgage
installments. In our analysis a positive significant relation was
established in the unemployment rate and NPLs levels in
Pakistan. A positive relation was analyzed between the Tax
rate and NPL ratio. The higher the level of the tax rate the
lesser will the ability of the borrower to repay the loans.
At the end, we may conclude that the government and the
State Bank of Pakistan have to play their roles in order to keep
the Levels of NPL within control, A strong role should be
played to keep the GDP growth rate on rise while at the same
time keep the Inflation rate, Exchange rate, Unemployment
rate and tax rate low. So that a sustainable financial and
economic growth can be achieved by the country.
Future Research
The following areas may be looked at for the future research.
Corporate governance should be checked in terms of its
impact of NPLs.
Institutional factors should also be taken into
consideration as it may also contribute to the changing
nature of NPLs.
Time span can be increased to see its long term impact
and its influence by different variables.
Journal of Social Sciences and Humanities: Volume 26, Number 1, Spring 2018
156
References Aburime, U. T. (2009). Impact of Political Affiliation on Bank
Profitability in Nigeria. African Journal of Accounting, Economics, Finance, and Banking Research , 4(4), 61-75.
Adebola, S. S., & Yusoff, W. S. b., & Dahalan, DJ (2011). An
ardl Approach to the Determinants of Nonperforming Loans. Kuwait Chapter of Arabian Journal of Business and Management Review, 1(2).
Ahmed, F., & Bashir, T. (2013): Explanatory Power of
Macroeconomic Variables as Determinants of Non-Performing Loans: Evidence Form Pakistan, World Applied Sciences Journal 22 (2): 243-255, ISSN 1818-4952
Agresti, A.-M., Baudino, P., & Poloni, P. (2008). The ECB and
IMF Indicators for the Macro-prudential Analysis of the Banking Sector. European Central Bank.
Asari, F., Muhamad, N., Ahmad, W., Latif, N., Addullah, N., &
Jusoff, K. (2011). An Analysis of non-performing loan, Interest Rate and Inflation Rate Using Stata Software. World Applied Sciences Journal, 12, 41-48.
Ayalew, T. (2009). SCHOOL OF LAW (Doctoral Dissertation,
Addis Ababa University). Babouèek, I. and M. Janèar, 2005. Effects of Macroeconomic
Shock to the Quality of the Aggregate Loan Portfolio. Czech National Bank Working Paper Series, No., 1: 1-62.
Badar, M., & Yasmin Javid, A. (2013). Impact of
Macroeconomic Forces on Nonperforming Loans: An Empirical Study of Commercial Banks in Pakistan. WSEAS Transactions on Business & Economics, 10(1).
Basel Committee.(2001). Sound Practices for the Management
and Supervision of Operational Risk. Basel Committee on Banking Supervision.
Ihtesham Khan, Adnan Ahmad, Muhammad Tahir Khan & Muhammad Ilyas
157
Festic, Mejra., Kavkler, Alenka. and Repina, Sebastijan, 2011.
The Macroeconomic Sources of Systemic Risk in the Banking Sectors of Five New EU Member States. Journal of Banking and Finance, 35: 310-322.
Berger, A.N., DeYoung, R. (1997), Problem Loans and Cost
Efficiency in Commercial Banks. Journal of Banking and Finance, 21(6), 849‐870.
Berge, T.O., Boye, K.G., 2007. An Analysis of Bank’s Problem
Loans. Norges Bank Economic Bulletin 78, 65–76.
Bloem, A.M. and Gorter, C.N., 2001. The Treatment of Non-Performing Loans in Macroeconomic Statistics. IMF Working Paper, WP/01/209.
Boudriga Abdelkader , Boulila T. Neila and JellouliSana
(2009): Bank Specific, Business and Institutional, Environment Determinants of Nonperforming Loans: Evidence from MENA Countries, Journal of Financial Economic Policy, Vol. 1 No. 4, Pp. 286-318
Bofondi, M. and Ropele, T. (2011). Macroeconomic
Determinants of Bad Loans: Evidence from Italian Banks. Occasional Papers, 89.
Borio, C. and P. Lowe, 2002. Asset Prices, Financial and
Monetary Stability: Exploring the Nexus. BIS Working Papers, No. 114, Bank for International Settlements, Basel.
Boyd, J. H., & De Nicolo, G. (2005). The Theory of Bank Risk
Taking and Competition Revisited. The Journal of Finance, 60(3), 1329-1343.
Brownbridge, M. (1998, March). The Causes of Financial Distress in Local Banks in Africa and Implications for Prudential Policy. United Nations Conference on Trade and Development.
Journal of Social Sciences and Humanities: Volume 26, Number 1, Spring 2018
158
C. Brown, D.J. Mallet & M.G. Taylor.1993 Banks: an Industrial Accounting and Auditing Guide. Great Britain: Page Bros Ltd Ning Guo, Causes and Solutions of Non-performing Loans in Chinese Commercial Banks, Chinese Business Review, ISSN1537-1506, Vol. 6, No, 6, 2007
Calvo, A.G. and E. Mendoza, 2000. Contagion, Globalization
and the Volatility of Capital Flows. In: S. Edwards, Ed.), Capital Flows and Emerging Economies. University of Chicago Press, Chicago.
Camerer, C. F., & Johnson, E. J. (1997). 10 The process-
Performance Paradox in Expert Judgment: How can Experts Know so Much and Predict so Badly?.Research on Judgment and Decision Making: Currents, Connections, and Controversies, 342.
Chijoriga, M. (1997). Application of Credit Scoring and
Financial Distress Prediction Models to Commercial Banks Lending: The Case of Tanzania. Wirts Chaftsnnversitat Wien (WU), Vienna.
Collin‐Dufresne, P., & Goldstein, R. S. (2001). Do Credit Spreads Reflect Stationary Leverage Ratios? The Journal of Finance, 56(5), 1929-1957.
Collins, N.J. and Wanju, K., 2011. The Effects of Interest Rate
Spread on the Level of Nonperforming Assets: A Case of Commercial Banks in Kenya. International Journal of Business and Public Management, Vol. 1, No.1.
Dash, M., and Kabra, G. (2010). The Determinants of non-
Performing Assets in Indian Commercial Bank: An Econometric Study. Middle Eastern Finance and Economics, 7, 94-106.
Djiogap Fouopi and Ngomsi Augustin(2012): Determinants of
Bank Long-Term Lending Behavior in the Central African Economic and Monetary Community (CEMAC), Review of Economics &Finance; 1923-7529-2012-02-107-08,
Ihtesham Khan, Adnan Ahmad, Muhammad Tahir Khan & Muhammad Ilyas
159
De Juan, A. (2003). From Good Bankers to Bad Bankers: Ineffective Supervision and Management Deterioration as Major Elements in Banking Crises. Journal of Banking Regulation, 4(3), 237-246
DeYoung, Robert, and Gary Whalen. (1994). Is a Consolidated
Banking Industry a More Efficient Banking Industry? Office of the Comptroller of the Currency,13(3).
Drees, M. B., & Pazarbasioglu, C. (1998). The Nordic Banking
Crisis: Pitfalls in Financial Liberalization (No. 161). International Monetary Fund.
Dinc, I. S. (2005). Politicians and Banks: Political Influences on
Government-owned Banks in Emerging Markets. Journal of Financial Economics , 453-479.
Espinoza, R. A., & Prasad, A. (2010). Nonperforming Loans in
the GCC Banking System and their Macroeconomic Effects. IMF Working Papers, 1-24.
Fofack, H. (2005). Nonperforming Loans in Sub-Saharan
Africa: Causal Analysis and Macroeconomic Implications (Working Paper No. 3769).World Bank Policy Research.
Gambera, M. (2000). Simple Forecasts of Bank Loan Quality in
the Business Cycle. Chicago, IL: Federal Reserve Bank of Chicago.
Geletta, W. N. 2012. Determinants of Non-performing Loans:
The Case of Ethiopian Banks, Unpublished Master’s Thesis, University of South Africa.
Gonzalez-Hermosillo, B. (1999). Determinants of ex-ante
Banking System Distress: A Macro-micro Empirical Exploration of Some Recent Episodes. International Monetary Fund
Gujarati,D.(2003). Basic Econometrics (4th ed.).New
York:McGraw Hill Habib,S., Masood, H., H., Hassan, S.T.,
Journal of Social Sciences and Humanities: Volume 26, Number 1, Spring 2018
160
Mubin, M. & Baig, U.(2014). Operational risk Management in Corporate and Banking Sector of Pakistan. Information and Knowledge Management, 4(5), 58-66
Habtamu Negussie (2012): Determinants of Bank Profitability:
An Empirical Study on Ethiopian Private Commercial Banks: Published thesis (MSC), Addis Ababa University
Haneef Djiogap Fouopi and Ngomsi Augustin(2012):
Determinants of Bank Long-Term Lending Behavior in the Central African Economic and
Monetary Community (CEMAC), Review of Economics &Finance; 1923-7529-2012-02-107-08,
Hoque, M.Z. and Hossain, M.Z., 2008. Flawed Interest rate policy and loan default: experience from developing country. International review of business research papers, Col.5, No.5, 235-246.
Hassan, H. U., Ilyas, M., & Rehman, C. A. (2015). Quantitative
Study of Bank-Specific and Social factors of Non-Performing Loans of Pakistani Banking Sector. International Letters of Social and Humanistic Sciences (ILSHS), 2, 192-213.
Hu, J., Yang, L. & Yung-Ho, C. (2006). Ownership and Nonperforming Loans: Evidence from Taiwan’s Banks. Developing Economies.
Hu, J.L., Li, Y., Chiu, Y.H. (2004), Ownership and
Nonperforming Loans: Evidence from Taiwan’s Banks. The Developing Economies, 42(3), 405-420.
Hu, Jin-Li, Yang Li & Yung-Ho, Chiu. 2006. Ownership and
Non-performing Loans: Evidence from Taiwan’s Banks. Developing Economies.

Ihtesham Khan, Adnan Ahmad, Muhammad Tahir Khan & Muhammad Ilyas
161
Hughes, J. P., Lang, W., Mester, L. J., & Moon, C.-G. (1996). Efficient Banking Under Interstate Branching. Journal of Money, Credit and Banking, 1045-1071.
Jiménez, G., Salas, V., & Saurina, J. (2009). Organizational
distance and use of collateral for business loans. Journal of Banking & Finance, 33(2), 234-243.
Kaplin, A., Levy, A., Qu, S., Wang, D., Wang, Y., & Zhang, J.
(2009). The relationship between default risk and interest rates: An empirical study. Moody’s Analytics, Moody’s KMV Company.
Keeton, W. R. (1999). Does Faster Loan Growth Lead to
Higher Loan Losses? Economic Review-Federal Reserve Bank of Kansas City, 84, 57-76.
Keeton W. & C. S. Morris .(1987). Why Do Banks’ Loan Losses
Differ? Federal Reserve Bank of Kansas City, Economic Review, May, pp. 3‐21.
Khemraj, T., & Pasha, S. (2009). The Determinants of Non-
Performing Loans: an Econometric Case Study of Guyana. Khwaja, A. I., & Mian, A. (2005). Do Lenders Favor Politically
Connected Firms? Rent Provision in an Emerging Financial market. The Quarterly Journal of Economics, 120(4), 1371-1411.
Kwack, S. Y. (2000). An Empirical Analysis of the Factors
Determining the Financial Crisis in Asia. Journal of Asian Economics, 11(2), 195-206.
Lee, C. C. (2005), Energy Consumption and GDP in
Developing Countries: A Cointegrated Panel Analysis”, Energy Economics, Vol. 27, pp. 415-427.
Louzis, D.P., Vouldis, A.T., Metaxas, V.L. (2010),
Macroeconomic and Bank Specific Determinants of Nonperforming Loans in Greece: a Comparative Study of
Journal of Social Sciences and Humanities: Volume 26, Number 1, Spring 2018
162
Mortgage, Business and Consumer Loan Portfolios. Bank of Greece, Working Paper, n°118.
Louzis, D. P., Vouldis, A. T., & Metaxas, V. L. (2011).
Macroeconomic and Bank-specific Determinants of non-Performing Loans in Greece: A Comparative Study of Mortgage, Business and Consumer loan Portfolios. Journal of Banking & Finance, 36(4), 1012-1027.
Makri, V. (2015). What Triggers Loan Losses? An Empirical
Investigation of Greek financial sector. Makri Vasiliki, Tsagkanos Athanasios and Bellas
Athanasios(2014): Determinants of Nonperforming Loans: The Case of Eurozone” Panoeconomicus, Volume 2, Pp. 193-206 Mileris
Masood, O. (2009). Determinants of Non-performing Bank
Loans and Bank Loan Recovery in Pakistan A Survey Approach. Euro-Mediterranean Economics And Finance Review , 89-104.
Masood, O., Bellalah, M., & Mansour, W. (2010). Non-Performing Bank Loans and Credit Managers’ Role:A Comparative Approach from Pakistan and Turkey. International Journal Of Business , 15(3), 347-362.
Nanto, D. K., & Sinha, R. (2002). China's Banking Reform.
Post-Communist Economies, 14(4), 469-493. Nkusu, M. (2011). Nonperforming Loans and Macro Financial
Vulnerabilities in Advanced Economies. IMF Working Papers, 1-27.
Patersson, Jessica & Isac Wadman.2004 . Non- Performing
Loans-The Markets of Italy and Sweden, Uppsala University Thesis, Department of Business Studies.
Patnaik, I., & Shah, A. (2004). Interest Rate Volatility and Risk
in Indian Banking(Vol. 4). International Monetary Fund.
Ihtesham Khan, Adnan Ahmad, Muhammad Tahir Khan & Muhammad Ilyas
163
Podpiera, J., Weill, L. (2008), Bad Luck or Bad Management? Emerging Banking Market Experience. Journal of Financial Stability, 4(2), 135-148.
Ranjan Rajiv and D. Chandra Sarat(2003): Non-Performing
Loans and Terms of Credit of Public Sector Banks in India: An Empirical Assessment; India, Reserve Bank of India Occasional Papers Vol. 24, No. 3,
Rajan, R., & Dhal, S. C. (2003). Non-performing Loans and
Terms of Credit of Public Sector Banks in India: An Empirical Assessment. Occasional Papers, 24(3), 81-121.
Ranjan Rajiv and D. Chandra Sarat(2003): Non-Performing
Loans and Terms of Credit of Public Sector Banks in India: An Empirical Assessment; India, Reserve Bank of India Occasional Papers Vol. 24, No. 3,
Reynolds, S. E., Ratanakomut, S., & Gander, J. (2000). Bank financial structure in pre-crisis East and Southeast Asia. Journal of Asian Economics,11(3), 319-331.
Rinaldi, L., Sanchis-Arellano, A., 2006. Household Debt
Sustainability: What Explains Household Non-performing Loans? An Empirical Analysis. ECB Working Paper.
Saba, Irum., Kouser Rehana & Azeem Muhammad. (2012).
Determinants of non performing loans: Case of US banking sector. The Romanian Economic Journal, 15(44), 125-136
Sahir, M. H. and A. H. Qureshi (2007), “Specific Concerns of
Pakistan in the Context of Energy Security Issues and Geopolitics of the Region”, Energy Policy, Vol. 35, pp. 2031-2037.
Salas, V. & Saurina, J. (2002). Credit Risk in Two Institutional
Regimes: Spanish Commercial and Savings Banks. Journal of Financial Services Research, 22 (3), 203-224.
Journal of Social Sciences and Humanities: Volume 26, Number 1, Spring 2018
164
Sinkey, J. F. (1992). Commercial Bank Financial Management in the Financial Services Industry. Macmillan New York, NY.
Sinkey, J. F. & Mary B. G. (1991). Loan-Loss Experience and
Risk-Taking Behavior at Large Commercial Banks. Journal of Financial Services Research, 5, 43-59. Web Sources www.bloomberg.com
State Bank of Pakistan, 2016. Annual Report 2015-16.
Available at: www.sbp.org.pk/publications/prudential/index.htm [Accessed 27 December 2016].
State Bank of Pakistan, 2016. Annual Report 2015-16.
Available at: http://www.sbp.org.pk/reports/annual/arFY10/MoneyBanking.pdf [Accessed 12 April 2017].
Stiglitz, J. E., & Weiss, A. (1981). Credit Rationing in Markets
with Imperfect Information. The American Economic Review, 393-410.
Sorge, M. (2004). Stress-testing Financial Systems: an
Overview of Current Methodologies. Walter, N. and Werlang, S. 1995. Inflationary Bias and State-
Owned Financial Institutions. Journal of Development Economics, 47, 135-54 Weinberg, J. A. (1995). .Cycles in Lending Standards?. Federal
Reserve Bank of Richmond, Economic Review, Summer. Williamson, S. (1987), Financial Intermediation, Business
Failures, and Real Business Cycles. Journal of Political Economy, 95(6), 1196–1216.
Zeman,J. and P. Jurèa, 2008. Macro stress testing of the
Slovak banking sector. Slovak National Bank, Bratislava Working Paper, No. 1/2008.
Mudassir Mukhtar*
Noshina Saleem**
Stephen D. McDowell***
Critical Boundaries of Activism in Public
Relations in Pakistan: A Comparative Analysis of
Effects of Professional Practices
ABSTRACT
This paper explores that how do professional and craft public
relations practices affect department level of involvement to deal
with the activist pressure in public and private sector
organizations in Pakistan. The effects of role and model
preferences in Pakistan are discussed in the light of assumptions
of excellence theory of public relations. Models preferences are
discussed within the parameters of four western models
including press a gentry, public information, two-way
asymmetrical and two-way symmetrical. Similarly, role
preferences are elaborated within two major (manager and
technician) and two minor roles (media relations and
communication Liaison).
The population of interest are highest ranking public
relations practitioners heading public relations departments in
public and private sectors organizations in Pakistan. Data is
* PhD Scholar, Institute of Communication Studies, University of the
Punjab, Lahore **
Assistant Professor, Institute of Communication Studies, University of
the Punjab, Lahore ***
Associate Dean, College of Communication and Information, Florida
State University, Tallahassee, Florida USA
Journal of Social Sciences and Humanities: Volume 26, Number 1, Spring 2018
166
collected through a national survey using a random sample of
101 practitioners.
Results support the major assumptions of the excellence
theory. Although practitioners are using all four models as per
their expertise to involve with the activist pressure but
symmetrical communication proved comparatively most
effective in dealing with activist pressure in public and private
sector organizations in Pakistan.
Keywords: PR in Pakistan, PR Models, PR Roles, PR and
Activism
Introduction
Any group consisting more than one person that has the
potential to create effects or impact on any organization is
called an activist group. Pressure tactics of activists’ groups
involve forces like edification, negotiation and persuasion to
generate desire effects on organizations. Being an outside
stimulus, activists’ groups challenge organizational functioning
to improve its policies and actions. On the other hand, public
relations infrastructures within organizations offer their
expertise as inside agents to improve organizational
functioning. The corporations and government agencies do not
want to surrender their autonomy while negotiating with the
activist groups and thus activists’ groups pose competitive
threats and challenges to organizations in this market
economy era (Grunig et al., 2003; Grunig, J., 2008; Grunig, J.,
& Grunig, L., 1992).
Public relations literature has elaborated different
viewpoints about activism and activist pressure. Mostly
shared views discuss the reasons behind the existence of
Mudassir Mukhtar, Noshina Saleem & Stephen D. McDowell
167
activist groups and the kind of threats they pose to
corporations and government agencies. Obligations of public
relations practitioners to ensure public interest while dealing
with activism within organizations are also widely discussed.
Activism as main paradigm of critical public relations and its
recognition against mainstream corporate public relations is
also one of the most sought subjects (Uysal &Yang, 2013; De
Moya & Bravo, 2016).
Public relations set ups within organization employ
different models to deal with the forces of activism. Larisa, A.
Grunig (2013) examined and analyzed the ability of the four
models of the excellence theory while observing the effects
of activism in organizations. Her results proposed following
assumptions:
a. Organizations feel hostility towards activists’ groups and
vice versa and similarly both blame media for providing
advantage of coverage to the other.
b. Organizations accept the power of activist groups and
their reputation is vulnerable to be damaged by the
activists’ groups.
c. Public relations tools are practiced by both activists’ groups
and organizations. But organizational engagement with
public relations is more obvious and visible as compare to
activist groups side.
d. Activist actions directly create pressure on organizational
policy making process and there are few organizations
those deny outside pressure of any group.
e. Organizations excessively employ Grunig and Hunt (1984)
four models of public relations with varying combinations
and tendencies to deal with activist groups.
f. Two-way symmetrical models are not the only choice by
organizations while dealing with activists’ pressure but
Journal of Social Sciences and Humanities: Volume 26, Number 1, Spring 2018
168
organizations employ any of the models as per their need
and expertise.
g. Preference of two-way asymmetrical model by practitioners
for issue management cannot be taken as a thumb rule as
sometimes they rely on one-way models.
h. The results did not provide enough evidence to support
or reject the rare position of two-way symmetrical model
to be used effectively against pressure groups.
Thus, the relationship between activism and public relations
was discussed during the assumptions of two-way
symmetrical model in Excellence theory. This theory also
discussed the possibilities of using a-symmetrical model when
symmetrical communication failed to counter activist’s
concerns against corporate interests (Grunig et al., 2013;
Grunig and Hunt, 1984; Grunig et al., 1995; Grunig et al., 2002;
Grunig et al., 2003).
History of activism is rooted in the abolition movement of
the 19th century (Heath, Toth & Waymer, 2009). Classical
roots of activism in Pakistan can be linked to left wing
movement of the decade of seventies (Mubarik, A., 2012).
While the contemporary practices of activism are reflected by
the Justice Movement at the start of the new millennium
(Jammiluddin, Mufti, A., 2011). Coombs & Holladay (2012)
elaborated characteristics of activism as main force of critical
public relations and its differences from mainstream public
relations. Further he threw light on the shift of the field of
public relations from profitable to non-profitable status.
This paper elaborates how do professional models and
roles practices by public relations departments/practitioners
effect their level of involvement to deal outside activist
pressure. Pakistan is a democracy with weak institutional
infrastructures. Although the professional growth of public
Mudassir Mukhtar, Noshina Saleem & Stephen D. McDowell
169
relations field is on the rise in Pakistan but still most of the
public relations departments within organizational setups
have inappropriate professional structures. Due to lacking
professional infrastructures of public relations, organizations
in Pakistan are more vulnerable to deal with and survive
against outside activist pressure. Although the public
relations departments involve the outside activist groups to
fulfill their organizational objectives but the success rate is
not calculated using rational professional scales.
Professional and craft public relations practices are
reflected in the light of the excellence theory. The
excellences theory discusses the employment of four public
relations models and four public relations roles. These four
models included Press agentry, public information, two-way
asymmetrical and two-way symmetrical. Press agentry and
public information models are referred as one-way models
while two-way asymmetrical and two-way symmetrical
models are referred as symmetrical models (Grunig, J.,1976;
Grunig, J.,1984; Grunig, J.,1997; Grunig, J., 2001). These four
roles comprised manager, technician, media relations and
communication liaison role. Professional public relations
means practicing symmetrical models () and craft public
relations means practicing one-way models and similarly
manager role enactment is professional public relations while
technician role enactment is craft public relations (Grunig et
el, 2013; Broom & Dozier, 1986; Cutlip, Center & Broom,
2000; Dozier, M., 1984; Dozier & Broom, 1995).
RQ1: How do model usage and role adoption patterns affect
departmental level of involvement with the activist group?
RQ2: How do experience and dealing with activist groups
(level of activist pressure) differ in public and private sectors?
Journal of Social Sciences and Humanities: Volume 26, Number 1, Spring 2018
170
Methods
The population of interest are highest ranking public
relations practitioners heading public relations departments
in public and private sectors organizations in Pakistan. Data
is collected through a national survey using a random
sample. Total analyzable responses collected at the end of
the survey were 101. Each model and role construct was
made up of four items while activist pressure construct was
consisted of eight items. Each item was answered on a five-
point Likert scale.
Results and Analysis
RQ1: How do model usage and role adoption patterns affect
departmental level of involvement with the activist group?
To explore the theoretical model explaining significant
effects of model usage and role adoption patterns on
departmental involvement with the activist pressure, one-
way between-groups analysis of variance with post-hoc tests
was conducted between model/roles constructs and
involvement with activist pressure construct. Activist pressure
construct was treated as dependent variables while model/
roles constructs were considered as independent variables.
The results of the F-test clarified that when organizations/
practitioners employed any model/role, how did it affected
their practical concerns and intensity of involvement with the
activist group and in other words how successful or failed it
proved against different aspects/activities/actions/measures
(items) taken to deal with the activist pressure.
Mudassir Mukhtar, Noshina Saleem & Stephen D. McDowell
171
To meet the requirements of Anova, all model and role
variable were transformed into categorical form using visual
binning option in SPSS. All model and roles variables were
divided into three categories each. Models variables
categories included low or no usage (1. <= 2.97), moderate
usage (2 = 2.98 - 3.99) and high usage (3= 4.00+). Similarly,
roles variables categories included low or no adoption (1. <=
2.97), moderate adoption (2 = 2.98 - 3.99) and high adoption
(3= 4.00+).
The results of one-way analysis of variance concluded that
three models including press agentry, public information and
two-way asymmetrical models (independent variables) were
not significantly affecting PR departmental level of
involvement with the activist group. Thus, out of four models,
three models were insignificant with the dependent variable
of involvement with the activist pressure. PR departmental
level of involvement with the activist group was not
dependent on the intensity of usage of these models.
The only model that was significantly affecting PR
departmental level of involvement with the activist group
was two-way symmetrical model. The significance level of
two-way symmetrical model (F=3.658, p=.029) with the
involvement of the activist group is interpreted in Table 1.
There was a statistically significant difference at the p<.05
level in involvement with the activist scores for three
categories of two-way symmetrical model usage. The effect
size was calculated using eta squared and it was medium
(.07). Post-hoc comparisons using the Tukey HSD test
specified that mean score for category 1 (M=3.22, SD=.81)
was significantly different from mean score of category 3
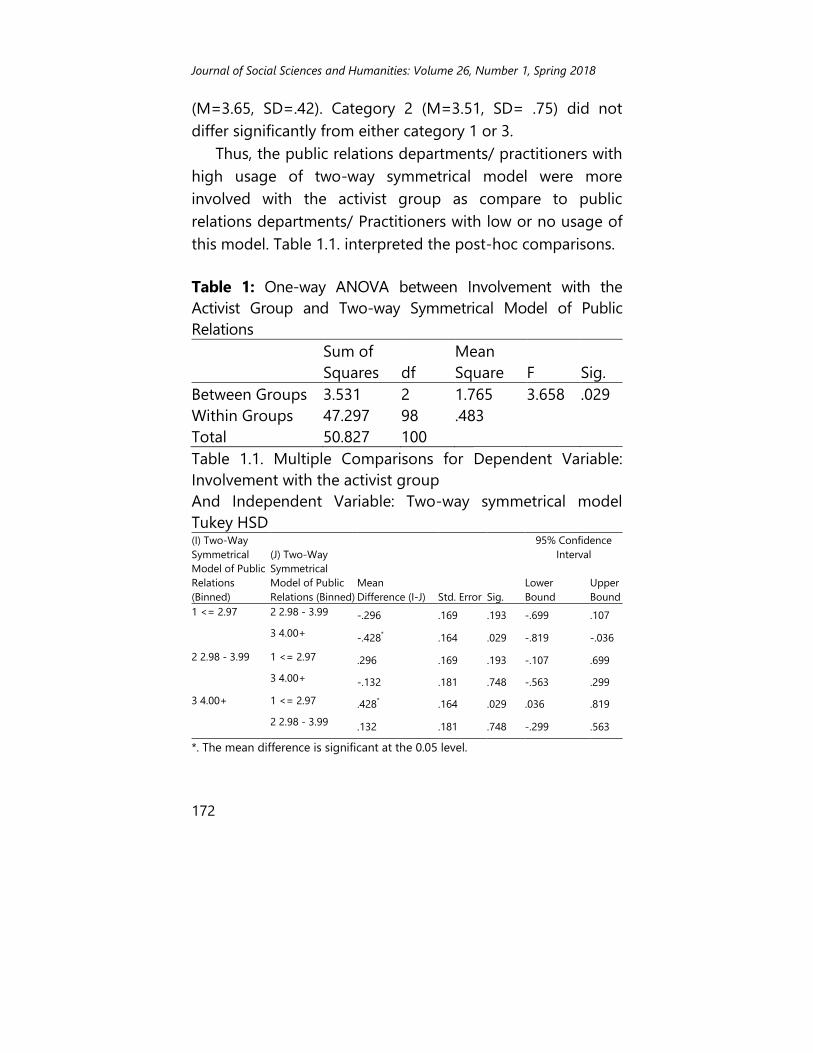
Journal of Social Sciences and Humanities: Volume 26, Number 1, Spring 2018
172
(M=3.65, SD=.42). Category 2 (M=3.51, SD= .75) did not
differ significantly from either category 1 or 3.
Thus, the public relations departments/ practitioners with
high usage of two-way symmetrical model were more
involved with the activist group as compare to public
relations departments/ Practitioners with low or no usage of
this model. Table 1.1. interpreted the post-hoc comparisons.
Table 1: One-way ANOVA between Involvement with the
Activist Group and Two-way Symmetrical Model of Public
Relations
Sum of
Squares df
Mean
Square F Sig.
Between Groups 3.531 2 1.765 3.658 .029
Within Groups 47.297 98 .483
Total 50.827 100
Table 1.1. Multiple Comparisons for Dependent Variable:
Involvement with the activist group
And Independent Variable: Two-way symmetrical model
Tukey HSD (I) Two-Way
Symmetrical
Model of Public
Relations
(Binned)
(J) Two-Way
Symmetrical
Model of Public
Relations (Binned)
Mean
Difference (I-J) Std. Error Sig.
95% Confidence
Interval
Lower
Bound
Upper
Bound
1 <= 2.97 2 2.98 - 3.99 -.296 .169 .193 -.699 .107
3 4.00+ -.428* .164 .029 -.819 -.036
2 2.98 - 3.99 1 <= 2.97 .296 .169 .193 -.107 .699
3 4.00+ -.132 .181 .748 -.563 .299
3 4.00+ 1 <= 2.97 .428* .164 .029 .036 .819
2 2.98 - 3.99 .132 .181 .748 -.299 .563
*. The mean difference is significant at the 0.05 level.
Mudassir Mukhtar, Noshina Saleem & Stephen D. McDowell
173
To better explain more involvement of the public
relations department with the activist group while high
employment of two-way symmetrical model, one-way
analysis of variance was conducted between categories of
two-way symmetrical model usage (independent variable)
and all items of involvement with the activist groups
(dependent variables). Out of eight items of the involvement
with the activist group, five items were significant at p<.05
level with the usage of two-way symmetrical models. These
items included “my organization was successful at reaching
its goal” (F= 2.419, p=.041), “my organization researched the
activist group in our response to their pressure” (F=4.762,
p=.011), “a special program was developed to respond to the
activist group” (F=3.679, p=.029), “the activist group had
direct involvement in planning our organization’s response
to them” (F=5.583. P=.005) and “my organization always
evaluates its response to activist groups” (F=5.776, p=.004).
The effect sizes calculated through eta squared for these five
items were small including .02, .04, .03, .05 and .05
respectively.
The post-hoc comparisons calculated through Tukey HSD
specified that the mean score of item “my organization was
successful at reaching its goal” was significantly different for
category 1 (M=3.79, SD= .90) and category 3 (M=4.13,
SD=.43). It concluded that public relations departments/
practitioners with high usage of two-way symmetrical model
were more significantly successful in accomplishing their
organizational goals against activist pressure than those with
low or no usage of the model.
Journal of Social Sciences and Humanities: Volume 26, Number 1, Spring 2018
174
The mean score of item “my organization researched the
activist group in our response to their pressure” was
significantly different for category 1 (M=3.12, SD= 1.29) and
category 2(M=3.79, SD=1.07) and category 1(M=3.12, SD=
1.29) and category 3 (M=3.81, SD= .75). It determined that
public relations departments/practitioners with moderate
and high usage of two-way symmetrical model were more
significantly involved in researching activist pressure to
better respond than those with low or no usage of the
model.
The mean score of item “a special program was
developed to respond to the activist group” was significantly
different for category 1 (M=3.12, SD= 1.45) and category
3(M=3.87, SD=.67). It determined that public relations
departments/practitioners with high usage of two-way
symmetrical model were more significantly involved in
developing a special program to respond to activist group
than those with low or no usage of the model.
The mean score of item “the activist group had direct
involvement in planning our organization’s response to
them” was significantly different for category 1 (M=2.50,
SD=1.25) and category 2 (M=3.18, SD=1.06) and category
1(M=2.50, SD=1.25) and category 3(M=3.26, SD=.77).
It determined that public relations departments/
practitioners with moderate and high usage of two-way
symmetrical model were more significantly involving the
activist group in planning organizational response than those
with low or no usage of the model.
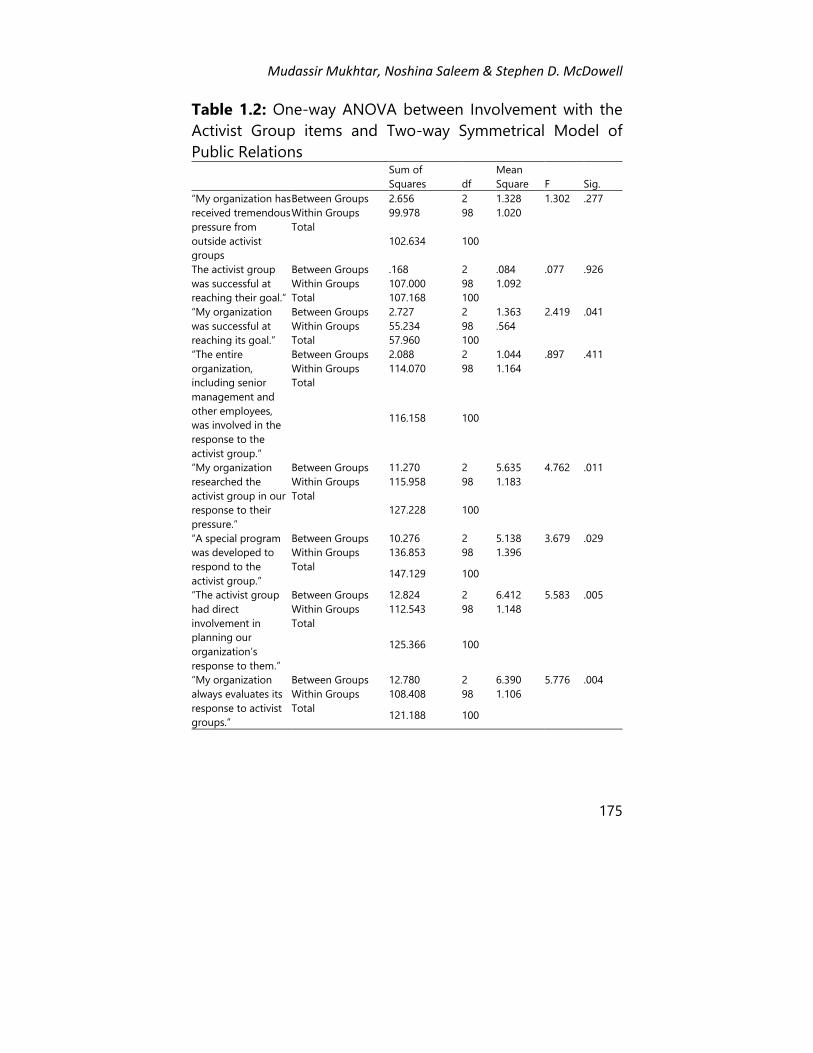
Mudassir Mukhtar, Noshina Saleem & Stephen D. McDowell
175
Table 1.2: One-way ANOVA between Involvement with the
Activist Group items and Two-way Symmetrical Model of
Public Relations
Sum of
Squares df
Mean
Square F Sig.
“My organization has
received tremendous
pressure from
outside activist
groups
Between Groups 2.656 2 1.328 1.302 .277
Within Groups 99.978 98 1.020
Total
102.634 100
The activist group
was successful at
reaching their goal.”
Between Groups .168 2 .084 .077 .926
Within Groups 107.000 98 1.092
Total 107.168 100
“My organization
was successful at
reaching its goal.”
Between Groups 2.727 2 1.363 2.419 .041
Within Groups 55.234 98 .564
Total 57.960 100
“The entire
organization,
including senior
management and
other employees,
was involved in the
response to the
activist group.”
Between Groups 2.088 2 1.044 .897 .411
Within Groups 114.070 98 1.164
Total
116.158 100
“My organization
researched the
activist group in our
response to their
pressure.”
Between Groups 11.270 2 5.635 4.762 .011
Within Groups 115.958 98 1.183
Total
127.228 100
“A special program
was developed to
respond to the
activist group.”
Between Groups 10.276 2 5.138 3.679 .029
Within Groups 136.853 98 1.396
Total 147.129 100
“The activist group
had direct
involvement in
planning our
organization’s
response to them.”
Between Groups 12.824 2 6.412 5.583 .005
Within Groups 112.543 98 1.148
Total
125.366 100
“My organization
always evaluates its
response to activist
groups.”
Between Groups 12.780 2 6.390 5.776 .004
Within Groups 108.408 98 1.106
Total 121.188 100
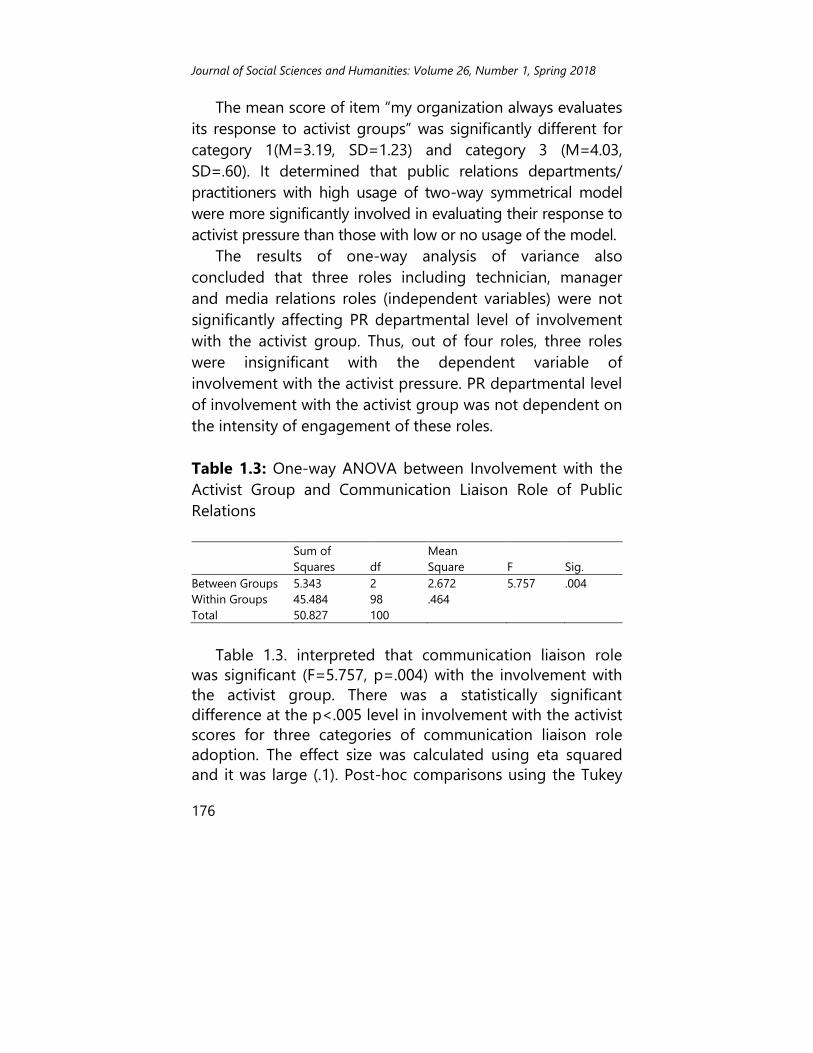
Journal of Social Sciences and Humanities: Volume 26, Number 1, Spring 2018
176
The mean score of item “my organization always evaluates
its response to activist groups” was significantly different for
category 1(M=3.19, SD=1.23) and category 3 (M=4.03,
SD=.60). It determined that public relations departments/
practitioners with high usage of two-way symmetrical model
were more significantly involved in evaluating their response to
activist pressure than those with low or no usage of the model.
The results of one-way analysis of variance also
concluded that three roles including technician, manager
and media relations roles (independent variables) were not
significantly affecting PR departmental level of involvement
with the activist group. Thus, out of four roles, three roles
were insignificant with the dependent variable of
involvement with the activist pressure. PR departmental level
of involvement with the activist group was not dependent on
the intensity of engagement of these roles.
Table 1.3: One-way ANOVA between Involvement with the
Activist Group and Communication Liaison Role of Public
Relations
Sum of
Squares df
Mean
Square F Sig.
Between Groups 5.343 2 2.672 5.757 .004
Within Groups 45.484 98 .464
Total 50.827 100
Table 1.3. interpreted that communication liaison role
was significant (F=5.757, p=.004) with the involvement with
the activist group. There was a statistically significant
difference at the p<.005 level in involvement with the activist
scores for three categories of communication liaison role
adoption. The effect size was calculated using eta squared
and it was large (.1). Post-hoc comparisons using the Tukey
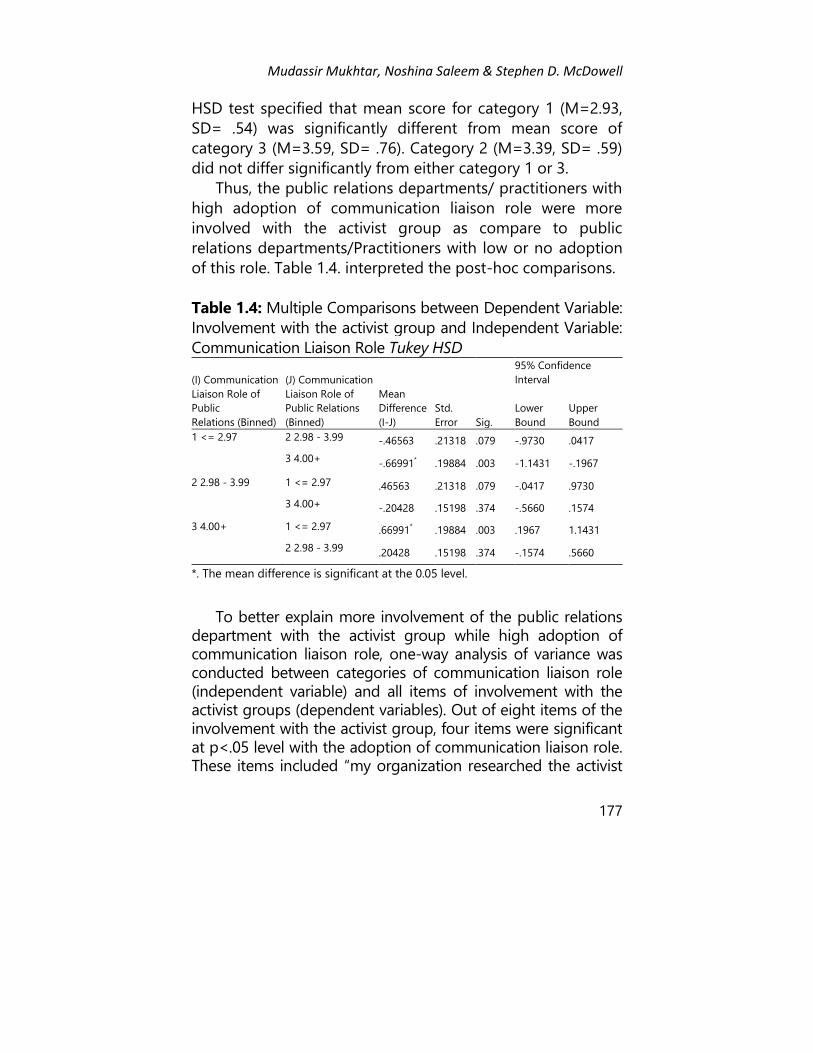
Mudassir Mukhtar, Noshina Saleem & Stephen D. McDowell
177
HSD test specified that mean score for category 1 (M=2.93,
SD= .54) was significantly different from mean score of
category 3 (M=3.59, SD= .76). Category 2 (M=3.39, SD= .59)
did not differ significantly from either category 1 or 3.
Thus, the public relations departments/ practitioners with
high adoption of communication liaison role were more
involved with the activist group as compare to public
relations departments/Practitioners with low or no adoption
of this role. Table 1.4. interpreted the post-hoc comparisons.
Table 1.4: Multiple Comparisons between Dependent Variable:
Involvement with the activist group and Independent Variable:
Communication Liaison Role Tukey HSD
(I) Communication
Liaison Role of
Public
Relations (Binned)
(J) Communication
Liaison Role of
Public Relations
(Binned)
Mean
Difference
(I-J)
Std.
Error Sig.
95% Confidence
Interval
Lower
Bound
Upper
Bound
1 <= 2.97 2 2.98 - 3.99 -.46563 .21318 .079 -.9730 .0417
3 4.00+ -.66991* .19884 .003 -1.1431 -.1967
2 2.98 - 3.99 1 <= 2.97 .46563 .21318 .079 -.0417 .9730
3 4.00+ -.20428 .15198 .374 -.5660 .1574
3 4.00+ 1 <= 2.97 .66991* .19884 .003 .1967 1.1431
2 2.98 - 3.99 .20428 .15198 .374 -.1574 .5660
*. The mean difference is significant at the 0.05 level.
To better explain more involvement of the public relations department with the activist group while high adoption of communication liaison role, one-way analysis of variance was conducted between categories of communication liaison role (independent variable) and all items of involvement with the activist groups (dependent variables). Out of eight items of the involvement with the activist group, four items were significant at p<.05 level with the adoption of communication liaison role. These items included “my organization researched the activist
Journal of Social Sciences and Humanities: Volume 26, Number 1, Spring 2018
178
group in our response to their pressure” (F=6.070, p=.003), “a special program was developed to respond to the activist group” (F=15.127, p=.000), “the activist group had direct involvement in planning our organization’s response to them” (F=3.459, p=.035) and “my organization always evaluates its response to activist groups” (F=10.471, p=.000). The effect sizes calculated through eta squared for three items were large including .10, .20 and .17 respectively. The effect size for item “the activist group had direct involvement in planning our organization’s response to them” was medium (.06). The post-hoc comparisons calculated through Tukey HSD specified that the mean score of item “my organization researched the activist group in our response to their pressure” was significantly different for category 1 (M=2.67, SD=1.05) and category 2(M=3.50, SD=1.14) and category 1(M=2.67, SD=1.05) and category 3 (M=3.76, SD=1.04). It was determined that public relations departments/ practitioners with moderate and high adoption of communication liaison role were more significantly involved in researching activist pressure to better respond than those with low or no adoption of this role. The mean score of item “a special program was developed to respond to the activist group” was significantly different for category 1 (M=2.13, SD=.92) and category 2(M=3.44, SD=1.24) and category 1 (M=2.13, SD=.92) and category 3(M=3.85, SD=1.00). It was determined that public relations departments/practitioners with moderate and high adoption of communication liaison role were more significantly involved in developing a special program to respond to activist group than those with low or no adoption of this role. The mean score of item “the activist group had direct involvement in planning our organization’s response to them” was significantly different for category 1 (M=2.40, SD=1.12) and category 3(M=3.17, SD=1.16). It was determined that public relations departments/practitioners with moderate and high employment of communication liaison role were more significantly involving the activist
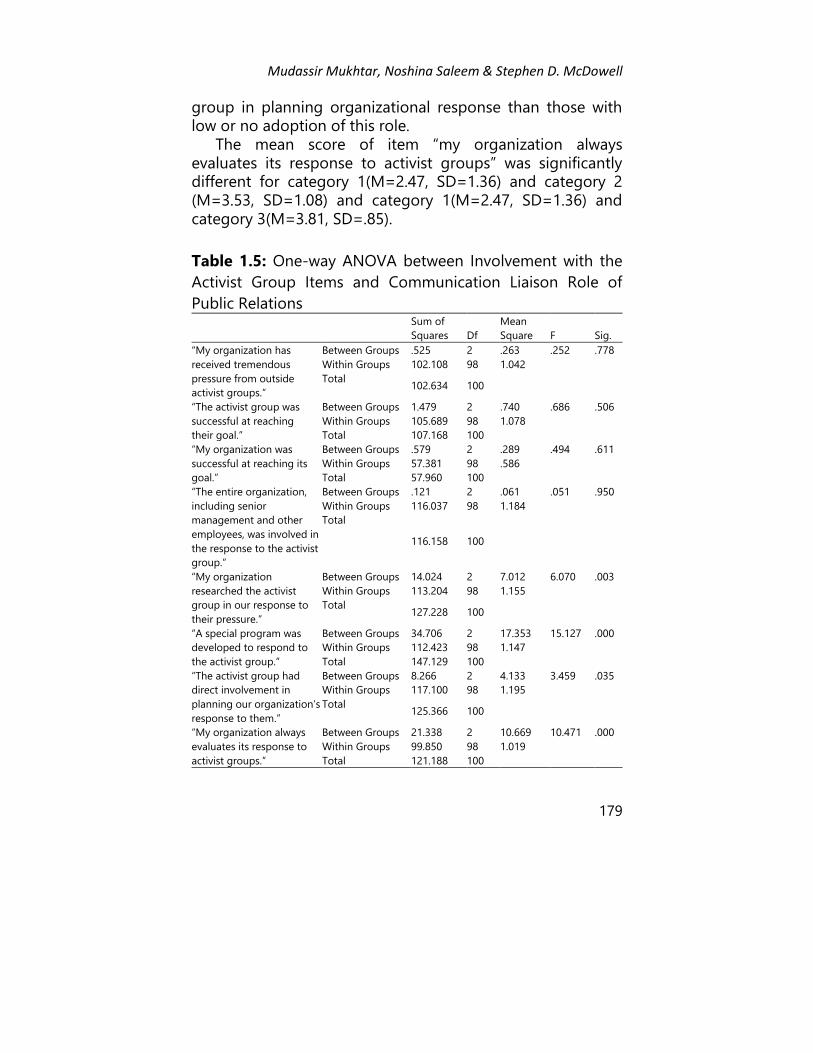
Mudassir Mukhtar, Noshina Saleem & Stephen D. McDowell
179
group in planning organizational response than those with low or no adoption of this role. The mean score of item “my organization always evaluates its response to activist groups” was significantly different for category 1(M=2.47, SD=1.36) and category 2 (M=3.53, SD=1.08) and category 1(M=2.47, SD=1.36) and category 3(M=3.81, SD=.85).
Table 1.5: One-way ANOVA between Involvement with the
Activist Group Items and Communication Liaison Role of
Public Relations
Sum of
Squares Df
Mean
Square F Sig.
“My organization has
received tremendous
pressure from outside
activist groups.”
Between Groups .525 2 .263 .252 .778
Within Groups 102.108 98 1.042
Total 102.634 100
“The activist group was
successful at reaching
their goal.”
Between Groups 1.479 2 .740 .686 .506
Within Groups 105.689 98 1.078
Total 107.168 100
“My organization was
successful at reaching its
goal.”
Between Groups .579 2 .289 .494 .611
Within Groups 57.381 98 .586
Total 57.960 100
“The entire organization,
including senior
management and other
employees, was involved in
the response to the activist
group.”
Between Groups .121 2 .061 .051 .950
Within Groups 116.037 98 1.184
Total
116.158 100
“My organization
researched the activist
group in our response to
their pressure.”
Between Groups 14.024 2 7.012 6.070 .003
Within Groups 113.204 98 1.155
Total 127.228 100
“A special program was
developed to respond to
the activist group.”
Between Groups 34.706 2 17.353 15.127 .000
Within Groups 112.423 98 1.147
Total 147.129 100
“The activist group had
direct involvement in
planning our organization’s
response to them.”
Between Groups 8.266 2 4.133 3.459 .035
Within Groups 117.100 98 1.195
Total 125.366 100
“My organization always
evaluates its response to
activist groups.”
Between Groups 21.338 2 10.669 10.471 .000
Within Groups 99.850 98 1.019
Total 121.188 100
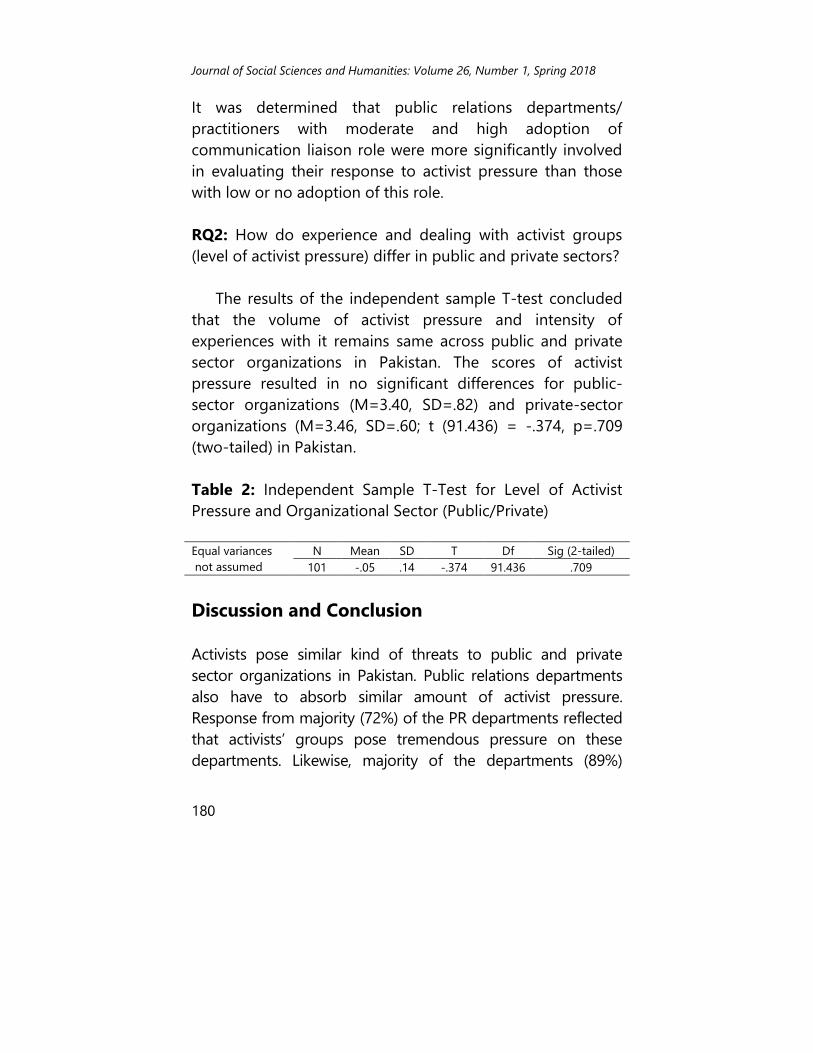
Journal of Social Sciences and Humanities: Volume 26, Number 1, Spring 2018
180
It was determined that public relations departments/
practitioners with moderate and high adoption of
communication liaison role were more significantly involved
in evaluating their response to activist pressure than those
with low or no adoption of this role.
RQ2: How do experience and dealing with activist groups
(level of activist pressure) differ in public and private sectors?
The results of the independent sample T-test concluded
that the volume of activist pressure and intensity of
experiences with it remains same across public and private
sector organizations in Pakistan. The scores of activist
pressure resulted in no significant differences for public-
sector organizations (M=3.40, SD=.82) and private-sector
organizations (M=3.46, SD=.60; t (91.436) = -.374, p=.709
(two-tailed) in Pakistan.
Table 2: Independent Sample T-Test for Level of Activist
Pressure and Organizational Sector (Public/Private)
Equal variances
not assumed
N Mean SD T Df Sig (2-tailed)
101 -.05 .14 -.374 91.436 .709
Discussion and Conclusion
Activists pose similar kind of threats to public and private
sector organizations in Pakistan. Public relations departments
also have to absorb similar amount of activist pressure.
Response from majority (72%) of the PR departments reflected
that activists’ groups pose tremendous pressure on these
departments. Likewise, majority of the departments (89%)
Mudassir Mukhtar, Noshina Saleem & Stephen D. McDowell
181
believed that their success rate is better to attain their
organizational objectives against activists’ goals. Only a less
number of departments (21%) were of the view that activist’s
groups remain successful to achieve their goals. Slightly, more
half number of departments (59%) were of the view that “entire
organization, including senior management and other
employees, remain involved in dealing with activist group”.
Similarly, more than half number of the departments (59%)
replied that “our organization investigates the activist group in
our response to their pressure”. Fifty-eight % of the
departments answered that “they develop a special program
against activist pressure”. Thirty-one % of the departments
responded that “the activist group has direct involvement in
planning our organization’s response to them”. Fifty-five % of
the departments responded that “they always evaluate their
response to activist groups”.
To counter pressure from outside activists’ groups,
Grunig and Hunt’s (1992) four models are employed by PR
departments in Pakistan. Out of four models, three models
(press agentry, public information and two-way
asymmetrical) are insignificant with the involvement of public
relations department with activist group. Thus, variations in
the usage of these models do not affect the level of
involvement with the activist pressure.
The only model that produces significant effects on the
level of involvement with the activist pressure is two-way
symmetrical model. Two-way symmetrical model is
considered the most efficient against activist pressure. high
usage of two-way symmetrical model to deal with the activist
pressure results in more success of organizational objectives
while low or no usage results in less and no success. Thus, PR
departments employing two-way symmetrical model are
Journal of Social Sciences and Humanities: Volume 26, Number 1, Spring 2018
182
significantly more successful in dealing with the activists’
groups than PR departments with less or no employment of
this model. PR departments employing two-way symmetrical
model are significantly more successful because they
generate significantly more research based activities to
identify and tackle activist group, produce and implement
significantly more research oriented programs, involve with
the activists group in a more significantly direct way and
evaluate their response significantly more rationally than PR
departments with less or no employment of two-way
symmetrical model.
It can be concluded that employment of two-way
symmetrical model by PR departments in Pakistan to deal
with activist pressure is major justification behind their
success to gain their objectives against activism. But
employment of one-way models by PR departments in
Pakistan to deal with the activist pressure becomes a reason
for failure against activist pressure. Results indicate that
activist pressure can be effectively dealt by applying two-way
symmetrical model and in other words activist pressure acts
as a stimulus to force organization to employ excellent
public relations (Grunig, 2013).
The results of this paper can be related with Larisa, A.
Grunig (2013) assumptions. Activists groups can potentially
damage organizational reputation and prestige of
organizations in Pakistan by poisoning public opinion
against them.
Activist activities have a direct effect on organizational
image in Pakistan and there are few organizations those do
not feel difficulty in facing outside pressure of any group.
Organizations in public and private sectors in Pakistan do
employ Grunig and Hunt (1984) four models of public
Mudassir Mukhtar, Noshina Saleem & Stephen D. McDowell
183
relations with varying combinations and tendencies to deal
with activist groups. Two-way symmetrical models are not
the preferred choice of organizations in Pakistan to counter
activists pressure but they prefer use any of the models as
per their need and expertise.
The results of this paper also contributed that the only
significant role in organizations in Pakistan that is efficient and
effective in dealing with the activist pressure is communication
liaison role. More intensive employment of communication
liaison role by public PR departments secure more effective
results against activist pressure than low or no engagement of
this. The justifications for this compatible effectiveness are
more departmental involvement in research based tasks, more
implementation of specific programs, more proactive planning
about activist groups and more proactive evaluation of
departmental action before implementation against activist
group targeting. The results also concluded that technician,
manager and media relations roles are potentially insignificant
for countering the activist pressure. The PR departmental
effectiveness is not dependent on the high or low engagement
with these roles.
Journal of Social Sciences and Humanities: Volume 26, Number 1, Spring 2018
184
References
Broom, G. M. & Dozier, D.M. (1986). Advancement for Public
Relations role Models. Public Relations Review, 12 (1), 37-56.
Cutlip, S. M., Center, A. H., & Broom, G. M. (2000). Effective
Public Relations (8th
ed.). Englewood Cliffs, NJ: Prentice-
Hall.
Coombs, W. T., & Holladay, S. J. (2012). Fringe Public
Relations: How Activism Moves Critical PR Toward the
Mainstream. Public Relations Review, 38(5), 880-887.
De Moya, M., & Bravo, V. (2016). The Role of Public Relations
in Ethnic Advocacy and Activism: A Proposed Research
Agenda. Public Relations Inquiry, 5(3), 233-251.
Dozier, D. M. (1984). Program Evaluation and Roles of
Practitioners. Public Relations Review, 10(2), 13-21.
Dozier, D. M., & Broom, G. M. (1995). Evolution of the
Manager Role in Public Relations Practice. Journal of
Public Relations Research, 7(1), 3-26.
Grunig, J. E. (1976). Organizations and Public Relations:
Testing a Communication Theory. Journalism and
Communication Monographs, 46.
Grunig, J. E. (1984). Organizations, Environments, and Models
of Public Relations. Public Relations Research & Education,
1(1), 6-29.
Mudassir Mukhtar, Noshina Saleem & Stephen D. McDowell
185
Grunig, J. E. (1997). A Situational Theory of Publics: Conceptual
History, Recent Challenges and New Research. Public
Relations Research: An International Perspective, 3, 48.
Grunig, J. E. (2001). Two-way Symmetrical Public Relations: Past,
Present, and Future. Handbook of Public Relations, 11, 30.
Grunig, J. E. (2013). Excellence in Public Relations and
Communication Management, Routledge.
Grunig, J. E. (2008). Excellence in Public Relations and
Communication Management, Routledge.
Grunig, J. E., Grunig, L. A., & Dozier, D. M. (2006). The
Excellence Theory. Public Relations Theory II, 21-62.
Grunig, L.A., Grunig, J.E. and Dozier, D.M. (2002), Excellent
Public Relations and Effective Organizations, Lawrence
Erlbaum Associates, Mahwah, NJ
Grunig, J. E., & Dozier, D. M. (2003). Excellent Public Relations
and Effective Organizations: A Study of Communication
Management in Three Countries. Routledge.
Grunig, J. E., & Hunt, T. (1984). Managing Public Relations
(Vol. 343). New York: Holt, Rinehart and Winston.
Grunig, J. E., Grunig, L. A., Sriramesh, K., Huang, Y. H., & Lyra,
A. (1995). Models of Public Relations in An International
Setting. Journal of Public Relations Research, 7(3), 163-
186.
Journal of Social Sciences and Humanities: Volume 26, Number 1, Spring 2018
186
Grunig, L. A., Grunig, J. E., & Dozier, D. M. (2002). Excellent
Public Relations and Effective Organizations: A Study of
Communication Management in Three Countries.
Mahwah, NJ: Lawrence Erlbaum Associates.
Heath, R. L., Toth, E. L., & Waymer, D. (Eds.). (2009). Rhetorical
and Critical Approaches to Public Relations II. Routledge.
Jammiluddin, Mufti, A., 2011). Framing the Lawyers
Movement: A Study of Editorials from Two Major
Language dallies of Pakistan. M.Phil. Thesis, Unpublished,
AIOU Islamabad.
Mubarak, Ali, (2012). Tareekh Ki Awaz, Fiction House: Lahore
Uysal, N., & Yang, A. (2013). The Power of Activist Networks
in the Mass self-Communication Era: A Triangulation
Study of the Impact of WikiLeaks on the Stock Value of
Bank of America. Public Relations Review, 39(5), 459-469.
Related Documents