Journal of Virus Eradication An online open-access journal published by Mediscript Ltd Volume 2 · Supplement 4 · November 2016 ISSN 2055-66-40 – Print | ISSN 2055-66-59 – Online www.viruseradication.com i Editors Jintanat Ananworanich (USA) Margaret Johnson (UK) Sabine Kinloch-de Loës (UK) Editorial Board Nicolas Chomont (Canada) Steven Deeks (USA) Geoff Dusheiko (UK) Sarah Fidler (UK) Paul Griffiths (UK) Alain Lafeuillade (France) Nelson Michael (USA) Jrgen Rockstroh (Germany) Irini Sereti (USA) Janet Siliciano (USA) Robert Siliciano (USA) Guido Silvestri (USA) Linos Vandekerckhove (Belgium) Editorial Panel David Asboe (UK) Georg Behrens (Germany) Monsef Benkirane (France) Michael R Betts (USA) Charles Boucher (Netherlands) David Cooper (Australia) Zeger Debyser (Belgium) Jean-Francois Delfraissy (France) Lucy Dorrell (UK) Daniel Douek (USA) Caroline Foster (UK) Graham Foster (UK) John Frater (UK) Brian Gazzard (UK) Anna Maria Geretti (UK) Carlo Giaquinto (Italy) Marie-Lise Gougeon (France) George Hanna (USA) Daria Hazuda (USA) Andrew Hill (UK) Rowena Johnston (USA) Jerome Kim (USA) Richard Koup (USA) Nagalingeswaran Kumarasamy (India) Alan Landay (USA) Clifford Leen (UK) Yves Lévy (France) Hermione Lyall (UK) Michael Malim (UK) Gail Matthews (Australia) Veronica Miller (USA) Melanie Ott (USA) Carlo Perno (Italy) Nittaya Phanuphak (Thailand) Guido Poli (Italy) Sarah Read (USA) Doug Richman (USA) Christine Rouzioux (France) Asier Saez-Cirion (France) Serena Spudich (USA) Victor Valcour (USA) Carine Van Lint (Belgium) Jan Van Lunzen (Germany) Mark Wainberg (Canada) Foreword Since 1984, when HIV was first detected in Thailand, almost 1.4 million of the estimat- ed 3.5 million people living with HIV in the WHO South-East Asia Region are on HIV treatment as of 2015. From over 200,000 annual AIDS-related deaths at the peak of the epidemic in 2005, mortality is now down to 130,000 annually. Prevention interven- tions combined with expansion in treatment have led to a decrease in new infections from over 300,000 a year in 2001 to 180,000 in 2015. Despite low general prevalence, the HIV ep- idemic in the Region is concentrated among key populations. Of people living with HIV, 99� are found in five member states – India, Indonesia, Myanmar, Nepal and Thailand. While member states in the Re- gion have made progress in the health-sector response to HIV, more needs to be done and at an increased pace if we are to achieve the 2020 target of 90-90-90, that is: 90� of people living with HIV tested; 90� of those identified on treatment; and 90� of those on treatment virally suppressed. Having committed to Sustainable Development Goal target 3.3 of ending AIDS as a public health threat by 2030, this interim 2020 goal is a key milestone. It will require scaling up HIV prevention, test- ing, treatment and retention in care through innovative service delivery models in partnership with communities and ensuring sustainable financing through inclusive and integrated service provision within the Universal Health Coverage framework, as outlined in the WHO Global Health Sector Strategy 2016–2021. This supplement, with articles from national HIV programmes, describes the HIV epi- demic and response within member states of the Region. I hope that it will provide insights into key issues and challenges on strategies and interventions implemented, lessons learned and actions needing further and urgent attention for policy-makers, governments, development partners and civil society to fast-track the response to- wards ending AIDS by 2030. Dr Poonam Khetrapal Singh WHO Regional Director for South-East Asia

Welcome message from author
This document is posted to help you gain knowledge. Please leave a comment to let me know what you think about it! Share it to your friends and learn new things together.
Transcript
Journal of Virus EradicationAn online open-access journal published by Mediscript Ltd
Volume 2 · Supplement 4 · November 2016
ISSN 2055-66-40 – Print | ISSN 2055-66-59 – Onlinewww.viruseradication.com
i
2/Supplement 4 November 2016
Editors
Jintanat Ananworanich (USA)Margaret Johnson (UK)Sabine Kinloch-de Loës (UK)
Editorial Board
Nicolas Chomont (Canada)Steven Deeks (USA)Geoff Dusheiko (UK)Sarah Fidler (UK)Paul Griffiths (UK)Alain Lafeuillade (France)Nelson Michael (USA)Jurgen Rockstroh (Germany)Irini Sereti (USA)Janet Siliciano (USA)Robert Siliciano (USA)Guido Silvestri (USA)Linos Vandekerckhove (Belgium)
Editorial Panel
David Asboe (UK)Georg Behrens (Germany)Monsef Benkirane (France)Michael R Betts (USA)Charles Boucher (Netherlands)David Cooper (Australia)Zeger Debyser (Belgium)Jean-Francois Delfraissy (France)Lucy Dorrell (UK)Daniel Douek (USA)Caroline Foster (UK) Graham Foster (UK)John Frater (UK)Brian Gazzard (UK)Anna Maria Geretti (UK)Carlo Giaquinto (Italy)Marie-Lise Gougeon (France)George Hanna (USA)Daria Hazuda (USA)Andrew Hill (UK)Rowena Johnston (USA)Jerome Kim (USA)Richard Koup (USA)Nagalingeswaran Kumarasamy (India)Alan Landay (USA)Clifford Leen (UK)Yves Lévy (France)Hermione Lyall (UK) Michael Malim (UK)Gail Matthews (Australia)
Veronica Miller (USA)
Melanie Ott (USA)
Carlo Perno (Italy)
Nittaya Phanuphak (Thailand)
Guido Poli (Italy)
Sarah Read (USA)
Doug Richman (USA)
Christine Rouzioux (France)
Asier Saez-Cirion (France)
Serena Spudich (USA)
Victor Valcour (USA)
Carine Van Lint (Belgium)
Jan Van Lunzen (Germany)
Mark Wainberg (Canada)
Foreword
Since 1984, when HIV was first detected in Thailand, almost 1.4 million of the estimat-ed 3.5 million people living with HIV in the WHO South-East Asia Region are on HIV treatment as of 2015. From over 200,000 annual AIDS-related deaths at the peak of the epidemic in 2005, mortality is now down to 130,000 annually. Prevention interven-tions combined with expansion in treatment have led to a decrease in new infections from over 300,000 a year in 2001 to 180,000 in 2015.
Despite low general prevalence, the HIV ep-idemic in the Region is concentrated among key populations. Of people living with HIV, 99� are found in five member states – India, Indonesia, Myanmar, Nepal and Thailand. While member states in the Re-gion have made progress in the health-sector response to HIV, more needs to be done and at an increased pace if we are to achieve the 2020 target of 90-90-90, that is: 90� of people living with HIV tested; 90� of those identified on treatment; and 90� of those on treatment virally suppressed. Having committed to Sustainable Development Goal target 3.3 of ending AIDS as a public health threat by 2030, this interim 2020 goal is a key milestone. It will require scaling up HIV prevention, test-ing, treatment and retention in care through innovative service delivery models in partnership with communities and ensuring sustainable financing through inclusive and integrated service provision within the Universal Health Coverage framework, as outlined in the WHO Global Health Sector Strategy 2016–2021.
This supplement, with articles from national HIV programmes, describes the HIV epi-demic and response within member states of the Region. I hope that it will provide insights into key issues and challenges on strategies and interventions implemented, lessons learned and actions needing further and urgent attention for policy-makers, governments, development partners and civil society to fast-track the response to-wards ending AIDS by 2030.
Dr Poonam Khetrapal SinghWHO Regional Director for South-East Asia
Journal of Virus EradicationAn online open-access journal published by Mediscript Ltd
Volume 2 · Supplement 4 · November 2016
ISSN 2055-66-40 – Print | ISSN 2055-66-59 – Onlinewww.viruseradication.com
ii
Aims and objectivesThe aim of this journal is to provide a specialist, open access forum and fast-track pathway to publish work in the rapidly developing field of virus eradication, particularly of HIV, HBV and HCV. The Journal has been set up especially for these and other viruses, including herpes and flu, in a context of new therapeutic strategies, as well as societal eradication of viral infections with preventive interventions.
ScopeThe Journal not only publishes original research, but also provides an opportunity for opinions, reviews, case studies and comments on the published literature. It focuses on evidence-based medicine as the major thrust in the successful management of HIV and AIDS, HBV and HCV as well as includes relevant work for other viral infections. The Journal encompasses virological, immunological, epidemiological, modelling, pharmacological, pre-clinical and in vitro, as well as clinical, data including but not limited to drugs, immunotherapy and gene therapy. It will be an important source of information on the development of vaccine programmes and preventative measures aimed at virus eradication.
Information for subscribersJournal of Virus Eradication is an international open-access journal that is free for authors and readers alike. It is available online at www.viruseradication.com
Subscription to the printed journalSubscription copies of the Journal are available via the website or from the Publishers ([email protected]).
Support for the JournalThe publication of this open-access journal has been made possible by support and sponsorship from a number of organisations and advertisements, particularly:
• The Royal Free Charity
• Children’s HIV Association (CHIVA)
• Gilead Sciences Europe Ltd which has had no input into the content of this publication, other than the relevant advertisement(s) bearing the Gilead name and logo;
AdvertisingOur advertising rate card can be found on our website: www.viruseradication.com.
If you would like any further information, please contact us at: [email protected]
DisclaimerThe Publisher, Editors and Authors cannot be held responsible for errors or any consequences arising from the use of the information contained in this Journal; the views and opinions expressed do not necessarily reflect those of the Publisher or the Editors, neither does the publication of advertisements constitute any endorsement by the Publisher and the Editors of the products advertised.
Before prescribing any medication, please consult the full prescribing information of the product.
Note to NIH grant-holdersThe Publisher will post final published articles, written by NIH grant-holders, to PubMed Central.
Journal copyrightCopyright © Mediscript Ltd 2016.
All articles are published under licence from the authors or their institutions. Unless otherwise marked, articles are open access under the terms of either:
(a) The Creative Commons Attribution-NonCommercial License (CC BY-NC 4.0), which permits use and distribution in any medium, provided the original work is properly cited.
(b) The Creative Commons Attribution-NonCommercial- NoDerivs License (CC BY-NC-ND 4.0), which permits use and distribution in any medium, provided the original work is properly cited, the use is non-commercial and no modifications or adaptations are made.
For all other parts of the Journal, all rights reserved. No part may be translated, reproduced, stored in a retrieval system, or transmitted in any form, by any means, electrical, mechanical, photocopying or broadcasting or otherwise, without prior permission from the Publisher.
Editorial office Journal of Virus Eradication
Published by: Mediscript LtdEditorial Director: Fatima Patel
Editorial Office: Fiona CreaghMediscript Ltd, 1 Mountview Court,310 Friern Barnet Lane, London N20 0LD, UK
T: 44 (0)208 446 8898 · E: [email protected]
ISSN 2055-66-40 (Print) · ISSN 2055-66-59 (Online)
Journal of Virus EradicationAn online open-access journal published by Mediscript Ltd
Volume 2 · Supplement 4 · November 2016
ISSN 2055-66-40 – Print | ISSN 2055-66-59 – Onlinewww.viruseradication.com
iii
C O N T E N T S
■ FOREWORD i
■ GUEST EDITORIAL
What needs to be done in South East Asia to End AIDS? Poonam Khetrapal Singh iv
■ REVIEWS
HIV/AIDS in the South-East Asia region: progress and challenges R Pendse, S Gupta, D Yu and S Sarkar 1
The impact of Thailand‘s public health response to the HIV epidemic 1984–2015: understanding the ingredients of success T Siraprapasiri, S Ongwangdee, P Benjarattanaporn, W Peerapatanapokin, M Sharma 7
India‘s HIV programme: successes and challenges S Tanwar, BB Rewari, CVD Rao and N Seguy 15
Evolution of the health sector response to HIV in Myanmar: progress, challenges and the way forward HN Oo, S Hone, M Fujita, A Maw-Naing, K Boonto, M Jacobs, S Phyu, P Bollen, J Cheung, H Aung,
MTA Sang, AM Soe, R Pendse and E Murphy 20
From the Millennium Development Goals to Sustainable Development Goals. The response to the HIV epidemic in Indonesia: challenges and opportunities F Wijayanti, SN Tarmizi, V Tobing,
T Nisa, M Akhtar, I Trihandini and R Djuwita 27
A success story: identified gaps and the way forward for low HIV prevalence in Bangladesh MK Rezwan, HS Khan, T Azim, R Pendse, S Sarkar and N Kumarasamy 32
Epidemiology of HIV, programmatic progress and gaps in last 10 years in Nepal T Paudel,
N Singh, MR Banjara, SP Kafle, YC Ghimire, BR Pokharel, BB Rawal, K Badal, M Chaulagain, RN Pendse, P Ghimire 35
Factors associated with clinic escorts in peer-led HIV prevention interventions for men who have sex with men (MSM) in Sri Lanka MS Suranga, DA Karawita, SMAS Bandara and RMDK Rajakaruna 41
Twenty-two years of HIV infection in Bhutan: epidemiological profile P Tshering, K Lhazeen,
S Wangdi and N Tshering 45
The HIV epidemic in South-east Asia: initial responses towards the UNAIDS 90–90–90 goalEdited by: N Kumarasamy and R Pendse
What needs to be done in South East Asia to End AIDS?Poonam Khetrapal Singh
Regional Director for South East Asia, World Health Organization
Journal of Virus Edadication 2016; 2 (Supplement 4): iv GUEST EDITORIAL
The countries of the South East Asia region (SEAR) confront a turning point in the fight against HIV. Progress over the last two decades in reducing new HIV infections and AIDS-
related deaths – combined with the emergence of powerful HIV treatment and prevention tools – makes it possible to end AIDS once and for all in the region by 2030. However, achieving this goal will demand that SEAR countries heed warning signs of complacency and redouble efforts to reach those most in need with proven prevention and treatment interventions.
This is not the first time that SEAR has faced a moment of truth in the regional AIDS response. Two decades ago, the world’s leading AIDS experts forecast that the epidemic would soon explode across South East Asia [1]. Although AIDS did evolve to become a serious health problem in the region, the startling escalation of the epidemic projected by experts did not occur, as countries across the region took action in the 1990s to fully leverage available prevention and treatment tools, focus pro-grammes on those most in need, and base national responses on human rights and community involvement [2].
Although HIV prevalence in SEAR is lower than in sub-Saharan Africa, the region nevertheless accounts for roughly one in 10 people living with HIV worldwide [2]. The number of people newly infected with HIV in SEAR in 2015 was 47� lower than in 2000, but there are disturbing signs that progress on HIV prevention has slowed [2]. The number of new HIV infections in SEAR in 2015 (180,000) was only marginally lower than the number in 2010 (200,000) [2]. If AIDS is to be ended as a public health threat in SEAR, a rejuvenation of efforts is clearly needed. However, international HIV assistance is on the decline [3], and governments in the SEAR region have not stepped up domestic resource allocations that the fight against AIDS requires. [2].
While working to mobilise sufficient political will and financial resources to accelerate progress towards ending AIDS, decision-makers in SEAR need to take several key steps to enhance the public health impact of their efforts. First, all SEAR countries urgently need to embrace the 90-90-90 HIV treatment target and ensure that this approach is reflected in national policy and programmatic strategies. Although rapidly scaling up treatment towards the 90-90-90 target has the potential to sharply lower new HIV infections and AIDS-related deaths [4], HIV treatment coverage in SEAR (39� in 2015) remains lower than the global average for low- and middle-income countries (46�) [2]. Ex-pediting progress towards Universal Health Coverage can help SEAR countries close the HIV treatment gap while laying a sus-tainable foundation to address the full array of regional health challenges.
Second, while scaled-up antiretroviral therapy is the single inter-vention likely to have the greatest impact on reducing new HIV infections [5], ending AIDS will also require much greater success in reducing the risk of HIV acquisition through primary preven-tion [6]. Weaknesses in primary prevention efforts in the region are apparent. Most countries in the region are not currently on track to eliminate new HIV infections among children, they have adopted widely variable approaches towards implementation of
validated harm reduction strategies to reduce new infections among people who inject drugs, and meaningful roll-out of pre-exposure antiretroviral prophylaxis (PrEP) has only just begun [2]. Countries in SEAR should immediately prioritise primary HIV infection measures, taking inspiration from Thailand’s successful elimination of mother-to-child HIV transmission and from the region’s previous prevention successes.
The third step that decision-makers in SEAR must take is to bet-ter target efforts on those most at risk. While progress in the regional AIDS response is clear, the most marginalised communi-ties are being left behind. Even though transmission among such key populations as sex workers, men who have sex with men, people who inject drugs and transgender people are driving na-tional epidemics across the region, only 24� of domestic HIV spending in Asia and the Pacific supports programming for key populations [2]. Focusing prevention and treatment resources on the populations and locations in greatest need not only en-hances equity but also increases the public health impact of HIV spending as well as the return on investments.
Finally, the regional AIDS response needs to be firmly grounded in human rights and in the values of solidarity, inclusion and fairness. In addition to investing in anti-stigma programmes, implementing a rights-based response will also require legal re-form in some countries. Six of the 11 SEAR countries criminalise same-sex relations, four impose criminal penalties for sex work, and four operate detention centres for people who inject drugs [2]. Unless they are repealed, such punitive laws and policies will continue to drive those most in need away from life-saving prevention and treatment services, undermining hopes for end-ing the epidemic.
The choice facing SEAR is clear. Either we renew our commit-ment, redouble our efforts and invest in smart programmatic choices to end AIDS once and for all, or we watch while the op-portunity to end the epidemic evaporates. Even more concern-ing, modelling studies indicate that a failure to build on coverage gains achieved thus far will lead by 2030 to a worsening of the epidemic, effectively erasing the region’s progress over the last 20 years [5].
We possess the means to win the AIDS fight, both globally and across SEAR. History will rightly judge us harshly if we let pass by this historic opportunity to build the foundation for a healthier world for future generations.
References1. Mann D, Tarantola D. AIDS in the World II. New York and Oxford: Oxford University
Press; 1996.2. WHO. Fast-tracking the HIV response in the South-East Asia Region. New Delhi:
World Health Organization Regional Office for South-East Asia; 2016.3. Kates J, Wexler A, Lief E. Financing the response to HIV in low- and middle-income
countries: international assistance from donor governments in 2015. Washington DC: Henry J Kaiser Family Foundation, UNAIDS; 2016.
4. UNAIDS. 90:90-90: An ambitious treatment target to help end the AIDS epidemic. Geneva: UNAIDS; 2014.
5. UNAIDS. Fast-track: ending the AIDS epidemic by 2030. Geneva: UNAIDS; 2014.6. Isbell M, Kilonzo N, Mugurungi O, Bekker L. We neglect primary HIV prevention at
our peril. Lancet HIV 2016; 3: e284–e285.
HIV/AIDS in the South-East Asia region: progress and challengesRazia Pendse*, Somya Gupta, Dongbao Yu and Swarup Sarkar
World Health Organization South-East Asia Region, New Delhi, India
Abstract
The South-East Asia region, with 11 member states, has an estimated 3.5 million people living with HIV (PLHIV). Morethan 99% of PLHIV live in five countries where HIV prevalence among the population aged 15–49 remains low but isbetween 2% and 29% among key populations. Since 2010, the region has made progress to combat the epidemic. Maturecondom programmes exist in most countries but opioid substitution therapy, and needle and syringe exchange programmesneed to be scaled up. HIV testing is recommended nationwide in four countries and is prioritised in high prevalence areasor for key populations in the rest. In 2015, PLHIV aware of their HIV status ranged from 26% to 89%. Antiretroviraltherapy (ART) is recommended for all PLHIV in Thailand and Maldives while six countries recommend ART at CD4 cellcounts <500 cells/mm3. In 2015, 1.4 million (39%) PLHIV were receiving ART compared to 670,000 (20%) in 2010.Coverage of HIV testing and treatment among HIV-positive pregnant women has also improved but remains low in allcountries except Thailand, which has eliminated mother-to-child transmission of HIV and syphilis. Between 2010 and2015, AIDS-related deaths and new HIV infections have shown a declining trend in all the high-burden countries exceptIndonesia. But the region is far from achieving the 90-90-90 target by 2020 and the end of AIDS by 2030. The futureHIV response requires that governments work in close collaboration with communities, address stigma and discrimination,and efficiently invest domestic resources in evidence-based HIV testing and treatment interventions for populations inlocations that need them most.
Keywords: HIV prevalence, testing, PMTCT, ART, viral load, key population
Introduction
The HIV/AIDS epidemic still remains a major public health concernin the World Health Organization (WHO) South-East Asia region(the region henceforth). The region, comprising 11 member states,is home to a quarter of the world‘s population and has the secondlargest HIV burden after sub-Saharan Africa. Even though HIVprevalence is low at 0.3%, an estimated 3.5 million (3.0 million–4.1million) people are living with HIV [1]. There were an estimated180,000 (150,000–210,000) new HIV infections and 130,000(110,000–150,000) AIDS-related deaths in 2015 [1].
Since 2000, member states in the Region have made significantprogress towards Goal 6 of the Millennium Development Goals(MDGs) [2,3]. Prevention and control of HIV has resulted inimproved access to antiretroviral therapy (ART) and a decline inHIV-related illnesses, deaths and transmission. As the era of MDGscomes to an end and the Sustainable Development Goals (SDGs)[4] commence, it is time to assess the Member States’ keyachievements in the AIDS response in the last 5 years and identifythe gaps and challenges they face. This article describes the currentstate of the HIV epidemic, the health sector response (inputs,outputs and outcomes along the HIV result chain) and impact ofHIV programmes on epidemiological trends for the region and itsmember states (excluding the Democratic People‘s Republic ofKorea) for the period 2010–2015. Such a review will help guidethe HIV response in the near future in order to achieve the endof the AIDS epidemic by 2030 in the region.
Characteristics of the HIV/AIDS epidemicin the region
The epidemic is heterogeneous among and within the memberstates in terms of levels and trends. The number of people livingwith HIV (PLHIV) has remained more or less stable at 3.5 million(3.0 million–4.1 million) since 2005 and includes 1.3 million (1.1million–1.5 million) women aged 15 years and above [1]. More
than 99% of PLHIV live in five countries: India, Indonesia,Myanmar, Nepal and Thailand (Table 1). With 2.1 million (1.7million–2.6 million) PLHIV, India has the largest number of PLHIVin the region [5]. Five countries (Bangladesh, Bhutan, Maldives,Sri Lanka and Timor-Leste) together represent less than 1% ofall PLHIV and has been categorised as a low-level epidemic inthese countries. Less than 1000 people live with HIV in Bhutanand Timor-Leste (using data from 2014 as 2015 data areunavailable) [6,7]. The Democratic People‘s Republic of Korea hasnot reported any case so far.
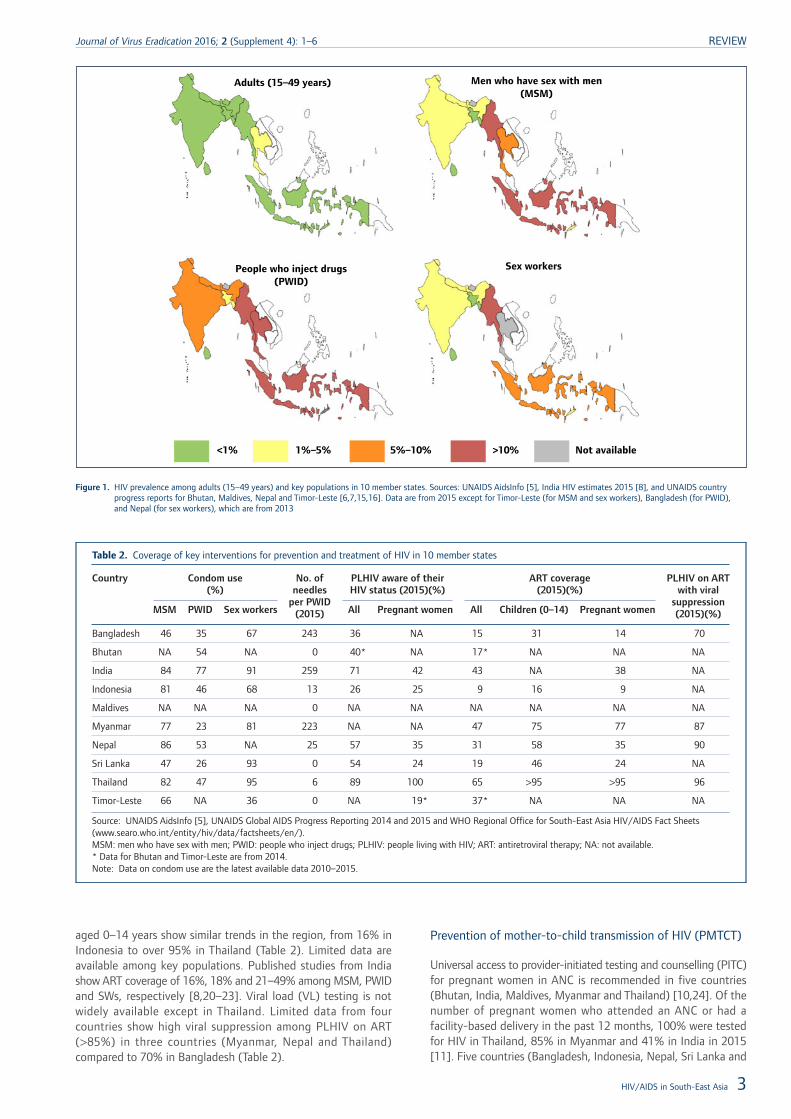
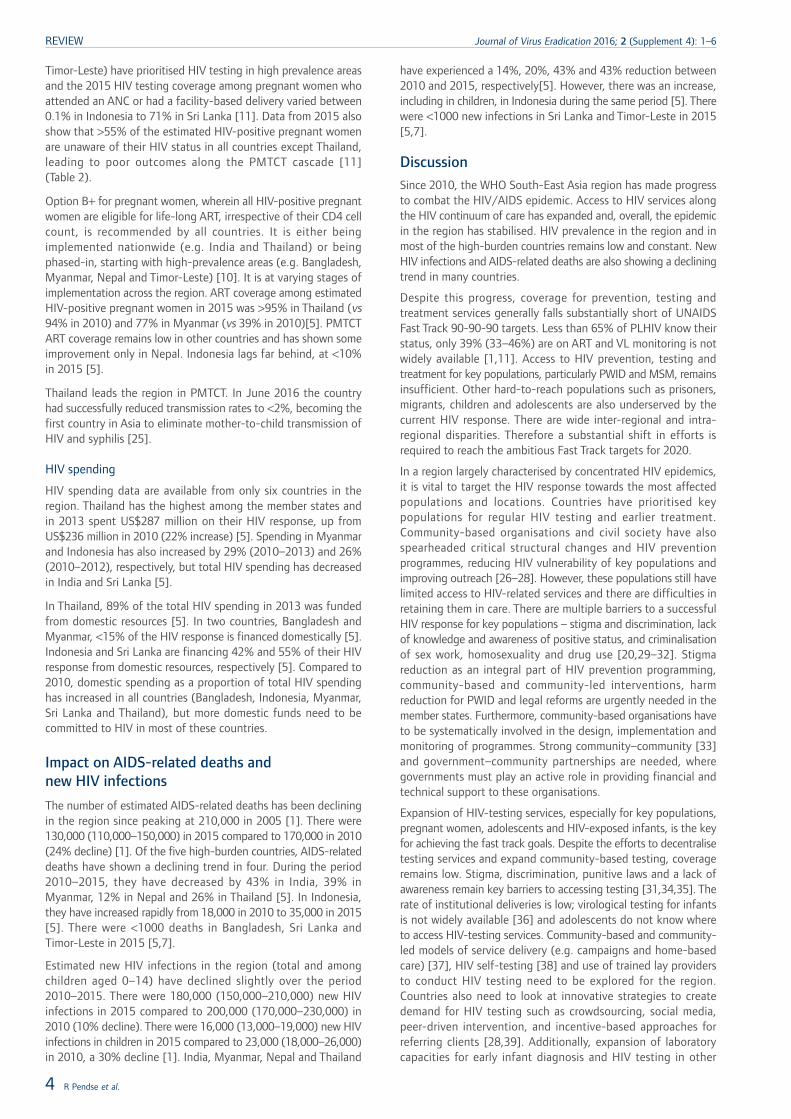
HIV prevalence among the adult population aged 15–49, 0.3%in 2015, has remained low and stable across the region [1].Thailand is the only country with an HIV prevalence of over 1%(Figure 1), which has declined from 1.7% in 2001 to 1.1% in 2015[5]. The prevalence in India (0.26%), Myanmar (0.8%) and Nepal(0.2%) has remained almost the same during the period 2001–2015 [5,8]; however, it is showing an upward trend in Indonesia(<0.1% in 2001 vs 0.5% in 2015)[5]. There are geographicalvariations within countries as well, as demonstrated by highprevalence in the southern and northeastern states of India andin Papua and West Papua in Indonesia [8,9].
The five countries in the region with 99% of the HIV burden areexperiencing concentrated epidemics among certain keypopulations that are at a high risk for acquiring HIV. These includesex workers (SW) and their clients, men who have sex with men(MSM), people who inject drugs (PWID) and transgenderindividuals. Prevalence rates among PWID were 10% in India, 19%in Thailand, 23% in Myanmar and 29% in Indonesia [5]. They arealso high among MSM, ranging from 2.4% in Nepal to 26% inIndonesia [5] (Figure 1).
Health sector responses to HIV
HIV prevention for key populations
Condom programmes have been the cornerstone of HIV preventionin the region. The five countries with a concentrated epidemic havemature condom programmes for key populations and report highcondom use among MSM and SWs [5]. Condom use was >80%for MSM in India, Indonesia, Nepal and Thailand, and >90% for
*Corresponding author: Razia Pendse, Regional Adviser – HIV/STI/HEP,WHO Regional Office for South-East Asia, Indraprastha Estate, Mahatma
Gandhi Marg, New Delhi 110002, IndiaEmail: [email protected]
Journal of Virus Eradication 2016; 2 (Supplement 4): 1–6 REVIEW
© 2016 The Authors. Journal of Virus Eradication published by Mediscript LtdThis is an open access article published under the terms of a Creative Commons License. 1
SWs in India, Sri Lanka and Thailand (Table 2). However, condompromotion programs for PWID are not getting strong results: Indiareports the highest rates for the region at 77% [5].
All but three countries (Bhutan, Sri Lanka and Timor-Leste) haveopioid substitution therapy (OST) programmes for PWID [10].Limited available data show that only 2% of PWID in Bangladesh,15% in India, 12% in Myanmar and 35% in Indonesia werereceiving OST in 2015 [11]. Six countries (Bangladesh, India,Indonesia, Myanmar, Nepal and Thailand) have needle and syringeexchange programmes for PWID [10] but only India, Bangladesh,and Myanmar have achieved the global standard of over 200needles distributed per PWID per year in 2015 [5] (Table 2).
In 2015, the WHO issued guidelines that recommend antiretroviralpre-exposure prophylaxis (PrEP) as an additional prevention toolfor people at substantial risk of HIV [12]. Thailand is the onlycountry in the region that recommends PrEP for key populations(national treatment guidelines 2014) [13]. Implementation scienceresearch of PrEP is ongoing in India and Thailand [14].
HIV testing, care and treatment
HIV testing policies differ across countries. India, Maldives,Myanmar and Thailand recommend HIV testing for all populationsnationwide while the others have prioritised testing in high-prevalence areas and/or for high-risk populations. HIV testingservices are provided in a variety of facilities such as antenatal(ANC), ART, tuberculosis (TB), sexually transmitted infection andOST clinics [10]. Community-based testing is also provided in somecountries to increase accessibility, especially for key populations.
In Thailand, 89% of the estimated number of PLHIV were awareof their HIV status in 2015, this is the only country from the regionthat is on track to achieve the first of the 90-90-90 targets of90% of PLHIV diagnosed by 2020 [11] (Table 2). In othercountries, the estimated number of PLHIV who have beendiagnosed range from 26% in Indonesia to 71% in India (2015)[11]. Fewer PLHIV are aware of their HIV status in countries thatprioritise testing geographically or for high-risk populations.Coverage of testing and counselling for key populations alsoremains low in many countries. The latest available surveillancedata show that rates of HIV testing for SWs are highest in India
at 91%, followed by Timor-Leste at 66% (2013 data), but standbelow 50% in other countries [5]. Testing rates vary from 8% inSri Lanka to 64% in India for PWID and from 14% in Sri Lankato 71% in India for MSM [5].
ART eligibility criteria also vary among countries [13]. Of the 10member states two (Thailand and Maldives) recommend ARTirrespective of CD4 cell count for all PLHIV, in line with the recentlyreleased 2015 WHO guidelines [12]. Six countries, excluding Indiaand Indonesia, recommend initiation of ART at the 2013 WHOguideline [17] level of CD4 cell count <500 cells/mm3, andirrespective of CD4 counts for PLHIV co-infected with TB orhepatitis B, pregnant women and serodiscordant couples. Indiaand Indonesia recommend treatment at 2010 WHO guideline [18]levels of CD4 cell count <350 cells/mm3 and irrespective of CD4count for PLHIV co-infected with TB or hepatitis B and pregnantwomen. Indonesia has also prioritised serodiscordant couples, keypopulations and PLHIV in high-prevalence areas for ARTirrespective of CD4 cell count. Seven countries recommend ARTirrespective of CD4 cell count for children below 5 years of age[13]. India recommends ART irrespective of CD4 cell count forchildren below 2 years of age, while in Sri Lanka and Thailand,ART irrespective of CD4 count is recommended for children agedbelow 1 year [13]. Since 2010, all countries have updated theirtreatment guidelines periodically to keep pace with the latestevidence and follow WHO guidelines. As a result, ART scale uphas been impressive in the region.
At the end of 2015 more than 1.4 million PLHIV were receivingART compared to 670,000 in 2010 [1]. ART coverage among theestimated number of PLHIV has nearly doubled from 20%(17–23%) in 2010 to 39% (33–46%) in 2015 [1]. However, theregion and its member states have a long way to go in order toachieve the second 90-90-90 [19] target of 81% of estimatedPLHIV on ART by 2020. Thailand has the highest coverage of ARTat 65% in 2015 (Table 2) compared to 44% in 2010 [5]. India,Myanmar and Nepal have also shown a significant increase inaccess to ART but only 43%, 47% and 27% of the estimatednumber of PLHIV were receiving ART, respectively (Table 2).Treatment coverage was extremely low in Indonesia at 9% in 2015and has improved at a slow pace [5]. ART coverage among children
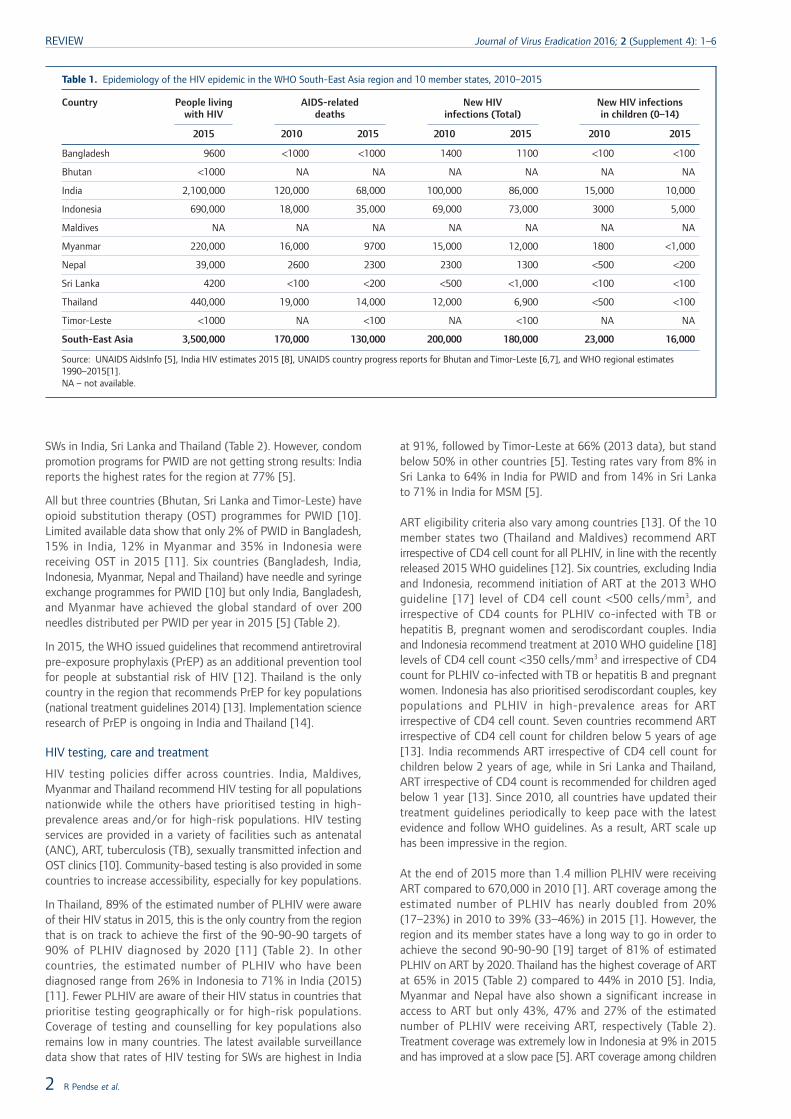
Table 1. Epidemiology of the HIV epidemic in the WHO South-East Asia region and 10 member states, 2010–2015
Country People livingwith HIV
AIDS-relateddeaths
New HIVinfections (Total)
New HIV infectionsin children (0–14)
2015 2010 2015 2010 2015 2010 2015
Bangladesh 9600 <1000 <1000 1400 1100 <100 <100
Bhutan <1000 NA NA NA NA NA NA
India 2,100,000 120,000 68,000 100,000 86,000 15,000 10,000
Indonesia 690,000 18,000 35,000 69,000 73,000 3000 5,000
Maldives NA NA NA NA NA NA NA
Myanmar 220,000 16,000 9700 15,000 12,000 1800 <1,000
Nepal 39,000 2600 2300 2300 1300 <500 <200
Sri Lanka 4200 <100 <200 <500 <1,000 <100 <100
Thailand 440,000 19,000 14,000 12,000 6,900 <500 <100
Timor-Leste <1000 NA <100 NA <100 NA NA
South-East Asia 3,500,000 170,000 130,000 200,000 180,000 23,000 16,000
Source: UNAIDS AidsInfo [5], India HIV estimates 2015 [8], UNAIDS country progress reports for Bhutan and Timor-Leste [6,7], and WHO regional estimates1990–2015[1].NA – not available.
REVIEW Journal of Virus Eradication 2016; 2 (Supplement 4): 1–6
2 R Pendse et al.
aged 0–14 years show similar trends in the region, from 16% inIndonesia to over 95% in Thailand (Table 2). Limited data areavailable among key populations. Published studies from Indiashow ART coverage of 16%, 18% and 21–49% among MSM, PWIDand SWs, respectively [8,20–23]. Viral load (VL) testing is notwidely available except in Thailand. Limited data from fourcountries show high viral suppression among PLHIV on ART(>85%) in three countries (Myanmar, Nepal and Thailand)compared to 70% in Bangladesh (Table 2).
Prevention of mother-to-child transmission of HIV (PMTCT)
Universal access to provider-initiated testing and counselling (PITC)for pregnant women in ANC is recommended in five countries(Bhutan, India, Maldives, Myanmar and Thailand) [10,24]. Of thenumber of pregnant women who attended an ANC or had afacility-based delivery in the past 12 months, 100% were testedfor HIV in Thailand, 85% in Myanmar and 41% in India in 2015[11]. Five countries (Bangladesh, Indonesia, Nepal, Sri Lanka and
Adults (15–49 years) Men who have sex with men(MSM)
People who inject drugs(PWID)
Sex workers
<1% 1%–5% 5%–10% >10% Not available
Figure 1. HIV prevalence among adults (15–49 years) and key populations in 10 member states. Sources: UNAIDS AidsInfo [5], India HIV estimates 2015 [8], and UNAIDS countryprogress reports for Bhutan, Maldives, Nepal and Timor-Leste [6,7,15,16]. Data are from 2015 except for Timor-Leste (for MSM and sex workers), Bangladesh (for PWID),and Nepal (for sex workers), which are from 2013
Table 2. Coverage of key interventions for prevention and treatment of HIV in 10 member states
Country Condom use(%)
No. ofneedles
per PWID(2015)
PLHIV aware of theirHIV status (2015)(%)
ART coverage(2015)(%)
PLHIV on ARTwith viral
suppression(2015)(%)MSM PWID Sex workers All Pregnant women All Children (0–14) Pregnant women
Bangladesh 46 35 67 243 36 NA 15 31 14 70
Bhutan NA 54 NA 0 40* NA 17* NA NA NA
India 84 77 91 259 71 42 43 NA 38 NA
Indonesia 81 46 68 13 26 25 9 16 9 NA
Maldives NA NA NA 0 NA NA NA NA NA NA
Myanmar 77 23 81 223 NA NA 47 75 77 87
Nepal 86 53 NA 25 57 35 31 58 35 90
Sri Lanka 47 26 93 0 54 24 19 46 24 NA
Thailand 82 47 95 6 89 100 65 >95 >95 96
Timor-Leste 66 NA 36 0 NA 19* 37* NA NA NA
Source: UNAIDS AidsInfo [5], UNAIDS Global AIDS Progress Reporting 2014 and 2015 and WHO Regional Office for South-East Asia HIV/AIDS Fact Sheets(www.searo.who.int/entity/hiv/data/factsheets/en/).MSM: men who have sex with men; PWID: people who inject drugs; PLHIV: people living with HIV; ART: antiretroviral therapy; NA: not available.* Data for Bhutan and Timor-Leste are from 2014.Note: Data on condom use are the latest available data 2010–2015.
HIV/AIDS in South-East Asia 3
Journal of Virus Eradication 2016; 2 (Supplement 4): 1–6 REVIEW
Timor-Leste) have prioritised HIV testing in high prevalence areasand the 2015 HIV testing coverage among pregnant women whoattended an ANC or had a facility-based delivery varied between0.1% in Indonesia to 71% in Sri Lanka [11]. Data from 2015 alsoshow that >55% of the estimated HIV-positive pregnant womenare unaware of their HIV status in all countries except Thailand,leading to poor outcomes along the PMTCT cascade [11](Table 2).
Option B+ for pregnant women, wherein all HIV-positive pregnantwomen are eligible for life-long ART, irrespective of their CD4 cellcount, is recommended by all countries. It is either beingimplemented nationwide (e.g. India and Thailand) or beingphased-in, starting with high-prevalence areas (e.g. Bangladesh,Myanmar, Nepal and Timor-Leste) [10]. It is at varying stages ofimplementation across the region. ART coverage among estimatedHIV-positive pregnant women in 2015 was >95% in Thailand (vs94% in 2010) and 77% in Myanmar (vs 39% in 2010)[5]. PMTCTART coverage remains low in other countries and has shown someimprovement only in Nepal. Indonesia lags far behind, at <10%in 2015 [5].
Thailand leads the region in PMTCT. In June 2016 the countryhad successfully reduced transmission rates to <2%, becoming thefirst country in Asia to eliminate mother-to-child transmission ofHIV and syphilis [25].
HIV spending
HIV spending data are available from only six countries in theregion. Thailand has the highest among the member states andin 2013 spent US$287 million on their HIV response, up fromUS$236 million in 2010 (22% increase) [5]. Spending in Myanmarand Indonesia has also increased by 29% (2010–2013) and 26%(2010–2012), respectively, but total HIV spending has decreasedin India and Sri Lanka [5].
In Thailand, 89% of the total HIV spending in 2013 was fundedfrom domestic resources [5]. In two countries, Bangladesh andMyanmar, <15% of the HIV response is financed domestically [5].Indonesia and Sri Lanka are financing 42% and 55% of their HIVresponse from domestic resources, respectively [5]. Compared to2010, domestic spending as a proportion of total HIV spendinghas increased in all countries (Bangladesh, Indonesia, Myanmar,Sri Lanka and Thailand), but more domestic funds need to becommitted to HIV in most of these countries.
Impact on AIDS-related deaths andnew HIV infections
The number of estimated AIDS-related deaths has been decliningin the region since peaking at 210,000 in 2005 [1]. There were130,000 (110,000–150,000) in 2015 compared to 170,000 in 2010(24% decline) [1]. Of the five high-burden countries, AIDS-relateddeaths have shown a declining trend in four. During the period2010–2015, they have decreased by 43% in India, 39% inMyanmar, 12% in Nepal and 26% in Thailand [5]. In Indonesia,they have increased rapidly from 18,000 in 2010 to 35,000 in 2015[5]. There were <1000 deaths in Bangladesh, Sri Lanka andTimor-Leste in 2015 [5,7].
Estimated new HIV infections in the region (total and amongchildren aged 0–14) have declined slightly over the period2010–2015. There were 180,000 (150,000–210,000) new HIVinfections in 2015 compared to 200,000 (170,000–230,000) in2010 (10% decline). There were 16,000 (13,000–19,000) new HIVinfections in children in 2015 compared to 23,000 (18,000–26,000)in 2010, a 30% decline [1]. India, Myanmar, Nepal and Thailand
have experienced a 14%, 20%, 43% and 43% reduction between2010 and 2015, respectively[5]. However, there was an increase,including in children, in Indonesia during the same period [5]. Therewere <1000 new infections in Sri Lanka and Timor-Leste in 2015[5,7].
DiscussionSince 2010, the WHO South-East Asia region has made progressto combat the HIV/AIDS epidemic. Access to HIV services alongthe HIV continuum of care has expanded and, overall, the epidemicin the region has stabilised. HIV prevalence in the region and inmost of the high-burden countries remains low and constant. NewHIV infections and AIDS-related deaths are also showing a decliningtrend in many countries.
Despite this progress, coverage for prevention, testing andtreatment services generally falls substantially short of UNAIDSFast Track 90-90-90 targets. Less than 65% of PLHIV know theirstatus, only 39% (33–46%) are on ART and VL monitoring is notwidely available [1,11]. Access to HIV prevention, testing andtreatment for key populations, particularly PWID and MSM, remainsinsufficient. Other hard-to-reach populations such as prisoners,migrants, children and adolescents are also underserved by thecurrent HIV response. There are wide inter-regional and intra-regional disparities. Therefore a substantial shift in efforts isrequired to reach the ambitious Fast Track targets for 2020.
In a region largely characterised by concentrated HIV epidemics,it is vital to target the HIV response towards the most affectedpopulations and locations. Countries have prioritised keypopulations for regular HIV testing and earlier treatment.Community-based organisations and civil society have alsospearheaded critical structural changes and HIV preventionprogrammes, reducing HIV vulnerability of key populations andimproving outreach [26–28]. However, these populations still havelimited access to HIV-related services and there are difficulties inretaining them in care. There are multiple barriers to a successfulHIV response for key populations – stigma and discrimination, lackof knowledge and awareness of positive status, and criminalisationof sex work, homosexuality and drug use [20,29–32]. Stigmareduction as an integral part of HIV prevention programming,community-based and community-led interventions, harmreduction for PWID and legal reforms are urgently needed in themember states. Furthermore, community-based organisations haveto be systematically involved in the design, implementation andmonitoring of programmes. Strong community–community [33]and government–community partnerships are needed, wheregovernments must play an active role in providing financial andtechnical support to these organisations.
Expansion of HIV-testing services, especially for key populations,pregnant women, adolescents and HIV-exposed infants, is the keyfor achieving the fast track goals. Despite the efforts to decentralisetesting services and expand community-based testing, coverageremains low. Stigma, discrimination, punitive laws and a lack ofawareness remain key barriers to accessing testing [31,34,35]. Therate of institutional deliveries is low; virological testing for infantsis not widely available [36] and adolescents do not know whereto access HIV-testing services. Community-based and community-led models of service delivery (e.g. campaigns and home-basedcare) [37], HIV self-testing [38] and use of trained lay providersto conduct HIV testing need to be explored for the region.Countries also need to look at innovative strategies to createdemand for HIV testing such as crowdsourcing, social media,peer-driven intervention, and incentive-based approaches forreferring clients [28,39]. Additionally, expansion of laboratorycapacities for early infant diagnosis and HIV testing in other
REVIEW Journal of Virus Eradication 2016; 2 (Supplement 4): 1–6
4 R Pendse et al.
settings/programmes is needed. HIV testing algorithms should befurther simplified and streamlined to address losses at the firststep of the HIV continuum of care [40].
Based on the results from the HPTN 052 [41], INSIGHT-START[42] and TEMPRANO trials [43], the WHO updated its treatmentguidelines in 2015 to recommend immediate ART initiation [12].While two countries in the region have taken up thisrecommendation, the majority of them recommend treatmentinitiation according to the WHO 2013 guidelines [17]. Theimplementation of national guidelines has been slow in the regionand ART coverage remains low. Substantial challenges are relatedto limited financial resources, drug procurement and supply, costof HIV care, human resource constraints and low HIV-testing rates[44–46]. Similarly, despite clear guidance, the scaling up of routineVL monitoring is lagging behind due to high costs, poorinfrastructure and lack of training [47]. Achieving the 90-90-90targets will require countries to move to treatment for all, and toprovide routine treatment monitoring. Strong political commitment,financial resources and programme efficiency are needed to addressthe current challenges.
HIV programmes in all but a few countries remain heavilydependent on international funding, which is shrinking,unpredictable and risky. Furthermore, economic growth in anumber of countries has resulted in the fact that they are no longereligible for support from the Global Fund. Combined with a slowincrease in domestic HIV spending and a further need of fundingto achieve the 90-90-90 targets, there are serious concernsregarding transition management, financing mechanisms andsustainability of HIV programmes [48]. Governments need to lookat innovative and sustainable funding mechanisms to increasedomestic HIV spending and decrease their reliance on donors.There is also room for greater efficiency as countries will needto allocate their resources in policies and practices that willmaximise cost-effectiveness.
In conclusion, the South-East Asia region has come a long wayin its HIV response but there remain major gaps. Much needs tobe done in order to strengthen and sustain this response in thecontext of universal health coverage in the post-2015 era of SDGs.Ending the HIV epidemic in the region will require thatgovernments work in close collaboration with communities andkey stakeholders and efficiently use their scarce resources toprovide evidence-based HIV prevention and treatmentinterventions for populations in locations that need them most.
Acknowledgements
Disclaimer
The opinions and statements in this article are those of the authorsand do not represent the official policy, endorsement or views ofthe WHO.
Conflicts of interest
None of the authors have conflicts of interest to declare.
References1. WHO Regional Data Estimates 1990–2015.
2. United Nations. Millennium Development Goals. Available at: www.mdgmonitor.org/mdg-6-combat-hiv-aids-malaria-and-other-diseases/ (accessed November 2016).
3. UNAIDS. How AIDS changed everything MDG 6: 15 years, 15 lessons of hope fromAIDS response. 2015. Available at: www.unaids.org/sites/default/files/media_asset/MDG6Report_en.pdf (accessed November 2016).
4. United Nations. Sustainable Development Goals. Available at: https://sustainabledevelopment.un.org/ (accessed November 2016).
5. UNAIDS. AIDSInfo. Available at: http://aidsinfo.unaids.org/. (accessed November2016).
6. National AIDS Control Programme, Department of Health, Ministry of Health. CountryProgress Report on the HIV Response in Bhutan 2015. 2015. Available at:
www.unaids.org/sites/default/files/country/documents/BTN_narrative_report_2015.pdf (accessed November 2016).
7. Ministry of Health Timor-Leste. National AIDS Programme, UNAIDS Global AIDSResponse Progress Report 2015. 2015. Available at: www.unaids.org/sites/default/files/country/documents/TLS_narrative_report_2015.pdf (accessed November 2016).
8. National AIDS Control Organization India. India HIV Estimations 2015. TechnicalReport. Available at: www.naco.gov.in/sites/default/files/India%20HIV%20Estimations%202015.pdf (accessed November 2016).
9. Indonesia National AIDS Commission. Indonesia Country Progress Report 2014.Available at: www.unaids.org/sites/default/files/country/documents/IDN_narrative_report_2014.pdf (accessed May 2016).
10. WHO SEAR. Evaluation of the Regional Health Sector Strategy on HIV 2011–2015.In press.
11. UNAIDS. Global AIDS Response Progress Reporting 2015. 2015. Available at:www.unaids.org/sites/default/files/media_asset/JC2702_GARPR2015guidelines_en.pdf (accessed November 2016).
12. WHO. Guideline on when to start antiretroviral therapy and on pre-exposureprophylaxis for HIV. Available at: www.who.int/hiv/pub/guidelines/earlyrelease-arv/en/ (accessed November 2016).
13. International Association of Providers of AIDS Care. Global HIV Policy Watch[database online]. Updated 12 July 2016.
14. AIDS Vaccine Advocacy Coalition (AVAC). Ongoing and Planned PrEP Demonstrationand Implementation Studies [database online]. Updated June 2016. Availableat: www.avac.org/resource/ongoing-and-planned-prep-demonstration-and-implementation-studies (accessed November 2016).
15. Government of Nepal, Ministry of Health and Population, National Centre for AIDSand STD Control. UNAIDS Country Progress Report 2015. Available at:www.unaids.org/sites/default/files/country/documents/NPL_narrative_report_2015.pdf (accessed June 2016).
16. Government of Maldives. UNAIDS Country Progress Report 2015. Available at:www.unaids.org/sites/default/files/country/documents/MDV_narrative_report_2015.pdf (accessed June 2016).
17. WHO. Consolidated guidelines on the use of antiretroviral drugs for treating andpreventing HIV infection. 2013. Available at: http://apps.who.int/iris/bitstream/10665/85321/1/9789241505727_eng.pdf. (accessed November 2016).
18. WHO. Antiretroviral Therapy for HIV Infection in Adults and Adolescents. 2010.Available at: http://whqlibdoc.who.int/publications/2010/9789241599764_eng.pdf(accessed May 2016).
19. UNAIDS. 90-90-90 An ambitious treatment target to help end the AIDS epidemic.2014. Available at: www.unaids.org/sites/default/files/media_asset/90-90-90_en_0.pdf (accessed May 2016).
20. Mehta SH, Lucas GM, Solomon S et al. HIV care continuum among men who havesex with men and persons who inject drugs in India: barriers to successfulengagement. Clin Infect Dis 2015.
21. Becker ML, Mishra S, Satyanarayana et al. Rates and determinants of HIV-attributablemortality among rural female sex workers in Northern Karnataka, India. Int J STDAIDS 2012; 23: 36–40.
22. Chakrapani V, Newman PA, Shunmugam M et al. Barriers to free antiretroviraltreatment access for female sex workers in Chennai, India. AIDS Patient Care STDS2009; 23: 973–980.
23. Jadhav A, Bhattacharjee P, Raghavendra T et al. Risky behaviors among HIV-positivefemale sex workers in northern Karnataka, India. AIDS Res Treat 2013; 2013: 878151.
24. Pendse R, Gupta S, Yu D. HIV testing as a bottleneck to elimination of mother tochild transmission in the South-East Asia region. AIDS 2016. July 2016. Durban,South Africa. Abstract THPEC101.
25. UNAIDS Press Release. Thailand is the first country in Asia to eliminate mother-to-child transmission of HIV and Syphilis. Available from: http://www.unaids.org/en/resources/presscentre/pressreleaseandstatementarchive/2016/june/20160607_Thailand. Accessed 19 June 2016.
26. News article. Sri Lanka‘s Supreme Court makes landmark decision prohibiting HIVdiscrimination. 2 May 2016. Available from: http://www.unaids.org/en/resources/presscentre/featurestories/2016/may/20160502_Srilanka_nodiscrimination. Accessed11 May 2016.
27. Mabuchi S, Singh S, Bishnu R, Bennett S. Management characteristics of successfulpublic health programs: ‘Avahan’ HIV prevention program in India. Int J Health PlannManage 2013; 28: 333–345.
28. Bhattacharjee P, Prakash R, Pillai P et al. Understanding the role of peer groupmembership in reducing HIV-related risk and vulnerability among female sex workersin Karnataka, India. AIDS Care 2013; 25 Suppl 1: S46–54.
29. Hayashi K, Ti L, Avihingsanon A et al. Compulsory drug detention exposure isassociated with not receiving antiretroviral treatment among people who inject drugsin Bangkok, Thailand: a cross-sectional study. Subst Abuse Treat Prev Policy 2015;10: 16.
30. Heath AJ, Kerr T, Ti L et al. Healthcare avoidance by people who inject drugs inBangkok, Thailand. J Public Health 2015.
31. Logie CH, Newman PA, Weaver J et al. HIV-Related Stigma and HIV PreventionUptake Among Young Men Who Have Sex with Men and Transgender Women inThailand. AIDS Patient Care STDS 2016; 30: 92–100.
32. Reid G, Sharma M, Higgs P. The long winding road of opioid substitution therapyimplementation in South-East Asia: challenges to scale up. J Public Health Res 2014;3: 204.
33. Sadhu S, Manukonda AR, Yeruva AR et al. Role of a community-to-communitylearning strategy in the institutionalization of community mobilization among femalesex workers in India. PLoS One 2014; 9: e90592.
34. Sinha G, Dyalchand A, Khale M et al. Low utilization of HIV testing during pregnancy:what are the barriers to HIV testing for women in rural India? J Acquir ImmuneDefic Syndr 2008; 47: 248–252.
HIV/AIDS in South-East Asia 5
Journal of Virus Eradication 2016; 2 (Supplement 4): 1–6 REVIEW
35. Woodford MR, Chakrapani V, Newman PA, Shunmugam M. Barriers and facilitatorsto voluntary HIV testing uptake among communities at high risk of HIV exposurein Chennai, India. Glob Public Health 2015; 1–17.
36. Diese M, Shrestha L, Pradhan B et al. Bottlenecks and opportunities for deliveringintegrated pediatric HIV services in Nepal. Curr Opin HIV AIDS 2016; 11: S21–29.
37. Sweat M, Morin S, Celentano D et al. Community-based intervention to increaseHIV testing and case detection in people aged 16–32 years in Tanzania, Zimbabwe,and Thailand (NIMH Project Accept, HPTN 043): a randomised study. Lancet InfectDis 2011; 11: 525–532.
38. Tucker JD, Wei C, Pendse R, Lo YR. HIV self-testing among key populations: animplementation science approach to evaluating self-testing. J Virus Erad 2015; 1:38–42.
39. WHO Consolidated Guidelines on HIV Prevention, Diagnosis, Treatment and Carefor Key Populations 2014. Case study: Online strategies to increase uptake of HTCservices in Bangkok. Available from: http://apps.who.int/iris/bitstream/10665/128048/1/9789241507431_eng.pdf?ua=1&ua=1. Accessed 11 May 2016.
40. Indrati AR, van Crevel R, Parwati I et al. Screening and diagnosis of HIV-infectionin Indonesia: one, two or three tests? Acta Med Indones 2009; 41 Suppl 1: 28–32.
41. Cohen MS, Chen YQ, McCauley M et al. Prevention of HIV-1 infection with earlyantiretroviral therapy. N Engl J Med 2011; 365: 493–505.
42. Insight Start Study Group, Lundgren JD, Babiker AG et al. Initiation of antiretroviraltherapy in early asymptomatic HIV infection. N Engl J Med 2015; 373: 795–807.
43. Temprano ANTRS Study Group, Danel C, Moh R et al. A trial of early antiretroviralsand isoniazid preventive therapy in Africa. N Engl J Med 2015; 373: 808–822.
44. Riyarto S, Hidayat B, Johns B et al. The financial burden of HIV care, includingantiretroviral therapy, on patients in three sites in Indonesia. Health Policy Plan 2010;25: 272–282.
45. Wasti SP, Simkhada P, Teijlingen ER. Antiretroviral treatment programmes in Nepal:Problems and barriers. Kathmandu University Medical Journal 2009; 7: 306–314.
46. News article. India set to run out of critical free drug for HIV/AIDS programme.October 1 2014. Available at: http://in.reuters.com/article/aids-india-idINKCN0HQ3DU20141001 (accessed November 2016).
47. Roberts T, Cohn J, Bonner K, Hargreaves S. Scale-up of routine viral load testingin resource-poor settings: current and future implementation challenges. Clin InfectDis 2016; 62: 1043–1048.
48. Stuart RM, Lief E, Donald B et al. The funding landscape for HIV in Asia and thePacific. J Int AIDS Soc 2015; 18: 20004.
REVIEW Journal of Virus Eradication 2016; 2 (Supplement 4): 1–6
6 R Pendse et al.
The impact of Thailand‘s public health response to the HIVepidemic 1984–2015: understanding the ingredients of successTaweesap Siraprapasiri1, Sumet Ongwangdee2, Patchara Benjarattanaporn3, Wiwat Peerapatanapokin4, Mukta Sharma5*
1 National AIDS Management Centre, Nonthaburi, Thailand2 Bureau of AIDS TB and STIs, Nonthaburi, Thailand
3 UNAIDS, Bangkok, Thailand4 Policy Research and Development Institute Foundation, Thailand/East-West Center, USA
5 WHO Country Office for Thailand, Bangkok, Thailand
Abstract
Introduction: Thailand has been heralded as a global leader in HIV prevention and treatment, and its experience withthe HIV/AIDS epidemic holds valuable lessons for public health. This paper documents Thailand‘s response to its HIVepidemic from the late 1980s until today, and analyses its epidemiological impact (incidence and mortality). We discussthe association between the trajectory of HIV incidence and mortality rates over time, and the programmatic investments,policies and interventions that were implemented in the last three decades.
Methods: This is a review paper that draws on published literature, unpublished sources and routine behavioural andserological surveillance data since 1989. It is informed by the modelling of epidemiological impacts using the AIDS EpidemicModel. The AIDS Epidemic Model and Spectrum were used to assess the impact on incidence and mortality. Apart fromepidemiological data, National AIDS Spending Assessment and programme data were also used to assess financial investments.
Results: Thailand is well on its way to meeting the 90-90-90 targets, the goal that by 2020, 90% of people living withHIV know their HIV status, 90% of people with diagnosed HIV infection receive sustained antiretroviral therapy, and 90%of people receiving antiretroviral therapy (ART) are virally suppressed. In Thailand, 89% of people living with HIV knowtheir status, 72% receive ART and 82% have viral load testing – 99% of whom are suppressed. The public health responseto HIV in Thailand has averted 5.7 million infections since 1991. If Thailand had not responded in 1991 to the HIV epidemic,and had there been no prevention and ART provision, the country would have experienced an estimated 158,000–225,000deaths in the 2001–2006 period. This figure would have risen to 231,000–268,924 in the 2007–2014 period. A total of196,000 deaths were averted between 2001 and 2014. If ART scale-up had not occurred in 2001, Thailand would haveexperienced between 50,000 and 55,000 deaths per year in the period 2001–2006, and 31,000–46,000 annual deathsbetween 2007 and 2014. The main impact in terms of deaths averted is seen from 2004 onwards, reflecting treatmentscale up.
Conclusions: Thailand‘s AIDS response has prevented needless morbidity and mortality due to the HIV epidemic. In thecontext of Thailand‘s ageing population, it is faced with the twin challenges of maintaining life-long quality services amongHIV patients and sustaining behaviour change to maintain primary prevention gains. Keeping the focus of the policy makersand health administrators on ‘Ending the HIV epidemic’ will require consistent advocacy, and evidence-based, innovativeand efficient approaches.
Keywords: HIV/AIDS, Thailand, incidence, impact, interventions, ART, universal health, health governance
Introduction
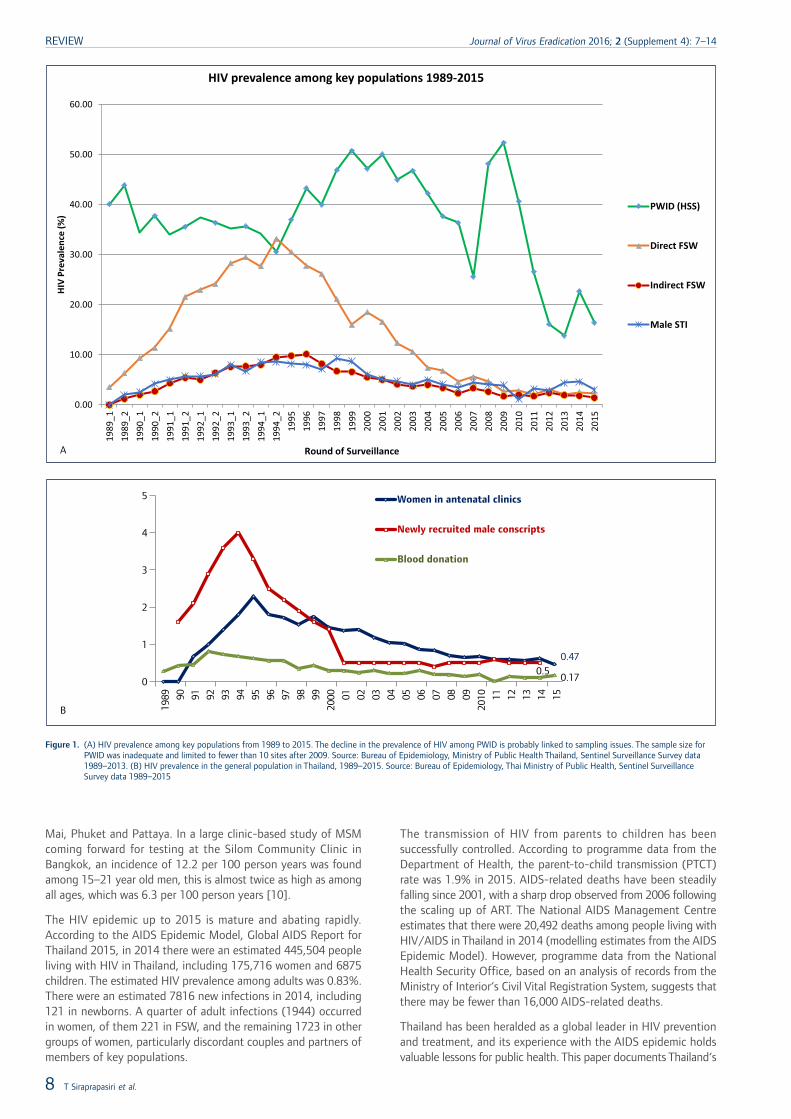
Thailand‘s first case of HIV was reported in 1984. The epidemichas evolved and changed strikingly over the last three decades.The early phase of the epidemic was mostly that of HIV-1, subtypeB, which rapidly escalated among people who inject drugs (PWID)in 1988 [1,2]. The virus then quickly spread to populations offemale sex workers (FSWs), with increasing documentation ofsubtype E [3]. The epidemic spread rapidly in the early 1990s,driven by infections among sex workers and their clients [4–6].The prevalence among direct FSWs was much higher, peaking inthe mid-1990s, and declining rapidly after that (Figure 1a). Therewere clear geographical differences in the prevalence of HIV. Theupper-northern provinces accounted for a disproportionate numberof HIV case reports [7]. By 1993, some 600,000–800,000 peoplewere estimated to be living with HIV [11]. At the same time, theprevalence of HIV in the general population – as measured bywomen attending antenatal clinics, newly recruited male conscriptsas well as blood donors – also showed an increase, peaking inthe early 1990s, and then declining slowly (Figure 1b).
Data based on AIDS case surveillance between 1984 and 1998showed that the most frequently reported opportunistic infectionswere tuberculosis (19%), Pneumocystis carinii pneumonia (19%),cryptococcosis (17%), candidiasis of oesophagus, trachea or lung(5%) and recurrent bacterial pneumonia (4%) [2]. Cross-sectionalsurvey data of hospital admissions between 1993 and 1996 alsoindicated that the most common AIDS-defining conditions werecryptococcosis, tuberculosis and HIV-wasting syndrome; PWID weremore likely to have tuberculosis or suffer from HIV-wastingsyndrome [8].
As HIV prevalence began to decline among FSWs and their clientsin the mid-1990s, data from serial prospective cohorts amongyoung Thai military conscripts also showed simultaneous declinesin the incidence of both HIV and sexually transmitted infections,suggesting successful interventions and changes in transmissionpatterns [7]. The early 2000s saw marked changes in thetransmission routes in Thailand, with sharp increases in theestimated HIV incidence among young men who have sex withmen (MSM) – from 4.1% to 7.7% between 2003 and 2007 [9],with a median of 9.2% as a national estimate in 2014. Prevalenceamong MSM in Thailand has remained high (Integrated BiologicalBehavioral Surveillance Round, 2014). HIV incidence among MSMis especially high among those living in large urban areas andinternational tourist destinations for example, Bangkok, Chiang
*Corresponding author: Mukta Sharma, 88/20 Permanent SecretaryBuilding, Ministry of Public Health, Tiwanon Road 11000,
Nonthaburi, ThailandEmail: [email protected]
Journal of Virus Eradication 2016; 2 (Supplement 4): 7–14 REVIEW
© 2016 The Authors. Journal of Virus Eradication published by Mediscript LtdThis is an open access article published under the terms of a Creative Commons License. 7
Mai, Phuket and Pattaya. In a large clinic-based study of MSMcoming forward for testing at the Silom Community Clinic inBangkok, an incidence of 12.2 per 100 person years was foundamong 15–21 year old men, this is almost twice as high as amongall ages, which was 6.3 per 100 person years [10].
The HIV epidemic up to 2015 is mature and abating rapidly.According to the AIDS Epidemic Model, Global AIDS Report forThailand 2015, in 2014 there were an estimated 445,504 peopleliving with HIV in Thailand, including 175,716 women and 6875children. The estimated HIV prevalence among adults was 0.83%.There were an estimated 7816 new infections in 2014, including121 in newborns. A quarter of adult infections (1944) occurredin women, of them 221 in FSW, and the remaining 1723 in othergroups of women, particularly discordant couples and partners ofmembers of key populations.
The transmission of HIV from parents to children has beensuccessfully controlled. According to programme data from theDepartment of Health, the parent-to-child transmission (PTCT)rate was 1.9% in 2015. AIDS-related deaths have been steadilyfalling since 2001, with a sharp drop observed from 2006 followingthe scaling up of ART. The National AIDS Management Centreestimates that there were 20,492 deaths among people living withHIV/AIDS in Thailand in 2014 (modelling estimates from the AIDSEpidemic Model). However, programme data from the NationalHealth Security Office, based on an analysis of records from theMinistry of Interior‘s Civil Vital Registration System, suggests thatthere may be fewer than 16,000 AIDS-related deaths.
Thailand has been heralded as a global leader in HIV preventionand treatment, and its experience with the AIDS epidemic holdsvaluable lessons for public health. This paper documents Thailand‘s
0.470.5
0.170
1
2
3
4
5
1989 90 91 92 93 94 95 96 97 98 99
2000 01 02 03 04 05 06 07 08 09
2010 11 12 13 14 15
Women in antenatal clinics
Newly recruited male conscripts
Blood donation
A
B
0.00
10.00
20.00
30.00
40.00
50.00
60.00 19
89_1
19
89_2
19
90_1
19
90_2
19
91_1
19
91_2
19
92_1
19
92_2
19
93_1
19
93_2
19
94_1
19
94_2
19
95
1996
19
97
1998
19
99
2000
20
01
2002
20
03
2004
20
05
2006
20
07
2008
20
09
2010
20
11
2012
20
13
2014
20
15
HIV
Pre
vale
nce
(%)
Round of Surveillance
HIV prevalence among key popula�ons 1989-2015
PWID (HSS)
Direct FSW
Indirect FSW
Male STI
Figure 1. (A) HIV prevalence among key populations from 1989 to 2015. The decline in the prevalence of HIV among PWID is probably linked to sampling issues. The sample size forPWID was inadequate and limited to fewer than 10 sites after 2009. Source: Bureau of Epidemiology, Ministry of Public Health Thailand, Sentinel Surveillance Survey data1989–2013. (B) HIV prevalence in the general population in Thailand, 1989–2015. Source: Bureau of Epidemiology, Thai Ministry of Public Health, Sentinel SurveillanceSurvey data 1989–2015
REVIEW Journal of Virus Eradication 2016; 2 (Supplement 4): 7–14
8 T Siraprapasiri et al.
response to its HIV epidemic from the late 1980s until today, andanalyses its scope and epidemiological impact (incidence andmortality). We discuss the association between the trajectory ofHIV incidence and mortality rates over time, and the programmaticinvestments, policies and interventions that were implemented inthe last three decades. In doing so, we document and describenot just the public health interventions, but also consider issuesof governance, universal health coverage as well as structural andpolicy constraints that influence public health outcomes.
Methods
This review draws on published literature and unpublished sourcesand routine behavioural and serological surveillance data since1989. It is informed by the modelling of epidemiological impactsusing the AIDS Epidemic Model (AEM). Electronic data sourcesinclude Medline, PubMed, the Social Sciences Citation Index, SocialSciences Index and Abstracts, and the International Bibliographyof the Social Sciences. Key peer-reviewed journals publishedbetween 1984 and 2015 were searched. Serological andbehavioural data collected by the Bureau of Epidemiology (BOE),covering the period since the establishment of the HIV sero-surveillance system (1989) and the behaviour sentinel surveillanceprogramme (1995) were also reviewed. These data provideinformation on key affected populations (KAPs) and the generalpopulation. Finally, AEM models to assess impact on incidenceand mortality in conjunction with vital registration data were alsoanalysed.
Apart from epidemiological data, we used information fromNational AIDS Spending Assessment (NASA) and programme datafrom the Ministry of Public Health (MOPH) and National HealthSecurity Office (NHSO) to assess financial investment and trackmonetary flows to specific interventions.
Results
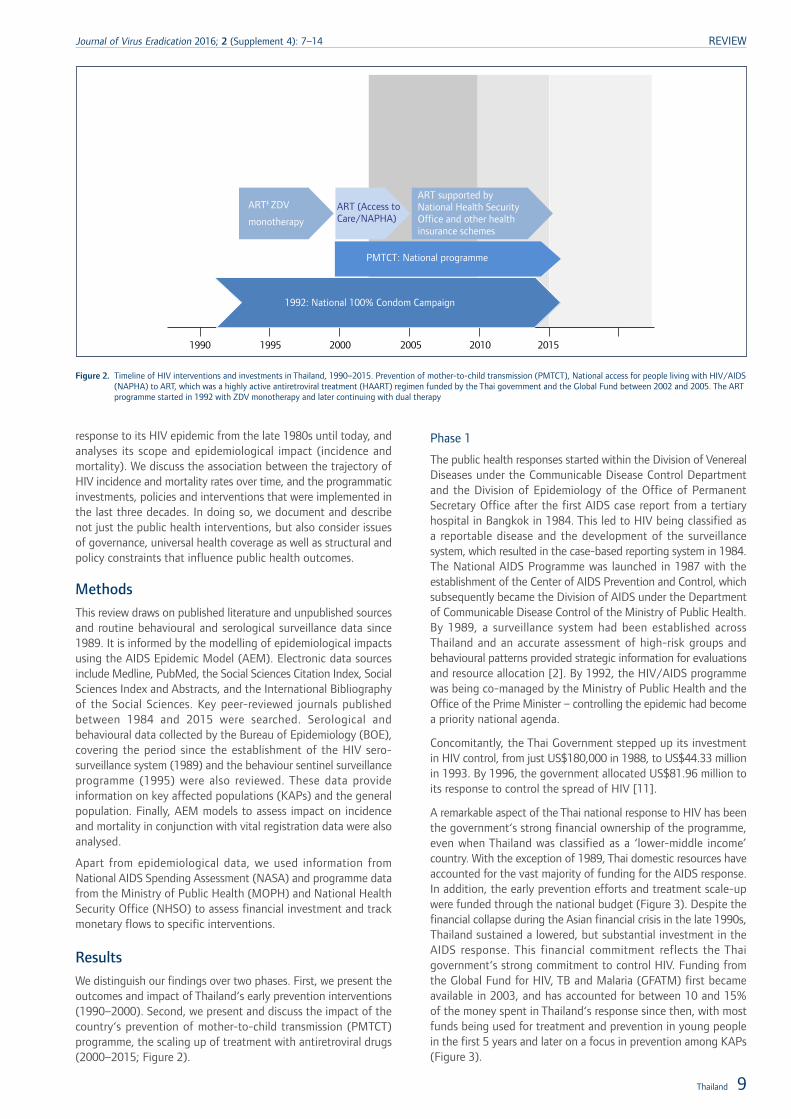
We distinguish our findings over two phases. First, we present theoutcomes and impact of Thailand‘s early prevention interventions(1990–2000). Second, we present and discuss the impact of thecountry‘s prevention of mother-to-child transmission (PMTCT)programme, the scaling up of treatment with antiretroviral drugs(2000–2015; Figure 2).
Phase 1
The public health responses started within the Division of VenerealDiseases under the Communicable Disease Control Departmentand the Division of Epidemiology of the Office of PermanentSecretary Office after the first AIDS case report from a tertiaryhospital in Bangkok in 1984. This led to HIV being classified asa reportable disease and the development of the surveillancesystem, which resulted in the case-based reporting system in 1984.The National AIDS Programme was launched in 1987 with theestablishment of the Center of AIDS Prevention and Control, whichsubsequently became the Division of AIDS under the Departmentof Communicable Disease Control of the Ministry of Public Health.By 1989, a surveillance system had been established acrossThailand and an accurate assessment of high-risk groups andbehavioural patterns provided strategic information for evaluationsand resource allocation [2]. By 1992, the HIV/AIDS programmewas being co-managed by the Ministry of Public Health and theOffice of the Prime Minister – controlling the epidemic had becomea priority national agenda.
Concomitantly, the Thai Government stepped up its investmentin HIV control, from just US$180,000 in 1988, to US$44.33 millionin 1993. By 1996, the government allocated US$81.96 million toits response to control the spread of HIV [11].
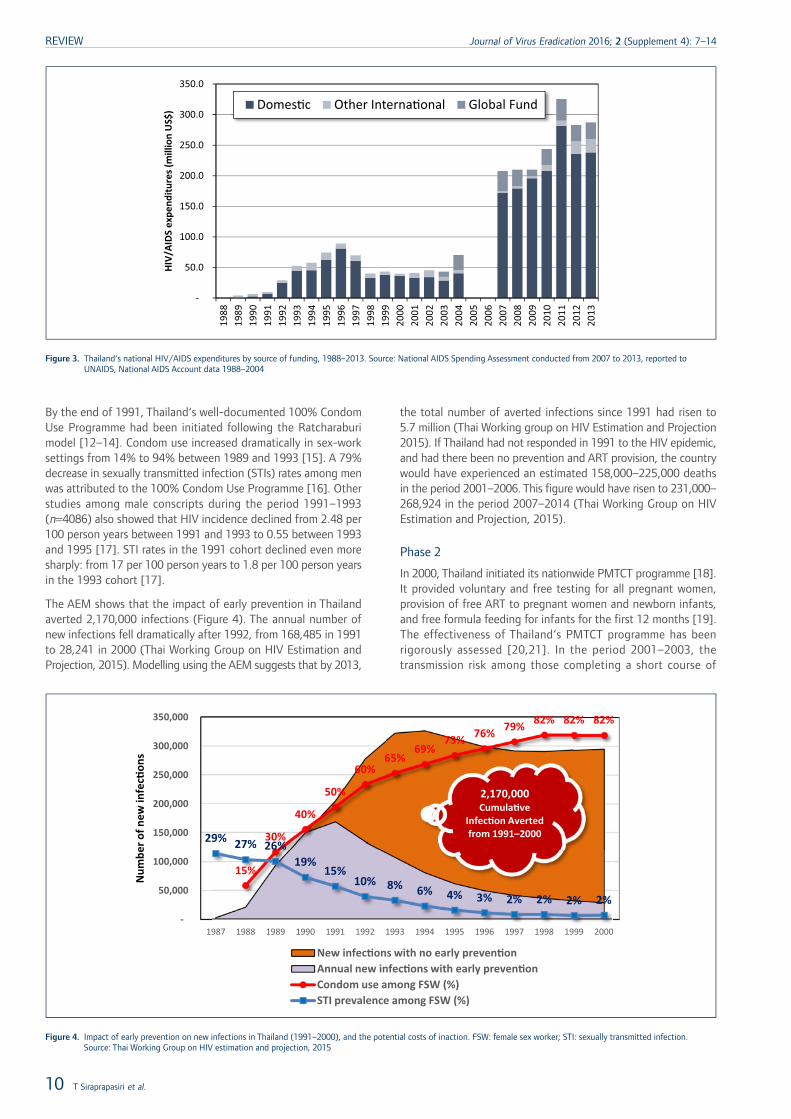
A remarkable aspect of the Thai national response to HIV has beenthe government‘s strong financial ownership of the programme,even when Thailand was classified as a ‘lower-middle income’country. With the exception of 1989, Thai domestic resources haveaccounted for the vast majority of funding for the AIDS response.In addition, the early prevention efforts and treatment scale-upwere funded through the national budget (Figure 3). Despite thefinancial collapse during the Asian financial crisis in the late 1990s,Thailand sustained a lowered, but substantial investment in theAIDS response. This financial commitment reflects the Thaigovernment‘s strong commitment to control HIV. Funding fromthe Global Fund for HIV, TB and Malaria (GFATM) first becameavailable in 2003, and has accounted for between 10 and 15%of the money spent in Thailand‘s response since then, with mostfunds being used for treatment and prevention in young peoplein the first 5 years and later on a focus in prevention among KAPs(Figure 3).
ART‡ ZDV
monotherapy
ART (Access toCare/NAPHA)
ART supported byNational Health SecurityOffice and other healthinsurance schemes
PMTCT: National programme
1992: National 100% Condom Campaign
1990 1995 2000 2005 2010 2015
Figure 2. Timeline of HIV interventions and investments in Thailand, 1990–2015. Prevention of mother-to-child transmission (PMTCT), National access for people living with HIV/AIDS(NAPHA) to ART, which was a highly active antiretroviral treatment (HAART) regimen funded by the Thai government and the Global Fund between 2002 and 2005. The ARTprogramme started in 1992 with ZDV monotherapy and later continuing with dual therapy
Thailand 9
Journal of Virus Eradication 2016; 2 (Supplement 4): 7–14 REVIEW
By the end of 1991, Thailand‘s well-documented 100% CondomUse Programme had been initiated following the Ratcharaburimodel [12–14]. Condom use increased dramatically in sex-worksettings from 14% to 94% between 1989 and 1993 [15]. A 79%decrease in sexually transmitted infection (STIs) rates among menwas attributed to the 100% Condom Use Programme [16]. Otherstudies among male conscripts during the period 1991–1993(n=4086) also showed that HIV incidence declined from 2.48 per100 person years between 1991 and 1993 to 0.55 between 1993and 1995 [17]. STI rates in the 1991 cohort declined even moresharply: from 17 per 100 person years to 1.8 per 100 person yearsin the 1993 cohort [17].
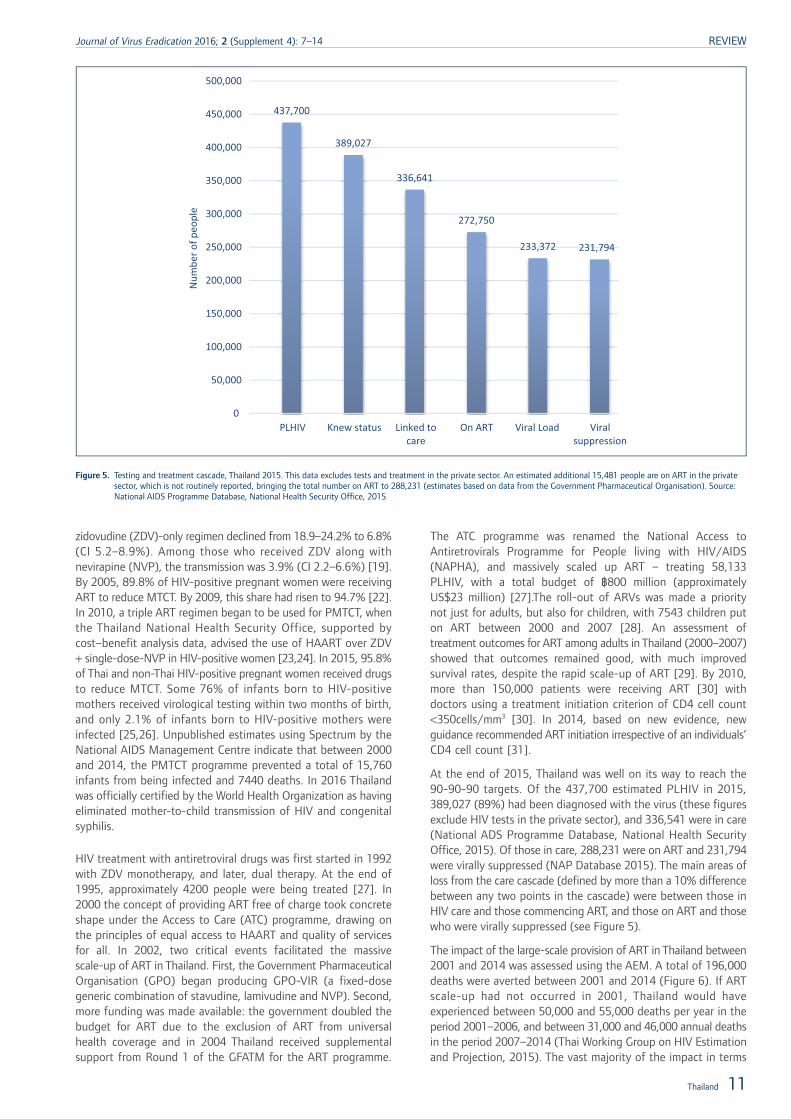
The AEM shows that the impact of early prevention in Thailandaverted 2,170,000 infections (Figure 4). The annual number ofnew infections fell dramatically after 1992, from 168,485 in 1991to 28,241 in 2000 (Thai Working Group on HIV Estimation andProjection, 2015). Modelling using the AEM suggests that by 2013,
the total number of averted infections since 1991 had risen to5.7 million (Thai Working group on HIV Estimation and Projection2015). If Thailand had not responded in 1991 to the HIV epidemic,and had there been no prevention and ART provision, the countrywould have experienced an estimated 158,000–225,000 deathsin the period 2001–2006. This figure would have risen to 231,000–268,924 in the period 2007–2014 (Thai Working Group on HIVEstimation and Projection, 2015).
Phase 2
In 2000, Thailand initiated its nationwide PMTCT programme [18].It provided voluntary and free testing for all pregnant women,provision of free ART to pregnant women and newborn infants,and free formula feeding for infants for the first 12 months [19].The effectiveness of Thailand‘s PMTCT programme has beenrigorously assessed [20,21]. In the period 2001–2003, thetransmission risk among those completing a short course of
-
50.0
100.0
150.0
200.0
250.0
300.0
350.0
1988
19
89
1990
19
91
1992
19
93
1994
19
95
1996
19
97
1998
19
99
2000
20
01
2002
20
03
2004
20
05
2006
20
07
2008
20
09
2010
20
11
2012
20
13
HIV/
AIDS
exp
endi
ture
s (m
illio
n U
S$) Domes�c Other Interna�onal Global Fund
Figure 3. Thailand‘s national HIV/AIDS expenditures by source of funding, 1988–2013. Source: National AIDS Spending Assessment conducted from 2007 to 2013, reported toUNAIDS, National AIDS Account data 1988–2004
15%
30%
40%
50%
60% 65%
69% 73% 76% 79% 82% 82% 82%
29% 27% 26% 19%
15% 10% 8% 6% 4% 3% 2% 2% 2% 2%
-
50,000
100,000
150,000
200,000
250,000
300,000
350,000
1987 1988 1989 1990 1991 1992 1993 1994 1995 1996 1997 1998 1999 2000
Num
ber o
f new
infe
c�on
s
New infec�ons with no early preven�on Annual new infec�ons with early preven�on Condom use among FSW (%) STI prevalence among FSW (%)
2,170,000 Cumula�ve
Infec�on Averted from 1991–2000
Figure 4. Impact of early prevention on new infections in Thailand (1991–2000), and the potential costs of inaction. FSW: female sex worker; STI: sexually transmitted infection.Source: Thai Working Group on HIV estimation and projection, 2015
REVIEW Journal of Virus Eradication 2016; 2 (Supplement 4): 7–14
10 T Siraprapasiri et al.
zidovudine (ZDV)-only regimen declined from 18.9–24.2% to 6.8%(CI 5.2–8.9%). Among those who received ZDV along withnevirapine (NVP), the transmission was 3.9% (CI 2.2–6.6%) [19].By 2005, 89.8% of HIV-positive pregnant women were receivingART to reduce MTCT. By 2009, this share had risen to 94.7% [22].In 2010, a triple ART regimen began to be used for PMTCT, whenthe Thailand National Health Security Office, supported bycost–benefit analysis data, advised the use of HAART over ZDV+ single-dose-NVP in HIV-positive women [23,24]. In 2015, 95.8%of Thai and non-Thai HIV-positive pregnant women received drugsto reduce MTCT. Some 76% of infants born to HIV-positivemothers received virological testing within two months of birth,and only 2.1% of infants born to HIV-positive mothers wereinfected [25,26]. Unpublished estimates using Spectrum by theNational AIDS Management Centre indicate that between 2000and 2014, the PMTCT programme prevented a total of 15,760infants from being infected and 7440 deaths. In 2016 Thailandwas officially certified by the World Health Organization as havingeliminated mother-to-child transmission of HIV and congenitalsyphilis.
HIV treatment with antiretroviral drugs was first started in 1992with ZDV monotherapy, and later, dual therapy. At the end of1995, approximately 4200 people were being treated [27]. In2000 the concept of providing ART free of charge took concreteshape under the Access to Care (ATC) programme, drawing onthe principles of equal access to HAART and quality of servicesfor all. In 2002, two critical events facilitated the massivescale-up of ART in Thailand. First, the Government PharmaceuticalOrganisation (GPO) began producing GPO-VIR (a fixed-dosegeneric combination of stavudine, lamivudine and NVP). Second,more funding was made available: the government doubled thebudget for ART due to the exclusion of ART from universalhealth coverage and in 2004 Thailand received supplementalsupport from Round 1 of the GFATM for the ART programme.
The ATC programme was renamed the National Access toAntiretrovirals Programme for People living with HIV/AIDS(NAPHA), and massively scaled up ART – treating 58,133PLHIV, with a total budget of ฿800 million (approximatelyUS$23 million) [27].The roll-out of ARVs was made a prioritynot just for adults, but also for children, with 7543 children puton ART between 2000 and 2007 [28]. An assessment oftreatment outcomes for ART among adults in Thailand (2000–2007)showed that outcomes remained good, with much improvedsurvival rates, despite the rapid scale-up of ART [29]. By 2010,more than 150,000 patients were receiving ART [30] withdoctors using a treatment initiation criterion of CD4 cell count<350cells/mm3 [30]. In 2014, based on new evidence, newguidance recommended ART initiation irrespective of an individuals’CD4 cell count [31].
At the end of 2015, Thailand was well on its way to reach the90-90-90 targets. Of the 437,700 estimated PLHIV in 2015,389,027 (89%) had been diagnosed with the virus (these figuresexclude HIV tests in the private sector), and 336,541 were in care(National ADS Programme Database, National Health SecurityOffice, 2015). Of those in care, 288,231 were on ART and 231,794were virally suppressed (NAP Database 2015). The main areas ofloss from the care cascade (defined by more than a 10% differencebetween any two points in the cascade) were between those inHIV care and those commencing ART, and those on ART and thosewho were virally suppressed (see Figure 5).
The impact of the large-scale provision of ART in Thailand between2001 and 2014 was assessed using the AEM. A total of 196,000deaths were averted between 2001 and 2014 (Figure 6). If ARTscale-up had not occurred in 2001, Thailand would haveexperienced between 50,000 and 55,000 deaths per year in theperiod 2001–2006, and between 31,000 and 46,000 annual deathsin the period 2007–2014 (Thai Working Group on HIV Estimationand Projection, 2015). The vast majority of the impact in terms
437,700
389,027
336,641
272,750
233,372 231,794
0
50,000
100,000
150,000
200,000
250,000
300,000
350,000
400,000
450,000
500,000
PLHIV Knew status Linked to care
On ART Viral Load Viral suppression
Num
ber o
f peo
ple
Figure 5. Testing and treatment cascade, Thailand 2015. This data excludes tests and treatment in the private sector. An estimated additional 15,481 people are on ART in the privatesector, which is not routinely reported, bringing the total number on ART to 288,231 (estimates based on data from the Government Pharmaceutical Organisation). Source:National AIDS Programme Database, National Health Security Office, 2015
Thailand 11
Journal of Virus Eradication 2016; 2 (Supplement 4): 7–14 REVIEW
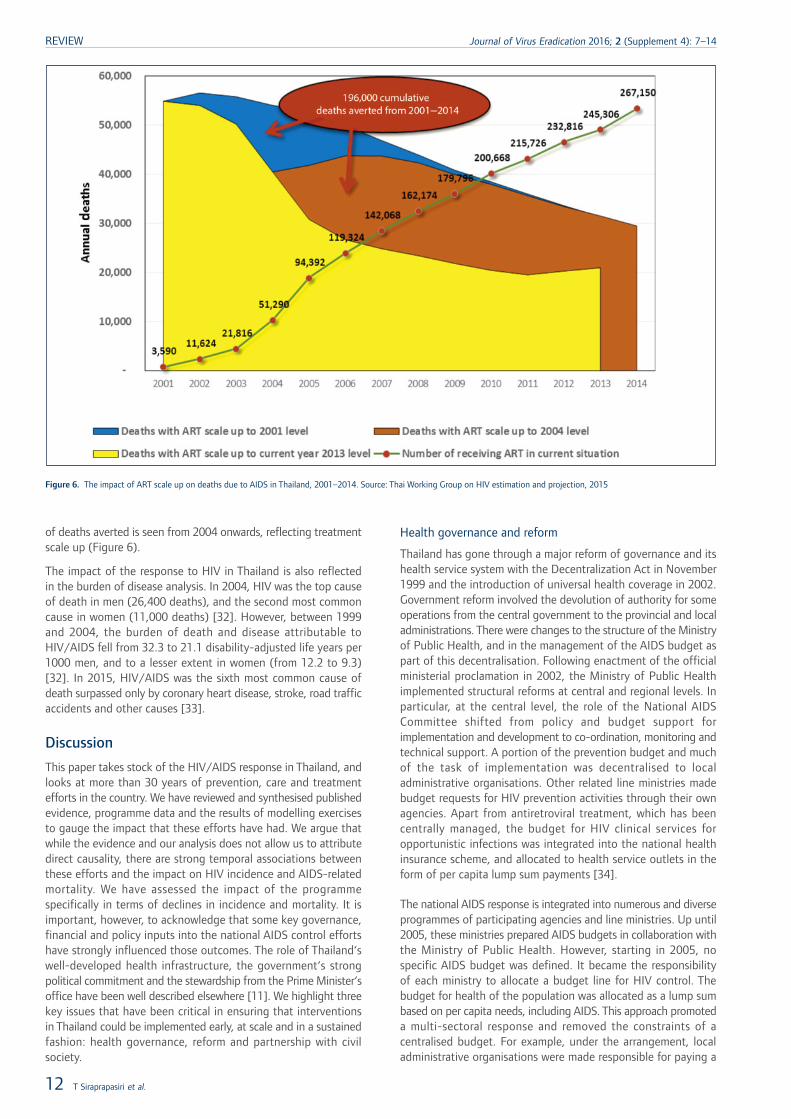
of deaths averted is seen from 2004 onwards, reflecting treatmentscale up (Figure 6).
The impact of the response to HIV in Thailand is also reflectedin the burden of disease analysis. In 2004, HIV was the top causeof death in men (26,400 deaths), and the second most commoncause in women (11,000 deaths) [32]. However, between 1999and 2004, the burden of death and disease attributable toHIV/AIDS fell from 32.3 to 21.1 disability-adjusted life years per1000 men, and to a lesser extent in women (from 12.2 to 9.3)[32]. In 2015, HIV/AIDS was the sixth most common cause ofdeath surpassed only by coronary heart disease, stroke, road trafficaccidents and other causes [33].
Discussion
This paper takes stock of the HIV/AIDS response in Thailand, andlooks at more than 30 years of prevention, care and treatmentefforts in the country. We have reviewed and synthesised publishedevidence, programme data and the results of modelling exercisesto gauge the impact that these efforts have had. We argue thatwhile the evidence and our analysis does not allow us to attributedirect causality, there are strong temporal associations betweenthese efforts and the impact on HIV incidence and AIDS-relatedmortality. We have assessed the impact of the programmespecifically in terms of declines in incidence and mortality. It isimportant, however, to acknowledge that some key governance,financial and policy inputs into the national AIDS control effortshave strongly influenced those outcomes. The role of Thailand‘swell-developed health infrastructure, the government‘s strongpolitical commitment and the stewardship from the Prime Minister‘soffice have been well described elsewhere [11]. We highlight threekey issues that have been critical in ensuring that interventionsin Thailand could be implemented early, at scale and in a sustainedfashion: health governance, reform and partnership with civilsociety.
Health governance and reform
Thailand has gone through a major reform of governance and itshealth service system with the Decentralization Act in November1999 and the introduction of universal health coverage in 2002.Government reform involved the devolution of authority for someoperations from the central government to the provincial and localadministrations. There were changes to the structure of the Ministryof Public Health, and in the management of the AIDS budget aspart of this decentralisation. Following enactment of the officialministerial proclamation in 2002, the Ministry of Public Healthimplemented structural reforms at central and regional levels. Inparticular, at the central level, the role of the National AIDSCommittee shifted from policy and budget support forimplementation and development to co-ordination, monitoring andtechnical support. A portion of the prevention budget and muchof the task of implementation was decentralised to localadministrative organisations. Other related line ministries madebudget requests for HIV prevention activities through their ownagencies. Apart from antiretroviral treatment, which has beencentrally managed, the budget for HIV clinical services foropportunistic infections was integrated into the national healthinsurance scheme, and allocated to health service outlets in theform of per capita lump sum payments [34].
The national AIDS response is integrated into numerous and diverseprogrammes of participating agencies and line ministries. Up until2005, these ministries prepared AIDS budgets in collaboration withthe Ministry of Public Health. However, starting in 2005, nospecific AIDS budget was defined. It became the responsibilityof each ministry to allocate a budget line for HIV control. Thebudget for health of the population was allocated as a lump sumbased on per capita needs, including AIDS. This approach promoteda multi-sectoral response and removed the constraints of acentralised budget. For example, under the arrangement, localadministrative organisations were made responsible for paying a
Figure 6. The impact of ART scale up on deaths due to AIDS in Thailand, 2001–2014. Source: Thai Working Group on HIV estimation and projection, 2015
REVIEW Journal of Virus Eradication 2016; 2 (Supplement 4): 7–14
12 T Siraprapasiri et al.
monthly allowance to PLHIV. Provinces were also expected toprioritise and budget for health issues at the local level. This madefinancing directly available at the local level (rather than indirectlythrough a centralised funding mechanism). While thisdecentralisation has led to some positive changes, the risk thatthere may be varying capacities and awareness across provincesregarding continued investment and engagement with HIV hasremained a challenge [35].
With the ultimate goal of equal rights to the access of qualityhealth services for all – as stipulated under Section 52 of the 1997Constitution – the government also implemented the UniversalHealth Security Scheme namely the ‘30 Baht scheme’ (in additionto the Social Security Scheme and the Civil Servant Medical BenefitScheme). This package entitled all Thai citizens to free medicalservices and health promotion and prevention. At the introductionof the scheme, antiretroviral treatment was excluded from theservice package, but included in 2006. The National Health SecurityOffice-supported ART programme is highly cost effective at lessthan US$1 per day per patient, and was supported by thegovernment‘s bold policies in initiating generic production, costnegotiation and compulsory licensing of ARV drugs, specificallyfor efavirenz and lopinavir/ritonavir [36,37].
Partnership
The Ministry of Public Health had begun to engage with civilsociety partners in Thailand on the issue of HIV prevention andtreatment since the early 1990s. A key partner is the Thai NGOCoalition on AIDS (TNCA), a network of 168 Thai NGOs, whichaims to improve the quality of life of PLHIV. It is notable that theBureau of AIDS, TB and STIs (BATS) not only worked in closepartnership with TNCA from the beginning of the epidemic, butalso provided it with an annual budget of ฿65–90 million tosupport their activities. TNCA was seen, along with the ThaiNetwork of People Living with HIV/AIDS (TNP+), as an equalpartner in the AIDS response, with a dedicated line of fundingfrom the NHSO.
Apart from working closely with the government, Thai civil societyhas successfully held governments accountable, and championedthe cause of equal access. For example, on 30 November 2001,1200 PLHIVs from all parts of the country demonstrated in frontof parliament and met with Minister of Public Health. The ministeragreed, in principle, to their demands, and doubled the budgetfor ART and also committed the government to include ARVs inthe universal health scheme. The working committee, whichconsisted of representatives from TNP+, NGO/AIDS and thegovernment, was set up to prepare for implementation of thescheme. At that time, there were fewer than 4000 individualsreceiving ART. Arguably, civil society action has been fundamentalin shaping government policy, an illustration that a well-informedand motivated civil society, which is able to negotiate and partnerwith government agencies, can be highly beneficial to the AIDSresponse.
Conclusions
We conclude by noting that, despite the outstanding successesof Thailand‘s AIDS response, the programme is faced by amultitude of challenges. A key dilemma is how to position HIVin the era of the sustainable development goals and move towards‘Ending AIDS’. HIV is a chronic disease, and in the context ofThailand‘s ageing population, it poses the twin challenges ofmaintaining life-long quality services for HIV patients andsustaining behavioural change to maintain primary preventiongains. Keeping the focus of policymakers and health administrators
on ‘Ending the HIV epidemic’ requires consistent advocacy,evidence-based cost effectiveness and innovative approaches toaddressing shortages of human resources.
Stigma and discrimination in healthcare settings is still a majorobstacle to a more effective response to HIV. Observed behaviourstowards KAPs among health staff in two Thai provinces indicatedisturbing levels of discrimination [38]. Thailand has also struggledwith ongoing policy and legislative barriers that have an impacton access and quality of services. Despite recent progress inreducing barriers to access (for example, no further requirementfor parental consent for HIV testing in young people; a pilot harmreduction policy in 19 provinces; and health insurance forhealthcare for migrants) Thailand has a rocky road to travel beforeending AIDS [24]. Some regulations, such as those that only allowa ‘medical technologist’ under the responsibility of a physicianto provide HIV test results, do not promote community-basedtesting.
To support Thailand in achieving the ambitious ‘Fast Track’ EndAIDS and move towards the attainment of the SustainableDevelopment Goals, the Ministry of Public Health and otherpartners are working towards establishing policies and systemsto increase funding flows to community partners at national andregional levels, including the accreditation of community services,and continuing ‘test and start ART’ for all HIV-infected people.The Ministry of Public Health is also implementing a programmeto reduce system-wide stigma and discrimination in healthcaresettings, and address human rights concerns.
In order to ‘End AIDS’, Thailand will need to focus on areas thatenhance the ability of the programme staff, service providers,health insurance agencies, civil society partners and PLHIV to workin a co-ordinated manner, and develop the capacity of the healthand community system to move beyond a ‘control’ agenda to an‘Ending AIDS’ agenda.
Acknowledgements
We would like to acknowledge Dr Nima Asgari from WHO Thailandfor reviewing early drafts of this paper. We would also like toacknowledge Tom F Joehnk for editorial support.
Declaration of conflict of interest
The authors do not have any conflict of interest to declare.
Disclaimer
MS is a staff member of the World Health Organization. Theauthors alone are responsible for the views expressed in this articleand they do not necessarily represent the decisions, policy or viewsof the World Health Organization.
References1. Weniger BG, Limpakarnjanarat K, Ungchusak K et al. The epidemiology of HIV
infection and AIDS in Thailand, AIDS 1991; 5 Suppl 2: S71–85.
2. Saengwonloey O, Jiraphongsa C, Foy H. Thailand report: HIV/AIDS surveillance 1998.J Acquir Immune DeficSyndr 2003; 32 Suppl 1: S63–67.
3. Ou CY, Takebe Y, Weniger BG et al. Independent introduction of two major HIV-1genotypes into distinct high-risk populations in Thailand. Lancet 1993; 341:1171–1174.
4. Siraprapasiri T, Thanprasertsuk S, Rodklay A et al. Risk factors for HIV amongprostitutes in Chiangmai, Thailand. AIDS 1991; 5: 579–582.
5. Sawanpanyalert P, Ungchusak K, Thanprasertsuk S, Akarasewi P. HIV seroconversionrates among female sex workers in Chiang Mai, Thailand: a multi-cross-sectionalstudy. AIDS 1994; 8: 825–829.
6. Brown T, Sittitrai W, Vanichseni S, Thisyakorn U. The recent epidemiology of HIVand AIDS in Thailand. AIDS 1994; 8 Suppl 2: S131–141.
7. Celentano DD, Bond KC, Lyles CM et al. Preventive intervention to reduce sexuallytransmitted infections: a field trial in the Royal Thai Army. Arch Intern Med 2000;160: 535–540.
Thailand 13
Journal of Virus Eradication 2016; 2 (Supplement 4): 7–14 REVIEW
8. Tansuphasawadikul S, Amornkul PN, Tanchanpong C et al. Clinical presentation ofhospitalized adult patients with HIV infection and AIDS in Bangkok, Thailand. J AcquirImmune DeficSyndr 1999; 21: 326–332.
9. van Griensven F, Varangrat A, Wimonsate W et al. Trends in HIV prevalence, estimatedHIV incidence, and risk behavior among men who have sex with men in Bangkok,Thailand, 2003–2007. J Acquir Immune DeficSyndr 2010; 53: 234–239.
10. Ananworanich J, Chitwarakorn A, Wimonsate W et al. HIV and syphilis infectionamong men who have sex with men – Bangkok, Thailand, 2005–2011. MMWR MorbMortal Wkly Rep 2013; 62: 518–520.
11. Phoolcharoen W, Ungchusak K, Sittitrai W, Brown T. Thailand: lessons from a strongnational response to HIV. AIDS 1998; 12 Suppl B: S123–135.
12. Brown T, Sittitrai W. Estimates of recent HIV infection levels in Thailand. ResearchReport No. 9. Program on AIDS, Thai Red Cross Society, Bangkok; 1993.
13. Punpanich W, Ungchusak K, Detels R. Thailand‘s response to the HIV epidemic:yesterday, today, and tomorrow. AIDS Educ Prev 2004; 16 Suppl A: 119–136.
14. Hanenberg RS, Rojanapithayakorn W, Kunasol P et al. Impact of Thailand‘s HIVcontrol programme as indicated by the decline of sexually transmitted diseases. Lancet1994; 344: 243–245.
15. Visrutaratna S, Lindan CP, Sirhorachai A, Mandel JS. ‘Superstar’ and ‘model brothel’:developing and evaluating a condom promotion program for sex establishments inChiang Mai, Thailand. AIDS 1995; 9 Suppl 1: S69–75.
16. Rojanapithayakorn W, Hanenberg RS. The 100% condom programme in Thailand.AIDS 1996; 10: 1–7.
17. Celentano DD, Nelson KE, Lyles CM et al. Decreasing incidence of HIV and sexuallytransmitted diseases in young Thai men: evidence for success of the HIV/AIDS controland prevention program. AIDS 1998; 12: F29–36.
18. Kanshana S, Simonds RJ. National programme for preventing mother to child HIVtransmission in Thailand: successful implementation and lessons learned. AIDS 2002;16: 953–959.
19. Phanuphak N, Chokephaibulkit K, Boonsuk S et al. Evolution of interventions toprevent mother-to-child transmission of hiv: perspective from Thailand. Siriraj MedJ 2011; 63: 20–24.
20. Plipat T, Naiwatanakul T, Rattanasuporn N et al. Reduction in mother-to-childtransmission of HIV in Thailand, 2001–2003: results from population-basedsurveillance in six provinces. AIDS 2007; 21: 145–151.
21. Teeraratkul A, Simonds RJ, Asavapiriyanont S et al. Evaluating programs to preventmother-to-child HIV transmission in two large Bangkok hospitals, 1999–2001.J Acquir Immune Defic Syndr 2005; 38: 208–212.
22. National AIDS Prevention and Alleviation Committee, Thailand; 2010. UNGASSCountry Progress Report. Available at: http://data.unaids.org/pub/Report/2010/thailand_2010_country_progress_report_en.pdf (accessed November 2016).
23. Health Intervention and Technology Assessment Program (HITAP). Cost benefit andfeasibility study of HAART for prevention of mother-to-child HIV transmission inThailand. Presented at Steering Group Committee of HIV/AIDS System Development.Bangkok, 2009, cited in Phanuphak et al [24].
24. Phanuphak N, Lolekha R, Chokephaibulkit K et al. for the Thai National HIVGuidelines Working Group. Thai national guidelines for the prevention of mother-to-child transmission of HIV: March 2010. Asian Biomed 2010; 4: 529–540.
25. National AIDS Committee, Thailand. Thailand Ending AIDS. AIDS Response ProgressReport, 2015. Available at: www.unaids.org/sites/default/files/country/documents/THA_narrative_report_2015.pdf (accessed November 2016).
26. Ministry of Public Health Thailand. Validation of elimination of Mother-To-Child-Transmission of HIV and Syphilis in Thailand 2013–2015 Report. Department ofHealth report to WHO Global Validation Committee for Elimination of mother tochild transmission of HIV and congenital syphilis May 2016.
27. Chasombat S, Lertpiriyasuwat C, Thanprasertsuk S et al. The National Access toAntiretroviral Program for PHA (NAPHA) in Thailand. Southeast Asian J Trop MedPublic Health 2006; 37: 704–715.
28. McConnell MS, Chasombat S, Siangphoe U et al. National program scale-up andpatient outcomes in a pediatric antiretroviral treatment program, Thailand,2000–2007. J Acquir Immune Defic Syndr 2010; 54: 423–429.
29. Chasombat S, McConnell MS, Siangphoe U et al. National expansion of antiretroviraltreatment in Thailand, 2000–2007: program scale-up and patient outcomes. J AcquirImmune Defic Syndr 2009; 50: 506–512.
30. Sungkanuparpha S, Techasathit W, Utaipiboon C et al. for the Adults and AdolescentsCommittee of the Thai National HIV Guidelines Working Group. Thai nationalguidelines for antiretroviral therapy in HIV-1 infected adults and adolescents 2010.Asian Biomed 2010; 4: 515–528.
31. Manosuthi W, Ongwandee S, Bhakeecheep S et al. Guidelines for antiretroviral therapyin HIV-1 infected adults and adolescents 2014, Thailand. AIDS Res Ther 2015; 12:12.
32. Bundhamcharoen K, Bundhamcharoen K, Odton P et al. Burden of disease inThailand: changes in health gap between 1999 and 2004. BMC Public Health 2011;11: 53.
33. World Health Organization. Thailand: WHO statistical profile. Available at:http://www.who.int/gho/countries/tha.pdf?ua=1 (accessed November 2016).
34. Mahidol University, Asean Institute for Health Development. Evaluation of theNational AIDS Response in Thailand. Available at: https://www.mottmac.com/download/file/127/7038/2011_evaluation_of_the_national_aids_response_in_thailand.pdf (accessed November 2016).
35. Ministry of Public Health Thailand and the World Health Organisation, SEARO.External Review of the Health Sector Response to HIV/AIDS in Thailand 2005.Available at: http://apps.searo.who.int/PDS_DOCS/B0181.pdf (accessed November2016).
36. Cohen J. Thailand‘s do-it-yourself therapy. Science 2003; 301: 1662.
37. Rungpry S, Kelly EJ. Compulsory Licensing Developments in Thailand. Asia law IPReview. July 2008. Available at: www.tilleke.com/sites/default/files/compulsory_licensing_developments_TH.pdf (accessed November 2016).
38. International Health Policy Programme, Ministry of Public Health, Thailand 2014.Report of a pilot: Developing Tools and Methods to measure HIV related stigmaand discrimination in Health Care Settings in Thailand. Available at: http://ihppthaigov.net/DB/publication/attachresearch/349/chapter1.pdf (accessedNovember 2016).
REVIEW Journal of Virus Eradication 2016; 2 (Supplement 4): 7–14
14 T Siraprapasiri et al.
India‘s HIV programme: successes and challengesSukarma Tanwar1, BB Rewari2*, CV Dharma Rao3 and Nicole Seguy4
1 Formerly WHO Country Office for India, New Delhi, India2 WHO Regional Office for South East Asia, New Delhi, India3 Joint Secretary, National AIDS Control Organisation, India
4 WHO Country Office for India, New Delhi, India
Abstract
Over the last two decades, India‘s National AIDS Control Programme (NACP) has evolved and expanded to provide HIVprevention, testing and treatment services countrywide. Scaling up has been uniform across all strategic components andhas not only halted, but also reversed, the spread of the epidemic and ensured a major reduction in the number ofAIDS-related annual deaths. As the epidemic has been driven by key populations, there was a special focus on thesegroups from the outset, with various innovative strategies for prevention and testing services. The treatment componenthas also been scaled up over the years through various models of service delivery that ensured access to free antiretroviraltherapy for eligible HIV-infected patients. The programme, now in its fourth phase, has to ensure that new policies andstrategies are developed in view of the global UNAIDS targets. The scale up over the years has ensured access to services;however, it is now important to ensure the quality and sustainability of newer models of interventions to ensure thatthe 2030 sustainable development goals are achieved.
Keywords: National AIDS Control Organization, India, HIV, success, challenges
Introduction
India, the second most populated country in the world, is hometo an estimated 2.1 million people living with HIV (PLHIV) [1],the third highest population globally after South Africa and Nigeria.The HIV epidemic in India is highly heterogeneous. It isconcentrated in specific regions of the country and in high-riskgroups (HRGs) such as people who inject drugs (PWID), femalesex workers (FSW), men who have sex with men (MSM) andtransgender people. HIV prevalence among all adults (15–49 years)has been declining steadily from 0.38% in 2001 to 0.26% in 2015,while among FSW, MSM and PWID it remains at 2.2%, 4.3%, and9.9%, respectively. Over the period 2000–2015, the annualestimated number of new HIV infections has decreased by 66%,while the number of annual AIDS-related deaths has decreasedby 54% since 2007 (Table 1)[1].
India‘s National AIDS Control Programme (NACP), implementedby the National AIDS Control Organization (NACO) under theMinistry of Health and Family Welfare, is one of the most successfulpublic health programmes in India today (Figure 1). Started in 1992,with the objective of understanding the HIV disease burden andepidemiological trends [2,3], the programme has now evolved intoa major public health prevention and treatment programme. It issupported financially by the Government of India (63.4%), theGlobal Fund and the World Bank (23%), and other multilateraland bilateral agencies [4]. Over the last two decades, four phasesof the NACP have been implemented, each with a duration of 5years. The focus in each phase has been on improving coverageof comprehensive HIV prevention, care and treatment servicesnationwide. The NACP IV (2012–2017) was launched with the aimof consolidating gains made to date, accelerating the process ofreversal and further strengthening the response to the epidemicin India. Its objectives include: (1) reduce new infections by 50%from the 2007 baseline of NACP III; and (2) provide comprehensivecare and support to all persons living with HIV/AIDS, and treatmentservices for all those who require it [5].
This article presents an overview of the key components of theNACP IV, highlights the policy and programme actions to improve
access to key services, evaluates progress towards achieving theNACP IV targets, and discusses the challenges and way forwardto strengthen the epidemic response in India.
Health sector response to HIV
HIV prevention for high-risk groups and bridge populations
Prevention services for high-risk groups and bridge populations(e.g. migrants and truck drivers;Table 2, Figure 2) have been scaledup nationwide through targeted-intervention projects.These providea comprehensive package of prevention, support and linkage servicesthrough an outreach-based service delivery model implementedby non-governmental and community-based organisations. UnderNACP IV, targeted-intervention services include needle/syringeexchange programmes and oral-substitution therapy for PWID,condom promotion and distribution, and linkage to HIV and sexuallytransmitted infections (STI) testing and treatment services.Furthermore, many new HIV prevention initiatives such asinterventions for migrant workers and focused strategies fortransgender people have been initiated under NACP IV.
Against a target of 2459, there were 1840 targeted-interventionprojects in the country in 2014–2015, which were successful in reachingnearly 5.6 million people. In 2014–2015 the coverage of the coreHRGs, FSWs, MSM and PWID was 80%, 68% and 75%, respectively[4]. However, concerns such as inequality, stigma and discrimination,especially among HRGs, still remain predominant [7,8].
Moving forward, the following steps are being taken to reach theprevention targets set out in NACP IV:
• Greater involvement of PLHIV to address stigma anddiscrimination.
• Planned demonstration of the oral pre-exposure prophylaxis(PrEP) project as part of an HIV combination preventiveintervention for sex workers.
• Test and treat for key populations will be initiated under thesupport of the Global Fund‘s New Funding Model [9].
HIV counselling and testing
When moving towards ending the HIV epidemic by 2030, one ofthe key challenges remains to ensure that PLHIV, especially thosein key populations, are aware of their status so that they can be
*Corresponding author: BB Rewari, WHO Regional Office for South-EastAsia, Indraprastha Estate, Mahatma Gandhi Marg, New Delhi 110002,
IndiaEmail: [email protected]
Journal of Virus Eradication 2016; 2 (Supplement 4): 15–19 REVIEW
© 2016 The Authors. Journal of Virus Eradication published by Mediscript LtdThis is an open access article published under the terms of a Creative Commons License. 15
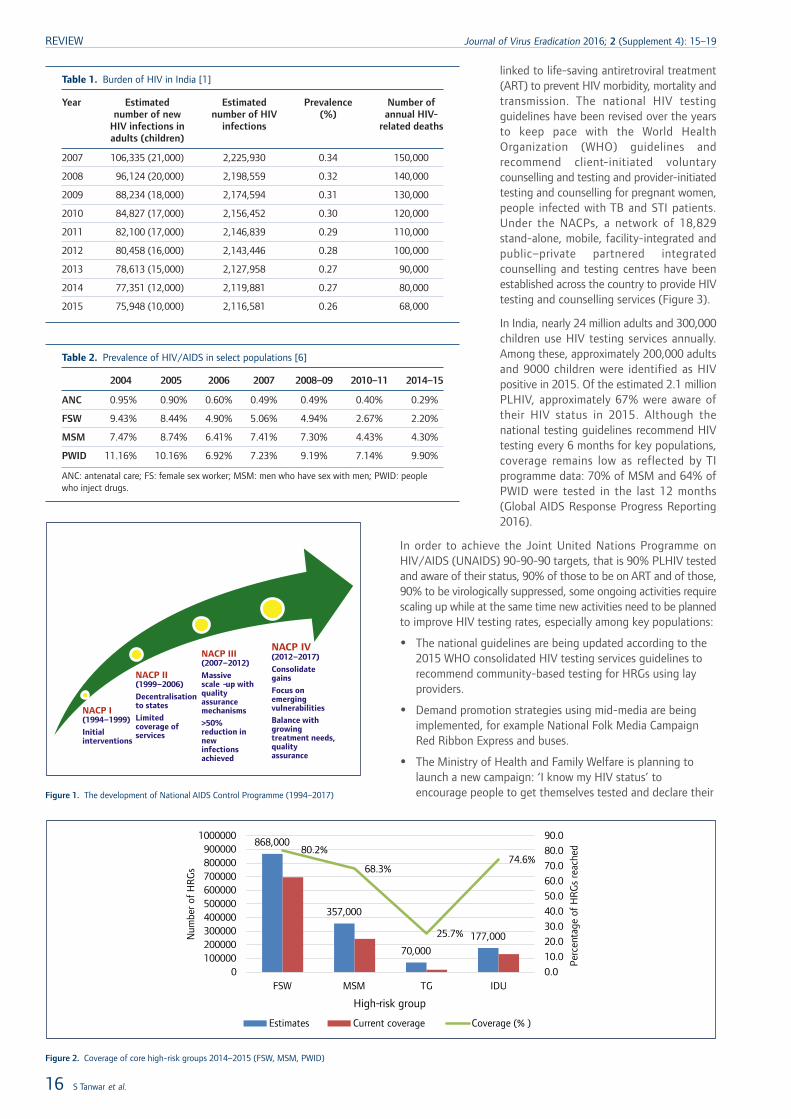
linked to life-saving antiretroviral treatment(ART) to prevent HIV morbidity, mortality andtransmission. The national HIV testingguidelines have been revised over the yearsto keep pace with the World HealthOrganization (WHO) guidelines andrecommend client-initiated voluntarycounselling and testing and provider-initiatedtesting and counselling for pregnant women,people infected with TB and STI patients.Under the NACPs, a network of 18,829stand-alone, mobile, facility-integrated andpublic–private partnered integratedcounselling and testing centres have beenestablished across the country to provide HIVtesting and counselling services (Figure 3).
In India, nearly 24 million adults and 300,000children use HIV testing services annually.Among these, approximately 200,000 adultsand 9000 children were identified as HIVpositive in 2015. Of the estimated 2.1 millionPLHIV, approximately 67% were aware oftheir HIV status in 2015. Although thenational testing guidelines recommend HIVtesting every 6 months for key populations,coverage remains low as reflected by TIprogramme data: 70% of MSM and 64% ofPWID were tested in the last 12 months(Global AIDS Response Progress Reporting2016).
In order to achieve the Joint United Nations Programme onHIV/AIDS (UNAIDS) 90-90-90 targets, that is 90% PLHIV testedand aware of their status, 90% of those to be on ART and of those,90% to be virologically suppressed, some ongoing activities requirescaling up while at the same time new activities need to be plannedto improve HIV testing rates, especially among key populations:
• The national guidelines are being updated according to the2015 WHO consolidated HIV testing services guidelines torecommend community-based testing for HRGs using layproviders.
• Demand promotion strategies using mid-media are beingimplemented, for example National Folk Media CampaignRed Ribbon Express and buses.
• The Ministry of Health and Family Welfare is planning tolaunch a new campaign: ‘I know my HIV status’ toencourage people to get themselves tested and declare their
Table 1. Burden of HIV in India [1]
Year Estimatednumber of new
HIV infections inadults (children)
Estimatednumber of HIV
infections
Prevalence(%)
Number ofannual HIV-
related deaths
2007 106,335 (21,000) 2,225,930 0.34 150,000
2008 96,124 (20,000) 2,198,559 0.32 140,000
2009 88,234 (18,000) 2,174,594 0.31 130,000
2010 84,827 (17,000) 2,156,452 0.30 120,000
2011 82,100 (17,000) 2,146,839 0.29 110,000
2012 80,458 (16,000) 2,143,446 0.28 100,000
2013 78,613 (15,000) 2,127,958 0.27 90,000
2014 77,351 (12,000) 2,119,881 0.27 80,000
2015 75,948 (10,000) 2,116,581 0.26 68,000
Table 2. Prevalence of HIV/AIDS in select populations [6]
2004 2005 2006 2007 2008–09 2010–11 2014–15
ANC 0.95% 0.90% 0.60% 0.49% 0.49% 0.40% 0.29%
FSW 9.43% 8.44% 4.90% 5.06% 4.94% 2.67% 2.20%
MSM 7.47% 8.74% 6.41% 7.41% 7.30% 4.43% 4.30%
PWID 11.16% 10.16% 6.92% 7.23% 9.19% 7.14% 9.90%
ANC: antenatal care; FS: female sex worker; MSM: men who have sex with men; PWID: peoplewho inject drugs.
NACP I (1994–1999)
Initial interventions
NACP II (1999–2006)
Decentralisation to states
Limited coverage of services
NACP III (2007–2012)
Massive scale -up with quality assurance mechanisms
>50% reduction in new infections achieved
NACP IV (2012–2017)
Consolidate gains
Focus on emerging vulnerabilities
Balance with growing treatment needs, quality assurance
Figure 1. The development of National AIDS Control Programme (1994–2017)
868,000
357,000
70,000177,000
80.2%
68.3%
25.7%
74.6%
0.0
10.0
20.0
30.0
40.0
50.0
60.0
70.0
80.0
90.0
0100000200000300000400000500000600000700000800000900000
1000000
FSW MSM TG IDU
Perc
enta
ge o
f H
RG
s re
ache
d
Num
ber
of H
RG
s
High-risk group
Estimates Current coverage Coverage (% )
Figure 2. Coverage of core high-risk groups 2014–2015 (FSW, MSM, PWID)
REVIEW Journal of Virus Eradication 2016; 2 (Supplement 4): 15–19
16 S Tanwar et al.
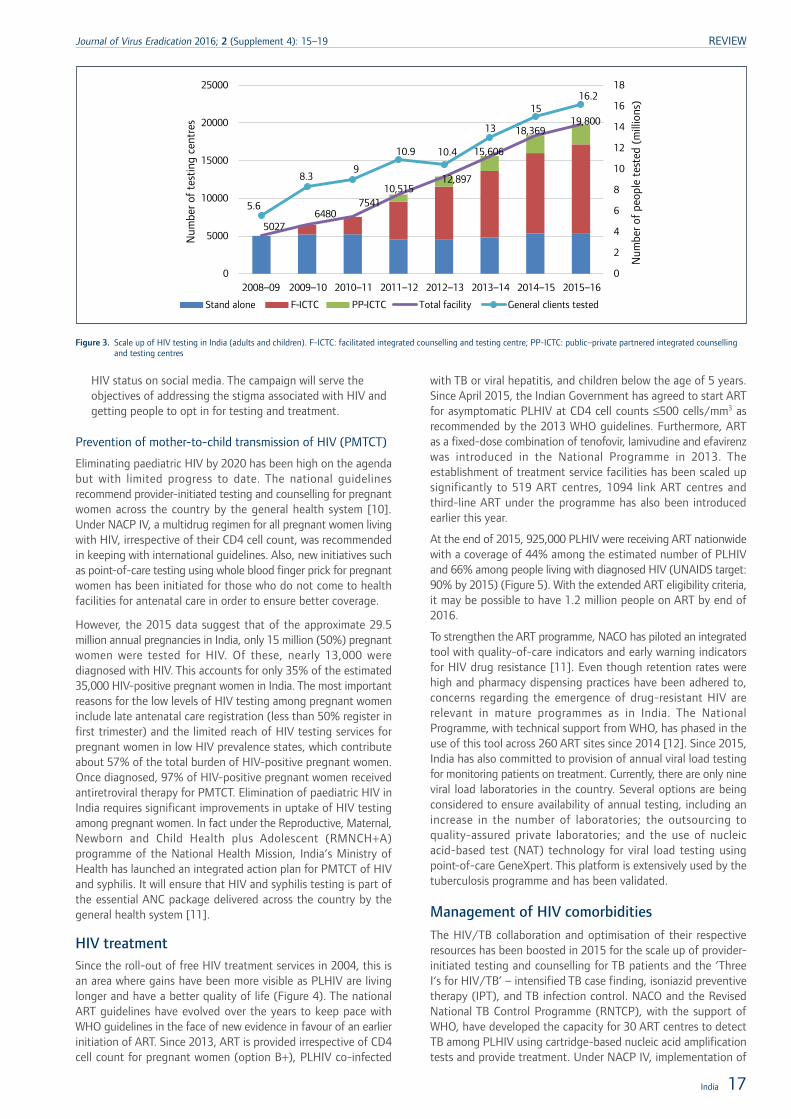
HIV status on social media. The campaign will serve theobjectives of addressing the stigma associated with HIV andgetting people to opt in for testing and treatment.
Prevention of mother-to-child transmission of HIV (PMTCT)
Eliminating paediatric HIV by 2020 has been high on the agendabut with limited progress to date. The national guidelinesrecommend provider-initiated testing and counselling for pregnantwomen across the country by the general health system [10].Under NACP IV, a multidrug regimen for all pregnant women livingwith HIV, irrespective of their CD4 cell count, was recommendedin keeping with international guidelines. Also, new initiatives suchas point-of-care testing using whole blood finger prick for pregnantwomen has been initiated for those who do not come to healthfacilities for antenatal care in order to ensure better coverage.
However, the 2015 data suggest that of the approximate 29.5million annual pregnancies in India, only 15 million (50%) pregnantwomen were tested for HIV. Of these, nearly 13,000 werediagnosed with HIV. This accounts for only 35% of the estimated35,000 HIV-positive pregnant women in India. The most importantreasons for the low levels of HIV testing among pregnant womeninclude late antenatal care registration (less than 50% register infirst trimester) and the limited reach of HIV testing services forpregnant women in low HIV prevalence states, which contributeabout 57% of the total burden of HIV-positive pregnant women.Once diagnosed, 97% of HIV-positive pregnant women receivedantiretroviral therapy for PMTCT. Elimination of paediatric HIV inIndia requires significant improvements in uptake of HIV testingamong pregnant women. In fact under the Reproductive, Maternal,Newborn and Child Health plus Adolescent (RMNCH+A)programme of the National Health Mission, India‘s Ministry ofHealth has launched an integrated action plan for PMTCT of HIVand syphilis. It will ensure that HIV and syphilis testing is part ofthe essential ANC package delivered across the country by thegeneral health system [11].
HIV treatmentSince the roll-out of free HIV treatment services in 2004, this isan area where gains have been more visible as PLHIV are livinglonger and have a better quality of life (Figure 4). The nationalART guidelines have evolved over the years to keep pace withWHO guidelines in the face of new evidence in favour of an earlierinitiation of ART. Since 2013, ART is provided irrespective of CD4cell count for pregnant women (option B+), PLHIV co-infected
with TB or viral hepatitis, and children below the age of 5 years.Since April 2015, the Indian Government has agreed to start ARTfor asymptomatic PLHIV at CD4 cell counts ≤500 cells/mm3 asrecommended by the 2013 WHO guidelines. Furthermore, ARTas a fixed-dose combination of tenofovir, lamivudine and efavirenzwas introduced in the National Programme in 2013. Theestablishment of treatment service facilities has been scaled upsignificantly to 519 ART centres, 1094 link ART centres andthird-line ART under the programme has also been introducedearlier this year.
At the end of 2015, 925,000 PLHIV were receiving ART nationwidewith a coverage of 44% among the estimated number of PLHIVand 66% among people living with diagnosed HIV (UNAIDS target:90% by 2015) (Figure 5). With the extended ART eligibility criteria,it may be possible to have 1.2 million people on ART by end of2016.
To strengthen the ART programme, NACO has piloted an integratedtool with quality-of-care indicators and early warning indicatorsfor HIV drug resistance [11]. Even though retention rates werehigh and pharmacy dispensing practices have been adhered to,concerns regarding the emergence of drug-resistant HIV arerelevant in mature programmes as in India. The NationalProgramme, with technical support from WHO, has phased in theuse of this tool across 260 ART sites since 2014 [12]. Since 2015,India has also committed to provision of annual viral load testingfor monitoring patients on treatment. Currently, there are only nineviral load laboratories in the country. Several options are beingconsidered to ensure availability of annual testing, including anincrease in the number of laboratories; the outsourcing toquality-assured private laboratories; and the use of nucleicacid-based test (NAT) technology for viral load testing usingpoint-of-care GeneXpert. This platform is extensively used by thetuberculosis programme and has been validated.
Management of HIV comorbidities
The HIV/TB collaboration and optimisation of their respectiveresources has been boosted in 2015 for the scale up of provider-initiated testing and counselling for TB patients and the ‘ThreeI‘s for HIV/TB’ – intensified TB case finding, isoniazid preventivetherapy (IPT), and TB infection control. NACO and the RevisedNational TB Control Programme (RNTCP), with the support ofWHO, have developed the capacity for 30 ART centres to detectTB among PLHIV using cartridge-based nucleic acid amplificationtests and provide treatment. Under NACP IV, implementation of
50276480
754110,515
12,897
15,606
18,36919,800
5.6
8.39
10.9 10.4
13
1516.2
0
2
4
6
8
10
12
14
16
18
0
5000
10000
15000
20000
25000
2008–09 2009–10 2010–11 2011–12 2012–13 2013–14 2014–15 2015–16
Num
ber o
f pe
ople
tes
ted
(mill
ions
)
Num
ber o
f te
stin
g ce
ntre
s
Stand alone F-ICTC PP-ICTC Total facility General clients tested
Figure 3. Scale up of HIV testing in India (adults and children). F-ICTC: facilitated integrated counselling and testing centre; PP-ICTC: public–private partnered integrated counsellingand testing centres
India 17
Journal of Virus Eradication 2016; 2 (Supplement 4): 15–19 REVIEW
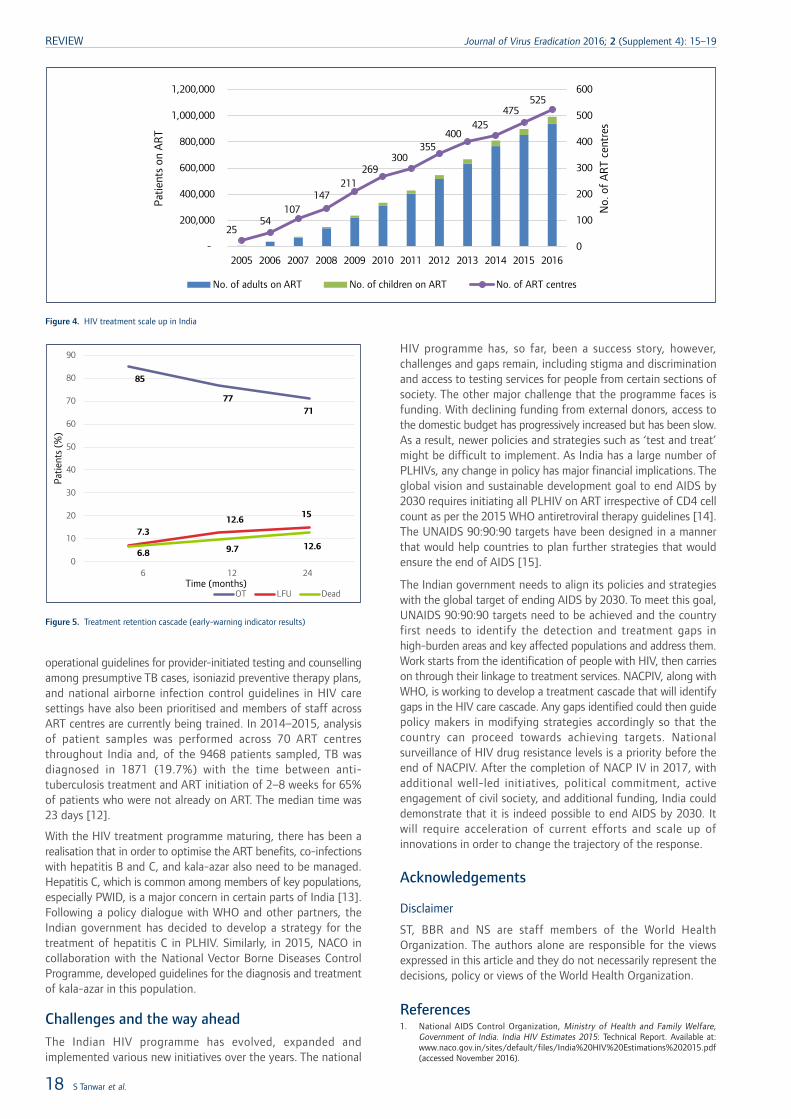
operational guidelines for provider-initiated testing and counsellingamong presumptive TB cases, isoniazid preventive therapy plans,and national airborne infection control guidelines in HIV caresettings have also been prioritised and members of staff acrossART centres are currently being trained. In 2014–2015, analysisof patient samples was performed across 70 ART centresthroughout India and, of the 9468 patients sampled, TB wasdiagnosed in 1871 (19.7%) with the time between anti-tuberculosis treatment and ART initiation of 2–8 weeks for 65%of patients who were not already on ART. The median time was23 days [12].
With the HIV treatment programme maturing, there has been arealisation that in order to optimise the ART benefits, co-infectionswith hepatitis B and C, and kala-azar also need to be managed.Hepatitis C, which is common among members of key populations,especially PWID, is a major concern in certain parts of India [13].Following a policy dialogue with WHO and other partners, theIndian government has decided to develop a strategy for thetreatment of hepatitis C in PLHIV. Similarly, in 2015, NACO incollaboration with the National Vector Borne Diseases ControlProgramme, developed guidelines for the diagnosis and treatmentof kala-azar in this population.
Challenges and the way aheadThe Indian HIV programme has evolved, expanded andimplemented various new initiatives over the years. The national
HIV programme has, so far, been a success story, however,challenges and gaps remain, including stigma and discriminationand access to testing services for people from certain sections ofsociety. The other major challenge that the programme faces isfunding. With declining funding from external donors, access tothe domestic budget has progressively increased but has been slow.As a result, newer policies and strategies such as ‘test and treat’might be difficult to implement. As India has a large number ofPLHIVs, any change in policy has major financial implications. Theglobal vision and sustainable development goal to end AIDS by2030 requires initiating all PLHIV on ART irrespective of CD4 cellcount as per the 2015 WHO antiretroviral therapy guidelines [14].The UNAIDS 90:90:90 targets have been designed in a mannerthat would help countries to plan further strategies that wouldensure the end of AIDS [15].
The Indian government needs to align its policies and strategieswith the global target of ending AIDS by 2030. To meet this goal,UNAIDS 90:90:90 targets need to be achieved and the countryfirst needs to identify the detection and treatment gaps inhigh-burden areas and key affected populations and address them.Work starts from the identification of people with HIV, then carrieson through their linkage to treatment services. NACPIV, along withWHO, is working to develop a treatment cascade that will identifygaps in the HIV care cascade. Any gaps identified could then guidepolicy makers in modifying strategies accordingly so that thecountry can proceed towards achieving targets. Nationalsurveillance of HIV drug resistance levels is a priority before theend of NACPIV. After the completion of NACP IV in 2017, withadditional well-led initiatives, political commitment, activeengagement of civil society, and additional funding, India coulddemonstrate that it is indeed possible to end AIDS by 2030. Itwill require acceleration of current efforts and scale up ofinnovations in order to change the trajectory of the response.
Acknowledgements
Disclaimer
ST, BBR and NS are staff members of the World HealthOrganization. The authors alone are responsible for the viewsexpressed in this article and they do not necessarily represent thedecisions, policy or views of the World Health Organization.
References1. National AIDS Control Organization, Ministry of Health and Family Welfare,
Government of India. India HIV Estimates 2015: Technical Report. Available at:www.naco.gov.in/sites/default/files/India%20HIV%20Estimations%202015.pdf(accessed November 2016).
2554
107147
211269
300355
400425
475525
0
100
200
300
400
500
600
-
200,000
400,000
600,000
800,000
1,000,000
1,200,000
2005 2006 2007 2008 2009 2010 2011 2012 2013 2014 2015 2016
No.
of
AR
T ce
ntre
s
Patie
nts
on A
RT
No. of adults on ART No. of children on ART No. of ART centres
Figure 4. HIV treatment scale up in India
85
7771
7.312.6
15
6.8 9.7 12.6
0
10
20
30
40
50
60
70
80
90
6 12 24
Patie
nts
(%)
Time (months)OT LFU Dead
Figure 5. Treatment retention cascade (early-warning indicator results)
REVIEW Journal of Virus Eradication 2016; 2 (Supplement 4): 15–19
18 S Tanwar et al.
2. Godbole S, Mehendale S. HIV/AIDS epidemic in India: risk factors, risk behaviorand strategies for prevention and control. Indian J Med Res 2005; 121: 356–368.
3. Ministry of Health and Family Welfare, Government of India. About NACO.Available at: www.indiahivinfo.naco.gov.in/naco/content/national-aids-control-organisation-naco (accessed September 2016).
4. National AIDS Control Organization, Ministry of Health and Family Welfare,Government of India. Annual Report 2014–2015. New Delhi: National AIDS ControlOrganization; 2015. Available at: www.naco.gov.in/sites/default/files/annual_report%20_NACO_2014-15_0.pdf (accessed November 2016).
5. National AIDS Control Organization, Ministry of Health and Family Welfare,Government of India. National AIDS Control Programme Phase- IV (2012–2017)Strategy Document. Available at: www.naco.gov.in/nacp-iv-components (accessedNovember 2016).
6. National AIDS Control Organization, Ministry of Health and Family Welfare,Government of India. National Integrated Biological and Behavioural Surveillance(IBBS). 2014–2015. New Delhi. 2015. Available at: www.aidsdatahub.org/sites/default/files/highlight-reference/document/India_IBBS_report_2014-15.pdf(accessed November 2016).
7. Thomas B, Mimiaga MJ, Mayer KH et al. The influence of stigma on HIV risk behavioramong men who have sex with men in Chennai, India. AIDS Care 2012; 24:1401–1406.
8. Chakrapani V, Velayudham J, Shunmugam M et al. Barriers to antiretroviral treatmentaccess for injecting drug users living with HIV in Chennai, South India. AIDS Care2014; 26: 835–841.
9. Global Fund. The Global Fund‘s New Funding Model. The Global Fund to Fight AIDS,Tuberculosis and Malaria, Fourth Replenishment (2014–2016). April 2013. Availableat: www.theglobalfund.org/en/fundingmodel/ (accessed October 2016).
10. Ministry of Health and Family Welfare, Government of India. The National Strategyand Operational Guidelines Towards Elimination of Congenital Syphilis 2015. Availableat: www.searo.who.int/india/publications/elimination_of_congenital_syphilis_part1.pdf?ua=1 (accessed October 2016).
11. WHO. World Health Organization Global Strategy for the Surveillance and Monitoringof HIV Drug Resistance 2012. Geneva: World Health Organization; 2012. Availableat: http://apps.who.int/iris/bitstream/10665/77349/1/9789241504768_eng.pdf(accessed October r 2016).
12. WHO. Global Tuberculosis Report. Geneva: World Health Organization; 2015.Available at: www.who.int/tb/publications/global_report/en/ (accessed October2016).
13. Solomon SS, Mehta SH, Srikrishnan AK et al. Burden of hepatitis C virus diseaseand access to hepatitis C virus services in people who inject drugs in India: across-sectional study. Lancet Infect Dis 2015; 15: 36–45.
14. WHO. Guideline on when to start antiretroviral therapy and on pre-exposureprophylaxis for HIV. September 2015. Available at: http://apps.who.int/iris/bitstream/10665/186275/1/9789241509565_eng.pdf?ua=1 (accessed October2016).
15. UNAIDS. Fast-track. Ending the AIDS Epidemic by 2030. Geneva: UNAIDS; 2014.Available at: www.unaids.org/sites/default/files/media_asset/JC2686_WAD2014report_en.pdf (accessed October 2016).
India 19
Journal of Virus Eradication 2016; 2 (Supplement 4): 15–19 REVIEW
Evolution of the health sector response to HIV in Myanmar:progress, challenges and the way forward
Htun Nyunt Oo1, San Hone1, Masami Fujita2*, Amaya Maw-Naing3, Krittayawan Boonto4, Marjolein Jacobs4, Sabe Phyu4,Phavady Bollen2, Jacquie Cheung4, Htin Aung2, May Thu Aung Sang2, Aye Myat Soe2, Razia Pendse5 and Eamonn Murphy4
1 National AIDS Program, Department of Public Health, Ministry of Health and Sports, Myanmar2 World Health Organization, Country Office for Myanmar
3 Formerly World Health Organization, Regional Office for South-East Asia4 United Nations Joint Programme for HIV/AIDS, Myanmar
5 World Health Organization, Regional Office for South-East Asia
Abstract
Critical building blocks for the response to HIV were made until 2012 despite a series of political, social and financialchallenges. A rapid increase of HIV service coverage was observed from 2012 to 2015 through collaborative efforts ofgovernment and non-governmental organisations (NGOs). Government facilities, in particular, demonstrated their capacityto expand services for antiretroviral therapy (ART), prevention of mother-to-child transmission (PMTCT) of HIV, tuberculosisand HIV co-infection and methadone-maintenance therapy (MMT). After nearly three decades into the response to HIV,Myanmar has adopted strategies to provide the right interventions to the right people in the right places to maximiseimpact and cost efficiency. In particular, the country is now using strategic information to classify areas into high-, medium-and low-HIV burden and risk of new infections for geographical prioritisation – as HIV remains concentrated among keypopulation (KP) groups in specific geographical areas. Ways forward include:
• Addressing structural barriers for KP to access services, and identifying and targeting KPs at higher risk;
• Strengthening the network of public facilities, NGOs and general practitioners and introducing a case managementapproach to assist KPs and other clients with unknown HIV status, HIV-negative clients and newly diagnosed clientsto access the health services across the continuum to increase the number of people testing for HIV and to reduceloss to follow-up in both prevention and treatment;
• Increasing the availability of HIV testing and counselling services for KPs, clients of female sex workers (FSW), andother populations at risk, and raising the demand for timely testing including expansion of outreach and client-initiatedvoluntary counselling and testing (VCT) services;
• Monitoring and maximising retention from HIV diagnosis to ART initiation and expanding quality HIV laboratory services,especially viral load;
• Prioritising integration of HIV and related services in high-burden areas;
• Increasing the proportion of PLHIV receiving testing and treatment at public facilities by improving human resourcesand increasing public facilities providing these services to ensure sustainability;
• Obtaining intelligence and tailoring services in hard-to-reach/under-served areas;
• Strengthening planning, monitoring, and coordination capacity especially at regional levels.
Introduction: Myanmar in context
Myanmar is classified as a lower-middle-income and a leastdeveloped country in Southeast Asia with a population of 51.4million [1]. Administratively, the country is composed of NayPyiTawunion territories and 14 states and regions. More than 60 yearsof internal conflict, military rule, and sanctions from internationalgovernments have affected the country‘s economic growth anddevelopment. The total health expenditure in Myanmar, 1.7–2.3%of its gross domestic product (GDP) between 2001 and 2014, isamong the lowest in the Asia Pacific region.
Myanmar detected its first case of HIV from a person who injecteddrugs in 1988 and the first AIDS case was diagnosed in 1991.Between 1990 and 2000, prevalence remained elevated in high-riskgroups, notably people who inject drugs (PWID) peaking alarminglyat 74.3% in 1993, men who have sex with men (MSM), and femalesex workers (FSWs), peaking at 38% in 2000. Over the followingdecade (2001–2010), the epidemic reached clients of sex workersand partners of PWID, and female sexual partners of men whoare from key population groups, leading to vertical transmissionof HIV to their newborns. National level HIV prevalence wasestimated to be 28.5% among PWID in 2014, and 14.6% amongFSW and 11.6% among MSM in 2015 according to the AIDS
Epidemic Model (AEM) based on the Integrated Bio-BehaviouralSurveillance (IBBS) surveys among key populations and HIVsentinel surveillance (HSS). According to the AEM in 2015, thehighest proportion of new infections was among PWID (28%) fromthe use of contaminated injecting equipment, followed by ‘low-risk’women (24%), and FSW clients (23%). New infections in 2015were estimated to be 11,763, approximately 32 new infectionsdaily, according to Spectrum 2016. The overall HIV epidemic inMyanmar seems to be declining with HIV prevalence among adults,15 years and older, estimated to be less than 0.6% nationally. Therewere an estimated 224,795 people living with HIV (PLHIV)including those aged under 15, one-third of whom were female.The severity of the HIV epidemic in Myanmar varies widely bygeographical area. HIV prevalence in some locations in Myanmaris among the highest in the Asia-Pacific region. Approximately65% of KPs are estimated to be in five regions and states(Mandalay, Yangon, Sagaing, Kachin and Shan North), largely inurban areas. In Yangon, among MSM, the HIV prevalence at 26.6%is the highest in a specific geographical location in the Asia-Pacificregion, higher than Bangkok at 24.4% in 2012. Whereas in sometownships in Kachin and Shan North, nearly one in two PWID whoparticipated in the 2014 IBBS survey tested HIV positive.
In financing the HIV response, Myanmar has received externalfunding support since 2002, albeit with some challenges. In 2003,the Fund for HIV in Myanmar (FHAM) was established by Norway,UK, Sweden and the Netherlands. The Three Diseases Fund (3DF),
*Corresponding author: Masami Fujita, No. 2, Pyay Road, (7 Mile),Mayangone Township, Yangon 11061, Myanmar
Email: [email protected]
Journal of Virus Eradication 2016; 2 (Supplement 4): 20–26REVIEW
© 2016 The Authors. Journal of Virus Eradication published by Mediscript LtdThis is an open access article published under the terms of a Creative Commons License.20
a multi-donor trust fund was formed in 2006 to replace the GlobalFund to Fight AIDS, Tuberculosis and Malaria (GFATM) grant uponwithdrawal from the country. The FHAM was merged into the newfund to provide much needed assistance for HIV, tuberculosis (TB)and malaria. The 3DF then transitioned into the Three MillenniumDevelopment Goal Fund (3MDG), which was launched in 2012by seven bilateral donors (Australia, Denmark, European Union,Sweden, Switzerland, United Kingdom and USA) to supportmaternal, newborn and child health (MNCH), HIV, TB and malaria,and health systems strengthening. Following the termination ofa previous grant, the GFATM grant Round 9 was re-establishedin Myanmar in 2011 and continued as the New Funding Model(NFM) through 2016 [2]. As of 2015, GFATM is the single largestfinancing source covering 50% of the HIV response in Myanmar.Its funding beyond 2016 is being explored. Responding to HIVis a national priority, as evidenced by increasing domestic funding.The proportion of Government spending as part of total HIVexpenditures increased from 2% (US$ 0.6 million) in 2012 to 7.7%(US$ 4.1 million) in 2013, and even further to 12.3% (US$ 10.4million) in 2015 [3]. The change from military rule to a civiliangovernment in 2011 brought increased support from bothgovernment and donors. A newly established government in April2016 will potentially bring additional increased external resourcesto health and development in Myanmar.
This article reviews and document Myanmar‘s response to the HIVepidemic over the last decades (1990–2016) and how it is movingtowards the goal of ending the AIDS epidemic as a public healththreat.
Review methodsThe review is based on a literature review of available data,documents and reports (published and unpublished), validatedwith key partners (National AIDS Programme, WHO, and UNAIDS).
Review findingsThis article describes Myanmar‘s response to HIV of nearly threedecades in a nutshell, and the continuous efforts taken tostrengthen policy and strategic directions, overcome challengesand attempts to reach the goal of ending AIDS by 2030. Inparticular, this review focuses on the building blocks of thecountry‘s response through four phases (Table 1).
Response: 1991–2000
Government recognition of HIV
An inter-sectoral National AIDS Committee chaired by the Ministerof Health was established in 1989 and provided oversight. A shortterm plan for the prevention and control of HIV transmission waslaunched that same year. The first national medium-term plan forprevention and control of HIV/AIDS was formulated in 1991,followed by a joint plan by the National AIDS Programme (NAP),Ministry of Health, and the United Nations DevelopmentProgramme (UNDP) in 1994. In the late 1990s, severalcollaborative projects were undertaken with the support of UNentities and bilateral agencies to enhance efforts for HIV preventionand care [4]. A limited number of international non-governmentalorganisations (INGOs) worked directly, or through a few nationalcivil society organisations, with key populations such as PWID andFSW.
Information, education and communication (IEC)across different sectors
A multilingual public education campaign was adopted as amulti-sectoral approach by several Ministries. HIV prevention, inparticular IEC for key populations with HIV/AIDS and peer
education for PWIDs were the mainstay of the national programme.Counselling, STI education and treatment were provided to FSWsby 45 STI/AIDS teams in priority townships and via NGOs. HIVtesting and confirmation was performed only at government-assigned laboratories, leading to delays in providing test results.
HIV sentinel surveillance
The national programme started systematic surveillance amongkey population groups in selected geographical areas in 1991.Biennial HIV sentinel surveillance (HSS) [5] was established in 1992among different population groups (PWID, sex workers, male andfemale patients with sexually transmitted infections, pregnantwomen and military recruits), along with HIV surveillance amongblood donors.
Response: 2001–2010
The 100% Targeted Condom Programme (TCP)
In 2001, the government started a 100% targeted condomprogramme (TCP) in sex-work settings and rapidly scaled up fromfour sites in 2001 to 170 sites in 78 townships by 2010 [6].Client-oriented STI services, free distribution and social marketingof condoms, voluntary counselling and confidential testing (VCCT)were scaled up through the public and private network of serviceproviders. In 2008, 95% of FSWs reported condom use with themost recent client while 77.6% of PWID used a condom at lastsex (Progress Report 2008, National Strategic Plan for HIV/AIDSin Myanmar). Targeted outreach programmes became increasinglycommunity-centred by 2006, being run mostly by their ownmembers: sex workers, MSMs and PWID [7].
New sources of funding
In 2004, following the termination of the grant from the GlobalFund to Fight Against AIDS, Tuberculosis and Malaria (GFATM),the Fund for HIV in Myanmar (FHAM) was subsequentlyestablished, with technical support from UNAIDS, bringingsignificant resources to the response. A group of donor countriesformed the Three Diseases Fund (3DF) to support HIV efforts andcontinued as the Three Millennium Development Goal Fund(3MDG Fund) providing joint donor support and expanding toencompass maternal and child health and longer-termsustainability. The 2009 Global Fund 9th Round (January 2011–31December 2012) was later integrated as a single-stream grant withthe New Funding Model (NFM; 2013–2016).
First National Strategic Plan
The First National Strategic Plan 2006–2010 was developed bythe government and international partners including INGOs, andwas then funded by the 3DF to implement the following provisions.
Interventions targeting PWID and FSW were expanded by NGOsand INGOs. Needle and syringe distribution grew five-fold from2005, from 545,000 needles and syringes to nearly 7 milliondistributed by 2010. In addition, 1101 PWID were receivingmethadone [8]. Services for PWID were geographicallyconcentrated in only three areas (Shan state, Kachin state andMandalay division) as these were economic and trade zones foropium with noted higher HIV prevalence [9].
Small scale projects for MSM initiated by NGOs and INGOsprovided condoms, lubricants and other HIV preventioninterventions. IEC was provided through peer outreach focusingon hard-to-reach MSM. VCCT and STI services were provided byprivate and public sectors.
Initially, VCCT and other HIV testing and counselling (HTC) serviceswere provided only by the public sector and at sentinel surveillance
Myanmar 21
Journal of Virus Eradication 2016; 2 (Supplement 4): 20–26 REVIEW
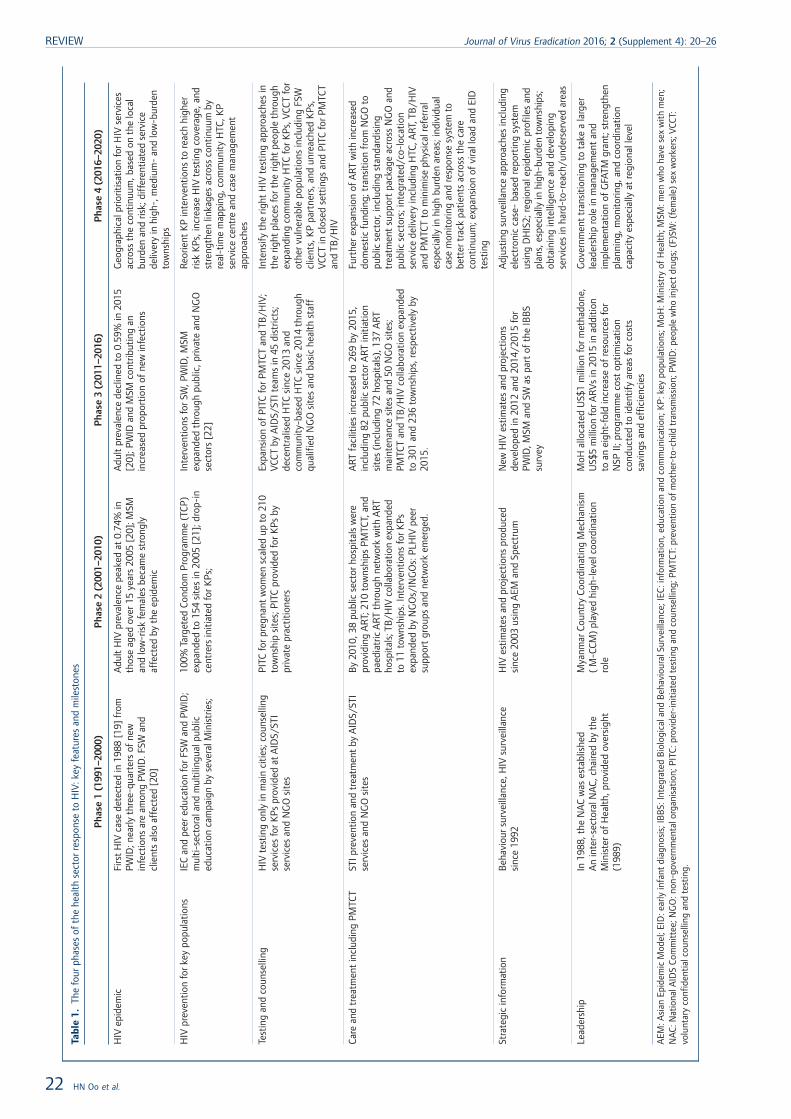
Tabl
e1.
The
four
phas
esof
the
heal
thse
ctor
resp
onse
toH
IV:k
eyfe
atur
esan
dm
ilest
ones
Pha
se1
(199
1–20
00)
Pha
se2
(200
1–20
10)
Pha
se3
(201
1–20
16)
Pha
se4
(201
6–20
20)
HIV
epid
emic
Firs
tH
IVca
sede
tect
edin
1988
[19]
from
PWID
;nea
rlyth
ree-
quar
ters
ofne
win
fect
ions
are
amon
gPW
ID.F
SWan
dcl
ient
sal
soaf
fect
ed[2
0]
Adu
ltH
IVpr
eval
ence
peak
edat
0.74
%in
thos
eag
edov
er15
year
s20
05[2
0];M
SMan
dlo
w-r
isk
fem
ales
beca
me
stro
ngly
affe
cted
byth
eep
idem
ic
Adu
ltpr
eval
ence
decl
ined
to0.
59%
in20
15[2
0];P
WID
and
MSM
cont
ribut
ing
anin
crea
sed
prop
ortio
nof
new
infe
ctio
ns
Geo
grap
hica
lprio
ritis
atio
nfo
rHIV
serv
ices
acro
ssth
eco
ntin
uum
,bas
edon
the
loca
lbu
rden
and
risk;
diff
eren
tiate
dse
rvic
ede
liver
yin
high
-,m
ediu
m-
and
low
-bur
den
tow
nshi
ps
HIV
prev
entio
nfo
rkey
popu
latio
nsIE
Can
dpe
ered
ucat
ion
forF
SWan
dPW
ID;
mul
ti-se
ctor
alan
dm
ultil
ingu
alpu
blic
educ
atio
nca
mpa
ign
byse
vera
lMin
istr
ies;
100%
Targ
eted
Cond
omPr
ogra
mm
e(T
CP)
expa
nded
to15
4si
tes
in20
05[2
1];d
rop-
ince
ntre
rsin
itiat
edfo
rKPs
;
Inte
rven
tions
forS
W,P
WID
,MSM
expa
nded
thro
ugh
publ
ic,p
rivat
ean
dN
GO
sect
ors
[22]
Reo
rient
KP
inte
rven
tions
tore
ach
high
erris
kK
Ps,i
ncre
ase
HIV
test
ing
cove
rage
,and
stre
ngth
enlin
kage
sac
ross
cont
inuu
mby
real
-tim
em
appi
ng,c
omm
unity
HTC
,KP
serv
ice
cent
rean
dca
sem
anag
emen
tap
proa
ches
Test
ing
and
coun
selli
ngH
IVte
stin
gon
lyin
mai
nci
ties;
coun
selli
ngse
rvic
esfo
rKPs
prov
ided
atA
IDS/
STI
serv
ices
and
NG
Osi
tes
PITC
forp
regn
ant
wom
ensc
aled
upto
210
tow
nshi
psi
tes;
PITC
prov
ided
forK
Psby
priv
ate
prac
titio
ners
Expa
nsio
nof
PITC
forP
MTC
Tan
dTB
/HIV
;VC
CTby
AID
S/ST
Itea
ms
in45
dist
ricts
;de
cent
ralis
edH
TCsi
nce
2013
and
com
mun
ity-b
ased
HTC
sinc
e20
14th
roug
hqu
alifi
edN
GO
site
san
dba
sic
heal
thst
aff
Inte
nsify
the
right
HIV
test
ing
appr
oach
esin
the
right
plac
esfo
rthe
right
peop
leth
roug
hex
pand
ing
com
mun
ityH
TCfo
rKPs
,VCC
Tfo
rot
herv
ulne
rabl
epo
pula
tions
incl
udin
gFS
Wcl
ient
s,K
Ppa
rtne
rs,a
ndun
reac
hed
KPs
,VC
CTin
clos
edse
ttin
gsan
dPI
TCfo
rPM
TCT
and
TB/H
IV
Care
and
trea
tmen
tin
clud
ing
PMTC
TST
Ipre
vent
ion
and
trea
tmen
tby
AID
S/ST
Ise
rvic
esan
dN
GO
site
sB
y20
10,3
8pu
blic
sect
orho
spita
lsw
ere
prov
idin
gA
RT;2
10to
wns
hips
PMTC
T,an
dpa
edia
tric
ART
thro
ugh
netw
ork
with
ART
hosp
itals
;TB
/HIV
colla
bora
tion
expa
nded
to11
tow
nshi
ps.I
nter
vent
ions
forK
Psex
pand
edby
NG
Os/
ING
Os:
PLH
IVpe
ersu
ppor
tgr
oups
and
netw
ork
emer
ged.
ART
faci
litie
sin
crea
sed
to26
9by
2015
,in
clud
ing
82pu
blic
sect
orA
RTin
itiat
ion
site
s(in
clud
ing
72ho
spita
ls),
137
ART
mai
nten
ance
site
san
d50
NG
Osi
tes;
PMTC
Tan
dTB
/HIV
colla
bora
tion
expa
nded
to30
1an
d23
6to
wns
hips
,res
pect
ivel
yby
2015
.
Furt
here
xpan
sion
ofA
RTw
ithin
crea
sed
dom
estic
fund
ing;
tran
sitio
nfr
omN
GO
topu
blic
sect
or,i
nclu
ding
stan
dard
isin
gtr
eatm
ent
supp
ort
pack
age
acro
ssN
GO
and
publ
icse
ctor
s;in
tegr
ated
/co-
loca
tion
serv
ice
deliv
ery
incl
udin
gH
TC,A
RT,T
B/H
IVan
dPM
TCT
tom
inim
ise
phys
ical
refe
rral
espe
cial
lyin
high
burd
enar
eas;
indi
vidu
alca
sem
onito
ring
and
resp
onse
syst
emto
bett
ertr
ack
patie
nts
acro
ssth
eca
reco
ntin
uum
;exp
ansi
onof
vira
lloa
dan
dEI
Dte
stin
g
Stra
tegi
cin
form
atio
nB
ehav
iour
surv
eilla
nce,
HIV
surv
eilla
nce
sinc
e19
92H
IVes
timat
esan
dpr
ojec
tions
prod
uced
sinc
e20
03us
ing
AEM
and
Spec
trum
New
HIV
estim
ates
and
proj
ectio
nsde
velo
ped
in20
12an
d20
14/2
015
for
PWID
,MSM
and
SWas
part
ofth
eIB
BS
surv
ey
Adj
ustin
gsu
rvei
llanc
eap
proa
ches
incl
udin
gel
ectr
onic
case
-ba
sed
repo
rtin
gsy
stem
usin
gD
HIS
2;re
gion
alep
idem
icpr
ofile
san
dpl
ans,
espe
cial
lyin
high
-bur
den
tow
nshi
ps;
obta
inin
gin
telli
genc
ean
dde
velo
ping
serv
ices
inha
rd-t
o-re
ach/
unde
rser
ved
area
s
Lead
ersh
ipIn
1988
,the
NA
Cw
ases
tabl
ishe
dA
nin
ter-
sect
oral
NA
C,ch
aire
dby
the
Min
iste
rof
Hea
lth,p
rovi
ded
over
sigh
t(1
989)
Mya
nmar
Coun
try
Coor
dina
ting
Mec
hani
sm(
M-C
CM)
play
edhi
gh-l
evel
coor
dina
tion
role
MoH
allo
cate
dU
S$1
mill
ion
form
etha
done
,U
S$5
mill
ion
forA
RV
sin
2015
inad
ditio
nto
anei
ght-
fold
incr
ease
ofre
sour
ces
for
NSP
II;pr
ogra
mm
eco
stop
timis
atio
nco
nduc
ted
toid
entif
yar
eas
forc
osts
savi
ngs
and
effic
ienc
ies
Gov
ernm
ent
tran
sitio
ning
tota
kea
larg
erle
ader
ship
role
inm
anag
emen
tan
dim
plem
enta
tion
ofG
FATM
gran
t;st
reng
then
plan
ning
,mon
itorin
g,an
dco
ordi
natio
nca
paci
tyes
peci
ally
atre
gion
alle
vel
AEM
:Asi
anEp
idem
icM
odel
;EID
:ear
lyin
fant
diag
nosi
s;IB
BS:
Inte
grat
edB
iolo
gica
land
Beh
avio
ural
Surv
eilla
nce;
IEC:
info
rmat
ion,
educ
atio
nan
dco
mm
unic
atio
n;K
P:ke
ypo
pula
tions
;MoH
:Min
istr
yof
Hea
lth;M
SM:m
enw
hoha
vese
xw
ithm
en;
NA
C:N
atio
nalA
IDS
Com
mitt
ee;N
GO
:non
-gov
ernm
enta
lorg
anis
atio
n;PI
TC:p
rovi
der-
initi
ated
test
ing
and
coun
selli
ng;P
MTC
T:pr
even
tion
ofm
othe
r-to
-chi
ldtr
ansm
issi
on;P
WID
:peo
ple
who
inje
ctdr
ugs;
(F)S
W:(
fem
ale)
sex
wor
kers
;VCC
T:vo
lunt
ary
conf
iden
tialc
ouns
ellin
gan
dte
stin
g.
REVIEW Journal of Virus Eradication 2016; 2 (Supplement 4): 20–26
22 HN Oo et al.
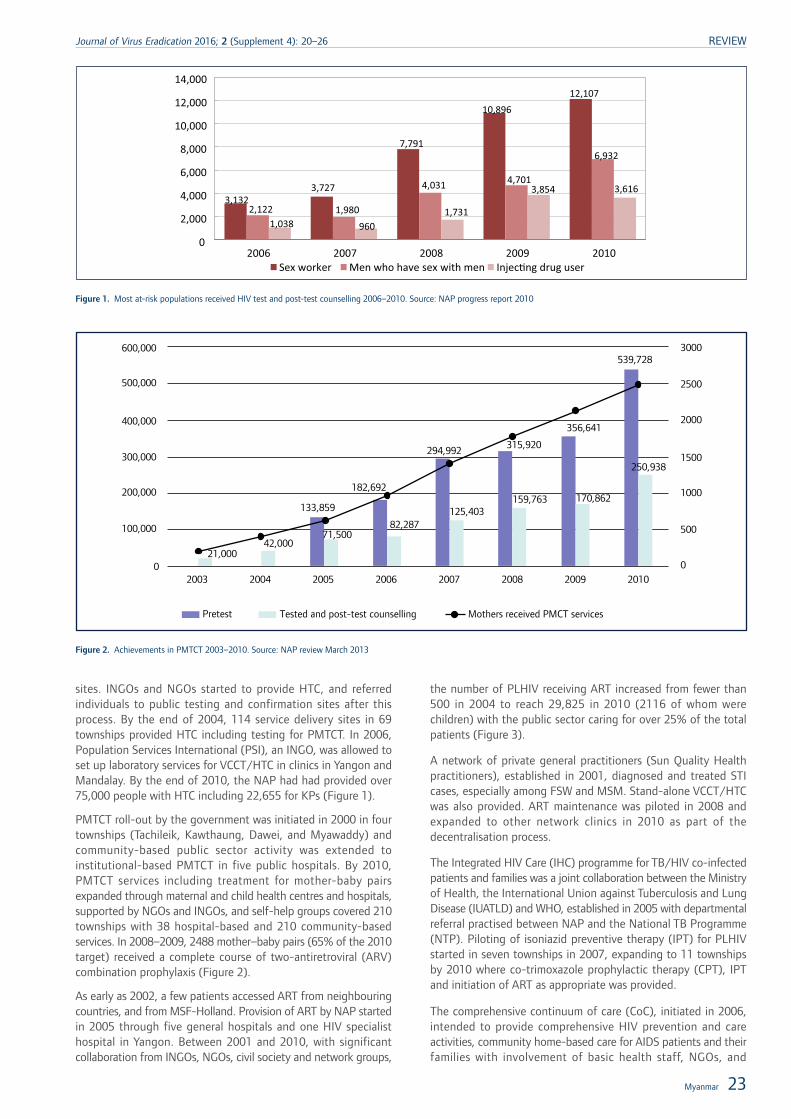
sites. INGOs and NGOs started to provide HTC, and referredindividuals to public testing and confirmation sites after thisprocess. By the end of 2004, 114 service delivery sites in 69townships provided HTC including testing for PMTCT. In 2006,Population Services International (PSI), an INGO, was allowed toset up laboratory services for VCCT/HTC in clinics in Yangon andMandalay. By the end of 2010, the NAP had had provided over75,000 people with HTC including 22,655 for KPs (Figure 1).
PMTCT roll-out by the government was initiated in 2000 in fourtownships (Tachileik, Kawthaung, Dawei, and Myawaddy) andcommunity-based public sector activity was extended toinstitutional-based PMTCT in five public hospitals. By 2010,PMTCT services including treatment for mother-baby pairsexpanded through maternal and child health centres and hospitals,supported by NGOs and INGOs, and self-help groups covered 210townships with 38 hospital-based and 210 community-basedservices. In 2008–2009, 2488 mother–baby pairs (65% of the 2010target) received a complete course of two-antiretroviral (ARV)combination prophylaxis (Figure 2).
As early as 2002, a few patients accessed ART from neighbouringcountries, and from MSF-Holland. Provision of ART by NAP startedin 2005 through five general hospitals and one HIV specialisthospital in Yangon. Between 2001 and 2010, with significantcollaboration from INGOs, NGOs, civil society and network groups,
the number of PLHIV receiving ART increased from fewer than500 in 2004 to reach 29,825 in 2010 (2116 of whom werechildren) with the public sector caring for over 25% of the totalpatients (Figure 3).
A network of private general practitioners (Sun Quality Healthpractitioners), established in 2001, diagnosed and treated STIcases, especially among FSW and MSM. Stand-alone VCCT/HTCwas also provided. ART maintenance was piloted in 2008 andexpanded to other network clinics in 2010 as part of thedecentralisation process.
The Integrated HIV Care (IHC) programme for TB/HIV co-infectedpatients and families was a joint collaboration between the Ministryof Health, the International Union against Tuberculosis and LungDisease (IUATLD) and WHO, established in 2005 with departmentalreferral practised between NAP and the National TB Programme(NTP). Piloting of isoniazid preventive therapy (IPT) for PLHIVstarted in seven townships in 2007, expanding to 11 townshipsby 2010 where co-trimoxazole prophylactic therapy (CPT), IPTand initiation of ART as appropriate was provided.
The comprehensive continuum of care (CoC), initiated in 2006,intended to provide comprehensive HIV prevention and careactivities, community home-based care for AIDS patients and theirfamilies with involvement of basic health staff, NGOs, and
3,132 3,727
7,791
10,896 12,107
2,122 1,980
4,031 4,701
6,932
1,038 960 1,731
3,854 3,616
0
2,000
4,000
6,000
8,000
10,000
12,000
14,000
2006 2007 2008 2009 2010 Sex worker Men who have sex with men Injec�ng drug user
Figure 1. Most at-risk populations received HIV test and post-test counselling 2006–2010. Source: NAP progress report 2010
600,000
500,000
400,000
300,000
200,000
100,000
02003
Tested and post-test counselling Mothers received PMCT services
2004 2005 2007 2008 2009 20100
500
1000
1500
2000
2500
3000
2006
539,728
356,641
170,862159,763
315,920294,992
125,403
182,692
133,859
82,28771,500
42,00021,000
250,938
Pretest
Figure 2. Achievements in PMTCT 2003–2010. Source: NAP review March 2013
Myanmar 23
Journal of Virus Eradication 2016; 2 (Supplement 4): 20–26 REVIEW
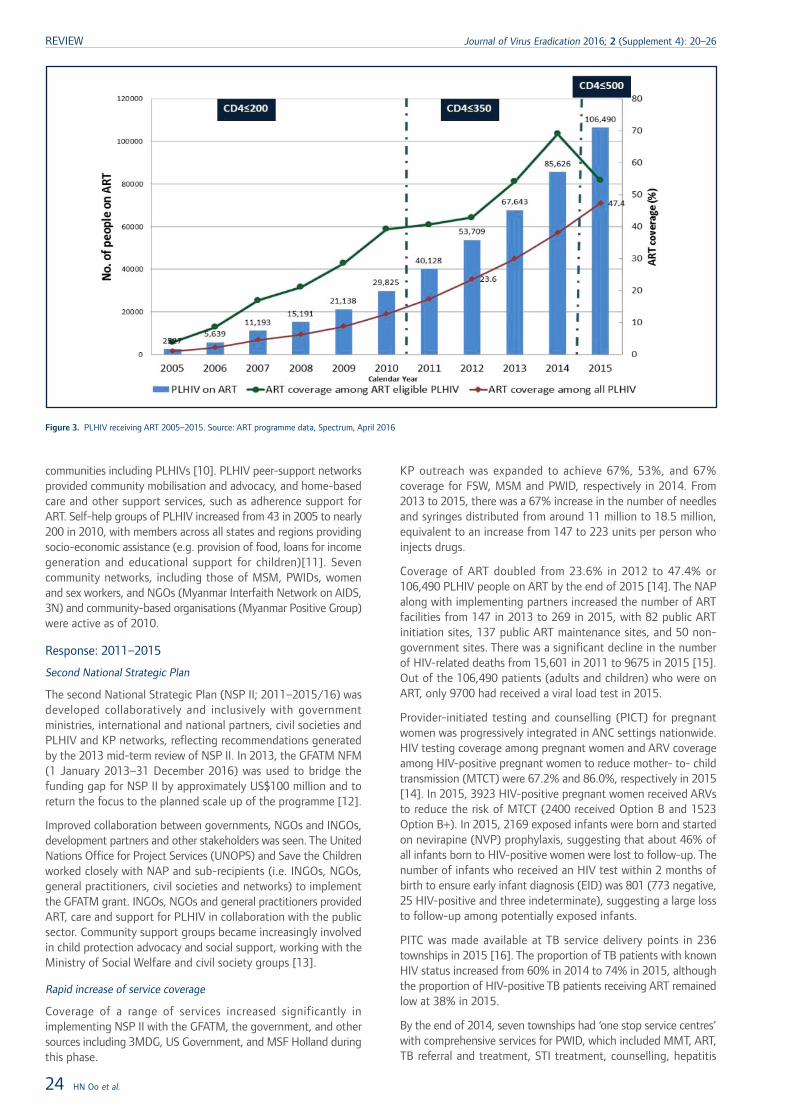
communities including PLHIVs [10]. PLHIV peer-support networksprovided community mobilisation and advocacy, and home-basedcare and other support services, such as adherence support forART. Self-help groups of PLHIV increased from 43 in 2005 to nearly200 in 2010, with members across all states and regions providingsocio-economic assistance (e.g. provision of food, loans for incomegeneration and educational support for children)[11]. Sevencommunity networks, including those of MSM, PWIDs, womenand sex workers, and NGOs (Myanmar Interfaith Network on AIDS,3N) and community-based organisations (Myanmar Positive Group)were active as of 2010.
Response: 2011–2015
Second National Strategic Plan
The second National Strategic Plan (NSP II; 2011–2015/16) wasdeveloped collaboratively and inclusively with governmentministries, international and national partners, civil societies andPLHIV and KP networks, reflecting recommendations generatedby the 2013 mid-term review of NSP II. In 2013, the GFATM NFM(1 January 2013–31 December 2016) was used to bridge thefunding gap for NSP II by approximately US$100 million and toreturn the focus to the planned scale up of the programme [12].
Improved collaboration between governments, NGOs and INGOs,development partners and other stakeholders was seen. The UnitedNations Office for Project Services (UNOPS) and Save the Childrenworked closely with NAP and sub-recipients (i.e. INGOs, NGOs,general practitioners, civil societies and networks) to implementthe GFATM grant. INGOs, NGOs and general practitioners providedART, care and support for PLHIV in collaboration with the publicsector. Community support groups became increasingly involvedin child protection advocacy and social support, working with theMinistry of Social Welfare and civil society groups [13].
Rapid increase of service coverage
Coverage of a range of services increased significantly inimplementing NSP II with the GFATM, the government, and othersources including 3MDG, US Government, and MSF Holland duringthis phase.
KP outreach was expanded to achieve 67%, 53%, and 67%coverage for FSW, MSM and PWID, respectively in 2014. From2013 to 2015, there was a 67% increase in the number of needlesand syringes distributed from around 11 million to 18.5 million,equivalent to an increase from 147 to 223 units per person whoinjects drugs.
Coverage of ART doubled from 23.6% in 2012 to 47.4% or106,490 PLHIV people on ART by the end of 2015 [14]. The NAPalong with implementing partners increased the number of ARTfacilities from 147 in 2013 to 269 in 2015, with 82 public ARTinitiation sites, 137 public ART maintenance sites, and 50 non-government sites. There was a significant decline in the numberof HIV-related deaths from 15,601 in 2011 to 9675 in 2015 [15].Out of the 106,490 patients (adults and children) who were onART, only 9700 had received a viral load test in 2015.
Provider-initiated testing and counselling (PICT) for pregnantwomen was progressively integrated in ANC settings nationwide.HIV testing coverage among pregnant women and ARV coverageamong HIV-positive pregnant women to reduce mother- to- childtransmission (MTCT) were 67.2% and 86.0%, respectively in 2015[14]. In 2015, 3923 HIV-positive pregnant women received ARVsto reduce the risk of MTCT (2400 received Option B and 1523Option B+). In 2015, 2169 exposed infants were born and startedon nevirapine (NVP) prophylaxis, suggesting that about 46% ofall infants born to HIV-positive women were lost to follow-up. Thenumber of infants who received an HIV test within 2 months ofbirth to ensure early infant diagnosis (EID) was 801 (773 negative,25 HIV-positive and three indeterminate), suggesting a large lossto follow-up among potentially exposed infants.
PITC was made available at TB service delivery points in 236townships in 2015 [16]. The proportion of TB patients with knownHIV status increased from 60% in 2014 to 74% in 2015, althoughthe proportion of HIV-positive TB patients receiving ART remainedlow at 38% in 2015.
By the end of 2014, seven townships had ‘one stop service centres’with comprehensive services for PWID, which included MMT, ART,TB referral and treatment, STI treatment, counselling, hepatitis
Figure 3. PLHIV receiving ART 2005–2015. Source: ART programme data, Spectrum, April 2016
REVIEW Journal of Virus Eradication 2016; 2 (Supplement 4): 20–26
24 HN Oo et al.
B vaccination, hepatitis C testing, condoms and educationalmaterials [17].
General practitioners were also involved in HIV diagnosis, treatmentof opportunistic infections, care for TB and HIV co-infection, ARTmaintenance, and adherence to the treatment.
Government financial contributions to ART and MMT
The government demonstrated a strong commitment by allocatingUS$1 million for methadone in 2014 and US$5 million for ARVdrugs in 2015, in addition to an eight-fold resource increase forthe NSP II by the Ministry of Health [18].
The way forward: 2016–2020
Based on the review of NSP II implementation successes andchallenges, the Myanmar National Strategic Plan on HIV and AIDS(2016–2020) (NSP III) has been developed. It aims to end HIVas a public health threat in Myanmar by 2030 through fast-trackingaccess for PLHIV to a continuum of integrated and high-qualityservices that protect and promote human rights for all. The NSPIII defines five strategic milestones for Myanmar to achieve:
(1) 90% of SW, MSM, PWID, prisoners and migrants haveaccess to combination prevention services;
(2) 90% of PLHIV know their status;
(3) 90% of PLHIV who know their status receive treatment;
(4) 90% of people on treatment have achieved viralsuppression;
(5) 90% of people living with, at risk of and affected by HIVreport no discrimination, especially in health, education andworkplace settings.
The NSP III intends to ensure highly focused and cost efficientapproaches that will provide the right interventions to the rightpeople in the right places. New features of the NSP III includethe following:
• Geographical prioritisation through categorisation oftownships based on epidemic burden and risk of newinfections;
• Differentiation of service delivery approaches for higherimpact to reach priority populations and expedite theiraccess to services;
• Continuum of HIV prevention, testing, care and treatmentservices including strengthened partnerships between thepublic, INGOs, NGOs, community and private sectors;
• Prioritising integration/co-location of services in high-burden areas;
• Transition to increased public sector management, especiallyof ART; and
• Streamlined programme costs to ensure savings andefficiency gains from economies of scale and scope.
Regarding the geographical prioritisation, existing data wereanalysed through a process of triangulating population sizeestimates of priority populations, known HIV prevalence, reportedHIV-positive and TB/HIV-positive data, number of PLHIV on ARTand reported PMTCT/HIV-positive data. This analysis resulted inthe classification of 85 high-burden townships; 151 medium-burden townships; and 94 low-burden townships. It was estimatedthat between 63% and 77% of key populations were in high-burden townships, while 76% of adult PLHIV and 78% of adultson ART resided in high-burden townships. Between 19% and 31%of key populations and adults on ART were in medium-burden
townships and only up to 6% of key populations were withinlow-burden townships.
Each township plans to implement differentiated service deliveryapproaches. For prevention, in high-burden townships, governmentand INGO and NGO partners will jointly scale up programmes thatare relevant to the needs of the key population through the KeyPopulation Service Centre approach, which includes drop-in-centres,mobile outreach units, peer educators, as well as internet and smartphone-based applications, among other initiatives. Medium- andlow-priority townships will receive a standardised basic programmepackage, consisting mainly of IEC, condom distribution, preventionand HIV testing information, and HIV awareness raising throughactivities such as World AIDS Day campaigns.
HIV testing will be optimised through intensifying different HIVtesting approaches to target different priority populations.Specifically, community HTC for KPs and VCCT for other vulnerablepopulations including FSW clients, KP partners, and unreachedKPs will be prioritised in high-burden areas while PITC for PMTCTand TB/HIV will be made available throughout the countryregardless of the level of burden.
ART initiation will be focused in high-burden townships. Inmedium- and low-burden townships, the ART initiation servicewill be accessible on-site, or by referral. PMTCT services willcontinue to be available throughout the country. The NSP IIIprioritises the transition of ART services from INGOs and NGOsto the public sector. It also aims to increase community involvementin the HIV response and supports the strengthening of communitysystems. Providing familiarity and interactions with communitiesand KPs also serves to increase understanding and compassionof public sector healthcare providers towards PLHIV and KPs,ultimately reducing HIV-related stigma and discrimination.
Integrated/co-location service delivery including HTC, ART, TB/HIVand PMTCT should minimise physical referral, especially inhigh-burden areas, resulting in fewer loss-to-follow-up cases.Individual case monitoring and improved response systems willhelp to better track patients across the care continuum.
Other focus areas in the NSP III include: building infrastructureand capacity for viral load monitoring and testing, includingpoint-of-care viral load testing in order to achieve viral suppressionin ART patients; improving and speeding up treatment of TBpatients who need ART; and addressing problems identified aroundthe continued high MTCT rate.
Ultimately NSP III interventions were selected based on those thatare most likely to achieve results and impact the epidemic. Withrigorous programme and cost-efficiency reviews, the new NSP hasidentified up to US$150 million in savings for the duration of theNSP from 2016 to 2020. Through these evidence-informed,results-oriented, innovative approaches, Myanmar strives to reachits goals to eliminate HIV as a public health threat, as part of awider health agenda that includes providing universal access tohealth.
Acknowledgements
The authors thank Dr Yu Dongbao for facilitating the initiationof writing this article and Dr Wai Phyo Thant for reviewing somefigures and references of this article.
Disclaimer
MF, AM-M, PB, HA, MTAS, AMS and RP are staff members ofthe World Health Organization. The authors alone are responsiblefor the views expressed in this article and they do not necessarily
Myanmar 25
Journal of Virus Eradication 2016; 2 (Supplement 4): 20–26 REVIEW
represent the decisions, policy or views of the World HealthOrganization.
References1. National census 2014
2. NSPIII, NAP-MoH 2015
3. National AIDS Spending Assessment (2012–2013) and (2014–2015)
4. Report on HIV AIDS in Myanmar – 2005 progress report
5. Myanmar NSP 2006–2010
6. NAP annual review 2011–2012
7. Fund for HIV/AIDS in Myanmar: annual progress report 2006
8. Progress Report on the National Response to HIV 2010
9. HIV sentinel sero-surveillance survey 2009
10. http://www.moh.gov.mm/file/DiseasesofNationalConcern.pdf
11. NAP review conducted March 2006
12. Mid-Term Review (MTR) of the Myanmar National Strategic Plan on HIV andAIDS
13. National Progress Report 2013
14. GARPR 2016
15. Asian Epidemic Model April 2016
16. National TB Registry NTP, 2015 received from WHO
17. http://idpc.net/blog/2014/11/new-drug-treatment-services-announced-for-myanmar
18. WAD speech, Minister of Health Myanmar, 2015
19. Report on HIV AIDS in Myanmar – 2005 progress report HIVAIDS in Burma andUSAID involvement: the Synergy project September 2001
20. Spectrum 2016
21. Myanmar country progress report 2010
22. Midterm review NSP 2011–2015
REVIEW Journal of Virus Eradication 2016; 2 (Supplement 4): 20–26
26 HN Oo et al.
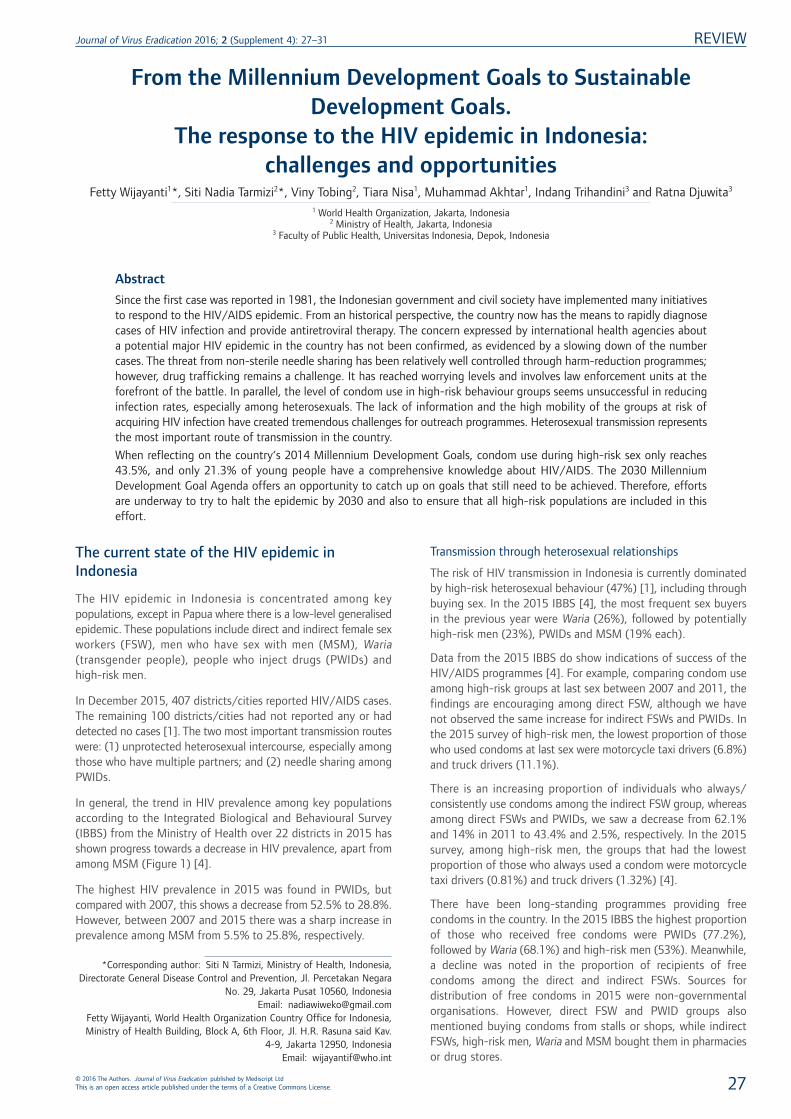
From the Millennium Development Goals to SustainableDevelopment Goals.
The response to the HIV epidemic in Indonesia:challenges and opportunities
Fetty Wijayanti1*, Siti Nadia Tarmizi2*, Viny Tobing2, Tiara Nisa1, Muhammad Akhtar1, Indang Trihandini3 and Ratna Djuwita3
1 World Health Organization, Jakarta, Indonesia2 Ministry of Health, Jakarta, Indonesia
3 Faculty of Public Health, Universitas Indonesia, Depok, Indonesia
Abstract
Since the first case was reported in 1981, the Indonesian government and civil society have implemented many initiativesto respond to the HIV/AIDS epidemic. From an historical perspective, the country now has the means to rapidly diagnosecases of HIV infection and provide antiretroviral therapy. The concern expressed by international health agencies abouta potential major HIV epidemic in the country has not been confirmed, as evidenced by a slowing down of the numbercases. The threat from non-sterile needle sharing has been relatively well controlled through harm-reduction programmes;however, drug trafficking remains a challenge. It has reached worrying levels and involves law enforcement units at theforefront of the battle. In parallel, the level of condom use in high-risk behaviour groups seems unsuccessful in reducinginfection rates, especially among heterosexuals. The lack of information and the high mobility of the groups at risk ofacquiring HIV infection have created tremendous challenges for outreach programmes. Heterosexual transmission representsthe most important route of transmission in the country.
When reflecting on the country‘s 2014 Millennium Development Goals, condom use during high-risk sex only reaches43.5%, and only 21.3% of young people have a comprehensive knowledge about HIV/AIDS. The 2030 MillenniumDevelopment Goal Agenda offers an opportunity to catch up on goals that still need to be achieved. Therefore, effortsare underway to try to halt the epidemic by 2030 and also to ensure that all high-risk populations are included in thiseffort.
The current state of the HIV epidemic inIndonesia
The HIV epidemic in Indonesia is concentrated among keypopulations, except in Papua where there is a low-level generalisedepidemic. These populations include direct and indirect female sexworkers (FSW), men who have sex with men (MSM), Waria(transgender people), people who inject drugs (PWIDs) andhigh-risk men.
In December 2015, 407 districts/cities reported HIV/AIDS cases.The remaining 100 districts/cities had not reported any or haddetected no cases [1]. The two most important transmission routeswere: (1) unprotected heterosexual intercourse, especially amongthose who have multiple partners; and (2) needle sharing amongPWIDs.
In general, the trend in HIV prevalence among key populationsaccording to the Integrated Biological and Behavioural Survey(IBBS) from the Ministry of Health over 22 districts in 2015 hasshown progress towards a decrease in HIV prevalence, apart fromamong MSM (Figure 1) [4].
The highest HIV prevalence in 2015 was found in PWIDs, butcompared with 2007, this shows a decrease from 52.5% to 28.8%.However, between 2007 and 2015 there was a sharp increase inprevalence among MSM from 5.5% to 25.8%, respectively.
Transmission through heterosexual relationships
The risk of HIV transmission in Indonesia is currently dominatedby high-risk heterosexual behaviour (47%) [1], including throughbuying sex. In the 2015 IBBS [4], the most frequent sex buyersin the previous year were Waria (26%), followed by potentiallyhigh-risk men (23%), PWIDs and MSM (19% each).
Data from the 2015 IBBS do show indications of success of theHIV/AIDS programmes [4]. For example, comparing condom useamong high-risk groups at last sex between 2007 and 2011, thefindings are encouraging among direct FSW, although we havenot observed the same increase for indirect FSWs and PWIDs. Inthe 2015 survey of high-risk men, the lowest proportion of thosewho used condoms at last sex were motorcycle taxi drivers (6.8%)and truck drivers (11.1%).
There is an increasing proportion of individuals who always/consistently use condoms among the indirect FSW group, whereasamong direct FSWs and PWIDs, we saw a decrease from 62.1%and 14% in 2011 to 43.4% and 2.5%, respectively. In the 2015survey, among high-risk men, the groups that had the lowestproportion of those who always used a condom were motorcycletaxi drivers (0.81%) and truck drivers (1.32%) [4].
There have been long-standing programmes providing freecondoms in the country. In the 2015 IBBS the highest proportionof those who received free condoms were PWIDs (77.2%),followed by Waria (68.1%) and high-risk men (53%). Meanwhile,a decline was noted in the proportion of recipients of freecondoms among the direct and indirect FSWs. Sources fordistribution of free condoms in 2015 were non-governmentalorganisations. However, direct FSW and PWID groups alsomentioned buying condoms from stalls or shops, while indirectFSWs, high-risk men, Waria and MSM bought them in pharmaciesor drug stores.
*Corresponding author: Siti N Tarmizi, Ministry of Health, Indonesia,Directorate General Disease Control and Prevention, Jl. Percetakan Negara
No. 29, Jakarta Pusat 10560, IndonesiaEmail: [email protected]
Fetty Wijayanti, World Health Organization Country Office for Indonesia,Ministry of Health Building, Block A, 6th Floor, Jl. H.R. Rasuna said Kav.
4-9, Jakarta 12950, IndonesiaEmail: [email protected]
Journal of Virus Eradication 2016; 2 (Supplement 4): 27–31 REVIEW
© 2016 The Authors. Journal of Virus Eradication published by Mediscript LtdThis is an open access article published under the terms of a Creative Commons License. 27
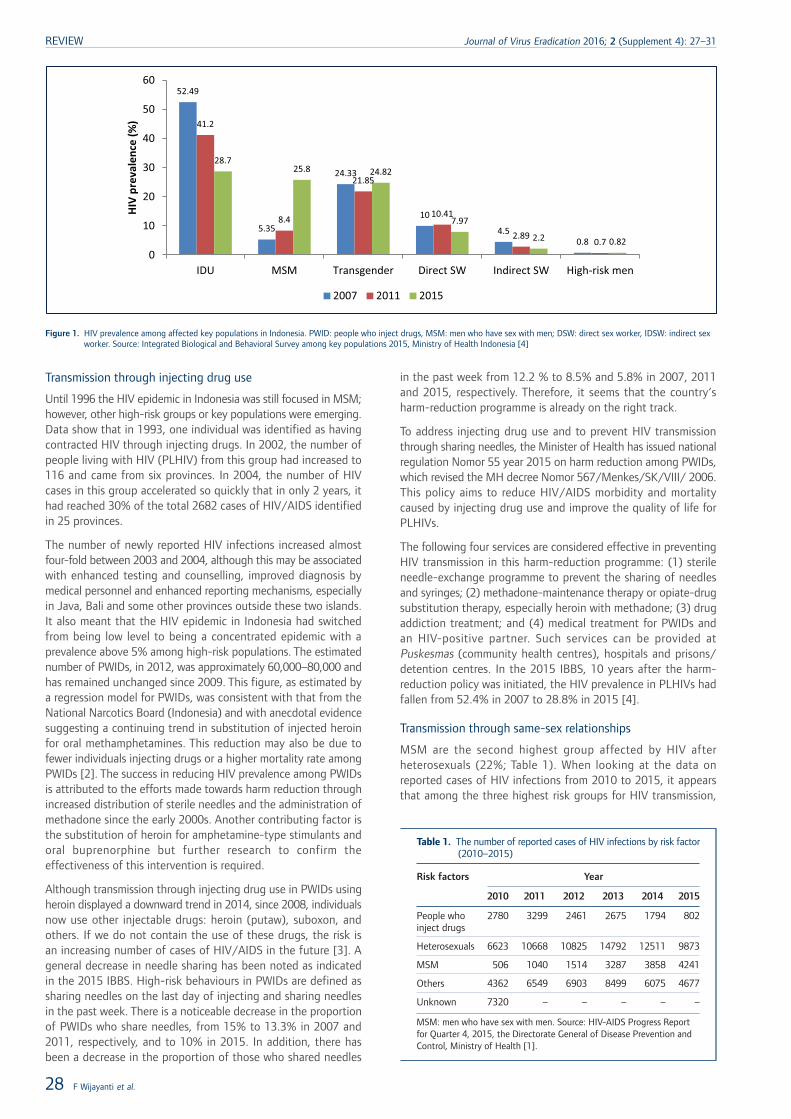
Transmission through injecting drug use
Until 1996 the HIV epidemic in Indonesia was still focused in MSM;however, other high-risk groups or key populations were emerging.Data show that in 1993, one individual was identified as havingcontracted HIV through injecting drugs. In 2002, the number ofpeople living with HIV (PLHIV) from this group had increased to116 and came from six provinces. In 2004, the number of HIVcases in this group accelerated so quickly that in only 2 years, ithad reached 30% of the total 2682 cases of HIV/AIDS identifiedin 25 provinces.
The number of newly reported HIV infections increased almostfour-fold between 2003 and 2004, although this may be associatedwith enhanced testing and counselling, improved diagnosis bymedical personnel and enhanced reporting mechanisms, especiallyin Java, Bali and some other provinces outside these two islands.It also meant that the HIV epidemic in Indonesia had switchedfrom being low level to being a concentrated epidemic with aprevalence above 5% among high-risk populations. The estimatednumber of PWIDs, in 2012, was approximately 60,000–80,000 andhas remained unchanged since 2009. This figure, as estimated bya regression model for PWIDs, was consistent with that from theNational Narcotics Board (Indonesia) and with anecdotal evidencesuggesting a continuing trend in substitution of injected heroinfor oral methamphetamines. This reduction may also be due tofewer individuals injecting drugs or a higher mortality rate amongPWIDs [2]. The success in reducing HIV prevalence among PWIDsis attributed to the efforts made towards harm reduction throughincreased distribution of sterile needles and the administration ofmethadone since the early 2000s. Another contributing factor isthe substitution of heroin for amphetamine-type stimulants andoral buprenorphine but further research to confirm theeffectiveness of this intervention is required.
Although transmission through injecting drug use in PWIDs usingheroin displayed a downward trend in 2014, since 2008, individualsnow use other injectable drugs: heroin (putaw), suboxon, andothers. If we do not contain the use of these drugs, the risk isan increasing number of cases of HIV/AIDS in the future [3]. Ageneral decrease in needle sharing has been noted as indicatedin the 2015 IBBS. High-risk behaviours in PWIDs are defined assharing needles on the last day of injecting and sharing needlesin the past week. There is a noticeable decrease in the proportionof PWIDs who share needles, from 15% to 13.3% in 2007 and2011, respectively, and to 10% in 2015. In addition, there hasbeen a decrease in the proportion of those who shared needles
in the past week from 12.2 % to 8.5% and 5.8% in 2007, 2011and 2015, respectively. Therefore, it seems that the country‘sharm-reduction programme is already on the right track.
To address injecting drug use and to prevent HIV transmissionthrough sharing needles, the Minister of Health has issued nationalregulation Nomor 55 year 2015 on harm reduction among PWIDs,which revised the MH decree Nomor 567/Menkes/SK/VIII/ 2006.This policy aims to reduce HIV/AIDS morbidity and mortalitycaused by injecting drug use and improve the quality of life forPLHIVs.
The following four services are considered effective in preventingHIV transmission in this harm-reduction programme: (1) sterileneedle-exchange programme to prevent the sharing of needlesand syringes; (2) methadone-maintenance therapy or opiate-drugsubstitution therapy, especially heroin with methadone; (3) drugaddiction treatment; and (4) medical treatment for PWIDs andan HIV-positive partner. Such services can be provided atPuskesmas (community health centres), hospitals and prisons/detention centres. In the 2015 IBBS, 10 years after the harm-reduction policy was initiated, the HIV prevalence in PLHIVs hadfallen from 52.4% in 2007 to 28.8% in 2015 [4].
Transmission through same-sex relationships
MSM are the second highest group affected by HIV afterheterosexuals (22%; Table 1). When looking at the data onreported cases of HIV infections from 2010 to 2015, it appearsthat among the three highest risk groups for HIV transmission,
52.49
5.35
24.33
10
4.50.8
41.2
8.4
21.85
10.41
2.890.7
28.725.8 24.82
7.97
2.2 0.82
0
10
20
30
40
50
60
IDU MSM Transgender Direct SW Indirect SW High-risk men
HIV
prev
alen
ce (%
)
2007 2011 2015
Figure 1. HIV prevalence among affected key populations in Indonesia. PWID: people who inject drugs, MSM: men who have sex with men; DSW: direct sex worker, IDSW: indirect sexworker. Source: Integrated Biological and Behavioral Survey among key populations 2015, Ministry of Health Indonesia [4]
Table 1. The number of reported cases of HIV infections by risk factor(2010–2015)
Risk factors Year
2010 2011 2012 2013 2014 2015
People whoinject drugs
2780 3299 2461 2675 1794 802
Heterosexuals 6623 10668 10825 14792 12511 9873
MSM 506 1040 1514 3287 3858 4241
Others 4362 6549 6903 8499 6075 4677
Unknown 7320 – – – – –
MSM: men who have sex with men. Source: HIV-AIDS Progress Reportfor Quarter 4, 2015, the Directorate General of Disease Prevention andControl, Ministry of Health [1].
REVIEW Journal of Virus Eradication 2016; 2 (Supplement 4): 27–31
28 F Wijayanti et al.
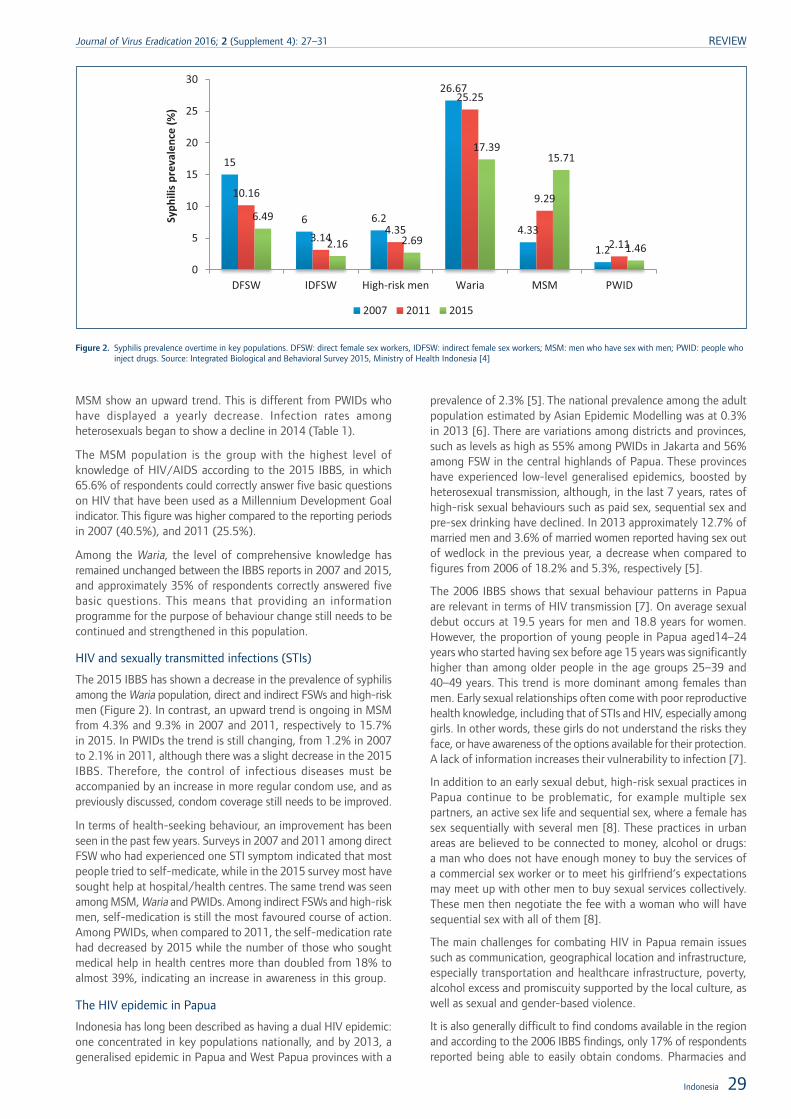
MSM show an upward trend. This is different from PWIDs whohave displayed a yearly decrease. Infection rates amongheterosexuals began to show a decline in 2014 (Table 1).
The MSM population is the group with the highest level ofknowledge of HIV/AIDS according to the 2015 IBBS, in which65.6% of respondents could correctly answer five basic questionson HIV that have been used as a Millennium Development Goalindicator. This figure was higher compared to the reporting periodsin 2007 (40.5%), and 2011 (25.5%).
Among the Waria, the level of comprehensive knowledge hasremained unchanged between the IBBS reports in 2007 and 2015,and approximately 35% of respondents correctly answered fivebasic questions. This means that providing an informationprogramme for the purpose of behaviour change still needs to becontinued and strengthened in this population.
HIV and sexually transmitted infections (STIs)
The 2015 IBBS has shown a decrease in the prevalence of syphilisamong the Waria population, direct and indirect FSWs and high-riskmen (Figure 2). In contrast, an upward trend is ongoing in MSMfrom 4.3% and 9.3% in 2007 and 2011, respectively to 15.7%in 2015. In PWIDs the trend is still changing, from 1.2% in 2007to 2.1% in 2011, although there was a slight decrease in the 2015IBBS. Therefore, the control of infectious diseases must beaccompanied by an increase in more regular condom use, and aspreviously discussed, condom coverage still needs to be improved.
In terms of health-seeking behaviour, an improvement has beenseen in the past few years. Surveys in 2007 and 2011 among directFSW who had experienced one STI symptom indicated that mostpeople tried to self-medicate, while in the 2015 survey most havesought help at hospital/health centres. The same trend was seenamong MSM, Waria and PWIDs. Among indirect FSWs and high-riskmen, self-medication is still the most favoured course of action.Among PWIDs, when compared to 2011, the self-medication ratehad decreased by 2015 while the number of those who soughtmedical help in health centres more than doubled from 18% toalmost 39%, indicating an increase in awareness in this group.
The HIV epidemic in Papua
Indonesia has long been described as having a dual HIV epidemic:one concentrated in key populations nationally, and by 2013, ageneralised epidemic in Papua and West Papua provinces with a
prevalence of 2.3% [5]. The national prevalence among the adultpopulation estimated by Asian Epidemic Modelling was at 0.3%in 2013 [6]. There are variations among districts and provinces,such as levels as high as 55% among PWIDs in Jakarta and 56%among FSW in the central highlands of Papua. These provinceshave experienced low-level generalised epidemics, boosted byheterosexual transmission, although, in the last 7 years, rates ofhigh-risk sexual behaviours such as paid sex, sequential sex andpre-sex drinking have declined. In 2013 approximately 12.7% ofmarried men and 3.6% of married women reported having sex outof wedlock in the previous year, a decrease when compared tofigures from 2006 of 18.2% and 5.3%, respectively [5].
The 2006 IBBS shows that sexual behaviour patterns in Papuaare relevant in terms of HIV transmission [7]. On average sexualdebut occurs at 19.5 years for men and 18.8 years for women.However, the proportion of young people in Papua aged14–24years who started having sex before age 15 years was significantlyhigher than among older people in the age groups 25–39 and40–49 years. This trend is more dominant among females thanmen. Early sexual relationships often come with poor reproductivehealth knowledge, including that of STIs and HIV, especially amonggirls. In other words, these girls do not understand the risks theyface, or have awareness of the options available for their protection.A lack of information increases their vulnerability to infection [7].
In addition to an early sexual debut, high-risk sexual practices inPapua continue to be problematic, for example multiple sexpartners, an active sex life and sequential sex, where a female hassex sequentially with several men [8]. These practices in urbanareas are believed to be connected to money, alcohol or drugs:a man who does not have enough money to buy the services ofa commercial sex worker or to meet his girlfriend‘s expectationsmay meet up with other men to buy sexual services collectively.These men then negotiate the fee with a woman who will havesequential sex with all of them [8].
The main challenges for combating HIV in Papua remain issuessuch as communication, geographical location and infrastructure,especially transportation and healthcare infrastructure, poverty,alcohol excess and promiscuity supported by the local culture, aswell as sexual and gender-based violence.
It is also generally difficult to find condoms available in the regionand according to the 2006 IBBS findings, only 17% of respondentsreported being able to easily obtain condoms. Pharmacies and
15
6 6.2
26.67
4.33
1.2
10.16
3.144.35
25.25
9.29
2.11
6.49
2.16 2.69
17.3915.71
1.46
0
5
10
15
20
25
30
DFSW IDFSW High-risk men Waria MSM PWID
Syph
ilis
prev
alen
ce (%
)
2007 2011 2015
Figure 2. Syphilis prevalence overtime in key populations. DFSW: direct female sex workers, IDFSW: indirect female sex workers; MSM: men who have sex with men; PWID: people whoinject drugs. Source: Integrated Biological and Behavioral Survey 2015, Ministry of Health Indonesia [4]
Indonesia 29
Journal of Virus Eradication 2016; 2 (Supplement 4): 27–31 REVIEW
clinics are their main sources; however, these sources are oftendifficult to access because of large distances to travel.
The HIV epidemic in Indonesia and thehealthcare sector responseBy the end of 2015 the coverage of HIV services had expandedto all provinces as well as priority districts and cities, and was deliveredby the government and supported by communities and NGOs foroutreach activities. There has been a considerable expansion inthe number of HIV counselling and testing (HCT), STI testing,treatment and harm-reduction sites. Antiretroviral therapy (ART)delivery has been scaled up and is increasingly decentralised atthe primary healthcare level in high-burden areas. IntegratedTB/HIVtesting and treatment are more widely available and there has beena huge expansion in the coverage and implementation of preventionof mother-to-child transmission (PMTCT) strategies, particularlythrough its integration into maternal and child health (MCH) services,thereby resulting in more than 298,050 pregnant women aged15 years and above testing for HIV and receiving their result in2014, as compared to 100,718 in the previous year [1].
In 2014, the Ministry of Health released an estimate of the numberof PLHIVs, which then stood at 600,000. This number was muchlower than the previous estimate of 700,000 people in 2012. Froma total of 200,618 individuals who had tested positive, 63,066were on ART in December 2015.
Antiretroviral therapy in Indonesia: history, challenges,barriers and opportunities
At the beginning of the epidemic, the major barrier to treatmentaccess was cost. The Pelita Ilmu Foundation workshop recorded25 PLHIVs in Jakarta who received antiretroviral treatment (ART)in 1998. Each month these needed Rp6–7 million/person to buytheir medication. However, with the help of benefactors, a PLHIVnow pays only an average of Rp1.5 million/month for medication.
Today the government provides first-line and several second-lineantiretrovirals for free. It is important to note that the journeyto provide free ARVs did not only involve the government, butalso civil society and the medical community who have runsuccessful advocacy campaigns. Co-operation between severalgovernment agencies has proven that strong leadership could bringpositive results. In 1997, thanks to the advocacy of the publicand the medical community, the National Agency of Drug andFood Control, (NA-DFC) and the Ministry of Health issued anofficial letter to the Directorate General of Customs, Ministry ofCommerce. It informed the Directorate General of Customs andExcise that NA-DFC was expecting a shipment of AIDS drugs fromabroad that was addressed to Pokdisus AIDS and that these shouldbe released immediately without having to go through a trial bythe Head of NA-DFC, In reality, PT Pos Indonesia delivered thedrugs directly to Pokdisus AIDS. In the same year, the Ministerof Finance also issued a decree to exempt ARVs from import duties.
Thanks to good co-ordination and support from the NA-DFCchairperson, a number of generic anti-HIV drugs from India suchas zidovudine (ZDV), didanosine, lamivudine (3TC), saquinavir andritonavir have been available in Indonesia since 1997 althoughmost PLHIVs could not afford them. Subsequently, in 2002, theDirector General of Pharmaceutical Ministry of Health includedZDV, 3TC and nevirapine in the National Essential Drugs List forall type A and type B hospitals. The Government, among others,with the support from the Global Fund, has continued to expandtreatment access. The Minister of Health in March 2003 statedthat the government would subsidise generic ARVs up toRp200,000/month for each PLHIV. In July of the same year, theGlobal Fund began its programme to support 100 PLHIVs in five
provinces. By the end of 2003 approximately 1100 PLHIVs wereprojected to have access to ARVs [9]. In the same year Kimia Farma,a state-owned pharmaceutical company began producing genericARVs. This important step towards self-reliance was unfortunatelyhalted due to political issues. Currently, Indonesia offers quite alimited choice of ARVs as compared to many other developedcountries. However, the availability of three drugs in one pill(tenofovir, lamivudine and efavirenz) facilitates the task for doctors.Since 2006, the government is committed to providing free ARVsto PLHIVs with only 10% supported by a non-governmental budget.
The latest ART data in Indonesia have shown that the numberof people with HIV/AIDS who have received ARVs up to December2015 was at 63,066. Most of them (75.6%) were using the originalfirst-line regimen, 21.2% used substitutes and 3.3% had switchedregimen. This number was far below the total number of peoplewho tested positive for HIV/AIDS, e.g. 268,185, and is less than25% especially when compared to the estimate in September 2014of 600,000 individuals living with HIV.
To close the gap in the linkage to care, an important strategy isthe 2015–2019 National Strategic Action Plan, which aims tointensify and accelerate the Strategic Use of ARVs (SUFA) thatwas launched by the Ministry of Health in mid-2013. It aims toincrease HIV testing and ART coverage and retention, aimedparticularly at pregnant women, HIV/TB co-infected patients,HIV/hepatitis B and C co-infected patients, FSWs, PWIDs, MSM,and serodiscordant couples with inconsistent condom use. SUFAwas implemented in 13 districts/cities and expanded gradually in2014 to cover a total of 75 districts/cities [10].
In 2013, the Ministry of Health issued the following regulationsto address the challenges of the HIV epidemic [1]:
• The Health Minister Regulation No. 21 in 2013 on HIV/AIDScontrol. The scope of the policy includes health promotion,prevention, diagnosis, treatment and rehabilitation for theindividual, family and community.
• The Health Minister Circular Letter Nomor 129 year 2013 onthe implementation of the HIV/AIDS and STI control. Theletter requested the Head Provincial Office, District HealthOffice and Director of Hospitals in Indonesia to strengthenhealth promotion and prevention, expand HIV counsellingand testing and care-support-treatment.
• The Health Minister Regulation N0. 51 in 2013 on theguidelines for PMTCT. The guidance aims to develop andimplement PMTCT activities, develop human resources atcentral and regional levels, mobilise and increase thecommitment from stakeholders and communities.
Other policy strengthening actions that support the responseinclude the launch of the National Social Security System whichincludes a financial package as part of HIV service costs foropportunistic infections and STI treatment for PLHIVs, and theroll-out of gender-sensitive planning and budgeting at the nationaland regional levels. At the local level, however, gaps remain inlocal policies and/or regulations that support access to servicesfor affected key populations and PLHIV.
From Millennium Development Goals (MDG) toSustainable Development Goals (SDG): somelessons learned
Millennium Development Goals: what have we achieved?
Based on the latest MDG report, the percentage of the populationaged 15–24 years who have comprehensive knowledge about
REVIEW Journal of Virus Eradication 2016; 2 (Supplement 4): 27–31
30 F Wijayanti et al.
HIV/AIDS is still as low as 21%. This indicates that the group isstill highly vulnerable to HIV infection. One type of interventionis the provision of information focused on HIV/AIDS through thecampaign Aku Bangga Aku Tahu (ABAT), which literally means ‘I‘mProud I Know’. This campaign is a strategy to promote responsiblesexual behaviour and information on modes of HIV transmission.This campaign started simultaneously in all provinces of Indonesiain 2012 and involves the government and businesses, and is aimedin particular at young people. Other efforts include attempts todecrease the number of cases and improve people‘s access totreatment and integrated HIV/AIDS services. Up until December2015, there were 2221 HIV counselling and testing (HCT) sitesand 528 care, support and treatment (CST) sites in existence.Furthermore, 261 sites for PMTCT were integrated into maternaland child health services. As a result, there is an increasing numberof pregnant women (100,718) aged 15 years and over who havetested and have received their test results in the past 12 months,as compared to 42,276 the previous year [1].
In addition, there are already 1643 service places for themanagement of STIs and 90 places for the methadone maintenanceprogramme. Another achievement is the issue of various localregulations strengthening initiatives to prevent HIV/AIDS, suchas 10 Regional Regulation (Perda) Provincial levels; one Regulationof the Governor and 13 Perda Regency/City. The number of localregulations is expected to continue to increase in the future [11].
Decentralisation of ART distribution
In the past few years the Ministry of Health has developed asystem to decentralise ARV provision by strengthening supply chainmanagement. As a result more accurate data about the adequacyof ARV supplies and reporting have been obtained. In theimplementation of decentralisation, the Provincial Health Officeis responsible for the reporting of ART management anddistribution in the region. Decentralised ARV distribution startedin 2011 and has gradually expanded. Up to 2015, there were 23provinces that had implemented this policy [11].
What needs to be improved?
Some of the differences between the MDGs and the 2030 Agenda(SDGs) include: Zero Goals, Universal Goals, More ComprehensiveGoals, Inclusive Goal Setting, Differentiate Hunger from Poverty,Financing, Peace, Data Revolution and Education Quality [11].
Regarding health, the SDG has Goal 3 for all health issues, effortsto ensure the well-being and promote fulfilment of the right tohealth for all people without exception. Target 3.3 reads: ‘By 2030,end the epidemics of AIDS, tuberculosis, malaria and neglectedtropical diseases and combat hepatitis, water-borne diseases andother communicable diseases’.
In addition, the following goals and targets in SDGs are relevantto the plan to end the AIDS epidemic by 2030, those are goalsnumber 1–5, 8, 10, 11, 16 and 17. It is important to see theseas a united effort to ensure that nobody is left behind [12].
ConclusionsHIV has attracted worldwide attention as a continuing global epidemic.Developed countries have allocated huge amounts of funds forprevention, including in Indonesia.Treatment for HIV has been securedby government funding, while HIV prevention and management mayneed further support from other sources. When sexually transmittedHIV began to spread, massive free condom distribution programmeswere carried out. With an increasing number of PWIDs, HIV preventionhas also focused on the use of sterile needles and the provision offree needle exchange and outreach programmes.
In terms of HIV management, Indonesia is still facing a numberof challenges [10]. First, to improve HIV treatment coverage, whichrequires extra effort, the following strategies are recommended:
• Increasing the number of people who have access to HIVtesting and treatment through routine tests
• Ensuring the benefit of such interventions by starting earlytreatment
• Strengthening referral systems between field officers
• Improving the quality of HIV testing and treatment
• Providing support to those who do not have access to ARVs
• Supporting those who are on ARVs and the necessarylaboratory monitoring, particularly with regard to CD4 T cellcount and HIV viral load testing.
Secondly, to establish and strengthen networks among self-helpgroups in key affected populations. These need encouragementto advocate for comprehensive services and to improve and updatetheir members’ knowledge about HIV. Various types of research,protocols and treatment guidelines, including for STIs, andprevention programmes are ongoing. It would be very unfortunateif the research findings and documentation established were notused to promote health-seeking behaviours. Thirdly, consistentcondom use should be encouraged to avoid STIs, as well as healthysexual behaviour to further support the impact of ARVs.
In conclusion tangible success has been achieved in the past fewyears in terms of the HIV epidemic in Indonesia with theimplementation of policies aimed at its prevention and treatment;however, there remain many challenges that need to be overcometo reach the 2030 MDGs.
Acknowledgements
Disclaimer
FW, TN and MA are staff members of the World HealthOrganization. The authors alone are responsible for the viewsexpressed in this article and they do not necessarily represent thedecisions, policy or views of the World Health Organization.
References1. Directorate General of Disease Prevention and Control. HIV-AIDS Progress Report,
Fourth Quarter of 2015. Ministry of Health Indonesia, 26 February 2016.
2. Ministry of Health Indonesia. 2012 Size Estimation of Key Affected Populations(KAPs). Available at: http://www.kebijakanaidsindonesia.net/jdownloads/Publikasi%20Publication/2012_size_estimation_of_key_affected_populations_kaps.pdf (accessed November 2016).
3. National Narcotics Board Indonesia. Final Report of Substance Abuse Survey, FiscalYear 2014. 2015.
4. Ministry of Health Indonesia. Integrated Biological and Behavioral Survey amongkey populations 2015.
5. Ministry of Health Indonesia. Integrated Biological and Behavioral Survey Tanah Papua2013.
6. Ministry of Health Indonesia. Projection of HIV/AIDS report. 2014.
7. Ministry of Health Indonesia. Integrated Biological and Behavioral Survey TanahPapua. 2006.
8. Butt L, Numbery G, Morin J. Preventing AIDS in Papua: revised research report.Lembaga Penelitian, Universitas Cenderawasih and Family Health International –Aksi Stop AIDS Program, December 2002. Available at: http://papuaweb.org/dlib/tema/hiv-aids/butt-2002-prevent.pdf (accessed November 2016).
9. Spiritia Foundation. The history of HIV in Indonesia. Available at: http://spiritia.or.id/art/bacaart.php?artno=1040 (accessed November 2016).
10. Center for Policy and Management, Faculty of Medicine, Gajah Mada University.Apakah Pemerintah Indonesia Mampu Mengakselerasi Pembiayaan Obat-obatan[Strategic Use of Antiretroviral (SUFA)]. Policy Brief 02. Available at: http://www.kebijakanaidsindonesia.net/id/policy-brief/hiv-dan-aids/1370-apakah-pemerintah-indonesia-mampu-mengakselerasi-pembiayaan-obat-obatan-strategic-use-of-antiretroviral-sufa (accessed November 2016).
11. Ministry of National Development Planning/National Development Planning Agency(BAPPENAS). Report on the achievement of the Millennium Development GoalsReport in Indonesia 2014. 2015.
12. Sustainable Development Knowledge Platform. Available at: https://sustainabledevelopment.un.org/ (accessed November 2016).
Indonesia 31
Journal of Virus Eradication 2016; 2 (Supplement 4): 27–31 REVIEW
A success story: identified gaps and the way forward for low HIVprevalence in Bangladesh
Md Kamar Rezwan1, Hussain Sarwar Khan2, Tasnim Azim3, Razia Pendse4, Swarup Sarkar4 and N Kumarasamy5*1 WHO Country Office, Bangladesh
2 National STD/HIV Program, Bangladesh3 ICDDR-B, Dhaka, Bangladesh
4 WHO – Regional Office for South East Asia, New Delhi, India5 YRGCARE Medical Centre, VHS, Chennai, India
Abstract
Bangladesh remains a low prevalence country for HIV infection. In this article we attempt to address the reasons for thepresent success in this country and the challenges lying ahead to minimise the spread of HIV in the future.
Keywords: Bangladesh, HIV, migration
Epidemiology
The first case of HIV infection in Bangladesh was reported in amigrant in 1989 [1]. The country is considered to have a lowprevalence for HIV as it is estimated that only around 9600(8400–11,000) individuals are living with HIV [2]. There were 3674individuals reported to have HIV up until December 2015 [2]. Theprevalence in the general population remains low and below 0.1%.In key populations such as people who inject drugs (PWIDs) andin men who have sex with men (MSM), prevalence is at 5% and1%, respectively [2,3].
Testing for HIV
Currently the National AIDS/STD Programme (NASP) offersvoluntary counselling and testing (VCT) through 12 drop-in-centres(DICs), which are hospital-based. Non-governmental organisations(NGOs) and community-based organisations (CBOs) offer HIVtesting to key populations (KPs) with the support from the GlobalFund to fight AIDS, Tuberculosis and Malaria (GFATM).
Routine HIV testing is not offered to pregnant women due to thelow HIV prevalence in the general population. Among patientswith tuberculosis (TB), HIV testing is performed in those withmulti-drug resistant (MDR) TB and treatment failure. HIV testingis not offered in sexual health clinics. Sentinel surveillance wasperformed among PWIDs, MSM and female sex workers (FSW)until 2011.
HIV prevention programmes are carried out by NGOs and CBOswith external funding. This is understood to be one of the keyfactors behind the low HIV prevalence in Bangladesh.
Of those diagnosed HIV, 50% of infected persons are migrantswho have been deported from the Gulf countries. Couplescounselling and testing are not performed owing to the stigmaattached to HIV [4]. There is no HIV testing policy for returningmigrants or structured HIV prevention programme in place for thispopulation.
The Bandhu Social Welfare Society, a community organisation,offers an intervention and testing programme for MSM andtransgender populations. Among MSM, 1% are HIV positive. Itis estimated that around 40,000–150,000 MSM live in Bangladesh.Only around 40,000 of them will be covered by the GFATM andamong them, only 35% will have tested for HIV. Fifty percent ofMSM are married to female partners and no interventions or testing
programmes are in place for their spouses owing to thestigmatisation of HIV.
There are around 10,000 transgender individuals in the countryand 1% of them are HIV positive. Not all are routinely offeredHIV testing.
MUKTHI, a CBO, has been running an intervention programmefor PWIDs since 1998 and offers HIV testing. There is an estimatedHIV prevalence of around 5% and a poor uptake of HIV testingin this population. In this context, behavioural intervention shouldbe coupled with HIV testing.
Community-based organisations are involved in interventionprogrammes such as condom distribution for FSWs. Testing andSTI services are not widely accessible for this population. NGOsare increasingly seeing that resources are decreasing in terms ofprevention, testing and STI services. Interventions such as mobileVCT centres should be studied and implemented for this populationto promote HIV testing.
Linkage to care and treatment
There are 3674 persons diagnosed with HIV infection inBangladesh. Among them, 2536 are linked to care [2]. NASP worksclosely with the Ashar Alo Society (AAS), a CBO facilitating thelinkage to antiretroviral therapy (ART) care and clinical follow-up.Around 2000 HIV-positive individuals are registered with thissociety and approximately 1200 have initiated ART.
Treatment is provided by the government. The programme wasinitiated in 2005 by the International Centre for Diarrhoeal DiseaseResearch, Bangladesh (ICDDR-B) with its own funding for a smallnumber of patients. The GFATM-supported ART programme startedin 2008 and has been supported by the government since 2012.
Patients with a CD4 T cell count below 500 cells/mm3 are initiatedon ART, with a new threshold of CD4 T cell count above 500cells/mm3 to be implemented by this end of this year. First- andsecond-line ART regimens are available. Two centres in the countryhave the facilities for HIV viral load testing but due to lack ofresources, it is not performed for treatment monitoring. There areeight centres for CD4 T cell measurements but the majority of themare affected by a chronic lack of resources and cannot sustainregular testing (Figure 1).
Patients who are sick with opportunistic infections (OIs) and drugtoxicities are admitted to infectious diseases hospitals (IDH),ICDDR-B and medical college hospitals. Few facilities are availablefor the diagnosis of OIs and co-infections but dedicated doctorsand nursing staff are available in these in-patient wards.
*Corresponding author: N Kumarasamy, YRGCARE Medical Centre, VHS,Rajiv Gandhi Salai Chennai-600113, India
Email: [email protected]
Journal of Virus Eradication 2016; 2 (Supplement 4): 32–34REVIEW
© 2016 The Authors. Journal of Virus Eradication published by Mediscript LtdThis is an open access article published under the terms of a Creative Commons License.32
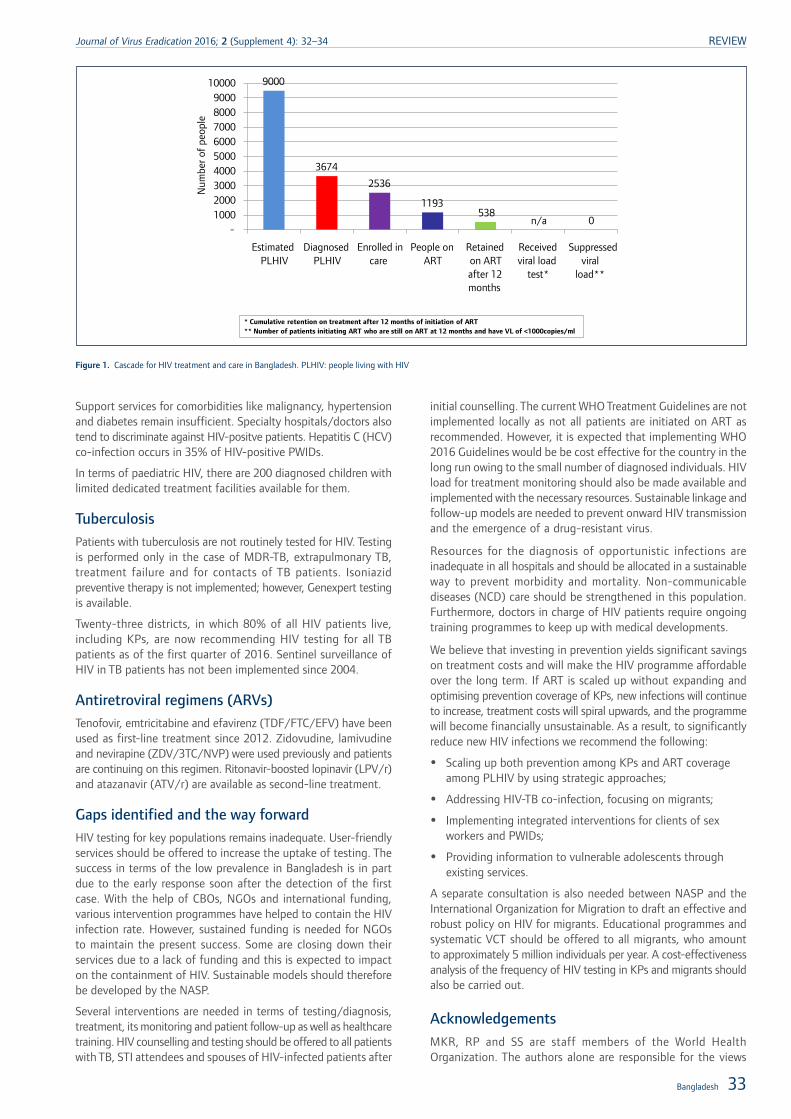
Support services for comorbidities like malignancy, hypertensionand diabetes remain insufficient. Specialty hospitals/doctors alsotend to discriminate against HIV-positve patients. Hepatitis C (HCV)co-infection occurs in 35% of HIV-positive PWIDs.
In terms of paediatric HIV, there are 200 diagnosed children withlimited dedicated treatment facilities available for them.
TuberculosisPatients with tuberculosis are not routinely tested for HIV. Testingis performed only in the case of MDR-TB, extrapulmonary TB,treatment failure and for contacts of TB patients. Isoniazidpreventive therapy is not implemented; however, Genexpert testingis available.
Twenty-three districts, in which 80% of all HIV patients live,including KPs, are now recommending HIV testing for all TBpatients as of the first quarter of 2016. Sentinel surveillance ofHIV in TB patients has not been implemented since 2004.
Antiretroviral regimens (ARVs)Tenofovir, emtricitabine and efavirenz (TDF/FTC/EFV) have beenused as first-line treatment since 2012. Zidovudine, lamivudineand nevirapine (ZDV/3TC/NVP) were used previously and patientsare continuing on this regimen. Ritonavir-boosted lopinavir (LPV/r)and atazanavir (ATV/r) are available as second-line treatment.
Gaps identified and the way forwardHIV testing for key populations remains inadequate. User-friendlyservices should be offered to increase the uptake of testing. Thesuccess in terms of the low prevalence in Bangladesh is in partdue to the early response soon after the detection of the firstcase. With the help of CBOs, NGOs and international funding,various intervention programmes have helped to contain the HIVinfection rate. However, sustained funding is needed for NGOsto maintain the present success. Some are closing down theirservices due to a lack of funding and this is expected to impacton the containment of HIV. Sustainable models should thereforebe developed by the NASP.
Several interventions are needed in terms of testing/diagnosis,treatment, its monitoring and patient follow-up as well as healthcaretraining. HIV counselling and testing should be offered to all patientswith TB, STI attendees and spouses of HIV-infected patients after
initial counselling. The current WHO Treatment Guidelines are notimplemented locally as not all patients are initiated on ART asrecommended. However, it is expected that implementing WHO2016 Guidelines would be be cost effective for the country in thelong run owing to the small number of diagnosed individuals. HIVload for treatment monitoring should also be made available andimplemented with the necessary resources. Sustainable linkage andfollow-up models are needed to prevent onward HIV transmissionand the emergence of a drug-resistant virus.
Resources for the diagnosis of opportunistic infections areinadequate in all hospitals and should be allocated in a sustainableway to prevent morbidity and mortality. Non-communicablediseases (NCD) care should be strengthened in this population.Furthermore, doctors in charge of HIV patients require ongoingtraining programmes to keep up with medical developments.
We believe that investing in prevention yields significant savingson treatment costs and will make the HIV programme affordableover the long term. If ART is scaled up without expanding andoptimising prevention coverage of KPs, new infections will continueto increase, treatment costs will spiral upwards, and the programmewill become financially unsustainable. As a result, to significantlyreduce new HIV infections we recommend the following:
• Scaling up both prevention among KPs and ART coverageamong PLHIV by using strategic approaches;
• Addressing HIV-TB co-infection, focusing on migrants;
• Implementing integrated interventions for clients of sexworkers and PWIDs;
• Providing information to vulnerable adolescents throughexisting services.
A separate consultation is also needed between NASP and theInternational Organization for Migration to draft an effective androbust policy on HIV for migrants. Educational programmes andsystematic VCT should be offered to all migrants, who amountto approximately 5 million individuals per year. A cost-effectivenessanalysis of the frequency of HIV testing in KPs and migrants shouldalso be carried out.
Acknowledgements
MKR, RP and SS are staff members of the World HealthOrganization. The authors alone are responsible for the views
9000
3674
2536
1193 538
n/a 0-
1000 2000 3000 4000 5000 6000 7000 8000 9000
10000
Num
ber o
f pe
ople
Estimated PLHIV
Diagnosed PLHIV
Enrolled in care
People on ART
Retained on ART after 12 months
Received viral load
test*
Suppressed viral
load**
* Cumulative retention on treatment after 12 months of initiation of ART** Number of patients initiating ART who are still on ART at 12 months and have VL of <1000copies/ml
Figure 1. Cascade for HIV treatment and care in Bangladesh. PLHIV: people living with HIV
Bangladesh 33
Journal of Virus Eradication 2016; 2 (Supplement 4): 32–34 REVIEW
expressed in this article and they do not necessarily represent thedecisions, policy or views of the World Health Organization.
References1. Islam MN. Strategy and significance of AIDS control programme in Bangladesh.
Bangladesh Med J 1991; 20: 1–3.
2. Government of the People‘s Republic of Bangladesh. Third National Strategic Planfor HIV and AIDS response 2011–2015. National AIDS/SD Programme (NASP)Directorate General of Health Services. Ministry of Health & Family Welfare.Available at: www.aidsdatahub.org/sites/default/files/documents/3rd_national
_strategic_plan_for_hiv_and_aids_response_(NSP)_2011_2015.pdf (accessedNovember 2016).
3. National AIDS/STD Programme (NASP). Assessment of impact of harm reductioninterventions among people who inject drugs (PWID) in Dhaka city. 2014. Dhaka,Bangladesh: Ministry of Health and Family Welfare, Directorate General of HealthServices, NASP. Available at: www.aidsdatahub.org/sites/default/files/publication/Assessment_of_impact_of_harm_reduction_interventions_among_PWID_in_Dhaka_city_2014.pdf (accessed November 2016).
4. Urmi AZ, Leung DT, Wilkinson V et al. Profile of an HIV testing and counselingunit in Bangladesh: majority of new diagnoses among returning migrant workersand spouses. PLoS One 2015; 10: e0141483.
REVIEW Journal of Virus Eradication 2016; 2 (Supplement 4): 32–34
34 MK Rezwan et al.
Epidemiology of HIV, programmatic progress and gaps in last10 years in Nepal
Tarun Paudel1, Nihal Singh2, Megha Raj Banjara3, Sambhu Prasad Kafle1, Yadu Chandra Ghimire1, Bhesh Raj Pokharel1,Bir Bahadur Rawal1, Komal Badal4, Madhav Chaulagain1, Razia Narayan Pendse5, Prakash Ghimire2*
1 National Centre for AIDS and STI Control, Department of Health Services, Ministry of Health, Government of Nepal2 Communicable Diseases, WHO Country Office for Nepal, Lalitpur, Nepal
3 Tribhuvan University, Central Department of Microbiology, Kathmandu, Nepal4 UNAIDS, Nepal
5 World Health Organization South East Asia Region, New Delhi, India
Abstract
Background and objectives: Nepal has made progress with the control of HIV infection in recent years. There havebeen changes in epidemiology, programme interventions in different population groups, and changes in policies overthe last 10 years, particularly in diagnosis and treatment. Therefore, this review was conducted to identify the effectivenessof different interventions/policies in different sub-populations at risk, targeted towards epidemiology and treatment outcomesfor those with HIV infection in Nepal.
Methods: This review was prepared based on a review of published and unpublished documents from the Nepalese HIVinfection control programme, published articles in different journals, different survey reports including integratedbio-behavioural surveillance (IBBS) survey reports.
Results: The prevalence of HIV infection among adults in 2014 was 0.20% with a progressive decreasing trend from2005. The prevalence of HIV infection among injecting drug users (51.7% in 2005 and 6.4% in 2015 in Kathmandu valley)was relatively high in all years as compared to other risk groups. HIV infection prevalence among women attending antenatalclinics was higher in the year 2006 (0.25%) but there was a decreasing trend in the following years to 2015, when prevalencewas 0.077%. Although different interventions were conducted to cover key populations at risk, the coverage in some riskpopulation was very low. HIV testing status among the general population was very low (7.5% among males and 2.9%among females) in 2011. Only one-third of HIV-infected individuals were on ART in 2015, although this proportion hasincreased since 2005. The share of domestic budget among the total expenditure on HIV control program is below 15%.
Conclusions: There is the need for implementation of control programmes more efficiently and effectively with expandinggeographical and population coverage. Surveillance systems should be strengthened to get up-to-date information forevidence-based planning and developing strategies. The domestic budget for HIV control programme should be increasedto improve their sustainability.
Keywords: epidemiology, HIV infection, control programmes, gaps, Nepal
IntroductionThe first case of HIV was reported in Nepal in 1988, thereafter,there was a trend for increasing numbers of infections beingrecorded among specific groups of the population and in thelow-risk general population for 20 years. However, numbers appearto be decreasing [1]. Although Nepal‘s HIV control programmehas achieved some progress in reducing the incidence of HIVinfections, it needs to be implemented effectively and efficientlyto achieve the targets set.
HIV in Nepal is characterised as a concentrated epidemic in specificgroups of the population, for example people who inject drugs(PWID), men who have sex with men (MSM) and female sexworkers (FSW) [2]. Male migrants who work particularly in India,where migrant labourers often visit female sex workers, areconsidered a bridging population that transfers infections to thegeneral population. Forty-eight per cent of Nepal‘s populationare between the age of 15 and 49 years, and are vulnerable foracquiring and transmitting HIV infection [2].
There is a commitment to ending the HIV epidemic globally by2030 [3]. The global health sector strategy on HIV 2016–2021has proposed the vision of zero new infections, zero new deathsand zero HIV-related discrimination in a world where people livingwith HIV are able to live long and healthy lives [4].
Nepal‘s National HIV/AIDS Strategy 2011–2016 has adoptedstrengthening of the Second Generation Surveillance (SGS) system[5]. However, before starting SGS, it is important to know thestatus and progress made in HIV/AIDS control so as to furtherstrengthen control programmes based on identified interventiongaps.
The epidemiology of HIV in Nepal has changed due to evolutionsin policies over the last 10 years, particularly in diagnosis andtreatment, and the various efforts to control HIV in the differentpopulation groups. Therefore, this review aims to improveknowledge on the effectiveness of the interventions/policies indifferent sub-populations at risk.
Methodology
This article was prepared by reviewing published and unpublisheddocuments from the Nepalese HIV control programme,published journal articles and various survey reports includingIBBS surveys. Medline and PubMed were searched for keypeer-reviewed literature published up to April 2016 forinformation on key affected populations as well as the generalpopulation.
Furthermore, the strategic information unit of the National Centrefor AIDS and STD Control (NCASC) was consulted for routineprogramme data on epidemiology and services on the currentstatus of HIV infections in different risk populations and controlefforts of the programme in Nepal.
*Corresponding author: Prakash Ghimire, WHO Country Office for Nepal,United Nations House, Pulchowk, Lalitpur, Kathmandu, PO Box No. 108,
NepalEmail: [email protected]; [email protected]
Journal of Virus Eradication 2016; 2 (Supplement 4): 35–40 REVIEW
© 2016 The Authors. Journal of Virus Eradication published by Mediscript LtdThis is an open access article published under the terms of a Creative Commons License. 35
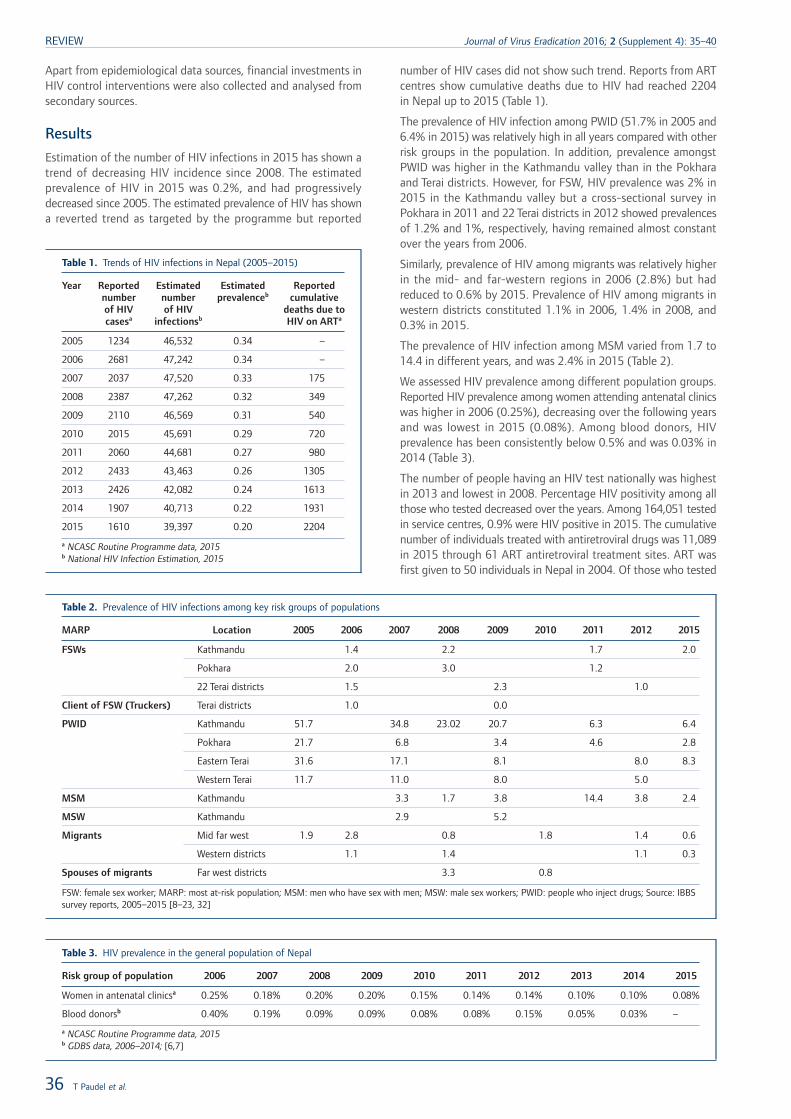
Apart from epidemiological data sources, financial investments inHIV control interventions were also collected and analysed fromsecondary sources.
Results
Estimation of the number of HIV infections in 2015 has shown atrend of decreasing HIV incidence since 2008. The estimatedprevalence of HIV in 2015 was 0.2%, and had progressivelydecreased since 2005. The estimated prevalence of HIV has showna reverted trend as targeted by the programme but reported
number of HIV cases did not show such trend. Reports from ARTcentres show cumulative deaths due to HIV had reached 2204in Nepal up to 2015 (Table 1).
The prevalence of HIV infection among PWID (51.7% in 2005 and6.4% in 2015) was relatively high in all years compared with otherrisk groups in the population. In addition, prevalence amongstPWID was higher in the Kathmandu valley than in the Pokharaand Terai districts. However, for FSW, HIV prevalence was 2% in2015 in the Kathmandu valley but a cross-sectional survey inPokhara in 2011 and 22 Terai districts in 2012 showed prevalencesof 1.2% and 1%, respectively, having remained almost constantover the years from 2006.
Similarly, prevalence of HIV among migrants was relatively higherin the mid- and far-western regions in 2006 (2.8%) but hadreduced to 0.6% by 2015. Prevalence of HIV among migrants inwestern districts constituted 1.1% in 2006, 1.4% in 2008, and0.3% in 2015.
The prevalence of HIV infection among MSM varied from 1.7 to14.4 in different years, and was 2.4% in 2015 (Table 2).
We assessed HIV prevalence among different population groups.Reported HIV prevalence among women attending antenatal clinicswas higher in 2006 (0.25%), decreasing over the following yearsand was lowest in 2015 (0.08%). Among blood donors, HIVprevalence has been consistently below 0.5% and was 0.03% in2014 (Table 3).
The number of people having an HIV test nationally was highestin 2013 and lowest in 2008. Percentage HIV positivity among allthose who tested decreased over the years. Among 164,051 testedin service centres, 0.9% were HIV positive in 2015. The cumulativenumber of individuals treated with antiretroviral drugs was 11,089in 2015 through 61 ART antiretroviral treatment sites. ART wasfirst given to 50 individuals in Nepal in 2004. Of those who tested
Table 1. Trends of HIV infections in Nepal (2005–2015)
Year Reportednumberof HIVcasesa
Estimatednumberof HIV
infectionsb
Estimatedprevalenceb
Reportedcumulative
deaths due toHIV on ARTa
2005 1234 46,532 0.34 –
2006 2681 47,242 0.34 –
2007 2037 47,520 0.33 175
2008 2387 47,262 0.32 349
2009 2110 46,569 0.31 540
2010 2015 45,691 0.29 720
2011 2060 44,681 0.27 980
2012 2433 43,463 0.26 1305
2013 2426 42,082 0.24 1613
2014 1907 40,713 0.22 1931
2015 1610 39,397 0.20 2204
a NCASC Routine Programme data, 2015b National HIV Infection Estimation, 2015
Table 2. Prevalence of HIV infections among key risk groups of populations
MARP Location 2005 2006 2007 2008 2009 2010 2011 2012 2015
FSWs Kathmandu 1.4 2.2 1.7 2.0
Pokhara 2.0 3.0 1.2
22 Terai districts 1.5 2.3 1.0
Client of FSW (Truckers) Terai districts 1.0 0.0
PWID Kathmandu 51.7 34.8 23.02 20.7 6.3 6.4
Pokhara 21.7 6.8 3.4 4.6 2.8
Eastern Terai 31.6 17.1 8.1 8.0 8.3
Western Terai 11.7 11.0 8.0 5.0
MSM Kathmandu 3.3 1.7 3.8 14.4 3.8 2.4
MSW Kathmandu 2.9 5.2
Migrants Mid far west 1.9 2.8 0.8 1.8 1.4 0.6
Western districts 1.1 1.4 1.1 0.3
Spouses of migrants Far west districts 3.3 0.8
FSW: female sex worker; MARP: most at-risk population; MSM: men who have sex with men; MSW: male sex workers; PWID: people who inject drugs; Source: IBBSsurvey reports, 2005–2015 [8–23, 32]
Table 3. HIV prevalence in the general population of Nepal
Risk group of population 2006 2007 2008 2009 2010 2011 2012 2013 2014 2015
Women in antenatal clinicsa 0.25% 0.18% 0.20% 0.20% 0.15% 0.14% 0.14% 0.10% 0.10% 0.08%
Blood donorsb 0.40% 0.19% 0.09% 0.09% 0.08% 0.08% 0.15% 0.05% 0.03% –
a NCASC Routine Programme data, 2015b GDBS data, 2006–2014; [6,7]
REVIEW Journal of Virus Eradication 2016; 2 (Supplement 4): 35–40
36 T Paudel et al.
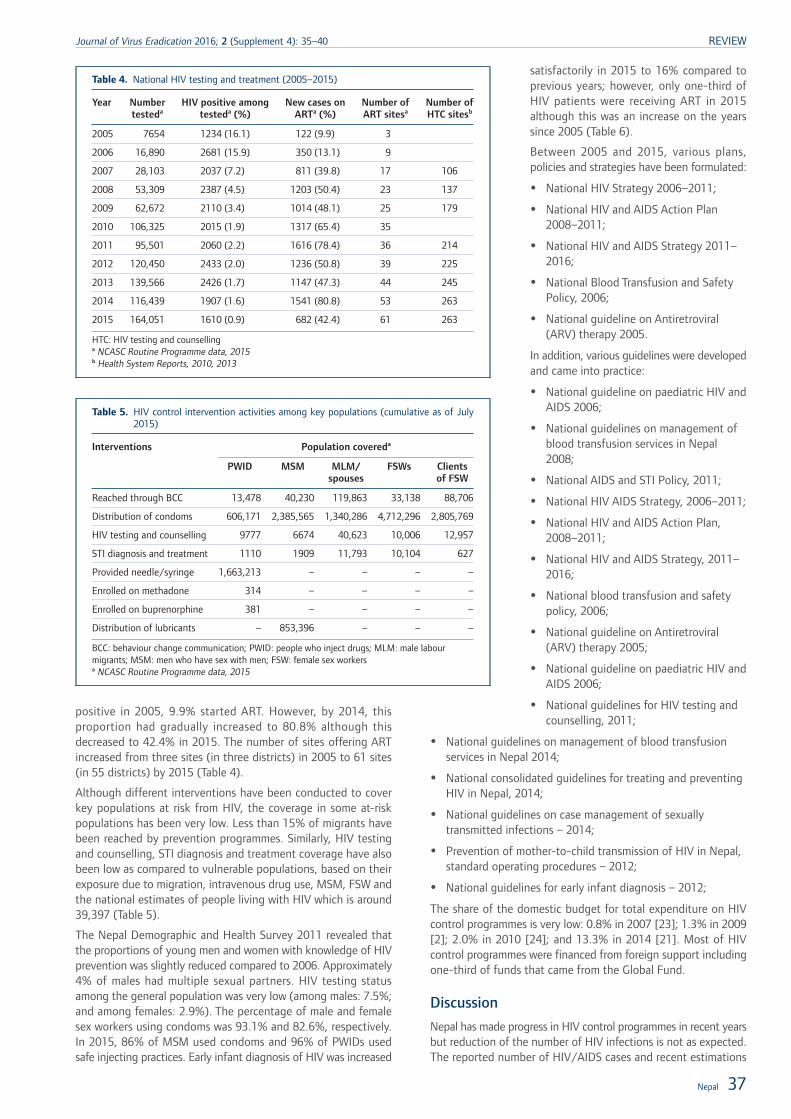
positive in 2005, 9.9% started ART. However, by 2014, thisproportion had gradually increased to 80.8% although thisdecreased to 42.4% in 2015. The number of sites offering ARTincreased from three sites (in three districts) in 2005 to 61 sites(in 55 districts) by 2015 (Table 4).
Although different interventions have been conducted to coverkey populations at risk from HIV, the coverage in some at-riskpopulations has been very low. Less than 15% of migrants havebeen reached by prevention programmes. Similarly, HIV testingand counselling, STI diagnosis and treatment coverage have alsobeen low as compared to vulnerable populations, based on theirexposure due to migration, intravenous drug use, MSM, FSW andthe national estimates of people living with HIV which is around39,397 (Table 5).
The Nepal Demographic and Health Survey 2011 revealed thatthe proportions of young men and women with knowledge of HIVprevention was slightly reduced compared to 2006. Approximately4% of males had multiple sexual partners. HIV testing statusamong the general population was very low (among males: 7.5%;and among females: 2.9%). The percentage of male and femalesex workers using condoms was 93.1% and 82.6%, respectively.In 2015, 86% of MSM used condoms and 96% of PWIDs usedsafe injecting practices. Early infant diagnosis of HIV was increased
satisfactorily in 2015 to 16% compared toprevious years; however, only one-third ofHIV patients were receiving ART in 2015although this was an increase on the yearssince 2005 (Table 6).
Between 2005 and 2015, various plans,policies and strategies have been formulated:
• National HIV Strategy 2006–2011;
• National HIV and AIDS Action Plan2008–2011;
• National HIV and AIDS Strategy 2011–2016;
• National Blood Transfusion and SafetyPolicy, 2006;
• National guideline on Antiretroviral(ARV) therapy 2005.
In addition, various guidelines were developedand came into practice:
• National guideline on paediatric HIV andAIDS 2006;
• National guidelines on management ofblood transfusion services in Nepal2008;
• National AIDS and STI Policy, 2011;
• National HIV AIDS Strategy, 2006–2011;
• National HIV and AIDS Action Plan,2008–2011;
• National HIV and AIDS Strategy, 2011–2016;
• National blood transfusion and safetypolicy, 2006;
• National guideline on Antiretroviral(ARV) therapy 2005;
• National guideline on paediatric HIV andAIDS 2006;
• National guidelines for HIV testing andcounselling, 2011;
• National guidelines on management of blood transfusionservices in Nepal 2014;
• National consolidated guidelines for treating and preventingHIV in Nepal, 2014;
• National guidelines on case management of sexuallytransmitted infections – 2014;
• Prevention of mother-to-child transmission of HIV in Nepal,standard operating procedures – 2012;
• National guidelines for early infant diagnosis – 2012;
The share of the domestic budget for total expenditure on HIVcontrol programmes is very low: 0.8% in 2007 [23]; 1.3% in 2009[2]; 2.0% in 2010 [24]; and 13.3% in 2014 [21]. Most of HIVcontrol programmes were financed from foreign support includingone-third of funds that came from the Global Fund.
Discussion
Nepal has made progress in HIV control programmes in recent yearsbut reduction of the number of HIV infections is not as expected.The reported number of HIV/AIDS cases and recent estimations
Table 4. National HIV testing and treatment (2005–2015)
Year Numbertesteda
HIV positive amongtesteda (%)
New cases onARTa (%)
Number ofART sitesa
Number ofHTC sitesb
2005 7654 1234 (16.1) 122 (9.9) 3
2006 16,890 2681 (15.9) 350 (13.1) 9
2007 28,103 2037 (7.2) 811 (39.8) 17 106
2008 53,309 2387 (4.5) 1203 (50.4) 23 137
2009 62,672 2110 (3.4) 1014 (48.1) 25 179
2010 106,325 2015 (1.9) 1317 (65.4) 35
2011 95,501 2060 (2.2) 1616 (78.4) 36 214
2012 120,450 2433 (2.0) 1236 (50.8) 39 225
2013 139,566 2426 (1.7) 1147 (47.3) 44 245
2014 116,439 1907 (1.6) 1541 (80.8) 53 263
2015 164,051 1610 (0.9) 682 (42.4) 61 263
HTC: HIV testing and counsellinga NCASC Routine Programme data, 2015b Health System Reports, 2010, 2013
Table 5. HIV control intervention activities among key populations (cumulative as of July2015)
Interventions Population covereda
PWID MSM MLM/spouses
FSWs Clientsof FSW
Reached through BCC 13,478 40,230 119,863 33,138 88,706
Distribution of condoms 606,171 2,385,565 1,340,286 4,712,296 2,805,769
HIV testing and counselling 9777 6674 40,623 10,006 12,957
STI diagnosis and treatment 1110 1909 11,793 10,104 627
Provided needle/syringe 1,663,213 – – – –
Enrolled on methadone 314 – – – –
Enrolled on buprenorphine 381 – – – –
Distribution of lubricants – 853,396 – – –
BCC: behaviour change communication; PWID: people who inject drugs; MLM: male labourmigrants; MSM: men who have sex with men; FSW: female sex workersa NCASC Routine Programme data, 2015
Nepal 37
Journal of Virus Eradication 2016; 2 (Supplement 4): 35–40 REVIEW
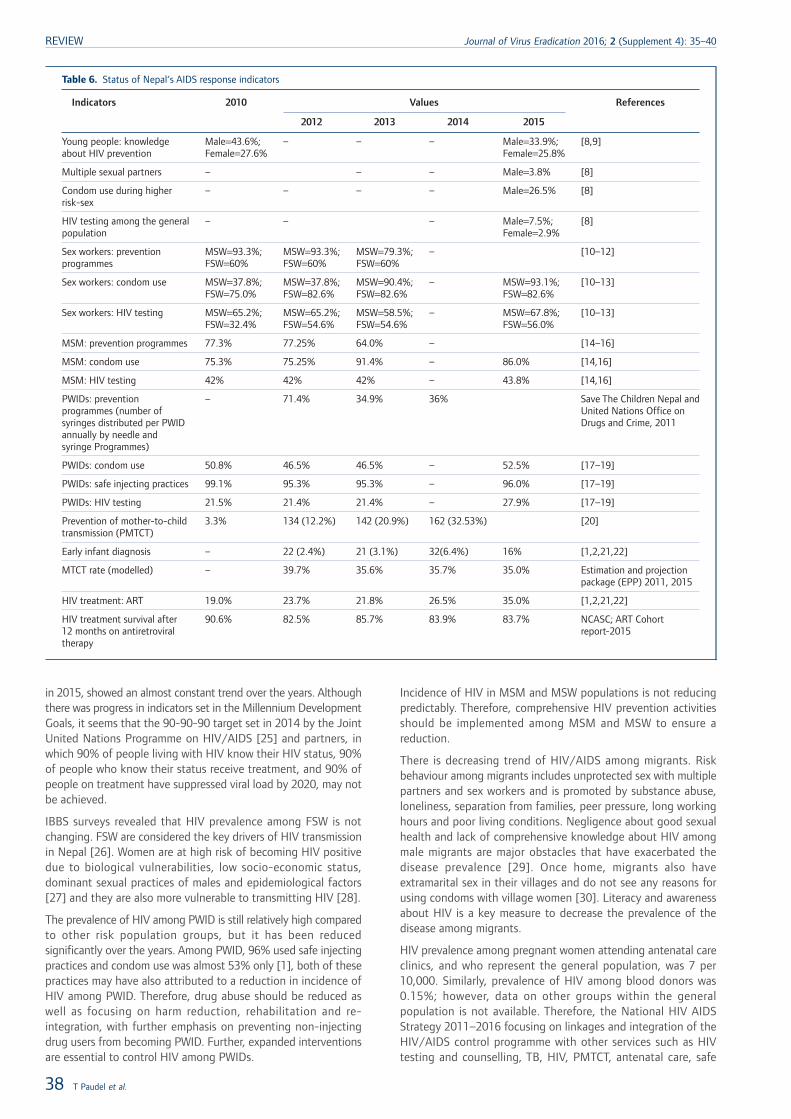
in 2015, showed an almost constant trend over the years. Althoughthere was progress in indicators set in the Millennium DevelopmentGoals, it seems that the 90-90-90 target set in 2014 by the JointUnited Nations Programme on HIV/AIDS [25] and partners, inwhich 90% of people living with HIV know their HIV status, 90%of people who know their status receive treatment, and 90% ofpeople on treatment have suppressed viral load by 2020, may notbe achieved.
IBBS surveys revealed that HIV prevalence among FSW is notchanging. FSW are considered the key drivers of HIV transmissionin Nepal [26]. Women are at high risk of becoming HIV positivedue to biological vulnerabilities, low socio-economic status,dominant sexual practices of males and epidemiological factors[27] and they are also more vulnerable to transmitting HIV [28].
The prevalence of HIV among PWID is still relatively high comparedto other risk population groups, but it has been reducedsignificantly over the years. Among PWID, 96% used safe injectingpractices and condom use was almost 53% only [1], both of thesepractices may have also attributed to a reduction in incidence ofHIV among PWID. Therefore, drug abuse should be reduced aswell as focusing on harm reduction, rehabilitation and re-integration, with further emphasis on preventing non-injectingdrug users from becoming PWID. Further, expanded interventionsare essential to control HIV among PWIDs.
Incidence of HIV in MSM and MSW populations is not reducingpredictably. Therefore, comprehensive HIV prevention activitiesshould be implemented among MSM and MSW to ensure areduction.
There is decreasing trend of HIV/AIDS among migrants. Riskbehaviour among migrants includes unprotected sex with multiplepartners and sex workers and is promoted by substance abuse,loneliness, separation from families, peer pressure, long workinghours and poor living conditions. Negligence about good sexualhealth and lack of comprehensive knowledge about HIV amongmale migrants are major obstacles that have exacerbated thedisease prevalence [29]. Once home, migrants also haveextramarital sex in their villages and do not see any reasons forusing condoms with village women [30]. Literacy and awarenessabout HIV is a key measure to decrease the prevalence of thedisease among migrants.
HIV prevalence among pregnant women attending antenatal careclinics, and who represent the general population, was 7 per10,000. Similarly, prevalence of HIV among blood donors was0.15%; however, data on other groups within the generalpopulation is not available. Therefore, the National HIV AIDSStrategy 2011–2016 focusing on linkages and integration of theHIV/AIDS control programme with other services such as HIVtesting and counselling, TB, HIV, PMTCT, antenatal care, safe
Table 6. Status of Nepal‘s AIDS response indicators
Indicators 2010 Values References
2012 2013 2014 2015
Young people: knowledgeabout HIV prevention
Male=43.6%;Female=27.6%
– – – Male=33.9%;Female=25.8%
[8,9]
Multiple sexual partners – – – Male=3.8% [8]
Condom use during higherrisk-sex
– – – – Male=26.5% [8]
HIV testing among the generalpopulation
– – – Male=7.5%;Female=2.9%
[8]
Sex workers: preventionprogrammes
MSW=93.3%;FSW=60%
MSW=93.3%;FSW=60%
MSW=79.3%;FSW=60%
– [10–12]
Sex workers: condom use MSW=37.8%;FSW=75.0%
MSW=37.8%;FSW=82.6%
MSW=90.4%;FSW=82.6%
– MSW=93.1%;FSW=82.6%
[10–13]
Sex workers: HIV testing MSW=65.2%;FSW=32.4%
MSW=65.2%;FSW=54.6%
MSW=58.5%;FSW=54.6%
– MSW=67.8%;FSW=56.0%
[10–13]
MSM: prevention programmes 77.3% 77.25% 64.0% – [14–16]
MSM: condom use 75.3% 75.25% 91.4% – 86.0% [14,16]
MSM: HIV testing 42% 42% 42% – 43.8% [14,16]
PWIDs: preventionprogrammes (number ofsyringes distributed per PWIDannually by needle andsyringe Programmes)
– 71.4% 34.9% 36% Save The Children Nepal andUnited Nations Office onDrugs and Crime, 2011
PWIDs: condom use 50.8% 46.5% 46.5% – 52.5% [17–19]
PWIDs: safe injecting practices 99.1% 95.3% 95.3% – 96.0% [17–19]
PWIDs: HIV testing 21.5% 21.4% 21.4% – 27.9% [17–19]
Prevention of mother-to-childtransmission (PMTCT)
3.3% 134 (12.2%) 142 (20.9%) 162 (32.53%) [20]
Early infant diagnosis – 22 (2.4%) 21 (3.1%) 32(6.4%) 16% [1,2,21,22]
MTCT rate (modelled) – 39.7% 35.6% 35.7% 35.0% Estimation and projectionpackage (EPP) 2011, 2015
HIV treatment: ART 19.0% 23.7% 21.8% 26.5% 35.0% [1,2,21,22]
HIV treatment survival after12 months on antiretroviraltherapy
90.6% 82.5% 85.7% 83.9% 83.7% NCASC; ART Cohortreport-2015
REVIEW Journal of Virus Eradication 2016; 2 (Supplement 4): 35–40
38 T Paudel et al.
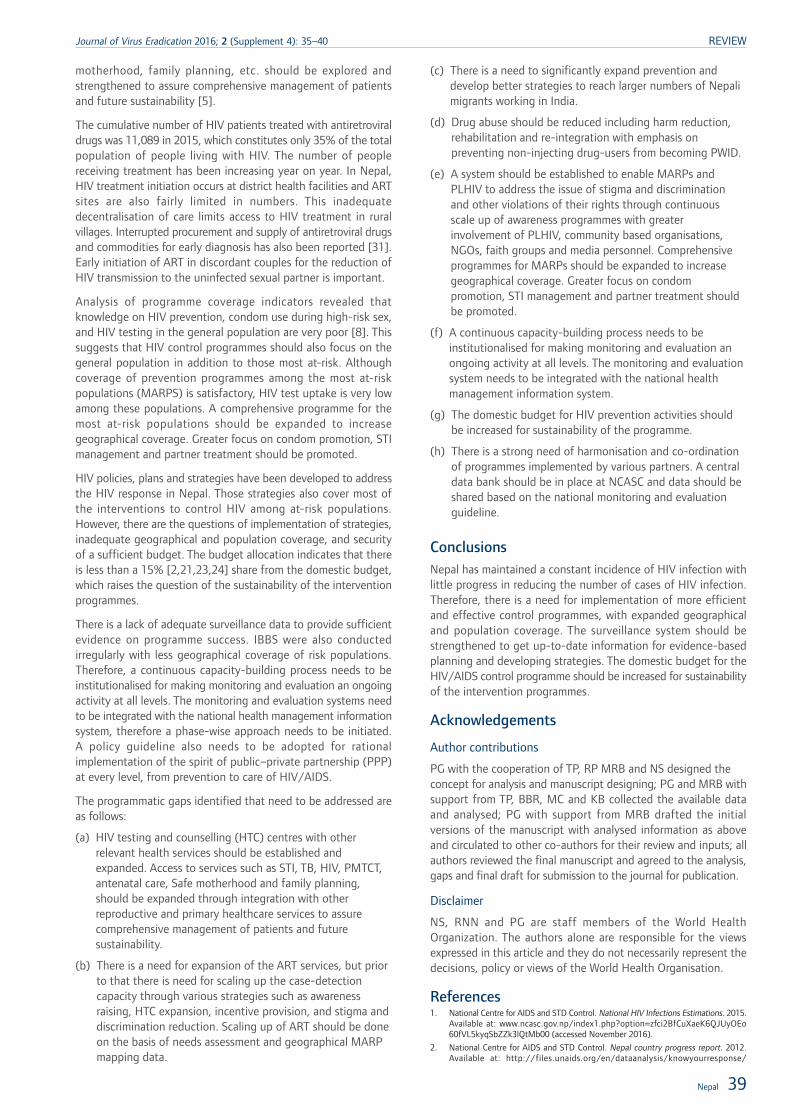
motherhood, family planning, etc. should be explored andstrengthened to assure comprehensive management of patientsand future sustainability [5].
The cumulative number of HIV patients treated with antiretroviraldrugs was 11,089 in 2015, which constitutes only 35% of the totalpopulation of people living with HIV. The number of peoplereceiving treatment has been increasing year on year. In Nepal,HIV treatment initiation occurs at district health facilities and ARTsites are also fairly limited in numbers. This inadequatedecentralisation of care limits access to HIV treatment in ruralvillages. Interrupted procurement and supply of antiretroviral drugsand commodities for early diagnosis has also been reported [31].Early initiation of ART in discordant couples for the reduction ofHIV transmission to the uninfected sexual partner is important.
Analysis of programme coverage indicators revealed thatknowledge on HIV prevention, condom use during high-risk sex,and HIV testing in the general population are very poor [8]. Thissuggests that HIV control programmes should also focus on thegeneral population in addition to those most at-risk. Althoughcoverage of prevention programmes among the most at-riskpopulations (MARPS) is satisfactory, HIV test uptake is very lowamong these populations. A comprehensive programme for themost at-risk populations should be expanded to increasegeographical coverage. Greater focus on condom promotion, STImanagement and partner treatment should be promoted.
HIV policies, plans and strategies have been developed to addressthe HIV response in Nepal. Those strategies also cover most ofthe interventions to control HIV among at-risk populations.However, there are the questions of implementation of strategies,inadequate geographical and population coverage, and securityof a sufficient budget. The budget allocation indicates that thereis less than a 15% [2,21,23,24] share from the domestic budget,which raises the question of the sustainability of the interventionprogrammes.
There is a lack of adequate surveillance data to provide sufficientevidence on programme success. IBBS were also conductedirregularly with less geographical coverage of risk populations.Therefore, a continuous capacity-building process needs to beinstitutionalised for making monitoring and evaluation an ongoingactivity at all levels. The monitoring and evaluation systems needto be integrated with the national health management informationsystem, therefore a phase-wise approach needs to be initiated.A policy guideline also needs to be adopted for rationalimplementation of the spirit of public–private partnership (PPP)at every level, from prevention to care of HIV/AIDS.
The programmatic gaps identified that need to be addressed areas follows:
(a) HIV testing and counselling (HTC) centres with otherrelevant health services should be established andexpanded. Access to services such as STI, TB, HIV, PMTCT,antenatal care, Safe motherhood and family planning,should be expanded through integration with otherreproductive and primary healthcare services to assurecomprehensive management of patients and futuresustainability.
(b) There is a need for expansion of the ART services, but priorto that there is need for scaling up the case-detectioncapacity through various strategies such as awarenessraising, HTC expansion, incentive provision, and stigma anddiscrimination reduction. Scaling up of ART should be doneon the basis of needs assessment and geographical MARPmapping data.
(c) There is a need to significantly expand prevention anddevelop better strategies to reach larger numbers of Nepalimigrants working in India.
(d) Drug abuse should be reduced including harm reduction,rehabilitation and re-integration with emphasis onpreventing non-injecting drug-users from becoming PWID.
(e) A system should be established to enable MARPs andPLHIV to address the issue of stigma and discriminationand other violations of their rights through continuousscale up of awareness programmes with greaterinvolvement of PLHIV, community based organisations,NGOs, faith groups and media personnel. Comprehensiveprogrammes for MARPs should be expanded to increasegeographical coverage. Greater focus on condompromotion, STI management and partner treatment shouldbe promoted.
(f) A continuous capacity-building process needs to beinstitutionalised for making monitoring and evaluation anongoing activity at all levels. The monitoring and evaluationsystem needs to be integrated with the national healthmanagement information system.
(g) The domestic budget for HIV prevention activities shouldbe increased for sustainability of the programme.
(h) There is a strong need of harmonisation and co-ordinationof programmes implemented by various partners. A centraldata bank should be in place at NCASC and data should beshared based on the national monitoring and evaluationguideline.
ConclusionsNepal has maintained a constant incidence of HIV infection withlittle progress in reducing the number of cases of HIV infection.Therefore, there is a need for implementation of more efficientand effective control programmes, with expanded geographicaland population coverage. The surveillance system should bestrengthened to get up-to-date information for evidence-basedplanning and developing strategies. The domestic budget for theHIV/AIDS control programme should be increased for sustainabilityof the intervention programmes.
Acknowledgements
Author contributions
PG with the cooperation of TP, RP MRB and NS designed theconcept for analysis and manuscript designing; PG and MRB withsupport from TP, BBR, MC and KB collected the available dataand analysed; PG with support from MRB drafted the initialversions of the manuscript with analysed information as aboveand circulated to other co-authors for their review and inputs; allauthors reviewed the final manuscript and agreed to the analysis,gaps and final draft for submission to the journal for publication.
Disclaimer
NS, RNN and PG are staff members of the World HealthOrganization. The authors alone are responsible for the viewsexpressed in this article and they do not necessarily represent thedecisions, policy or views of the World Health Organisation.
References1. National Centre for AIDS and STD Control. National HIV Infections Estimations. 2015.
Available at: www.ncasc.gov.np/index1.php?option=zfci2BfCuXaeK6QJUyOEo60fVL5kyqSbZZk3lQtMb00 (accessed November 2016).
2. National Centre for AIDS and STD Control. Nepal country progress report. 2012.Available at: http://files.unaids.org/en/dataanalysis/knowyourresponse/
Nepal 39
Journal of Virus Eradication 2016; 2 (Supplement 4): 35–40 REVIEW
countryprogressreports/2012countries/ce_NP_Narrative_Report.pdf (accessedNovember 2016).
3. United Nations General Assembly. Political declaration on HIV and AIDS: on thefast-track to accelerate the fight against HIV and to end the AIDS epidemic by 2030.2016. Available at: www.unaids.org/en/resources/documents/2016/2016-political-declaration-HIV-AIDS (accessed November 2016).
4. WHO. Global Health Sector Strategy on HIV 2016–2021. Geneva: 2015. Availableat: www.who.int/hiv/strategy2016-2021/en/ (accessed November 2016).
5. National Centre for AIDS and STD Control. National HIV/AIDS Strategy (2011–2016)Nepal. 2011.
6. Kandel SR, Ghimire P, Tiwari BR, Rajkarnikar M (2013). HIV and Hepatitis Bseroprevalence among the Nepalese blood donors. Journal of Pathology of Nepal3: 383–386.
7. Karki S, Ghimire P, Tiwari BR, Shrestha AC, Gautam A, Rajkarnikar M (2009).Seroprevalence of HIV and hepatitis C co-infection among blood donors inKathmandu valley, Nepal. Southeast Asian J Trop Med Public Health 40(1): 66–70.
8. Ministry of Health and Population. Nepal Demographic and Health Survey. 2011.Available at: http://dhsprogram.com/pubs/pdf/FR257/FR257%5B13April2012%5D.pdf (accessed November 2016).
9. Ministry of Health and Population. Nepal Demographic and Health Survey. 2006.Available at: http://dhsprogram.com/pubs/pdf/fr191/fr191.pdf (accessed November2016).
10. National Centre for AIDS and STD Control, ASHA Project. Integrated biological andbehavioural surveillance survey (IBBS) among female sex workers in Kathmandu valley,Nepal. 2011. Available at: www.aidsdatahub.org/sites/default/files/documents/IBBS_2011_IDU_Kathmandu.pdf (accessed November 2016).
11. National Centre for AIDS and STD Control, ASHA Project. Integrated biological andbehavioural surveillance survey (IBBS) among female sex workers in Pokhara valley,Nepal. 2011. Available at: www.ncasc.gov.np/uploaded/publication/Reports/IBBS/IDUs/IBBS_IDUs_Pokhara_Final_Report_2011.pdf. (accessed November 2016).
12. FHI 360. Integrated biological and behavioural surveillance survey (IBBS) amongfemale sex workers in 22 terai highway districts of Nepal. 2009. Available at:www.fhi360.org/sites/default/files/media/documents/Integrated%20Biological%20and%20Behavioral%20Surveillance%20Survey%20(IBBS)%20among%20Female%20Sex%20Workers%20in%2022%20Terai%20Highway%20Districts%20of%20Nepal%20(July%202009).pdf (accessed November 2016).
13. National Centre for AIDS and STD Control. Integrated biological and behavioralsurveillance survey (IBBS) female sex workers (FSW) in Kathmandu Valley, Round5. 2015. Available at: www.aidsdatahub.org/integrated-biological-and-behavioral-surveillance-ibbs-survey-female-sex-workers-fsw-kathmandu (accessed November2016).
14. FHI 360, Project A. Integrated biological and behavioral surveillance survey (IBBS)among men who have sex with Men (MSM) in the Kathmandu Valley. 2009. Availableat: https://www.fhi360.org/sites/default/files/media/documents/Integrated%20Biological%20and%20Behavioral%20Surveillance%20Survey%20(IBBS)%20among%20Men%20who%20have%20Sex%20with%20Men%20(MSM)%20in%20the%20Kathmandu%20Valley%20(Round%20III%202009).pdf (accessed November2016).
15. National Centre for AIDS and STD Control. Integrated biological and behavioralsurveillance survey (IBBS) among men who have sex with men (MSM) andtransgender (TG) people in Kathmandu Valley, Nepal. 2012. Available at:www.aidsdatahub.org/sites/default/files/publication/2012_IBBS_MSM_TG_Kathmandu_Report_Nov_11_2013.pdf (accessed November 2016).
16. National Centre for AIDS and STD Control. Integrated biological and behavioralsurveillance survey (IBBS) among men who have sex with men (MSM & Transgender(TG) people in Kathmandu Valley. 2015. Available at: http://www.aidsdatahub.org/sites/default/files/publication/Nepal_IBBS_Full_Report_MSMTG_Kathmandu_Rd5_2015.pdf (accessed November 2016).
17. ASHA Project, FHI 360. Integrated biological and behavioural surveillance survey(IBBS) among injecting drug users in Kathmandu valley, Nepal. Round IV. 2009.
Available at: https://www.fhi360.org/sites/default/files/media/documents/Integrated%20Biological%20and%20Behavioral%20Surveillance%20Survey%20(IBBS)%20among%20Injecting%20Drug%20Users%20in%20Kathmandu%20Valley%20(Round%20IV%202009).pdf (accessed November 2016).
18. National Centre for AIDS and STI Control, ASHA. Integrated biological and behaviouralsurveillance survey (IBBS) among injecting drug users in Pokhara valley, Nepal. 2011.Available at: www.ncasc.gov.np/uploaded/publication/Reports/IBBS/IDUs/IBBS_IDUs_Pokhara_Final_Report_2011.pdf (accessed November 2016).
19. National Centre for AIDS and STD Control, New Era, FHI 360. Integrated biologicaland behavioural surveillance survey among male injecting drug users (IDU) in Westernto Far western terai of Nepal. 2009. Available at: https://www.fhi360.org/sites/default/files/media/documents/Integrated%20Biological%20and%20Behavioral%20Surveillance%20Survey%20(IBBS)%20among%20Male%20Injecting%20Drug%20Users%20(IDUs)%20in%20Western%20to%20Far-Western%20Terai%20of%20Nepal%20(Round%20III%202009).pdf (accessed November 2016).
20. NCASC monthly PMTCT report. Available at: http://www.ncasc.gov.np/(accessedNovember 2016).
21. National Centre for AIDS and STD Control. Country Progress Report on the HIV/AIDSResponse, Nepal. 2014. Available at: http://files.unaids.org/en/dataanalysis/knowyourresponse/countryprogressreports/2014countries/NPL_narrative_report_2014.pdf (accessed November 2016).
22. NCASC 2015- Country progress report-Nepal. Available at http://www.unaids.org/sites/default/files/country/documents/NPLnarativereport2015.pdf.
23. New Era, SACTS, National Centre for AIDS and STD Control. Integrated biologicaland behavioral surveillance survey among wives of migrant laborers in four districtsof Far Western Region of Nepal. 2008. Available at: https://www.fhi360.org/sites/default/files/media/documents/Integrated%20Biological%20and%20Behavioral%20Surveillance%20Survey%20among%20Wives%20of%20Migrant%20Laborers%20in%20Four%20Districts%20of%20Far-Western%20Region%20of%20Nepal%20(Round%20I%20June–September%202008).pdf (accessed November2016).
24. Roos J, Gleason GR, Poudyal PR, Dixit S. DFID support to the national HIV/AIDSprogramme in Nepal 2005–2010. Evaluation report. 2011.
25. UNAIDS. 90–90–90: An ambitious treatment target to help end the aids epidemic.2014. Available at: http://www.unaids.org/en/resources/documents/2014/90-90-90(accessed November 2016).
26. Paudel V, Baral KP. Women living with HIV/AIDS (WLHA), battling stigma,discrimination and denial and the role of support groups as a coping strategy: areview of literature. Reprod Health 2015; 12: 53.
27. Bandewar SV, Bharat S, Kongelf A et al. Considering risk contexts in explaining theparadoxical HIV increase among female sex workers in Mumbai and Thane, India.BMC public health 2016; 16: 85.
28. Yang Y, Lewis FM, D W. Culturally embedded risk factors for Cambodian husband–wifeHIV transmission: from women‘s point of view. J Nurs Scholarsh 2016; 48: 154–162.
29. Awasthi KR, Adefemi K, Tamrakar M. HIV/AIDS: A Persistent Health Issue for Womenand Children in Mid and Far Western Nepal. Kathmandu Univ Med J (KUMJ) 2015;13: 88–93.
30. Poudel KC, Jimba M, Okumura J et al. Migrants’ risky sexual behaviours in Indiaand at home in far western Nepal. Trop Med Int Health 2004; 9: 897–903.
31. Kisesa A, Chamla D. Getting to 90-90-90 targets for children and adolescents HIVin low and concentrated epidemics: bottlenecks, opportunities, and solutions. CurrOpin HIV AIDS 2016; 11 Suppl 1: S1–5.
32. ASHA, FHI 360. Integrated Biological and Behavioral Surveillance Survey (IBBS)among Male Injecting Drug Users (IDUs) in the Eastern Terai of Nepal. 2009. Availableat: https://www.fhi360.org/sites/default/files/media/documents/Integrated%20Biological%20and%20Behavioral%20Surveillance%20Survey%20(IBBS)%20among%20Male%20Injecting%20Drug%20Users%20(IDUs)%20in%20the%20Eastern%20Terai%20of%20Nepal%20(Round%20IV%202009).pdf (accessedNovember 2016).
REVIEW Journal of Virus Eradication 2016; 2 (Supplement 4): 35–40
40 T Paudel et al.
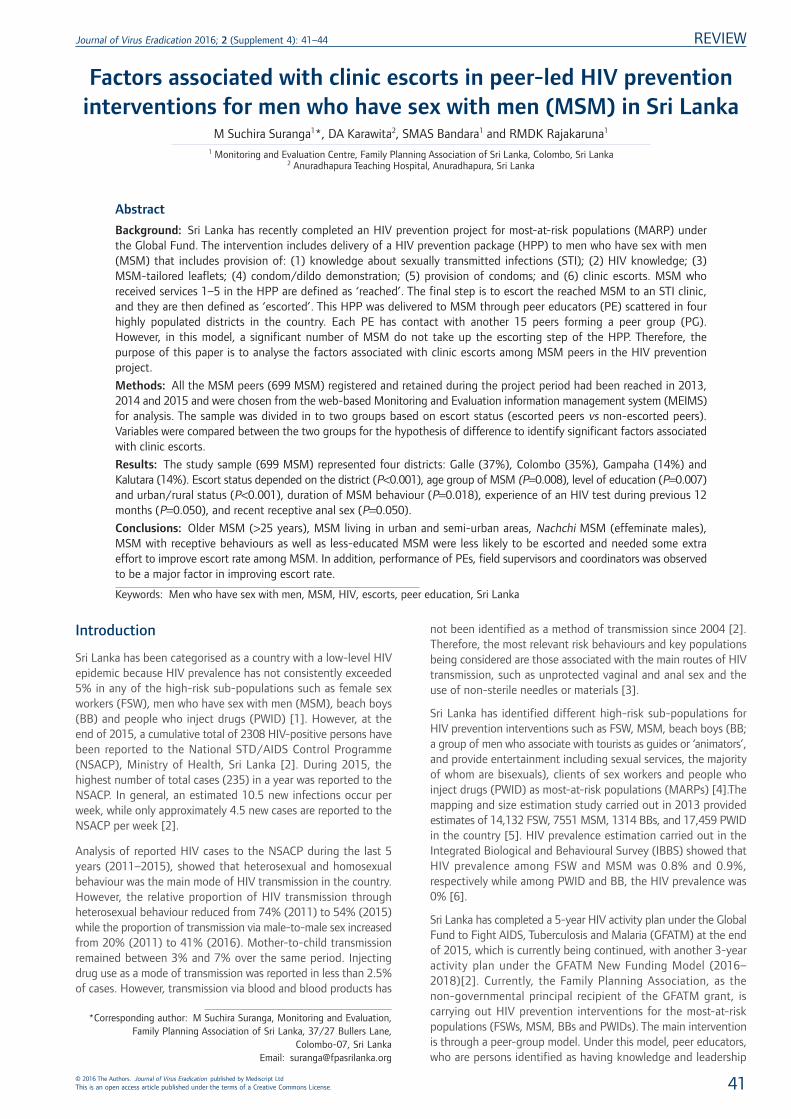
Factors associated with clinic escorts in peer-led HIV preventioninterventions for men who have sex with men (MSM) in Sri Lanka
M Suchira Suranga1*, DA Karawita2, SMAS Bandara1 and RMDK Rajakaruna1
1 Monitoring and Evaluation Centre, Family Planning Association of Sri Lanka, Colombo, Sri Lanka2 Anuradhapura Teaching Hospital, Anuradhapura, Sri Lanka
Abstract
Background: Sri Lanka has recently completed an HIV prevention project for most-at-risk populations (MARP) underthe Global Fund. The intervention includes delivery of a HIV prevention package (HPP) to men who have sex with men(MSM) that includes provision of: (1) knowledge about sexually transmitted infections (STI); (2) HIV knowledge; (3)MSM-tailored leaflets; (4) condom/dildo demonstration; (5) provision of condoms; and (6) clinic escorts. MSM whoreceived services 1–5 in the HPP are defined as ‘reached’. The final step is to escort the reached MSM to an STI clinic,and they are then defined as ‘escorted’. This HPP was delivered to MSM through peer educators (PE) scattered in fourhighly populated districts in the country. Each PE has contact with another 15 peers forming a peer group (PG).However, in this model, a significant number of MSM do not take up the escorting step of the HPP. Therefore, thepurpose of this paper is to analyse the factors associated with clinic escorts among MSM peers in the HIV preventionproject.
Methods: All the MSM peers (699 MSM) registered and retained during the project period had been reached in 2013,2014 and 2015 and were chosen from the web-based Monitoring and Evaluation information management system (MEIMS)for analysis. The sample was divided in to two groups based on escort status (escorted peers vs non-escorted peers).Variables were compared between the two groups for the hypothesis of difference to identify significant factors associatedwith clinic escorts.
Results: The study sample (699 MSM) represented four districts: Galle (37%), Colombo (35%), Gampaha (14%) andKalutara (14%). Escort status depended on the district (P<0.001), age group of MSM (P=0.008), level of education (P=0.007)and urban/rural status (P<0.001), duration of MSM behaviour (P=0.018), experience of an HIV test during previous 12months (P=0.050), and recent receptive anal sex (P=0.050).
Conclusions: Older MSM (>25 years), MSM living in urban and semi-urban areas, Nachchi MSM (effeminate males),MSM with receptive behaviours as well as less-educated MSM were less likely to be escorted and needed some extraeffort to improve escort rate among MSM. In addition, performance of PEs, field supervisors and coordinators was observedto be a major factor in improving escort rate.
Keywords: Men who have sex with men, MSM, HIV, escorts, peer education, Sri Lanka
Introduction
Sri Lanka has been categorised as a country with a low-level HIVepidemic because HIV prevalence has not consistently exceeded5% in any of the high-risk sub-populations such as female sexworkers (FSW), men who have sex with men (MSM), beach boys(BB) and people who inject drugs (PWID) [1]. However, at theend of 2015, a cumulative total of 2308 HIV-positive persons havebeen reported to the National STD/AIDS Control Programme(NSACP), Ministry of Health, Sri Lanka [2]. During 2015, thehighest number of total cases (235) in a year was reported to theNSACP. In general, an estimated 10.5 new infections occur perweek, while only approximately 4.5 new cases are reported to theNSACP per week [2].
Analysis of reported HIV cases to the NSACP during the last 5years (2011–2015), showed that heterosexual and homosexualbehaviour was the main mode of HIV transmission in the country.However, the relative proportion of HIV transmission throughheterosexual behaviour reduced from 74% (2011) to 54% (2015)while the proportion of transmission via male-to-male sex increasedfrom 20% (2011) to 41% (2016). Mother-to-child transmissionremained between 3% and 7% over the same period. Injectingdrug use as a mode of transmission was reported in less than 2.5%of cases. However, transmission via blood and blood products has
not been identified as a method of transmission since 2004 [2].Therefore, the most relevant risk behaviours and key populationsbeing considered are those associated with the main routes of HIVtransmission, such as unprotected vaginal and anal sex and theuse of non-sterile needles or materials [3].
Sri Lanka has identified different high-risk sub-populations forHIV prevention interventions such as FSW, MSM, beach boys (BB;a group of men who associate with tourists as guides or ‘animators’,and provide entertainment including sexual services, the majorityof whom are bisexuals), clients of sex workers and people whoinject drugs (PWID) as most-at-risk populations (MARPs) [4].Themapping and size estimation study carried out in 2013 providedestimates of 14,132 FSW, 7551 MSM, 1314 BBs, and 17,459 PWIDin the country [5]. HIV prevalence estimation carried out in theIntegrated Biological and Behavioural Survey (IBBS) showed thatHIV prevalence among FSW and MSM was 0.8% and 0.9%,respectively while among PWID and BB, the HIV prevalence was0% [6].
Sri Lanka has completed a 5-year HIV activity plan under the GlobalFund to Fight AIDS, Tuberculosis and Malaria (GFATM) at the endof 2015, which is currently being continued, with another 3-yearactivity plan under the GFATM New Funding Model (2016–2018)[2]. Currently, the Family Planning Association, as thenon-governmental principal recipient of the GFATM grant, iscarrying out HIV prevention interventions for the most-at-riskpopulations (FSWs, MSM, BBs and PWIDs). The main interventionis through a peer-group model. Under this model, peer educators,who are persons identified as having knowledge and leadership
*Corresponding author: M Suchira Suranga, Monitoring and Evaluation,Family Planning Association of Sri Lanka, 37/27 Bullers Lane,
Colombo-07, Sri LankaEmail: [email protected]
Journal of Virus Eradication 2016; 2 (Supplement 4): 41–44 REVIEW
© 2016 The Authors. Journal of Virus Eradication published by Mediscript LtdThis is an open access article published under the terms of a Creative Commons License. 41
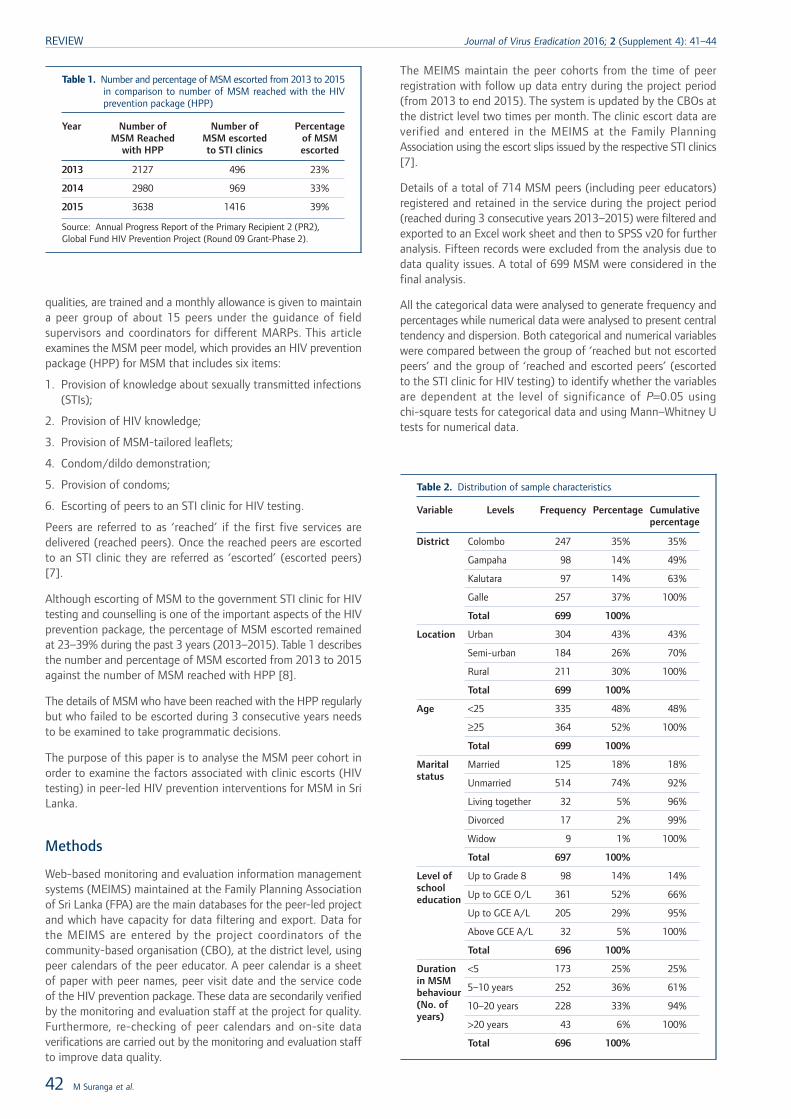
qualities, are trained and a monthly allowance is given to maintaina peer group of about 15 peers under the guidance of fieldsupervisors and coordinators for different MARPs. This articleexamines the MSM peer model, which provides an HIV preventionpackage (HPP) for MSM that includes six items:
1. Provision of knowledge about sexually transmitted infections(STIs);
2. Provision of HIV knowledge;
3. Provision of MSM-tailored leaflets;
4. Condom/dildo demonstration;
5. Provision of condoms;
6. Escorting of peers to an STI clinic for HIV testing.
Peers are referred to as ‘reached’ if the first five services aredelivered (reached peers). Once the reached peers are escortedto an STI clinic they are referred as ‘escorted’ (escorted peers)[7].
Although escorting of MSM to the government STI clinic for HIVtesting and counselling is one of the important aspects of the HIVprevention package, the percentage of MSM escorted remainedat 23–39% during the past 3 years (2013–2015). Table 1 describesthe number and percentage of MSM escorted from 2013 to 2015against the number of MSM reached with HPP [8].
The details of MSM who have been reached with the HPP regularlybut who failed to be escorted during 3 consecutive years needsto be examined to take programmatic decisions.
The purpose of this paper is to analyse the MSM peer cohort inorder to examine the factors associated with clinic escorts (HIVtesting) in peer-led HIV prevention interventions for MSM in SriLanka.
Methods
Web-based monitoring and evaluation information managementsystems (MEIMS) maintained at the Family Planning Associationof Sri Lanka (FPA) are the main databases for the peer-led projectand which have capacity for data filtering and export. Data forthe MEIMS are entered by the project coordinators of thecommunity-based organisation (CBO), at the district level, usingpeer calendars of the peer educator. A peer calendar is a sheetof paper with peer names, peer visit date and the service codeof the HIV prevention package. These data are secondarily verifiedby the monitoring and evaluation staff at the project for quality.Furthermore, re-checking of peer calendars and on-site dataverifications are carried out by the monitoring and evaluation staffto improve data quality.
The MEIMS maintain the peer cohorts from the time of peerregistration with follow up data entry during the project period(from 2013 to end 2015). The system is updated by the CBOs atthe district level two times per month. The clinic escort data areverified and entered in the MEIMS at the Family PlanningAssociation using the escort slips issued by the respective STI clinics[7].
Details of a total of 714 MSM peers (including peer educators)registered and retained in the service during the project period(reached during 3 consecutive years 2013–2015) were filtered andexported to an Excel work sheet and then to SPSS v20 for furtheranalysis. Fifteen records were excluded from the analysis due todata quality issues. A total of 699 MSM were considered in thefinal analysis.
All the categorical data were analysed to generate frequency andpercentages while numerical data were analysed to present centraltendency and dispersion. Both categorical and numerical variableswere compared between the group of ‘reached but not escortedpeers’ and the group of ‘reached and escorted peers’ (escortedto the STI clinic for HIV testing) to identify whether the variablesare dependent at the level of significance of P=0.05 usingchi-square tests for categorical data and using Mann–Whitney Utests for numerical data.
Table 1. Number and percentage of MSM escorted from 2013 to 2015in comparison to number of MSM reached with the HIVprevention package (HPP)
Year Number ofMSM Reached
with HPP
Number ofMSM escortedto STI clinics
Percentageof MSMescorted
2013 2127 496 23%
2014 2980 969 33%
2015 3638 1416 39%
Source: Annual Progress Report of the Primary Recipient 2 (PR2),Global Fund HIV Prevention Project (Round 09 Grant-Phase 2).
Table 2. Distribution of sample characteristics
Variable Levels Frequency Percentage Cumulativepercentage
District Colombo 247 35% 35%
Gampaha 98 14% 49%
Kalutara 97 14% 63%
Galle 257 37% 100%
Total 699 100%
Location Urban 304 43% 43%
Semi-urban 184 26% 70%
Rural 211 30% 100%
Total 699 100%
Age <25 335 48% 48%
≥25 364 52% 100%
Total 699 100%
Maritalstatus
Married 125 18% 18%
Unmarried 514 74% 92%
Living together 32 5% 96%
Divorced 17 2% 99%
Widow 9 1% 100%
Total 697 100%
Level ofschooleducation
Up to Grade 8 98 14% 14%
Up to GCE O/L 361 52% 66%
Up to GCE A/L 205 29% 95%
Above GCE A/L 32 5% 100%
Total 696 100%
Durationin MSMbehaviour(No. ofyears)
<5 173 25% 25%
5–10 years 252 36% 61%
10–20 years 228 33% 94%
>20 years 43 6% 100%
Total 696 100%
REVIEW Journal of Virus Eradication 2016; 2 (Supplement 4): 41–44
42 M Suranga et al.
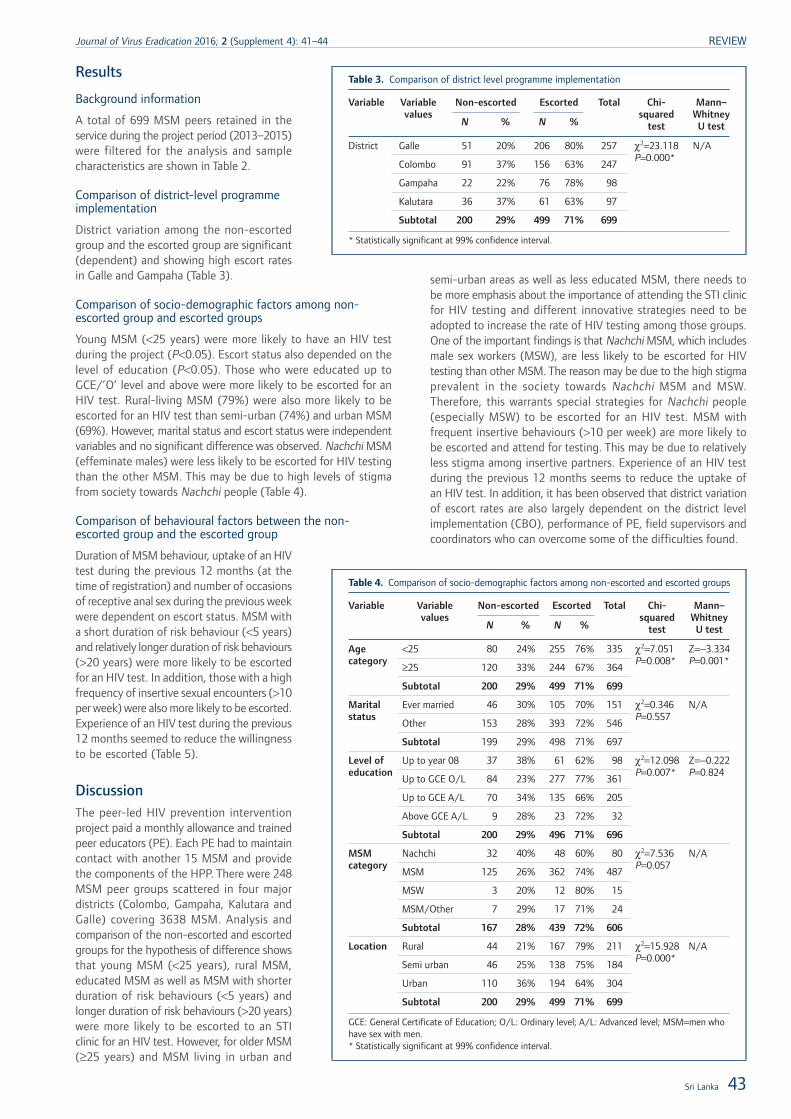
Results
Background information
A total of 699 MSM peers retained in theservice during the project period (2013–2015)were filtered for the analysis and samplecharacteristics are shown in Table 2.
Comparison of district-level programmeimplementation
District variation among the non-escortedgroup and the escorted group are significant(dependent) and showing high escort ratesin Galle and Gampaha (Table 3).
Comparison of socio-demographic factors among non-escorted group and escorted groups
Young MSM (<25 years) were more likely to have an HIV testduring the project (P<0.05). Escort status also depended on thelevel of education (P<0.05). Those who were educated up toGCE/’O’ level and above were more likely to be escorted for anHIV test. Rural-living MSM (79%) were also more likely to beescorted for an HIV test than semi-urban (74%) and urban MSM(69%). However, marital status and escort status were independentvariables and no significant difference was observed. Nachchi MSM(effeminate males) were less likely to be escorted for HIV testingthan the other MSM. This may be due to high levels of stigmafrom society towards Nachchi people (Table 4).
Comparison of behavioural factors between the non-escorted group and the escorted group
Duration of MSM behaviour, uptake of an HIVtest during the previous 12 months (at thetime of registration) and number of occasionsof receptive anal sex during the previous weekwere dependent on escort status. MSM witha short duration of risk behaviour (<5 years)and relatively longer duration of risk behaviours(>20 years) were more likely to be escortedfor an HIV test. In addition, those with a highfrequency of insertive sexual encounters (>10per week) were also more likely to be escorted.Experience of an HIV test during the previous12 months seemed to reduce the willingnessto be escorted (Table 5).
DiscussionThe peer-led HIV prevention interventionproject paid a monthly allowance and trainedpeer educators (PE). Each PE had to maintaincontact with another 15 MSM and providethe components of the HPP. There were 248MSM peer groups scattered in four majordistricts (Colombo, Gampaha, Kalutara andGalle) covering 3638 MSM. Analysis andcomparison of the non-escorted and escortedgroups for the hypothesis of difference showsthat young MSM (<25 years), rural MSM,educated MSM as well as MSM with shorterduration of risk behaviours (<5 years) andlonger duration of risk behaviours (>20 years)were more likely to be escorted to an STIclinic for an HIV test. However, for older MSM(≥25 years) and MSM living in urban and
semi-urban areas as well as less educated MSM, there needs tobe more emphasis about the importance of attending the STI clinicfor HIV testing and different innovative strategies need to beadopted to increase the rate of HIV testing among those groups.One of the important findings is that Nachchi MSM, which includesmale sex workers (MSW), are less likely to be escorted for HIVtesting than other MSM. The reason may be due to the high stigmaprevalent in the society towards Nachchi MSM and MSW.Therefore, this warrants special strategies for Nachchi people(especially MSW) to be escorted for an HIV test. MSM withfrequent insertive behaviours (>10 per week) are more likely tobe escorted and attend for testing. This may be due to relativelyless stigma among insertive partners. Experience of an HIV testduring the previous 12 months seems to reduce the uptake ofan HIV test. In addition, it has been observed that district variationof escort rates are also largely dependent on the district levelimplementation (CBO), performance of PE, field supervisors andcoordinators who can overcome some of the difficulties found.
Table 3. Comparison of district level programme implementation
Variable Variablevalues
Non-escorted Escorted Total Chi-squared
test
Mann–WhitneyU testN % N %
District Galle 51 20% 206 80% 257 χ2=23.118P=0.000*
N/A
Colombo 91 37% 156 63% 247
Gampaha 22 22% 76 78% 98
Kalutara 36 37% 61 63% 97
Subtotal 200 29% 499 71% 699
* Statistically significant at 99% confidence interval.
Table 4. Comparison of socio-demographic factors among non-escorted and escorted groups
Variable Variablevalues
Non-escorted Escorted Total Chi-squared
test
Mann–WhitneyU testN % N %
Agecategory
<25 80 24% 255 76% 335 χ2=7.051P=0.008*
Z=−3.334P=0.001*≥25 120 33% 244 67% 364
Subtotal 200 29% 499 71% 699
Maritalstatus
Ever married 46 30% 105 70% 151 χ2=0.346P=0.557
N/A
Other 153 28% 393 72% 546
Subtotal 199 29% 498 71% 697
Level ofeducation
Up to year 08 37 38% 61 62% 98 χ2=12.098P=0.007*
Z=−0.222P=0.824
Up to GCE O/L 84 23% 277 77% 361
Up to GCE A/L 70 34% 135 66% 205
Above GCE A/L 9 28% 23 72% 32
Subtotal 200 29% 496 71% 696
MSMcategory
Nachchi 32 40% 48 60% 80 χ2=7.536P=0.057
N/A
MSM 125 26% 362 74% 487
MSW 3 20% 12 80% 15
MSM/Other 7 29% 17 71% 24
Subtotal 167 28% 439 72% 606
Location Rural 44 21% 167 79% 211 χ2=15.928P=0.000*
N/A
Semi urban 46 25% 138 75% 184
Urban 110 36% 194 64% 304
Subtotal 200 29% 499 71% 699
GCE: General Certificate of Education; O/L: Ordinary level; A/L: Advanced level; MSM=men whohave sex with men.* Statistically significant at 99% confidence interval.
Sri Lanka 43
Journal of Virus Eradication 2016; 2 (Supplement 4): 41–44 REVIEW
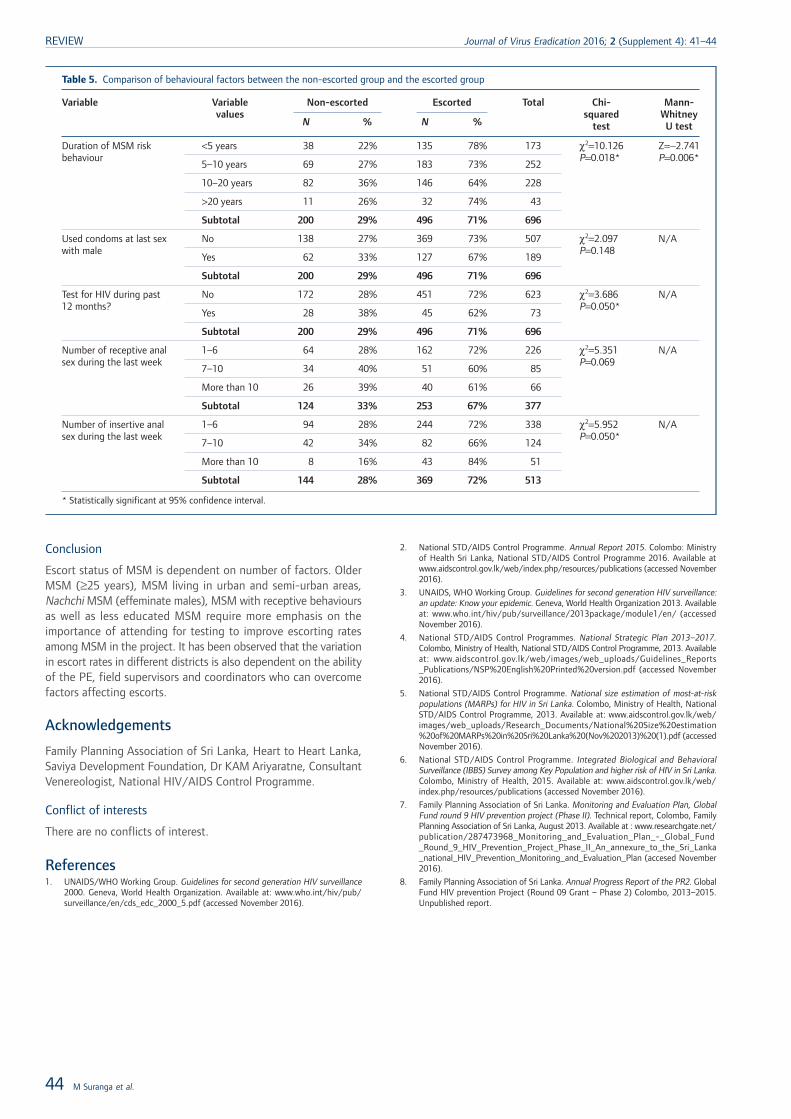
Conclusion
Escort status of MSM is dependent on number of factors. OlderMSM (≥25 years), MSM living in urban and semi-urban areas,Nachchi MSM (effeminate males), MSM with receptive behavioursas well as less educated MSM require more emphasis on theimportance of attending for testing to improve escorting ratesamong MSM in the project. It has been observed that the variationin escort rates in different districts is also dependent on the abilityof the PE, field supervisors and coordinators who can overcomefactors affecting escorts.
Acknowledgements
Family Planning Association of Sri Lanka, Heart to Heart Lanka,Saviya Development Foundation, Dr KAM Ariyaratne, ConsultantVenereologist, National HIV/AIDS Control Programme.
Conflict of interests
There are no conflicts of interest.
References1. UNAIDS/WHO Working Group. Guidelines for second generation HIV surveillance
2000. Geneva, World Health Organization. Available at: www.who.int/hiv/pub/surveillance/en/cds_edc_2000_5.pdf (accessed November 2016).
2. National STD/AIDS Control Programme. Annual Report 2015. Colombo: Ministryof Health Sri Lanka, National STD/AIDS Control Programme 2016. Available atwww.aidscontrol.gov.lk/web/index.php/resources/publications (accessed November2016).
3. UNAIDS, WHO Working Group. Guidelines for second generation HIV surveillance:an update: Know your epidemic. Geneva, World Health Organization 2013. Availableat: www.who.int/hiv/pub/surveillance/2013package/module1/en/ (accessedNovember 2016).
4. National STD/AIDS Control Programmes. National Strategic Plan 2013–2017.Colombo, Ministry of Health, National STD/AIDS Control Programme, 2013. Availableat: www.aidscontrol.gov.lk/web/images/web_uploads/Guidelines_Reports_Publications/NSP%20English%20Printed%20version.pdf (accessed November2016).
5. National STD/AIDS Control Programme. National size estimation of most-at-riskpopulations (MARPs) for HIV in Sri Lanka. Colombo, Ministry of Health, NationalSTD/AIDS Control Programme, 2013. Available at: www.aidscontrol.gov.lk/web/images/web_uploads/Research_Documents/National%20Size%20estimation%20of%20MARPs%20in%20Sri%20Lanka%20(Nov%202013)%20(1).pdf (accessedNovember 2016).
6. National STD/AIDS Control Programme. Integrated Biological and BehavioralSurveillance (IBBS) Survey among Key Population and higher risk of HIV in Sri Lanka.Colombo, Ministry of Health, 2015. Available at: www.aidscontrol.gov.lk/web/index.php/resources/publications (accessed November 2016).
7. Family Planning Association of Sri Lanka. Monitoring and Evaluation Plan, GlobalFund round 9 HIV prevention project (Phase II). Technical report, Colombo, FamilyPlanning Association of Sri Lanka, August 2013. Available at : www.researchgate.net/publication/287473968_Monitoring_and_Evaluation_Plan_-_Global_Fund_Round_9_HIV_Prevention_Project_Phase_II_An_annexure_to_the_Sri_Lanka_national_HIV_Prevention_Monitoring_and_Evaluation_Plan (accesed November2016).
8. Family Planning Association of Sri Lanka. Annual Progress Report of the PR2. GlobalFund HIV prevention Project (Round 09 Grant – Phase 2) Colombo, 2013–2015.Unpublished report.
Table 5. Comparison of behavioural factors between the non-escorted group and the escorted group
Variable Variablevalues
Non-escorted Escorted Total Chi-squared
test
Mann-WhitneyU testN % N %
Duration of MSM riskbehaviour
<5 years 38 22% 135 78% 173 χ2=10.126P=0.018*
Z=−2.741P=0.006*
5–10 years 69 27% 183 73% 252
10–20 years 82 36% 146 64% 228
>20 years 11 26% 32 74% 43
Subtotal 200 29% 496 71% 696
Used condoms at last sexwith male
No 138 27% 369 73% 507 χ2=2.097P=0.148
N/A
Yes 62 33% 127 67% 189
Subtotal 200 29% 496 71% 696
Test for HIV during past12 months?
No 172 28% 451 72% 623 χ2=3.686P=0.050*
N/A
Yes 28 38% 45 62% 73
Subtotal 200 29% 496 71% 696
Number of receptive analsex during the last week
1–6 64 28% 162 72% 226 χ2=5.351P=0.069
N/A
7–10 34 40% 51 60% 85
More than 10 26 39% 40 61% 66
Subtotal 124 33% 253 67% 377
Number of insertive analsex during the last week
1–6 94 28% 244 72% 338 χ2=5.952P=0.050*
N/A
7–10 42 34% 82 66% 124
More than 10 8 16% 43 84% 51
Subtotal 144 28% 369 72% 513
* Statistically significant at 95% confidence interval.
REVIEW Journal of Virus Eradication 2016; 2 (Supplement 4): 41–44
44 M Suranga et al.
Twenty-two years of HIV infection in Bhutan:epidemiological profile
Pandup Tshering1, Karma Lhazeen2, Sonam Wangdi3* and Namgay Tshering4
1 Department of Public Health, Ministry of Health, Bhutan2 Communicable Disease Division, Department of Public Health, Bhutan
3 HIV/STI/Hepatitis Unit, Communicable Disease Division, WHO – Regional Office for South East Asia, New Delhi, India4 Namgay Tshering National STI and HIV/AIDS Control Programme, Department of Public Health, Bhutan
Abstract
Aims: To describe the HIV epidemiology in Bhutan.
Methods: Data from the database of people living with HIV infection in Bhutan, survey reports from the National STIand HIV/AIDS Control Programme from the Ministry of Health and published literature on HIV in Bhutan were reviewed.
Results: Bhutan continues to have a low HIV prevalence with only 470 cases reported by the end of 2015. However,there is a slow but steady recent increase in the number of cases. The main mode of transmission is unsafe heterosexualpractice in the general population and is occurring mostly in urban and business districts. More than half of cases havebeen diagnosed in only three districts. Although the number of cases among key populations such as sex workers andintravenous drug users remains significantly low, the information available remains very limited. There is only scarce publishedliterature on HIV in Bhutan and an absence of a strategic surveillance system. A high level of sexually transmitted infectionsand multiple sexual relationships represent the existing threats that may fuel a larger epidemic.
Conclusions: Bhutan has a maintained a low HIV prevalence over the past two decades, which is reflected in the nationalresponse to HIV. However, with the presence of existing and newly emerging risk factors, this response needs to adaptcontinually. To ensure that HIV prevalence remains low, it is crucial to invest in a strategic information system to monitorrates of infections to guide the public health response.
Introduction
Bhutan is a small land-locked country located between China inthe north and India in the south, with an estimated populationof 733,643 of whom 53% are male and 48% female. The majorityof the population continues to live in rural areas (65.5%) and isengaged in agriculture and livestock farming. Nearly 61% of thepopulation is in the economically active age group of 15–64 years,while about 5% is over the age of 64. According to the Populationand Housing Census of Bhutan, life expectancy stands at 66.2years (65.65 for males and 66.85 for females) [1]. More than 90%of the population has access to primary healthcare delivered througha network of 31 hospitals, 178 basic health unit clinics and 654outreach clinics [2]. The Constitution of Bhutan mandates thegovernment to provide free access to basic health services [3].
For the past 30 years HIV infection has been one of the majorcauses of ill-health and mortality in the world. It is a globalpandemic with over 37 million people estimated to be infectedacross the globe [4]. It has spared no country, not even the mostisolated, such as Bhutan. The country has remained isolated fromthe outside world for the major part of its existence as a nation.It was only in 1971 that it became a member of the United Nationsand started slowly opening its doors to the outside world. Televisionand the internet were introduced in 1999.
The first case of HIV infection was detected in 1993 with a totalcumulative number of cases of 470 by the end of 2015 [5]. Whilethe number of reported cases seems small compared to othercountries in the region with very high burden of infection, it isstill of public health concern given the small size of its population.Its two immediate neighbours are China, with an estimated 0.7million people living with HIV (PLHIVs), and India with whichBhutan shares an open border with over 2.1 million PLHIVs [6].
Therefore, HIV was given the due attention it deserved with theestablishment of the National STI and HIV/AIDS ControlProgramme in 1988, even before the first case of HIV was detectedwithin its border [7].
The challenge for the country is to continue to maintain this lowprevalence when considering the risks that come withmodernisation and globalisation. In order to move forward withan HIV intervention programme, it needs to learn from goodpractices and the experience of other countries. However, this isa challenge as there is a lack of information regarding HIV infectionin small countries with a low population similar to Bhutan. Themajority of the evidence comes from highly populated countrieswith a large epidemic and, in most cases, concentrated in keypopulations.
This article is an attempt to review the current data on theepidemiology of HIV infection in Bhutan since the first case ofHIV was diagnosed in 1993. It aims to analyse and describe theinfection trend in the country with the hope that it will informfuture interventions and serve as a reference for other similar typesof countries.
Surveillance system and data sources
The National STI and HIV/AIDS Control Programme in Bhutan hasan HIV case reporting system with unique identifiers that maintainsa database of HIV cases. All PLHIVs are assigned a unique identifierby the Care, Support and Treatment Unit upon confirmation oftheir status. Information such as age, occupation, mode oftransmission, diagnosis location and address are collected. Thisfacilitates follow-up and patient tracking and forms the basis ofa database that can be analysed over time to improve theunderstanding of the dynamics of HIV infection in the country.The information is collected on paper-based forms and thentransferred onto Excel spreadsheets centrally where the informationis collated. This programme also produces biannual reports toupdate and disseminate information on new recorded cases. Thereis, however, no sentinel surveillance programme currently in place
*Corresponding author: Sonam Wangdi, HIV/STI/Hepatitis Unit,Communicable Disease Division, World Health Organization Regional
Office for South-East Asia, Indraprastha Estate, Mahatma Gandhi Marg,New Delhi, 110 002 IndiaEmail: [email protected]
Journal of Virus Eradication 2016; 2 (Supplement 4): 45–48 REVIEW
© 2016 The Authors. Journal of Virus Eradication published by Mediscript LtdThis is an open access article published under the terms of a Creative Commons License. 45
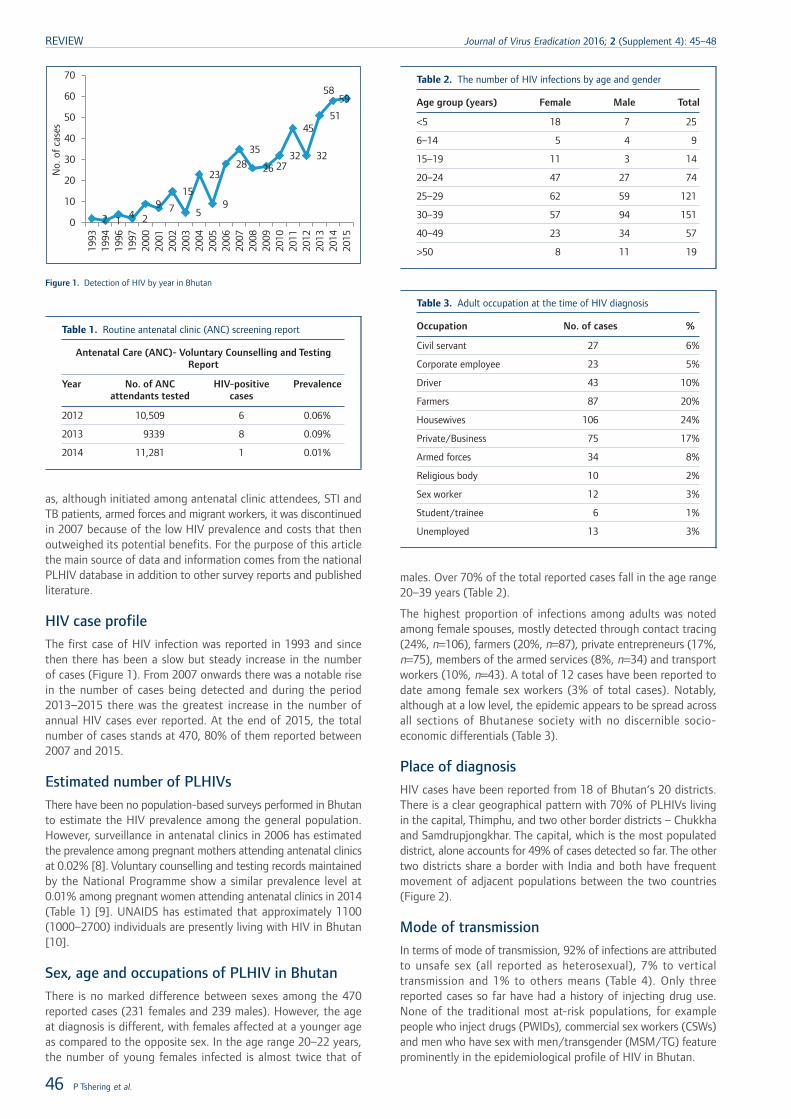
as, although initiated among antenatal clinic attendees, STI andTB patients, armed forces and migrant workers, it was discontinuedin 2007 because of the low HIV prevalence and costs that thenoutweighed its potential benefits. For the purpose of this articlethe main source of data and information comes from the nationalPLHIV database in addition to other survey reports and publishedliterature.
HIV case profile
The first case of HIV infection was reported in 1993 and sincethen there has been a slow but steady increase in the numberof cases (Figure 1). From 2007 onwards there was a notable risein the number of cases being detected and during the period2013–2015 there was the greatest increase in the number ofannual HIV cases ever reported. At the end of 2015, the totalnumber of cases stands at 470, 80% of them reported between2007 and 2015.
Estimated number of PLHIVs
There have been no population-based surveys performed in Bhutanto estimate the HIV prevalence among the general population.However, surveillance in antenatal clinics in 2006 has estimatedthe prevalence among pregnant mothers attending antenatal clinicsat 0.02% [8]. Voluntary counselling and testing records maintainedby the National Programme show a similar prevalence level at0.01% among pregnant women attending antenatal clinics in 2014(Table 1) [9]. UNAIDS has estimated that approximately 1100(1000–2700) individuals are presently living with HIV in Bhutan[10].
Sex, age and occupations of PLHIV in Bhutan
There is no marked difference between sexes among the 470reported cases (231 females and 239 males). However, the ageat diagnosis is different, with females affected at a younger ageas compared to the opposite sex. In the age range 20–22 years,the number of young females infected is almost twice that of
males. Over 70% of the total reported cases fall in the age range20–39 years (Table 2).
The highest proportion of infections among adults was notedamong female spouses, mostly detected through contact tracing(24%, n=106), farmers (20%, n=87), private entrepreneurs (17%,n=75), members of the armed services (8%, n=34) and transportworkers (10%, n=43). A total of 12 cases have been reported todate among female sex workers (3% of total cases). Notably,although at a low level, the epidemic appears to be spread acrossall sections of Bhutanese society with no discernible socio-economic differentials (Table 3).
Place of diagnosis
HIV cases have been reported from 18 of Bhutan‘s 20 districts.There is a clear geographical pattern with 70% of PLHIVs livingin the capital, Thimphu, and two other border districts – Chukkhaand Samdrupjongkhar. The capital, which is the most populateddistrict, alone accounts for 49% of cases detected so far. The othertwo districts share a border with India and both have frequentmovement of adjacent populations between the two countries(Figure 2).
Mode of transmission
In terms of mode of transmission, 92% of infections are attributedto unsafe sex (all reported as heterosexual), 7% to verticaltransmission and 1% to others means (Table 4). Only threereported cases so far have had a history of injecting drug use.None of the traditional most at-risk populations, for examplepeople who inject drugs (PWIDs), commercial sex workers (CSWs)and men who have sex with men/transgender (MSM/TG) featureprominently in the epidemiological profile of HIV in Bhutan.
2 14 2
9 7
15
5
23
9
2835
26 2732
45
32
51
5859
0
10
20
30
No.
of
case
s
40
50
60
70
1993
1994
1996
1997
2000
2001
2002
2003
2004
2005
2006
2007
2008
2009
2010
2011
2012
2013
2014
2015
Figure 1. Detection of HIV by year in Bhutan
Table 1. Routine antenatal clinic (ANC) screening report
Antenatal Care (ANC)- Voluntary Counselling and TestingReport
Year No. of ANCattendants tested
HIV-positivecases
Prevalence
2012 10,509 6 0.06%
2013 9339 8 0.09%
2014 11,281 1 0.01%
Table 2. The number of HIV infections by age and gender
Age group (years) Female Male Total
<5 18 7 25
6–14 5 4 9
15–19 11 3 14
20–24 47 27 74
25–29 62 59 121
30–39 57 94 151
40–49 23 34 57
>50 8 11 19
Table 3. Adult occupation at the time of HIV diagnosis
Occupation No. of cases %
Civil servant 27 6%
Corporate employee 23 5%
Driver 43 10%
Farmers 87 20%
Housewives 106 24%
Private/Business 75 17%
Armed forces 34 8%
Religious body 10 2%
Sex worker 12 3%
Student/trainee 6 1%
Unemployed 13 3%
REVIEW Journal of Virus Eradication 2016; 2 (Supplement 4): 45–48
46 P Tshering et al.
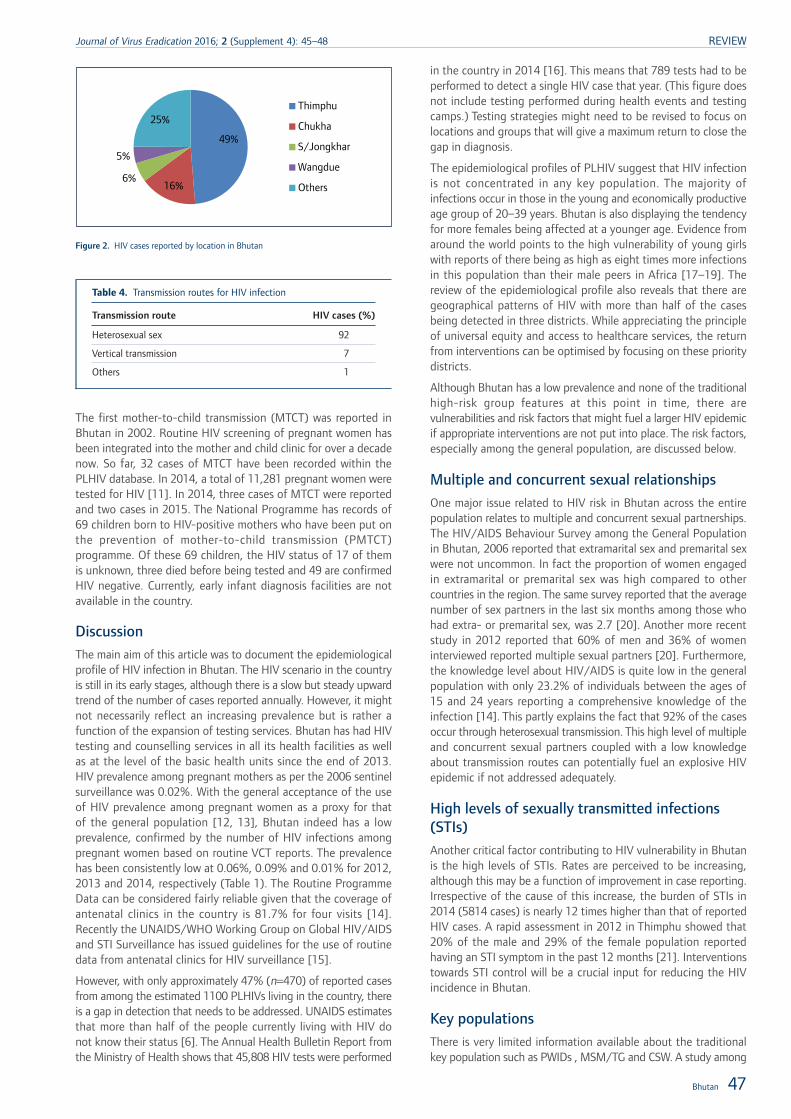
The first mother-to-child transmission (MTCT) was reported inBhutan in 2002. Routine HIV screening of pregnant women hasbeen integrated into the mother and child clinic for over a decadenow. So far, 32 cases of MTCT have been recorded within thePLHIV database. In 2014, a total of 11,281 pregnant women weretested for HIV [11]. In 2014, three cases of MTCT were reportedand two cases in 2015. The National Programme has records of69 children born to HIV-positive mothers who have been put onthe prevention of mother-to-child transmission (PMTCT)programme. Of these 69 children, the HIV status of 17 of themis unknown, three died before being tested and 49 are confirmedHIV negative. Currently, early infant diagnosis facilities are notavailable in the country.
DiscussionThe main aim of this article was to document the epidemiologicalprofile of HIV infection in Bhutan. The HIV scenario in the countryis still in its early stages, although there is a slow but steady upwardtrend of the number of cases reported annually. However, it mightnot necessarily reflect an increasing prevalence but is rather afunction of the expansion of testing services. Bhutan has had HIVtesting and counselling services in all its health facilities as wellas at the level of the basic health units since the end of 2013.HIV prevalence among pregnant mothers as per the 2006 sentinelsurveillance was 0.02%. With the general acceptance of the useof HIV prevalence among pregnant women as a proxy for thatof the general population [12, 13], Bhutan indeed has a lowprevalence, confirmed by the number of HIV infections amongpregnant women based on routine VCT reports. The prevalencehas been consistently low at 0.06%, 0.09% and 0.01% for 2012,2013 and 2014, respectively (Table 1). The Routine ProgrammeData can be considered fairly reliable given that the coverage ofantenatal clinics in the country is 81.7% for four visits [14].Recently the UNAIDS/WHO Working Group on Global HIV/AIDSand STI Surveillance has issued guidelines for the use of routinedata from antenatal clinics for HIV surveillance [15].
However, with only approximately 47% (n=470) of reported casesfrom among the estimated 1100 PLHIVs living in the country, thereis a gap in detection that needs to be addressed. UNAIDS estimatesthat more than half of the people currently living with HIV donot know their status [6]. The Annual Health Bulletin Report fromthe Ministry of Health shows that 45,808 HIV tests were performed
in the country in 2014 [16]. This means that 789 tests had to beperformed to detect a single HIV case that year. (This figure doesnot include testing performed during health events and testingcamps.) Testing strategies might need to be revised to focus onlocations and groups that will give a maximum return to close thegap in diagnosis.
The epidemiological profiles of PLHIV suggest that HIV infectionis not concentrated in any key population. The majority ofinfections occur in those in the young and economically productiveage group of 20–39 years. Bhutan is also displaying the tendencyfor more females being affected at a younger age. Evidence fromaround the world points to the high vulnerability of young girlswith reports of there being as high as eight times more infectionsin this population than their male peers in Africa [17–19]. Thereview of the epidemiological profile also reveals that there aregeographical patterns of HIV with more than half of the casesbeing detected in three districts. While appreciating the principleof universal equity and access to healthcare services, the returnfrom interventions can be optimised by focusing on these prioritydistricts.
Although Bhutan has a low prevalence and none of the traditionalhigh-risk group features at this point in time, there arevulnerabilities and risk factors that might fuel a larger HIV epidemicif appropriate interventions are not put into place. The risk factors,especially among the general population, are discussed below.
Multiple and concurrent sexual relationships
One major issue related to HIV risk in Bhutan across the entirepopulation relates to multiple and concurrent sexual partnerships.The HIV/AIDS Behaviour Survey among the General Populationin Bhutan, 2006 reported that extramarital sex and premarital sexwere not uncommon. In fact the proportion of women engagedin extramarital or premarital sex was high compared to othercountries in the region. The same survey reported that the averagenumber of sex partners in the last six months among those whohad extra- or premarital sex, was 2.7 [20]. Another more recentstudy in 2012 reported that 60% of men and 36% of womeninterviewed reported multiple sexual partners [20]. Furthermore,the knowledge level about HIV/AIDS is quite low in the generalpopulation with only 23.2% of individuals between the ages of15 and 24 years reporting a comprehensive knowledge of theinfection [14]. This partly explains the fact that 92% of the casesoccur through heterosexual transmission. This high level of multipleand concurrent sexual partners coupled with a low knowledgeabout transmission routes can potentially fuel an explosive HIVepidemic if not addressed adequately.
High levels of sexually transmitted infections(STIs)
Another critical factor contributing to HIV vulnerability in Bhutanis the high levels of STIs. Rates are perceived to be increasing,although this may be a function of improvement in case reporting.Irrespective of the cause of this increase, the burden of STIs in2014 (5814 cases) is nearly 12 times higher than that of reportedHIV cases. A rapid assessment in 2012 in Thimphu showed that20% of the male and 29% of the female population reportedhaving an STI symptom in the past 12 months [21]. Interventionstowards STI control will be a crucial input for reducing the HIVincidence in Bhutan.
Key populations
There is very limited information available about the traditionalkey population such as PWIDs , MSM/TG and CSW. A study among
49%
16%6%
5%
25%Thimphu
Chukha
S/Jongkhar
Wangdue
Others
Figure 2. HIV cases reported by location in Bhutan
Table 4. Transmission routes for HIV infection
Transmission route HIV cases (%)
Heterosexual sex 92
Vertical transmission 7
Others 1
Bhutan 47
Journal of Virus Eradication 2016; 2 (Supplement 4): 45–48 REVIEW
drug users found only 11% of this group (n=991) to have everinjected and only 31 admitted to have injected in the past month[22]. There are no estimates for sex workers and MSM/TG inBhutan. With no networks or formal establishment for sex work,there are no self-identified sex workers. Most of the sex happensas transactional sex. At the bordering towns some form of formalsex work exists with limited number of girls both from Bhutanand India operating through hotels and bars. A formativeassessment was carried out to see the feasibility of conductingan integrated biological and behavioural survey (IBBS) among thesekey populations; however, given the small size and the hiddennature of these populations, an IBBS was not found feasible [23].This has not deterred the government from initiating preventionprogrammes despite the limited evidence of HIV among these keypopulations in Bhutan. A pilot study for oral substitution iscurrently under way in the capital city for PWIDs. For MSM andTGs, a peer-based programme has been initiated alongsideadvocacy to create a supportive environment. Venue-basedinterventions for potential sex workers and their clients have beenput into place in major towns. All of these initiatives support thecreation of informal networks and help to gather strategicinformation.
Conclusions
The main aim of this article was to document the epidemiologicalprofile of HIV in Bhutan as well as to describe the progress made.Based on the available data we can conclude that the country hasa low HIV prevalence. A timely intervention by the Governmentand its partners has ensured the persistence of this low prevalenceover the last two decades.
However, the increasing number of cases being detected remainsa cause for concern. The present low prevalence does not meanthat the status quo in the country will be maintained. Major HIVepidemics often transition from an initial low prevalence with aslow growth. Existing risk factors such as high STI rates andmultiple sexual partners, if not rapidly addressed, can fuel a largeHIV epidemic. Furthermore, the limited data and informationavailable, especially among key populations at risk of acquiringHIV infection, is a major limitation. Building evidence would bekey to inform the future strategic direction of the nationalresponse. Efforts to gather and use data to advocate, mobiliseresources and design evidence-based programmes relevant to thecountry‘s specific needs and epidemiological pattern are of crucialimportance to attempt to maintain the present low HIV prevalencestatus of the country.
Acknowledgements
Disclaimer
SW is a staff member of the World Health Organization. Theauthors alone are responsible for the views expressed in this articleand they do not necessarily represent the decisions, policy or viewsof the World Health Organization.
References1. Bhutan National Statistical Bureau. Population and Housing Census. 2005. Available
at: www.nsb.gov.bt/nsbweb/publication/files/pub6ri44cs.pdf (accessed November2016).
2. Tobgay T, Dorji T, Pelzom D, Gibbons R. Progress and delivery of health care inBhutan, the land of the thunder dragon and gross national happiness. Trop MedInt Health 2011; 16: 731–736.
3. The Royal Government of Bhutan. The Constitution of the Kingdom of Bhutan;2008. Available at: www.nab.gov.bt/assets/templates/images/constitution-of-bhutan-2008.pdf (accessed November 2016).
4. UNAIDS. AIDS by the numbers. 2015. Available at: www.unaids.org/sites/default/files/media_asset/AIDS_by_the_numbers_2015_en.pdf. Accessed November 2016).
5. National STI & HIV/AIDS Control Program, Ministry of Health, Bhutan. PLHIVdatabase; 2016. Data provided by the record manager in excel sheet.
6. UNAIDS. The Gap Report. 2013. Available at: www.unaids.org/sites/default/files/media_asset/UNAIDS_Gap_report_en.pdf (accessed November 2016).
7. National STI & HIV/AIDS Control Program, Ministry of Health, Bhutan. Nationalstrategic plan for the prevention and control of STIs and HIV and AIDS. 2008.Available at: www.hsph.harvard.edu/population/aids/bhutan.aidsplan.08.pdf(accessed November 2016).
8. National STI & HIV/AIDS Control Program, Ministry of Health, Bhutan. HIV/RPRSentinel sero-surveillance Report; 2006. Available at: www.health.gov.bt/wp-content/uploads/ict-files/2014/11/HIV-RPR-SENTINEL-SERO-SURVEILLANCE-REPORT.pdf (accessed November 2016).
9. National STI & HIV/AIDS Control Program, Ministry of Health, Bhutan. Annual VCTreport; 2012,2013,2014.
10. UNAIDS. HIV in Asia and the Pacific. 2013. Available at: www.unaids.org/sites/default/files/media_asset/2013_HIV-Asia-Pacific_en_0.pdf (accessed November2016)
11. National STI & HIV/AIDS Control Program, Ministry of Health, Bhutan. Annual VCTreport. 2014.
12. UNAIDS, WHO. Guidelines for Conducting HIV Sentinel Serosurveys among PregnantWomen and Other Groups 2003. Available at: www.who.int/hiv/pub/surveillance/en/ancguidelines.pdf (accessed November 2016).
13. Joint United Nations Programme on HIV/AIDS/World Health Organization WorkingGroup on Global HIV/AIDS and STI Surveillance. Guidelines for second generationHIV surveillance. An update: Know your epidemic. 2013. Available at: http://apps.who.int/iris/bitstream/10665/85511/1/9789241505826_eng.pdf (accessedNovember 2016).
14. Ministry of Health, Thimphu, Bhutan. National Health Survey (NHS); 2012. Availableat: www.health.gov.bt/publications/national-health-survey/ (accessed November2016).
15. UNAIDS/WHO working group on global HIV/AIDS and STI surveillance. ConductingHIV surveillance based on routine program data among pregnant women attendingantenatal clinics. 2015. Availabe at: http://apps.who.int/iris/bitstream/10665/197864/1/9789241509725_eng.pdf?ua=1 (accessed November 2016).
16. Ministry of Health, Thimphu, Bhutan. Annual Health Bulletin. 2015. Available at:www.health.gov.bt/wp-content/uploads/ftps/annual-health-bulletins/Annual%20Health%20Bulletin-2015.pdf (accessed November 2016).
17. Dellar R, Dlamini S, Karim Q. Adolescent girls and young women: key populationsfor HIV epidemic control. J Int AIDS Soc 2015; 18: Suppl 1.
18. Idele P, Gillespie A, Porth T et al. Epidemiology of HIV and AIDS among adolescents.J Acquir Immune Defic Syndr 2014; 66: S144–S153.
19. Peltzer K, Pengpid S. Sexual abuse, violence and HIV risk among adolescents inSouth Africa. Gender Behav 2008; 6:1462–1478.
20. National STI & HIV/AIDS Control Program, Ministry of Health, Bhutan. GeneralPopulation Survey 2006; 2008. Available at: www.aidsdatahub.org/sites/default/files/documents/HIVAIDS_Behaviour_Survey_among_the_General_Population_in_Bhutan_2006_April_21_2008.pdf (accessed November 2016).
21. National STI & HIV/AIDS Control Program, Ministry of Health, Bhutan. SexualBehaviors and Networks in Thimphu, Bhutan: A Rapid Assessment. 2012. Availableat: www.aidsdatahub.org/sexual-behaviors-and-networks-in-thimphu-bhutan-a-rapid-assessment-national-aids-control-programme-2010 (accessed November 2016).
22. Bhutan Narcotic Control Agency, UNODC. National Baseline Assessment of Drugsand Controlled Substance Use in Bhutan. 2009. Available at: www.unodc.org/documents/southasia/reports/National_Baseline_Assessment_of_Drugs_and_Controlled_Substance_use_in_Bhutan_2009.pdf (accessed November 2016).
23. National AIDS Control Program in Bhutan, United Nations Development ProgramAsia-Pacific Regional Centre. Formative Assessment on the Feasibility of an IntegratedBiological and Behavioral Survey among Key and Vulnerable Populations in Bhutan.2015. Available at: www.health.gov.bt/wp-content/uploads/ict-files/2014/11/FA-IBBS-Bhutan_FINAL_.pdf (accessed November 2016).
REVIEW Journal of Virus Eradication 2016; 2 (Supplement 4): 45–48
48 P Tshering et al.
Related Documents