Journal of Tropical Ecology http://journals.cambridge.org/TRO Additional services for Journal of Tropical Ecology: Email alerts: Click here Subscriptions: Click here Commercial reprints: Click here Terms of use : Click here Determinants of rain-forest oristic variation on an altitudinal gradient in southern Costa Rica Adina Chain-Guadarrama, Bryan Finegan, Sergio Vilchez and Fernando Casanoves Journal of Tropical Ecology / Volume 28 / Issue 05 / September 2012, pp 463 - 481 DOI: 10.1017/S0266467412000521, Published online: 29 August 2012 Link to this article: http://journals.cambridge.org/abstract_S0266467412000521 How to cite this article: Adina Chain-Guadarrama, Bryan Finegan, Sergio Vilchez and Fernando Casanoves (2012). Determinants of rain-forest oristic variation on an altitudinal gradient in southern Costa Rica. Journal of Tropical Ecology, 28, pp 463-481 doi:10.1017/ S0266467412000521 Request Permissions : Click here Downloaded from http://journals.cambridge.org/TRO, IP address: 129.101.79.200 on 13 Mar 2015

Welcome message from author
This document is posted to help you gain knowledge. Please leave a comment to let me know what you think about it! Share it to your friends and learn new things together.
Transcript

Journal of Tropical Ecologyhttp://journals.cambridge.org/TRO
Additional services for Journal of Tropical Ecology:
Email alerts: Click hereSubscriptions: Click hereCommercial reprints: Click hereTerms of use : Click here
Determinants of rain-forest oristic variation on an altitudinal gradient insouthern Costa Rica
Adina Chain-Guadarrama, Bryan Finegan, Sergio Vilchez and Fernando Casanoves
Journal of Tropical Ecology / Volume 28 / Issue 05 / September 2012, pp 463 - 481DOI: 10.1017/S0266467412000521, Published online: 29 August 2012
Link to this article: http://journals.cambridge.org/abstract_S0266467412000521
How to cite this article:Adina Chain-Guadarrama, Bryan Finegan, Sergio Vilchez and Fernando Casanoves (2012). Determinants of rain-forestoristic variation on an altitudinal gradient in southern Costa Rica. Journal of Tropical Ecology, 28, pp 463-481 doi:10.1017/S0266467412000521
Request Permissions : Click here
Downloaded from http://journals.cambridge.org/TRO, IP address: 129.101.79.200 on 13 Mar 2015

Journal of Tropical Ecology (2012) 28:463–481. © Cambridge University Press 2012doi:10.1017/S0266467412000521
Determinants of rain-forest floristic variation on an altitudinal gradientin southern Costa Rica
Adina Chain-Guadarrama∗,1, Bryan Finegan†, Sergio Vilchez‡ and Fernando Casanoves‡
∗ Graduate School, Mailbox 152, Tropical Agricultural Centre for Research and Higher Education (CATIE), Turrialba 30501, Costa Rica† Production and Conservation in Forests Program, Tropical Agricultural Centre for Research and Higher Education (CATIE), Turrialba 30501, Costa Rica‡ Biostatistics Unit, Tropical Agricultural Centre for Research and Higher Education (CATIE), Turrialba 30501, Costa Rica
(Received 27 July 2012)
Abstract: The degree to which geographical location rather than environment affects the maintenance of high tropicalforest beta diversity on altitudinal gradients is not well understood. Forest composition and its relationship to climate,soil, altitude and geographical distance were determined across an 1114-km2 landscape in south Pacific Costa Ricaspanning an altitudinal gradient (0–1500 m asl). In 37 0.25-ha plots, > 200 species of dicot trees (≥ 30 cm dbh) andcanopy palms (≥ 10 cm dbh) were found. Ordination analysis showed strong species composition patterns related toaltitude; plot coordinates on the main axis showed negative correlations to the abundance of lowland-forest speciesIriartea deltoidea (r = −0.54) and Brosimum utile (r = −0.65), and positive correlations to higher-altitude speciesAlchornea glandulosa (r = 0.63), Quercus sp. (r = 0.50) and Ocotea sp. 2 (r = 0.48). Mantel correlations, correlogramsand variation partitioning analysis of relationships between floristic composition and spatial and environmental factorsindicated that spatial location of the plots – potentially, dispersal limitation – was the single most important (R2
adj =0.149) driver of beta diversity, but that environmental heterogeneity also plays an important role. In particular, palmspecies turnover was strongly related to soil chemical properties. The effects of dispersal limitation on floristic assemblycould determine the future distribution of plant communities as a result of climate change.
Key Words: altitude, beta diversity, canopy trees, canopy palms, climate change, dispersal assembly, geographicaldistance, niche assembly, variation partitioning
Resumen: El efecto relativo de la ubicacion espacial yel ambiente sobre el mantenimiento de la alta diversidadbeta de los bosques tropicales en gradientes altitudinalesno es bien entendido. La composicion florıstica y surelacion con el suelo, el clima, la elevacion y la distanciageografica fue determinada en un paisaje de 1114 km2
en el Pacıfico sur de Costa Rica, a lo largo de ungradiente altitudinal (0–1500 msnm). En 37 parcelasde 0.25-ha, > 200 especies de arboles (≥ 30 cm dap)y palmas de dosel (≥ 10 cm dap) fueron encontradas.Analisis de ordenacion mostraron fuertes patrones decomposicion de especies relacionados a la altitud; lascoordenadas de las parcelas sobre los principales ejesmostraron correlaciones negativas con la abundanciade Iriartea deltoidea (r = −0.54) y Brosimum utile(r = −0.65) ambas especies de bosques de bajura, ycorrelaciones positivas con especies de mayores altitudescomo Alchornea glandulosa (r = 0.63), Quercus sp.
1 Corresponding author. Email: [email protected]
(r = 0.50) y Ocotea sp. 2 (r = 0.48). Correlacionesde Mantel, correlogramas y analisis de particion de lavarianza de las relaciones entre la composicion florısticay factores espaciales y ambientales indicaron que laubicacion espacial de las parcelas – potencialmentelimitacion en la dispersion – fue el determinante masimportante (R2
adj = 0.149) de la diversidad beta, peroque la heterogeneidad ambiental tambien juega un rolimportante. En particular, el recambio de las especies depalmas estuvo fuertemente relacionado a las propiedadesquımicas del suelo. Los efectos de la limitacion en ladispersion sobre el ensamblaje florıstico podrıa determinarla distribucion futura de las comunidades vegetales comoresultado del cambio climatico.
INTRODUCTION
The theories of niche assembly and dispersalassembly provide a valuable framework for interpretingthe relationships between species composition and

464 ADINA CHAIN-GUADARRAMA ET AL.
environmental and spatial heterogeneity, leading to abetter understanding of the high species turnover anddiversity of Neotropical rain forests (Condit et al. 2002,Potts et al. 2002). Niche assembly theory states thatvegetation abundance and species composition patternsare determined by local environmental conditionsand competition (de Blois et al. 2002, Jones et al.2006). Under dispersal assembly theory, in contrast,community composition depends on the compositionof the surrounding communities and species dispersalcapacity, and floristic similarity among sites is predictedto decrease with increasing geographical distance (higherspatial isolation) because of spatially limited dispersal,independent of any environmental difference (Hubbell2001).
There is no consensus regarding the relativeimportance of niche and dispersal assembly in tropicalforests. Several authors (Costa et al. 2009, Duque et al.2002, Jones et al. 2006, 2008; Phillips et al. 2003,Pyke et al. 2001, Ruokolainen et al. 2007, Sesnieet al. 2009, Tuomisto et al. 2003a, 2003b) suggestthat environmental variables are the most importantdeterminants of beta diversity. Others indicate apredominant role for dispersal limitation (Bohlman et al.2008, Chust et al. 2006, Duque et al. 2009, Normandet al. 2006, Vormisto et al. 2004). Contrasting resultsseem likely to be due partly to differences in the plantgroups studied (Sesnie et al. 2009), the environmentalvariables measured (Jones et al. 2008), the spatial scale ofobservation and the associated degree of environmentalheterogeneity in the landscapes (Condit et al. 2002, Costaet al. 2009, Honorio Coronado et al. 2009, Jones et al.2006, Sesnie et al. 2009). Bohlman et al. (2008), Conditet al. (2002), Duque et al. (2002, 2009) and Tuomistoet al. (2003a) report that environmental control ofcompositional similarities is stronger at regional scalesand geographical control at finer scales. Across theAmazon basin, on the other hand, Honorio Coronadoet al. (2009) report that geographical distance is moreimportant in explaining species turnover, while soilfertility plays a more important role at smaller scales.
The lack of attention to altitudinal gradients in thesestudies is notable. Variation in tropical forest structureand floristics with altitude is marked (Homeier et al. 2010,Lieberman et al. 1996, Macıa et al. 2007, Martin et al.2011) making a major contribution to high biodiversityin global hotspots (Malhi et al. 2011), and its underlyingcauses are complex (Grubb 1977). In all these studies,niche assembly is the implicit underlying model of speciesturnover. The potential roles of spatial location anddispersal limitation remain largely untested.
Working in terra firme forest sites along an altitudinalgradient in a fragmented landscape of south PacificCosta Rica, we therefore sought to (1) characterizeforest sites according to their floristic composition,
(2) quantify floristic and environmental differencesamong forest sites, (3) determine the spatial structureof floristic and environmental characteristics, and (4)assess relationships between species composition andenvironment, altitude and geographical distance. Twoalternative general hypotheses are proposed: (1) speciescomposition is determined by environmental variability,with spatial autocorrelation of species compositionrelated to the existence of environmental gradients,even when geographical distance is controlled (nicheassembly); and (2) species composition is determined bydispersal limitation, thus floristic similarity decreases asgeographical distance increases, even when environmentis controlled (dispersal assembly). Because palmsrepresent an a priori functional group (Chazdon et al.2010) and show a well-defined response to environmentalvariation (Clark et al. 1995, Costa et al. 2009, Poulsenet al. 2006, Sesnie et al. 2009) we determined theirresponse separately from that of dicot trees.
METHODS
Study site
The study was carried out in a landscape that linksLa Amistad International Park, in the Cordillera deTalamanca, and the protected areas of the Osa Peninsula,in the south Pacific region of Costa Rica (Figure 1).The 1114-km2 landscape encompasses an altitudinalgradient from sea level to more than 1500 m asl. Fromsouth-west to north-east, terrain rises abruptly from thecoast to 1500 m asl in the south coastal range (FilaCostena del Sur), which functions as a geographicalbarrier 18–20 km from the coast. It is a fragmentedlandscape where remnant forest patches are surroundedby coffee plantations on higher ground in the north andoil palm in the lowlands to the south (Cespedes et al.2008). Three large forest patches (>1000 ha) exist withinareas containing a low probability of land-use change, inaddition to an important number of smaller forest patches(Cespedes et al. 2008).
Predominant soil types are poorly developed entisolsand acid, infertile utisols, and moderately fertileinceptisols (Fassbender & Bornemisza 1987, ITCR 2004,Sanchez 1981). Annual rainfall ranges from 3000 to5500 mm (ITCR 2004). Two seasons are recognized, adrier one from December to April, with the lowest rainfallin February, and a wetter season the rest of the year whereOctober is the wettest month (IMN, http://www.imn.ac.cr/educacion/climacr/pacifico_sur.html). Mean an-nual temperature at the lowest point in in our samplingcorresponded to c. 26 ◦C and c. 19 ◦C at the highest point(Figure 2; Table 1).

Forest beta diversity on an altitudinal gradient 465
Figure 1. Location of the studied landscape at the south Pacific region of Costa Rica. Remnant forest patches, protected areas and locations of sampleplots are observed.
Field sampling and measurements
We adopted the sampling protocol developed by Ramos& Finegan (2006) and Sesnie et al. (2009) and shownby the latter authors to be effective for testing hypotheseslike ours. A total of thirty-seven 0.25-ha plots (50 m ×50 m) were established between the altitudes of 64 m and1528 m asl in forest patches with a minimum area of 5ha (Figure 1). Sites with manageable access were selectedand extreme conditions of flooded or disturbed areas wereavoided, identifying only terra firme environments. Plotswere positioned at random points at a minimum distanceof 150 m from the forest edge and at least 300 m fromthe nearest neighbouring plot. On large forest patcheswe often established more than one plot. All plots weregeo-referenced using a GPS (Garmin GPSMAP R©60CSx),and altitude was recorded using a calibrated altimeter.On each plot, the stem diameter at breast height (dbh,1.3 m) of all dicot trees ≥ 30 cm dbh and palms ≥ 10 cmdbh was measured. Species were identified on site by a
parataxonomist and when necessary, herbarium sampleswere taken and identified by Nelson Zamora, curator ofbotany at Costa Rica’s National Institute for Biodiversity(INBio) (Bouroncle & Finegan 2011, Finegan & Delgado2000, Sesnie et al. 2009).
We collected a homogenized soil sample compiled fromfive subsamples up to 30 cm depth in each sampleplot. Soil depth was determined using a 1.10-m-longmetal rod. Soil was analysed at the soils laboratoryof the Centro Agronomico Tropical de Investigaciony Ensenanza (CATIE), in Turrialba, Costa Rica, wheresamples were air-dried and soil chemical and physicalanalysis conducted. Soil texture (per cent of sand, siltand clay) was determined by the Bouyoucos method.Extractable K and P were measured using Modified Olsenextractions with a 0.5 M sodium bicarbonate (NaHCO3)solution at a pH of 8.5. Soil pH in water was measured,and extractable Ca, Mg, and total acidity extractionswere done in a 1N suspension of potassium chloride(KCl).

466 ADINA CHAIN-GUADARRAMA ET AL.
Figure 2. (Colour online) Illustration of climate gradients in the studied landscape. Sampled vegetation plots are indicated by black squares. Altitude(a), temperature seasonality given by temperature standard deviation (b), annual precipitation (c), and seasonal precipitation regimes given byprecipitation of the driest month (d) and precipitation coefficient of variation (e), are shown.

Forest beta diversity on an altitudinal gradient 467
Table 1. Climatic and altitude attributes of the 37 (0.25 ha) vegetationplots sampled in the studied landscape.
Mean ± SE Range
Altitude (m asl) 759 ± 70.9 64–1528Mean annual temperature (◦C) 23.0 ± 0.4 18.6–26.4Temperature standard deviation 6.8 ± 0.1 5.8–7.8Minimum temperature of the coldest
month (◦C) 16.7 ± 0.4 12.4–20.3Annual precipitation (mm) 3374 ± 75.4 2852–5057Precipitation coefficient of variation 60.6 ± 1.1 44–72Precipitation of the driest month (mm) 52.3 ± 4.8 17–146
Temperature and precipitation data were takenfor each sample plot from Worldclim (http://www.worldclim.org/) digital data layers. Worldclim datarepresent average global climate grids from the years1950–2000, with a resolution of c. 1 km2 (30 arc-second). Worldclim data have been previously usedto map and spatially model species distributions usinggeographical information systems (Hijmans et al. 2005).We used mean annual temperature (Ann Temp) and twomeasures of seasonal temperature variation, minimumtemperature of the coldest month (Min Temp) andtemperature standard deviation (Temp SD). Annualprecipitation (Ann prec) and rainfall seasonality fromprecipitation coefficient of variation (Prec CV) and pre-cipitation of the driest month (Prec Driest) were alsotaken for further statistical comparison with floristic data.
Data analyses
To visualize relationships between plots and the mostimportant species contained within them we performed aNon-metric Multidimensional Scaling (NMS) ordinationanalysis in PC-ORD v. 4.25 (PC-ORD. Multivariateanalysis of ecological data, Version 4.25, MjM SoftwareDesign, Gleneden Beach, Oregon, USA), using theautopilot option and the Sørensen similarity coefficient.Ordination was carried out using the importance valueindex (IVI) of each species. Forty runs with real data and50 runs with randomized data were used to evaluate thestability of the final ordination. Only species recorded intwo or more plots were taken into account for this analysis(Greig-Smith 1983).
Pearson correlations to determine whether significantrelationships (P < 0.05) existed among soil, climate, andaltitude variables were performed using the InfoStatstatistical package (InfoStat 2010, Grupo InfoStat,Universidad Nacional de Cordoba, Cordoba, Argentina).
Relationships between floristic, environmental, alti-tude and geographical distances were assessed throughMantel correlation tests. Bray–Curtis distance matriceswere computed for abundances of all species and forpalm abundance separately. Euclidean distance matriceswere obtained for soil, climate and altitude variables, aswell for geographical distance (from plots coordinates)
which were transformed to natural logarithms (Hubbell2001). Combined Euclidean environmental matriceswere obtained for all climate variables (Climate), allsoil variables (Soil), all soil texture variables (Soil T),and all soil chemical variables (Soil Q); when necessarythe variables were standardized before computing thecombined matrices. The statistical significance of simplerM was estimated by 999 permutations (Legendre& Legendre 1998). Since multiple tests are donesimultaneously we compared probabilities P to aBonferroni-corrected probability level of α’ = α/k, whereα = 0.05 and k is the total number of tests performed(Legendre & Legendre 1998).
When multiple factors are correlated with floristiccomposition, the assessment of spatial autocorrelationallows spatial patterns to be identified among environ-mental variables, providing a better understanding ofthe relationship between environmental variables andfloristic composition and distribution. Using the PASSaGEv.2 software (Rosenberg & Anderson 2011), the degreeof spatial autocorrelation between floristic compositionand environmental variables was evaluated using Mantelcorrelograms, where Mantel correlation coefficients (rM)are compared between distance classes to determine thelevel of spatial autocorrelation among variables throughincreasing interplot distances. Distance classes rangedfrom 0.3–48 km, according to minimum and maximumdistance between plot pairs, spaced initially in 0.3-kmintervals and then at 3-km intervals. The statisticalsignificance of rM in the correlogram was estimated by999 permutations, and P values were adjusted using aprogressive Bonferroni correction following Legendre &Legendre (1998).
In addition to the frequently used Mantel correlation-based approach to test hypotheses like ours, we performeda variation partitioning analysis (Borcard et al. 1992,Legendre 2008) to partition the variation of speciescomposition into the contributions of soil, climate, altitudeand space mechanisms that are correlated to dicot treeand palm species in the landscape. Following Legendre& Gallagher (2001) and Jones et al. (2008), prior tothe analysis we transformed the species abundancesusing a Hellinger transformation to downweight the mostabundant species in the analysis. The decostand functionin the vegan library (vegan: Community Ecology Package,R package version 2.1–14/r2120, http://R-Forge.R-project.org/projects/vegan/) of R statistical software (R: ALanguage and Environment for Statistical Computing, RDevelopment Core Team, http://www.R-project.org) wasused.
The spatial structure was represented by positiveeigenvalues generated by a principal coordinates ofneighbour matrices (PCNM) analysis. PCNMs areconstructed from a matrix of geographical distanceamong samples and used as spatial predictors that

468 ADINA CHAIN-GUADARRAMA ET AL.
can be easily incorporated as explanatory variablesinto regression models or canonical analysis (Borcard& Legendre 2002, Dray et al. 2006). PCNMs weregenerated using the PCNM library in R (PCNM:PCNM spatial eigenfunction and principal coordinateanalyses, R package version 2.1/r82, http://R-Forge.R-project.org/projects/sedar/).
Following Jones et al. (2008) and Legendre et al.(2009), a two-step forward selection (Blanchet etal. 2008) was run on each set of environmental(climate or soil variables significantly related to speciescomposition according to previous Mantel tests) andspatial (PCNMs) explanatory variables separately in orderto select those with a significant (P < 0.05, 999 randompermutations) contribution to explaining variation infloristic composition. The function forward.sel in packforR library (packfor: Forward Selection with permutation(Canoco p.46), R package version 0.0–8/r100, http://R-Forge.R-project.org/projects/sedar/) was used, and onlythe selected variables were used in subsequent analyses.The forward selection procedure is based on permutationprocedure using residuals from the reduced model in aredundancy analysis.
The variation of the dicot tree and palm communitycomposition data and palm community separatelywas partitioned between soil, climate, altitude andPCNMs explanatory variables using redundancy analysis(Borcard et al. 1992, Legendre et al. 2009). This analysispartitions the variation of response table Y with respectto two, three, or four explanatory tables, without therequirement of removing collinear variables prior topartitioning (Borcard et al. 1992). Adjusted R2 values(Radj
2) indicating the proportion of variation explained byeach set of explanatory variables were reported (Peres-Neto et al. 2006). The significance of these fractions wastested by permutation tests (P < 0.05, 999 permutations).These analyses were computed using the functionsvarpart, rda and anova in the vegan library of R.
The use of canonical analysis on raw data offersmore powerful tests of significance than regression ondistance matrices (Gilbert & Bennett 2010, Legendreet al. 2005). However, the use of Mantel tests in ouranalysis permits comparison with previous studies testinghypothesis about the origin of beta diversity (Bohlman etal. 2008, Duque et al. 2009, Honorio Coronado et al. 2009,Macıa et al. 2007, Sesnie et al. 2009).
RESULTS
Floristics
A total of 1365 individuals (391 palms and 974dicot trees) from 237 species (eight species of palmand 229 of tree), 149 genera and 54 families were
recorded (Appendix 1). More than 80% of individualswere identified to the species level; grouping individualswith similar morphological characteristics the restwere assigned either to genus (14%) or unknownmorphospecies (3%) level.
A three-dimensional solution was obtained from theNMS analysis (Figure 3), performed with informationof 131 species recorded in two or more plots (106species recorded in only one plot were not taken intoaccount), with a final stress index of 18.0 that wassignificantly lower than 95% of the runs from Monte Carlorandomizations (P < 0.05). Axes 1, 2 and 3 respectivelyexplained 10.7%, 30.7% and 24.4% of floristic variationamong plots, for a total of 65.9% of explained variation.
Axis 2 represented an altitudinal gradient. It showedstrong negative correlations with two palm species,Iriartea deltoidea (r = −0.54) and Socratea exorrhiza(r = −0.39), and dicot tree species such as Brosimumutile (r = −0.65), Brosimum lactescens (r = −0.44), Ingasp. (r =−0.44), and Carapa guianensis (r =−0.41), whichdominate lowland forests; and strong positive correlationswith Alchornea glandulosa (r = 0.63), Beilschmiediatovarensis (r = 0.56), Pseudolmedia mollis (r = 0.54),Dacryodes sp. (r = 0.50), Quercus sp. (r = 0.50) and Ocoteasp. 2 (r = 0.48), dicot tree species characteristic of higher-altitude sites. Compositional differences between lowlandsites were brought out by Axis 3 and were determinedby variation in the abundance of the palms Welfia regia(r = 0.54) and Euterpe precatoria (r = 0.47), and dicottree species of the genus Vochysia (V. ferruginea, V. allenii,r = 0.68 and r = 0.39, respectively), as well as otherspecies such as Hirtella triandra (r = 0.49), Aspidospermamegalocarpon (r = 0.43) and Calophyllum longifolium (r =0.39), all positively correlated with Axis 3. Anacardiumexcelsum (r = −0.54) and Tetragastris panamensis (r =−0.46), negatively correlated with Axis 1, also played animportant role in the differentiation of the lowland sites.
Altitude, climate and soil gradients
The more than 20-fold variation in altitude was the mostevident gradient in the landscape (Table 1; Figure 2).Altitude was correlated negatively with all temperaturevariables, annual and precipitation of the driest monthvalues, and positively correlated with precipitationcoefficient of variation (so that higher-altitude sites, aswell as being cooler, tend to have lower and moreseasonal rainfall; Table 2). Mean annual and minimumtemperature of the coldest month showed considerablevariation across the landscape, with temperature beingmoderately cooler in plots of higher altitudes. Annualprecipitation and precipitation of driest month also variedwidely (Table 1, Figure 2).
Chemical and physical soil properties also showed ahigh degree of variation (Table 3). Cations (Ca, Mg, K)

Forest beta diversity on an altitudinal gradient 469
Figure 3. Ordination of vegetation plots along NMS axes two and one (a), and two and three (b). Plot’s symbol size represents plot altitude, so biggersquares are equal to higher altitudes. Species better correlated to these two main axes of variation are shown (cross symbol): Vochysia ferruginea(VOCHFE), Welfia regia (WELFRE) and Socratea exorrhiza (SOCREX), Tetragastris panamensis (TETRPA), Iriartea deltoidea (IRIADE) and Anacardiumexcelsum (ANACEX) characteristic of lowland forests; and Beilschmiedia tovarensis (BEILTO), Alchornea glandulosa (ALCHGL) and Quercus sp. (QUERSP)characteristic of higher altitude forests.

47
0A
DIN
AC
HA
IN-G
UA
DA
RR
AM
AE
TA
L.
Table 2. Correlation matrix and coefficients from simple Pearson correlation tests between soil, climate and altitude values from forest plots. Significant correlation are shown as ∗∗∗P < 0.001,∗∗P < 0.01, ∗P < 0.05. See text for those variables with abbreviations.
Altitude Soil depth Sand Silt Clay pH Acidity Ca Mg K P Ann Temp Temp SD Min Temp Ann Prec Prec Driest
Soil depth 0.47∗∗Sand 0.65∗∗∗ 0.58∗∗∗Silt −0.38∗ −0.03 −0.51∗∗Clay −0.59∗∗∗ −0.65∗∗∗ −0.93 0.15pH −0.35∗ −0.38∗ −0.29 0.56∗∗∗ 0.10Acidity −0.17 0.08 0.20 −0.55∗∗∗ 0.01 −0.54∗∗∗Ca −0.30 −0.39∗ −0.17 0.25 0.09 0.82∗∗∗ −0.20Mg −0.44∗ −0.08 −0.34∗ 0.49∗∗ 0.17 0.44∗∗ −0.03 0.55∗∗∗K −0.27 −0.29 −0.13 0.39∗ −0.02 0.43∗∗ −0.09 0.41∗∗ 0.41∗∗P 0.14 −0.06 0.06 −0.0017 −0.06 −0.09 −0.04 0.03 0.05 0.08Ann Temp −0.97∗∗∗ −0.46∗∗ −0.65∗∗∗ 0.36∗ 0.59∗∗∗ 0.29 0.23 0.30 0.44∗∗ 0.33∗ −0.15SD Temp −0.82∗∗∗ −0.48∗∗ −0.46∗∗∗ 0.12 0.47∗∗ 0.24 0.30 0.42∗∗ 0.42∗∗ 0.24 −0.05 0.85∗∗∗MinTemp −0.98∗∗∗ −0.46∗∗ −0.64∗∗∗ 0.34∗ 0.59∗∗∗ 0.28 0.23 0.29 0.42∗∗ 0.31 −0.16 0.99∗∗∗ 0.86∗∗∗Ann Prec −0.51∗∗ −0.01 −0.24 0.21 0.19 0.04 0.07 0.12 0.13 0.04 0.09 0.53∗∗∗ 0.52∗∗∗ 0.56∗∗∗Prec Driest −0.68∗∗∗ −0.09 −0.36∗ 0.26 0.30 0.06 0.17 0.11 0.20 0.15 −0.05 0.70∗∗∗ 0.59∗∗∗ 0.73∗∗∗ 0.93∗∗∗Prec CV 0.77∗∗∗ 0.24 0.49∗∗ −0.37∗ −0.40∗∗ −0.19 −0.08 −0.18 −0.27 −0.27 0.13 −0.78∗∗∗ −0.60∗∗∗ −0.81∗∗∗ −0.82∗∗∗ −0.90∗∗∗
Forest beta diversity on an altitudinal gradient 471
Table 3. Summarized soil chemical and physical properties of all sampledforest plots across the fragmented landscape in south Pacific Costa Rica.
Mean ± SE Range
Ca (cmol(+) l−1) 5.2 ± 0.8 0.21–22.7K (cmol(+) l−1) 0.2 ± 0.02 0.06–0.4Mg (cmol(+) l−1) 1.9 ± 0.3 0.18–11.2P (mg l−1) 1.8 ± 0.7 0.4–6.3Total acidity (cmol(+) l−1) 3.3 ± 0.5 0.09–13.9pH 5.1 ± 0.1 4.22–6.4Sand (%) 48.2 ± 2.7 21–75.2Silt (%) 24.5 ± 1 13.8–35.9Clay (%) 27.3 ± 2.3 5–51.3Soil depth (cm) 75.3 ± 3 42.8–108
were positively correlated among themselves and with pH,in turn negatively correlated with acidity (Table 2). Soilswith a high percentage of silt were positively associatedwith Mg and K presence (Table 2). Extractable phosphorus(P) did not correlate with any soil or climate variables.Soil trends with altitude were increasing depth and sandcontent, and decreasing pH, silt and clay content and Mg.No significant relationship between other soil cations andaltitude was found (Table 2).
Spatial autocorrelation among variables
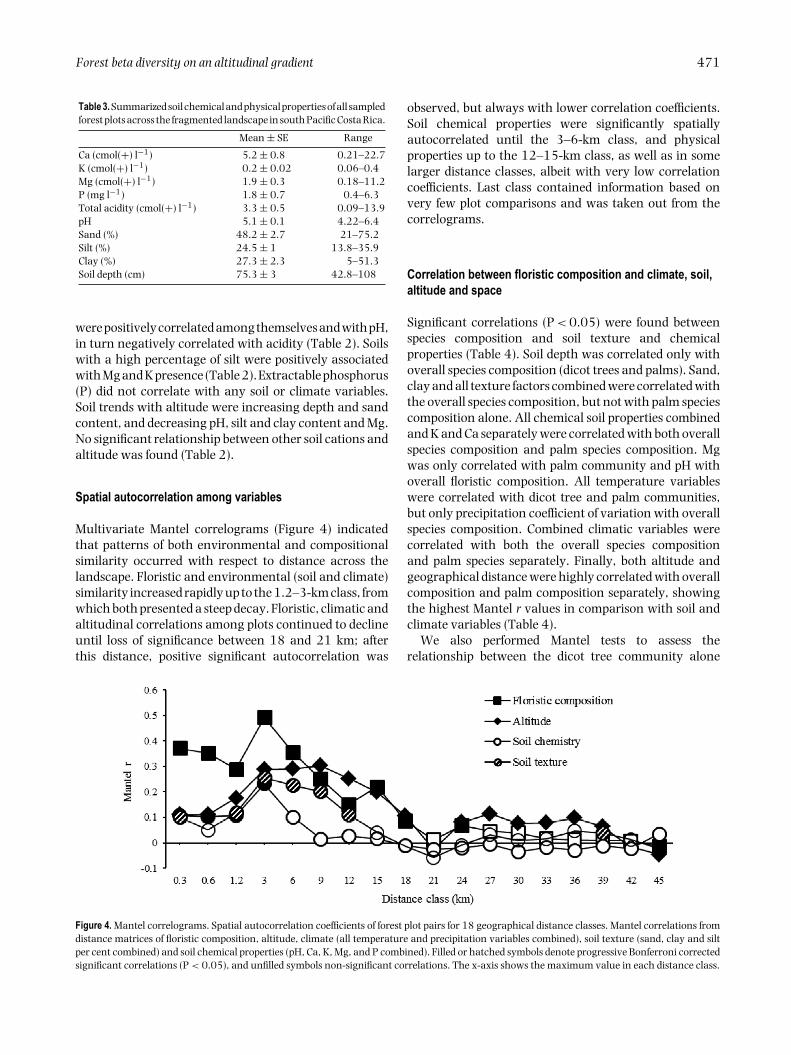
Multivariate Mantel correlograms (Figure 4) indicatedthat patterns of both environmental and compositionalsimilarity occurred with respect to distance across thelandscape. Floristic and environmental (soil and climate)similarity increased rapidly up to the 1.2–3-km class, fromwhich both presented a steep decay. Floristic, climatic andaltitudinal correlations among plots continued to declineuntil loss of significance between 18 and 21 km; afterthis distance, positive significant autocorrelation was
observed, but always with lower correlation coefficients.Soil chemical properties were significantly spatiallyautocorrelated until the 3–6-km class, and physicalproperties up to the 12–15-km class, as well as in somelarger distance classes, albeit with very low correlationcoefficients. Last class contained information based onvery few plot comparisons and was taken out from thecorrelograms.
Correlation between floristic composition and climate, soil,altitude and space
Significant correlations (P < 0.05) were found betweenspecies composition and soil texture and chemicalproperties (Table 4). Soil depth was correlated only withoverall species composition (dicot trees and palms). Sand,clay and all texture factors combined were correlated withthe overall species composition, but not with palm speciescomposition alone. All chemical soil properties combinedand K and Ca separately were correlated with both overallspecies composition and palm species composition. Mgwas only correlated with palm community and pH withoverall floristic composition. All temperature variableswere correlated with dicot tree and palm communities,but only precipitation coefficient of variation with overallspecies composition. Combined climatic variables werecorrelated with both the overall species compositionand palm species separately. Finally, both altitude andgeographical distance were highly correlated with overallcomposition and palm composition separately, showingthe highest Mantel r values in comparison with soil andclimate variables (Table 4).
We also performed Mantel tests to assess therelationship between the dicot tree community alone
Figure 4. Mantel correlograms. Spatial autocorrelation coefficients of forest plot pairs for 18 geographical distance classes. Mantel correlations fromdistance matrices of floristic composition, altitude, climate (all temperature and precipitation variables combined), soil texture (sand, clay and siltper cent combined) and soil chemical properties (pH, Ca, K, Mg, and P combined). Filled or hatched symbols denote progressive Bonferroni correctedsignificant correlations (P < 0.05), and unfilled symbols non-significant correlations. The x-axis shows the maximum value in each distance class.

472 ADINA CHAIN-GUADARRAMA ET AL.
Table 4. Simple Mantel correlation (rM) tests between floristiccomposition and climate, soil, altitude and geographical distance.Tests were performed for the overall canopy community (dicot treesand palms) and palms separately. Significant correlations denoted byan asterisk (∗) were determined from 999 permutations and furtherBonferroni-corrected (α′ = 0.05/22). See text for those variables withabbreviations.
Dicot trees and palms Palms
Variable rM rM
Soil Ca 0.17∗ 0.15∗K 0.21∗ 0.25∗Mg 0.09 0.14∗P −0.01 0.10Acidity −0.01 0.04pH 0.18∗ 0.12Soil Q 0.18∗ 0.26∗Depth 0.11∗ 0.07Sand 0.30∗ 0.09Silt 0.06 0.10Clay 0.22∗ 0.05Soil T 0.23∗ 0.10Soil 0.26∗ 0.26∗
Climate Ann Temp 0.38∗ 0.27∗Temp SD 0.32∗ 0.24∗Min Temp 0.38∗ 0.29∗Ann Prec 0.04 0.09Prec CV 0.12∗ 0.09Prec Driest 0.05 0.09Climate 0.25∗ 0.21∗
Geographical distance 0.47∗ 0.30∗Altitude 0.44∗ 0.31∗
and all environmental and space variables. Associationpatterns were similar to those observed for tree and palmcombined, so in subsequent sections we only presentanalysis for the overall community of canopy species.
Variation partitioning of dicot tree and palm speciescomposition
The forward selection procedure retained five principalcoordinates of neighbour matrices (PCNMs) for modelling
the overall species composition variation and two PCNMsfor modelling palm species separately. The final soilcomponent related to the overall species compositionincluded clay, Ca and K, and Ca and Mg for palmsseparately. The climate component included minimumtemperature of the coldest minth for dicot trees and palmscombined, and temperature standard deviation for palmsseparately.
Soil, climate, altitude and space were related to20.4% of variation of the overall species composition,while 79.6% remained unexplained (Figure 5). PNCMswere more strongly correlated with variation of speciescomposition (R2
adj = 0.15%), in comparison with soil,climate and altitude components (R2
adj of 0.09, 0.07and 0.07 respectively, Figure 5). These results indicatedthat a relatively high proportion of the variation inspecies composition is spatially structured, which iscorroborated by the percentage of species compositionvariation related to soil, climate and altitude componentsthat could not be separated from space (48.0%, 83.3% and81.3% respectively, calculated from Table 5), i.e. a highpercentage of these components is spatialized (Figure 5).In turn, 28.2% of the total variation related to PCNMs wasassociated to the soil component and 38.6% to the altitudeand 38.2% to climate. Furthermore, when observingthe proportion related to the pure effect of each oneof the four measured components, i.e. while controllingthe three other components, climate and altitude werenot significant or null fractions and the space and soilcomponents were best related to variation in speciescomposition (Table 5).
Thirty-one per cent of variation of palm speciescomposition was related to soil, climate, altitude and spacefactors. As in the case of overall species composition,the results indicated that variation of palm floristiccomposition was spatially structured. PCNMs were alsobetter related to palm variation among sites (R2
adj =0.22), followed by the climate component (R2
adj = 0.20),
Figure 5. Total explained variation by all and each one of the four measured components (soil, climate, altitude and space) for both the overall plantcommunity and palm community separately. The amount of variance that could not be separated from space is indicated by the diagonally hatchedsection of each bar.

Forest beta diversity on an altitudinal gradient 473
Table 5. Variation partitioning results for dicot tree and palmcommunities sampled in 37 0.25-ha plots in the studied landscape.Adjusted R2 statistics (R2
adj) and F statistics are presented for allmeasured factors, S: soil, C: climate, A: altitude, SP: space. The effect offactors controlling for any combinations of other factors is denoted bysymbol |. Negative or null fractions are denoted with a dash.
Dicot trees and palms Palms
Factor R2adj F P R2
adj F P
S 0.087 2.15 0.005 0.118 3.41 0.005C 0.068 3.64 0.005 0.198 9.90 0.005A 0.071 3.74 0.005 0.173 8.55 0.005SP 0.149 2.26 0.005 0.222 6.13 0.005All 0.204 1.93 0.005 0.313 4.48 0.005S | C,A,SP 0.037 1.45 0.005 0.053 2.29 0.017C | S,A,SP 0.002 1.08 0.360 0.003 0.00 N/A
A| S,C,SP – – – – – –SP| S,C,SP 0.059 1.46 0.005 0.033 1.95 0.044S | SP 0.045 1.58 0.005 0.085 3.08 0.005C | SP 0.011 1.42 0.034 0.052 3.41 0.018A | SP 0.013 1.49 0.020 0.018 1.80 0.150SP | S 0.107 1.88 0.005 0.188 5.62 0.005SP | C 0.092 1.77 0.005 0.075 2.81 0.010SP | A 0.091 1.76 0.005 0.066 2.53 0.013
altitude (R2adj = 0.17) and soil (0.12.1%; Figure 5).
The amount of palm community variance related to theintersection of altitude, climate and PCNMs (R2
adj =0.13), that represents a considerable proportion of thevariance related to each one of this factors separately(77.1%, 67.4% and 60.2% in the above given order),suggest that is difficult to separate the effect of thesethree factors on palm species distribution. In fact 74%and 89.7% of the variation of palm community relatedto climate and altitude was spatialized, and 66.2% and70.1% of variation related to space could not be separatedfrom climate and altitude processes respectively. Againthe pure effects of climate and altitude were non-significant, and altitude was not significantly related topalm species composition when space was controlled for.Moreover, the pure contribution of soil and space washigher than any of the other components (Table 5) and,in contrast to results obtained for the overall speciescomposition, the effect of soil on palm composition wasless spatialized, suggesting the importance of edaphicproperties in the determination of variation in palmcomposition across the landscape.
DISCUSSION
Recognized plant communities
Multivariate analysis of vegetation, carried out with datafrom dicot canopy trees ≥ 30 cm dbh and palms ≥ 10cm dbh, allowed us to identify a clear pattern of floristicdifferences among vegetation plots in the study landscape.Previous studies conducted with both understorey andcanopy plant species have not found important differences
between these groups in their relationship with theenvironment (Duque et al. 2002, 2009; Macıa et al. 2007),allowing us to conclude that recognized floristic patternsfor trees≥30 cm dbh and palms≥10 cm dbh are probablyrepresentative of the forest as a whole. This assessmentof forest compositional variation was a baseline forsubsequent assessment of relationships between forestfloristic composition and environmental factors.
Altitude, environment and floristic gradients
Species composition turnover displayed an evident spatialpattern associated with environmental variables andgeographical distance, as observed in the correlograms.As in other studies in Central America (Condit et al. 2002,Sesnie et al. 2009), environmental and floristic similarityin this study showed first a steep decline and then apersistent decline to a point where significance was lost(between 40 km and 50 km very low floristic correlationwas found). Sesnie et al. (2009) evaluated these trends onan altitudinal gradient to 1200 m asl although Condit et al.(2002) make no reference to the altitude of their lowlandplots; in both studies, maximum interplot distances werevery similar.
The complex topography of Costa Rica results in greatclimate variability over short distances. Similar trends areseen in soils, whose variables of structure, compositionand fertility are determined in part by climatic andtopographic factors (Grayum et al. 2004, Grubb 1977).In our study, floristic and environmental similarity bothrespond to altitude changes, both interestingly decreasingto the lowest point at the same distance where the coastalrange rises up (18–20 km from the coast). Increasinggeographical distance is associated with changes inaltitude and correlated changes in soils and climate. Inthis way, geographical distance and especially altituderepresent indirect environmental gradients along whichfloristic composition varies (Gentry 1988, Givnish 1999,Homeier et al. 2010, Macıa et al. 2007, Sesnie et al. 2009).Altitude not only closely covaried with temperature andprecipitation variables, but was also correlated withedaphic factors indicating a decrease in soil nutrientand fertility as altitude rises (Homeier et al. 2010).In the absence of dispersal limitation, this terrain-related environmental heterogeneity is bound to generatedifferential species responses, in accordance to the nicheassembly rule. The key question is, what evidence is therefor dispersal limitation?
Determinants of dicot tree and palm floristic patterns
When examining the relationships between plant speciescomposition and soil, climate, altitude and geographical

474 ADINA CHAIN-GUADARRAMA ET AL.
distance, it is clear that all these factors are intercorrelatedand that the understanding of their relative importancein determining floristic composition is not an easytask. However, from our distance matrix and variationpartitioning analyses we found general trends showingthat environmental and floristic patterns evidence aspatial structure across the landscape and that differencesexist among factors related to overall and palm speciescomposition individually.
In spite of the very marked environmental hetero-geneity in our study landscape, Mantel correlations andvariation partitioning analyses show that geographicaldistance was the single most important factor in thedetermination of variation in the overall compositionof dicot tree and palm species. Complete support forthe dispersal limitation hypothesis is not expected insuch a variable environment, but in our landscapeenvironmental control was correlated to less variationin species composition than space. Some authors (Chustet al. 2006, Condit et al. 2002, Ruokolainen et al. 2007,Vormisto et al. 2004) have pointed out that such apredominance of dispersal limitation over environmentalfiltering (Chust et al. 2006, Condit et al. 2002, Duqueet al. 2009, Normand et al. 2006) might be attributed toinadequate representation of key environmental variablessuch as soil physical and chemical properties; however,in the present study, a range of such variables weremeasured in each plot.
Altitude is an important correlate of variation in plantspecies composition, due to both environmental andspatial changes associated with it. Macıa et al. (2007) alsofound that altitude and geographical distance explainedspecies composition patterns in Bolivian Amazonia, buttheir results and those of Sesnie et al. (2009) in northernCosta Rica more strongly supported edaphic control onplant species composition. These studies had a shorteraltitudinal gradient than ours and Macıa et al. (2007)did not include climatic variables in their analysis.Even though the construction of the climate modelwe used is strongly dependent on altitude (Hijmanset al. 2005), our results suggest that altitude is notmerely a climate surrogate, but also a component ofgeographical distance in the terrain. In fact, the variationpartitioning approach pointed out that there is novariation in species composition that can be correlatedto the pure effect of climate and altitude, demonstratingthat even when altitude and temperature show strongcorrelation coefficients with species composition they arenot separable from influences of the environmental andspatial position components.
Soil factors showed significant correlation coefficientswith plant patterns, contributing to explain dicot tree andpalm floristic patterns in the landscape. Ca, K and clay con-tent were correlated with overall species composition, inagreement with other studies that indicate a contribution
of environmental control to the determination of floristicpatterns (Costa et al. 2009, Duque et al. 2002, Joneset al. 2006, Macıa et al. 2007, Phillips et al. 2003,Pyke et al. 2001, Rukolainen et al. 2007, Sesnie et al.2009, Tuomisto et al. 2003a, 2003b). Values of thesechemical properties have been shown to be correlatedwith tropical plant diversity (Gentry 1988, HonorioCoronado et al. 2009, Macıa et al. 2007) and variationin tree species composition (Phillips et al. 2003, Pottset al. 2002, Ruokolainen et al. 2007, Tuomisto et al.2003c).
In the variation partitioning analysis, the soilcomponents related to the overall species compositionincluded clay, Ca and K; however, a high percentage ofthe soil explanation was spatialized. This was not the casefor the palm species variation, in which a smaller factionof the soil component related to palm composition wasspatialized. This suggests that palm species have strongerresponse than dicot canopy trees to chemical soil gradientswhich may not be spatially structured at the studied scale(see also Clark et al. 1995, Costa et al. 2009, John et al.2007, Sesnie et al. 2009). It was also observed that theabundance of W. regia declined substantially in sandysoils at altitudes up to c. 500 m asl, while I. deltoidea andE. precatoria were distributed in a much wider area ina longer altitudinal (up to c. 1000 m asl) and edaphicgradient, as found by Lieberman et al. (1996) and Sesnieet al. (2009).
Our results support space as the major individual factorinfluencing beta diversity of dicot trees and palms evenin this environmentally variable altitudinal gradient, butalso show that neutral forces are complementary with,not exclusive from, environmental control. Dicot tree andpalm species turnover in these Neotropical terra firmeforests, 64–1528 m asl appear to be better explained bya coupled effect of both dispersal limitation and environ-mental filtering as suggested by several studies in lowlandenvironments (Chust et al. 2006, Condit et al. 2002,Duivenvoorden et al. 2002, Duque et al. 2009, Normandet al. 2006, Valencia et al. 2004, Vormisto et al. 2004).
A relatively high proportion of community variation inthe landscape could not be related to neither climate, soil,altitude and spatial data, which can be attributed to otherrandom dispersal and mortality mechanisms, or variationcaused by unmeasured environmental or biological (e.g.species traits) variables (Legendre et al. 2009). Land-useconfiguration, another variable not taken into accountin the analysis, could also have an effect on the plantspecies composition (Marini et al. 2011). Our samplingprotocol is designed to minimize edge effects on forestcharacteristics (Sesnie et al. 2009), but the possibleinfluence of the fragmentation of the landscape remainsunknown. Other processes underlying the influence ofgeographical location on the species composition of theseforests may be those acting at larger scales. Boundaries of

Forest beta diversity on an altitudinal gradient 475
climatically defined forest types may have shifted by up to700 m during the last glaciation (Islebe et al. 1995), so thatthe current distributions of species are partly the result oftheir capacity to disperse in relation to natural climatechange. They may also be related to species radiationsfrom different centres of origin especially in this regionof the Central American isthmus where species fromthe Amazonian region and the North American regioncoincide (Gentry 1992). Finally, we need to considerfactors related to study design and statistical power.A higher number of plots and replicates at particularpoints on the altitudinal gradient may have allowed theexplanation of a higher amount of variance in speciescomposition turnover.
Implications for conservation on tropical altitudinalgradients
This is one of the first studies to determine the relative rolesof niche and dispersal in determining forest compositionalturnover on tropical mountains, which has traditionallybeen interpreted as a result of niche assembly. We thuscontribute to a more comprehensive understanding ofspatial patterns of tree species diversity (Lomolino 2001,Malhi et al. 2011). This is particularly important toconservation and sustainable use of biodiversity in regionslike Central America where the wide range of altitudes andhigh topographic complexity gives rise to high landscapediversity (Enquist 2002), and where vulnerability torising temperatures and changing rainfall patterns is high(Imbach et al. 2012).
The finding that geographical position may greatlyinfluence forest composition on a tropical altitudinalgradient is important for several reasons. First, if speciesdistributions determined in a landscape relatively free ofhuman disturbance – as detected by our sampling protocol(Sesnie et al. 2009) – partly reflect dispersal limitation,then species adaptation to climate change taking placeover a few decades (Imbach et al. 2012) could be morestrongly limited by their dispersal capacities (Pearson &Dawson 2005) than by their capacity to adapt to newenvironmental conditions. This point emphasizes oncemore the need to take into account the connectivity andsize of forest patches when protecting plant species fromextinction (Duque et al. 2009, Pearson & Dawson 2005).On the other hand, if environmental tolerances of speciesare wider than their current distributions indicate, thentheir capacity to tolerate change in situ might be greaterthan thought. Second, the contingent nature of com-munities emphasized in neutral theory (Hubbell 2001)suggests that ecosystem-based conservation planningcontinues to be valid as an approach to ‘keeping commonspecies common’ (Caicco et al. 1995) but that treatingecosystems as equivalent to species as conservationobjects as proposed by Rodrıguez et al. (2011) is illusory.
Finally, if species distributions partially reflect dispersallimitation, then the limitations of bioclimatic envelopemodels in the prediction of climate change impacts(Pearson & Dawson 2003) are further emphasized.
ACKNOWLEDGEMENTS
This research was supported by The Nature Conservancyto perform field work, and Consejo Nacional de Cienciay Tecnologıa (CONACyT), Mexico, which supported thefirst author with a complete scholarship during hermaster studies. We especially thank Vicente Herra, LeonelCoto, Octavio Palacio, Bernardo Hernandez, Alvaro Avila,Agustın Zuniga and Astrid Pulido for their assistanceduring fieldwork; Hugo Brenes for assistance withdatabase management; Diego Delgado for his assistancewith field work logistics; Nelson Zamora who identifiedleaf specimens that allowed us to carry out the analysis;and Lee Vierling for his insightful comments on themanuscript.
LITERATURE CITED
BLANCHET, G., LEGENDRE, P. & BORCARD, D. 2008. Forward selection
of explanatory variables. Ecology 89:2623–2632.
BOHLMAN, S. A., LAURANCE, W. F., LAURANCE,, S. G., NASCIMENTO,
H. E. M., FEARNSIDE, P. M. & ANDRADE, A. 2008. Importance
of soils, topography and geographic distance in structuring central
Amazonian tree communities. Journal of Vegetation Science 19:863–
874.
BORCARD, D. & LEGENDRE, P. 2002. All-scale spatial analysis of
ecological data by means of principal coordinates of neighbour
matrices. Ecological Modelling 153:51–68.
BORCARD, D., LEGENDRE, P. & DRAPEAU, P. 1992. Partialling out the
spatial component of ecological variation. Ecology 73:1045–1055.
BOURONCLE, C. & FINEGAN, B. 2011. Tree regeneration and
understory woody plants show diverse responses to forest–pasture
edges in Costa Rica. Biotropica 43:562–571.
CAICCO, S. L., SCOTT, J. M., BUTTERFIELD, B. & CSUTI, B. 1995. A GAP
analysis of the management status of the vegetation of Idaho (USA).
Conservation Biology 9:498–511.
CESPEDES, M., FINEGAN, B., HERRERA, B., DELGADO, L. D.,
VELASQUEZ, S. & CAMPOS, J. J. 2008. Diseno de una red ecologica
de conservacion entre la Reserva de Biosfera La Amistad y las
areas protegidas del Area de Conservacion Osa, Costa Rica. Recursos
Naturales y Ambiente 54:44–50.
CHAZDON, R. L., FINEGAN, B., CAPERS, R. S., SALGADO-NEGRET, B.,
CASANOVES, F., BOUKILI, V. & NORDEN, N. 2010. Composition
and dynamics of functional groups of trees during tropical forest
succession in Northeastern Costa Rica. Biotropica 42:31–40.
CHUST, G., CHAVE, J., CONDIT, R., AGUILAR, S., LAO, S. & PEREZ,
R. 2006. Determinants and spatial modeling of tree β-diversity in
a tropical forest landscape in Panama. Journal of Vegetation Science
17:83–92.

476 ADINA CHAIN-GUADARRAMA ET AL.
CLARK, D. A., CLARK, D. B., SANDOVAL, R. & CASTRO, M. V.
1995. Edaphic and human effects on landscape-scale distributions of
tropical rain forest palms. Ecology 76:2581–2594.
CONDIT, R., PITMAN, N., LEIGH, E. G., CHAVE, J., TERBORGH, J.,
FOSTER, R. B., NUNEZ, P., AGUILAR, S., VALENCIA, R., VILLA,
G., MULLER-LANDAU, H. C., LOSOS, E. & HUBBELL, S. P. 2002.
Beta-diversity in tropical forest trees. Science 295:666–669.
COSTA, F. R. C., GUILLAUMET, J.-L., LIMA, A. P. & PEREIRA, O. 2009.
Gradients within gradients: the mesoscale distribution patterns of
palms in a central Amazonian forest. Journal of Vegetation Science
20:69–78.
DE BLOIS, S., DOMON, G. & BOUCHARD, A. 2002. Landscape issues in
plant ecology. Ecography 25:244–256.
DRAY, S., LEGENDRE, P. & PERES-NETO, P. R. 2006. Spatial modelling:
a comprehensive framework for principal coordinate analysis
of neighbour matrices (PCNM). Ecological Modelling 196:483–
493.
DUIVENVOORDEN, J. F., SVENNING, J. C. & WRIGHT, S. J. 2002. Beta-
diversity in tropical forests. Science 395:636–637.
DUQUE, A., SANCHEZ, M., CAVELIER, J. & DUIVENVOORDEN, F. 2002.
Different floristic patterns of woody understorey and canopy plants
in Colombian Amazonia. Journal of Tropical Ecology 18:499–525.
DUQUE, A., PHILLIPS, J. F., VON HILDEBRAND, P., POSADA, C. A.,
PRIETO, A., RUDAS, A., SUESCUN, M. & STEVENSON, P. 2009.
Distance decay of tree species similarity in protected areas on terra
firme forests in Colombian Amazonia. Biotropica 41:599–607.
ENQUIST, C. A. F. 2002. Predicted regional impacts of climate change
on the geographical distribution and diversity of tropical forests in
Costa Rica. Journal of Biogeography 29:529–534.
FASSBENDER, H. W. & BORNEMISZA, E. 1987. Quımica de suelos con
enfasis en suelos de America Latina. (Second Edition). IICA, San Jose.
420 pp.
FINEGAN, B. & DELGADO, D. 2000. Structural and floristic
heterogeneity in a 30-year-old Costa Rican rain forest restored on
pasture through natural secondary succession. Restoration Ecology
8:380–393.
GENTRY, A. H. 1988. Changes in plant community diversity and floristic
composition on environmental and geographical gradients. Annals
of the Missouri Botanical Garden 75:1–34.
GENTRY, A. H. 1992. Tropical forest biodiversity: distributional patterns
and their conservational significance. Oikos 63:19–28.
GILBERT, B. & BENNETT, J. R. 2010. Partitioning variation in ecological
communities: do the numbers add up? Journal of Applied Ecology
47:1071–1082.
GIVNISH, T. J. 1999. On the causes of gradients in tropical tree diversity.
Journal of Ecology 87:193–210.
GRAYUM, M. H., HAMMEL, B. E. & ZAMORA, N. 2004. El ambiente
fısico. Pp. 51–90 in Hammel, B. E., Grayum, M. H., Herrera, C.
& Zamora, N. (eds.). Manual de plantas de Costa Rica Volumen I:
Introduccion. Missouri Botanical Garden Press, St. Louis. 299 pp.
GREIG-SMITH, P. 1983. Quantitative plant ecology. (Third Edition).
Blackwell Scientific, Oxford. 359 pp.
GRUBB, P. J. 1977. Control of forest growth and distribution on wet
tropical mountains: with special reference to mineral nutrition.
Annual Review of Ecology and Systematics 8:83–107.
HIJMANS, R. J., CAMERON, S. E., PARRA, J. L., JONES, P. G. & JARVIS,
A. 2005. Very high resolution interpolated climate surfaces for global
land areas. International Journal of Climatology 25:1965–1978.
HOMEIER, J., BRECKLE, S.-W., GUNTER, S., ROLLENBECK, R. T.
& LEUSCHNER, C. 2010. Tree diversity, forest structure and
productivity along altitudinal and topographical gradients in a
species-rich Ecuadorian montane rain forest. Biotropica 42:140–148.
HONORIO CORONADO, E. N., BAKER, T. R., PHILLIPS, O. L.,
PITMAN, N. C. A., PENNINGTON, R. T., VASQUEZ MARTINEZ, R.,
MONTEAGUDO, A., MOGOLLON, H., DAVILA CARDOZO, N., RIOS,
M., GARCIA-VILLACORTA, R., VALDERRAMA, E., AHUITE, M.,
HUAMANTUPA, I., NEILL, D. A., LAURANCE, W. F., NASCIMENTO,
H. E. M., SOARES DE ALMEIDA, S., KILLEEN, T. J., ARROYO,
L., NUNEZ, P. & FREITAS ALVARADO, L. 2009. Multi-scale
comparisons of tree composition in Amazonian terra firme forests.
Biogeosciences 6:2719–2731.
HUBBELL, S. P. 2001. The unified neutral theory of biodiversity and
biogeography. Princeton University Press, Princeton. 448 pp.
IMBACH, P., MOLINA, L., LOCATELLI, B., ROUPSARD, O., MAHE,
G., NEILSON, R., CORRALES, L., SCHOLZE, M. & CIAIS, P. 2012.
Modeling potential equilibrium states of vegetation and terrestrial
water cycle of Mesoamerica under climate change scenarios. Journal
of Hydrometeorology 13:665–680.
ISLEBE, G. A., HOOGHIEMSTRA, H. & VAN DER BORG, K. 1995.
A cooling event during the Younger Dryas Chron in Costa Rica.
Palaeogeography, Palaeoclimatology, Palaeoecology 117:73–80.
ITCR 2004. Atlas digital de Costa Rica. Instituto Tecnologico de Costa
Rica, Escuela de Ingenierıa Forestal, Laboratorio de Informacion
Geografica, Cartago, CR.
JOHN, R., DALLING, J. W., HARMS, K. E., YAVITT, J. B., STALLARD, R.
F., MIRABELLO, M., HUBBELL, S. P., VALENCIA, R., NAVARRETE,
H., VALLEJO, M. & FOSTER, R. B. 2007. Soil nutrients influence
spatial distributions of tropical tree species. Proceedings of the National
Academy of Sciences USA 104:864–869.
JONES, M. M., TUOMISTO, H., CLARK, D. B. & OLIVAS, P. 2006. Effects of
mesoscale environmental heterogeneity and dispersal limitation on
floristic variation in rain forest ferns. Journal of Ecology 94:181–195.
JONES, M. M., TUOMISTO, H., BORCARD, D., LEGENDRE, P., CLARK,
D. B. & OLIVAS, P. C. 2008. Explaining variation in tropical plant
community composition: influence of environmental and spatial data
quality. Oecologia 155:593–604.
LEGENDRE, P. 2008. Studying beta diversity: ecological variation
partitioning by multiple regression and canonical analysis. Journal
of Plant Ecology 31:976–981.
LEGENDRE, P. & GALLAGHER, E. D. 2001. Ecologically meaningful
transformations for ordination of species data. Oecologia 129:271–
280.
LEGENDRE, P. & LEGENDRE, L. 1998. Numerical ecology. (Second English
Edition). Elsevier Science, Amsterdam. 853 pp.
LEGENDRE, P., BORCARD, D. & PERES-NETO, P. R. 2005. Analyzing
beta diversity: partitioning the spatial variation of community
composition data. Ecological Monographs 75:435–450.
LEGENDRE, P., MI, X., REN, H., MA, K., YU, M., SUN, I-F. & HE, F.
2009. Partitioning beta diversity in a subtropical broad-leaved forest
of China. Ecology 90:663–674.

Forest beta diversity on an altitudinal gradient 477
LIEBERMAN, D., LIEBERMAN, M., PERALTA, R. & HARTSHORN, G.
S. 1996. Tropical forest structure and composition on a large scale
altitudinal gradient in Costa Rica. Journal of Ecology 84:137–152.
LOMOLINO, M. V. 2001. Elevation gradients of species-density:
historical and prospective views. Global Ecology and Biogeography
10:3–13.
MACIA, M. J., RUOKOLAINEN, K., TUOMISTO, H., QUISBERT, J. &
CALA, D. V. 2007. Congruence between floristic patterns of trees
and lianas in a southwest Amazonian rain forest. Ecography 30:561–
577.
MALHI, Y., SILMAN, M., SALINAS, N., BUSH, M., MEIR, P. & SAATCHI,
S. 2011. Introduction: Elevation gradients in the tropics: laboratories
for ecosystem ecology and global change research. Global Change
Biology 16:3171–3175.
MARINI, L., BONA, E., KUNIN, W. E. & GASTON, K. J. 2011. Exploring
anthropogenic and natural processes shaping fern species richness
along elevational gradients. Journal of Biogeography 38:78–88.
MARTIN, P. H., FAHEY, T. J. & SHERMAN, R. E. 2011. Vegetation
zonation in a Neotropical montane forest: environment, disturbance
and ecotones. Biotropica 43:533–543.
NORMAND, S., VORMISTO, J., SVENNING, J., GRANDEZ, C. & BALSLEV,
H. 2006. Geographical and environmental controls of palm beta
diversity in paleo-riverine terrace forests in Amanonian Peru. Plant
Ecology 186:161–176.
PEARSON, R. G. & DAWSON, T. P. 2003. Predicting the impacts of
climate change on the distribution of species: are bioclimate envelope
models useful? Global Ecology and Biogeography 12:361–371.
PEARSON, R. G. & DAWSON, T. P. 2005. Long-distance plant
dispersal and habitat fragmentation: identifying conservation targets
for spatial landscape planning under climate change. Biological
Conservation 123:389–401.
PERES-NETO, P. R., LEGENDRE, P., DRAY, S. & BORCARD, D. 2006.
Variation partitioning of species data matrices: estimation and
comparison of fractions. Ecology 87:2614–2625.
PHILLIPS, O. L., NUNEZ-VARGAS, P., MONTEAGUDO, A. L.,
PENA-CRUZ, A., CHUSPEZANS, M. E., GALIANO-SANCHEZ, W., YLI-
HALLA, M. & ROSE, S. 2003. Habitat association among Amazonian
tree species: a landscape-scale approach. Journal of Ecology 91:757–
775.
POTTS, M. D., ASHTON, P. S., KAUFMAN, L. S. & PLOTKIN, J. B. 2002.
Habitat patterns in tropical rain forests: a comparison of 105 plots in
northwest Borneo. Ecology 83:2782–2797.
POULSEN, A. D., TOUMISTO, H. & BALSLEV, H. 2006. Edaphic and
floristic variation within a 1-ha plot of lowland Amazonian rain
forest. Biotropica 38:468–478.
PYKE, C. R., CONDIT, R., AGUILAR, S. & LAO, S. 2001. Floristic
composition across a climatic gradient in a Neotropical lowland
forest. Journal of Vegetation Science 12:553–566.
RAMOS, Z. & FINEGAN, B. 2006. Red ecologica de conectividad
potencial: estrategia para el manejo del paisaje en el corredor
biologico San Juan – La Selva. Revista de Recursos Naturales y Ambiente
49:112–123.
RODRIGUEZ, J. P., RODRIGUEZ-CLARK, K. M., BAILLIE, J. E. M., ASH, N.,
BENSON, J., BOUCHER, T., BROWN, C., BURGESS, N. D., COLLEN,
B., JENNINGS, M., KEITH, D. A., NICHOLSON, E., REVENGA, C.,
REYERS, B., ROUGET, M., SMITH, T., SPALDING, M., TABER, A.,
WALPOLE, M., ZAGER, I. & ZAMIN, T. 2011. Establishing IUCN
red list criteria for threatened ecosystems. Conservation Biology
25:21–9.
ROSENBERG, M. S. & ANDERSON, C. D. 2011. PASSaGE: Pattern
Analysis, Spatial Statistics, and Geographic Exegesis. Version 2.
Methods in Ecology and Evolution 2:229–232.
RUOKOLAINEN, K., TUOMISTO, H., MACIA, M. J., HIGGINS, M. A.
& YLI-HALLA, M. 2007. Are floristic and edaphic patterns in
Amazonian rain forests congruent for trees, pteridophytes and
Melastomataceae? Journal of Tropical Ecology 23:13–25.
SANCHEZ, P. A. 1981. Suelos del tropico: caracterısticas y manejo. IICA,
San Jose. 660 pp.
SESNIE, S. E., FINEGAN, B., GESSLER, P. & RAMOS, Z. 2009. Landscape-
scale environmental and floristic variation in Costa Rican old-growth
rain forest remnants. Biotropica 41:16–26.
TUOMISTO, H., RUOKOLAINEN, K. & YLI-HALLA, M. 2003a. Dispersal,
environment, and floristic variation of western Amazonian forests.
Science 299:241–244.
TUOMISTO, H., RUOKOLAINEN, K., AGUILAR, M. & SARMIENTO,
A. 2003b. Floristic patterns along a 43-km long transect in an
Amazonian rain forest. Journal of Ecology 91:743–756.
TUOMISTO, H., POULSEN, A. D., RUOKOLAINEN, K., MORAN, R.
C., QUINTANA, C., CELI, J. & CANAS, G. 2003c. Linking floristic
patterns with soil heterogeneity and satellite imagery in Ecuadorian
Amazonia. Ecological Applications 13:352–371.
VALENCIA, R., FOSTER, R. B., VILLA, G., CONDIT, R., SVENNING,
J.-C., HERNANDEZ, C., ROMOLEROUX, K., LOSOS, E., MAGARD, E.
& BALSLEV, H. 2004. Tree species distributions and local habitat
variation in the Amazon: large forest plot in eastern Ecuador. Journal
of Ecology 92:214–229.
VORMISTO, J., SVENNING, J. C., HALL, P. & BALSLEV, H. 2004.
Diversity and dominance in palm (Arecaceae) communities in terra
firme forests in the western Amazon Basin. Journal of Ecology 92:577–
588.

478 ADINA CHAIN-GUADARRAMA ET AL.
Appendix 1. Species list. The family and scientific name of all tree and palm species recorded in 37 vegetation plots (0.25 ha)are given, followed by their altitudinal range and number of plots in which they were present. A single altitude value is givenfor those species recorded in one plot only. Species nomenclature conforms to that of the flora of Costa Rica as listed by theNational Institute of Biodiversity (INBio) (http://atta.inbio.ac.cr/).
Family Scientific name Altitude range and median (m asl) Number of plots
Actinidaceae Saurauia yasicae 64–1285, 724 3Anacardiaceae Anacardium excelsum 528–631, 559 3
Astronium graveolens 554 1Spondias mombin 156 1Tapirira guianensis 156–1435, 930 9
Annonaceae Annona montana 765–796, 781 2Guatteria aeruginosa 64–109, 70.4 2Guatteria aff. recurvisepala 194–456, 388 3Guatteria amplifolia 109–621, 365 2Guatteria chiriquiensis 659–1435, 1103 3Guatteria costaricensis 510 1Xylopia sericophylla 338 1Xylopia sp. 1316 1
Apocynaceae Aspidosperma megalocarpon 379–463, 410 3Lacmellea panamensis 429–771, 579 4
Araliaceae Dendropanax arboreus 194–765, 432 5Dendropanax globosus 1341 1Dendropanax sp. 1 429–1341, 934 6Dendropanax sp. 2 64–631, 309 3
Arecaceae Attalea butyracea 554 1Cryosophila guagara 194–338, 266 2Euterpe precatoria 379–1435, 787 15Geonoma sp. 1435 1Iriartea deltoidea 64–805, 320 10Socratea exorrhiza 156–822, 559 14Welfia regia 109–463, 356 9
Bignoniaceae Jacaranda copaia 109 1Tabebuia chrysantha 771 1
Bombacaceae Ceiba pentandra 64–429, 247 2Matisia tinamastiana 771–822, 788 2Pachira aquatica 379 1Pseudobombax septenatum 510 1Quararibea sp. 1098 1
Boraginaceae Cordia cymosa 160–429, 339 2Cordia megalantha 822 1
Burseraceae Bursera simaruba 64 1Dacryodes sp. 1129–1435, 1245 4Protium ravenii 621–1056, 911 2Tetragastris panamensis 160–822, 556 8Trattinnickia aspera 109 1
Caryocaraceae Caryocar costaricense 338–771, 554.5 2Cecropiaceae Cecropia insignis 621–1528, 1174.6 9
Cecropia peltata 1435 1Pourouma bicolor 156–1316, 922.6 6
Chrysobalanaceae Hirtella triandra 379–463, 434 4Maranthes panamensis 429–621, 525 2
Clusiaceae Calophyllum brasiliense 181–1341, 981 11Calophyllum longifolium 388–463, 419 3Chrysochlamys allenii 1341–1528, 1435 2Dystovomita paniculata 1341–1528, 1445 2Garcinia intermedia 1010 1Marila laxiflora 338–463, 432 2Symphonia globulifera 160–1435, 781 11Tovomita longifolia 64–429, 229 3
Combretaceae Terminalia amazonia 765–1010, 860 3Terminalia bucidoides 160–659, 410 2
Dichapetalaceae Stephanopodium costaricense 156–621, 389 2Elaeocarpaceae Sloanea longipes 1134 1

Forest beta diversity on an altitudinal gradient 479
Appendix 1. Continued
Family Scientific name Altitude range and median (m asl) Number of plots
Euphorbiaceae Alchornea glandulosa 1098–1435, 1206 8Alchornea latifolia 554–1273, 896 6Drypetes standleyi 771–1285, 984 4Hyeronima alchorneoides 109–1528, 723 5Hyeronima oblonga 429–1528, 1026 5Mabea occidentalis 338–388, 363 2Richeria obovata 463 1Sapium glandulosum 109–1056, 740 2
Fabaceae Acosmium panamense 510 1Dialium guianense 181 1Dussia aff. macroprophyllata 1528 1Dussia macroprophyllata 194–338, 266 2Dussia sp. 64–1214, 599 5Inga sp. 109–429, 222 4Inga cotobrusensis 1262–1273, 1268 2Inga densiflora 765 1Inga golfodulcencis 338 1Inga jinicuil 160 1Inga nobilis 631–822, 766 3Inga oerstediana 1528 1Inga pezizifera 109–1316, 662 4Inga punctata 621–1010, 812 3Inga sertulifera 156 1Inga thibaudiana 109–631, 299 3Inga vera 771 1Lecointea amazonica 160 1Lonchocarpus heptaphyllus 1341 1Machaerium biovulatum 765 1Macrolobium colombianum 156–379, 198 4Peltogyne purpurea 160–463, 295 3Platymiscium aff. curuense 621 1Platymiscium sp. 510 1Pseudopiptadenia suaveolens 379 1Pterocarpus rohrii 528 1Pterocarpus sp. 631–822, 712 3Schizolobium parahibum 631–822, 720 3Tachigali versicolor 463–805, 721 3Vatairea sp. 1 109 1
Fagaceae Quercus sp. 1098–1316, 1215 6Flacourtiaceae Casearia arborea 1316 1
Hasseltia guatemalensis 338–1341, 1121 5Lindackeria laurina 554 1Macrohasseltia macroterantha 1316 1Pleuranthodendron lindenii 64–1056, 395 2
Hernandiaceae Hernandia didymantha 64–1285, 675 2Hernandia stenura 1341 1
Hippocastanaceae Billia colombiana 64 1Billia rosea 1285–1316, 1295 2
Humiriaceae Humiriastrum diguense 160–805, 680 5Juglandaceae Oreomunnea pterocarpa 1098 1Lauraceae Beilschmiedia sp. 1 1098 1
Beilschmiedia sp. 2 510–1435, 846 8Beilschmiedia tovarensis 1129–1435, 1327 7Caryodaphnopsis burgeri 156 1Cinnamomum tonduzii 1226 1Cinnamomum triplinerve 765–1273, 1151 5Cinnamomun aff. tonduzii 1285 1Lauraceae sp. 1 1435 1Lauraceae sp. 2 1226 1Licaria sp. 1 771 1Licaria sp. 2 528–1285, 1041 4

480 ADINA CHAIN-GUADARRAMA ET AL.
Appendix 1. Continued
Family Scientific name Altitude range and median (m asl) Number of plots
Licaria sp. 3 1098–1226, 1151 3Nectandra umbrosa 554–1285, 835 3Ocotea aff. praetermissa 1214–1285, 1250 2Ocotea insularis 1129 1Ocotea oblonga 554–1010, 782 2Ocotea pullifolia 1010 1Ocotea sp. 1 1226–1528, 1427 2Ocotea sp. 2 1129–1435, 1307 4Ocotea sp. 3 1010 1Ocotea stenoneura 1134–1214, 1187 2Persea americana 109 1Persea rigens 1134 1Pleurothyrium sp. 1 1098 1Rhodostemonodaphne kunthiana 1056–1226, 1113 2
Lecythidaceae Couratari guianensis 456–463, 460 2Grias cauliflora 64–160, 134 3Lecythis mesophylla 156–160, 158 2
Magnoliaceae Talauma gloriensis 160 1Malpigiaceae Bunchosia sp. 1 631 1
Bunchosia sp. 2 1010 1Malvaceae Hampea appendiculata 1226 1Melastomataceae Graffenrieda galeottii 822–1098, 960 2
Miconia multispicata 194–765, 575 2Miconia sp. 1 1341 1Miconia tonduzii 1316 1Mouriri gleasoniana 338 1
Meliaceae Carapa guianensis 181–463, 345 6Guarea bullata 194 1Guarea glabra 194–771, 483 2Guarea grandifolia 156–1341, 1069 3Guarea kunthiana 1134 1Guarea microcarpa 771 1Guarea rhopalocarpa 64–822, 443 2Trichilia martiana 1056–1098, 1077 2Trichilia pallida 510–765, 680 2Trichilia pittieri 1056 1
Moraceae Batocarpus costaricensis 631–1341, 834 2Brosimum costaricanum 194–554, 499 4Brosimum guianense 156–1056, 590 4Brosimum lactescens 156–621, 399 7Brosimum utile 109–1341, 468 13Castilla elastica 64–338, 155 3Castilla tunu 528–822, 656 3Ficus sp. 2 429–1528, 832 4Ficus sp. 1 1226 1Ficus tonduzii 64–1226, 832 5Ficus velutina 1435 1Maquira guianensis subsp. costaricana 160 1Naucleopsis naga 160–659, 410 2Pseudolmedia mollis 822–1435, 1195 9Pseudolmedia spuria 510 1Sorocea pubivena 822 1
Myristicaceae Otoba novogranatensis 160–1285, 983 11Virola guatemalensis 429–1134, 605 2Virola koschnyi 64–1273, 648 14Virola sebifera 181–1010, 545 6
Myrtaceae Byrsonima arthropoda 338 1Eugenia aff. aeruginea 1134 1

Forest beta diversity on an altitudinal gradient 481
Appendix 1. Continued
Family Scientific name Altitude range and median (m asl) Number of plots
Olacaceae Chaunochiton kappleri 338–554, 467 6Minquartia guianensis 194–621, 408 2
Polygonaceae Coccoloba mollis 621 1Coccoloba padiformis 1134 1
Proteaceae Roupala montana 156 1Rhizophoraceae Cassipourea elliptica 379 1Rosaceae Licania hypoleuca 181–1316, 971 3
Licania sparsipilis 379 1Prunus brachybotrya 621–1285, 1087 4
Rubiaceae Chimarrhis parviflora 109–659, 396 6Elaeagia auriculata 1056–1528, 1256 4Elaeagia myriantha 1056 1Genipa americana 621 1Ladenbergia heterophylla 1129 1Rubiaceae sp. 528–631, 562 2
Rutaceae Zanthoxylum ekmanii 554 1Zanthoxylum riedelianum 1010 1
Sabiaceae Meliosma grandiflora 822–1129, 1032 4Sapindaceae Allophylus gentryi 822 1
Cupania sp. 771 1Matayba oppositifolia 456–463, 460 2
Sapotaceae Elaeoluma glabrescens 388–456, 422 2Micropholis melinoniana 1316 1Pouteria congestifolia 1528 1Pouteria fossicola 64 1Pouteria laevigata 160 1Pouteria reticulata 388–1056, 758 6Pouteria sp. 1 463–771, 617 2Pouteria torta 156–659, 408 2Pradosia atroviolacea 109 1Sarcaulus brasiliensis 510–1435, 1062 4
Simaroubaceae Simarouba amara 109–1262, 611 6Sterculiaceae Sterculia recordiana 379–659, 553 3
Theobroma angustifolium 765 1Styracaceae Styrax argenteus 822 1Symplocaceae Symplocos austin-smithii 379–1056, 718 2
Symplocos sp. 338 1Theaceae Gordonia brandegeei 1273 1
Gordonia fruticosa 1214–1528, 1353 5Ticodendraceae Ticodendron incognitum 1134–1341, 1203 2Tiliaceae Apeiba membranacea 194–429, 320 3
Goethalsia meiantha 64–765, 240 4Heliocarpus appendiculatus 64–1435, 1080 6Mortoniodendron abelianum 1285 1Trichospermum grewiifolium 194–1010, 466 2
Ulmaceae Ampelocera macrocarpa 338 1Trema micrantha 1226 1
Unknown Unknown 1 181 1Unknown 2 181 1Unknown 3 181–659, 420 2Unknown 4 194 1Unknown 5 1285 1Unknown 6 1010 1Unknown 7 379 1
Vochysiaceae Qualea polychroma 109–388, 316 3Vochysia allenii 160–456, 352 5Vochysia ferruginea 156–1273, 671 14Vochysia guatemalensis 765 1Vochysia megalophylla 379–463, 442 2
Related Documents


