Welcome message from author
This document is posted to help you gain knowledge. Please leave a comment to let me know what you think about it! Share it to your friends and learn new things together.
Transcript

1 JOURNAL OF THE ECONOMICS SOCIETY
Journal of the Economics Society Ramjas College 2017-18
EDITORIAL BOARD
Maajid Mehaboob Chakkarathodi Editor-in-Chief [email protected] Purushottam Mohanty Deputy Editor [email protected] Prashant Kumar Managing Editor [email protected] Members Ishan Bhardwaj Sayyam Mubeen Varun Agarwal Somesh Narayan Aravind Nair Anindya Tomar Publisher’s Details – Dr. Deb Kusum Das (Teacher-in-charge) [email protected] +91-9899594581 Flat 253, tower II Windsor Green Apartment F28 Sector 50 Noida - 201301 Issuing Body – Department of Economics Ramjas College University of Delhi University Enclave, North Campus, Delhi – 110007 Contact - +91-11-27667706

2 JOURNAL OF THE ECONOMICS SOCIETY
ACKNOWLEDGEMENTS
The release of this edition of the journal has been made possible by concerted efforts of all authors and committed
members of the Editorial Board.
First and foremost, I would like to thank Dr. Sonia Goel for her guidance and valuable suggestions as the Staff Advisor
for the Journal. I thank Dr. Deb Kusum Das for constantly engaging with the Editorial Board and helping us in all ways
that he could. I would like to express my sincere gratitude to Prof. Devashish Mitra for taking out time from his busy
schedule and giving us a chance to interview him. It was an illuminating conversation with him about contemporary
domestic and international issues.
Given the fact that we are constrained to publish only selected entries, we heartily thank all authors for their
contributions.
From the outset, the whole Editorial Team has worked hard with cohesion and passion. A huge credit goes to them!
On behalf of the Editorial Board,
Prashant Kumar
- Managing Editor
3 JOURNAL OF THE ECONOMICS SOCIETY
STAFF ADVISOR’S NOTE
DR. SONIA GOEL [email protected] STAFF ADVISOR DEPARTMENT OF ECONOMICS, RAMJAS COLLEGE
The revived Journal of the Ramjas Economics Society, is now into its 4th year, and has stood the test of time. It is a
successfully established and well-circulated student journal. What started off as an ambitious experiment is today the
pride of the Department of Economics.
Over the years, the journal has served as a catalyst for the development of our students’ capabilities by encouraging
them to explore their subject beyond the realm of the classroom. To this end, the Journal of the Ramjas Economics
Society has been a very important anchor for grooming the students into budding professionals of tomorrow.
Additionally, the Society under the leadership of an elected Student Council organizes seminars, talks, panel discussions
and career counseling to inculcate the practice of applying classroom economics to community, society, country and
the world at large. The experience that they gain from the publication is tremendous. This edition of the journal is the
culmination of several weeks of dedicated hard work by our team of editors.
I sincerely hope that you find this edition intriguing and informative, and enjoy reading it as much as we did making it.
Happy Reading!
4 JOURNAL OF THE ECONOMICS SOCIETY

5 JOURNAL OF THE ECONOMICS SOCIETY
EDITOR’S NOTE
MAAJID MEHABOOB CHAKKARATHODI [email protected]
EDITOR-IN-CHIEF
Critical Thinking: The need of the hour to understand our Volatile, Uncertain, Complex and Ambiguous economic
conditions
I am delighted to introduce the 4th edition of the Journal of The Ramjas Economics Society. This edition comes out at
a time of great churn in the world of economics, both domestically and internationally.
While we see a rising trend of protectionist policies around the globe, the question of sustainable development has also
taken center stage. The mounting income inequalities beckon us to re-examine the structural issues of our economic
system. The Indian government has implemented the much-awaited GST, and students of economics, as usual, have
been busy following the zeitgeist – behavioral economics, universal basic income, and crypto currency.
These events considerably impact undergraduate students, as they constantly try to link the real-world phenomena
with the theories they learn in the classroom. The primary motive of our journal is to provide students an exciting
opportunity to explore the vast interdisciplinary nature of economics. The journal aspires to be engaging, integrative
and challenging.
Ideally, a Bachelor of Arts in Economics should provide the student a fine liberal arts education integrated with
specialized knowledge of economic history, theory, and statistical methods. A true liberal arts education, by definition,
equips students with the tools of learning, critical thinking, and eloquent expression. Arguably, the liberal arts
component is often devalued in the present system.
One of the results of this is that most students presume tools of analysis they are being taught to be value-neutral. Let
me give you a few examples. The concept of consumer surplus and producer surplus are seen by many as ideologically
neutral. But through a closer look, we can realize that the market demand curve used in this analysis is derived by
summing up the utilities of all the individuals – from the person who has the highest willingness to pay to the person
with the lowest. Note that we are giving the same value to the richest and poorest individual’s utility. This is in essence
‘utilitarianism’. Another concept is the Coase Theorem which is frequently cited in policy to explain the optimal
pollution level. Among the many assumptions in the theorem, the central one is that ‘transfer of wealth does not change
production patterns’. Similarly, the First Fundamental Theorem and Second Fundamental Theorem also require around
seven conditions to hold.
In this way, much of the economic analyses students learn may seem like ‘positive analysis’, but they certainly contain
inherent assumptions and value-judgments which are seldom explicitly pointed out in textbooks. Therefore when
economists opine that a particular policy “ought” to be implemented, the debates that follow are essentially about
conflicting worldviews. It boils down to questions of ethics and morality from where these worldviews arise. But
unfortunately, the diversification of disciplines in the modern era had divorced ethics from all of the sciences.
In this increasingly post-modern world, there is an urgent need to integrate ethics into economics. In the book “On
Ethics and Economics”, Amartya Sen provides a terse synthesis of the relevant literature on ethics and economics. The
foundation of Sen's arguments rests in the view that economics, as it has emerged, can be made more productive by
paying greater and more explicit attention to the ethical considerations that shape human behavior and judgment.

6 JOURNAL OF THE ECONOMICS SOCIETY
Another matter of contention is the larger problem of higher education across India, which gives teachers very limited
autonomy. This constricts the course structure, not allowing better course designs to evolve as opposed to foreign
universities. Therefore the students themselves need to take initiative for a worthwhile college degree. The Journal of
The Economics Society is an initiative in that direction – shifting the focus to being more investigative and intuitive
through a ‘research-based’ approach. It seeks to assist students in independent research, critical reasoning, at the same
time dealing with contemporary economic issues.
This edition has a series of articles and papers that span a wide array of topics. It includes write-ups on the Indian
economy, evaluation of various policies, and writings on other contemporary topics which have significant relevance.
Some students have tried to develop robust microeconomic models while others have conducted top-notch primary
research. All the members of the editorial board have put in much effort to bring out this journal. I hope you enjoy
reading it.
7 JOURNAL OF THE ECONOMICS SOCIETY
AN INTERVIEW
WITH DEVASHISH MITRA
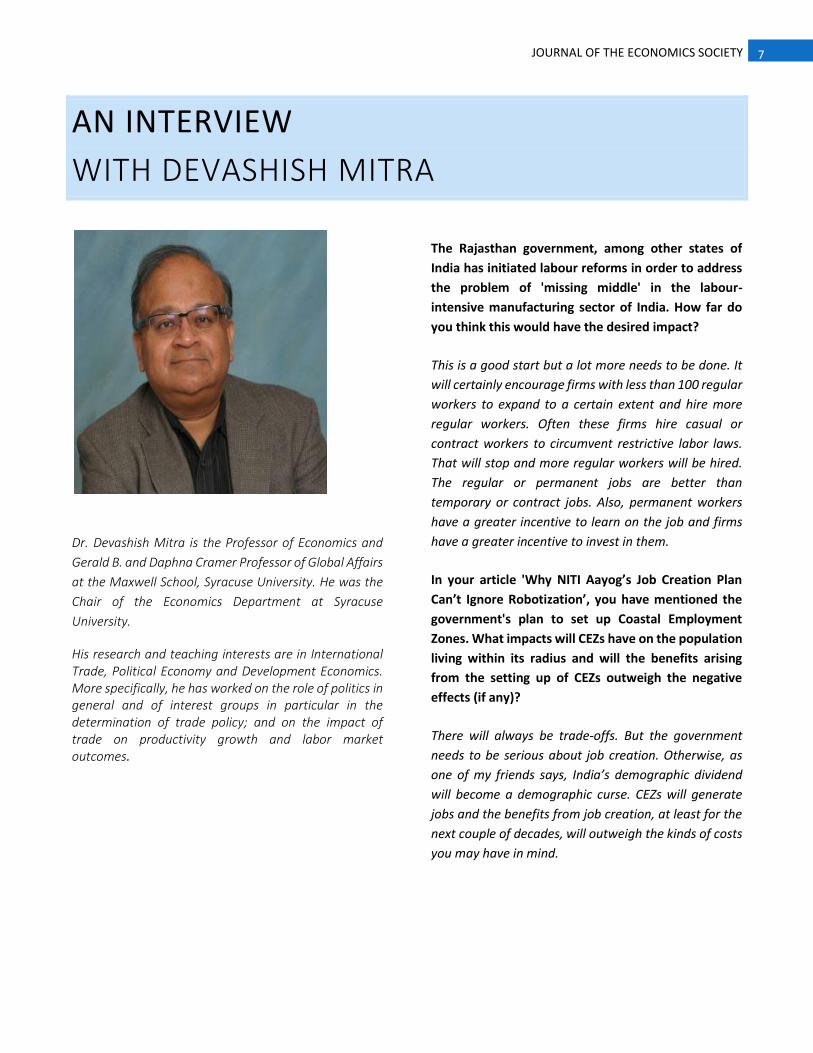
Dr. Devashish Mitra is the Professor of Economics and
Gerald B. and Daphna Cramer Professor of Global Affairs
at the Maxwell School, Syracuse University. He was the
Chair of the Economics Department at Syracuse
University.
His research and teaching interests are in International Trade, Political Economy and Development Economics. More specifically, he has worked on the role of politics in general and of interest groups in particular in the determination of trade policy; and on the impact of trade on productivity growth and labor market outcomes.
The Rajasthan government, among other states of
India has initiated labour reforms in order to address
the problem of 'missing middle' in the labour-
intensive manufacturing sector of India. How far do
you think this would have the desired impact?
This is a good start but a lot more needs to be done. It
will certainly encourage firms with less than 100 regular
workers to expand to a certain extent and hire more
regular workers. Often these firms hire casual or
contract workers to circumvent restrictive labor laws.
That will stop and more regular workers will be hired.
The regular or permanent jobs are better than
temporary or contract jobs. Also, permanent workers
have a greater incentive to learn on the job and firms
have a greater incentive to invest in them.
In your article 'Why NITI Aayog’s Job Creation Plan
Can’t Ignore Robotization’, you have mentioned the
government's plan to set up Coastal Employment
Zones. What impacts will CEZs have on the population
living within its radius and will the benefits arising
from the setting up of CEZs outweigh the negative
effects (if any)?
There will always be trade-offs. But the government
needs to be serious about job creation. Otherwise, as
one of my friends says, India’s demographic dividend
will become a demographic curse. CEZs will generate
jobs and the benefits from job creation, at least for the
next couple of decades, will outweigh the kinds of costs
you may have in mind.

8 JOURNAL OF THE ECONOMICS SOCIETY
How do you see FTAs [Free Trade Agreements] vis-à-
vis multilateral agreement like the TFA [Trade
Facilitation Agreement] which was recently signed by
WTO member countries? On one hand, WTO and the
World Bank have often been accused of pandering to
the interests of developed countries by pushing terms
more favourable to them, and on the other hand,
developing countries usually have to accept a
relatively weaker position while signing FTAs with
developed countries. Do you think it is all about
choosing the lesser of two evils for developing
countries?
I support multilateral trade agreements within the
WTO. The TFA was about making ports and customs
procedures more efficient. There should be no doubt
that these improvements should be made. Within the
WTO and the World Bank, China, India and other BRICS
countries have become very powerful. By forming
common-interest coalitions, these countries have
acquired bargaining power. Also, economic growth has
made these countries more powerful. In fact, when it
comes to bilateral trade agreements or FTAs with
developed countries outside the WTO, India’s
bargaining power is lower than in multilateral
agreements under the WTO since coalitions with other
developing countries are not possible in most FTAs or
bilateral deals.
You have been a vocal advocate of FDI in retail in
India. The Union Cabinet, earlier this year, approved
100% FDI in single-brand retail through the automatic
route. Do you see such a move coming for multi-brand
retail in the near future given the opposition that such
measures have drawn from various quarters? To what
extent is FDI in multi-brand retail necessary for
alleviating the sufferings of Indian farmers?
No, I don’t see FDI liberalization in multi-brand retail
taking place soon. Politically, it might not be feasible
since owners of small shops are an important part of
BJP’s base. Multi-brand retail can create jobs. It also will
have linkage effects through investment in storage
facilities, transportation etc. It will cut the profits of
middlemen, giving farmers a better deal. Consumers
will be the biggest beneficiaries.
In the article ‘Why Trump’s Anti-Globalisation Agenda
is Bad for America’, you had noted that the recent
studies about wages and job losses in the US have not
taken into account a possible increase in automation
due to restriction of trade. How do protectionist trade
policies lead to a rise in automation and how will this
affect the wages and employment in the US?
Protectionism can destroy global production networks.
Inputs produced in China will become more expensive in
the US, since tariffs will have to be paid. The cost of
getting products assembled in China will be higher for
the same reasons. Producing inputs domestically and
assembling them in the US will be even more expensive
due to much higher wages in the US. Thus the benefit
from automation will be much greater under
protectionist policies since automation will save
corporations the high American labor costs or the high
tariff-inclusive costs of inputs produced in China. Once
this automation takes place, it will mechanize not only
all the tasks that were being performed abroad
previously but also a large number of domestic jobs. Of
course, that will lower the demand for labor and
therefore also lower wages and employment.
The US has recently announced a string of tough trade
measures against China which has fuelled fears of a
looming trade war. Do you see China's predatory
trade practices that have undermined both its
partners and the trading system (for instance, forcing
US businesses to transfer valuable technology to
Chinese firms and restricting access to Chinese
markets) as the trigger behind such a move? How will
the move towards protectionism owing to national
interests impact Asian economies like India?
It turns out that while these actions were supposed to
be targeted at China, they are hurting other countries
considerably. One example is the tariff on steel. Due to
antidumping tariffs on Chinese steel already in place,
the US imports very little steel from China, so the new

9 JOURNAL OF THE ECONOMICS SOCIETY
tariff will be felt by other trade partners unless they are
able to negotiate exceptions with the US. Note also that
China is putting tariffs on agricultural products
produced by swing states and by people in rural areas
who are part of Trump’s base. Producers in the US who
rely on exporting are being hurt as a result. So
ultimately the US tariffs will probably be lifted due to
pressure from their exporters. India will not have much
to gain since there already are more efficient producers
in countries like Vietnam. India has failed to grasp its
comparative advantage in labor-intensive products due
to restrictive regulations on labor and land. Even
Bangladesh is outperforming India in textile and
apparel exports.
Many of the policy decisions taken by the NDA
government to boost the ‘Make in India’ project has
been seen by many, including you, to emulate
characteristics of policies of the pre-1991
protectionist era. How should the government frame
policies to boost the manufacturing sector without
having a protectionist tone?
There are no easy fixes here. The government will have
to bring about reforms in regulations related to labor
and land. Those are politically not easy. Also, the
government should consider reducing tariffs on inputs,
especially within industries like electronics. Cheaper
inputs will boost the production of the final product.
Processing or assembly of inputs in the electronics
industry can be done with low-skilled labor and can
generate hundreds of thousands of jobs, as was done in
China.

10 JOURNAL OF THE ECONOMICS SOCIETY
STABILITY IN THE MARKET FOR E-RICKSHAW
SERVICESTANAY RAJ BHATT, 3 R D YEAR, DYAL SINGH COLLEGE [email protected]
The author won the Best Paper award for the Paper
Presentation event under the 16th Annual Winter
Conference organised by the Department of Economics,
Ramjas College.
ABSTRACT
Following paper is an attempt to model the market for
e-Rickshaw services. In Delhi, most e-rickshaws operate
near metro stations and bazaars to carry people to and
from nearby localities. Government of India has been
pondering over whether to intervene in the market by
necessitating licenses or creating other barriers. Given
the abundance of qualitative studies and the lack of
theoretical ones which seek to understand the
dynamics of this new and peculiar market, this paper is
a miniscule step in the directions of the latter. The first
section notes the various characteristics of this market
and discusses the inadequacies in using methods
prevalent in economic theory for modelling the market.
The second and third sections model the two different
states in the market, viz. cooperation and competition,
respectively. The fourth section outlines the conditions
necessary for a particular state to exist and also points
out the characteristics of equilibrium (and stable) state.
Keywords: E-rickshaw, Co-operation, Competition,
Linear-location model, Stability
JEL Classification: L19, C62, D49
The notion of stability has, for a long time, been a major
source of interest among economists. (Hotelling, 1929)
introduced the famous “Linear Location Model” and
made the observation that, in many markets, it is
rational for producers to make their products as similar
as possible, which is now referred to as Hotelling’s law.
His paper serves as an excellent generalisation of the
duopoly model which was first introduced by Cournot
and later revised by Bertrand. Hotelling proposed that
markets in reality exist somewhere between the
extremes of perfect competition and monopoly.
Hotelling also outlines the conditions under which
there will be stability in competitive markets and draws
several analogies from his Linear Location Model.
I believe that the notion of stability, albeit of a different
kind, is demonstrated beautifully in the market for e-
Rickshaw services and to explore them, I consider the
markets which usually operate near metro stations or
local bazaars. The market for e-rickshaws can be
thought of as an extreme case of Hotelling’s linear
location model, where all the “sellers” collect at one
particular point and have homogenous products, and
therefore, they charge the same price and behave in
similar manner. It is therefore possible to comment on
the general behaviour in the market by studying the
case of a single service provider. Frequent users of this
service would agree that two distinct types of
behaviours can be observed in this market. On some
occasion, one might observe that the service providers
cooperate with each other, taking turns while making
trips; on other occasions, the service providers
compete against each other, trying to score maximum
number of trips possible. If they adopt the former
exercise, each operator will get approximately equal
11 JOURNAL OF THE ECONOMICS SOCIETY
passengers and the market will proceed in a stable
manner with each operator making approximately the
same revenue. If they practice the latter, some
operators might get more trips, some less and some
might end up with no trips at all. The services in this
market are homogeneous in nature and therefore,
passengers are indifferent between operators.
Simple eyeballing makes it tempting to think of this
market along the lines of an oligopolistic competition
or Cournot or Bertrand type. However, I argue that
both could be misleading in this case. Since the services
are homogenous, and who gets a particular trip would
ultimately depend on the consumers, two important
things are not very clear, a) how the service providers
can select the right amount of “quantity supplied” (in
this case, the number of trips that each service provider
makes) and b) that even if everyone charges a price at
the level of marginal cost, are the service providers
going to cooperate or compete.
Another possible method of going about the market for
e-rickshaw services could be along the lines of an n-
player assurance game or “stag hunt”, as it is commonly
known. Each player (service provider) has two possible
actions, “cooperate” (c) and “not cooperate” (nc). Now,
cooperation is not going to make sense if sufficiently
larger number of players decide not to cooperate. If
many players are competing for trips, then there is no
sense for other players to cooperate, since there is no
guarantee that the trips will be equally divided among
those who decide to cooperate and eventually, they
too, will switch to “not cooperate”. Similarly, if
relatively larger number of players are cooperating,
then those who are not will be better off by switching
to “cooperate”. Thus, there are two Nash equilibria,
(c,c,c,…,c) and (nc,nc,nc,…nc).
Although the implications are satisfactory, the analysis
is not in that it does not help us obtain the conditions
under which a particular equilibrium is attained. The
existence of two equilibria raises the possibility that
one equilibrium might more likely be the outcome of
the game than the other (Osborne, 2004). Therefore, to
find the conditions under which a particular equilibrium
is more likely, we need a different approach.
An important motivation behind the proposed model is
the idea that, in this market, cooperation itself leads to
an opportunity cost. When service providers agree to
cooperate, they take trips turn by turn. After making a
trip, they have to wait for their turn. By waiting for their
turn, they miss out some trips which they could have
made had they not cooperated. This extra revenue lost
due to cooperation is conceived as an opportunity cost
and forms an essential part of the analysis both when
players cooperate and when they compete. As we shall
see, this opportunity cost is what makes stability arise
naturally. The following section proposes a partial
equilibrium model to study this market, taking demand
as a given function of price.
To facilitate the model, it is assumed that the demand
is concentrated at two points between which the
rickshaws operate. Suppose now, that T is the total
time for which the rickshaws operate and 𝑡0 is the time
taken in one trip. It is further assumed that the total
demand for trips, D, is uniformly distributed over T. Let
𝑛 be the number of e-rickshaws providing services in
the area. Lastly, it is assumed that when the market is
stable, the demand is evenly distributed among all the
operating e-rickshaws. We now try to study how
individual service providers maximize profits in the two
different states.
Keeping in mind the assumptions made above,
following functions can be constructed to represent the
scenario faced by each individual service provider
under cooperation,
𝑇𝐶𝑖𝑐 = 𝑟 + 𝑝 (
𝑇
𝑡0−
𝐷
𝑛) + 𝑐 (1)
𝑇𝑅𝑖𝑐 = 𝑝
𝐷
𝑛 (2)

12 JOURNAL OF THE ECONOMICS SOCIETY
In the above equations, r is the daily rent and c is the
cost of charging the battery rickshaws21. The second
term in (1) gives the total revenue lost during the time
the operator spent between consecutive trips; this will
be called the “opportunity cost of cooperation”. It is
also assumed that 𝜕𝐷
𝜕𝑝< 0 and
𝜕2𝐷
𝜕𝑝2< 02.
Having described the behaviour of all the relevant
variables, maximisation problem can now be set up.
Each operator will solve the problem,
maxp
𝜋𝑖𝑐 = 𝑝
𝐷
𝑛− 𝑟 − 𝑐 − 𝑝 (
𝑇
𝑡0−
𝐷
𝑛) (3)
The first order condition is,
𝑑𝜋𝑖𝑐
𝑑𝑝= 2
𝑝
𝑛
𝜕𝐷
𝜕𝑝+ 2
𝐷
𝑛−
𝑇
𝑡0 (4)
Solving for p,
𝑝 =1
2 (𝑇𝑛
𝑡0−2𝐷)
𝜕𝐷
𝜕𝑝
(5)
Since 𝜕𝐷
𝜕𝑝< 0, for the first order condition to give a valid
result, a necessary condition is,
𝑇𝑛
𝑡0< 2𝐷 (6)
That is, for price to be valid, the maximum possible
number of total trips made must be less than twice the
total number of trips that are demanded. Put another
way,
𝑛 < 2𝐷𝑡0
𝑇 (7)
(7) says that n must be less than twice the ratio of total
number of trips demanded and maximum number of
trips that each service provider can make. That is, for a
valid value of p, the number of service providers must
be less than twice the number of e-rickshaws required,
if each e-rickshaw makes the maximum number of trips
1 Both r and c are considered constant (or, “fixed”) costs.
(𝑇/𝑡0). If this condition is not satisfied, the practice of
cooperating and dividing the demand equally will not
lead to setting of any plausible price.
Second order condition yields,
𝑑2𝜋𝑖𝑐
𝑑𝑝2= 2
𝑝
𝑛
𝜕2𝐷
𝜕𝑝2+
4
𝑛
𝜕𝐷
𝜕𝑝 (8)
If (7) holds, then, 𝜕2𝜋𝑖
𝑐
𝜕𝑝2< 0 and the profits are
maximised (given our assumptions regarding 𝜕𝐷
𝜕𝑝
and 𝜕2𝐷
𝜕𝑝2). The maximum profits that each service
provider earns, therefore, is
𝜋𝑖𝑐 = −
𝑛(𝑇
𝑡0−2𝐷
𝑛)2
2𝜕𝐷
𝜕𝑝
− 𝑟 − 𝑐 (9)
We now try to study the case where the service
providers compete against each other. Our earlier
assumption of demand being uniformly distributed
through time plays an important role here by making
the analysis easier. It should be noted that no generality
is lost here since, even if demand is not distributed
uniformly over time, the case studied here can be
thought of as a “smoothed out” rendition of the same.
It can also thought of as the case where service
providers consider “average demand” to make
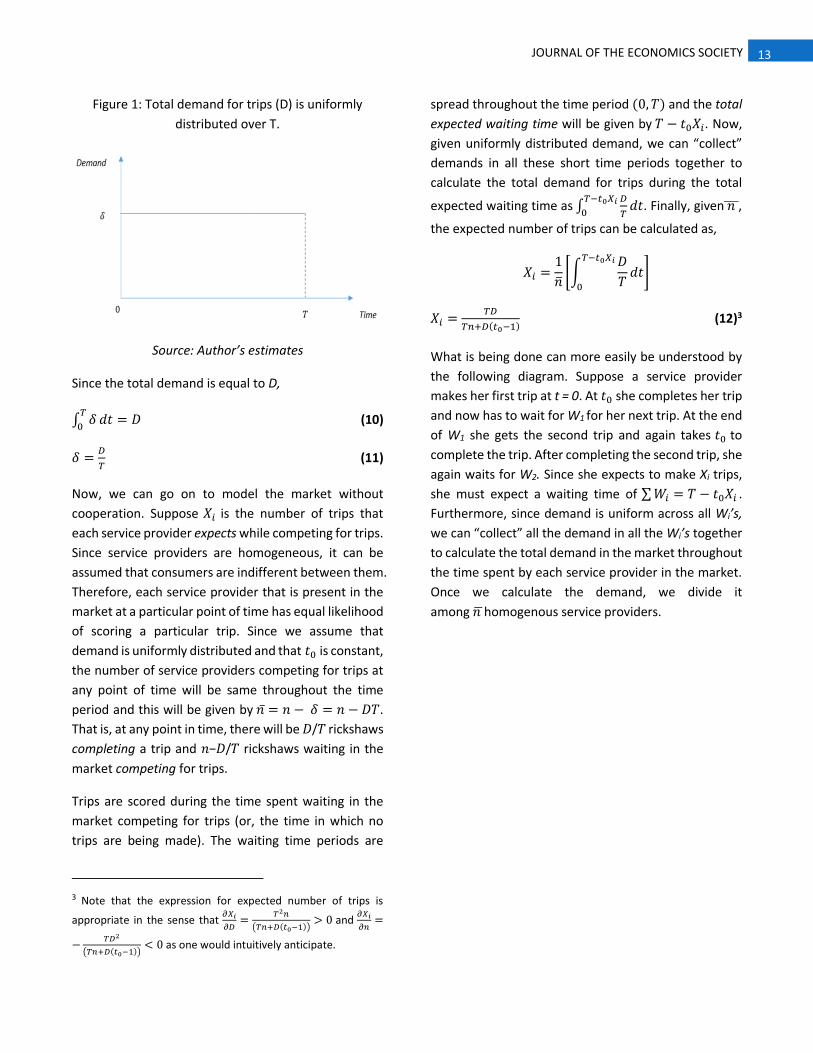
decisions. The uniformity assumption implies that the
level of demand at any point in (0, 𝑇) is same (δ, say).
2 That is, demand decreases with an increase in price at a decreasing rate. This assumption is made in order to reflect poor substitutability of e-rickshaws as a mode of transport.
13 JOURNAL OF THE ECONOMICS SOCIETY
Figure 1: Total demand for trips (D) is uniformly
distributed over T.
Source: Author’s estimates
Since the total demand is equal to D,
∫ 𝛿𝑇
0𝑑𝑡 = 𝐷 (10)
𝛿 =𝐷
𝑇 (11)
Now, we can go on to model the market without
cooperation. Suppose 𝑋𝑖 is the number of trips that
each service provider expects while competing for trips.
Since service providers are homogeneous, it can be
assumed that consumers are indifferent between them.
Therefore, each service provider that is present in the
market at a particular point of time has equal likelihood
of scoring a particular trip. Since we assume that
demand is uniformly distributed and that 𝑡0 is constant,
the number of service providers competing for trips at
any point of time will be same throughout the time
period and this will be given by 𝑛 = 𝑛 − 𝛿 = 𝑛 − 𝐷𝑇.
That is, at any point in time, there will be 𝐷/𝑇 rickshaws
completing a trip and 𝑛−𝐷/𝑇 rickshaws waiting in the
market competing for trips.
Trips are scored during the time spent waiting in the
market competing for trips (or, the time in which no
trips are being made). The waiting time periods are
3 Note that the expression for expected number of trips is
appropriate in the sense that 𝜕𝑋𝑖
𝜕𝐷=
𝑇2𝑛
(𝑇𝑛+𝐷(𝑡0−1))> 0 and
𝜕𝑋𝑖
𝜕𝑛=
−𝑇𝐷2
(𝑇𝑛+𝐷(𝑡0−1))< 0 as one would intuitively anticipate.
spread throughout the time period (0, 𝑇) and the total
expected waiting time will be given by 𝑇 − 𝑡0𝑋𝑖. Now,
given uniformly distributed demand, we can “collect”
demands in all these short time periods together to
calculate the total demand for trips during the total
expected waiting time as ∫𝐷
𝑇
𝑇−𝑡0𝑋𝑖0
𝑑𝑡. Finally, given 𝑛 ̅̅ ̅,
the expected number of trips can be calculated as,
𝑋𝑖 =1
�̅�[∫
𝐷
𝑇𝑑𝑡
𝑇−𝑡0𝑋𝑖
0
]
𝑋𝑖 =𝑇𝐷
𝑇𝑛+𝐷(𝑡0−1) (12)3
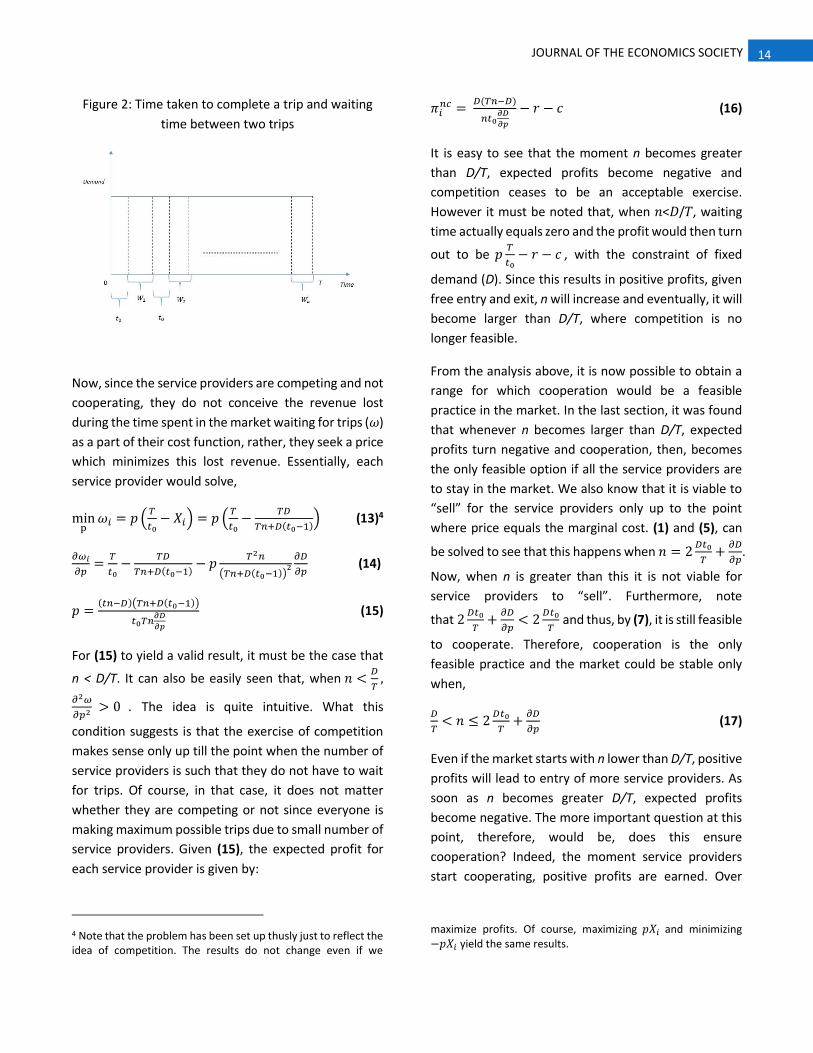
What is being done can more easily be understood by
the following diagram. Suppose a service provider
makes her first trip at t = 0. At 𝑡0 she completes her trip
and now has to wait for W1 for her next trip. At the end
of W1 she gets the second trip and again takes 𝑡0 to
complete the trip. After completing the second trip, she
again waits for W2. Since she expects to make Xi trips,
she must expect a waiting time of ∑𝑊𝑖 = 𝑇 − 𝑡0𝑋𝑖 .
Furthermore, since demand is uniform across all Wi’s,
we can “collect” all the demand in all the Wi’s together
to calculate the total demand in the market throughout
the time spent by each service provider in the market.
Once we calculate the demand, we divide it
among 𝑛 ̅homogenous service providers.
14 JOURNAL OF THE ECONOMICS SOCIETY
Figure 2: Time taken to complete a trip and waiting
time between two trips
Now, since the service providers are competing and not
cooperating, they do not conceive the revenue lost
during the time spent in the market waiting for trips (𝜔)
as a part of their cost function, rather, they seek a price
which minimizes this lost revenue. Essentially, each
service provider would solve,
minp
𝜔𝑖 = 𝑝(𝑇
𝑡0− 𝑋𝑖) = 𝑝 (
𝑇
𝑡0−
𝑇𝐷
𝑇𝑛+𝐷(𝑡0−1)) (13)4
𝜕𝜔𝑖
𝜕𝑝=
𝑇
𝑡0−
𝑇𝐷
𝑇𝑛+𝐷(𝑡0−1)− 𝑝
𝑇2𝑛
(𝑇𝑛+𝐷(𝑡0−1))2
𝜕𝐷
𝜕𝑝 (14)
𝑝 =(𝑡𝑛−𝐷)(𝑇𝑛+𝐷(𝑡0−1))
𝑡0𝑇𝑛𝜕𝐷
𝜕𝑝
(15)
For (15) to yield a valid result, it must be the case that
n < D/T. It can also be easily seen that, when 𝑛 <𝐷
𝑇,
𝜕2𝜔
𝜕𝑝2 > 0 . The idea is quite intuitive. What this
condition suggests is that the exercise of competition
makes sense only up till the point when the number of
service providers is such that they do not have to wait
for trips. Of course, in that case, it does not matter
whether they are competing or not since everyone is
making maximum possible trips due to small number of
service providers. Given (15), the expected profit for
each service provider is given by:
4 Note that the problem has been set up thusly just to reflect the idea of competition. The results do not change even if we
𝜋𝑖𝑛𝑐 =
𝐷(𝑇𝑛−𝐷)
𝑛𝑡0𝜕𝐷
𝜕𝑝
− 𝑟 − 𝑐 (16)
It is easy to see that the moment n becomes greater
than D/T, expected profits become negative and
competition ceases to be an acceptable exercise.
However it must be noted that, when 𝑛<𝐷/𝑇, waiting
time actually equals zero and the profit would then turn
out to be 𝑝𝑇
𝑡0− 𝑟 − 𝑐 , with the constraint of fixed
demand (D). Since this results in positive profits, given
free entry and exit, n will increase and eventually, it will
become larger than D/T, where competition is no
longer feasible.
From the analysis above, it is now possible to obtain a
range for which cooperation would be a feasible
practice in the market. In the last section, it was found
that whenever n becomes larger than D/T, expected
profits turn negative and cooperation, then, becomes
the only feasible option if all the service providers are
to stay in the market. We also know that it is viable to
“sell” for the service providers only up to the point
where price equals the marginal cost. (1) and (5), can
be solved to see that this happens when 𝑛 = 2𝐷𝑡0
𝑇+
𝜕𝐷
𝜕𝑝.
Now, when n is greater than this it is not viable for
service providers to “sell”. Furthermore, note
that 2𝐷𝑡0
𝑇+
𝜕𝐷
𝜕𝑝< 2
𝐷𝑡0
𝑇 and thus, by (7), it is still feasible
to cooperate. Therefore, cooperation is the only
feasible practice and the market could be stable only
when,
𝐷
𝑇< 𝑛 ≤ 2
𝐷𝑡0
𝑇+
𝜕𝐷
𝜕𝑝 (17)
Even if the market starts with n lower than D/T, positive
profits will lead to entry of more service providers. As
soon as n becomes greater D/T, expected profits
become negative. The more important question at this
point, therefore, would be, does this ensure
cooperation? Indeed, the moment service providers
start cooperating, positive profits are earned. Over
maximize profits. Of course, maximizing 𝑝𝑋𝑖 and minimizing −𝑝𝑋𝑖 yield the same results.
15 JOURNAL OF THE ECONOMICS SOCIETY
medium to long run, given positive profits and free
entry and exit, more service providers enter the market
and continue to enter until, 𝑛 = 2𝐷𝑡0
𝑇+
𝜕𝐷
𝜕𝑝, at which
point, price equals marginal cost, service providers
cooperate, and every service provider earns the same
revenue. Also, at this level of n, price equals 𝑇
2𝑡0. But
does this guarantee that as soon n becomes larger than
D/T, players immediately start cooperating?
It could be argued that service providers never
cooperate and free entry and exit always keep n below
D/T. But this leaves out much of the possible profits
which could be earned by cooperation and moreover,
we do see markets where the service providers
cooperate. The contradiction may be put to rest by
invoking what Kauhik Basu calls “Public Good Urge”.
(Basu, 2010) argues that “individuals do often act in the
interest of what they consider to be their group…Once
people are persuaded that a particular behaviour, if
undertaken by all, is good for the group, they have a
tendency to undertake the behaviour.” Therefore, it
can be argued that cooperation will arise by itself in the
market and ultimately, price would fall to the level of
marginal cost. It must also be noted that, the level of
price under cooperation will be higher. Under
competition, the level of price is likely to fall to the level
of marginal cost, since, if it does not, then any one
reducing the price can capture almost all demand. Also,
even if price falls to the level of marginal cost in case of
cooperation, this price is going to be higher than that in
case of competition, since the marginal cost in this case
is higher due to the opportunity cost of cooperation.
Hence, even though there are additional costs of
cooperation, these costs are compensated by a higher
price. Therefore, it is the cost of cooperation which
leads to cooperation itself.
Hence, I argue that the market for e-rickshaw services
obtains stability by itself, given free entry and exit.
While it is possible that the equilibrium of the kind
(nc,nc,nc,…,nc) exists at the beginning, over the period
of time, it transforms into the equilibrium of the kind
(c,c,c,…,c) and that too, without any external stimulus.
It is possible that the service providers resort to
competition when n becomes larger than 2𝐷𝑡0
𝑇+
𝜕𝐷
𝜕𝑝,
but, under competition, some would be able to more
trips, some less and some no trips at all. Eventually,
some will leave the market, given free exit, and n will
get back to the equilibrium level at which price is 𝑇
2𝑡0.
Therefore, the market becomes stable by itself and
there is no tendency for deviation. This also implies that,
theoretically, any level of demand would be fulfilled by
the market with suitable adjustments of p and n over
time and ultimately, price would again fall to the level
of marginal cost.
REFERENCES
1. Basu, Kaushik. 2010. Beyond the Invisible Hand: Groundwork for a New Economics. Princeton, NJ: Princeton
University Press.
2. Hotelling, Harold. 1929. "Stability in Competition." The Economic Journal 41-57.
3. Osborne, Martin J. 2004. An Introduction to Game Theory. New Delhi: Oxford University Press.

16 JOURNAL OF THE ECONOMICS SOCIETY
BEHAVIOURAL ECONOMICS: A CHALLENGE
TO MAINSTREAM ECONOMIC MODELSSAMIRAN DUTTA – 1S T YEAR, RAMJAS COLLGE [email protected]
1. INTRODUCTION
Behavioural economics is a relatively new field that
combines insights from psychology, judgement,
decision making and economics to generate a more
accurate understanding of human behaviour.
Economics has long differed from other disciplines in its
belief that most if not all human behaviour can be easily
explained by relying on the assumption that our
preferences are well-defined and stable across time
and are rational. Behavioural economics emerged
against the backdrop of the traditional economic
approach known as the rational choice model. The
basic message of behavioural economics is that humans
are hard-wired to make judgement errors and they
need a nudge to make decisions that are in their own
best interest. This approach complements and
enhances the rational choice model.
2. THE RATIONAL CONSUMER
Economists try to build efficient models by making
simplifying assumptions about consumer behaviour.
One of the most common assumptions being that the
consumer is rational, that is, a consumer that believes
in maximising his/her utility. Such simplistic
assumptions have allowed economists to come up with
powerful models and analyse different markets and
economic issues. However, deviations from this
rational behaviour can be noted, as humans might try
to make rational decisions having limited willpower and
cognitive abilities. Decisions can be guided by self-
interest but may also depend on fairness and equity.
Such insights from psychology into economic analysis
has sprouted the field of behavioural economics.
3. ENDOWMENT EFFECT
Thaler coined the term 'endowment effect' for the
tendency of individuals to value items more just
because they own them. Endowment effect can be
understood by taking an example from a study by
Richard Thaler, Daniel Kahneman & Jack Knetsch, in
which participants were given a mug and then offered
the chance to sell or trade it for an equally valued
alternative. It was found that the amount participants
required as compensation for the mug once their
ownership of the mug was established (willingness to
accept) was twice as high as their willingness to pay to
acquire the mug (willingness to pay).
A neoclassical explanation by Hanemann (1991) :
When an individual is given good X, such that he moves
from point A (quantity: Xo) to point B (quantity: X1).
Their willingness to pay is represented by the vertical
distance BC, because after giving up that amount of
wealth the individual is indifferent between points A
and C. However, an individual who gives up good X and
moves from point B to point A, their willingness to
accept is represented by the vertical distance AD
because after receiving that much wealth the individual
is indifferent between point B and D. The willingness to
accept (WTA) is thus larger than the willingness to pay
(WTP).

17 JOURNAL OF THE ECONOMICS SOCIETY
Figure 1: Hanemann's Endowment Effect Explanation
4. LOSS AVERSION
There are several explanations for the phenomenon of
the endowment effect. One of the most prominent
basis lies in the idea of loss aversion. According to this
idea, the prospect of selling or losing an item has a
stronger influence on the decision making than
purchasing or gaining the item. In other words, it is
more painful to lose something than to gain something.
This idea is widely used in marketing techniques.The
prospect of selling or losing the mug has a stronger
influence than purchasing or gaining the mug. This
discrepancy manifests itself in the different prices. The
prospect of losing the mug for the seller is more
significant than the prospect of gaining the mug for the
buyer, thus the seller is willing to accept $6 while the
consumer is willing to pay $3.
5. PROSPECT THEORY
Prospect Theory is a behavioural model that shows how
people decide between alternatives that involve risk
and uncertainty. It demonstrates that people think in
terms of expected utility rather than absolute
outcomes. Prospect theory (Kahneman & Trvesky,
1979) was developed by framing risky choices, and it
indicates that people are loss-averse, and since
individuals dislike losses more than an equivalent gain,
they are more willing to take risks, in order to avoid a
loss.
I) A prospect of gain :
A) A certain win of $250, versus
B) A 25% chance to win $1000 and a 75% chance to win
nothing?
II) A prospect of loss :
C) A certain loss of $750, versus
D) A 75% chance to lose $1000 and a 25% chance to
lose nothing?
Tversky and Kahneman’s work shows that responses
are different if choices are framed as a gain (I) or a loss
(II). When faced with the first type of decision, a greater
proportion of people will opt for the riskless alternative
A), while for the second problem people are more likely
to choose the riskier D). This happens because we
dislike losses more than we like an equivalent gain.
6. MENTAL ACCOUNTING & CONSUMER CHOICE
This important concept of behavioural economics can
be understood by looking at the work of Richard Thaler,
Amos Tversky and Daniel Kahneman on the idea of
mental accounting. The premise of mental accounting
lies in the idea that consumers do not treat all of their
money (or other resources) as if they have a huge pile
of it. Consumers rather tend to have separate mental
accounts and such accounts are based on people's
goals. When the money (or other resources) is spent,
consumers keep track of it based on the mental account
it came from.
SCENARIO 1:
A person decides to watch a movie and purchases a
ticket worth ₹10. After reaching the theatre door, the
person realises that he has lost the ticket.

18 JOURNAL OF THE ECONOMICS SOCIETY
In this scenario, according to the survey carried out by
Kahneman and Tversky
54% said they'd probably just head back home.
SCENARIO 2:
In another scenario, assume that the person goes to
purchase a ₹10 worth ticket from the cashier. But the
person now realises that he has lost his ₹10 bill.
In the same survey, when asked if people would like to
purchase the ticket, 88% people said they'd probably go
watch the movie.
Figure 2: Response to Purchasing Another Ticket
Source: (Kahneman and Tversky, 1981)
In both cases, there is a loss of ₹10. But losing a ₹10
worth ticket enters into the mental account of say
'entertainment'. Perhaps the person does not want to
spend too much on entertainment so he/she chooses
not to spend another ₹10 and have a total expenditure
of ₹20. However, in the case of losing a ₹10 bill, it is not
clear in which mental account the loss must be
accounted for.
We use different mental accounts all the time, our
minds just naturally keep things separate. However,
our intuition to keep things separate violates a classic
economic principle: the idea that money should be
fungible .Is a ₹10 worth ticket the same as a ₹10 bill?
For an economist, it should be. But for our minds, not
so much.
7. CONCLUSION
John Maynard Keynes famously wrote about how the
economy is driven by the animal spirit — or human
psychology. Economics took an important turn some
four decades ago when models of the macroeconomy
began to be built on assumptions about individual
human behaviour — or microeconomic foundations.
The first such models assumed the representative
human being was perfectly rational. Rational
expectations assumption in modern macroeconomics
has led too many people to believe that all economists
have a uni-dimensional view of human nature.
Behavioural economics poses a powerful challenge to
that assumption at the level of individual decision-
making and further enhances the understanding of
economics. The challenge is to integrate its insights into
0 20 40 60 80 100
SCENARIO 1 (46%)
SCENARIO 2 (88%)

19 JOURNAL OF THE ECONOMICS SOCIETY
mainstream models that look at the broader economy.
Some of the recent Nobel Prize awards—including the
most recent to Richard Thaler, shows the process has
already begun.
REFERENCES
1. Samson, Alain. (n.d.). An Introduction to Behavioral Economics. Retrieved from:
https://www.behavioraleconomics.com/introduction-behavioral-economics.
2. Shefrin, H., & Thaler, R. (1981). An Economic Theory of Self-Control. Journal of Political Economy 89(2): 392-
406.
3. Thaler, R. (1985). ‘Mental Accounting and Consumer Choice.’ Marketing Science 4(3): 199-214.
4. Tversky, A., & Kahneman, D. (1981). The framing of decisions and the psychology of choice. Retrieved from:
https://www.uzh.ch/cmsssl/suz/dam/jcr:ffffffff-fad3-547b-ffff-ffffe54d58af/10.18_kahneman_tversky_81.pdf.
5. Kahneman, D., & Tversky, A. (1979). Prospect Theory: An Analysis of Decision under Risk. Econometrica. 47(2):
263.

20 JOURNAL OF THE ECONOMICS SOCIETY
NIPPING THE BUD: FACTORS AFFECTING
FEMALE DROPOUT RATES NIKITA SHARMA- 3R D YEAR, MIRANDA HOUSE [email protected]
Development concerns today are becoming
increasingly focused on gender bias and gender
inequality (Chakravarty, 1998) which make
development efforts hollow without a more inclusive
and equitable outcome. At the confluence of this
concern lies the issue of female children dropping out
of schools. The positive contribution of female literacy
towards lowering fertility rates, infant and child
mortality and reducing population growth has been
well established and makes it a major driver of social
development (Kingdon, 1999). The education of
women heralds improvement in the nutrition level
among children and health care practices. Yet, it must
be borne in mind that the matter of female literacy is
pertinent not just because of the positive social and
economic spillovers of education among females but
more importantly because of the opportunity
education holds for them, like any other able individual,
to lead a fulfilling and creative life. Efforts have
undoubtedly been made to bring the female child
under the ambit of education. Unfortunately, they have
fizzled out as half-hearted attempts or pending goals.
The wastage of human resource is a particularly acute
problem amongst female students. Analysis of dropout
statistics reveals a disturbing insight; dropout rates
have consistently remained higher for female students
than for male students (Choudhury, 2006). This skewed
trend stems from social, cultural and economic reasons
that are generally seen as falling broadly under three
categories: (i) family related reasons (socio-economic
status, family size, parental education); (ii) school
related reasons (infrastructure of schools, quality of
teachers and education being imparted, academic
performance, interest in school and school work,
distance from school and security); (iii) personal
reasons (onset of puberty and personal and physical
discomfort arising thereof, extenuating circumstances
like marriage, financial pressure to work) (Weber, 1989).
This matches with the results from India-specific
studies. In a study of District Primary Education
Programme it was found that “general household
characteristics like income, caste, occupation and
education level of parents continue to determine
access, attendance, completion and learning
achievements’’ (Ramchandran & Saihjee, 2002). Family
is a crucial unit in a country like India which is largely
deeply rooted in tradition. A study of female children in
West Bengal revealed that the strongest factors behind
school participation, enrolment and dropouts were
household factors such as parental schooling,
household income and father’s occupation (Sengupta &
Guha, 2002). Along with these, caste and religion came
out as significant determinants (which will be discussed
later) as well.
Other familial factors are the family size and the
number of siblings. These factors become significant
because a large family size could put financial
constraints on families with limited means. Moreover,
the need for looking after younger siblings has often
come up in studies and reports as an impediment to
female education. A study revealed that an increase in
the family size by one increases the chances of
dropping out by 1.7 times. Going by a number of
empirical investigations in the country it can be
concluded that larger families inflict more educational

21 JOURNAL OF THE ECONOMICS SOCIETY
disadvantages than smaller families (Choudhury, 2006).
These factors are likely to have a larger impact in the
education prospects of the female children due to the
gender bias against them in the allocation of the family
resources.
However, unlike the relation with family size, studies in
India have reached inconclusive results about the
influence of parental education (as to which parent’s
education impacts more) on dropout rates among
children. A study holds the father’s education to be
more significant with the chances of student dropout
reducing by 16 percent for every year’s increase in the
father’s education (Choudhury, 2006). Similar
conclusions have been reported by a study in West
Bengal (Sengupta & Guha, 2002). However,
contradictory results have been observed by Zeba A
Sathar, 1994.
While family units still have some control over their
monetary resources, there are nevertheless some
social endowments that are beyond the control of an
individual. Religion and Caste are examples of such
social endowments and are significant determinants of
an individual’s socio-economic status. Among students
those who are Muslim are less likely to continue in
school as compared to their Hindu and Sikh peers
(Borooah, 2003). As per a study, Muslim children are
1.9 times more likely to drop out of schools than Hindu
or Sikh students (Choudhury, 2006). The argument
provided for the increased dropout rates among the
Muslim children stems from the positive influence of
higher educated parents on education attainment and
comes after analysis of the 1991 census data and the
43rd and 50th round of the NSSO. Communities that
were able to reap the benefits of education earlier
passed the advantage further down the line and in this
respect the Muslims lagged behind. At the time of
independence Hindus were in a better position to gain
from secondary education while the Muslims were
waiting to catch up in literacy and primary education
(Bhat & Zavier, 2005). Often, the conservative values of
Muslim households reflect in the lower probability of
female Muslim children in enrolling in schools, higher
likelihood of dropping out and lower grade completion
levels in comparison to those from Hindu families
(Sengupta & Guha, 2002). Owing to social
discrimination and atrocities born of the caste system,
the children of the backward classes have also shown
lower enrolment and higher dropout rates in
comparison to those from Hindu families. A child from
a backward caste is 3.2 times more likely to dropout
than a child from a privileged caste (Choudhury, 2006).
While the efforts of the government have led to some
improvement in their status, however, it has not been
substantive enough to make up for centuries of
marginalisation and entrenched prejudices. Similar
trends have also been noticed in the case of tribal
communities (Sengupta & Guha, 2002).
As per the data from 52nd round of National Sample
Survey (NSS), the lack of interest on part of the child is
the major factor behind dropouts among both male and
female students with 37 per cent responses to that
effect in both rural and urban areas. The reason behind
this disinterest among students ranges over
expectations from and worthiness of education being
received. Parents discourage female children from
pursuing studies because they do not believe in its
utility for in their minds their daughters will soon get
married and eventually manage a household only. To
parents, by continuing with her education a female
child tends to become ‘over-qualified’, making it
difficult for her to get a hand in marriage. From their
perspective, marriage may seem as a way of ensuring
for the provision of the female child in adulthood and
protection against financial risks. The social influence
also at play here sees marriage as a guard against the
dangers and stigma of pre-marital sex. Education is
demonised for instilling ‘non-conformist’ zeal among
‘impressionable’ female children as well (Chowdhury,
1994). Moreover, seeing that the economic benefits of
spending on the education of the female child will
accrue to the family that she is married into and not the
natal family which is making the investment also deters
parents from sending their daughters to school
(Sengupta & Guha, 2002).
However, studies and surveys have shown that the
intensity of these factors lessens with the transition
22 JOURNAL OF THE ECONOMICS SOCIETY
from rural to urban areas. This is likely to be due to the
modernising influence of the urban spaces. Better
economic opportunities in the urban areas also ease
out the financial constraints and the improved access
to education positively influences its attainment. Urban
areas have a greater demand for a skilled labour force
which gives an impetus towards human resource
development. As per the data from 52nd round of
National Sample Survey (NSS) which highlights the
reasons behind female children dropping out of schools,
‘Parents not interested in studies’ affect 17 per cent
and 11 per cent female children in rural and urban
areas respectively.A higher proportion of female
children get absorbed in domestic duties than the male
children in rural (6.7 per cent) and urban (6.3 per cent)
areas. This fall in percentages from rural to urban areas
potentially points to a more equitable treatment of
children in urban areas which come with modern values.
Familial fears and expectations are a part of the social
fabric which changes at its own pace but access to
quality education is dependent on the policy structure
and reach which changes with governments. A study on
a large Indian database constructed by National Council
for Applied Economic Research (NCAER) led to the
observation that while only 11 per cent children lived in
villages without a primary school, 30 per cent resided
in villages with or without a middle school (Borooah,
2003). Distance from school translates into distance
from education. In the remote parts of the country,
children have to walk for hours over kilometers to reach
their school. For the female children this problem gets
compounded with additional security concerns. For
them a longer journey from home means a greater risk
of sexual assault on the way and this, regrettably,
comes as no surprise given India’s unfortunate infamy
for not having a completely safe environment for
women.
Female students have also expressed a fear of
bathrooms (if they are there) which have not been
gender-segregated. To them it puts them at a
vulnerable spot and prone to bullying and harassment
from fellow male students and to avoid this they often
miss school while menstruating (Lives, 2015).
Sometimes due to lack of availability of pad/cloth in
school, female children often go back to their homes
and simply not come back. There is an absence of
dialogue and a certain stigmatisation around
menstruation which makes it difficult for adolescent
girls to physically and mentally deal with this natural
process. In the absence of a support system at school
or particular encouragement at home, female children
often dropout after hitting puberty.
Security and distance couple with infrastructural
inadequacies and qualitative deficiencies of the
government schools to disenchant female children
from pursuing education. With priorities skewed
towards enrolment than functioning, government
schools continue to remain plagued with teacher
absenteeism and under-qualification, insufficient
sanitation and crumbling infrastructure.
Female children have to encounter additional social,
economic, cultural, logistical, and attitudinal hurdles in
their pursuit of education. They have to fight not only
with the ideals of a patriarchal society, but also their
spirit which would die without any form of
encouragement. Family is centric to most o of the
constraints preventing female children from pursuing
education. Family size has a direct relationship with the
dropout rate in the Indian context, while income varies
inversely. Parental education has shown to play a
definite role. However, results have been inconclusive
with regard to which parent (the mother or the father)
has the greater role to play. Family’s social standing in
the caste hierarchy, religious outlook, and orthodox
expectations are significant impediments to the access
of education for the female children. Educational
attainment is also prevented by security concerns and
distance from schools. The inadequate infrastructure,
teacher absenteeism and poor quality of education
being imparted act as discouraging elements as well.
These are the major factors which nip the potential of
the female children in the bud by prompting their
dropping out of schools.

23 JOURNAL OF THE ECONOMICS SOCIETY
REFERENCES 1. Bhat, P. N., & Zavier, A. J. (2005). Role of Religion in Fertility Decline: The Case of Indian Muslims. Economic
and Political Weekly, XL,5, 385-402.
2. Borooah, V. K. (2003). Births, Infants and Education: An Econometric Portrait of Women and Children in India.
Development and Change, 34, 67-102.
3. Chakravarty, M. (1998). Neglect, Cruelty and Wastage of Human Resource The Girl child. Indian Anthropologist,
Vol. 28, No. 2 (December), pp. 9-20.
4. Choudhury, A. (2006). Revisiting Dropouts Old Issues, Fresh Perspectives. Economic and Political Weekly, Vol.
41, No. 51 (Dec. 23-29), 5257-5263.
5. Chowdhury, K. P. (1994). Literacy and Primary Education, Working Paper, Human Capital Development and
Operations Policy. Washington DC: The World Bank.
6. Kingdon, G. G. (1999). Gender Gap in India Schools: Is Labour Market a Factor? Id21 Insights, Issue 29.
7. Lives, Y. (2015). How Gender Shapes Adolescence: Diverging paths and opportunities. Oxford: Oxford
Department of International Development.
8. Ramchandran, V., & Saihjee, A. (2002). The New Segregation: Refllections on Gender and Equity in Primary
Education. Economic and Political Weekly, 37(17). April 27, 1600-13.
9. Sateesh Gouda M, D. (2014). Factors Leading to School Dropouts in India: An Analysis of National Family Health
Survey-3 Data. IOSR Journal of Research & Method in Education (IOSR-JRME), 75-83.
10. Sengupta, P., & Guha, J. (2002). Enrolment, Dropout and Grade Completion of Girl Children in West Bengal.
Economic and Political Weekly, Vol. 37, No. 17 (Apr. 27 - May 3), 1621-1637.

24 JOURNAL OF THE ECONOMICS SOCIETY
ROSCA: WHY DO PEOPLE PARTICIPATE IN IT?
AN EMPIRICAL STUDY IN URBAN SLUMS OF
DELHI ADITYA RAJ [email protected]
PRASHANT KUMAR [email protected]
PURUSHOTTAM MOHANTY [email protected]
ABSTRACT
Participating in ROSCA allows members to buy
indivisible goods, commit to savings, and get insured
against financial contingency in a framework which is
both flexible and simple. ROSCA fulfils the demand for
financial services like savings and credit in a unique way
that caters to the specific needs of the urban slum
households which formal financial institutions such as
Banks cannot, thereby making ROSCA a popular
informal financial institution among urban slum
households.
Keywords: ROSCAs; Informal finance; Savings; Credit;
Urban slums; India
JEL Classification: D71; G21; G22; O16; O17
1. INTRODUCTION
“ROSCA is the poor man's bank, where money is not idle
for long but changes hands rapidly, satisfying both
consumption and production needs."
- F.J.A. Bouman (1983)
Rotating Savings and Credit Association (hereafter
referred to as ROSCA), also known as committees, can
be defined as a self-selected, voluntarily formed group
of individuals who agree to save and contribute a pre-
committed amount of money in every period towards
the creation of a fund. This fund is then used to allot
fixed amounts to each member in turn in accordance
with some pre-arranged principle such as through an
order determined by list, lottery, or auction. Once a
member has received the fund, s/he is excluded from
any allotments until the ROSCA ends, but must
continue to participate in contributing to the fund. In
random/ lottery ROSCA, a member is randomly chosen
(by lottery) for the allotment of the fund. In the next
period, the process repeats itself except that the
previous winner is excluded from the lottery so that the
probability of a member receiving the fund in any
period is increasing (Besley, Coate, and Loury, 1993). It
continues until each member of the ROSCA has been

25 JOURNAL OF THE ECONOMICS SOCIETY
given the fund once. On the other hand, a bidding
ROSCA is a scheme which uses competitive bidding to
determine the rank order in which loans are awarded
to ROSCA members. The higher the winning bid of an
auction, the higher the interest rate implicit in the loan
awarded to the auction's winner. The auction
mechanism thus allows a bidding ROSCA to allocate a
loan flexibly to the member with the greatest
concurrent need for funds (Klonner 2003). ROSCA is
thus, a special type of microcredit organization that
largely meets the credit needs of the poor. By
aggregating individual funds and channelling them to
individual members, ROSCAs play an important
intermediation function, based on revolving funds.
They do not require physical capital as collateral.
Instead, repayment is based on reciprocity and social
pressure.
The poor households in urban slums pose complex
challenges to financial institutions. Due to information
asymmetry and high monitoring costs, financial
institutions like banks refrain from lending to the poor.
Against the backdrop of missing credit from formal
financial institutions, ROSCA emerges as a popular
source of financial services like savings and credit for
households in slums. Not much study has been done
concerning the relevance of institution like ROSCA in
the lives of urban slum dwellers in a mega city like Delhi
where financial institutions like banks are
geographically accessible. Thus, it becomes vital to
understand the role of institutions like ROSCA in
shaping up the lives of urban poor.
The study was carried out from January to February
2017, and we collected primary data from sixty
households in the slums of Anna Nagar (Indraprastha)
and Timarpur in Delhi. Random sampling was done
using the tools of interview and questionnaire. The
research question that this study aims to answer is:
Why do people in urban slums participate in ROSCAs?
Using the data collected, the study found and analyzed
factors that motivate urban slum dwellers to be a
ROSCA member.
ROSCA fund allows members to buy indivisible goods
and acts as insurance in case of financial contingency.
As a mechanism for exhibiting self-control in the
presence of time-inconsistent preferences, ROSCA
allows a member to commit to savings. In addition to
these, ROSCA’s innate quality of flexibility provides an
incentive to participate in it.
Section 2 talks about background and motivation for
the study. Section 3 mentions the existing literature on
various reasons for ROSCA participation. In section 4,
we analyze our sample and discuss the research
methodology. In section 5, an in-depth analysis of
factors for ROSCA participation is done. Section 6
conclusively discusses the factors for ROSCA
participation that have been featured in the study. It
also talks about implications and limitations of our
study.
2. BACKGROUND
2.1. WHY DON’T BANKS LEND TO THE POOR?
Due to information asymmetry, the advancement of
credit to poor households in urban slums suffers from
the problem of adverse selection and moral hazard
which, in turn, results in high monitoring costs and high
risk of default. Rajan and Zingales (2003) blame the
“tyranny of collateral” in making credit inaccessible to
the poor. The poor often don’t possess titles to their
property, and hence cannot pledge collateral
demanded by banks. Most of the poor have little or no
credit history. Kedir, Disney, and Dasgupta (2011) point
out that an increasing proportion of households have
access to basic saving and deposit institutions, but
developed institutions for raising investment capital
(arising from the lack of a formal venture capital market,
of sophisticated credit scoring agencies, etc.) are
missing. This perhaps forms the rationale for the
existence of alternative institutions like ROSCAs that
can extend credit to the poor. It is, therefore, clear that
a germane finance model for poor urban households
remains a key gap in administering financial services to

26 JOURNAL OF THE ECONOMICS SOCIETY
them. Bouman (1983) highlights that against this
background, ROSCA materializes as poor man's bank,
where money is not idle for long but changes hands
rapidly, satisfying both consumption and production
needs.
2.2. WHY IS ROSCA PARTICIPATION WIDELY
PREVALENT?
ROSCAs are found throughout the world, from Africa to
Latin America to Asia including India. They are one of
the most common informal financial channels, in
particular for the poor and low-income households. It
is imperative to understand what makes ROSCA such a
widely accepted system. This paper also aims to delve
into its structure and the role that it plays in the lives of
the people, mainly urban poor. It is crucial to study
ROSCA vis-à-vis banks to understand the lacunas of
banks that ROSCAs can fill. ROSCA makes financial
services like credit and insurance available, accessible
and affordable to its members who are often
overlooked by banks. Evaluating the role of ROSCAs can
also help us to recognize relevant policy measures that
could be undertaken to increase financial inclusion
among the poor and low-income households.
Drawing from these, this study aims to answer
questions of why do people participate in ROSCAs and
what importance or role does it play in the lives of
urban slum dwellers?
3. LITERATURE REVIEW
Rotating Savings and Credit Associations (ROSCA) is one
of the most common informal financial institutions in
the world. They are existent in countries with greatly
different levels economic development. Initial
literature suggests that ROSCAs are primarily
institutions that allow individuals to save in order to
purchase an indivisible durable good. Besley, Coate,
and Loury (1993) suggest that individuals join ROSCAs
to purchase indivisible goods by taking advantage of
inter-temporal gains from trade. However, further
research on ROSCAs brought into light other reasons
for participation. Ardener (1995) contended that
individuals participate in ROSCAs to insure themselves
against financial emergencies. He implied that distant,
cumbersome and impersonal banking systems could
never match the speed with which close and
trustworthy members of a ROSCA react. Klonner (2003)
also emphasized on the same aspect by showing how
risk-averse individuals can insure themselves against
unforeseen risks by participating in a ROSCA. Anderson
and Baland (2002), using data from African nations
asserted that participation in ROSCA is done by women
as a strategy against intra-household conflict.
The next breakthrough article in the field of ROSCA was
by Gugerty (2005). He refuted the theory that
participation in ROSCA is to purchase indivisible goods.
He said, "There is no relationship between the
lumpiness of ROSCA purchases and the allocation
mechanism as an indivisible good model might suggest”
(Gugerty, 2005). He stated that individuals participate
in ROSCAs to commit to saving since ROSCAs provide a
collective mechanism of individual self-control in the
presence of time-inconsistent preferences and the
absence of any commitment technologies. The paper
also mentions that an individual would want to tie
himself to a saving pattern since he/she is prone to
procrastination, i.e., he/she would rather save in the
future than today.
ROSCA is also considered as a social and cultural
institution with participants receiving considerable
returns apart from ROSCA funds. The members receive
valuable information on wide range of topics and get
advice on many issues. Socializing in ROSCA might also
lead to a cost-effective benefit. (Ardener, 1995).
Studies show that default rate in ROSCA is low, the
inherent problem does not manifest itself. The studies
point to the reliance on social collateral (network
connections between individuals can be used as social
collateral to secure informal borrowing) to avoid
defaults (Chiteji, 2002). There might exist incentives for
those who complete the full term of ROSCA, e.g. , the
promise of advancement in line in future ROSCAs (Van
den Brink and Chavas, 1997). The avoidance of default

27 JOURNAL OF THE ECONOMICS SOCIETY
is essential for the sustainability of ROSCA because
when defaults are high, profitability from ROSCA is low.
Chiteji (2002) argues that there exists a negative
relationship between the size of ROSCA and the ability
to enforce the ROSCA contract. This idea also resonates
in the Olson's logic of collective action, i.e., larger the
group size easier free riding becomes and thus, more
difficult would be collective action. However,
researchers like Ostrom et al. (2006) challenge this idea
by stating that larger groups are more efficient because
they have command over a larger resource base.
The literature on the comparison of ROSCAs with Banks
is small. Due to information asymmetries, banks do not
extend credit to all individuals, even when they have a
deposit-taking option. The monitoring costs
experienced by the bank contribute to the existence of
ROSCAs. The greater the monitoring costs, more are
the individuals who are left to seek out ROSCA financing.
(Chiteji, 2002). Thus, it points out to the existence of
financial dualism in developing countries where both
formal and informal financial systems exist
simultaneously. For most of the ROSCA members, using
formal systems is time taking, complicated and
cumbersome or there is no freedom to spend money in
the area they want. (Bisrat, et al. 2012). Kedir, Disney,
and Dasgupta (2011) also conclude that ROSCAs and
Banks can simultaneously co-exist.
4. METHODOLOGY
The study was based on primary research conducted in
the slums of North East Delhi and East Delhi. Primary
data was collected through individual interview with
the help of a questionnaire. The questionnaire was
systematically divided into two parts; the first part was
devoted to questions about the structure and
functioning of ROSCAs, and in the second part
respondents were also made to answer questions on
banks to understand the working of ROSCA vis-à-vis
banks. The final questionnaire was prepared after
conducting and evaluating the pilot survey which was
carried out on a smaller sample size. The field survey
was divided into phases wherein pilot survey was
followed by the main survey. The main survey was
conducted from January to February 2017.
Households were selected using random sampling, and
one member who was also a ROSCA participant was
surveyed from each household. The primary survey
included 60 data points, 30 data points from the slum
of Anna Nagar (Indraprastha, East Delhi) and 30 data
points from a slum in Timarpur (North East Delhi). Both
the slum were unauthorized, but the residents were
permanent.
5. FACTORS RESPONSIBLE FOR ROSCA
PARTICIPATION
5.1 COMMITMENT TO SAVINGS
It wasn’t considered as a reason for participation in
ROSCAs until Gugerty (2005) brought the issue into the
limelight. Thereafter, it was considered as the most
important reason for participation in ROSCAs. He
argued that ROSCAs provide a mechanism for
exhibiting self-control in the presence of time-
inconsistent preferences thereby resulting in a high
degree of commitment to savings. This factor is
essentially true and holds out even today. Out of 60
respondents, 52 (86.7%) reported that commit to
savings is indeed a reason for participation in a ROSCA.
Figure 1
Source – Author’s calculation based on survey data
Commit to Savings as a Reason for Participation
Yes No

28 JOURNAL OF THE ECONOMICS SOCIETY
An individual who is a participant in a ROSCA has to
mandatorily set aside an amount equal to his/her
monthly ROSCA contribution at the beginning of every
month. It ensures that a particular amount is set aside
every month as savings in the form of ROSCA
contribution. One may argue that an individual can
simply keep the money in his house or may choose to
deposit it in the bank. However, the mechanism is
completely different in these cases. If he/she chooses
to keep it in the house, then the money may get spend
due to the human tendency to spend more when there
is available money. If he/she chooses to deposit the
money in the bank, then it is easy to withdraw the
money through ATMs and by visiting the bank itself,
even if there's little need for money. Although it
depends on the preferences and self-restrain capacity
of the individual, generally it is incredibly tough to
commit to a particular amount every month.
ROSCA provides an effective mechanism that enables a
person to exercise a strong commitment to savings.
Thus, by making their ROSCA contribution, an individual
can save up certain money which would have got spend
otherwise.
5.2 FLEXIBILITY
The structure of ROSCA is such that it provides
unparalleled flexibility to its participants regarding a
number of factors. Flexibility is one of the greatest
advantages of the ROSCA system. Participants have a
choice regarding the type of ROSCA they want to take
part in, the number of members in the ROSCA and the
fixed monthly amount that they want to contribute in.
This doesn't mean that different participants can
contribute a different monthly amount within the same
ROSCA. Flexibility in ROSCA means that the participants
always have a choice to switch to a different ROSCA
where the monthly contribution amount is as per
his/her need. Similarly, a person has a choice whether
to participate in a bidding or a lottery ROSCA. Flexibility
in ROSCA means that there are multiple ROSCAs each
with a different set of rules and people can choose
which ROSCA to participate in.
ROSCA system is also flexible regarding the fact that
participants have a choice to shift to a ROSCA of their
choice if they have any personal issue with the cashier
in case of late payment. Individuals also shift to a
different ROSCA in case of fraud by a member or the
cashier.
Flexibility is an important aspect in the ROSCA system
as it allows individuals to participate in an informal
financial system that is very specific to their needs or
requirements. It is one of the primary reasons for
satisfaction in the system.
a) ROSCA Type
It was found that out of 60 respondents, 32 participated
in Lottery ROSCA only, 26 participated in Bidding
ROSCA only, and 2 participated in both Lottery and
Bidding ROSCA. (Figure 2) The participants choose the
type of ROSCA they want to take part in based on their
preference. Reasons for participation might differ
depending on the type of ROSCA. The most common
reason for participation in a Lottery ROSCA is to commit
to savings and insurance against financial contingencies.
Whereas those participating in Bidding ROSCA do so to
earn a profit and have access to ROSCA pot as per their
need.
Figure 2
Source - Author’s calculation based on survey data
0
20
40
Lottery Only Bidding Only Both
Number of Participants
Number of Participants

29 JOURNAL OF THE ECONOMICS SOCIETY
b) Change in Monthly ROSCA Contribution
This section compares the Monthly ROSCA
Contribution of the previous ROSCA Cycle in which the
participant was taking part in, with the current one in
which the same individual is taking part in. The ROSCA
might be the same or a different one, but the individual
we are analysing is the same one.
Out of the 60 respondents, 28 (46.7%) reported an
increase in monthly ROSCA contribution, 12 reported a
decrease whereas 16 reported an unchanged ROSCA
contribution. 4 respondents started taking part in
ROSCA for the first time.
Overall 40 out of 60 respondents (66.67%) reported
changes in their monthly ROSCA contribution in
comparison with previous ROSCA cycle. This is a
substantial amount of respondents reporting changes
in monthly ROSCA contribution. It shows the high
degree of flexibility in ROSCA structure where
participants have the liberty to switch to a different
ROSCA more suitable as per their current needs.
Individuals switching to a ROSCA with a higher or lower
monthly contribution can be attributed to the fact that
their income might have increased or decreased hence
they do not want to commit to a higher amount of
savings. An increase in monthly contribution also
implies continued trust in the ROSCA structure. The
individual might choose to contribute a higher amount
monthly because he/she might need to save a greater
amount in the current period. Hence, he/she would
want to commit to saving a higher amount each month.
The need for higher savings arises to finance children's
education or marriage.
Figure 3
Source - Author’s calculation based on survey data
c) Change in ROSCA
Flexibility in ROSCA also comes from the freedom to
select a ROSCA based on the current requirements of
the participant. Participants change their ROSCA if they
prefer to shift to a bidding ROSCA from a lottery ROSCA
or vice-versa. They also change their ROSCA because of
a different choice of monthly contribution or the
ROSCA size, i.e., number of members in a ROSCA. Apart
from that, an individual also changes his/her ROSCA
because of non-payment of pot on time or due to fraud
by a cashier or member. Individuals also change their
ROSCA if they have a personal issue against the cashier.
Out of 60 respondents, 25 (41.7%) reported having
changed their ROSCA at some point in time, while 35
(58.3%) reported that they hadn't changed their ROSCA.
(Figure 4) It means that 41.7% participants have been
able to switch to a ROSCA as per their preference. This
is indicative of the high degree of flexibility in the
ROSCA system.
It was observed that among those who changed their
ROSCA, 32% did so because of fraud or a personal issue
against the cashier and another 32% changed their
Change in ROSCA Contribution
Increased Decreased
Remained Same Started This Year
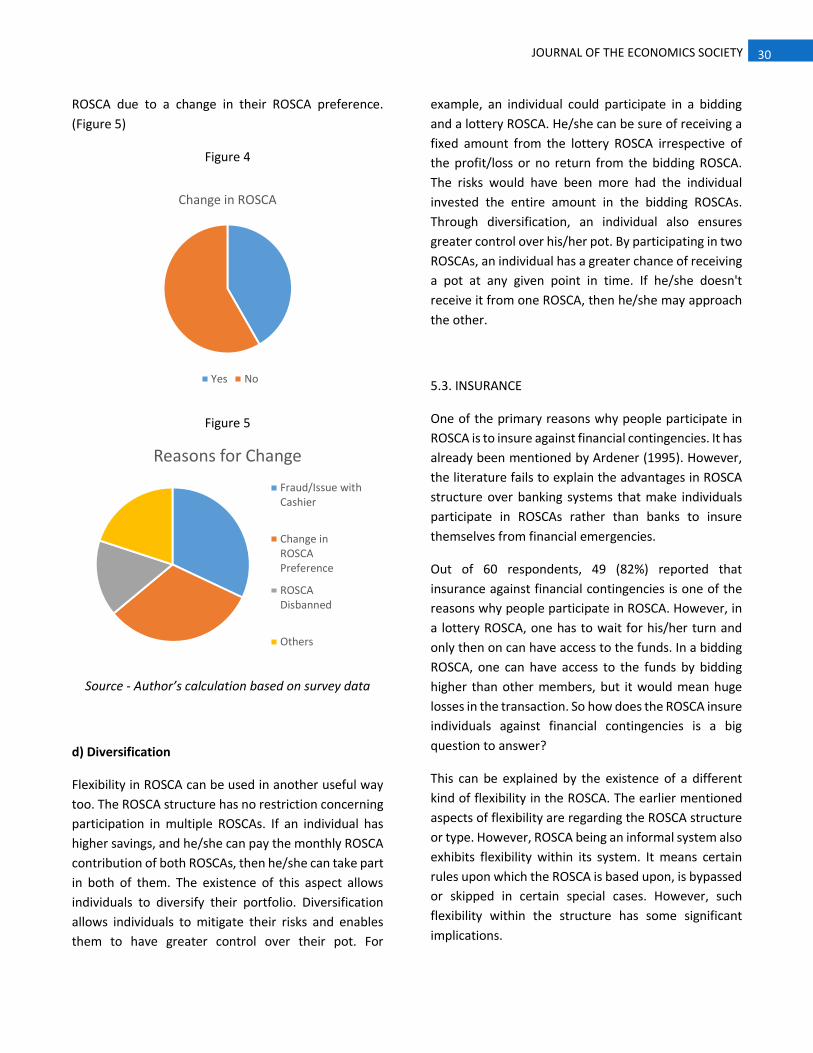
30 JOURNAL OF THE ECONOMICS SOCIETY
ROSCA due to a change in their ROSCA preference.
(Figure 5)
Figure 4
Figure 5
Source - Author’s calculation based on survey data
d) Diversification
Flexibility in ROSCA can be used in another useful way
too. The ROSCA structure has no restriction concerning
participation in multiple ROSCAs. If an individual has
higher savings, and he/she can pay the monthly ROSCA
contribution of both ROSCAs, then he/she can take part
in both of them. The existence of this aspect allows
individuals to diversify their portfolio. Diversification
allows individuals to mitigate their risks and enables
them to have greater control over their pot. For
example, an individual could participate in a bidding
and a lottery ROSCA. He/she can be sure of receiving a
fixed amount from the lottery ROSCA irrespective of
the profit/loss or no return from the bidding ROSCA.
The risks would have been more had the individual
invested the entire amount in the bidding ROSCAs.
Through diversification, an individual also ensures
greater control over his/her pot. By participating in two
ROSCAs, an individual has a greater chance of receiving
a pot at any given point in time. If he/she doesn't
receive it from one ROSCA, then he/she may approach
the other.
5.3. INSURANCE
One of the primary reasons why people participate in
ROSCA is to insure against financial contingencies. It has
already been mentioned by Ardener (1995). However,
the literature fails to explain the advantages in ROSCA
structure over banking systems that make individuals
participate in ROSCAs rather than banks to insure
themselves from financial emergencies.
Out of 60 respondents, 49 (82%) reported that
insurance against financial contingencies is one of the
reasons why people participate in ROSCA. However, in
a lottery ROSCA, one has to wait for his/her turn and
only then on can have access to the funds. In a bidding
ROSCA, one can have access to the funds by bidding
higher than other members, but it would mean huge
losses in the transaction. So how does the ROSCA insure
individuals against financial contingencies is a big
question to answer?
This can be explained by the existence of a different
kind of flexibility in the ROSCA. The earlier mentioned
aspects of flexibility are regarding the ROSCA structure
or type. However, ROSCA being an informal system also
exhibits flexibility within its system. It means certain
rules upon which the ROSCA is based upon, is bypassed
or skipped in certain special cases. However, such
flexibility within the structure has some significant
implications.
Change in ROSCA
Yes No
Reasons for Change
Fraud/Issue withCashier
Change inROSCAPreference
ROSCADisbanned
Others

31 JOURNAL OF THE ECONOMICS SOCIETY
ROSCA participants were asked whether they are
willing to change their pot position when another
member has an emergency (medical emergency, etc.).
Out of 60 respondents, 54 responded that they are
willing to change their pot position. It means 90% of
respondents are willing to allow the needy member an
easy access to funds. It is indicative of the trust
between members and in the ROSCA system.
Figure 6
Source - Author’s calculation based on survey data
However, willingness doesn't imply actual
implementation. Hence the questionnaire included two
follow-up questions – whether a similar favor has been
asked by the individual and whether the request was
accepted or not.
Concerning the first question, 37 respondents reported
that they have asked for the same favor whereas 23
respondents reported that they haven't. It shows that a
significant 62% respondents have requested for the
same favor. However requesting for a change in pot
position doesn't guarantee its implementation in the
ROSCA. Hence the second question was asked to those
who reported that they requested for a change in pot
position at some point in time. Among the 37
respondents who reported to have asked for a change
in pot position, 34 reported that their request was
accepted.
It is a clear indication of the flexibility within the ROSCA
structure. 92% respondents reported that their request
for a change in pot position due to an emergency was
accepted. It shows the ability of the members to
understand a fellow member’s situation and grant
him/her access to the fund which might turn out to be
lifesaving. It is the presence of this human element that
makes ROSCA such an effective system.
Figure 7
Figure 8
Source - Author’s calculation based on survey data
ROSCA system also exhibits a form of flexibility in the
case of penalty charged upon its members. The penalty
Willing to Change Pot Position
Yes No
Have You Asked for the Same Favour?
Yes No
Was Your Request Accepted?
Yes No

32 JOURNAL OF THE ECONOMICS SOCIETY
in ROSCA is defined as the additional charge per day,
levied in excess to the monthly contribution in case of
late payment of monthly ROSCA contribution. (Usually,
a day in the 1st week of every month is the fixed day for
payment of monthly contribution). As per survey
results, the penalty is levied in 70% of ROSCAs which is
₹50 on an average. However, its implementation is
carried out generally in a conditional manner. If a
member cannot pay on time due to a certain
emergency in his/her family, then their case is
understood and late payment is accepted. In that case,
the cashier pays for that particular member for the time
being. Later when the member can pay the amount,
he/she returns the money to the cashier. In certain
cases, the ROSCA is skipped for that particular month.
The following flexibility or conditional implementation
of penalty is only possible due to high trust factor in
ROSCA, the reasons for which have been mentioned
earlier.
The existence of the power to "bend the rules" into
one's favor plays an important role in securing against
financial emergencies. The high degree of these factors
ensures that one has quick access to funds in times of
financial emergencies. One may argue that a similar
service can be provided by banks as well. However,
credit accessibility from banks is a time taking and
cumbersome process with low chances of getting credit,
especially for these slum residents. As the name itself
suggests that it is an emergency, it is important that the
individuals have access to the funds in a short span.
5.4. SIMPLICITY
Participation in a ROSCA neither requires a member to
go through the cumbersome process of documentation
and nor is the participant subject to the tyranny of
collateral. This keeps the structure simple and removes
some of the disincentives to participation in ROSCA.
Figure 9
Figure 10
Source: Authors’ calculation based on survey data
Only 10% of the ROSCA members had to submit
documents to establish their credibility. However,
almost 52% of respondents reported that some
rudimentary documentation such as identity proofs
should be submitted in ROSCA to ensure credibility and
curb default.
10%
90%
Documentation in ROSCA
Yes No
52%43%
5%
Preference for Documentation
Yes No Doesn't matter
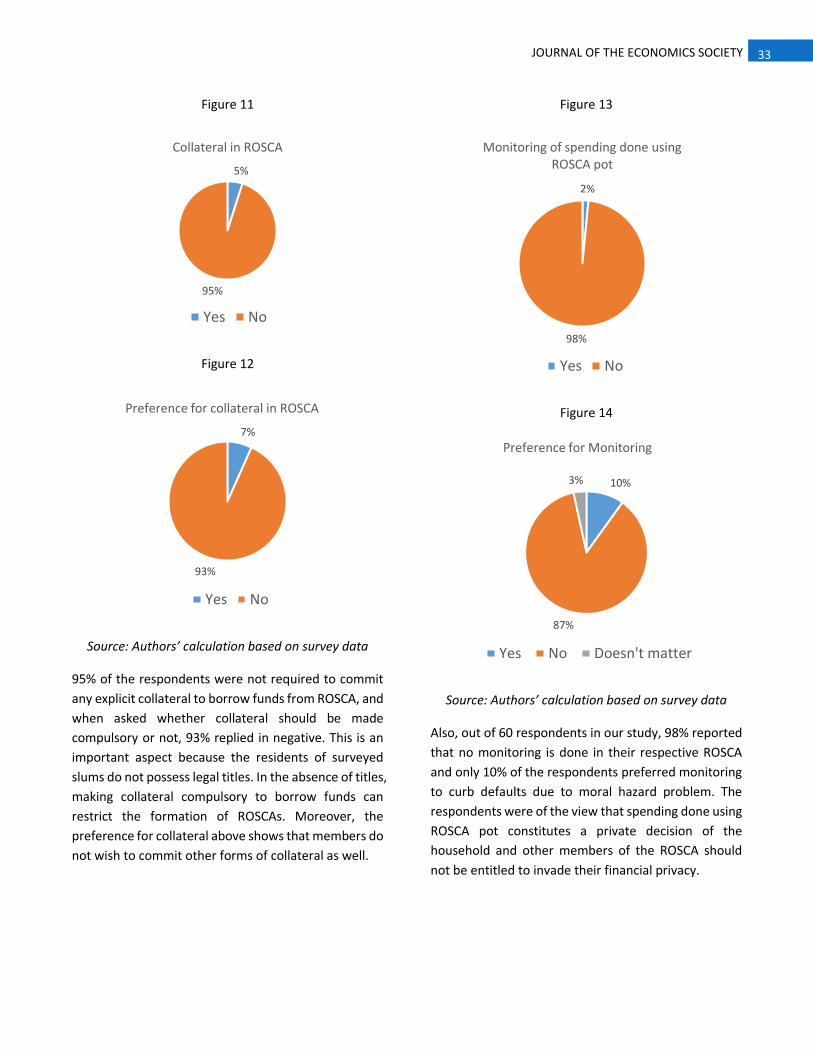
33 JOURNAL OF THE ECONOMICS SOCIETY
Figure 11
Figure 12
Source: Authors’ calculation based on survey data
95% of the respondents were not required to commit
any explicit collateral to borrow funds from ROSCA, and
when asked whether collateral should be made
compulsory or not, 93% replied in negative. This is an
important aspect because the residents of surveyed
slums do not possess legal titles. In the absence of titles,
making collateral compulsory to borrow funds can
restrict the formation of ROSCAs. Moreover, the
preference for collateral above shows that members do
not wish to commit other forms of collateral as well.
Figure 13
Figure 14
Source: Authors’ calculation based on survey data
Also, out of 60 respondents in our study, 98% reported
that no monitoring is done in their respective ROSCA
and only 10% of the respondents preferred monitoring
to curb defaults due to moral hazard problem. The
respondents were of the view that spending done using
ROSCA pot constitutes a private decision of the
household and other members of the ROSCA should
not be entitled to invade their financial privacy.
5%
95%
Collateral in ROSCA
Yes No
7%
93%
Preference for collateral in ROSCA
Yes No
2%
98%
Monitoring of spending done using ROSCA pot
Yes No
10%
87%
3%
Preference for Monitoring
Yes No Doesn't matter

34 JOURNAL OF THE ECONOMICS SOCIETY
5.5. INDIVISIBLE GOODS
Existing studies on ROSCAs tells us that one of the
reasons why people participate in ROSCAs is to buy
indivisible goods which are lumpy investment and often
cost more than what they earn on a monthly basis. The
intertemporal gains from trade attract them to ROSCAs.
When asked about the motive to participate in ROSCA,
62% of our respondents stated that they took part in
ROSCA to buy indivisible goods. Of them about 68%
were females and all were married. Out of all the
women participating in ROSCAs to buy indivisible goods,
40% were in the age group 30-40 years and 28% were
in age group 40-50 years. This shows that ROSCA serves
a very important purpose by allowing women to
accumulate assets that they otherwise find difficult to
buy. ROSCA also helps them to carry out lumpy
expenditure in family ceremonies, and in many cases,
female respondents told us that investment in
indivisible goods through ROSCA helps them in the
future, for instance in daughter’s marriage. Similarly, of
all the men participating in ROSCA to buy indivisible
goods about 72% were in the age group of 20-40 years
which is the prime working age group.
Figure 15
Source: Authors’ calculation based on survey data
Furthermore, 41.67% of the total sample were
unemployed and of them 60% participated in ROSCAs
to buy indivisible goods. Also, about 68% of wage
earners and salary earners in our sample participated in
ROSCAs to buy indivisible goods. If look at the data on
nature of employment and participation in ROSCAs to
buy indivisible goods, we found that about 52% of the
people working in private sector and 85% of the self-
employed participated in ROSCA to buy indivisible
goods.
Thus, ROSCA helps the urban poor residing in slums to
undertake purchase of indivisible goods that are sold in
discrete quantities like television sets, refrigerators, etc.
which, in turn, enhances the quality of life of these
people.
6. CONCLUSION
The study documents factors responsible for ROSCA
participation. ROSCA plays a pivotal role in the life of
surveyed slum dwellers as it gives fund that allows
members to buy indivisible goods and acts as insurance
in case of financial contingency. ROSCA allows a
member to commit to savings as a mechanism for
exhibiting self-control in the presence of time-
inconsistent preferences. ROSCA’s intrinsic qualities in
the form of flexibility and simplicity also incentivize
urban slum dwellers to participate in it.
Out of 60 respondents, 82% reported that insurance
against financial contingencies is one of the reasons
why they participate in ROSCA. There is undoubtedly a
correlation between ROSCA participation and
insurance against financial emergency, but the causal
relation is unclear. It might be the case that people
participate in ROSCA because they don't have insurance
or else they do not go for insurance because they trust
that ROSCAs will deliver when required.
Notwithstanding, providing insurance can make the
lives of people more stable and secure. The role of
government becomes paramount to provide insurance
to people at subsidized rates. Life cover and accidental
insurance under Pradhan Mantri Jan Dhan Yojana could
62%
38%
Purchase of indivisible goods using ROSCA pot
Yes No
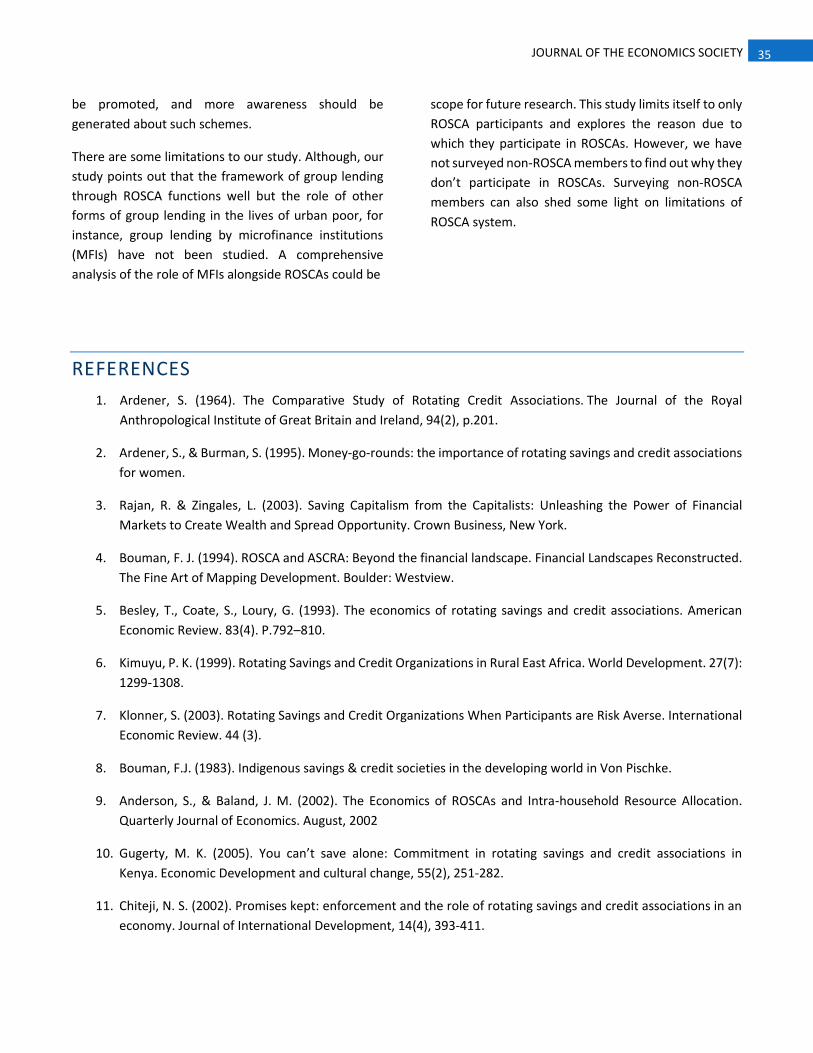
35 JOURNAL OF THE ECONOMICS SOCIETY
be promoted, and more awareness should be
generated about such schemes.
There are some limitations to our study. Although, our
study points out that the framework of group lending
through ROSCA functions well but the role of other
forms of group lending in the lives of urban poor, for
instance, group lending by microfinance institutions
(MFIs) have not been studied. A comprehensive
analysis of the role of MFIs alongside ROSCAs could be
scope for future research. This study limits itself to only
ROSCA participants and explores the reason due to
which they participate in ROSCAs. However, we have
not surveyed non-ROSCA members to find out why they
don’t participate in ROSCAs. Surveying non-ROSCA
members can also shed some light on limitations of
ROSCA system.
REFERENCES
1. Ardener, S. (1964). The Comparative Study of Rotating Credit Associations. The Journal of the Royal
Anthropological Institute of Great Britain and Ireland, 94(2), p.201.
2. Ardener, S., & Burman, S. (1995). Money-go-rounds: the importance of rotating savings and credit associations
for women.
3. Rajan, R. & Zingales, L. (2003). Saving Capitalism from the Capitalists: Unleashing the Power of Financial
Markets to Create Wealth and Spread Opportunity. Crown Business, New York.
4. Bouman, F. J. (1994). ROSCA and ASCRA: Beyond the financial landscape. Financial Landscapes Reconstructed.
The Fine Art of Mapping Development. Boulder: Westview.
5. Besley, T., Coate, S., Loury, G. (1993). The economics of rotating savings and credit associations. American
Economic Review. 83(4). P.792–810.
6. Kimuyu, P. K. (1999). Rotating Savings and Credit Organizations in Rural East Africa. World Development. 27(7):
1299-1308.
7. Klonner, S. (2003). Rotating Savings and Credit Organizations When Participants are Risk Averse. International
Economic Review. 44 (3).
8. Bouman, F.J. (1983). Indigenous savings & credit societies in the developing world in Von Pischke.
9. Anderson, S., & Baland, J. M. (2002). The Economics of ROSCAs and Intra-household Resource Allocation.
Quarterly Journal of Economics. August, 2002
10. Gugerty, M. K. (2005). You can’t save alone: Commitment in rotating savings and credit associations in
Kenya. Economic Development and cultural change, 55(2), 251-282.
11. Chiteji, N. S. (2002). Promises kept: enforcement and the role of rotating savings and credit associations in an
economy. Journal of International Development, 14(4), 393-411.
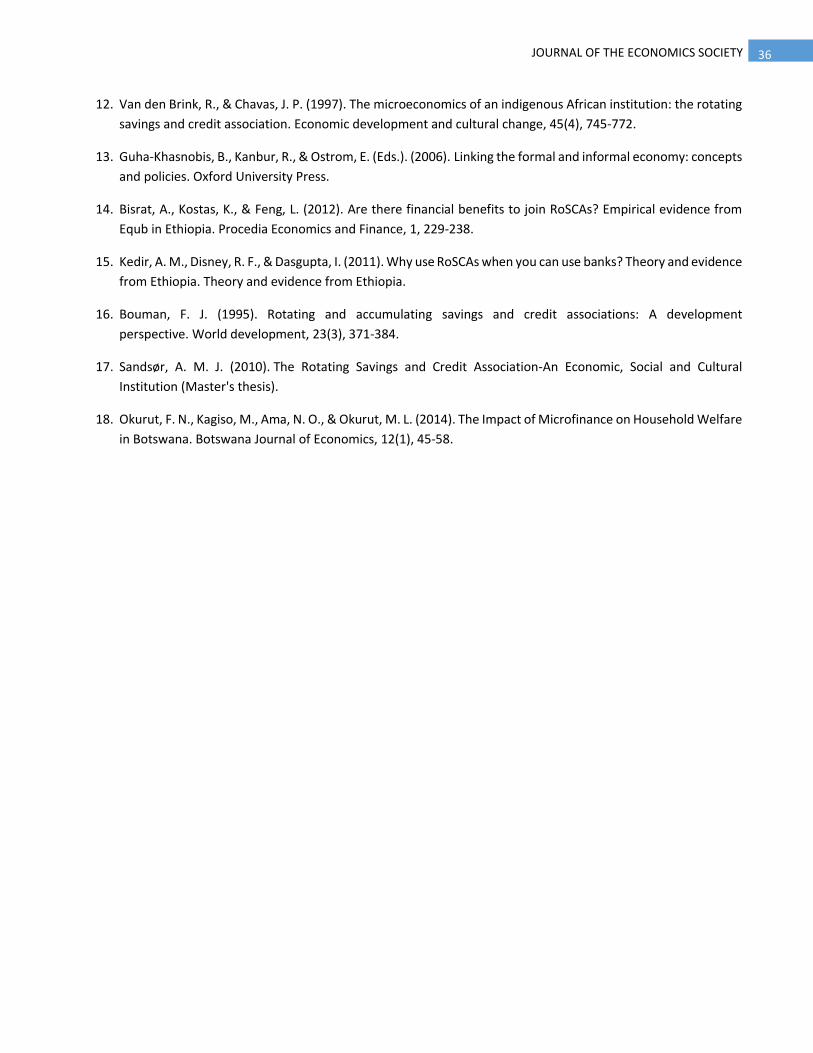
36 JOURNAL OF THE ECONOMICS SOCIETY
12. Van den Brink, R., & Chavas, J. P. (1997). The microeconomics of an indigenous African institution: the rotating
savings and credit association. Economic development and cultural change, 45(4), 745-772.
13. Guha-Khasnobis, B., Kanbur, R., & Ostrom, E. (Eds.). (2006). Linking the formal and informal economy: concepts
and policies. Oxford University Press.
14. Bisrat, A., Kostas, K., & Feng, L. (2012). Are there financial benefits to join RoSCAs? Empirical evidence from
Equb in Ethiopia. Procedia Economics and Finance, 1, 229-238.
15. Kedir, A. M., Disney, R. F., & Dasgupta, I. (2011). Why use RoSCAs when you can use banks? Theory and evidence
from Ethiopia. Theory and evidence from Ethiopia.
16. Bouman, F. J. (1995). Rotating and accumulating savings and credit associations: A development
perspective. World development, 23(3), 371-384.
17. Sandsør, A. M. J. (2010). The Rotating Savings and Credit Association-An Economic, Social and Cultural
Institution (Master's thesis).
18. Okurut, F. N., Kagiso, M., Ama, N. O., & Okurut, M. L. (2014). The Impact of Microfinance on Household Welfare
in Botswana. Botswana Journal of Economics, 12(1), 45-58.

37 JOURNAL OF THE ECONOMICS SOCIETY
RESOURCE CURSE: A BRIEF STUDY OF
VARIOUS FACTORSVARUN AGARWAL- 3RD YEAR, RAMJAS COLLEGE [email protected]
1. MEANING OF RESOURCE CURSE
Natural resources play a crucial role in the development
of a country as they facilitate the process of its
economic growth. A country having large reserves of
minerals has the potential for long-term development
of its industrial sector by providing inputs and thus
sustaining high economic growth. The failure of the
country to benefit itself from its huge mineral reserves
and its inability to distribute benefits accruing from
natural resources to its citizens is referred as “resource
curse”5. This situation creates a paradox of having large
resources but the government’s inability to extract and
distribute the benefits. It has been observed in various
studies in several countries that mineral-rich countries
tend to perform poorly as compared to their less
mineral rich counterpart countries. Table 16 shows that
as one moves up the income ladder the natural
resource wealth falls and produced capital wealth 7
increases.
5 It has been named after the country Dutch where this phenomenon was first observed. (Coutinho, 2011)
6 The table has been reproduced from Canuto, O., &Cavallari, M. (n.d.). Natural Capital and the Resource Curse. Retrieved from http://siteresources.worldbank.org/EXTPREMNET/Resources/EP83.pdf.
7 The figures for lower middle-income group have inflated due to the presence of China in that group.
Table1. Wealth and Per capita Wealth by Type of
Capital and Income Group, 1995 and 2005
Source: World Bank (2011)
However, the empirical study regarding the negative
relationship between natural wealth and development
did not find the relationship significant8 as the paradox
does not apply to all the mineral-rich countries and due
to some prevailing economic and political situations9,
the resources have a negative impact on these
countries and therefore turn out to be a curse for the
country rather than a boon.
Following are some economic, political and social
situations which prevail in areas facing resource curse.
8Refer Canuto, O., & Cavallari, M. (n.d.). Natural Capital and the Resource Curse. Retrieved from http://siteresources.worldbank.org/EXTPREMNET/Resources/EP83.pdf
9 Refer (Coutinho, 2011), (Anshasy), (The Resource Curse: The Political and Economic Challenges of Natural Resource Wealth)
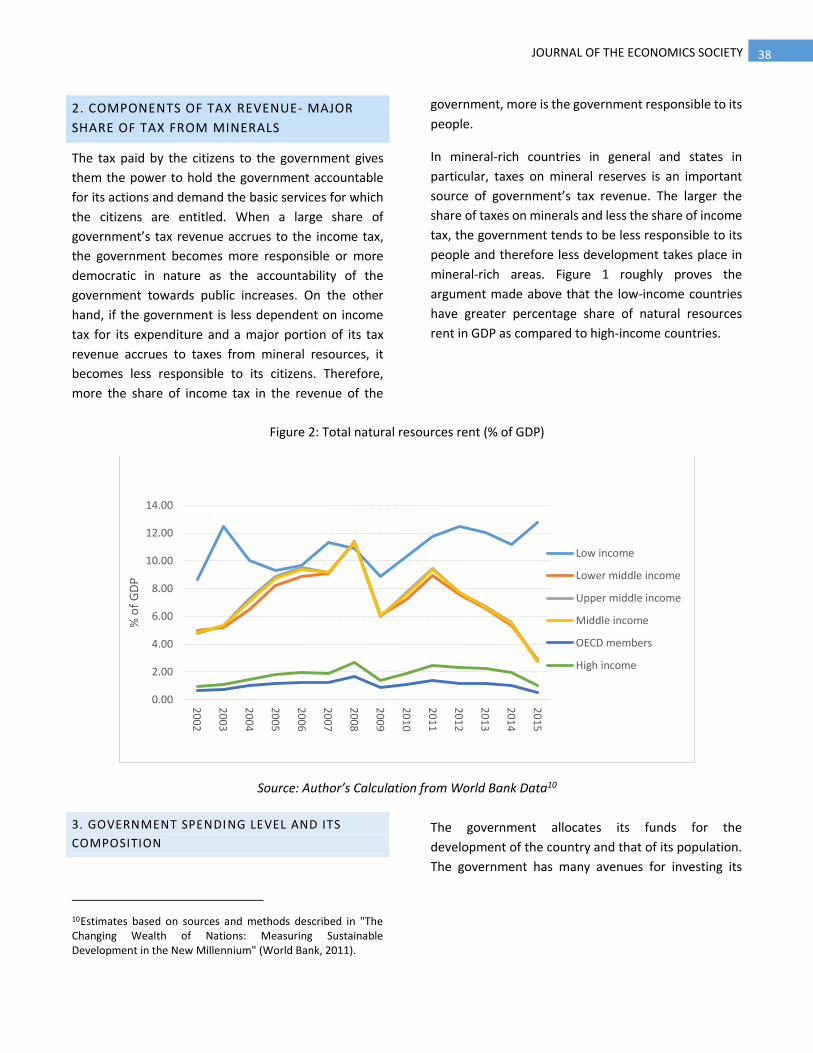
38 JOURNAL OF THE ECONOMICS SOCIETY
2. COMPONENTS OF TAX REVENUE- MAJOR
SHARE OF TAX FROM MINERALS
The tax paid by the citizens to the government gives
them the power to hold the government accountable
for its actions and demand the basic services for which
the citizens are entitled. When a large share of
government’s tax revenue accrues to the income tax,
the government becomes more responsible or more
democratic in nature as the accountability of the
government towards public increases. On the other
hand, if the government is less dependent on income
tax for its expenditure and a major portion of its tax
revenue accrues to taxes from mineral resources, it
becomes less responsible to its citizens. Therefore,
more the share of income tax in the revenue of the
government, more is the government responsible to its
people.
In mineral-rich countries in general and states in
particular, taxes on mineral reserves is an important
source of government’s tax revenue. The larger the
share of taxes on minerals and less the share of income
tax, the government tends to be less responsible to its
people and therefore less development takes place in
mineral-rich areas. Figure 1 roughly proves the
argument made above that the low-income countries
have greater percentage share of natural resources
rent in GDP as compared to high-income countries.
Figure 2: Total natural resources rent (% of GDP)
Source: Author’s Calculation from World Bank Data10
3. GOVERNMENT SPENDING LEVEL AND ITS
COMPOSITION
10Estimates based on sources and methods described in "The Changing Wealth of Nations: Measuring Sustainable Development in the New Millennium" (World Bank, 2011).
The government allocates its funds for the
development of the country and that of its population.
The government has many avenues for investing its
0.00
2.00
4.00
6.00
8.00
10.00
12.00
14.00
20
02
20
03
20
04
20
05
20
06
20
07
20
08
20
09
20
10
20
11
20
12
20
13
20
14
20
15
% o
f G
DP
Low income
Lower middle income
Upper middle income
Middle income
OECD members
High income
39 JOURNAL OF THE ECONOMICS SOCIETY
funds. The government invests in the education sector,
health sector and other such sectors which directly
adds to the development of the society. The
government also invests in mega projects such as
highways, bridges, and infrastructure which facilitates
the economic growth of the country but locks in a
largeamount of funds for a long duration. In the
mineral-richsectors, if the share of taxes from minerals
tends to be large, the government in the resource-rich
areas tends to spend more on government salaries,
megaprojects, unnecessary subsidies and less on health,
education and social security benefits which directly
benefits its population.
4. DUTCH DISEASE
The discovery of more natural resources or an increase
in the profits from natural resources can negatively
affect other non-resource tradable sector and the
economy as a whole of that area. This negative impact
on natural resources is known as “Dutch Disease”. The
discovery of natural resources or an increase in profits
attracts domestic as well as foreign capital to the
resource sector thus appreciating the domestic
currency. The appreciation of the domestic currency
increases the demand for domestic currency leading to
inflation. The prices of domestic non-resource
abundant tradable goods increase, thus leading to
declining of their exports and increasing imports.
Therefore, natural resources can negatively impact the
economy by causing inflation and decreasing the
demand for tradable goods in the domestic as well as
foreign market. Another negative impact is on the labor
force. The increased profits in the natural sector
increase the wages thus shifting labor from tradable
goods sector to resource sector thus negatively
impacting other sectors. Therefore, an abundance of
natural resources may lead to de-industrialization and
contraction of other sectors. The presence of Dutch
disease in the mineral-rich areas hinders the growth of
11 The intangible wealth of a nation includes its institutional arrangement, governance, law and order, educational attainment, R&D etc.
other sectors and the presence of weak institutional
support further worsens the situation.
5. WEAK INSTITUTIONAL ARRANGEMENT AND
PROPERTY RIGHTS
A weak institutional arrangement in the mineral-rich
areas may lead to underutilization of natural resources
and improper extraction of benefits from them. With
the presence of weak property rights in such areas, any
windfall gain from natural resources will influence
people to establish their control over land in order to
extract the benefits of the mineral-rich land. The
interest groups will try to influence institutions to
allocate the resources in their areas, and in the
presence of weak institutional arrangement, the
resources may be distributed to unproductive avenues
thus hindering the process of growth. Also, due to weak
property rights, there tend to be more cases of land
conflicts in these areas among various stakeholders
such as the owner of the land, government bodies,
companies extracting minerals. The cases of conflicts
might further increase in scheduled areas where the
land is commonly owned and there are many claimants
to the property. On the other hand, strong institutional
arrangement and well- defined property rights will
restrict any such influence of interest groups and the
resources will be distributed to productive activities.
Again, looking at Table 1, there is a negative
relationship between intangible wealth 11 and the
natural wealth of a country.
6. CONCLUSION
The negative relationship between natural resource
wealth and the development of a country is empirically
weak and factors discussed above indeed play an
important role in determining whether the natural
wealth a country possesses will turn out to be a curse

40 JOURNAL OF THE ECONOMICS SOCIETY
or a boon. The countries endowed with vast natural
resources and still faring poorly in the development
process must understand the importance of good
governance. The problems arising because of natural
resources can be tackled if there are efficient
institutions working to protect property rights, well-
functioning markets to avoid Dutch disease and
government expenditure concentrated more on basic
services rather than locking up resources for long
period of time. The scope of this article is limited to
providing theoretical arguments for why some
economies despite having vast natural resources fare
poorly and more empirical research needs to be done
to show strong relationship between the factors
discussed and the resource curse.
REFERENCES
1. Anshasy, A. A. (2011). Oil Windfall Shocks, Government Spending, and the Resource Curse. Journal of Applied
Business and Economics 12(4): 44-63.
2. Coutinho, L. (2011). The Resource Curse and Fiscal Policy. Cyprus Economic Policy Review 5(1): 43-70.
3. Kumar, Mukund. (2016). The Resource Curse: The Political and Economic Challenges of Natural Resource
Wealth. Retrieved from: https://www.linkedin.com/pulse/resource-cursethe-political-economic-challenges-
natural-kumar-mukund
4. Canuto, O., & Cavallari, M. (2012). Natural Capital and the Resource Curse. Retrieved from:
http://siteresources.worldbank.org/EXTPREMNET/Resources/EP83.pdf

41 JOURNAL OF THE ECONOMICS SOCIETY
A STUDY ON RAJASTHAN RURAL LIVELIHOOD
PROJECT
TANIA AGGARWAL [email protected]
ARUSHI GUPTA [email protected]
PRAGATI DABAS [email protected]
Rajasthan Rural Livelihood Project (RRLP) is a
government of Rajasthan initiative funded by the World
Bank for the purpose of poverty reduction in the year
2010. It covers BPL families and other poor families who
were not included in the BPL list. RRLP intent to focus
and support the BPL families’ overall development by
the way of providing credit, additional source of income,
enhancing the income from existing sources and
creating productive assets. The project has four main
components. The first component is institution building
and social empowerment. The objective of this
component is to help the poor mobilize themselves into
Self Help Groups (SGHs), and gradually develop their
own capacity to initiate and expand sustainable
livelihoods activities. The second component is the
community investment support. The objective of this
component is to support asset creation of SHGs and
their federations and identify and support innovative
approaches to improve the livelihoods of the rural poor.
The third component is the skill development and
employment promotion. The objective of this
component is to support beneficiaries to capture new
employment opportunities through the establishment
of a structured mechanism for skill development and
job creation. The fourth component is the project
implementation support. This component focuses on
the efficient implementation of the scheme at the
ground level. The project covers 5,769 villages under its
purview and has a three tier system. At the lowest level
there are Self Help Groups. A Self Help Group is a group
of 10-12 women belonging to below poverty line
families. At the second level there is Village
organization which is a group of 20 SHGs. VO provides
various funds to different SHGs and it receive two funds
namely – Start-up fund of Rs. 50000 and Vulnerability
reduction fund of Rs 150000. Cluster Level Federation
is at the top and it comprises of 30 Village organizations
and provides funds to them. It is also responsible for
solving disputes between SHGs and VOs. It receives a
start up fund of Rs 3,50,000.
Initially a SHG group is formed and the members are
encouraged to save a minimum of Rs.10 per week. Any
member of the SHG can take a loan from this pooled
amount at an interest rate of 1.5% - 2% per month. A
proper record of all the transactions is kept by one
literate member. Once they start functioning they can
join a pre existing Village organisation by paying an
admission fee of Rs.100 per member to the VO. A bank
account is also opened in the name of the SHG and all
the funds that are transferred from Village organisation
to SHG is done through this bank account. If the SHG is
regular in its meetings, savings, bookkeeping, taking
loans and repaying them, for 3 months, it qualifies for a
grant of Rs. 15000 from the Village Organisation. This
grant is called Tranche 1. In the next 3 months SHG is
linked through bank i.e. it receives a loan of Rs. 50000
from bank. This loan is given on the basis of good
repayment history of the SHG. Then, after 6 months of
functioning, a Micro Credit Livelihood Plan (MCLP) is
prepared for each and every SHG member. This
includes their family details, income source and
expenditure details. In the first round 5 of the most
vulnerable members are given a loan of Rs.20000 each
42 JOURNAL OF THE ECONOMICS SOCIETY
for investment purpose. When these members repay
their loan rest of the members receive Rs.20000 each.
The investment purpose is decided by the member and
the management together. The loan for the investment
plan is provided by the Village organisation and it
amounts to Rs.110, 000. This loan is called Tranche 2 or
Community Investment Fund. SHG members can invest
in livestock, Agriculture (improving the productivity –
Well, Motor) or business. Since it is a loan from VO to
SHG, SHG repays it back to VO and VO further repays it
back to CLF. In case of an emergency, any SHG member
can approach VO, through their SHG, for a loan without
interest. VO covers this loan from Vulnerability
Reduction Fund.
The SHG members can take three types of loans from
the SHG. The short term loans also known as micro
loans, are given for liquidity crunches. The loans
amount can vary from Rs. 100 to Rs. 10000. The long
term loans are call macro loans and its amount varies
from Rs. 5000 to Rs. 50000. The investment loan is
called Micro credit livelihood plan loan and its aim is to
help poor people generate some additional income.
The interest rate for all the three loans varies from 1.5%
to 2% and is decided by the group together. The loan is
to be repaid back in installments of Rs 1000 plus the
interest every month.
A survey was conducted in Rajwas, village of Rajasthan.
The aim was to assess the efficacy of the project by
comparing SHG and Non SHG women of the same
village. Both the groups included BPL families with
similar employment activities and lifestyle. The
significance of financial inclusion provided by the
scheme was mapped in terms of member’s access to
the credit facilities, their sources of credit and the
affordability of loans measured in terms of interest rate
offered by different sources and their collateral
requirement. It was found that a SHG member took
multiple loans whereas on an average a Non SHG
member took just one loan in the past three years. The
magnitude of loan was also found to be higher in case
of SHGs. This supports the claim that members of SHG
have better accessibility to credit. It was further
discovered that this increase in availability of loans was
largely due to the introduction of the scheme.However,
it is crucial to take into account the presence of
persistent dependency of the SHG members on non-
institutional sources. This may be because of the
unavailability of large sum of money from the SHG due
to low corpus. They may also resort to non-institutional
sources in case of emergency situations. Even though
SHG members are still dependent on the non-
institutional sources; this dependency ratio has
declined considerably as compared to the Non-SHG
members who still take a large chunk of its loan amount
from non- institutional sources.
A resident of Rajwas has various options when it comes
to source of credit. For short term as well as long term
loans he can turn to moneylender, landlord, relatives
and back - KCC. So, why should SHG loans be preferred
over them? It was found that the interest rate offered
by SHG and moneylender (for short-term loans) is the
same but SHGs prove to be better because unlike
moneylender and landlord, it does not require any
collateral for availing credit. Also, long term loans from
Moneylender are available at a higher interest rate as
compared to the SHG.
Although KCC provides loans at lower interest rate than
SHG, it is not preferred to SHG by the members. This is
plausibly because of the complexities associated with
the banking system in terms of paper work and various
other formalities for accessing credit. Another plausible
reason is that KCC provides loans only for agricultural
purposes while people require loans for numerous
other activities too. It also hikes up the interest rate to
24% per year in case of default in the repayment. This
brings us to the affordability of SHG loans and the study
shows that out of the total loans, taken by the sample
in the past three years from the SHG, the default rate
was approximately 3% and the total pending loans
were approximately 7%. All the other loans were
successfully paid with interest. Looking at the
aggregate of all the loans (Micro, Macro and MCLP), the
default rate is not beyond the level of significance. But,
it is significantly high i.e., 17.6%, in the Macro loans

43 JOURNAL OF THE ECONOMICS SOCIETY
which have comparatively longer repayment period
than the other loans. MCLP loans are also long -term
loans with same installments as that of Macro loans but
they did not have any default rate. This difference can
also be explained with the intuition that there might be
a greater sense of responsibility among the SHG
member regarding the repayment of MCLP loans which
were loaned by the VO to the SHG and not given from
the corpus collected. Micro loans have a negligible
default rate of only 1.6% with no pending loans. It could
be because it is easier and more convenient for the SHG
members to handle small loans given for short
durations than the large ones which are spread over
longer durations.
On the other hand, Non SHG member’s default rate is
much higher than the SHG’s whereas their pending rate
is almost equal. This suggests that SHG is being less
exploitative than the Non institutional sources of credit.
In the study, it was also attempted to track the
purposes of the loans taken by both SHG and Non SHG
members. For simplification, the loans were divided
into two groups: Productive and Non-Productive loans.
Productive loans include loans taken for Agricultural
activity, Livestock rearing, Business, Well construction,
Freeing Mortgaged land and Education. Non-
Productive loans include loans taken for Consumption,
Health and Marriage. Also, Productive loans were
assumed to be better than the non-productive loans
because they help in increasing the ability to generate
more income in the future.
The findings suggested that SHG members took higher
proportion of their loans for the productive purpose.
Whereas the Non SHG group took a higher proportion
of its loan for non-productive purposes which adds to
their expenditure. This explains the higher default rate
of the Non SHG group. The SHG group took smaller per
head loan for non-productive purpose and found
themselves in a better position in terms of the rate of
default .
The hypothesis that higher proportion of productive
loans lead to higher income has been supported by this
study. The SHG group’s savings and income was found
to be proportionately higher than that of the Non-SHG
group. The Non SHG group had negative savings which
could be because of the higher proportion of non
productive loans which increases expenditure without
adding to the income. In the long run, negative savings
might disappear as members cut short their
expenditure according to their income. It was found
that variation in income and savings was due to
increased productive loans. SHG members were able to
generate additional revenues and even profits from
each productive activity. Activities such as Livestock
rearing and Tailoring gave the highest returns.
Caste wise distribution of income and expenditure for
both the groups was also taken into account. The
chosen sample consisted of two major backward castes
namely OBC and SC. The income and savings of both the
castes belonging to the SHG group was found to be
proportionately higher than that of the Non SHG ones.
After comparing OBC and SC groups belonging to SHG,
it was evident that the OBC group benefited more from
this scheme
The most crucial aspect of this study is that it assesses
the real effects of the increase in income of the SHG
members on Education, Housing characteristics and
Asset accumulation.
In order to measure the impact of RRLP on the quality
of life, the data was collected on the children's
education for both SHG and Non-SHG faction and there
was no major difference between the schooling
pattern , resulting into the conclusion that the income
enhancement due to scheme had no major impact on
the quality of education. Similarly, there was not any
significant difference between the SHG and Non-SHG
housing characteristics. So this scheme did not affect
the type of house that the sample owns.
Finally, the asset holding of both SHG and NON SHG
were compared and it was observed that only a small
proportion, i.e. 20% of the members bought assets
after the scheme.

44 JOURNAL OF THE ECONOMICS SOCIETY
Maximum number of people invested in Motorcycles.
Although, the higher savings generated by the scheme
did help a few people to invest in the assets, but the
number is not very significant for us to conclude that
the scheme had remarkable impact on the lives of the
people.
This study also traces the distribution of assets amongst
the SHG and NON SHG group. On an average, there is
not much difference between the asset holding of SHG
and NON SHG group.
Increase in incremental income did not affect the
quality of life much. This implies that high interest rate
is sucking up all the funds, leaving the SHG members in
the same state. High interest rate is required to meet
the operational cost of the SHG. Hence, there is a
tradeoff between the two.
To conclude, SHG did improve access to credit of its
members but it charges high interest rate which is a
necessary evil because it covers the operational cost of
the SHG. Even with a high interest rate, the default rate
was found to be low. One plausible exposition for this
behavior is that the SHG members take higher
proportion of their loans for productive purposes which
in turn strengthen their repayment capability. One of
the primary objectives of the scheme was to provide a
permanent source of income to the SHG members. Our
study showed, that only a handful of businesses were
established and most of the productive loans were used
up for livestock rearing and agricultural activities. Given
the magnitude of the scheme and the cost incurred by
the government, the results are not very remarkable.
However, given some time, credit access can have
significant economic effects in the long run. Also, the
management should focus more on the MCLP loans
because these loans have a direct impact on
beneficiary’s income.
REFERENCES
1. Klaus, D. and Liu, Y. (2009). ‘Long Term Economic Impacts of SHG’S in India.’ Policy Research working paper
no. WPS 4886. Washington, DC: World Bank. Retrieved from:
http://documents.worldbank.org/curated/en/473751468268776052/Longer-term-economic-impacts-of-self-
help-groups-in-india
2. Puhazhendi, V. and Badatya, K. C. (2002). ‘SHG-Bank Linkage Programme for Rural Poor - An Impact
Assessment.’ National Bank for Agriculture and Rural Development, Mumbai.
3. Planning Commission of India (2008). ‘A report on success and failures of SHGs in India, Impediments and
Paradigm of success’
4. Natalia, G. and Navas, M. (2014). ‘Self-Help Groups In India: A Tool For Empowering Rural Women And
Eradicating Poverty? (Analysis of the Situation In Karnataka State)’

45 JOURNAL OF THE ECONOMICS SOCIETY
5. Dipti, B. (2015). ‘Socio-Economic Development of Women through Self Help Groups With Reference to
Rajnandgaon District of Chhattisgarh’. Research Scholar Institute of Management, Pt. Ravishankar Shukla
University, Raipur
6. Chatterjee, Tanmoyee. (2009). ‘Economic impact of Self Help Group—A Case Study.’ Journal Of Rural
Development 28(4).
7. Barua, P. B. (2012). ‘Impact of Micro -finance on Poverty: A Study of Twenty Self -Help Groups in Nalbari
District, Assam.’
8. Emerlson, M. (2011). ‘Women empowerment through SHGs: A micro study’
9. Chandra P., Parida and Sinha, Anushree. (2010). ‘Women SHG Programmes and Rural Poverty: A Micro
Study’. Southern Economist: 47-50

46 JOURNAL OF THE ECONOMICS SOCIETY
KUDUMBASHREE – A SCHEME FOR POVERTY
ERADICATION AND WOMEN EMPOWERMENT
ARAVIND NAIR – 2ND YEAR, RAMJAS COLLEGE [email protected]
Poverty eradication and women empowerment are
matters of extreme importance for all countries in the
modern world. Policies for poverty eradication are
indispensable for the development of a nation, and
development will be complete only when men and
women get equal opportunities in the society. Self Help
Groups (SHGs) play an important role in the economic,
social and personal development of women (Minimol &
Makesh, 2012). SHGs are predominantly found in South
and Southeast Asia. These groups usually have 10-20
members who contribute a nominal amount at regular
intervals, and the sum collected is lent to the members
of the group, according to their needs.
Varma (2014) stated, “In a country that has been
criticized as lacking commitment to women’s rights,
one program in the southwest state of Kerala has been
quietly serving as an example that a government can
indeed successfully empower women, both
economically and socially.” This statement has been
made with reference to Kudumbashree, a unique
poverty eradication scheme initiated by the
government of Kerala in 1998 with the support of the
government of India and NABARD. The word
‘Kudumbashree’ means “prosperity of the family” in
Malayalam (the local language of Kerala). The objective
of this program is to eradicate poverty and help in the
socio-economic and personal development of women
by forming SHGs at different levels, for providing easy
microcredit and entrepreneurship opportunities
(Varma, 2014).
The structure of Kudumbashree is federal and has three
tiers. The first and most basic level is the Neighborhood
Group (NHG). There are 10-20 members in one NHG.
The members are usually from the same locality and
have similar financial backgrounds. NHGs have regular
meetings, and the members pool their savings. This
sum is used for providing loans to match the credit
requirements of members. The next tier is the Area
Development Society (ADS). It is governed by
committee members who are elected from those NHGs
which form the ADS. The elected committee supervises
and provides assistance to the NHGs. The apex level in
the three-tier structure is the Community Development
Society (CDS). These bodies are governed by the
provisions of the Travancore-Cochin Literary, Scientific
and Charitable Societies Registration Act, 1955, and
acts as a link between the state government and the
various ADS(s) which come under it. (“Community
Structure “, n.d.)
The objectives of Kudumbashree can be broadly
classified as thrift and credit, micro-entrepreneurship,
social and personal development, and bank linkage
(Anupama, 2015). The NHGs under the Kudumbashree
program operate in a way that inculcates the habit of
thrift amongst the members, and the savings are used
to provide easy credit at negligible rates of interest.
Kudumbashree encourages women to mobilize
themselves into groups and initiate income-generating
entrepreneurship ventures. For bank linkage, the banks
rate the NHGs on the basis of a 15 point index
introduced by NABARD. This index is used to judge the
performance of the group, and the NHGs are linked to
various banks based on their rating (Anupama, 2015).
The banks use ‘social collateral’ for recovering the loans
given to NHGs, i.e., each member is pressurized to pay
by other members of the group (John, 2009). For the

47 JOURNAL OF THE ECONOMICS SOCIETY
financial year 2017-18, the total amount collected
internally by the NHGs amounted to 241.68 crores, and
the total amount of internal loans amounted to 984.54
crores. (“Micro Finance”, n.d.)
Initially, the program had numerous challenges.
Women, especially from rural or backward areas were
reluctant to come out of their homes and participate in
NHG meetings. The microcredit system was not
functioning properly, and there were many defaulters.
Many women utilized the bank loan for personal
purposes and the loans had to be written off as the
entrepreneurship had no profits that could be used for
repaying the loan. Also, some men did not initially
support the idea of women leaving the house and
earning for themselves. Lack of teamwork and disputes
between members were some of the other challenges
for the NHGs. Many business ideas were not successful
because of lack of skills in the entrepreneurs.
Effective training programs devised by the government
and CDS have helped the NHGs in overcoming many of
the initial challenges. General orientation, skill
development, team building, entrepreneurship
development, accounting training, and performance
improvement are some of the training programs
offered by Kudumbashree.
Kerala has been witnessing many significant social
changes after the introduction of the Kudumbashree
project. Through this program, the women have made
their entry into many areas of employment and
entrepreneurship which are dominated by men. The
various accolades awarded to Kudumbashree and the
numerous success stories indicate that the
Kudumbashree mission is slowly, but surely producing
results. In Kannur, a northern district of Kerala, 2 groups
of women have formed ‘panchari melam’ bands
(percussion ensembles). Also, the members of the
Kudumbashree mission are engaged in a hybrid version
of the traditional percussion art coupled with rhythmic
foot movements, ‘singari melam’. These women are
making their presence felt in the field of traditional
percussion ensembles, an art form usually performed
by men. (Nazeer, 2008) There has been a significant
increase in the number of such bands across Kerala in
the last five years, and these bands are in high demand
for performing at inaugurations, weddings, etc. There
are around 45 bands in Kerala, and each member earns
750-1500 rupees for one performance. Members of
these bands earn a decent amount through their
performances, and performing in front of crowds has
boosted their confidence (Madathil, 2013).
Kudumbashree members have stepped into many
male-dominated areas of employment like masonry,
taxi service, fast food service, commercial crop
cultivation, etc.
Balasabhas are collective groups for children formed
under Kudumbashree. These groups are formed for the
overall development of children. The members of
Balasabha are exposed to a democratic environment,
and undergo interactive training in various aspects of
health, personal development, sex education,
computer literacy, etc. At present, there are 66,743
Balasabhas and each Sabha consists of 15-30 children.
Balasabhas aim at enhancing the capabilities of children
so that the effects of poverty do not get transmitted to
the next generation (Praghabaldas, 2017).
Kudumbashree has 2 more flagship social development
projects- Asraya and BUDs. Asraya is a program for
identification and rehabilitation of destitute people,
and BUDs are schools for differently abled children. At
present, Kudumbashree has managed to establish 63
BUDs in Kerala, where differently abled children are
given education, training, and care. (“Social
Development,” n.d.)
Involvement in Kudumbashree gives women economic
independence, which helps them in developing
confidence and self-respect. The thrift and credit
system encourages women to use money judiciously,
and the easy availability of credit makes them depend
less on the males in their family. The CDS, along with

48 JOURNAL OF THE ECONOMICS SOCIETY
the government has approved various income
generating ventures, and many of these were
suggested by the members of Kudumbashree units. The
micro-entrepreneurship listed under Kudumbashree
include fast food stalls and tea stalls, manufacturing of
pickles, jams, and curry powders, waste management,
cultivation of paddy, banana, and other vegetables,
painting services, animal husbandry, masonry,
manufacturing of soaps and detergents and handicraft
making (Dinesh, 2014). A study by Beena & Sari
(2014) on Kudumbashree shows that more than half of
the respondents felt that they could see economic and
personal development within themselves and that
there was some development in their respective
families as well. The major reason for these
developments must have been the fact that the
financial independence achieved through the
availability of credit and the income received through
the micro-entrepreneurship of Kudumbashree gave the
women higher decision making power and increased
their social participation, along with increasing their
confidence and equipping them to effectively handle
the finance in their family.
It cannot be denied that the project still has
shortcomings and challenges to overcome. A number of
Kudumbashree micro-entrepreneurship ventures have
been closed down, or are running on losses because of
poor management, lack of teamwork, internal disputes,
politicization, or poor choice of business ideas. Many
members of micro-entrepreneurship programs
admitted that after their incomes started going up,
there was a fall in savings because their expenditures
had also increased drastically (Beena & Sari, 2014). A
fall in savings indicates a failure of the thrift and credit
system, which is the backbone of the Kudumbashree
program. The CDS and concerned authorities should
ensure that the members are educated about the
importance of saving a part of their income, for the
economic development of their families, and for
ensuring the long-term sustainability of the program.
Also, the members should be given proper assistance in
identifying and implementing feasible projects, and
proper training should be imparted in the fields of
accounting, management, and teamwork for maximum
efficiency.
The Kudumbashree mission has transformed the lives
of millions of families in Kerala, facilitating economic
development through thrift, easy credit schemes and
income-generating projects, and ensuring social
development by increasing the self-confidence,
decision making power, and awareness of the members
of the program. Nearly half of Kerala’s population is
associated with this mission (Sanandakumar &
Krishnakumar, 2014), and improvements in current
ventures along with fresh and inclusive initiatives can
establish this program as one of the most effective
schemes for poverty eradication and women
empowerment in India.
REFERENCES
1. Minimol, M.C., & Makesh, K.G., (2012). ‘Empowering the women in Kerala: A study on the role of Self Help
Groups (SHGs).’ International Journal of Sociology and Anthropology 4(9): 270-280.
2. Varma, V. (2014). ‘A Rare Government Success Story for Women’s Empowerment in Kerala.’ The New York
Times. Retrieved from: https://india.blogs.nytimes.com/2014/03/07/a-rare-government-success-story-for-
womens-empowerment-in-kerala/?_php=true&_type=blogs&_r=1

49 JOURNAL OF THE ECONOMICS SOCIETY
3. Government of Kerela. (n.d.) State Poverty Eradication Mission. ‘Community Structure.’ Retrieved from:
http://www.kudumbashree.org
4. R., Anupama, (2015). ‘Role of Kudumbashree in Financial Inclusion’. Retrieved from:
http://chitturcollegecommercedepartment.ac.in/materials.php?action=Project%20Reports%20of%20M.com
5. John, J. (2009). ‘A Study on Kudumbashree Project- A Poverty Eradication Programme in Kerala: Performance,
Impact, and Lessons for Other States.’ Delhi: Kerala Development Society (KDS- Delhi).
6. Government of Kerela. (n.d.) State Poverty Eradication Mission. ‘Micro Finance.’ Retrieved from:
http://www.kudumbashree.org/monitor-progress/102/510
7. Nazeer, M. (2008, October 14). ‘New-found self-esteem.’ The Hindu. Retrieved from:
http://www.thehindu.com/todays-paper/tp-national/tp-kerala/New-found-self-esteem/article15321617.ece
8. Madathil, S (2013, March 11). ‘Singari melam is not just a percussion ensemble!’ Retrieved from:
http://funnel.thegoaproject.com/2013/193-singari-melam-is-not-just-a-percussion-ensemble
9. Pragabhaldas, K.V. (2017). ‘Role of Kudumbasree in Poverty Alleviation in Kerala.’ International Journal Of
Advanced Research 5 (2): 1096-1104.
10. Government of Kerela. (n.d.) State Poverty Eradication Mission. ‘Social development.’ Retrieved from:
http://www.kudumbashree.org
11. Dinesh, P.K. (2014). ‘A study on the marketing problems of Self Help Groups in Kerala.’ Retrieved from:
http://hdl.handle.net/10603/46474
12. Beena, C.A., & Sari, T.C., (2014). ‘Socio-economic Changes of Women Through Kudumbashree- A Study From
Thrissur Corporation of Kerala State, India.’ Vistas, 3(1): 30-36.
13. Sanandakumar, S., & Krishnakumar, P.K. (2014). ‘Kudumbashree: Kerala's all-women Rs 2,262 crore savings
group finances microenterprises of members.’ The Economic Times. Retrieved from:
https://economictimes.indiatimes.com/small-biz/entrepreneurship/kudumbashree-keralas-all-women-rs-
2262-crore-savings-group-finances-microenterprises-of-members/articleshow/42397292.cms

50 JOURNAL OF THE ECONOMICS SOCIETY
AN ANALYSIS OF WORK AND MODELLING
UNIVERSAL BASIC INCOME
SANKALP SHARMA [email protected]
ABSTRACT
This paper attempts to trace the history of work and use
the analytical premise to argue for reasons behind the
centrality of work in modern life and how this centrality
is currently being threatened with the rise of
automation and increasing redundancy of human
capital. It then argues for a radical alternative in order
to preserve income security of the working class in the
context of a post-work society by providing a Universal
Basic Income and then provides a rudimentary
mathematical framework for implementation. Policy
implications of income redistribution through providing
a basic income is traced from the mathematical analysis
and certain model limitations are also specified.
Keywords: Work, Automation, Universal Basic Income,
Inequality
INTRODUCTION
In most cultures, work predicates the survival of an
economy. The economy of any given culture primarily
comprises of institutions which produce and distribute
goods and services. The extent of modernity and
quality of such institutions although, may vary spatially
and temporally.
Economic and sociological literature is abound with the
analysis of work and its impact on society. The
frequency of writings on the subject increased
exponentially with the onset of the Industrial
Revolution. Durkheim (1964) and Marx were one of the
first intellectuals to assess the conditions of the
working class, analyzing how transition from
individualized production to factory-based production
resulted in alienation. Other sociologists such as Weber,
focused on the genesis of new types of authoritarian
hierarchical forms that emerged in modern industrial
systems.
However, it is practically impossible to come to a
consensus on standard definition of what constitutes as
“work”. The term has acquired a plethora of definitions
and understanding in various realms, to come to a
commonly understood and standardized definition of
work is bound to leave out some aspect or another.
Work can either be conceived as creation of a new
product(s) or a mundane, trite involvement in everyday
banalities. It can also be used to refer to activities
undertaken in the domestic and non-market spheres
such as households. This difference in understanding
becomes even more divergent in the academic sphere,
which has seen a disquieting series of attempts to

51 JOURNAL OF THE ECONOMICS SOCIETY
standardize the definition of work. (Granter, 2009)
However for the purpose of analysis, Andre Gorz’s
understanding of work in the context of modern
capitalist societies is sufficient. Work, according to Gorz,
can be defined as a series of activities undertaken for
the fundamental purpose of earning a remuneration
which may or may not be commensurate to the task
performed. (Gorz, 1997)
1. HISTORICAL CONCEPTION OF WORK
In ancient times, work was perceived as a base and
menial form of activity which was at best relegated to
the lowest rungs of society due to its mundane nature,
i.e. to slaves and other form of indentured labor. It was
seen as something that prevented humans from
indulging in other forms of pleasure seeking activities
such as arts, hunting, philosophy and governance,
which were monopolized by the upper echelons. Work
was only seen as a necessity for bodily survival (Frayne,
2015). The attitudinal transformation towards work
coincided with the rise of non-orthodox forms of
religion, mercantilism and the decline in the power of
feudal lords. Before this transformation, the prevalent
attitude was the almost universal prioritization of
leisure over profits or any kind of financial reward. It
was loquaciously characterized by Weber, “a man does
not ‘by nature ‘wish to earn more and more money, but
simply to live as he is accustomed to live and earn as
much as necessary for that purpose” (Weber, 2003).
However, the rise of global trade in commodities
associated with the Age of Exploration led to an
increase in global trade flows and generated the need
for a constantly engaged working class to ensure
continuity in the free movement of trade and services.
This was also a time when Europe’s population was cut
short by a third due to the Black Death. Not only did it
create a dearth of a functional, working class
population but also prompted the then rising forms of
non-orthodox religions such as the Protestant
movement to endorse the idea of work as a virtuous
end in itself, a narrative which was also supported by
the newly rich mercantilist class to achieve their
material ends. There was a conflation of ideas such as
dedication to work and salvation, which were
propagated as different sides of the same coin. The
permeation of puritanical ethics in work culture led to
further rationalization and standardization of
procedures within professional spaces, be it commerce,
academia, administration etc. (Kalberg, 1980). This is
the process that led to the rise of the modern spirit of
capitalism, driven by commitment to hard work and its
consequent reward in terms of profitability and
quantitatively measurable growth.
2. CENTRALITY OF WORK IN MODERN LIFE
In the neoliberal era, work has occupied a predominant
space in the human psyche. It has become the primary
mechanism for the distribution of income and
therefore, the channel to fulfil material needs and a
means to achieve social and economic mobility. This
centrality is moreover reinforced by the rise of
consumerism in capitalist societies (Stavrakkais). The
desire and ability to earn more money is fueled by how
and where the money is spent. An increase in income
necessitates an improvement in lifestyle driven by
aspirational values generated by mass media or by
social circles (which have a tendency to be
homogeneous and stratified in terms of class). This
creates an interlocking cycle of working harder to earn
more income and obtain access to even higher
pathways of social and economic status.
However, more significant than the socio-economic
value of work, is its cultural value. In most societies,
getting a job to earn a livelihood acts as a cultural
marker of adulthood and financial independence
(Frayne, 2015). Moreover, education systems are
oriented in a manner that prioritize qualification
earning over academic learning since knowledge
systems are themselves perceived as an entry point to
earn a living. This is also evident in the ever-increasing
demand for jobs in industries which offer higher returns
on education in the least possible timespan. Moreover,

52 JOURNAL OF THE ECONOMICS SOCIETY
the perception of education itself has become one of a
risk-taking, entrepreneurial activity with the
expectation of pay-offs in a particular time period due
to the increasing costs attached with it. Therefore, even
attainment of education can be thought of as ‘work’
simply by virtue of its remuneration-oriented
undertaking (Maisano, 2012).
Having or not having the ability or opportunity to
undertake work can also be seen from the lens of its
associated stigma. Ideas like “being unemployed “or
“unpaid jobs” are still looked down upon simply due to
lack of a monetary value attached to it. This monetary
obsession is grounded in economic theories
propounded by the neoclassical school of economics.
Specifically, support for the existence of economic
phenomena such as “voluntary unemployment”12 has
gained traction across the political spectrum since it
offers a politically convenient justification to shrug off
the burden of correcting structural problems that
create conditions for unemployment such as labor
market frictions, demand-supply mismatch and the
blind faith in the clearing of markets.
Unemployment has also become an economic weapon
to control other critical aspects of the economy such as
inflation (due to the inverse relationship between both
of them given by the NAIRU13 theory). This technocratic
faith in the power of economic theories prompts
governments to systematically maintain a specific level
of unemployment to presumably keep inflation under
check. The impact of this political toying with economic
theory shifts the burden of unemployment from the
state’s failure to the individual. Finally, the glorification
of work gets concretized in grand narratives such as the
American Dream, that encapsulates elements of
consumerism, capitalism and hard work into an
appealing body of inviolable ethos and just like that, the
centrality of work becomes embedded in the fabric of
our lives while pertinent problems such as
12 People choose not to work willingly if the prevailing real wage
rate is greater than their current wage rate
disproportionate returns to labor, its exploitation and
the concentration of wealth in the hands of few go
unnoticed by the masses.
3. CRISIS OF WORK AND RISE OF
AUTOMATION
Despite the centrality of work in modern life,
disenchantment and stagnation in work is not unknown
to a majority of the working class in the modern society
(Frayne, 2015). There are various attributive factors
such as a constant fear of losing jobs to machines
(especially so in the manufacturing sector), performing
standardized tasks in a mechanical fashion, low
incomes and lack of incentives to name a few. This
coincides with the rise of skill-biased technological
change (Violante), where those who have better access
to education and skills are compensated with better
opportunities and returns. The problem with this setup
is with how it prioritizes those with privilege and access
to material resources. This kind of growth has become
a priority in the developed world, where it has been
envisaged as an alternative to periodic stagnation of
economic growth and falling labor productivity.
The advancement of technology has engendered one
very specific manifestation: automation. It can be
defined as the utilization of technology to perform
mechanical tasks in order to minimize the use of human
resources and other associated costs. Automation in
the 21st century has taken two broad forms: artificial
intelligence (when machines can act intelligently like
humans) and machine learning (mathematical
framework often used to solve tasks within artificial
intelligence). While previous technological changes
either replaced physical strength or allowed ease of
performing tasks (wheel, lever, for instance) or
augmented the human capacity to think (calculators,
13 Non-accelerating inflation rate of unemployment refers to a level of unemployment below which inflation rises. It was first introduced by Franco Modigliani and Lucas Papademos in 1975.

53 JOURNAL OF THE ECONOMICS SOCIETY
initial computational technology), automation-driven
economic growth has the ability to duplicate an
attribute that has been historically monopolized by
humans: intelligence.
This radical new form of technological advancement
allows for automation of tasks that require utilization
of cognitive abilities. Even though automation
possesses vast potential to increase economic growth,
it also has the capability to disrupt the status quo
insofar as work is concerned. There are efficiency and
distributional problems inherently associated with the
growth of automation. The incidence of potential job-
loss is tilted disproportionately towards the lower-paid,
lower-skilled and less-educated working class since
they are the ones mostly engaged in mechanical tasks.
This has already led to a decline in their demand in the
job market, a consequent fall in wages and a rise in
inequality. Furthermore, the long-term effects can be
even more deleterious. Given that increases in
productivity due to automation do not necessarily
translate into wage increments for the median worker
(an efficiency problem) (Card & DiNardo, 2001) the
benefits of automation consequently accrue only to a
very small class of individuals since it compensates a
certain class of individuals (programmers, developers,
entrepreneurs) and production factors (capital)
significantly more than others (a distributional
problem). Moreover, with the rise of the gig economy
and zero-hour contracts, the obligation owed to labor
by firms has also declined steadily, especially in the
information technology sector, thus leading to an
erosion of job security.
Taking aforementioned analysis into account,
predicting the future of the job market and the income
security of the current workforce is extremely difficult.
More critical is the question of how income accrued
from work will be affected in the shifting paradigm of
capital-driven output generation. There is already an
increasing schism of inequality across the developing
and developed world which can be partly attributed to
technologically-biased economic growth.
Unemployment rates are increasing globally, the
economic recovery in the aftermath of financial crises
is unable to generate employment and nominal income
growth has either stagnated or has been systematically
gravitated to upper echelons of the working class,
namely top executives and middle level management
(Equilar, 2016). All these problems have persisted
despite large scale policy-driven and institutional
reform. Therefore, a radical alternative is required for
envisioning the future of work and engagement with
these aforesaid structural problems is crucial
Various alternatives have been proposed over time and
most of them focus on creating more jobs. However, I
intend to look at an alternative that is not only being
debated upon in Western liberal democracies
extensively in status quo, but also has critical
implications for the way work and society will be
organized in the future. Instead of generating jobs that
pay, governments are now discussing the viability of
providing an alternative that might tackle the potential
inability to create jobs in the future: a universal basic
income.
4. UNIVERSAL BASIC INCOME
Historically disguised under various terminologies and
vindicated with a broad spectrum of argumentation,
UBI is a simple, yet complex idea. The most
rudimentary definition of UBI has two components: an
unconditional cash transfer entitlement and its
universal applicability irrespective of present income or
employment status (Van, 2012).
However, before moving into a formal inquiry of UBI,
certain clarifications are in order. Given the vast body
of literature around the subject, it is impossible to
incorporate every facet while analyzing certain specific
issues. Moreover, I leave the mechanics of
implementation, political dynamics and questions of
affordability aside from an analytical perspective,
despite the fact that they are all critical policy
dimensions. After explaining certain significant
features and variations of UBI, I intend to look at the
54 JOURNAL OF THE ECONOMICS SOCIETY
distributional impact of UBI by constructing a
rudimentary mathematical model to analyze the effects
of a universal basic income on the levels of inequality in
a society.
4.1 FEATURES OF UBI
Cash payment: Instead of providing in-kind subsidies,
UBI is provided in cash without any conditionalities on
its consumption or saving.
Regularized periodicity of payment: There can be
multiple frequency-based caveats depending on the
modalities of the proposed policy. Periodicity can be
monthly, annually etc.
State is the sole agency of dissemination: Even though
the dynamics of accountability can differ, in principle,
the state should hold monopoly over providing a basic
income as a welfare-enhancing measure. This also
means that the state will be responsible for obtaining
the requisite amount of funding to implement the
policy.
Redistributive intentions: The fundamental motive of
providing UBI should be a clear intention to enhance
standard of living uniformly and targeted reduction of
income inequality.
Paid to individual rather than households: To achieve
standards of fairness, this policy is implemented at the
individual level. Moreover, even if UBI is paid
individually, the amount paid can still be dependent on
the household composition. It is empirically well
established that an increase in the household size has
an inverse relation with the per capita cost of living. UBI
programs can distribute differential incomes on an
individual level after accounting for people’s household
situation.
4.2. POLICY VARIATIONS
Without-Means Test: Simply put, this variation pays the
same level of cash benefit to every individual
irrespective of their income status. The problem with
this variation however, is the evident inability to
engage with systemic inequality, rather reinforcing it,
unless integrated with a progressive taxation structure.
With-Means Test (Van, 2005): In this variation, UBI paid
to each individual will vary with their income level. This
can be done by stratification of income into various
brackets and then deciding the amount contingent on
the proportion of population lying within a particular
bracket. Even though it is a relatively complex
proposition, it is extremely effective in systematically
targeting income inequality.
Without-Work Requirement: What can potentially
distinguish UBI from current working-class welfare
programs in the West such as American Earned Income
Tax Credit or UK’s Working Families Tax Credit (Dilnot
& McCrae, 1999) is that it will not be restricted to those
who have jobs or who had jobs in the past or their
present welfare entitlements. A more recent variant
has also been the exclusion of willingness to work as a
criteria for providing UBI, which is especially gaining
more importance as people who are losing jobs to
automation may not be willing to acquire new skills and
therefore, not willing to work.
5. A PRELIMINARY MATHEMATICAL MODEL
FOR INCOME REDISTRIBUTION THROUGH UBI
I develop a rudimentary model of income redistribution
via UBI. Assume a 10-people world with the following
income levels:

55 JOURNAL OF THE ECONOMICS SOCIETY
Table 1: Hypothetical Income of Individuals
Source: Author’s calculation
The state provides UBI at an individual level. I will assess
the inequality levels before and after the policy
prescription and furthermore analyze the
consequential income convergence. This policy
prescription does not factor household income
variations while calculating UBI (however, individuals
can be stratified into households and weights can be
attached to the number of people living in a household)
The specific assumptions of the model are:
1. There is no exogenous annual change in income, i.e.
once UBI is given at the current income level,
individuals have no other source of income apart from
an annual UBI. (This is merely a simplifying assumption)
2. All the collected tax revenue is distributed as UBI (the
model can be modified to tweak the proportion of tax
distributed as UBI)
A progressive taxation model is implemented, the
structure of which is as follows:
Table 2: Tax Brackets
Income Level Tax
Rate Greater than 1000 (y > 1000) 60%
Less than 1000 but greater
than 200 (1000 > y > 200)
25%
Less than 200 (y < 200) 10%
Source: Author’s calculation
The aforementioned tax rates are arbitrary, but can be
optimized by assigning proportional weights to income
distribution and proportion of population in different
tax brackets.
UBI is given after deducting tax liabilities and is
calculated as follows:
Let tax rate be “r”, total population be “n” and total
income be “yn”
Total tax revenue “t” is calculated by multiplying
income with tax rate and summing it across all
observations, while applying differential tax rates
according to the income distributions.
t=∑ (yn)(r)
k
n=1
UBI is then calculated by simply dividing total tax
revenue t by the total population n
UBI=t
n=∑ (yn)(r)k
n=1
n
The following table shows the breakdown of
calculating the income of individuals after taxes are
collected and redistributed as UBI.
Individual Current Income
1 1200
2 356
3 232
4 134
5 56
6 900
7 546
8 678
9 425
10 999

56 JOURNAL OF THE ECONOMICS SOCIETY
Table 3: Tax collection after UBI implementation
INDIVIDUAL yn ypost-tax TAX COLLECTION ypost-UBI
A 1200 480 720 657.3
B 356 267 89 444.3 Mean Income 552.6
C 232 174 58 351.3 Total Tax Collected 1773
D 134 120.6 13.4 297.9 Average Tax 177.3
E 56 50.4 5.6 227.7
F 900 675 225 852.3
G 546 409.5 136.5 586.8
H 678 508.5 169.5 685.8
I 425 318.75 106.25 496.05
J 999 749.25 249.75 926.55
Source: Author’s calculation
Where,
Post-Tax Income= (𝒚𝒏)(𝟏 − 𝐫)
Tax Collected from one individual = (𝒚𝒏)(𝐫)
Post-UBI Income = (𝒚𝒏)(𝟏 − 𝐫) +∑ (𝒚𝒏)(𝟏−𝒓)𝒌𝒏=𝟏
𝒏
For example, Post-UBI Income of individual “A” in Year
2 can be calculated as follows:
Post-UBI IncomeA = (𝟏𝟐𝟎𝟎)(𝟎. 𝟒) +𝟏𝟕𝟕𝟑
𝟏𝟎= 𝟔𝟓𝟕.𝟑
Similarly, in Year 3, we can again repeat the process,
Post-UBI IncomeA = (𝟔𝟓𝟕. 𝟑)(𝟏 − 𝟎. 𝟐𝟓) +𝟏𝟑𝟖𝟏.𝟓
𝟏𝟎=
𝟔𝟑𝟏. 𝟏𝟐𝟓
Iterations of providing annual UBI can be repeated and
convergence in income can be observed. Iteration at
the aforementioned tax rates and income levels over 40
years has been provided in the appendix. Note that the
tax brackets in which individuals lie will also change as
their income levels change.
I now turn to look at the policy dimensions of this
simple exercise in redistribution. Given the welfare-
enhancing outlook of this policy, I first assess its impact
on the level of inequality in this 10-person society. A
popular measure of quantifying inequality is the Gini
coefficient, which ranges from 0 (perfect equality) to 1
(perfect inequality). It is a numerical encapsulation of
the Lorenz curve, which arranges the population from
poorest to richest, and shows the cumulative
proportion of the population on the horizontal axis and
the cumulative proportion of expenditure (or income)
on the vertical axis (World Bank). Furthermore, it
satisfies all the fundamental properties of a good
inequality measure (Population principle, anonymity
principle, relative income principle, Lorenz principle
and Dalton-Pigou Principle). It is calculated as follows:

57 JOURNAL OF THE ECONOMICS SOCIETY
G=1
2n2μ∑∑ njnk |yj-yk|
m
k=1
m
j=1
G is calculated for 10 years and the following values
are obtained:
Table 4: Gini Co-efficient of individuals
Year Gini
1 0.376
2 0.228
3 0.171
4 0.128
5 0.096
6 0.072
7 0.054
8 0.04
9 0.03
10 0.02
Source: Author’s calculation
Figure 1: Graphing the change in Gini Coefficient
across iterated income redistribution via UBI
Source: Author’s calculation
5.1. PRELIMINARY OBSERVATIONS
Continuous implementation of income redistribution
via UBI leads to convergence at the mean income level.
The number of years required for convergence can
change depending on the growth rate of income
(assumed constant in this model). In the neoliberal era,
income growth of the top one percentile has been
sharply higher via-a-vis the bottom 20th percentile. If
the rate of income growth is greater than the rate of
decline in inequality, then this policy will be ineffective.
The number of years in which income convergence
occurs is inversely proportional to tax rates, which play
an important role in deciding the amount to be
redistributed as UBI and the rate of decline in inequality.
The rate of tax imposed on every income strata is also
critical since it might disincentivize work.
Figure 2: Convergence in income after repeated
income redistribution via UBI
Source: Author’s calculation
0.00
200.00
400.00
600.00
800.00
1000.00
1200.00
1 2 3 4 5 6 7 8 9 101112131415161718
Post-UBI Income Convergence
A B C D E
F G H I J

58 JOURNAL OF THE ECONOMICS SOCIETY
5.2. IMPROVING MODEL ACCURACY
By no means is this model a fully accurate
representation of reality. However, by controlling for
extraneous variables, it can be conclusively proven that
UBI can act as an effective leveler of income, provided
certain assumptions hold true. There are certain other
aspects that might assist in dropping more such
assumptions, thus making the model as realistic as
possible.
Exogenous income growth can be incorporated in the
model in two distinct forms: either as a uniform
increase in income (unrealistic, but helps in
simplification of analysis) or as a disproportionate
increase in income across different strata. This will
assist in the determination of tax rates for every
bracket.
Since most incomes are nominal in nature, an inflation
adjustment can be made to determine real income
growth and adjust the provision of UBI to counteract
the effects of inflation or deflation since it directly
affects the purchasing power of individuals.
Optimization of tax rates on the basis of population
proportion lying in specific income brackets. This can be
accounted for by setting up dynamic optimization
models that maximize tax rates at any given income
level and minimize the time period to reduce Gini
coefficients.
Finding a general equation that incorporates tax rates
and number of years required to reduce Gini coefficient
to a specific value. This equation can have far-reaching
policy implications since it can improve the decision
making process for welfare-enhancing policies,
formulating progressive taxation structures, assessing
the costs and benefits of income redistribution and
create realistic targets for poverty reduction.
CONCLUSION
Although this paper adopts a myopic, utopian and a
mathematized perspective on a multidimensional issue
of providing Universal Basic Income, it also acts as a
reminder of its theoretical validity, if not its pragmatic
viability. There has been a lot of political and ideological
polarization ever since the dawn of Industrial
Revolution on this pertinent issue. However, the
bottom line is that in an unequal world where the
original starting line decides how much individuals are
likely to succeed, we need a radical alternative to
envision how we intend to correct such deficiencies.
Despite various institutional reforms, we still continue
to live in an era where the world around us continues
to become more unequal every day. A Universal Basic
Income may not necessarily be the best alternative, but
it is an avant-garde to initiate a radical reassessment of
inequality.
Today, various nations across the world are carrying out
the basic income experiment. Netherlands agreed to
carry out a Municipal Social Assistance Experiment in
Utrecht (Wavern, 2017). Finland has finalized
“Perustulokokeilu”, a trial to provide a 2000-people
experimental group with 560 euros a month as stipend.
Alaska is giving unconditional annual dividends to all its
citizens by creating an Alaskan Permanent Fund, the
revenue for which is generated by oil wealth (Howard,
2012) among other trials.
These examples not just show the extent of the
problems discussed in the paper but also the extent to
which conventional wisdom has failed to adequately
address them, which in turn has made countries more
accommodating towards the idea of a basic income.
What remains to be seen is how politically sustainable
such alternatives are.
Not delving into the socio-political debate surrounding
basic income is deliberate. It requires a detailed
characterization of the historical and ideological
background on which the current polarization is
predicated upon. What remains to be understood is
how much nations will choose to prioritize the

59 JOURNAL OF THE ECONOMICS SOCIETY
reduction of inequality in the coming years since such
factors will be crucial in deciding economic outcomes
and growth. Furthermore, how much will automation
perversely impact job creation is also a question which
will be decided by national priorities.
As a concluding remark, even though work predicates
the survival of an economy, its demise requires an
alternative to ensure economic survival and only those
who adapt to the change shall subsist.
REFERENCES
1. Dilnot, A. (1999). 'Family Credit and Working Families' Tax Credit', presented at OECD workshop on Making
Work Pay, The Institute of Fiscal Studies, London, 1999.
2. Haughton, Jonathan, Khandker, Shahidur R., (2009) Handbook on poverty and inequality (English).
Washington, DC: World Bank. Retrieved from:
3. http://documents.worldbank.org/curated/en/488081468157174849/Handbook-on-poverty-and-inequality
4. Caines, Roxy, (2015). 'Earned Income Tax Credit', Center on Budget and Policy Priorities.
5. Card, David and John E. DiNardo (2002). "Skill-Based Technological Change And Rising Wage Inequality: Some
Problems And Puzzles," Journal of Labor Economics.
6. Durkheim, Emile, (1964). 'The Division of Labour in Society (trans. By George Simpson)', Macmillan, New York.
7. Gorz, Andre, (1997). Farewell to the working class: an essay on post-industrial socialism, Pluto Press.
8. Howard, Karl Widerquist and Michael W., (2012). 'Alaska’s Permanent Fund Dividend: Examining Its
Suitability as a Model', Palgrave Macmillan.
9. Institute, Economic Research, Executive Compensation Trends, edited, 2016.
10. Maisano, Chris, (2012). 'The Soul of Student Debt', Jacobin Magazine.
11. Parijs, Philippe Van, (2012). 'The Universal Basic Income: Why Utopian Thinking Matters, and How
Sociologists Can Contribute to It', Politics & Society, vol. 41(2).
12. President, Executive Office of the, (2016). 'Artificial Intelligence, Automation, and the Economy'.
13. Stavrakakis, Yannis, (2006). 'Objects of Consumption, Causes of Desire: Consumerism and Advertising in
Societies of Commanded Enjoyment'.
14. Violante, Giovanni L., (2008). 'Skill-Biased Technical Change', MIT Press.
15. Wavern, Bob Van, (2017). 'Dutch municipalities start experiment with red tape-trimmed social assistance
benefits', European Social Policy Network.

60 JOURNAL OF THE ECONOMICS SOCIETY
16. Cantillon S and McLean C (2016) Basic income guarantee: The gender impact within household’s symposium
on the basic income guarantee. Journal of Sociology and Social Welfare 43(3): 97–120.
17. De Wispelaere J and Stirton L (2013) the politics of unconditional basic income: Bringing bureaucracy back in.
Political Studies 61(4): 915–932.
18. Dean M (1995) Governing the unemployed self in an active society. Economy and Society 24(4): 559–583.
19. Ackerman, B., and Alstott, A. (1999) the Stakeholder Society. New Haven: Yale University Press.
20. Anderson, E. (1999) ‘What is the Point of Equality?’ Ethics, Vol. 109, No. 2.
21. Atkinson, A.B. (1988) Poverty in Europe. Oxford: Blackwell Publishing, pp. 148-149
22. Burchardt, T. (2008) Time and Income Poverty. London: Centre for Analysis of Social Exclusion, London School
of Economics.
23. Dworkin, G. (1971). ‘Paternalism’, in Richard A. Wasserstrom (ed.), Morality and the Law. Belmont: CA,
Wadworth, pp. 10–126.
24. Paine, T. ‘Agrarian Justice’ [1795], in M. Foot and I. Kramnick (eds.) (1987) The Thomas Paine Reader.
Harmondsworth: Penguin, p. 478.
25. Sen, A. (1992) Inequality Reexamined. Oxford: Oxford University Press, p. 39.
26. Tobin, J., Pechman, J. A. and Mieszkowski (1967) ‘Is a Negative Income Tax Practical?’, Yale Law Journal 77.
27. Van Parijs, P. (1997) Real Freedom for All: What (if anything) can justify capitalism? Oxford: Oxford University
Press.
28. Van Parijs, P. (2003) ‘A Basic Income for All’, in J. Cohen and J. Rogers (eds.), What’s Wrong with a Free
Lunch? Boston: Beacon Press, pp. 4–7.
29. Engels, F. (1987) The Condition of the Working Class in England, Stanford: Stanford University Press. (Original
work published 1845.)
30. Dooley, D. and R. Catalano (1988) ‘Recent Research on the Psychological Effects of Unemployment’, Journal
of Social Issues, 44, 4.
31. Granter, E. (2009) Critical Social Theory and the End of Work: Rethinking Classical Sociology, Farnham:
Ashgate.
32. Lodziak, C. (2002) The Myth of Consumerism, London: Pluto
33. Sen, A. (1999) Development as Freedom, Oxford, New York: Oxford University Press.

61 JOURNAL OF THE ECONOMICS SOCIETY
PLANNED OBSOLESCENCE: MAKING
PROBLEMS, SELLING SOLUTIONS
MAAJID MEHABOOB CHAKKARATHODI – 3RD YEAR, RAMJAS COLLEGE [email protected]
FIZZA SUHEL- 1S T YEAR, RAMJAS COLLEGE
1. MEANING
Planned obsolescence is a strategy done in order to
deliberately limit the lifespan of products so that
consumers feel the urge to repair or replace them.
Companies producing electronic devices, washing
machines, clothes and even books follow this strategy
to earn profits in the long term. There are several ways
in which planned obsolescence can be practiced. For
instance, the products are designed in such a way that
some of the important parts worn out within few years.
Repair, if possible, costs as much as a new product and
therefore, consumers tend to replace it. This is
common in washing machines and printers. In case of
mobile phones and laptops, companies launch new
technology or new updates incompatible with the old
devices, again leading to new purchase by the users.
Planned obsolescence is not just limited to durable
goods but also prevalent in the fashion industry. This
happens when designers change the styling of products
so that customers buy them due to a decrease in the
desirability of unfashionable goods. This is common in
case of clothes.
2. HISTORY
“Furniture and clothing and other commodities should
have a span of life, just as humans have. They should be
retired, and replaced by fresh merchandise. It should
be the duty of the State as the regulator of business to
see that the system functions smoothly.” This was said
by the man who coined the term planned obsolescence.
Bernard London encouraged legal obsolescence to
expand consumption in his famous article “Ending the
Depression through Planned Obsolescence”. In 1954,
Brooke Stevens popularized the phrase by his talk on
planned obsolescence at a conference. The first
instance of this strategy was in the 1920s when General
Motors decided to launch new car models every year.
This challenged Ford’s firm belief in simplicity and
designs to scale. However, GM was able to capture the
market and soon its sales outnumbered Ford’s. Though
GM faltered after the energy crisis of the1970s,
planned obsolescence still continued, only to spread to
a large number of products.
3. TYPES OF PLANNED OBSOLESCENCE
I. TECHNOLOGICAL
First and most important type of obsolescence is
technological. Consumers are easily driven by such
changes and can be fooled into believing that it has
made the product more efficient. To some extent, we
can agree that technological advancements have been
of great help to the consumers when it comes to smart
phones, automobile or gas stoves. However, these
changes are expensive and demanding. Hence, to
attract more consumers, companies bring about minor
changes in designs or functions to sell more in the name
of technology. To compare the new iPhone X with the
previous models, we can see that the wider screen
display and face recognition are the only new
features.(If possible, calculate the profit margin
increased by Apple compared with the previous model,
also if possible try to find out the cost of new

62 JOURNAL OF THE ECONOMICS SOCIETY
technology introduced to give a comparative picture.)
These changes cannot be considered as a major
technological modification yet it has helped Apple
make more money by taking advantage of the
consumers ‘confusion.
II. MANIPULATED FAILURES
Easy to carry out and most difficult to identify,
manipulated obsolescence has become quite common
now. Manufacturers just have to produce goods with
cheap material to make sure it fails to work in few years.
Batteries, spare parts, printers are few examples of
things which are deliberately made to wear out.
Although such practices are forbidden in some
countries, it usually passes undetected because of low
consumer interference and awareness. Some common
examples of manipulated failures like Apple iPod’s
batteries (here, in the footnote provide the article or
news report where this charge was proven), printers
and lightbulbs have already been discussed above.
III. PERCIEVED OBSOLESCENCE
This strategy works by changing designs or styles of the
products. Products like clothes and footwears are
desired for their looks rather than their utility. For such
goods, the designers can easily bring about change in
their appearances and, therefore, make the old ones
useless. Brooks Stevens was a promoter of this strategy
and attracted many consumers through appealing
designs. This was further promoted by the belief (in the
footnote mention the article where this ‘social belief’
was mentioned/proven) that buying new products
showed one’s social status and people would actually
feel embarrassed owning an old cell phone or car for
that matter.
4. ECONOMIC THEORY
14 Martin [1962], Kleiman and Ophir [1966], Levhari and Srinivasan [1969], and Schmalensee [1970] all notes the flawed analyses behind it.
15J. Guiltinan “Creative Destruction and Destructive Creations: Environmental Ethics and Planned
Even amidst the widespread prevalence of planned
obsolescence, the economic theory behind it seems
notably weak. 14 Maintaining steady revenue is a
challenge for every producer. But when the good is
more durable, the consumer comes back fewer times
to the producer. The second-hand goods is also a
detriment because it competes with the first-hand
goods, often exacerbating the problem. Businesses,
therefore, argue that obsolescence can increase
revenue and curb competition. Technology has enabled
and advanced the ability of faster production and
adaptability to changing demand.15 So they advocate
that the costs accrued to changing the mix of products
in their economies of scale model will be covered by the
increased revenue.
Natural questions arise: Won’t customers pay less for
products with shorter life? Why would a profit-
maximization firm choose an inefficient durability?
Jeremy Bulow16 tries to address this issue by creating a
theory for planned obsolescence. Assuming durability
as a proxy for obsolescence, combined with a perfect
second-hand market, Bulow comes with certain results.
A monopolist not threatened with theentry has an
incentive to use planned obsolescence. An oligopolist
or a monopolist expecting future entry faces a Cournot-
Nash competition. Although they have similar
considerations as compared to a monopolist, the
durability will affect the future competitor’s future
strategies. Thereby to deter entry, such firms have an
incentive to produce goods with longer durability. On
the other hand, oligopolists can collide to set the
industry durability limits; also leading to planned
obsolescence. Although this model gives desirable
results, its weakness would be its primary assumptions
(state the assumptions in the footnote) which greatly
simplifies the model. Other theoretical models like
Obsolescence,” Journal of Business Ethics 89, pp.19-28, 2009.
16J. Bulow, “An economic theory of planned obsolescence”, “Quarterly Journal of economics”,Vol. 101 No. 4, pp. 729-750, 1986.
63 JOURNAL OF THE ECONOMICS SOCIETY
those espoused by Benjamin and Kormendi17 indicates
that under certain conditions (state the conditions in
the footnote if available), profitability can be increased
by limiting durability. However, substantial quantitative
data is not available to verify the claims of these
theoretical models.
5. CASE STUDY
LIGHT BULB
This is one of the oldest and most important examples
of planned obsolescence. You would be surprised to
know that a bulb made in the 19th century has lasted
for one hundred and fifteen years which is impossible
for the bulbs sold in this era. This change in the
durability of light bulbs is an evidence of the theory of
planned obsolescence. In the 1920s, the prominent
light bulb producing companies like Germany’s Osram,
UK’s Associated Electrical Industries and USA’s General
Electric formed the ‘Phoebus Cartel’. They together
planned to use a technology to limit its lifetime to one
thousand hours. These manufacturers saw an immense
increase in the sale of their bulbs by using delicate bulbs.
The cartel sold 335.7 million bulbs in 1926 which
increased to 420.8 million in four years. Therefore, just
by making delicate and less efficient bulbs, the cartel
was able to use planned obsolescence in their favour.
APPLE IPHONE
Apple has been in the headlines for its peculiar ways of
carrying out planned obsolescence. Lawsuits have been
filed in three countries- US, Israel,and France. The
French authorities have started investigating a
complaint filed by a consumer rights group against the
company. The company is alleged to have slowed down
the old models of the much celebrated “iPhones”
through a new software update to motivate consumers
to buy their new products. However, the company
claimed to have done it to avoid battery issues. Despite
17D.K. Benjamin, and R.C. Kormendi, “The Interrelationship between Markets for New and Used
this, the company has been involved in several other
ways of planned obsolescence. For instance, the screws
used in this product are such that the device can only
be dismantled by the authorized centers, thus making
repair difficult and expensive.
Spare parts like the iPod’s battery cost$49 which is the
same price at which you can buy a new iPod. Hence it is
not wrong to say that costly repairs, new upgrades, and
software advancements are few ways in which Apple
has been successful in increasing sales.
6. IMPACT
The outdated phone you threw, the refrigerator you
replaced due to high repair cost and the printer you
changed because of costly ink refills are all taken and
dumped away in developing countries. The dark side of
planned obsolescence is that most of these products in
the landfill are still working.
These products are disposed of inappropriately,
causing immense harm to the environment. For
instance, phones contain lead, cadmium which keeps
on collecting in the landfills and enter the soil. Another
problem which arises due to planned obsolescence is
the issue of disposables. Things like shopping bags,
bottles, and even cameras are treated as use and throw
items and contribute to waste and according to the UN,
around 50 million tons of electronic waste is being
dumped each year.
7. ETHICS
In an increasingly post-modern world, the ethics of
exploiting planned obsolescence doesn’t seem to be in
consensus. While it may seem that purposeful
reduction in durability is unethical, producers argue
that it is not illegal by law, helps advances in innovation
and provides employment.
Durable Goods,” The Journal of Law and Economics, vol. 17, no. 2, pp. 381–401, 1974
64 JOURNAL OF THE ECONOMICS SOCIETY
On the other hand, consumer’s perception about the
product seems positively affected by technological
obsolescence. Frequent updates are seen as
improvements to their device, and consumers
positively respond by buying frequently. This sheds
light on the consumerist narrative: “I Shop, therefore I
am”. The 20th century saw the rise of consumerism
through planned obsolescence and advertisements,
given the crisis of excess supply. Conspicuous
consumption is now seen as the path to self-fulfillment.
This seems merely as a display of status (through
surplus) as opposed to any functionality or
usefulness.18 In this consumerist culture, the regard to
ethical issues of planned obsolescence seems to be in
murky waters. However, the biggest externality of this
is the environmental effects. Higher production leads
to more pollution and waste. This is a challenge for the
human race, and often the people who are affected by
the negative externalities are not the ones who enjoy
the benefits.
8. CONCLUSION
Increasingly there has been a focus on encouraging
consumers to prefer eco-efficient, more sustainable
products, and services. Therefore, sustainable product
development is now a motivating force for many
product development engineers and designers. But as
Iyer (1999) points out, this “green” behavior may not
be enough. He notes that the “anthropocentric view”
means that the consumers will not make choices that
reduce their human quality of life, which makes
achieving the desirable outcome difficult. Pro-
environment product design and marketing practices
and innovative government policies may alleviate the
problem over time. But fundamentally, planned
obsolescence boils down to the question of ethics and
morality; of what ought to be done. Therefore while
addressing this issue, we must take into account its
context in the history of economics. Amartya Sen deftly
diagnoses the separation of morality and economic
choice with the advent of Utilitarianism. Keeping that
in mind, the challenge is to cultivate ameliorative ideas
and methodologies to find better solutions.
18Thorstein Veblen, The Theory of the Leisure Class: An Economic Study of Institutions (1899). ISBN-13: 978-1537426730

65 JOURNAL OF THE ECONOMICS SOCIETY
ECONOMIC WARFARE
KASHISH SAXENA- 3RD YEAR, RAMJAS COLLEGE [email protected]
Since long, civilizations have witnessed war which leads
to destruction and loss of resources; both human and
physical. War, no doubt, is a dismal proposition, and no
matter how hard it might be to accept this fact, but it is
a bitter truth that nations do fight among each other
for various monetary or pecuniary benefits. .
Throughout the years, human warfare has become
more sophisticated; to enunciate in other sense more
‘destructive’. From axe made up of stone and stick to
metal armor and swords, to cross bow, to rifle and
bayonets, to machine gun and sniper, now the era of
ballistic and more recently nuclear warfare has
emerged. More recently, with the advent of global
trade, a new weapon has emerged- Economics. It may
sounds amusing, intriguing even, but economics has
been used as a weapon by nations to fight battles which
could not be fought by force.
In a very popular movie, “Batman Begins” , the
notorious villain ‘Ra’s Al Ghul’ asserts that they tried to
rattle‘Gotham’ by using economics forces prior to
adopting other methods. However, their efforts were
went in vain but the question that arises is, "is it
possible to destroy populations using economic
activities". Intuitively, it is indeed possible to weaken, if
not critically damage a nation using economic forces.
Economic warfare or economic war involves "an
economic strategy based on the use of measures (e.g.
blockade) of which the primary effect is to weaken the
economy of another state. Economic wars between
nations are not an unknown fact, but the method is so
subtle that it can be initiated without breaking any
peace accord among nations (which could attract
attention from UN and other international
organizations). It uses, or threatens to use, economic
policies against a country in order to weaken its
economy and thereby reduce its political and military
power. Economic warfare also includes the use of
economic means to compel an adversary to change its
policies or behavior or to undermine its ability to
conduct normal relations with other countries.
In today’s globalized world, interdependence among
nations makes it even more convenient to use such
methods. The theory is that countries are intertwined
to such an extent that, a rogue state excluded from
normal trade and financial relations will be forced to
reconsider its political options. The tools adopted
include export embargoes, import restrictions and
financial sanctions. They also include covert actions:
counterfeiting currency to discredit state finances,
using agents to stir up labor disputes, deploying rebel
forces against strategic targets like electricity plants
and oil refineries, road, ports and railways, the food
supply system and most importantly disrupting the
main export industries.
Though there is not much literature devoted to this
area that is not the case with its practical
manifestations. The methods are subtle, yet they are
being observed since ages or since the time two
countries decided to wage war against each other in
lieu of domestic protections. Economic warfare
consisting of blockades and the interception of
contraband among belligerents has been practiced
since before the Peloponnesian War (431–404 BC) in
ancient Greece. During his term as president, Richard
Nixon called for United States to wage war against
Chile, retaliating to Chile’s decision of electing a Marxist
Chief of state and nationalizing American owned
business. However he didn’t call for Marines or Navy
but instead attacked Chile’s export, assaulted its
finances and blocked its import of food and spare parts.
As a result the economy came to a screeching halt.
Using its allies, US also sabotaged the international
credit facilities. As a result, unemployment soared and

66 JOURNAL OF THE ECONOMICS SOCIETY
inflation rate topped 1000 percent. More instances can
be observed from more recent incidences. Oil is
perhaps the most strategic good used to wage war. The
oil rich countries of OPEC and especially Saudi Arabia
have been able to dominate the world market by
restricting import to rival nations. Two most prominent
cases are the two oil shocks of 1973 and 1979. The US
being the main victim, has now discovered shale gas
resources so that it can domestically produce energy,
thereby acting as a counter against the policies of the
Saudis.
Since the victory of Donald Trump, under the motto ‘to
make America great again’, he appears to believe that
the quickest way to create new jobs and improve living
standards of Americans, requires revamping and
restructuring US global economics relationships,
particularly with China. We know that the US can
mount a military operation anywhere in the world but
whether it can compete economically across the globe
is much less certain. Trump clearly intends to change
that and could use an arsenal of trade sanctions,
economic tariffs and market access to do so.In such a
situation using military power is not only senseless but
will be expensive to the US. A more familiar example
could be observed by considering the much discussed
‘Doklam’ issue. India is a sprawling market for Chinese
manufactured goods and hence is essential for Chinese
exporters. During the ‘Doklam issue’, radical
organizations proclaimed the slogan of ‘Boycott
Chinese products’. Though the ideology was cultivated
and propagated to instill nationalist feelings, its logic
was more economic than a layman could perceive.
China, often regarded as the ‘world’s factory’ survives
to a large extent on exports(the conventional view is
that China's growth has been largely domestically
driven which is somewhat misguided.) If somehow,
Indians boycott Chinese goods then there will be a
reduction in world demand for Chinese goods;
considering the ‘Standard Trade Model’ of
International Trade theory, this would result in fall in
relative price of Chinese exports leading to a worsening
of their terms of trade.
We have seen that economic warfare is not as
uncommon as it appears. It is not that visible only
because none of the involved nations openly declare
clashes amongst them. However a question that may
arise is that ‘Is it even effective to wage war in such a
way?’ or ‘Are there any repercussions associated with
such form for the attacking country?’. This brings us to
the effectiveness of economic warfare. A regression
analysis of such a study is tedious and requires
expertise, however an intuitive argument could be
studied. The effectiveness of such Economic Weapons
depends on a large number of factors. One such factor
is the capability of the afflicted country to either
produce the affected good domestically or to acquire it
from other global producers. For example, efforts by
the United States to oust Fidel Castro from power in
Cuba by maintaining a decades-long embargo were
frustrated by increased trade between Cuba and
Mexico, Canada, and Western Europe. Another factor
comes from the fact that Economic warfare is
considered to be an inexpensive or more cost effective
counter part of military operation as it can impose
economic cost on the other nation's domestic
economy. For instance, a consumer in a country might
have to pay a higher price for a domestically produced
good than it could have from international trade (it
loses its competitive advantage). Another reason for
which economic means are undertaken are to weaken
the military capability of the opponent. However, it is
limited by the ability of the adversary’s government to
redistribute domestic wealth towards the military or
other institutions to compensate for distortion caused
by the policies of the other nation. It also depends on
the size of the nation. A relatively small country like
Prague or Bangladesh, undoubtedly cannot affect the
much developed nations like US, UK or Japan.
Economic Warfare though appearing to be a promising
weapon for political fights among nations has its own
limitations. Since the advent of international exchange
of goods, countries are waging such wars among
themselves causing economic, political and social
damages to their rivals. As put by a famous adage, ‘War
is indubitably worse for all, its impact is worst felt by
67 JOURNAL OF THE ECONOMICS SOCIETY
humanity’. No such war creates a win-lose situation. In
fact, it creates a lose-lose situation for all. Still such
methods are extensively adopted by countries to wage
silent war among them. Though several bodies like UN
or WTO dispute settlement body has been enacted,
their operation is limited to suggestions rather than
giving direct verdicts. Such mandating rules cannot
resolve conflict among nations, but can reduce the
aggravating effect of economic weapons.
REFERENCES
1. Shambaugh, G. (2002.) Economic warfare, International law Britannica. Retrieved from:
https://www.britannica.com/topic/economic-warfare
2. Cui, L. (2017). China’s Growing External Dependence - IMF. Retrieved from:
http://www.imf.org/external/pubs/ft/fandd/2007/09/pdf/cui.pdf
3. Yahya, H. (2017). ‘How effective are embargoes?’ Retrieved from:
http://www.pravdareport.com/opinion/columnists/22-12-2017/139514-embargo-0/

68 JOURNAL OF THE ECONOMICS SOCIETY
OPEN DEFECATION IN INDIA: CAUSES AND
CONSEQUENCES
AMOL SINGH RASWAN- SHRI RAM COLLEGE OF COMMERCE [email protected]
ABSTRACT
India is home to more than half of the world’s
population that defecates in the open, and it has seen a
plodding progress in ending open defecation when
compared with other countries. This paper critically
evaluates different reasons advanced for the country's
dismal performance in the area of sanitation while it
also looks at recent research that holds cultural
idiosyncrasies responsible for the abysmal record. After
identifying and qualifying the factors underlying the
widespread open defecation in rural India, we briefly
outline its consequences on India's economic growth via
its adverse impact on children's physical growth and
cognitive development.
19 The joint WHO/UNICEF Joint Monitoring Programme provides regular global reports on drinking-water and
1. INTRODUCTION Open defecation, as defined by UNICEF, refers to the
practice whereby people go out in fields, bushes, open
bodies of water, or other open spaces (rather than a
toilet) to defecate. According to the Joint Monitoring
Programme 19 (JMP) estimates, about 882 million
people or 12% of the world’s population defecated in
the open in the year 2015, and more than half of these
individuals lived in India (about 520 million or 40% of
India’s population).
India’s situation is peculiar since people in India have
been adopting alternatives to open defecation slower
than those in other developing countries have been.
This peculiarity is borne by the data as well: India’s
share of the world’s open defecation numbers has
grown from about 56% in 2000 to 60% in 2015 which
does not match the country’s fast growth rates (and
relatively higher incomes) in the corresponding period.
We compare India’s performance relative to other
countries/sub-national regions in detail in the next
section.
Moreover, the situation in rural India is more severe
than in urban areas. According to NSSO’s Swacchta
Status Report 2016, which is based on its rapid survey
carried out during May-June 2015, 55.5% of rural
households contributed to Open Defecation compared
to 8.9% of their urban counterparts. There are inter-
state disparities as well. More than 65% rural
households in Bihar, Chhattisgarh, Jharkhand, Madhya
Pradesh, Uttar Pradesh and Odisha defecate in the
sanitation coverage by collecting data through government census, DHS, WHO or UNICEF surveys. JMP’s data is available online at www.washdata.org

69 JOURNAL OF THE ECONOMICS SOCIETY
open compared with less than 5% in Mizoram, Kerala,
Nagaland, Manipur, Meghalaya and Sikkim. (Swachhta
Status Report, 2016)
However, the policy response to this grave issue has
been lackadaisical and whenever active, has often been
misguided. Past programmes, such as Central Rural
Sanitation Programme, Total Sanitation Campaign and
Nirmal Bharat Abhiyan, have primarily focussed on
latrine construction. However, the issue of open
defecation doesn't seem to arise because of lack of
access to latrines; the Sanitation Quality, Use, Access
and Trends (SQUAT) survey20 data shows that 40% of
households in the survey's sample with a working
latrine had at least one member who defecated in the
open. The Indian government's Swachh Bharat
Abhiyan, launched in 2014, did improve over the
failures of previous government campaigns by
explicitly, albeit limitedly, focussing on changing
people's attitude towards using the toilet for
defecation. However, its approach has often been
problematic since there is an overt focus on numbers of
toilets constructed and less emphasis on their actual
use.
Given this context, this paper looks at rural India and
identifies the causes of such high-spread open
defecation and its consequences for the future human
capital and growth of the Indian economy. Section II
compares India with other regions/countries and looks
at the inter-state performance which helps us debunk
20SQUAT survey was conducted by the r.i.c.e institute between November 2013 and March 2014 in the states of Haryana,
some of the commonly-held beliefs about open
defecation in India and understand the unique causes
of the problem in India. Section III draws the pathways
and linkages between sanitation and health, outlines
the immediate consequences of open defecation on
child health, and the resultant drag on income-earning
potential of the affected.
2. FACTORS UNDERLYING OPEN DEFECATION
IN INDIA
2.1. INCOME
It is commonly assumed that people in Indian villages
defecate in the open because they cannot afford to
build a latrine for themselves. This view, which sees
affordability of toilets as a significant factor, has also
guided the actions of the Indian government whose
sanitation programmes have, in the past, focussed on
funding the building of toilets in rural households.
However, the table below, which looks at India, its
neighbours and Sub-Saharan Africa, presents a
different picture, one which shows that countries and
regions with per capita GDP less than that of India have
much less open defecation (as a proportion of
population practising it). For instance, Nepal’s GDP per
capita is less than half of India’s; yet, 35% of its rural
people defecate in the open as opposed to 56% in India.
Bihar, Uttar Pradesh, Madhya Pradesh and Rajasthan. For more information, refer to Coffey et al. (2014)

70 JOURNAL OF THE ECONOMICS SOCIETY
Figure 1: Open Defecation in India: International Comparison
Atleast
Basic
(Rural)
Limited
(Rural)
Unimproved
(Rural)
Open
Defecation
(Rural)
Poverty
rate
(National)
GDP per
capita (PPP
current)
dollars
Access to
improved
drinking
water
source
(rural)
Year 2015 2015 2015 2015 Multiple 2015 2015
India 34 7 3 56 21.2 6126.5 90
Pakistan 48 9 24 19 6.1 4998.8 90
Bangladesh 43 19 38 0 18.5 3335.3 98
Sri Lanka 95 2 0 3 1.9 11777.9 94
Nepal 45 14 6 35 15 2449.8 89
Bhutan 57 4 39 0 2.2 8236.4 100
Sub Saharan
Africa 20 9 38 32 41 3705.2 59
Source: World Bank Databank (2015)
Note: First four columns contain data on the type of sanitation facility available which was taken from JMP report for the
year 2015. Poverty rates are based on World Bank's international poverty line of $1.90 per capita per day and pertain to
different years for different countries. Data on access to improved drinking water source has also been taken from JMP
while GDP per capita data was taken from World Bank’s databank.
One could argue that per capita GDP hides essential
income inequalities between these countries, in
response to which we can look at the extreme poverty
rates (as defined by the World Bank’s $1.90-a-day
poverty line) for these countries in comparison with
India. The Sub-Saharan African region’s poverty
headcount ratio stands at 41% which is nearly double
that of India’s, yet, its open defecation rate is full 24
percentage points lower than that of India. Moreover,
Bangladesh and India have similar poverty ratios which
do not correspond to the vast gulf between their
sanitation outcomes; there is no open defecation in
Bangladesh while the majority of India’s rural populace
practises it.
21See Table 2: Inter-State comparison in the appendix
A comparison of rural poverty and open defecation
rates of Indian states reveals a similar non-existence of
a strong relationship between the two in India. We look
at Census 2011 data for open defecation while we take
poverty rates from the results of the Tendulkar
Methodology set by the former Planning Commission21.
Note that the census collected information on the
availability of a latrine; hence, the proportion of
households having ‘no latrine’ in the census data has
been taken to be the same as the one practising open
defecation. We can see from the table that there is only
a tenuous relationship between poverty and open
defecation for Indian states. Although some states like
Kerala, Sikkim and Tripura have low poverty and open
defecation rates, there are states with small rural

71 JOURNAL OF THE ECONOMICS SOCIETY
poverty rates like Andhra Pradesh (11%), Jammu and
Kashmir (11.5%) and Tamil Nadu (15.8%) that have very
high open defecation rates (67.8%, 61.4% and 76.8%,
respectively). On the other spectrum, we have states
like Manipur and Mizoram with high rural poverty rates
(38.8% and 35.4%) but low open defecation incidence
(14% and 15.4%). We also have, in the data, states like
Assam and Bihar that have similar rural poverty ratios
(33.9% and 34.1%) but very different open defecation
rates (40.4% for Assam versus 82.4 % for Bihar).
Naturally, the correlation coefficient between these
two indicators stands at a low 0.43.
2.2. ACCESS TO WATER
Another explanation cited for India’s high open
defecation record is access to water. It is argued that
people defecate in the open since they do not have
access to water to clean their latrines. However, as is
evident in table 1, access to an improved drinking water
source is similar among the South Asian countries and
yet there is a clear difference in India’s open defecation
rates from others. Moreover, India’s rural OD rates are
24 percentage points higher than Sub-Saharan Africa’s
despite the fact that 90% of India’s rural population had
access to an improved drinking water source compared
with 59% for Sub-Saharan African countries. Kumar,
Murgai and Spears (2015) looked at 2012 JMP data and
found that 87% of countries with less access to
improved water in rural areas than India had lower
defecation rates. They also looked at Census 2011 data
on access to water (there are three categories:
households with piped water, those with water near
the home and those with water away from home) and
found that 46.6% of rural households with piped water
defecated in the open. Also, 80.7% of households with
water away from home defecated in the open as
opposed to the 77.6% of those with water near their
homes. These findings suggest that access to water
does not have a substantial effect on open defecation
in rural India. (Kumar, Murgai and Spears, 2015)
Additionally, in a study to gauge the impact of the total
sanitation campaign in Odisha, Barnard et al. (2013)
sampled 447 households of which 321 households had
a latrine. Of the 1933 individuals that lived in these 321
houses, only 47% reported always using a latrine while
37% reported defecating in the open (others reported
utilising it sometimes or usually). It is pertinent to note
here that only 1 household ascribed the non-use to
water being distant from the house.
2.3. GENDER
It is often argued that men are less concerned about
toilets and public sanitation than women for the
reasons that men’s requirements in discharging bodily
functions are less complex and that women perceive
embarrassment, fear and anxiety in defecating in the
open. (Pardeshi, 2009) Also, women need to go out in
the dark of early morning in order to relieve themselves
and often suffer from unnecessary urinary and genital
infections because they abstain from drinking water
due to unavailability of toilets (personal and
community) (Doron and Jeffrey, 2014). In their SQUAT
survey, researchers from r.i.c.e. Institute observed that
among households with a latrine, men were more likely
to defecate in the open than women (a difference of
10-15 percentage points for most age groups) except
for among young children who may be unable to go out
in the open themselves. They also noted that open
defecation decreased with age for young women with
access to latrines which could either be due to their
preference for latrine use or the North Indian cultural
norm of keeping women in their reproductive years
inside the home. (Coffey et al., 2014)
However, it is also true that women defecate in the
open in groups, and this often provides them with a
chance to socialise and escape the strict rules of
conformity at home. Coffey et al. (2017) document an
interview with a young woman in Haryana who
defecates in the open: “The reason that (I and my
sisters-in-law) go outside (to defecate) is that we get to
wander a bit… you know, we live cooped up inside.”
Moreover, it is important to note that women do not
hold enough bargaining power in the household to

72 JOURNAL OF THE ECONOMICS SOCIETY
demand the building of a latrine even if they wanted
one. In fact, Coffey, Spears and Vyas (2017) find a weak
association between latrine adoption and newly
married women joining the household in their study
involving the IHDS 22 dataset. However, Stopnitzky
(2017) evaluated Haryana government’s programme of
‘No toilet, No bride’ which encouraged bride’s family to
demand a latrine before agreeing to marry a male
suitor and found that the programme increased latrine
ownership, especially in areas with skewed sex ratios23.
However, care should be taken that toilets are not
solely sold as a women’s issue since this may confine
them inside their homes instead of empowering them.
2.4. EDUCATION
It can be seen from a country-wide comparison that
82% of countries with worse adult literacy rates than
India have lower open defecation rates (Coffey and
Spears, 2017). Also, though there is a high correlation (-
0.84) between female literacy and open defecation in
Indian states24, it is clear that there are various states
with similar levels of female literacy and yet very
different OD outcomes. One example is Tamil Nadu
which has similar rural female literacy as Punjab,
Uttarakhand and West Bengal but has much higher
open defecation.
Moreover, as Coffey and Spears (2017) observe from
the 2012 IHDS Survey data, 32% of rural households in
which a member has a bachelor’s degree, defecate in
the open. They report that 51% of Indian rural
households where the highest educated adult
completed secondary school defecate in the open; the
figure for Bangladesh stands at 4%. Moreover, in the
Barnard et al. (2013) study in Odisha, the most
commonly reported benefit of latrine use was health
benefits, regardless of the fact if the household had no
latrine, had a latrine but did not use it or had a latrine
22 India Human Development Survey (IHDS) is nationally representative panel dataset collected in 2005 and 2012 by National Council of Applied Economic Research and University of Maryland. Available at https://ihds.umd.edu/
and at least one member used it. Indeed, a higher
proportion of households with no latrine reported
health benefits than households with at least one
member using it. However, the above study also found
that households in which the female head had been to
secondary school were more likely to use the latrine
provided by the government.
Additionally, Coffey, Spear and Vyas (2017) found a
statistically significant yet weak association between
education (education levels of male and female
members of households) and latrine adoption by
households between 2005 and 2012. They report, “in
49% of households, the most educated male has six
years of education or less, and 81% have a most
educated male with ten years of education or less. This
four-year difference – a large 32 point shift in the
percentile rank of the household – is linearly associated
with the household being only about four percentage
points more likely to switch to a toilet or latrine. The
coefficients on female education in these controlled
regressions are similarly small in magnitude.”
2.5. (LACK OF) GOVERNANCE
It is common to hear corruption and improper
implementation as reasons for the failure of many
government programmes. Take for instance the Total
Sanitation Campaign (TSC) which was launched by the
Indian government in 1999 and was led by the
Department of Drinking Water and Sanitation. The
department reported rural sanitation coverage of 68%
in 2011 which was significantly higher than the 31%
coverage reported by the 2011 census. Given that the
2001 census reported 22% rural sanitation coverage, it
means that only one in five toilets reportedly
constructed under the TSC were built (Hueso and Bell,
2013). They attributed the failure of the campaign to
low state priority for rural sanitation, misdirected
23Stopnitzky (2017) also observes that the programme was more successful in areas where women were relatively scarce (high male-biased sex ratios), thus giving them more bargaining power in the marriage market 24See Table 2: Inter-State comparison in the appendix

73 JOURNAL OF THE ECONOMICS SOCIETY
accountability, infrastructure-focussed bureaucracy
(instead of focussing on demand), flawed monitoring
system, and corruption among other factors.
While the above factors can explain TSC’s failure, it is
pertinent to ask ourselves if other countries that have
better sanitation outcomes than India necessarily
better in governance and policy implementation.
Coffey and Spears (2017) looked at the World Bank’s
Ease of Doing Business Index and noted that 83% of the
countries that are more difficult to do business in than
India have a lower rate of open defecation.
Additionally, Mundle, Chowdhury and Sikdar (2016)
have constructed a Governance Performance Index
(GPI)25 and have accordingly ranked 19 Indian states on
their performance on the index. Gujarat, Tamil Nadu,
and Andhra Pradesh sit at the top of the table (i.e., the
states with best governance indicators) which is in
contrast with their disappointingly high open
defecation rates; there are similar but limited
disparities for other states as well. Thus, we cannot
count lack of governance as a dominant hurdle in
India’s path of eliminating open defecation.
2.6. RELIGION AND CASTE
Writing in the EPW, Anand Teltumbde evocatively
proclaims that "Bharat (India) will not be swachh unless
the caste ethos is completely eradicated." (Teltumbde,
2014) Though some may baulk at the forceful
conclusion adopted by him, recent research does
provide evidence of a possibly strong association
between caste 26 and sanitation (Coffey et al., 2017;
Spears and Thorat, 2015; Coffey et al., 2014). Deeply
25See Appendix Table 3: Governance Performance Index for the Indian States for the year 2011 26The caste system refers to a hereditary social division prevalent in Hinduism (while also practised to some extent by Indian Christians and Muslims) in which individuals are divided into social groups (castes or jatis) by their parents' caste. Such divisions are highly restrictive vertical groupings with some castes deemed to be 'high' while some 'low' in social status. In the lowest rung of this stratification live the Dalits which have historically been relegated to performing menial (and often ritually impure) occupations such as, but not limited to, carcass
enmeshed with the caste system is the concept of ritual
purity which may not at all times be the same as
physical cleanliness. For instance, an accidental
physical contact with a Dalit can clearly not be
physically unclean but it is still considered ritually
impure in many areas in India. Indeed, one of the
reasons for the caste divisions is that some castes are
ritually purer than others. (Harper, 1964)
Hence, we need to consider two factors now. First,
ritual purity is distinct (though overlapping to some
extent) from physical cleanliness in Hinduism.
Secondly, higher castes are believed to be (ritually)
purer than lower castes; this idea has been reinforced
through the imposition of ritually impure jobs such as
manual scavenging and carcass disposal on Dalits.
Because of these factors, the work of cleaning pit
latrines27 is not only physically dirty but also ritually
impure. Thus, higher-caste households reject such
latrines because they cannot welcome the idea of
cleaning the pit latrines themselves (and also consider
it ritually impure to build a latrine inside their houses)
while Dalit households abandon them in order to
challenge their social position, i.e., to tackle the
centuries-long discrimination that they have had to
face. (Coffey and Spears, 2017)
One of the implications of this aversion to pit-emptying
is reflected in the rejection of affordable pit latrines by
Indian villagers. Coffey et al. (2017) note that a
Bangladeshi pit latrine costs only about Rs 3000 while
the Swachh Bharat Abhiyan subsidises latrines in India
at Rs 12000. Nevertheless, Indian villagers tend to
disposal, manual scavenging and collecting kafan after cremation. Their history is one of high discrimination, from Dalit children not being allowed to study with non-Dalits in classrooms to an accidental touch between a non-Dalit and Dalit leading to the former's defilement. It is also to note that discrimination exists within the Dalits as well; for instance, the caste associated with manual scavenging, the Bhangis, "faces discrimination from higher castes as well Dalit castes considered less polluting than them." (Coffey, Gupta and Spears, 2016) 27 Manual scavenging has been banned in India through Prohibition of Employment as Manual Scavengers and their Rehabilitation Act, 2013.

74 JOURNAL OF THE ECONOMICS SOCIETY
spend even a greater amount than this because they
build larger pits than what can be constructed under Rs
12000 28 . They construct larger pits because of two
reasons: they hold an incorrect idea of how much time
a government-provided pit takes to fill up and even
when they know this, they construct larger pits that can
last around 15-20 years to avoid the task of emptying
them. (Coffey et al., 2017)
Another implication of ritual impurity being associated
with having toilets in homes is the non-use of
constructed latrines. Indeed, the above study also
found that 40% of Hindus who owned a government-
constructed latrine chose to defecate in the open.
While this could be partly attributed to the
incomplete/faulty construction of such latrines, such an
explanation fails to account for the fact that less than
10% of Muslims who owned a government latrine
opted for open defecation. Coffey et al. (2017)
conclude that this “consistent with a story in which
Hindus are more concerned about pit emptying than
Muslims” while noting that Indian Muslims also hold
concerns about polluting effects of latrines and pit
emptying (compared with Muslims in other parts of the
world).
Spears and Thorat (2015) used the 2012 IHDS data to
test whether there was a relationship between
untouchability and open defecation in rural areas in
India. Among their findings was the result that villages
with higher untouchability practices (measured by the
fraction of households reporting that they practise it)
also had higher open defecation (measured by latrine
ownership). The statistically significant and strong
relationship between the two holds even after
controlling for income and education (including health
knowledge) levels. Moreover, this relationship was
specific which means that the prevalence of
untouchability did not have a significant relationship
with health beliefs, modernity and social conservatism.
Thus, one is persuaded to recognise the fact that
sanitation in the rustic landscape is deeply entrenched
in cultural and status values because of which it is
necessary to devise improvements in terms of
perceived cultural values rather than solely focussing
on epidemiological benefits and infrastructural (supply-
side) bottlenecks. In this section, we looked at various
explanations that are commonly forwarded for
widespread open defecation in rural India and tried to
qualify them in the light of recent evidence and
research in the area. In the next section, we draw the
relationship between sanitation and health, and
attempt to quantify the effects of open defecation on
India’s economic development.
3. CONSEQUENCES OF OPEN DEFECATION
Open defecation poses a threat to public health
because a person’s action of defecating in the open has
negative externalities on the health of other
individuals, especially of children, through diseases
such as diarrhoea, environmental enteropathy,
parasitic infections, and cholera among others. Such
maladies which, when they don’t cause mortality
among the young, lead to malnutrition and stunting,
and hamper learning outcomes. These deleterious
effects carry through an individual’s life, reducing their
capability to lead a life of their choice. The primary
transmission of faecal pathogens from an infected host
to a new host can be visualised through the following F-
diagram which was conceptualised by Wagner and
Lanoix (1958):
28 Coffey et al. (2017) note that the volume of the median privately constructed pit in their survey was 250 cubic metres
opposed to the 60 cubic metres volume of WHO-recommended pits

75 JOURNAL OF THE ECONOMICS SOCIETY
Figure 2: Transmission Channel of faecally – transmitted infection
It is essential to understand that it is not one’s
sanitation behaviour that affects health outcomes but
it is the neighbourhood sanitation behaviour that
influences the health of an individual. In this sense, it is
the open defecation of one’s neighbours, rather than
the household’s own, that matters the most.
Interestingly, Geruso and Spears (2015) found that
moving from a locality where everybody defecates in
the open to an area where nobody defecates in the
open results in a more significant drop in child mortality
than moving from the bottom quintile to the top
quintile of asset wealth. Moreover, Coffey and Spears
(2017) (conservatively) computed that about 200,000
children under the age of 5 would not die each year if
India were to become open defecation free.
Given that open defecation results in a large number of
deaths, another critical question is what happens to
those children who do not die but are nonetheless
exposed to faecal pathogens. We find the answer in
stunting which is often considered an indicator of
undernutrition. It is not only a reflection of a child’s
early development (Chambers and Medeazza, 2013)
but also a predictor for future earnings since height is
positively correlated with cognitive development (Case
and Paxson, 2008).
Epidemiologically, open defecation causes stunting
through diarrhoea, environmental enteropathy and
parasitic infections which impede absorption of
essential nutrients during a child’s growth years.
Empirically, Hammer and Spears (2016) analysed data
from a randomised controlled trial of sanitation
programme in Maharashtra and found a 0.3-0.4
standard deviation increase in children’s height-for-age
z-scores because of the sanitation intervention.
Another study by Gertler et al. (2015) estimated the
causal relationship between open defecation and child
height and found that eliminating open defecation
from a village (with 100% open defecation initially)
resulted in an increase of child height by 0.44 standard
deviations.
As described earlier, low heights are an indicator of
insufficient cognitive development. This is true because
diseases that hinder physical growth are often the same
as those which prevent cognitive ability from growing
to its potential. For instance, Spears (2011) studied the
effect of height of Indian children in the IHDS dataset
on their cognitive achievement and reported that being
one standard deviation taller was associated with being
3.4 percentage points more likely to be able to write,
76 JOURNAL OF THE ECONOMICS SOCIETY
even after controlling for early-life conditions (the
effect was around 2.4 percentage points for reading
and 1.8 percentage points for math; all were significant
at the 0.1% significance level). Hence, open defecation
affects cognitive development of children which in turn
influences their wages when they grow up. (Lawson
and Spears, 2015)
One can also estimate the economic impact of poor
sanitation by looking at its sectoral effects. The
Economics of Sanitation Initiative29 did precisely this by
computing health, water, access time and tourism-
related impacts of inadequate sanitation in India for the
year 2006. It concluded that the total annual economic
impact amounted to $53.8 billion which was 6.4% of
India’s GDP in 2006; of this, the impact of health-
related effects stood at $38.49 billion which was nearly
72% of the total.
4. CONCLUSION
Though this paper cannot claim to have studied open
defecation in its entirety, a useful image of the issue
does arise from it: one that accepts its complexity and
intricacy in India. It is simply not a numbers game, one
that would be concerned with supply-side solutions to
the problem of lack of toilets but is a complication
steeped in gender, religion, caste, and corruption. Its
consequences reach far beyond the immediate health
effects on children; it worsens their prospects and
deprives them of the capability they would want to lead
the life of their choice. If not solved, it will create a
future workforce marred by constant ill-health and low
cognitive abilities, thus gravely impeding India’s path to
growth and development.
However, this leads to another question: how do we
end open defecation? The answer: there is no one or
simple solution. The standard government policy of
subsidising latrine construction has had and will have
only limited success since low income is not a major
hurdle in latrine construction. There is, thus, a need to
move away from traditional campaigns and towards
innovative, state-specific and holistic sanitation
campaigns. Moreover, the problem of non-use of
constructed latrines by some household members
remains high in India. As discussed in section II, cultural
values play a crucial role in shaping an individual’s
choice of using the available facilities; any government
programme that does not attempt to change these
values will see only limited success. A related issue is
that government collects household-level data on
latrine ownership and not latrine use30. Therefore, the
government needs to formulate and conduct a
nationwide household survey on latrine use so that its
policies can be tracked for their efficacy in terms of
latrine use in addition to the number of latrines
constructed.
Policymakers should keep in mind that only a concerted
action plan that takes into account the multi-
dimensional nature of sanitation in India, targets
people’s behavioural and cultural values, and tracks
latrine use will be successful in ending the scourge of
open defecation from Indian villages.
29Economic Impacts of Inadequate Sanitation in India (2011) 30 Although the Swacchta Status Report (2016) does contain information on latrine use, Coffey and Spears (2017) point out that the NSSO Rapid Survey’s data (on which the report is based) likely contains over-reporting of latrine use because the questionnaire did not ask a person-level question but had a column for all village households on a single form. Moreover, there was no proper question on the form (no reference period
was specified nor was the question’s description balanced). With regards to GraminSwacchSurvekshan Report 2016, they observe that the districts chosen were not representative of the whole country and were “chosen purposively chosen to be high-performing districts.” The problem of an unbalanced question on open defecation persisted in this survey as well. (Coffey and Spears, 2017)

77 JOURNAL OF THE ECONOMICS SOCIETY
REFERENCES 1. Barnard, S., Routray, P., Majorin, F., Peletz, R., Boisson, S., Sinha, A. and Clasen, T. (2013). Impact of Indian
Total Sanitation Campaign on Latrine Coverage and Use: A Cross-Sectional Study in Orissa Three Years following
Programme Implementation. PLoSONE, 8(8).
2. Case, A. and Paxson, C. (2008). Stature and status: height, ability, and labor market outcomes. Journal of
Political Economy, 116(3).
3. Chambers, R. and Medeazza, G. (2013). Sanitation and Stunting in India. Economic and Political Weekly, 48(25),
p.15.
4. Coffey, D. and Spears, D. (2017). Where India Goes. HarperCollins Publishers India, pp.37-38.
5. Coffey, D., Gupta, A., Hathi, P., Khurana, N., Spears, D., Srivastav, N. and Vyas, S. (2014). Revealed Preference
for Open Defecation. Economic and Political Weekly, [online] 49(38). Available at:
http://www.epw.in/journal/2014/38/special-articles/revealed-preference-open-defecation.html.
6. Coffey, D., Gupta, A., Hathi, P., Spears, D., Srivastav, N. and Vyas, S. (2017). Understanding Open Defecation in
Rural India. Economic and Political Weekly, 52(1).
7. Coffey, D., Spears, D. and Vyas, S. (2017). Switching to sanitation: Understanding latrine adoption in a
representative panel of rural Indian households. Social Science & Medicine, 188, pp.41-50.
8. Doron, A. and Jeffrey, R. (2014). Open Defecation in India. Economic and Political Weekly, [online] 49(49).
Available at: http://www.epw.in/journal/2014/49/notes/open-defecation-india.html.
9. Economic Impacts of Inadequate Sanitation in India. (2011). Flagship Report. Water and Sanitation Programme,
p.9.
10. Gertler, P., Shah, M., Alzua, M., Cameron, L., Martinez, S. and Patil, S. (2015). How does health promotion work?
Evidence from the dirty business of eliminating open defecation. Working Paper W20997. National Bureau of
Economic Research.
11. Geruso, M. and Spears, D. (2015). Neighbourhood Sanitation and Infant Mortality. Working Paper No. W21184.
National Bureau of Economic Research.
12. Gupta, A., Coffey, D. and Spears, D. (2016). Purity, pollution, and untouchability: challenges affecting the
adoption, use, and sustainability of sanitation programmes in rural India. In: P. Bongartz, N. Vernon and J. Fox,
ed., Sustainable Sanitation for All: Experiences, Challenges, and Innovations. Practical Action Publishing, p.295.
13. Hammer, J. and Spears, D. (2016). Village sanitation and child health: Effects and external validity in a
randomized field experiment in rural India. Journal of Health Economics, 48, pp.135-148.
14. Harper, E. (1964). Ritual Pollution as an Integrator of Caste and Religion. The Journal of Asian Studies, 23,
pp.151-197.
15. Hueso, A. and Bell, B. (2013). An untold story of policy failure: the Total Sanitation Campaign in India. Water
Policy, 15(6).
78 JOURNAL OF THE ECONOMICS SOCIETY
16. Kumar, M., Murgai, R. and Spears, D. (2015). Access to water does not explain exceptionally common open
defecation in India. Working Paper. [online] Centre for Development Economics, Delhi School of Economics and
r.i.c.e. Available at: http://riceinstitute.org/wp-content/uploads/2015/09/water-paper-draft-v1-
references.pdf.
17. Lawson, N. and Spears, D. (2015). What doesn’t kill you makes you poorer: Adult wages and early-life mortality
in India. Economics and Human Biology.
18. Mundle, S., Chowdhury, S. and Sikdar, S. (2016). Governance Performance of Indian States 2001-02 and 2011-
12. NIPFP Working Paper. [online] New Delhi: National Institute of Public Finance and Policy, p.14. Available at:
http://www.nipfp.org.in/media/medialibrary/2016/04/WP_2016_164.pdf.
19. Pardeshi, G. (2009). Women in Total Sanitation Campaign: A Case Study from Yavatmal District, Maharashtra,
India. Journal of Human Ecology, 25(2).
20. Spears, D. (2011). Height and cognitive achievement among Indian children. Economics and Human Biology.
21. Spears, D. and Thorat, A. (2015). Caste, purity, and pollution and the puzzle of open defecation in India: Evidence
from a novel measure in a nationally-representative survey. Working Paper. r.i.c.e.
22. Stopnitzky, Y. (2017). No toilet no bride? Intrahousehold bargaining in male-skewed marriage markets in India.
Journal of Development Economics.
23. Swachhta Status Report. (2016). [online] National Sample Survey Office, Government of India, pp.71-72.
Available at:
http://mospi.nic.in/sites/default/files/publication_reports/Swachhta_Status_Report%202016_17apr17.pdf.
24. Teltumbde, A. (2014). No Swachh Bharat without Annihilation of Caste. Economic and Political Weekly, 49(45).
25. Unicef.in. (n.d.). Eliminate Open Defecation | UNICEF. [online] Available at:
http://unicef.in/Whatwedo/11/Eliminate-Open-Defecation
26. Wagner, E. and Lagnoix, J. (1958). Excreta Disposal for Rural Areas and Small Communities. WHO Monograph
Series No. 39. Geneva: World Health Organisation, p.12.
27. Washdata.org. (n.d.). Home | JMP. [online] Available at: https://washdata.org/
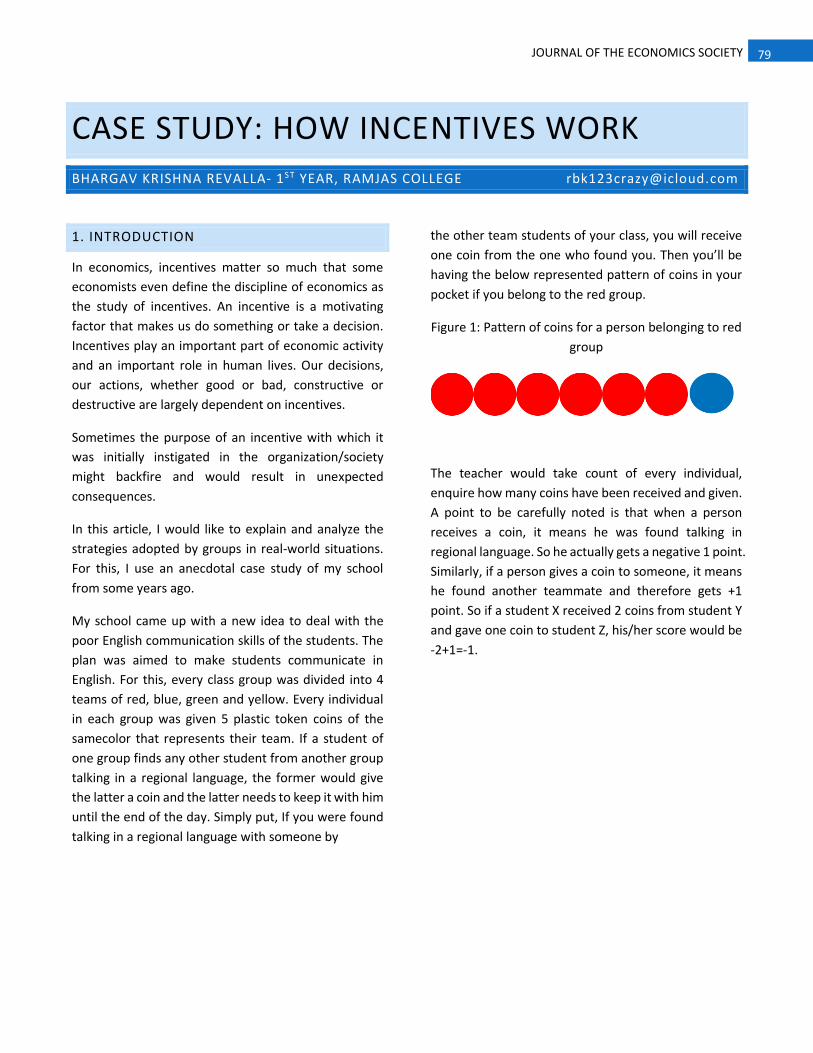
79 JOURNAL OF THE ECONOMICS SOCIETY
CASE STUDY: HOW INCENTIVES WORK
BHARGAV KRISHNA REVALLA- 1ST YEAR, RAMJAS COLLEGE [email protected]
1. INTRODUCTION
In economics, incentives matter so much that some
economists even define the discipline of economics as
the study of incentives. An incentive is a motivating
factor that makes us do something or take a decision.
Incentives play an important part of economic activity
and an important role in human lives. Our decisions,
our actions, whether good or bad, constructive or
destructive are largely dependent on incentives.
Sometimes the purpose of an incentive with which it
was initially instigated in the organization/society
might backfire and would result in unexpected
consequences.
In this article, I would like to explain and analyze the
strategies adopted by groups in real-world situations.
For this, I use an anecdotal case study of my school
from some years ago.
My school came up with a new idea to deal with the
poor English communication skills of the students. The
plan was aimed to make students communicate in
English. For this, every class group was divided into 4
teams of red, blue, green and yellow. Every individual
in each group was given 5 plastic token coins of the
samecolor that represents their team. If a student of
one group finds any other student from another group
talking in a regional language, the former would give
the latter a coin and the latter needs to keep it with him
until the end of the day. Simply put, If you were found
talking in a regional language with someone by
the other team students of your class, you will receive
one coin from the one who found you. Then you’ll be
having the below represented pattern of coins in your
pocket if you belong to the red group.
Figure 1: Pattern of coins for a person belonging to red
group
The teacher would take count of every individual,
enquire how many coins have been received and given.
A point to be carefully noted is that when a person
receives a coin, it means he was found talking in
regional language. So he actually gets a negative 1 point.
Similarly, if a person gives a coin to someone, it means
he found another teammate and therefore gets +1
point. So if a student X received 2 coins from student Y
and gave one coin to student Z, his/her score would be
-2+1=-1.

80 JOURNAL OF THE ECONOMICS SOCIETY
Table 1: Scores of students belonging to various groups
RED BLUE GREEN YELLOW
Coins received
Coins given
-12
+15
-5
+1
-17
+8
-18
+20
end score +3 +4 -9 +2
In this way, the respective class teacher of every section
would take account, the number of coins given and
received by every group as a whole and make a balance
sheet. The team which has got the biggest positive
integer would be announced as “the winner of the day”.
Also, the student who would show a substantial
improvement would be praised in the class and
occasionally gets rewarded with a pen or a book by the
class teacher.
In this way, the school authorities thought of improving
the communication skills among the students by
providing them such incentives.
Indeed, it worked well, but only for a few days. After
some time, students started to lose motivation for
making their team win. However, they were afraid of
ateacher making complaints against them to their
parents about their poor scores. If a student gets
negative score frequently, he/she would be punished
with extra homework. This made students behave in a
very unusual way.
Students started to make agreements by exchanging
coins among themselves. When the teacher comes to
every individual, one would claim that he/she received
some amount of coins from some and gave his coins to
some other person. For example, say, student A would
make a false claim before teacher that he had received
two coins and gave one coin to some other student and
that other student would accept it. In this way,
everyone helped each other. The students used to
change their partners and days of the trade so that the
teacher wouldn't doubt them. It continued for some
time and the colored coins even acquired some basic
functions of money. In the long term, the incentives
provided to students deliberately created value to the
coins. The coins were durable, portable, divisible and
uniform. These characteristics of colored token coins
are very similar to that of commodity money.
During the time of exams, the students used to
exchange coins in return for helping/copying in exams
or sharing the snackbox during break times. For
example, say, individual A would approach and accept
five coins(-5 points) for this day and give no coins in
return if individual B helps him pass out the exam (or) X
would ask Y to get some of his maggie in return for
receiving 4 coins(-4 points) that day. The typical thing is
that after the teacher's counting and announcing of the
winner, everyone would take back their own coins and

81 JOURNAL OF THE ECONOMICS SOCIETY
by the next day, they all start fresh. (everyone having 5
coins in their pocket)
The teachers slowly started to doubt what’s happening
in the class but they kept quiet. The reason for this
mysterious behavior will be explained in the analysis
part. Things became messy only when students came
to know that the coins they’re using were similar to the
tokens used in a nearby bakery. Some students used
them for a plate of panipuri. Realising this, both the
school authorities and bakery shops stopped the usage
of token coins. The school authorities ordered all the
class teachers to collect back all the coins and imposed
a fine of Rs. 20 per coin lost/used.
2. ANALYSIS
If we closely examine what happened in the above
illustration, we get to know that the students have just
behaved in a rational way to achieve Pareto efficient
equilibrium. This analysis would help us to understand
how incentives sometimes backfire vanishing out the
very behavior they’re meant to encourage. In the
beginning, when the school authorities introduced coin
system, the students got two incentives in the short
term.
INCENTIVE 1(POSITIVE INCENTIVE): To make their
respective teams “winner of the day”. This is motivated
by their self-interest and made them talk in English.
INCENTIVE 2(NEGATIVE INCENTIVE): Not to get
scolded by teachers and parents by getting more coins
as it is a shame among classmates also.
These two incentives combined to make students act in
a way they’re intended to, as forecasted by the school
authorities. Teachers also initially got the
incentive/payoff for taking up this task in the form of
respect among colleagues/principal and also
expectations of promotions or rewards in case of good
results.
The first alteration came with students. The students
realized that they’re disappointing and spoiling their
friendship by charging them with coins. The cost of the
team winning seemed to be more when they’ve got to
lose the friendship.
The extrinsic incentives work to induce people to do
what was incentivized, but that is not all they do. They
can also affect other intrinsic motivation. The extrinsic
incentive of their own team winning the day got
diminished and it even damaged the intrinsic
motivation of talking in English. However, the second
incentive of avoiding rebukes from teachers and
parents remained. This made students get into an
agreement within themselves before every end of the
day irrespective of teams. When the extrinsic
motivation crowds out intrinsic motivation, incentives
backfire.
THE INCENTIVE FOR TEACHERS:
Some teachers slowly started to doubt students as
there is no significant growth in their speaking skills
even after months. Even though, they never
complained it to higher authorities as they considered
that it would put even more burdensome tasks upon
them. Atleast, students remained silent without
chattering during class hours and it was satisfactory for
them.
The below table represents how the incentives worked
in the short term and backfired in the long-term:

82 JOURNAL OF THE ECONOMICS SOCIETY
Table 2: Impact of incentives on students and teachers
SHORT TERM LONG TERM
STUDENTS incentive 1
Incentive 2
to win points
To make team win
To avoid rebukes from parents and teachers
to make team win got vanished.
To win points still remained
(No change)
TEACHERS Incentive expected promotions, respect among colleagues
Completely vanished
RESULT SYNERGIC INCENTIVE PERVERSE INCENTIVE
Incentives are often recommended for fostering
behavioral change. As the discussion above shows,
incentives may fail or even backfire. Offering incentives
might send signals to the incentivized that the task is
either difficult or undesirable. And this is what
happened in our case in the long run. The incentives
worked as synergic incentives in the short run, fostering
the purpose of its inception, but, turned perverse in the
long run bringing out unintended results.
3. PARETO EFFICIENT EQUILIBRIUM IN THE
LONG TERM
Every student in his/her verge of improving scores used
to make agreements with different individuals
everyday. They’d reach a point of stability in agreement
and this can be compared to Pareto efficient
equilibrium in a simple case.
The teacher generally used to scold students if they get
less than -1 or messages a complaint to parents if it is
even less. So students have a negative incentive of not
scoring below -1 points. For suppose, consider that
student B accepted 2 coins from A. A’s net score would
be +2 and B’s net score of points would be -2. Both A
and B work for Pareto improvement. B is worse off with
-1 point. To avoid rebukes from teachers, B would, in

83 JOURNAL OF THE ECONOMICS SOCIETY
turn, make a counter trade of one coin to A. Then A’s
net score is +2-1=+1, B’s net score is -2+1=-1. A readily
accepts this as he is still better off with +1 points. This
combination of exchange is reversed between A and B
some other day. The students at the end achieve stable
equilibrium as both of them have no tendency to move
from the point and both of them considered it as the
best option available. The Pareto efficient equilibrium
was achieved everyday as students used to exchange
partners and number of coins traded. This achievement
of Pareto efficient equilibrium can only be
considered/explained when the partners involved are
only two.
4. CONCLUSION:
The detailed analysis of the above illustration helps
understand incentives and their short-term and long-
term effects. The examination of the working of
incentives can help us in framing more effective policies.
REFERENCES
1. Ariely, D., Bracha, A., & Meier, S. (2009). Doing good or doing well? Image motivation and monetary incentives
in behaving prosocially. The American Economic Review, 544-555.
2. Bénabou, R., & Tirole, J. (2006). Incentives and Prosocial Behavior. The American Economic Review, 96(5), 1652-
1678.
3. Benabou, R., & Tirole, J. (2003). Intrinsic and extrinsic motivation. The Review of Economic Studies, 70(3), 489-
520.
4. Gneezy, U., Meier, S., & Rey-Biel, P. (2011). When and why incentives (don’t) work to modify behavior. The
Journal of Economic Perspectives, 191-209
84 JOURNAL OF THE ECONOMICS SOCIETY
SOCIAL SECURITY – INSURANCE PLAN OR
TICKING TIME BOMB?
ADITYA VARDHAN SHARMA- 3RD YEAR, ASHOKA UNIVERSITY [email protected]
With the United States passing $20 trillion dollars in
debt, a significant area of study coming to light is the
need for a government spending reduction. But the
primary cause of their long-term fiscal insolvency is not
Foreign Aid or Defence Spending, it is programs like
Social Security and Medicare. In 2016, the U.S.
government devoted almost a quarter of its federal
budget alone on Social Security itself (approximately
$948 billion). To put this into perspective, the annual
spending on defense the same year amounted to $604
billion – around 15%. To make matters worse, the
government estimates an 81% increase in Social
Security spending from 2010 to 2021. Even in U.K.,
Social Security comprised of 34% of total spending of
the 2017 budget. To understand why this imposes a
huge problem, one needs to understand why Social
Security is not sustainable in the long term.
As Franklin Roosevelt put it, it is a form of “social
insurance” to the elderly or disabled created after the
Great Depression. It was advertised as an insurance
program or a transfer payment. But it is neither of
them. The Congressional Budget Office of the United
States claims that Social Security fund is likely to go
broke by 2029, so this means that the generation
funding it may or may not even receive the benefits. In
other words, unlike a standard insurance scheme, they
are not legally entitled to any money when they retire
because the government can alter the benefits at any
time – which it has to, in order to prevent a fiscal
disaster. But one might ask – why will it be one? This is
because it is not a transfer payment. Social Security
taxes do not entirely fund the benefits. It does not have
enough assets to cover its liabilities. Therefore,
this program (just like Medicare) is partially funded by
borrowing. The deficit is only going to widen when they
expand the program.
The Social Security Trust Fund in the U.S.A. runs a
surplus every year - $2.85 trillion at the beginning of
2017. But unlike any private sector trust fund, this
money is not invested in real assets like stocks, bonds
or mortgages. It is entirely used to buy a special kind of
Treasury Bond that can only be redeemed by the Social
Security Administration. Basically, the government is
borrowing from Social Security (or itself). The sole way
to repay is by borrowing from or taxing future
taxpayers when the IOU’s mature. Renowned
economists like Thomas Sowell have compared Social
Security to fraudulent practices of Bernie Madoff and
Charles Ponzi. The similarity is that the investors are not
paid using any income-generating asset – the first
round of investors receive returns only using funds
from the next group of investors, and thus an unending
cycle is created.
With stagnant wages, job growth rate nearing zero and
an aging population; the beneficiaries are growing at a
faster pace than the workers currently covering them.
In 1950, the United States had 35 million workers who
paid Social Security taxes for around 220,000 retirees –
a 160 to 1 ratio. But by 2031, the SSA has forecasted
this number to drop to 2.1 workers for one retiree. The
Baby Boomers all across Europe and the U.S. got a high-
yielding return on their investment. Observing the
trends, the current workers are clearly paying into a
scheme for which the costs majorly exceed the
benefits. Obviously, they can be paid off by printing
money to maintain the program’s solvency. But, this
85 JOURNAL OF THE ECONOMICS SOCIETY
will merely add to the debt burden. Also, the benefits
are inflation-indexed, so the real value of the returns
will practically be worthless.
Realistically, the benefits should be tightened by
adopting a method called “means testing” i.e. the ones
who are wealthier get lesser in benefits. Basically, it
should be made a welfare program directed towards
the needy and not an entitlement to all. This is one of
the many solutions facing the problem, what is a viable
option in the long term? Social Security destroys the
incentive to save, and bringing that back will have two
advantages. Savings is what drives investment and
growth in the economy. Secondly, the money stays in
your own account; it is not spent. If the idea behind this
program was that people are too reckless with their
money, the government can make it mandatory to have
a comprehensive savings account. Singapore and Hong
Kong have adopted this approach where working
citizens and their employers make monthly
contributions to a Provident Fund for their retirement,
housing, and healthcare needs. The payroll tax
dedicated to Social Security is funded in the same
manner.
Chile has had a privately administered system of a
Pensions Savings Account since 1981. Along with having
a positive impact on the labor market, it also gives the
individual the freedom to decide for himself. The
savings rate in Chile almost tripled from 1986 (less than
10%) to 1996 (almost 29%). According to Nobel Prize-
winning economist Milton Friedman, the present
participants (funders and beneficiaries) should receive
a Social Security bond equal to the current expected
value of their benefit streams. Following that, it should
be shut down. This would also call for the government
to finance the unfunded liability.
Crippled with high taxes and student debt, the middle
class is being hurt the most because they are unable to
leave aside any savings. They have become dependent
on Social Security benefits, which are uncertain. Any
dialogue about reforming this program is equated with
snatching money away from the ones currently
enrolled in it. It would be bad politics to even suggest
such an idea in countries where the elderly form the
majority voter base. Nevertheless, it is essential to
think of an alternative solution and recognize the
costliness of such an unsound scheme.
REFERENCES 1. DeSilver, D. (2017, April 04). What does the federal government spend your tax dollars on? Social insurance
programs, mostly. PEW Research Center. Retrieved from: http://www.pewresearch.org/fact-
tank/2017/04/04/what-does-the-federal-government-spend-your-tax-dollars-on-social-insurance-programs-
mostly/
2. Office of National Statistics. (n.d.). How is the welfare budget spent? Retrieved from:
https://visual.ons.gov.uk/welfare-spending/
3. Congressional Budget Office. (2011). CBO's 2011 Long-Term Projections for Social Security. Retrieved from:
https://www.cbo.gov/publication/52298
4. Social Security Administration. (n.d.). Retrieved from https://www.ssa.gov/policy/trust-funds-summary.html

86 JOURNAL OF THE ECONOMICS SOCIETY
5. Piñera, J. (1997). Empowering People: The Privatization of Social Security in Chile. CATO Institute. Retrieved
from: https://www.cato.org/publications/congressional-testimony/empowering-people-privatization-social-
security-chile-0
6. Cohen, W. J., & Friedman, M. (1972). Social security: Universal or selective? Washington: American Enterprise
Institute for Public Policy Research.

87 JOURNAL OF THE ECONOMICS SOCIETY
UNIVERSAL BASIC INCOME: IDEOLOGICAL
SUCCESS AND AN ECONOMIC FAILURE
VRINDA SAXENA- 1ST YEAR, RAMJAS COLLEGE [email protected]
HIMANSHI MITTAL- 1S T YEAR, RAMJAS COLEGE
1. INTRODUCTION
Universal Basic Income (UBI) can be loosely defined as
a periodic cash transfer unconditionally delivered to all
citizens on an individual basis, without means-test or
work requirement. It is basically centered on the
concept that all individuals should have access to a
basic income in order to procure basic goods and lead
a decent life, by virtue of them being citizens. UBI is
supported by many across the globe for it is considered
to be the baton bearer for ideas like social justice, anti-
paternalism, equity etc. While it may, no doubt, be
conducive in bringing such ideals into greater practice,
the concern of this article shall be whether it is
economically feasible or not. Broadly, it has three
components- universality, un-conditionality and
agency. Examination of UBI from these aspects will give
us possible answers.
2. WHY AN IDEOLOGICAL W INNER?
Firstly, the UBI rests majorly on the theory of social
justice and is seen as a propounder of that- and I do
not dispute the claim. John Rawls’ popular theory on
social justice, called ‘Veil of Ignorance’ can very well
claim UBI as an example. It suggests a manner of
policy formation in which the makers imagine
themselves behind a veil wherein they don’t know
their social identities like economic background, caste,
sex etc. He suggested that this way the policies made
would benefit everyone, but not at the cost of anyone.
UBI’s components of universality and unconditionality
quite adequately capture this. Secondly,
implementation of UBI is intended to have a
favourable result on the
society by reducing poverty. Next, UBI is intended as a
transfer payment targeted at individual beneficiaries
and not units like households as a whole, which means
even women will have access to it separately. Hence, it
can also be called as anti-paternalistic and giving the
agency of women a boost. Besides, there is strong
support for it because it is believed to be providing the
marginal benefit of improving the status-quo. Lastly,
inter alia, another strong ground for UBI to gain
brownie points ideologically is that it liberates incentive
to work. That is, since all people have access to a
minimum basic income to support them, they will not
be ready to accept the exploitative rates of their labour,
just to make ends meet. Instead, the UBI, in these terms
is considered as pro-creativity and productive.
3. ECONOMIC UNFEASIBI LTY
Among the many ideological aspects where UBI
emerges as a hero, we now examine its economic
credibility. Firstly, UBI is a cash transfer and cash
transfers raise the income of the households for each
unit of labour they already supply. So, they can afford
to reduce the labour supplied without much
commensurate effect on their income. A look at the
larger picture tells us that since now human resources
are not operating at their optimal capacity (that is less
than from what they were earlier operating at, if we
assume them to be operating most efficiently earlier),
the economy shifts from producing at a point on the
Production Possibility Frontier to a point under it.
Secondly, for the UBI to achieve its intended target,
allocation of resources is a crucial aspect. Studies show

88 JOURNAL OF THE ECONOMICS SOCIETY
that it is a y=f(x) function, where the resources
allocated to districts are a function of their ability to
spend them. Statistically, richer districts are known to
have better administration. Hence, more resources
should technically be allocated to richer districts but
that gives rise to the dilemma of better allocation of
resources at the cost of sacrificing the development of
poorer districts. Hence, the inclusion error is created by
the universality element of UBI.
Thirdly, there seems to be a hugely apparent paradox
in the scheme. It is widely believed that UBI can
potentially unlock credit constraints in the form of
higher income. This is because there is a direct relation
between income levels and proportion of formal loans.
However, there is another side to it. Since UBI is
universal in nature, it raises income levels on the
aggregate level thereby pushing up the income
threshold itself. Going by the consumption function, we
know that higher income implies higher consumption
expenditure. This in turn leads to inflation.
Still, this is not the end of the story.
As inflation rises, the RBI’s policy aimed at targeting it,
such as increasing Repo rate and CRR, reduces credit
availability. So in practice, UBI, in the long run dampens
also the short run effect of releasing credit constraints.
Next, since UBI is a cash transfer, its ‘real’ value tends
to be determined by inflation in the economy. So over
time, the same amount of cash transfers may not buy
the same amount of goods. It is therefore important to
index it to prices such that the amount gets revised
periodically. Here, politics plays a vital role and many
times keeps the UBI from achieving the goal. Though
normative, but it is still a failure of the policy. There is
one way of tackling this issue that is fixing the UBI at a
constant percentage of the GDP. However, its effectcan
only be determined on its real implementation.
Also, there are so many issues in targeting. One way
suggested for setting up UBI is self-targeting i.e. a
system where the beneficiaries regularly verify
themselves in order to avail UBI. However, it will
adversely affect the lower income groups since their
opportunity cost of time (in the sense of per day wages,
hourly incentives etc., is high and therefore
economically unfeasible).
4. IS IT VIABLE IN THE INDIAN CONTEXT?
In India, the primary issue is of providing financial
security to the economically weaker sections. The
advantage that UBI offers in a developing country like
India is that here UBI can be pegged at relatively lower
levels than if compared to more developed and richer
nations, but will still wield considerable benefit. It is
quite correct that despite the fact that it might incur a
fiscal cost of about 3% of the GDP, it will still
outperform public food distribution system and fuel
subsidies. However, if this is true then it is only
reasonable to question if it will at all be economically
relevant to run the fair price shops?
Another inter-related question is that while most of the
capital expenditure that the government incurs right
now on economic and social services mostly focus on
the nutritional requirements of people and accordingly
aim to achieve those goals. However, if they are
scrapped to make way for UBI, how effective will it be
to hand over money, with endless means of spending
it, in lieu of the earlier schemes of eradicating health
woes?
Also, the flipside of eliminating these wide subsidies
would require a sharper increase in prices than the case
when budget subsidies are withdrawn.
It is suggested that an acceptable level of the UBI could
be an income equivalent of the poverty line. However,
the total cost of providing this income to all Indians
would be nearly equal to the Union Government’s
budget, and hence difficult to be made accessible due
to budgetary constraints.
A pilot study conducted by UNICEF and Self Employed
Women’s Association (SEWA)in a few villages in
Madhya Pradesh in 2011 showed that a monthly
unconditional grant of Rs. 300 to each adult and Rs. 150
89 JOURNAL OF THE ECONOMICS SOCIETY
to each child led to considerable improvements in their
lives. However, adjusting this amount for inflation, with
a variable UBI (with different entitlements), would be
an additional function for the bureaucracy. (Courtesy:
www.livemint.com)
The natural question then is- can we afford it?
In India, the concern is not limited to cash transfers but
accessibility of basic services to the masses. Presently,
there already exist a number of government transfer
schemes and scholarships. However, the lack of basic
infrastructure paves way for leakages and corruption.
Instead of focusing on eliminating these glitches, when
an additional provision such as the UBI would be
initiated, the demand for infrastructure will rise
without a considerable rise in its supply. The challenge
for Indian government is to improve the general
accessibility of the universal basic services for all
citizens. The UBI cannot be a substitute for that.
UBI is definitely not the answer to poverty in India.
Venal officers suck up a lot of money from the poor and
there is no clear way of identifying who should receive
ration and who should not. Hence, the universality
component of the scheme is also a slippery slope.
5. CONCLUSION
Ultimately, there are certain things that this scheme
does not address and which can also be seen as its
failures in some senses. For instance, if the UBI includes
children, can it not induce households to have more
children and adversely impact the government’s
population control programme? Another concern is as
regards its funding. There are suggestions that this
pressure can be eased on other fronts such as asking
people to voluntarily give up subsidies. However, taking
the example of this voluntary giving up of subsidies, is
it not possible that on one hand if the people who were
earlier wrongly availing the subsidy, now give it up to
avail UBI (not taking into consideration the universality
element here), wrongly again? As far as the emphasis
on boosting women’s agency goes, we need to keep in
mind that no economic policy flourishes without
political and sociological considerations. Similarly, in
rural India, a lot of women are able to work and step
out of the confines of their houses citing reasons like
financial independence and enhancement of family
income. If the UBI serves it to them unconditionally, can
it be effectively said that UBI liberates women?
REFERENCES 1. Basic Income Earth Network. (n.d.). What is basic income? Retrieved from: http://basicincome.org/basic-
income/
2. Government of India. (2017). Economic Survey of India. Retrieved from: http://indiabudget.nic.in/es2016-
17/echapter.pdf
3. Garg, I. S. (2017, February 01). India's Universal Basic Income Debate. The Diplomat. Retrieved from:
https://thediplomat.com/2017/02/indias-universal-basic-income-debate/
4. Mohan. N. C. (2017). India is not ready for universal income. Hindustan Times. Retrieved from:
https://www.hindustantimes.com/opinion/india-is-not-ready-for-universal-basic-income/story-
T6Qb5R912nY9ZWpynAn4YP.html

90 JOURNAL OF THE ECONOMICS SOCIETY
THE CASE OF MISSING WOMEN:
UNDERSTANDING DECLINING FEMALE
LABOUR FORCE PARTICIPATION IN INDIA
SHRESHTHA MISHRA- 3RD YEAR, MIRANDA HOUSE [email protected]
There has been a lot of discussion regarding the
demographic transition that India has been going
through, with falling fertility rates and death rates and
a swelling up of the labour force. While this
demographic transition has the potential to reap
dividends, it could also turn into a disaster lest the
youth is productively employed. One of the major
precursors to reaping a demographic dividend is the
rise in female labour force participation rates that
accompanies a fall in fertility rates. In India, the
historically low female labour force participation rate
has been a drag on the economy and a major
hindrance to the modernisation of the labour market.
Now, this historically low rate is also falling. The Indian
story of a falling female labour force participation rate
despite strong growth, rising wages, and a decline in
total fertility rates presents a puzzle that is contrary to
what has been predicted by standard development
theories and by the experience of other countries
including China, Bangladesh etc 31 . As stated in the
ILO’s Global Employment Trends 2013 report, out of
31 With the exception of Turkey 32 Ministry of Finance Monthly Economic Report, April 2016
33 National Sample Survey, Employment and Unemployment
Schedule, 61st, 66th and 68th rounds, and Labour Bureau’s
2013-14 annual employment unemployment data.. (Consist of
estimates for females 15 years or above in age)
131 countries with available data, India ranks 11th
from the bottom in female labour force participation.
1. TRENDS
In 2012-13, India’s Real GDP grew at 5.6% and
increased to 7.6% in 2015-1632. During this period, the
female labour force participation rates (FLFP) fell from
42.7% to 31.1%33. The main highlight is that the female
labour force participation rate in rural areas is
continuously declining34, while that in the urban areas
is showing a marginal increase even as the overall rate
continues to fall. Infact, 53% of the total fall is
attributed to a drop in participation rates in rural India,
among those aged 15 to 24 years35.
34 Close to 22 million women left the agricultural sector between 2004-05 to 2009-10; 19 million of these were self employed. 35 Further, a larger number of the working women end up in marginal or subsidiary employment in
comparison to the earlier years.

91 JOURNAL OF THE ECONOMICS SOCIETY
Figure 1: Female labour force participation in Urban and rural areas
Source: ILOSTAT database (International Labour Organization), and World Bank population estimates
In the current essay, the factors considered to study
the low FLFP rates are: the effect of unearned
household incomes, the effect of increasing
enrollments in secondary education, limited female
mobility across sectors, measurement issues,
employment opportunities and finally, other cultural
and social factors.36
2. THE EFFECT OF UNEARNED INCOME:
INCOME AND SUBSTITUTION EFFECTS
Of all the factors that affect FLFP rates, the simplest is
the effect of unearned income (in the form of
husband’s wage, family wealth etc). In Neoclassical
theory, labour supply decisions depend on labour-
36 When studying the effects of any factor, all other factors
are held as constant.
37 Any expected wage is an opportunity cost of not working and thus, contributes to both substitution and income effects while unearned incomes contribute to the income effects. Based on the substitution effect, as wages
leisure choice i.e. on income and substitution effects37.
It is highly likely that with rising growth, as the incomes
and wages of the male workers in the household rises,
the income effect outweighs the substitution effect and
females choose to supply lesser labour. This effect is
higher for females than for males because of the
traditionally accepted roles of men and women in the
Indian society.
To illustrate, between 1999-2000 to 2004-05, real
wages in the agricultural sector were stagnant and
growth in this sector was not statistically significant.
However, this period witnessed a large increase in
the FLFP rates in the agricultural sector due to
distress employment. Out of the 18.5 million people
who joined the agricultural labour force in this period,
rise people will choose to work more. However, as wages rise, people might choose to reduce their labour hours because they feel richer due to higher income. An increase in unearned income (non-labor income or labor income earned by other household members, particularly the husband) reduces the marginal utility of the women's earnings and therefore reduces labor force participation

92 JOURNAL OF THE ECONOMICS SOCIETY
16.9 million were women38. However, between 2004-
05 to 2009-10, as the real wages in the agricultural
sector rose 39 , close to 22 million women left the
workforce due to rising incomes at the household
level. This clearly shows that increasing household
incomes play an important role in determining the
FLFP rates controlling for other factors.
3. EDUCATION LEVELS AND LACK OF
EMPLOYMENT OPPORTUNITIES
Increasing enrollments of women in secondary
education are also believed to form an important
explanation for declining FLFP rates40.
As seen from table1, the enrollment ratio of both
rural and urban females in the age group of 15-24
years has risen steadily from 1993-94 to 2011-12. In
addition, the mean years of education after 14 years
i.e. secondary schooling has also been on the rise in
both rural and urban areas.
While increasing education levels among women is a
positive trend, its effect on FLFP rates requires greater
attention. Most human capital theories estimate rising
FLFP rates with rising education, however, a U-shaped
curve is hypothesised to exist between the
educational status and FLFP in India.
38 Further, this effect was seen across all income groups in
the rural areas, primarily because close to 40% of even the
rich rural households tend to live just above subsistence levels and were thus, adversely affected by the slowdown
in the agricultural wages.
39 Due to government schemes to increase the rural sector employment, chiefly due to NREGA (National Rural employment guarantee act) which aims to enhance livelihood security in rural areas by providing at least 100 days of wage employment in a financial year to every household whose adult members volunteer to do unskilled manual work
Among the poorest sections of the society, with the
added-worker effect and large fluctuations associated
with household incomes, the participation rate among
women is high. At high levels of education, on the other
hand, high potential wages raise the opportunity cost
of not working and swamp the negative forces, thus
inducing women to work. This is also because the
stigma associated with women working in the service
sector is lesser. It has been observed around the world
that women in the labour force across the world tend
to cluster in certain occupations, especially in the
services sector 41 . Between these two levels of
education, women may be discouraged to seek work
because of large income effects, lower access to service
sector and other socially acceptable jobs. Thus,
education seems to play a major role in affecting the
preferences of women and their willingness to actively
seek a job.
As education levels rise, as has been the case in India,
women prefer certain kind of jobs (especially white-
collar jobs). Lack of access to these contributes to
educated women being discouraged from
participating in the labour force 42 . How the
education-labour force participation link evolves over
time depends on the structure of labour demand
growth in the economy and the status associated
with different types of work.43
40 Rangarajan et al. (2011)
41 World Bank, 2011; Gaddis and Pieters, 2012
42 Desai et al., 2010
43 For instance, in 1989, almost 65% of the highly educated
women were employed in public administration and education.
In 2009, this share had fallen to 45%. Further, although the share
of women in other sectors like finance and business services has
increased overtime, these account for a very less portion of the
overall female employment. Thus, as the demand for white-
collar jobs is limited to women with a graduate degree or above,
the employment growth decline in major sectors like public
administration and services might be an important contributor

93 JOURNAL OF THE ECONOMICS SOCIETY
Table 1: Enrolment ratio and Mean years of
Education after 14 years in NSSO rounds
Enrolment Ratio Mean Years of
Education after
14 Years
NSSO Rounds Rural female Urban female Rural female Urban female
1993–1994 8.4 27.8 1.7 2.5
1999–2000 11.3 29.9 1.8 2.7
2004–2005 14.8 33.2 1.9 2.7
2009–2010 15.2 34.5 2.1 3.2
2011-2012 19.7 35.7 2.1 3.4
Source: Esitimates based on various NSSO rounds
to declining FLFP rates. This effect is further exacerbated due to
limited female labour mobility between sectors due to
occupational segregation and the attached stigma.

94 JOURNAL OF THE ECONOMICS SOCIETY
4. A PROBLEM OF MEASUREMENT
A third potential contributor to the falling FLFP rates
in India is a large number of women who report
attending to domestic duties as their primary status.
In 2009-10, the number of women attending to
domestic duties in India was 216 million, which is
larger than the population of Brazil. Among these,
12.7 million women had a graduate degree and
above. A major reason behind this is the very belief
that it is the responsibility of a woman to undertake
all domestic duties. This is even manifest in the fact
that men were excluded from the role of domestic
work and from all records of extra-domestic work in
NSS 55th round. This demonstrates a growing
patriarchal role demarcation in India. It is widely
seen as very dignified for men to be uninvolved with
domestic matters.
Table 2: Number of females who reported attending to domestic duties in 2009-10 and the increase in this number
between 2004-05 to 2009-10
Not literate Primary and Secondary Graduate Total
middle and higher and above
In 2009-10 84.8 81.4 37.1 12.7 216.1
Increase 13.0 16.8 14.4 4.6 49.4
between
2004-05 and
2009-10
Source: Estimates based on NSSO 2011 (all figures in millions)
As is indicated by the table above, there was an
increase in the number of females attending to
domestic duties by around 50 million, in which the
share of women with a graduate degree and above
was 4.6 million.
In rural areas, the number of women who report
primarily attending to domestic duties has been
steadily rising from 2004-05 to 2011-12 and was at a
staggering rate of 92% in 2011-12.
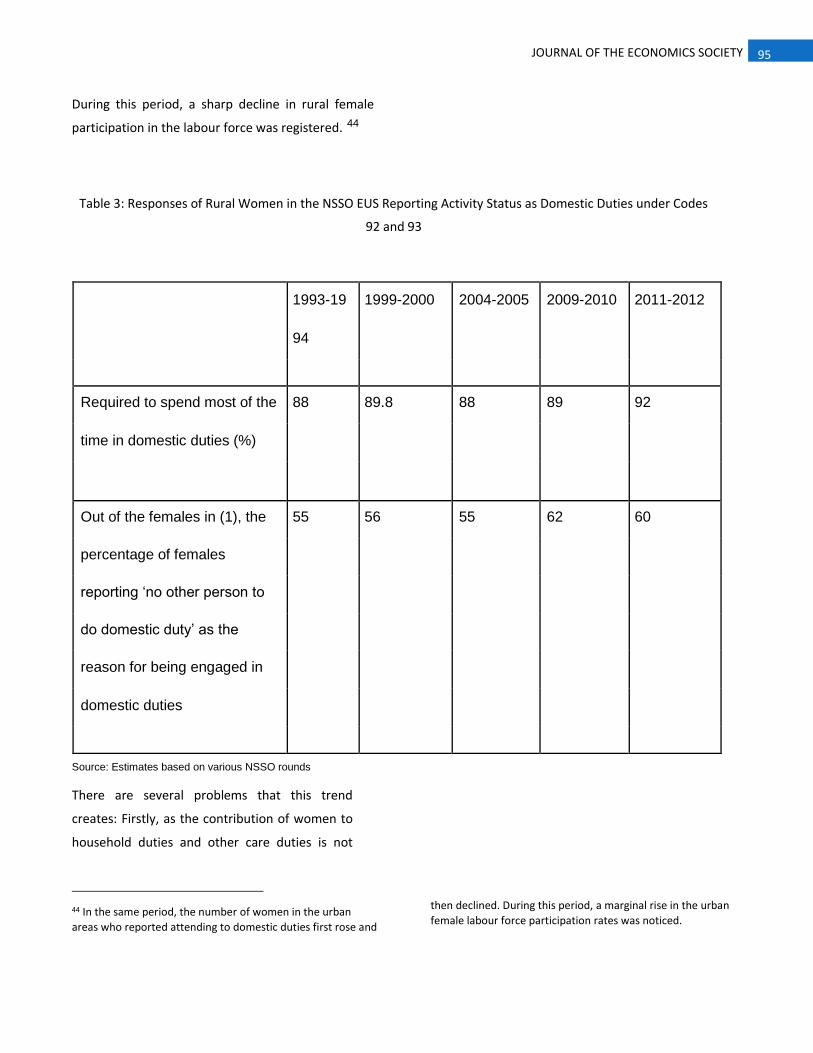
95 JOURNAL OF THE ECONOMICS SOCIETY
During this period, a sharp decline in rural female
participation in the labour force was registered. 44
Table 3: Responses of Rural Women in the NSSO EUS Reporting Activity Status as Domestic Duties under Codes
92 and 93
1993-19 1999-2000 2004-2005 2009-2010 2011-2012
94
Required to spend most of the 88 89.8 88 89 92
time in domestic duties (%)
Out of the females in (1), the 55 56 55 62 60
percentage of females
reporting ‘no other person to
do domestic duty’ as the
reason for being engaged in
domestic duties
Source: Estimates based on various NSSO rounds
There are several problems that this trend
creates: Firstly, as the contribution of women to
household duties and other care duties is not
44 In the same period, the number of women in the urban
areas who reported attending to domestic duties first rose and
then declined. During this period, a marginal rise in the urban
female labour force participation rates was noticed.

96 JOURNAL OF THE ECONOMICS SOCIETY
accounted for in the National Income Accounts,
there is a severe underreporting of female labour
participation rates45.
However, these are productive economic activities as,
if women did not do these work, someone else would
have to be employed to do them and be paid for it.
Although the System of National accounts includes the
production of goods for self-consumption within its
purview, it does not include the ‘invisible work’ done by
women which takes several forms including, but not
limited to, cooking, reproductive activities, care and
other responsibilities 46 . This mis-measurement may
not only affect the level but also the trend in the
participation rates.
Secondly, as women are traditionally expected to take
care of all household responsibilities, it limits their
ability and willingness to take up formal employment47.
There is an opportunity cost in terms of time as well as
in terms of wages that could have been received if the
same activities were conducted outside the household.
This cost time constraint restricts them from pursuing
employment opportunities48.
However, as a positive change, it is also noted that
there has been a fall in the number of women not
willing to work. Around one-third of females above 15
years of age in rural areas and more than one-fourth in
45 Further, the International Labour Organisation equates the homemaker with a student, terming housework activities as ‘non-economic’, and the work of homemakers as voluntary. However, a major question is whether a homemaker’s work really voluntary. In the Indian context, this is highly controversial asalmost 60% of the women in the rural areas attending to domestic duties claim that the lack of people to attend to domestic duties is the reason from their being engaged in domestic work.
46 As traditional surveys cannot capture this work adequately, time-use surveys can be used to capture such activities.
47 To illustrate the effect that having a broader definition of national income and including household responsibilities might have, a few facts might help. A study conducted by the
urban areas, who were engaged in domestic duties (by
usual principal activity), were willing to accept work
opportunities at the household premises, if such work
were made available. Specifically, there was a strong
willingness among females primarily involved in
household chores to take up tailoring work within their
premises. This highlights the benefits that can be
reaped by providing skill training to such females in
vocational occupations such as tailoring, beauty-
related work etc. Further, there should be institutional
support to help them obtain the required loans, market
their products and overcome any logistical difficulties.
Currently, only 2-3% of the workforce in India receives
some form of formal training.
Therefore, in a way, the declining trend in the female
work participation rate highlights the lack of skill
training and employment opportunities for females.
5. OTHER FACTORS
While the factors mentioned above are important
contributors to declining FLFP rates, several other
factors operate at different levels to dissuade women
from seeking employment. Workplace safety concerns,
the widespread pay-gap between men and women
working at the same position and with the same level
of education and skills, the fear of harassment,
Organization for Economic Cooperation and Development (OECD) in its 26 member countries and three emerging economies of India, China and South Africa
48 Between 1999-2000 and 2004-05, due to rural distress, the
number of women who reported their principal activity status
as ‘attending to domestic duties’, fell sharply and consequently,
the female labour force participation rates rose. However, as
the female labour force participation rates in 2004-05 declined
(due to a rise in household incomes), the number of women
attending to domestic duties also rose. This shows that time
constraint restricts most women from pursuing both formal
employment and household duties together.

97 JOURNAL OF THE ECONOMICS SOCIETY
especially prevalent in the informal sector, contribute
to the low participation rates.
Additionally, socio-cultural factors such as caste,
marital status etc. play an important role in restricting
access of women to formal employment. The process
of housewification and sanskritization is common 49 .
This is a vicious cycle in the sense that usually women
without a means of earning income have a lesser
bargaining power in the household which reinforces
gender discrimination and further restricts access to
paid work. For instance, it has been noted that married
women work less than single women because working
decisions for the former are not entirely voluntary and
are made by the household (in which the woman has
very low bargaining power).
6. SUGGESTIONS
There are two reasons to be interested in the declining
female labour force participation rates: the intrinsic
level and the functional level. Females are an important
part of the society and are responsible for its efficient
functioning. Thus, they deserve equal access to
employment opportunities that will provide them
agency, greater bargaining power and allow them to be
agents of economic growth. At a functional level,
capturing the demographic dividend is contingent
upon productive employment of females.
1. As argued above, the problem of declining female
labour force participation rates is a result of various
factors working at different levels and in tandem,
each supplementing the effects of the others. A few
steps that policymakers can take to reverse the
current trend are:
2. Methods must be devised to better capture
unpaid work done by women. The magnitude of
49 Chakravarti, 1993; George, 2002; Poitevin and Rairkar, 1993
50 According to some studies, if that unpaid work were to be valued and compensated in the same way as paid work, it would contribute US$300 billion a year to India’s economic output
51 Currently, paternity leaves are largely absent in the private and unorganised sectors and even otherwise, the leaves are of a very short duration. The Paternity Benefit Bill, 2017 is due to be tabled soon in the Parliament under which men might be be
unpaid work by women in India is extremely large50.
Thus, if this gender parity were to be tackled, we are
looking at some big-time growth in our GDP.
There must be a move towards equal sharing of work
at the household level so that women have more
time to devote to formal employment opportunities.
This can be facilitated by policies such as longer
maternity leaves, contractually fixed working hours
(at least for women) and most importantly, the
introduction of longer paternity leaves51. This will be
an important step by allowing men to infrastructural
development must be prioritised in order to reduce
the time taken by women in attending to domestic
duties.
3. The importance of dedicated skill training,
especially in rural areas and among women with low
levels of education, can hardly be overemphasized52.
This can be achieved through infrastructural
development, hiring females for teaching purposes
in rural areas, providing greater incentives for
women to attend these vocational schools by
ensuring the availability of non-farm jobs that match
their educational potential53. As highlighted before,
the willingness of women to take up part-time and
full-time vocational employment is high. If
eligible for leave up to 30 days as paternity leave. This will include men in the private and the unorganised sectors as well
52 One of the main drivers of the East Asian Miracle was the human capital formation through adequate skill training
53 Such as jobs in the rural manufacturing sector that allows
women to work from their households or as a community so as to avoid the stigma associated with women working in the manufacturing sector.

98 JOURNAL OF THE ECONOMICS SOCIETY
successfully teamed with skill training, the rural FLFP
rates will increase drastically from the current 23.5%
to around 39%. In addition, micro-finance and self-
help groups must be promoted as these provide
women with access to economic opportunities and
promote discussions on a variety of social issues.
4. Subsidies for female employment in sectors less
explored by women must be provided for a fixed time
period so as to promote female mobility across
different sectors. This can take the form of the
government incentivizing certain sectors to employ
more women. For example, the government could
consider paying a part of the income of women in
certain sectors.
5. Decent working conditions must be ensured and
policies must be devised to ensure safety especially in
the unorganized sector as women are heavily
represented in the informal economy where their
exposure to the risk of exploitation is usually greatest.
Further, gender sensitization must be actively
promoted and females should be encouraged to speak
up against harassment at work. There should also be
transparency in the wages paid and stricter
punishments against gender-biased pay.
While all of the above tackle certain aspects of the
problem, a cultural shift is necessary. Gender-specific
constraints must be evaluated and policies must be
formed accordingly. The goal should not be to increase
just participation rates but ensure decent working
conditions for women.
As highlighted by Amartya Sen, the agency of women is
a significant driver of an economy not just in terms of
growth rates, but also in terms of its effects of nutrition
of children, better healthcare and ultimately, towards
creating a better society. Women agency has the
power to lead to ‘development’ in the true sense of the
word. Thus, it is about time that we start talking about
the ‘gender dividend’ in conjunction with the
demographic dividend in India54
REFERENCES
1. Choudhary, R. & Verick, S. (2014). Female Labour Force Participation In India And Beyond. ILO Asia- Pacific
Working Paper Series.
2. India Labour Market Update. (2016). ILO Decent Work Team for South Asia and Country Office for India.
3. Klasen, S. & Pieters, J. (2015). What Explains the Stagnation of Female Labor Force Participation in Urban
India? World Bank Economic Review.
4. Lahoti, R. & Swaminathan, H. (2013). Economic Growth and Female Labour Force Participation in India. SSRN
Electronic Journal.
5. Institute of Applied Manpower Research. (2013). Low Female Employment in a Period of High Growth.
International Labour Organisation Working Paper.
54 A new ILO report estimates that the Indian economy could gain a whopping $1 trillion if it closes the wide gender gap in employment by 2025

99 JOURNAL OF THE ECONOMICS SOCIETY
6. Olson, W. (2006). A Pluralist Account of Labour Participation in India. Global Poverty Research Group.
7. Sen, A. K. (2001). Development as freedom. Oxford: Oxford University Press.
8. Sanghi, S., Srija, A. & Vijay, S. S. (2015). Decline in Rural Female Labour Force Participation in India: A Relook
into the Causes. The Journal for Decision Makers.
9. Women at Work: Trends. (2016). International Labour Office – Geneva
10. Verick, K. (2014). Women’s Labour Force Participation In India: Why Is It So Low? International Labour
Organisation - India

100 JOURNAL OF THE ECONOMICS SOCIETY
REVISITING THE COMMONS: SUSTAINABLE
RESOURCE MANAGEMENT STRATEGIES FOR
INCLUSIVE GROWTH
ROHIT JAMES JOSEPH- 3RD YEAR, ST. XAVIER’S, MUMBAI [email protected]
ABSTRACT
Conceptualizing anthropogenic climate change as the
modern day 'tragedy of commons', the study simulates
the effects—1.15% lesser CO2 emissions, 2.62% lesser
use of coal for meeting energy needs and 2.29% lesser
fuel usage by 2025—of introducing a nominal 'carbon-
indexed energy tax' of ₹ 400 on all fuel users. Its
distributional consequences and regressive nature
prompted an evaluation of the "fairness" and
effectiveness of various carbon pricing strategies—
quotas, cap and trade, compensation—using Hardin's
analogy. Although inclusive growth and sustainable
management of the commons seems elusive, local
enforcement and public participation can ensure it. The
paper also recommends cross-border CPR
management and intra-regional cooperation (BCAs and
disaster management) for long- term green growth
across South Asia.
1. INTRODUCTION
An ecosystem confronts human populations as
both "a given and a variable" (Herring, 1987) and
while societies adapt to meet certain ecological
constraints, they struggle to recognize natural
limits until 'tragedies' arise. Hardin's (1968) classic
paper 'The Tragedy of the Commons' expounded
that within an open-access resource system,
individual actors to maximize their self-interest
behave contrary to the common good of all users
by degrading the common resource.
The fate of South Asia's famed 'commons' —forest and
marine— has been intertwined with a central dynamic
of sub-continental history : the need to carve one's
livelihood and habitat from nature without
encroachment. The 'counter-finality' posed by such
decisions of rational actors (individuals) increase local
pressures on conservation of the instrumental value of
ecological systems and the socio-economic
development of South Asia hinge directly on its ability
to regenerate its commons to create a steady
opportunity/person ratio.
This paper seeks to focus on mitigation and adaptation
efforts by governments to combat anthropogenic
climate change in South Asia, in cognizance with the
fact that climate related risks including riverine, coastal
and urban floods, severe malnutrition, heat waves, etc.
could undermine the growth prospects of South Asian
economies (IPCC, 2014). Using the framework of
carbon - indexed Pigouvian energy taxes, applied to
market activities that generate negative
externalities, this paper studies the exploding demand
for fossil fuels and its impact on the atmospheric
commons. It also explores other ‘progressive’
alternatives to sustain the commons. The objectives
are:
● To examine the role of a 'carbon-indexed energy tax' in effectively reducing global CO2 emissions and encouraging
sustainable use of atmospheric commons.
101 JOURNAL OF THE ECONOMICS SOCIETY
● To understand the distributional
consequences of a carbon-indexed
energy tax and related concerns of 'fuel
poverty' among lower income groups.
● To suggest sustainable self-governance
initiatives as a 'progressive alternative'
that ensure inclusive growth and
equitable access to the forest and marine
commons.
Centred on a relevant hypothesis—"a carbon-
indexed energy tax can effectively avert the
modernday tragedy of the commons i.e.
anthropogenic global warming", the paper shall
examine the escalating conflict between
utilization of an existing habitat-cum-common
pool resource i.e. the environment as a 'sink' and
the pressing need to limit human interference in
the functioning of natural systems (or deep
ecology).
Recognising the importance of low carbon
emissions and accelerated conservation efforts
for sustainable management of commons across
South Asia, the paper shall involve
recommendations on a similar line : adequate
border provisions and intra-regional
cooperation to reduce 'carbon leakages' and to
check movement of carbon-intensive activities
from regulated jurisdictions to 'pollution havens',
promoting climate resilient development,
harmonisation of carbon tax regimes across
SAARC nations, assisting disaster management
efforts and integrated management of forests and
oceans for carbon sequestration.
The paper is organised as follows : Section 1
comprises an introduction to the paper with the
background, objectives and hypothesis of the
study. Section 2 presents a literature review of
common pool resource management with special
emphasis on Pigouvian taxes, property rights and
local self-governance initiatives and identifies the
research gap. Section 3 outlines the methodology
(E3-India model) and data sources of the study.
Sections 4 and 5 present the major findings of the
study and use economic theory to suggest a
solution to achieve the policy objective of
reducing atmospheric CO2 emissions — carbon
pricing. In Section 6, the author uses 'The Tragedy
of the Commons' to examine the 'fairness' of
levying a carbon-indexed energy tax and suggests
"progressive" alternatives or measures to manage
global commons and ensure inclusive growth.
Section 7 concludes with a summary of the major
arguments of the paper.
2. REVIEW OF LITERATURE
The tragedy of the commons (Hardin, 1968) was
essentially the failure of collective social
institutions to arrest the externalities of self-
interest maximising behaviour of individual
actors from ruining a common pool resource to
the disadvantage of all individuals in the social
system. The theoretical alternatives within the
tragedy paradigm assumed that no cooperative
strategies would emerge among individual
shepherds maximising gains from a given pasture.
As a consequence, many policy analysts including
Smith (1981), Demsetz (1967) and Johnson (1972)
have called for the imposition of private property
rights for sustainable management of local
commons. Welch (1983) argued that "the
establishment of full property rights is necessary
to avoid the inefficiency of overgrazing" and was
concerned over the imposition of private
ownership on a set of unwilling local users. Such
private ownership would divide the land into
separate parcels and assign individual rights to
hold, use and transfer the same assigned share of
land wherein each herder will be playing a game
against nature in a smaller terrain rather than a
game against another player in a larger terrain

102 JOURNAL OF THE ECONOMICS SOCIETY
(Ostrom,1990).
However, as Clark (1980) pointed out, the
difficulty in "establishment of individual property
rights" in case of non-stationary resources like
marine fishery resources and its exclusion of large
classes of society in South Asia with significant
human costs has made the tragedy difficult to
counteract. Hence, another solution to the
commons dilemma is Hobbesian : "a powerful
state which could enforce its will on subjects for
their own good" and this Leviathan centralized
power with accurate information could provide
equitable access to the local commons.
Coasean market-based trading mechanisms,
named after Coase (1960) such as tradable
permits, allowances and certificates and
Pigouvian instruments of fines and taxation,
named after Pigou (1932) are two variants of the
above approach with governments playing a
supervisory role to reduce atmospheric emissions.
Eliminating the uncertainty in price setting,
tradable permits are priced according to market
forces of demand and supply and traded by
emitting corporations, often involving high
transaction costs (Lloyd, 2007). On the other
hand, Slesser and King (2002) advocate the
phased replacement of an income tax by a
Pigouvian energy tax (with lower transaction
costs) applied to market activities that generate
negative externalities in a bid to internalise the
marginal social damage at the efficient level of
pollution.
Carruthers and Stoner (1981) argued that without
public control, "overgrazing and soil erosion of
communal pastures, or less fish at higher average
cost" would happen and such centralized control
is key "if economic efficiency is to result from their
development." On the contrary, Herring (1987)
concluded that the permeability of the local state
to powerful and exploitative interests in the
subcontinent, incomplete information (which
leads to sanctioning errors) and a clear absence
of political will to protect ecological systems
prevent it from resolving the tragedy effectively.
There's a third possible solution to the tragedy —
cooperation and social learning among the
individuals using the commons. Axelrod (1984)
has argued that in repeated games involving use
of common property resources, cooperation
becomes a live possibility and conflict produces
self-correcting change. Likewise, Ostrom (1990) in
her noted book 'Governing the Commons'
provides examples of successful local mechanisms
to preserve their source of livelihood —the
commons. She also articulated a set of 'eight
design principles' (Ostrom, 2005) to facilitate
sustained, self-organised management of the
commons and it has had profound implications for
the indigenous communities' access to local
commons. Also, Chhatre and Agrawal (2008)
conclude from IFRI studies in India that
"government involvement may be negatively
associated with forest condition" in some
contexts, while community management of
forests may be better suited to meet local
requirements.
The literature thus suggests that climate change
mitigation strategies could significantly influence
the sustainable use of atmospheric, forest and
marine commons. Carbon -indexed energy taxes
can adversely affect growth and income
distribution of an economy and this paper also
mulls over various demand management
strategies for inclusive growth and equal access
to the commons. The present paper differs
from previous studies in this area in, mainly, its
use of policy parameters derived from the E3-
India model to show the impact of a carbon-
indexed energy tax on atmospheric emissions in
the Indian context and its analysis of Hardin's
analogy to ascertain the 'fairness' of carbon

103 JOURNAL OF THE ECONOMICS SOCIETY
pricing strategies.
3. MODEL
The paper employs the E3-India model, a dynamic
macro-econometric simulation model which is
similar in design to the E3M3 model. Designed to
assess energy and climate policy in a highly
empirical structure, the model combines an
accounting framework with a set of parameters
that have been estimated econometrically from a
detailed time-series database. Covering 28 states
and four union territories, the E3-India model
comprises of three modules:
(A) ECONOMY MODULE
The economic module comprises multiple loops of
interdependence between the sectors such as the
income loop, investment loop and the trade loop
which explain the relationships between output
and input (Type I multiplier), output, employment
and incomes (Type II multiplier) and output,
production capacity and demand for investment
goods respectively. Demographic factors and
economic policy rates such as tax rates, growth in
public expenditure, interest and exchange rates,
etc. are treated as exogenous variables.
Apart from wages, three econometric price
equations are used in the model to represent
domestic production prices, import prices and
export prices and estimated at the sectoral level.
It also accounts for important social indicators
such as sectoral employment and working
hours, unemployment, an estimate of real income
distribution, etc.The data sources for economic
variables are the Census of India, NSSO Surveys
on Employment and Unemployment, Household
Expenditure and Employment Situation, RBI
State Finances : A Study of Budgets, MOSPI Gross
and Net State Domestic Product series.
(B). ENERGY MODULE
The energy module is constructed, estimated and
solved for each energy user and energy carrier at
the state level. Although it can be described as a
top-down model in its energy modelling, the E3-
India model finds a bottom-up sub-model in the
electricity supply sector. Global oil prices and
energy policies are treated as exogenous
variables. The power -sector model is modelled on
an innovative technology diffusion model known
as FTT: Power (Future Technology
Transformations for the Power Sector) featuring
constraints on the supply of renewable resources.
The data1 sources for the energy variables are
MOSPI data on installed capacity, generation and
consumption, E3ME national coal, oil, gas,
electricity and biomass consumption data, E3ME
national fuel prices, E3-India Output data and E3-
India Population data.
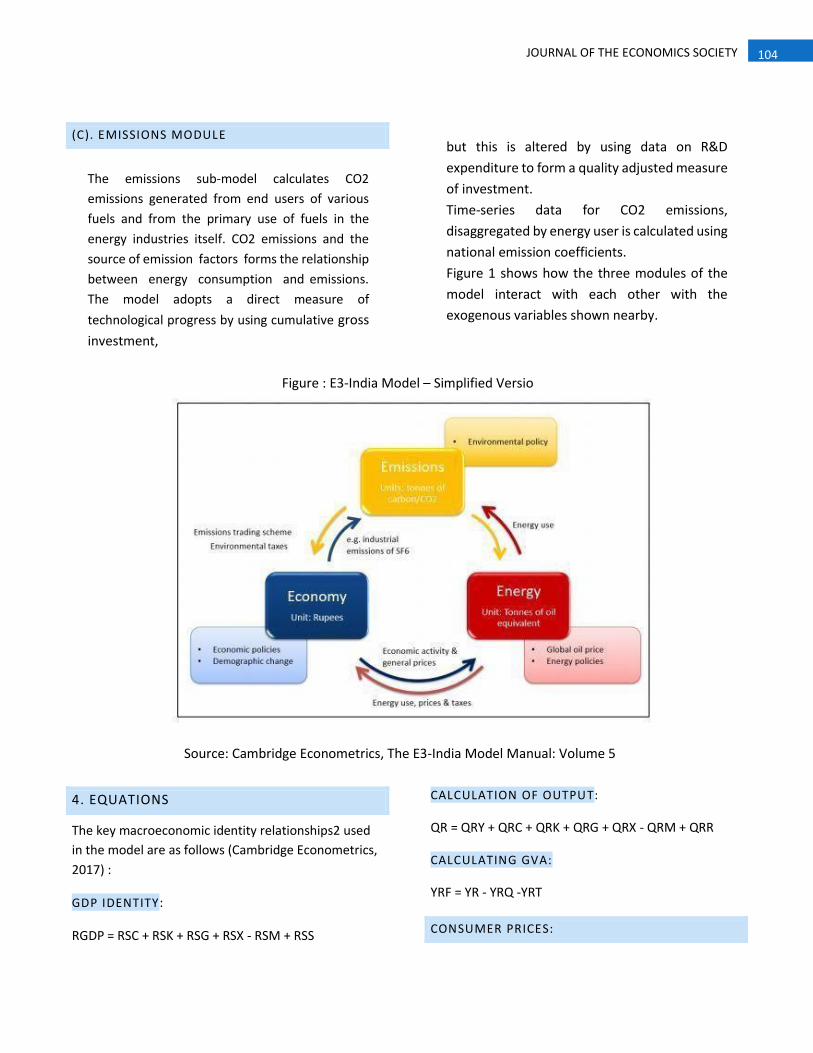
104 JOURNAL OF THE ECONOMICS SOCIETY
(C). EMISSIONS MODULE
The emissions sub-model calculates CO2
emissions generated from end users of various
fuels and from the primary use of fuels in the
energy industries itself. CO2 emissions and the
source of emission factors forms the relationship
between energy consumption and emissions.
The model adopts a direct measure of
technological progress by using cumulative gross
investment,
but this is altered by using data on R&D
expenditure to form a quality adjusted measure
of investment.
Time-series data for CO2 emissions,
disaggregated by energy user is calculated using
national emission coefficients.
Figure 1 shows how the three modules of the
model interact with each other with the
exogenous variables shown nearby.
Figure : E3-India Model – Simplified Versio
Source: Cambridge Econometrics, The E3-India Model Manual: Volume 5
4. EQUATIONS
The key macroeconomic identity relationships2 used
in the model are as follows (Cambridge Econometrics,
2017) :
GDP IDENTITY:
RGDP = RSC + RSK + RSG + RSX - RSM + RSS
CALCULATION OF OUTPUT:
QR = QRY + QRC + QRK + QRG + QRX - QRM + QRR
CALCULATING GVA:
YRF = YR - YRQ -YRT
CONSUMER PRICES:

105 JOURNAL OF THE ECONOMICS SOCIETY
PCR = (BQRC * PQRD * CR) * ((1+CRTR) / CR)
CONSUMER PRICE INDEX :
PRSC = sum (PCR * CR) / RSC
CALCULATING REAL INCOMES:
RRPD = (sum (YRW * YRE) + RRI) / PRSC
AGGREGATE ENERGY DEMAND:
PREN = PFR0(.) / PRYR
DISAGGREGATE ENERGY DEMAND EQUATION :
PFRP = PFRF(.)/PFR0(.)
AGGREGATE CONSUMPTION EQUATIONS :
RRLR = 1 + (RLR–DLN(PRSC))/100 [real rate of interest]
RRPD = (RGDI / PRSC) [real gross disposable
income] Disaggregate consumption equations :
SHAR = (VCR(.)/VCRT) / (1-(VCR(.)/VCRT)) [consumers’
budget share, logistic form] RRPD = (RGDI/RPSC)/RPOP
[real gross disposable income]
PRCR = VCR(.)/CR(.)/PRSC [real price of consumption]
RRLR = 1+(RLR-DLN(PRSC))/100 [real rate of interest]
INVESTMENT EQUATION :
RRLR = 1 + (RLR – DLN(PRSC)) / 100
EXPORT PRICE EQUATIONS :
PQWE = QMC(.) * PM [world commodity price
index] YRULT = (YRLC(.) + YRT(.)) / QR(.)
[unit labour and tax costs]
IMPORT PRICE EQUATIONS :
PQWE = QMC(.) * PM [world commodity price
index] YRULT = (YRLC(.) + YRT(.)) / QR(.) [unit labour
and tax costs]
DOMESTIC INDUSTRY PRICE EQUATIONS:
PYH = (VQR(.) - VQRX(.)) / (QR(.) - QRX(.)) [price of
home sales by home producers]
YRUC = YRUM(.,) + YRUL(.) + YRUT(.) [unit costs]
YRUL = YRLC(.) / YR(.) [unit labour cost]
YRUT = YRT(.) / YR(.) [unit tax cost]
YRUM = (BQRY(.)*YR(.))* PQRD(.) [unit material cost]
Employment equation :
LYLC = (YRLC(.)/PYR(.)) / YREE(.)
INDUSTRIAL AVERAGE WAGE EQUATIONS:
YRWE(.) = SUM OVER I, J (I, J = all other industries and
regions) [external industry wage rates] (LN(YRW(I)) *
YRLC(I) / SUM(YRLC(I)))
LABOUR PARTICIPATION RATE:
LRP = LABF / POP
5. RESULTS
The E3-India model is employed to develop, first and
foremost, a 'no-policy' benchmark scenario,
conventionally known as the baseline or business-as-
usual (BAU) scenario and then, counterfactual
scenarios are developed to derive policy lessons after
comparing the two.
BASELINE SCENARIO:
To develop the baseline scenario, the given E3-India
model is solved using the E3-India Model Manager
software under the assumption of a 'no market-based
climate change mitigation policy such as carbon tax,
energy tax, etc. and an average annual growth in coal
(6.80%) and oil (6.94%) prices, given GDP growth rates
of India's major trading partners and Rest of the
World.
In the baseline scenario, the projected user emissions
of CO2 grew from 4,56,364.75 units (in '000 tonnes of
106 JOURNAL OF THE ECONOMICS SOCIETY
carbon) in 1995 to 13,58,739.43 units (in '000 tonnes
of carbon) in 2025 with year on year growth rates of
CO2 emissions peaking around the new millennium —
14.57% in 1996 and 11.59% in 2002 and later
stabilising in the range of 3.1% - 4.1% post early 2000s
with the last few years (2021-2025) showing a
significant 1% reduction in rate of growth of
emissions.
Estimates of coal use for energy needs (in '000
tonnes of oil equivalent) too show an increasing
trend — from 2,36,024.80 units in 1995 to about
8,78,860.40 units in 2025. In a manner similar to that
of the user emissions, year on year growth rates of
coal use can be seen to be increasing around 2000s
with rates as high as 13.87% in 1999 and 8.95% in
2002. Recording a sharp fall post 2002, the growth
rates tend to be sticky and stabilises at around 2.7% in
the early half of 2020s.
Albeit recording an increase from 1,90,449.81 units in
1995 to 5,44,760.49 units in 2025, fuel use (in '000
tonnes of oil equivalent) shows only a steady
movement of about 2.4%-2.6% with respect to year on
year growth in fuel usage.
POLICY SCENARIO :
A policy scenario is developed for a domestic carbon-
indexed energy tax policy with revenue recycling i.e.
the tax is revenue-neutral and all revenues from a ₹
400 tax (per tonne of carbon) levied on all energy
users of all fuels is used to reduce income tax within
the region (in accordance with H1). The scenario is
obtained by solving the given E3-India model in the
E3- India Model Manager software under the
following assumptions : a uniform carbon-indexed
energy tax of ₹ 400 (from 2005) with full coverage of
all energy users of all fuels, import and domestic
production of fuels to be charged but exemption of
exports from tax coverage, price elasticities shall
remain unchanged and the net effect on consumer
prices to affect relative consumption of goods and
services based on their carbon content.
Results show that projected user emissions of CO2 will
be 1.15% lesser — reduction in CO2 emissions of
about 15,658.24 units (in '000 tonnes of carbon) —
than baseline in a mere span of 20 years (i.e. by 2025)
with year-on-year growth rates of user emissions
(CO2) tending to less than 3% around early 2020 from
about 3.7%-3.9% growth in 2010s.
Similarly, coal use for energy will be 2.62% lesser —
reduction in coal use worth 22,996.978 (in '000 tonnes
of oil equivalent) —than baseline by 2025 and the
projected year-on-year growth of the coal use around
2025 resembles mid-2000s at just about 2.5%. Fuel
use (in '000 tonnes of oil equivalent) too shows a
significant reduction of about 2.29% i.e. 12,475.79
units at 2025 levels with year-on-year growth rates
falling to a much lower 2.2%.
6. MAKING A CASE FOR CARBON-INDEXED
ENERGY TAX
This part of the paper advances an 'carbon-indexed
energy tax' as a practical solution to address the
demand-supply mismatch with respect to energy
resources (especially fossil fuels). Carbon pricing
realigns economic incentives in such a way that
demand for carbon-based fuels is reduced.
There are two kinds of externalities associated with
non-renewable or carbon-based energy sources —
user-on-user externality (i.e. congestion costs due to
high demand for private transport) and pollution of
the environment. When a person demands fossil fuels,
he/she is only concerned with the marginal private
cost (MPC) but not the cost of the negative externality
in question i.e. pollution of the environment. Social
cost incorporates all the costs associated with a
particular economic activity and hence marginal social
cost (MSC) is the sum of both MPC accruing to the
individual and the cost of pollution he/she imposes on
the other energy users. Rational individuals shall
continue to exploit or overuse the given fossil fuel as
long as their marginal private benefit (MPB) exceeds

107 JOURNAL OF THE ECONOMICS SOCIETY
MPC and if left unabated, the externality may result in
a market failure i.e. anthropogenic climate change.
In Fig.2, the traditional demand curve which
represents the marginal benefit (MB) cuts the MSC
curve at a lower level of fossil fuel use than its
intersection with the ASC curve. Q opt. is the social
optimum level of fossil fuel use on the same demand
curve, beyond which problems of pollution arise. To
bring the level of fossil fuel use from Q1 to Q opt., the
price needs to be increased by introducing a 'tax' T*
equivalent to P1 P opt. on each fuel user
contributing to degradation of the atmospheric
commons.
Figure 2: Using Tax Policy to 'optimise' pollution
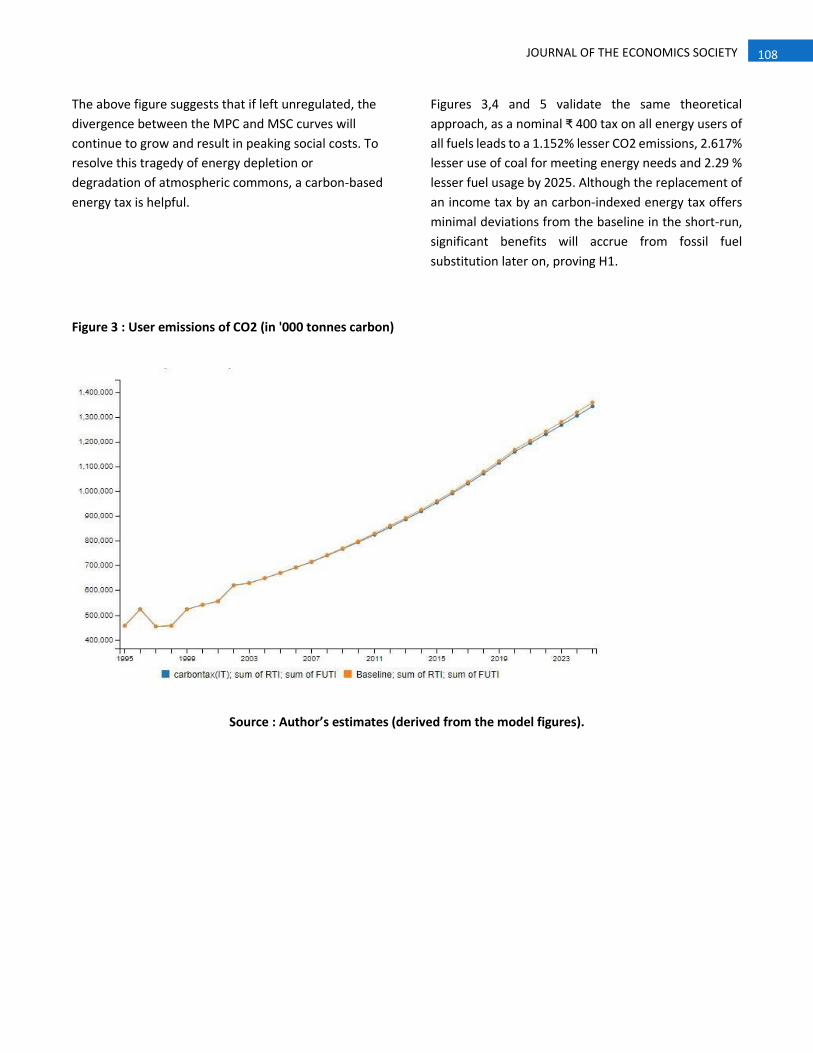
108 JOURNAL OF THE ECONOMICS SOCIETY
The above figure suggests that if left unregulated, the
divergence between the MPC and MSC curves will
continue to grow and result in peaking social costs. To
resolve this tragedy of energy depletion or
degradation of atmospheric commons, a carbon-based
energy tax is helpful.
Figures 3,4 and 5 validate the same theoretical
approach, as a nominal ₹ 400 tax on all energy users of
all fuels leads to a 1.152% lesser CO2 emissions, 2.617%
lesser use of coal for meeting energy needs and 2.29 %
lesser fuel usage by 2025. Although the replacement of
an income tax by an carbon-indexed energy tax offers
minimal deviations from the baseline in the short-run,
significant benefits will accrue from fossil fuel
substitution later on, proving H1.
Figure 3 : User emissions of CO2 (in '000 tonnes carbon)
Source : Author’s estimates (derived from the model figures).

109 JOURNAL OF THE ECONOMICS SOCIETY
Figure 4 : Coal use for energy (in '000 tonnes of oil equivalent)
Source : Author’s estimates (derived from the model figures).
Figure 5 : Fuel use (in '000 tonnes of oil equivalent)
Source : Author’s estimates (derived from the model figures).

110 JOURNAL OF THE ECONOMICS SOCIETY
7. MANAGING THE COMMONS
The following are different methods of pricing
carbon which corrects the previously discussed
market failure and equates MPC with the MSC.
Using the concept of 'Tragedy of the
Commons' advanced by Hardin (1968), this
section seeks to identify a relatively 'fair' system
of carbon pricing while analysing the
effectiveness of these demand management
strategies. To sustain the life of the metaphorical
pasture, the following methods could be
adopted:
(A) NOT ALL SHEEP WILL BE ALLOWED TO
GRAZE
Every shepherd can have only a certain number
of sheep (say, two) grazing at a time and this
would manage the insatiable utility maximizing
behaviour of individual herder and ensure social
equity. In the context of atmospheric commons,
the demand for even one vehicle which runs on
non-renewable fuel and the derived demand for
fossil fuels is too much to maintain ambient air
quality. Given India's population of 1.324 billion3
and growing purchasing power of its middle-class,
this method would work only if the 'quota' per
person is just a small fraction (carpooling, fishing
quotas) or if the infamous 'odd-even' rule (Delhi),
which required odd and even numbered (last two
digits of the vehicle registration number) vehicles
to run on alternate days, was imposed.
A modified version of this argument would
entitle the herder to buy a sheep that is always
allowed to graze. Applying it to the case of
industrial emissions and its role in climate change,
the 'cap and trade' system of reducing pollutants
by trading pollution permits is a classic example.
Although it enjoys certainty in emission levels
and an inelastic demand for these permits (since
corporations are prohibited from pollution
without a requisite license/permit), the risk of a
carbon leakage exists as emissions may shift from
existing sectors to less-efficient sectors with no
mitigation policy i.e. a 'pollution haven'. Small-
scale industries are at a disadvantage in this
system as it has few resources to offset rising
emissions via a re - investment in a clean energy
initiative like the Clean Development Mechanism
(CDM) and hence, it cannot be considered 'fair'.
(B). THE SHEPHERD MUST PAY FOR HIS
SHEEP TO GRAZE ON THE GREENEST GRASS
This solution is similar to heavily charging
individuals or corporations for exploiting
resource rich but fragile forest and marine
commons such as Sundarbans, eastern
Himalayas and the mineral abundant central
Indian districts of Chhattisgarh and Jharkhand.
Conservation pressures are rife as the forest
commons become a source of conflict between
local users "seeking an extension of livelihoods",
statist claims to conservation and management
and private interests which seeks to limit either
processes (Herring, 1987). However, with open
access commons transitioning to privatized
property at the margins and a shrinking
ecological zone in the present age, any
compensation by the metaphorical shepherd
would not save the commons from inevitable
degradation and won't be fair to other users.
(C). THE SHEPHERD MUST PAY IN
PROPORTION TO THE DAMAGE HE CAUSES
If a shepherd allows his sheep to graze a smaller
parcel of land as compared to another shepherd
grazing his sheep over a larger pocket of land, it
follows that the former causes less damage to
others and to the life of the commons. Since the
first shepherd generates a lower negative
externality, this method is fair in the sense that
he pays less than the second shepherd. Thus,
according to this 'polluter-pays' principle, those
who cause more pollution by a higher fossil fuel
consumption will have to pay a higher tax than
the others. This principle is of direct relevance to
marine commons where the polluters may be
held responsible for habitat damage, dumping of
effluents and rehabilitation of affected areas.
111 JOURNAL OF THE ECONOMICS SOCIETY
Although it is often touted as a cost-effective and
equitable form of taxation, carbon-based taxes
can be regressive in nature. Bowen (2011) finds
that the lower-income groups spend a large
proportion of income on energy and in poorer
countries, least well off have very poor access to
fossil fuel energy. In such a scenario, rising
energy bills against given energy requirements
can occupy a large share of per capita disposable
income and lead to acute 'fuel poverty'. However,
such distributional consequences may be
mitigated by offsetting their disproportionate
burden via compensatory payments, reducing
other distortionary taxes, improving energy
efficiency etc.
(D). COMMUNITY MANAGEMENT OF THE
PASTURE
However, the lack of inclusivity decreases the
political viability of each of these demand
management strategies. Ostrom's (1990) idea of
how "a community of citizens can organize
themselves to solve the problems of institutional
supply, commitment and monitoring" motivates
the author to analyse sustainable management
of commons by local users which is not limited by
the individual's ability to pay.
(D.1) CASE STUDY: COMMUNITY FOREST
GOVERNANCE IN THE INDIAN HIMALAYAS
The ecologically diverse state of Himachal
Pradesh is nestled in the western Himalayas and
houses over 3,200 identified plant species
including Himalayan pine, oak, deodar, silver fir
and so on. Critical to hill agriculture, the forests
also contribute directly to livelihoods by
providing resin, raw material for paper and pulp,
wood packing cases, etc. Institutional
arrangements such as cooperatives, sacred
forests, corporate clan-owned forests, etc.
govern and ensure public participation in the
management of the forested landscape of
Himachal Pradesh.
Agrawal and Chhatre (2006) collected data on
205 forests, sampling equally from the lower,
middle and high hills of Himachal Pradesh and 95
of them were jointly managed by village
communities. After holding multiple interviews
with multiple individuals and decision makers
involved in the local community institutions, they
developed a Forest Condition Index ranging from
1 - 5 (1-very bad forest condition and 5-very good
forest condition) and a resulting OLS regression
equation for forest condition — a linear function
of a suite of causal variables (biophysical,
economic, demographic, institutional and socio-
political variables).
Measuring duration of community-based
conservation, institutional enforcement via fines
and the involvement of government or forest
department officials in decision making, the
authors examine if these institutional variables
are key to the forest condition. Edmonds (2002)
asserts the importance of local control in
reducing resource extraction from forests.
In a similar fashion, Agrawal and Chhatre's (2006)
results indicated that all five institutional
variables used were highly statistically significant.
Although duration of community management of
forests is positively correlated to thriving forest
condition, the presence of a guard runs in the
negative direction, probably implying that in
forests maintained in good conditions, there's
less need for enforcement. Co-management of
forests with forest officials is negatively related
to forest condition and signifies the known
bureaucratic reluctance against participating in
co-management.
(E). INTRA-REGIONAL COOPERATION
In view of rising 'carbon leakages' and shifting of
energy-intensive sectors to pollution havens or
even from carbon priced to non-carbon priced
economies in a bid to improve overall economic
competitiveness, it becomes imperative for
South Asian nations to harmonise their carbon
tax regimes and initiate cross-border provisions
112 JOURNAL OF THE ECONOMICS SOCIETY
in addition to Nationally Appropriate Mitigation
Actions (NAMAs). Such border carbon
adjustments (BCAs) encourage emission
reductions abroad by motivating foreign
producers to become more carbon-efficient and
to persuade nations to assume legally binding
abatement targets (Neuhoff, 2011).
Integrated management of cross-border
common property resources such as the
mangrove forests in Sundarbans involve peaceful
resolution of water conflicts between India and
Bangladesh. Shared political commitment and
promotion of regional mechanisms to
implement and oversee disaster risk
management (early warnings and climate
forecasting systems) can help South Asia adapt
better to climate change, with beneficial effects
on regional stability and resilient communities.
8. CONCLUSION
As anthropogenic climate change unfolds itself to
be 'the modern day tragedy of commons', the
paper discusses the intensifying conflict between
man and nature - his utilization of the
environment as a 'sink' and its eventual
degradation. Using the E3-India model to
simulate the effects of an 'carbon-indexed
energy tax' with revenue recycling, this paper
shows that a nominal tax (say, ₹ 400) on all
energy users of all fuels leads to 1.152% lesser
CO2 emissions, 2.617% lesser use of coal for
meeting energy needs and 2.29% lesser fuel
usage by 2025.
Although a carbon-based energy tax equates
MPC and MSC with cost-effectiveness, its
distributional consequences and regressive
nature prompts an analysis of the fairness and
effectiveness of other forms of carbon pricing—
quotas, cap and trade, compensation, etc.—
using Hardin's classic analogy. Notably, inclusive
growth and sustainable management of forest
and marine commons is best achieved in the
hands of local users and via institutional
enforcement as in the case of forests in the
Indian Himalayas. Border carbon adjustments
(BCAs) and intra-regional cooperation on disaster
management can help South Asia build resilient
communities and adapt better to the global
environmental crisis.
The study was limited by the lack of national data
on 'Common Property Resources in India' post
the 54th Round of NSSO Survey (January-June,
1998). Nevertheless, the present paper adds to
the existing literature by using the relatively new
E3-India model to derive carbon-tax based policy
lessons on climate change adaptation and
mitigation and analyses the 'fairness' of carbon
pricing strategies using Hardin's classic
metaphor—the tragedy of the commons.
REFERENCES
1. Agrawal, A., & Chhatre, A. (2006). Explaining success on the commons: Community forest
governance in the Indian Himalaya. World Development, 34(1), 149-166.
2. Axelrod, R. (1984). The evolution of cooperation. (Vol. 5145). Basic Books. New York. Bowen, A.
(2011). The case for carbon pricing. Policy Brief, Grantham Research
3. Cambridge Econometrics (2017), Technical model manual, Volume 4: Model Specification.
Cambridge, UK.
4. Carruthers, I. D., & Stoner, R. (1981). Economic aspects and policy issues in groundwater
development (Vol. 494). Staff working paper No. 496. Washington, DC: World Bank.

113 JOURNAL OF THE ECONOMICS SOCIETY
5. Chhatre, A., & Agrawal, A. (2008). Forest commons and local enforcement. Proceedings of the
national Academy of sciences, 105(36), 13286-13291.
6. Clark, C. W. (1980). Restricted access to common-property fishery resources: A game theoretic
analysis. Dynamic optimization and mathematical economics, 117, 117-18.
7. Coase, R. H. (2013). The problem of social cost. The journal of Law and Economics, 56(4), 837-877.
8. Demsetz, H. (1967). Toward a Theory of Property Rights. The American Economic Review,
57(2), 347-359.
9. Edmonds, E. V. (2002). Government-initiated community resource management and local resource
extraction from Nepal's forests. Journal of development economics, 68(1), 89-115.
10. Hardin, G. (1968). The Tragedy of the Commons. Science, 162 (3859), 1243-1248.
11. Herring, R. J. (1988). The Commons and its' Tragedy 'as Analytical Framework: Understanding
Environmental Degradation. In workshop programme on “The Commons in South Asia: Societal
Pressures and the Environmental Integrity in the Sunderbans”, Smithsonian Institution,
Washington DC.
12. IPCC. (2014). Climate Change 2014: Synthesis Report. Contribution of Working Groups I, II and III
to the Fifth Assessment Report of the Intergovernmental Panel on Climate Change [Core Writing
Team, R.K. Pachauri and L.A. Meyer (eds.)]. IPCC, Geneva, Switzerland.
13. Johnson, O. E. (1972). Economic analysis, the legal framework and land tenure systems. The journal
of law and economics, 15(1), 259-276.
14. Lloyd, B. (2007). The commons revisited: the tragedy continues. Energy Policy, 35(11), 5806-5818.
15. Neuhoff, K. (2011). Climate policy after Copenhagen: the role of carbon pricing. Cambridge
University Press.
16. Ostrom, E. (1990). Governing the commons. Cambridge University Press.
17. Ostrom, E. (2005). Understanding institutional diversity (Vol. 241). Princeton, NJ: Princeton
University Press.
18. Pigou, A. C. (1932). The economics of welfare. McMillan & Co., London.
19. Slesser, M., & King, J. (2002). Not by money alone: Economics as Nature Intended. Jon Carpenter
Publishing.
20. Smith, R. J. (1981). Resolving the tragedy of the commons by creating private property rights in
wildlife. Cato J., 1, 439.
21. Welch, W. P. (1983). The political feasibility of full ownership property rights: The cases of pollution
and fisheries. Policy Sciences, 16(2), 165-180.

114 JOURNAL OF THE ECONOMICS SOCIETY
Related Documents