ACHARYA N.G. RANGA AGRICULTURAL UNIVERSITY Lam, Guntur - 522 034 ISSN 0970-0226 ANGRAU THE JOURNAL OF RESEARCH ANGRAU Indexed by CAB International (CABI), AGRIS (FAO) and ICI www.jorangrau.org The J. Res. ANGRAU, Vol. XLVIII No. (2), pp.1-96, April-June 2020

Welcome message from author
This document is posted to help you gain knowledge. Please leave a comment to let me know what you think about it! Share it to your friends and learn new things together.
Transcript
ACHARYA N.G. RANGA AGRICULTURAL UNIVERSITYLam, Guntur - 522 034
ISSN 0970-0226
ANGRAU
THE JOURNAL OFRESEARCHANGRAU
Indexed by CAB International (CABI), AGRIS (FAO) and ICIwww.jorangrau.org
The J. Res. ANGRAU, Vol. XLVIII No. (2), pp.1-96, April-June 2020
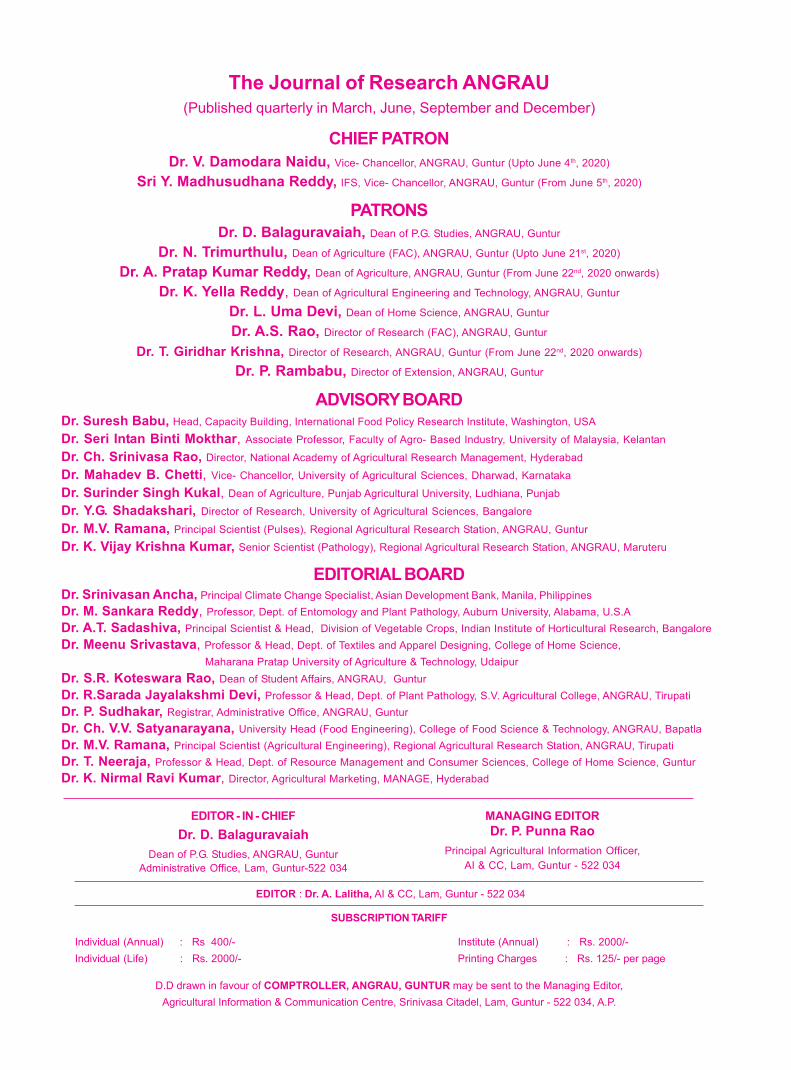
SUBSCRIPTION TARIFF
Individual (Annual) : Rs 400/- Institute (Annual) : Rs. 2000/-Individual (Life) : Rs. 2000/- Printing Charges : Rs. 125/- per page
D.D drawn in favour of COMPTROLLER, ANGRAU, GUNTUR may be sent to the Managing Editor,Agricultural Information & Communication Centre, Srinivasa Citadel, Lam, Guntur - 522 034, A.P.
EDITOR : Dr. A. Lalitha, AI & CC, Lam, Guntur - 522 034
EDITOR - IN - CHIEFDr. D. Balaguravaiah
Dean of P.G. Studies, ANGRAU, GunturAdministrative Office, Lam, Guntur-522 034
MANAGING EDITORDr. P. Punna Rao
Principal Agricultural Information Officer,AI & CC, Lam, Guntur - 522 034
The Journal of Research ANGRAU(Published quarterly in March, June, September and December)
CHIEF PATRONDr. V. Damodara Naidu, Vice- Chancellor, ANGRAU, Guntur (Upto June 4th, 2020)
Sri Y. Madhusudhana Reddy, IFS, Vice- Chancellor, ANGRAU, Guntur (From June 5th, 2020)
PATRONSDr. D. Balaguravaiah, Dean of P.G. Studies, ANGRAU, Guntur
Dr. N. Trimurthulu, Dean of Agriculture (FAC), ANGRAU, Guntur (Upto June 21st, 2020)
Dr. A. Pratap Kumar Reddy, Dean of Agriculture, ANGRAU, Guntur (From June 22nd, 2020 onwards)
Dr. K. Yella Reddy, Dean of Agricultural Engineering and Technology, ANGRAU, Guntur
Dr. L. Uma Devi, Dean of Home Science, ANGRAU, Guntur
Dr. A.S. Rao, Director of Research (FAC), ANGRAU, Guntur
Dr. T. Giridhar Krishna, Director of Research, ANGRAU, Guntur (From June 22nd, 2020 onwards)
Dr. P. Rambabu, Director of Extension, ANGRAU, Guntur
ADVISORY BOARDDr. Suresh Babu, Head, Capacity Building, International Food Policy Research Institute, Washington, USA
Dr. Seri Intan Binti Mokthar, Associate Professor, Faculty of Agro- Based Industry, University of Malaysia, Kelantan
Dr. Ch. Srinivasa Rao, Director, National Academy of Agricultural Research Management, Hyderabad
Dr. Mahadev B. Chetti, Vice- Chancellor, University of Agricultural Sciences, Dharwad, Karnataka
Dr. Surinder Singh Kukal, Dean of Agriculture, Punjab Agricultural University, Ludhiana, Punjab
Dr. Y.G. Shadakshari, Director of Research, University of Agricultural Sciences, Bangalore
Dr. M.V. Ramana, Principal Scientist (Pulses), Regional Agricultural Research Station, ANGRAU, Guntur
Dr. K. Vijay Krishna Kumar, Senior Scientist (Pathology), Regional Agricultural Research Station, ANGRAU, Maruteru
EDITORIAL BOARDDr. Srinivasan Ancha, Principal Climate Change Specialist, Asian Development Bank, Manila, PhilippinesDr. M. Sankara Reddy, Professor, Dept. of Entomology and Plant Pathology, Auburn University, Alabama, U.S.ADr. A.T. Sadashiva, Principal Scientist & Head, Division of Vegetable Crops, Indian Institute of Horticultural Research, BangaloreDr. Meenu Srivastava, Professor & Head, Dept. of Textiles and Apparel Designing, College of Home Science, Maharana Pratap University of Agriculture & Technology, UdaipurDr. S.R. Koteswara Rao, Dean of Student Affairs, ANGRAU, GunturDr. R.Sarada Jayalakshmi Devi, Professor & Head, Dept. of Plant Pathology, S.V. Agricultural College, ANGRAU, TirupatiDr. P. Sudhakar, Registrar, Administrative Office, ANGRAU, GunturDr. Ch. V.V. Satyanarayana, University Head (Food Engineering), College of Food Science & Technology, ANGRAU, BapatlaDr. M.V. Ramana, Principal Scientist (Agricultural Engineering), Regional Agricultural Research Station, ANGRAU, TirupatiDr. T. Neeraja, Professor & Head, Dept. of Resource Management and Consumer Sciences, College of Home Science, GunturDr. K. Nirmal Ravi Kumar, Director, Agricultural Marketing, MANAGE, Hyderabad
.
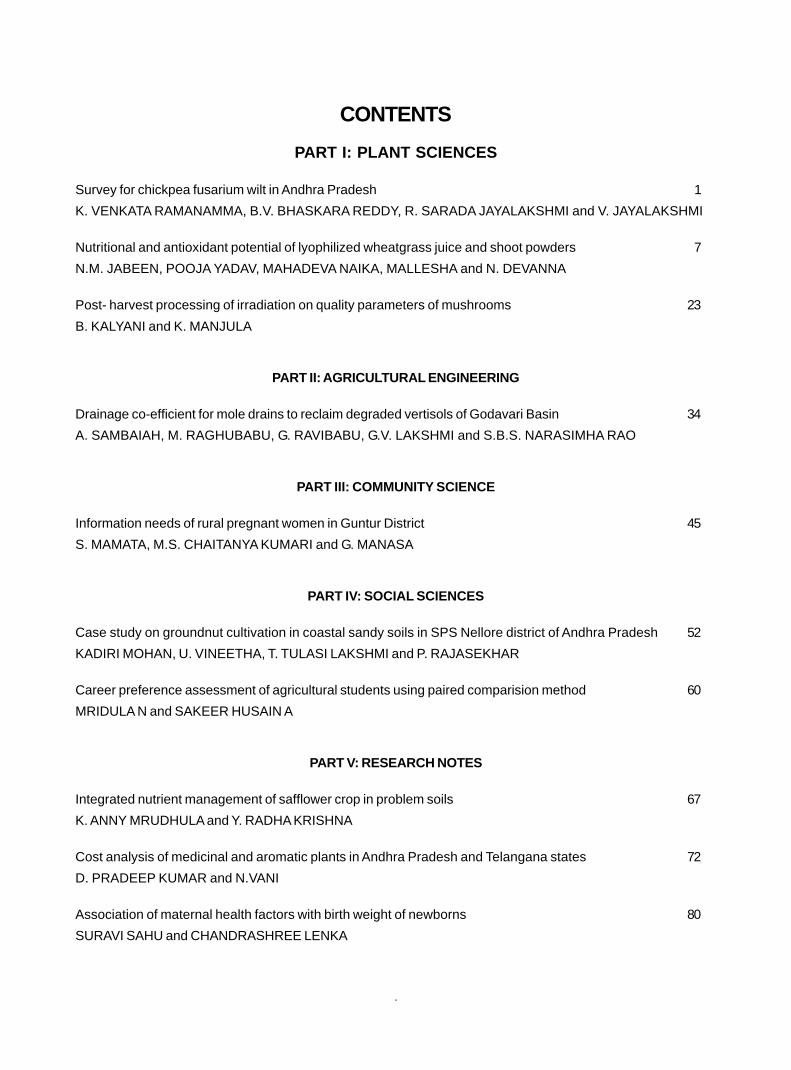
CONTENTS
PART I: PLANT SCIENCES
Survey for chickpea fusarium wilt in Andhra Pradesh 1
K. VENKATA RAMANAMMA, B.V. BHASKARA REDDY, R. SARADA JAYALAKSHMI and V. JAYALAKSHMI
Nutritional and antioxidant potential of lyophilized wheatgrass juice and shoot powders 7
N.M. JABEEN, POOJA YADAV, MAHADEVA NAIKA, MALLESHA and N. DEVANNA
Post- harvest processing of irradiation on quality parameters of mushrooms 23
B. KALYANI and K. MANJULA
PART II: AGRICULTURAL ENGINEERING
Drainage co-efficient for mole drains to reclaim degraded vertisols of Godavari Basin 34
A. SAMBAIAH, M. RAGHUBABU, G. RAVIBABU, G.V. LAKSHMI and S.B.S. NARASIMHA RAO
PART III: COMMUNITY SCIENCE
Information needs of rural pregnant women in Guntur District 45
S. MAMATA, M.S. CHAITANYA KUMARI and G. MANASA
PART IV: SOCIAL SCIENCES
Case study on groundnut cultivation in coastal sandy soils in SPS Nellore district of Andhra Pradesh 52
KADIRI MOHAN, U. VINEETHA, T. TULASI LAKSHMI and P. RAJASEKHAR
Career preference assessment of agricultural students using paired comparision method 60
MRIDULA N and SAKEER HUSAIN A
PART V: RESEARCH NOTES
Integrated nutrient management of safflower crop in problem soils 67
K. ANNY MRUDHULA and Y. RADHA KRISHNA
Cost analysis of medicinal and aromatic plants in Andhra Pradesh and Telangana states 72
D. PRADEEP KUMAR and N.VANI
Association of maternal health factors with birth weight of newborns 80
SURAVI SAHU and CHANDRASHREE LENKA

.
.

1
SURVEY FOR CHICKPEA FUSARIUM WILT IN A.P.J. Res. ANGRAU 47(4) 1-11, 2019
SURVEY FOR CHICKPEA FUSARIUM WILT IN ANDHRA PRADESH
K. VENKATA RAMANAMMA*, B.V.BHASKARA REDDY, R. SARADA JAYALAKSHMI and V.JAYALAKSHMIDepartment of Plant Pathology, S.V. Agricultural College,
Acharya N.G. Ranga Agricultural University, Tirupati -517 502
Date of Receipt: 11.2.2020 Date of Acceptance: 06.4.2020
ABSTRACT
The survey on Fusarium wilt was conducted to record the incidence, prevalence and distribution of the
disease in major chickpea cultivated areas of Andhra Pradesh i.e., Kurnool, Prakasam, Nellore, YSR Kadapa,
Anantapuramu and Guntur districts during rabi 2014-15. The wilt disease was recorded in the range from 0.2%
to 15.2% during the survey at different crop growth stages. Lower mean wilt incidence (average wilt incidence
at three stages- vegetative, flowering and pod formation stages) of 5.9% was observed in Nellore district,
whereas, the higher mean wilt incidence of 8.32% was found in Kadapa district. Out of all the 30 mandals
surveyed, Kondapuram, Nellore district and Ongole, Prakasam district recorded lower mean wilt incidence of
2.0%. Atmakur (Kurnool dist.) and Vajrakarur (Anantapuramu dist.) were observed with higher mean wilt incidence
of 9.7%. Fusarium wilt was reported in the range from 0.5% to 15.2% at vegetative stage, 0.2% to 12% at
flowering stage and 7.5% to 8% during pod formation stage.
Key Words: Chickpea, Fusarium wilt, Survey, Andhra Pradesh
*Corresponding Author E-mail : [email protected]; Ph.D. thesis submitted to Acharya N.G. Ranga AgriculturalUniversity, Guntur
INTRODUCTION:
Chickpea is one of the main pulse crops
cultivated in Andhra Pradesh (A.P.) as well as
in India. In A.P, it was cultivated in an area of
5.2 lakh ha with a production of 5.88 lakh tons
during 2017-18 (IIPR, 2019) and productivity of
1132 kg ha-1. Several factors were noticed for
yield losses in chickpea and is reported that
the crop is attacked by about 52 pathogens
(Nene et al., 1984). Among the pathogens,
Fusarium wilt caused by Fusarium oxysporum
f.sp. ciceris, is one of the important pathogen
that causes yield losses in chickpea.This
disease was reported in 32 countries across
six continents (Singh et al., 2014). Important
symptoms of wilt include collapsing of the
infected plants at seedling stage and drooping
of petioles, rachis and leaflets in grown plants
retaining the dull green colour (Pande and
Sharma, 2012). Though there was no external
rotting of wilting plants, the plants exhibited dark
brown discoloration of xylem. Highly susceptible
varieties show symptoms within 25 days after
sowing (DAS). More losses were caused by
early wilting than late wilting and seeds obtained
from the chickpea plants with late wilt
symptoms are lighter than seeds obtained from
healthy plants (Haware and Nene, 1980).
Depending on agro climatic conditions and
varietal susceptibility yield losses were reported
ranging from 10% to 100% (Warda et al.,
2017).
J. Res. ANGRAU 48 (2) 1-6, 2020

2
VENKATA RAMANAMMA et al.
MATERIAL AND METHODS
An extensive roving survey was conducted
in farmers fields covering the six major
chickpea grown districts of Andhra Pradesh viz.,
Kurnool, Prakasam, Anantapuramu, Kadapa,
Nellore and Guntur viz., vegetative, flowering
and pod formation stages during rabi 2014-15
to report the Fusarium wilt occurrence,
distribution and incidence. In each district, five
mandals were selected. From each mandal, a
total of five villages were chosen for the survey.
In each surveyed field, a plot size of 1.0 m2 ×
1.0 m2 was selected at five locations diagonally
to record the disease incidence. The plants
were carefully examined for wilt symptoms to
identify the disease affected plants and then wilt
incidence was calculated. Disease affected
plants and disease-free plants were counted
per meter square and per cent disease
incidence was calculated as below:
Wilt incidence (%) =
Number of wilted plants x 100
Total number of plants
In order to assess disease incidence, various
agronomic practices followed by farmers in
different chickpea eco systems were recorded
by using a common data format. Data on
different parameters viz., variety grown, soil
type, area surveyed and stage of the chickpea
crop were recorded (Ghosh et al., 2013).
RESULTS AND DISCUSSION
Widely distributed Fusarium wilt incidence
was observed in all the chickpea grown areas
during survey. Survey also provided details
about the intensity over the period of time.
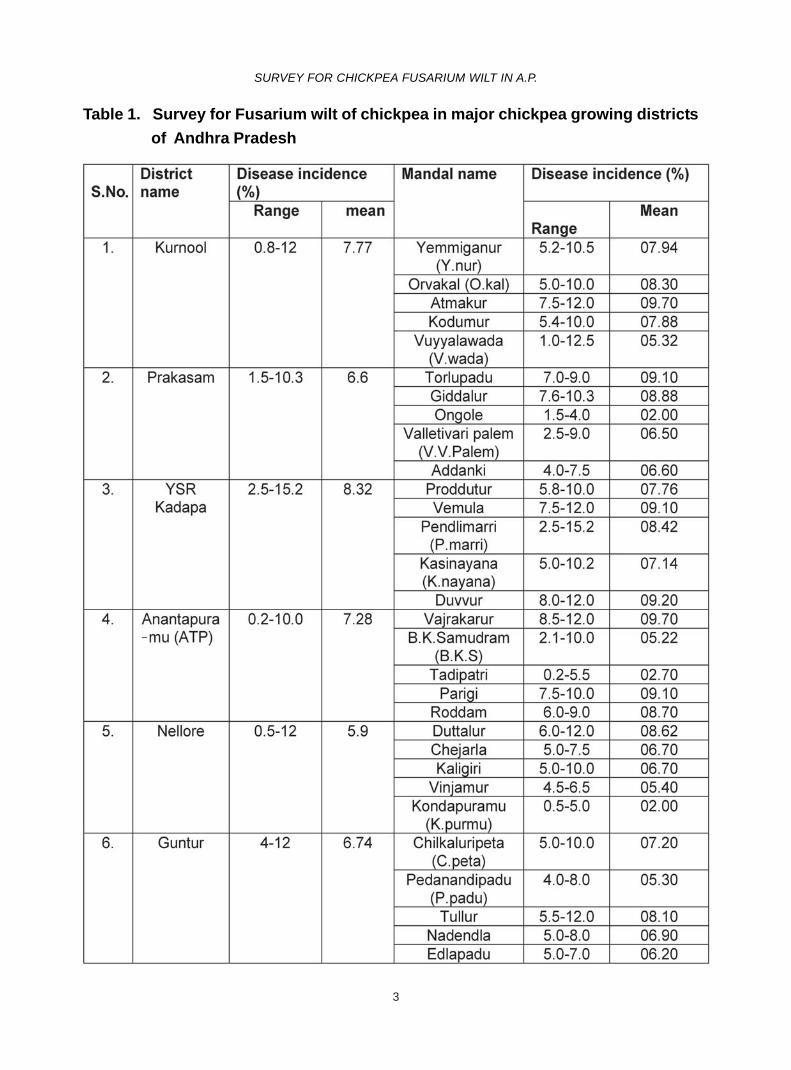
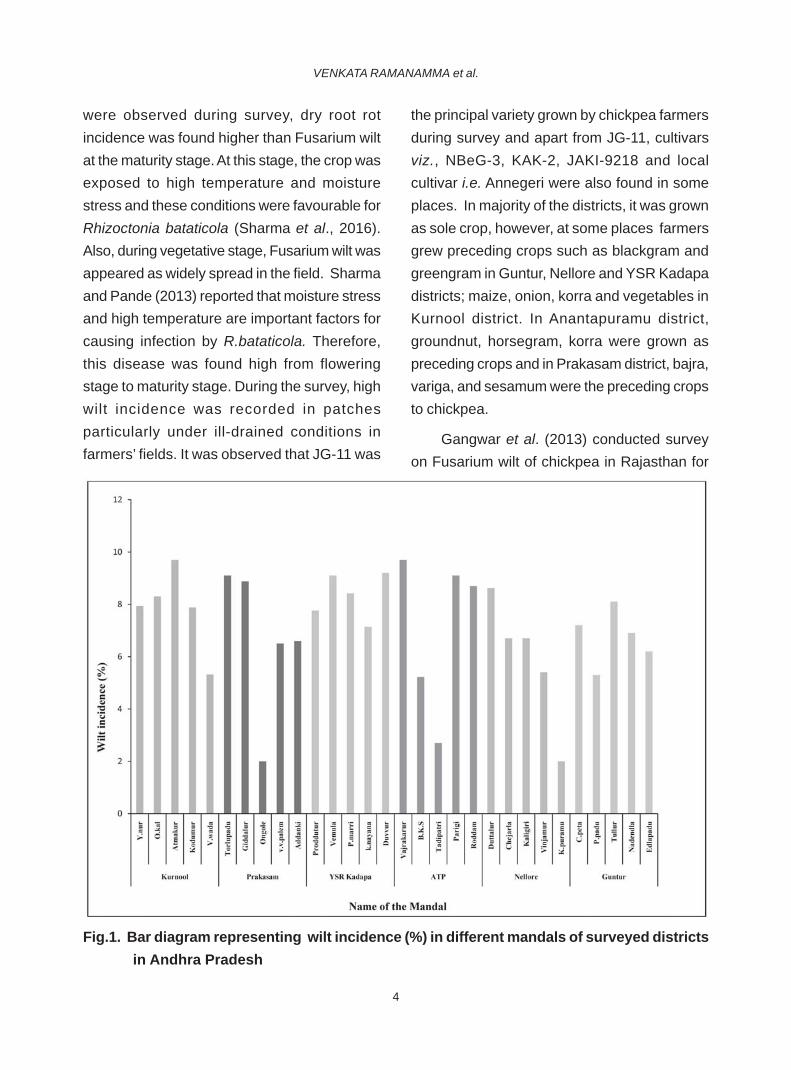
Among the six districts surveyed, lower mean
wilt incidence of 5.9% was found in Nellore
district, whereas, the higher mean wilt incidence
of 8.32% was observed in Kadapa district.
Other districts viz., Anantapuramu, Kurnool,
Prakasam and Guntur recorded mean incidence
of 7.28%, 7.77%, 6.6% and 6.74% respectively.
In different mandals surveyed, Atmakur
(Kurnool dist.) and Vajrakarur (Anantapuramu
dist.) were observed with higher mean wilt
incidence of 9.7%, whereas, Kondapuram
mandal of Nellore and Ongole mandal of
Prakasam district recorded low mean wilt
incidence of 2.0% (Table.1). Among the different
villages, Bramhanapalli village, Tadipatri mandal
found with low mean wilt incidence of 0.2% and
higher average wilt incidence of 15.5% was
recorded in Vaddamanu (Kasinayana mandal)
and Peddajuturu (Vemula mandal) villages of
YSR Kadapa district. Data of wilt incidence in
different mandals of six surveyed districts were
represented in Fig.1. Similarly, Anuragi and
Sharma (2016) reported wilt incidence of 0%
to 36% during survey in Bhundelkhand region.
Sankar et al. (2018) surveyed in four districts
of Tamilnadu such as Coimbatore, Dindigul,
Dharmapuri and Tiruppur during rabi, 2015 and
observed more than fifty per cent incidence
(57.33%) in Gomangalampudur, Tiruppur district
on cultivar JAKI-9218 and 34% incidence was
recorded on CO4 cultivar at Idigarai in
Coimbatore district.
During the survey, the disease incidence
was observed in the range of 0.5% to 15.2% at
vegetative stage, 0.2% to 12% at flowering, and
7.5% to 8% at pod formation stage. Apart from
wilt, dry root rot, black root rot and collar rot
3
SURVEY FOR CHICKPEA FUSARIUM WILT IN A.P.
Table 1. Survey for Fusarium wilt of chickpea in major chickpea growing districts
of Andhra Pradesh
4
VENKATA RAMANAMMA et al.
Fig.1. Bar diagram representing wilt incidence (%) in different mandals of surveyed districts
in Andhra Pradesh
were observed during survey, dry root rot
incidence was found higher than Fusarium wilt
at the maturity stage. At this stage, the crop was
exposed to high temperature and moisture
stress and these conditions were favourable for
Rhizoctonia bataticola (Sharma et al., 2016).
Also, during vegetative stage, Fusarium wilt was
appeared as widely spread in the field. Sharma
and Pande (2013) reported that moisture stress
and high temperature are important factors for
causing infection by R.bataticola. Therefore,
this disease was found high from flowering
stage to maturity stage. During the survey, high
wilt incidence was recorded in patches
particularly under ill-drained conditions in
farmers’ fields. It was observed that JG-11 was
the principal variety grown by chickpea farmers
during survey and apart from JG-11, cultivars
viz., NBeG-3, KAK-2, JAKI-9218 and local
cultivar i.e. Annegeri were also found in some
places. In majority of the districts, it was grown
as sole crop, however, at some places farmers
grew preceding crops such as blackgram and
greengram in Guntur, Nellore and YSR Kadapa
districts; maize, onion, korra and vegetables in
Kurnool district. In Anantapuramu district,
groundnut, horsegram, korra were grown as
preceding crops and in Prakasam district, bajra,
variga, and sesamum were the preceding crops
to chickpea.
Gangwar et al. (2013) conducted survey
on Fusarium wilt of chickpea in Rajasthan for
5
SURVEY FOR CHICKPEA FUSARIUM WILT IN A.P.
two years i.e., 2011-12 and 2012-13 and
observed the disease in all the surveyed areas
with incidence varying from 27.43% to 45.88%
having an average of 37.48%. The disease was
observed high in the seedling stage viz., 23.96%
and 21.9% during 2011-12 and 2012-13,
respectively with 4.5% and 14.6% at maturity
stage during 2011-12 and 2012-13, respectively.
In this study, high wilt incidence was observed
at vegetative stage than pod formation stage.
Ghosh et al. (2013) conducted survey for
chickpea diseases in 2010-2011 during rabi in
four states such as Andhra Pradesh, Madhya
Pradesh, Karnataka and Chhattisgarh and
Fusarium wilt, dry root rot and collar rot in all
four states, whereas, black root rot disease
was only in A.P and Karnataka states. In A.P.,
Fusarium wilt incidence was higher in chickpea
followed by dry root rot, collar rot and black root
rot diseases and wilt incidence recorded is in
the range of 9.86 % -18.76%.
In this survey, Fusarium wilt was observed
in the range of 0.2% to 15.2% at various growth
stages of the crop and more severity was noted
during vegetative stage. This study apprises the
state of Fusarium wilt disease in chickpea
which is essential to understand the disease
situation and plan the disease management
strategies.
CONCLUSION
During the survey, Fusarium wilt was
recorded in the range of 0.5% to 15.2% at
vegetative stage, 0.2% to 12% at flowering
stage and less incidence i.e., upto 8% was
noted during pod formation stage in Andhra
Pradesh.
REFERENCES
Anuragi, M and Sharma, T.K. 2016. Effect of
different growth parameters on Fusarium
oxysporum f.sp. ciceri (“wilt” causing
pathogen of chickpea). Flora and Fauna.
22(1): 11-16.
Gangwar, R.K., Shalini Singh, T.P., Verma, L.N.,
Gupta, N.K and Agarwal, N.K. 2013. Studies
on the status of chickpea wilt in Rajasthan.
Agriways. (1): 38-41.
Ghosh, R., Sharma, M., Telangre, R and Pande,
S. 2013. Occurrence and distribution of
chickpea diseases in central and southern
parts of India. American Journal of Plant
Sciences. 4: 940-944.
Haware, M.P and Nene, Y.L. 1980. Influence of
wilt at different stages on the yield loss in
chickpea. Tropical Grain Legume Bulletin.
19: 38-44.
IIPR. 2019. Project Coordinator’s Report. 2018-
19. All-India Coordinated Research Project
on Chickpea. ICAR-Indian Institute of
Pulses Research, Kanpur. pp.20.
Nene, Y.L., Sheila, V.K and Sharma, S.B. 1984.
A world list of chickpea (Cicer arietinum L.)
and pigeonpea (Cajanus cajan (L) Millsp.)
pathogens. ICRISAT Pulse Pathology
Progress Report. 32: pp.19.
Nene, Y. L., Reddy, M. V., Haware, M. P.,
Ghanekar, A. M and Amin, K.S. 2012. Field
diagnosis of chickpea diseases and their
control. In: Information Bulletin No. 28.
Technical Report. International Crops
Research Institute for the Semi-Arid
Tropics, Patancheru, India.

6
VENKATA RAMANAMMA et al.
Pande, S and Sharma, M. 2012. Field diagnosis
of Chickpea Diseases and their control
(Revised version of Nene, Y.L., Reddy, M.V.,
Haware, M.P., Ghanekar, A.M., Amin, K.S).
Information Bulletin No.28. International
Crops Research Institute for the Semi-Arid
Tropics, Patancheru, India. pp.60.
Sankar, P.M., Vanitha, S., Kamalakannan, A.,
Raju, A.P and Jeyakumar, P. 2018.
Prevalence of Fusarium oxysporum f.sp.
ciceris causing wilt of chickpea and its
pathogenic, cultural and morphological
characterization. International Journal of
Current Microbiology and Applied
Sciences. 7(2): 1301-1313.
Sharma, M., Ghosh, R and Suresh, P. 2016.
Dry root rot (Rhizoctonia bataticola (Taub.)
Butler): an emerging disease of chickpea-
where do we stand?. Archives of
Phytopathology and Plant Protection.
48(13): 1-16.
Sharma, M and Pande, S.2013. Unravelling
effects of temperature and soil moisture
stress response on development of dry
root rot (Rhizoctonia bataticola (Taub.)
Butler) in chickpea. American Journal of
Plant Sciences. 4: 584-589.
Singh, S., Singh, I., Kapoor, K and Gaur, P.M.
2014. Chickpea. In: Broadening the
Genetic Base of Grain Legumes. National
Bureau of Plant Genetic Resources: New
Delhi, India.
Warda, J., Mariem, B., Amal, B., Mohamed, B
and Mohamed, K. 2017. A review on
Fusarium wilt affecting chickpea crop.
Agriculture. 7( 23): 1-16.
7
NUTRITIONAL AND ANTIOXIDANT POTENTIAL OF LYOPHILIZED WHEAT GRASS JUICE AND SHOOT POWDERSJ. Res. ANGRAU 47(4) 1-11, 2019
NUTRITIONAL AND ANTIOXIDANT POTENTIAL OF LYOPHILIZEDWHEAT GRASS JUICE AND SHOOT POWDERS
N.M. JABEEN*, POOJA YADAV, MAHADEVA NAIKA, MALLESHA and N. DEVANNADepartment of Food Technology, JNTUA-Oil Technological and Pharmaceutical Research Institute,
Anantapuramu – 515 005
Date of Receipt: 16.3.2020 Date of Acceptance: 24.5.2020
ABSTRACT
Young wheatgrass is rich in vitamins, minerals, chlorophyll, bioactive compounds, and fiber. In thisstudy, phytochemicals, proximate analysis, amino acids, individual polyphenols, minerals, and antioxidantsof lyophilized wheatgrass juice powder and shoot powder were estimated. Both the samples (juice and shootpowders) showed the presence of phytochemicals such as alkaloids, tannins, cardio-glycosides, coumarins,flavonoids, carbohydrates, etc. Further more, HPLC analysis of individual polyphenols showed that the juicepowder had significantly higher (P <0.05%) quercitin, sinnapic acid, chlorophyll, and essential amino acidslike valine, threonine. Wheat grass juice powder have shown significantly higher (p<0.05%) Fe and Zn thanshoot powder. Juice powder had significantly more (P<0.05) total polyphenols (15.20±1.0 mg/g), total flavonoids(6.27±0.68 mg/g) than shoot powder, and DPPH activity with IC50 1.48±0.15 mg/g. This study highlights thenutritional benefits of wheatgrass juice powder as lyophilization could reduce losses of nutrients and antioxidants.These findings confirm that lyophilized wheatgrass juice powder is medicinally important with bioactivecompounds, antioxidant capacity, and have significant potential to incorporate in functional food productsthose can be used to enhance the health benefits of consumer.
Keywords: Phytochemicals, HPLC, Polyphenols, DPPH activity
*Corresponding Author E-mail i.d: [email protected]; Ph.D. thesis submitted to Jawaharlal NehruTechnological University, Anantapur
J. Res. ANGRAU 48 (2) 7-22, 2020
INTRODUCTION
Wheat (Triticum aestivum) is the second mostcultivated and vital staple cereal food in Indiaand young wheatgrass is nutrient-rich. It findsuses in the traditional system of medicine totreat various ailments (Rajesh et al., 2011). Itholds a substantial amount of protein, vitamins,minerals (Ca, Mg, iron, zinc), phenolics,flavonoids, fiber, and bioactive componentssuch as chlorophyllin, quercetin, rutin, andsinapic acid compared to seed kernel.Wheatgrass contains about 70 percent ofchlorophyll out of total chemical constituents
(Swati et al., 2010). Many accredited biologicalproperties to wheatgrass include bodybuildingactivity (Marvaha et al., 2004), antidiabetic(Chauhan, 2014), anti-cancer (Dey et al., 2006),anti-inflammatory and antiaging (Smith et al.,2000), blood pressure reduction, heavy metaldetoxification, and immune system modulation(Suriyavathana et al., 2015). Fresh wheatgrassjuice is recommended for daily consumptiondue to the fact that it possesses maximumtherapeutic qualities (Walters, 1992). It reducesthe toxic side effects of chemotherapy in breast
8
JABEEN et al.
cancer patients (Bar-sela et al., 2007).A substantial number of phenolic compoundsincluding flavonoids contained in wheat grassextract can reverse the effect of ROS (ReactiveOxygen Species) mechanism by variouspathways and reduce cancer (Calzuola et al.,2004). Wheatgrass also exhibits a preventiveeffect on oxidative DNA damage (Falcioni et al.,2002). Today wheatgrass is one of the importantand widely used supplemental health food andavailable in many health foods stores as freshproduce, tablets, frozen juice, and powder. Themajor utilization of wheatgrass juice is due toits antioxidant action which consists of highbioflavonoids such as apigenin, quercitin, andluteolin. Its pharmacological properties due toits enzymes viz., protease, analyze, lipase,superoxide dismutase, cytochrome oxidase,bioactive components, and nutrient contentmake it a functional food and nutraceutical. Thestudy was carried out to examine thephytochemical screening of bioactivecomponents, nutritive composition andantioxidant properties of lyophilized wheatgrassjuice powder and shoot powder with anobjective of sculpting it as a neutraceutical andto develop functional food products.
MATERIAL AND METHODS
Cultivation of wheat grass and sample
preparation
Wheat seed variety ‘HD 3086’ wascollected from Indian Agricultural ResearchInstitute (IARI), New Delhi. Wheat seeds weresown in the laboratory garden in an area of50 sq. ft with enough shade and water. Plantsamples from these seeds were collected onthe 9th day of its growth and shoots were of
10 cm height above the soil (Dhaliwal et al.,2015) and washed thoroughly by deionisedautoclaved (Ultra-pure water deionizerPURELAB® Ultra systems) water and thenseparated into two equal parts. Then,wheatgrass juice was squeezed from the firstpart by the mechanical extraction method usinga juicer (Phillips juicer, HR 185) and stored inthe deep freezer (Blue star chest model No.304)for pre-freezing at -40° C for 24 hrs. Next, thestored juice was lyophilized (commerciallyophilizer system, Li-LYfo-55) and collected asjuice powder. Immediately sample was packedin polypropylene pouches in dry room andstored. The other half of the shoots were groundas paste, lyophilized and collected as shootpowder. This shoot powder was also stored inpolypropylene pouches and sealed immediately.Both the sample powders were analysed andcompared for different properties.
Extraction of plant material
Lyophilized wheatgrass powder wassubjected to Soxhlet extraction by usingsolvents such as double distilled water and 70%ethanol. Ten grams of each sample wasweighed, homogenized and transferred into twodifferent conical flasks and one hundred mL ofsolvent was added and shaked using shakingwater bath at 60° C for 40 min. Each solventextract was allowed to flash evaporate todryness. Water extract was also obtained toknow the solubility of components in pure waterwhich was immediately lyophilized and used forfurther studies. As wheatgrass is consumed inthe form of juice, a freshly prepared crudewheatgrass sample was also used.Wheatgrass powder was dissolved in ethanol
9
NUTRITIONAL AND ANTIOXIDANT POTENTIAL OF LYOPHILIZED WHEAT GRASS JUICE AND SHOOT POWDERS
through 0.45 μm filter tips and aliquots of 20 μLfrom this solution were injected into the HPLCby using auto-sampler. Analytical reversed-phase C-18 column (ODS column, 250 × 4.6mm, 5 μm, Phenomenex, Inc.) was used forthe separation. The mobile phase consisting ofa mixture of buffer and methanol in the ratio of96:4 (v/v) was delivered at a flow rate of 1 ml/min with UV detection at 210 nm. 20 μL aliquotsof the standard solutions and sample solutionswere injected (Nazmul Hasan et al., 2013).
Amino acid analysis by HPLC
Agilent chromatography system 1260, USAhaving an auto-analyzer and PDA detector wasused for analysis.The amino acid separationwas achieved using RP C-18 column (250 mmx 4.5 mm and 0.5 um particle size) using lineargradient elution with a mobile phase A with 3%(v/v) tetrahydrofuran in 17 mM sodium acetatetrihydrate [pH 7.2 adjusted using 2% (v/v) glacialacetic acid], while mobile phase B was a mixtureof 85 mM sodium acetate trihydrate [pH 7.2adjusted using 2% (v/v) glacial acetic acid]–Acetonitrile–methanol (1:2:2 v/v/v). Theanalysis was carried out with a flow rate of 0.8mL/min at 280 nm with a gradient system.100mg of both wheatgrass extract samples wereadded to 1mL of 6N HCl and 0.1N HCl followedby solid-phase extraction with activated the sep-pack C18 column by using methanol. A solutionconsisting of 0.1% tetrahydrofuran (TFA) inwater was added twice. The amino acids werederivatized with o-phthalaldehyde reagent(OPA) and 9-fluorenylmethyl chloroformate(FMOC) reagent by programming of auto-
and double distilled water and an extractsupernatant was utilized for variousexperiments (Garima Shakya et al., 2014).
Qualitative phytochemical screening of
lyophilized wheat grass powder
The screening of phytochemicalconstituents was carried out with 70% ethanolicextract and aqueous extract of wheatgrass toanalyse the presence of different bioactivecomponents as per standard methods (Kokateet al., 2001).
Proximate analysis
Moisture, ash and fat were analysed bystandard AOAC methods of analysis (2005).Carbohydrate by difference method from thelevels of nutrients analysed and fiber contentby Automatic fiber analyser. Nitrogen contentwas estimated by standard Kjeldahl method andtotal protein content was calculated using aconversion factor of 6.25.
Total chlorophyll content
Chlorophyll content was determined usingthe dimethyl sulfoxide (DMSO) method(Ghumman et al., 2017).
Water soluble vitamins analysis by HPLC
B complex vitamins (thiamine, riboflavin,niacin, folic acid, pyridoxine) and vitamin Canalysis were carried out using a High-Performance Liquid Chromatographic system(Shimadzu-UFLC Prominence), equipped withan autosampler (Model-SIL 20AC HT) and UV-Visible detector (Model-SPD 20A). The datawas recorded using LC-solutions software.Extracted samples of 100 mg was filtered
10
JABEEN et al.
sampler. The eluted samples containing aminoacids were then analysed by the Agilent HPLCsystem with the above condition.
Determination of individual polyphenols by
HPLC
Identification of individual polyphenols wascompleted by the method of Hartl and Stenzal(2007) with slight modifications using HPLCanalysis with Agilent chromatography system.The best solvent system as a mobile phase forthe study consisted of methanol to water in theratio of 80:20 along with 0.1% TFA, with a flowrate of 1.0 mL/min and detection of thecomponent was achieved at 200 to 400 nm atambient temperature. The HPLC peaks ofanalytes were confirmed and quantified withknown reference standards by comparing theirretention times (Anand Rojoria et al., 2015).
Mineral composition
Minerals in the wheatgrass powder weredetermined using inductive coupled plasma -optical emission spectrophotometer (ICP-OES)at vimta Labs, Hyderabad (Matthew et al., 2011).
ANTIOXIDANT ANALYSIS
DPPH radical scavenging activity
For free radical scavenging activity, thelyophilized wheatgrass powders (10mg) weredissolved in 100 mL of methanol for 2 hours inthe dark. Freshly prepared 5mL of DPPH (0.1mM) was added to 100 μL extract and incubatedfor 30 min. The absorbance of DPPH was takenat 517 nm. Methanol was taken as solventblank. The reduction of the purple colour of the
DPPH solution to pale colour gave thepercentage of Inhibition (Tripathi, 2017).
IC50
value
One parameter (IC50) inhibition concentra-tion was introduced for the interpretation of theresults from DPPH method. IC50 was theamount of sample necessary to decrease theabsorbance of DPPH by 50%. Ascorbic acidwas used as a standard.
Total phenolic content
The total polyphenol content of the ethanolicextract was analysed using Folin-Ciocalteureagent according to the protocol designed byMakkar et al. (2003). Briefly, 1 mL of variousconcentrations of the sample was mixed with0.5mL of 1N Folin-Ciocalteu reagent and added2.5 mL of 5% sodium carbonate. Afterincubation for 40 min in a dark room, absor-bance was measured at 725 nm using aspectrophotometer (Agilent technologies, cary60 Uv-vis). Gallic acid dissolved in methanol wasused as a standard. The total phenolic contentwas reported in terms of μmole of gallic acidequivalents/g of extract (GAEs).
Total flavonoids content
The aluminium chloride method was usedfor flavonoid content estimation (Zhishen et al.,1999).500 μL of ethanolic extract was mixedwith 150 μL of 10% aluminium chloride. Theabsorbance of the reaction mixture wasmeasured at 530 nm with a double beamspectrophotometer. A calibration curve wasrepaved using a standard solution of rutin
11
NUTRITIONAL AND ANTIOXIDANT POTENTIAL OF LYOPHILIZED WHEAT GRASS JUICE AND SHOOT POWDERS
hydrate (0.05-0.5mg/ml). Final results wereexpressed as mg rutin equivalents/g of sample.
Statistical analysis
The results are presented as the mean ±SD of triplicate observations. All the data wereanalysed for analysis of variance (ANOVA) usingrandomized design with the least significantdifference (LSD) at 0.05 levels by using theSPSS 13-Windows students version software.
RESULTS AND DISCUSSION
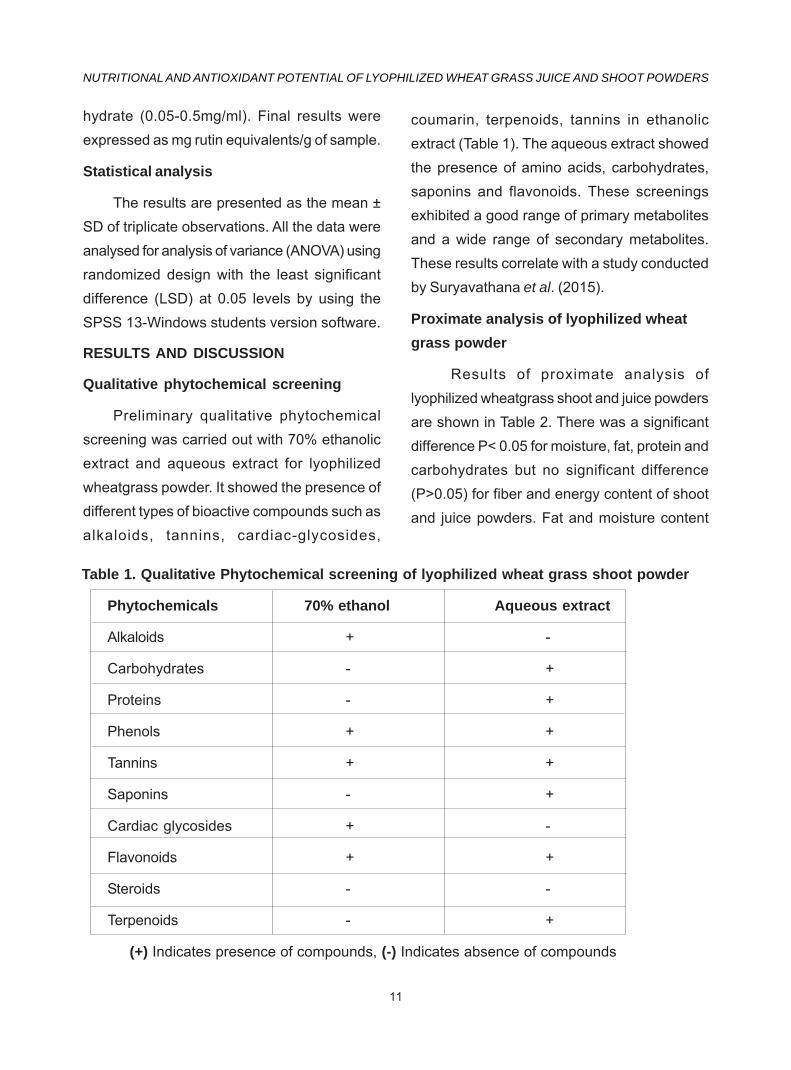
Qualitative phytochemical screening
Preliminary qualitative phytochemicalscreening was carried out with 70% ethanolicextract and aqueous extract for lyophilizedwheatgrass powder. It showed the presence ofdifferent types of bioactive compounds such asalkaloids, tannins, cardiac-glycosides,
coumarin, terpenoids, tannins in ethanolicextract (Table 1). The aqueous extract showedthe presence of amino acids, carbohydrates,saponins and flavonoids. These screeningsexhibited a good range of primary metabolitesand a wide range of secondary metabolites.These results correlate with a study conductedby Suryavathana et al. (2015).
Proximate analysis of lyophilized wheat
grass powder
Results of proximate analysis oflyophilized wheatgrass shoot and juice powdersare shown in Table 2. There was a significantdifference P< 0.05 for moisture, fat, protein andcarbohydrates but no significant difference(P>0.05) for fiber and energy content of shootand juice powders. Fat and moisture content
Table 1. Qualitative Phytochemical screening of lyophilized wheat grass shoot powder
Phytochemicals 70% ethanol Aqueous extract
Alkaloids + -
Carbohydrates - +
Proteins - +
Phenols + +
Tannins + +
Saponins - +
Cardiac glycosides + -
Flavonoids + +
Steroids - -
Terpenoids - +
(+) Indicates presence of compounds, (-) Indicates absence of compounds
12
JABEEN et al.
were almost less in lyophilized juice powderwhich contributes to good stability in storagethan WSP. Results revealed that wheatgrass
has a significant source of nutrients. The resultsare in corroboration with the studies ofGhumman et al. (2017).
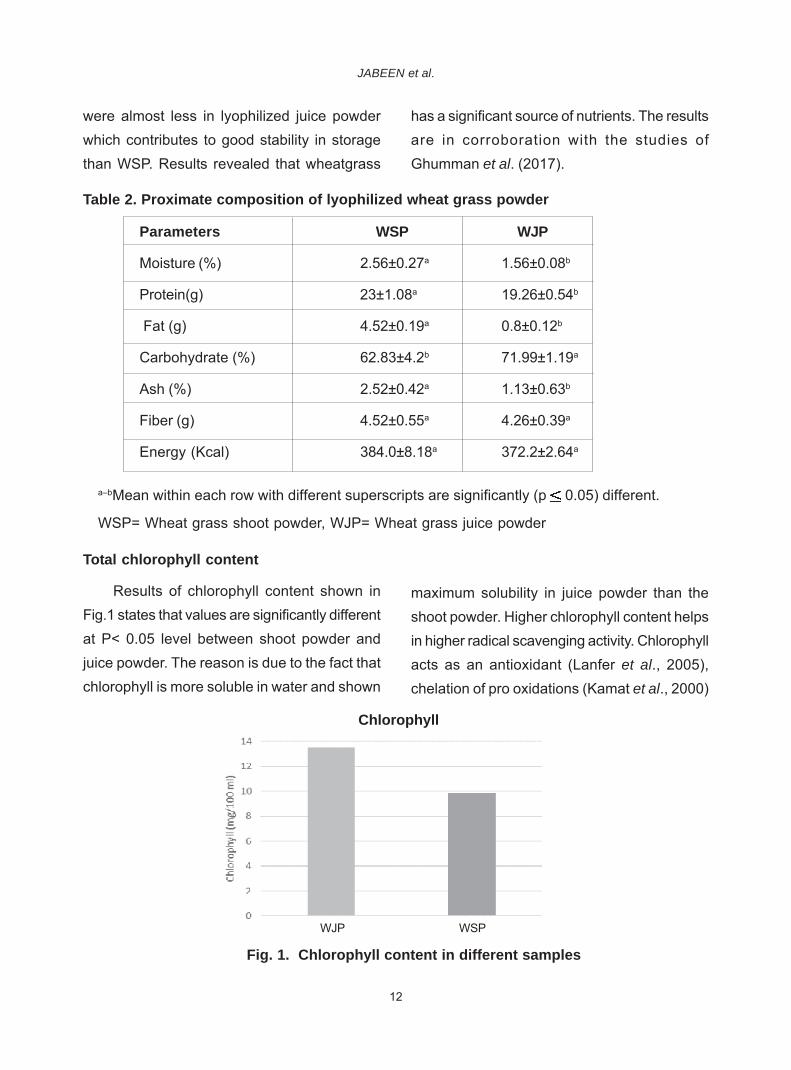
Total chlorophyll content
Results of chlorophyll content shown inFig.1 states that values are significantly differentat P< 0.05 level between shoot powder andjuice powder. The reason is due to the fact thatchlorophyll is more soluble in water and shown
Parameters WSP WJP
Moisture (%) 2.56±0.27a 1.56±0.08b
Protein(g) 23±1.08a 19.26±0.54b
Fat (g) 4.52±0.19a 0.8±0.12b
Carbohydrate (%) 62.83±4.2b 71.99±1.19a
Ash (%) 2.52±0.42a 1.13±0.63b
Fiber (g) 4.52±0.55a 4.26±0.39a
Energy (Kcal) 384.0±8.18a 372.2±2.64a
maximum solubility in juice powder than theshoot powder. Higher chlorophyll content helpsin higher radical scavenging activity. Chlorophyllacts as an antioxidant (Lanfer et al., 2005),chelation of pro oxidations (Kamat et al., 2000)
Fig. 1. Chlorophyll content in different samples
Table 2. Proximate composition of lyophilized wheat grass powder
a–bMean within each row with different superscripts are significantly (p 0.05) different.
WSP= Wheat grass shoot powder, WJP= Wheat grass juice powder
WJP WSP
Chlorophyll
13
NUTRITIONAL AND ANTIOXIDANT POTENTIAL OF LYOPHILIZED WHEAT GRASS JUICE AND SHOOT POWDERS
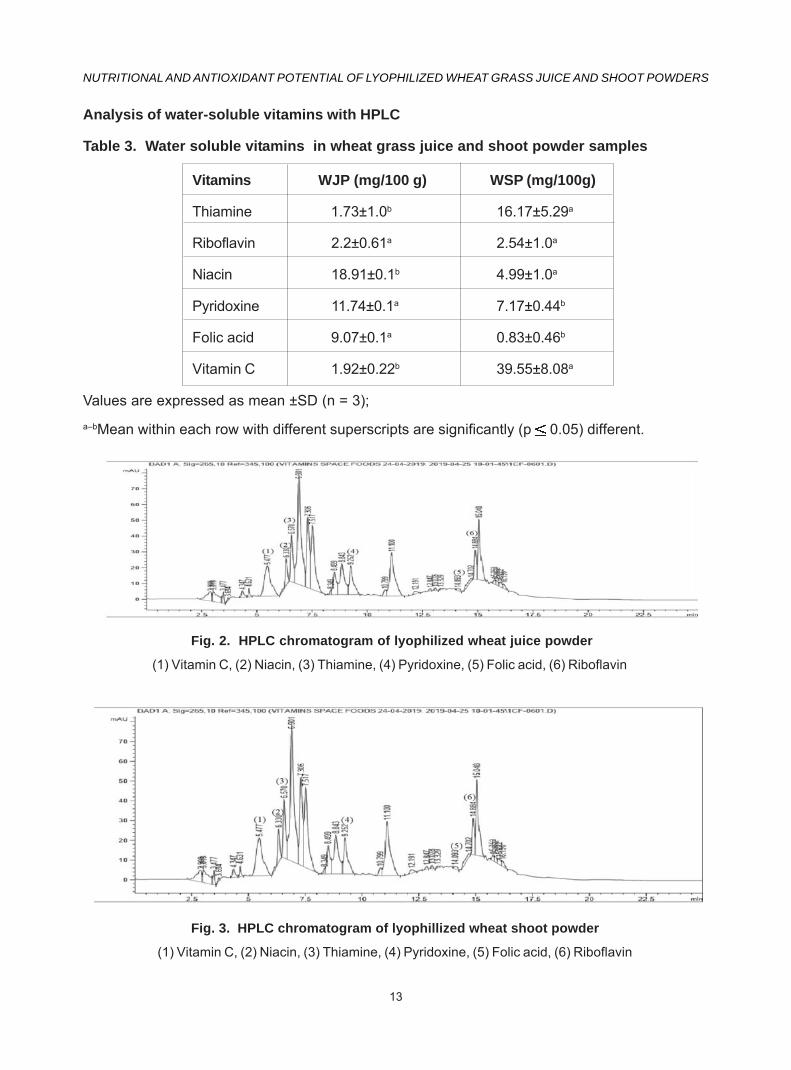
Vitamins WJP (mg/100 g) WSP (mg/100g)
Thiamine 1.73±1.0b 16.17±5.29a
Riboflavin 2.2±0.61a 2.54±1.0a
Niacin 18.91±0.1b 4.99±1.0a
Pyridoxine 11.74±0.1a 7.17±0.44b
Folic acid 9.07±0.1a 0.83±0.46b
Vitamin C 1.92±0.22b 39.55±8.08a
Fig. 3. HPLC chromatogram of lyophillized wheat shoot powder
(1) Vitamin C, (2) Niacin, (3) Thiamine, (4) Pyridoxine, (5) Folic acid, (6) Riboflavin
Fig. 2. HPLC chromatogram of lyophilized wheat juice powder
(1) Vitamin C, (2) Niacin, (3) Thiamine, (4) Pyridoxine, (5) Folic acid, (6) Riboflavin
a–bMean within each row with different superscripts are significantly (p 0.05) different.
Analysis of water-soluble vitamins with HPLC
Table 3. Water soluble vitamins in wheat grass juice and shoot powder samples
Values are expressed as mean ±SD (n = 3);

14
JABEEN et al.
and binds to carcinogenic molecules, (Endo et
al., 1985), thus act as an antioxidant byscavenging free radicals. The results coincidewith the studies of Rattanaane Echomchanet al. (2016).
Results of HPLC analysis of water-solublevitamins of juice powder and shoot powder aretabulated in Table 3. Results showed that exceptriboflavin, all other vitamins significantly variedbetween juice and shoot powder samples.WSP had higher vitamin content than juicepowder. Among the B vitamins, thiamine wasmore i.e. 16.17 mg/100 g and least was folicacid with 0.83 mg/100 g in shoot powder
(Fig. 3), whereas in juice powder (Fig. 2)thiamine was 1.73 mg/g and least was vitaminc was 1.92 mg/100 g, but in shoot powder,vitamin C content was more (39.5 mg/100 g).The reason may be the polarity and solubility ofvitamins in the aqueous extract.
Amino acid analysis by HPLC
Composition of different amino acids inlyophilized juice powder and shoot powder ispresented in Table 4 and shown HPLCchromatograms of lyophilized samples. Theaminoacid analysis showed the presence of17-20 different peaks in both the samples.Among them, 12 were identified and in that
Amino acids WJP (mg/g) WSP (mg/g)
Arginine 1.7±0.62b 6.1±0.90a
Serine 0.57±0.26a 0.22±0.12a
Threonine 1.16±0.21a 0.97±0.34a
Valine 1.76±0.68b 0.45±0.15a
Methionine 0.17±0.15b 1.03±0.29a
Isoleucine 0.58±0.43b 2.6±0.64a
Leucine 0.22±0.18b 2.69±0.70a
Lysine 0.13±0.11a 0.19±0.07a
Proline 0.50±0.26a 0.24±0.18a
Aspartic acid 2.71 ± 0.22a 1.53 ± 0.01b
Cysteine ND 0.46
Glutamic acid 2.36± 0.08a 2.56± 0.02a
Values are expressed as mean ±SD (n = 3);a–bMean within each row with different superscripts are significantly (p 0.05) different.
Table 4. Composition of amino acids in wheat grass juice powder and shoot powder samples
15
NUTRITIONAL AND ANTIOXIDANT POTENTIAL OF LYOPHILIZED WHEAT GRASS JUICE AND SHOOT POWDERS
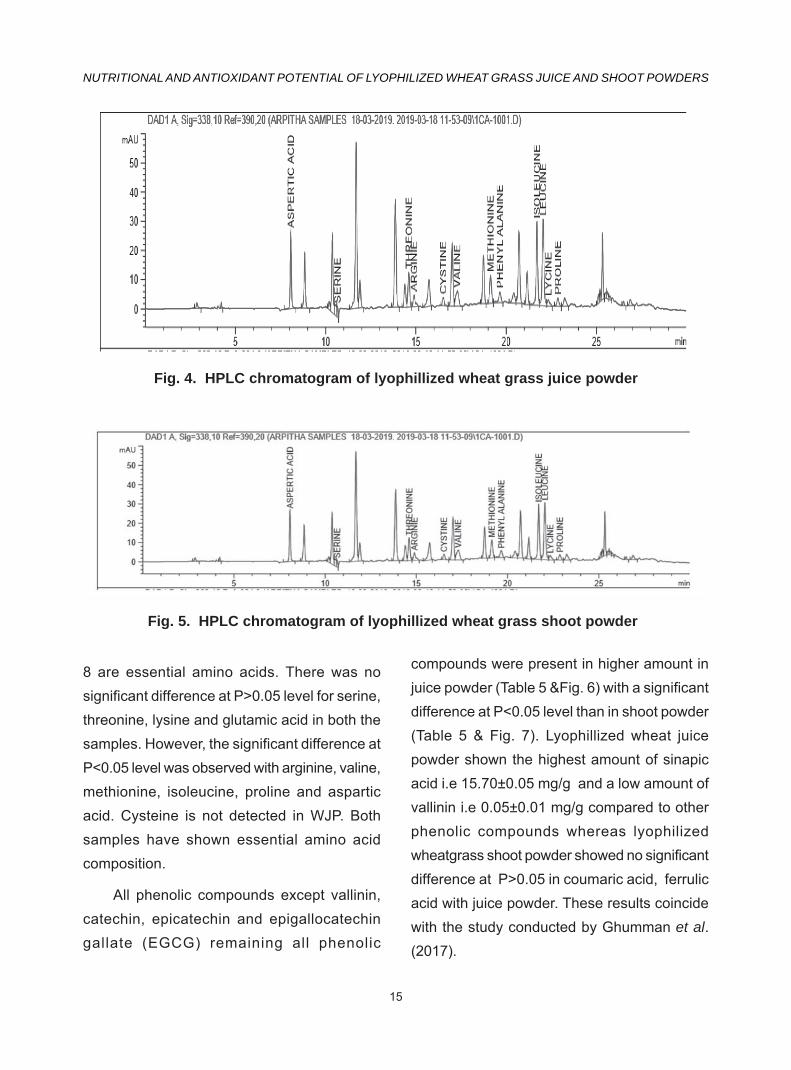
Fig. 4. HPLC chromatogram of lyophillized wheat grass juice powder
Fig. 5. HPLC chromatogram of lyophillized wheat grass shoot powder
8 are essential amino acids. There was nosignificant difference at P>0.05 level for serine,threonine, lysine and glutamic acid in both thesamples. However, the significant difference atP<0.05 level was observed with arginine, valine,methionine, isoleucine, proline and asparticacid. Cysteine is not detected in WJP. Bothsamples have shown essential amino acidcomposition.
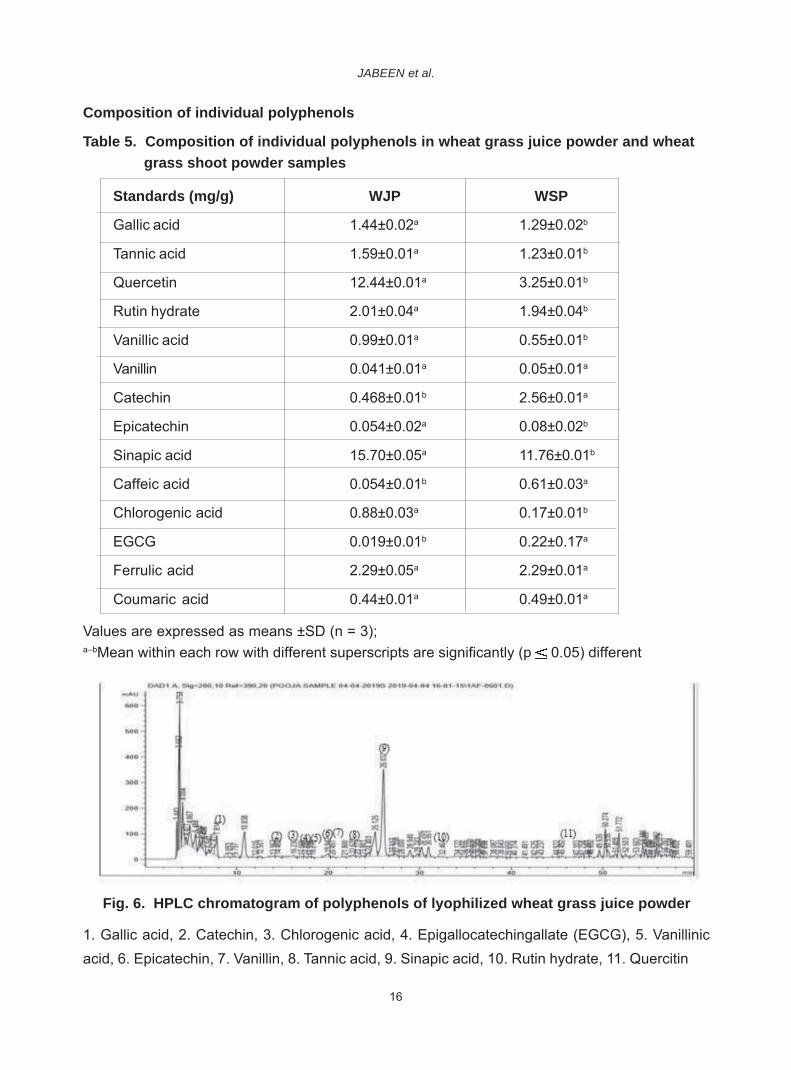
All phenolic compounds except vallinin,catechin, epicatechin and epigallocatechingallate (EGCG) remaining all phenolic
compounds were present in higher amount injuice powder (Table 5 &Fig. 6) with a significantdifference at P<0.05 level than in shoot powder(Table 5 & Fig. 7). Lyophillized wheat juicepowder shown the highest amount of sinapicacid i.e 15.70±0.05 mg/g and a low amount ofvallinin i.e 0.05±0.01 mg/g compared to otherphenolic compounds whereas lyophilizedwheatgrass shoot powder showed no significantdifference at P>0.05 in coumaric acid, ferrulicacid with juice powder. These results coincidewith the study conducted by Ghumman et al.(2017).
16
JABEEN et al.
Standards (mg/g) WJP WSP
Gallic acid 1.44±0.02a 1.29±0.02b
Tannic acid 1.59±0.01a 1.23±0.01b
Quercetin 12.44±0.01a 3.25±0.01b
Rutin hydrate 2.01±0.04a 1.94±0.04b
Vanillic acid 0.99±0.01a 0.55±0.01b
Vanillin 0.041±0.01a 0.05±0.01a
Catechin 0.468±0.01b 2.56±0.01a
Epicatechin 0.054±0.02a 0.08±0.02b
Sinapic acid 15.70±0.05a 11.76±0.01b
Caffeic acid 0.054±0.01b 0.61±0.03a
Chlorogenic acid 0.88±0.03a 0.17±0.01b
EGCG 0.019±0.01b 0.22±0.17a
Ferrulic acid 2.29±0.05a 2.29±0.01a
Coumaric acid 0.44±0.01a 0.49±0.01a
Fig. 6. HPLC chromatogram of polyphenols of lyophilized wheat grass juice powder
1. Gallic acid, 2. Catechin, 3. Chlorogenic acid, 4. Epigallocatechingallate (EGCG), 5. Vanillinicacid, 6. Epicatechin, 7. Vanillin, 8. Tannic acid, 9. Sinapic acid, 10. Rutin hydrate, 11. Quercitin
Values are expressed as means ±SD (n = 3);a–bMean within each row with different superscripts are significantly (p 0.05) different
Composition of individual polyphenols
Table 5. Composition of individual polyphenols in wheat grass juice powder and wheat
grass shoot powder samples
17
NUTRITIONAL AND ANTIOXIDANT POTENTIAL OF LYOPHILIZED WHEAT GRASS JUICE AND SHOOT POWDERS
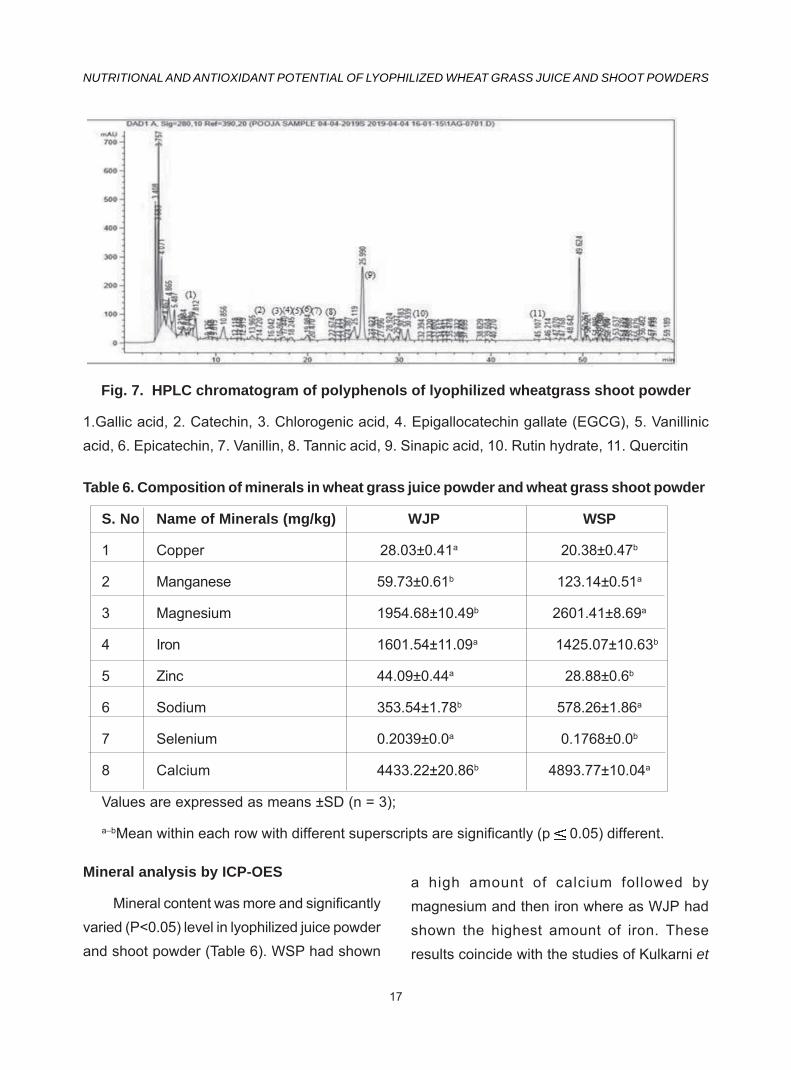
Fig. 7. HPLC chromatogram of polyphenols of lyophilized wheatgrass shoot powder
1.Gallic acid, 2. Catechin, 3. Chlorogenic acid, 4. Epigallocatechin gallate (EGCG), 5. Vanillinicacid, 6. Epicatechin, 7. Vanillin, 8. Tannic acid, 9. Sinapic acid, 10. Rutin hydrate, 11. Quercitin
Table 6. Composition of minerals in wheat grass juice powder and wheat grass shoot powder
S. No Name of Minerals (mg/kg) WJP WSP
1 Copper 28.03±0.41a 20.38±0.47b
2 Manganese 59.73±0.61b 123.14±0.51a
3 Magnesium 1954.68±10.49b 2601.41±8.69a
4 Iron 1601.54±11.09a 1425.07±10.63b
5 Zinc 44.09±0.44a 28.88±0.6b
6 Sodium 353.54±1.78b 578.26±1.86a
7 Selenium 0.2039±0.0a 0.1768±0.0b
8 Calcium 4433.22±20.86b 4893.77±10.04a
Values are expressed as means ±SD (n = 3);
a–bMean within each row with different superscripts are significantly (p 0.05) different.
Mineral analysis by ICP-OES
Mineral content was more and significantlyvaried (P<0.05) level in lyophilized juice powderand shoot powder (Table 6). WSP had shown
a high amount of calcium followed bymagnesium and then iron where as WJP hadshown the highest amount of iron. Theseresults coincide with the studies of Kulkarni et

18
JABEEN et al.
Fig. 8. Antioxidant potential of lyophilized wheat grass powders
al. (2006). Zinc and magnesium are importantfor anti-oxidant activity. Manganese acts as acofactor for super oxidase dismutase enzyme.Zinc is an activator for many plant enzymes(Zago et al., 2000) and Magnesium is thecentral element of the porphyrin ring ofchlorophyll. Studies clearly showed that Ca andMg are higher and this result coincides withstudies of Ben-Arye et al. (2002).
ANTIOXIDANT ANALYSIS
Lyophilized juice and shoot powders inrespect of antioxidant potential were shown inFig. 8 & Fig. 9. Results revealed that there was
a no significant difference at P>0.05 levelbetween the samples for DPPH activity with IC50
value 1.48±0.15 mg/g compared to shootpowder IC50 value 1.32±0.05 mg/g (Fig 9). Totalphenolic content and flavonoid content wasfound to be significantly higher (p<0.05%) i.e.
1520 mg/100 g and 627 mg/100 g respectively,in juice powder than shoot powder (Fig 8). Thereason might be due to the fact that the juicepowder was aqueous extract, hence, phenolicsand flavonoids showed better solubility andactivity. Results are in agreement with thestudies of Kulkarni et al. (2006). Phenolic
Fig. 9. DPPH activity of lyophilized wheat grass juice and shoot powders
DPPH radical scavenging activity

19
NUTRITIONAL AND ANTIOXIDANT POTENTIAL OF LYOPHILIZED WHEAT GRASS JUICE AND SHOOT POWDERS
compounds including flavonoids are mostresponsible for radical scavenging activity.These possess many hydroxyl groups includingo-dihydroxy group which has a very strongradical scavenging effect and antioxidant power.Results are consistent with the Yang et al.(2001) where it was concluded that wheat grassreached maximum antioxidant potential afterseven days of plant growth.
CONCLUSION
The qualitative phytochemical analysis oflyophilized wheatgrass juice powder and shootpowder showed the presence of a wide rangeof phytochemical constituents. Proximateanalysis, HPLC analysis of individualpolyphenols shown better results in juicepowder than shoot powder. However, HPLCanalysis of water-soluble vitamins of lyophilizedwheatgrass juice powder shown good essentialamino acid composition. Results of antioxidantanalysis clearly revealed the high antioxidantactivity of juice powder. Wheatgrass juicepowder has better nutritional properties withmore bioactive components and it can be usedto design functional food products which canbe used to enhance the health benefits ofconsumer.
ACKNOWLEDGEMENTS
Authors acknowledge Dr.Harikrishna,Scientist, Department of Genetics and PlantBreeding ICAR-Indian Agricultural ResearchInstitute (IARI), New Delhi for providing samplesthroughout the research and Defence FoodResearch Laboratory, Mysuru, India forsupporting this study.
REFERENCES
Alitheen, N.B, Oon C.L, Keong, Y.S, Chuan, T.K,H.K and Yong, H.W. 2011. Cytotoxiceffects of commercial wheatgrass andfibre towards human acute promyelocyticleukaemia cells (HL60). Pakistan Journalof Pharmaceutical Sciences. 24(3): 243-250.
Anand Rojoria 2015. Phytochemical analysisand estimation of major bioactivecompounds from Triticum aestivumL.grass with antimicrobial potential.Pakistan Journal of Pharmacy. 28(6):2221-2225.
Association of Official Agricultural Chemists.(AOAC). 2005. Official Methods ofAnalysis, 18th Edition. Washington, DC.pp. 256.
Ayoola, G.A, Coker, H.A.B., Adesegun, S.A,Adepoju-Bello, A.A, Obaweya, K, EzenniaE.C and Atangbayila. 2008. Phyto-chemical screening and antioxidantactivities of some selected medicinalplants used for malaria therapy in SouthWestern Nigeria. Tropical Journal ofPharmaceutical Research. (7):1019-1024.
Bar-sela, G, Tsalic, M, Fried, G and Goldberg,H. 2007. Wheat grass juice may improvehematological toxicity related tochemotherapy in breast cancer patients.A pilot study. Journal of Nutrition andCancer. 58: 43-48.

20
JABEEN et al.
Calzuola, I., Marsili,V and Gianfranceschi,G.L.2004.Synthesis of antioxidants inwheat sprouts. Journal of Agriculture andFood Chemistry. 52: 5201-5206.
Chauhan, M. 2014. A pilot study on wheat grassjuice for its phytochemical, nutritional andtherapeutic potential on chronic diseases.International Journal of Chemistry. 2(4):27-34.
Dey, S., Sarkar, R. Ghosh, P, Khatun, R., GhoraiK, Choudhari, R, Ahmad, R, Gupta, P andMukopadhya, A. 2006. Effect of wheatgrass juice in supportive care of terminallyill cancer patients-A tertiary cancer centreexperience from India. Journal of ClinicalOncology ASCO meeting proceedingsPart I. 18(1):8634.
Dhawliwal, H. S., Sharma, N, Bano, A, Kumar,S and Sharma V. 2015.Non–Enzymaticassay based in vitro Antioxidant Activityand Phytochemical screening of Freeze-dried wheat seedlings juice powder.Nature´s Finest Medicine-Part-II. Inter-national Journal of Chemistry. 6(9):4036-46.
Endo, Y, Usuki, R and Kaneda, T. 1985. anti-oxidant effects of chlorophyll andpheophytin on the auto-oxidation of oil inthe dark. The mechanism of oxidativechlorophyll. Journal of the American OilChemist’s Society. 62:1387-1390.
Falconi.G., Calzuola L.M, Marsilli. V andGianfranceschi, G.2002. Antioxidantactivity of wheat sprout extraction vitro:
inhibition of DNA oxidative damage.Journal of Food Science. 67: 2918-2922.
Garima Shakya, Sankar Pajaaniradje,Muddasarul Hoda, Varalakshmi Durairaj,Rukkumani Rajagopalan. 2014. GC-MSanalysis, in vitro antioxidant and cytotoxicstudies of wheat grass extract. AmericanJournal of Phytomedicine and ClinicalTherapeutics. (7):877-893.
Ghumman A., Narpinder Singh and AmritpalKaur. 2017. Chemical, nutritional andphenolic composition of wheat grass andpulse shoots. International Journal of FoodScience and Technology. pp.1-10.
Ghumman, A., Kaur, A and Singh, N .2016.Impact of germination on flour, protein andstarch characteristics of lentillns culinarisand hoarse gram (Macrotylo mauniflorum
L.) lines. International Journal of FoodScience and Technology.65:137-144.
Hartl, A.W and Stenzel, R. 2007. Developmentof a method for the determination ofcitrinin in barley, rye and wheat by solidphase extraction on amino propylcolumns and HPLC-FLD. MycotoxinResearch journal. 23:127-131.
Hiscox, J.D and Israelstam, G.F.1979.A methodfor the extraction of chlorophyll from leaftissue without maceration. CanadianJournal of Botany. 57.1332-1334.
Kamat, J.P. Boloor, K, K and Devasagayam, T,P. 2000. Chlorophyllin as an effectiveantioxidant against membrane damage invitro and ex vivo. Biochimicia et Bio-Physica Acta Journal. 1487. 113-127.
21
NUTRITIONAL AND ANTIOXIDANT POTENTIAL OF LYOPHILIZED WHEAT GRASS JUICE AND SHOOT POWDERS
Kokate, C. K, Purohit, A.P and Gokulae,S.B.2001. Text book of Pharmacognosy.Nirali Prakashan Publications, New Delhi,India. pp.21-28.
Kulkarni S. D, Acharya, R., Nair, A.G.C, RajurkurN.S and Reddy A.V.R. 2006. Determina-tion of elemental concentration profiles intender wheat grass using instrumentationneuron activation analysis. Food Che-mistry. 95:699-707.
Lanfar-Marquez, U., Barros, R and Sinnecker,P. 2005. Antioxidant activity of chlorophyllsand their derivatives. Food ResearchInternational. 38:885-891.
Makkar H.P.S. 2003.Effect of fate of tannins inruminant animals. Adaptation of tanninsand strategies to overcome detrimentaleffects of feeding tanning rich feeds.Small Ruminant Research Journal.49(3):241-256.
Marwaha, R.K., Bansal, D., Kaur, S and Trehan,A. 2004. Wheat grass juice reduces thetransfusion requirement in patients withThalamessia. A major pilot study. IndianPaediatrics.41:716-720.
Matthew, S., Wheal, Teresa, O., Fowles andLyndon T. Palmer. 2011. A cost-effectiveacid digestion method using closedpolypropylene tubes for inductivelycoupled plasma optical emissionspectrometry (ICP-OES) analysis ofplant essential elements. AnalyticalMethods. 3: 2854–2863.
Nazmul Hasan, Md., Akhtaruzaman, M and Md.Zakir Sultan. 2013. Estimation of VitaminsB-Complex (B2, B3, B5 and B6) of someleafy vegetables indigenous toBangladesh by HPLC Method. Journal ofAnalytical Sciences, Methods andInstrumentation. (3): 24-29.
Rajesh, M and Ramesh, B. 2011. A study onwheat grass and its nutritional value.Journal of Food Science and QualityManagement.2:1-8.
Rattanamanee Chomchan, Sunisasiripongvu-tikorn, Panupongputtarak and RungtipRattanapon. 2016. Investigation ofphytochemical constituents, phenolicsprofiles and antioxidant activities of ricegrass compared to wheat grass juice.Journal of Functional Foods and HealthDiseases. 6 (12): 822-835.
Ross, K.A., Beta, T Arntfild and S.D .2009. Acomparative study on the phenolic acidsidentified and quantified in dry beans usingHPLC as affected by different extractionand hydrolysis methods. Journal of FoodChemistry.113: 336-344.
Schwarz, K. Bertelsen, G. Nissen, L.R, Gardner,P.T, Heinonen, M, I, Hopia, A, Huynh-BaT, Lambelet P, Mc Phail, D, Skibsted, L.Hand Tijburg, L. 2001.Investigation of plantextracts for the protection of processedfoods against lipid oxidation. Comparisionof antioxidant assays based on radicalscavenging. Lipid oxidation and analysisof the principal antioxidant compounds.
22
JABEEN et al.
Europian Food Research Technology.212: 319-328.
Singh, N., Verma, P and Pandey, B. R.2012.Therapeutic potential of organic Triticum
aestivum Linn (wheat grass) in preventionand treatment of chronic diseases- Anoverview. International Journal ofPharmaceutics Sciences and DrugResearch. 4:10-14.
Smith, B.H. 2000. Generalization of spatiallyvariant apodization to non-integral Nyquistsampling rates. IEEE Trans imageprocess. Journal of Pain. 9:1088-1093.
Suriyavathana, M., Roopavathi, I. and Vinu-vijayan. 2015. Phytochemical characteri-zation of triticum aestivun Journal ofPharmacognosy and Phytochemistry.5(1):283-286.
Suriyavathana, M. and Roopavathi, I. 2016.Evaluation of antioxidants level in Triticum
aestivum. Journal of Medical PlantsStudies. 4(5): 18-23.
Swathi, P., Sushma, D., Indira, R and Alka GandMamta, D.2010. Multitude potential ofwheat grass juice (green blood): AnOverview Chronicle of Young Scientists.1(2):23-28.
Thompson, L.U.1994. Antioxidants andhormone-mediated health benefits ofwhole grains. Critical Reviews in FoodScience Nutrition. 34: 473-97.
Varalakshmi Durairaj, Muddasarul Hoda,Garima Shakya, Sankar PajaniradjePreedia Babu, Rukkumani Rajagopalan.2014. Phytochemical screening andanalysis of antioxidant properties ofaqueous extract of wheat grass. AsianPacific Journal of Tpropical Medicine.7(1):S398-S404.
Walters, R. 1992. The alternative cancer therapybook. New York: Avery Publishing Group.pp. 299-308.
Yang F, Basu T; K, and Ooraikul B.2001.Studieson germination conditions and antioxidantcontent of wheat grass. InternationalJournal of Food Science Nutrition. 52:319-330.
Zago M. P., Verstraetan, S. V and Oteiza, P.I.2000.zinc in the prevention of Fe 2+initiated lipid and protein oxidation.Biological Research journal. 33.143-150.
Zang, Z-Q, Xiang, J-J and Zhou, L-M; 2015.Antioxidant activity of three componentsof wheat grass leaves, ferulic acid,flavonoids and ascorbic acid. Journal ofFood Science and Technology. 52(11):7297-7304.
Zhishen, J., Mengcheng, T and Jianming.1999.The determination of flavonoid contentsin mulberry and their scavenging effectson superoxide radicals. Journal of FoodChemistry. 64: 555-559.

23
POST- HARVEST PROCESSING OF IRRADIATION ON QUALITY PARAMETERS OF MUSHROOMSJ. Res. ANGRAU 47(4) 1-11, 2019
POST- HARVEST PROCESSING OF IRRADIATION ON QUALITYPARAMETERS OF MUSHROOMS
B. KALYANI* and K. MANJULADivision of Food Technology, Department of Home Science,
S.V.University, Tirupati-517502
Date of Receipt: 21.3.2020 Date of Acceptance: 22.5.2020
ABSTRACT
Effect of irradiation at different doses on shelf life and quality parameters of mushrooms was studied
during 2015-17. Irradiation was done by using gamma irradiation at 0.25 kGy and 0.75 kGy doses. Results of
the study revealed that PLW, colour(L*, a* and b* values), moisture and fibre in mushrooms were significantly
reduced among non-irradiated. Whereas, slight but insignificant changes were noticed in moisture, carbohydrate,
fibre and protein content of irradiated mushrooms at 0.25 kGy. Sodium content and potassium content of
mushrooms was significantly increased in all the samples.Gamma irradiation of mushrooms maintained the
overall quality without determinant to their physico-chemical quality along with increased shelf life of mushrooms.
Key Words: Mushroom, Irradiation, Shelf life, Food Processing, Agriculture, Quality
*Corresponding Author E-mail : [email protected]; Ph.D. thesis submitted to S.V. University, Tirupati
India is the second largest producer of
fruits and vegetables in the world. A vegetable
crop plays an important role in Indian agriculture
due to their short duration nature, high yields,
nutritional richness, economic viability and
ability to generate on-farm and off-farm
employment. Post-harvest losses are high in
fruits and vegetables (20-40%) (Vanitha et al.,
2013).Hence, processing is very important to
extend the shelf life, bythis thefarm produce can
be preserved. Food preservation is an action
or a method of maintain foods at a desired level
of properties or nature for obtain maximum
benefits. The principal method of preservation
is based on inhibition, inactivation and avoiding
recontamination (Rahman, 2007). The process
is currently moving from an art to an
interdisciplinary science.
Innovative technologies in preservation are
being developed in food processing industry that
can extend shelf life; minimize risk can improve
sensory,functional, and nutritional properties
and environment friendly. The search was ever
on for newer methods of food preservation with
the least change in nutritional composition and
sensory qualities. Irradiation is one of the latest
methods in food preservation.Food irradiation
technology has unique merits over conventional
methods of preservation as this process does
not lead to loss of flavour, odour, texture, and
freshness. Food irradiation promises to offer
effective means for minimizing these losses,
thereby increasing the availability and
stimulating exports. Export development
authorities, food industry, farmers, commodity
boards, traders, and exporters of agricultural
J. Res. ANGRAU 48 (2) 23-33, 2020
24
KALYANI and MANJULA
produce can be benefited by the use of radiation
processing technology. The application of low
dose irradiation can be effectively used to extend
the shelf life of some fruits and vegetable
produce by delaying ripening and/or sprouting
and also minimize the nutritional losses by
controlling microorganisms (Farzana, 2006).
Mushrooms which belong to the fungi
kingdom, has much awareness as food among
all segments of population and also possess
the functional properties. Button Mushroom
(Agaricus bisporus) is the popular variety,
fetches high price, still dominating the Indian
and International market. It contributes about
90% of total countries production and its global
share of about 40%. Due to huge functional
benefits, its demand and consumption is
increasing day to day among the consumers.
Mushrooms are the only vegetative source of
vitamin D, which is very important for normal
bodily functions and especially regarding the
deposition of calcium in bones. They are most
perishable in nature possessing 85%-95% of
moisture; because of this high moisture its shelf
life becomes a major problem for the
storage.Presently, mushroom has been
recognized universally as a highly nutritive food
and is getting more importance as medicinal/
functional food.The nature of Button
mushrooms are very delicate and have a short
shelf life of 3 to 5 days at 20C and around 1 to 2
days under ambient conditions which is an
impediment to the distribution and marketing of
the fresh produces. Because of the perishable
characteristic of mushroom there is a need to
increase the shelf life (Okechukwu et al., 2011).
With the gamma irradiation processing the
quality and quantity of bioactive components
was enhanced and also increases the shelf life
of mushrooms. The research was mainly
aimed to study the effect of Gamma Radiation
processing on physical and nutritional
parameters of mushroom (2015-17).
MATERIAL AND METHODS
Sample collection - The fresh mature
mushrooms (Agaricus bisporus) free from
physical defects were obtained from
commercial mushroom growers at Hyderabad.
Immediately after harvesting, mushrooms were
cleaned and then packed in high density
polyethylene covers each with 200g due to light
weight and also to avoid the damage of
mushrooms during processingandstorage.
Irradiation Process - In this study
mushrooms were irradiated by the use of
Gamma (d) Irradiation chamber unit at Quality
control lab, ProfessorJayashankar Agricultural
University, Hyderabad. The source for the
radiation processing was cobalt -60. In the
study, the low dose levels (0.25 kGy and 0.75
kGy) were employed to irradiate Mushrooms to
know the effect of radiation processing. Physical
parameters-The physiological loss in weight
(PLW) is the main sign of quality indicator and
loss in weight is the major factor which affects
the fruit or vegetable quality and quantity during
storage.Mushrooms the colour itself indicates
the quality because of its sensitivity to colour.
PLW : PLW was determined by periodical

25
POST- HARVEST PROCESSING OF IRRADIATION ON QUALITY PARAMETERS OF MUSHROOMS
weighing of mushroom samples and calculated
by dividing the weight change during storage
by the initial weight.Colour:The colour of
mushrooms was analyzed by using the Colour
- Hunter lab manual for Colour Flex
spectrocolourimeterMaster colour data
(CEILAB 10 /D65). In colour measurement, the
L* value indicates Lightness, a* indicates hue
and b* indicates the value of brightness of the
samples.Proximate analysis - Proximate
analysis provides information on the nutritional
and biochemical composition. The proximate
analysis was analysed by using standard
analytical protocols and procedures. The
moisture, fibre and protein content were
estimated by standard methods AOAC (2005).
The carbohydrate content was estimated by the
standardprocedure (Raghuramulu et al., 1983).
Minerals - Potassium and Sodium were
estimated in mushrooms by the standard
testing method followed by Ranganna (2001).
Experimental period : The analysis was
analysed at initially (Initial phase) and at the
end of the experimental period (Final phase).
The irradiated mushrooms at 0.25 kGy (I1), 0.75
kGy (I2) and non-irradiated mushrooms (NI)
were stored for a period of 21 days. The results
of the study were compared among the initial
and final phase of the experiment.
The statistical analysis was completed by
using SPSS-20 version. The control and
experimental samples was analyzed by using
the paired sample test, ANOVA (repeated
measures mixed model ANOVA).
RESULTS AND DISCUSSION
Physical parameters of mushrooms -
The physical parameters include the
physiological loss in weight and colour in terms
of L*(lightness), a*(hue) and b* (brightness)
was observed in non-irradiated and irradiated
mushroomsduring the experimental period.
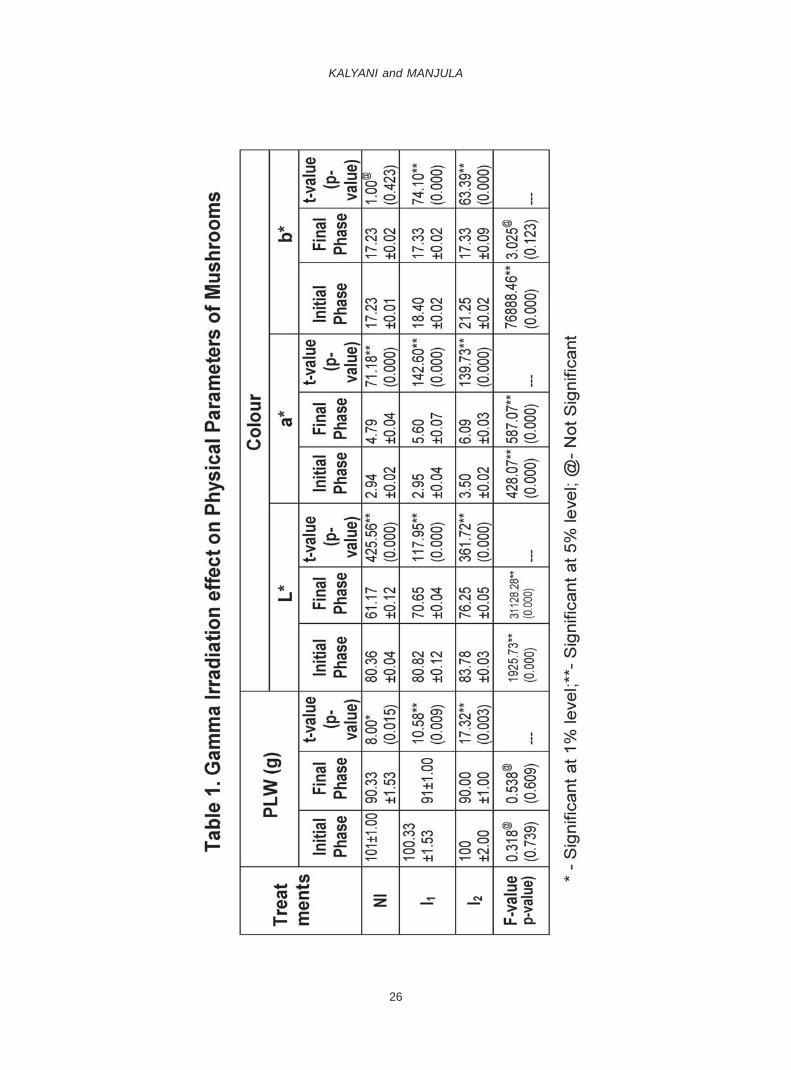
PLW- The results (Table 1) revealed that
there was a slight decrease in weight of
mushrooms irradiated at 0.25 kGy and 0.75 kGy
when compared to non-irradiated mushrooms.
The PLW in non-irradiated samples of
mushroom was more from initial to final phase
(100g to 90.33g) of the experimental period
compared to the mushrooms irradiated at 0.25
(100.33g to 91g) and 0.75 kGy (100g to 91g).
The statistical analysis show a significant
difference in PLW of all the samples from initial
to final phase of experimental period.
Storage losses of fresh produce in India
are high due to high temperature and humidity.
Respiration is the main metabolic sequence
sensitive to alteration in temperature.
Mushrooms are one of the most perishable
vegetable and lost its quality immediately after
harvest.The weight difference of Mushrooms
was due to mainly evaporation of water from
the fruit or vegetable surface as a result of
respiration, transpiration rate and Co2 loss
during respiration (Mami et al., 2013).
26
KALYANI and MANJULA
27
POST- HARVEST PROCESSING OF IRRADIATION ON QUALITY PARAMETERS OF MUSHROOMS
These results are in accord with the
findings reported by Fernandes et al. (2012).
The effect of the irradiation on physical
parameters of Lactarius delicious a wild edible
mushroom, pertaining to weight loss profiles
during eight days of storage were similar in
irradiated and non-irradiated samples
(Fernandes et al., 2012). The PLW was mainly
due to evaporation of water from surface of
vegetable as aeffect of respiration and
transpiration rate during storage.
Colour- Whiteness of mushrooms is often
used as important index of visible quality as
rapid discolouration occur after harvest
(Gormely, 1975).The gamma irradiation
affected the lightness (L* value), hue (a*) and
brightness (b * value) of colour, which were
increased immediately in irradiated samples
when compared with non-irradiated samples.
The colour values L*, a*, and b* were
statistically significant between non-irradiated
and irradiated samples instantly after irradiation.
The maximum increase was noticed in
mushrooms irradiated at 0.75 kGy followed by
0.25 kGy and non-irradiated samples. During
the storage period of mushrooms rapid changes
occurred in colour (L*, a* and b*) values. The
lightness of mushrooms was increased
(decrease of L* Value) in the non-irradiated and
irradiated samples. The a* value (hue) was also
increased in non-irradiated and irradiated
samples of mushrooms from initial to final
phase of experimental period whereas the
brightness (b* Value) was decreased from initial
to final phase (Table1) in all samples during the
experimental period.A significant difference was
observed in L* Value (brightness) and a * Value
(hue) among non-irradiated and irradiated
samples of mushrooms. No significant
difference was observed in b* value (brightness)
of mushrooms among the treated and non-
treated samples during the experimental period.
Most of the researchers agree that
irradiated mushrooms retain their original skin
colour for longer periods or darken less rapidly
than non-irradiated samples (Fernandes et al.,
2012). The increase of L* value indicate the
whiteness of mushrooms, a* value is for hue
and b* value indicates brightness of
mushrooms. The colour L*, a* and b* values
might be related to a secondary effect of water
radiolysis, which results in the production of
chemical kinds such as hydrated electrons,
hydroxide radicals or hydrogen atoms might
oxidize colour compounds such as carotenoids
(Kim et al., 2008). The colouration change in
mushrooms upon irradiation is still the subject
of some controversies. The colour values L*,
a* and b* of mushrooms was improved by
irradiation process. The mushrooms irradiated
at 0.75 kGy shows most effective in retention
of colour compared to non-irradiated sample.
The irradiation process inhibits the polyphenol
oxidase which condenses to form the brown
melanin pigments, hence improving the
appearance and colour.
Nutrient analysis of mushrooms
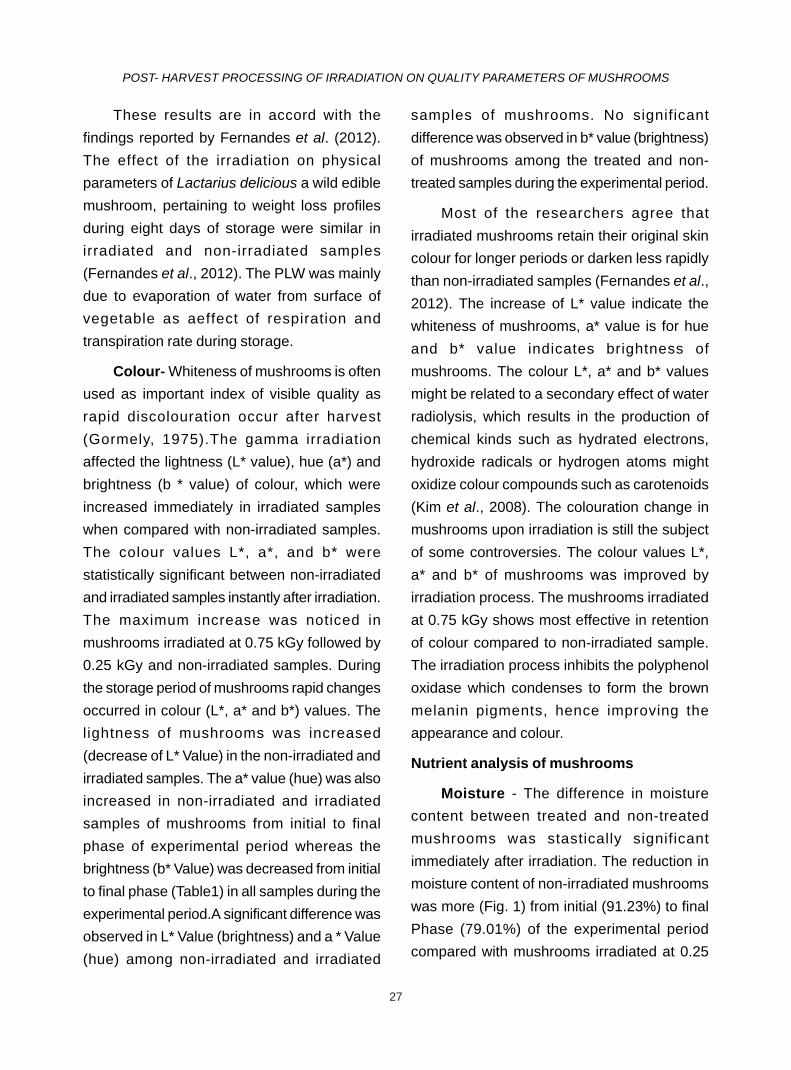
Moisture - The difference in moisture
content between treated and non-treated
mushrooms was stastically significant
immediately after irradiation. The reduction in
moisture content of non-irradiated mushrooms
was more (Fig. 1) from initial (91.23%) to final
Phase (79.01%) of the experimental period
compared with mushrooms irradiated at 0.25
28
KALYANI and MANJULA
kGy (92.20% to77.42%) and 0.75 kGy (92.00%
to 77.53%). The statistical analysis showed a
significant difference in moisture content of all
samples from initial to final phase of
experimental phase as well as between non-
treated and treated mushrooms among the
irradiated samples at 0.25 kGy and 0.75 kGy
moreover, no significant difference was
observed in moisture content. The reason for
increase in moisture content was that ionizing
radiations has a direct effect on matter due to
ionization or excitation of its molecules by
quanta of radiation. However, it also has an
indirect effect produced by radiolysis of nature
which thenreact with the molecule of the
irradiated substance. When the water content
is low, changes depends mainly on the direct
effect of radiation, but when the moisture
increases, the importance of the indirect effect
increases progressively.
Wild mushrooms were subjected to
different processing methods (fresh, frozen and
dried) and subjected to gamma irradiation at 0,
0.5, 1.0 kGy. The moisture content among the
gamma irradiation doses (0, 0.5, 1.0 kGy)
decreased immediately after the radiation
process but no significant difference was
observed (Fernandes et al., 2014). The
irradiation process did not affect moisture
percentage in mushrooms; the maximum
retention was observed in 0.75 kGy irradiated
mushrooms. The results indicate a positive
influence of irradiation on the respiratory
behaviour of vegetable during long term storage
of low temperature.
Fibre- The slight reduction in fibre content
of mushrooms samples irradiated at 0.25 kGy
and 0.75 kGy when compared to non-irradiated
mushrooms. Among irradiated mushrooms, the
decrease in fibre content was more in 0.25 kGy
(0.98%) than 0.75 kGy (1.35%) irradiated
sample when compared to non-irradiated
mushrooms (1.49%). The fibre content in non-
treated mushrooms exhibit slight reduction
(Fig. 1) from initial (1.49%) to final (1.43%) phase
of the experimental period compared to
mushrooms treated at 0.25 (0.98% to 0.93%)
and 0.75 kGy (1.35% to 1.31%). The statistical
analysis showed a significant difference in
fibrecontent of non-irradiated sample, whereas,
no significant difference was observed in treated
(0.25 kGy and 0.75 kGy) samples from initial to
final phase of experimental period.
Fibres are generally stable to processing,
29
POST- HARVEST PROCESSING OF IRRADIATION ON QUALITY PARAMETERS OF MUSHROOMS
storage and cooking, but may lose in peeling
and other removal steps during processing. The
loss in fibre may be attributed to thermally
induced hydrolysis of complex carbohydrates
within the cell wall (Rickman et al., 2007). Fibre
content in mushrooms was found to be slightly
affected by irradiation processing during the
experimental period. However, the decrease of
fibre was noticed, minimum loss was
observedamong irradiated mushrooms at 0.75
kGy followed by other samples.
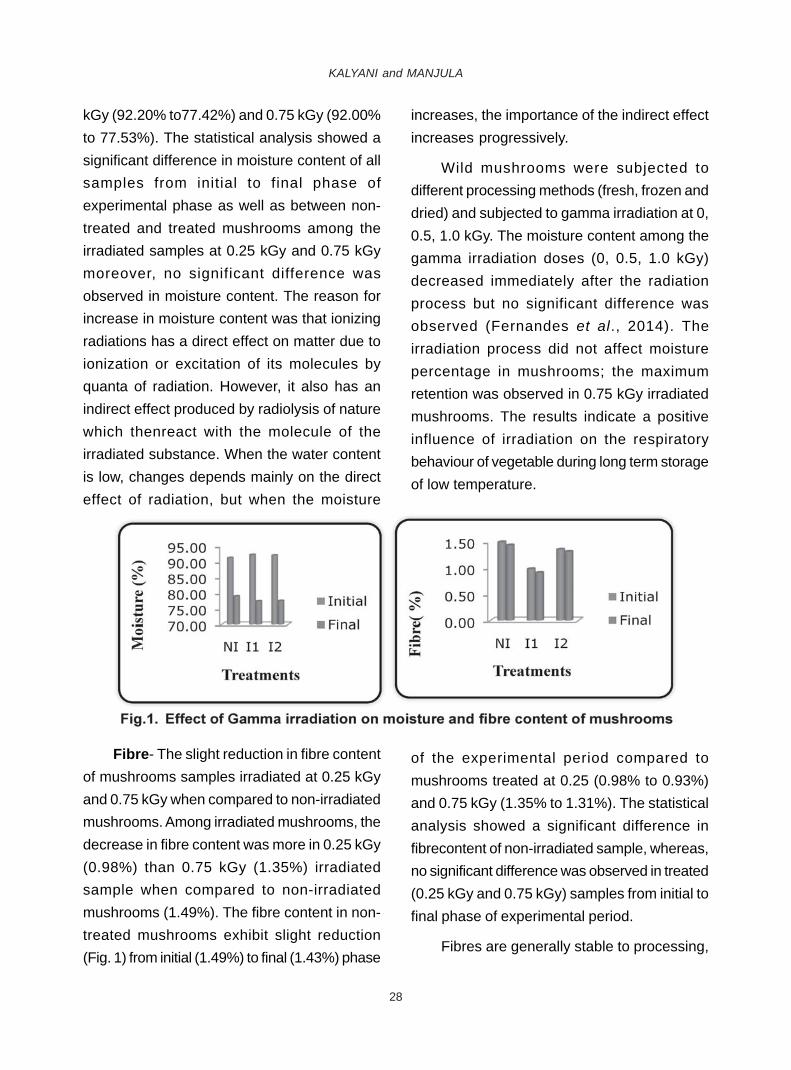
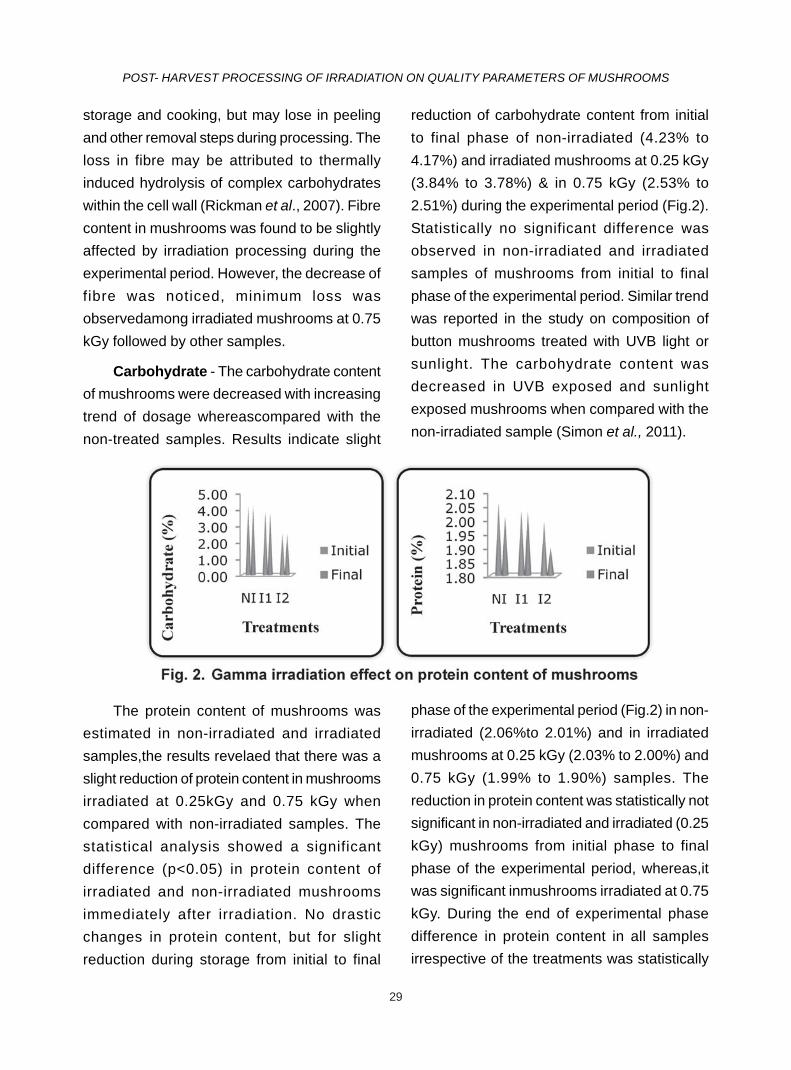
Carbohydrate - The carbohydrate content
of mushrooms were decreased with increasing
trend of dosage whereascompared with the
non-treated samples. Results indicate slight
reduction of carbohydrate content from initial
to final phase of non-irradiated (4.23% to
4.17%) and irradiated mushrooms at 0.25 kGy
(3.84% to 3.78%) & in 0.75 kGy (2.53% to
2.51%) during the experimental period (Fig.2).
Statistically no significant difference was
observed in non-irradiated and irradiated
samples of mushrooms from initial to final
phase of the experimental period. Similar trend
was reported in the study on composition of
button mushrooms treated with UVB light or
sunlight. The carbohydrate content was
decreased in UVB exposed and sunlight
exposed mushrooms when compared with the
non-irradiated sample (Simon et al., 2011).
The protein content of mushrooms was
estimated in non-irradiated and irradiated
samples,the results revelaed that there was a
slight reduction of protein content in mushrooms
irradiated at 0.25kGy and 0.75 kGy when
compared with non-irradiated samples. The
statistical analysis showed a significant
difference (p<0.05) in protein content of
irradiated and non-irradiated mushrooms
immediately after irradiation. No drastic
changes in protein content, but for slight
reduction during storage from initial to final
phase of the experimental period (Fig.2) in non-
irradiated (2.06%to 2.01%) and in irradiated
mushrooms at 0.25 kGy (2.03% to 2.00%) and
0.75 kGy (1.99% to 1.90%) samples. The
reduction in protein content was statistically not
significant in non-irradiated and irradiated (0.25
kGy) mushrooms from initial phase to final
phase of the experimental period, whereas,it
was significant inmushrooms irradiated at 0.75
kGy. During the end of experimental phase
difference in protein content in all samples
irrespective of the treatments was statistically
30
KALYANI and MANJULA
significant (p<0.01). The results are in line with
Mami et al.(2013) who carried out a study on
improvement of shelf-life and postharvest
quality of white button mushroom by 60Co γ-ray
irradiation.
The differences in proximate composition
were due to degradation reactions such as
scissions of the C-N bonds in the backbone of
polypeptide chain. The dose dependent
irradiation has been attributed to de-
polymerization and delignification of the plant
matrix (Bhat et al., 2009). This might be reason
for the slight variation in carbohydrate, fibre and
protein content of the mushrooms initially.
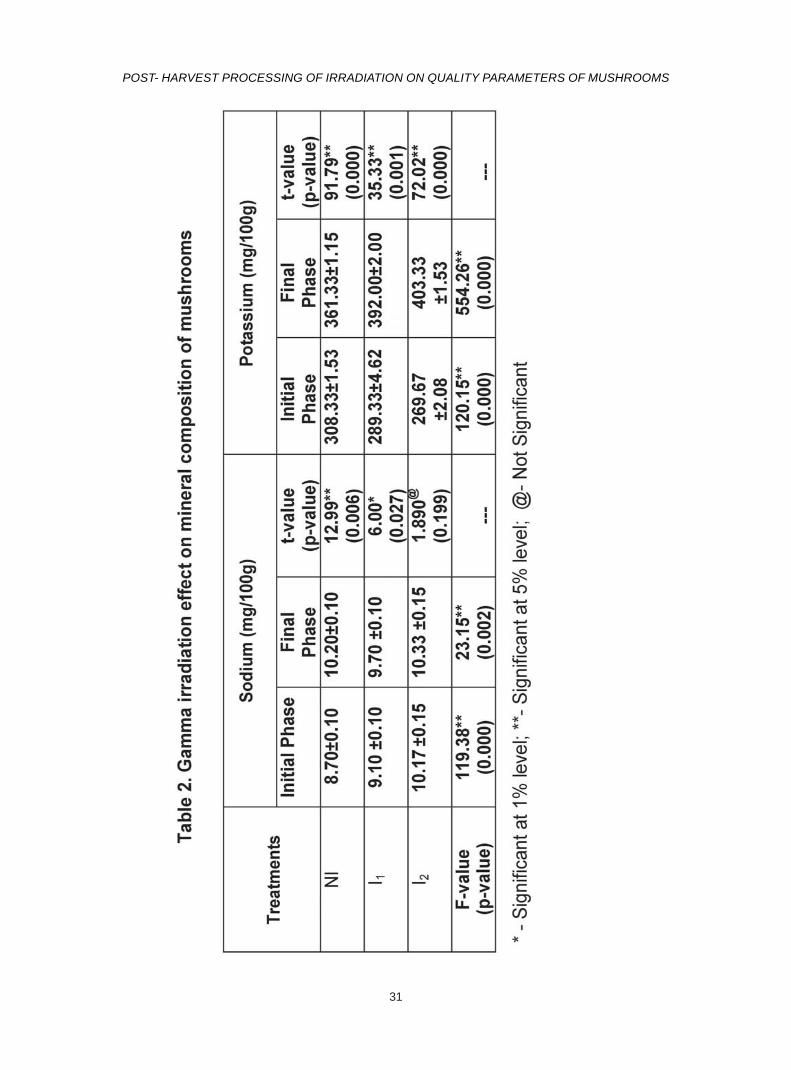
Minerals
Initially the sodium content increased in
mushrooms irradiated at 0.25kGy and 0.75 kGy
with the increase of dose levels. The change in
sodium and potassium content in mushrooms
was found to be significant among non-treated
and treated samples.The increasing trend in
sodium content from initial phase to final phase
of the experimental period was high in non-
irradiated mushrooms (8.70mg to 10.20mg)
than in mushrooms irradiated at 0.25 (9.10mg
to 9.70mg) and 0.75 kGy (10.17mg to 10.33mg).
A considerable increase of potassium levels
was noticed in non-irradiated sample
(308.13mg to 361.33mg), followed by
mushrooms irradiated at 0.25kGy (289.33mg
to 392.08mg) and 0.75 kGy (269.67mg to
403.33mg) from initial to final phase of the
experimental period. The sodium content was
more in non-treated mushrooms, whereas,
potassium content was more in treated
mushrooms from initial to final phase of the
experimental period (Table 2).
The nutritional quality of minerals in food
depends on their quality as well as their bio
availability. The bio availability of key minerals
is significantly affected by the fibre, phytic acid
and tannin content of foods. The minerals
content of food is influenced by chemical
stability, extent of processing, environmental
factor, and the form in which foods are delivered
also can impact their stability.The effect of
physicochemical and functional properties of
lotus seed flour exposed to low and high doses
of gamma radiation (0-30 kGy) was observed
(Bhat et al., 2009),which showed a slight
decrease of sodium levels and no change in
potassium levels. Wyatt and Ronan (1983)
conducted a study on effects of processing on
the sodium: potassium and calcium:
phosphorus content in foods and concluded that
processing had a significant effect on the
potassium and sodium content in canned
peaches. Blanching process caused a
significant increase in sodium and potassium
content. However, there were no abundant
studies available on the effect of radiation
processing on the mineral content.
Generally, minerals do not degrade on
irradiation, however, a change in their oxidation
state might occur. The mineral concentrations
might naturally be present between each
individual sample. The possible reason for
decrease of some minerals might be due to the
presence of certain antinutrients at higher
concentrations that could have increased on
irradiation and possibly be capable of chelating
the minerals cations, forming insoluble
complexes leading to reduced bio availability of
trace minerals.
31
POST- HARVEST PROCESSING OF IRRADIATION ON QUALITY PARAMETERS OF MUSHROOMS
32
KALYANI and MANJULA
The actual mechanism for decrease in
some minerals is still incomprehensible, which
needs further investigation. The mineral content
of mushrooms is influenced by chemical
stability, extent of processing and environmental
factors.
CONCLUSION
Mushrooms irradiated at 0.25 kGy was
least affected in PLW, colour, moisture,
protein,fibreand carbohydrate content than at
0.75 kGy.The irradiation process did not affect
moisture percent in mushrooms, the maximum
retention was observed in 0.75 kGy irradiated
mushrooms, the decrease in carbohydrate,
fibrecontent and in protein content in irradiated
mushrooms was due to degradation reactions
such as scissions of the C-N bonds in the
backbone of polypeptide chain. The irradiation
of mushrooms increases the mineral content.
Usually minerals do not degrade on irradiation,
but a change in their oxidation state might occur.
This study revealed that gamma irradiation in
low doses has satisfactorily increase the shelf
life of foods.
REFERENCES
AOAC International. 2011. Official Methods of
Analysis of AOAC International. AOAC
International. pp. 25-35.
Bhat, R., Sridhar, K.R., Karim, A.A., Young, C.C
and Arun, A.B. 2009. Influence of γ-radiation
on the nutritional and functional qualities
of lotus seed flour. Journal of Agricultural
and Food Chemistry. 57(20):9524-9531.
Farzana, P. 2006. Post-harvest technology of
fruits and vegetables. Eco Service
International, USA.pp.14-15.
Fernandes, A., Antonio, A.L., Barreira, J.C.,
Oliveira, M.B.P., Martins, A and Ferreira,
I.C. 2012. Effects of gamma irradiation on
physical parameters of Lactarius
deliciosus wild edible mushrooms.
Postharvest Biology and Technology.
74:79-84.
Fernandes, A., Barreira, J.C., Antonio, A.L.,
Oliveira, M.B.P., Martins, A and Ferreira,
I.C. 2014. Effects of gamma irradiation on
chemical composition and antioxidant
potential of processed samples of the wild
mushroom Macrolepiota procera. Food
Chemistry. 149:91-98.
Kim, J.W., Lee, B.C., Lee, J.H., Nam, K.C and
Lee, S.C. 2008. Effect of electron-beam
irradiation on the antioxidant activity of
extracts from Citrus unshiu pomaces.
Radiation Physics and Chemistry.
77(1):87-91.
Mami, Y., Peyvast, G., Ziaie, F., Ghasemnezhad,
M and Salmanpour, V. 2013. Improvement
of shelf-life and post-harvest quality of
white button mushroom by 60Co gamma-
ray irradiation. Plant Knowledge Journal.
2(2):1.
Mami, Y., Peyvast, G., Ziaie, F., Ghasemnezhad,
M and Salmanpour, V. 2014. Improvement
of shelf life and post-harvest quality of white
button mushroom by electron beam
irradiation. Journal of Food Processing and
Preservation. 38(4):1673-1681.
Okechukwu, R.L., Okereke, J.N.,Onyedineke,
N.E and Obi, R.K. 2011. Microbial and
nutritional qualities of mushroom. Asian
Journal of Experimental and Biology
Science. 2:746-749.
33
POST- HARVEST PROCESSING OF IRRADIATION ON QUALITY PARAMETERS OF MUSHROOMS
Raghuramulu, N., Nair, M.K and Kalyan
sundaram, S. 1983. A manual of laboratory
techniques. National Institute of Nutrition,
ICMR. Hyderabad, India: Jamia Osmania.
pp.178-179.
Rahman, M.S. 2007. Handbook of Food
Preservation. 2nd Edition, CRC Press.
pp.3-4.
Ranganna, S. 2001. Proximate analysis, colour
measurement and sensory evaluation.
Handbook of analysis and quality control
of fruits and vegetable products, Tata
McGraw Hill Co. Ltd., New Delhi, India.64:
245-248.
Rickman, J.C., Bruhn, C.M and Barrett, D.M.,
2007. Nutritional comparision of fresh,
frozen, and canned fruits and Vegetables
II. Vitamin A and carotenoids, vitamin E,
minerals and fibre. Journal of the Science
of Food and Agriculture. 87(7):1185-1196.
Simon, R.R., Phillips, K.M., Horst, R.L and
Munro, I.C.2011. Vitamin D mushrooms:
comparison of the composition of button
mushrooms (Agaricus bisporus) treated
postharvest with UVB light or sunlight.
Journal of Agricultural and Food Chemistry.
59(16):8724-8732.
Vanitha, S.M., Chaurasia, S.N.S., Singh, P.M and
Naik, P.S. 2013. Vegetable Statistics
(Technical Bulletin No. 51). ICAR-IIVR,
Varanasi. pp.250.
Wyatt, C.J and Ronan, K. 1983. Effects of
processing on the sodium: potassium and
calcium: phosphorus content in foods.
Journal of Agricultural and Food Chemistry.
31(2):415-420.
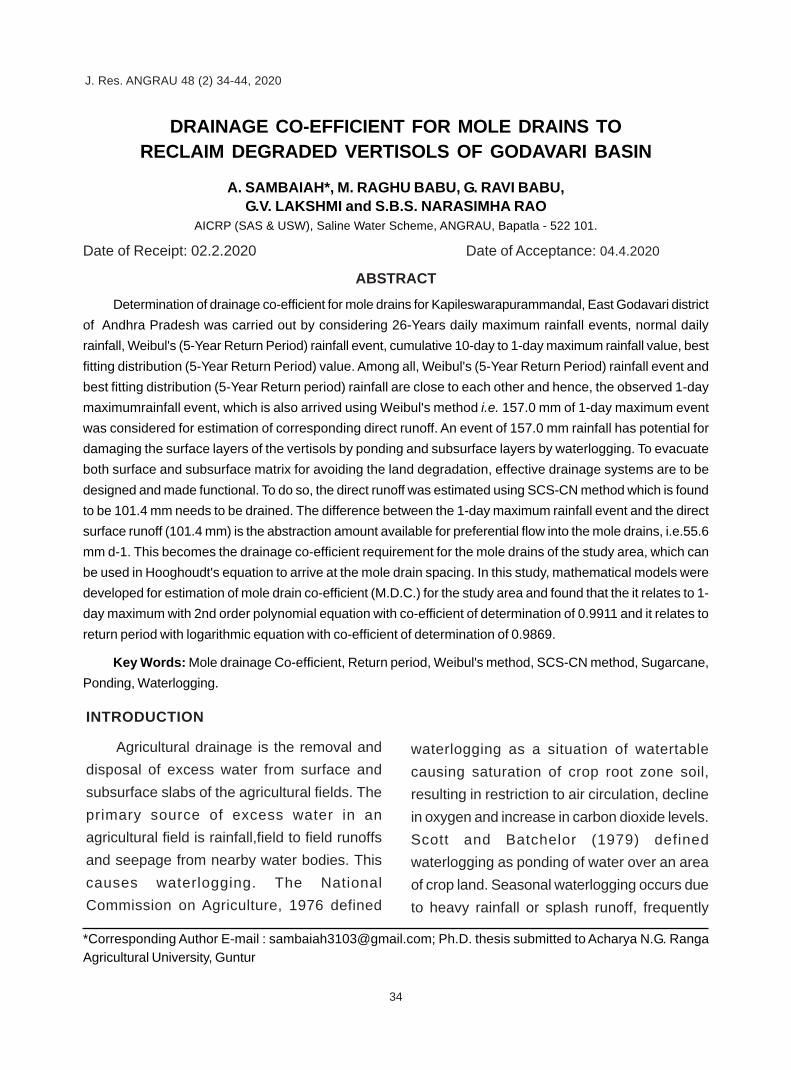
34
DRAINAGE CO-EFFICIENT FOR MOLE DRAINSJ. Res. ANGRAU 47(4) 1-11, 2019
DRAINAGE CO-EFFICIENT FOR MOLE DRAINS TORECLAIM DEGRADED VERTISOLS OF GODAVARI BASIN
A. SAMBAIAH*, M. RAGHU BABU, G. RAVI BABU,G.V. LAKSHMI and S.B.S. NARASIMHA RAO
AICRP (SAS & USW), Saline Water Scheme, ANGRAU, Bapatla - 522 101.
Date of Receipt: 02.2.2020 Date of Acceptance: 04.4.2020
ABSTRACT
Determination of drainage co-efficient for mole drains for Kapileswarapurammandal, East Godavari district
of Andhra Pradesh was carried out by considering 26-Years daily maximum rainfall events, normal daily
rainfall, Weibul's (5-Year Return Period) rainfall event, cumulative 10-day to 1-day maximum rainfall value, best
fitting distribution (5-Year Return Period) value. Among all, Weibul's (5-Year Return Period) rainfall event and
best fitting distribution (5-Year Return period) rainfall are close to each other and hence, the observed 1-day
maximumrainfall event, which is also arrived using Weibul's method i.e. 157.0 mm of 1-day maximum event
was considered for estimation of corresponding direct runoff. An event of 157.0 mm rainfall has potential for
damaging the surface layers of the vertisols by ponding and subsurface layers by waterlogging. To evacuate
both surface and subsurface matrix for avoiding the land degradation, effective drainage systems are to be
designed and made functional. To do so, the direct runoff was estimated using SCS-CN method which is found
to be 101.4 mm needs to be drained. The difference between the 1-day maximum rainfall event and the direct
surface runoff (101.4 mm) is the abstraction amount available for preferential flow into the mole drains, i.e.55.6
mm d-1. This becomes the drainage co-efficient requirement for the mole drains of the study area, which can
be used in Hooghoudt's equation to arrive at the mole drain spacing. In this study, mathematical models were
developed for estimation of mole drain co-efficient (M.D.C.) for the study area and found that the it relates to 1-
day maximum with 2nd order polynomial equation with co-efficient of determination of 0.9911 and it relates to
return period with logarithmic equation with co-efficient of determination of 0.9869.
Key Words: Mole drainage Co-efficient, Return period, Weibul's method, SCS-CN method, Sugarcane,
Ponding, Waterlogging.
*Corresponding Author E-mail : [email protected]; Ph.D. thesis submitted to Acharya N.G. RangaAgricultural University, Guntur
INTRODUCTION
Agricultural drainage is the removal and
disposal of excess water from surface and
subsurface slabs of the agricultural fields. The
primary source of excess water in an
agricultural field is rainfall,field to field runoffs
and seepage from nearby water bodies. This
causes waterlogging. The National
Commission on Agriculture, 1976 defined
waterlogging as a situation of watertable
causing saturation of crop root zone soil,
resulting in restriction to air circulation, decline
in oxygen and increase in carbon dioxide levels.
Scott and Batchelor (1979) defined
waterlogging as ponding of water over an area
of crop land. Seasonal waterlogging occurs due
to heavy rainfall or splash runoff, frequently
J. Res. ANGRAU 48 (2) 34-44, 2020
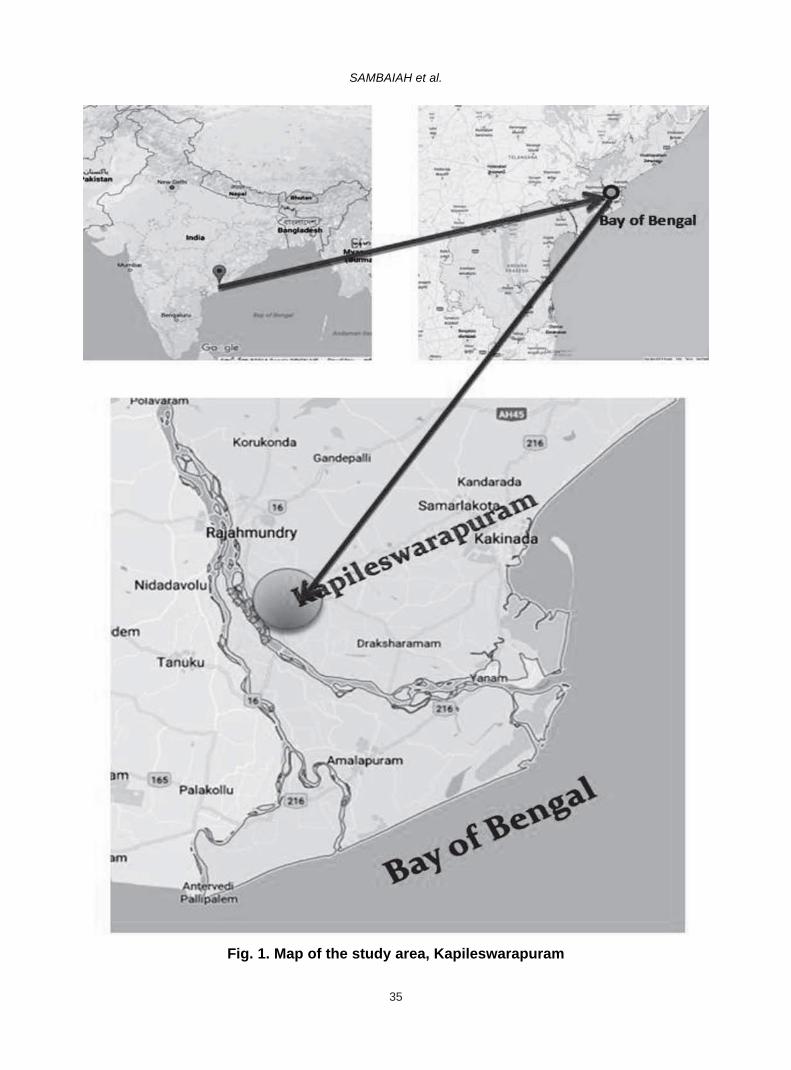
35
SAMBAIAH et al.
Fig. 1. Map of the study area, Kapileswarapuram

36
DRAINAGE CO-EFFICIENT FOR MOLE DRAINS
super saturating the soils for more than a week
period. Out of 147 mha of degraded lands,
14.30 m ha is under waterlogging which
includes 1.66 mha of wasteland (Majiet al.,
2010). The waterlogged soils can be
successfully reclaimed using any one or
combination of surface, subsurface and mole
drains.
Gebrehiwot (2018) reported that the
Ethiopia’s agricultural production has been
challenged by severe waterlogging and
salinity.Lack of functional drainage system
significantly contributed to waterlogging and salt
build-up in irrigated fields, for which a mole
drainage system is advised.
Radha etal. (2017) reported that waterlog-
ging is a serious environmental constraint for
optimum growth, yield and juice quality of
sugarcane crop.Gomathiet al. (2014) reported
that waterlogging drastically reduces the growth
and survival of sugarcane, which leads
inreduction of cane yield to the extent of 15–45
%. Under such conditions, subsurface drainage
is considered as a most suitable approach for
controlling these waterlogging conditions
especially in vertisols. This drainage also
facilitates water and salt balancing in the
rootzone so as to facilitate favorable
environment for the crop growth and contains
the water table at suitable level; Gates and
Grismer, 1989). The sugarcane crop is very
sensitive to waterlogging conditions, especially,
when it crosses 1400 cm-days sum of excess
water index.
Drainage need is quantified in terms of
drainage co-efficient. The purpose of surface
or subsurface drainage of agricultural land is to
prevent water from ponding on land and in the
soil thus prevent damageto crops by removing
excess water in a timely manner and aerate
and desalinise the root zone of the soil. The
drainage co-efficient of an area depends on 1-
day maximum rainfall amount received in the
area of interest and the duration of crop
waterlogging tolerance. A model was developed
to predict drainage rates from a flat tile-drained
basin, using a probability analysis ofdrainage
rates for the 11-year period from 1962 through
1973. Probability analysis is a sound way of
choosing drainage co-efficient for designing and
evaluating tile drainage systems (Sharma and
Irwin, 1976).
The study (2017-2018) is conducted for
reclaiming the waterlogged sugarcane fields of
East Godavari district of Andhra Pradesh using
mole drainage systems to enhance the yield.
MATERIAL AND METHODS
The study area is located in the
Kapileswarapurammandal of East Godavari
district of Andhra Pradesh, India (Fig. 1). East
Godavari district is one of the agriculturally
productive districts of the state. The sugarcane
is cultivated in 17,000 hectares in the district
during 2011-12 and the same is reduced to
10,000 hectares by 2017-18, i.e. at a decreasing
rate of 1167 ha per year. Withdrawal from
sugarcane cultivation owing to waterlogging and
salinity problems resulting in poor yield, other
associated farm mechanization and marketing
constraints which collectively made sugarcane
cultivation nonprofitablein the district. The soils
of Kapileswarapuram mandal are very deep
deltaic black cracking vertisols, very fine,
imperfectly drained with very high available
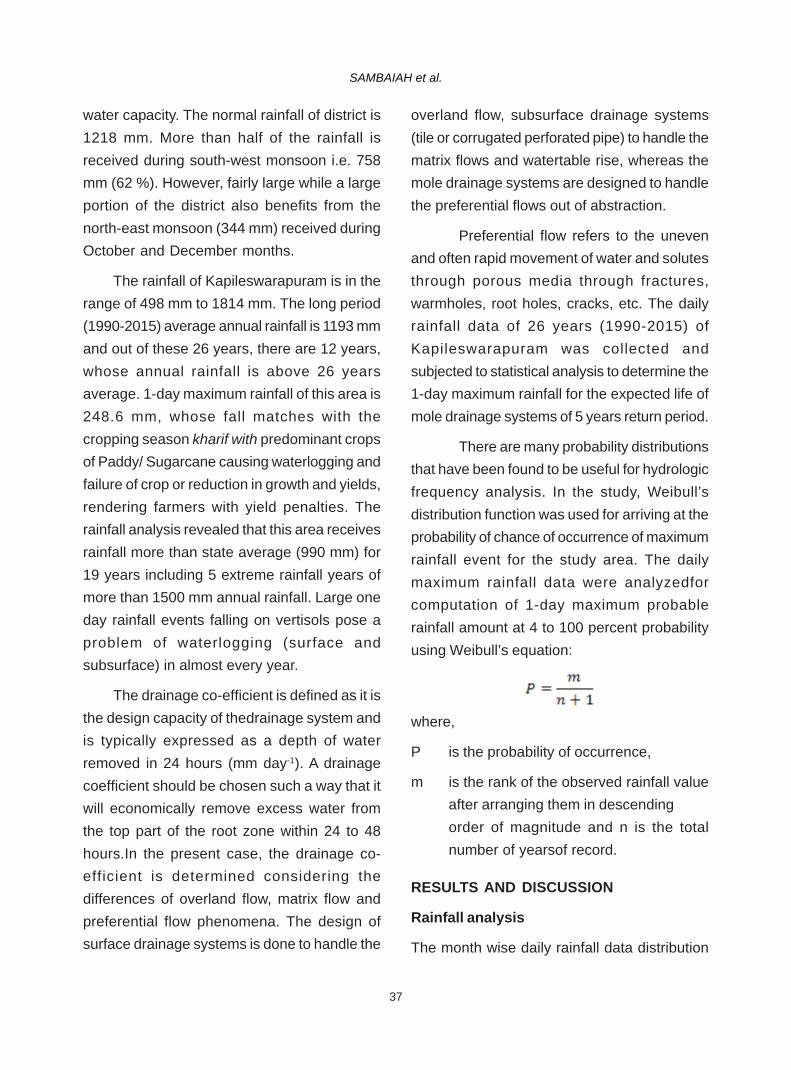
37
SAMBAIAH et al.
water capacity. The normal rainfall of district is
1218 mm. More than half of the rainfall is
received during south-west monsoon i.e. 758
mm (62 %). However, fairly large while a large
portion of the district also benefits from the
north-east monsoon (344 mm) received during
October and December months.
The rainfall of Kapileswarapuram is in the
range of 498 mm to 1814 mm. The long period
(1990-2015) average annual rainfall is 1193 mm
and out of these 26 years, there are 12 years,
whose annual rainfall is above 26 years
average. 1-day maximum rainfall of this area is
248.6 mm, whose fall matches with the
cropping season kharif with predominant crops
of Paddy/ Sugarcane causing waterlogging and
failure of crop or reduction in growth and yields,
rendering farmers with yield penalties. The
rainfall analysis revealed that this area receives
rainfall more than state average (990 mm) for
19 years including 5 extreme rainfall years of
more than 1500 mm annual rainfall. Large one
day rainfall events falling on vertisols pose a
problem of waterlogging (surface and
subsurface) in almost every year.
The drainage co-efficient is defined as it is
the design capacity of thedrainage system and
is typically expressed as a depth of water
removed in 24 hours (mm day-1). A drainage
coefficient should be chosen such a way that it
will economically remove excess water from
the top part of the root zone within 24 to 48
hours.In the present case, the drainage co-
efficient is determined considering the
differences of overland flow, matrix flow and
preferential flow phenomena. The design of
surface drainage systems is done to handle the
overland flow, subsurface drainage systems
(tile or corrugated perforated pipe) to handle the
matrix flows and watertable rise, whereas the
mole drainage systems are designed to handle
the preferential flows out of abstraction.
Preferential flow refers to the uneven
and often rapid movement of water and solutes
through porous media through fractures,
warmholes, root holes, cracks, etc. The daily
rainfall data of 26 years (1990-2015) of
Kapileswarapuram was collected and
subjected to statistical analysis to determine the
1-day maximum rainfall for the expected life of
mole drainage systems of 5 years return period.
There are many probability distributions
that have been found to be useful for hydrologic
frequency analysis. In the study, Weibull’s
distribution function was used for arriving at the
probability of chance of occurrence of maximum
rainfall event for the study area. The daily
maximum rainfall data were analyzedfor
computation of 1-day maximum probable
rainfall amount at 4 to 100 percent probability
using Weibull’s equation:
where,
P is the probability of occurrence,
m is the rank of the observed rainfall value
after arranging them in descending
order of magnitude and n is the total
number of yearsof record.
RESULTS AND DISCUSSION
Rainfall analysis
The month wise daily rainfall data distribution

38
DRAINAGE CO-EFFICIENT FOR MOLE DRAINS
Fig.2. Daily rainfall variability in Kapileswarapuram in 26 years (1990-2015)
of the Kapileswarapuram station revealed that
the rainfall is highly varying between 0 and 248.6
mm (Fig. 2) spanning from January to
December. It can be inferred from the Figure 2
that the sugarcane crop in this region suffers
from surface inundation for 6 months from June
to November, which if not attended, results in a
damage to the land, water and crop productivity.
This situation alarms for facilitation of drainage
systems to stop the menace of surface and
subsurface waterlogging in the study area.
It is found that the 1-day maximum rainfall
events are falling in the range of 42.6 to 248.6
mm in 26 years spanning from 1990-2015. The
simple mean of the 1-day maximum is found to
be 119.6 mm. The probability analysis of the 26
years data revealed that a 1-day maximum
event of 157.0 mm (Fig. 3) is occurring with
5- year return period, which is used in
determination of the mole- drainage co-efficient
for the study area, Kapileswarapuram.
The analysis of the annual rainfall of the
study region revealed that there are 11 years
whose annual rainfall is above 26 years mean
i.e. 1193 mm and 19 annual events which are
more than 26 years mean and 7 events less
than the average rainfall of the state of Andhra
Pradesh (Fig. 4). The probability analysis was
conducted for arriving at the 1-day maximum
rainfall of the study area with a return period of
5 years as the effective life span of the mole
drainage systems is estimated to be 3-5 years.
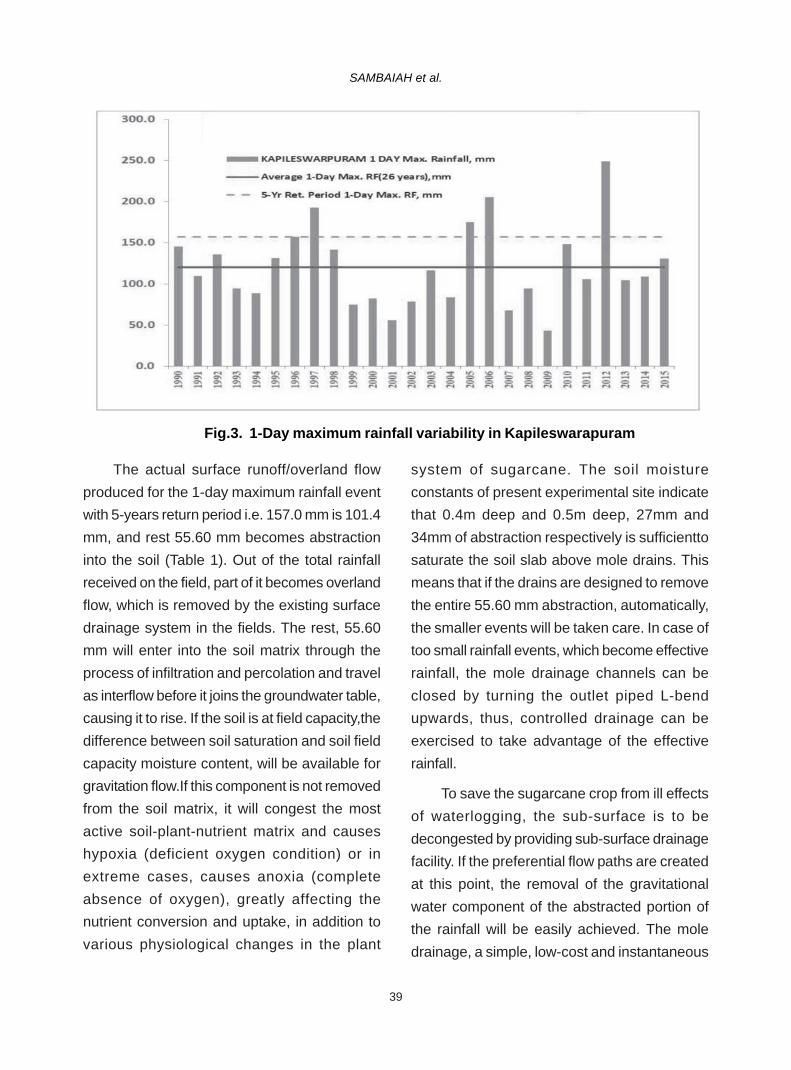
39
SAMBAIAH et al.
Fig.3. 1-Day maximum rainfall variability in Kapileswarapuram
The actual surface runoff/overland flow
produced for the 1-day maximum rainfall event
with 5-years return period i.e. 157.0 mm is 101.4
mm, and rest 55.60 mm becomes abstraction
into the soil (Table 1). Out of the total rainfall
received on the field, part of it becomes overland
flow, which is removed by the existing surface
drainage system in the fields. The rest, 55.60
mm will enter into the soil matrix through the
process of infiltration and percolation and travel
as interflow before it joins the groundwater table,
causing it to rise. If the soil is at field capacity,the
difference between soil saturation and soil field
capacity moisture content, will be available for
gravitation flow.If this component is not removed
from the soil matrix, it will congest the most
active soil-plant-nutrient matrix and causes
hypoxia (deficient oxygen condition) or in
extreme cases, causes anoxia (complete
absence of oxygen), greatly affecting the
nutrient conversion and uptake, in addition to
various physiological changes in the plant
system of sugarcane. The soil moisture
constants of present experimental site indicate
that 0.4m deep and 0.5m deep, 27mm and
34mm of abstraction respectively is sufficientto
saturate the soil slab above mole drains. This
means that if the drains are designed to remove
the entire 55.60 mm abstraction, automatically,
the smaller events will be taken care. In case of
too small rainfall events, which become effective
rainfall, the mole drainage channels can be
closed by turning the outlet piped L-bend
upwards, thus, controlled drainage can be
exercised to take advantage of the effective
rainfall.
To save the sugarcane crop from ill effects
of waterlogging, the sub-surface is to be
decongested by providing sub-surface drainage
facility. If the preferential flow paths are created
at this point, the removal of the gravitational
water component of the abstracted portion of
the rainfall will be easily achieved. The mole
drainage, a simple, low-cost and instantaneous
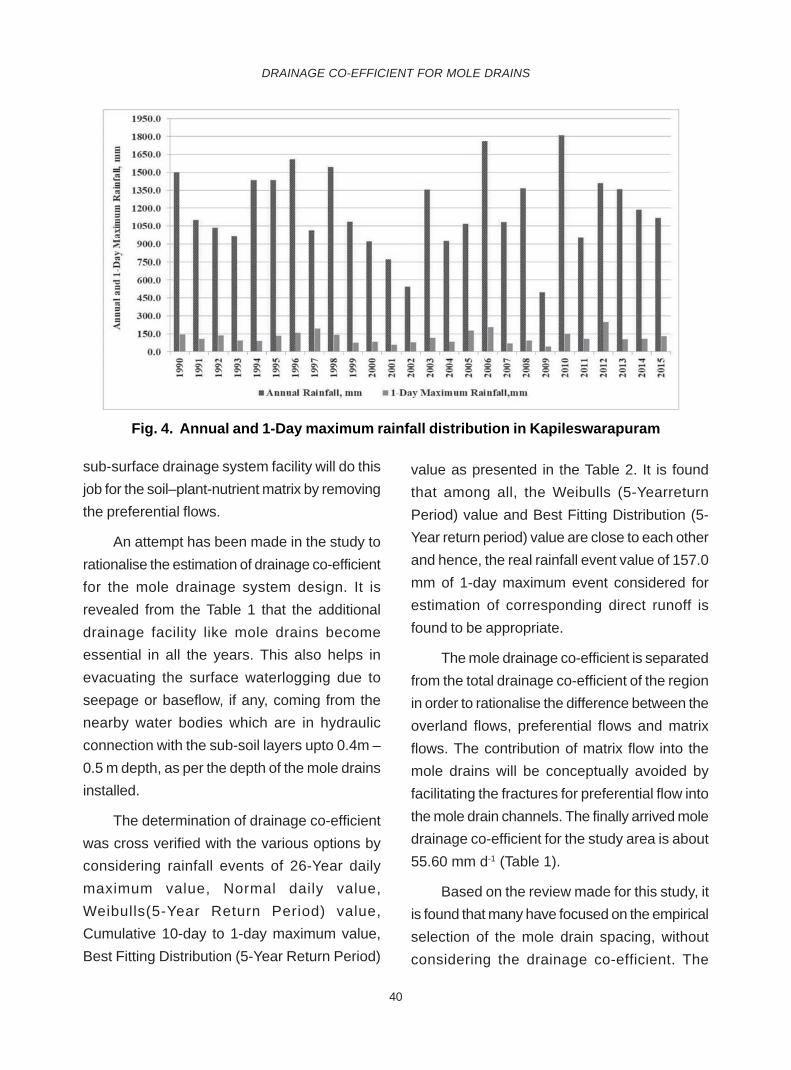
40
DRAINAGE CO-EFFICIENT FOR MOLE DRAINS
Fig. 4. Annual and 1-Day maximum rainfall distribution in Kapileswarapuram
sub-surface drainage system facility will do this
job for the soil–plant-nutrient matrix by removing
the preferential flows.
An attempt has been made in the study to
rationalise the estimation of drainage co-efficient
for the mole drainage system design. It is
revealed from the Table 1 that the additional
drainage facility like mole drains become
essential in all the years. This also helps in
evacuating the surface waterlogging due to
seepage or baseflow, if any, coming from the
nearby water bodies which are in hydraulic
connection with the sub-soil layers upto 0.4m –
0.5 m depth, as per the depth of the mole drains
installed.
The determination of drainage co-efficient
was cross verified with the various options by
considering rainfall events of 26-Year daily
maximum value, Normal daily value,
Weibulls(5-Year Return Period) value,
Cumulative 10-day to 1-day maximum value,
Best Fitting Distribution (5-Year Return Period)
value as presented in the Table 2. It is found
that among all, the Weibulls (5-Yearreturn
Period) value and Best Fitting Distribution (5-
Year return period) value are close to each other
and hence, the real rainfall event value of 157.0
mm of 1-day maximum event considered for
estimation of corresponding direct runoff is
found to be appropriate.
The mole drainage co-efficient is separated
from the total drainage co-efficient of the region
in order to rationalise the difference between the
overland flows, preferential flows and matrix
flows. The contribution of matrix flow into the
mole drains will be conceptually avoided by
facilitating the fractures for preferential flow into
the mole drain channels. The finally arrived mole
drainage co-efficient for the study area is about
55.60 mm d-1 (Table 1).
Based on the review made for this study, it
is found that many have focused on the empirical
selection of the mole drain spacing, without
considering the drainage co-efficient. The

41
SAMBAIAH et al.
Tab
le 1
. E
stim
ati
on
of
mo
le d
rain
ag
e c
o-e
ffic
ien
t
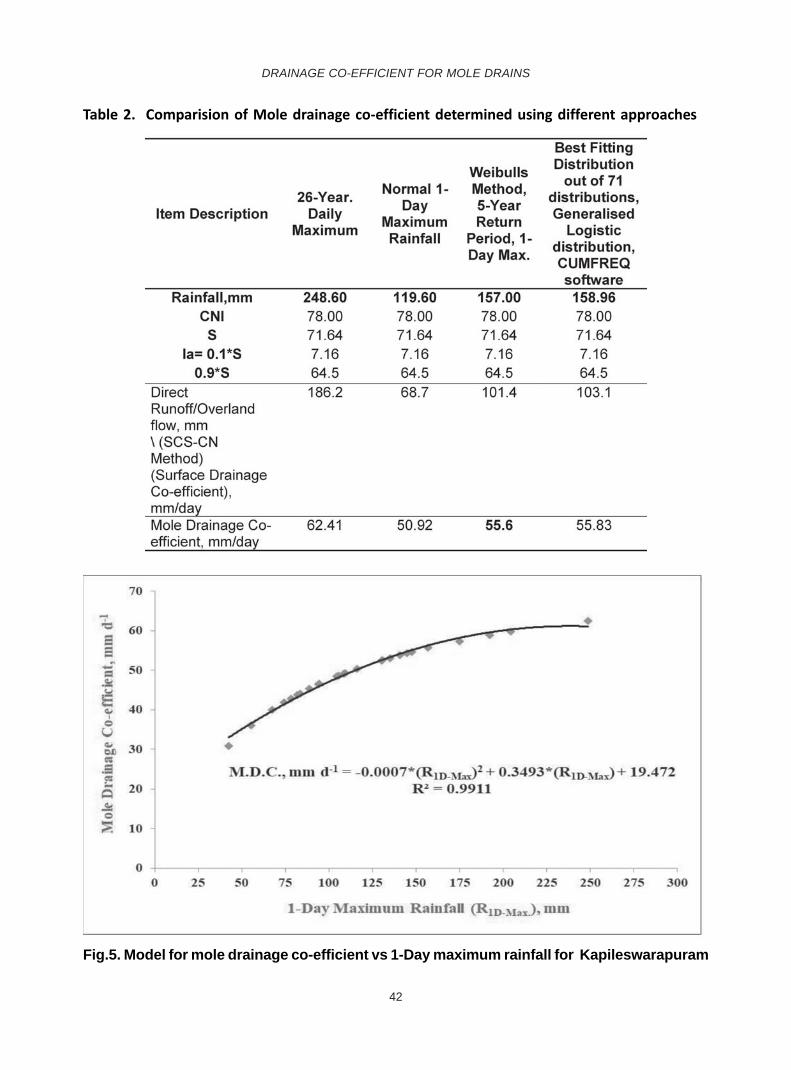
42
DRAINAGE CO-EFFICIENT FOR MOLE DRAINS
Table 2. Comparision of Mole drainage co-efficient determined using different approaches
Fig.5. Model for mole drainage co-efficient vs 1-Day maximum rainfall for Kapileswarapuram

43
SAMBAIAH et al.
present study establishes a scientific
relationship between the preferential flow,
drainage co-efficient and the mole drain spacing
for effective mole drainage and thus reducing
the land degradation due to waterlogging to
enhance sugarcane yields. The preferential flow
is the main component identified as drainage
co-efficient for the design of the mole drain
spacing using Hooghoudt’s equation. Analysis
of rainfall data using the procedure developed
in this study gives the rational and new approach
for arriving mole drainage co-efficient to
determine spacing for moling of vertisols.
CONCLUSION
Among the different approaches studied,
the Weibulls (5-Year Return Period) value and
Best Fitting Distribution (5-Year Return period)
value are close to each other and hence, the
observed rainfall event value (157.0 mm of 1-
day maximum), which is also arrived using
Weibuls method was considered for estimation
Fig. 6. Mathematical model for mole drainage co-efficient vs return period for Kapileswarapuram
Table 3. Mathematical models developed for Mole drainage co-efficient
44
DRAINAGE CO-EFFICIENT FOR MOLE DRAINS
of corresponding direct runoff. The
corresponding abstraction amount is found to
be 55.6 mm d-1, which needs to be drained
through preferential flows. This becomes the
drainage co-efficient requirement for the mole
drains, which can be used in Hooghoudt’s
equation to arrive at the mole drain spacing for
designing of mole drain spacing to effectively
reclaim the degraded lands for further crop
development. The new procedure developed in
this study exemplifies the capability to use
analytical solutions like Hooghoudt’s equation
for design of mole drain spacing.
ACKNOWLEDGMENTS
Financial support for this work was
provided by the NRM Division of Indian Council
of Agricultural Research, New Delhi through
Extra Mural Project funding. We thank the
Acharya N.G. Ranga Agricultural University,
Andhra Pradesh, India for providing the
administrative support. We thank M/s. Sri
Sarvaraya Sugars, Chellore, East Godavari
District, Andhra Pradesh for providing theland
and all other support for the study.
REFERENCES
Gates, T.K and Grismer, M.E. 1989. Irrigation
and drainage strategies in a salinity affected
region. Journal of Irrigation and Drainage
Engineering. 115(2):87–99.
Gebrehiwot, K.A. 2018.A review on waterlogging
salinization and drainage in Ethiopian
irrigated agriculture. Sustainable Water
Resources Management. 4(1):55-62.
Gomathi,R., GururajaRao, P.N., Chandran, K
and Selvi, A. 2014. Adaptive responses of
sugarcane to waterlogging stress: an over
view. Review Article. Sugar Technology.
17(4):325-338.
Maji, A.K., Obi Reddy, G.P and Dipak Sarkar.
2010. Degraded and wastelands of India:
Status and spatial distribution. Directorate
of Information and Publications of
Agriculture, Indian Council of Agricultural
Research, New Delhi. June, 2010. pp. 3-5.
National Commission on Agriculture (NCA), GoI,
New Delhi.1976. Report of the National
Commission on Agriculture. Part-V:
Resource Development.pp.186.
Radha Jain, Anshu Singh, Singh, S., Singh, C.P.,
Singh, R.K., Singh, S.P., Srivastava, V.K.,
Chandra, A., Pathak, A.D and Solomon, S.
2017. Variation in juice quality traits of
sugarcane genotypes under waterlogged
condition in subtropical India.Climate
Change and Environmental Sustainability.
5(1):50-58.
Scott, H.D and Batchelor, J.T. 1979. Dry weight
and leaf area production rates of irrigated
determinate soybeans. Agronomy Journal.
71: 776-782.
Sharma, T.C and Irwin, R.W. 1976. A model to
determine a subsurface drainage co-
efficient for flat land soils.Canadian
Agricultural Engineering. 18(1): 46-48.
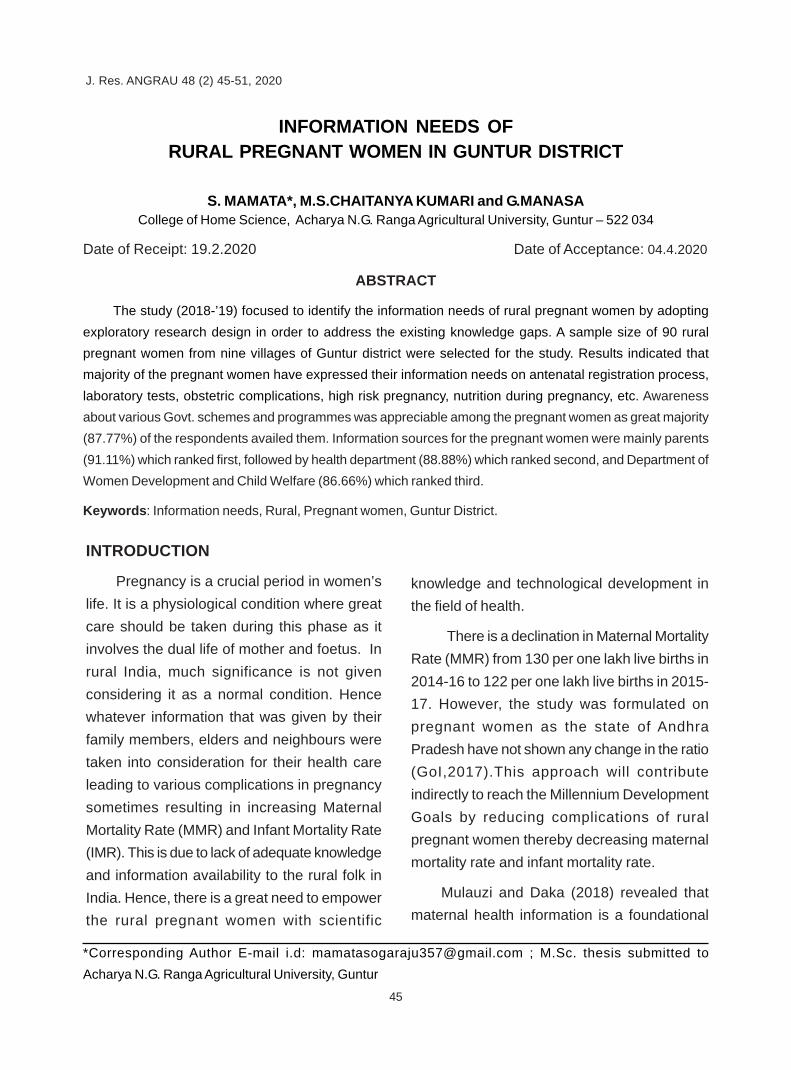
45
INFORMATION NEEDS OF RURAL PREGNANT WOMEN IN GUNTUR DISTRICTJ. Res. ANGRAU 47(4) 1-11, 2019
INFORMATION NEEDS OFRURAL PREGNANT WOMEN IN GUNTUR DISTRICT
S. MAMATA*, M.S.CHAITANYA KUMARI and G.MANASACollege of Home Science, Acharya N.G. Ranga Agricultural University, Guntur – 522 034
Date of Receipt: 19.2.2020 Date of Acceptance: 04.4.2020
ABSTRACT
The study (2018-’19) focused to identify the information needs of rural pregnant women by adopting
exploratory research design in order to address the existing knowledge gaps. A sample size of 90 rural
pregnant women from nine villages of Guntur district were selected for the study. Results indicated that
majority of the pregnant women have expressed their information needs on antenatal registration process,
laboratory tests, obstetric complications, high risk pregnancy, nutrition during pregnancy, etc. Awareness
about various Govt. schemes and programmes was appreciable among the pregnant women as great majority
(87.77%) of the respondents availed them. Information sources for the pregnant women were mainly parents
(91.11%) which ranked first, followed by health department (88.88%) which ranked second, and Department of
Women Development and Child Welfare (86.66%) which ranked third.
Keywords: Information needs, Rural, Pregnant women, Guntur District.
*Corresponding Author E-mail i.d: [email protected] ; M.Sc. thesis submitted to
Acharya N.G. Ranga Agricultural University, Guntur
J. Res. ANGRAU 48 (2) 45-51, 2020
INTRODUCTION
Pregnancy is a crucial period in women’s
life. It is a physiological condition where great
care should be taken during this phase as it
involves the dual life of mother and foetus. In
rural India, much significance is not given
considering it as a normal condition. Hence
whatever information that was given by their
family members, elders and neighbours were
taken into consideration for their health care
leading to various complications in pregnancy
sometimes resulting in increasing Maternal
Mortality Rate (MMR) and Infant Mortality Rate
(IMR). This is due to lack of adequate knowledge
and information availability to the rural folk in
India. Hence, there is a great need to empower
the rural pregnant women with scientific
knowledge and technological development in
the field of health.
There is a declination in Maternal Mortality
Rate (MMR) from 130 per one lakh live births in
2014-16 to 122 per one lakh live births in 2015-
17. However, the study was formulated on
pregnant women as the state of Andhra
Pradesh have not shown any change in the ratio
(GoI,2017).This approach will contribute
indirectly to reach the Millennium Development
Goals by reducing complications of rural
pregnant women thereby decreasing maternal
mortality rate and infant mortality rate.
Mulauzi and Daka (2018) revealed that
maternal health information is a foundational

46
MAMATA et al.
element of women’s positive health during
prenatal period, childbirth and the postnatal
period. All around the world, a lot of attention is
provided on mother and child health care, but
still many maternal information needs are
unfulfilled. Rural women generally possess
inadequate information and education on health
care during pregnancy and as a result, the
mortality rate during child birth is still high, chiefly
in developing countries. Hence, the study was
focused on identification of information needs
of rural pregnant women.
MATERIAL AND METHODS
This study was conducted in Guntur district of
Andhra Pradesh during the year 2018-19. Three
mandals and three villages from each mandal
were selected randomly. Ten pregnant women
were selected from each village, thus, making
a total sample of ninety respondents from nine
villages for the study. After thorough literature
survey, an interview schedule was developed
using dichotomous items such as ‘Unaware’
and ‘Aware’ duly assigning ‘1’ and ‘2’ scores
respectively to elicit the informational needs on
prenatal and postnatal care from the pregnant
women. Based on the total score of each type
of information the highest score given for the
‘unaware’ option represents the information gap
and were finalised as the information needs of
the selected pregnant women.
RESULTS AND DISCUSSION
Information needs during prenatal period
Identifying the information needs of the
selected respondents is vital to assess the
existing knowledge gaps of the pregnant women
on prenatal care. Prenatal period refers to the
stage in which a baby develops from a single
cell after conception into an embryo and later
into a foetus i.e. during the period of pregnancy.
Table 1. Classification of rural pregnant women based on the information needs during
prenatal period (n=90)
S. No. Information need Unaware Aware
Frequency (f) Percentage (%) Frequency(f) Percentage(%)
1. Expected date of delivery 88 97.77 2 2.22
calculation
2. Antenatal registration 53 58.88 37 41.11
3. Symptoms during the pregnancy 52 57.77 38 42.22
4. Laboratory investigations 47 52.22 43 47.77
5. Scanning 48 53.33 42 46.66
6. High risk pregnancy 73 81.11 17 18.88
7. Obstetric complications 77 85.55 13 14.44
8. Nutrition during the pregnancy 68 75.55 22 24.44
9. Personal care to be taken during 48 53.33 42 46.66
the pregnancy
Information needS. No.
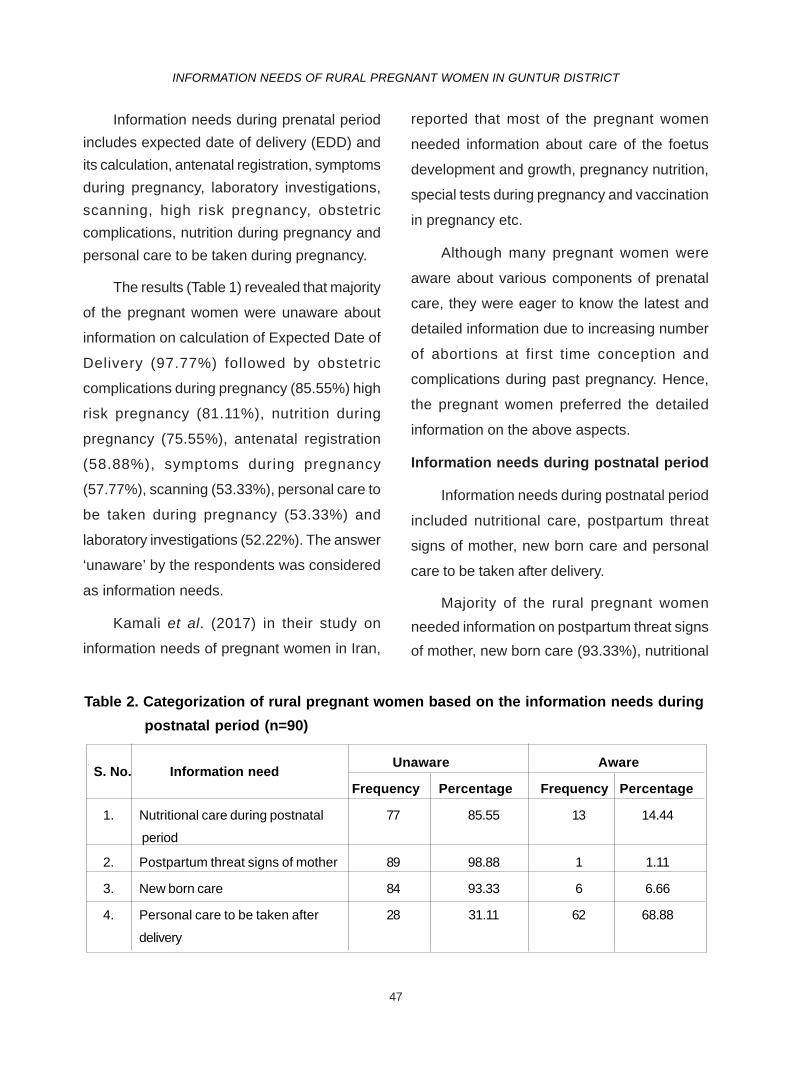
47
INFORMATION NEEDS OF RURAL PREGNANT WOMEN IN GUNTUR DISTRICT
reported that most of the pregnant women
needed information about care of the foetus
development and growth, pregnancy nutrition,
special tests during pregnancy and vaccination
in pregnancy etc.
Although many pregnant women were
aware about various components of prenatal
care, they were eager to know the latest and
detailed information due to increasing number
of abortions at first time conception and
complications during past pregnancy. Hence,
the pregnant women preferred the detailed
information on the above aspects.
Information needs during postnatal period
Information needs during postnatal period
included nutritional care, postpartum threat
signs of mother, new born care and personal
care to be taken after delivery.
Majority of the rural pregnant women
needed information on postpartum threat signs
of mother, new born care (93.33%), nutritional
Table 2. Categorization of rural pregnant women based on the information needs during
postnatal period (n=90)
S. No Information need Unaware Aware
Frequency Percentage Frequency Percentage
1. Nutritional care during postnatal 77 85.55 13 14.44
period
2. Postpartum threat signs of mother 89 98.88 1 1.11
3. New born care 84 93.33 6 6.66
4. Personal care to be taken after 28 31.11 62 68.88
delivery
S. No. Information need
Information needs during prenatal period
includes expected date of delivery (EDD) and
its calculation, antenatal registration, symptoms
during pregnancy, laboratory investigations,
scanning, high risk pregnancy, obstetric
complications, nutrition during pregnancy and
personal care to be taken during pregnancy.
The results (Table 1) revealed that majority
of the pregnant women were unaware about
information on calculation of Expected Date of
Delivery (97.77%) followed by obstetric
complications during pregnancy (85.55%) high
risk pregnancy (81.11%), nutrition during
pregnancy (75.55%), antenatal registration
(58.88%), symptoms during pregnancy
(57.77%), scanning (53.33%), personal care to
be taken during pregnancy (53.33%) and
laboratory investigations (52.22%). The answer
‘unaware’ by the respondents was considered
as information needs.
Kamali et al. (2017) in their study on
information needs of pregnant women in Iran,
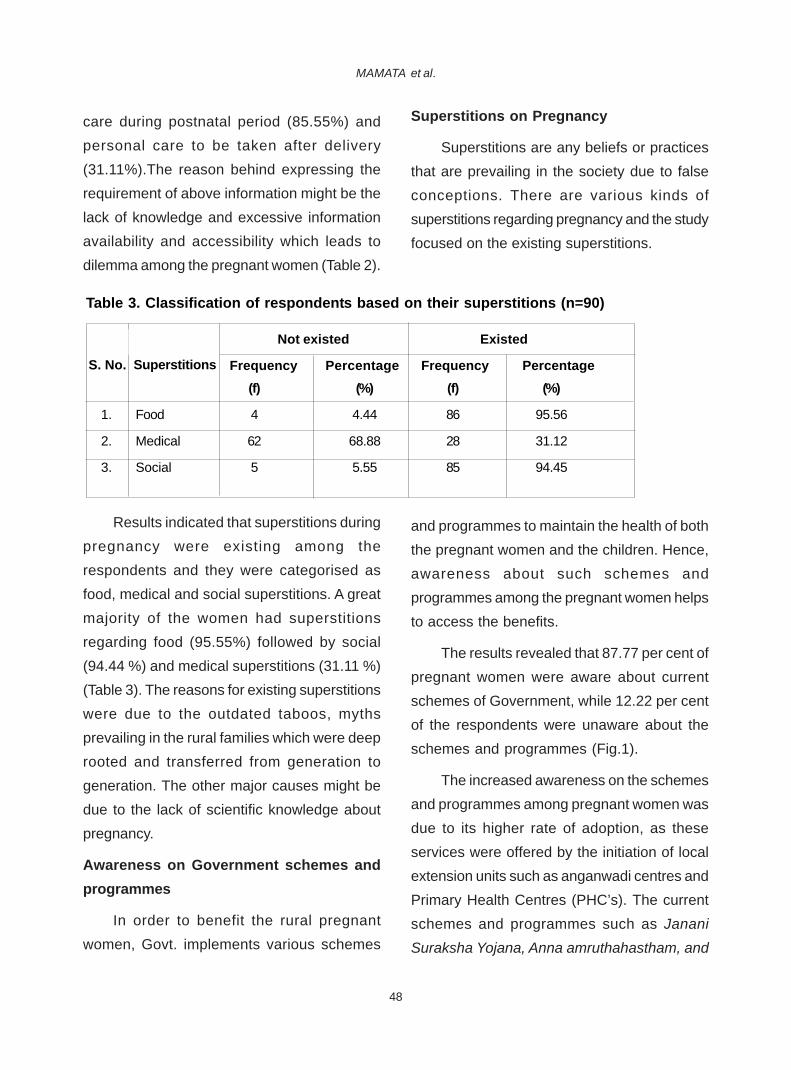
48
MAMATA et al.
care during postnatal period (85.55%) and
personal care to be taken after delivery
(31.11%).The reason behind expressing the
requirement of above information might be the
lack of knowledge and excessive information
availability and accessibility which leads to
dilemma among the pregnant women (Table 2).
Superstitions on Pregnancy
Superstitions are any beliefs or practices
that are prevailing in the society due to false
conceptions. There are various kinds of
superstitions regarding pregnancy and the study
focused on the existing superstitions.
Table 3. Classification of respondents based on their superstitions (n=90)
S. No Superstitions Not existed Existed
Frequency Percentage Frequency Percentage
(f) (%) (f) (%)
1. Food 4 4.44 86 95.56
2. Medical 62 68.88 28 31.12
3. Social 5 5.55 85 94.45
SuperstitionsS. No.
Results indicated that superstitions during
pregnancy were existing among the
respondents and they were categorised as
food, medical and social superstitions. A great
majority of the women had superstitions
regarding food (95.55%) followed by social
(94.44 %) and medical superstitions (31.11 %)
(Table 3). The reasons for existing superstitions
were due to the outdated taboos, myths
prevailing in the rural families which were deep
rooted and transferred from generation to
generation. The other major causes might be
due to the lack of scientific knowledge about
pregnancy.
Awareness on Government schemes and
programmes
In order to benefit the rural pregnant
women, Govt. implements various schemes
and programmes to maintain the health of both
the pregnant women and the children. Hence,
awareness about such schemes and
programmes among the pregnant women helps
to access the benefits.
The results revealed that 87.77 per cent of
pregnant women were aware about current
schemes of Government, while 12.22 per cent
of the respondents were unaware about the
schemes and programmes (Fig.1).
The increased awareness on the schemes
and programmes among pregnant women was
due to its higher rate of adoption, as these
services were offered by the initiation of local
extension units such as anganwadi centres and
Primary Health Centres (PHC’s). The current
schemes and programmes such as Janani
Suraksha Yojana, Anna amruthahastham, and
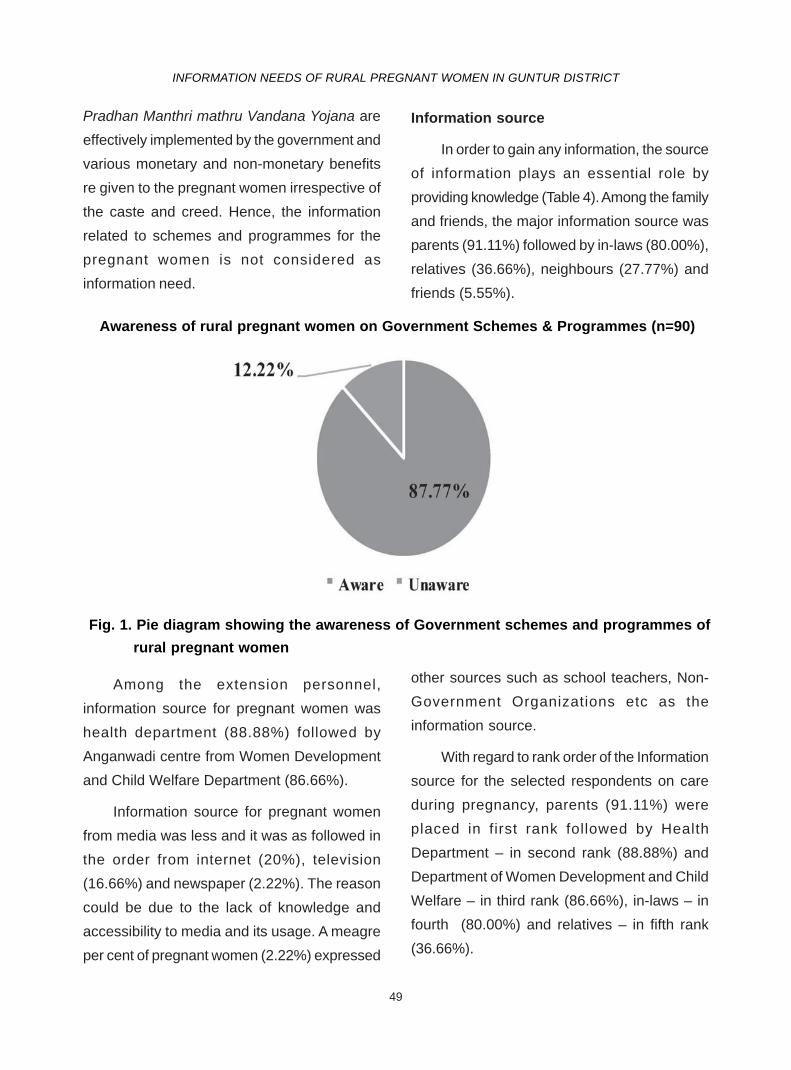
49
INFORMATION NEEDS OF RURAL PREGNANT WOMEN IN GUNTUR DISTRICT
Pradhan Manthri mathru Vandana Yojana are
effectively implemented by the government and
various monetary and non-monetary benefits
re given to the pregnant women irrespective of
the caste and creed. Hence, the information
related to schemes and programmes for the
pregnant women is not considered as
information need.
Information source
In order to gain any information, the source
of information plays an essential role by
providing knowledge (Table 4). Among the family
and friends, the major information source was
parents (91.11%) followed by in-laws (80.00%),
relatives (36.66%), neighbours (27.77%) and
friends (5.55%).
Fig. 1. Pie diagram showing the awareness of Government schemes and programmes of
rural pregnant women
Awareness of rural pregnant women on Government Schemes & Programmes (n=90)
Among the extension personnel,
information source for pregnant women was
health department (88.88%) followed by
Anganwadi centre from Women Development
and Child Welfare Department (86.66%).
Information source for pregnant women
from media was less and it was as followed in
the order from internet (20%), television
(16.66%) and newspaper (2.22%). The reason
could be due to the lack of knowledge and
accessibility to media and its usage. A meagre
per cent of pregnant women (2.22%) expressed
other sources such as school teachers, Non-
Government Organizations etc as the
information source.
With regard to rank order of the Information
source for the selected respondents on care
during pregnancy, parents (91.11%) were
placed in first rank followed by Health
Department – in second rank (88.88%) and
Department of Women Development and Child
Welfare – in third rank (86.66%), in-laws – in
fourth (80.00%) and relatives – in fifth rank
(36.66%).
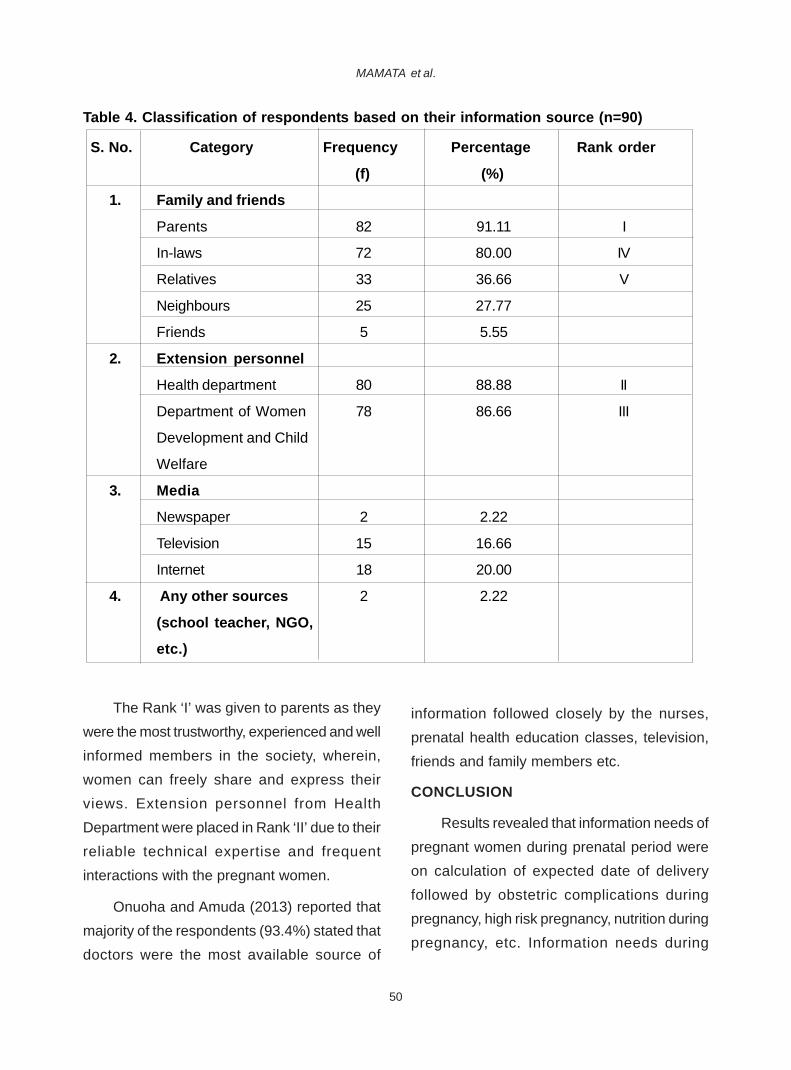
50
MAMATA et al.
The Rank ‘I’ was given to parents as they
were the most trustworthy, experienced and well
informed members in the society, wherein,
women can freely share and express their
views. Extension personnel from Health
Department were placed in Rank ‘II’ due to their
reliable technical expertise and frequent
interactions with the pregnant women.
Onuoha and Amuda (2013) reported that
majority of the respondents (93.4%) stated that
doctors were the most available source of
Table 4. Classification of respondents based on their information source (n=90)
S. No. Category Frequency Percentage Rank order
(f) (%)
1. Family and friends
Parents 82 91.11 I
In-laws 72 80.00 IV
Relatives 33 36.66 V
Neighbours 25 27.77
Friends 5 5.55
2. Extension personnel
Health department 80 88.88 II
Department of Women 78 86.66 III
Development and Child
Welfare
3. Media
Newspaper 2 2.22
Television 15 16.66
Internet 18 20.00
4. Any other sources 2 2.22
(school teacher, NGO,
etc.)
information followed closely by the nurses,
prenatal health education classes, television,
friends and family members etc.
CONCLUSION
Results revealed that information needs of
pregnant women during prenatal period were
on calculation of expected date of delivery
followed by obstetric complications during
pregnancy, high risk pregnancy, nutrition during
pregnancy, etc. Information needs during
51
INFORMATION NEEDS OF RURAL PREGNANT WOMEN IN GUNTUR DISTRICT
postnatal period were on postpartum threat
signs of mother, new born care, nutritional care
during postnatal period and personal care to be
taken after delivery. Awareness about various
government schemes and programmes was
appreciable among the pregnant women as a
great majority of the respondents availed them.
Major information source for pregnant women
were parents followed by health departments.
REFERENCES
GoI. 2017. Special bulletin on maternal mortality
in India. 2015-17. Sample Registration
System of India. Retrieved from the
website (www.censusindia.gov.in) on
12.2.2020.
Kamali, S., Ahmadian, L., Khajouei, R and
Bahaadinbeigy, K. 2017. Health
information needs of pregnant women:
information sources, motives and
barriers.Health Information and Libraries
Journal. 35(1): 24-37.
Mulauzi, F and Daka, K.L. 2018. Maternal health
information needs of women: A survey of
literature. Journal of Lexicography and
Terminology. 2(1): 57-82.
Onuoha, U.D and Amuda, A.A. 2013.
Information seeking behaviour of
pregnant women in selected hospitals of
Ibadan Metropolis. Journal of Information
and Knowledge Management. 4: 76-91.
52
MOHAN et al.J. Res. ANGRAU 47(4) 1-11, 2019
CASE STUDY ON GROUNDNUT CULTIVATION IN COASTAL SANDYSOILS IN SPS NELLORE DISTRICT OF ANDHRA PRADESH
KADIRI MOHAN*, U. VINEETHA, T. TULASI LAKSHMI and P. RAJASEKHARRegional Agricultural Research Station,
Acharya N.G. Ranga Agricultural University, Tirupati - 517 502
Date of Receipt: 28.2.2020 Date of Acceptance: 16.4.2020
ABSTRACT
The case study was undertaken to document the cultivation practices from seed to seed and issues
related to the intensive cultivation of groundnut crop in coastal sandy soils during Rabi season of2018-19. A
total of around 4000 acres is spread in a single patch of area, wherein, farmers from 10 habitations in three
revenue villages cultivate groundnut as mono crop as their main livelihood since last three decades as a
common group activity. The farmers are following their own groundnut cultivation package of practices tried
and tested by themselves to suit their coastal sandy soils ecosystem. The unique cultivation practices the
farmers are following include taking up uniform crop calendar, use of single variety viz., TAG 24,seed rate 200-
240 kg of kernels per acre, use of own seed, sowing by seed drill, cent percent seed treatment, use of higher
doses of weedicides, higher rate of fertilizer application, sprinkler irrigation, contract mode of labourfor operations
and sheep penning.Some of the identified constraints as perceived by the farmers include lack of advanced
suitable short duration varieties, lack of recommended package of practices, lack of combined harvester and
threshers, labour shortage during peak season, water shortage during drought years and no storage facility.
SWOT analysis indicates some of the important aspects to be strengthened, attended and addressed for
sustainable development of groundnut cultivation in the study area.
Keywords : Groundnut cultivation, Coastal sandy soils, Package of practices,Constraints in cultivation and
SWOT analysis.
*Corresponding Author E-mail : [email protected]
J. Res. ANGRAU 48 (2) 52-59, 2020
INTRODUCTION
India has an extended coastline of
approximately 7516.6 km (mainland 5422.6 km
and Island Territories 2094 km) (CCZMCSB,
2020) and the State of Andhra Pradesh is one
of the coastal stateshaving974 kmlength
(EDB,2020) of coastal lands. SPS Nellore
district is one of the coastal districts of Andhra
Pradesh which is having a coast line of 163 km
length (CPO, 2018) of Bay of Bengal on East.
Groundnut is an important commercial crop
in Andhra Pradesh cultivated in an extent of 7.35
lakh hectares(DES, 2018) in various types of
soils but predominantly grown in red soils. As
groundnut crop grows well in loose textured
soils, it is being cultivated in some locations of
coastal sandy soils in SPS Nellore, Prakasam,
Guntur and Krishna districts of Andhra Pradesh.
Coastal sandy soils are predominant along
the coast line and are characterised by light
texture with poor nutrient status, low Cation
53
CASE STUDY ON GROUNDNUT CULTIVATION IN A.P.
Exchange Capacity (CEC) and soil organic
matter coupled with low microbial activity, deficit
in zinc and boron (Singravel et al., 2005). To
add, these coastal sandy soils have low water
holding capacity, low fertility and non-suitability
for majority of crops, thus creating complex
management problems for farmers to cultivate
crops (Caldwell et al., 2005). In spite of the
adversities due to poor soil conditions, still,
farmers are cultivating groundnut crop with
unique local practices for sustaining their
livelihood in their coastal sandy soils.
One such case is coastal sandy soils in
Vidavaluru mandal of SPS Nellore district in
Andhra Pradesh. Spread across ten habitations
in three revenue villages of the mandal, a stretch
of around 4000 acres in a single geographical
areais under intensive monocropping of
groundnut crop since last three decades.
Groundnut cultivation is the only livelihood for
all the farmers in study area. The farming
community comprises majorly of small and
marginal farmers with an average land holding
ranging from 3 to 20 acres. Earlier, farmers
cultivated yam, vegetables, greens in their
sandy soils, and later all the farmers switched
to cultivation of groundnut crop (as mono crop)
since last three decades because of higher
returns. All the farmers in the area adopted
similar cultivation practices like following one
crop calendar, common package of practices,
common set of inputs, group marketing, etc.
Presently, a set of recommended groundnut
cultivation practices are available for red loamy
soils and red soils, but they are largely differing
from the practices being followed by the farmers
in the study area.As the cultivation in coastal
sandy soils required entirely a new set of
practices and inputs with varied doses and their
mode of application, farmers started cultivating
groundnut crop with their own practices and
refining them on a trial and error basis since
last three decades.At present, farmers were
practicing a set of cultivation practices like more
seed rate, excess fertilizer application, dense
plant population, single variety cultivation, more
frequent irrigation, etc., which are entirely
different from the regular groundnut cultivation
practices available for red sandy loamy soils.
The farmers cultivating groundnut in coastal
sandy soils were in need for location specific
groundnut production technology for reduction
of cost of cultivation and more quality yield.
Case studies will explore complex interventions
of the farming community in special conditions
(Yin, 2003). To feed the research and extension
systems with a real-time situation of groundnut
cultivation in coastal sandy soils, this case study
was taken up to understand the various
cultivation practices, inputs usage patterns,
returns, etc. The study aimed at documenting
farmers' practices such that these can be taken
up by the research system to develop a suitable
groundnut production technology for coastal
sandy soils. Further, the study also aimed to
document the constraints as perceived by
famers and to identify the Strengths,
Weaknesses, Opportunities and Threats
(SWOT) of cultivating groundnut in coastal
sandy soils.
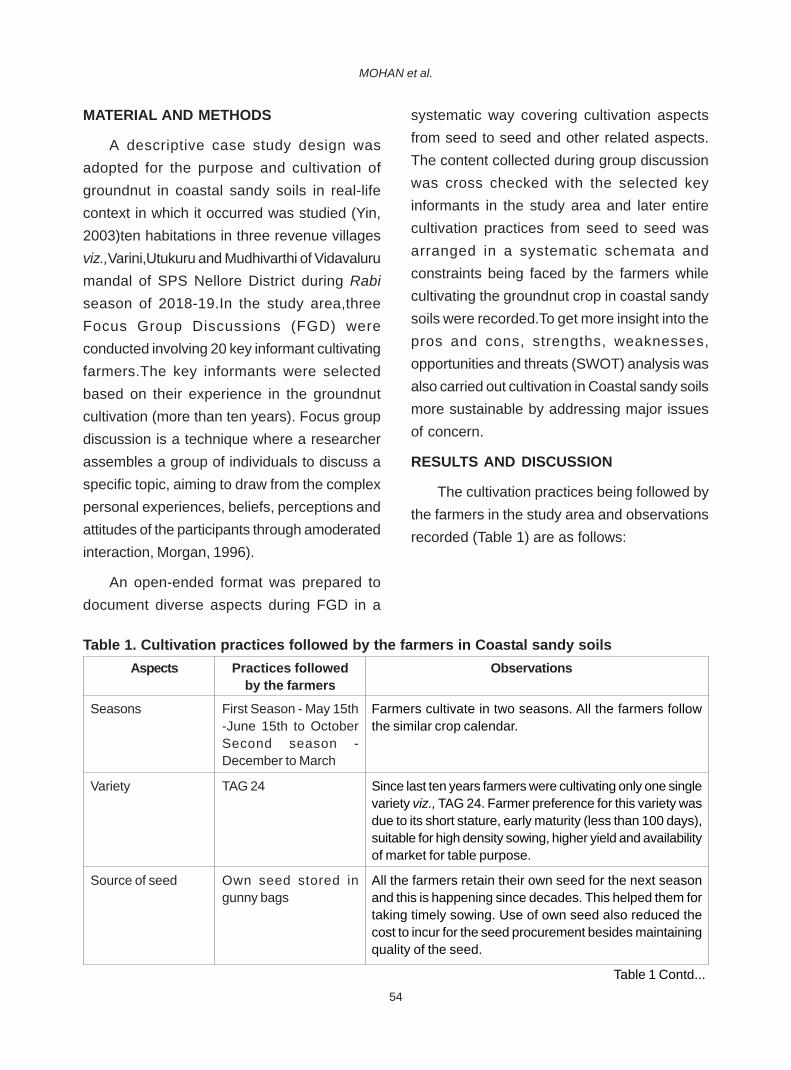
54
MOHAN et al.
Table 1. Cultivation practices followed by the farmers in Coastal sandy soils
MATERIAL AND METHODS
A descriptive case study design was
adopted for the purpose and cultivation of
groundnut in coastal sandy soils in real-life
context in which it occurred was studied (Yin,
2003)ten habitations in three revenue villages
viz.,Varini,Utukuru and Mudhivarthi of Vidavaluru
mandal of SPS Nellore District during Rabi
season of 2018-19.In the study area,three
Focus Group Discussions (FGD) were
conducted involving 20 key informant cultivating
farmers.The key informants were selected
based on their experience in the groundnut
cultivation (more than ten years). Focus group
discussion is a technique where a researcher
assembles a group of individuals to discuss a
specific topic, aiming to draw from the complex
personal experiences, beliefs, perceptions and
attitudes of the participants through amoderated
interaction, Morgan, 1996).
An open-ended format was prepared to
document diverse aspects during FGD in a
systematic way covering cultivation aspects
from seed to seed and other related aspects.
The content collected during group discussion
was cross checked with the selected key
informants in the study area and later entire
cultivation practices from seed to seed was
arranged in a systematic schemata and
constraints being faced by the farmers while
cultivating the groundnut crop in coastal sandy
soils were recorded.To get more insight into the
pros and cons, strengths, weaknesses,
opportunities and threats (SWOT) analysis was
also carried out cultivation in Coastal sandy soils
more sustainable by addressing major issues
of concern.
RESULTS AND DISCUSSION
The cultivation practices being followed by
the farmers in the study area and observations
recorded (Table 1) are as follows:
Aspects Practices followed Observationsby the farmers
Seasons First Season - May 15th-June 15th to OctoberSecond season -December to March
Farmers cultivate in two seasons. All the farmers followthe similar crop calendar.
Variety TAG 24 Since last ten years farmers were cultivating only one singlevariety viz., TAG 24. Farmer preference for this variety wasdue to its short stature, early maturity (less than 100 days),suitable for high density sowing, higher yield and availabilityof market for table purpose.
Source of seed Own seed stored ingunny bags
All the farmers retain their own seed for the next seasonand this is happening since decades. This helped them fortaking timely sowing. Use of own seed also reduced thecost to incur for the seed procurement besides maintainingquality of the seed.
Table 1 Contd...

55
CASE STUDY ON GROUNDNUT CULTIVATION IN A.P.
Aspects Practices followed Observationsby the farmers
Very high seed rate was used for dense planting (100 plantsper square meter).
Entire operation was done on per acre contract basis forall the farmers at the same time.
Complete sowing operation in the entire area is undertakingwith tractor mounted seed drill on contract hire basis@Rs. 1000 per acre. Some innovative farmers in the studyarea brought seed drills ten years before and now all thefarmers were using the 16 tyned seed drill for sowingoperation.At present, many farmers now own these typeof seed drills.
Each and every farmer follow seed treatment without fail tocurtail soil borne pathogens.
Pre-emergence weedicides were being applied at higherrate than the recommended (recommend dose @1 litreperacre. Crop was maintained weed free for the entireseason with two hand weedings manually.
Seed rate 200-240 kg kernelper acre of land
Tractor drawn Cultivator
Tractor mounted seed drill
Seed treatment withMancozeb 45 andCarbendazim
Pre-emergence:Pendimethalin (or)Butachlor @2 -2.5 litre peracre (or)Pendimethalin 1litre +Butachlor 1 litre in 200litres of water by powersprayers (8-9 tanks peracre)Post emergence:Two hand weedings at 20and 40 days after sowing
Seed rate andspacing
Preparatorycultivation
Sowing
Seed treatment
Weedmanagement
In spite of less availability and high cost during the sowingseason all the farmers are still applying at least two tonnesof FYM per acre.
FYM @ 2 t per acre peryear
Manures
When compared to the recommended dose of fertilizersfor red loamy soils, farmers in the study area were applyingvery high dose of fertilizers. Due to more leaching ofnutrients, very high plant density and continuous irrigationfor every three to five days during the entire crop season,farmers opted for applying more fertilizers to replenish thenutrient availability to the crop. Farmers were resorting touse of complex fertilizers to overcome the labour shortagethat is required for mixing and application of straightfertilizers.
Basal: Urea - 50kg peracre; SSP 150 kg per acre
I Topdressing at 20DAS:28:28:0 @ 50 kg per acre;Urea@ 25 -50 kg per acre
II Top dressing at 40 DAS:50 kg of 14:35:14 per acreand Urea @ 25-50 kg peracre. Gypsum @200 kgper acre
III Top dressing at 60 DAS:Urea @ 25-50 kg per acre
Fertilizers
Table 1 Contd...
Table 1 Contd...

56
MOHAN et al.
Aspects Practices followed Observationsby the farmers
Irrigationwatermanagement
Sprinkler irrigationfor entire area
Entire area is under sprinkler irrigation systems. Water isavailable in tube wells at 20 feet depth. Irrigation was givenfor every three to five days for the entire crop season.Recently, some farmers adopted micro sprinklers (@10raisers per acre) to save water. For all the fields, irrigationoperations were done by specially skilled labour on contractbasis @ Rs.2000 per month per acre. One skilled manhas been engaged for every six acres.
Pest and Diseases Insects viz.,Spodopteraand diseases viz.,leafspots, Stem and Budnecrosis are common
A total of 8-9 sprays with different mix of agro-chemicalswere applied during one cropping season as per theavailability of chemicals.
Harvesting &Heaping
Manual harvesting Harvesting was done with 25 women labour per acre. Somefarmers were completing the harvesting on contract basis@ Rs. 5000 per acre. After harvesting farmers used to leavethe harvested crop in their fields itself for five days to dryand make it ready for threshing.
Threshing andseparating pods
Machine threshing.Around 100 machineswere available in thearea.
Farmers were using local threshing machine on rental [email protected] per acre and completes in three hours. Afterseparation, pods allowed to dry in the field itself for oneday.
Bagging Plastic sheet bags of 40kg of pods.
Farmers take the portion of the produce for storing in gunnybags for the seed purpose for next season and remainingproduce was bagged for sale in plastic bags.
Yield range 45-55 bags per acre Ranged from 1800 -2200 kg pods per acre. Some farmersharvesting 2600 - 2800 kg pods per acre.
Haulms Left in the field for sheepfeeding.
After threshing, the haulms, were left in the field itself.Sheep herds (about 20-25 herds with 400-500 sheep ineach herd) from the nearby areas visit the harvested fieldstofeed on the haulms by staying around 45-60 days. Thefarmers were being benefited by sheep penning for enrichingtheir soil.
Farm Mechanization Adopting mechanizationfor many farm operations
Due to intensive cultivation and for taking timely operationson a common crop calendar basis farmer opted for moremechanization and using machines for field preparation,sowing operations, spraying of agrochemicals, irrigationand threshing operations. During the study, farmersexpressed their need to have a combined harvester andthresher to harvest the produce in less time and also toovercome the labour shortage during the harvesting time.
Table 1 Contd...
Table 1 Contd...

57
CASE STUDY ON GROUNDNUT CULTIVATION IN A.P.
Aspects Practices followed Observationsby the farmers
Marketing Buyers come to fields
during harvesting
season.
Other area farmers also
buy for seed purpose.
As the entire area of around 4000 acres was in one
locationand availability of large quantity of produce, the
buyers came to the fields to purchase the produce. These
farmers are supplying majority of seed required by the other
farmers in the district for sowing Khairf season crop from
the Rabiseason crop produce. There is huge potential for
groundnut seed production in the study area.
Table 2. Major constraints perceived by the farmers in the study area with regards to
groundnut cultivation in coastal sandy soils
S. No. Perceived Constraint Priority Rank
1 Lack of improved short duration varieties suitable for coastal sandy soils I
2 Lack of recommended package of practices for coastal sandy soils II
3 Lack of combine harvester and threshers to overcome labour problem III
4 Labour shortage during peak season IV
5 Water shortage during drought years leading to reduced area under
cultivation V
6 Lack of facility for storage of the produce for better market price or
for storing it forseed purpose VI
The constraints perceived by the farmers
were prime importance to consider and work
out the strategies for reducing losses and
address them by developing cost reduction
cultivation technologies. Few constraints such
as 'lack of improved short duration varieties' and
'research based recommended package of
practices' can be taken up as future
researchable issues (Table 2).The constraint of
lack of storage facility can be addressed by
establishing seed godowns so that intensive
seed production activity can be taken up.
SWOT Analysis of groundnut cultivation
in Coastal sandy soils
SWOT analysis results (Fig. 3.) reveal that
the strengths identified during SWOT analysis
include high suitability of the soil for groundnut
cultivation, no alternative suitable and
remunerative crop other than groundnut and
more irrigation water availability and good
livelihood for the farmers. When opportunities
were examined, there was a possibility of
complete seed to seed mechanisation of
groundnut cultivation, promotion of Custom
Hiring Centres (CHCs) for farm machinery,
initiating Farmers Producers Organisation
(FPO) especially for seed production, instead
of selling the pods in the field as bulk to the
traders, farmers can start processing and value
Table 1 Contd...

58
MOHAN et al.
addition activities As area is under intensive
cultivation of groundnut,the entire area or a
significant part of the area can be promoted as
The major weaknesses were non-
availability of suitable short duration varieties,
lack of specific package of practices /
recommendations suitable for coastal sandy
soils, high cost of cultivation due to heavy
application of inputs and more labour cost. On
the other hand, the perceived threats include
water shortage in the tube wells during the
drought years leading to the reduction in the area
of cultivation. Due to lack of recommend
package of practices, farmers own practice and
desire to take more yield led to indiscriminate
use of inputs and there by leading to soil and
environmentdegradation.
Fig. 3. SWOT analysis of groundnut cultivation in coastal sandy soils in SPS Nellore District
CONCLUSION
The case study documented the groundnut
crop cultivation practices being followed by the
farmers as a groupin coastal sandy soils of SPS
Nellore district. Even without standard location
specific recommended package of practices
coastal sandy soils in the study area, farmers
were intensively cultivating the groundnut crop
since decades. The documented practices will
become a source for formulating researchable
issues for development of suitable package of
practices in these ecosystems. The research-
able issues as detailed in this case study will
seed production hub by the competent seed
agencies.

59
CASE STUDY ON GROUNDNUT CULTIVATION IN A.P.
help to conduct the On-farm research in the
study area in Participatory Technology
Development (PTD) approach to develop
interventions and suitable location specific
technologies which may also be useful for
similar coastal sandy soils ecosystems where
groundnut is being cultivated.There isa huge
potential in this district to promote Custom
Hiring Centres (CHCs) mechanisation,
development of Farmers Producers
Organisations (FPOs), promotion of processing
centres, and seed production hub.
REFERENCES
Cald Well, Jon, S., Somask Sukchen and
Ogura, C. 2005. Challenges for Farmers-
researcher Parmership for sandy soils in
Northeast Thailand.
CCZMCSB. 2020. Centre for Coastal Zone
Management and Coastal Shelter Belt,
Indian Institute of Ocean Management,
Anna University, Chennai. Retrieved from
the website (http://iomenvis.nic.in/
index2.aspx?slid=758&sublinkid=119&
langid =1&mid=1) on March 25th, 2020.
CPO. 2018. Hand book of statistics-SPS.
Nellore District Chief Planning Officer. Sri
Potti Sriramulu Nellore district, Andhra
Pradesh. pp.26-30.
DES. 2018. Agricultural Statistics at a Glance
2017-18.Directorate of Economics and
Statistics, Government of Andhra Pradesh,
Vijayawada. Andhra Pradesh. Retrieved
from the website (https://www.core.ap.gov.
in/cmdashboard/Download/Publications)
on March 25th, 2020.
EDB. 2020. Economic Development Board,
Government of Andhra Pradesh.Retrieved
from the website (http://apedb.gov.in/
infrastrctr.html) on March 25th, 2020.
Morgan, D. L. 1996.Focus Groups.Annual
Review of Sociology.22: 129-152
Singravel, R., Prasanth, V and Elayaraja, D.
2005. Role of bio-resources in improving
the fertility of coastal sandy soils for suitable
groundnut production. Proceedings of the
Conference on Management of Tropical
Sandy Soils for Sustainable
Agriculture.27th November-2nd December
2005, Khon Kean, Thailand.
Yin, Robert K. 2003. Case Study Research:
Design and Methods (3rd Edition).
Thousand Oaks,California: Sage
Publications.
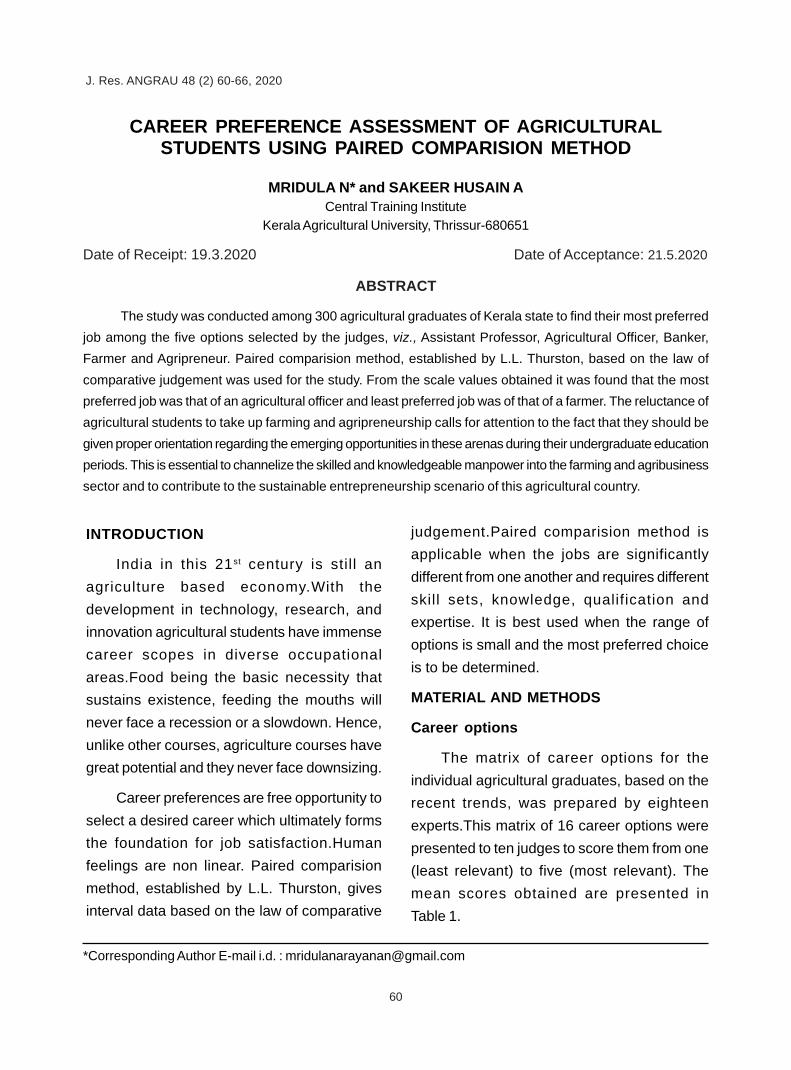
60
MRIDULA et al.J. Res. ANGRAU 47(4) 1-11, 2019
CAREER PREFERENCE ASSESSMENT OF AGRICULTURALSTUDENTS USING PAIRED COMPARISION METHOD
MRIDULA N* and SAKEER HUSAIN ACentral Training Institute
Kerala Agricultural University, Thrissur-680651
Date of Receipt: 19.3.2020 Date of Acceptance: 21.5.2020
ABSTRACT
The study was conducted among 300 agricultural graduates of Kerala state to find their most preferred
job among the five options selected by the judges, viz., Assistant Professor, Agricultural Officer, Banker,
Farmer and Agripreneur. Paired comparision method, established by L.L. Thurston, based on the law of
comparative judgement was used for the study. From the scale values obtained it was found that the most
preferred job was that of an agricultural officer and least preferred job was of that of a farmer. The reluctance of
agricultural students to take up farming and agripreneurship calls for attention to the fact that they should be
given proper orientation regarding the emerging opportunities in these arenas during their undergraduate education
periods. This is essential to channelize the skilled and knowledgeable manpower into the farming and agribusiness
sector and to contribute to the sustainable entrepreneurship scenario of this agricultural country.
*Corresponding Author E-mail i.d. : [email protected]
J. Res. ANGRAU 48 (2) 60-66, 2020
INTRODUCTION
India in this 21st century is stil l an
agriculture based economy.With the
development in technology, research, and
innovation agricultural students have immense
career scopes in diverse occupational
areas.Food being the basic necessity that
sustains existence, feeding the mouths will
never face a recession or a slowdown. Hence,
unlike other courses, agriculture courses have
great potential and they never face downsizing.
Career preferences are free opportunity to
select a desired career which ultimately forms
the foundation for job satisfaction.Human
feelings are non linear. Paired comparision
method, established by L.L. Thurston, gives
interval data based on the law of comparative
judgement.Paired comparision method is
applicable when the jobs are significantly
different from one another and requires different
skill sets, knowledge, qualification and
expertise. It is best used when the range of
options is small and the most preferred choice
is to be determined.
MATERIAL AND METHODS
Career options
The matrix of career options for the
individual agricultural graduates, based on the
recent trends, was prepared by eighteen
experts.This matrix of 16 career options were
presented to ten judges to score them from one
(least relevant) to five (most relevant). The
mean scores obtained are presented in
Table 1.
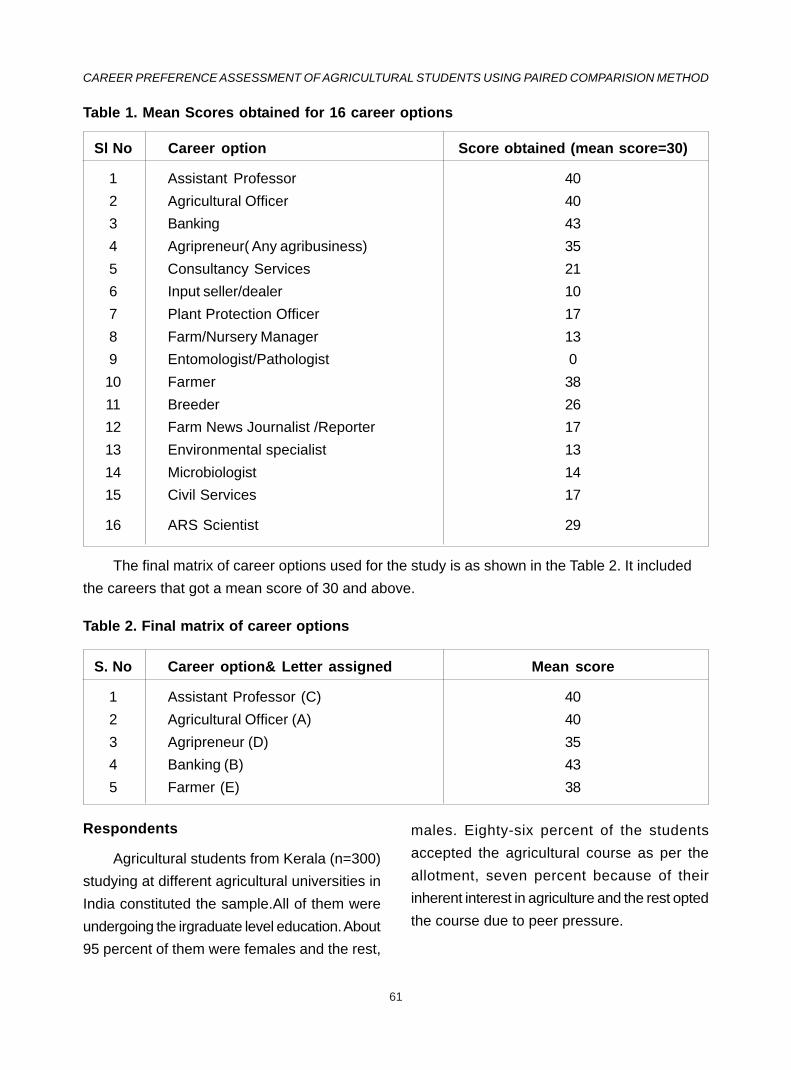
61
CAREER PREFERENCE ASSESSMENT OF AGRICULTURAL STUDENTS USING PAIRED COMPARISION METHOD
Table 1. Mean Scores obtained for 16 career options
Sl No Career option Score obtained (mean score=30)
1 Assistant Professor 40
2 Agricultural Officer 40
3 Banking 43
4 Agripreneur( Any agribusiness) 35
5 Consultancy Services 21
6 Input seller/dealer 10
7 Plant Protection Officer 17
8 Farm/Nursery Manager 13
9 Entomologist/Pathologist 0
10 Farmer 38
11 Breeder 26
12 Farm News Journalist /Reporter 17
13 Environmental specialist 13
14 Microbiologist 14
15 Civil Services 17
16 ARS Scientist 29
The final matrix of career options used for the study is as shown in the Table 2. It included
the careers that got a mean score of 30 and above.
Table 2. Final matrix of career options
S. No Career option& Letter assigned Mean score
1 Assistant Professor (C) 40
2 Agricultural Officer (A) 40
3 Agripreneur (D) 35
4 Banking (B) 43
5 Farmer (E) 38
Respondents
Agricultural students from Kerala (n=300)
studying at different agricultural universities in
India constituted the sample.All of them were
undergoing the irgraduate level education. About
95 percent of them were females and the rest,
males. Eighty-six percent of the students
accepted the agricultural course as per the
allotment, seven percent because of their
inherent interest in agriculture and the rest opted
the course due to peer pressure.
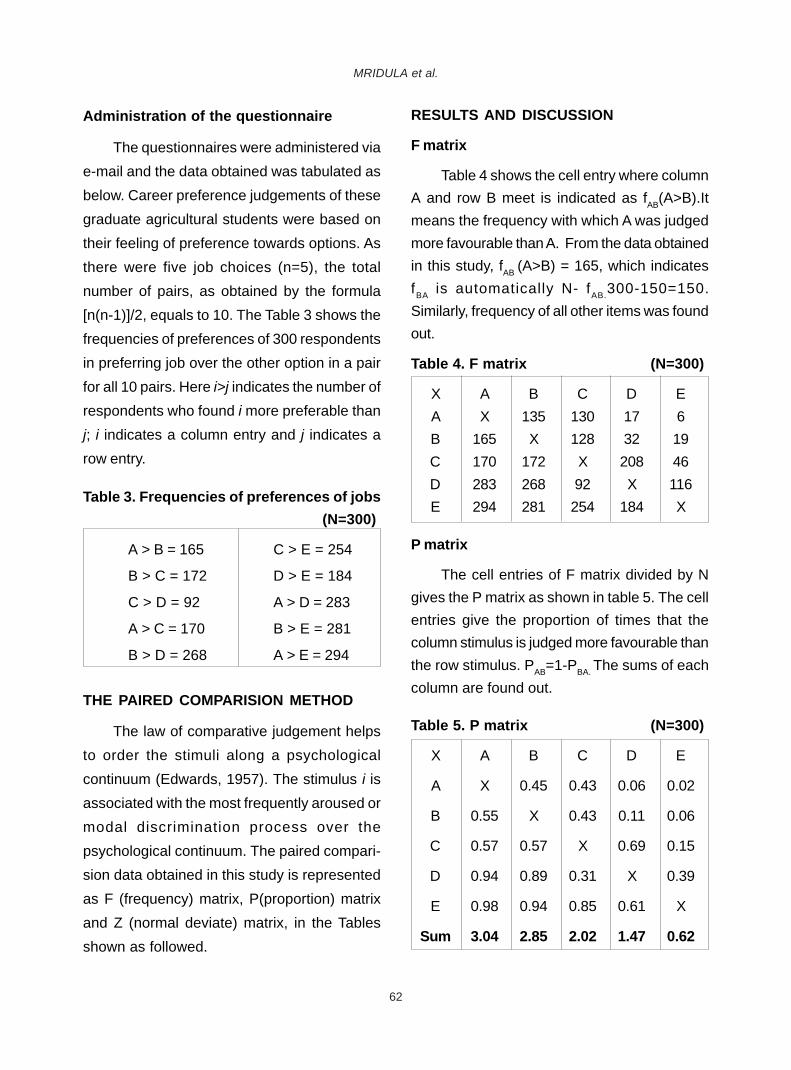
62
MRIDULA et al.
Administration of the questionnaire
The questionnaires were administered via
e-mail and the data obtained was tabulated as
below. Career preference judgements of these
graduate agricultural students were based on
their feeling of preference towards options. As
there were five job choices (n=5), the total
number of pairs, as obtained by the formula
[n(n-1)]/2, equals to 10. The Table 3 shows the
frequencies of preferences of 300 respondents
in preferring job over the other option in a pair
for all 10 pairs. Here i>j indicates the number of
respondents who found i more preferable than
j; i indicates a column entry and j indicates a
row entry.
Table 3. Frequencies of preferences of jobs
(N=300)
A > B = 165 C > E = 254
B > C = 172 D > E = 184
C > D = 92 A > D = 283
A > C = 170 B > E = 281
B > D = 268 A > E = 294
THE PAIRED COMPARISION METHOD
The law of comparative judgement helps
to order the stimuli along a psychological
continuum (Edwards, 1957). The stimulus i is
associated with the most frequently aroused or
modal discrimination process over the
psychological continuum. The paired compari-
sion data obtained in this study is represented
as F (frequency) matrix, P(proportion) matrix
and Z (normal deviate) matrix, in the Tables
shown as followed.
RESULTS AND DISCUSSION
F matrix
Table 4 shows the cell entry where column
A and row B meet is indicated as fAB
(A>B).It
means the frequency with which A was judged
more favourable than A. From the data obtained
in this study, fAB
(A>B) = 165, which indicates
fBA
is automatically N- fAB.
300-150=150.
Similarly, frequency of all other items was found
out.
Table 4. F matrix (N=300)
X A B C D E
A X 135 130 17 6
B 165 X 128 32 19
C 170 172 X 208 46
D 283 268 92 X 116
E 294 281 254 184 X
P matrix
The cell entries of F matrix divided by N
gives the P matrix as shown in table 5. The cell
entries give the proportion of times that the
column stimulus is judged more favourable than
the row stimulus. PAB
=1-PBA.
The sums of each
column are found out.
Table 5. P matrix (N=300)
X A B C D E
A X 0.45 0.43 0.06 0.02
B 0.55 X 0.43 0.11 0.06
C 0.57 0.57 X 0.69 0.15
D 0.94 0.89 0.31 X 0.39
E 0.98 0.94 0.85 0.61 X
Sum 3.04 2.85 2.02 1.47 0.62
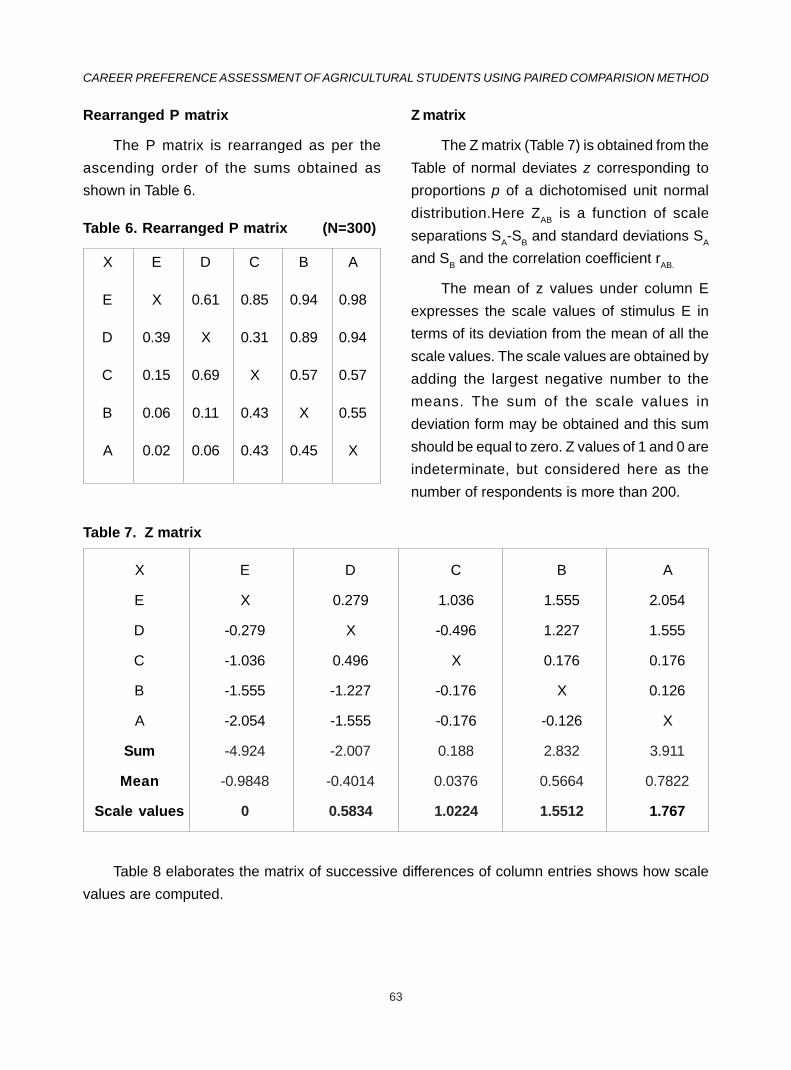
63
CAREER PREFERENCE ASSESSMENT OF AGRICULTURAL STUDENTS USING PAIRED COMPARISION METHOD
Rearranged P matrix
The P matrix is rearranged as per the
ascending order of the sums obtained as
shown in Table 6.
Table 6. Rearranged P matrix (N=300)
X E D C B A
E X 0.61 0.85 0.94 0.98
D 0.39 X 0.31 0.89 0.94
C 0.15 0.69 X 0.57 0.57
B 0.06 0.11 0.43 X 0.55
A 0.02 0.06 0.43 0.45 X
Z matrix
The Z matrix (Table 7) is obtained from the
Table of normal deviates z corresponding to
proportions p of a dichotomised unit normal
distribution.Here ZAB
is a function of scale
separations SA-S
B and standard deviations S
A
and SB and the correlation coefficient r
AB.
The mean of z values under column E
expresses the scale values of stimulus E in
terms of its deviation from the mean of all the
scale values. The scale values are obtained by
adding the largest negative number to the
means. The sum of the scale values in
deviation form may be obtained and this sum
should be equal to zero. Z values of 1 and 0 are
indeterminate, but considered here as the
number of respondents is more than 200.
Table 7. Z matrix
X E D C B A
E X 0.279 1.036 1.555 2.054
D -0.279 X -0.496 1.227 1.555
C -1.036 0.496 X 0.176 0.176
B -1.555 -1.227 -0.176 X 0.126
A -2.054 -1.555 -0.176 -0.126 X
Sum -4.924 -2.007 0.188 2.832 3.911
Mean -0.9848 -0.4014 0.0376 0.5664 0.7822
Scale values 0 0.5834 1.0224 1.5512 1.767
Table 8 elaborates the matrix of successive differences of column entries shows how scale
values are computed.
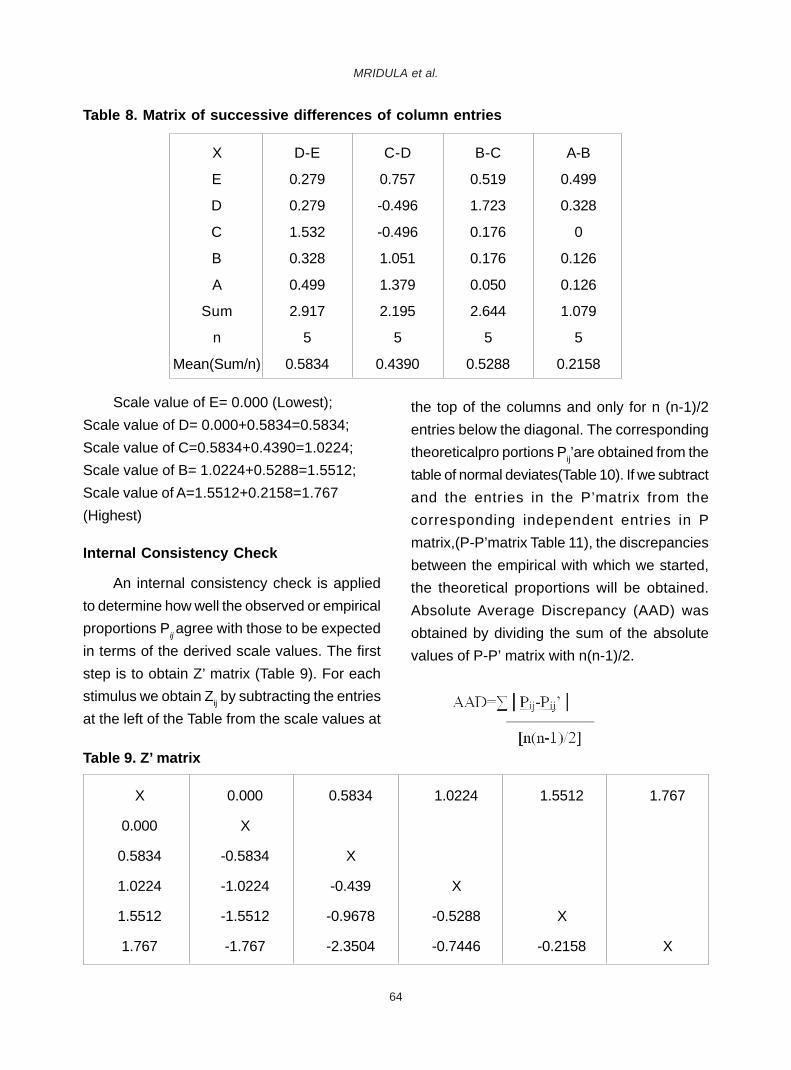
64
MRIDULA et al.
Table 8. Matrix of successive differences of column entries
X D-E C-D B-C A-B
E 0.279 0.757 0.519 0.499
D 0.279 -0.496 1.723 0.328
C 1.532 -0.496 0.176 0
B 0.328 1.051 0.176 0.126
A 0.499 1.379 0.050 0.126
Sum 2.917 2.195 2.644 1.079
n 5 5 5 5
Mean(Sum/n) 0.5834 0.4390 0.5288 0.2158
Scale value of E= 0.000 (Lowest);
Scale value of D= 0.000+0.5834=0.5834;
Scale value of C=0.5834+0.4390=1.0224;
Scale value of B= 1.0224+0.5288=1.5512;
Scale value of A=1.5512+0.2158=1.767
(Highest)
Internal Consistency Check
An internal consistency check is applied
to determine how well the observed or empirical
proportions Pij agree with those to be expected
in terms of the derived scale values. The first
step is to obtain Z’ matrix (Table 9). For each
stimulus we obtain Zij by subtracting the entries
at the left of the Table from the scale values at
the top of the columns and only for n (n-1)/2
entries below the diagonal. The corresponding
theoreticalpro portions Pij’are obtained from the
table of normal deviates(Table 10). If we subtract
and the entries in the P’matrix from the
corresponding independent entries in P
matrix,(P-P’matrix Table 11), the discrepancies
between the empirical with which we started,
the theoretical proportions will be obtained.
Absolute Average Discrepancy (AAD) was
obtained by dividing the sum of the absolute
values of P-P’ matrix with n(n-1)/2.
Table 9. Z’ matrix
X 0.000 0.5834 1.0224 1.5512 1.767
0.000 X
0.5834 -0.5834 X
1.0224 -1.0224 -0.439 X
1.5512 -1.5512 -0.9678 -0.5288 X
1.767 -1.767 -2.3504 -0.7446 -0.2158 X
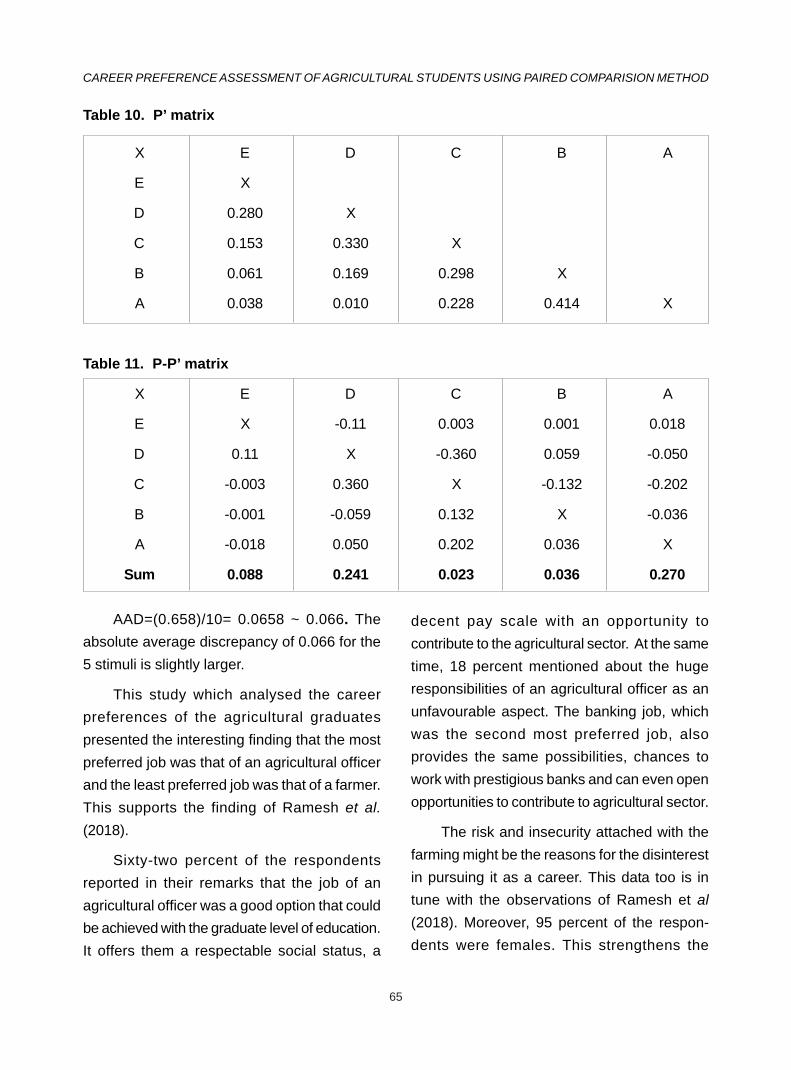
65
CAREER PREFERENCE ASSESSMENT OF AGRICULTURAL STUDENTS USING PAIRED COMPARISION METHOD
Table 10. P’ matrix
X E D C B A
E X
D 0.280 X
C 0.153 0.330 X
B 0.061 0.169 0.298 X
A 0.038 0.010 0.228 0.414 X
Table 11. P-P’ matrix
X E D C B A
E X -0.11 0.003 0.001 0.018
D 0.11 X -0.360 0.059 -0.050
C -0.003 0.360 X -0.132 -0.202
B -0.001 -0.059 0.132 X -0.036
A -0.018 0.050 0.202 0.036 X
Sum 0.088 0.241 0.023 0.036 0.270
AAD=(0.658)/10= 0.0658 ~ 0.066. The
absolute average discrepancy of 0.066 for the
5 stimuli is slightly larger.
This study which analysed the career
preferences of the agricultural graduates
presented the interesting finding that the most
preferred job was that of an agricultural officer
and the least preferred job was that of a farmer.
This supports the finding of Ramesh et al.
(2018).
Sixty-two percent of the respondents
reported in their remarks that the job of an
agricultural officer was a good option that could
be achieved with the graduate level of education.
It offers them a respectable social status, a
decent pay scale with an opportunity to
contribute to the agricultural sector. At the same
time, 18 percent mentioned about the huge
responsibilities of an agricultural officer as an
unfavourable aspect. The banking job, which
was the second most preferred job, also
provides the same possibilities, chances to
work with prestigious banks and can even open
opportunities to contribute to agricultural sector.
The risk and insecurity attached with the
farming might be the reasons for the disinterest
in pursuing it as a career. This data too is in
tune with the observations of Ramesh et al
(2018). Moreover, 95 percent of the respon-
dents were females. This strengthens the

66
MRIDULA et al.
conclusion of Hasan et al. (2019) that female
students scored less for risk-taking behaviour
in comparision to their male counterpart.
Additionally, 43 percent of the respondents
reported that they were reluctant to pursue higher
studies and other academic pursuits which
enable them for an academic job. It is a notable
result that eighty-nine percent informed that the
career choice after graduation will solely be
based on their own interest, whereas, the rest
were ready to consider the career options their
parents or peers would suggest. However,
almost all the respondents agreed that career
choice is based on professional experience
(97%) and good salary (96%). Good working
environment and career advancement
opportunities were other important factors in
deciding careers,as reported by 87% and 83%
of the respondents, respectively. This result
supports the findings of Mcgraw et al.(2012).
CONCLUSION
Paired comparision method is a useful tool
for weighing up the relative importance of
different options when the prime concerns
aren’t clear, where the options are completely
different, where evaluation criteria are
subjective, or where they’re competing in
importance. The finding of the study using this
tool was a promising one indicating that the
agricultural officer was the most preferred job
among the agricultural graduates. On the other
hand, the graduate students were reluctant to
take up agripreneurship or farming. This calls
for attention to the fact that agricultural students
should be given proper orientation regarding the
scope and immense possibilities in agri-
business, farming and related activities during
their undergraduate education period. This is
essential to channelize the skilled and
knowledgeable manpower into the farming and
agribusiness sector and to build entrepreneurial
culture in our society.
REFERENCES
Edwards, A.L. 1957. Techniques of attitude scale
construction. Ardent Media, U.S.pp.265.
Hasan, N., Sobnom, S and Uzzaman, S. 2019.
The effect of risk taking behaviour in gender
and educational level (Secondary and
Higher Secondary). International Journal of
Research and Innovation in Social
Science.3 (5): 15-21.
McGraw, K., Popp, J.S., Dixon, B.L and Newton,
D.J.2012. Factors influencing job choice
among Agricultural Economics Pro-
fessionals. Journal of Agricultural and
Applied Economics. 44(2): 251-265.
Ramesh, N.,Sagar, M.P., Tiwari, R.,
Pachaiyappan, K and Balaraju, B.L. 2018.
Career preferences of agriculture and
animal sciences undergraduates.
International Journal of Livestock
Research. 8(4):195-201.
67
INM OF SAFFLOWER CROP IN PROBLEM SOILSJ. Res. ANGRAU 47(4) 1-11, 2019
INTEGRATED NUTRIENT MANGEMENT OF SAFFLOWER CROP INPROBLEM SOILS
K. ANNY MRUDHULA* and Y. RADHA KRISHNASaline Water Scheme, Agricultural College Farm,
Acharya N.G. Ranga Agricultural University, Bapatla-522101
Date of Receipt: 02.3.2020 Date of Acceptance: 14.5.2020
*Corresponding Author E-mail : [email protected]
J. Res. ANGRAU 48 (2) 67-71, 2020
India has a total total geographical area 329
mha.Out of the 329 mha, the arid and semi-
arid zones occupy more than one-third of the
area (127.4 mha). The salt affected soils
occurring in these zones occupy 12 mha area
spread over in 15 states of the country, out of
which 4.12 mha are alkali, 3.26 mha are saline
soils and 4.62 mha saline alkali soils. Among
these salt affected soils, alkali soils are found
to be highly problematic for crop production
because of very poor physical and chemical
environment particularly in irrigated areas.
Sodicity problem in irrigated agriculture is
becoming more serious because of faulty
methods of irrigation, intensive cultivation of
high water requirement crops, use of poor
quality water, lack of adequate knowledge about
soils and poor management practices. The
amelioration of these alkali soils is not only
expensive but also time consuming and
laborious. (Gupta et al., 1995). Management
practices which can be adopted to reduce
negative effects of salts on plant growth
includes leaching out salts from the soil profile,
use of amendments such as gypsum, use of
farmyard manure. Addition of organic
amendments to soil improves soil properties
and it is highly accepted by the farmers
(Prapagar et al., 2012). Gypsum is the most
commonly used amendment due to its
availability at low cost. Joachim et al. (2007)
attributed the beneficial effect of combined use
of farm yard manure and gypsum on the
reclamation of sodic soils.
Safflower (Carthamus tinctorius L.) is
considered to be a moderately salt-tolerant crop.
There are very few reports about safflower
resistance to salt stress or alkali stress (Liu &
Baird, 2003). Salt content of 7 dSm-1 reduced
safflower yield by 10-15% (Francois and
Berstein, 1964). Safflower is a versatile crop
that can be grown on a range of soil types, but
comes up well on deep and well drained neutral
to alkaline soils. Extensive deep root system
combined with a long duration can break hard-
pans and create channels in the soil profile,
thus, facilitating air and water movement and
benefit the management of soils prone to
salinity (Houmanat, 2016). The study was
carried out to evaluate the performance of
safflower crop in alkali soil under different
agronomic management practices.
The field experiment was conducted during
rabi,2017 at Bhavanamvaripalem farmer’s
fields on sandy clay loam soil in randomized
block design with five treatments and four
replications (Table 1). Recommended
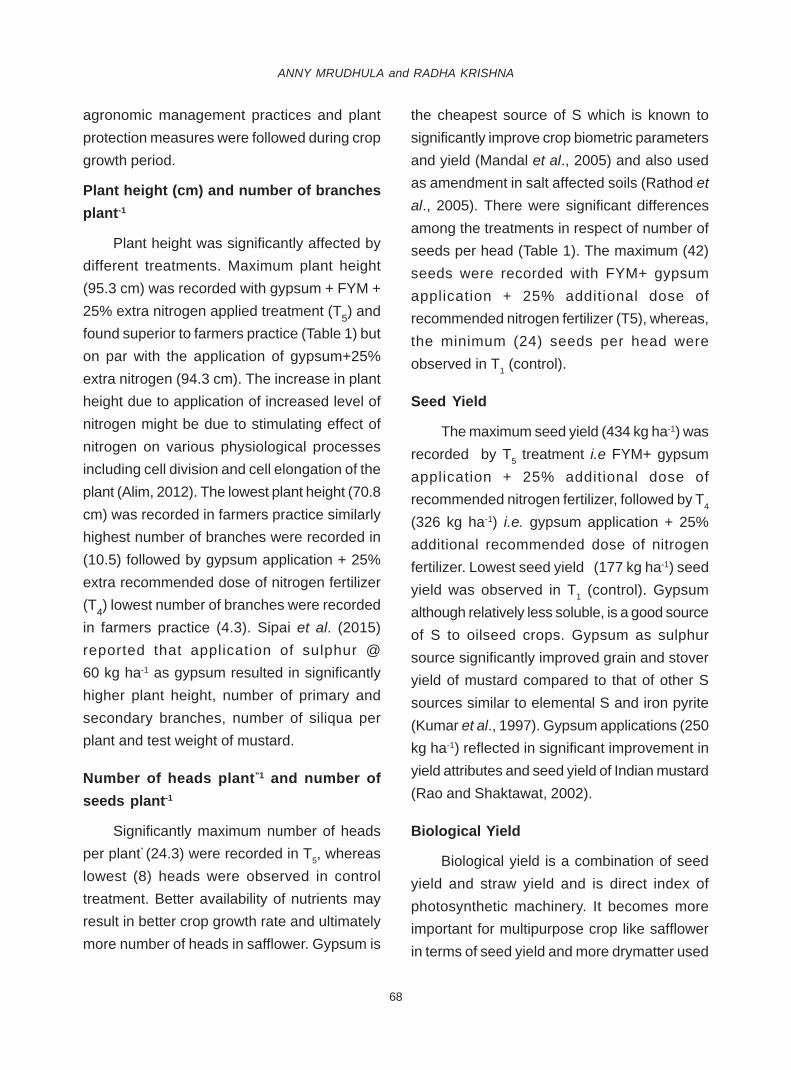
68
ANNY MRUDHULA and RADHA KRISHNA
agronomic management practices and plant
protection measures were followed during crop
growth period.
Plant height (cm) and number of branches
plant-1
Plant height was significantly affected by
different treatments. Maximum plant height
(95.3 cm) was recorded with gypsum + FYM +
25% extra nitrogen applied treatment (T5) and
found superior to farmers practice (Table 1) but
on par with the application of gypsum+25%
extra nitrogen (94.3 cm). The increase in plant
height due to application of increased level of
nitrogen might be due to stimulating effect of
nitrogen on various physiological processes
including cell division and cell elongation of the
plant (Alim, 2012). The lowest plant height (70.8
cm) was recorded in farmers practice similarly
highest number of branches were recorded in
(10.5) followed by gypsum application + 25%
extra recommended dose of nitrogen fertilizer
(T4) lowest number of branches were recorded
in farmers practice (4.3). Sipai et al. (2015)
reported that application of sulphur @
60 kg ha-1 as gypsum resulted in significantly
higher plant height, number of primary and
secondary branches, number of siliqua per
plant and test weight of mustard.
Number of heads plant”1 and number of
seeds plant-1
Significantly maximum number of heads
per plant” (24.3) were recorded in T5, whereas
lowest (8) heads were observed in control
treatment. Better availability of nutrients may
result in better crop growth rate and ultimately
more number of heads in safflower. Gypsum is
the cheapest source of S which is known to
significantly improve crop biometric parameters
and yield (Mandal et al., 2005) and also used
as amendment in salt affected soils (Rathod et
al., 2005). There were significant differences
among the treatments in respect of number of
seeds per head (Table 1). The maximum (42)
seeds were recorded with FYM+ gypsum
application + 25% additional dose of
recommended nitrogen fertilizer (T5), whereas,
the minimum (24) seeds per head were
observed in T1 (control).
Seed Yield
The maximum seed yield (434 kg ha-1) was
recorded by T5 treatment i.e FYM+ gypsum
application + 25% additional dose of
recommended nitrogen fertilizer, followed by T4
(326 kg ha-1) i.e. gypsum application + 25%
additional recommended dose of nitrogen
fertilizer. Lowest seed yield (177 kg ha-1) seed
yield was observed in T1 (control). Gypsum
although relatively less soluble, is a good source
of S to oilseed crops. Gypsum as sulphur
source significantly improved grain and stover
yield of mustard compared to that of other S
sources similar to elemental S and iron pyrite
(Kumar et al., 1997). Gypsum applications (250
kg ha-1) reflected in significant improvement in
yield attributes and seed yield of Indian mustard
(Rao and Shaktawat, 2002).
Biological Yield
Biological yield is a combination of seed
yield and straw yield and is direct index of
photosynthetic machinery. It becomes more
important for multipurpose crop like safflower
in terms of seed yield and more drymatter used
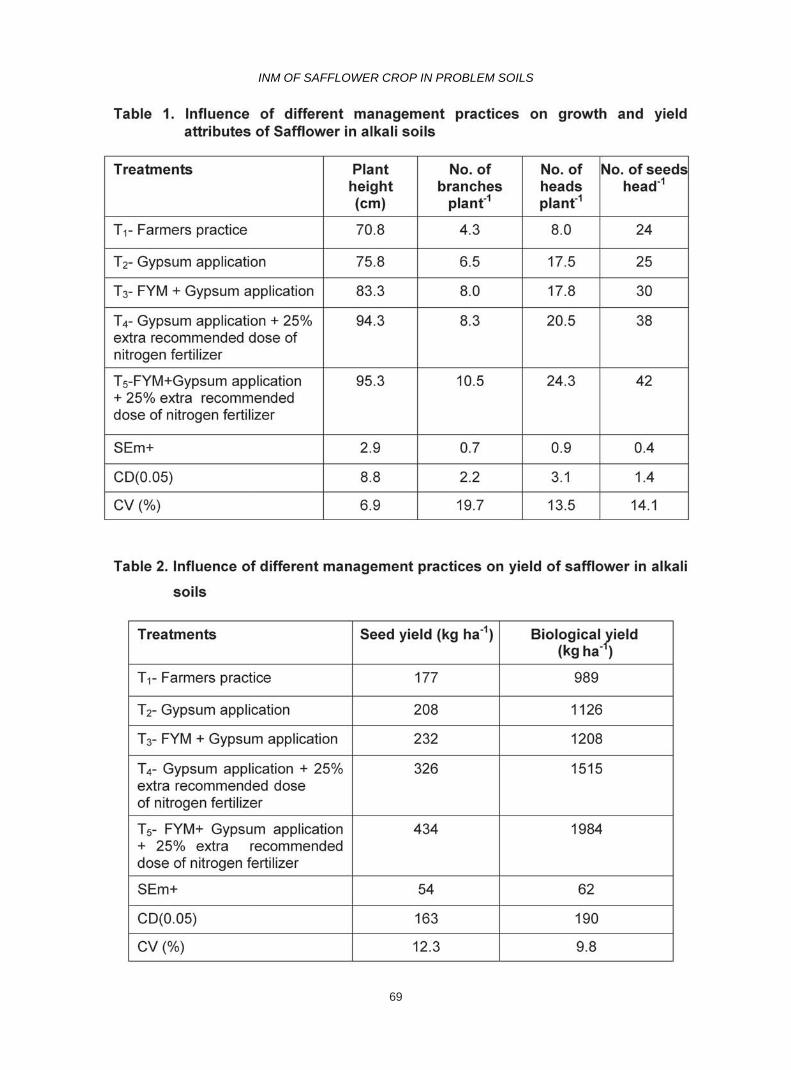
69
INM OF SAFFLOWER CROP IN PROBLEM SOILS
70
ANNY MRUDHULA and RADHA KRISHNA
for fodder purpose. Maximum biological yield
(1984 kg ha-1) was recorded in T5which was at
par with T4.Application of gypsum with organic
manures is a less expensive alternative not only
to improve soil condition but also to enhance
crop yields. The addition of gypsum and organic
manure to the saline and sodic soils has a
synergistic effect between the two antagonists
especially for monovalent cations such as Na+
(Mahmoodabadi et al., 2012). In a study by
Hosmath et al. (2014), 20 kg S ha-1 applied in
the form of gypsum improved the yield of
soybean by 12%. The oil content and quality
also improved with application of S along with
other nutrients.
This study indicated that there is a scope
of increasing crop yields through use of
integrated nutrient management. Application of
gypsum + FYM + 25% additional nitrogen
resulted in better yield attributing characters and
yield followed by gypsum+25% additional
nitrogen treatment while, the lowest yield was
recorded in farmers practice.
REFERENCES
Alim, M. A. 2012. Effect of organic and inorganic
sources and doses of nitrogen fertilizer on
the yield of Boro rice. Journal of
Environmental Science & Natural
Resources. 5(1): 273- 282.
Gupta, R.K., Sharma, O.P and Dubey, S. K.
1995. Effect of dose and frequency of
gypsum application on properties of sodic
soil and on performance of rice
(Oryzasativa) and bread wheat (Triticum
aestivum). Indian Journal of Agricultural
Sciences. 58(6):449-53.
Hosmath, J.A., Babalad, H.B., Basavaraj, G.T.,
Shamarao Jahagirdar, Patil, R.H., Athoni,
B.K and Agasimani S.C. 2014. Sulphur
Nutrition in Soybean [Glycine max (L.)
Merril] in India. International Conference on
Biological, Civil and Environmental
Engineering (BCEE-2014) March 17-18,
2014 held at Dubai (UAE).
Houmanat, K., Charafi, J., Mazouz, H.,Fechtali,
M and Nabloussi, A. 2016. Genetic
diversity analysis of safflower (Carthamus
tinctorius) accessions from different
geographic origins using ISSR markers.
International Journal of Agriculture and
Biology.18: 10811087.
Joachim, H.J.R., Makoi, PandNdakidemi, A.
2007. Reclamation of sodic soils in
northern Tanzania, using locally available
organic and inorganic resources. African
Journal of Biotechnology. 6(16), 1926-
1931.
Liu, X and Baird, W. V. 2003. Differential
expression of genes regulated in
responses to drought or salinity stress in
sunflower. Crop Science. 43:678-687.
Mahmoodabadi, M., Yazdanpanah, N., Sinobas,
L.R., Pazira, E and Neshat, A. 2012.
Reclamation of calcareous saline sodic
soil with different amendment (I):
redistribution of soluble cations within the
soil profile. Agriculture Water Manage-
ment.Retrieved from website (http://
dx.doi.org/10.1016/j.agwat.2012.08.018)
on 29.2.2020.
Mandal, S., Samui, R.C and Mandal, A. 2005.
Growth, yield and yield attributes of

71
INM OF SAFFLOWER CROP IN PROBLEM SOILS
groundnut (Arachis hypogaea) cultivars as
influenced by gypsum application. Legume
Research. 28 (2): 119 – 121.
Prapagar, K., Indraratne, S.P and Prema-
nandharajah, P. 2012. Effect of FYM and
gypsum combinations on reclamation of
saline-sodic Soil. Tropical Agricultural
Research. 23 (2): 168 –176.
Rao, S.S and Shaktawat, M.S. 2005. Effect of
organic manure, phosphorus and gypsum
on nutrient uptake in groundnut.
Agropedology.15(2): 100-106.
Rathod, V.B., Sagare, B.N., Ravankar, H.N. and
Sarap, P.A. 2005. Response of cotton to
applied gypsum and FYM on an alkali
irrigated soil of Purna valley of Vidarbha,
Maharashtra. Agriculture Science Digest.
25 (1): 53 – 55.
Sipai, A.H., Patel, J.J and Patel, N.I. 2015. Effect
of sulphur and zinc with and without FYM
on yield and yield attributes of mustard
[Brassica juncea (L.) Czern amd Coss]
grown on light textured soils of Kachchh.
Asian Journal of Soil Science. 10(2): 191-
200.
72
PRADEEP KUMAR and VANIJ. Res. ANGRAU 47(4) 1-11, 2019
COST ANALYSIS OF MEDICINAL AND AROMATIC PLANTS INANDHRA PRADESH AND TELANGANA STATES
D. PRADEEP KUMAR* and N. VANIDepartment of Agri Business Management, S.V. Agricultural College Campus,
Acharya N.G. Ranga Agricultural University, Tirupati -517 502
Date of Receipt: 30.3.2020 Date of Acceptance: 19.5.2020
*Corresponding Author E-mail i.d: [email protected]; M.Sc thesis submitted to Acharya
N.G. Ranga Agricultural University, Guntur
J. Res. ANGRAU 48 (2) 72-79, 2020
Medicinal and aromatic plants are
receiving substantial amount of attention across
the worldas the products made with these
plants offer a wide range of safe, cost effective,
preventive and curative therapies. Though,
there exists cultivation of different species of
number of medicinal and aromatic plants, this
study was limited to most cultivated two plants
viz.,Coleus (Coleus forskolii), and Palmarosa
(Cymbopogan martini). Coleus is considered
as one of the most potential medicinal plants
for its pharmaceutical properties.
In India, medicinal and aromatic plants are
grown in an area of 720 thousand ha, with total
production of 866 thousand tones and total
productivity 1.2 MT per hectare. (Indiastat,
2018). In Andhra Pradesh, the total area under
medicinal and aromatic plants is 6000 ha with
a total production of 9000 MT (Indiastat, 2018).
In Telangana state, the total cultivated area is
2538 ha with a production of 4410 MT (Indiastat,
2018). Keeping this in view, the study was
conducted to estimate the cost analysis of the
selected two medicinal and aromatic plants
Coleus and Palmarosa.
The study was conducted in Mahabub-
nagar and Chittoor districts of Telangana and
Andhra Pradesh, respectively. The lists of
farmers cultivating the two crops were collected
from the (Department of Agriculture offices from
both districts) selected villages. All the mandals
in Chittoor district with their coleus cultivated
area were listed in descending order and top
one mandal was selected i.e. Nagari for this
study. Similarly, Bijinapally mandal In Mahabub-
nagar district was selected for studying
Palmarosa crop. For each crop 30 farmers
were selected randomly, thus, making a total
of 60 farmers. The primary data was collected
through personal interview using a pre-tested
scheduleduring the year 2015-2016.For the
computation of costs, cost concepts as
suggested by the Commission for Agricultural
Costs and Prices (CACP, 2020) were included.
On an average, the total cost of cultivation
of coleus was Rs.90452. It was found that the

73
COST ANALYSIS OF MEDICINAL AND AROMATIC PLANTS IN A.P. AND TELANGANA STATES
S.No. Item Amount (Rs.)
I. Operational Costs
1 Human labour 47968 (53.03)
Owned 3436 (3.80)
Hired 44532 (49.23)
2 Cattle labour 2084 (2.31)
Owned 282 (0.31)
Hired 1802 (2.00)
3 Machine power 3848 (4.25)
Owned 1190 (1.31)
Hired 2658 (2.94)
4 Seed 4997(5.52)
5 Manures and fertilizers 11702 (12.94)
a. Manures 6000 (6.64)
b. Fertilizers 5702 (6.30)
6 Plant protection chemicals 1369 (1.51)
Irrigation charger’s 876 (0.97)
Interest on working capital 1912 (2.11)
Total Operational Costs 74756 (82.64)
II Fixed costs
1 Land revenue 150(0.17)
2 Rental value of owned land 10000(11.06)
3 Depreciation 3865(4.27)
4 Interest on fixed capital 1682(1.86)
Total fixed costs 15696 (17.36)
Total costs 90452 (100)
Table 1. Cost of cultivation of Coleus(component-wise per ha)
Note:Figures in parentheses indicate percentages to total
74
PRADEEP KUMAR and VANI
operational costs accounted for a major share
in the total cost of cultivation. The total
operational costs were Rs.74756 (Table 1).In
case of Coleus, the costs of both owned, hired
human labour was the major cost component
among operational costs with an amount of
Rs.47968/- accounting for 53%.The next
important operational cost was manures and
fertilizers with an amount of Rs.11702 (12.94%).
The other items of expenditure in the order of
importance were seed (5.52%), machine power
(4.25%), cattle labour (2.31%), interest on
working capital (2.11%) plant protection
chemicals (1.51%), and, irrigation chargers
(0.97%).
Fixed costs per hectare were estimated
at Rs.15696/-accounting for 17.36% of total
cost of cultivation.The rental value of owned land
was the major cost item among the fixed costs
which accounted for 11.06%. Depreciation,
interest on fixed capital and land revenue were
other fixed cost items accounting for 4.27%,
1.86 % and 0.17 %, respectively.
Palmarosa
The cost of both owned and hired human
labour was the major cost components among
the operational costs with an amount of
Rs.43348/- accounting for 57.66% of cultivation
of Palmarosa for the main crop (Table 2). The
next important operational cost was manures
and fertilizers with an amount of Rs.13687/-
(18.20 %)main crop.The other items of
expenditure in main crop in the order of
importance were seed (6.46 %), machine power
(5.59 %), cattle labour (3.09 %), irrigation
charges (1.50), interest on working capital (1.23
%) and plant protection chemicals (0.97 %).
Fixed costs for main crop stood at Rs.3687
accounting for 4.90 % of total cost of cultivation.
The rental value of owned land was the major
cost item among the fixed costs which
accounted for 3.32 %. Depreciation, interest on
fixed capital and land revenue were other fixed
cost items accounting for 1.00%, 0.53 % and
0.05%, respectively.
In case of ratoon –I, the cost of labour both
owned and hired human labour was the major
cost components among the operational costs
with an amount of Rs.29442/-(69.16%) of
cultivation costs of Palmarosa. The next
important operational cost was fertilizers with
an amount of Rs.7200/- (16.91%) of
Palmarosa. The other items of expenditure
were irrigation charges (2.42%), protection
chemicals (1.65%), and interest on working
capital (1.20%) plant.Fixed costs per hectare
for Palmarosa were at Rs.3687 accounting for
8.66 % of the total cost of cultivation. The rental
value of owned land was the major cost item
among the fixed costs which accounted for
5.87% of Palmarosa cultivation. Depreciation,
interest on fixed capital and land revenue were
the other minor fixed cost components
accounting for 1.770%, 0.93% and 0.09%,
respectively.
In case of ratoon – II, the cost of both
owned, hired human labour was the major cost
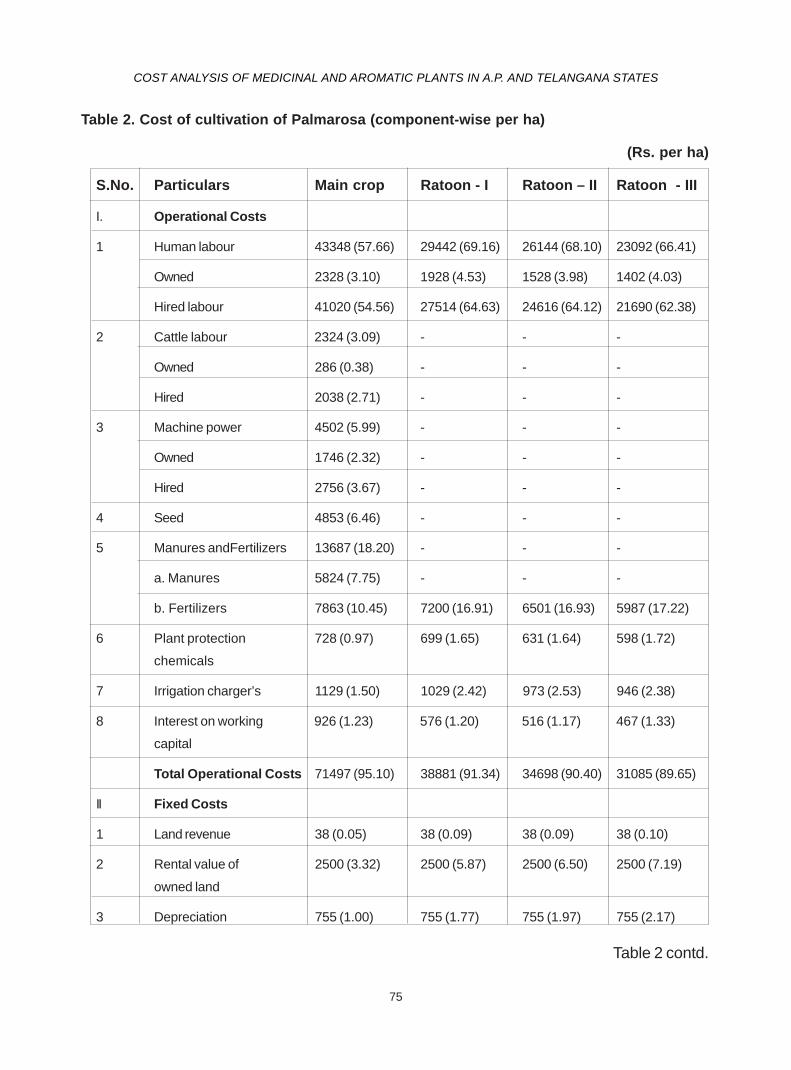
75
COST ANALYSIS OF MEDICINAL AND AROMATIC PLANTS IN A.P. AND TELANGANA STATES
Table 2. Cost of cultivation of Palmarosa (component-wise per ha)
(Rs. per ha)
S.No. Particulars Main crop Ratoon - I Ratoon – II Ratoon - III
I. Operational Costs
1 Human labour 43348 (57.66) 29442 (69.16) 26144 (68.10) 23092 (66.41)
Owned 2328 (3.10) 1928 (4.53) 1528 (3.98) 1402 (4.03)
Hired labour 41020 (54.56) 27514 (64.63) 24616 (64.12) 21690 (62.38)
2 Cattle labour 2324 (3.09) - - -
Owned 286 (0.38) - - -
Hired 2038 (2.71) - - -
3 Machine power 4502 (5.99) - - -
Owned 1746 (2.32) - - -
Hired 2756 (3.67) - - -
4 Seed 4853 (6.46) - - -
5 Manures andFertilizers 13687 (18.20) - - -
a. Manures 5824 (7.75) - - -
b. Fertilizers 7863 (10.45) 7200 (16.91) 6501 (16.93) 5987 (17.22)
6 Plant protection 728 (0.97) 699 (1.65) 631 (1.64) 598 (1.72)
chemicals
7 Irrigation charger’s 1129 (1.50) 1029 (2.42) 973 (2.53) 946 (2.38)
8 Interest on working 926 (1.23) 576 (1.20) 516 (1.17) 467 (1.33)
capital
Total Operational Costs 71497 (95.10) 38881 (91.34) 34698 (90.40) 31085 (89.65)
II Fixed Costs
1 Land revenue 38 (0.05) 38 (0.09) 38 (0.09) 38 (0.10)
2 Rental value of 2500 (3.32) 2500 (5.87) 2500 (6.50) 2500 (7.19)
owned land
3 Depreciation 755 (1.00) 755 (1.77) 755 (1.97) 755 (2.17)
Table 2 contd.
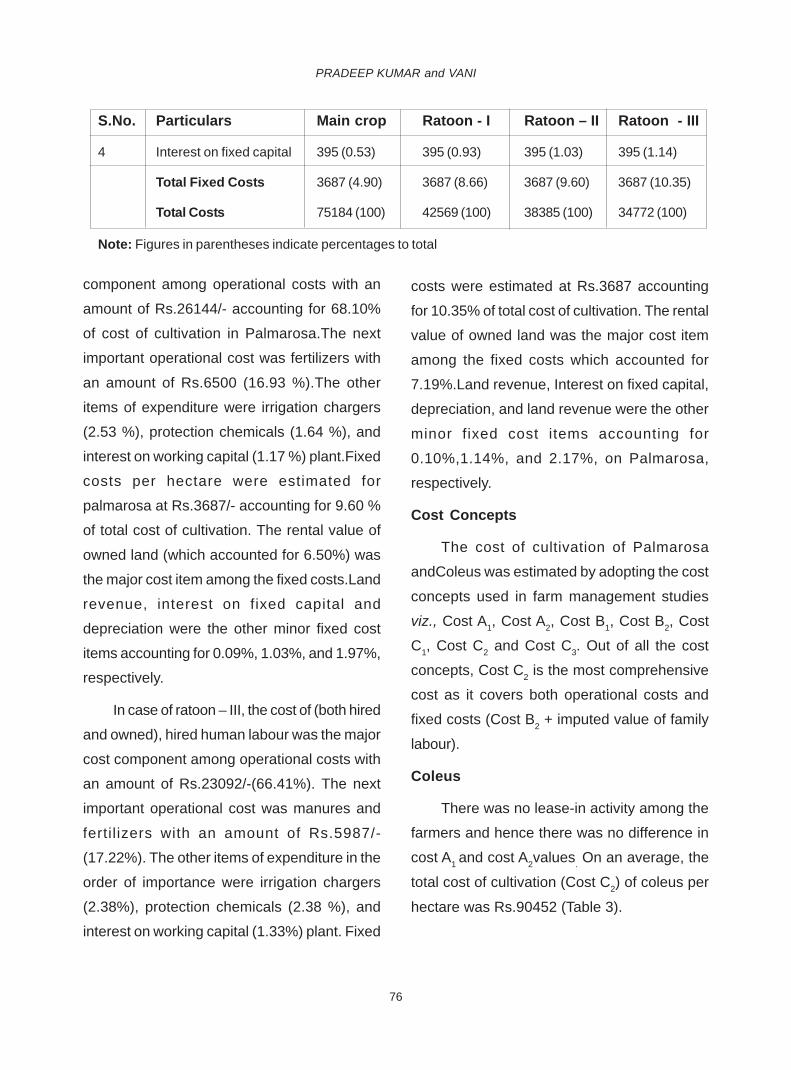
76
PRADEEP KUMAR and VANI
S.No. Particulars Main crop Ratoon - I Ratoon – II Ratoon - III
4 Interest on fixed capital 395 (0.53) 395 (0.93) 395 (1.03) 395 (1.14)
Total Fixed Costs 3687 (4.90) 3687 (8.66) 3687 (9.60) 3687 (10.35)
Total Costs 75184 (100) 42569 (100) 38385 (100) 34772 (100)
Note: Figures in parentheses indicate percentages to total
component among operational costs with an
amount of Rs.26144/- accounting for 68.10%
of cost of cultivation in Palmarosa.The next
important operational cost was fertilizers with
an amount of Rs.6500 (16.93 %).The other
items of expenditure were irrigation chargers
(2.53 %), protection chemicals (1.64 %), and
interest on working capital (1.17 %) plant.Fixed
costs per hectare were estimated for
palmarosa at Rs.3687/- accounting for 9.60 %
of total cost of cultivation. The rental value of
owned land (which accounted for 6.50%) was
the major cost item among the fixed costs.Land
revenue, interest on fixed capital and
depreciation were the other minor fixed cost
items accounting for 0.09%, 1.03%, and 1.97%,
respectively.
In case of ratoon – III, the cost of (both hired
and owned), hired human labour was the major
cost component among operational costs with
an amount of Rs.23092/-(66.41%). The next
important operational cost was manures and
fertil izers with an amount of Rs.5987/-
(17.22%). The other items of expenditure in the
order of importance were irrigation chargers
(2.38%), protection chemicals (2.38 %), and
interest on working capital (1.33%) plant. Fixed
costs were estimated at Rs.3687 accounting
for 10.35% of total cost of cultivation. The rental
value of owned land was the major cost item
among the fixed costs which accounted for
7.19%.Land revenue, Interest on fixed capital,
depreciation, and land revenue were the other
minor fixed cost items accounting for
0.10%,1.14%, and 2.17%, on Palmarosa,
respectively.
Cost Concepts
The cost of cultivation of Palmarosa
andColeus was estimated by adopting the cost
concepts used in farm management studies
viz., Cost A1, Cost A
2, Cost B
1, Cost B
2, Cost
C1, Cost C
2 and Cost C
3. Out of all the cost
concepts, Cost C2 is the most comprehensive
cost as it covers both operational costs and
fixed costs (Cost B2 + imputed value of family
labour).
Coleus
There was no lease-in activity among the
farmers and hence there was no difference in
cost A1 and cost A
2values
. On an average, the
total cost of cultivation (Cost C2) of coleus per
hectare was Rs.90452 (Table 3).
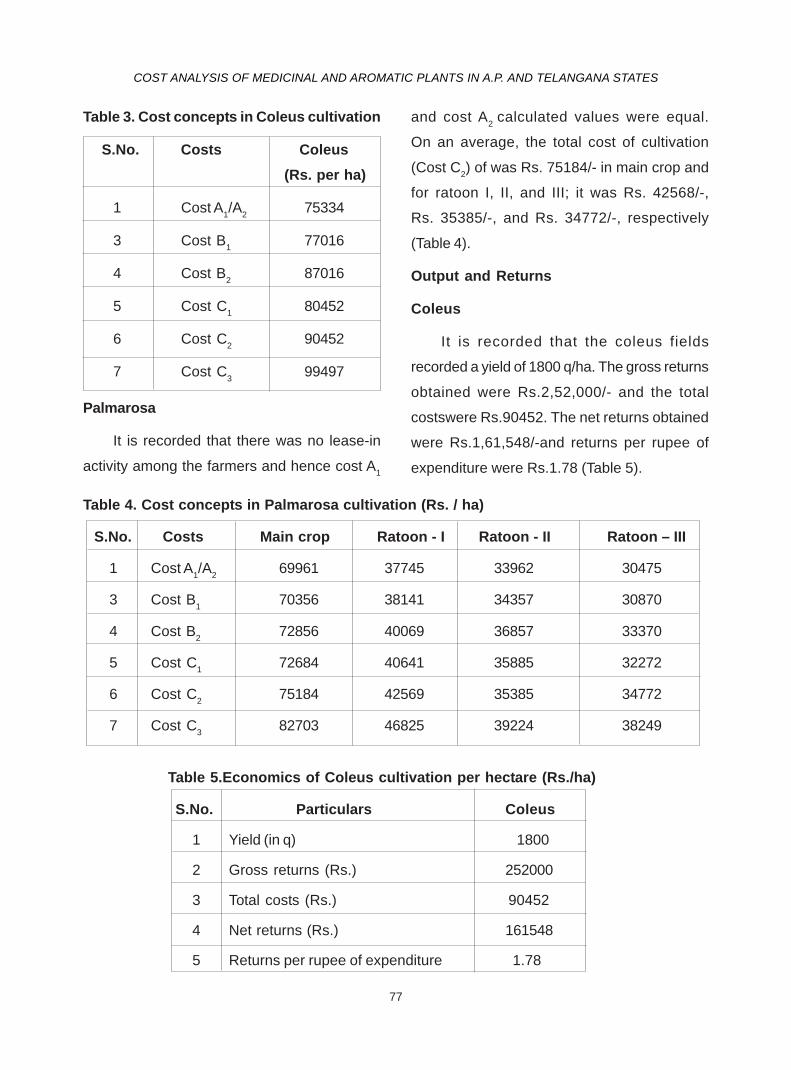
77
COST ANALYSIS OF MEDICINAL AND AROMATIC PLANTS IN A.P. AND TELANGANA STATES
Table 3. Cost concepts in Coleus cultivation
S.No. Costs Coleus
(Rs. per ha)
1 Cost A1/A
275334
3 Cost B1
77016
4 Cost B2
87016
5 Cost C1
80452
6 Cost C2
90452
7 Cost C3
99497
Palmarosa
It is recorded that there was no lease-in
activity among the farmers and hence cost A1
and cost A2
calculated values were equal.
On an average, the total cost of cultivation
(Cost C2) of was Rs. 75184/- in main crop and
for ratoon I, II, and III; it was Rs. 42568/-,
Rs. 35385/-, and Rs. 34772/-, respectively
(Table 4).
Output and Returns
Coleus
It is recorded that the coleus fields
recorded a yield of 1800 q/ha. The gross returns
obtained were Rs.2,52,000/- and the total
costswere Rs.90452. The net returns obtained
were Rs.1,61,548/-and returns per rupee of
expenditure were Rs.1.78 (Table 5).
Table 4. Cost concepts in Palmarosa cultivation (Rs. / ha)
S.No. Costs Main crop Ratoon - I Ratoon - II Ratoon – III
1 Cost A1/A
269961 37745 33962 30475
3 Cost B1
70356 38141 34357 30870
4 Cost B2
72856 40069 36857 33370
5 Cost C1
72684 40641 35885 32272
6 Cost C2
75184 42569 35385 34772
7 Cost C3
82703 46825 39224 38249
Table 5.Economics of Coleus cultivation per hectare (Rs./ha)
S.No. Particulars Coleus
1 Yield (in q) 1800
2 Gross returns (Rs.) 252000
3 Total costs (Rs.) 90452
4 Net returns (Rs.) 161548
5 Returns per rupee of expenditure 1.78

78
PRADEEP KUMAR and VANI
Table 6. Economics of Palmarosa cultivation (Rs./ ha)
S.No. Particulars Main crop Ratoon - I Ratoon - II Ratoon – III
1 Yield (q) 700 700 700 700
2 Gross returns 154000 140000 119000 105000
3 Total cost 75184 42569 35385 34772
4 Net returns 78816 97431 83615 70228
5 Returns of rupee expenditure 1.04 2.28 2.36 2.02
Rs.75334/-, Rs.77,016/-, Rs.87,016/-,
Rs.80,452/-, Rs.90,452/- and Rs.99,497/-,
respectively. The coleus yield per ha was1800q
and the gross returns were Rs. 2,52,000/-. The
returns per rupee of expenditure were Rs.1.78.
In case of Palmarosa, Cost A1/A
2, Cost B
1,
CostB2, Cost C
1, Cost C
2, and Cost C
3 were
Rs.69961, Rs.70,356, Rs.72,856, Rs.72,684,
Rs.75,184, and Rs.82,703 for main crop,
respectively. The yield per hectare was same
for main crop, ratoon I, II and III i.e., 700 q.
Furthermore, the returns per rupee of
expenditure were Rs.1.04, Rs.2.28, Rs.2.36
and Rs.2.02 for main crop, ratoon I, II and III,
respectively. It could be observed that second
ratoon crop is giving higher return per rupee
spent which is Rs.2.36, when compared with
the main crop, ratoon I and III.
Palmarosa
It is recorded that the Palmarosa farm
recorded a yield of 700 q of crop per hectare
for main crop and for subsequent- ratoons as
well. In ratoon crop no need to spend on
operational cost for some activities so the
returns of rupee expenditure is high compare
to main crop.The average gross returns
obtained were Rs. 1,54,000/- in main crop and
the same for ratoons were Rs.1,40,000,
Rs.1,19,000, Rs. 1,05,000, respectively. The
net returns obtained in were Rs. 78816/-,
Rs. 97431/-, Rs. 83615/-, and Rs. 70,228/- and
returns per rupee of expenditure were Rs.1.04,
Rs. 2.28, Rs. 2.36, and Rs. 2.02, respectively
(Table 6).
In case of Coleus, Cost A1/A
2, Cost B
1,
Cost B2, CostC
1, Cost C
2, and Cost C
3 were
REFERENCES
CACP.2020. Determinants of MSP. Retrieved
from the website (https://cacp.dacnet.
nic.in) on 08.6.2020.
Devi, P. R., Aparna, D., Babu, M. R., Sekhar, M.
R and Sunitha, P. 2017. Status, scope
and promotion of medicinal and aromatic
plants in Andhra Pradesh. Journal of
79
COST ANALYSIS OF MEDICINAL AND AROMATIC PLANTS IN A.P. AND TELANGANA STATES
Pharmacognosy and Phytochemistry.
6(6): 283-289.
Dharmendra Kalauni and Arati Joshi. 2018.
Status of medicinal and aromatic plant
(MAPs) and socio-economic influence in
Nepalese livelihood. Review Research
Acta Scientific Agriculture.2(9): 123-130.
Guleria, C., Manojkumar, V., Ravinder Sharma
and Dogra, D. 2014. Economics of
production and marketing of important
medicinal and aromatic plants in mid hills
of Himachal Pradesh. Economic
affairs.59(3): 363.
Ramsuresh, Sanjaykumar, Gangwar, S.P.,
Harishankar, Tomar, V. K. S., Bansal, R.P
and Singh, A. K. 2014.Economic analysis
of palmarosa cultivation in India. Indian
Journal of Agricultural Research. 48(6):
480-483.
Ramsuresh, Sanjaykumar, Singh,V.,
Rampravesh, Tomar, V.K.S and Singh, A.
K. 2012. Economics of production and
marketing of aromatic crops in Uttar
Pradesh. Agricultural Economics
Research Review. 25(1): 157-160.
80
SURAVI and CHANDRASHREEJ. Res. ANGRAU 47(4) 1-11, 2019
ASSOCIATION OF MATERNAL HEALTH FACTORSWITH BIRTH WEIGHT OF NEWBORNS
SURAVI SAHU*and CHANDRASHREE LENKAP.G. Department of Home Science, Sambalpur University, Odisha-768019
Date of Receipt: 13.3.2020 Date of Acceptance: 18.5.2020
*Corresponding Author E-mail : [email protected]; Ph.D. thesis submitted to Sambalpur University,
Odisha
J. Res. ANGRAU 48 (2) 80-86, 2020
Healthy women are the foundation of a
strong community and healthy newborns are
the future. Maternal health is closely associated
with newborns health and survival(Ray et al.,
2015). Pregnancy is the crucial and most
intensive period for fetal development. The
diagnosis of any risk factor during pregnancy
affects the fetal outcome negatively. Low birth
weight is a single most predictor that is closely
related to mortality, morbidity, physical
development, and survival of newborns
(Sathenahalli et al.,2015).The most influencing
multi-factors for the prevalence of low birth
weight among newborns are maternal age,
gestational age, weight,weight gained during
pregnancy, parity, lack of antenatal care, low
body mass index, and low hemoglobin level.
(Kader et al.,2014).
According to the UNICEF report, every
year 20 lakh babies die globally within the
neonatal period. Out of this 6.4 lakh deaths
alone occur in India. Moreover, the neonatal
mortality rate in India is 25.4. India is ranked
12th among 52 lower-middle-income nations in
newborn mortality (UNICEF, 2018). The report
mentioned that India is the only major country
in the world, which has higher mortality among
girls children than boys. Kerala and Goa have
10% of neonatal mortality rate, whereas, Bihar
and Uttarakhand have 44%. Uttar Pradesh,
Madhya Pradesh, Rajasthan stands at 57% of
the neonatal mortality rate. The infant mortality
rate is 41 in Odisha (GoI, 2019). It is recognised
that about 61% of the infant death occurs during
the first 28 days of life due to asphyxia,
prematurity, low birth weight, respiratory
infections, diarrhea, and malnutrition(Govt. of
Odisha, 2019).
The sustainable development goals
(SDGs) aim to end child mortality by the year
2030 because the deaths of newborns are
preventable. Despite remarkable development
in maternal and newborn health due to the
implementation of several programmes and
interventions worldwide, there is a gap between
reality and practice. There is also paucity of data
on the birth weight of newborns with maternal
health factors in remote areas of Odisha.
Therefore, the research is designed to study
the risk factors associated with maternal health
parameters and the birth weight of
newborns.The objective of the research was
to study the association of maternal health
parameters with the birth weight of the new-
borns.
For this study,Lakhanpur and Jharsuguda
Block of Jharsuguda district of Odisha were
selected. There are 957 Anganwadi centers in
total in Jharsuguda District of Odisha. Out of
these 16 Anganwadi centers of Lakanpur block
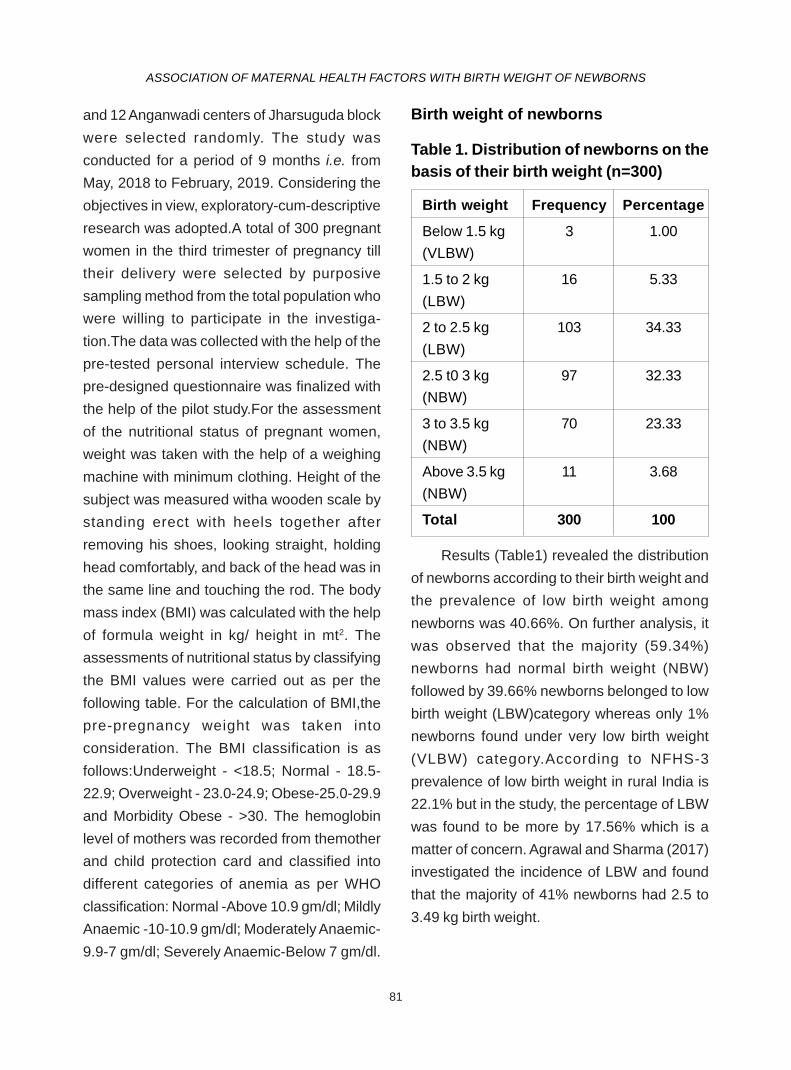
81
ASSOCIATION OF MATERNAL HEALTH FACTORS WITH BIRTH WEIGHT OF NEWBORNS
and 12 Anganwadi centers of Jharsuguda block
were selected randomly. The study was
conducted for a period of 9 months i.e. from
May, 2018 to February, 2019. Considering the
objectives in view, exploratory-cum-descriptive
research was adopted.A total of 300 pregnant
women in the third trimester of pregnancy till
their delivery were selected by purposive
sampling method from the total population who
were willing to participate in the investiga-
tion.The data was collected with the help of the
pre-tested personal interview schedule. The
pre-designed questionnaire was finalized with
the help of the pilot study.For the assessment
of the nutritional status of pregnant women,
weight was taken with the help of a weighing
machine with minimum clothing. Height of the
subject was measured witha wooden scale by
standing erect with heels together after
removing his shoes, looking straight, holding
head comfortably, and back of the head was in
the same line and touching the rod. The body
mass index (BMI) was calculated with the help
of formula weight in kg/ height in mt2. The
assessments of nutritional status by classifying
the BMI values were carried out as per the
following table. For the calculation of BMI,the
pre-pregnancy weight was taken into
consideration. The BMI classification is as
follows:Underweight - <18.5; Normal - 18.5-
22.9; Overweight - 23.0-24.9; Obese-25.0-29.9
and Morbidity Obese - >30. The hemoglobin
level of mothers was recorded from themother
and child protection card and classified into
different categories of anemia as per WHO
classification: Normal -Above 10.9 gm/dl; Mildly
Anaemic -10-10.9 gm/dl; Moderately Anaemic-
9.9-7 gm/dl; Severely Anaemic-Below 7 gm/dl.
Birth weight of newborns
Table 1. Distribution of newborns on thebasis of their birth weight (n=300)
Birth weight Frequency Percentage
Below 1.5 kg 3 1.00
(VLBW)
1.5 to 2 kg 16 5.33
(LBW)
2 to 2.5 kg 103 34.33
(LBW)
2.5 t0 3 kg 97 32.33
(NBW)
3 to 3.5 kg 70 23.33
(NBW)
Above 3.5 kg 11 3.68
(NBW)
Total 300 100
Results (Table1) revealed the distribution
of newborns according to their birth weight and
the prevalence of low birth weight among
newborns was 40.66%. On further analysis, it
was observed that the majority (59.34%)
newborns had normal birth weight (NBW)
followed by 39.66% newborns belonged to low
birth weight (LBW)category whereas only 1%
newborns found under very low birth weight
(VLBW) category.According to NFHS-3
prevalence of low birth weight in rural India is
22.1% but in the study, the percentage of LBW
was found to be more by 17.56% which is a
matter of concern. Agrawal and Sharma (2017)
investigated the incidence of LBW and found
that the majority of 41% newborns had 2.5 to
3.49 kg birth weight.
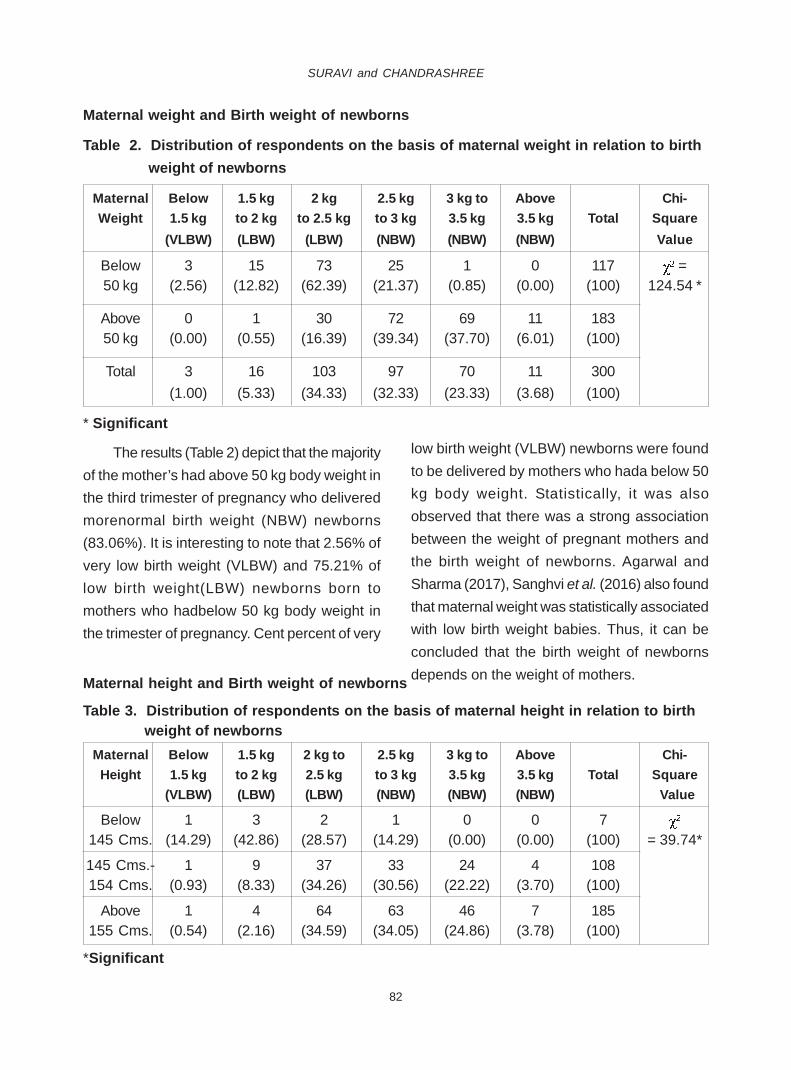
82
SURAVI and CHANDRASHREE
Maternal weight and Birth weight of newborns
Table 2. Distribution of respondents on the basis of maternal weight in relation to birth
weight of newborns
Maternal Below 1.5 kg 2 kg 2.5 kg 3 kg to Above Chi-
Weight 1.5 kg to 2 kg to 2.5 kg to 3 kg 3.5 kg 3.5 kg Total Square
(VLBW) (LBW) (LBW) (NBW) (NBW) (NBW) Value
Below 3 15 73 25 1 0 117 =50 kg (2.56) (12.82) (62.39) (21.37) (0.85) (0.00) (100) 124.54 *
Above 0 1 30 72 69 11 18350 kg (0.00) (0.55) (16.39) (39.34) (37.70) (6.01) (100)
Total 3 16 103 97 70 11 300
(1.00) (5.33) (34.33) (32.33) (23.33) (3.68) (100)
* Significant
Maternal height and Birth weight of newborns
Table 3. Distribution of respondents on the basis of maternal height in relation to birth weight of newborns
Maternal Below 1.5 kg 2 kg to 2.5 kg 3 kg to Above Chi-
Height 1.5 kg to 2 kg 2.5 kg to 3 kg 3.5 kg 3.5 kg Total Square
(VLBW) (LBW) (LBW) (NBW) (NBW) (NBW) Value
Below 1 3 2 1 0 0 7145 Cms. (14.29) (42.86) (28.57) (14.29) (0.00) (0.00) (100) = 39.74*
145 Cms.- 1 9 37 33 24 4 108154 Cms. (0.93) (8.33) (34.26) (30.56) (22.22) (3.70) (100)
Above 1 4 64 63 46 7 185155 Cms. (0.54) (2.16) (34.59) (34.05) (24.86) (3.78) (100)
*Significant
The results (Table 2) depict that the majority
of the mother’s had above 50 kg body weight in
the third trimester of pregnancy who delivered
morenormal birth weight (NBW) newborns
(83.06%). It is interesting to note that 2.56% of
very low birth weight (VLBW) and 75.21% of
low birth weight(LBW) newborns born to
mothers who hadbelow 50 kg body weight in
the trimester of pregnancy. Cent percent of very
low birth weight (VLBW) newborns were found
to be delivered by mothers who hada below 50
kg body weight. Statistically, it was also
observed that there was a strong association
between the weight of pregnant mothers and
the birth weight of newborns. Agarwal and
Sharma (2017), Sanghvi et al. (2016) also found
that maternal weight was statistically associated
with low birth weight babies. Thus, it can be
concluded that the birth weight of newborns
depends on the weight of mothers.

83
ASSOCIATION OF MATERNAL HEALTH FACTORS WITH BIRTH WEIGHT OF NEWBORNS
The results (Table 4) showed that more
percentage of normal birth weight
newborns(94.59%) were born to the mothers
who hada weight gain of 8-12 kg during
pregnancy. It was interesting to note that none
of theVLBW babies born to mothers who hada
weight gain of 8-12 kg. Similarly, 65.28% and
1.39% LBW and VLBW babies born to mothers
who hada weight gain of 2-5 kg, respectively. It
was noted that the percentage of VLBW and
LBW babies decrease with the increase in
weight gain of mothers during pregnancy such
as 1.22% VLBW babies born to mothers who
had 5-8 kg weight gain and nil VLBW newborns
born to mothers who had 8-12 kg weight gain.
However, a strong statistical association was
observed between the birth weight of newborns
with weight gain of mothers during pregnancy.
Thus, it can be concluded that the weight gain
of mothers during pregnancy plays a significant
role in the birth weight of newborns. Konapur
et al., (2017)also found a similar significant
association between weight gain during the third
trimester of pregnancy and the birth weight of
newborns.
Maternal weight gain and Birth weight of newborns
Table 4. Distribution of respondents on the basis of weight gain of mothers in relation to birth weight of newborns
Weight Below 1.5 kg 2 kg to 2.5 kg 3 kg to Above Chi-
gain 1.5 kg To 2 kg 2.5 kg to 3 kg 3.5 kg 3.5 kg Total Square
(kg) (VLBW) (LBW) (LBW) (NBW) (NBW) (NBW) Value
2-5 2 15 79 42 6 6 144(1.39) (10.42) (54.86) (29.17) (4.17) 0(0.00) (100)
5-8 1 1 20 31 26 3 82 =(1.22) (1.22) (24.39) (37.80) (31.71) (3.66) (100) 119.41*
8-12 0 0 4 24 38 8 74(0.00) (0.00) (5.41) (32.43) (51.35) (10.81) (100)
*Significant
Results delineates (Table 3) that the
percentage of very low birth weight (VLBW) and
low birth weight (LBW) newborns were more
i.e.14.29% and 71.43%, respectively among the
mothers that had below 145 cm height (short
stature) in comparision to their counterparts. It
was also observed that the percentage of
normal birth weight newborns increased with
the increase in height of the mothers i.e. 56.48%
and 62.69% for 145-154cms and above 155 cm
height of mothers respectively. However, a
significant statistical association between the
maternal height and the birth weight of newborns
was found in this study. Similar findings were
also observed by Agarwal and Sharma (2017)
andSanghviet al.,(2016)who reported that the
majority of low birth weight babies belonged to
pregnant women having below 145 cms of
height.Thus, it can be concluded that the
incidence of low birth weight newborns was
more prevalent among short stature mothers.
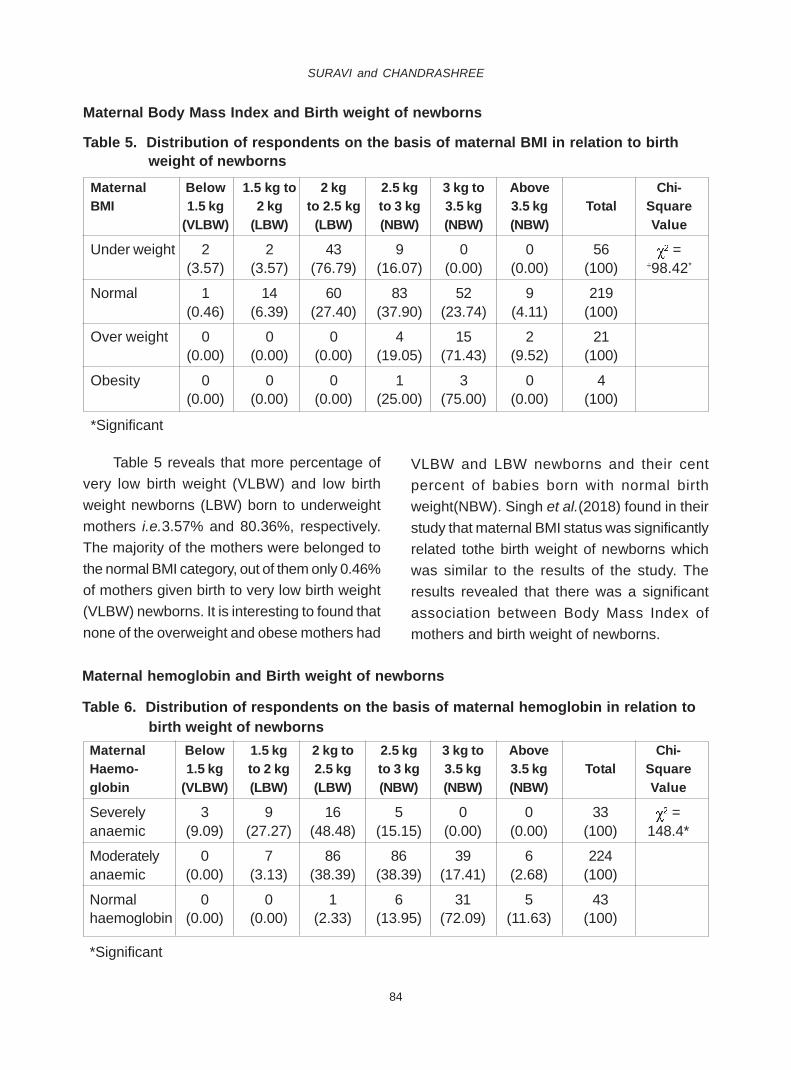
84
SURAVI and CHANDRASHREE
Table 5 reveals that more percentage of
very low birth weight (VLBW) and low birth
weight newborns (LBW) born to underweight
mothers i.e.3.57% and 80.36%, respectively.
The majority of the mothers were belonged to
the normal BMI category, out of them only 0.46%
of mothers given birth to very low birth weight
(VLBW) newborns. It is interesting to found that
none of the overweight and obese mothers had
VLBW and LBW newborns and their cent
percent of babies born with normal birth
weight(NBW). Singh et al.(2018) found in their
study that maternal BMI status was significantly
related tothe birth weight of newborns which
was similar to the results of the study. The
results revealed that there was a significant
association between Body Mass Index of
mothers and birth weight of newborns.
Maternal Body Mass Index and Birth weight of newborns
Table 5. Distribution of respondents on the basis of maternal BMI in relation to birth weight of newborns
Maternal Below 1.5 kg to 2 kg 2.5 kg 3 kg to Above Chi-BMI 1.5 kg 2 kg to 2.5 kg to 3 kg 3.5 kg 3.5 kg Total Square
(VLBW) (LBW) (LBW) (NBW) (NBW) (NBW) Value
Under weight 2 2 43 9 0 0 56 =(3.57) (3.57) (76.79) (16.07) (0.00) (0.00) (100) ÷98.42*
Normal 1 14 60 83 52 9 219(0.46) (6.39) (27.40) (37.90) (23.74) (4.11) (100)
Over weight 0 0 0 4 15 2 21(0.00) (0.00) (0.00) (19.05) (71.43) (9.52) (100)
Obesity 0 0 0 1 3 0 4(0.00) (0.00) (0.00) (25.00) (75.00) (0.00) (100)
*Significant
Maternal hemoglobin and Birth weight of newborns
Table 6. Distribution of respondents on the basis of maternal hemoglobin in relation to birth weight of newborns
Maternal Below 1.5 kg 2 kg to 2.5 kg 3 kg to Above Chi-Haemo- 1.5 kg to 2 kg 2.5 kg to 3 kg 3.5 kg 3.5 kg Total Square
globin (VLBW) (LBW) (LBW) (NBW) (NBW) (NBW) Value
Severely 3 9 16 5 0 0 33 =anaemic (9.09) (27.27) (48.48) (15.15) (0.00) (0.00) (100) 148.4*
Moderately 0 7 86 86 39 6 224anaemic (0.00) (3.13) (38.39) (38.39) (17.41) (2.68) (100)
Normal 0 0 1 6 31 5 43haemoglobin (0.00) (0.00) (2.33) (13.95) (72.09) (11.63) (100)
*Significant
85
ASSOCIATION OF MATERNAL HEALTH FACTORS WITH BIRTH WEIGHT OF NEWBORNS
Results (Table 6) showed that the mothers
who were severely anemic delivered more
percentage of VLBW(very low birth weight)and
LBW(low birth weight) newborns i.e. 9.09% and
63.75% respectively in comparison to mothers
from moderate anemic and normal hemoglobin
level. It was also interesting to note that the
percentage of VLBW(very low birth
weight)newborn was nil among the mothers
from moderate anemic or normal hemoglobin
levels.However,41.52% of low birth weight
newborns were born to mothers from moderate
anemic and only 2.33% LBW(low birth
weight)newborns were born to mothers who
had a normal level of hemoglobin.None of the
mothers found to be mildly anemic in this study.
Statistically,a strong significant association was
also found with maternal hemoglobin levels
during pregnancy and birth weight of
newborns.A similar statistical association
wasalso observed by Dayanithiet al.(2018).
Association of some significant maternal
health factors in relation to the birth weight of
newborns is established in this study. Mothers
who havebelow 50 kg bodyweight during the
third trimester of pregnancy found to delivered
more percentage(75.21%) of low birth weight
newborns. The incidenceof low birth weight
newborns was found to be highest (85.71%)
among the short stature mothers in comparison
to their counterparts. The study indicated that
with an increase in weight gain during
pregnancy the percentage of low birth weight
newborns decreases. It was found that 80.36%
of low birth weight newborns born to the
motherswhose weight gain was 2-5kg duringthe
third trimester of pregnancy. It was also
interesting to note that none of the overweight
and obese mothers had VLBW and LBW
newborns.Mothers suffered from severe
anemia found to delivered75.75% low birth
weightnewborns.Thus, it can be concluded that
the prevalence of low birth weight among
newborns decreases with an increase in
maternal body weight, height, level of
hemoglobin, and BMI of mothers,weight gain
during pregnancy.
REFERENCES
Agarwal, A and Sharma V. 2017.To Study the
maternal factors which determine the low
birth weight babies. Pediatric Review.
International Journal of Pediatric Research.
4(01) : 8-13.
Dayanithi, M. 2018. Low birth weight and
premature births and their associated
maternal factors. International Journal of
Community Medicine And Public Health.
5(6): 2277-2285.
GoI.2019. India’s infant mortality, Sample
Registration System. Retrieved from the
website (www.censusindia.gov.in) on
March 16th , 2020.
Governent of Odisha. 2019. Infant mortality rate
mission- 2017. Retrieved from the website
(www. health.odisha.gov.in /imr-mission.
asp) on March 6th, 2020.
GoI. 2006. National family health survey-3, 2005-
06. Retrieved from the website (http://
www.rchiips.org/nfhs) on March 3rd, 2020.
GoI. 2018. Neonatal Mortality. Retrieved from
the website (www. Data. unicef.org/child
–survival, ). on September 20th 2019 .

86
SURAVI and CHANDRASHREE
Kader, M and Perera, N.K.P. 2014. Socio-
economic and nutritional determinants of
low birth weight in India. North American
Journal of Medical Science. 6(7): 302–308.
Konapur, K. S and Srikanth, J. 2017. Maternal
biosocial factors influencing newborn birth
weight at a municipal corporation maternity
home in Bangalore city. International
Journal of Community Medicine and Public
Health. 4(7): 2395-2399.
Prudhivi, S and Bhosgi, R. 2015. Maternal
factors influencing low birth weight babies.
International Journal of Contemporary
Pediatrics. 2(4): 287–296.
Ray, S., Choudhury, A. R., Ram, R.,
Chakraborty, M., Saha, J. B., Rout, A. J and
Dubey, M. 2015. Bio - social determinants
of mothers of lbw babies and association
of their health knowledge regarding low
birth weight babies: a community based
study in an urban slum (dilawarganj) near
mgm medical college, Kishanganj, Bihar.
Journal of Evolution of Medical and Dental
Sciences. 4(72): 12594–12602.
Sanghvi, J and Patel, A. 2016. Study of neonatal
outcome in relation to maternal nutrition
and anthropometry. International Journal of
Contemporary Pediatrics. 3(2):524-529.
Sathenahalli V.B., Hussain, Z., Gornale, V and
Singh, H.P. 2016. Influence of maternal
biosocial factors in fetal outcome.
International Journal of Medical Science
and Public Health.5 (03):1-4.
Singh, S., Kumar, P and Thakur, B. R. 2018.
Anthropometric measurements of a
neonate vis-à-vis maternal nutritional
status. International Journal of
Contemporary Pediatrics. 5(2): 640-644.
Singhal, V., Agal, P and Kamath, N. 2012.
Detection of fetal malnutrition by can score
at birth and its comparision with other
methods of determining intrauterine
growth. Indian Journal of Clinical Practice.
22(11): 576-582.
The Journal of Research ANGRAU is published
quarterly by Acharya N.G. Ranga Agricultural
University. Papers submitted will be peer reviewed.
On the basis of referee’s comments, author(s) will
be asked by the editor to revise the paper. All
authors must be members. Papers are accepted
on the understanding that the work described is
original and has not been published elsewhere and
that the authors have obtained necessary
authorization for publication of the material submitted.
A certificate signed by all authors indicating the
originality of research work should be enclosed along
with the manuscript. Articles should contain data
not older than five years. The period shall be
caluclated from the following January or July
after the completion of the field experiment in
Kharif (rainy) and Rabi (winter) seasons,
respectively.
Subject Matter: Articles on all aspects of agriculture,
horticulture, forestry, agricultural engineering, home
sciences and social sciences with research and
developments on basic and applied aspects of crop
improvement, crop management, crop protection,
farm implements, agro-technologies, rural
development, extension activities and other suitable
topics.
Typed script: It should be in clear concise English,
typewritten in double space using Times New Roman
Font (size 12) on one side of A4 size paper with at
least 2 cm margin. Full research paper should not
exceed 10 typed pages including tables and figures
and should contain abstract, introduction, material
and methods, results and discussion, conclusion and
references. All articles should be submitted at E-
mail i.d.: [email protected]. Hard copy
is not required.
The contents of Research Paper should be
organized as Title, Abstract, Introduction,
Material and Methods, Results and Discussion,
Conclusion and References.
TITLE: This should be informative but concise. While
typing the title of the paper/note all the letters must
be in upper case. The title must be typed just before
the commencement of abstract. No abbreviations
should be used in the title.
Names should be in capitals prefixed with initials and
separated by commas. For more than two
authors the names should be followed by ‘and’ in
small letters before the end of last name. Full
address of the place of research in small letters
should be typed below the names. E-mail i.d of the
author may be given as foot note.
ABSTRACT : A brief informative abstract should follow
on the first page of the manuscript. It should clearly
bring out the scope of the work and its salient
features. It should be single paragraph of not more
than 200 words.
INTRODUCTION : It should be brief, crisp and
introduce the work in clear terms. It should state the
objective of the experiment. Key references related
to the work must be cited.
MATERIAL AND METHODS
This should include experimental design, treatments
and techniques employed. The year of experiment/
investigation carried out should be mentioned.
Standard and already reported method must be
clearly given or cited. Any modification of the original
method must be duly highlighted. Use standard
abbreviations of the various units.
INSTRUCTIONS TO AUTHORS
RESULTS AND DISCUSSION
This should govern the presentation and interpretation
of experimental data only and each of the experiment
should be properly titled. Salient results must be
highlighted and discussed with related works.
Common names of plant species, micro- organisms,
insects etc., should be supported with authentic,
latest Latin names, which should be Italics in the
typescript. When such names are first mentioned,
the full generic name and the species name with the
authority should be mentioned and in subsequent
reference, the generic name must be abbreviated and
the authority be deleted. The treatments should be
briefly expressed instead of abbreviations like T1, T
2,
etc.
All headings must be typed in upper case from the
left hand margin. The sub- headings must be typed
in lower case and only first letter must be in capital.
Sub –headings must start from the left hand margin.
CONCLUSION(S) : A brief conclusion(s) of the
research finding and future line of work may be given
at the end.
Tables : Tables should be typed on separate sheets
and numbered consecutively within the text. The units
of the data should be defined. The weights and
measures should be given in the metric system
following the latest units. For e.g.: kg ha-1, kg ha-1
cm, mg g-1, dS m-1, g m-3, C mol kg-1, etc.
Illustrations : The illustrations, text- figures and photo
prints should be clear. Legends to figures and photos
should be typed on the foot of the figure/photo.
Figures must be numbered with figure numbers like
Fig.1, Fig 2, and their approximate position in the
text indicated. It is author’s responsibility to provide
suitable figures. Colour photos, if needed in research
articles could be printed at extra cost.
Abbreviations should be used sparingly if
advantageous to the reader. All new or unusual
abbreviations should be defined when they are used
for the first time in the paper. Ordinarily, the sentences
should not begin with abbreviations or numbers.
REFERENCES : Relevant references shall be quoted
under each section and must be cited in full in the
reference section. References to unpublished work
and abstract citation may be avoided. References
need not be numbered but should be arranged
alphabetically in chronological order. Please avoid
using “Anonymous” in the reference. In the text, the
references should be cited as (Kumar, 2009) or Kumar
(2009), Shivay and Prasad (2009) or (Shivay and
Prasad, 2009), Lee et al. (2012) or (Lee et al., 2012),
when there are more than two authors. Full name
of the Journal should be mentioned. Recent
references should be included. Names of
authors, their spelling and year of publication
should coincide both in the text and references.
Citing References: The papers cited in the text should
only be included in the References. While listing the
References, the following format should be followed
strictly.
While citing an article from:
Journals and Bulletins
Hu, J., Yue, B and Vick, B.A. 2007. Integration of
trap makers onto a sunflower SSR marker linkage
map constructed from 92 recombinant inbred lines.
Helia. 30 (46):25-36.
Sharma, D.K., Thimmappa, K., Chinchmalatpure, R.
Anil, Mandal, A.K., Yadav, R.K., Chaudari, S.K.,
Kumar, S and Sikka, A.K. 2015. Assessment of
production and monetary losses from salf- affected
soils in India. Technical Bulletin No. 5, ICAR-CSSRI,
Karnal.
Books
AOAC. 1990. Official methods of analysis.
Association of official analytical chemists. 15th
Edition. Washington DC. USA. pp. 256.
Yellamanda Reddy, T and Sankara Reddy, G.H. 2005.
Principles of Agronomy. Kalyani Publishers, Ludhiana,
India. pp. 125.
Edited Book
Breckler, S.J and Wiggins, E.C.1992. On defining
attitude and attitude theory: Once more with feeling.
In: Attitude Structure and Function. Pratkins, A.R.,
Breckler, S.J and Greenwald, A.G.(Eds). Hillsdale,
NJ: Lawrence Erlbaum Associates. pp. 407-427.
Thesis
Ibrahim, F. 2007. Genetic variability for resistance to
sorghum aphid (Melanaphis sacchari, Zentner) in
sorghum. Ph.D. Thesis submitted to Acharya N.G.
Ranga Agricultural University, Hyderabad.
Seminars / Symposia / Workshops
Naveen Kumar, P.G and Shaik Mohammad. 2007.
Farming Systems approach – A way towards organic
farming. Paper presented at the National symposium
on integrated farming systems and its role towards
livelihood improvement. Jaipur, 26th – 28th October,
2007. pp. 43-46.
Proceedings of Seminars / Symposia
Bind, M and Howden, M. 2004. Challenges and
opportunities for cropping systems in a changing
climate. Proceedings of International crop science
congress. Brisbane –Australia. 26th September – 1st
October, 2004. pp. 52-54.
Website
Cotton Corporation of India. 2017. Area, production
and productivity of cotton in India. Retreived from
website (www.cotcorp.gov.in/statistics.aspx) on
21.9.2017.
Annual Report
AICCIP. 2017. Annual Report 2016-17. All India
Coordinated Cotton Improvement Project.
Coimbatore, Tamilnadu. pp. 26-28.
Manuscripts and communication
• Give your e-mail address and mobile number for
fast communication.
• Send soft copy of the manuscript at E-mail i.d:
SUBSCRIPTION RATES
ANNUAL
Individual: Rs. 400/- per author
Institution: Rs. 2000/-
LIFE
Individual: Rs. 2000/-
PRINTING CHARGES
Per page: Rs. 125/- (Black and White)
Demand drafts drawn in favour of Comptroller,
ANGRAU payable at Guntur should be sent to the
Managing Editor, Agricultural Information &
Communication Centre, Srinivasa Citadel, Lam,
Guntur 522 034, Andhra Pradesh.
URL: www.jorangrau.org; www.angrau.ac.in/
publications
Further details on Journal style can be obtained from
book “Style Manual for Biological Journals” Edition
4, 1978, American Institute of Biological Sciences,
Washington, D.C.

.

THE JOURNAL OF RESEARCH ANGRAU
DECLARATION CERTIFICATE TO BE SUBMITTED BY THE AUTHOR(S)
Certified that the article entitled __________________________________________________________
____________________________________________________________________________________
1. is based on my / our original research work / M.Sc / Ph.D thesis (strike off whichever is not applicable)
2. The article has been seen by all the authors and the order of authorship is agreed.
3. The results presented have not been published or submitted for publication elsewhere in part or full underthe same or other title
4. The names of the authors are those who made a notable contribution.
5. No authorship is given to anyone who did not make a notable contribution.
S.No. Name/s Present address Permanent address Signature
1.
2.
3.
CERTIFICATE BY THE COMPETENT AUTHORITY
( Professor & Head of the Department/ Principal Scientist of the Station/ Associate Director of Research).
Certified that the article ————————————————————————————————————
———————————————————————————————————————————————
authored by —————————————————————————————————————————
———————————————————————— is fit for publication. It fulfills all the requirements for
publication in The Journal of Research ANGRAU.
Name :
Signature :
Office seal :
Note: In case it is not possible to obtain the signature of a particular author for reasons beyond
his/her reach, the reasons thereof should be explained.

.
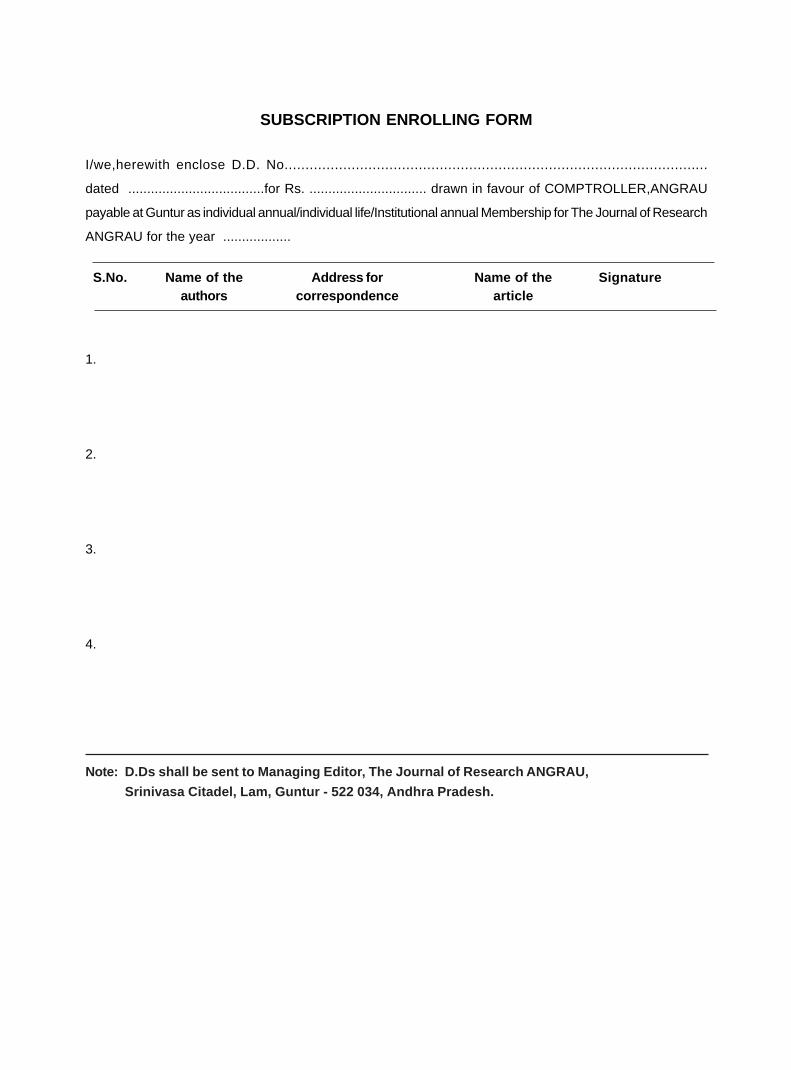
SUBSCRIPTION ENROLLING FORM
I/we,herewith enclose D.D. No.....................................................................................................
dated ....................................for Rs. ............................... drawn in favour of COMPTROLLER,ANGRAU
payable at Guntur as individual annual/individual life/Institutional annual Membership for The Journal of Research
ANGRAU for the year ..................
S.No. Name of the Address for Name of the Signatureauthors correspondence article
1.
2.
3.
4.
Note: D.Ds shall be sent to Managing Editor, The Journal of Research ANGRAU,
Srinivasa Citadel, Lam, Guntur - 522 034, Andhra Pradesh.

.
.
Statement about the ownership and other particulars about Journal
THE JOURNAL OF RESEARCH ANGRAU (since 1973)
Form IV (SEE RULE 8)
Place of Publication : Guntur
Periodicity of publication : Once in three months (Quarterly)
Printer’s Name : Sree Lakshmi Press, Guntur
Nationality : INDIAN
Address : Sreelakshmi Press
14th Line, Arunadalpet, Guntur - 522 002
Publisher’s Name : Dr. D. Balaguravaiah
Address : Dean of P.G. Studies, Administrative Office,
Acharya N.G. Ranga Agricultural University,
Lam, Guntur- 522 034, Andhra Pradesh
Editor -in - Chief 's Name : Dr. D. Balaguravaiah
Nationality : INDIAN
Address : Dean of P.G. Studies, Administrative Office,
Acharya N.G. Ranga Agricultural University,
Lam, Guntur- 522 034, Andhra Pradesh
Name and address of the individuals : Acharya N.G.Ranga Agricultural University,
who own the Journal and partners or Administrative Office,
share holders holding more than one Lam, Guntur- 522 034,
percent of the total capital Andhra Pradesh.
I, Dr. D. Balaguravaiah, hereby declare that the particulars given above are true to the best of my knowledge
and belief.
Signature of the Publisher
Sd/- D.Balaguravaiah

.

ANGRAU/AI & CC/April-June 2020 Regd. No. 25487/73
Printed at Sreelakshmi Press, Guntur and Published by Dr. D. Balaguravaiah, Dean of P.G. Studies and Editor-in- Chief,The Journal of Research ANGRAU, Acharya N.G. Ranga Agricultural University, Lam, Guntur - 522 034
E-mail : [email protected]; URL: www.jorangrau.org
Related Documents