Modelling and control of combined cooling and antisolvent crystallization processes Z.K. Nagy a, * , M. Fujiwara b , R.D. Braatz b a Department of Chemical Engineering, Loughborough University, Loughborough LE11 3TU, United Kingdom b Department of Chemical and Biomolecular Engineering, University of Illinois at Urbana-Champaign, Urbana, IL 61801, USA article info Available online xxxx Keywords: Crystallization control Optimal control Process analytical technology abstract Although for decades nearly all pharmaceuticals have been purified by crystallization, there have been a disproportionate number of problems associated with the operation and control of these processes. This paper provides an overview of the recent advances in model-based and model-free (direct design) approaches to control the crystallization of pharmaceuticals, treating both antisolvent and cooling crys- tallization. A model-based combined technique which simultaneously controls the antisolvent addition rate and the cooling profile is presented. A population balance model of the combined cooling-antisolvent addition system is developed and a moments model is used in optimal control strategies with various objective functions. The simulation and experimental results show the advantages of the combined approach. Ó 2008 Elsevier Ltd. All rights reserved. 1. Introduction Batch crystallization is among the oldest unit operations in the chemical industry. Despite this long history and the widespread application of crystallization, there are still a disproportionate number of problems associated with the understanding and con- trol of the process. These problems have become highly important in recent years as an increased interest has been directed towards crystallization of pharmaceuticals and proteins, which have addi- tional complications compared to the inorganic crystallizations studied extensively before [8]. The major concern in the pharma- ceutical industry is to optimize consistency and quality of the final product while improving productivity if possible. Pharmaceutical manufacture has traditionally been a recipe-based operation, in which the processes are controlled by following operating trajecto- ries in accordance to the specifications submitted for regulatory fil- ings. In recent years the application of experimental design techniques to identify a robust envelope for crystallization opera- tion has become more and more widespread in the pharmaceutical industries. The response surface method can be used to design optimal cooling trajectories [19]. However, these approaches usu- ally require many experiments for reliable determination of opti- mal operating policies which are robust during scale-up. In recent years accurate in situ sensors have become available, which are robust enough to be applied in the production environment. This opened the possibility of feedback control-based crystalliza- tion design and operation. The new opportunities are well de- scribed by the guideline document [6] issued in 2004 by the US Food and Drug Administration (FDA), as part of a broader initiative on current Good Manufacturing Practices (cGMP), which puts a growing emphasis on the development and use of novel technolo- gies based on process analytical technologies (PAT) as a tool for ‘‘21st Century Manufacturing” [1,2,23] and the development of tai- lored process control strategies is being recognized as the most important way to prevent or mitigate the risk of producing poor quality products. Recent research has indicated the significant eco- nomic potential of using advanced feedback control strategies within the framework of PAT (see [3,8,16] and references cited therein), to reduce time-to-market and increase product quality. The new policy adopted by the FDA with the aim to achieve and consistently maintain product quality and performance allows a certain degree of flexibility for changes in operating conditions in the manufacturing process, as opposed to the previously adopted rather restrictive recipe-based operation. This provides a signifi- cant potential for implementation of optimal and adaptive control methodologies with real economic benefits associated with better product quality and reduced waste due to failed batches. Such con- trol algorithms have been implemented at several pharmaceutical companies (e.g., [12,24]). The fundamental driving force for crystallization from solution is the difference in the chemical potential between the solution and the solid phase, which is usually expressed in terms of the clo- sely related supersaturation, which is the difference between the solution concentration and the saturation concentration or some related expression. The size, shape, and solid-state phase of the product crystals are dependent on the supersaturation profile achieved during the crystallization process. Most often supersatu- ration is created by cooling, evaporation, or antisolvent addition, with the two main technologies used for batch or semi-batch 0959-1524/$ - see front matter Ó 2008 Elsevier Ltd. All rights reserved. doi:10.1016/j.jprocont.2008.06.002 * Corresponding author. E-mail address: [email protected] (Z.K. Nagy). Journal of Process Control xxx (2008) xxx–xxx Contents lists available at ScienceDirect Journal of Process Control journal homepage: www.elsevier.com/locate/jprocont ARTICLE IN PRESS Please cite this article in press as: Z.K. Nagy et al., Modelling and control of combined cooling and antisolvent crystallization processes, J. Process Contr. (2008), doi:10.1016/j.jprocont.2008.06.002

Welcome message from author
This document is posted to help you gain knowledge. Please leave a comment to let me know what you think about it! Share it to your friends and learn new things together.
Transcript
Journal of Process Control xxx (2008) xxx–xxx
ARTICLE IN PRESS
Contents lists available at ScienceDirect
Journal of Process Control
journal homepage: www.elsevier .com/locate / jprocont
Modelling and control of combined cooling and antisolvent crystallization processes
Z.K. Nagy a,*, M. Fujiwara b, R.D. Braatz b
a Department of Chemical Engineering, Loughborough University, Loughborough LE11 3TU, United Kingdomb Department of Chemical and Biomolecular Engineering, University of Illinois at Urbana-Champaign, Urbana, IL 61801, USA
a r t i c l e i n f o a b s t r a c t
Available online xxxx
Keywords:Crystallization controlOptimal controlProcess analytical technology
0959-1524/$ - see front matter � 2008 Elsevier Ltd. Adoi:10.1016/j.jprocont.2008.06.002
* Corresponding author.E-mail address: [email protected] (Z.K. Nagy).
Please cite this article in press as: Z.K. NagProcess Contr. (2008), doi:10.1016/j.jproco
Although for decades nearly all pharmaceuticals have been purified by crystallization, there have been adisproportionate number of problems associated with the operation and control of these processes. Thispaper provides an overview of the recent advances in model-based and model-free (direct design)approaches to control the crystallization of pharmaceuticals, treating both antisolvent and cooling crys-tallization. A model-based combined technique which simultaneously controls the antisolvent additionrate and the cooling profile is presented. A population balance model of the combined cooling-antisolventaddition system is developed and a moments model is used in optimal control strategies with variousobjective functions. The simulation and experimental results show the advantages of the combinedapproach.
� 2008 Elsevier Ltd. All rights reserved.
1. Introduction
Batch crystallization is among the oldest unit operations in thechemical industry. Despite this long history and the widespreadapplication of crystallization, there are still a disproportionatenumber of problems associated with the understanding and con-trol of the process. These problems have become highly importantin recent years as an increased interest has been directed towardscrystallization of pharmaceuticals and proteins, which have addi-tional complications compared to the inorganic crystallizationsstudied extensively before [8]. The major concern in the pharma-ceutical industry is to optimize consistency and quality of the finalproduct while improving productivity if possible. Pharmaceuticalmanufacture has traditionally been a recipe-based operation, inwhich the processes are controlled by following operating trajecto-ries in accordance to the specifications submitted for regulatory fil-ings. In recent years the application of experimental designtechniques to identify a robust envelope for crystallization opera-tion has become more and more widespread in the pharmaceuticalindustries. The response surface method can be used to designoptimal cooling trajectories [19]. However, these approaches usu-ally require many experiments for reliable determination of opti-mal operating policies which are robust during scale-up. Inrecent years accurate in situ sensors have become available, whichare robust enough to be applied in the production environment.This opened the possibility of feedback control-based crystalliza-tion design and operation. The new opportunities are well de-scribed by the guideline document [6] issued in 2004 by the US
ll rights reserved.
y et al., Modelling and contrnt.2008.06.002
Food and Drug Administration (FDA), as part of a broader initiativeon current Good Manufacturing Practices (cGMP), which puts agrowing emphasis on the development and use of novel technolo-gies based on process analytical technologies (PAT) as a tool for‘‘21st Century Manufacturing” [1,2,23] and the development of tai-lored process control strategies is being recognized as the mostimportant way to prevent or mitigate the risk of producing poorquality products. Recent research has indicated the significant eco-nomic potential of using advanced feedback control strategieswithin the framework of PAT (see [3,8,16] and references citedtherein), to reduce time-to-market and increase product quality.The new policy adopted by the FDA with the aim to achieve andconsistently maintain product quality and performance allows acertain degree of flexibility for changes in operating conditions inthe manufacturing process, as opposed to the previously adoptedrather restrictive recipe-based operation. This provides a signifi-cant potential for implementation of optimal and adaptive controlmethodologies with real economic benefits associated with betterproduct quality and reduced waste due to failed batches. Such con-trol algorithms have been implemented at several pharmaceuticalcompanies (e.g., [12,24]).
The fundamental driving force for crystallization from solutionis the difference in the chemical potential between the solutionand the solid phase, which is usually expressed in terms of the clo-sely related supersaturation, which is the difference between thesolution concentration and the saturation concentration or somerelated expression. The size, shape, and solid-state phase of theproduct crystals are dependent on the supersaturation profileachieved during the crystallization process. Most often supersatu-ration is created by cooling, evaporation, or antisolvent addition,with the two main technologies used for batch or semi-batch
ol of combined cooling and antisolvent crystallization processes, J.

Temperature and/or Solvent/antisolvent ratio
Solu
tion
Con
cent
ratio
n Solubility curve Metastable limit for primary nucleation
Seeded operation
Introduction of seed
Unseeded operation
Fig. 1. Operations of seeded and unseeded batch cooling and/or antisolventcrystallizers.
2 Z.K. Nagy et al. / Journal of Process Control xxx (2008) xxx–xxx
ARTICLE IN PRESS
crystallization being the cooling and antisolvent addition, respec-tively. A significant number of publications deal with each ap-proach separately [3,10]. Optimal temperature profiles have beendetermined for numerous systems [17]. Although in the pharma-ceutical industries the heuristic combination of these two proce-dures is fairly common, a systematic study of the combinedprocedure has not been presented in the literature yet.
The paper first presents a comparative overview of the antisol-vent and cooling crystallizations and describes how to systemati-cally combine the two technologies both in the direct design(model-free) and the model-based control framework. Then themodel-based combined approach is presented and evaluatedthrough both simulations and experiments. The novelty of the pro-posed model-based approach is that an optimal control problem isformulated that simultaneously optimizes the antisolvent additionrate and temperature profile in order to improve the quality of theproduct. The model system used in the evaluation studies is lova-statin (an active pharmaceutical ingredient, API, used as hypolipi-demic agent in drugs) in acetone-water mixture. Solubilityexperiments have been performed using attenuated total reflec-tion-Fourier transform infrared (ATR-FTIR) spectroscopy, in orderto determine the solubility of the product as a function of the tem-perature and antisolvent concentration [11,7,5,12,24]. The solubil-ity of lovastatin is fit with an artificial neural network as a functionof temperature and acetone/water ratio. A population balancemodel for the antisolvent crystallization has been developed andsolved using the method of moments. The model with the experi-mentally determined solubility data was used to obtain optimalcontrol strategies via simultaneous cooling and antisolvent addi-tion considering different productivity and quality objectives. Thecombined approach is compared to the techniques in which anti-solvent addition or cooling is used independently.
2. Model-based and direct design approaches for antisolventand cooling crystallization systems
By far one of the most common batch crystallization approachesis cooling crystallization in which supersaturation is generated bydecreasing the temperature. The rate in which the temperature isdecreased influences the level of supersaturation, and can be usedas a control variable to achieve desired solid-state properties. Themain advantage of the cooling crystallization is that no additionalraw material (e.g., antisolvent) is needed, which could create addi-tional problems in product purity and increase operating and cap-ital costs. Crystallization from solution using an antisolvent (oftencalled precipitation, however this term more correctly should beused when reaction is involved) is commonly applied in the phar-maceutical industry, in which solute is crystallized from a primarysolvent by the addition of a second solvent (antisolvent) in whichthe solute is relatively insoluble. Typically, a solution of the solutein a solvent, which is often saturated or close to saturation, is ini-tially formed. Then, an antisolvent that is miscible with the pri-mary solvent is added. Sometimes multiple solvents orantisolvents are used, to produce a sharper solubility curve or toproduce a more desirable crystal shape or polymorph (crystalstructure).
When the antisolvent is added to the solution, the solute crys-tallizes due to the reduction in solubility. The main advantages ofthe antisolvent crystallization include the use of low operatingtemperature, which is important for thermally sensitive products.Another advantage is that the solvent activity also changes signif-icantly, hence this approach can have more profound effect on thecrystal morphology or polymorphic form than in the case of thecooling crystallization. Disadvantages of the antisolvent crystalli-zation approach include the higher supersaturation gradients
Please cite this article in press as: Z.K. Nagy et al., Modelling and contrProcess Contr. (2008), doi:10.1016/j.jprocont.2008.06.002
within the solution in larger scale systems, the additional costsassociated with the solvent separation, and the larger capital costsrequired due to the often higher operating volumes. Fig. 1 showsthe schematic representation of the operating curves for bothseeded and unseeded systems for cooling or antisolvent crystalli-zation. The main difference between seeded and unseeded systemsis that for the unseeded case the operating curve has to cross thenucleation boundary to generate in situ the seed, whereas in theseeded operation crystals with well determined properties areadded at small but positive supersaturation. The operating curvesare similar conceptually independently whether cooling or antisol-vent is used to generate the supersaturation, however the bound-aries of the metastable zone change, and the shape of theoptimal operating curve can vary significantly.
Several approaches have been proposed for designing the oper-ating curves for crystallization systems. Generally speaking, twomain categories can be distinguished, which are schematically de-picted in Fig. 2. The model-based design approach is based ondeveloping a detailed model which is used with optimization tech-niques to determine temperature versus time or antisolvent addi-tion rate versus time trajectories [17]. Advantages of the model-based approach include its ability to obtain a theoretically optimalrecipe, much smaller number of experiments than for statisticalexperimental design of batches [20], increased process under-standing, and the possibility of incorporating the effects ofnonideal mixing via computational fluid dynamics [22]. Disadvan-tages associated to the model-based approach are mainly relatedto the difficulty in modelling practical objectives (e.g., filterability,purity, tablet stability, etc.), and the significant time and engineer-ing effort required for the model development. Additionally, theperformance of the model-based approach depends on the modelaccuracy; the robustness of the approach can be improved byincorporating linear or nonlinear robustness analysis into the opti-mization [14,15].
The model-free (or direct design) approach is based on theunderstanding of the basic concept of crystallization to operatethe system within the metastable zone bounded by the nucleationand solubility curves (see Fig. 1). A supersaturation setpoint is fol-lowed in the phase diagram using concentration measurement andsupersaturation control approaches. This approach also generatesexperimentally the temperature or antisolvent versus time pro-files, which can be implemented at the production scale wherethe concentration measurement might not be readily available.The main advantage of the direct design technique is that it pro-vides a fast approach for recipe design, which also can be highlyautomated. It also requires very simple mathematical tools, with-out any modelling effort. The main disadvantage of the approachis that the operating curve chosen in the phase diagram is not nec-essarily optimal. Although the close-to-optimal setpoint profilemostly provides very good performance for practical purposes, it
ol of combined cooling and antisolvent crystallization processes, J.

dt j�1;s
Determinemetastable
zone
Model identification
Model basedoptimization
Implement trajectory in timedomain (direct operation) or
in phase diagram(supersaturation control)
Optimalperformanceachieved ?
Select concentration versus temperature (orantisolvent ratio) curvesin the metastable zone
Nominal optimal recipe
Suboptimalrecipe
Robust optimal recipe
Measurement based optimization
Experimental design
Yes
No
No
Model-based design approach
Model-free (direct design) approach
Fig. 2. Schematic representation of the model-based and model-free (direct design) approaches for cooling, antisolvent, or combined crystallization systems.
Z.K. Nagy et al. / Journal of Process Control xxx (2008) xxx–xxx 3
ARTICLE IN PRESS
is also possible to apply measurement-based optimization ap-proaches [21] to improve the initial setpoint profile according toa run-to-run control scheme, leading to an optimal direct designstrategy.
Both the direct design and model-based design approaches arebased on the fundamental concept that the ideal region for thecrystallization operation is within the metastable zone once thenuclei have formed or were introduced via seeding. However, inmore modern crystallization designs this concept has been ex-tended, and it has been shown that driving the system into theundersaturated region can yield better crystal quality via con-trolled fine dissolution [4]. Controlled in situ dissolution is alsoan efficient way for adaptive crystallization control, which can cor-rect the effects of changes in operating conditions due to scale-upor disturbances (e.g., variations in seeding). The main idea of theapproach is based on in situ measurement of the particle countsin the system (e.g., using focused beam reflectance measurement– FBRM), and when excessive increase in the desired number ofcounts per unit time is detected, dissolution is used to correctthe number of counts. Dissolution can be controlled by addingmore solvent into the system or increasing the temperature witha predetermined rate, or by applying a control algorithm whichdetermines the degree of dissolution in correlation with the extentof nucleation detected. After the desired number of counts isachieved supersaturation is controlled again by cooling or antisol-vent addition or the combination of the two.
3. Mathematical modelling of combined cooling andantisolvent crystallization system
3.1. Population balance model and solution approach
The population balance for a batch or semi-batch system [18],when crystals are characterized by one characteristic length andthe volume is time-varying, is given by:
oðnðL; tÞVÞot
þ oðnðL; tÞGVÞoL
¼ BV ð1Þ
where n is the volumetric number density (expressed on the basisof mother liquor), V is the volume of the mother liquor (m3), G isthe growth rate (m s�1), L is the characteristic crystal size (m),and B is the total rate of nucleation (#/m3 s�1). The above equationis derived from the generic population balance equation (PBE),assuming that the crystals retain their shape and there is no break-age or aggregation. The working volume of the semi-batch system,
Please cite this article in press as: Z.K. Nagy et al., Modelling and contrProcess Contr. (2008), doi:10.1016/j.jprocont.2008.06.002
characteristic to the antisolvent crystallization, is time-varying,therefore it is more convenient to redefine the number density non the basis of the total volume of the mother liquor of thecrystallizer
~nðL; tÞ ¼ nðL; tÞV : ð2Þ
Substituting (2) into (1) the PBE becomes:
o~nðL; tÞot
þ oð~nðL; tÞGÞoL
¼ BV : ð3Þ
There have been a variety of different approaches proposed toreformulate the population balance model into computationallymore affordable forms suitable for optimization. Model reductionbased on the fact that the dominant dynamics of the crystallizercan be described by a small number of degrees of freedom canbe applied using the method of moments [18]. The jth momentof the distribution ~nðL; tÞ is defined by
~ljðtÞ ¼Z 1
0Lj~nðL; tÞdL; j ¼ 0;1; . . . ;1; ð4Þ
where the moment ~lj is in units of mj. These moments have phys-ical meaning. For example, ~l0 is the total number, ~l1=~l0 is the aver-age length, ~l2 is proportional to the total surface area, and ~l3 isproportional to the total volume of crystals in the batch. Multiply-ing the population Eq. (3) by Lj, and integrating over all crystal sizes,results in an infinite set of ordinary differential equations (ODEs),which describes the rate of change of the moments of the crystalsize distribution. Assuming the nuclei have essentially zero size[18], the method of moments leads to:
d~l0ðtÞdt
¼ BðtÞVðtÞ; ð5Þ
d~ljðtÞdt
¼ j~lj�1ðtÞGðtÞ; j ¼ 1; . . . ;1: ð6Þ
The moments ~lj characterize the total crystal population (crys-tals grown from seeds as well as new crystals formed through pri-mary nucleation). In order to characterize the distribution of theseed-grown crystals only, the PBE can be written exclusively forthe seed, and applying the method of moments yields the addi-tional ODEs [17]:
d~l0;sðtÞdt
¼ 0; ð7Þ
d~lj;sðtÞ ¼ j~l ðtÞGðtÞ; j ¼ 1; . . . ;1: ð8Þ
ol of combined cooling and antisolvent crystallization processes, J.
9001100
13001500
–0.6
–0.4
–0.2
0
0.2
time
wavelength (cm–1)
Abs
orba
nce
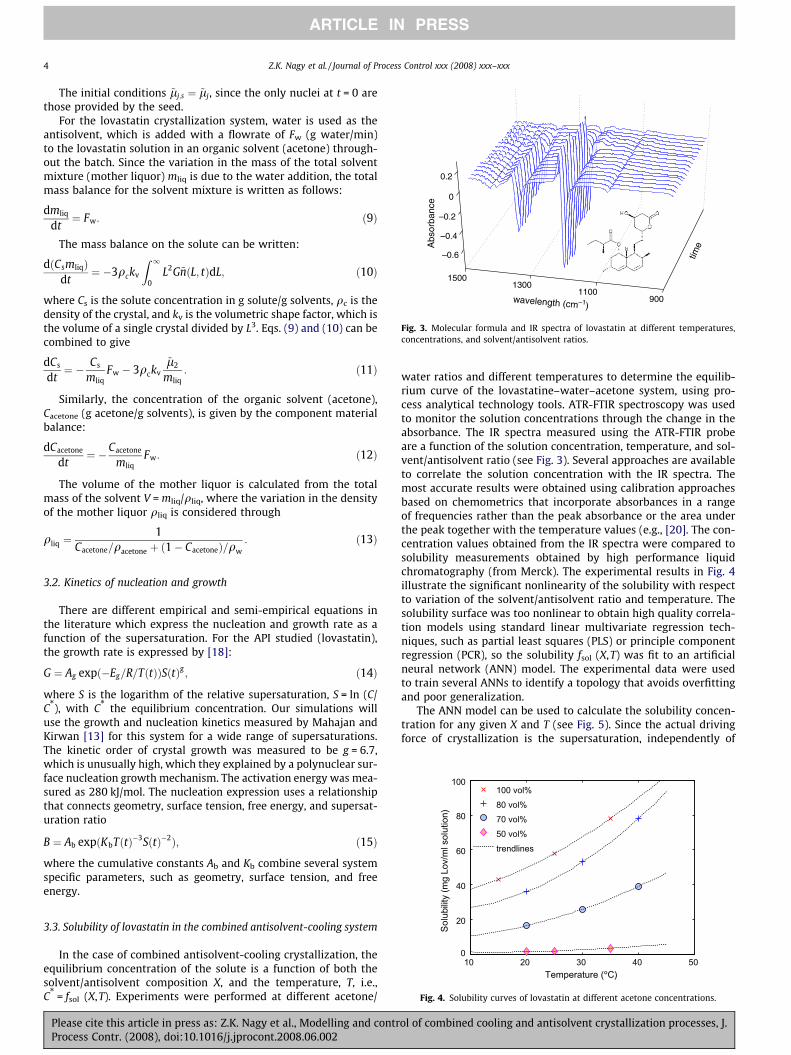
Fig. 3. Molecular formula and IR spectra of lovastatin at different temperatures,concentrations, and solvent/antisolvent ratios.
4 Z.K. Nagy et al. / Journal of Process Control xxx (2008) xxx–xxx
ARTICLE IN PRESS
The initial conditions ~lj;s ¼ ~lj, since the only nuclei at t = 0 arethose provided by the seed.
For the lovastatin crystallization system, water is used as theantisolvent, which is added with a flowrate of Fw (g water/min)to the lovastatin solution in an organic solvent (acetone) through-out the batch. Since the variation in the mass of the total solventmixture (mother liquor) mliq is due to the water addition, the totalmass balance for the solvent mixture is written as follows:
dmliq
dt¼ Fw: ð9Þ
The mass balance on the solute can be written:
dðCsmliqÞdt
¼ �3qckv
Z 1
0L2G~nðL; tÞdL; ð10Þ
where Cs is the solute concentration in g solute/g solvents, qc is thedensity of the crystal, and kv is the volumetric shape factor, which isthe volume of a single crystal divided by L3. Eqs. (9) and (10) can becombined to give
dCs
dt¼ � Cs
mliqFw � 3qckv
~l2
mliq: ð11Þ
Similarly, the concentration of the organic solvent (acetone),Cacetone (g acetone/g solvents), is given by the component materialbalance:
dCacetone
dt¼ �Cacetone
mliqFw: ð12Þ
The volume of the mother liquor is calculated from the totalmass of the solvent V = mliq/qliq, where the variation in the densityof the mother liquor qliq is considered through
qliq ¼1
Cacetone=qacetone þ ð1� CacetoneÞ=qw: ð13Þ
40
60
80
100
ty (m
g Lo
v/m
l sol
utio
n)
100 vol% 80 vol%70 vol% 50 vol%trendlines
3.2. Kinetics of nucleation and growth
There are different empirical and semi-empirical equations inthe literature which express the nucleation and growth rate as afunction of the supersaturation. For the API studied (lovastatin),the growth rate is expressed by [18]:
G ¼ Ag expð�Eg=R=TðtÞÞSðtÞg ; ð14Þ
where S is the logarithm of the relative supersaturation, S = ln (C/C*), with C* the equilibrium concentration. Our simulations willuse the growth and nucleation kinetics measured by Mahajan andKirwan [13] for this system for a wide range of supersaturations.The kinetic order of crystal growth was measured to be g = 6.7,which is unusually high, which they explained by a polynuclear sur-face nucleation growth mechanism. The activation energy was mea-sured as 280 kJ/mol. The nucleation expression uses a relationshipthat connects geometry, surface tension, free energy, and supersat-uration ratio
B ¼ Ab expðKbTðtÞ�3SðtÞ�2Þ; ð15Þ
where the cumulative constants Ab and Kb combine several systemspecific parameters, such as geometry, surface tension, and freeenergy.
10 20 30 40 500
20
Temperature (°C)
Sol
ubili
Fig. 4. Solubility curves of lovastatin at different acetone concentrations.
3.3. Solubility of lovastatin in the combined antisolvent-cooling system
In the case of combined antisolvent-cooling crystallization, theequilibrium concentration of the solute is a function of both thesolvent/antisolvent composition X, and the temperature, T, i.e.,C* = fsol (X,T). Experiments were performed at different acetone/
Please cite this article in press as: Z.K. Nagy et al., Modelling and contrProcess Contr. (2008), doi:10.1016/j.jprocont.2008.06.002
water ratios and different temperatures to determine the equilib-rium curve of the lovastatine–water–acetone system, using pro-cess analytical technology tools. ATR-FTIR spectroscopy was usedto monitor the solution concentrations through the change in theabsorbance. The IR spectra measured using the ATR-FTIR probeare a function of the solution concentration, temperature, and sol-vent/antisolvent ratio (see Fig. 3). Several approaches are availableto correlate the solution concentration with the IR spectra. Themost accurate results were obtained using calibration approachesbased on chemometrics that incorporate absorbances in a rangeof frequencies rather than the peak absorbance or the area underthe peak together with the temperature values (e.g., [20]. The con-centration values obtained from the IR spectra were compared tosolubility measurements obtained by high performance liquidchromatography (from Merck). The experimental results in Fig. 4illustrate the significant nonlinearity of the solubility with respectto variation of the solvent/antisolvent ratio and temperature. Thesolubility surface was too nonlinear to obtain high quality correla-tion models using standard linear multivariate regression tech-niques, such as partial least squares (PLS) or principle componentregression (PCR), so the solubility fsol (X,T) was fit to an artificialneural network (ANN) model. The experimental data were usedto train several ANNs to identify a topology that avoids overfittingand poor generalization.
The ANN model can be used to calculate the solubility concen-tration for any given X and T (see Fig. 5). Since the actual drivingforce of crystallization is the supersaturation, independently of
ol of combined cooling and antisolvent crystallization processes, J.

Fig. 5. Solubility surface of lovastatin in acetone/water mixture, obtained from theANN model. The stars represent the experimental concentrations obtained from theIR spectra. Point A indicates high sensitivity for temperature change and lowsensitivity for change in antisolvent concentration, whereas point B shows highsensitivity for change in antisolvent concentration.
Fig. 6. Schematic representation of the equipment (not drawn to scale).
Z.K. Nagy et al. / Journal of Process Control xxx (2008) xxx–xxx 5
ARTICLE IN PRESS
whether it is generated by antisolvent addition or cooling, the sol-ubility surface shown in Fig. 5 can be used for systematic determi-nation of the conditions under which the process is bettercontrolled by antisolvent addition or by cooling, based on the sen-sitivity of the solubility with respect to change in solvent/antisol-vent ratio or temperature. Point A on Fig. 5, for example,corresponds to a temperature-controlled operating region, sincethe solubility in this operating region exhibits higher sensitivityto changes in temperature than in anitsolvent concentration. Ifthe operating point is in other region of the solubility surface(e.g., due to different initial concentration), such as point B onFig. 5, the system exhibits significantly higher sensitivity tochanges in the antisolvent concentration.
4. Materials and equipment
Pure lovastatin from an industrial batch were used in all exper-iments. Deionized water and acetone of laboratory grade wereused in all tests. Experiments were performed in a jacketed 500-ml round-bottomed flask. The temperature was measured using aFluke 80TK Teflon-coated thermocouple module connected to acomputer, and it was controlled by rationing hot and cold waterusing a research control valve (Badger Meter, Inc.) via a propor-tional-integral computer control system designed via internalmodel control. Chord length distributions of lovastatin crystals insolution were obtained using FBRM (Lasentec) connected to a Pen-tium III running version 6.0b9 of the FBRM Control Interface soft-ware. The chord length distributions are closely related to thecrystal size distribution (e.g., see [9], and references cited therein).The IR spectra of the lovastatin solution were obtained using a DIP-PER-210 ATR immersion probe with two reflections (Axiom Ana-lytical) with ZnSe as the internal reflectance element. The probewas attached to a Nicolet Protégé 460 FTIR spectrophotometer con-nected to a Pentium II computer running OMNIC 4.1a softwarefrom Nicolet Instrument Corp. The spectrophotometer was purgedwith N2 gas 1 h before and while measurements were taken to re-duce the effect of CO2 absorption in its optical path. Temperaturereadings were collected every 2 s and averaged during the collec-tion of each spectra, which consisted of 32 scans (1 min interval).The water used as antisolvent was pumped into the apparatusthrough L/S 6409-13 tubing by a MasterFlex Console Driver withEasyLoad II peristaltic pump, calibrated before the experiments.A 6-cm oval blade attached to an IKA overhead mixer with a flex-
Please cite this article in press as: Z.K. Nagy et al., Modelling and contrProcess Contr. (2008), doi:10.1016/j.jprocont.2008.06.002
ible shaft was used to stir the solution. Additionally a Lasentec par-ticle vision measurement (PVM) probe was also introduced in thesystem for monitoring purposes. The three computers connectedto the instruments were supervised by a fourth master computervia a software written in LabVIEW (National Instruments). Theexperimental setup is shown schematically on Fig. 6.
5. Optimal control – simulation results
Using the model in Section 3, the control problem of computingthe optimal temperature and antisolvent addition rate profiles isformulated as a nonlinear optimization problem, which was solvedusing sequential quadratic programming (SQP). A convenient wayto describe the optimal trajectories is to discretize the batch timein N intervals and consider the temperatures and anitsolvent flowrates at every discrete time k = 0,..., N as the optimization variables.In this case the optimal control problem can be written as follows(similar to the formulation for cooling, see [17]):
optimizeTðkÞ; FwðkÞ
J; ð16Þ
subject to:
Tmin 6 TðkÞ 6 Tmax;
RT;min 6 dT=dt 6 RT;max;
Fw;min 6 FwðkÞ 6 Fw;max; ð17ÞCðNÞ 6 Cmax;
VðNÞ 6 Vmax;
where Tmin, Tmax, RT,min, and RT,max are the minimum and maximumtemperatures and temperature ramp rates, respectively, and Fw,min
and Fw,max the minimum and maximum flow rates during the batch.The first three constraints ensure that the temperature and antisol-vent flowrate profiles stay within the operating range of the crystal-lizer. The fourth constraint ensures that the solute concentration atthe end of the batch Cfinal is smaller then a certain maximum valueCfinal,max set by the minimum yield required by economic consider-ations, whereas the final constraint limits the total amount of anti-solvent, which can be added due to the limit in the capacity of thecrystallizer, Vmax. The objective J is written in terms of some desiredcharacteristic of the crystals at the end of the batch. In this studythe following crystal size distribution (CSD) properties were consid-ered: number-average crystal size Jn:m:s ¼ ~l1=~l0, coefficient of vari-ation Jc:v: ¼ ð~l2 ~l0=~l2
1 � 1Þ1=2, nucleation-to-seed-mass ratio Jn:s:r ¼ð~l3 � ~l3;sÞ=~l3;s, and weight-mean size Jw:m:s: ¼ ~l4=~l3.
The optimization results are in Table 1. For easier comparisonnormalized values are shown, considering the cooling batch
ol of combined cooling and antisolvent crystallization processes, J.
0 50 100 150 200
20
30
40
Tem
pera
ture
(°C
)
Time (min)
0 50 100 150 2000
5
10
Flow
rate
(g/m
in)
Time (min)
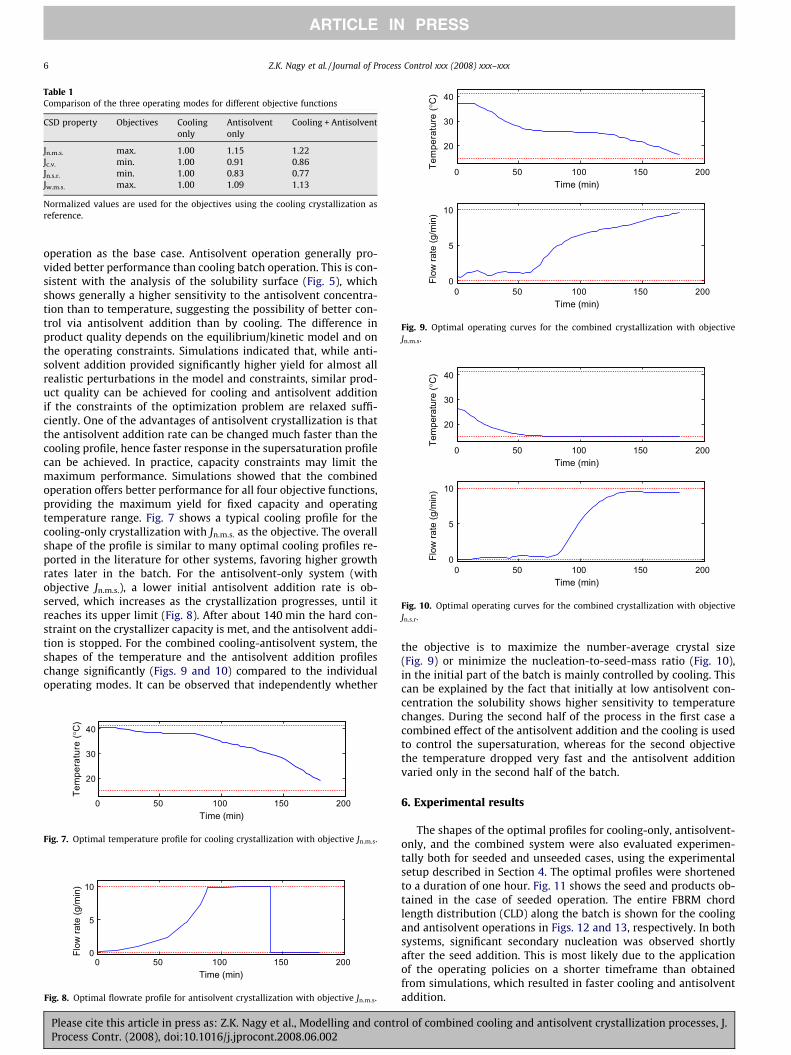
Fig. 10. Optimal operating curves for the combined crystallization with objectiveJn.s.r.
Table 1Comparison of the three operating modes for different objective functions
CSD property Objectives Coolingonly
Antisolventonly
Cooling + Antisolvent
Jn.m.s. max. 1.00 1.15 1.22Jc.v. min. 1.00 0.91 0.86Jn.s.r. min. 1.00 0.83 0.77Jw.m.s. max. 1.00 1.09 1.13
Normalized values are used for the objectives using the cooling crystallization asreference.
0 50 100 150 200
20
30
40
Tem
pera
ture
(°C
)
Time (min)
0 50 100 150 2000
5
10
Flow
rate
(g/m
in)
Time (min)
Fig. 9. Optimal operating curves for the combined crystallization with objectiveJn.m.s.
6 Z.K. Nagy et al. / Journal of Process Control xxx (2008) xxx–xxx
ARTICLE IN PRESS
operation as the base case. Antisolvent operation generally pro-vided better performance than cooling batch operation. This is con-sistent with the analysis of the solubility surface (Fig. 5), whichshows generally a higher sensitivity to the antisolvent concentra-tion than to temperature, suggesting the possibility of better con-trol via antisolvent addition than by cooling. The difference inproduct quality depends on the equilibrium/kinetic model and onthe operating constraints. Simulations indicated that, while anti-solvent addition provided significantly higher yield for almost allrealistic perturbations in the model and constraints, similar prod-uct quality can be achieved for cooling and antisolvent additionif the constraints of the optimization problem are relaxed suffi-ciently. One of the advantages of antisolvent crystallization is thatthe antisolvent addition rate can be changed much faster than thecooling profile, hence faster response in the supersaturation profilecan be achieved. In practice, capacity constraints may limit themaximum performance. Simulations showed that the combinedoperation offers better performance for all four objective functions,providing the maximum yield for fixed capacity and operatingtemperature range. Fig. 7 shows a typical cooling profile for thecooling-only crystallization with Jn.m.s. as the objective. The overallshape of the profile is similar to many optimal cooling profiles re-ported in the literature for other systems, favoring higher growthrates later in the batch. For the antisolvent-only system (withobjective Jn.m.s.), a lower initial antisolvent addition rate is ob-served, which increases as the crystallization progresses, until itreaches its upper limit (Fig. 8). After about 140 min the hard con-straint on the crystallizer capacity is met, and the antisolvent addi-tion is stopped. For the combined cooling-antisolvent system, theshapes of the temperature and the antisolvent addition profileschange significantly (Figs. 9 and 10) compared to the individualoperating modes. It can be observed that independently whether
0 50 100 150 200
20
30
40
Tem
pera
ture
(°C
)
Time (min)
Fig. 7. Optimal temperature profile for cooling crystallization with objective Jn.m.s.
0 50 100 150 2000
5
10
Flow
rate
(g/m
in)
Time (min)
Fig. 8. Optimal flowrate profile for antisolvent crystallization with objective Jn.m.s.
Please cite this article in press as: Z.K. Nagy et al., Modelling and contrProcess Contr. (2008), doi:10.1016/j.jprocont.2008.06.002
the objective is to maximize the number-average crystal size(Fig. 9) or minimize the nucleation-to-seed-mass ratio (Fig. 10),in the initial part of the batch is mainly controlled by cooling. Thiscan be explained by the fact that initially at low antisolvent con-centration the solubility shows higher sensitivity to temperaturechanges. During the second half of the process in the first case acombined effect of the antisolvent addition and the cooling is usedto control the supersaturation, whereas for the second objectivethe temperature dropped very fast and the antisolvent additionvaried only in the second half of the batch.
6. Experimental results
The shapes of the optimal profiles for cooling-only, antisolvent-only, and the combined system were also evaluated experimen-tally both for seeded and unseeded cases, using the experimentalsetup described in Section 4. The optimal profiles were shortenedto a duration of one hour. Fig. 11 shows the seed and products ob-tained in the case of seeded operation. The entire FBRM chordlength distribution (CLD) along the batch is shown for the coolingand antisolvent operations in Figs. 12 and 13, respectively. In bothsystems, significant secondary nucleation was observed shortlyafter the seed addition. This is most likely due to the applicationof the operating policies on a shorter timeframe than obtainedfrom simulations, which resulted in faster cooling and antisolventaddition.
ol of combined cooling and antisolvent crystallization processes, J.
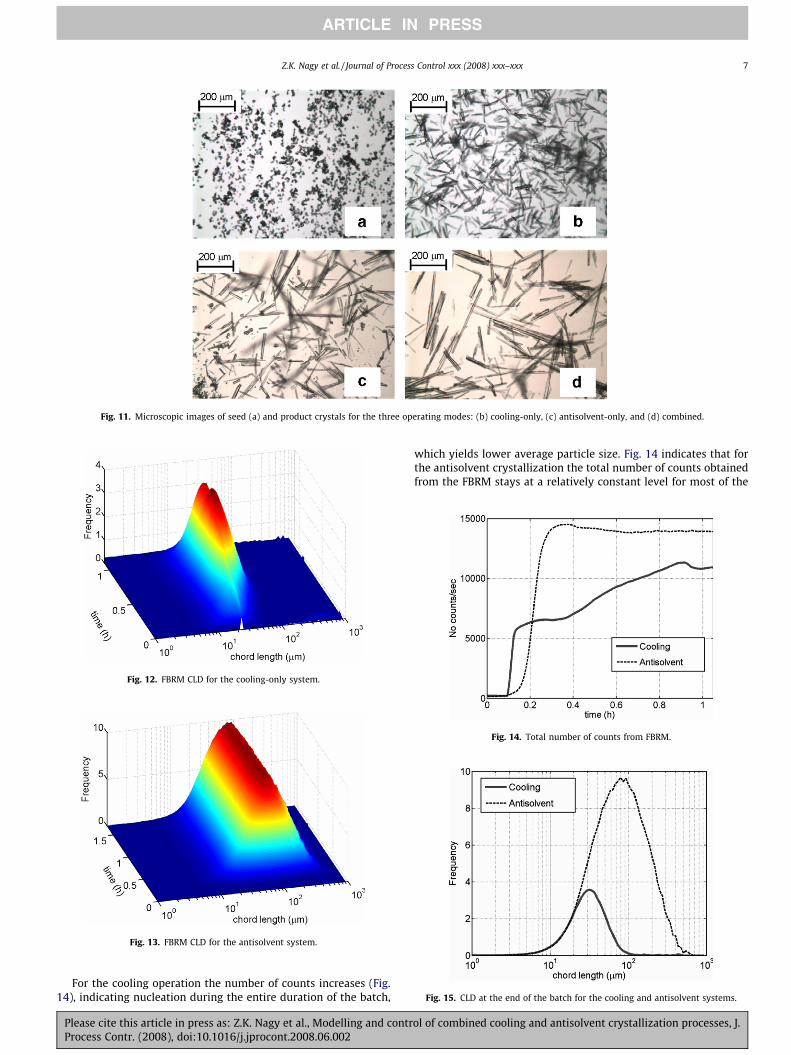
Fig. 11. Microscopic images of seed (a) and product crystals for the three operating modes: (b) cooling-only, (c) antisolvent-only, and (d) combined.
Fig. 12. FBRM CLD for the cooling-only system.
Fig. 13. FBRM CLD for the antisolvent system.
Fig. 14. Total number of counts from FBRM.
Fig. 15. CLD at the end of the batch for the cooling and antisolvent systems.
Z.K. Nagy et al. / Journal of Process Control xxx (2008) xxx–xxx 7
ARTICLE IN PRESS
For the cooling operation the number of counts increases (Fig.14), indicating nucleation during the entire duration of the batch,
Please cite this article in press as: Z.K. Nagy et al., Modelling and contrProcess Contr. (2008), doi:10.1016/j.jprocont.2008.06.002
which yields lower average particle size. Fig. 14 indicates that forthe antisolvent crystallization the total number of counts obtainedfrom the FBRM stays at a relatively constant level for most of the
ol of combined cooling and antisolvent crystallization processes, J.
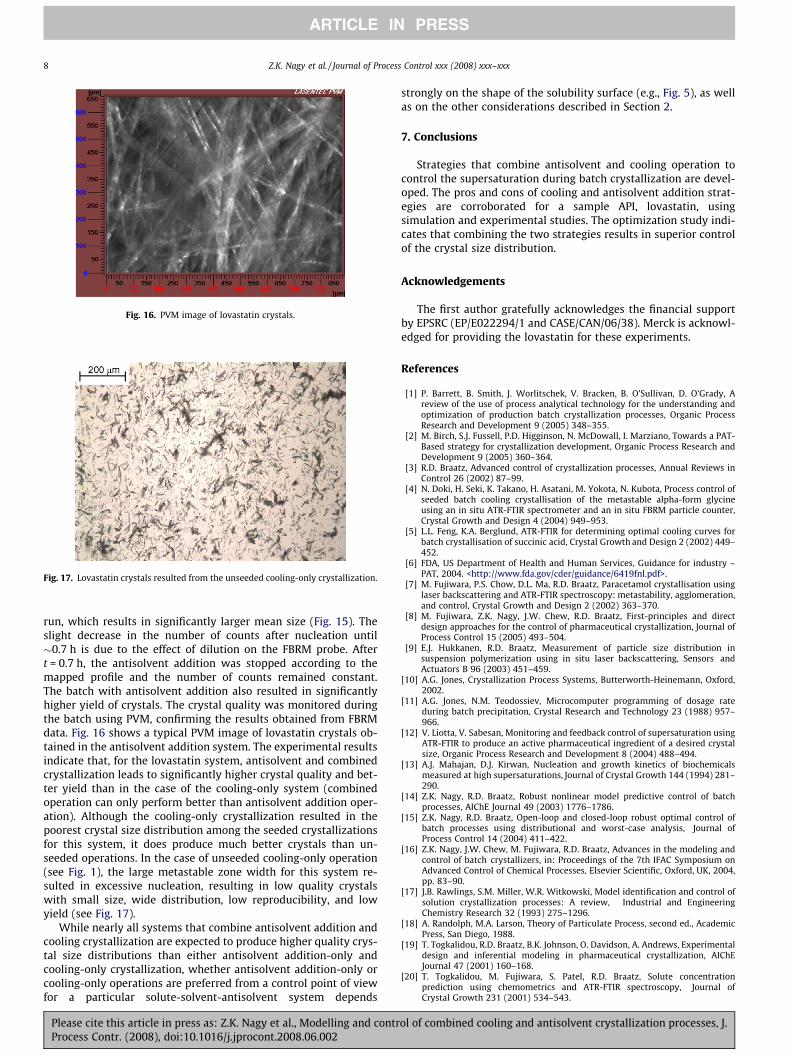
Fig. 16. PVM image of lovastatin crystals.
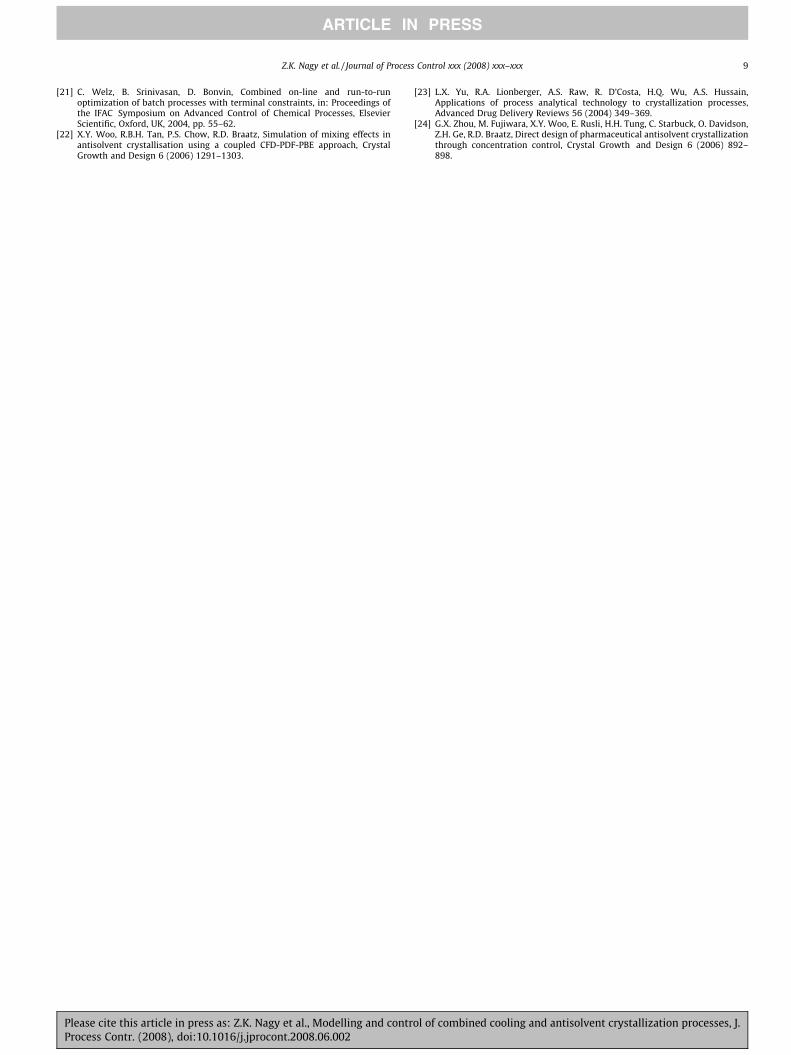
Fig. 17. Lovastatin crystals resulted from the unseeded cooling-only crystallization.
8 Z.K. Nagy et al. / Journal of Process Control xxx (2008) xxx–xxx
ARTICLE IN PRESS
run, which results in significantly larger mean size (Fig. 15). Theslight decrease in the number of counts after nucleation until�0.7 h is due to the effect of dilution on the FBRM probe. Aftert = 0.7 h, the antisolvent addition was stopped according to themapped profile and the number of counts remained constant.The batch with antisolvent addition also resulted in significantlyhigher yield of crystals. The crystal quality was monitored duringthe batch using PVM, confirming the results obtained from FBRMdata. Fig. 16 shows a typical PVM image of lovastatin crystals ob-tained in the antisolvent addition system. The experimental resultsindicate that, for the lovastatin system, antisolvent and combinedcrystallization leads to significantly higher crystal quality and bet-ter yield than in the case of the cooling-only system (combinedoperation can only perform better than antisolvent addition oper-ation). Although the cooling-only crystallization resulted in thepoorest crystal size distribution among the seeded crystallizationsfor this system, it does produce much better crystals than un-seeded operations. In the case of unseeded cooling-only operation(see Fig. 1), the large metastable zone width for this system re-sulted in excessive nucleation, resulting in low quality crystalswith small size, wide distribution, low reproducibility, and lowyield (see Fig. 17).
While nearly all systems that combine antisolvent addition andcooling crystallization are expected to produce higher quality crys-tal size distributions than either antisolvent addition-only andcooling-only crystallization, whether antisolvent addition-only orcooling-only operations are preferred from a control point of viewfor a particular solute-solvent-antisolvent system depends
Please cite this article in press as: Z.K. Nagy et al., Modelling and contrProcess Contr. (2008), doi:10.1016/j.jprocont.2008.06.002
strongly on the shape of the solubility surface (e.g., Fig. 5), as wellas on the other considerations described in Section 2.
7. Conclusions
Strategies that combine antisolvent and cooling operation tocontrol the supersaturation during batch crystallization are devel-oped. The pros and cons of cooling and antisolvent addition strat-egies are corroborated for a sample API, lovastatin, usingsimulation and experimental studies. The optimization study indi-cates that combining the two strategies results in superior controlof the crystal size distribution.
Acknowledgements
The first author gratefully acknowledges the financial supportby EPSRC (EP/E022294/1 and CASE/CAN/06/38). Merck is acknowl-edged for providing the lovastatin for these experiments.
References
[1] P. Barrett, B. Smith, J. Worlitschek, V. Bracken, B. O’Sullivan, D. O’Grady, Areview of the use of process analytical technology for the understanding andoptimization of production batch crystallization processes, Organic ProcessResearch and Development 9 (2005) 348–355.
[2] M. Birch, S.J. Fussell, P.D. Higginson, N. McDowall, I. Marziano, Towards a PAT-Based strategy for crystallization development, Organic Process Research andDevelopment 9 (2005) 360–364.
[3] R.D. Braatz, Advanced control of crystallization processes, Annual Reviews inControl 26 (2002) 87–99.
[4] N. Doki, H. Seki, K. Takano, H. Asatani, M. Yokota, N. Kubota, Process control ofseeded batch cooling crystallisation of the metastable alpha-form glycineusing an in situ ATR-FTIR spectrometer and an in situ FBRM particle counter,Crystal Growth and Design 4 (2004) 949–953.
[5] L.L. Feng, K.A. Berglund, ATR-FTIR for determining optimal cooling curves forbatch crystallisation of succinic acid, Crystal Growth and Design 2 (2002) 449–452.
[6] FDA, US Department of Health and Human Services, Guidance for industry –PAT, 2004. <http://www.fda.gov/cder/guidance/6419fnl.pdf>.
[7] M. Fujiwara, P.S. Chow, D.L. Ma, R.D. Braatz, Paracetamol crystallisation usinglaser backscattering and ATR-FTIR spectroscopy: metastability, agglomeration,and control, Crystal Growth and Design 2 (2002) 363–370.
[8] M. Fujiwara, Z.K. Nagy, J.W. Chew, R.D. Braatz, First-principles and directdesign approaches for the control of pharmaceutical crystallization, Journal ofProcess Control 15 (2005) 493–504.
[9] E.J. Hukkanen, R.D. Braatz, Measurement of particle size distribution insuspension polymerization using in situ laser backscattering, Sensors andActuators B 96 (2003) 451–459.
[10] A.G. Jones, Crystallization Process Systems, Butterworth-Heinemann, Oxford,2002.
[11] A.G. Jones, N.M. Teodossiev, Microcomputer programming of dosage rateduring batch precipitation, Crystal Research and Technology 23 (1988) 957–966.
[12] V. Liotta, V. Sabesan, Monitoring and feedback control of supersaturation usingATR-FTIR to produce an active pharmaceutical ingredient of a desired crystalsize, Organic Process Research and Development 8 (2004) 488–494.
[13] A.J. Mahajan, D.J. Kirwan, Nucleation and growth kinetics of biochemicalsmeasured at high supersaturations, Journal of Crystal Growth 144 (1994) 281–290.
[14] Z.K. Nagy, R.D. Braatz, Robust nonlinear model predictive control of batchprocesses, AIChE Journal 49 (2003) 1776–1786.
[15] Z.K. Nagy, R.D. Braatz, Open-loop and closed-loop robust optimal control ofbatch processes using distributional and worst-case analysis, Journal ofProcess Control 14 (2004) 411–422.
[16] Z.K. Nagy, J.W. Chew, M. Fujiwara, R.D. Braatz, Advances in the modeling andcontrol of batch crystallizers, in: Proceedings of the 7th IFAC Symposium onAdvanced Control of Chemical Processes, Elsevier Scientific, Oxford, UK, 2004,pp. 83–90.
[17] J.B. Rawlings, S.M. Miller, W.R. Witkowski, Model identification and control ofsolution crystallization processes: A review, Industrial and EngineeringChemistry Research 32 (1993) 275–1296.
[18] A. Randolph, M.A. Larson, Theory of Particulate Process, second ed., AcademicPress, San Diego, 1988.
[19] T. Togkalidou, R.D. Braatz, B.K. Johnson, O. Davidson, A. Andrews, Experimentaldesign and inferential modeling in pharmaceutical crystallization, AIChEJournal 47 (2001) 160–168.
[20] T. Togkalidou, M. Fujiwara, S. Patel, R.D. Braatz, Solute concentrationprediction using chemometrics and ATR-FTIR spectroscopy, Journal ofCrystal Growth 231 (2001) 534–543.
ol of combined cooling and antisolvent crystallization processes, J.
Z.K. Nagy et al. / Journal of Process Control xxx (2008) xxx–xxx 9
ARTICLE IN PRESS
[21] C. Welz, B. Srinivasan, D. Bonvin, Combined on-line and run-to-runoptimization of batch processes with terminal constraints, in: Proceedings ofthe IFAC Symposium on Advanced Control of Chemical Processes, ElsevierScientific, Oxford, UK, 2004, pp. 55–62.
[22] X.Y. Woo, R.B.H. Tan, P.S. Chow, R.D. Braatz, Simulation of mixing effects inantisolvent crystallisation using a coupled CFD-PDF-PBE approach, CrystalGrowth and Design 6 (2006) 1291–1303.
Please cite this article in press as: Z.K. Nagy et al., Modelling and contrProcess Contr. (2008), doi:10.1016/j.jprocont.2008.06.002
[23] L.X. Yu, R.A. Lionberger, A.S. Raw, R. D’Costa, H.Q. Wu, A.S. Hussain,Applications of process analytical technology to crystallization processes,Advanced Drug Delivery Reviews 56 (2004) 349–369.
[24] G.X. Zhou, M. Fujiwara, X.Y. Woo, E. Rusli, H.H. Tung, C. Starbuck, O. Davidson,Z.H. Ge, R.D. Braatz, Direct design of pharmaceutical antisolvent crystallizationthrough concentration control, Crystal Growth and Design 6 (2006) 892–898.
ol of combined cooling and antisolvent crystallization processes, J.
Related Documents