Contents lists available at ScienceDirect Journal of Network and Computer Applications journal homepage: www.elsevier.com/locate/jnca Renewable-aware geographical load balancing of web applications for sustainable data centers Adel Nadjaran Toosi a, ⁎ , Chenhao Qu a , Marcos Dias de Assunção b , Rajkumar Buyya a a Cloud Computing and Distributed Computing Laboratory, School of Computing and Information Systems, The University of Melbourne, Australia b Inria, ENS de Lyon, France ARTICLE INFO Keywords: Geographical load balancing Web applications Renewable energy Green computing Wikipedia Auto-scaling Brown energy Green Energy Cost saving System prototype ABSTRACT The ever-increasing demand for web applications deployed across multiple data centers results in large electricity costs for service providers and significant impact on the environment. This has motivated service providers to move towards more sustainable data centers powered by renewable or green sources of energy, such as solar or wind. However, efficient utilization of green energy to service web applications is a challenging problem due to intermittency and unpredictability of both application workload and renewable energy availability. One possible solution to reduce cost and increase renewable energy utilization is to exploit the spatio-temporal variations in on-site power and grid power prices by balancing the load among multiple data centers geographically distributed. In this paper, we propose a framework for reactive load balancing of web application requests among Geo-distributed sustainable data centers based on the availability of renewable energy sources on each site. A system prototype is developed, its underlying design and algorithms are described, and experiments are conducted with it using real infrastructure (Grid'5000 in France) and workload traces (real traffic to English Wikipedia). The experimental results demonstrate that our approach can reduce cost and brown energy usage with efficient utilization of green energy and without a priori knowledge of future workload, availability of renewable energy, and grid electricity prices. 1. Introduction Data centers are known to be consuming enormous amount of power leading to high operational cost and high carbon footprint on the environment. According to a report from NRDC 1 (NRDC, 2014), in 2013, US data centers alone consumed 91 billion kilowatt-hours of electricity, equivalent to two-year power consumption of all households in New York city. This is projected to increase to roughly 140 billion kilowatt-hours and is responsible for the emission of nearly 150 million metric tons of carbon dioxide per annum in 2020. These costs and environmental concerns have prompted service providers to reduce their energy consumption and their dependence on power generated from fossil fuels (i.e., Brown energy). Large companies (e.g., Google, 2 Microsoft 3 and Amazon 4 ) are working towards sustainable data centers by using renewable energy sources (i.e., Green energy) and making direct investments in on-site green power generation. Photovoltaic solar panels that directly convert sunlight into electricity and wind turbines that capture wind energy and turn it into electricity are among the most popular on-site power sources used by contemporary data centers. For example Amazon Web Services (AWS) is building a wind farm that will be operational by late 2016 and generate 40% of its electrical usage. 5 Powering data centers entirely with renewable energy sources, unlike brown energy, is challenging due to the intermittent and unpredictable availability of wind and solar energy. For example, photovoltaic (PV) solar energy is only available during the day time and the amount of power produced depends on the weather and geographical location of the data center. To mitigate this variability, besides on-site renewable energy sources, service providers end up using grid power or brown energy as a backup in their data centers. http://dx.doi.org/10.1016/j.jnca.2017.01.036 Received 8 April 2016; Received in revised form 1 December 2016; Accepted 30 January 2017 ⁎ Corresponding author. E-mail addresses: [email protected] (A. Nadjaran Toosi), [email protected] (C. Qu), [email protected] (M.D. de Assunção), [email protected] (R. Buyya). 1 Natural Resources Defense Council,http://www.nrdc.org. 2 http://www.google.com.au/green/energy/. 3 http://www.microsoft.com/environment/renewable.aspx/. 4 http://aws.amazon.com/about-aws/sustainable-energy/. 5 http://www.reuters.com/article/2015/07/14/us-amazon-iberdrola-idUSKCN0PO1PF20150714. Journal of Network and Computer Applications 83 (2017) 155–168 Available online 04 February 2017 1084-8045/ © 2017 Elsevier Ltd. All rights reserved. MARK

Welcome message from author
This document is posted to help you gain knowledge. Please leave a comment to let me know what you think about it! Share it to your friends and learn new things together.
Transcript
Contents lists available at ScienceDirect
Journal of Network and Computer Applications
journal homepage: www.elsevier.com/locate/jnca
Renewable-aware geographical load balancing of web applications forsustainable data centers
Adel Nadjaran Toosia,⁎, Chenhao Qua, Marcos Dias de Assunçãob, Rajkumar Buyyaa
a Cloud Computing and Distributed Computing Laboratory, School of Computing and Information Systems, The University of Melbourne, Australiab Inria, ENS de Lyon, France
A R T I C L E I N F O
Keywords:Geographical load balancingWeb applicationsRenewable energyGreen computingWikipediaAuto-scalingBrown energyGreen EnergyCost savingSystem prototype
A B S T R A C T
The ever-increasing demand for web applications deployed across multiple data centers results in largeelectricity costs for service providers and significant impact on the environment. This has motivated serviceproviders to move towards more sustainable data centers powered by renewable or green sources of energy,such as solar or wind. However, efficient utilization of green energy to service web applications is a challengingproblem due to intermittency and unpredictability of both application workload and renewable energyavailability. One possible solution to reduce cost and increase renewable energy utilization is to exploit thespatio-temporal variations in on-site power and grid power prices by balancing the load among multiple datacenters geographically distributed. In this paper, we propose a framework for reactive load balancing of webapplication requests among Geo-distributed sustainable data centers based on the availability of renewableenergy sources on each site. A system prototype is developed, its underlying design and algorithms aredescribed, and experiments are conducted with it using real infrastructure (Grid'5000 in France) and workloadtraces (real traffic to English Wikipedia). The experimental results demonstrate that our approach can reducecost and brown energy usage with efficient utilization of green energy and without a priori knowledge of futureworkload, availability of renewable energy, and grid electricity prices.
1. Introduction
Data centers are known to be consuming enormous amount ofpower leading to high operational cost and high carbon footprint on theenvironment. According to a report from NRDC1 (NRDC, 2014), in2013, US data centers alone consumed 91 billion kilowatt-hours ofelectricity, equivalent to two-year power consumption of all householdsin New York city. This is projected to increase to roughly 140 billionkilowatt-hours and is responsible for the emission of nearly 150 millionmetric tons of carbon dioxide per annum in 2020. These costs andenvironmental concerns have prompted service providers to reducetheir energy consumption and their dependence on power generatedfrom fossil fuels (i.e., Brown energy).
Large companies (e.g., Google,2 Microsoft3 and Amazon4) areworking towards sustainable data centers by using renewable energy
sources (i.e., Green energy) and making direct investments in on-sitegreen power generation. Photovoltaic solar panels that directly convertsunlight into electricity and wind turbines that capture wind energyand turn it into electricity are among the most popular on-site powersources used by contemporary data centers. For example Amazon WebServices (AWS) is building a wind farm that will be operational by late2016 and generate 40% of its electrical usage.5
Powering data centers entirely with renewable energy sources,unlike brown energy, is challenging due to the intermittent andunpredictable availability of wind and solar energy. For example,photovoltaic (PV) solar energy is only available during the day timeand the amount of power produced depends on the weather andgeographical location of the data center. To mitigate this variability,besides on-site renewable energy sources, service providers end upusing grid power or brown energy as a backup in their data centers.
http://dx.doi.org/10.1016/j.jnca.2017.01.036Received 8 April 2016; Received in revised form 1 December 2016; Accepted 30 January 2017
⁎ Corresponding author.E-mail addresses: [email protected] (A. Nadjaran Toosi), [email protected] (C. Qu), [email protected] (M.D. de Assunção),
[email protected] (R. Buyya).1 Natural Resources Defense Council,http://www.nrdc.org.2 http://www.google.com.au/green/energy/.3 http://www.microsoft.com/environment/renewable.aspx/.4 http://aws.amazon.com/about-aws/sustainable-energy/.5 http://www.reuters.com/article/2015/07/14/us-amazon-iberdrola-idUSKCN0PO1PF20150714.
Journal of Network and Computer Applications 83 (2017) 155–168
Available online 04 February 20171084-8045/ © 2017 Elsevier Ltd. All rights reserved.
MARK

However, to minimize brown energy usage, they need to obtain thehighest possible renewable energy utilization.
Even though data centers can store power generated by renewablesources of energy in batteries for later needs, this approach has manyproblems (Goiri et al., 2012). For example, 1) batteries lose energy dueto internal resistance and self-discharge, 2) battery-related costs candominate the cost of power systems, and lastly 3) batteries usechemicals that are harmful to the environment. Given aforementionedproblems, the best way to take full advantage of the available greenenergy is to match the energy demand to supply.
There is a large number of studies illustrating the potential of using“geographical load balancing” in reducing brown energy usage andaccordingly maximizing renewable energy utilization (Lin et al., 2012;Liu et al., 2011; Adnan et al., 2012). Geographical load balancing(GLB) allows for “follow the renewables” by utilizing resources fromgeographically distributed data centers (Liu et al., 2011). Additionally,it routes the load to places with lower electricity prices even ifrenewable power is fully utilized or not available. This eventually leadsto significant cost savings.
Among different types of applications, web-applications are highlypopular and widely adopted these days. Web applications are ideal forgeographical load balancing as they can quickly adapt to changes in thedemand and their mostly small sized requests can be easily redirectedamong multiple data centers. Using multi-tier clustered web serverarchitectures, web applications are able to efficiently allocate resourceswithin and among data centers according to time varying demand andrenewable energy availability. In fact, if the Quality of Service (QoS)requirement of web requests in terms of response time can be satisfied,the load balancing algorithm distributes requests among targeted datacenters so that overall renewable energy usage is maximized. Pleasenote that web application workload is not deferrable that means everytime a request is received, the response should be generated immedi-ately afterwards. Therefore, the load balancing technique must makereal-time scheduling of the load which does not delay the currentrequests.
Fig. 1 depicts an architectural overview of multiple sustainable datacenters and a green load balancer. The power infrastructure generatesand delivers power for the IT equipment and cooling facilities of thedata center using grid power and local renewable power supplies. Datacenters host resources for the web application and the load balancer is
responsible for sharing requests according to the availability of renew-able energy sources on each site. In this paper we aim to address theinteresting and challenging question posed by this architecture:“Without a priori knowledge of the future demand, dynamic andunpredictable nature of renewable energy sources, and electricityprices, how can the load balancer distribute web application requestsamong multiple data centers so that the overall renewable energy usageis maximized and the total cost of power consumption is minimized?”
To address this problem, we propose a framework for reactive loadbalancing of web application requests among multiple geographicallydistributed data centers based on the availability of renewable energysources on each site. We develop a prototype, detail its underlyingdesign and algorithms, describe technical aspects of that, and experi-ment with it using real life infrastructure (i.e., Grid'5000 in France) andworkload traces (i.e., real traffic to English Wikipedia). We also modelrenewable energy power generation using real traces of meteorologicaldata for wind and solar radiation in the location of each data center.Using the prototype, we evaluate the optimization techniques anddemonstrate that our simple, yet practical, approach can achievesignificant cost savings without advance knowledge of future demands,availability of renewable energy, and electricity prices. The proposedload balancing algorithm is triggered periodically and collects thecurrent available renewable power and electricity price at each datacenter. Then, based on the present rate of requests at the load balancer,it adjusts the load distribution among data centers. By using thistechnique, load distribution among data centers is adapted to thedynamic and varying renewable power and electricity prices.
The load balancing technique proposed in this paper is an onlinealgorithm that acts without future knowledge of demand, renewableenergy availabilities, and electricity prices. Online algorithms havebeen previously used in the literature to tackle the problem ofgeographical load balancing (Lin et al., 2011; Adnan et al., 2012).However, since we focus on the implementation aspects of the system,we do not provide the analytical reasoning on the competitive analysisof the proposed online algorithm.
One of the unique features of our work is that in contrast to themajority of other studies evaluating their system performance throughsimulations and analytical reasoning; our experiments are conductedin a real testbed with realistic workload traces. Moreover, results ofexperiments are generated based on the fine-grained measurements of
Fig. 1. Architectural overview of sustainable data centers and green load balancing.
A. Nadjaran Toosi et al. Journal of Network and Computer Applications 83 (2017) 155–168
156

power consumption using real-time probes provided by a live monitor-ing system.
The main contributions of the paper are as follows:
• A reactive load balancing algorithm to distribute a web applicationload among different data centers in a region to maximize on-siterenewable energy utilization at each data center and to minimizeoverall cost. Our proposed method has a linear order of complexityand does not require any future knowledge of demands, availabilityof renewable energy, and electricity prices. This removes the needfor any prediction component and its simplicity is very appealing inpractice.
• Design and implementation of a two-layered load balancing proto-type by extending “3-tier architecture” common to web applications.
• Evaluation and validation of the proposed load balancing algorithmusing the developed system prototype in a real testbed with realisticworkload traces. Results of experiments are generated based on thereal-time measurements of actual power consumption.Meteorological data in the location of each data center used tomodel renewable power generation.
The rest of the paper is organized as follows: Section 2.1 motivatesour work. We describe the system architecture in Section 2.2. Section2.3 presents a detailed discussion on the design and implementation ofthe system. Section 3 proposes our load balancing and auto-scalingalgorithms. The performance evaluation of the system is presented inSection 4. First, we describe the testbed setup, the benchmarkalgorithm, traces of workload, renewable power and electricity pricesin Section 4.1. Then, benchmark policies and the experimental resultsare discussed in Sections 4.2 and 4.3, respectively. Section 5 discussesrelated work. Finally, our conclusions are presented in Section 6.
2. Load balancing in sustainable data centers
2.1. Motivation and background
Internet-scale distributed systems such as web applications useresources provided by geographically dispersed data centers withhundreds of thousands of physical nodes. The enormous and growingenergy demands of such data centers have motivated constructingsustainable data centers for both economical and environmentalreasons. Renewable sources of energy (e.g, wind and solar) have thepotential to play an important role in such sustainable data centers.However, the intermittent and variable nature of renewable energysources, caused by being heavily dependent on weather conditions,prevents them from being used as primary power supplies for datacenters. Essentially, a data center must be operational even whenrenewable energy is not available. This is possible by feeding the datacenter with brown energy from the grid in case the local renewableenergy is insufficient. Data centers often contract with power compa-nies to pay variable brown electricity prices for their excess usageprovided by the utility grid.
Web application providers using resources from sustainable datacenters (i.e., those equipped with on-site renewable energy facilities inour definition) in a specific region can distribute load by following therenewable energy supply in each site to save cost and reduce carbonemissions. That is, more requests must be redirected to the places withhigher availability of renewable energy. The availability of the renew-able electricity at each data center might vary due to reasons such asgeographical location, weather conditions, workload, and capacity ofpower generators. Eventually, if there is not enough available renew-able power from all data centers to handle the entire load, requestsmust be routed to places with lower electricity price. Indeed, withwidespread adoption of smart grid technologies, spatial and temporaldifferences in electricity prices, even in a small region, provide anopportunity for the load redirection to save cost.
In order to make this possible, we design and implement aframework for green load balancing of web requests among sustainabledata centers hosting the web application and dispersed throughout aregion. In this system, it is assumed that the “operational cost” of on-site power generated from renewable sources of energy at each datacenter is zero. This is a valid assumption as renewable power genera-tion needs one-time installation and very low maintenance cost duringthe lifespan of the renewable power generators. Decision makingregarding the investment on on-site renewable power generation basedon its “capital cost” and “return on investment” is not in the scope ofthis work. Interested readers are referred to Liu et al. (2011) forfeasibility of powering internet-scale systems using renewable energyand optimal portfolio of solar and wind energy mix.
Moreover, delay related changes due to geographical routing are nota concern in this work as we only consider data centers located within acertain region. In our terminology, a region is a geographic area (e.g.,Europe, US East, Central Asia) with multiple and isolated data centersconnected through low latency links. In the performance evaluationsection, we show that for a testbed of the same characteristics, responsetime remains below the acceptable delay requirements of the studiedweb application (i.e., Wikipedia)6 and will not significantly be affecteddue to geographical load balancing within the region.
2.2. System architecture
Our approach to green load balancing of web applications extendsmulti-tier clustered web server architecture by adding an extra layer ofload balancing responsible for sharing load at the data-center level asshown in Fig. 2. A standard multi-tier web application often consists ofthree logical layers (Grozev and Buyya, 2014):
1. Presentation Layer – represents the interface displayed to the end-user, e.g., a web page viewed on a web browser.
2. Business/Domain Layer – implements the core application logic,e.g., core web application deployed on web servers.
3. Data Layer – handles access to the persistent storage, e.g., adatabase server.
This layered architecture allows for software components of each layerto be deployed within single/multiple separate machines and easilyscale out based on the load. For example, the number of web serverscan increase or decrease dynamically in response to the demand. Webservers of the business/domain layer are often deployed behind a loadbalancer, which redirects the incoming requests among them. In ourarchitecture, we introduce two level of load balancing:
1. Local Load Balancing – redirects requests between web serverswithin a data center, and
2. Global Load Balancing – redirects requests among local loadbalancers, each associated with a data center.
In this paper, we focus on load sharing at the global load balancer(Global-LB). Global-LB is the main entry point of the system and allincoming requests at this point are distributed among geographicallydispersed data centers based on the proposed policy.
In each data center, there is an auto-scaler that dynamically andadaptively adds and removes web servers behind the local loadbalancer in response to the dynamic workload. Here, we only focuson auto-scaling of the application layer which is a common practice inthe real world. Auto-scaling can be done based on statistics gathered bythe monitors responsible for fetching corresponding system informa-tion such as resource utilization at web server nodes, request rates, etc.According to the obtained information, when it is necessary, the auto-
6Web-based encyclopedia project supported by the Wikimedia Foundation.
A. Nadjaran Toosi et al. Journal of Network and Computer Applications 83 (2017) 155–168
157
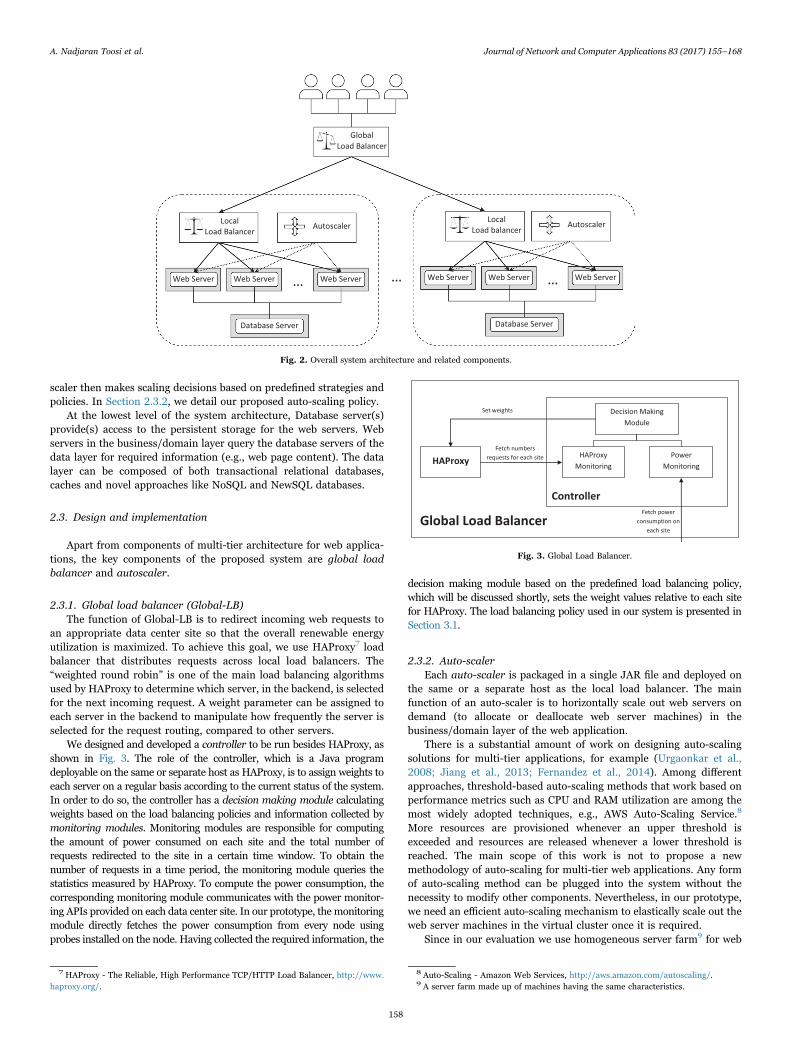
scaler then makes scaling decisions based on predefined strategies andpolicies. In Section 2.3.2, we detail our proposed auto-scaling policy.
At the lowest level of the system architecture, Database server(s)provide(s) access to the persistent storage for the web servers. Webservers in the business/domain layer query the database servers of thedata layer for required information (e.g., web page content). The datalayer can be composed of both transactional relational databases,caches and novel approaches like NoSQL and NewSQL databases.
2.3. Design and implementation
Apart from components of multi-tier architecture for web applica-tions, the key components of the proposed system are global loadbalancer and autoscaler.
2.3.1. Global load balancer (Global-LB)The function of Global-LB is to redirect incoming web requests to
an appropriate data center site so that the overall renewable energyutilization is maximized. To achieve this goal, we use HAProxy7 loadbalancer that distributes requests across local load balancers. The“weighted round robin” is one of the main load balancing algorithmsused by HAProxy to determine which server, in the backend, is selectedfor the next incoming request. A weight parameter can be assigned toeach server in the backend to manipulate how frequently the server isselected for the request routing, compared to other servers.
We designed and developed a controller to be run besides HAProxy, asshown in Fig. 3. The role of the controller, which is a Java programdeployable on the same or separate host as HAProxy, is to assign weights toeach server on a regular basis according to the current status of the system.In order to do so, the controller has a decision making module calculatingweights based on the load balancing policies and information collected bymonitoring modules. Monitoring modules are responsible for computingthe amount of power consumed on each site and the total number ofrequests redirected to the site in a certain time window. To obtain thenumber of requests in a time period, the monitoring module queries thestatistics measured by HAProxy. To compute the power consumption, thecorresponding monitoring module communicates with the power monitor-ing APIs provided on each data center site. In our prototype, the monitoringmodule directly fetches the power consumption from every node usingprobes installed on the node. Having collected the required information, the
decision making module based on the predefined load balancing policy,which will be discussed shortly, sets the weight values relative to each sitefor HAProxy. The load balancing policy used in our system is presented inSection 3.1.
2.3.2. Auto-scalerEach auto-scaler is packaged in a single JAR file and deployed on
the same or a separate host as the local load balancer. The mainfunction of an auto-scaler is to horizontally scale out web servers ondemand (to allocate or deallocate web server machines) in thebusiness/domain layer of the web application.
There is a substantial amount of work on designing auto-scalingsolutions for multi-tier applications, for example (Urgaonkar et al.,2008; Jiang et al., 2013; Fernandez et al., 2014). Among differentapproaches, threshold-based auto-scaling methods that work based onperformance metrics such as CPU and RAM utilization are among themost widely adopted techniques, e.g., AWS Auto-Scaling Service.8
More resources are provisioned whenever an upper threshold isexceeded and resources are released whenever a lower threshold isreached. The main scope of this work is not to propose a newmethodology of auto-scaling for multi-tier web applications. Any formof auto-scaling method can be plugged into the system without thenecessity to modify other components. Nevertheless, in our prototype,we need an efficient auto-scaling mechanism to elastically scale out theweb server machines in the virtual cluster once it is required.
Since in our evaluation we use homogeneous server farm9 for web
Fig. 2. Overall system architecture and related components.
Fig. 3. Global Load Balancer.
7 HAProxy - The Reliable, High Performance TCP/HTTP Load Balancer, http://www.haproxy.org/.
8 Auto-Scaling - Amazon Web Services, http://aws.amazon.com/autoscaling/.9 A server farm made up of machines having the same characteristics.
A. Nadjaran Toosi et al. Journal of Network and Computer Applications 83 (2017) 155–168
158

servers in each data center, we employ a simple yet effective auto-scaling method based on profiling data collected from web servermachines in each data center. Accordingly, we set an upper thresholdfor the request rate at or below which web server machines of thespecific type can provide responses in a timely manner. Thus, the auto-scaler allocates more web server machines whenever request rate goeshigher than the threshold. In section 3.2, we present a detaileddiscussion on the auto-scaling algorithm.
3. Load balancing and auto-scaling policies
In this section, first, we detail our proposed load balancingalgorithm used in Global-LB and then the auto-scaling algorithmemployed to scale out web servers in each data centers is presented.
Algorithm 1. Green Load Balancing (GreenLB) Policy
1: R ← 02: for all data centers d in the list do3: c← Fetch the data center's energy consumption
in Watt-hour within the time window4: t← Fetch the number of requests redirected to the
site within the same time window5: a← Fetch currently available renewable power at
the site in Watt6: w← Compute Watt-hour consumption per request
c t( ÷ )7: r ←d Compute the request rate (#reqs/hour) data
centerd can accommodate using renewables a w( ÷ )8: R R r← + d
9: end for10: γ←Fetch request rate (#reqs/hour) at Global-LB
11: if γ R< .then12: for all data centers d in the list do13: set weight as r R÷d
14: end for15: else16: Find the data center d′ with the cheapest price of
brown energy per request.17: L γ←18: for all data centers d in the list except d′do19: set weight as r γ÷d
20: L L r← −21: end for22
:Set the weight for d′ as L γ÷
23: end if24: Update HAProxy weights accordingly
3.1. Green load balancing policy
Algorithm 1 shows the pseudo code of the Green Load Balancing(GreenLB) policy used by the Global-LB component of the proposedsystem. Variable R is defined to maintain the overall rate of requeststhat can be handled by the power generated from renewable energysources in all data centers. Lines 2–9 gather the required informationusing the monitoring modules and compute request rates at which adata center could accommodate requests only using renewable powerwithin the time window (e.g., for the last 10 min). c and t keep track ofthe energy consumption and total number of requests served by thedata center, respectively (Lines 3 and 4). a is a value for the totalamount of renewable power currently available in the site (Line 5). Bydividing value of c to t, we compute the amount of energy w consumedat the specific data center to serve each request (Line 6). Accordingly,the maximum rate of requests rd specifying the rate at which this data
center can provide service only using renewable power is computed(Line 7). The value of R is updated based on the calculated rate rditeratively.
When the computation of rd is done for each data center, therequest rate at which global load balancer received requests in therecent time window, γ, is fetched from HAProxy (Line 10). If γ R< , itmeans that enough renewable energy is available to handle allincoming requests at the current rate (Line 11) and the weight foreach data center is computed proportionally to the availability ofrenewable energy on each site (Line 13). Otherwise, if there is notenough renewable energy available to handle all requests at this rate(Line 15), each data center will receive requests based on the maximumrate of requests they can serve with renewable energy sources (Line 19)and the one with the lowest price of brown energy consumption perrequest accommodates the remaining parts of requests (Line 22).Finally, at Line 24, the HAProxy weight parameters are updatedaccording to the computed values.
Please note that our policy never deallocates all web servermachines in a specific data center and there is always at least oneweb server running on each data center. Therefore, if the availabilityof renewable energy sources at a certain data center is lower than theenergy required for running even one web server machine, we set theweight in a way that the data center receives the minimum rateenough for one web server. Details related to this calculation are notshown in Algorithm 1 for the sake of preserving clarity. In addition,we assumed that there are sufficient resources available in each datacenter to accommodate the whole workload. Therefore, we did notconsider the case that the data center with the cheapest brownenergy price cannot accommodate the remaining part of the re-quests. If this is the case, a cap/limit on the maximum rate ofrequests each data center can handle must be considered by thealgorithm.
Algorithm 1 runs a loop on all data centers to fetch requiredinformation to calculate values of R and rd. Then according to thecondition in Line 11 makes another loop to set weight values for eachdata center. Therefore, the asymptotic time complexity of algorithm isO(n), where n is the number of data centers.
3.2. Auto-scaling policy
Algorithm 2 shows the details of the auto-scaling policy used in oursystem. The auto-scaling policy proposed in this paper is a reactiveauto-scaling working based on threshold-based rules. By conductingprofiling study, we set an upper threshold below which the web serveris able to provide responses within an acceptable time frame. The ratioof arrival request rate at local load balancer to the threshold value givesus the total number of required web servers.
Note that, Algorithm 2 is an algorithm without a loop or arecursion and incurs the time complexity of O(1). The auto-scalerbased on the profiling information sets the request rate at or belowwhich a web server running on a specific machine type can efficientlygenerate responses for the web requests (Line 1). Then, in Lines 2–4,the total number of required web servers is computed according tothe average request rate in the last time window (e.g., last 3 min).The number of required web servers is computed by diving theaverage arrival rate of web requests at the local load balancer to thethreshold value and taking the ceiling of the result (Line 4). If totalnumber of required web server machines is higher than the numberof the currently running web servers, it allocates more web servermachines (Line 7); otherwise, if the number is lower, it deallocatesexcess machines (Line 9). Finally, in Line 13, the local load balanceris informed by the updated list of web servers. Please note that thelocal load balancing between the web server machines is done in anevenly weighted round robin fashion as the server farm is homo-geneous.
A. Nadjaran Toosi et al. Journal of Network and Computer Applications 83 (2017) 155–168
159

Algorithm 2. Auto-scaling Policy.
1: t← Set the threshold (i.e., appropriate rate for aweb server) based on the profiling data
2: r← Fetch the request rate in the recent time windowfrom the local HAProxy load balancer
3: o← Fetch the number of currently ON web servermachines
4: m r t← ⌈ ÷ ⌉ Compute the total number of web server
machines required5: n m o← −6: if n > 0 then7: Add n more web servers8: else if n < 0 then9: Remove n web servers10: else11: No scaling is required12: end if13: Inform local load balancer with the new list of web
servers
4. Performance evaluation
To evaluate our system, we developed a prototype and performedexperimental studies in a real testbed (Grid'5000) using real traces ofrequests for English Wikipedia pages. In the following, we explaindetails of the testbed, workload, renewable power traces, and electricityprices. Then, we present results of experiments conducted using thissetup. Our aim is to understand the cost and energy consumptionperformance of the proposed system in realistic settings.
4.1. Experimental setup
4.1.1. TestbedAs testbed, we used Grid'5000 (Bolze et al., 2006), a French
experimental grid platform.10 Grid'5000 comprises sites geographicallydistributed across France. We consider a group of 3 sites equipped withpower monitoring APIs (Clouet et al., 2015) in the following locations:Lyon, Rennes and Reims shown in Fig. 4. We set up the experimentaltestbed by preparing 3 deployable environments as follows:
• Database (DB): a mysql database server loaded with the EnglishWikipedia dataset as of Jan 3rd, 2008 containing roughly 2 millionwiki pages and size of 3 GB.
• Web Server (WS): an Apache Web Server (version 2.4.10) with theinstalled Mediawiki application.
• Local Load Balancer (Local-LB): HAProxy (version 1.6) load bal-ancer along with the auto-scaler Java program.
All deployable environments run on the Debian Linux Wheezyoperating system. The characteristics of machines used in each site forhosting web servers are summarized in Table 1. To switch on/off adeployed web server, we used Grid'5000 APIs for accessing the “Wake-on-LAN” interfaces. By switching off, we set the physical machine tothe “hard” power off mode (i.e., physical shut down) (Fig. 5).
To replay traces of requests by Wikipedia users, we used wikibenchbenchmark tool (van Baaren, 2009).11 Wikibench is a web hostingbenchmark allowing the stress-test of systems designed to host webapplications. Using wikijector software module of wikibench, one cangenerate traffic by replaying traces of user requests actually made toWikipedia. For our experimental study, we deploy wikijector on a
machine in the Nancy site to mimic Wikipedia users sending requeststo the Global-LB. Global-LB is deployed on a separate host in theNancy site besides the controller Java program. The architecture of theprototype system deployed on the Grid'5000 testbed is shown in Fig. 5.
4.1.2. WorkloadWe used real traces of requests to the web servers from the
Wikimedia Foundation as workload. Our workload contains 5% of alluser requests issued to English Wikipedia resources during the periodof 19th to 21st of September 2007.12 Fig. 6 depicts the number ofrequests per second for the same period.
4.1.3. Availability of renewable energyTo capture the availability of solar energy in the location of each
data center, we use data traces by SoDa Service13 with 30 mingranularity between 19th and 21st of Sept 2007. The GlobalHorizontal Irradiance (GHI) in the location of each data center is usedto calculate the output for solar photovoltaics (PV) power. We assumethat each data center uses power generated by the PV panels of total4000 m2 area with tilt angle of 45° degree and PV cell efficiency of 30%(Roughly the highest efficiency reported so far (Green et al., 2015)). Wecalculate the PV power module output on the tilt surface based on themodel in Solar Radiation on a Tilted Surface.
We use meteorological data collected from Weather Underground14
traces to model wind power for the same dates. We presume each datacenter uses a GE 1.5 MW wind turbine to generate wind power. Toestimate the average wind power production, the model proposed byFripp and Wiser (2008) is employed where the wind speed, the airtemperature, and the air pressure measurements in the location of eachsite are fed into the model.
The summation of power generated from these two sources for
Fig. 4. Grid'5000 testbed.
Table 1The characteristics of machines hosting web servers in different sites.
Site CPU Number of cores MemoryLyon AMD Opteron 250 2.4 GHz 2 2 GBReims AMD Opteron 6164 HE 1.7 GHz 2 48 GBRennes AMD Opteron 6164 HE 1.7 GHz 2 48 GB
10 The Grid 5000 project, http://www.grid5000.org/.11 Wikibench, the realistic web hosting benchmark, http://www.wikibench.eu/.
12 http://www.wikibench.eu/wiki/2007-09/13 http://www.soda-is.com, The SoDa Service is a broker to a list of services and
webservices related to Solar Radiation proposed by several providers in Europe andabroad. The SoDa Service is provided by two mirror sites: one hosted in MINESParisTech, Sophia Antipolis France, and the other by Transvalor S.A., Mougins.
14 http://www.wunderground.com/history/
A. Nadjaran Toosi et al. Journal of Network and Computer Applications 83 (2017) 155–168
160

every 30 min is computed as available renewable power for everysite. Figs. 7 (a), (b) and (c) show respectively the solar, wind, andnormalized total power generated from renewable sources on eachsite for the 2-day period. In our investigation, we scale the normal-ized value of renewable power availability linearly in a way that theaverage renewable power generation is roughly enough to serve theaverage workload. Accordingly, every normalized power value ismultiplied by 2128.5 computed in this way.
4.1.4. Electricity pricesIn France, the utility grid power is mostly generated by Électricité de
France (EDF), French utility company, and is primarily produced fromnuclear power sources. Moreover, EDF offers wide range of tariffs whichare consistent all over France. In our experiment, we assume on-peak/off-peak scheme, the most common type of variable energy pricing in themarket. The electricity prices charged by EDF for on-peak (between 8 amand 8 pm) and off-peak are set to €0.1636/kWh and €0.1150/kWh,respectively. In order to incorporate price variability and effect of brown
Fig. 5. The architecture of the prototype system.
Fig. 6. The English Wikipedia workload for 19th and 20th of September 2007.
Fig. 7. Renewable Power Generation for two days.
A. Nadjaran Toosi et al. Journal of Network and Computer Applications 83 (2017) 155–168
161
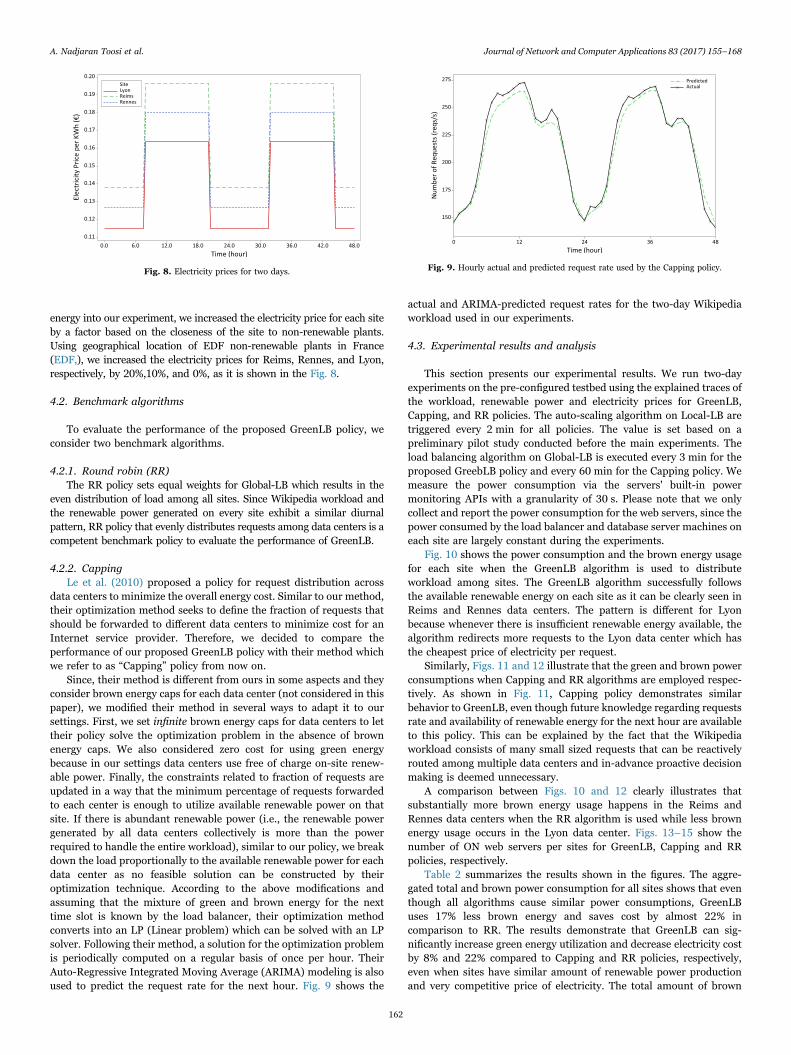
energy into our experiment, we increased the electricity price for each siteby a factor based on the closeness of the site to non-renewable plants.Using geographical location of EDF non-renewable plants in France(EDF,), we increased the electricity prices for Reims, Rennes, and Lyon,respectively, by 20%,10%, and 0%, as it is shown in the Fig. 8.
4.2. Benchmark algorithms
To evaluate the performance of the proposed GreenLB policy, weconsider two benchmark algorithms.
4.2.1. Round robin (RR)The RR policy sets equal weights for Global-LB which results in the
even distribution of load among all sites. Since Wikipedia workload andthe renewable power generated on every site exhibit a similar diurnalpattern, RR policy that evenly distributes requests among data centers is acompetent benchmark policy to evaluate the performance of GreenLB.
4.2.2. CappingLe et al. (2010) proposed a policy for request distribution across
data centers to minimize the overall energy cost. Similar to our method,their optimization method seeks to define the fraction of requests thatshould be forwarded to different data centers to minimize cost for anInternet service provider. Therefore, we decided to compare theperformance of our proposed GreenLB policy with their method whichwe refer to as “Capping” policy from now on.
Since, their method is different from ours in some aspects and theyconsider brown energy caps for each data center (not considered in thispaper), we modified their method in several ways to adapt it to oursettings. First, we set infinite brown energy caps for data centers to lettheir policy solve the optimization problem in the absence of brownenergy caps. We also considered zero cost for using green energybecause in our settings data centers use free of charge on-site renew-able power. Finally, the constraints related to fraction of requests areupdated in a way that the minimum percentage of requests forwardedto each center is enough to utilize available renewable power on thatsite. If there is abundant renewable power (i.e., the renewable powergenerated by all data centers collectively is more than the powerrequired to handle the entire workload), similar to our policy, we breakdown the load proportionally to the available renewable power for eachdata center as no feasible solution can be constructed by theiroptimization technique. According to the above modifications andassuming that the mixture of green and brown energy for the nexttime slot is known by the load balancer, their optimization methodconverts into an LP (Linear problem) which can be solved with an LPsolver. Following their method, a solution for the optimization problemis periodically computed on a regular basis of once per hour. TheirAuto-Regressive Integrated Moving Average (ARIMA) modeling is alsoused to predict the request rate for the next hour. Fig. 9 shows the
actual and ARIMA-predicted request rates for the two-day Wikipediaworkload used in our experiments.
4.3. Experimental results and analysis
This section presents our experimental results. We run two-dayexperiments on the pre-configured testbed using the explained traces ofthe workload, renewable power and electricity prices for GreenLB,Capping, and RR policies. The auto-scaling algorithm on Local-LB aretriggered every 2 min for all policies. The value is set based on apreliminary pilot study conducted before the main experiments. Theload balancing algorithm on Global-LB is executed every 3 min for theproposed GreebLB policy and every 60 min for the Capping policy. Wemeasure the power consumption via the servers' built-in powermonitoring APIs with a granularity of 30 s. Please note that we onlycollect and report the power consumption for the web servers, since thepower consumed by the load balancer and database server machines oneach site are largely constant during the experiments.
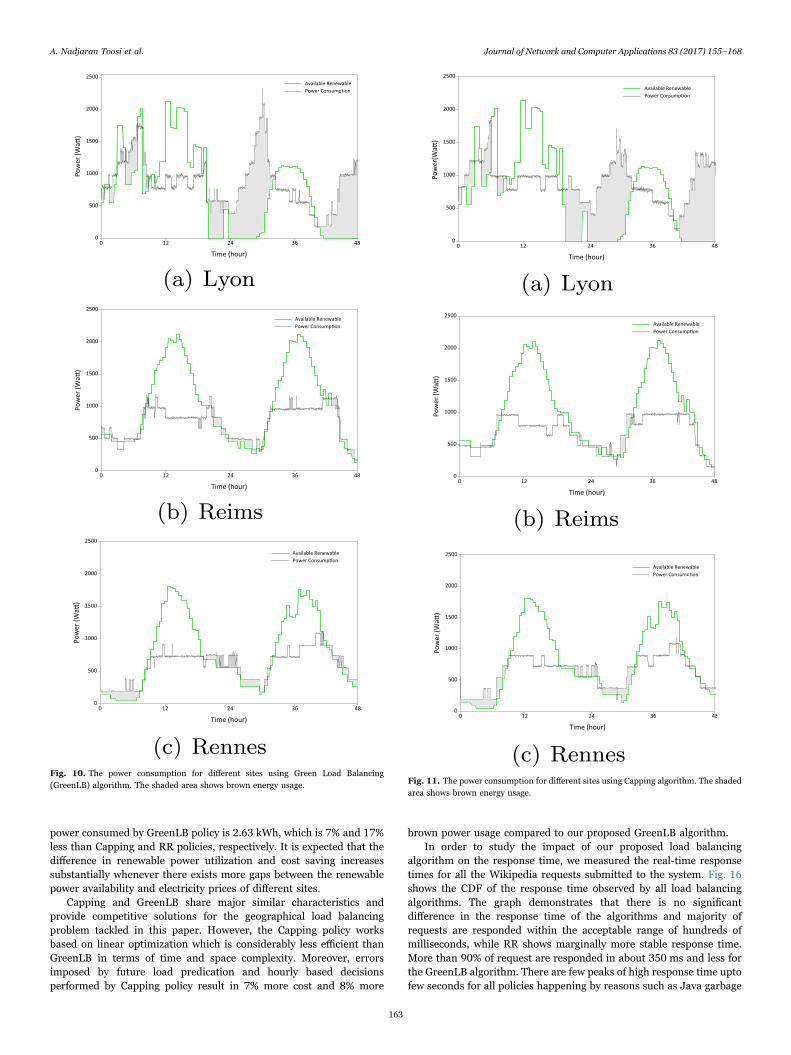
Fig. 10 shows the power consumption and the brown energy usagefor each site when the GreenLB algorithm is used to distributeworkload among sites. The GreenLB algorithm successfully followsthe available renewable energy on each site as it can be clearly seen inReims and Rennes data centers. The pattern is different for Lyonbecause whenever there is insufficient renewable energy available, thealgorithm redirects more requests to the Lyon data center which hasthe cheapest price of electricity per request.
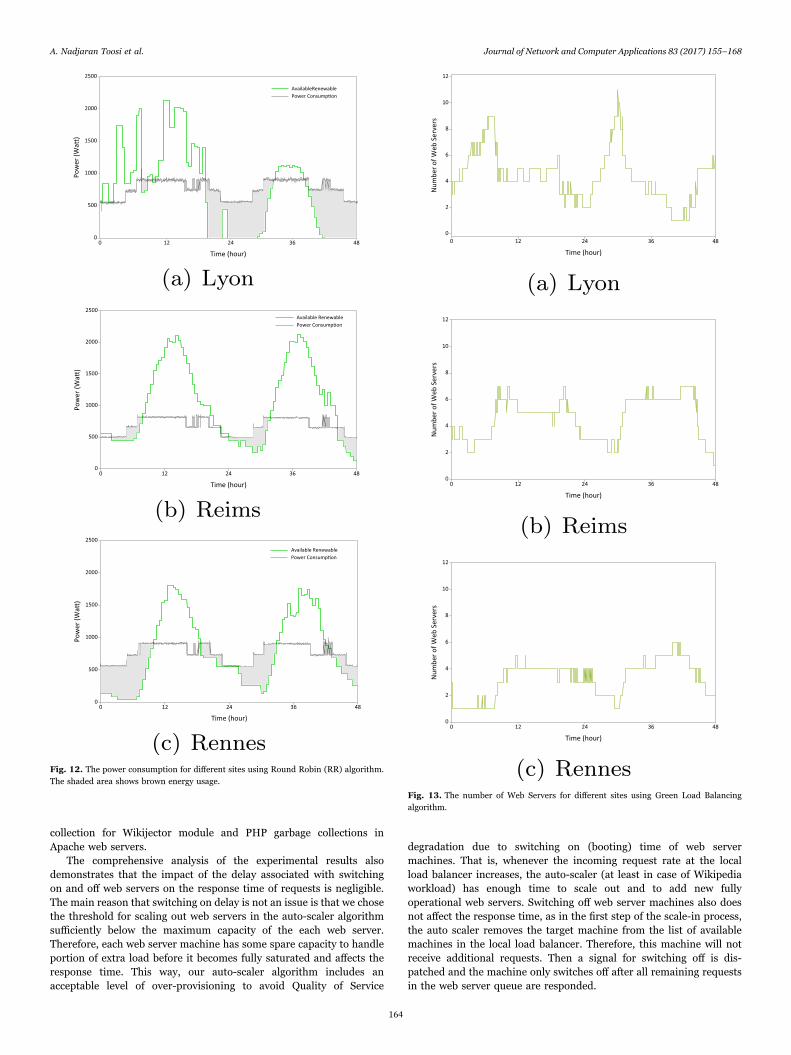
Similarly, Figs. 11 and 12 illustrate that the green and brown powerconsumptions when Capping and RR algorithms are employed respec-tively. As shown in Fig. 11, Capping policy demonstrates similarbehavior to GreenLB, even though future knowledge regarding requestsrate and availability of renewable energy for the next hour are availableto this policy. This can be explained by the fact that the Wikipediaworkload consists of many small sized requests that can be reactivelyrouted among multiple data centers and in-advance proactive decisionmaking is deemed unnecessary.
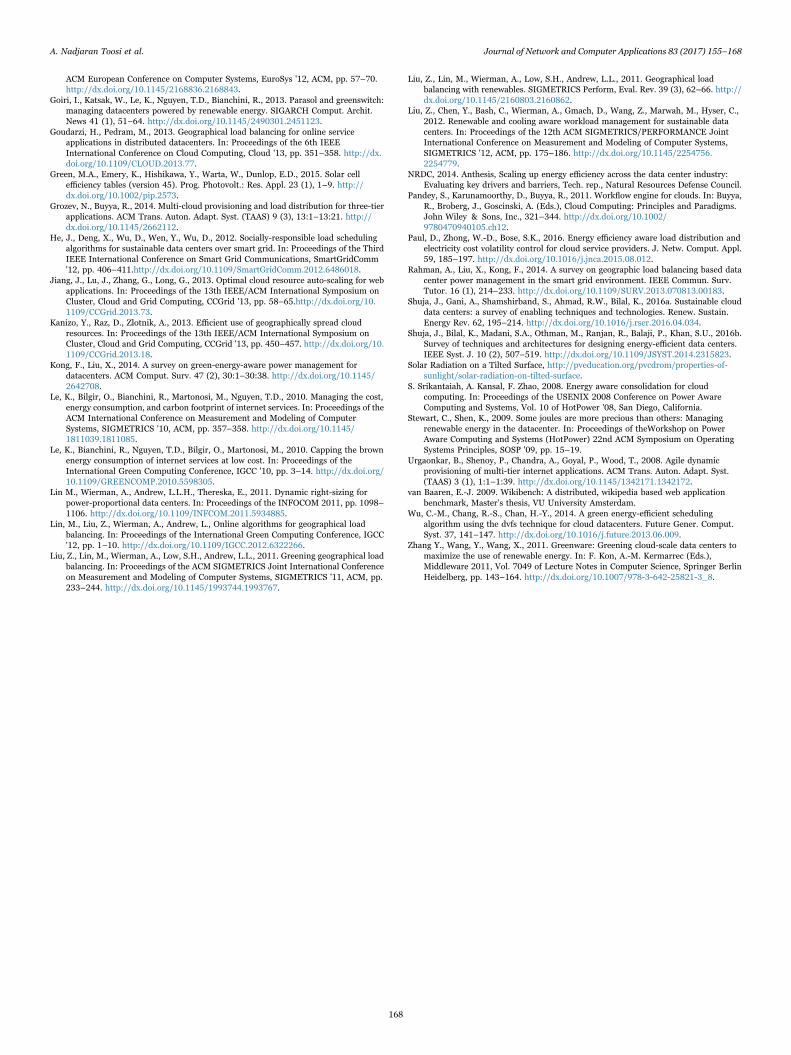
A comparison between Figs. 10 and 12 clearly illustrates thatsubstantially more brown energy usage happens in the Reims andRennes data centers when the RR algorithm is used while less brownenergy usage occurs in the Lyon data center. Figs. 13–15 show thenumber of ON web servers per sites for GreenLB, Capping and RRpolicies, respectively.
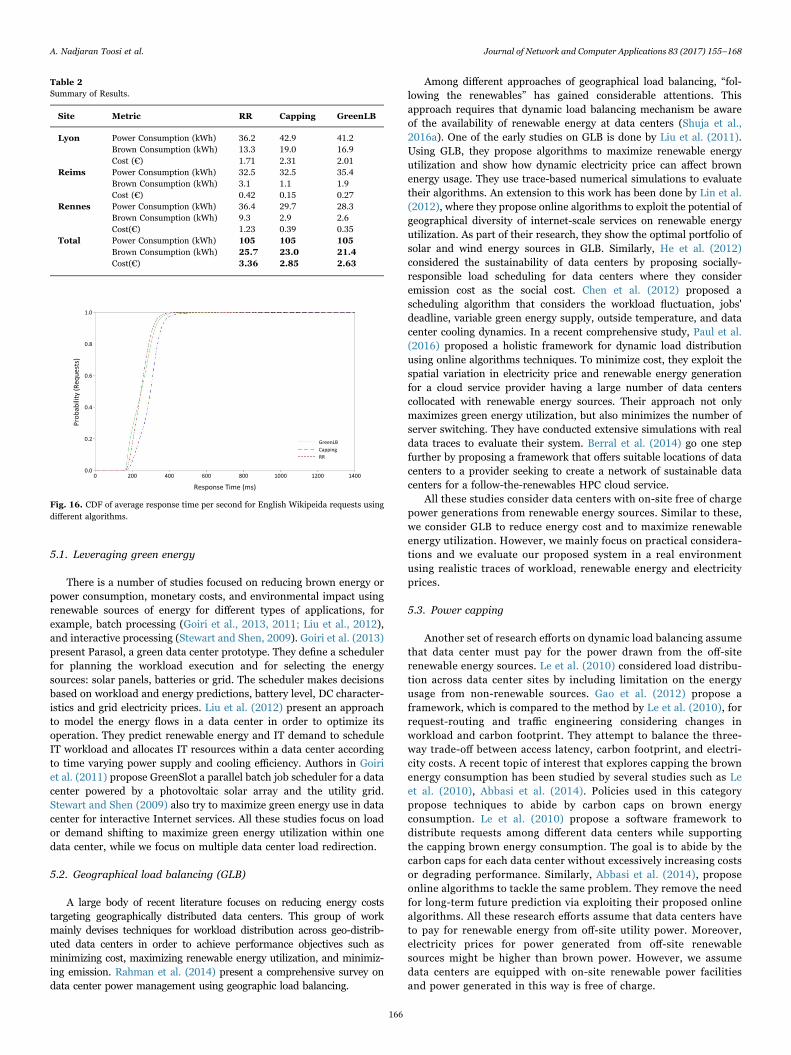
Table 2 summarizes the results shown in the figures. The aggre-gated total and brown power consumption for all sites shows that eventhough all algorithms cause similar power consumptions, GreenLBuses 17% less brown energy and saves cost by almost 22% incomparison to RR. The results demonstrate that GreenLB can sig-nificantly increase green energy utilization and decrease electricity costby 8% and 22% compared to Capping and RR policies, respectively,even when sites have similar amount of renewable power productionand very competitive price of electricity. The total amount of brown
Fig. 8. Electricity prices for two days. Fig. 9. Hourly actual and predicted request rate used by the Capping policy.
A. Nadjaran Toosi et al. Journal of Network and Computer Applications 83 (2017) 155–168
162
power consumed by GreenLB policy is 2.63 kWh, which is 7% and 17%less than Capping and RR policies, respectively. It is expected that thedifference in renewable power utilization and cost saving increasessubstantially whenever there exists more gaps between the renewablepower availability and electricity prices of different sites.
Capping and GreenLB share major similar characteristics andprovide competitive solutions for the geographical load balancingproblem tackled in this paper. However, the Capping policy worksbased on linear optimization which is considerably less efficient thanGreenLB in terms of time and space complexity. Moreover, errorsimposed by future load predication and hourly based decisionsperformed by Capping policy result in 7% more cost and 8% more
brown power usage compared to our proposed GreenLB algorithm.In order to study the impact of our proposed load balancing
algorithm on the response time, we measured the real-time responsetimes for all the Wikipedia requests submitted to the system. Fig. 16shows the CDF of the response time observed by all load balancingalgorithms. The graph demonstrates that there is no significantdifference in the response time of the algorithms and majority ofrequests are responded within the acceptable range of hundreds ofmilliseconds, while RR shows marginally more stable response time.More than 90% of request are responded in about 350 ms and less forthe GreenLB algorithm. There are few peaks of high response time uptofew seconds for all policies happening by reasons such as Java garbage
Fig. 10. The power consumption for different sites using Green Load Balancing(GreenLB) algorithm. The shaded area shows brown energy usage. Fig. 11. The power consumption for different sites using Capping algorithm. The shaded
area shows brown energy usage.
A. Nadjaran Toosi et al. Journal of Network and Computer Applications 83 (2017) 155–168
163
collection for Wikijector module and PHP garbage collections inApache web servers.
The comprehensive analysis of the experimental results alsodemonstrates that the impact of the delay associated with switchingon and off web servers on the response time of requests is negligible.The main reason that switching on delay is not an issue is that we chosethe threshold for scaling out web servers in the auto-scaler algorithmsufficiently below the maximum capacity of the each web server.Therefore, each web server machine has some spare capacity to handleportion of extra load before it becomes fully saturated and affects theresponse time. This way, our auto-scaler algorithm includes anacceptable level of over-provisioning to avoid Quality of Service
degradation due to switching on (booting) time of web servermachines. That is, whenever the incoming request rate at the localload balancer increases, the auto-scaler (at least in case of Wikipediaworkload) has enough time to scale out and to add new fullyoperational web servers. Switching off web server machines also doesnot affect the response time, as in the first step of the scale-in process,the auto scaler removes the target machine from the list of availablemachines in the local load balancer. Therefore, this machine will notreceive additional requests. Then a signal for switching off is dis-patched and the machine only switches off after all remaining requestsin the web server queue are responded.
Fig. 12. The power consumption for different sites using Round Robin (RR) algorithm.The shaded area shows brown energy usage.
Fig. 13. The number of Web Servers for different sites using Green Load Balancingalgorithm.
A. Nadjaran Toosi et al. Journal of Network and Computer Applications 83 (2017) 155–168
164

5. Related work
Over the last decade, power management techniques to mini-mize data centers' costs and environmental impacts have gainedconsiderable attention by both academia and industry. Large datacenters such as those used by big companies like Google andAmazon can host thousands of physical servers and require up totens of megawatts to power them Kong and Liu (2014). As result,service providers are under huge pressure to reduce their energyconsumption and its associated costs. This has pushed themtowards using more sustainable and green data centers. In arecent study, Shuja et al. (2016a) have provided a survey of
enabling techniques and technologies for sustainable and greendata centers.
Most of the early research studies on energy efficiency of datacenters focus on making green data centers using optimizationtechniques within a single data center; techniques such as CPUdynamic voltage and frequency scaling (DVFS) (Wu et al., 2014),virtualization and VM consolidation (Beloglazov and Buyya, 2013;Srikantaiah et al., 2008), and workload scheduling (Ghamkhari andMohsenian-Rad, 2013). An extensive survey and taxonomy of these canbe found in Beloglazov et al. (2011). Similarly, Shuja et al. (2016b)conducted a survey of techniques and architectures for designing anenergy-efficient data center.
Fig. 14. The number of Web Servers for different sites using Capping algorithm.
Fig. 15. The number of Web Servers for different sites using Round Robin (RR)algorithm.
A. Nadjaran Toosi et al. Journal of Network and Computer Applications 83 (2017) 155–168
165
5.1. Leveraging green energy
There is a number of studies focused on reducing brown energy orpower consumption, monetary costs, and environmental impact usingrenewable sources of energy for different types of applications, forexample, batch processing (Goiri et al., 2013, 2011; Liu et al., 2012),and interactive processing (Stewart and Shen, 2009). Goiri et al. (2013)present Parasol, a green data center prototype. They define a schedulerfor planning the workload execution and for selecting the energysources: solar panels, batteries or grid. The scheduler makes decisionsbased on workload and energy predictions, battery level, DC character-istics and grid electricity prices. Liu et al. (2012) present an approachto model the energy flows in a data center in order to optimize itsoperation. They predict renewable energy and IT demand to scheduleIT workload and allocates IT resources within a data center accordingto time varying power supply and cooling efficiency. Authors in Goiriet al. (2011) propose GreenSlot a parallel batch job scheduler for a datacenter powered by a photovoltaic solar array and the utility grid.Stewart and Shen (2009) also try to maximize green energy use in datacenter for interactive Internet services. All these studies focus on loador demand shifting to maximize green energy utilization within onedata center, while we focus on multiple data center load redirection.
5.2. Geographical load balancing (GLB)
A large body of recent literature focuses on reducing energy coststargeting geographically distributed data centers. This group of workmainly devises techniques for workload distribution across geo-distrib-uted data centers in order to achieve performance objectives such asminimizing cost, maximizing renewable energy utilization, and minimiz-ing emission. Rahman et al. (2014) present a comprehensive survey ondata center power management using geographic load balancing.
Among different approaches of geographical load balancing, “fol-lowing the renewables” has gained considerable attentions. Thisapproach requires that dynamic load balancing mechanism be awareof the availability of renewable energy at data centers (Shuja et al.,2016a). One of the early studies on GLB is done by Liu et al. (2011).Using GLB, they propose algorithms to maximize renewable energyutilization and show how dynamic electricity price can affect brownenergy usage. They use trace-based numerical simulations to evaluatetheir algorithms. An extension to this work has been done by Lin et al.(2012), where they propose online algorithms to exploit the potential ofgeographical diversity of internet-scale services on renewable energyutilization. As part of their research, they show the optimal portfolio ofsolar and wind energy sources in GLB. Similarly, He et al. (2012)considered the sustainability of data centers by proposing socially-responsible load scheduling for data centers where they consideremission cost as the social cost. Chen et al. (2012) proposed ascheduling algorithm that considers the workload fluctuation, jobs'deadline, variable green energy supply, outside temperature, and datacenter cooling dynamics. In a recent comprehensive study, Paul et al.(2016) proposed a holistic framework for dynamic load distributionusing online algorithms techniques. To minimize cost, they exploit thespatial variation in electricity price and renewable energy generationfor a cloud service provider having a large number of data centerscollocated with renewable energy sources. Their approach not onlymaximizes green energy utilization, but also minimizes the number ofserver switching. They have conducted extensive simulations with realdata traces to evaluate their system. Berral et al. (2014) go one stepfurther by proposing a framework that offers suitable locations of datacenters to a provider seeking to create a network of sustainable datacenters for a follow-the-renewables HPC cloud service.
All these studies consider data centers with on-site free of chargepower generations from renewable energy sources. Similar to these,we consider GLB to reduce energy cost and to maximize renewableenergy utilization. However, we mainly focus on practical considera-tions and we evaluate our proposed system in a real environmentusing realistic traces of workload, renewable energy and electricityprices.
5.3. Power capping
Another set of research efforts on dynamic load balancing assumethat data center must pay for the power drawn from the off-siterenewable energy sources. Le et al. (2010) considered load distribu-tion across data center sites by including limitation on the energyusage from non-renewable sources. Gao et al. (2012) propose aframework, which is compared to the method by Le et al. (2010), forrequest-routing and traffic engineering considering changes inworkload and carbon footprint. They attempt to balance the three-way trade-off between access latency, carbon footprint, and electri-city costs. A recent topic of interest that explores capping the brownenergy consumption has been studied by several studies such as Leet al. (2010), Abbasi et al. (2014). Policies used in this categorypropose techniques to abide by carbon caps on brown energyconsumption. Le et al. (2010) propose a software framework todistribute requests among different data centers while supportingthe capping brown energy consumption. The goal is to abide by thecarbon caps for each data center without excessively increasing costsor degrading performance. Similarly, Abbasi et al. (2014), proposeonline algorithms to tackle the same problem. They remove the needfor long-term future prediction via exploiting their proposed onlinealgorithms. All these research efforts assume that data centers haveto pay for renewable energy from off-site utility power. Moreover,electricity prices for power generated from off-site renewablesources might be higher than brown power. However, we assumedata centers are equipped with on-site renewable power facilitiesand power generated in this way is free of charge.
Table 2Summary of Results.
Site Metric RR Capping GreenLB
Lyon Power Consumption (kWh) 36.2 42.9 41.2Brown Consumption (kWh) 13.3 19.0 16.9Cost (€) 1.71 2.31 2.01
Reims Power Consumption (kWh) 32.5 32.5 35.4Brown Consumption (kWh) 3.1 1.1 1.9Cost (€) 0.42 0.15 0.27
Rennes Power Consumption (kWh) 36.4 29.7 28.3Brown Consumption (kWh) 9.3 2.9 2.6Cost(€) 1.23 0.39 0.35
Total Power Consumption (kWh) 105 105 105Brown Consumption (kWh) 25.7 23.0 21.4Cost(€) 3.36 2.85 2.63
Fig. 16. CDF of average response time per second for English Wikipeida requests usingdifferent algorithms.
A. Nadjaran Toosi et al. Journal of Network and Computer Applications 83 (2017) 155–168
166

5.4. Online application load balancing
Efficient Use of geographically dispersed resources for onlineinteractive application such as web applications has been explored byseveral authors. Goudarzi and Pedram (2013) investigate the loadbalancing problem for online service applications using a cloud systemcomprised of geographically dispersed data centers. Offline and onlinealgorithms are proposed to determine the application placement andmigration based on renewable energy generation capacities at differentdata centers in the cloud system. Similar to our work, Kanizo et al.(2013) use Wikimedia access logs to test their threshold-based loadsharing techniques. However, they did not consider renewable energypower generation in their work. Using the same workload, Zhang et al.(2011) proposed GreenWare, a framework to maximize renewableenergy utilization of Geo-distributed data centers. Contrary to ourwork, they use simulation for evaluation purposes and assume thatrenewable energy is more expensive than brown energy.
6. Conclusions and future work
We proposed a cost and energy efficient load balancing algorithm todistribute web applications requests among multiple data centersgeographically distributed in a region. A prototype was implementedand experimental studies in a real testbed are performed using it. Agroup of 3 data centers from Grid5000 testbed scattered in France andequipped with power monitoring APIs were selected. Meteorologicaldata in the location of each data center used to model solar and windpower generation. Real traces of web requests for English Wikipediapages were replayed to generate the workload. Our proposed green loadbalancing algorithm was employed to distribute load among datacenters based on the availability of renewable energy and prices ofgrid brown energy for each site. Finally, total power consumption,brown power usage, and cost of electricity were measured andcompared to two benchmark algorithms. Results showed that, evenin case similar amount of renewable power production in sites and verycompetitive price of electricity, our proposed policy is able to reducethe cost by 22% and 8% and brown energy by 17% and 7% incomparison to round robin and policy proposed in Le et al. (2010),respectively. We also demonstrated that the average response time ofrequests is not affected by our proposed load balancing algorithm.
Studies like the one presented in this article can be used to measurethe required amount of energy to handle certain workload. Accordingly,this provides insights regarding the renewable energy facilities requiredby each data center to handle the load. Future research needs to bedone to incorporate our proposed method with support for investmentdecisions on establishing renewable power generators in a real-worldsystem.
In our proposed system, we only considered stateless web applica-tions in which requests can be responded individually regardless ofwhich user issued them. In future, we focus on the design andimplementation of “Sticky load balancing” policies in which after asession between a client and an application server is established, allsubsequent requests from this session are redirected to the sameserver. Moreover, in this paper, we limit our geographical loadbalancing to data centers dispersed throughout a small region (e.g.,France or Europe) where routing requests among different data centerswill not significantly affect response time as network delays remains inan acceptable range. We are interested to extend our system forworldwide geographical load balancing in which network proximityof the user is considered in the policy.
The rest of our future work will focus on renewable energy-awaregeographical load balancing for other types of workloads/applicationssuch as bag of tasks, scientific workflows, where platforms and toolssuch as Aneka (Buyya and Barreto, 2015) or workflow engine (Pandeyet al., 2011) can be employed. Demand response and capping thebrown power consumption to reduce carbon footprint and promote
carbon neutrality are among recent topics of interests which can also beconsidered as future research targets.
Acknowledgments
This work was partially supported by Australian Research Council(ARC) Future Fellowship (grant no. FL170100099) and DiscoveryProject grants (grant no. DP130101378). Experiments presented inthis paper were carried out using the Grid'5000 testbed, supported by ascientific interest group hosted by INRIA and including CNRS,RENATER and several Universities as well as other organizations(see https://www.grid5000.fr). Authors would like to thank AdamWierman from Caltech for his inspiring thoughts on this work andDavid Margery and Laurent Lefevre from Inria for their technicalsupport of the experiments. They would also like to thank Rodrigo N.Calheiros, the editors of this journal, and three anonymous reviewersfor their many helpful comments and suggestions on an earlier versionof this article.
References
Abbasi, Z., Pore, M., Gupta, S.K.S., 2014. Online server and workload management forjoint optimization of electricity cost and carbon footprint across data centers. In:Proceedings of the 28th IEEE International Parallel and Distributed ProcessingSymposium, IPDPS '14, pp. 317–326. doi:10.1109/IPDPS.2014.42.
Adnan, M., Sugihara, R., Gupta, R., 2012. Energy efficient geographical load balancingvia dynamic deferral of workload. In: Proceedings of the 5th IEEE InternationalConference on Cloud Computing, CLOUD '12, pp. 188–195. http://dx.doi.org/10.1109/CLOUD.2012.45.
Beloglazov, A., Buyya, R., 2013. Managing overloaded hosts for dynamic consolidation ofvirtual machines in cloud data centers under quality of service constraints. IEEETrans. Parallel Distrib. Syst. 24 (7), 1366–1379. http://dx.doi.org/10.1109/TPDS.2012.240.
Beloglazov, A., Buyya, R., Lee, Y.C., Zomaya, A., 2011. A taxonomy and survey of energy-efficient data centers and cloud computing systems. Adv. Comput. 82 (2), 47–111.
Berral J.L,. Goiri, Nguyen, T.D., Gavald, R., Torres, J., Bianchini, R., 2014. Buildinggreen cloud services at low cost. In: Proceedings of the 34th IEEE InternationalConference onDistributed Computing Systems, ICDCS '14, pp. 449–460.http://dx.doi.org/10.1109/ICDCS.2014.53.
Bolze, R., Cappello, F., Caron, E., Daydé, M., Desprez, F., Jeannot, E., Jégou, Y., Lanteri,S., Leduc, J., Melab, N., et al., 2006. Grid'5000: a large scale and highlyreconfigurable experimental grid testbed. Int. J. High Perform. Comput. Appl. 20 (4),481–494. http://dx.doi.org/10.1177/1094342006070078.
Buyya, R., Barreto, D., 2015. Multi-cloud resource provisioning with aneka: A unified andintegrated utilisation of microsoft azure and amazon EC2 instances. In: Proceedingsof the 2015 International Conference on Computing and Network Communications,CoCoNet '15, IEEE, pp. 216–229. http://dx.doi.org/10.1109/CoCoNet.2015.7411190.
Chen, C., He, B., Tang, X., 2012. Green-aware workload scheduling in geographicallydistributed data centers. In: Proceedings of the 4th IEEE International Conferenceon Cloud Computing Technology and Science, CloudCom '12, pp. 82–89.http://dx.doi.org/10.1109/CloudCom.2012.6427545.
Clouet, F., Delamare, S., Gelas, J.-P., Lefevre, L., Nussbaum, L., Parisot, C., Pouilloux, L.,Rossigneux, F., 2015. A unified monitoring framework for energy consumption andnetwork traffic. In: International Conference on Testbeds and ResearchInfrastructures for the Development of Networks & Communities, TridentCom '15,pp. 10.
EDF, Fossil-fired energy URL:http://energie.edf.com/fichiers/fckeditor/Commun/En_Direct_Centrales/collection_nos_energies/edf_thermique_bd_va.pdf.
Fernandez H., Pierre G., Kielmann, T., 2014. Autoscaling web applications inheterogeneous cloud infrastructures. In: Proceedings of IEEE InternationalConference on Cloud Engineering, IC2E '14, pp. 195–204. http://dx.doi.org/10.1109/IC2E.2014.25.
Fripp, M., Wiser, R.H., 2008. Effects of temporal wind patterns on the value of wind-generated electricity in california and the northwest. IEEE Trans. Power Syst. 23 (2),477–485. http://dx.doi.org/10.1109/TPWRS.2008.919427.
Gao, P.X., Curtis, A.R., Wong, B., Keshav, S., 2012. It's not easy being green. SIGCOMMComput. Commun. Rev. 42 (4), 211–222. http://dx.doi.org/10.1145/2377677.2377719.
Ghamkhari, M., Mohsenian-Rad, H., 2013. Energy and performance management ofgreen data centers: a profit maximization approach. IEEE Trans. Smart Grid 4 (2),1017–1025. http://dx.doi.org/10.1109/TSG.2013.2237929.
Goiri, I., Le, K., Haque, M.E., Beauchea, R., Nguyen, T.D., Guitart, J., Torres, J.,Bianchini, R., 2011. Greenslot: Scheduling energy consumption in green datacenters.In: Proceedings of the 2011 International Conference for High PerformanceComputing, Networking, Storage and Analysis, SC '11, ACM, pp. 20:1–20:11.http://dx.doi.org/10.1145/2063384.2063411.
Goiri, I., Le, K., Nguyen, T.D., Guitart, J., Torres, J., Bianchini, R., 2012. Greenhadoop:Leveraging green energy in data-processing frameworks. In: Proceedings of the 7th
A. Nadjaran Toosi et al. Journal of Network and Computer Applications 83 (2017) 155–168
167
ACM European Conference on Computer Systems, EuroSys '12, ACM, pp. 57–70.http://dx.doi.org/10.1145/2168836.2168843.
Goiri, I., Katsak, W., Le, K., Nguyen, T.D., Bianchini, R., 2013. Parasol and greenswitch:managing datacenters powered by renewable energy. SIGARCH Comput. Archit.News 41 (1), 51–64. http://dx.doi.org/10.1145/2490301.2451123.
Goudarzi, H., Pedram, M., 2013. Geographical load balancing for online serviceapplications in distributed datacenters. In: Proceedings of the 6th IEEEInternational Conference on Cloud Computing, Cloud '13, pp. 351–358. http://dx.doi.org/10.1109/CLOUD.2013.77.
Green, M.A., Emery, K., Hishikawa, Y., Warta, W., Dunlop, E.D., 2015. Solar cellefficiency tables (version 45). Prog. Photovolt.: Res. Appl. 23 (1), 1–9. http://dx.doi.org/10.1002/pip.2573.
Grozev, N., Buyya, R., 2014. Multi-cloud provisioning and load distribution for three-tierapplications. ACM Trans. Auton. Adapt. Syst. (TAAS) 9 (3), 13:1–13:21. http://dx.doi.org/10.1145/2662112.
He, J., Deng, X., Wu, D., Wen, Y., Wu, D., 2012. Socially-responsible load schedulingalgorithms for sustainable data centers over smart grid. In: Proceedings of the ThirdIEEE International Conference on Smart Grid Communications, SmartGridComm'12, pp. 406–411.http://dx.doi.org/10.1109/SmartGridComm.2012.6486018.
Jiang, J., Lu, J., Zhang, G., Long, G., 2013. Optimal cloud resource auto-scaling for webapplications. In: Proceedings of the 13th IEEE/ACM International Symposium onCluster, Cloud and Grid Computing, CCGrid '13, pp. 58–65.http://dx.doi.org/10.1109/CCGrid.2013.73.
Kanizo, Y., Raz, D., Zlotnik, A., 2013. Efficient use of geographically spread cloudresources. In: Proceedings of the 13th IEEE/ACM International Symposium onCluster, Cloud and Grid Computing, CCGrid '13, pp. 450–457. http://dx.doi.org/10.1109/CCGrid.2013.18.
Kong, F., Liu, X., 2014. A survey on green-energy-aware power management fordatacenters. ACM Comput. Surv. 47 (2), 30:1–30:38. http://dx.doi.org/10.1145/2642708.
Le, K., Bilgir, O., Bianchini, R., Martonosi, M., Nguyen, T.D., 2010. Managing the cost,energy consumption, and carbon footprint of internet services. In: Proceedings of theACM International Conference on Measurement and Modeling of ComputerSystems, SIGMETRICS '10, ACM, pp. 357–358. http://dx.doi.org/10.1145/1811039.1811085.
Le, K., Bianchini, R., Nguyen, T.D., Bilgir, O., Martonosi, M., 2010. Capping the brownenergy consumption of internet services at low cost. In: Proceedings of theInternational Green Computing Conference, IGCC '10, pp. 3–14. http://dx.doi.org/10.1109/GREENCOMP.2010.5598305.
Lin M., Wierman, A., Andrew, L.L.H., Thereska, E., 2011. Dynamic right-sizing forpower-proportional data centers. In: Proceedings of the INFOCOM 2011, pp. 1098–1106. http://dx.doi.org/10.1109/INFCOM.2011.5934885.
Lin, M., Liu, Z., Wierman, A., Andrew, L., Online algorithms for geographical loadbalancing. In: Proceedings of the International Green Computing Conference, IGCC'12, pp. 1–10. http://dx.doi.org/10.1109/IGCC.2012.6322266.
Liu, Z., Lin, M., Wierman, A., Low, S.H., Andrew, L.L., 2011. Greening geographical loadbalancing. In: Proceedings of the ACM SIGMETRICS Joint International Conferenceon Measurement and Modeling of Computer Systems, SIGMETRICS '11, ACM, pp.233–244. http://dx.doi.org/10.1145/1993744.1993767.
Liu, Z., Lin, M., Wierman, A., Low, S.H., Andrew, L.L., 2011. Geographical loadbalancing with renewables. SIGMETRICS Perform, Eval. Rev. 39 (3), 62–66. http://dx.doi.org/10.1145/2160803.2160862.
Liu, Z., Chen, Y., Bash, C., Wierman, A., Gmach, D., Wang, Z., Marwah, M., Hyser, C.,2012. Renewable and cooling aware workload management for sustainable datacenters. In: Proceedings of the 12th ACM SIGMETRICS/PERFORMANCE JointInternational Conference on Measurement and Modeling of Computer Systems,SIGMETRICS '12, ACM, pp. 175–186. http://dx.doi.org/10.1145/2254756.2254779.
NRDC, 2014. Anthesis, Scaling up energy efficiency across the data center industry:Evaluating key drivers and barriers, Tech. rep., Natural Resources Defense Council.
Pandey, S., Karunamoorthy, D., Buyya, R., 2011. Workflow engine for clouds. In: Buyya,R., Broberg, J., Goscinski, A. (Eds.), Cloud Computing: Principles and Paradigms.John Wiley & Sons, Inc., 321–344. http://dx.doi.org/10.1002/9780470940105.ch12.
Paul, D., Zhong, W.-D., Bose, S.K., 2016. Energy efficiency aware load distribution andelectricity cost volatility control for cloud service providers. J. Netw. Comput. Appl.59, 185–197. http://dx.doi.org/10.1016/j.jnca.2015.08.012.
Rahman, A., Liu, X., Kong, F., 2014. A survey on geographic load balancing based datacenter power management in the smart grid environment. IEEE Commun. Surv.Tutor. 16 (1), 214–233. http://dx.doi.org/10.1109/SURV.2013.070813.00183.
Shuja, J., Gani, A., Shamshirband, S., Ahmad, R.W., Bilal, K., 2016a. Sustainable clouddata centers: a survey of enabling techniques and technologies. Renew. Sustain.Energy Rev. 62, 195–214. http://dx.doi.org/10.1016/j.rser.2016.04.034.
Shuja, J., Bilal, K., Madani, S.A., Othman, M., Ranjan, R., Balaji, P., Khan, S.U., 2016b.Survey of techniques and architectures for designing energy-efficient data centers.IEEE Syst. J. 10 (2), 507–519. http://dx.doi.org/10.1109/JSYST.2014.2315823.
Solar Radiation on a Tilted Surface, http://pveducation.org/pvcdrom/properties-of-sunlight/solar-radiation-on-tilted-surface.
S. Srikantaiah, A. Kansal, F. Zhao, 2008. Energy aware consolidation for cloudcomputing. In: Proceedings of the USENIX 2008 Conference on Power AwareComputing and Systems, Vol. 10 of HotPower '08, San Diego, California.
Stewart, C., Shen, K., 2009. Some joules are more precious than others: Managingrenewable energy in the datacenter. In: Proceedings of theWorkshop on PowerAware Computing and Systems (HotPower) 22nd ACM Symposium on OperatingSystems Principles, SOSP '09, pp. 15–19.
Urgaonkar, B., Shenoy, P., Chandra, A., Goyal, P., Wood, T., 2008. Agile dynamicprovisioning of multi-tier internet applications. ACM Trans. Auton. Adapt. Syst.(TAAS) 3 (1), 1:1–1:39. http://dx.doi.org/10.1145/1342171.1342172.
van Baaren, E.-J. 2009. Wikibench: A distributed, wikipedia based web applicationbenchmark, Master’s thesis, VU University Amsterdam.
Wu, C.-M., Chang, R.-S., Chan, H.-Y., 2014. A green energy-efficient schedulingalgorithm using the dvfs technique for cloud datacenters. Future Gener. Comput.Syst. 37, 141–147. http://dx.doi.org/10.1016/j.future.2013.06.009.
Zhang Y., Wang, Y., Wang, X., 2011. Greenware: Greening cloud-scale data centers tomaximize the use of renewable energy. In: F. Kon, A.-M. Kermarrec (Eds.),Middleware 2011, Vol. 7049 of Lecture Notes in Computer Science, Springer BerlinHeidelberg, pp. 143–164. http://dx.doi.org/10.1007/978-3-642-25821-3_8.
A. Nadjaran Toosi et al. Journal of Network and Computer Applications 83 (2017) 155–168
168
Related Documents