
Welcome message from author
This document is posted to help you gain knowledge. Please leave a comment to let me know what you think about it! Share it to your friends and learn new things together.
Transcript
Journal of Geology, Geography and Geoecology________________________________________________________________________________________________________________________________________________________________
The main aim of the Journal of Geology, Geography andGeoecology is to publish high quality research works andprovide Open Access to the articles using thisplatform. Collection of scientific works publishes refereedoriginal research articles and reviews on various aspects in thefield of geological, geographical and geoecological sciences.Journal materials designed for teachers, researchers andstudents specializing in the relevant or related fields of science.Journal included in the list of professional publications, youcan publish the main results of dissertations for the degree ofdoctor and candidate of geological sciences. The scope ofdistribution: international scientific journal. All publishedarticles will be assigned DOI provided by Cross Ref.
EDITORIAL BOARD
Editor-in-Chief:Associate professor, Ph.D., Manyuk Volodymyr, Director ofthe Scientific Research Institute of Geology, Oles GoncharDnipro National University, Dnipro, Ukraine;E-mail: [email protected]; tel.: +38 067 947 45 04;+38 095 824 61 77.
Deputy Editors:Professor, Dr. hab., Andrzej Tomasz Solecki, ScientificHead of the team of WS Atkins-Polska Sp. z o.o. expertspreparing the report on uranium metallogeny, Institute ofGeological Sciences University of Wrocław, WrocławUniversity, market and prospects in Poland for the PolishMinistry of the Environment, Wrocław, Poland; e-mail:[email protected]; tel. +48 600 96 63 61.Professor Şaşmaz Ahmet, Dr. Sc. in environmentalgeochemistry and mining deposits, Head of GeologyDepartment, Firat University, Elazığ, Turke 89 41y; e-mail:[email protected], tel. +90 424-2370000.Professor, Dr. Sc., Sherstyuk Natalya Petrivna, OlesGonchar Dniprovsk National University, Dean of the Facultyof Geology and Geography, Ukraine; e-mail:[email protected]; tel.+38-096-124-15-35.
Executive Editor:Associate professor, Ph.D., Manyuk Volodymyr, Director ofthe Scientific Research Institute of Geology, Oles Gonchar
Dniprovsk National University, Dnipro, Ukraine; E-mail:[email protected]; tel. +38 067 947 45 04.
Members of the editorial board:
Professor (mult.), Dr. hab., Harald G. Dill, Dr. h.c ineconomic geology (additional focal disciplines: appliedsedimentology/ geomorphology, technical mineralogy),Gottfried-Wilhelm-Leibniz University, MineralogicalDepartment, Hannover, Germany; e-mail: [email protected];tel. +49-(0) 511 643 2361.Professor in Biostratigraphy-Micropaleontology, Dr.Sc.,Karoui – Yaakoub Narjess, Carthage University, Faculty ofScience of Bizerte (Departament of Earth Science), Jarzoura,Bizerte, Tunisia; e-mail: [email protected] Fellow William A.P. Wimbledon, Dept of EarthSciences, University of Bristol; Member Geological Society ofLondon's Conservation Committee, Member of Berriasian(Jurassic-Cretaceous) Working Group (InternationalSubcommission on Cretaceous Stratigraphy); e-mail:[email protected]., Dr.Sc., José Bernardo Rodrigues Brilha, University ofMinho, Department of Earth Science, Braga, Portugal; e-mail:[email protected]; tel. +351-25-3604306.Ph.D., MSc., Afsoon Moatari-Kazerouni, Geology LecturerGeology Department- Rhodes UniversityGrahamstown,Eastern Cape, South Africane, E-mail:[email protected]
tel: +27 (0)46-603-8618Prof., Dr. Sc.,Mokritskaya Tatiana, Head of Department ofGeology and Hydrogeology, Oles Gonchar Dniprovsk NationalUniversity, Ukraine; e-mail: [email protected]; tel.: 098 257 7019.Prof., Dr. Sc., Reynard Emmanuel, Prof. of physicalgeography at the University of Lausanne, Faculty ofgeosciences, Lausanne, Switzerland; E-mail:[email protected] Prof. Afroz Ahmad Shan, Assoc. Prof. of StructuralGeology with the Faculty of Science, Department of PetroleumGeology Universiti of Brunei Darussalam,., Brunei;Email: [email protected];Prof., Dr. Sc., Gerasimenko Natalia, Department of EarthSciences and Geomorphology Taras Schevchenko National
University of Kyiv, Kyiv, Ukraine; E-mail: [email protected] professor PhD Anatoliy Melnychuk, Assoc. Prof. ofDepartment of Economic and Social Geography TarasShevchenko Kyiv National University, Kyiv, Ukraine; E-mail: [email protected]., Dr. Sc., Baranov Volodymyr, Head of Lab. Invest.Structural changes in rock, Senior Researcher Institute ofGeotechnical Mechanics of NAS of Ukraine, Department ofGeology and exploration of mineral deposits SHEI "NationalMining University," Ukraine; e-mail: [email protected].: +38 097 506 43 73.Prof., Dr. Sc. Berezovsky Anatolii, Dean of Mining -Processing Faculty, Krivyi Rig Technical University, Ukraine;e-mail: [email protected]; tel.: +38 098236 84 27.Prof., Dr. Sc., Kroik Anna Arkadyevna, Dniprovsk NationalUniversityOles Gonchar, Ukraine; e-mail: [email protected]; tel.: +38 095 149 65 50.Prof., Dr. Sc., Prikhodchenko Vasiliy Fedorovich, Dean ofthe Faculty of exploration, Head. Department of Geology andmineral exploration National Mining University of Ukraine; e-mail: [email protected]; tel.: +38 0562 473352.Prof., Dr. Sc., Lurie Anatolii, V.N. Karazin Kharkiv NationalUniversity, Ukraine; e-mail: [email protected]; tel.:+38 067 579 89 41.Prof., Dr. Sc., Zelenska Lyubov Ivanivna, Oles GoncharDnipro National University, Head of Department of geography,Dnipro, Ukraine; e-mail: [email protected]
Prof., Dr. Sc., Shevchyuk Viktor Vasylievych, TarasShevchenko National University of Kyiv, Ukraine; e-mail:[email protected]; tel.: +38 050 656 33 20.Prof., Dr. Sc., Baranov Petro M., Oles Honcha DniproNational University, Dnipro, Ukraine; e-mail:[email protected]; тел. +38 097 291 68 13.___________________________________________________Literary editors: P.W. Bradbeer, M.O. Tikhomyrov. Coverdesign: Vadym V. Manyuk. Text Layout: N.І. Derevyagina,Volodymyr V. Manyuk.
Information about publication: Journal of Geology,Geography and Geoecology. (ISSN 2617-2909 (print),ISSN2617-2119 (online). Complete information on therequirements for the publication of copyright articles in thecollection can be found on the website of the journalwww.geology-dnu.dp.ua or by addressing the responsiblesecretary of the editorial board of Volodymyr Maniuk [email protected].
Approved by the Decision of the Scientific Council of the OlesGonchar Dnipro National University, 72 Gagarin ave., Dnipro,49010, Ukraine.___________________________________________________
©Дніпровський національний університетімені Олеся Гончара 2018
V. Asotskyi, Y. Buts, O. Kraynyuk, R. Ponomarenko Journ.Geol.Geograph.Geoecology,27(2), 178-186________________________________________________________________________________________________________________________________________________________________
175
Journal of Geology,Geography and Geoecology
Journal home page: geology-dnu-dp.ua
ISSN 2617-2909 (print)ISSN 2617-2119 (online)
Journ.Geol.Geograph.Geoecology,
27(2),175-183doi:10.15421/111843
V. Asotskyi, Y. Buts, O. Kraynyuk, R. Ponomarenko Journ.Geol.Geograph.Geoecology, 27(2), 175-183________________________________________________________________________________________________________________________________________________________________
Post-pyrogenic changes in the properties of grey forest podzolic soils of ecogeosystems of pineforests under conditions of anthropogenic loading
V. Asotskyi1, Y. Buts2, O. Kraynyuk3, R. Ponomarenko4
1National University of Civil Defence of Ukraine, Kharkiv, Ukraine, e-mail: [email protected] Kuznets Kharkiv National University of Economics, Kharkiv, Ukraine, e-mail: [email protected] National Automobile and Highway University, Kharkiv, Ukraine, e-mail: [email protected] University of Civil Defence of Ukraine, Kharkiv, Ukraine, e-mail: [email protected]
Abstract. This article presents the analysis of results of experimental data of post-pyrogenic change of soils of ecological systems of pine forests.Ground fires transformthe surface organogenic horizons of soils. The negative influence of low-intensity firesof different intensity on the change of humus stock, qualitative fractional composition oforganogenic soil horizons and their chemical composition is shown.Post-pyrogenictransformations of physical and chemical soil characteristics are found, which are not
simply their corresponding reaction to the pyrogenic effect, but a clear signal reflecting the state of the soil immediately after the fire,taking into account its strength and intensity, and after a certain period of time. There is a certain dependence of the degree of pyro-genicity on the duration of the effect of fire on the soil. The recent influence of a medium intensity fire on the soil is marked by aclear reaction of the complex of its properties.Physical and chemical properties of soils after fires deteriorate: humus burns, the con-tent of nitrate nitrogen decreases.Forest fires sharply change the morphological state of the upper part of the soil profile. The natureof the surface horizons of soils changes, a new pyrogenic horizon is formed, which differs from natural analogues in terms of physi-cal and chemical properties and the content of ash elements. Under the influence of fire there are changes in such properties as: pH,content of exchange cations, gross and moving forms of nitrogen, etc.The heavy metal concentration in surface horizons increasesseveral times and exceeds the background values due to the mineralization of forest litter and herbaceous vegetation from the com-bustion and subsequent migration of chemical elements , which presents an environmental hazard.The change in the chemical com-position of soils can create conditions for the impossibility of the existence of a root ecosystem, its death, and development, after acertain time, of another modified ecogeosystem.
Key words: pine forests, grass fires, biogenic pyrogenic horizons of soils, physical and chemical properties of soils, trace metals.
Постпірогенні зміни властивостей сірих лісових опідзолених ґрунтів екогеосистем сос-нових лісів в умовах техногенного навантаження
В. В. Асоцький1, Ю. В. Буц2, О. В. Крайнюк3, Р. В. Пономаренко4
1Національний університет цивільного захисту України, Харків, Україна, e-mail: [email protected]Харківський національний економічний університет імені Семена Кузнеця, Харків, Україна, e-mail:[email protected]Харківський національний автомобільно-дорожній університет, Харків, Україна, e-mail: [email protected]Національний університет цивільного захисту України, Харків, Україна, e-mail: [email protected]
Анотація. Наведено аналіз результатів експериментальних даних постпірогенної зміни ґрунтів екогеосистем соснових лісів.Низові пожежі трансформують поверхневі органогенні горизонти ґрунтів. Показано негативний вплив низових пожеж різноїінтенсивності на зміну запасу гумусу, якісного фракційного складу органогенних горизонтів ґрунтів і їх хімічного складу.Виявлено постпірогенні трансформації фізико-хімічних показників ґрунтів, що є не просто їх відповідною реакцією напірогенний вплив, а чітким сигналом, що відображає стан ґрунтів, як відразу після впливу пожежі, з урахуванням їх сили іінтенсивності, так і через певний період часу. Спостерігається певна залежність ступеня пірогенності від давності впливупожежі на ґрунт. Недавній вплив пожежі середньої інтенсивності на ґрунт відзначений чіткою реакцією цілого комплексу їївластивостей. Фізико-хімічні властивості ґрунтів після пожеж погіршуються: вигорає гумус, зменшується вміст нітратногоазоту. Лісові низові пожежі різко змінюють морфологічний стан верхньої частини ґрунтового профілю. Змінюється харак-тер поверхневих горизонтів ґрунтів, нерідко формується пірогенний горизонт, який за фізико-хімічними властивостями і
Received 18.07.2018;Received in revised form 09.08.2018;Accepted 19.09.2018
V. Asotskyi, Y. Buts, O. Kraynyuk, R. Ponomarenko Journ.Geol.Geograph.Geoecology,27(2), 175-183________________________________________________________________________________________________________________________________________________________________
176
вмістом зольних елементів відрізняється від природних аналогів. Під впливом вогню виникають зміни таких властивостей,як: рН, вміст обмінних катіонів, валових і рухомих форм азоту та ін. Концентрація ВМ у поверхневих горизонтах підвищу-ється в декілька разів і перевищує фонові значення внаслідок мінералізації лісової підстилки та трав’янистої рослинності відзгорання і подальшої міграції хімічних елементів, що являє екологічну небезпеку. Зміна хімічного складу ґрунтів можестворювати умови для неможливості існування корінної екогеосистеми, її загибелі і розвитку через певний час іншої моди-фікованої екогеосистеми.
Ключові слова: соснові ліси, низові пожежі, біогенні пірогенні горизонти ґрунтів, фізико-хімічні властивості ґрунтів, важ-кі метали.
Introduction. Forest fires cannot be considered oneof the main soil-forming factors, but at the sametime they have both direct and indirect effects onthe formation of soils. The literature contains somestudies which prove the significance of pyrogenicload on soils and prove the role of pyrogenic impacton the evolution and functioning of soil in forestecosystems (Aleksandrovskiy, 2007, Chevyichelov,A.P. 2002, Bento-Goncalves, 2012, Doerr SH &Cerda A. 2005, Krasnoschekov, 2014). Transforma-tion of morphological and chemical properties ofsoils in pine forests after fires was studied byShahmatova Y. U. (Shahmatova 2008).
More and more works appear, in which au-thors consider fire as an important factor in soilformation, which has various effects on the forma-tion of the soil cover in forest ecosystems. At thesame time, the pattern and the extent of pyrogenicimpact on soil can be different depending on thephysical-geographic conditions, type of forest, ini-tial soil properties, and also the type and intensityof the fire.
Some work has also been done on describingthe peculiarities of the changes in morphological,physical-chemical and chemical properties of soilsof pine forests in the first months after a fire. Thisresearch has revealed the changes in morphologicalstructure of forest litter, its density and changes inchemical properties. The formation of soils in apost-fire period is related to the pyrogenic trans-formation of the organogenic horizons, thereforetheir changes are indicators of the fire`s impact onsoil. A new diagnostic dynamic organogenic pyro-genic horizon (Opir) forms, which by its physical-chemical properties significantly differs from thenatural unchanged analogues. During combustionof the organic substances, large amounts of ashcompounds are released from the upper horizons,which automatically changes the reaction of theenvironment, the amount of humus, content of ni-trogen, number of exchangeable cations (Dyimov etal., 2014).
The analysis of the presence of polycyclicaromatic hydrocarbons (PAHs) indicated that theconcentrations of chrysene, fluorene, naphthalene,pyrene, and anthracene in the horizon Opirincreasedsignificantly compared to the pine forest in the ter-ritory unaffected by the technogenic impact. Thetotal content of polycyclic aromatic hydrocarbons
(PAHs) in the horizon Opir increased mostly due tothe increase in the share of two- and three-nucleiPAHs (naphthalene, fluorene). Mineral horizons ofsoils in burned areas are enriched with the mostmobile amphiphilic fractions of the organic com-pound, which is manifested in the increase both intotal and relative content of hydrophilic fractionswhich are possibly represented by the products ofcombustion of plant remains (Dyimov et al., 2014).
Forest fires also cause changes in geochemi-cal peculiarities of ecogeosystems due to the migra-tion via smoke and the further wash-out of the nu-trients from the soil, and changes in hydrothermalregime. Change in abiotic conditions leads to trans-formation of the range and qualities of the ecologicniches in the burned area, loss of structural relation-ships between the environment and the spatialstructure of the soil cover. In such conditions, theprevious soil fauna is unable to perform its ecologi-cal functions, and the areas damaged by fire can beplaces where other species migrate to within theecogeosystem (Gongalskiy, 2015).
The impact of fire on the components of eco-geosystems significantly varies and was studied bya number of researchers, but remains uncertain.Once again, we should mention that the geoecolog-ical assessments of the impact of the fires on natu-ral complexes in general are currently absent in theliterature. At the same time, there are detailed stu-dies on the effects of the fires on particular compo-nents of the ecosystem, or generalized characteris-tics of post-fire formation of vegetation, whichreveal indirect results of this impact. Currently,most results of post-pyrogenic studies focus partic-ularly on vegetation as the most important and dy-namic component and indicator of natural com-plexes. At the same time, various indirect effects ofthe fires on the environment through post-pyrogenic changes in the content and the structureof phytocenoses can be much significant than thedirect effects.
The objective of this study was to analyzethe post-pyrogenic changes in the properties of soilsin the ecogeosystems of pine forests in KharkivOblast in the conditions of technogenic load andassessment of "pyrogenicity" (extent and durationof its manifestation) in the soil.To achieve the goal, the following tasks had to besolved:
V. Asotskyi, Y. Buts, O. Kraynyuk, R. Ponomarenko Journ.Geol.Geograph.Geoecology,27(2), 175-183________________________________________________________________________________________________________________________________________________________________
177
Study the impact of the pyrogenic factor onthe main physical-chemical properties of grey for-est podzolic soils in pine forests of Scots pine. De-termine the peculiarities of transformation of thechem-ical properties of soils affected by the pyro-genicfacor.
Conduct a comparative analysis of the pecu-liarities of distribution of mobile compounds ofheavy metals (HM) in undisturbed soils and in py-rogenic soils.Material and methods. The formation of soils inthe post-fire period is related to the pyrogenic trans-formation of organogenic horizons, therefore theirchanges are an indicator of the fire`s mpact on thesoil.
Generally, fires affect all components ofecogeosystems, including their regime of function-ing and evolution. A significant role must be playedby soil as a lithogenous base for any natural com-plex.
The plantations which are most severelydamaged by the fires are forest areas near largeurbanized centers in the conditions of technogenicload. In Kharkiv Oblast, one of such objects offorest area is "Zhovtnevy lishosp" state enterpriseof the Kharkiv Oblast administration of forestry andhunting (KOAFH), which is located near Kharkiv.Over the recent years, the area of the fires in theterritory of this forest land continues to increase upto 30 ha each year. Therefore, as the object ofstudy, we chose a part of a pine terrace near theUda river within the territory of “Zhovtnevy li-shosp”state enterprise.
For the study, we selected sample (experi-mental) plots (SP).
SP №1 was a flattened area of insignificantlydeclined slope of the facies of pine terrace withgrey forest podzolic soil under the pine forest dom-inated by Scots pine (Pinus sylvestris L.) and grass-forb association with domination of greater celan-dine (Chelidonium majus L.) in the grass stand,leafy spurge(Euphorbiavirgata Waldst.), yellowbedstraw(Galium verum L.) and blue lettuce(Lactuca tatarica L.). On the plot, there were rec-orded and clearly seen the signs of fire which oc-curred 4-5 years ago: pines were affected by the fireup to the height of 1-2.5 m, the forest litter wasdamaged and in some places, the signs of thesources of fire and the areas with no vegetationwere seen. The total area of the fire was around 0.8ha. The fire which occurred within SP №1 wasevaluated as a fire of the first degree for the treestand was damaged insignificantly. Much moresignificant damage was caused to the undergrowthand shrub-herbaceous cover.
Sample plot №2 was selected because thatarea was affected by a forest fire of the third degreeten years ago, and now, the only signs of that fireare some pine trunks burned up to the height of 2-3m. It is a plot of declined facies with grey forestpodzolic soil under the pine forest of Scots pine(Pinus sylvestris L.) and domination of grasses(Gramineae). There was sparse growth of Canadianhawkweed(Hieracium umbellatum L.), leafyspurge(Euphorbia virgata Waldst.) and greatercelandine (Chelidonium majus L.).
Sample plot №3 is located in 200-300 metersto the south-east of sample plot №1. It has a phyto-cenotic plant community similar to the sample plot№2. Unlike the previous facies, there are no signsof the fire. Its distinctive characteristic is the pres-ence of intact forest litter of up to 10-12 cm thick-ness, which consists of dry pine branches, dryneedles, strobili ( pine cones )and dead remains ofgrass vegetation.
The grey podzolic soils we studied were thesoils of a Scots pine forest with domination ofgrasses. On SP №1, the forest fire took place in2013, SP №2 was affected by fire in 2008. After thefires, no pyrogenic impacts were observed in theterritory. The last samples were collected in 2018 -5 and 10 years after the forest fires (Table 1).
On each plot, we collected several samples ofsoil from the depth of up to 15 cm, and analyzedmean values. For all samples, we determined pH ofthe water extracted from soil using potentiometricmethod, content of humus and total nitrogen usingTurin`s method, granulometric composition usingKaczyński`s method, mobile forms of phosphorusand potassium using Machigin`s method [Spirina &Soloveva 2014]. The concentrations of mobileforms of heavy metals (HM) were determined usingnuclear-absorptional method on a S-115M (Russian- С-115М) spectrometer.Study on the acidity of soils. During the study ofacidity of the soils, we determined the followingpattern: acidic values of pH were determined forthe litter in the old burned area, and pH was closerto the norm in the newly burned area. In general,after the fires, changes of acidity towards alka-linity were observed in the burned areas in organo-genic horizons. In soil of newly burned areas, in-crease in the content of potassium cations in orga-nogenic horizons occurs (Table 1).
The results of the study of acidic-alkalineconditions in the researched soils revealed increasein pH in soils affected by the fires. Therefore, in thecontrol sample of the upper layer of grey forestpodzolic soils (SP №1), pH equaled 4.1. In the sim-ilar soil of the experimental plot (SP №2), the reac-tion changed towards alkalinity after the fire (рН =4.8).
V. Asotskyi, Y. Buts, O. Kraynyuk, R. Ponomarenko Journ.Geol.Geograph.Geoecology,27(2), 175-183________________________________________________________________________________________________________________________________________________________________
178
Table 1.Analysis of pH of the soil environment
year SP№2* SP№1** Control
рН
2008 4.8 - 4.1
2013 4.6 5,1 4.2
2018 4.3 4,7 4.2*The fire occurred on the plot in 2008**The fire occurred on the plot in 2013
In 2013, there was observed a steep increasein pH of the environment on SP №1. Acidity on theplot slightly increased, but three years after the fire,it was still higher than the values of the control.
In 2018, change in pH towards acidity wasobserved on both plots. On SP №2, 10 years afterthe fire, the reaction of the environment practicallyreached the values of the control.
As a result of the combustion of the litter, pHin the upper layer of 0-10 cm changed towards neu-tral conditions to 4.8 and 5.1 compared to 4.1–4.2in the control. The values of this parameter in otherhorizons were close to neutral.
The tendency towards increase in pH of soilsafter fires could be explained by the fact that theash water-soluble compounds, after penetrating thesoil, saturate the absorption complex with alkalineearth elements and cause change in the reaction ofthe environment to the neutral range. An importantrole in determining the pH values belongs to thetime elapsed since an area had burned . In soils ofold burned areas, pH values are close to the control,which was also mentioned by other researchers(Gyininova & Syimpilova 1999, Tsibart &Gennadiev 2008).Physical-chemical analysis of the soils. Favoura-ble conditions for forest growth in the conditions ofsaturation of soil with main elements up to 50-80%,the content of easily soluble compounds of potas-sium and phosphorus is higher than 5 mg per 100 gof soil. Pine grows well at absorption capacity of 7-12 mg-equ .At the same time, growth of most treespecies becomes inhibited in highly acidic or alka-line soil.
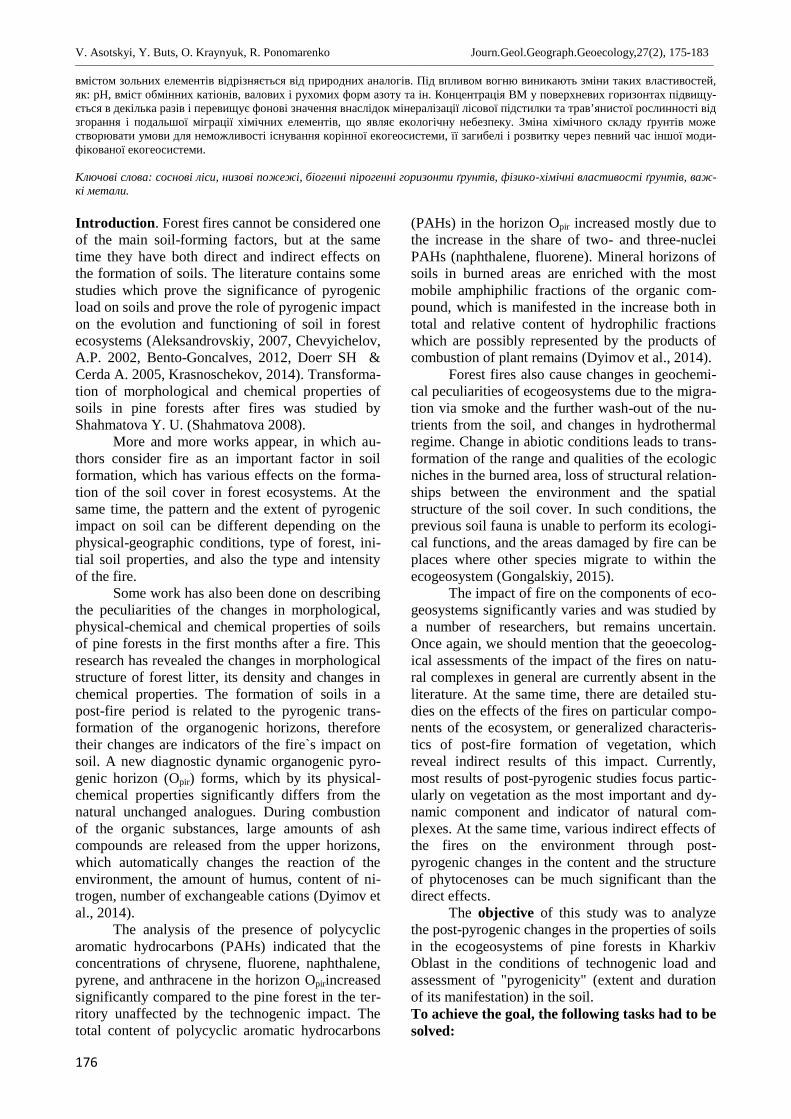
Four-five years after the low-intensity forestfire (SP №1, 2013), the composition and the struc-ture of the surface organogenic horizons changed.During that period, a 3-4 cm layer of litter formedon the surface which was completely burned duringthe fire. However, on the plots not affected by thefire, this layer composed completely of recentlyfallen needles, including large needles, bark, reach-
es 10-12 cm. In the fraction composition, largefragments dominate (brushwood, bark, strobili) -77.1%. The needles and grass equal 17.5 and 5.3%respectively. The organogenic pyrogenic horizon is3.6 cm thick.
The analysis of the area after the fire whichtook place 10 years ago (SP №2, 2018) revealedthat the layer of forest litter increased to 5.2 cm.Fraction composition had the following structure:fraction (knots, bark, strobili) – 70%. Needle-sandgrassequal 28.1 and 1.9% respectively (Fig. 1).
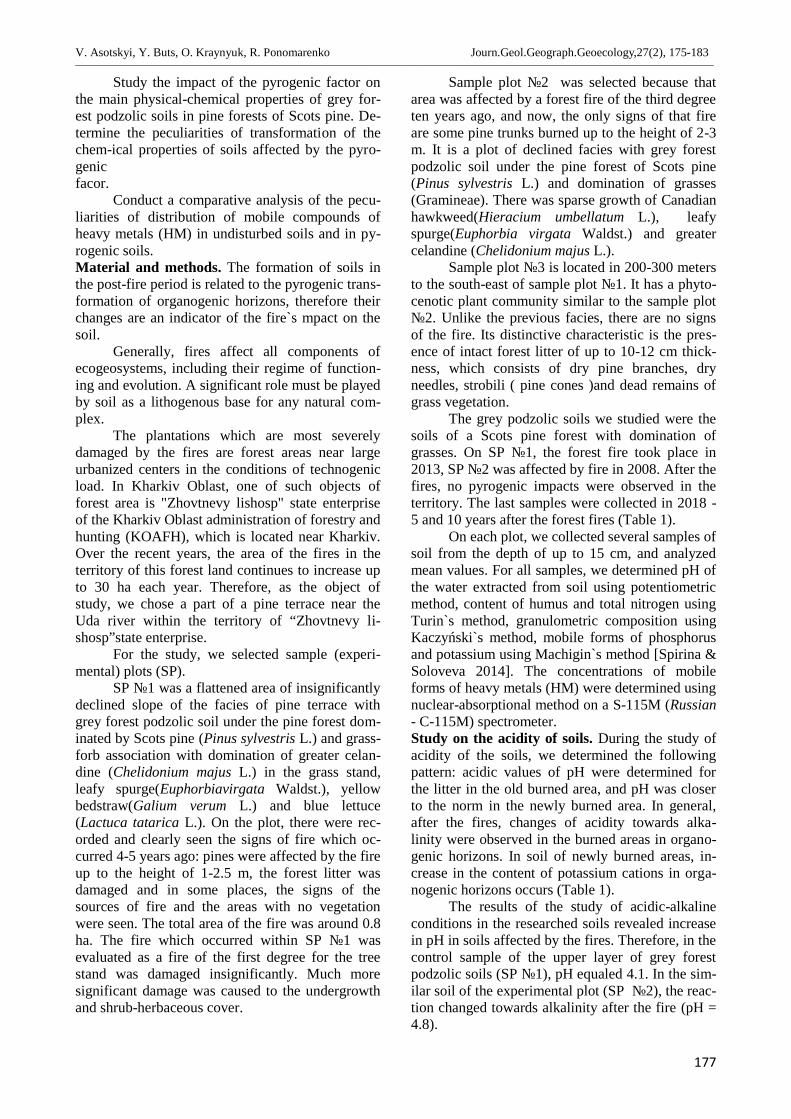
The soils are characterized by low content ofhumus in the upper accumulatng horizon. As thedepth increases, its content steeply decreases,which is typical for this type of soil, the largestamount of total nitrogen is typical for organogenichorizons (Table 2, Fig. 2). Therefore, the impact ofa ground fire causes the humus horizons of greypodzolic soils to respond with loss of nitrogen as aresult of its partial combustion in the organic com-pounds.
A number of researchers indicate that in soilsaffected by fire, the humus content sometimes in-creases. This phenomenon can be explained by theintensification of the sod processes after the com-bustion of tree vegetation, and also decompositionof unburned remains of roots, needles, branches inthe first hour after the fire.
In the studied samples, the humus content inthe burned areas was lower compared to the controlduring quite a long period of time.
One of the main sources of organic com-pound and ash elements for soil is the forest litter.Ground fires lead to partial or complete combustionof forest litter, which further affects the organogen-ic characteristics of soils, first of all their upperhorizons.
The older the burned areas, the lower thevalues of pH, content of exchangeable cations andhumus. This is related to the fact that the reaction ofthe soil to pyrogenic impact diminishes (Fig. 2).
V. Asotskyi, Y. Buts, O. Kraynyuk, R. Ponomarenko Journ.Geol.Geograph.Geoecology,27(2), 175-183________________________________________________________________________________________________________________________________________________________________
179
Fig. 1. Fraction composition of forest litter, % (SP №2)
Fig. 2. Decrease in the humus content in the soils after forest fire (SP №1) compared to the control, %
Granulometric composition of grey forestpodzolic soils in general is represented by sandyfractions. The content of sand in the horizonsranges from 71 to 97.2%.
The temperature of the ground layer of air inthe felled areas of pine forests reaches around 50°С,which often causes death of young plants. A biolog-ical feedback occurs between the humidity andtemperature of soil. Similarly to humidity, the tem-perature depends on the exposition of the slopes. Asthe steepness of the slope increases, the soil hu-midity in the same types of forests diminishes.
Therefore, the meteorological ecological fac-tors after the fires provide a possibility of naturalrecovery of the coniferous trees, except for dayswith high temperature on the soil surface, mostly insummer.
Studying possible changes in the main proper-ties of soils in particular areas of ground affected byfires, the change in chemical properties of soils in pineforests after the fires was proved and named "pyroge-nicity of soils" by Y. U. Shahmatova (Shahmatova2015), indicating the response reaction manifested inchange (transformation) of a whole complex of soilproperties.
V. Asotskyi, Y. Buts, O. Kraynyuk, R. Ponomarenko Journ.Geol.Geograph.Geoecology,27(2), 175-183________________________________________________________________________________________________________________________________________________________________
180
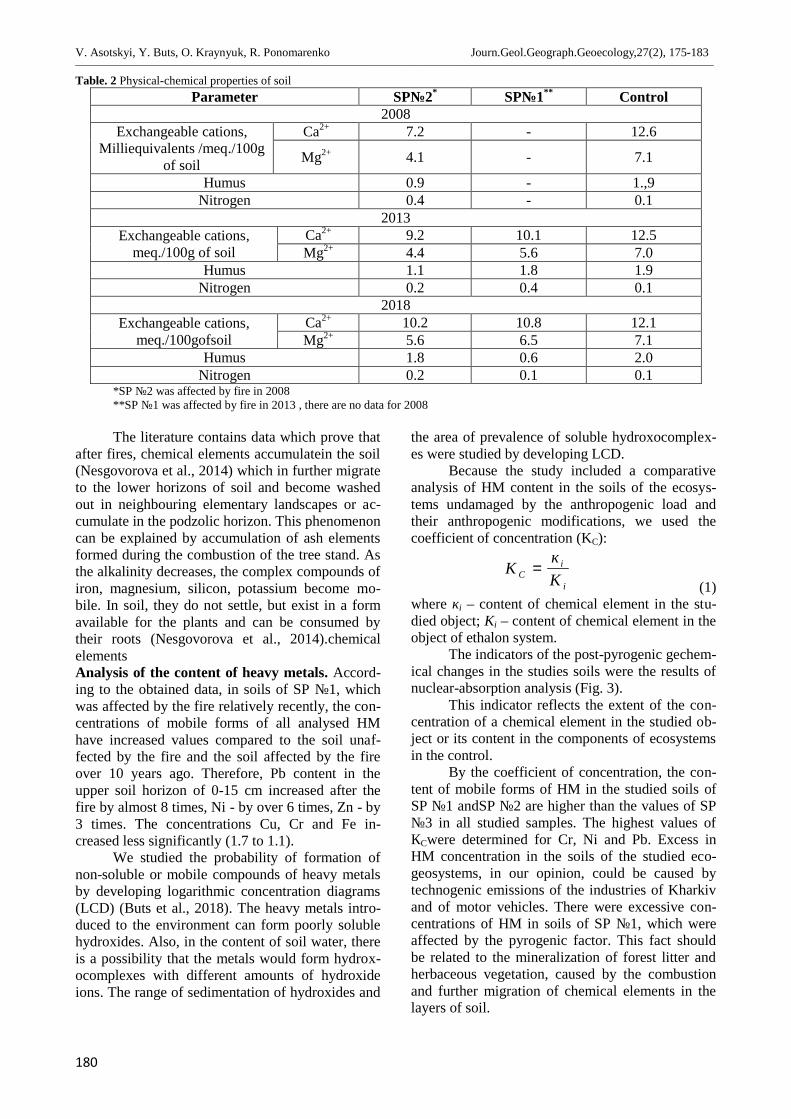
Table. 2 Physical-chemical properties of soilParameter SP№2* SP№1** Control
2008Exchangeable cations,
Milliequivalents /meq./100gof soil
Са2+ 7.2 - 12.6
Mg2+ 4.1 - 7.1
Humus 0.9 - 1.,9Nitrogen 0.4 - 0.1
2013Exchangeable cations,
meq./100g of soilСа2+ 9.2 10.1 12.5Mg2+ 4.4 5.6 7.0
Humus 1.1 1.8 1.9Nitrogen 0.2 0.4 0.1
2018Exchangeable cations,
meq./100gofsoilСа2+ 10.2 10.8 12.1Mg2+ 5.6 6.5 7.1
Humus 1.8 0.6 2.0Nitrogen 0.2 0.1 0.1
*SP №2 was affected by fire in 2008**SP №1 was affected by fire in 2013 , there are no data for 2008
The literature contains data which prove thatafter fires, chemical elements accumulatein the soil(Nesgovorova et al., 2014) which in further migrateto the lower horizons of soil and become washedout in neighbouring elementary landscapes or ac-cumulate in the podzolic horizon. This phenomenoncan be explained by accumulation of ash elementsformed during the combustion of the tree stand. Asthe alkalinity decreases, the complex compounds ofiron, magnesium, silicon, potassium become mo-bile. In soil, they do not settle, but exist in a formavailable for the plants and can be consumed bytheir roots (Nesgovorova et al., 2014).chemicalelementsAnalysis of the content of heavy metals. Accord-ing to the obtained data, in soils of SP №1, whichwas affected by the fire relatively recently, the con-centrations of mobile forms of all analysed HMhave increased values compared to the soil unaf-fected by the fire and the soil affected by the fireover 10 years ago. Therefore, Pb content in theupper soil horizon of 0-15 cm increased after thefire by almost 8 times, Ni - by over 6 times, Zn - by3 times. The concentrations Cu, Cr and Fe in-creased less significantly (1.7 to 1.1).
We studied the probability of formation ofnon-soluble or mobile compounds of heavy metalsby developing logarithmic concentration diagrams(LCD) (Buts et al., 2018). The heavy metals intro-duced to the environment can form poorly solublehydroxides. Also, in the content of soil water, thereis a possibility that the metals would form hydrox-ocomplexes with different amounts of hydroxideions. The range of sedimentation of hydroxides and
the area of prevalence of soluble hydroxocomplex-es were studied by developing LCD.
Because the study included a comparativeanalysis of HM content in the soils of the ecosys-tems undamaged by the anthropogenic load andtheir anthropogenic modifications, we used thecoefficient of concentration (KC):
(1)where кі – content of chemical element in the stu-died object; Кі – content of chemical element in theobject of ethalon system.
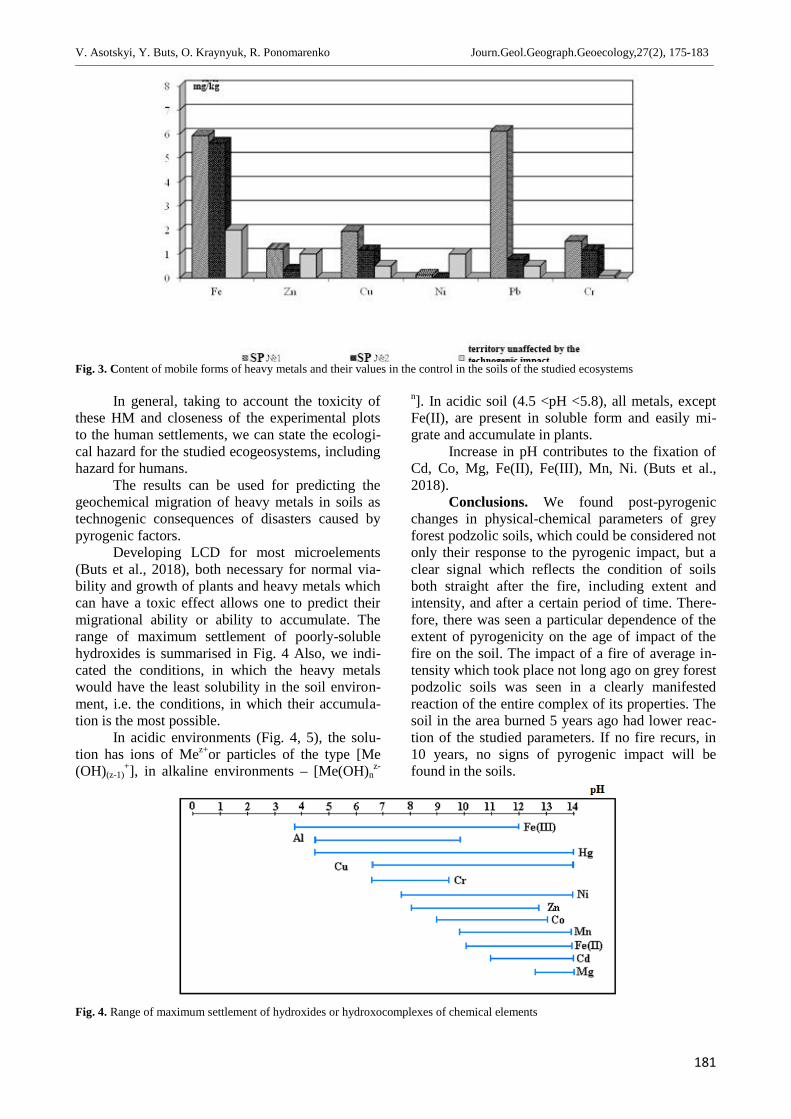
The indicators of the post-pyrogenic gechem-ical changes in the studies soils were the results ofnuclear-absorption analysis (Fig. 3).
This indicator reflects the extent of the con-centration of a chemical element in the studied ob-ject or its content in the components of ecosystemsin the control.
By the coefficient of concentration, the con-tent of mobile forms of HM in the studied soils ofSP №1 andSP №2 are higher than the values of SP№3 in all studied samples. The highest values ofКСwere determined for Cr, Ni and Pb. Excess inHM concentration in the soils of the studied eco-geosystems, in our opinion, could be caused bytechnogenic emissions of the industries of Kharkivand of motor vehicles. There were excessive con-centrations of HM in soils of SP №1, which wereaffected by the pyrogenic factor. This fact shouldbe related to the mineralization of forest litter andherbaceous vegetation, caused by the combustionand further migration of chemical elements in thelayers of soil.
КкКС
i
i
=
V. Asotskyi, Y. Buts, O. Kraynyuk, R. Ponomarenko Journ.Geol.Geograph.Geoecology,27(2), 175-183________________________________________________________________________________________________________________________________________________________________
181
Fig. 3. Content of mobile forms of heavy metals and their values in the control in the soils of the studied ecosystems
In general, taking to account the toxicity ofthese HM and closeness of the experimental plotsto the human settlements, we can state the ecologi-cal hazard for the studied ecogeosystems, includinghazard for humans.
The results can be used for predicting thegeochemical migration of heavy metals in soils astechnogenic consequences of disasters caused bypyrogenic factors.
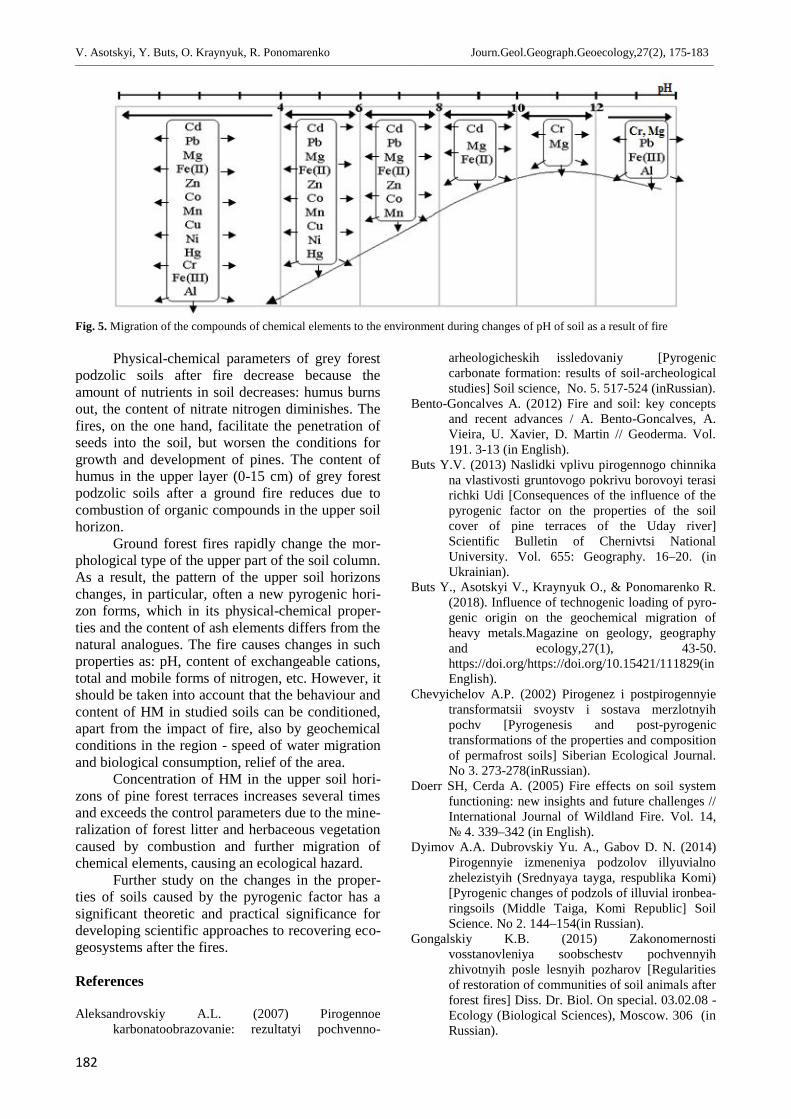
Developing LCD for most microelements(Buts et al., 2018), both necessary for normal via-bility and growth of plants and heavy metals whichcan have a toxic effect allows one to predict theirmigrational ability or ability to accumulate. Therange of maximum settlement of poorly-solublehydroxides is summarised in Fig. 4 Also, we indi-cated the conditions, in which the heavy metalswould have the least solubility in the soil environ-ment, i.e. the conditions, in which their accumula-tion is the most possible.
In acidic environments (Fig. 4, 5), the solu-tion has ions of Mez+or particles of the type [Mе(ОН)(z-1)
+], in alkaline environments – [Mе(ОН)nz-
n]. In acidic soil (4.5 <рН <5.8), all metals, exceptFe(II), are present in soluble form and easily mi-grate and accumulate in plants.
Increase in pH contributes to the fixation ofCd, Co, Mg, Fe(II), Fe(III), Mn, Ni. (Buts et al.,2018).
Conclusions. We found post-pyrogenicchanges in physical-chemical parameters of greyforest podzolic soils, which could be considered notonly their response to the pyrogenic impact, but aclear signal which reflects the condition of soilsboth straight after the fire, including extent andintensity, and after a certain period of time. There-fore, there was seen a particular dependence of theextent of pyrogenicity on the age of impact of thefire on the soil. The impact of a fire of average in-tensity which took place not long ago on grey forestpodzolic soils was seen in a clearly manifestedreaction of the entire complex of its properties. Thesoil in the area burned 5 years ago had lower reac-tion of the studied parameters. If no fire recurs, in10 years, no signs of pyrogenic impact will befound in the soils.
Fig. 4. Range of maximum settlement of hydroxides or hydroxocomplexes of chemical elements
V. Asotskyi, Y. Buts, O. Kraynyuk, R. Ponomarenko Journ.Geol.Geograph.Geoecology,27(2), 175-183________________________________________________________________________________________________________________________________________________________________
182
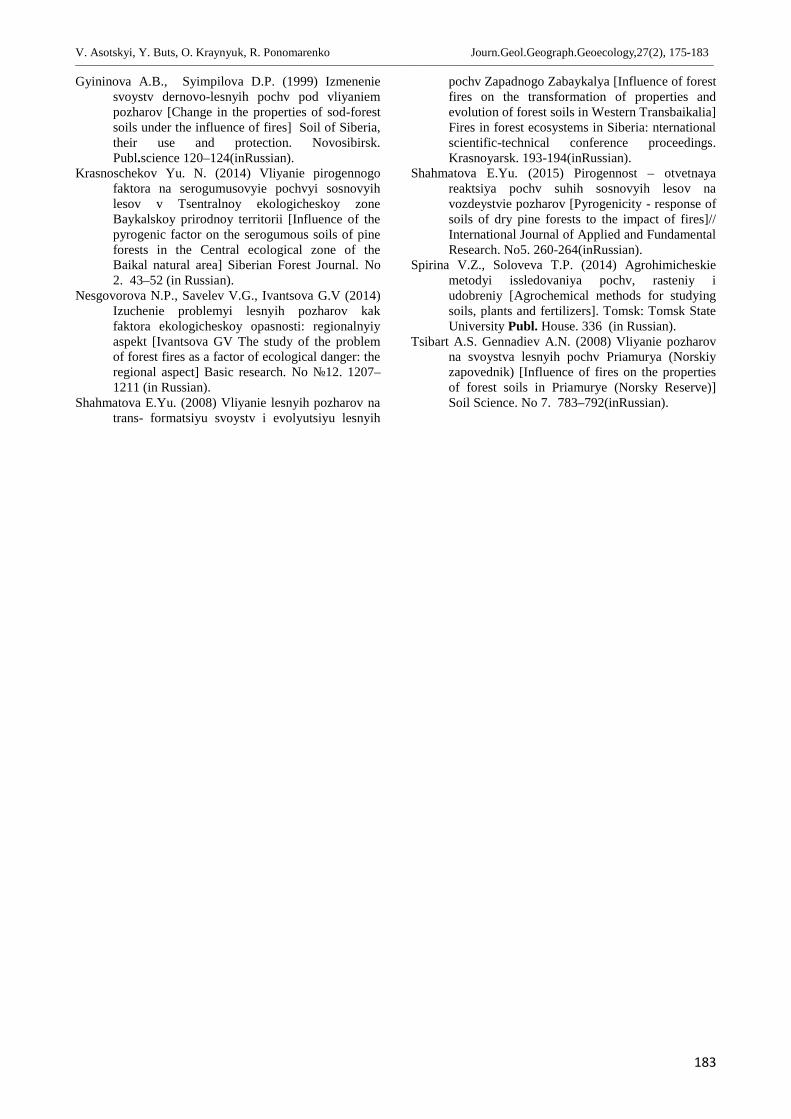
Fig. 5. Migration of the compounds of chemical elements to the environment during changes of pH of soil as a result of fire
Physical-chemical parameters of grey forestpodzolic soils after fire decrease because theamount of nutrients in soil decreases: humus burnsout, the content of nitrate nitrogen diminishes. Thefires, on the one hand, facilitate the penetration ofseeds into the soil, but worsen the conditions forgrowth and development of pines. The content ofhumus in the upper layer (0-15 cm) of grey forestpodzolic soils after a ground fire reduces due tocombustion of organic compounds in the upper soilhorizon.
Ground forest fires rapidly change the mor-phological type of the upper part of the soil column.As a result, the pattern of the upper soil horizonschanges, in particular, often a new pyrogenic hori-zon forms, which in its physical-chemical proper-ties and the content of ash elements differs from thenatural analogues. The fire causes changes in suchproperties as: pH, content of exchangeable cations,total and mobile forms of nitrogen, etc. However, itshould be taken into account that the behaviour andcontent of HM in studied soils can be conditioned,apart from the impact of fire, also by geochemicalconditions in the region - speed of water migrationand biological consumption, relief of the area.
Concentration of HM in the upper soil hori-zons of pine forest terraces increases several timesand exceeds the control parameters due to the mine-ralization of forest litter and herbaceous vegetationcaused by combustion and further migration ofchemical elements, causing an ecological hazard.
Further study on the changes in the proper-ties of soils caused by the pyrogenic factor has asignificant theoretic and practical significance fordeveloping scientific approaches to recovering eco-geosystems after the fires.
References
Aleksandrovskiy A.L. (2007) Pirogennoekarbonatoobrazovanie: rezultatyi pochvenno-
arheologicheskih issledovaniy [Pyrogeniccarbonate formation: results of soil-archeologicalstudies] Soil science, No. 5. 517-524 (inRussian).
Bento-Goncalves A. (2012) Fire and soil: key conceptsand recent advances / A. Bento-Goncalves, A.Vieira, U. Xavier, D. Martin // Geoderma. Vol.191. 3-13 (in English).
Buts Y.V. (2013) Naslidki vplivu pirogennogo chinnikana vlastivosti gruntovogo pokrivu borovoyi terasirichki Udi [Consequences of the influence of thepyrogenic factor on the properties of the soilcover of pine terraces of the Uday river]Scientific Bulletin of Chernivtsi NationalUniversity. Vol. 655: Geography. 16–20. (inUkrainian).
Buts Y., Asotskyi V., Kraynyuk O., & Ponomarenko R.(2018). Influence of technogenic loading of pyro-genic origin on the geochemical migration ofheavy metals.Magazine on geology, geographyand ecology,27(1), 43-50.https://doi.org/https://doi.org/10.15421/111829(inEnglish).
Chevyichelov A.P. (2002) Pirogenez i postpirogennyietransformatsii svoystv i sostava merzlotnyihpochv [Pyrogenesis and post-pyrogenictransformations of the properties and compositionof permafrost soils] Siberian Ecological Journal.No 3. 273-278(inRussian).
Doerr SH, Cerda A. (2005) Fire effects on soil systemfunctioning: new insights and future challenges //International Journal of Wildland Fire. Vol. 14,№ 4. 339–342 (in English).
Dyimov A.A. Dubrovskiy Yu. A., Gabov D. N. (2014)Pirogennyie izmeneniya podzolov illyuvialnozhelezistyih (Srednyaya tayga, respublika Komi)[Pyrogenic changes of podzols of illuvial ironbea-ringsoils (Middle Taiga, Komi Republic] SoilScience. No 2. 144–154(in Russian).
Gongalskiy K.B. (2015) Zakonomernostivosstanovleniya soobschestv pochvennyihzhivotnyih posle lesnyih pozharov [Regularitiesof restoration of communities of soil animals afterforest fires] Diss. Dr. Biol. On special. 03.02.08 -Ecology (Biological Sciences), Moscow. 306 (inRussian).
V. Asotskyi, Y. Buts, O. Kraynyuk, R. Ponomarenko Journ.Geol.Geograph.Geoecology,27(2), 175-183________________________________________________________________________________________________________________________________________________________________
183
Gyininova A.B., Syimpilova D.P. (1999) Izmeneniesvoystv dernovo-lesnyih pochv pod vliyaniempozharov [Change in the properties of sod-forestsoils under the influence of fires] Soil of Siberia,their use and protection. Novosibirsk.Publ.science 120–124(inRussian).
Krasnoschekov Yu. N. (2014) Vliyanie pirogennogofaktora na serogumusovyie pochvyi sosnovyihlesov v Tsentralnoy ekologicheskoy zoneBaykalskoy prirodnoy territorii [Influence of thepyrogenic factor on the serogumous soils of pineforests in the Central ecological zone of theBaikal natural area] Siberian Forest Journal. No2. 43–52 (in Russian).
Nesgovorova N.P., Savelev V.G., Ivantsova G.V (2014)Izuchenie problemyi lesnyih pozharov kakfaktora ekologicheskoy opasnosti: regionalnyiyaspekt [Ivantsova GV The study of the problemof forest fires as a factor of ecological danger: theregional aspect] Basic research. No №12. 1207–1211 (in Russian).
Shahmatova E.Yu. (2008) Vliyanie lesnyih pozharov natrans- formatsiyu svoystv i evolyutsiyu lesnyih
pochv Zapadnogo Zabaykalya [Influence of forestfires on the transformation of properties andevolution of forest soils in Western Transbaikalia]Fires in forest ecosystems in Siberia: nternationalscientific-technical conference proceedings.Krasnoyarsk. 193-194(inRussian).
Shahmatova E.Yu. (2015) Pirogennost – otvetnayareaktsiya pochv suhih sosnovyih lesov navozdeystvie pozharov [Pyrogenicity - response ofsoils of dry pine forests to the impact of fires]//International Journal of Applied and FundamentalResearch. No5. 260-264(inRussian).
Spirina V.Z., Soloveva T.P. (2014) Agrohimicheskiemetodyi issledovaniya pochv, rasteniy iudobreniy [Agrochemical methods for studyingsoils, plants and fertilizers]. Tomsk: Tomsk StateUniversity Publ. House. 336 (in Russian).
Tsibart A.S. Gennadiev A.N. (2008) Vliyanie pozharovna svoystva lesnyih pochv Priamurya (Norskiyzapovednik) [Influence of fires on the propertiesof forest soils in Priamurye (Norsky Reserve)]Soil Science. No 7. 783–792(inRussian).
L. P. Bosevska, Anirban Chowdhury Journ.Geol.Geograph.Geoecology, 27(2), 187-204________________________________________________________________________________________________________________________________________________________________
184
Journal of Geology,Geography and Geoecology
Journal home page: geology-dnu-dp.ua
ISSN 2617-2909 (print)ISSN 2617-2119 (online)
Journ.Geol.Geograph.Geoecology,
27(2), 184-201doi:10.15421/111844
L. P. Bosevska, Anirban Chowdhury Journ.Geol.Geograph.Geoecology, 27(2), 184-201________________________________________________________________________________________________________________________________________________________________
Labile technogenic geological system of the flooded Shevchenko salt mine (Ukraine)
Larysa P. Bosevska1, Anirban Chowdhury2
1 Ukrainian Salt Research Institute, Bakhmut, Ukraine, e-mail: [email protected] Sidhu Kanu Birsha University, Purulia, India, e-mail: [email protected]
Abstract. This paper presents the analog ecological-mining-geological model of thelabile technogenic geological system created at the Shevchenko flooded salt mine areawithin Artyomovsk rock salt deposit, which is the largest rock salt deposit in Europe.Description of all the system elements taking into account their interconnection andinteraction are presented on the basis of the analytical processing and compilation of
basic mining and geological data as well as the results of the long-term complex ecological-mining-geological monitoring.The paperdescribes both the geology of the mine area and the condition assessment of the mine including its shape, parameters, and layout. Inaddition, scientific interpretation of the mechanism of multi-act intrasystem destructive processes, which have been taking place inthe last few decades are provided. Natural and technogenic factors determining the development of the created technogenic geologi-cal system (such as man-made karst and critical geomechanical deformations) are summarized and analysed. Predictive evaluation ofthe time-dependent deformation processes development has been carried out using theexisting methodology for assessing the geome-chanical condition of the mined-out area of the salt massive. Correctness of the method for evaluation of stability of the unsupportedworkings system currently in use for the Artyomovsk rock salt deposit development has been confirmed. This work concerns thescientific problems of maintenance of the geo-ecological safety in the densely populated areas disturbed by underground salt mining.Hereinabove research results add information and analytical base to improve the deformation control system for ductile salt layers invarious dynamic conditions of man-caused and natural loads. It is shown that such control is required for the aim of reduction ofenvironmental risks and ensuring the safe operation of salt deposits, salt resources protection as well as infrastructure objects at theEarth’s surface nearby sites of modern salt mining activity.
Key words: rock salt, salt mine, destructive processes, deformations, Earth’s surfacesubsidence,monitoring
Лабільна техногенно-геологічна система території затопленного соляного рудникаШевченко (Україна)
Л.П. Босевская1, Анирбан Чаудхyри2
1 Украинский научно-исследовательский институт соляной промышленности, Бахмут, Украинаe-mail: [email protected] Университет Сидхо-Канго-Бирша, Пурулия, Западная Бенгалия, Индияe-mail: [email protected]
Анотація. У даній роботі представлена аналогова еколого-гірничо-геологічна модель лабільної техногенно-геологічноїсистеми, створеної на території затопленої соляної шахти імені Шевченка в межах Артемівського родовища кам'яної солі,найбільшого родовища солі в Європі. На підставі аналітичної обробки і компіляції первинних гірничо-геологічних даних, атакож результатів тривалого комплексного еколого-гірничо-геологічного моніторингу представлено опис всіх елементівсистеми в їх взаємозв'язку і взаємодії і дано наукове тлумачення механізму багатоактних внутрішньосистемних деструктив-них процесів, що протікають протягом декількох десятиліть. Узагальнені та проаналізовані природні та техногенні фактори,що визначають розвиток створеної техногенно-геологічної системи (техногенний карст і критичні геомеханічні деформаціїсоляного масиву). Виконана прогнозна оцінка розвитку деформаційних процесів з використанням існуючої методики оцінкигеомеханічного стану відпрацьованої ділянки соляного масиву. Підтверджено коректність застосовуваної методики оцінкистійкості системи незакріплених виробок при розробці Артемівського родовища кам'яної солі. Робота зачіпає наукові про-блеми забезпечення геоекологічної безпеки в густонаселених районах, порушених підземним видобутком кам'яної солі.Викладені результати досліджень поповнюють базу інформаційно-аналітичного забезпечення системи управліннядеформаціями пластичного розчинного середовища соляних товщ в різних динамічних режимах техногенних і природних
Received 15.05.2018;Received in revised form 29.05.2018;Accepted 16.06.2018
L. P. Bosevska, Anirban Chowdhury Journ.Geol.Geograph.Geoecology, 27(2), 184-201________________________________________________________________________________________________________________________________________________________________
185
навантажень для зниження екологічних ризиків і забезпечення безпечної експлуатації родовищ солей, охорони солянихресурсів, а також об'єктів інфраструктури на земній поверхні поблизу ділянок сучасної розробки кам'яної солі.
Ключові слова: кам'яна сіль, соляна копальня, деструктивні процеси, деформації, осідання поверхні, моніторинг
Introduction. Problem setting. Deep scientificinvestigation of the geological-environmental straindue to man-made intervention into salt strata is amatter of concern for present day salt mining prac-tice. It is caused by the growing multilateral interestin salt strata both as a raw material base for rocksalt extraction and as an environment for variousengineering objects creation such as hydrocarbonand waste storage facilities (including radioactiveones), speleosanatoriums, touristic objects, etc.
A generalized task of many contemporarystudies concerning salt deposits is the enhancementof the theory of environmentally acceptable man-made intervention into salt strata. Some importanttasks of the environmental safety and commercialgoals are in conflict, in particular as it relates to thetechnical requirements for a reasonable permissiblerecovery ratio of minerals (rock salt). Particularlyan acute issue is finding one of the correct metho-dology for controlling the rate of strain in salt rocksat all stages of technogenic interference for ensur-ing their safe level. This research direction is consi-dered to be of high significance for the salt miningactivity within densely populated territories sinceuncontrolled deformations can entail any seriousecological and economic damage endangering theimportant objects of social and economic infra-structures and people's lives.
All aspects of technogenic deformations ofthe rock massif and their adverse ecological impactare the separate theoretical and practical issuesaimed at developing a system of integrated controland forecasting of these deformationprocesses.Different scientist around the world hasdevoted their works to these issues. Salt massifs’geomechanics and physical-mechanical propertiesof rock salt determining geomechanical processesare considered in the works of Michael L. Jeremicand Saeed Nazary Moghadam (Саnada), A.А. Ba-ryakh and V.A. Asanov (Russia), Alla R. Seraya(Ukraine) and many others. Issues of the naturaland technogenic karst are detailed in the works ofG.V. Korotkevich (Ukraine), Anthony H.Cooperand F. Gutiérrez (Great Britaine) and others. Inte-raction of different aspects of strain manifestationand consequences as well as monitoring results fordeformable areas influenced by the technogenicobject created inside salt strata are presented in theworks of T.G. Brooks, N. J. o'Riordan and Jamie K.Pringle (Great Britain), Dmytro P. Khrushchov(Ukraine), Mihaela Toderas (Romania), GloriaDesir (Spain), Astrid Gessert and Thomas Schicht(Germany), M. Cała and A. Tajduś (Poland), M.
Karimi-Jafari and Pierre Berest (France), Bill Shef-chik (USA) and others.
It is important to analyze a significant num-ber of examples of deformation processes devel-opment associated with the construction and exploi-tation of various objects in salt strata in order tocreate the correct system of salt massif deformationcontrol. Though the manifestation of the destructiveprocesses and land degradation are different inevery case, because of the various geological andhydrogeological conditions and various technologyapplied, it reveals similarities in similar technogen-ic geological systems (further in the text – TGS).
There is insufficient complex research resultsdealing with salt environment deformations and theEarth’s subsidence monitoring on the territories ofman-made objects within salt massifs. Based onlong-term monitoring, this work provides a detaildescription of the active deformation processes andconcomitant ecological changes ongoing within thearea of old flooded Shevchenko salt mine that ex-ploited the thickest bed of the Artyomovsk rock saltdeposit.
The objective of the paper is to present ana-log model of the technogenic geological system(TGS) of the Shevchenko flooded salt mine areaand to interpret mechanisms and factors of its de-velopment.
As already mentioned in general, the signi-ficance of the work is related to the need for furtherdevelopment of the risk control methodology re-lated to technogenic interference in salt massifsassociated with new technologies, to achieve a bal-ance between scientifically based technical re-quirements and commercial benefits (Brooks et al,2006).
But the performed research urgency is furtherstrengthened due to the fact that this flooded mineis located in the central part of the modern opera-tion field and its location is adjacent to such animportant infrastructure facility as the railway (110m). A safety pillar with reasonable thickness de-taching the flooded mine workings from today op-erational areas of mine # 4 has been left around thisold mine.
It should be noted, there is one more reasonof this paper urgency at popular science level. Thefact is that some media (including Internet-sources)have presented salt lakes above the flooded saltmine as a certain anomalous zone and have in-cluded it in numerous lists of mystical zones ofUkraine. This point also requires the scientific cla-rifications.
L. P. Bosevska, Anirban Chowdhury Journ.Geol.Geograph.Geoecology, 27(2), 184-201________________________________________________________________________________________________________________________________________________________________
186
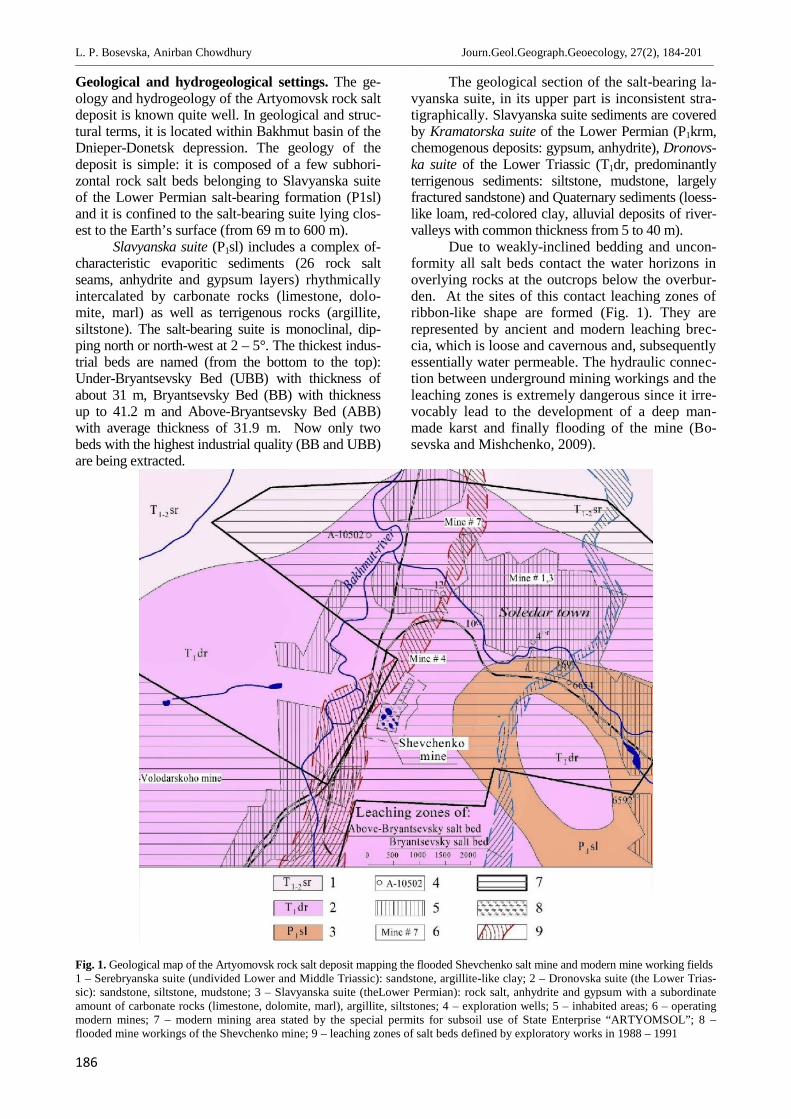
Geological and hydrogeological settings. The ge-ology and hydrogeology of the Artyomovsk rock saltdeposit is known quite well. In geological and struc-tural terms, it is located within Bakhmut basin of theDnieper-Donetsk depression. The geology of thedeposit is simple: it is composed of a few subhori-zontal rock salt beds belonging to Slavyanska suiteof the Lower Permian salt-bearing formation (P1sl)and it is confined to the salt-bearing suite lying clos-est to the Earth’s surface (from 69 m to 600 m).
Slavyanska suite (P1sl) includes a complex of-characteristic evaporitic sediments (26 rock saltseams, anhydrite and gypsum layers) rhythmicallyintercalated by carbonate rocks (limestone, dolo-mite, marl) as well as terrigenous rocks (argillite,siltstone). The salt-bearing suite is monoclinal, dip-ping north or north-west at 2 – 5°. The thickest indus-trial beds are named (from the bottom to the top):Under-Bryantsevsky Bed (UBB) with thickness ofabout 31 m, Bryantsevsky Bed (BB) with thicknessup to 41.2 m and Above-Bryantsevsky Bed (ABB)with average thickness of 31.9 m. Now only twobeds with the highest industrial quality (BB and UBB)are being extracted.
The geological section of the salt-bearing la-vyanska suite, in its upper part is inconsistent stra-tigraphically. Slavyanska suite sediments are coveredby Kramatorska suite of the Lower Permian (P1krm,chemogenous deposits: gypsum, anhydrite), Dronovs-ka suite of the Lower Triassic (T1dr, predominantlyterrigenous sediments: siltstone, mudstone, largelyfractured sandstone) and Quaternary sediments (loess-like loam, red-colored clay, alluvial deposits of river-valleys with common thickness from 5 to 40 m).
Due to weakly-inclined bedding and uncon-formity all salt beds contact the water horizons inoverlying rocks at the outcrops below the overbur-den. At the sites of this contact leaching zones ofribbon-like shape are formed (Fig. 1). They arerepresented by ancient and modern leaching brec-cia, which is loose and cavernous and, subsequentlyessentially water permeable. The hydraulic connec-tion between underground mining workings and theleaching zones is extremely dangerous since it irre-vocably lead to the development of a deep man-made karst and finally flooding of the mine (Bo-sevska and Mishchenko, 2009).
Fig. 1. Geological map of the Artyomovsk rock salt deposit mapping the flooded Shevchenko salt mine and modern mine working fields1 – Serebryanska suite (undivided Lower and Middle Triassic): sandstone, argillite-like clay; 2 – Dronovska suite (the Lower Trias-sic): sandstone, siltstone, mudstone; 3 – Slavyanska suite (theLower Permian): rock salt, anhydrite and gypsum with a subordinateamount of carbonate rocks (limestone, dolomite, marl), argillite, siltstones; 4 – exploration wells; 5 – inhabited areas; 6 – operatingmodern mines; 7 – modern mining area stated by the special permits for subsoil use of State Enterprise “ARTYOMSOL”; 8 –flooded mine workings of the Shevchenko mine; 9 – leaching zones of salt beds defined by exploratory works in 1988 – 1991
L. P. Bosevska, Anirban Chowdhury Journ.Geol.Geograph.Geoecology, 27(2), 184-201________________________________________________________________________________________________________________________________________________________________
187
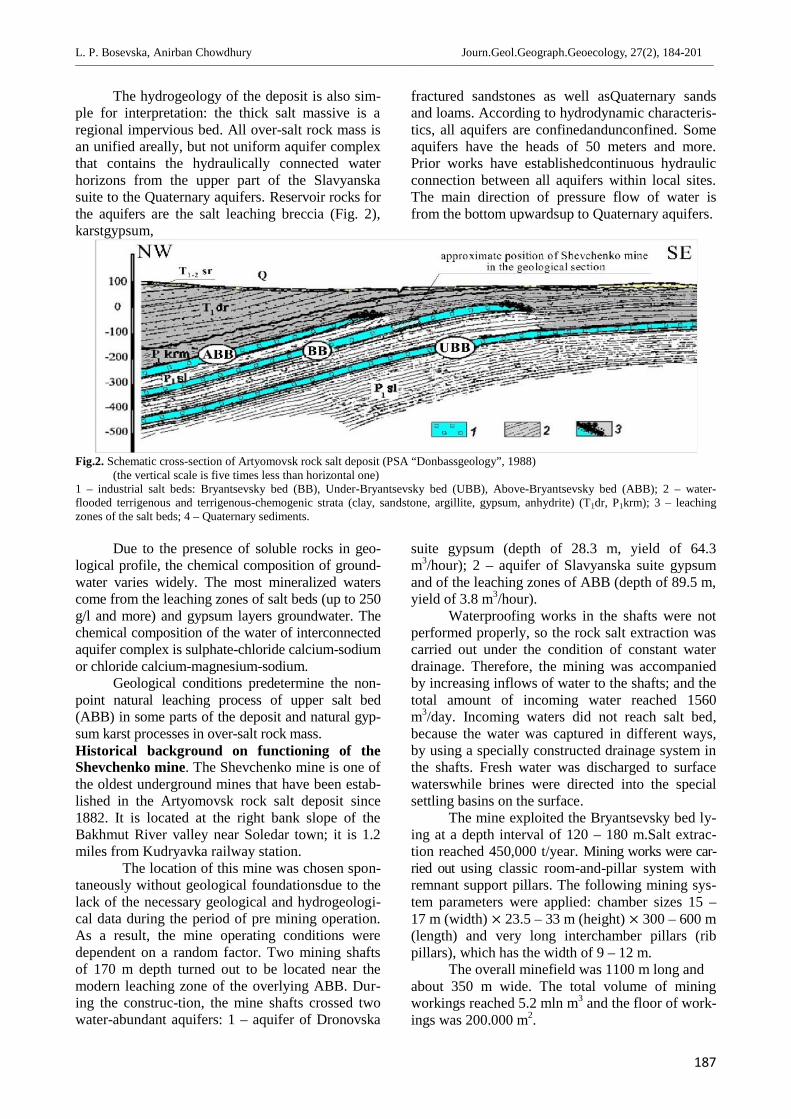
The hydrogeology of the deposit is also sim-ple for interpretation: the thick salt massive is aregional impervious bed. All over-salt rock mass isan unified areally, but not uniform aquifer complexthat contains the hydraulically connected waterhorizons from the upper part of the Slavyanskasuite to the Quaternary aquifers. Reservoir rocks forthe aquifers are the salt leaching breccia (Fig. 2),karstgypsum,
fractured sandstones as well asQuaternary sandsand loams. According to hydrodynamic characteris-tics, all aquifers are confinedandunconfined. Someaquifers have the heads of 50 meters and more.Prior works have establishedcontinuous hydraulicconnection between all aquifers within local sites.The main direction of pressure flow of water isfrom the bottom upwardsup to Quaternary aquifers.
Fig.2. Schematic cross-section of Artyomovsk rock salt deposit (PSA “Donbassgeology”, 1988)(the vertical scale is five times less than horizontal one)
1 – industrial salt beds: Bryantsevsky bed (BB), Under-Bryantsevsky bed (UBB), Above-Bryantsevsky bed (ABB); 2 – water-flooded terrigenous and terrigenous-chemogenic strata (clay, sandstone, argillite, gypsum, anhydrite) (T1dr, Р1krm); 3 – leachingzones of the salt beds; 4 – Quaternary sediments.
Due to the presence of soluble rocks in geo-logical profile, the chemical composition of ground-water varies widely. The most mineralized waterscome from the leaching zones of salt beds (up to 250g/l and more) and gypsum layers groundwater. Thechemical composition of the water of interconnectedaquifer complex is sulphate-chloride calcium-sodiumor chloride calcium-magnesium-sodium.
Geological conditions predetermine the non-point natural leaching process of upper salt bed(ABB) in some parts of the deposit and natural gyp-sum karst processes in over-salt rock mass.Historical background on functioning of theShevchenko mine. The Shevchenko mine is one ofthe oldest underground mines that have been estab-lished in the Artyomovsk rock salt deposit since1882. It is located at the right bank slope of theBakhmut River valley near Soledar town; it is 1.2miles from Kudryavka railway station.
The location of this mine was chosen spon-taneously without geological foundationsdue to thelack of the necessary geological and hydrogeologi-cal data during the period of pre mining operation.As a result, the mine operating conditions weredependent on a random factor. Two mining shaftsof 170 m depth turned out to be located near themodern leaching zone of the overlying ABB. Dur-ing the construc-tion, the mine shafts crossed twowater-abundant aquifers: 1 – aquifer of Dronovska
suite gypsum (depth of 28.3 m, yield of 64.3m3/hour); 2 – aquifer of Slavyanska suite gypsumand of the leaching zones of ABB (depth of 89.5 m,yield of 3.8 m3/hour).
Waterproofing works in the shafts were notperformed properly, so the rock salt extraction wascarried out under the condition of constant waterdrainage. Therefore, the mining was accompaniedby increasing inflows of water to the shafts; and thetotal amount of incoming water reached 1560m3/day. Incoming waters did not reach salt bed,because the water was captured in different ways,by using a specially constructed drainage system inthe shafts. Fresh water was discharged to surfacewaterswhile brines were directed into the specialsettling basins on the surface.
The mine exploited the Bryantsevsky bed ly-ing at a depth interval of 120 – 180 m.Salt extrac-tion reached 450,000 t/year. Mining works were car-ried out using classic room-and-pillar system withremnant support pillars. The following mining sys-tem parameters were applied: chamber sizes 15 –17 m (width) × 23.5 – 33 m (height) × 300 – 600 m(length) and very long interchamber pillars (ribpillars), which has the width of 9 – 12 m.
The overall minefield was 1100 m long andabout 350 m wide. The total volume of miningworkings reached 5.2 mln m3 and the floor of work-ings was 200.000 m2.
L. P. Bosevska, Anirban Chowdhury Journ.Geol.Geograph.Geoecology, 27(2), 184-201________________________________________________________________________________________________________________________________________________________________
188
The mine had been functioning for almost 60years. In autumn 1941, due to military operations ofthe Second World War, the mine stopped workingand drainage was forcibly terminated. From thattime, the uncontrollable flooding of the mine withfresh and salty waters began, that resulted in a rapiduneven development of the deep salt karst. Inplaces of fresh water inflow,pillars bases were “un-dercut” by leaching and the pillars quickly lostbearing capacity.
A year later, the first concentric cracks ap-peared on the Earth's surface near the shafts andlater multiple small concentric craters, which testi-fied to the beginning of the process of the rockmass total destruction over the mine workings.
Over the next 8 years, the destruction of therock massif over the flooded mine workings and the
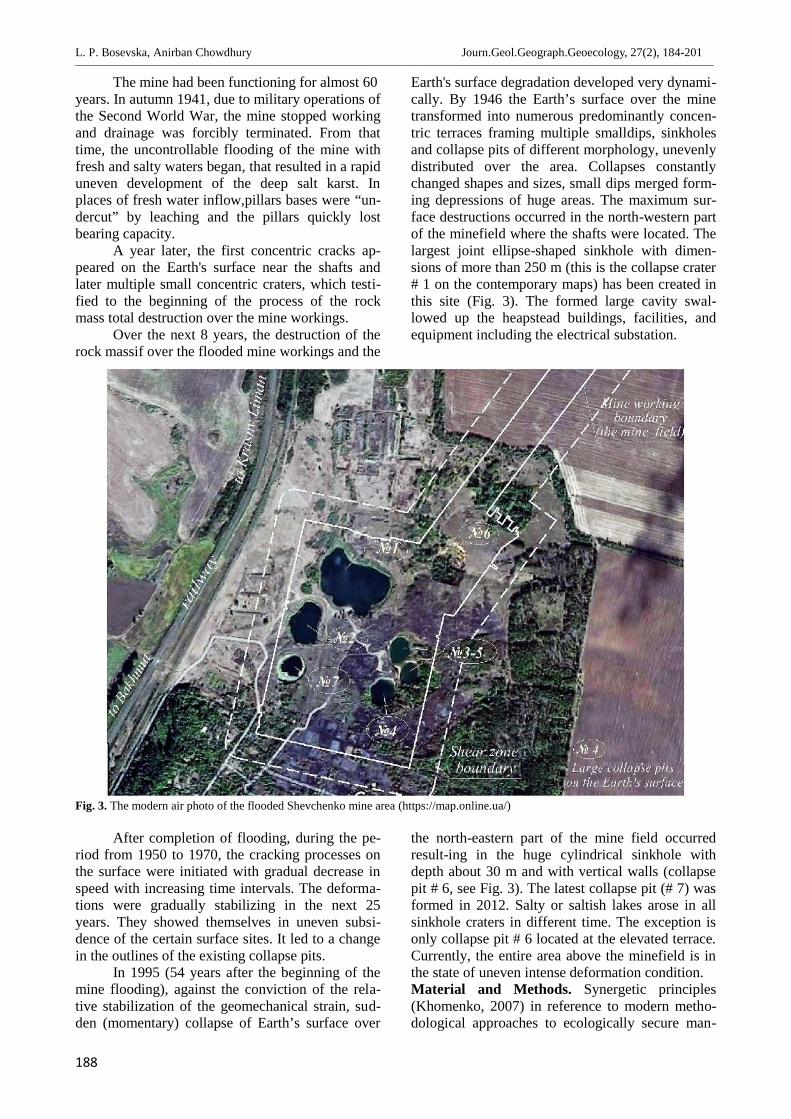
Earth's surface degradation developed very dynami-cally. By 1946 the Earth’s surface over the minetransformed into numerous predominantly concen-tric terraces framing multiple smalldips, sinkholesand collapse pits of different morphology, unevenlydistributed over the area. Collapses constantlychanged shapes and sizes, small dips merged form-ing depressions of huge areas. The maximum sur-face destructions occurred in the north-western partof the minefield where the shafts were located. Thelargest joint ellipse-shaped sinkhole with dimen-sions of more than 250 m (this is the collapse crater# 1 on the contemporary maps) has been created inthis site (Fig. 3). The formed large cavity swal-lowed up the heapstead buildings, facilities, andequipment including the electrical substation.
Fig. 3. The modern air photo of the flooded Shevchenko mine area (https://map.online.ua/)
After completion of flooding, during the pe-riod from 1950 to 1970, the cracking processes onthe surface were initiated with gradual decrease inspeed with increasing time intervals. The deforma-tions were gradually stabilizing in the next 25years. They showed themselves in uneven subsi-dence of the certain surface sites. It led to a changein the outlines of the existing collapse pits.
In 1995 (54 years after the beginning of themine flooding), against the conviction of the rela-tive stabilization of the geomechanical strain, sud-den (momentary) collapse of Earth’s surface over
the north-eastern part of the mine field occurredresult-ing in the huge cylindrical sinkhole withdepth about 30 m and with vertical walls (collapsepit # 6, see Fig. 3). The latest collapse pit (# 7) wasformed in 2012. Salty or saltish lakes arose in allsinkhole craters in different time. The exception isonly collapse pit # 6 located at the elevated terrace.Currently, the entire area above the minefield is inthe state of uneven intense deformation condition.Material and Methods. Synergetic principles(Khomenko, 2007) in reference to modern metho-dological approaches to ecologically secure man-
L. P. Bosevska, Anirban Chowdhury Journ.Geol.Geograph.Geoecology, 27(2), 184-201________________________________________________________________________________________________________________________________________________________________
189
made intervention into salt massifs have been usedfor evaluation of today’s conditions of the Shev-chenko salt mine TGS (technogenic geologicalsystem). The main methodological principles of thecorrect exploitation of salt massifs and evaluationof the consequences of the incorrect one have beenvividly discussed in the current scientific literature(Jeremic, 1994; Karimi-Jafari et al, 2008; Bosevs-ka, 2010; Khrushchov et al, 2010; Moghadam, etal., 2012; Mechanical, 2012; Khrushchov and Bo-sevska, 2014; Toderas, 2013; Kortas, 2014 andothers). The views of scientists from different coun-tries do not have significant contradictions, but onlycomplement each other and have several aspectsfocusing on the specific problems of this area. Theinternational experience of assessing the conse-quences of salt mines flooding shows general regu-larity of disturbances in the geological environmentand trends in the deformation process developmenton the Earth's surface. At the same time, differentgeological features of the territories and miningtechnical conditions for the construction of variousengineering facilities determine the formation ofvarious TGS (Tenison, 2016).
Shevchenko salt mine TGS is presented asthe analog ecological-mining-geological model,which adequately reflects all the elements of thissystem, including the identified processes and phe-nomena occurring within the system, their interrela-tion and development, as well as the interaction ofthe system with external factors.
In order to develop the model, classicalme-thodsof background analysis were applied:
compilation of data from all types of eco-logical-geological works carried out on the territo-ry, and data on methods and technology of the de-posit exploitation (Bosevska and Mischenko, 2009;Bosevska, 2010; Khomenko, 2007; Yeschenko etal, 2011);
qualitative evaluation of the functionalproperties of rock salt, first of all, its protectabilityfrom technogenic karst (Cooper, 2002; Gutiérrez etal, 2008; Khrushchov et al, 2009, 2010);
assessment of the long-term geomechani-cal stability of mine workings system within saltbed, based on proven calculation methods (Sav-chenko and Seraya, 1970; Baryakh et al, 1996;Asanov, 2010; Metodicheskie, 1997; Moghadam,2012);
analysis of the results of prolonged localcomplex ecological-mining-geological monitoring(Lee and Sakalas, 2001; Brooks et al, 2006; Koro-lyov, 2007; Shefchik et al, 2011; Pringle et al,2012; Gessert, 2013; Cała et al, 2017; Desir, 2018);
ecological audit: identification of geologi-cal environment disturbances caused by salt massifdeformation; ecological risks evaluation and fore-
casting (Cooper, 2002; Khrushchov et al, 2010).Thedata for model development are as follows:
1 – the results of the series of the geologicalexploration, hydrogeological, karstological andgeophysical studies (PSA “Donbassgeology”, theUkrainian Salt Research Institute (USRI)) per-formed in the 1980s and 1990s due to the urgentneed to assess threats to infrastructure, namely: ofthe nearby railway section;
2 – the results of the integrated monitoringconducted by the USRI from the early 1980s in-cluding geomorphologic, hydrogeological (termi-nated after the stabilization of the hydrogeologicalsituation), hydrological and geomechanical obser-vations.
Hydrogeological works had been performedin a net of deep paired observation wells with a fullcycle of experimental work (17 wells in total).
Geomechanical monitoring is a traditionalinstrumental tracking of the Earth's surface subsi-dence using the system of ground levelling marksoriented along the observed levelled lines. Thistype of work is being carried out annually since1965 (since 1994 frequency is two times a year).The installation of instrument tracking lines, thevolume and composition of annual observations areperiodically adjusted and regulated by a number ofnormative documents and recommendations.
The basic postulate for assessing the situationand interpreting all initial data is the followingproved tenet: geological environment strainingalways accompanies the creation of engineer facili-ties in salt massifs. The main factors for assessmentof the strain are geomechanical and hydrogeologi-cal implying the development of man-made karst(Bosevska, 2010).
Deformations associated with salt karst candevelop only in the unprotected, from the aggres-sive waters penetration, parts of the salt massif(Khrushchov et al, 2009). The rate and trends ofthese deformations are important in understandingthe salt karst theory (Korotkevich, 1970).
The multi stage geomechanical deformationsalways take place during the transition of salt mas-sifs into a strained-deformed state due to high plas-tic properties and specific rheological characteris-tics of rock salt. The mechanical behavior of rocksalt in a strained state is very complex because ofits tendency to flow or creep when subjected to ashear stress. Rock salt creep property research hasbeen the subject of a large number of studies(Pfeifle and Senseny, 1982; Jeremic, 1994; Me-chanical, 2012; Cała, 2017 and others). As is wellknown, rock salt responds on loading with differentcreep rates (transient or steady) in a manner nearlyequivalent mechanically dependent upon the de-formation stage and the pillar loads. The creep rate
L. P. Bosevska, Anirban Chowdhury Journ.Geol.Geograph.Geoecology, 27(2), 184-201________________________________________________________________________________________________________________________________________________________________
190
may be large enough. The consequence of creepingis gradual compression of the bearing pillars in situ(reduction of their height and dilatancy), the inhe-rited shifting of the entire over-salt rock mass andthe subsidence of the Earth's surface. At the laststage of plastic deformations, creep is characterizedby accelerating creep rates and, finally, rock saltpillar failure by rupture. In plastic deformation, thecontinuity of the deformed pillars is maintained; inruptural deformation, bearing pillars is broken; apillar failure occurs and the TGS loses its continui-ty and stability. It may result in significant distur-bances of the geological environment, degradationof the Earth's surface with the corresponding threatsto the condition of terrestrial objects and the eco-logical balance of the territory overall (Brooks etal., 2006; Khrushchov,2014).
Taking into account the unique properties ofthe salt environment and its ability to change duringthe change of external factors without fracture, thestable condition of the TGS is the state of slow safeplastic deformations of the salt mass without dis-turbing its continuity, resulting in a slow safe sub-sidence of the Earth's surface (several mm peryear). The areas of the geological environment,which have lost integrity because of the develop-ment of destructive processes, are unsuitable forfurther use. Destructed parts of salt massif and ad-jacent geological environment are excluded frombeing further used.Results and Discussion. The ecological-mining-geological model of Shevchenko salt mine’s TGS.This TGS is composed of four large interconnectedelements: 1 – part of the salt bed (BB) containingthe mining workings; 2 – the geological environ-ment above the mine workings and within the zoneof the influence of mine workings; 3 – Earth’s sur-face over the mine field; 4 – surface watersrepresented by lakes in sinkholes (collapse craters).
The part of the salt bed (BB) containing themining workings. It includes 3 elements: 1 – voidspace (mine workings filled with brines); 2 – loadbearing pillars of rock salt; 3 – intact salt mass sur-rounding the mine workings.
1. Mine workings are located at a depth ofmore than 120 m (up to the roof) and are mostlydestroyed. To date, some mine workings are filledwith over-salt rocks caved in the worked-outrooms. The rest of the underground space of themine workings is filled with saturated chloride so-dium brines of mineralization up to 320 g/l being incongestive regime. Obviously, in the stable rooms,the cushions of trapped air are created at the roof.Since the roof of the flooded rooms is approximate-ly 50 m below the active water exchange zone,under the hydrogeological circumstances, minebrines cannot be involved in the active groundwatermovement; and expansion of mine workings con-
tour in terms of karst is impossible even hypotheti-cally. This is confirmed by the results of performedgeophysical studies.The hydraulical connection ofthe saturated mine brines and upper aquifers is one-way: the brines can penetrate the collapse cracksand enter into the upper aquifers due to extrusionduring rock collapse.
The flooding of the mine took a long time.The ratio of the volumes of mine workings andknown indicators of water inflows make it possibleto estimate that the mine flooding lasted about 10years at least. Flooding occurred by fresh and saltywaters through the mine shafts with a stable hydro-geological regime of incoming water, as the supply-ing aquifers had relatively stable hydrodynamic andhydrochemical parameters.
A feature of the flooding was the differentia-tion of the incoming water: fresh water was mainlyflowing along the main shaft # 1, while the saltywaters of the leaching zone came mainly along theshaft # 2. It led to the development of rapid techno-genic karst and leaching of the pillars bases (under-cutting them) near the shaft # 1 and the loss of theirbearing capacity. Therefore, the first sinkholearound the main shafts was formed a year after thebeginning of flooding.
At once, the mineralization increasing of in-coming fresh waters occurred directly near the mineshafts; and salty waters flowed the other parts ofmine field. Thus, in general, for the most part of theminefield, the flooding regime is defined as a gra-dual, uniformly time-based rise in the level of sal-tish water at a rate corresponding to the linear dis-solution rate of rock salt (Cherevko, 2006).
USRI investigated the influence of suchflooding regime on the state of mine workings andon the bearing capacity of the pillars after the com-pletion of flooding by the means of mathematicalmodeling by the finite element method and model-ing based on natural materials (rock salt of theBryantsevsky bed).
The results of complex modelling showed thefollowing: in the flooding process, uniform leach-ing of the lateral surface of the pillars took place;the depth of leaching penetration into the pillarmassif did not exceed 10% of its width. As a result,an insignificant change in strain tensor in the ele-ments of the bearing structure occurred: verticalstresses increased by 6%, horizontal stresses in-creased by 1.5 – 2.0%, maximum tangential onesincreased by 3%. In contexts of a slight decrease inthe pillars width and a slight increase in strains, thecalculated strength of the massif decreased by ap-proximately 15%, which could lead to a decrease inthe bearing capacity of the structure. However, thestudy of the influence of saturated brine on the pil-lars bearing capacity after completion of floodingshowed a significant increase in horizontal stresses
L. P. Bosevska, Anirban Chowdhury Journ.Geol.Geograph.Geoecology, 27(2), 184-201________________________________________________________________________________________________________________________________________________________________
191
while maintaining the distribution pattern of thevertical and maximum tangential stresses. It meansthat brine pressure on the pillar lateral surface con-tributed to the strengthening of the edge zone of thewhole pillars, since horizontal stresses in the pillarsbecame compressive ones under the effect of brine.The concentration coefficients of vertical stresseswere reduced by about 5% (Cherevko, 2006).
Thus, for the conditions of the Shevchenkomine, the uniform decrease in the pillars width iscompensated by the pressure of the saturated brineon their walls in a certain approximation.
It makes it possible to evaluate the bearingcapacity of the flooded mine structure without tak-ing into account the changes in the parameters dur-ing theflooding process and the pressure of thebrine.
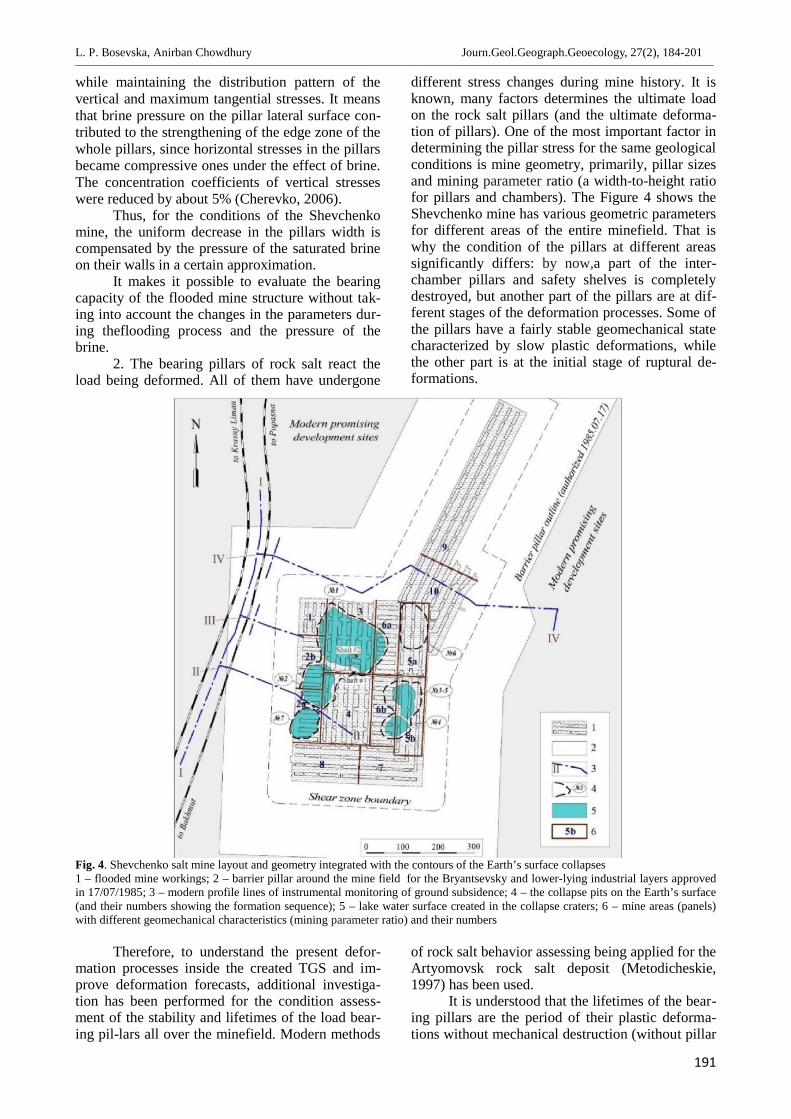
2. The bearing pillars of rock salt react theload being deformed. All of them have undergone
different stress changes during mine history. It isknown, many factors determines the ultimate loadon the rock salt pillars (and the ultimate deforma-tion of pillars). One of the most important factor indetermining the pillar stress for the same geologicalconditions is mine geometry, primarily, pillar sizesand mining parameter ratio (a width-to-height ratiofor pillars and chambers). The Figure 4 shows theShevchenko mine has various geometric parametersfor different areas of the entire minefield. That iswhy the condition of the pillars at different areassignificantly differs: by now,a part of the inter-chamber pillars and safety shelves is completelydestroyed, but another part of the pillars are at dif-ferent stages of the deformation processes. Some ofthe pillars have a fairly stable geomechanical statecharacterized by slow plastic deformations, whilethe other part is at the initial stage of ruptural de-formations.
Fig. 4. Shevchenko salt mine layout and geometry integrated with the contours of the Earth’s surface collapses1 – flooded mine workings; 2 – barrier pillar around the mine field for the Bryantsevsky and lower-lying industrial layers approvedin 17/07/1985; 3 – modern profile lines of instrumental monitoring of ground subsidence; 4 – the collapse pits on the Earth’s surface(and their numbers showing the formation sequence); 5 – lake water surface created in the collapse craters; 6 – mine areas (panels)with different geomechanical characteristics (mining parameter ratio) and their numbers
Therefore, to understand the present defor-mation processes inside the created TGS and im-prove deformation forecasts, additional investiga-tion has been performed for the condition assess-ment of the stability and lifetimes of the load bear-ing pil-lars all over the minefield. Modern methods
of rock salt behavior assessing being applied for theArtyomovsk rock salt deposit (Metodicheskie,1997) has been used.
It is understood that the lifetimes of the bear-ing pillars are the period of their plastic deforma-tions without mechanical destruction (without pillar
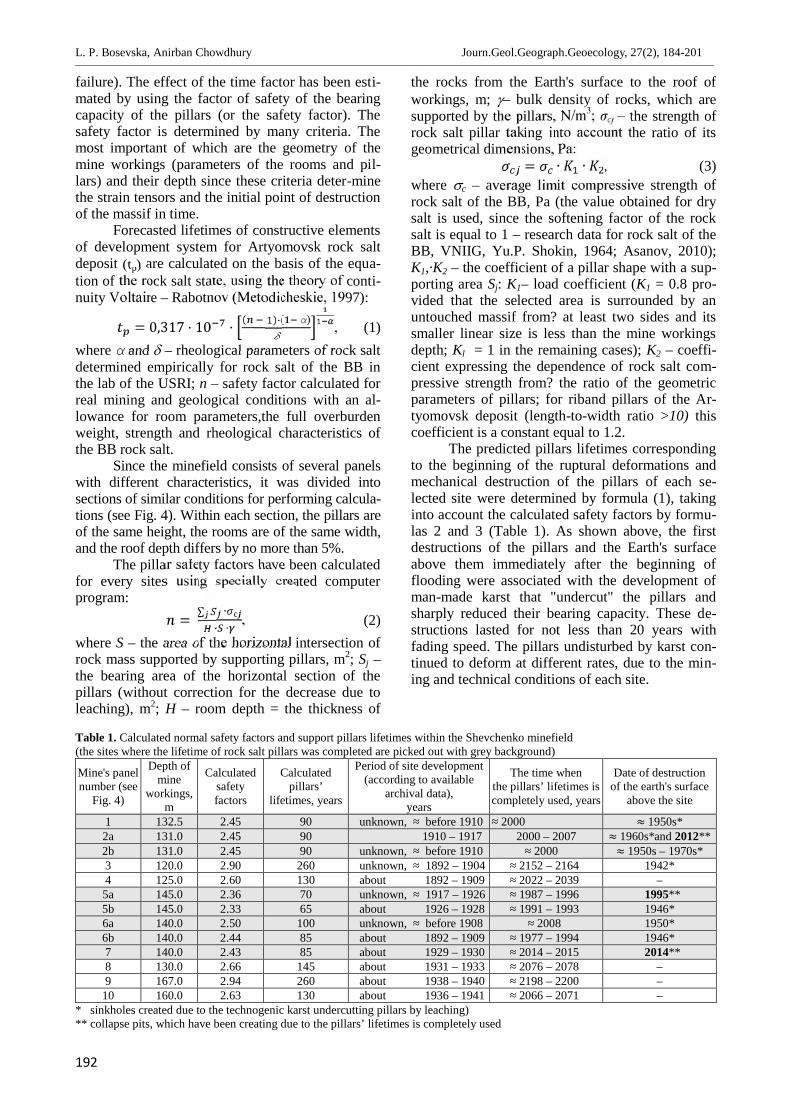
L. P. Bosevska, Anirban Chowdhury Journ.Geol.Geograph.Geoecology, 27(2), 184-201________________________________________________________________________________________________________________________________________________________________
192
failure). The effect of the time factor has been esti-mated by using the factor of safety of the bearingcapacity of the pillars (or the safety factor). Thesafety factor is determined by many criteria. Themost important of which are the geometry of themine workings (parameters of the rooms and pil-lars) and their depth since these criteria deter-minethe strain tensors and the initial point of destructionof the massif in time.
Forecasted lifetimes of constructive elementsof development system for Artyomovsk rock saltdeposit (tp) are calculated on the basis of the equa-tion of the rock salt state, using the theory of conti-nuity Voltaire – Rabotnov (Metodicheskie, 1997):= 0,317 · 10 · ( )·( α)
, (1)
where α and – rheological parameters of rock saltdetermined empirically for rock salt of the BB inthe lab of the USRI; n – safety factor calculated forreal mining and geological conditions with an al-lowance for room parameters,the full overburdenweight, strength and rheological characteristics ofthe BB rock salt.
Since the minefield consists of several panelswith different characteristics, it was divided intosections of similar conditions for performing calcula-tions (see Fig. 4). Within each section, the pillars areof the same height, the rooms are of the same width,and the roof depth differs by no more than 5%.
The pillar safety factors have been calculatedfor every sites using specially created computerprogram: = ∑ ∙ с∙ ∙ , (2)where S – the area of the horizontal intersection ofrock mass supported by supporting pillars, m2; Sj –the bearing area of the horizontal section of thepillars (without correction for the decrease due toleaching), m2; H – room depth = the thickness of
the rocks from the Earth's surface to the roof ofworkings, m; – bulk density of rocks, which aresupported by the pillars, N/m3; σcj – the strength ofrock salt pillar taking into account the ratio of itsgeometrical dimensions, Pа:= ∙ ∙ , (3)where с – average limit compressive strength ofrock salt of the BB, Pа (the value obtained for drysalt is used, since the softening factor of the rocksalt is equal to 1 – research data for rock salt of theBB, VNIIG, Yu.P. Shokin, 1964; Asanov, 2010);К1,·К2 – the coefficient of a pillar shape with a sup-porting area Sj: К1– load coefficient (K1 = 0.8 pro-vided that the selected area is surrounded by anuntouched massif from? at least two sides and itssmaller linear size is less than the mine workingsdepth; Kl = 1 in the remaining cases); К2 – coeffi-cient expressing the dependence of rock salt com-pressive strength from? the ratio of the geometricparameters of pillars; for riband pillars of the Ar-tyomovsk deposit (length-to-width ratio >10) thiscoefficient is a constant equal to 1.2.
The predicted pillars lifetimes correspondingto the beginning of the ruptural deformations andmechanical destruction of the pillars of each se-lected site were determined by formula (1), takinginto account the calculated safety factors by formu-las 2 and 3 (Table 1). As shown above, the firstdestructions of the pillars and the Earth's surfaceabove them immediately after the beginning offlooding were associated with the development ofman-made karst that "undercut" the pillars andsharply reduced their bearing capacity. These de-structions lasted for not less than 20 years withfading speed. The pillars undisturbed by karst con-tinued to deform at different rates, due to the min-ing and technical conditions of each site.
Table 1. Calculated normal safety factors and support pillars lifetimes within the Shevchenko minefield(the sites where the lifetime of rock salt pillars was completed are picked out with grey background)
Mine's panelnumber (see
Fig. 4)
Depth ofmine
workings,m
Calculatedsafetyfactors
Calculatedpillars’
lifetimes, years
Period of site development(according to available
archival data),years
The time whenthe pillars’ lifetimes iscompletely used, years
Date of destructionof the earth's surface
above the site
1 132.5 2.45 90 unknown, ≈ before 1910 ≈ 2000 ≈ 1950s*2а 131.0 2.45 90 1910 – 1917 2000 – 2007 ≈ 1960s*and 2012**2b 131.0 2.45 90 unknown, ≈ before 1910 ≈ 2000 ≈ 1950s – 1970s*3 120.0 2.90 260 unknown, ≈ 1892 – 1904 ≈ 2152 – 2164 1942*4 125.0 2.60 130 about 1892 – 1909 ≈ 2022 – 2039 –5а 145.0 2.36 70 unknown, ≈ 1917 – 1926 ≈ 1987 – 1996 1995**5b 145.0 2.33 65 about 1926 – 1928 ≈ 1991 – 1993 1946*6а 140.0 2.50 100 unknown, ≈ before 1908 ≈ 2008 1950*6b 140.0 2.44 85 about 1892 – 1909 ≈ 1977 – 1994 1946*7 140.0 2.43 85 about 1929 – 1930 ≈ 2014 – 2015 2014**8 130.0 2.66 145 about 1931 – 1933 ≈ 2076 – 2078 –9 167.0 2.94 260 about 1938 – 1940 ≈ 2198 – 2200 –
10 160.0 2.63 130 about 1936 – 1941 ≈ 2066 – 2071 –* sinkholes created due to the technogenic karst undercutting pillars by leaching)** collapse pits, which have been creating due to the pillars’ lifetimes is completely used
L. P. Bosevska, Anirban Chowdhury Journ.Geol.Geograph.Geoecology, 27(2), 184-201________________________________________________________________________________________________________________________________________________________________
193
As it can be seen in Table 1, by the begin-ning of 2000s the pillars’ lifetimes within the mostpart of the minefield were already completely usedor near completion. In this regard, a new series ofdestruction of the pillars and the formation of sur-face collapses began according to the geomechani-cal criterion. The destruction mechanism of thepillars and the all over-salt strata is described indetail in a number of works (Khrushchov et al,2010; Asanov, 2010; Khrushchov and Bosevska,2014). The main factor of destruction is the excessof rock pressure over the bearing capacity of therock massif. Destroyed rocks (rock salt and non-saltrocks overlying the BB) filled the conforming minerooms. In the next few years, the destruction of thepillars within the site # 7 will be completed, in afew more years the destruction of the central part ofthe minefield (site # 4), where the formation of avery large collapse is predicted, will begin. Sharpincrease of Earth’ surface subsidence rate over thismined-out area has already been determined by theresults of instrumental monitoring of ground shifts(see below).
It should be underline that the calculatedtime for finishing of the pillar’s lifetime (basic cal-culations were performed in 1990s) with great ac-curacy coincides with the time of large surface de-formations (including the collapse formation). It isa clear confirmation of the correctness of the ac-cepted methodological approach to ensure envi-ronmental safety during the Artyomovsk rock saltdeposit development. From the standpoint of mod-ern methodological approaches only support pillarswith safety factor 3.0 and more meet the criterionof ensuring long-term stability (300 years andmore) (Metodicheskie, 1997). From the standpointof modern methodological approaches only loadbearing pillars with safety factor 3.0 and more meetthe criterion of ensuring long-term stability (300years and more) (Metodicheskie, 1997). Modernmining areas are designed with safety factor 4.0 andmore, despite the fact that in consequence it leadsto decrease in the extraction ratio of rock salt.
The safety factors of the load-bearing capaci-ty of the Shevchenko mine’s pillars are predomi-nantly less than 3.0 with the exception of two sites(# 3 и # 9). However the site # 3 was destroyed inearly mine flooding (in 1942) due to leaching of thepillars bases near the mine shaft and the loss oftheir bearing capacity because of karst. Thereby, ifthe mine work-ings were not flooded and mineoperation continued, this mine would be in anemergency condition due to the loss of pillar sta-bility by the end of 1980s yet. In this case, the issueof measures developing to im-prove the pillars sta-bility (e.g. by the method of backfilled of mined-
out areas) or even mine abandonment (e.g. by me-thod of man-made flooding)would be up for debate.
3. The salt massif of the BB surrounding theminefield is not disturbed, stable and practicallydoes not suffer changes. It has been confirmed bygeophysical studies. Within the sections of the saltbed bordering the mined-out areas, the strain ten-sors are slightly modified, but it does not affect thestable time-dependent condition of the surroundingmassif as a whole. The karst processes are alsoexcluded because the leaching zone of the BB isremoved to the east of the mine workings outlinefor a distance of 1.8 – 2.5 km. In connection withthis, an increase in the minefield area is impossible.
The geological environment above the mineworkings. In the undisturbed state, it was composedof easily deformable or brittle rocks, which arealternation of karst cavernous gypsum, crackedanhydrite, siltstone, argillite and clay. These rocksare not able to form stable “bridges” over voids,and therefore are prone to rapid destruction inhe-rited from the destructed parts of the salt bed.
In this regard, the geological environmentsite in the impacted zone of the flooded mine issubject to complex technogenic disturbances, whichare 1. Mechanical, 2. Hydrogeological, and 3. Geo-chemical (Khrushchov, et al, 2010).
1. 1. The mechanical disturbances include thefollowing processes: large vertical shifts of rockslabs, crack growth, and crushing and grinding ofthe rock. Disruptive disturbances are activated cy-clically and usually accompany the rock salt pillarscollapse with a possible slight backlog in time(from several days to several months). The mainacting factor for mechanical disturbances is theaction of overburden pressure.
The long deformational processes occurringinside the rock mass are very uneven in area extentand over time. It is due to the difference in the bear-ing capacity of rock salt pillars. After failure of thebearing support, the accumulation of stress in therock mass over the formed cavities occurs beforethe threshold limit of the geomechanical stability isreached, after which ruptural deformation of a cor-responding block of the overlying rock mass be-gins.
To date, the entire massif of rocks over theminefield has been degraded; it has lost continuityand is divided into separate blocks with differentvarying geodynamic characteristics. Seismic explo-ration has showed that the largest disturbances inthe massif are the system of deep subvertical crackssep-arating large rock blocks. The mechanisms ofdeformation in each block differ somewhat depend-ing on its position in the geological cross-section
L. P. Bosevska, Anirban Chowdhury Journ.Geol.Geograph.Geoecology, 27(2), 184-201________________________________________________________________________________________________________________________________________________________________
194
and deformation dynamics. With instant verticalmovements such as natural vertical fault, someblocks still retain the primary layered structure.However, predomi-nantly every block are com-posed of shattered and redeployed rocks.
Deformations of the overlying rocks aregreatly enhanced in connection with the ongoinggeneral process of rock shifting (subsidence) as aresult of plastic compression deformation of theremaining ("working") rock salt pillars. These de-formations are also unevenly redistributed over thearea due to different safety factors at different partsof the minefield ranging from 2.45 to 2.9 (see Table1). Various deformation mechanisms of the overly-ing strata at the boundary of these blocks are supe-rimposed with a cumulative effect.
Described condition of the overlying stratawithin the Shevchenko TGS is confirmed by allkinds of geophysical studies: gravitational and elec-tric fields show instability, noticeable changes with-in the zones of increased cracking and indicate thecontinuing loss of continuity of rocks with differentdynamic.
It should be mentioned in natural undisturbedconditions, there was gypsum karst in this area. Wecannot deny the gypsum karst development now;however, it is obviously that changed local geologi-cal conditions do not promote gypsum karstprocesses, but slow down them. Therefore, the for-mation of large cavities associated with gypsumkarst is practically excluded (Cooper, 1996; Coop-er, 2002).
2. Hydrogeological disturbances in the over-lying strata are secondary. They arose because ofthe disruption of the massif continuity as a result ofwhich the entire strata of rocks inside the TGS werepractically devoid of waterproof properties. Thedestroyed rock mass comprises a unified aquifersystem. The active water exchange zone is abovethe mine workings by 40 – 50 m; it does not affectthe flooded mine workings. The main stream of thegroundwater is subhorizontal and directed to north-west toward the flood plain of the Bakhmut River(see Fig. 1). Its recharge is predominantly water ofnatural aquifers preserved outside the TGS. Hy-draulic connection between the active water ex-change zone and saturated salt water in the mine isone-way: the periodic upward flow of brines fromthe mine workings occurs because of extrusion bythe subsiding rock strata and collapsed rocks. Re-verse movement of aggressive water from the aqui-fer system toward the mine workings is impossiblebecause of the lack of drainage conditions (Ko-rotkevich, 1970). In case of huge collapses, satu-rated brines can rise up to the surface and drain intothe lake basins (this process is described below).
3. Geochemical disturbances of the geologi-cal environment are associated with the periodicextrusion of saturated brines from the flooded mineworkings. Ecological damage is minimal, sinceunder-ground waters in the natural state are alsomineralized because of salt and gypsum karst. Inaddition, as noted above, an aquifer support withhighly mineralized brines of the leaching zone ofthe Above-Bryantsevsky bed takes place. The mi-neralization of the waters ranges from 156.3 to310.0 g / l, so drainage of brines from TGS intoadjacent aquifers westerly has practically no effecton the resulting chemical characteristics of naturalaquifers. Nevertheless, by the results of calculationusing the Dupuy formula the total removal of readi-ly soluble salts from the TGS is about 220 tons /year.
Earth’s surface over the minefield. Beforethe flooding of the mine began, the relief of theEarth’s surface was flat, slightly hilly. The ongoingdeformations of the rock mass are provoking a con-stant change in the geomorphological appearance ofthe over-mine area. Currently all surface deforma-tions are associated with the uneven rock salt pil-lars’ deformations and the inherited collapse of theoverlying strata. The surface shapes clearly reflectlarge deep deformations due to the geological fea-tures of the rocks (predominantly loose deposits).Only little localized deep collapses could occurwithout clear evidence at the surface. Therefore,monitoring of the surface condition permits control-ling of the deep processes with a high degree ofaccuracy.
The surface condition monitoring includes ageomorphological monitoring and an instrumentalsubsidence monitoring, which were being per-formed for more than 50 years. The results of sucha monitoring adequately characterize the develop-ment of surface deformations in terms of area, theirspatial-temporal patterns, dynamics and the defor-mation style (Desir, 2018).
Geomorphological monitoring allows us totrack the ongoing progressive degradation of thesurface within the area, which is the projection ofthe mine workings on the surface. At the presenttime, the Earth’s surface is intensely dissected; by2018, there are seven major collapse pits and sev-eral pronounced depressions. The approximate di-mensions of the largest collapse in the area of theshafts (# 1, see Fig. 3) are 115 m × 175 m. Themain geomorphological forms of relief clearly re-flecting deeper deformations are as follows: saucer-shaped depressions of the surface, subsidence nar-row gullies, large fracture cracks, finally, collapsepits with abrupt sides (Fig. 5). The lithologicalcomposition of Quaternary sediments (mainly redclays and loams) also predetermined the formationof second-order geo-morphological elements. Their
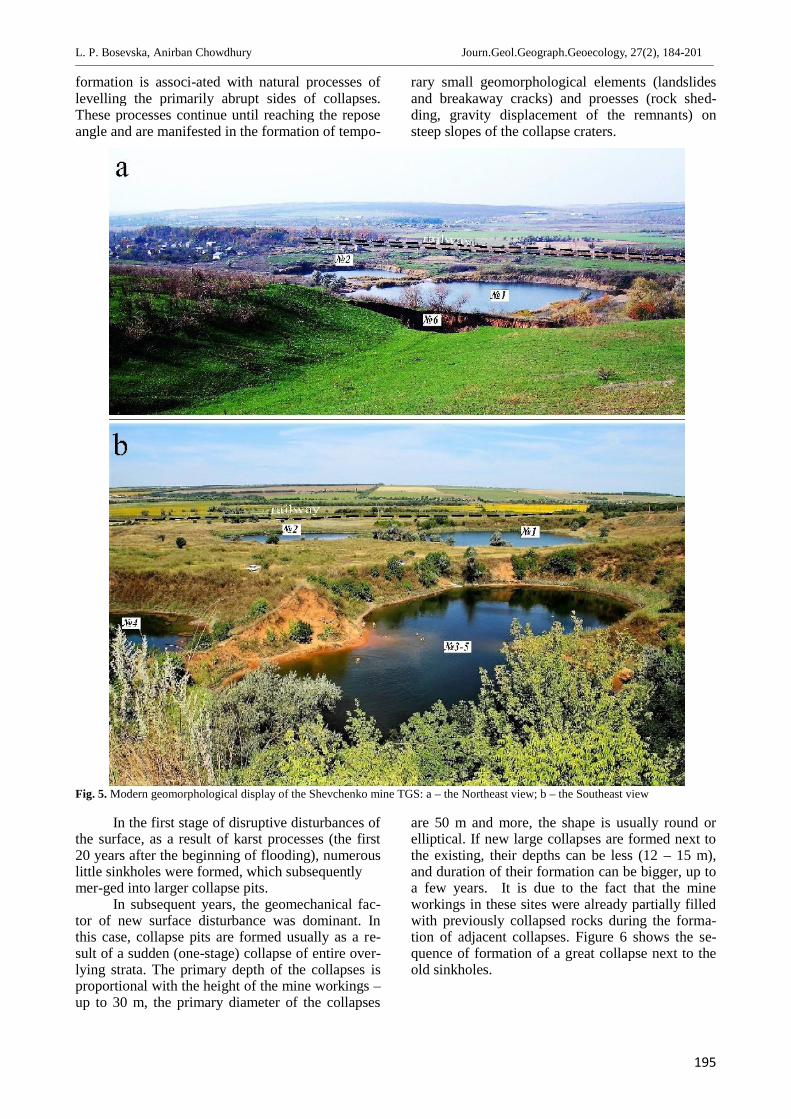
L. P. Bosevska, Anirban Chowdhury Journ.Geol.Geograph.Geoecology, 27(2), 184-201________________________________________________________________________________________________________________________________________________________________
195
formation is associ-ated with natural processes oflevelling the primarily abrupt sides of collapses.These processes continue until reaching the reposeangle and are manifested in the formation of tempo-
rary small geomorphological elements (landslidesand breakaway cracks) and proesses (rock shed-ding, gravity displacement of the remnants) onsteep slopes of the collapse craters.
Fig. 5. Modern geomorphological display of the Shevchenko mine TGS: a – the Northeast view; b – the Southeast view
In the first stage of disruptive disturbances ofthe surface, as a result of karst processes (the first20 years after the beginning of flooding), numerouslittle sinkholes were formed, which subsequentlymer-ged into larger collapse pits.
In subsequent years, the geomechanical fac-tor of new surface disturbance was dominant. Inthis case, collapse pits are formed usually as a re-sult of a sudden (one-stage) collapse of entire over-lying strata. The primary depth of the collapses isproportional with the height of the mine workings –up to 30 m, the primary diameter of the collapses
are 50 m and more, the shape is usually round orelliptical. If new large collapses are formed next tothe existing, their depths can be less (12 – 15 m),and duration of their formation can be bigger, up toa few years. It is due to the fact that the mineworkings in these sites were already partially filledwith previously collapsed rocks during the forma-tion of adjacent collapses. Figure 6 shows the se-quence of formation of a great collapse next to theold sinkholes.
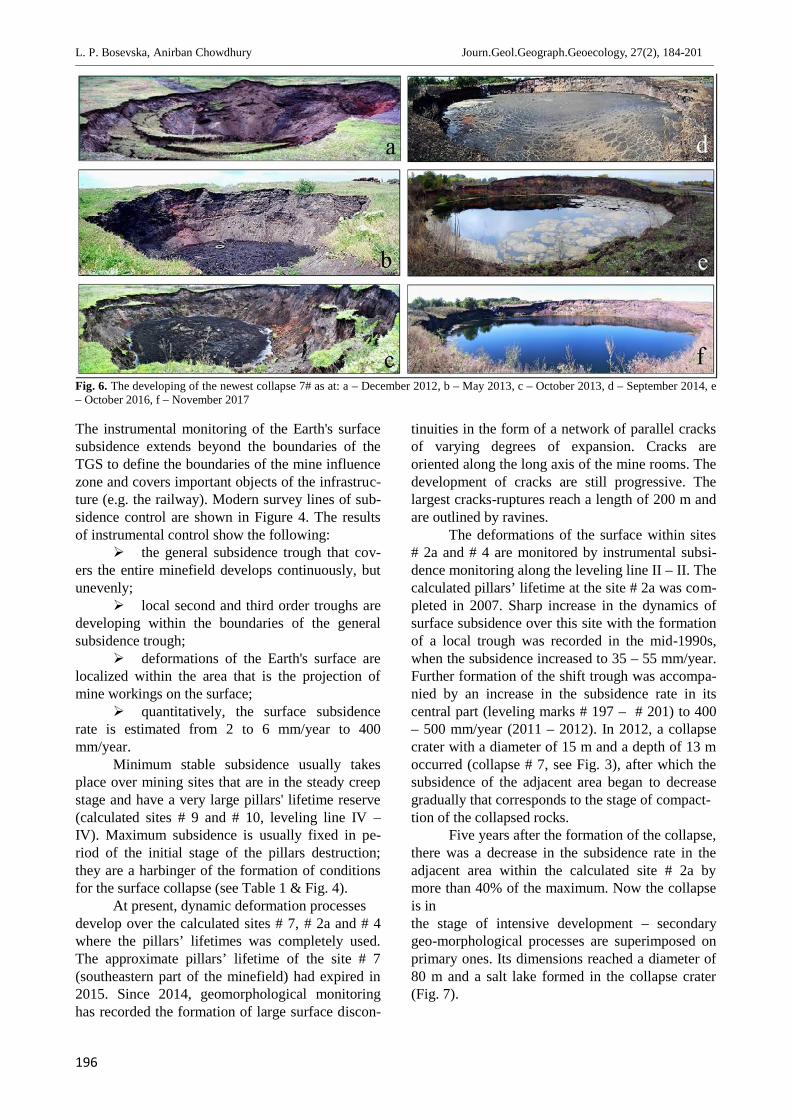
L. P. Bosevska, Anirban Chowdhury Journ.Geol.Geograph.Geoecology, 27(2), 184-201________________________________________________________________________________________________________________________________________________________________
196
Fig. 6. The developing of the newest collapse 7# as at: a – December 2012, b – May 2013, c – October 2013, d – September 2014, e– October 2016, f – November 2017
The instrumental monitoring of the Earth's surfacesubsidence extends beyond the boundaries of theTGS to define the boundaries of the mine influencezone and covers important objects of the infrastruc-ture (e.g. the railway). Modern survey lines of sub-sidence control are shown in Figure 4. The resultsof instrumental control show the following:
the general subsidence trough that cov-ers the entire minefield develops continuously, butunevenly;
local second and third order troughs aredeveloping within the boundaries of the generalsubsidence trough;
deformations of the Earth's surface arelocalized within the area that is the projection ofmine workings on the surface;
quantitatively, the surface subsidencerate is estimated from 2 to 6 mm/year to 400mm/year.
Minimum stable subsidence usually takesplace over mining sites that are in the steady creepstage and have a very large pillars' lifetime reserve(calculated sites # 9 and # 10, leveling line IV –IV). Maximum subsidence is usually fixed in pe-riod of the initial stage of the pillars destruction;they are a harbinger of the formation of conditionsfor the surface collapse (see Table 1 & Fig. 4).
At present, dynamic deformation processesdevelop over the calculated sites # 7, # 2a and # 4where the pillars’ lifetimes was completely used.The approximate pillars’ lifetime of the site # 7(southeastern part of the minefield) had expired in2015. Since 2014, geomorphological monitoringhas recorded the formation of large surface discon-
tinuities in the form of a network of parallel cracksof varying degrees of expansion. Cracks areoriented along the long axis of the mine rooms. Thedevelopment of cracks are still progressive. Thelargest cracks-ruptures reach a length of 200 m andare outlined by ravines.
The deformations of the surface within sites# 2a and # 4 are monitored by instrumental subsi-dence monitoring along the leveling line II – II. Thecalculated pillars’ lifetime at the site # 2a was com-pleted in 2007. Sharp increase in the dynamics ofsurface subsidence over this site with the formationof a local trough was recorded in the mid-1990s,when the subsidence increased to 35 – 55 mm/year.Further formation of the shift trough was accompa-nied by an increase in the subsidence rate in itscentral part (leveling marks # 197 – # 201) to 400– 500 mm/year (2011 – 2012). In 2012, a collapsecrater with a diameter of 15 m and a depth of 13 moccurred (collapse # 7, see Fig. 3), after which thesubsidence of the adjacent area began to decreasegradually that corresponds to the stage of compact-tion of the collapsed rocks.
Five years after the formation of the collapse,there was a decrease in the subsidence rate in theadjacent area within the calculated site # 2a bymore than 40% of the maximum. Now the collapseis inthe stage of intensive development – secondarygeo-morphological processes are superimposed onprimary ones. Its dimensions reached a diameter of80 m and a salt lake formed in the collapse crater(Fig. 7).
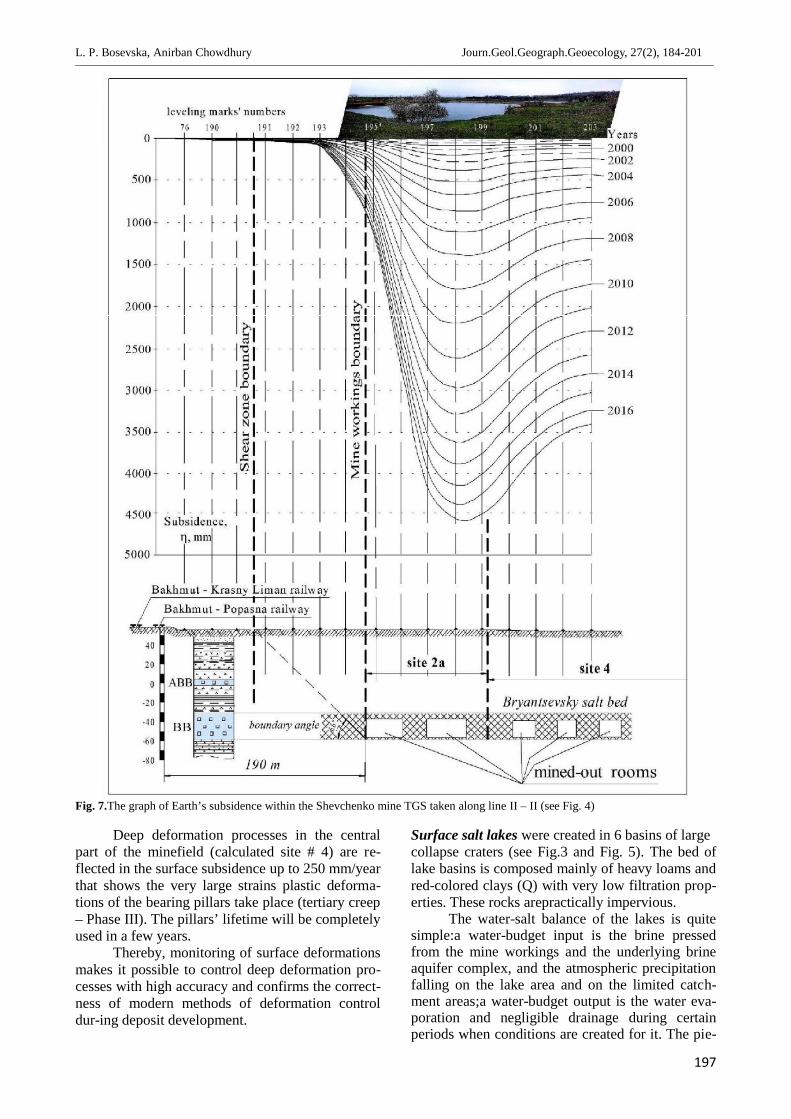
L. P. Bosevska, Anirban Chowdhury Journ.Geol.Geograph.Geoecology, 27(2), 184-201________________________________________________________________________________________________________________________________________________________________
197
Fig. 7.The graph of Earth’s subsidence within the Shevchenko mine TGS taken along line ΙΙ – II (see Fig. 4)
Deep deformation processes in the centralpart of the minefield (calculated site # 4) are re-flected in the surface subsidence up to 250 mm/yearthat shows the very large strains plastic deforma-tions of the bearing pillars take place (tertiary creep– Phase III). The pillars’ lifetime will be completelyused in a few years.
Thereby, monitoring of surface deformationsmakes it possible to control deep deformation pro-cesses with high accuracy and confirms the correct-ness of modern methods of deformation controldur-ing deposit development.
Surface salt lakes were created in 6 basins of largecollapse craters (see Fig.3 and Fig. 5). The bed oflake basins is composed mainly of heavy loams andred-colored clays (Q) with very low filtration prop-erties. These rocks arepractically impervious.
The water-salt balance of the lakes is quitesimple:a water-budget input is the brine pressedfrom the mine workings and the underlying brineaquifer complex, and the atmospheric precipitationfalling on the lake area and on the limited catch-ment areas;a water-budget output is the water eva-poration and negligible drainage during certainperiods when conditions are created for it. The pie-
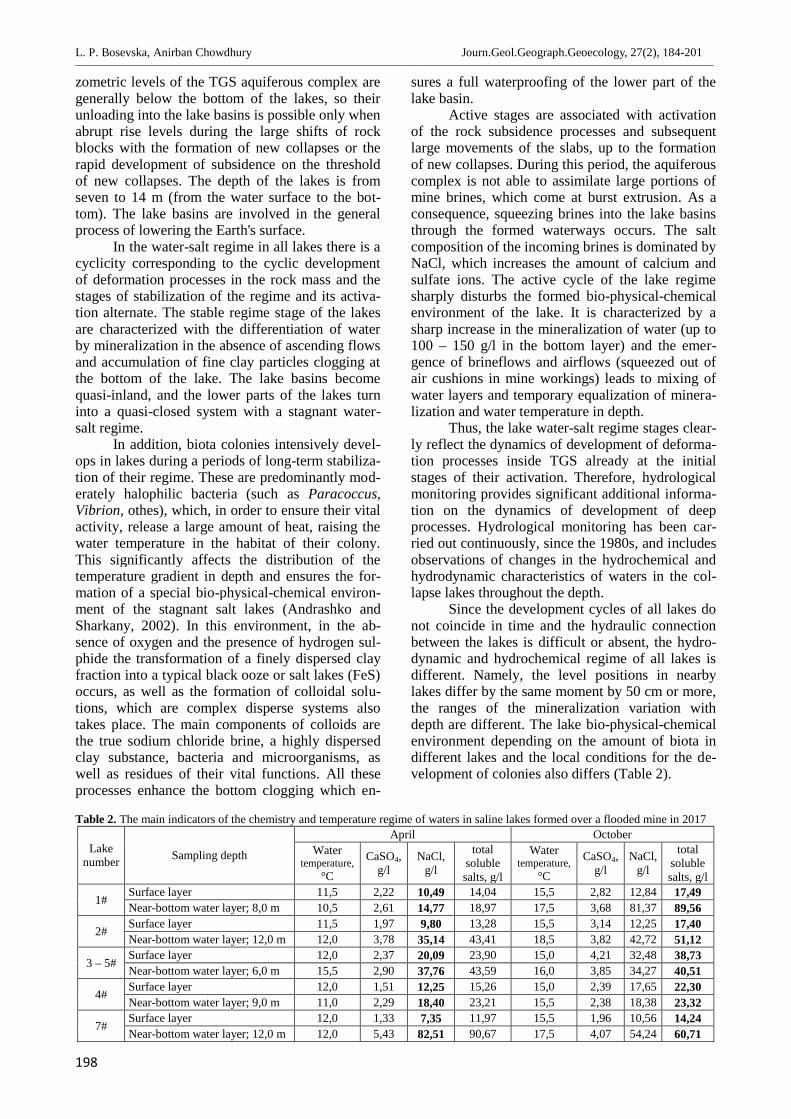
L. P. Bosevska, Anirban Chowdhury Journ.Geol.Geograph.Geoecology, 27(2), 184-201________________________________________________________________________________________________________________________________________________________________
198
zometric levels of the TGS aquiferous complex aregenerally below the bottom of the lakes, so theirunloading into the lake basins is possible only whenabrupt rise levels during the large shifts of rockblocks with the formation of new collapses or therapid development of subsidence on the thresholdof new collapses. The depth of the lakes is fromseven to 14 m (from the water surface to the bot-tom). The lake basins are involved in the generalprocess of lowering the Earth's surface.
In the water-salt regime in all lakes there is acyclicity corresponding to the cyclic developmentof deformation processes in the rock mass and thestages of stabilization of the regime and its activa-tion alternate. The stable regime stage of the lakesare characterized with the differentiation of waterby mineralization in the absence of ascending flowsand accumulation of fine clay particles clogging atthe bottom of the lake. The lake basins becomequasi-inland, and the lower parts of the lakes turninto a quasi-closed system with a stagnant water-salt regime.
In addition, biota colonies intensively devel-ops in lakes during a periods of long-term stabiliza-tion of their regime. These are predominantly mod-erately halophilic bacteria (such as Paracoccus,Vibrion, othes), which, in order to ensure their vitalactivity, release a large amount of heat, raising thewater temperature in the habitat of their colony.This significantly affects the distribution of thetemperature gradient in depth and ensures the for-mation of a special bio-physical-chemical environ-ment of the stagnant salt lakes (Andrashko andSharkany, 2002). In this environment, in the ab-sence of oxygen and the presence of hydrogen sul-phide the transformation of a finely dispersed clayfraction into a typical black ooze or salt lakes (FeS)occurs, as well as the formation of colloidal solu-tions, which are complex disperse systems alsotakes place. The main components of colloids arethe true sodium chloride brine, a highly dispersedclay substance, bacteria and microorganisms, aswell as residues of their vital functions. All theseprocesses enhance the bottom clogging which en-
sures a full waterproofing of the lower part of thelake basin.
Active stages are associated with activationof the rock subsidence processes and subsequentlarge movements of the slabs, up to the formationof new collapses. During this period, the aquiferouscomplex is not able to assimilate large portions ofmine brines, which come at burst extrusion. As aconsequence, squeezing brines into the lake basinsthrough the formed waterways occurs. The saltcomposition of the incoming brines is dominated byNaCl, which increases the amount of calcium andsulfate ions. The active cycle of the lake regimesharply disturbs the formed bio-physical-chemicalenvironment of the lake. It is characterized by asharp increase in the mineralization of water (up to100 – 150 g/l in the bottom layer) and the emer-gence of brineflows and airflows (squeezed out ofair cushions in mine workings) leads to mixing ofwater layers and temporary equalization of minera-lization and water temperature in depth.
Thus, the lake water-salt regime stages clear-ly reflect the dynamics of development of deforma-tion processes inside TGS already at the initialstages of their activation. Therefore, hydrologicalmonitoring provides significant additional informa-tion on the dynamics of development of deepprocesses. Hydrological monitoring has been car-ried out continuously, since the 1980s, and includesobservations of changes in the hydrochemical andhydrodynamic characteristics of waters in the col-lapse lakes throughout the depth.
Since the development cycles of all lakes donot coincide in time and the hydraulic connectionbetween the lakes is difficult or absent, the hydro-dynamic and hydrochemical regime of all lakes isdifferent. Namely, the level positions in nearbylakes differ by the same moment by 50 cm or more,the ranges of the mineralization variation withdepth are different. The lake bio-physical-chemicalenvironment depending on the amount of biota indifferent lakes and the local conditions for the de-velopment of colonies also differs (Table 2).
Table 2. The main indicators of the chemistry and temperature regime of waters in saline lakes formed over a flooded mine in 2017
Lakenumber Sampling depth
April OctoberWater
temperature,°С
CaSO4,g/l
NaCl,g/l
totalsolublesalts, g/l
Watertemperature,
°С
CaSO4,g/l
NaCl,g/l
totalsolublesalts, g/l
1#Surface layer 11,5 2,22 10,49 14,04 15,5 2,82 12,84 17,49Near-bottom water layer; 8,0 m 10,5 2,61 14,77 18,97 17,5 3,68 81,37 89,56
2# Surface layer 11,5 1,97 9,80 13,28 15,5 3,14 12,25 17,40Near-bottom water layer; 12,0 m 12,0 3,78 35,14 43,41 18,5 3,82 42,72 51,12
3 – 5#Surface layer 12,0 2,37 20,09 23,90 15,0 4,21 32,48 38,73Near-bottom water layer; 6,0 m 15,5 2,90 37,76 43,59 16,0 3,85 34,27 40,51
4# Surface layer 12,0 1,51 12,25 15,26 15,0 2,39 17,65 22,30Near-bottom water layer; 9,0 m 11,0 2,29 18,40 23,21 15,5 2,38 18,38 23,32
7#Surface layer 12,0 1,33 7,35 11,97 15,5 1,96 10,56 14,24Near-bottom water layer; 12,0 m 12,0 5,43 82,51 90,67 17,5 4,07 54,24 60,71
L. P. Bosevska, Anirban Chowdhury Journ.Geol.Geograph.Geoecology, 27(2), 184-201________________________________________________________________________________________________________________________________________________________________
199
Nevertheless, for regimes of all lakes, thegeneral patterns are noted: the same seasonal fluc-tuations in water levels, the increase in mineraliza-tion with depth and in the seasonal cycle fromspring to autumn, the direction of the temperaturegradient is increasing towards the top directionduring warm season and increasing towards bottomduring clod season.
At different stages of lakes development, themineralization of waters on the lakesurfaces varybetween 0.4 and 120 g/l, and at a depth of 7.0 – 144g/l. During the entire monitoring period, the highestmineralization was recorded in the bottom layers oflake # 3 (160 g/l). At the same time, the highestwater temperature at the bottom was + 29oC, whilethe surface water temperature was 17oC (long-termstabilization period). In each time, the highest mi-neralization is characteristic of lakes located withinan actively deformable area. For example, as of2017, the highest salinity of the bottom layer wasrecorded in lake # 7, which formed at the end(2012), the rock mass site under the lake basin re-mains in the stage of slow progressive deformations(see Table 2, fig. 6).
It occurs owing to the rise in level during thehigh water period and the possible emergence ofconditions for drainage through non-clogging sidesof the collapse (contain thin sand interlayers), theincreasing dilution with fresh atmospheric waterduring expansion of the collapse pit due and thedischarge of low-yield aquifers in some areas (e.g.the eastern side of the collapse # 3, where a freshwater source is periodically formed). The averageseasonal fluctuations in the water level in the saltlakes are 0.35 m with a range of variations from0.20 to 0.55 m.
Accordingly, despite the spatial proximity ofall lakes there is a difference in the bio-physical-chemical environment in each of the salt lake. Anychanges in this environment are also a “litmus test”for predicting deformational processes at depth.Conclusion. Within the territory of the abandonedflooded Shevchenko salt mine, the labile quasi-closed technogenic geological system (TGS) hasbeen formed in which long-term, multi-active de-structive processes are occurring. The TGS is lim-ited in area by a nominal enclosed vertical surface,the projection of which coincides with the shearzone boundary. At the bottom the TGS is limited bythe base of the spent Bryantsevsky bed.
The driving force of TGS development is theprocesses of salt massif degradation up to mechani-cal destruction of the rock salt pillars within theminefield, provoked by hydrogeological and geo-mechanical factors in series.
All internal elements of the system have astable one-way connection directed from the bot-tom up to the earth's surface. The deformationprocesses are localized within the created system.They do not practically influence the geo-ecological situation beyond its borders. The bindingof TGS and the surrounding rock mass is only car-ried out through the aquifers in the middle part ofthe geological section. Some removal of salts fromthe system is assimilated by the natural brine aqui-fer of the leaching zone of the overlying Above-Bryantsevsky salt bed, which adjoins it from thewest closely.
The result of the formation and developmentof the system is a long destabilization of the reliefof the Earth's surface and the formation of uniquelakes in the water-salt regime. The active processesof discontinuous deformations and surface col-lapses will continue unevenly for several tens ofyears.The deformation processes is expected tocomplete within a time period of 200 years or more.During this period of 200 years the first 50 – 60years of them are an active period of collapse de-velopment in the main isometric part of the mine-field. In this period, the geological environment andthe Earth's surface within the TGS completely loos-es their utility for any purposes however the like-lihood of creating a threat to the nearby railwaysection is negligible.
On the one hand, the described deformationprocesses are typical for the flooded salt minesareas where the supporting rock salt pillars losttheir stability. On the other hand, a combination ofmining and geological factors has led to the crea-tion of rather unique conditions, when all the nega-tive effects have been localized within the system;while on the surface the salt lakes with a uniquebio-physical-chemical environment have beenformed. The unusual regime of the lakes with un-expected temperature changes and variable minera-lization with the presence of colloids are of greatmedia interest.
The performed assessment of the dynamicsof the system development in time confirms thecor-rectness of the taken methodical approach tocontrol mechanical behavior of salt during the Ar-tyomovsk rock salt deposit development. In addi-tion, the results of the investigations can be used toimprove the methodology of salt mining in terms ofdecreasing of environmental risks in the denselypopulated areas overall as well as to develop ofalternate improved safe room-and-pillar mininggeometries that provide higher salt extraction whilemaintaining an appropriate safety factor for this andother rock salt deposits.
L. P. Bosevska, Anirban Chowdhury Journ.Geol.Geograph.Geoecology, 27(2), 184-201________________________________________________________________________________________________________________________________________________________________
200
Acknowledgements.The authors express their deeprespect and gratitude to the author of the method ofscientific control of rock mass deformations duringthe Artyomovsk rock salt deposit development, theformer USRI employee Seraya Alla Romanovna aswell as to all authors of works dealing with thedeformations of salt strata under the techno-genicimpact on them and their monitoring, which wasused in this work. In addition, we appreciate to theState Enterprise ARTYOMSOL, which continu-ously finances scientific and monitoring workswithin the territory of the abandoned Shevchenkomine for 40 years.
References
Andrashko, Iu.V., Sharkany, I.P., 2002. Halofilni bakte-rii ozera Kunihunda – ekzohennyi fotosensybili-zator [The halophilic bacteria of Kunihunda Lakeis the exogenic fotosensibilizer]. Ukr. journ. ofDermatology, Venereology, Cosmetology, 2, 6 –8 (in Ukrainian).
Asanov, V.A., Ievseev, A.V., 2010. Vliyanie rassolov namekhanicheskiye svoistva solyanykh porod[Brines influence on mechanical properties ofrock salt]. Mining information-analitical bulletin,2, 363 – 366 (in Russian) = http://www.giab-online.ru/files/Data/2010/2/Asanov_2_2010.pdf
Baryakh, A.А., Konstantinova, S.A., Asanov, V.A.,1996. Deformirovaniye solyanykh porod [Saltrocks deforming]. Iekaterinburg: Mining Instituteof RAS, 203 p. (in Russian).
Bosevska,L.P., Mishchenko, S.I., 2009. Vykonanniadoslidzhen z otsinky vplyvu diialnosti solianykhpidpryiemstv Ukrainy na navkolyshnie pryrodneseredovyshche ta rozrobka naukovo obgruntova-nykh rekomendatsii i inzhenernykh propozytsiishchodo polipshennia ekolohichnoho stanu tery-torii solianykh vyrobnytstv[Carrying out researchfor the evaluation of environmental impact of theUkrainian salt mining activities and developingscientifically grounded recommendations and en-gineering proposals to improve the environmentof salt production areas]. Ukr. Salt Research Insti-tute, research report, 95/4, SR 0108U006372,arch. 7125, Artyomovsk (Bakhmut), 185 p. (inUkrainian).
Bosevska, L.P., 2010. Osnovnye printsipy inzhenerno-heolohicheskoi otsenki solyanykh massivov, is-pol’zovanie ikh kak sredy dlya sooruzheniya pod-zemnykh ob’iektov razlychnoho naznacheniya[Basic principles of salt masses engineering-geological evaluation to use them as an environ-ment for creation of multipurpose undergroundfacilities]. Bul. of the Dnipropetr. Univ. Ser.Geol. Geogr., 12, 95 – 105 (in Russian).
Brooks, T.G., o'Riordan, N.J., Bird, J.F., Stirling, R. &Billington, D., 2006. Stabilisation of abandonedsalt mines in North West England. The Geologi-cal Society of London. IAEG2006 Paper number781.
Cała, M., Tajduś, A., Andrusiewicz, W., Kowalski, M.,Kolano, M., Stopkowicz, A., Cyran, K. ,Jakobczyk, J., 2017. Long term analysis of de-formations in salt mines: KŁODAWA salt mine.Case study, Central Poland. Arch. Min. Sci. 62(2017), 3, 565 – 577, doi: 10.1515/amsc-2017-0041
Cherevko, P. I., 2006. Vykonannia kompleksu doslidz-hen z otsinky vplyvu hirnychykh vyrobok solia-nykh shakht na stan zemnoi poverkhni i pidho-tovka naukovo obhruntovanykh rekomendatsii zkonservatsii ta likvidatsii vidpratsovanykh dilia-nok ta shakht z minimalnym vplyvom na dovkil-lia [The accomplishment of complex researchworks to evaluate the salt mines influence on theEarth’s surface condition; the preparation of sci-entifically-based recommendations for the con-servation of the mined-out areas and mine aban-donment with minimal environmental impact].Ukr. Salt Research Institute, research report,6.05.18, SR 0107U006491, Artyomovsk(Bakhmut), 136 p. (in Ukrainian).
Cooper, Anthony H., 1996. Gypsum karst of Great Brit-ain. International Journal of Speleology, 25 (3-4),195 – 202, doi: 10.5038/1827-806X.25.3.14
Cooper, A. H., 2002. Halite karst geohazards (naturaland man-made) in the United Kingdom. Envi-ronmental Geology, 42, 505 – 512.
Cooper, Anthony H., 2002. Environmental problemscaused by gypsum karst and salt karst in GreatBritain. Carbonates and Evaporites, vol. 17, 2,116 – 120, doi: 10.1007 /BF03176477
Desir, G., Gutiérrez, F., Merino, J., Carbonel, D., Benito-Calvo, A., Guerrero, J., Fabregat, I., 2018. Rapidsubsidence in damaging sinkholes: Measurementby high-precision leveling and the role of salt dis-solution. Geomorphology, vol. 303, 15 February2018, 393 – 409, doi:10.1016/j.geomorph.2017.12.004
Gessert Astrid, Schicht Thomas, 2013. Seismologicaland geotechnical long-term monitoring of anabandonedpotash mine. K-UTEC AG Salt Tech-nologies. – https://www.k-utec.de/fileadmin/redakteur/GY/Dokumente/Artikel_seismic_monitoring_FB_052013.pdf
Gutiérrez, F, Johnson, Kenneth, Cooper, Anthony, 2008.Evaporite-karst processes, landforms, and envi-ronmental problems. Environmental Geology, 53(5), 935 – 936, doi: 10.1007/s00254-007-0715-9
Jeremic, Michael L. 1994. Rock mechanics in salt min-ing. – Laureutian University, Sudbury, Canada. –Rotterdam, Brookfield, VT: Balkema; 532 p.,ISBN-13: 978-9054101031.
Karimi-Jafari, M., Bérest, P., Brouard, B. 2008. Subsi-dence, Sinkholes and Craters above Salt Caverns.SMRI Spring Technical Conference, Porto, Por-tugal, 269 – 278. = http://www.brouard-consulting.com/sites/default/files/Karimi_et_al-Porto-2008.pdf
Khomenko, О. Ye, 2007. Sinergetika v upravlenii sosto-janiem massiva gornych porod [Synergetics usingin management of rocks mass state]. Retrieved
L. P. Bosevska, Anirban Chowdhury Journ.Geol.Geograph.Geoecology, 27(2), 184-201________________________________________________________________________________________________________________________________________________________________
201
from http://www.rudana.in.ua/sinergetika.htm(accessed 07.04.2017) (in Russian)
Khrushchov, D.P., Bosevska, L.P., Kyrpach, Yu.V.,Stepanyuk, O.V., 2009. Metodolohichni ta prak-tychni aspekty vyznachennia zakhyshchenosti so-lianykh tovshch [Metodological and practical as-pects of salt strata vulnerability definition]. Proc.5th Int. Scient.-Practical Conf. “Ecological safety:the problems and solution ways”. Kharkiv, Raid-er, vol. 1, 99 – 104 (in Ukrainian)
Khrushchov, D.P., Bosevska, L.P., Kyrpach, Yu.V.,Stepanuyk, O.V., 2010. Human made interventioninto salt massifs environment: mechanisms, fac-tors, results and ecological problems. An Over-view Paper, Int. Conf. “GeoDarmstadt 2010 –Geosciences Secure the Future”, Darmstadt,Germany (October 10 – 13), 305 – 306.
Khrushchov D.P., Bosevska L.P., 2014. Environmentalproblems of salt mining in Ukraine. GEM NEWS– Newsletter of the IUGS commission on geos-cience for environmental management. No. 22, 11– 16. =http://iugs.org/uploads/GEM%20newsletter%20No.%2022-1.pdf
Korolyov, V.A., 2007. Osnovnye printsipy organizatsiimonitoringa geologicheskikh, litotekhnicheskikh iekologicheskikh system [Basic principles of ar-rangement monitoring of geological, lithotechnic-al & ecological systems]. Geological engineering,December, 24 – 29 (in Russian)
Korotkevich, G.V, 1970. Solyanoi karst [Salt karst].Leningrad, Nedra, 256 p.
Kortas, Grzegorz, Maj, Agnieszka, 2014. Deformationsof the protection shelf in the “Wapno” salt mine,based on model studies. Arch. Min. Sci., Vol. 59(2014), 4, 869 – 886, doi: 10.2478/amsc-2014-0060.
Lee, E. M., Sakalas, C. F., 2001. Subsidence map devel-opment in an area of abandoned salt mines. Geologi-cal Society, London, Engineering Geology Spe-cial Publications, 18, 193 – 195, 2001,https://doi.org/10.1144/GSL.ENG.2001.018.01.27
Mechanical Behavior of Salt VII, 2012. Berest, P., Gho-reychi, M., Hadj-Hassen, F., Tijani, M. (eds).Taylor & Francis Group, London, CRC Press,March 22, 506 p., ISBN 10: 0415621224 ISBN13: 978-0-415-62122-9
Metodicheskie ukazaniya po raschetu parametrov siste-my razrabotki svity plastov kamennoy soli Ar-tyomovskogo mestorozhdeniya (normativnyiydokument) [Methodological agreed guidelines ondetermination of mining method parameters forsalt strata series of the Artyomovsk rock salt de-posit (normative document)], 1997. USRI, Se-
raya, A.R., Cherevko, P.I., Miroshnichenko, V.G.(eds), Artyomovsk, 99 p. (in Russian).
Moghadam, S. Nazary, Mirzabozorg, H., Noorzad, A. &Nazokkar, K., 2012. Stability analysis of cavernsexcavated in heterogeneous salt formations. In-dian Journal of Science and Technology, vol. 5,no. 8 (August), 3128 – 3031. ISSN: 0974-6846
Pfeifle, Tom W., Senseny, Paul E., 1982. Steady-StateCreep Of Rock Salt In Geoengineering. The 23rdU.S Symposium on Rock Mechanics (USRMS),25 – 27 August, Berkeley, California. AmericanRock Mechanics Association, ARMA-82-307.
Pringle, J.K., Styles, P., Howell, C.P., Branston, M.W.,Furner, R., Toon, S.M., 2012. Case History.Long-term time-lapse microgravity and geotech-nical monitoring of relict salt mines, Marston,Cheshire, U.K. Geophysics, vol. 77, 6 (Nov. –Dec. 2012); B287–B294, doi: 10.1190/GEO2011-0491.1.
Savchenko, A.Ph., Seraya, A.R., 1970. Rezul’taty issle-dovaniya prochnostnych svoistv kamennoi soliArtyomovskogo mestorozhdeniya [Results of theresearch strength properties of rock salt from Ar-tyomovsk rock salt deposit]. All-Union researchInst.’s works; is. 14(22), part 1, Artyomovsk:ONTI VNIISOL, 14 – 17 (in Russian)
Shefchik, B., Tomes, R., Belli, R., 2011. Salt CavernMonitoring System for Early Warning of Sink-hole Formation. Geotechnical News. December2011, 30 – 33.
Tenison, L. O., 2016. Prognozirovanie vertikal’nykhdeformatsiy zemnoi poverkhnosti v usloviyakhzatoplennogo rudnika BKPRU – 1 [Forecasting ofthe earth's surface vertical deformations under theflooded mine BKPRU – 1]. Mining inform.-analit. bul., #1, 230 – 242 (in Russian) =http://www.giab-online.ru/files/Data/2016/1/230_242_1_2016.pdf
Toderas, M., 2013. The Stability of the UndergroundStructures Achieved in Salt Massif andTheirMonitoring. World Scientific and Engineer-ing Academy and Society (WSEAS) – RecentAdvances in Civil and MiningEngineering, Proc.1st Europ. Conf. of Mining Engineering (MI-NENG '13), Antalya,Turkey, Oct. 8 – 10, 2013,41 – 51, ISSN 2227-4588; ISBN 978-960-474-337-7
Yeschenko, A.N., Dotsenko, D.N., Eschenko, S.A.,2011. Podzemnaya dobycha kamennoi soli na Ar-tyomovskom mestorozhdenii [Underground ex-traction of rock salt at the Artyomovsk deposit].Donetsk, Nord-Press, 144 p. (in Russian).
V. V. Grubinko, H.B. Humeniuk, V.O. Khomenchuk,N.M. Garmatiy,V. B. Voytiuk, M.M. Barna. Journ.Geol.Geograph.Geoecology, 27(2), 205-215________________________________________________________________________________________________________________________________________________________________
202
Journal of Geology,Geography and Geoecology
Journal home page: geology-dnu-dp.ua
ISSN 2617-2909 (print)ISSN 2617-2119 (online)
Journ.Geol.Geograph.Geoecology,
27(2), 202-212doi:10.15421/111845
V. V. Grubinko, H.B. Humeniuk, V.O. Khomenchuk,N.M. Garmatiy,V. B. Voytiuk, M.M. Barna. Journ.Geol.Geograph.Geoecology, 27(2), 202-212________________________________________________________________________________________________________________________________________________________________
Ecotoxicological status and prognosis of the state of an urbanized hydroecosystem(on the example of the reservoir "Ternopil pond")
V. V. Grubinko1, H.B. Humeniuk1, V.O. Khomenchuk1, N.M. Garmatiy2, V. B. Voytiuk1, M.M. Barna
1TernopilVolodymyr Hnatiuk National Pedagogical University,Ukraine,Е-mail: [email protected] Ivan Pului National Technical University, Ukraine, Е-mail: [email protected]
Abstract. As a result of a complex hydroecological research on the reservoir “TernopilPond”and comparison of these data with environmental and quality water standards weassessed the environmental threat posed by the content of certain substances, and theecotoxicological state of the pond in general. A high concentration of HCO3- was found,but the critical factor of water pollution is the significant concentration of ammonia, as
well as the excess over the permissible levels of sodium ions. Moreover, we found polymetallic contamination of the bottom sedi-ments with a high ratio of biologically dangerous mobile forms, with the exception of iron, and the excess over permissible levels(MPS), which in some places was ten times higher than the norm. The high level of the content of mobile metals forms was found atsampling areaswith a considerable sedimentation.The content of the mobile form of copper exceeded the norm by 24-86 times, nickel- from 2 to 17 times, cobalt – 4-8 times. The content of the mobile form of cadmium exceeded the permissible norm by 5-80 times,and lead – by 4.5-12 times. It was established that the content of the metals of the essential group in the water of the reservoir wasbe-low the permissible values, and in the places where active flushing waters are flowing high concentrations of copper wasfound.Among the nonessential metals, cadmium and lead were found with fairlyhigh cadmium content , which is biologically dangerous
because of the toxicity of this metal. In case of changes in the hydrochemical balance, the mobility of metals may increase, whichwill substantially worsen the almost disastrous pollution of the reservoir with highly toxic and biologically hazardous met-als.Economic-mathematical modeling and statistical methods based on correlation-regression analysis using Matlab software wereused to investigate the influence of ammonium content on the water pH index. The correlation index is ststistically significant andamounts to 0.86. This research will allow us to predict pH index of the water depending on the content of ammonium. The calculatedelasticity coefficient shows that with an increase in ammonia by 10%, the pH index of the water will vary by 8%. In order to studythe environmental situation in the near future, namely the content of metals in the bottom sediments, a forecast of the content of suchmetals as magnesium and cobaltfor the next two seasonal periods according to the theory of Markov chains has been made. Thistheory allows us to make predictions of the factor, taking into account the possibility of random effects on the environment, andinvestigates the greatest probability of presence of a factor in a certain numerical parameter.
Key words: water, bottom sediments, elasticity coefficient, correlation-regression analysis.
Екотоксикологічний статус і прогнозування стану урбанізованої гідроекосистеми (наприкладі водосховища "Тернопільський став")
В.В. Грубінко1, Г.Б. Гуменюк1, В.О. Хоменчук1, Н.М. Гарматій2, В.Б. Войтюк1, М.М. Барна
1Тернопільський національний педагогічний університет ім. В. Гнатюка, Тернопіль, Україна,Е-mail: [email protected]Тернопільський національний технічний університет ім. І. Пулюя, Тернопіль, Україна,Е-mail: [email protected]
Анотація. У результаті комплексного гідроекологічного дослідження водосховища «Тернопільський став» шляхом порів-няння отриманих показників з екологічними нормативами та стандартами якості навколишнього середовища оцінено еколо-гічну небезпеку вмісту окремих речовин та екотоксикологічну ситуацію в цілому. Виявлено високі концентрації НСO3
- і,критичним фактором у водоймі є накопичення аміаку у значних концентраціях, а також значне перевищення допустимихрівнів для йонів натрію, встановлено поліметалічне забруднення мулу з високою і біологічно небезпечною, крім заліза,часткою рухомих форм металів та переважанням допустимих рівнів у окремих місцях у десятки разів проти норми, відміче-
Received 16.05.2018;Received in revised form 26.06.2018;Accepted 20.08.2018
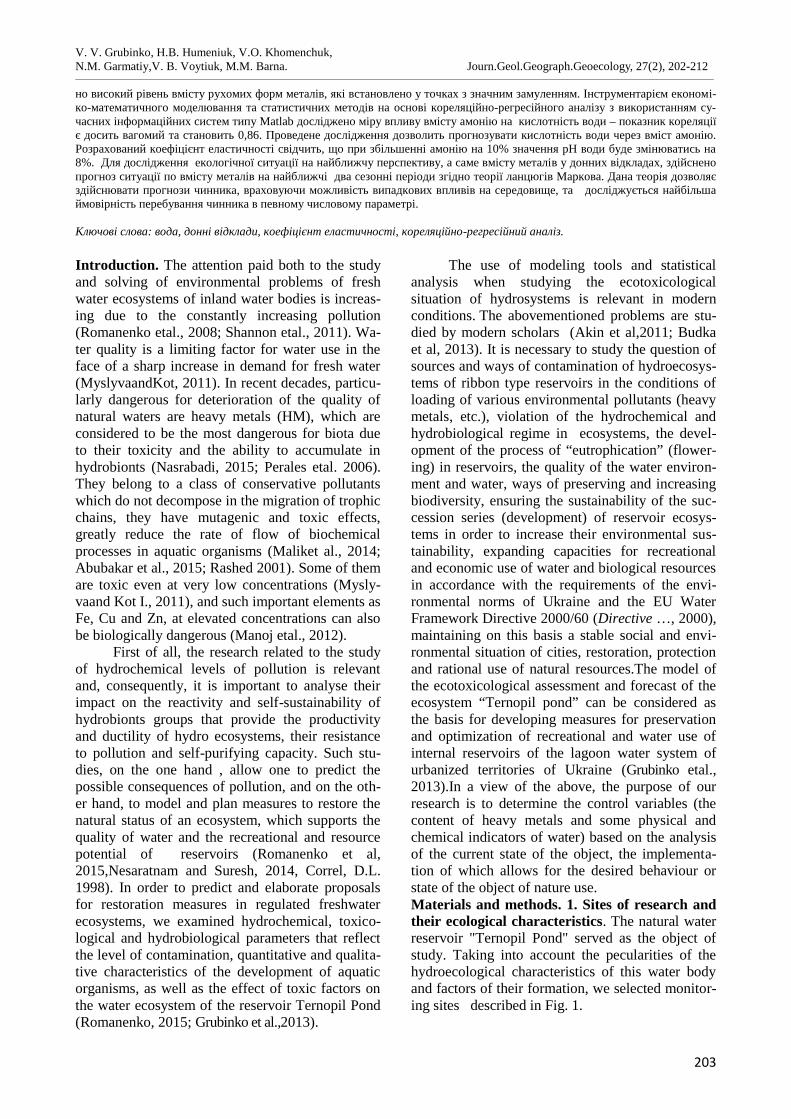
V. V. Grubinko, H.B. Humeniuk, V.O. Khomenchuk,N.M. Garmatiy,V. B. Voytiuk, M.M. Barna. Journ.Geol.Geograph.Geoecology, 27(2), 202-212________________________________________________________________________________________________________________________________________________________________
203
но високий рівень вмісту рухомих форм металів, які встановлено у точках з значним замуленням. Інструментарієм економі-ко-математичного моделювання та статистичних методів на основі кореляційно-регресійного аналізу з використанням су-часних інформаційних систем типу Matlab досліджено міру впливу вмісту амонію на кислотність води – показник кореляціїє досить вагомий та становить 0,86. Проведене дослідження дозволить прогнозувати кислотність води через вміст амонію.Розрахований коефіцієнт еластичності свідчить, що при збільшенні амонію на 10% значення рН води буде змінюватись на8%. Для дослідження екологічної ситуації на найближчу перспективу, а саме вмісту металів у донних відкладах, здійсненопрогноз ситуації по вмісту металів на найближчі два сезонні періоди згідно теорії ланцюгів Маркова. Дана теорія дозволяєздійснювати прогнози чинника, враховуючи можливість випадкових впливів на середовище, та досліджується найбільшаймовірність перебування чинника в певному числовому параметрі.
Ключові слова: вода, донні відклади, коефіцієнт еластичності, кореляційно-регресійний аналіз.
Introduction. The attention paid both to the studyand solving of environmental problems of freshwater ecosystems of inland water bodies is increas-ing due to the constantly increasing pollution(Romanenko etal., 2008; Shannon etal., 2011). Wa-ter quality is a limiting factor for water use in theface of a sharp increase in demand for fresh water(MyslyvaandKot, 2011). In recent decades, particu-larly dangerous for deterioration of the quality ofnatural waters are heavy metals (HM), which areconsidered to be the most dangerous for biota dueto their toxicity and the ability to accumulate inhydrobionts (Nasrabadi, 2015; Perales etal. 2006).They belong to a class of conservative pollutantswhich do not decompose in the migration of trophicchains, they have mutagenic and toxic effects,greatly reduce the rate of flow of biochemicalprocesses in aquatic organisms (Maliket al., 2014;Abubakar et al., 2015; Rashed 2001). Some of themare toxic even at very low concentrations (Mysly-vaand Kot I., 2011), and such important elements asFe, Cu and Zn, at elevated concentrations can alsobe biologically dangerous (Manoj etal., 2012).
First of all, the research related to the studyof hydrochemical levels of pollution is relevantand, consequently, it is important to analyse theirimpact on the reactivity and self-sustainability ofhydrobionts groups that provide the productivityand ductility of hydro ecosystems, their resistanceto pollution and self-purifying capacity. Such stu-dies, on the one hand , allow one to predict thepossible consequences of pollution, and on the oth-er hand, to model and plan measures to restore thenatural status of an ecosystem, which supports thequality of water and the recreational and resourcepotential of reservoirs (Romanenko et al,2015,Nesaratnam and Suresh, 2014, Correl, D.L.1998). In order to predict and elaborate proposalsfor restoration measures in regulated freshwaterecosystems, we examined hydrochemical, toxico-logical and hydrobiological parameters that reflectthe level of contamination, quantitative and qualita-tive characteristics of the development of aquaticorganisms, as well as the effect of toxic factors onthe water ecosystem of the reservoir Ternopil Pond(Romanenko, 2015; Grubinko et al.,2013).
The use of modeling tools and statisticalanalysis when studying the ecotoxicologicalsituation of hydrosystems is relevant in modernconditions. The abovementioned problems are stu-died by modern scholars (Akin et al,2011; Budkaet al, 2013). It is necessary to study the question ofsources and ways of contamination of hydroecosys-tems of ribbon type reservoirs in the conditions ofloading of various environmental pollutants (heavymetals, etc.), violation of the hydrochemical andhydrobiological regime in ecosystems, the devel-opment of the process of “eutrophication” (flower-ing) in reservoirs, the quality of the water environ-ment and water, ways of preserving and increasingbiodiversity, ensuring the sustainability of the suc-cession series (development) of reservoir ecosys-tems in order to increase their environmental sus-tainability, expanding capacities for recreationaland economic use of water and biological resourcesin accordance with the requirements of the envi-ronmental norms of Ukraine and the EU WaterFramework Directive 2000/60 (Directive …, 2000),maintaining on this basis a stable social and envi-ronmental situation of cities, restoration, protectionand rational use of natural resources.The model ofthe ecotoxicological assessment and forecast of theecosystem “Ternopil pond” can be considered asthe basis for developing measures for preservationand optimization of recreational and water use ofinternal reservoirs of the lagoon water system ofurbanized territories of Ukraine (Grubinko etal.,2013).In a view of the above, the purpose of ourresearch is to determine the control variables (thecontent of heavy metals and some physical andchemical indicators of water) based on the analysisof the current state of the object, the implementa-tion of which allows for the desired behaviour orstate of the object of nature use.Materials and methods. 1. Sites of research andtheir ecological characteristics. The natural waterreservoir "Ternopil Pond" served as the object ofstudy. Taking into account the pecularities of thehydroecological characteristics of this water bodyand factors of their formation, we selected monitor-ing sites described in Fig. 1.
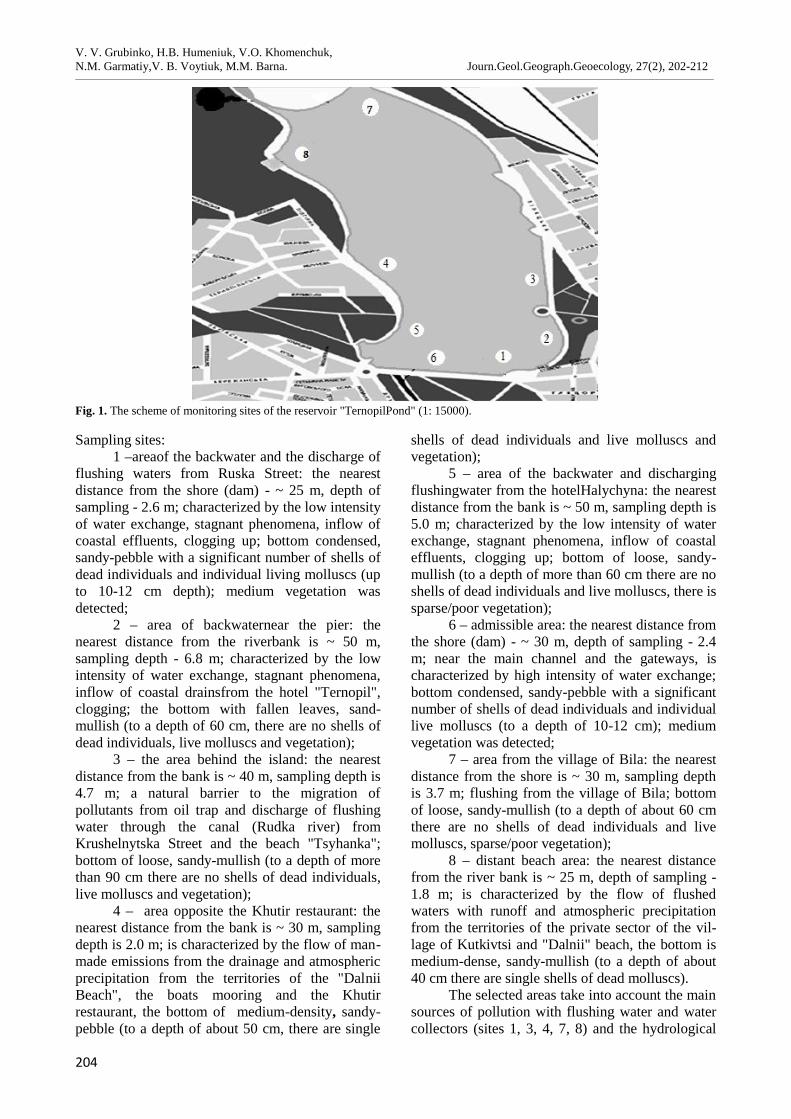
V. V. Grubinko, H.B. Humeniuk, V.O. Khomenchuk,N.M. Garmatiy,V. B. Voytiuk, M.M. Barna. Journ.Geol.Geograph.Geoecology, 27(2), 202-212________________________________________________________________________________________________________________________________________________________________
204
Fig. 1. The scheme of monitoring sites of the reservoir "TernopilPond" (1: 15000).
Sampling sites:1 –areaof the backwater and the discharge of
flushing waters from Ruska Street: the nearestdistance from the shore (dam) - ~ 25 m, depth ofsampling - 2.6 m; characterized by the low intensityof water exchange, stagnant phenomena, inflow ofcoastal effluents, clogging up; bottom condensed,sandy-pebble with a significant number of shells ofdead individuals and individual living molluscs (upto 10-12 cm depth); medium vegetation wasdetected;
2 – area of backwaternear the pier: thenearest distance from the riverbank is ~ 50 m,sampling depth - 6.8 m; characterized by the lowintensity of water exchange, stagnant phenomena,inflow of coastal drainsfrom the hotel "Ternopil",clogging; the bottom with fallen leaves, sand-mullish (to a depth of 60 cm, there are no shells ofdead individuals, live molluscs and vegetation);
3 – the area behind the island: the nearestdistance from the bank is ~ 40 m, sampling depth is4.7 m; a natural barrier to the migration ofpollutants from oil trap and discharge of flushingwater through the canal (Rudka river) fromKrushelnytska Street and the beach "Tsyhanka";bottom of loose, sandy-mullish (to a depth of morethan 90 cm there are no shells of dead individuals,live molluscs and vegetation);
4 – area opposite the Khutir restaurant: thenearest distance from the bank is ~ 30 m, samplingdepth is 2.0 m; is characterized by the flow of man-made emissions from the drainage and atmosphericprecipitation from the territories of the "DalniiBeach", the boats mooring and the Khutirrestaurant, the bottom of medium-density, sandy-pebble (to a depth of about 50 cm, there are single
shells of dead individuals and live molluscs andvegetation);
5 – area of the backwater and dischargingflushingwater from the hotelHalychyna: the nearestdistance from the bank is ~ 50 m, sampling depth is5.0 m; characterized by the low intensity of waterexchange, stagnant phenomena, inflow of coastaleffluents, clogging up; bottom of loose, sandy-mullish (to a depth of more than 60 cm there are noshells of dead individuals and live molluscs, there issparse/poor vegetation);
6 – admissible area: the nearest distance fromthe shore (dam) - ~ 30 m, depth of sampling - 2.4m; near the main channel and the gateways, ischaracterized by high intensity of water exchange;bottom condensed, sandy-pebble with a significantnumber of shells of dead individuals and individuallive molluscs (to a depth of 10-12 cm); mediumvegetation was detected;
7 – area from the village of Bila: the nearestdistance from the shore is ~ 30 m, sampling depthis 3.7 m; flushing from the village of Bila; bottomof loose, sandy-mullish (to a depth of about 60 cmthere are no shells of dead individuals and livemolluscs, sparse/poor vegetation);
8 – distant beach area: the nearest distancefrom the river bank is ~ 25 m, depth of sampling -1.8 m; is characterized by the flow of flushedwaters with runoff and atmospheric precipitationfrom the territories of the private sector of the vil-lage of Kutkivtsi and "Dalnii" beach, the bottom ismedium-dense, sandy-mullish (to a depth of about40 cm there are single shells of dead molluscs).
The selected areas take into account the mainsources of pollution with flushing water and watercollectors (sites 1, 3, 4, 7, 8) and the hydrological

V. V. Grubinko, H.B. Humeniuk, V.O. Khomenchuk,N.M. Garmatiy,V. B. Voytiuk, M.M. Barna. Journ.Geol.Geograph.Geoecology, 27(2), 202-212________________________________________________________________________________________________________________________________________________________________
205
regularities of migration and accumulation of toxicsubstances and correlate with the places ofeutrophicationin the reservoir that were observed inprevious years. (Grubinko, etal. 2013., Gumenyuk,2003).Methods of hydrochemical research. Allmeasuring instruments used in the research arestandardized and endorsed with the expertise of theState Enterprise "Ternopil Scientific andProduction Center of Standardization, Metrologyand Certification" by the issue of certificates ofverification of the regulated regulatory instrumentof measuring equipment from 14.09.2016: atomicabsorption spectrophotometer C 115 M (CertificateNo. 743 -F); ionizer EV 74 (Certificate No. 745-F);spectrophotometer SF 46 (Certificate No. 742-F);Fluorocarbonometer KFK-2 (Certificate No. 744-F); Oxygenizer AHA-101,1 V1 (Certificate No.741-F); liquid chromatograph "Crystal 200"(certificate number 266-F).
The number of samples at each site was re-peated three times. The measurements are given asan arithmetic mean of three measurements at eachsampling site.
The content of heavy metals in water andsediment was determined by atomic absorptionspectrophotometry (Ermachenko, 1997).
Ammonium cations in water and sedimentwere determined colorimetrically (Romanenko,2006). The method is based on the ability ofammonia and ammonium ions to form a yellowishbrown colour of the compound with a Nesslerreagent.
The determination of the concentration ofnitrates was carried out by colorimetric methodwith phenol disulfonic acid (Romanenko, 2006).The method is based on the reaction betweennitrates and phenol disulfonic acid to form nitro-derivative phenols, which form yellow compoundswith alkali
compounds.Determination of nitrites was carried out
colorimetrically (Romanenko, 2006). The methodsare based on the formation of azure colour of redcolour when passing the reaction of nitrite ions withthe Grissa reagent.
The ecological danger of the content of cer-tain substances and the ecotoxicological situation asa whole were assessed by comparing the indicatorswith environmental norms and environmental stan-dards: toxicity on the basis of comparison of indica-tors with the values of MPC (Maximum permissibleconcentrations of harmful substances in water ofwater reservoirs of household and drinking andcultural and household purposes) (Rules…, 1999),and ecotoxicological danger in accordance with the"List of pollutants for determining the chemicalstatus of the arrays of surface and ground water andecological potential of anartificialor substantiallymodified surface water massif” (List …, 2017).
In order to study the effect of ammonium onwater pH index, the statistical analysis methods,namely correlation-regression analysis (Akin B.S.,2011), are used, the correlation index is quitesignificant and is 0.86, the study will allow adjust-ment of the water pH index through the content ofammonium. The calculated elasticity coefficientshows that with an increase in ammonia by 10%,the water pH index will change by 8%. Also, theprediction of the content of heavy metals in thebottom sediments by the method of Markov chaintheory is carried out. This theory allows us to makepredictions of the factor, taking into account thepossibility of random effects on the environment,and investigates the greatest probability of presenceof a factor in a certain numerical parameter(Rogatunskiy R. аnd Garmatiy N.2015).
ResultspH Index of water (Table 1).
Тable 1. pH index of water (M±m)Indexes range Selection Sites
1 2 3 4 5 6 7 8рН 1-14 8.02±0.05 7.31±0.03 7.40±0.04 7.52±0.03 7.39±0.02 7.52±0.03 7.24±0.05 7.46±0.02
At all the sites investigated, the water has apH> 7, which contributes to the presence of carbondioxide in the form of a hydrocarbonate ion, pro-viding an environmentally acceptable gas regime ofwater and the absence of obsolescent phenomena.The increase of pH of watermay be the decay oforganic sucstances in the bottom layer and thesludge with the formation of ammonia and the sa-linity of the reservoir with alkaline equivalents of
flushing origin. High alkalinity of water also con-tributes to the transition of a significant amount ofammonia to highly toxic ammonia, which degradesthe ecotoxicological situation of the reservoir, sinceammonia is 200 times more toxic than ammonium(MAC NH4 + = 2.0 mg / l; HDCNH3 = 0.01 mg / l).
2. The content of nitrogen compounds(Table 2,3).
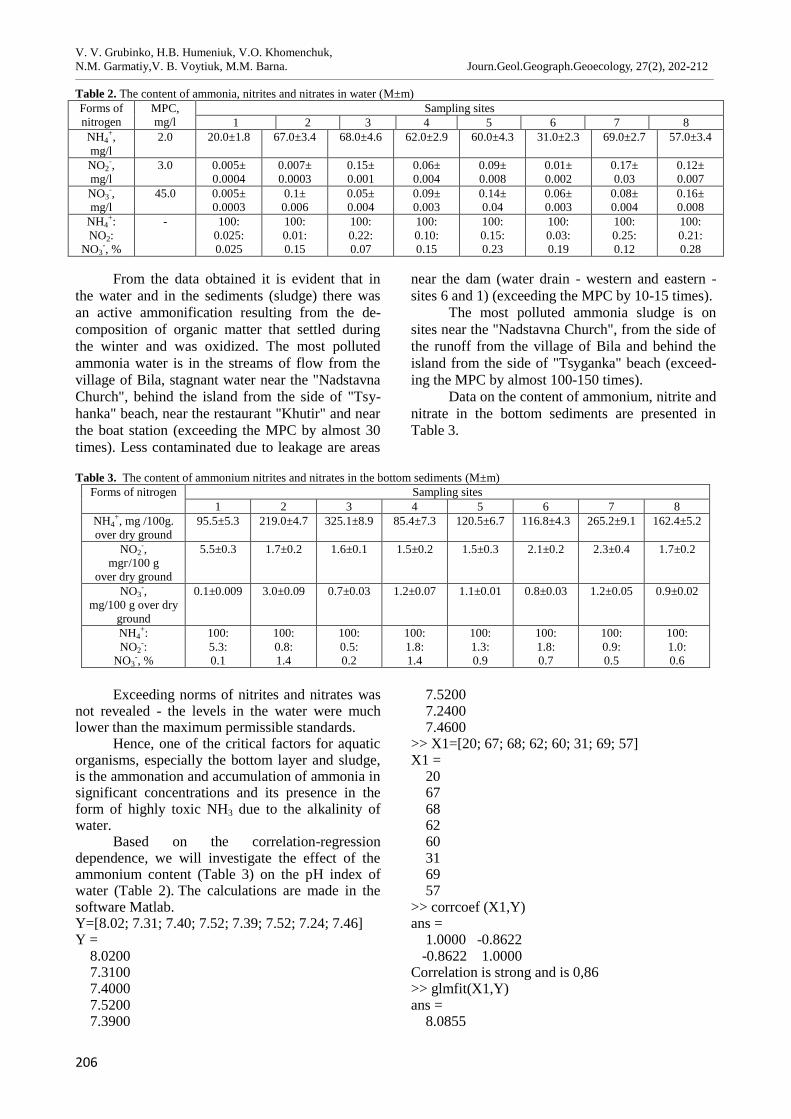
V. V. Grubinko, H.B. Humeniuk, V.O. Khomenchuk,N.M. Garmatiy,V. B. Voytiuk, M.M. Barna. Journ.Geol.Geograph.Geoecology, 27(2), 202-212________________________________________________________________________________________________________________________________________________________________
206
Тable 2. The content of ammonia, nitrites and nitrates in water (M±m)Forms ofnitrogen
MPC,mg/l
Sampling sites1 2 3 4 5 6 7 8
NH4+,
mg/l2.0 20.0±1.8 67.0±3.4 68.0±4.6 62.0±2.9 60.0±4.3 31.0±2.3 69.0±2.7 57.0±3.4
NO2-,
mg/l3.0 0.005±
0.00040.007±0.0003
0.15±0.001
0.06±0.004
0.09±0.008
0.01±0.002
0.17±0.03
0.12±0.007
NO3-,
mg/l45.0 0.005±
0.00030.1±0.006
0.05±0.004
0.09±0.003
0.14±0.04
0.06±0.003
0.08±0.004
0.16±0.008
NH4+:
NO2:NO3
-, %
- 100:0.025:0.025
100:0.01:0.15
100:0.22:0.07
100:0.10:0.15
100:0.15:0.23
100:0.03:0.19
100:0.25:0.12
100:0.21:0.28
From the data obtained it is evident that inthe water and in the sediments (sludge) there wasan active ammonification resulting from the de-composition of organic matter that settled duringthe winter and was oxidized. The most pollutedammonia water is in the streams of flow from thevillage of Bila, stagnant water near the "NadstavnaChurch", behind the island from the side of "Tsy-hanka" beach, near the restaurant "Khutir" and nearthe boat station (exceeding the MPC by almost 30times). Less contaminated due to leakage are areas
near the dam (water drain - western and eastern -sites 6 and 1) (exceeding the MPC by 10-15 times).
The most polluted ammonia sludge is onsites near the "Nadstavna Church", from the side ofthe runoff from the village of Bila and behind theisland from the side of "Tsyganka" beach (exceed-ing the MPC by almost 100-150 times).
Data on the content of ammonium, nitrite andnitrate in the bottom sediments are presented inTable 3.
Тable 3. The content of ammonium nitrites and nitrates in the bottom sediments (M±m)Forms of nitrogen Sampling sites
1 2 3 4 5 6 7 8NH4
+, mg /100g.over dry ground
95.5±5.3 219.0±4.7 325.1±8.9 85.4±7.3 120.5±6.7 116.8±4.3 265.2±9.1 162.4±5.2
NO2-,
mgг/100 gover dry ground
5.5±0.3 1.7±0.2 1.6±0.1 1.5±0.2 1.5±0.3 2.1±0.2 2.3±0.4 1.7±0.2
NO3-,
mg/100 g over dryground
0.1±0.009 3.0±0.09 0.7±0.03 1.2±0.07 1.1±0.01 0.8±0.03 1.2±0.05 0.9±0.02
NH4+:
NO2-:
NO3-, %
100:5.3:0.1
100:0.8:1.4
100:0.5:0.2
100:1.8:1.4
100:1.3:0.9
100:1.8:0.7
100:0.9:0.5
100:1.0:0.6
Exceeding norms of nitrites and nitrates wasnot revealed - the levels in the water were muchlower than the maximum permissible standards.
Hence, one of the critical factors for aquaticorganisms, especially the bottom layer and sludge,is the ammonation and accumulation of ammonia insignificant concentrations and its presence in theform of highly toxic NH3 due to the alkalinity ofwater.
Based on the correlation-regressiondependence, we will investigate the effect of theammonium content (Table 3) on the pH index ofwater (Table 2). The calculations are made in thesoftware Matlab.Y=[8.02; 7.31; 7.40; 7.52; 7.39; 7.52; 7.24; 7.46]Y =
8.02007.31007.40007.52007.3900
7.52007.24007.4600
>> X1=[20; 67; 68; 62; 60; 31; 69; 57]X1 =
2067686260316957
>> corrcoef (X1,Y)ans =
1.0000 -0.8622-0.8622 1.0000
Correlation is strong and is 0,86>> glmfit(X1,Y)ans =
8.0855
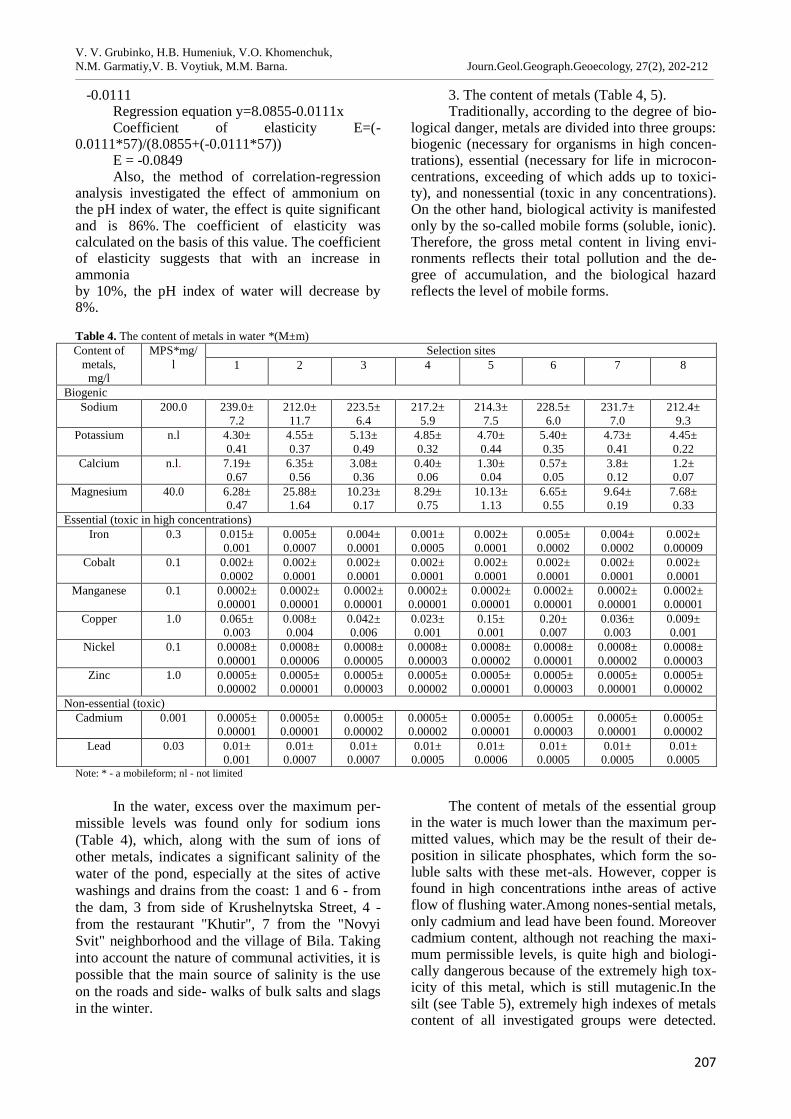
V. V. Grubinko, H.B. Humeniuk, V.O. Khomenchuk,N.M. Garmatiy,V. B. Voytiuk, M.M. Barna. Journ.Geol.Geograph.Geoecology, 27(2), 202-212________________________________________________________________________________________________________________________________________________________________
207
-0.0111Regression equation y=8.0855-0.0111xCoefficient of elasticity E=(-
0.0111*57)/(8.0855+(-0.0111*57))E = -0.0849Also, the method of correlation-regression
analysis investigated the effect of ammonium onthe pH index of water, the effect is quite significantand is 86%. The coefficient of elasticity wascalculated on the basis of this value. The coefficientof elasticity suggests that with an increase inammoniaby 10%, the pH index of water will decrease by8%.
3. The content of metals (Table 4, 5).Traditionally, according to the degree of bio-
logical danger, metals are divided into three groups:biogenic (necessary for organisms in high concen-trations), essential (necessary for life in microcon-centrations, exceeding of which adds up to toxici-ty), and nonessential (toxic in any concentrations).On the other hand, biological activity is manifestedonly by the so-called mobile forms (soluble, ionic).Therefore, the gross metal content in living envi-ronments reflects their total pollution and the de-gree of accumulation, and the biological hazardreflects the level of mobile forms.
Table 4. The content of metals in water *(M±m)Content of
metals,mg/l
MPS*mg/l
Selection sites1 2 3 4 5 6 7 8
BiogenicSodium 200.0 239.0±
7.2212.0±
11.7223.5±
6.4217.2±
5.9214.3±
7.5228.5±
6.0231.7±
7.0212.4±
9.3Potassium n.l 4.30±
0.414.55±0.37
5.13±0.49
4.85±0.32
4.70±0.44
5.40±0.35
4.73±0.41
4.45±0.22
Calcium n.l. 7.19±0.67
6.35±0.56
3.08±0.36
0.40±0.06
1.30±0.04
0.57±0.05
3.8±0.12
1.2±0.07
Magnesium 40.0 6.28±0.47
25.88±1.64
10.23±0.17
8.29±0.75
10.13±1.13
6.65±0.55
9.64±0.19
7.68±0.33
Essential (toxic in high concentrations)Iron 0.3 0.015±
0.0010.005±0.0007
0.004±0.0001
0.001±0.0005
0.002±0.0001
0.005±0.0002
0.004±0.0002
0.002±0.00009
Cobalt 0.1 0.002±0.0002
0.002±0.0001
0.002±0.0001
0.002±0.0001
0.002±0.0001
0.002±0.0001
0.002±0.0001
0.002±0.0001
Manganese 0.1 0.0002±0.00001
0.0002±0.00001
0.0002±0.00001
0.0002±0.00001
0.0002±0.00001
0.0002±0.00001
0.0002±0.00001
0.0002±0.00001
Copper 1.0 0.065±0.003
0.008±0.004
0.042±0.006
0.023±0.001
0.15±0.001
0.20±0.007
0.036±0.003
0.009±0.001
Nickel 0.1 0.0008±0.00001
0.0008±0.00006
0.0008±0.00005
0.0008±0.00003
0.0008±0.00002
0.0008±0.00001
0.0008±0.00002
0.0008±0.00003
Zinc 1.0 0.0005±0.00002
0.0005±0.00001
0.0005±0.00003
0.0005±0.00002
0.0005±0.00001
0.0005±0.00003
0.0005±0.00001
0.0005±0.00002
Non-essential (toxic)Cadmium 0.001 0.0005±
0.000010.0005±0.00001
0.0005±0.00002
0.0005±0.00002
0.0005±0.00001
0.0005±0.00003
0.0005±0.00001
0.0005±0.00002
Lead 0.03 0.01±0.001
0.01±0.0007
0.01±0.0007
0.01±0.0005
0.01±0.0006
0.01±0.0005
0.01±0.0005
0.01±0.0005
Note: * - a mobileform; nl - not limited
In the water, excess over the maximum per-missible levels was found only for sodium ions(Table 4), which, along with the sum of ions ofother metals, indicates a significant salinity of thewater of the pond, especially at the sites of activewashings and drains from the coast: 1 and 6 - fromthe dam, 3 from side of Krushelnytska Street, 4 -from the restaurant "Khutir", 7 from the "NovyiSvit" neighborhood and the village of Bila. Takinginto account the nature of communal activities, it ispossible that the main source of salinity is the useon the roads and side- walks of bulk salts and slagsin the winter.
The content of metals of the essential groupin the water is much lower than the maximum per-mitted values, which may be the result of their de-position in silicate phosphates, which form the so-luble salts with these met-als. However, copper isfound in high concentrations inthe areas of activeflow of flushing water.Among nones-sential metals,only cadmium and lead have been found. Moreovercadmium content, although not reaching the maxi-mum permissible levels, is quite high and biologi-cally dangerous because of the extremely high tox-icity of this metal, which is still mutagenic.In thesilt (see Table 5), extremely high indexes of metalscontent of all investigated groups were detected.
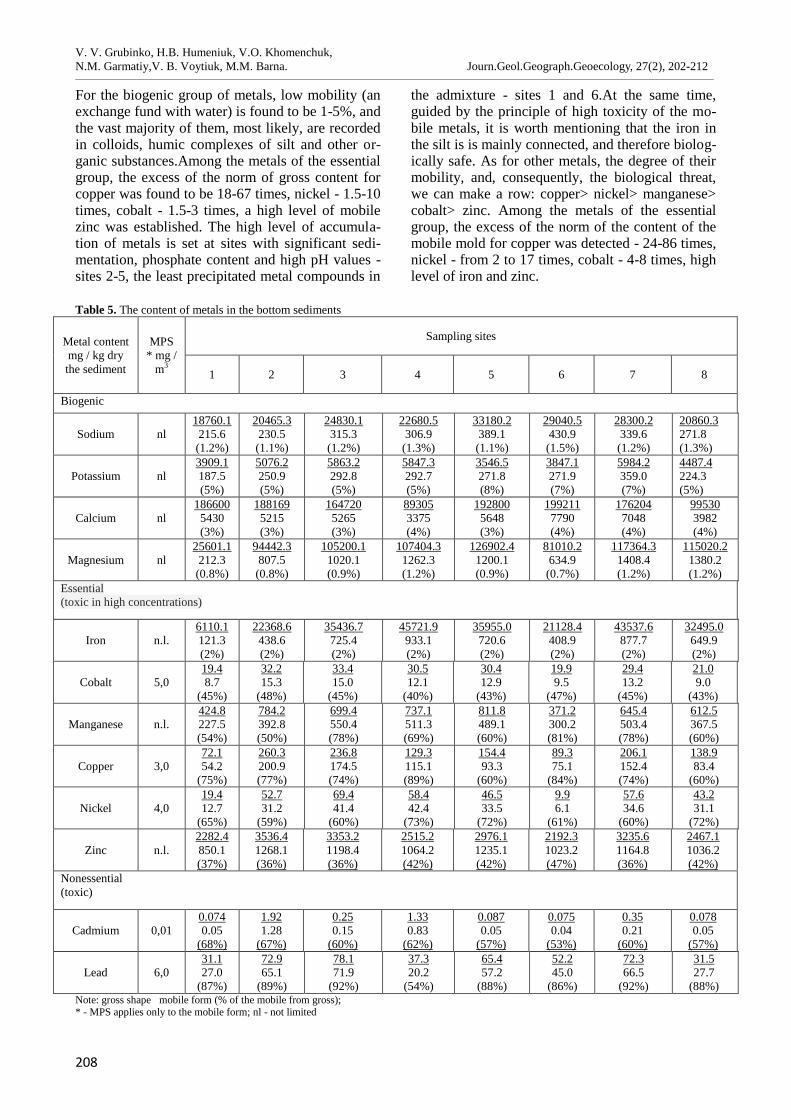
V. V. Grubinko, H.B. Humeniuk, V.O. Khomenchuk,N.M. Garmatiy,V. B. Voytiuk, M.M. Barna. Journ.Geol.Geograph.Geoecology, 27(2), 202-212________________________________________________________________________________________________________________________________________________________________
208
For the biogenic group of metals, low mobility (anexchange fund with water) is found to be 1-5%, andthe vast majority of them, most likely, are recordedin colloids, humic complexes of silt and other or-ganic substances.Among the metals of the essentialgroup, the excess of the norm of gross content forcopper was found to be 18-67 times, nickel - 1.5-10times, cobalt - 1.5-3 times, a high level of mobilezinc was established. The high level of accumula-tion of metals is set at sites with significant sedi-mentation, phosphate content and high pH values -sites 2-5, the least precipitated metal compounds in
the admixture - sites 1 and 6.At the same time,guided by the principle of high toxicity of the mo-bile metals, it is worth mentioning that the iron inthe silt is is mainly connected, and therefore biolog-ically safe. As for other metals, the degree of theirmobility, and, consequently, the biological threat,we can make a row: copper> nickel> manganese>cobalt> zinc. Among the metals of the essentialgroup, the excess of the norm of the content of themobile mold for copper was detected - 24-86 times,nickel - from 2 to 17 times, cobalt - 4-8 times, highlevel of iron and zinc.
Table 5. The content of metals in the bottom sediments
Metal contentmg / kg drythe sediment
MPS* mg /
m3
Sampling sites
1 2 3 4 5 6 7 8
Biogenic
Sodium nl18760.1215.6(1.2%)
20465.3230.5(1.1%)
24830.1315.3(1.2%)
22680.5306.9
(1.3%)
33180.2389.1(1.1%)
29040.5430.9(1.5%)
28300.2339.6(1.2%)
20860.3271.8(1.3%)
Potassium nl3909.1187.5(5%)
5076.2250.9(5%)
5863.2292.8(5%)
5847.3292.7(5%)
3546.5271.8(8%)
3847.1271.9(7%)
5984.2359.0(7%)
4487.4224.3(5%)
Calcium nl186600
5430(3%)
1881695215(3%)
1647205265(3%)
893053375(4%)
1928005648(3%)
1992117790(4%)
1762047048(4%)
995303982(4%)
Magnesium nl25601.1212.3(0.8%)
94442.3807.5(0.8%)
105200.11020.1(0.9%)
107404.31262.3(1.2%)
126902.41200.1(0.9%)
81010.2634.9(0.7%)
117364.31408.4(1.2%)
115020.21380.2(1.2%)
Essential(toxic in high concentrations)
Iron n.l.6110.1121.3(2%)
22368.6438.6(2%)
35436.7725.4(2%)
45721.9933.1(2%)
35955.0720.6(2%)
21128.4408.9(2%)
43537.6877.7(2%)
32495.0649.9(2%)
Cobalt 5,019.48.7
(45%)
32.215.3
(48%)
33.415.0
(45%)
30.512.1
(40%)
30.412.9
(43%)
19.99.5
(47%)
29.413.2
(45%)
21.09.0
(43%)
Manganese n.l.424.8227.5(54%)
784.2392.8(50%)
699.4550.4(78%)
737.1511.3(69%)
811.8489.1(60%)
371.2300.2(81%)
645.4503.4(78%)
612.5367.5(60%)
Copper 3,072.154.2
(75%)
260.3200.9(77%)
236.8174.5(74%)
129.3115.1(89%)
154.493.3
(60%)
89.375.1
(84%)
206.1152.4(74%)
138.983.4
(60%)
Nickel 4,019.412.7
(65%)
52.731.2
(59%)
69.441.4
(60%)
58.442.4
(73%)
46.533.5
(72%)
9.96.1
(61%)
57.634.6
(60%)
43.231.1
(72%)
Zinc n.l.2282.4850.1(37%)
3536.41268.1(36%)
3353.21198.4(36%)
2515.21064.2(42%)
2976.11235.1(42%)
2192.31023.2(47%)
3235.61164.8(36%)
2467.11036.2(42%)
Nonessential(toxic)
Cadmium 0,010.0740.05
(68%)
1.921.28
(67%)
0.250.15
(60%)
1.330.83
(62%)
0.0870.05
(57%)
0.0750.04
(53%)
0.350.21
(60%)
0.0780.05
(57%)
Lead 6,031.127.0
(87%)
72.965.1
(89%)
78.171.9
(92%)
37.320.2
(54%)
65.457.2
(88%)
52.245.0
(86%)
72.366.5
(92%)
31.527.7
(88%)Note: gross shape mobile form (% of the mobile from gross);* - MPS applies only to the mobile form; nl - not limited
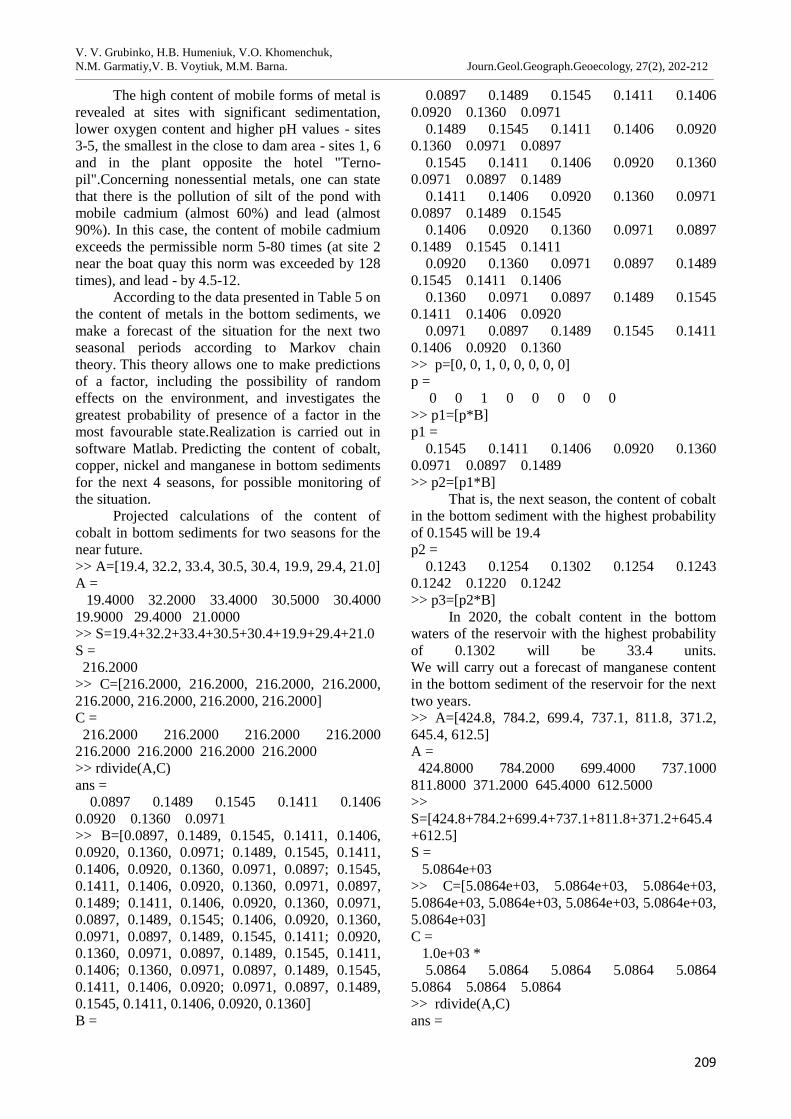
V. V. Grubinko, H.B. Humeniuk, V.O. Khomenchuk,N.M. Garmatiy,V. B. Voytiuk, M.M. Barna. Journ.Geol.Geograph.Geoecology, 27(2), 202-212________________________________________________________________________________________________________________________________________________________________
209
The high content of mobile forms of metal isrevealed at sites with significant sedimentation,lower oxygen content and higher pH values - sites3-5, the smallest in the close to dam area - sites 1, 6and in the plant opposite the hotel "Terno-pil".Concerning nonessential metals, one can statethat there is the pollution of silt of the pond withmobile cadmium (almost 60%) and lead (almost90%). In this case, the content of mobile cadmiumexceeds the permissible norm 5-80 times (at site 2near the boat quay this norm was exceeded by 128times), and lead - by 4.5-12.
According to the data presented in Table 5 onthe content of metals in the bottom sediments, wemake a forecast of the situation for the next twoseasonal periods according to Markov chaintheory. This theory allows one to make predictionsof a factor, including the possibility of randomeffects on the environment, and investigates thegreatest probability of presence of a factor in themost favourable state.Realization is carried out insoftware Matlab. Predicting the content of cobalt,copper, nickel and manganese in bottom sedimentsfor the next 4 seasons, for possible monitoring ofthe situation.
Projected calculations of the content ofcobalt in bottom sediments for two seasons for thenear future.>> A=[19.4, 32.2, 33.4, 30.5, 30.4, 19.9, 29.4, 21.0]A =
19.4000 32.2000 33.4000 30.5000 30.400019.9000 29.4000 21.0000>> S=19.4+32.2+33.4+30.5+30.4+19.9+29.4+21.0S =
216.2000>> C=[216.2000, 216.2000, 216.2000, 216.2000,216.2000, 216.2000, 216.2000, 216.2000]C =
216.2000 216.2000 216.2000 216.2000216.2000 216.2000 216.2000 216.2000>> rdivide(A,C)ans =
0.0897 0.1489 0.1545 0.1411 0.14060.0920 0.1360 0.0971>> B=[0.0897, 0.1489, 0.1545, 0.1411, 0.1406,0.0920, 0.1360, 0.0971; 0.1489, 0.1545, 0.1411,0.1406, 0.0920, 0.1360, 0.0971, 0.0897; 0.1545,0.1411, 0.1406, 0.0920, 0.1360, 0.0971, 0.0897,0.1489; 0.1411, 0.1406, 0.0920, 0.1360, 0.0971,0.0897, 0.1489, 0.1545; 0.1406, 0.0920, 0.1360,0.0971, 0.0897, 0.1489, 0.1545, 0.1411; 0.0920,0.1360, 0.0971, 0.0897, 0.1489, 0.1545, 0.1411,0.1406; 0.1360, 0.0971, 0.0897, 0.1489, 0.1545,0.1411, 0.1406, 0.0920; 0.0971, 0.0897, 0.1489,0.1545, 0.1411, 0.1406, 0.0920, 0.1360]B =
0.0897 0.1489 0.1545 0.1411 0.14060.0920 0.1360 0.0971
0.1489 0.1545 0.1411 0.1406 0.09200.1360 0.0971 0.0897
0.1545 0.1411 0.1406 0.0920 0.13600.0971 0.0897 0.1489
0.1411 0.1406 0.0920 0.1360 0.09710.0897 0.1489 0.1545
0.1406 0.0920 0.1360 0.0971 0.08970.1489 0.1545 0.1411
0.0920 0.1360 0.0971 0.0897 0.14890.1545 0.1411 0.1406
0.1360 0.0971 0.0897 0.1489 0.15450.1411 0.1406 0.0920
0.0971 0.0897 0.1489 0.1545 0.14110.1406 0.0920 0.1360>> p=[0, 0, 1, 0, 0, 0, 0, 0]p =
0 0 1 0 0 0 0 0>> p1=[p*B]p1 =
0.1545 0.1411 0.1406 0.0920 0.13600.0971 0.0897 0.1489>> p2=[p1*B]
That is, the next season, the content of cobaltin the bottom sediment with the highest probabilityof 0.1545 will be 19.4p2 =
0.1243 0.1254 0.1302 0.1254 0.12430.1242 0.1220 0.1242>> p3=[p2*B]
In 2020, the cobalt content in the bottomwaters of the reservoir with the highest probabilityof 0.1302 will be 33.4 units.We will carry out a forecast of manganese contentin the bottom sediment of the reservoir for the nexttwo years.>> A=[424.8, 784.2, 699.4, 737.1, 811.8, 371.2,645.4, 612.5]A =424.8000 784.2000 699.4000 737.1000
811.8000 371.2000 645.4000 612.5000>>S=[424.8+784.2+699.4+737.1+811.8+371.2+645.4+612.5]S =
5.0864e+03>> C=[5.0864e+03, 5.0864e+03, 5.0864e+03,5.0864e+03, 5.0864e+03, 5.0864e+03, 5.0864e+03,5.0864e+03]C =
1.0e+03 *5.0864 5.0864 5.0864 5.0864 5.0864
5.0864 5.0864 5.0864>> rdivide(A,C)ans =
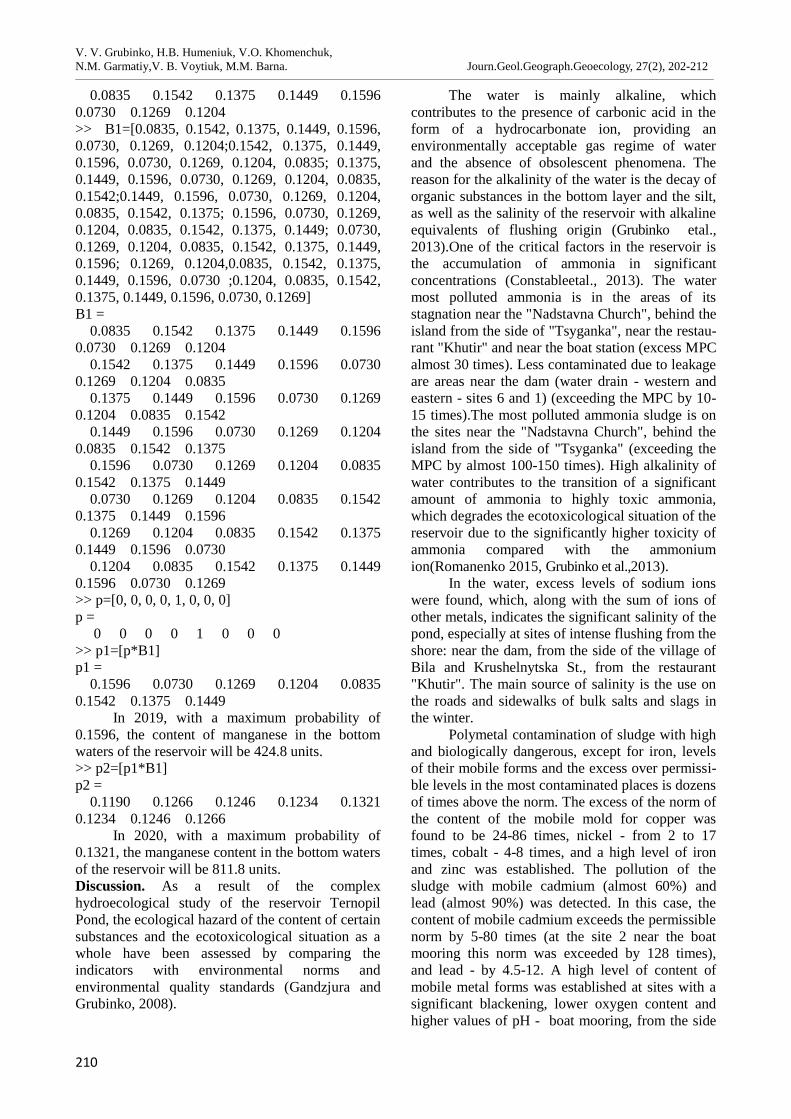
V. V. Grubinko, H.B. Humeniuk, V.O. Khomenchuk,N.M. Garmatiy,V. B. Voytiuk, M.M. Barna. Journ.Geol.Geograph.Geoecology, 27(2), 202-212________________________________________________________________________________________________________________________________________________________________
210
0.0835 0.1542 0.1375 0.1449 0.15960.0730 0.1269 0.1204>> B1=[0.0835, 0.1542, 0.1375, 0.1449, 0.1596,0.0730, 0.1269, 0.1204;0.1542, 0.1375, 0.1449,0.1596, 0.0730, 0.1269, 0.1204, 0.0835; 0.1375,0.1449, 0.1596, 0.0730, 0.1269, 0.1204, 0.0835,0.1542;0.1449, 0.1596, 0.0730, 0.1269, 0.1204,0.0835, 0.1542, 0.1375; 0.1596, 0.0730, 0.1269,0.1204, 0.0835, 0.1542, 0.1375, 0.1449; 0.0730,0.1269, 0.1204, 0.0835, 0.1542, 0.1375, 0.1449,0.1596; 0.1269, 0.1204,0.0835, 0.1542, 0.1375,0.1449, 0.1596, 0.0730 ;0.1204, 0.0835, 0.1542,0.1375, 0.1449, 0.1596, 0.0730, 0.1269]B1 =
0.0835 0.1542 0.1375 0.1449 0.15960.0730 0.1269 0.1204
0.1542 0.1375 0.1449 0.1596 0.07300.1269 0.1204 0.0835
0.1375 0.1449 0.1596 0.0730 0.12690.1204 0.0835 0.1542
0.1449 0.1596 0.0730 0.1269 0.12040.0835 0.1542 0.1375
0.1596 0.0730 0.1269 0.1204 0.08350.1542 0.1375 0.1449
0.0730 0.1269 0.1204 0.0835 0.15420.1375 0.1449 0.1596
0.1269 0.1204 0.0835 0.1542 0.13750.1449 0.1596 0.0730
0.1204 0.0835 0.1542 0.1375 0.14490.1596 0.0730 0.1269>> p=[0, 0, 0, 0, 1, 0, 0, 0]p =
0 0 0 0 1 0 0 0>> p1=[p*B1]p1 =
0.1596 0.0730 0.1269 0.1204 0.08350.1542 0.1375 0.1449
In 2019, with a maximum probability of0.1596, the content of manganese in the bottomwaters of the reservoir will be 424.8 units.>> p2=[p1*B1]p2 =
0.1190 0.1266 0.1246 0.1234 0.13210.1234 0.1246 0.1266
In 2020, with a maximum probability of0.1321, the manganese content in the bottom watersof the reservoir will be 811.8 units.Discussion. As a result of the complexhydroecological study of the reservoir TernopilPond, the ecological hazard of the content of certainsubstances and the ecotoxicological situation as awhole have been assessed by comparing theindicators with environmental norms andenvironmental quality standards (Gandzjura andGrubіnko, 2008).
The water is mainly alkaline, whichcontributes to the presence of carbonic acid in theform of a hydrocarbonate ion, providing anenvironmentally acceptable gas regime of waterand the absence of obsolescent phenomena. Thereason for the alkalinity of the water is the decay oforganic substances in the bottom layer and the silt,as well as the salinity of the reservoir with alkalineequivalents of flushing origin (Grubinko etal.,2013).One of the critical factors in the reservoir isthe accumulation of ammonia in significantconcentrations (Constableetal., 2013). The watermost polluted ammonia is in the areas of itsstagnation near the "Nadstavna Church", behind theisland from the side of "Tsyganka", near the restau-rant "Khutir" and near the boat station (excess MPCalmost 30 times). Less contaminated due to leakageare areas near the dam (water drain - western andeastern - sites 6 and 1) (exceeding the MPC by 10-15 times).The most polluted ammonia sludge is onthe sites near the "Nadstavna Church", behind theisland from the side of "Tsyganka" (exceeding theMPC by almost 100-150 times). High alkalinity ofwater contributes to the transition of a significantamount of ammonia to highly toxic ammonia,which degrades the ecotoxicological situation of thereservoir due to the significantly higher toxicity ofammonia compared with the ammoniumion(Romanenko 2015, Grubinko et al.,2013).
In the water, excess levels of sodium ionswere found, which, along with the sum of ions ofother metals, indicates the significant salinity of thepond, especially at sites of intense flushing from theshore: near the dam, from the side of the village ofBila and Krushelnytska St., from the restaurant"Khutir". The main source of salinity is the use onthe roads and sidewalks of bulk salts and slags inthe winter.
Polymetal contamination of sludge with highand biologically dangerous, except for iron, levelsof their mobile forms and the excess over permissi-ble levels in the most contaminated places is dozensof times above the norm. The excess of the norm ofthe content of the mobile mold for copper wasfound to be 24-86 times, nickel - from 2 to 17times, cobalt - 4-8 times, and a high level of ironand zinc was established. The pollution of thesludge with mobile cadmium (almost 60%) andlead (almost 90%) was detected. In this case, thecontent of mobile cadmium exceeds the permissiblenorm by 5-80 times (at the site 2 near the boatmooring this norm was exceeded by 128 times),and lead - by 4.5-12. A high level of content ofmobile metal forms was established at sites with asignificant blackening, lower oxygen content andhigher values of pH - boat mooring, from the side
V. V. Grubinko, H.B. Humeniuk, V.O. Khomenchuk,N.M. Garmatiy,V. B. Voytiuk, M.M. Barna. Journ.Geol.Geograph.Geoecology, 27(2), 202-212________________________________________________________________________________________________________________________________________________________________
211
of the village Bila, the beach "Tsyganka", the smal-lest was near the dam territory and the factory op-posite the hotel "Ternopil" (Gumeniuk, 2003).
Using economic-mathematical modelingbased on the theory of Markov chains, we havecalculated the predicted values of the content ofcobalt and manganese in the bottom sediment of thestudied reservoir for the next two years, which willallow monitoring of the situation regarding thecontent of metals in the bottom sediment of thereservoir. Also, the method of correlation-regression analysis investigated the effect of am-monium on the pH index of water, the effect isquite significant and is 86%. The coefficient ofelasticity was calculated on the basis of this val-ue. The coefficient of elasticity suggests that withan increase in ammonia by 10%, the pH index ofwater will decrease by 8%(Akin et al,2011; Budka,2013).Conclusion. Thus, regarding essential, and espe-cially, nonessential metals, it is possible to statethat pollution of the silts of the pond is polymetallicwith a high and biologically dangerous, except foriron, share of their mobile forms and excess overthe maximum permissible levels in the most conta-minated places, ten times above the norm. In caseof change in the hydrochemical balance (primarilypH index, carbon dioxide), the mobility of metalsmay increase, which will substantially exacerbatethe virtually catastrophic contamination of the pondwith extremely toxic and biologically hazardousmetals. The areas most polluted with metals with ahigh degree of biological risk are the silty backwa-ters – site and the places of active surface runoffsite. With the river runoff in the reservoir about halfof the mobile metal form is brought, the rest is ac-cumulating due to emissions. Knowing thepredicted values of the content of such metals asmanganese and cobalt, using the theory ofprediction based on the theory of Markov chains,we can monitor the situation in the near future. Ifthe hydrochemical balance is changed (first of all,pH index, carbon dioxide), the mobility of metalsmay increase, which will substantially aggravatethe almost catastrophic contamination of the pondwith highly toxic and biologically hazardousmetals.
References
«Perelіk zabrudnjujuchih rechovin dlja viznachennjahіmіchnogo stanu masivіv poverhnevih іpіdzemnih vod ta ekologіchnogo potencіalushtuchnogo abo іstotno zmіnenogo masivu po-verhnevih vod». Nakaz Mіnіsterstva ekologії taprirodnih resursіv Ukraїni 06.02.2017 № 45.Zareєstrovano v Mіnіsterstvі justicії Ukraїni 20
ljutogo 2017 r.za № 235/30103. [“List of pollu-tants for the determination of the chemical stateof the arrays of surface and groundwater and theecological potential of an artificial or substantial-ly changed massif of surface waters”. Order ofthe Ministry of Ecology and Natural Resources ofUkraine, No.201 of 06.02.2017. Registered withthe Ministry of Justice of Ukraine on February20, 2017, No. 235/30103].
«Pravila ohoroni poverhnevih vod vіd zabrudnennjazvorotnimi vodami». Zatverdzheno postanovojuKabіnetu Mіnіstrіv Ukraїni vіd 25 bereznja 1999r. N 465 [Rules for the protection of surface waterfrom contamination by reverse water. Approvedby the Resolution of the Cabinet of Ministers ofUkraine dated March 25, 1999 No. 465.].
Abubakar, A., Saleh, Y., Shehu, K., 2015. Heavy metalspollution on surface water sources in Kaduna me-tropolis, Nigeria. Science World Journal, 10(2),1-5.
Akin B. S., Atici T., Katircioglu H. Keskin F.:Investigation of water quality on Gökçekaya damlake using multivariate statistical analysis, inEskişehir. Environmental Earth Sciences. 63(6),1251–1261 (2011). Doi: 10.1007/s12665-010-0798-6
Brahman, K. D., Kazi, T. G., Afridi, H. I., Naseem, S.,Arain, S. S., Wadhwa, S. K., Shah, F.:Simultaneous evaluation of the toxic levels offluoride and arsenic species in the undergroundwater of Tharparkar and possible contaminantsources. A multivariate study. Ecotoxicology andenvironmental safety. 89, 95–107(2013).Doi: 10.1016/j.ecoenv.2012.11.023
Budka, A., Kayzer, D., Pietruczuk, K., Szoszkiewicz, K.:Zastosowanie wybranych procedur dowykrywania obserwacji nietypowych w oceniejako- ści rzek. Infrastruktura i Ekologia TerenówWiejskich. 3(II), 85–95 (2013).
Constable, M, Charlton, M., Jensen, F, McDonald K.,Craig G. & Taylor, K.W. (2010) An EcologicalRisk Assessment of Ammonia in the Aquatic En-vironment, Human and Ecological Risk Assess-ment: An International Journal, 9(2), 527-548,doi: 10.1080/713609921).
Correl, D.L. (1998). The Role of Phosphorus in the Eu-trophication of Receiving Waters: A Review.Journal of Environmental Quality, 28, 261-266.doi:10.2134/jeq1998.00472425002700020004x
Ermachenko, L.A. (1997). Atomno-absorbcionnyj analizv sanitarno-gigienicheskih issledovanijah/ Podred. Podunovoj L.G. [Atomic absorption analysisin sanitary-hygienic research]. Chuvashija,Cheboksary, (in Russian).
Gandzjura, V.P., Grubіnko, V.V. (2008). Koncepcіjashkodochinnostі v ekologії [Concept ofharmfulness in ecology]. Vid–vo TNPU іm. V.Gnatjuka, Kiїv–Ternopіl' (in Ukrainian).
Grubіnko V.V., Gumeniuk, G.B., Volіk, O.V., Svinko,J.M., Makkartі, F.M.G. (2013). Ekosistemazaregul'ovanoї vodojmi v umovahurbonavantazhennja: na prikladі Ternopіl's'kogo
V. V. Grubinko, H.B. Humeniuk, V.O. Khomenchuk,N.M. Garmatiy,V. B. Voytiuk, M.M. Barna. Journ.Geol.Geograph.Geoecology, 27(2), 202-212________________________________________________________________________________________________________________________________________________________________
212
vodoshovishha [Ecosystem of the regulatedreservoir under the conditions of urban loading:on the example of Ternopil reservoir]. Vektor,Ternopіl' (in Ukrainian).
Gumeniuk H., (2003). Rozpodil vazhkyh metaliv u hi-droekosystemi prisnoi vodoimy (na prykladi Ter-nopilskoho stavu) [Heavy metals distribution inhydroecosystem of fresh water (on the example ofTernopil pond)] Ph.D. dissertation (ecolo-gy).Chernivtsi (in Ukrainian).
Directive 2000/60/ EU of the European Parliament andof the Council of 23 October 2000 establishing aframework for Community action in the field ofwater policy // Off. J. Eur. Community. – 2000. –P. 327.
Malik, D., Singh, S., Thakur, J., Singh, R., Kaur,A.,Nijhawan,S., 2014. Heavy Metal Pollution ofthe Yamuna River: AnIntrospection. Int. J. Curr.Microbiol. App. Sci 3(10),856-863.
Manoj, K., Padhy, P., Chaundhury, S.,2012. Study ofHeavy Metal Contamination of the River Waterthrough Index Analysis Approach and Environ-metrics. Bulletin of Environment, Pharmacologyand Life SciencesVolume 1(10), 7-15.
Myslyva,T., Kot I., 2011. Vazhkimetalyuvodakhmalyk-hrichokZhytomyrskohoPolisia [Heavy metals issmall rivers of Zhutomyr region]. Bulletin of Zhy-tomyr National Agroecological University, 2, 58-68 (in Ukrainian).
Nasrabadi, T., 2015. An index approach to metallicpollution in riverwaters. Int. J. Environ. Res. 9(1),385-394.
Nesaratnam, Suresh T. (2014). Water Pollution Control.Hoboken: Wiley. Doi:10.1002/9781118863831.
Perales, H. V., Pena-Castro, J. M., & Canizares-Villanueva, R. O. (2006). Heavy metal detoxifica-tion in eukaryotic microalgae. Chemosphere, 64,1–10. doi:10.1016/j.chemosphere.2005.11.024.).
Rashed, M. N. (2001). Monitoring of environmentalheavy metals in fish from Nasser Lake, Environ.Internat., 27, 27-33. doi.org/10.1016/S0160-4120(01)00050-2).
Rogatinsky R.M., Garmatiy N.M «Mathematicalmethods of market economy for specialists-kibnetikov».Ternopil, Aston-2015. C. 205
Romanenko, O.V., Arsan, O.M., Kіpnіs, L.S., Sitnik,Ju.M. (2015) Ekologіchnі problemi Kiїvs'kih vo-dojm і prileglih teritorіj [Environmental problemsof the Kyiv reservoirs and adjoining territories].Naukova Dumka, Kyiv (in Ukrainian).
Romanenko, V.D. (Ed.). (2006). Metodigіdroekologіchnih doslіdzhen' poverhnevih vod[Methods of hydroecological surveys of surfacewaters]. Logos, Kiyv (in Ukrainian).
Romanenko, V.D., (2015). Gіdroekologіchnі problemi vumovah urbanіzacії [Hydroecological problemsin the conditions of urbanization]. Naukovi za-pysky TNPU im. V. Hnatiuka. Seria Biolohia[The Scientific Notes of Ternopil VolodymyrHnatiuk National Pedagogical University. Series:biology], 3-4 (64), 18-21. (in Ukrainian).
Shannon, K.L., Lawrence, R.S., and McDonald, D. 2011.Antropogenic sources of water pollution: parts 1and 2. In Water and Sanitation-Related Diseasesand the Environment: Challenges, Interventions,and Preventive Measures. Edited by J.M.H. Se-lendy. John Wiley & Sons, Inc., Hoboken (NJ,U.S.A.). pp. 289–302.doi.org/10.1002/9781118148594.ch2
O. V. Havriushyn Journ.Geol.Geograph.Geoecology, 27(2), 216-224________________________________________________________________________________________________________________________________________________________________
213
Journal of Geology,Geography and Geoecology
Journal home page: geology-dnu-dp.ua
ISSN 2617-2909 (print)ISSN 2617-2119 (online)
Journ.Geol.Geograph.Geoecology,
27(2), 213-221doi:10.15421/111846
O. V. Havriushyn. Journ.Geol.Geograph.Geoecology, 27(2), 213-221________________________________________________________________________________________________________________________________________________________________
Mapping the spatial and temporal distribution of changesin the administrative-territorial division
O. V. Havriushyn
Oles Honchar Dnipro National University, Dnipro, Ukraine, e-mail: [email protected]
Abstract.The article is devoted to the development of the content of generalized mapson the history of administrative-territorial division. The purpose of such maps is to reflectthe features of the space-time distribution of administrative changes.We have found thatit is better to link indicators of dynamics to such spatial objects as the territories of mod-ern administrative-territorial units (or the territory of historical administrative-territorial
ones as of a certain date), to polygons of a single history of administrative membership, to administrative-territorial units as dynamicobjects.Under the polygons of a single history of administrative ownership, we mean the territories identified during the analysis, allpoints within which belonged to the same administrative-territorial unit at any time during the analyzed period. Unlike polygons ofthe smallest common geometry (used in the method of space-time composites), such objects can be allocated for different periods oftime and for different administrative levels.For such spatial objects, we propose to calculate and display on the map the number ofchanges in administrative ownership or the total duration of belonging to some administrative-territorial unit (usually, a high level).For larger static areas than the polygons of a single history of administrative affiliation, we suggest calculating and displaying on themap the indicator of administrative variability and the average duration of ownership. In our opinion, the indicator of administrativevariability should consider the size of the analyzed territory, the number and volume of spatial changes. We have developed a formu-la for calculating such an indicator.The indicators that we calculate for historical administrative-territorial units on the map are dis-played within the static contour. However, these indicators are calculated for a dynamic object. These indicators are: the number ofchanges, the total number of changes in parameters, the total number of dates of change, the spatial configuration variability index,the area-weighted average area and its relation to the modern one. We propose to calculate the index of the variability of the configu-ration of the administrative-territorial unit as the sum of the relations of the areas of the reassigned territories to the areas of the ad-ministrative-territorial unit at the time before the change. Since different administrative-territorial units have different duration ofexistence, in our opinion, it is important to analyze not only the quantity but also the intensity of the changes. To reflect on the mapthe course of changes in the administrative-territorial unit in time, we developed a timeline-based chart.
Key words: administrative-territorial division, mapping, timelines, generalization of time-varying data, spatial and temporaldistribution of changes
Картографування просторово-часового розподілу змінадміністративно-територіального поділу
О.В. Гаврюшин
Дніпровський національний університет імені Олеся Гончара, Дніпро, Україна, e-mail: [email protected]
Анотація. Виявлено, що показники динаміки доцільно прив'язати до таких просторових об'єктів як території сучасних ад-міністративно-територіальних одиниць (або територій історичних адміністративно-територіальних одиниць станом напевну дату), полігони єдиної історії адміністративної приналежності, адміністративно-територіальних одиниць як динаміч-них об'єктів. Для полігонів єдиної історії адміністративної належності пропонуємо розраховувати та відображати на картікількість змін адміністративної належності або сумарної тривалості належності до певної адміністративно-територіальноїодиниці. Для більших статичних територій, ніж полігони єдиної історії адміністративної приналежності, пропонуємо розра-ховувати та відображати на карті показник адміністративної мінливості та середньої тривалості належності. Показник адмі-ністративної мінливості повинен враховувати розміри аналізованої території, кількість та обсяги просторових змін. Розроб-лено формулу розрахунку такого показника. Показники, які ми розраховуємо для історичних адміністративно-територіальних одиниць, на карті відображаються в межах статичних контурів. Однак ці показники в дійсності розрахованідля динамічного об'єкта. Такими показниками є: кількість змін конкретного виду, загальна кількість змін параметрів, зага-льна кількість дат змін, показник мінливості простору, середньозважена в часі площа і її відношення до сучасної. Пропону-
Received 30.07.2018;Received in revised form 09.08.2018;Accepted 04.10.2018
O. V. Havriushyn Journ.Geol.Geograph.Geoecology, 27(2), 213-221________________________________________________________________________________________________________________________________________________________________
214
ємо розраховувати показник мінливості конфігурації адміністративно-територіальної одиниці як суму відношень площперепідпорядкованих територій до площ АТО на момент до зміни. Обґрунтовано доцільність аналізу крім кількості змін їхінтенсивності. Для відображення на карті змін адміністративно-територіальної одиниці в часі розроблено діаграму на основітаймлайну.
Ключові слова: адміністративно-територіальний поділ, картографування, таймлайни, узагальнення різночасових даних,просторово-часовий розподіл змін
Introduction. In independent Ukraine, the interestto the topic of administrative-territorial division(ATD) in general and history of its development inparticular increases. A scientific discussion of re-forming the current administrative division goes onin the country. However, in retrospective studies onthe administrative division of Ukraine, the carto-graphic method of study and modern geoinforma-tion techonogies were not used broadly. The mapsof the history of the administrative division areavailable in many history atlases, and also in par-ticular scientific works (Trotsenko, 2008). Nonethe-less, in content, they are mostly combinations of theborders in different periods on a single map or themaps which demonstrate the course of administra-tive changes over a short period of time. At thesame time, there are no generalized maps whichwould reflect the pe-culiarities of spatio-temporaldivision of changes over a long period demonstrat-ing the differences in the administrative history ofdifferent objects (territories).
In foreign countries, the aspects of cartogra-phy of the spatio-temporal division of the adminis-trative changes are also insufficiently developed .Some cartographic works demonstrate the changesin the situation using special graphic models, forexample the timelines in the GeaCron Atlas (this isnot on the map, but presented as additional infor-mation), theoretical aspects of developing suchgraphic models for political territorial objects werestudied by A. Renolen. More developed are theissues of the history of administrative division (orpolitical map) in the GIS data bases and their visua-lizations, and also general issues of the data analy-sis related to the ad-ministrative-territorial unitsvariable over time. Especially notable are the stu-dies by I.Gregory. M. Berman, M. DeMoor, T.Wiedemann, M. Nüssli, C. Nüssli, E. VanHauteand also the studies conducted earlier and generaltheoretic studies on the presentation and analysis ofhistorical data in GIS, particularly Langran(1992).Some developments in the sphere of pre-senting data can be used and for visualizing thespatio-temporal distribution of changes. E.VanHaute considers one of the advantages of de-scribing changes in ATD using the method of "leastcommon geometry" (LCG), also known as "space-
time composite"or"spatiotemporalcomposite"(STC)to be the opportunity of using LCG polygons forstudying the changes in the attributive data overtime (VanHaute, 2005). That is, the LCG polygonsare considered not only as the units of data mainta-nence for the next aggregation and depiction of theadministrative units of higher levels, but as thespatial basis for the attributive data and their visua-lizations.The goal of the study was to develop a content(objects of mapping, parameters) and graphic toolsfor creating maps which demonstrate the peculiari-ties of spatial and spatio-temporal division of ad-ministrative changes and duration of the adminis-trative belonging.Materials and methods. The study is methodolog-ical and was made on cartographic and text mate-rials on the history of administrative-territorial divi-sion of Dnipropetrovsk Oblast. During the devel-opment of the approaches for mapping the spatio-temporal division of administrative changes, wefollowed the idea of division of the administrative-territorial units into smaller polygons, which lays inthe basis of the method of spatio-temporal compo-sites and the method of visualizing the course ofevents in time, known as timeline.Results and their analysis. The parameters whichcharacterize the level of ATD dynamic can havedifferent spatial localization and be calculated forstatic polygon objects, for dynamic polygonal ob-jects, linear objects, points of regular network, etc.(Havriushyn, 2018).
As static polygonal objects, we can considerthe territories located within administrative borders.They can correspond to the administrative-territorial unit (ATU) either at a certain date or be aresult of generalized borders of ATU over differentperiods of time.
Among static polygonal objects created as aresult of generalizing the borders of an ATU overdifferent time periods, special significance belongsto the polygons of the common history of adminis-trative belonging (CHAB) - a territory, all points ofwhich belong to the same historical ATU in everymoment of the period of study.
Dynamic polygonal objects are historic ATUin time dimension (Table 1)
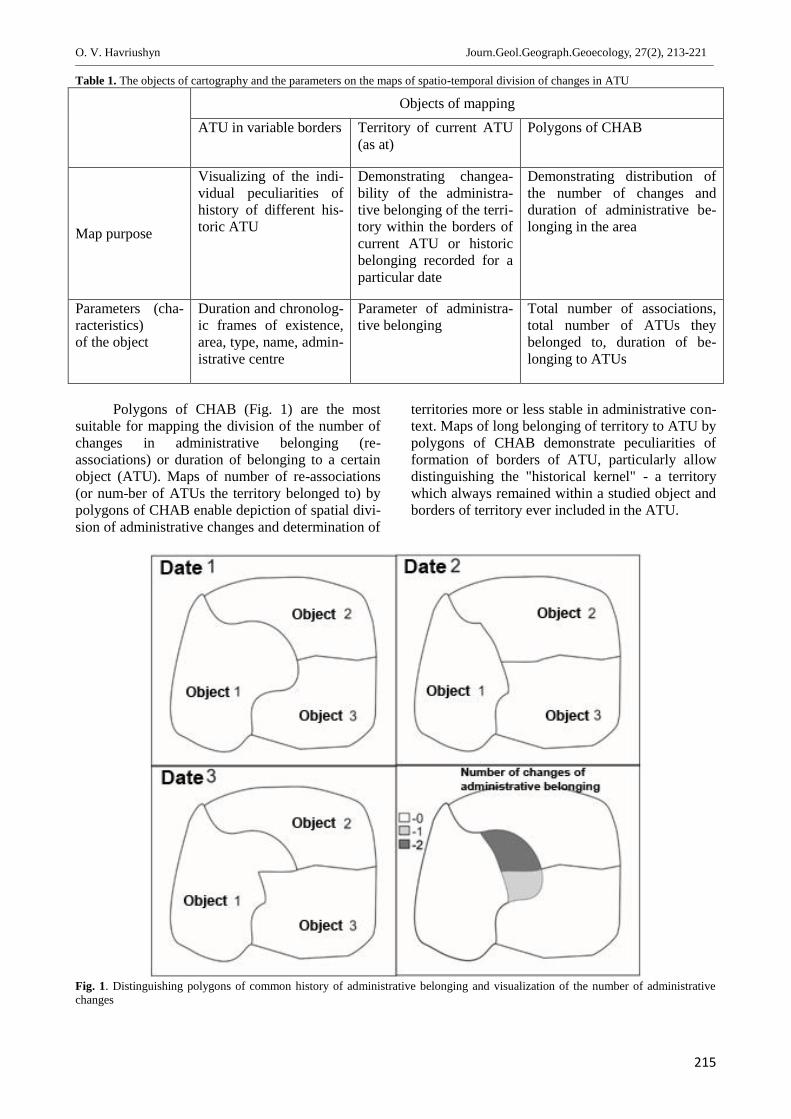
O. V. Havriushyn Journ.Geol.Geograph.Geoecology, 27(2), 213-221________________________________________________________________________________________________________________________________________________________________
215
Table 1. The objects of cartography and the parameters on the maps of spatio-temporal division of changes in ATU
Objects of mappingATU in variable borders Territory of current ATU
(as at)Polygons of CHAB
Map purpose
Visualizing of the indi-vidual peculiarities ofhistory of different his-toric ATU
Demonstrating changea-bility of the administra-tive belonging of the terri-tory within the borders ofcurrent ATU or historicbelonging recorded for aparticular date
Demonstrating distribution ofthe number of changes andduration of administrative be-longing in the area
Parameters (cha-racteristics)of the object
Duration and chronolog-ic frames of existence,area, type, name, admin-istrative centre
Parameter of administra-tive belonging
Total number of associations,total number of ATUs theybelonged to, duration of be-longing to ATUs
Polygons of CHAB (Fig. 1) are the mostsuitable for mapping the division of the number ofchanges in administrative belonging (re-associations) or duration of belonging to a certainobject (ATU). Maps of number of re-associations(or num-ber of ATUs the territory belonged to) bypolygons of CHAB enable depiction of spatial divi-sion of administrative changes and determination of
territories more or less stable in administrative con-text. Maps of long belonging of territory to ATU bypolygons of CHAB demonstrate peculiarities offormation of borders of ATU, particularly allowdistinguishing the "historical kernel" - a territorywhich always remained within a studied object andborders of territory ever included in the ATU.
Fig. 1. Distinguishing polygons of common history of administrative belonging and visualization of the number of administrativechanges
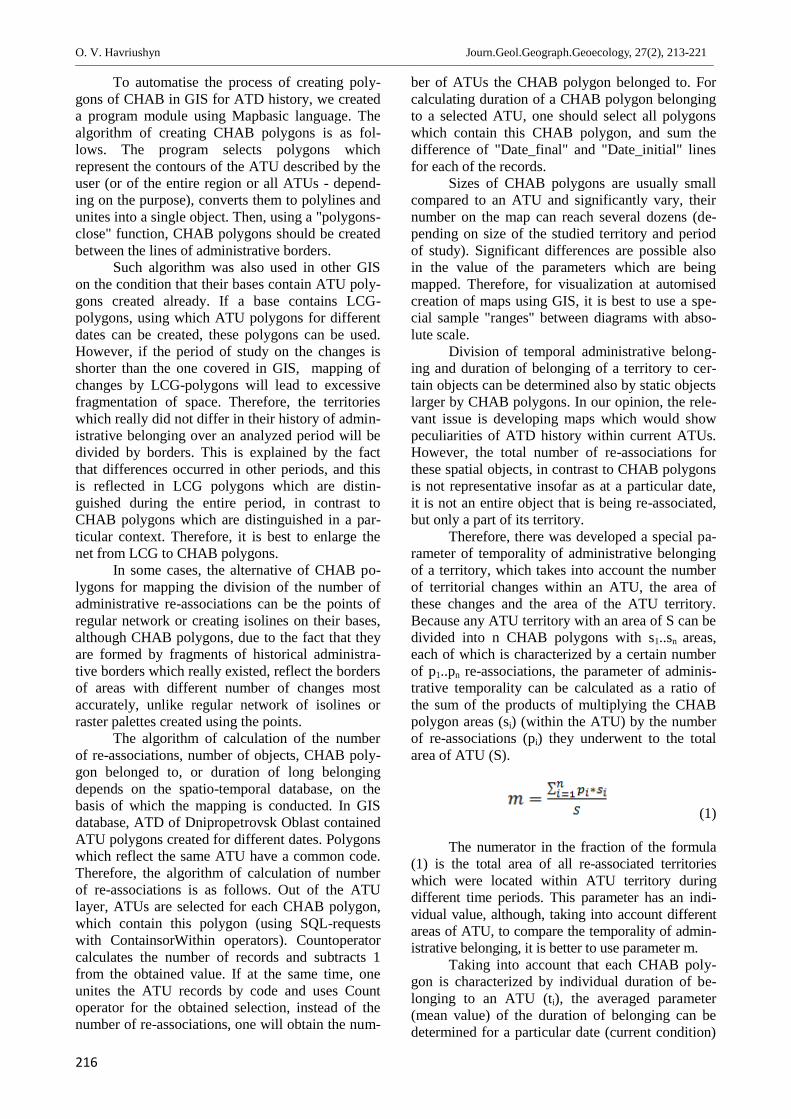
O. V. Havriushyn Journ.Geol.Geograph.Geoecology, 27(2), 213-221________________________________________________________________________________________________________________________________________________________________
216
To automatise the process of creating poly-gons of CHAB in GIS for ATD history, we createda program module using Mapbasic language. Thealgorithm of creating CHAB polygons is as fol-lows. The program selects polygons whichrepresent the contours of the ATU described by theuser (or of the entire region or all ATUs - depend-ing on the purpose), converts them to polylines andunites into a single object. Then, using a "polygons-close" function, CHAB polygons should be createdbetween the lines of administrative borders.
Such algorithm was also used in other GISon the condition that their bases contain ATU poly-gons created already. If a base contains LCG-polygons, using which ATU polygons for differentdates can be created, these polygons can be used.However, if the period of study on the changes isshorter than the one covered in GIS, mapping ofchanges by LCG-polygons will lead to excessivefragmentation of space. Therefore, the territorieswhich really did not differ in their history of admin-istrative belonging over an analyzed period will bedivided by borders. This is explained by the factthat differences occurred in other periods, and thisis reflected in LCG polygons which are distin-guished during the entire period, in contrast toCHAB polygons which are distinguished in a par-ticular context. Therefore, it is best to enlarge thenet from LCG to CHAB polygons.
In some cases, the alternative of CHAB po-lygons for mapping the division of the number ofadministrative re-associations can be the points ofregular network or creating isolines on their bases,although CHAB polygons, due to the fact that theyare formed by fragments of historical administra-tive borders which really existed, reflect the bordersof areas with different number of changes mostaccurately, unlike regular network of isolines orraster palettes created using the points.
The algorithm of calculation of the numberof re-associations, number of objects, CHAB poly-gon belonged to, or duration of long belongingdepends on the spatio-temporal database, on thebasis of which the mapping is conducted. In GISdatabase, ATD of Dnipropetrovsk Oblast containedATU polygons created for different dates. Polygonswhich reflect the same ATU have a common code.Therefore, the algorithm of calculation of numberof re-associations is as follows. Out of the ATUlayer, ATUs are selected for each CHAB polygon,which contain this polygon (using SQL-requestswith ContainsorWithin operators). Countoperatorcalculates the number of records and subtracts 1from the obtained value. If at the same time, oneunites the ATU records by code and uses Countoperator for the obtained selection, instead of thenumber of re-associations, one will obtain the num-
ber of ATUs the CHAB polygon belonged to. Forcalculating duration of a CHAB polygon belongingto a selected ATU, one should select all polygonswhich contain this CHAB polygon, and sum thedifference of "Date_final" and "Date_initial" linesfor each of the records.
Sizes of CHAB polygons are usually smallcompared to an ATU and significantly vary, theirnumber on the map can reach several dozens (de-pending on size of the studied territory and periodof study). Significant differences are possible alsoin the value of the parameters which are beingmapped. Therefore, for visualization at automisedcreation of maps using GIS, it is best to use a spe-cial sample "ranges" between diagrams with abso-lute scale.
Division of temporal administrative belong-ing and duration of belonging of a territory to cer-tain objects can be determined also by static objectslarger by CHAB polygons. In our opinion, the rele-vant issue is developing maps which would showpeculiarities of ATD history within current ATUs.However, the total number of re-associations forthese spatial objects, in contrast to CHAB polygonsis not representative insofar as at a particular date,it is not an entire object that is being re-associated,but only a part of its territory.
Therefore, there was developed a special pa-rameter of temporality of administrative belongingof a territory, which takes into account the numberof territorial changes within an ATU, the area ofthese changes and the area of the ATU territory.Because any ATU territory with an area of S can bedivided into n CHAB polygons with s1..sn areas,each of which is characterized by a certain numberof p1..pn re-associations, the parameter of adminis-trative temporality can be calculated as a ratio ofthe sum of the products of multiplying the CHABpolygon areas (si) (within the ATU) by the numberof re-associations (pi) they underwent to the totalarea of ATU (S).
(1)
The numerator in the fraction of the formula(1) is the total area of all re-associated territorieswhich were located within ATU territory duringdifferent time periods. This parameter has an indi-vidual value, although, taking into account differentareas of ATU, to compare the temporality of admin-istrative belonging, it is better to use parameter m.
Taking into account that each CHAB poly-gon is characterized by individual duration of be-longing to an ATU (ti), the averaged parameter(mean value) of the duration of belonging can bedetermined for a particular date (current condition)
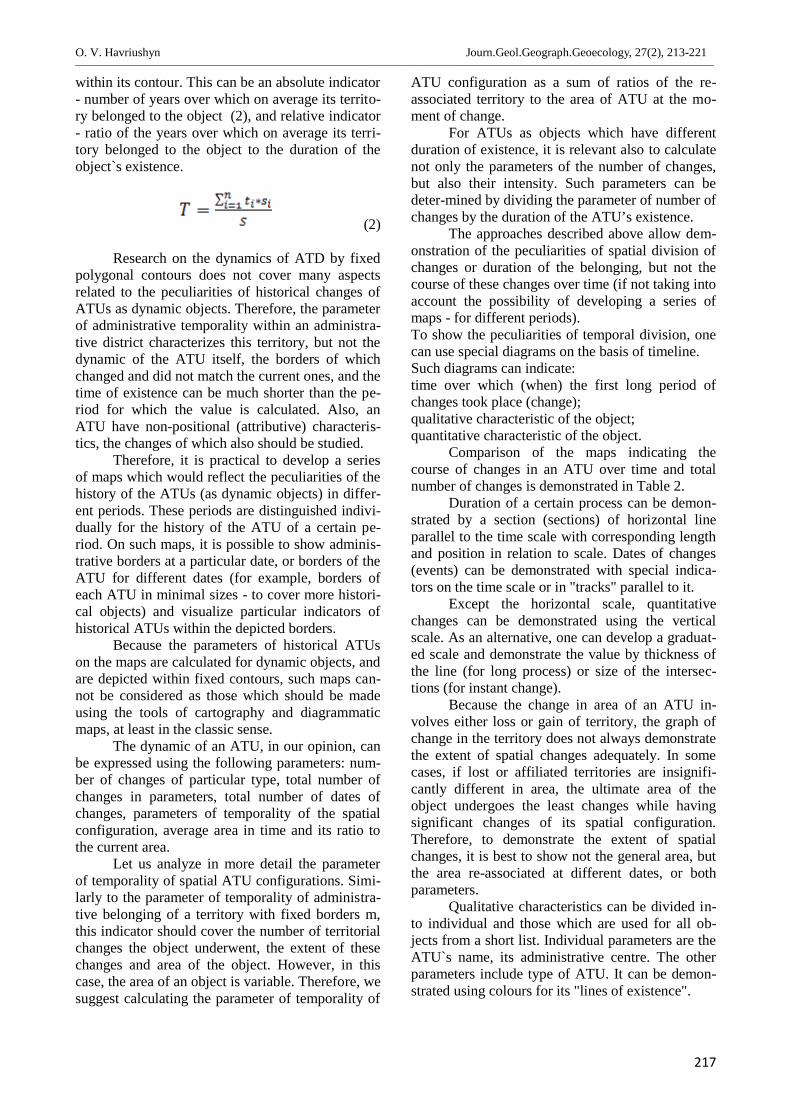
O. V. Havriushyn Journ.Geol.Geograph.Geoecology, 27(2), 213-221________________________________________________________________________________________________________________________________________________________________
217
within its contour. This can be an absolute indicator- number of years over which on average its territo-ry belonged to the object (2), and relative indicator- ratio of the years over which on average its terri-tory belonged to the object to the duration of theobject`s existence.
(2)
Research on the dynamics of ATD by fixedpolygonal contours does not cover many aspectsrelated to the peculiarities of historical changes ofATUs as dynamic objects. Therefore, the parameterof administrative temporality within an administra-tive district characterizes this territory, but not thedynamic of the ATU itself, the borders of whichchanged and did not match the current ones, and thetime of existence can be much shorter than the pe-riod for which the value is calculated. Also, anATU have non-positional (attributive) characteris-tics, the changes of which also should be studied.
Therefore, it is practical to develop a seriesof maps which would reflect the peculiarities of thehistory of the ATUs (as dynamic objects) in differ-ent periods. These periods are distinguished indivi-dually for the history of the ATU of a certain pe-riod. On such maps, it is possible to show adminis-trative borders at a particular date, or borders of theATU for different dates (for example, borders ofeach ATU in minimal sizes - to cover more histori-cal objects) and visualize particular indicators ofhistorical ATUs within the depicted borders.
Because the parameters of historical ATUson the maps are calculated for dynamic objects, andare depicted within fixed contours, such maps can-not be considered as those which should be madeusing the tools of cartography and diagrammaticmaps, at least in the classic sense.
The dynamic of an ATU, in our opinion, canbe expressed using the following parameters: num-ber of changes of particular type, total number ofchanges in parameters, total number of dates ofchanges, parameters of temporality of the spatialconfiguration, average area in time and its ratio tothe current area.
Let us analyze in more detail the parameterof temporality of spatial ATU configurations. Simi-larly to the parameter of temporality of administra-tive belonging of a territory with fixed borders m,this indicator should cover the number of territorialchanges the object underwent, the extent of thesechanges and area of the object. However, in thiscase, the area of an object is variable. Therefore, wesuggest calculating the parameter of temporality of
ATU configuration as a sum of ratios of the re-associated territory to the area of ATU at the mo-ment of change.
For ATUs as objects which have differentduration of existence, it is relevant also to calculatenot only the parameters of the number of changes,but also their intensity. Such parameters can bedeter-mined by dividing the parameter of number ofchanges by the duration of the ATU’s existence.
The approaches described above allow dem-onstration of the peculiarities of spatial division ofchanges or duration of the belonging, but not thecourse of these changes over time (if not taking intoaccount the possibility of developing a series ofmaps - for different periods).To show the peculiarities of temporal division, onecan use special diagrams on the basis of timeline.Such diagrams can indicate:time over which (when) the first long period ofchanges took place (change);qualitative characteristic of the object;quantitative characteristic of the object.
Comparison of the maps indicating thecourse of changes in an ATU over time and totalnumber of changes is demonstrated in Table 2.
Duration of a certain process can be demon-strated by a section (sections) of horizontal lineparallel to the time scale with corresponding lengthand position in relation to scale. Dates of changes(events) can be demonstrated with special indica-tors on the time scale or in "tracks" parallel to it.
Except the horizontal scale, quantitativechanges can be demonstrated using the verticalscale. As an alternative, one can develop a graduat-ed scale and demonstrate the value by thickness ofthe line (for long process) or size of the intersec-tions (for instant change).
Because the change in area of an ATU in-volves either loss or gain of territory, the graph ofchange in the territory does not always demonstratethe extent of spatial changes adequately. In somecases, if lost or affiliated territories are insignifi-cantly different in area, the ultimate area of theobject undergoes the least changes while havingsignificant changes of its spatial configuration.Therefore, to demonstrate the extent of spatialchanges, it is best to show not the general area, butthe area re-associated at different dates, or bothparameters.
Qualitative characteristics can be divided in-to individual and those which are used for all ob-jects from a short list. Individual parameters are theATU`s name, its administrative centre. The otherparameters include type of ATU. It can be demon-strated using colours for its "lines of existence".
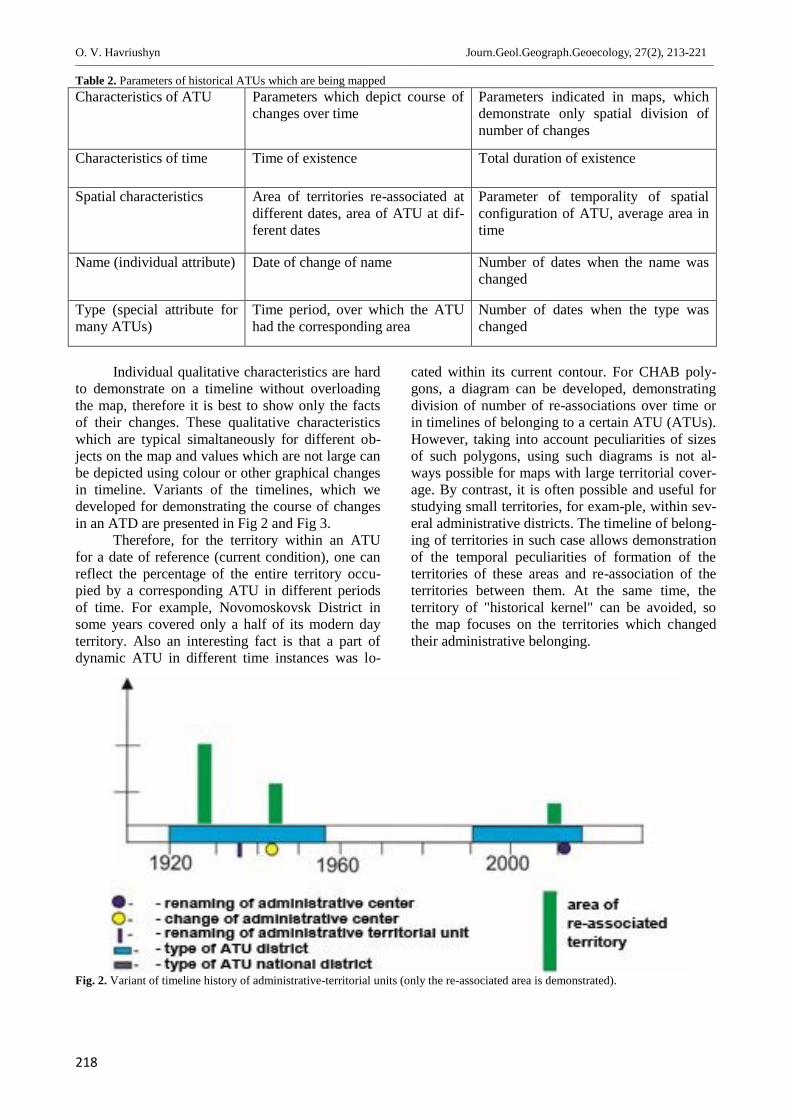
O. V. Havriushyn Journ.Geol.Geograph.Geoecology, 27(2), 213-221________________________________________________________________________________________________________________________________________________________________
218
Table 2. Parameters of historical ATUs which are being mappedCharacteristics of ATU Parameters which depict course of
changes over timeParameters indicated in maps, whichdemonstrate only spatial division ofnumber of changes
Characteristics of time Time of existence Total duration of existence
Spatial characteristics Area of territories re-associated atdifferent dates, area of ATU at dif-ferent dates
Parameter of temporality of spatialconfiguration of ATU, average area intime
Name (individual attribute) Date of change of name Number of dates when the name waschanged
Type (special attribute formany ATUs)
Time period, over which the ATUhad the corresponding area
Number of dates when the type waschanged
Individual qualitative characteristics are hardto demonstrate on a timeline without overloadingthe map, therefore it is best to show only the factsof their changes. These qualitative characteristicswhich are typical simaltaneously for different ob-jects on the map and values which are not large canbe depicted using colour or other graphical changesin timeline. Variants of the timelines, which wedeveloped for demonstrating the course of changesin an ATD are presented in Fig 2 and Fig 3.
Therefore, for the territory within an ATUfor a date of reference (current condition), one canreflect the percentage of the entire territory occu-pied by a corresponding ATU in different periodsof time. For example, Novomoskovsk District insome years covered only a half of its modern dayterritory. Also an interesting fact is that a part ofdynamic ATU in different time instances was lo-
cated within its current contour. For CHAB poly-gons, a diagram can be developed, demonstratingdivision of number of re-associations over time orin timelines of belonging to a certain ATU (ATUs).However, taking into account peculiarities of sizesof such polygons, using such diagrams is not al-ways possible for maps with large territorial cover-age. By contrast, it is often possible and useful forstudying small territories, for exam-ple, within sev-eral administrative districts. The timeline of belong-ing of territories in such case allows demonstrationof the temporal peculiarities of formation of theterritories of these areas and re-association of theterritories between them. At the same time, theterritory of "historical kernel" can be avoided, sothe map focuses on the territories which changedtheir administrative belonging.
Fig. 2. Variant of timeline history of administrative-territorial units (only the re-associated area is demonstrated).
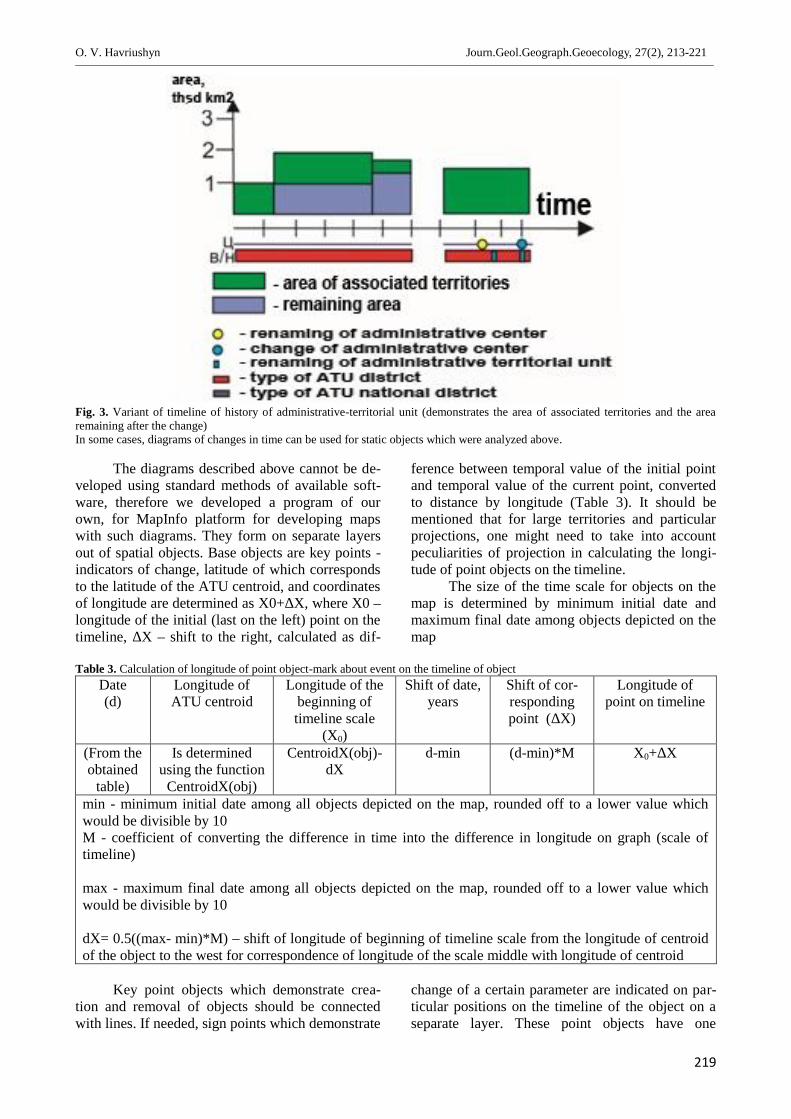
O. V. Havriushyn Journ.Geol.Geograph.Geoecology, 27(2), 213-221________________________________________________________________________________________________________________________________________________________________
219
Fig. 3. Variant of timeline of history of administrative-territorial unit (demonstrates the area of associated territories and the arearemaining after the change)In some cases, diagrams of changes in time can be used for static objects which were analyzed above.
The diagrams described above cannot be de-veloped using standard methods of available soft-ware, therefore we developed a program of ourown, for MapInfo platform for developing mapswith such diagrams. They form on separate layersout of spatial objects. Base objects are key points -indicators of change, latitude of which correspondsto the latitude of the ATU centroid, and coordinatesof longitude are determined as X0+ΔX, where X0 –longitude of the initial (last on the left) point on thetimeline, ΔX – shift to the right, calculated as dif-
ference between temporal value of the initial pointand temporal value of the current point, convertedto distance by longitude (Table 3). It should bementioned that for large territories and particularprojections, one might need to take into accountpeculiarities of projection in calculating the longi-tude of point objects on the timeline.
The size of the time scale for objects on themap is determined by minimum initial date andmaximum final date among objects depicted on themap
Table 3. Calculation of longitude of point object-mark about event on the timeline of objectDate(d)
Longitude ofATU centroid
Longitude of thebeginning oftimeline scale
(X0)
Shift of date,years
Shift of cor-respondingpoint (ΔX)
Longitude ofpoint on timeline
(From theobtained
table)
Is determinedusing the function
CentroidX(obj)
CentroidX(obj)-dX
d-min (d-min)*M X0+ΔX
min - minimum initial date among all objects depicted on the map, rounded off to a lower value whichwould be divisible by 10M - coefficient of converting the difference in time into the difference in longitude on graph (scale oftimeline)
max - maximum final date among all objects depicted on the map, rounded off to a lower value whichwould be divisible by 10
dX= 0.5((max- min)*M) – shift of longitude of beginning of timeline scale from the longitude of centroidof the object to the west for correspondence of longitude of the scale middle with longitude of centroid
Key point objects which demonstrate crea-tion and removal of objects should be connectedwith lines. If needed, sign points which demonstrate
change of a certain parameter are indicated on par-ticular positions on the timeline of the object on aseparate layer. These point objects have one
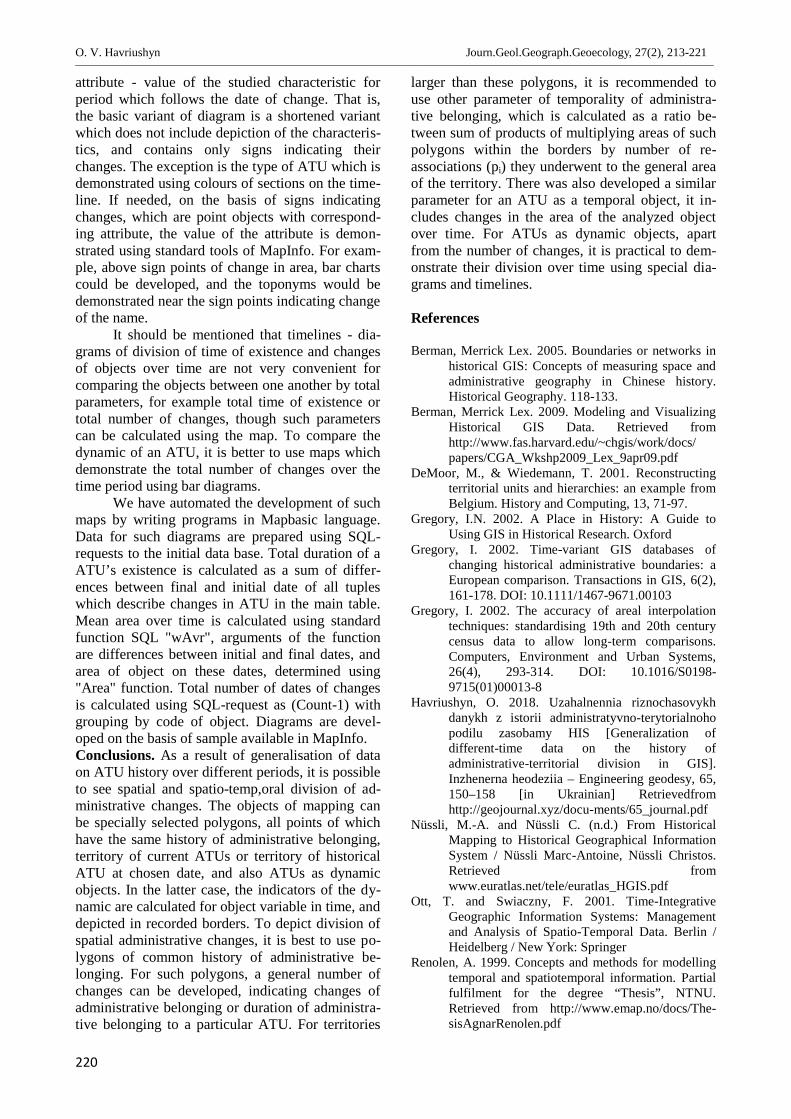
O. V. Havriushyn Journ.Geol.Geograph.Geoecology, 27(2), 213-221________________________________________________________________________________________________________________________________________________________________
220
attribute - value of the studied characteristic forperiod which follows the date of change. That is,the basic variant of diagram is a shortened variantwhich does not include depiction of the characteris-tics, and contains only signs indicating theirchanges. The exception is the type of ATU which isdemonstrated using colours of sections on the time-line. If needed, on the basis of signs indicatingchanges, which are point objects with correspond-ing attribute, the value of the attribute is demon-strated using standard tools of MapInfo. For exam-ple, above sign points of change in area, bar chartscould be developed, and the toponyms would bedemonstrated near the sign points indicating changeof the name.
It should be mentioned that timelines - dia-grams of division of time of existence and changesof objects over time are not very convenient forcomparing the objects between one another by totalparameters, for example total time of existence ortotal number of changes, though such parameterscan be calculated using the map. To compare thedynamic of an ATU, it is better to use maps whichdemonstrate the total number of changes over thetime period using bar diagrams.
We have automated the development of suchmaps by writing programs in Mapbasic language.Data for such diagrams are prepared using SQL-requests to the initial data base. Total duration of aATU’s existence is calculated as a sum of differ-ences between final and initial date of all tupleswhich describe changes in ATU in the main table.Mean area over time is calculated using standardfunction SQL "wAvr", arguments of the functionare differences between initial and final dates, andarea of object on these dates, determined using"Area" function. Total number of dates of changesis calculated using SQL-request as (Count-1) withgrouping by code of object. Diagrams are devel-oped on the basis of sample available in MapInfo.Conclusions. As a result of generalisation of dataon ATU history over different periods, it is possibleto see spatial and spatio-temp,oral division of ad-ministrative changes. The objects of mapping canbe specially selected polygons, all points of whichhave the same history of administrative belonging,territory of current ATUs or territory of historicalATU at chosen date, and also ATUs as dynamicobjects. In the latter case, the indicators of the dy-namic are calculated for object variable in time, anddepicted in recorded borders. To depict division ofspatial administrative changes, it is best to use po-lygons of common history of administrative be-longing. For such polygons, a general number ofchanges can be developed, indicating changes ofadministrative belonging or duration of administra-tive belonging to a particular ATU. For territories
larger than these polygons, it is recommended touse other parameter of temporality of administra-tive belonging, which is calculated as a ratio be-tween sum of products of multiplying areas of suchpolygons within the borders by number of re-associations (pi) they underwent to the general areaof the territory. There was also developed a similarparameter for an ATU as a temporal object, it in-cludes changes in the area of the analyzed objectover time. For ATUs as dynamic objects, apartfrom the number of changes, it is practical to dem-onstrate their division over time using special dia-grams and timelines.
References
Berman, Merrick Lex. 2005. Boundaries or networks inhistorical GIS: Concepts of measuring space andadministrative geography in Chinese history.Historical Geography. 118-133.
Berman, Merrick Lex. 2009. Modeling and VisualizingHistorical GIS Data. Retrieved fromhttp://www.fas.harvard.edu/~chgis/work/docs/papers/CGA_Wkshp2009_Lex_9apr09.pdf
DeMoor, M., & Wiedemann, T. 2001. Reconstructingterritorial units and hierarchies: an example fromBelgium. History and Computing, 13, 71-97.
Gregory, I.N. 2002. A Place in History: A Guide toUsing GIS in Historical Research. Oxford
Gregory, I. 2002. Time-variant GIS databases ofchanging historical administrative boundaries: aEuropean comparison. Transactions in GIS, 6(2),161-178. DOI: 10.1111/1467-9671.00103
Gregory, I. 2002. The accuracy of areal interpolationtechniques: standardising 19th and 20th centurycensus data to allow long-term comparisons.Computers, Environment and Urban Systems,26(4), 293-314. DOI: 10.1016/S0198-9715(01)00013-8
Havriushyn, O. 2018. Uzahalnennia riznochasovykhdanykh z istorii administratyvno-terytorialnohopodilu zasobamy HIS [Generalization ofdifferent-time data on the history ofadministrative-territorial division in GIS].Inzhenerna heodeziia – Engineering geodesy, 65,150–158 [in Ukrainian] Retrievedfromhttp://geojournal.xyz/docu-ments/65_journal.pdf
Nüssli, M.-A. and Nüssli C. (n.d.) From HistoricalMapping to Historical Geographical InformationSystem / Nüssli Marc-Antoine, Nüssli Christos.Retrieved fromwww.euratlas.net/tele/euratlas_HGIS.pdf
Ott, T. and Swiaczny, F. 2001. Time-IntegrativeGeographic Information Systems: Managementand Analysis of Spatio-Temporal Data. Berlin /Heidelberg / New York: Springer
Renolen, A. 1999. Concepts and methods for modellingtemporal and spatiotemporal information. Partialfulfilment for the degree “Thesis”, NTNU.Retrieved from http://www.emap.no/docs/The-sisAgnarRenolen.pdf
O. V. Havriushyn Journ.Geol.Geograph.Geoecology, 27(2), 213-221________________________________________________________________________________________________________________________________________________________________
221
Trotsenko, O.V. 2008. Doslidzhennia zmin admi-nistratyvno-terytorialnoho ustroiu rehionu yakbazovoi skladovoi systemy vtrachenykhheohrafichnykh obiektiv (na prykladiDnipropetrovskoi oblasti) [Investigation ofchanges in the administrative-territorial structureof the region as the basic component of thesystem of lost geographic objects (for example,Dnipropetrovsk region)] Naukovi zapysky
Vinnytskoho pedahohichnoho universytetu –Scientific notes of Vinnytsya State PedagogicalUniversity named after Michailo Kotzubynsky.Series: Geography. issue. 17, 25-30 [inUkrainian].
Vanhaute, E. 2005. The Belgium Historical GIS.Historical Geography, 33, 136–139.
World History Maps & Timelines | GeaCron Retrievedfrom http://geacron.com/
D. V. Kasiyanchuk, E. D. Kuzmenko,M. M. Tymkiv, A. V. Vitiuk Journ.Geol.Geograph.Geoecology, 27(2), 225-234________________________________________________________________________________________________________________________________________________________________
222
Journal of Geology,Geography and Geoecology
Journal home page: geology-dnu-dp.ua
ISSN 2617-2909 (print)ISSN 2617-2119 (online)
Journ.Geol.Geograph.Geoecology,
27(2), 222-231doi:10.15421/111847
D.V. Kasiyanchuk, E.D. Kuzmenko,M.M. Tymkiv, A.V. Vitiuk Journ.Geol.Geograph.Geoecology, 27(2), 222-231________________________________________________________________________________________________________________________________________________________________
Geo-information modelling of the insolation level within Ivano-Frankivsk region
D.V. Kasiyanchuk, E.D. Kuzmenko, M.M. Tymkiv, A.V. Vitiuk
Ivano-Frankivsk National Technical University of Oil and Gas, e-mail: [email protected]
Abstract.Useof alternative energy sources is one of the promising directions in economicand environmental development of any territory. The purpose of this article is to conductgeo-information analysis of the insolation level within Ivano-Frankivsk region located inthe western part of Ukraine. When considering any research territory, it is worth conduct-ing a factorial analysis, which gives the possibility to characterize any advantages and
disadvantages of the use of alternative energy. Justification of approaches to the study of territories where alternative energy sourcesare located or generated is needed to create a unified system for assessment of the potential of the renewable energy sources. Ac-cording to data of the European Space Agency, the insolation level on the research territory varies from 1175 to 1425 kW/hour* sq.m/per day. The method of our research involves the statistical analysis of the insolation level and the factor approach to determiningthe existing level of insolation Insolation values, meteorological and geomorphological factor characteristics are used to substantiatethe new methodology for calculating the existing insolation level. According to the statistical analysis and geo-information analysis,this reasonably permits us to structure months by the level of insolation as well as to calculate the insolation level at a specific pointfor a certain time of year. Taking into account the angle of inclination above the horizon – the Sun’s declination, the slope exposure –the Sun’s azimuth gives us the possibility to reduce the value of the relief point with its selected factor characteristics and the insola-tion value to the single coefficients, which permits us to clarify the information as to the insolation level of the selected region. Fi-nally, this is resulted in creation of a map with the isolation levels for Ivano-Frankivsk region taking into account the factor charac-teristics. The map represents the changing of the insolation level for seven grouped months. It should be noted that insolation level isuneven and it is characterized by the widest gradation within the territories with complex relief. In that event, the optimal angle ofsolar photovoltaic module inclination equals 49° within Ivano-Frankivsk region. Such structuring clearly reflects the dynamics ofchanges in the insolation level for an individually selected zone. The scientific novelty of the obtained results is assessment of distri-bution of the solar energy potential required for further selection of areas to design and locate the solar power stations. The practicalsignificance lies in obtaining the digital cartographic materials which allow assessment of the insolation value at a specific point inthe studied region. Structuring of the insolation maps gives the possibility for further development of a unified insolation assessmentscheme that is convenient for any user.
Key words: solar insolation, geo-information analyses, potential, renewable energy sources
Геоінформаційне моделювання рівня інсоляції території Івано-Франківської області
Д.В. Касіянчук, Е.Д. Кузьменко, М.М. Тимків, А.В. Вітюк
Івано-Франківський національний технічний університет нафти і газу, м. Івано-Франківськ, Україна,e-mail: [email protected]
Анотація.Використання альтернативних джерел енергії є одним із найперспективнішим напрямком економіко-екологічногорозвитку територій. Метою публікації є геоінформаційний аналіз рівня інсоляції території Івано-Франківської області, якарозташована у західній частині України.При розгляді будь-якої території досліджень, варто виконати факторний аналіз, щодозволить охарактеризувати усі переваги на недоліки використання альтернативної енергетики. Обґрунтування підходів довивчення територій розміщення та видобутку альтернативних джерел енергії викликано необхідністю створення єдиноїсистеми проведення оцінки потенціалу відновлювальних джерел енергії. Рівень інсоляції на території дослідження зміню-ється від1175 до 1425 кВт/год*кв.м в день згідно з даними Європейського космічного агенства. Методика роботи полягає устатистичному аналізі рівня інсоляції та у факторному підході до визначення приведеного рівня інсоляції. Значення інсоля-ції, метеорологічні та геоморфологічні факторні характеристики використані для обґрунтування нової методики розрахунку
Received 02.05.2018;Received in revised form 12.07.2018;Accepted 30.07.2018
D. V. Kasiyanchuk, E. D. Kuzmenko,M. M. Tymkiv, A. V. Vitiuk Journ.Geol.Geograph.Geoecology,27(2), 222-231________________________________________________________________________________________________________________________________________________________________
223
приведеного рівня інсоляції. Це дозволило на основі статистичного та геоінформаційного аналізу обґрунтовано підійти доструктурування місяців за рівнем інсоляції та розрахунку рівня інсоляції в конкретній точці для певного періоду року. Ура-хування кута нахилу схилу – схилення Сонця, експозиції схилу – азимута Сонця дозволило привести значення точки рельє-фу з його вибраними факторними характеристиками та інсоляційним значенням до єдиних коефіцієнтів, які дозволили уто-чнити інформацію щодо рівня інсоляції обраного регіону. Кінцевим результатом є побудована карта рівнів інсоляції длятериторії Івано-Франківської області з урахуванням факторних характеристик. Карта репрезентує зміну рівня інсоляції длясеми згрупованих місяців. Необхідно відмітити, що рівень інсоляції є нерівномірним, і найбільшою градацією він характе-ризується на територіях зі складним рельєфом. При цьому оптимальний кут нахилу сонячного фотомодуля для територіїІвано-Франківської області є 49°. Таке структурування наочно відображає динаміку зміни рівня інсоляції для окремо вибра-ної зони. Науковою новизною одержаних результатів є оцінка розподілу потенціалу використання сонячної енергії, необ-хідної для подальшого вибору ділянок проектування та розміщення сонячних електростанцій. Практична значимість поля-гає в отриманні цифрових картографічних матеріалах, які дозволяють оцінити значення інсоляції в певній точці досліджу-ваного регіону. Структурування карт інсоляції дає змогу в подальшому розробити уніфіковану схему оцінки інсоляції, зруч-ну для будь-якого користувача.
Ключові слова: сонячна інсоляція, геоінформаційний аналіз, потенціал, відновлювальні джерела енергії
Problem definition. The growth of multi-yearworld temperatures, which is mainly conditioned byincrease in the carbon monoxide content, promotesinterest in planning and sustainable development ofeconomic activity in the country. The use of solar-cell panels is one of the effective methods ofelectric power and heat production. Unlike thetraditional methods (such as burning ofhydrocarbons, using atomic energy, etc.), they arenot so widely used but arouse interest because oftheir environmental friendliness and renewability.The introduction and ecological justification of thesolar-cell panels require the knowledge of thereduced insolation level (Іпр.) in regions as well asthe factors that may influence the functioning ofsuch energy systems. The use of geo-informationsystems (GIS) will offer the possibility to unify theprocess of selecting territories and assessingpotential of the renewable energy sources (RES).Analysis of recent researches and publications.Working out the energy-efficient programs, whichare co-financed by state and international funds,allows measures to be planned for the developmentof alternative energy sources. These programs intheir regulatory and technical aspect are governedby the State Agency on Energy Efficiency andEnergy Saving of Ukraine, in accordance with the‘National Strategy 2035’(Sukhodolya, 2014).
The need to develop alternative sources as aresource base has encouraged further developmentin the scientific work by (Ellabbanab, Abu-Rubb,Blaabjergc, 2014). The authors have analyzed thetechnological basis of extraction and prospects ofusing alternative energy resources in future.
The problem connected with the influence ofdirect sunlight, as a factor of the insolationduration, and the form of buildings and structureswas considered in the scientific work by KazakovG.V. (Kazakov, 2013), in which the author hasspecified the morphological role of theenvironment.
The scientific work by (Dotsenko, 2016)shows the connection between the insolation andconsumption of energy in accordance with thegeographic location of the solar-cell panels,weather conditions, and seasons.
British scientists have made a significantcontribution to developing the issue. They areconsidering in detail the solar insolation level oncloudless and cloudy days.
Their examination results show that theinsolation level varies with respect to the latitude,day length, location of absorption plane, as well asextent of cloud cover (Twidell, Weir, 2015).
The amount of solar energy amount whichfalls on the Ukrainian territory has been analyzedaccording to geographical location, namelyaccording to latitudes, in the scientific work by(Gelichy, 2015). The author has obtained empiricalfunctional relations to calculate the solar energyreaching the Earth’s surface.
There is a need for rational use of the landresources, especially of those areas which are notsuitable for active economic activity but whichmay be used for generating alternative energy. Thisis especially important when there is a problem ofsignificant negative influence over the environment(Tiapkin, Pihulevskyi, Dovbnich 2017).Highlighting of previously unsolved parts of thegeneral problem. Analysis of the renewableenergy sources within Ivano-Frankivsk region bymeans of the geo-information system (Tymkiv,Kasiyanchuk, 2017) is one of the promisingdirections in research due to the availability ofsignificant energy renewable potential, which is notyet exploited.
An organized system for solar potentialassessment is created by means of developing astructure for selecting and analyzing factors thatdetermine the insolation level.
Determination of a solar power plants’ (SPP)potential does not depend on the solar insolationonly but it is also related to a number of values of
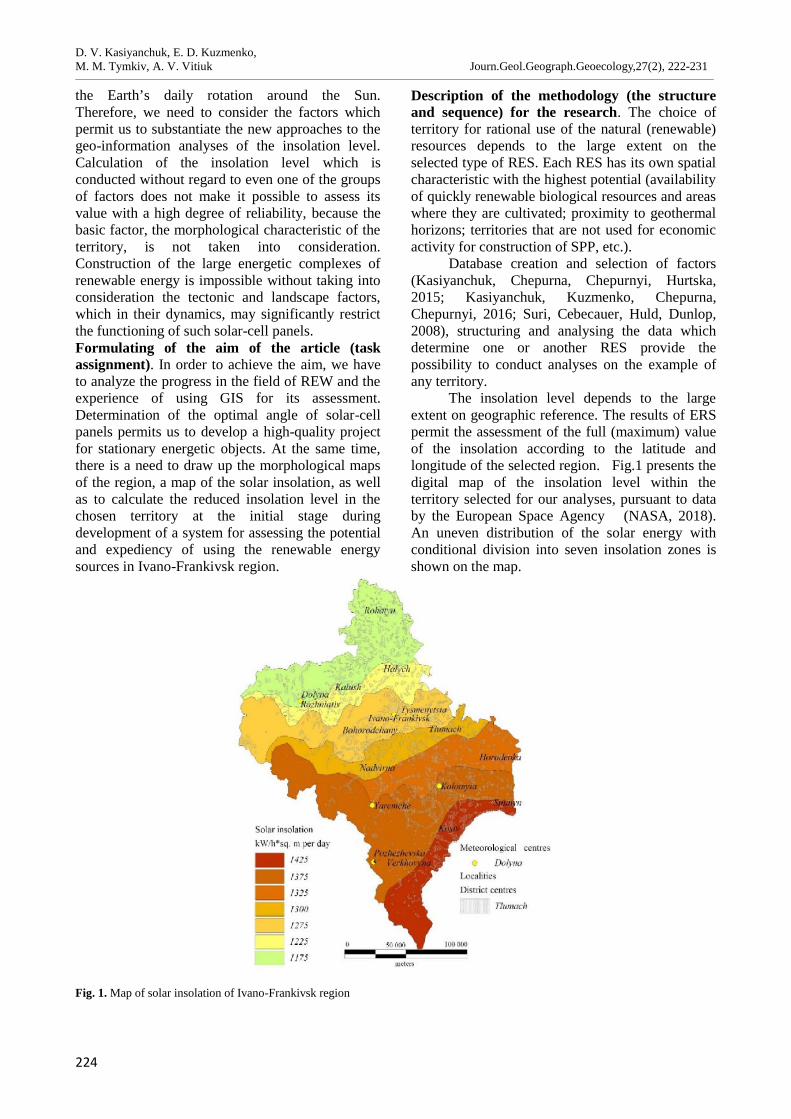
D. V. Kasiyanchuk, E. D. Kuzmenko,M. M. Tymkiv, A. V. Vitiuk Journ.Geol.Geograph.Geoecology,27(2), 222-231________________________________________________________________________________________________________________________________________________________________
224
the Earth’s daily rotation around the Sun.Therefore, we need to consider the factors whichpermit us to substantiate the new approaches to thegeo-information analyses of the insolation level.Calculation of the insolation level which isconducted without regard to even one of the groupsof factors does not make it possible to assess itsvalue with a high degree of reliability, because thebasic factor, the morphological characteristic of theterritory, is not taken into consideration.Construction of the large energetic complexes ofrenewable energy is impossible without taking intoconsideration the tectonic and landscape factors,which in their dynamics, may significantly restrictthe functioning of such solar-cell panels.Formulating of the aim of the article (taskassignment). In order to achieve the aim, we haveto analyze the progress in the field of REW and theexperience of using GIS for its assessment.Determination of the optimal angle of solar-cellpanels permits us to develop a high-quality projectfor stationary energetic objects. At the same time,there is a need to draw up the morphological mapsof the region, a map of the solar insolation, as wellas to calculate the reduced insolation level in thechosen territory at the initial stage duringdevelopment of a system for assessing the potentialand expediency of using the renewable energysources in Ivano-Frankivsk region.
Description of the methodology (the structureand sequence) for the research. The choice ofterritory for rational use of the natural (renewable)resources depends to the large extent on theselected type of RES. Each RES has its own spatialcharacteristic with the highest potential (availabilityof quickly renewable biological resources and areaswhere they are cultivated; proximity to geothermalhorizons; territories that are not used for economicactivity for construction of SPP, etc.).
Database creation and selection of factors(Kasiyanchuk, Chepurna, Chepurnyi, Hurtska,2015; Kasiyanchuk, Kuzmenko, Chepurna,Chepurnyi, 2016; Suri, Cebecauer, Huld, Dunlop,2008), structuring and analysing the data whichdetermine one or another RES provide thepossibility to conduct analyses on the example ofany territory.
The insolation level depends to the largeextent on geographic reference. The results of ERSpermit the assessment of the full (maximum) valueof the insolation according to the latitude andlongitude of the selected region. Fig.1 presents thedigital map of the insolation level within theterritory selected for our analyses, pursuant to databy the European Space Agency (NASA, 2018).An uneven distribution of the solar energy withconditional division into seven insolation zones isshown on the map.
Fig. 1. Map of solar insolation of Ivano-Frankivsk region
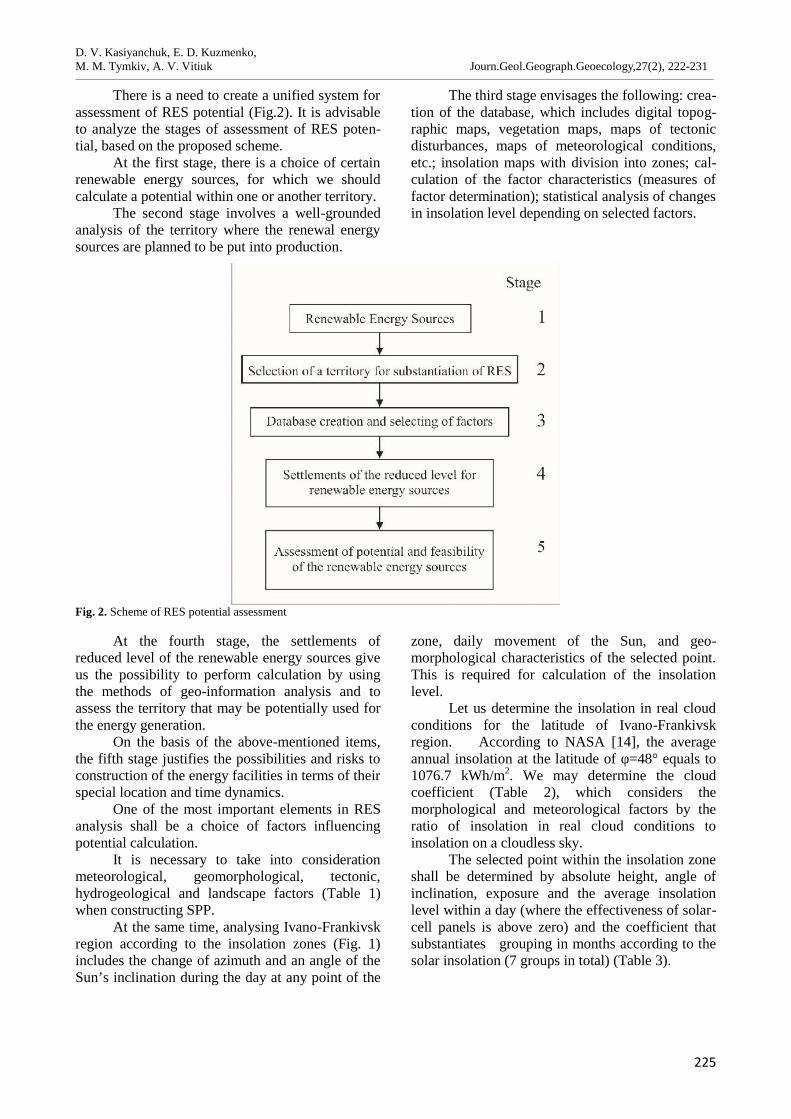
D. V. Kasiyanchuk, E. D. Kuzmenko,M. M. Tymkiv, A. V. Vitiuk Journ.Geol.Geograph.Geoecology,27(2), 222-231________________________________________________________________________________________________________________________________________________________________
225
There is a need to create a unified system forassessment of RES potential (Fig.2). It is advisableto analyze the stages of assessment of RES poten-tial, based on the proposed scheme.
At the first stage, there is a choice of certainrenewable energy sources, for which we shouldcalculate a potential within one or another territory.
The second stage involves a well-groundedanalysis of the territory where the renewal energysources are planned to be put into production.
The third stage envisages the following: crea-tion of the database, which includes digital topog-raphic maps, vegetation maps, maps of tectonicdisturbances, maps of meteorological conditions,etc.; insolation maps with division into zones; cal-culation of the factor characteristics (measures offactor determination); statistical analysis of changesin insolation level depending on selected factors.
Fig. 2. Scheme of RES potential assessment
At the fourth stage, the settlements ofreduced level of the renewable energy sources giveus the possibility to perform calculation by usingthe methods of geo-information analysis and toassess the territory that may be potentially used forthe energy generation.
On the basis of the above-mentioned items,the fifth stage justifies the possibilities and risks toconstruction of the energy facilities in terms of theirspecial location and time dynamics.
One of the most important elements in RESanalysis shall be a choice of factors influencingpotential calculation.
It is necessary to take into considerationmeteorological, geomorphological, tectonic,hydrogeological and landscape factors (Table 1)when constructing SPP.
At the same time, analysing Ivano-Frankivskregion according to the insolation zones (Fig. 1)includes the change of azimuth and an angle of theSun’s inclination during the day at any point of the
zone, daily movement of the Sun, and geo-morphological characteristics of the selected point.This is required for calculation of the insolationlevel.
Let us determine the insolation in real cloudconditions for the latitude of Ivano-Frankivskregion. According to NASA [14], the averageannual insolation at the latitude of φ=48° equals to1076.7 kWh/m2. We may determine the cloudcoefficient (Table 2), which considers themorphological and meteorological factors by theratio of insolation in real cloud conditions toinsolation on a cloudless sky.
The selected point within the insolation zoneshall be determined by absolute height, angle ofinclination, exposure and the average insolationlevel within a day (where the effectiveness of solar-cell panels is above zero) and the coefficient thatsubstantiates grouping in months according to thesolar insolation (7 groups in total) (Table 3).
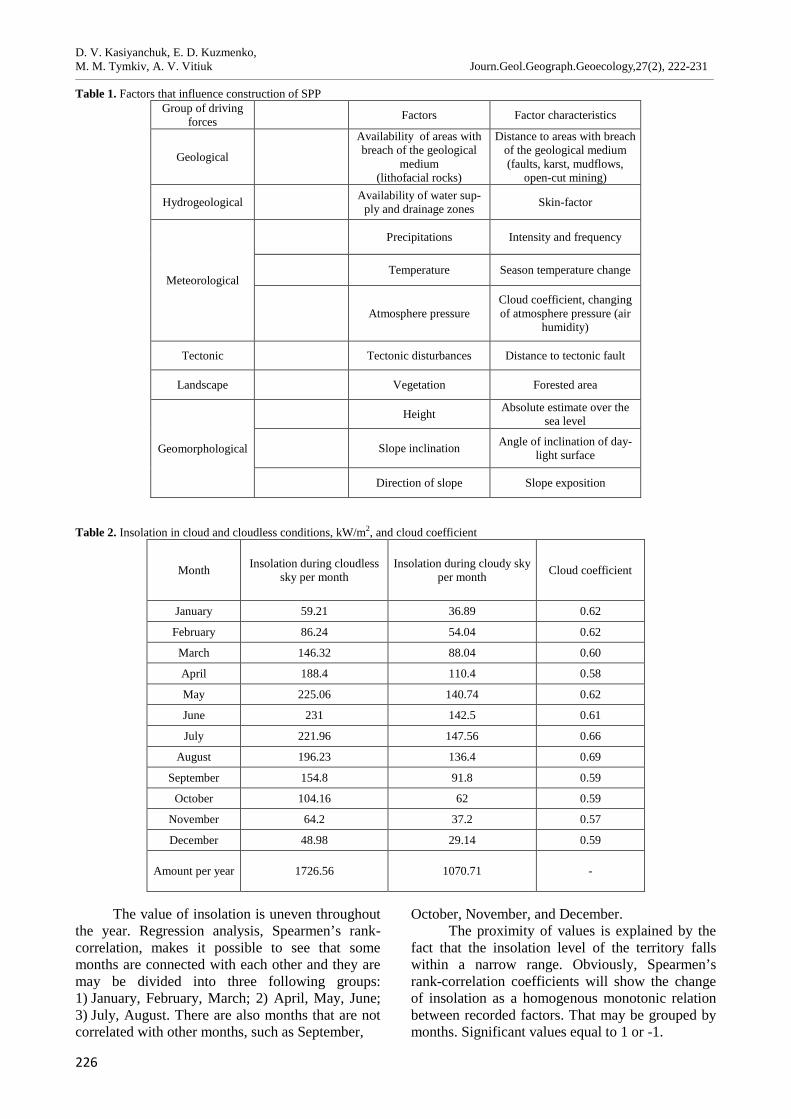
D. V. Kasiyanchuk, E. D. Kuzmenko,M. M. Tymkiv, A. V. Vitiuk Journ.Geol.Geograph.Geoecology,27(2), 222-231________________________________________________________________________________________________________________________________________________________________
226
Table 1. Factors that influence construction of SPPGroup of driving
forces Factors Factor characteristics
Geological
Availability of areas withbreach of the geological
medium(lithofacial rocks)
Distance to areas with breachof the geological medium(faults, karst, mudflows,
open-cut mining)
Hydrogeological Availability of water sup-ply and drainage zones Skin-factor
Meteorological
Precipitations Intensity and frequency
Temperature Season temperature change
Atmosphere pressureCloud coefficient, changingof atmosphere pressure (air
humidity)
Tectonic Tectonic disturbances Distance to tectonic fault
Landscape Vegetation Forested area
Geomorphological
Height Absolute estimate over thesea level
Slope inclination Angle of inclination of day-light surface
Direction of slope Slope exposition
Table 2. Insolation in cloud and cloudless conditions, kW/m2, and cloud coefficient
Month Insolation during cloudlesssky per month
Insolation during cloudy skyper month Cloud coefficient
January 59.21 36.89 0.62
February 86.24 54.04 0.62
March 146.32 88.04 0.60
April 188.4 110.4 0.58
May 225.06 140.74 0.62
June 231 142.5 0.61
July 221.96 147.56 0.66
August 196.23 136.4 0.69
September 154.8 91.8 0.59
October 104.16 62 0.59
November 64.2 37.2 0.57
December 48.98 29.14 0.59
Amount per year 1726.56 1070.71 -
The value of insolation is uneven throughoutthe year. Regression analysis, Spearmen’s rank-correlation, makes it possible to see that somemonths are connected with each other and they aremay be divided into three following groups:1) January, February, March; 2) April, May, June;3) July, August. There are also months that are notcorrelated with other months, such as September,
October, November, and December.The proximity of values is explained by the
fact that the insolation level of the territory fallswithin a narrow range. Obviously, Spearmen’srank-correlation coefficients will show the changeof insolation as a homogenous monotonic relationbetween recorded factors. That may be grouped bymonths. Significant values equal to 1 or -1.
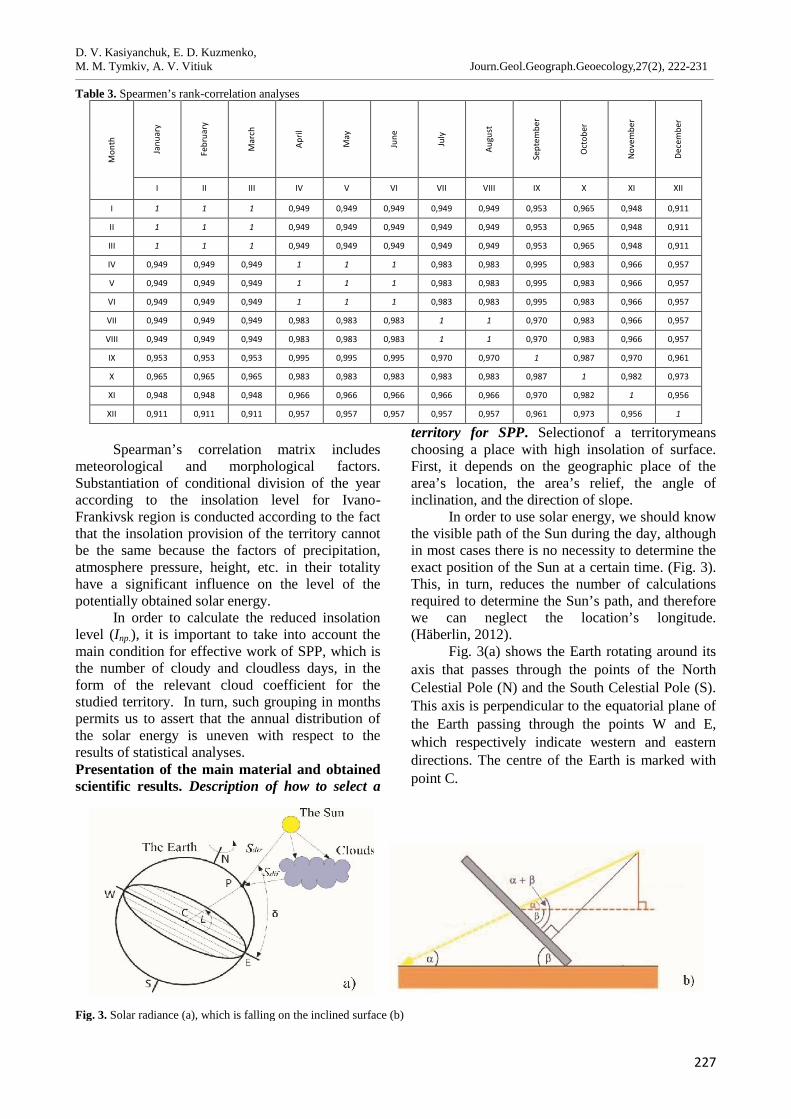
D. V. Kasiyanchuk, E. D. Kuzmenko,M. M. Tymkiv, A. V. Vitiuk Journ.Geol.Geograph.Geoecology,27(2), 222-231________________________________________________________________________________________________________________________________________________________________
227
Table 3. Spearmen’s rank-correlation analysesM
onth
Janu
ary
Febr
uary
Mar
ch
April
May
June
July
Augu
st
Sept
embe
r
Oct
ober
Nov
embe
r
Dece
mbe
r
I II III IV V VI VII VIII IX X XI XII
I 1 1 1 0,949 0,949 0,949 0,949 0,949 0,953 0,965 0,948 0,911
II 1 1 1 0,949 0,949 0,949 0,949 0,949 0,953 0,965 0,948 0,911
III 1 1 1 0,949 0,949 0,949 0,949 0,949 0,953 0,965 0,948 0,911
IV 0,949 0,949 0,949 1 1 1 0,983 0,983 0,995 0,983 0,966 0,957
V 0,949 0,949 0,949 1 1 1 0,983 0,983 0,995 0,983 0,966 0,957
VI 0,949 0,949 0,949 1 1 1 0,983 0,983 0,995 0,983 0,966 0,957
VII 0,949 0,949 0,949 0,983 0,983 0,983 1 1 0,970 0,983 0,966 0,957
VIIІ 0,949 0,949 0,949 0,983 0,983 0,983 1 1 0,970 0,983 0,966 0,957
IX 0,953 0,953 0,953 0,995 0,995 0,995 0,970 0,970 1 0,987 0,970 0,961
X 0,965 0,965 0,965 0,983 0,983 0,983 0,983 0,983 0,987 1 0,982 0,973
XI 0,948 0,948 0,948 0,966 0,966 0,966 0,966 0,966 0,970 0,982 1 0,956
XII 0,911 0,911 0,911 0,957 0,957 0,957 0,957 0,957 0,961 0,973 0,956 1
Spearman’s correlation matrix includesmeteorological and morphological factors.Substantiation of conditional division of the yearaccording to the insolation level for Ivano-Frankivsk region is conducted according to the factthat the insolation provision of the territory cannotbe the same because the factors of precipitation,atmosphere pressure, height, etc. in their totalityhave a significant influence on the level of thepotentially obtained solar energy.
In order to calculate the reduced insolationlevel (Іпр.), it is important to take into account themain condition for effective work of SPP, which isthe number of cloudy and cloudless days, in theform of the relevant cloud coefficient for thestudied territory. In turn, such grouping in monthspermits us to assert that the annual distribution ofthe solar energy is uneven with respect to theresults of statistical analyses.Presentation of the main material and obtainedscientific results. Description of how to select a
territory for SPP. Selectionof a territorymeanschoosing a place with high insolation of surface.First, it depends on the geographic place of thearea’s location, the area’s relief, the angle ofinclination, and the direction of slope.
In order to use solar energy, we should knowthe visible path of the Sun during the day, althoughin most cases there is no necessity to determine theexact position of the Sun at a certain time. (Fig. 3).This, in turn, reduces the number of calculationsrequired to determine the Sun’s path, and thereforewe can neglect the location’s longitude.(Häberlin, 2012).
Fig. 3(a) shows the Earth rotating around itsaxis that passes through the points of the NorthCelestial Pole (N) and the South Celestial Pole (S).This axis is perpendicular to the equatorial plane ofthe Earth passing through the points W and E,which respectively indicate western and easterndirections. The centre of the Earth is marked withpoint C.
Fig. 3. Solar radiance (a), which is falling on the inclined surface (b)
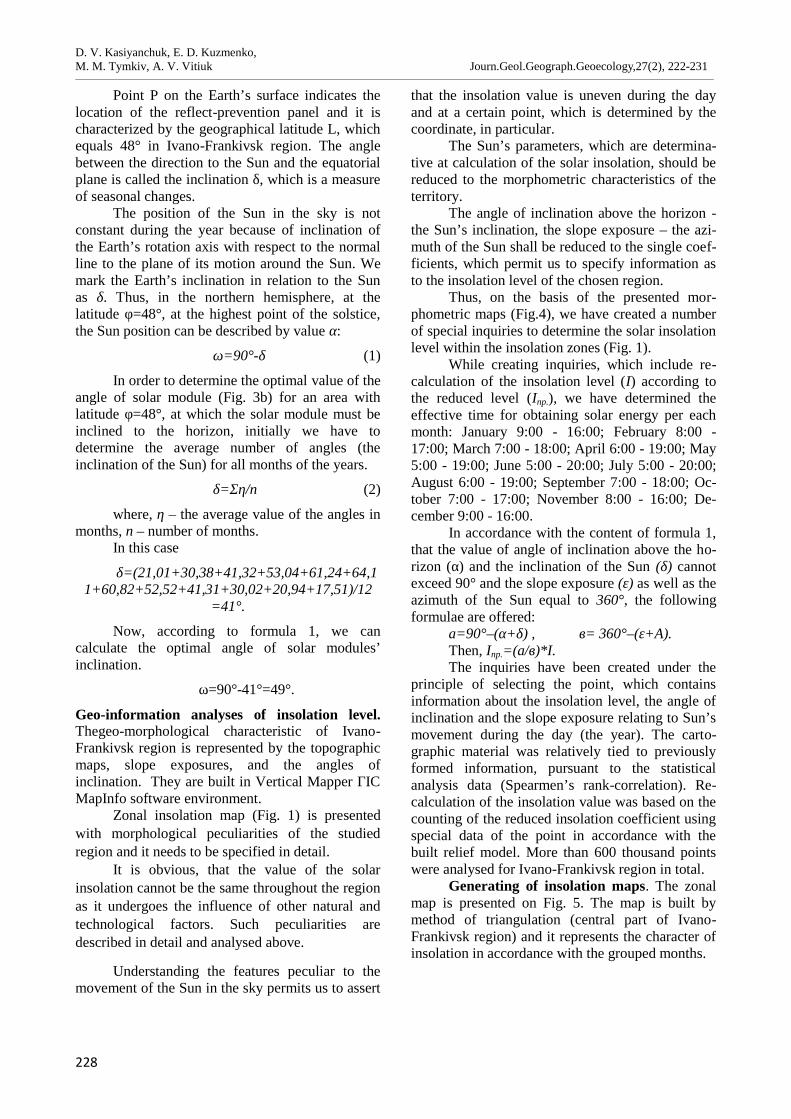
D. V. Kasiyanchuk, E. D. Kuzmenko,M. M. Tymkiv, A. V. Vitiuk Journ.Geol.Geograph.Geoecology,27(2), 222-231________________________________________________________________________________________________________________________________________________________________
228
Point P on the Earth’s surface indicates thelocation of the reflect-prevention panel and it ischaracterized by the geographical latitude L, whichequals 48° in Ivano-Frankivsk region. The anglebetween the direction to the Sun and the equatorialplane is called the inclination δ, which is a measureof seasonal changes.
The position of the Sun in the sky is notconstant during the year because of inclination ofthe Earth’s rotation axis with respect to the normalline to the plane of its motion around the Sun. Wemark the Earth’s inclination in relation to the Sunas δ. Thus, in the northern hemisphere, at thelatitude φ=48°, at the highest point of the solstice,the Sun position can be described by value α:
ω=90°-δ (1)
In order to determine the optimal value of theangle of solar module (Fig. 3b) for an area withlatitude φ=48°, at which the solar module must beinclined to the horizon, initially we have todetermine the average number of angles (theinclination of the Sun) for all months of the years.
δ=Ση/п (2)
where, η – the average value of the angles inmonths, п – number of months.
In this case
δ=(21,01+30,38+41,32+53,04+61,24+64,11+60,82+52,52+41,31+30,02+20,94+17,51)/12
=41°.
Now, according to formula 1, we cancalculate the optimal angle of solar modules’inclination.
ω=90°-41°=49°.
Geo-information analyses of insolation level.Thegeo-morphological characteristic of Ivano-Frankivsk region is represented by the topographicmaps, slope exposures, and the angles ofinclination. They are built in Vertical Mapper ГІСMapInfo software environment.
Zonal insolation map (Fig. 1) is presentedwith morphological peculiarities of the studiedregion and it needs to be specified in detail.
It is obvious, that the value of the solarinsolation cannot be the same throughout the regionas it undergoes the influence of other natural andtechnological factors. Such peculiarities aredescribed in detail and analysed above.
Understanding the features peculiar to themovement of the Sun in the sky permits us to assert
that the insolation value is uneven during the dayand at a certain point, which is determined by thecoordinate, in particular.
The Sun’s parameters, which are determina-tive at calculation of the solar insolation, should bereduced to the morphometric characteristics of theterritory.
The angle of inclination above the horizon -the Sun’s inclination, the slope exposure – the azi-muth of the Sun shall be reduced to the single coef-ficients, which permit us to specify information asto the insolation level of the chosen region.
Thus, on the basis of the presented mor-phometric maps (Fig.4), we have created a numberof special inquiries to determine the solar insolationlevel within the insolation zones (Fig. 1).
While creating inquiries, which include re-calculation of the insolation level (І) according tothe reduced level (Іпр.), we have determined theeffective time for obtaining solar energy per eachmonth: January 9:00 - 16:00; February 8:00 -17:00; March 7:00 - 18:00; April 6:00 - 19:00; May5:00 - 19:00; June 5:00 - 20:00; July 5:00 - 20:00;August 6:00 - 19:00; September 7:00 - 18:00; Oc-tober 7:00 - 17:00; November 8:00 - 16:00; De-cember 9:00 - 16:00.
In accordance with the content of formula 1,that the value of angle of inclination above the ho-rizon (α) and the inclination of the Sun (δ) cannotexceed 90° and the slope exposure (ε) as well as theazimuth of the Sun equal to 360°, the followingformulae are offered:
а=90°–(α+δ) , в= 360°–(ε+А).Then, Іпр.=(а/в)*І.The inquiries have been created under the
principle of selecting the point, which containsinformation about the insolation level, the angle ofinclination and the slope exposure relating to Sun’smovement during the day (the year). The carto-graphic material was relatively tied to previouslyformed information, pursuant to the statisticalanalysis data (Spearmen’s rank-correlation). Re-calculation of the insolation value was based on thecounting of the reduced insolation coefficient usingspecial data of the point in accordance with thebuilt relief model. More than 600 thousand pointswere analysed for Ivano-Frankivsk region in total.
Generating of insolation maps. The zonalmap is presented on Fig. 5. The map is built bymethod of triangulation (central part of Ivano-Frankivsk region) and it represents the character ofinsolation in accordance with the grouped months.
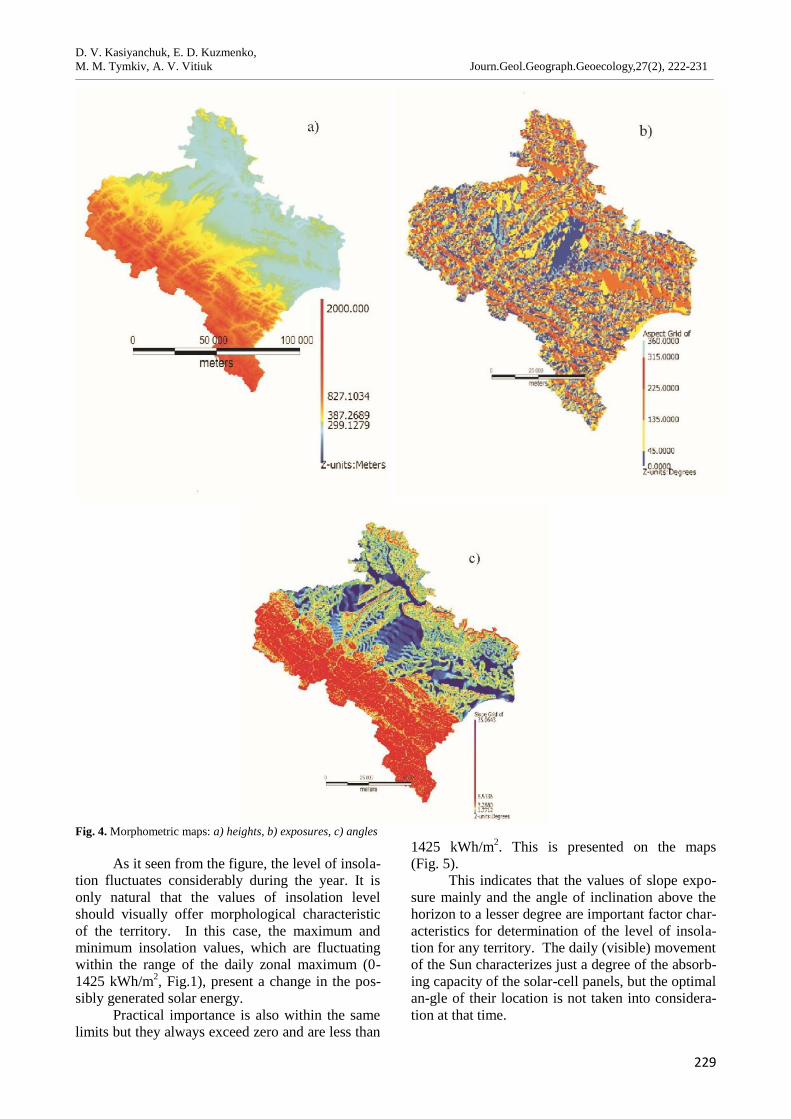
D. V. Kasiyanchuk, E. D. Kuzmenko,M. M. Tymkiv, A. V. Vitiuk Journ.Geol.Geograph.Geoecology,27(2), 222-231________________________________________________________________________________________________________________________________________________________________
229
Fig. 4. Morphometric maps: а) heights, b) exposures, c) angles
As it seen from the figure, the level of insola-tion fluctuates considerably during the year. It isonly natural that the values of insolation levelshould visually offer morphological characteristicof the territory. In this case, the maximum andminimum insolation values, which are fluctuatingwithin the range of the daily zonal maximum (0-1425 kWh/m2, Fig.1), present a change in the pos-sibly generated solar energy.
Practical importance is also within the samelimits but they always exceed zero and are less than
1425 kWh/m2. This is presented on the maps(Fig. 5).
This indicates that the values of slope expo-sure mainly and the angle of inclination above thehorizon to a lesser degree are important factor char-acteristics for determination of the level of insola-tion for any territory. The daily (visible) movementof the Sun characterizes just a degree of the absorb-ing capacity of the solar-cell panels, but the optimalan-gle of their location is not taken into considera-tion at that time.
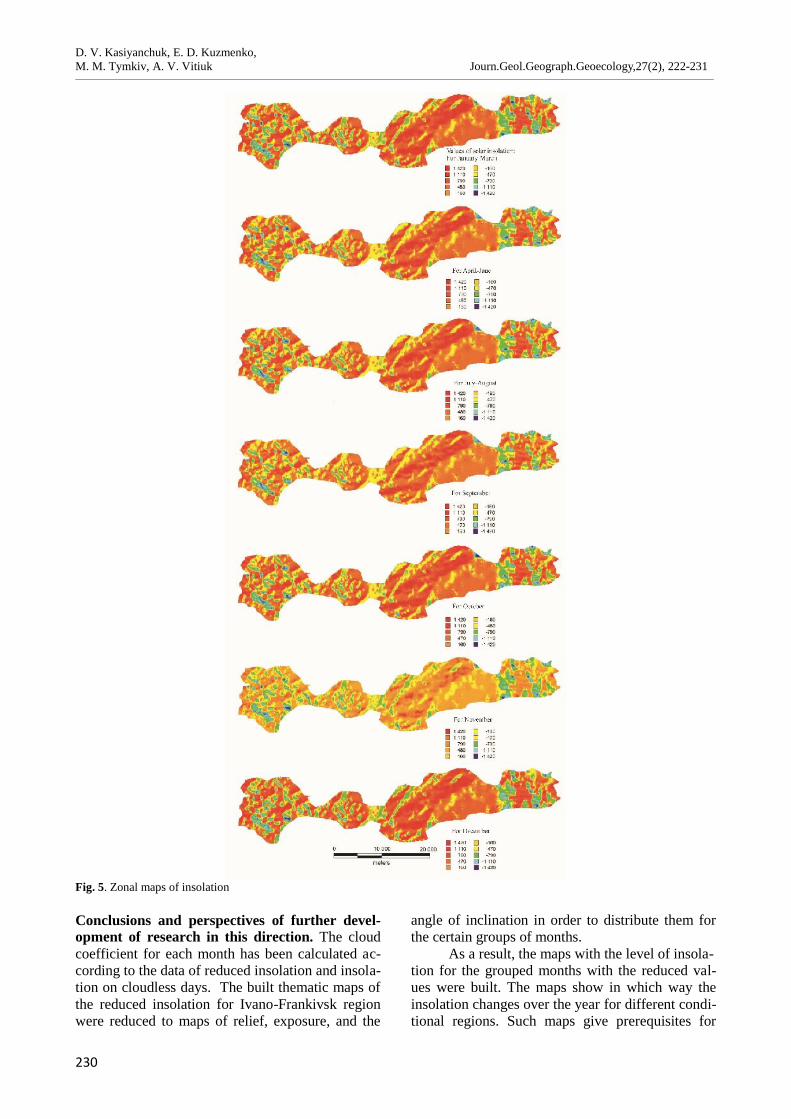
D. V. Kasiyanchuk, E. D. Kuzmenko,M. M. Tymkiv, A. V. Vitiuk Journ.Geol.Geograph.Geoecology,27(2), 222-231________________________________________________________________________________________________________________________________________________________________
230
Fig. 5. Zonal maps of insolation
Conclusions and perspectives of further devel-opment of research in this direction. The cloudcoefficient for each month has been calculated ac-cording to the data of reduced insolation and insola-tion on cloudless days. The built thematic maps ofthe reduced insolation for Ivano-Frankivsk regionwere reduced to maps of relief, exposure, and the
angle of inclination in order to distribute them forthe certain groups of months.
As a result, the maps with the level of insola-tion for the grouped months with the reduced val-ues were built. The maps show in which way theinsolation changes over the year for different condi-tional regions. Such maps give prerequisites for
D. V. Kasiyanchuk, E. D. Kuzmenko,M. M. Tymkiv, A. V. Vitiuk Journ.Geol.Geograph.Geoecology,27(2), 222-231________________________________________________________________________________________________________________________________________________________________
231
further factor analysis as to the feasibility of usingand building of solar power stations in any selectedterritory.
Perspectives for further development of re-search are improvement of the quality of calcula-tion of the reduced insolation level by means ofincreasing the number of re-counted points withinthe insolation zone and taking into account the newfactors.
References
Häberlin H., 2012. Photovoltaics: System Design andPractice / Heinrich Häberlin. 732.John Twidell,Tony Weir. Taylor & Francis Ltd, 2015. Renew-able Energy Resources. ROUTLEDGE: London,United Kingdom, 816.
Kasiyanchuk, D., Kuzmenko, E., Chepurna, T. andChepurnyi, I., 2016. Rozrakhunok ekoloho-heolohichnoyi otsinky ryzykiv zsuvnoyi nebez-peky[Calculation of that environmental and geo-logical landslide risk estimate]. Eastern EuropeanJournal of Enterprise Technologies, 1(10), 18 –25. DOI: 10.15587/1729-4061.2016.59687 (inUkrainian).
Kasiyanchuk, D.V.,Chepurna, T.B., Chepurnyi, I.V. andHurtska N.V., 2015. Metodolohiya kil’kisnoyiprohnoznoyi otsinky ryzykiv ekzohennykh heolo-hichnykh protsesiv z vykorystannyam HIS-tekhnolohiy [Methodology of quantitative fore-casting risk assessments of exogenous geologicalprocesses using GIS technology]. InternationalConference Geoinformatics: Theoretical and Ap-plied Aspects. DOI: 10.3997/2214-4609.201412408 (in Ukrainian).
Kazakov G.V, 2013. Morfolohichna rol insolyatsiyi varkhitekturi mistobudivnoho seredovyshcha[Morphological role of insolation in the architec-ture of city-planning environment]. Bulletin ofthe National University "Lviv Polytechnic". Se-ries: Architecture. № 757, 398 – 402 (in Ukrai-nian).
SuriМ., CebecauerT., HuldT., DunlopE. D., 2001-2008.Map of solar radiation in Europe: Ukraine. Mate-ri-als of JRC European commission. – PVGIS:European communities, 27.
NASA Surface meteorology and Solar Energy –Choices, 2018. Atmospheric Science Data Centre.Retrieved from https://eosweb.larc.nasa.gov/cgi-bin/sse/grid.cgi?email=&step=1&lat=&lon=&submit=Submit.
Omar Ellabbanab, Haitham, Abu-Rubb, Frede Blaab-jergc Reviews, 2014. Renewable energy re-sources: Current status, future prospects and theirenabling technology. Renewable and SustainableEnergy. Volume 39, November, 748 – 764
DotsenkoS., TymchukS., ShendrykS., ShulymaO., 2016.Rozrakhunok potuznosti insolyatsyi dlya progno-zuvannya vyrobnytsnva electrychnoyi energiyifotoelektrychnymy panelyamy [Calculation ofcapacity insolation for forecasting the productionof electrical energy by photovoltaic panels]. Bul-letin of Kharkov National Technical University ofAgriculture P. Vasilenko. № 176, 8 – 11 (inUkrainian).
Sukhodolya О. М., 2016. Enerhetychna stratehiiaUkrainy na period do 2035. [Power strategy ofUkraine for the period through to 2035]. Re-trieved from http://niss.gov.ua/public/File/2014.../Energy%20Strategy%202035.pdf.
Tiapkin, O.K., Pihulevskyi, P.H.,Dovbnich, M.M., 2017.Taking into account of influence of earth crustfaults in solving geological and geoecologicaltasks by geophysical methods. Naukovyi VisnykNatsionalnoho Hirnychoho Universytetu, 6, 15 –22 (in English).
Tymkiv M M , Kasiyanchuk D.V., 2017. Analiz vidnov-lyuval’nykh dzherel enerhiyi na terytoriyi Ivano-Frankivs’koyi oblasti z vykorystannyam heoin-formatsiynykh system [Analysis of renewable en-ergy sources in Ivano-Frankivsk region usinggeoinformation systems]. Ecological safety andbalanced resource use – № 2 (16), 153-159 (inUkrainian).
GelichyV., OmelychukO., ShapovalS., VengrinI., 2015.Enerhetychnyy potentsial sonyachnoyi radiatsiy-ina terytoriyi Ukrayiny. [The energy potential ofsolar radiation in Ukraine]. Bulletin of the Na-tional University "Lviv Polytechnic". Series:Theory and practice of construction: a collectionof scientific works, № 823, 117 – 121 (in Ukrai-nian).
V.К. Khilchevskyi, M.R. Zabokrytska, N.P. Sherstyuk Journ.Geol.Geograph.Geoecology, 27(2), 235-246________________________________________________________________________________________________________________________________________________________________
232
Journal of Geology,Geography and Geoecology
Journal home page: geology-dnu-dp.ua
ISSN 2617-2909 (print)ISSN 2617-2119 (online)
Journ.Geol.Geograph.Geoecology,
27(2), 232-243doi:10.15421/111848
V.К. Khilchevskyi, M.R. Zabokrytska, N.P. Sherstyuk Journ.Geol.Geograph.Geoecology, 27(2), 232-243________________________________________________________________________________________________________________________________________________________________
Hydrography and hydrochemistry of the transboundary riverWestern Bug on the territory of Ukraine
V.К. Khilchevskyi1, M.R. Zabokrytska2, N.P. Sherstyuk 3
1 Taras Shevchenko National University of Kyiv, Kyiv, Ukrainee-mail: [email protected] LesyaUkrainka Eastern European National University, Lutsk, Ukrainee-mail:[email protected] GoncharDnipro National University, Dnipro, Ukrainee-mail:[email protected]
Abstract.The analysis of the hydrographic network of the Western Bug basin on theterritory of Ukraine. This basin is estimated according to the requirements of the EUWater Framework Directive and has 2,044 rivers. Classification of the rivers of theWestern Bug by area of drainage basins has shown the following results: in this basinwithin Ukraine there is one very big river, in fact this is the Western Bug itself. There are
also three large rivers – Poltva, Rata and Luha. There are also 30 medium and 2,010 small rivers (among which 1,966 rivers have alength of less than 10 km). Theleading role of natural factors in the formation of the hydrocarbonate-calcium ion composition of theriver waters of the Western Bug basin is determined. The content of the main ions and the salinity of the river waters are distin-guished by a sufficiently clear seasonal character: a decrease in the spring flood and an increase in the low water level (mineraliza-tion of the water of the Western Bug – 497-573 mg/l). Mineralization of the Poltva River (the left tributary of the Western Bug),located in the same natural conditions, is significantly different: in the area of the city of Lviv (the upper reaches of the Poltva River),it reaches 784-871 mg/l, and at the estuary of the river (Busk city, at the confluence of the Western Bug) is slightly reduced - 613-670mg/l, while in the chemical type of water, sulfates and chlorides appear. This situation is explained by the discharge of sewage fromthe city of Lviv into the Poltva River. In the regime of nutrients, microelements, and also specific pollutants in the water of the WestBug, no general regularities in their seasonal variations were found, which is associated with the significant idiosyncratic character ofthe influence of anthropogenic factors on the formation of their concentrations. We estimated the balance of substances, both naturaland anthropogenic, which are carried out with the waters of the Western Bug from the territory of Ukraine (93%), as well as from theterritory of Poland (7%) to the border with Belarus. The comparative methodological approach allowed us to make a quantitativeassessment of the significant influence of the Poltva River on the formation of the chemical composition of the water of the WesternBug, especially in its upper part. The share of Poltva's water flow when it flows into the Western Bug is 58% of its water flow. At thesame time, the share of the total ion flow is higher – 66%. The share of the discharge of individual principal ions reaches: 76% (Cl-),87% (Mg2 +) and 98% (SO4
2-). For nitrogen, this figure is 68%, for phosphates – up to 80%.
Key words:transboundary river, hydrography, chemical composition of water, hydrochemical regime, ionic stream, waste of chemi-cal substances
Гідрографія і гідрохімія транскордонної річки Західний Буг на території України
Хільчевський В.К.1, Забокрицка М.Р.2, Шерстюк Н.П.3
1Київський національний університет імені Тараса Шевченка, Київ, Україна, e-mail: [email protected]Східноєвропейський національний університет імені Лесі Українки, Луцьк, Україна, e-mail: [email protected]Дніпровський національний університет імені Олеся Гончара, Дніпро, Україна, e-mail: [email protected]
Анотація.Наведено характеристику гідрографічних особливостей транскордонного басейну Західного Бугу на територіїУкраїни, гідрографічна мережа якого, оцінена за вимогами ВРД ЄС, налічує 2044 річки. Для гідрохімічних досліджень булообрано 14 створів. Мінералізація води р. Західний Буг становить 497–573 мг/л. Мінералізація води р. Полтва, лівої притокиЗахідного Бугу, що знаходиться в тих же природних умовах, істотно відрізняється. Так, в районі м. Львова (верхів'я річкиПолтва) вона сягає 784-871 мг/л, а в гирлі річки дещо знижується – 613–670 мг/л. Ця ситуація пояснюється скиданням стіч-них вод м. Львова в річку Полтва. Дослідження гідрохімічного режиму р. Західний Буг та її приток за головними іонами
Received 27.05.2018;Received in revised form 05.07.2018;Accepted 23.07.2018
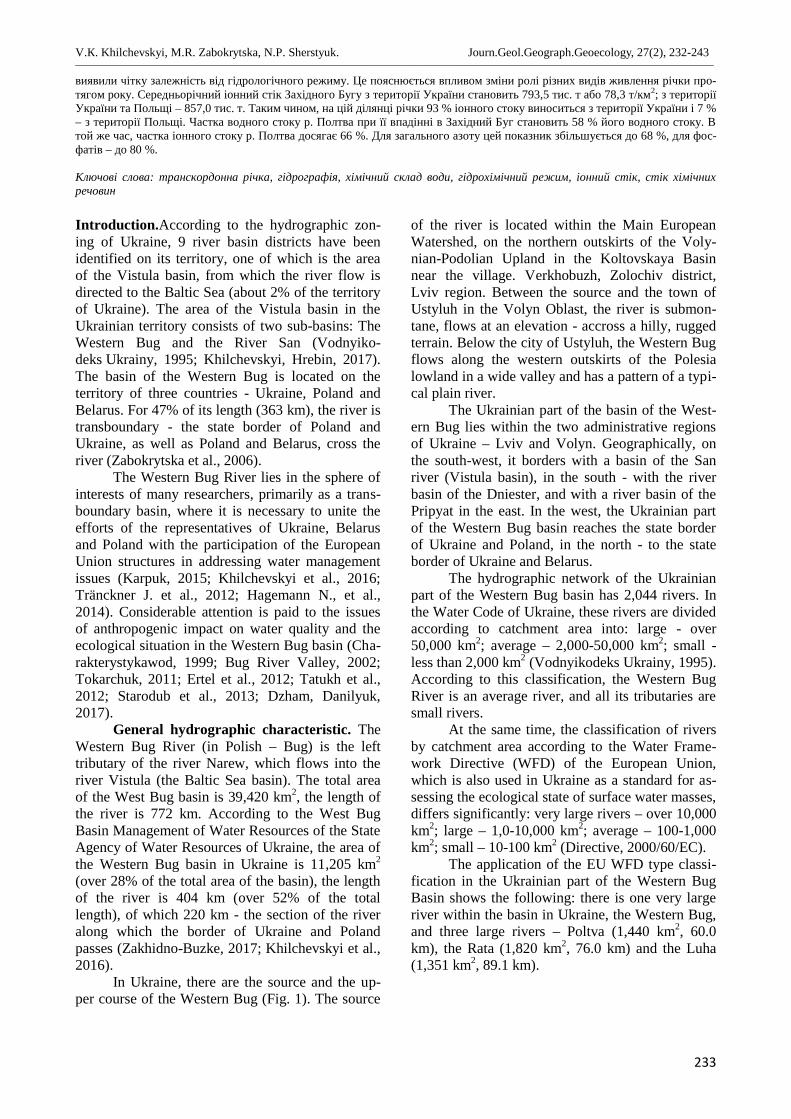
V.К. Khilchevskyi, M.R. Zabokrytska, N.P. Sherstyuk. Journ.Geol.Geograph.Geoecology, 27(2), 232-243________________________________________________________________________________________________________________________________________________________________
233
виявили чітку залежність від гідрологічного режиму. Це пояснюється впливом зміни ролі різних видів живлення річки про-тягом року. Середньорічний іонний стік Західного Бугу з території України становить 793,5 тис. т або 78,3 т/км2; з територіїУкраїни та Польщі – 857,0 тис. т. Таким чином, на цій ділянці річки 93 % іонного стоку виноситься з території України і 7 %– з території Польщі. Частка водного стоку р. Полтва при її впадінні в Західний Буг становить 58 % його водного стоку. Втой же час, частка іонного стоку р. Полтва досягає 66 %. Для загального азоту цей показник збільшується до 68 %, для фос-фатів – до 80 %.
Ключові слова: транскордонна річка, гідрографія, хімічний склад води, гідрохімічний режим, іонний стік, стік хімічнихречовин
Introduction.According to the hydrographic zon-ing of Ukraine, 9 river basin districts have beenidentified on its territory, one of which is the areaof the Vistula basin, from which the river flow isdirected to the Baltic Sea (about 2% of the territoryof Ukraine). The area of the Vistula basin in theUkrainian territory consists of two sub-basins: TheWestern Bug and the River San (Vodnyiko-deks Ukrainy, 1995; Khilchevskyi, Hrebin, 2017).The basin of the Western Bug is located on theterritory of three countries - Ukraine, Poland andBelarus. For 47% of its length (363 km), the river istransboundary - the state border of Poland andUkraine, as well as Poland and Belarus, cross theriver (Zabokrytska et al., 2006).
The Western Bug River lies in the sphere ofinterests of many researchers, primarily as a trans-boundary basin, where it is necessary to unite theefforts of the representatives of Ukraine, Belarusand Poland with the participation of the EuropeanUnion structures in addressing water managementissues (Karpuk, 2015; Khilchevskyi et al., 2016;Tränckner J. et al., 2012; Hagemann N., et al.,2014). Considerable attention is paid to the issuesof anthropogenic impact on water quality and theecological situation in the Western Bug basin (Cha-rakterystykawod, 1999; Bug River Valley, 2002;Tokarchuk, 2011; Ertel et al., 2012; Tatukh et al.,2012; Starodub et al., 2013; Dzham, Danilyuk,2017).
General hydrographic characteristic. TheWestern Bug River (in Polish – Bug) is the lefttributary of the river Narew, which flows into theriver Vistula (the Baltic Sea basin). The total areaof the West Bug basin is 39,420 km2, the length ofthe river is 772 km. According to the West BugBasin Management of Water Resources of the StateAgency of Water Resources of Ukraine, the area ofthe Western Bug basin in Ukraine is 11,205 km2
(over 28% of the total area of the basin), the lengthof the river is 404 km (over 52% of the totallength), of which 220 km - the section of the riveralong which the border of Ukraine and Polandpasses (Zakhidno-Buzke, 2017; Khilchevskyi et al.,2016).
In Ukraine, there are the source and the up-per course of the Western Bug (Fig. 1). The source
of the river is located within the Main EuropeanWatershed, on the northern outskirts of the Voly-nian-Podolian Upland in the Koltovskaya Basinnear the village. Verkhobuzh, Zolochiv district,Lviv region. Between the source and the town ofUstyluh in the Volyn Oblast, the river is submon-tane, flows at an elevation - accross a hilly, ruggedterrain. Below the city of Ustyluh, the Western Bugflows along the western outskirts of the Polesialowland in a wide valley and has a pattern of a typi-cal plain river.
The Ukrainian part of the basin of the West-ern Bug lies within the two administrative regionsof Ukraine – Lviv and Volyn. Geographically, onthe south-west, it borders with a basin of the Sanriver (Vistula basin), in the south - with the riverbasin of the Dniester, and with a river basin of thePripyat in the east. In the west, the Ukrainian partof the Western Bug basin reaches the state borderof Ukraine and Poland, in the north - to the stateborder of Ukraine and Belarus.
The hydrographic network of the Ukrainianpart of the Western Bug basin has 2,044 rivers. Inthe Water Code of Ukraine, these rivers are dividedaccording to catchment area into: large - over50,000 km2; average – 2,000-50,000 km2; small -less than 2,000 km2 (Vodnyikodeks Ukrainy, 1995).According to this classification, the Western BugRiver is an average river, and all its tributaries aresmall rivers.
At the same time, the classification of riversby catchment area according to the Water Frame-work Directive (WFD) of the European Union,which is also used in Ukraine as a standard for as-sessing the ecological state of surface water masses,differs significantly: very large rivers – over 10,000km2; large – 1,0-10,000 km2; average – 100-1,000km2; small – 10-100 km2 (Directive, 2000/60/EC).
The application of the EU WFD type classi-fication in the Ukrainian part of the Western BugBasin shows the following: there is one very largeriver within the basin in Ukraine, the Western Bug,and three large rivers – Poltva (1,440 km2, 60.0km), the Rata (1,820 km2, 76.0 km) and the Luha(1,351 km2, 89.1 km).
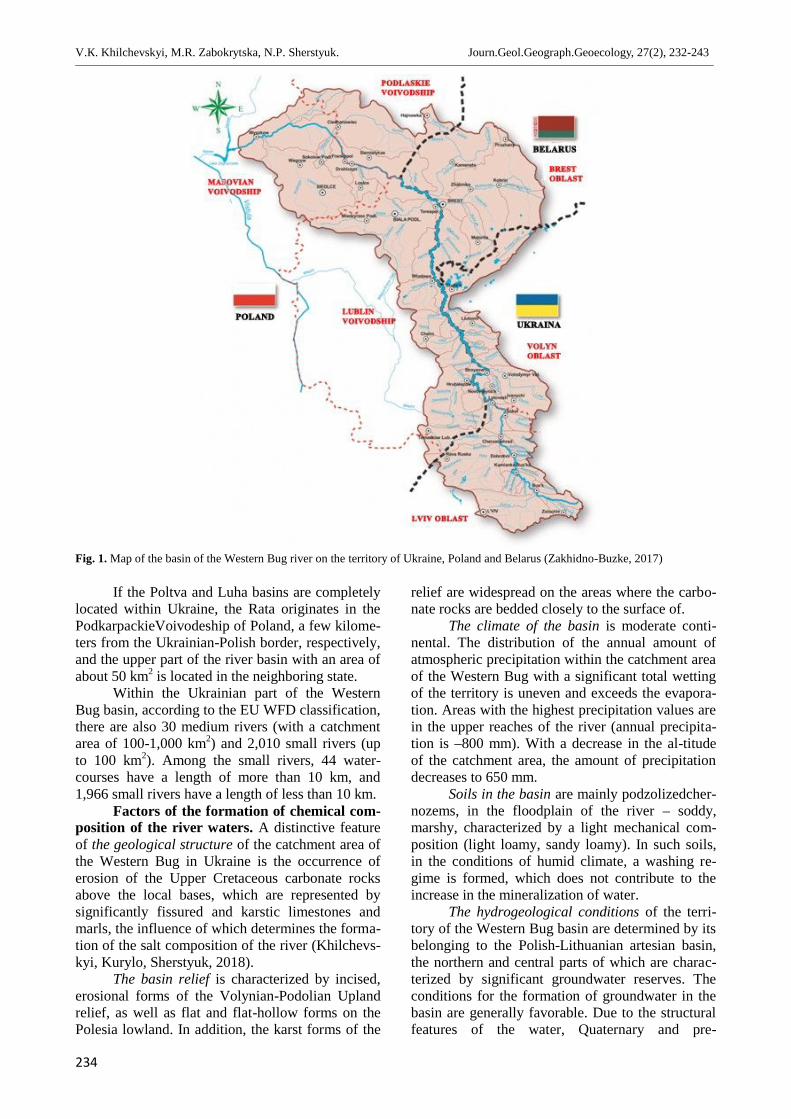
V.К. Khilchevskyi, M.R. Zabokrytska, N.P. Sherstyuk. Journ.Geol.Geograph.Geoecology, 27(2), 232-243________________________________________________________________________________________________________________________________________________________________
234
Fig. 1. Map of the basin of the Western Bug river on the territory of Ukraine, Poland and Belarus (Zakhidno-Buzke, 2017)
If the Poltva and Luha basins are completelylocated within Ukraine, the Rata originates in thePodkarpackieVoivodeship of Poland, a few kilome-ters from the Ukrainian-Polish border, respectively,and the upper part of the river basin with an area ofabout 50 km2 is located in the neighboring state.
Within the Ukrainian part of the WesternBug basin, according to the EU WFD classification,there are also 30 medium rivers (with a catchmentarea of 100-1,000 km2) and 2,010 small rivers (upto 100 km2). Among the small rivers, 44 water-courses have a length of more than 10 km, and1,966 small rivers have a length of less than 10 km.
Factors of the formation of chemical com-position of the river waters. A distinctive featureof the geological structure of the catchment area ofthe Western Bug in Ukraine is the occurrence oferosion of the Upper Cretaceous carbonate rocksabove the local bases, which are represented bysignificantly fissured and karstic limestones andmarls, the influence of which determines the forma-tion of the salt composition of the river (Khilchevs-kyi, Kurylo, Sherstyuk, 2018).
The basin relief is characterized by incised,erosional forms of the Volynian-Podolian Uplandrelief, as well as flat and flat-hollow forms on thePolesia lowland. In addition, the karst forms of the
relief are widespread on the areas where the carbo-nate rocks are bedded closely to the surface of.
The climate of the basin is moderate conti-nental. The distribution of the annual amount ofatmospheric precipitation within the catchment areaof the Western Bug with a significant total wettingof the territory is uneven and exceeds the evapora-tion. Areas with the highest precipitation values arein the upper reaches of the river (annual precipita-tion is –800 mm). With a decrease in the al-titudeof the catchment area, the amount of precipitationdecreases to 650 mm.
Soils in the basin are mainly podzolizedcher-nozems, in the floodplain of the river – soddy,marshy, characterized by a light mechanical com-position (light loamy, sandy loamy). In such soils,in the conditions of humid climate, a washing re-gime is formed, which does not contribute to theincrease in the mineralization of water.
The hydrogeological conditions of the terri-tory of the Western Bug basin are determined by itsbelonging to the Polish-Lithuanian artesian basin,the northern and central parts of which are charac-terized by significant groundwater reserves. Theconditions for the formation of groundwater in thebasin are generally favorable. Due to the structuralfeatures of the water, Quaternary and pre-
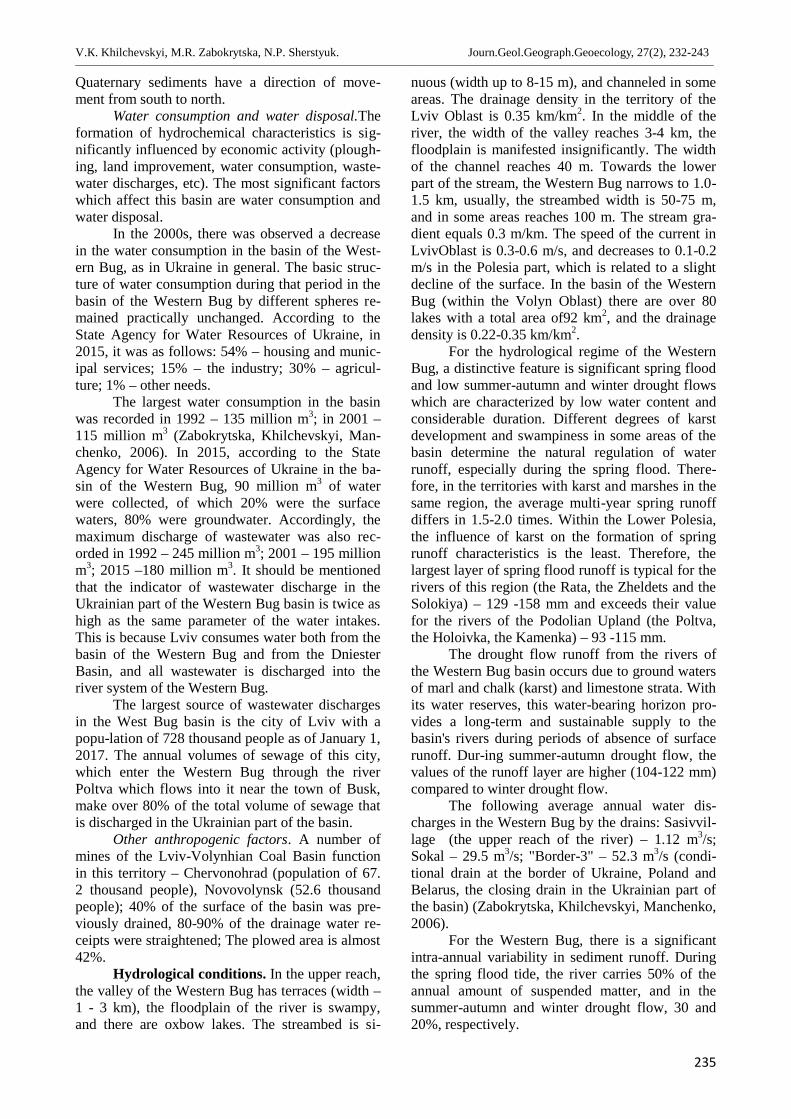
V.К. Khilchevskyi, M.R. Zabokrytska, N.P. Sherstyuk. Journ.Geol.Geograph.Geoecology, 27(2), 232-243________________________________________________________________________________________________________________________________________________________________
235
Quaternary sediments have a direction of move-ment from south to north.
Water consumption and water disposal.Theformation of hydrochemical characteristics is sig-nificantly influenced by economic activity (plough-ing, land improvement, water consumption, waste-water discharges, etc). The most significant factorswhich affect this basin are water consumption andwater disposal.
In the 2000s, there was observed a decreasein the water consumption in the basin of the West-ern Bug, as in Ukraine in general. The basic struc-ture of water consumption during that period in thebasin of the Western Bug by different spheres re-mained practically unchanged. According to theState Agency for Water Resources of Ukraine, in2015, it was as follows: 54% – housing and munic-ipal services; 15% – the industry; 30% – agricul-ture; 1% – other needs.
The largest water consumption in the basinwas recorded in 1992 – 135 million m3; in 2001 –115 million m3 (Zabokrytska, Khilchevskyi, Man-chenko, 2006). In 2015, according to the StateAgency for Water Resources of Ukraine in the ba-sin of the Western Bug, 90 million m3 of waterwere collected, of which 20% were the surfacewaters, 80% were groundwater. Accordingly, themaximum discharge of wastewater was also rec-orded in 1992 – 245 million m3; 2001 – 195 millionm3; 2015 –180 million m3. It should be mentionedthat the indicator of wastewater discharge in theUkrainian part of the Western Bug basin is twice ashigh as the same parameter of the water intakes.This is because Lviv consumes water both from thebasin of the Western Bug and from the DniesterBasin, and all wastewater is discharged into theriver system of the Western Bug.
The largest source of wastewater dischargesin the West Bug basin is the city of Lviv with apopu-lation of 728 thousand people as of January 1,2017. The annual volumes of sewage of this city,which enter the Western Bug through the riverPoltva which flows into it near the town of Busk,make over 80% of the total volume of sewage thatis discharged in the Ukrainian part of the basin.
Other anthropogenic factors. A number ofmines of the Lviv-Volynhian Coal Basin functionin this territory – Chervonohrad (population of 67.2 thousand people), Novovolynsk (52.6 thousandpeople); 40% of the surface of the basin was pre-viously drained, 80-90% of the drainage water re-ceipts were straightened; The plowed area is almost42%.
Hydrological conditions. In the upper reach,the valley of the Western Bug has terraces (width –1 - 3 km), the floodplain of the river is swampy,and there are oxbow lakes. The streambed is si-
nuous (width up to 8-15 m), and channeled in someareas. The drainage density in the territory of theLviv Oblast is 0.35 km/km2. In the middle of theriver, the width of the valley reaches 3-4 km, thefloodplain is manifested insignificantly. The widthof the channel reaches 40 m. Towards the lowerpart of the stream, the Western Bug narrows to 1.0-1.5 km, usually, the streambed width is 50-75 m,and in some areas reaches 100 m. The stream gra-dient equals 0.3 m/km. The speed of the current inLvivOblast is 0.3-0.6 m/s, and decreases to 0.1-0.2m/s in the Polesia part, which is related to a slightdecline of the surface. In the basin of the WesternBug (within the Volyn Oblast) there are over 80lakes with a total area of92 km2, and the drainagedensity is 0.22-0.35 km/km2.
For the hydrological regime of the WesternBug, a distinctive feature is significant spring floodand low summer-autumn and winter drought flowswhich are characterized by low water content andconsiderable duration. Different degrees of karstdevelopment and swampiness in some areas of thebasin determine the natural regulation of waterrunoff, especially during the spring flood. There-fore, in the territories with karst and marshes in thesame region, the average multi-year spring runoffdiffers in 1.5-2.0 times. Within the Lower Polesia,the influence of karst on the formation of springrunoff characteristics is the least. Therefore, thelargest layer of spring flood runoff is typical for therivers of this region (the Rata, the Zheldets and theSolokiya) – 129 -158 mm and exceeds their valuefor the rivers of the Podolian Upland (the Poltva,the Holoivka, the Kamenka) – 93 -115 mm.
The drought flow runoff from the rivers ofthe Western Bug basin occurs due to ground watersof marl and chalk (karst) and limestone strata. Withits water reserves, this water-bearing horizon pro-vides a long-term and sustainable supply to thebasin's rivers during periods of absence of surfacerunoff. Dur-ing summer-autumn drought flow, thevalues of the runoff layer are higher (104-122 mm)compared to winter drought flow.
The following average annual water dis-charges in the Western Bug by the drains: Sasivvil-lage (the upper reach of the river) – 1.12 m3/s;Sokal – 29.5 m3/s; "Border-3" – 52.3 m3/s (condi-tional drain at the border of Ukraine, Poland andBelarus, the closing drain in the Ukrainian part ofthe basin) (Zabokrytska, Khilchevskyi, Manchenko,2006).
For the Western Bug, there is a significantintra-annual variability in sediment runoff. Duringthe spring flood tide, the river carries 50% of theannual amount of suspended matter, and in thesummer-autumn and winter drought flow, 30 and20%, respectively.
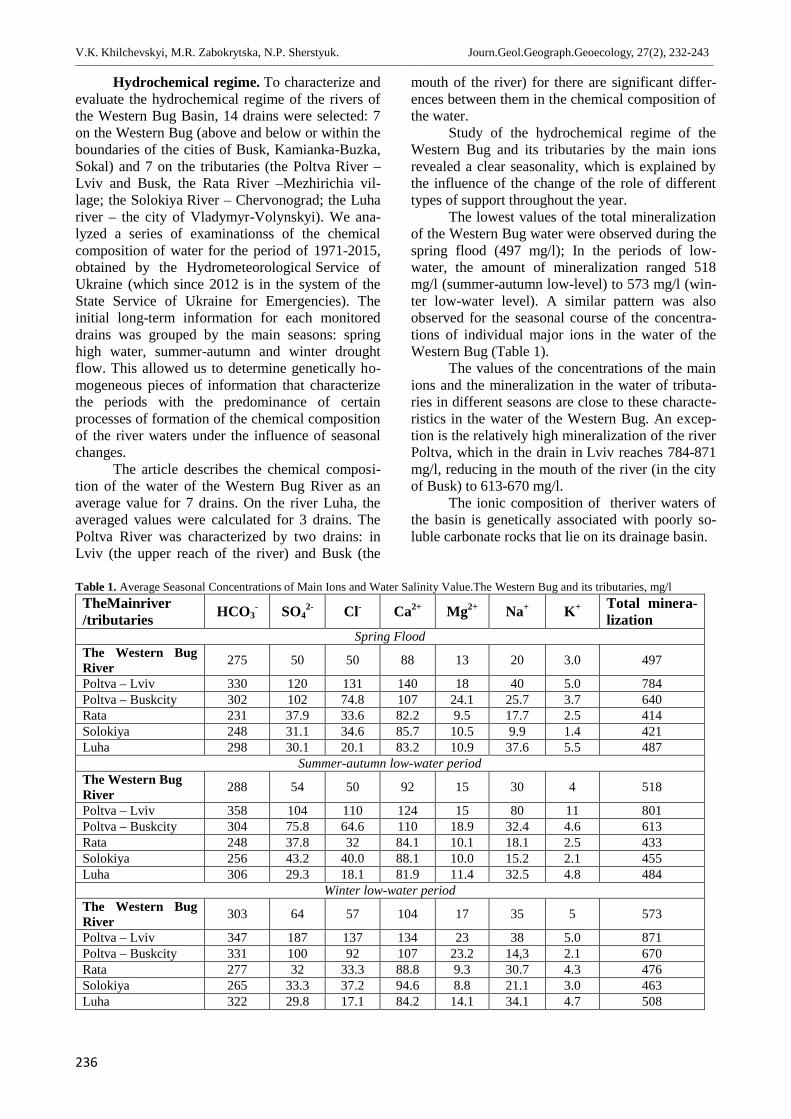
V.К. Khilchevskyi, M.R. Zabokrytska, N.P. Sherstyuk. Journ.Geol.Geograph.Geoecology, 27(2), 232-243________________________________________________________________________________________________________________________________________________________________
236
Hydrochemical regime. To characterize andevaluate the hydrochemical regime of the rivers ofthe Western Bug Basin, 14 drains were selected: 7on the Western Bug (above and below or within theboundaries of the cities of Busk, Kamianka-Buzka,Sokal) and 7 on the tributaries (the Poltva River –Lviv and Busk, the Rata River –Mezhirichia vil-lage; the Solokiya River – Chervonograd; the Luhariver – the city of Vladymyr-Volynskyi). We ana-lyzed a series of examinationss of the chemicalcomposition of water for the period of 1971-2015,obtained by the Hydrometeorological Service ofUkraine (which since 2012 is in the system of theState Service of Ukraine for Emergencies). Theinitial long-term information for each monitoreddrains was grouped by the main seasons: springhigh water, summer-autumn and winter droughtflow. This allowed us to determine genetically ho-mogeneous pieces of information that characterizethe periods with the predominance of certainprocesses of formation of the chemical compositionof the river waters under the influence of seasonalchanges.
The article describes the chemical composi-tion of the water of the Western Bug River as anaverage value for 7 drains. On the river Luha, theaveraged values were calculated for 3 drains. ThePoltva River was characterized by two drains: inLviv (the upper reach of the river) and Busk (the
mouth of the river) for there are significant differ-ences between them in the chemical composition ofthe water.
Study of the hydrochemical regime of theWestern Bug and its tributaries by the main ionsrevealed a clear seasonality, which is explained bythe influence of the change of the role of differenttypes of support throughout the year.
The lowest values of the total mineralizationof the Western Bug water were observed during thespring flood (497 mg/l); In the periods of low-water, the amount of mineralization ranged 518mg/l (summer-autumn low-level) to 573 mg/l (win-ter low-water level). A similar pattern was alsoobserved for the seasonal course of the concentra-tions of individual major ions in the water of theWestern Bug (Table 1).
The values of the concentrations of the mainions and the mineralization in the water of tributa-ries in different seasons are close to these characte-ristics in the water of the Western Bug. An excep-tion is the relatively high mineralization of the riverPoltva, which in the drain in Lviv reaches 784-871mg/l, reducing in the mouth of the river (in the cityof Busk) to 613-670 mg/l.
The ionic composition of theriver waters ofthe basin is genetically associated with poorly so-luble carbonate rocks that lie on its drainage basin.
Table 1. Average Seasonal Concentrations of Main Ions and Water Salinity Value.The Western Bug and its tributaries, mg/lTheMainriver/tributaries HCO3
- SO42- Cl- Ca2+ Mg2+ Na+ K+ Total minera-
lizationSpring Flood
The Western BugRiver 275 50 50 88 13 20 3.0 497
Poltva – Lviv 330 120 131 140 18 40 5.0 784Poltva – Buskcity 302 102 74.8 107 24.1 25.7 3.7 640Rata 231 37.9 33.6 82.2 9.5 17.7 2.5 414Solokiya 248 31.1 34.6 85.7 10.5 9.9 1.4 421Luha 298 30.1 20.1 83.2 10.9 37.6 5.5 487
Summer-autumn low-water periodThe Western BugRiver 288 54 50 92 15 30 4 518
Poltva – Lviv 358 104 110 124 15 80 11 801Poltva – Buskcity 304 75.8 64.6 110 18.9 32.4 4.6 613Rata 248 37.8 32 84.1 10.1 18.1 2.5 433Solokiya 256 43.2 40.0 88.1 10.0 15.2 2.1 455Luha 306 29.3 18.1 81.9 11.4 32.5 4.8 484
Winter low-water periodThe Western BugRiver 303 64 57 104 17 35 5 573
Poltva – Lviv 347 187 137 134 23 38 5.0 871Poltva – Buskcity 331 100 92 107 23.2 14,3 2.1 670Rata 277 32 33.3 88.8 9.3 30.7 4.3 476Solokiya 265 33.3 37.2 94.6 8.8 21.1 3.0 463Luha 322 29.8 17.1 84.2 14.1 34.1 4.7 508
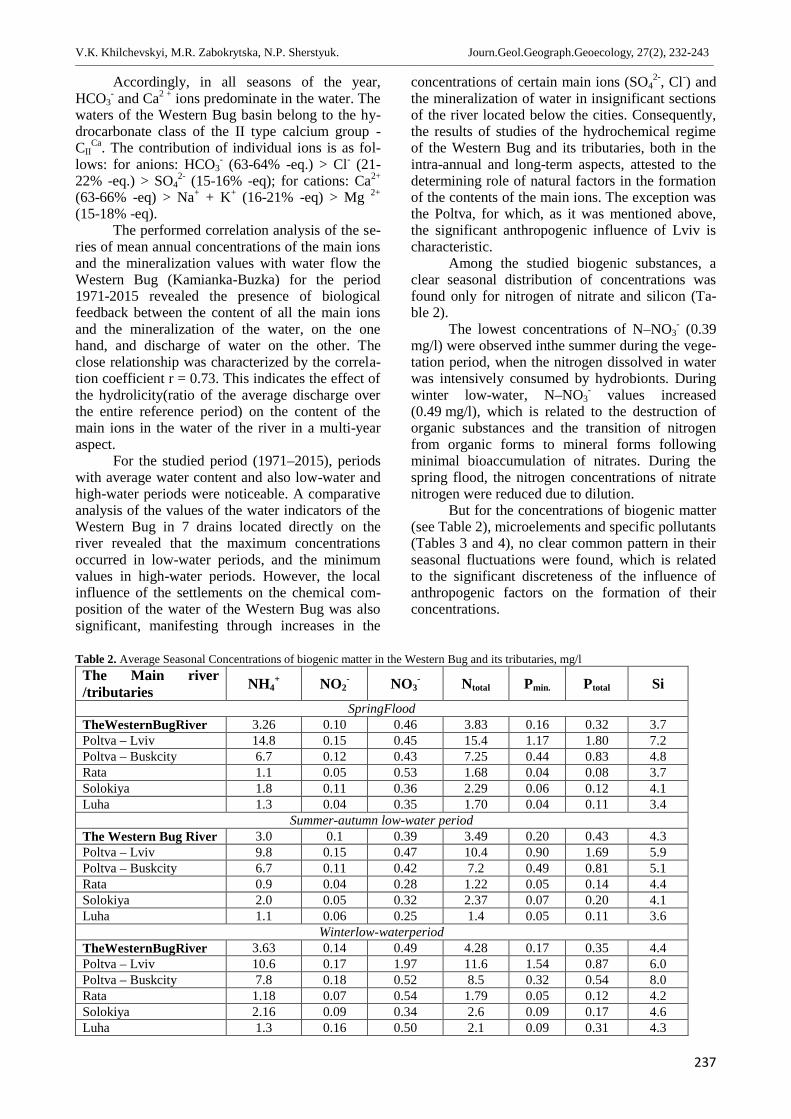
V.К. Khilchevskyi, M.R. Zabokrytska, N.P. Sherstyuk. Journ.Geol.Geograph.Geoecology, 27(2), 232-243________________________________________________________________________________________________________________________________________________________________
237
Accordingly, in all seasons of the year,HCO3
- and Ca2 + ions predominate in the water. Thewaters of the Western Bug basin belong to the hy-drocarbonate class of the II type calcium group -СІІ
Са. The contribution of individual ions is as fol-lows: for anions: HCO3
- (63-64% -eq.) > Cl- (21-22% -eq.) > SO4
2- (15-16% -eq); for cations: Ca2+
(63-66% -eq) > Na+ + K+ (16-21% -eq) > Mg 2+
(15-18% -eq).The performed correlation analysis of the se-
ries of mean annual concentrations of the main ionsand the mineralization values with water flow theWestern Bug (Kamianka-Buzka) for the period1971-2015 revealed the presence of biologicalfeedback between the content of all the main ionsand the mineralization of the water, on the onehand, and discharge of water on the other. Theclose relationship was characterized by the correla-tion coefficient r = 0.73. This indicates the effect ofthe hydrolicity(ratio of the average discharge overthe entire reference period) on the content of themain ions in the water of the river in a multi-yearaspect.
For the studied period (1971–2015), periodswith average water content and also low-water andhigh-water periods were noticeable. A comparativeanalysis of the values of the water indicators of theWestern Bug in 7 drains located directly on theriver revealed that the maximum concentrationsoccurred in low-water periods, and the minimumvalues in high-water periods. However, the localinfluence of the settlements on the chemical com-position of the water of the Western Bug was alsosignificant, manifesting through increases in the
concentrations of certain main ions (SO42-, Cl-) and
the mineralization of water in insignificant sectionsof the river located below the cities. Consequently,the results of studies of the hydrochemical regimeof the Western Bug and its tributaries, both in theintra-annual and long-term aspects, attested to thedetermining role of natural factors in the formationof the contents of the main ions. The exception wasthe Poltva, for which, as it was mentioned above,the significant anthropogenic influence of Lviv ischaracteristic.
Among the studied biogenic substances, aclear seasonal distribution of concentrations wasfound only for nitrogen of nitrate and silicon (Ta-ble 2).
The lowest concentrations of N–NO3- (0.39
mg/l) were observed inthe summer during the vege-tation period, when the nitrogen dissolved in waterwas intensively consumed by hydrobionts. Duringwinter low-water, N–NO3
- values increased(0.49 mg/l), which is related to the destruction oforganic substances and the transition of nitrogenfrom organic forms to mineral forms followingminimal bioaccumulation of nitrates. During thespring flood, the nitrogen concentrations of nitratenitrogen were reduced due to dilution.
But for the concentrations of biogenic matter(see Table 2), microelements and specific pollutants(Tables 3 and 4), no clear common pattern in theirseasonal fluctuations were found, which is relatedto the significant discreteness of the influence ofanthropogenic factors on the formation of theirconcentrations.
Table 2. Average Seasonal Concentrations of biogenic matter in the Western Bug and its tributaries, mg/lThe Main river/tributaries NH4
+ NO2- NO3
- Ntotal Рmin. Рtotal SiSpringFlood
TheWesternBugRiver 3.26 0.10 0.46 3.83 0.16 0.32 3.7Poltva – Lviv 14.8 0.15 0.45 15.4 1.17 1.80 7.2Poltva – Buskcity 6.7 0.12 0.43 7.25 0.44 0.83 4.8Rata 1.1 0.05 0.53 1.68 0.04 0.08 3.7Solokiya 1.8 0.11 0.36 2.29 0.06 0.12 4.1Luha 1.3 0.04 0.35 1.70 0.04 0.11 3.4
Summer-autumn low-water periodThe Western Bug River 3.0 0.1 0.39 3.49 0.20 0.43 4.3Poltva – Lviv 9.8 0.15 0.47 10.4 0.90 1.69 5.9Poltva – Buskcity 6.7 0.11 0.42 7.2 0.49 0.81 5.1Rata 0.9 0.04 0.28 1.22 0.05 0.14 4.4Solokiya 2.0 0.05 0.32 2.37 0.07 0.20 4.1Luha 1.1 0.06 0.25 1.4 0.05 0.11 3.6
Winterlow-waterperiodTheWesternBugRiver 3.63 0.14 0.49 4.28 0.17 0.35 4.4Poltva – Lviv 10.6 0.17 1.97 11.6 1.54 0.87 6.0Poltva – Buskcity 7.8 0.18 0.52 8.5 0.32 0.54 8.0Rata 1.18 0.07 0.54 1.79 0.05 0.12 4.2Solokiya 2.16 0.09 0.34 2.6 0.09 0.17 4.6Luha 1.3 0.16 0.50 2.1 0.09 0.31 4.3
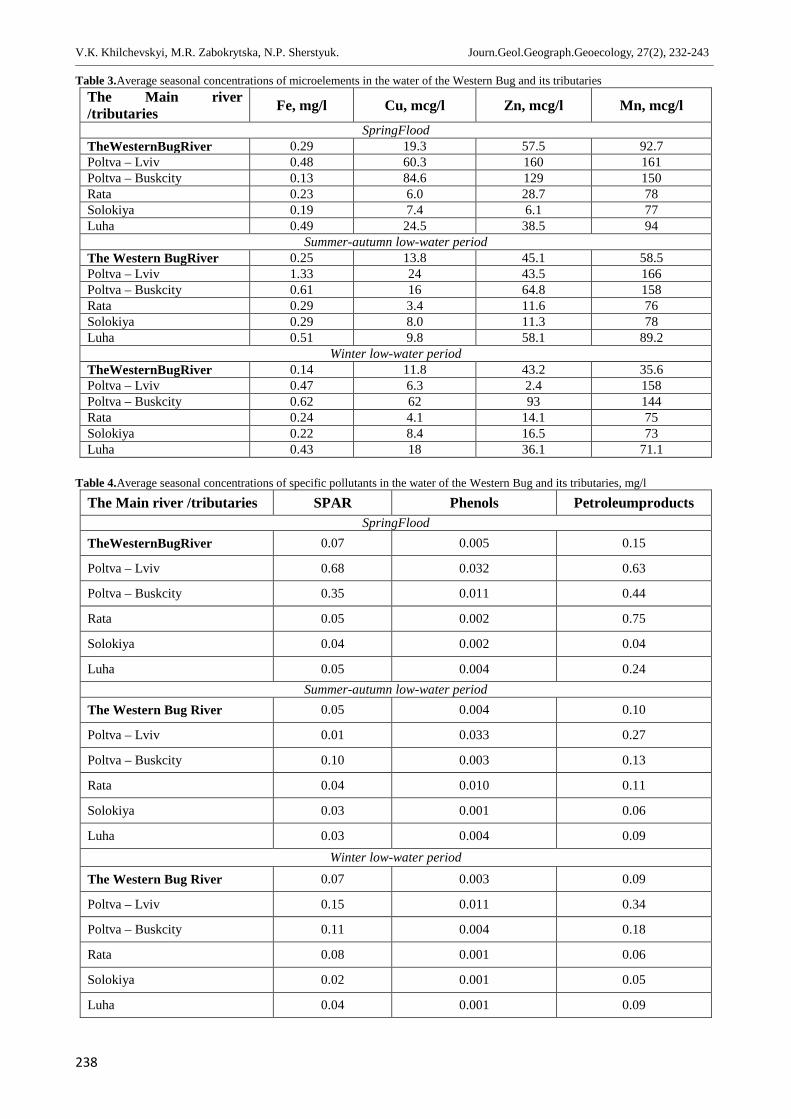
V.К. Khilchevskyi, M.R. Zabokrytska, N.P. Sherstyuk. Journ.Geol.Geograph.Geoecology, 27(2), 232-243________________________________________________________________________________________________________________________________________________________________
238
Table 3.Average seasonal concentrations of microelements in the water of the Western Bug and its tributariesThe Main river/tributaries Fe, mg/l Cu, mcg/l Zn, mcg/l Mn, mcg/l
SpringFloodTheWesternBugRiver 0.29 19.3 57.5 92.7Poltva – Lviv 0.48 60.3 160 161Poltva – Buskcity 0.13 84.6 129 150Rata 0.23 6.0 28.7 78Solokiya 0.19 7.4 6.1 77Luha 0.49 24.5 38.5 94
Summer-autumn low-water periodThe Western BugRiver 0.25 13.8 45.1 58.5Poltva – Lviv 1.33 24 43.5 166Poltva – Buskcity 0.61 16 64.8 158Rata 0.29 3.4 11.6 76Solokiya 0.29 8.0 11.3 78Luha 0.51 9.8 58.1 89.2
Winter low-water periodTheWesternBugRiver 0.14 11.8 43.2 35.6Poltva – Lviv 0.47 6.3 2.4 158Poltva – Buskcity 0.62 62 93 144Rata 0.24 4.1 14.1 75Solokiya 0.22 8.4 16.5 73Luha 0.43 18 36.1 71.1
Table 4.Average seasonal concentrations of specific pollutants in the water of the Western Bug and its tributaries, mg/l
The Main river /tributaries SPAR Phenols PetroleumproductsSpringFlood
TheWesternBugRiver 0.07 0.005 0.15
Poltva – Lviv 0.68 0.032 0.63
Poltva – Buskcity 0.35 0.011 0.44
Rata 0.05 0.002 0.75
Solokiya 0.04 0.002 0.04
Luha 0.05 0.004 0.24Summer-autumn low-water period
The Western Bug River 0.05 0.004 0.10
Poltva – Lviv 0.01 0.033 0.27
Poltva – Buskcity 0.10 0.003 0.13
Rata 0.04 0.010 0.11
Solokiya 0.03 0.001 0.06
Luha 0.03 0.004 0.09Winter low-water period
The Western Bug River 0.07 0.003 0.09
Poltva – Lviv 0.15 0.011 0.34
Poltva – Buskcity 0.11 0.004 0.18
Rata 0.08 0.001 0.06
Solokiya 0.02 0.001 0.05
Luha 0.04 0.001 0.09
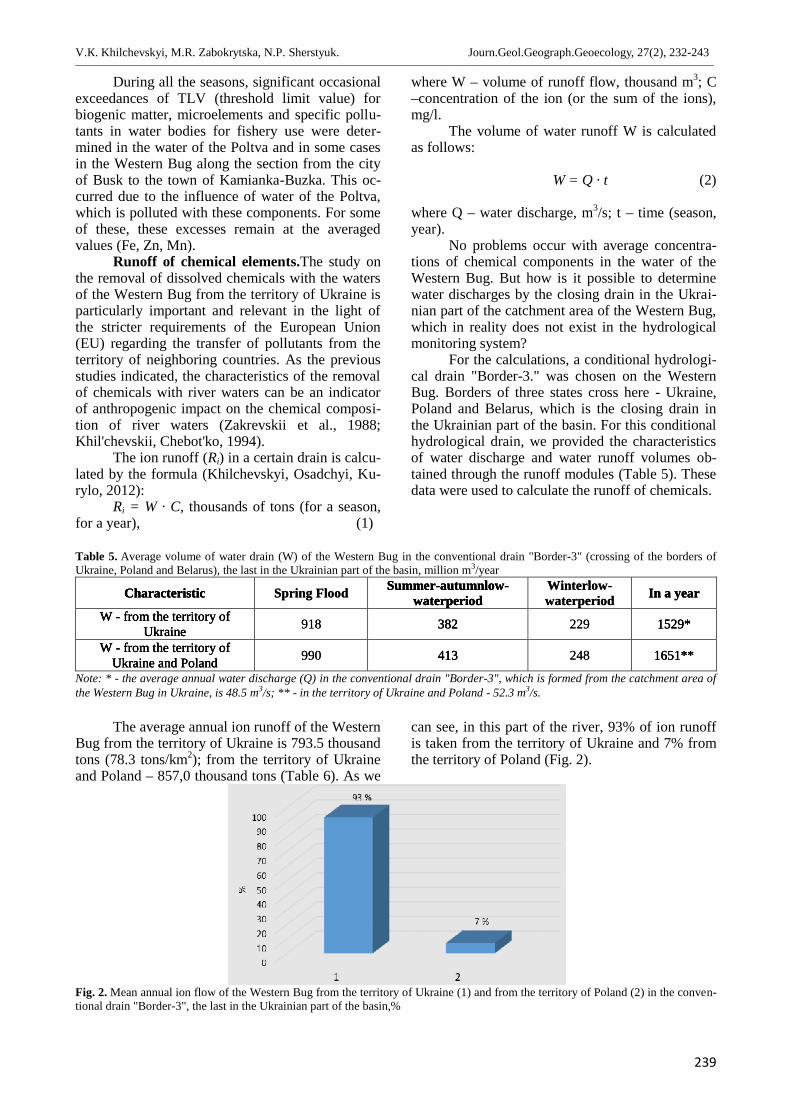
V.К. Khilchevskyi, M.R. Zabokrytska, N.P. Sherstyuk. Journ.Geol.Geograph.Geoecology, 27(2), 232-243________________________________________________________________________________________________________________________________________________________________
239
During all the seasons, significant occasionalexceedances of TLV (threshold limit value) forbiogenic matter, microelements and specific pollu-tants in water bodies for fishery use were deter-mined in the water of the Poltva and in some casesin the Western Bug along the section from the cityof Busk to the town of Kamianka-Buzka. This oc-curred due to the influence of water of the Poltva,which is polluted with these components. For someof these, these excesses remain at the averagedvalues (Fe, Zn, Mn).
Runoff of chemical elements.The study onthe removal of dissolved chemicals with the watersof the Western Bug from the territory of Ukraine isparticularly important and relevant in the light ofthe stricter requirements of the European Union(EU) regarding the transfer of pollutants from theterritory of neighboring countries. As the previousstudies indicated, the characteristics of the removalof chemicals with river waters can be an indicatorof anthropogenic impact on the chemical composi-tion of river waters (Zakrevskii et al., 1988;Khil'chevskii, Chebot'ko, 1994).
The ion runoff (Ri) in a certain drain is calcu-lated by the formula (Khilchevskyi, Osadchyi, Ku-rylo, 2012):
Ri = W · C, thousands of tons (for a season,for a year), (1)
where W – volume of runoff flow, thousand m3; C–concentration of the ion (or the sum of the ions),mg/l.
The volume of water runoff W is calculatedas follows:
W = Q · t (2)
where Q – water discharge, m3/s; t – time (season,year).
No problems occur with average concentra-tions of chemical components in the water of theWestern Bug. But how is it possible to determinewater discharges by the closing drain in the Ukrai-nian part of the catchment area of the Western Bug,which in reality does not exist in the hydrologicalmonitoring system?
For the calculations, a conditional hydrologi-cal drain "Border-3." was chosen on the WesternBug. Borders of three states cross here - Ukraine,Poland and Belarus, which is the closing drain inthe Ukrainian part of the basin. For this conditionalhydrological drain, we provided the characteristicsof water discharge and water runoff volumes ob-tained through the runoff modules (Table 5). Thesedata were used to calculate the runoff of chemicals.
Table 5. Average volume of water drain (W) of the Western Bug in the conventional drain "Border-3" (crossing of the borders ofUkraine, Poland and Belarus), the last in the Ukrainian part of the basin, million m3/year
Characteristic Spring Flood Summer-autumnlow-waterperiod
Winterlow-waterperiod In a year
W - from the territory ofUkraine 918 382 229 1529*
W - from the territory ofUkraine and Poland 990 413 248 1651**
Note: * - the average annual water discharge (Q) in the conventional drain "Border-3", which is formed from the catchment area ofthe Western Bug in Ukraine, is 48.5 m3/s; ** - in the territory of Ukraine and Poland - 52.3 m3/s.
The average annual ion runoff of the WesternBug from the territory of Ukraine is 793.5 thousandtons (78.3 tons/km2); from the territory of Ukraineand Poland – 857,0 thousand tons (Table 6). As we
can see, in this part of the river, 93% of ion runoffis taken from the territory of Ukraine and 7% fromthe territory of Poland (Fig. 2).
Fig. 2. Mean annual ion flow of the Western Bug from the territory of Ukraine (1) and from the territory of Poland (2) in the conven-tional drain "Border-3", the last in the Ukrainian part of the basin,%
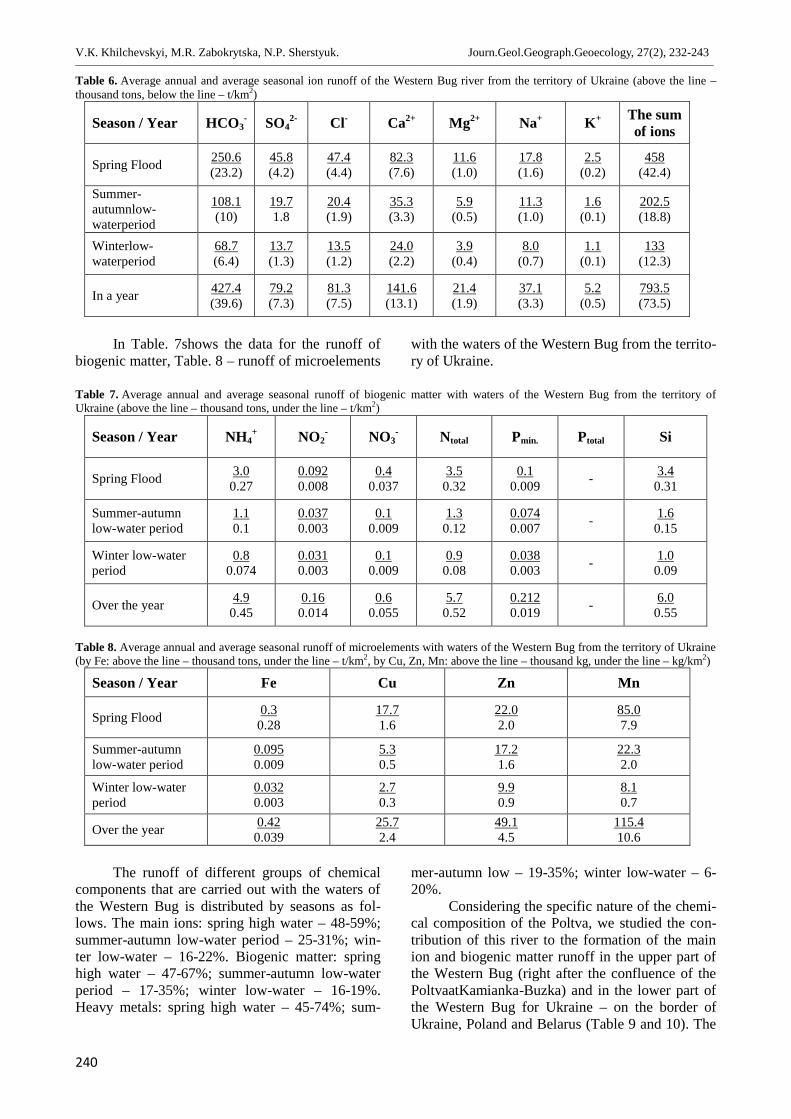
V.К. Khilchevskyi, M.R. Zabokrytska, N.P. Sherstyuk. Journ.Geol.Geograph.Geoecology, 27(2), 232-243________________________________________________________________________________________________________________________________________________________________
240
Table 6. Average annual and average seasonal ion runoff of the Western Bug river from the territory of Ukraine (above the line –thousand tons, below the line – t/km2)
Season / Year HCO3- SO4
2- Cl- Ca2+ Mg2+ Na+ K+ The sumof ions
Spring Flood 250.6(23.2)
45.8(4.2)
47.4(4.4)
82.3(7.6)
11.6(1.0)
17.8(1.6)
2.5(0.2)
458(42.4)
Summer-autumnlow-waterperiod
108.1(10)
19.71.8
20.4(1.9)
35.3(3.3)
5.9(0.5)
11.3(1.0)
1.6(0.1)
202.5(18.8)
Winterlow-waterperiod
68.7(6.4)
13.7(1.3)
13.5(1.2)
24.0(2.2)
3.9(0.4)
8.0(0.7)
1.1(0.1)
133(12.3)
In a year 427.4(39.6)
79.2(7.3)
81.3(7.5)
141.6(13.1)
21.4(1.9)
37.1(3.3)
5.2(0.5)
793.5(73.5)
In Table. 7shows the data for the runoff ofbiogenic matter, Table. 8 – runoff of microelements
with the waters of the Western Bug from the territo-ry of Ukraine.
Table 7. Average annual and average seasonal runoff of biogenic matter with waters of the Western Bug from the territory ofUkraine (above the line – thousand tons, under the line – t/km2)
Season / Year NH4+ NO2
- NO3- Ntotal Рmin. Рtotal Si
Spring Flood 3.00.27
0.0920.008
0.40.037
3.50.32
0.10.009 - 3.4
0.31
Summer-autumnlow-water period
1.10.1
0.0370.003
0.10.009
1.30.12
0.0740.007 - 1.6
0.15
Winter low-waterperiod
0.80.074
0.0310.003
0.10.009
0.90.08
0.0380.003 - 1.0
0.09
Over the year 4.90.45
0.160.014
0.60.055
5.70.52
0.2120.019 - 6.0
0.55
Table 8. Average annual and average seasonal runoff of microelements with waters of the Western Bug from the territory of Ukraine(by Fe: above the line – thousand tons, under the line – t/km2, by Cu, Zn, Mn: above the line – thousand kg, under the line – kg/km2)
Season / Year Fe Cu Zn Mn
Spring Flood 0.30.28
17.71.6
22.02.0
85.07.9
Summer-autumnlow-water period
0.0950.009
5.30.5
17.21.6
22.32.0
Winter low-waterperiod
0.0320.003
2.70.3
9.90.9
8.10.7
Over the year 0.420.039
25.72.4
49.14.5
115.410.6
The runoff of different groups of chemicalcomponents that are carried out with the waters ofthe Western Bug is distributed by seasons as fol-lows. The main ions: spring high water – 48-59%;summer-autumn low-water period – 25-31%; win-ter low-water – 16-22%. Biogenic matter: springhigh water – 47-67%; summer-autumn low-waterperiod – 17-35%; winter low-water – 16-19%.Heavy metals: spring high water – 45-74%; sum-
mer-autumn low – 19-35%; winter low-water – 6-20%.
Considering the specific nature of the chemi-cal composition of the Poltva, we studied the con-tribution of this river to the formation of the mainion and biogenic matter runoff in the upper part ofthe Western Bug (right after the confluence of thePoltvaatKamianka-Buzka) and in the lower part ofthe Western Bug for Ukraine – on the border ofUkraine, Poland and Belarus (Table 9 and 10). The
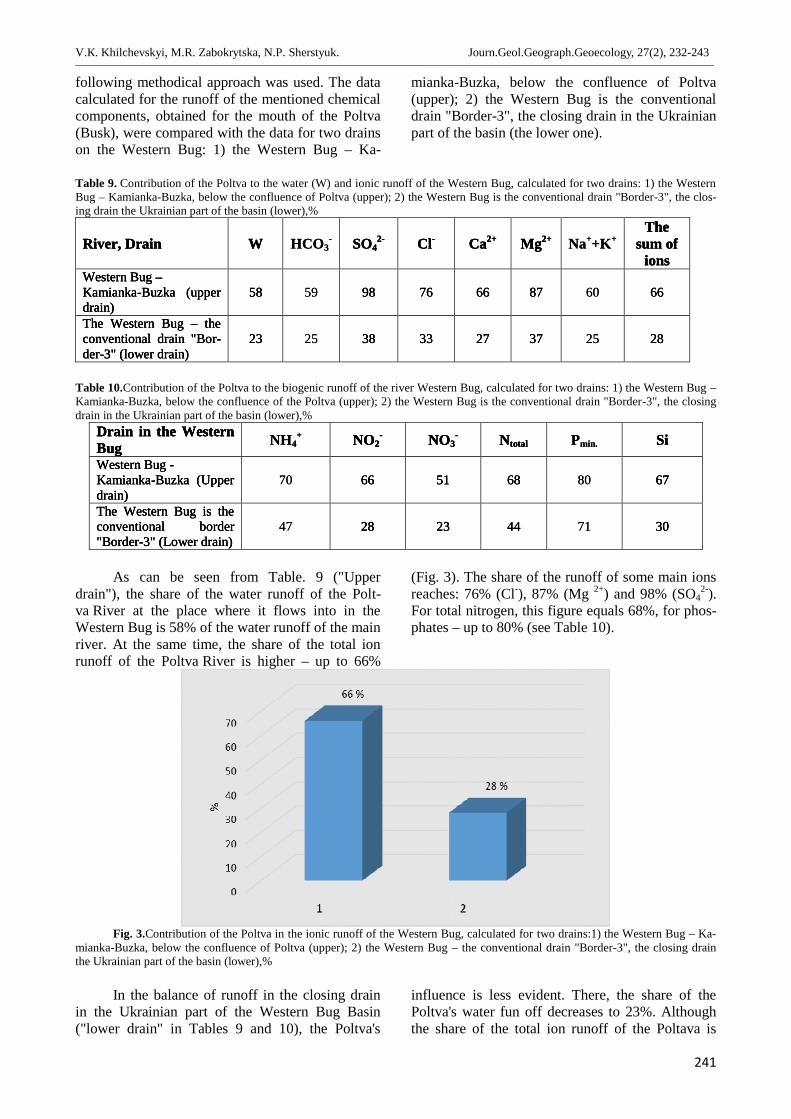
V.К. Khilchevskyi, M.R. Zabokrytska, N.P. Sherstyuk. Journ.Geol.Geograph.Geoecology, 27(2), 232-243________________________________________________________________________________________________________________________________________________________________
241
following methodical approach was used. The datacalculated for the runoff of the mentioned chemicalcomponents, obtained for the mouth of the Poltva(Busk), were compared with the data for two drainson the Western Bug: 1) the Western Bug – Ka-
mianka-Buzka, below the confluence of Poltva(upper); 2) the Western Bug is the conventionaldrain "Border-3", the closing drain in the Ukrainianpart of the basin (the lower one).
Table 9. Contribution of the Poltva to the water (W) and ionic runoff of the Western Bug, calculated for two drains: 1) the WesternBug – Kamianka-Buzka, below the confluence of Poltva (upper); 2) the Western Bug is the conventional drain "Border-3", the clos-ing drain the Ukrainian part of the basin (lower),%
River, Drain W HCO3- SO4
2- Cl- Ca2+ Mg2+ Na++K+The
sum ofions
Western Bug –Kamianka-Buzka (upperdrain)
58 59 98 76 66 87 60 66
The Western Bug – theconventional drain "Bor-der-3" (lower drain)
23 25 38 33 27 37 25 28
Table 10.Contribution of the Poltva to the biogenic runoff of the river Western Bug, calculated for two drains: 1) the Western Bug –Kamianka-Buzka, below the confluence of the Poltva (upper); 2) the Western Bug is the conventional drain "Border-3", the closingdrain in the Ukrainian part of the basin (lower),%
Drain in the WesternBug NH4
+ NO2- NO3
- Ntotal Рmin. SiWestern Bug -Kamianka-Buzka (Upperdrain)
70 66 51 68 80 67
The Western Bug is theconventional border"Border-3" (Lower drain)
47 28 23 44 71 30
As can be seen from Table. 9 ("Upperdrain"), the share of the water runoff of the Polt-va River at the place where it flows into in theWestern Bug is 58% of the water runoff of the mainriver. At the same time, the share of the total ionrunoff of the Poltva River is higher – up to 66%
(Fig. 3). The share of the runoff of some main ionsreaches: 76% (Cl-), 87% (Mg 2+) and 98% (SO4
2-).For total nitrogen, this figure equals 68%, for phos-phates – up to 80% (see Table 10).
Fig. 3.Contribution of the Poltva in the ionic runoff of the Western Bug, calculated for two drains:1) the Western Bug – Ka-mianka-Buzka, below the confluence of Poltva (upper); 2) the Western Bug – the conventional drain "Border-3", the closing drainthe Ukrainian part of the basin (lower),%
In the balance of runoff in the closing drainin the Ukrainian part of the Western Bug Basin("lower drain" in Tables 9 and 10), the Poltva's
influence is less evident. There, the share of thePoltva's water fun off decreases to 23%. Althoughthe share of the total ion runoff of the Poltava is
V.К. Khilchevskyi, M.R. Zabokrytska, N.P. Sherstyuk. Journ.Geol.Geograph.Geoecology, 27(2), 232-243________________________________________________________________________________________________________________________________________________________________
242
still somewhat higher – 28%, and the share of ru-noff of some main ions, anthropogenic impact indi-cators, reaches: 33% (Cl-), 37% (Mg 2+) and 38%(SO4
2-). For total nitrogen, this indicator was 44%,for phosphates – up to 71% (see Table 10).
Thus, the comparative methodological ap-proach allowed determining a significant influenceof the Poltva on the formation of the chemicalcomposition of the Western Bug, especially in itsupper part.
Conclusions1. The hydrographic network of the Western Bugbasin on the territory of Ukraine has 2,044 rivers.2. The classification of the rivers of the WesternBug basin by catchment area, performed in accor-dance with the requirements of the EU WFD,showed the following results: in this basin withinUkraine there is one very large river, (actually thisis the West Bug itself), and also three large rivers –the Poltva, Rata and Luha. There are also 30 me-dium and 2,010 small rivers (among which 1,966rivers are less than 10 km).3. The data obtained and the revealed regularitiesallowed us to determine the leading role of naturalfac-tors in the formation of the hydrocarbonate-calcium ion composition of the river waters of theWestern Bug basin. The content of the main ionsand the salinity of the river waters are distinguishedby a sufficiently clear seasonal character: a de-crease in the spring flood and an increase in the lowwater level (mineralization of the water of theWestern Bug – 497-573 mg/l).4. Mineralization of the Poltva River (the left tribu-tary of the Western Bug), located in the same natu-ral conditions, is significantly different. So, in thearea of the city of Lviv (the upper area of the PoltvaRiver), it reaches 784-871 mg/l, and at the mouth ofthe river (in the city of Busk, at the confluence ofthe Western Bug) 613-670 mg/l. In this case, thechemical type of water begins to affect sulfates andchlorides. This situation is explained by the dis-charge of sewage from the city of Lviv into thePoltva River.5. At the same time, studies of the regime of nu-trients, microelements, and specific pollutants inthe water of the Western Bug did not find commonregularities in their seasonal variations, which isrelated to the significant discreteness of the influ-ence of anthropogenic factors on the formation oftheir concentrations.6. The methodological approach used to calculatethe flow of dissolved chemicals allowed us to esti-mate the balance of substances, both natural andanthropogenic, that are taken out with the waters ofthe Western Bug from the territory of Ukraine
(93%), as well as from the territory of Poland (7%)to the border with Belarus.7. The comparative methodological approach al-lowed us to quantify the significant influence of thePoltva River on the formation of the chemical com-position of the water of the Western Bug, especiallyin its upper part. The share of Poltva's water flowwithin the Western Bug is 58% of its water flow. Atthe same time, the share of the total ion flow ishigher – 66%. The share of the discharge of indi-vidual principal ions reaches: 76% (Cl-), 87% (Mg2+) and 98% (SO4
2-). For nitrogen, this figure is68%, for phosphates – up to 80%.
References
Bug River Valley as the ecological corridor. State –Threats – Protection, 2002. IUCN European Pro-gramme.
Сharakterystyka wod granicznego odcinkarzeki Bugwla-tach 1990–1996. (1997) [Characteristics of thewater of the border section of the Bug river in theyears 1990–1996. (1997)]. Chelm: Bibliotekamonitoringu srodowiska (in Polish).
Directive 2000/60/EC of the European Parliament and ofthe Councilof 23 October 2000 establishing aframework for Communityaction in the field ofwaterpolicy.Official Journal EU. L 327.22/12/2000 P. 0001–0073. Retrieved fromhttp://eur-lex.europa.eu/legal-content/EN/TXT/?uri=CELEX:32000L0060.
Dzham O.A., Danilyuk I.V., 2017. Dinamika sostoya-niya kachestva poverhnostnyih vod baseyna r.Zapadnyiy Bug [Dynamics of the state of surfacewaters quality of the river basin Western Bug].Vestnik Odesskogo gos. ekolog. un-ta. 21, 56–65(in Russian).
Ertel A.-M. et al., 2012. Heavy loadand high potential:anthropogenic pressures and their impacts on thewater quality along a lowland river (Western Bug,Ukraine). Environ Earth Sci. 65, 1459–1473.
Hagemann N., Blumensaat F., Tavares Wahren F. et al.(2014). The long road to improving the waterquality of the Western BugRiver (Ukraine) – Amulti-scale analysis. Journal of Hydrology. 519,2436-2447. DOI: 10.1016/j.jhydrol.2014.01.013.
Karpuk V.K., 2015. Antropogennoe vliyanie na ka-chestvo rechnyih vod v basseyne Zapadnogo Bu-ga. Institutsionalnyie osnovyi transgranichnogopredprinimatelstva [Anthropogenic impact on thequality of river water in the basin of the WesternBug. Institutional framework for cross-border en-trepreneurship]. Byala-Podlyaska. Brest. 2, 71–76(in Russian).
Khil'chevskii V.K., Chebot'ko K.A., 1994. Evaluationof the ecological and hydrochemical state of natu-ral waters in Ukraine. Water Resources. 21(2),166–172.
Khilchevskyi V. K., Hrebin V.V., 2017. Hidrohrafichneta vodohospodarske raionuvannia terytorii Ukrai-ny, zetverdzhene u 2016 r. – realizetsiia polozhen
V.К. Khilchevskyi, M.R. Zabokrytska, N.P. Sherstyuk. Journ.Geol.Geograph.Geoecology, 27(2), 232-243________________________________________________________________________________________________________________________________________________________________
243
VRD ЕS [Hydrographic and water-managementzoning of the territory of Ukraine, approved in2016 - Implementation of the provisions of theEU WFD]. Hidrolohiia, hidrokhimiia i hidroeko-lohiia. 1(44), 8–20. (in Ukrainian).
Khilchevskyi V.K., Hrebin V.V., Zabokrytska M.R.,2016. Otsinka hidrohrafichnoi merezhi raionurichkovoho baseinu Visly (Zakhidnoho Buhu taSanu) na terytorii Ukrainy zghidno typolohiiVodnoi ramkovoi dyrektyvy YeS [Assessment ofthe hydrographic network of the Vistula river ba-sin (Western Bug and San) in the territory ofUkraine according to the typology of the EU Wa-ter Framework Directive]. Hidrolohiia, hidrokhi-miia i hidroekolohiia. 1(40), 29–41 (in Ukrai-nian).
Khilchevskyi V.К., Kurylo S.М., Sherstyuk N.P., 2018.Chemical composition of different types of natu-ral waters in Ukraine. Journal of Geology, Geo-graphy and Geoecology. 27(1), 68-80.
Khilchevskyi V.K., Osadchyi V.I., Kurylo S.M. 2012.Osnovy hidrokhimii [Basics of hydrochemistry].Nika-tsentr, Kiev (in Ukrainian).
Starodub G., Karabyn B., Ursulyak P., Pyroszok S.,2013. Assessment of anthropogenic changes natu-ral hydrochemical pool Western Bug river. Studiaregionalne i lokalne Polski poludniowo-wschodniej.Dzierdziówka – Kraków, T. XI. P.79-90.
Tatukh S., Chalyi P., Mukha O., Mykhnovych A., 2012.Natural Conditions and Man-Made Influenceupon Surface Waters Quality in the Western BugRiver Basins. In: Transboundary Aquifers in theEastern Borders of the European Union. NATOScience for Peace and Security Series C: Envi-ronmental Security. Springer, Dor-drecht..Retrieved fromhttps://doi.org/10.1007/978-94-007-3949-9_5.
Tokarchuk O.V., 2011. Monitoring kachestva poverh-nostnyih vod transgranichnoy chasti basseyna re-ki Zapadnyiy Bug: sostoyanie i problemyi opti-mizatsii [Surface water quality monitoring of thetransboundary part of the Western BugRiver ba-sin: the state and problems of optimization].Nauchnyie zapiski Brest.un-ta. 7. Ch. 2, 133–140(in Russian).
Tränckner J., Helm B., Blumensaat F., Terekhanova T.,2012. Integrated Water Resources Management:Approach to Improve River Water Quality in theWestern Bug River Basin. In: TransboundaryAquifers in the Eastern Borders of the EuropeanUnion. NATO Science for Peace and Security Se-ries C: Environmental Security. Springer, Dor-drecht.Retrieved fromhttps://doi.org/10.1007/978-94-007-3949-9_6.
Vodnyi kodeks Ukrainy, 1995 (z dopovnenniamy iz2000 r.) [The Water Code of Ukraine, 1995 (withamendments from 2000 year] (in Ukrainian). Re-trieved from http://zakon.rada.gov.ua/go/213/95-вр.
Zabokrytska M.R., Khilchevskyi V.K., Manchenko A.P.,2006. Hidroekolohichnyi stan baseinu Zakhidno-ho Buhu na terytorii Ukrainy [Hydroecologicalstate of the basin of the Western Bug on the terri-tory of Ukraine]. Nika-Tsentr, Kiev (in Ukrai-nian).
Zakhidno-Buzke baseinove upravlinnia vodnykh resursivDerzhvodahentstva Ukrainy, 2017. Ofitsiinyi sait.[West-Bug water basin department of the StateAgency of Water Supply of Ukraine. Officialsite]. Retrieved from http://zbbuvr.gov.ua. (inUkrainian).
Zakrevskii D.V., Peleshenko V.I., Khil'chevskii V.K.,1988. Dissolved load of Ukrainian rivers. WaterResources. 15(6), 63–73.
Yu.T. Khomenko, L.V. Isakov, V.V. Manyuk Journ.Geol.Geograph.Geoecology, 27(2), 247-263________________________________________________________________________________________________________________________________________________________________
244
Journal of Geology,Geography and Geoecology
Journal home page: geology-dnu-dp.ua
ISSN 2617-2909 (print)ISSN 2617-2119 (online)
Journ.Geol.Geograph.Geoecology,
27(2), 244-260doi:10.15421/111849
Yu.T. Khomenko, L.V. Isakov, V.V. Manyuk Journ.Geol.Geograph.Geoecology, 27(2), 244-260________________________________________________________________________________________________________________________________________________________________
On the development of geotouristic routes on the objects of the Precambrian Rock Associationof the Western Priazоvia
Yu.T. Khomenko1, L.V. Isakov1, V.V. Manyuk2
1 National Mining University, Dnipro, Ukraine, e-mail: [email protected] Gonchar Dnipropetrovsk National University, e-mail: [email protected]
Abstract. The article describes the priorities of the development of a new sphere intourism – the geological sphere (geotourism). We have developed a complex of neces-sary measures for increasing the touristic attractiveness of objects of the geologicalheritage including justification of the touristic value of the objects selected for creatingthe touristic routes, posting information about the objects on available web-sites, includ-
ing not only geotouristic routes and objects in the surrounding area, but also any other tourist attractions: geobotanical, landscape,archeological, historical-cultural, sacral, ethnic, etc. The paper justifies the necessity of involving the outcrop of Precambrian rocksof crystalline basement as geotouristic objects of Western Pryazovia. It was determined that almost all the most attractive geotouristicobjects are geological relics of nature or geosites, some of which have official status and are included in the Nature-Reserve Lands ofUkraine. The paper describes the most important pages of the ancient history of Pryazovia in general and the Berda river in particu-lar. Three variants of routes have been proposed, each based on the observations of the authors and their colleagues during geologicalsurveys and field geological practice with university students specializing in geology. It was found that the most promising objectsfor touristic routes are the outcrops of crystalline Precambrian rocks located along the Berda river and surrounding territories. There,one can see a practically full section of outcrops of rock associations of the Osypenkivska Archean seria, which compose the Olz-hinska metabasite and Krutobalkivska metasedimental suites; intrusive and ultrametamorphic formations which form the Osypen-kivskyi gabbro-diorite, the Shevchenkivskyi plagiogranite-tonalite and the Saltychanskyi granite complexes. Among the geologicalobjects which are exposed to observation in this relatively small territory, there are deposits of gold (Surozhske), rare metals (KrutaBalka), ceramical pegmatite (Mohyla Zelena and Velykyi Tabir Ravinne), iron (Korsak Mohyla). These objects give us a full impres-sion of the structure of the crystalline massif of the Western Pryazovia megastructure of the Ukrainian shield. We have formulatedthe main recommendations for the preparation and conducting of geotourism routes in Ukraine,which can be the basis for develop-ment of both internal and external geotourism.
Key words: geotourism, Precambrian, geological site, geosite, intrusive complexes, ultrametamorphic complexes, Western Azov Sea,Ukrainian shield.
До питання розробки геотуристичних маршрутів по об’єктах докембрійського фундаменту За-хідного Приазов’я
Ю.Т. Хоменко1, Л.В. Ісаков1, В.В. Манюк2
1Державний вищий навчальний заклад «Національний гірничий університет», Дніпро, Україна,e-mail:[email protected]Дніпровський національний університет імені Олеся Гончара, Дніпро, Україна,e-mail:[email protected]
Анотація. Розглянуто пріоритетність розвитку нового напрямку в туризмі - геологічного (геотуризму). Розроблено ком-плекс необхідних заходів для підвищення туристичної привабливості об’єктів геологічної спадщини, серед яких розробкаобґрунтування туристичної цінності вибраного для проведення геологічних маршрутів об'єкту, розміщення в інтернет-ресурсах інформації про об'єкт на легкодоступному сайті, включення до маршруту не тільки довколишніх геотуристичнихмаршрутів і об'єктів, але й будь-яких туристичних атракцій: геоботанічних, ландшафтних, археологічних, історико-культурних, сакральних, етнічних та інше. Обґрунтовано необхідність для Західного Приазов’я залучати у якості геотурис-тичних об’єктів саме вихід порід докембрійського кристалічного фундаменту. Визначено, що практично всі найбільш при-вабливі об’єкти геотуризму являють собою геологічні пам’ятки природи або геосайти, частина з яких має офіційний приро-доохоронний статус і входить до Природно-заповідного фонду України. Наведено важливі сторінки давньої історії Приа-
Received 26.04.2018;Received in revised form 01.08.2018;Accepted 08.08.2018
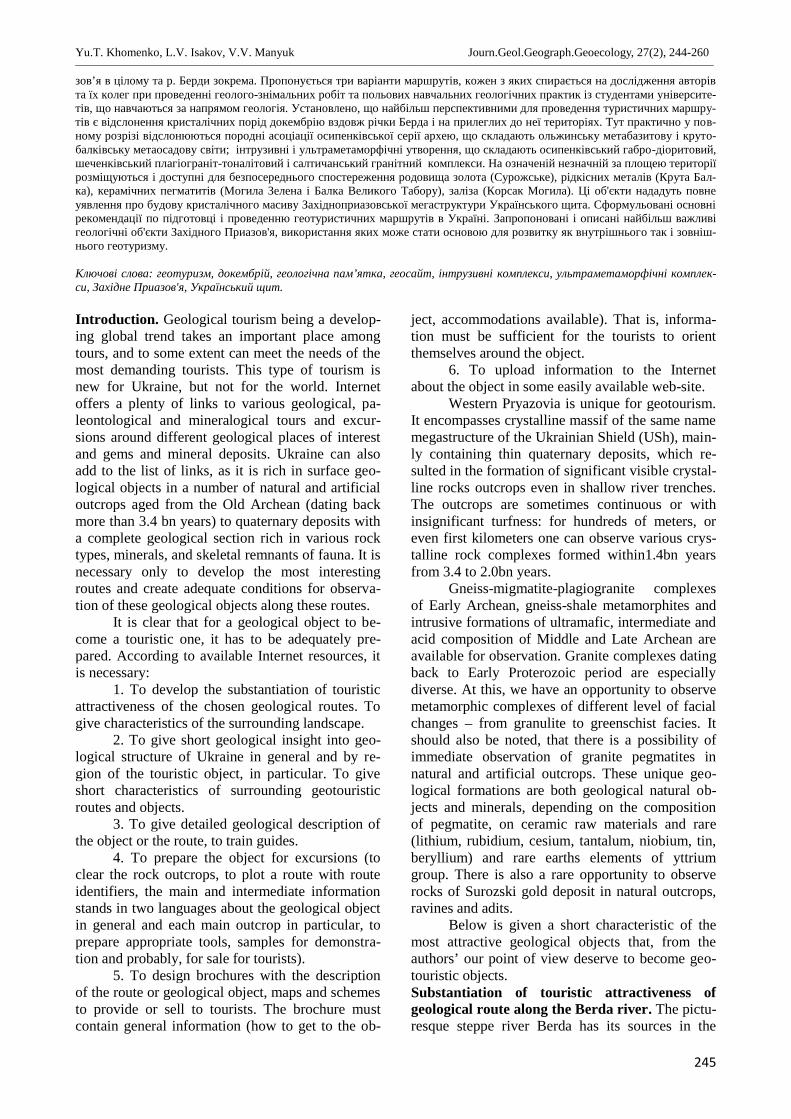
Yu.T. Khomenko, L.V. Isakov, V.V. Manyuk Journ.Geol.Geograph.Geoecology, 27(2), 244-260________________________________________________________________________________________________________________________________________________________________
245
зов’я в цілому та р. Берди зокрема. Пропонується три варіанти маршрутів, кожен з яких спирається на дослідження авторівта їх колег при проведенні геолого-знімальних робіт та польових навчальних геологічних практик із студентами університе-тів, що навчаються за напрямом геологія. Установлено, що найбільш перспективними для проведення туристичних маршру-тів є відслонення кристалічних порід докембрію вздовж річки Берда і на прилеглих до неї територіях. Тут практично у пов-ному розрізі відслонюються породні асоціації осипенківської серії архею, що складають ольжинську метабазитову і круто-балківську метаосадову світи; інтрузивні і ультраметаморфічні утворення, що складають осипенківський габро-діоритовий,шеченківський плагіограніт-тоналітовий і салтичанський гранітний комплекси. На означеній незначній за площею територіїрозміщуються і доступні для безпосереднього спостереження родовища золота (Сурожське), рідкісних металів (Крута Бал-ка), керамічних пегматитів (Могила Зелена і Балка Великого Табору), заліза (Корсак Могила). Ці об'єкти нададуть повнеуявлення про будову кристалічного масиву Західноприазовської мегаструктури Українського щита. Сформульовані основнірекомендації по підготовці і проведенню геотуристичних маршрутів в Україні. Запропоновані і описані найбільш важливігеологічні об'єкти Західного Приазов'я, використання яких може стати основою для розвитку як внутрішнього так і зовніш-нього геотуризму.
Ключові слова: геотуризм, докембрій, геологічна пам’ятка, геосайт, інтрузивні комплекси, ультраметаморфічні комплек-си, Західне Приазов'я, Український щит.
Introduction. Geological tourism being a develop-ing global trend takes an important place amongtours, and to some extent can meet the needs of themost demanding tourists. This type of tourism isnew for Ukraine, but not for the world. Internetoffers a plenty of links to various geological, pa-leontological and mineralogical tours and excur-sions around different geological places of interestand gems and mineral deposits. Ukraine can alsoadd to the list of links, as it is rich in surface geo-logical objects in a number of natural and artificialoutcrops aged from the Old Archean (dating backmore than 3.4 bn years) to quaternary deposits witha complete geological section rich in various rocktypes, minerals, and skeletal remnants of fauna. It isnecessary only to develop the most interestingroutes and create adequate conditions for observa-tion of these geological objects along these routes.
It is clear that for a geological object to be-come a touristic one, it has to be adequately pre-pared. According to available Internet resources, itis necessary:
1. To develop the substantiation of touristicattractiveness of the chosen geological routes. Togive characteristics of the surrounding landscape.
2. To give short geological insight into geo-logical structure of Ukraine in general and by re-gion of the touristic object, in particular. To giveshort characteristics of surrounding geotouristicroutes and objects.
3. To give detailed geological description ofthe object or the route, to train guides.
4. To prepare the object for excursions (toclear the rock outcrops, to plot a route with routeidentifiers, the main and intermediate informationstands in two languages about the geological objectin general and each main outcrop in particular, toprepare appropriate tools, samples for demonstra-tion and probably, for sale for tourists).
5. To design brochures with the descriptionof the route or geological object, maps and schemesto provide or sell to tourists. The brochure mustcontain general information (how to get to the ob-
ject, accommodations available). That is, informa-tion must be sufficient for the tourists to orientthemselves around the object.
6. To upload information to the Internetabout the object in some easily available web-site.
Western Pryazovia is unique for geotourism.It encompasses crystalline massif of the same namemegastructure of the Ukrainian Shield (USh), main-ly containing thin quaternary deposits, which re-sulted in the formation of significant visible crystal-line rocks outcrops even in shallow river trenches.The outcrops are sometimes continuous or withinsignificant turfness: for hundreds of meters, oreven first kilometers one can observe various crys-talline rock complexes formed within1.4bn yearsfrom 3.4 to 2.0bn years.
Gneiss-migmatite-plagiogranite complexesof Early Archean, gneiss-shale metamorphites andintrusive formations of ultramafic, intermediate andacid composition of Middle and Late Archean areavailable for observation. Granite complexes datingback to Early Proterozoic period are especiallydiverse. At this, we have an opportunity to observemetamorphic complexes of different level of facialchanges – from granulite to greenschist facies. Itshould also be noted, that there is a possibility ofimmediate observation of granite pegmatites innatural and artificial outcrops. These unique geo-logical formations are both geological natural ob-jects and minerals, depending on the compositionof pegmatite, on ceramic raw materials and rare(lithium, rubidium, cesium, tantalum, niobium, tin,beryllium) and rare earths elements of yttriumgroup. There is also a rare opportunity to observerocks of Surozski gold deposit in natural outcrops,ravines and adits.
Below is given a short characteristic of themost attractive geological objects that, from theauthors’ our point of view deserve to become geo-touristic objects.Substantiation of touristic attractiveness ofgeological route along the Berda river. The pictu-resque steppe river Berda has its sources in the
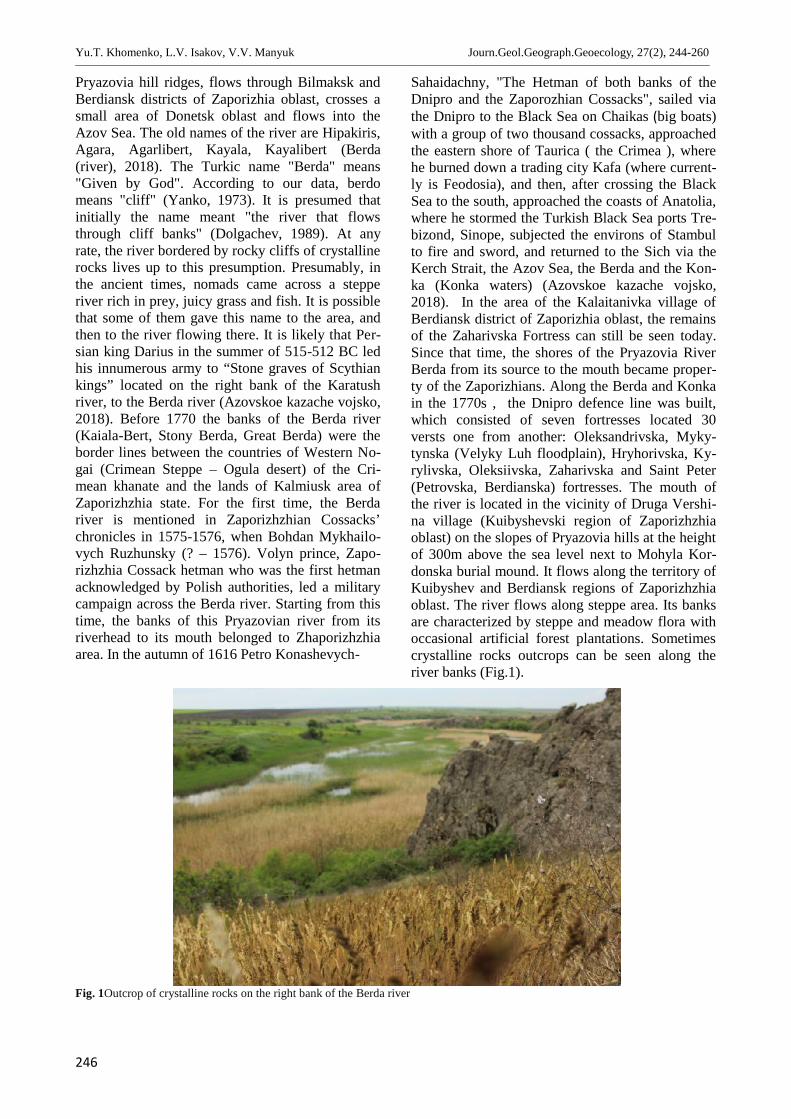
Yu.T. Khomenko, L.V. Isakov, V.V. Manyuk Journ.Geol.Geograph.Geoecology, 27(2), 244-260_______________________________________________________________________________________________________________________________________________________________
246
Pryazovia hill ridges, flows through Bilmaksk andBerdiansk districts of Zaporizhia oblast, crosses asmall area of Donetsk oblast and flows into theAzov Sea. The old names of the river are Hipakiris,Agara, Agarlibert, Kayala, Kayalibert (Berda(river), 2018). The Turkic name "Berda" means"Given by God". According to our data, berdomeans "cliff" (Yanko, 1973). It is presumed thatinitially the name meant "the river that flowsthrough cliff banks" (Dolgachev, 1989). At anyrate, the river bordered by rocky cliffs of crystallinerocks lives up to this presumption. Presumably, inthe ancient times, nomads came across a stepperiver rich in prey, juicy grass and fish. It is possiblethat some of them gave this name to the area, andthen to the river flowing there. It is likely that Per-sian king Darius in the summer of 515-512 BC ledhis innumerous army to “Stone graves of Scythiankings” located on the right bank of the Karatushriver, to the Berda river (Azovskoe kazache vojsko,2018). Before 1770 the banks of the Berda river(Kaiala-Bert, Stony Berda, Great Berda) were theborder lines between the countries of Western No-gai (Crimean Steppe – Ogula desert) of the Cri-mean khanate and the lands of Kalmiusk area ofZaporizhzhia state. For the first time, the Berdariver is mentioned in Zaporizhzhian Cossacks’chronicles in 1575-1576, when Bohdan Mykhailo-vych Ruzhunsky (? – 1576). Volyn prince, Zapo-rizhzhia Cossack hetman who was the first hetmanacknowledged by Polish authorities, led a militarycampaign across the Berda river. Starting from thistime, the banks of this Pryazovian river from itsriverhead to its mouth belonged to Zhaporizhzhiaarea. In the autumn of 1616 Petro Konashevych-
Sahaidachny, "The Hetman of both banks of theDnipro and the Zaporozhian Cossacks", sailed viathe Dnipro to the Black Sea on Chaikas (big boats)with a group of two thousand cossacks, approachedthe eastern shore of Taurica ( the Crimea ), wherehe burned down a trading city Kafa (where current-ly is Feodosia), and then, after crossing the BlackSea to the south, approached the coasts of Anatolia,where he stormed the Turkish Black Sea ports Tre-bizond, Sinope, subjected the environs of Stambulto fire and sword, and returned to the Sich via theKerch Strait, the Azov Sea, the Berda and the Kon-ka (Konka waters) (Azovskoe kazache vojsko,2018). In the area of the Kalaitanivka village ofBerdiansk district of Zaporizhia oblast, the remainsof the Zaharivska Fortress can still be seen today.Since that time, the shores of the Pryazovia RiverBerda from its source to the mouth became proper-ty of the Zaporizhians. Along the Berda and Konkain the 1770s , the Dnipro defence line was built,which consisted of seven fortresses located 30versts one from another: Oleksandrivska, Myky-tynska (Velyky Luh floodplain), Hryhorivska, Ky-rylivska, Oleksiivska, Zaharivska and Saint Peter(Petrovska, Berdianska) fortresses. The mouth ofthe river is located in the vicinity of Druga Vershi-na village (Kuibyshevski region of Zaporizhzhiaoblast) on the slopes of Pryazovia hills at the heightof 300m above the sea level next to Mohyla Kor-donska burial mound. It flows along the territory ofKuibyshev and Berdiansk regions of Zaporizhzhiaoblast. The river flows along steppe area. Its banksare characterized by steppe and meadow flora withoccasional artificial forest plantations. Sometimescrystalline rocks outcrops can be seen along theriver banks (Fig.1).
Fig. 1Outcrop of crystalline rocks on the right bank of the Berda river
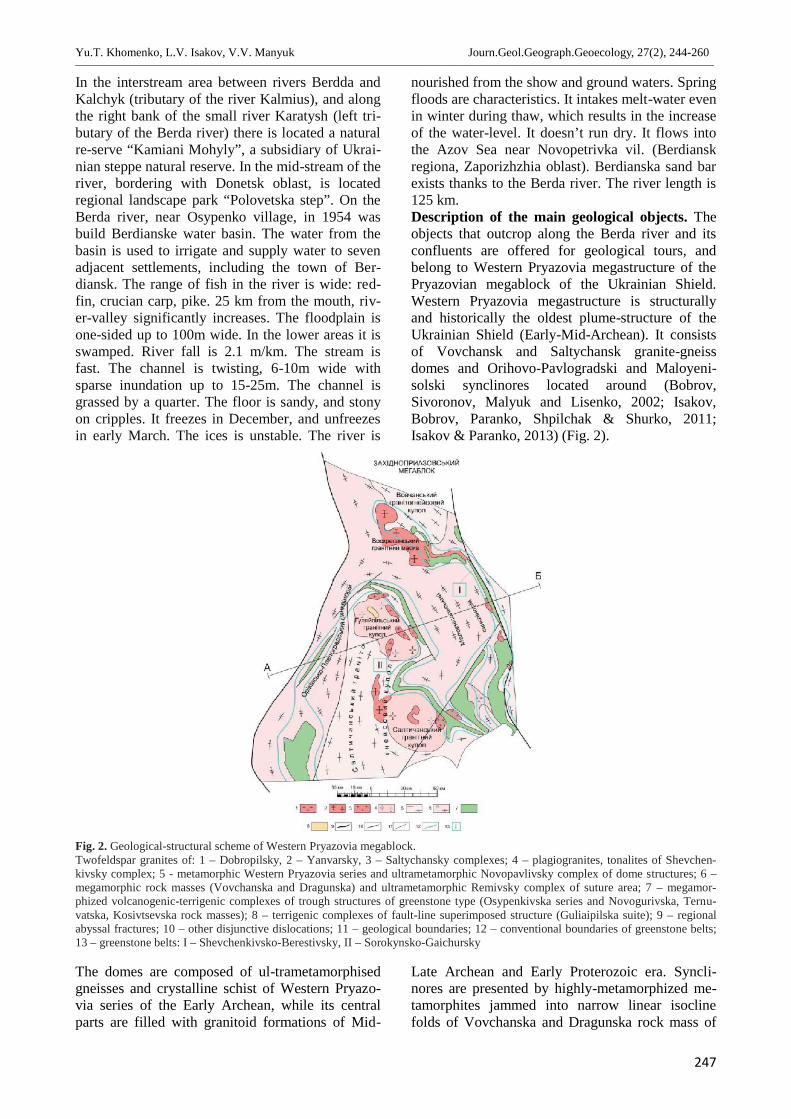
Yu.T. Khomenko, L.V. Isakov, V.V. Manyuk Journ.Geol.Geograph.Geoecology, 27(2), 244-260________________________________________________________________________________________________________________________________________________________________
247
In the interstream area between rivers Berdda andKalchyk (tributary of the river Kalmius), and alongthe right bank of the small river Karatysh (left tri-butary of the Berda river) there is located a naturalre-serve “Kamiani Mohyly”, a subsidiary of Ukrai-nian steppe natural reserve. In the mid-stream of theriver, bordering with Donetsk oblast, is locatedregional landscape park “Polovetska step”. On theBerda river, near Osypenko village, in 1954 wasbuild Berdianske water basin. The water from thebasin is used to irrigate and supply water to sevenadjacent settlements, including the town of Ber-diansk. The range of fish in the river is wide: red-fin, crucian carp, pike. 25 km from the mouth, riv-er-valley significantly increases. The floodplain isone-sided up to 100m wide. In the lower areas it isswamped. River fall is 2.1 m/km. The stream isfast. The channel is twisting, 6-10m wide withsparse inundation up to 15-25m. The channel isgrassed by a quarter. The floor is sandy, and stonyon cripples. It freezes in December, and unfreezesin early March. The ices is unstable. The river is
nourished from the show and ground waters. Springfloods are characteristics. It intakes melt-water evenin winter during thaw, which results in the increaseof the water-level. It doesn’t run dry. It flows intothe Azov Sea near Novopetrivka vil. (Berdianskregiona, Zaporizhzhia oblast). Berdianska sand barexists thanks to the Berda river. The river length is125 km.Description of the main geological objects. Theobjects that outcrop along the Berda river and itsconfluents are offered for geological tours, andbelong to Western Pryazovia megastructure of thePryazovian megablock of the Ukrainian Shield.Western Pryazovia megastructure is structurallyand historically the oldest plume-structure of theUkrainian Shield (Early-Mid-Archean). It consistsof Vovchansk and Saltychansk granite-gneissdomes and Orihovo-Pavlogradski and Maloyeni-solski synclinores located around (Bobrov,Sivoronov, Malyuk and Lisenko, 2002; Isakov,Bobrov, Paranko, Shpilchak & Shurko, 2011;Isakov & Paranko, 2013) (Fig. 2).
Fig. 2. Geological-structural scheme of Western Pryazovia megablock.Twofeldspar granites of: 1 – Dobropilsky, 2 – Yanvarsky, 3 – Saltychansky complexes; 4 – plagiogranites, tonalites of Shevchen-kivsky complex; 5 - metamorphic Western Pryazovia series and ultrametamorphic Novopavlivsky complex of dome structures; 6 –megamorphic rock masses (Vovchanska and Dragunska) and ultrametamorphic Remivsky complex of suture area; 7 – megamor-phized volcanogenic-terrigenic complexes of trough structures of greenstone type (Osypenkivska series and Novogurivska, Ternu-vatska, Kosivtsevska rock masses); 8 – terrigenic complexes of fault-line superimposed structure (Guliaipilska suite); 9 – regionalabyssal fractures; 10 – other disjunctive dislocations; 11 – geological boundaries; 12 – conventional boundaries of greenstone belts;13 – greenstone belts: I – Shevchenkivsko-Berestivsky, II – Sorokynsko-Gaichursky
The domes are composed of ul-trametamorphisedgneisses and crystalline schist of Western Pryazo-via series of the Early Archean, while its centralparts are filled with granitoid formations of Mid-
Late Archean and Early Proterozoic era. Syncli-nores are presented by highly-metamorphized me-tamorphites jammed into narrow linear isoclinefolds of Vovchanska and Dragunska rock mass of
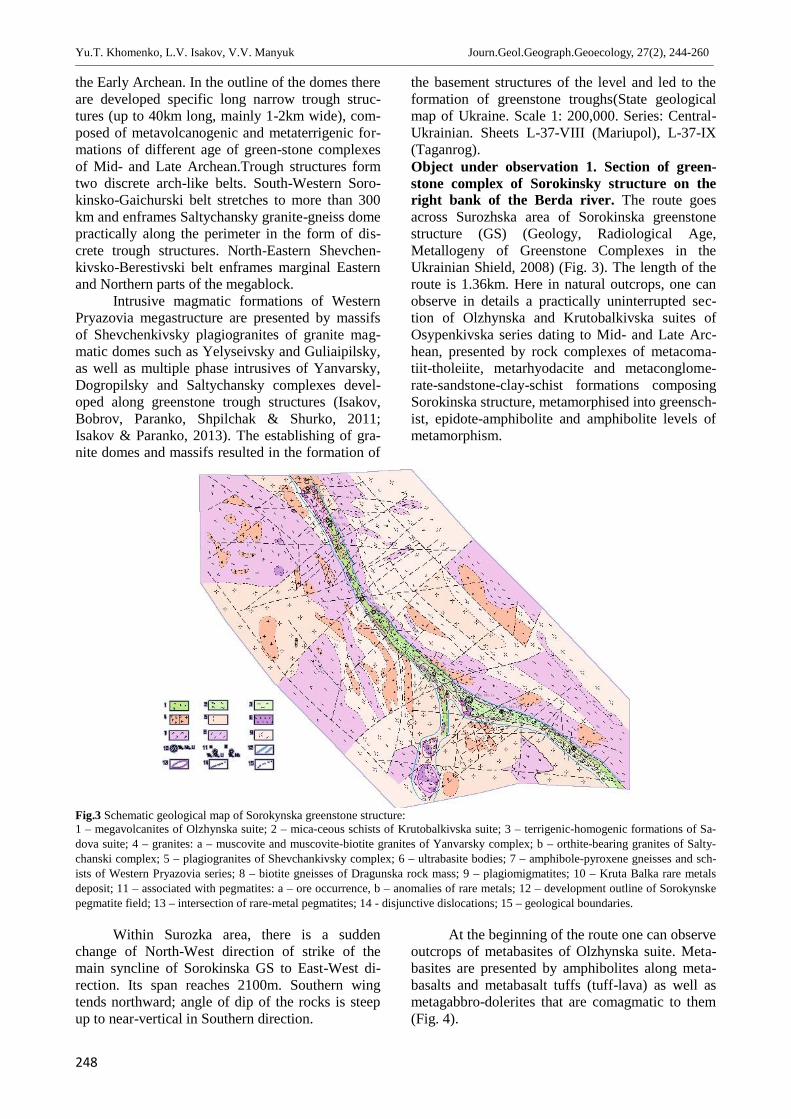
Yu.T. Khomenko, L.V. Isakov, V.V. Manyuk Journ.Geol.Geograph.Geoecology, 27(2), 244-260________________________________________________________________________________________________________________________________________________________________
248
the Early Archean. In the outline of the domes thereare developed specific long narrow trough struc-tures (up to 40km long, mainly 1-2km wide), com-posed of metavolcanogenic and metaterrigenic for-mations of different age of green-stone complexesof Mid- and Late Archean.Trough structures formtwo discrete arch-like belts. South-Western Soro-kinsko-Gaichurski belt stretches to more than 300km and enframes Saltychansky granite-gneiss domepractically along the perimeter in the form of dis-crete trough structures. North-Eastern Shevchen-kivsko-Berestivski belt enframes marginal Easternand Northern parts of the megablock.
Intrusive magmatic formations of WesternPryazovia megastructure are presented by massifsof Shevchenkivsky plagiogranites of granite mag-matic domes such as Yelyseivsky and Guliaipilsky,as well as multiple phase intrusives of Yanvarsky,Dogropilsky and Saltychansky complexes devel-oped along greenstone trough structures (Isakov,Bobrov, Paranko, Shpilchak & Shurko, 2011;Isakov & Paranko, 2013). The establishing of gra-nite domes and massifs resulted in the formation of
the basement structures of the level and led to theformation of greenstone troughs(State geologicalmap of Ukraine. Scale 1: 200,000. Series: Central-Ukrainian. Sheets L-37-VIII (Mariupol), L-37-IX(Taganrog).Object under observation 1. Section of green-stone complex of Sorokinsky structure on theright bank of the Berda river. The route goesacross Surozhska area of Sorokinska greenstonestructure (GS) (Geology, Radiological Age,Metallogeny of Greenstone Complexes in theUkrainian Shield, 2008) (Fig. 3). The length of theroute is 1.36km. Here in natural outcrops, one canobserve in details a practically uninterrupted sec-tion of Olzhynska and Krutobalkivska suites ofOsypenkivska series dating to Mid- and Late Arc-hean, presented by rock complexes of metacoma-tiit-tholeiite, metarhyodacite and metaconglome-rate-sandstone-clay-schist formations composingSorokinska structure, metamorphised into greensch-ist, epidote-amphibolite and amphibolite levels ofmetamorphism.
Fig.3 Schematic geological map of Sorokynska greenstone structure:1 – megavolcanites of Olzhynska suite; 2 – mica-ceous schists of Krutobalkivska suite; 3 – terrigenic-homogenic formations of Sa-dova suite; 4 – granites: a – muscovite and muscovite-biotite granites of Yanvarsky complex; b – orthite-bearing granites of Salty-chanski complex; 5 – plagiogranites of Shevchankivsky complex; 6 – ultrabasite bodies; 7 – amphibole-pyroxene gneisses and sch-ists of Western Pryazovia series; 8 – biotite gneisses of Dragunska rock mass; 9 – plagiomigmatites; 10 – Kruta Balka rare metalsdeposit; 11 – associated with pegmatites: a – ore occurrence, b – anomalies of rare metals; 12 – development outline of Sorokynskepegmatite field; 13 – intersection of rare-metal pegmatites; 14 - disjunctive dislocations; 15 – geological boundaries.
Within Surozka area, there is a suddenchange of North-West direction of strike of themain syncline of Sorokinska GS to East-West di-rection. Its span reaches 2100m. Southern wingtends northward; angle of dip of the rocks is steepup to near-vertical in Southern direction.
At the beginning of the route one can observeoutcrops of metabasites of Olzhynska suite. Meta-basites are presented by amphibolites along meta-basalts and metabasalt tuffs (tuff-lava) as well asmetagabbro-dolerites that are comagmatic to them(Fig. 4).
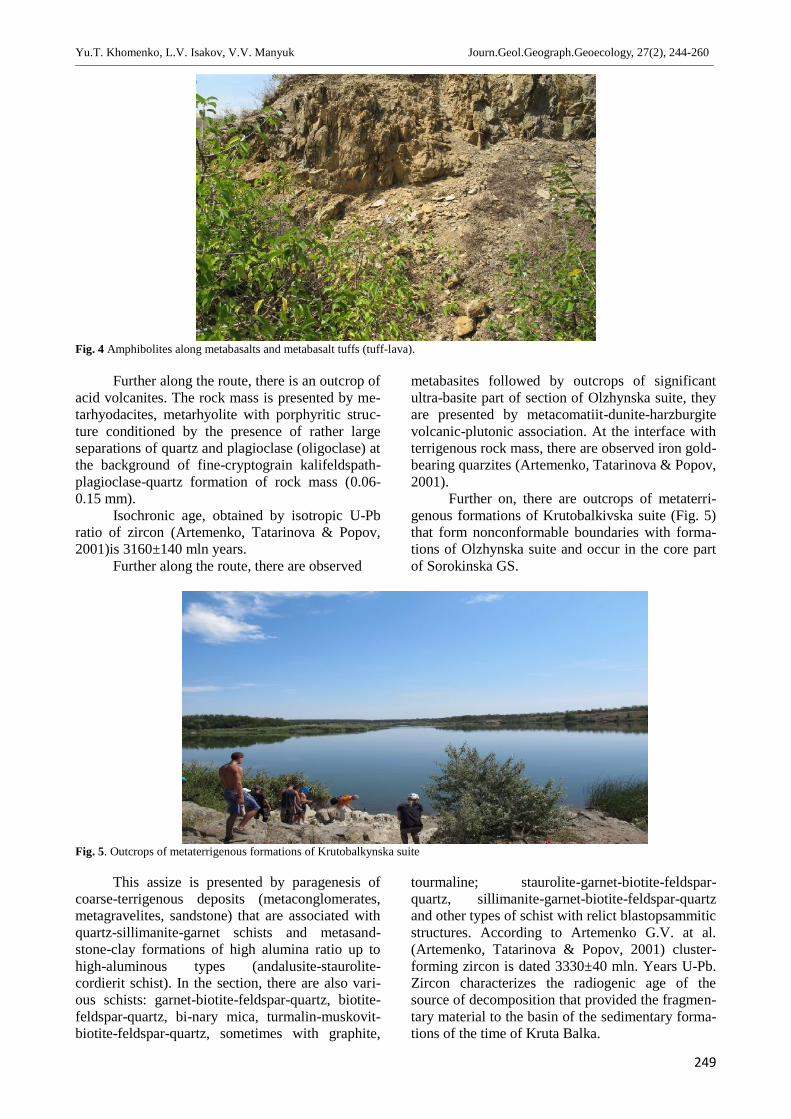
Yu.T. Khomenko, L.V. Isakov, V.V. Manyuk Journ.Geol.Geograph.Geoecology, 27(2), 244-260________________________________________________________________________________________________________________________________________________________________
249
Fig. 4 Amphibolites along metabasalts and metabasalt tuffs (tuff-lava).
Further along the route, there is an outcrop ofacid volcanites. The rock mass is presented by me-tarhyodacites, metarhyolite with porphyritic struc-ture conditioned by the presence of rather largeseparations of quartz and plagioclase (oligoclase) atthe background of fine-cryptograin kalifeldspath-plagioclase-quartz formation of rock mass (0.06-0.15 mm).
Isochronic age, obtained by isotropic U-Pbratio of zircon (Artemenko, Tatarinova & Popov,2001)is 3160±140 mln years.
Further along the route, there are observed
metabasites followed by outcrops of significantultra-basite part of section of Olzhynska suite, theyare presented by metacomatiit-dunite-harzburgitevolcanic-plutonic association. At the interface withterrigenous rock mass, there are observed iron gold-bearing quarzites (Artemenko, Tatarinova & Popov,2001).
Further on, there are outcrops of metaterri-genous formations of Krutobalkivska suite (Fig. 5)that form nonconformable boundaries with forma-tions of Olzhynska suite and occur in the core partof Sorokinska GS.
Fig. 5. Outcrops of metaterrigenous formations of Krutobalkynska suite
This assize is presented by paragenesis ofcoarse-terrigenous deposits (metaconglomerates,metagravelites, sandstone) that are associated withquartz-sillimanite-garnet schists and metasand-stone-clay formations of high alumina ratio up tohigh-aluminous types (andalusite-staurolite-cordierit schist). In the section, there are also vari-ous schists: garnet-biotite-feldspar-quartz, biotite-feldspar-quartz, bi-nary mica, turmalin-muskovit-biotite-feldspar-quartz, sometimes with graphite,
tourmaline; staurolite-garnet-biotite-feldspar-quartz, sillimanite-garnet-biotite-feldspar-quartzand other types of schist with relict blastopsammiticstructures. According to Artemenko G.V. at al.(Artemenko, Tatarinova & Popov, 2001) cluster-forming zircon is dated 3330±40 mln. Years U-Pb.Zircon characterizes the radiogenic age of thesource of decomposition that provided the fragmen-tary material to the basin of the sedimentary forma-tions of the time of Kruta Balka.
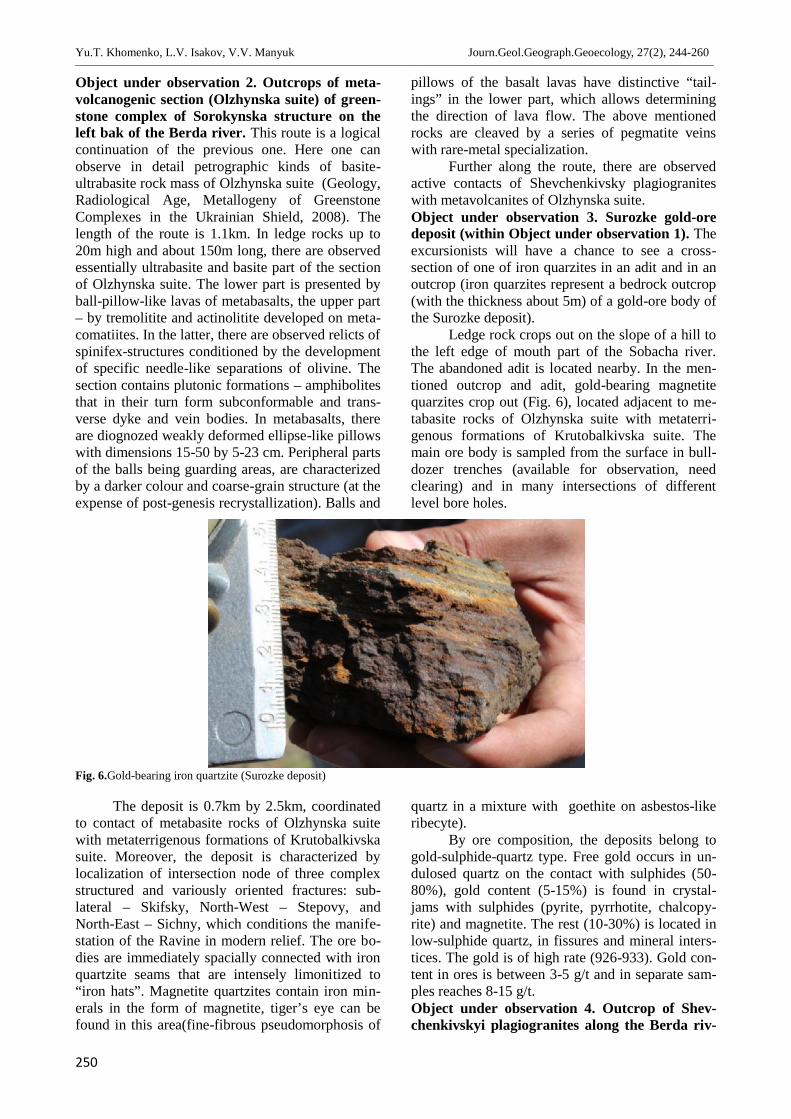
Yu.T. Khomenko, L.V. Isakov, V.V. Manyuk Journ.Geol.Geograph.Geoecology, 27(2), 244-260________________________________________________________________________________________________________________________________________________________________
250
Object under observation 2. Outcrops of meta-volcanogenic section (Olzhynska suite) of green-stone complex of Sorokynska structure on theleft bak of the Berda river. This route is a logicalcontinuation of the previous one. Here one canobserve in detail petrographic kinds of basite-ultrabasite rock mass of Olzhynska suite (Geology,Radiological Age, Metallogeny of GreenstoneComplexes in the Ukrainian Shield, 2008). Thelength of the route is 1.1km. In ledge rocks up to20m high and about 150m long, there are observedessentially ultrabasite and basite part of the sectionof Olzhynska suite. The lower part is presented byball-pillow-like lavas of metabasalts, the upper part– by tremolitite and actinolitite developed on meta-comatiites. In the latter, there are observed relicts ofspinifex-structures conditioned by the developmentof specific needle-like separations of olivine. Thesection contains plutonic formations – amphibolitesthat in their turn form subconformable and trans-verse dyke and vein bodies. In metabasalts, thereare diognozed weakly deformed ellipse-like pillowswith dimensions 15-50 by 5-23 cm. Peripheral partsof the balls being guarding areas, are characterizedby a darker colour and coarse-grain structure (at theexpense of post-genesis recrystallization). Balls and
pillows of the basalt lavas have distinctive “tail-ings” in the lower part, which allows determiningthe direction of lava flow. The above mentionedrocks are cleaved by a series of pegmatite veinswith rare-metal specialization.
Further along the route, there are observedactive contacts of Shevchenkivsky plagiograniteswith metavolcanites of Olzhynska suite.Object under observation 3. Surozke gold-oredeposit (within Object under observation 1). Theexcursionists will have a chance to see a cross-section of one of iron quarzites in an adit and in anoutcrop (iron quarzites represent a bedrock outcrop(with the thickness about 5m) of a gold-ore body ofthe Surozke deposit).
Ledge rock crops out on the slope of a hill tothe left edge of mouth part of the Sobacha river.The abandoned adit is located nearby. In the men-tioned outcrop and adit, gold-bearing magnetitequarzites crop out (Fig. 6), located adjacent to me-tabasite rocks of Olzhynska suite with metaterri-genous formations of Krutobalkivska suite. Themain ore body is sampled from the surface in bull-dozer trenches (available for observation, needclearing) and in many intersections of differentlevel bore holes.
Fig. 6.Gold-bearing iron quartzite (Surozke deposit)
The deposit is 0.7km by 2.5km, coordinatedto contact of metabasite rocks of Olzhynska suitewith metaterrigenous formations of Krutobalkivskasuite. Moreover, the deposit is characterized bylocalization of intersection node of three complexstructured and variously oriented fractures: sub-lateral – Skifsky, North-West – Stepovy, andNorth-East – Sichny, which conditions the manife-station of the Ravine in modern relief. The ore bo-dies are immediately spacially connected with ironquartzite seams that are intensely limonitized to“iron hats”. Magnetite quartzites contain iron min-erals in the form of magnetite, tiger’s eye can befound in this area(fine-fibrous pseudomorphosis of
quartz in a mixture with goethite on asbestos-likeribecyte).
By ore composition, the deposits belong togold-sulphide-quartz type. Free gold occurs in un-dulosed quartz on the contact with sulphides (50-80%), gold content (5-15%) is found in crystal-jams with sulphides (pyrite, pyrrhotite, chalcopy-rite) and magnetite. The rest (10-30%) is located inlow-sulphide quartz, in fissures and mineral inters-tices. The gold is of high rate (926-933). Gold con-tent in ores is between 3-5 g/t and in separate sam-ples reaches 8-15 g/t.Object under observation 4. Outcrop of Shev-chenkivskyi plagiogranites along the Berda riv-
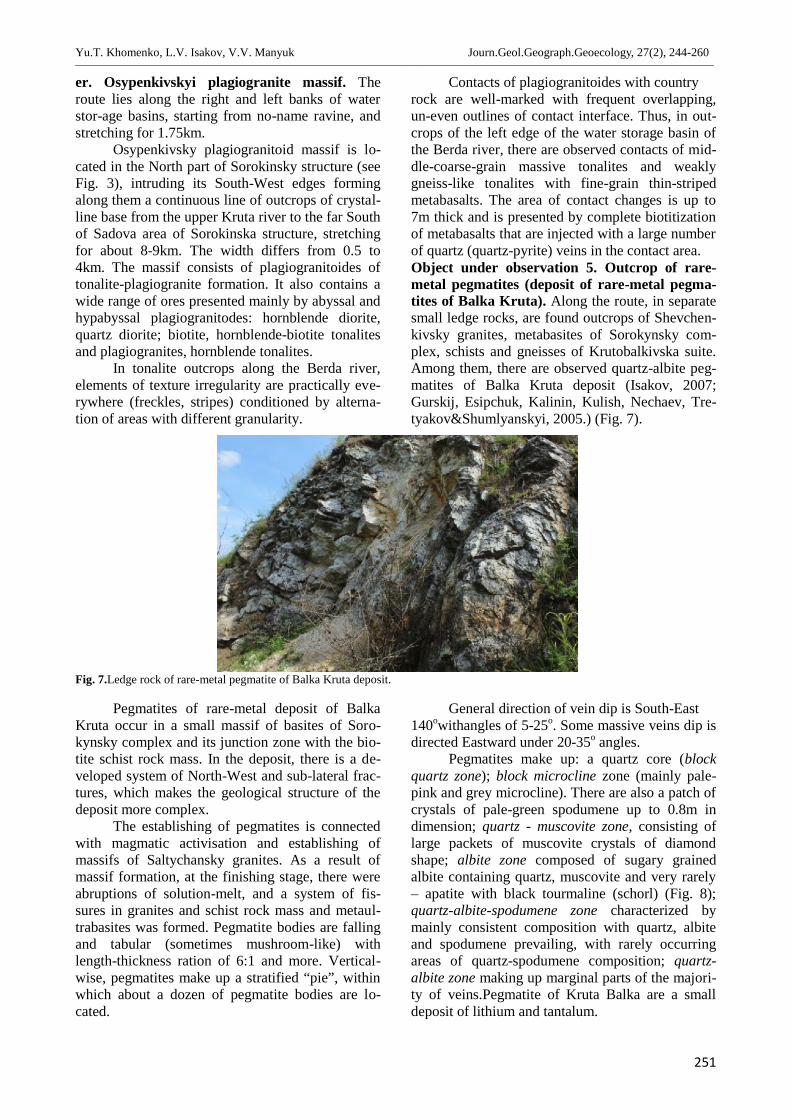
Yu.T. Khomenko, L.V. Isakov, V.V. Manyuk Journ.Geol.Geograph.Geoecology, 27(2), 244-260________________________________________________________________________________________________________________________________________________________________
251
er. Osypenkivskyi plagiogranite massif. Theroute lies along the right and left banks of waterstor-age basins, starting from no-name ravine, andstretching for 1.75km.
Osypenkivsky plagiogranitoid massif is lo-cated in the North part of Sorokinsky structure (seeFig. 3), intruding its South-West edges formingalong them a continuous line of outcrops of crystal-line base from the upper Kruta river to the far Southof Sadova area of Sorokinska structure, stretchingfor about 8-9km. The width differs from 0.5 to4km. The massif consists of plagiogranitoides oftonalite-plagiogranite formation. It also contains awide range of ores presented mainly by abyssal andhypabyssal plagiogranitodes: hornblende diorite,quartz diorite; biotite, hornblende-biotite tonalitesand plagiogranites, hornblende tonalites.
In tonalite outcrops along the Berda river,elements of texture irregularity are practically eve-rywhere (freckles, stripes) conditioned by alterna-tion of areas with different granularity.
Contacts of plagiogranitoides with countryrock are well-marked with frequent overlapping,un-even outlines of contact interface. Thus, in out-crops of the left edge of the water storage basin ofthe Berda river, there are observed contacts of mid-dle-coarse-grain massive tonalites and weaklygneiss-like tonalites with fine-grain thin-stripedmetabasalts. The area of contact changes is up to7m thick and is presented by complete biotitizationof metabasalts that are injected with a large numberof quartz (quartz-pyrite) veins in the contact area.Object under observation 5. Outcrop of rare-metal pegmatites (deposit of rare-metal pegma-tites of Balka Kruta). Along the route, in separatesmall ledge rocks, are found outcrops of Shevchen-kivsky granites, metabasites of Sorokynsky com-plex, schists and gneisses of Krutobalkivska suite.Among them, there are observed quartz-albite peg-matites of Balka Kruta deposit (Isakov, 2007;Gurskij, Esipchuk, Kalinin, Kulish, Nechaev, Tre-tyakov&Shumlyanskyi, 2005.) (Fig. 7).
Fig. 7.Ledge rock of rare-metal pegmatite of Balka Kruta deposit.
Pegmatites of rare-metal deposit of BalkaKruta occur in a small massif of basites of Soro-kynsky complex and its junction zone with the bio-tite schist rock mass. In the deposit, there is a de-veloped system of North-West and sub-lateral frac-tures, which makes the geological structure of thedeposit more complex.
The establishing of pegmatites is connectedwith magmatic activisation and establishing ofmassifs of Saltychansky granites. As a result ofmassif formation, at the finishing stage, there wereabruptions of solution-melt, and a system of fis-sures in granites and schist rock mass and metaul-trabasites was formed. Pegmatite bodies are fallingand tabular (sometimes mushroom-like) withlength-thickness ration of 6:1 and more. Vertical-wise, pegmatites make up a stratified “pie”, withinwhich about a dozen of pegmatite bodies are lo-cated.
General direction of vein dip is South-East140оwithangles of 5-25о. Some massive veins dip isdirected Eastward under 20-35о angles.
Pegmatites make up: a quartz core (blockquartz zone); block microcline zone (mainly pale-pink and grey microcline). There are also a patch ofcrystals of pale-green spodumene up to 0.8m indimension; quartz - muscovite zone, consisting oflarge packets of muscovite crystals of diamondshape; albite zone composed of sugary grainedalbite containing quartz, muscovite and very rarely– apatite with black tourmaline (schorl) (Fig. 8);quartz-albite-spodumene zone characterized bymainly consistent composition with quartz, albiteand spodumene prevailing, with rarely occurringareas of quartz-spodumene composition; quartz-albite zone making up marginal parts of the majori-ty of veins.Pegmatite of Kruta Balka are a smalldeposit of lithium and tantalum.
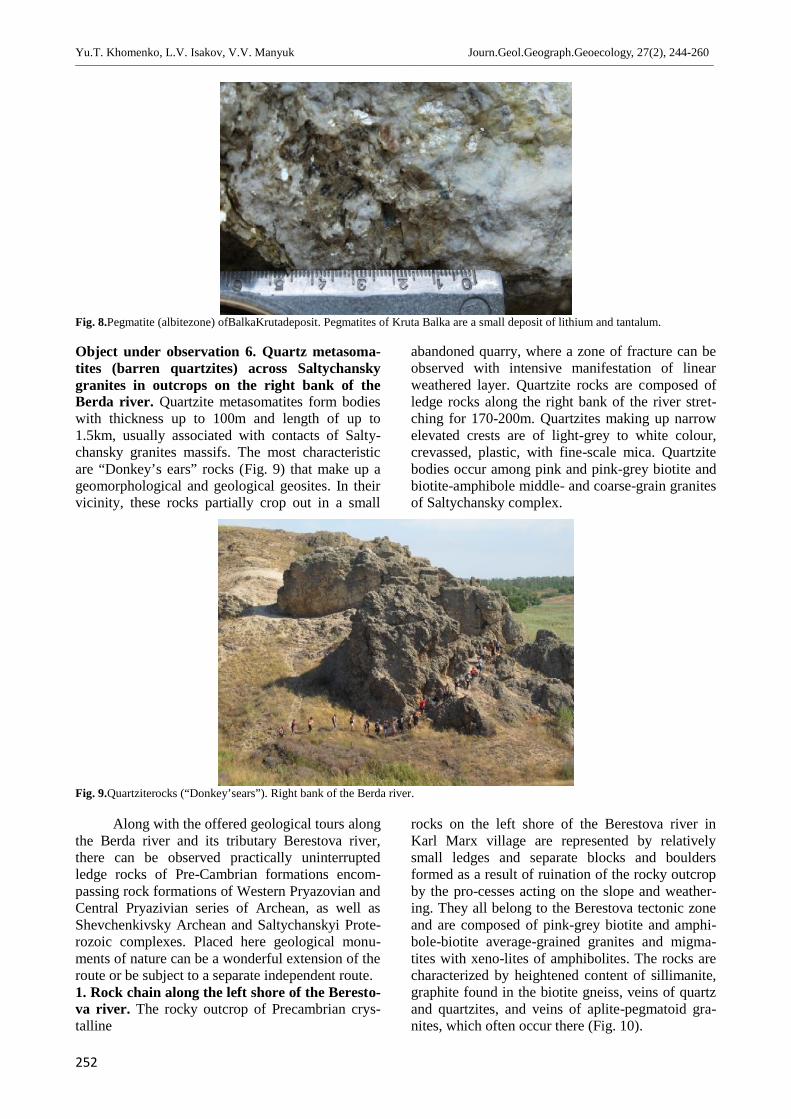
Yu.T. Khomenko, L.V. Isakov, V.V. Manyuk Journ.Geol.Geograph.Geoecology, 27(2), 244-260________________________________________________________________________________________________________________________________________________________________
252
Fig. 8.Pegmatite (albitezone) ofBalkaKrutadeposit. Pegmatites of Kruta Balka are a small deposit of lithium and tantalum.
Object under observation 6. Quartz metasoma-tites (barren quartzites) across Saltychanskygranites in outcrops on the right bank of theBerda river. Quartzite metasomatites form bodieswith thickness up to 100m and length of up to1.5km, usually associated with contacts of Salty-chansky granites massifs. The most characteristicare “Donkey’s ears” rocks (Fig. 9) that make up ageomorphological and geological geosites. In theirvicinity, these rocks partially crop out in a small
abandoned quarry, where a zone of fracture can beobserved with intensive manifestation of linearweathered layer. Quartzite rocks are composed ofledge rocks along the right bank of the river stret-ching for 170-200m. Quartzites making up narrowelevated crests are of light-grey to white colour,crevassed, plastic, with fine-scale mica. Quartzitebodies occur among pink and pink-grey biotite andbiotite-amphibole middle- and coarse-grain granitesof Saltychansky complex.
Fig. 9.Quartziterocks (“Donkey’sears”). Right bank of the Berda river.
Along with the offered geological tours alongthe Berda river and its tributary Berestova river,there can be observed practically uninterruptedledge rocks of Pre-Cambrian formations encom-passing rock formations of Western Pryazovian andCentral Pryazivian series of Archean, as well asShevchenkivsky Archean and Saltychanskyi Prote-rozoic complexes. Placed here geological monu-ments of nature can be a wonderful extension of theroute or be subject to a separate independent route.1. Rock chain along the left shore of the Beresto-va river. The rocky outcrop of Precambrian crys-talline
rocks on the left shore of the Berestova river inKarl Marx village are represented by relativelysmall ledges and separate blocks and bouldersformed as a result of ruination of the rocky outcropby the pro-cesses acting on the slope and weather-ing. They all belong to the Berestova tectonic zoneand are composed of pink-grey biotite and amphi-bole-biotite average-grained granites and migma-tites with xeno-lites of amphibolites. The rocks arecharacterized by heightened content of sillimanite,graphite found in the biotite gneiss, veins of quartzand quartzites, and veins of aplite-pegmatoid gra-nites, which often occur there (Fig. 10).
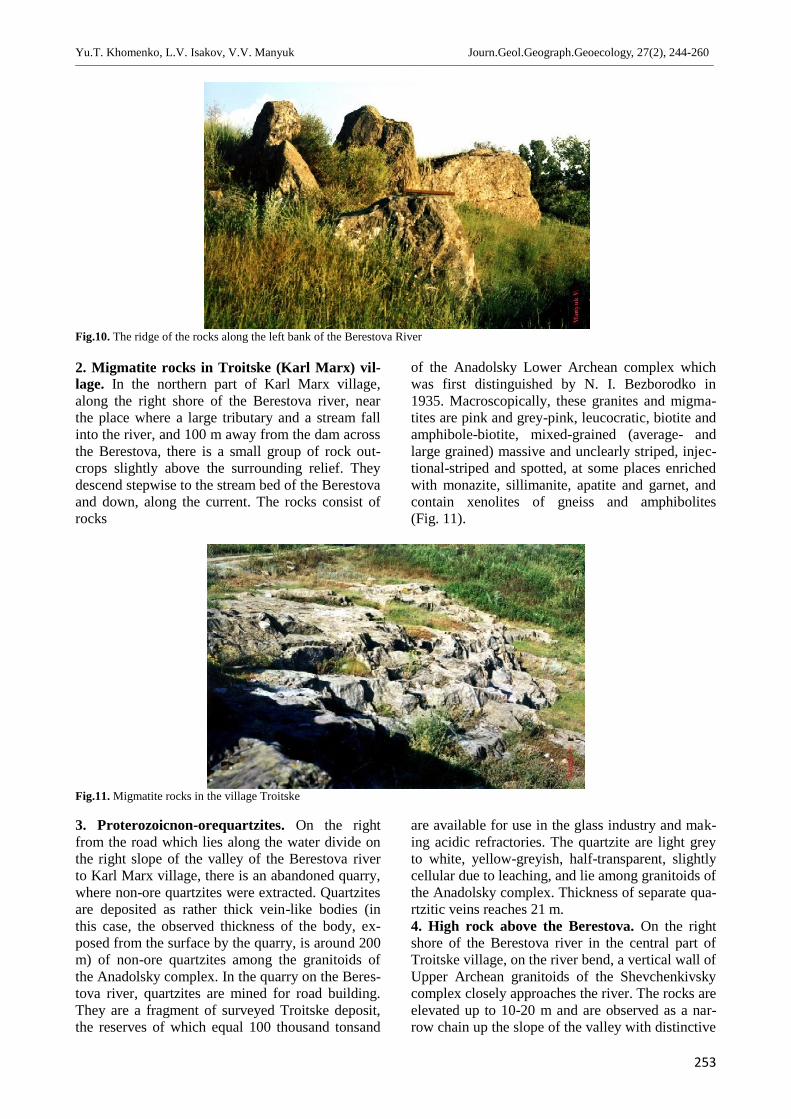
Yu.T. Khomenko, L.V. Isakov, V.V. Manyuk Journ.Geol.Geograph.Geoecology, 27(2), 244-260________________________________________________________________________________________________________________________________________________________________
253
Fig.10. The ridge of the rocks along the left bank of the Berestova River
2. Migmatite rocks in Troitske (Karl Marx) vil-lage. In the northern part of Karl Marx village,along the right shore of the Berestova river, nearthe place where a large tributary and a stream fallinto the river, and 100 m away from the dam acrossthe Berestova, there is a small group of rock out-crops slightly above the surrounding relief. Theydescend stepwise to the stream bed of the Berestovaand down, along the current. The rocks consist ofrocks
of the Anadolsky Lower Archean complex whichwas first distinguished by N. I. Bezborodko in1935. Macroscopically, these granites and migma-tites are pink and grey-pink, leucocratic, biotite andamphibole-biotite, mixed-grained (average- andlarge grained) massive and unclearly striped, injec-tional-striped and spotted, at some places enrichedwith monazite, sillimanite, apatite and garnet, andcontain xenolites of gneiss and amphibolites(Fig. 11).
Fig.11. Migmatite rocks in the village Troitske
3. Proterozoicnon-orequartzites. On the rightfrom the road which lies along the water divide onthe right slope of the valley of the Berestova riverto Karl Marx village, there is an abandoned quarry,where non-ore quartzites were extracted. Quartzitesare deposited as rather thick vein-like bodies (inthis case, the observed thickness of the body, ex-posed from the surface by the quarry, is around 200m) of non-ore quartzites among the granitoids ofthe Anadolsky complex. In the quarry on the Beres-tova river, quartzites are mined for road building.They are a fragment of surveyed Troitske deposit,the reserves of which equal 100 thousand tonsand
are available for use in the glass industry and mak-ing acidic refractories. The quartzite are light greyto white, yellow-greyish, half-transparent, slightlycellular due to leaching, and lie among granitoids ofthe Anadolsky complex. Thickness of separate qua-rtzitic veins reaches 21 m.4. High rock above the Berestova. On the rightshore of the Berestova river in the central part ofTroitske village, on the river bend, a vertical wall ofUpper Archean granitoids of the Shevchenkivskycomplex closely approaches the river. The rocks areelevated up to 10-20 m and are observed as a nar-row chain up the slope of the valley with distinctive
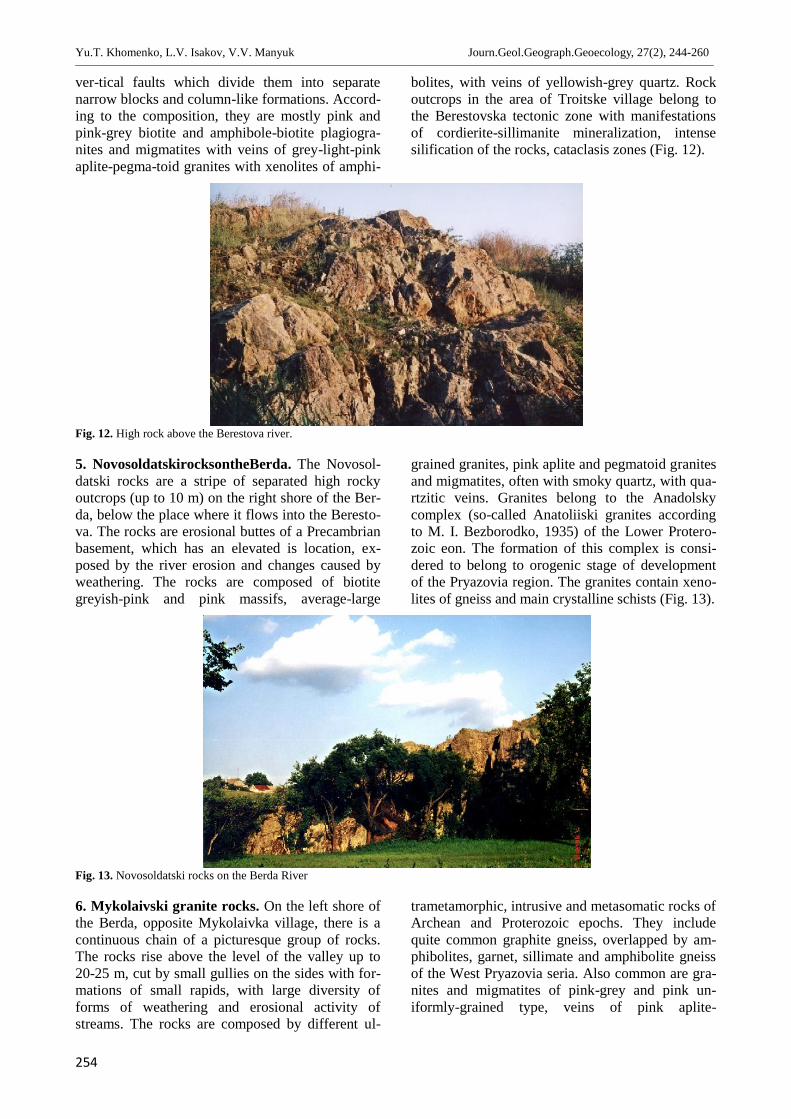
Yu.T. Khomenko, L.V. Isakov, V.V. Manyuk Journ.Geol.Geograph.Geoecology, 27(2), 244-260________________________________________________________________________________________________________________________________________________________________
254
ver-tical faults which divide them into separatenarrow blocks and column-like formations. Accord-ing to the composition, they are mostly pink andpink-grey biotite and amphibole-biotite plagiogra-nites and migmatites with veins of grey-light-pinkaplite-pegma-toid granites with xenolites of amphi-
bolites, with veins of yellowish-grey quartz. Rockoutcrops in the area of Troitske village belong tothe Berestovska tectonic zone with manifestationsof cordierite-sillimanite mineralization, intensesilification of the rocks, cataclasis zones (Fig. 12).
Fig. 12. High rock above the Berestova river.
5. NovosoldatskirocksontheBerda. The Novosol-datski rocks are a stripe of separated high rockyoutcrops (up to 10 m) on the right shore of the Ber-da, below the place where it flows into the Beresto-va. The rocks are erosional buttes of a Precambrianbasement, which has an elevated is location, ex-posed by the river erosion and changes caused byweathering. The rocks are composed of biotitegreyish-pink and pink massifs, average-large
grained granites, pink aplite and pegmatoid granitesand migmatites, often with smoky quartz, with qua-rtzitic veins. Granites belong to the Anadolskycomplex (so-called Anatoliiski granites accordingto M. I. Bezborodko, 1935) of the Lower Protero-zoic eon. The formation of this complex is consi-dered to belong to orogenic stage of developmentof the Pryazovia region. The granites contain xeno-lites of gneiss and main crystalline schists (Fig. 13).
Fig. 13. Novosoldatski rocks on the Berda River
6. Mykolaivski granite rocks. On the left shore ofthe Berda, opposite Mykolaivka village, there is acontinuous chain of a picturesque group of rocks.The rocks rise above the level of the valley up to20-25 m, cut by small gullies on the sides with for-mations of small rapids, with large diversity offorms of weathering and erosional activity ofstreams. The rocks are composed by different ul-
trametamorphic, intrusive and metasomatic rocks ofArchean and Proterozoic epochs. They includequite common graphite gneiss, overlapped by am-phibolites, garnet, sillimate and amphibolite gneissof the West Pryazovia seria. Also common are gra-nites and migmatites of pink-grey and pink un-iformly-grained type, veins of pink aplite-
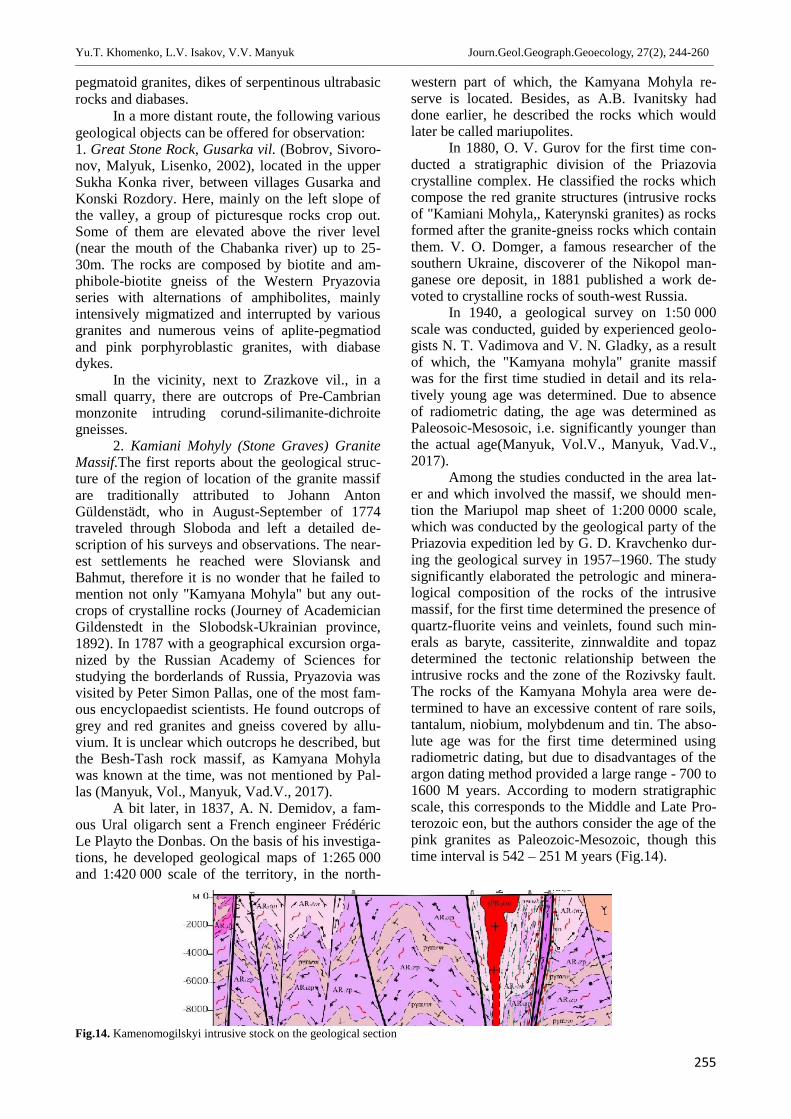
Yu.T. Khomenko, L.V. Isakov, V.V. Manyuk Journ.Geol.Geograph.Geoecology, 27(2), 244-260________________________________________________________________________________________________________________________________________________________________
255
pegmatoid granites, dikes of serpentinous ultrabasicrocks and diabases.
In a more distant route, the following variousgeological objects can be offered for observation:1. Great Stone Rock, Gusarka vil. (Bobrov, Sivoro-nov, Malyuk, Lisenko, 2002), located in the upperSukha Konka river, between villages Gusarka andKonski Rozdory. Here, mainly on the left slope ofthe valley, a group of picturesque rocks crop out.Some of them are elevated above the river level(near the mouth of the Chabanka river) up to 25-30m. The rocks are composed by biotite and am-phibole-biotite gneiss of the Western Pryazoviaseries with alternations of amphibolites, mainlyintensively migmatized and interrupted by variousgranites and numerous veins of aplite-pegmatiodand pink porphyroblastic granites, with diabasedykes.
In the vicinity, next to Zrazkove vil., in asmall quarry, there are outcrops of Pre-Cambrianmonzonite intruding corund-silimanite-dichroitegneisses.
2. Kamiani Mohyly (Stone Graves) GraniteMassif.The first reports about the geological struc-ture of the region of location of the granite massifare traditionally attributed to Johann AntonGüldenstädt, who in August-September of 1774traveled through Sloboda and left a detailed de-scription of his surveys and observations. The near-est settlements he reached were Sloviansk andBahmut, therefore it is no wonder that he failed tomention not only "Kamyana Mohyla" but any out-crops of crystalline rocks (Journey of AcademicianGildenstedt in the Slobodsk-Ukrainian province,1892). In 1787 with a geographical excursion orga-nized by the Russian Academy of Sciences forstudying the borderlands of Russia, Pryazovia wasvisited by Peter Simon Pallas, one of the most fam-ous encyclopaedist scientists. He found outcrops ofgrey and red granites and gneiss covered by allu-vium. It is unclear which outcrops he described, butthe Besh-Tash rock massif, as Kamyana Mohylawas known at the time, was not mentioned by Pal-las (Manyuk, Vol., Manyuk, Vad.V., 2017).
A bit later, in 1837, A. N. Demidov, a fam-ous Ural oligarch sent a French engineer FrédéricLe Playto the Donbas. On the basis of his investiga-tions, he developed geological maps of 1:265 000and 1:420 000 scale of the territory, in the north-
western part of which, the Kamyana Mohyla re-serve is located. Besides, as A.B. Ivanitsky haddone earlier, he described the rocks which wouldlater be called mariupolites.
In 1880, O. V. Gurov for the first time con-ducted a stratigraphic division of the Priazoviacrystalline complex. He classified the rocks whichcompose the red granite structures (intrusive rocksof "Kamiani Mohyla,, Katerynski granites) as rocksformed after the granite-gneiss rocks which containthem. V. O. Domger, a famous researcher of thesouthern Ukraine, discoverer of the Nikopol man-ganese ore deposit, in 1881 published a work de-voted to crystalline rocks of south-west Russia.
In 1940, a geological survey on 1:50 000scale was conducted, guided by experienced geolo-gists N. T. Vadimova and V. N. Gladky, as a resultof which, the "Kamyana mohyla" granite massifwas for the first time studied in detail and its rela-tively young age was determined. Due to absenceof radiometric dating, the age was determined asPaleosoic-Mesosoic, i.e. significantly younger thanthe actual age(Manyuk, Vol.V., Manyuk, Vad.V.,2017).
Among the studies conducted in the area lat-er and which involved the massif, we should men-tion the Mariupol map sheet of 1:200 0000 scale,which was conducted by the geological party of thePriazovia expedition led by G. D. Kravchenko dur-ing the geological survey in 1957–1960. The studysignificantly elaborated the petrologic and minera-logical composition of the rocks of the intrusivemassif, for the first time determined the presence ofquartz-fluorite veins and veinlets, found such min-erals as baryte, cassiterite, zinnwaldite and topazdetermined the tectonic relationship between theintrusive rocks and the zone of the Rozivsky fault.The rocks of the Kamyana Mohyla area were de-termined to have an excessive content of rare soils,tantalum, niobium, molybdenum and tin. The abso-lute age was for the first time determined usingradiometric dating, but due to disadvantages of theargon dating method provided a large range - 700 to1600 M years. According to modern stratigraphicscale, this corresponds to the Middle and Late Pro-terozoic eon, but the authors consider the age of thepink granites as Paleozoic-Mesozoic, though thistime interval is 542 – 251 M years (Fig.14).
Fig.14. Kamenomogilskyi intrusive stock on the geological section
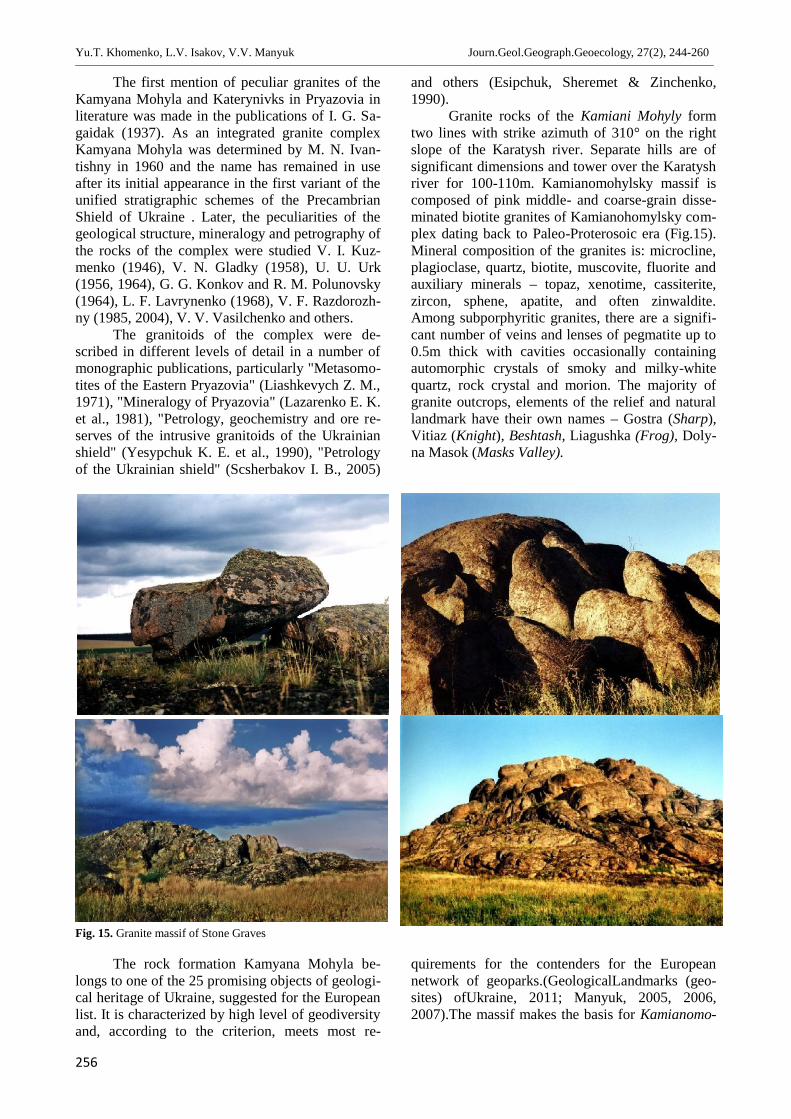
Yu.T. Khomenko, L.V. Isakov, V.V. Manyuk Journ.Geol.Geograph.Geoecology, 27(2), 244-260________________________________________________________________________________________________________________________________________________________________
256
The first mention of peculiar granites of theKamyana Mohyla and Katerynivks in Pryazovia inliterature was made in the publications of I. G. Sa-gaidak (1937). As an integrated granite complexKamyana Mohyla was determined by M. N. Ivan-tishny in 1960 and the name has remained in useafter its initial appearance in the first variant of theunified stratigraphic schemes of the PrecambrianShield of Ukraine . Later, the peculiarities of thegeological structure, mineralogy and petrography ofthe rocks of the complex were studied V. I. Kuz-menko (1946), V. N. Gladky (1958), U. U. Urk(1956, 1964), G. G. Konkov and R. M. Polunovsky(1964), L. F. Lavrynenko (1968), V. F. Razdorozh-ny (1985, 2004), V. V. Vasilchenko and others.
The granitoids of the complex were de-scribed in different levels of detail in a number ofmonographic publications, particularly "Metasomo-tites of the Eastern Pryazovia" (Liashkevych Z. M.,1971), "Mineralogy of Pryazovia" (Lazarenko E. K.et al., 1981), "Petrology, geochemistry and ore re-serves of the intrusive granitoids of the Ukrainianshield" (Yesypchuk K. E. et al., 1990), "Petrologyof the Ukrainian shield" (Scsherbakov I. B., 2005)
and others (Esipchuk, Sheremet & Zinchenko,1990).
Granite rocks of the Kamiani Mohyly formtwo lines with strike azimuth of 310° on the rightslope of the Karatysh river. Separate hills are ofsignificant dimensions and tower over the Karatyshriver for 100-110m. Kamianomohylsky massif iscomposed of pink middle- and coarse-grain disse-minated biotite granites of Kamianohomylsky com-plex dating back to Paleo-Proterosoic era (Fig.15).Mineral composition of the granites is: microcline,plagioclase, quartz, biotite, muscovite, fluorite andauxiliary minerals – topaz, xenotime, cassiterite,zircon, sphene, apatite, and often zinwaldite.Among subporphyritic granites, there are a signifi-cant number of veins and lenses of pegmatite up to0.5m thick with cavities occasionally containingautomorphic crystals of smoky and milky-whitequartz, rock crystal and morion. The majority ofgranite outcrops, elements of the relief and naturallandmark have their own names – Gostra (Sharp),Vitiaz (Knight), Beshtash, Liagushka (Frog), Doly-na Masok (Masks Valley).
Fig. 15. Granite massif of Stone Graves
The rock formation Kamyana Mohyla be-longs to one of the 25 promising objects of geologi-cal heritage of Ukraine, suggested for the Europeanlist. It is characterized by high level of geodiversityand, according to the criterion, meets most re-
quirements for the contenders for the Europeannetwork of geoparks.(GeologicalLandmarks (geo-sites) ofUkraine, 2011; Manyuk, 2005, 2006,2007).The massif makes the basis for Kamianomo-
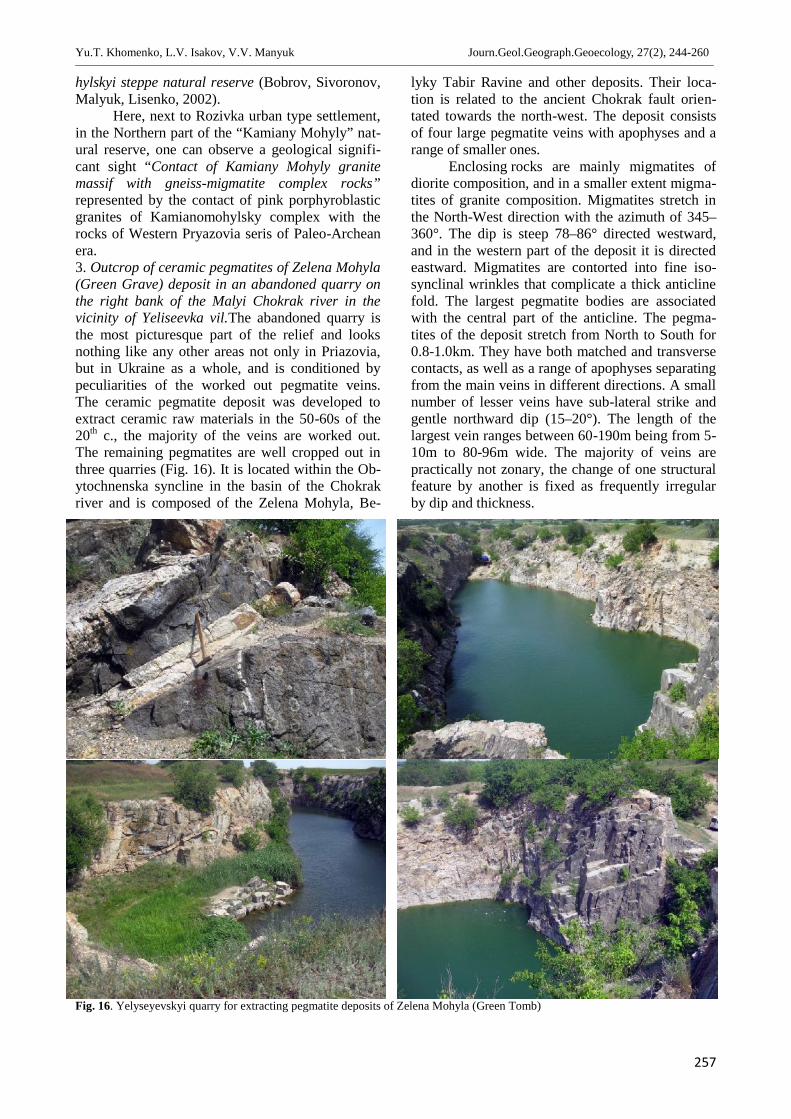
Yu.T. Khomenko, L.V. Isakov, V.V. Manyuk Journ.Geol.Geograph.Geoecology, 27(2), 244-260________________________________________________________________________________________________________________________________________________________________
257
hylskyi steppe natural reserve (Bobrov, Sivoronov,Malyuk, Lisenko, 2002).
Here, next to Rozivka urban type settlement,in the Northern part of the “Kamiany Mohyly” nat-ural reserve, one can observe a geological signifi-cant sight “Contact of Kamiany Mohyly granitemassif with gneiss-migmatite complex rocks”represented by the contact of pink porphyroblasticgranites of Kamianomohylsky complex with therocks of Western Pryazovia seris of Paleo-Archeanera.3. Outcrop of ceramic pegmatites of Zelena Mohyla(Green Grave) deposit in an abandoned quarry onthe right bank of the Malyi Chokrak river in thevicinity of Yeliseevka vil.The abandoned quarry isthe most picturesque part of the relief and looksnothing like any other areas not only in Priazovia,but in Ukraine as a whole, and is conditioned bypeculiarities of the worked out pegmatite veins.The ceramic pegmatite deposit was developed toextract ceramic raw materials in the 50-60s of the20th c., the majority of the veins are worked out.The remaining pegmatites are well cropped out inthree quarries (Fig. 16). It is located within the Ob-ytochnenska syncline in the basin of the Chokrakriver and is composed of the Zelena Mohyla, Be-
lyky Tabir Ravine and other deposits. Their loca-tion is related to the ancient Chokrak fault orien-tated towards the north-west. The deposit consistsof four large pegmatite veins with apophyses and arange of smaller ones.
Enclosing rocks are mainly migmatites ofdiorite composition, and in a smaller extent migma-tites of granite composition. Migmatites stretch inthe North-West direction with the azimuth of 345–360°. The dip is steep 78–86° directed westward,and in the western part of the deposit it is directedeastward. Migmatites are contorted into fine iso-synclinal wrinkles that complicate a thick anticlinefold. The largest pegmatite bodies are associatedwith the central part of the anticline. The pegma-tites of the deposit stretch from North to South for0.8-1.0km. They have both matched and transversecontacts, as well as a range of apophyses separatingfrom the main veins in different directions. A smallnumber of lesser veins have sub-lateral strike andgentle northward dip (15–20°). The length of thelargest vein ranges between 60-190m being from 5-10m to 80-96m wide. The majority of veins arepractically not zonary, the change of one structuralfeature by another is fixed as frequently irregularby dip and thickness.
Fig. 16. Yelyseyevskyi quarry for extracting pegmatite deposits of Zelena Mohyla (Green Tomb)
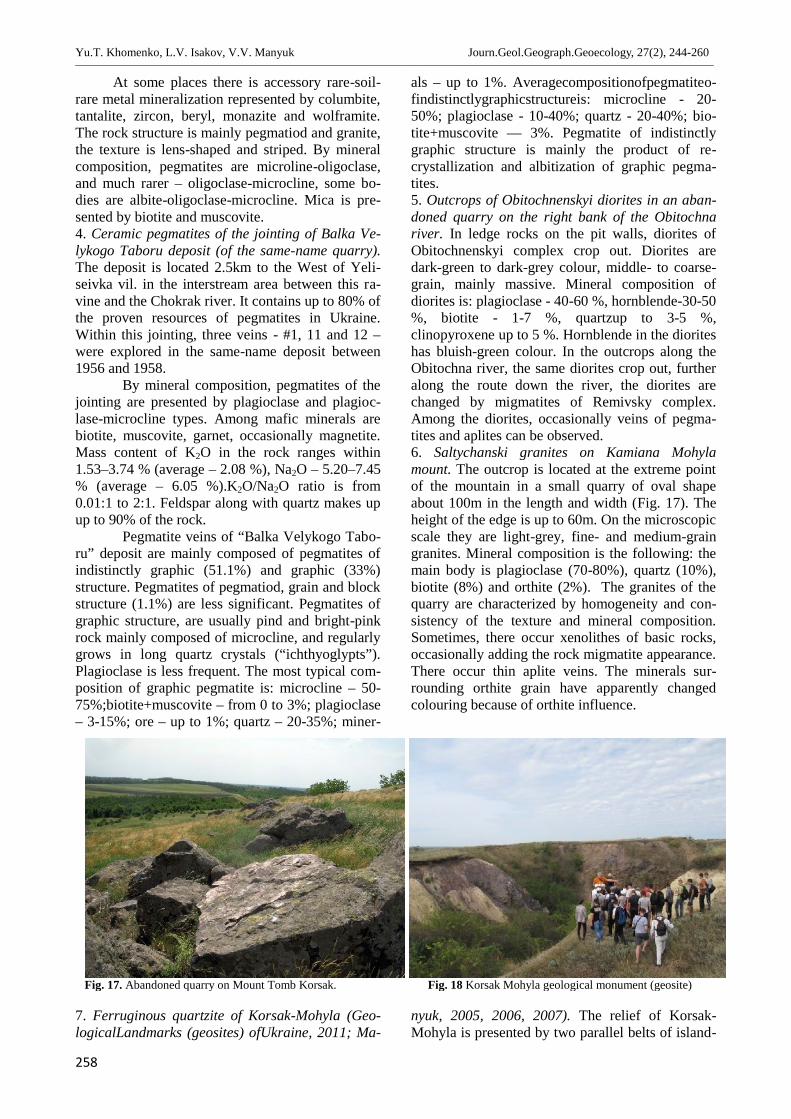
Yu.T. Khomenko, L.V. Isakov, V.V. Manyuk Journ.Geol.Geograph.Geoecology, 27(2), 244-260________________________________________________________________________________________________________________________________________________________________
258
At some places there is accessory rare-soil-rare metal mineralization represented by columbite,tantalite, zircon, beryl, monazite and wolframite.The rock structure is mainly pegmatiod and granite,the texture is lens-shaped and striped. By mineralcomposition, pegmatites are microline-oligoclase,and much rarer – oligoclase-microcline, some bo-dies are albite-oligoclase-microcline. Mica is pre-sented by biotite and muscovite.4. Ceramic pegmatites of the jointing of Balka Ve-lykogo Taboru deposit (of the same-name quarry).The deposit is located 2.5km to the West of Yeli-seivka vil. in the interstream area between this ra-vine and the Chokrak river. It contains up to 80% ofthe proven resources of pegmatites in Ukraine.Within this jointing, three veins - #1, 11 and 12 –were explored in the same-name deposit between1956 and 1958.
By mineral composition, pegmatites of thejointing are presented by plagioclase and plagioc-lase-microcline types. Among mafic minerals arebiotite, muscovite, garnet, occasionally magnetite.Mass content of K2O in the rock ranges within1.53–3.74 % (average – 2.08 %), Na2O – 5.20–7.45% (average – 6.05 %).K2O/Na2O ratio is from0.01:1 to 2:1. Feldspar along with quartz makes upup to 90% of the rock.
Pegmatite veins of “Balka Velykogo Tabo-ru” deposit are mainly composed of pegmatites ofindistinctly graphic (51.1%) and graphic (33%)structure. Pegmatites of pegmatiod, grain and blockstructure (1.1%) are less significant. Pegmatites ofgraphic structure, are usually pind and bright-pinkrock mainly composed of microcline, and regularlygrows in long quartz crystals (“ichthyoglypts”).Plagioclase is less frequent. The most typical com-position of graphic pegmatite is: microcline – 50-75%;biotite+muscovite – from 0 to 3%; plagioclase– 3-15%; ore – up to 1%; quartz – 20-35%; miner-
als – up to 1%. Averagecompositionofpegmatiteo-findistinctlygraphicstructureis: microcline - 20-50%; plagioclase - 10-40%; quartz - 20-40%; bio-tite+muscovite — 3%. Pegmatite of indistinctlygraphic structure is mainly the product of re-crystallization and albitization of graphic pegma-tites.5. Outcrops of Obitochnenskyi diorites in an aban-doned quarry on the right bank of the Obitochnariver. In ledge rocks on the pit walls, diorites ofObitochnenskyi complex crop out. Diorites aredark-green to dark-grey colour, middle- to coarse-grain, mainly massive. Mineral composition ofdiorites is: plagioclase - 40-60 %, hornblende-30-50%, biotite - 1-7 %, quartzup to 3-5 %,clinopyroxene up to 5 %. Hornblende in the dioriteshas bluish-green colour. In the outcrops along theObitochna river, the same diorites crop out, furtheralong the route down the river, the diorites arechanged by migmatites of Remivsky complex.Among the diorites, occasionally veins of pegma-tites and aplites can be observed.6. Saltychanski granites on Kamiana Mohylamount. The outcrop is located at the extreme pointof the mountain in a small quarry of oval shapeabout 100m in the length and width (Fig. 17). Theheight of the edge is up to 60m. On the microscopicscale they are light-grey, fine- and medium-graingranites. Mineral composition is the following: themain body is plagioclase (70-80%), quartz (10%),biotite (8%) and orthite (2%). The granites of thequarry are characterized by homogeneity and con-sistency of the texture and mineral composition.Sometimes, there occur xenolithes of basic rocks,occasionally adding the rock migmatite appearance.There occur thin aplite veins. The minerals sur-rounding orthite grain have apparently changedcolouring because of orthite influence.
Fig. 17. Abandoned quarry on Mount Tomb Korsak. Fig. 18 Korsak Mohyla geological monument (geosite)
7. Ferruginous quartzite of Korsak-Mohyla (Geo-logicalLandmarks (geosites) ofUkraine, 2011; Ma-
nyuk, 2005, 2006, 2007). The relief of Korsak-Mohyla is presented by two parallel belts of island-
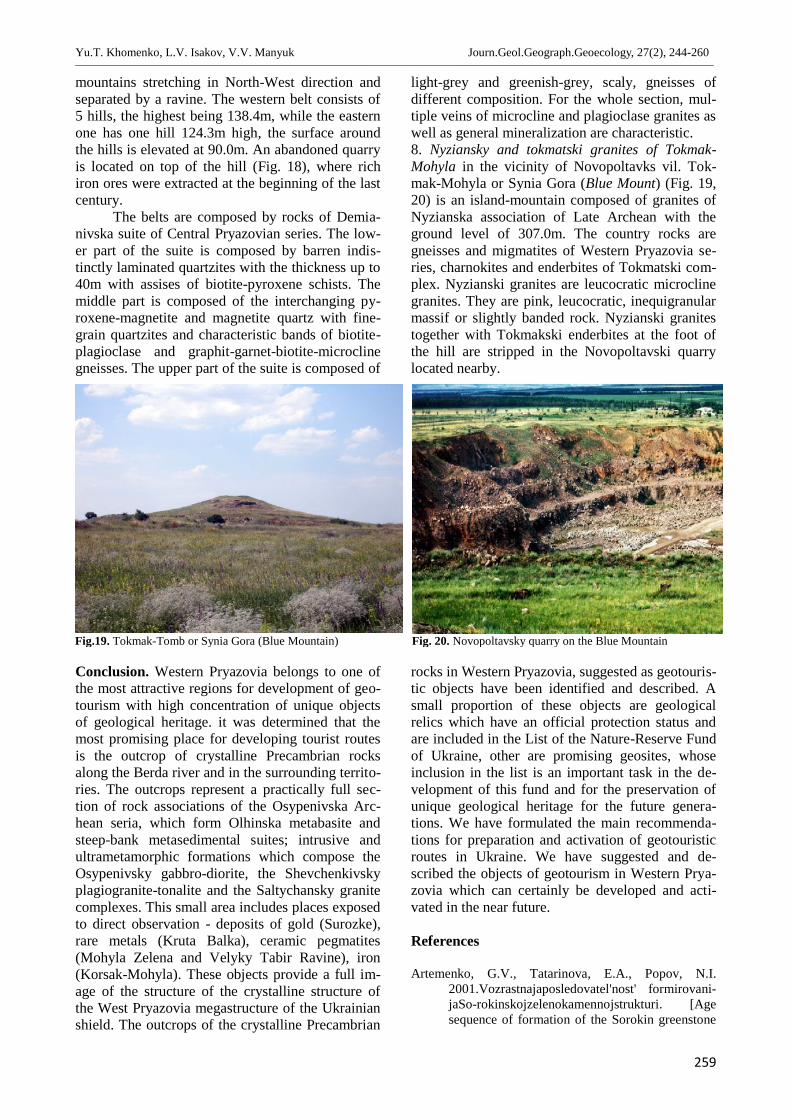
Yu.T. Khomenko, L.V. Isakov, V.V. Manyuk Journ.Geol.Geograph.Geoecology, 27(2), 244-260________________________________________________________________________________________________________________________________________________________________
259
mountains stretching in North-West direction andseparated by a ravine. The western belt consists of5 hills, the highest being 138.4m, while the easternone has one hill 124.3m high, the surface aroundthe hills is elevated at 90.0m. An abandoned quarryis located on top of the hill (Fig. 18), where richiron ores were extracted at the beginning of the lastcentury.
The belts are composed by rocks of Demia-nivska suite of Central Pryazovian series. The low-er part of the suite is composed by barren indis-tinctly laminated quartzites with the thickness up to40m with assises of biotite-pyroxene schists. Themiddle part is composed of the interchanging py-roxene-magnetite and magnetite quartz with fine-grain quartzites and characteristic bands of biotite-plagioclase and graphit-garnet-biotite-microclinegneisses. The upper part of the suite is composed of
light-grey and greenish-grey, scaly, gneisses ofdifferent composition. For the whole section, mul-tiple veins of microcline and plagioclase granites aswell as general mineralization are characteristic.8. Nyziansky and tokmatski granites of Tokmak-Mohyla in the vicinity of Novopoltavks vil. Tok-mak-Mohyla or Synia Gora (Blue Mount) (Fig. 19,20) is an island-mountain composed of granites ofNyzianska association of Late Archean with theground level of 307.0m. The country rocks aregneisses and migmatites of Western Pryazovia se-ries, charnokites and enderbites of Tokmatski com-plex. Nyzianski granites are leucocratic microclinegranites. They are pink, leucocratic, inequigranularmassif or slightly banded rock. Nyzianski granitestogether with Tokmakski enderbites at the foot ofthe hill are stripped in the Novopoltavski quarrylocated nearby.
Fig.19. Tokmak-Tomb or Synia Gora (Blue Mountain) Fig. 20. Novopoltavsky quarry on the Blue Mountain
Conclusion. Western Pryazovia belongs to one ofthe most attractive regions for development of geo-tourism with high concentration of unique objectsof geological heritage. it was determined that themost promising place for developing tourist routesis the outcrop of crystalline Precambrian rocksalong the Berda river and in the surrounding territo-ries. The outcrops represent a practically full sec-tion of rock associations of the Osypenivska Arc-hean seria, which form Olhinska metabasite andsteep-bank metasedimental suites; intrusive andultrametamorphic formations which compose theOsypenivsky gabbro-diorite, the Shevchenkivskyplagiogranite-tonalite and the Saltychansky granitecomplexes. This small area includes places exposedto direct observation - deposits of gold (Surozke),rare metals (Kruta Balka), ceramic pegmatites(Mohyla Zelena and Velyky Tabir Ravine), iron(Korsak-Mohyla). These objects provide a full im-age of the structure of the crystalline structure ofthe West Pryazovia megastructure of the Ukrainianshield. The outcrops of the crystalline Precambrian
rocks in Western Pryazovia, suggested as geotouris-tic objects have been identified and described. Asmall proportion of these objects are geologicalrelics which have an official protection status andare included in the List of the Nature-Reserve Fundof Ukraine, other are promising geosites, whoseinclusion in the list is an important task in the de-velopment of this fund and for the preservation ofunique geological heritage for the future genera-tions. We have formulated the main recommenda-tions for preparation and activation of geotouristicroutes in Ukraine. We have suggested and de-scribed the objects of geotourism in Western Prya-zovia which can certainly be developed and acti-vated in the near future.
References
Artemenko, G.V., Tatarinova, E.A., Popov, N.I.2001.Vozrastnajaposledovatel'nost' formirovani-jaSo-rokinskojzelenokamennojstrukturi. [Agesequence of formation of the Sorokin greenstone
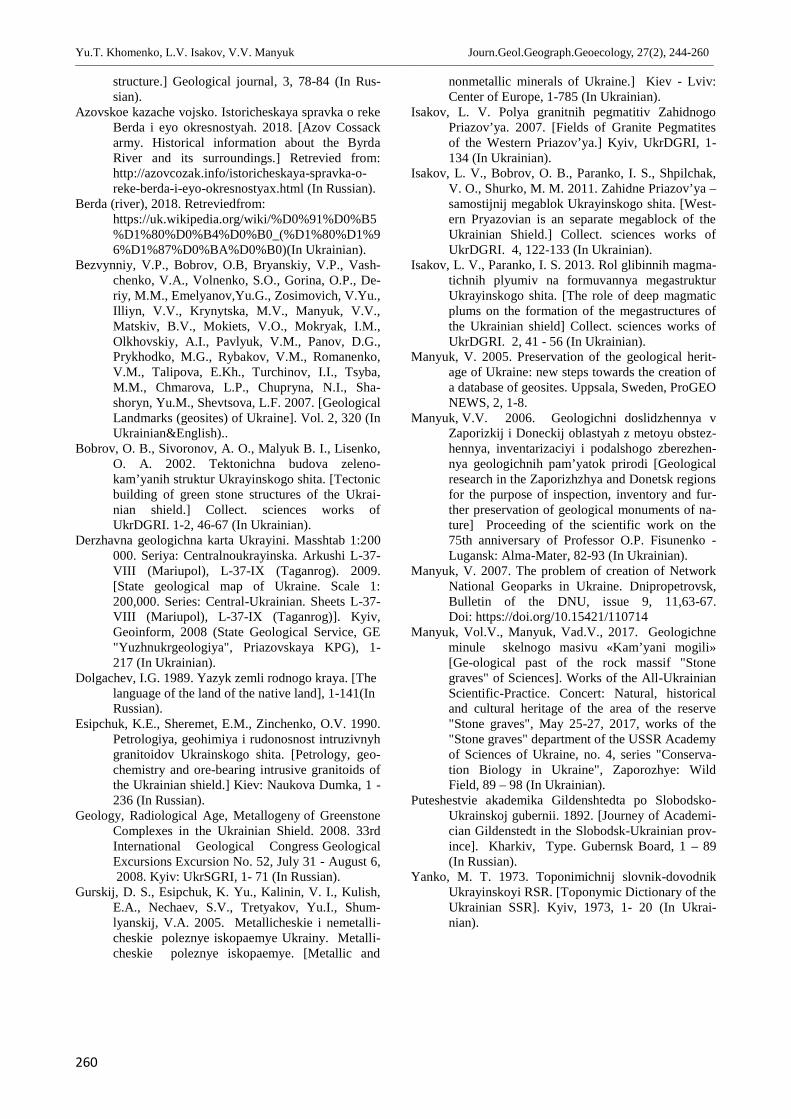
Yu.T. Khomenko, L.V. Isakov, V.V. Manyuk Journ.Geol.Geograph.Geoecology, 27(2), 244-260________________________________________________________________________________________________________________________________________________________________
260
structure.] Geological journal, 3, 78-84 (In Rus-sian).
Azovskoe kazache vojsko. Istoricheskaya spravka o rekeBerda i eyo okresnostyah. 2018. [Azov Cossackarmy. Historical information about the ByrdaRiver and its surroundings.] Retrevied from:http://azovcozak.info/istoricheskaya-spravka-o-reke-berda-i-eyo-okresnostyax.html (In Russian).
Berda (river), 2018. Retreviedfrom:https://uk.wikipedia.org/wiki/%D0%91%D0%B5%D1%80%D0%B4%D0%B0_(%D1%80%D1%96%D1%87%D0%BA%D0%B0)(In Ukrainian).
Bezvynniy, V.P., Bobrov, O.B, Bryanskiy, V.P., Vash-chenko, V.A., Volnenko, S.O., Gorina, O.P., De-riy, M.M., Emelyanov,Yu.G., Zosimovich, V.Yu.,Illiyn, V.V., Krynytska, M.V., Manyuk, V.V.,Matskiv, B.V., Mokiets, V.O., Mokryak, I.M.,Olkhovskiy, A.I., Pavlyuk, V.M., Panov, D.G.,Prykhodko, M.G., Rybakov, V.M., Romanenko,V.M., Talipova, E.Kh., Turchinov, I.I., Tsyba,M.M., Chmarova, L.P., Chupryna, N.I., Sha-shoryn, Yu.M., Shevtsova, L.F. 2007. [GeologicalLandmarks (geosites) of Ukraine]. Vol. 2, 320 (InUkrainian&English)..
Bobrov, O. B., Sivoronov, A. O., Malyuk B. I., Lisenko,O. A. 2002. Tektonichna budova zeleno-kam’yanih struktur Ukrayinskogo shita. [Tectonicbuilding of green stone structures of the Ukrai-nian shield.] Collect. sciences works ofUkrDGRI. 1-2, 46-67 (In Ukrainian).
Derzhavna geologichna karta Ukrayini. Masshtab 1:200000. Seriya: Centralnoukrayinska. Arkushi L-37-VIII (Mariupol), L-37-IX (Taganrog). 2009.[State geological map of Ukraine. Scale 1:200,000. Series: Central-Ukrainian. Sheets L-37-VIII (Mariupol), L-37-IX (Taganrog)]. Kyiv,Geoinform, 2008 (State Geological Service, GE"Yuzhnukrgeologiya", Priazovskaya KPG), 1-217 (In Ukrainian).
Dolgachev, I.G. 1989. Yazyk zemli rodnogo kraya. [Thelanguage of the land of the native land], 1-141(InRussian).
Esipchuk, K.E., Sheremet, E.M., Zinchenko, O.V. 1990.Petrologiya, geohimiya i rudonosnost intruzivnyhgranitoidov Ukrainskogo shita. [Petrology, geo-chemistry and ore-bearing intrusive granitoids ofthe Ukrainian shield.] Kiev: Naukova Dumka, 1 -236 (In Russian).
Geology, Radiological Age, Metallogeny of GreenstoneComplexes in the Ukrainian Shield. 2008. 33rdInternational Geological Congress GeologicalExcursions Excursion No. 52, July 31 - August 6,2008. Kyiv: UkrSGRI, 1- 71 (In Russian).
Gurskij, D. S., Esipchuk, K. Yu., Kalinin, V. I., Kulish,E.A., Nechaev, S.V., Tretyakov, Yu.I., Shum-lyanskij, V.A. 2005. Metallicheskie i nemetalli-cheskie poleznye iskopaemye Ukrainy. Metalli-cheskie poleznye iskopaemye. [Metallic and
nonmetallic minerals of Ukraine.] Kiev - Lviv:Center of Europe, 1-785 (In Ukrainian).
Isakov, L. V. Polya granitnih pegmatitiv ZahidnogoPriazov’ya. 2007. [Fields of Granite Pegmatitesof the Western Priazov’ya.] Kyiv, UkrDGRI, 1-134 (In Ukrainian).
Isakov, L. V., Bobrov, O. B., Paranko, I. S., Shpilchak,V. O., Shurko, M. M. 2011. Zahidne Priazov’ya –samostijnij megablok Ukrayinskogo shita. [West-ern Pryazovian is an separate megablock of theUkrainian Shield.] Collect. sciences works ofUkrDGRI. 4, 122-133 (In Ukrainian).
Isakov, L. V., Paranko, I. S. 2013. Rol glibinnih magma-tichnih plyumiv na formuvannya megastrukturUkrayinskogo shita. [The role of deep magmaticplums on the formation of the megastructures ofthe Ukrainian shield] Collect. sciences works ofUkrDGRI. 2, 41 - 56 (In Ukrainian).
Manyuk, V. 2005. Preservation of the geological herit-age of Ukraine: new steps towards the creation ofa database of geosites. Uppsala, Sweden, ProGEONEWS, 2, 1-8.
Manyuk, V.V. 2006. Geologichni doslidzhennya vZaporizkij i Doneckij oblastyah z metoyu obstez-hennya, inventarizaciyi i podalshogo zberezhen-nya geologichnih pam’yatok prirodi [Geologicalresearch in the Zaporizhzhya and Donetsk regionsfor the purpose of inspection, inventory and fur-ther preservation of geological monuments of na-ture] Proceeding of the scientific work on the75th anniversary of Professor O.P. Fisunenko -Lugansk: Alma-Mater, 82-93 (In Ukrainian).
Manyuk, V. 2007. The problem of creation of NetworkNational Geoparks in Ukraine. Dnipropetrovsk,Bulletin of the DNU, issue 9, 11,63-67.Doi: https://doi.org/10.15421/110714
Manyuk, Vol.V., Manyuk, Vad.V., 2017. Geologichneminule skelnogo masivu «Kam’yani mogili»[Ge-ological past of the rock massif "Stonegraves" of Sciences]. Works of the All-UkrainianScientific-Practice. Concert: Natural, historicaland cultural heritage of the area of the reserve"Stone graves", May 25-27, 2017, works of the"Stone graves" department of the USSR Academyof Sciences of Ukraine, no. 4, series "Conserva-tion Biology in Ukraine", Zaporozhye: WildField, 89 – 98 (In Ukrainian).
Puteshestvie akademika Gildenshtedta po Slobodsko-Ukrainskoj gubernii. 1892. [Journey of Academi-cian Gildenstedt in the Slobodsk-Ukrainian prov-ince]. Kharkiv, Type. Gubernsk Board, 1 – 89(In Russian).
Yanko, M. T. 1973. Toponimichnij slovnik-dovodnikUkrayinskoyi RSR. [Toponymic Dictionary of theUkrainian SSR]. Kyiv, 1973, 1- 20 (In Ukrai-nian).
261
Journal of Geology,Geography and Geoecology
Journal home page: geology-dnu-dp.ua
ISSN 2617-2909 (print)ISSN 2617-2119 (online)
Journ.Geol.Geograph.Geoecology,
27(2), 261-273doi:10.15421/111850
O.P. Krupskyi, K.O. Temchur Journ.Geol.Geograph.Geoecology,27(2), 261-273________________________________________________________________________________________________________________________________________________________________
Media tourism in the Chernobyl Exclusion Zone as a new tourist phenomenon
O. P. Krupskyi, K.O. Temchur
Oles Honchar Dnipro National University, Dnipro, Ukraine, e- mail: [email protected]
Abstract. Every year, the number of tourists in the Chernobyl Exclusion Zone isincreasing. The most numerous visitors are journalists who come to perform theirofficial duties. At the same time, researchers have not yet shown interest in such aninteresting and important tourist phenomenon. The purpose of this article is to de-scribe a new phenomenon of media tourism in the Chernobyl Exclusion Zone and its
features. The study was conducted with a help of a qualitative case study analysis method. The websites of the state and privateenterprises and mass media publications based on the results of trips to the territory for 2013-2017 were analyzed. As a result, thespecific features of journalists who visit the Chernobyl Exclusion Zone were identified. Such journalists mainly have confidence inthe absence of a threat to health (55%), developed empathy (45%) and imagination of thinking (45%). Consequently, the tragedy ofhistory and the gloomy appearance of the territory, the suffering of local residents make it attractive to journalists. In addition, due topersonal interest, the voluntary travel motive (61,5%) prevails over conditional forced travel (38,5%). At the same time, the attentionof journalists to the territory is attracted due to the activities of tourists. The authors describe the so-called «compensation effect»,when the reduction of tourists' attention to the territory is balanced by an increase in the attention of the mass media. The presence ofrisk explains the predominance of men among journalists in the Chernobyl Exclusion Zone (54%). For example, women can betterassess the risk due to greater vulnerability. The peculiarity of journalists' work in the Chernobyl Exclusion Zone is the risk of radia-tion exposure and ethical controversy. The study shows that journalists' inherent positive world perception and profound sense ofprofessional duty can successfully overcome these obstacles. The results of the study can be used by the following researchers toidentify ways and strategies for promoting media tourism in the Chernobyl Exclusion Zone. The benefit of this study is to drawattention to a new unexplored tourist phenomenon. Mass media have a great influence on the formation of a positive attitude towardsthe territory and attracting the attention of tourists. Taking into account the specific features of media tourism will help to attractmore tourists and improve the quality of rendering service to journalists.
Keywords: journalists, mass-media, tourism, Chernobyl exclusion zone.
Медійний туризм у Чорнобильській зоні відчуження як новий туристичний феномен
О.П. Крупський, К.О. Темчур
Дніпровський національний університет імені Олеся Гончара, Дніпро, Україна, e- mail:[email protected]
Анотація. Щорічне збільшення туристичної активності у Чорнобильській зоні відчуження привертає увагу журналістів доцієї території. При цьому дослідники досі не виявили інтересу до цього феномену. Мета статті – описати новий феноменмедійного туризму у Чорнобильській зоні відчуження та його особливості. Невивченість цього явища змусила звернутисядо якісного експлоративного методу, який дозволяє описати новий феномен та надати матеріал для настуних досліджень. Устатті описано діяльність державного та приватного підприємств з надання організаційно-інформаційних послуг журналіс-там. З’ясовано особистісні якості журналістів, які змушують їх здійснювати таку поїздку. Наприклад, переконаність у відсу-тності загрози для здоров’я (55%), здатність співпереживати (45%) та образність мислення (45%) привертають увагу журна-лістів до цієї території. Більше того, особиста зацікавленість пояснює переважання добровільного мотиву поїздки (61,5%)над умовно вимушеним командируванням (38,5%). Встановлено, що серед журналістів у ЧЗВ переважають чоловіки (54%)через їхню меншу здатність до оцінки ризику. З’ясовано особливості роботи журналістів у Чорнобильській зоні відчуження,які відрізняють її від роботи на інших територіях. Охаракетризовано закономірності зв’язку кількості публікацій мас-медіа зописом туристичного досвіду та кількості туристів. Авторами описано так званий «ефект компенсації», коли зменшенняуваги туристів до території компенсується збільшенням уваги мас-медіа.
Ключові слова: журналісти, мас-медіа, туризм, Чорнобильська зона відчуження.
Received 12.06.2018;Received in revised form 12.07.2018;Accepted 30.07.2018
O.P. Krupskyi, K.O. Temchur Journ.Geol.Geograph.Geoecology, 27(2), 261-273________________________________________________________________________________________________________________________________________________________________
262
Introduction. The Chernobyl accident has causedthe phenomenon of Chornobyl's journalism to cometo life. The first visitors to Chernobyl after the ex-plosion were precisely the journalists who per-formed the professional responsibility for docu-menting the scale and consequences of the accident(Kuzmych-Pohodenko, 2015).
By its number, representatives of the Ukrai-nian and foreign mass media are the second groupof visitors after foreign scientists conducting re-search in the Chernobyl Exclusion Zone (СEZ)together with Ukrainian counterparts (Golovata,2010).
Dark tourism, which includes tourism in theСEZ, is today a promising area. The term was firstused by researchers J. Lennon and M. Foley tomark the tourist interest in places of recent deaths,catastrophes and crimes (Foley, Lennon, 1996). TheCEZ is one of the most famous destinations of thistype (Yankovska, Hannam, 2014). The fact that theauthoritative economic edition Forbes recognizedthe Chernobyl Nuclear Power Plant (СhNPP) asone of the most exotic places for tourism in theworld also contributes to the popularity of the terri-tory among tourists (Forbes, 2009).
It should be noted that there is no unanimityamong the researchers regarding the classificationof journalists' travel in the СEZ as tourists. Someresearchers suggest classifying Chernobyl journal-ism as business tourism and emphasize the profes-sional preconditions for such visits (Pestushko,Chubuk, 2010; Derkach, 2014). In this article wewill follow this very approach, because often thepurpose of journalists' travel to the СEZ is to coverthe tourist attractions of the infected area and itsstate within the limits of their professional activity.At the same time, mass media follow certain touristroutes, developed according to their professionalinterests. It is clear that journalists can come toexcursions to the СEZ as ordinary tourists. That is,such a trip will be carried out for recreational andcognitive purposes, and not within the frameworkof professional activity. Such visits can not be con-sidered as media tourism and are not regarded inour article.
The scientific literature on the topic empha-sizes the decisive role of the media in promotingdark tourism, in particular in the СEZ (Butler,1990; Kim, Richardson, 2003; Iwashita, 2006;Young; Young; 2008; Yankovska, Hannam, 2014).Other authors emphasize that the study of the phe-nomenon of Chernobyl's journalism, despite thesignificance of such activity, has not yet becomerelevant in scientific circles (Kuzmych-Pohodenko,2015).
The urgency of the study is conditioned bythe lack of research on media tourism in the СEZ,
as well as the growing popularity of tourism in theСEZ.
The purpose of the study is to describe a newphenomenon of media tourism in the СEZ and itsfeatures.
Accordingly, the following tasks are set:- to analyze the activities of tourist enterpris-
es and state institutions for organizing travel ofjournalists to the СEZ;
- to analyze the materials of the media, pre-pared according to the results of visiting the СEZ;
- to analyze the legal acts regulating the legalaspects of the activity in the СEZ.Methods and materials. This study was conductedwith a help of a qualitative case study analysis me-thod. R. Yin explains the usage of this method bythe necessity to understand complex social pheno-mena and generalize them to make theoretical as-sumptions (Yin, 2009). Appeal to this method isjustified by the insufficient attention of researchersto the phenomenon of media tourism in the СEZ.This situation has led to the necessity to describe itand to provide the next researchers with materialfor quantitative research and testing of hypotheses.
For analysis, sites of two companies - theState Agency of Ukraine on Exclusion Zone Man-agement (SAUEZM) (Derzhavne agentstvoUkrai'ny z upravlinnja zonoju vidchuzhennja, 2018)and Chernobyl-tour (Chernobyl-tur, 2018) wereselected. This choice was dictated by their exclu-sive role in the organization of tourism activities inthe СEZ. SAUEZM manages access to the СEZ,makes the issuance of permits for all official visitsand approves their programs. The State Enterprise«Technical and Information Support ManagementCenter of the exclusion zone» (TISMCEZ), whichis in the field of SAUEZM management, regulatestourism activity in the СEZ. The function of thecompany is the organization of visits to CEZ forjournalists of Ukrainian and foreign mass mediaand their information support.
The Kyiv Travel Agency «Chеrnobyl-tour»is a leading private travel agency that provides tar-geted organizational and information services tomass media representatives in the СEZ. The infor-mation agency of the company cooperates withleading world mass media such as The Times,Forbes, Associated Press, BBC, Discovery, LonelyPlanet and many others.
The search on the site SAUEZM for thekeywords «tourism», «journalists» provided only23 publications for the period 2016-2017 years. Onthe site of the travel agency «Chеrnobyl-tour»wewere interested in the tabs «Information agency»and «Media and Chernobyl-tour». The content ofthese materials is directly connected with coopera-tion with journalists and reflects their tourism activ-
O.P. Krupskyi, K.O. Temchur Journ.Geol.Geograph.Geoecology, 27(2), 261-273________________________________________________________________________________________________________________________________________________________________
263
ities in the СEZ. In particular, in the «Media andChernobyl-tour» tab, there are 9 mass media publi-cations following the 2010-2016 trips.
The research of mass media publicationstook place during the year, starting from July 2017.We made a request to the Google search engine forthe keywords «Chernobyl», «journalists». So thesearch was limited by territorial and professionalbackground. The criterion for selecting publicationsfor research is their publication based on the resultsof the trip to the СEZ. Only 20% of the publicationsmet this criterion, while others were ignored. Allinvestigated materials were exceptionally based oninformation resources. These materials can be di-vided into three thematic groups: coverage of thenewsbreak, research of the current state of the terri-tory and a description of the tourist trip. In total,1300 pages of text, 75 hours of video, 29 forumswere analyzed. All videos were transcribed, com-ments on the forums were collected manually andrecorded.
For information on the dynamics of the jour-nalists' visit to the CEZ over the past 5-10 years, wehave sent a formal request to the SAUEZM. Theanswer is that there is no separate record of journal-ists' visits, that is why the requested informationcan not be provided. The corresponding requestwas also sent to the office of the tourist agency«Chеrnobyl-tour», but no replies were received.
We sought to find out whether an increase intourist flows provokes the interest of the media orthe publication attracts tourists to the territory. Suc-cessively we restricted the chronological range ofsearch from January 1 to December 31, 2013, 2014,2015, 2016, 2017. The first 1,000 of the total vo-lume of relevant results were investigated in eachcase. We guessed that only publications about tour-ist routes connected with tourist interest. Then weformed a theoretical sample of 10 materials inwhich the phenomenon studied is expressed in thepurest and most transparent form (Eisenhardt,1989). According to Eisenhardt, «the purpose of thetheoretical sample is the selection of cases that canexpand the emerging theory». This made it possibleto verify that namely publications describing touristexperience are related with the dynamics of tourismflows. We have established a strong positive corre-lation between the number of visitors to the СEZand the number of available materials about thisterritory (the correlation coefficient is 0.8021 at p<= (less or equal to 0.05). We cited quotes fromthese materials further for visibility of some of ourconclusions.
We assumed that visiting the СEZ requires ajournalist to have certain characterological features.Our task was to make a portrait of such a journalist.We also wondered if there was a connection be-
tween sex and interest in such visits. We encodedthe following categories: (1) purpose - the reasonfor the trip; (2) motive - an impulse to travel (coer-cion or good will); (3) sexual affiliation (male, fe-male); (4) character - the specific personality traitsof journalists who visited the territory. The lastcategory included those fragments of journalisticmaterials that clearly traced the manifestation ofsome aspect of the personality of the journalist. Allencodings were manually processed in the Excelfile. First, each of us analyzed the materials forthese categories, after which we discussed the re-sults and ideas that arose. Each of us got identicalresults, with the exception of the last category. Wegot both identical and different results.
At the second stage, we analyzed each publi-cation by category (1) «positive world perception»,(2) «confidence in the absence of a threat tohealth», (3) «profound sense of professional duty»,(4) «curiosity», (5) «impressionability», (6), «incli-nation to sensationalism» (7), «developed empa-thy», (8) «household unpretentiousness», and (9)«imagination of thinking». Finally, we recorded thepart of publications containing each of the catego-ries. Our results were identical.
To verify the correctness of our study, weprovided preliminary conclusions at each stage toexperts in the field of economics and tourism man-agement (Lincoln, Guba, 1985). The remarks madein each case were taken into account when neces-sary having gathered additional information on thetopic (Alvesson, Kärreman, 2007). To confirm ourassertions, we compared the obtained results withthe typology developed by Myers-Briggs, which isused to determine the occupational inclination ofindividuals. Specific features of journalists in theCEZ correspond to their professional features. Wealso contacted the jobseekers websites Career Castand Superjob, which empirically confirmed theinherent nature of the gender and personality traitsof journalists in the СEZ.Results.Organizational aspect of media tourism inthe СEZ. Organizational activity of state enterpris-es. 2016 was declared a year in memory of the par-ticipants in the liquidation of the Chernobyl acci-dent and the victims of the Chernobyl disaster,which dates back to the 30th anniversary of thetragedy. In connection with this, the SAUEZMtogether with the enterprises of the sphere of itsmanagement organized events for visitors. Duringthese events, state institutions reported on thecourse of liquidation of the consequences of theaccident, the work on reducing the radiation hazard,the results of the implementation of internationalprojects, the current state of СEZ, etc. (Derzhavneagentstvo Ukrai'ny z zapravlinnja zonoju vidchuz-hennja, 2016). The necessity to attract the attention
O.P. Krupskyi, K.O. Temchur Journ.Geol.Geograph.Geoecology, 27(2), 261-273________________________________________________________________________________________________________________________________________________________________
264
of the world community to the problems of СEZand liquidators has led to special measures for me-dia workers. This led to a significant increase injournalists' tourism activity in the СEZ.
On April 22, 2016, the SAUEZM togetherwith the TISMCEZ organized a press tour (an eventfor journalists - excursion) for the representatives ofthe Ukrainian and foreign mass media. The purposeof the tour was to familiarize journalists with thework of enterprises, the status of implementation ofinternational projects and the prospect of reformingthe СEZ. The journalists attended the briefing ofthe head of the agency, visited the observation deckof the Shelter Object to familiarize themselves withthe progress of the construction of a new safe con-finement, learned about the progress of work on thestorage of spent nuclear fuel (ISF-2), talked withChNPP chief engineer on its further functioning,and аt the end of the tour, they visited Pripyat,where they could see how the city changed over 30years after the resettlement of residents (Derzhavneagentstvo Ukrai'ny z upravlinnja zonoju vidchuz-hennja, 2016).
The commemoration of the 30th anniversaryof the Chernobyl accident has attracted the attentionof not only Ukrainian but also world media. At theend of February 2016, the СEZ was visited by acrew of the ВВС Scottish office for the filming ofthe special program «Europe» for this date. Thejournalists set out to show the consequences of theaccident and the changes that occurred after it. Ac-companied by the specialists of the TISMCEZ, theyinterviewed the liquidators of the accident, got ac-quainted with the work of the measuring center«EcoCenter», visited the observation deck of theShelter Оbject, the city of Pripyat. As a result of thetrip, a 30-minute film was prepared (Derzhavneagentstvo Ukrai'ny z upravlinnja zonoju vidchuz-hennja, 2016).
Organizational activity of private enterpris-es. The task of the staff of the tourist agency«Chernobyl-tour» is to make the journalists' visit tothe СEZ as comfortable and productive as possible.Their duties include organizing a working visit,conducting excursions for journalists, providinginterviews, information on the Chernobyl accidentand its consequences, the current state and pros-pects for the development of the СEZ, providingadvice on correct and scientifically accurate cover-age of this information in the media. They alsosearch for speakers for interviews, organize meet-ings with eyewitnesses and liquidators of the acci-dent, «self-settlers», specialists (СEZ staff and re-search institutes), develop individual programs forvisiting the objects of the СEZ.
Employees of the company are experiencedspecialists in the Chernobyl accident, ecology, tour-
ism, eyewitnesses and liquidators of the accident,who have accumulated a great deal of knowledgeabout the СEZ and related issues. They conductlectures and trainings on radiation treatment, sur-vival in the event of man-made disasters, organizeaviation tours over the СEZ (Chernobyl'-tur, 2018).It precents grate interest to the jounalist communi-ty, as it is a potentially interesting to the mass me-dia audience, an unusual and vivid news opportuni-ty. They also provide accurate, up-to-date, literallyinterpreted information on the Chernobyl accidentand other man-made disasters and their conse-quences through their own research unit, presentingit as interesting and accessible (Chernobyl-tur,2018). It attracts to СEZ journalists who are tryingto satisfy the interest of their audience to the actualand popular tourist destination.
The task of the Chernobyl-tour agency is alsothe organization of special events with the partici-pation of mass media. So, on May 20, 2016, a fieldseminar "Representation of cultural, historical andnatural values of the СEZ for Ukraine and theworld: searching for effective paths and forms" wasorganized together with the SAUEZM. Journalistsfrom leading tourist mass media were invited toparticipate as mediators in this process. The eventwas held in the form of a one-day visit to the СEZon the basis of the standard program of «Cher-nobyl-tour». To participate in the seminar, eachparticipant was required to pay a registration fee of300 UAH. The program includes the gathering anddeparture from Kiev, the visit to the most famouslocations of the СEZ (city of Pripyat, the formersecret city of Chernobyl-2, the city of Chernobyl,with a visit to the exhibition exposition of the na-tional culture of the Chernobyl Polissya, opened tothe 30th anniversary of the accident, etc.), tradi-tional feeding of the Chernobyl catfishes, lunch inthe СEZ, professional discussion and coming backto Kiev (Chernobyl-tur, 2018).
«Chernobyl-tour» announces the purpose ofits activities as the elimination of information «pol-lution» in a society that arose after the Chernobylaccident (Chernobyl-tur, 2018). The agency playsan extraordinary role in increasing mass medialiteracy, and, through the mass media, eliminatingthe world's ignorance of the disaster-related issues.The unique feature of «Chernobyl-tour» is that theprovision of such comprehensive information re-quires extensive knowledge and experience fromvarious fields, which puts it over the competition inthe sphere of organizational and informational ser-vice of journalists in the СEZ.
The economic aspect of media tourism in theСEZ. Understanding and peculiarities of mediatourism in the СEZ. The materials of the media andthe official websites of SAUEZM and «Chernobyl-
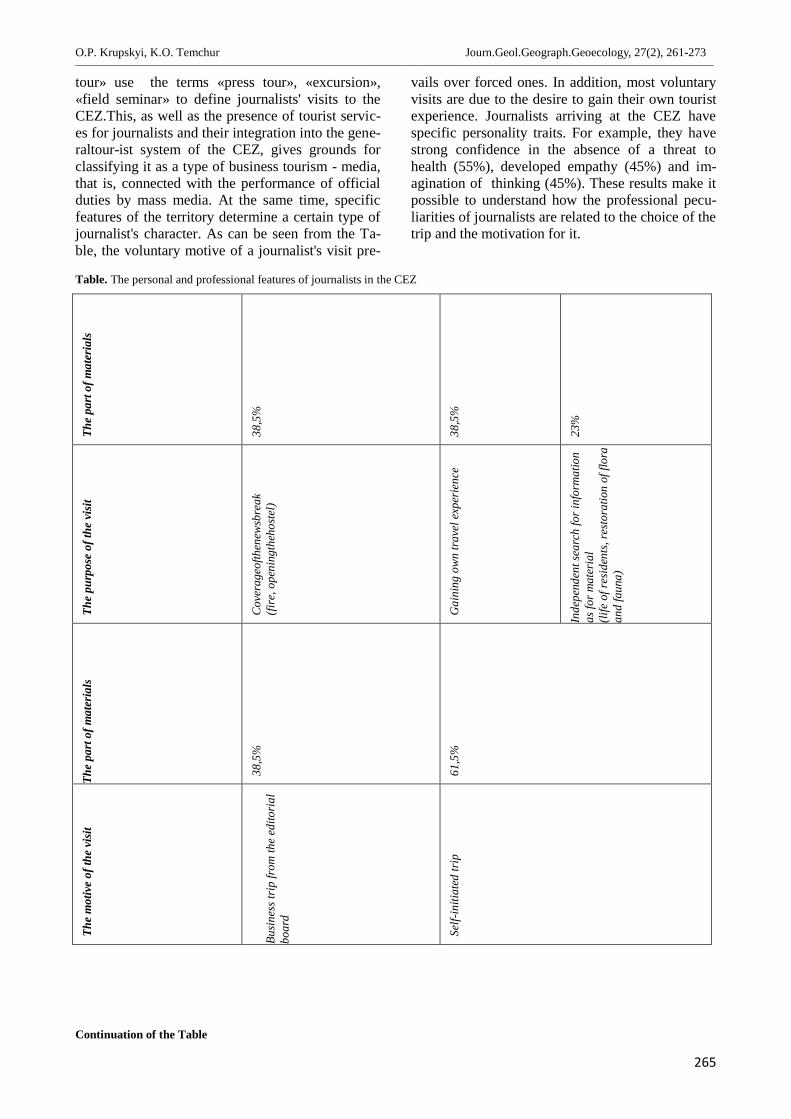
O.P. Krupskyi, K.O. Temchur Journ.Geol.Geograph.Geoecology, 27(2), 261-273________________________________________________________________________________________________________________________________________________________________
265
tour» use the terms «press tour», «excursion»,«field seminar» to define journalists' visits to theСEZ.This, as well as the presence of tourist servic-es for journalists and their integration into the gene-raltour-ist system of the СEZ, gives grounds forclassifying it as a type of business tourism - media,that is, connected with the performance of officialduties by mass media. At the same time, specificfeatures of the territory determine a certain type ofjournalist's character. As can be seen from the Ta-ble, the voluntary motive of a journalist's visit pre-
vails over forced ones. In addition, most voluntaryvisits are due to the desire to gain their own touristexperience. Journalists arriving at the СEZ havespecific personality traits. For example, they havestrong confidence in the absence of a threat tohealth (55%), developed empathy (45%) and im-agination of thinking (45%). These results make itpossible to understand how the professional pecu-liarities of journalists are related to the choice of thetrip and the motivation for it.
Table. The personal and professional features of journalists in the СEZ
Continuation of the Table
The
part
of m
ater
ials
38,5
%
38,5
%
23%
The
purp
ose
of th
e vi
sit
Сov
erag
eofth
enew
sbre
ak(fi
re,o
peni
ngth
ehos
tel)
Gai
ning
ow
n tr
avel
exp
erie
nce
Inde
pend
ent s
earc
h fo
rinf
orm
atio
nas
for m
ater
ial
(life
of r
esid
ents
, res
tora
tion
of fl
ora
and
faun
a)
The
part
of m
ater
ials
38,5
%
61,5
%
The
mot
ive
of th
e vi
sit
Вusi
ness
trip
from
the
edito
rial
boar
d
Self-
initi
ated
trip
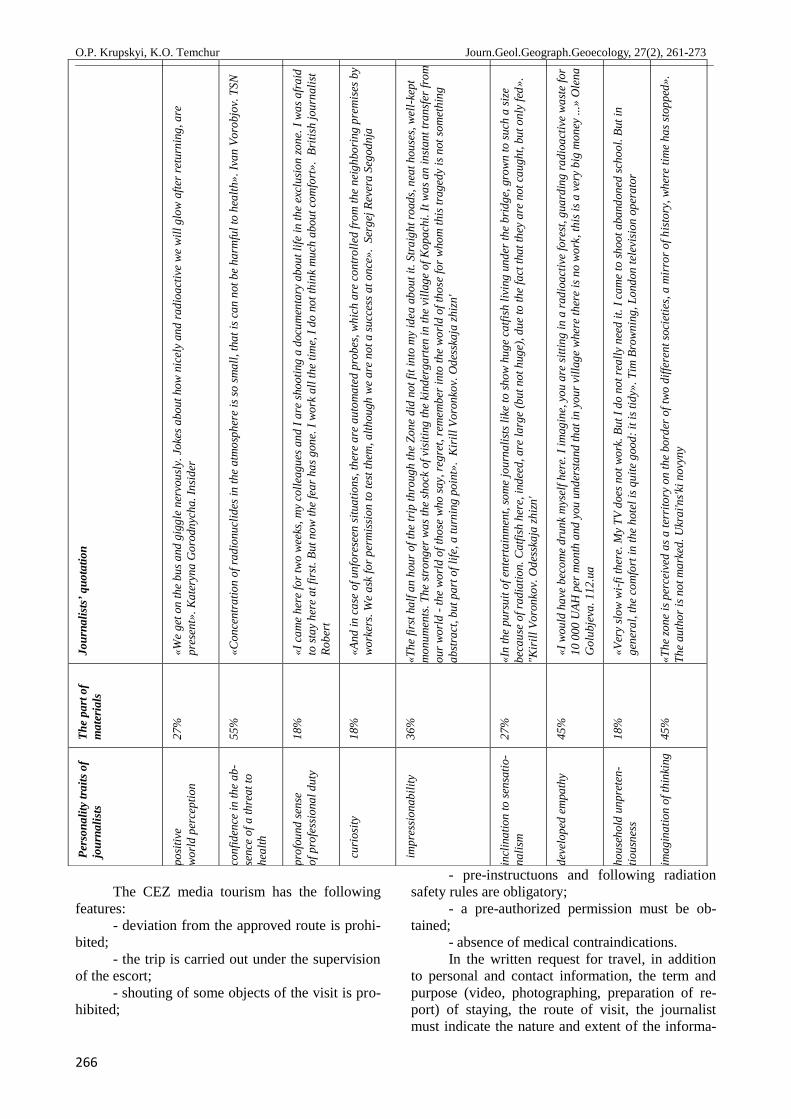
O.P. Krupskyi, K.O. Temchur Journ.Geol.Geograph.Geoecology, 27(2), 261-273________________________________________________________________________________________________________________________________________________________________
266
The СEZ media tourism has the followingfeatures:
- deviation from the approved route is prohi-bited;
- the trip is carried out under the supervisionof the escort;
- shouting of some objects of the visit is pro-hibited;
- pre-instructuons and following radiationsafety rules are obligatory;
- a pre-authorized permission must be ob-tained;
- absence of medical contraindications.In the written request for travel, in addition
to personal and contact information, the term andpurpose (video, photographing, preparation of re-port) of staying, the route of visit, the journalistmust indicate the nature and extent of the informa-
Jour
nalis
ts’q
uota
tion
«We
get o
n th
e bu
s and
gig
gle
nerv
ousl
y. J
okes
abo
ut h
ow n
icel
y an
dra
dioa
ctiv
e w
e w
ill g
low
afte
r ret
urni
ng, a
repr
esen
t».K
ater
yna
Gor
odny
cha.
Insi
der
«Con
cent
ratio
n of
radi
onuc
lides
in th
e at
mos
pher
e is
so sm
all,
that
is c
an n
ot b
e ha
rmfu
l to
heal
th».
Ivan
Vor
objo
v. T
SN
«I c
ame
here
for t
wo
wee
ks, m
y co
lleag
ues a
nd I
are
shoo
ting
a do
cum
enta
ry a
bout
life
in th
e ex
clus
ion
zone
. I w
as a
frai
dto
stay
her
e at
firs
t. Bu
t now
the
fear
has
gon
e. I
work
all
the
time,
I do
not t
hink
muc
h ab
out c
omfo
rt».
Briti
sh jo
urna
list
Robe
rt
«And
in c
ase
of u
nfor
esee
n si
tuat
ions
, the
re a
re a
utom
ated
pro
bes,
whi
ch a
re c
ontro
lled
from
the
neig
hbor
ing
prem
ises
by
wor
kers
. We
ask
for p
erm
issi
on to
test
them
, alth
ough
we
are
not a
succ
ess a
t onc
e».
Serg
ej R
ever
a Se
godn
ja
«The
firs
t hal
f an
hour
of t
he tr
ip th
roug
h th
e Zo
ne d
id n
ot fi
t int
o m
y id
ea a
bout
it. S
trai
ght r
oads
, nea
t hou
ses,
wel
l-kep
tm
onum
ents
. The
stro
nger
was
the
shoc
k of
vis
iting
the
kind
erga
rten
in th
e vi
llage
of K
opac
hi. I
t was
an
inst
ant t
rans
fer f
rom
our w
orld
-the
wor
ld o
f tho
se w
ho sa
y, re
gret
, rem
embe
r int
o th
e w
orld
of t
hose
for w
hom
this
trag
edy
is n
ot so
met
hing
abst
ract
, but
part
of l
ife, a
turn
ing
poin
t».
Kir
ill V
oron
kov.
Ode
sska
ja zh
izn'
«In
the
purs
uit o
f ent
erta
inm
ent,
som
e jo
urna
lists
like
to sh
ow h
uge
catfi
sh li
ving
und
er th
e br
idge
, gro
wn
to su
ch a
size
beca
use
ofra
diat
ion.
Cat
fish
here
, ind
eed,
are
larg
e (b
ut n
ot h
uge)
, due
to th
e fa
ct th
at th
ey a
re n
ot c
augh
t, bu
t onl
y fe
d».
"Kir
ill V
oron
kov.
Ode
sska
ja zh
izn'
«I w
ould
hav
e be
com
e dr
unk
mys
elf h
ere.
I im
agin
e, y
ou a
re si
tting
in a
radi
oact
ive
fore
st, g
uard
ing
radi
oact
ive
was
te fo
r10
000
UAH
per
mon
th a
nd y
ou u
nder
stan
d th
at in
you
r vill
age
whe
re th
ere
is n
o wo
rk, t
his i
s a v
ery
big
mon
ey ..
.»O
lena
Gol
ubje
va. 1
12.u
a
«Ver
y sl
ow w
i-fi t
here
. My
TV d
oes n
ot w
ork.
But
I do
not
real
ly n
eed
it. I
cam
e to
shoo
t aba
ndon
ed sc
hool
. But
inge
nera
l, th
e co
mfo
rt in
the
hote
l is q
uite
goo
d: it
is ti
dy».
Tim
Bro
wni
ng, L
ondo
n te
levi
sion
ope
rato
r
«The
zone
is p
erce
ived
as a
terr
itory
on
the
bord
er o
f two
diff
eren
t soc
ietie
s, a
mir
ror o
f his
tory
, whe
re ti
me
has s
topp
ed».
The
auth
or is
not
mar
ked.
Ukr
ai'n
s'ki n
ovyn
y
The
part
ofm
ater
ials
27%
55%
18%
18%
36%
27%
45%
18%
45%
Pers
onal
ity tr
aits
ofjo
urna
lists
рosi
tive
wor
ld p
erce
ptio
n
conf
iden
ce in
the
ab-
senc
e of
a th
reat
tohe
alth
prof
ound
sens
eof
pro
fess
iona
l dut
y
curi
osity
impr
essi
onab
ility
incl
inat
ion
to se
nsat
io-
nalis
m
deve
lope
d em
path
y
hous
ehol
d un
pret
en-
tious
ness
imag
inat
ion
of th
inki
ng
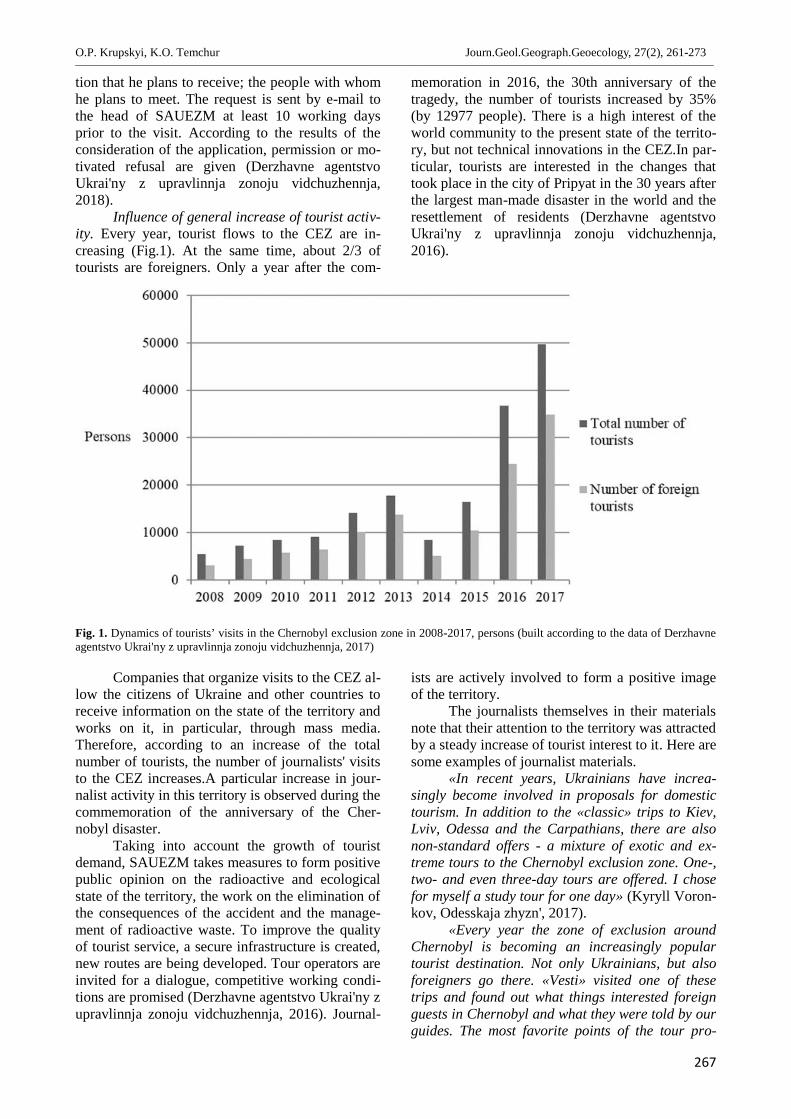
O.P. Krupskyi, K.O. Temchur Journ.Geol.Geograph.Geoecology, 27(2), 261-273________________________________________________________________________________________________________________________________________________________________
267
tion that he plans to receive; the people with whomhe plans to meet. The request is sent by e-mail tothe head of SAUEZM at least 10 working daysprior to the visit. According to the results of theconsideration of the application, permission or mo-tivated refusal are given (Derzhavne agentstvoUkrai'ny z upravlinnja zonoju vidchuzhennja,2018).
Influence of general increase of tourist activ-ity. Every year, tourist flows to the СEZ are in-creasing (Fig.1). At the same time, about 2/3 oftourists are foreigners. Only a year after the com-
memoration in 2016, the 30th anniversary of thetragedy, the number of tourists increased by 35%(by 12977 people). There is a high interest of theworld community to the present state of the territo-ry, but not technical innovations in the СEZ.In par-ticular, tourists are interested in the changes thattook place in the city of Pripyat in the 30 years afterthe largest man-made disaster in the world and theresettlement of residents (Derzhavne agentstvoUkrai'ny z upravlinnja zonoju vidchuzhennja,2016).
Fig. 1. Dynamics of tourists’ visits in the Chernobyl exclusion zone in 2008-2017, persons (built according to the data of Derzhavneagentstvo Ukrai'ny z upravlinnja zonoju vidchuzhennja, 2017)
Companies that organize visits to the СEZ al-low the citizens of Ukraine and other countries toreceive information on the state of the territory andworks on it, in particular, through mass media.Therefore, according to an increase of the totalnumber of tourists, the number of journalists' visitsto the СEZ increases.A particular increase in jour-nalist activity in this territory is observed during thecommemoration of the anniversary of the Cher-nobyl disaster.
Taking into account the growth of touristdemand, SAUEZM takes measures to form positivepublic opinion on the radioactive and ecologicalstate of the territory, the work on the elimination ofthe consequences of the accident and the manage-ment of radioactive waste. To improve the qualityof tourist service, a secure infrastructure is created,new routes are being developed. Tour operators areinvited for a dialogue, competitive working condi-tions are promised (Derzhavne agentstvo Ukrai'ny zupravlinnja zonoju vidchuzhennja, 2016). Journal-
ists are actively involved to form a positive imageof the territory.
The journalists themselves in their materialsnote that their attention to the territory was attractedby a steady increase of tourist interest to it. Here aresome examples of journalist materials.
«In recent years, Ukrainians have increa-singly become involved in proposals for domestictourism. In addition to the «classic» trips to Kiev,Lviv, Odessa and the Carpathians, there are alsonon-standard offers - a mixture of exotic and ex-treme tours to the Chernobyl exclusion zone. One-,two- and even three-day tours are offered. I chosefor myself a study tour for one day» (Kyryll Voron-kov, Odesskaja zhyzn', 2017).
«Every year the zone of ехсlusion aroundChernobyl is becoming an increasingly populartourist destination. Not only Ukrainians, but alsoforeigners go there. «Vesti» visited one of thesetrips and found out what things interested foreignguests in Chernobyl and what they were told by ourguides. The most favorite points of the tour pro-
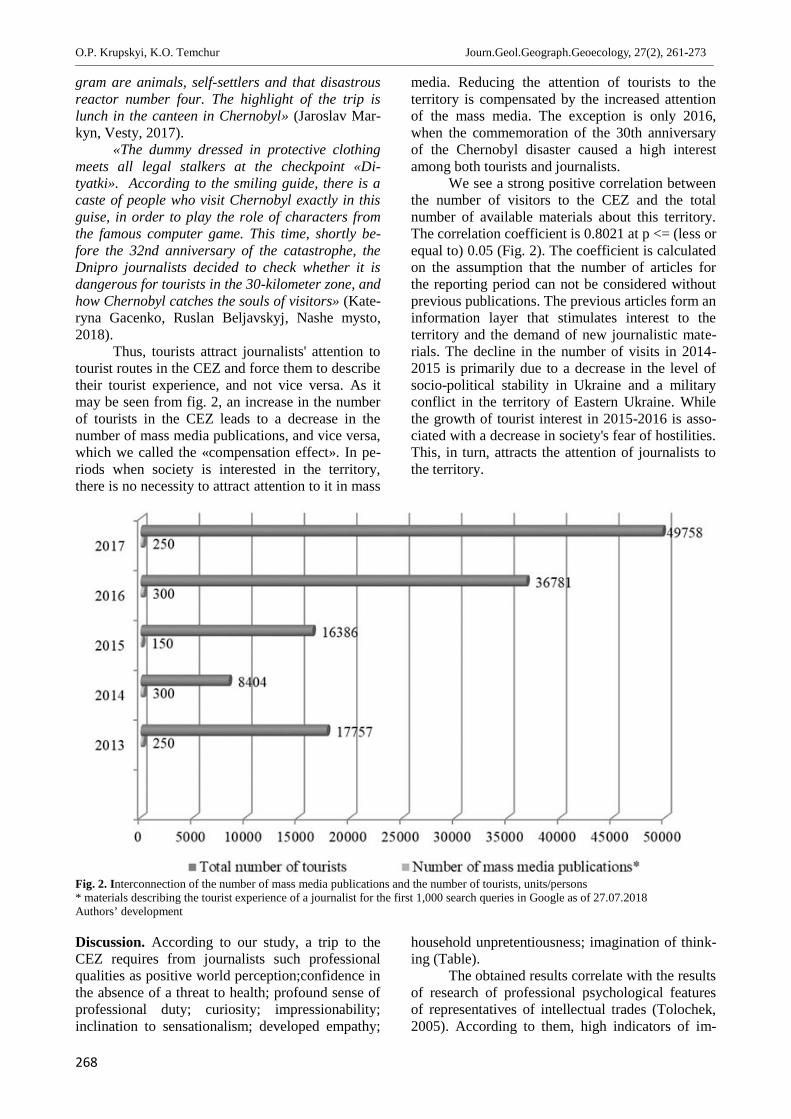
O.P. Krupskyi, K.O. Temchur Journ.Geol.Geograph.Geoecology, 27(2), 261-273________________________________________________________________________________________________________________________________________________________________
268
gram are animals, self-settlers and that disastrousreactor number four. The highlight of the trip islunch in the canteen in Chernobyl» (Jaroslav Mar-kyn, Vesty, 2017).
«The dummy dressed in protective clothingmeets all legal stalkers at the checkpoint «Di-tyatki». According to the smiling guide, there is acaste of people who visit Chernobyl exactly in thisguise, in order to play the role of characters fromthe famous computer game. This time, shortly be-fore the 32nd anniversary of the catastrophe, theDnipro journalists decided to check whether it isdangerous for tourists in the 30-kilometer zone, andhow Chernobyl catches the souls of visitors» (Kate-ryna Gacenko, Ruslan Beljavskyj, Nashe mysto,2018).
Thus, tourists attract journalists' attention totourist routes in the СEZ and force them to describetheir tourist experience, and not vice versa. Аs itmay be seen from fig. 2, an increase in the numberof tourists in the СEZ leads to a decrease in thenumber of mass media publications, and vice versa,which we called the «compensation effect». In pe-riods when society is interested in the territory,there is no necessity to attract attention to it in mass
media. Reducing the attention of tourists to theterritory is compensated by the increased attentionof the mass media. The exception is only 2016,when the commemoration of the 30th anniversaryof the Chernobyl disaster caused a high interestamong both tourists and journalists.
We see a strong positive correlation betweenthe number of visitors to the СEZ and the totalnumber of available materials about this territory.The correlation coefficient is 0.8021 at p <= (less orequal to) 0.05 (Fig. 2). The coefficient is calculatedon the assumption that the number of articles forthe reporting period can not be considered withoutprevious publications. The previous articles form aninformation layer that stimulates interest to theterritory and the demand of new journalistic mate-rials. The decline in the number of visits in 2014-2015 is primarily due to a decrease in the level ofsocio-political stability in Ukraine and a militaryconflict in the territory of Eastern Ukraine. Whilethe growth of tourist interest in 2015-2016 is asso-ciated with a decrease in society's fear of hostilities.This, in turn, attracts the attention of journalists tothe territory.
Fig. 2. Interconnection of the number of mass media publications and the number of tourists, units/persons* materials describing the tourist experience of a journalist for the first 1,000 search queries in Google as of 27.07.2018Authors’ development
Discussion. According to our study, a trip to theСEZ requires from journalists such professionalqualities as positive world perception;confidence inthe absence of a threat to health; profound sense ofprofessional duty; curiosity; impressionability;inclination to sensationalism; developed empathy;
household unpretentiousness; imagination of think-ing (Table).
The obtained results correlate with the resultsof research of professional psychological featuresof representatives of intellectual trades (Tolochek,2005). According to them, high indicators of im-
O.P. Krupskyi, K.O. Temchur Journ.Geol.Geograph.Geoecology, 27(2), 261-273________________________________________________________________________________________________________________________________________________________________
269
agination of thinking (45%) and impressionability(36%) are explained by the personal qualities ofjournalists, such as inclination to abstract thinking,emotional sensitivity, sentimentality. At the sametime, the focus of journalists on dark tourism can beexplained by the breadth of views and radicalism.
The inclination to certain professional activi-ties is explained by the psychotype of the employee(Pittenger, 1993). Journalists belong to the ENFRtype - an individual of this type takes an active partin the lives of others, tries new types of activities, isnot afraid of difficulties, is inclined to make deci-sions under the influence of emotions, can not livewithout dramas and shocks (Krups'kyj, 2015).These peculiarities of journalists are explain theirdeveloped empathy (compassion and sensitive per-ception of events), the ease of making a decision totravel to the СEZ. At the same time, the tragedy ofthe history and the gloomy appearance of the terri-tory, the problems of its former and current resi-dents make it attractive to journalists.
An interesting situation arises when a jour-nalist seeks to get into the territory, and then hefeels confused by the emotions. Personal interestexplains the predominance of the voluntary motiveof the trip (61.5%) over the forced (38.5%). In thiscase, the professional and personal components ofthe trip are balanced (by 38%): in addition to thecuriosity and impressionability of ordinary tourists,journalists have a profound sense of professionalduty and a inclination to sensationalism.
The professional interest of journalists in vis-its to the СEZ may be due to their inclination torisk. According to studies conducted by CareerCast,newspaper reporters take the 6th place in the top 10most stressed professions by 2018 (after a militaryofficer, firefighter, pilot, police officer, coordinatorof events) (CareerCast, 2018). Among the causes ofstress in this profession, in addition to the hardeneddeadlines and the fixed attention of society, re-searchers call the necessity to respond to unex-pected risks. In addition, people at risk are morelikely to smoke than those who are not at risk (Clif-ton et al., 2018). Meanwhile, 30% of male journal-ists are smokers, female journalists - 27% (Super-job, 2011).In addition, women are better able toassess the presence of risk in a particular situation,that is explained by their increased vulnerability incomparison with men (Bord, O'Connor, 1997). Theimpact of this factor on the decision to travel to thecontaminated area can explain the results of ourstudy: a slightly smaller number of women journal-ists in the СEZ (46% of women versus 54% ofmen) and a rather high level of confidence in theabsence of a threat to health (55%).
Regulation of media tourism in the CEZ.Provision of tourist services is not provided in the
territory of the СEZ. Therefore, from the legal pointof view, it is expedient to use the term «visit» andnot «tourism» (Derzhavne agentstvo Ukrai'ny zupravlinnja zonoju vidchuzhennja, 2016). This isdue to the fact that coming and staying at the terri-tory is limited, and staying without an official per-mit is prohibited. Hence, fears of public disregardfor the provision of commercial services in a terri-tory that was recently the center of a disaster con-firms the concept that fear is an obstacle on the wayto innovation (Rogers 1995; Hargadon, Douglas,2001).
In spite of this, in the scientific opinion anapproach to visits to the CEZ was formed just likefor tourism (Pestushko, Chubuk, 2010; YankovskaG., Hannam K., 2014). During the 1990s, visitors tothe territory were exclusively scientists and special-ists of the consequences of the accident (Pestushko,Chubuk, 2010). That is why such visits can not beconsidered as tourism. The beginning of the thereal tourism activity in the СEZ refers to 2000s,when in 2004 the first official tourist routes weredeveloped.
It means that, despite the apparent develop-ment of tourism in the СEZ, the emotional bias thatexisting in the society does not allow recognize itofficially. M. Voronov and R. Vince emphasize theinclinatioms of individuals to manifest emotions inresponse to certain aspects of institutions (Voronov,Vince, 2012), for example, legislative decisions. Inthis case, such negative aspect is the moral inad-missibility of speculation on the human sorrow.
In favor of asserting that journalists' visits tothe СEZ are the media tourism, speaks the defini-tion of business tourism to which it belongs. It em-phasizes the connection of such trips with businessactivity: «Business tourism refers to journeys un-dertaken for work-related purposes» (Davidson,1994). As our research has shown, despite certainnatural limitations, connected with the peculiarityof the territory, the travels of journalists is condi-tioned by the fulfillment of the professional dutiesand are carried out within the framework of pre-drawn up routes. The precence of targeted travelservices for journalists and the extensive experienceof tourist companies as to their work with massmedia in this area make it possible to classify intheory journalists’ visits to CEZ as media tourism.
It is impossible to talk about official recogni-tion and legislative consolidation of tourism in theСEZ at this stage. The adoption of such a decisionrequires the study of emotional obstacles to tourismactivities in the СEZ and the realization of the wayson their elimination in practice.
The role of media presentation of the territo-ry in promoting dark tourism. According to thefounder of the «Chernobyl-tour», Ukraine receives
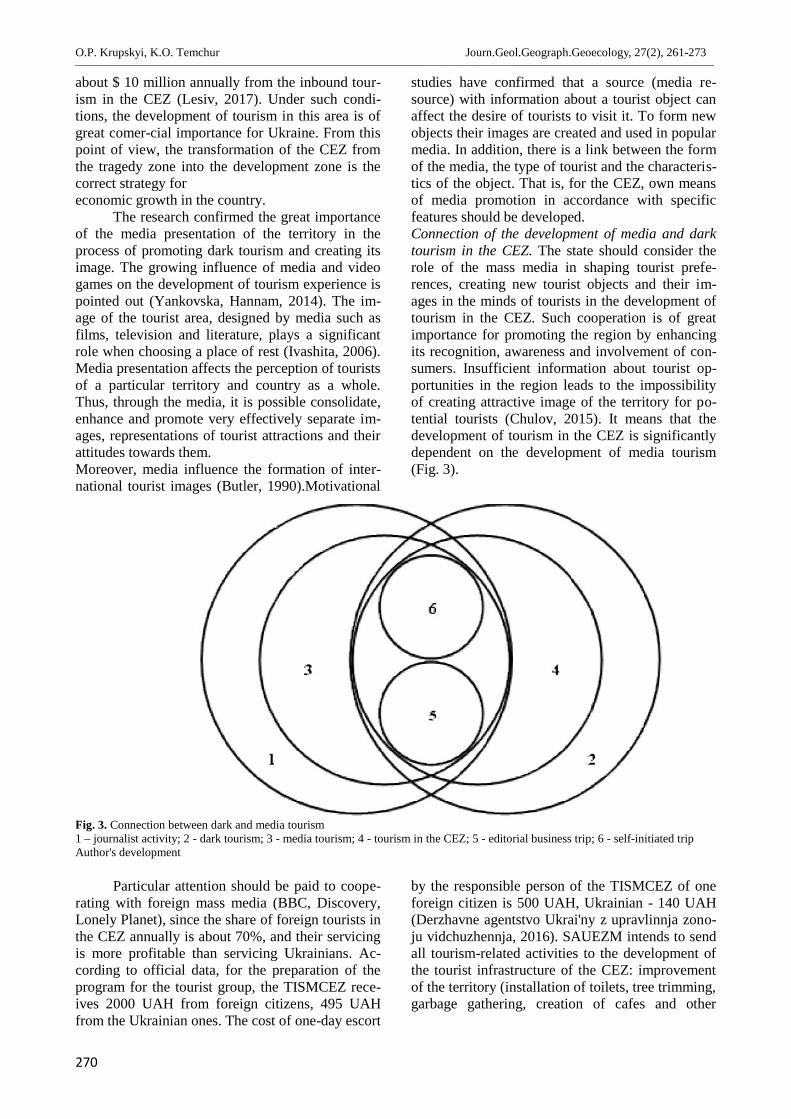
O.P. Krupskyi, K.O. Temchur Journ.Geol.Geograph.Geoecology, 27(2), 261-273________________________________________________________________________________________________________________________________________________________________
270
about $ 10 million annually from the inbound tour-ism in the СEZ (Lesiv, 2017). Under such condi-tions, the development of tourism in this area is ofgreat comer-cial importance for Ukraine. From thispoint of view, the transformation of the СEZ fromthe tragedy zone into the development zone is thecorrect strategy foreconomic growth in the country.
The research confirmed the great importanceof the media presentation of the territory in theprocess of promoting dark tourism and creating itsimage. The growing influence of media and videogames on the development of tourism experience ispointed out (Yankovska, Hannam, 2014). The im-age of the tourist area, designed by media such asfilms, television and literature, plays a significantrole when choosing a place of rest (Ivashita, 2006).Media presentation affects the perception of touristsof a particular territory and country as a whole.Thus, through the media, it is possible consolidate,enhance and promote very effectively separate im-ages, representations of tourist attractions and theirattitudes towards them.Moreover, media influence the formation of inter-national tourist images (Butler, 1990).Motivational
studies have confirmed that a source (media re-source) with information about a tourist object canaffect the desire of tourists to visit it. To form newobjects their images are created and used in popularmedia. In addition, there is a link between the formof the media, the type of tourist and the characteris-tics of the object. That is, for the СEZ, own meansof media promotion in accordance with specificfeatures should be developed.Connection of the development of media and darktourism in the СEZ. The state should consider therole of the mass media in shaping tourist prefe-rences, creating new tourist objects and their im-ages in the minds of tourists in the development oftourism in the СEZ. Such cooperation is of greatimportance for promoting the region by enhancingits recognition, awareness and involvement of con-sumers. Insufficient information about tourist op-portunities in the region leads to the impossibilityof creating attractive image of the territory for po-tential tourists (Chulov, 2015). It means that thedevelopment of tourism in the СEZ is significantlydependent on the development of media tourism(Fig. 3).
Fig. 3. Connection between dark and media tourism1 – journalist activity; 2 - dark tourism; 3 - media tourism; 4 - tourism in the CEZ; 5 - editorial business trip; 6 - self-initiated tripАuthor's development
Particular attention should be paid to coope-rating with foreign mass media (BBC, Discovery,Lonely Planet), since the share of foreign tourists inthe СEZ annually is about 70%, and their servicingis more profitable than servicing Ukrainians. Ac-cording to official data, for the preparation of theprogram for the tourist group, the TISMCEZ rece-ives 2000 UAH from foreign citizens, 495 UAHfrom the Ukrainian ones. The cost of one-day escort
by the responsible person of the TISMCEZ of oneforeign citizen is 500 UAH, Ukrainian - 140 UAH(Derzhavne agentstvo Ukrai'ny z upravlinnja zono-ju vidchuzhennja, 2016). SAUEZM intends to sendall tourism-related activities to the development ofthe tourist infrastructure of the СEZ: improvementof the territory (installation of toilets, tree trimming,garbage gathering, creation of cafes and other
O.P. Krupskyi, K.O. Temchur Journ.Geol.Geograph.Geoecology, 27(2), 261-273________________________________________________________________________________________________________________________________________________________________
271
events) (Derzhavne agentstvo Ukrai'ny z upravlinn-ja zonoju vidchuzhennja, 2016).
It is necessary to continue developing a statestrategy for coverage of the CEZ in the world massmedia, which would contribute to the formation ofa positive image of the territory and tourist prefe-rences in this direction. One of the steps of thisstrategy is to formulate the essence of the brand:holding special bright cultural events, attractingattention to unusual historical values, monuments,facts, events, etc. (Smirnova, Privarnikova, 2015).It is expedient to develop special tourism programs,to conduct regular excursions and seminars forjournalists, to cooperate with mass media on con-tent production to attract tourists from their au-dience - documentaries and feature films, televisionspecial projects, and other media support tools. Inaddition, information about the region should besubmitted in detail, emotionally, personally andregularly (Chulov, 2015).
Cultural aspect of media tourism in the СEZ.The local government should engage in public di-alogue to explain the benefits of developing darktourism and help it in the decision-making process(Kim, Butler, 2015). This work is of particular im-portance in the conditions of polarization of publicopinion on the ethics of the development of suchtourism, which took place in Snowtown (SouthernAustralia) (Kim, Butler, 2015). The overwhelmingmajority of local "long-livers" was against the ex-ploitation of recent criminal events in the city toattract tourists. While other residents, especiallythose who arrived in the city after the arrest of themurderous killers in Snowtown (after 1999), sup-ported this idea.In the Ukrainian society, there isalso a problem of the ethics of such tourism in rela-tion to the Chernobyl veterans and victims of thedisaster. Also, despite the explanatory work, thereare biases regarding the environmental and radia-tion hazards of the territory. The elimination ofthese obstacles can be achieved by dialogue withthe public through the Ukrainian and world massmedia.
It should take into account the attitude ofjournalists themselves to the development of darktourism, which they cover and to which their publi-cations contribute. The professional duty of journal-ists makes them cover all relevant social phenome-na such as tourism in the СEZ even if it is harmfulfor their health. This allows them to work in themost unfavorable conditions - in any area wherethere is a risk or danger to health and life. This canalso explain such a feature of journalists in theСEZ, as profound sense of professional duty (Ta-ble).
The feature of the СEZ is not only the per-sonal attitude of the journalist to the work, but also
his fear of his health after the trip. If the work at hotspots has a risk of injury or death, then work at theСEZ - the risk of radiation exposure in case of dev-iation from the route and violation of safety rules(Derzhavne agentstvo Ukrai'ny z upravlinnja zono-ju vidchuzhennja, 2014). As our study showed,journalists have a confidence in the radioactivesafety of the territory of the СEZ (Table). Profes-sional characterological features allow them to ig-nore those aspects of information that can be per-ceived by others as negative. On the contrary, theyhave positive view of the phenomena they have todeal with in their professional activities. Such anattitude is one of the mechanisms of psychologicalprotection in condi-tions of increased stress in theprofession. Thus, the psychological peculiarities ofworld perception allow journalists to overcomesuccessfully the specific barriers that distinguishthe work of the СEZ from work in other territories.
Recommendations for future researchers.The research showed that the motivation for jour-nalists' visits to the СEZ is business trip for cover-ing newsbreak and looking for information as forpublications on the state of the territory (includingtourist routes). However, in the course of the study,the authors had a hypothesis about monetary rewardas one of the main motivations of a journalist's visitto the СEZ. It needs to be checked in further re-search. To do this, it is necessary to create a data-base of journalists who visited the СEZ, indicatingtheir contact details, and conduct questionnairesand interviews. Among other issues, it is necessaryto develop the presence/absence of material incen-tives and rewards for such journalists for work in aradioactive contaminated area.
In order to solve the problem of the ethicalaspect of media tourism, it is necessary during theinterview to find out the personal attitude of jour-nalists to performing such a kind of work. It shouldbe taken into account, which part of those who vi-sited the СEZ, felt internal discomfort before, dur-ing and after the trip. It is also necessary to deter-mine how many journalists refused the proposedtrip and for what reasons (fear for the state ofhealth, ethical beliefs, etc.).Conclusions. In our study, we were able to de-scribe a new phenomenon of media tourism in theChernobyl Exclusion Zone and to establish its pe-culiarities. Journalists traveling to the ChernobylExclusion Zone have specific personality traits. Themost striking of them is confidence in the absenceof risk, ability to empathize and imaginative think-ing. Thus, the tragedy of history and the gloomyappearance of the territory, the suffering of its resi-dents make it attractive for journalists. Personalinterest explains the predominance of the voluntarymotive of traveling over forced ones. Positive
O.P. Krupskyi, K.O. Temchur Journ.Geol.Geograph.Geoecology, 27(2), 261-273________________________________________________________________________________________________________________________________________________________________
272
world perception and sense of professional dutyallows journalists to ignore such features of theterritory as the risk of radiation exposure and theproblem of ethics. At the same time, the prevalenceamong them of male journalists is due to their low-er ability to assess risk. The attention of journaliststo the territory is attracted by the activity of touristson it.There is a phenomenon of the so-called «com-pensation effect», when the reduction of tourists'attention to the territory is com-pensated by an in-crease in the attention of the mass media.
The organization of visits of journalists con-tributes to the formation of a positive image of theterritory and the elimination of «information»pollu-tion. It is important to make cooperation withmass media a key element of the strategy of devel-oping the tourist potential of this territory. At thesame time, this work should be considered not onlyas an instrument of promotion, but also in terms ofthe prospects of media tourism. Further researchwill be devoted to the search for strategic directionsfor the promotion of media tourism in the Cher-nobyl Exclusion Zone.
References
Alvesson M., Kärreman D., 2007. Constructing mystery:Empirical matters in theory development. TheAcademy of Management Review, 32(4). 1265–1281. doi:10.5465/amr.2007.26586822
Bord, R. J., O’Connor, R. E., 1997. The gender gap inenvironmental attitudes: the case of perceivedvulnerability to risk. Social Science Quarterly,78(4), 830-840.
Butler R. W., 1990. The Influence of the Media in Shap-ing International Tourist Patterns. TourismRecreation Research, 15(2), 46-53.doi:10.1080/02508281.1990.11014584.
Careercast, 2018. The Most Stressful Jobs of 2018. Ca-reercast. Retrieved from URL:https://www.careercast.com/jobs-rated/2018-most-stressful-jobs?page=0 Available at17.04.2018.
Chernobyl'-tur. [Chernobyl tour]. Retrieved from URL:https://www.chernobyl-tour.com/index.php
Chulov D. A., 2015. Brending i territorial'noe razvitie vturizme: vzaimodejstvie so SMI i potrebitelem[Branding and territorial development in tourism:interaction with mass media and a consumer],Services in Russia and Abroad, 5, 140-157. doi:10.12737/ 17471. (In Russian).
Clifton E. A., Perry J. R., Imamura F., Lotta L. A., BrageS., Forouhi N. G., Griffin S. J., Wareham N. J.,Ong K. K. , Day F.R., 2018. Genome–wide asso-ciation study for risk taking propensity indicatesshared pathways with body mass index. Commu-nications Biology, 1(1), 1-10.doi:10.1038/s42003-018-0042-6
Davidson R., 1994. Business Travel. London. AddisonWesley Longman
Derkach U., 2014. Osoblyvosti organizacii' turyzmutehnogennyh katastrof v Ukrai'ni [Features ofman-made disasters tourism in Ukraine]. Visn. ofthe Lviv Univ. Series international relations, 34,56–66 (In Ukrainian).
Derzhavne agentstvo Ukrai'ny z upravlinnja zonojuvidchuzhennja (DAZV) [State agency of Ukraineon Exclusion zone management (SAUEZM)]. Re-trieved from URL: http://dazv.gov.ua.
Eisenhardt, K. M., 1989. Building theories from casestudy research. Academy of Management Review,14(4), 532–550. doi:10.5465/amr.1989.4308385.
Foley M., Lennon J. J., 1996. JFK and dark tourism: Afascination with assassination. InternationalJournal of Heritage Studies, 2(4), 198–211. doi:10.1080/13527259608722175.
Forbes, 2009. In Pictures: World's Most Unique PlacesTo Visit. Forbes. Retrieved from URL:https://www.forbes.com/2009/11/04/unique-vacations-travel-lifestyle-travel-adventure-tourism_slide/. Available at 17.04.2018.
Gacenko E., Beljavskij R., 2018. Gorod-prizrak i atmos-fera smerti: kakie tajny skryvaet zlopoluchnajaChernobyl'skaja zona . [Ghost city and the atmos-phere of death: what secrets the disastrous Cher-nobyl zone hides]. Retrieved from URL:http://nashemisto.dp.ua/2018/04/26/gorod-prizrak-i-atmosfera-smerti-kakie-tajny-tait-zlopoluchnaya-chernobylskaya-zona-foto/ (inRussian). Available at 17.04.2018.
Goleva O. P., 2015. Celevye auditoria ivent-marketinga ividy sobytijnyh meroprijatij [The target audienceof event marketing and types of events]. Vestn.MGUP by Ivan Fedorov, 4, 22-24. (In Russian).
Golovata L., 2010. Chornobylski stalkery [Chernobylstalkers]. Zaxid.net. Retrieved from URL:https://zaxid.net/chornobilski_stalkeri_n1101343(in Ukrainian).
Hargadon, A., Douglas, Y., 2001. When innovationsmeet institutions: Edison and the design of theelectric light. Administrative Science Quarterly,46(3), 476–501. doi:10.2307/3094872.
Iwashita C., 2006. Media representation of the UK as adestination for Japanese tourists: Popular cultureand tourism. Tourist Studies, 6(1), 59–77.doi:10.1177/1468797606071477.
Kim H., Richardson S. L., 2003. Motion picture impactson destination images. Annals of Tourism Re-search, 30(1), 216-237. doi:10.1016/S0160-7383(02)00062-2.
Kim S., Butler G., 2015. Local community perspectivestowards dark tourism development: The case ofSnowtown, South Australia. Journal of Tourismand Cultural Change, 13(1), 78-89.doi:10.1080/14766825.2014.918621.
Krups'kyj O. P., 2015. The cognitive style as a factor ofthe development of tourism and hospitality en-terprises. Problems of the economy, (2), 140–146.http://doi.org/10.5281/zenodo.1323421. (inUkrainian)
Kuz'mych-Pohodenko A. S., 2015. Problema Chornobyl-ja u publicystyci Liny Kostenko [Problem of
O.P. Krupskyi, K.O. Temchur Journ.Geol.Geograph.Geoecology, 27(2), 261-273________________________________________________________________________________________________________________________________________________________________
273
Chernobyl in Lina Kostenko’spublicism]. «Youngscientist», 12(27), 150-153. (in Ukrainian).
Lesiv M., 2017. Tury v Chernobyl' prinosjat Ukrainemillion dollarov [Tours to Chernobyl bringUkraine millions of dollars]. Public people. Re-trieved from URL: https://pl.com.ua/tury-v-chernobyl-prinosyat-ukraine-milliony-dollarov/(In Russian).
Lincoln Y. S., Guba E. G. (1985) Naturalistic Inquiry.Beverly Hills, CA: SAGE.
Markin Ja., 2017. Pushka i gosti iz Kanady: chto inos-trancam rasskazyvajut o Chernobyle. [Cannonand guests from Canada: what is told to forignersabout Chornobyl]. Retrieved from URL:https://vesti-ukr.com/strana/241753-chto-inostrantsam-rasskazyvajut-o-chernobyle- (inRussian). Available at 17.04.2018.
Pestushko V. Ju, Chubuk Ju. P., 2010. Chornobyl's'kaAES jak turystychna destynacija. [Chernobylatomic electric power station as tourist destina-tion]. Geography and Tourism, 9, 82-86. (InUkrainian).
Pittenger, D. J., 1993. Measuring the MBTI… and com-ing up short. Journal of Career Planning andEmployment, 54(1), 48-52.
Rogers, E. M. 1995. Diffusion of innovations (4th ed.).New York. Simon and Schuster.
Smirnova, T., Privarnikova, I., 2015. Formation of thebrand the city as an innovative way to improve itsattractiveness for tourism. European Journal ofManagement Issues, 23(5), 93-100.doi:10.15421/191526 (in Ukrainian).
Superjob, 2011. Sredi brosivshih kurit' lidirujut jekologi.[Among those who quit smoking, ecologists areleading]. Superjob. Retrieved from URL:https://www.superjob.uz/community/life/52442/(in Russian). Available at 17.04.2018.
Tolochek V. A., 2005. Sovremennaja psihologija truda[Modern psychology of work]. Peter, Saint Pe-tersburg (in Russian).
Voronkov K., 2017. Chto odesskij zhurnalist uvidel vzone otchuzhdenija Chernobyl'skoj AJeS? [Whatdid the journalist from Odessa see in the zone ofexclusion of the Chernobyl nuclear power plant?]. Retrieved from URL: http://odessa-life.od.ua/article/8143-Chto-odesskiy-zhurnalist-uvidel-v-zone-otchuzhdeniya-Chernobylskoy-AES (in Russian). Available at 17.04.2018.
Voronov, M., Vince, R., 2012. Integrating Emotions intoAnalysis of Institutional Work. Academy of Man-agement Review, 37(1), 58–81.doi:10.5465/armr.2010.0247
Yankovska G., Hannam K., 2014. Dark and toxic tour-ism in the Chernobyl exclusion zone. Current Is-sues in Tourism, 17(10), 929-939.doi:10.1080/13683500.2013.820260.
Yin, R., 2009. Case study research: Design and methods(4th ed.). Los Angeles Calif., Sage Publications.
Young A. F., Young R., 2008. Measuring the Effects ofFilm and Television on Tourism to Screen Loca-tions: A Theoretical and Empirical Perspective.Journal of Travel & Tourism Marketing, 24(2-3),195-212. doi:10.1080/10548400802092742.
D.V. Kulikova, O.S. Kovrov,Yu.V. Buchavy, V.V. Fedotov Journ.Geol.Geograph.Geoecology, 27(2), 277-288________________________________________________________________________________________________________________________________________________________________
274
Journal of Geology,Geography and Geoecology
Journal home page: geology-dnu-dp.ua
ISSN 2617-2909 (print)ISSN 2617-2119 (online)
Journ.Geol.Geograph.Geoecology,
27(2), 274-285doi:10.15421/111851
D.V. Kulikova, O.S. Kovrov,Yu.V. Buchavy, V.V. Fedotov Journ.Geol.Geograph.Geoecology, 27(2), 274-285________________________________________________________________________________________________________________________________________________________________
GIS-based Assessment of the Assimilative Capacity of Rivers in Dnipropetrovsk Region
D.V. Kulikova, O.S. Kovrov, Yu.V. Buchavy, V.V. Fedotov
National Mining University, Dnipro, Ukrainee-mail: [email protected]
Abstract.The objective of this paper is to identify the level of changes in the ecologicalstatus of surface reservoirs of Dnipropetrovsk region under the impact of anthropogenicfactors and to find a rationale for the limit loads on aquatic ecosystems, based on aquantitative assessment of their assimilative capacity values using GIS-technologies.Tocharacterize and evaluate economic activity in the river basins of Dnipropetrovsk re-
gion, the data of state statistical reporting by the form of 2-TP "Water resources management" of the State Agency for Water Re-sources of Ukraine were used. Parameters characterizing the assimilative capacity of water bodies were determined by taking intoconsideration the perennial average values of river runoff resources of the priority watercourses of Dnipropetrovsk region in the yearswith varying degrees of supply: with an average (50%), a low (75%) and a very low (95%) river water content. The main indicatorscharacterizing the assimilative capacity of the water bodies of Dnipropetrovsk region are actual and necessary multiplicity of waste-water dilution, the limit to assimilative capacity of surface reservoirs, index of assimilative capacity utilization of river runoff re-sources of varying degrees of supply. A classification that characterizes the level of assimilative capacity utilization for water bodiesis proposed. The level of assimilative capacity utilization of the Dnipro River in the reservoir areas, regardless of the degree of riverrunoff supply, is estimated as “allowable” . At 95% degree of river runoff supply, the level of assimilative capacity utilization of theOril and Vovcha Rivers is characterized as “moderate”, the Samara River (after the confluence with the Vovcha River) as “high” andthe Ingulets River with tributary the Saksagan River, and the Samara River (before confluence with the Vovcha River) as “veryhigh”. It should be noted that irrespective of the level of river runoff supply, the index of assimilative capacity utilization of theSamara River (before its confluence with the Vovcha River) exceeds the limit value by 19-115 times. For the spatial analysis ofhydrological parameters and visualizion of the data in the form of thematic maps, the geoinformation system “Rivers of Dniprope-trovsk region” was developed on the basis of the ESRI ArcGIS Desktop10 software package. Using the geoprocessing tools, on thebasis of hydrological indices of 7 priority watercourses for each of the 22 administrative-territorial districts of Dnipropetrovsk region,the main indicators characterizing the assimilative capacity of water resources were calculated and ranked. The use of indicatorscharacterizing the assimilative capacity of river runoff resources allows us to identify the threshold levels of anthropogenic transfor-mation of aquatic ecosystems, develop and implement environmental measures to improve the ecological status and ensure environ-mental safety of surface reservoirs.
Key words: assimilative capacity,multiplicity of wastewater dilution, index of assimilative capacity utilization, river runoff, self-purification of water reservoirs
Оценка ассимиляционной емкости рек Днепропетровской области с использованиемгеоинформационных технологий
Д.В. Кулікова, О.С. Ковров, Ю.В. Бучавий, В.В. Федотов
Державний вищий навчальний заклад «Національний гірничий університет», Дніпро, Українаe-mail: [email protected]
Анотація. Проведено аналіз забору річкової води й скиду стічних вод у поверхневі водойми Дніпропетровщини. Визначеновеличини фактичної та необхідної для самоочищення кратності розведення стічних вод різної категорії якості річковимиводами. Встановлено значення граничної асиміляційної ємності ресурсів річкового стоку Дніпропетровської області різногоступеня забезпеченості. Розраховано значення індексу використання асиміляційної ємності ресурсів річкового стоку різногоступеня забезпеченості. Запропоновано класифікацію, що характеризує рівень використання асиміляційної ємності воднихоб'єктів. Встановлено, що рівень використання асиміляційної ємності річки Дніпро на ділянці водоймищ незалежно від
Received 22.06.2018;Received in revised form 08.08.2018;Accepted 03.09.2018
D.V. Kulikova, O.S. Kovrov,Yu.V. Buchavy, V.V. Fedotov Journ.Geol.Geograph.Geoecology, 27(2), 274-285________________________________________________________________________________________________________________________________________________________________
275
рівня забезпеченості річковим стоком, оцінюється як "припустимий". При 95%-вому ступені забезпеченості річковим сто-ком рівень використання асиміляційної ємності річок Оріль і Вовча характеризується як "помірний", р. Самари (після впа-діння в неї р. Вовча) – "високий" та річок Інгулець з припливом Саксагань і Самара (до впадіння в неї р. Вовча) – "надзви-чайно високий". За результатами розрахунків на основі програмного комплексу ESRІ ArcGі Desktop10 розроблено геоінфо-рмаційну систему "Річки Дніпропетровської області". Визначено питомі показники, що характеризують асиміляційну єм-ність водних ресурсів у дуже маловодні роки за адміністративно-територіальними районами області.
Ключові слова: асиміляційна ємність, кратність розведення стічних вод, індекс використання асиміляційної ємності, за-безпеченість річковим стоком, самоочищення водойм
Introduction. Intensive economic activity in theriver basins of Dnipropetrovsk region significantlyaffects the quantitative and qualitative indicators ofwater resources and their ecological status. Theoverwhelming majority of Dnipropetrovsk region’srivers are degraded, as a result of an excessive anth-ropogenic load, prevailing over the capacity of wa-ter bodies for self-purification and self-repair. This,in turn, is exacerbated by the low level of watersupply of the region. The resources of local riverrunoff are very small and amount to 450 m3 per 1inhabitant (Regional report on the state of the envi-ronment in Dnipropetrovsk region in 2016, 2017).
Small and medium-sized rivers experienceanthropogenic impact more acutely than large ones,due to their small water content , and as a rule, theworst purification of wastewater dischargedintothem . The river beds accept the main technogenicload from water-users. Today, human economicactivity has led to a crisis situation in the small andmedium-sized rivers of Dnipropetrovsk region,which to a large extent determine the overall stateof the DniproRiver. The largest tributaries of theDnipro are the rivers Oril, Samara with the tributaryof Vovcha and the Ingulets with the tributary ofSaksagan. These rivers are the main sources ofwater supply in Dnipropetrovsk region, so far asthey have a constant water flow. To ensure of theecological safety of surface reservoirs, it is neces-sary that the paces of water resources use caused bynatural processes and anthropogenic impact corres-pond to the paces of resumption (restoration) ofaquatic ecosystems within the framework of ba-lanced water use.
The result of technogenic impact on rivers isthe loss of capacity of aquatic ecosystems for natu-ral self-purification and self-restoration, that is, tocause a decrease in their assimilative capacity(Cairns Jr., 1999; Fallah-Mehdipour, 2015). Assim-ilative capacity (potential) of an ecosystem is anindicator of the maximum dynamic capacity of theamount of pollutants which can be accumulated,destroyed, transformed and transferred beyond thevolume of the ecosystem without disturbing itsnormal activity (Izrael, Tsyban, 1989).
One method used to normalize the ecologicalstate of aquatic ecosystems is assessment theirability to purify themselves by calculating the as-
similative capacity for each water body or part ofits water area (Glasoe, Steiner, Budd, Young, 1990;Hoang Ngos, Tran Quang, 2012; Hernandez, Ud-dameri, 2013). Thus, the use of indicators characte-rizing the assimilative capacity of river runoff re-sources allows us to identify the threshold levels ofanthropogenic transformation of aquatic ecosys-tems, develop and implement environmental meas-ures to improve the ecological status and ensureenvironmental safety of surface reservoirs.The objective of the paper is to identify the levelof change in the ecological status of surface reser-voirs of Dnipropetrovsk region under the impact ofanthropogenic factors and to find a rationale for thelimit loads on aquatic ecosystems, based on thequantitative assessment of their assimilative capaci-ty values using GIS-technologies.Materials and methods of research. To character-ize and evaluate economic activity in Dniprope-trovsk region’s river basins, the data of state statis-tical reporting by the form of 2-TP "Water re-sources management" of the State Agency for Wa-ter Resources of Ukraine were used. To determinethe limit assimilative capacity of water bodies, weused perennial average values of river runoff re-sources of the priority watercourses of Dniprope-trovsk region in the years with varying degrees ofsupply: with an average (50%), a low (75%) and avery low (95%) river water content.
As the main water bodies, for which the indi-cators characterizing their assimilative capacitywere calculated, the largest watercourses of Dni-propetrovsk region were selected:
1 – the InguletsRiver, including its tributarythe SaksaganRiver;
2 – the Dnipro River, site I (the area of theDniprodzerzhinsk-Dnipro reservoirs);
3 – the OrilRiver;4 – the Samara River, site I (before the con-
fluence with the Vovcha River);5 – the Samara River, site II (after the con-
fluence with the Vovcha River);6 – the VovchaRiver;7 – the Dnipro River, site II (the area of the
Dnipro-Kakhovka reservoirs).Assimilative capacity of water bodies was
assessed using the following groups of indicators:1. Basic:
D.V. Kulikova, O.S. Kovrov,Yu.V. Buchavy, V.V. Fedotov Journ.Geol.Geograph.Geoecology, 27(2), 274-285________________________________________________________________________________________________________________________________________________________________
276
– total wastewater discharge into surface wa-ter bodies, mln. m3;
– amount of wastewater discharged into wa-ter bodies as normatively clean (without purifica-tion), mln. m3;
– amount of wastewater discharged into wa-ter bodies as normatively purified, mln. m3;
– amount of wastewater discharged into wa-ter bodies as contaminated or insufficiently puri-fied, mln. m3;
– volume of river runoff the varying degreesof supply (in the years with an average, a low, avery low river water content), mln. m3.
2. Estimated:– value of necessary multiplicity of wastewa-
ter dilution discharged into surface reservoirs, conv.units;
– value of limit assimilative capacity of thewater body that accepts discharged wastewater,mln. m3;
– index of assimilative capacity utilization ofthe water body, conv. units.
The main criterion of assimilative potentialof the water body is the multiplicity of wastewaterdilution.
The indicator of necessary multiplicity dilu-tion of wastewater volume in the water body vo-lume is a universal characteristic (Farhadian, Bo-zorg Haddad, Seifollahi-Aghmiuni, Loáiciga, 2014;Monfared, Darmian, Snyder, Azizyan, Pirzadeh,Moghaddam, 2017). It shows by how many timesthe water volume that takes part in river runoffdilution increases relative to the primary dischargedwastewater volume.
Depending on the ratio of the dischargedwastewater volume and the water body volume,taking into account the intensity of dilution andself-cleaning processes occurring in it, variousamounts of wastewater can be discharged into eachwater body for a certain time. At the same time, thelimit volume of wastewater that can be dischargedinto a water body without violating sanitary re-quirements is conditioned by a certain dependencerelative to water quality standards.
The natural self-cleaning ability of water bo-dies and watercourses is very low. A self-cleaningprocess occurs only if the wastewater is dischargedinto the surface reservoirs completely purified, andin a water body they have been diluted with riverwater in a ratio of 1:12-15. If, in water bodies andwatercourses, wastewater is discharged in a largevolume, and all the more so сontaminated (or insuf-ficiently purified), the stable natural balance ofaquatic ecosystems is gradually lost, their normalfunctioning is disturbed, which makes these riversunsuitable for use.
According to the recommendation of (Ko-ronkevich, 1990), the multiplicity of dilution ofconditionally pure water should be 1:3, purifiedhousehold wastewaste – 1:5, unpurified – 1:20,purified industrial wastewaters – 1:15, unpurified –1:50, for drains from urban territories – 1:3, fromagricultural fields – 1:1. These values of the multip-licity of wastewater dilution were accepted as thebasis for calculations.
For a more detailed study of the assimilativecapacity of surface water bodies, various approach-es and methods are used (Lee, Wen, 1996; Watson,Wyss, Booth, Sousa, 2012; Chiejine, Igboanugo,Ezemonye, 2016). Geoinformation technologies arethe most important modern tool for analyzing datarelated to natural objects, which allow not onlyvisualization of actual and forecasted situations onmaps, but also generate new data and patterns. Forexample, the solution of tasks on the rational useand restoration of water resources can be carriedout using automated GIS-zoning of study area (Ra-tional Use and Recovery of Water Resources,2016). For the assessment of levels of assimilativecapacity utilization the rivers of Dnipropetrovskregion and visualization of data in the form of the-matic maps, the geoinformation system “Rivers ofDnipropetrovsk region” was developed on the basisof the ESRI ArcGIS Desktop10 software package.To calculate and rank the indicators characterizingthe assimilative capacity of water bodies, on thebasis of hydrological indices of the seven priorityrivers, geoprocessing tools such as overlay / identi-ty were used for the administrative-territorial dis-tricts of Dnipropetrovsk region.Results and their analysis. The main river ofhydrographic networkofDnepropetrovsk region isthe DniproRiver, which is represented by a cascadeof reservoirs across the region territory: Dniprod-zerzhinskoye, Dniprovskoye and Kakhovskoye.The total length of the DniproRiver within the re-gion is 261 km, including 66 km within the Dni-prodzerzhinskoye, 94 km within Dniprovskoye and101 km within Kakhovskoye reservoirs.
In general, the hydrographic network of theDnipro River basin within the region (Fig.1) isrepresented by 291 rivers, over 10 km long (ofwhich 9 rivers are medium-sized), 101 reservoirs,3,292 ponds and 1,129 lakes.
Currently, the water resources of Dnipropetrovskregion are intensively used for various needs. Thereare practically no rivers with a natural hydrologicalregime that has not been affected by economic ac-tivity. Most rivers are affected by the discharge of
contaminated and/or insufficiently treated wastewa-ter discharged by industrial, agricultural and com-
munal enterprises directly into water bodies.
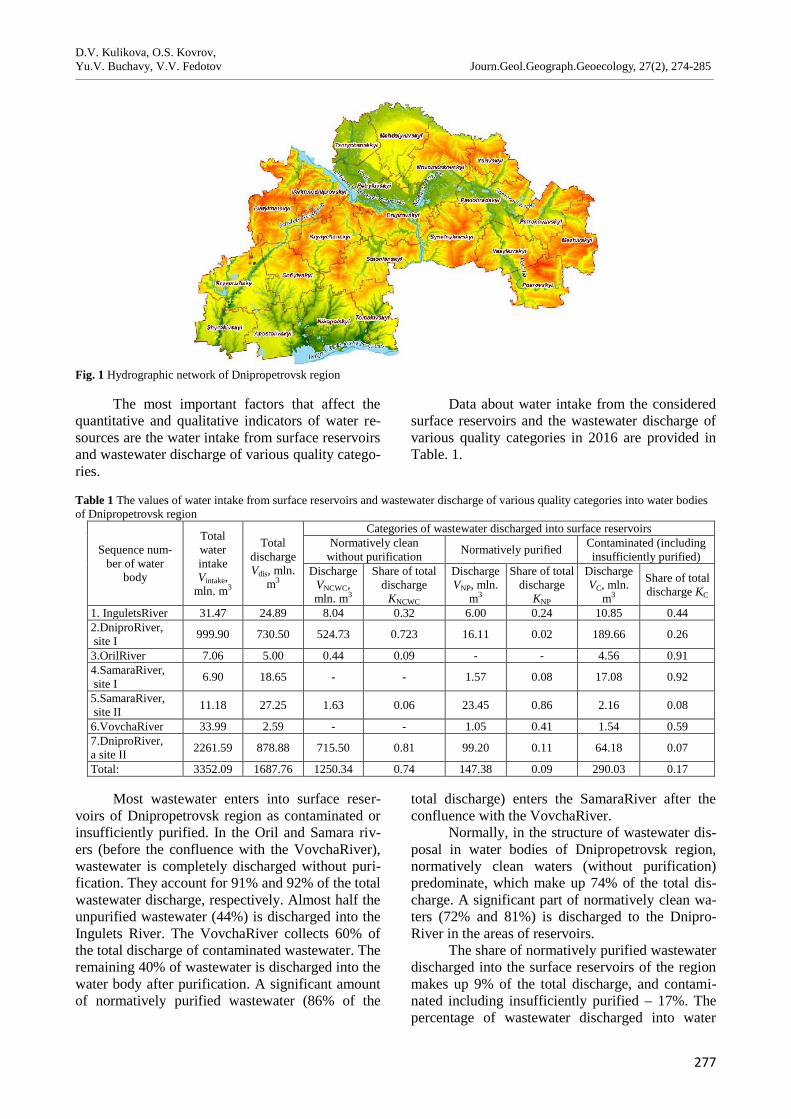
D.V. Kulikova, O.S. Kovrov,Yu.V. Buchavy, V.V. Fedotov Journ.Geol.Geograph.Geoecology, 27(2), 274-285________________________________________________________________________________________________________________________________________________________________
277
Fig. 1 Hydrographic network of Dnipropetrovsk region
The most important factors that affect thequantitative and qualitative indicators of water re-sources are the water intake from surface reservoirsand wastewater discharge of various quality catego-ries.
Data about water intake from the consideredsurface reservoirs and the wastewater discharge ofvarious quality categories in 2016 are provided inTable. 1.
Table 1 The values of water intake from surface reservoirs and wastewater discharge of various quality categories into water bodiesof Dnipropetrovsk region
Sequence num-ber of water
body
TotalwaterintakeVintake,
mln. m3
TotaldischargeVdis, mln.
m3
Categories of wastewater discharged into surface reservoirsNormatively clean
without purification Normatively purified Contaminated (includinginsufficiently purified)
DischargeVNCWC,mln. m3
Share of totaldischarge
КNCWC
DischargeVNP, mln.
m3
Share of totaldischarge
КNP
DischargeVC, mln.
m3
Share of totaldischarge КC
1. InguletsRiver 31.47 24.89 8.04 0.32 6.00 0.24 10.85 0.442.DniproRiver,site I 999.90 730.50 524.73 0.723 16.11 0.02 189.66 0.26
3.OrilRiver 7.06 5.00 0.44 0.09 - - 4.56 0.914.SamaraRiver,site I 6.90 18.65 - - 1.57 0.08 17.08 0.92
5.SamaraRiver,site II 11.18 27.25 1.63 0.06 23.45 0.86 2.16 0.08
6.VovchaRiver 33.99 2.59 - - 1.05 0.41 1.54 0.597.DniproRiver,a site II 2261.59 878.88 715.50 0.81 99.20 0.11 64.18 0.07
Total: 3352.09 1687.76 1250.34 0.74 147.38 0.09 290.03 0.17
Most wastewater enters into surface reser-voirs of Dnipropetrovsk region as contaminated orinsufficiently purified. In the Oril and Samara riv-ers (before the confluence with the VovchaRiver),wastewater is completely discharged without puri-fication. They account for 91% and 92% of the totalwastewater discharge, respectively. Almost half theunpurified wastewater (44%) is discharged into theIngulets River. The VovchaRiver collects 60% ofthe total discharge of contaminated wastewater. Theremaining 40% of wastewater is discharged into thewater body after purification. A significant amountof normatively purified wastewater (86% of the
total discharge) enters the SamaraRiver after theconfluence with the VovchaRiver.
Normally, in the structure of wastewater dis-posal in water bodies of Dnipropetrovsk region,normatively clean waters (without purification)predominate, which make up 74% of the total dis-charge. A significant part of normatively clean wa-ters (72% and 81%) is discharged to the Dnipro-River in the areas of reservoirs.
The share of normatively purified wastewaterdischarged into the surface reservoirs of the regionmakes up 9% of the total discharge, and contami-nated including insufficiently purified – 17%. Thepercentage of wastewater discharged into water
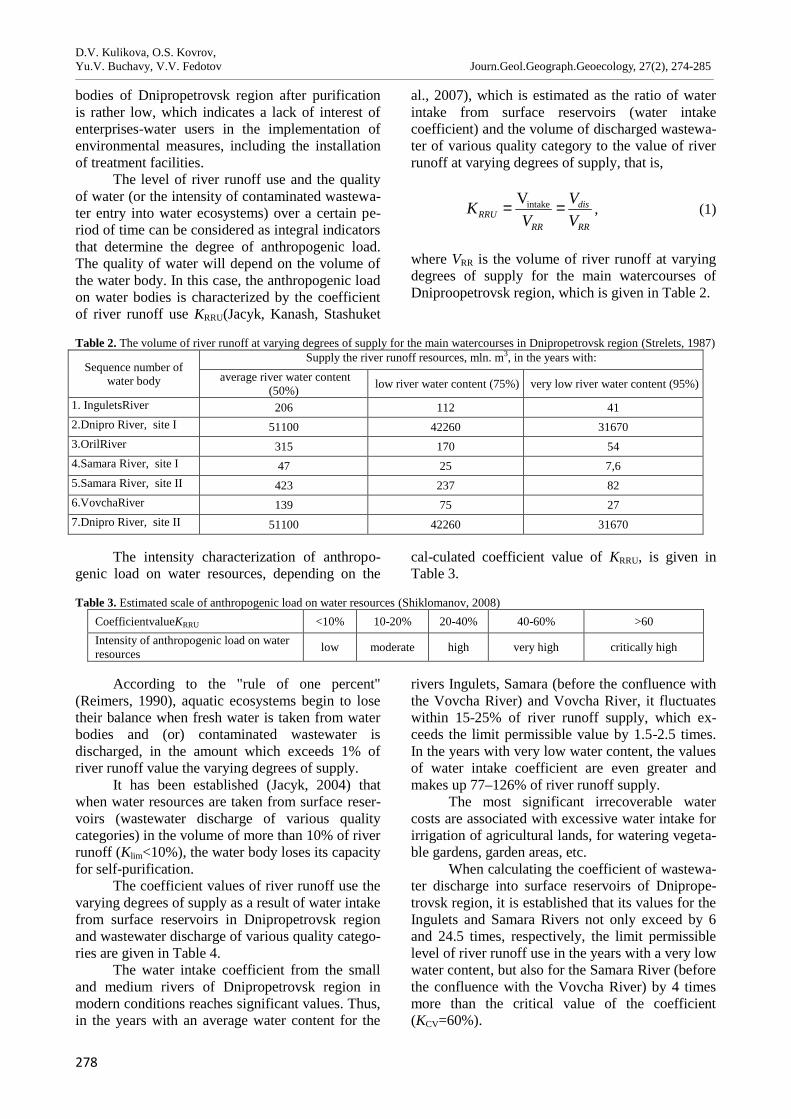
D.V. Kulikova, O.S. Kovrov,Yu.V. Buchavy, V.V. Fedotov Journ.Geol.Geograph.Geoecology, 27(2), 274-285________________________________________________________________________________________________________________________________________________________________
278
bodies of Dnipropetrovsk region after purificationis rather low, which indicates a lack of interest ofenterprises-water users in the implementation ofenvironmental measures, including the installationof treatment facilities.
The level of river runoff use and the qualityof water (or the intensity of contaminated wastewa-ter entry into water ecosystems) over a certain pe-riod of time can be considered as integral indicatorsthat determine the degree of anthropogenic load.The quality of water will depend on the volume ofthe water body. In this case, the anthropogenic loadon water bodies is characterized by the coefficientof river runoff use KRRU(Jacyk, Kanash, Stashuket
al., 2007), which is estimated as the ratio of waterintake from surface reservoirs (water intakecoefficient) and the volume of discharged wastewa-ter of various quality category to the value of riverrunoff at varying degrees of supply, that is,
RR
dis
RRRRU V
VV
К == intakeV, (1)
where VRR is the volume of river runoff at varyingdegrees of supply for the main watercourses ofDniproopetrovsk region, which is given in Table 2.
Table 2. The volume of river runoff at varying degrees of supply for the main watercourses in Dnipropetrovsk region (Strelets, 1987)
Sequence number ofwater body
Supply the river runoff resources, mln. m3, in the years with:average river water content
(50%) low river water content (75%) very low river water content (95%)
1. InguletsRiver 206 112 412.Dnipro River, site I 51100 42260 316703.OrilRiver 315 170 544.Samara River, site I 47 25 7,65.Samara River, site II 423 237 826.VovchaRiver 139 75 277.Dnipro River, site II 51100 42260 31670
The intensity characterization of anthropo-genic load on water resources, depending on the
cal-culated coefficient value of KRRU, is given inTable 3.
Table 3. Estimated scale of anthropogenic load on water resources (Shiklomanov, 2008)CoefficientvalueКRRU <10% 10-20% 20-40% 40-60% >60Intensity of anthropogenic load on waterresources low moderate high very high critically high
According to the "rule of one percent"(Reimers, 1990), aquatic ecosystems begin to losetheir balance when fresh water is taken from waterbodies and (or) contaminated wastewater isdischarged, in the amount which exceeds 1% ofriver runoff value the varying degrees of supply.
It has been established (Jacyk, 2004) thatwhen water resources are taken from surface reser-voirs (wastewater discharge of various qualitycategories) in the volume of more than 10% of riverrunoff (Klim<10%), the water body loses its capacityfor self-purification.
The coefficient values of river runoff use thevarying degrees of supply as a result of water intakefrom surface reservoirs in Dnipropetrovsk regionand wastewater discharge of various quality catego-ries are given in Table 4.
The water intake coefficient from the smalland medium rivers of Dnipropetrovsk region inmodern conditions reaches significant values. Thus,in the years with an average water content for the
rivers Ingulets, Samara (before the confluence withthe Vovcha River) and Vovcha River, it fluctuateswithin 15-25% of river runoff supply, which ex-ceeds the limit permissible value by 1.5-2.5 times.In the years with very low water content, the valuesof water intake coefficient are even greater andmakes up 77–126% of river runoff supply.
The most significant irrecoverable watercosts are associated with excessive water intake forirrigation of agricultural lands, for watering vegeta-ble gardens, garden areas, etc.
When calculating the coefficient of wastewa-ter discharge into surface reservoirs of Dniprope-trovsk region, it is established that its values for theIngulets and Samara Rivers not only exceed by 6and 24.5 times, respectively, the limit permissiblelevel of river runoff use in the years with a very lowwater content, but also for the Samara River (beforethe confluence with the Vovcha River) by 4 timesmore than the critical value of the coefficient(КCV=60%).
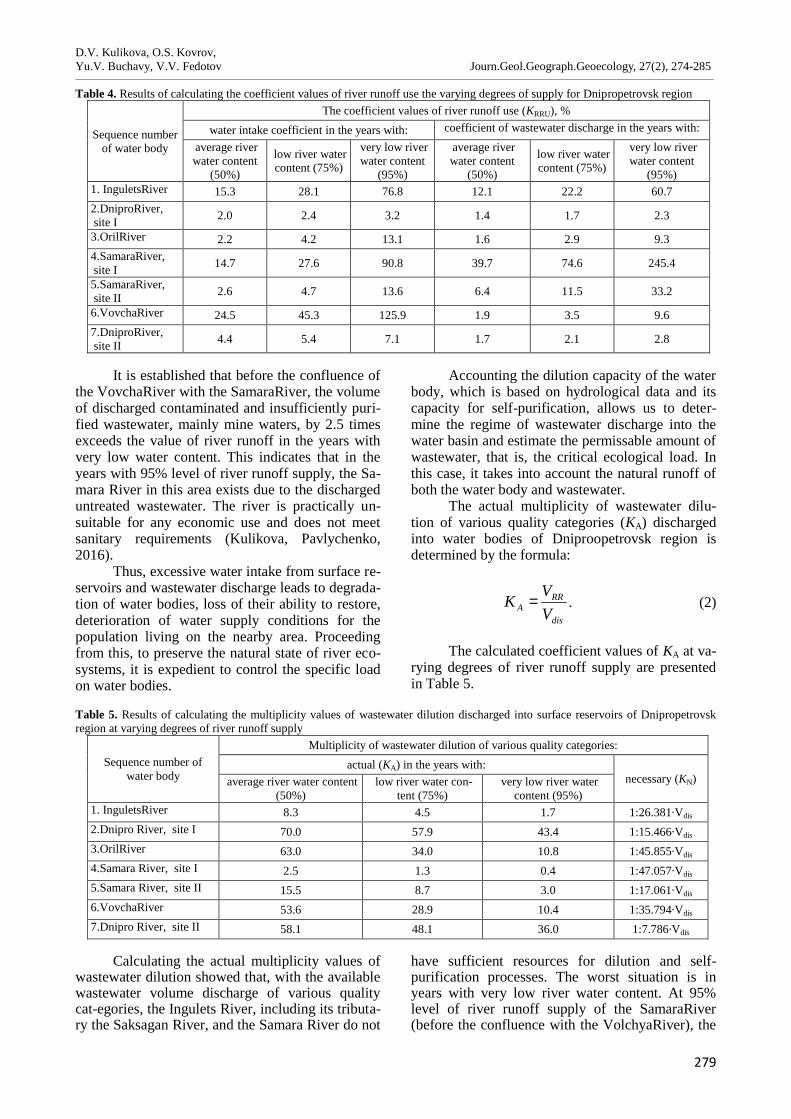
D.V. Kulikova, O.S. Kovrov,Yu.V. Buchavy, V.V. Fedotov Journ.Geol.Geograph.Geoecology, 27(2), 274-285________________________________________________________________________________________________________________________________________________________________
279
Table 4. Results of calculating the coefficient values of river runoff use the varying degrees of supply for Dnipropetrovsk region
Sequence numberof water body
The coefficient values of river runoff use (КRRU), %water intake coefficient in the years with: coefficient of wastewater discharge in the years with:
average riverwater content
(50%)
low river watercontent (75%)
very low riverwater content
(95%)
average riverwater content
(50%)
low river watercontent (75%)
very low riverwater content
(95%)1. InguletsRiver 15.3 28.1 76.8 12.1 22.2 60.72.DniproRiver,site I 2.0 2.4 3.2 1.4 1.7 2.3
3.OrilRiver 2.2 4.2 13.1 1.6 2.9 9.34.SamaraRiver,site I 14.7 27.6 90.8 39.7 74.6 245.4
5.SamaraRiver,site II 2.6 4.7 13.6 6.4 11.5 33.2
6.VovchaRiver 24.5 45.3 125.9 1.9 3.5 9.67.DniproRiver,site II 4.4 5.4 7.1 1.7 2.1 2.8
It is established that before the confluence ofthe VovchaRiver with the SamaraRiver, the volumeof discharged contaminated and insufficiently puri-fied wastewater, mainly mine waters, by 2.5 timesexceeds the value of river runoff in the years withvery low water content. This indicates that in theyears with 95% level of river runoff supply, the Sa-mara River in this area exists due to the dischargeduntreated wastewater. The river is practically un-suitable for any economic use and does not meetsanitary requirements (Kulikova, Pavlychenko,2016).
Thus, excessive water intake from surface re-servoirs and wastewater discharge leads to degrada-tion of water bodies, loss of their ability to restore,deterioration of water supply conditions for thepopulation living on the nearby area. Proceedingfrom this, to preserve the natural state of river eco-systems, it is expedient to control the specific loadon water bodies.
Accounting the dilution capacity of the waterbody, which is based on hydrological data and itscapacity for self-purification, allows us to deter-mine the regime of wastewater discharge into thewater basin and estimate the permissable amount ofwastewater, that is, the critical ecological load. Inthis case, it takes into account the natural runoff ofboth the water body and wastewater.
The actual multiplicity of wastewater dilu-tion of various quality categories (KA) dischargedinto water bodies of Dniproopetrovsk region isdetermined by the formula:
dis
RRА V
VК = . (2)
The calculated coefficient values of KA at va-rying degrees of river runoff supply are presentedin Table 5.
Table 5. Results of calculating the multiplicity values of wastewater dilution discharged into surface reservoirs of Dnipropetrovskregion at varying degrees of river runoff supply
Sequence number ofwater body
Multiplicity of wastewater dilution of various quality categories:actual (КA) in the years with:
necessary (КN)average river water content(50%)
low river water con-tent (75%)
very low river watercontent (95%)
1. InguletsRiver 8.3 4.5 1.7 1:26.381∙Vdis
2.Dnipro River, site I 70.0 57.9 43.4 1:15.466∙Vdis
3.OrilRiver 63.0 34.0 10.8 1:45.855∙Vdis
4.Samara River, site I 2.5 1.3 0.4 1:47.057∙Vdis
5.Samara River, site II 15.5 8.7 3.0 1:17.061∙Vdis
6.VovchaRiver 53.6 28.9 10.4 1:35.794∙Vdis
7.Dnipro River, site II 58.1 48.1 36.0 1:7.786∙Vdis
Calculating the actual multiplicity values ofwastewater dilution showed that, with the availablewastewater volume discharge of various qualitycat-egories, the Ingulets River, including its tributa-ry the Saksagan River, and the Samara River do not
have sufficient resources for dilution and self-purification processes. The worst situation is inyears with very low river water content. At 95%level of river runoff supply of the SamaraRiver(before the confluence with the VolchyaRiver), the
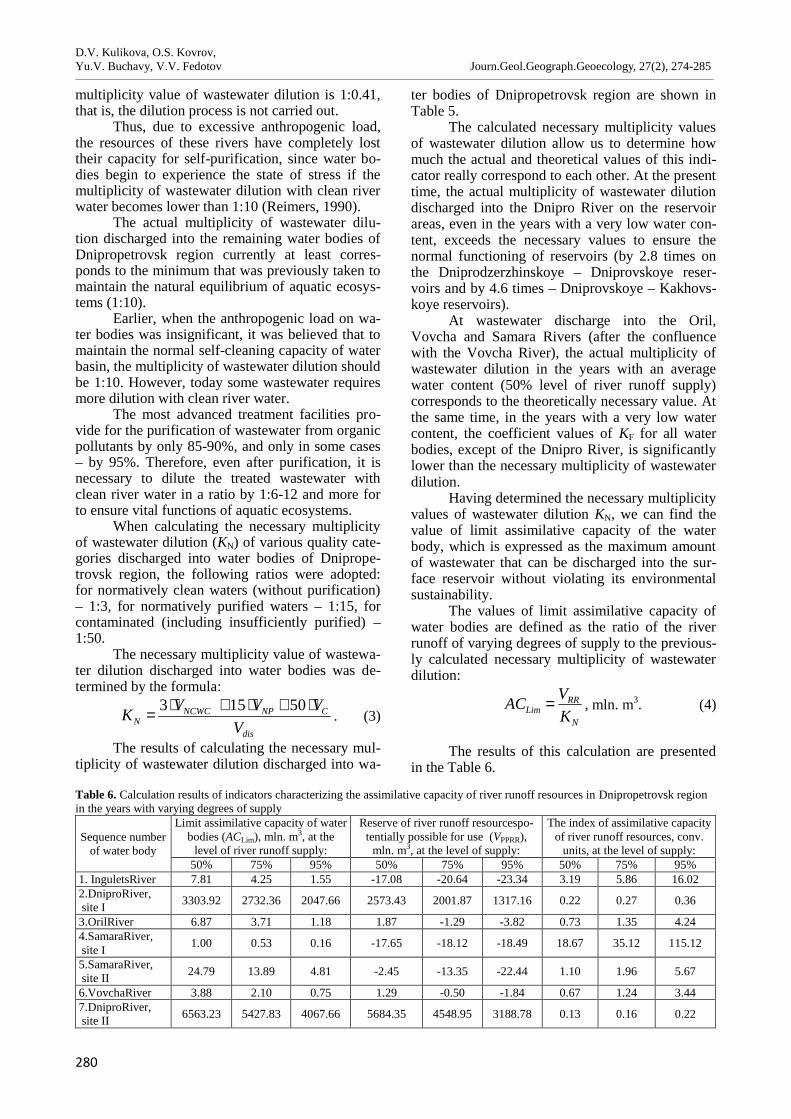
D.V. Kulikova, O.S. Kovrov,Yu.V. Buchavy, V.V. Fedotov Journ.Geol.Geograph.Geoecology, 27(2), 274-285________________________________________________________________________________________________________________________________________________________________
280
multiplicity value of wastewater dilution is 1:0.41,that is, the dilution process is not carried out.
Thus, due to excessive anthropogenic load,the resources of these rivers have completely losttheir capacity for self-purification, since water bo-dies begin to experience the state of stress if themultiplicity of wastewater dilution with clean riverwater becomes lower than 1:10 (Reimers, 1990).
The actual multiplicity of wastewater dilu-tion discharged into the remaining water bodies ofDnipropetrovsk region currently at least corres-ponds to the minimum that was previously taken tomaintain the natural equilibrium of aquatic ecosys-tems (1:10).
Earlier, when the anthropogenic load on wa-ter bodies was insignificant, it was believed that tomaintain the normal self-cleaning capacity of waterbasin, the multiplicity of wastewater dilution shouldbe 1:10. However, today some wastewater requiresmore dilution with clean river water.
The most advanced treatment facilities pro-vide for the purification of wastewater from organicpollutants by only 85-90%, and only in some cases– by 95%. Therefore, even after purification, it isnecessary to dilute the treated wastewater withclean river water in a ratio by 1:6-12 and more forto ensure vital functions of aquatic ecosystems.
When calculating the necessary multiplicityof wastewater dilution (KN) of various quality cate-gories discharged into water bodies of Dniprope-trovsk region, the following ratios were adopted:for normatively clean waters (without purification)– 1:3, for normatively purified waters – 1:15, forcontaminated (including insufficiently purified) –1:50.
The necessary multiplicity value of wastewa-ter dilution discharged into water bodies was de-termined by the formula:
dis
CNPNCWCN V
VVVК ⋅+⋅+⋅= 50153. (3)
The results of calculating the necessary mul-tiplicity of wastewater dilution discharged into wa-
ter bodies of Dnipropetrovsk region are shown inTable 5.
The calculated necessary multiplicity valuesof wastewater dilution allow us to determine howmuch the actual and theoretical values of this indi-cator really correspond to each other. At the presenttime, the actual multiplicity of wastewater dilutiondischarged into the Dnipro River on the reservoirareas, even in the years with a very low water con-tent, exceeds the necessary values to ensure thenormal functioning of reservoirs (by 2.8 times onthe Dniprodzerzhinskoye – Dniprovskoye reser-voirs and by 4.6 times – Dniprovskoye – Kakhovs-koye reservoirs).
At wastewater discharge into the Oril,Vovcha and Samara Rivers (after the confluencewith the Vovcha River), the actual multiplicity ofwastewater dilution in the years with an averagewater content (50% level of river runoff supply)corresponds to the theoretically necessary value. Atthe same time, in the years with a very low watercontent, the coefficient values of KF for all waterbodies, except of the Dnipro River, is significantlylower than the necessary multiplicity of wastewaterdilution.
Having determined the necessary multiplicityvalues of wastewater dilution KN, we can find thevalue of limit assimilative capacity of the waterbody, which is expressed as the maximum amountof wastewater that can be discharged into the sur-face reservoir without violating its environmentalsustainability.
The values of limit assimilative capacity ofwater bodies are defined as the ratio of the riverrunoff of varying degrees of supply to the previous-ly calculated necessary multiplicity of wastewaterdilution:
N
RRLim К
VАC = , mln. m3. (4)
The results of this calculation are presentedin the Table 6.
Table 6. Calculation results of indicators characterizing the assimilative capacity of river runoff resources in Dnipropetrovsk regionin the years with varying degrees of supply
Sequence numberof water body
Limit assimilative capacity of waterbodies (АCLim), mln. m3, at the
level of river runoff supply:
Reserve of river runoff resourcespo-tentially possible for use (VPPRR),
mln. m3, at the level of supply:
The index of assimilative capacityof river runoff resources, conv.
units, at the level of supply:50% 75% 95% 50% 75% 95% 50% 75% 95%
1. InguletsRiver 7.81 4.25 1.55 -17.08 -20.64 -23.34 3.19 5.86 16.022.DniproRiver,site I 3303.92 2732.36 2047.66 2573.43 2001.87 1317.16 0.22 0.27 0.36
3.OrilRiver 6.87 3.71 1.18 1.87 -1.29 -3.82 0.73 1.35 4.244.SamaraRiver,site I 1.00 0.53 0.16 -17.65 -18.12 -18.49 18.67 35.12 115.12
5.SamaraRiver,site II 24.79 13.89 4.81 -2.45 -13.35 -22.44 1.10 1.96 5.67
6.VovchaRiver 3.88 2.10 0.75 1.29 -0.50 -1.84 0.67 1.24 3.447.DniproRiver,site II 6563.23 5427.83 4067.66 5684.35 4548.95 3188.78 0.13 0.16 0.22
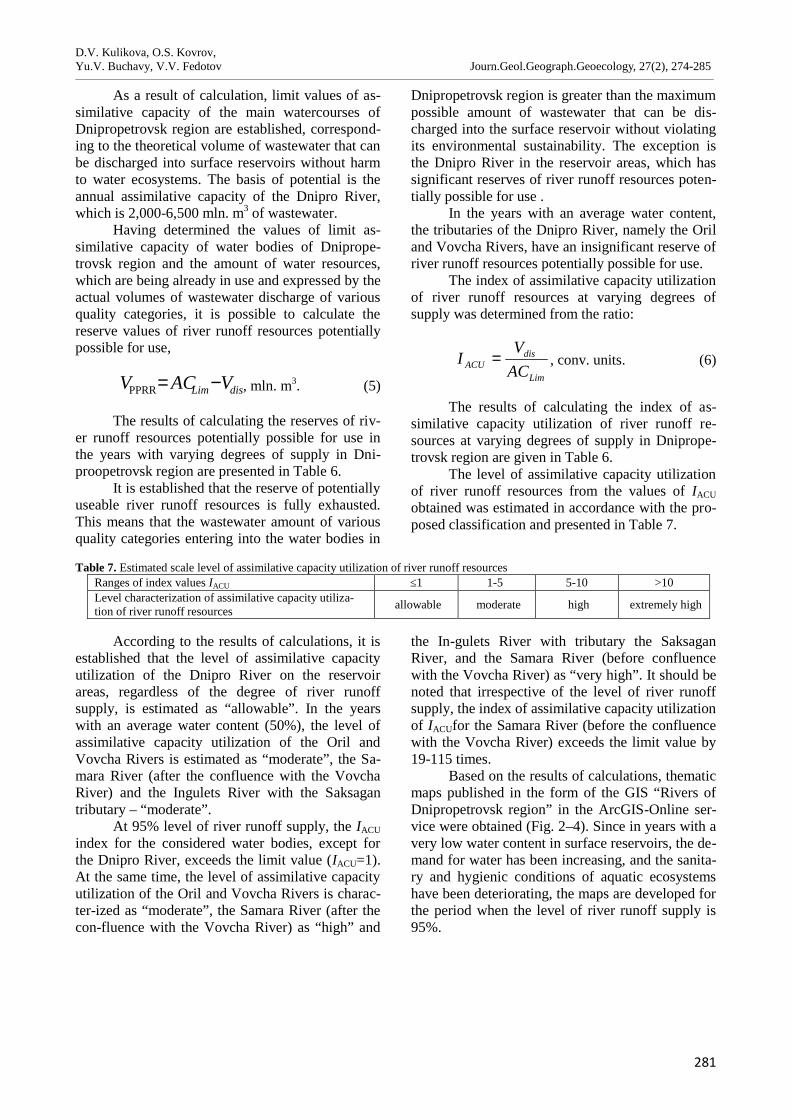
D.V. Kulikova, O.S. Kovrov,Yu.V. Buchavy, V.V. Fedotov Journ.Geol.Geograph.Geoecology, 27(2), 274-285________________________________________________________________________________________________________________________________________________________________
281
As a result of calculation, limit values of as-similative capacity of the main watercourses ofDnipropetrovsk region are established, correspond-ing to the theoretical volume of wastewater that canbe discharged into surface reservoirs without harmto water ecosystems. The basis of potential is theannual assimilative capacity of the Dnipro River,which is 2,000-6,500 mln. m3 of wastewater.
Having determined the values of limit as-similative capacity of water bodies of Dniprope-trovsk region and the amount of water resources,which are being already in use and expressed by theactual volumes of wastewater discharge of variousquality categories, it is possible to calculate thereserve values of river runoff resources potentiallypossible for use,
disLim VАCV −=PPRR , mln. m3. (5)
The results of calculating the reserves of riv-er runoff resources potentially possible for use inthe years with varying degrees of supply in Dni-proopetrovsk region are presented in Table 6.
It is established that the reserve of potentiallyuseable river runoff resources is fully exhausted.This means that the wastewater amount of variousquality categories entering into the water bodies in
Dnipropetrovsk region is greater than the maximumpossible amount of wastewater that can be dis-charged into the surface reservoir without violatingits environmental sustainability. The exception isthe Dnipro River in the reservoir areas, which hassignificant reserves of river runoff resources poten-tially possible for use .
In the years with an average water content,the tributaries of the Dnipro River, namely the Oriland Vovcha Rivers, have an insignificant reserve ofriver runoff resources potentially possible for use.
The index of assimilative capacity utilizationof river runoff resources at varying degrees ofsupply was determined from the ratio:
Lim
disАCU АC
VІ = , conv. units. (6)
The results of calculating the index of as-similative capacity utilization of river runoff re-sources at varying degrees of supply in Dniprope-trovsk region are given in Table 6.
The level of assimilative capacity utilizationof river runoff resources from the values of IACUobtained was estimated in accordance with the pro-posed classification and presented in Table 7.
Table 7. Estimated scale level of assimilative capacity utilization of river runoff resourcesRanges of index values ІАCU ≤1 1-5 5-10 >10Level characterization of assimilative capacity utiliza-tion of river runoff resources allowable moderate high extremely high
According to the results of calculations, it isestablished that the level of assimilative capacityutilization of the Dnipro River on the reservoirareas, regardless of the degree of river runoffsupply, is estimated as “allowable”. In the yearswith an average water content (50%), the level ofassimilative capacity utilization of the Oril andVovcha Rivers is estimated as “moderate”, the Sa-mara River (after the confluence with the VovchaRiver) and the Ingulets River with the Saksagantributary – “moderate”.
At 95% level of river runoff supply, the ІАCUindex for the considered water bodies, except forthe Dnipro River, exceeds the limit value (IACU=1).At the same time, the level of assimilative capacityutilization of the Oril and Vovcha Rivers is charac-ter-ized as “moderate”, the Samara River (after thecon-fluence with the Vovcha River) as “high” and
the In-gulets River with tributary the SaksaganRiver, and the Samara River (before confluencewith the Vovcha River) as “very high”. It should benoted that irrespective of the level of river runoffsupply, the index of assimilative capacity utilizationof IACUfor the Samara River (before the confluencewith the Vovcha River) exceeds the limit value by19-115 times.
Based on the results of calculations, thematicmaps published in the form of the GIS “Rivers ofDnipropetrovsk region” in the ArcGIS-Online ser-vice were obtained (Fig. 2–4). Since in years with avery low water content in surface reservoirs, the de-mand for water has been increasing, and the sanita-ry and hygienic conditions of aquatic ecosystemshave been deteriorating, the maps are developed forthe period when the level of river runoff supply is95%.
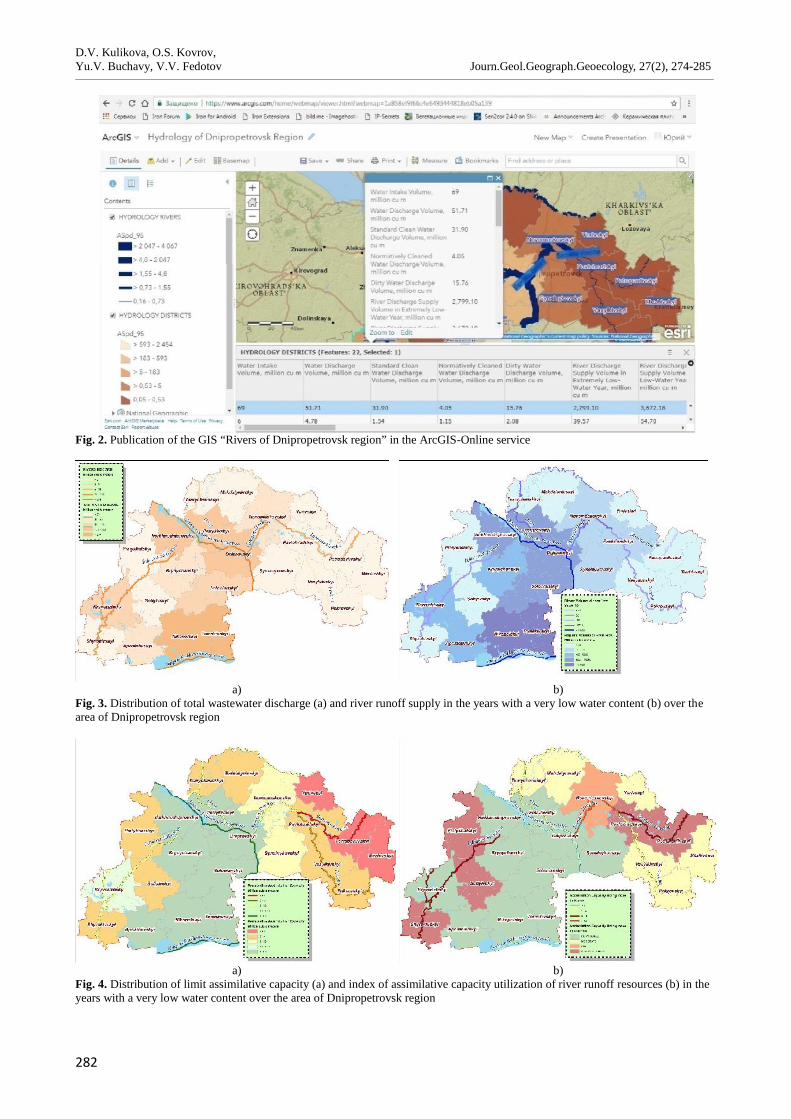
D.V. Kulikova, O.S. Kovrov,Yu.V. Buchavy, V.V. Fedotov Journ.Geol.Geograph.Geoecology, 27(2), 274-285________________________________________________________________________________________________________________________________________________________________
282
Fig. 2. Publication of the GIS “Rivers of Dnipropetrovsk region” in the ArcGIS-Online service
а) b)Fig. 3. Distribution of total wastewater discharge (a) and river runoff supply in the years with a very low water content (b) over thearea of Dnipropetrovsk region
а) b)Fig. 4. Distribution of limit assimilative capacity (a) and index of assimilative capacity utilization of river runoff resources (b) in theyears with a very low water content over the area of Dnipropetrovsk region
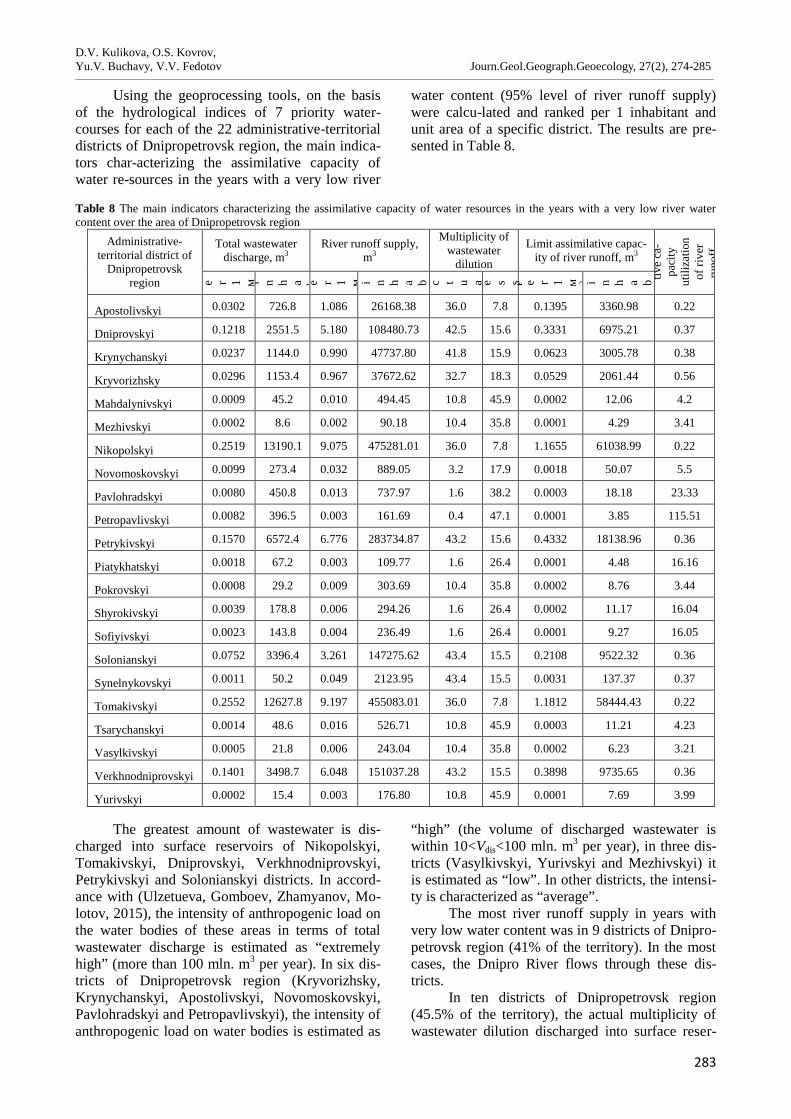
D.V. Kulikova, O.S. Kovrov,Yu.V. Buchavy, V.V. Fedotov Journ.Geol.Geograph.Geoecology, 27(2), 274-285________________________________________________________________________________________________________________________________________________________________
283
Using the geoprocessing tools, on the basisof the hydrological indices of 7 priority water-courses for each of the 22 administrative-territorialdistricts of Dnipropetrovsk region, the main indica-tors char-acterizing the assimilative capacity ofwater re-sources in the years with a very low river
water content (95% level of river runoff supply)were calcu-lated and ranked per 1 inhabitant andunit area of a specific district. The results are pre-sented in Table 8.
Table 8 The main indicators characterizing the assimilative capacity of water resources in the years with a very low river watercontent over the area of Dnipropetrovsk region
Administrative-territorial district of
Dnipropetrovskregion
Total wastewaterdischarge, m3
River runoff supply,m3
Multiplicity ofwastewater
dilution
Limit assimilative capac-ity of river runoff, m3
Inde
x of
assi
mila
-tiv
e ca
-pa
city
utili
zatio
nof
rive
rru
noff
,co
nv.
units
p e r 1 м 2p e r 1 i n h a b it a n tp e r 1 м 2p e r 1 i n h a b it a n ta c t u a ln e c e s s a r yp e r 1 м 2p e r 1 i n h a b it a n t
Apostolivskyi 0.0302 726.8 1.086 26168.38 36.0 7.8 0.1395 3360.98 0.22
Dniprovskyi 0.1218 2551.5 5.180 108480.73 42.5 15.6 0.3331 6975.21 0.37
Krynychanskyi 0.0237 1144.0 0.990 47737.80 41.8 15.9 0.0623 3005.78 0.38
Kryvorizhsky 0.0296 1153.4 0.967 37672.62 32.7 18.3 0.0529 2061.44 0.56
Mahdalynivskyi 0.0009 45.2 0.010 494.45 10.8 45.9 0.0002 12.06 4.2
Mezhivskyi 0.0002 8.6 0.002 90.18 10.4 35.8 0.0001 4.29 3.41
Nikopolskyi 0.2519 13190.1 9.075 475281.01 36.0 7.8 1.1655 61038.99 0.22
Novomoskovskyi 0.0099 273.4 0.032 889.05 3.2 17.9 0.0018 50.07 5.5
Pavlohradskyi 0.0080 450.8 0.013 737.97 1.6 38.2 0.0003 18.18 23.33
Petropavlivskyi 0.0082 396.5 0.003 161.69 0.4 47.1 0.0001 3.85 115.51
Petrykivskyi 0.1570 6572.4 6.776 283734.87 43.2 15.6 0.4332 18138.96 0.36
Piatykhatskyi 0.0018 67.2 0.003 109.77 1.6 26.4 0.0001 4.48 16.16
Pokrovskyi 0.0008 29.2 0.009 303.69 10.4 35.8 0.0002 8.76 3.44
Shyrokivskyi 0.0039 178.8 0.006 294.26 1.6 26.4 0.0002 11.17 16.04
Sofiyivskyi 0.0023 143.8 0.004 236.49 1.6 26.4 0.0001 9.27 16.05
Solonianskyi 0.0752 3396.4 3.261 147275.62 43.4 15.5 0.2108 9522.32 0.36
Synelnykovskyi 0.0011 50.2 0.049 2123.95 43.4 15.5 0.0031 137.37 0.37
Tomakivskyi 0.2552 12627.8 9.197 455083.01 36.0 7.8 1.1812 58444.43 0.22
Tsarychanskyi 0.0014 48.6 0.016 526.71 10.8 45.9 0.0003 11.21 4.23
Vasylkivskyi 0.0005 21.8 0.006 243.04 10.4 35.8 0.0002 6.23 3.21
Verkhnodniprovskyi 0.1401 3498.7 6.048 151037.28 43.2 15.5 0.3898 9735.65 0.36
Yurivskyi 0.0002 15.4 0.003 176.80 10.8 45.9 0.0001 7.69 3.99
The greatest amount of wastewater is dis-charged into surface reservoirs of Nikopolskyi,Tomakivskyi, Dniprovskyi, Verkhnodniprovskyi,Petrykivskyi and Solonianskyi districts. In accord-ance with (Ulzetueva, Gomboev, Zhamyanov, Mo-lotov, 2015), the intensity of anthropogenic load onthe water bodies of these areas in terms of totalwastewater discharge is estimated as “extremelyhigh” (more than 100 mln. m3 per year). In six dis-tricts of Dnipropetrovsk region (Kryvorizhsky,Krynychanskyi, Apostolivskyi, Novomoskovskyi,Pavlohradskyi and Petropavlivskyi), the intensity ofanthropogenic load on water bodies is estimated as
“high” (the volume of discharged wastewater iswithin 10<Vdis<100 mln. m3 per year), in three dis-tricts (Vasylkivskyi, Yurivskyi and Mezhivskyi) itis estimated as “low”. In other districts, the intensi-ty is characterized as “average”.
The most river runoff supply in years withvery low water content was in 9 districts of Dnipro-petrovsk region (41% of the territory). In the mostcases, the Dnipro River flows through these dis-tricts.
In ten districts of Dnipropetrovsk region(45.5% of the territory), the actual multiplicity ofwastewater dilution discharged into surface reser-
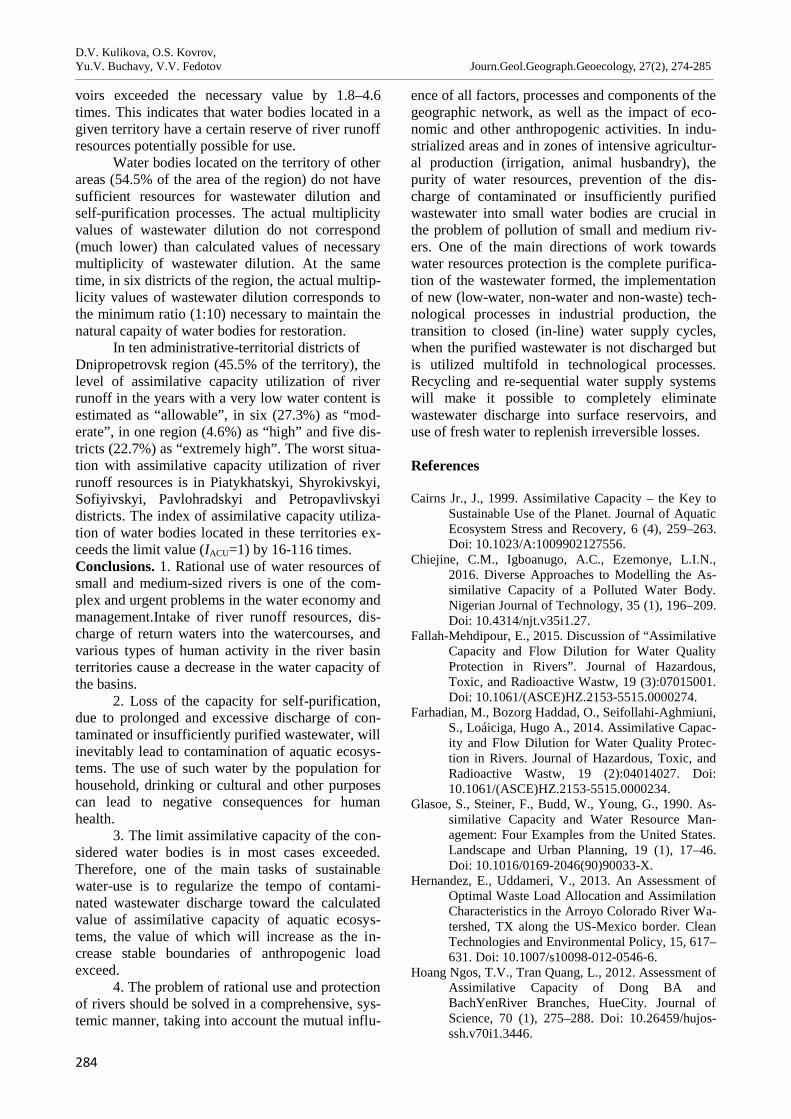
D.V. Kulikova, O.S. Kovrov,Yu.V. Buchavy, V.V. Fedotov Journ.Geol.Geograph.Geoecology, 27(2), 274-285________________________________________________________________________________________________________________________________________________________________
284
voirs exceeded the necessary value by 1.8–4.6times. This indicates that water bodies located in agiven territory have a certain reserve of river runoffresources potentially possible for use.
Water bodies located on the territory of otherareas (54.5% of the area of the region) do not havesufficient resources for wastewater dilution andself-purification processes. The actual multiplicityvalues of wastewater dilution do not correspond(much lower) than calculated values of necessarymultiplicity of wastewater dilution. At the sametime, in six districts of the region, the actual multip-licity values of wastewater dilution corresponds tothe minimum ratio (1:10) necessary to maintain thenatural capaity of water bodies for restoration.
In ten administrative-territorial districts ofDnipropetrovsk region (45.5% of the territory), thelevel of assimilative capacity utilization of riverrunoff in the years with a very low water content isestimated as “allowable”, in six (27.3%) as “mod-erate”, in one region (4.6%) as “high” and five dis-tricts (22.7%) as “extremely high”. The worst situa-tion with assimilative capacity utilization of riverrunoff resources is in Piatykhatskyi, Shyrokivskyi,Sofiyivskyi, Pavlohradskyi and Petropavlivskyidistricts. The index of assimilative capacity utiliza-tion of water bodies located in these territories ex-ceeds the limit value (IACU=1) by 16-116 times.Conclusions. 1. Rational use of water resources ofsmall and medium-sized rivers is one of the com-plex and urgent problems in the water economy andmanagement.Intake of river runoff resources, dis-charge of return waters into the watercourses, andvarious types of human activity in the river basinterritories cause a decrease in the water capacity ofthe basins.
2. Loss of the capacity for self-purification,due to prolonged and excessive discharge of con-taminated or insufficiently purified wastewater, willinevitably lead to contamination of aquatic ecosys-tems. The use of such water by the population forhousehold, drinking or cultural and other purposescan lead to negative consequences for humanhealth.
3. The limit assimilative capacity of the con-sidered water bodies is in most cases exceeded.Therefore, one of the main tasks of sustainablewater-use is to regularize the tempo of contami-nated wastewater discharge toward the calculatedvalue of assimilative capacity of aquatic ecosys-tems, the value of which will increase as the in-crease stable boundaries of anthropogenic loadexceed.
4. The problem of rational use and protectionof rivers should be solved in a comprehensive, sys-temic manner, taking into account the mutual influ-
ence of all factors, processes and components of thegeographic network, as well as the impact of eco-nomic and other anthropogenic activities. In indu-strialized areas and in zones of intensive agricultur-al production (irrigation, animal husbandry), thepurity of water resources, prevention of the dis-charge of contaminated or insufficiently purifiedwastewater into small water bodies are crucial inthe problem of pollution of small and medium riv-ers. One of the main directions of work towardswater resources protection is the complete purifica-tion of the wastewater formed, the implementationof new (low-water, non-water and non-waste) tech-nological processes in industrial production, thetransition to closed (in-line) water supply cycles,when the purified wastewater is not discharged butis utilized multifold in technological processes.Recycling and re-sequential water supply systemswill make it possible to completely eliminatewastewater discharge into surface reservoirs, anduse of fresh water to rеplenish irreversible losses.
References
Cairns Jr., J., 1999. Assimilative Capacity – the Key toSustainable Use of the Planet. Journal of AquaticEcosystem Stress and Recovery, 6 (4), 259–263.Doi: 10.1023/A:1009902127556.
Chiejine, C.M., Igboanugo, A.C., Ezemonye, L.I.N.,2016. Diverse Approaches to Modelling the As-similative Capacity of a Polluted Water Body.Nigerian Journal of Technology, 35 (1), 196–209.Doi: 10.4314/njt.v35i1.27.
Fallah-Mehdipour, E., 2015. Discussion of “AssimilativeCapacity and Flow Dilution for Water QualityProtection in Rivers”. Journal of Hazardous,Toxic, and Radioactive Wastw, 19 (3):07015001.Doi: 10.1061/(ASCE)HZ.2153-5515.0000274.
Farhadian, M., Bozorg Haddad, O., Seifollahi-Aghmiuni,S., Loáiciga, Hugo A., 2014. Assimilative Capac-ity and Flow Dilution for Water Quality Protec-tion in Rivers. Journal of Hazardous, Toxic, andRadioactive Wastw, 19 (2):04014027. Doi:10.1061/(ASCE)HZ.2153-5515.0000234.
Glasoe, S., Steiner, F., Budd, W., Young, G., 1990. As-similative Capacity and Water Resource Man-agement: Four Examples from the United States.Landscape and Urban Planning, 19 (1), 17–46.Doi: 10.1016/0169-2046(90)90033-X.
Hernandez, E., Uddameri, V., 2013. An Assessment ofOptimal Waste Load Allocation and AssimilationCharacteristics in the Arroyo Colorado River Wa-tershed, TX along the US-Mexico border. CleanTechnologies and Environmental Policy, 15, 617–631. Doi: 10.1007/s10098-012-0546-6.
Hoang Ngos, T.V., Tran Quang, L., 2012. Assessment ofAssimilative Capacity of Dong BA andBachYenRiver Branches, HueCity. Journal ofScience, 70 (1), 275–288. Doi: 10.26459/hujos-ssh.v70i1.3446.
D.V. Kulikova, O.S. Kovrov,Yu.V. Buchavy, V.V. Fedotov Journ.Geol.Geograph.Geoecology, 27(2), 274-285________________________________________________________________________________________________________________________________________________________________
285
Izrael, Yu.A., Tsyban, A.V., 1989. Antropogennayaekologiya okeana. [Anthropogenic ecology of theocean]. Gidrometeoizdat, Leningrad (in Russian).
Jacyk, A.V. 2004. Vodogospodarska ekologiya. [WaterManagement Ecology]: in 4 vol., 7 books. Vol.3,book 5.Geneza, Kyiv (in Ukrainian).
Jacyk, A.V., Kanash,O.P., Stashuk, V.A.et al., 2007.Metodika rozrahunku antropogennogo navantaz-hennya i klasifikatsiyi ekologichnogo stanubaseyniv malih richok Ukrayini. [Method ofcalculation of anthropogenic loading andclassification of the ecological state in the basinsof small rivers of Ukraine]. UNIVIV, Kyiv (inU-krainian).
Koronkevich, N.I., 1990. Vodnyiybalans-Russkoyravninyiiegoantropogennyieizmeneniya.[The water balance of the Russian Plain and itsanthropogenic changes]. Nauka, Moscow (inRussian).
Kulikova,D.V., Pavlychenko, А.V., 2016. Estimation ofecological state of surface water bodies in coalmining region as based on the complex of hydro-chemical indicators. Scientific and technicaljournal “Scientific Bulletin of the NationalMining University”, 4, 62–70.
Lee, C.-S., Wen, C.-G., 1996. River Assimilative Capac-ity Analysis via Fuzzy Linear Programming.Fuzzy Sets and Systems, 79 (2), 191–201. Doi:10.1016/0165-0114(95)00171-9.
Monfared, SAH, Darmian, MD, Snyder, SA, Azizyan,G., Pirzadeh, B., Moghaddam, MA, 2017. WaterQuality Planning in Rivers: Assimilative Capacityand Dilution Flow. Bulletin of Environmental
Contamination and Toxicology, 99 (5), 531–541.Doi: 10.1007/s00128-017-2182-7.
Rational Use and Recovery of Water Resources. 2016.Publ. House of ZhytomyrStateUniversity namedafter Ivan Franko, Zhytomyr (in Ukrainian).
Regional report on the state of the environment inDnipropetrovsk region in 2016. 2017, Dnipro.Retrieved from:https://menr.gov.ua/news/31778.html
Reimers, N.F. 1990. Prirodopolzovanie: Slovar-spravochnik. [Nature management: Dictionary-reference]. Mysl, Moscow (in Russian).
Shiklomanov, I.A. 2008. Vodnyie resursyi Rossii i ihispolzovanie. [Water resources of Russia andtheir use]. State Hydrological Institute, St. Peters-burg (in Russian).
Strelets, B.I., 1987. Spravochnik po vodnyim resursam.[Handbook on water resources]. Urozhai, Kyiv(in Russian).
Ulzetueva, I.D., Gomboev, V.O., Zhamyanov, D.Ts.-D.,Molotov, V.S., 2015. Assessmentof Anthropo-genic Impact on Water Objects of the SelengaRi-verTransboundaryBasin. Scientific-theoreticalmagazine“Bulletin of the BuryatStateUniversity”,4, 68–75.
Watson, B.J., Wyss, J., Booth, E.A., Sousa, G., 2012.Assimilative Capacity Modelling Using Inte-grated Watershed and LakeModels in Support ofthe Georgia Comprehensive Statewide WaterManagement Plan. International Journal ofDesing & Nature and Ecodynamics, 7 (2), 155–165. Doi: 10.2495/DNE-V7-N2-155-165.
Kuzyshyn A.V., Poplavska I.V. Journ.Geol.Geograph.Geoecology, 27(2), 289-296________________________________________________________________________________________________________________________________________________________________
286
Journal of Geology,Geography and Geoecology
Journal home page: geology-dnu-dp.ua
ISSN 2617-2909 (print)ISSN 2617-2119 (online)
Journ.Geol.Geograph.Geoecology,
27(2), 285-293doi:10.15421/111852
Kuzyshyn A.V., Poplavska I.V. Journ.Geol.Geograph.Geoecology, 27(2), 285-293________________________________________________________________________________________________________________________________________________________________
Analysis of Territorial Differences of the Social Sphere elements in the Areas of the Carpa-thian-Podillia Region
Kuzyshyn A.V., Poplavska I.V.
Ternopil Volodymyr Hnatiuk National Pedagogical University, Ternopil, Ukraine, e-mail: [email protected],[email protected]
Abstract. The article is devoted to the problem of the social sphere functioning of theareas in the Carpathian-Podillia region, in particular the emphasis is placed on the differ-entiation of the levels of its individual components, the dynamics of their changes and thecomplex analysis of functionality. The state of this sphere directly influences the economyand culture of the country and the region, and therefore the sectors of education, health
care, culture, housing and communal services, etc. play a significant role in the economic development of the territory. Territorialboundaries of the research are defined within Transcarpathian, Lviv, Ivano-Frankivsk, Chernivtsi, Vinnytsia, Khmelnytskyi andTernopil regions, among which there are established economic, labor-resource and informational-communicative connections, whichalso should be considered as the strong side of such cooperation. Several basic components of the social sphere (education, culture,medicine, housing and communal services, trade and mass catering, communication) were selected for studying the differentiation ofthe social sphere elements of the areas of the Carpathian-Podillia region, for each several criteria were chosen (in general over 20).All suggested criteria represent a qualitative component of functioning: in education. They are the amount of preschool institutionsfor children, the number of pupils / listeners / students per number of inhabitants. Medical sphere includes the providing the popula-tion with doctors, middle medical personnel, hospital beds, planned capacity of outpatient clinics. The sphere of culture deals withthe provision of population with cultural institutions and their attendance. The housing and communal services sector embraces thelevel of equipped apartments and indicator of residential space. Retail and catering services cover the indicators of trade turnover formain groups of goods and providing a decent number of trade areas, the field of communication includes access to communicationfacilities for different variants of their activity. This allowed analysing the level of formation and functionality of the social sphereindividual components of the region in general and in its individual areas. On this basis, the ranking of the areas of the Carpathian-Podillia region was carried out in terms of the social infrastructure elements formation. In addition, a comparative analysis of thesocial sphere development level to the indicators of the Western Ukrainian region and Ukrainian is provided. Official statistics fromthe State Statistics Service of Ukraine, as well as regional statistical offices, were used for the survey.
Key words: Carpathian-Podillia region, geospatial organization, social sphere, education, culture, medicine, housing and communalservices, trade and mass catering, communication, matrix of functioning level
Аналіз територіальних відмінностей елементів соціальної сфери областей Карпатсько-Подільського регіону
Кузишин А.В., Поплавська І.В.
Тернопільський національний педагогічний університет імені Володимира Гнатюка, Тернопіль, Україна, [email protected], [email protected]
Анотація. Стаття присвячена проблемі функціонування соціальної сфери областей Карпатсько-Подільського регіону, зок-рема закцентовано увагу на диференціації рівнів окремих її компонентів, динаміці їх зміни та комплексному аналізу функ-ціональності. Стан даної сфери безпосередньо впливає на економіку й культуру країни та регіону, а тому сектори освіти,охорони здоров’я, культури, житлово-комунального господарства тощо відіграє значну роль в господарському розвиткутериторії. Територіальні межі дослідження визначені в межах Закарпатської, Львівської, Івано-Франківської, Чернівецької,Вінницької, Хмельницької та Тернопільської областей, між якими склалися усталені господарські, працересурсні таінформаційно-комунікативні зв’язки, які також варто вважати сильною стороною такої співпраці. Для дослідженнядиференціації елементів соціальної сфери областей Карпатсько-Подільського регіону було обрано кілька базових складовихсоціальної сфери (освіта, культура, медицина, житлово-комунальне господарство, торгівля і масове харчування, зв’язок),для кожної з яких було обрано кілька критеріїв (загалом їх понад 20). Це дозволило проаналізувати рівень сформованостіта функціональності окремих складових соціальної сфери регіону загалом та в окремих його областях. На цій основі було
Received 17.07.2018;Received in revised form04.09.2018;Accepted 19.09.2018
Kuzyshyn A.V., Poplavska I.V. Journ.Geol.Geograph.Geoecology, 27(2), 285-293________________________________________________________________________________________________________________________________________________________________
287
проведено ранжування областей Карпатсько-Подільського регіону за рівнем сформованості елементів соціальноїінфраструктури. Також подано порівняльний аналіз рівня розвитку соціальної сфери до показників Західноукраїнськогорегіону та пересічноукраїнських. Для проведення дослідження було використані офіційні статистичні дані Державної служ-би статистики України, а також обласних управлінь статистики.
Ключові слова: Карпатсько-Подільський регіон, геопроторова організація, соціальна сфера, освіта, культура, медицина,житлово-комунальне господарство, торгівля і масове харчування, зв’язок, матриця рівня функціонування.
Introduction. The modern stage of Ukrainian soci-ety development is oriented on social values that inthe current environment reflects growing socialweight of the creation of socially necessary prod-uct. The state of this sphere directly affects theeconomy and culture of the country; on this basis,one could claim that people engaged in education,health care, culture, housing and communal ser-vices etc. play a significant role in the economy.The example of the leading countries of the worldshows that in addition to much attention to materialproduction, a lot of effort are applied to prioritysocial development, the prerequisites for socialorientation of the economy are formed, to carry outstate policy in the name of human as the main gen-erator of civilization progress.
The problem of the development and func-tioning of the constituent elements of the socialsphere is the research area of a large number ofnational and foreign scientists. V.I. Kutsenko andY.V. Ostafiichuk consider the social sphere as asphere of human activity, the result of which areservices that meet the needs of society as well asindividual members and are associated with thecreation of added value (Kutsenko, Ostafiichuk,2005). N.G. Pigul points out that the organizationalmechanism for building a social sphere should bebased on clearly defined functions, principles andtasks that will allow more effective implementationof the state social policy in order to improve thequality of life of the population (Pigul, 2013).Y. Oliinyk and A. Stepanenko consider the study ofthe social space of territorial communities and theirsocial locality as an important direction in the studyof social geography (Oliinyk, Stepanenko, 2012).L.M. Niemec considers the social sphere from thepoint of view of the spatial-temporal organizationof society in terms of globalization influences; in-novation-investment image of territories, modeldevelopment and social-geographic zoning for op-timization of the society territorial organization andensuring optimal living conditions of the popula-tion, participation in the regions development ofstrategies (Niemec, 2003). We have also partiallyconsidered this problem when evaluating the em-ployment of the Carpathian-Podillia region in thesocial sphere (Kuzyshyn, 2015a; Kuzyshyn,2015b;Kuzyshyn, 2018).
With the increasing significance of the socialsphere functioning, there is a need for a detailedanalysis of the level of its components formation
and the achievement of the complexity in providingthe relevant services. The relevant issues seem tohave the need to determine the current state of for-mation and demand of individual elements of thesocial sphere, as well as the level of their provisionin a specific region, which allows determining itsrating position in the region. To do this, we need toanalyse a system of indicators that will allow us toform a comprehensive view of the social sphere ofthe Carpathian-Podillia region.Purpose, task and methods of research. In prepa-ration of this study, it was planned to determine,based on the analysing statistical information, thelevel of formation and functionality of the socialsphere of the research region. For this purpose,statistical information was used over the periodfrom the 90's of the twentieth century to 2016. Thisallowed to determine the trends of the functioningof the social sphere and its components.
To conduct research, we have selected a sys-tem of indicators, which served the criteria forevaluating certain elements of the social sphere –educational sphere (the coverage of children bypreschool institutions; the number of students ofcomprehensive educational institutions per 10 thou-sand people; the number of students of vocationalschools per 10 thousand people; the number of stu-dents of higher educational institutions with I-IVlevels of accreditation per 10 thousand people),cultural sphere (availability of library funds per100 people; availability of club membership per100 people; attendance of museum institutions per100 people; 8 – attendance of theatres per 100 peo-ple; 9 – attendance of concert events per 100 peo-ple), sphere of health care (availability of doctorsper 10 thousand people; availability of averagemedical personnel per 10 thousand peo-ple;availability of hospital beds per 10 thousandpeople; planned capacity of outpatient clinics per10 thousand people), housing and communal ser-vices (availability of housing space; an indicator ofthe level of private houses), trade and mass cater-ing (availability of trade areas, retail turnover ofenterprises per person (thousand UAH), retail saleof alcoholic beverages per person (l)), connection(number of subscribers of mobile communication;number of cable connection subscribers; the shareof households having access to the Internet. Itshould be emphasized that they allow to evaluatethe functionality of certain elements not from thepoint of view of quantity, but quality - provision,
Kuzyshyn A.V., Poplavska I.V. Journ.Geol.Geograph.Geoecology, 27(2), 285-293________________________________________________________________________________________________________________________________________________________________
288
availability, demand of a certain social sphere ele-ment, which, in our opinion, reflect the real state offormation of the social sphere and makes it possibleto differentiate its components according to thelevel of functionality formation.
In the process of research, the method ofclusterisation was used. On the basis of the qualita-tive indicators analysis characterizing the socialsphere of the areas of the Carpathian-Podillia re-gion, a hierarchical cluster analysis was carried outwith the subsequent construction of the dendrogram(using the Euclidean distance at clusterization).Presentation of the main material. Territorialboundaries of the research are defined within Tran-scarpathian, Lviv, Ivano-Frankivsk, Chernivtsi,Vinnytsia, Khmelnytskyi and Ternopil regions (thearea covers 19.1% of the territory of Ukraine and ishome to 23.5% of the country's population). Theseareas have a compact location, which positivelyaffects their cooperation and high interdependence.Sufficiently well-established business, labour, in-formation and communication should also be con-sidered as the strong side of such cooperation.However, historically, these territories were formednot as one, because in different historical periodsthey were part of various state institutions. To acertain extent, such territorial attachment also af-fected the ethnic composition of the population inthe mentioned areas, which can be defined as di-verse.
Consideration of social sphere elementsshould be carried out in the sectorial version of theassessment, but taking into consideration a certainterritorial level.
The level of social sphere development is de-termined by the demand for services, and those, intheir turn, vary according to the real possibilities ofsociety at one or another stage of development. Intoday's conditions of an unstable economic situa-tion in the country, the demand for many types ofservices has decreased due to low profits of thepopulation, although there is an increase in interestin certain types of services (information, advertis-ing, including tourism, health care, etc.).
The social sphere has certain territorial dif-ferences in the level of development and structure.Significantly higher level of its development and awider sectorial structure is in cities compared torural areas, in more economically developed indus-trial regions than in less developed agriculturalareas.
The educational sphere is an important ele-ment in the formation of the social environment, theformation of an enlightened society and is a prereq-uisite for the preservation of intellectual society.Important indicators that characterize this area ofthe social sphere are qualitative characteristics of
the educational space of the study area, for exam-ple, the coverage of children by preschool institu-tions, the number of students in general educationinstitutions per 10 thousand people, the number ofstudents of vocational schools , the number ofhigher education institutions students of I-IV ac-creditation levels per 10 thousand people. Suchindicators allow us to assess the state of the educa-tional environment in the research area. During1995-2016, in the areas of the Carpathian-Podilliaregion, the rate of coverage of children in pre-school institutions increased (from 31 preschoolers/ 100 children of the corresponding age in 1995 to62 preschoolers / 100 children of the correspondingage in 2016), which even exceeded the averageUkrainian index starting from 2010 (StatisticalCollection «Regions of Ukraine», 2017. Part1).Higher level of security is characteristic of thePodilsk regions. From 1995/1996 academic year upto 2013/2014 the number of students of comprehen-sive educational institutions in the amount of 10thousand people decreased (from 1464 to 1039students per 10 thousand population) and only dur-ing 2016/2017 academic year there was a tendencyfor an increase in the number of students in accor-dance to the number of residents (1067 students per10 thousand population). It should be noted that thisindicator has more positive numbers than the aver-age in Ukraine. Over the period of 2000-2016 therewas a decrease in the number of students of voca-tional education institutions per 10 thousand peoplefrom 104 to 81 students (but it is worth mentioningthat these indicators are more positive than inUkraine in general). The highest indicator is char-acteristic of the Lviv region (in 2016 - 107 studentsof vocational schools per 10 thousand people). Asto the indicator of the number of higher educationalinstitutions students in the Carpathian-Podillia re-gion there was an increase in the number of stu-dents per 10 thousand people from 2000/2001 aca-demic year to 2005/2006 academic year, but insubsequent academic years their number decreasedfaster than in Ukraine in general (StatisticalCollection «Regions of Ukraine», 2017. Part 1).
When evaluating the educational sphere ac-cording to the criteria chosen by us, the matrix tableconfirms that the most developed this sphere is inthe Lviv region, and the indicators of the educa-tional environment functioning in the Vinnytsia,Ternopil and Chernivtsi regions are also high, whilein other areas of the region there are problems withthe separate components of the estimation of avail-ability development of the educational sphere, orgenerally low efficiency of their functioning (Table1). Compared with the average Ukrainian indicatorsand indicators characteristic to all areas of theWestern Ukrainian region. In this territory there
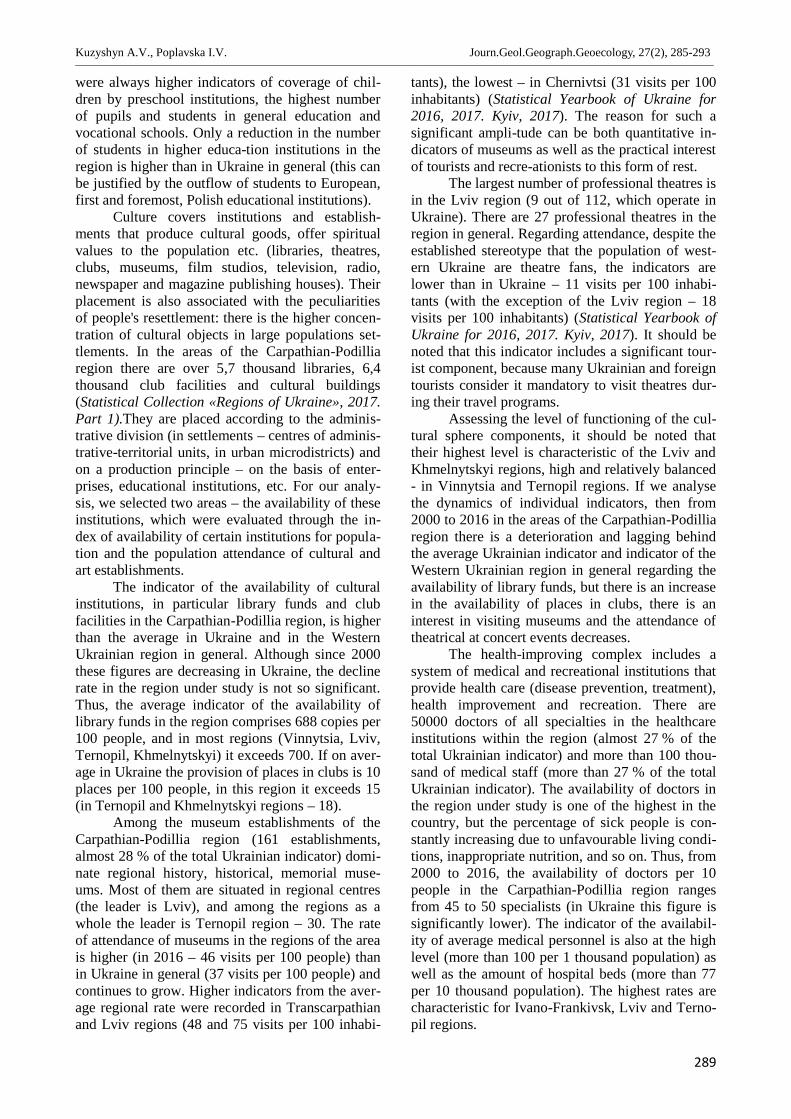
Kuzyshyn A.V., Poplavska I.V. Journ.Geol.Geograph.Geoecology, 27(2), 285-293________________________________________________________________________________________________________________________________________________________________
289
were always higher indicators of coverage of chil-dren by preschool institutions, the highest numberof pupils and students in general education andvocational schools. Only a reduction in the numberof students in higher educa-tion institutions in theregion is higher than in Ukraine in general (this canbe justified by the outflow of students to European,first and foremost, Polish educational institutions).
Culture covers institutions and establish-ments that produce cultural goods, offer spiritualvalues to the population etc. (libraries, theatres,clubs, museums, film studios, television, radio,newspaper and magazine publishing houses). Theirplacement is also associated with the peculiaritiesof people's resettlement: there is the higher concen-tration of cultural objects in large populations set-tlements. In the areas of the Carpathian-Podilliaregion there are over 5,7 thousand libraries, 6,4thousand club facilities and cultural buildings(Statistical Collection «Regions of Ukraine», 2017.Part 1).They are placed according to the adminis-trative division (in settlements – centres of adminis-trative-territorial units, in urban microdistricts) andon a production principle – on the basis of enter-prises, educational institutions, etc. For our analy-sis, we selected two areas – the availability of theseinstitutions, which were evaluated through the in-dex of availability of certain institutions for popula-tion and the population attendance of cultural andart establishments.
The indicator of the availability of culturalinstitutions, in particular library funds and clubfacilities in the Carpathian-Podillia region, is higherthan the average in Ukraine and in the WesternUkrainian region in general. Although since 2000these figures are decreasing in Ukraine, the declinerate in the region under study is not so significant.Thus, the average indicator of the availability oflibrary funds in the region comprises 688 copies per100 people, and in most regions (Vinnytsia, Lviv,Ternopil, Khmelnytskyi) it exceeds 700. If on aver-age in Ukraine the provision of places in clubs is 10places per 100 people, in this region it exceeds 15(in Ternopil and Khmelnytskyi regions – 18).
Among the museum establishments of theCarpathian-Podillia region (161 establishments,almost 28 % of the total Ukrainian indicator) domi-nate regional history, historical, memorial muse-ums. Most of them are situated in regional centres(the leader is Lviv), and among the regions as awhole the leader is Ternopil region – 30. The rateof attendance of museums in the regions of the areais higher (in 2016 – 46 visits per 100 people) thanin Ukraine in general (37 visits per 100 people) andcontinues to grow. Higher indicators from the aver-age regional rate were recorded in Transcarpathianand Lviv regions (48 and 75 visits per 100 inhabi-
tants), the lowest – in Chernivtsi (31 visits per 100inhabitants) (Statistical Yearbook of Ukraine for2016, 2017. Kyiv, 2017). The reason for such asignificant ampli-tude can be both quantitative in-dicators of museums as well as the practical interestof tourists and recre-ationists to this form of rest.
The largest number of professional theatres isin the Lviv region (9 out of 112, which operate inUkraine). There are 27 professional theatres in theregion in general. Regarding attendance, despite theestablished stereotype that the population of west-ern Ukraine are theatre fans, the indicators arelower than in Ukraine – 11 visits per 100 inhabi-tants (with the exception of the Lviv region – 18visits per 100 inhabitants) (Statistical Yearbook ofUkraine for 2016, 2017. Kyiv, 2017). It should benoted that this indicator includes a significant tour-ist component, because many Ukrainian and foreigntourists consider it mandatory to visit theatres dur-ing their travel programs.
Assessing the level of functioning of the cul-tural sphere components, it should be noted thattheir highest level is characteristic of the Lviv andKhmelnytskyi regions, high and relatively balanced- in Vinnytsia and Ternopil regions. If we analysethe dynamics of individual indicators, then from2000 to 2016 in the areas of the Carpathian-Podilliaregion there is a deterioration and lagging behindthe average Ukrainian indicator and indicator of theWestern Ukrainian region in general regarding theavailability of library funds, but there is an increasein the availability of places in clubs, there is aninterest in visiting museums and the attendance oftheatrical at concert events decreases.
The health-improving complex includes asystem of medical and recreational institutions thatprovide health care (disease prevention, treatment),health improvement and recreation. There are50000 doctors of all specialties in the healthcareinstitutions within the region (almost 27 % of thetotal Ukrainian indicator) and more than 100 thou-sand of medical staff (more than 27 % of the totalUkrainian indicator). The availability of doctors inthe region under study is one of the highest in thecountry, but the percentage of sick people is con-stantly increasing due to unfavourable living condi-tions, inappropriate nutrition, and so on. Thus, from2000 to 2016, the availability of doctors per 10people in the Carpathian-Podillia region rangesfrom 45 to 50 specialists (in Ukraine this figure issignificantly lower). The indicator of the availabil-ity of average medical personnel is also at the highlevel (more than 100 per 1 thousand population) aswell as the amount of hospital beds (more than 77per 10 thousand population). The highest rates arecharacteristic for Ivano-Frankivsk, Lviv and Terno-pil regions.
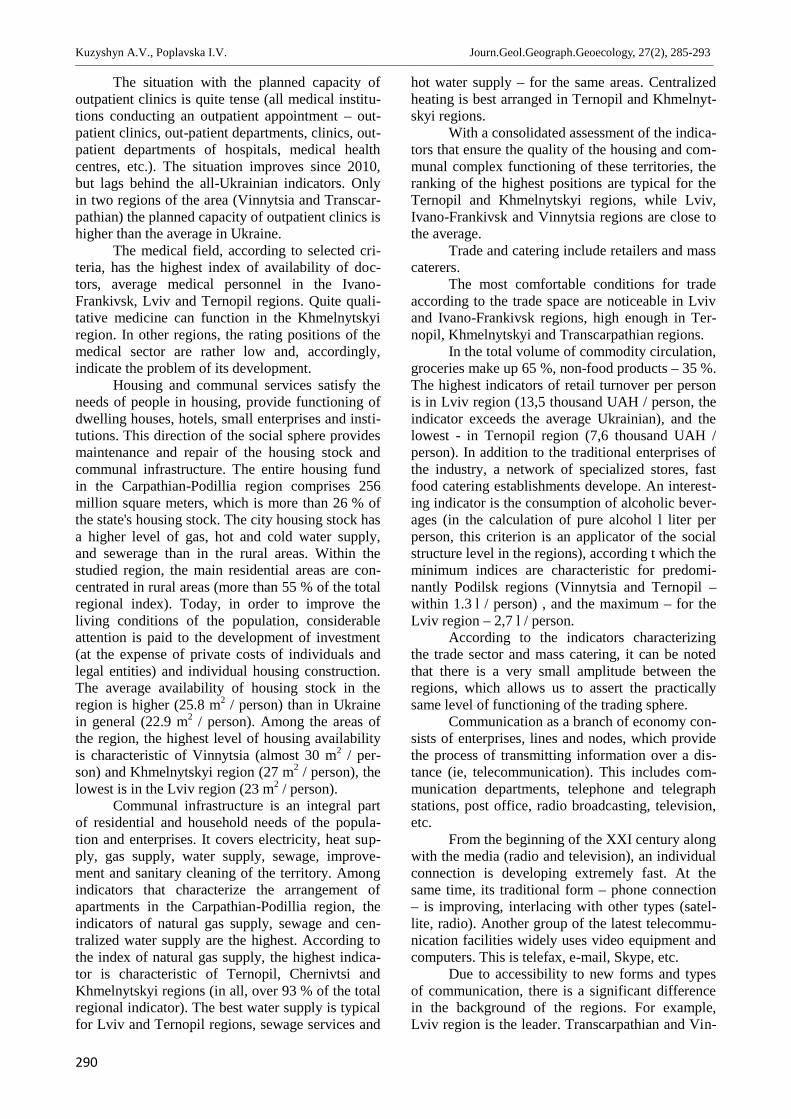
Kuzyshyn A.V., Poplavska I.V. Journ.Geol.Geograph.Geoecology, 27(2), 285-293________________________________________________________________________________________________________________________________________________________________
290
The situation with the planned capacity ofoutpatient clinics is quite tense (all medical institu-tions conducting an outpatient appointment – out-patient clinics, out-patient departments, clinics, out-patient departments of hospitals, medical healthcentres, etc.). The situation improves since 2010,but lags behind the all-Ukrainian indicators. Onlyin two regions of the area (Vinnytsia and Transcar-pathian) the planned capacity of outpatient clinics ishigher than the average in Ukraine.
The medical field, according to selected cri-teria, has the highest index of availability of doc-tors, average medical personnel in the Ivano-Frankivsk, Lviv and Ternopil regions. Quite quali-tative medicine can function in the Khmelnytskyiregion. In other regions, the rating positions of themedical sector are rather low and, accordingly,indicate the problem of its development.
Housing and communal services satisfy theneeds of people in housing, provide functioning ofdwelling houses, hotels, small enterprises and insti-tutions. This direction of the social sphere providesmaintenance and repair of the housing stock andcommunal infrastructure. The entire housing fundin the Carpathian-Podillia region comprises 256million square meters, which is more than 26 % ofthe state's housing stock. The city housing stock hasa higher level of gas, hot and cold water supply,and sewerage than in the rural areas. Within thestudied region, the main residential areas are con-centrated in rural areas (more than 55 % of the totalregional index). Today, in order to improve theliving conditions of the population, considerableattention is paid to the development of investment(at the expense of private costs of individuals andlegal entities) and individual housing construction.The average availability of housing stock in theregion is higher (25.8 m2 / person) than in Ukrainein general (22.9 m2 / person). Among the areas ofthe region, the highest level of housing availabilityis characteristic of Vinnytsia (almost 30 m2 / per-son) and Khmelnytskyi region (27 m2 / person), thelowest is in the Lviv region (23 m2 / person).
Communal infrastructure is an integral partof residential and household needs of the popula-tion and enterprises. It covers electricity, heat sup-ply, gas supply, water supply, sewage, improve-ment and sanitary cleaning of the territory. Amongindicators that characterize the arrangement ofapartments in the Carpathian-Podillia region, theindicators of natural gas supply, sewage and cen-tralized water supply are the highest. According tothe index of natural gas supply, the highest indica-tor is characteristic of Ternopil, Chernivtsi andKhmelnytskyi regions (in all, over 93 % of the totalregional indicator). The best water supply is typicalfor Lviv and Ternopil regions, sewage services and
hot water supply – for the same areas. Centralizedheating is best arranged in Ternopil and Khmelnyt-skyi regions.
With a consolidated assessment of the indica-tors that ensure the quality of the housing and com-munal complex functioning of these territories, theranking of the highest positions are typical for theTernopil and Khmelnytskyi regions, while Lviv,Ivano-Frankivsk and Vinnytsia regions are close tothe average.
Trade and catering include retailers and masscaterers.
The most comfortable conditions for tradeaccording to the trade space are noticeable in Lvivand Ivano-Frankivsk regions, high enough in Ter-nopil, Khmelnytskyi and Transcarpathian regions.
In the total volume of commodity circulation,groceries make up 65 %, non-food products – 35 %.The highest indicators of retail turnover per personis in Lviv region (13,5 thousand UAH / person, theindicator exceeds the average Ukrainian), and thelowest - in Ternopil region (7,6 thousand UAH /person). In addition to the traditional enterprises ofthe industry, a network of specialized stores, fastfood catering establishments develope. An interest-ing indicator is the consumption of alcoholic bever-ages (in the calculation of pure alcohol l liter perperson, this criterion is an applicator of the socialstructure level in the regions), according t which theminimum indices are characteristic for predomi-nantly Podilsk regions (Vinnytsia and Ternopil –within 1.3 l / person) , and the maximum – for theLviv region – 2,7 l / person.
According to the indicators characterizingthe trade sector and mass catering, it can be notedthat there is a very small amplitude between theregions, which allows us to assert the practicallysame level of functioning of the trading sphere.
Communication as a branch of economy con-sists of enterprises, lines and nodes, which providethe process of transmitting information over a dis-tance (ie, telecommunication). This includes com-munication departments, telephone and telegraphstations, post office, radio broadcasting, television,etc.
From the beginning of the XXI century alongwith the media (radio and television), an individualconnection is developing extremely fast. At thesame time, its traditional form – phone connection– is improving, interlacing with other types (satel-lite, radio). Another group of the latest telecommu-nication facilities widely uses video equipment andcomputers. This is telefax, e-mail, Skype, etc.
Due to accessibility to new forms and typesof communication, there is a significant differencein the background of the regions. For example,Lviv region is the leader. Transcarpathian and Vin-
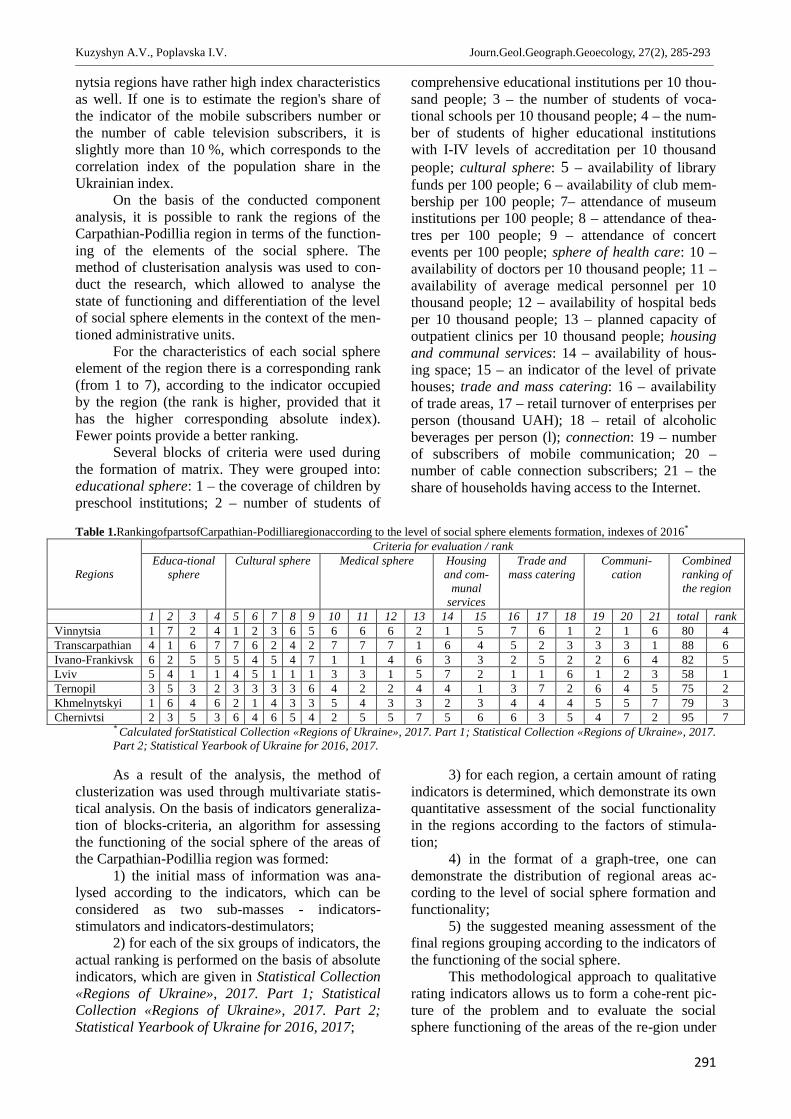
Kuzyshyn A.V., Poplavska I.V. Journ.Geol.Geograph.Geoecology, 27(2), 285-293________________________________________________________________________________________________________________________________________________________________
291
nytsia regions have rather high index characteristicsas well. If one is to estimate the region's share ofthe indicator of the mobile subscribers number orthe number of cable television subscribers, it isslightly more than 10 %, which corresponds to thecorrelation index of the population share in theUkrainian index.
On the basis of the conducted componentanalysis, it is possible to rank the regions of theCarpathian-Podillia region in terms of the function-ing of the elements of the social sphere. Themethod of clusterisation analysis was used to con-duct the research, which allowed to analyse thestate of functioning and differentiation of the levelof social sphere elements in the context of the men-tioned administrative units.
For the characteristics of each social sphereelement of the region there is a corresponding rank(from 1 to 7), according to the indicator occupiedby the region (the rank is higher, provided that ithas the higher corresponding absolute index).Fewer points provide a better ranking.
Several blocks of criteria were used duringthe formation of matrix. They were grouped into:educational sphere: 1 – the coverage of children bypreschool institutions; 2 – number of students of
comprehensive educational institutions per 10 thou-sand people; 3 – the number of students of voca-tional schools per 10 thousand people; 4 – the num-ber of students of higher educational institutionswith I-IV levels of accreditation per 10 thousandpeople; cultural sphere: 5 – availability of libraryfunds per 100 people; 6 – availability of club mem-bership per 100 people; 7– attendance of museuminstitutions per 100 people; 8 – attendance of thea-tres per 100 people; 9 – attendance of concertevents per 100 people; sphere of health care: 10 –availability of doctors per 10 thousand people; 11 –availability of average medical personnel per 10thousand people; 12 – availability of hospital bedsper 10 thousand people; 13 – planned capacity ofoutpatient clinics per 10 thousand people; housingand communal services: 14 – availability of hous-ing space; 15 – an indicator of the level of privatehouses; trade and mass catering: 16 – availabilityof trade areas, 17 – retail turnover of enterprises perperson (thousand UAH); 18 – retail of alcoholicbeverages per person (l); connection: 19 – numberof subscribers of mobile communication; 20 –number of cable connection subscribers; 21 – theshare of households having access to the Internet.
Table 1.RankingofpartsofCarpathian-Podilliaregionaccording to the level of social sphere elements formation, indexes of 2016*
Regions
Criteria for evaluation / rankEduca-tional
sphereCultural sphere Medical sphere Housing
and com-munal
services
Trade andmass catering
Communi-cation
Combinedranking ofthe region
1 2 3 4 5 6 7 8 9 10 11 12 13 14 15 16 17 18 19 20 21 total rankVinnytsia 1 7 2 4 1 2 3 6 5 6 6 6 2 1 5 7 6 1 2 1 6 80 4Transcarpathian 4 1 6 7 7 6 2 4 2 7 7 7 1 6 4 5 2 3 3 3 1 88 6Ivano-Frankivsk 6 2 5 5 5 4 5 4 7 1 1 4 6 3 3 2 5 2 2 6 4 82 5Lviv 5 4 1 1 4 5 1 1 1 3 3 1 5 7 2 1 1 6 1 2 3 58 1Ternopil 3 5 3 2 3 3 3 3 6 4 2 2 4 4 1 3 7 2 6 4 5 75 2Khmelnytskyi 1 6 4 6 2 1 4 3 3 5 4 3 3 2 3 4 4 4 5 5 7 79 3Chernivtsi 2 3 5 3 6 4 6 5 4 2 5 5 7 5 6 6 3 5 4 7 2 95 7
* Calculated forStatistical Collection «Regions of Ukraine», 2017. Part 1; Statistical Collection «Regions of Ukraine», 2017.Part 2; Statistical Yearbook of Ukraine for 2016, 2017.
As a result of the analysis, the method ofclusterization was used through multivariate statis-tical analysis. On the basis of indicators generaliza-tion of blocks-criteria, an algorithm for assessingthe functioning of the social sphere of the areas ofthe Carpathian-Podillia region was formed:
1) the initial mass of information was ana-lysed according to the indicators, which can beconsidered as two sub-masses - indicators-stimulators and indicators-destimulators;
2) for each of the six groups of indicators, theactual ranking is performed on the basis of absoluteindicators, which are given in Statistical Collection«Regions of Ukraine», 2017. Part 1; StatisticalCollection «Regions of Ukraine», 2017. Part 2;Statistical Yearbook of Ukraine for 2016, 2017;
3) for each region, a certain amount of ratingindicators is determined, which demonstrate its ownquantitative assessment of the social functionalityin the regions according to the factors of stimula-tion;
4) in the format of a graph-tree, one candemonstrate the distribution of regional areas ac-cording to the level of social sphere formation andfunctionality;
5) the suggested meaning assessment of thefinal regions grouping according to the indicators ofthe functioning of the social sphere.
This methodological approach to qualitativerating indicators allows us to form a cohe-rent pic-ture of the problem and to evaluate the socialsphere functioning of the areas of the re-gion under
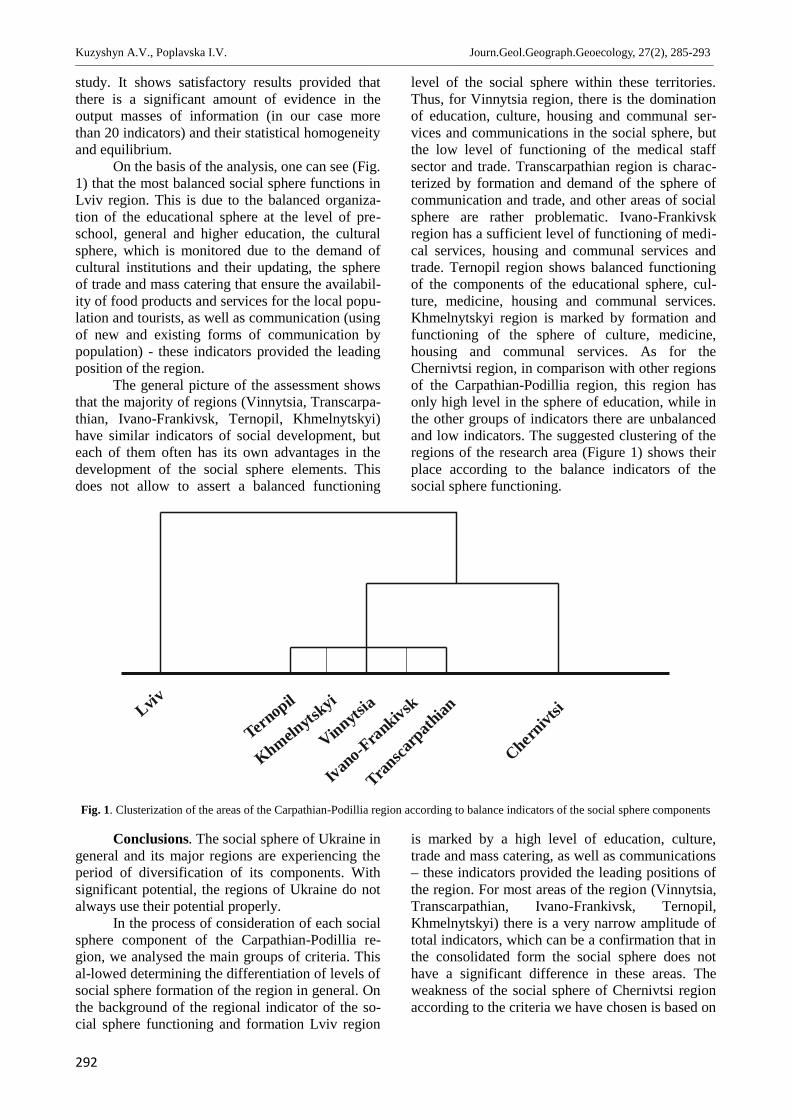
Kuzyshyn A.V., Poplavska I.V. Journ.Geol.Geograph.Geoecology, 27(2), 285-293________________________________________________________________________________________________________________________________________________________________
292
study. It shows satisfactory results provided thatthere is a significant amount of evidence in theoutput masses of information (in our case morethan 20 indicators) and their statistical homogeneityand equilibrium.
On the basis of the analysis, one can see (Fig.1) that the most balanced social sphere functions inLviv region. This is due to the balanced organiza-tion of the educational sphere at the level of pre-school, general and higher education, the culturalsphere, which is monitored due to the demand ofcultural institutions and their updating, the sphereof trade and mass catering that ensure the availabil-ity of food products and services for the local popu-lation and tourists, as well as communication (usingof new and existing forms of communication bypopulation) - these indicators provided the leadingposition of the region.
The general picture of the assessment showsthat the majority of regions (Vinnytsia, Transcarpa-thian, Ivano-Frankivsk, Ternopil, Khmelnytskyi)have similar indicators of social development, buteach of them often has its own advantages in thedevelopment of the social sphere elements. Thisdoes not allow to assert a balanced functioning
level of the social sphere within these territories.Thus, for Vinnytsia region, there is the dominationof education, culture, housing and communal ser-vices and communications in the social sphere, butthe low level of functioning of the medical staffsector and trade. Transcarpathian region is charac-terized by formation and demand of the sphere ofcommunication and trade, and other areas of socialsphere are rather problematic. Ivano-Frankivskregion has a sufficient level of functioning of medi-cal services, housing and communal services andtrade. Ternopil region shows balanced functioningof the components of the educational sphere, cul-ture, medicine, housing and communal services.Khmelnytskyi region is marked by formation andfunctioning of the sphere of culture, medicine,housing and communal services. As for theChernivtsi region, in comparison with other regionsof the Carpathian-Podillia region, this region hasonly high level in the sphere of education, while inthe other groups of indicators there are unbalancedand low indicators. The suggested clustering of theregions of the research area (Figure 1) shows theirplace according to the balance indicators of thesocial sphere functioning.
Lviv
Ternopil
Khmelnyts
kyi
Vinnytsia
Ivano-Frankivsk
Transca
rpath
ian
Chernivt
si
Fig. 1. Clusterization of the areas of the Carpathian-Podillia region according to balance indicators of the social sphere components
Conclusions. The social sphere of Ukraine ingeneral and its major regions are experiencing theperiod of diversification of its components. Withsignificant potential, the regions of Ukraine do notalways use their potential properly.
In the process of consideration of each socialsphere component of the Carpathian-Podillia re-gion, we analysed the main groups of criteria. Thisal-lowed determining the differentiation of levels ofsocial sphere formation of the region in general. Onthe background of the regional indicator of the so-cial sphere functioning and formation Lviv region
is marked by a high level of education, culture,trade and mass catering, as well as communications– these indicators provided the leading positions ofthe region. For most areas of the region (Vinnytsia,Transcarpathian, Ivano-Frankivsk, Ternopil,Khmelnytskyi) there is a very narrow amplitude oftotal indicators, which can be a confirmation that inthe consolidated form the social sphere does nothave a significant difference in these areas. Theweakness of the social sphere of Chernivtsi regionaccording to the criteria we have chosen is based on
Kuzyshyn A.V., Poplavska I.V. Journ.Geol.Geograph.Geoecology, 27(2), 285-293________________________________________________________________________________________________________________________________________________________________
293
the low positions of the cultural sphere, housingand communal services as well as medical sphere.
References
Kutsenko, V.I., 2008. Sotsial'na sfera: real'nist' i konturymaybutn'oho (pytannya teoriyi i praktyky) [Socialsphere: reality and contours of the future(questions of theory and practice)]. Aspekt-Poligraf Publishing Ltd., Nizhyn(in Ukrainian).
Kutsenko, V.I, Ostafiychuk Y.V., 2005. Transformatsiyisotsial'noyi sfery Ukrayiny: rehional'nyy aspekt[Transformation of the social sphere of Ukraine:the regional aspect. Orion, Kyiv (inUkrainian).
Kuzyshyn, А.V., 2015. Kharakterystyka sotsial'noyisfery zakhidnoukrayins'kykh oblastey v svitlizaynyatosti naselennya. [Characteristics of thesocial sphere of the western Ukrainian regions inthe light of employment of the population]Lvivsocial-geographical school: history, theory,Ukrainian studies studios: Materials of the All-Ukrainian conference with the participation offoreign scientists devoted to the 70th anniversaryof the Department of Economic and SocialGeography of the Ivan Franko NationalUniversity of Lviv (Lviv, November 19-20,2015). Lviv Ivan Franko National University,Lviv. 378-384 (in Ukrainian).
Kuzyshyn, А., 2018. Heoprostorova dyferentsiatsiyaelementiv sotsial'noyi sfery oblastey Karpat·s'ko-Podil's'koho rehionu [Geospatial differentiation ofthe social sphere elements of the Carpathian-Podillia region]. The Scientific Issues of TernopilVolodymyr Hnatiuk National Pedagogical Uni-
versity. Series: Geography. 44(1). 64-71 (inUkrainian).
Kuzyshyn, A., 2015. Function of social sphere of theCarpathian-Podillia region through the assess-ment of employment Service industries in theCarpathia-Podilla Region. Probltmatyka 31Międzynarodowej Konferencii Naukowej nt.«Miedzynarodowt uwarunkowania rozwojoprzemysłu i usług». Warszawa – Krakow. 69.
Niemec, L.N., 2003. Ustojchivoe razvitie: social'no-geograficheskie aspekty (na primere Ukrainy)[Sustainable development: socio-geographicalaspects (on the example of Ukraine)]. Fakt, Khar-kiv(in In Russian).
Oliinyk,Y.B., Stepanenko, A.V., 2012. Sotsial'nyy loka-litet zhyttya osobystostey i terytorial'nykhspil'nostey [Social locality of the life ofindividuals and territorial communities].Economic and Social Geography (65) 2 (65), 3-22(in Ukrainian).
Pigul, N.G., 2013. Osnovy funktsionuvannya sotsial'noyisfery [Fundamentals of the social sphere func-tioning]. Scientific Bulletin of the PoltavaUniversity of Economics and Trade. 56(1), 46-50(in Ukrainian).
Statystychnyy zbirnyk «Rehiony Ukrayiny», 2017[Statistical Collection «Regions of Ukraine»,2017]. Part 1. Kyiv(in Ukrainian).
Statystychnyy zbirnyk «Rehiony Ukrayiny», 2017[Statistical Collection «Regions of Ukraine»,2017.] Part 2.Kyiv (in Ukrainian).
Statystychnyy shchorichnyk Ukrayiny za 2016 rik,2017[Statistical Yearbook of Ukraine for 2016],Kyiv(in Ukrainian).

E.O. Maksymova, S.I. Kostrytska. Journ.Geol.Geograph.Geoecology, 27(2), 297-307________________________________________________________________________________________________________________________________________________________________
294
Journal of Geology,Geography and Geoecology
Journal home page: geology-dnu-dp.ua
ISSN 2617-2909 (print)ISSN 2617-2119 (online)
Journ.Geol.Geograph.Geoecology,
27(2), 294-304doi:10.15421/111853
E.O. Maksymova, S.I. Kostrytska. Journ.Geol.Geograph.Geoecology, 27(2), 294-304________________________________________________________________________________________________________________________________________________________________
Geological and structural prerequisites of gas-bearing capacity and gas hydrate formation inthe World Ocean (in terms of the Black Sea)
Ella Maksymova, Svitlana Kostrytska
National Mining University, Dnipro, Ukraine, email: [email protected]; [email protected]
Abstract.Gas hydrates occurring in the World Ocean are considered as the additional andperspective non-traditional resource of hydrocarbon materials. The proposed classifica-tion of deposits as for mining and geological conditions of their occurrence as well asmethodological approach to their development and calculation of technological parame-ters of methane extraction from the World Ocean floor with minimum impact upon the
Earth’s hydrosphere is of considerable importance in the context of current studies of new and most prospective source of energy interms of the available experience gap as for the development of gas hydrate deposits. The approach to search for and explore gashydrate deposits occurring on and under the World Ocean floor has been suggested; the approach is based upon the regularities of gashydrate distribution in lithological varieties and geological structures. The necessity to take into consideration the pore space enclos-ing gas hydrate thicknesses to calculate their reserves has been substantiated. The overview of scientific literature sources summariz-ing the results of marine expeditions as well as the analysis of publications of world scientific community dealing with the studies ofgas hydrates has made it possible to determine that gas hydrate deposits are associated to the zones of jointing of continental platesand oceanic troughs. In their turn, those zones, due to different genesis, are made up of the corresponding various products of sedi-mentary rock accumulations. Detailed analysis of the Black Sea floor structure has been performed. Three geomorphological zoneshave been singled out; basic types of gas-bearing capacity manifestation and methane liberation from the interior have beenrepresented. Quantitative evaluation of methane content in gas hydrate deposits has been given taking into account the detected ones.Data concerning gas-bearing capacity of the Black Sea floor proved by the map of mud volcanoes location within the areas of gashydrate sampling have been considered. That was the basis to analyze peculiarities of the formation of bottom-sediment gas hydratesbasing upon genetic origin of lithological composition of their enclosing rocks and their structures in terms of the Black Sea floor.Relation between the features of the World Ocean floor structure and the distribution of gas hydrate deposits has been determined.Theoretical approach to search for and explore gas hydrate deposits both in the Black Sea and in the World Ocean has been devel-oped and proposed. Interaction between different zones of the World Ocean floor and types of gas hydrate deposits based upon thecompositions of their enclosing rock has been shown. Lithological composition of the rocks enclosing gas hydrates has been ana-lyzed in detail. That will make it possible to determine the type of any specific deposit and elaborate technological scheme to openand develop methane-containing gas hydrate deposits.
Key words: the Black Sea, the World Ocean, gas hydrate, methane, bottom sediments.
Геолого - структурні передумови газоносності та гідратоутворення в Світовому океані(на прикладі Чорного моря)
Е. О. Максимова, С.І. Кострицька
Державний вищий навчальний заклад «Національний гірничий університет», Дніпро, Україна,email: [email protected]; [email protected]
Анотація. Родовища газових гідратів є перспективним додатковим джерелом вуглеводневої сировини. На сучасному етапідосліджень цього нового і найбільш перспективного джерела енергетичних ресурсів, має велике значення розробка техно-логічних параметрів процесу вилучення метану з дна Світового океану з мінімальним впливом на гідросферу Землі. Длядосягнення цієї мети, є вельми актуальним встановлення геолого-структурних особливостей залягання цього ресурсу, вияв-лення закономірностей його поширення в донних відкладеннях та оцінка впливу літологічного складу порід, що вміщуютьгазогідрат на формування його структур. Запропонована класифікація родовищ газових гідратів, що залягають на дні і піддном Світового океану, заснована на закономірностях їх поширення в різних літологічних різновидах і геологічних струк-турах, надає можливості для їх пошуку і розвідки. Обґрунтовано необхідність врахування оцінки порового простору, що
Received 09.05.2018;Received in revised form 16.052018;Accepted 20.06.2018
E.O. Maksymova, S.I. Kostrytska. Journ.Geol.Geograph.Geoecology, 27(2), 294-304________________________________________________________________________________________________________________________________________________________________
295
вміщає газогідратні товщі для підрахунку їх запасів. Виконано детальний аналіз будови дна Чорного моря, виділені тригеоморфологічних зони і наведені основні види прояви газоносності і виділення метану з надр. На цій основі виконаноаналіз особливостей формування газогідратів донних відкладень, на основі генетичного походження літологічного складупорід, що вміщують і їх структур, на прикладі дна Чорного моря. З урахуванням виявлених родовищ газових гідратів, наве-дена кількісна оцінка вмісту метану в газогідратних відкладеннях.
Ключові слова: Чорне море, Світовий океан, газовий гідрат, метан, донні відкладення.
Introduction. International scientific com-munity considers huge deposits of gas hydrates inthe World Ocean as the extra nontraditional sourceof carbohydrates. Studies of gas hydrates have be-come more active in recent 50 years. Many ofscientists from different countries discuss the issuesconcerning the availability of gas hydrates and con-ditions of gas hydrate formations. Over that period,various scientists (Okuda, 1988;Kvenvolden,Robertson, Simons, 1988;Shnyukov, Gozhik, Kra-yushkin, Klochko, 2007; Makogon, 2010; Chen,Zhou, Su, Liu, Lu, Wang, 2011; Kobolev, 2017 andothers) have determined the availability of gas hy-drates within the mainland and considerable occur-rences of gas hydrate deposits within the shelf andfloor of the World Ocean. Such authors as Sloan,1990;Yamamoto, Terao, Fujii, Ikawa, Seki, Matsu-zawa, Kanno, 2014; Zhao, Song, Lim, Lam, 2017)state that gas hydrate reserves (2 ∙ 1016 m3) arecomparable to the amount of oxygen in the Earth’satmosphere (8 ∙ 1017 m3). Taking into considera-tion high specific gas concentration in natural hy-drates (up to 160 m / m3), their relatively shallowoccurrence (under seafloor starting from the waterdepth of 300-500 m) (Byakov, Krugliakova2001),deep-sea hydrates are considered as a real alterna-tive to the traditionally extracted gas. Nowadays,Great Britain, Germany, Canada, China, the USA,Norway, and Japan are involved in the developmentof gas hydrate extraction technologies.
Japanese and Canadian researchers havemade successful attempts of gas hydrate depositdevelopment. In 2012, Japan initiated one of thetop-priority national budget-financing programmersin the world aimed at the development of marinegas hydrate deposits of Nankai Trough at the depthof 950 m (Yamamoto, Terao, Fujii, Ikawa, Seki,Matsuzawa, Kanno, 2014). For the first time in theworld practice, Japanese gas enterprise has ma-naged to extract gas from the seafloor gas hydrates.The extraction may be called as a well productiontesting. For instance, Canadian experts have ex-tracted gas from the gas hydrates deposits locatedwithin the permafrost zone. Irrespective the factsthat gas emission was stable only during six daysand the experiments cost CDN 48 mln, scientificcommunity took the news as a real breakthrough inthe sphere of “blue fuel” extraction as Arctic areaof Canada is characterized by gas hydrate depositsbeing sufficient to satisfy the needs of Canadiandomestic market for some hundred years to come.
Topicality of the research is proved by the no avail-ability of both direct and indirect methods to searchand explore gas hydrate deposits within the WorldOcean floor apart from geophysical one. Geophysi-cal methods are widely applied by modern scienceto detect such deposits, taking into considerationspecific features of their occurrence and expansion.However, to plan any geophysical expeditions, it isimportant to have previous outline of the zone forsearching and exploring; further evaluation of thedeposits requires innovative approach consideringpore space, facility, and enclosing rock structure.The paper proposes to predict these parametersaccording to the bottom structure before the begin-ning of deep drilling operations.
The author deals with the problem not onlyin terms of the obtaining additional power resource,but also because of the concerns that there may beserious environmental and climatic problems as aresult of possible accidental methane release intothe atmosphere not only during incorrect develop-ment of gas hydrate deposits but also in the contextof relatively minor changes in thermodynamic(climatic) conditions being close to the limit of gashydrate phase stability (Bondarenko, Maksymova,Koval 2013; Maksymova, 2015, 2016, 2018). Inother words, as a result of global warming and in-crease in the World Ocean temperature, deep-seagas hydrates may begin their uncontrollable de-composition even without human involvement asthe shift in phase balance in terms of environmentaltemperature rise will result in chain reaction of gasliberation. That is true about the Black Sea as well.Currently, there is no scientifically substantiatedtechnology to develop gas hydrate deposits. Ration-al development of that additional natural energyresource requires the elaboration of a technologicalscheme taking into consideration the specific geo-logical and morphological structure of each depositas well as the utmost environmentally friendlytechnology of gas extraction from gas hydrate de-posits. Thus, the main task for today is to formulatea complex approach for that natural resource devel-opment. With respect to the available wide-scaleworldwide studies in the area, it is obvious that weneed detailed analysis of the relations of all theprocesses within the considered systems from theviewpoint of geological conditions and regulari-ties.
Thus, the objective of the paper is to demon-strate the relations between the World Ocean floor
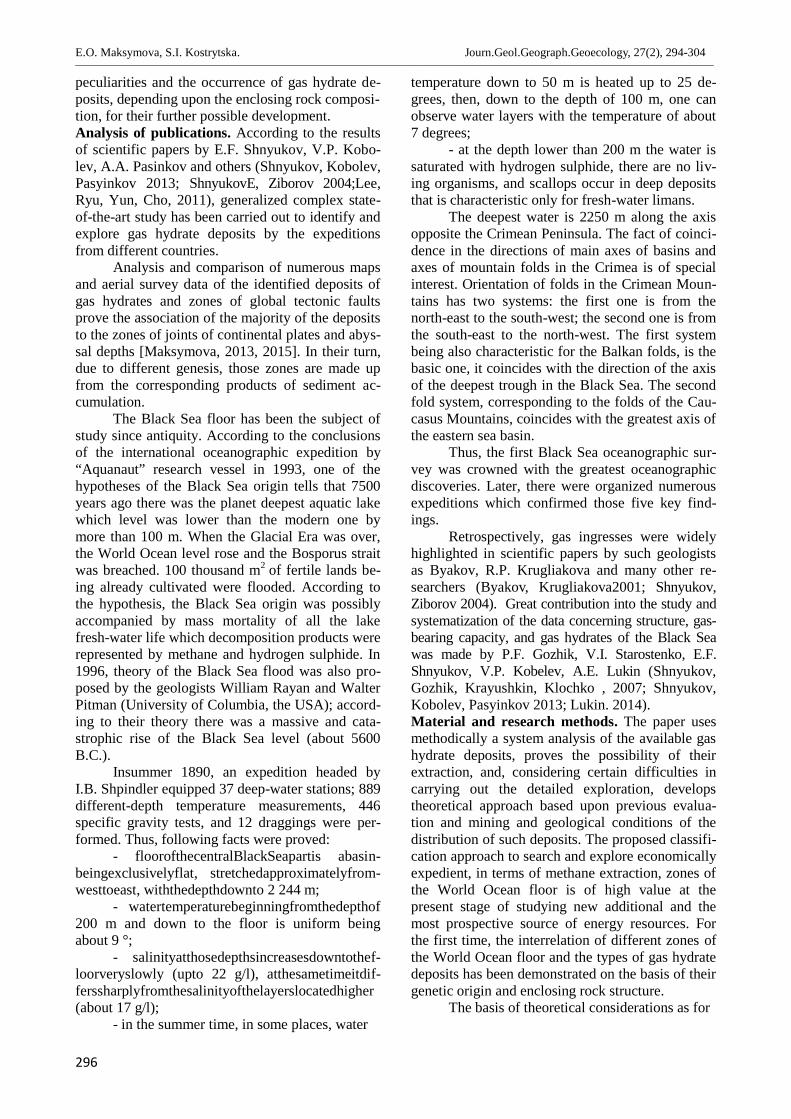
E.O. Maksymova, S.I. Kostrytska. Journ.Geol.Geograph.Geoecology, 27(2), 294-304________________________________________________________________________________________________________________________________________________________________
296
peculiarities and the occurrence of gas hydrate de-posits, depending upon the enclosing rock composi-tion, for their further possible development.Analysis of publications. According to the resultsof scientific papers by E.F. Shnyukov, V.P. Kobo-lev, A.A. Pasinkov and others (Shnyukov, Kobolev,Pasyinkov 2013; ShnyukovE, Ziborov 2004;Lee,Ryu, Yun, Cho, 2011), generalized complex state-of-the-art study has been carried out to identify andexplore gas hydrate deposits by the expeditionsfrom different countries.
Analysis and comparison of numerous mapsand aerial survey data of the identified deposits ofgas hydrates and zones of global tectonic faultsprove the association of the majority of the depositsto the zones of joints of continental plates and abys-sal depths [Maksymova, 2013, 2015]. In their turn,due to different genesis, those zones are made upfrom the corresponding products of sediment ac-cumulation.
The Black Sea floor has been the subject ofstudy since antiquity. According to the conclusionsof the international oceanographic expedition by“Aquanaut” research vessel in 1993, one of thehypotheses of the Black Sea origin tells that 7500years ago there was the planet deepest aquatic lakewhich level was lower than the modern one bymore than 100 m. When the Glacial Era was over,the World Ocean level rose and the Bosporus straitwas breached. 100 thousand m2 of fertile lands be-ing already cultivated were flooded. According tothe hypothesis, the Black Sea origin was possiblyaccompanied by mass mortality of all the lakefresh-water life which decomposition products wererepresented by methane and hydrogen sulphide. In1996, theory of the Black Sea flood was also pro-posed by the geologists William Rayan and WalterPitman (University of Columbia, the USA); accord-ing to their theory there was a massive and cata-strophic rise of the Black Sea level (about 5600B.C.).
Insummer 1890, an expedition headed byI.B. Shpindler equipped 37 deep-water stations; 889different-depth temperature measurements, 446specific gravity tests, and 12 draggings were per-formed. Thus, following facts were proved:
- floorofthecentralBlackSeapartis abasin-beingexclusivelyflat, stretchedapproximatelyfrom-westtoeast, withthedepthdownto 2 244 m;
- watertemperaturebeginningfromthedepthof200 m and down to the floor is uniform beingabout 9 °;
- salinityatthosedepthsincreasesdowntothef-loorveryslowly (upto 22 g/l), atthesametimeitdif-ferssharplyfromthesalinityofthelayerslocatedhigher(about 17 g/l);
- in the summer time, in some places, water
temperature down to 50 m is heated up to 25 de-grees, then, down to the depth of 100 m, one canobserve water layers with the temperature of about7 degrees;
- at the depth lower than 200 m the water issaturated with hydrogen sulphide, there are no liv-ing organisms, and scallops occur in deep depositsthat is characteristic only for fresh-water limans.
The deepest water is 2250 m along the axisopposite the Crimean Peninsula. The fact of coinci-dence in the directions of main axes of basins andaxes of mountain folds in the Crimea is of specialinterest. Orientation of folds in the Crimean Moun-tains has two systems: the first one is from thenorth-east to the south-west; the second one is fromthe south-east to the north-west. The first systembeing also characteristic for the Balkan folds, is thebasic one, it coincides with the direction of the axisof the deepest trough in the Black Sea. The secondfold system, corresponding to the folds of the Cau-casus Mountains, coincides with the greatest axis ofthe eastern sea basin.
Thus, the first Black Sea oceanographic sur-vey was crowned with the greatest oceanographicdiscoveries. Later, there were organized numerousexpeditions which confirmed those five key find-ings.
Retrospectively, gas ingresses were widelyhighlighted in scientific papers by such geologistsas Byakov, R.P. Krugliakova and many other re-searchers (Byakov, Krugliakova2001; Shnyukov,Ziborov 2004). Great contribution into the study andsystematization of the data concerning structure, gas-bearing capacity, and gas hydrates of the Black Seawas made by P.F. Gozhik, V.I. Starostenko, E.F.Shnyukov, V.P. Kobelev, A.E. Lukin (Shnyukov,Gozhik, Krayushkin, Klochko , 2007; Shnyukov,Kobolev, Pasyinkov 2013; Lukin. 2014).Material and research methods. The paper usesmethodically a system analysis of the available gashydrate deposits, proves the possibility of theirextraction, and, considering certain difficulties incarrying out the detailed exploration, developstheoretical approach based upon previous evalua-tion and mining and geological conditions of thedistribution of such deposits. The proposed classifi-cation approach to search and explore economicallyexpedient, in terms of methane extraction, zones ofthe World Ocean floor is of high value at thepresent stage of studying new additional and themost prospective source of energy resources. Forthe first time, the interrelation of different zones ofthe World Ocean floor and the types of gas hydratedeposits has been demonstrated on the basis of theirgenetic origin and enclosing rock structure.
The basis of theoretical considerations as for
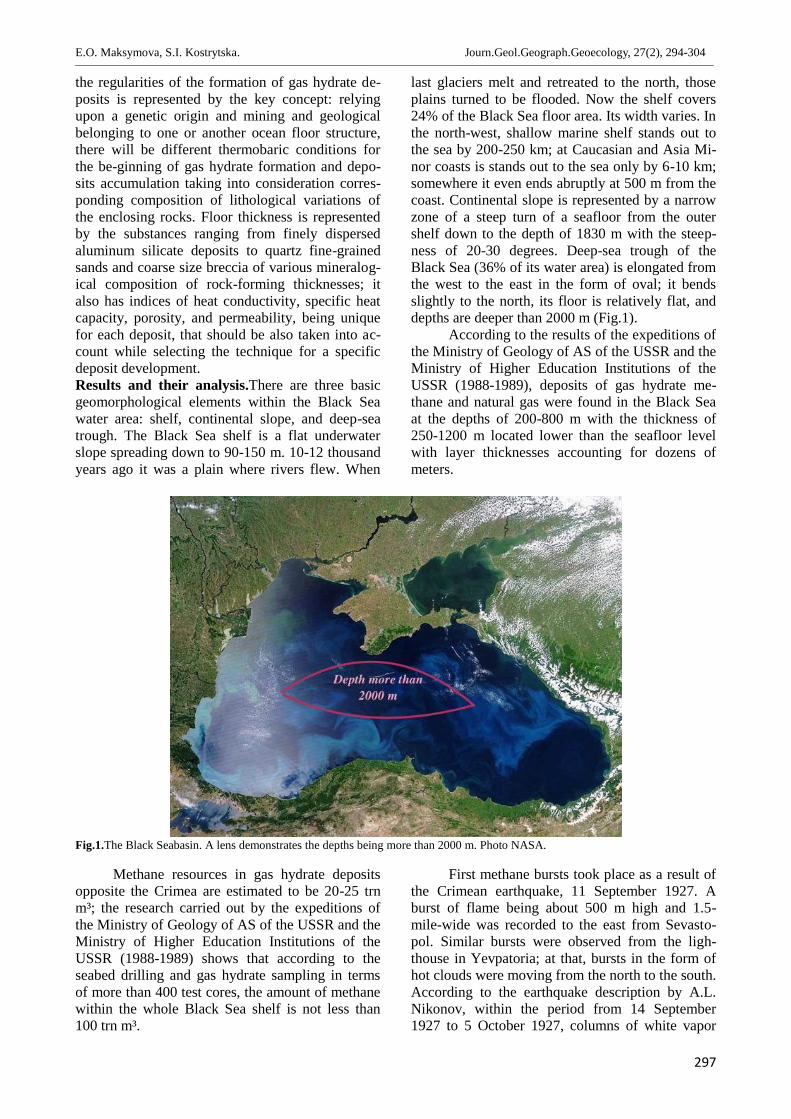
E.O. Maksymova, S.I. Kostrytska. Journ.Geol.Geograph.Geoecology, 27(2), 294-304________________________________________________________________________________________________________________________________________________________________
297
the regularities of the formation of gas hydrate de-posits is represented by the key concept: relyingupon a genetic origin and mining and geologicalbelonging to one or another ocean floor structure,there will be different thermobaric conditions forthe be-ginning of gas hydrate formation and depo-sits accumulation taking into consideration corres-ponding composition of lithological variations ofthe enclosing rocks. Floor thickness is representedby the substances ranging from finely dispersedaluminum silicate deposits to quartz fine-grainedsands and coarse size breccia of various mineralog-ical composition of rock-forming thicknesses; italso has indices of heat conductivity, specific heatcapacity, porosity, and permeability, being uniquefor each deposit, that should be also taken into ac-count while selecting the technique for a specificdeposit development.Results and their analysis.There are three basicgeomorphological elements within the Black Seawater area: shelf, continental slope, and deep-seatrough. The Black Sea shelf is a flat underwaterslope spreading down to 90-150 m. 10-12 thousandyears ago it was a plain where rivers flew. When
last glaciers melt and retreated to the north, thoseplains turned to be flooded. Now the shelf covers24% of the Black Sea floor area. Its width varies. Inthe north-west, shallow marine shelf stands out tothe sea by 200-250 km; at Caucasian and Asia Mi-nor coasts is stands out to the sea only by 6-10 km;somewhere it even ends abruptly at 500 m from thecoast. Continental slope is represented by a narrowzone of a steep turn of a seafloor from the outershelf down to the depth of 1830 m with the steep-ness of 20-30 degrees. Deep-sea trough of theBlack Sea (36% of its water area) is elongated fromthe west to the east in the form of oval; it bendsslightly to the north, its floor is relatively flat, anddepths are deeper than 2000 m (Fig.1).
According to the results of the expeditions ofthe Ministry of Geology of AS of the USSR and theMinistry of Higher Education Institutions of theUSSR (1988-1989), deposits of gas hydrate me-thane and natural gas were found in the Black Seaat the depths of 200-800 m with the thickness of250-1200 m located lower than the seafloor levelwith layer thicknesses accounting for dozens ofmeters.
Fig.1.The Black Seabasin. A lens demonstrates the depths being more than 2000 m. Photo NASA.
Methane resources in gas hydrate depositsopposite the Crimea are estimated to be 20-25 trnm³; the research carried out by the expeditions ofthe Ministry of Geology of AS of the USSR and theMinistry of Higher Education Institutions of theUSSR (1988-1989) shows that according to theseabed drilling and gas hydrate sampling in termsof more than 400 test cores, the amount of methanewithin the whole Black Sea shelf is not less than100 trn m³.
First methane bursts took place as a result ofthe Crimean earthquake, 11 September 1927. Aburst of flame being about 500 m high and 1.5-mile-wide was recorded to the east from Sevasto-pol. Similar bursts were observed from the ligh-thouse in Yevpatoria; at that, bursts in the form ofhot clouds were moving from the north to the south.According to the earthquake description by A.L.Nikonov, within the period from 14 September1927 to 5 October 1927, columns of white vapor
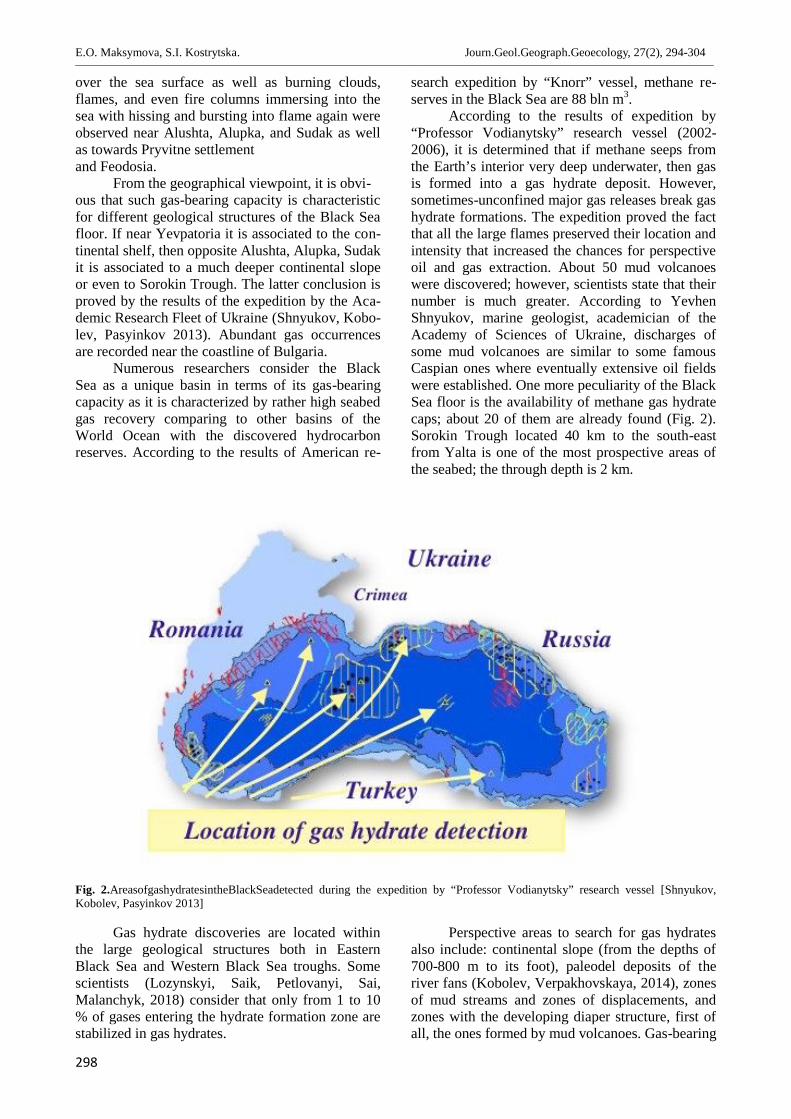
E.O. Maksymova, S.I. Kostrytska. Journ.Geol.Geograph.Geoecology, 27(2), 294-304________________________________________________________________________________________________________________________________________________________________
298
over the sea surface as well as burning clouds,flames, and even fire columns immersing into thesea with hissing and bursting into flame again wereobserved near Alushta, Alupka, and Sudak as wellas towards Pryvitne settlementand Feodosia.
From the geographical viewpoint, it is obvi-ous that such gas-bearing capacity is characteristicfor different geological structures of the Black Seafloor. If near Yevpatoria it is associated to the con-tinental shelf, then opposite Alushta, Alupka, Sudakit is associated to a much deeper continental slopeor even to Sorokin Trough. The latter conclusion isproved by the results of the expedition by the Aca-demic Research Fleet of Ukraine (Shnyukov, Kobo-lev, Pasyinkov 2013). Abundant gas occurrencesare recorded near the coastline of Bulgaria.
Numerous researchers consider the BlackSea as a unique basin in terms of its gas-bearingcapacity as it is characterized by rather high seabedgas recovery comparing to other basins of theWorld Ocean with the discovered hydrocarbonreserves. According to the results of American re-
search expedition by “Knorr” vessel, methane re-serves in the Black Sea are 88 bln m3.
According to the results of expedition by“Professor Vodianytsky” research vessel (2002-2006), it is determined that if methane seeps fromthe Earth’s interior very deep underwater, then gasis formed into a gas hydrate deposit. However,sometimes-unconfined major gas releases break gashydrate formations. The expedition proved the factthat all the large flames preserved their location andintensity that increased the chances for perspectiveoil and gas extraction. About 50 mud volcanoeswere discovered; however, scientists state that theirnumber is much greater. According to YevhenShnyukov, marine geologist, academician of theAcademy of Sciences of Ukraine, discharges ofsome mud volcanoes are similar to some famousCaspian ones where eventually extensive oil fieldswere established. One more peculiarity of the BlackSea floor is the availability of methane gas hydratecaps; about 20 of them are already found (Fig. 2).Sorokin Trough located 40 km to the south-eastfrom Yalta is one of the most prospective areas ofthe seabed; the through depth is 2 km.
Fig. 2.AreasofgashydratesintheBlackSeadetected during the expedition by “Professor Vodianytsky” research vessel [Shnyukov,Kobolev, Pasyinkov 2013]
Gas hydrate discoveries are located withinthe large geological structures both in EasternBlack Sea and Western Black Sea troughs. Somescientists (Lozynskyi, Saik, Petlovanyi, Sai,Malanchyk, 2018) consider that only from 1 to 10% of gases entering the hydrate formation zone arestabilized in gas hydrates.
Perspective areas to search for gas hydratesalso include: continental slope (from the depths of700-800 m to its foot), paleodel deposits of theriver fans (Kobolev, Verpakhovskaya, 2014), zonesof mud streams and zones of displacements, andzones with the developing diaper structure, first ofall, the ones formed by mud volcanoes. Gas-bearing
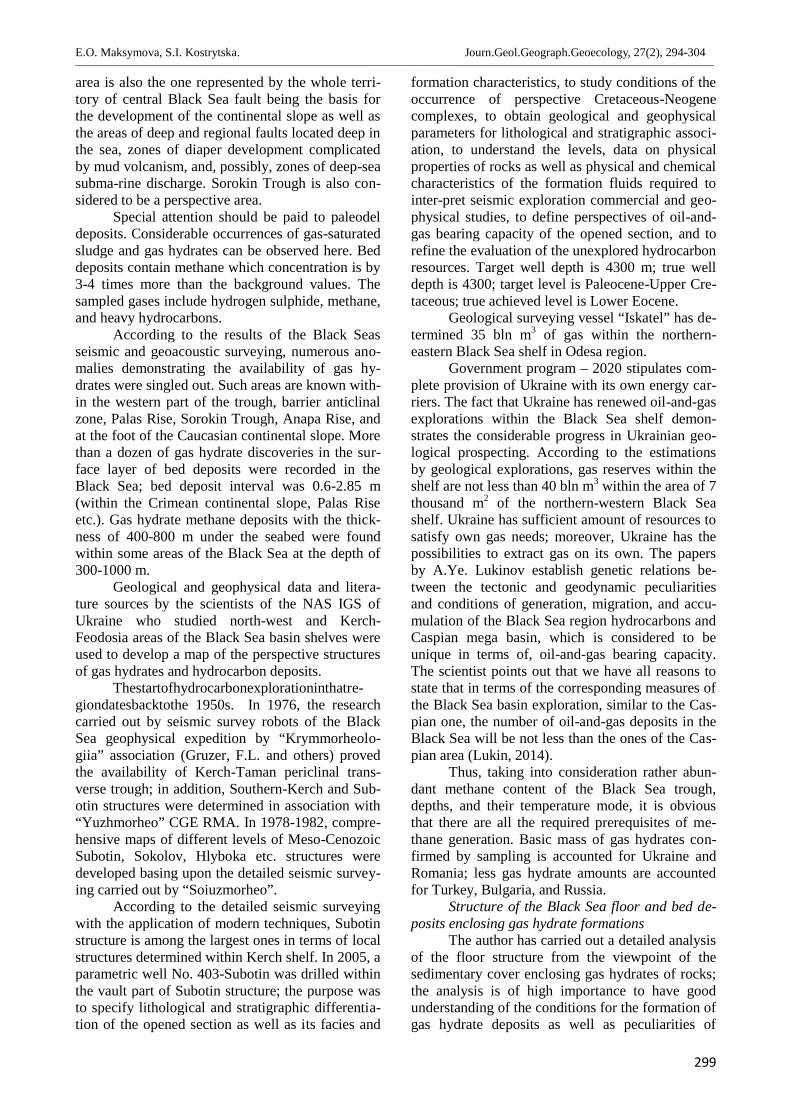
E.O. Maksymova, S.I. Kostrytska. Journ.Geol.Geograph.Geoecology, 27(2), 294-304________________________________________________________________________________________________________________________________________________________________
299
area is also the one represented by the whole terri-tory of central Black Sea fault being the basis forthe development of the continental slope as well asthe areas of deep and regional faults located deep inthe sea, zones of diaper development complicatedby mud volcanism, and, possibly, zones of deep-seasubma-rine discharge. Sorokin Trough is also con-sidered to be a perspective area.
Special attention should be paid to paleodeldeposits. Considerable occurrences of gas-saturatedsludge and gas hydrates can be observed here. Beddeposits contain methane which concentration is by3-4 times more than the background values. Thesampled gases include hydrogen sulphide, methane,and heavy hydrocarbons.
According to the results of the Black Seasseismic and geoacoustic surveying, numerous ano-malies demonstrating the availability of gas hy-drates were singled out. Such areas are known with-in the western part of the trough, barrier anticlinalzone, Palas Rise, Sorokin Trough, Anapa Rise, andat the foot of the Caucasian continental slope. Morethan a dozen of gas hydrate discoveries in the sur-face layer of bed deposits were recorded in theBlack Sea; bed deposit interval was 0.6-2.85 m(within the Crimean continental slope, Palas Riseetc.). Gas hydrate methane deposits with the thick-ness of 400-800 m under the seabed were foundwithin some areas of the Black Sea at the depth of300-1000 m.
Geological and geophysical data and litera-ture sources by the scientists of the NAS IGS ofUkraine who studied north-west and Kerch-Feodosia areas of the Black Sea basin shelves wereused to develop a map of the perspective structuresof gas hydrates and hydrocarbon deposits.
Thestartofhydrocarbonexplorationinthatre-giondatesbacktothe 1950s. In 1976, the researchcarried out by seismic survey robots of the BlackSea geophysical expedition by “Krymmorheolo-giia” association (Gruzer, F.L. and others) provedthe availability of Kerch-Taman periclinal trans-verse trough; in addition, Southern-Kerch and Sub-otin structures were determined in association with“Yuzhmorheo” CGE RMA. In 1978-1982, compre-hensive maps of different levels of Meso-CenozoicSubotin, Sokolov, Hlyboka etc. structures weredeveloped basing upon the detailed seismic survey-ing carried out by “Soiuzmorheo”.
According to the detailed seismic surveyingwith the application of modern techniques, Subotinstructure is among the largest ones in terms of localstructures determined within Kerch shelf. In 2005, aparametric well No. 403-Subotin was drilled withinthe vault part of Subotin structure; the purpose wasto specify lithological and stratigraphic differentia-tion of the opened section as well as its facies and
formation characteristics, to study conditions of theoccurrence of perspective Cretaceous-Neogenecomplexes, to obtain geological and geophysicalparameters for lithological and stratigraphic associ-ation, to understand the levels, data on physicalproperties of rocks as well as physical and chemicalcharacteristics of the formation fluids required tointer-pret seismic exploration commercial and geo-physical studies, to define perspectives of oil-and-gas bearing capacity of the opened section, and torefine the evaluation of the unexplored hydrocarbonresources. Target well depth is 4300 m; true welldepth is 4300; target level is Paleocene-Upper Cre-taceous; true achieved level is Lower Eocene.
Geological surveying vessel “Iskatel” has de-termined 35 bln m3 of gas within the northern-eastern Black Sea shelf in Odesa region.
Government program – 2020 stipulates com-plete provision of Ukraine with its own energy car-riers. The fact that Ukraine has renewed oil-and-gasexplorations within the Black Sea shelf demon-strates the considerable progress in Ukrainian geo-logical prospecting. According to the estimationsby geological explorations, gas reserves within theshelf are not less than 40 bln m3 within the area of 7thousand m2 of the northern-western Black Seashelf. Ukraine has sufficient amount of resources tosatisfy own gas needs; moreover, Ukraine has thepossibilities to extract gas on its own. The papersby A.Ye. Lukinov establish genetic relations be-tween the tectonic and geodynamic peculiaritiesand conditions of generation, migration, and accu-mulation of the Black Sea region hydrocarbons andCaspian mega basin, which is considered to beunique in terms of, oil-and-gas bearing capacity.The scientist points out that we have all reasons tostate that in terms of the corresponding measures ofthe Black Sea basin exploration, similar to the Cas-pian one, the number of oil-and-gas deposits in theBlack Sea will be not less than the ones of the Cas-pian area (Lukin, 2014).
Thus, taking into consideration rather abun-dant methane content of the Black Sea trough,depths, and their temperature mode, it is obviousthat there are all the required prerequisites of me-thane generation. Basic mass of gas hydrates con-firmed by sampling is accounted for Ukraine andRomania; less gas hydrate amounts are accountedfor Turkey, Bulgaria, and Russia.
Structure of the Black Sea floor and bed de-posits enclosing gas hydrate formations
The author has carried out a detailed analysisof the floor structure from the viewpoint of thesedimentary cover enclosing gas hydrates of rocks;the analysis is of high importance to have goodunderstanding of the conditions for the formation ofgas hydrate deposits as well as peculiarities of
E.O. Maksymova, S.I. Kostrytska. Journ.Geol.Geograph.Geoecology, 27(2), 294-304________________________________________________________________________________________________________________________________________________________________
300
thermal and physical properties of their enclosingrocks to develop further schemes of extracting thatvaluableenergy resource.
Beginning from the depth of 25-50 m, beddeposits of the Black Sea are represented by graveland sand. The Black Sea shelf starts from the coastand goes down to the depth of 100-140 m. General-ly, at the levels higher than 2000 m depths, withinthe lim-its of firths, sedimentations of a steep conti-nental slope are stipulated by river discharge; theyare rep-resented by sand, pebbles, and mud bankwith shells. Remains of mussels and horse musselscan be found within the shelf. They form so-calledphaseoline ooze. Central part of the Black Seafloor, deeper than 200 m, is represented by abyssalplain represented by bluish-grey terrigenous mud;occasionally it is covered with white encrustation ofamorphous carbonate limestone. Sedimentationmass occurs on a basalt bed covering the Earth’smantle.
Huge quantities of benthos, plankton, zoop-lankton, and other biomass defined and evaluatedby the scientists of the Institute of the Biology ofSouthern Seas of the NAS of Ukraine may be addi-tional sources of organics along with endogenousmethane. Not only benthos but also some species ofplankton was found by the scientists within thehydro sulfuric zone of the Black Sea as well as atthe depths being more than 1500 m near the seaf-loor. That is an interesting fact confirming geneticconnection of the Black Sea with fresh-water com-plexes. Bathyal zone of the Black Sea bottom, cov-ering both shelf and continental slope depths, i.e.from 200 m down to 3000 m, is colonized: totalamount of zooplankton at the depths of 0-50 m iswithin the range of 347-7185 sp. / m3; biomass –29.19-330.98 mg / m3; average values of total num-ber of planktonic organism biomass in bottom se-diments in terms of two depth ranges being 1250-1850 m and 2060-2110 vary from 1 867 to 18844sp. / 0.1 m2and from 98.91 to 1195.97 mg / 0.1 m2
respectively. Not less than 100 mln tons of organicsper year merged into the lower sea layer being tak-en by sulfate-reducing bacteria generating hydrogensulphide. Sediment accumulation rate in the BlackSea in not less than 1 m / th years, 100 m per 100 thyears, and 1 km per one mln years.
Thickness of bottom sediments accumulatedin the Black Sea basin (within the abyssal plain) is4-8 times more than the depth of the Black Seawater column; thus, the thickness is from 8 to 16km. That is the thickest layer of the World Oceanbottom deposit. Analysis of core samples from thedepths of several thousand meters under the seabedfrom various regions of the Pacific and AtlanticOceans as well as the Black Sea demonstrates that
archaea prevail having adapted to live in such acomplex environment (Chen, Zhou, Su, Liu, Lu,Wang, 2011).
Archaea live on ooze, mud, and remains, pe-trified and processed by other organisms. As a re-sult of their activity, archaea generate methane.According to the literature data and the studies bythe Institute of Geological Sciences of the NAS ofUkraine, S.I. Subotin Institute of Geophysics of theNAS of Ukraine, Marine Hydrophysical Institute,and the Department of Marine Geology and Sedi-mental Ore-Formation of the National Museum ofNatural History of the NAS of Ukraine, the general-ized crosscut of deep water bottom sediments of theBlack Sea is as follows:
1. Modern sediment layer is the surface layerwith the thickness up to 1 m (maximum thickness is1.09 m) consisting of the alternating thinnest inter-layers (0.5-3 mm) of oozy substance with coccolithinclusions.
2. Ancient Black Sea deposits are characte-rized by the increased amount of organic substance.The complex consists of three layers:
Upper intermediate layer enriched with or-ganic substance represented by high-plastic greyand reddish-brown (within the areas of decay ooze)micro-layered oozes. That layer thickness is about0.20 m (maximum thickness is 0.6. m). Upperboundary of the complex is clear due to almostconstant availability of turbidities-argillaceous in-terlayers within its roof.
Middle layer is represented by sapropel beinghomogeneous, dense, and olive green to black in itscolor. Its average density is 0.40-0.50 m at maxi-mum value of 0.80 m.
Lower level is represented by pelitic dark-greyish ooze with the characteristic increased con-tent of organic substance. In addition, they are se-parated by the interlayers of turbidities.
3. Novoeuxinian deposits are not opened totheir full capacity (down to 3 m from their roof).The opened cut of Novoeuxinian deposits isrepresented by three benches (Bondarenko, Vytiaz,Zotsenko, 2015):
Upper bench is made up by light grey oozeswith the thickness up to 0.40 m. At the top, withinthe boundary with sapropel level, turbidities inter-layer is often observed. There is the same layer (upto 0.1-0.11 m) within the lower boundary of theoozes. Lower, there are the benches of terrigenouspelitic muds being plastic, bluish-grey with hydro-troilite interlayers within their lower share. Occa-sionally, there can be observed a turbidities level(up to 0.12 m) within the thickness of the bench;the basis of that level is represented by the interlay-ers of fine-grained sand, changing upwards into
E.O. Maksymova, S.I. Kostrytska. Journ.Geol.Geograph.Geoecology, 27(2), 294-304________________________________________________________________________________________________________________________________________________________________
301
muddy sediments, and by inclusions of dense yel-lowish-brown clay.
The lowest bench, among the opened No-voeuxinian ones, is represented by black hydrotroi-lite oozes, with occasional minor interlayers ofterrigenous blue-grey ooze.
Threegenetictypesofsedimentsaresingledou-tinadeep waterpartoftheBlackSea: terrigenous,biogenous, andterrigenous-biogenous. In their tex-ture, sediments are layered, sometimes crypto-layered, with flowing or soft consistency. Biogen-ous oozes are represented by coccolith, sapro-pel,sapropel-like, and sapropel-coccolith varieties. Interms of physical and mechanical properties, oozesare represented by the types ranging from liquid tohigh-plastic ones.
Such a detailed analysis of lithological com-position carried out by the scientists of the NAS ofUkraine is of high importance; thus, the author ofthe paper takes it as the basis for the developedmethodology to calculate the dissociation rate ofvarious-genesis gas hydrate thicknesses. Thoselithological varieties have individual indices ofthermal capacity, thermal conductivity, porosity
etc. being essential while developing such depositsin future.
Having studied and analyzed numerous na-tional and foreign literature sources dealing withnat-ural gas hydrates, the author of the paper inter-links conditions of their formation in the WorldOcean in general and in the Black Sea in particularand bottom sediments being their enclosing rocks.Apart from high pressure and low temperature,such parameters as gas saturation, porosity, andthermal conductivity of a certain lithological differ-ence are of considerable importance.
The author is stick to the hypothesis of hy-drate formation from the Earth’s crust interior(Maksymova, 2013). Its essence is in the fact thatmethane outgoes from the Earth’s interior throughfaults in the oceanic crust from deep depths, aboutseveral dozens of kilometers. Gas flows go throughgeological sedimentary layers of sea and oceanfloors. Certain conditions (increased pressure -from11 MPa to 15 MPa and low temperatures - from 5 °C to 14 ° C), in terms of the available water, effectnatural gases; finally, gas hydrates are formed (Fig.3).
Fig. 3.Scheme of gas hydrates generation (Maksymova 2013).
Thus, within the boundaries of continentalslope and deep water bed of the Black Sea trough,there are all the necessary conditions to accumulate
natural hydrocarbons in solid (gas hydrate) andliberated (gaseous) state: rather low water tempera-tures, the required pressure, alternation of porous
E.O. Maksymova, S.I. Kostrytska. Journ.Geol.Geograph.Geoecology, 27(2), 294-304________________________________________________________________________________________________________________________________________________________________
302
and argillaceous sediments in the cut, wide-scalegas-bearing capacity of the water basin. Geologicalzones of gas hydrate development are often con-nected with the development of argillaceous diaperscomplicated by mud volcanoes. Fragments andseparate inclusions of gas hydrates are often foundin the outbursts of mud volcanoes. Thickness of gashydrate deposits may reach up to 400 – 500 m; insome cases, the thickness may be even 1000 m. Asa rule, under-hydrate gas is accumulated under thegas hy-drate deposits. The Black Sea gas hydratesare most often represented by irregular fine inclu-sions within the semi-liquid oozes, snow-likeflakes, or cakes located both on and in the cavitiesof oozes of various lithological composition. Gashydrates may develop both in quaternary and Neo-gene deposits. Deposits containing gas hydratesforms impermeable cover for gases; under-hydrategas deposits are accumulated under that cover.
It is quite possible that the whole system is indynamic balance; however, the system, experienc-ing certain unloading through the funnels of volca-noes and by means of gushers, is refilled at theexpense of gas deposits from the deeper levels inthe interior.
Scientists of different periods of time devel-oped various classifications of gas hydrate depositsaccording to the conditions of accumulation andavailability: in terms of cryohydrate features, de-pending upon the phase state of rock fluids(Istomin, Yakushev, 1992), in terms of geologicaland physical peculiarities (Moridis, 2003), and asfor thermobaric condition of the occurrence(Makogon, 1997).
In the author’s opinion, a classification is re-quired to achieve final practical objective. The ob-jective is the development of that unusual newenergy resource with maximally possible expedien-cy and minimum impact upon the World Oceanenvironment. That is why classification features aretaken in a complex way, i.e. in terms of the originof the deposits, conditions of their future develop-ment, peculiarities of porous medium, and structur-al features. Basing upon the detailed analysis of theorigin of gas hydrate deposits as well as upon struc-ture and lithological composition of gas hydrateenclosing rocks, their corresponding classificationin terms of genetic type has been developed. Theauthor has developed classification according to thesubstance composition of the enclosing rocks andtheir geological and structural features(Maksymova,2013):
Type one. Gas hydrate deposits representingcontinuous deposits on the sea and ocean floors,within shelves and troughs as well as within largetectonic disturbances: along faults, rises, displace-
ments, and inside grabens. Those amorphous depo-sits of gas hydrates are in the form of pure ice oc-curring as independent layer of considerable thick-ness (from 2-3 m up to 150-200 m). While selectingthe development technique for those deposits, it isrequired to take into consideration their high andintense specific gas recovery factor reaching 80-90%.
Type two. Gas hydrate deposits in the form ofcontinuous thicknesses with practically homogene-ous, fine-grained structures of gas hydrate massesoccurring in shelves and troughs of seas andoceans, mostly in sands, abraded coarse-grainedcrushed cataclasites, within the boundary and underthe seabed; they may also occur in the continents inthe permafrost zones within the boundaries of bu-ried faults. Those are uncemented or weakly ce-mented terrigenous deposits with super capillaryporous channels of 0.5-2.0 mm in diameter. Whileestimating the reserves and selecting the develop-ment technique for the deposits of type two, itshould be taken into account that specific gas re-covery factor will be up to 60 %, and porosity valueshould be taken within the range of 60-80 %.
Type three. Gas hydrate deposits associatedto sabulous, argillaceous, and mud deposits whichcapillary pores are 0.0002-0.5 mm being saturatedwith gas hydrate. Porosity values are within therange of 40-60 %. They may form layered andblanket deposits occurring at different slope anglesof anticlinal or synclinal folds, under the sea andocean floors. In terms of such deposits, specific gasrecovery factor is not more than 50 %, the processof development will be accompanied by considera-ble losses at the expense of the available turbulentconditions.
Type four. Gas hydrate deposits within thefragments of rock breccia of various types. Such adeposit type is formed under different geodynamicconditions; it is characterized by rather diversestructure of the enclosing thickness and formed atthe points of rock mass displacements under thefloors of seas and oceans as well as within the per-mafrost areas. Values of porosity and permeabilitywill fluctuate within a wide range depending uponthe lithological differences of the enclosing thick-ness and tectonic fragmentation.
Type five. Gas hydrate deposits in the form ofvein deposits formed within large masses of mag-matic rocks, along faults; correspondingly, gas hy-drates occur in the form of large veins. They are ofmixed structure – from visible coarse-grained brec-cia to amorphous ones occurring under the sea andocean floors; they may be also available within thepermafrost zones. In other words, in terms of largeveins, cavities, or caves, gas hydrate will not occurin the form of type one, in the form of pure ice with
E.O. Maksymova, S.I. Kostrytska. Journ.Geol.Geograph.Geoecology, 27(2), 294-304________________________________________________________________________________________________________________________________________________________________
303
the highest values of permeability and specific gasrecovery factor. In terms of non-vein areas, so-called border zones of tectonic faults, gas hydratedeposits will be characterized by filtration indicesof either type three or type four of the classifica-tion.
The classification means further supplement-ing and correcting taking into consideration theresults of geological explorations of gas hydratedeposits according to the current expeditions car-ried out in different countries.
Conclusions.1. Association of the deposits of oil, gas, gas-
condensate, and gas hydrates of the sedimentarycover to the tectonic structure of the Earth’s crust asthe additional sign to discover gas hydrate depositshas been proved.
2. Classification of natural deposits of gashydrates according to the types depending upontheir belonging to various tectonic structures, oc-currence conditions, and material composition oftheir enclosing rock has been developed. Distribu-tion of gas hydrate deposits according to their ge-netic origin makes it possible to be more specifiedin the selection of rational technological schemes oftheir development.
3. Methodological approach to evaluate gashydrate deposits has been elaborated to select theappropriate technological schemes of the processesto extract methane from the World Ocean floorwith minimum impact upon the Earth’s hydros-phere.
4. It is proposed to develop methods andtechnologies for gas extraction from natural gashydrate deposits on the basis of the correspondingdeposit types.
The study has been carried out in the Nation-al Mining University according to the Law ofUkraine “On the priorities in the development ofscience and technology” of 12.10.2010,No. 2519-17, within the framework of Complex Program“Development of methods and technologies of gasextraction from natural gas hydrates and productionof artificial gas hydrates to optimize operatingprocesses”, (state research subject ДП - 467, 473)under the scientific guidance of Professor Bonda-renko, V.I. whom the author expresses her deepgratitude for permanent assistance and extensivesupport.
References.
Bondarenko, V., Maksymova, E., Koval, O. 2013.Genetic Classification of Gas Hydrates DepositsTypes by Geologic-Structural Criteria. Mining ofMineral Deposits, 115-119.https://doi.org/10.1201/b16354-21
Bondarenko, V., Svietkina, O., Sai, K. 2017. Study ofthe Formation Mechanism of Gas Hydrates ofMethane in the Presence of Surface-Active Sub-stances. Eastern-European Journal of EnterpriseTechnologies, 5(6(89)), 48-55.https://doi.org/10.15587/1729-4061.2017.112313
Bondarenko, V., Vytiaz, O., Zotsenko, 2015. Hazo-hidraty. Hidratoutvorennia ta osnovy rоzrobkyhazovykh hidrativ. [Gas hydrates formation andbasics of their recovery]. Litograf, Dnepropet-rovsk (in Ukrainian).
Byakov, Y., Krugliakova R. 2001. Gazogidraty osa-dochnoy tolschi Chernogo Morya - uglevodorod-noe syire buduschego [Gas hydrates of sedimen-tary strata of the Black Sea – hydrocarbon raw ofthe
future] Survey and protection of resources. 8, 14-19 (inRussian).
Chen, F., Zhou, Y., Su, X., Liu, G., Lu, H., Wang, J.2011. Gas Hydrate Saturation and Its Relationwith Grain Size of the Hydrate-Bearing Sedi-ments in the Shenhu Area of Northern SouthChina Sea. Marine Geology & Quaternary Geol-ogy, 31(5), 95-100.https://doi.org/10.3724/sp.j.1140.2011.05095
Chong, Z.R., Yang, S.H.B., Babu, P., Linga, P., Li, X.-S.2016. Review of Natural Gas Hydrates as an En-ergy Resource: Prospects and Challenges. Ap-plied Energy, (162), 1633-1652.https://doi.org/10.1016/j.apenergy.2014.12.061
Huo, R., Duan, K.B. 2014. Research Status and Trend ofNatural Gas Hydrate in China. Advanced Materi-als Research, (978), 165-168.https://doi.org/10.4028/www.scientific.net/amr.978.165
Istomin V., Yakushev V. 1992. Gazovyie gidratyi vprirodnyih usloviyah [Gas hydrates in naturalconditions]. Nedra, Moskva (in Russian).
Kobolev, V. 2017. Structural, tectonic and fluid-dynamicaspects of deep degassing of the Black Sea mega-trench. Mining of Mineral Deposits, 11(1), 31-49.https://doi.org/10.15407/mining11.01.031
Kobolev, V., Verpakhovskaya, A. 2014. Skopleniyagazovykh gidratov v paleodel’te Dnepra kakob’ektseysmicheskikh issledovaniy [Accumula-tions of gas hydrates in the paleodel of Dnepr asan object of seismic researches] Geologiya iPoleznye Iskopaemye Mirovogo Okeana, 1(35),81-93 (in Russian).
Kvenvolden, K. Robertson J. Simons S. 1988. MethaneHydrate – A Major Reservoir of Carbon in theShallow Geosphere? Chemical Geology, 71(1-3),41-51. https://doi.org/10.1016/0009-2541(88)90104-0
Lee, J.Y., Ryu, B.J., Yun, T.S., Lee, J., Cho, G. 2011.Review on the Gas Hydrate Development andProduction as a New Energy Resource. KSCEJournal of Civil Engineering, 15(4), 689-696.https://doi.org/10.1007/s12205-011-0009-3
Lozynskyi, V., Saik, P., Petlovanyi, M., Sai, K.,Malanchyk, Ye. 2018. Analytical Research of theStress-Deformed State in the Rock Massif
E.O. Maksymova, S.I. Kostrytska. Journ.Geol.Geograph.Geoecology, 27(2), 294-304________________________________________________________________________________________________________________________________________________________________
304
Around Faulting. International Journal of Engi-neering Research in Africa, (35), 77-88. https://doi.org/10.4028/www.scientific.net/JERA.35.77
Lukin, A. 2014. Uglevodorodnyiy potentsial bolshihglubin i perspektivyi ego osvoeniya v Ukraine[Hydrocarbon potential of great depths and pros-pects of its development in Ukraine]. Visn.Natsionalnoyi akademiyi nauk Ukrayini. 5, 31-36.(in Ukrain-ian). http://nbuv.gov.ua/UJRN/vnanu_2014_5_8
Moridis, G. 2003. Numerical Studies of Gas Productionfrom Methane Hydrates. SPE Journal Society ofPetroleum Engineers, 8 (4), 359-370.https://doi.org/10.2118/87330-pa
Makogon, Y. 2007. Natural gas-hydrates — A potentialenergy source for the 21st Century. Journal of Pe-troleum Science and Engineers, 56 (3), 14-31.https://doi.org/10.1016/j.petrol.2005.10.009
Makogon, Y. 2010. Natural Gas Hydrates – A PromisingSource of Energy. Journal of Natural Gas Scienceand Engineering, 2(1), 49-59.https://doi.org/10.1016/j.jngse.2009.12.004
Maksymova, E. 2013. Tipyi mestorozhdeniy gazovyihgidratov i ih uchet pri podzemnoy razrabotke[Types of gas hydrates deposits and their consid-eration during underground mining]. Sb. nauch-nyih trudov DonGTU. 40, 65-69 (in Russian).
Maksymova, E. 2015. Methodological approach to thedevelopment of gas hydrate deposits. Theoreticaland Practical Solutions of Mineral ResourcesMining, CRC Press Taylor & Francis Group Lon-don, 129-132. https://doi.org/10.1201/b19901-24
Maksymova, E. 2016.Osobennosti mestorozhdeniy ga-zovyih gidratov pri ih razrabotke v razlichnyihgorno-geologicheskih usloviyah [Features of gashydrate deposits when developing in various geo-logical conditions] Visn. Nats. tehn. univ.Ukrayini "Kiyivskiy politehnichniy Institut".Ser.Girnitstvo. 30, 67-75 (in Russian).
Maksymova, E. 2018. Selecting the method of gas hy-drate deposits development in terms of the regu-
larities of their formation. Mining of Mineral De-posits, 12(1), 103-108.
https://doi.org/10.15407/mining12.01.103Okuda, Y. 1998. Introduction to exploration of gas hy-
drates in Japan. Bulletin of the Geological Surveyof Japan. 10. 46–53 (in Russian).
Sloan, E.1990. Clathrate Hydrates of Natural Gases.Marcel Dekker, Inc. 1-641
Shnyukov, E., Gozhik P., Krayushkin V., Klochko V.,2007. V treh shagah ot submarinnoy dobyichi ga-zogidratov [In three steps from the submarine gashydrate extraction]. Geologiya i poleznyieiskopaemyie mirovogo okeana.1, 32-51 (in Rus-sia). http://dspace.nbuv.gov.ua/handle/123456789/58020
Shnyukov E., Kobolev V., Pasyinkov A. 2013. Gazovyiyvulkanizm Chernogo morya [Gas volcanism ofthe Black Sea]. Logos, Kyiv (in Russian).
Shnyukov E., Ziborov A. 2004. Mineralnyie bogatstvaChernogo morya [Mineral wealth of the BlackSea]Scien. Issue NAS of Ukraine. 98-105 (in Rus-sian).
Wu, N., Zhang, H., Yang, S., Zhang, G., Liang, J., Lu, J.,Zhu, Y. 2011. Gas Hydrate System of ShenhuArea, Northern South China Sea: GeochemicalResults. Journal of Geological Research, (2011),1-10.https://doi.org/10.1155/2011/370298
Yamamoto, K., Terao, Y., Fujii, T., Ikawa, T., Seki, M.,Matsuzawa, M., Kanno, T. 2014. OperationalOverview of the First Offshore Production Test ofMethane Hydrates in the Eastern Nankai Trough.In Offshore Technology Conference (OTC-25243-MS). Houston, Texas, United States: OTC.https://doi.org/10.4043/25243-ms
Zhao, J., Song, Y., Lim, X.-L., Lam, W. 2017. Opportu-nities and Challenges of Gas Hydrate Policieswith Consideration of Environmental Impacts.Renewable and Sustainable Energy Reviews,(70), 875-885.https://doi.org/10.1016/j.rser.2016.11.269
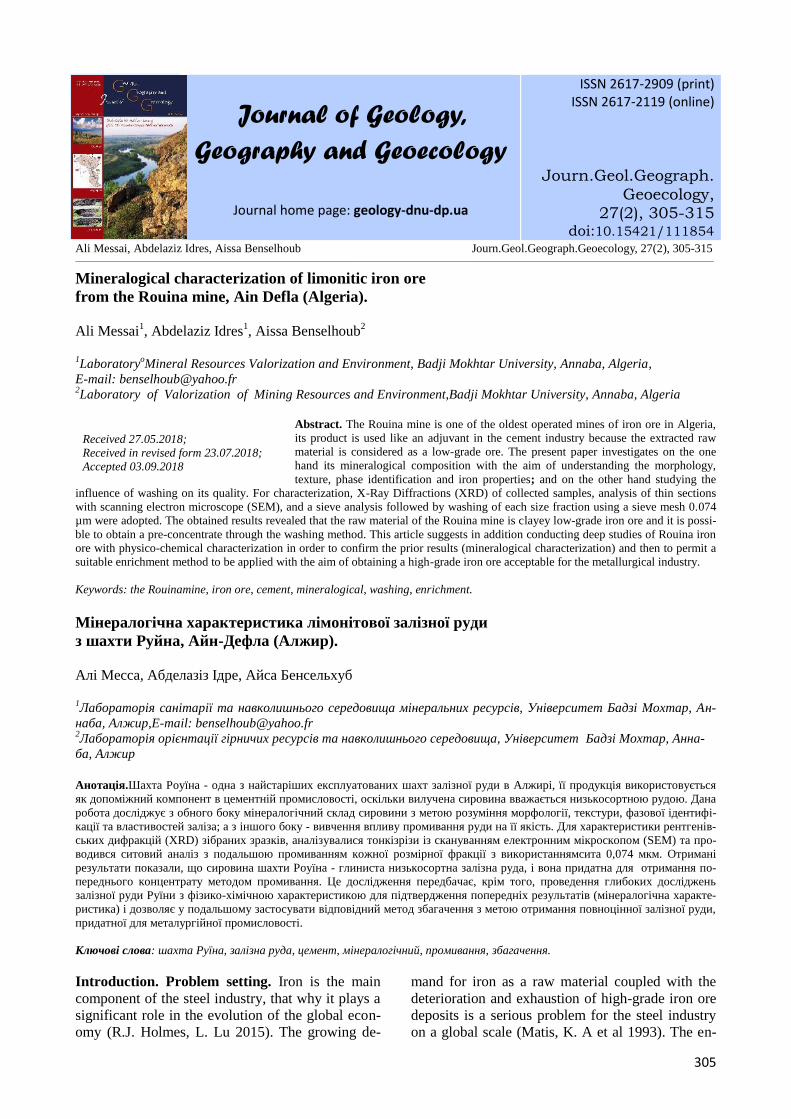
305
Journal of Geology,Geography and Geoecology
Journal home page: geology-dnu-dp.ua
ISSN 2617-2909 (print)ISSN 2617-2119 (online)
Journ.Geol.Geograph.Geoecology,
27(2), 305-315doi:10.15421/111854
Ali Messai, Abdelaziz Idres, Aissa Benselhoub Journ.Geol.Geograph.Geoecology, 27(2), 305-315________________________________________________________________________________________________________________________________________________________________
Mineralogical characterization of limonitic iron orefrom the Rouina mine, Ain Defla (Algeria).
Ali Messai1, Abdelaziz Idres1, Aissa Benselhoub2
1LaboratoryoMineral Resources Valorization and Environment, Badji Mokhtar University, Annaba, Algeria,E-mail: [email protected] of Valorization of Mining Resources and Environment,Badji Mokhtar University, Annaba, Algeria
Abstract. The Rouina mine is one of the oldest operated mines of iron ore in Algeria,its product is used like an adjuvant in the cement industry because the extracted rawmaterial is considered as a low-grade ore. The present paper investigates on the onehand its mineralogical composition with the aim of understanding the morphology,texture, phase identification and iron properties; and on the other hand studying the
influence of washing on its quality. For characterization, X-Ray Diffractions (XRD) of collected samples, analysis of thin sectionswith scanning electron microscope (SEM), and a sieve analysis followed by washing of each size fraction using a sieve mesh 0.074µm were adopted. The obtained results revealed that the raw material of the Rouina mine is clayey low-grade iron ore and it is possi-ble to obtain a pre-concentrate through the washing method. This article suggests in addition conducting deep studies of Rouina ironore with physico-chemical characterization in order to confirm the prior results (mineralogical characterization) and then to permit asuitable enrichment method to be applied with the aim of obtaining a high-grade iron ore acceptable for the metallurgical industry.
Keywords: the Rouinamine, iron ore, cement, mineralogical, washing, enrichment.
Мінералогічна характеристика лімонітової залізної рудиз шахти Руйна, Айн-Дефла (Алжир).
Алі Месса, Абделазіз Ідре, Айса Бенсельхуб
1Лабораторія санітарії та навколишнього середовища мінеральних ресурсів, Університет Бадзі Мохтар, Ан-наба, Алжир,E-mail: [email protected]Лабораторія орієнтації гірничих ресурсів та навколишнього середовища, Університет Бадзі Мохтар, Анна-ба, Алжир
Анотація.Шахта Роуїна - одна з найстаріших експлуатованих шахт залізної руди в Алжирі, її продукція використовуєтьсяяк допоміжний компонент в цементній промисловості, оскільки вилучена сировина вважається низькосортною рудою. Данаробота досліджує з обного боку мінералогічний склад сировини з метою розуміння морфології, текстури, фазової ідентифі-кації та властивостей заліза; а з іншого боку - вивчення впливу промивання руди на її якість. Для характеристики рентгенів-ських дифракцій (XRD) зібраних зразків, аналізувалися тонкізрізи із скануванням електронним мікроскопом (SEM) та про-водився ситовий аналіз з подальшою промиванням кожної розмірної фракції з використаннямсита 0,074 мкм. Отриманірезультати показали, що сировина шахти Роуїна - глиниста низькосортна залізна руда, і вона придатна для отримання по-переднього концентрату методом промивання. Це дослідження передбачає, крім того, проведення глибоких дослідженьзалізної руди Руїни з фізико-хімічною характеристикою для підтвердження попередніх результатів (мінералогічна характе-ристика) і дозволяє у подальшому застосувати відповідний метод збагачення з метою отримання повноцінної залізної руди,придатної для металургійної промисловості.
Ключові слова: шахта Руїна, залізна руда, цемент, мінералогічний, промивання, збагачення.
Introduction. Problem setting. Iron is the maincomponent of the steel industry, that why it plays asignificant role in the evolution of the global econ-omy (R.J. Holmes, L. Lu 2015). The growing de-
mand for iron as a raw material coupled with thedeterioration and exhaustion of high-grade iron oredeposits is a serious problem for the steel industryon a global scale (Matis, K. A et al 1993). The en-
Received 27.05.2018;Received in revised form 23.07.2018;Accepted 03.09.2018
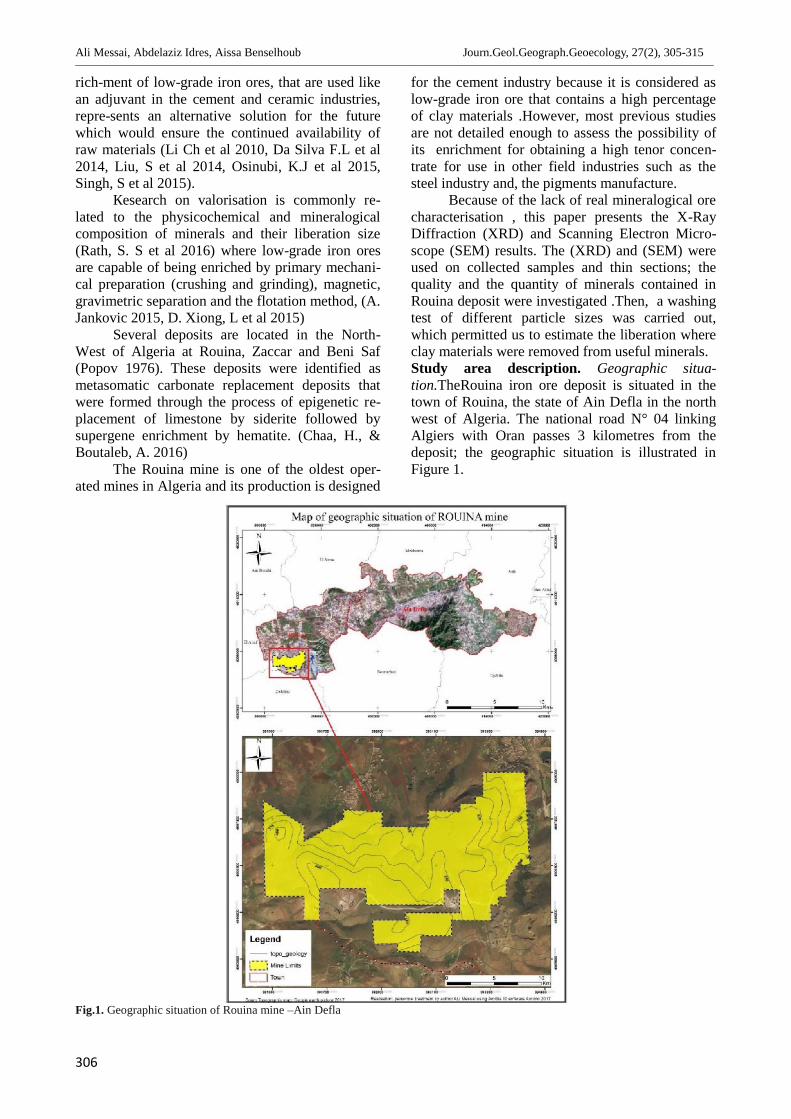
Ali Messai, Abdelaziz Idres, Aissa Benselhoub Journ.Geol.Geograph.Geoecology, 27(2), 305-315________________________________________________________________________________________________________________________________________________________________
306
rich-ment of low-grade iron ores, that are used likean adjuvant in the cement and ceramic industries,repre-sents an alternative solution for the futurewhich would ensure the continued availability ofraw materials (Li Ch et al 2010, Da Silva F.L et al2014, Liu, S et al 2014, Osinubi, K.J et al 2015,Singh, S et al 2015).
Кesearch on valorisation is commonly re-lated to the physicochemical and mineralogicalcomposition of minerals and their liberation size(Rath, S. S et al 2016) where low-grade iron oresare capable of being enriched by primary mechani-cal preparation (crushing and grinding), magnetic,gravimetric separation and the flotation method, (A.Jankovic 2015, D. Xiong, L et al 2015)
Several deposits are located in the North-West of Algeria at Rouina, Zaccar and Beni Saf(Popov 1976). These deposits were identified asmetasomatic carbonate replacement deposits thatwere formed through the process of epigenetic re-placement of limestone by siderite followed bysupergene enrichment by hematite. (Chaa, H., &Boutaleb, A. 2016)
The Rouina mine is one of the oldest oper-ated mines in Algeria and its production is designed
for the cement industry because it is considered aslow-grade iron ore that contains a high percentageof clay materials .However, most previous studiesare not detailed enough to assess the possibility ofits enrichment for obtaining a high tenor concen-trate for use in other field industries such as thesteel industry and, the pigments manufacture.
Because of the lack of real mineralogical orecharacterisation , this paper presents the X-RayDiffraction (XRD) and Scanning Electron Micro-scope (SEM) results. The (XRD) and (SEM) wereused on collected samples and thin sections; thequality and the quantity of minerals contained inRouina deposit were investigated .Then, a washingtest of different particle sizes was carried out,which permitted us to estimate the liberation whereclay materials were removed from useful minerals.Study area description. Geographic situa-tion.TheRouina iron ore deposit is situated in thetown of Rouina, the state of Ain Defla in the northwest of Algeria. The national road N° 04 linkingAlgiers with Oran passes 3 kilometres from thedeposit; the geographic situation is illustrated inFigure 1.
Fig.1. Geographic situation of Rouina mine –Ain Defla
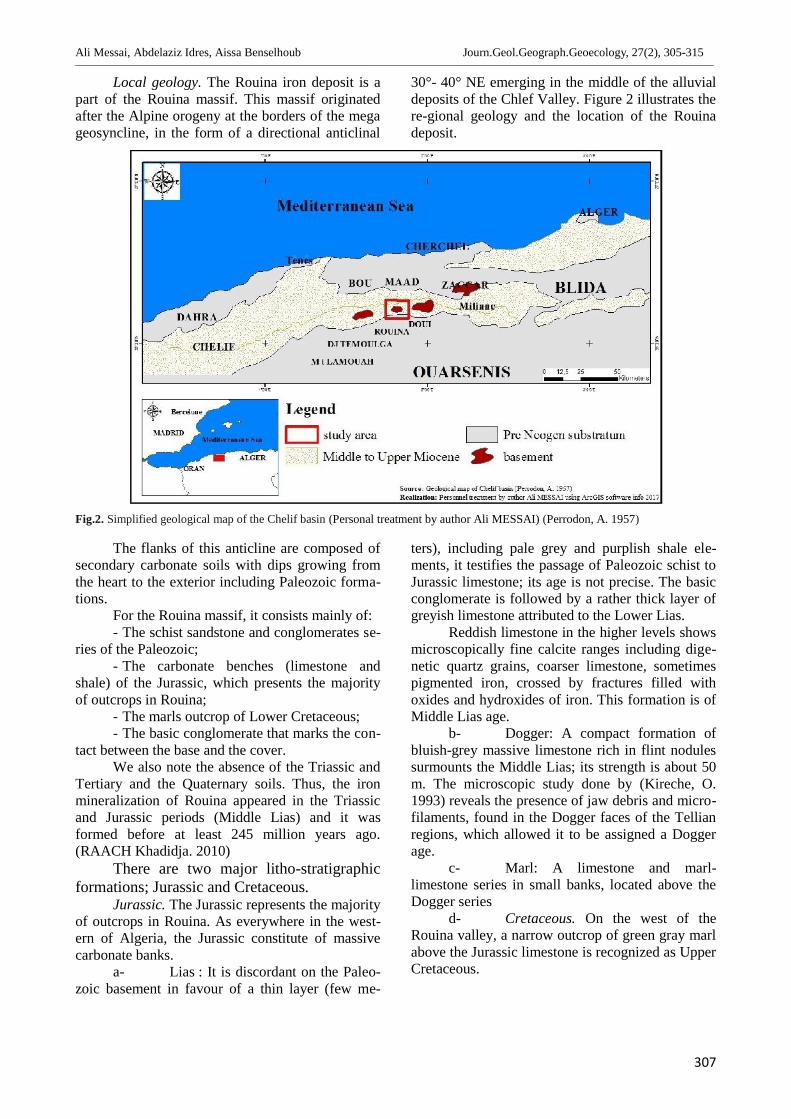
Ali Messai, Abdelaziz Idres, Aissa Benselhoub Journ.Geol.Geograph.Geoecology, 27(2), 305-315________________________________________________________________________________________________________________________________________________________________
307
Local geology. The Rouina iron deposit is apart of the Rouina massif. This massif originatedafter the Alpine orogeny at the borders of the megageosyncline, in the form of a directional anticlinal
30°- 40° NE emerging in the middle of the alluvialdeposits of the Chlef Valley. Figure 2 illustrates there-gional geology and the location of the Rouinadeposit.
Fig.2. Simplified geological map of the Chelif basin (Personal treatment by author Ali MESSAI) (Perrodon, A. 1957)
The flanks of this anticline are composed ofsecondary carbonate soils with dips growing fromthe heart to the exterior including Paleozoic forma-tions.
For the Rouina massif, it consists mainly of:- The schist sandstone and conglomerates se-
ries of the Paleozoic;- The carbonate benches (limestone and
shale) of the Jurassic, which presents the majorityof outcrops in Rouina;
- The marls outcrop of Lower Cretaceous;- The basic conglomerate that marks the con-
tact between the base and the cover.We also note the absence of the Triassic and
Tertiary and the Quaternary soils. Thus, the ironmineralization of Rouina appeared in the Triassicand Jurassic periods (Middle Lias) and it wasformed before at least 245 million years ago.(RAACH Khadidja. 2010)
There are two major litho-stratigraphicformations; Jurassic and Cretaceous.
Jurassic. The Jurassic represents the majorityof outcrops in Rouina. As everywhere in the west-ern of Algeria, the Jurassic constitute of massivecarbonate banks.
a- Lias : It is discordant on the Paleo-zoic basement in favour of a thin layer (few me-
ters), including pale grey and purplish shale ele-ments, it testifies the passage of Paleozoic schist toJurassic limestone; its age is not precise. The basicconglomerate is followed by a rather thick layer ofgreyish limestone attributed to the Lower Lias.
Reddish limestone in the higher levels showsmicroscopically fine calcite ranges including dige-netic quartz grains, coarser limestone, sometimespigmented iron, crossed by fractures filled withoxides and hydroxides of iron. This formation is ofMiddle Lias age.
b- Dogger: A compact formation ofbluish-grey massive limestone rich in flint nodulessurmounts the Middle Lias; its strength is about 50m. The microscopic study done by (Kireche, O.1993) reveals the presence of jaw debris and micro-filaments, found in the Dogger faces of the Tellianregions, which allowed it to be assigned a Doggerage.
c- Marl: A limestone and marl-limestone series in small banks, located above theDogger series
d- Cretaceous. On the west of theRouina valley, a narrow outcrop of green gray marlabove the Jurassic limestone is recognized as UpperCretaceous.
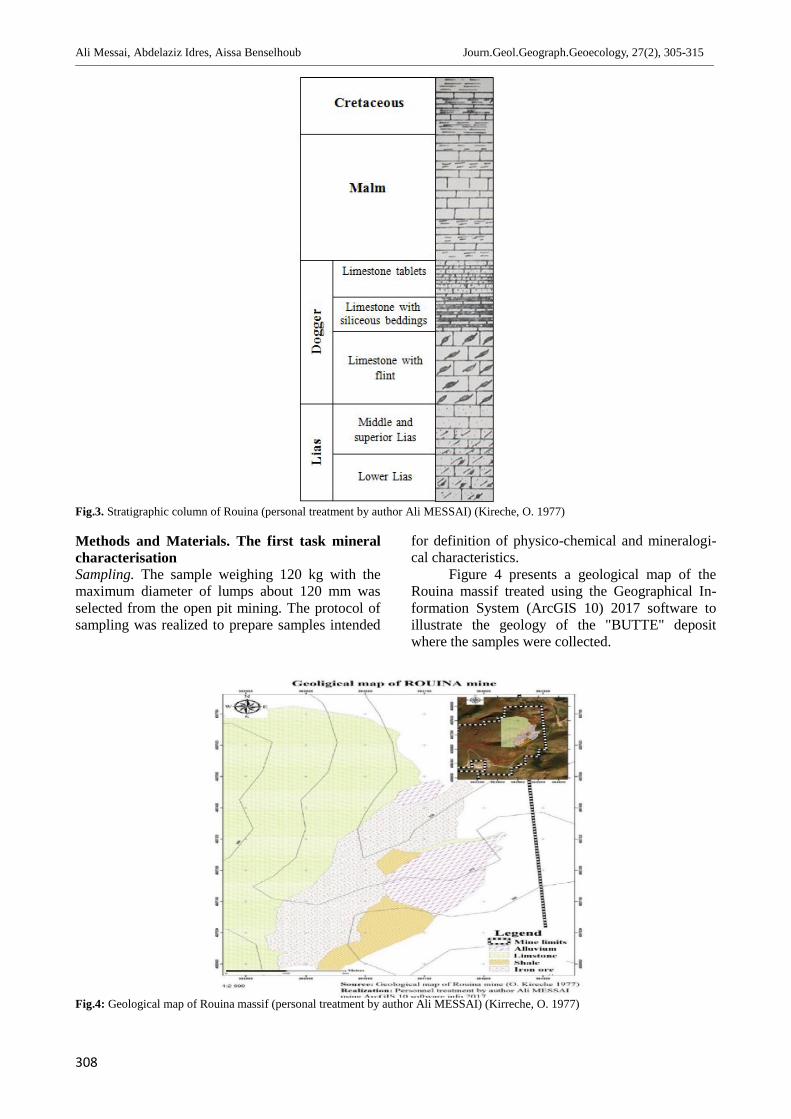
Ali Messai, Abdelaziz Idres, Aissa Benselhoub Journ.Geol.Geograph.Geoecology, 27(2), 305-315________________________________________________________________________________________________________________________________________________________________
308
Fig.3. Stratigraphic column of Rouina (personal treatment by author Ali MESSAI) (Kireche, O. 1977)
Methods and Materials. The first task mineralcharacterisationSampling. The sample weighing 120 kg with themaximum diameter of lumps about 120 mm wasselected from the open pit mining. The protocol ofsampling was realized to prepare samples intended
for definition of physico-chemical and mineralogi-cal characteristics.
Figure 4 presents a geological map of theRouina massif treated using the Geographical In-formation System (ArcGIS 10) 2017 software toillustrate the geology of the "BUTTE" depositwhere the samples were collected.
Fig.4: Geological map of Rouina massif (personal treatment by author Ali MESSAI) (Kirreche, O. 1977)
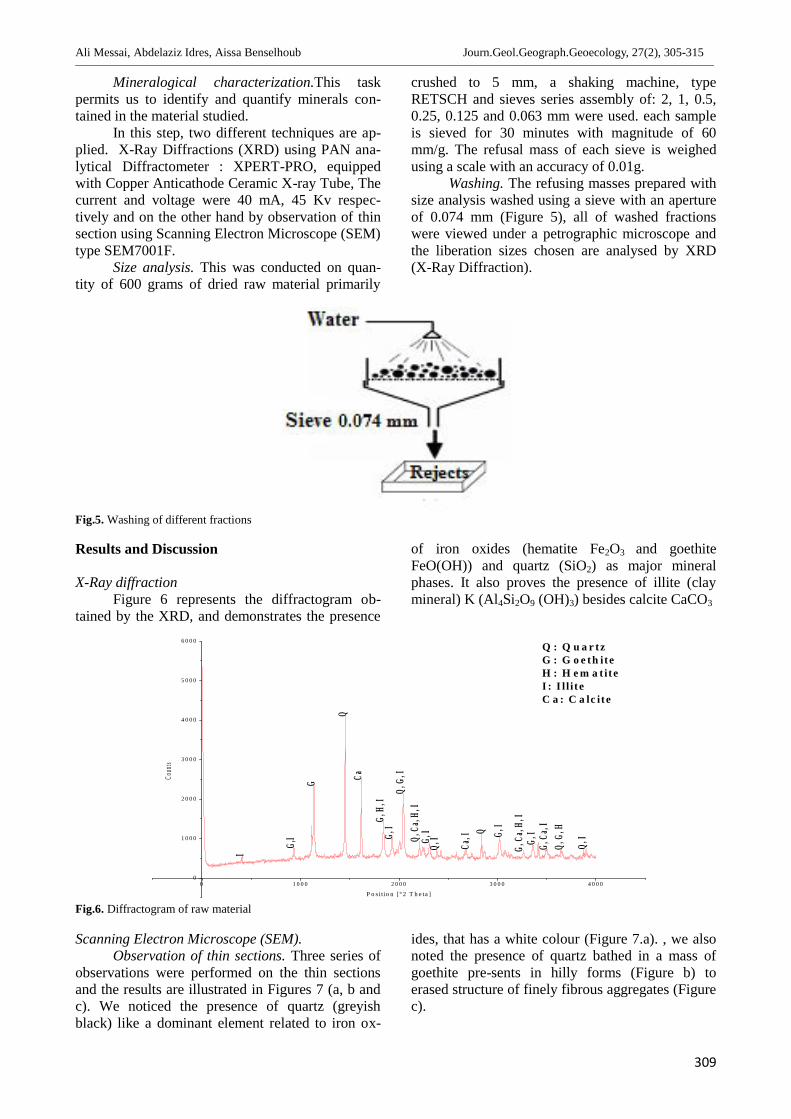
Ali Messai, Abdelaziz Idres, Aissa Benselhoub Journ.Geol.Geograph.Geoecology, 27(2), 305-315________________________________________________________________________________________________________________________________________________________________
309
Mineralogical characterization.This taskpermits us to identify and quantify minerals con-tained in the material studied.
In this step, two different techniques are ap-plied. X-Ray Diffractions (XRD) using PAN ana-lytical Diffractometer : XPERT-PRO, equippedwith Copper Anticathode Ceramic X-ray Tube, Thecurrent and voltage were 40 mA, 45 Kv respec-tively and on the other hand by observation of thinsection using Scanning Electron Microscope (SEM)type SEM7001F.
Size analysis. This was conducted on quan-tity of 600 grams of dried raw material primarily
crushed to 5 mm, a shaking machine, typeRETSCH and sieves series assembly of: 2, 1, 0.5,0.25, 0.125 and 0.063 mm were used. each sampleis sieved for 30 minutes with magnitude of 60mm/g. The refusal mass of each sieve is weighedusing a scale with an accuracy of 0.01g.
Washing. The refusing masses prepared withsize analysis washed using a sieve with an apertureof 0.074 mm (Figure 5), all of washed fractionswere viewed under a petrographic microscope andthe liberation sizes chosen are analysed by XRD(X-Ray Diffraction).
Fig.5. Washing of different fractions
Results and Discussion
X-Ray diffractionFigure 6 represents the diffractogram ob-
tained by the XRD, and demonstrates the presence
of iron oxides (hematite Fe2O3 and goethiteFeO(OH)) and quartz (SiO2) as major mineralphases. It also proves the presence of illite (claymineral) K (Al4Si2O9 (OH)3) besides calcite CaCO3
0 1 0 0 0 2 0 0 0 3 0 0 0 4 0 0 00
1 0 0 0
2 0 0 0
3 0 0 0
4 0 0 0
5 0 0 0
6 0 0 0Q : Q u a r tzG : G o e th iteH : H e m a t iteI : I l l i t eC a : C a lc it e
Q, IG,
I
Ca, I
Q, I
Ca
G, C
a, I
Q, G
, H
G, C
a, H,
I
G, IQ
G, IQ, C
a, H,
I
G, I
Q, G
, I
G, H
, I
I
G,I
G
Q
Coun
ts
P o s i t io n [° 2 T h e ta ]
Fig.6. Diffractogram of raw material
Scanning Electron Microscope (SEM).Observation of thin sections. Three series of
observations were performed on the thin sectionsand the results are illustrated in Figures 7 (a, b andc). We noticed the presence of quartz (greyishblack) like a dominant element related to iron ox-
ides, that has a white colour (Figure 7.a). , we alsonoted the presence of quartz bathed in a mass ofgoethite pre-sents in hilly forms (Figure b) toerased structure of finely fibrous aggregates (Figurec).
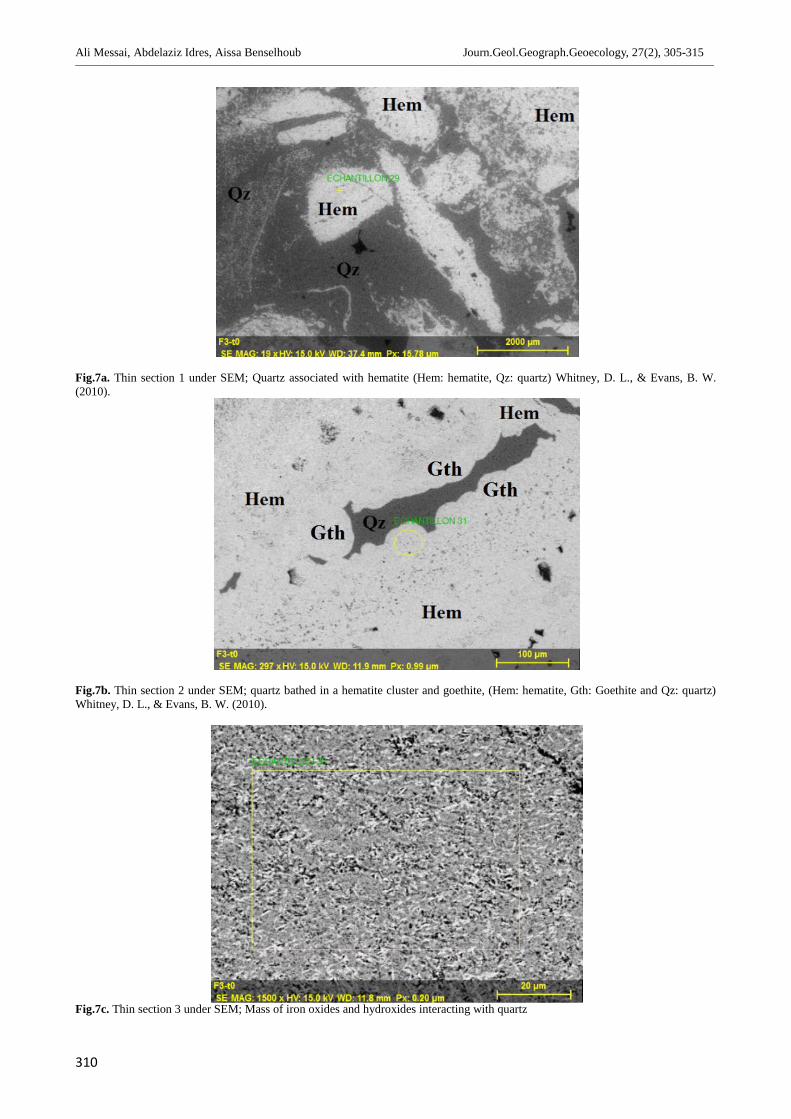
Ali Messai, Abdelaziz Idres, Aissa Benselhoub Journ.Geol.Geograph.Geoecology, 27(2), 305-315________________________________________________________________________________________________________________________________________________________________
310
Fig.7a. Thin section 1 under SEM; Quartz associated with hematite (Hem: hematite, Qz: quartz) Whitney, D. L., & Evans, B. W.(2010).
Fig.7b. Thin section 2 under SEM; quartz bathed in a hematite cluster and goethite, (Hem: hematite, Gth: Goethite and Qz: quartz)Whitney, D. L., & Evans, B. W. (2010).
Fig.7c. Thin section 3 under SEM; Mass of iron oxides and hydroxides interacting with quartz
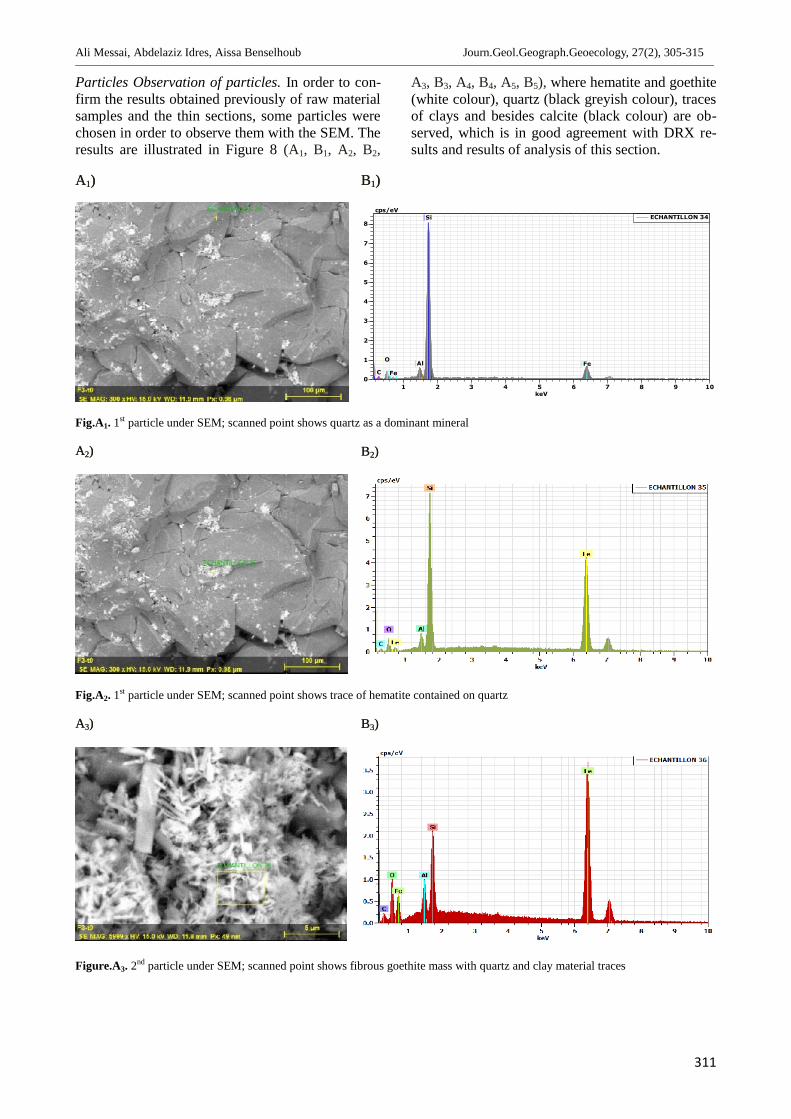
Ali Messai, Abdelaziz Idres, Aissa Benselhoub Journ.Geol.Geograph.Geoecology, 27(2), 305-315________________________________________________________________________________________________________________________________________________________________
311
Particles Observation of particles. In order to con-firm the results obtained previously of raw materialsamples and the thin sections, some particles werechosen in order to observe them with the SEM. Theresults are illustrated in Figure 8 (A1, B1, A2, B2,
A3, B3, A4, B4, A5, B5), where hematite and goethite(white colour), quartz (black greyish colour), tracesof clays and besides calcite (black colour) are ob-served, which is in good agreement with DRX re-sults and results of analysis of this section.
A1) B1)
Fig.A1. 1st particle under SEM; scanned point shows quartz as a dominant mineral
A2) B2)
Fig.A2. 1st particle under SEM; scanned point shows trace of hematite contained on quartz
A3) B3)
Figure.A3. 2nd particle under SEM; scanned point shows fibrous goethite mass with quartz and clay material traces
1 2 3 4 5 6 7 8 9 10keV
0
1
2
3
4
5
6
7
8
cps/eV Si
Fe Fe C
O Al
ECHANTILLON 34
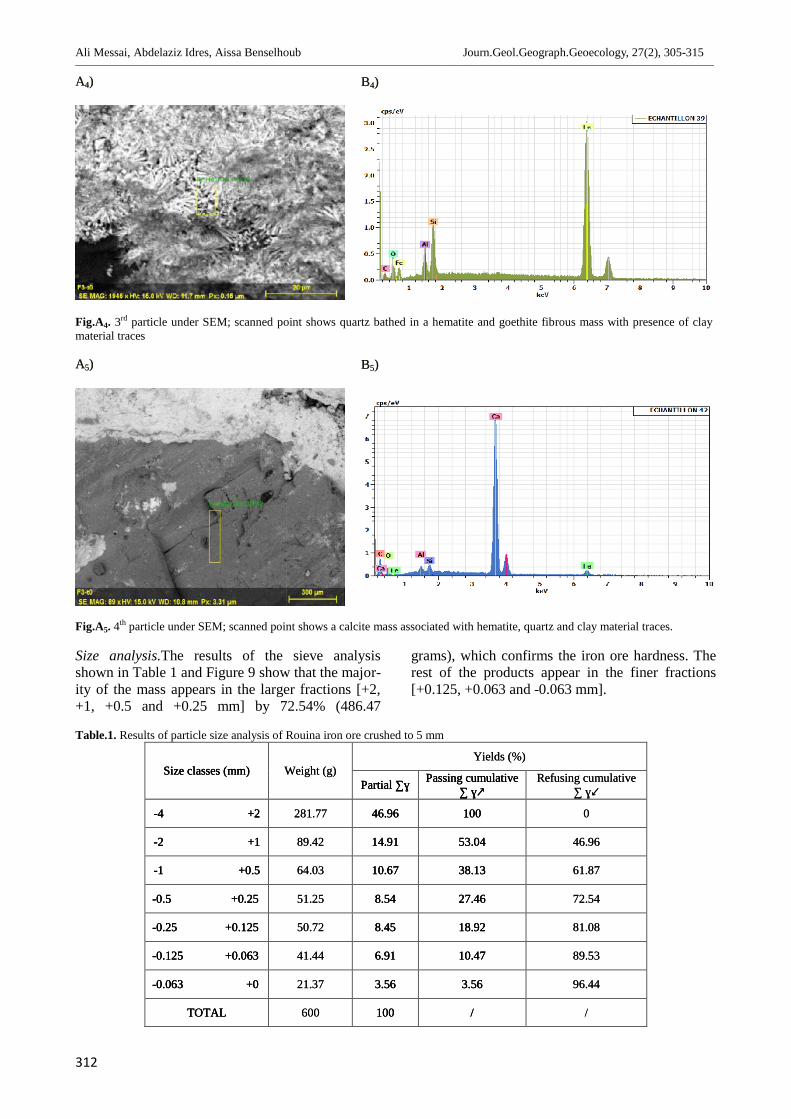
Ali Messai, Abdelaziz Idres, Aissa Benselhoub Journ.Geol.Geograph.Geoecology, 27(2), 305-315________________________________________________________________________________________________________________________________________________________________
312
A4) B4)
Fig.A4. 3rd particle under SEM; scanned point shows quartz bathed in a hematite and goethite fibrous mass with presence of claymaterial traces
A5) B5)
Fig.A5. 4th particle under SEM; scanned point shows a calcite mass associated with hematite, quartz and clay material traces.
Size analysis.The results of the sieve analysisshown in Table 1 and Figure 9 show that the major-ity of the mass appears in the larger fractions [+2,+1, +0.5 and +0.25 mm] by 72.54% (486.47
grams), which confirms the iron ore hardness. Therest of the products appear in the finer fractions[+0.125, +0.063 and -0.063 mm].
Table.1. Results of particle size analysis of Rouina iron ore crushed to 5 mm
Size classes (mm) Weight (g)Yields (%)
Partial ∑ɣ Passing cumulative∑ ɣ↗ Refusing cumulative
∑ ɣ↙-4 +2 281.77 46.96 100 0
-2 +1 89.42 14.91 53.04 46.96
-1 +0.5 64.03 10.67 38.13 61.87
-0.5 +0.25 51.25 8.54 27.46 72.54
-0.25 +0.125 50.72 8.45 18.92 81.08
-0.125 +0.063 41.44 6.91 10.47 89.53
-0.063 +0 21.37 3.56 3.56 96.44
TOTAL 600 100 / /
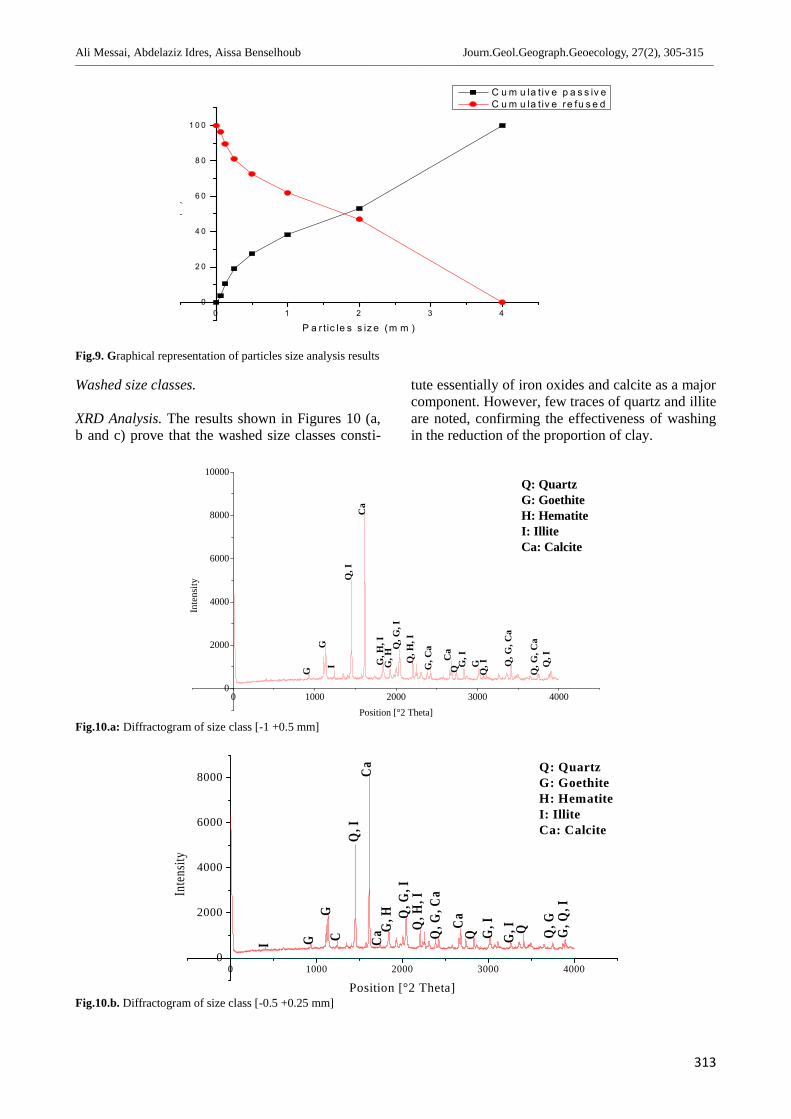
Ali Messai, Abdelaziz Idres, Aissa Benselhoub Journ.Geol.Geograph.Geoecology, 27(2), 305-315________________________________________________________________________________________________________________________________________________________________
313
0 1 2 3 40
2 0
4 0
6 0
8 0
1 0 0
Yield
(%)
P a r t ic le s s iz e (m m )
C u m u la t iv e p a s s iv e C u m u la t iv e re fu s e d
Fig.9. Graphical representation of particles size analysis results
Washed size classes.
XRD Analysis. The results shown in Figures 10 (a,b and c) prove that the washed size classes consti-
tute essentially of iron oxides and calcite as a majorcomponent. However, few traces of quartz and illiteare noted, confirming the effectiveness of washingin the reduction of the proportion of clay.
0 1000 2000 3000 40000
2000
4000
6000
8000
10000
Q, G
, Ca
Q, IG
, H
I Q, I
Q, G
, Ca
Q G, I
GG, C
a
Ca
Q, H
, IQ, G
, IG
, H, I
Ca
Q, I
G
Q: QuartzG: GoethiteH: HematiteI: IlliteCa: Calcite
G
Inte
nsity
Position [°2 Theta]Fig.10.a: Diffractogram of size class [-1 +0.5 mm]
0 1000 2000 3000 40000
2000
4000
6000
8000
G, I
CaC
Q: QuartzG: GoethiteH: HematiteI: IlliteCa: Calcite
G, Q
, I
QCaQ
, G, C
a
Ca
Q, G
G, I
QQ, H
, IQ
, G, I
G, H
I GG
Q, I
Inten
sity
Position [°2 Theta]Fig.10.b. Diffractogram of size class [-0.5 +0.25 mm]
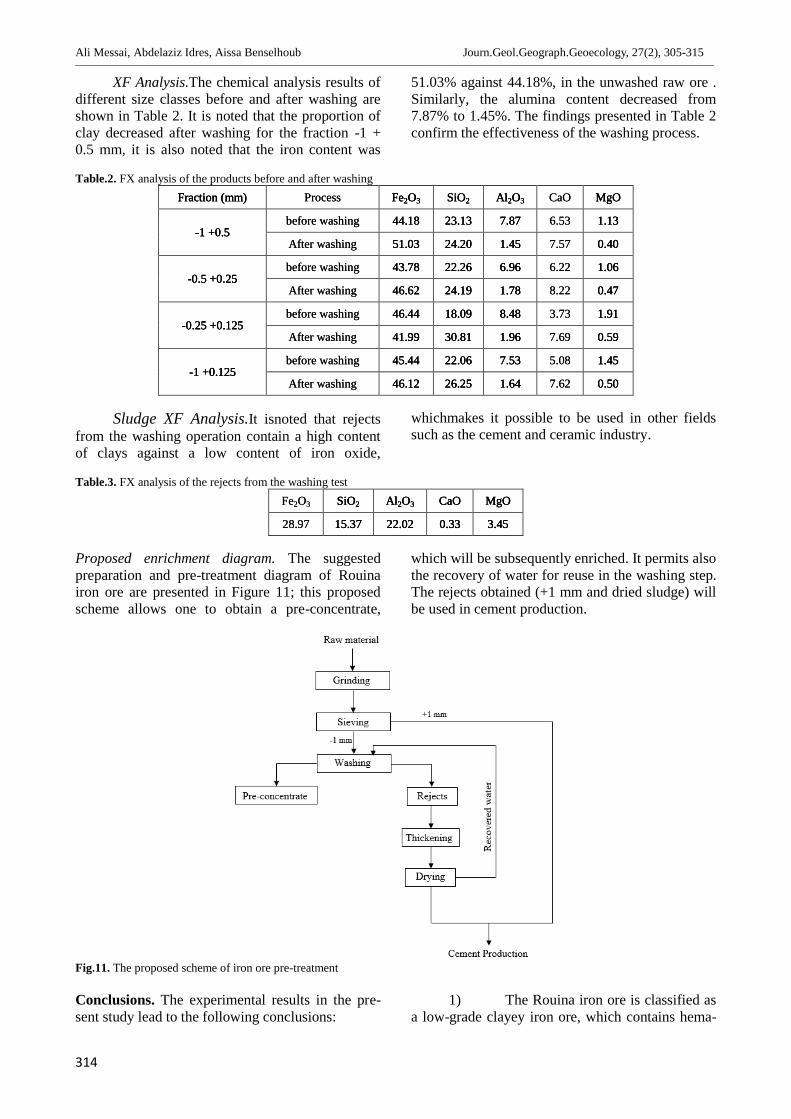
Ali Messai, Abdelaziz Idres, Aissa Benselhoub Journ.Geol.Geograph.Geoecology, 27(2), 305-315________________________________________________________________________________________________________________________________________________________________
314
XF Analysis.The chemical analysis results ofdifferent size classes before and after washing areshown in Table 2. It is noted that the proportion ofclay decreased after washing for the fraction -1 +0.5 mm, it is also noted that the iron content was
51.03% against 44.18%, in the unwashed raw ore .Similarly, the alumina content decreased from7.87% to 1.45%. The findings presented in Table 2confirm the effectiveness of the washing process.
Table.2. FX analysis of the products before and after washingFraction (mm) Process Fe2O3 SiO2 Al2O3 CaO MgO
-1 +0.5before washing 44.18 23.13 7.87 6.53 1.13
After washing 51.03 24.20 1.45 7.57 0.40
-0.5 +0.25before washing 43.78 22.26 6.96 6.22 1.06
After washing 46.62 24.19 1.78 8.22 0.47
-0.25 +0.125before washing 46.44 18.09 8.48 3.73 1.91
After washing 41.99 30.81 1.96 7.69 0.59
-1 +0.125before washing 45.44 22.06 7.53 5.08 1.45
After washing 46.12 26.25 1.64 7.62 0.50
Sludge XF Analysis.It isnoted that rejectsfrom the washing operation contain a high contentof clays against a low content of iron oxide,
whichmakes it possible to be used in other fieldssuch as the cement and ceramic industry.
Table.3. FX analysis of the rejects from the washing testFe2O3 SiO2 Al2O3 CaO MgO
28.97 15.37 22.02 0.33 3.45
Proposed enrichment diagram. The suggestedpreparation and pre-treatment diagram of Rouinairon ore are presented in Figure 11; this proposedscheme allows one to obtain a pre-concentrate,
which will be subsequently enriched. It permits alsothe recovery of water for reuse in the washing step.The rejects obtained (+1 mm and dried sludge) willbe used in cement production.
Fig.11. The proposed scheme of iron ore pre-treatment
Conclusions. The experimental results in the pre-sent study lead to the following conclusions:
1) The Rouina iron ore is classified asa low-grade clayey iron ore, which contains hema-
Ali Messai, Abdelaziz Idres, Aissa Benselhoub Journ.Geol.Geograph.Geoecology, 27(2), 305-315________________________________________________________________________________________________________________________________________________________________
315
tite and goethite as useful minerals with quartz,calcite and clays as gangue minerals.
2) Application of washing as a pre-liminary enrichment method is effective for de-creasing clay content and other associated gangueminerals (calcite and quartz) from the raw material,where the results obtained from the chemical analy-sis show a significant decrease in clay percentagesafter washing. It is also noted that the iron contentis 51.03% against 44.18% in the raw material be-fore washing. Similarly, the content of Al2O3 de-creases from 7.87% to 1.45%, which confirms thesignificant results obtained by this preliminary en-richment (wet sieving).
3) On the one hand, the sludge residuefrom the washing process will be used as an adju-vant in the cement industry and on the other hand,the pre-concentrate will be enriched with the aim ofrecovering the maximum of useful minerals andobtaining a high-grade concentrate.Acknowledgement. The authors would like to ex-press their thanks to:
- Engineers of ROUINA deposit, Ain Defla,Algeria.
- Engineers of Division of Technologies andDevelopment (DTD), subsidiary SONATRACH –Boumerdes- Algeria.
- Djabri Mohamed Tayeb, PhD student, Fac-ulty of Earth Sciences and Architecture , Universityof Larbi Ben M’hidi -Oum Bouaghi- Algeria.
- Boustila Amir, PhD student, Mining De-partment, Earth Sciences Faculty, University ofBadji Mokhtar –Annaba- Algeria.
For their help and contribution to realizingthis scientific work.
References
Jankovic, A., 2015. Developments in iron ore comminu-tion and classification technologies In: Iron Ore:Mineralogy, Processing and Environmental Sus-tainability, Woodhead publications, Elsevier,Cambridge, pp. 251–282.
Chaa, H., & Boutaleb, A. 2016. Mineralogical and geo-chemical characteristics of the Zaccar Fe-(Ba-Pb-Zn-Cu) deposit in Ain Defla, Algeria (Northwest-ern Algeria). Arabian Journal of Geo-sciences, 9(4), 266.
Xiong D., L. Lu, R.J. Holmes. 2015. Developments inthe physical separation of iron ore: magneticseparation In: Iron Ore: Mineralogy, Processingand Environmental Sustainability, Woodheadpublications, Elsevier, Cambridge, pp. 283–307.
Da Silva, F. L., Araújo, F. G. S., Teixeira, M. P., Gomes,R. C., & Von Krüger, F. L. 2014. Study of the re-covery and recycling of tailings from the concen-tration of iron ore for the production of ceramic.Ceramics International, 40(10), 16085-16089.
Kireche, O. 1977. Etude géologique et structurale desmassifs de la plaine du Chéliff (Doui, Rouina,Tamoulga). Doctorat 3ème cycle, University ofAlgiers, Algeria.
Kireche, O. 1993. Evolution géodynamique de la margetellienne des maghrébides d'aprés l'étude dudomaine par autochtone schistosé" massifs duChélif et d'Oranie de Blida-Bou Maad des Baborset biban" (Doctoral dissertation).
Li, C., Sun, H., Bai, J., & Li, L. 2010. Innovative meth-odology for comprehensive utilization of iron oretailings: Part 1. The recovery of iron from ironore tailings using magnetic separation after mag-netizing roasting. Journal of Hazardous Materials,174(1-3), 71-77.
Liu, S., Zhao, Y., Wang, W., & Wen, S. 2014. Benefici-ation of a low-grade, hematite magnetite ore inChina. Minerals & Metallurgical Processing,31(2).
Matis, K. A., Gallios, G. P., & Kydros, K. A. 1993.Separation of fines by flotation techniques. Sepa-rations Technology, 3(2), 76-90.
Osinubi, K. J., Yohanna, P., & Eberemu, A. O. 2015.Cement modification of tropical black clay usingiron ore tailings as admixture. TransportationGeotechnics, 5, 35-49.
Perrodon, A. 1957. Etude géologique des bassinsnéogènes sublittoraux de l'Algérieoccidentale (Doctoral dissertation).
Popov, A. 1976. Les gisements de fer en Algérie. Theiron ore deposits of Europe and adjacent areas, 1,83-89.
R.J. Holmes, L. Lu. 2015. Introduction: overview of theglobal iron ore industry, in Iron Ore: Mineralogy,Processing and Environmental Sustainability,Woodhead publications, Elsevier, Cambridge, pp.1–42
RAACH Khadidja. 2010. Contribution à l'étudegéologique et gîtologique des minéralisationsferrifères du massif de ROUINA Bassin duChelif, Mémoire en vue de l’obtention de diplômed’Ingénieur d’Etat en Géologie de l’université deUSTHB.
Rath, S. S., Dhawan, N., Rao, D. S., Das, B., & Mishra,B. K. 2016. Beneficiation studies of a difficult totreat iron ore using conventional and microwaveroasting. Powder Technology, 301, 1016-1024.
Singh, S., Sahoo, H., Rath, S. S., Sahu, A. K., & Das, B.2015. Recovery of iron minerals from Indian ironore slimes using colloidal magnetic coating.Powder Technology, 269, 38-45.
Whitney, D. L., & Evans, B. W. 2010. Abbreviations fornames of rock-forming minerals. American min-eralogist, 95(1), 185-18.
Narjess Karoui-Yaakoub, Moncef Said MtimetSemeh Bejaoui, Bienvenido Martínez-Navarro Journ.Geol.Geograph.Geoecology, 27(2), 319-325________________________________________________________________________________________________________________________________________________________________
316
Journal of Geology,Geography and Geoecology
Journal home page: geology-dnu-dp.ua
ISSN 2617-2909 (print)ISSN 2617-2119 (online)
Journ.Geol.Geograph.Geoecology,
27(2),316-322doi:10.15421/111855
Narjess Karoui-Yaakoub, Moncef Said MtimetSemeh Bejaoui, Bienvenido Martínez-Navarro Journ.Geol.Geograph.Geoecology, 27(2), 316-322________________________________________________________________________________________________________________________________________________________________
Paleoenvironmental reconstruction of the Pleistocene site of Oued Sarrat(Northwestern Tunisia) using mineralogical and geochemical data
Narjess Karoui-Yaakoub1, Moncef Said Mtimet1, Semeh Bejaoui1, Bienvenido Martínez-Navarro2,3,4
1Département des Sciences de la Terre, Faculté des Sciences de Bizerte, Université de Carthage, Jarzouna, 7021Bizerte, Tunisia, [email protected] ICREA, Barcelona, Spain3Institut Català de Paleoecologia Humana i Evolució Social. Campus Sescelades URV (Edifici W3), 43007 –Tarragona, Spain4Àrea de Prehistoria, Universitat Rovira i Virgili (URV). Avda. Catalunya, 35. 43002 - Tarragona, Spain
Abstract. The mineralogical and geochemical analyses of Pleistocene sediments andmollusks shells (gastropods and bivalves) from the archaeopaleontological site of OuedSarrat (Tejerouine, NW Tunisia) permitted us to determine the paleoenvironmentalconditions and to reconstruct the local depositional environment during the Middle and
Late Pleistocene. The mineralogical cortege of the sediments, for all the analyzed samples, records the characteristics of a mixture ofsilica and calcite dominance with a small fraction of gypsum and aragonite. The mineralogical analyses of all mollusk species reflecta cortege dominated by aragonite, associated with low amounts of calcite, silica, hematite and goethite. We consider that the domin-ance of aragonite indicates that the tests have not yet or little undergone mineralogical transformations linked to the phenomena offossilization, as evidenced by the absence or low calcite content. On the other hand, the low percentages of silica, goethite and hema-tite are probably related to the existence of impurities and sediments trapped in lodges, or adhered to the shell surface. The minera-logical data confirm a composition dominated by calcium carbonates, expressed by high contents of CaO and CO2, reflecting a chem-ical test of organisms’ development in continental environment.This kind of environment is characterized by the absence of MgO,which is usually present in the organisms’ tests developed in marine environment. However, the contents of SiO2, Fe2O3, Al2O3 arerelated, as it was reported during the mineralogical study, to the lithological impurities trapped mainly in the lodges of helicides.Mineralogical and geochemical data tracing, carried out on sediments and tests, converge to deduce the establishment of paleoenvi-ronment attributable to fluvial deposition of sufficiently high energy where the ultrafine fractions of clay minerals are remarkablylacking. The absence of indicators of marine chemistry such as magnesium in sediments and in the tests of organisms confirms al-most total contribution of the continental meteoric water without marine influence. Such environment, however, is affected by inter-mittent episodes of aridity as attested by the presence of evaporate minerals such as gypsumand aragonite.
Key words:Environment reconstruction, Geochemistry, Mineralogy, Pleistocene, Oued Sarrat, Tunisia
Палео-екологічна реконструкція плейстоценового місцезнаходження Оуд Саррат (пів-нічно-західний Туніс) з використанням мінералогічних та геохімічних даних
Нарьес Каруї-Яакуб1, Монсєф Саїд Мтімет1, Семех Беджу1 , Бенвенідо Мартінез-Наварро2,3,4
1 Департамент наук в Ла-Терре, факультет наук Бізера, Карфагенський університет, Ярзуна, 7021 Бізерта,Туніс, [email protected], Барселона, Іспанія3 Каталонський інститут палеоекології людини та соціальної еволюції. CampusSesceladesURV (EdificiW3),43007 - Таррагона, Іспані4 Доісторична область, Університет Ровіра і Вергілі (УРВ). Avda Каталонія, 35. 43002 - Таррагона, Іспанія
Анотація. У мінералогічному та геохімічному аналізах плейстоценових осадів та черепашок молюсків (черевоногих тадвостулкових) з археопалеонтологічного об'єкта Оуд-Саррат (Тейчеруін, Північний Туніс) дозволили визначити палеоеко-логічні умови навколишнього середовища та реконструювати локальне осадове середовище протягом середнього та пізньо-го плейстоцену. Мінералогічна послідовність відкладів для всіх аналізованих зразків фіксує характеристики суміші кремне-
Received 07.05.2018;Received in revised form 27.07.2018;Accepted 01.06.2018
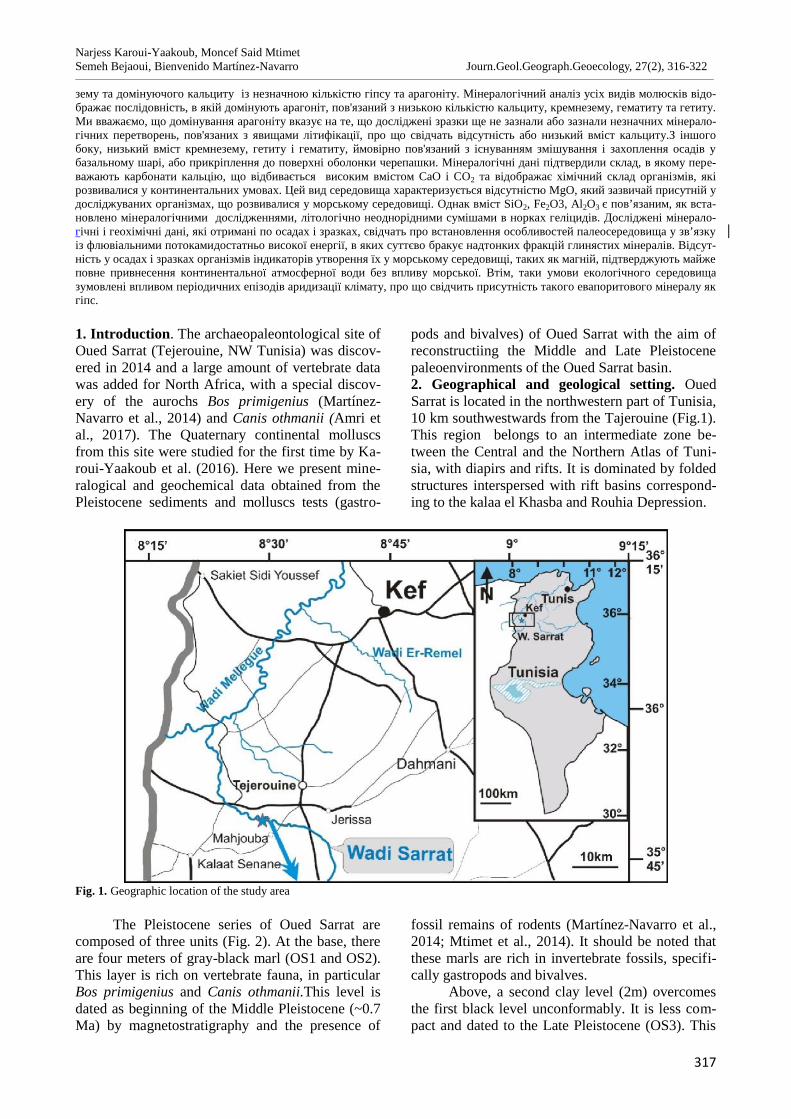
Narjess Karoui-Yaakoub, Moncef Said MtimetSemeh Bejaoui, Bienvenido Martínez-Navarro Journ.Geol.Geograph.Geoecology, 27(2), 316-322________________________________________________________________________________________________________________________________________________________________
317
зему та домінуючого кальциту із незначною кількістю гіпсу та арагоніту. Мінералогічний аналіз усіх видів молюсків відо-бражає послідовність, в якій домінують арагоніт, пов'язаний з низькою кількістю кальциту, кремнезему, гематиту та гетиту.Ми вважаємо, що домінування арагоніту вказує на те, що досліджені зразки ще не зазнали або зазнали незначних мінерало-гічних перетворень, пов'язаних з явищами літифікації, про що свідчать відсутність або низький вміст кальциту.З іншогобоку, низький вміст кремнезему, гетиту і гематиту, ймовірно пов'язаний з існуванням змішування і захоплення осадів убазальному шарі, або прикріплення до поверхні оболонки черепашки. Мінералогічні дані підтвердили склад, в якому пере-важають карбонати кальцію, що відбивається високим вмістом CaO і CO2 та відображає хімічний склад організмів, якірозвивалися у континентальних умовах. Цей вид середовища характеризується відсутністю MgO, який зазвичай присутній удосліджуваних організмах, що розвивалися у морському середовищі. Однак вміст SiO2, Fe2O3, Al2O3 є пов’язаним, як вста-новлено мінералогічними дослідженнями, літологічно неоднорідними сумішами в норках геліцидів. Досліджені мінерало-гічні і геохімічні дані, які отримані по осадах і зразках, свідчать про встановлення особливостей палеосередовища у зв’язкуіз флювіальними потокамидостатньо високої енергії, в яких суттєво бракує надтонких фракцій глинястих мінералів. Відсут-ність у осадах і зразках організмів індикаторів утворення їх у морському середовищі, таких як магній, підтверджують майжеповне привнесення континентальної атмосферної води без впливу морської. Втім, таки умови екологічного середовищазумовлені впливом періодичних епізодів аридизації клімату, про що свідчить присутність такого евапоритового мінералу якгіпс.
1. Introduction. The archaeopaleontological site ofOued Sarrat (Tejerouine, NW Tunisia) was discov-ered in 2014 and a large amount of vertebrate datawas added for North Africa, with a special discov-ery of the aurochs Bos primigenius (Martínez-Navarro et al., 2014) and Canis othmanii (Amri etal., 2017). The Quaternary continental molluscsfrom this site were studied for the first time by Ka-roui-Yaakoub et al. (2016). Here we present mine-ralogical and geochemical data obtained from thePleistocene sediments and molluscs tests (gastro-
pods and bivalves) of Oued Sarrat with the aim ofreconstructiing the Middle and Late Pleistocenepaleoenvironments of the Oued Sarrat basin.2. Geographical and geological setting. OuedSarrat is located in the northwestern part of Tunisia,10 km southwestwards from the Tajerouine (Fig.1).This region belongs to an intermediate zone be-tween the Central and the Northern Atlas of Tuni-sia, with diapirs and rifts. It is dominated by foldedstructures interspersed with rift basins correspond-ing to the kalaa el Khasba and Rouhia Depression.
Fig. 1. Geographic location of the study area
The Pleistocene series of Oued Sarrat arecomposed of three units (Fig. 2). At the base, thereare four meters of gray-black marl (OS1 and OS2).This layer is rich on vertebrate fauna, in particularBos primigenius and Canis othmanii.This level isdated as beginning of the Middle Pleistocene (~0.7Ma) by magnetostratigraphy and the presence of
fossil remains of rodents (Martínez-Navarro et al.,2014; Mtimet et al., 2014). It should be noted thatthese marls are rich in invertebrate fossils, specifi-cally gastropods and bivalves.
Above, a second clay level (2m) overcomesthe first black level unconformably. It is less com-pact and dated to the Late Pleistocene (OS3). This
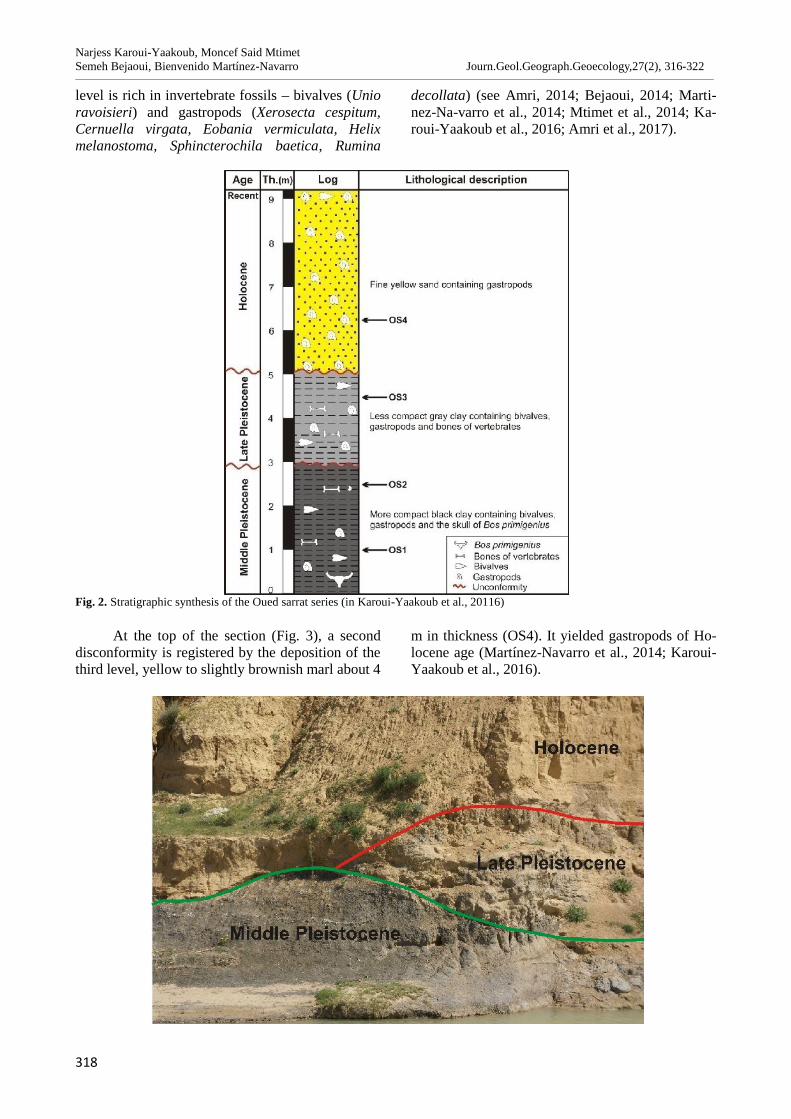
Narjess Karoui-Yaakoub, Moncef Said MtimetSemeh Bejaoui, Bienvenido Martínez-Navarro Journ.Geol.Geograph.Geoecology,27(2), 316-322________________________________________________________________________________________________________________________________________________________________
318
level is rich in invertebrate fossils – bivalves (Unioravoisieri) and gastropods (Xerosecta cespitum,Cernuella virgata, Eobania vermiculata, Helixmelanostoma, Sphincterochila baetica, Rumina
decollata) (see Amri, 2014; Bejaoui, 2014; Marti-nez-Na-varro et al., 2014; Mtimet et al., 2014; Ka-roui-Yaakoub et al., 2016; Amri et al., 2017).
Fig. 2. Stratigraphic synthesis of the Oued sarrat series (in Karoui-Yaakoub et al., 20116)
At the top of the section (Fig. 3), a seconddisconformity is registered by the deposition of thethird level, yellow to slightly brownish marl about 4
m in thickness (OS4). It yielded gastropods of Ho-locene age (Martínez-Navarro et al., 2014; Karoui-Yaakoub et al., 2016).
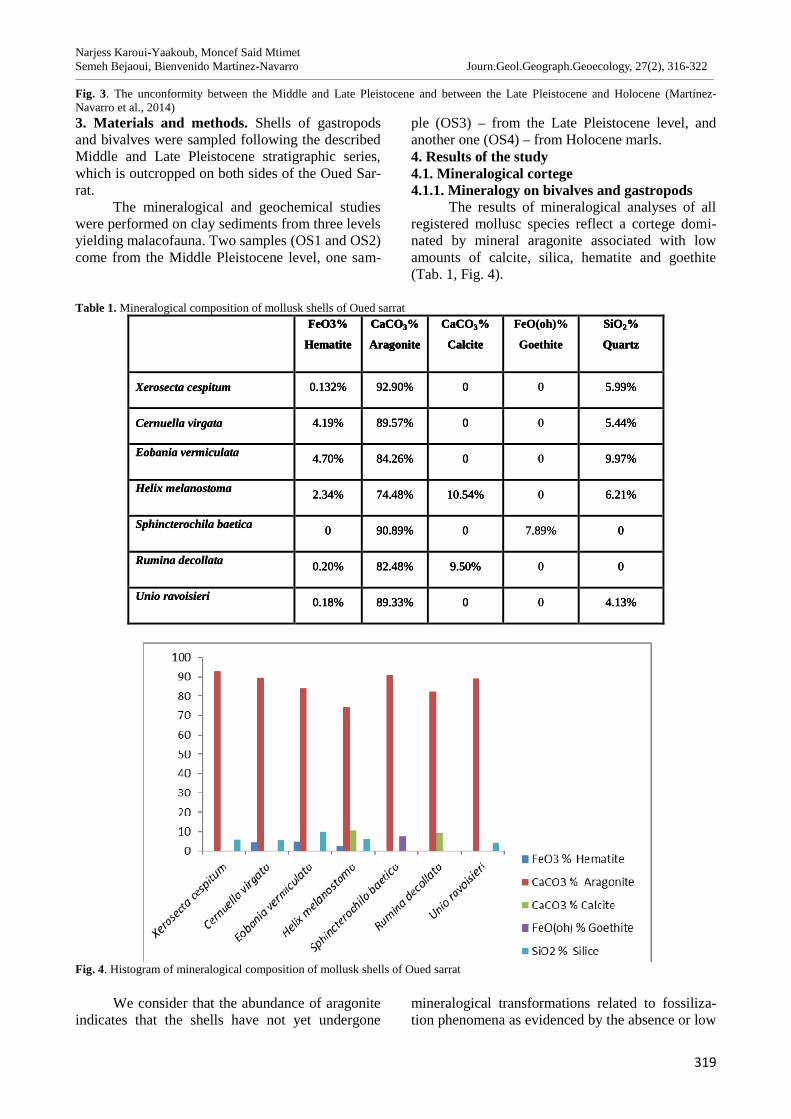
Narjess Karoui-Yaakoub, Moncef Said MtimetSemeh Bejaoui, Bienvenido Martínez-Navarro Journ.Geol.Geograph.Geoecology, 27(2), 316-322________________________________________________________________________________________________________________________________________________________________
319
Fig. 3. The unconformity between the Middle and Late Pleistocene and between the Late Pleistocene and Holocene (Martínez-Navarro et al., 2014)3. Materials and methods. Shells of gastropodsand bivalves were sampled following the describedMiddle and Late Pleistocene stratigraphic series,which is outcropped on both sides of the Oued Sar-rat.
The mineralogical and geochemical studieswere performed on clay sediments from three levelsyielding malacofauna. Two samples (OS1 and OS2)come from the Middle Pleistocene level, one sam-
ple (OS3) – from the Late Pleistocene level, andanother one (OS4) – from Holocene marls.4. Results of the study4.1. Mineralogical cortege4.1.1. Mineralogy on bivalves and gastropods
The results of mineralogical analyses of allregistered mollusc species reflect a cortege domi-nated by mineral aragonite associated with lowamounts of calcite, silica, hematite and goethite(Tab. 1, Fig. 4).
Table 1. Mineralogical composition of mollusk shells of Oued sarratFeO3%
Hematite
CaCO3%
Aragonite
CaCO3%
Calcite
FeO(oh)%
Goethite
SiO2%
Quartz
Xerosecta cespitum 0.132% 92.90% 0 0 5.99%
Cernuella virgata 4.19% 89.57% 0 0 5.44%
Eobania vermiculata 4.70% 84.26% 0 0 9.97%
Helix melanostoma 2.34% 74.48% 10.54% 0 6.21%
Sphincterochila baetica 0 90.89% 0 7.89% 0
Rumina decollata 0.20% 82.48% 9.50% 0 0
Unio ravoisieri 0.18% 89.33% 0 0 4.13%
Fig. 4. Histogram of mineralogical composition of mollusk shells of Oued sarrat
We consider that the abundance of aragoniteindicates that the shells have not yet undergone
mineralogical transformations related to fossiliza-tion phenomena as evidenced by the absence or low
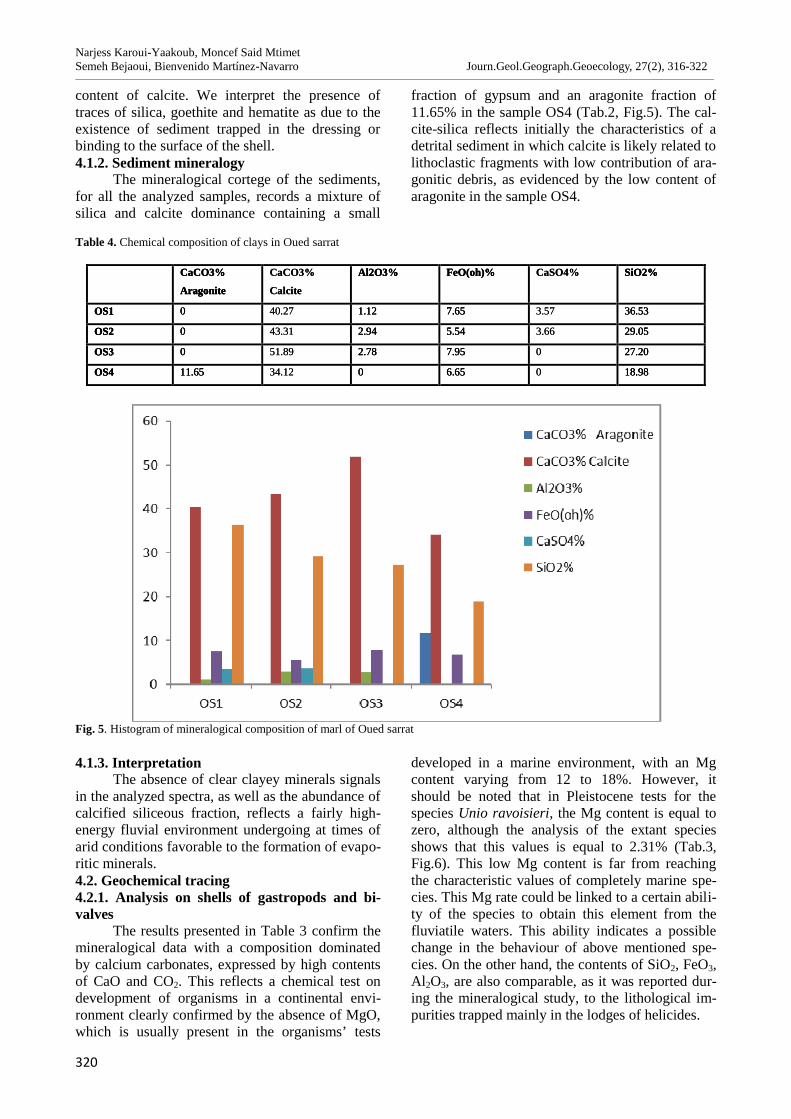
Narjess Karoui-Yaakoub, Moncef Said MtimetSemeh Bejaoui, Bienvenido Martínez-Navarro Journ.Geol.Geograph.Geoecology, 27(2), 316-322________________________________________________________________________________________________________________________________________________________________
320
content of calcite. We interpret the presence oftraces of silica, goethite and hematite as due to theexistence of sediment trapped in the dressing orbinding to the surface of the shell.4.1.2. Sediment mineralogy
The mineralogical cortege of the sediments,for all the analyzed samples, records a mixture ofsilica and calcite dominance containing a small
fraction of gypsum and an aragonite fraction of11.65% in the sample OS4 (Tab.2, Fig.5). The cal-cite-silica reflects initially the characteristics of adetrital sediment in which calcite is likely related tolithoclastic fragments with low contribution of ara-gonitic debris, as evidenced by the low content ofaragonite in the sample OS4.
Table 4. Chemical composition of clays in Oued sarrat
Fig. 5. Histogram of mineralogical composition of marl of Oued sarrat
4.1.3. InterpretationThe absence of clear clayey minerals signals
in the analyzed spectra, as well as the abundance ofcalcified siliceous fraction, reflects a fairly high-energy fluvial environment undergoing at times ofarid conditions favorable to the formation of evapo-ritic minerals.4.2. Geochemical tracing4.2.1. Analysis on shells of gastropods and bi-valves
The results presented in Table 3 confirm themineralogical data with a composition dominatedby calcium carbonates, expressed by high contentsof CaO and CO2. This reflects a chemical test ondevelopment of organisms in a continental envi-ronment clearly confirmed by the absence of MgO,which is usually present in the organisms’ tests
developed in a marine environment, with an Mgcontent varying from 12 to 18%. However, itshould be noted that in Pleistocene tests for thespecies Unio ravoisieri, the Mg content is equal tozero, although the analysis of the extant speciesshows that this values is equal to 2.31% (Tab.3,Fig.6). This low Mg content is far from reachingthe characteristic values of completely marine spe-cies. This Mg rate could be linked to a certain abili-ty of the species to obtain this element from thefluviatile waters. This ability indicates a possiblechange in the behaviour of above mentioned spe-cies. On the other hand, the contents of SiO2, FeO3,Al2O3, are also comparable, as it was reported dur-ing the mineralogical study, to the lithological im-purities trapped mainly in the lodges of helicides.
CaCO3%
Aragonite
CaCO3%
Calcite
Al2O3% FeO(oh)% CaSO4% SiO2%
OS1 0 40.27 1.12 7.65 3.57 36.53
OS2 0 43.31 2.94 5.54 3.66 29.05
OS3 0 51.89 2.78 7.95 0 27.20
OS4 11.65 34.12 0 6.65 0 18.98
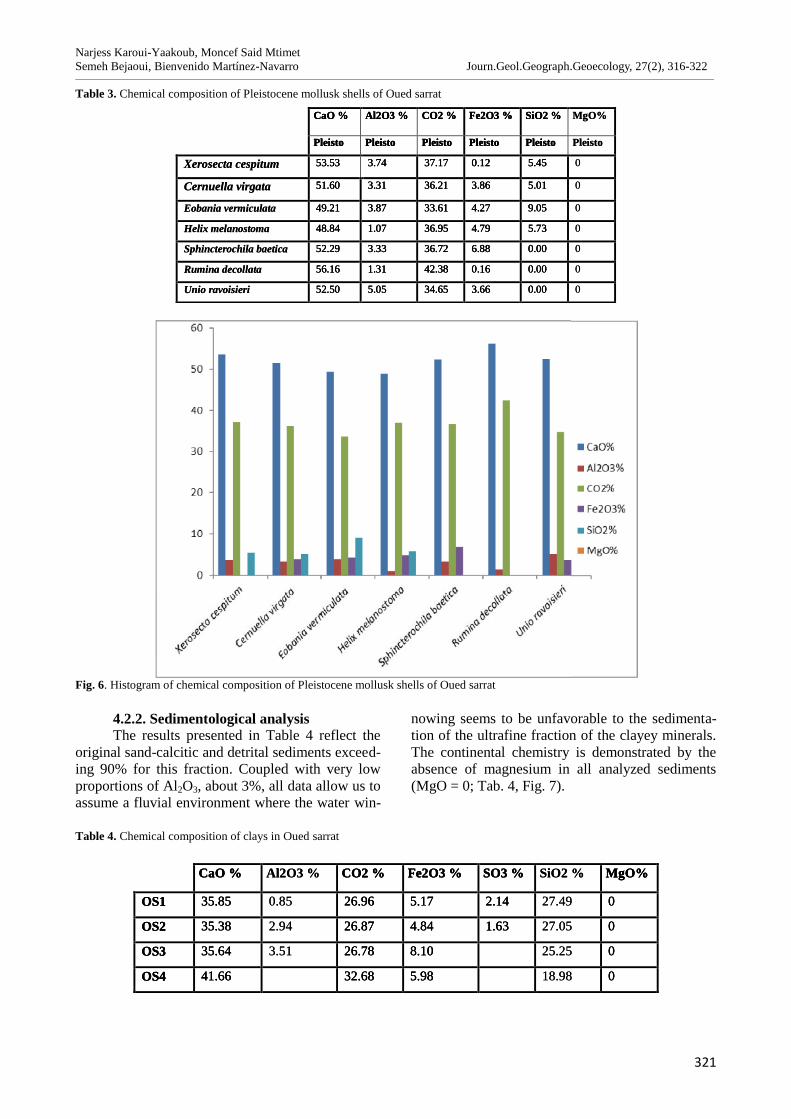
Narjess Karoui-Yaakoub, Moncef Said MtimetSemeh Bejaoui, Bienvenido Martínez-Navarro Journ.Geol.Geograph.Geoecology, 27(2), 316-322________________________________________________________________________________________________________________________________________________________________
321
Table 3. Chemical composition of Pleistocene mollusk shells of Oued sarrat
Fig. 6. Histogram of chemical composition of Pleistocene mollusk shells of Oued sarrat
4.2.2. Sedimentological analysisThe results presented in Table 4 reflect the
original sand-calcitic and detrital sediments exceed-ing 90% for this fraction. Coupled with very lowproportions of Al2O3, about 3%, all data allow us toassume a fluvial environment where the water win-
nowing seems to be unfavorable to the sedimenta-tion of the ultrafine fraction of the clayey minerals.The continental chemistry is demonstrated by theabsence of magnesium in all analyzed sediments(MgO = 0; Tab. 4, Fig. 7).
Table 4. Chemical composition of clays in Oued sarrat
CaO % Al2O3 % CO2 % Fe2O3 % SiO2 % MgO%
Pleisto Pleisto Pleisto Pleisto Pleisto Pleisto
Xerosecta cespitum 53.53 3.74 37.17 0.12 5.45 0
Cernuella virgata 51.60 3.31 36.21 3.86 5.01 0
Eobania vermiculata 49.21 3.87 33.61 4.27 9.05 0
Helix melanostoma 48.84 1.07 36.95 4.79 5.73 0
Sphincterochila baetica 52.29 3.33 36.72 6.88 0.00 0
Rumina decollata 56.16 1.31 42.38 0.16 0.00 0
Unio ravoisieri 52.50 5.05 34.65 3.66 0.00 0
CaO % Al2O3 % CO2 % Fe2O3 % SO3 % SiO2 % MgO%
OS1 35.85 0.85 26.96 5.17 2.14 27.49 0
OS2 35.38 2.94 26.87 4.84 1.63 27.05 0
OS3 35.64 3.51 26.78 8.10 25.25 0
OS4 41.66 32.68 5.98 18.98 0
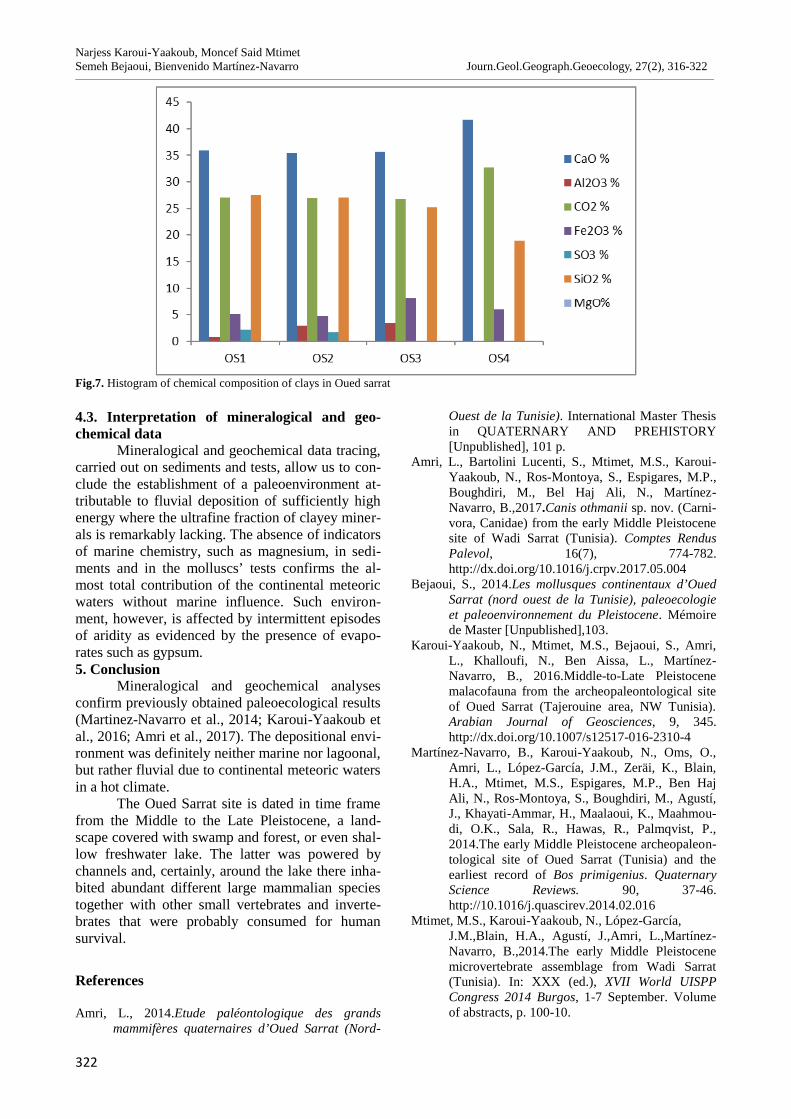
Narjess Karoui-Yaakoub, Moncef Said MtimetSemeh Bejaoui, Bienvenido Martínez-Navarro Journ.Geol.Geograph.Geoecology, 27(2), 316-322________________________________________________________________________________________________________________________________________________________________
322
Fig.7. Histogram of chemical composition of clays in Oued sarrat
4.3. Interpretation of mineralogical and geo-chemical data
Mineralogical and geochemical data tracing,carried out on sediments and tests, allow us to con-clude the establishment of a paleoenvironment at-tributable to fluvial deposition of sufficiently highenergy where the ultrafine fraction of clayey miner-als is remarkably lacking. The absence of indicatorsof marine chemistry, such as magnesium, in sedi-ments and in the molluscs’ tests confirms the al-most total contribution of the continental meteoricwaters without marine influence. Such environ-ment, however, is affected by intermittent episodesof aridity as evidenced by the presence of evapo-rates such as gypsum.5. Conclusion
Mineralogical and geochemical analysesconfirm previously obtained paleoecological results(Martinez-Navarro et al., 2014; Karoui-Yaakoub etal., 2016; Amri et al., 2017). The depositional envi-ronment was definitely neither marine nor lagoonal,but rather fluvial due to continental meteoric watersin a hot climate.
The Oued Sarrat site is dated in time framefrom the Middle to the Late Pleistocene, a land-scape covered with swamp and forest, or even shal-low freshwater lake. The latter was powered bychannels and, certainly, around the lake there inha-bited abundant different large mammalian speciestogether with other small vertebrates and inverte-brates that were probably consumed for humansurvival.
References
Amri, L., 2014.Etude paléontologique des grandsmammifères quaternaires d’Oued Sarrat (Nord-
Ouest de la Tunisie). International Master Thesisin QUATERNARY AND PREHISTORY[Unpublished], 101 p.
Amri, L., Bartolini Lucenti, S., Mtimet, M.S., Karoui-Yaakoub, N., Ros-Montoya, S., Espigares, M.P.,Boughdiri, M., Bel Haj Ali, N., Martínez-Navarro, B.,2017.Canis othmanii sp. nov. (Carni-vora, Canidae) from the early Middle Pleistocenesite of Wadi Sarrat (Tunisia). Comptes RendusPalevol, 16(7), 774-782.http://dx.doi.org/10.1016/j.crpv.2017.05.004
Bejaoui, S., 2014.Les mollusques continentaux d’OuedSarrat (nord ouest de la Tunisie), paleoecologieet paleoenvironnement du Pleistocene. Mémoirede Master [Unpublished],103.
Karoui-Yaakoub, N., Mtimet, M.S., Bejaoui, S., Amri,L., Khalloufi, N., Ben Aissa, L., Martínez-Navarro, B., 2016.Middle-to-Late Pleistocenemalacofauna from the archeopaleontological siteof Oued Sarrat (Tajerouine area, NW Tunisia).Arabian Journal of Geosciences, 9, 345.http://dx.doi.org/10.1007/s12517-016-2310-4
Martínez-Navarro, B., Karoui-Yaakoub, N., Oms, O.,Amri, L., López-García, J.M., Zeräi, K., Blain,H.A., Mtimet, M.S., Espigares, M.P., Ben HajAli, N., Ros-Montoya, S., Boughdiri, M., Agustí,J., Khayati-Ammar, H., Maalaoui, K., Maahmou-di, O.K., Sala, R., Hawas, R., Palmqvist, P.,2014.The early Middle Pleistocene archeopaleon-tological site of Oued Sarrat (Tunisia) and theearliest record of Bos primigenius. QuaternaryScience Reviews. 90, 37-46.http://10.1016/j.quascirev.2014.02.016
Mtimet, M.S., Karoui-Yaakoub, N., López-García,J.M.,Blain, H.A., Agustí, J.,Amri, L.,Martínez-Navarro, B.,2014.The early Middle Pleistocenemicrovertebrate assemblage from Wadi Sarrat(Tunisia). In: XXX (ed.), XVII World UISPPCongress 2014 Burgos, 1-7 September. Volumeof abstracts, p. 100-10.
323
Journal of Geology,Geography and Geoecology
Journal home page: geology-dnu-dp.ua
ISSN 2617-2909 (print)ISSN 2617-2119 (online)
Journ.Geol.Geograph.Geoecology,
27(2),323-331doi:10.15421/111856
I. Rusanova, Y. Onufriv, A. Ignatyuk Journ.Geol.Geograph.Geoecology, 27(2), 323-331________________________________________________________________________________________________________________________________________________________________
Recreational skiing in the formation of local settlement systems of Prykarpattya region
I. Rusanova, Y.Onufriv, A.Ignatyuk
Department of Urban Planning and Design, Institute of Architecture, Lviv Polytechnic National University;Bandery Street, 12, room 323, 79013, Lviv, Ukraine, e-mail: [email protected]
Abstract. The formation of local settlement systems is considered on the example ofmountainous areas of Ivano-Frankivsk region (Ukraine), so-called Prykarpattya region,and is based on a complex set of factors. Recreational skiing plays an important role inthe functioning and development of such systems and is simultaneously an integral part
of them. The settlement systems in the mountainous areas of Ivano-Frankivsk region, which are based on recreational skiing arehighlighted and investigated, in particular they are: the Kosiv system, the Yaremche-Vorokhta system (consisting of two subsystemsof the Yaremche and Vorokhta -Yablunytsya), the Verkhovyna system and autonomous centers of recreational skiing in the villagesVyshkiv and Guta . Their detailed profile in demographic terms, including migration processes; natural resource possibilities; socio-economic potential and interaction with recreational skiing is outlined. The methodological principles of the spatial structureformation of local settlement systems are based on the following states of the system approach: - the main territorial-planningelements of the systems are defined: skiing complexes (one large enterprise or a group of enterprises) with a ski area and adevelopment zone; center of the system, which is a tourist center with services, production and transport; settlements with ruralterritories and enterprises of the agro-industrial complex; valuable landscape (national parks, nature reserves); focal points of touristdestinations;- functional and spatial associations of ski recreation facilities with settlements, recreational, natural and nature-protectedareas, and engineering-transport infrastructure are established;- the approximate boundaries of systems are determined on the basis ofspatial, functional and labour relations, types of their territorial-spatial structure, distances between settlements accepted within theradius of one hour transport accessibility.Planning types, directions and trends of development and spatial transformation of localsettlement systems with recreational skiing are identified. The role and significance of local settlement systems with recreationalskiing as an urban planning object is demonstrated within the general system of recreational zoning.
Key words: local settlement systems, recreational skiing, spatial structure of resettlement
Гірськолижна рекреація у формуванні локальних систем розселення Прикарпаття
І.В. Русанова, Я.О. Онуфрів, А.О. Ігнатюк
Кафедра містобудування, Інститут архітектури, Національний університет «Львівська політехніка»;вул. С. Бандери, 12, к.323, 79013, Львів, Україна;e-mail: [email protected]
Анотація. Формування локальних систем розселення, розглянутих на прикладі гірських районів Прикарпаття (Івано-Франківська область, Україна) відбувається на основі складного комплексу чинників, серед яких гірськолижна рекреаціявідіграє провідну роль у функціонуванні і розвитку таких систем та одночасно є їх складовою. Виділено і досліджено сис-теми розселення в гірській частині Івано-Франківської області, які розвиваються на базі гірськолижної рекреації, а саме:Косівську, Яремчансько-Ворохтянську (до складу якої входять дві підсистеми Яремчанська і Ворохтянсько-Яблуницька),Верховинську та автономні осередки гірськолижної рекреації в с. Вишків і в с. Гута. Подана їх детальна характеристика задемографічною ситуацією, в тому числі міграційними процесами; природно-ресурсними можливостями; соціально-економічним потенціалом та взаємодією з гірськолижною рекреацією. Розроблені методичні засади формування територіа-льно-просторової структури локальних систем розселення на основі положень системного підходу. Визначено типи плану-вальних структур, напрямки і тенденції розвитку й просторової трансформації систем розселення . Показано роль і значеннясистем розселення з гірськолижною рекреацією як об’єкта містобудівного проектування у загальній системі рекреаційногорайонування.
Ключові слова: локальна система розселення, гірськолижна рекреація, територіальна структура розселення
Received 08.07.2018;Received in revised form 27.07.2018;Accepted 01.08.2018
I. Rusanova, Y. Onufriv, A. Ignatyuk Journ.Geol.Geograph.Geoecology, 27(2), 323-331________________________________________________________________________________________________________________________________________________________________
324
Introduction. Nowadays recreational skiing is oneof the most popular types of winter recreation. Itspopularity is attested by the construction of new skiresorts and other objects connected to this form ofrecreation in mountains, and their spread through-out the world.
Ski resorts or sets of recreational skiing ob-jects function in settlement systems of differenthierarchical ranks – regional, district and local. Theclosest connections between recreational skiingobjects exist within a limited local area because ofthe common use of recreational potential of theterritory, infrastructure, workforce and socio-economic base of the settlements, which are subor-dinated to self-government bodies and territorialcommunities.
The formation of local settlement systems isconsidered on the example of Ivano-Frankivsk re-gion (Ukraine), which consists of six mountainousareas. These areas differ in the amount of recrea-tional skiing objects of different capacity, naturalresource potential, socio-economic development ofthe settlements and infrastructure.
Recreational skiing as a leading branch ofeconomic activity of closely located and intercon-nected settlements (local settlement systems)creates the base for the production activity of thepopulation, increases the chances of introducingother additional sectors of tourist servicing, therebyexercising the mutual influence of mountainrecreation and settlement systems.
Investigation of recreational territories ishighlighted in numerous works of researchers cov-ering a wide range of problems in the spheres ofgeography, economics, social ecology, urban plan-ning, etc. In Ukraine, a thorough basis of settlementsystems research was laid out by the urbanist re-searchers: Y. Bilokon, I. Fomin, M. Kushnirenko,M. Dyomin, M. Habrel, I. Rusanova and others.The formation of territorial recreational systemswas investigated by the urbanists T. Panchenko, V.Shulyk, V. Vladimirov, and also by geographers O.Preobragenskyi, V. Dgaman, A, Dotsenko, P. Mas-lyak, M. Palamarchuk, F. Mazur, O. Beidyk andothers. Regional problems of the Ukrainian Carpa-thians, in particular landscape and urban problems,resource base, historical and cultural potential, wereexplored by T. Panchenko, M. Habrel, Y. Taras, H.Petryshyn, G. Shulga and others. The influence ofvarious types of recreation, and in particular recre-ational skiing, on the activation of the developmentof settlements of the Carpathian region is discussedby scientists: M. Greta, T. Kostrzewa-Zielinska, J.Mirek, A. Ilieş, D. Ilieş, O. Dehoorne.
In recent years on the initiative of the Euro-pean Union and with the participation of Ukraine,mountainous areas development programmes and
strategies have been developed and implemented.One of them, “EU Macro-regional strategy for theCarpathian region” (Szuba, 2017) determines themodern directions of development of this region,which mainly concerns higher-ranking systems.This work has not paid attention to the formation ofsettlement systems at the local level with the speci-ficity of solving problems and taking into accountthe features of the territorial planning on the basisof recreational skiing.
The aim of this study is to develop criteriaand mechanisms for the formation of local settle-ment systems on the basis of recreational skiing inthe mountainous areas of the Carpathians (on theexample of Ivano-Frankivsk region) and to deter-mine the principles for improving their territorialorganisation and development.Material and methods. The research is based onthe analysis of the research publications and projectmaterials in relation to this topic, as well as on fieldsurveys of 13 ski resorts in the mountain districts ofIvano-Frankivsk region.During field surveys thecapacity of ski resorts, the quantity and quality oftheir services, their role and significance beyondand within the boundaries of the state, region anddistrict were determined (Onufriv, 2017).
During the study of individual settlements,statistical data, empirical methods and contentanalysis of the theory and practice of recreationformation in resettlement systems were used. In thesurvey of ski recreation objects and settlementswithin the studied territory, cartographic materialswere used.
The basic method of research is system anal-ysis and principles of system formation, where atthe lowest level - the local system, interconnectedsettlements are considered as a single organismwith territorial-production, cultural and economic,transport, tourist and recreational links.Results and discussion. On the Ukrainian territoryof the Carpathians, the Prykarpattya region is dis-tinguished as a separate region with the predomi-nant function of mountain recreation. Part of Ivano-Frankivsk region is fully part of Prykarpattya, andthis is almost 50% of the area of the region withmountain ranges: the Eastern Beskydy, Gorgany,Pokutski mountains, and separately - the ranges ofChornogora with the highest peak of Hoverla. Es-tablishment of settlements in these areas is traced tothe 16th-17th centuries, and the population consistsmainly of Ukrainian-highlanders - Hutsuls withtheir rich culture, customs, architecture, which isreflected in the specifics of these mountainous re-gions.
Since ancient times, natural conditions havemade this region a tourist pilgrimage area, whichlater became the place of recreational skiing on a
I. Rusanova, Y. Onufriv, A. Ignatyuk Journ.Geol.Geograph.Geoecology, 27(2), 323-331________________________________________________________________________________________________________________________________________________________________
325
large scale- the main direction of economic activityand socio-economic development of local settle-ments.
The recreational attractiveness of this arealies not only in the natural-landscape conditions andpicturesque landscapes, but also in its geographicalpo-sition on the border with Romania, throughwhich the tourist routes to Bulgaria, Serbia, Monte-negro, and Greece are laid.
A group of recreational facilities (or one ob-ject) create their own zone of influence associatedwith the zoning of the recreational area. In thiscase, the concept of "recreational territory" istreated as a component of the land fund with a sys-tem of interconnected natural, natural-social andsocial components (Beidyk, 2001). The methodolo-gy of taxonomic zoning of recreational territories isconsidered by T. Panchenko (2009) at the level ofthe region, district, tourist area, taking into accountthe area of the recreational territories. Specialistsuse different criteria for zoning of territories, re-flecting the spatial dispersion of recreational re-sources . According to V. Shulyk (2007), a recrea-tional area is a type of functional-branch zoning,which is based on recreational orientation. G. Shul-ga (2015) emphasizes the role of landscapes in thezoning of a territory. The proposed methodology of"landscape-spatial pools", which are territories li-mited by watersheds of different order, is attachedto urban systems at the level of the region, zone,district, area.
The existing method of regionalisation of re-creational territories does not give a clear definitionof the size and subordination of taxonomic units ofthese territories, their connection with the settle-ment systems. A more objective definition existsfor territorial-recreational systems in the territory ofa certain taxonomic rank of the complex of recrea-tional establishments based on the use of resourcesof this territory, spatially and territorially intercon-nected ones (Maslyak, 2008). Thus, the systemconcept of recreation, which includes the territorialintegrity of the system with interconnected subsys-tems (natural resources, objects of historical andurban planning and cultural heritage, engineeringinfrastructure, service and management), is in-cluded in this definition; hierarchy (region, zone,district, territorial recreation complex). The terri-torial recreational complex can be regarded as alow link in such a hierarchy, represented by an ob-ject or a group of recreational facilities operating ona particular territory with natural and socio-economic characteristics. Objects of territorial recr-eational complexes provide a significant set of va-riants of territorial and economic system formationat different hierarchical levels. At the lower hierar-chical level, recreational facilities (ski resorts) are
located on a limited local area, establish close linkswith neighbouring settlements, providing not onlyrecreational services, but also performing territorialfunctions through the sharingof natural, labour and other resources.
Ski complexes, as a rule, are combined withother types of recreation (from extreme to passiverecreation), and aimed at their year-round operationregardless of the season. Mountain recreationspreads its influence on the surrounding settlementswith their cultural-historical and ethnic characteris-tics, which provide a material base and service, andpromote the attractiveness and multiplicity ofmountain resorts. Due to such interconnectionslocal settlements are formed, in which mountainrecreation becomes the organizer of socio-economic development of settlements themselvesand in the system.
Methodological aspects of the research onsettlement systems that operate on a separate terri-tory include the following factors: natural re-sources, socio-economic potential, demographicsituation, migration processes in the formation ofsettlement potential (Dgaman, 2003). The generalfactors of formation affecting local systems of re-settlement with recreational skiing are manifestedin the identification of natural and recreational re-sources that contribute to the directions of the re-lated types of recreation within such systems, thesocio-economic and demographic situation of set-tlements for recreation services and infrastructuredevelopment. These same factors generally deter-mine the spatial structure of systems.
The methodological principles of the forma-tion of the spatial structure of local systems arebased on the following states of the system ap-proach:
- the main territorial-planning elements of thesystems are defined: skiing complexes (one largeenterprise or a group of enterprises) with a ski areaand a development zone; center of the system,which is a tourist center with services, productionand transport; settlements with rural territories andenterprises of the agro-industrial complex; valuablelandscape (national parks, nature reserves); focalpoints of tourist destinations.
- functional and spatial associations of recre-ational skiing facilities with settlements, recreation-al, natural and nature-protected areas, and engineer-ing-transport infrastructure are established.
- the approximate boundaries of systems aredetermined on the basis of spatial, functional andlabour relations, types of their territorial-spatialstructure, distances between settlements acceptedwithin the radius of one hour transport accessibility.
Local settlement systems are not internallyclosed, but exist in the system of external connec-
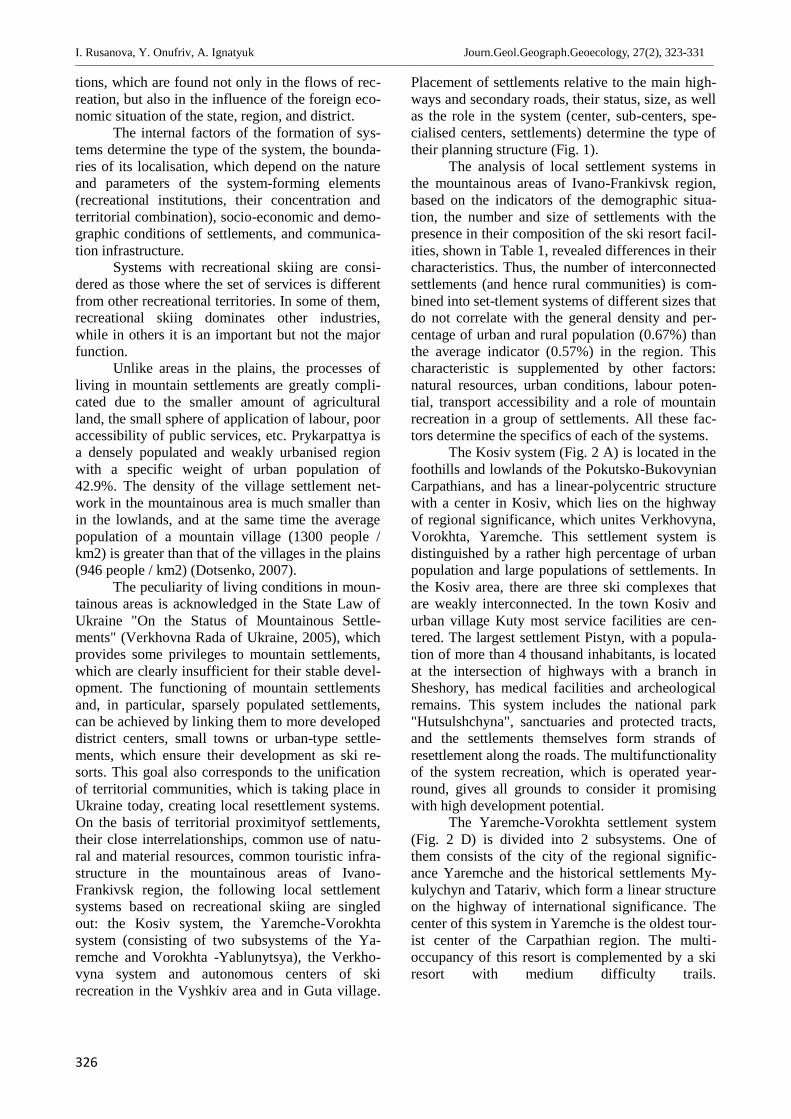
I. Rusanova, Y. Onufriv, A. Ignatyuk Journ.Geol.Geograph.Geoecology, 27(2), 323-331________________________________________________________________________________________________________________________________________________________________
326
tions, which are found not only in the flows of rec-reation, but also in the influence of the foreign eco-nomic situation of the state, region, and district.
The internal factors of the formation of sys-tems determine the type of the system, the bounda-ries of its localisation, which depend on the natureand parameters of the system-forming elements(recreational institutions, their concentration andterritorial combination), socio-economic and demo-graphic conditions of settlements, and communica-tion infrastructure.
Systems with recreational skiing are consi-dered as those where the set of services is differentfrom other recreational territories. In some of them,recreational skiing dominates other industries,while in others it is an important but not the majorfunction.
Unlike areas in the plains, the processes ofliving in mountain settlements are greatly compli-cated due to the smaller amount of agriculturalland, the small sphere of application of labour, pooraccessibility of public services, etc. Prykarpattya isa densely populated and weakly urbanised regionwith a specific weight of urban population of42.9%. The density of the village settlement net-work in the mountainous area is much smaller thanin the lowlands, and at the same time the averagepopulation of a mountain village (1300 people /km2) is greater than that of the villages in the plains(946 people / km2) (Dotsenko, 2007).
The peculiarity of living conditions in moun-tainous areas is acknowledged in the State Law ofUkraine "On the Status of Mountainous Settle-ments" (Verkhovna Rada of Ukraine, 2005), whichprovides some privileges to mountain settlements,which are clearly insufficient for their stable devel-opment. The functioning of mountain settlementsand, in particular, sparsely populated settlements,can be achieved by linking them to more developeddistrict centers, small towns or urban-type settle-ments, which ensure their development as ski re-sorts. This goal also corresponds to the unificationof territorial communities, which is taking place inUkraine today, creating local resettlement systems.On the basis of territorial proximityof settlements,their close interrelationships, common use of natu-ral and material resources, common touristic infra-structure in the mountainous areas of Ivano-Frankivsk region, the following local settlementsystems based on recreational skiing are singledout: the Kosiv system, the Yaremche-Vorokhtasystem (consisting of two subsystems of the Ya-remche and Vorokhta -Yablunytsya), the Verkho-vyna system and autonomous centers of skirecreation in the Vyshkiv area and in Guta village.
Placement of settlements relative to the main high-ways and secondary roads, their status, size, as wellas the role in the system (center, sub-centers, spe-cialised centers, settlements) determine the type oftheir planning structure (Fig. 1).
The analysis of local settlement systems inthe mountainous areas of Ivano-Frankivsk region,based on the indicators of the demographic situa-tion, the number and size of settlements with thepresence in their composition of the ski resort facil-ities, shown in Table 1, revealed differences in theircharacteristics. Thus, the number of interconnectedsettlements (and hence rural communities) is com-bined into set-tlement systems of different sizes thatdo not correlate with the general density and per-centage of urban and rural population (0.67%) thanthe average indicator (0.57%) in the region. Thischaracteristic is supplemented by other factors:natural resources, urban conditions, labour poten-tial, transport accessibility and a role of mountainrecreation in a group of settlements. All these fac-tors determine the specifics of each of the systems.
The Kosiv system (Fig. 2 A) is located in thefoothills and lowlands of the Pokutsko-BukovynianCarpathians, and has a linear-polycentric structurewith a center in Kosiv, which lies on the highwayof regional significance, which unites Verkhovyna,Vorokhta, Yaremche. This settlement system isdistinguished by a rather high percentage of urbanpopulation and large populations of settlements. Inthe Kosiv area, there are three ski complexes thatare weakly interconnected. In the town Kosiv andurban village Kuty most service facilities are cen-tered. The largest settlement Pistyn, with a popula-tion of more than 4 thousand inhabitants, is locatedat the intersection of highways with a branch inSheshory, has medical facilities and archeologicalremains. This system includes the national park"Hutsulshchyna", sanctuaries and protected tracts,and the settlements themselves form strands ofresettlement along the roads. The multifunctionalityof the system recreation, which is operated year-round, gives all grounds to consider it promisingwith high development potential.
The Yaremche-Vorokhta settlement system(Fig. 2 D) is divided into 2 subsystems. One ofthem consists of the city of the regional signific-ance Yaremche and the historical settlements My-kulychyn and Tatariv, which form a linear structureon the highway of international significance. Thecenter of this system in Yaremche is the oldest tour-ist center of the Carpathian region. The multi-occupancy of this resort is complemented by a skiresort with medium difficulty trails.
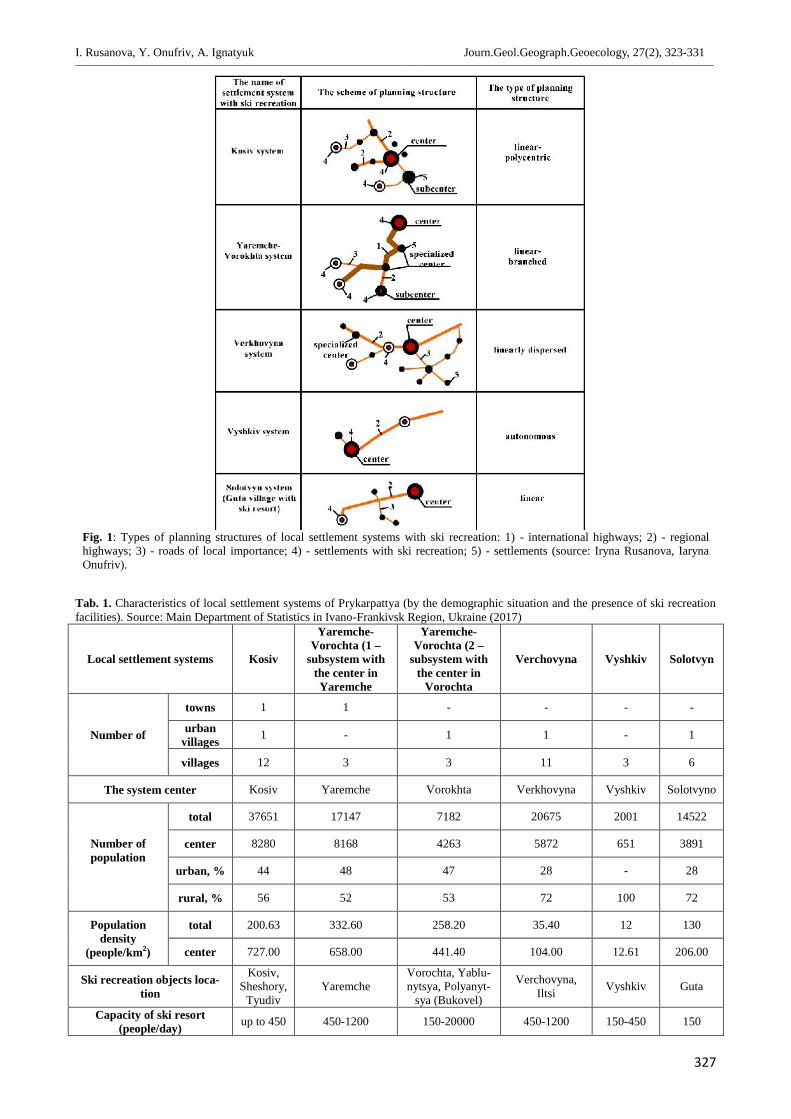
I. Rusanova, Y. Onufriv, A. Ignatyuk Journ.Geol.Geograph.Geoecology, 27(2), 323-331________________________________________________________________________________________________________________________________________________________________
327
Fig. 1: Types of planning structures of local settlement systems with ski recreation: 1) - international highways; 2) - regionalhighways; 3) - roads of local importance; 4) - settlements with ski recreation; 5) - settlements (source: Iryna Rusanova, IarynaOnufriv).
Tab. 1. Characteristics of local settlement systems of Prykarpattya (by the demographic situation and the presence of ski recreationfacilities). Source: Main Department of Statistics in Ivano-Frankivsk Region, Ukraine (2017)
Local settlement systems Kosiv
Yaremche-Vorochta (1 –
subsystem withthe center inYaremche
Yaremche-Vorochta (2 –
subsystem withthe center in
Vorochta
Verchovyna Vyshkiv Solotvyn
Number of
towns 1 1 - - - -
urbanvillages 1 - 1 1 - 1
villages 12 3 3 11 3 6
The system center Kosiv Yaremche Vorokhta Verkhovyna Vyshkiv Solotvyno
Number ofpopulation
total 37651 17147 7182 20675 2001 14522
center 8280 8168 4263 5872 651 3891
urban, % 44 48 47 28 - 28
rural, % 56 52 53 72 100 72
Populationdensity
(people/km2)
total 200.63 332.60 258.20 35.40 12 130
center 727.00 658.00 441.40 104.00 12.61 206.00
Ski recreation objects loca-tion
Kosiv,Sheshory,
TyudivYaremche
Vorochta, Yablu-nytsya, Polyanyt-
sya (Bukovel)
Verchovyna,Iltsi Vyshkiv Guta
Capacity of ski resort(people/day) up to 450 450-1200 150-20000 450-1200 150-450 150
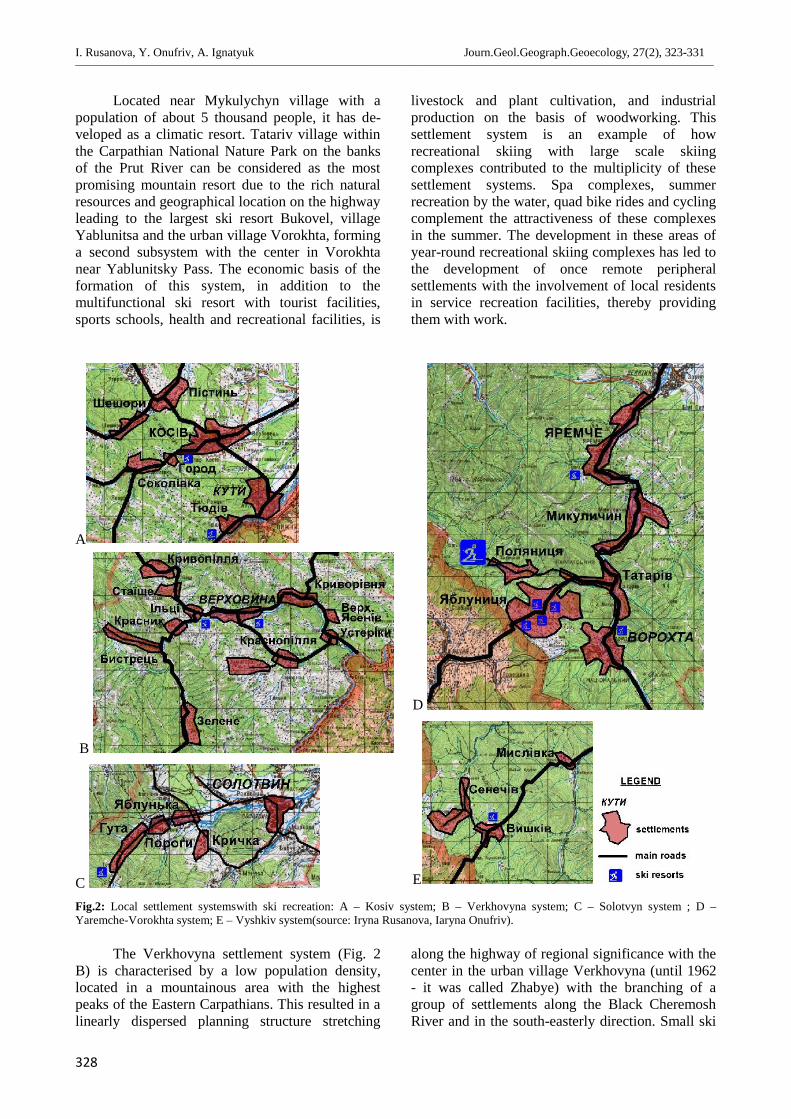
I. Rusanova, Y. Onufriv, A. Ignatyuk Journ.Geol.Geograph.Geoecology, 27(2), 323-331________________________________________________________________________________________________________________________________________________________________
328
Located near Mykulychyn village with apopulation of about 5 thousand people, it has de-veloped as a climatic resort. Tatariv village withinthe Carpathian National Nature Park on the banksof the Prut River can be considered as the mostpromising mountain resort due to the rich naturalresources and geographical location on the highwayleading to the largest ski resort Bukovel, villageYablunitsa and the urban village Vorokhta, forminga second subsystem with the center in Vorokhtanear Yablunitsky Pass. The economic basis of theformation of this system, in addition to themultifunctional ski resort with tourist facilities,sports schools, health and recreational facilities, is
livestock and plant cultivation, and industrialproduction on the basis of woodworking. Thissettlement system is an example of howrecreational skiing with large scale skiingcomplexes contributed to the multiplicity of thesesettlement systems. Spa complexes, summerrecreation by the water, quad bike rides and cyclingcomplement the attractiveness of these complexesin the summer. The development in these areas ofyear-round recreational skiing complexes has led tothe development of once remote peripheralsettlements with the involvement of local residentsin service recreation facilities, thereby providingthem with work.
А
D
E
B
CFig.2: Local settlement systemswith ski recreation: A – Kosiv system; B – Verkhovyna system; C – Solotvyn system ; D –Yaremche-Vorokhta system; E – Vyshkiv system(source: Iryna Rusanova, Iaryna Onufriv).
The Verkhovyna settlement system (Fig. 2B) is characterised by a low population density,located in a mountainous area with the highestpeaks of the Eastern Carpathians. This resulted in alinearly dispersed planning structure stretching
along the highway of regional significance with thecenter in the urban village Verkhovyna (until 1962- it was called Zhabye) with the branching of agroup of settlements along the Black CheremoshRiver and in the south-easterly direction. Small ski
I. Rusanova, Y. Onufriv, A. Ignatyuk Journ.Geol.Geograph.Geoecology, 27(2), 323-331________________________________________________________________________________________________________________________________________________________________
329
resorts are concentrated in Verkhovyna and Iltsi,and such villages as Kryvorivnya (ethnographic andcognitive tourism), Kryvopillya, Bystrets,Zamagora are specialised centers of hiking tourism,Dzembronja - the center of rural and extremetourism (Kryvoruchko, Korol, Ignatyuk, 2007). Themultifunctionality of recreation contributed to thedevelopment of light and food industries in thesettlements. Land resources, unfavourable forarable land, led to the development of livestock andlogging.
The Vyshkiv settlement system (Fig. 2 E)includes the autonomous group of settlements in themountainous area of the Dolynsky district - thevillage of Vyshkiv and Myslivka on the highwayLviv-Khust and the village Senechiv near thevillage Vishkiv. This is a sparsely populated areawith the lowest population density in the region.However, the rich natural conditions, the locationalong the tourist routes along the road to LakeSynevir, Vyshkivsky and the Torunsky Pass havecreated a tourist center here with hotels, camps, skiinfrastructure in Vishkiv and Myslivka. Therecreational potential of this area is far fromexhausted, which makes it possible to create newmultidisciplinary ski resorts here.
Recreational skiing in Guta village, which isa part of the Solotvyn settlement system (Fig. 2 C),is not dominant. The settlements are mainlyconcentrated in the valley of the Bistrica river,where the population is mostly occupied inagriculture and forestry, which is the economicbasis for the development of this system. Gutavillage is considered to be the residence of eliterecreation, here a small ski complex "Sinegora"works, as well as the beginning of tourist hikingtrails in the mountain range of Gorgany .
The results of the analysis of existingsettlement systems showed their irregularity in size,number and density of population, natural andurban conditions, infrastructure, the degree ofrecreational potential development, socio-economicbase. According to these indicators, the mostdeveloped systems are the Yaremche-Vorokhta,Kosiv and Verkhovina systems.
Determination of trends in the furtherdevelopment of settlement systems should be basedon factors that reflect the specifics of mountainareas:
- natural conditions (mountain ranges,reservoirs, forests, national parks and naturereserves);
- recreational and tourist resources(availability and diversity of recreation, its capacityand attractiveness, conditions for all types oftourism);
- ecological (climate, lack of sources of airpollution, etc.);
- urban planning (number and size ofsettlements, transport infrastructure, the presence oflinks);
- demographic (population density, age andgender structure, migration processes, etc.);
- economic (recreational sphere, localproduction base, folk crafts).
As an obstacle to the development of thesettlement network, the external factors inherent tothe mountainous areas are: difficult livingconditions at a distance to the centers with publicservices; deficit of agricultural land; lowemployment rate. The specificity of mountainterritories is reflected in the "Development Strategyof the Ivano-Frankivsk Region 2020" (Ivano-Frankivsk Regional Administration, 2014), whichfocuses on the social needs of the population andthe economic benefits of the territories. With regardto local settlement systems, this meanssubordination to local interests and those internalfactors that promote the development of territorialcommunities. The local settlement systemsthemselves are becoming areas of a community-based administrative-territorial entities networkformation.
Currently, within the framework of localsettlement systems, the consolidation of territorialcommunities aimed at coherence of socio-economicand environmental measures, which will promotethe sustainable development of systems, is beingimplemented. The association of villages with eachother, as well as with urban settlements to solvecommon problems can be considered as an essentialmechanism for the promotion of local systems to aqualitatively new level. The effect of such amechanism can be seen on the example ofYaremche district in the developed strategy of theYaremche-Vorokhta system development with themost important center of ski recreation.
On the example of the considered settlementsystems it is possible to determine their future spa-tial development, having different forms of manife-station, defined as follows:
- Functional specialisation of each settlementsystem while preserving the leading role of thecenter of the system (Yaremche-Verkhovyna sys-tem: Mykulychyn, Tatariv, Polyanitsa).
- Territorial association of a group of settle-ments with the purpose of creating a specialisedcenter-node (Verkhovyna, Kosiv system).
- Creation of a chain of settlements by inte-grating small settlements with a concentration ofservice functions in the center (Vyshkiv system).
Factors and principles of settlement systemsformation, considered on the example of mountain-
I. Rusanova, Y. Onufriv, A. Ignatyuk Journ.Geol.Geograph.Geoecology, 27(2), 323-331________________________________________________________________________________________________________________________________________________________________
330
ous areas of Ukrainian Carpathians, can be appliedto other regions of the Carpathian Mountains.These settlement systems are based on new criteriain the conditions of dynamic economic entities. Thepeculiarity of the considered systems is the activeinclusion in the process of their development ofrecreational skiing, which is associated with thecreation of a single natural-economic complex andat present is a critical condition for their function-ing in the long term perspective.Conclusions. Based on the above-mentioned ma-terial, it can be argued that local settlement systemsare the main form of resettlement in the moun-tainous regions of the Carpathians. The principlesof the formation of such systems on the basis ofrecreational skiing are considered only as a frag-ment of scientific knowledge on this problem,which allows a connection to be established be-tween recreational skiing and settlement systems.
The placement of objects of recreationalskiing in settlement systems is depicted in the de-sign of schemes of local level. Within the spatialplanning, the boundaries of settlement systems, themain and secondary axes of settlement systemsdevelopment, as well as territories of different func-tional purposes are determined.
Thus, local settlement systems become aseparate object of territorial planning at a lowerlevel, where urgent problems are identified, priorityto their solutions is given, and objects for invest-ments are set.
In planning local settlement systems the op-portunity is provided to make more informed deci-sions unlike the master plans that are currently be-ing developed for settlements without consideringthem as elements of settlement systems and withouttaking into account systemic links, in particular,with objects of recreation.
Thus, local settlement systems as a multidis-ciplinary object of urban and spatial planning allowfor a more in-depth study of the socio-economic,urban and natural basis of the settlement network ata lower level associated with the recreational skiingof the Carpathians in the framework of the overallstrategy for the development of this macro-region.
References
Beydyk, O., 2001. Rekreatsiino-turystychni resursyUkrainy. Metodolohiia i metodyka analizu, ter-minolohiia, raionuvannia [Recreational and tour-ist resources of Ukraine. Methodology and me-thods of analysis, terminology, zoning]. Kyiv,Kyiv University Publishing House (In Ukrainian).
Dgaman, V., 2003. Rehionalni systemy rozselennia:demohrafichni aspekty[Regional settlement sys-tems: demographic aspects]. Chernivtsi, Ruta (InUkrainian)..
Dotsenko, A., 2007. Sotsialno-ekonomichni problemyrozselennia i zainiatosti naselennia hustozasele-noho slabourbanizovanoho rehionu (na prykladiIvano-Frankivskoi oblasti)[Socio-economicproblems of resettlement and employment of thepopulation of a densely populated weaklyurbanised region (on example of Ivano-Frankivskregion)]. Retrieved from:http://ekhsuir.kspu.edu/bitstream/123456789/5217/1/А.%20І.%20Доценко.pdf
Greta, M. andKostrzewa-Zielinska, T.,2011.Turystykaelementemaktywizacjigospodarczejregionówperyferyjnych – funkcjonowanieEuro-regionuBeskidy[Tourism as an element ofeconomic activation of peripheral regions -functioning of the Beskidy Euroregion]. Zeszytynaukowe Uniwersytetu Szczecińskiego, 690(79)“Sport i recreacja. Szansa rozwoju regionu”,Szczecin, Wydawnictwo Naukowe UniwersytetuSzczecińskiego, 35-50.
Ilieş, A., Dehoorne, O., Ilieş, D.C.,2012. The cross-border territorial system in the Romanian-Ukrainian Carpathian area. Elements, mechan-isms and structures generating premises for an in-tegrated cross-border territorial system with tour-ist function. Carpathian Journal of Earth and En-vironmental Sciences, 7(1), 27 – 38 (In Ukrai-nian)..
Ivano-Frankivsk Regional Administration, 2014. Strate-hiia rozvytku Ivano-Frankivskoi Oblasti na perioddo 2020 r. [Development Strategy of the Ivano-Frankivsk Region 2020]. Retrieved from:http://www.if.gov.ua/files/SP_IF_oblast_4.pdf
Kryvoruchko, Y., Korol, Y., Ignatyk, A., 2007. Planu-valna orhanizatsiia turystychno-rekreatsiinoistruktury Verkhovynskoho raionu Ivano-Frankivskoi oblasti[Planning organisation oftourist and recreational structure of Verkhovynadistrict of Ivano-Frankivsk region]. ScientificJournal of Lviv Polytechnic National University,585, 65-70 (In Ukrainian)..
Main Department of Statistics in Ivano-Frankivsk Re-gion, 2017. Statistical Yearbook of the Ivano-Frankivsk Region in 2016. Ivano-Frankivsk.
Maslyak, T., 2008. Metodolohichni zasady rekreatsiinoiheohrafii. Terytorialni rekreatsiinisystemy[Methodological principles ofrecreational geography. Territorial recreationalsystems]. In: Recreational geography, Chapter 4,Kyiv, Znannya (In Ukrainian)..
Mirek, J., 2011. Sport i rekreacja jako czynnik podnos-zenia atrakcyjności gmin uzdrowiskowych naprzykładzie Krynicy-Zdroju [Sport and recreationas a factor in increasing attractiveness of healthresort communes on the example of Krynica-Zdrój]. Zeszyty naukowe UniwersytetuSzczecińskiego 690(79) “Sport i recreacja. Szansarozwoju regionu”, Szczecin, Wydawnictwo Nau-kowe Uniwersytetu Szczecińskiego, 303-318.
Onufriv, I., 2017. Kompozytsiini osnovy landshaftno-prostorovoi orhanizatsii hirskolyzhnykh kom-pleksiv (na prykladi Ukrainskykh Kar-pat)[Compositional foundations of ski resorts’
I. Rusanova, Y. Onufriv, A. Ignatyuk Journ.Geol.Geograph.Geoecology, 27(2), 323-331________________________________________________________________________________________________________________________________________________________________
331
landscape and spatial organisation (on example ofthe Ukrainian Carpathian Mountains]. PhD thesis.Lviv, Lviv Polytechnic National University (InUkrainian)..
Panchenko, T., 2009. Turystychne seredovyshche: archi-tektura, pryroda, infrastruktura [Touristic envi-ron-ment: architecture, nature, infrastructure].Kyiv,Logos (In Ukrainian)..
Rusanova, I., 2015. Formuvannia funktsionalno-planuvalnoi struktury monotsentrychnykhmiskykh ahlomeratsii 60-80 rokach XX stolittia(na prykladi Lvivskoi ahlomeratsii) [Formation ofthe functional and planning structure of monocen-tric urban agglomerations of the 60-80s of the20th century (on the example of the Lviv agglo-mera-tion)] Lviv, Publishing house “Rastr-7” (InUkrainian)..
Shulha, G., 2015. Metodyka modelyrovanyia planyro-vochnoi orhanyzatsyy terrytoryi system rekreat-syy v Ukraynskykh Karpatakh [Methodology ofmodeling of planning organisation of territories ofrecreation systems in the Ukrainian Carpathians].
Science and Education, a New Dimension, Natu-ral and Technical Sciences, 3(5), Issue 41, 87-90(In Russian).
Shulyk, V., 2007. Pro rekreatsiine rayonuvannya teryto-rii Ukrainy [About recreational zoning of the ter-ritory of Ukraine]. Komunalnoye chozyaistvo go-rodov, 76, 431 – 442 (In Ukrainian)..
Szuba, G., 2017. EU Macro-regional strategy for theCarpathian region. Ministry of the Environment,Poland, Modra. Retrieved from:http://www.carpathianconvention.org/tl_files/carpathian-con/Downloads/03%20Meetings%20and%20EEvent/Implementation%20Committee/CCIC_Modra%202017/documents/MRS%20for%20CarpaCarpa%20Region%20presentation.pdf
Verkhovna Rada of Ukraine, 2005. State Law ofUkraine: Pro status hirskykh naselenykh punktivv Ukraini [About the status of mountain settle-ments in Ukraine]. Retrieved from:http://zakon2.rada.gov.ua/laws/show/56/95-вр (InUkrainian).
332
Journal of Geology,Geography and Geoecology
Journal home page: geology-dnu-dp.ua
ISSN 2617-2909 (print)ISSN 2617-2119 (online)
Journ.Geol.Geograph.Geoecology,
27(2), 332-336doi:10.15421/111857
I.O. Sadovenko, O.V. Inkin,N.I. Dereviahina, Y.V. Hriplivec Journ.Geol.Geograph.Geoecology, 27(2), 332-336________________________________________________________________________________________________________________________________________________________________
Analyzing the parameters influencing the efficiency of undereground coal gasification
I.O. Sadovenko, O.V. Inkin, N.I. Dereviahina, Yu.V. Hriplivec
National Mining University, Dnipro, Ukraine,e-mail: [email protected]
Abstract. Relying upon the theory and practice of Podzemgaz stations operation, thepaper has analyzed the basic factors working on the efficiency of underground coal gasi-fication; moreover, it has estimated their function in the formation of gas loss from un-derground gas generator. The determined factors have been divided into initial factorsand controllable ones according to their process characteristics and degree of their influ-
ence of gasification process itself.The data confirm the dependence of the increased pressure upon the increased heat output. Moreo-ver, high static pressure within gas generator prevents from rock roof caving and reaction channel filling up with molten rock. It hasbeen substantiated that almost all disturbing factors have negative effect on gas calorifity whereas parameters of blast rate increaseand static pressure growth in a gas generator have the most positive effect among the controlling factors. Aspects concerning theincrease in loss of the produced gas that may reduce economic efficiency and environmental safety of underground coal gasificationhave been considered as well.
Keywords: filtration and crossflow processes, capacitive parameters, hydraulic fracturing, repression, relaxation, coal gasification
Дослідження параметрів, що впливають на ефективність процесупідземної газифікації вугілля
І.О. Садовенко, О.В. Інкін, Н. І. Деревягіна, Ю.В. Хрипливець
Державний ВНЗ "Національний гірничий університет", Україна, e-mail: [email protected]
Анотація. В даній роботі на базі науково-практичного досвіду роботи станцій «Підземгаз» досліджено основні фактори, щовпливають на ефективність процесу підземної газифікації вугілля, а також оцінюється їх роль у формуванні витоків газу зпідземного газогенератора. Встановлені фактори структуровані по технологічним ознакам на вихідні та керовані та ступеніїх впливу на процес газифікації. Наведені дані підтверджують залежність між підвищенням тиску і збільшенням теплотво-рення газу. Крім того, створення високого статичного тиску в газогенераторі перешкоджає обваленню його породноїпокрівлі і заповнення реакційного каналу розплавленою породою.Обґрунтовано, що практично всі обурюючі фактори нега-тивно впливають на теплотворну здатність газу, а найбільш позитивний вплив з керуючих факторів надають параметризбільшення витрати дуття та підвищення статичного тиску в газовому генераторі. Також розглянуті аспекти збільшеннявідходів виробленого газу, що може знизити рентабельність та екологічну безпеку підземної газифікації вугілля.
Ключові слова: фільтрація та процеси в покрівлі, ємнісні параметри, гідророзрив, репресії, релаксація, газифікація вугілля.
Introduction. The necessity to make a technique ofcoal extraction, conversion, and use more ecologi-cally feasible on the crucially new basis, while mi-nimizing the environmental impact and reducingwaste volume, is one of the topical problems to besolved by energy sector of Ukraine. Undergroundcoal gasification (UCG) is the innovative solutionto the problem. The process relies upon the transi-tion of a mineral into a movable gas-condensatestate within its occurrence by means of thermo-
chemical and mass-exchange reactions. Gasifica-tion is fol-lowed by the loss of gas, being formed,into enclosing rocks which value is influenced by anumber of factors. In this context, gas loss mayachieve 30% affecting ecological compatibility andefficiency of UCG significantly. Thus, object of thepaper is to study the parameters affecting theprocess of underground coal gasification as well asgas loss into roof rocks of underground gas genera-tor.
Received 20.07.2018;Received in revised form 05.08.2018;Accepted 04.10.2018
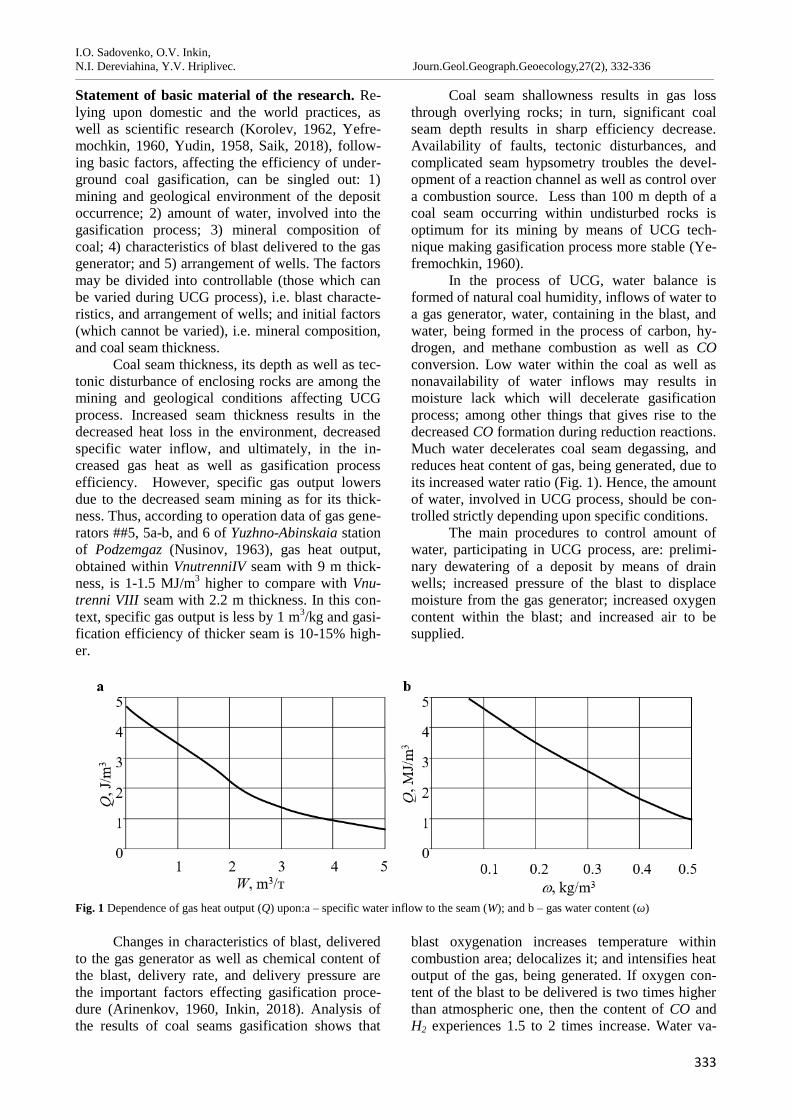
I.O. Sadovenko, O.V. Inkin,N.I. Dereviahina, Y.V. Hriplivec. Journ.Geol.Geograph.Geoecology,27(2), 332-336________________________________________________________________________________________________________________________________________________________________
333
Statement of basic material of the research. Re-lying upon domestic and the world practices, aswell as scientific research (Korolev, 1962, Yefre-mochkin, 1960, Yudin, 1958, Saik, 2018), follow-ing basic factors, affecting the efficiency of under-ground coal gasification, can be singled out: 1)mining and geological environment of the depositoccurrence; 2) amount of water, involved into thegasification process; 3) mineral composition ofcoal; 4) characteristics of blast delivered to the gasgenerator; and 5) arrangement of wells. The factorsmay be divided into controllable (those which canbe varied during UCG process), i.e. blast characte-ristics, and arrangement of wells; and initial factors(which cannot be varied), i.e. mineral composition,and coal seam thickness.
Coal seam thickness, its depth as well as tec-tonic disturbance of enclosing rocks are among themining and geological conditions affecting UCGprocess. Increased seam thickness results in thedecreased heat loss in the environment, decreasedspecific water inflow, and ultimately, in the in-creased gas heat as well as gasification processefficiency. However, specific gas output lowersdue to the decreased seam mining as for its thick-ness. Thus, according to operation data of gas gene-rators ##5, 5a-b, and 6 of Yuzhno-Abinskaia stationof Podzemgaz (Nusinov, 1963), gas heat output,obtained within VnutrenniІV seam with 9 m thick-ness, is 1-1.5 MJ/m3 higher to compare with Vnu-trenni VІІІ seam with 2.2 m thickness. In this con-text, specific gas output is less by 1 m3/kg and gasi-fication efficiency of thicker seam is 10-15% high-er.
Coal seam shallowness results in gas lossthrough overlying rocks; in turn, significant coalseam depth results in sharp efficiency decrease.Availability of faults, tectonic disturbances, andcomplicated seam hypsometry troubles the devel-opment of a reaction channel as well as control overa combustion source. Less than 100 m depth of acoal seam occurring within undisturbed rocks isoptimum for its mining by means of UCG tech-nique making gasification process more stable (Ye-fremochkin, 1960).
In the process of UCG, water balance isformed of natural coal humidity, inflows of water toa gas generator, water, containing in the blast, andwater, being formed in the process of carbon, hy-drogen, and methane combustion as well as COconversion. Low water within the coal as well asnonavailability of water inflows may results inmoisture lack which will decelerate gasificationprocess; among other things that gives rise to thedecreased CO formation during reduction reactions.Much water decelerates coal seam degassing, andreduces heat content of gas, being generated, due toits increased water ratio (Fig. 1). Hence, the amountof water, involved in UCG process, should be con-trolled strictly depending upon specific conditions.
The main procedures to control amount ofwater, participating in UCG process, are: prelimi-nary dewatering of a deposit by means of drainwells; increased pressure of the blast to displacemoisture from the gas generator; increased oxygencontent within the blast; and increased air to besupplied.
Fig. 1 Dependence of gas heat output (Q) upon:а – specific water inflow to the seam (W); and b – gas water content (ω)
Changes in characteristics of blast, deliveredto the gas generator as well as chemical content ofthe blast, delivery rate, and delivery pressure arethe important factors effecting gasification proce-dure (Arinenkov, 1960, Inkin, 2018). Analysis ofthe results of coal seams gasification shows that
blast oxygenation increases temperature withincombustion area; delocalizes it; and intensifies heatoutput of the gas, being generated. If oxygen con-tent of the blast to be delivered is two times higherthan atmospheric one, then the content of CO andH2 experiences 1.5 to 2 times increase. Water va-
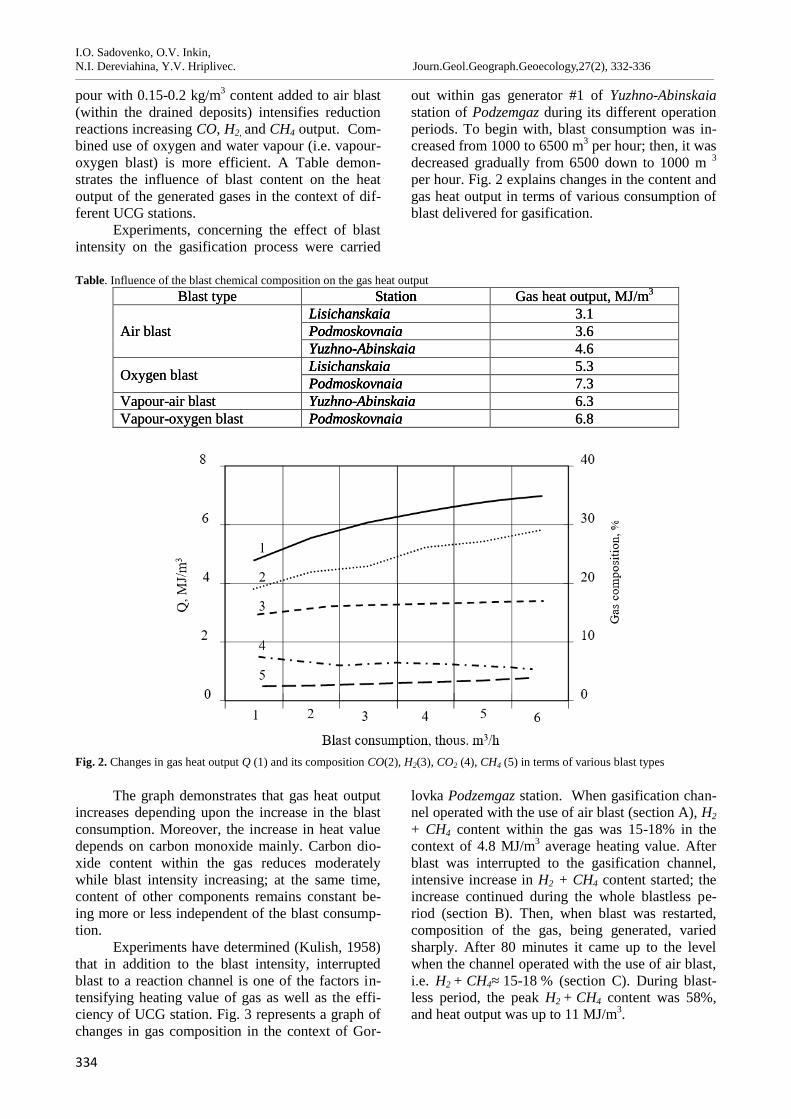
I.O. Sadovenko, O.V. Inkin,N.I. Dereviahina, Y.V. Hriplivec. Journ.Geol.Geograph.Geoecology,27(2), 332-336________________________________________________________________________________________________________________________________________________________________
334
pour with 0.15-0.2 kg/m3 content added to air blast(within the drained deposits) intensifies reductionreactions increasing СО, H2, and CH4 output. Com-bined use of oxygen and water vapour (i.e. vapour-oxygen blast) is more efficient. A Table demon-strates the influence of blast content on the heatoutput of the generated gases in the context of dif-ferent UCG stations.
Experiments, concerning the effect of blastintensity on the gasification process were carried
out within gas generator #1 of Yuzhno-Abinskaiastation of Podzemgaz during its different operationperiods. To begin with, blast consumption was in-creased from 1000 to 6500 m3 per hour; then, it wasdecreased gradually from 6500 down to 1000 m 3
per hour. Fig. 2 explains changes in the content andgas heat output in terms of various consumption ofblast delivered for gasification.
Table. Influence of the blast chemical composition on the gas heat outputBlast type Station Gas heat output, МJ/m3
Air blastLisichanskaia 3.1Podmoskovnaia 3.6Yuzhno-Abinskaia 4.6
Oxygen blast Lisichanskaia 5.3Podmoskovnaia 7.3
Vapour-air blast Yuzhno-Abinskaia 6.3Vapour-oxygen blast Podmoskovnaia 6.8
Fig. 2. Changes in gas heat output Q (1) and its composition СО(2), Н2(3), СО2 (4), СН4 (5) in terms of various blast types
The graph demonstrates that gas heat outputincreases depending upon the increase in the blastconsumption. Moreover, the increase in heat valuedepends on carbon monoxide mainly. Carbon dio-xide content within the gas reduces moderatelywhile blast intensity increasing; at the same time,content of other components remains constant be-ing more or less independent of the blast consump-tion.
Experiments have determined (Kulish, 1958)that in addition to the blast intensity, interruptedblast to a reaction channel is one of the factors in-tensifying heating value of gas as well as the effi-ciency of UCG station. Fig. 3 represents a graph ofchanges in gas composition in the context of Gor-
lovka Podzemgaz station. When gasification chan-nel operated with the use of air blast (section A), H2+ CH4 content within the gas was 15-18% in thecontext of 4.8 MJ/m3 average heating value. Afterblast was interrupted to the gasification channel,intensive increase in H2 + CH4 content started; theincrease continued during the whole blastless pe-riod (section B). Then, when blast was restarted,composition of the gas, being generated, variedsharply. After 80 minutes it came up to the levelwhen the channel operated with the use of air blast,i.e. Н2 + СН4≈ 15-18 % (section C). During blast-less period, the peak Н2 + СН4 content was 58%,and heat output was up to 11 МJ/m3.
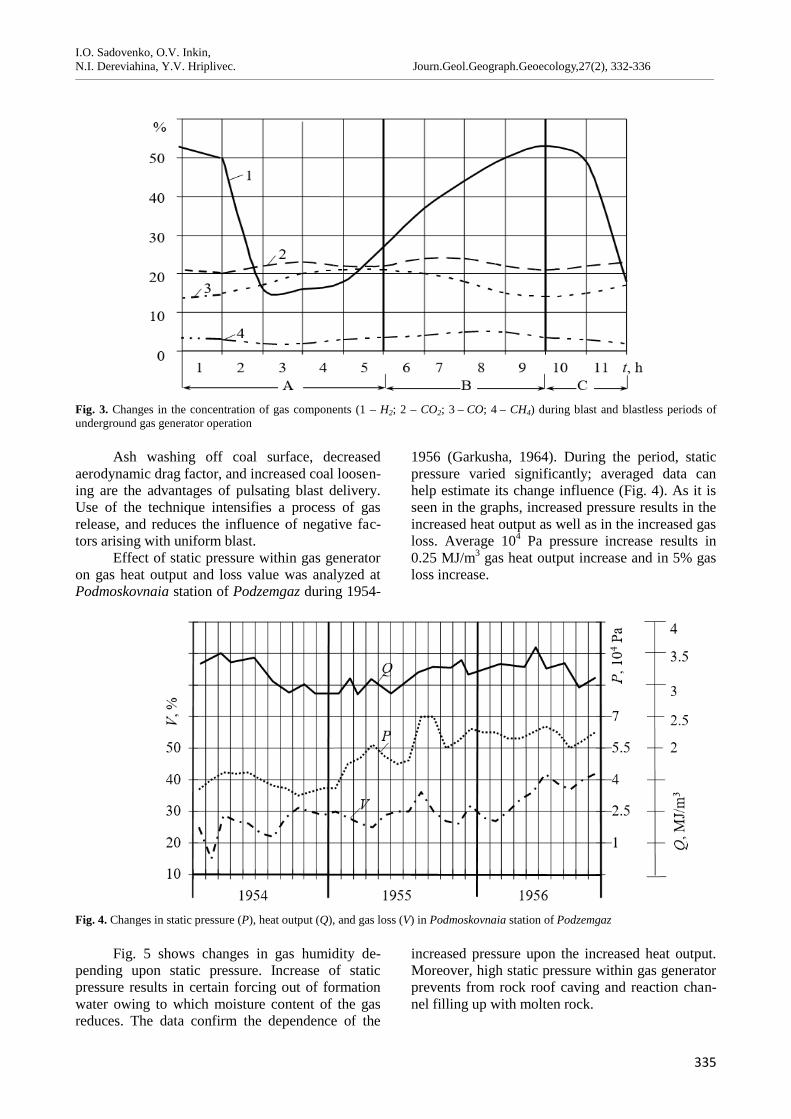
I.O. Sadovenko, O.V. Inkin,N.I. Dereviahina, Y.V. Hriplivec. Journ.Geol.Geograph.Geoecology,27(2), 332-336________________________________________________________________________________________________________________________________________________________________
335
Fig. 3. Changes in the concentration of gas components (1 – Н2; 2 – СО2; 3 – СО; 4 – СН4) during blast and blastless periods ofunderground gas generator operation
Ash washing off coal surface, decreasedaerodynamic drag factor, and increased coal loosen-ing are the advantages of pulsating blast delivery.Use of the technique intensifies a process of gasrelease, and reduces the influence of negative fac-tors arising with uniform blast.
Effect of static pressure within gas generatoron gas heat output and loss value was analyzed atPodmoskovnaia station of Podzemgaz during 1954-
1956 (Garkusha, 1964). During the period, staticpressure varied significantly; averaged data canhelp estimate its change influence (Fig. 4). As it isseen in the graphs, increased pressure results in theincreased heat output as well as in the increased gasloss. Average 104 Pa pressure increase results in0.25 MJ/m3 gas heat output increase and in 5% gasloss increase.
Fig. 4. Changes in static pressure (Р), heat output (Q), and gas loss (V) in Podmoskovnaia station of Podzemgaz
Fig. 5 shows changes in gas humidity de-pending upon static pressure. Increase of staticpressure results in certain forcing out of formationwater owing to which moisture content of the gasreduces. The data confirm the dependence of the
increased pressure upon the increased heat output.Moreover, high static pressure within gas generatorprevents from rock roof caving and reaction chan-nel filling up with molten rock.
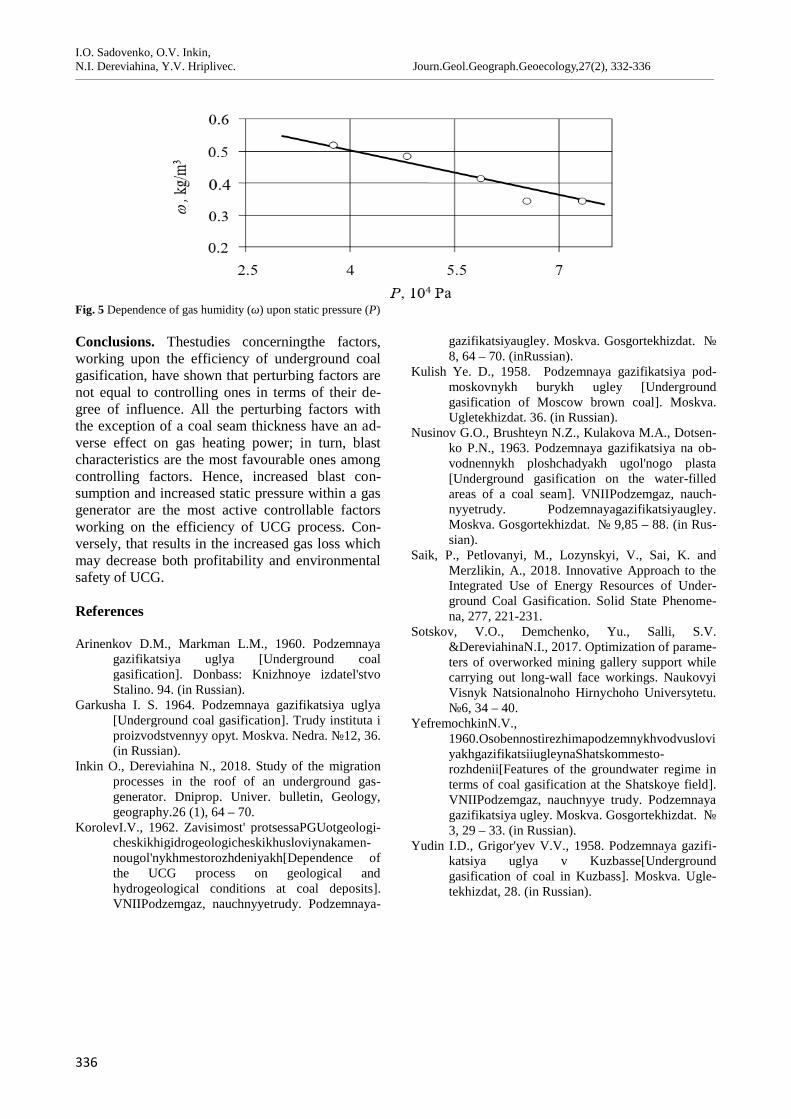
I.O. Sadovenko, O.V. Inkin,N.I. Dereviahina, Y.V. Hriplivec. Journ.Geol.Geograph.Geoecology,27(2), 332-336________________________________________________________________________________________________________________________________________________________________
336
Fig. 5 Dependence of gas humidity (ω) upon static pressure (Р)
Conclusions. Thestudies concerningthe factors,working upon the efficiency of underground coalgasification, have shown that perturbing factors arenot equal to controlling ones in terms of their de-gree of influence. All the perturbing factors withthe exception of a coal seam thickness have an ad-verse effect on gas heating power; in turn, blastcharacteristics are the most favourable ones amongcontrolling factors. Hence, increased blast con-sumption and increased static pressure within a gasgenerator are the most active controllable factorsworking on the efficiency of UCG process. Con-versely, that results in the increased gas loss whichmay decrease both profitability and environmentalsafety of UCG.
References
Arinenkov D.M., Markman L.M., 1960. Podzemnayagazifikatsiya uglya [Underground coalgasification]. Donbass: Knizhnoye izdatel'stvoStalino. 94. (in Russian).
Garkusha I. S. 1964. Podzemnaya gazifikatsiya uglya[Underground coal gasification]. Trudy instituta iproizvodstvennyy opyt. Moskva. Nedra. №12, 36.(in Russian).
Inkin O., Dereviahina N., 2018. Study of the migrationprocesses in the roof of an underground gas-generator. Dniprop. Univer. bulletin, Geology,geography.26 (1), 64 – 70.
KorolevI.V., 1962. Zavisimost' protsessaPGUotgeologi-cheskikhigidrogeologicheskikhusloviynakamen-nougol'nykhmestorozhdeniyakh[Dependence ofthe UCG process on geological andhydrogeological conditions at coal deposits].VNIIPodzemgaz, nauchnyyetrudy. Podzemnaya-
gazifikatsiyaugley. Moskva. Gosgortekhizdat. №8, 64 – 70. (inRussian).
Kulish Ye. D., 1958. Podzemnaya gazifikatsiya pod-moskovnykh burykh ugley [Undergroundgasification of Moscow brown coal]. Moskva.Ugletekhizdat. 36. (in Russian).
Nusinov G.O., Brushteyn N.Z., Kulakova M.A., Dotsen-ko P.N., 1963. Podzemnaya gazifikatsiya na ob-vodnennykh ploshchadyakh ugol'nogo plasta[Underground gasification on the water-filledareas of a coal seam]. VNIIPodzemgaz, nauch-nyyetrudy. Podzemnayagazifikatsiyaugley.Moskva. Gosgortekhizdat. № 9,85 – 88. (in Rus-sian).
Saik, Р., Petlovanyi, М., Lozynskyi, V., Sai, K. andMerzlikin, A., 2018. Innovative Approach to theIntegrated Use of Energy Resources of Under-ground Coal Gasification. Solid State Phenome-na, 277, 221-231.
Sotskov, V.O., Demchenko, Yu., Salli, S.V.&DereviahinaN.I., 2017. Optimization of parame-ters of overworked mining gallery support whilecarrying out long-wall face workings. NaukovyiVisnyk Natsionalnoho Hirnychoho Universytetu.№6, 34 – 40.
YefremochkinN.V.,1960.OsobennostirezhimapodzemnykhvodvusloviyakhgazifikatsiiugleynaShatskommesto-rozhdenii[Features of the groundwater regime interms of coal gasification at the Shatskoye field].VNIIPodzemgaz, nauchnyye trudy. Podzemnayagazifikatsiya ugley. Moskva. Gosgortekhizdat. №3, 29 – 33. (in Russian).
Yudin I.D., Grigor'yev V.V., 1958. Podzemnaya gazifi-katsiya uglya v Kuzbasse[Undergroundgasification of coal in Kuzbass]. Moskva. Ugle-tekhizdat, 28. (in Russian).
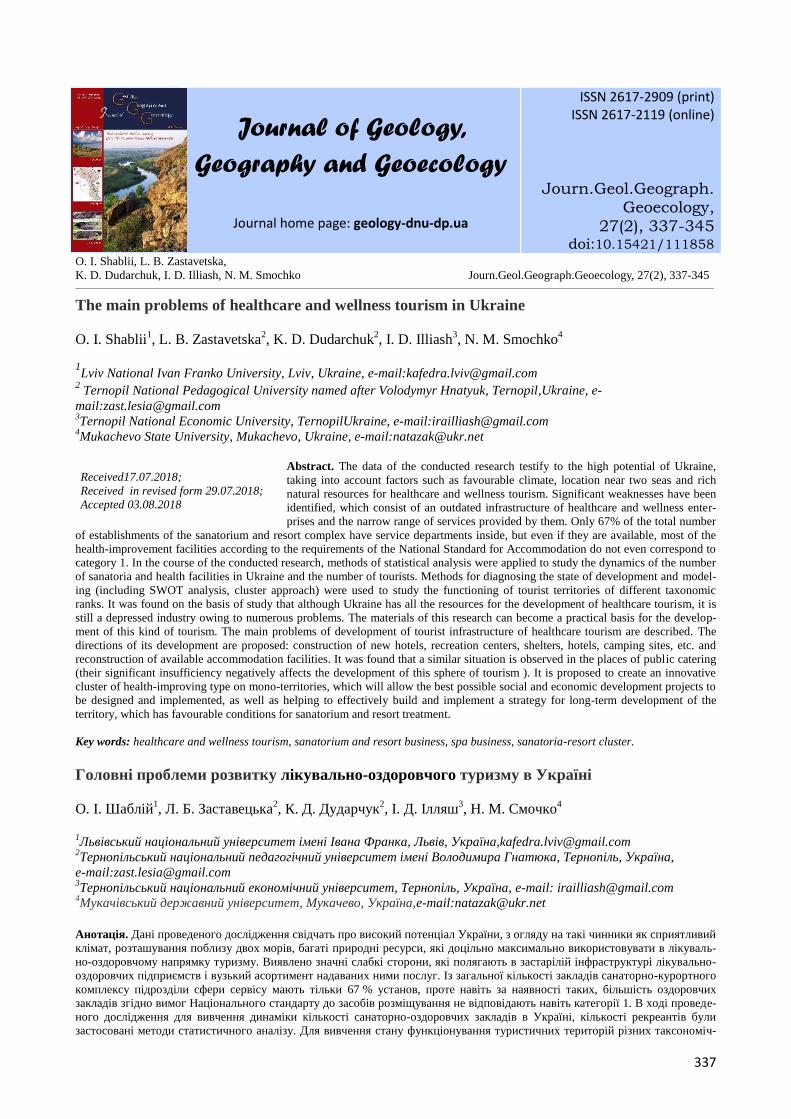
O. I. Shablii, L. B. Zastavetska,K. D. Dudarchuk, I. D. Illiash, N. M. Smochko Journ.Geol.Geograph.Geoecology, 27(2), 340-348________________________________________________________________________________________________________________________________________________________________
337
Journal of Geology,Geography and Geoecology
Journal home page: geology-dnu-dp.ua
ISSN 2617-2909 (print)ISSN 2617-2119 (online)
Journ.Geol.Geograph.Geoecology,
27(2), 337-345doi:10.15421/111858
O. I. Shablii, L. B. Zastavetska,K. D. Dudarchuk, I. D. Illiash, N. M. Smochko Journ.Geol.Geograph.Geoecology, 27(2), 337-345________________________________________________________________________________________________________________________________________________________________
The main problems of healthcare and wellness tourism in Ukraine
O. I. Shablii1, L. B. Zastavetska2, K. D. Dudarchuk2, I. D. Illiash3, N. M. Smochko4
1Lviv National Ivan Franko University, Lviv, Ukraine, e-mail:[email protected] Ternopil National Pedagogical University named after Volodymyr Hnatyuk, Ternopil,Ukraine, e-mail:[email protected] National Economic University, TernopilUkraine, e-mail:[email protected] State University, Mukachevo, Ukraine, e-mail:[email protected]
Abstract. The data of the conducted research testify to the high potential of Ukraine,taking into account factors such as favourable climate, location near two seas and richnatural resources for healthcare and wellness tourism. Significant weaknesses have beenidentified, which consist of an outdated infrastructure of healthcare and wellness enter-prises and the narrow range of services provided by them. Only 67% of the total number
of establishments of the sanatorium and resort complex have service departments inside, but even if they are available, most of thehealth-improvement facilities according to the requirements of the National Standard for Accommodation do not even correspond tocategory 1. In the course of the conducted research, methods of statistical analysis were applied to study the dynamics of the numberof sanatoria and health facilities in Ukraine and the number of tourists. Methods for diagnosing the state of development and model-ing (including SWOT analysis, cluster approach) were used to study the functioning of tourist territories of different taxonomicranks. It was found on the basis of study that although Ukraine has all the resources for the development of healthcare tourism, it isstill a depressed industry owing to numerous problems. The materials of this research can become a practical basis for the develop-ment of this kind of tourism. The main problems of development of tourist infrastructure of healthcare tourism are described. Thedirections of its development are proposed: construction of new hotels, recreation centers, shelters, hotels, camping sites, etc. andreconstruction of available accommodation facilities. It was found that a similar situation is observed in the places of public catering(their significant insufficiency negatively affects the development of this sphere of tourism ). It is proposed to create an innovativecluster of health-improving type on mono-territories, which will allow the best possible social and economic development projects tobe designed and implemented, as well as helping to effectively build and implement a strategy for long-term development of theterritory, which has favourable conditions for sanatorium and resort treatment.
Key words: healthcare and wellness tourism, sanatorium and resort business, spa business, sanatoria-resort cluster.
Головні проблеми розвитку лікувально-оздоровчого туризму в Україні
О. І. Шаблій1, Л. Б. Заставецька2, К. Д. Дударчук2, І. Д. Ілляш3, Н. М. Смочко4
1Львівський національний університет імені Івана Франка, Львів, Україна,[email protected]Тернопільський національний педагогічний університет імені Володимира Гнатюка, Тернопіль, Україна,e-mail:[email protected]Тернопільський національний економічний університет, Тернопіль, Україна, e-mail: [email protected]Мукачівський державний університет, Мукачево, Україна,e-mail:[email protected]
Анотація. Дані проведеного дослідження свідчать про високий потенціал України, з огляду на такі чинники як сприятливийклімат, розташування поблизу двох морів, багаті природні ресурси, які доцільно максимально використовувати в лікуваль-но-оздоровчому напрямку туризму. Виявлено значні слабкі сторони, які полягають в застарілій інфраструктурі лікувально-оздоровчих підприємств і вузький асортимент надаваних ними послуг. Із загальної кількості закладів санаторно-курортногокомплексу підрозділи сфери сервісу мають тільки 67 % установ, проте навіть за наявності таких, більшість оздоровчихзакладів згідно вимог Національного стандарту до засобів розміщування не відповідають навіть категорії 1. В ході проведе-ного дослідження для вивчення динаміки кількості санаторно-оздоровчих закладів в Україні, кількості рекреантів булизастосовані методи статистичного аналізу. Для вивчення стану функціонування туристичних територій різних таксономіч-
Received17.07.2018;Received in revised form 29.07.2018;Accepted 03.08.2018
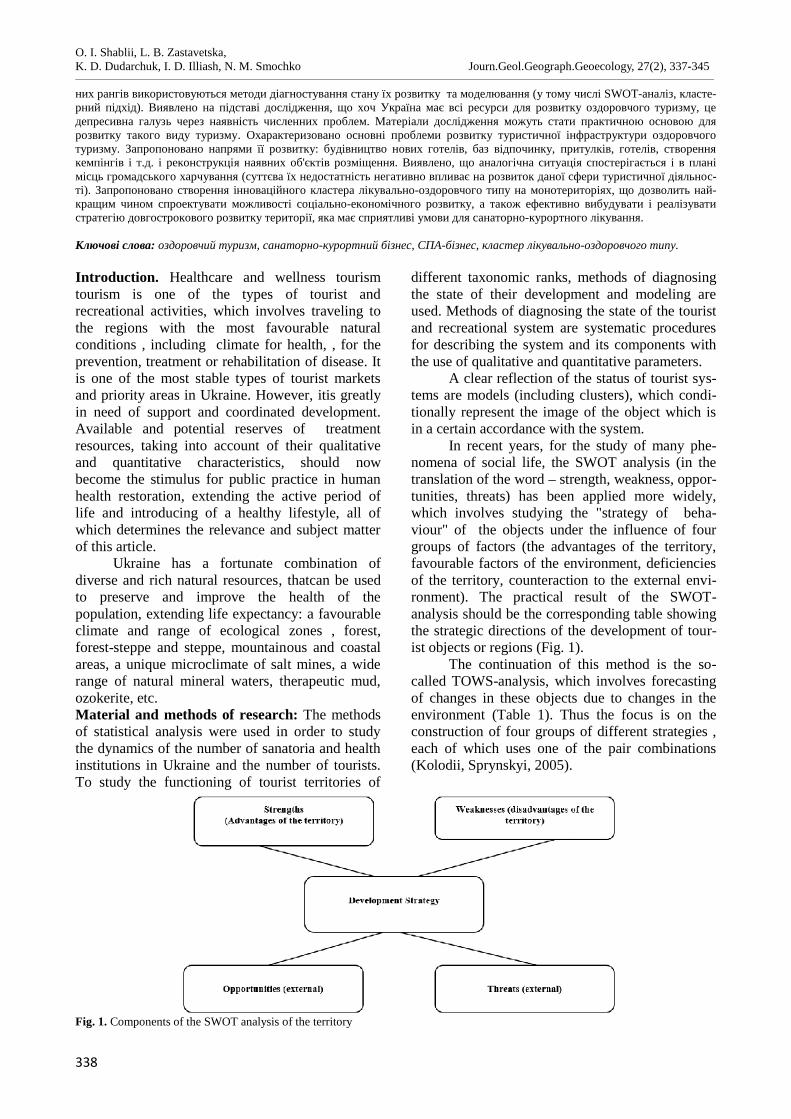
O. I. Shablii, L. B. Zastavetska,K. D. Dudarchuk, I. D. Illiash, N. M. Smochko Journ.Geol.Geograph.Geoecology, 27(2), 337-345________________________________________________________________________________________________________________________________________________________________
338
них рангів використовуються методи діагностування стану їх розвитку та моделювання (у тому числі SWOT-аналіз, класте-рний підхід). Виявлено на підставі дослідження, що хоч Україна має всі ресурси для розвитку оздоровчого туризму, цедепресивна галузь через наявність численних проблем. Матеріали дослідження можуть стати практичною основою длярозвитку такого виду туризму. Охарактеризовано основні проблеми розвитку туристичної інфраструктури оздоровчоготуризму. Запропоновано напрями її розвитку: будівництво нових готелів, баз відпочинку, притулків, готелів, створеннякемпінгів і т.д. і реконструкція наявних об'єктів розміщення. Виявлено, що аналогічна ситуація спостерігається і в планімісць громадського харчування (суттєва їх недостатність негативно впливає на розвиток даної сфери туристичної діяльнос-ті). Запропоновано створення інноваційного кластера лікувально-оздоровчого типу на монотериторіях, що дозволить най-кращим чином спроектувати можливості соціально-економічного розвитку, а також ефективно вибудувати і реалізуватистратегію довгострокового розвитку території, яка має сприятливі умови для санаторно-курортного лікування.
Ключові слова: оздоровчий туризм, санаторно-курортний бізнес, СПА-бізнес, кластер лікувально-оздоровчого типу.
Introduction. Healthcare and wellness tourismtourism is one of the types of tourist andrecreational activities, which involves traveling tothe regions with the most favourable naturalconditions , including climate for health, , for theprevention, treatment or rehabilitation of disease. Itis one of the most stable types of tourist marketsand priority areas in Ukraine. However, itis greatlyin need of support and coordinated development.Available and potential reserves of treatmentresources, taking into account of their qualitativeand quantitative characteristics, should nowbecome the stimulus for public practice in humanhealth restoration, extending the active period oflife and introducing of a healthy lifestyle, all ofwhich determines the relevance and subject matterof this article.
Ukraine has a fortunate combination ofdiverse and rich natural resources, thatcan be usedto preserve and improve the health of thepopulation, extending life expectancy: a favourableclimate and range of ecological zones , forest,forest-steppe and steppe, mountainous and coastalareas, a unique microclimate of salt mines, a widerange of natural mineral waters, therapeutic mud,ozokerite, etc.Material and methods of research: The methodsof statistical analysis were used in order to studythe dynamics of the number of sanatoria and healthinstitutions in Ukraine and the number of tourists.To study the functioning of tourist territories of
different taxonomic ranks, methods of diagnosingthe state of their development and modeling areused. Methods of diagnosing the state of the touristand recreational system are systematic proceduresfor describing the system and its components withthe use of qualitative and quantitative parameters.
A clear reflection of the status of tourist sys-tems are models (including clusters), which condi-tionally represent the image of the object which isin a certain accordance with the system.
In recent years, for the study of many phe-nomena of social life, the SWOT analysis (in thetranslation of the word – strength, weakness, oppor-tunities, threats) has been applied more widely,which involves studying the "strategy of beha-viour" of the objects under the influence of fourgroups of factors (the advantages of the territory,favourable factors of the environment, deficienciesof the territory, counteraction to the external envi-ronment). The practical result of the SWOT-analysis should be the corresponding table showingthe strategic directions of the development of tour-ist objects or regions (Fig. 1).
The continuation of this method is the so-called TOWS-analysis, which involves forecastingof changes in these objects due to changes in theenvironment (Table 1). Thus the focus is on theconstruction of four groups of different strategies ,each of which uses one of the pair combinations(Kolodii, Sprynskyi, 2005).
Fig. 1. Components of the SWOT analysis of the territory
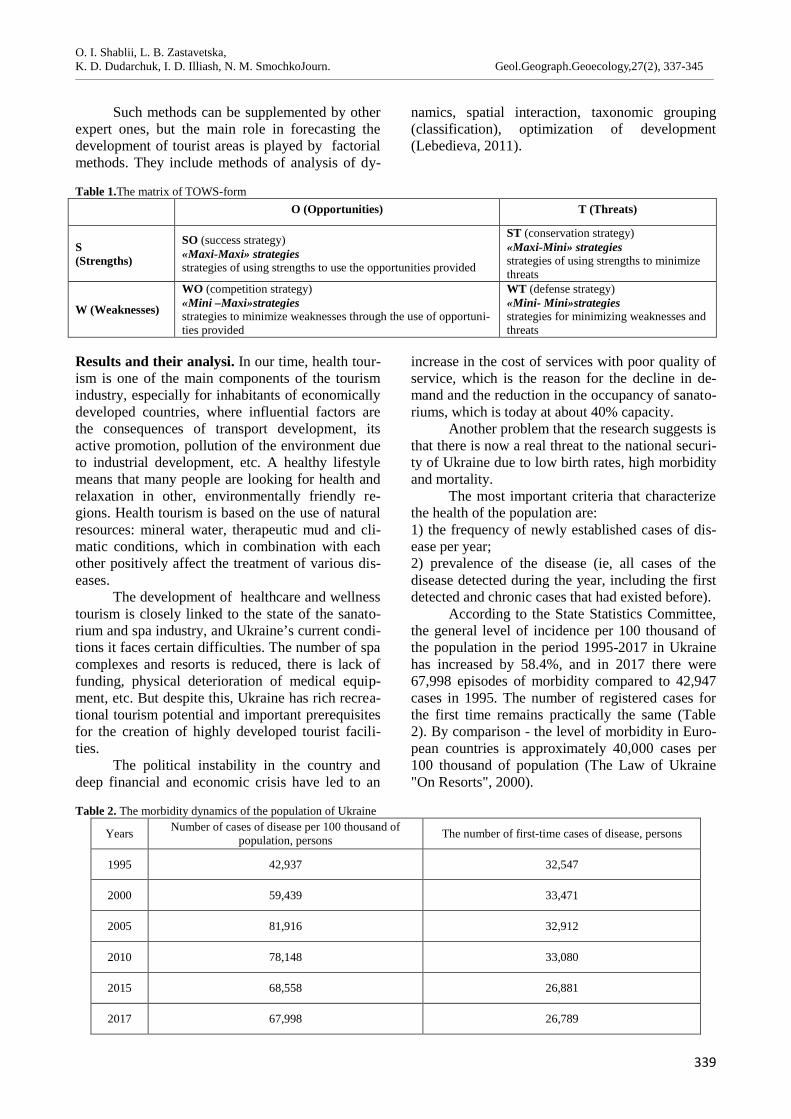
O. I. Shablii, L. B. Zastavetska,K. D. Dudarchuk, I. D. Illiash, N. M. SmochkoJourn. Geol.Geograph.Geoecology,27(2), 337-345________________________________________________________________________________________________________________________________________________________________
339
Such methods can be supplemented by otherexpert ones, but the main role in forecasting thedevelopment of tourist areas is played by factorialmethods. They include methods of analysis of dy-
namics, spatial interaction, taxonomic grouping(classification), optimization of development(Lebedieva, 2011).
Table 1.The matrix of TOWS-formO (Opportunities) T (Threats)
S(Strengths)
SO (success strategy)«Maxi-Maxi» strategiesstrategies of using strengths to use the opportunities provided
ST (conservation strategy)«Maxi-Mini» strategiesstrategies of using strengths to minimizethreats
W (Weaknesses)
WO (competition strategy)«Mini –Maxi»strategiesstrategies to minimize weaknesses through the use of opportuni-ties provided
WT (defense strategy)«Mini- Mini»strategiesstrategies for minimizing weaknesses andthreats
Results and their analysi. In our time, health tour-ism is one of the main components of the tourismindustry, especially for inhabitants of economicallydeveloped countries, where influential factors arethe consequences of transport development, itsactive promotion, pollution of the environment dueto industrial development, etc. A healthy lifestylemeans that many people are looking for health andrelaxation in other, environmentally friendly re-gions. Health tourism is based on the use of naturalresources: mineral water, therapeutic mud and cli-matic conditions, which in combination with eachother positively affect the treatment of various dis-eases.
The development of healthcare and wellnesstourism is closely linked to the state of the sanato-rium and spa industry, and Ukraine’s current condi-tions it faces certain difficulties. The number of spacomplexes and resorts is reduced, there is lack offunding, physical deterioration of medical equip-ment, etc. But despite this, Ukraine has rich recrea-tional tourism potential and important prerequisitesfor the creation of highly developed tourist facili-ties.
The political instability in the country anddeep financial and economic crisis have led to an
increase in the cost of services with poor quality ofservice, which is the reason for the decline in de-mand and the reduction in the occupancy of sanato-riums, which is today at about 40% capacity.
Another problem that the research suggests isthat there is now a real threat to the national securi-ty of Ukraine due to low birth rates, high morbidityand mortality.
The most important criteria that characterizethe health of the population are:1) the frequency of newly established cases of dis-ease per year;2) prevalence of the disease (ie, all cases of thedisease detected during the year, including the firstdetected and chronic cases that had existed before).
According to the State Statistics Committee,the general level of incidence per 100 thousand ofthe population in the period 1995-2017 in Ukrainehas increased by 58.4%, and in 2017 there were67,998 episodes of morbidity compared to 42,947cases in 1995. The number of registered cases forthe first time remains practically the same (Table2). By comparison - the level of morbidity in Euro-pean countries is approximately 40,000 cases per100 thousand of population (The Law of Ukraine"On Resorts", 2000).
Table 2. The morbidity dynamics of the population of Ukraine
Years Number of cases of disease per 100 thousand ofpopulation, persons The number of first-time cases of disease, persons
1995 42,937 32,547
2000 59,439 33,471
2005 81,916 32,912
2010 78,148 33,080
2015 68,558 26,881
2017 67,998 26,789
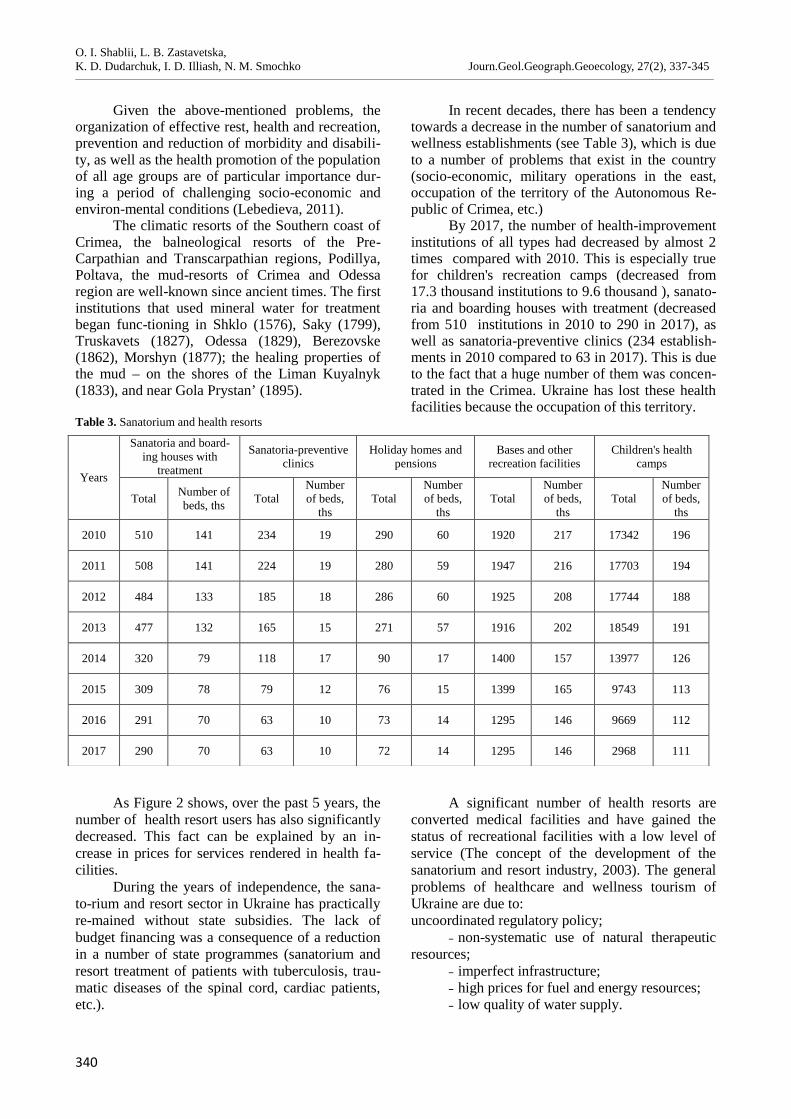
O. I. Shablii, L. B. Zastavetska,K. D. Dudarchuk, I. D. Illiash, N. M. Smochko Journ.Geol.Geograph.Geoecology, 27(2), 337-345________________________________________________________________________________________________________________________________________________________________
340
Given the above-mentioned problems, theorganization of effective rest, health and recreation,prevention and reduction of morbidity and disabili-ty, as well as the health promotion of the populationof all age groups are of particular importance dur-ing a period of challenging socio-economic andenviron-mental conditions (Lebedieva, 2011).
The climatic resorts of the Southern coast ofCrimea, the balneological resorts of the Pre-Carpathian and Transcarpathian regions, Podillya,Poltava, the mud-resorts of Crimea and Odessaregion are well-known since ancient times. The firstinstitutions that used mineral water for treatmentbegan func-tioning in Shklo (1576), Saky (1799),Truskavets (1827), Odessa (1829), Berezovske(1862), Morshyn (1877); the healing properties ofthe mud – on the shores of the Liman Kuyalnyk(1833), and near Gola Prystan’ (1895).
In recent decades, there has been a tendencytowards a decrease in the number of sanatorium andwellness establishments (see Table 3), which is dueto a number of problems that exist in the country(socio-economic, military operations in the east,occupation of the territory of the Autonomous Re-public of Crimea, etc.)
By 2017, the number of health-improvementinstitutions of all types had decreased by almost 2times compared with 2010. This is especially truefor children's recreation camps (decreased from17.3 thousand institutions to 9.6 thousand ), sanato-ria and boarding houses with treatment (decreasedfrom 510 institutions in 2010 to 290 in 2017), aswell as sanatoria-preventive clinics (234 establish-ments in 2010 compared to 63 in 2017). This is dueto the fact that a huge number of them was concen-trated in the Crimea. Ukraine has lost these healthfacilities because the occupation of this territory.
Table 3. Sanatorium and health resorts
As Figure 2 shows, over the past 5 years, thenumber of health resort users has also significantlydecreased. This fact can be explained by an in-crease in prices for services rendered in health fa-cilities.
During the years of independence, the sana-to-rium and resort sector in Ukraine has practicallyre-mained without state subsidies. The lack ofbudget financing was a consequence of a reductionin a number of state programmes (sanatorium andresort treatment of patients with tuberculosis, trau-matic diseases of the spinal cord, cardiac patients,etc.).
A significant number of health resorts areconverted medical facilities and have gained thestatus of recreational facilities with a low level ofservice (The concept of the development of thesanatorium and resort industry, 2003). The generalproblems of healthcare and wellness tourism ofUkraine are due to:uncoordinated regulatory policy;
˗ non-systematic use of natural therapeuticresources;
˗ imperfect infrastructure;˗ high prices for fuel and energy resources;˗ low quality of water supply.
Years
Sanatoria and board-ing houses with
treatment
Sanatoria-preventiveclinics
Holiday homes andpensions
Bases and otherrecreation facilities
Children's healthcamps
Total Number ofbeds, ths Total
Numberof beds,
thsTotal
Numberof beds,
thsTotal
Numberof beds,
thsTotal
Numberof beds,
ths
2010 510 141 234 19 290 60 1920 217 17342 196
2011 508 141 224 19 280 59 1947 216 17703 194
2012 484 133 185 18 286 60 1925 208 17744 188
2013 477 132 165 15 271 57 1916 202 18549 191
2014 320 79 118 17 90 17 1400 157 13977 126
2015 309 78 79 12 76 15 1399 165 9743 113
2016 291 70 63 10 73 14 1295 146 9669 112
2017 290 70 63 10 72 14 1295 146 2968 111
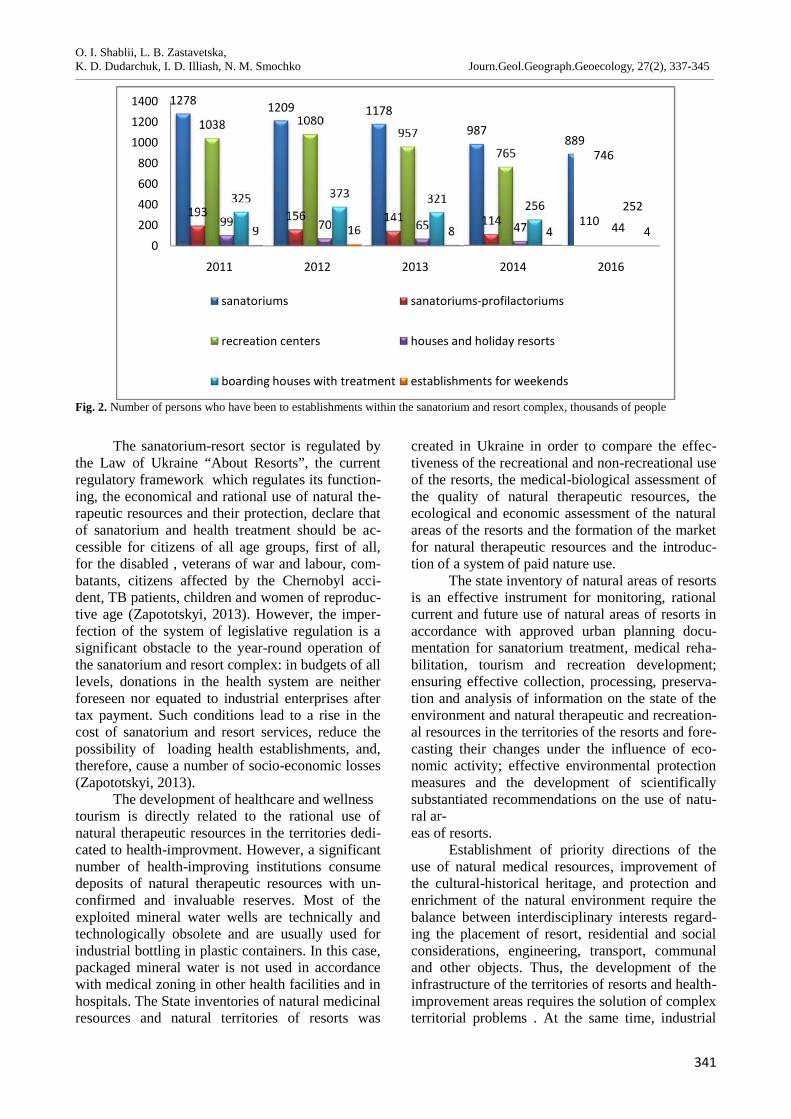
O. I. Shablii, L. B. Zastavetska,K. D. Dudarchuk, I. D. Illiash, N. M. Smochko Journ.Geol.Geograph.Geoecology, 27(2), 337-345________________________________________________________________________________________________________________________________________________________________
341
Fig. 2. Number of persons who have been to establishments within the sanatorium and resort complex, thousands of people
The sanatorium-resort sector is regulated bythe Law of Ukraine “About Resorts”, the currentregulatory framework which regulates its function-ing, the economical and rational use of natural the-rapeutic resources and their protection, declare thatof sanatorium and health treatment should be ac-cessible for citizens of all age groups, first of all,for the disabled , veterans of war and labour, com-batants, citizens affected by the Chernobyl acci-dent, TB patients, children and women of reproduc-tive age (Zapototskyi, 2013). However, the imper-fection of the system of legislative regulation is asignificant obstacle to the year-round operation ofthe sanatorium and resort complex: in budgets of alllevels, donations in the health system are neitherforeseen nor equated to industrial enterprises aftertax payment. Such conditions lead to a rise in thecost of sanatorium and resort services, reduce thepossibility of loading health establishments, and,therefore, cause a number of socio-economic losses(Zapototskyi, 2013).
The development of healthcare and wellnesstourism is directly related to the rational use ofnatural therapeutic resources in the territories dedi-cated to health-improvment. However, a significantnumber of health-improving institutions consumedeposits of natural therapeutic resources with un-confirmed and invaluable reserves. Most of theexploited mineral water wells are technically andtechnologically obsolete and are usually used forindustrial bottling in plastic containers. In this case,packaged mineral water is not used in accordancewith medical zoning in other health facilities and inhospitals. The State inventories of natural medicinalresources and natural territories of resorts was
created in Ukraine in order to compare the effec-tiveness of the recreational and non-recreational useof the resorts, the medical-biological assessment ofthe quality of natural therapeutic resources, theecological and economic assessment of the naturalareas of the resorts and the formation of the marketfor natural therapeutic resources and the introduc-tion of a system of paid nature use.
The state inventory of natural areas of resortsis an effective instrument for monitoring, rationalcurrent and future use of natural areas of resorts inaccordance with approved urban planning docu-mentation for sanatorium treatment, medical reha-bilitation, tourism and recreation development;ensuring effective collection, processing, preserva-tion and analysis of information on the state of theenvironment and natural therapeutic and recreation-al resources in the territories of the resorts and fore-casting their changes under the influence of eco-nomic activity; effective environmental protectionmeasures and the development of scientificallysubstantiated recommendations on the use of natu-ral ar-eas of resorts.
Establishment of priority directions of theuse of natural medical resources, improvement ofthe cultural-historical heritage, and protection andenrichment of the natural environment require thebalance between interdisciplinary interests regard-ing the placement of resort, residential and socialconsiderations, engineering, transport, communaland other objects. Thus, the development of theinfrastructure of the territories of resorts and health-improvement areas requires the solution of complexterritorial problems . At the same time, industrial
1278 1209
193 156
1038
99
325
90
200400600800
100012001400
2011
sanatoriums
recreation centers
boarding houses with treatment
O. I. Shablii, L. B. Zastavetska,K. D. Dudarchuk, I. D. Illiash, N. M. Smochko Journ.Geol.Geograph.Geoecology, 27(2), 337-345________________________________________________________________________________________________________________________________________________________________
341
Fig. 2. Number of persons who have been to establishments within the sanatorium and resort complex, thousands of people
The sanatorium-resort sector is regulated bythe Law of Ukraine “About Resorts”, the currentregulatory framework which regulates its function-ing, the economical and rational use of natural the-rapeutic resources and their protection, declare thatof sanatorium and health treatment should be ac-cessible for citizens of all age groups, first of all,for the disabled , veterans of war and labour, com-batants, citizens affected by the Chernobyl acci-dent, TB patients, children and women of reproduc-tive age (Zapototskyi, 2013). However, the imper-fection of the system of legislative regulation is asignificant obstacle to the year-round operation ofthe sanatorium and resort complex: in budgets of alllevels, donations in the health system are neitherforeseen nor equated to industrial enterprises aftertax payment. Such conditions lead to a rise in thecost of sanatorium and resort services, reduce thepossibility of loading health establishments, and,therefore, cause a number of socio-economic losses(Zapototskyi, 2013).
The development of healthcare and wellnesstourism is directly related to the rational use ofnatural therapeutic resources in the territories dedi-cated to health-improvment. However, a significantnumber of health-improving institutions consumedeposits of natural therapeutic resources with un-confirmed and invaluable reserves. Most of theexploited mineral water wells are technically andtechnologically obsolete and are usually used forindustrial bottling in plastic containers. In this case,packaged mineral water is not used in accordancewith medical zoning in other health facilities and inhospitals. The State inventories of natural medicinalresources and natural territories of resorts was
created in Ukraine in order to compare the effec-tiveness of the recreational and non-recreational useof the resorts, the medical-biological assessment ofthe quality of natural therapeutic resources, theecological and economic assessment of the naturalareas of the resorts and the formation of the marketfor natural therapeutic resources and the introduc-tion of a system of paid nature use.
The state inventory of natural areas of resortsis an effective instrument for monitoring, rationalcurrent and future use of natural areas of resorts inaccordance with approved urban planning docu-mentation for sanatorium treatment, medical reha-bilitation, tourism and recreation development;ensuring effective collection, processing, preserva-tion and analysis of information on the state of theenvironment and natural therapeutic and recreation-al resources in the territories of the resorts and fore-casting their changes under the influence of eco-nomic activity; effective environmental protectionmeasures and the development of scientificallysubstantiated recommendations on the use of natu-ral ar-eas of resorts.
Establishment of priority directions of theuse of natural medical resources, improvement ofthe cultural-historical heritage, and protection andenrichment of the natural environment require thebalance between interdisciplinary interests regard-ing the placement of resort, residential and socialconsiderations, engineering, transport, communaland other objects. Thus, the development of theinfrastructure of the territories of resorts and health-improvement areas requires the solution of complexterritorial problems . At the same time, industrial
1209 1178987
889
156 141 114 110
1080957
765
70 65 47
373 321 256
16 8 4
2012 2013 2014
sanatoriums sanatoriums-profilactoriums
recreation centers houses and holiday resorts
boarding houses with treatment establishments for weekends
O. I. Shablii, L. B. Zastavetska,K. D. Dudarchuk, I. D. Illiash, N. M. Smochko Journ.Geol.Geograph.Geoecology, 27(2), 337-345________________________________________________________________________________________________________________________________________________________________
341
Fig. 2. Number of persons who have been to establishments within the sanatorium and resort complex, thousands of people
The sanatorium-resort sector is regulated bythe Law of Ukraine “About Resorts”, the currentregulatory framework which regulates its function-ing, the economical and rational use of natural the-rapeutic resources and their protection, declare thatof sanatorium and health treatment should be ac-cessible for citizens of all age groups, first of all,for the disabled , veterans of war and labour, com-batants, citizens affected by the Chernobyl acci-dent, TB patients, children and women of reproduc-tive age (Zapototskyi, 2013). However, the imper-fection of the system of legislative regulation is asignificant obstacle to the year-round operation ofthe sanatorium and resort complex: in budgets of alllevels, donations in the health system are neitherforeseen nor equated to industrial enterprises aftertax payment. Such conditions lead to a rise in thecost of sanatorium and resort services, reduce thepossibility of loading health establishments, and,therefore, cause a number of socio-economic losses(Zapototskyi, 2013).
The development of healthcare and wellnesstourism is directly related to the rational use ofnatural therapeutic resources in the territories dedi-cated to health-improvment. However, a significantnumber of health-improving institutions consumedeposits of natural therapeutic resources with un-confirmed and invaluable reserves. Most of theexploited mineral water wells are technically andtechnologically obsolete and are usually used forindustrial bottling in plastic containers. In this case,packaged mineral water is not used in accordancewith medical zoning in other health facilities and inhospitals. The State inventories of natural medicinalresources and natural territories of resorts was
created in Ukraine in order to compare the effec-tiveness of the recreational and non-recreational useof the resorts, the medical-biological assessment ofthe quality of natural therapeutic resources, theecological and economic assessment of the naturalareas of the resorts and the formation of the marketfor natural therapeutic resources and the introduc-tion of a system of paid nature use.
The state inventory of natural areas of resortsis an effective instrument for monitoring, rationalcurrent and future use of natural areas of resorts inaccordance with approved urban planning docu-mentation for sanatorium treatment, medical reha-bilitation, tourism and recreation development;ensuring effective collection, processing, preserva-tion and analysis of information on the state of theenvironment and natural therapeutic and recreation-al resources in the territories of the resorts and fore-casting their changes under the influence of eco-nomic activity; effective environmental protectionmeasures and the development of scientificallysubstantiated recommendations on the use of natu-ral ar-eas of resorts.
Establishment of priority directions of theuse of natural medical resources, improvement ofthe cultural-historical heritage, and protection andenrichment of the natural environment require thebalance between interdisciplinary interests regard-ing the placement of resort, residential and socialconsiderations, engineering, transport, communaland other objects. Thus, the development of theinfrastructure of the territories of resorts and health-improvement areas requires the solution of complexterritorial problems . At the same time, industrial
889
110
746
44
252
4
2016
establishments for weekends
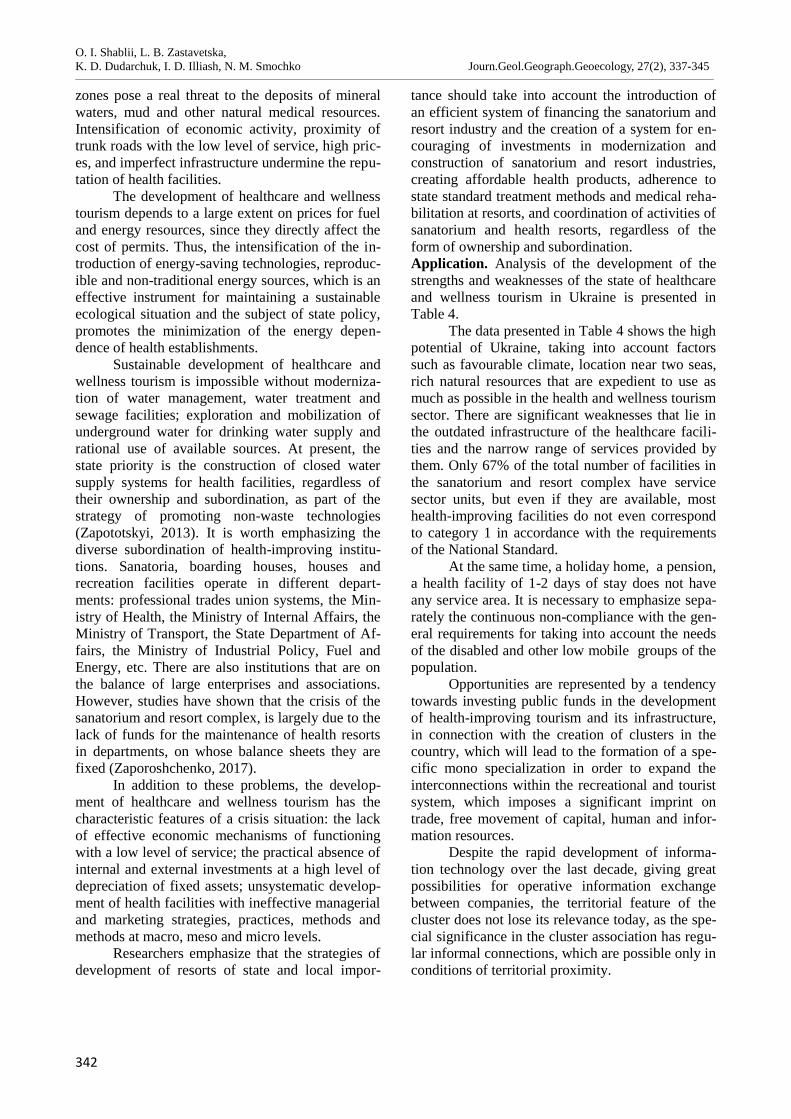
O. I. Shablii, L. B. Zastavetska,K. D. Dudarchuk, I. D. Illiash, N. M. Smochko Journ.Geol.Geograph.Geoecology, 27(2), 337-345________________________________________________________________________________________________________________________________________________________________
342
zones pose a real threat to the deposits of mineralwaters, mud and other natural medical resources.Intensification of economic activity, proximity oftrunk roads with the low level of service, high pric-es, and imperfect infrastructure undermine the repu-tation of health facilities.
The development of healthcare and wellnesstourism depends to a large extent on prices for fueland energy resources, since they directly affect thecost of permits. Thus, the intensification of the in-troduction of energy-saving technologies, reproduc-ible and non-traditional energy sources, which is aneffective instrument for maintaining a sustainableecological situation and the subject of state policy,promotes the minimization of the energy depen-dence of health establishments.
Sustainable development of healthcare andwellness tourism is impossible without moderniza-tion of water management, water treatment andsewage facilities; exploration and mobilization ofunderground water for drinking water supply andrational use of available sources. At present, thestate priority is the construction of closed watersupply systems for health facilities, regardless oftheir ownership and subordination, as part of thestrategy of promoting non-waste technologies(Zapototskyi, 2013). It is worth emphasizing thediverse subordination of health-improving institu-tions. Sanatoria, boarding houses, houses andrecreation facilities operate in different depart-ments: professional trades union systems, the Min-istry of Health, the Ministry of Internal Affairs, theMinistry of Transport, the State Department of Af-fairs, the Ministry of Industrial Policy, Fuel andEnergy, etc. There are also institutions that are onthe balance of large enterprises and associations.However, studies have shown that the crisis of thesanatorium and resort complex, is largely due to thelack of funds for the maintenance of health resortsin departments, on whose balance sheets they arefixed (Zaporoshchenko, 2017).
In addition to these problems, the develop-ment of healthcare and wellness tourism has thecharacteristic features of a crisis situation: the lackof effective economic mechanisms of functioningwith a low level of service; the practical absence ofinternal and external investments at a high level ofdepreciation of fixed assets; unsystematic develop-ment of health facilities with ineffective managerialand marketing strategies, practices, methods andmethods at macro, meso and micro levels.
Researchers emphasize that the strategies ofdevelopment of resorts of state and local impor-
tance should take into account the introduction ofan efficient system of financing the sanatorium andresort industry and the creation of a system for en-couraging of investments in modernization andconstruction of sanatorium and resort industries,creating affordable health products, adherence tostate standard treatment methods and medical reha-bilitation at resorts, and coordination of activities ofsanatorium and health resorts, regardless of theform of ownership and subordination.Application. Analysis of the development of thestrengths and weaknesses of the state of healthcareand wellness tourism in Ukraine is presented inTable 4.
The data presented in Table 4 shows the highpotential of Ukraine, taking into account factorssuch as favourable climate, location near two seas,rich natural resources that are expedient to use asmuch as possible in the health and wellness tourismsector. There are significant weaknesses that lie inthe outdated infrastructure of the healthcare facili-ties and the narrow range of services provided bythem. Only 67% of the total number of facilities inthe sanatorium and resort complex have servicesector units, but even if they are available, mosthealth-improving facilities do not even correspondto category 1 in accordance with the requirementsof the National Standard.
At the same time, a holiday home, a pension,a health facility of 1-2 days of stay does not haveany service area. It is necessary to emphasize sepa-rately the continuous non-compliance with the gen-eral requirements for taking into account the needsof the disabled and other low mobile groups of thepopulation.
Opportunities are represented by a tendencytowards investing public funds in the developmentof health-improving tourism and its infrastructure,in connection with the creation of clusters in thecountry, which will lead to the formation of a spe-cific mono specialization in order to expand theinterconnections within the recreational and touristsystem, which imposes a significant imprint ontrade, free movement of capital, human and infor-mation resources.
Despite the rapid development of informa-tion technology over the last decade, giving greatpossibilities for operative information exchangebetween companies, the territorial feature of thecluster does not lose its relevance today, as the spe-cial significance in the cluster association has regu-lar informal connections, which are possible only inconditions of territorial proximity.
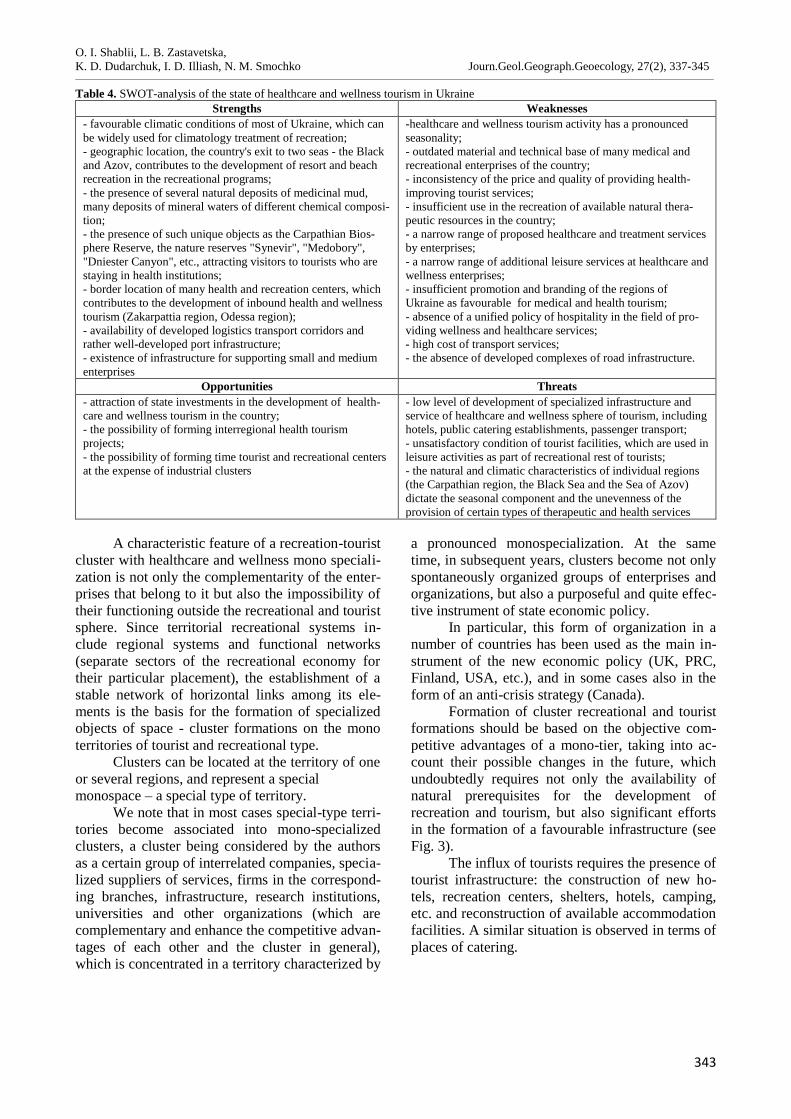
O. I. Shablii, L. B. Zastavetska,K. D. Dudarchuk, I. D. Illiash, N. M. Smochko Journ.Geol.Geograph.Geoecology, 27(2), 337-345________________________________________________________________________________________________________________________________________________________________
343
Table 4. SWOT-analysis of the state of healthcare and wellness tourism in UkraineStrengths Weaknesses
- favourable climatic conditions of most of Ukraine, which canbe widely used for climatology treatment of recreation;- geographic location, the country's exit to two seas - the Blackand Azov, contributes to the development of resort and beachrecreation in the recreational programs;- the presence of several natural deposits of medicinal mud,many deposits of mineral waters of different chemical composi-tion;- the presence of such unique objects as the Carpathian Bios-phere Reserve, the nature reserves "Synevir", "Medobory","Dniester Canyon", etc., attracting visitors to tourists who arestaying in health institutions;- border location of many health and recreation centers, whichcontributes to the development of inbound health and wellnesstourism (Zakarpattia region, Odessa region);- availability of developed logistics transport corridors andrather well-developed port infrastructure;- existence of infrastructure for supporting small and mediumenterprises
-healthcare and wellness tourism activity has a pronouncedseasonality;- outdated material and technical base of many medical andrecreational enterprises of the country;- inconsistency of the price and quality of providing health-improving tourist services;- insufficient use in the recreation of available natural thera-peutic resources in the country;- a narrow range of proposed healthcare and treatment servicesby enterprises;- a narrow range of additional leisure services at healthcare andwellness enterprises;- insufficient promotion and branding of the regions ofUkraine as favourable for medical and health tourism;- absence of a unified policy of hospitality in the field of pro-viding wellness and healthcare services;- high cost of transport services;- the absence of developed complexes of road infrastructure.
Opportunities Threats- attraction of state investments in the development of health-care and wellness tourism in the country;- the possibility of forming interregional health tourismprojects;- the possibility of forming time tourist and recreational centersat the expense of industrial clusters
- low level of development of specialized infrastructure andservice of healthcare and wellness sphere of tourism, includinghotels, public catering establishments, passenger transport;- unsatisfactory condition of tourist facilities, which are used inleisure activities as part of recreational rest of tourists;- the natural and climatic characteristics of individual regions(the Carpathian region, the Black Sea and the Sea of Azov)dictate the seasonal component and the unevenness of theprovision of certain types of therapeutic and health services
A characteristic feature of a recreation-touristcluster with healthcare and wellness mono speciali-zation is not only the complementarity of the enter-prises that belong to it but also the impossibility oftheir functioning outside the recreational and touristsphere. Since territorial recreational systems in-clude regional systems and functional networks(separate sectors of the recreational economy fortheir particular placement), the establishment of astable network of horizontal links among its ele-ments is the basis for the formation of specializedobjects of space - cluster formations on the monoterritories of tourist and recreational type.
Clusters can be located at the territory of oneor several regions, and represent a specialmonospace – a special type of territory.
We note that in most cases special-type terri-tories become associated into mono-specializedclusters, a cluster being considered by the authorsas a certain group of interrelated companies, specia-lized suppliers of services, firms in the correspond-ing branches, infrastructure, research institutions,universities and other organizations (which arecomplementary and enhance the competitive advan-tages of each other and the cluster in general),which is concentrated in a territory characterized by
a pronounced monospecialization. At the sametime, in subsequent years, clusters become not onlyspontaneously organized groups of enterprises andorganizations, but also a purposeful and quite effec-tive instrument of state economic policy.
In particular, this form of organization in anumber of countries has been used as the main in-strument of the new economic policy (UK, PRC,Finland, USA, etc.), and in some cases also in theform of an anti-crisis strategy (Canada).
Formation of cluster recreational and touristformations should be based on the objective com-petitive advantages of a mono-tier, taking into ac-count their possible changes in the future, whichundoubtedly requires not only the availability ofnatural prerequisites for the development ofrecreation and tourism, but also significant effortsin the formation of a favourable infrastructure (seeFig. 3).
The influx of tourists requires the presence oftourist infrastructure: the construction of new ho-tels, recreation centers, shelters, hotels, camping,etc. and reconstruction of available accommodationfacilities. A similar situation is observed in terms ofplaces of catering.
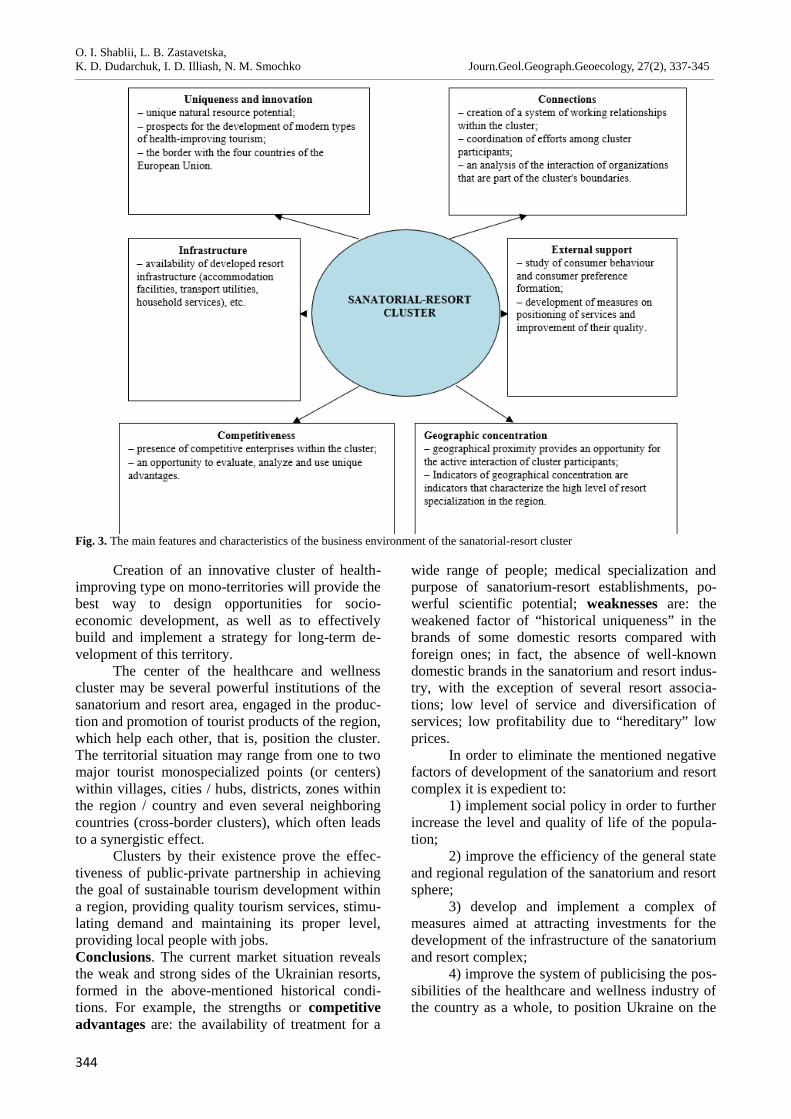
O. I. Shablii, L. B. Zastavetska,K. D. Dudarchuk, I. D. Illiash, N. M. Smochko Journ.Geol.Geograph.Geoecology, 27(2), 337-345________________________________________________________________________________________________________________________________________________________________
344
Fig. 3. The main features and characteristics of the business environment of the sanatorial-resort cluster
Creation of an innovative cluster of health-improving type on mono-territories will provide thebest way to design opportunities for socio-economic development, as well as to effectivelybuild and implement a strategy for long-term de-velopment of this territory.
The center of the healthcare and wellnesscluster may be several powerful institutions of thesanatorium and resort area, engaged in the produc-tion and promotion of tourist products of the region,which help each other, that is, position the cluster.The territorial situation may range from one to twomajor tourist monospecialized points (or centers)within villages, cities / hubs, districts, zones withinthe region / country and even several neighboringcountries (cross-border clusters), which often leadsto a synergistic effect.
Clusters by their existence prove the effec-tiveness of public-private partnership in achievingthe goal of sustainable tourism development withina region, providing quality tourism services, stimu-lating demand and maintaining its proper level,providing local people with jobs.Conclusions. The current market situation revealsthe weak and strong sides of the Ukrainian resorts,formed in the above-mentioned historical condi-tions. For example, the strengths or competitiveadvantages are: the availability of treatment for a
wide range of people; medical specialization andpurpose of sanatorium-resort establishments, po-werful scientific potential; weaknesses are: theweakened factor of “historical uniqueness” in thebrands of some domestic resorts compared withforeign ones; in fact, the absence of well-knowndomestic brands in the sanatorium and resort indus-try, with the exception of several resort associa-tions; low level of service and diversification ofservices; low profitability due to “hereditary” lowprices.
In order to eliminate the mentioned negativefactors of development of the sanatorium and resortcomplex it is expedient to:
1) implement social policy in order to furtherincrease the level and quality of life of the popula-tion;
2) improve the efficiency of the general stateand regional regulation of the sanatorium and resortsphere;
3) develop and implement a complex ofmeasures aimed at attracting investments for thedevelopment of the infrastructure of the sanatoriumand resort complex;
4) improve the system of publicising the pos-sibilities of the healthcare and wellness industry ofthe country as a whole, to position Ukraine on the
O. I. Shablii, L. B. Zastavetska,K. D. Dudarchuk, I. D. Illiash, N. M. Smochko Journ.Geol.Geograph.Geoecology, 27(2), 337-345________________________________________________________________________________________________________________________________________________________________
345
world market of healthcare and wellness services asa major region of treatment and rehabilitation;
5) develop the information and advertisingand marketing activities of sanatorium and resortestablishments; balance the price policy and qualityof the basic and additional healthcare and wellnessservices, introduce a system of discounts;
6) improve the organization of the activitiesof sanatorium and spa establishments, aimed atreducing the cost of their maintenance and reducingthe cost of travel vouchers;
7) pay more attention to the development andimplementation of innovative measures for the of-fer of individualization at the resort and the forma-tion of new domestic brands in the market of sana-torium and resort services of Ukraine by the enter-prises of the healthcare and wellness industry;
8) staffing of the healthcare and wellness es-tablishments with qualified specialists.
References
Honhalo P.F., 2004. Problemy vidtvorennia resursnohokompleksu Ukrainy [Problems of reproduction ofthe resource complex of Ukraine]. Economics andecology. 15. 125-127 (in Ukrainian).
Zakon Ukrainy «Pro kurorty» (№2026-III vid05.10.2000 r.) [The Law of Ukraine "On Resorts"(No. 2026-III dated October 5, 2000)] Retrievedfromhttp://www.kmu.gov.ua.
Zaporoshchenko A. S., 2017.Statystychna otsinka rivniazakhvoriuvanosti ta yakosti medychnohoobsluhovuvannia naselennia Ukrainy[Statisticalestimation of the morbidity and quality of medi-cal care of the population of Ukraine]. Statistics -a tool for socio-economic research. 3. 77 –81(inUkrainian).
Zapototskyi S.P., 2013. Rehionalnakonkurentospromozhnist yak stratehichnyinapriam suchasnoi rehionalnoi polityky [Regionalcompetitiveness as a strategic direction of modernregional policy]. Economic and social geography.79-86(inUkrainian).
Informatsiinyi potral dlia profesion alivfarmatsevtychnoi ta medychnoi sfery Ukrainy tainshykh krain. [Informational portal for profes-sionals in the pharmaceutical and medical sectors
of Ukraine and other countries] Retrievedfromhttp://medpharmconnect.com/Ukrainian_market/Ukrainian_Healthcare.
Kolodii V.V., Sprynskyi M.I., 2005. Mineralni vodykarpatskoi provintsii [Mineral waters of the Car-pathian province]. Problems of mineral waters.458 (inUkrainian).
Kontseptsiia rozvytku sanatorno-kurortnoi haluzi,skhvalena rozporiadzhenniam Kabinetu MinistrivUkrainy № 231-r. vid 23.04.2003 r. [The conceptof the development of the sanatorium and resortindustry, approved by the Cabinet of Ministers ofUkraine No. 231-p. of 23.04.2003] / Retrievedfromhttp://www.kmu.gov.ua
Lebedieva V.V., 2011. Stratehiia rozvytku pidpryiemstvsanatorno-kurortnoho kompleksu [Strategy of de-velopment of enterprises of sanatorium and resortcomplex]: dys… kand. ekon. nauk:08.00.04.167(inUkrainian).
Postanova KMU vid 26 lypnia 2001 r. №872 «Prozatverdzhennia Poriadku stvorennia i vedenniaDerzhavnoho kadastru pryrodnykh likuvalnykhresursiv» [Resolution of the Cabinet of Ministersof Ukraine of July 26, 2001, No. 872 "On Ap-proval of the Procedure for the Establishment andMaintenance of the State Cadastre of NaturalMedicinal Resources"]Retrievedfromhttp://zakon4.rada.gov.ua (inU-krainian).
Postanova KMU vid 23 travnia 2001 r. №562 «Prozatverdzhennia Poriadku stvorennia i vedenniaDerzhavnoho kadastru pryrodnykh terytoriikurortiv» [Resolution of the Cabinet of Ministersof Ukraine of May 23, 2001 N522 "On Approvalof the Procedure for the Establishment and Main-tenance of the State Cadastre of Natural Resortsof Resorts"] Retrievedfromhttp://zakon4.rada.gov.ua (inUkrainian).
Savosta O., 2008.Efektyvnist derzhavnoho upravlinnia[Effectiveness of public administration]. 16/17.365-371(inUkrainian).
Posluhy turystychni. Klasyfikatsiia hoteliv: DSTU4269:2003. – [Chynnyi vid 2003-12-23]. K.:Derzhspozhyvstandart Ukrainy. 17(inUkrainian).
Shablii O. I., 2003.Osnovy zahalnoi suspilnoi heohrafii[Fundamentals of general social geography].Lviv: Vyd. tsentr LNU. 444 (inUkrainian).
S. Sonko, Y. Kyselov, S. Polovka. Journ.Geol.Geograph.Geoecology, 27(2), 349-359________________________________________________________________________________________________________________________________________________________________
______________________________________________________________________________________________________________________________
346
Journal of Geology,Geography and Geoecology
Journal home page: geology-dnu-dp.ua
ISSN 2617-2909 (print)ISSN 2617-2119 (online)
Journ.Geol.Geograph.Geoecology,
27(2), 346-356doi:10.15421/111859
S. Sonko, Y. Kyselov, S. Polovka. Journ.Geol.Geograph.Geoecology,27(2), 346-356________________________________________________________________________________________________________________________________________________________________
On the modern conception of environment
1S. Sonko, 1Yu. Kyselov, 2S. Polovka
1Uman National University of Horticulture, Uman, Ukraine, e-mail: [email protected] State Pedagogical University named after Pavlo Tychyna, Uman, Ukraine, e-mail:[email protected]
Abstract. Currently a large number of, geographers and representatives of relatedsciences claim to have created integrated environmental concepts . This applies, inparticular, to the concepts of "environmental science", "sociogeosystems","anthropogenic landscape", "eco-geosophia", etc. All of them confirm the importance ofsolving the global environmental problem, and the need to unite scholars in all
specialties. There is a significant revival of interest in the integral essence of geography, especially among anthropogeographers. Thistestifies to the fundamental unity of geographical science without its distinct division into natural and social geography, which di-vides the discipline up into a plethora of specific objects and subjects. Anthropogeographers have come to understand that the earth'sspace was initially organized by Nature itself. Mankind from the Neolithic Age has transformed his use of nature into the noosphere.If before the Neolithic revolution there still existed natural landscapes on the surface of the planet , then the Neolithic populations ofHomo sapiens started to actively change the environments they inhabited. Approximately then, the search for ways to justify such,often destructive, intervention began. Such a change in the landscape was brought about by man, which encouraged scientists unwit-tingly to develop an "intentional paradigm", according to which the methodology of each science tries to take into account the role ofman not only as a component of nature, but as its researcher. Even Strabo having realized the many-sidedness of human existence onour planet, already in ancient times, considered himself "not a geographer, not a historian, but a philosopher." Hettner, with his ideaof "embedding" into the earth's space of all things, considered the object of studying geography this very earthly space with objectsand phenomena that filled it and interacted with each other. According to Hettner, the connections between them have a landscapecausal nature. To such systems of geobjects, Hettner also related human society. The idea of "through" was found in the works of ourcontemporary physicist and geographer Aleksey Reteyum, who discovered integral (socio-natural) spatial entities on the surface ofthe planet ("choriones" and "sphragids"), once again proving the "right to exist" of the noosphere suggested by VolodymyrVernadsky. At present, it is geographers who must create an adequate concept of the environment, which is not yet developed incompleted form. Its final design will require the rejection of the mechanistic perception of the world, divided into objects andsubjects of research. It is geographers who should identify in time and space such integrated environmental systems (socio-naturalsystems, whose subsystems can be natural landscape systems and sociogeosystems), which are shaped as a result of the jointdevelopment of nature and society. Prospects for the productive development of environmental science are related to the concept ofnoosphere ecosystems.
Keywords: environment, noosphere, anthropogenic landscape, intentional paradigm, socio-natural systems.
Про сучасну концепцію довкілля
С. Сонько*, Ю. Кисельов*, С. Половка**
*Уманський національний університет садівництва, Умань, Україна, e-mail: [email protected]**Уманський державний педагогічний університет імені Павла Тичини, Умань, Україна,e-mail:[email protected]
Анотація. Численні сучасні концепції довкілля часто претендують на інтегральність. Це стосується, зокрема, концепцій«середовищезнавства», «соціогеосистем», «антропогенного ландшафту», «екогеософії» тощо. Знаковим є відродження інте-ресу до інтегральної сутності географії саме серед антропогеографів, що свідчить про принципову єдність географічноїнауки. Антропогеографи поступово доходять розуміння того, що земний простір від початку був організований самою При-родою. Людство ще з неоліту здійснює на Землі ноосферне природокористування. Якщо до неолітичної революції на деннійповерхні планети ще існували природні ландшафти, то з неоліту популяція Ноmо sapiens починає їх активно змінювати.Приблизно тоді ж почались пошуки способів виправдання такого, часто руйнівного, втручання. Така змінена до непізнава-ності людиною ландшафтна оболонка спонукала науковців розробляти «інтенціональну парадигму», за якою методологія
Received 15.06.2018;Received in revised form 05.07.2018;Accepted 23.07.2018
S. Sonko, Y. Kyselov, S. Polovka. Journ.Geol.Geograph.Geoecology, 27(2), 346-356________________________________________________________________________________________________________________________________________________________________
347
кожної науки намагається врахувати роль людини не лише як складової природи, але як її дослідника. Сьогодні саме геог-рафам належить створити адекватну дійсності концепція довкілля, яка в завершеному вигляді поки що не розроблена. Їїостаточне оформлення вимагатиме відмови від механістичного сприйняття навколишнього світу, поділеного на об’єкти іпредмети дослідження. Саме географам належить позначити в часі й у просторі такі інтегративні системи навколишньогосередовища (соціоприродні системи, підсистемами яких можуть бути природні ландшафтні системи у різному ступені змі-нені людиною), які утворені в результаті спільного розвитку природи і суспільства. Перспективи продуктивного розвиткунауки про довкілля (довкіллєзнавства) пов’язані з концепцією ноосферних екосистем.
Ключові слова: довкілля, ноосфера, антропогенний ландшафт, інтенціональна парадигма, соціоприродні системи.
Introduction.The article is the continuation of thediscussion about the concept of the environment,which once again (after V. Nikolayev (Nikolayev,2006), V. Nekos (Nekos, Nekos, Safranov, 2011),М. Holubets (Holubets, 2015), O. Kovalyov (Kova-lyov, 2014), H. Denysyk (Denysyk, 2001) and oth-ers) was carried on in the article by O. Topchiev,D. Malchykova, I. Pylypenko and V. Yavorska(Topchiev, Malchykova, Pylypenko, Yavorska,2017).
The very fact that the article was published in‘Ukrainian Geographic Journal’ in the section ‘Callfor Discussion’, testifies to the extraordinary ur-gency of this problem. It is noteworthy that thissection in UGJ reminds one of an old trap, whichthe editorial board regularly walks into, however, italways appears on its way. Indeed, there have beenmore than 10-15 articles dealing with the problemin this section since the mid-1990s (V. Pashchenko,I. Chervaniov, O. Kovalyov, O. Topchiev,M. Holubets, L. Rudenko, M. Bagrov, S. Sonko,etc.). In spite of the fact that the national geo-graphic establishment openly neglects methodo-logical problems of geography, it (the methodol-ogy) nevertheless makes its way up above theground, like shoots that lean towards the sun. Thisis confirmed by all attempts to develop a singleconcept of the environment. Such attempts testifyto the fact that this problem can gradually movemost other problems in the subject area of manysciences to the background. The processes associ-ated with this were noticed by V. Vernadsky1 andemphasized by one of the authors in the early 2000s(Sonko, 2003).
The fact that the authors of the above-mentioned article are anthropogeographers (repre-sentatives of economic, or, broadly speaking, socialgeography) is really significant. Perhaps the revivalof in-terest in the integral essence of geographyamong anthropogeographers marks the transition of
‘Nowadays, the framework of individual sciences,which scientific knowledge is streamed into cannot accu-rately determine the area of the scientific idea of a re-searcher and exactly describe his scientific effort. Theproblems that are of interest to him often do not fit intothe framework of an individual, well-formed science.We specialize not in sciences but in problems’ (Ver-nadsky, 1991).
this science to a qualitatively new (old?2) level ofinterpretation of reality. This is obvious to a greatextent, since the monographic study of both thecentre and periphery relations (Pylypenko, 2015)and the basics of geo-planning (Topchiev, 2014)once would certainly have led the authors to under-standing the integral properties of the Earth's space— without dividing it into ‘the objects the study’ ofnatural geographers and anthropogeographers —geospheres (Topchiev, Malchykova, Pylypenko,Yavorska, 2017), and without its vague attributionto ‘the subject area’ of either social or natural geog-raphy (Topchiev, 2004). The present-day fragmen-tation of geography, which used to be integral, issometimes absurd. One may visit the site of ‘Bibli-ometrics of Ukrainian Science’. In the section‘Earth Sciences’ only the scientific preferences ofphysiographers (mainly geography and cartogra-phy, or the environment) (T. Bobra, M. Hrodzyn-skyi, H. Denysyk, I. Kovalchuk, etc.) are more orless adequately given an account of. As for eco-nomic geographers, perhaps only O. Topchiev ap-peared in the section ‘Geography and Cartography’in the branch called ‘Social Sciences". The rest ofthe representatives of this modern geographybranch are at best marked as ‘Geography and Car-tography’. Most scientists are referred to the purelynatural ‘Earth Sciences’, ‘Environmental Sciences’and ‘Ecology’. As a result, it gives an impression ofthe inappropriateness of ‘discrimination’ of bothsocial and public geography.
We are convinced that it is anthropogeogra-phers who have to be most concerned about theproblem of the integral nature of the Earth's space.
2 Did not the classic of economic geography N. Baranskyin the 30s of the twentieth century urge that a territory(of a country or a region, etc.) be considered as a com-plex ‘from geology to ideology’? Was not it our compa-triot Serhiy Podolynskyi in the 19th century who empha-sized the energetic essence of all economic processes,thus trying to implement truly objective (physical andeconomic) pricing mechanisms for goods and services inthe world economic system? Taking into account the factthat it is economics and economic sciences that are theleaders in a complex system of developing natural re-sources of the planet (including its landscape envelope),it may be more appropriate to call oneself an economicgeographer, rather than a social geographer or publicgeographer.
S. Sonko, Y. Kyselov, S. Polovka. Journ.Geol.Geograph.Geoecology, 27(2), 346-356________________________________________________________________________________________________________________________________________________________________
348
Eventually, these scientists will realize that theEarth's space from the very beginning was appro-priately or-ganized by Nature itself. Various termshave been suggested for the interpretation of theEarth's space itself and its individual fragments, aswell as for the science that would conduct its inte-grated study. In particular, various aspects of exis-tence of the Earth's space today are explored in thecontext of the concepts of sociogeosystems(Nemets, Nemets, 2014), environmental studies(Holubets, 2015), neoecology (Nekos, Nekos, Sa-franov, 2011), anthropogenic landscape (Denysyk,2001), intentional paradigm (Topchiev, Nudelman,Rudenko, 2012), ecogeosophy (Kyselov, 2015), etc.
In fact, the recent intensive growth of the de-bate on environmental studies also has another root– the civilizational one. There is an inevitable ques-tion that geographers of the anthropogenic andlandscape branch (Yablokov, Levchenko, 2015)face today, in the era of radical man-made changesin the biosphere, — is it still safe to further ‘scien-tifically justify’ the change of natural landscapes byman? Is this safe as long as such ‘scientific justifi-cation’ gives a powerful tool to ‘constructors’ ofthe ‘mining’, ‘uranium’ and other landscapes forfurther human attacks on nature (Sonko, Mak-symenko, 2016).Material and methods of research. The researchis based on the elucidation of the main provisionsof the existing concepts of environmental studiesthat have features of integrity with respect to thenatural sciences, the theoretical foundations ofwhich lie in their basis.
In the course of the research, mostly philoso-phical and general scientific methods were used,including the logical ones (analysis, synthesis,comparison, deduction, induction), as well as dia-lectics.
The analysis was implemented at each stageof the research. When considering different con-cepts, their objects were determined and the contentcharacterized, geographical and ecological compo-nents were compared. Synthesis, which is the dia-lectical opposite of analysis and is logically ap-plied after the latter, consists in highlighting thecommon features of different environmental con-cepts that can form the basis of the integrated envi-ronmental study concept. Comparison of the ana-lysed scientific constructions is an indispensabletool for extracting their common or similar ele-ments.
The study used the deductive and inductivemethods. In particular, the deduction manifestsitself in taking the idea of creating an integratedenvironmental study concept as a starting point, andeach item of individual natural science conceptswas characterized in terms of its conformity with
the general purpose of our research. The inductionreveals itself in the selection of such provisions ofeach scientific construction, which can become‘building material’ for the creation of an integratedconcept of the environment.
Dialectics as a philosophical method is pre-sent in the research due to the application of thelaws of unity and struggle of opposites (through acombi-nation of analysis and synthesis, deductionand induction), and the transition of quantitativechanges to qualitative ones (due to the gradual ac-cumulation of individual concepts in natural sci-ence, which, taken together, give the necessaryfacts and scientific provisions for the constructionof an integrated concept of the geographic and en-vironmental study).
The research made use of the historicalmethod, in particular, when analysing the develop-ment of environmental ideas in time (from the noo-sphere by V. Vernadsky up to environmental stud-ies by M. Holubets).Results and their analysis. Taking into accountthe unsuccessful attempts of non-geographers tosolve a purely geographical problem (the concept of‘environmental studies’ by M. Holubets), one of theauthors, considering himself to be an economicgeographer (not even a social or a public geogra-pher), solved this problem for himself 15 years ago(Sonko, 2003).
In fact, humanity has for a long time (ap-proximately from the Neolithic period) exercisednature management of the noosphere on our planet.But if, before the Neolithic revolution, there hadbeen natural landscapes on its daylight surface,after it Homo sapiens started to actively modifythem, ‘building himself’ into the landscape enve-lope and forming anthropogenic landscape stripssuch as a ‘forest field’ (Denysyk, 2001) withecotones — without explicit boundaries of naturalzones. Approximately at that time, the search forthe ways to justify such intervention, which wasoften destructive, began. Thus, in recent years, thelandscape envelope, unrecognizably changed byman, has prompted scientists to develop an ‘inten-tional paradigm’, according to which the methodol-ogy of each science tries to take into account therole of man not only as a component of nature, butas a researcher who creates different branches ofknowledge and sets respective subjective targetguides for them (Topchiev, Nudelman, Rudenko,2012). In our opinion, this is an obvious step back,as this emphasizes the return to the object-objectrelations between man and nature, which mostmodern landscape scientists (M. D. Hrodzynsky)rejected long ago in favour of the post-classicalsubject-subject ones (Maksymenko, 2018).
S. Sonko, Y. Kyselov, S. Polovka. Journ.Geol.Geograph.Geoecology, 27(2), 346-356________________________________________________________________________________________________________________________________________________________________
349
Therefore, the idea of the noosphere (almosttwo thousand years before the term appeared) ‘em-bedded’ in the Earth's atmosphere, has embarrassedgeographers from the times this science appeared.Thus Strabo, the author of the world-famous ‘Ge-ography’, understanding the many-sidedness ofhuman existence on our planet, even in ancienttimes, considered himself to be ‘not a geographer,not a histo-rian, but a philosopher’ (Arsky, 2015).A. Hettner, with his idea of ‘embedding’ all thingsin existence into the Earth's space, considered thisvery earthly space with all the objects and phenom-ena present in it and interacting with each other tobe the object of geographical studies. The linksamong them, according to A. Hettner, have a land-scape, causal nature. A. Hettner also referred hu-man society to similar systems of geo-objects.Some unique combinations of certain objects andphenomena in a particular territory lead to theemergence of geographic countries (choros, space)(Hettner, 1927).
However, the idea of ‘transversality’ wasfully elucidated in the book by our contemporary O.Reteyum ‘The Earth's Worlds’. He ‘discovered’integrative (socio-natural) spatial entities (‘chori-ons’ and ‘sphragis’) on the daylight surface of theplanet (the term by O. Kovalyov) and once againproved the right of the noosphere as defined by V.Vernadsky to exist. At the same time, being aphysical geographer, O. Reteyum was constantlyreinforcing this idea by examples of consortiumrelations in ‘pure’ (without humans) nature (Rete-yum, 1988).
Dozens (or even hundreds) of scientists (notonly geographers) can be listed as those who havecome up with an idea of the integrity of the plane-tary structure (J. Lovelock, L. Margulis,V. Gorshkov, etc.). This idea turned out to be soobvious that even well-known movie makers(James Cameron, ‘Avatar’) succeeded in promotingit. Nevertheless, its real implementation into life,which gave rise to the ‘strategy of sustainable de-velopment’, in its twenties (Johannesburg, 2002)became deficient, which has been written aboutmany times (Sonko, 2018).
The comprehension of the reclaimed Earth'sspace substantially transformed by the versatileactivity of humans (at different levels — from theplanetary up to the local level) is also carried out byecogeosophy. The sources of ecogeosophy, whichwas founded at the end of the twentieth century, are‘classical’ geosophy and modern ecology.
We used the epithet ‘classical’ in invertedcomas with respect to geosophy, because even theage of this discipline — not only ecogeosophy — isless than a century. Geosophy is a philosophy ofhuman space that explores spiritual aspects of the
natural landscape’s influence (conditionally, un-changed by man) on human communities, in par-ticular ethnos. L. Gumilev considered ethnos to bea geographical, landscape phenomenon, and thelandscape itself — its storage and nutritional me-dium (Gumilev, 2006). Consequently, geosophy isa science of landscape and ethnic interaction.
The synthesis of geosophy with modernecology, which long ago evolved out of the formerposition of a branch of biology, becoming an inde-pendent science and, moreover, an extensive sys-tem of many bio-, geo-, socio- and technical eco-logical disciplines, is ecogeoseophy. If the schemeof geosophical regionalization of the Earth's space(Earthworld), based on the nature of landscape-ethnic interaction (Kyselov, 2011) became the logi-cal result of our geosophical research, then the pe-culiarities of human space caused by more or lesssignificant changes in landscapes as a result of eco-nomic and other types of human activities shouldbe taken into account when conducting ecogeoso-phic research. In particular, in terms of ecogeoso-phy, the Donbas appears to be not only and not somuch in the Donets Territory, a fragment of thesteppe landscape and an extrazonal island of theforest steppe in the steppe for the territory ofUkraine, and, above all, a region with a predomi-nance of ‘anthropogenic’ (according to the termi-nology of one of the authors (Kyselov, 2017) land-scapes proper. Thus, this region seems to be takenout of human space, becoming a virtually unfitenvironment for the life of the landscape predeter-mined human communities - ethnoses. The exampleof the Donbas illustrates the discrepancy of eco-geophysical realia, which we will later depict in theform of sketch maps as already mapped geosophi-cal earth-spatial formations.
The post-classical approach to the formationof the ecological network can be the confirmationof the anthropogenic component of landscape de-velopment (especially for the regions of old indus-trial development). According to this approach, notonly natural objects but also the man-made onesmust be bequeathed today, (Sonko, Kazakova,2016).
We present the analysis of the above-mentioned modern environmental concepts, whichmore or less claim to be integral, in Table 1.
In our opinion, the main feature of all the en-vironmental concepts analysed is their interdiscipli-nary nature. Mostly the tendencies for integrationbetween geography and ecology (in particular,geosociosystemology, environmental studies, an-thropogenic landscape studies, neoecology), as wellas between ecology and noosphereology (in theconcept of noosphere ecosystems), among geogra-
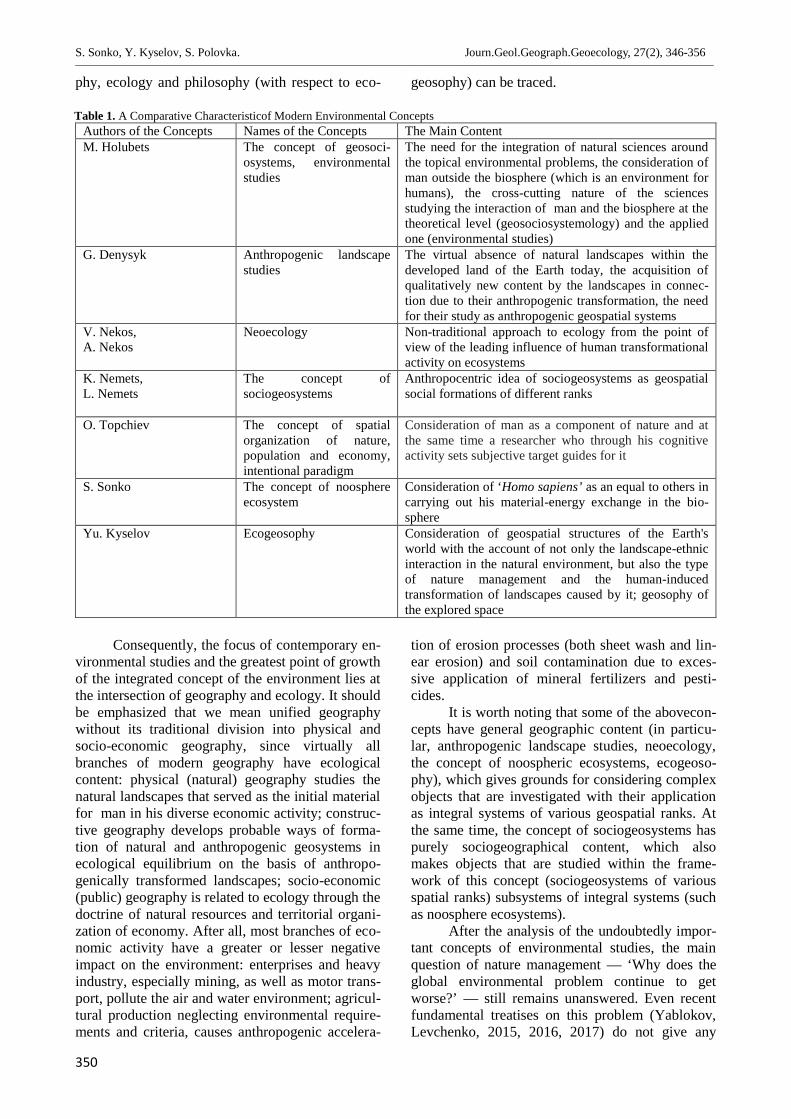
S. Sonko, Y. Kyselov, S. Polovka. Journ.Geol.Geograph.Geoecology, 27(2), 346-356________________________________________________________________________________________________________________________________________________________________
350
phy, ecology and philosophy (with respect to eco- geosophy) can be traced.
Table 1. A Comparative Characteristicof Modern Environmental ConceptsAuthors of the Concepts Names of the Concepts The Main ContentM. Holubets The concept of geosoci-
osystems, environmentalstudies
The need for the integration of natural sciences aroundthe topical environmental problems, the consideration ofman outside the biosphere (which is an environment forhumans), the cross-cutting nature of the sciencesstudying the interaction of man and the biosphere at thetheoretical level (geosociosystemology) and the appliedone (environmental studies)
G. Denysyk Anthropogenic landscapestudies
The virtual absence of natural landscapes within thedeveloped land of the Earth today, the acquisition ofqualitatively new content by the landscapes in connec-tion due to their anthropogenic transformation, the needfor their study as anthropogenic geospatial systems
V. Nekos,A. Nekos
Neoecology Non-traditional approach to ecology from the point ofview of the leading influence of human transformationalactivity on ecosystems
K. Nemets,L. Nemets
The concept ofsociogeosystems
Anthropocentric idea of sociogeosystems as geospatialsocial formations of different ranks
O. Topchiev The concept of spatialorganization of nature,population and economy,intentional paradigm
Consideration of man as a component of nature and atthe same time a researcher who through his cognitiveactivity sets subjective target guides for it
S. Sonko The concept of noosphereecosystem
Consideration of ‘Homo sapiens’ as an equal to others incarrying out his material-energy exchange in the bio-sphere
Yu. Kyselov Ecogeosophy Consideration of geospatial structures of the Earth'sworld with the account of not only the landscape-ethnicinteraction in the natural environment, but also the typeof nature management and the human-inducedtransformation of landscapes caused by it; geosophy ofthe explored space
Consequently, the focus of contemporary en-vironmental studies and the greatest point of growthof the integrated concept of the environment lies atthe intersection of geography and ecology. It shouldbe emphasized that we mean unified geographywithout its traditional division into physical andsocio-economic geography, since virtually allbranches of modern geography have ecologicalcontent: physical (natural) geography studies thenatural landscapes that served as the initial materialfor man in his diverse economic activity; construc-tive geography develops probable ways of forma-tion of natural and anthropogenic geosystems inecological equilibrium on the basis of anthropo-genically transformed landscapes; socio-economic(public) geography is related to ecology through thedoctrine of natural resources and territorial organi-zation of economy. After all, most branches of eco-nomic activity have a greater or lesser negativeimpact on the environment: enterprises and heavyindustry, especially mining, as well as motor trans-port, pollute the air and water environment; agricul-tural production neglecting environmental require-ments and criteria, causes anthropogenic accelera-
tion of erosion processes (both sheet wash and lin-ear erosion) and soil contamination due to exces-sive application of mineral fertilizers and pesti-cides.
It is worth noting that some of the abovecon-cepts have general geographic content (in particu-lar, anthropogenic landscape studies, neoecology,the concept of noospheric ecosystems, ecogeoso-phy), which gives grounds for considering complexobjects that are investigated with their applicationas integral systems of various geospatial ranks. Atthe same time, the concept of sociogeosystems haspurely sociogeographical content, which alsomakes objects that are studied within the frame-work of this concept (sociogeosystems of variousspatial ranks) subsystems of integral systems (suchas noosphere ecosystems).
After the analysis of the undoubtedly impor-tant concepts of environmental studies, the mainquestion of nature management — ‘Why does theglobal environmental problem continue to getworse?’ — still remains unanswered. Even recentfundamental treatises on this problem (Yablokov,Levchenko, 2015, 2016, 2017) do not give any
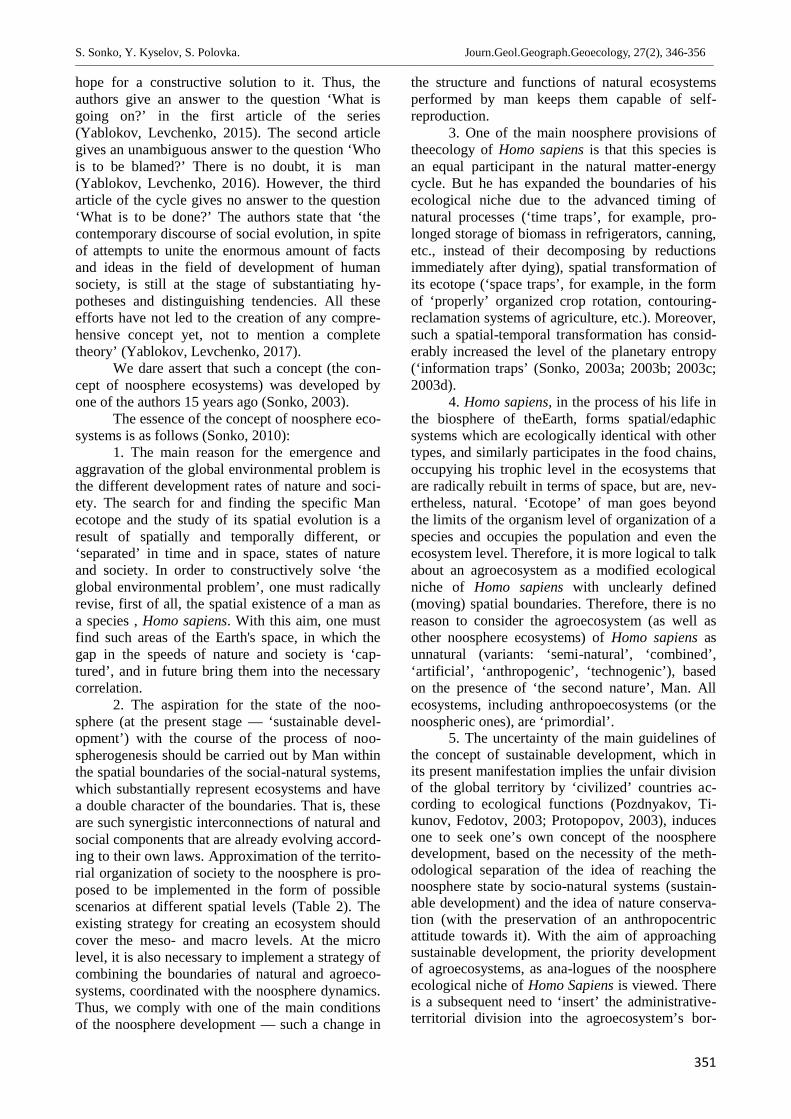
S. Sonko, Y. Kyselov, S. Polovka. Journ.Geol.Geograph.Geoecology, 27(2), 346-356________________________________________________________________________________________________________________________________________________________________
351
hope for a constructive solution to it. Thus, theauthors give an answer to the question ‘What isgoing on?’ in the first article of the series(Yablokov, Levchenko, 2015). The second articlegives an unambiguous answer to the question ‘Whois to be blamed?’ There is no doubt, it is man(Yablokov, Levchenko, 2016). However, the thirdarticle of the cycle gives no answer to the question‘What is to be done?’ The authors state that ‘thecontemporary discourse of social evolution, in spiteof attempts to unite the enormous amount of factsand ideas in the field of development of humansociety, is still at the stage of substantiating hy-potheses and distinguishing tendencies. All theseefforts have not led to the creation of any compre-hensive concept yet, not to mention a completetheory’ (Yablokov, Levchenko, 2017).
We dare assert that such a concept (the con-cept of noosphere ecosystems) was developed byone of the authors 15 years ago (Sonko, 2003).
The essence of the concept of noosphere eco-systems is as follows (Sonko, 2010):
1. The main reason for the emergence andaggravation of the global environmental problem isthe different development rates of nature and soci-ety. The search for and finding the specific Manecotope and the study of its spatial evolution is aresult of spatially and temporally different, or‘separated’ in time and in space, states of natureand society. In order to constructively solve ‘theglobal environmental problem’, one must radicallyrevise, first of all, the spatial existence of a man asa species , Homo sapiens. With this aim, one mustfind such areas of the Earth's space, in which thegap in the speeds of nature and society is ‘cap-tured’, and in future bring them into the necessarycorrelation.
2. The aspiration for the state of the noo-sphere (at the present stage — ‘sustainable devel-opment’) with the course of the process of noo-spherogenesis should be carried out by Man withinthe spatial boundaries of the social-natural systems,which substantially represent ecosystems and havea double character of the boundaries. That is, theseare such synergistic interconnections of natural andsocial components that are already evolving accord-ing to their own laws. Approximation of the territo-rial organization of society to the noosphere is pro-posed to be implemented in the form of possiblescenarios at different spatial levels (Table 2). Theexisting strategy for creating an ecosystem shouldcover the meso- and macro levels. At the microlevel, it is also necessary to implement a strategy ofcombining the boundaries of natural and agroeco-systems, coordinated with the noosphere dynamics.Thus, we comply with one of the main conditionsof the noosphere development — such a change in
the structure and functions of natural ecosystemsperformed by man keeps them capable of self-reproduction.
3. One of the main noosphere provisions oftheecology of Homo sapiens is that this species isan equal participant in the natural matter-energycycle. But he has expanded the boundaries of hisecological niche due to the advanced timing ofnatural processes (‘time traps’, for example, pro-longed storage of biomass in refrigerators, canning,etc., instead of their decomposing by reductionsimmediately after dying), spatial transformation ofits ecotope (‘space traps’, for example, in the formof ‘properly’ organized crop rotation, contouring-reclamation systems of agriculture, etc.). Moreover,such a spatial-temporal transformation has consid-erably increased the level of the planetary entropy(‘information traps’ (Sonko, 2003a; 2003b; 2003c;2003d).
4. Homo sapiens, in the process of his life inthe biosphere of theEarth, forms spatial/edaphicsystems which are ecologically identical with othertypes, and similarly participates in the food chains,occupying his trophic level in the ecosystems thatare radically rebuilt in terms of space, but are, nev-ertheless, natural. ‘Ecotope’ of man goes beyondthe limits of the organism level of organization of aspecies and occupies the population and even theecosystem level. Therefore, it is more logical to talkabout an agroecosystem as a modified ecologicalniche of Homo sapiens with unclearly defined(moving) spatial boundaries. Therefore, there is noreason to consider the agroecosystem (as well asother noosphere ecosystems) of Homo sapiens asunnatural (variants: ‘semi-natural’, ‘combined’,‘artificial’, ‘anthropogenic’, ‘technogenic’), basedon the presence of ‘the second nature’, Man. Allecosystems, including anthropoecosystems (or thenoospheric ones), are ‘primordial’.
5. The uncertainty of the main guidelines ofthe concept of sustainable development, which inits present manifestation implies the unfair divisionof the global territory by ‘civilized’ countries ac-cording to ecological functions (Pozdnyakov, Ti-kunov, Fedotov, 2003; Protopopov, 2003), inducesone to seek one’s own concept of the noospheredevelopment, based on the necessity of the meth-odological separation of the idea of reaching thenoosphere state by socio-natural systems (sustain-able development) and the idea of nature conserva-tion (with the preservation of an anthropocentricattitude towards it). With the aim of approachingsustainable development, the priority developmentof agroecosystems, as ana-logues of the noosphereecological niche of Homo Sapiens is viewed. Thereis a subsequent need to ‘insert’ the administrative-territorial division into the agroecosystem’s bor-
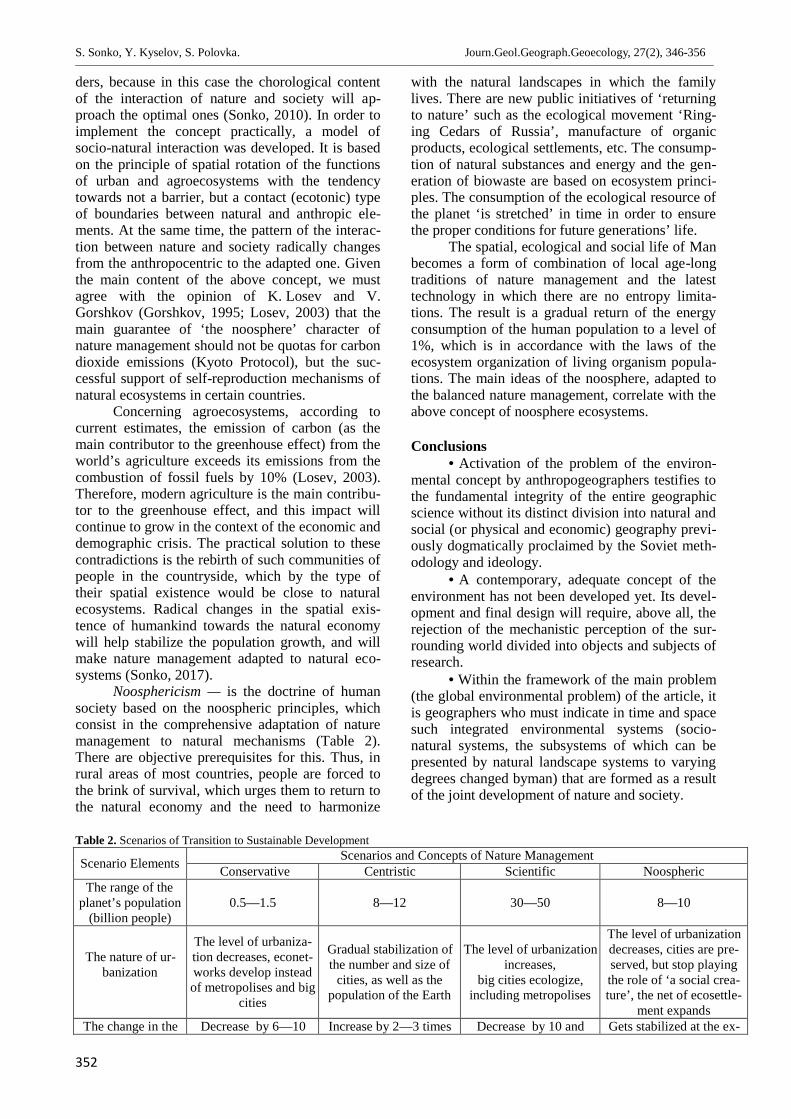
S. Sonko, Y. Kyselov, S. Polovka. Journ.Geol.Geograph.Geoecology, 27(2), 346-356________________________________________________________________________________________________________________________________________________________________
352
ders, because in this case the chorological contentof the interaction of nature and society will ap-proach the optimal ones (Sonko, 2010). In order toimplement the concept practically, a model ofsocio-natural interaction was developed. It is basedon the principle of spatial rotation of the functionsof urban and agroecosystems with the tendencytowards not a barrier, but a contact (ecotonic) typeof boundaries between natural and anthropic ele-ments. At the same time, the pattern of the interac-tion between nature and society radically changesfrom the anthropocentric to the adapted one. Giventhe main content of the above concept, we mustagree with the opinion of K. Losev and V.Gorshkov (Gorshkov, 1995; Losev, 2003) that themain guarantee of ‘the noosphere’ character ofnature management should not be quotas for carbondioxide emissions (Kyoto Protocol), but the suc-cessful support of self-reproduction mechanisms ofnatural ecosystems in certain countries.
Concerning agroecosystems, according tocurrent estimates, the emission of carbon (as themain contributor to the greenhouse effect) from theworld’s agriculture exceeds its emissions from thecombustion of fossil fuels by 10% (Losev, 2003).Therefore, modern agriculture is the main contribu-tor to the greenhouse effect, and this impact willcontinue to grow in the context of the economic anddemographic crisis. The practical solution to thesecontradictions is the rebirth of such communities ofpeople in the countryside, which by the type oftheir spatial existence would be close to naturalecosystems. Radical changes in the spatial exis-tence of humankind towards the natural economywill help stabilize the population growth, and willmake nature management adapted to natural eco-systems (Sonko, 2017).
Noosphericism — is the doctrine of humansociety based on the noospheric principles, whichconsist in the comprehensive adaptation of naturemanagement to natural mechanisms (Table 2).There are objective prerequisites for this. Thus, inrural areas of most countries, people are forced tothe brink of survival, which urges them to return tothe natural economy and the need to harmonize
with the natural landscapes in which the familylives. There are new public initiatives of ‘returningto nature’ such as the ecological movement ‘Ring-ing Cedars of Russia’, manufacture of organicproducts, ecological settlements, etc. The consump-tion of natural substances and energy and the gen-eration of biowaste are based on ecosystem princi-ples. The consumption of the ecological resource ofthe planet ‘is stretched’ in time in order to ensurethe proper conditions for future generations’ life.
The spatial, ecological and social life of Manbecomes a form of combination of local age-longtraditions of nature management and the latesttechnology in which there are no entropy limita-tions. The result is a gradual return of the energyconsumption of the human population to a level of1%, which is in accordance with the laws of theecosystem organization of living organism popula-tions. The main ideas of the noosphere, adapted tothe balanced nature management, correlate with theabove concept of noosphere ecosystems.
Conclusions• Activation of the problem of the environ-
mental concept by anthropogeographers testifies tothe fundamental integrity of the entire geographicscience without its distinct division into natural andsocial (or physical and economic) geography previ-ously dogmatically proclaimed by the Soviet meth-odology and ideology.
• A contemporary, adequate concept of theenvironment has not been developed yet. Its devel-opment and final design will require, above all, therejection of the mechanistic perception of the sur-rounding world divided into objects and subjects ofresearch.
• Within the framework of the main problem(the global environmental problem) of the article, itis geographers who must indicate in time and spacesuch integrated environmental systems (socio-natural systems, the subsystems of which can bepresented by natural landscape systems to varyingdegrees changed byman) that are formed as a resultof the joint development of nature and society.
Table 2. Scenarios of Transition to Sustainable Development
Scenario Elements Scenarios and Concepts of Nature ManagementConservative Centristic Scientific Noospheric
The range of theplanet’s population
(billion people)0.5—1.5 8—12 30—50 8—10
The nature of ur-banization
The level of urbaniza-tion decreases, econet-works develop insteadof metropolises and big
cities
Gradual stabilization ofthe number and size of
cities, as well as thepopulation of the Earth
The level of urbanizationincreases,
big cities ecologize,including metropolises
The level of urbanizationdecreases, cities are pre-served, but stop playingthe role of ‘a social crea-ture’, the net of ecosettle-
ment expandsThe change in the Decrease by 6—10 Increase by 2—3 times Decrease by 10 and Gets stabilized at the ex-
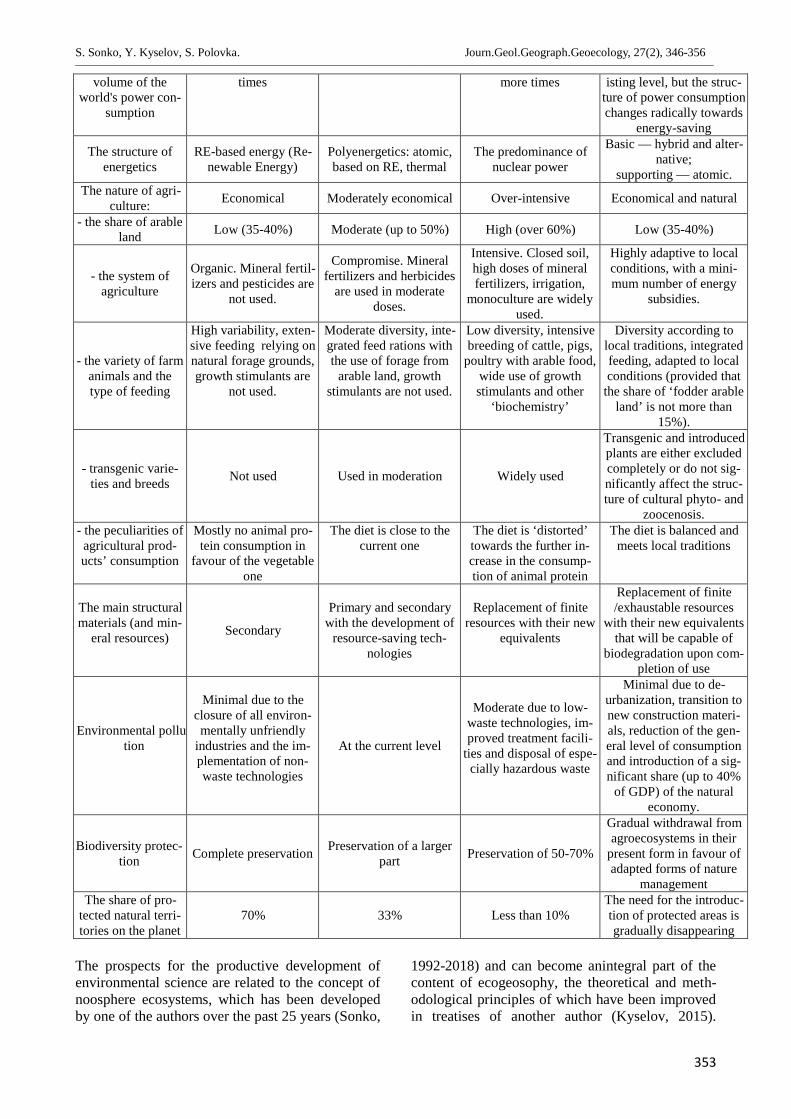
S. Sonko, Y. Kyselov, S. Polovka. Journ.Geol.Geograph.Geoecology, 27(2), 346-356________________________________________________________________________________________________________________________________________________________________
353
volume of theworld's power con-
sumption
times more times isting level, but the struc-ture of power consumptionchanges radically towards
energy-saving
The structure ofenergetics
RE-based energy (Re-newable Energy)
Polyenergetics: atomic,based on RE, thermal
The predominance ofnuclear power
Basic — hybrid and alter-native;
supporting — atomic.The nature of agri-
culture: Economical Moderately economical Over-intensive Economical and natural
- the share of arableland Low (35-40%) Moderate (up to 50%) High (over 60%) Low (35-40%)
- the system ofagriculture
Organic. Mineral fertil-izers and pesticides are
not used.
Compromise. Mineralfertilizers and herbicides
are used in moderatedoses.
Intensive. Closed soil,high doses of mineralfertilizers, irrigation,
monoculture are widelyused.
Highly adaptive to localconditions, with a mini-mum number of energy
subsidies.
- the variety of farmanimals and thetype of feeding
High variability, exten-sive feeding relying onnatural forage grounds,growth stimulants are
not used.
Moderate diversity, inte-grated feed rations withthe use of forage from
arable land, growthstimulants are not used.
Low diversity, intensivebreeding of cattle, pigs,
poultry with arable food,wide use of growthstimulants and other
‘biochemistry’
Diversity according tolocal traditions, integratedfeeding, adapted to localconditions (provided that
the share of ‘fodder arableland’ is not more than
15%).
- transgenic varie-ties and breeds Not used Used in moderation Widely used
Transgenic and introducedplants are either excludedcompletely or do not sig-nificantly affect the struc-ture of cultural phyto- and
zoocenosis.- the peculiarities ofagricultural prod-ucts’ consumption
Mostly no animal pro-tein consumption in
favour of the vegetableone
The diet is close to thecurrent one
The diet is ‘distorted’towards the further in-crease in the consump-tion of animal protein
The diet is balanced andmeets local traditions
The main structuralmaterials (and min-
eral resources) Secondary
Primary and secondarywith the development of
resource-saving tech-nologies
Replacement of finiteresources with their new
equivalents
Replacement of finite/exhaustable resources
with their new equivalentsthat will be capable of
biodegradation upon com-pletion of use
Environmental pollu-tion
Minimal due to theclosure of all environ-mentally unfriendly
industries and the im-plementation of non-waste technologies
At the current level
Moderate due to low-waste technologies, im-proved treatment facili-
ties and disposal of espe-cially hazardous waste
Minimal due to de-urbanization, transition tonew construction materi-als, reduction of the gen-eral level of consumptionand introduction of a sig-nificant share (up to 40%
of GDP) of the naturaleconomy.
Biodiversity protec-tion Complete preservation Preservation of a larger
part Preservation of 50-70%
Gradual withdrawal fromagroecosystems in their
present form in favour ofadapted forms of nature
managementThe share of pro-
tected natural terri-tories on the planet
70% 33% Less than 10%The need for the introduc-tion of protected areas isgradually disappearing
The prospects for the productive development ofenvironmental science are related to the concept ofnoosphere ecosystems, which has been developedby one of the authors over the past 25 years (Sonko,
1992-2018) and can become anintegral part of thecontent of ecogeosophy, the theoretical and meth-odological principles of which have been improvedin treatises of another author (Kyselov, 2015).
S. Sonko, Y. Kyselov, S. Polovka. Journ.Geol.Geograph.Geoecology, 27(2), 346-356________________________________________________________________________________________________________________________________________________________________
354
References
ArskyF. N., 2015. YeslibynebyloStrabona [IfStrabo-didn’t exist]. /http://booksonline.com.ua/view.php?book=87675. (In Russian).
Denysyk H. I., 2001. Lisopole Ukrayiny : Monohrafiya[The “forest-and-field” of Ukraine: A mono-graph]. Tezys, Vinnytsya. 264 p. (In Ukrainian).
Gorshkov V. G., 1995. Fizicheskiye i biologicheskiyeosnovy ustoychivosti zhizni [Physical and biolog-ical fundamentals of the sustainable life]. VINITI,Moscow. 470 p. (In Russian).
Gumilev L. N., 2006. Etnogenez i biosfera Zemli [Eth-nogenesis and the Earth’s biosphere]. – Airis-Press, Moscow. 558 p. (In Russian).
Hettner A., 1927. Die Geographie, ihre Geschichte, ihrWesen und ihre Methoden [Geography, its histo-ry, being and methods]. – Ferdinand Hirt, Bres-lau. 463 S. (In German).
Holubets M. A., 2015. Seredovyshcheznavstvo – v heo-hrafichnu nauku [Environmental studies – to thegeographical science]. Ukrainian GeographicalJournal. – #2. 10–15. (In Ukrainian).
KovalyovO. P., 2014.Zahalnaheohrafiya: yakoyuyereal-nist, yaku, yakvvazhayutheohrafy, vonydoslidz-huyut? [General geography: whatistherealitythat,asthegeographers consider, they research?]/http://www.geography.pp.ua/2014/12/blog-post_8.html#more. (In Ukrainian).
Kyselov Iu. O., 2011. Osnovy heosofiyi: problemy teo-riyi ta metodolohiyi [Fundamentals of geosophy:issues of the theory and methodology]. SF “Lu-hansk Taras Shevchenko National University”,Luhansk. 208 p. (In Ukrainian).
KyselovIu. O., 2015. Doformuvannyanaukovykhzasade-kolohichnoyiheosofiyi [Onshapingscientificfun-damentalsofecologicalgeosophy] Heraldofthe-ChernivtsiYuriyFedkovychNationalUniversity.Ser. Geogr. – #762–763. 28–33.(In Ukrainian).
Kyselov Iu. O., 2017. Deyaki terminolohichni aspektyproblemy antropohennoho peretvorennya land-shaftu [Some terminological aspects of the issueof the anthropogenic transformation of land-scape]. Ecology – ways of harmonization of therelations between nature and society. Uman. 12-14. (In Ukrainian).
Losev K. S., 2003. Byudzhet antropogennogo ugleroda irol ekosistem v yego emissii i stoke v globalnom ikontinentalnom masshtabe [The budget of anth-ropogenic carbon and the role of ecosystems in itsemission and flow in the global and continentalscales]. Countries and regions on the way to sus-tainable development. Akademperiodika, Kyiv.36-41. (In Russian).
Nekos V. Yu., Nekos A. N., Safranov T. A., 2011. Za-halna ekolohiya ta neoekolohiya: pidruchnyk dlyastudentiv ekolohichnykh spetsialnostey vysh-chykh navchalnykh zakladiv [General ecologyand neoecology: a textbook for the students ofecological specialties in higher educational insti-tutions]. Kharkiv Vasyl Karazin National Univer-sity, Kharkiv. 596 p. (In Ukrainian).
NyemetsK. A., NyemetsL. M.,2014.Teoriyaimetodolohiyaheohrafichnoyinauky:metodyprostorovohoanalizu [Theoryandmethodo-logyofthegeographicalscience: methodsofspatia-lanalysis]. Kharkiv Vasyl Karazin National Uni-versity, Kharkiv.172 с.(In Ukrainian).
NikolayevV. A., 2006.Garmonicheskiyekanonyprirody[Theharmoniccanonsofthenature]. Herald of theMoscow University. Ser. 5. Geography. – #4. –8–14. (In Russian).
PozdnyakovD. V., TikunovV. S., FedotovA. P.,2003.Razrabotkaikartografirovaniyeintegralnykhpokazateleyustoychivogorazvitiyastranmira [Crea-tingandcartographingintegralindexesofsustainab-ledevelopmentofthecountriesoftheworld]. Heraldof the Moscow University. Ser. 5. Geography. #2.20–29. (In Russian).
Protopopov P., 2014. Biokorellirovannaya paradigmarazvitiya (elektronnyi resurs) [The bio-correlatedparadigm of development (An electronic re-source)] http://images. yandex.com/yandsearchource=wiz&fp=0&text=ПаисийПротопопов (InRussian).
PylypenkoI. O., 2015.Suspilno-heohrafichnaperyferiya:kontseptsiya, parametryzatsiyaidelimitatsiya :Monohrafiya [Socialandgeographicalperiphery:aconception, parameterization and delimitation :A monograph]. Hrin DS, Kherson. (In Ukrainian).
Reteyum A. Yu., 1988. Zemnyye miry [Earth realms].Mysl, Moscow. 272p.http://geoman.ru/books/item/f00/s00/z0000078/index.shtml. (In Russian).
Sonko S. P., 2018. Spysok naukovykh i naukovo-metodychnykh prats profesora Sonka S. P. sta-nom na 1.01.17. Pozytsiyi: 29, 31, 45, 46, 47, 48,49, 51, 52, 54, 57, 58, 61, 63, 65, 68, 70, 71, 73,74, 78, 86, 90, 93, 94, 97, 103, 124, 125, 134,141, 142, 164, 178, 187 [The list of scientific andscientific and methodical works by Professor S.P. Sonko as of 1.01.17. Positions: 29, 31, 45, 46,47, 48, 49, 51, 52, 54, 57, 58, 61, 63, 65, 68, 70,71, 73, 74, 78, 86, 90, 93, 94, 97, 103, 124, 125,134, 141, 142, 164, 178, 187]/http://lib.udau.edu.ua/handle/123456789/5320.(InUkrainian).
SonkoS. P., 2003.Prostorovyi rozvytoksotsiopryrod-nykhsystem: shlyakhdonovoyiparadyhmy: Mono-hrafiya [Spatialdevelopmentofthesocialandnatu-ralsystems: thewaytoanewparadigm: A mono-graph]. Nika-Tsentr, Kyiv. 287 p. /http://lib.udau.edu.ua/handle/123456789/367.(InUkrainian).
SonkoS. P., 2003.Heohrafichna interpretatsiyadopovi-deyRymskomuklubu [Ageographicalinterpreta-tionofthereportstotheClub of Rome ]. UkrainianGeographical Journal. № 1. 55–62. (In Ukrai-nian).
SonkoS. P., 2003.Prostorovi doslidzhenny ainfrastruktu-ryvelykohomistadlyarozrobkykontseptsiyiinfrae-kosystem (naprykladiKryvohoRohu) [Spatialre-searchesontheinfrastructureofagreatcityforcrea-tingaconceptionofinfraecosystems (ontheexam-
S. Sonko, Y. Kyselov, S. Polovka. Journ.Geol.Geograph.Geoecology, 27(2), 346-356________________________________________________________________________________________________________________________________________________________________
355
pleofKryvyiRih)].Economic and Social Geogra-phy. #54. 188–197. (In Ukrainian).
Sonko S. P., 2003. Regionalizatsiya, prykordonni kon-flikty ta maybutni shlyakhy rozvytku pryrody isuspilstva [Regionalization, boundary conflictsand future ways of development of nature and so-ciety]. Countries and regions on the way to sus-tainable development. (In Ukrainian).
SonkoS. P., 2010. Kontseptsiyanoosfernykhekosyste-myakprodovzhennyaideyV. I. Vernadskoho [The-conceptionofnoosphericecosystemsascontinuationofV. I. Vernadsky’sideas]. Noosphere and civili-zation. All-Ukrainian Philosophical Journal. #8-9(11). 230-241. (In Ukrainian).
SonkoS. P., 2011.Heohrafichnanaukavnovykhsotsialno-ekonomichnykhumovakhrozvytkuUkrayiny[Thegeographicalscienceinnewsocialandecono-micconditionsofdevelopmentofUkraine]. Con-structivisminthemoderngeography. Ukrainian-GeographicalJournal. #1. 32–33. /http://lib.udau.edu.ua/handle/123456789/388.(InUkrainian).
SonkoS. P., MaksymenkoN. V., 2013. Prostorovi i cha-sovi mekhanizmy ekolohichnoyi ekspansiyi agro-landshaftu [Space and time mechanisms of theecological expansion of agrarian landscape]. Hu-man and environment. #2(15). Kharkiv : KharkivVasyl Karazin National University. 5–21. /http://lib.udau.edu.ua/handle/123456789/351. (InUkrainian).
SonkoS. P., Kyselov Iu. O., 2014.Landshaftno-etnichnavzayemodiyayakmetodolohichnaproble-maekolohiyi [Landscapeandethnicalcooperationa-samethodologicalissueofecology]. Ecology –ways of harmonization of relations between na-ture and society. Uman : Uman National Univer-sity of Horticulture. 9–13. /http://lib.udau.edu.ua/handle/123456789/536. (InUkrainian).
Sonko S. P., Maksymenko N. V., Kyselov Iu. O., Me-zentsev K. V., 2015. Ekolohichni osnovy udosko-nalennya administratyvno-terytorialnoho ustroyuUkrayiny [Ecological fundamentals of optimiza-tion of the administrative and territorial order ofUkraine]. Uman : Uman National University ofHorticulture.http://lib.udau.edu.ua/handle/123456789/6195.(InUkrainian).
SonkoS. P., 2015.QUO VADIS, vitchyznyanasuspilna-heohrafiya? [QUO VADIS,native human geogra-phy?]. Up-to-date issues of development of thegeographical science and education in UkraineKyiv : Obriyi. 51–53.http://lib.udau.edu.ua/handle/123456789/901. (InUkrainian).
SonkoS. P., MaksymenkoN. V.. 2016.Pro “pryrodnist” ta“antropohennist” landshaftotvorennya [Aboutthe“naturality” andthe “anthropogenity” oflandsca-peshaping]. Human and environment. Issues ofneoecology. Modern geographical and ecologicalresearches of environment. #1–2(25). Kharkiv :Kharkiv Vasyl Karazin National University. 9–13.
http://lib.udau.edu.ua/handle/123456789/2783.(In Ukrainian).
Sonko S. P., Yamchuk P. M., Kyselov Iu. O., SukhanovaI. P., 2016. Vzayemozvyazok rozvytku agrarnoyihaluzi i metodolohiyi agrarnoyi nauky v umovakhpostindustrialnoyi ekonomiky (u konteksti perek-hodu na novi standarty vyshchoyi osvity) [Inter-connection of development of the agrarian branchand the methodology of the agrarian science inthe conditions of post-industrial economy (in thecontext of passage to the new standards of highereducation)].Social and economic aspects of sus-tainable development of the Ukrainian economy:A collective monograph. Uman : Sochynsky M.M. 122–134.http://lib.udau.edu.ua/handle/123456789/2639.(InUkrainian).
Sergiy Sonko, 2016. The concept of spatial redistributionin modern subject field of social geogra-phy.JournalofSocialandEconomicGeography. #21(2). Kharkiv : KharkivVasylKarazinNationalUni-versity.12–18.
SonkoS. P., KazakovaT. A., 2016. Chytrebazapovida-tyantropohennilandshafty (postneklasychnyipoh-lyadnaskladnatsionalnoyi ekolohichnoyi merezhi)[Is it necessary to reserve anthropogenic land-scapes (a post-non-classical view on the structureof the national ecological network]. Perspectivesof the development of forestry and landscape gar-dening. Uman : Vizavi. 18-20. (In Ukrainian).
Sonko S. P., 2017. Biosferotsentryzm u suchasnykhkontseptsiyakh vzayemodiyi pryrody i suspilstva[Biospherocentrism in the modern conceptions ofcollaboration between nature and society]. Anecological strategy of the future.Umanhttp://lib.udau.edu.ua/handle/123456789/6164 (In Ukrainian).
Sonko S. P., 2018. Stalyi rozvytok: 25 rokiv nadiy tarozcharuvan [Sustainable development: 25 yearsof hope and disappointment]. Sustainable devel-opment– state and perspectives. Lviv : Lviv Poly-technics publishers. 59–63.http://lib.udau.edu.ua/handle/123456789/6620.(In Ukrainian).
TopchievO. H., 2004.Pro predmetnu oblastipredmetsus-pilnoyiheohrafiyi [Aboutthesubjectareaandthe-subjectofgeography]. Ukrainian Geographical-Journal. № 2. 3–7. (InUkrainian).
TopchievO. H., NudelmanV. I., RudenkoL. H.,2012.Heohrafiyaperednovitnimyvyklykamyizapytamy (ukrayinskyiaspekt) [Geographyinthe faceofthenewestchallengesandrequire-ments(Ukrainianaspect)]. Ukrainian GeographicalJournal. № 2. 3–10. (InUkrainian).
TopchievO. H., Malchykova D. S., 2014. Planuvannya-terytoriy [Planningofterritories]. Hrin D. S.,Kherson. 268 p. (In Ukrainian).
Topchiev O. H., Malchykova D. S., Pylypenko I. O.,Yavorska V. V., 2017. Kontseptsiya dovkillya –suchasnyi napryam integratsiyi pryrodnycho- tasuspilno-heohrafichnykh doslidzhen [The concep-tion of environment as a modern branch of inte-gration natural- and social and geographical re-
S. Sonko, Y. Kyselov, S. Polovka. Journ.Geol.Geograph.Geoecology, 27(2), 346-356________________________________________________________________________________________________________________________________________________________________
356
searches]. Ukrainian Geographical Journal. #3.64–70. (InUkrainian).
VernadskyV. I., 1991.Nauchnaya mysl kak planetnoyeyavleniye [Scientificthoughtasaplanetarypheno-menon]. Nauka, Moscow. 270 p. (In Russian).
Yablokov A., Levchenko V., 2015.The decision exists:transition to controlled evolution of the biosphere/ The Journal of Philosophy and Cosmology. Vol.14. 92–118.
Yablokov A., Levchenko V., 2016.The biosphere as aliving system. On peculiarities of the evolutionaryprocess on the biosphere level / The Journal ofPhilosophy and Cosmology. Vol. 17. 152–175.
Yablokov A., Levchenko V., 2017.The Biosphere as aLiving System 1. On the Harmonization of Hu-man and Biosphere Relationship / The JournalofPphilosophy and Cosmology. Vol. 18. 52–83.

Sopov, N. Sopova, O. Dankeyeva, S. Chuhaiev Journ.Geol.Geograph.Geoecology, 27(2), 363-373D. Sopov, N. Sopova, O. Dankeyeva, S. Chuhaiev Journ.Geol.Geograph.Geoecology, 27(2), 360-370______________________________________________________________________________________________________________________________________________________________
357
Journal of Geology,Geography and Geoecology
Journal home page: geology-dnu-dp.ua
ISSN 2617-2909 (print)ISSN 2617-2119 (online)
Journ.Geol.Geograph.Geoecology,
27(2), 357-367doi:10.15421/111860
D. Sopov, N. Sopova, O. Dankeyeva, S. Chuhaiev Journ.Geol.Geograph.Geoecology, 27(2), 357-367________________________________________________________________________________________________________________________________________________________________
Natural-historical and ecological analysis of land resources and land use in Lugansk region
D. Sopov1, N. Sopova2, O. Dankeyeva3, S. Chuhaiev4
Lugansk National Agrarian University, Kharkov, Ukraine, e-mail:[email protected], [email protected],[email protected], [email protected]
The recent but intensive economic development of the region has led to the formation ofa modern land use structure, caused both by natural and historical factors. Thedestructive anthropogenic impact on the geomorphosphere has led to the degradation ofsoils and the degradation of the land fund. A retrospective analysis of the problem canreveal the causes and consequences of the land use system established in the region and
suggest some adjustments to land management and land use policies. The influence of human economic activity (in particular,agriculture and the coal industry) on the nature of land use in the Lugansk region is considered (separately for the right bank and theleft bank part thereof). The significance of the extent of ravines in the territory and the surface washout in the process of degradationof soils and lands is emphasized, which is especially expressed on the Donetsk ridge (right bank of the River Seversky Donets). Therole of the semi-mountainous terrain of the Donetsk ridge as a natural factor in the spread of erosion processes is noted. A briefhistorical review of attempts to combat the development of ravines in Lugansk region, which have been conducted since the secondhalf of the nineteenth century, is presented, but the vast majority of these efforts were not effective. One of the negative factors thatinfluenced the structure of land use is the removal of an increasingly large area from use as grazing land, which increases theintensity of erosion processes. The destructive influence of mine production on the structure of land use in the studied region ishighlighted. We note the ecological consequences of physical alienation of lands as a result of their occupation by waste heaps andother anthropogenic forms of relief, formed by the mining industry. It is emphasized that not only the mines themselves, but alsoconcentration of factories, communication structures, etc. play a role in reducing the area occupied by agricultural land, and thereforecause a negative change in the structure of land use in the right-bank part of the territory of Lugansk region. It is noted that extensiveand excessive intensive land use in agriculture and the coal mining industry in Lugansk region have led to the degradation of largeareas of land and impoverishment of the land fund. It is stressed that the current structure of land use requires radical changes whichshould be based on new conceptual principles and a systematic approach to the problems of nature management.
Key words: land resources, land fund, land plot structure, land use structure, land management, land degradation, landfill, extensiveuse of land, nature use.
Природно-історичний та екологічний аналіз земельних ресурсів та землекористуванняв Луганській області
Д. С. Сопов1, Н. В. Сопова2, О. Є. Данкеєва3, С. В. Чугаєв4
Луганський національний аграрний університет, Харків, Україна, e-mail:[email protected],[email protected], [email protected], [email protected]
Недавнє, але інтенсивне господарське освоєння краю призвело до формування сучасної структури землекористування,зумовленої як природними, так і історичними факторами. Деструктивний антропогенний вплив на геоморфосферу призвівдо деградації ґрунтів і зубожіння земельного фонду. Ретроспективний аналіз порушеної у роботі проблеми дозволяє виявитипричини та наслідки усталеної в реґіоні системи землекористування та вносити певні корективи в політикуземлевпорядкування та землекористування.Розглянуто вплив господарської діяльності людини (зокрема, сільськогогосподарства та вугільної промисловості) на характер землекористування в Луганській області (окремо для правобережноїта лівобережної її частин). Наголошено на значенні заяруженості території й площинного змиву в процесі деградації ґрунтіві земель, що особливо виражено на Донецькому кряжі (правобережжі Сіверського Дінця). Відзначено роль напівгірськогорельєфу Донецького кряжа як природного чинника поширення ерозійних процесів. Наведено короткий історичний оглядспроб боротьби з розвитком ярів на Луганщині, які проводилися, починаючи ще з другої половини ХІХ ст., але в переважнійбільшості не були ефективними. Як один із негативних чинників, що вплинули на структуру землекористування, окресленовідведення дедалі більшої площі під пасовища, що підвищує інтенсивність ерозійних процесів. Висвітлено згубний вплив
Received 14.07.2018;Received in revised form 07.08.2018;Accepted 04.10.2018
D. Sopov, N. Sopova, O. Dankeyeva, S. Chuhaiev Journ.Geol.Geograph.Geoecology, 27(2), 357-367________________________________________________________________________________________________________________________________________________________________
358
шахтного виробництва на структуру землекористування в досліджуваному реґіоні. Зауважено щодо екологічних наслідківфізичного відчуження земель внаслідок їх зайняття породними відвалами, териконами та іншими антропогенними формамирельєфу, утвореними гірничопромисловою діяльністю. Підкреслено, що не лише власне шахти, а й збагачувальні фабрики,комунікаційні споруди тощо відіграють певну роль у зменшенні площ, зайнятих сільськогосподарськими угіддями, а отже –викликають негативні зміни структури землекористування у правобережній частині території Луганської області.Відзначено, що екстенсивне, а також надміру інтенсивне землекористування в сільському господарстві та вуглевидобувнійпромисловості в Луганській області призвели до деградації великих площ земель та зубожіння земельного фонду.Наголошено, що сформована структура землекористування потребує радикальних змін, які б мали базуватися на новихконцептуальних принципах і системному підході до проблем природокористування.
Ключові слова: земельні ресурси, земельний фонд, структура земельних угідь, структура землекористування,землевпорядкування, деградація земель, площинний змив, екстенсивне використання земель, природокористування.
Introduction. Problem setting. Land resources arethe most important part of the natural environment,which predetermine the existence and use of allother natural resources. At the core of all types ofnature management is the land use system, which isformed under the influence of natural, historical,ethno-cultural, socio-economic factors, which leadto a combination of different areas of land use andthe formation of a particular ecological situation.
Extensive methods of using naturalresources, including land, have led to thedevelopment of a number of destructive processes,the deterioration of environmental quality of theenvironment and unidirectional land use.
In Lugansk region an almost practicallycatastrophic situation has developed in the area ofland use associated with intense violent use of landin agriculture and the mining industry.
Economic development of the easternterritories of Ukraine began later than the rest of itsterritories and took place quite intensively. Theheterogeneity of the natural conditions of variousparts of the modern Lugansk region causeddifferences in the nature of management, and,consequently, different pressures on the naturalenvironment, in particular, on land resources. Thenature of the relief and climatic features of the leftbankof the River Seversky Donets led to thedevelopment of agriculture, intensive ploughing ofland with all the negative consequences. On theright bank of the River Seversky Donets, inaddition, due to the unique geological structure ofthe area, the mining industry has concentrated -again, with significant negative environmentalconsequences. The main pressure fell on thegeomorphosphere, or more precisely, on thepedosphere - due to reduced agricultural use, soildegradation, fertility decline, physical reduction inthe area of fertile soils, deterioration of the physicaland chemical properties of the soils, andconsequently - loss of crop, pollution of allcomponents of the natural environment,deterioration of the sanitary and hygienic livingconditions of the population, etc. That is, a numberof environmental problems arose, which for
Lugansk region, in the current conditions, havebecome a matter of special urgency.
The land use structure requires radicalchanges not only because of the impoverishment ofland due to inefficient use of the land fund, but alsodue to the destructive events in the regionassociated with the recent war and the temporaryRussian occupation of part of the territory ofLugansk region, which together have led to tragicconsequences both in society and in the naturalenvironment.
A retrospective and up-to-date view of theseproblems can reveal the causes and consequencesof the existing land management and land usesystem and make constructive conclusions.
The above mentioned postulates lead to therelevance of the chosen topic of study.The purpose of the work is the natural-historicaland ecological analysis of land resources and landuse in Lugansk region, identifying the causes andconsequences of the impoverishment of the landfund - the basis of the socio-economic developmentof the region.Tasks that were delivered:
- to identify and analyze the influence ofnatural-historical conditions of the region on theformation of land use structure;
- to make a description of the structure ofland use and its changes in time;
- to create a base of basic indicators thatreflect the state of land use and trends in itschanges;
- to determine the nature of the negativeimpact of existing approaches to land use in theregion;
- to substantiate practical recommendationsaimed at optimizing the land use structure in theregion.The object of scientific research is the landresources of the Lugansk region.The subject of scientific research is the structureof land use, its changes over time, in particular thestate of land used in agriculture and industry.The methodological basis of scientific research isthe laws and principles of dialectics; the basicmethodological basis is the systematic approach as
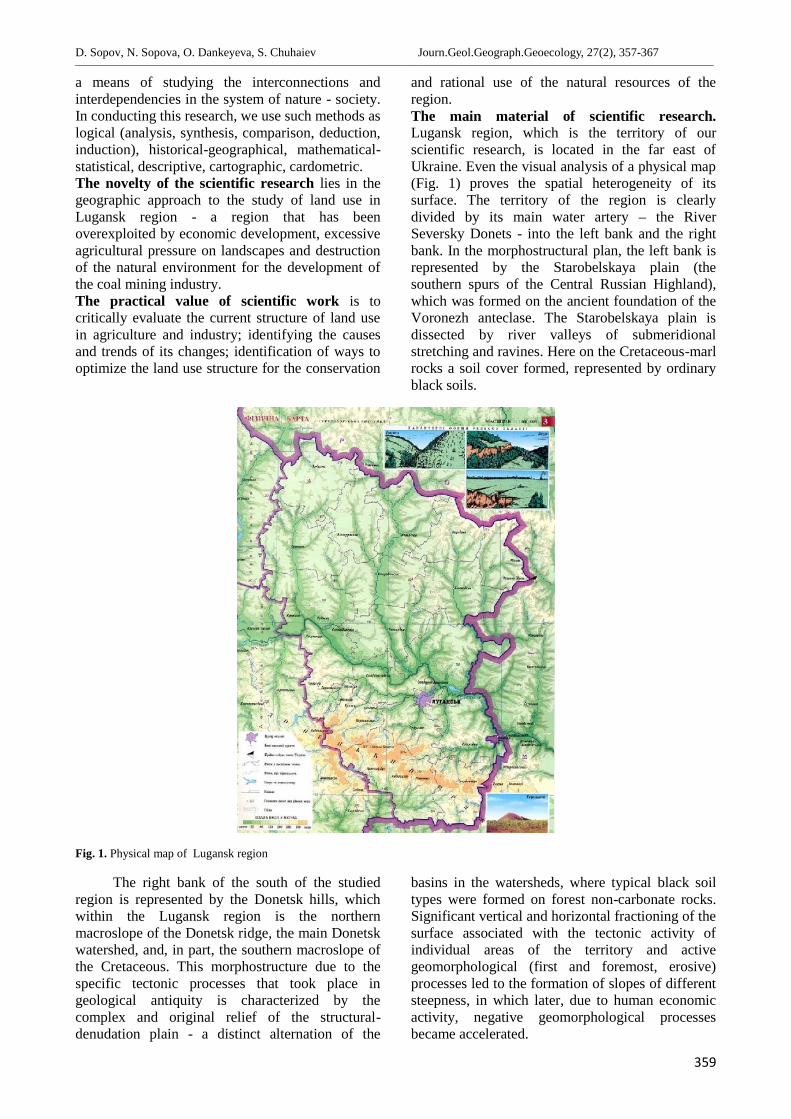
D. Sopov, N. Sopova, O. Dankeyeva, S. Chuhaiev Journ.Geol.Geograph.Geoecology, 27(2), 357-367________________________________________________________________________________________________________________________________________________________________
359
a means of studying the interconnections andinterdependencies in the system of nature - society.In conducting this research, we use such methods aslogical (analysis, synthesis, comparison, deduction,induction), historical-geographical, mathematical-statistical, descriptive, cartographic, cardometric.The novelty of the scientific research lies in thegeographic approach to the study of land use inLugansk region - a region that has beenoverexploited by economic development, excessiveagricultural pressure on landscapes and destructionof the natural environment for the development ofthe coal mining industry.The practical value of scientific work is tocritically evaluate the current structure of land usein agriculture and industry; identifying the causesand trends of its changes; identification of ways tooptimize the land use structure for the conservation
and rational use of the natural resources of theregion.The main material of scientific research.Lugansk region, which is the territory of ourscientific research, is located in the far east ofUkraine. Even the visual analysis of a physical map(Fig. 1) proves the spatial heterogeneity of itssurface. The territory of the region is clearlydivided by its main water artery – the RiverSeversky Donets - into the left bank and the rightbank. In the morphostructural plan, the left bank isrepresented by the Starobelskaya plain (thesouthern spurs of the Central Russian Highland),which was formed on the ancient foundation of theVoronezh anteclase. The Starobelskaya plain isdissected by river valleys of submeridionalstretching and ravines. Here on the Cretaceous-marlrocks a soil cover formed, represented by ordinaryblack soils.
Fig. 1. Physical map of Lugansk region
The right bank of the south of the studiedregion is represented by the Donetsk hills, whichwithin the Lugansk region is the northernmacroslope of the Donetsk ridge, the main Donetskwatershed, and, in part, the southern macroslope ofthe Cretaceous. This morphostructure due to thespecific tectonic processes that took place ingeological antiquity is characterized by thecomplex and original relief of the structural-denudation plain - a distinct alternation of the
basins in the watersheds, where typical black soiltypes were formed on forest non-carbonate rocks.Significant vertical and horizontal fractioning of thesurface associated with the tectonic activity ofindividual areas of the territory and activegeomorphological (first and foremost, erosive)processes led to the formation of slopes of differentsteepness, in which later, due to human economicactivity, negative geomorphological processesbecame accelerated.
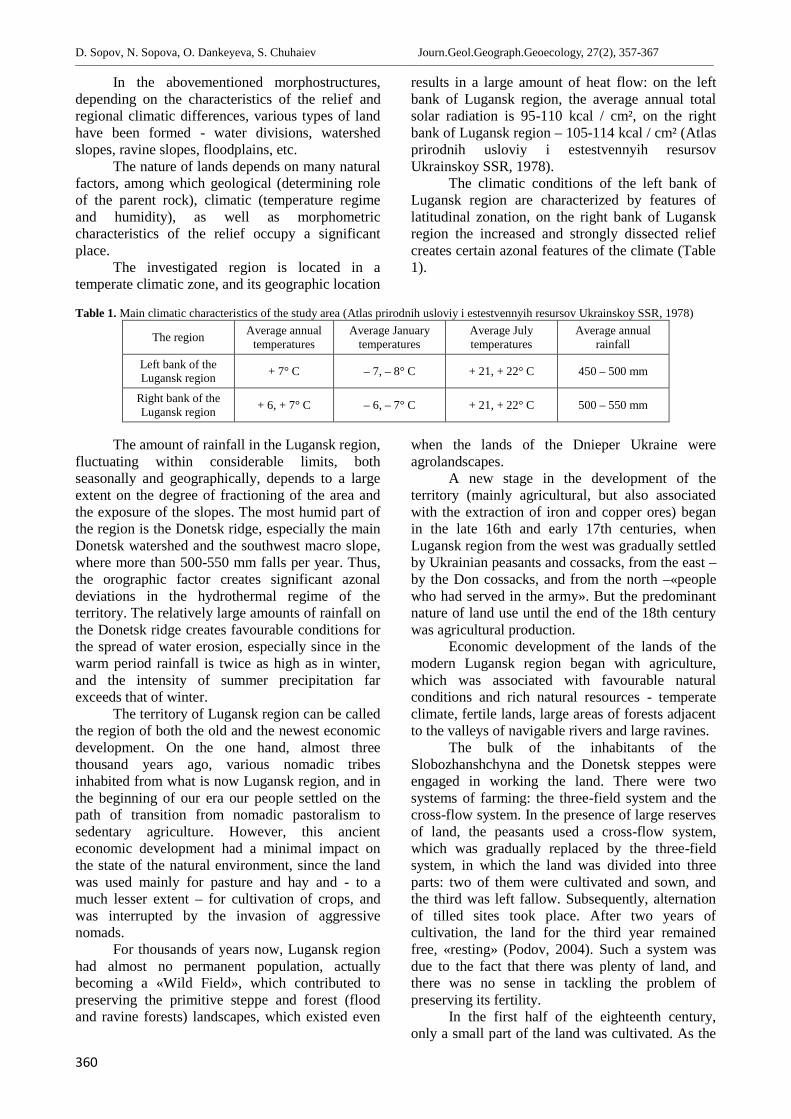
D. Sopov, N. Sopova, O. Dankeyeva, S. Chuhaiev Journ.Geol.Geograph.Geoecology, 27(2), 357-367________________________________________________________________________________________________________________________________________________________________
360
In the abovementioned morphostructures,depending on the characteristics of the relief andregional climatic differences, various types of landhave been formed - water divisions, watershedslopes, ravine slopes, floodplains, etc.
The nature of lands depends on many naturalfactors, among which geological (determining roleof the parent rock), climatic (temperature regimeand humidity), as well as morphometriccharacteristics of the relief occupy a significantplace.
The investigated region is located in atemperate climatic zone, and its geographic location
results in a large amount of heat flow: on the leftbank of Lugansk region, the average annual totalsolar radiation is 95-110 kcal / cm², on the rightbank of Lugansk region – 105-114 kcal / cm² (Atlasprirodnih usloviy i estestvennyih resursovUkrainskoy SSR, 1978).
The climatic conditions of the left bank ofLugansk region are characterized by features oflatitudinal zonation, on the right bank of Luganskregion the increased and strongly dissected reliefcreates certain azonal features of the climate (Table1).
Table 1. Main climatic characteristics of the study area (Atlas prirodnih usloviy i estestvennyih resursov Ukrainskoy SSR, 1978)
The region Average annualtemperatures
Average Januarytemperatures
Average Julytemperatures
Average annualrainfall
Left bank of theLugansk region + 7° С – 7, – 8° С + 21, + 22° С 450 – 500 mm
Right bank of theLugansk region + 6, + 7° С – 6, – 7° С + 21, + 22° С 500 – 550 mm
The amount of rainfall in the Lugansk region,fluctuating within considerable limits, bothseasonally and geographically, depends to a largeextent on the degree of fractioning of the area andthe exposure of the slopes. The most humid part ofthe region is the Donetsk ridge, especially the mainDonetsk watershed and the southwest macro slope,where more than 500-550 mm falls per year. Thus,the orographic factor creates significant azonaldeviations in the hydrothermal regime of theterritory. The relatively large amounts of rainfall onthe Donetsk ridge creates favourable conditions forthe spread of water erosion, especially since in thewarm period rainfall is twice as high as in winter,and the intensity of summer precipitation farexceeds that of winter.
The territory of Lugansk region can be calledthe region of both the old and the newest economicdevelopment. On the one hand, almost threethousand years ago, various nomadic tribesinhabited from what is now Lugansk region, and inthe beginning of our era our people settled on thepath of transition from nomadic pastoralism tosedentary agriculture. However, this ancienteconomic development had a minimal impact onthe state of the natural environment, since the landwas used mainly for pasture and hay and - to amuch lesser extent – for cultivation of crops, andwas interrupted by the invasion of aggressivenomads.
For thousands of years now, Lugansk regionhad almost no permanent population, actuallybecoming a «Wild Field», which contributed topreserving the primitive steppe and forest (floodand ravine forests) landscapes, which existed even
when the lands of the Dnieper Ukraine wereagrolandscapes.
A new stage in the development of theterritory (mainly agricultural, but also associatedwith the extraction of iron and copper ores) beganin the late 16th and early 17th centuries, whenLugansk region from the west was gradually settledby Ukrainian peasants and cossacks, from the east –by the Don cossacks, and from the north –«peoplewho had served in the army». But the predominantnature of land use until the end of the 18th centurywas agricultural production.
Economic development of the lands of themodern Lugansk region began with agriculture,which was associated with favourable naturalconditions and rich natural resources - temperateclimate, fertile lands, large areas of forests adjacentto the valleys of navigable rivers and large ravines.
The bulk of the inhabitants of theSlobozhanshchyna and the Donetsk steppes wereengaged in working the land. There were twosystems of farming: the three-field system and thecross-flow system. In the presence of large reservesof land, the peasants used a cross-flow system,which was gradually replaced by the three-fieldsystem, in which the land was divided into threeparts: two of them were cultivated and sown, andthe third was left fallow. Subsequently, alternationof tilled sites took place. After two years ofcultivation, the land for the third year remainedfree, «resting» (Podov, 2004). Such a system wasdue to the fact that there was plenty of land, andthere was no sense in tackling the problem ofpreserving its fertility.
In the first half of the eighteenth century,only a small part of the land was cultivated. As the
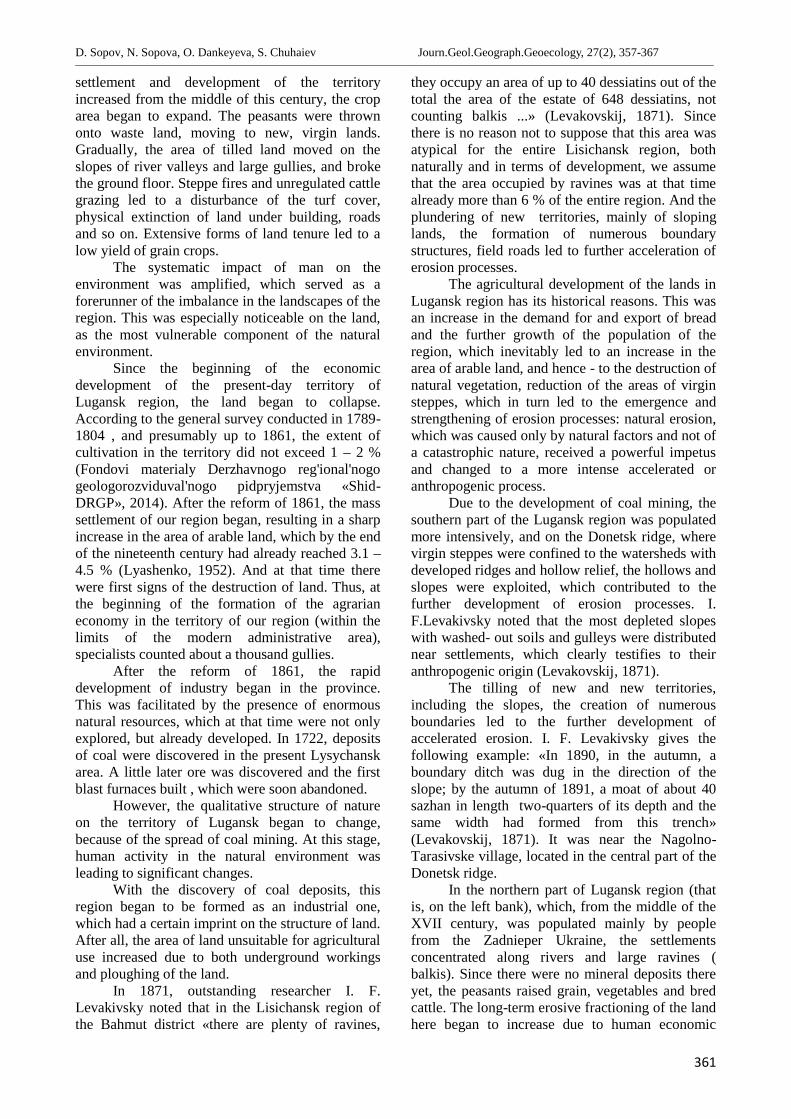
D. Sopov, N. Sopova, O. Dankeyeva, S. Chuhaiev Journ.Geol.Geograph.Geoecology, 27(2), 357-367________________________________________________________________________________________________________________________________________________________________
361
settlement and development of the territoryincreased from the middle of this century, the croparea began to expand. The peasants were thrownonto waste land, moving to new, virgin lands.Gradually, the area of tilled land moved on theslopes of river valleys and large gullies, and brokethe ground floor. Steppe fires and unregulated cattlegrazing led to a disturbance of the turf cover,physical extinction of land under building, roadsand so on. Extensive forms of land tenure led to alow yield of grain crops.
The systematic impact of man on theenvironment was amplified, which served as aforerunner of the imbalance in the landscapes of theregion. This was especially noticeable on the land,as the most vulnerable component of the naturalenvironment.
Since the beginning of the economicdevelopment of the present-day territory ofLugansk region, the land began to collapse.According to the general survey conducted in 1789-1804 , and presumably up to 1861, the extent ofcultivation in the territory did not exceed 1 – 2 %(Fondovi materialy Derzhavnogo reg'ional'nogogeologorozviduval'nogo pidpryjemstva «Shid-DRGP», 2014). After the reform of 1861, the masssettlement of our region began, resulting in a sharpincrease in the area of arable land, which by the endof the nineteenth century had already reached 3.1 –4.5 % (Lyashenko, 1952). And at that time therewere first signs of the destruction of land. Thus, atthe beginning of the formation of the agrarianeconomy in the territory of our region (within thelimits of the modern administrative area),specialists counted about a thousand gullies.
After the reform of 1861, the rapiddevelopment of industry began in the province.This was facilitated by the presence of enormousnatural resources, which at that time were not onlyexplored, but already developed. In 1722, depositsof coal were discovered in the present Lysychanskarea. A little later ore was discovered and the firstblast furnaces built , which were soon abandoned.
However, the qualitative structure of natureon the territory of Lugansk began to change,because of the spread of coal mining. At this stage,human activity in the natural environment wasleading to significant changes.
With the discovery of coal deposits, thisregion began to be formed as an industrial one,which had a certain imprint on the structure of land.After all, the area of land unsuitable for agriculturaluse increased due to both underground workingsand ploughing of the land.
In 1871, outstanding researcher I. F.Levakivsky noted that in the Lisichansk region ofthe Bahmut district «there are plenty of ravines,
they occupy an area of up to 40 dessiatins out of thetotal the area of the estate of 648 dessiatins, notcounting balkis ...» (Levakovskij, 1871). Sincethere is no reason not to suppose that this area wasatypical for the entire Lisichansk region, bothnaturally and in terms of development, we assumethat the area occupied by ravines was at that timealready more than 6 % of the entire region. And theplundering of new territories, mainly of slopinglands, the formation of numerous boundarystructures, field roads led to further acceleration oferosion processes.
The agricultural development of the lands inLugansk region has its historical reasons. This wasan increase in the demand for and export of breadand the further growth of the population of theregion, which inevitably led to an increase in thearea of arable land, and hence - to the destruction ofnatural vegetation, reduction of the areas of virginsteppes, which in turn led to the emergence andstrengthening of erosion processes: natural erosion,which was caused only by natural factors and not ofa catastrophic nature, received a powerful impetusand changed to a more intense accelerated oranthropogenic process.
Due to the development of coal mining, thesouthern part of the Lugansk region was populatedmore intensively, and on the Donetsk ridge, wherevirgin steppes were confined to the watersheds withdeveloped ridges and hollow relief, the hollows andslopes were exploited, which contributed to thefurther development of erosion processes. I.F.Levakivsky noted that the most depleted slopeswith washed- out soils and gulleys were distributednear settlements, which clearly testifies to theiranthropogenic origin (Levakovskij, 1871).
The tilling of new and new territories,including the slopes, the creation of numerousboundaries led to the further development ofaccelerated erosion. I. F. Levakivsky gives thefollowing example: «In 1890, in the autumn, aboundary ditch was dug in the direction of theslope; by the autumn of 1891, a moat of about 40sazhan in length two-quarters of its depth and thesame width had formed from this trench»(Levakovskij, 1871). It was near the Nagolno-Tarasivske village, located in the central part of theDonetsk ridge.
In the northern part of Lugansk region (thatis, on the left bank), which, from the middle of theXVII century, was populated mainly by peoplefrom the Zadnieper Ukraine, the settlementsconcentrated along rivers and large ravines (balkis). Since there were no mineral deposits thereyet, the peasants raised grain, vegetables and bredcattle. The long-term erosive fractioning of the landhere began to increase due to human economic
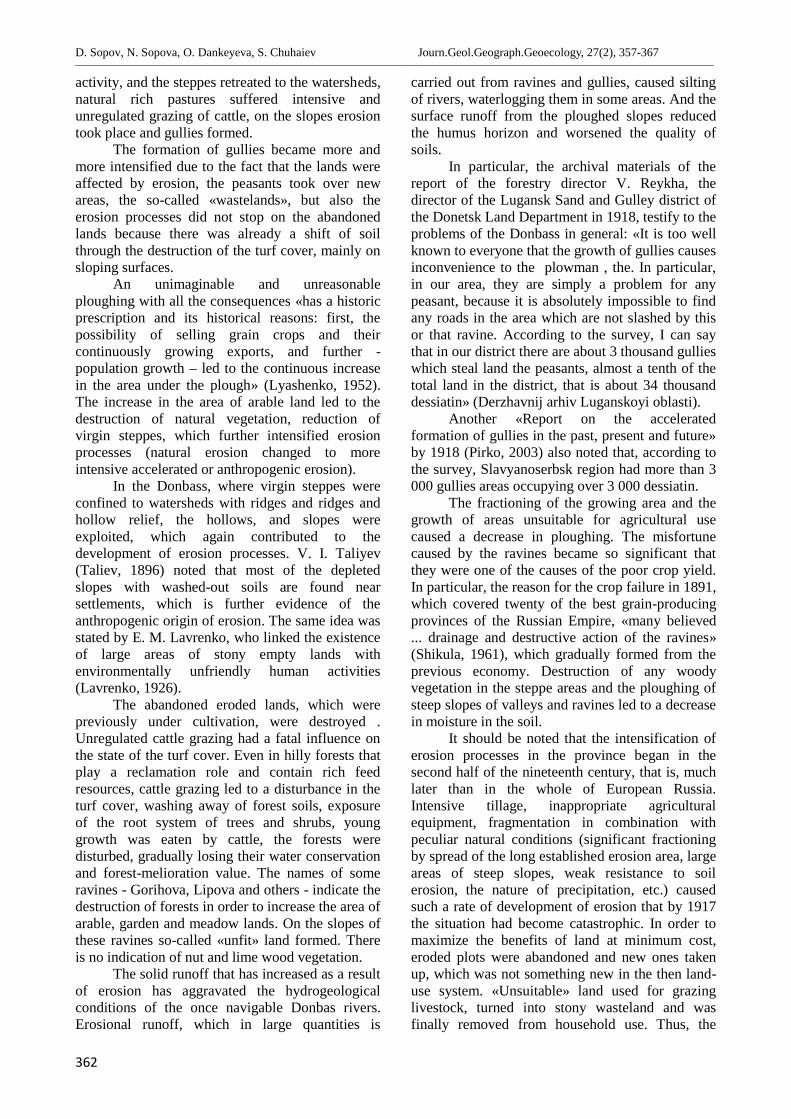
D. Sopov, N. Sopova, O. Dankeyeva, S. Chuhaiev Journ.Geol.Geograph.Geoecology, 27(2), 357-367________________________________________________________________________________________________________________________________________________________________
362
activity, and the steppes retreated to the watersheds,natural rich pastures suffered intensive andunregulated grazing of cattle, on the slopes erosiontook place and gullies formed.
The formation of gullies became more andmore intensified due to the fact that the lands wereaffected by erosion, the peasants took over newareas, the so-called «wastelands», but also theerosion processes did not stop on the abandonedlands because there was already a shift of soilthrough the destruction of the turf cover, mainly onsloping surfaces.
An unimaginable and unreasonableploughing with all the consequences «has a historicprescription and its historical reasons: first, thepossibility of selling grain crops and theircontinuously growing exports, and further -population growth – led to the continuous increasein the area under the plough» (Lyashenko, 1952).The increase in the area of arable land led to thedestruction of natural vegetation, reduction ofvirgin steppes, which further intensified erosionprocesses (natural erosion changed to moreintensive accelerated or anthropogenic erosion).
In the Donbass, where virgin steppes wereconfined to watersheds with ridges and ridges andhollow relief, the hollows, and slopes wereexploited, which again contributed to thedevelopment of erosion processes. V. I. Taliyev(Taliev, 1896) noted that most of the depletedslopes with washed-out soils are found nearsettlements, which is further evidence of theanthropogenic origin of erosion. The same idea wasstated by E. M. Lavrenko, who linked the existenceof large areas of stony empty lands withenvironmentally unfriendly human activities(Lavrenko, 1926).
The abandoned eroded lands, which werepreviously under cultivation, were destroyed .Unregulated cattle grazing had a fatal influence onthe state of the turf cover. Even in hilly forests thatplay a reclamation role and contain rich feedresources, cattle grazing led to a disturbance in theturf cover, washing away of forest soils, exposureof the root system of trees and shrubs, younggrowth was eaten by cattle, the forests weredisturbed, gradually losing their water conservationand forest-melioration value. The names of someravines - Gorihova, Lipova and others - indicate thedestruction of forests in order to increase the area ofarable, garden and meadow lands. On the slopes ofthese ravines so-called «unfit» land formed. Thereis no indication of nut and lime wood vegetation.
The solid runoff that has increased as a resultof erosion has aggravated the hydrogeologicalconditions of the once navigable Donbas rivers.Erosional runoff, which in large quantities is
carried out from ravines and gullies, caused siltingof rivers, waterlogging them in some areas. And thesurface runoff from the ploughed slopes reducedthe humus horizon and worsened the quality ofsoils.
In particular, the archival materials of thereport of the forestry director V. Reykha, thedirector of the Lugansk Sand and Gulley district ofthe Donetsk Land Department in 1918, testify to theproblems of the Donbass in general: «It is too wellknown to everyone that the growth of gullies causesinconvenience to the plowman , the. In particular,in our area, they are simply a problem for anypeasant, because it is absolutely impossible to findany roads in the area which are not slashed by thisor that ravine. According to the survey, I can saythat in our district there are about 3 thousand gullieswhich steal land the peasants, almost a tenth of thetotal land in the district, that is about 34 thousanddessiatin» (Derzhavnij arhiv Luganskoyi oblasti).
Another «Report on the acceleratedformation of gullies in the past, present and future»by 1918 (Pirko, 2003) also noted that, according tothe survey, Slavyanoserbsk region had more than 3000 gullies areas occupying over 3 000 dessiatin.
The fractioning of the growing area and thegrowth of areas unsuitable for agricultural usecaused a decrease in ploughing. The misfortunecaused by the ravines became so significant thatthey were one of the causes of the poor crop yield.In particular, the reason for the crop failure in 1891,which covered twenty of the best grain-producingprovinces of the Russian Empire, «many believed... drainage and destructive action of the ravines»(Shikula, 1961), which gradually formed from theprevious economy. Destruction of any woodyvegetation in the steppe areas and the ploughing ofsteep slopes of valleys and ravines led to a decreasein moisture in the soil.
It should be noted that the intensification oferosion processes in the province began in thesecond half of the nineteenth century, that is, muchlater than in the whole of European Russia.Intensive tillage, inappropriate agriculturalequipment, fragmentation in combination withpeculiar natural conditions (significant fractioningby spread of the long established erosion area, largeareas of steep slopes, weak resistance to soilerosion, the nature of precipitation, etc.) causedsuch a rate of development of erosion that by 1917the situation had become catastrophic. In order tomaximize the benefits of land at minimum cost,eroded plots were abandoned and new ones takenup, which was not something new in the then land-use system. «Unsuitable» land used for grazinglivestock, turned into stony wasteland and wasfinally removed from household use. Thus, the
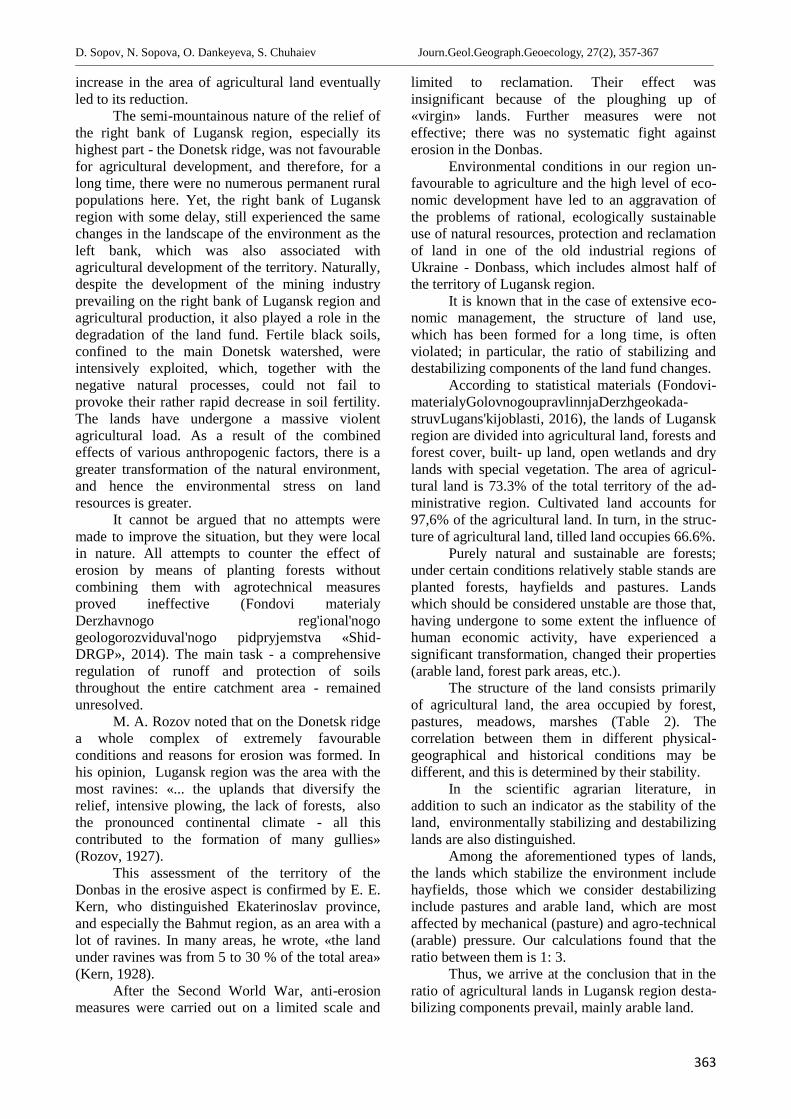
D. Sopov, N. Sopova, O. Dankeyeva, S. Chuhaiev Journ.Geol.Geograph.Geoecology, 27(2), 357-367________________________________________________________________________________________________________________________________________________________________
363
increase in the area of agricultural land eventuallyled to its reduction.
The semi-mountainous nature of the relief ofthe right bank of Lugansk region, especially itshighest part - the Donetsk ridge, was not favourablefor agricultural development, and therefore, for along time, there were no numerous permanent ruralpopulations here. Yet, the right bank of Luganskregion with some delay, still experienced the samechanges in the landscape of the environment as theleft bank, which was also associated withagricultural development of the territory. Naturally,despite the development of the mining industryprevailing on the right bank of Lugansk region andagricultural production, it also played a role in thedegradation of the land fund. Fertile black soils,confined to the main Donetsk watershed, wereintensively exploited, which, together with thenegative natural processes, could not fail toprovoke their rather rapid decrease in soil fertility.The lands have undergone a massive violentagricultural load. As a result of the combinedeffects of various anthropogenic factors, there is agreater transformation of the natural environment,and hence the environmental stress on landresources is greater.
It cannot be argued that no attempts weremade to improve the situation, but they were localin nature. All attempts to counter the effect oferosion by means of planting forests withoutcombining them with agrotechnical measuresproved ineffective (Fondovi materialyDerzhavnogo reg'ional'nogogeologorozviduval'nogo pidpryjemstva «Shid-DRGP», 2014). The main task - a comprehensiveregulation of runoff and protection of soilsthroughout the entire catchment area - remainedunresolved.
M. A. Rozov noted that on the Donetsk ridgea whole complex of extremely favourableconditions and reasons for erosion was formed. Inhis opinion, Lugansk region was the area with themost ravines: «... the uplands that diversify therelief, intensive plowing, the lack of forests, alsothe pronounced continental climate - all thiscontributed to the formation of many gullies»(Rozov, 1927).
This assessment of the territory of theDonbas in the erosive aspect is confirmed by E. E.Kern, who distinguished Ekaterinoslav province,and especially the Bahmut region, as an area with alot of ravines. In many areas, he wrote, «the landunder ravines was from 5 to 30 % of the total area»(Kern, 1928).
After the Second World War, anti-erosionmeasures were carried out on a limited scale and
limited to reclamation. Their effect wasinsignificant because of the ploughing up of«virgin» lands. Further measures were noteffective; there was no systematic fight againsterosion in the Donbas.
Environmental conditions in our region un-favourable to agriculture and the high level of eco-nomic development have led to an aggravation ofthe problems of rational, ecologically sustainableuse of natural resources, protection and reclamationof land in one of the old industrial regions ofUkraine - Donbass, which includes almost half ofthe territory of Lugansk region.
It is known that in the case of extensive eco-nomic management, the structure of land use,which has been formed for a long time, is oftenviolated; in particular, the ratio of stabilizing anddestabilizing components of the land fund changes.
According to statistical materials (Fondovi-materialyGolovnogoupravlinnjaDerzhgeokada-struvLugans'kijoblasti, 2016), the lands of Luganskregion are divided into agricultural land, forests andforest cover, built- up land, open wetlands and drylands with special vegetation. The area of agricul-tural land is 73.3% of the total territory of the ad-ministrative region. Cultivated land accounts for97,6% of the agricultural land. In turn, in the struc-ture of agricultural land, tilled land occupies 66.6%.
Purely natural and sustainable are forests;under certain conditions relatively stable stands areplanted forests, hayfields and pastures. Landswhich should be considered unstable are those that,having undergone to some extent the influence ofhuman economic activity, have experienced asignificant transformation, changed their properties(arable land, forest park areas, etc.).
The structure of the land consists primarilyof agricultural land, the area occupied by forest,pastures, meadows, marshes (Table 2). Thecorrelation between them in different physical-geographical and historical conditions may bedifferent, and this is determined by their stability.
In the scientific agrarian literature, inaddition to such an indicator as the stability of theland, environmentally stabilizing and destabilizinglands are also distinguished.
Among the aforementioned types of lands,the lands which stabilize the environment includehayfields, those which we consider destabilizinginclude pastures and arable land, which are mostaffected by mechanical (pasture) and agro-technical(arable) pressure. Our calculations found that theratio between them is 1: 3.
Thus, we arrive at the conclusion that in theratio of agricultural lands in Lugansk region desta-bilizing components prevail, mainly arable land.
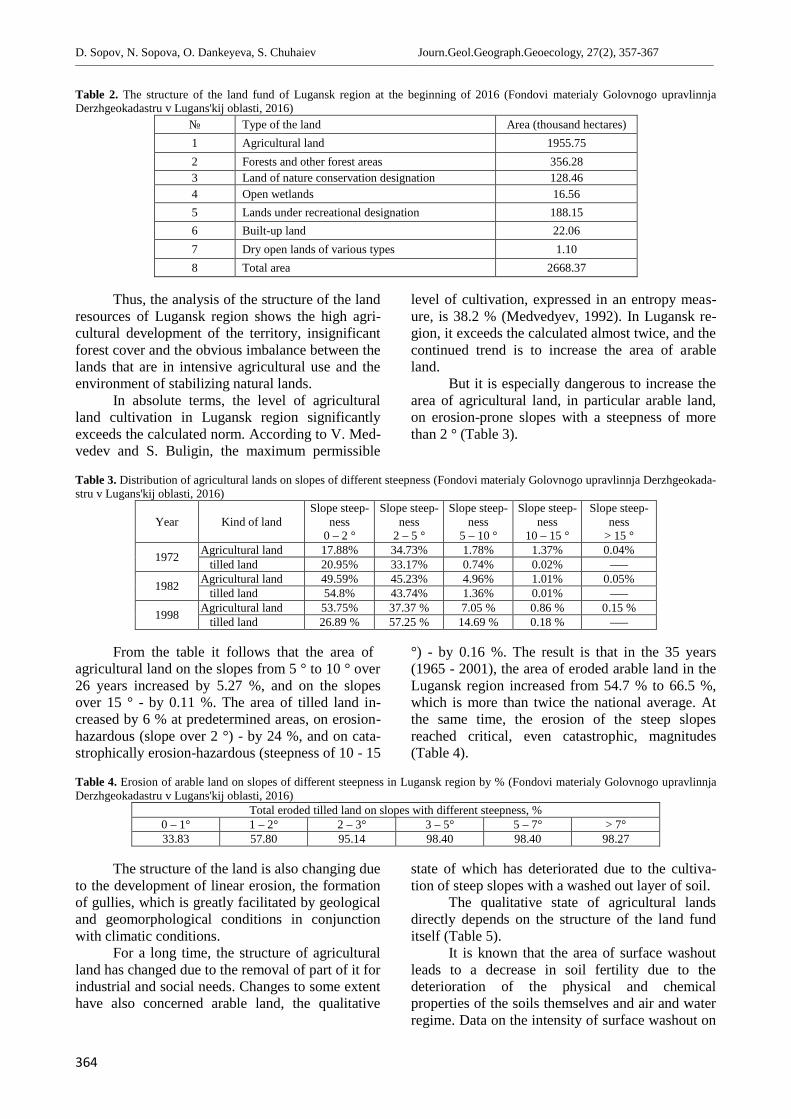
D. Sopov, N. Sopova, O. Dankeyeva, S. Chuhaiev Journ.Geol.Geograph.Geoecology, 27(2), 357-367________________________________________________________________________________________________________________________________________________________________
364
Table 2. The structure of the land fund of Lugansk region at the beginning of 2016 (Fondovi materialy Golovnogo upravlinnjaDerzhgeokadastru v Lugans'kij oblasti, 2016)
№ Type of the land Area (thousand hectares)1 Agricultural land 1955.752 Forests and other forest areas 356.283 Land of nature conservation designation 128.464 Open wetlands 16.565 Lands under recreational designation 188.156 Built-up land 22.067 Dry open lands of various types 1.108 Total area 2668.37
Thus, the analysis of the structure of the landresources of Lugansk region shows the high agri-cultural development of the territory, insignificantforest cover and the obvious imbalance between thelands that are in intensive agricultural use and theenvironment of stabilizing natural lands.
In absolute terms, the level of agriculturalland cultivation in Lugansk region significantlyexceeds the calculated norm. According to V. Med-vedev and S. Buligin, the maximum permissible
level of cultivation, expressed in an entropy meas-ure, is 38.2 % (Medvedyev, 1992). In Lugansk re-gion, it exceeds the calculated almost twice, and thecontinued trend is to increase the area of arableland.
But it is especially dangerous to increase thearea of agricultural land, in particular arable land,on erosion-prone slopes with a steepness of morethan 2 ° (Table 3).
Table 3. Distribution of agricultural lands on slopes of different steepness (Fondovi materialy Golovnogo upravlinnja Derzhgeokada-stru v Lugans'kij oblasti, 2016)
Year Kind of landSlope steep-
ness0 – 2 °
Slope steep-ness
2 – 5 °
Slope steep-ness
5 – 10 °
Slope steep-ness
10 – 15 °
Slope steep-ness
> 15 °
1972 Agricultural land 17.88% 34.73% 1.78% 1.37% 0.04%tilled land 20.95% 33.17% 0.74% 0.02% –––
1982 Agricultural land 49.59% 45.23% 4.96% 1.01% 0.05%tilled land 54.8% 43.74% 1.36% 0.01% –––
1998 Agricultural land 53.75% 37.37 % 7.05 % 0.86 % 0.15 %tilled land 26.89 % 57.25 % 14.69 % 0.18 % –––
From the table it follows that the area ofagricultural land on the slopes from 5 ° to 10 ° over26 years increased by 5.27 %, and on the slopesover 15 ° - by 0.11 %. The area of tilled land in-creased by 6 % at predetermined areas, on erosion-hazardous (slope over 2 °) - by 24 %, and on cata-strophically erosion-hazardous (steepness of 10 - 15
°) - by 0.16 %. The result is that in the 35 years(1965 - 2001), the area of eroded arable land in theLugansk region increased from 54.7 % to 66.5 %,which is more than twice the national average. Atthe same time, the erosion of the steep slopesreached critical, even catastrophic, magnitudes(Table 4).
Table 4. Erosion of arable land on slopes of different steepness in Lugansk region by % (Fondovi materialy Golovnogo upravlinnjaDerzhgeokadastru v Lugans'kij oblasti, 2016)
Total eroded tilled land on slopes with different steepness, %0 – 1° 1 – 2° 2 – 3° 3 – 5° 5 – 7° > 7°33.83 57.80 95.14 98.40 98.40 98.27
The structure of the land is also changing dueto the development of linear erosion, the formationof gullies, which is greatly facilitated by geologicaland geomorphological conditions in conjunctionwith climatic conditions.
For a long time, the structure of agriculturalland has changed due to the removal of part of it forindustrial and social needs. Changes to some extenthave also concerned arable land, the qualitative
state of which has deteriorated due to the cultiva-tion of steep slopes with a washed out layer of soil.
The qualitative state of agricultural landsdirectly depends on the structure of the land funditself (Table 5).
It is known that the area of surface washoutleads to a decrease in soil fertility due to thedeterioration of the physical and chemicalproperties of the soils themselves and air and waterregime. Data on the intensity of surface washout on
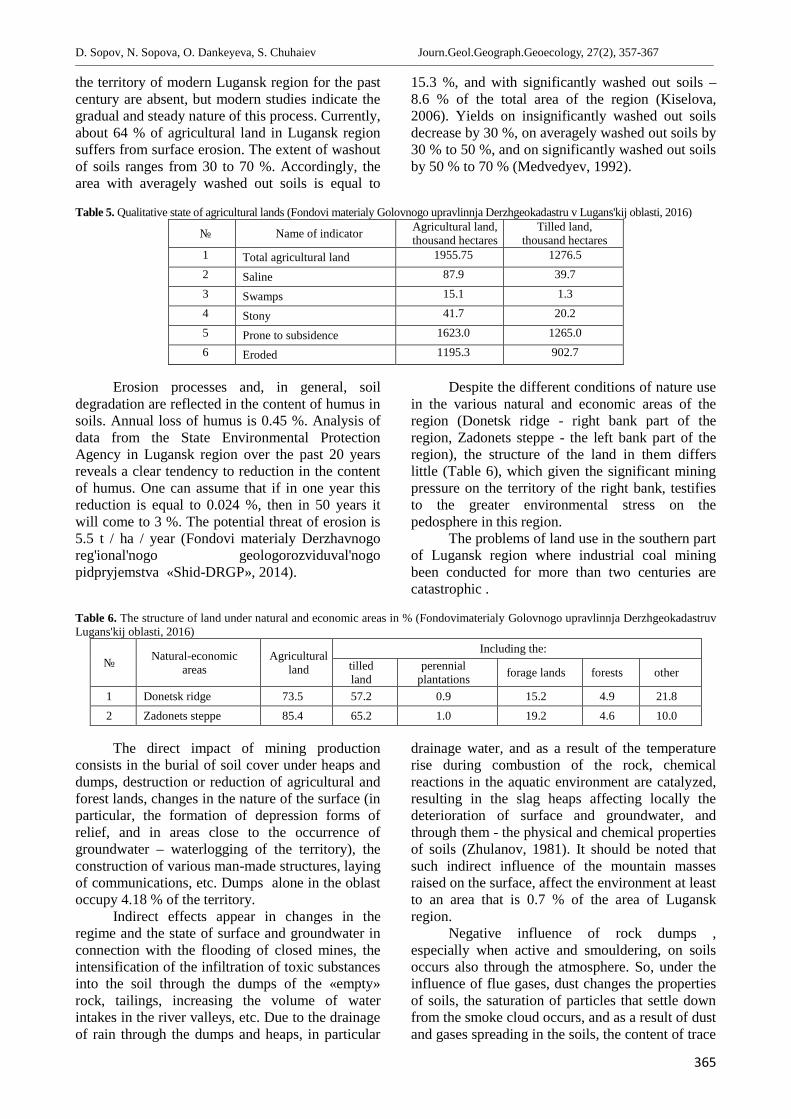
D. Sopov, N. Sopova, O. Dankeyeva, S. Chuhaiev Journ.Geol.Geograph.Geoecology, 27(2), 357-367________________________________________________________________________________________________________________________________________________________________
365
the territory of modern Lugansk region for the pastcentury are absent, but modern studies indicate thegradual and steady nature of this process. Currently,about 64 % of agricultural land in Lugansk regionsuffers from surface erosion. The extent of washoutof soils ranges from 30 to 70 %. Accordingly, thearea with averagely washed out soils is equal to
15.3 %, and with significantly washed out soils –8.6 % of the total area of the region (Kiselova,2006). Yields on insignificantly washed out soilsdecrease by 30 %, on averagely washed out soils by30 % to 50 %, and on significantly washed out soilsby 50 % to 70 % (Medvedyev, 1992).
Table 5. Qualitative state of agricultural lands (Fondovi materialy Golovnogo upravlinnja Derzhgeokadastru v Lugans'kij oblasti, 2016)
№ Name of indicator Agricultural land,thousand hectares
Tilled land,thousand hectares
1 Total agricultural land 1955.75 1276.52 Saline 87.9 39.73 Swamps 15.1 1.34 Stony 41.7 20.25 Prone to subsidence 1623.0 1265.06 Eroded 1195.3 902.7
Erosion processes and, in general, soildegradation are reflected in the content of humus insoils. Annual loss of humus is 0.45 %. Analysis ofdata from the State Environmental ProtectionAgency in Lugansk region over the past 20 yearsreveals a clear tendency to reduction in the contentof humus. One can assume that if in one year thisreduction is equal to 0.024 %, then in 50 years itwill come to 3 %. The potential threat of erosion is5.5 t / ha / year (Fondovi materialy Derzhavnogoreg'ional'nogo geologorozviduval'nogopidpryjemstva «Shid-DRGP», 2014).
Despite the different conditions of nature usein the various natural and economic areas of theregion (Donetsk ridge - right bank part of theregion, Zadonets steppe - the left bank part of theregion), the structure of the land in them differslittle (Table 6), which given the significant miningpressure on the territory of the right bank, testifiesto the greater environmental stress on thepedosphere in this region.
The problems of land use in the southern partof Lugansk region where industrial coal miningbeen conducted for more than two centuries arecatastrophic .
Table 6. The structure of land under natural and economic areas in % (Fondovimaterialy Golovnogo upravlinnja DerzhgeokadastruvLugans'kij oblasti, 2016)
№ Natural-economicareas
Agriculturalland
Including the:tilledland
perennialplantations forage lands forests other
1 Donetsk ridge 73.5 57.2 0.9 15.2 4.9 21.82 Zadonets steppe 85.4 65.2 1.0 19.2 4.6 10.0
The direct impact of mining productionconsists in the burial of soil cover under heaps anddumps, destruction or reduction of agricultural andforest lands, changes in the nature of the surface (inparticular, the formation of depression forms ofrelief, and in areas close to the occurrence ofgroundwater – waterlogging of the territory), theconstruction of various man-made structures, layingof communications, etc. Dumps alone in the oblastoccupy 4.18 % of the territory.
Indirect effects appear in changes in theregime and the state of surface and groundwater inconnection with the flooding of closed mines, theintensification of the infiltration of toxic substancesinto the soil through the dumps of the «empty»rock, tailings, increasing the volume of waterintakes in the river valleys, etc. Due to the drainageof rain through the dumps and heaps, in particular
drainage water, and as a result of the temperaturerise during combustion of the rock, chemicalreactions in the aquatic environment are catalyzed,resulting in the slag heaps affecting locally thedeterioration of surface and groundwater, andthrough them - the physical and chemical propertiesof soils (Zhulanov, 1981). It should be noted thatsuch indirect influence of the mountain massesraised on the surface, affect the environment at leastto an area that is 0.7 % of the area of Luganskregion.
Negative influence of rock dumps ,especially when active and smouldering, on soilsoccurs also through the atmosphere. So, under theinfluence of flue gases, dust changes the propertiesof soils, the saturation of particles that settle downfrom the smoke cloud occurs, and as a result of dustand gases spreading in the soils, the content of trace
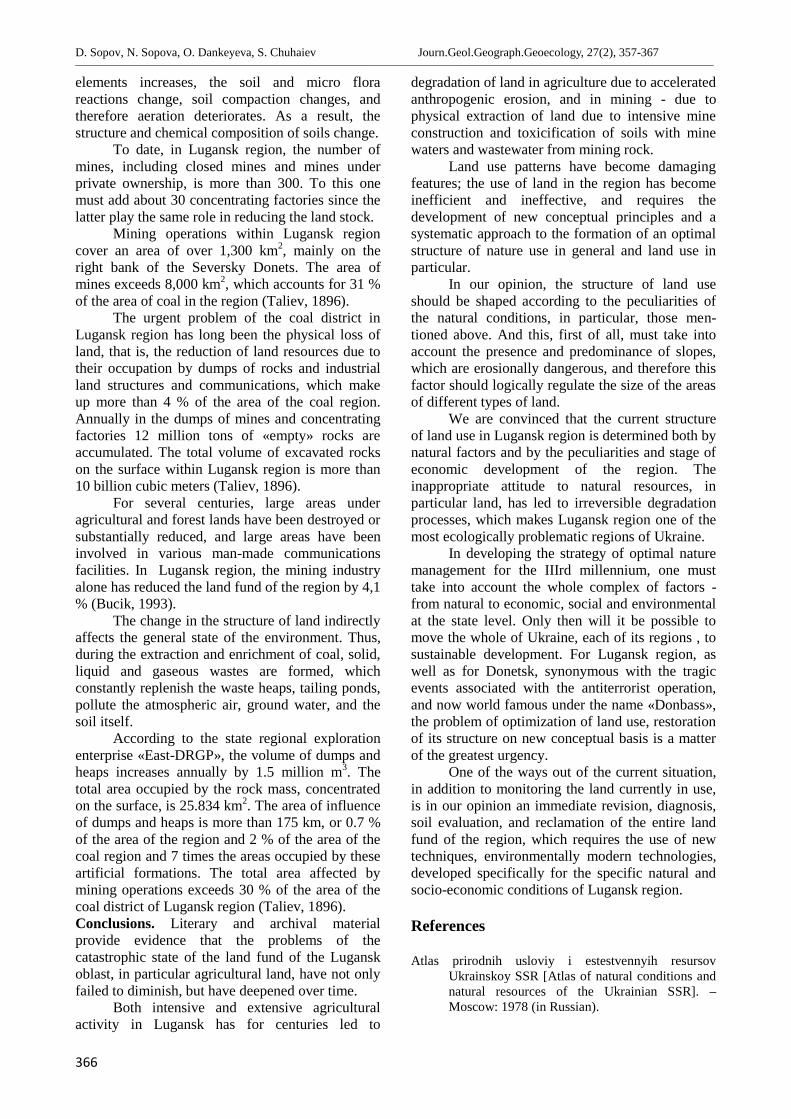
D. Sopov, N. Sopova, O. Dankeyeva, S. Chuhaiev Journ.Geol.Geograph.Geoecology, 27(2), 357-367________________________________________________________________________________________________________________________________________________________________
366
elements increases, the soil and micro florareactions change, soil compaction changes, andtherefore aeration deteriorates. As a result, thestructure and chemical composition of soils change.
To date, in Lugansk region, the number ofmines, including closed mines and mines underprivate ownership, is more than 300. To this onemust add about 30 concentrating factories since thelatter play the same role in reducing the land stock.
Mining operations within Lugansk regioncover an area of over 1,300 km2, mainly on theright bank of the Seversky Donets. The area ofmines exceeds 8,000 km2, which accounts for 31 %of the area of coal in the region (Taliev, 1896).
The urgent problem of the coal district inLugansk region has long been the physical loss ofland, that is, the reduction of land resources due totheir occupation by dumps of rocks and industrialland structures and communications, which makeup more than 4 % of the area of the coal region.Annually in the dumps of mines and concentratingfactories 12 million tons of «empty» rocks areaccumulated. The total volume of excavated rockson the surface within Lugansk region is more than10 billion cubic meters (Taliev, 1896).
For several centuries, large areas underagricultural and forest lands have been destroyed orsubstantially reduced, and large areas have beeninvolved in various man-made communicationsfacilities. In Lugansk region, the mining industryalone has reduced the land fund of the region by 4,1% (Bucik, 1993).
The change in the structure of land indirectlyaffects the general state of the environment. Thus,during the extraction and enrichment of coal, solid,liquid and gaseous wastes are formed, whichconstantly replenish the waste heaps, tailing ponds,pollute the atmospheric air, ground water, and thesoil itself.
According to the state regional explorationenterprise «East-DRGP», the volume of dumps andheaps increases annually by 1.5 million m3. Thetotal area occupied by the rock mass, concentratedon the surface, is 25.834 km2. The area of influenceof dumps and heaps is more than 175 km, or 0.7 %of the area of the region and 2 % of the area of thecoal region and 7 times the areas occupied by theseartificial formations. The total area affected bymining operations exceeds 30 % of the area of thecoal district of Lugansk region (Taliev, 1896).Conclusions. Literary and archival materialprovide evidence that the problems of thecatastrophic state of the land fund of the Luganskoblast, in particular agricultural land, have not onlyfailed to diminish, but have deepened over time.
Both intensive and extensive agriculturalactivity in Lugansk has for centuries led to
degradation of land in agriculture due to acceleratedanthropogenic erosion, and in mining - due tophysical extraction of land due to intensive mineconstruction and toxicification of soils with minewaters and wastewater from mining rock.
Land use patterns have become damagingfeatures; the use of land in the region has becomeinefficient and ineffective, and requires thedevelopment of new conceptual principles and asystematic approach to the formation of an optimalstructure of nature use in general and land use inparticular.
In our opinion, the structure of land useshould be shaped according to the peculiarities ofthe natural conditions, in particular, those men-tioned above. And this, first of all, must take intoaccount the presence and predominance of slopes,which are erosionally dangerous, and therefore thisfactor should logically regulate the size of the areasof different types of land.
We are convinced that the current structureof land use in Lugansk region is determined both bynatural factors and by the peculiarities and stage ofeconomic development of the region. Theinappropriate attitude to natural resources, inparticular land, has led to irreversible degradationprocesses, which makes Lugansk region one of themost ecologically problematic regions of Ukraine.
In developing the strategy of optimal naturemanagement for the IIIrd millennium, one musttake into account the whole complex of factors -from natural to economic, social and environmentalat the state level. Only then will it be possible tomove the whole of Ukraine, each of its regions , tosustainable development. For Lugansk region, aswell as for Donetsk, synonymous with the tragicevents associated with the antiterrorist operation,and now world famous under the name «Donbass»,the problem of optimization of land use, restorationof its structure on new conceptual basis is a matterof the greatest urgency.
One of the ways out of the current situation,in addition to monitoring the land currently in use,is in our opinion an immediate revision, diagnosis,soil evaluation, and reclamation of the entire landfund of the region, which requires the use of newtechniques, environmentally modern technologies,developed specifically for the specific natural andsocio-economic conditions of Lugansk region.
References
Atlas prirodnih usloviy i estestvennyih resursovUkrainskoy SSR [Atlas of natural conditions andnatural resources of the Ukrainian SSR]. –Moscow: 1978 (in Russian).
D. Sopov, N. Sopova, O. Dankeyeva, S. Chuhaiev Journ.Geol.Geograph.Geoecology, 27(2), 357-367________________________________________________________________________________________________________________________________________________________________
367
Bucik Yu. V., 1993. Obobshenie materialov potehnogennomu vozdejstviyu ugolnyh shaht nageologo-ekologicheskuyu obstanovku vUkrainskoj chasti Donbassa [Generalization ofmaterials on the man-caused impact of coal mineson the geological and ecological situation in theUkrainian part of Donbass]. – K. – 299 p. (inUkrainian).
Derzhavnij arhiv Luganskoyi oblasti [The State Archiveof the Lugansk Region]. - F. R-733, op. 1, sp. 1(in Ukrainian).
Zhulanov G. A., 1981. Ocenka haraktera i razmerovvrednogo vliyaniya terrikonov na prilegayushieterritorii [Estimation of character and size ofharmful influence of terricons on adjoiningterritories]. G. А. Zhulanov, G. G. Voznyuk //Protection and rational use of natural resources. -Perm. – 32 – 36 p. (in Russian).
Kern E. E., 1928. Ovragi, ih zakreplenie, oblesenie izapruzhivanie [Landslips, their stabilisation,afforestation and ponding]. E. E. Kern – M. – L.:Gosizdat. – 198 p. (in Russian).
Kiselova O. O., 2006. Problemi ekologichnoyi bezpekizemelnih resursiv u Luganskij oblasti [Problemsof ecological safety of land resources in theLugansk region]. О. О. Kiselyova // Regionalgeographic studies of Ukraine and adjoiningterritories / Materials of the International.Science-practice Conference devoted to the 70thanniversary of the Formation of the Departmentof Geography LNPU them. T. Shevchenko(Lugansk, November 27 – 29, 2006). – Lugansk:Alma Mater. – 33 – 35 p. (in Ukrainian).
Lavrenko E. M., 1926. Lesa Doneckogo kryazha[Forests of the Donetsk ridge]. E. M. Lavrenko //Soil Science. – № 3 – 4. – 20 – 25 p. (in Russian).
Levakovskij I. F., 1871. O prichinah razlichiya v formesklonov rechnyh dolin (Dnepra i Dona) [Thereasons for the difference in the form of slopes ofriver valleys (Dnieper and Don)]. I. F.Levakovsky // Proceedings of the Society ofNaturalists at the Kharkov University. - T. 3 - X.– 32 – 35 p. (in Russian).
Lyashenko P. I., 1952. Istoriya narodnogo hozyajstvaSSSR [History of the National Economy of theUSSR]. P. I. Lyashchenko – Leningrad:Publishing house of the USSR Academy ofSciences. – 399 p. (in Russian).
Medvedyev V. V., 1992. Do 100-richchya vihodu v svitknigi V. V. Dokuchayeva «Nashi stepi prezhde iteper» [On the 100th anniversary of thepublication of the book V. V. Dokuchaev «Oursteppes before and now»]. V. V. Medvedev, S.Yu. Buligin // Bulletin of Agrarian Science. – №4. – 53 – 55 p. (in Ukrainian).
Pirko V., 2003. Zaselennya Donechchini u ХVІ–ХVІІІst. [Population of Donetsk region in theseventeenth and eighteenth centuries]. VasylPirko. – Donetsk. – 25 – 26 p. (in Ukrainian).
Podov V. I., 2004. Istoriya Donbassa: V 3-h t. – T. 1. –Donbass v ХVІІ–ХVІІІ vekah [The history ofDonbass: In 3 t. – T. 1. – Donbass in theSeventeenth and Eighteenth centuries]. V. I.Podov – Lugansk: Alma Mater. – 336 p. (inRussian).
Rozov N. A., 1927. Ovragi Ukrainy. Materialy poovrazhno-peschanomu voprosu Ukrainy [Theravines of Ukraine. Materials on the ravine-sandquestion of Ukraine]. N. А. Rozov. – K. – 61 p.(in Russian).
Taliev V. I., 1896. Rastitelnost krajnego yugo-vostochnogo punkta Ekaterinoslavskoj gubernii[Vegetation of the extreme southeastern point ofEkaterinoslav province]. V. I. Taliev //Proceedings of the Society of Naturalists atKharkov University. – 15 – 26 p. (in Russian).
Fondovi materialy Golovnogo upravlinnjaDerzhgeokadastru v Lugans'kij oblasti [StockMaterials of the Main Department of the StateService for Geodesy, Cartography and Cadastreof Ukraine in the Lugansk region]. – 2016 (inUkrainian).
Fondovi materialy Derzhavnogo reg'ional'nogogeologorozviduval'nogo pidpryjemstva «Shid-DRGP» [ Archival Materials of the StateRegional Exploration Enterprise «East-DRHP»].– 2014 (in Ukrainian).
Shikula N. K., 1961. Razvitie erozionnyh processov vDonbasse [The development of erosion processesin the Donbas]. N. K. Shikula // Natural resourcesof the left-bank Ukraine and their use.Interdepartmental materials. sci. Confer. – T. II. –Kh .: Kharkov Publishing House. University. –332 – 338 p. (in Russian).
О. Ulytsky, V. Yermakov, О. Lunova, O. Buglak Journ.Geol.Geograph.Geoecology, 27(2), 371-379________________________________________________________________________________________________________________________________________________________________
368
Journal of Geology,Geography and Geoecology
Journal home page: geology-dnu-dp.ua
ISSN 2617-2909 (print)ISSN 2617-2119 (online)
Journ.Geol.Geograph.Geoecology,
27(2), 368-376doi:10.15421/111861
О. Ulytsky, V. Yermakov, О. Lunova, O. Buglak Journ.Geol.Geograph.Geoecology, 27(2), 368-376________________________________________________________________________________________________________________________________________________________________
Environmental risks and assessment of the hydrodynamic situation in the mines of Donetskand Lugansk regions of Ukraine
О. Ulytsky, V. Yermakov, О. Lunova, O. Buglak
State ecology academy of postgraduate education and management, Kyive-mail: [email protected]
Abstract. Modern environmental risks and threats relate with the negative impact ofanthropogenic and natural factors on ecosystems, man-caused negative impact of indus-trial and potentially hazardous objects, pollution of drinking water sources, agriculturalland, atmospheric air, deviation of the geological environment and subsoil on the safetyof life in certain areas. Coal enterprises are one of the objects of high ecological danger
and critical infrastructure. Today, environmental safety in the east of Ukraine should be considered in close connection with theecological and man-made threats associated with combat operations in these territories. The authors carried out an analysis of scien-tific researches of past years and provided an assessment of environmental risks in the territories of coal mining enterprises in thepresent conditions considering the structural-geological, geofiltration and mining-geological parameters typically for the Donetsk andLuhansk regions of Ukraine. The article considers the location of mines in Donetsk and Lugansk regions as zones of high ecologicaldanger. The existing ecological threats and risks are determined, recommendations for minimization threats and risks in case ofanthropogenic and environmental disasters are provided. The equation of calculating the coefficient of filtration in rocks is made,mineral-technical parameters of coal mines are analyzed. It is shown that one of the most probable factors of the transition of theterritory into a zone of an emergency situation of a regional scale is the emergence of real threats to the life of a large number ofpeople in the conditions of mass flooding of mines due to the termination of power supply of drainage and ventilation systems. Alsoin the article scientifically substantiated the provision of an acceptable level of environmental safety of the constituent parts of theenvironment (water environment) for the population living within the mining and agglomeration, taking into account the environ-mental factors of the negative factor-forming factors, as well as forecasting the hydrodynamic situation.
Key words:ecological safety, threats and risks, mine waters, hydrodynamic situation, groundwater, coefficient of filtration, floodingof the territory.
Екологічні ризики та оцінка гідродинамічної ситуації на шахтах Донецької таЛуганської областей України
О.А. Улицький, В.М. Єрмаков, О.В. Луньова, О.В. Буглак
Державна екологічна академія піcлядіпломної освіти та управління, Київ,e-mail: [email protected]
Анотація.Сучасні екологічні ризики та загрози стосуються негативного впливу антропогенних та природних чинників наекосистеми, техногенні – негативного впливу промислових та потенційно небезпечних об’єктів, забруднення джерел питної води,сільськогосподарських земель, атмосферного повітря, вплив геологічного середовища та надр на безпеку життєдіяльності навизначених територіях. Вугільні підприємства є одним із об’єктів підвищеної екологічної небезпеки та критичної інфраструктури.Сьогодні екологічну безпеку на Сході України треба розглядати в тісному зв’язку з еколого-техногенними загрозами, що пов’язаніз бойовими діями на цих територіях. Автори здійснили аналіз наукових досліджень мінулих років та надали оцінкуекологічних ризиків на територіях вуглевидобувних підприємств в сучасних умовах врахувавши структурно-геологічні,геофільтраційні та гірничо-геологічні параметри, що є характерними для Донецької та Луганської областей України. Встатті розглянуті території розміщення шахт Донецької та Луганської областей як зон підвищеної екологічної небезпеки.Визначено наявні екологічні загрози та ризики, надано рекомендації щодо їх мінімізації у разі виникнення техногенно-екологічних катастроф. Складено рівняння розрахунку коефіцієнта фільтрації у гірських породах, проаналізовано гірничо-технічні параметри вугільних шахт. Показано, що одним із найбільш ймовірних факторів переходу території в зонунадзвичайної ситуації регіонального масштабу є виникнення реальної загрози життю великої кількості людей в умовахмасового затоплення шахт через припинення енергопостачання водовідливних та вентиляційних комплексів. Також в статті
Received 20.07.2018;Received in revised form 04.09.2018;Accepted 19.09.2018
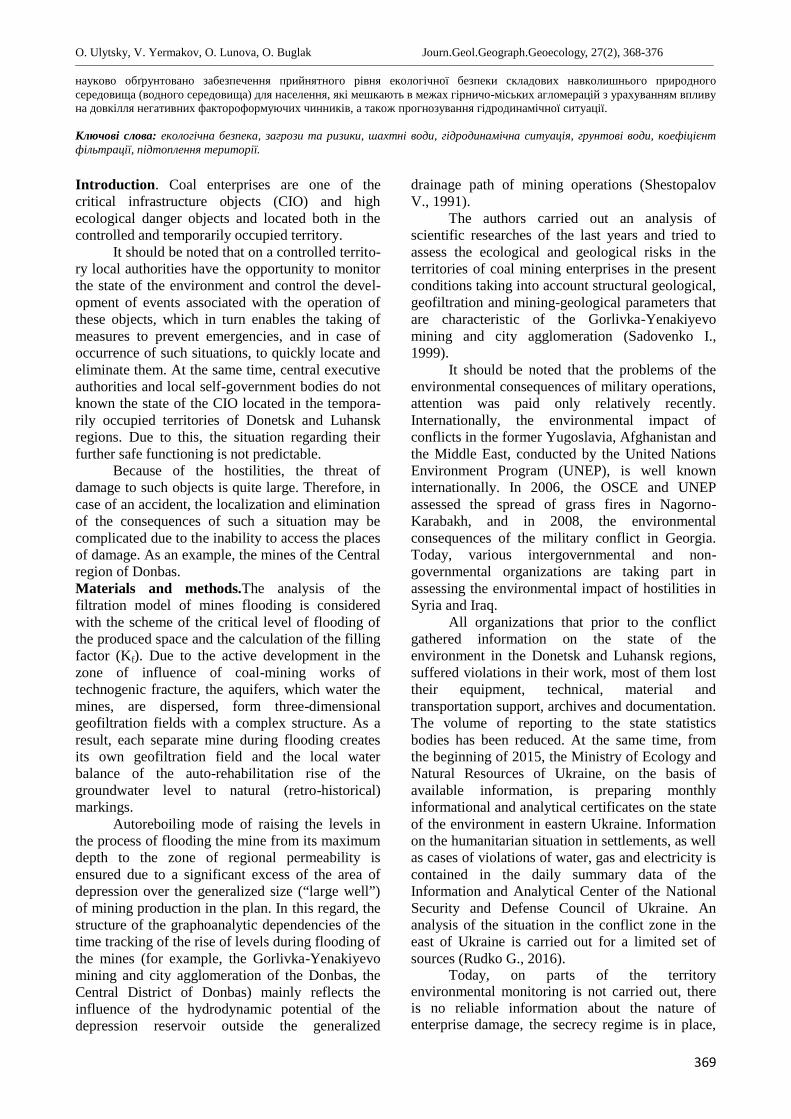
О. Ulytsky, V. Yermakov, О. Lunova, O. Buglak Journ.Geol.Geograph.Geoecology, 27(2), 368-376________________________________________________________________________________________________________________________________________________________________
369
науково обґрунтовано забезпечення прийнятного рівня екологічної безпеки складових навколишнього природногосередовища (водного середовища) для населення, які мешкають в межах гірничо-міських агломерацій з урахуванням впливуна довкілля негативних фактороформуючих чинників, а також прогнозування гідродинамічної ситуації.
Ключові слова: екологічна безпека, загрози та ризики, шахтні води, гідродинамічна ситуація, грунтові води, коефіцієнтфільтрації, підтоплення території.
Introduction. Coal enterprises are one of thecritical infrastructure objects (CIO) and highecological danger objects and located both in thecontrolled and temporarily occupied territory.
It should be noted that on a controlled territo-ry local authorities have the opportunity to monitorthe state of the environment and control the devel-opment of events associated with the operation ofthese objects, which in turn enables the taking ofmeasures to prevent emergencies, and in case ofoccurrence of such situations, to quickly locate andeliminate them. At the same time, central executiveauthorities and local self-government bodies do notknown the state of the CIO located in the tempora-rily occupied territories of Donetsk and Luhanskregions. Due to this, the situation regarding theirfurther safe functioning is not predictable.
Because of the hostilities, the threat ofdamage to such objects is quite large. Therefore, incase of an accident, the localization and eliminationof the consequences of such a situation may becomplicated due to the inability to access the placesof damage. As an example, the mines of the Centralregion of Donbas.Materials and methods.The analysis of thefiltration model of mines flooding is consideredwith the scheme of the critical level of flooding ofthe produced space and the calculation of the fillingfactor (Kf). Due to the active development in thezone of influence of coal-mining works oftechnogenic fracture, the aquifers, which water themines, are dispersed, form three-dimensionalgeofiltration fields with a complex structure. As aresult, each separate mine during flooding createsits own geofiltration field and the local waterbalance of the auto-rehabilitation rise of thegroundwater level to natural (retro-historical)markings.
Autoreboiling mode of raising the levels inthe process of flooding the mine from its maximumdepth to the zone of regional permeability isensured due to a significant excess of the area ofdepression over the generalized size (“large well”)of mining production in the plan. In this regard, thestructure of the graphoanalytic dependencies of thetime tracking of the rise of levels during flooding ofthe mines (for example, the Gorlivka-Yenakiyevomining and city agglomeration of the Donbas, theCentral District of Donbas) mainly reflects theinfluence of the hydrodynamic potential of thedepression reservoir outside the generalized
drainage path of mining operations (ShestopalovV., 1991).
The authors carried out an analysis ofscientific researches of the last years and tried toassess the ecological and geological risks in theterritories of coal mining enterprises in the presentconditions taking into account structural geological,geofiltration and mining-geological parameters thatare characteristic of the Gorlivka-Yenakiyevomining and city agglomeration (Sadovenko I.,1999).
It should be noted that the problems of theenvironmental consequences of military operations,attention was paid only relatively recently.Internationally, the environmental impact ofconflicts in the former Yugoslavia, Afghanistan andthe Middle East, conducted by the United NationsEnvironment Program (UNEP), is well knowninternationally. In 2006, the OSCE and UNEPassessed the spread of grass fires in Nagorno-Karabakh, and in 2008, the environmentalconsequences of the military conflict in Georgia.Today, various intergovernmental and non-governmental organizations are taking part inassessing the environmental impact of hostilities inSyria and Iraq.
All organizations that prior to the conflictgathered information on the state of theenvironment in the Donetsk and Luhansk regions,suffered violations in their work, most of them losttheir equipment, technical, material andtransportation support, archives and documentation.The volume of reporting to the state statisticsbodies has been reduced. At the same time, fromthe beginning of 2015, the Ministry of Ecology andNatural Resources of Ukraine, on the basis ofavailable information, is preparing monthlyinformational and analytical certificates on the stateof the environment in eastern Ukraine. Informationon the humanitarian situation in settlements, as wellas cases of violations of water, gas and electricity iscontained in the daily summary data of theInformation and Analytical Center of the NationalSecurity and Defense Council of Ukraine. Ananalysis of the situation in the conflict zone in theeast of Ukraine is carried out for a limited set ofsources (Rudko G., 2016).
Today, on parts of the territoryenvironmental monitoring is not carried out, thereis no reliable information about the nature ofenterprise damage, the secrecy regime is in place,
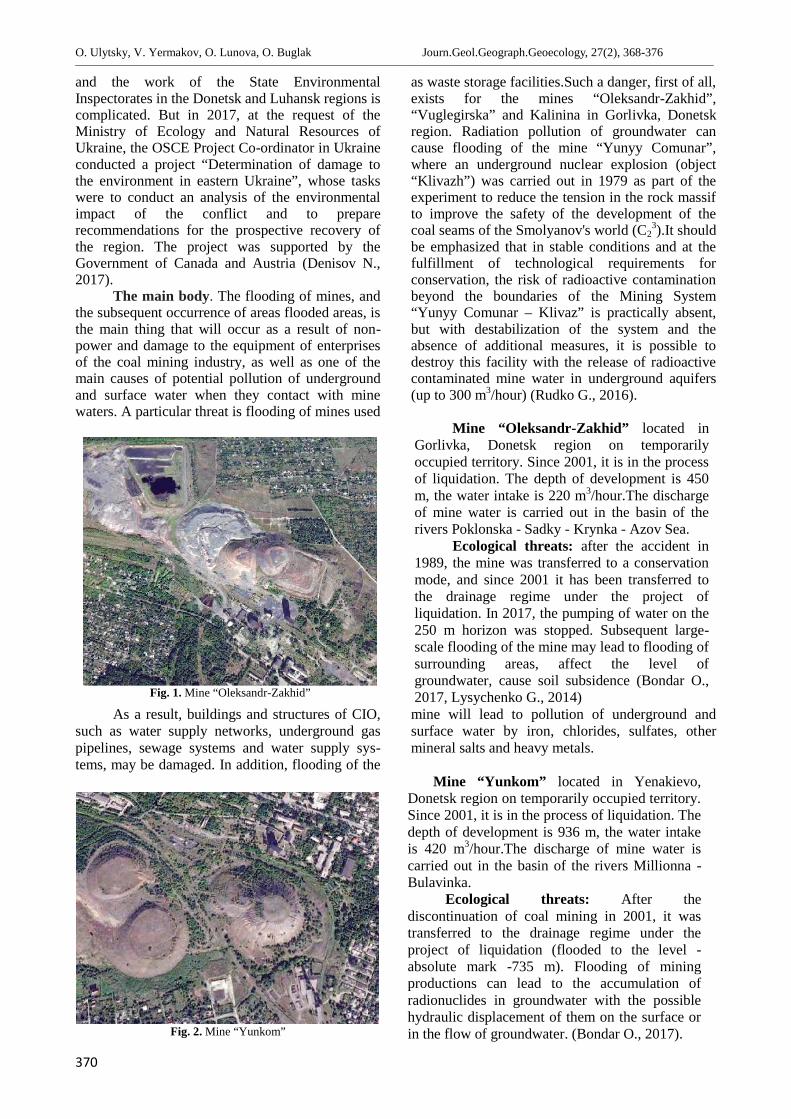
О. Ulytsky, V. Yermakov, О. Lunova, O. Buglak Journ.Geol.Geograph.Geoecology, 27(2), 368-376________________________________________________________________________________________________________________________________________________________________
370
and the work of the State EnvironmentalInspectorates in the Donetsk and Luhansk regions iscomplicated. But in 2017, at the request of theMinistry of Ecology and Natural Resources ofUkraine, the OSCE Project Co-ordinator in Ukraineconducted a project “Determination of damage tothe environment in eastern Ukraine”, whose taskswere to conduct an analysis of the environmentalimpact of the conflict and to preparerecommendations for the prospective recovery ofthe region. The project was supported by theGovernment of Canada and Austria (Denisov N.,2017).
The main body. The flooding of mines, andthe subsequent occurrence of areas flooded areas, isthe main thing that will occur as a result of non-power and damage to the equipment of enterprisesof the coal mining industry, as well as one of themain causes of potential pollution of undergroundand surface water when they contact with minewaters. A particular threat is flooding of mines used
as waste storage facilities.Such a danger, first of all,exists for the mines “Oleksandr-Zakhid”,“Vuglegirska” and Kalinina in Gorlivka, Donetskregion. Radiation pollution of groundwater cancause flooding of the mine “Yunyy Comunar”,where an underground nuclear explosion (object“Klivazh”) was carried out in 1979 as part of theexperiment to reduce the tension in the rock massifto improve the safety of the development of thecoal seams of the Smolyanov's world (C2
3).It shouldbe emphasized that in stable conditions and at thefulfillment of technological requirements forconservation, the risk of radioactive contaminationbeyond the boundaries of the Mining System“Yunyy Comunar – Klivaz” is practically absent,but with destabilization of the system and theabsence of additional measures, it is possible todestroy this facility with the release of radioactivecontaminated mine water in underground aquifers(up to 300 m3/hour) (Rudko G., 2016).
Mine “Oleksandr-Zakhid” located inGorlivka, Donetsk region on temporarilyoccupied territory. Since 2001, it is in the processof liquidation. The depth of development is 450m, the water intake is 220 m3/hour.The dischargeof mine water is carried out in the basin of therivers Poklonska - Sadky - Krynka - Azov Sea.
Ecological threats: after the accident in1989, the mine was transferred to a conservationmode, and since 2001 it has been transferred tothe drainage regime under the project ofliquidation. In 2017, the pumping of water on the250 m horizon was stopped. Subsequent large-scale flooding of the mine may lead to flooding ofsurrounding areas, affect the level ofgroundwater, cause soil subsidence (Bondar O.,2017, Lysychenko G., 2014)Fig. 1. Mine “Oleksandr-Zakhid”
As a result, buildings and structures of CIO,such as water supply networks, underground gaspipelines, sewage systems and water supply sys-tems, may be damaged. In addition, flooding of the
mine will lead to pollution of underground andsurface water by iron, chlorides, sulfates, othermineral salts and heavy metals.
Mine “Yunkom” located in Yenakievo,Donetsk region on temporarily occupied territory.Since 2001, it is in the process of liquidation. Thedepth of development is 936 m, the water intakeis 420 m3/hour.The discharge of mine water iscarried out in the basin of the rivers Millionna -Bulavinka.
Ecological threats: After thediscontinuation of coal mining in 2001, it wastransferred to the drainage regime under theproject of liquidation (flooded to the level -absolute mark -735 m). Flooding of miningproductions can lead to the accumulation ofradionuclides in groundwater with the possiblehydraulic displacement of them on the surface orin the flow of groundwater. (Bondar O., 2017).Fig. 2. Mine “Yunkom”
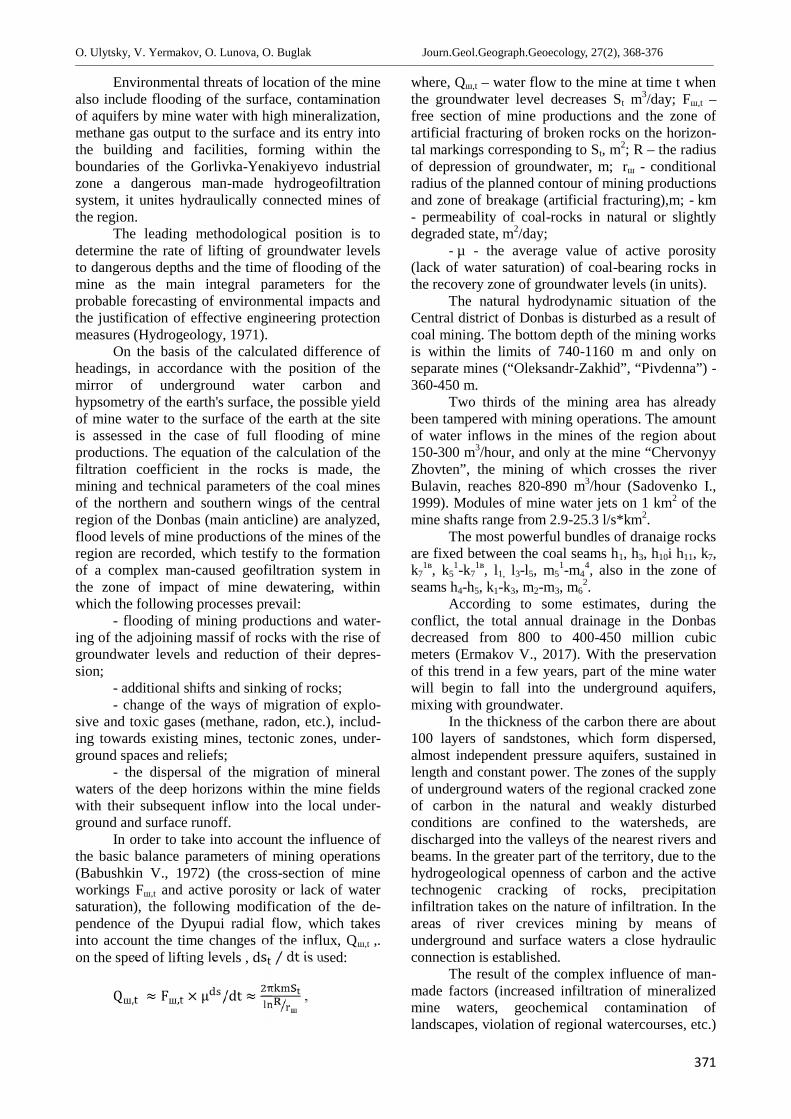
О. Ulytsky, V. Yermakov, О. Lunova, O. Buglak Journ.Geol.Geograph.Geoecology, 27(2), 368-376________________________________________________________________________________________________________________________________________________________________
371
Environmental threats of location of the minealso include flooding of the surface, contaminationof aquifers by mine water with high mineralization,methane gas output to the surface and its entry intothe building and facilities, forming within theboundaries of the Gorlivka-Yenakiyevo industrialzone a dangerous man-made hydrogeofiltrationsystem, it unites hydraulically connected mines ofthe region.
The leading methodological position is todetermine the rate of lifting of groundwater levelsto dangerous depths and the time of flooding of themine as the main integral parameters for theprobable forecasting of environmental impacts andthe justification of effective engineering protectionmeasures (Hydrogeology, 1971).
On the basis of the calculated difference ofheadings, in accordance with the position of themirror of underground water carbon andhypsometry of the earth's surface, the possible yieldof mine water to the surface of the earth at the siteis assessed in the case of full flooding of mineproductions. The equation of the calculation of thefiltration coefficient in the rocks is made, themining and technical parameters of the coal minesof the northern and southern wings of the centralregion of the Donbas (main anticline) are analyzed,flood levels of mine productions of the mines of theregion are recorded, which testify to the formationof a complex man-caused geofiltration system inthe zone of impact of mine dewatering, withinwhich the following processes prevail:
- flooding of mining productions and water-ing of the adjoining massif of rocks with the rise ofgroundwater levels and reduction of their depres-sion;
- additional shifts and sinking of rocks;- change of the ways of migration of explo-
sive and toxic gases (methane, radon, etc.), includ-ing towards existing mines, tectonic zones, under-ground spaces and reliefs;
- the dispersal of the migration of mineralwaters of the deep horizons within the mine fieldswith their subsequent inflow into the local under-ground and surface runoff.
In order to take into account the influence ofthe basic balance parameters of mining operations(Babushkin V., 1972) (the cross-section of mineworkings Fш,t and active porosity or lack of watersaturation), the following modification of the de-pendence of the Dyupui radial flow, which takesinto account the time changes of the influx, Qш,t ,.on the speed of lifting levels , ds ⁄ dt is used:Qш, ≈ Fш, × μ /dt ≈ ш ,
where, Qш,t – water flow to the mine at time t whenthe groundwater level decreases St m3/day; Fш,t –free section of mine productions and the zone ofartificial fracturing of broken rocks on the horizon-tal markings corresponding to St, m2; R – the radiusof depression of groundwater, m; rш - conditionalradius of the planned contour of mining productionsand zone of breakage (artificial fracturing),m; - km- permeability of coal-rocks in natural or slightlydegraded state, m2/day;
- µ - the average value of active porosity(lack of water saturation) of coal-bearing rocks inthe recovery zone of groundwater levels (in units).
The natural hydrodynamic situation of theCentral district of Donbas is disturbed as a result ofcoal mining. The bottom depth of the mining worksis within the limits of 740-1160 m and only onseparate mines (“Oleksandr-Zakhid”, “Pivdenna”) -360-450 m.
Two thirds of the mining area has alreadybeen tampered with mining operations. The amountof water inflows in the mines of the region about150-300 m3/hour, and only at the mine “ChervonyyZhovten”, the mining of which crosses the riverBulavin, reaches 820-890 m3/hour (Sadovenko I.,1999). Modules of mine water jets on 1 km2 of themine shafts range from 2.9-25.3 l/s*km2.
The most powerful bundles of dranaige rocksare fixed between the coal seams h1, h3, h10і h11, k7,k7
1в, k51-k7
1в, l1, l3-l5, m51-m4
4, also in the zone ofseams h4-h5, k1-k3, m2-m3, m6
2.According to some estimates, during the
conflict, the total annual drainage in the Donbasdecreased from 800 to 400-450 million cubicmeters (Ermakov V., 2017). With the preservationof this trend in a few years, part of the mine waterwill begin to fall into the underground aquifers,mixing with groundwater.
In the thickness of the carbon there are about100 layers of sandstones, which form dispersed,almost independent pressure aquifers, sustained inlength and constant power. The zones of the supplyof underground waters of the regional cracked zoneof carbon in the natural and weakly disturbedconditions are confined to the watersheds, aredischarged into the valleys of the nearest rivers andbeams. In the greater part of the territory, due to thehydrogeological openness of carbon and the activetechnogenic cracking of rocks, precipitationinfiltration takes on the nature of infiltration. In theareas of river crevices mining by means ofunderground and surface waters a close hydraulicconnection is established.
The result of the complex influence of man-made factors (increased infiltration of mineralizedmine waters, geochemical contamination oflandscapes, violation of regional watercourses, etc.)
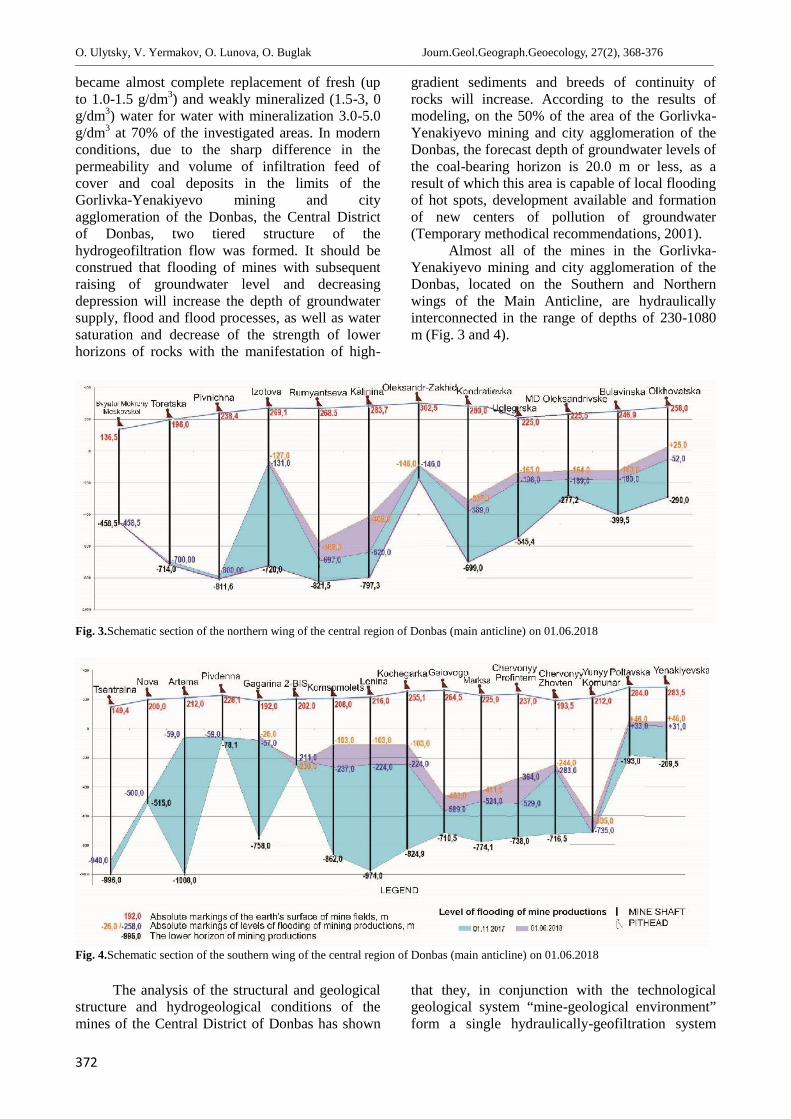
О. Ulytsky, V. Yermakov, О. Lunova, O. Buglak Journ.Geol.Geograph.Geoecology, 27(2), 368-376________________________________________________________________________________________________________________________________________________________________
372
became almost complete replacement of fresh (upto 1.0-1.5 g/dm3) and weakly mineralized (1.5-3, 0g/dm3) water for water with mineralization 3.0-5.0g/dm3 at 70% of the investigated areas. In modernconditions, due to the sharp difference in thepermeability and volume of infiltration feed ofcover and coal deposits in the limits of theGorlivka-Yenakiyevo mining and cityagglomeration of the Donbas, the Central Districtof Donbas, two tiered structure of thehydrogeofiltration flow was formed. It should beconstrued that flooding of mines with subsequentraising of groundwater level and decreasingdepression will increase the depth of groundwatersupply, flood and flood processes, as well as watersaturation and decrease of the strength of lowerhorizons of rocks with the manifestation of high-
gradient sediments and breeds of continuity ofrocks will increase. According to the results ofmodeling, on the 50% of the area of the Gorlivka-Yenakiyevo mining and city agglomeration of theDonbas, the forecast depth of groundwater levels ofthe coal-bearing horizon is 20.0 m or less, as aresult of which this area is capable of local floodingof hot spots, development available and formationof new centers of pollution of groundwater(Temporary methodical recommendations, 2001).
Almost all of the mines in the Gorlivka-Yenakiyevo mining and city agglomeration of theDonbas, located on the Southern and Northernwings of the Main Anticline, are hydraulicallyinterconnected in the range of depths of 230-1080m (Fig. 3 and 4).
Fig. 3.Schematic section of the northern wing of the central region of Donbas (main anticline) on 01.06.2018
Fig. 4.Schematic section of the southern wing of the central region of Donbas (main anticline) on 01.06.2018
The analysis of the structural and geologicalstructure and hydrogeological conditions of themines of the Central District of Donbas has shown
that they, in conjunction with the technologicalgeological system “mine-geological environment”form a single hydraulically-geofiltration system
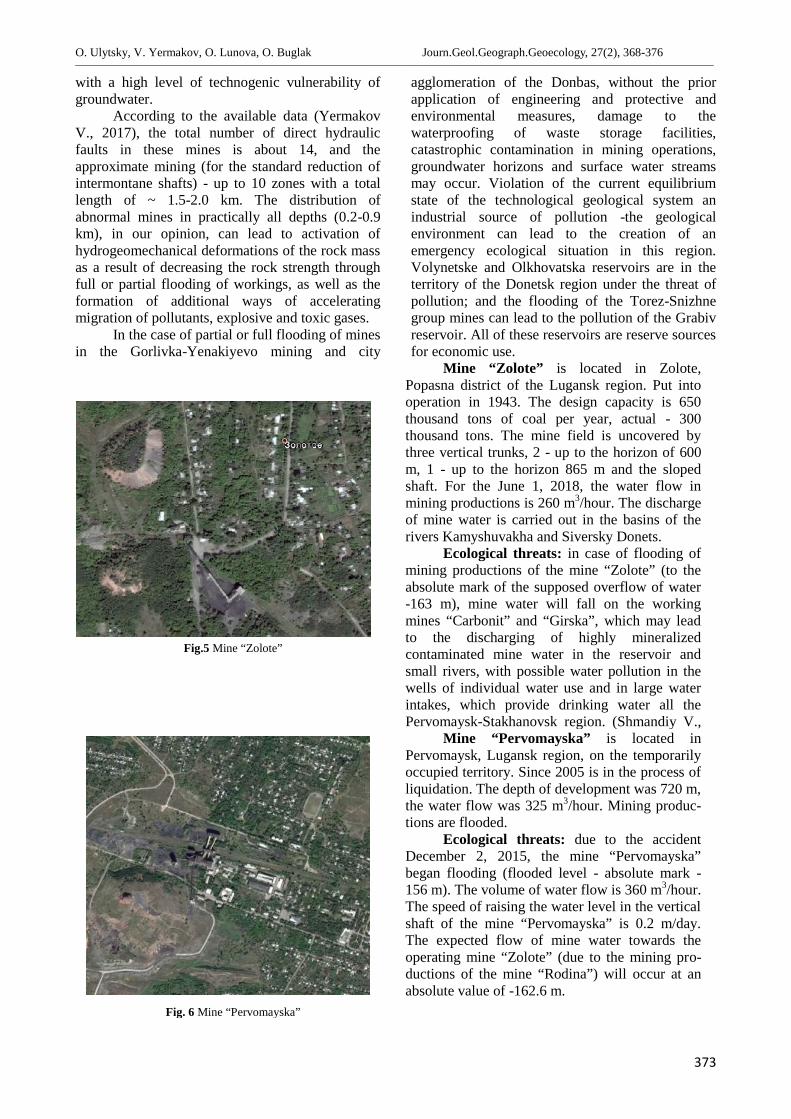
О. Ulytsky, V. Yermakov, О. Lunova, O. Buglak Journ.Geol.Geograph.Geoecology, 27(2), 368-376________________________________________________________________________________________________________________________________________________________________
373
with a high level of technogenic vulnerability ofgroundwater.
According to the available data (YermakovV., 2017), the total number of direct hydraulicfaults in these mines is about 14, and theapproximate mining (for the standard reduction ofintermontane shafts) - up to 10 zones with a totallength of ~ 1.5-2.0 km. The distribution ofabnormal mines in practically all depths (0.2-0.9km), in our opinion, can lead to activation ofhydrogeomechanical deformations of the rock massas a result of decreasing the rock strength throughfull or partial flooding of workings, as well as theformation of additional ways of acceleratingmigration of pollutants, explosive and toxic gases.
In the case of partial or full flooding of minesin the Gorlivka-Yenakiyevo mining and city
agglomeration of the Donbas, without the priorapplication of engineering and protective andenvironmental measures, damage to thewaterproofing of waste storage facilities,catastrophic contamination in mining operations,groundwater horizons and surface water streamsmay occur. Violation of the current equilibriumstate of the technological geological system anindustrial source of pollution -the geologicalenvironment can lead to the creation of anemergency ecological situation in this region.Volynetske and Olkhovatska reservoirs are in theterritory of the Donetsk region under the threat ofpollution; and the flooding of the Torez-Snizhnegroup mines can lead to the pollution of the Grabivreservoir. All of these reservoirs are reserve sourcesfor economic use.
Fig.5 Mine “Zolote”
Mine “Zolote” is located in Zolote,Popasna district of the Lugansk region. Put intooperation in 1943. The design capacity is 650thousand tons of coal per year, actual - 300thousand tons. The mine field is uncovered bythree vertical trunks, 2 - up to the horizon of 600m, 1 - up to the horizon 865 m and the slopedshaft. For the June 1, 2018, the water flow inmining productions is 260 m3/hour. The dischargeof mine water is carried out in the basins of therivers Kamyshuvakha and Siversky Donets.
Ecological threats: in case of flooding ofmining productions of the mine “Zolote” (to theabsolute mark of the supposed overflow of water-163 m), mine water will fall on the workingmines “Carbonit” and “Girska”, which may leadto the discharging of highly mineralizedcontaminated mine water in the reservoir andsmall rivers, with possible water pollution in thewells of individual water use and in large waterintakes, which provide drinking water all thePervomaysk-Stakhanovsk region. (Shmandiy V.,2013).
Fig. 6 Mine “Pervomayska”
Mine “Pervomayska” is located inPervomaysk, Lugansk region, on the temporarilyoccupied territory. Since 2005 is in the process ofliquidation. The depth of development was 720 m,the water flow was 325 m3/hour. Mining produc-tions are flooded.
Ecological threats: due to the accidentDecember 2, 2015, the mine “Pervomayska”began flooding (flooded level - absolute mark -156 m). The volume of water flow is 360 m3/hour.The speed of raising the water level in the verticalshaft of the mine “Pervomayska” is 0.2 m/day.The expected flow of mine water towards theoperating mine “Zolote” (due to the mining pro-ductions of the mine “Rodina”) will occur at anabsolute value of -162.6 m.
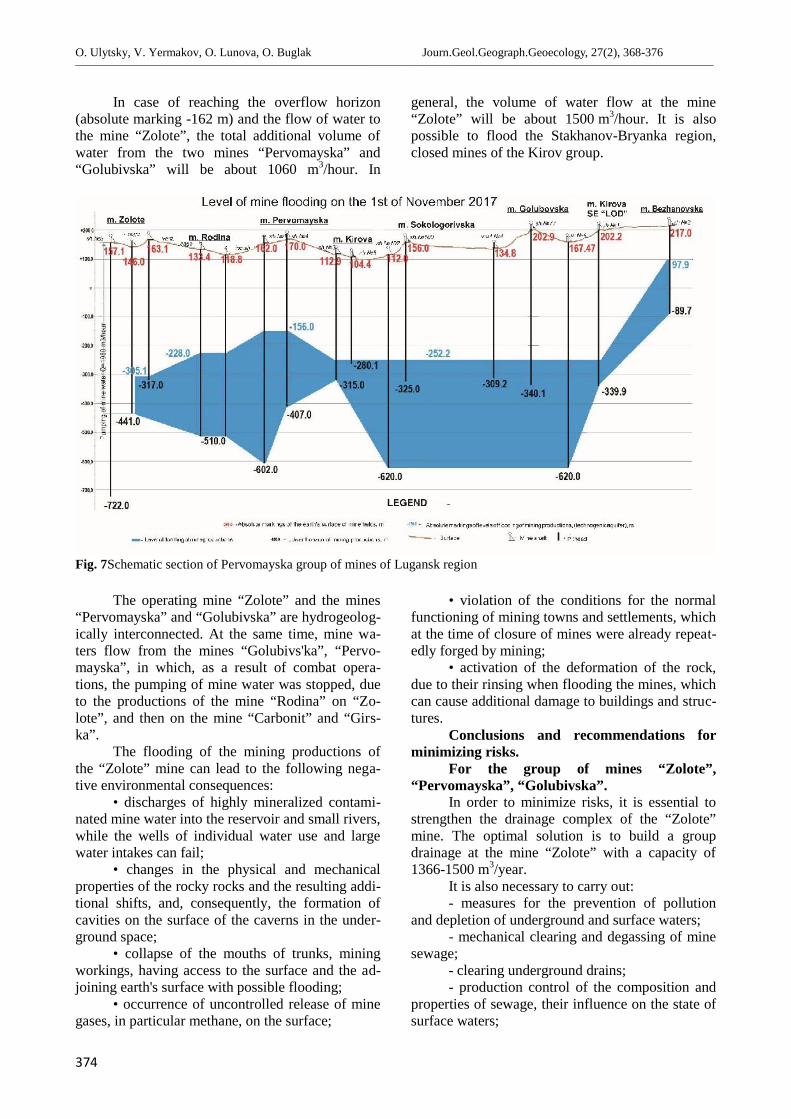
О. Ulytsky, V. Yermakov, О. Lunova, O. Buglak Journ.Geol.Geograph.Geoecology, 27(2), 368-376________________________________________________________________________________________________________________________________________________________________
374
In case of reaching the overflow horizon(absolute marking -162 m) and the flow of water tothe mine “Zolote”, the total additional volume ofwater from the two mines “Pervomayska” and“Golubivska” will be about 1060 m3/hour. In
general, the volume of water flow at the mine“Zolote” will be about 1500 m3/hour. It is alsopossible to flood the Stakhanov-Bryanka region,closed mines of the Kirov group.
Fig. 7Schematic section of Pervomayska group of mines of Lugansk region
The operating mine “Zolote” and the mines“Pervomayska” and “Golubivska” are hydrogeolog-ically interconnected. At the same time, mine wa-ters flow from the mines “Golubivs'ka”, “Pervo-mayska”, in which, as a result of combat opera-tions, the pumping of mine water was stopped, dueto the productions of the mine “Rodina” on “Zo-lote”, and then on the mine “Carbonit” and “Girs-ka”.
The flooding of the mining productions ofthe “Zolote” mine can lead to the following nega-tive environmental consequences:
• discharges of highly mineralized contami-nated mine water into the reservoir and small rivers,while the wells of individual water use and largewater intakes can fail;
• changes in the physical and mechanicalproperties of the rocky rocks and the resulting addi-tional shifts, and, consequently, the formation ofcavities on the surface of the caverns in the under-ground space;
• collapse of the mouths of trunks, miningworkings, having access to the surface and the ad-joining earth's surface with possible flooding;
• occurrence of uncontrolled release of minegases, in particular methane, on the surface;
• violation of the conditions for the normalfunctioning of mining towns and settlements, whichat the time of closure of mines were already repeat-edly forged by mining;
• activation of the deformation of the rock,due to their rinsing when flooding the mines, whichcan cause additional damage to buildings and struc-tures.
Conclusions and recommendations forminimizing risks.
For the group of mines “Zolote”,“Pervomayska”, “Golubivska”.
In order to minimize risks, it is essential tostrengthen the drainage complex of the “Zolote”mine. The optimal solution is to build a groupdrainage at the mine “Zolote” with a capacity of1366-1500 m3/year.
It is also necessary to carry out:- measures for the prevention of pollution
and depletion of underground and surface waters;- mechanical clearing and degassing of mine
sewage;- clearing underground drains;- production control of the composition and
properties of sewage, their influence on the state ofsurface waters;
О. Ulytsky, V. Yermakov, О. Lunova, O. Buglak Journ.Geol.Geograph.Geoecology, 27(2), 368-376________________________________________________________________________________________________________________________________________________________________
375
- radiological examination of the territory;- prevention of spontaneous combustion of
rock mass in dumps;- measures to prevent the development of
dangerous geological processes (karst, landslides,subsidence, flood, etc.);
- if possible, to resume pumping of minewater in the mines “Golubivska” and“Pervomayska”.
For the mine “Oleksandr-Zakhid”- it is necessary to monitor the migration
processes of explosive and highly toxic gases andcompounds;
- it is necessary to develop measures for theprevention of pollution and depletion ofunderground and surface waters, the developmentof dangerous geological processes (karst,landslides, subsidence, flooding, etc.);
- if possible, resume pumping of mine waterinto the mine.
For the mine “Yunkom”- conduct a comprehensive radioecological
survey of the mine “Yunkom” and its zone ofinfluence in order to identify areas of accumulation,ways of distribution and migration of groundwater(with dangerous solutions present in them) that riseto the surface during uncontrolled flooding of themine;
- to create a monitoring system on the levelof raising and distribution of water supplies toadjacent mining and industrial objects, non-industrial objects and the environment;
- on the basis of the evaluations carried outand according to the obtained data, to carry out theclassification of the object “Klivazh” in accordancewith the requirements of the regulatory frameworkin the field of radioactive waste management andradiation safety;
- taking into account the above and in orderto prevent the contaminated water from entering thegeneral water supply system, take urgent measuresto ensure an adequate level of safety at the mine“Yunkom” and in the area of migration of pollutedwaters in the area of the mine location.
- development of measures to preventpollution and depletion of underground and surfacewaters, development of dangerous geologicalprocesses (karst, landslides, subsidence of thesurface, flooding, etc.).
Thus, one of the most probable factors of thetransition of the territory of Donetsk and Luganskregions to the state of emergency on atransboundary scale is the risk of massiveuncontrolled flooding of the mines due to thecessation of the supply of drainage and ventilationsystems. The consequences of rising groundwaterto the surface may be the flooding of large areas of
adjacent cities and towns, subsidence of the earth'ssurface in built-up areas, pollution of surface andunderground water intakes. In addition, there is arisk of methane migration to basements, ravines,gullies and basins, which will increase the risk ofexplosions and fires.
Given the impossibility of verifying andcarrying out a comprehensive analysis of thehydrogeological state of the mines in the Donetskand Luhansk regions of Ukraine due to theirlocation on the uncontrolled territory by theUkrainian authorities, we consider it expedient towork out the issue raised during the meeting of theTripartite Contact Group in Minsk on the settlementof the situation in the Donbas for discussion withrepresentatives of certain districts of the Donetskregion, where the mines are located, to takeappropriate response and protection measures.
References
Babushkin V.D., 1972. Prognoz vodopritokov v gornyyevyrabotki i vodozabory podzemnykh vod v tresh-chinovatykh i zakarstovannykh porodakh [Fore-cast of water inflows into mine workings and wa-ter intakes of underground waters in fractured andkarsted rocks]. V.D.Babushkin,Z.P.Lebedyanskaya, P.Z.Levi M.: Nedra, 1 –175.
Bondar О. Ulytsky О., Yermakov V., 2017. Zvit pronadannya poslugy “Provedennya otsinky tavyvchennya tekhnogennogo stanu Donetskoi taLuganskoi oblastei z metoyu rozrobkyrecomendatsii shchodo pryrodno-resursnogovidnovlennya na ekologichnykh zasadakh”[Report on the provision of the service“Assessment and study of the ecological andman-made state of Donetsk and Luhansk regionsin order to develop recommendations onenvironmental rehabilitation on an ecologicalbasis”] Kyiv, 177 (in Ukrainian),
Denisov N. D.Averin, А.Yushchuk, O.Ulytsky,P.Bystrov, S.Zibtsev, S.Chumachenko,Y.Nabyvanets, 2017. Otsinka ekologichnoishkody ta priorytety vidnovlennya dovkillya naskhodi Ukrainy [Assessment of environmentaldamage and environmental recovery priorities ineastern Ukraine] Organization for Security andCo-operation in Europe, 88 (in Ukrainian).
Gidrogeologiya SSSR. Tom VI. Zatopleniye i otkachkashakht Donbassa. [Hydrogeology of the USSR.Volume VI. Flooding and pumping of mines inDonbas] – M.: Nedra, 1971. – 480
Lysychenko G., Zabulonov Y., Khmil G. (2008)Pryrodnyi tekhnogennyi ta ekologichnyi ryzyky:analiz, otsinka, upravlinnya [Natural man-madeand environmental risks: analysis, evaluation,management] К.: Joint-Stock Company «Vitol»(in Ukrainian), 544
Rudko G., Yakovlev О. and other (2016) Ekologichnabezpeka vugilnykh rodovyshch [Ecological safety
О. Ulytsky, V. Yermakov, О. Lunova, O. Buglak Journ.Geol.Geograph.Geoecology, 27(2), 368-376________________________________________________________________________________________________________________________________________________________________
376
of coal deposits of Ukraine] monography,VVDBuk Rekm, Chernivtsi (in Ukrainian), 608
Sadovenko I., Razumniy Y.and other (1999) Zvit pronaukovo-doslidnu robotu “Obosnovat gidrologi-cheskiy rezhim i tekhnologicheskiye resheniya poyego podderzhaniyu pri zakrytii ugolnykh shakhtTsentralnogo rayona Donbassa” [Report “Tosubstantiate the hydrological regime and technol-ogical decisions on its maintenance at the closingof coal mines of the Central region of Donbas”],Dnepropetrovsk, 160
Shestopalov V.M., Ognyanyk N.S., Drobnokhod N.N.and other/ Vodoobmen v gidrogeologicheskikhstrukturakh Ukrainy: vodoobmen v narushennykhusloviyakh [Water exchange in hydrogeologicalstructures of Ukraine: water exchange indisturbed conditions] – Institute of geologicalsciences. – Kiev: Nauk.dumka, 1991. - 528
Shmandіy V.M. and other (2013) Ekologіchna bezpeka:pіdruchnyk [Ecological safety: textbook]-Herson:Oldі plyus, 366
Vremennyye metodicheskiye rekomendatsii. Pometodam predvaritelnoy otsenki izmeneniy
gidrogeologicheskoy obstanovki i optimizatsiinablyudatelnoy seti v sisteme monitoringapodzemnykh vod v Donbasse pri zakrytiishakht.[Temporary methodologicalrecommendations. On methods of preliminaryassessment of changes in the hydrogeologicalsituation and optimization of the observationnetwork in the groundwater monitoring system inDonbas when mines are closed. -Dnepropetrovsk: TO UkrGGRI, 2001. - 67 p.] –Dnepropetrovsk: DO UkrGGRI, 2001. – 67
Yermakov V., Ulytsky О., Bondar О. (2017) and other.Zvit pro naukovo-doslidnu robotu “Monitoryngvykonannya pryrodookhoronnykh robit ta ekolo-hichnogo stanu pryrodnogo dovkillya diyuchykhta likvidovanykh vugilnykh pidpryyemstv, ro-zroblennya propozytsiy shchodo yogo polipshen-nya [Report “Monitoring the performance of en-vironmental works and ecological state of the en-vironment of operating and liquidated coal enter-prises, developing proposals for its improve-ment”], Kyiv, 97
V. V. Yavorska, I. V. Hevko,V. A. Sych, K. V. Kolomiyets Journ.Geol.Geograph.Geoecology, 27(2), 380-388________________________________________________________________________________________________________________________________________________________________
377
Journal of Geology,Geography and Geoecology
Journal home page: geology-dnu-dp.ua
ISSN 2617-2909 (print)ISSN 2617-2119 (online)
Journ.Geol.Geograph.Geoecology,
27(2), 377-385doi:10.15421/111862
V. V. Yavorska, I. V. Hevko,V. A. Sych, K. V. Kolomiyets Journ.Geol.Geograph.Geoecology, 27(2), 377-385________________________________________________________________________________________________________________________________________________________________
Organization of tourist and recreational activity within the objects of the natural protectedfund in the Odessa region
V. V. Yavorska1, I. V. Hevko2, V. A. Sych1, K. V. Kolomiyets1
1Odesa I .I. Mechnykov National University, Odesa, Ukraine, e-mail: [email protected] Volodymyr Hnatiuk National Pedagogical University
Abstract. The article deals with the issues of nature use in protected areas, theexploitation of objects of the nature reserve fund for recreational and tourist purposes.It is emphasized that ecotourism, which includes, first of all, orientation of tourists tothe consumption of ecological resources – recreational aspect, preservation of theenvironment – nature protection, is an important direction of recreation within the
territories of the nature reserve fund, support of the traditional way of life of the local population – social aspect. The purpose of thework is to find out the features of the present state, to determine the problems and perspectives of the organization of recreationwithin the natural reserve areas of the state level in the Odessa region. Recreational and tourist attraction of the region for visitors arenot only a wonderful climate and water resources but also available on territory of the region objects of the nature reserve fund,among which there are 16 objects of national importance. According to the recommendation of the International Union ofConservation of Nature and Ukrainian legislation, most of the categories of objects of the nature reserve fund provide for tourist andrecreational activities within their territories in specially designated areas. Thus, the Danube Biosphere Reserve and two nationalnatural parks, «Nizhnednistrovsky» and «Tuzlovsky Limany», joined the tourists for both short–term and long–term recreation. Withthe purpose of ecological education, the abovementioned objects of the nature reserve fund of national importance are used to createecological trails and organize tourist routes. Thus, the most popular water tours in the Danube Delta to the mouth of the river with avisit to the symbolic «0 km» of the Danube, as well as tours for the observation of birds. On the river Dniester are popular sportfishing trips, as well as landscape tours. On the relatively untouched coast of the Black Sea, including the territory of the nationalpark «Tuzlovsky Limany» lies one of the most interesting and cognitive routes of the Odessa region, which includes elements ofecological, rural, ethnic and extreme tourism. It is established that at the present time, organizational and recreational activities withinthe protected areas of Ukraine, as well as the Odessa region are at the stage of formation, the result of which is that its economicefficiency is extremely low.
Key words:recreation, ecotourism, nature reserve fund, national natural park, biosphere reserve, biotic diversity.
Організація туристично–рекреаційної діяльності в межах об'єктів природно–заповідного фонду в Одеській області
В. В. Яворська1, І. В. Гевко2, В. А. Сич1, К. В. Коломієць1
1Одеський національний університет імені І. І. Мечникова, e-mail: [email protected]Тернопільський національний педагогічний університет імені Володимира Гнатюка
Анотація. В статті розглянуто питання природокористування на природоохоронних територіях, а саме використанняоб’єктів природно–заповідного фонду в рекреаційних та туристичних цілях. Наголошено, що важливим напрямком рекреа-ції в межах територій природно–заповідного фонду є екотуризм, який об'єднує всі ті види туризму, що орієнтовані на довго-тривале збереження природного довкілля (зокрема, заповідних ландшафтів), формування інтелектуально–гуманістичногосвітогляду, налагодження гуманних стосунків з місцевим населенням та органами самоврядування, поліпшення фінансово–економічного благополуччя віддалених регіонів. Розглянуто особливості організації туристично–рекреаційної діяльності вмежах Дунайського біосферного заповідника, Нижньодністровського національного парку та національного парку «Тузлов-ські лимани». Встановлено, організаційно–рекреаційна діяльність в межах природно–заповідних територій, як України, так і
Received 23.07.2018;Received in revised form 28.07.2018;Accepted 19.09.2018
V. V. Yavorska, I. V. Hevko,V. A. Sych, K. V. Kolomiyets Journ.Geol.Geograph.Geoecology, 27(2), 377-385________________________________________________________________________________________________________________________________________________________________
378
Одеської області знаходиться на стадії становлення, результатом чого є те, що її економічна ефективність надзвичайнонизька.
Ключові слова: рекреація, екотуризм, природно–заповідний фонд, національний природний парк, біосферний заповідник,біотичне різноманіття.
Introduction. In the Odessa region, unique naturalcomplexes and ecosystems, highly valued wetlandsof international importance are concentrated in theterritory of which a large number of rare andendangered species of plants, mammals and birdsare registered, which determines the developmentof ecological tourism in the region. Ecotourism is atrip to places of relatively untouched nature that donot lead to a violation of the integrity of ecosystemsin order to get an idea of the natural and culturaland ethnographic features of this territory, whichcreates such economic conditions, when natureprotection becomes beneficial to the localpopulation, which subsequently becomesconscious, that nature is the main value of theterritory and the source of their own profits.Recreational and tourist attraction of the region forvisitors, in addition to the natural conditions (waterobjects, climate, scenic landscapes, diversity offlora and fauna, etc.), also make available on itsterritory objects of the nature reserve fund. Thepurpose of the work is to find out the features ofthe present state, to determine the problems andperspectives of the organization of recreationwithin the natural reserve areas of the state level inthe Odessa region. Analysis of previous researchesshows that various aspects of recreational andtourist activity in protected natural territories arecovered in the works such authors as Boreyko V.,Kotenko T., Mironovа L., Stilmark F., KekushevV., Sergeyeva T., Stepanitsky V., Lyubitseva O.,Dmytruk O. and others. However, some issuesremain controversial and require further study.Data and methods. The materials of the studyserved as literary sources, as well as individualdevelopments of modern domestic and foreignscientists on the study of recreation and tourismactivities within the protected areas of the world.The cartographic method was used to assess theterritorial peculiarities of the recreational activityorganization in the Odessa region within theboundaries of nature–protected territories ofnational importance; The method of field researchwas used to gather material on the organization ofrecreational activities on the territory of the DanubeBiosphere Reserve, Nizhnednistrovsky NationalNature Park and the Tuzlovsky Limani NationalNature Park.Results of the study and their discussion. Bydefinition of The International Union for theConservation of Nature (IUCN) the natureprotection (nature reserve) area is «a land and / or
sea area specifically designated for the conservationof biodiversity, natural and related culturalresources, an environmental protection regime,within which it is provided by legislative and othereffective means». Since 1992, IUCN has identifiedsix categories of protected areas (Lausche, 2011).These categories are determined depending on thedirection of the management objectives (Table 1).
As can be seen from Table 2, recreationalactivities are foreseen for practically allinternational categories of the organization ofprotected areas (except category I). Priorityrecreational activity is defined for categories ІІ, ІІІ,V.
In Ukraine, all protected areas are united intothe Nature Reserve Fund (NRF), which is dividedinto 11 categories, three of which are nationalnatural parks (NNPs), natural and biospherereserves – have a national status (Pro prirodno,1992). The category «Biosphere Park» is includedin the list of categories of the nature reserve fund ofUkraine – as an analogue of the internationalcategory «Biosphere Reserve» and combines thefunctions of biodiversity conservation andsustainable socio–economic development. Touristand recreational activity in the territory ofbiosphere parks of Ukraine may be conductedwithin the zone of anthropogenic landscapes and anarea of regulated reserve regime.
National nature parks of Ukraine perform thesame functions and pursue the same managementobjectives as National Parks under category II ofIUCN. At the same time, large areas of economiczones of Ukraine's NPPs show that they haveelements of category V «Protected landscape /marine water», and the fact that each of theUkrainian NPPs includes a protected zone allows usto speak about the presence of an element of thefirst category of IUCN here. Although, unlikenatural reserves, according to Art. 21 of the Law ofUkraine «About the Nature Reserve Fund ofUkraine» (Zakon, 1992) in the national natureparks, in order to preserve nature, theimplementation of health improvement, scientificand educational work, environmental education, inaddition to protected areas and economic zones, itshould be distinguished zones of regulatedrecreation and zone of stationary recreation. Withinthe regulated recreation zone, short–term rest andimprovement of people are carried out also anoverview of especially picturesque and memorableplaces.
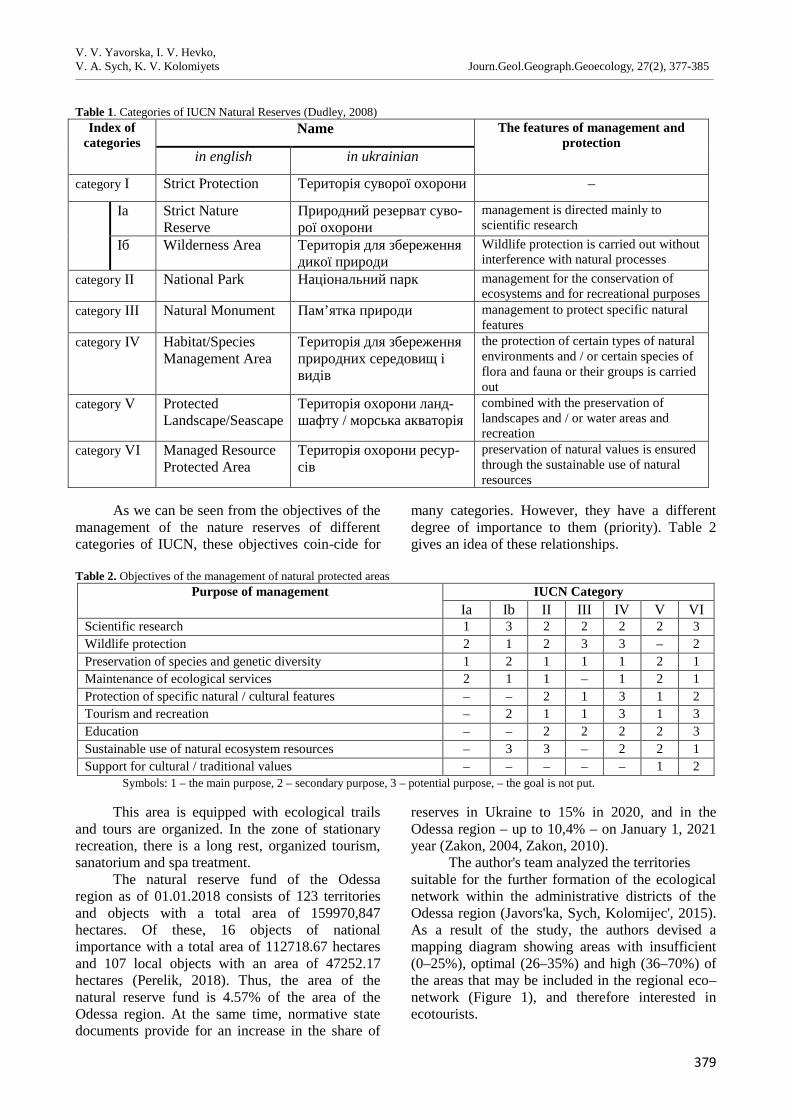
V. V. Yavorska, I. V. Hevko,V. A. Sych, K. V. Kolomiyets Journ.Geol.Geograph.Geoecology, 27(2), 377-385________________________________________________________________________________________________________________________________________________________________
379
Table 1. Categories of IUCN Natural Reserves (Dudley, 2008)Index of
categoriesName The features of management and
protectionin english in ukrainian
category І Strict Protection Територія суворої охорони –
Іа Strict NatureReserve
Природний резерват суво-рої охорони
management is directed mainly toscientific research
Іб Wilderness Area Територія для збереженнядикої природи
Wildlife protection is carried out withoutinterference with natural processes
category ІІ National Park Національний парк management for the conservation ofecosystems and for recreational purposes
category III Natural Monument Пам’ятка природи management to protect specific naturalfeatures
category IV Habitat/SpeciesManagement Area
Територія для збереженняприродних середовищ івидів
the protection of certain types of naturalenvironments and / or certain species offlora and fauna or their groups is carriedout
category V ProtectedLandscape/Seascape
Територія охорони ланд-шафту / морська акваторія
combined with the preservation oflandscapes and / or water areas andrecreation
category VI Managed ResourceProtected Area
Територія охорони ресур-сів
preservation of natural values is ensuredthrough the sustainable use of naturalresources
As we can be seen from the objectives of themanagement of the nature reserves of differentcategories of IUCN, these objectives coin-cide for
many categories. However, they have a differentdegree of importance to them (priority). Table 2gives an idea of these relationships.
Table 2. Objectives of the management of natural protected areasPurpose of management IUCN Category
Іа Іb ІІ ІІІ ІV V VІScientific research 1 3 2 2 2 2 3Wildlife protection 2 1 2 3 3 – 2Preservation of species and genetic diversity 1 2 1 1 1 2 1Maintenance of ecological services 2 1 1 – 1 2 1Protection of specific natural / cultural features – – 2 1 3 1 2Tourism and recreation – 2 1 1 3 1 3Education – – 2 2 2 2 3Sustainable use of natural ecosystem resources – 3 3 – 2 2 1Support for cultural / traditional values – – – – – 1 2
Symbols: 1 – the main purpose, 2 – secondary purpose, 3 – potential purpose, – the goal is not put.
This area is equipped with ecological trailsand tours are organized. In the zone of stationaryrecreation, there is a long rest, organized tourism,sanatorium and spa treatment.
The natural reserve fund of the Odessaregion as of 01.01.2018 consists of 123 territoriesand objects with a total area of 159970,847hectares. Of these, 16 objects of nationalimportance with a total area of 112718.67 hectaresand 107 local objects with an area of 47252.17hectares (Perelik, 2018). Thus, the area of thenatural reserve fund is 4.57% of the area of theOdessa region. At the same time, normative statedocuments provide for an increase in the share of
reserves in Ukraine to 15% in 2020, and in theOdessa region – up to 10,4% – on January 1, 2021year (Zakon, 2004, Zakon, 2010).
The author's team analyzed the territoriessuitable for the further formation of the ecologicalnetwork within the administrative districts of theOdessa region (Javors'ka, Sych, Kolomijec', 2015).As a result of the study, the authors devised amapping diagram showing areas with insufficient(0–25%), optimal (26–35%) and high (36–70%) ofthe areas that may be included in the regional eco–network (Figure 1), and therefore interested inecotourists.
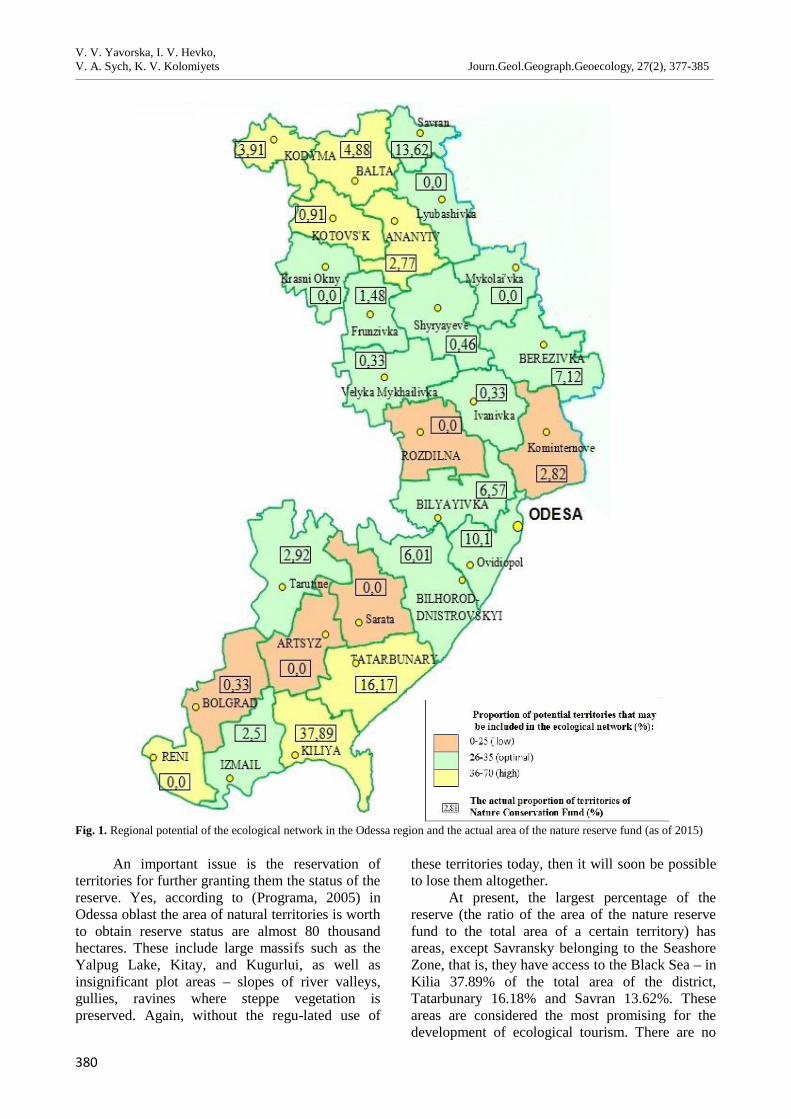
V. V. Yavorska, I. V. Hevko,V. A. Sych, K. V. Kolomiyets Journ.Geol.Geograph.Geoecology, 27(2), 377-385________________________________________________________________________________________________________________________________________________________________
380
Fig. 1. Regional potential of the ecological network in the Odessa region and the actual area of the nature reserve fund (as of 2015)
An important issue is the reservation ofterritories for further granting them the status of thereserve. Yes, according to (Programa, 2005) inOdessa oblast the area of natural territories is worthto obtain reserve status are almost 80 thousandhectares. These include large massifs such as theYalpug Lake, Kitay, and Kugurlui, as well asinsignificant plot areas – slopes of river valleys,gullies, ravines where steppe vegetation ispreserved. Again, without the regu-lated use of
these territories today, then it will soon be possibleto lose them altogether.
At present, the largest percentage of thereserve (the ratio of the area of the nature reservefund to the total area of a certain territory) hasareas, except Savransky belonging to the SeashoreZone, that is, they have access to the Black Sea – inKilia 37.89% of the total area of the district,Tatarbunary 16.18% and Savran 13.62%. Theseareas are considered the most promising for thedevelopment of ecological tourism. There are no
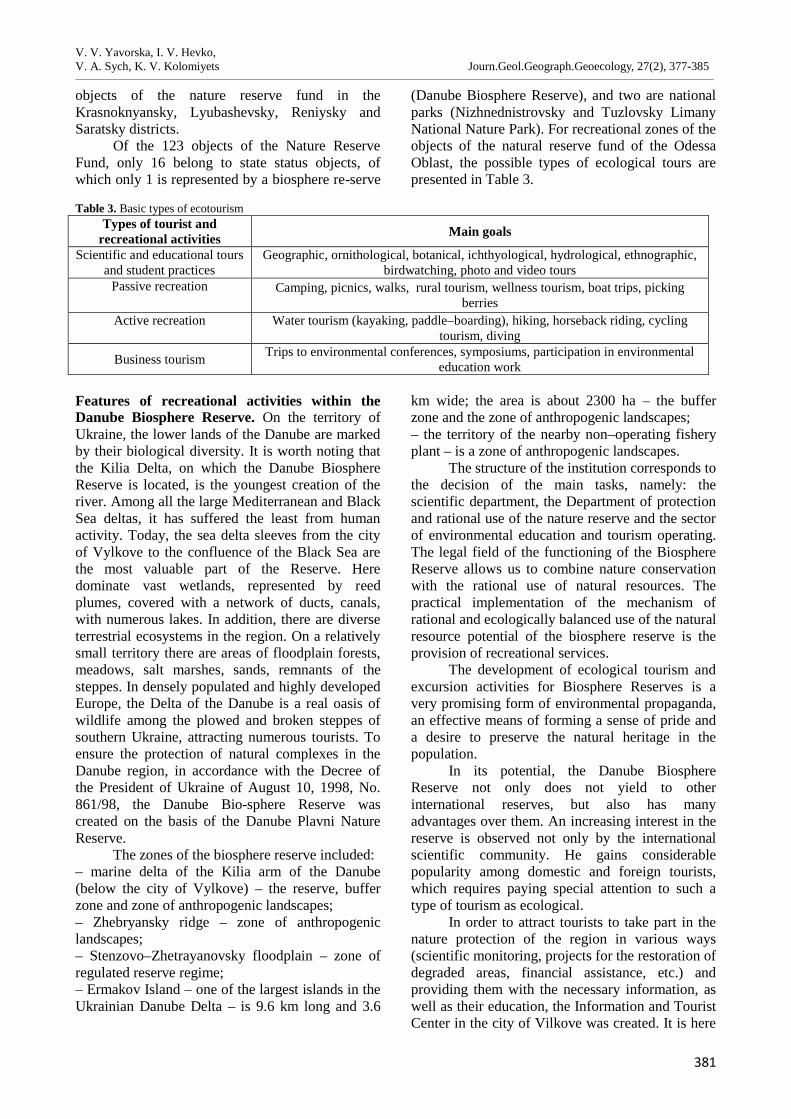
V. V. Yavorska, I. V. Hevko,V. A. Sych, K. V. Kolomiyets Journ.Geol.Geograph.Geoecology, 27(2), 377-385________________________________________________________________________________________________________________________________________________________________
381
objects of the nature reserve fund in theKrasnoknyansky, Lyubashevsky, Reniysky andSaratsky districts.
Of the 123 objects of the Nature ReserveFund, only 16 belong to state status objects, ofwhich only 1 is represented by a biosphere re-serve
(Danube Biosphere Reserve), and two are nationalparks (Nizhnednistrovsky and Tuzlovsky LimanyNational Nature Park). For recreational zones of theobjects of the natural reserve fund of the OdessaOblast, the possible types of ecological tours arepresented in Table 3.
Table 3. Basic types of ecotourismTypes of tourist and
recreational activities Main goals
Scientific and educational toursand student practices
Geographic, ornithological, botanical, ichthyological, hydrological, ethnographic,birdwatching, photo and video tours
Passive recreation Camping, picnics, walks, rural tourism, wellness tourism, boat trips, pickingberries
Active recreation Water tourism (kayaking, paddle–boarding), hiking, horseback riding, cyclingtourism, diving
Business tourism Trips to environmental conferences, symposiums, participation in environmentaleducation work
Features of recreational activities within theDanube Biosphere Reserve. On the territory ofUkraine, the lower lands of the Danube are markedby their biological diversity. It is worth noting thatthe Kilia Delta, on which the Danube BiosphereReserve is located, is the youngest creation of theriver. Among all the large Mediterranean and BlackSea deltas, it has suffered the least from humanactivity. Today, the sea delta sleeves from the cityof Vylkove to the confluence of the Black Sea arethe most valuable part of the Reserve. Heredominate vast wetlands, represented by reedplumes, covered with a network of ducts, canals,with numerous lakes. In addition, there are diverseterrestrial ecosystems in the region. On a relativelysmall territory there are areas of floodplain forests,meadows, salt marshes, sands, remnants of thesteppes. In densely populated and highly developedEurope, the Delta of the Danube is a real oasis ofwildlife among the plowed and broken steppes ofsouthern Ukraine, attracting numerous tourists. Toensure the protection of natural complexes in theDanube region, in accordance with the Decree ofthe President of Ukraine of August 10, 1998, No.861/98, the Danube Bio-sphere Reserve wascreated on the basis of the Danube Plavni NatureReserve.
The zones of the biosphere reserve included:– marine delta of the Kilia arm of the Danube(below the city of Vylkove) – the reserve, bufferzone and zone of anthropogenic landscapes;– Zhebryansky ridge – zone of anthropogeniclandscapes;– Stenzovo–Zhetrayanovsky floodplain – zone ofregulated reserve regime;– Ermakov Island – one of the largest islands in theUkrainian Danube Delta – is 9.6 km long and 3.6
km wide; the area is about 2300 ha – the bufferzone and the zone of anthropogenic landscapes;– the territory of the nearby non–operating fisheryplant – is a zone of anthropogenic landscapes.
The structure of the institution corresponds tothe decision of the main tasks, namely: thescientific department, the Department of protectionand rational use of the nature reserve and the sectorof environmental education and tourism operating.The legal field of the functioning of the BiosphereReserve allows us to combine nature conservationwith the rational use of natural resources. Thepractical implementation of the mechanism ofrational and ecologically balanced use of the naturalresource potential of the biosphere reserve is theprovision of recreational services.
The development of ecological tourism andexcursion activities for Biosphere Reserves is avery promising form of environmental propaganda,an effective means of forming a sense of pride anda desire to preserve the natural heritage in thepopulation.
In its potential, the Danube BiosphereReserve not only does not yield to otherinternational reserves, but also has manyadvantages over them. An increasing interest in thereserve is observed not only by the internationalscientific community. He gains considerablepopularity among domestic and foreign tourists,which requires paying special attention to such atype of tourism as ecological.
In order to attract tourists to take part in thenature protection of the region in various ways(scientific monitoring, projects for the restoration ofdegraded areas, financial assistance, etc.) andproviding them with the necessary information, aswell as their education, the Information and TouristCenter in the city of Vilkove was created. It is here
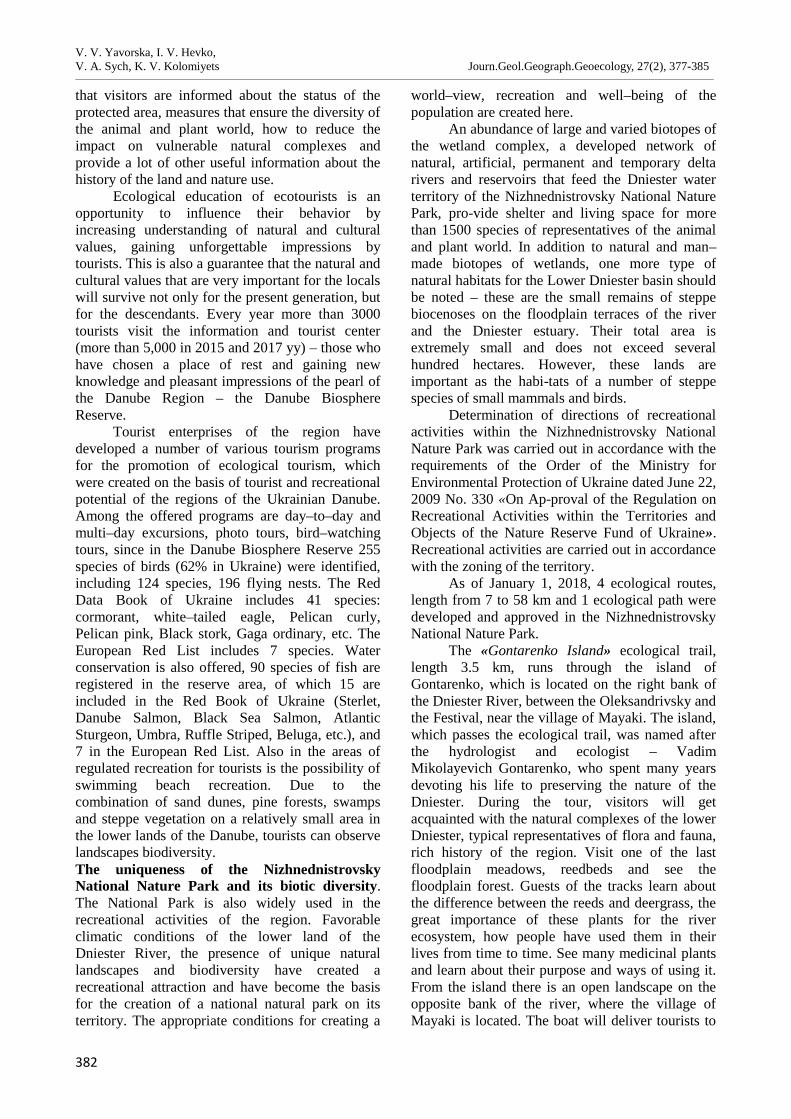
V. V. Yavorska, I. V. Hevko,V. A. Sych, K. V. Kolomiyets Journ.Geol.Geograph.Geoecology, 27(2), 377-385________________________________________________________________________________________________________________________________________________________________
382
that visitors are informed about the status of theprotected area, measures that ensure the diversity ofthe animal and plant world, how to reduce theimpact on vulnerable natural complexes andprovide a lot of other useful information about thehistory of the land and nature use.
Ecological education of ecotourists is anopportunity to influence their behavior byincreasing understanding of natural and culturalvalues, gaining unforgettable impressions bytourists. This is also a guarantee that the natural andcultural values that are very important for the localswill survive not only for the present generation, butfor the descendants. Every year more than 3000tourists visit the information and tourist center(more than 5,000 in 2015 and 2017 yy) – those whohave chosen a place of rest and gaining newknowledge and pleasant impressions of the pearl ofthe Danube Region – the Danube BiosphereReserve.
Tourist enterprises of the region havedeveloped a number of various tourism programsfor the promotion of ecological tourism, whichwere created on the basis of tourist and recreationalpotential of the regions of the Ukrainian Danube.Among the offered programs are day–to–day andmulti–day excursions, photo tours, bird–watchingtours, since in the Danube Biosphere Reserve 255species of birds (62% in Ukraine) were identified,including 124 species, 196 flying nests. The RedData Book of Ukraine includes 41 species:cormorant, white–tailed eagle, Pelican curly,Pelican pink, Black stork, Gaga ordinary, etc. TheEuropean Red List includes 7 species. Waterconservation is also offered, 90 species of fish areregistered in the reserve area, of which 15 areincluded in the Red Book of Ukraine (Sterlet,Danube Salmon, Black Sea Salmon, AtlanticSturgeon, Umbra, Ruffle Striped, Beluga, etc.), and7 in the European Red List. Also in the areas ofregulated recreation for tourists is the possibility ofswimming beach recreation. Due to thecombination of sand dunes, pine forests, swampsand steppe vegetation on a relatively small area inthe lower lands of the Danube, tourists can observelandscapes biodiversity.The uniqueness of the NizhnednistrovskyNational Nature Park and its biotic diversity.The National Park is also widely used in therecreational activities of the region. Favorableclimatic conditions of the lower land of theDniester River, the presence of unique naturallandscapes and biodiversity have created arecreational attraction and have become the basisfor the creation of a national natural park on itsterritory. The appropriate conditions for creating a
world–view, recreation and well–being of thepopulation are created here.
An abundance of large and varied biotopes ofthe wetland complex, a developed network ofnatural, artificial, permanent and temporary deltarivers and reservoirs that feed the Dniester waterterritory of the Nizhnednistrovsky National NaturePark, pro-vide shelter and living space for morethan 1500 species of representatives of the animaland plant world. In addition to natural and man–made biotopes of wetlands, one more type ofnatural habitats for the Lower Dniester basin shouldbe noted – these are the small remains of steppebiocenoses on the floodplain terraces of the riverand the Dniester estuary. Their total area isextremely small and does not exceed severalhundred hectares. However, these lands areimportant as the habi-tats of a number of steppespecies of small mammals and birds.
Determination of directions of recreationalactivities within the Nizhnednistrovsky NationalNature Park was carried out in accordance with therequirements of the Order of the Ministry forEnvironmental Protection of Ukraine dated June 22,2009 No. 330 «On Ap-proval of the Regulation onRecreational Activities within the Territories andObjects of the Nature Reserve Fund of Ukraine».Recreational activities are carried out in accordancewith the zoning of the territory.
As of January 1, 2018, 4 ecological routes,length from 7 to 58 km and 1 ecological path weredeveloped and approved in the NizhnednistrovskyNational Nature Park.
The «Gontarenko Island» ecological trail,length 3.5 km, runs through the island ofGontarenko, which is located on the right bank ofthe Dniester River, between the Oleksandrivsky andthe Festival, near the village of Mayaki. The island,which passes the ecological trail, was named afterthe hydrologist and ecologist – VadimMikolayevich Gontarenko, who spent many yearsdevoting his life to preserving the nature of theDniester. During the tour, visitors will getacquainted with the natural complexes of the lowerDniester, typical representatives of flora and fauna,rich history of the region. Visit one of the lastfloodplain meadows, reedbeds and see thefloodplain forest. Guests of the tracks learn aboutthe difference between the reeds and deergrass, thegreat importance of these plants for the riverecosystem, how people have used them in theirlives from time to time. See many medicinal plantsand learn about their purpose and ways of using it.From the island there is an open landscape on theopposite bank of the river, where the village ofMayaki is located. The boat will deliver tourists to
V. V. Yavorska, I. V. Hevko,V. A. Sych, K. V. Kolomiyets Journ.Geol.Geograph.Geoecology, 27(2), 377-385________________________________________________________________________________________________________________________________________________________________
383
the last stop of the route, where they will be ablefrom the observation tower on the shore of the OldTurunchchuk to see the entire Dniester estuary andthe immense reed beds. The back road runs alongthe Aleksandrovsky Channel and along the Dniesterto the village of Mayaki.
«Dnister Amazonia» – a river tourist routeruns in the zone of regulated recreation along theDniester River, the channel of Turunchchuk, thepic-turesque strait «Amazonka», introduces themysterious and unique floodplain forest and a hugearray of reed bed. On the route there is White Lake,which can be reached on the craft from the city ofBilyaivka and from the village of Mayaki. Thelength of the route from Bilyaivka – up to 8 km,from village Mayaky – 20 km. Duration of theroute is from 3 to 6 hours. This ecological trailintroduces tourists with the surrounding landscapeand diversity of wet-lands, beautiful vegetablecreatures – white lilies, yellow jugs and walnut.The tourists on the route constantly accompany theAboriginal birds of the Dniester and Turunchukrivers – swans, herons, gulls, etc.
«Kingdom of birds»– a water tourist route inthe zone of regulated recreation, which starts fromthe village Mayaki, runs along the Dniester, thenalong the channel of the Deep Turunchuk withaccess to the Dniester estuary. Back – along the«Kiliary» Strait with the entrance to the DeepTurunchuk, and then along the Dniester to thevillage of Mayaky. The length of the route is about20 km. Duration of the route is from 3 to 5 hours.On the route there are giant pelicans, gracefulswans, numerous small and large cormorants,graceful herons, wailing marsh tusks, thickets of themost rare plants – fringed water lily (Nymphoidespeltata), as well as the largest in Europe, theplantation of yellow water–lily (Nuphar lutea). Theshallow areas of the estuary are attractive forsummer swimming, both adults and children.
«Brilliant Ibis» car (bicycle, pedestrian)route, which passes through the economic zone andthe zone of regulated recreation along the Mayaky– Palanka motorway. Its length is 10 km. Durationof the route is 3 to 4 hours. Among the manyinhabitants of the delta can be called dozens ofspecies that can give people the opportunity toassess the environmental situation in their presenceor absence. However, the most interesting object isa brilliant bird or birdhouse. This graceful andsophisticated bird is the closest relative, probablyknown to many tourists, the sacred ibis, worshipedby ancient Egyptians. Korovayka is included in theRed Data Book of Ukraine. If the Dniester damdoes not hold the water during the spring flood, itdoes not nest, or it has very little nesting. It breaks
in reindeer thickets away from human eyes. Youcan watch these mysterious birds on flood plainsduring the flood period – in April – May.
«Yevsey's Trail» is an excellent pedestriantourist route in the zone of regulated recreation onthe slopes of the Dniester estuary. The length of theroute is 5 km and the duration is from 3 to 5 hours.The trail passes through the steppe landscape andpicturesque forest, formed by a tireless enthusiast –forestry Yevsey Pavlovich Kostetsky. This routewill introduce the rare birds of the steppe zone andforest–steppe. In the shallow waters of the Dniesterestuary there are numerous clumps (over a thousandspecimens) of large cormorants, resting pelicans,and in the air the white–tailed eagle is steaming.The uniqueness of the National Nature Park«Tuzlovsky Limany» and the organization ofrecreational activities within its borders. TheBlack Sea landscapes have suffered the mostbecause of its great recreational attractiveness. As aresult, in fact, in their natural form, there were onlyindividual fragments, one of which is the area ofthe so–called Tuzla estuaries. In January 2010 wascreated Tuzlovsky Limany National Nature Park.Its territory includes: the water area of the lakesBurnas, Alibey, Hadjider, Shahany Lagoon,Karachaus, Malyi Sasyk and Dzhantshey, the BlackSea sandspit, the mouths of the wetlands of theAlkaliy rivers, the Hadjider and the small riversflowing to the lakes Shahany and Karachaus, aswell as the forest tract «Lebedivka»– artificiallyplanted forest area.
As one of the most interesting andinformative routes of the Odessa region, whichincludes elements of ecological, rural, ethnic andextreme tourism, are offered a pedestrian ecotouristroute «Reserve coastline of Odessa region», whichruns from the resort of Serhijivka to the villagePrimorsk (Kiliysky district), which is located 18 kmfrom the city of Vilkovo. The total length of theroute is 85–90 km, part of the trail passes throughthe territory of the national nature park «Tuzlovskylimany».
The area is a plain–wavy steppe (SouthBessarabsky steppe), dissected by ravines andbeams, and is also characterized by diverse floodlandscapes, specific flora and fauna. The heights ofthe surface are reduced here from north to south, tothe sea. The flat surface is disturbed by valleys ofrivers, gullies, ravines. Hydrography is representedmainly by the river Danube and the Black Seacoast. In the marine part of the Danube plain thereare lake–estuaries between the rivers of theDanube–Dniester, according to the accepted typing,to periodically closed estuaries. These reservoirshave a number of shallow branches, which are
V. V. Yavorska, I. V. Hevko,V. A. Sych, K. V. Kolomiyets Journ.Geol.Geograph.Geoecology, 27(2), 377-385________________________________________________________________________________________________________________________________________________________________
384
highly saline and swampy floodplains of smallsteppe streams. With the exception of the lakeSasyk (Kunduk), the axis of other reservoirs isparallel to the seaside, sandspit. From the sea,periodically closed estuaries are separated by a sanddune (bar). The total length of the bar from theestuary of Sasyk to the Dniester estuary is 55 km,and the width varies from 50 to 400 m. Among theestuaries of the Danube–Dniester rivers, the estatesof the Tuzlov group – Shagans, Alibey, Burnas –occupy a special place. They have an internationalsta-tus (included in the so–called Ramsar List ofwet-lands), as they play an important role in thenatural functioning and interaction of coastalecosystems around the Black Sea. Tuzla estuariesare important for maintaining the biodiversity of theregion; provide wintering of many species of birds.Here about 1 thousand pairs of waterbird nest andup to 120 thousand individuals form seasonalclusters, which are especially appreciated by birdwatchers. Generally, 243 species of birds are foundin the park, of which 28 are included in the RedData Book of Ukraine.
Since the park has been functioning quiterecently so recreational activity is almost notdeveloped. Its borders are not yet identified on theground, there are no barriers, no sign indicating thevalue of this territory, the park remains unprotectedon weekends when there is a mass arrival of huntersand fishermen. There are no good tracks connectinglarge settlements or Ukraine with neighboringcountries, which is why it significantly influencesthe number of tourists who could visit the park.There are, of course, roads that connect districtcenters, but it is worth turning aside and the roadsdisappearing altogether. Therefore, despite theunique places suitable for recreation, the number oftourists by an order of magnitude less than it couldbe, because of the unsuitability of roads, only fansof fishing, despite the impassability come here tofish. And if the leadership of the national park isactively starting to introduce various measures – tocreate tourist routes, excursion and walkingecological and educational paths, to equip placesfor overnight stays for recreation and to work fulltime, the park area will attract more tourists, whichin turn will attract funds to the local budget.Conclusions. The development of natural tourismin protected areas can carry a whole range ofdifferent consequences – both positive andnegative. On the one hand, the development oftourism in many parts of the world was a powerfulincentive for the protection of rare species andunique ecosystems, since natural tour-ism is one ofthe few forms of economic activity that is«inexhaustible», which does not involve the
removal of wildlife objects (with the exception ofhunting and fishing tourism). But without propercontrol and management successes in thedevelopment of natural tourism can quickly turninto a «reverse side». An unprecedented increase inthe number of supporters of natural tourism hascreated a complex of problems that fifty years agonobody could imagine. Excessive and uncontrolledflow of tourists is often the cause of degradation ofthe natural environment, reducing biological andcultural diversity. Negative effects from tourismcan extend beyond the boundaries of protectedareas, affecting the interests of local settlements. Itis noted: those places where the inflow of visitorshas increased significantly, may subsequentlysuffer a rapid decline in tourism business – becausethe participants of natural tours attracts the veryopportunity to feel «far from all». Strong flows oftourists, causing the destruction of natural areas andreducing their attractiveness for future visitors,«switch» to other regions, leaving behind pollutedbeaches, frustrated local residents and ruined localeconomies. In this case, we can say that along withthe destruction of the environment on which itdepends, tourism kills itself. Therefore, whenplanning regional development, including tourism,priority should be given to preserving its natural«base», including the identification of recreationalopportunities of nature resources and thedetermination of the value of recreational loads onthe landscape complexes of nature reserves.
References
Grodzyns'kyj, M.D., Stecenko, M.P., 2003. Zapovidnasprava v Ukrai'ni [Conservation in Ukraine]. – K.:Geografika, 306 (in Ukrainian).
Zakon Ukrai'ny №1864-IV "Pro ekologichnu merezhuUkrai'ny", 2004 [Law of Ukraine No. 1864-IV"About ecological network of Ukraine]. Retrievedfrom http://zakon5.rada.gov.ua/laws/show/1864-15 (in Ukrainian).
Zakon Ukrai'ny №2818-17 "Pro Osnovni zasady(strategiju) derzhavnoi' ekologichnoi' politykyUkrai'ny na period do 2020 roku", 2010 [Aboutthe Basic Principles (Strategy) of the StateEnvironmental Policy of Ukraine for the periodup to 2020]. Retrieved fromhttp://zakon5.rada.gov.ua/laws/show/2818-17 (inUkrainian).
Zakon Ukrai'ny №2456-12 "Pro pryrodno–zapovidnyjfond Ukrai'ny", 1992 [About the Nature ReserveFund of Ukraine]. Retrieved fromhttp://zakon4.rada.gov.ua/laws/show/2456–12 (inUkrainian).
Perelik terytorij ta ob’jektiv pryrodno–zapovidnogofondu Odes'koi' oblasti, 2018 [List of territoriesand objects of the natural reserve fund of the
V. V. Yavorska, I. V. Hevko,V. A. Sych, K. V. Kolomiyets Journ.Geol.Geograph.Geoecology, 27(2), 377-385________________________________________________________________________________________________________________________________________________________________
385
Odessa region]. Retrieved fromhttps://oda3.odessa.gov.ua (in Ukrainian).
Programa formuvannja nacional'noi' ekologichnoi'merezhi v Odes'kij oblasti na 2005 – 2015 roky,2015 [Program of formation of the nationalecological network in Odessa region for 2005-2015]. Retrieved fromhttp://ecology.odessa.gov.ua/files/ecology_portal/doc/4–1–programa_ecomeregi.pdf (in Ukrainian).
Sych, V.A., Kolomijec', K.V., 2014. Ekoturystychnyjmarshrut "Zapovidne uzberezhzhja Odeshhyny"[Ecotourist route "Reserve coastline of Odessaregion"]. Geography and Tourism. ScientificJournal, V. 28, 147-153 (in Ukrainian).
Javors'ka, V. V., Sych, V. A., Kolomijec', K. V., 2015.Osoblyvosti formuvannja ekomerezhi regionuUkrai'ns'kogo Prychornomor'ja [Features offormation of Ukrainian Black Sea region econet].Odesa National University Herald. Geographyand Geology, Vol. 20, issue 4, 90-103. (inUkrainian).
Dudley, N., 2008. Guidelines for Applying ProtectedArea Management Categories. – Switzerland,Gland: IUCN, 86.
Lausche, B., 2011. Guidelines for Protected AreasLegislation. – Switzerland, Gland: IUCN, 370.
V. Yu. Yukhnovskyi, O. V. Zibtseva Journ.Geol.Geograph.Geoecology, 27(2), 389-401________________________________________________________________________________________________________________________________________________________________
386
Journal of Geology,Geography and Geoecology
Journal home page: geology-dnu-dp.ua
ISSN 2617-2909 (print)ISSN 2617-2119 (online)
Journ.Geol.Geograph.Geoecology,
27(2), 386-398doi:10.15421/111863
V. Yu. Yukhnovskyi, O. V. Zibtseva Journ.Geol.Geograph.Geoecology, 27(2), 386-398________________________________________________________________________________________________________________________________________________________________
Dynamics of ecological stability of small towns in Kyiv region
V. Yu. Yukhnovskyi, O. V. Zibtseva
National University of Life and Environmental Sciences of Ukraine, Kyiv, Ukraine, e-mail: [email protected];[email protected]
Abstract. The purpose of this study is to provide a comprehensive assessment andcomparative analysis of the ecological balance of territories of the three key smalltowns in Kyiv region: Boyarka, Vyshneve and Irpin, as well as tracking the dynamicsof ecological stability of the towns` territories in the system of general planning. Thefollowing indicators of anthropogenic transformation and natural protection of urban
areas were calculatedaccording to known methodsbased on data available from the towns` new Master Plans: coefficients of anthro-pogenic impact, anthropogenic transformation, nature protection, and ecological stability, absolute and relative tension of the ecolog-ical and economic state. The rationality of general planning in terms of ecological balance of urban areas is estimated. The studyestablished that the territory of the town Irpin is characterized by moderate anthropogenic impact, while Boyarka and Vyshnevedemonstrated a high level of anthropogenic impact. The total area of the environmental fund on the territory of cities ranges from13.9% (Vyshneve) to 47.5% (Irpin) of the total area of their territories, which is insufficient in all cases. Currently, the territory ofIrpin is the most balanced in comparison with other towns. Implementation of the new Master Plans of the cities will improve theecological balance of the Boyarka and Irpin areas; improvement in Boyarka will be notably extensive due to the expansion of the cityboundaries by a threefold increase in the town`s area. The projected general development of Vyshneve will worsen the ecologicalbalance of its territory, despite the foreseen expansion of its boundaries. The pressure from the ecological and economic status of theterritories is not balanced by the degree of anthropogenic impact and the potential of the sustainability of nature. For the territory oftowns, the potential for sustainability of nature is significantly exceeded and requires the expansion of the environment of a stabiliz-ing group of lands. The areas of towns within the existing boundaries are environmentally unstable, the tensions in the ecological andeconomic conditions of the territories are not balanced, which testify to their ineffective organization. A significant correlation hasbeen found between the calculated coefficients and the area percentage of the environmental fund of urban areas. The obtained datatestifies to the expediency of using the indicated eco-geographical indicators within the system of general planning in order to optim-ize prospective solutions.
Keywords:urban landscape, anthropogenic impact, anthropogenic transformation of landscape, eco-geographical indices
Динаміка екологічної стабільності малих міст Київщини
В. Ю. Юхновський, О. В. Зібцева
Національний університет біоресурсів і природокористування України, Київ, Україна,e-mail: [email protected]; [email protected]
Анотація. Метою дослідженняєкомплексна оцінка і порівняльний аналіз екологічної збалансованості територій трьох малихміст Київської області – Боярки, Вишневого та Ірпеня з аналізом динаміки екологічної стабільності їх територій у системігенерального планування. За даними Генеральних планів міст розраховано показники антропогенного перетворення і при-родної захищеності міських територій. Встановлено, що територія м. Ірпінь характеризується помірним, а міст Боярка таВишневе – високим антропогенним навантаженням. Загальна площа екологічного фонду на території міст коливається від13,9 (Вишневе) до 47,5% (Ірпінь), що в усіх випадках є недостатнім. Території міст в чинних межах екологічно нестабільні,напруженість еколого-господарського стану територій не збалансована. Реалізація Генеральних планів міст покращитьекологічну збалансованість територій Боярки та Ірпеня, причому Боярки – кардинально за рахунок трикратного розширеннямежі міста. Прогнозований генеральним плануванням розвиток м. Вишневе погіршить екозбалансованість його території незважаючи на передбачене її розширення. Виявлено високий кореляційний зв’язок між розрахованими коефіцієнтами тавідсотковою площею екологічного фонду міських територій. Отримані дані свідчать про доцільність використання зазначе-них екогеографічних показників у системі генерального планування з метою оптимізації перспективних рішень.
Received 17.08.2018;Received in revised form 21.08.2018;Accepted 12.09.2018
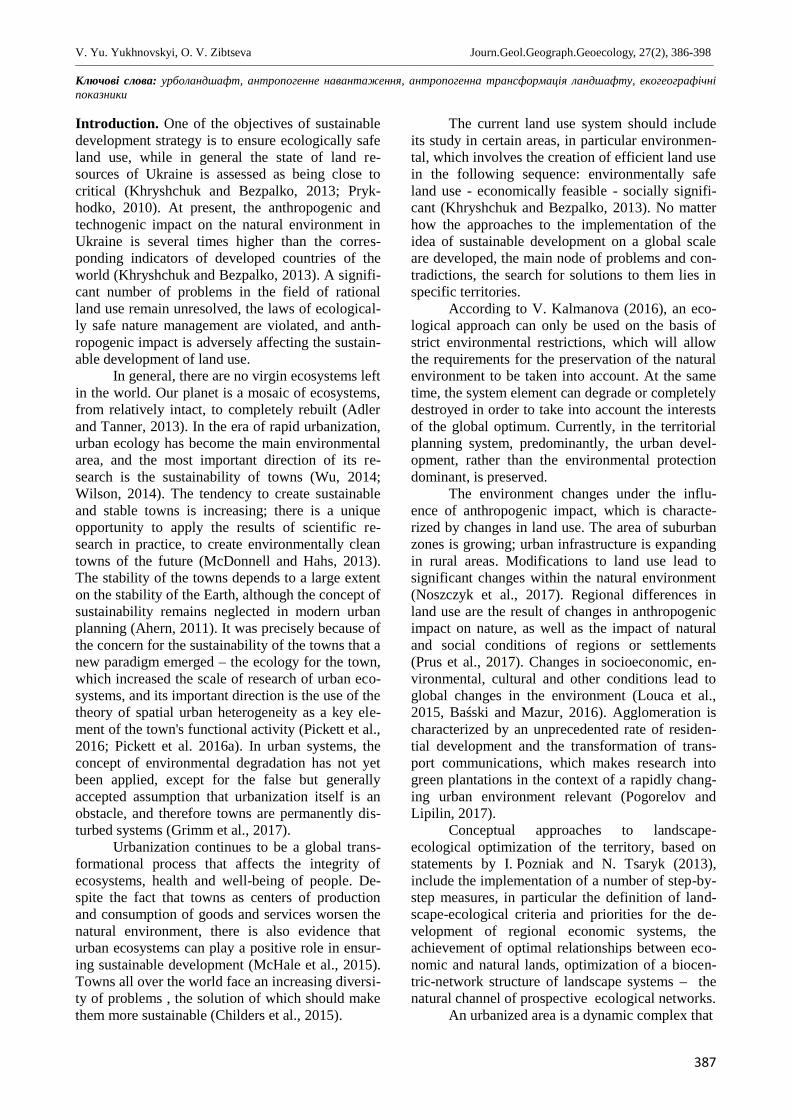
V. Yu. Yukhnovskyi, O. V. Zibtseva Journ.Geol.Geograph.Geoecology, 27(2), 386-398________________________________________________________________________________________________________________________________________________________________
387
Ключові слова: урболандшафт, антропогенне навантаження, антропогенна трансформація ландшафту, екогеографічніпоказники
Introduction. One of the objectives of sustainabledevelopment strategy is to ensure ecologically safeland use, while in general the state of land re-sources of Ukraine is assessed as being close tocritical (Khryshchuk and Bezpalko, 2013; Pryk-hodko, 2010). At present, the anthropogenic andtechnogenic impact on the natural environment inUkraine is several times higher than the corres-ponding indicators of developed countries of theworld (Khryshchuk and Bezpalko, 2013). A signifi-cant number of problems in the field of rationalland use remain unresolved, the laws of ecological-ly safe nature management are violated, and anth-ropogenic impact is adversely affecting the sustain-able development of land use.
In general, there are no virgin ecosystems leftin the world. Our planet is a mosaic of ecosystems,from relatively intact, to completely rebuilt (Adlerand Tanner, 2013). In the era of rapid urbanization,urban ecology has become the main environmentalarea, and the most important direction of its re-search is the sustainability of towns (Wu, 2014;Wilson, 2014). The tendency to create sustainableand stable towns is increasing; there is a uniqueopportunity to apply the results of scientific re-search in practice, to create environmentally cleantowns of the future (McDonnell and Hahs, 2013).The stability of the towns depends to a large extenton the stability of the Earth, although the concept ofsustainability remains neglected in modern urbanplanning (Ahern, 2011). It was precisely because ofthe concern for the sustainability of the towns that anew paradigm emerged – the ecology for the town,which increased the scale of research of urban eco-systems, and its important direction is the use of thetheory of spatial urban heterogeneity as a key ele-ment of the town's functional activity (Pickett et al.,2016; Pickett et al. 2016a). In urban systems, theconcept of environmental degradation has not yetbeen applied, except for the false but generallyaccepted assumption that urbanization itself is anobstacle, and therefore towns are permanently dis-turbed systems (Grimm et al., 2017).
Urbanization continues to be a global trans-formational process that affects the integrity ofecosystems, health and well-being of people. De-spite the fact that towns as centers of productionand consumption of goods and services worsen thenatural environment, there is also evidence thaturban ecosystems can play a positive role in ensur-ing sustainable development (McHale et al., 2015).Towns all over the world face an increasing diversi-ty of problems , the solution of which should makethem more sustainable (Childers et al., 2015).
The current land use system should includeits study in certain areas, in particular environmen-tal, which involves the creation of efficient land usein the following sequence: environmentally safeland use - economically feasible - socially signifi-cant (Khryshchuk and Bezpalko, 2013). No matterhow the approaches to the implementation of theidea of sustainable development on a global scaleare developed, the main node of problems and con-tradictions, the search for solutions to them lies inspecific territories.
According to V. Kalmanova (2016), an eco-logical approach can only be used on the basis ofstrict environmental restrictions, which will allowthe requirements for the preservation of the naturalenvironment to be taken into account. At the sametime, the system element can degrade or completelydestroyed in order to take into account the interestsof the global optimum. Currently, in the territorialplanning system, predominantly, the urban devel-opment, rather than the environmental protectiondominant, is preserved.
The environment changes under the influ-ence of anthropogenic impact, which is characte-rized by changes in land use. The area of suburbanzones is growing; urban infrastructure is expandingin rural areas. Modifications to land use lead tosignificant changes within the natural environment(Noszczyk et al., 2017). Regional differences inland use are the result of changes in anthropogenicimpact on nature, as well as the impact of naturaland social conditions of regions or settlements(Prus et al., 2017). Changes in socioeconomic, en-vironmental, cultural and other conditions lead toglobal changes in the environment (Louca et al.,2015, Baśski and Mazur, 2016). Agglomeration ischaracterized by an unprecedented rate of residen-tial development and the transformation of trans-port communications, which makes research intogreen plantations in the context of a rapidly chang-ing urban environment relevant (Pogorelov andLipilin, 2017).
Conceptual approaches to landscape-ecological optimization of the territory, based onstatements by I. Pozniak and N. Tsaryk (2013),include the implementation of a number of step-by-step measures, in particular the definition of land-scape-ecological criteria and priorities for the de-velopment of regional economic systems, theachievement of optimal relationships between eco-nomic and natural lands, optimization of a biocen-tric-network structure of landscape systems – thenatural channel of prospective ecological networks.
An urbanized area is a dynamic complex that
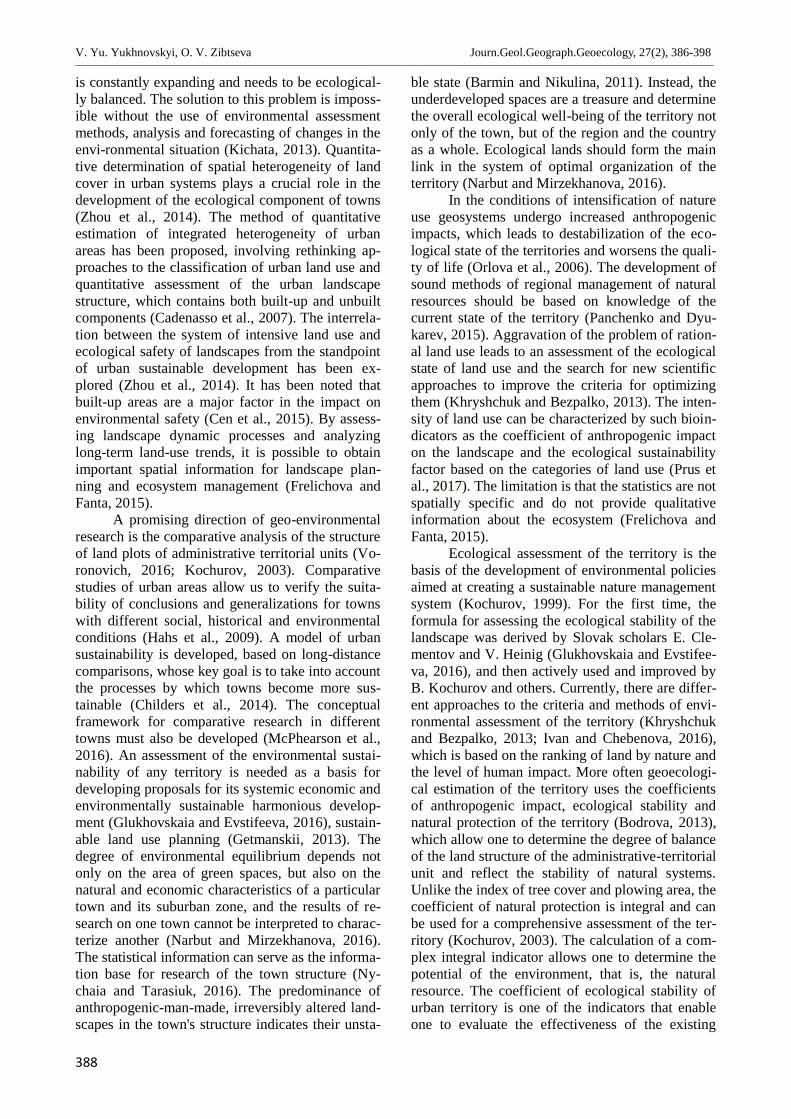
V. Yu. Yukhnovskyi, O. V. Zibtseva Journ.Geol.Geograph.Geoecology, 27(2), 386-398________________________________________________________________________________________________________________________________________________________________
388
is constantly expanding and needs to be ecological-ly balanced. The solution to this problem is imposs-ible without the use of environmental assessmentmethods, analysis and forecasting of changes in theenvi-ronmental situation (Kichata, 2013). Quantita-tive determination of spatial heterogeneity of landcover in urban systems plays a crucial role in thedevelopment of the ecological component of towns(Zhou et al., 2014). The method of quantitativeestimation of integrated heterogeneity of urbanareas has been proposed, involving rethinking ap-proaches to the classification of urban land use andquantitative assessment of the urban landscapestructure, which contains both built-up and unbuiltcomponents (Cadenasso et al., 2007). The interrela-tion between the system of intensive land use andecological safety of landscapes from the standpointof urban sustainable development has been ex-plored (Zhou et al., 2014). It has been noted thatbuilt-up areas are a major factor in the impact onenvironmental safety (Cen et al., 2015). By assess-ing landscape dynamic processes and analyzinglong-term land-use trends, it is possible to obtainimportant spatial information for landscape plan-ning and ecosystem management (Frelichova andFanta, 2015).
A promising direction of geo-environmentalresearch is the comparative analysis of the structureof land plots of administrative territorial units (Vo-ronovich, 2016; Kochurov, 2003). Comparativestudies of urban areas allow us to verify the suita-bility of conclusions and generalizations for townswith different social, historical and environmentalconditions (Hahs et al., 2009). A model of urbansustainability is developed, based on long-distancecomparisons, whose key goal is to take into accountthe processes by which towns become more sus-tainable (Childers et al., 2014). The conceptualframework for comparative research in differenttowns must also be developed (McPhearson et al.,2016). An assessment of the environmental sustai-nability of any territory is needed as a basis fordeveloping proposals for its systemic economic andenvironmentally sustainable harmonious develop-ment (Glukhovskaia and Evstifeeva, 2016), sustain-able land use planning (Getmanskii, 2013). Thedegree of environmental equilibrium depends notonly on the area of green spaces, but also on thenatural and economic characteristics of a particulartown and its suburban zone, and the results of re-search on one town cannot be interpreted to charac-terize another (Narbut and Mirzekhanova, 2016).The statistical information can serve as the informa-tion base for research of the town structure (Ny-chaia and Tarasiuk, 2016). The predominance ofanthropogenic-man-made, irreversibly altered land-scapes in the town's structure indicates their unsta-
ble state (Barmin and Nikulina, 2011). Instead, theunderdeveloped spaces are a treasure and determinethe overall ecological well-being of the territory notonly of the town, but of the region and the countryas a whole. Ecological lands should form the mainlink in the system of optimal organization of theterritory (Narbut and Mirzekhanova, 2016).
In the conditions of intensification of natureuse geosystems undergo increased anthropogenicimpacts, which leads to destabilization of the eco-logical state of the territories and worsens the quali-ty of life (Orlova et al., 2006). The development ofsound methods of regional management of naturalresources should be based on knowledge of thecurrent state of the territory (Panchenko and Dyu-karev, 2015). Aggravation of the problem of ration-al land use leads to an assessment of the ecologicalstate of land use and the search for new scientificapproaches to improve the criteria for optimizingthem (Khryshchuk and Bezpalko, 2013). The inten-sity of land use can be characterized by such bioin-dicators as the coefficient of anthropogenic impacton the landscape and the ecological sustainabilityfactor based on the categories of land use (Prus etal., 2017). The limitation is that the statistics are notspatially specific and do not provide qualitativeinformation about the ecosystem (Frelichova andFanta, 2015).
Ecological assessment of the territory is thebasis of the development of environmental policiesaimed at creating a sustainable nature managementsystem (Kochurov, 1999). For the first time, theformula for assessing the ecological stability of thelandscape was derived by Slovak scholars E. Cle-mentov and V. Heinig (Glukhovskaia and Evstifee-va, 2016), and then actively used and improved byB. Kochurov and others. Currently, there are differ-ent approaches to the criteria and methods of envi-ronmental assessment of the territory (Khryshchukand Bezpalko, 2013; Ivan and Chebenova, 2016),which is based on the ranking of land by nature andthe level of human impact. More often geoecologi-cal estimation of the territory uses the coefficientsof anthropogenic impact, ecological stability andnatural protection of the territory (Bodrova, 2013),which allow one to determine the degree of balanceof the land structure of the administrative-territorialunit and reflect the stability of natural systems.Unlike the index of tree cover and plowing area, thecoefficient of natural protection is integral and canbe used for a comprehensive assessment of the ter-ritory (Kochurov, 2003). The calculation of a com-plex integral indicator allows one to determine thepotential of the environment, that is, the naturalresource. The coefficient of ecological stability ofurban territory is one of the indicators that enableone to evaluate the effectiveness of the existing
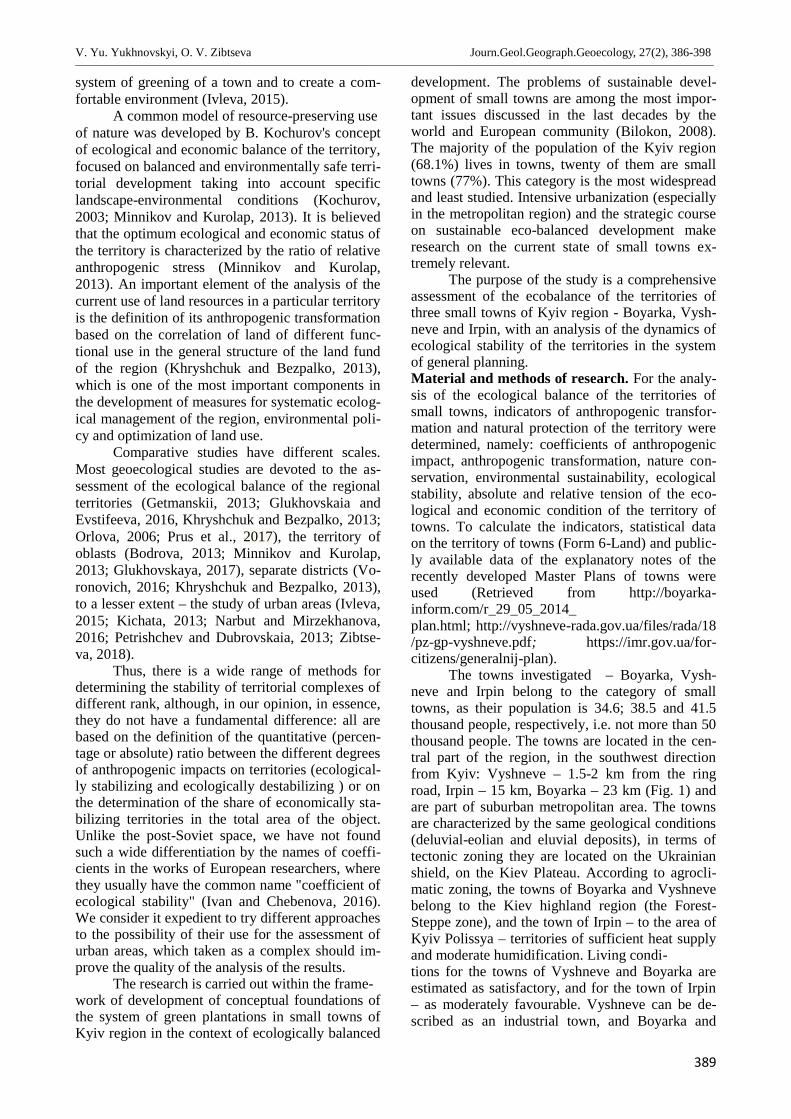
V. Yu. Yukhnovskyi, O. V. Zibtseva Journ.Geol.Geograph.Geoecology, 27(2), 386-398________________________________________________________________________________________________________________________________________________________________
389
system of greening of a town and to create a com-fortable environment (Ivleva, 2015).
A common model of resource-preserving useof nature was developed by B. Kochurov's conceptof ecological and economic balance of the territory,focused on balanced and environmentally safe terri-torial development taking into account specificlandscape-environmental conditions (Kochurov,2003; Minnikov and Kurolap, 2013). It is believedthat the optimum ecological and economic status ofthe territory is characterized by the ratio of relativeanthropogenic stress (Minnikov and Kurolap,2013). An important element of the analysis of thecurrent use of land resources in a particular territoryis the definition of its anthropogenic transformationbased on the correlation of land of different func-tional use in the general structure of the land fundof the region (Khryshchuk and Bezpalko, 2013),which is one of the most important components inthe development of measures for systematic ecolog-ical management of the region, environmental poli-cy and optimization of land use.
Comparative studies have different scales.Most geoecological studies are devoted to the as-sessment of the ecological balance of the regionalterritories (Getmanskii, 2013; Glukhovskaia andEvstifeeva, 2016, Khryshchuk and Bezpalko, 2013;Orlova, 2006; Prus et al., 2017), the territory ofoblasts (Bodrova, 2013; Minnikov and Kurolap,2013; Glukhovskaya, 2017), separate districts (Vo-ronovich, 2016; Khryshchuk and Bezpalko, 2013),to a lesser extent – the study of urban areas (Ivleva,2015; Kichata, 2013; Narbut and Mirzekhanova,2016; Petrishchev and Dubrovskaia, 2013; Zibtse-va, 2018).
Thus, there is a wide range of methods fordetermining the stability of territorial complexes ofdifferent rank, although, in our opinion, in essence,they do not have a fundamental difference: all arebased on the definition of the quantitative (percen-tage or absolute) ratio between the different degreesof anthropogenic impacts on territories (ecological-ly stabilizing and ecologically destabilizing ) or onthe determination of the share of economically sta-bilizing territories in the total area of the object.Unlike the post-Soviet space, we have not foundsuch a wide differentiation by the names of coeffi-cients in the works of European researchers, wherethey usually have the common name "coefficient ofecological stability" (Ivan and Chebenova, 2016).We consider it expedient to try different approachesto the possibility of their use for the assessment ofurban areas, which taken as a complex should im-prove the quality of the analysis of the results.
The research is carried out within the frame-work of development of conceptual foundations ofthe system of green plantations in small towns ofKyiv region in the context of ecologically balanced
development. The problems of sustainable devel-opment of small towns are among the most impor-tant issues discussed in the last decades by theworld and European community (Bilokon, 2008).The majority of the population of the Kyiv region(68.1%) lives in towns, twenty of them are smalltowns (77%). This category is the most widespreadand least studied. Intensive urbanization (especiallyin the metropolitan region) and the strategic courseon sustainable eco-balanced development makeresearch on the current state of small towns ex-tremely relevant.
The purpose of the study is a comprehensiveassessment of the ecobalance of the territories ofthree small towns of Kyiv region - Boyarka, Vysh-neve and Irpin, with an analysis of the dynamics ofecological stability of the territories in the systemof general planning.Material and methods of research. For the analy-sis of the ecological balance of the territories ofsmall towns, indicators of anthropogenic transfor-mation and natural protection of the territory weredetermined, namely: coefficients of anthropogenicimpact, anthropogenic transformation, nature con-servation, environmental sustainability, ecologicalstability, absolute and relative tension of the eco-logical and economic condition of the territory oftowns. To calculate the indicators, statistical dataon the territory of towns (Form 6-Land) and public-ly available data of the explanatory notes of therecently developed Master Plans of towns wereused (Retrieved from http://boyarka-inform.com/r_29_05_2014_plan.html; http://vyshneve-rada.gov.ua/files/rada/18/pz-gp-vyshneve.pdf; https://imr.gov.ua/for-citizens/generalnij-plan).
The towns investigated – Boyarka, Vysh-neve and Irpin belong to the category of smalltowns, as their population is 34.6; 38.5 and 41.5thousand people, respectively, i.e. not more than 50thousand people. The towns are located in the cen-tral part of the region, in the southwest directionfrom Kyiv: Vyshneve – 1.5-2 km from the ringroad, Irpin – 15 km, Boyarka – 23 km (Fig. 1) andare part of suburban metropolitan area. The townsare characterized by the same geological conditions(deluvial-eolian and eluvial deposits), in terms oftectonic zoning they are located on the Ukrainianshield, on the Kiev Plateau. According to agrocli-matic zoning, the towns of Boyarka and Vyshnevebelong to the Kiev highland region (the Forest-Steppe zone), and the town of Irpin – to the area ofKyiv Polissya – territories of sufficient heat supplyand moderate humidification. Living condi-tions for the towns of Vyshneve and Boyarka areestimated as satisfactory, and for the town of Irpin– as moderately favourable. Vyshneve can be de-scribed as an industrial town, and Boyarka and
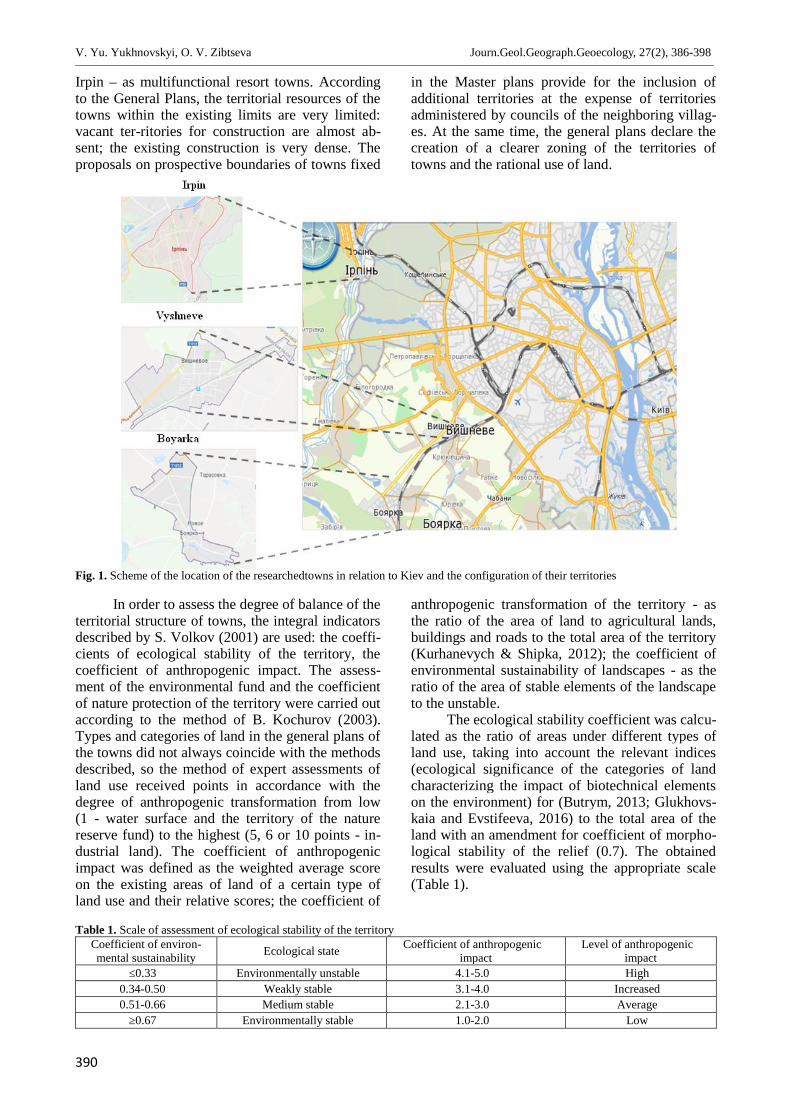
V. Yu. Yukhnovskyi, O. V. Zibtseva Journ.Geol.Geograph.Geoecology, 27(2), 386-398________________________________________________________________________________________________________________________________________________________________
390
Irpin – as multifunctional resort towns. Accordingto the General Plans, the territorial resources of thetowns within the existing limits are very limited:vacant ter-ritories for construction are almost ab-sent; the existing construction is very dense. Theproposals on prospective boundaries of towns fixed
in the Master plans provide for the inclusion ofadditional territories at the expense of territoriesadministered by councils of the neighboring villag-es. At the same time, the general plans declare thecreation of a clearer zoning of the territories oftowns and the rational use of land.
Fig. 1. Scheme of the location of the researchedtowns in relation to Kiev and the configuration of their territories
In order to assess the degree of balance of theterritorial structure of towns, the integral indicatorsdescribed by S. Volkov (2001) are used: the coeffi-cients of ecological stability of the territory, thecoefficient of anthropogenic impact. The assess-ment of the environmental fund and the coefficientof nature protection of the territory were carried outaccording to the method of B. Kochurov (2003).Types and categories of land in the general plans ofthe towns did not always coincide with the methodsdescribed, so the method of expert assessments ofland use received points in accordance with thedegree of anthropogenic transformation from low(1 - water surface and the territory of the naturereserve fund) to the highest (5, 6 or 10 points - in-dustrial land). The coefficient of anthropogenicimpact was defined as the weighted average scoreon the existing areas of land of a certain type ofland use and their relative scores; the coefficient of
anthropogenic transformation of the territory - asthe ratio of the area of land to agricultural lands,buildings and roads to the total area of the territory(Kurhanevych & Shipka, 2012); the coefficient ofenvironmental sustainability of landscapes - as theratio of the area of stable elements of the landscapeto the unstable.
The ecological stability coefficient was calcu-lated as the ratio of areas under different types ofland use, taking into account the relevant indices(ecological significance of the categories of landcharacterizing the impact of biotechnical elementson the environment) for (Butrym, 2013; Glukhovs-kaia and Evstifeeva, 2016) to the total area of theland with an amendment for coefficient of morpho-logical stability of the relief (0.7). The obtainedresults were evaluated using the appropriate scale(Table 1).
Table 1. Scale of assessment of ecological stability of the territoryCoefficient of environ-mental sustainability Ecological state Coefficient of anthropogenic
impactLevel of anthropogenic
impact≤0.33 Environmentally unstable 4.1-5.0 High
0.34-0.50 Weakly stable 3.1-4.0 Increased0.51-0.66 Medium stable 2.1-3.0 Average
≥0.67 Environmentally stable 1.0-2.0 Low
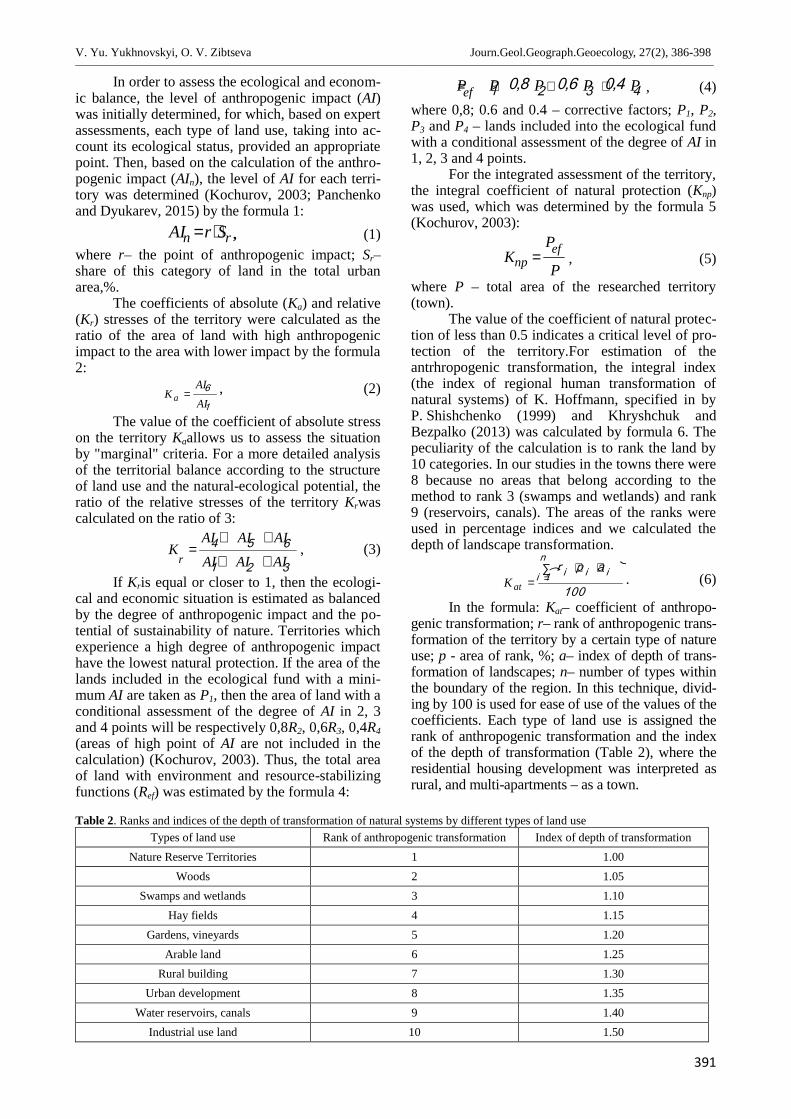
V. Yu. Yukhnovskyi, O. V. Zibtseva Journ.Geol.Geograph.Geoecology, 27(2), 386-398________________________________________________________________________________________________________________________________________________________________
391
In order to assess the ecological and econom-ic balance, the level of anthropogenic impact (AI)was initially determined, for which, based on expertassessments, each type of land use, taking into ac-count its ecological status, provided an appropriatepoint. Then, based on the calculation of the anthro-pogenic impact (AIn), the level of AI for each terri-tory was determined (Kochurov, 2003; Panchenkoand Dyukarev, 2015) by the formula 1:
rn SrAI ⋅= , (1)where r– the point of anthropogenic impact; Sr–share of this category of land in the total urbanarea,%.
The coefficients of absolute (Кa) and relative(Кr) stresses of the territory were calculated as theratio of the area of land with high anthropogenicimpact to the area with lower impact by the formula2:
1
6AI
AIK a = , (2)
The value of the coefficient of absolute stresson the territory Каallows us to assess the situationby "marginal" criteria. For a more detailed analysisof the territorial balance according to the structureof land use and the natural-ecological potential, theratio of the relative stresses of the territory Кrwascalculated on the ratio of 3:
321
654AIAIAI
AIAIAIK
r ++
++= , (3)
If Кris equal or closer to 1, then the ecologi-cal and economic situation is estimated as balancedby the degree of anthropogenic impact and the po-tential of sustainability of nature. Territories whichexperience a high degree of anthropogenic impacthave the lowest natural protection. If the area of thelands included in the ecological fund with a mini-mum AI are taken as P1, then the area of land with aconditional assessment of the degree of AI in 2, 3and 4 points will be respectively 0,8R2, 0,6R3, 0,4R4(areas of high point of AI are not included in thecalculation) (Kochurov, 2003). Thus, the total areaof land with environment and resource-stabilizingfunctions (Ref) was estimated by the formula 4:
4321 0,40,60,8 PPPPPef +++= , (4)where 0,8; 0.6 and 0.4 – corrective factors; P1, P2,P3 and P4 – lands included into the ecological fundwith a conditional assessment of the degree of AI in1, 2, 3 and 4 points.
For the integrated assessment of the territory,the integral coefficient of natural protection (Knp)was used, which was determined by the formula 5(Kochurov, 2003):
P
PK ef
np = , (5)
where Р – total area of the researched territory(town).
The value of the coefficient of natural protec-tion of less than 0.5 indicates a critical level of pro-tection of the territory.For estimation of theantrhropogenic transformation, the integral index(the index of regional human transformation ofnatural systems) of K. Hoffmann, specified in byP. Shishchenko (1999) and Khryshchuk andBezpalko (2013) was calculated by formula 6. Thepeculiarity of the calculation is to rank the land by10 categories. In our studies in the towns there were8 because no areas that belong according to themethod to rank 3 (swamps and wetlands) and rank9 (reservoirs, canals). The areas of the ranks wereused in percentage indices and we calculated thedepth of landscape transformation.
100
)ap( rn
1i iii∑ ⋅⋅= =
atK . (6)
In the formula: Kat– coefficient of anthropo-genic transformation; r– rank of anthropogenic trans-formation of the territory by a certain type of natureuse; p - area of rank, %; a– index of depth of trans-formation of landscapes; n– number of types withinthe boundary of the region. In this technique, divid-ing by 100 is used for ease of use of the values of thecoefficients. Each type of land use is assigned therank of anthropogenic transformation and the indexof the depth of transformation (Table 2), where theresidential housing development was interpreted asrural, and multi-apartments – as a town.
Table 2. Ranks and indices of the depth of transformation of natural systems by different types of land useTypes of land use Rank of anthropogenic transformation Index of depth of transformation
Nature Reserve Territories 1 1.00Woods 2 1.05
Swamps and wetlands 3 1.10Hay fields 4 1.15
Gardens, vineyards 5 1.20Arable land 6 1.25
Rural building 7 1.30Urban development 8 1.35
Water reservoirs, canals 9 1.40Industrial use land 10 1.50
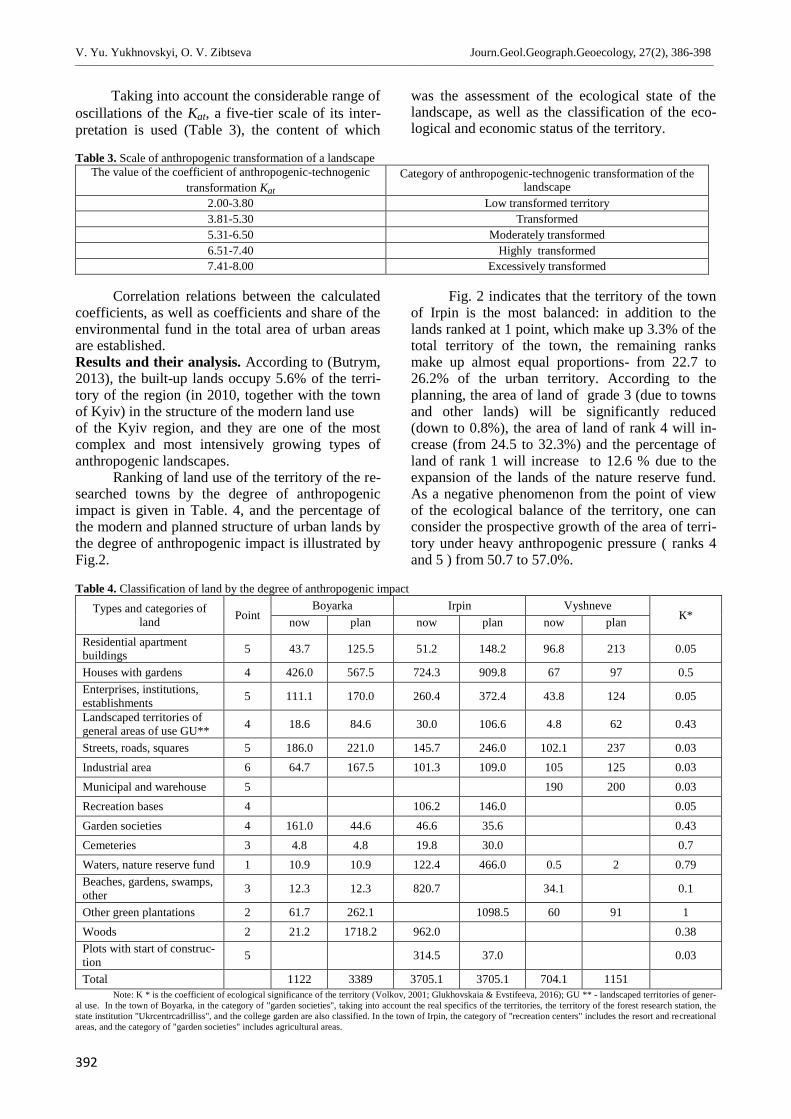
V. Yu. Yukhnovskyi, O. V. Zibtseva Journ.Geol.Geograph.Geoecology, 27(2), 386-398________________________________________________________________________________________________________________________________________________________________
392
Taking into account the considerable range ofoscillations of the Kat, a five-tier scale of its inter-pretation is used (Table 3), the content of which
was the assessment of the ecological state of thelandscape, as well as the classification of the eco-logical and economic status of the territory.
Table 3. Scale of anthropogenic transformation of a landscapeThe value of the coefficient of anthropogenic-technogenic
transformation Kat
Category of anthropogenic-technogenic transformation of thelandscape
2.00-3.80 Low transformed territory3.81-5.30 Transformed5.31-6.50 Moderately transformed6.51-7.40 Highly transformed7.41-8.00 Excessively transformed
Correlation relations between the calculatedcoefficients, as well as coefficients and share of theenvironmental fund in the total area of urban areasare established.Results and their analysis. According to (Butrym,2013), the built-up lands occupy 5.6% of the terri-tory of the region (in 2010, together with the townof Kyiv) in the structure of the modern land useof the Kyiv region, and they are one of the mostcomplex and most intensively growing types ofanthropogenic landscapes.
Ranking of land use of the territory of the re-searched towns by the degree of anthropogenicimpact is given in Table. 4, and the percentage ofthe modern and planned structure of urban lands bythe degree of anthropogenic impact is illustrated byFig.2.
Fig. 2 indicates that the territory of the townof Irpin is the most balanced: in addition to thelands ranked at 1 point, which make up 3.3% of thetotal territory of the town, the remaining ranksmake up almost equal proportions- from 22.7 to26.2% of the urban territory. According to theplanning, the area of land of grade 3 (due to townsand other lands) will be significantly reduced(down to 0.8%), the area of land of rank 4 will in-crease (from 24.5 to 32.3%) and the percentage ofland of rank 1 will increase to 12.6 % due to theexpansion of the lands of the nature reserve fund.As a negative phenomenon from the point of viewof the ecological balance of the territory, one canconsider the prospective growth of the area of terri-tory under heavy anthropogenic pressure ( ranks 4and 5 ) from 50.7 to 57.0%.
Table 4. Classification of land by the degree of anthropogenic impact
Types and categories ofland Point
Boyarka Irpin VyshneveК*now plan now plan now plan
Residential apartmentbuildings 5 43.7 125.5 51.2 148.2 96.8 213 0.05
Houses with gardens 4 426.0 567.5 724.3 909.8 67 97 0.5Enterprises, institutions,establishments 5 111.1 170.0 260.4 372.4 43.8 124 0.05
Landscaped territories ofgeneral areas of use GU** 4 18.6 84.6 30.0 106.6 4.8 62 0.43
Streets, roads, squares 5 186.0 221.0 145.7 246.0 102.1 237 0.03Industrial area 6 64.7 167.5 101.3 109.0 105 125 0.03Municipal and warehouse 5 190 200 0.03Recreation bases 4 106.2 146.0 0.05Garden societies 4 161.0 44.6 46.6 35.6 0.43Cemeteries 3 4.8 4.8 19.8 30.0 0.7Waters, nature reserve fund 1 10.9 10.9 122.4 466.0 0.5 2 0.79Beaches, gardens, swamps,other 3 12.3 12.3 820.7 34.1 0.1
Other green plantations 2 61.7 262.1 1098.5 60 91 1Woods 2 21.2 1718.2 962.0 0.38Plots with start of construc-tion 5 314.5 37.0 0.03
Total 1122 3389 3705.1 3705.1 704.1 1151Note: K * is the coefficient of ecological significance of the territory (Volkov, 2001; Glukhovskaia & Evstifeeva, 2016); GU ** - landscaped territories of gener-
al use. In the town of Boyarka, in the category of "garden societies", taking into account the real specifics of the territories, the territory of the forest research station, thestate institution "Ukrcentrcadrilliss", and the college garden are also classified. In the town of Irpin, the category of "recreation centers" includes the resort and recreationalareas, and the category of "garden societies" includes agricultural areas.
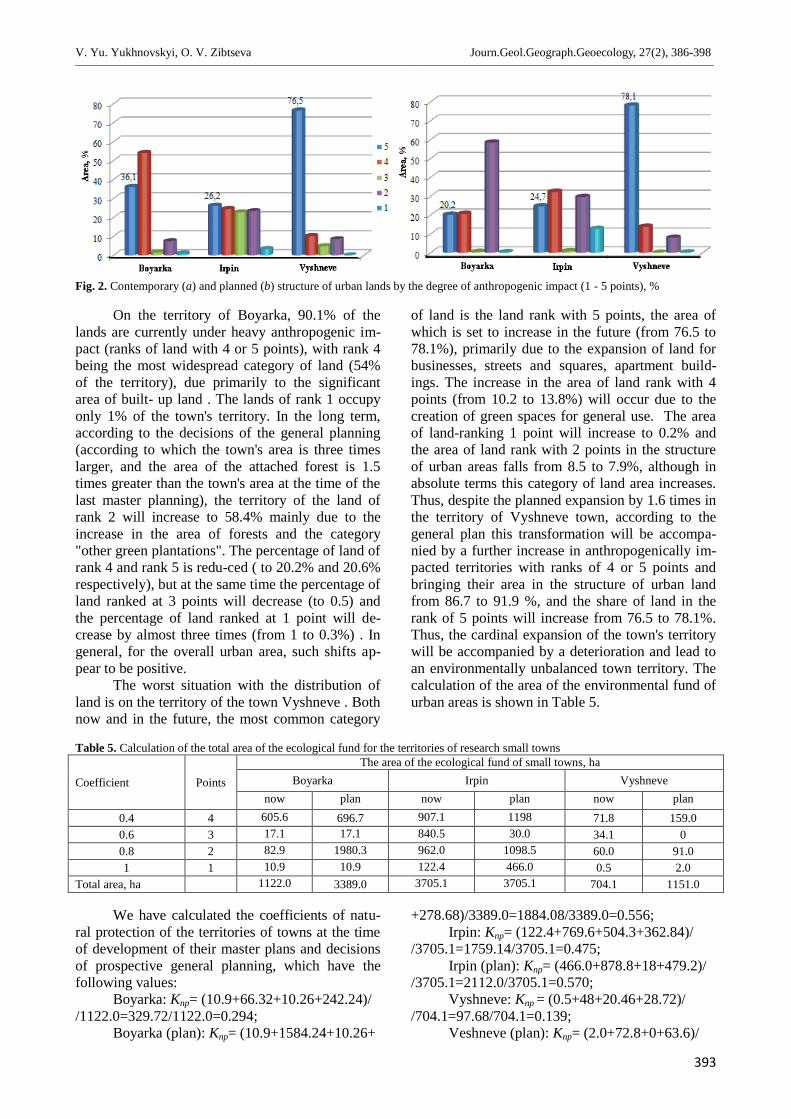
V. Yu. Yukhnovskyi, O. V. Zibtseva Journ.Geol.Geograph.Geoecology, 27(2), 386-398________________________________________________________________________________________________________________________________________________________________
393
Fig. 2. Contemporary (a) and planned (b) structure of urban lands by the degree of anthropogenic impact (1 - 5 points), %
On the territory of Boyarka, 90.1% of thelands are currently under heavy anthropogenic im-pact (ranks of land with 4 or 5 points), with rank 4being the most widespread category of land (54%of the territory), due primarily to the significantarea of built- up land . The lands of rank 1 occupyonly 1% of the town's territory. In the long term,according to the decisions of the general planning(according to which the town's area is three timeslarger, and the area of the attached forest is 1.5times greater than the town's area at the time of thelast master planning), the territory of the land ofrank 2 will increase to 58.4% mainly due to theincrease in the area of forests and the category"other green plantations". The percentage of land ofrank 4 and rank 5 is redu-ced ( to 20.2% and 20.6%respectively), but at the same time the percentage ofland ranked at 3 points will decrease (to 0.5) andthe percentage of land ranked at 1 point will de-crease by almost three times (from 1 to 0.3%) . Ingeneral, for the overall urban area, such shifts ap-pear to be positive.
The worst situation with the distribution ofland is on the territory of the town Vyshneve . Bothnow and in the future, the most common category
of land is the land rank with 5 points, the area ofwhich is set to increase in the future (from 76.5 to78.1%), primarily due to the expansion of land forbusinesses, streets and squares, apartment build-ings. The increase in the area of land rank with 4points (from 10.2 to 13.8%) will occur due to thecreation of green spaces for general use. The areaof land-ranking 1 point will increase to 0.2% andthe area of land rank with 2 points in the structureof urban areas falls from 8.5 to 7.9%, although inabsolute terms this category of land area increases.Thus, despite the planned expansion by 1.6 times inthe territory of Vyshneve town, according to thegeneral plan this transformation will be accompa-nied by a further increase in anthropogenically im-pacted territories with ranks of 4 or 5 points andbringing their area in the structure of urban landfrom 86.7 to 91.9 %, and the share of land in therank of 5 points will increase from 76.5 to 78.1%.Thus, the cardinal expansion of the town's territorywill be accompanied by a deterioration and lead toan environmentally unbalanced town territory. Thecalculation of the area of the environmental fund ofurban areas is shown in Table 5.
Table 5. Calculation of the total area of the ecological fund for the territories of research small towns
Coefficient Points
The area of the ecological fund of small towns, haBoyarka Irpin Vyshneve
now plan now plan now plan0.4 4 605.6 696.7 907.1 1198 71.8 159.00.6 3 17.1 17.1 840.5 30.0 34.1 00.8 2 82.9 1980.3 962.0 1098.5 60.0 91.01 1 10.9 10.9 122.4 466.0 0.5 2.0
Total area, ha 1122.0 3389.0 3705.1 3705.1 704.1 1151.0
We have calculated the coefficients of natu-ral protection of the territories of towns at the timeof development of their master plans and decisionsof prospective general planning, which have thefollowing values:
Boyarka: Knp= (10.9+66.32+10.26+242.24)//1122.0=329.72/1122.0=0.294;
Boyarka (plan): Knp= (10.9+1584.24+10.26+
+278.68)/3389.0=1884.08/3389.0=0.556;Irpin: Knp= (122.4+769.6+504.3+362.84)/
/3705.1=1759.14/3705.1=0.475;Irpin (plan): Knp= (466.0+878.8+18+479.2)/
/3705.1=2112.0/3705.1=0.570;Vyshneve: Knp = (0.5+48+20.46+28.72)/
/704.1=97.68/704.1=0.139;Veshneve (plan): Knp= (2.0+72.8+0+63.6)/
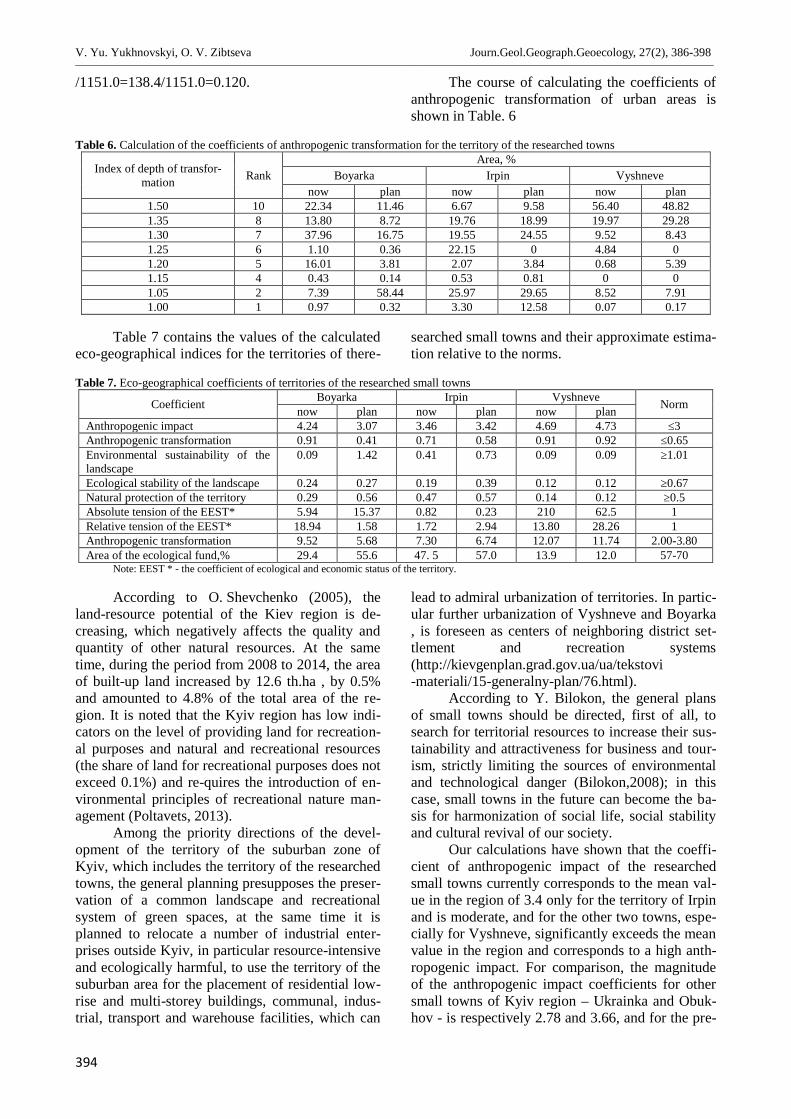
V. Yu. Yukhnovskyi, O. V. Zibtseva Journ.Geol.Geograph.Geoecology, 27(2), 386-398________________________________________________________________________________________________________________________________________________________________
394
/1151.0=138.4/1151.0=0.120. The course of calculating the coefficients ofanthropogenic transformation of urban areas isshown in Table. 6
Table 6. Calculation of the coefficients of anthropogenic transformation for the territory of the researched towns
Index of depth of transfor-mation Rank
Area, %Boyarka Irpin Vyshneve
now plan now plan now plan1.50 10 22.34 11.46 6.67 9.58 56.40 48.821.35 8 13.80 8.72 19.76 18.99 19.97 29.281.30 7 37.96 16.75 19.55 24.55 9.52 8.431.25 6 1.10 0.36 22.15 0 4.84 01.20 5 16.01 3.81 2.07 3.84 0.68 5.391.15 4 0.43 0.14 0.53 0.81 0 01.05 2 7.39 58.44 25.97 29.65 8.52 7.911.00 1 0.97 0.32 3.30 12.58 0.07 0.17
Table 7 contains the values of the calculatedeco-geographical indices for the territories of there-
searched small towns and their approximate estima-tion relative to the norms.
Table 7. Eco-geographical coefficients of territories of the researched small towns
Coefficient Boyarka Irpin Vyshneve Normnow plan now plan now planAnthropogenic impact 4.24 3.07 3.46 3.42 4.69 4.73 ≤3Anthropogenic transformation 0.91 0.41 0.71 0.58 0.91 0.92 ≤0.65Environmental sustainability of thelandscape
0.09 1.42 0.41 0.73 0.09 0.09 ≥1.01
Ecological stability of the landscape 0.24 0.27 0.19 0.39 0.12 0.12 ≥0.67Natural protection of the territory 0.29 0.56 0.47 0.57 0.14 0.12 ≥0.5Absolute tension of the EEST* 5.94 15.37 0.82 0.23 210 62.5 1Relative tension of the EEST* 18.94 1.58 1.72 2.94 13.80 28.26 1Anthropogenic transformation 9.52 5.68 7.30 6.74 12.07 11.74 2.00-3.80Area of the ecological fund,% 29.4 55.6 47. 5 57.0 13.9 12.0 57-70
Note: EEST * - the coefficient of ecological and economic status of the territory.
According to O. Shevchenko (2005), theland-resource potential of the Kiev region is de-creasing, which negatively affects the quality andquantity of other natural resources. At the sametime, during the period from 2008 to 2014, the areaof built-up land increased by 12.6 th.ha , by 0.5%and amounted to 4.8% of the total area of the re-gion. It is noted that the Kyiv region has low indi-cators on the level of providing land for recreation-al purposes and natural and recreational resources(the share of land for recreational purposes does notexceed 0.1%) and re-quires the introduction of en-vironmental principles of recreational nature man-agement (Poltavets, 2013).
Among the priority directions of the devel-opment of the territory of the suburban zone ofKyiv, which includes the territory of the researchedtowns, the general planning presupposes the preser-vation of a common landscape and recreationalsystem of green spaces, at the same time it isplanned to relocate a number of industrial enter-prises outside Kyiv, in particular resource-intensiveand ecologically harmful, to use the territory of thesuburban area for the placement of residential low-rise and multi-storey buildings, communal, indus-trial, transport and warehouse facilities, which can
lead to admiral urbanization of territories. In partic-ular further urbanization of Vyshneve and Boyarka, is foreseen as centers of neighboring district set-tlement and recreation systems(http://kievgenplan.grad.gov.ua/ua/tekstovi-materiali/15-generalny-plan/76.html).
According to Y. Bilokon, the general plansof small towns should be directed, first of all, tosearch for territorial resources to increase their sus-tainability and attractiveness for business and tour-ism, strictly limiting the sources of environmentaland technological danger (Bilokon,2008); in thiscase, small towns in the future can become the ba-sis for harmonization of social life, social stabilityand cultural revival of our society.
Our calculations have shown that the coeffi-cient of anthropogenic impact of the researchedsmall towns currently corresponds to the mean val-ue in the region of 3.4 only for the territory of Irpinand is moderate, and for the other two towns, espe-cially for Vyshneve, significantly exceeds the meanvalue in the region and corresponds to a high anth-ropogenic impact. For comparison, the magnitudeof the anthropogenic impact coefficients for othersmall towns of Kyiv region – Ukrainka and Obuk-hov - is respectively 2.78 and 3.66, and for the pre-
V. Yu. Yukhnovskyi, O. V. Zibtseva Journ.Geol.Geograph.Geoecology, 27(2), 386-398________________________________________________________________________________________________________________________________________________________________
395
viously investigated historical town of Vyshhorod –3.71, which corresponds to the elevated level. Rea-lization of the planned measures for the researchedtowns will allow reduction of the anthropogenicimpact on the territory of Boyarka (to a moderatelevel) and also to some extent in the territory ofIrpin, but will to some extent raise the already highanthropogenic impact on the territory of Vyshneve.
High values of the coefficient of anthropo-genic transformation and low coefficient of envi-ronmental sustainability of the landscape (pro-nounced instability) are characteristic of the currentstate of Boyarka and Vyshneve. Improvement ofthe prospects for Boyarka will take place throughthe expansion of the town's territory by three times(encompassing mostly adjacent forest lands), result-ing in the Boyarka territory being characterized asconditionally stable. The territory of Irpin will re-main unstable, but the situation with this indicatorwill improve almost twice. For Vyshneve, improv-ing the situation in the calculation period (until2030) is not expected, and anthropogenic transfor-mation will increase.
The ecological stability of the landscape inthe existing boundaries of the towns varies from0.12 (Vyshneve) to 0.24 (Boyarka), that is, the ter-ritories of all towns are environmentally unstable.In the long run, only the territory of Irpin will be-come unstable. For the territory of Vyshneve thisindicator will not improve its position.
The total area of the environmental funds ofthe towns is currently 13.9% of the urban area ofVyshneve, 29.4% of Boyarka and 47.5% of theterritory of Irpin, which according to the data (Pol-tavets, 2013) accounts for 15.39% of the regionalland for recreational purposes. According to thegeneral plans of the towns, the area of the environ-mental fund of Boyarka and Irpin will approach theoptimal value and will accordingly be 55.6 and57.0%. In Boyarka, such an optimization will takeplace due to the expansion of the urban area (almost1.7 th.ha of forests will be added), and in Irpin -due to an increase of more than 0.3 th.ha of thenature reserve fund area and the appearance of 1.1th.ha other green plantations, which, however, willbe accompanied by the disappearance of 962 hec-tares of forest lands. The area of the ecological fundof Vyshneve, in spite of the 1.6 times expansion ofthe town's territory, and contrary to the declaredobjective of ecologically balanced land use, willdecrease by 1.9% to 12.0%. The coefficient of natu-ral protection of the territory is currently the mostcritical for the territory of Vyshneve, although forall three towns this is less than 0.5, which indicatesthe critical level of protection of the territories ofthe researched small towns within their existingurban boundaries. In the case of general planning,
the coefficient of natural protection of the Boyarkaand Irpin areas will increase to 0.56 and 0.57,which will correspond to high natural-ecologicalpotential and resistance to anthropogenic impacts.Instead, the level of protection of the territory ofVyshneve will remain critical, and the coefficientof natural protection of the territory will deterioratefrom 0.14 to 0.12.
Thus, the current territories of the researchedsmall towns have a low degree of favourableness(Voronovich, 2016) of the territory (in all cases , amoderate or high anthropogenic impact is com-bined with a critical value of the coefficient of natu-ral protection).
Significant changes are observed in the abso-lute and relative tensions of the ecological and eco-nomic status of the territories of the researchedtowns. At present, according to these indicators, thesituation is closer to the optimal one only in Irpin,but in the long run even here it will sometimes de-teriorate. The coefficient of absolute tension of theecological and economic status of the Vyshneve is210 times the optimal value, but according to theplan it is to be doubled, whereas the relative inten-sity of the ecological and economic condition of theterritory will be halved in terms of the plan. Therelative intensity of the ecological and economiccondition of the territory is currently the highest forBoyarka, but according to the plan it is most impor-tant to approach the optimum value. The coeffi-cients of relative anthropogenic stress indicate anunbalanced ecological and economic condition ofthe urban areas both at the present stage and in thefuture. High values of the absolute ecological stressfactors indicate an unfavourable geoecological situ-ation in the studied territories and justify the needto create a stabilizing environment in the regionunder research.
According to general planning, the coeffi-cient of anthropogenic transformation of the territo-ry will change from the excess to the average forBoyarka, will remain high for Irpin and excessivefor Vyshneve, but with minor positive shifts in bothcases.
Between the area of the ecological fund withcalculated geoecological indicators (coefficients) arather high and mostly reliable correlation relation-ship was determined: the coefficients of correlationvary from 0.86 ± 0.258; P = 0.95 (coefficient ofecological stability of the landscape) and -0.67 ±0.370 (absolute tension of the ecological and eco-nomic condition of the territory, the relationship isunreliable) to -0.98 ± 0.097; P = 0.99 (coefficient ofanthropogenic pressure), -0.99 ± 0.082; P = 0.99(anthropogenic transformation) and 1.00 (coeffi-cient of natural protection of the territory). Theclosest negative correlation is observed, naturally,
V. Yu. Yukhnovskyi, O. V. Zibtseva Journ.Geol.Geograph.Geoecology, 27(2), 386-398________________________________________________________________________________________________________________________________________________________________
396
between the coefficient of natural protection of theterritory and the coefficients of anthropogenic im-pact and anthropogenic transformation (r = -0.99 inboth cases), and positive - between the coefficientof anthropogenic impact and anthropogenic trans-formation (r = 0.99).Conclusions. The analysis of the territorial struc-ture of the three small towns of Kyiv region indi-cates the diversity of trends in the ecological bal-ance of their territories and the feasibility of usingecogeographic indicators in the system of generalplanning in order to optimize prospective designdecisions. The town Irpin is characterized by anaverage degree of environmental favourablenessand its territory is now ecologically more balanced.The territories of Boyarka and Vyshneve have alow degree of favourableness (high level of anthro-pogenic impact and critical value of the coefficientof natural protection). The analysis of the masterplan has shown that the ecological situation will bedramatically improved in the territory of the townof Boyarka due to the threefold expansion of thetown boundaries. Instead, the extension by 1.6times of the boundaries of Vyshneve does not pro-vide for improvement of the ecological balance ofthe town. In order to ensure the sustainable devel-opment of urban areas in general planning we con-sider it expedient to take into account not only ur-ban, economic and social, but also environmentalfactors, to link them to a single principle of envi-ronmentalization of territories. Proposed measuresin the general plans should ensure the strengthen-ing of the natural basis of towns and increase envi-ronmental sustainability, which is justified by cal-culations of integral indicators: the factors of eco-logical stability of the territory, anthropogenic im-pact, natural protection of the territory.
References
Adler,F. R.,Tanner, C. J. (2013). Urban ecosystems:ecological principles for the built environment.Cambridge University. Press, Cambridge, UK.https://doi.org/10.1017/CBO9780511981050
Ahern, J. (2011). From fail‐safe to safe‐to‐fail:sustainability and resilience in the new urbanworld. Landscape and Urban Plannin, 100, 341–343. https://doi.org/10.1016/j.landurbplan.2011.02.021)
Baсski, J., Mazur, M. 2016. Classification of rural areasin Poland as an instrument of territorial policy.Land Use Policy, 54, 1-17.https://doi.org/10.1016/j.landusepol.2016.02.0053.
Barmin A. N., Nikulina E. M. (2011). Rol landshaftno-geograficheskogo podkhoda v postroeniiekologicheskogo karkasa gorodov [Significanceof landscape and geographical approach increation of ecological framework of cities].
Geologiia, geografiia i globalnaia energiia, 4 (43),168-174 (in Russian).
Bilokon, Yu. (2008).Mistobudibnyproblemystalohorozvytku malyhmist Ukrainy [Architecturalproblemsofstablede-velopmentofUkrainiansmalltowns] (inUkrainian). Retrieved fromhttp://www.nbuv.gov.ua/dprmu/2008_15/1_Bilokon.pdf
Bodrova, V. N. (2013). Raschet i otcenka ekologo-khoziaistvennogo balansa Volgogradskoi oblastiv geoinformatcionnoi sisteme [Estimation andassessment of ecological and economic balance ofthe Volgograd region]. Problemi regionalnoyekologii,2, 43–50 (in Russian).
Butrym, O. V. (2013). Struktura zemelnykh resursivKyivskoi oblasti ta optymizatsiia yikhvykorystannia [Structure of land resources of theKiev region and optimization of their use].Zbalansovane pryrodokorystuvannia.Zemlekorystuvannia, 2–3, 83-88 (in Ukrainian).
Cadenasso, M. L., Pickett, S. T. A., Schwarz, K. (2007).Spatial heterogeneity in urban ecosystems:reconceptualizing land cover and a framework forclassification. Frontiers in Ecology and theEnvironment, 5, 80-88. https://doi.org/10.1890/1540-9295(2007)5[80:SHIUER]2.0.CO;2
Cen,X., Wu, C., Xing, X., Fang, M., Garang, Z., Wu, Y.(2015). Coupling Intensive Land Use andLandscape Ecological Security for UrbanSustainability: An Integrated Socioeconomic Dataand Spatial Metrics Analysis in Hangzhou City.Sustainability, 7, 1459-1482, doi:10.3390/su7021459
Childers, D. L., Cadenasso, M. L., Grove J. M., MarshallV., McGrath, B., Pickett, S. T. A. (2015). Anecology for cities: a transformational nexus ofdesign and ecology to advance climate changeresilience and urban sustainability.Sustainability,7(4), 3774-3791;https://doi.org/10.3390/su7043774.
Childers, D. L., Pickett, S. T. A., Grove J. M., Ogden L.,Whitmer, A. (2014). Advancing urbansustainability theory and action: challenges andopportunities. Landscape and Urban Planning,125, 320-328. https://doi.org/10.1016/j.landurbplan.2014.01.022.
Frelichova, J., Fanta, J. (2015). Ecosystem serviceavailability in view of long‐term land‐usechanges: a regional case study in the CzechRepublic Journal. Ecosystem, Health andSustainability, 1, 10.https://doi.org/10.1890/EHS15-0024.1.
Getmanskii, M. Iu. (2013). Otcenka sbalansirovannostistruktury zemlepolzovaniia v Adygee dliageneralnogo planirovaniia [Assessment of a bal-ance of the land-utilization structure in Adygheafor general planning]. Vestnyk AGU,Estestvenno-matematicheskie i tekhnicheskienauki,2, 120-128 (in Russian).
Glukhovskaia, M. Iu. (2017). Analiz ekologicheskoiustoichivosti i stabilnosti regionalnoi territorii na
V. Yu. Yukhnovskyi, O. V. Zibtseva Journ.Geol.Geograph.Geoecology, 27(2), 386-398________________________________________________________________________________________________________________________________________________________________
397
primere Orenburgskoi oblasti [Theanalysis ofeco-logicalresistanceandstabilityofregionalterritory(on the example of Orenburgregion)]. VestnikOrenburgskogo gosudarstvennogo universiteta, 4,53-61 (in Russian).
Glukhovskaia, M. Iu., Evstifeeva, T. A. (2016). Analizustoichivosti regionalnykh territorii (na primereotdelnogo raiona Orenburgskoi oblasti)[Theanalysis ofstabilityofregionalterritories (onthe example ofseparatedistrictofOrenburgregion)] Universitetskiikompleks kak regionalnyi tcentr obrazovaniia,nauki i kultury, OGU, Orenburg, 779-785 (inRussian).
Grimm, N. B., Pickett, S. T. A., Hale, R. L., Mary, L.(2017). Does the ecological concept of distur-bance have utility in urban social-ecological-technological system?https://doi.org/10.1002/ehs2.1255)
Hahs, A., McDonnell, M. J., Breuste, J. (2009). Acomparative ecology of cities and towns:synthesis of opportunities and limitations.Ecology of cities and towns: a comparativeapproach. Cambridge University Press, NewYork, USA, 574–596.https://doi.org/10.1017/CBO9780511609763.036)
Ivan, P., Chebenova, T. (2016). Assessment of theecological stability of the Village of Bielovce as aresult of to changes in land use. Slovak Journal ofCivil Engineering, 24, 2, 1-6. doi: 10.1515/sjce-2016-0006
Ivleva, A. N. (2015). Otsenka effektivnosti organizaciisistemy ozeleneniya gorodov Nizhegorodskoyoblasti [The evaluation efficiencyof organizationof landscaping system cities in Nizhny Novgorodregion]. Nizhegorodskiy ASU, Nizhny Novgorod(in Russian).
Kalmanova, V. B. (2016) Ekologicheskii karkasurbanizirovannykh territorii na primere gorodaBirobidzhana [The ecological framework of theurbanized territories (on the example ofBirobidzhan city)]. Institut kompleksnogo analizaregionalnykh problem DVO RAN Birobidzhan,Birobidzhan, 385-388 (in Russian).
Khryschuk, S. Yu., Bespal’ko, R. I. (2013).Antropohenna peretvorenist yak kryteriioptymizatsii zemlekorystuvan na rehionalnomurivni [Anthropogenic transformation as a criterionof optimization of land-tenures at regionallevel].Science and Education a New Dimension:Natura and Technical Sciences, 1(2), 15, 138-141(in Ukrainian).
Kichata, N. (2013). Analiz otcenki ekologicheskogosostoianiia gorodskoi territorii [Analysis ofenvi-ronmentalassessmentofurbanareas], Kiev,NAU(in Russian). Retrieved fromer.nau.edu.ua/bitstream/NAU/29039/1/СТАТЬЯ.pdf
Kochurov, B. I. (1999). Geoekologiia: ekodiagnostika iekologo-khoziaistvennyi balans [Geoecology,ecodiagnostics and ecological and economicbalance]. SGU, Smolensk, 154. (in Russian).
Kochurov, B. І. (2003). Ekodiagnostika isbalansirovannoe razvitie [Ecological diagnosticsand balanced development]. Madzhenta,Moscow, Smolensk, 384. (in Russian).
Kovalchuk, А. Y. (2016). Ekologo-khoziaistvennyibalans territorii Aulie Respubliki Kazakhstan i eeestestvennaia zashchishchennost [Ecologicalandeconomical balance of the area of Auliecoldistrict of the Republic of Kazakhstan and itsnatural protection] (in Russian). DOI 10.21661/r-113349
Kurhanevych, L., Shіpka, M. (2012). Vyznachenniaekolohіchnoi stіikostі heokompleksіv baseinurіchky Poltvy [The estimation of ecologicalresistance of geocomplexes of the Poltva riverbasin]. Konstruktyvna heohrafiia i heoekolohiia.Naukovi zapysky, Ternopil, 2 (in Ukrainian).
Louca, M., Vogiatzakis, I.N., Moustakas, A. (2015).Modelling the combined effects of land use andclimatic changes: Coupling bioclimatic modellingwith Markov-chain Cellular Automata in a casestudy in Cyprus. Ecological Informatics, 30, 241–249. https://doi.org/10.1016/j.ecoinf.2015.05.008
McDonnell, M. J., Hahs, A. K.. (2013). The future ofurban biodiversity research: moving beyond the“low‐hanging fruit”. Urban Ecosystems, 16, 397–409. doi:10.1007/s11252-013-0315-2.
McHale, M. R., et al. (2015).The new global urbanrealm: complex, connected, diffuse, and diversesocial‐ecological systems. Sustainability, 7,5211–5240. https://doi.org/10.3390/su7055211
McPhearson, T., Pickett, S. T. A., Grimm, N., Niemela,J., Alberti, M., Elmqvist, T., weber, C., Breuste,J., Haase, D., Qureshi, S. (2016). Advancingurban ecology towards a science of cities.BioScience, 66, 198-212.http://dx.doi.org/10.1093/biosci/biw002.
Minnikov, I. V., Kurolap, S. A. (2013). Otcenkaekologo-khoziaistvennogo balansa territoriiVoronezhskoi oblasti [Assessment of ecologicaland economic balance in Voronezh oblast].Vestnik VGU, Geografiia. Geoekologiia, 1, 129-136 (in Russian).
Narbut, N. A., Mirzekhanova, Z. G. (2016). Osobennostiekologicheskogo planirovaniia gorodskoiterritorii v regionakh novogo osvoeniia (naprimere Khabarovska) [Specificofecologicalplan-ningintheregionsofnewdevelopment (Khaba-rovskcityasanexample)]. Materialimezhdunarod-noikonferentsiiInterKarto/InterGIS, 20, 600-605(in Russian).
Noszczyk, T., Rutkowska, A., Hernik, J. (2017).Determining Changes in Land Use Structure inMaіopolska Using Statistical Methods. PolishJournal of Environmental Studies, 26, 1, 211–220. https://doi.org/10.15244/pjoes/64913
Nychaia, O. O., Tarasiuk, N. A. (2016).Selitebnilandshafty v strukturi uhid vysochynnoi oblastiVolyni [The inhabited landscapes in the landstructure of Volyn region uplandarea]Dnipropetrovsk University Bulletin. Series
V. Yu. Yukhnovskyi, O. V. Zibtseva Journ.Geol.Geograph.Geoecology, 27(2), 386-398________________________________________________________________________________________________________________________________________________________________
398
geology, geography. 2016, 24(1), 112–119 (inUkrainian). doi: 10.15421/111617
Orlova, I. V., Rybkina, I. D., Stoiashcheva, N. V. (2006).Otcenka integralnoi antropogennoi nagruzki naterritoriiu Altaiskogo kraia [Assessment ofinte-gralanthropogenicloadonterritoryofAltaikrai].Polzunovskii vestnik, 4-2, 123-130 (in Russian).
Panchenko, E. M., Dyukarev, A. G. (2015).Otsenkaekologo-khoziaistvennogo balansa Ob-Tomskogomezhdurechia s uchetom antropogennoinagruzki[Assessment of ecological andeconomical balance of the territory of Ob-Tominterfluve concidering antropogenicload].Izvestiia Tomskogo politekhnicheskogouniversiteta Inzhiniring georesursov, 326, 12, 87-95 (in Russian).
Petrishchev, V. P., Dubrovskaia, S. A. (2013). Metodikakompleksnoi otcenki ekologicheskogo sostoianiiagorodskikh territorii [Method ofcomprehensi-veenvironmentalassessmentofurbanareas]. Izves-tiiaSamarskogonauchnogotsentraRAN, Problemyprikladnoi ekologii, ISU RAN, Orenburs, 15, 3,234-238 (in Russian).
Pickett, S. T. A,Candenasso M. L., Childwrs, D. L.,Mcdonnell, M. J., Zhou, W (2016). Evolution andfuture of urban ecological science: ecology in, of,and for the city. Journal Ecosystem Health andSustainability, 2, 7. https://doi.org/10.1002/ehs2.1229)
Pickett,S. T. A., Grimm, N., Niemel, J., Alberti, M.,Elmqvist, T., Weber, C., Breuste, J., Haase, D.,Qureshi, S. (2016a). Advancing urban ecologytowards a science of cities. BioScience, 66, 198–212. http://dx.doi.org/10.1093/biosci/biw002
Pogorelov, A., Lipilin, D. (2017).Zelenye nasazhdeniiagoroda Krasnodara. Otsenka I mnogoletnieizmeneniia [Green spaces of Krasnodar city.Evaluation and multy-year changes].VestnikPNIPU, Prikladnaia ekologiia, Urbanistika,Kuban, 3 (in Russian).1doi: 10.15593/2409-5125/2017.03.15
Poltavets, A. M. (2013). Aktualnі pytannia zberezhenniarekreatcіinoho potentsіalu Kyivskoi oblastі [Re-levantquestionsofretentionofrecreationalpotentia-lofKyiv region]. Vіsnyk Sumskoho NAU, 6 (57),162-166 (in Ukrainian).
Pozniak, I., Tsaryk, N. (2013). Pidkhody shchodozbalansovanogo rozvytku mista (na materialakhm. Ternopolia) [An approach to balanceddevelopment city (on the materials fromTernopil)]. Konstruktyvna heohrafiia iheoekolohiia. Naukovi zapysky, Ternopil, 2, 213-219 (in Ukrainian).
Prus, B., Bacior, S., Dudzinska, M. (2017). Assessmentof historical bio-index changes in rural areas inSouthern Poland – case study. Proceedings of the8th International Scientific Conference RuralDevelopment.http://doi.org/10.15544/RD.2017.012.
Prykhodko, M. M. (2010). Ekobezpeka pryrodnykh taantropohennykh heosystem: problemy, tsili,priorytety [Ecological safety of natural andanthropogenic geosystems: problems, aims,advantages]. Naukovi zapysky TernopilskohoNPU, Ternopil, 1(27), 96-100 (in Ukrainian).
Shevchenko, O. V. (2015).Ekoloho-ekonomіchniistansylskohospodarskohozemlekorystuvanniaKiivskoioblasti[Ecologicalandeconomic stateofagriculturalland-utilizationinKyivregion].Ekonomikataekolohiiazemlekorystuvannia, 2/3, 90-100(in Ukrainian).
Shishchenko, P. G. (1999). Printcipy i metodylandshaftnogo analiza v regionalnomproektirovanii [Principles and methods oflandscape analysis are in the regional planning].Fitosotciotcentr, Kyiv, 284 (in Russian).
Volkov, S. N. (2001) Zemleustroistvo.Zemleustroitelnoe proektirovanie. [Landmanagement], Moscow, Kolos, 2, 648 (inRussian).
Voronovich, E. N.(2016). Podkhody k otcenke ekologo-khoziaistvennogo balansa zemel Drogichinskogoraiona [Approaches to assessment of ecologica-landeconomicbalanceoflandofDrogichinskiydi-strict]. Ustoichivoe razvitie regionalnye aspekty,Brestskii GU, Brest,49-52 (in Russian).
Wilson, G.(2014). Urban ecology: advancing scienceand society. Frontiers in Ecology andEnvironment, 12, 574-581.https://doi.org/10.1890/140019 )
Wu, J. (2014).Urban ecology and sustainability: Thestate-of-the-science and future directions.Planning, 125, 209-221.https://doi.org/10.1016/j.landurbplan.2014.01.018
Zhou, W., Cadenasso M. L., Schwarz, K., Pickett, S. T.A. (2014). Quantifying spatial heterogeneity inurban landscapes: integrating visual interpretationand object‐based classification. Remote Sensing,6(4), 3369–3386. https://doi.org/10.3390/rs6043369
Zibtseva, O. V. (2018). Shchodo ekozbalansovanostiteritirii maloho mista [About ecological balanceof the small town territory]. Naukoviy vіsnykNUBiP Ukrainy(in Ukrainian).
O. V. Zhukov, K. P. Maslikova Journ.Geol.Geograph.Geoecology, 27(2), 402-410________________________________________________________________________________________________________________________________________________________________
399
Journal of Geology,Geography and Geoecology
Journal home page: geology-dnu-dp.ua
ISSN 2617-2909 (print)ISSN 2617-2119 (online)
Journ.Geol.Geograph.Geoecology,
27(2), 399-407doi:10.15421/111864
O. V. Zhukov, K. P. Maslikova Journ.Geol.Geograph.Geoecology, 27(2), 399-407________________________________________________________________________________________________________________________________________________________________
The dependence of the technosols models functional properties from the primary stratigraphydesigns
O. V. Zhukov1, K. P. Maslikova2
1Oles Gonchar Dnipro National University, Gagarin av., 72, 49000, Dnipro, Ukraine, e-mail: [email protected] State Agrarian and Economic UniversitySergey Yefremov Str. 25, Dnipro, 49600, Ukraine, e-mail: [email protected]
Abstract. In the present article the assumption that the design of the soil-like artificialbody in zero-moment of existence determines the dynamics and trajectory of soil-forming process was tasted. It was shown that an important aspect of the experiment isthe search criteria that you can perform evaluation of the functional properties of the
generated structures depending on their organization. The study of the water infiltration dynamics from the soil surface is highlyinformative non-destructive testing for evaluating the properties of the soil body. Studies showed that technosols as artificial creationhave fundamental differences between the natural soils for which the classic Philip equitation was proposed. Technosoils are porous,but heterogeneous formations. The process of filtering in technosols is not laminar, periods of smooth water infiltration is outbreakby disastrous water absorption. To simulate this process it was showed that the better results may be obtained due to originally mod-ified Philip equitation. Specific constant C describes the dynamics of the infiltration process the early stages of the experiment and isa specific indicator for technosols. In natural soils this constant is zero. The sorptivity of the pedozems was reveled to be dependedfrom the underlying layer. Organic components contribute to the formation of aggregate most of which is water resistant. Such for-mations smooth density variation of clay soil resulting from swelling and shrinkage processes that can maintain stable structure of thepore space. As a result, the soil after phytomeliorative rotation gets such features as reduced infiltration rate, but increased level offiltration. The artificial mixture of clay has significant waterproof properties, which ultimately can lead to complete discontinuanceof water absorption by technosols. Waterproof properties of soil may increase the risk of water erosion of technosols. For technosoilsstructural change of the pore space state are inherent in contact with water because hydrolabile units of their structure. Accordingly,during the infiltration process there are significant changes in the course of the rate of filtration of water.
Ключові слова: конфлікт, екологічний стан, ризик, постконфліктний період, туризм.
Залежність функціональних властивостей моделей техноземів від первинної стратиг-рафії насипок
О. В. Жуков1, К. П. Маслікова2
1Дніпровський національний університет імені Олеся Гончара, пр. Гагаріна, 72, 49000, Дніпро, Україна, e-mail:[email protected]Дніпровський державний аграрно-економічний університетВул. С. Єфремова 25, м. Дніпро 49600, Україна, e-mail: [email protected]
Анотація. У даній статті було перевірене припущення про те, що конструкція ґрунтоподібного штучного тіла у нульовиймомент існування визначає динаміку і траєкторію ґрунтотвірного процесу в процесі рекультивації. Було показано, що однимз найважливіших аспектів експерименту є пошук критеріїв, які дають змогу виконати оцінку функціональних властивостействорених структур у залежності від їх організації. Вивчення динаміки вбирання води з поверхні ґрунту є досить інформа-тивним інструментом для оцінки властивостей тіла ґрунту без порушення його структури. Дослідження показали, що техно-земи як штучні утворення мають принципові відмінності від природних ґрунтів, для описання інфільтрації яких було запро-поноване класичне рівняння Філіпа. Техноземи є пористими, але гетерогенними утвореннями. Процес інфільтрації технозе-мів не є ламінарним, а періоди гладкої інфільтрації води перериваються спалахами з катастрофічним поглинанням води. Дляімітації цього процесу було показано, що найкращі результати можуть бути отримані у результаті оригінально модифікова-ного рівняння Філіпа. Специфічна для модифікації константа C описує динаміку процесу інфільтрації на ранніх стадіях
Received 01.05.2018;Received in revised form 16.06.2018;Accepted17.06.2018
O. V. Zhukov, K. P. Maslikova Journ.Geol.Geograph.Geoecology, 27(2), 399-407________________________________________________________________________________________________________________________________________________________________
400
експерименту і є особливою характеристикою техноземів. У природних ґрунтах ця константа дорівнює нулю. Було показа-не, що сорптивність педоземів залежить від характеру підстилаючого шару. Органічні компоненти сприяють утвореннюагрегатів більшість з яких є водотривкими. Такі утворення згладжують зміни щільності глинистих ґрунтів, які виникають урезультаті набухання та усадки. Ці процес можуть підтримувати стабільну структуру порового простору. В результаті, післятого, як ґрунт зазнав впливу фітомеліосівозміни він набуває таких характеристик, як зниження швидкості інфільтрації, алепідвищений рівень фільтрації. Штучні суміші з глини мають значні водотривкі властивості, які у кінцевому рахунку можутьпризвести до повного припинення поглинання води техноземами. Водонепроникні властивості ґрунту можуть збільшитиризик водної ерозії техноземами. Для техноземів притаманні структурні зміни порового простору при контакті з водою,тому що їх структура представлена переважно неводотривкими агрегатами. Відповідно, в процесі інфільтрації відбуваютьсязначні зміни в процесі швидкості фільтрації води.
Ключовіслова: техноземи, інфільтрація, рекультивація, стратиграфія конструкцій, рівняння Філіпа
Introduction. Soil is a transitional link from theworld of living nature in the world of the inanimatenature, from the biosphere to the geosphere (Karpa-chevsky, 1983). Soil linkages mechanisms withother biogeoceonosis components and its main fea-ture – fertility are determined by the migration andtransformation of matter and energy that occur inthe soil depth under the influence of the introduc-tion and removal of biogenic and abiogenic sub-stances (Kharytonov et al., 2018). Material-energymetabolism of terrestrial biogeoceonosis in nosmall degree depends on the physical condition ofthe abiotic part of the soil (Karpachevsky, 2005).The soil is a most conservative component of thebiogeoceonosis (Anderson et al., 1998). Its bufferproperties contribute to the preservation of specificbiogeoceonosis type, regulation of thermal andwater regimes in biogeoceonosis, toxic substancesneutralizing that are formed in biogeoceonosis dur-ing his life (Heuvelink, Webster, 2001; Rode,1984).
In biogeoceonology soil is considered as apart of the internal environment converted by biota(Kunah, 2016). Study of space-time variability ofthe soils properties allowed to justify the concept ofsoil ecomorphes as a part of biogeocenotic cover(Zhukov, Zadorozhnaya, 2016). Soil ecomorphesand other biogeocenotic ecomorphes demonstrateregularly dynamics in the gradient humidity andtrophicity of soils (Zhukov, Shatalin, 2016). Hete-rogeneous soil conditions are formed as a result ofsmall biological cycle and determined by key spe-cies, creating the diversity of habitats (Zverkovskyiet al., 2017). Features of soil as habitat create eco-logical space for soil animals (Zhukov et al., 2016).Soil fertility is closely linked to its morphologicalcharacteristics, such as the color of the soil itself,the depth of the humus layer, the density of soilstructure (Yakovenko, 2008). The soil is a hierar-chical multi-level system, each level of which hasits own elemental structure (Fridland, 1972).
The gradual formation of morphologicalstructures is occurred in the technosols followingthe soil formation process after the beginning oftheir construction, which in the future will be con-verted into genetic horizons, which are homologous
genetic horizons of natural soils (Zadorozhna et al.,2012). The formation of morphological organiza-tion of the soil-like bodies leads to gain them func-tional properties that approach them to natural soils(Zabaluev, 2010). This trend is particularly impor-tant in the context of agriculture reclamation whichhas the goal of restoring the use of the land in agri-cultural production (Bekarevich, 1971). You canexpect that under the influence of general soil-forming factors over time the artificially createdsoil-like bodies will obtain properties and structure,similar to natural soils. But there remains an un-known trajectory of this process and its duration intime. Variable properties of technosols in space andtime can be estimated by a number of informativeand valuable indicators (Zhukov et al., 2016).
As a hypothesis can be considered the as-sumption that the design of the soil-like artificialbody in zero-moment of existence determines thedynamics and trajectory of soil-forming process.An important aspect of the experiment is the searchcriteria that you can perform evaluation of the func-tional properties of the generated structures depend-ing on their organization.Materials and methods. At the research station ofthe State Agrarian and Economic University a fieldexperiment with lysimeters, each of which containsa special combination of rocks or chernozem-likemass was started to test this hypothesis in the 1990s(Fig. 1) (Zabaluev, 2010).
The design of technosolsmodels allow toexplore different options of soils combinations(Figure 2). First of all, these monomodels which aremade up of only humus material, loess-like loam,reddish-brown clay and loam. Application of hu-mus material is quite natural, since it is by defini-tion is the most fertile and suitable for agriculturaluse. To some extent, such an option can be consi-dered as control. But the formation of a powerfullayer of humus mass does not solve all the prob-lems of reclamation. During technological actionsthe humus mass properties change significantly sothis mass cannot be considered as identical to ge-netic horizons of natural soil or agrozems.
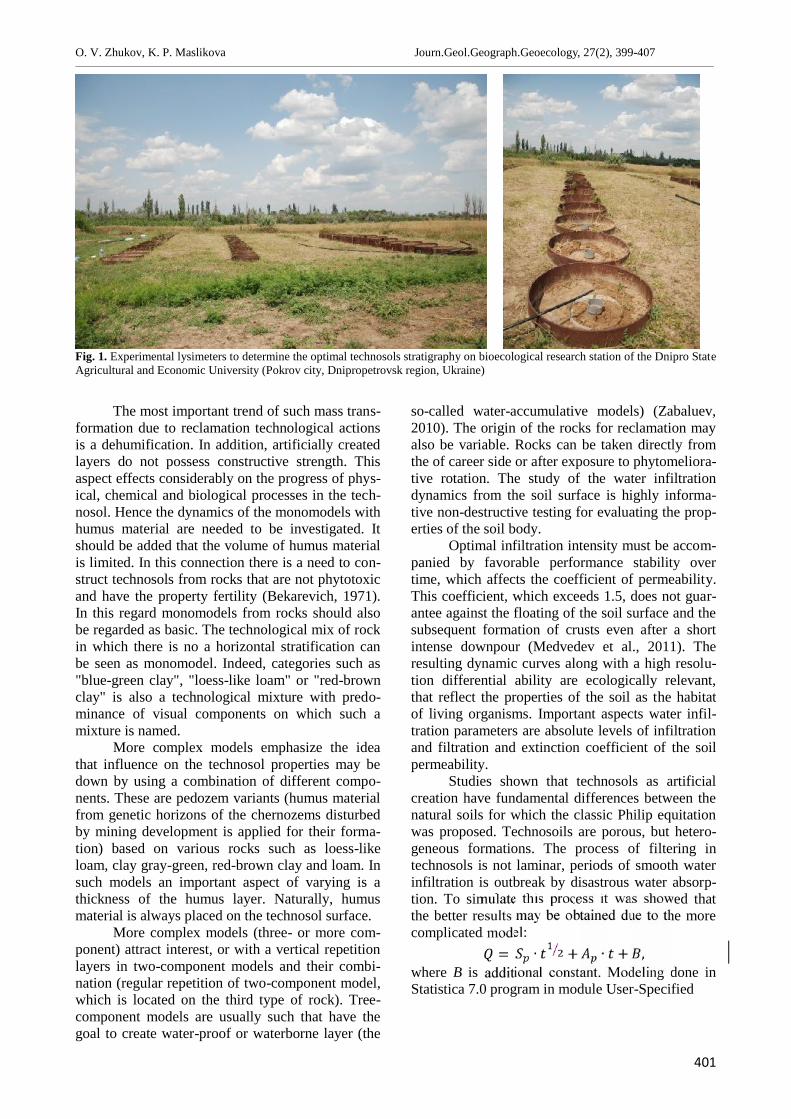
O. V. Zhukov, K. P. Maslikova Journ.Geol.Geograph.Geoecology, 27(2), 399-407________________________________________________________________________________________________________________________________________________________________
401
Fig. 1. Experimental lysimeters to determine the optimal technosols stratigraphy on bioecological research station of the Dnipro StateAgricultural and Economic University (Pokrov city, Dnipropetrovsk region, Ukraine)
The most important trend of such mass trans-formation due to reclamation technological actionsis a dehumification. In addition, artificially createdlayers do not possess constructive strength. Thisaspect effects considerably on the progress of phys-ical, chemical and biological processes in the tech-nosol. Hence the dynamics of the monomodels withhumus material are needed to be investigated. Itshould be added that the volume of humus materialis limited. In this connection there is a need to con-struct technosols from rocks that are not phytotoxicand have the property fertility (Bekarevich, 1971).In this regard monomodels from rocks should alsobe regarded as basic. The technological mix of rockin which there is no a horizontal stratification canbe seen as monomodel. Indeed, categories such as"blue-green clay", "loess-like loam" or "red-brownclay" is also a technological mixture with predo-minance of visual components on which such amixture is named.
More complex models emphasize the ideathat influence on the technosol properties may bedown by using a combination of different compo-nents. These are pedozem variants (humus materialfrom genetic horizons of the chernozems disturbedby mining development is applied for their forma-tion) based on various rocks such as loess-likeloam, clay gray-green, red-brown clay and loam. Insuch models an important aspect of varying is athickness of the humus layer. Naturally, humusmaterial is always placed on the technosol surface.
More complex models (three- or more com-ponent) attract interest, or with a vertical repetitionlayers in two-component models and their combi-nation (regular repetition of two-component model,which is located on the third type of rock). Tree-component models are usually such that have thegoal to create water-proof or waterborne layer (the
so-called water-accumulative models) (Zabaluev,2010). The origin of the rocks for reclamation mayalso be variable. Rocks can be taken directly fromthe of career side or after exposure to phytomeliora-tive rotation. The study of the water infiltrationdynamics from the soil surface is highly informa-tive non-destructive testing for evaluating the prop-erties of the soil body.
Optimal infiltration intensity must be accom-panied by favorable performance stability overtime, which affects the coefficient of permeability.This coefficient, which exceeds 1.5, does not guar-antee against the floating of the soil surface and thesubsequent formation of crusts even after a shortintense downpour (Medvedev et al., 2011). Theresulting dynamic curves along with a high resolu-tion differential ability are ecologically relevant,that reflect the properties of the soil as the habitatof living organisms. Important aspects water infil-tration parameters are absolute levels of infiltrationand filtration and extinction coefficient of the soilpermeability.
Studies shown that technosols as artificialcreation have fundamental differences between thenatural soils for which the classic Philip equitationwas proposed. Technosoils are porous, but hetero-geneous formations. The process of filtering intechnosols is not laminar, periods of smooth waterinfiltration is outbreak by disastrous water absorp-tion. To simulate this process it was showed thatthe better results may be obtained due to the morecomplicated model:= ∙ + ∙ + ,where B is additional constant. Modeling done inStatistica 7.0 program in module User-Specified
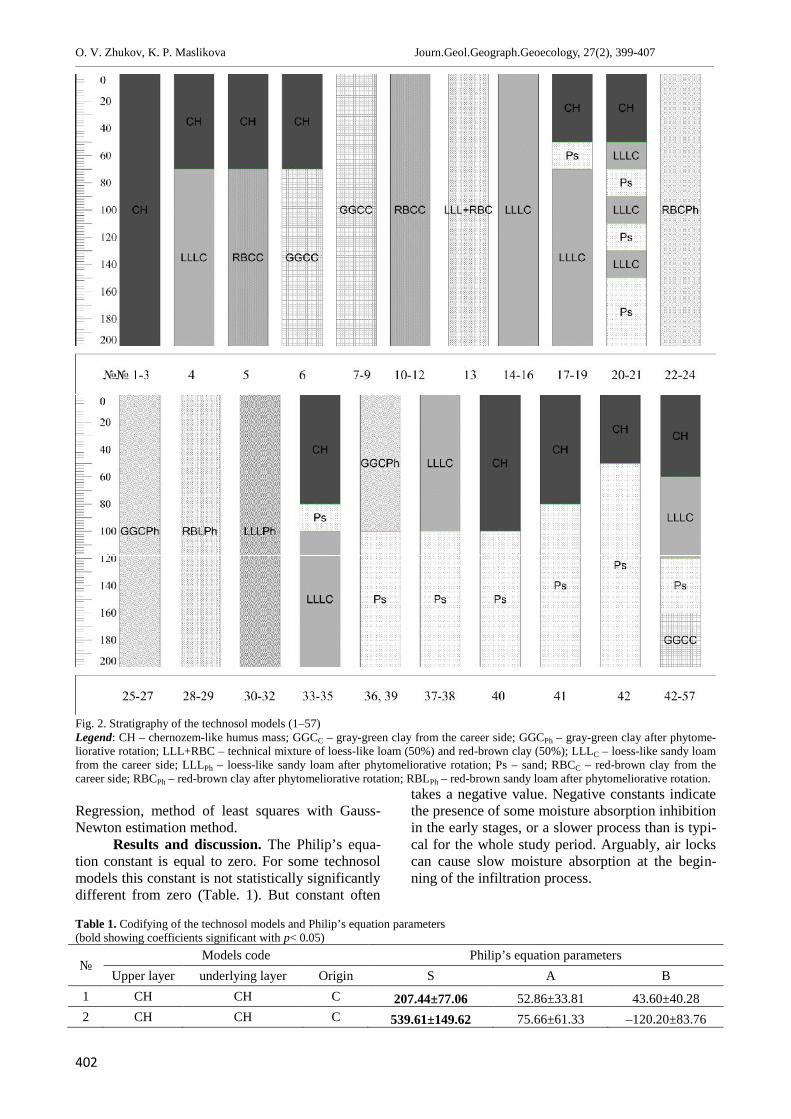
O. V. Zhukov, K. P. Maslikova Journ.Geol.Geograph.Geoecology, 27(2), 399-407________________________________________________________________________________________________________________________________________________________________
402
Fig. 2. Stratigraphy of the technosol models (1–57)Legend: CH – chernozem-like humus mass; GGCC – gray-green clay from the career side; GGCPh – gray-green clay after phytome-liorative rotation; LLL+RBC – technical mixture of loess-like loam (50%) and red-brown clay (50%); LLLC – loess-like sandy loamfrom the career side; LLLPh – loess-like sandy loam after phytomeliorative rotation; Ps – sand; RBCC – red-brown clay from thecareer side; RBCPh – red-brown clay after phytomeliorative rotation; RBLPh – red-brown sandy loam after phytomeliorative rotation.
Regression, method of least squares with Gauss-Newton estimation method.
Results and discussion. The Philip’s equa-tion constant is equal to zero. For some technosolmodels this constant is not statistically significantlydifferent from zero (Table. 1). But constant often
takes a negative value. Negative constants indicatethe presence of some moisture absorption inhibitionin the early stages, or a slower process than is typi-cal for the whole study period. Arguably, air lockscan cause slow moisture absorption at the begin-ning of the infiltration process.
Table 1. Codifying of the technosol models and Philip’s equation parameters(bold showing coefficients significant with p< 0.05)
№Models code Philip’s equation parameters
Upper layer underlying layer Origin S A B1 CH CH C 207.44±77.06 52.86±33.81 43.60±40.282 CH CH C 539.61±149.62 75.66±61.33 –120.20±83.76
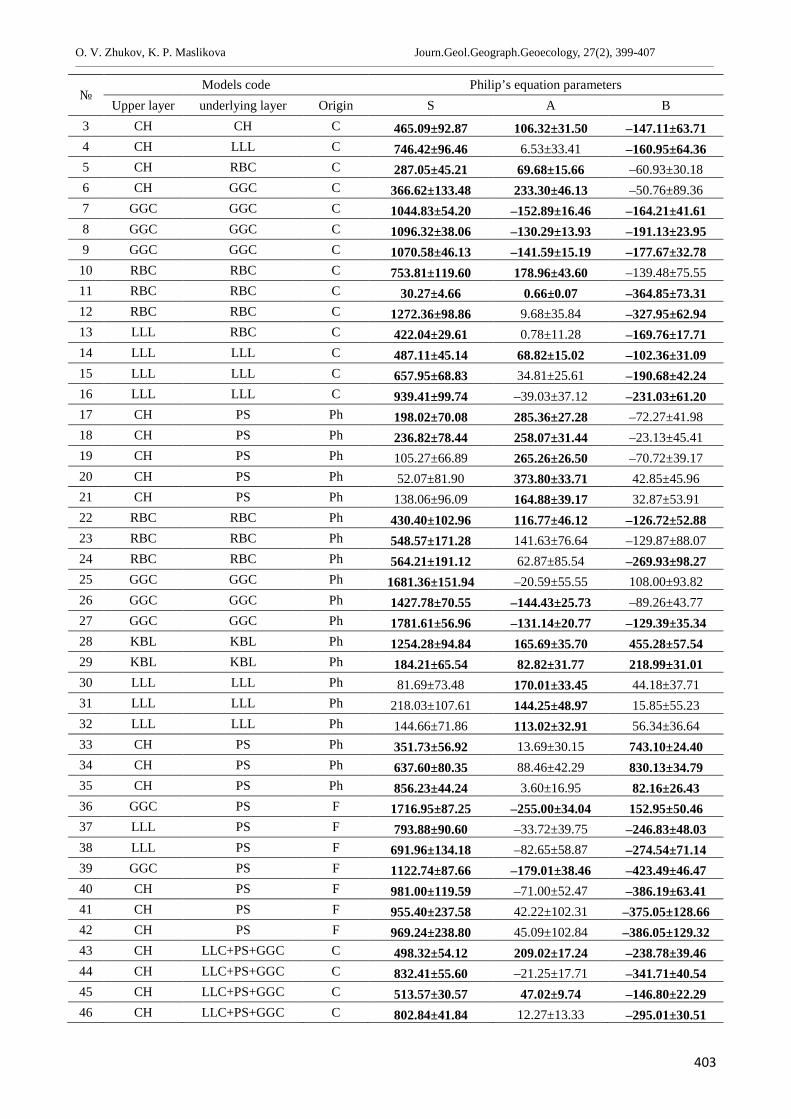
O. V. Zhukov, K. P. Maslikova Journ.Geol.Geograph.Geoecology, 27(2), 399-407________________________________________________________________________________________________________________________________________________________________
403
№Models code Philip’s equation parameters
Upper layer underlying layer Origin S A B3 CH CH C 465.09±92.87 106.32±31.50 –147.11±63.714 CH LLL C 746.42±96.46 6.53±33.41 –160.95±64.365 CH RBC C 287.05±45.21 69.68±15.66 –60.93±30.186 CH GGC C 366.62±133.48 233.30±46.13 –50.76±89.367 GGC GGC C 1044.83±54.20 –152.89±16.46 –164.21±41.618 GGC GGC C 1096.32±38.06 –130.29±13.93 –191.13±23.959 GGC GGC C 1070.58±46.13 –141.59±15.19 –177.67±32.78
10 RBC RBC C 753.81±119.60 178.96±43.60 –139.48±75.5511 RBC RBC C 30.27±4.66 0.66±0.07 –364.85±73.3112 RBC RBC C 1272.36±98.86 9.68±35.84 –327.95±62.9413 LLL RBC C 422.04±29.61 0.78±11.28 –169.76±17.7114 LLL LLL C 487.11±45.14 68.82±15.02 –102.36±31.0915 LLL LLL C 657.95±68.83 34.81±25.61 –190.68±42.2416 LLL LLL C 939.41±99.74 –39.03±37.12 –231.03±61.2017 CH PS Ph 198.02±70.08 285.36±27.28 –72.27±41.9818 CH PS Ph 236.82±78.44 258.07±31.44 –23.13±45.4119 CH PS Ph 105.27±66.89 265.26±26.50 –70.72±39.1720 CH PS Ph 52.07±81.90 373.80±33.71 42.85±45.9621 CH PS Ph 138.06±96.09 164.88±39.17 32.87±53.9122 RBC RBC Ph 430.40±102.96 116.77±46.12 –126.72±52.8823 RBC RBC Ph 548.57±171.28 141.63±76.64 –129.87±88.0724 RBC RBC Ph 564.21±191.12 62.87±85.54 –269.93±98.2725 GGC GGC Ph 1681.36±151.94 –20.59±55.55 108.00±93.8226 GGC GGC Ph 1427.78±70.55 –144.43±25.73 –89.26±43.7727 GGC GGC Ph 1781.61±56.96 –131.14±20.77 –129.39±35.3428 KBL KBL Ph 1254.28±94.84 165.69±35.70 455.28±57.5429 KBL KBL Ph 184.21±65.54 82.82±31.77 218.99±31.0130 LLL LLL Ph 81.69±73.48 170.01±33.45 44.18±37.7131 LLL LLL Ph 218.03±107.61 144.25±48.97 15.85±55.2332 LLL LLL Ph 144.66±71.86 113.02±32.91 56.34±36.6433 CH PS Ph 351.73±56.92 13.69±30.15 743.10±24.4034 CH PS Ph 637.60±80.35 88.46±42.29 830.13±34.7935 CH PS Ph 856.23±44.24 3.60±16.95 82.16±26.4336 GGC PS F 1716.95±87.25 –255.00±34.04 152.95±50.4637 LLL PS F 793.88±90.60 –33.72±39.75 –246.83±48.0338 LLL PS F 691.96±134.18 –82.65±58.87 –274.54±71.1439 GGC PS F 1122.74±87.66 –179.01±38.46 –423.49±46.4740 CH PS F 981.00±119.59 –71.00±52.47 –386.19±63.4141 CH PS F 955.40±237.58 42.22±102.31 –375.05±128.6642 CH PS F 969.24±238.80 45.09±102.84 –386.05±129.3243 CH LLC+PS+GGC C 498.32±54.12 209.02±17.24 –238.78±39.4644 CH LLC+PS+GGC C 832.41±55.60 –21.25±17.71 –341.71±40.5445 CH LLC+PS+GGC C 513.57±30.57 47.02±9.74 –146.80±22.2946 CH LLC+PS+GGC C 802.84±41.84 12.27±13.33 –295.01±30.51
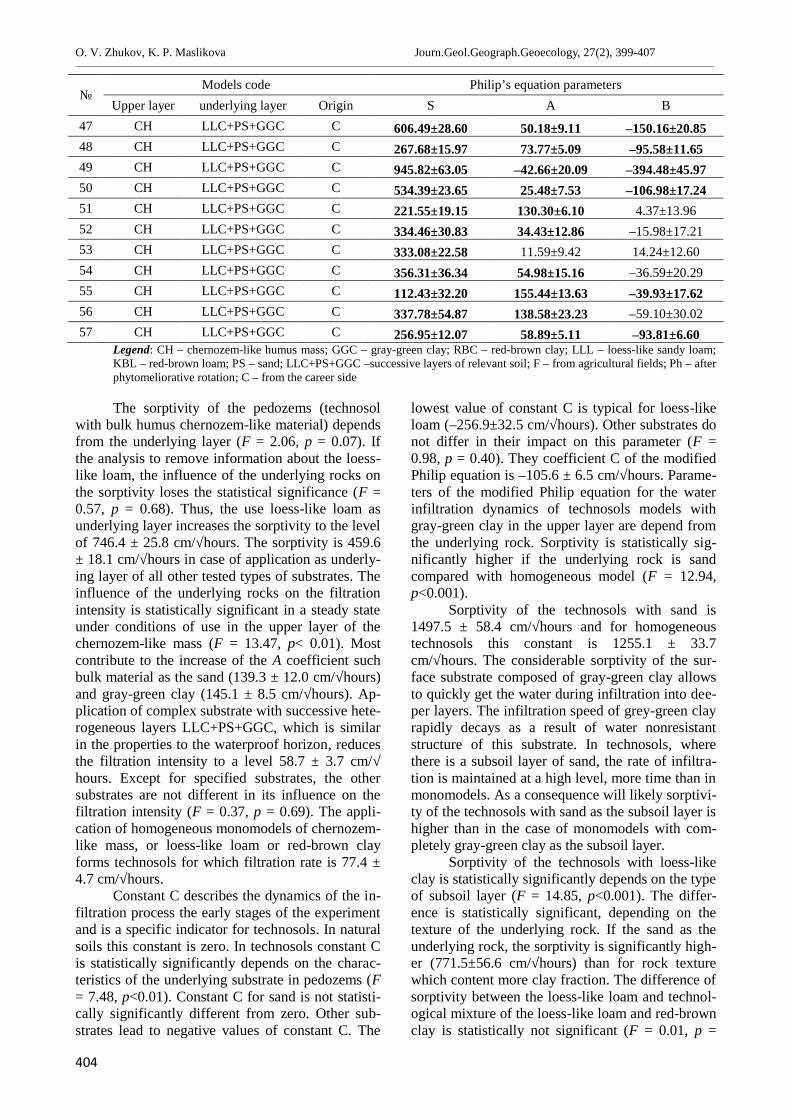
O. V. Zhukov, K. P. Maslikova Journ.Geol.Geograph.Geoecology, 27(2), 399-407________________________________________________________________________________________________________________________________________________________________
404
№Models code Philip’s equation parameters
Upper layer underlying layer Origin S A B47 CH LLC+PS+GGC C 606.49±28.60 50.18±9.11 –150.16±20.8548 CH LLC+PS+GGC C 267.68±15.97 73.77±5.09 –95.58±11.6549 CH LLC+PS+GGC C 945.82±63.05 –42.66±20.09 –394.48±45.9750 CH LLC+PS+GGC C 534.39±23.65 25.48±7.53 –106.98±17.2451 CH LLC+PS+GGC C 221.55±19.15 130.30±6.10 4.37±13.9652 CH LLC+PS+GGC C 334.46±30.83 34.43±12.86 –15.98±17.2153 CH LLC+PS+GGC C 333.08±22.58 11.59±9.42 14.24±12.6054 CH LLC+PS+GGC C 356.31±36.34 54.98±15.16 –36.59±20.2955 CH LLC+PS+GGC C 112.43±32.20 155.44±13.63 –39.93±17.6256 CH LLC+PS+GGC C 337.78±54.87 138.58±23.23 –59.10±30.0257 CH LLC+PS+GGC C 256.95±12.07 58.89±5.11 –93.81±6.60
Legend: CH – chernozem-like humus mass; GGC – gray-green clay; RBC – red-brown clay; LLL – loess-like sandy loam;KBL – red-brown loam; PS – sand; LLC+PS+GGC –successive layers of relevant soil; F – from agricultural fields; Ph – afterphytomeliorative rotation; C – from the career side
The sorptivity of the pedozems (technosolwith bulk humus chernozem-like material) dependsfrom the underlying layer (F = 2.06, p = 0.07). Ifthe analysis to remove information about the loess-like loam, the influence of the underlying rocks onthe sorptivity loses the statistical significance (F =0.57, p = 0.68). Thus, the use loess-like loam asunderlying layer increases the sorptivity to the levelof 746.4 ± 25.8 cm/√hours. The sorptivity is 459.6± 18.1 cm/√hours in case of application as underly-ing layer of all other tested types of substrates. Theinfluence of the underlying rocks on the filtrationintensity is statistically significant in a steady stateunder conditions of use in the upper layer of thechernozem-like mass (F = 13.47, p< 0.01). Mostcontribute to the increase of the A coefficient suchbulk material as the sand (139.3 ± 12.0 cm/√hours)and gray-green clay (145.1 ± 8.5 cm/√hours). Ap-plication of complex substrate with successive hete-rogeneous layers LLC+PS+GGC, which is similarin the properties to the waterproof horizon, reducesthe filtration intensity to a level 58.7 ± 3.7 cm/√hours. Except for specified substrates, the othersubstrates are not different in its influence on thefiltration intensity (F = 0.37, p = 0.69). The appli-cation of homogeneous monomodels of chernozem-like mass, or loess-like loam or red-brown clayforms technosols for which filtration rate is 77.4 ±4.7 cm/√hours.
Constant C describes the dynamics of the in-filtration process the early stages of the experimentand is a specific indicator for technosols. In naturalsoils this constant is zero. In technosols constant Cis statistically significantly depends on the charac-teristics of the underlying substrate in pedozems (F= 7.48, p<0.01). Constant C for sand is not statisti-cally significantly different from zero. Other sub-strates lead to negative values of constant C. The
lowest value of constant C is typical for loess-likeloam (–256.9±32.5 cm/√hours). Other substrates donot differ in their impact on this parameter (F =0.98, p = 0.40). They coefficient C of the modifiedPhilip equation is –105.6 ± 6.5 cm/√hours. Parame-ters of the modified Philip equation for the waterinfiltration dynamics of technosols models withgray-green clay in the upper layer are depend fromthe underlying rock. Sorptivity is statistically sig-nificantly higher if the underlying rock is sandcompared with homogeneous model (F = 12.94,p<0.001).
Sorptivity of the technosols with sand is1497.5 ± 58.4 cm/√hours and for homogeneoustechnosols this constant is 1255.1 ± 33.7cm/√hours. The considerable sorptivity of the sur-face substrate composed of gray-green clay allowsto quickly get the water during infiltration into dee-per layers. The infiltration speed of grey-green clayrapidly decays as a result of water nonresistantstructure of this substrate. In technosols, wherethere is a subsoil layer of sand, the rate of infiltra-tion is maintained at a high level, more time than inmonomodels. As a consequence will likely sorptivi-ty of the technosols with sand as the subsoil layer ishigher than in the case of monomodels with com-pletely gray-green clay as the subsoil layer.
Sorptivity of the technosols with loess-likeclay is statistically significantly depends on the typeof subsoil layer (F = 14.85, p<0.001). The differ-ence is statistically significant, depending on thetexture of the underlying rock. If the sand as theunderlying rock, the sorptivity is significantly high-er (771.5±56.6 cm/√hours) than for rock texturewhich content more clay fraction. The difference ofsorptivity between the loess-like loam and technol-ogical mixture of the loess-like loam and red-brownclay is statistically not significant (F = 0.01, p =
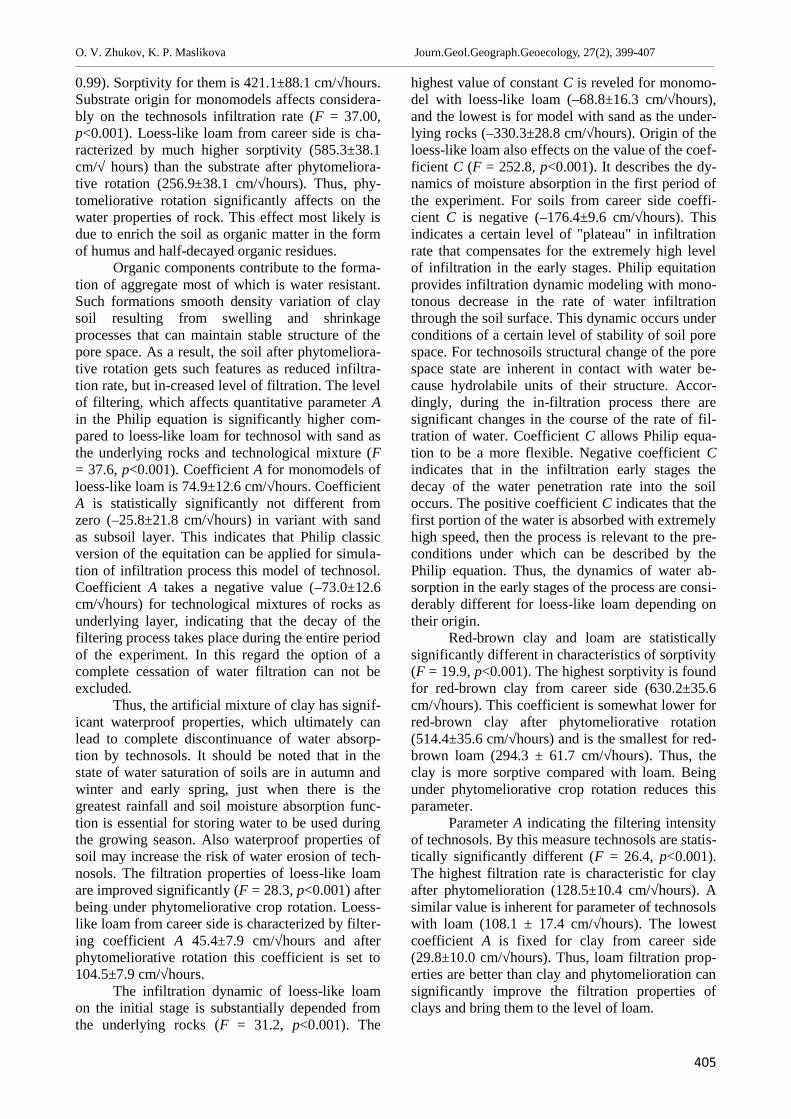
O. V. Zhukov, K. P. Maslikova Journ.Geol.Geograph.Geoecology, 27(2), 399-407________________________________________________________________________________________________________________________________________________________________
405
0.99). Sorptivity for them is 421.1±88.1 cm/√hours.Substrate origin for monomodels affects considera-bly on the technosols infiltration rate (F = 37.00,p<0.001). Loess-like loam from career side is cha-racterized by much higher sorptivity (585.3±38.1cm/√ hours) than the substrate after phytomeliora-tive rotation (256.9±38.1 cm/√hours). Thus, phy-tomeliorative rotation significantly affects on thewater properties of rock. This effect most likely isdue to enrich the soil as organic matter in the formof humus and half-decayed organic residues.
Organic components contribute to the forma-tion of aggregate most of which is water resistant.Such formations smooth density variation of claysoil resulting from swelling and shrinkageprocesses that can maintain stable structure of thepore space. As a result, the soil after phytomeliora-tive rotation gets such features as reduced infiltra-tion rate, but in-creased level of filtration. The levelof filtering, which affects quantitative parameter Ain the Philip equation is significantly higher com-pared to loess-like loam for technosol with sand asthe underlying rocks and technological mixture (F= 37.6, p<0.001). Coefficient A for monomodels ofloess-like loam is 74.9±12.6 cm/√hours. CoefficientA is statistically significantly not different fromzero (–25.8±21.8 cm/√hours) in variant with sandas subsoil layer. This indicates that Philip classicversion of the equitation can be applied for simula-tion of infiltration process this model of technosol.Coefficient A takes a negative value (–73.0±12.6cm/√hours) for technological mixtures of rocks asunderlying layer, indicating that the decay of thefiltering process takes place during the entire periodof the experiment. In this regard the option of acomplete cessation of water filtration can not beexcluded.
Thus, the artificial mixture of clay has signif-icant waterproof properties, which ultimately canlead to complete discontinuance of water absorp-tion by technosols. It should be noted that in thestate of water saturation of soils are in autumn andwinter and early spring, just when there is thegreatest rainfall and soil moisture absorption func-tion is essential for storing water to be used duringthe growing season. Also waterproof properties ofsoil may increase the risk of water erosion of tech-nosols. The filtration properties of loess-like loamare improved significantly (F = 28.3, p<0.001) afterbeing under phytomeliorative crop rotation. Loess-like loam from career side is characterized by filter-ing coefficient A 45.4±7.9 cm/√hours and afterphytomeliorative rotation this coefficient is set to104.5±7.9 cm/√hours.
The infiltration dynamic of loess-like loamon the initial stage is substantially depended fromthe underlying rocks (F = 31.2, p<0.001). The
highest value of constant C is reveled for monomo-del with loess-like loam (–68.8±16.3 cm/√hours),and the lowest is for model with sand as the under-lying rocks (–330.3±28.8 cm/√hours). Origin of theloess-like loam also effects on the value of the coef-ficient C (F = 252.8, p<0.001). It describes the dy-namics of moisture absorption in the first period ofthe experiment. For soils from career side coeffi-cient C is negative (–176.4±9.6 cm/√hours). Thisindicates a certain level of "plateau" in infiltrationrate that compensates for the extremely high levelof infiltration in the early stages. Philip equitationprovides infiltration dynamic modeling with mono-tonous decrease in the rate of water infiltrationthrough the soil surface. This dynamic occurs underconditions of a certain level of stability of soil porespace. For technosoils structural change of the porespace state are inherent in contact with water be-cause hydrolabile units of their structure. Accor-dingly, during the in-filtration process there aresignificant changes in the course of the rate of fil-tration of water. Coefficient C allows Philip equa-tion to be a more flexible. Negative coefficient Cindicates that in the infiltration early stages thedecay of the water penetration rate into the soiloccurs. The positive coefficient C indicates that thefirst portion of the water is absorbed with extremelyhigh speed, then the process is relevant to the pre-conditions under which can be described by thePhilip equation. Thus, the dynamics of water ab-sorption in the early stages of the process are consi-derably different for loess-like loam depending ontheir origin.
Red-brown clay and loam are statisticallysignificantly different in characteristics of sorptivity(F = 19.9, p<0.001). The highest sorptivity is foundfor red-brown clay from career side (630.2±35.6cm/√hours). This coefficient is somewhat lower forred-brown clay after phytomeliorative rotation(514.4±35.6 cm/√hours) and is the smallest for red-brown loam (294.3 ± 61.7 cm/√hours). Thus, theclay is more sorptive compared with loam. Beingunder phytomeliorative crop rotation reduces thisparameter.
Parameter A indicating the filtering intensityof technosols. By this measure technosols are statis-tically significantly different (F = 26.4, p<0.001).The highest filtration rate is characteristic for clayafter phytomelioration (128.5±10.4 cm/√hours). Asimilar value is inherent for parameter of technosolswith loam (108.1 ± 17.4 cm/√hours). The lowestcoefficient A is fixed for clay from career side(29.8±10.0 cm/√hours). Thus, loam filtration prop-erties are better than clay and phytomelioration cansignificantly improve the filtration properties ofclays and bring them to the level of loam.
O. V. Zhukov, K. P. Maslikova Journ.Geol.Geograph.Geoecology, 27(2), 399-407________________________________________________________________________________________________________________________________________________________________
406
The dynamics of infiltration at the start ofprocess is characterized by a parameter C. As ittechnosems are statistically significantly different(F = 205.5, p<0.001). Reddish-brown loam is cha-racterized by a positive value C (44.2±32.3cm/√hours). For clay is typical negative value ofthis parameter. For clay from career side coefficientC is the lowest (–289.1±20.1 cm/√hours), and islittle more for clay after phytomelioration (–169.1±20.1 cm/√hours). Negative coefficient Ccorresponds to an intense process of infiltration,accompanied by sporadic infiltration failure. Apositive coefficient is characteristic of the failedinfiltration in the first time of experiment.Conclusion. The study of the water infiltrationdynamics from the soil surface is highly informa-tive non-destructive testing for evaluating the prop-erties of the soil body. Studies showed that techno-sols as artificial creation have fundamental differ-ences between the natural soils for which the clas-sic Philip equitation was proposed. Technosoils areporous, but heterogeneous formations. The processof filtering in technosols is not laminar, periods ofsmooth water infiltration is outbreak by disastrouswater absorption. To simulate this process it wasshowed that the better results may be obtained dueto originally modified Philip equitation. Specificconstant C describes the dynamics of the infiltrationprocess the early stages of the experiment and is aspecific indicator for technosols. In natural soilsthis constant is zero. The sorptivity of the pedozemswas reveled to be depended from the underlyinglayer. Organic components contribute to the forma-tion of aggregate most of which is water resistant.Such formations smooth density variation of claysoil resulting from swelling and shrinkageprocesses that can maintain stable structure of thepore space. As a result, the soil after phytomeliora-tive rotation gets such features as reduced infiltra-tion rate, but increased level of filtration. The artifi-cial mixture of clay has significant waterproofproperties, which ultimately can lead to completediscontinuance of water absorption by technosols.Waterproof properties of soil may increase the riskof water erosion of technosols. For technosoilsstructural change of the pore space state are inhe-rent in contact with water because hydrolabile unitsof their structure. Accordingly, during the infiltra-tion process there are significant changes in thecourse of the rate of filtration of water.
References
Anderson, A. N., McBratney, A. B., Crawford, J. W.(1998). Applications of fractals to soil studies.Advances in Agronomy, 63, 1–76.
Bekarevich, N. E. (1971). Porody nadrudnoj tolshi i ihagrobiologicheskaya ocenka [The rocks of the su-praore column and their agricultural valuation].In: Bekarevich, N. E. (Ed.), About reclamation inthe steppes of Ukraine. Dnepropetrovsk, Promin,(in Russian).
Fridland, V. M. (1972). Structure of the soil cover. Mos-cow: Misl (in Russian).
Heuvelink, G. B. M., Webster, R. (2001). Modelling soilvariation: past, present, and future. Geoderma,100, 269–301.
Karpachevsky, L. O. (1983). Zerkalo landshafta [Land-scape mirror]. Moscow, Mysl (in Russian).
Karpachevsky, L. O. (2005). Ekologicheskie pochvo-voedenie [Ecological soil science]. Moscow,Geos (in Russian).
Kharytonov, M., Babenko, M., Velychko, O., Pardini, G.(2018). Prospects of medicinal herbs managementin reclaimed minelands of Ukraine. UkrainianJournal of Ecology, 8(1), 527–532. doi:10.15421/2018_245
Kunah, O.N. (2016). Functional and spatial structure ofthe urbotechnozem mesopedobiont community.Visnyk of Dnipropetrovsk University. Biology,ecology, 24(2), 473–483. DOIhttps://doi.org/10.15421/011664
Maslikova, K.P., Ladska, I.V., Zhukov, O.V. (2016).Permeability of soils in artificially created modelswith different stratigraphy. Biological Bulletin ofBogdan Chmelnitskiy Melitopol State Pedagogi-cal University. 6 (3), 234–247. DOI:http://dx.doi.org/10.15421/201693
Medvedev, V. V., Laktionova, E. V., Donsova, L. V.(2011). Vodnye svojstva pochv Ukrainy i vlagoo-bespechennost selskohozyajstvennyh kultur [Soilwater properties of Ukraine and agricultural cropswater supply]. Kharkiv: Apostrof (in Russian).
Philip, J. R. (1957). The Theory of Infiltration: Sorp-tivity and Algebraic Infiltration Equation, SoilScience, 84, 257–264.
Rode, A.A. (1984). Genezis pochv i sovremennye pro-cessy pochvoobrazovaniya [Genesis of soils andmodern soil formation processes]. Moscow, Nau-ka (in Russian).
Yakovenko, V. M. (2008). Mikromorfolohichna diah-nostyka chornozemiv Prysamar´ia Dniprovskoho[Micromorphological diagnosis Prisamare-Dniprovske chaernozems]. Soil science, 9, 3–4,119–127 (in Ukranian).
Zabaluev, V.A. (2010). Formirovanie agroekosistemrekultivirovannyh zemel v Stepi Ukrainy: edafi-cheskoe obosnovanie [Formation of agro-ecosystems reclaimed land in the steppe ofUkraine: edaphic study]. Kyiv (in Russian).
Zadorozhna, G. O., Kunah, O. N., Zhukov, O. V. (2012).Prostranstvennaya organizaciya dernovo–litogennyh pochv na krasno–buryh glinah [Thespatial organization of soddy–lithogenic soils onthe redbrown clays]. Problems of the ecology andnature protection of the technogenic region,1(12), 226–237 (in Russian).
Zhukov, A. V., Shatalin, D.B. (2016). Gigrotop itrofotop biogeocenozov stepnogo Pridneprovya
O. V. Zhukov, K. P. Maslikova Journ.Geol.Geograph.Geoecology, 27(2), 399-407________________________________________________________________________________________________________________________________________________________________
407
kak determinanty b–raznoobraziya soobshestvdozhdevyh chervej (Lumbricidae) [Hygrotopeand trophotope of the steppe pridniproviebiogeoceonosis as determinants of theearthworms (Lumbricidae) communities β–diversity]. Biological Bulletin of BogdanChmelnitskiy Melitopol State PedagogicalUniversity. 6 (2), 129–157(in Russian). DOI:10.15421/201651
Zhukov, A.V., Zadorozhnaya, G.A. 2016. Prostranstven-no–vremennaya dinamika tverdosti rekultiviro-vannyh pochv, sformirovannyh v rezultate doby-chi poleznyh iskopaemyh otkrytym sposobom[Spatio-temporal dynamics of the penetration re-sistance of recultivated soils formed after opencast mining[. Visnyk of Dnipropetrovsk Universi-ty. Biology, ecology. 24(2), 324–331 (in Rus-sian). DOI: 10.15421/011642
Zhukov, O.V (2015). GIS–podhod dlya ocenki vliyaniyaobychnyh i sdvoennyh koles na tverdost pochvy[Influence of usual and dual wheels on soilpenetration resistance: the GIS-approach[.Biological Bulletin Of Bogdan ChmelnitskiyMelitopol State Pedagogical University. 3, 73–100(in Russian). DOI: 10.7905/bbmspu.v5i3.988
Zhukov, O.V., Kunah, O.M., Taran, V.O., Lebedinska,M. M. (2016). Prostorova variabelnistelektroprovidnosti gruntiv areny dolyny r. Dnipro(u mezhakh pryrodnoho zapovidnyku«Dniprovsko–Orilskyi») [Spatial variability ofsoils electrical conductivity within arena of theriver dnepr valley (territory of the natural reserve“Dniprovsko–Orilsky”)[. Biological Bulletin ofBogdan Chmelnitskiy Melitopol StatePedagogical University, 6 (2), 129–157 (inUkranian). DOI:http://dx.doi.org/10.15421/201646
Zhukov, O.V., Kunah, O.N., Novikova, V.A. (2016).Funkcionalnaya struktura soobshestvamezopedobiontov dernovo–borovoj pochvy arenyr. Dnepr [The functional organisation of themesopedobionts community of sod pinewoodsoils on arena of the river Dnepr[. Visnyk ofDnipropetrovsk University. Biology, ecology.24(1), 26–39(in Russian). doi:10.15421/011604
Zverkovskyi, V.M., Sytnyk, S.A., Lovynska, V.M., Kha-rytonov, M.M., Mykolenko, S.Yu. (2017). Re-mediation potential of forest-forming species inthe reclamation planting. Ukrainian Journal ofEcology, 7(3), 64–72. doi: 10.15421/2017_50
408
Journal of Geology,Geography and Geoecology
Journal home page: geology-dnu-dp.ua
ISSN 2617-2909 (print)ISSN 2617-2119 (online)
Journ.Geol.Geograph.Geoecology,27(2)
doi:10.15421/11184201
CONTENTSAsotskyi V., Buts Y., Kraynyuk O., Ponomarenko R. Post-pyrogenic changes in the propertiesof grey forest podzolic soils of ecogeosystems of pine forests under conditions of anthropogen-ic loading 175Bosevska L.P., Chowdhury A. Labile technogenic geological system of the floodedShevchenko salt mine (Ukraine) 184Grubinko V.V., Humeniuk H.B., Khomenchuk V.O., Garmatiy N.M., Voytiuk V.B., Bar-na M.M. Ecotoxicological status and prognosis of the state of an urbanized hydroecosystem(on the example of the reservoir "Ternopil pond".) 202Havriushyn O.V. Mapping the spatial and temporal distribution of changes in theadministrative-territorial division 213Kasiyanchuk D.V., Kuzmenko E D., Tymkiv M.M., Vitiuk A.V. Geo-information modellingof the insolation level within Ivano-Frankivsk region 222Khilchevskyi V.К., Zabokrytska M.R., Sherstyuk N.P. Hydrography and hydrochemistry ofthe transboundary river Western Bug on the territory of Ukraine 232KhomenkoYu.T., Isakov L.V., Manyuk V.V. On the development of geotouristic routes on theobjects of the Precambrian Rock Association of the Western Priazоvia 244Krupskyi O. P., Temchur K. O. Media tourism in the Chernobyl Exclusion Zone as a newtourist phenomenon 261Kulikova D.V., Kovrov O.S., BuchavyYu.V., Fedotov V.V. GIS-based Assessment of theAssimilative Capacity of Rivers in Dnipropetrovsk Region 274Kuzyshyn A.V., Poplavska I.V.Analysis of Territorial Differences of the Social Sphereelements in the Areas of the Carpathian-Podillia Region 285Maksymova E., Kostrytska S.Geological and structural prerequisites of gas-bearing capacityand gas hydrate formation in the World Ocean (in terms of the Black Sea) 294Messai A., Idres A., Benselhoub A.Mineralogical characterization of limonitic iron ore fromthe Rouina mine, Ain Defla (Algeria). 305Narjess Karoui-Yaakoub, Moncef Said Mtimet, Semeh Bejaoui, Bienvenido Martínez-Navarro Paleoenvironmental reconstruction of the Pleistocene site of Oued Sarrat(Northwestern Tunisia) using mineralogical and geochemical data 316Rusanova I., Onufriv Y., Ignatyuk A.Recreational skiing in the formation of local settlementsystems of Prykarpattya region 323Sadovenko I.O., Inkin O.V., Dereviahina N.I., Hriplivec Yu.V. Analyzing the parametersinfluencing the efficiency of undereground coal gasification 332Shablii O.I., Zastavetska L.B., Dudarchuk K.D., Illiash I.D., Smochko N.M. The mainproblems of healthcare and wellness tourism in Ukraine 337Sonko S., Kyselov Yu., Polovka S. On the modern conception of environment 346Sopov D., Sopova N., Dankeyeva O., Chuhaiev S. Natural-historical and ecological analysisof land resources and land use in Lugansk region 357Ulytsky О., Yermakov V. , Lunova О., Buglak O. Environmental risks and assessment of thehydrodynamic situation in the mines of Donetsk and Lugansk regions of Ukraine 368Yavorska V.V., Hevko I.V., Sych V.A., Kolomiyets K.V. Organization of tourist and
409
recreational activity within the objects of the natural protected fund in the Odessa region 377Yukhnovskyi V.Yu., Zibtseva O.V. Dynamics of ecological stability of small towns in Kyivregion 386Zhukov O.V., Maslikova K.P. The dependence of the technosols models functional propertiesfrom the primary stratigraphy designs 399
JOURNAL OF GEOLOGY, GEOGRAPHY AND GEOECOLOGY
The Journal was founded in 1993 under the title«Dnipropetrovsk University Bulletin. Series: Geology»
The journal, beginning in June 2018, is published under the title«Journal of Geology, Geography and Geoecology».
Issue 22Volume 27 (2)
English
Certificate of state registration of a series of KV № 23167-13007 dated February 26, 2018 inaccordance with the order of the Ministry of Education and Science of Ukraine dated 24.05.2018
№527 (Annex 5), a printed (electronic) publication “Journal of Geology, Geography and Geoecolo-gy” is included in the List of Scientific Specialized Publications of Ukraine in the Field of
Geological Sciences (included in professional editions since 2003).The international level of the Journal obtained recognition in 2017 when it was included in the
Web of Science and over 20 well-known scientific citation databases
Literary editors: P.W. Bradbeer, M.O. Tikhomyrov.Text Layout: N.І. Derevyagina, Volodymyr V. Manyuk.
Cover design:Vadym V. Manyuk.____________________________________________________________
Підписано до друку 29.10.2018. Формат 60×84 1/16. Папір друкарський. Друк плоский. Ум. друк. арк. 27,67 Тираж 100 пр. Зам. № 308.
_____________________________________________________________________________________РВВ ДНУ, просп. Гагаріна, 72, м. Дніпро, 49010.
ПП «Ліра ЛТД», вул. Наукова, 5, м. Дніпро, 49107.Свідоцтво про внесення до Державного реєстру серія
ДК № 6042 від 26.02.2018
Related Documents


