International Journal of Computer Science & Information Security © IJCSIS PUBLICATION 2012 IJCSIS Vol. 10 No. 11, November 2012 ISSN 1947-5500

Welcome message from author
This document is posted to help you gain knowledge. Please leave a comment to let me know what you think about it! Share it to your friends and learn new things together.
Transcript

International Journal of Computer Science
& Information Security
© IJCSIS PUBLICATION 2012
IJCSIS Vol. 10 No. 11, November 2012 ISSN 1947-5500


Editorial Message from Managing Editor
The International Journal of Computer Science and Information Security (IJCSIS), since May 2009, contributes to dissemination of new knowledge in the emerging area of computer applications and practices, and latest advances in cloud computing, information security, green IT etc. The research themes focus mainly on innovative developments, research issues/solutions in computer science and related technologies. IJCSIS editorial board consisting of reputable experts solicits your research contribution to the journal with your research papers, projects, surveying works and industrial experiences. IJCSIS purpose is to enhance the development of theory, research, and practices to support IJCSIS archives publications, abstracting/indexing, editorial board and other important information are available online on homepage. IJCSIS appreciates all the insights and advice from authors and reviewers. Indexed by the following International Agencies and institutions: Google Scholar, Bielefeld Academic Search Engine (BASE), CiteSeerX, SCIRUS, Cornell’s University Library EI, Scopus, DBLP, DOI, ProQuest, EBSCO. Google Scholar reported a large amount of cited papers published in IJCSIS. IJCSIS is currently accepting manuscripts for upcoming issues based on original qualitative or quantitative research, an innovative conceptual framework, or a substantial literature review that opens new areas of inquiry and investigation in Computer science. Case studies and works of literary analysis are also welcome. We look forward to further collaboration. If you have further questions please do not hesitate to contact us at [email protected]. Our team is committed to provide a quick and supportive service throughout the publication process. A complete list of journals can be found at: http://sites.google.com/sit
/ijcsis/
IJCSIS Vol. 10, No. 11, November 2012 Edition
ISSN 1947-5500 © IJCSIS, USA.
Journal Indexed by (among others):
IJCSIS 2012
IJCSIS EDITORIAL BOARD Dr. Yong Li School of Electronic and Information Engineering, Beijing Jiaotong University, P. R. China Prof. Hamid Reza Naji Department of Computer Enigneering, Shahid Beheshti University, Tehran, Iran Dr. Sanjay Jasola Professor and Dean, School of Information and Communication Technology, Gautam Buddha University Dr Riktesh Srivastava Assistant Professor, Information Systems, Skyline University College, University City of Sharjah, Sharjah, PO 1797, UAE Dr. Siddhivinayak Kulkarni University of Ballarat, Ballarat, Victoria, Australia Professor (Dr) Mokhtar Beldjehem Sainte-Anne University, Halifax, NS, Canada Dr. Alex Pappachen James (Research Fellow) Queensland Micro-nanotechnology center, Griffith University, Australia Dr. T. C. Manjunath HKBK College of Engg., Bangalore, India.
Prof. Elboukhari Mohamed Department of Computer Science, University Mohammed First, Oujda, Morocco
TABLE OF CONTENTS
1. Paper 27101203: Design and Implementation of a Secure NeMo (pp. 1-5) Full Text: PDF Diyar Khairi M S, DEEI, FCT, University of Algarve, Portugal Amine Berqia, DEEI, FCT, University of Algarve, Portugal Abstract— Network Mobility (NEMO) Basic Support protocol enables Mobile Networks to attach to different points in the Internet. The protocol is an extension of Mobile IPv6 and allows session continuity for every node in the Mobile Network as the network moves. It also allows every node in the Mobile Network to be reachable while moving around. In this paper detailed implementation of such a system on Linux OS is presented. For wireless security measures, the Wired Equipment Privacy (WEP) method is deployed. Then it is showed that this method can be easily cracked using the BackTrack 5 operating system and the airecrack-ng application. Finally, to solve the security problem, a Wi-Fi Protected Access II (WPA2) Enterprise method is implemented using a Windows Server 2008 R2 with Network Policy Services (NPS) as a radius server and a simple router as a radius client. Keywords: NEMO, Security, Radius, Mobile IPv6 2. Paper 29101208: Virtual Zones and Virtual Coordinates on a Multi Layer Infrastructure for Wireless Sensor Networks (VMLI) (pp. 6-15) Full Text: PDF Amina MERBAH, Ahmed KAMIL, Olaf MALASSÉ, Hicham BELHADAOUI, Mohamed OUZZIF Casablanca,Morroco & Metz,France Abstract-- Wireless sensor network (WSN) is currently representing a rapidly developing field. The challenge that manifests itself, accordingly, is about reducing the per unit-energy consumption of these networks that show very limited capacity. Several academic undertakings have been interested in maximizing the network’s lifetime. The architectures of hierarchical structures ensure the provision of different network nodes in a way that accomplishes this goal. This paper offers a new WSN infrastructure based on a virtual organization through two layers representing the physical layer that contains all nodes of sensor network. The first virtual layer is based on a partitioning into sub-areas that are geographically localized by the sensors. The second is partitioned into four typical layers for the four units (sensors, aggregators, logger and users equipments) of the devices in our platform. This partitioning impacts on (affects) all resources to obtain a global surveillance of WSN at a larger scale. Simulation results have shown that the proposed partitioning algorithm has reduced both the capacity of consumed energy and the number of packets transmitted during topology construction. Key-words— Wireless sensor networks (WSN), Virtual zones, , Partitioning algorithms, WSN Infrastructures , Energy consumption. 3. Paper 31101216: Brain Connectivity Analysis Methods for Better Understanding of Coupling (pp. 16-22) Full Text: PDF Revati Shriram 1,2
1Sathyabama University, Research Scholar, Chennai. 2Cummins College of Engg for Women, Pune, INDIA Dr. M. Sundhararajan, Shri Lakshmi Ammal Engg. College, Chennai, INDIA Nivedita Daimiwal, Cummins College of Engineering for Women, Pune, INDIA
Abstract — Action, cognition, emotion and perception can be mapped in the brain by using set of techniques. Translating unimodal concepts from one modality to another is an important step towards understanding the neural mechanisms. This paper provides a comprehensive survey of multimodal analysis of brain signals such as fMRI, EEG, MEG, NIRS and motivations, assumptions and pitfalls associated with it. All these non-invasive brain modalities complement and restrain each other and hence improve our understating of functional and neuronal organization. By combining the various modalities together, we can exploit the strengths and flaws of individual brain imaging methods. Integrated anatomical analysis and functional measurements of human brain offer a powerful paradigm for the brain mapping. Here we provide the brief review on non invasive brain modalities, describe the future of co-analysis of these brain signals. Keywords- EEG, fMRI, MEG, NIRS and BMI. 4. Paper 31101217: Applications of fMRI for Brain Mapping (pp. 23-27) Full Text: PDF Nivedita Daimiwal 1,2
1Research Scholar,Sathyabama University,Chennai, INDIA 2Cummins college of Engg. For Women, Pune Dr. M. Sundhararajan, Principal, Shri Laxmi Ammal Engineering College,Chennai, INDIA Revati Shriram, Cummins College of Engg. For Women,Pune, INDIA Abstract — Brain-mapping techniques have proven to be vital in understanding the molecular, cellular, and functional mechanisms of the brain. Normal anatomical imaging can provide structural information on certain abnormalities in the brain. However there are many neurological disorders for which only structure studies are not sufficient. In such cases it is required to investigate the functional organization of the brain. Further it is necessary to study the brain functions under normal as well as diseased conditions. Brain mapping techniques can help in deriving useful and important information on these issues. Brain functions and brain area responsible for the particular activities like motor, sensory speech and memory process could be investigated. The authors provide an overview of various Brain Mapping techniques and fMRI signal processing methods. Keywords- Functional MRI (fMRI), Signal Processing, Brain Mapping. 5. Paper 31101218: Performance Evaluation of an Orthogonal Frequency Division Multiplexing based Wireless Communication System with implementation of Least Mean Square Equalization technique (pp. 28-32) Full Text: PDF Farhana Enam, Assistant Professor, Dept. of Information & Communication Engineering, University of Rajshahi, Rajshahi, Bangladesh Md. Arif Rabbani, Dept. of Information & Communication Engineering, University of Rajshahi, Rajshahi, Bangladesh Md. Ashraful Islam, Dept. of Information & Communication Engineering, University of Rajshahi, Rajshahi, Bangladesh Sohag Sarkar, Dept. of Information & Communication Engineering, University of Rajshahi, Rajshahi, Bangladesh Abstract— Orthogonal Frequency Division Multiplexing (OFDM) has recently been applied in wireless communication systems due to its high data rate transmission capability with high bandwidth efficiency and its robustness to multi-path delay. Fading is the one of the major aspect which is considered in the receiver. To cancel the effect of fading, channel estimation and equalization procedure must be done at the receiver before data demodulation. This paper mainly deals with pilot based channel estimation techniques for OFDM communication over frequency selective fading channels. This paper proposes a specific approach to channel equalization for Orthogonal Frequency Division Multiplex (OFDM) systems. Inserting an equalizer realized as an adaptive system before the FFT processing, the influence of variable delay and multi path could be mitigated in order to remove or

reduce considerably the guard interval and to gain some spectral efficiency. The adaptive algorithm is based on adaptive filtering with averaging (AFA) for parameter update. Based on the development of a model of the OFDM system, through extensive computer simulations, we investigate the performance of the channel equalized system. The results show much higher convergence and adaptation rate compared to one of the most frequently used algorithms - Least Mean Squares (LMS). Keywords- LMS (Least Mean Square), Adaptive Equalizer, OFDM, Fading Channel, AWGN Channel) 6. Paper 31101224: Microcontroller Based Security System: An electronic application for fire monitoring and surveillance (pp. 33-37) Full Text: PDF Md. Fasiul Alam, MSc. In Electronic System engineering, Politecnico di Milano, Milan, Italy Helena Bulbul, Assistant Professor, United International University, Dhaka, Bangladesh Md. Delwar Hossain, Assistant communication engineer, Boishaki International Television ltd., Dhaka, Bangladesh Abstract — The importance of electronic security is now an important term in the global world. Due to the lack of modern security equipments we often face problems and lose our valuable assets. Though there are some security system are available in the market but wireless system are not so common and economic to us. Therefore, a Microcontroller Based Security System has been developed to recover that limitation. It can be used for ensuring fire security in Offices, Banks, Apartments, Industry and so on. The system detects the fire fault situation and inform automatically to the desired destination without any human intervention. Microcontroller Based Security System is an intelligent stand alone system with proven performance and stability. The aim of an engineering design is to produce maximum output with minimum cost involved. According to that, our designed system involves low cost yet offers better performance in comparison to other security system available. Microcontroller is the heart in our security system which is interfaced with smoke sensors, SIMCom GSM Module, alarm circuit and LCD display unit. The important feature of the project are it can easily specify the location where the fire occurred and it instructs the SIMCom GSM Module to send SMS to the desired end for taking necessary action immediately. The results obtained stand as a proof of concept for the credibility of implementing wireless based Security System. Achieved result of the project encouraging to us. Keywords - Microcontroller, security, sensors, alarm, GPS, GSM 7. Paper 31101227: Internet Fraud as one of the cyber threat and its impact in India (pp. 38-41) Full Text: PDF Ashwini Manish Brahme, Assitant Professor, Indira Institute of Management(MCA), Pune, University of Pune, Maharashtra, India Abstract - India is becoming superpower in the IT field and also reached to the global world because of Internet but the fraud incidents are on the rise in almost every fast-growing industry across the country. The ratio of Internet fraud is growing significantly in India. Life is about a mix of good and evil so is the Internet. For all the good it does us, cyberspace has its dark sides too. This paper discusses about the Internet Fraud and how the Internet fraud is creating the Cyber Cold War. It also briefs about the Internet Users in India, its Scope and the role of Internet for the Indian Business Growth. This paper talks about the Cyber crime and Cyber threat in India and the motives behind any Cyber attack or Internet Fraud, the tools used for the cyber terrorism, the Impact of Internet Threat at Work, proportion of Internet Fraud in India, and cyber crime cases with different examples. Furthermore paper gives details regarding how the Internet fraud is becoming a growing threat for the online retailers and business, how to deal with Internet Fraud to overcome the cyber threat and the role of Government of India, to avoid the misuse of Internet and the act or penalties for it and the skill to take out the Cyber Threat. This paper also gives the details on the Current status of cyber threat, internet fraud, and future in India with respect to the different security aspects and also talks about the Challenges that India need to face to beat the cyber threat. Keywords: Cyber Crime, Cyber Cold war, Internet Fraud, Cyber Threat, IT
8. Paper 31101229: Application Of Polynomial Vector (PV) Processing To Improve The Estimation Performance Of Bio Diesel In Variable Compression Ratio Diesel Engine (pp. 42-49) Full Text: PDF Suresh M., Asst. Prof, Mechanical Engineering, Sri Sai Ram Engg. College,Chennai- 44,Tamilnadu,India Maheswar Dutta, Professor and Principal, M.N.R Engg. College, Hyderabad, India Purushothaman S, Professor and Dean, Mechanical Engineering, Udaya School of Engineering, India-629204 Abstract - This paper presents the implementation of polynomial vector back propagation algorithm (PVBPA) for estimating the power, torque, specific fuel consumption and presence of carbon monoxide, hydrocarbons in the emission of a direct injection diesel engine. Experimental readings were obtained using the biodiesel prepared form the waste low quality cooking oil collected from the canteen of Sri Sairam Engineering College, India.. This waste cooking oil was due to the preparation of varieties of food (vegetables fried and non vegetarian). Over more than a week, transesterification was done in chemical lab and the biodiesel was obtained. The biodiesel was mixed in proportions of 10%, 20 % , 30%,40%, 50% with remaining combinations of the diesel supplied by the Indian government. Variable compression ratio (VCR) diesel engine with single cylinder, four stroke diesel type was used. The outputs of the engine as power, torque and specific fuel consumption were obtained from the computational facility attached to the engine. The data collected for different input conditions of the engine was further used to train (PVBPA). The trained PVBPA network was further used to predict the power, torque and brake specific fuel consumption (SFC) for different speed, biodiesel and diesel combinations and full load condition. The estimation performance of the PVBPA network is discussed. Keywords: polynomial vector, back propagation algorithm, waste cooking oil, biodiesel. 9. Paper 31101234: Computerized Analysis of Breast Thermograms for Early Diagnosis of Breast Cancer (pp. 50-56) Full Text: PDF Mrs. Asmita Wakankar, Sathyabama University, Chennai, India & Cummins College of Engg, Pune Dr. G. R. Suresh, Eswari Engg College, Chennai, India Abstract — Breast cancer is one of the leading causes of death in women. Early detection of breast cancer is the key to improve survival rate. Malignant tumors causes localized temperature increase on breast surface which shows as hot spot and vascular patterns in breast infrared thermograms. Thermographic detection of breast cancer primarily depends on the visual analysis of these patterns by physicians, which is hard to provide objective and quantitative analysis. This paper proposes computerized analysis of thermograms using a series of statistical features extracted from the thermograms quantifying the bilateral differences between left and right breast area for diagnosis of breast cancer. Thermography is particularly well suited for checking of tumors in their early stages or in dense tissue and implants. Keywords- Breast Cancer –Infrared Thermal Imaging-Image Analysis 10. Paper 31101235: Information Security on The Communication Network In Nigeria Based On Digital Signature (pp. 57-63) Full Text: PDF O. S. Adebayo (MCPN), V. O. Waziri (PhD) and J.A Ojeniyi (MNCS) Cyber Security Science department, Federal University of Technology Minna, Nigeria S. A. Bashir (MNCS), Computer Science department, Federal University of Technology Minna, Nigeria Amit Mishra, Mathematics and Computer Science department, IBB University, Lapai, Nigeria
Abstract - This paper presents simple abstraction concepts for some digital signature scheme algorithms that include ElGamal Signature scheme, Schnorr Signature scheme, Elliptic Curve Signature (ECS), and Digital Signature Standard (DSA). It also examines the security of this digital signature scheme to measure its effectiveness and improve on the variability. The algorithms are essential in securing application in dispatching the documents on the communication network. We try to explain the algorithms in simple form and the examples are experimented in C++ programming language which presupposing little or easy mathematical background comprehension and easy computations. Keywords - ElGamal Signature scheme, Signature Scheme, Elliptic Curve Signature, Information Security, Digital Signature 11. Paper 31101230: Requirements Elicitation for Software Projects (pp. 64-71) Full Text: PDF Samaher Abdullah AL-Hothali, Department of Computer Science and Engineering, Yanbu University College, Saudi Arabia. Noor Abdulrahman AL-Zubaidi, Department of Computer Science and Engineering, Yanbu University College, Saudi Arabia Anusuyah Subbarao, Department of Computer Science and Engineering, Yanbu University College, Saudi Arabia Abstract - Requirements elicitation is the practice of collecting the requirements of a system from users, customers and other stakeholders. It is usually realized that requirements are elicited rather than just taking or gathering. This means there are discovery and development of elements to the elicitation process. Requirements elicitation is a complex process connecting with many activities with a different of available techniques, approaches, and tools for performing them. The objectives of this paper is to present the important aspects of how to plan for elicitation, the techniques, approaches, and tools for requirements elicitation, and some elicitation problems. Keywords: requirements, elicitation, techniques, approaches, problems.
(IJCSIS) International Journal of Computer Science and Information Security,
Vol. 10, No. 11, November 2012
Design and Implementation of a Secure NeMo
Diyar. Khairi M S
DEEI, FCT
University of Algarve, Portugal
Amine Berqia
DEEI, FCT
University of Algarve, Portugal
Abstract— Network Mobility (NEMO) Basic Support protocol
enables Mobile Networks to attach to different points in the
Internet. The protocol is an extension of Mobile IPv6 and allows
session continuity for every node in the Mobile Network as the
network moves. It also allows every node in the Mobile Network
to be reachable while moving around. In this paper detailed
implementation of such a system on Linux OS is presented. For
wireless security measures, the Wired Equipment Privacy (WEP)
method is deployed. Then it is showed that this method can be
easily cracked using the BackTrack 5 operating system and the
airecrack-ng application. Finally, to solve the security problem, a
Wi-Fi Protected Access II (WPA2) Enterprise method is
implemented using a Windows Server 2008 R2 with Network
Policy Services (NPS) as a radius server and a simple router as a
radius client.
Keywords: NEMO, Security, Radius, Mobile IPv6
I. INTRODUCTION
This In today's Internet, most communications between end-to-
end nodes are using the IP protocol. This protocol assigns an
unique address to all nodes connected to the Internet, and
provides the mechanisms to transport data between two nodes.
IP version 4 (known as IPv4) is the current version of this
protocol and was the first widely deployed IP protocol. It was
standardized 25 years ago. It is now suffering from several
design problems and will certainly restrain the creation of new
usages of the Internet. The most debated problem with IPv4 is
the lack of addresses, but it is not the only important one.
The need for addresses will increase in the near future. With
the voice-over-IP becoming more and more popular, we can
guess than billions of people will use an IP phone. Each vehicle
will embed tens of IP sensors and some multimedia devices.
Obviously, all of those equipments need an IP address. The
lack of addresses that can be assigned with IPv4 was solved
with the Network Address Translation (NAT) system.
However, many peer-to-peer applications (such as video-
conference or voice-over-IP softwares) suffer from this
mechanism: with NAT, the real address of the host is not
directly reachable from its correspondent. The communication
cannot be directly established and sometimes need a third part.
We expect more and more equipments will be connected to the
Internet, but the IPv4 protocol is not appropriate anymore to
distribute and manage the IP addresses. The IPv4 scheme to
allocate addresses is not based on any hierarchical scheme and
the high fragmentation of address space will lead to an heavy
load on backbone equipments (the routers). This is one of the
most critical problems with the current IP protocol as it might
cause the core routers of the Internet to stop working without
prior notice.
Eventually, the IPv4 protocol has a monolithic design that
makes it difficult to extend, and contains some mechanisms
that prevent new protocols like mobile IP to work flawlessly.
As IPv4 cannot meet the demand anymore, the IPv6 protocol
(RFC 2460) [3] has been standardized in 1998. It can allocate
much more addresses and allows to interconnect undecillions
of nodes at the same time. Nodes that connect to the Internet
can automatically acquire an address thanks to the auto-
configuration mechanism (RFC2462 "IPv6 Stateless Address
Autoconfiguration") [2]. IPv6 also simplifies the use of
multicast, that allows many to many (including one to many)
communications without wasting the bandwidth.
Besides those core features, IPv6 also allows the integration of
new features such as improved security, quality of service
where IPv4 only provides best effort, and mobility mechanisms
with Mobile IPv6 and NEMO Basic Support.
The scalability offered by IPv6 will thus allow to interconnect
any equipment and to design new services (such as connecting
each car to the Internet) and new usages of the Internet (for
instance use the vehicle connectivity for monitoring purposes)
that we could not imagine with IPv4.
When a node using an Internet wireless access physically
moves, it can be at some point of time out of the coverage area
of its access network and needs to move to another one. In
addition, because distinct operators may operate or the public
target is different (pedestrians, cars etc.), usually no single
access technology can cover one big area (such as a city). The
node thus has to select the best access technology available.
When a node moves from one access network to another or
switches between its access technologies, it acquires a new
IPv6 address and is not reachable to its previous one anymore.
It implies that all current communications (for example
1 http://sites.google.com/site/ijcsis/ ISSN 1947-5500

(IJCSIS) International Journal of Computer Science and Information Security,
Vol. 10, No. 11, November 2012
streaming video from the Internet) are stopped and later
restarted by the user or the application.
The Mobile IPv6 protocol (RFC 3775) [4] has been defined to
address those issues and allow the node to be always reachable
at the same IPv6 address whatever the access network it uses. It
allows the host to move transparently for the applications and
the users, without the need to reset all the current connections
each time the host moves to another access network.
With Mobile IPv6, a host has two addresses while moving in
the Internet topology: one permanent address that identifies the
host, and the other representing the location in the Internet
topology. The Mobile IPv6 protocol takes care of the binding
between these two addresses (thanks to a Home Agent), and
ensures that the host is always reachable at its permanent
address even if it moves in the Internet topology.
On one side Mobile IPv6 manages mobility for only one host,
on the other side NEMO Basic Support (RFC 3963) [1]
manages mobility for one whole network. Such a network can
be for instance a PAN (Personal Area Network, a small
network made of IPv6 sensors and PDAs), or an access
network deployed in cars, buses or trains. Thanks to NEMO
Basic Support, the only computer that needs to have mobility
functionnalities when the whole network moves is the one that
connects the network to the Internet (this computer is called a
Mobile Router), whereas with the Mobile IPv6 approach each
host in the network would have to handle mobility.
Running Mobile IPv6 on each node can be expensive,
especially for little devices such as sensors. NEMO Basic
Support only requires changes on the router, all others hosts in
the moving network do not need any new feature. Thus all
movement in the Internet topology will be handled by the
router, transparently to the hosts.
With NEMO, we can imagine lots of senarii where mobility
can play an important role. Using Network Mobility in a train
would allow the customers to stay connected to the Internet
without disruption during all their trip. Network Mobility in
cars can allow to set up a PAN (Personal Area Network) made
of tiny IPv6 sensors that can be queried from outside, and
PDAs that can have permanent access to the Internet.
II. THE ARCHITECTURE
In the near future, airplanes, automobiles, trains and even
people will carry entire networks of IP devices that
connect to the Internet. However, as they move, these
networks must change their point of attachment to the
Internet due to availability of Internet connectivity. NEMO
would enable devices on these networks to maintain
unchanged (in the sense of unchanged IP address and
network prefix) connections to other devices on the
Internet.
Until recently, wireless devices have been prohibited on
commercial airline flights due to the risk of interference with
airplanes electrical systems. However, in June of 2005, the
Federal Aviation Administration (FAA) gave permission to
United Airlines to install Wi-Fi (802.11) wireless network
equipment on some of its aircraft [10]. This new regulation will
open the door for in-flight Internet service and invite NEMO as
a solution to provide uninterrupted Internet connectivity to
multiple passengers.
It is not difficult to image networked systems or even Internet
enabled navigation, multimedia, or driving system on
automobiles. NEMO has the potential to provide a single,
shared Internet access point to these systems. In the case of
critical driving systems, NEMO would be essential in order to
maintain continuous connectivity and availability [11].
In July 2004 the European Space Agency (ESA) funded a
project called “Broadband to Trains” [5] that used satellite
communications as a connection service to provide internet
broadband to passengers and train operators.
The system architecture is based on two-way Ku-band satellite
transmission to provide connectivity between the internet
backbone and a master server on the train. Direct reception of
satellite television channels on the same satellite is also
possible but has not been trialled in this project.
Fig1. System view
A hub earth station provides the connection from the Internet
backbone (and from the network operations centre) via the
satellite directly to a low-profile tracking antenna on the train.
GPRS and Wi-Fi access between the train and available
networks is also provided (e.g. in stations and in tunnels). On
the train, Wi-Fi (wireless LAN) connections are used between
2 http://sites.google.com/site/ijcsis/ ISSN 1947-5500

(IJCSIS) International Journal of Computer Science and Information Security,
Vol. 10, No. 11, November 2012
the master server and customers with Wi-Fi enabled laptops
and PDAs.
Fig2. System Architecture
III. EXPERIMENTAL SETUP
For implementation, we used the above architecture. It consists
of a quad-core server that runs home agent, mobile router, and
radius server. There is also a router and a macbook air. There
are two links between HA and MR. The access point connects
to MR and radius server [6].
Fig3. System Lab view
Fig 4. UMIP configuration
Now, we will cover the configuration of the Mobile Router
(MR). Here is a modified UMIP Mobile Router configuration.
Changes made in the file are marked with NEMO ADDITION.
Modify your /usr/local/etc/mip6d.conf file accordingly.
# Sample UMIP configuration file for a Mobile
Router
NodeConfig MN;
# Set DebugLevel to 0 if you do not want debug
messages
DebugLevel 10;
# Enable the optimistic handovers
OptimisticHandoff enabled;
# Disable RO with other MNs (it is not compatible
# with IPsec Tunnel Payload)
DoRouteOptimizationMN disabled;
# The Binding Lifetime (in sec.)
MnMaxHaBindingLife 60;
# Use NEMO Explicit Mode
MobRtrUseExplicitMode enabled; ## NEMO
ADDITION ##
# List here the interfaces that you will use
# on your mobile node. The available one with
# the smallest preference number will be used.
Interface "eth0" {
MnIfPreference 1;
}
Interface "wlan0" {
MnIfPreference 2;
}
# Replace eth0 with one of your interface used on
# your mobile node
MnHomeLink "eth0" {
IsMobRtr enabled; ## NEMO
ADDITION ##
HomeAgentAddress 2001:db8:ffff:0::1000;
HomeAddress 2001:db8:ffff:0::1/64
(2001:db8:ffff:ff01::/64); ## NEMO ADDITION ##
}
# Enable IPsec static keying
UseMnHaIPsec enabled;
KeyMngMobCapability disabled;
# IPsec Security Policies information
IPsecPolicySet {
HomeAgentAddress 2001:db8:ffff:0::1000;
HomeAddress 2001:db8:ffff:0::1/64 ;
IPsecPolicy Mh UseESP 10;
IPsecPolicy TunnelPayload UseESP 11;
}
We enable the NEMO explicit registration mode with the
MobRtrUseExplicitMode parameter. Note that this is not
mandatory as this is enabled by default.
All the other changes take place in the MnHomeLink block.
We allow the MR to act as a router by enabling the IsMobRtr
parameter. The prefix that we previously configured on the
3 http://sites.google.com/site/ijcsis/ ISSN 1947-5500
(IJCSIS) International Journal of Computer Science and Information Security,
Vol. 10, No. 11, November 2012
NEMO HA side has been added to the HomeAddress
statement.
No changes are needed in the IPsec configuration. All the
traffic from the mobile network will also automatically be
protected with IPsec tunnel mode.
The IPsec SAs needed on the MN are the same as the one
installed on the HA for that MN. You can then use the same
IPsec SAs than the one we described in the HA section, and
copy them on the MN in the /usr/local/etc/setkey.conf file.
The MR needs to advertise its MNP in the mobile network
using Router Advertisements (RA). For that purpose, we use
the radvd software with the below configuration. Copy it in
/etc/radvd.conf:
# Mobile Router radvd configuration file
# Replace eth1 with your ingress interface name
interface eth1
{
AdvSendAdvert on;
MaxRtrAdvInterval 3;
MinRtrAdvInterval 1;
AdvIntervalOpt on;
IgnoreIfMissing on;
# Mobile Router address on the ingress
interface
prefix 2001:db8:ffff:ff01::1/64 {
AdvRouterAddr on;
AdvOnLink on;
AdvAutonomous on; AdvPreferredLifetime 60; AdvValidLifetime 120;
};
};
For wireless security measures, we deployed in the beginning
the Wired Equipment Privacy (WEP) method. Then it is
showed that this method can be easily cracked using the
BackTrack 5 operating system [7] and the airecrack-ng [8]
application. To solve the security problem, a Wi-Fi Protected
Access II (WPA2) Enterprise method is implemented using a
Windows Server 2008 R2 with Network Policy Services (NPS)
as a radius server and a simple router as a radius client.
Wi-Fi Protected Access (WPA) and Wi-Fi Protected Access
II (WPA2) are two security protocols and security certification
programs developed by the Wi-Fi Alliance to secure wireless
computer networks. The Alliance defined these in response to
serious weaknesses researchers had found in the previous
system, WEP (Wired Equivalent Privacy).
WPA2 has replaced WPA. WPA2, which requires testing and
certification by the Wi-Fi Alliance, implements the mandatory
elements of IEEE 802.11i. In particular, it introduces CCMP, a
new AES-based encryption mode with strong security.
Certification began in September, 2004; from March 13, 2006,
WPA2 certification is mandatory for all new devices to bear the
Wi-Fi trademark. To setup the radius server on windows server
2008 r2, we configured:
Access Points
Active Directory Domain Services
DNS
Network Policy and Access Services
Active Directory Certificate Services
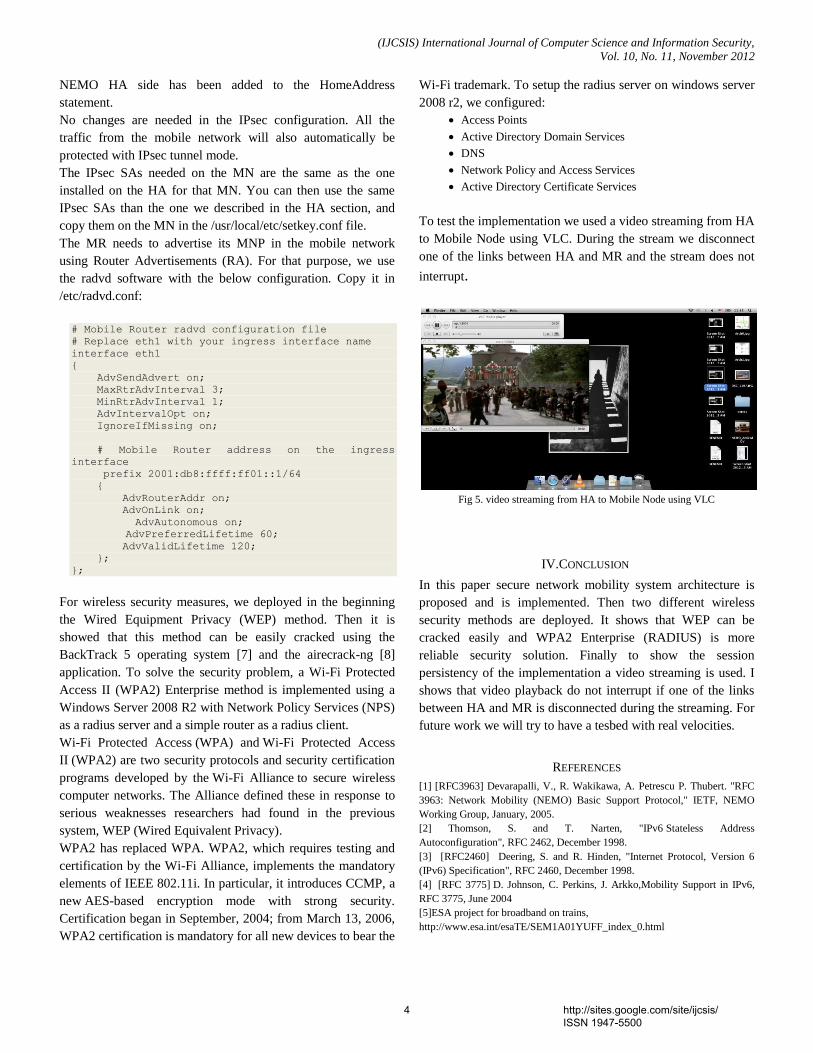
To test the implementation we used a video streaming from HA
to Mobile Node using VLC. During the stream we disconnect
one of the links between HA and MR and the stream does not
interrupt.
Fig 5. video streaming from HA to Mobile Node using VLC
IV.CONCLUSION
In this paper secure network mobility system architecture is
proposed and is implemented. Then two different wireless
security methods are deployed. It shows that WEP can be
cracked easily and WPA2 Enterprise (RADIUS) is more
reliable security solution. Finally to show the session
persistency of the implementation a video streaming is used. I
shows that video playback do not interrupt if one of the links
between HA and MR is disconnected during the streaming. For
future work we will try to have a tesbed with real velocities.
REFERENCES
[1] [RFC3963] Devarapalli, V., R. Wakikawa, A. Petrescu P. Thubert. "RFC
3963: Network Mobility (NEMO) Basic Support Protocol," IETF, NEMO
Working Group, January, 2005.
[2] Thomson, S. and T. Narten, "IPv6 Stateless Address
Autoconfiguration", RFC 2462, December 1998.
[3] [RFC2460] Deering, S. and R. Hinden, "Internet Protocol, Version 6
(IPv6) Specification", RFC 2460, December 1998.
[4] [RFC 3775] D. Johnson, C. Perkins, J. Arkko,Mobility Support in IPv6,
RFC 3775, June 2004
[5]ESA project for broadband on trains,
http://www.esa.int/esaTE/SEM1A01YUFF_index_0.html
4 http://sites.google.com/site/ijcsis/ ISSN 1947-5500

(IJCSIS) International Journal of Computer Science and Information Security,
Vol. 10, No. 11, November 2012
[6]http://www.techrepublic.com/article/ultimate-wireless-security-guide-self-
signed-certificates-for-your-radius-server/6148560
[7]http://www.corelan.be/index.php/2009/02/20/cheatsheet-cracking-wep-
with-backtrack-4-and-aircrack-ng/
[8] C. Devine, Aircrack, http://www.cr0.net:8040/code/network/aircrack/
[9] Leung, K., G. Dommety, V. Narayana, A. Petrescu. "IPv4 Network
Mobility (NEMO) Basic Support Protocol," IETF, NEMO Working roup,
February 24, 2006. http://ietf.org/internet-drafts/draft-ietf-nemo-v4-base-
00.txt
[10]"United to offer Web in the air," Reuters, CNNMoney.com, June 6,
2005. http://money.cnn.com/2005/06/06/technology/personaltech/united_wifi/ [11] Ernst, T., K. Uehara. "Connecting Automobiles to the Internet,"
Proceedings 3rd International Workshop on ITS Telecommunications (ITST),
November 2002. http://www.sfc.wide.ad.jp/~kei/papers/itst2002-ernst.pdf
AUTHORS PROFILE
Diyar Khair M S earned the B.Sc. in Computer
Science Department, Al-Mustansiriya University, Baghdad 2002-
2003. He was employed at University of Duhok (UoD), Kurdistan
Region, Iraq as a program assistant in a computer lab. At the year
2008 he earned his M.Sc. in Data Security from University of
Technology (UoT), Iraq – Baghdad and returned back to his own
University at Duhok (UoD) as a assistance lecturer at the Computer
Department, College of Science, and as the Manager of the Computer
center of the University. At the year 2008 he got a EM scholarship to
Study PhD in Computer Engineering at University of Algarve under
supervision of Professor Amine BERQIA working in NGN-Security.
Amine BERQIA earned the B.Sc. and the
M.S. in Applied Mathematics from the University Med V, Morocco.
He had Ph.D. degrees in Computer Sciences from the University of
Dijon, France. He was assistant professor in University of Geneva and
coordinator of the Swiss Virtual Campus Project VITELS from 2000
to 2003. Since 2003 till now he is auxiliary professor in University of
Algarve, Portugal Since 2007, he has served as the Vice-president of
EATIS Europe research group for Europe and America. Since 2008,
he has served as the Vice-President of e-NGN research group for
Africa and Middle-East which he co-founded. He is member of IEEE
and He was awarded by IEEE Education Society in 2012. He has
served as chair or co-chair in several international conferences
(NGNS´12, EDUCON 2012, NGNS2010, EATIS2007,
NOTERE2007...) and has taken part of several international program
committees. He published around 50 papers in journals and
conferences in the areas of networks performance, remote learning and
engineering education.
5 http://sites.google.com/site/ijcsis/ ISSN 1947-5500
http://www.corelan.be/index.php/2009/02/20/cheatsheet-cracking-wep-with-backtrack-4-and-aircrack-ng/
(IJCSIS) International Journal of Computer Science and Information Security,
Vol. 10, No. 11, November 2012
Virtual Zones and Virtual Coordinates on a Multi
Layer Infrastructure for Wireless Sensor Networks
(VMLI)
Abstract-- Wireless sensor network (WSN) is currently
representing a rapidly developing field. The challenge that
manifests itself, accordingly, is about reducing the per unit-
energy consumption of these networks that show very limited
capacity. Several academic undertakings have been interested in
maximizing the network’s lifetime. The architectures of
hierarchical structures ensure the provision of different network
nodes in a way that accomplishes this goal. This paper offers a
new WSN infrastructure based on a virtual organization
through two layers representing the physical layer that contains
all nodes of sensor network. The first virtual layer is based on a
partitioning into sub-areas that are geographically localized by
the sensors. The second is partitioned into four typical layers for
the four units (sensors, aggregators, logger and users
equipments) of the devices in our platform. This partitioning
impacts on (affects) all resources to obtain a global surveillance
of WSN at a larger scale. Simulation results have shown that the
proposed partitioning algorithm has reduced both the capacity
of consumed energy and the number of packets transmitted
during topology construction.
Key-words— Wireless sensor networks (WSN), Virtual zones, , Partitioning algorithms, WSN Infrastructures , Energy consumption.
I. INTRODUCTION:
Progress in the field of wireless networks has largely contributed to the evolution of Internet by facilitating access to users regardless of their geographical location. Like many technological challenges, wireless sensor networks have given way to several applications to emerge such as detecting natural disasters (forest fire, floods ...), and to many intelligent systems as well. Nodes that make wireless sensor networks are small and therefore offer insufficient computational and storage communication, and have very limited energy. Because of its size, a sensor is limited in energy. In most cases, battery replacement is impossible, which means that the lifetime of a sensor depends greatly on the life of the battery.
Consistent applications add the choice of routing protocol data which stands as the primary factor of energy consumption of sensors, and as the factor of data storage for further goals. Current researches have primarily focused on ways to optimize energy consumption by sensor nodes. However, in present traditional architectures, sensors are not fully autonomous because they require the use of cluster-heads, sinks and gateways to communicate with the computer equipment that already exists; adding to this high energy consumption of the cluster nodes. The use of the sinks that connect the network with the base station can produce several weaknesses in most critical monitoring applications since access to WSN is done through the sink node; direct access to sensor nodes without the use of the sink node in critical states is impossible.
The WSN topologies are based on three types of routing protocols (Possess different routing infrastructures) that can eventually be classified into three main categories:
Hierarchical protocols, such as LEACH (Low Energy Adaptive Clustring Hirarchical) is one of the hierarchical routing protocols best known for sensor networks (Ali, M., Ravula, S.K., 2008), (W, Heinzelman., A, Chandrakasan., H, Balakrishnan., 2000). The idea is to form clusters based on areas where there is a strong received signal, and use local cluster-heads as a gateway to reach the destination. PEGASIS (Power-Efficient in Sensor Information Systems) (Akkaya , K., Younis , M., 2005) is an improved version of LEACH protocol. PEGASIS forms chains rather than clusters of sensor nodes so that each node transmits and receives data only from its neighboring node. One node is selected from that chain to carry out transmission to the base station (S, Lindsey., C, Raghavendra., 2002.).
Routing protocols based on geographic location: Minimum Energy Communication Network (MECN) (Rodoplu, V., Ming, T.H., 1999) is a routing protocol that seeks to establish and maintain minimum energy in wireless networks while using low-power GPS. MECN uses a base station as destination of information, which is always the case
Amina MERBAH Ahmed KAMIL Olaf MALASSÉ Hicham BELHADAOUI Mohamed OUZZIF CE/RITM CE/RITM A3SI CE/RITM CE/RITM
ENSEM ENSEM ENSAM/ParisTech ESTC ESTC
Casablanca,Morroco Casablanca,Morroco Metz,France Casablanca,Morroco Casablanca,Morroco
[email protected] [email protected] [email protected] [email protected] [email protected]
6 http://sites.google.com/site/ijcsis/ ISSN 1947-5500
(IJCSIS) International Journal of Computer Science and Information Security,
Vol. 10, No. 11, November 2012
for sensor networks. MECN identifies a relay area for each node. The main idea of MECN is to find a sub-network that owns fewer nodes but with less power for transmission between any of the two nodes. This is accomplished by using a localized search for each node while considering its relay area (Akkaya , K., Younis , M., 2005).GAF (Geographic Adaptive Fidelity) (Xu ,Y., Heidemann , J., Estrin, D., 2001) is a routing protocol based on the location of nodes. The location of nodes in GAF could be provided with a GPS or other positioning techniques (Akkaya , K., Younis , M., 2005), Doherty ,L., Pister , K.S.J., El Ghaoui ,L., 2001, (Intanagonwiwat , C., Govindan, R., Estrin, D., 2000)]. The routing protocol GEAR (Geographic and Energy Aware Routing) [(Yu ,Y., Estrin, D., Govindan ,R., 2001), (Singh, S., Raghavendra,C., 1998), (Zeng, K., Ren, K., Lou , W., Moran , P. J., 2009)].It consists of using geographical information. The idea is to restrict the number of data in the directed broadcast by considering only a particular region rather than sending data to the entire network (Akkaya , K., Younis , M., 2005), (Yu ,Y., Estrin, D., Govindan ,R., 2001).
Data-centric protocols, such as SPIN (Sensor Protocols for Information via Negotiation) (Qi ,H., Kuruganti, P. T., Xu,Y., 2002) is the first data-centric protocol that was designed for wireless sensor networks. It has many similarities relative to the directed broadcast. It is effective in reducing redundant data and convenient in saving energy (Akkaya , K., Younis , M., 2005). Diffusion is the process of observing all individual sensors that are deployed in the network where all sensors are treated as destination nodes (Abbas, C. B., González, R., Cardenas, N., Villalba, L. J. G., 2008). The tasks assigned to these sensors are to collect the full view of the environment in the form of data and build a network structure with fault tolerance. Energy consumption during the calculation and communication processes must be controlled in order to extend the lifetime of the sensors within the network.
A. Motivation :
Works cited in (Winston, K., Guan, S., Hwee, P.T.,
2006) - (Oyman, E.I., Ersoy, C., 2004) present ample
research on WSN architectures that adopt several sinks to
avoid the problem of localization. In these topologies, data is
transmitted to end users by using one of the sinks in network,
according to the used routing protocol.
Few research endeavors focus on energy consumption
(Amina, M., Hicham, B., Mohamed, O., Olaf, M., 2011) -
(Ali, M., Ravula, S.K., 2008), see further data aggregation
(Akkaya , K., Younis , M., 2005) - (W, Heinzelman., A,
Chandrakasan., H, Balakrishnan., 2000. ). Recently, several
studies have focused on the location of multiple sinks in
larger scale sensor networks and have optimized the location
of the integration points in multi-sink wireless sensor
networks (MS-WSN). However, few studies are interested in
traffic engineering. Indeed, this major problem of this type of
topology is complex due to the difficulty of routing the
measured values. Also, we can perceive this complexity in
these works (S, Lindsey., C, Raghavendra., 2002.) - (W,
chen., K, Yang., 2008), which provide data routing solutions
in similar architectures. These research proposals still suffer
from lack of scalability. In addition, the WSN-MP
architectures do not allow direct access to sensors. This will
be one of our issues to solve.
B. Assumptions:
We have proposed a set of assumptions to design VMLI.
As is the case in entire wireless sensor networks, a set of
getways are required between the field sensor network and
the base station. Contrary to this, we inhibited this process.
The set of assumptions that we have proposed to perform
such architecture are the following:
We assume that all network nodes are not mobile.
All nodes are addressable.
Each node has a principal identifier After deployment of the infrastructure, each node
gets three identifiers (a principal identifier, host area
identifier, and an identifier responsible in the area).
Energy transmission and reception of packets is the
same for all nodes(that is to say at the same level of
power) The communication channel must support the
quality of service and ensure the reliability of data
transmitted through the network.
C. Contribution :
This article aims to present a novel architecture for
wireless sensor networks based on a virtual multilayer
structure with low energy consumption. Network devices are
grouped by type within specific meta- layers. In general our
platform consists of three layers:
A real layer that presents the physical network.
A second basic routing layer, which allows us to
have the partitioning of the sensor network by area.
The third organizational layer is designed to have
direct access to sensors without passing through a
sink, which is the essential element in traditional
architectures.
The final layer consists of a set of layers, each
representing a typical type of device (A "Sensor"
layer linked to the "Aggregator" layer in turn
linked to that of a "Logger" and last to "User"
which represents all users in the sensor network).
In addition to direct access, this organization allows us to
registr of all values passed by the sensors located throughout
the geographic area monitored in distributed data bases. This
allows the development of an algorithm that increases our
network's reliability. A connection algorithm is proposed to
7 http://sites.google.com/site/ijcsis/ ISSN 1947-5500
(IJCSIS) International Journal of Computer Science and Information Security,
Vol. 10, No. 11, November 2012
create a hierarchical organization of the wireless sensor
network. To make the architecture most efficient, we have
developed algorithms to ensure adequate functioning of the
communication process and increase reliability (Amina, M.,
Hicham, B., Mohamed, O., Olaf, M., 2011).
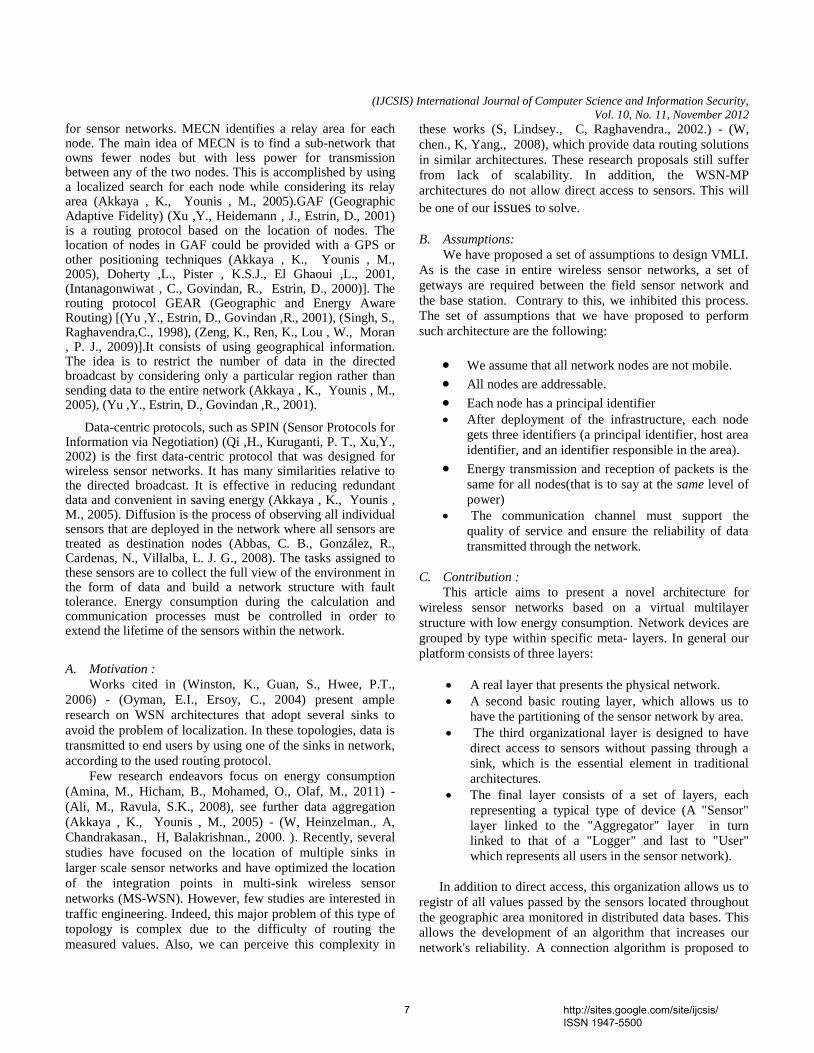
II. PARTITIONING OF INFRASTRUCTURE:
Our approach (VMLI-wsn) carries advantages over
existing topologies in terms of energy consumption and
reactivity. We have focused on infrastructures which have
routing protocols that support the constraint of energy
consumption and the hierarchy of the different roles of
network nodes. The challenge of this work is to build an
infrastructure based on virtual topology without worrying too
much about technical conditions. Our goal is to strengthen
the ability to access various network devices at any time
without having to go through special tools as seen before
(sinks) Figure.1.We have also introduced history managers
that keep the last values collected by sensors or aggregators
on which they are connected. These values are kept for a
specific period before they are replaced by new sensed
values. This method extends the lifetime of the network and
saves all the values marked permanently in history managers
in a distributed database, since most application areas require
the registration of all the values in the network. Thus, we
have proposed in our work (Amina, M., Hicham, B.,
Mohamed, O., Olaf, M., 2011) algorithms that check
reliability and reassure sending all sensor values in the
network without losing any message in order to increase the
performance of the architecture. All these algorithms will be
integrated in the routing protocol that establishes a
compromised quality service and reliability.
Figure.1: multiple access platform.
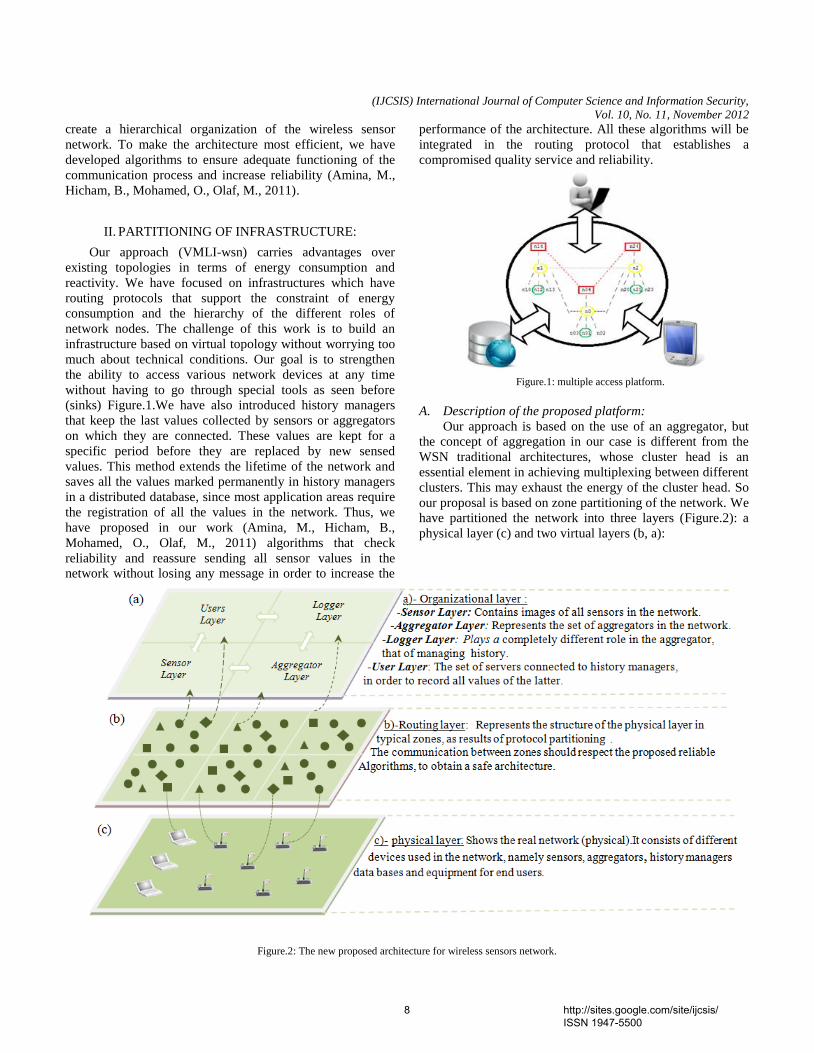
A. Description of the proposed platform:
Our approach is based on the use of an aggregator, but
the concept of aggregation in our case is different from the
WSN traditional architectures, whose cluster head is an
essential element in achieving multiplexing between different
clusters. This may exhaust the energy of the cluster head. So
our proposal is based on zone partitioning of the network. We
have partitioned the network into three layers (Figure.2): a
physical layer (c) and two virtual layers (b, a):
Figure.2: The new proposed architecture for wireless sensors network.
8 http://sites.google.com/site/ijcsis/ ISSN 1947-5500

(IJCSIS) International Journal of Computer Science and Information Security,
Vol. 10, No. 11, November 2012
B. The construction of routing layer & organizational
layer:
From the outset, we assume that the routing layer is
partitioned into zones with the same surfaces, and each zone
is located geographically in relation to the virtual coordinates
of the routing layer (Figure.3). The surface of the zone
depends on the nature of the network and on the number of
devices deployed in the latter to establish global surveillance.
Our proposal does not consider the random deployment of
sensor nodes invoked in (W, chen., K, Yang., 2008). Yet,
this deployment must follow a process of operation so that it
is assigned to the area.
1) Definition of parameters :
Routing layer will regroup all the sensors of the
geographic layer depending on the type of the devices in
different virtual subzones mentioned in (b-Figure.2)
Figure.3- Virtual decomposition of routing layer
To join a new sensor to the grid (Figure.3), this very sensor
should be geographically located by sending its physical
coordinates in order to be assigned to the closest area. Ther
efore, we suggest function (1) to calculate the virtual
coordinates of the suitable zone.
Let the physical coordinates returned by the
sensor node such as x s, ys : [0, n [
Let the virtual coordinates of the looking zone.
Such as : [0, n]
: Unit of the subzones.
(1)
In this system, we consider the role assigned for each sensor
belonging to the network, which induces an identifier for
each role. We consider a maximum of 3 sensors to be
connected for each aggregator to avoid both network
saturation and aggregator nodes saturation as well (2).
∑Sensors (1..Sn) = ∑ Sensor + ∑ Agg +∑ Logg +∑ Db +∑
User
∑Agg = ∑Logg = ∑Sensor / 3 (2)
Such as:
- Sensor: defines the sensor node with the ability to make
measurements.
- Agg: defines the ability to aggregate messages coming from
the sensors into a single message.
- Logg: Supports the backup of the latest values handled by
aggregators.
- Db: The permanent record of values passed by the historic
managers.
- User: The user workstations characterizing the application
that has the ability to use the sensed values.
2) Partitioning algorithm of the architecture
In the proposed algorithm, we take into account both the
geographic location of all nodes (each node is equipped with
a GPS) and energy capabilities of these which vary from one
node to another. Details of the algorithm are listed in
Algorithm.1
Firstly, Case1 (Algorithm.1) allocates an aggregator node
which is the essential node for connecting a sensor node, and
it assigns an IDZone for each aggregator node (Figure.3),
then it ascribes the latter to a historic manager.
Case2, treats the case of launching a new sensor in the
network. We should first locate it geographically in relation
to the nearest zone by a simple referential calculation of its
coordinates (1). Then the sensor obtains new virtual
coordinates also containing the id of the new zone Case 2-1:
Then comes the start-up of a sensor.
Case3: Thus, we obtain three states, namely:
Active (x): Case 3-1. This state means that the sensor has
found few asset aggregators, each of which manages less than
3 sensors. Hence, the function "choose" turns the nearest
geographical sensor into a new arrival, knowing that the
chosen aggregator must be assigned to a logger unit (historic
managers).
Wait (): Case 3-2. This state means that all zone aggregators
are busy (2). The latter will therefore be brought to a halt
state for some time to activate a new aggregator and ascribe it
to the zone. The sensor will accordingly make a new
reconnection.
Transitory (): Case3-3. In this state, the sensor cannot be
declared in the network. This occurs when the selected
aggregator that has just been activated becomes unable to be
assigned to a logger unit (an essential operation to the
complete functionality of the aggregator).
9 http://sites.google.com/site/ijcsis/ ISSN 1947-5500
(IJCSIS) International Journal of Computer Science and Information Security,
Vol. 10, No. 11, November 2012
Algorithm.1: Construction algorithm of the new -WSN- infrastructures
Input N.
Case1: If (N.id= IdAg) Then
Browsing[i] [j].ZoneId ==IdAg [z].
i ++, j ++, z ++
EndIf
Case2: If (N.id= IdSensor) Then
Check (IdSensor) v1 = xs And v2 = ys Then
nxs = v1/ uz, nys = v2/uz
Return (nxs, nys)
EndIf
Case 2-1:
Return IdSensor (nxs, nys, IdZone)
Case3:
Case3-1:
For Each IdAg.Idzone Do
If ((S.IdZone) < 3) Then
An : = Choose (min(d( |Cz(fXz (v),fYz(v))|,|Cs(v1 , v2 )| ))
Active (N);
EndIf
EndFor
Case3-2:
ElseIfAll ((S.IdZone) = 3) Then
Idsensor.SendRequest(Active(newIdAg))
Idsensor.wait(t)
SendRequest :
If (L.ZoneId >0) then
newIdAg.Affect(NewIdLogger)
Case 3-3:
Else Idsensor.transitory ();
EndIf
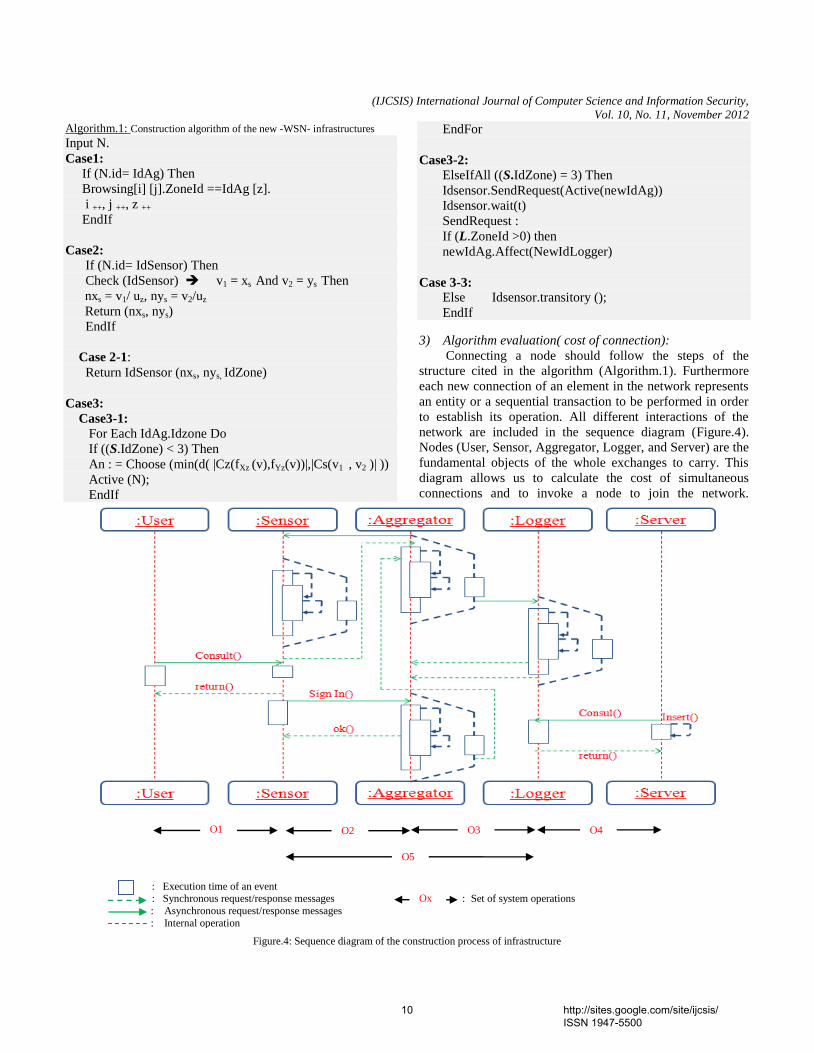
3) Algorithm evaluation( cost of connection):
Connecting a node should follow the steps of the
structure cited in the algorithm (Algorithm.1). Furthermore
each new connection of an element in the network represents
an entity or a sequential transaction to be performed in order
to establish its operation. All different interactions of the
network are included in the sequence diagram (Figure.4).
Nodes (User, Sensor, Aggregator, Logger, and Server) are the
fundamental objects of the whole exchanges to carry. This
diagram allows us to calculate the cost of simultaneous
connections and to invoke a node to join the network.
Figure.4: Sequence diagram of the construction process of infrastructure
: Execution time of an event : Synchronous request/response messages : Set of system operations
: Asynchronous request/response messages
: Internal operation
O1 O2 O3 O4
O5
Ox
10 http://sites.google.com/site/ijcsis/ ISSN 1947-5500

(IJCSIS) International Journal of Computer Science and Information Security,
Vol. 10, No. 11, November 2012
To estimate the cost of a node connection, we suggest a
metric to calculate the cost of each communication between
two or several nodes using the two primitives:
Unicast: This type can appear to reassure communication
between two nodes having the same type. The cost according
to this type is Cu. The different connection requests of this
type in a specific zone are: («sensor-sensor», «aggregator-
aggregator», and «logger-logger»).
Multicast: This type is used to contact all nodes of different
types. For our system, the operations of this kind are:
(connection of a sensor or an aggregator). The cost is
Cm.Table.1
The scenario becomes that of a subzone composed of "n"
aggregator, obviously "3 n" sensor and "n" storage nodes in
an area J.
Note that the cost Cu is higher to that of Cm.
A: Total number of aggregators, L: Total number of storage
nodes
Objets Opération Cost
User O1 Cm + 3Cu
Sensor
O2 Cm + (2+A) Cu
O3 Cm + 2Cu
O4 Cm + 3Cu
O5 3Cm + (7+A) Cu
Aggregator
- -
O3 A Cu
O4 Cm+3Cu
O5 Cm + (3+A) Cu
Logger O4 Cm + (3+L) Cu
Server O4 Cm+2Cu
Table.1 .The estimated cost for each operation.
III. SIMULATION AND RESULTS:
In this section, we present the simulation environment and
evaluations conducted to test the success of infrastructure
algorithm partitioning.
A. Simulation environment:
We simulated the behavior of our architecture under the
J-Sim simulator. Open-source, J-Sim is built on the basis of
ACA (Autonomous Component Architecture), developed
entirely in Java. The basic elements of J-Sim are components
that communicate interchangeably by sending and receiving
data through ports. The specifications of each behavior of a
component are determined by contracts. Each component can
be developed and tested independently from all other
components of the architecture. This makes J-Sim
environment a truly independent, extensible and reusable
platform- (Ahmed,S., Chen ,W.P., Jennifer, C.H, Kung, L-C.,
Li, Ning., Lim, Hyuk., Tyan, H-Y., Zhang, H., 2005).
We examined the performance of our architecture within
the parameters of the proposed partitioning zone algorithm.
The complete evaluation of the construction phase of virtual
layers consists of three metrics: the allocation rate of nodes in
each subzone of the virtual layer, the number of sent and
received packets to establish the assignment that influences
energy consumption during this phase , which is compared
with that of zone-based protocol RZRP (W, chen., K, Yang.,
2008) In terms of the construction phase, but not the
functioning of the RZRP routing,, the partitioning process of
the compared protocol is similar to that cited in (Joa-Ng , M.,
Lu, I.T., 1999)
The simulation parameters for the experiments are as follows:
a. The dimensions of the monitored area: 1000 m
/1000m
b. The number of sub areas varies between :20, 30,40,
60, 80 et 100
c. Number of nodes: 204, 300, 402, 504 et 600
(Table.2)
d. Channel : Wireless
e. The topography:
800: #X dimension of the topography.
800: #Y dimension of the topography.
f. The communication range of nodes is : 100 meter
Nbr. of
nodes
Nbr. of
Sensosr
Nbr. of
aggregator
Nbr .of
Logger
204 136 34 34
300 200 50 50
402 268 67 67
504 336 84 84
600 400 100 100
Table.2: figures for each device
Figure.5 shows an example of topology simulation. The latter
is composed of 300 nodes (Table .7). Figure.5. (a) shows the
triggering of a new node in the network by sending Cartesian
coordinates to join a sub zone.Figure6. (b) shows that the
node has found an obstacle that prevents it to be ascribed to
the field it must affect. So the node re-launches its
reassignment. Figure6. (c) The new arrival is now assigned to
a zone, it also obtains an IDzone and virtual coordinates (XV,
YV). Figure6. (d) This device starts executing the second part
of the partitioning algorithm for its operation.
11 http://sites.google.com/site/ijcsis/ ISSN 1947-5500

(IJCSIS) International Journal of Computer Science and Information Security,
Vol. 10, No. 11, November 2012
(a)
(b)
(c)
(d)
Figure.5: Shooting simulation and positioning of 300 nodes.
B.Evaluation of nodes allocation rate To evaluate the performance of this architecture, the first
successful factor is the substantial allocation of all the nodes
assigned to ensure better monitoring required of the latter;
depending on the parameters of the zone partitioning
algorithm. The rate is shown in Figures (6, 7 and 8) by the
reverse state (The percentage of unassigned node), based on
two criteria: The number of areas on which the routing layer
is formed Na, and a variance number of nodes Nn (Table.2).
We need to find the right relationship between the number of
zones and the number of nodes to satisfy the main condition.
Figure.6: The percentage of unassigned nodes for 204, 300 and 402
nodes
Figure.6 shows that the rate of non-assignment for 300 nodes
decreases and becomes null whereas the number of areas
increases (Na = 16). If we increase the number of nodes to
300 and 402, the rate differs slightly compared to 300 nodes;
but also it tends to zero from the (Na = 20, 24).
Figure.7: The percentage of unassigned nodes for 504,600 and 702
nodes
If we take a large number of nodes as 504, 600 and 702 with
the same variance numbers of zones (4 < Na <32). Figure.7
shows that the rate of non-assignment increases to 60%, then
12 http://sites.google.com/site/ijcsis/ ISSN 1947-5500

(IJCSIS) International Journal of Computer Science and Information Security,
Vol. 10, No. 11, November 2012
it begins to decrease, but the establishment of the total
allocation only begins from (Na = 32), and not for 700 nodes.
Nodes 204 300 402 Average 2,88621951 3,95864634 6,73019512
Table.3: The average assignment for 204, 300 and 402 nodes
Nodes 504 600 702 Average 13,5915556 18,5601111 24,2516914
Table.4: The average assignment for 504, 600 and 702 nodes
Table (3) and (4) show the allocation rate for the 6 types of
node numbers tested in a small scale network. We discover a
great difference if we increase the number of zones. The rate
in table 4 reaches 24.25% of non-success against the rate
displayed in table.3 that has not exceeded the threshold of
6.7%.
Figure.8: The percentage of unassigned nodes for 504,600 and 702
nodes (more than 16 zones)
Nœuds 504 600 702 Moyennes 1,08057143 2,79153521 5,28948571
Table.5: The average assignment for 504, 600 and 702 nodes (more
than 16 zones)
Figure.8 shows that the increasing number of areas with an
interesting number of nodes was successful due to reduced
rates to 20% for 40 zones and 0% from Nn = 40, this is
reflected in table 5 through the remarkable decline in rates of
non-allocation for each iteration node numbers. To sum up,
our partitioning algorithm has shown very good results for
such large scale networks.
1) Average packet delivery ratio :
To strengthen the evaluation of the platform construction, we
studied the average ratio of packets transmitted during this
phase. The parameters to calculate this ratio are represented
in equation (3):
(3)
NPs: the number of packets sent. NPr: The number of
packets received.
The graph presented in the figure represents the average ratio
calculated for the construction of topology for 200, 300, 400,
500, 600 and 700 nodes:
We find that the average packet delivery ratio reached
0.916657% for the construction of a network of 600 nodes
Figure.9.
Figure.9: the average packet delivery ratio
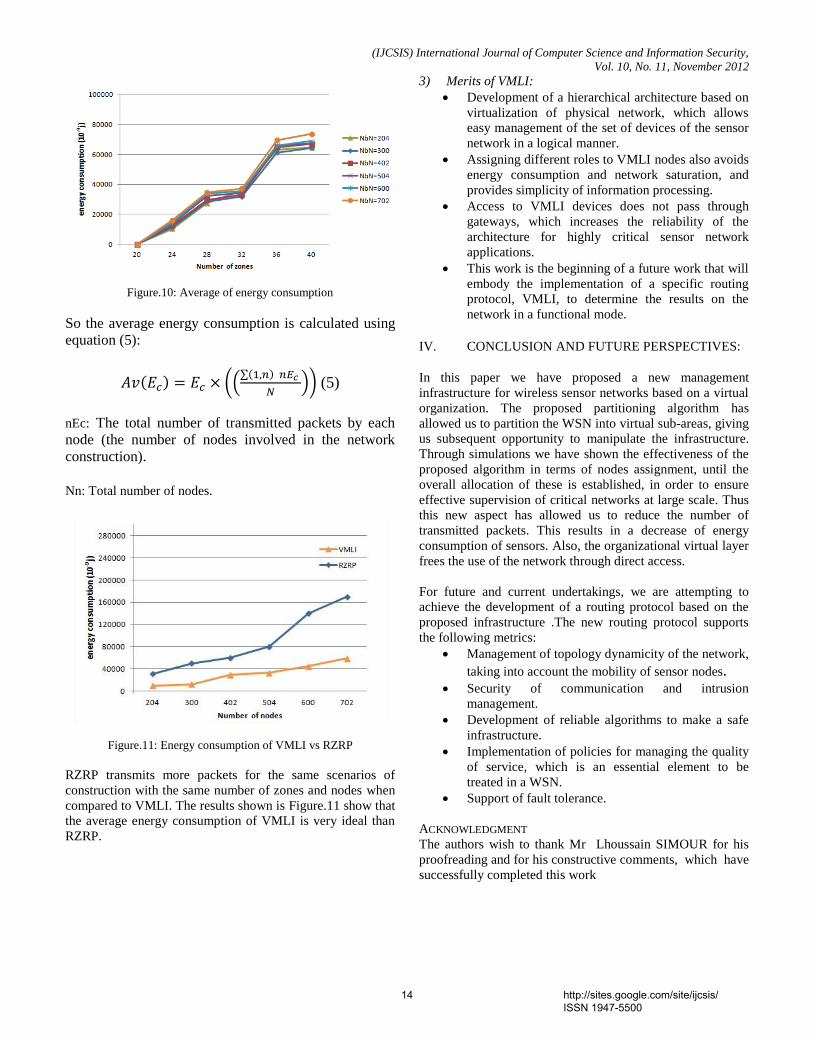
2) Energy consumption:
Energy consumption in a network in general is influenced
by the number of packets transmitted over the network. As
we have presented in this work the evaluation of the first part
of the construction, energy consumption rate is very reduced
Figure.10.
To calculate the energy consumption for each number of
nodes, we have used equation (4), quoted in the work
(Feeney, L.M.; Nilsson, M., 2001):
(4)
Size = the packet size.
m= is the required energy for sending each bit (m = 10 *
10-9 joules).
b = the required energy to prepare a packet for sending
(b=100 *10-9
joules).
13 http://sites.google.com/site/ijcsis/ ISSN 1947-5500
(IJCSIS) International Journal of Computer Science and Information Security,
Vol. 10, No. 11, November 2012
Figure.10: Average of energy consumption
So the average energy consumption is calculated using
equation (5):
(5)
nEc: The total number of transmitted packets by each
node (the number of nodes involved in the network
construction).
Nn: Total number of nodes.
Figure.11: Energy consumption of VMLI vs RZRP
RZRP transmits more packets for the same scenarios of
construction with the same number of zones and nodes when
compared to VMLI. The results shown is Figure.11 show that
the average energy consumption of VMLI is very ideal than
RZRP.
3) Merits of VMLI:
Development of a hierarchical architecture based on
virtualization of physical network, which allows
easy management of the set of devices of the sensor
network in a logical manner.
Assigning different roles to VMLI nodes also avoids
energy consumption and network saturation, and
provides simplicity of information processing.
Access to VMLI devices does not pass through
gateways, which increases the reliability of the
architecture for highly critical sensor network
applications.
This work is the beginning of a future work that will
embody the implementation of a specific routing
protocol, VMLI, to determine the results on the
network in a functional mode.
IV. CONCLUSION AND FUTURE PERSPECTIVES:
In this paper we have proposed a new management
infrastructure for wireless sensor networks based on a virtual
organization. The proposed partitioning algorithm has
allowed us to partition the WSN into virtual sub-areas, giving
us subsequent opportunity to manipulate the infrastructure.
Through simulations we have shown the effectiveness of the
proposed algorithm in terms of nodes assignment, until the
overall allocation of these is established, in order to ensure
effective supervision of critical networks at large scale. Thus
this new aspect has allowed us to reduce the number of
transmitted packets. This results in a decrease of energy
consumption of sensors. Also, the organizational virtual layer
frees the use of the network through direct access.
For future and current undertakings, we are attempting to
achieve the development of a routing protocol based on the
proposed infrastructure .The new routing protocol supports
the following metrics:
Management of topology dynamicity of the network,
taking into account the mobility of sensor nodes. Security of communication and intrusion
management.
Development of reliable algorithms to make a safe
infrastructure.
Implementation of policies for managing the quality
of service, which is an essential element to be
treated in a WSN.
Support of fault tolerance.
ACKNOWLEDGMENT
The authors wish to thank Mr Lhoussain SIMOUR for his
proofreading and for his constructive comments, which have
successfully completed this work
14 http://sites.google.com/site/ijcsis/ ISSN 1947-5500
(IJCSIS) International Journal of Computer Science and Information Security,
Vol. 10, No. 11, November 2012
REFERENCES
Winston, K., Guan, S., Hwee, P.T., 2006. “Multipath virtual sink architecture for wireless sensor networks in harsh environments,”InterSense
Cheick-Tidjane, K., Francis L., Michael, D., 2010. “Auto-organisation avec canaux et puits multiples de réseaux de capteurs sans fil de grande taille, ” Sixième Conférence Internationale Francophone d'Automatique, CIFA 2010, Nancy : France "
Oyman, E.I., Ersoy, C., 2004. “Multiple sink network design problem in large scale wireless sensor networks,” ,” in Proc. of ICC, Paris, France June
Amina, M., Hicham, B., Mohamed, O., Olaf, M., 2011. “Performance Reliability Assessment of a Mecatronic Sensor System in Wireless Sensor Networks”. International Journal of Computer Science and Network Security, VOL.11 Nsso.8, August, pp.179-188
Ali, M., Ravula, S.K., 2008. “Real-time support and energy efficiency in wireless sensor networks”. Technical report, IDE0805, January.
Akkaya , K., Younis , M., 2005. “A Survey on Routing Protocols for Wireless Sensor Networks”. Journal of Ad Hoc Networks, Vol. 3, No. 3, May, pp. 325-349.
W, Heinzelman., A, Chandrakasan., H, Balakrishnan., 2000. “Energy-efficient communication protocol for wireless sensor networks ”. In the Proceeding of the HawaiiInternational Conference System Sciences, Hawaii, January.
S, Lindsey., C, Raghavendra., 2002. “PEGASIS: Power-Efficient Gathering in Sensor Information Systems”. Proceedings of the IEEE Aerospace Conference, vol. 3, Big Sky,MT, USA, March, pp. 1125-1130.
W, chen., K, Yang., 2008.“Zone-based Two-level Routing Protocol for Wireless Mobile Ad Hoc Networks: A Fully Reactive Approach”. IWCMC,August 6-8. 2008
Rodoplu, V., Ming, T.H., 1999. “Minimum energy mobile wireless networks”. IEEE Journal of Selected Areas in Communications, Vol. 17, No. 8, , pp. 1333-1344.
Doherty ,L., Pister , K.S.J., El Ghaoui ,L., 2001. “Convex position estimation in wireless sensor networks”. In Proceedings of the IEEE INFOCOM, vol.3, Alaska, , pp.1655-1663.
Intanagonwiwat , C., Govindan, R., Estrin, D., 2000. “Directed diffusion: A scalable and robust communication paradigm for sensor networks”. In the Proceedings of the 6th Annual ACM/IEEE International Conference on Mobile Computing and Networking (MobiCom'00), Boston, MA, August.
Yu ,Y., Estrin, D., Govindan ,R., 2001. “Geographical and Energy-Aware Routing: A Recursive Data Dissemination Protocol for Wireless Sensor Networks,” UCLA Computer Science Department Technical Report, UCLA-CSD TR-01-0023, May 2001.
Singh, S., Raghavendra,C., 1998. “PAMAS: Power aware multi-access protocol with signaling for ad hoc networks”. ACM Computer Communication Review, July 1998, pp. 5-26.
Zeng, K., Ren, K., Lou , W., Moran , P. J., 2009. “Energy aware efficient geographic routing in lossy wireless sensor networks with environmental energy supply”. Kluwer Academic Publishers Hingham, MA, USA,.
Xu ,Y., Heidemann , J., Estrin, D., 2001. “Geography-informed Energy Conservation for Ad hoc Routing”. In Proceedings of the 7th Annual ACM/IEEE International Conference on Mobile Computing and Networking (MOBICOM’01), Rome, Italy, July, pp.70-84.
Qi ,H., Kuruganti, P. T., Xu,Y., 2002. “The Development of Localized Algorithms in Wireless Sensor Networks”. Published on SENSORS ISSN, 22 July, pp. 1424- 8220.
Abbas, C. B., González, R., Cardenas, N., Villalba, L. J. G., 2008. “A proposal of a wireless sensor network routing protocol”. Springer Science and Business Media .Telecommunication Systems. March, pp. 61–68.
Ahmed,S., Chen ,W.P., Jennifer, C.H, Kung, L-C., Li, Ning., Lim, Hyuk., Tyan, H-Y., Zhang, H., 2005. J-Sim: A Simulation and Emulation Environment for Wireless Sensor Networks, To appear in Proceedings of the Annual Simulation Symposium(ANSS 2005), April.
Feeney, L.M.; Nilsson, M., 2001. Investigating the Energy Consumption of a Wireless Network Interface in an Ad Hoc Networking Environment. In Proceedings IEEE INFOCOM 2001, Conference on Computer Communications. Piscataway, NJ, USA, April,; Volume 3, pp. 1548-57.
Joa-Ng , M., Lu, I.T., 1999. “A Peer-to-Peer Zone-Based Two-Levl Link State Routing for Mobile Ad Hoc Networks”. IEEE Journal on Selected Areas in Communication, 17(8):1415-1425.
AUTHORS PROFILE
Mohamed OUZZIF Presently working as a Professor
Ability in University Hassan II /ESTC. Received his Phd
degree from University Hassan II /ENSEM, Casablanca Morroco.
Research : Distributed Systems and Computer Engineering .
Hicham BELHADAOUI Currently working as a Assistant
Professor in University Hassan II /ESTC, Casablanca
Morroco.Received his Phd degree at National Polytechnic Institute of Lorraine/France.
Research : Reliability ,Automatic Signal Processing and
Computer Engineering.
Ahmed KAMIL Currently a PhD student, University
Hassan II /ENSEM Casablanca Morroco. Received his
engineering degree from The National School of Mineral Industry, Rabat. Morroco.
Research :Domain of Wireless sensor networks .
Olaf MALASSÉ he is currently attached with National School of Arts/ and Crafts/ ParisTech in Metz/France as
Associate Professor in A3SI department.
Research : Automatic Signal Processing and Computer Engineering.
Amina MERBAH Currently a PhD student ,University
Hassan II /ENSEM Casablanca Morroco. Received a master’s degree in 2010 at University of Sciences
Semlalia–Cadi Ayyad, Marrakech, Morroco.
Research: Reliability in Wirrelss Sensor Networks.
15 http://sites.google.com/site/ijcsis/ ISSN 1947-5500
(IJCSIS) International Journal of Computer Science and Information Security,
Vol. 10, No. 11, November 2012
Brain Connectivity Analysis Methods for Better Understanding of Coupling
Revati Shriram1,2
1Research Scholar, Sathyabama University, Chennai.
2Cummins College of Engg for Women, Pune, INDIA
Dr. M. Sundhararajan Shri Lakshmi Ammal Engg. College, Chennai, INDIA
Nivedita Daimiwal Cummins College of Engineering
for Women, Pune, INDIA
Abstract— Action, cognition, emotion and perception can be
mapped in the brain by using set of techniques. Translating
unimodal concepts from one modality to another is an
important step towards understanding the neural
mechanisms. This paper provides a comprehensive survey of
multimodal analysis of brain signals such as fMRI, EEG,
MEG, NIRS and motivations, assumptions and pitfalls
associated with it. All these non-invasive brain modalities
complement and restrain each other and hence improve our
understating of functional and neuronal organization. By
combining the various modalities together, we can exploit
the strengths and flaws of individual brain imaging methods.
Integrated anatomical analysis and functional measurements
of human brain offer a powerful paradigm for the brain
mapping. Here we provide the brief review on non invasive
brain modalities, describe the future of co-analysis of these
brain signals.
Keywords- EEG, fMRI, MEG, NIRS and BMI.
I. INTRODUCTION
The in vivo measurement of blood perfusion in an organ has been a topic of interest for many years. Modern imaging methods provide the opportunity for non-invasive in vivo study of human organs and can provide measurements of local neuronal activity of the living human brain (A Toga et al, 2001). These imaging modalities can be divided into two global categories: Functional Imaging or Structural Imaging (Fantini et al,
2001). Functional imaging technique can be used along with the structural imaging to better examine the anatomy and functioning of particular areas of the brain in an individual.
Functional Imaging:
Functional imaging represents a range of measurement techniques in which the aim is to extract quantitative information about physiological function from image-
based data. The emphasis is on the extraction of physiological parameters rather than the visual interpretation of the images. Functional modalities include Single Positron Emission Computed Tomography (SPECT) and Positron Emission Tomography (PET), these are the nuclear medicine imaging modalities. Along with them Functional Magnetic Resonance Imaging (fMRI), Electroencephalogram (EEG), Magnetoencephalogram (MEG), Electrical Impedance Tomography (EIT) can also be named as a functional imaging techniques (Fantini et al, 2001).
Structural Imaging:
Structural imaging represents a range of measurement techniques which can display anatomical information. These modalities include X-ray, Computer Tomography (CT), Magnetic Resonance Imaging (MRI), Transcranial Magnetic Stimulation (TCM) and Ultrasound (US) (Fantini et al, 2001). There are many reasons to determine the regional blood flow in organs such as in the brain or kidney, or in cancerous tissue regions of the body. For example, the assessment of cerebral blood flow and its autoregulation can be used to investigate the normal physiology and the nature of various diseases of the brain (T. S. Koh, Z. Hou, 2002). Also, the efficacy of radiotherapy treatment of cancer cells depends on the local oxygen concentration which is governed by the local blood flow. A convenient, minimally invasive method of assessing blood flow within organs is hence constantly being sought (A Toga et al, 2001).
II. NEUROIMAGING METHODS
EEG: Electroencephalogram
EEG signal originates mainly in the outer layer of the brain mainly known as the cerebral cortex, a 4–5mm thick highly folded brain region responsible for activities such
16 http://sites.google.com/site/ijcsis/ ISSN 1947-5500
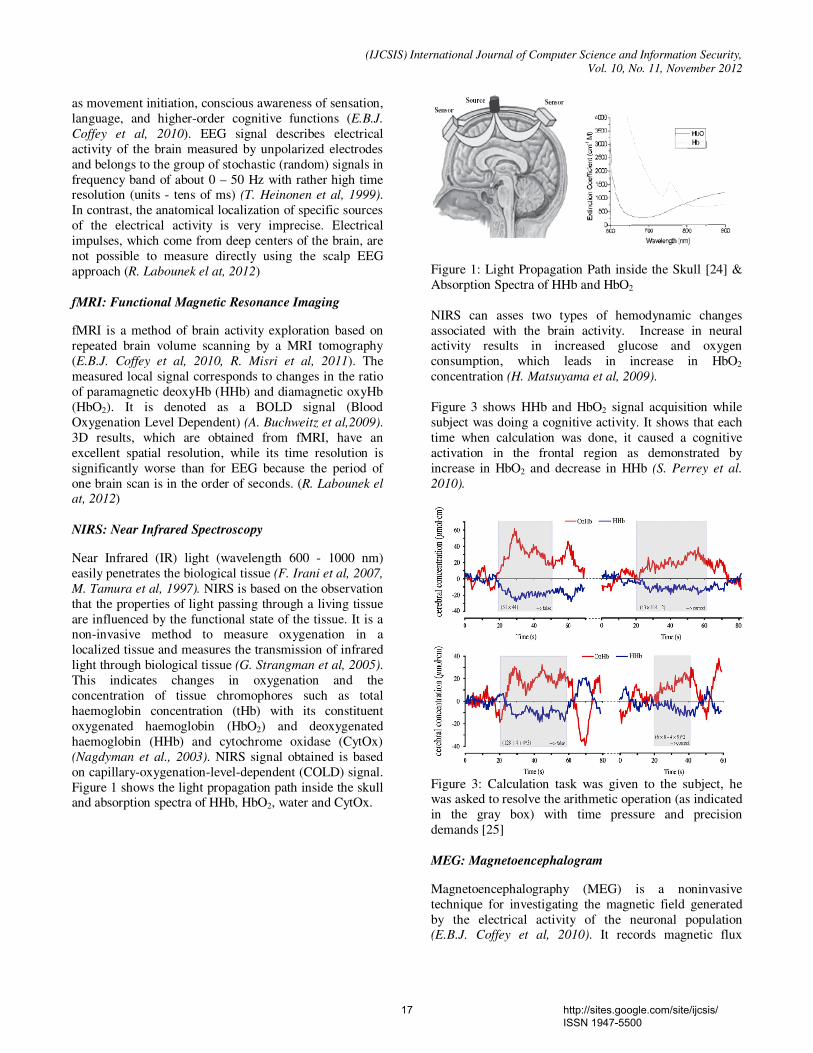
(IJCSIS) International Journal of Computer Science and Information Security,
Vol. 10, No. 11, November 2012
as movement initiation, conscious awareness of sensation, language, and higher-order cognitive functions (E.B.J.
Coffey et al, 2010). EEG signal describes electrical activity of the brain measured by unpolarized electrodes and belongs to the group of stochastic (random) signals in frequency band of about 0 – 50 Hz with rather high time resolution (units - tens of ms) (T. Heinonen et al, 1999). In contrast, the anatomical localization of specific sources of the electrical activity is very imprecise. Electrical impulses, which come from deep centers of the brain, are not possible to measure directly using the scalp EEG approach (R. Labounek el at, 2012) fMRI: Functional Magnetic Resonance Imaging
fMRI is a method of brain activity exploration based on repeated brain volume scanning by a MRI tomography (E.B.J. Coffey et al, 2010, R. Misri et al, 2011). The measured local signal corresponds to changes in the ratio of paramagnetic deoxyHb (HHb) and diamagnetic oxyHb (HbO2). It is denoted as a BOLD signal (Blood Oxygenation Level Dependent) (A. Buchweitz et al,2009). 3D results, which are obtained from fMRI, have an excellent spatial resolution, while its time resolution is significantly worse than for EEG because the period of one brain scan is in the order of seconds. (R. Labounek el
at, 2012) NIRS: Near Infrared Spectroscopy
Near Infrared (IR) light (wavelength 600 - 1000 nm) easily penetrates the biological tissue (F. Irani et al, 2007,
M. Tamura et al, 1997). NIRS is based on the observation that the properties of light passing through a living tissue are influenced by the functional state of the tissue. It is a non-invasive method to measure oxygenation in a localized tissue and measures the transmission of infrared light through biological tissue (G. Strangman et al, 2005). This indicates changes in oxygenation and the concentration of tissue chromophores such as total haemoglobin concentration (tHb) with its constituent oxygenated haemoglobin (HbO2) and deoxygenated haemoglobin (HHb) and cytochrome oxidase (CytOx) (Nagdyman et al., 2003). NIRS signal obtained is based on capillary-oxygenation-level-dependent (COLD) signal. Figure 1 shows the light propagation path inside the skull and absorption spectra of HHb, HbO2, water and CytOx.
Figure 1: Light Propagation Path inside the Skull [24] & Absorption Spectra of HHb and HbO2
NIRS can asses two types of hemodynamic changes associated with the brain activity. Increase in neural activity results in increased glucose and oxygen consumption, which leads in increase in HbO2 concentration (H. Matsuyama et al, 2009). Figure 3 shows HHb and HbO2 signal acquisition while subject was doing a cognitive activity. It shows that each time when calculation was done, it caused a cognitive activation in the frontal region as demonstrated by increase in HbO2 and decrease in HHb (S. Perrey et al.
2010).
Figure 3: Calculation task was given to the subject, he was asked to resolve the arithmetic operation (as indicated in the gray box) with time pressure and precision demands [25] MEG: Magnetoencephalogram
Magnetoencephalography (MEG) is a noninvasive technique for investigating the magnetic field generated by the electrical activity of the neuronal population (E.B.J. Coffey et al, 2010). It records magnetic flux
17 http://sites.google.com/site/ijcsis/ ISSN 1947-5500
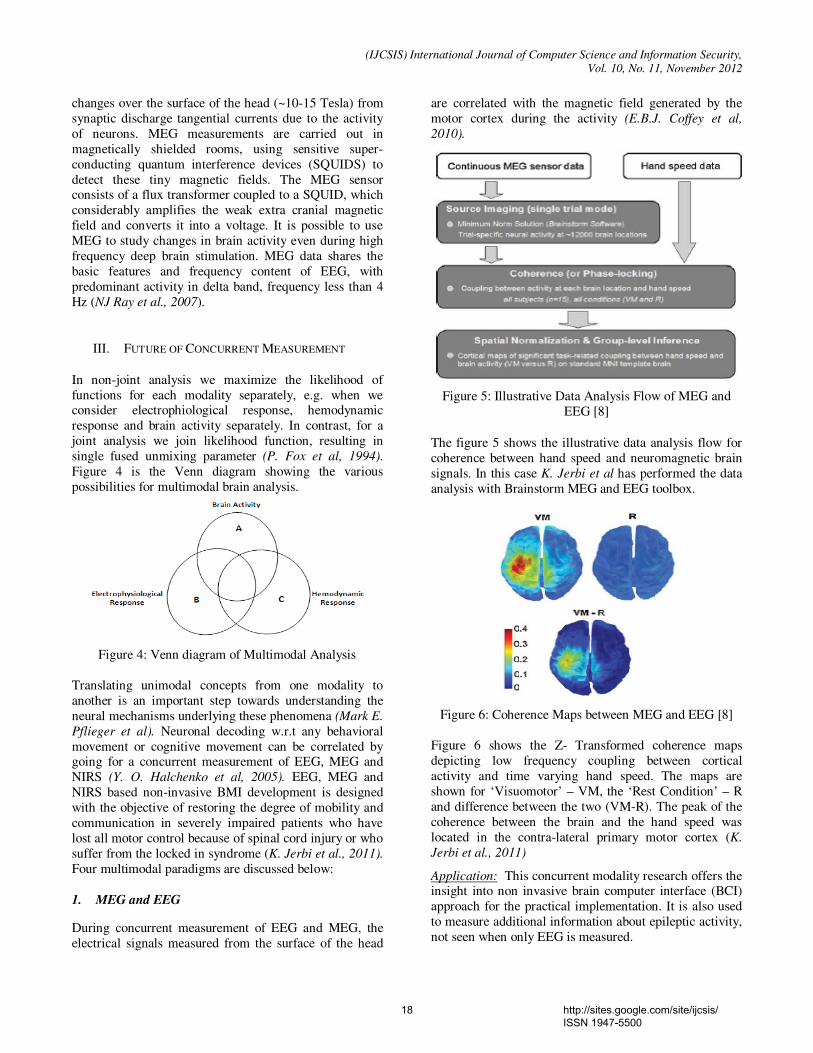
(IJCSIS) International Journal of Computer Science and Information Security,
Vol. 10, No. 11, November 2012
changes over the surface of the head (~10-15 Tesla) from synaptic discharge tangential currents due to the activity of neurons. MEG measurements are carried out in magnetically shielded rooms, using sensitive super-conducting quantum interference devices (SQUIDS) to detect these tiny magnetic fields. The MEG sensor consists of a flux transformer coupled to a SQUID, which considerably amplifies the weak extra cranial magnetic field and converts it into a voltage. It is possible to use MEG to study changes in brain activity even during high frequency deep brain stimulation. MEG data shares the basic features and frequency content of EEG, with predominant activity in delta band, frequency less than 4 Hz (NJ Ray et al., 2007).
III. FUTURE OF CONCURRENT MEASUREMENT
In non-joint analysis we maximize the likelihood of functions for each modality separately, e.g. when we consider electrophiological response, hemodynamic response and brain activity separately. In contrast, for a joint analysis we join likelihood function, resulting in single fused unmixing parameter (P. Fox et al, 1994). Figure 4 is the Venn diagram showing the various possibilities for multimodal brain analysis.
Figure 4: Venn diagram of Multimodal Analysis
Translating unimodal concepts from one modality to another is an important step towards understanding the neural mechanisms underlying these phenomena (Mark E.
Pflieger et al). Neuronal decoding w.r.t any behavioral movement or cognitive movement can be correlated by going for a concurrent measurement of EEG, MEG and NIRS (Y. O. Halchenko et al, 2005). EEG, MEG and NIRS based non-invasive BMI development is designed with the objective of restoring the degree of mobility and communication in severely impaired patients who have lost all motor control because of spinal cord injury or who suffer from the locked in syndrome (K. Jerbi et al., 2011). Four multimodal paradigms are discussed below: 1. MEG and EEG
During concurrent measurement of EEG and MEG, the electrical signals measured from the surface of the head
are correlated with the magnetic field generated by the motor cortex during the activity (E.B.J. Coffey et al,
2010).
Figure 5: Illustrative Data Analysis Flow of MEG and EEG [8]
The figure 5 shows the illustrative data analysis flow for coherence between hand speed and neuromagnetic brain signals. In this case K. Jerbi et al has performed the data analysis with Brainstorm MEG and EEG toolbox.
Figure 6: Coherence Maps between MEG and EEG [8]
Figure 6 shows the Z- Transformed coherence maps depicting low frequency coupling between cortical activity and time varying hand speed. The maps are shown for ‘Visuomotor’ – VM, the ‘Rest Condition’ – R and difference between the two (VM-R). The peak of the coherence between the brain and the hand speed was located in the contra-lateral primary motor cortex (K.
Jerbi et al., 2011)
Application: This concurrent modality research offers the insight into non invasive brain computer interface (BCI) approach for the practical implementation. It is also used to measure additional information about epileptic activity, not seen when only EEG is measured.
18 http://sites.google.com/site/ijcsis/ ISSN 1947-5500
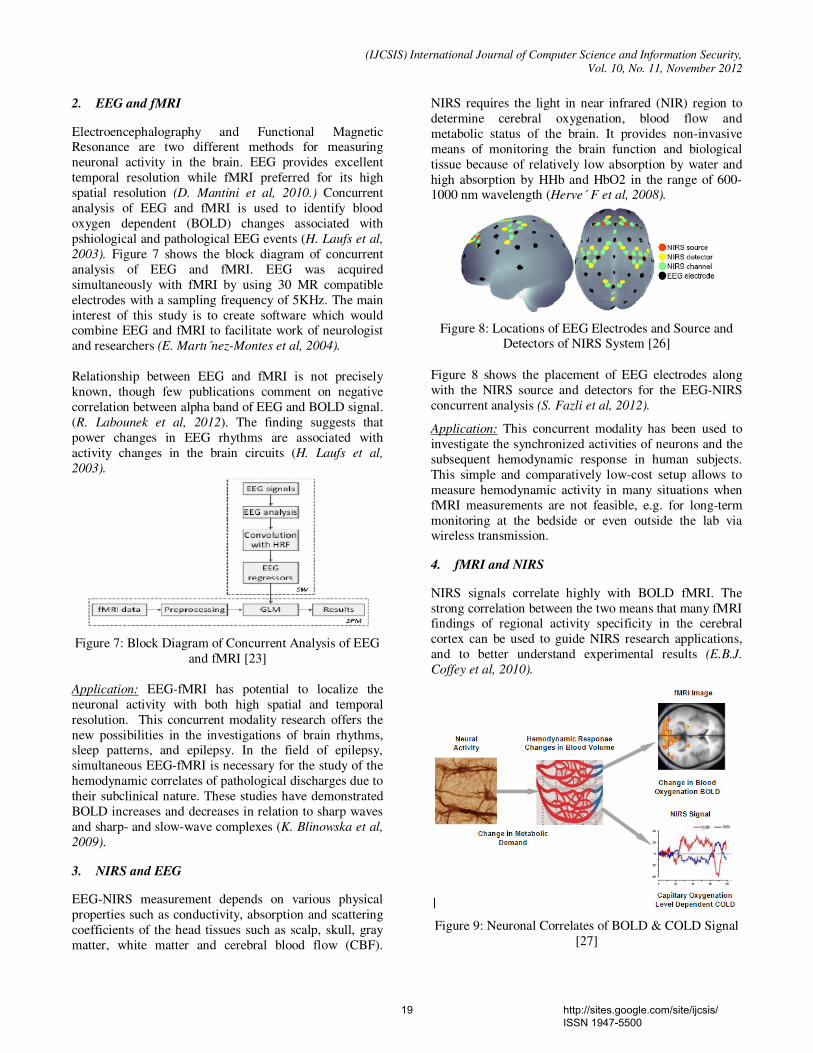
(IJCSIS) International Journal of Computer Science and Information Security,
Vol. 10, No. 11, November 2012
2. EEG and fMRI
Electroencephalography and Functional Magnetic Resonance are two different methods for measuring neuronal activity in the brain. EEG provides excellent temporal resolution while fMRI preferred for its high spatial resolution (D. Mantini et al, 2010.) Concurrent analysis of EEG and fMRI is used to identify blood oxygen dependent (BOLD) changes associated with pshiological and pathological EEG events (H. Laufs et al,
2003). Figure 7 shows the block diagram of concurrent analysis of EEG and fMRI. EEG was acquired simultaneously with fMRI by using 30 MR compatible electrodes with a sampling frequency of 5KHz. The main interest of this study is to create software which would combine EEG and fMRI to facilitate work of neurologist and researchers (E. Martı´nez-Montes et al, 2004). Relationship between EEG and fMRI is not precisely known, though few publications comment on negative correlation between alpha band of EEG and BOLD signal. (R. Labounek et al, 2012). The finding suggests that power changes in EEG rhythms are associated with activity changes in the brain circuits (H. Laufs et al,
2003).
Figure 7: Block Diagram of Concurrent Analysis of EEG and fMRI [23]
Application: EEG-fMRI has potential to localize the neuronal activity with both high spatial and temporal resolution. This concurrent modality research offers the new possibilities in the investigations of brain rhythms, sleep patterns, and epilepsy. In the field of epilepsy, simultaneous EEG-fMRI is necessary for the study of the hemodynamic correlates of pathological discharges due to their subclinical nature. These studies have demonstrated BOLD increases and decreases in relation to sharp waves and sharp- and slow-wave complexes (K. Blinowska et al,
2009).
3. NIRS and EEG
EEG-NIRS measurement depends on various physical properties such as conductivity, absorption and scattering coefficients of the head tissues such as scalp, skull, gray matter, white matter and cerebral blood flow (CBF).
NIRS requires the light in near infrared (NIR) region to determine cerebral oxygenation, blood flow and metabolic status of the brain. It provides non-invasive means of monitoring the brain function and biological tissue because of relatively low absorption by water and high absorption by HHb and HbO2 in the range of 600-1000 nm wavelength (Herve´ F et al, 2008).
Figure 8: Locations of EEG Electrodes and Source and Detectors of NIRS System [26]
Figure 8 shows the placement of EEG electrodes along with the NIRS source and detectors for the EEG-NIRS concurrent analysis (S. Fazli et al, 2012).
Application: This concurrent modality has been used to investigate the synchronized activities of neurons and the subsequent hemodynamic response in human subjects. This simple and comparatively low-cost setup allows to measure hemodynamic activity in many situations when fMRI measurements are not feasible, e.g. for long-term monitoring at the bedside or even outside the lab via wireless transmission.
4. fMRI and NIRS
NIRS signals correlate highly with BOLD fMRI. The strong correlation between the two means that many fMRI findings of regional activity specificity in the cerebral cortex can be used to guide NIRS research applications, and to better understand experimental results (E.B.J.
Coffey et al, 2010).
Figure 9: Neuronal Correlates of BOLD & COLD Signal [27]
19 http://sites.google.com/site/ijcsis/ ISSN 1947-5500
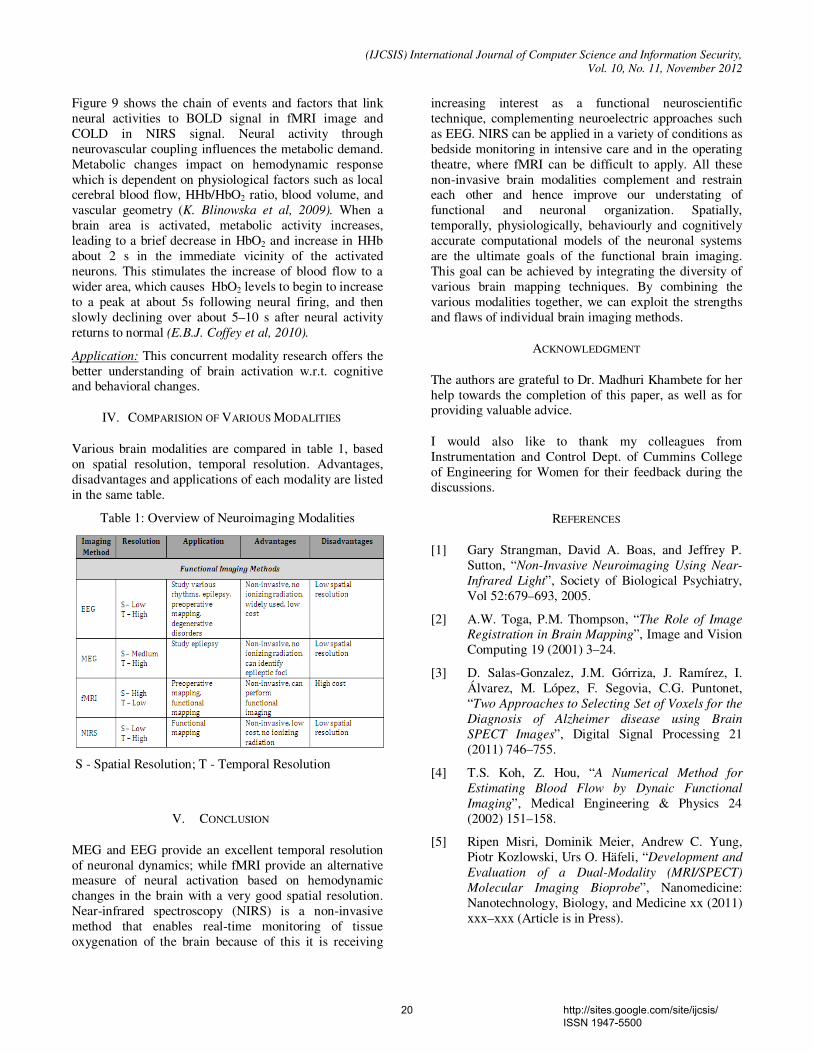
(IJCSIS) International Journal of Computer Science and Information Security,
Vol. 10, No. 11, November 2012
Figure 9 shows the chain of events and factors that link neural activities to BOLD signal in fMRI image and COLD in NIRS signal. Neural activity through neurovascular coupling influences the metabolic demand. Metabolic changes impact on hemodynamic response which is dependent on physiological factors such as local cerebral blood flow, HHb/HbO2 ratio, blood volume, and vascular geometry (K. Blinowska et al, 2009). When a brain area is activated, metabolic activity increases, leading to a brief decrease in HbO2 and increase in HHb about 2 s in the immediate vicinity of the activated neurons. This stimulates the increase of blood flow to a wider area, which causes HbO2 levels to begin to increase to a peak at about 5s following neural firing, and then slowly declining over about 5–10 s after neural activity returns to normal (E.B.J. Coffey et al, 2010).
Application: This concurrent modality research offers the better understanding of brain activation w.r.t. cognitive and behavioral changes.
IV. COMPARISION OF VARIOUS MODALITIES
Various brain modalities are compared in table 1, based on spatial resolution, temporal resolution. Advantages, disadvantages and applications of each modality are listed in the same table.
Table 1: Overview of Neuroimaging Modalities
S - Spatial Resolution; T - Temporal Resolution
V. CONCLUSION
MEG and EEG provide an excellent temporal resolution of neuronal dynamics; while fMRI provide an alternative measure of neural activation based on hemodynamic changes in the brain with a very good spatial resolution. Near-infrared spectroscopy (NIRS) is a non-invasive method that enables real-time monitoring of tissue oxygenation of the brain because of this it is receiving
increasing interest as a functional neuroscientific technique, complementing neuroelectric approaches such as EEG. NIRS can be applied in a variety of conditions as bedside monitoring in intensive care and in the operating theatre, where fMRI can be difficult to apply. All these non-invasive brain modalities complement and restrain each other and hence improve our understating of functional and neuronal organization. Spatially, temporally, physiologically, behaviourly and cognitively accurate computational models of the neuronal systems are the ultimate goals of the functional brain imaging. This goal can be achieved by integrating the diversity of various brain mapping techniques. By combining the various modalities together, we can exploit the strengths and flaws of individual brain imaging methods.
ACKNOWLEDGMENT
The authors are grateful to Dr. Madhuri Khambete for her help towards the completion of this paper, as well as for providing valuable advice.
I would also like to thank my colleagues from Instrumentation and Control Dept. of Cummins College of Engineering for Women for their feedback during the discussions.
REFERENCES
[1] Gary Strangman, David A. Boas, and Jeffrey P. Sutton, “Non-Invasive Neuroimaging Using Near-
Infrared Light”, Society of Biological Psychiatry, Vol 52:679–693, 2005.
[2] A.W. Toga, P.M. Thompson, “The Role of Image
Registration in Brain Mapping”, Image and Vision Computing 19 (2001) 3–24.
[3] D. Salas-Gonzalez, J.M. Górriza, J. Ramírez, I. Álvarez, M. López, F. Segovia, C.G. Puntonet, “Two Approaches to Selecting Set of Voxels for the
Diagnosis of Alzheimer disease using Brain
SPECT Images”, Digital Signal Processing 21 (2011) 746–755.
[4] T.S. Koh, Z. Hou, “A Numerical Method for
Estimating Blood Flow by Dynaic Functional
Imaging”, Medical Engineering & Physics 24 (2002) 151–158.
[5] Ripen Misri, Dominik Meier, Andrew C. Yung, Piotr Kozlowski, Urs O. Häfeli, “Development and
Evaluation of a Dual-Modality (MRI/SPECT)
Molecular Imaging Bioprobe”, Nanomedicine: Nanotechnology, Biology, and Medicine xx (2011) xxx–xxx (Article is in Press).
20 http://sites.google.com/site/ijcsis/ ISSN 1947-5500

(IJCSIS) International Journal of Computer Science and Information Security,
Vol. 10, No. 11, November 2012
[6] Augusto Buchweitz, Robert A. Mason, Lêda M. B. Tomitch and Marcel Adam Just, “Brain Activation
for Reading and Listening Comprehension: An
fMRI Study of Modality Effects and Individual
Differences in Language Comprehension”, Psychology & Neuroscience, 2009, 2, 2, 111 – 123.
[7] Peter T Fox, Marty G Woldorff, “Integrating
Human Brain Maps”, Current Opinion in Neurobiology 1994, 4:151-156.
[8] K. Jerbi, J.R. Vidal, J. Mattout, E. Maby, F. Lecaignard, T. Ossandon, C.M. Hamamé, S.S. Dalal, R. Bouet, J.-P. Lachaux, R.M. Leahy, S. Baillet, L. Garnero, C. Delpuech, O. Bertrand, “Inferring hand movement kinematics from MEG,
EEG and intracranial EEG: From brain-machine
interfaces to motor rehabilitation”, IRBM 32 (2011) 8–18.
[9] H. Laufs, A. Kleinschmidt, A. Beyerle, E. Eger, A. Salek-Haddadi, C. Preibisch, K. Krakow, “EEG-correlated fMRI of Human Alpha Activity”, H. Laufs et al. / NeuroImage 19 (2003) 1463–1476
[10] Sarah J. Erickson, Anuradha Godavarty, “Hand-
held Based Near-infrared Optical Imaging
Devices: A Review”, Medical Engineering & Physics 31 (2009) 495–509.
[11] H. Matsuyama, H. Asama, and M. Otake, “Design
of differential Near-Infrared Spectroscopy based
Brain Machine Interface”, The 18th IEEE International Symposium on Robot and Human Interactive Communication Toyama, Japan, Sept. 27-Oct. 2, 2009.
[12] Mamoru Tamura, Yoko Hoshi" Fumihiko Okada, “Localized Near-Infrared Spectroscopy and
Functional Optical Imaging Of Brain Activity”, Phil. Trans. R. Soc. Lond. B (1997) 352, 737±742, # 1997 The Royal Society, Printed in Great Britain.
[13] Farzin Irani, Steven M. Platek, Scott Bunce, Anthony C. Ruocco, Douglas Chute, “Functional
Near Infrared Spectroscopy (fNIRS): An Emerging
Neuroimaging Technology with Important
Applications for the Study of Brain Disorders”, The Clinical Neuropsychologist, Volume 21, Issue 1 January 2007, pages 9 – 37.
[14] Tomi Heinonen, Antti Lahtinen, Veikko Hakkinen, “Implementation of Three-Dimensional EEG Brain
Mapping”, Computers and Biomedical Research 32, 123–131 (1999).
[15] K. Jerbi, J.R. Vidal, J. Mattout, E. Maby, F. Lecaignard, T. Ossandon, C.M. Hamamé, S.S. Dalal, R. Bouet, J.-P. Lachaux, R.M. Leahy, S. Baillet, L. Garnero, C. Delpuech, O. Bertrand,
“Inferring hand movement kinematics from MEG,
EEG and intracranial EEG: From brain-machine
interfaces to motor rehabilitation”, IRBM 32 (2011) 8–18.
[16] Yaroslav O. Halchenko, Stephen Jos´e Hanson, Barak A. Pearlmutter, “Multimodal Integration:
fMRI, MRI, EEG, MEG”, Appears as pages 223-265 of Advanced Image Processing in Magnetic Resonance Imaging, Dekker, book series on Signal Processing and Communications, ISBN 0824725425, 2005.
[17] Mark E. Pflieger, Randall L. Barbour, “Multimodal
Integration of fMRI, EEG, and NIRS”.
[18] D. Mantini, L. Marzetti, M. Corbetta, G. L. Romani, C. Del Gratta, “Multimodal Integration of
fMRI and EEG Data for High Spatial and
Temporal Resolution Analysis of Brain Networks”, Brain Topogr (2010) 23:150–158.
[19] Eduardo Martı´nez-Montes, Pedro A. Valde´s-Sosa, Fumikazu Miwakeichi, Robin I. Goldman, Mark S. Cohen, “Concurrent EEG/fMRI analysis
by multiway Partial Least Squares”, NeuroImage 22 (2004) 1023–1034.
[20] N. Nagdyman, T. P. K. Fleck, P. Ewert, H. Abdul-Khaliq, M. Redlin, P. E. Lange, “Cerebral
oxygenation measured by near-infrared
spectroscopy during circulatory arrest and
cardiopulmonary resuscitation”, British Journal of Anaesthesia 91 (3): 438±42 (2003).
[21] NJ Ray, ML Kringelbach, N Jenkinson, SLF Owen, P Davies, S Wang, N De Pennington, PC Hansen, J Stein, TZ Aziz, “Using
magnetoencephalography to investigate brain
activity during high frequency deep brain
stimulation in a cluster headache patient”, Biomedical Imaging and Intervention Journal, doi: 10.2349/biij.3.1.e25
[22] R. Labounek, M. Lamoš, R. Mareček, J. Jan,
“Analysis of Connections between Simultaneous
EEG and fMRI Data”, IWSSIP 2012, 11-13 April 2012, Vienna, Austria, ISBN 978-3-200-02328-4.
[23] Herve´ F. Achigui, Mohamad Sawan, Christian J.B. Fayomi, “A monolithic Based NIRS Front-end
Wireless Sensor”, Microelectronics Journal 39 (2008) 1209–1217.
[24] Emily B.J.Coffey, Anne-MarieBrouwer, EllenS.Wilschut, JanB.F.vanErp, “Brain–Machine
Interfaces In Space: Using Spontaneous Rather
Than Intentionally Generated Brain Signals”, Acta Astronautica 67 (2010) 1–11, doi:10.1016/j.actaastro.2009.12.016
21 http://sites.google.com/site/ijcsis/ ISSN 1947-5500
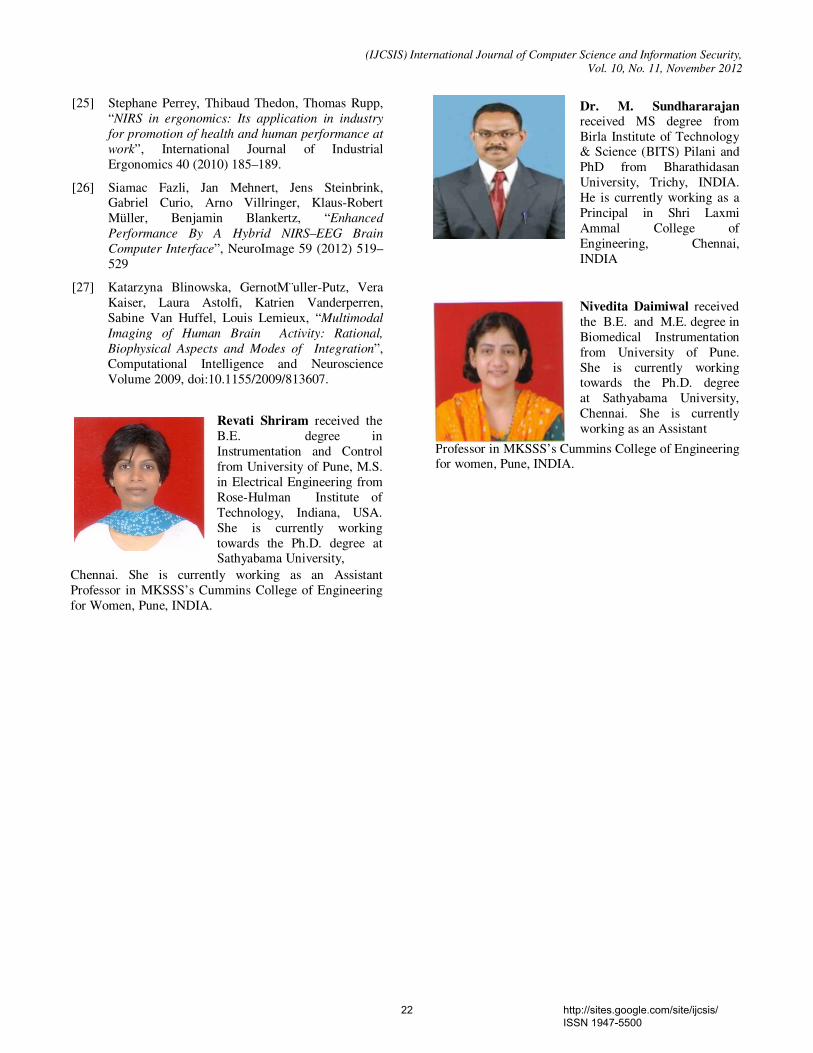
(IJCSIS) International Journal of Computer Science and Information Security,
Vol. 10, No. 11, November 2012
[25] Stephane Perrey, Thibaud Thedon, Thomas Rupp, “NIRS in ergonomics: Its application in industry
for promotion of health and human performance at
work”, International Journal of Industrial Ergonomics 40 (2010) 185–189.
[26] Siamac Fazli, Jan Mehnert, Jens Steinbrink, Gabriel Curio, Arno Villringer, Klaus-Robert Müller, Benjamin Blankertz, “Enhanced
Performance By A Hybrid NIRS–EEG Brain
Computer Interface”, NeuroImage 59 (2012) 519– 529
[27] Katarzyna Blinowska, GernotM¨uller-Putz, Vera Kaiser, Laura Astolfi, Katrien Vanderperren, Sabine Van Huffel, Louis Lemieux, “Multimodal
Imaging of Human Brain Activity: Rational,
Biophysical Aspects and Modes of Integration”, Computational Intelligence and Neuroscience Volume 2009, doi:10.1155/2009/813607.
Revati Shriram received the B.E. degree in Instrumentation and Control from University of Pune, M.S. in Electrical Engineering from Rose-Hulman Institute of Technology, Indiana, USA. She is currently working towards the Ph.D. degree at Sathyabama University, Chennai. She is currently working as an Assistant
Professor in MKSSS’s Cummins College of Engineering for Women, Pune, INDIA.
Nivedita Daimiwal received the B.E. and M.E. degree in Biomedical Instrumentation from University of Pune. She is currently working towards the Ph.D. degree at Sathyabama University, Chennai. She is currently working as an Assistant
Dr. M. Sundhararajan received MS degree from Birla Institute of Technology & Science (BITS) Pilani and PhD from Bharathidasan University, Trichy, INDIA. He is currently working as a Principal in Shri Laxmi Ammal College of Engineering, Chennai, INDIA
Professor in MKSSS’s Cummins College of Engineering for women, Pune, INDIA.
22 http://sites.google.com/site/ijcsis/ ISSN 1947-5500
(IJCSIS) International Journal of Computer Science and Information Security,
Vol. 10, No. 11, November 2012
Applications of fMRI for Brain Mapping
Nivedita Daimiwal1,2
1Research Scholar,Sathyabama University,Chennai, INDIA
2Cummins college of Engg. For Women, Pune
Dr.M.Sundhararajan Principal,Shri Laxmi Ammal Engineering
College,Chennai, INDIA [email protected]
Revati Shriram Cummins College of Engg. For
Women,Pune, INDIA [email protected]
Abstract— Brain-mapping techniques have proven to be vital in
understanding the molecular, cellular, and functional mechanisms
of the brain. Normal anatomical imaging can provide structural
information on certain abnormalities in the brain. However there
are many neurological disorders for which only structure studies
are not sufficient. In such cases it is required to investigate the
functional organization of the brain. Further it is necessary to
study the brain functions under normal as well as diseased
conditions. Brain mapping techniques can help in deriving useful
and important information on these issues. Brain functions and
brain area responsible for the particular activities like motor,
sensory speech and memory process could be investigated. The
authors provide an overview of various Brain Mapping techniques
and fMRI signal processing methods.
Keywords- Functional MRI (fMRI), Signal Processing,Brain
Mapping.
I. INTRODUCTION
Modern imaging has transformed practice in the clinical neurosciences by providing information about structural abnormalities in the brain non invasively. However many chronic neurological or psychiatric complaints confronted in the clinic (for example pain, movement, disorders, depression and psychosis) are not associated with structural abnormalities that can be detected in an individual patient with current clinical technologies. There are many approaches to measurement of functional changes in brain. While some method directly monitor electrical events in neurons, others by secondary effects of increased neuronal firing rates. Metabolic demand and the requisite changes in blood delivery are useful for localizing the sites and magnitude of brain activity. Several functional brain mapping techniques have been developed over the 3 decades which have revolutionized our ability to map activity in the living brain. [1, 22]
II. BRAIN MAPPING METHODS
A. Functional MRI (fMRI): Is one of the techniques that is used to identify the brain regions that are associated with certain motor or sensory tasks. The most common fMRI techniques used to capture functional images of the brain employs Blood Oxygenation level Dependent (BOLD) contrast. In the BOLD effect, a neural activity in the brain caused by some sensory or motor tasks produces localized changes in the blood flow and hence the resulting oxygenation level is subjected to variations. Whenever some task is performed, neuronal in these areas also increases followed by an increase in glucose and oxygen rates. The hemodynamic and metabolic changes associated with brain functions affect the deoxyhaemoglobin contents in the tissue. This gives rise to a contrast that can be detected using the MRI scanner. Functional activation in fMRI studies by mapping changes in cerebral venous oxygen concentration that correlate with neuronal activity. Such approaches require fast two dimensional brain imaging. Using echo planar imaging two dimensional slice data can be acquired in 40 ms with an in plane anatomical resolution of about 1 mm. thus functional maps of the human brain can be obtained without ionizing radiation or the administration of exogenous contrast material.[2]
B. Positron Emission Tomography (PET): RP (Radio pharmaceuticals) labeled with positron emitting radionuclides are used. Positron emitting radionuclides like C-11, N-13, O-15 & F-18 are used in PET RP, as all these are bio-molecules (F-18 mimics like Hydrogen). One of the stable bio-molecule can be replaced by positron emitting one to study the in-vivo biochemistry. PET plays vital role in Oncology, Cardiology and Neurology. Since all these radioisotopes are cyclotron produced and short lived it
23 http://sites.google.com/site/ijcsis/ ISSN 1947-5500
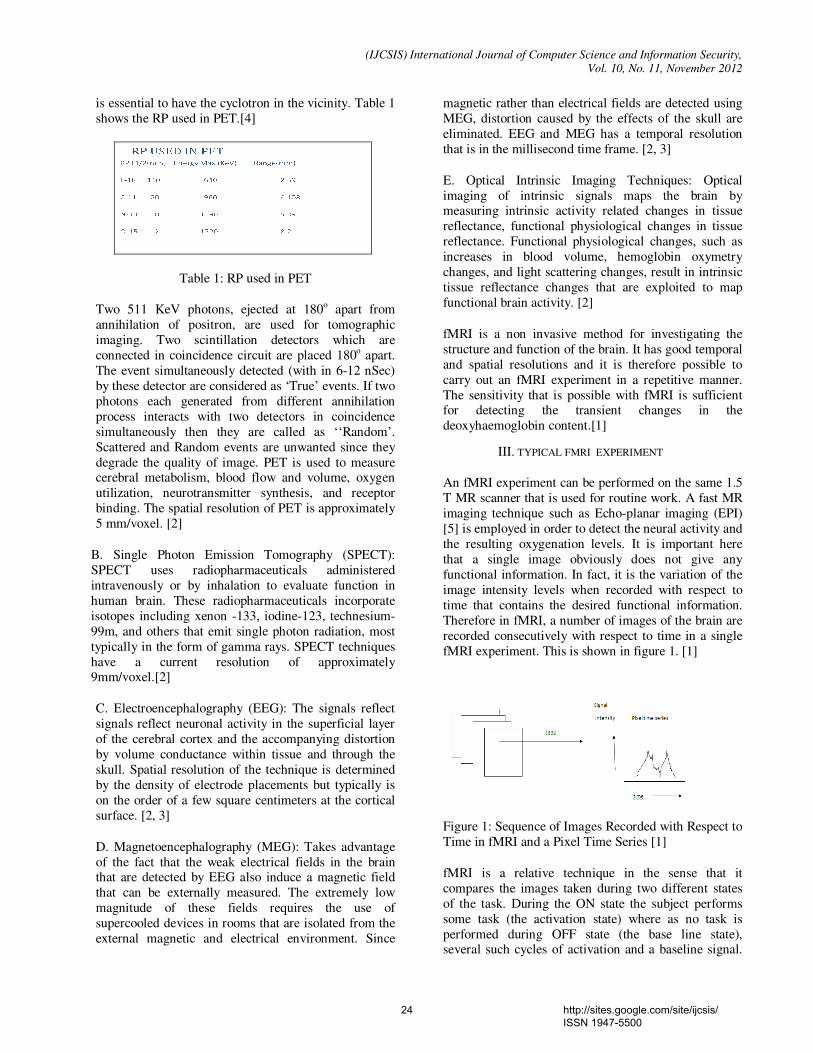
(IJCSIS) International Journal of Computer Science and Information Security,
Vol. 10, No. 11, November 2012
is essential to have the cyclotron in the vicinity. Table 1 shows the RP used in PET.[4]
Table 1: RP used in PET
Two 511 KeV photons, ejected at 180o apart from annihilation of positron, are used for tomographic imaging. Two scintillation detectors which are connected in coincidence circuit are placed 180o apart. The event simultaneously detected (with in 6-12 nSec) by these detector are considered as ‘True’ events. If two photons each generated from different annihilation process interacts with two detectors in coincidence simultaneously then they are called as ‘‘Random’. Scattered and Random events are unwanted since they degrade the quality of image. PET is used to measure cerebral metabolism, blood flow and volume, oxygen utilization, neurotransmitter synthesis, and receptor binding. The spatial resolution of PET is approximately 5 mm/voxel. [2]
B. Single Photon Emission Tomography (SPECT): SPECT uses radiopharmaceuticals administered intravenously or by inhalation to evaluate function in human brain. These radiopharmaceuticals incorporate isotopes including xenon -133, iodine-123, technesium-99m, and others that emit single photon radiation, most typically in the form of gamma rays. SPECT techniques have a current resolution of approximately 9mm/voxel.[2]
C. Electroencephalography (EEG): The signals reflect signals reflect neuronal activity in the superficial layer of the cerebral cortex and the accompanying distortion by volume conductance within tissue and through the skull. Spatial resolution of the technique is determined by the density of electrode placements but typically is on the order of a few square centimeters at the cortical surface. [2, 3]
D. Magnetoencephalography (MEG): Takes advantage of the fact that the weak electrical fields in the brain that are detected by EEG also induce a magnetic field that can be externally measured. The extremely low magnitude of these fields requires the use of supercooled devices in rooms that are isolated from the external magnetic and electrical environment. Since
magnetic rather than electrical fields are detected using MEG, distortion caused by the effects of the skull are eliminated. EEG and MEG has a temporal resolution that is in the millisecond time frame. [2, 3]
E. Optical Intrinsic Imaging Techniques: Optical imaging of intrinsic signals maps the brain by measuring intrinsic activity related changes in tissue reflectance, functional physiological changes in tissue reflectance. Functional physiological changes, such as increases in blood volume, hemoglobin oxymetry changes, and light scattering changes, result in intrinsic tissue reflectance changes that are exploited to map functional brain activity. [2]
fMRI is a non invasive method for investigating the structure and function of the brain. It has good temporal and spatial resolutions and it is therefore possible to carry out an fMRI experiment in a repetitive manner. The sensitivity that is possible with fMRI is sufficient for detecting the transient changes in the deoxyhaemoglobin content.[1]
III. TYPICAL FMRI EXPERIMENT
An fMRI experiment can be performed on the same 1.5 T MR scanner that is used for routine work. A fast MR imaging technique such as Echo-planar imaging (EPI) [5] is employed in order to detect the neural activity and the resulting oxygenation levels. It is important here that a single image obviously does not give any functional information. In fact, it is the variation of the image intensity levels when recorded with respect to time that contains the desired functional information. Therefore in fMRI, a number of images of the brain are recorded consecutively with respect to time in a single fMRI experiment. This is shown in figure 1. [1]
Figure 1: Sequence of Images Recorded with Respect to Time in fMRI and a Pixel Time Series [1]
fMRI is a relative technique in the sense that it compares the images taken during two different states of the task. During the ON state the subject performs some task (the activation state) where as no task is performed during OFF state (the base line state), several such cycles of activation and a baseline signal.
24 http://sites.google.com/site/ijcsis/ ISSN 1947-5500
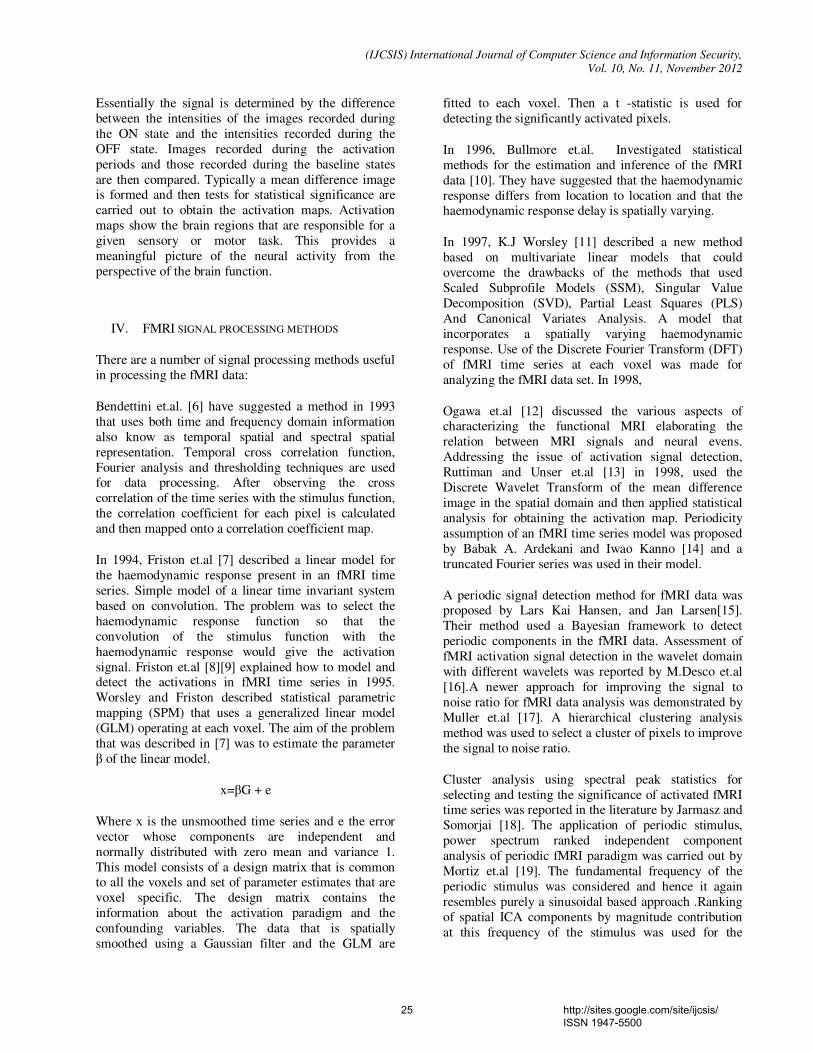
(IJCSIS) International Journal of Computer Science and Information Security,
Vol. 10, No. 11, November 2012
Essentially the signal is determined by the difference between the intensities of the images recorded during the ON state and the intensities recorded during the OFF state. Images recorded during the activation periods and those recorded during the baseline states are then compared. Typically a mean difference image is formed and then tests for statistical significance are carried out to obtain the activation maps. Activation maps show the brain regions that are responsible for a given sensory or motor task. This provides a meaningful picture of the neural activity from the perspective of the brain function.
IV. FMRI SIGNAL PROCESSING METHODS
There are a number of signal processing methods useful in processing the fMRI data:
Bendettini et.al. [6] have suggested a method in 1993 that uses both time and frequency domain information also know as temporal spatial and spectral spatial representation. Temporal cross correlation function, Fourier analysis and thresholding techniques are used for data processing. After observing the cross correlation of the time series with the stimulus function, the correlation coefficient for each pixel is calculated and then mapped onto a correlation coefficient map.
In 1994, Friston et.al [7] described a linear model for the haemodynamic response present in an fMRI time series. Simple model of a linear time invariant system based on convolution. The problem was to select the haemodynamic response function so that the convolution of the stimulus function with the haemodynamic response would give the activation signal. Friston et.al [8][9] explained how to model and detect the activations in fMRI time series in 1995. Worsley and Friston described statistical parametric mapping (SPM) that uses a generalized linear model (GLM) operating at each voxel. The aim of the problem that was described in [7] was to estimate the parameter β of the linear model.
x=βG + e
Where x is the unsmoothed time series and e the error vector whose components are independent and normally distributed with zero mean and variance 1. This model consists of a design matrix that is common to all the voxels and set of parameter estimates that are voxel specific. The design matrix contains the information about the activation paradigm and the confounding variables. The data that is spatially smoothed using a Gaussian filter and the GLM are
fitted to each voxel. Then a t -statistic is used for detecting the significantly activated pixels.
In 1996, Bullmore et.al. Investigated statistical methods for the estimation and inference of the fMRI data [10]. They have suggested that the haemodynamic response differs from location to location and that the haemodynamic response delay is spatially varying.
In 1997, K.J Worsley [11] described a new method based on multivariate linear models that could overcome the drawbacks of the methods that used Scaled Subprofile Models (SSM), Singular Value Decomposition (SVD), Partial Least Squares (PLS) And Canonical Variates Analysis. A model that incorporates a spatially varying haemodynamic response. Use of the Discrete Fourier Transform (DFT) of fMRI time series at each voxel was made for analyzing the fMRI data set. In 1998,
Ogawa et.al [12] discussed the various aspects of characterizing the functional MRI elaborating the relation between MRI signals and neural evens. Addressing the issue of activation signal detection, Ruttiman and Unser et.al [13] in 1998, used the Discrete Wavelet Transform of the mean difference image in the spatial domain and then applied statistical analysis for obtaining the activation map. Periodicity assumption of an fMRI time series model was proposed by Babak A. Ardekani and Iwao Kanno [14] and a truncated Fourier series was used in their model.
A periodic signal detection method for fMRI data was proposed by Lars Kai Hansen, and Jan Larsen[15]. Their method used a Bayesian framework to detect periodic components in the fMRI data. Assessment of fMRI activation signal detection in the wavelet domain with different wavelets was reported by M.Desco et.al [16].A newer approach for improving the signal to noise ratio for fMRI data analysis was demonstrated by Muller et.al [17]. A hierarchical clustering analysis method was used to select a cluster of pixels to improve the signal to noise ratio.
Cluster analysis using spectral peak statistics for selecting and testing the significance of activated fMRI time series was reported in the literature by Jarmasz and Somorjai [18]. The application of periodic stimulus, power spectrum ranked independent component analysis of periodic fMRI paradigm was carried out by Mortiz et.al [19]. The fundamental frequency of the periodic stimulus was considered and hence it again resembles purely a sinusoidal based approach .Ranking of spatial ICA components by magnitude contribution at this frequency of the stimulus was used for the
25 http://sites.google.com/site/ijcsis/ ISSN 1947-5500

(IJCSIS) International Journal of Computer Science and Information Security,
Vol. 10, No. 11, November 2012
detection purpose. Figure 2 shows the activation map. Colour pixels indicate the activated regions in the brain.
Figure 2: Activation map for one of the slices [20]
V. CLINICAL APPLICATIONS
• Examine the anatomy of the brain. • Determine precisely which part of the brain is
handling critical functions such as thought, speech, movement and sensation, which is called brain mapping.
• Help assess the effects of stroke, trauma or degenerative disease (such as Alzheimer's) on brain function.
• Monitor the growth and function of brain tumors. • Guide the planning of surgery, radiation therapy, or
other surgical treatments for the brain. [20][2]
VI. CONCLUSION
Neural activity and functional studies of the brain can be investigated with modalities like Positron Emission Tomography (PET), Single photon Emission Computed Tomography (SPECT), Magnetic Encephalography (MEG), and optical Imaging. All these modalities are compared briefly. fMRI is a non invasive method for investigating the structure and function of the brain. It has good temporal and spatial resolutions and it is therefore possible to carry out an fMRI experiment in a repetitive manner. fMRI based investigations, because of the safety, wide availability and extraordinary flexibility in terms of the application of this non ionizing imaging approach. Most recently, fMRI has emerged as a promising new extension of the technology for clinical neuroimaging.
ACKNOWLEDGMENT
The authors are grateful to Dr. Madhuri Khambete and Prof A. D. Gaikwad for their motivation, and help towards the completion of this paper, as well as for providing valuable advice.
We would also like to thank our colleagues from Instrumentation and Control Dept. of Cummins College of
Engineering for Women for their feedback during the discussions.
REFERENCES
[1] “Functional Magnetic Resonance Imaging”, novel transform method, Ajay V.Deshmukh, Vikram M.Gadre. [2 ]”Brain Mapping the Methods”, Arthur W. Toga, John C. Mazziotta [3] Dale,A.M., and Sereno, M.I.(1993).”Improved localization of critical activity by combining EEG and MEG with MRI cortical surface reconstruction –A linear approach “J.cognit.Neurosci.5,162-176. [4] Frackowiak, R.S., and Friston, K.J. (1994).Functional neuroanatomy of the human brain: Positron Emission tomography-A new neuroanatomical technique.J.Anat.184, 211-225. [5] Michal K.stehling, Robert turner, Peter Mansfield, ”Echo-planar Imaging Magnetic resonance imaging in a fraction of second”, Science,vol.254,pp.44-49. [6] P.A Bendettini, A.Jesmanowicz, E.C. Wong and J.S.Hyde,” Processing strategies for time course data sets in functional MRI of the human brain”, Magn.Reson.Med.
vol.30, pp.161-171, 1993.
[7] K.J.Friston, P.Jezzard and R.Turner,”Analysis of functional time series”, Hum. Brain Mapp.Vol.1, pp.153-
171, 1994.
[8]K.J.Friston, A.P.Holmes,J.B.Polin,B.J.Grasby,C.R.Williams,R.S.J.Frackowiiiak,nad R.Turner, ”Analysis of time series Revisited”, Neuroimage,vol.2,pp.45-53,1995.
[9] K.J.Friston, A.P.Holmes, K.J.Worsley, J.B.pline, C.D.frith, and R.S.J.Frackowiak,”Statistical Parametric Maps In Functional Imaging: A Generalized Linear Approach”. Human Brain Map. Vol.2.pp.189-210,1995. [10]E.T.Bullmore,M.J.Brammer,S.C.R.williams,S.Rabe-Henketh,N.Janot,A.david,et.al,”statistical Methods of estimation and Inference for Functional MR Image Analysis”,Magn.Reson.Med.,vol.35,pp 261-277,1996. [11] K.J.Worsley, J.B.Poline, K.J.Friston, and A.C.Evans,” Characterizing the response of PET and fMRI data using multivariate linear models”, Neuroimage,vol.6,pp.305-319,1997. [12] S.Ogawa, R.S.Menon, S.G.Kim, and K. Ugurbil, ”On the Characterizing o Functional Magnetic Resonance Imaging of the Brain”,Annu.Rev.Biomol.Struct.,vol.27,pp.447-474,1998. [13]Urs.E.Ruttimann, Michael Unser, Robert R.Rawlings, Daniel Rio, nick R.Ramsey, Venkata S.Mattay, Dniel W.Hommer, Oseph A.frank,and Daniel R.Wienberger, ”Statisitical Analysis of functional MRI data in the Wavelet domin”,IEEE Trans.Med.Imag.,vol.17,No2,pp.142-153,1998 [14]Babak A.Ardekani, and Iwao Kanno,” Statistical methods for detection activation regions in functional MRI brain”, Mag.Reson.Imag., Vol 16,No10,pp.1217-1255,1998.
26 http://sites.google.com/site/ijcsis/ ISSN 1947-5500

(IJCSIS) International Journal of Computer Science and Information Security,
Vol. 10, No. 11, November 2012
[15]Lars Kai Hansen, Nielsen and Jan Larsen,”Exploring fMRI Data for periodic Signal Components”, AI in
medicine, Vol25,no1,pp.35-44,2002 [16]M.Desco, J.A.Hernandez, A.Santosh and M.Brammer,”Multiresolution analysis in fMRI: “Sensitivity and Specificity in the Detection of Brain Activity”, Human
Brain Map., vol.14,pp.16-27,2001. [17]H.P.Muller, E.Kraft A.Lodolph, S.N.Erne, ”New methods in fMRI Analysis” IEEE Engg.Med. and Bio., pp134-142,2002 [18] M.Jarmasz, R.L. Somorjai,” Exploring regions of interest with clusters analysis using a spectral peak statistic for selecting and testing the significance of fMRI activation time series”’ AI in Medicine,VOL.25,45-67,2002 [19] Chad H.Moritz, Baxter P.Rogers, and M.Elizabeth Meyerand,”Power spectrum ranked independent component analysis of a periodic fMRI complex Motor paradigm”, Human Brain Mapping,vol.18,pp.111-122,2003. [20] “Functional Brain Mapping”, E. Mark Haacke, Ph.D.Washington University, St. Louis [21] Brain-Mapping Techniques for Evaluating Post stroke
Recovery and Rehabilitation: A Review [22]”Applications of fMRI in translational medicine and
clinical practice”, Paul M.Matthew, Garry D.Honey and Edward T.Bullmore, September 2006, volume7.
Received the B.E degree
Nivedita Daimiwal received the B.E and M.E Degree in Biomedical Instrumentation from Pune University. She is currently working towards the PhD from Sathyabama University, Chennai. She is currently working as an Assistant Professor in MKSSS’s Cummins College of Engineering for women, Pune, India.
Dr.M.Sundararanjan received the M.S Degree from Birla Institute of Technology & Science (BITS), Pilani and PhD from Bharathidasan University, Trichy, INDIA. He is Currently Principal in Shri Laxmi Ammal College of Enginnering, Chennai.
Revati Shriram received the BE Degree in Instrumentation and Control from University of Pune, MS in Electrical Engineering from Rose-Hulman Institute of Technology, Indiana, USA and she is currently working towards the PhD from Sathyabama University, Chennai.
She is currently working as an Assistant Professor in MKSSS’s Cummins College of Engineering for Women, Pune, INDIA
27 http://sites.google.com/site/ijcsis/ ISSN 1947-5500
(IJCSIS) International Journal of Computer Science and Information Security,
Vol. 10, No. 11, November 2012
Performance Evaluation of Orthogonal
Frequency Division Multiplexing (OFDM) based
Wireless Communication System with
implementation of Least Mean Square
Equalization technique
Farhana Enam
Assistant Professor
Dept. of Information & Communication Engineering
University of Rajshahi, Rajshahi,
Bangladesh
Md. Arif Rabbani
Dept. of Information & Communication Engineering
University of Rajshahi, Rajshahi,
Bangladesh
Md. Ashraful Islam
Lecturer
Dept. of Information & Communication Engineering
University of Rajshahi, Rajshahi, Bangladesh
e-mail: [email protected]
Sohag Sarkar
Dept. of Information & Communication Engineering
University of Rajshahi, Rajshahi,
Bangladesh
Abstract— Orthogonal Frequency Division Multiplexing
(OFDM) has recently been applied in wireless
communication systems due to its high data rate
transmission capability with high bandwidth efficiency and
its robustness to multi-path delay. Fading is the one of the
major aspect which is considered in the receiver. To cancel
the effect of fading, channel estimation and equalization
procedure must be done at the receiver before data
demodulation. This paper mainly deals with pilot based
channel estimation techniques for OFDM communication
over frequency selective fading channels. This paper
proposes a specific approach to channel equalization for
Orthogonal Frequency Division Multiplex (OFDM)
systems. Inserting an equalizer realized as an adaptive
system before the FFT processing, the influence of variable
delay and multi path could be mitigated in order to remove
or reduce considerably the guard interval and to gain some
spectral efficiency. The adaptive algorithm is based on
adaptive filtering with averaging (AFA) for parameter
update. Based on the development of a model of the OFDM
system, through extensive computer simulations, we
investigate the performance of the channel equalized
system. The results show much higher convergence and
adaptation rate compared to one of the most frequently
used algorithms - Least Mean Squares (LMS)
Keywords- LMS (Least Mean Square), Adaptive Equalizer,
OFDM, Fading Channel, AWGN Channel)
I. INTRODUCTION
Multimedia wireless services require high data-rate
transmission over mobile radio channels. Orthogonal
Frequency Division Multiplexing (OFDM) is widely
considered as a promising choice for future wireless
communications systems due to its high-data-rate transmission
capability with high bandwidth efficiency. In OFDM, the
entire channel is divided into many narrow subchannels,
converting a frequency-selective channel into a collection of
frequency-flat channels[1].Moreover, intersymbol interference
(ISI) is avoided by the use of cyclic prefix (CP), which is
achieved by extending an OFDM symbol with some portion of
its head or tail [2]. In fact, OFDM has been adopted in digital
audio broadcasting (DAB), digital video broadcasting (DVB),
digital subscriber line (DSL), and wireless local area network
(WLAN) standards such as the IEEE 802.11a/b/g/n [3–6]. It
has also been adopted for wireless broadband access standards
such as the IEEE 802.16e [7, 8, 9], and as the core technique
for the fourth-generation (4G) wireless mobile
Communications [10].To eliminate the need for channel
estimation and tracking, Quadrature phase-shift keying
(QPSK) can be used in OFDM systems. However, this result
in a 3 dB loss in signal-to-noise ratio (SNR) compared with
coherent demodulation such as phase-shift keying (PSK) [11].
The performance of OFDM systems can be improved by
allowing for coherent demodulation when an accurate channel
estimation technique is used. Channel estimation techniques
for OFDM systems can be grouped into two categories: blind
28 http://sites.google.com/site/ijcsis/ ISSN 1947-5500
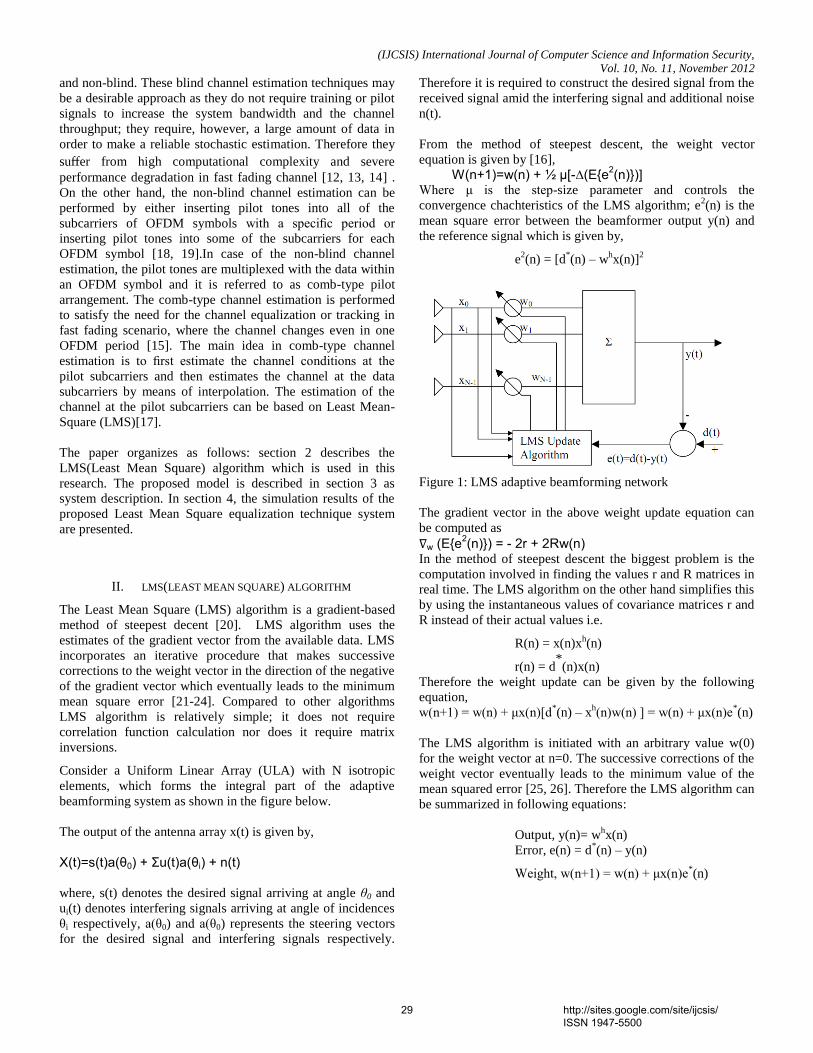
(IJCSIS) International Journal of Computer Science and Information Security,
Vol. 10, No. 11, November 2012
and non-blind. These blind channel estimation techniques may
be a desirable approach as they do not require training or pilot
signals to increase the system bandwidth and the channel
throughput; they require, however, a large amount of data in
order to make a reliable stochastic estimation. Therefore they
suffer from high computational complexity and severe
performance degradation in fast fading channel [12, 13, 14] .
On the other hand, the non-blind channel estimation can be
performed by either inserting pilot tones into all of the
subcarriers of OFDM symbols with a specific period or
inserting pilot tones into some of the subcarriers for each
OFDM symbol [18, 19].In case of the non-blind channel
estimation, the pilot tones are multiplexed with the data within
an OFDM symbol and it is referred to as comb-type pilot
arrangement. The comb-type channel estimation is performed
to satisfy the need for the channel equalization or tracking in
fast fading scenario, where the channel changes even in one
OFDM period [15]. The main idea in comb-type channel
estimation is to first estimate the channel conditions at the
pilot subcarriers and then estimates the channel at the data
subcarriers by means of interpolation. The estimation of the
channel at the pilot subcarriers can be based on Least Mean-
Square (LMS)[17].
The paper organizes as follows: section 2 describes the
LMS(Least Mean Square) algorithm which is used in this
research. The proposed model is described in section 3 as
system description. In section 4, the simulation results of the
proposed Least Mean Square equalization technique system
are presented.
II. LMS(LEAST MEAN SQUARE) ALGORITHM
The Least Mean Square (LMS) algorithm is a gradient-based
method of steepest decent [20]. LMS algorithm uses the
estimates of the gradient vector from the available data. LMS
incorporates an iterative procedure that makes successive
corrections to the weight vector in the direction of the negative
of the gradient vector which eventually leads to the minimum
mean square error [21-24]. Compared to other algorithms
LMS algorithm is relatively simple; it does not require
correlation function calculation nor does it require matrix
inversions.
Consider a Uniform Linear Array (ULA) with N isotropic
elements, which forms the integral part of the adaptive
beamforming system as shown in the figure below.
The output of the antenna array x(t) is given by,
X(t)=s(t)a(θ0) + Σu(t)a(θi) + n(t) where, s(t) denotes the desired signal arriving at angle θ0 and
ui(t) denotes interfering signals arriving at angle of incidences
θi respectively, a(θ0) and a(θ0) represents the steering vectors
for the desired signal and interfering signals respectively.
Therefore it is required to construct the desired signal from the
received signal amid the interfering signal and additional noise
n(t).
From the method of steepest descent, the weight vector
equation is given by [16],
W(n+1)=w(n) + ½ µ[-∆(E{e2(n)})]
Where μ is the step-size parameter and controls the
convergence chachteristics of the LMS algorithm; e2(n) is the
mean square error between the beamformer output y(n) and
the reference signal which is given by,
e2(n) = [d
*(n) – w
hx(n)]
2
Figure 1: LMS adaptive beamforming network
The gradient vector in the above weight update equation can
be computed as
∇w (E{e2(n)}) = - 2r + 2Rw(n) In the method of steepest descent the biggest problem is the
computation involved in finding the values r and R matrices in
real time. The LMS algorithm on the other hand simplifies this
by using the instantaneous values of covariance matrices r and
R instead of their actual values i.e.
R(n) = x(n)xh(n)
r(n) = d*(n)x(n)
Therefore the weight update can be given by the following
equation,
w(n+1) = w(n) + μx(n)[d*(n) – x
h(n)w(n) ] = w(n) + μx(n)e
*(n)
The LMS algorithm is initiated with an arbitrary value w(0)
for the weight vector at n=0. The successive corrections of the
weight vector eventually leads to the minimum value of the
mean squared error [25, 26]. Therefore the LMS algorithm can
be summarized in following equations:
Output, y(n)= whx(n)
Error, e(n) = d*(n) – y(n)
Weight, w(n+1) = w(n) + μx(n)e*(n)
29 http://sites.google.com/site/ijcsis/ ISSN 1947-5500
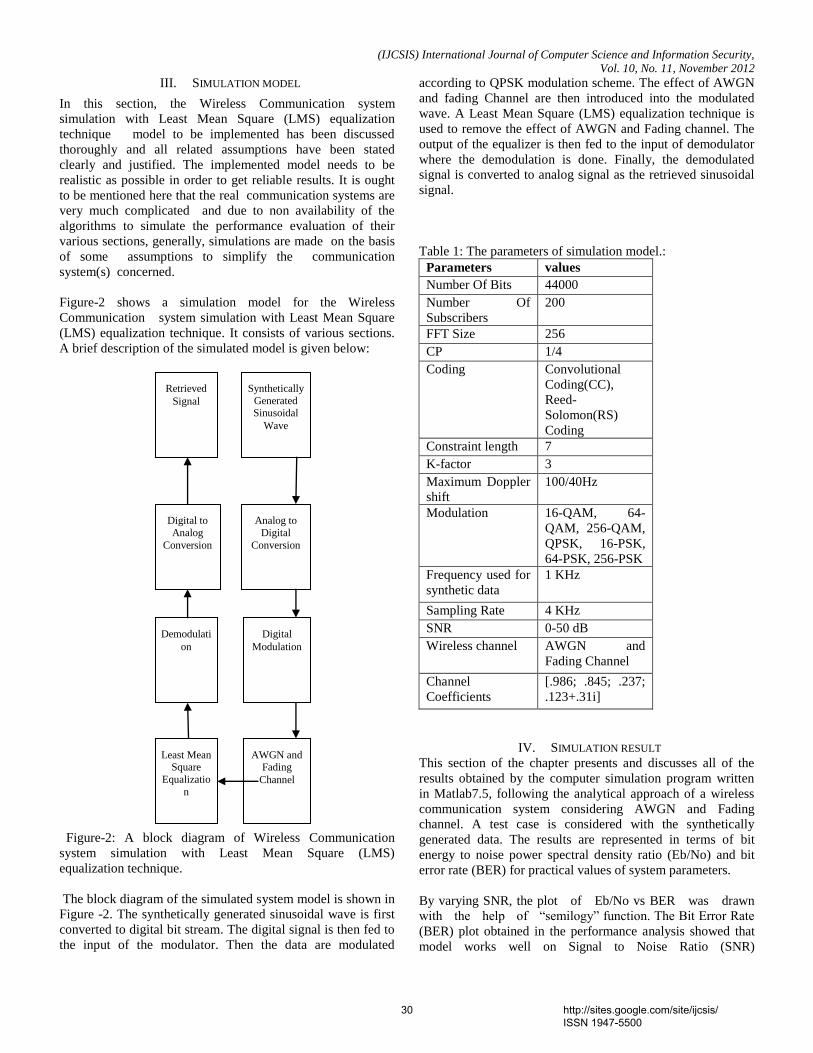
(IJCSIS) International Journal of Computer Science and Information Security,
Vol. 10, No. 11, November 2012
III. SIMULATION MODEL
In this section, the Wireless Communication system
simulation with Least Mean Square (LMS) equalization
technique model to be implemented has been discussed
thoroughly and all related assumptions have been stated
clearly and justified. The implemented model needs to be
realistic as possible in order to get reliable results. It is ought
to be mentioned here that the real communication systems are
very much complicated and due to non availability of the
algorithms to simulate the performance evaluation of their
various sections, generally, simulations are made on the basis
of some assumptions to simplify the communication
system(s) concerned.
Figure-2 shows a simulation model for the Wireless
Communication system simulation with Least Mean Square
(LMS) equalization technique. It consists of various sections.
A brief description of the simulated model is given below:
Figure-2: A block diagram of Wireless Communication
system simulation with Least Mean Square (LMS)
equalization technique.
The block diagram of the simulated system model is shown in
Figure -2. The synthetically generated sinusoidal wave is first
converted to digital bit stream. The digital signal is then fed to
the input of the modulator. Then the data are modulated
according to QPSK modulation scheme. The effect of AWGN
and fading Channel are then introduced into the modulated
wave. A Least Mean Square (LMS) equalization technique is
used to remove the effect of AWGN and Fading channel. The
output of the equalizer is then fed to the input of demodulator
where the demodulation is done. Finally, the demodulated
signal is converted to analog signal as the retrieved sinusoidal
signal.
Table 1: The parameters of simulation model.:
Parameters values
Number Of Bits 44000
Number Of
Subscribers
200
FFT Size 256
CP 1/4
Coding Convolutional
Coding(CC),
Reed-
Solomon(RS)
Coding
Constraint length 7
K-factor 3
Maximum Doppler
shift
100/40Hz
Modulation 16-QAM, 64-
QAM, 256-QAM,
QPSK, 16-PSK,
64-PSK, 256-PSK
Frequency used for
synthetic data
1 KHz
Sampling Rate 4 KHz
SNR 0-50 dB
Wireless channel AWGN and
Fading Channel
Channel
Coefficients
[.986; .845; .237;
.123+.31i]
IV. SIMULATION RESULT
This section of the chapter presents and discusses all of the
results obtained by the computer simulation program written
in Matlab7.5, following the analytical approach of a wireless
communication system considering AWGN and Fading
channel. A test case is considered with the synthetically
generated data. The results are represented in terms of bit
energy to noise power spectral density ratio (Eb/No) and bit
error rate (BER) for practical values of system parameters.
By varying SNR, the plot of Eb/No vs BER was drawn
with the help of ―semilogy‖ function. The Bit Error Rate
(BER) plot obtained in the performance analysis showed that
model works well on Signal to Noise Ratio (SNR)
Synthetically
Generated Sinusoidal
Wave
Analog to
Digital
Conversion
Digital
Modulation
AWGN and Fading
Channel
Least Mean Square
Equalizatio
n
Demodulati
on
Digital to
Analog
Conversion
Retrieved
Signal
30 http://sites.google.com/site/ijcsis/ ISSN 1947-5500

(IJCSIS) International Journal of Computer Science and Information Security,
Vol. 10, No. 11, November 2012
less than 50 dB. Simulation results in figure-3 and figure-4
shows the performance of the system over AWGN and
fading channels using QPSK, 16-PSK, 64-PSK, 256-PSK, 16-
QAM, 64-QAM and 256-QAM modulation schemes
respectively.
From figure-2, it is observed that the BER performance of the
system with implementation of Least Mean Square algorithm
(LMS) in QPSK outperforms as compared to other digital
modulations. The system shows worst performance in 256
PSK. For a typical SNR value of 10dB, the system
performance is improved by 8.26 dB. It is also noticeable that
the system performance degrades with increase of order of
modulation.
Figure-2: BER performance of a Wireless Communication System fewer than seven types of digital modulations over AWGN channel.
Figure-3: BER performance of a Wireless Communication
System under different modulation schemes under fading
channel
Figure-3 shows the BER performance of a Wireless Communication System under different modulation schemes under fading channel. From figure-3, it is also observed that the BER performance of the system with implementation of Least Mean Square algorithm (LMS) in QPSK is better as compared to other digital modulations. The system shows worst performance in 256 PSK. For a typical SNR value of 10dB, the
system performance is improved by 4.511dB. It is also noticeable that the system performance degrades with increase of order of modulation.
V. CONCLUTION
In this research work, it has been studied the performance of
an OFDM based wireless communication system with
implementation of Least Mean square equalization technique
and different digital modulation schemes. A range of system
performance results highlights the impact of digital
modulations in AWGN and fading channels. From the present
study it is found that the system performance is improved
7.36dB for QPSK modulation at SNR 9dB, 7.113dB for
64PSK modulation at SNR 31dB, 12.04dB for 64QAM
modulation at SNR 22dB, 3.375dB for 16QAM modulation at
SNR 15dB and 3.988dB for 256PSK modulation than uncoded
situation over AWGN channel.
In the case of fading channel the system performance is
improved 4.511dB for QPSK modulation at SNR 10dB,
7.203dB for 16PSK modulation at SNR 25dB, 7.964dB for
64PSK modulation at SNR 37dB, 6.0588dB for 16PSK
modulation at SNR 22dB and 11.18dB for 256PSK
modulation at SNR 47dB than uncoded situation.
In the present study, it has been observed that the OFDM, an
elegant and effective multi carrier technique sed FEC encoded
wireless communication system can overcome multipath
distortion. In Bangladesh, WiMAX technology is going to be
implemented and its physical layer is based on OFDM. The
present work can be extended in MIMO-OFDM technology to
ensure high data rate transmission.
REFERENCES
[1] [Engels. M, 2002] M. Engels. Wireless OFDM Systems: How to Make
Them Work? Kluwer AcademicPublishers, 2002.
[2] IEEE Standard 802.11a 1999, Wireless LAN Medium Access Control (MAC) andPhysical Layer (PHY) Specifications: High-speed Physical Layer in the 5GHz Band.IEEE, September 1999. IEEE Standard 802.11b 1999.
[3] [IEEE, 1999] Wireless LAN Medium Access Control (MAC) and Physical Layer (PHY) Specifications: High-speed Physical Layer in the 2.4GHz Band.IEEE, September 1999.
[4] IEEE Standard 802.11g 2003. Wireless LAN Medium Access Control (MAC) and physical Layer (PHY) Specifications: Future Higher Data Rate Extension in the 2.4 GHz Band. IEEE, September 2003.
[5] IEEE Standard 802.11nD2.00 2007. Wireless LAN Medium Access Control (MAC) and Physical Layer (PHY) Specifications: Enhancements for Higher Throughput. IEEE, September 2007.
[6] IEEE Standard 802.16e 2005. Local and Metropolitan Area Networks - Part 16, Air Interface for Fixed Broadband Wireless Access Systems. IEEE, September 2005.
[7] [Kopman et al, 2002] I. Kopman and V. Roman. Broadband wireless access solutions based on OFDM access in IEEE 802.16. EEE Commun. Mag., 51(6):96–103, June 2002.
[8] J. Proakis. Digital Communications. McGraw-Hill, 1989.
[9] R. Zhang A. P. Petropulu and R. Lin. Blind ofdm channel estimation through simple linear precoding. IEEE Trans. Wireless Commun., 3(2):647–655, Mar. 2004.
31 http://sites.google.com/site/ijcsis/ ISSN 1947-5500
(IJCSIS) International Journal of Computer Science and Information Security,
Vol. 10, No. 11, November 2012 [10] [Athaudage ea al, 2004] C. R. N. Athaudage and A. D. S. Jayalath.
Enhanced mmse channel estimation using timing error statistics for wireless ofdm systems. IEEE Trans. Broadcast., 50(4), Dec.2004.
[11] X. You J. Wang B. Han, X. Gao and E. Costa, "An iterative joint channel estimation and symbol detection algorithm applied in OFDMsystem with high data to pilot power ratio",In Proc. IEEE Int’l. Conf. Commun., volume 3, pages 2076–2080, Anchorage, AK, May 2003.
[12] F. Gao and A. Nallanathan, "Blind channel estimation for ofdm systems via a gener- alized precoding",IEEE Trans Vehicular Technol, 56(3):1155–1164, May 2007.
[13] ] L. Tong and S. Perreau. Multichannel blind identification: From subspace to maximum likelihood methods. In Proc. IEEE, volume 86, pages 1951–1968, Oct. 1998.
[14] [Muquet et al, 2002] B. Muquet S. Zhou and G. B. Giannakis,"Subspace-based (semi-) blind channel esti- mation for block precoded space-time ofdm", IEEE Trans Signal Process., 50(5):1215–1228, May 2002.
[15] R. Zhang"Blind OFDM channel estimation through linear precoding: A subspace approach", In Proc 36th Asilomar Conf, Pacific Grove, CA., pages 631–633, Nov.2002.
[16] L. Hanzo B. J. Choi, T. Keller and M. Munster. OFDM and MC-CDMA for Broadband Multi-User Communications, WLANs and Broadcasting. Wiley-IEEE Press, Aug.2003.
[17] [Petropulu et al. 2002] A. P. Petropulu and R. Zhang, "Blind channel estimation for OFDM systems", In Proc. DSP/SPE, Atlanta, GA, pages 366–370, Oct. 2002.
[18] X. Cai and A. N. Akansu, "A subspace method for blind channel identification in OFDM systems", In Proc, ICC, pages 929–933, New Orleans, LA, Jul. 2000.
[19] J. Cardoso E. Moulines, P. Duhamel and S. Mayrargue, "Subspace methods for the blind identification of multichannel fir filters", IEEE Trans. Signal Process, 43(2):516–525, Feb, 1995.
[20] R.W. Heath and G. B. Giannakis. Exploiting input cyclostationarity for blind channel identification in ofdm systems. IEEE Trans. Signal Process., 47:848–856, Mar 1999.
[21] B. Muquet and M. de Courville. Blind and semi-blind channel identification methods using second order statistics for OFDM systems. In Proc. SPAWC, volume 5, pages 170–173, Annapolis, MD, May 1999.
[22] Z. Ding X. Zhuang and A. L. Swindlehurst, "A statistical subspace method for blind channel identification in OFDM communications", In Proc, ICASSP, volume 5, pages2493–2496, 2000.
[23] C. Li and S. Roy, "Subspace-based blind channel estimation for ofdm by exploitingvirtural carriers", IEEE Trans Wireless Commun, 2(1):141–150, Jan. 2003.
[24] [Wu et al. 2003] S. Wu and Y. Bar-Ness. OFDM channel estimation in the presence of frequency opset and phase noise. In Proc. IEEE Int’l. Conf. Commun., pages 3366–70, May 2003.
[25] S. Roy Y. Song and L. A. Akers,"Joint blind estimation of channel and data symbolsin OFDM", In Proc IEEE VTC 2000, volume 1, pages 46–50, Tokyo,2000.
[26] Theodore S.Rappaport, ―Wireless Communication Principles and Practice‖, Second Edition, Pearson Education, Inc, 2004, ISBN 81-7808-648-4.
32 http://sites.google.com/site/ijcsis/ ISSN 1947-5500
(IJCSIS) International Journal of Computer Science and Information Security, Vol. 10, No. 11, 2012
Microcontroller Based Security System: An electronic application for fire monitoring and surveillance
Md. Fasiul Alam
MSc. In Electronic System engineering
Politecnico di Milano
Milan, Italy
Email: [email protected]
Helena Bulbul
Assistant Professor,
United International University
Dhaka, Bangladesh
Email: [email protected]
Md. Delwar Hossain
Assistant communication engineer
Boishaki International Television ltd.
Dhaka, Bangladesh
Email: [email protected]
Abstract— The importance of electronic security is now an
important term in the global world. Due to the lack of modern
security equipments we often face problems and lose our valuable
assets. Though there are some security system are available in the
market but wireless system are not so common and economic to
us. Therefore, a Microcontroller Based Security System has been
developed to recover that limitation. It can be used for ensuring
fire security in Offices, Banks, Apartments, Industry and so on.
The system detects the fire fault situation and inform
automatically to the desired destination without any human
intervention. Microcontroller Based Security System is an
intelligent stand alone system with proven performance and
stability. The aim of an engineering design is to produce
maximum output with minimum cost involved. According to that,
our designed system involves low cost yet offers better
performance in comparison to other security system available.
Microcontroller is the heart in our security system which is
interfaced with smoke sensors, SIMCom GSM Module, alarm
circuit and LCD display unit. The important feature of the
project are it can easily specify the location where the fire
occurred and it instructs the SIMCom GSM Module to send SMS
to the desired end for taking necessary action immediately. The
results obtained stand as a proof of concept for the credibility of
implementing wireless based Security System. Achieved result of
the project encouraging to us.
Keywords-Microcontroller, security, sensors, alarm, GPS, GSM
I. INTRODUCTION
Recently, applications of Microcontroller [1] based device continue to rise more than ever before. Furthermore, with the increase of that devices application in recent year, the Microcontroller is the only specification targeted at this new market. A Microcontroller is a chip, containing processor, memory and input/output function though in smaller capacity. It is a microprocessor emphasizing high integration, in contrast
The research project is completed by partial funding from United International University (UIU), Dhaka, Bangladesh.
to a general purpose microprocessor. In addition to usual arithmetic and logic element of general purpose microprocessor, it integrates additional elements such as read & writes memory for data storage, read only memory for program storage, EEPROM for reprogramming, peripheral device and input and output interface. A few MHz clock speeds Microcontroller often operate at very low speed compared to the modern microprocessor, but this is adequate for typical applications. It consumes relatively low power (mw); it has sleep and wake up options etc. Microcontrollers are frequently used in automatically controlled products and devices such as automobile engine control system, remote controls, office machines, appliances, programmable interval timer, power tools and toys and analog to digital and digital to analog converter etc. By reducing the size, cost and power consumption compared to a design using a separate microprocessor, memory, input/ output device, microcontroller makes it economical to electronically control many more processes. The proposed system offers unparalleled confidence and security thanks to a unique dual-network system that continually monitors our houses. Every houses protected by smart monitoring is constantly monitored in real time from central monitoring station. If an alert is triggered by the system, they'll know about it instantly. The system checks itself continuously to ensure that it's working properly, and that the network connection is functioning properly. That means user can relax, knowing their houses is always connected, protected and safe. Microcontroller is the heart of our designed security system which is interfaced with smoke sensors, GSM Module, alarm circuit and display unit. Smoke sensor sense the smoke particle and give signal to the Microcontroller. Microcontroller test different situation of the smoke detector and gives output to the alarm circuit as well as display unit for different conditions of the security system. The designed system can also easily identify location. The overall objectives of this security system involves: to save our valuable asset, interface a Microcontroller with different electronic devices, to implement the idea with low infrastructure porting to more standard and power-full OS like portable SW architecture, to get area’s information automatically without any human intervention, to establish GSM/GPRS Capability.
33 http://sites.google.com/site/ijcsis/ ISSN 1947-5500

(IJCSIS) International Journal of Computer Science and Information Security, Vol. 10, No. 11, 2012
II. SYSTEM SETUP
A. Block Diagram:
In order to fulfill the aim of the project, it is necessary to drive the hardware architecture design based on the understanding of the communication link and to send message. Different hardware components interacting with each other to achieve this goal. In our project, we used ATMega32 Microcontroller [1] which plays a role of heart in the project. It takes decision based on different situations received as logical changes in its port. It is simply a highly integrated chip that contains all the components comprising Controller. Typically this includes a CPU, RAM, ROM, I/O ports, Digital Communication Modules, Timers and other integrated components. The overall design of the project is shown in the fig: 1 block diagram A smoke detector or smoke alarm [2] is devices that detects smoke and confirm that there is a potential fire. A household smoke detector will typically be mounted in a disk shaped plastic enclosure about 150 mm in diameter and 25 mm thick, but the shape can vary by manufacturer. Because smoke rises, most detectors are mounted on the ceiling or on a wall near the ceiling. To avoid the nuisance of false alarms, most smoke detectors are mounted away from kitchens. To increase the chances of waking sleeping occupants, most homes have at least one smoke detector near any bedrooms; ideally in a hallway as well as in the bedroom itself. Smoke detectors are usually powered by one or more batteries but some can be connected directly to household wiring. Often smoke detectors that are directly connected to household wiring also have a battery as a power supply backup in case the household wiring goes out. It is usually necessary to replace the batteries once a year to ensure appropriate protection. Smoke detectors are placed in different positions in an area.
SIM 508c [3] is a dual band GSM/GPRS engine works on frequencies EGSM 900 MHz/DCS 1800 MHz. SIM508C also supports GPS technology for satellite navigation. SIM508C provides GPRS multi-slot class10 capabilities and supports the GPRS coding schemes CS-1, CS-2, CS-3 and CS4. With a tiny configuration of 50mm x 33mm x 8.8mm, SIM508C can meet almost all the space requirement in our application, such as smart phone, PDA phone, GPS hand-held device and other mobile device, or application of AVL, location service and so on. The physical interface to the mobile application is a 60-pin board to board connector, which provides all hardware interfaces between the module and microcontroller except the RF antenna included two microphone inputs and two speakers’ output, charge interface, GSM RF antenna interface with alternative antenna connector and antenna pad, low power consumption, it is integrated with TCP/IP protocol and extended TCP/IP AT command.
III . WORKING PROCEDURE
In figure 3, the overall schematic connection has shown. Smoke sensors/detectors are placed in different locations which are connected to the Microcontroller input ports. When smoke detector sense smoke, it generate signal which is applied to the port B of Microcontroller.
To maintain logical low (0) at port B of the Microcontroller, initially Port B is connected to ground by a 4.7k resistor. When port B gets logical high signal (1) from the smoke detector at that time a logical change (0 to 1) is occurred at port B of the Microcontroller. Microcontroller continuously scans its port B. When any logical changes (0 to 1) at port B occurred, Microcontroller detects which pin of port B changes its logical state. Suppose smoke detector one to eight’s outputs are connected to pin 1 to pin 8 of the port B respectively. Now if detector number three, detector number five and detector number six detect fire, then pins B3, B5 and B6 get logical changes (0 to 1). At that time, Microcontroller executes the following condition in its software routine.
Fig. 1: Block diagram of the project
Fig. 2: Flow chart of the project
Start
Initialization
IF Fire
Detect
LCD Shows
Normal
Green LED
ON
Red LED
ON
LCD Shows Fire
Fire Alarm ON
Message
Send to Fire
Service
Reset the
System IF Fault
Clear
Scan Detectors
34 http://sites.google.com/site/ijcsis/ ISSN 1947-5500
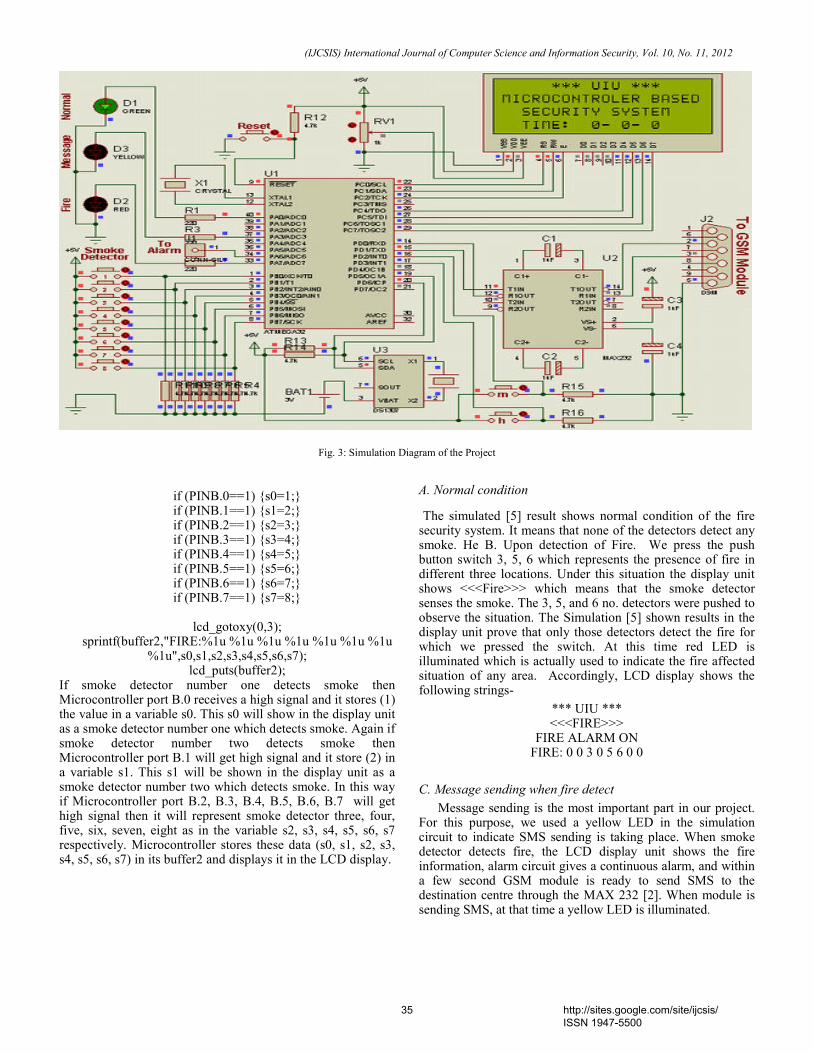
(IJCSIS) International Journal of Computer Science and Information Security, Vol. 10, No. 11, 2012
Fig. 3: Simulation Diagram of the Project
if (PINB.0==1) {s0=1;} if (PINB.1==1) {s1=2;} if (PINB.2==1) {s2=3;} if (PINB.3==1) {s3=4;} if (PINB.4==1) {s4=5;} if (PINB.5==1) {s5=6;} if (PINB.6==1) {s6=7;} if (PINB.7==1) {s7=8;}
lcd_gotoxy(0,3);
sprintf(buffer2,"FIRE:%1u %1u %1u %1u %1u %1u %1u %1u",s0,s1,s2,s3,s4,s5,s6,s7);
lcd_puts(buffer2); If smoke detector number one detects smoke then Microcontroller port B.0 receives a high signal and it stores (1) the value in a variable s0. This s0 will show in the display unit as a smoke detector number one which detects smoke. Again if smoke detector number two detects smoke then Microcontroller port B.1 will get high signal and it store (2) in a variable s1. This s1 will be shown in the display unit as a smoke detector number two which detects smoke. In this way if Microcontroller port B.2, B.3, B.4, B.5, B.6, B.7 will get high signal then it will represent smoke detector three, four, five, six, seven, eight as in the variable s2, s3, s4, s5, s6, s7 respectively. Microcontroller stores these data (s0, s1, s2, s3, s4, s5, s6, s7) in its buffer2 and displays it in the LCD display.
A. Normal condition
The simulated [5] result shows normal condition of the fire security system. It means that none of the detectors detect any smoke. He B. Upon detection of Fire. We press the push button switch 3, 5, 6 which represents the presence of fire in different three locations. Under this situation the display unit shows <<<Fire>>> which means that the smoke detector senses the smoke. The 3, 5, and 6 no. detectors were pushed to observe the situation. The Simulation [5] shown results in the display unit prove that only those detectors detect the fire for which we pressed the switch. At this time red LED is illuminated which is actually used to indicate the fire affected situation of any area. Accordingly, LCD display shows the following strings-
*** UIU *** <<<FIRE>>>
FIRE ALARM ON FIRE: 0 0 3 0 5 6 0 0
C. Message sending when fire detect
Message sending is the most important part in our project. For this purpose, we used a yellow LED in the simulation circuit to indicate SMS sending is taking place. When smoke detector detects fire, the LCD display unit shows the fire information, alarm circuit gives a continuous alarm, and within a few second GSM module is ready to send SMS to the destination centre through the MAX 232 [2]. When module is sending SMS, at that time a yellow LED is illuminated.
35 http://sites.google.com/site/ijcsis/ ISSN 1947-5500
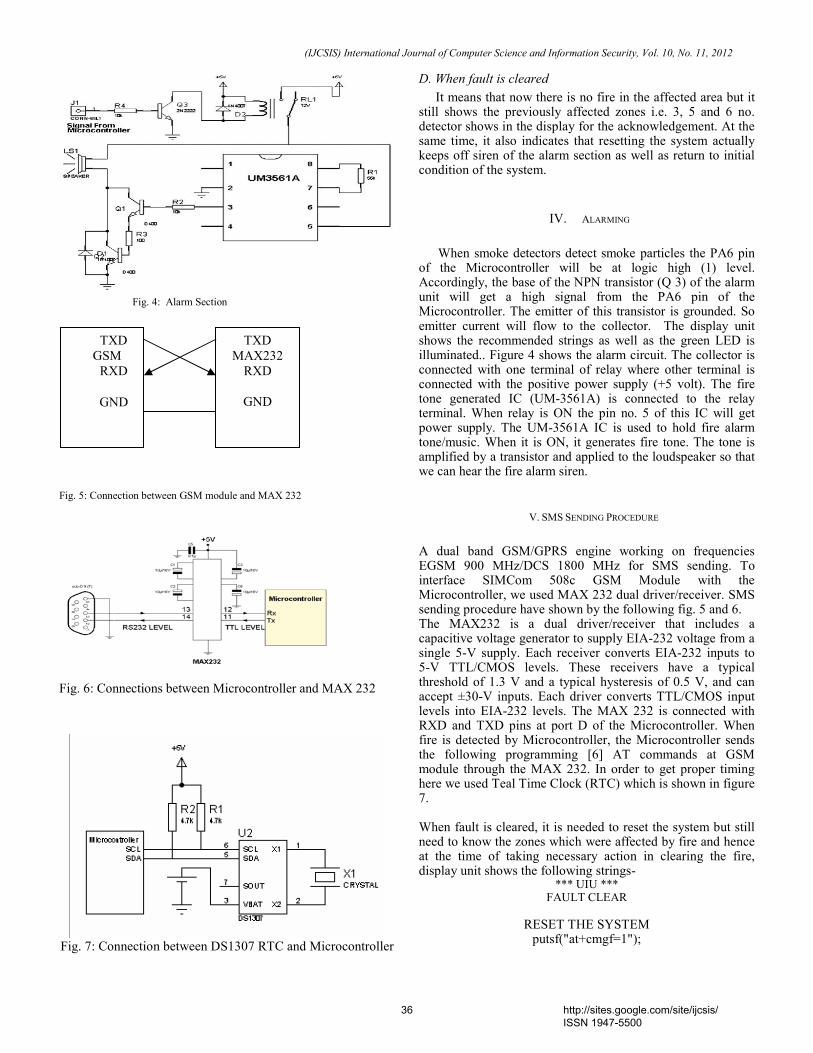
(IJCSIS) International Journal of Computer Science and Information Security, Vol. 10, No. 11, 2012
Fig. 4: Alarm Section
Fig. 5: Connection between GSM module and MAX 232
Fig. 6: Connections between Microcontroller and MAX 232
Fig. 7: Connection between DS1307 RTC and Microcontroller
D. When fault is cleared
It means that now there is no fire in the affected area but it still shows the previously affected zones i.e. 3, 5 and 6 no. detector shows in the display for the acknowledgement. At the same time, it also indicates that resetting the system actually keeps off siren of the alarm section as well as return to initial condition of the system.
IV. ALARMING
When smoke detectors detect smoke particles the PA6 pin
of the Microcontroller will be at logic high (1) level. Accordingly, the base of the NPN transistor (Q 3) of the alarm unit will get a high signal from the PA6 pin of the Microcontroller. The emitter of this transistor is grounded. So emitter current will flow to the collector. The display unit shows the recommended strings as well as the green LED is illuminated.. Figure 4 shows the alarm circuit. The collector is connected with one terminal of relay where other terminal is connected with the positive power supply (+5 volt). The fire tone generated IC (UM-3561A) is connected to the relay terminal. When relay is ON the pin no. 5 of this IC will get power supply. The UM-3561A IC is used to hold fire alarm tone/music. When it is ON, it generates fire tone. The tone is amplified by a transistor and applied to the loudspeaker so that we can hear the fire alarm siren.
V. SMS SENDING PROCEDURE
A dual band GSM/GPRS engine working on frequencies EGSM 900 MHz/DCS 1800 MHz for SMS sending. To interface SIMCom 508c GSM Module with the Microcontroller, we used MAX 232 dual driver/receiver. SMS sending procedure have shown by the following fig. 5 and 6. The MAX232 is a dual driver/receiver that includes a capacitive voltage generator to supply EIA-232 voltage from a single 5-V supply. Each receiver converts EIA-232 inputs to 5-V TTL/CMOS levels. These receivers have a typical threshold of 1.3 V and a typical hysteresis of 0.5 V, and can accept ±30-V inputs. Each driver converts TTL/CMOS input levels into EIA-232 levels. The MAX 232 is connected with RXD and TXD pins at port D of the Microcontroller. When fire is detected by Microcontroller, the Microcontroller sends the following programming [6] AT commands at GSM module through the MAX 232. In order to get proper timing here we used Teal Time Clock (RTC) which is shown in figure 7. When fault is cleared, it is needed to reset the system but still need to know the zones which were affected by fire and hence at the time of taking necessary action in clearing the fire, display unit shows the following strings-
*** UIU *** FAULT CLEAR
RESET THE SYSTEM putsf("at+cmgf=1");
TXD
GSM
RXD
GND
TXD
MAX232
RXD
GND
36 http://sites.google.com/site/ijcsis/ ISSN 1947-5500
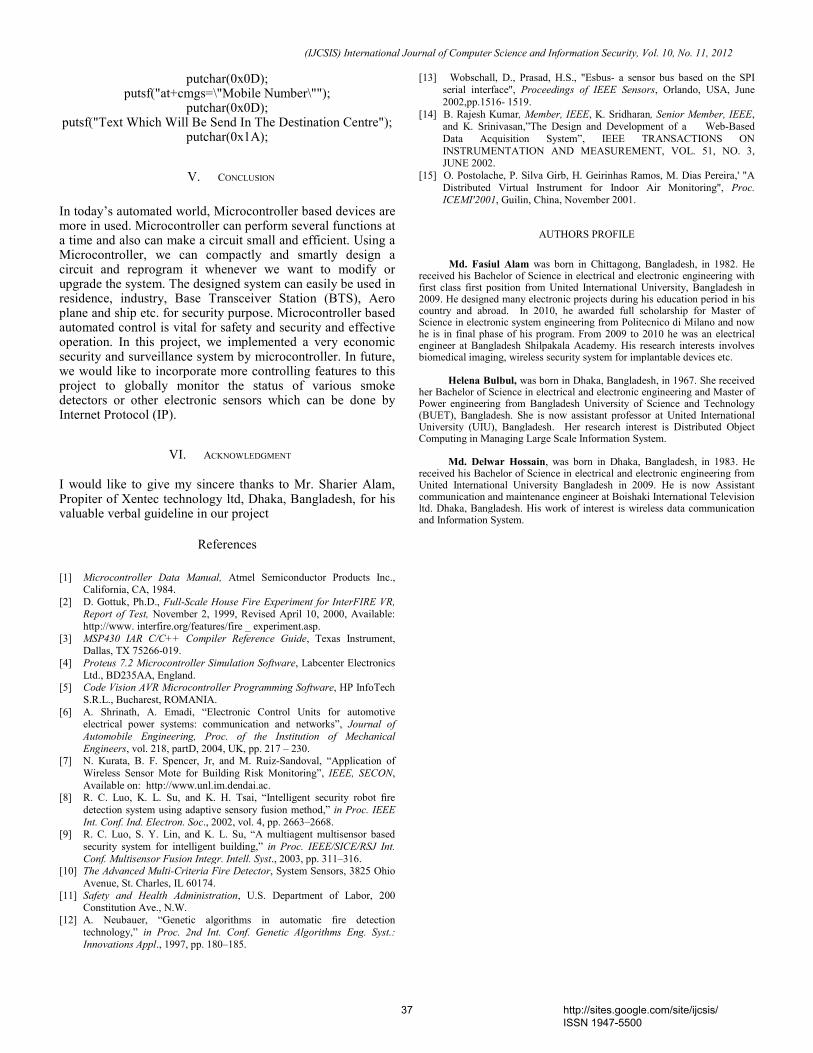
(IJCSIS) International Journal of Computer Science and Information Security, Vol. 10, No. 11, 2012
putchar(0x0D); putsf("at+cmgs=\"Mobile Number\"");
putchar(0x0D); putsf("Text Which Will Be Send In The Destination Centre");
putchar(0x1A);
V. CONCLUSION
In today’s automated world, Microcontroller based devices are more in used. Microcontroller can perform several functions at a time and also can make a circuit small and efficient. Using a Microcontroller, we can compactly and smartly design a circuit and reprogram it whenever we want to modify or upgrade the system. The designed system can easily be used in residence, industry, Base Transceiver Station (BTS), Aero plane and ship etc. for security purpose. Microcontroller based automated control is vital for safety and security and effective operation. In this project, we implemented a very economic security and surveillance system by microcontroller. In future, we would like to incorporate more controlling features to this project to globally monitor the status of various smoke detectors or other electronic sensors which can be done by Internet Protocol (IP).
VI. ACKNOWLEDGMENT
I would like to give my sincere thanks to Mr. Sharier Alam, Propiter of Xentec technology ltd, Dhaka, Bangladesh, for his valuable verbal guideline in our project
References
[1] Microcontroller Data Manual, Atmel Semiconductor Products Inc.,
California, CA, 1984.
[2] D. Gottuk, Ph.D., Full-Scale House Fire Experiment for InterFIRE VR, Report of Test, November 2, 1999, Revised April 10, 2000, Available:
http://www. interfire.org/features/fire _ experiment.asp.
[3] MSP430 IAR C/C++ Compiler Reference Guide, Texas Instrument, Dallas, TX 75266-019.
[4] Proteus 7.2 Microcontroller Simulation Software, Labcenter Electronics
Ltd., BD235AA, England. [5] Code Vision AVR Microcontroller Programming Software, HP InfoTech
S.R.L., Bucharest, ROMANIA.
[6] A. Shrinath, A. Emadi, “Electronic Control Units for automotive electrical power systems: communication and networks”, Journal of
Automobile Engineering, Proc. of the Institution of Mechanical
Engineers, vol. 218, partD, 2004, UK, pp. 217 – 230. [7] N. Kurata, B. F. Spencer, Jr, and M. Ruiz-Sandoval, “Application of
Wireless Sensor Mote for Building Risk Monitoring”, IEEE, SECON,
Available on: http://www.unl.im.dendai.ac. [8] R. C. Luo, K. L. Su, and K. H. Tsai, “Intelligent security robot fire
detection system using adaptive sensory fusion method,” in Proc. IEEE
Int. Conf. Ind. Electron. Soc., 2002, vol. 4, pp. 2663–2668. [9] R. C. Luo, S. Y. Lin, and K. L. Su, “A multiagent multisensor based
security system for intelligent building,” in Proc. IEEE/SICE/RSJ Int.
Conf. Multisensor Fusion Integr. Intell. Syst., 2003, pp. 311–316. [10] The Advanced Multi-Criteria Fire Detector, System Sensors, 3825 Ohio
Avenue, St. Charles, IL 60174.
[11] Safety and Health Administration, U.S. Department of Labor, 200 Constitution Ave., N.W.
[12] A. Neubauer, “Genetic algorithms in automatic fire detection
technology,” in Proc. 2nd Int. Conf. Genetic Algorithms Eng. Syst.: Innovations Appl., 1997, pp. 180–185.
[13] Wobschall, D., Prasad, H.S., "Esbus- a sensor bus based on the SPI serial interface", Proceedings of IEEE Sensors, Orlando, USA, June
2002,pp.1516- 1519.
[14] B. Rajesh Kumar, Member, IEEE, K. Sridharan, Senior Member, IEEE, and K. Srinivasan,”The Design and Development of a Web-Based
Data Acquisition System”, IEEE TRANSACTIONS ON
INSTRUMENTATION AND MEASUREMENT, VOL. 51, NO. 3, JUNE 2002.
[15] O. Postolache, P. Silva Girb, H. Geirinhas Ramos, M. Dias Pereira,' "A
Distributed Virtual Instrument for Indoor Air Monitoring", Proc. ICEMI'2001, Guilin, China, November 2001.
AUTHORS PROFILE
Md. Fasiul Alam was born in Chittagong, Bangladesh, in 1982. He received his Bachelor of Science in electrical and electronic engineering with first class first position from United International University, Bangladesh in 2009. He designed many electronic projects during his education period in his country and abroad. In 2010, he awarded full scholarship for Master of Science in electronic system engineering from Politecnico di Milano and now he is in final phase of his program. From 2009 to 2010 he was an electrical engineer at Bangladesh Shilpakala Academy. His research interests involves biomedical imaging, wireless security system for implantable devices etc. Helena Bulbul, was born in Dhaka, Bangladesh, in 1967. She received her Bachelor of Science in electrical and electronic engineering and Master of Power engineering from Bangladesh University of Science and Technology (BUET), Bangladesh. She is now assistant professor at United International University (UIU), Bangladesh. Her research interest is Distributed Object Computing in Managing Large Scale Information System. Md. Delwar Hossain, was born in Dhaka, Bangladesh, in 1983. He received his Bachelor of Science in electrical and electronic engineering from United International University Bangladesh in 2009. He is now Assistant communication and maintenance engineer at Boishaki International Television ltd. Dhaka, Bangladesh. His work of interest is wireless data communication and Information System.
37 http://sites.google.com/site/ijcsis/ ISSN 1947-5500

(IJCSIS) International Journal of Computer Science and Information Security, Vol. 10, No. 11, November 2012
Author : Ashwini Manish Brahme1 Assitant Professor, Indira Institute of Management(MCA), Pune, University of Pune, Maharashtra, India [email protected], [email protected]
Abstract India is becoming superpower in the IT field and also reached to the global world because of Internet but the fraud incidents are on the rise in almost every fast-growing industry across the country. The ratio of Internet fraud is growing significantly in India. Life is about a mix of good and evil so is the Internet. For all the good it does us, cyberspace has its dark sides too. This paper discusses about the Internet Fraud and how the Internet fraud is creating the Cyber Cold War. It also briefs about the Internet Users in India, its Scope and the role of Internet for the Indian Business Growth. This paper talks about the Cyber crime and Cyber threat in India and the motives behind any Cyber attack or Internet Fraud, the tools used for the cyber terrorism, the Impact of Internet Threat at Work, proportion of Internet Fraud in India, and cyber crime cases with different examples. Furthermore paper gives details regarding how the Internet fraud is becoming a growing threat for the online retailers and business, how to deal with Internet Fraud to overcome the cyber threat and the role of Government of India, to avoid the misuse of Internet and the act or penalties for it and the skill to take out the Cyber Threat. This paper also gives the details on the Current status of cyber threat, internet fraud, and future in India with respect to the different security aspects and also talks about the Challenges that India need to face to beat the cyber threat. Keywords: Cyber Crime, Cyber Cold war, Internet Fraud, Cyber Threat, IT
I. INTRODUCTION TO INTERNET FRAUD AND CYBER COLD WAR
Internet plays vital role over the global world and the acceptance of Internet moves towards the boundary less trade medium in the era of globalization. A majority of employees today spend a significant time on the Internet ; however mass of them are not aware of many things in Internet and hence not worried about the security threats arising from the Internet and because of this there are lot of chances of Internet Fraud and Cyber Threat which is becoming a part of “Cyber Cold War”. Internet fraud is any type of fraud scheme that uses one or more. components of the Internet - such as chat rooms, e-mail, message boards, or Web sites - to present fraudulent solicitations to prospective victims, to conduct fraudulent
transactions or to transmit the proceeds of fraud to financial institutions or to others those are becoming a part of this scheme. There are various types of Internet Fraud like Auction and Retail Schemes Online, Business Opportunity/"Work-at-Home" Schemes Online, Investment Schemes Online Credit-Card Schemes, Chatting, Make your online friend circle by using various sites, Mail spoofing etc.
II. INTERNET USERS IN INDIA
Internet adoption continues to grow in India and the low cost of broadband has helped to increase Internet usage. Indians go online for a number of activities including e-mail and IM (98 percent); job search (51 percent); banking (32 percent); bill payment (18 percent); stock trading (15 percent); and matrimonial search (15 percent) etc.
The number of active Internet users in India had reached 32 million in September 2007, up only 10.9 million from 21.1 million in September 2006. Internet users (those who have used the Internet at least once in their lifetime) of 46 million in September 2007. [6]
Source: Internet and Mobile Association of India (IAMAI) and IMRB International
This chart shows the growth of Claimed Internet users and Active Internet Users yearly. [3]
Internet Fraud as One of the Cyber Threat and its Impact in India
38 http://sites.google.com/site/ijcsis/ ISSN 1947-5500

(IJCSIS) International Journal of Computer Science and Information Security, Vol. 10, No. 11, November 2012
III. SCOPE OF INTERNET IN INDIA The low cost of the PC and the growing use of the Internet has shown the tremendous growth of business in India, in the recent years. According to the Indian Ecommerce Report released by Internet and Mobile Association of India (IAMAI) and IMRB International, “ The total online transactions in India was Rs. 7080 crores (approx $1.75 billion) in the year 2006-2007 and expected to grow by 30% to touch 9210 crores (approx $2.15 billion) by the year 2007-2008. [2]
Home Internet usage in India grew 19% from April 2006 to April 2007. In April 2007 it became 30.32 million and the eMarketer accept that there will be 71 million total Internet users in India by 2011. Rival tradeindia.com has 700,000 registered buyers and it has the growth rate of 35% every year which is likely to double in the year 2008. Indiamart.com claims revenues of Rs. 38 crores and has a growing rate of 50 every year. It receives around 500,000 enquiries per month. Undoubtedly, with the middle class of 288 million people, online shopping shows unlimited potential in India. The real estate costs are touching the sky. The travel portals' share in the online business contributed to 50% of Rs 4800 crore online market in 2007-08. The travel portal MakeMyTrip.com has attained Rs 1000 crores of turnovers which are around 20% of total e-commerce market in India. Further an annual growth of 65% has been anticipated annually in the travel portals alone. [3]
IV. CYBER CRIME AND CYBER THREAT Life is about a mix of good and evil. So is the Internet. For all the good it does us, cyberspace has its dark sides too. Unlike conventional communities though, there are no policemen patrolling the information superhighway, leaving it open to everything from Trojan horses and viruses to cyber stalking, trademark counterfeiting and cyber terrorism. Cyber crime is an unlawful act where in the computer is either a tool or a target which is used for creation of Cyber threat and Cyber terrorism as a premeditated use of disruptive activities or the threat in cyber space, with the intention to further social, ideological, religious, political or similar objectives, or to intimidate any person in furtherance of such objectives. The Cyber Criminals may be children and adolescents aged b/w 6-18 years, they may be organized hackers, may be professional hackers or crackers, discontented employees, cheaters or even psychic persons. A full-fledged cyber attack on a nation may involve three steps. first, bring down the transportation and control systems. Second, bring down the financial systems (the stock markets and banks) and third, take control of the nations’ utilities. A full-scale cyber attack can cause panic among people. It can trigger alarm systems in all major establishments, be it Parliament, Rashtrapati Bhavan, major hospitals, schools or colleges. A hack into the traffic light systems can cause havoc on roads in terms of accidents. A break into the IT systems controlling the metro rail services can cause disasters. A break into your bank’s system or tax department can fish out your pan number, your salary, the
investments you have made, the assets you possess to the cars you own. A hack into your demat account can hurt you financially. One can know everything from details of your parents to the number of children you have. A hack into your personal computer can reveal all the searches you have made in the past to all the chat windows. Imagine what chaos can prevail if the IT networks which control our power plants and nuclear plants fall into the hands of a rival nation. Imagine what can happen if one is able to break into the communication links of the defense ministry. It is very important to find out the reasons behind any attack . Motives behind any Attacks/ Internet Fraud:- 1. Creating threat in public. 2. Create disobedience between different religious, racial, language, castes or communities. 3. Destructing the government established by law 4.Attitude of breaking the rules and integrity of the nation etc.
Tools of Cyber Terrorism:- Cyber terrorists use various tools and methods to unleash their terrorism. Some of the major tools are as follows: 1. Hacking 2. Cryptography 3. Trojan Attacks 4. Computer worms 5. Computer viruses 6. Denial of service attacks 7. E-mail related crimes etc.
V. IMPACT OF INTERNET THREAT AT WORK
Unsafe IT behavior leads to unintentional loss of confidential information. The survey was conducted by The Nielsen Company, India across five Indian metros from Manufacturing, IT, Pharmaceuticals, etc. - Mumbai, Delhi, Bangalore, Chennai and Hyderabad among Employees of large, medium and small organizations in India with Internet access to gauge the impact of Internet at work and the security risks it poses. 63 per cent of respondents from Delhi use their personal email ID for work purposes, against the average of 36 per cent. Delhi and Bangalore also have the highest proportion of respondents (32 per cent) who send work documents to personal e-mail accounts, versus the average of 23 per cent. In Bangalore, an average of 17 per cent of respondents admitted to clicking on links in e-mail sent from unknown sources and 22 per cent on pop-up ads highlighting a significant section of Internet users who are ignorant of online threats.57 per cent employees feel leaking sensitive company information or infecting their company with malicious spyware or viruses (38 per cent) puts them at greater risk of losing their job, than not adhering to their organization’s Internet policy (20 per cent).
39 http://sites.google.com/site/ijcsis/ ISSN 1947-5500

(IJCSIS) International Journal of Computer Science and Information Security, Vol. 10, No. 11, November 2012
Internet - A critical work enabler Normally all the Employees spend an average of 4.25 hrs per day on the Internet. Employees spend 45 per cent of their time (3.5 hours) per day surfing work-related websites, the highest being in Chennai 50 per cent (4.25 hours), and in Hyderabad 65 per cent (5.5 hours). The average time spent on non work-related websites is 5 hours per week. Enterprises incur a productivity loss of approximately Rs160, 000 per employee per annum due to non work-related surfing. Data leakage 35 per cent of employees feel most worried about losing both personal as well as work-related information. However, 28 per cent of employees do not feel worried at all about any personal or private information being stolen or accessed from their work PC.[5]
VI. INTERNET FRAUD AS THREAT FOR ONLINE RETAILERS Online retailers are increasingly becoming victims of repeated, opportunistic and unsophisticated fraud. Online retailers either do no checking or rely almost totally on manual fraud prevention measures. Almost half said they did not use any external data when verifying a customer’s name and address, before authorizing an online transaction. 70% of companies interviewed thought that the internet was inherently more risky than other routes to market, with the majority of respondents experiencing an increase in fraud on the Internet over the last year. 52% of online traders claimed that Internet fraud was a problem for their organization and 55% said it was a growing problem. Examples of Internet Fraud in India The major reason for the internet fraud in developing countries is due to the weakest security polices less technical infrastructure and no proper legislation. The past 12 months have witnessed almost 400 registered attacks on Indian sites, owned by government departments or private institutions. That makes for more than one major government site being attacked on a daily basis. In the private sector, about 51% sites attacked belonged to the e-commerce sector, 47% belonged to the financial services sector. 1) China mounts cyber attacks on Indian sites China has mounted almost daily attacks on Indian computer networks, both government and private, showing its intent and capability. The core of the assault is that the Chinese are constantly scanning and mapping India’s official networks. This gives them a very good idea of not only the content but also of how to disable the networks or distract them during a conflict. 2) Phisherman nets Cash Rs. 2.7 lakh were siphoned off from an NRI’s joint account with his wife in two separate incidents. In both incidents, transactions were made to the same persons ICICI bank account through e-banking.
3) Online advertise Clickers According to an article written by Times Of India, In India, A woman called Maya Sharma(not the real name),was actively participating in clicking online ads for some couple of hours daily to get paid for clicking the ads. How this can be regarded as fraud because, generally the deal between the companies and the internet advertisers is, whenever the customers click the ads then, the companies tend to pay the money to the advertisers because of promoting their company for the customers. The pay rate normally varies from company to company and ad to ad, it was in the range of $0.10 to $0.25 depending upon the ad and company.
VII. HOW TO DEAL WITH INTERNET FRAUD AND CYBER THREAT
Since the Internet is the medium for huge information and a large base of communications around the world, it is necessary to take certain precautions while operating it. Any person who operates the Internet should always abide by and following principles: 1.Should not disclose any personal information on internet and please keep your password and user id and access rights confidential.
2. Updated and latest anti-virus software should be used to protect the computer system against virus attacks. 3. While chatting on the net avoid sending photographs to anyone with personal data as it can be misused. 4. Backup of the data should always be kept to prevent loss from virus infectivity. 5. Children should be not permitted from accessing adult’s sites by the parents to protect them from spoiling their mind and career. 6. A credit card number shall never be sent to an unsecured site. 7. Routers and firewalls can be used to protect the computer network. 9. The Cyber Cafes should be checked frequently and if any misuse is seen then report to the concerned authorities. 10. Make awareness of misuse of computers and access to unauthorized data and the penalties for it. 11. Don’t reveal your credit card/ debit card PIN number. 12.Don’t reveal your net banking and e-banking passwords. 13.Dont download files or software’s without verifying its authenticity. 14.Avoid carrying of e-banking operations or any other important operations from cyber café and so on.
VIII. CURRENT STATUS OF INTERNET FRAUD IN INDIA
An increase in the cyber crime is a nation wide phenomenon. The number of cyber crime incidents registered under the IT Act in the 35 mega cities in the country increased from 89 in 2006 to 118 in 2007 showing an increase of 32.6 per cent. Bangalore has registered the highest number of 40 cyber crime cases under IT act in 2007 followed by Pune with 14 cases, 10
40 http://sites.google.com/site/ijcsis/ ISSN 1947-5500
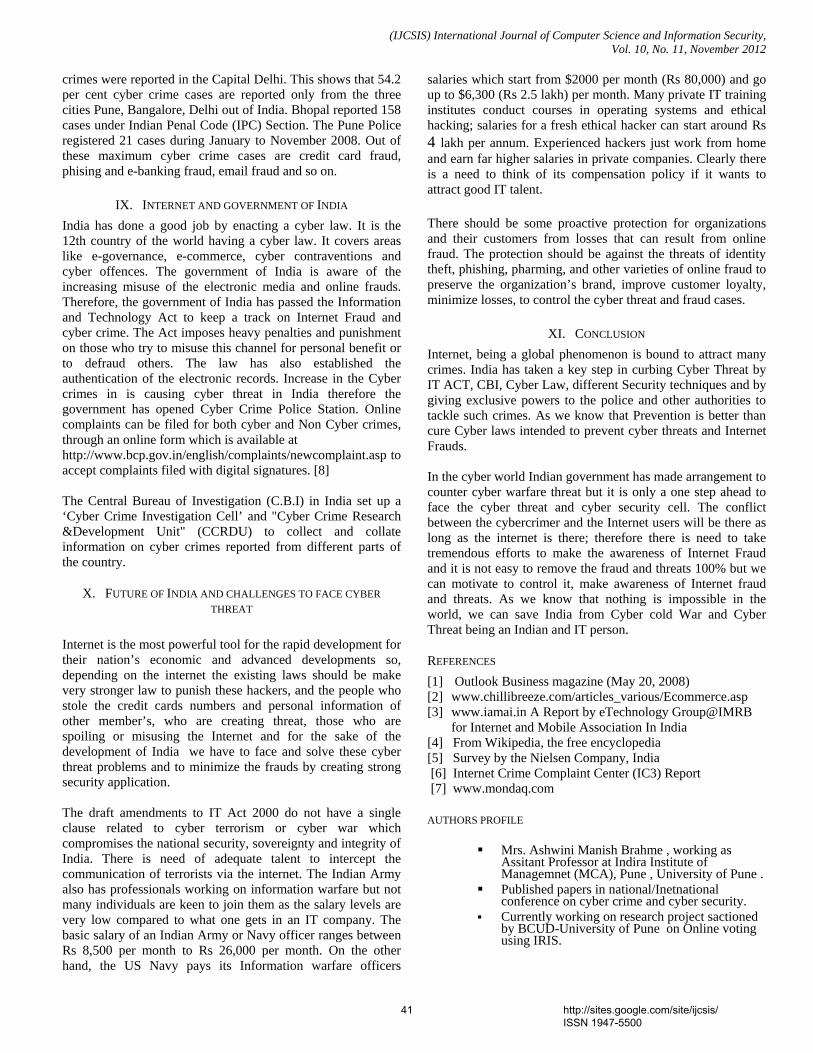
(IJCSIS) International Journal of Computer Science and Information Security, Vol. 10, No. 11, November 2012
crimes were reported in the Capital Delhi. This shows that 54.2 per cent cyber crime cases are reported only from the three cities Pune, Bangalore, Delhi out of India. Bhopal reported 158 cases under Indian Penal Code (IPC) Section. The Pune Police registered 21 cases during January to November 2008. Out of these maximum cyber crime cases are credit card fraud, phising and e-banking fraud, email fraud and so on.
IX. INTERNET AND GOVERNMENT OF INDIA India has done a good job by enacting a cyber law. It is the 12th country of the world having a cyber law. It covers areas like e-governance, e-commerce, cyber contraventions and cyber offences. The government of India is aware of the increasing misuse of the electronic media and online frauds. Therefore, the government of India has passed the Information and Technology Act to keep a track on Internet Fraud and cyber crime. The Act imposes heavy penalties and punishment on those who try to misuse this channel for personal benefit or to defraud others. The law has also established the authentication of the electronic records. Increase in the Cyber crimes in is causing cyber threat in India therefore the government has opened Cyber Crime Police Station. Online complaints can be filed for both cyber and Non Cyber crimes, through an online form which is available at http://www.bcp.gov.in/english/complaints/newcomplaint.asp to accept complaints filed with digital signatures. [8] The Central Bureau of Investigation (C.B.I) in India set up a ‘Cyber Crime Investigation Cell’ and "Cyber Crime Research &Development Unit" (CCRDU) to collect and collate information on cyber crimes reported from different parts of the country.
X. FUTURE OF INDIA AND CHALLENGES TO FACE CYBER THREAT
Internet is the most powerful tool for the rapid development for their nation’s economic and advanced developments so, depending on the internet the existing laws should be make very stronger law to punish these hackers, and the people who stole the credit cards numbers and personal information of other member’s, who are creating threat, those who are spoiling or misusing the Internet and for the sake of the development of India we have to face and solve these cyber threat problems and to minimize the frauds by creating strong security application. The draft amendments to IT Act 2000 do not have a single clause related to cyber terrorism or cyber war which compromises the national security, sovereignty and integrity of India. There is need of adequate talent to intercept the communication of terrorists via the internet. The Indian Army also has professionals working on information warfare but not many individuals are keen to join them as the salary levels are very low compared to what one gets in an IT company. The basic salary of an Indian Army or Navy officer ranges between Rs 8,500 per month to Rs 26,000 per month. On the other hand, the US Navy pays its Information warfare officers
salaries which start from $2000 per month (Rs 80,000) and go up to $6,300 (Rs 2.5 lakh) per month. Many private IT training institutes conduct courses in operating systems and ethical hacking; salaries for a fresh ethical hacker can start around Rs 4 lakh per annum. Experienced hackers just work from home and earn far higher salaries in private companies. Clearly there is a need to think of its compensation policy if it wants to attract good IT talent.
There should be some proactive protection for organizations and their customers from losses that can result from online fraud. The protection should be against the threats of identity theft, phishing, pharming, and other varieties of online fraud to preserve the organization’s brand, improve customer loyalty, minimize losses, to control the cyber threat and fraud cases.
XI. CONCLUSION Internet, being a global phenomenon is bound to attract many crimes. India has taken a key step in curbing Cyber Threat by IT ACT, CBI, Cyber Law, different Security techniques and by giving exclusive powers to the police and other authorities to tackle such crimes. As we know that Prevention is better than cure Cyber laws intended to prevent cyber threats and Internet Frauds. In the cyber world Indian government has made arrangement to counter cyber warfare threat but it is only a one step ahead to face the cyber threat and cyber security cell. The conflict between the cybercrimer and the Internet users will be there as long as the internet is there; therefore there is need to take tremendous efforts to make the awareness of Internet Fraud and it is not easy to remove the fraud and threats 100% but we can motivate to control it, make awareness of Internet fraud and threats. As we know that nothing is impossible in the world, we can save India from Cyber cold War and Cyber Threat being an Indian and IT person.
REFERENCES [1] Outlook Business magazine (May 20, 2008) [2] www.chillibreeze.com/articles_various/Ecommerce.asp [3] www.iamai.in A Report by eTechnology Group@IMRB
for Internet and Mobile Association In India [4] From Wikipedia, the free encyclopedia [5] Survey by the Nielsen Company, India [6] Internet Crime Complaint Center (IC3) Report [7] www.mondaq.com AUTHORS PROFILE
Mrs. Ashwini Manish Brahme , working as Assitant Professor at Indira Institute of Managemnet (MCA), Pune , University of Pune .
Published papers in national/Inetnational conference on cyber crime and cyber security.
Currently working on research project sactioned by BCUD-University of Pune on Online voting using IRIS.
41 http://sites.google.com/site/ijcsis/ ISSN 1947-5500

APPLICATION OF POLYNOMIAL VECTOR
(PV) PROCESSING TO IMPROVE THE
ESTIMATION PERFORMANCE OF BIO
DIESEL IN VARIABLE COMPRESSION
RATIO DIESEL ENGINE
Suresh M.,
Asst.Prof,Mechanical
Engineering, Sri Sai Ram Engg.
College,Chennai-
44,Tamilnadu,India
Maheswar Dutta
Professor and Principal, M.N.R
Engg. College, Hyderabad, India
Purushothaman S
Professor and Dean, Mechanical
Engineering, Udaya School of
Engineering, India-629204
Abstract-This paper presents the implementation of
polynomial vector back propagation algorithm
(PVBPA) for estimating the power, torque, specific fuel
consumption and presence of carbon monoxide,
hydrocarbons in the emission of a direct injection diesel
engine. Experimental readings were obtained using the
biodiesel prepared form the waste low quality cooking
oil collected from the canteen of Sri Sairam Engineering
College, India.. This waste cooking oil was due to the
preparation of varieties of food (vegetables fried and
non vegetarian). Over more than a week, trans
esterification was done in chemical lab and the biodiesel
was obtained. The biodiesel was mixed in proportions of
10%, 20 % , 30%,40%, 50% with remaining
combinations of the diesel supplied by the Indian
government. Variable compression ratio (VCR) diesel
engine with single cylinder, four stroke diesel type was
used. The outputs of the engine as power, torque and
specific fuel consumption were obtained from the
computational facility attached to the engine. The data
collected for different input conditions of the engine was
further used to train (PVBPA). The trained PVBPA
network was further used to predict the power, torque
and brake specific fuel consumption (SFC) for different
speed, biodiesel and diesel combinations and full load
condition. The estimation performance of the PVBPA
network is discussed.
Keywords: polynomial vector, back propagation
algorithm, waste cooking oil, biodiesel.
I INTRODUCTION
In this paper, performance of a diesel engine
and exhaust emission content of the diesel engine
when using Biodiesel blended with diesel has been
analyzed. Data collected from the engine for various
(IJCSIS) International Journal of Computer Science and Information Security, Vol. 10, No. 11, November 2012
42 http://sites.google.com/site/ijcsis/ ISSN 1947-5500

loads / speed were used to train polynomial vector
back propagation (PVBPA) neural networks..
Subsequently, the PVBPA was used to estimate the
performance of the diesel engine and estimate the
quality of the exhaust gas for different loads / speeds
and combinations of fuel other than that used for
training of the PVBPA.
Biodiesel refers to a vegetable oil or animal
based diesel fuel consisting of long chain (methyl,
propyl or ethyl) esters. Biodiesel [1-3] is typically
made by chemically reacting lipids (eg. Vegetable
oil, animal fat, tallow) with an alcohol producing
fatty acid esters. The various Multipurpose oils [8,10-
12]also used as biofuel such as Castor oil, Coconut
oil (copra oil), Colza oil, Corn oil, Cottonseed oil,
False flax oil, Hemp oil, Mustard oil, Palm oil,
Peanut oil, Radish oil. Rapeseed oil, Ramtil oil, Rice
bran oil, Safflower oil, Salicornia oil, Soybean oil,
Sunflower oil, Tigernut oil , Tung oil, are lists of
vegetable oils that are suitable for biodiesel.
Similarly, Inedible oils used only or primarily as
biofuel such as Copaiba, Honge oil, Jatropha oil,
Jojoba oil, Milk bush, Nahor oil, Paradise oil,
Petroleum nut oil.
Vegetable oils are evaluated for use as a
biofuel based on: a) Suitability as a fuel, based on
flash point, energy content, viscosity, combustion
products and other factors, b) Cost, based in part on
yield, effort required to grow and harvest, and post-
harvest processing cost.
Alternative fuels for diesel engines are
becoming increasingly important due to diminishing
petroleum reserves and the environmental
consequences of exhaust gases from petroleum
fuelled engines. A number of studies have shown that
triglycerides hold promise as alternative diesel engine
fuels. So, many countries are interested in that.
II EXPERIMENTAL INVESTIGATION
The setup consists of single cylinder, four
stroke, VCR (Variable Compression Ratio) Diesel
engine connected to eddy current type dynamometer
for loading. The compression ratio can be changed
without stopping the engine and without altering the
combustion chamber geometry by specially designed
tilting cylinder block arrangement. Setup is provided
with necessary instruments for combustion pressure
measurements. The setup has stand-alone panel box
consisting of air box, two fuel tanks for duel fuel test,
manometer, fuel measuring unit, transmitters for air
and fuel flow measurements, process indicator and
engine indicator. Rotameters are provided for cooling
water and calorimeter water flow measurement.
The setup enables study of VCR engine
performance for brake power, indicated power,
frictional power, brake mean effective pressure
(BMEP), indicated mean effective pressure (IMEP),
brake thermal efficiency, indicated thermal
efficiency, Mechanical efficiency, volumetric
efficiency, specific fuel consumption, A/F ratio and
heat balance. Labview based Engine Performance
Analysis software package “EnginesoftLV” is
provided for on line performance evaluation.
1.Brake power (BP)= 2 * π * n T/ (60 * 1000)
2.Brake specific fuel consumption (Kg/kwh)= Fuel
flow in kg / hour / BP
3.Specific fuel consumption (SFC): Brake specific
fuel consumption and indicated specific fuel
consumption, abbreviated BSFC and ISFC, are the
fuel consumptions on the basis of Brake power and
Indicated power respectively.
2.1. Biodiesel preparation
In the present investigation, biodiesel was
produced from waste cooking oil from the canteen of
(IJCSIS) International Journal of Computer Science and Information Security, Vol. 10, No. 11, November 2012
43 http://sites.google.com/site/ijcsis/ ISSN 1947-5500

Sri Sairam Engineering College, India. 2 gram Alkali
catalyst and 35 cc methanol (as an alcohol) was
applied for 150 gram waste cooking oil in this
reaction. Biodiesel production reaction time was two
hour with stirring and with moderate heat. Upto two
weeks time is needed for separation. The waste
cooking oil methyl ester was added to diesel fuel in
10 to 50 percent ratios and then used as fuel for one
cylinder diesel engine.
2.2. Experimental set up and test procedure
The experimental setup consists of single
cylinder diesel engine, an engine test bed and a gas
analyzer. The engine setup is shown in Figure 1. The
schematic of the experimental setup is shown in
Figure 2.
Figure 1. Variable compression ratio diesel engine
(Apex innovations)
Figure 2. Schematic layout of the setup (Apex
innovations)
where
F1 Fuel consumption kg/hr
F2 Air consumption kg/hr
F3,F4 Calorimeter water flow kg/hr
T3 Calorimeter water inlet temperature oK
T2,T4 Calorimeter water outlet temperature oK
T5 Exhaust gas to calorimeter inlet temp. oK
T6 Exhaust gas from calorimeter outlet temp. oK
There are two fuel tanks, one is for diesel fuel and the
other for fuel blends. The engine under study is a
VCR, water cooled single cylinder, in-line, naturally
aspirated, Kirlosker diesel engine. The test engine
was coupled to an electric eddy current
dynamometer. A vehicle gas analyzer model was
used for measuring CO and HC emissions. Engine
was run at several speeds at full load and power,
torque, fuel consumption and emissions was
measured. Table 1 presents experimental data
obtained. Table 2 presents the CO and HC emissions
value obtained from exhaust gas analyzer. TABLE I. 1 Experimental data obtained
S.N
o.
Full
load
Was
te
cook
ing
oil
(Bio
dies
el)
Die
sel
Spee
d(rp
m)
of th
e en
gine
Pow
er (K
W)
Tor
que
(N-M
)
Spec
ific
fuel
co
nsum
ptio
n (S
FC)
Litr
e/K
W-
1 1 0 1 1200 6.2 48 0.32
2 1 0 1 1600 9.2 54 0.33
3 1 0 1 2000 12.3 57 0.34
4 1 0 1 2400 16.0 63 0.33
5 1 0 1 2800 17.6 53 0.33
6 1 0 1 3200 17.7 51 0.34
7 1 10 90 1200 7.0 54 0.34
8 1 10 90 1600 9.8 57 0.35
9 1 10 90 2000 12.0 56 0.33
10 1 10 90 2400 15.2 62 0.30
11 1 10 90 2800 16.1 55 0.31
12 1 10 90 3200 16.3 48 0.37
13 1 20 80 1200 6.6 51 0.33
14 1 20 80 1600 9.2 53 0.33
15 1 20 80 2000 12.8 55 0.30
16 1 20 80 2400 16.3 58 0.29
(IJCSIS) International Journal of Computer Science and Information Security, Vol. 10, No. 11, November 2012
44 http://sites.google.com/site/ijcsis/ ISSN 1947-5500
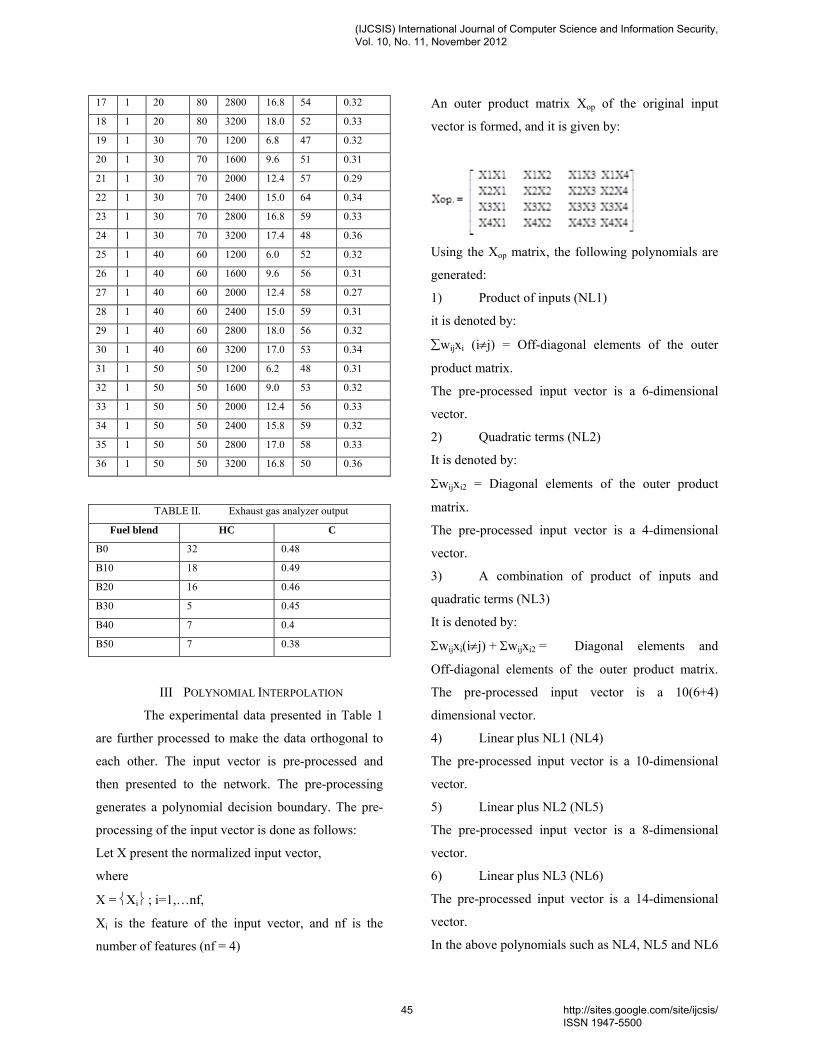
17 1 20 80 2800 16.8 54 0.32
18 1 20 80 3200 18.0 52 0.33
19 1 30 70 1200 6.8 47 0.32
20 1 30 70 1600 9.6 51 0.31
21 1 30 70 2000 12.4 57 0.29
22 1 30 70 2400 15.0 64 0.34
23 1 30 70 2800 16.8 59 0.33
24 1 30 70 3200 17.4 48 0.36
25 1 40 60 1200 6.0 52 0.32
26 1 40 60 1600 9.6 56 0.31
27 1 40 60 2000 12.4 58 0.27
28 1 40 60 2400 15.0 59 0.31
29 1 40 60 2800 18.0 56 0.32
30 1 40 60 3200 17.0 53 0.34
31 1 50 50 1200 6.2 48 0.31
32 1 50 50 1600 9.0 53 0.32
33 1 50 50 2000 12.4 56 0.33
34 1 50 50 2400 15.8 59 0.32
35 1 50 50 2800 17.0 58 0.33
36 1 50 50 3200 16.8 50 0.36
TABLE II. Exhaust gas analyzer output
Fuel blend HC C
B0 32 0.48
B10 18 0.49
B20 16 0.46
B30 5 0.45
B40 7 0.4
B50 7 0.38
III POLYNOMIAL INTERPOLATION
The experimental data presented in Table 1
are further processed to make the data orthogonal to
each other. The input vector is pre-processed and
then presented to the network. The pre-processing
generates a polynomial decision boundary. The pre-
processing of the input vector is done as follows:
Let X present the normalized input vector,
where
X = ⎨Xi⎬ ; i=1,…nf,
Xi is the feature of the input vector, and nf is the
number of features (nf = 4)
An outer product matrix Xop of the original input
vector is formed, and it is given by:
Using the Xop matrix, the following polynomials are
generated:
1) Product of inputs (NL1)
it is denoted by:
∑wijxi (i≠j) = Off-diagonal elements of the outer
product matrix.
The pre-processed input vector is a 6-dimensional
vector.
2) Quadratic terms (NL2)
It is denoted by:
Σwijxi2 = Diagonal elements of the outer product
matrix.
The pre-processed input vector is a 4-dimensional
vector.
3) A combination of product of inputs and
quadratic terms (NL3)
It is denoted by:
Σwijxi(i≠j) + Σwijxi2 = Diagonal elements and
Off-diagonal elements of the outer product matrix.
The pre-processed input vector is a 10(6+4)
dimensional vector.
4) Linear plus NL1 (NL4)
The pre-processed input vector is a 10-dimensional
vector.
5) Linear plus NL2 (NL5)
The pre-processed input vector is a 8-dimensional
vector.
6) Linear plus NL3 (NL6)
The pre-processed input vector is a 14-dimensional
vector.
In the above polynomials such as NL4, NL5 and NL6
(IJCSIS) International Journal of Computer Science and Information Security, Vol. 10, No. 11, November 2012
45 http://sites.google.com/site/ijcsis/ ISSN 1947-5500

vector, the term ‘linear’ represents the normalized
input pattern without pre-processing.
When the training of the network is done with a fixed
pre-processing of the input vector, the number of
iterations required is less than that required for the
training of the network without pre-processing of the
input vector to reach the desired MSE.
The combinations of different pre-processed methods
with different synaptic weight update algorithms are
shown in Table 3. As shown in Table 3, BPA weight
update algorithms have been used with fixed pre-
processed input vectors for learning.
TABLE III Combination of BPA with
different pre-processed input vectors BPA + NL1 BPA + NL2
BPA + NL3 BPA + NL4
BPA + NL5 BPA + NL6
NL is non-linear , 1-6 are the types
IV BACK PROPAGATION ALGORITHM
A neural network is constructed by highly
interconnected processing units (nodes or neurons)
which perform simple mathematical operations, [5].
Neural networks are characterized by their
topologies, weight vectors and activation function
which are used in the hidden layers and output layer,
[9]. The topology refers to the number of hidden
layers and connection between nodes in the hidden
layers. The activation functions that can be used are
sigmoid, hyperbolic tangent and sine. The network
models can be static or dynamic [7]. Static networks
include single layer perceptrons and multilayer
perceptrons. A perceptron or adaptive linear element
(ADALINE), [4,6], refers to a computing unit. This
forms the basic building block for neural networks.
The input to a perceptron is the summation of input
pattern vectors by weight vectors. In most of the
applications one hidden layer is sufficient. The
activation function which is used to train the ANN, is
the sigmoid function.
TRAINING STEPS INVOLVED.
Forward propagation
Step 1: The weights of the network are initialized.
Step 2: The inputs and outputs of a pattern are
presented to the network.
Step 3: The output of each node in the successive
layers is calculated.
o(output of a node) = 1/(1+exp( - ∑wij xi)) (1)
Step 4: The error of a pattern is calculated
E(p) = (1/2) ∑(d(p) – o(p))2 (2)
Reverse propagation
Step 1: The error for the nodes in the output layer is
calculated.
δ(output layer) = o(1-o)(d-o) (3)
Step 2: The weights between output layer and hidden
layer are updated.
W(n+1) = W(n) + ηδ(output layer) o(hidden layer) (4)
Step 3: The error for the nodes in the hidden layer is
calculated
δ(hidden layer)=o(1-o) ∑δ(output layer) W(updated weights
between hidden and output layer) (5)
Step 4: The weights between hidden and input layer
are updated.
W(n+1) = W(n) + ηδ(hidden layer) o(input layer) (6)
Where
o is the actual output of a node in hidden or output
layer.
η is the learning factor.
δ is the error of node.
P is the pattern number.
E is the errors of nodes in the output layer for a
pattern.
(IJCSIS) International Journal of Computer Science and Information Security, Vol. 10, No. 11, November 2012
46 http://sites.google.com/site/ijcsis/ ISSN 1947-5500

The above steps complete one weight updation.
Second pattern is presented and the above steps are
followed for the second weight updation. When all
the training patterns are presented, a cycle of iteration
or epoch is completed. The errors of all the training
patterns are calculated and displayed on the monitor
as the mean squared error (MSE).
Figure 3. PVBPA network for predicting engine
performance
V. RESULTS AND DISCUSSION
4.1 Properties of waste cooking oil biodiesel fuels
Property Biodiesel
Flash point, closed cup 182 °C
Pour point -3°C
Kinematical viscosity, 40°C 4.15 mm2/s
Total Sulfur 0.0018 wt. %
Copper strip corrosion 1a
Cloud point 0 °C
4.2. Torque and Power
Fuel rack is placed in maximum fuel
injection position for full load conditions. The engine
is loaded slowly. The engine speed is reduced with
increasing load. Range of speed was selected
between 1200 – 3600 rpm. Engine test results with
net diesel fuel showed that maximum torque was 64.2
Nm which occurred at 2400 rpm. The maximum
power was 18.12 kW at 3200 rpm. Power and torque
for fuel blends at full load is shown in Table 1. The
power estimation by different BPA with NL
combinations are shown in Figures 4-9. The torque
estimation by BPA with different NL are presented in
Figures 10-15.
0 10 20 30 400
0.2
0.4
0.6
0.8
1
1.2
1.4
Iterations
MS
E
6 X 5 X 1
0 10 20 30 400
20
40
60
80
100
Iterations
% E
stim
atio
n of
pow
er, k
w
6 X 5 X 1
Figure 4. Estimation of power by BPA+ NL1
0 500 1000
0
0.2
0.4
0.6
0.8
1
1.2
Iterations
MS
E
4 X 5 X 1
0 500 1000
0
20
40
60
80
Iterations
% E
stim
atio
n of
pow
er, k
w
4 X 5 X 1
Figure 5. Estimation of power by BPA+ NL2
0 50 1000
0.5
1
1.5
2
Iterations
MS
E
10 X 3 X 1
0 50 1000
20
40
60
80
100
Iterations
% E
stim
atio
n of
pow
er
10 X 3 X 1
Figure 6. Estimation of power by BPA+ NL3
(IJCSIS) International Journal of Computer Science and Information Security, Vol. 10, No. 11, November 2012
47 http://sites.google.com/site/ijcsis/ ISSN 1947-5500
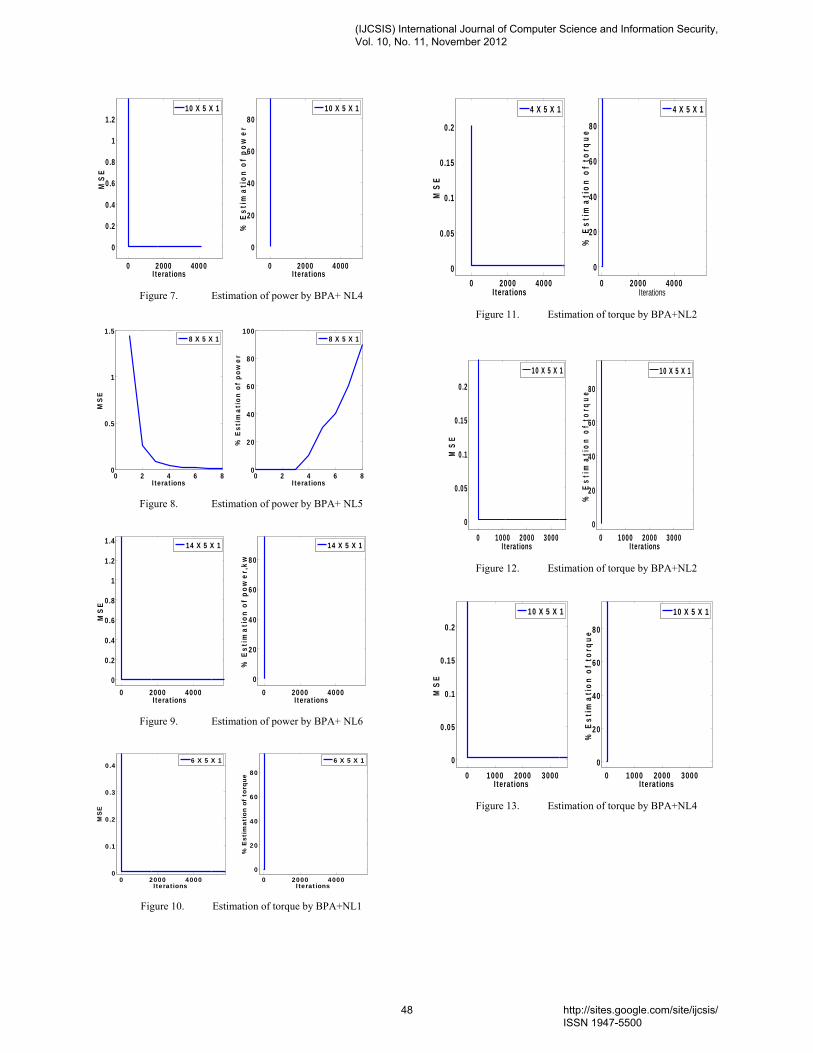
0 2000 4000
0
0.2
0.4
0.6
0.8
1
1.2
Iterations
MS
E
10 X 5 X 1
0 2000 4000
0
20
40
60
80
Iterations
% E
stim
atio
n of
pow
er
10 X 5 X 1
Figure 7. Estimation of power by BPA+ NL4
0 2 4 6 80
0.5
1
1.5
Iterations
MS
E
8 X 5 X 1
0 2 4 6 80
20
40
60
80
100
Iterations
% E
stim
atio
n of
pow
er
8 X 5 X 1
Figure 8. Estimation of power by BPA+ NL5
0 2000 40000
0.2
0.4
0.6
0.8
1
1.2
1.4
Iterations
MS
E
14 X 5 X 1
0 2000 40000
20
40
60
80
Iterations
% E
stim
atio
n of
pow
er,k
w
14 X 5 X 1
Figure 9. Estimation of power by BPA+ NL6
0 2000 40000
0.1
0.2
0.3
0.4
Iterations
MS
E
6 X 5 X 1
0 2000 40000
20
40
60
80
Iterations
% E
stim
atio
n of
tor
que
6 X 5 X 1
Figure 10. Estimation of torque by BPA+NL1
0 2000 40000
0.05
0.1
0.15
0.2
Iterations
MS
E
4 X 5 X 1
0 2000 40000
20
40
60
80
Iterations
% E
stim
atio
n of
tor
que
4 X 5 X 1
Figure 11. Estimation of torque by BPA+NL2
0 1000 2000 3000
0
0.05
0.1
0.15
0.2
Iterations
MS
E
10 X 5 X 1
0 1000 2000 30000
20
40
60
80
Iterations
% E
stim
atio
n of
tor
que
10 X 5 X 1
Figure 12. Estimation of torque by BPA+NL2
0 1000 2000 3000
0
0.05
0.1
0.15
0.2
Iterations
MS
E
10 X 5 X 1
0 1000 2000 30000
20
40
60
80
Iterations
% E
stim
atio
n of
tor
que
10 X 5 X 1
Figure 13. Estimation of torque by BPA+NL4
(IJCSIS) International Journal of Computer Science and Information Security, Vol. 10, No. 11, November 2012
48 http://sites.google.com/site/ijcsis/ ISSN 1947-5500

0 2000 4000
0
0.05
0.1
0.15
0.2
Iterations
MS
E
8 X 5 X 1
0 2000 4000
0
20
40
60
80
Iterations
% E
stim
atio
n of
tor
que
8 X 5 X 1
Figure 14. Estimation of torque by BPA+NL5
0 5000 10000 15000
0
0.05
0.1
0.15
0.2
Iterations
MS
E
14 X 5 X 1
0 5000 10000 15000
0
20
40
60
80
Iterations
% E
stim
atio
n of
tor
que
14 X 5 X 1
Figure 15. Estimation of torque by BPA+NL6
VI. CONCLUSION
The engine has been tested under same
operating conditions with diesel fuel and waste
cooking biodiesel fuel blends. The results were found
to be very comparable. The maximum power and
torque produced using diesel fuel was 18.2 kW and
64.2 Nm at 3200 and 2400 rpm respectively. By
adding 20% of waste cooking oil methyl ester, the
maximum power and torque increased by 2.7% and
2.9% respectively. The concentration of the CO and
HC emissions were significantly decreased when
biodiesel was used (Table 2).
REFERENCES
[1] Al-Widyan, M.I.; Al-Shyoukh, A.O., 2002,
Experimental evaluation of the transesterification of
waste palm oil into biodiesel, Bioresource Technology,
Vol. 85, Issue 3, pp. 253-256.
[2] Bento, F.M.; Camargo, F.A.O., Okeke, B.C., and
Frankenberger, W.T., 2005, Comparative
bioremediation of soils contaminated with diesel oil by
natural attenuation, biostimulation and
bioaugmentation, Bioresource Technology, Vol.96,
Issue 9, pp.1049-1055.
[3] Karmee, S.K.; Chadha, A., 2005, Preparation of
biodiesel from crude oil of Pongamia pinnata
Bioresource Technology, Vol. 96, Issue 13, pp.1425-
1429.
[4] Bernard Widrow, 1990, 30 Years of adaptive neural
networks, Perceptron, madaline and back-propagation,
Proc. of the IEEE, Vol.18, No. 9, pp. 1415–1442.
[5] Fortuna, L., Graziani, S., LoPresti, M., and Muscato.
G., 1992, Improving back propagation learning using
auxiliary neural networks, Int. J of Cont., Vol. 55, No.
4, pp 793-807.
[6] Hirose, Y, Yamashita, K.Y. and Hijiya, S., 1991, Back-
propagation algorithm which varies the number of
hidden units, Neural Networks, 4, pp. 61-66.
[7] Hush, D.R., and Horne. B.G., 1993, Progress in
supervised neural networks, IEEE Signal Proc. Mag.,
pp. 8-38.
[8] Lang, X.; Dalai, A.K.; Bakhshi, N.N.; Reaney, M.J.;
Hertz, P.B., 2001, Preparation and characterization of
bio-diesels from various bio-oils, Bioresource
Technology, Vol. 80, Issue 1, pp.53-62.
[9] Lippmann, R.P., 1987, An introduction to computing
with neural nets, IEEE Trans. On Acoustics, Speech
and Signal Processing Magazine, Vol. 35, No. 4, pp.4-
22.
[10] Noureddini, H.; Gao, X.; Philkana, R.S, 2005,
Immobilized Pseudomonas cepacia lipase for biodiesel
fuel production from soybean oil, Bioresource
Technology, Vol. 96, Issue 7, pp. 769-777.
[11] Palmarola-Adrados, B.; Choteborska, P.; Galbe, M.;
Zacchi, G, 2005,Ethanol production from non-starch
carbohydrates of wheat bran Bioresource Technology,
Vol. 96, Issue 7, pp.843-850.
[12] Zullaikah, S.; Lai, C.C.; Vali, S.R.; Ju, Y.H., 2005, A
two-step acid-catalyzed process for the production of
biodiesel from rice bran oil Bioresource Technology,
Vol. 96, Issue 17, pp.1889-1896.
(IJCSIS) International Journal of Computer Science and Information Security, Vol. 10, No. 11, November 2012
49 http://sites.google.com/site/ijcsis/ ISSN 1947-5500
(IJCSIS) International Journal of Computer Science and Information Security,
Vol. 10, No. 11, November 2012
Computerized Analysis of Breast Thermograms
for Early Diagnosis of Breast Cancer
Mrs. Asmita Wakankar1, 2 Dr. G. R. Suresh 1Research Scholar, Sathyabama University Professor, Eswari Engg College,
Chennai, India Chennai, India 2Asst Prof, Cummins College of Engg, Pune
[email protected] [email protected]
Abstract— Breast cancer is one of the leading causes of
death in women. Early detection of breast cancer is the
key to improve survival rate. Malignant tumors causes
localized temperature increase on breast surface which
shows as hot spot and vascular patterns in breast
infrared thermograms. Thermographic detection of
breast cancer primarily depends on the visual analysis of
these patterns by physicians, which is hard to provide
objective and quantitative analysis. This paper proposes
computerized analysis of thermograms using a series of
statistical features extracted from the thermograms
quantifying the bilateral differences between left and
right breast area for diagnosis of breast cancer.
Thermography is particularly well suited for checking of
tumors in their early stages or in dense tissue and
implants.
Keywords- Breast Cancer –Infrared Thermal Imaging-
Image Analysis
I. INTRODUCTION
Breast cancer is the second leading cause of cancer related deaths of women in US. The incidence of breast cancer in India is also on rise. One out of 22 women in India is diagnosed with breast cancer. [14] Despite of considerable advances in treatment, the death rate because of breast cancer is high. Given these circumstances, early detection of breast cancer is considered as an important public health goal. Efficient and accurate evaluation can maximize cancer detection and minimize unnecessary testing and procedures. [1, 4]
Important risk factors for female breast cancer include an early age at the onset of menarche, late age of menopause, a first full-term pregnancy after the age of 30 years, a history of breast cancer in mother or sister. Obesity, nulliparity, and urban residence have also been associated with an increased risk of breast cancer. [12]
II. TECHNIQUES USED FOR BREAST CANCER DETECTION
A. Physical Examination:
When breast cancer has grown to the point where physical signs and symptoms appear, the patient feels a breast lump (usually painless). The physician visually inspects the breasts, noting asymmetry, nipple discharge, obvious masses, and skin changes, such as dimpling, inflammation, rashes, and unilateral nipple retraction or inversion. Benign masses generally cause no skin change and are smooth, soft to firm, and mobile, with well-defined margins. Malignant masses generally are hard, immobile, and fixed to surrounding skin and soft tissue, with poorly defined or irregular margins. Problem with Clinical examination is that it is insensitive and examiner dependent.
B. Needle Biopsy:
Many suspicious breast abnormalities can be diagnosed without surgery by using needle biopsy. There are different types of needle biopsies:
Fine Needle Aspiration (FNA)
FNA biopsy uses a very thin, hollow needle to remove fluid and tiny fragments of tissue. This procedure involves inserting a thin needle into the breast to remove cells from a lump which are then examined under a microscope. Local anesthesia may be given. This test may be done to determine whether a lump is solid or is a fluid-filled cyst. A cyst will collapse and disappear after the fluid is removed. [12]
Core Needle Biopsy (CNB)
A core needle biopsy is a percutaneous procedure that involves removing small samples of breast tissue using a hollow ‘core’ needle. Core needle biopsy usually allows for a more accurate assessment of a breast mass than FNA because the larger core needle usually removes enough tissue for the pathologist to evaluate abnormal cells in relation to the surrounding small sample of breast tissue taken in the specimen. Nevertheless, core needle biopsy like FNA, only removes samples of a mass and not the entire
50 http://sites.google.com/site/ijcsis/ ISSN 1947-5500
(IJCSIS) International Journal of Computer Science and Information Security,
Vol. 10, No. 11, November 2012
area of concern. Therefore, it is possible that a more serious diagnosis may be missed by limiting the sampling of a lesion. [12]
Stereotactic Vacuum Assisted Biopsy:
The vacuum-assisted breast biopsy is a percutaneous procedure that relies on stereotactic mammography or ultrasound imaging. Stereotactic mammography involves using computers to pinpoint the exact location of a breast mass based on mammograms taken from two different angles. The computer coordinates will help the physician to guide the needle to the correct area in the breast. With ultrasound, the radiologist or surgeon will watch the needle on the ultrasound monitor to help guide it to the area of concern. Vacuum-assisted biopsy is a minimally invasive procedure that allows for the removal of multiple tissue samples. However, unlike core needle biopsy, which involves several separate needle insertions to acquire multiple samples, the special biopsy probe used during vacuum-assisted biopsy is inserted only once into the breast through a small skin nick made in the skin of the patient’s breast. [12]
C. Mammography:
Mammography is the primary imaging modality for breast cancer screening and diagnosis using x rays. Currently, it is considered as a most reliable and cost effective imaging modality and thus ‘golden standard’ for breast imaging. However, its false negative rate is higher. The danger of ionizing radiation results in increased cancer risk. It is also uncomfortable because the breast is compressed between two flat surfaces to improve image quality. It can’t be used for dense breasts and for breast implants. [4]
D. Ultrasound:
Ultrasonography is the most important adjunctive imaging modality for breast cancer diagnosis. Safety, ease of use and real-time imaging capability make breast ultrasound a method of choice for guiding breast biopsies and other interventional procedures. Breast ultrasound is routinely used for differentiating cysts and solid nodules with high specificity. In combination with mammography, ultrasound is used to characterize solid masses as benign or malignant. Ultrasound can be used in younger women and women with breast implants. But, the effectiveness depends on the ability of the radiologist performing the test. It has poor ability to visualize deep lesions and detect micro calcifications. [12]
E. Magnetic Resonnce Imaging (MRI):
Breast MRI offers valuable information about breast conditions that cannot be obtained by other imaging modalities, such as mammography or ultrasound. A benefit of MRI is that it can easily acquire direct views of the breast in any orientation while mammography requires re-
orientation of the breast and mammography system for each view desired. A few advantages of breast MRI are that it can be used in women with denser breasts, it is non-ionizing, it can take images in any orientation, it can determine multi-focal cancers and is useful in determining if the cancer has spread to the chest wall. It can also be used to check for recurrence of cancer in women who have undergone lumpectomy. The disadvantages are that it is expensive, requires injection of a contrast agent for functional imaging and long scan times in comparison to x-ray mammography. Specificity can be limited, it is highly sensitive to small abnormalities, and cannot image calcifications and can induce feelings of claustrophobia. [4]
F. Positron EmissionTomography (PET):
Positron emission tomography is one of the newest forms of imaging tests. A tiny amount of radioactive substance is injected into an arm vein. This substance gives off small amount of radiation that is detected by a special PET scanner to form an image. A PET scan may be combined with computed tomography (CT) to provide both an anatomical and functional view of the suspect cells. With all this information, doctors can better differentiate between healthy and cancerous cells, even when the cancer is too small to detect by conventional imaging. PET is being successfully used to detect metastatic disease. But it is expensive and scarce. [7, 12]
G. Electrical Impedance Tomography (EIT):
EIT is an imaging method that utilizes an array of electrodes to apply currents to an imaging domain and measures the resulting voltages on the periphery. EIT scans the breast for electrical conductivity based on the idea that breast cancer cells conduct electricity better. The test does not use radiation and does not require breast compression. It is a noninvasive low cost technique but has low S/N ratio and low resolution. It requires localization of lesion before hand, insensitive and observer dependent. [12]
All above methods are often too cumbersome, costly, inaccessible or invasive to be used as first line detection modalities alongside clinical examination and mammography. [7] Thus, thermogram appears as one of the most promising and suitable alternatives for preliminary screening.
H. Thermography:
Infrared thermography is a powerful detector of problems that affect human physiology. It uses an infrared camera to detect the natural thermal radiation emitted from human body and obtains an image recording the surface temperature distribution of the body. Thermography is a noninvasive, painless, low cost technique, requires no contact nor compression, no radiation or access and thus risk free for patients. [22] It is able to warm women up to 10 years before a cancer is found. It is the only method that
51 http://sites.google.com/site/ijcsis/ ISSN 1947-5500

(IJCSIS) International Journal of Computer Science and Information Security,
Vol. 10, No. 11, November 2012
mediates significant information on breast physiology. [7] Thus, thermogram plays a vital role in breast cancer, be it risk assessment, detection, diagnosis or prognosis. It is a proper choice for annual routine medical check up of breast cancer. [8] Despite of strengths reported, thermogram is associated with some of the limitations such as environment dependent, operator dependent, not descriptive, difficult to interpret, nonspecific, inconsistent and no standard analysis procedure.
Table 1 summarizes the available modalities for breast cancer detection and the reported accuracy respectively. The accuracy is only an estimate because these modalities perform differently on different types of breast cancer, on different age group and apart from that most of the tests are done on small populations. [7]
Table 1: Comparison of Different Breast Imaging Modalities [7]
Method Sensitivity
(%)
Specificity
(%)
Clinical Exam 48.3-59.8 90.2-96.9 FNA Biopsy 85-88 55.6-90.5 CN Biopsy 91-99 73-100
Vaccum Assisted Biopsy
95 98
Digital Mammography 64.3 88.2 Sonography 13-98.4 67.8-94
MRI 86-100 21-97 PET 96 100 EIT 62-93 52-69
Thermography 90 90
1. Principal of Thermography:
Thermography is based on the principle that metabolism and blood vessel proliferation in both pre-cancerous tissue and the area surrounding a developing breast cancer is almost always higher than in normal breast tissue. Developing tumors increase circulation to their cells by enlarging existing blood vessels and creating new ones in a process called vascularisation. This process frequently results in an increase in regional surface temperatures of the breast. Thermography uses ultra-sensitive infrared cameras and PCs to generate high-resolution diagnostic images of these temperature variations. [12]
2. Infrared Camera Developments:
Early infrared cameras were bulky and inconvenient to use. They required liquid nitrogen for cooling. Modern cameras are compact, portable, and can be used in any orientation. They have high spatial and temperature resolutions. [22]
3. Infrared Thermography of Normal Healthy
Subject:
Temperature is a long established indicator of health. Infrared thermal imaging has been used for several decades to monitor the temperature distribution of human skin. Abnormalities such as malignancies, inflammation and infection cause localized temperature increase which show as hot spot or as an asymmetrical patterns in an infrared thermogram. In a healthy subject, there is a contra lateral symmetry in skin temperature distribution and an asymmetry above a certain level is a strong indicator of abnormality. [22]
Table 2 gives contralateral skin temperature differences in normal subjects. It is observed that highest skin temperature on body is forehead and lowest was on toes.
Table 2: Contralateral Temperature Differences in Normal Subjects [22]
Body Segment Cutaneous Sensory
Nerves & Segments
Mean
∆T
(K)
SD
∆T
(K)
Forehead Trigeminal nerve (v1)
0.12 0.093
Cheek Trigeminal nerve (v2)
0.18 0.186
Chest Intercostal (T1-T7) 0.14 0.151 Abdomen Intercostal (T7-T10) 0.18 0.131
Neck Cervical (C2-C5) 0.15 0.091 Arm(Biceps) Med Antebrachial
(C8,T1) 0.13 0.119
Thigh(Anterior) Ant. Fem. Cutaneous
0.11 0.085
Forearm(Medial) Med. Antebrachial(C8,T1)
0.32 0.158
Heel Tibial (S1-2) 0.20 0.220 Average Finger
Tips Median & Ulnar 0.38 0.064
III. METHODS
A. Data Acquisition:
� Procedure:
In order to get the best possible examination, free of artifact, the following instructions are STRONGLY recommended.
• No prolonged sun exposure (especially sunburn) to the breasts 5 days prior to exam.
• No use of lotions, creams, powders, or makeup on the breasts on the day of the exam.
• No exercise 4 hours prior to exam. • No tobacco use, caffeinated soda, coffee, or tea 2
hours prior to exam.
The imaging room must be temperature and humidity-controlled and maintained between 18 and 23ºC, and kept to
52 http://sites.google.com/site/ijcsis/ ISSN 1947-5500
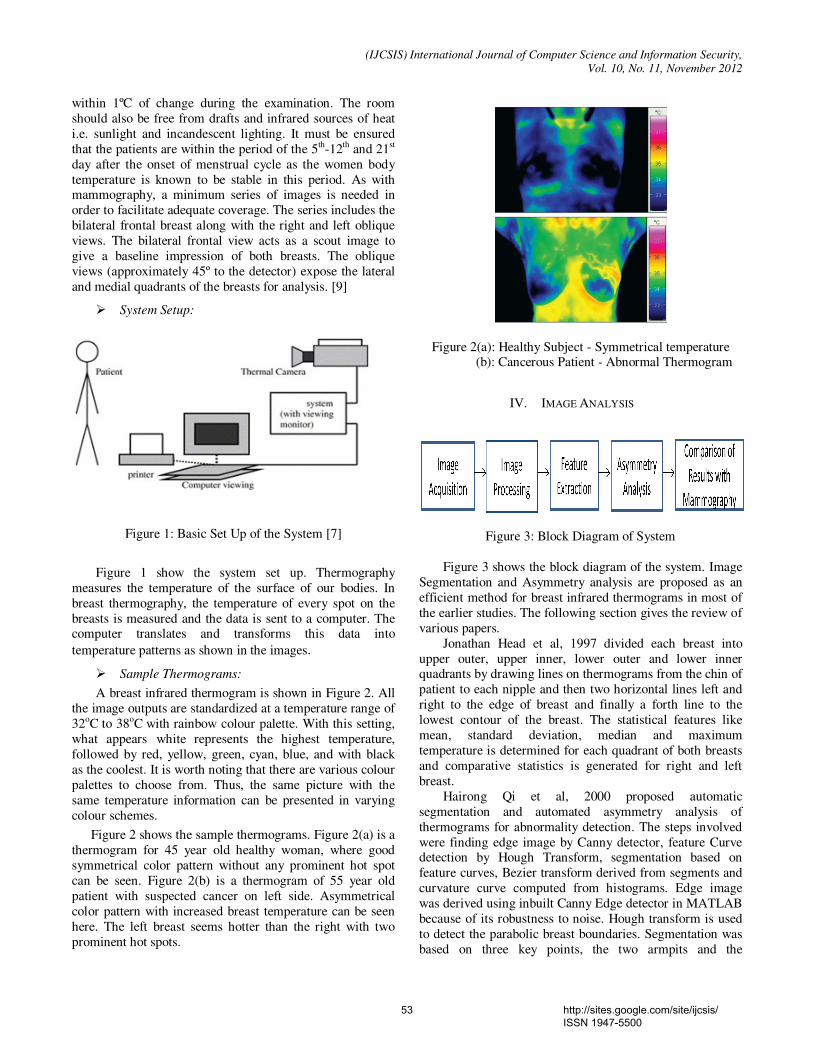
(IJCSIS) International Journal of Computer Science and Information Security,
Vol. 10, No. 11, November 2012
within 1ºC of change during the examination. The room should also be free from drafts and infrared sources of heat i.e. sunlight and incandescent lighting. It must be ensured that the patients are within the period of the 5th-12th and 21st day after the onset of menstrual cycle as the women body temperature is known to be stable in this period. As with mammography, a minimum series of images is needed in order to facilitate adequate coverage. The series includes the bilateral frontal breast along with the right and left oblique views. The bilateral frontal view acts as a scout image to give a baseline impression of both breasts. The oblique views (approximately 45º to the detector) expose the lateral and medial quadrants of the breasts for analysis. [9]
� System Setup:
Figure 1: Basic Set Up of the System [7]
Figure 1 show the system set up. Thermography measures the temperature of the surface of our bodies. In breast thermography, the temperature of every spot on the breasts is measured and the data is sent to a computer. The computer translates and transforms this data into temperature patterns as shown in the images.
� Sample Thermograms:
A breast infrared thermogram is shown in Figure 2. All the image outputs are standardized at a temperature range of 32oC to 38oC with rainbow colour palette. With this setting, what appears white represents the highest temperature, followed by red, yellow, green, cyan, blue, and with black as the coolest. It is worth noting that there are various colour palettes to choose from. Thus, the same picture with the same temperature information can be presented in varying colour schemes.
Figure 2 shows the sample thermograms. Figure 2(a) is a thermogram for 45 year old healthy woman, where good symmetrical color pattern without any prominent hot spot can be seen. Figure 2(b) is a thermogram of 55 year old patient with suspected cancer on left side. Asymmetrical color pattern with increased breast temperature can be seen here. The left breast seems hotter than the right with two prominent hot spots.
Figure 2(a): Healthy Subject - Symmetrical temperature (b): Cancerous Patient - Abnormal Thermogram
IV. IMAGE ANALYSIS
Figure 3: Block Diagram of System
Figure 3 shows the block diagram of the system. Image Segmentation and Asymmetry analysis are proposed as an efficient method for breast infrared thermograms in most of the earlier studies. The following section gives the review of various papers.
Jonathan Head et al, 1997 divided each breast into upper outer, upper inner, lower outer and lower inner quadrants by drawing lines on thermograms from the chin of patient to each nipple and then two horizontal lines left and right to the edge of breast and finally a forth line to the lowest contour of the breast. The statistical features like mean, standard deviation, median and maximum temperature is determined for each quadrant of both breasts and comparative statistics is generated for right and left breast.
Hairong Qi et al, 2000 proposed automatic segmentation and automated asymmetry analysis of thermograms for abnormality detection. The steps involved were finding edge image by Canny detector, feature Curve detection by Hough Transform, segmentation based on feature curves, Bezier transform derived from segments and curvature curve computed from histograms. Edge image was derived using inbuilt Canny Edge detector in MATLAB because of its robustness to noise. Hough transform is used to detect the parabolic breast boundaries. Segmentation was based on three key points, the two armpits and the
53 http://sites.google.com/site/ijcsis/ ISSN 1947-5500
(IJCSIS) International Journal of Computer Science and Information Security,
Vol. 10, No. 11, November 2012
intersection of two parabolic curves derived from lower boundaries of breast. Histogram giving the brightness distribution was calculated using Bezier splines.
J. Koay, 2004 et al used automated technique for segmentation which assumed an elliptic shape of breast boundaries. Hypothesizing that the centre of mass of all the edges was likely to be located within the breast area, edges closer to the centre of mass were considered to be part of breast. An inclusion factor to determine the cutoff distance from centre of mass is derived. The smallest convex region enclosing the remaining edges was sought and ellipse best fitting its contour was chosen as breast area.
N. Scales et al, 2004 implemented edge detection by Canny’s method. This method implements the first derivative of a Gaussian function to smooth the image and to obtain the magnitude and orientation of the gradient for each pixel. It is found that most images require different low/high threshold values in order to eliminate all but the strongest edges in the image without removing the bottom breast boundary. They have suggested use of adaptive filter to find threshold values for each image. The method to detect lower boundaries uses the fact that lines normal to the tangent of a circle at any point will cross through the circle centre. The most frequent intersection of the normals in the image determined the most likely candidate for circle centre. The image is divided in two small images and then Hough transform is applied. But HT proved to be too sensitive to small changes in curvature and thus many false edges are detected. Also it was unable to detect flat lower boundaries. So a simple strategy of connected edge algorithm is used . A recursive search algorithm is used to locate the pixels that are connected to their neighbours by a distance of no more than 2 pixels. The largest connected object in each half of the image is considered as lower boundary.
Hossein Zadech et al, 2011 used half circular and half parabola technique to detach breast region from the image. To delete the circles appearing outside the body, the edges are removed by applying SOBEL algorithm. Then using half parabola technique lower breast boundaries are found out. After segmentation, fuzzy K means clustering is used which compares the colors in relative sense and groups them in clusters. The red color represents the suspicious region for cancer.
In all above studies, feature extraction was done for asymmetry analysis of contralateral breasts. For each patient the mean, standard deviation, minimum, median and maximum temperature is calculated and comparison between two breasts is made. Histograms of left and right breast are plotted on the graphs. Then ‘moments’ are used through which valuable statistical information is presented. It includes mean, variance, skewness and kurtosis.
S.Umadevi et al, 2010 suggested use of two stages for thermogram analysis. First stage identifies the body boundary and second stage extracts highest temperature area of thermogram. Finally by combining output of two stages a single image is created which is easy to interpret. The pixels
of the thermogram are divided in two groups-first group of pixels belong to ambient temperature values and second group of pixels belong to surface body temperature values. Divided pixel values are then passed to edge detector algorithm to identify body boundary. From two dimensional matrix of temperature values representing the breast thermal image, maximum temperature value is selected. Further pixels of image are grouped into two. The first group of pixels is having temperature value less than maximum temperature and second group pixels having temperature values greater than or equal to maximum temperature values.
Xianwu Tang et al, 2008 have suggested use of localized temperature increase (LTI) as prominent feature of carcinomatous possibility. In this, the background temperature distribution of the LTI region is found out. Then the temperature increase value of each pixel can be calculated as its temperature minus the corresponding background temperature. The maximum of temperature increase values of all the pixels is defined as the LTI amplitude.
V. CONCLUSION
In conclusion, Thermography is an effective noninvasive diagnostic tool for early breast cancer detection. With the improved infrared camera developments and computer aided approach for automated image analysis, the technique would be of great practical use in diagnosing breast cancer in early stages. Use of Canny edge detector and Hough transform proves best for extracting breast region out of thermal image. Based on statistical parameters, pixel distribution asymmetries can be identified for both breasts. The color analysis of thermograms using K mean and C means clustering will be a supporting method to extract the cancerous region. For accurate results the calibration of camera is very important. The method can be a powerful adjunct tool together with mammography for diagnosis of breast cancer.
ACKNOWLEDGMENT
The authors are grateful to Dr. Madhuri Khambete and Prof A. D. Gaikwad for their motivation, and help towards the completion of this paper. We would also like to thank our colleagues from Instrumentation and Control Dept. of Cummins College of Engineering for Women for their feedback during the discussions.
REFERENCES
[1] E.Y.K. Ng , U. Rajendra Acharya , Louis G. Keith , Susan Lockwood, ‘Detection and Differentiation of Breast Cancer Using Neural Classifiers With First
54 http://sites.google.com/site/ijcsis/ ISSN 1947-5500
(IJCSIS) International Journal of Computer Science and Information Security,
Vol. 10, No. 11, November 2012
Warning Thermal Sensors’, Information Sciences 177, 2007, 4526–4538
[2] Gerald Schaefer, Michale Zavisek, Tomoharu Nakashima, ‘Thermography based Breast Cancer Analysis Using Statistical Features and Fuzzy Classification’ , Pattern Recognition 47, 2009, 1133-1137
[3] E.Y.-K. Ng,’A Review of Thermography as A Promising Non Invasive Detection Modality for Breast Tumor’, International Journal of Thermal Sciences 48, 2009, 849–859
[4] Ming-Yih Lee, Chi-Shih Yang, ‘Entropy Based Feature Extraction and Decision Tree Induction for Breast Cancer Diagnosis with Standardized Thermograph Images’, Computer Methods and Programs in Biomedicine 100, 2010, 269–282
[5] Paulo J. Lisboa a, Azzam F.G. Taktak, ‘The Use of Artificial Neural Networks in Decision Support in Cancer: A Systematic Review’, Neural Networks 19, 2006, 408–415
[6] J.P. Agnelli, A.A. Barrea, C.V. Turner,’Tumor Location and Parameter Estimation by Thermography’, Mathematical and Computer Modelling 53, 2011, 1527–1534
[7] T.Z. Tan , C. Quek , G.S. Ng , E.Y.K. Ng,’A Novel Cognitive Interpretation of Breast Cancer Thermography with Complementary Learning Fuzzy Neural Memory Structure’, Expert Systems with Applications 33, 2007, 652–666
[8] Xianwu Tang , Haishu Ding , Yun-e Yuan , Qing Wang,’Morphological Measurement of Localized Temperature Increase Amplitudes in Breast Infrared Thermograms and its Clinical Application ’, Biomedical Signal Processing and Control 3, 2008, 312–318
[9] Joseph D. Bronzino, ‘Medical Devices and Systems-Biomedical Enginerrg Handbook’,Edition 3,Chapter 25
[10] H.Ghayoumi Zadeh, I.Abaspur Kazerouni, J.Haddadnia,’Distinguish Breast Cancer Based on thermal features in Infrared Images’ , Canadian Journal on Image Processing and Computer Vision Vol. 2 No. 6, July 2011
[11] Nimmi Arora, Diana Martins, Alexander Micahale Obsorne, ‘Effectiveness of a Noninvasive Digital Infrared Thermal Imaging System in the Detection of Breast Cancer’, American Journal of Surgery, 2008, 196, 521-526
[12] Sachin Prasad, Dana Houserkova,’The Role of Various modalities in Breast Imaging’, Biomed Pap Med Fac
Univ Palacky Olomouc Czech Repub. 2007,
151(2):209–218
[13] Hairong Qi, Phani Teja Kuruganti, Wesley E. Snyder ‘Detecting Breast Cancer from Thermal Infrared Images by Asymmetry Analysis’,
[14] Hossein Ghayoumi Zadeh, Iman Abaspur Kazerouni, Javad Haddadni, ‘Diagnosis of Breast Cancer and Clustering Technique Using Thermal Indicators Exposed by Infrared images’, Journal of American Science, 2011;7(9);
[15] Pragati Kapoor, Ekta Bhayana, Dr. S. V. A. V Prasad,’Real Time Intelligent Thermal Analysis Approach for Early diagnosis of Breast Cancer’, International Journal of Computer Applications, 2010,(0975 – 8887) Volume 1 – No. 5
[16] Jonathan Head, charles A. Lipari, Fen Wang and Robert elliot,’Image Analysis of Digitized Infrared Images of The Breasts from A First Generation Infrared Imaging System’, 19th International Conference Proceedings, 1997, Chicago
[17] Hairong Qi, Wesley E. Snyder, Jonathan Head and Robert elliot ‘Detecting Breast Cancer from Infrared Images by Asymmetry Analysis’, 22nd Annual EMBS Conference, 2000, Chicago
[18] N.Scales, C.Herry, M.Frize, ‘Automated Image Segmentation for Breast Analysis Using Infrared Images’, 26th Annual International EMBS Conference, September 2004, Sanfrancisco
[19] N.Scales, C.Herry, M.Frize, ‘Processing Thermal Images to Detect Breast Cancer and Assess Pain’, 4th IEEE Conference on Information Technology Applications in Biomedicine, UK
[20] J.Koray, C.Herry, M. Frize,‘Analysis of Breast Thermography with an Artificial Neural Network’, 26th Annual International EMBS Conference, September 2004, Sanfrancisco
[21] E.Y.K. Ng , E. C. Kee, U. Rajendra Acharya, ‘Advanced Technique in Breast Thermography Analysis’, 27th Annual EMBS Conference Proceedings, September 2005, Shanghai, China
[22] Bryan F. Jones, ‘A Reappraisal of the Use of Infrared Thermal Image Analysis in Medicine’, IEEE Transactions on Medical Imaging, Vol 17, No 6, december 1998
[23] Yune Yuan, Quing Wang, Yan Tan, Li Rong, Li Ji Ye, ‘Analysis of Breast Diseases Examination with Thermal Texture Mapping, Mammography and Ultrasound’, 26th Annual International EMBS Conference, September 2004, Sanfrancisco
55 http://sites.google.com/site/ijcsis/ ISSN 1947-5500

(IJCSIS) International Journal of Computer Science and Information Security,
Vol. 10, No. 11, November 2012
Asmita Wakankar received the B.E. and M.E. degree in Biomedical Instrumentation from University of Pune. She is currently working towards the Ph.D. degree at Sathyabama University, Chennai. She is currently working as an Assistant Professor at MKS MKSSS’s Cummins College of Engineering for Women,
Pune, INDIA.
Dr. G. R. Suresh received the B.E. in Electronics and Telecommunication from Manonmanium Sundaranar University, Tirunelveli. M.E. degree in Communication Systems from Madurai Kamaraj University, Madurai. And Ph.D. degree from Anna University, Chenai, INDIA. He is currenlt working
As a Professor at Department of ECE, Easwari Engineering College, Ramapuram, Chennai, INDIA.
56 http://sites.google.com/site/ijcsis/ ISSN 1947-5500

(IJCSIS) International Journal of Computer Science and Information Security,
Vol. 10, No. 11, November 2012
Corresponding Author: Olawale Surajudeen Adebayo (MCPN, MNCS)
INFORMATION SECURITY ON THE
COMMUNICATION NETWORK IN
NIGERIA BASED ON DIGITAL
SIGNATURE
O. S. Adebayo (MCPN), V. O. Waziri (PhD) and J.A
Ojeniyi (MNCS)
Cyber Security Science department, Federal University of
Technology Minna, Nigeria [email protected], [email protected],
Abstract - This paper presents simple abstraction concepts for
some digital signature scheme algorithms that include ElGamal
Signature scheme, Schnorr Signature scheme, Elliptic Curve Signature (ECS), and Digital Signature Standard (DSA). It also
examines the security of this digital signature scheme to
measure its effectiveness and improve on the variability. The algorithms are essential in securing application in dispatching
the documents on the communication network. We try to
explain the algorithms in simple form and the examples are
experimented in C++ programming language which
presupposing little or easy mathematical background
comprehension and easy computations.
Keywords - ElGamal Signature scheme, Signature Scheme,
Elliptic Curve Signature, Information Security, Digital Signature
I. INTRODUCTION
Information security has become a serious concern
in disseminating secured data over the Internet. One of the
great advantages of Internet is the transmission of message
and data on the Internet. However, these pretty pieces of
data and some worthy information can be intercepted by the
enemies, read and modified which invalidate the originality
and authenticity of the document. A document sending to a
particular destination can also be forged in one way or the
other, which could undermine the essence of the message.
Digital signature has therefore, become a necessary tool to
sign an on line’s messages electronically and authenticate
the originality of its document in order to identify the
identity of the sender and check the activities of hackers. A
signature (binary construed) is used in everyday situations
such as writing a letter, withdrawing money from a bank,
signing a contract, etc.
Digital signature is a signature scheme of signing a
message stored in electronic form [1] as against the
“Conventional” handwritten signature attached to a paper
S. A. Bashir (MNCS)
Computer Science department, Federal University of
Technology Minna, Nigeria [email protected]
Amit Mishra
Mathematics and Computer Science department, IBB
University, Lapai, Nigeria [email protected]
document used to specify a person responsible for the
signature. A signed message over the Internet can be
transmitted over a computer and other communication
network systems. In signing an electronic message, an
algorithm that is used to sign the message must “bind” the
signature to the message as against the conventional
signature, where a signature is part of physical data or
Information.
The problem of signing an online message is in two
categories. The first problem is the problem of signing a
document while the second problem is that of verification. A
conventional signature could be easily verified by simply
compared with the original or authentic signature. For
example, a customer paycheck could be verified by a cashier
by comparing the signature on the check with the original
one in the bank for verification. Digital signature, on the
other hand requires publicly known verification algorithm,
thus a digital signature can be verified by anybody and
therefore, a need to use a secure signature scheme in order
to prevent the possibility of forgeries and abdication by
intruders.
The major challenge associated with digital
signature is its feature of reused. A copy of digital message
is identical to the original and can be easily reused by
anybody. For example, if Ade authorizing Ola to withdraw
certain amount of money from his account, in order to
prevent Ade from withdrawing the amount several time, the
digital message should contain certain information, such as
date in order to prevent it from being reused.
Digital signature scheme has two important
components; namely, Signing and Verification algorithms.
Message x that is signed by Ade using a signature algorithm
Sigk, which depends on his private key can be verified by
57 http://sites.google.com/site/ijcsis/ ISSN 1947-5500
(IJCSIS) International Journal of Computer Science and Information Security,
Vol. 10, No. 11, November 2012
Corresponding Author: Olawale Surajudeen Adebayo (MCPN, MNCS)
Ola using a publicly known verification algorithm Verk.
Consider a pair (x, y) where x is a message and y indicate a
signature on a message x, then the resulting verification
algorithm Verk x = y is true if a message x has been validly
signed and y = Verk; x is false if x is a forged signature or
not previously signed.
This paper examines various signature schemes
algorithms that are being used on the insecure Internet to
sign a message electronically (that is, signing and
verification algorithm). The security requirements of the
scheme are also highlighted. The rest of the paper is as
follows: In section 2 deals with related literatures review,
section 3 emphasizes on the methods for the sampled
modern public key infrastructure (PKI); while section 4
deals with experimental performance of the stipulated
algorithms in section 4, and finally in section 5, we present
some fundamental suggestions for future research works.
II. RELATED WORK
The notion of digital signature exists as a result of
quest to reduce or eradicate the spate digital data forgery on
the insecure communication network. To this end, [5]
developed an algorithm known as ElGamal signature
scheme, which is non-deterministic. This implies that for
any given message x, there exist many valid signatures Y as
a vector and a message can be signed with varied private
keys while the verification can be done using the public key
algorithm. This algorithmic process is known as the public
Key cryptographic infrastructure.
The National Institute of Standard and Technology
(NIST), [7] would later modified the ElGamal signature
scheme and produced another algorithm known as Digital
signature scheme, Today, the vulnerability of the
communication network is pervasive and required high
security attentions, which necessitates the use of a large
modulus p (a prime number that is one of the public keys
used to verify signed message). This was brought about the
development of variants of ElGamal signature scheme. All
the variants adopted the use of 2048 bits, which is effective
for powerful application like smart card and biometric
machine as against the 1024 bit modulus p used in ElGamal
signature. [4] proposed another variant of ElGamal signature
scheme, which reduces greatly the size of the signature.
[2] proposed Digital Signature Algorithm (DSA),
which is another modification of the ElGamal signature
scheme, adopts some ideas used in Schnorr signature
scheme in order to increase the security of the signature. In
order to present to a layman in a simplest form the idea of
encryption and decryption [6] illustrated how cryptography
could be used to enhance security on the internet. On the
other hand, the idea of decrypting ciphertext without the
knowledge of encryption was presented by [3] where they
presented differential cryptanalysis of DES like
cryptosystem.
III. METHODOLOGY
In this section, we present the useful sampled
algorithm in these sequential orders: The two important
components of Signature Scheme as mentioned earlier are
signing algorithm and verification algorithm. An online
message x that is signed by Ade using a signing algorithm,
with his private key can be in order way round verified by
Ola with a verification algorithm using a public key.
The Signature Scheme that is being used on the
Internet as a product of cryptosystem, with its signing and
verification algorithm in order to secure and protect
information from sender to a destination is given by the
generic definition:
A Signature Scheme is a five-tuple (P, A, K, S, V),
where each notation is given below.
P: is a finite set of possible messages
A: is a finite set of signatures
K: the keyspace is a finite set of possible keys
For each k Є K, there is signing algorithm Sigk Є S,
and a corresponding verification algorithm Verk Є V. Each
Sigk: P → A, and Verk: P x A → (true, false) are functions
such that the following verification algorithm are satisfied
for message x Є P and signature y Є A on the message
Where a pair (x, y) with x Є P and y Є S is called a signed
message
IV. THE ELGAMAL SIGNATURE SCHEME
The ElGamal signature algorithm was presented by
[5] in order to sign an online message x by Ade and sent
across the network to a second person Ola for verification
and authentication. According to ElGamal, Ade signs the
message x with his secrete random number k and private
key a, which is only known to him, while Ola can verify the
authenticity of the message x by using the public key p, α,
and β. The ElGamal signature scheme is a non-deterministic
algorithm where the verification algorithm is able to accept
as many valid signatures as possible for any given message.
Let us examine the message x sent from Ade to Ola
over an insecure communication network. The desire of Ade
is to send the message safely over the network without any
interception or disruption by intruders. However, a message
sent over a communication network can be intercepted,
examined, and modified due to the insecure nature of this
network. Thus the problem of making a message authentic
by signing it and subjecting it to verification electronically
was developed by ElGamal. He designed a signature
algorithm Sigk (x, k) for Ade, that can be used sign message
x, with his private key (a) and secret number (k), and
verification algorithm Verk (x, (γ, δ)) in order to ascertain
the authenticity and originality of the message x from Ade.
58 http://sites.google.com/site/ijcsis/ ISSN 1947-5500
(IJCSIS) International Journal of Computer Science and Information Security,
Vol. 10, No. 11, November 2012
Corresponding Author: Olawale Surajudeen Adebayo (MCPN, MNCS)
The algorithmic sequence of the ElGamal
Signature Scheme is given as follow:
Given that p is a prime over Zp where p = Zp*, A = Zp* x
Zp-1, and
K = {(p,α,a,β); β ≡ αa (mod p)},
where the values p, α, and β large prime number, public
key, and private key trspectively. The values P, A, Zp are as
defined previously.
The signature Sigk (x, k) = (γ, δ) (1)
where
γ = αk (mod p) (2)
and
δ = (x - aγ) k-1
modp-1 (3)
k here is a (secret) random number used by Ade to sign the
signature.
For x, γ ∈ Zp and δ ∈ Zp-1, the verification of the
algorithm is given as
Verk (x, (γ, δ)) = True �
βγγδ = αx
(mod p) (4)
It is worthwhile to note that if the signature was constructed
correctly, then the verification will succeed, since
βγγδ = αaγ
αkδ (mod p) ≡ αx
(mod p) (5)
Using the fact that
aγ + kδ = x (mod p-1)
The verification can be accomplished by using only
public information.
V. VARIANT OF ELGAMAL SIGNATURE SCHEME
Various challenges characterize the ElGamal
signature scheme and these range from authentication to
privacy issues. The categories of Signature scheme, which
are modification of the ElGamal Signature Scheme, were
developed. Among these are Digital signature Scheme,
Schnorr Signature Scheme, Elliptic curve Signature Scheme
to mention a few. Due to the security requirement of
signature scheme, various changes were made to ElGamal
signature. It is highly imperative to be cautious regarding
the security of a signature scheme, in which a signed
message could perform a vital financial and legal transaction
as opposed to a cryptosystem where a message might be
encrypted and decrypted only once using any cryptosystem
which is known to be secure at the time the message is being
encrypted. Again, a signed message is very likely to be
verified over a period of time after the message has been
signed.
Since the ElGamal Scheme is no more secure than
the Discrete Logarithm problem, this necessitates the use
of a large modulus p, which should have at least 512 bits
and the length of p should be 1024 bits in order to provide
security into the foreseeable future. However, for potential
applications, such as smart cards application among others,
a shorter signature is desirable.
A. The Schnnor Signature Scheme
[9] proposed a signature scheme in which the size
of the signature is greatly reduced. Schnorr proposed that
suppose that p and q are primes such that p-1 ≡ 0(mod)q,
where p is taking as 21024
and q is approximately 2160
.
It
modifies the ElGamal signature so that a log2 q-bit-message
digest is signed using a 2log2 q-bit signature, while the
computations are done in the Zp. The Signature scheme is
assumed secured based on the fact that the discrete
logarithm specified in subgroup of set of prime closure (Zp*)
is more secured. The α which is one of the public key use in
verifying signed message is taking as qth root of 1 mod p
i.e.
The algorithm of Schnorr Signature Scheme is
described below:
Given that p is a large prime number such that the
discrete log problem in Zp* is intractable, and q is a prime
that divides p-1. Then the followings are in order by
definitions:
α =
p = {o.1}*,
A = Zq x Zq, and
K = {( p, q, α, a, β): β ≡ αa (mod p)}
where
0 ≤ a ≤ q-1, p,q,α and β are the public key, and a is
the private key.
For K = ( p, q, α, a, β), and for a secret key k, 1 ≤ k ≤ q-1,
Sigk (x, k) = (γ, δ)
where
γ = h(x║ αk (mod p)) and
δ = k + aγ mod p
For x∈{0,1}*, and γ,δ ∈ Zq, the signature can be verified
through the following algorithmic process:
Verk (x, (γ, δ)) = True � h(x║ αδ β- γ (mod p)) = γ
A. The Digital Signature Standard (DSA)
The Digital signature Algorithm, 1994 (DSA)
proposed by [2] is another modification of ElGalma
Signature Scheme, which incorporates some characteristics
of Schnorr Algorithm. The DSA was first published in the
59 http://sites.google.com/site/ijcsis/ ISSN 1947-5500

(IJCSIS) International Journal of Computer Science and Information Security,
Vol. 10, No. 11, November 2012
Corresponding Author: Olawale Surajudeen Adebayo (MCPN, MNCS)
Federal Register in May 19, 1994 and was finally adopted as
a standard on December 1, 1994. DSS modifies the
ElGamal Scheme in an ingenious way so that a 160-bit
message is signed using a 320-bit signature, but the
computations are done using a 512-bit modulus p. However,
due to the criticisms from various quarters over the fixing of
prime p value as 512-bits, the NIST altered the description
of the standard and various modulus sizes can b e used. The
first change made is by changing the “-” to a “+” in equation
3 above, so that δ becomes
δ = (x + aγ) k-1
mod (p-1) (6)
This changes the verification condition to the
following:
αxβγ ≡ γ
δ (mod p) (7)
If gcd (x+aγ, p-1) = 1, then δ-1mod (p-1) exists, and
the equation (7) becomes:
αxδ-1β γδ-1 ≡ γ (mod p) (8). Also, the message x in DSA should be
hashed using SHA-1 before it is signed with a 320-bit
signature over 160-bit message digest.
B. The Elliptic Curve DSA (ECDSA)
The Elliptic Curve Digital Signature Scheme as
discussed by [11] and [12] is a modification of the Digital
Signature Algorithm (DSA) to the setting of elliptic curves.
There are two points P and Q on the elliptic curves, which
are define over Zp for some given prime number p. The
private key of ECDSA is the discrete logarithm value m =
logAB. In order to compute and verify a signature in this
ECDSA, a (secret) number k is chosen randomly and the
value of kA is computed.
Let p be a prime and E be an elliptic curve defined over Fp.
Let A be a point on E having prime order q, such that the
Discrete Logarithm problem in A is infeasible. Let
P = {0,1}*, A = Zq* x Zq*, and define
K = {(p, q, E, A, m, B) : B = mA},
Where 0 ≤ m ≤ q-1. The value p, q, E, A and B are the
public key, and m is the private key.
For a finite set of possible keys (keyspace), K and a (secret)
random number k, 1 ≤ k ≤ q-1,
Sigk (x, k) = (r, s),
where
kA = (u, v)
r = u mod q
s = k-1
(SHA-1(x) + mr) mod q
note: if either r or s = 0, then the new value of should be
selected.
For all x ∈{0, 1}* and r, s ∈Zq*, verification Verk(x, (r, s))
= true if and only if u mod q = r
Where w = s-1
mod q
i = wSHA-1(x) mod q
j = wr mod q
(u, v) = iA + jB
VI. MANUAL EXPERIMENTATIONS
These are some arithmetic examples and practical
experiment based on the research work as stated as the
examples depicted below:
A. Example (ElGamal Signature Scheme)
Suppose we take p = 467, α = 4, a = 101, we wish to verify
the signature of Ade on a message
x = 100 and his (secrete) random key, k = 213 and whether
Ola should accept this signature; then
We compute:
β = αa (mod p) = 4
101 (mod 467) = 449
γ = αk (mod p) = 4
213 (mod 467) = 374
Suppose further that Ade chooses the random value k = 213,
it is noted that great common divisor gcd(213, 466) = 1 and
213-1 mod 466 = 431
hence,
δ = (x - aγ) k-1
modp-1 = (100 – 374 * 101) *431 mod 466
= (100 - 37774) * 431 mod 466 = - 37674*431
mod 466 = -16237494 mod 466 = - 190 + 466 =
276
The computational analysis yields:
δ= 276, γ = 374
The signature 100 can therefore be verified by Ola or
anyone by checking whether congruent βγγδ = αx
(mod p) i.e
β = 449, δ= 276, γ = 374, x = 100, p = 467 and α = 4
then,
449374
374276
= 4100
mod 467 = 229 mod 467
This implies that the signature of Ade is valid and can be
accepted by Ola or anyone that the message is sent to
receive. Otherwise the signature should be rejected.
B. Example (DSA)
Suppose Ade uses DSA with q = 101, p = 7879, α = 170, a =
75 and β = 4567. We wish to determine Ade’s signature on a
message x such that SHA-1(x) = 52, using a random value k
= 49 and find out whether the signature is authentic or
forged.
Note: The value p, q, α, β, a, are as defined previously in the
signature algorithm
60 http://sites.google.com/site/ijcsis/ ISSN 1947-5500
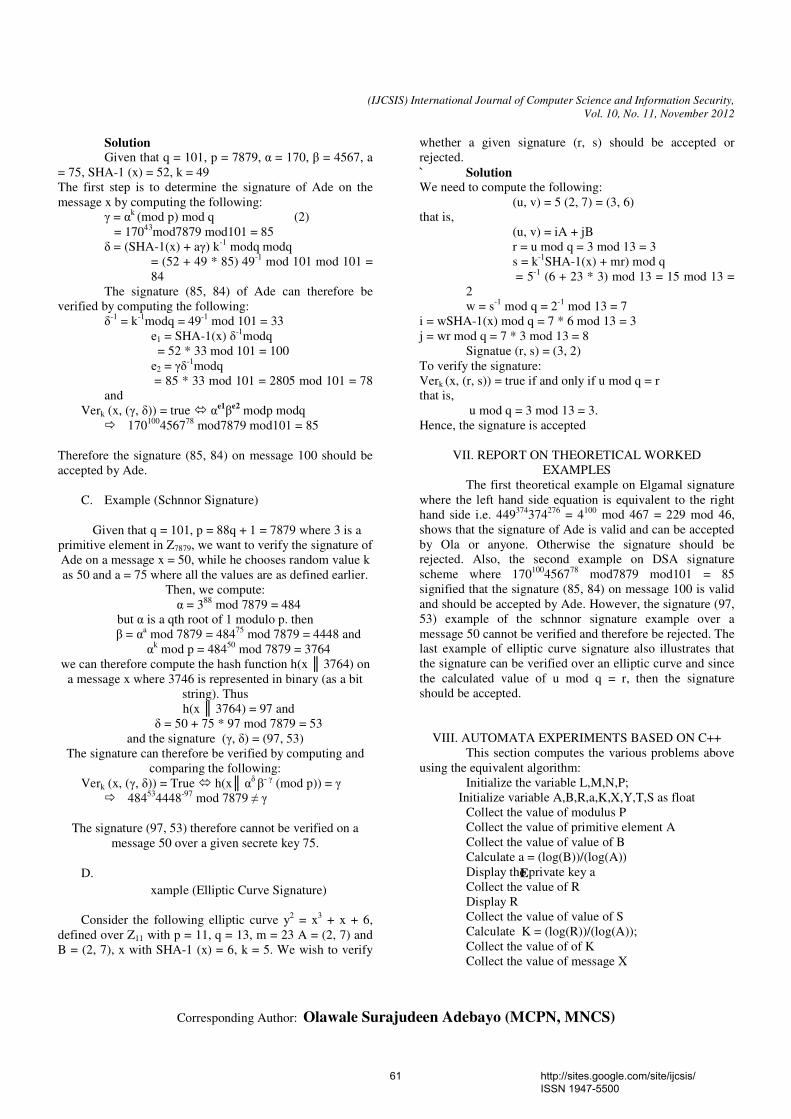
(IJCSIS) International Journal of Computer Science and Information Security,
Vol. 10, No. 11, November 2012
Corresponding Author: Olawale Surajudeen Adebayo (MCPN, MNCS)
Solution Given that q = 101, p = 7879, α = 170, β = 4567, a
= 75, SHA-1 (x) = 52, k = 49
The first step is to determine the signature of Ade on the
message x by computing the following:
γ = αk (mod p) mod q (2)
= 17043
mod7879 mod101 = 85
δ = (SHA-1(x) + aγ) k-1
modq modq
= (52 + 49 * 85) 49-1
mod 101 mod 101 =
84
The signature (85, 84) of Ade can therefore be
verified by computing the following:
δ-1 = k
-1modq = 49
-1 mod 101 = 33
е1 = SHA-1(x) δ-1modq
= 52 * 33 mod 101 = 100
е2 = γδ-1modq
= 85 * 33 mod 101 = 2805 mod 101 = 78
and
Verk (x, (γ, δ)) = true � αе1βе2 modp modq
� 170100
456778
mod7879 mod101 = 85
Therefore the signature (85, 84) on message 100 should be
accepted by Ade.
C. Example (Schnnor Signature)
Given that q = 101, p = 88q + 1 = 7879 where 3 is a
primitive element in Z7879, we want to verify the signature of
Ade on a message x = 50, while he chooses random value k
as 50 and a = 75 where all the values are as defined earlier.
Then, we compute:
α = 388
mod 7879 = 484
but α is a qth root of 1 modulo p. then
β = αa mod 7879 = 484
75 mod 7879 = 4448 and
αk mod p = 484
50 mod 7879 = 3764
we can therefore compute the hash function h(x ║ 3764) on
a message x where 3746 is represented in binary (as a bit
string). Thus
h(x ║ 3764) = 97 and
δ = 50 + 75 * 97 mod 7879 = 53
and the signature (γ, δ) = (97, 53)
The signature can therefore be verified by computing and
comparing the following:
Verk (x, (γ, δ)) = True � h(x║ αδ β- γ (mod p)) = γ
� 48453
4448-97
mod 7879 ≠ γ
The signature (97, 53) therefore cannot be verified on a
message 50 over a given secrete key 75.
D. E
xample (Elliptic Curve Signature)
Consider the following elliptic curve y2 = x
3 + x + 6,
defined over Z11 with p = 11, q = 13, m = 23 A = (2, 7) and
B = (2, 7), x with SHA-1 (x) = 6, k = 5. We wish to verify
whether a given signature (r, s) should be accepted or
rejected.
` Solution We need to compute the following:
(u, v) = 5 (2, 7) = (3, 6)
that is,
(u, v) = iA + jB
r = u mod q = 3 mod 13 = 3
s = k-1
SHA-1(x) + mr) mod q
= 5-1
(6 + 23 * 3) mod 13 = 15 mod 13 =
2
w = s-1
mod q = 2-1
mod 13 = 7
i = wSHA-1(x) mod q = 7 * 6 mod 13 = 3
j = wr mod q = 7 * 3 mod 13 = 8
Signatue (r, s) = (3, 2)
To verify the signature:
Verk (x, (r, s)) = true if and only if u mod q = r
that is,
u mod q = 3 mod 13 = 3.
Hence, the signature is accepted
VII. REPORT ON THEORETICAL WORKED
EXAMPLES
The first theoretical example on Elgamal signature
where the left hand side equation is equivalent to the right
hand side i.e. 449374
374276
= 4100
mod 467 = 229 mod 46,
shows that the signature of Ade is valid and can be accepted
by Ola or anyone. Otherwise the signature should be
rejected. Also, the second example on DSA signature
scheme where 170100
456778
mod7879 mod101 = 85
signified that the signature (85, 84) on message 100 is valid
and should be accepted by Ade. However, the signature (97,
53) example of the schnnor signature example over a
message 50 cannot be verified and therefore be rejected. The
last example of elliptic curve signature also illustrates that
the signature can be verified over an elliptic curve and since
the calculated value of u mod q = r, then the signature
should be accepted.
VIII. AUTOMATA EXPERIMENTS BASED ON C++
This section computes the various problems above
using the equivalent algorithm:
Initialize the variable L,M,N,P;
Initialize variable A,B,R,a,K,X,Y,T,S as float
Collect the value of modulus P
Collect the value of primitive element A
Collect the value of value of B
Calculate a = (log(B))/(log(A))
Display the private key a
Collect the value of R
Display R
Collect the value of value of S
Calculate K = (log(R))/(log(A));
Collect the value of of K
Collect the value of message X
61 http://sites.google.com/site/ijcsis/ ISSN 1947-5500
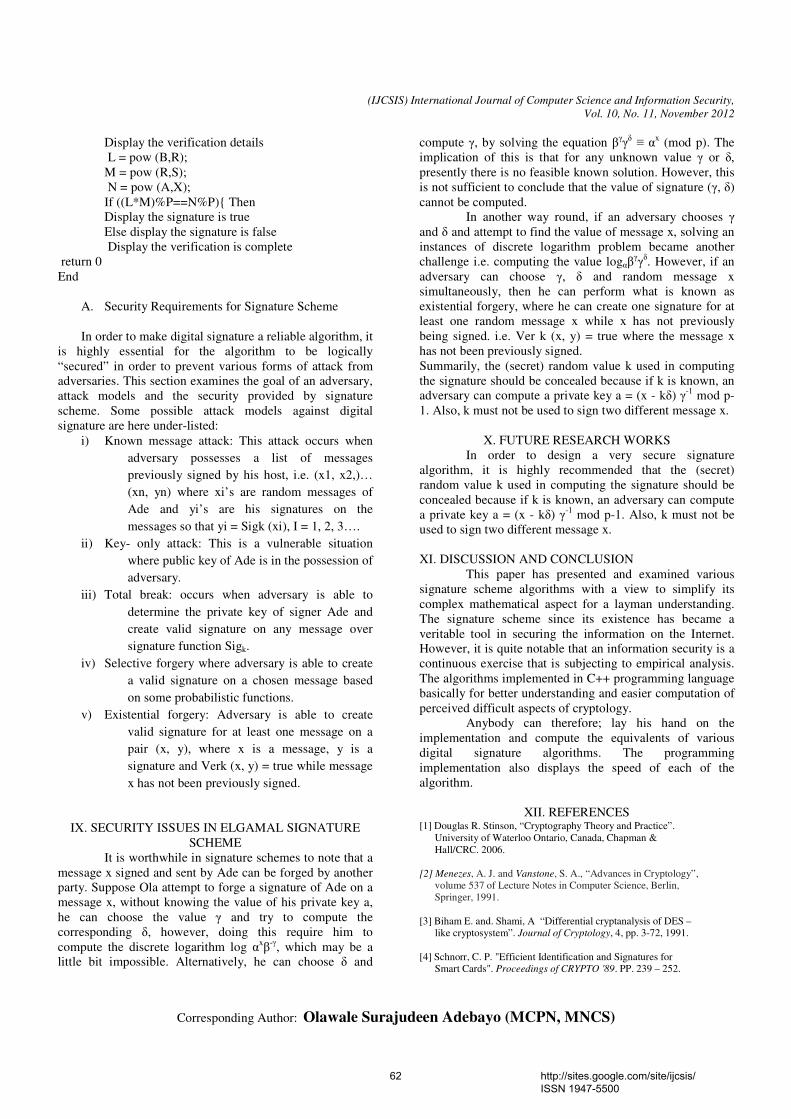
(IJCSIS) International Journal of Computer Science and Information Security,
Vol. 10, No. 11, November 2012
Corresponding Author: Olawale Surajudeen Adebayo (MCPN, MNCS)
Display the verification details
L = pow (B,R);
M = pow (R,S);
N = pow (A,X);
If ((L*M)%P==N%P){ Then
Display the signature is true
Else display the signature is false
Display the verification is complete
return 0
End
A. Security Requirements for Signature Scheme
In order to make digital signature a reliable algorithm, it
is highly essential for the algorithm to be logically
“secured” in order to prevent various forms of attack from
adversaries. This section examines the goal of an adversary,
attack models and the security provided by signature
scheme. Some possible attack models against digital
signature are here under-listed:
i) Known message attack: This attack occurs when
adversary possesses a list of messages
previously signed by his host, i.e. (x1, x2,)…
(xn, yn) where xi’s are random messages of
Ade and yi’s are his signatures on the
messages so that yi = Sigk (xi), I = 1, 2, 3….
ii) Key- only attack: This is a vulnerable situation
where public key of Ade is in the possession of
adversary.
iii) Total break: occurs when adversary is able to
determine the private key of signer Ade and
create valid signature on any message over
signature function Sigk.
iv) Selective forgery where adversary is able to create
a valid signature on a chosen message based
on some probabilistic functions.
v) Existential forgery: Adversary is able to create
valid signature for at least one message on a
pair (x, y), where x is a message, y is a
signature and Verk (x, y) = true while message
x has not been previously signed.
IX. SECURITY ISSUES IN ELGAMAL SIGNATURE
SCHEME
It is worthwhile in signature schemes to note that a
message x signed and sent by Ade can be forged by another
party. Suppose Ola attempt to forge a signature of Ade on a
message x, without knowing the value of his private key a,
he can choose the value γ and try to compute the
corresponding δ, however, doing this require him to
compute the discrete logarithm log αxβ-γ, which may be a
little bit impossible. Alternatively, he can choose δ and
compute γ, by solving the equation βγγδ ≡ αx
(mod p). The
implication of this is that for any unknown value γ or δ,
presently there is no feasible known solution. However, this
is not sufficient to conclude that the value of signature (γ, δ)
cannot be computed.
In another way round, if an adversary chooses γ
and δ and attempt to find the value of message x, solving an
instances of discrete logarithm problem became another
challenge i.e. computing the value logαβγγδ
. However, if an
adversary can choose γ, δ and random message x
simultaneously, then he can perform what is known as
existential forgery, where he can create one signature for at
least one random message x while x has not previously
being signed. i.e. Ver k (x, y) = true where the message x
has not been previously signed.
Summarily, the (secret) random value k used in computing
the signature should be concealed because if k is known, an
adversary can compute a private key a = (x - kδ) γ-1 mod p-
1. Also, k must not be used to sign two different message x.
X. FUTURE RESEARCH WORKS
In order to design a very secure signature
algorithm, it is highly recommended that the (secret)
random value k used in computing the signature should be
concealed because if k is known, an adversary can compute
a private key a = (x - kδ) γ-1 mod p-1. Also, k must not be
used to sign two different message x.
XI. DISCUSSION AND CONCLUSION
This paper has presented and examined various
signature scheme algorithms with a view to simplify its
complex mathematical aspect for a layman understanding.
The signature scheme since its existence has became a
veritable tool in securing the information on the Internet.
However, it is quite notable that an information security is a
continuous exercise that is subjecting to empirical analysis.
The algorithms implemented in C++ programming language
basically for better understanding and easier computation of
perceived difficult aspects of cryptology.
Anybody can therefore; lay his hand on the
implementation and compute the equivalents of various
digital signature algorithms. The programming
implementation also displays the speed of each of the
algorithm.
XII. REFERENCES
[1] Douglas R. Stinson, “Cryptography Theory and Practice”.
University of Waterloo Ontario, Canada, Chapman &
Hall/CRC. 2006.
[2] Menezes, A. J. and Vanstone, S. A., “Advances in Cryptology”,
volume 537 of Lecture Notes in Computer Science, Berlin,
Springer, 1991.
[3] Biham E. and. Shami, A “Differential cryptanalysis of DES –
like cryptosystem”. Journal of Cryptology, 4, pp. 3-72, 1991.
[4] Schnorr, C. P. "Efficient Identification and Signatures for
Smart Cards". Proceedings of CRYPTO '89. PP. 239 – 252.
62 http://sites.google.com/site/ijcsis/ ISSN 1947-5500

(IJCSIS) International Journal of Computer Science and Information Security,
Vol. 10, No. 11, November 2012
Corresponding Author: Olawale Surajudeen Adebayo (MCPN, MNCS)
1989.
[5] ElGamal, Taher, “A public key cryptosystem and a signature
scheme based on discrete logarithms". Advances in cryptology:
Proceedings of CRYPTO 84. Lecture Notes in Computer
Science. 196. Santa Barbara, California, United States:
Springer-Verlag, pp. 10–18. doi:10.1007/3-540-39568-72, 1985.
[6] Waziri, V.O “Information Security on the Internet in Nigeria
with some functions of Cryptography”, 10th Annual
Conference proceding, Nigerian Computer Society, Nicon
Luxury, Abuja, Nigeria, 2011.
[7] National Institute of Standards and Technology. Fact Sheet on
Digital Signature Standard. Online, 1994. Accessible online at
National Institute of Standards and Technology Website:
http://www.nist.gov/public_affairs/releases/digsigst.htm.
[8] Anderson, R. “Security Engineering: A Guild to Building
Dependable Distributed System”, John Willy and Sons.
[9] Steinfeld R., Wang H., and Pieprzyk J., “Efficient extension of
standard Schnorr / RSA signatures into universal designated-
verifier signatures, Public Key Cryptography-PKC”, LNCS
Springer-Verlag, 2947, pp.86-100, 2004
[10] Zhang, F. and Kim, K., “A universal forgery on Araki et al. ’s
convertible limited verifier signature scheme”, IEICE Trans.
Fundamentals, ol.E86-A, 2, pp. 515-516, 2003.
[11] Hankerson, D., Menezes, A., and Vanstone, S.A., “Guide to
Elliptic Curve Cryptography”, Springer-Verlag, 2004.
[12] Blake, I., Seroussi, G. and Smart, N., “Elliptic Curves in
Cryptography”, London Mathematical Society 265,
Cambridge University Press, 1999.
[13] Adebayo, O. S. and Waziri, V. O. “Information Security on the Communication Network in Nigeria Based on Digital Signature” In proceeding of 3rd Internation Conference on Mobile e-Services” Ladoke Akintola University, Ogbomoso, Nigeria, 25th – 27th, 2011.
AUTHORS PROFILE
Olawale Surajudeen Adebayo (MCPN, MNCS, MIACSIT)
is a lecturer in the department of Cyber security science
department, Federal University of Technology, Minna,
Niger State Nigeria. He bagged B.Tech. in Mathematics
and Computer science from Federal University of
Technology, Minna and the MSc. in Computer science from
University of Ilorin, Kwara state, Nigeria. He is presently a
PhD student in the department of cyber Security science,
Federal University of Technology, Minna.
His current research interests include: Information security,
Cryptology, Machine learning, Data mining and
computational intelligent. He has published some papers in
the above-mentioned research areas.
He is a member of Computer Professional Registration
Council of Nigeria (CPN), Nigeria Computer Society
(NCS), Global Development Network, International
Association of Computer Science and Information
Technology and many others.
63 http://sites.google.com/site/ijcsis/ ISSN 1947-5500

Requirements Elicitation For Software Projects
Samaher Abdullah AL-Hothali
Department of Computer Science and Engineering, Yanbu University College, Saudi Arabia.
Noor Abdulrahman AL-Zubaidi
Department of Computer Science and Engineering, Yanbu University College, Saudi Arabia.
Anusuyah Subbarao
Department of Computer Science and Engineering, Yanbu University College, Saudi Arabia.
Abstract - Requirements elicitation is the practice of collecting the requirements of a system from users, customers and other stakeholders. It is usually realized that requirements are elicited rather than just taking or gathering. This means there are discovery and development of elements to the elicitation process. Requirements elicitation is a complex process connecting with many activities with a different of available techniques, approaches, and tools for performing them. The objectives of this paper is to present the important aspects of how to plan for elicitation ,the techniques, approaches, and tools for requirements elicitation, and some elicitation problems.
Keywords: requirements, elicitation, techniques, approaches, problems.
Introduction:
There are lots of problems linked with requirements engineering, including problems in defining the system scope, problems in development or enhance the understanding among the different
communities influenced by the development of a given system, and problems in dealing with the changing nature of requirements. These problems may lead to lack of requirements and the stopping of system development, or else the development of a system that is later judged wrong or unacceptable, has high servicing costs, or undergoes common changes. The purpose of this paper is to provide the significant aspects of how to plan for elicitation, the techniques, approaches, and tools for requirements elicitation, and some elicitation troubles as elicitation troubles measured as a main problem area in the development of complex, software-intensive system.
ANALYSIS
1. What is elicitation
Elicitation indicates “to bring out, to
evoke, and to call forth“; Requirements
elicitation is “the process of discoverin
(IJCSIS) International Journal of Computer Science and Information Security, Vol. 10, No. 11, November 2012
64 http://sites.google.com/site/ijcsis/ ISSN 1947-5500

g the requirements for a system by
communication with
customers, system
users and others who have a stake in th
e system development”. Requirements
elicitation is all about studying and
comprehension the needs of users and
project sponsors with the final aim of
communicating these needs to the
system developers.
2. Goal of elicitation
The reason is to find information about : the domain model from which the requirements are written, the requirements from which system is developed.
3. Source of requirements
There are different sources for requirements such as {Clients, Pre-existing systems (not necessarily computer systems), Pre-existing documentation, Users (pre-existing and potential) , Competing systems , Domain experts ,Documentation about interfacing systems ,Standards and legislation }.
4. Planning for elicitation Elicitation plan is the most important step to start any project. 4.1 Objective Appoint what the elicitation is for. 4.2 Setting elicitation Strategies and processes
Approaches that will be used, usually a collection of approaches such as (questioner, interview, Group Work, task analysis…etc)
4.3 Schedule and resource estimates Identify development and customer participants in different elicitation activities, guess of effort for elicitation and Scheduling.
4.4 Risks Factors that could block completion of elicitation activities, and you have to severity of each and every risk then, reduction strategy for each risk.
5. Elicitation Techniques and Approaches 5.1 Interviews
Interviews present an effective way to gather big number of data quickly.
5.1.1 Planning and Preparation Essential to plan and prepare interviews by place goals and objectives for the interview, Prepare questions, get background knowledge of the subject matter, and organize the environment for performing an effective interview. 5.1.2 Interview groups of people together to get Synergy Users can not think of everything they need when asked separately, however will remind more requirements when they hear others' needs. This relation is called synergy, the result by which group responses
(IJCSIS) International Journal of Computer Science and Information Security, Vol. 10, No. 11, November 2012
65 http://sites.google.com/site/ijcsis/ ISSN 1947-5500
outperform the sum of the individuals' responses.
5.1.3 Common interviewing
mistakes
Not interviewing all of the right people. Sometimes, asking direct questions too early. Interviewing one at a time instead of in small groups (More people might help get juices flowing as in brainstorming and reduces attention on individuals may produce more attractive answers) imagining that situation needs are exactly correct. Trying to encourage Stakeholders that You Are Smart .
5.2 Brainstorming Brainstorming [1] is a method where participants from different stakeholder groups connect in informal discussion to quickly produce as many ideas as possible without focusing on any one in particular. It is essential when conducting this type of group work to keep away from exploring or critiquing ideas in huge details. It is not usually the future reason of brainstorming sessions to decide major issues or make key decisions. This technique is often used to expand the introductory task statement for the project and target system. One of the advantages in using brainstorming is that it encourages freethinking and expression, and allows the discovery of new and ingenious solutions to existing problems. 5.3 Observation Observation is one of the more broadly used ethnographic techniques. As the
name suggests the analyst observes the real enforcement of existing processes by the users without direct interference. This technique is often used in combination with others such as interviews and task analysis. As a general rule ethnographic techniques such as observation are very expensive to perform and require important skill and effort on the part of the analyst to interpret and understand the actions being performed. The effectiveness of observation and other ethnographic techniques can differ as users have a tendency to correct the way they perform tasks when knowingly being watched.
5.4 Group Work Group work such as collaborative meetings is a very common and often default technique for requirements elicitation. Groups are mainly effective because they include and commit the stakeholders directly and enhance cooperation. These types of sessions can be hard to classify due to the number of different stakeholders that may be involved in the project. Organization these sessions effectively requires both expertise and experience to guarantee that individual personalities do not control the discussions. Key factors in the success of group work are the makeup of participants and the cohesion within the group. Stakeholders must feel comfortable and confident in speaking openly and honestly, and it is for this reason that group work is less effective in highly political situations.
(IJCSIS) International Journal of Computer Science and Information Security, Vol. 10, No. 11, November 2012
66 http://sites.google.com/site/ijcsis/ ISSN 1947-5500
5.5 Questionnaires
Questionnaires [2] are mostly used
during the early stages of requirements elicitation and may consist of open and/or closed questions. For them to be useful, the terms, concepts, and boundaries of the domain must be well established and understood by the participants and questionnaire designer. Questions must be focused to stay away from gathering large amounts of redundant and irrelevant information. They provide an effective way to collect information from many stakeholders fast, but are limited in the depth of knowledge they are able to elicit. Questionnaires not have the opportunity to research further on a topic, or increase on new ideas.In the same way they present no technicality for the participants to request explanation or correct misunderstandings. Generally questionnaires are considered more helpful as informal checklists to ensure basic elements are addressed early on, and to establish the basis for following elicitation activities.
5.6 Laddering When using laddering [3] stakeholders are asked a series of short encouragement questions, known as probes, and required to order the resulting answers into a planned structure. A main supposition when employing laddering is that the knowledge to be elicited can really be arranged in a hierarchical fashion. For this technique to be useful, the
stakeholders must be able to express their comprehension of the domain and then place it in a logical way. This knowledge which is often displayed using tree diagrams, is reviewed and
modified dynamically as more is added. Like card sorting, laddering is mostly used as a way to clarify requirements and categorize domain entities.
5.7 Domain Analysis Observe existing and related documentation and applications to collect early requirements as well as understand and take domain knowledge, and recognize reusable concepts and works.
5.8 Task Analysis Task analysis [4, 5] uses a top-down approach where high-level tasks are spoiled into subtasks and finally detailed sequences until all actions and events are described. The main objectives of this technique is to build a hierarchy of the tasks performed by the users and the system, and decide the knowledge used or required to carry them out. Task analysis presents information on the interactions of both the user and the system with respect to the tasks as well as a background description of the activities that take place. In most cases considerable effort is necessary to perform thorough task analysis, and it is important to establish what level of detail is required and when works of the tasks need to be explorer more.
(IJCSIS) International Journal of Computer Science and Information Security, Vol. 10, No. 11, November 2012
67 http://sites.google.com/site/ijcsis/ ISSN 1947-5500
5.9 Apprenticing The analyst learns and performs the existing tasks under the instruction and supervision of an expert.
5.10 reflection The technique of introspection [6] requires the analyst to expand requirements based on what he or she believes the users and other stakeholders want and need from the system. Despite being employed by most analysts to some extent, this technique is mostly used only as an early point for other requirements elicitation efforts. Introspection is only really useful when the analyst is not only very familiar with the domain and goals of the system, but also specialist in the business processes achieved by the users. In cases where the analyst is forced to use this technique more, for instance when the users have little or no previous knowledge with software systems in their work environment, a type of facilitation introspection should take place via other elicitation techniques such as interviews and
protocol analysis.
5.11 Prototyping
Providing stakeholders with prototypes
of the system to support the study of
possible solutions is an effective way
to gather detailed information and
relevant feedback [7]. It is common
that prototypes are used in combination
with other elicitation techniques such
as interviews. Prototypes are typically
developed using introductory
requirements or existing examples of
similar systems. This technique is
particularly useful when developing
human-computer interfaces, or where
the stakeholders are unfamiliar with
the available solutions. There are a
number of different methods for
prototyping systems such as
storyboards, executable, throwaway
and evolutionary, with changeable
levels of effort required. In many cases
prototypes are expensive to create in
terms of time and cost. However, an
advantage of using prototypes is that
they support stakeholders, and more
specifically the users, to play an active
role in developing the requirements.
One of the possibility risks when using
prototypes for requirements elicitation
is that users may become close to
them, and therefore become resistant to
alternative solutions from then on.
Despite this the technique is very
helpful when developing new systems
for new applications.
6. Elicitation Problems and issues
(IJCSIS) International Journal of Computer Science and Information Security, Vol. 10, No. 11, November 2012
68 http://sites.google.com/site/ijcsis/ ISSN 1947-5500

There has been small doubt in the past
about the complexity and difficulty of
requirements elicitation in most
situations. We have classified some of
the more commonly occurring issues
and problems in requirements
elicitation faced by both practitioners
and researchers according to the aspect
of requirements elicitation that they
most relate to. These have been
composed from a variety of sources in
the literature [8] as well as from
practical experience and observation.
Interaction and comprehension
It is familiar that stakeholders have
difficulty articulating their
requirements. In some cases this may
be as a result of the analyst and
stakeholders are not sharing a common
understanding of concepts and terms,
or the analyst is unfamiliar with the
problem. Often stakeholders will have
difficulty seeing new ways of doing
things, or do not know the results of
their requirements and as such may not
know what is practical or true.
Stakeholders may understand the
problem domain very well, but are
unfamiliar with the available solutions
and the way in which their needs could
be met. Alternatively stakeholders
sometimes suggest solutions rather
than requirements. Things that are
petty or always repeated by
stakeholders are often supposed and
overlooked although they may not be
apparent to the analyst and other
stakeholders.
Process and Project
Each project is unique and no two
requirements elicitation situations are
ever exactly the same. The process can
be achieved as part of a custom
software development project, COTS
selection activity, product line
definition, and existing system
servicing operation. Projects can range
all the way from simple recommended
web-based applications to large and
complex project information system
product lines. The environment in
which the process takes place can also
vary greatly including the geographic
distribution of stakeholders and the
familiarity of users with software
systems. Furthermore the process of
requirements elicitation is inherently
imprecise as a result of the multiple
variable factors, large order of options
and decision, and its communication
and socially rich nature. Perhaps the
most common project based
requirements elicitation issue is that
the first domain of the project has not
been enough defined, and as such is
open to interpretations and
(IJCSIS) International Journal of Computer Science and Information Security, Vol. 10, No. 11, November 2012
69 http://sites.google.com/site/ijcsis/ ISSN 1947-5500

suppositions. Projects like all purposes
of a business are subject to change and
influence from insider or outsider
issues including economic, political,
social, legal, financial, psychological,
historical and geographical.
Quality of Requirements
The requirements elicited may not be
practical, cost-effective, or easy to
validate.
In other cases they can be unclear,
missing details, and not represented in
such a way as can be measured or
tested. Furthermore requirements may
be defined at different and low levels
of detail. Because the process of
elicitation is informal by nature, a set
of requirements may be incorrect,
incomplete, inconsistent, and not clear
to all stakeholders. The context in
which requirements are elicited and the
process itself is inherently unsteady.
As the project develops and
stakeholders become more familiar
with the problem and solution
domains, the goals of the system and
the wants of the users are liable to
change. In this way the
Process of elicitation can actually
cause requirements volatility and
therefore affect the quality of the
requirements as a whole.
Stakeholders
Conflicts between stakeholders and
their requirements are common and
almost unavoidable.
Furthermore stakeholders may not
want to compromise or prefer their
requirements when these conflicts
occur. Sometimes stakeholders do not
actually know what they want or what
their real needs are, and are therefore
limited in their ability to support the
study of possible solutions. Also
stakeholder can be opposite to the
change a new system may introduce
and therefore have varying levels of
obligation and cooperation towards the
project. Often stakeholders do not
understand or appreciate the needs of
the other stakeholders and might only
be concerned with those factors that
affect them directly. Like all humans,
stakeholders can change their minds
separately, or as a result of the
elicitation process itself.
The “User and the Developer” Syndrome
(IJCSIS) International Journal of Computer Science and Information Security, Vol. 10, No. 11, November 2012
70 http://sites.google.com/site/ijcsis/ ISSN 1947-5500

T
Conc
This requithe pwhat in thethe mrequielicitmakindevelelicitonly levelssourcvarietwhichsystemapprowill differ Refer
[1] ImagNew
Table 1- user
clusion
research rements elic
paper is to pa requireme
e light of thmain aspectsrements elication is a cng activitylopers, anation approon the va
s of thesces of requity of the ph ranges from to a new, oach to req
have varyrent projects
rences
Osborn, Aination, ChaYork.
and develop
paper talcitation. Thepresent a deents elicitatihat definitios of how tocitation. Reqcollaborativey involvin
nd customach is depe
ariety and ese cross-direments, buproblem beiom a fully unovel one. A
quirements ying succes.
A.F. (1979)arles Scribn
per
lks about e target of efinition of ion is, and
on, provide o plan for quirements e decision-ng users, ers. The endent not experience
disciplinary ut also the ing made, understood Any single elicitation
ess across
) Applied ner's Sons:
[2] FQuestQuestPress:
[3] Hpersonof a thUnive
[4] CaA urequirof theon Re152, CO.
[5] RShephAnalyfor InComp
[6] GTechnElicitaInternRequi164,Ja
[7] So
Engin
Wesle
[8] Ch
Issues
Carne
Unive
CMU/
Faddy, W. tions for tionnaires, C Cambridge
inkle, D. (1nal construcheory of impersity, Docto
arlshamre, Pusability-orierements engi Second Inte
equirements April 15-18
Richardson, herd, A. (199ysis in Capnterface Desputers, 9 (4),
Goguen, J.Aniques fation, Proce
national irements Enanuary 4-6, S
ommerville,
neering 6th
ey: USA.
hristel, M.G
s in Requ
egie Me llon
ersity T
/SEI-92-TR-
(1994) ConInterview
Cambridge .U.
1965): The cts from the vplications, O
oral Dissertat
P., Karlsson, ented apprineering, Prernational CEngineering8, Colorado
J., Ormero98): The Rolpturing Reqsign. Interacpp. 367-384
A., Linde, Cfor Reqeedings of
Symposiumngineering, San Diego, C
I. (2001):
h Edition,
G., Kang, K.C
uirements E
Technical
-012.
nstructing ws and University
change of viewpoint
Ohio State tion.
J. (1996): roach to oceedings
Conference g, pp. 145-o Springs,
od, T.C., le of Task
quirements cting with 4.
C. (1993): quirements the IEEE
m on pp. 152-
CA.
Software
Addison
C. (1992):
Elicitation,
Report,
(IJCSIS) International Journal of Computer Science and Information Security, Vol. 10, No. 11, November 2012
71 http://sites.google.com/site/ijcsis/ ISSN 1947-5500

(IJCSIS) International Journal of Computer Science and Information Security, Vol. 10, No. 11, November 2012
IJCSIS REVIEWERS’ LIST Assist Prof (Dr.) M. Emre Celebi, Louisiana State University in Shreveport, USA
Dr. Lam Hong Lee, Universiti Tunku Abdul Rahman, Malaysia
Dr. Shimon K. Modi, Director of Research BSPA Labs, Purdue University, USA
Dr. Jianguo Ding, Norwegian University of Science and Technology (NTNU), Norway
Assoc. Prof. N. Jaisankar, VIT University, Vellore,Tamilnadu, India
Dr. Amogh Kavimandan, The Mathworks Inc., USA
Dr. Ramasamy Mariappan, Vinayaka Missions University, India
Dr. Yong Li, School of Electronic and Information Engineering, Beijing Jiaotong University, P.R. China
Assist. Prof. Sugam Sharma, NIET, India / Iowa State University, USA
Dr. Jorge A. Ruiz-Vanoye, Universidad Autónoma del Estado de Morelos, Mexico
Dr. Neeraj Kumar, SMVD University, Katra (J&K), India
Dr Genge Bela, "Petru Maior" University of Targu Mures, Romania
Dr. Junjie Peng, Shanghai University, P. R. China
Dr. Ilhem LENGLIZ, HANA Group - CRISTAL Laboratory, Tunisia
Prof. Dr. Durgesh Kumar Mishra, Acropolis Institute of Technology and Research, Indore, MP, India
Jorge L. Hernández-Ardieta, University Carlos III of Madrid, Spain
Prof. Dr.C.Suresh Gnana Dhas, Anna University, India
Mrs Li Fang, Nanyang Technological University, Singapore
Prof. Pijush Biswas, RCC Institute of Information Technology, India
Dr. Siddhivinayak Kulkarni, University of Ballarat, Ballarat, Victoria, Australia
Dr. A. Arul Lawrence, Royal College of Engineering & Technology, India
Mr. Wongyos Keardsri, Chulalongkorn University, Bangkok, Thailand
Mr. Somesh Kumar Dewangan, CSVTU Bhilai (C.G.)/ Dimat Raipur, India
Mr. Hayder N. Jasem, University Putra Malaysia, Malaysia
Mr. A.V.Senthil Kumar, C. M. S. College of Science and Commerce, India
Mr. R. S. Karthik, C. M. S. College of Science and Commerce, India
Mr. P. Vasant, University Technology Petronas, Malaysia
Mr. Wong Kok Seng, Soongsil University, Seoul, South Korea
Mr. Praveen Ranjan Srivastava, BITS PILANI, India
Mr. Kong Sang Kelvin, Leong, The Hong Kong Polytechnic University, Hong Kong
Mr. Mohd Nazri Ismail, Universiti Kuala Lumpur, Malaysia
Dr. Rami J. Matarneh, Al-isra Private University, Amman, Jordan
Dr Ojesanmi Olusegun Ayodeji, Ajayi Crowther University, Oyo, Nigeria
Dr. Riktesh Srivastava, Skyline University, UAE
Dr. Oras F. Baker, UCSI University - Kuala Lumpur, Malaysia
Dr. Ahmed S. Ghiduk, Faculty of Science, Beni-Suef University, Egypt
and Department of Computer science, Taif University, Saudi Arabia
Mr. Tirthankar Gayen, IIT Kharagpur, India
Ms. Huei-Ru Tseng, National Chiao Tung University, Taiwan

(IJCSIS) International Journal of Computer Science and Information Security, Vol. 10, No. 11, November 2012
Prof. Ning Xu, Wuhan University of Technology, China
Mr Mohammed Salem Binwahlan, Hadhramout University of Science and Technology, Yemen
& Universiti Teknologi Malaysia, Malaysia.
Dr. Aruna Ranganath, Bhoj Reddy Engineering College for Women, India
Mr. Hafeezullah Amin, Institute of Information Technology, KUST, Kohat, Pakistan
Prof. Syed S. Rizvi, University of Bridgeport, USA
Mr. Shahbaz Pervez Chattha, University of Engineering and Technology Taxila, Pakistan
Dr. Shishir Kumar, Jaypee University of Information Technology, Wakanaghat (HP), India
Mr. Shahid Mumtaz, Portugal Telecommunication, Instituto de Telecomunicações (IT) , Aveiro, Portugal
Mr. Rajesh K Shukla, Corporate Institute of Science & Technology Bhopal M P
Dr. Poonam Garg, Institute of Management Technology, India
Mr. S. Mehta, Inha University, Korea
Mr. Dilip Kumar S.M, University Visvesvaraya College of Engineering (UVCE), Bangalore University,
Bangalore
Prof. Malik Sikander Hayat Khiyal, Fatima Jinnah Women University, Rawalpindi, Pakistan
Dr. Virendra Gomase , Department of Bioinformatics, Padmashree Dr. D.Y. Patil University
Dr. Irraivan Elamvazuthi, University Technology PETRONAS, Malaysia
Mr. Saqib Saeed, University of Siegen, Germany
Mr. Pavan Kumar Gorakavi, IPMA-USA [YC]
Dr. Ahmed Nabih Zaki Rashed, Menoufia University, Egypt
Prof. Shishir K. Shandilya, Rukmani Devi Institute of Science & Technology, India
Mrs.J.Komala Lakshmi, SNR Sons College, Computer Science, India
Mr. Muhammad Sohail, KUST, Pakistan
Dr. Manjaiah D.H, Mangalore University, India
Dr. S Santhosh Baboo, D.G.Vaishnav College, Chennai, India
Prof. Dr. Mokhtar Beldjehem, Sainte-Anne University, Halifax, NS, Canada
Dr. Deepak Laxmi Narasimha, Faculty of Computer Science and Information Technology, University of
Malaya, Malaysia
Prof. Dr. Arunkumar Thangavelu, Vellore Institute Of Technology, India
Mr. M. Azath, Anna University, India
Mr. Md. Rabiul Islam, Rajshahi University of Engineering & Technology (RUET), Bangladesh
Mr. Aos Alaa Zaidan Ansaef, Multimedia University, Malaysia
Dr Suresh Jain, Professor (on leave), Institute of Engineering & Technology, Devi Ahilya University, Indore
(MP) India,
Dr. Mohammed M. Kadhum, Universiti Utara Malaysia
Mr. Hanumanthappa. J. University of Mysore, India
Mr. Syed Ishtiaque Ahmed, Bangladesh University of Engineering and Technology (BUET)
Mr Akinola Solomon Olalekan, University of Ibadan, Ibadan, Nigeria
Mr. Santosh K. Pandey, Department of Information Technology, The Institute of Chartered Accountants of
India
Dr. P. Vasant, Power Control Optimization, Malaysia
Dr. Petr Ivankov, Automatika - S, Russian Federation

(IJCSIS) International Journal of Computer Science and Information Security, Vol. 10, No. 11, November 2012
Dr. Utkarsh Seetha, Data Infosys Limited, India
Mrs. Priti Maheshwary, Maulana Azad National Institute of Technology, Bhopal
Dr. (Mrs) Padmavathi Ganapathi, Avinashilingam University for Women, Coimbatore
Assist. Prof. A. Neela madheswari, Anna university, India
Prof. Ganesan Ramachandra Rao, PSG College of Arts and Science, India
Mr. Kamanashis Biswas, Daffodil International University, Bangladesh
Dr. Atul Gonsai, Saurashtra University, Gujarat, India
Mr. Angkoon Phinyomark, Prince of Songkla University, Thailand
Mrs. G. Nalini Priya, Anna University, Chennai
Dr. P. Subashini, Avinashilingam University for Women, India
Assoc. Prof. Vijay Kumar Chakka, Dhirubhai Ambani IICT, Gandhinagar ,Gujarat
Mr Jitendra Agrawal, : Rajiv Gandhi Proudyogiki Vishwavidyalaya, Bhopal
Mr. Vishal Goyal, Department of Computer Science, Punjabi University, India
Dr. R. Baskaran, Department of Computer Science and Engineering, Anna University, Chennai
Assist. Prof, Kanwalvir Singh Dhindsa, B.B.S.B.Engg.College, Fatehgarh Sahib (Punjab), India
Dr. Jamal Ahmad Dargham, School of Engineering and Information Technology, Universiti Malaysia Sabah
Mr. Nitin Bhatia, DAV College, India
Dr. Dhavachelvan Ponnurangam, Pondicherry Central University, India
Dr. Mohd Faizal Abdollah, University of Technical Malaysia, Malaysia
Assist. Prof. Sonal Chawla, Panjab University, India
Dr. Abdul Wahid, AKG Engg. College, Ghaziabad, India
Mr. Arash Habibi Lashkari, University of Malaya (UM), Malaysia
Mr. Md. Rajibul Islam, Ibnu Sina Institute, University Technology Malaysia
Professor Dr. Sabu M. Thampi, .B.S Institute of Technology for Women, Kerala University, India
Mr. Noor Muhammed Nayeem, Université Lumière Lyon 2, 69007 Lyon, France
Dr. Himanshu Aggarwal, Department of Computer Engineering, Punjabi University, India
Prof R. Naidoo, Dept of Mathematics/Center for Advanced Computer Modelling, Durban University of
Technology, Durban,South Africa
Prof. Mydhili K Nair, M S Ramaiah Institute of Technology(M.S.R.I.T), Affliliated to Visweswaraiah
Technological University, Bangalore, India
M. Prabu, Adhiyamaan College of Engineering/Anna University, India
Mr. Swakkhar Shatabda, Department of Computer Science and Engineering, United International University,
Bangladesh
Dr. Abdur Rashid Khan, ICIT, Gomal University, Dera Ismail Khan, Pakistan
Mr. H. Abdul Shabeer, I-Nautix Technologies,Chennai, India
Dr. M. Aramudhan, Perunthalaivar Kamarajar Institute of Engineering and Technology, India
Dr. M. P. Thapliyal, Department of Computer Science, HNB Garhwal University (Central University), India
Dr. Shahaboddin Shamshirband, Islamic Azad University, Iran
Mr. Zeashan Hameed Khan, : Université de Grenoble, France
Prof. Anil K Ahlawat, Ajay Kumar Garg Engineering College, Ghaziabad, UP Technical University, Lucknow
Mr. Longe Olumide Babatope, University Of Ibadan, Nigeria
Associate Prof. Raman Maini, University College of Engineering, Punjabi University, India

(IJCSIS) International Journal of Computer Science and Information Security, Vol. 10, No. 11, November 2012
Dr. Maslin Masrom, University Technology Malaysia, Malaysia
Sudipta Chattopadhyay, Jadavpur University, Kolkata, India
Dr. Dang Tuan NGUYEN, University of Information Technology, Vietnam National University - Ho Chi Minh
City
Dr. Mary Lourde R., BITS-PILANI Dubai , UAE
Dr. Abdul Aziz, University of Central Punjab, Pakistan
Mr. Karan Singh, Gautam Budtha University, India
Mr. Avinash Pokhriyal, Uttar Pradesh Technical University, Lucknow, India
Associate Prof Dr Zuraini Ismail, University Technology Malaysia, Malaysia
Assistant Prof. Yasser M. Alginahi, College of Computer Science and Engineering, Taibah University,
Madinah Munawwarrah, KSA
Mr. Dakshina Ranjan Kisku, West Bengal University of Technology, India
Mr. Raman Kumar, Dr B R Ambedkar National Institute of Technology, Jalandhar, Punjab, India
Associate Prof. Samir B. Patel, Institute of Technology, Nirma University, India
Dr. M.Munir Ahamed Rabbani, B. S. Abdur Rahman University, India
Asst. Prof. Koushik Majumder, West Bengal University of Technology, India
Dr. Alex Pappachen James, Queensland Micro-nanotechnology center, Griffith University, Australia
Assistant Prof. S. Hariharan, B.S. Abdur Rahman University, India
Asst Prof. Jasmine. K. S, R.V.College of Engineering, India
Mr Naushad Ali Mamode Khan, Ministry of Education and Human Resources, Mauritius
Prof. Mahesh Goyani, G H Patel Collge of Engg. & Tech, V.V.N, Anand, Gujarat, India
Dr. Mana Mohammed, University of Tlemcen, Algeria
Prof. Jatinder Singh, Universal Institutiion of Engg. & Tech. CHD, India
Mrs. M. Anandhavalli Gauthaman, Sikkim Manipal Institute of Technology, Majitar, East Sikkim
Dr. Bin Guo, Institute Telecom SudParis, France
Mrs. Maleika Mehr Nigar Mohamed Heenaye-Mamode Khan, University of Mauritius
Prof. Pijush Biswas, RCC Institute of Information Technology, India
Mr. V. Bala Dhandayuthapani, Mekelle University, Ethiopia
Dr. Irfan Syamsuddin, State Polytechnic of Ujung Pandang, Indonesia
Mr. Kavi Kumar Khedo, University of Mauritius, Mauritius
Mr. Ravi Chandiran, Zagro Singapore Pte Ltd. Singapore
Mr. Milindkumar V. Sarode, Jawaharlal Darda Institute of Engineering and Technology, India
Dr. Shamimul Qamar, KSJ Institute of Engineering & Technology, India
Dr. C. Arun, Anna University, India
Assist. Prof. M.N.Birje, Basaveshwar Engineering College, India
Prof. Hamid Reza Naji, Department of Computer Enigneering, Shahid Beheshti University, Tehran, Iran
Assist. Prof. Debasis Giri, Department of Computer Science and Engineering, Haldia Institute of Technology
Subhabrata Barman, Haldia Institute of Technology, West Bengal
Mr. M. I. Lali, COMSATS Institute of Information Technology, Islamabad, Pakistan
Dr. Feroz Khan, Central Institute of Medicinal and Aromatic Plants, Lucknow, India
Mr. R. Nagendran, Institute of Technology, Coimbatore, Tamilnadu, India
Mr. Amnach Khawne, King Mongkut’s Institute of Technology Ladkrabang, Ladkrabang, Bangkok, Thailand

(IJCSIS) International Journal of Computer Science and Information Security, Vol. 10, No. 11, November 2012
Dr. P. Chakrabarti, Sir Padampat Singhania University, Udaipur, India
Mr. Nafiz Imtiaz Bin Hamid, Islamic University of Technology (IUT), Bangladesh.
Shahab-A. Shamshirband, Islamic Azad University, Chalous, Iran
Prof. B. Priestly Shan, Anna Univeristy, Tamilnadu, India
Venkatramreddy Velma, Dept. of Bioinformatics, University of Mississippi Medical Center, Jackson MS USA
Akshi Kumar, Dept. of Computer Engineering, Delhi Technological University, India
Dr. Umesh Kumar Singh, Vikram University, Ujjain, India
Mr. Serguei A. Mokhov, Concordia University, Canada
Mr. Lai Khin Wee, Universiti Teknologi Malaysia, Malaysia
Dr. Awadhesh Kumar Sharma, Madan Mohan Malviya Engineering College, India
Mr. Syed R. Rizvi, Analytical Services & Materials, Inc., USA
Dr. S. Karthik, SNS Collegeof Technology, India
Mr. Syed Qasim Bukhari, CIMET (Universidad de Granada), Spain
Mr. A.D.Potgantwar, Pune University, India
Dr. Himanshu Aggarwal, Punjabi University, India
Mr. Rajesh Ramachandran, Naipunya Institute of Management and Information Technology, India
Dr. K.L. Shunmuganathan, R.M.K Engg College , Kavaraipettai ,Chennai
Dr. Prasant Kumar Pattnaik, KIST, India.
Dr. Ch. Aswani Kumar, VIT University, India
Mr. Ijaz Ali Shoukat, King Saud University, Riyadh KSA
Mr. Arun Kumar, Sir Padam Pat Singhania University, Udaipur, Rajasthan
Mr. Muhammad Imran Khan, Universiti Teknologi PETRONAS, Malaysia
Dr. Natarajan Meghanathan, Jackson State University, Jackson, MS, USA
Mr. Mohd Zaki Bin Mas'ud, Universiti Teknikal Malaysia Melaka (UTeM), Malaysia
Prof. Dr. R. Geetharamani, Dept. of Computer Science and Eng., Rajalakshmi Engineering College, India
Dr. Smita Rajpal, Institute of Technology and Management, Gurgaon, India
Dr. S. Abdul Khader Jilani, University of Tabuk, Tabuk, Saudi Arabia
Mr. Syed Jamal Haider Zaidi, Bahria University, Pakistan
Dr. N. Devarajan, Government College of Technology,Coimbatore, Tamilnadu, INDIA
Mr. R. Jagadeesh Kannan, RMK Engineering College, India
Mr. Deo Prakash, Shri Mata Vaishno Devi University, India
Mr. Mohammad Abu Naser, Dept. of EEE, IUT, Gazipur, Bangladesh
Assist. Prof. Prasun Ghosal, Bengal Engineering and Science University, India
Mr. Md. Golam Kaosar, School of Engineering and Science, Victoria University, Melbourne City, Australia
Mr. R. Mahammad Shafi, Madanapalle Institute of Technology & Science, India
Dr. F.Sagayaraj Francis, Pondicherry Engineering College,India
Dr. Ajay Goel, HIET , Kaithal, India
Mr. Nayak Sunil Kashibarao, Bahirji Smarak Mahavidyalaya, India
Mr. Suhas J Manangi, Microsoft India
Dr. Kalyankar N. V., Yeshwant Mahavidyalaya, Nanded , India
Dr. K.D. Verma, S.V. College of Post graduate studies & Research, India
Dr. Amjad Rehman, University Technology Malaysia, Malaysia

(IJCSIS) International Journal of Computer Science and Information Security, Vol. 10, No. 11, November 2012
Mr. Rachit Garg, L K College, Jalandhar, Punjab
Mr. J. William, M.A.M college of Engineering, Trichy, Tamilnadu,India
Prof. Jue-Sam Chou, Nanhua University, College of Science and Technology, Taiwan
Dr. Thorat S.B., Institute of Technology and Management, India
Mr. Ajay Prasad, Sir Padampat Singhania University, Udaipur, India
Dr. Kamaljit I. Lakhtaria, Atmiya Institute of Technology & Science, India
Mr. Syed Rafiul Hussain, Ahsanullah University of Science and Technology, Bangladesh
Mrs Fazeela Tunnisa, Najran University, Kingdom of Saudi Arabia
Mrs Kavita Taneja, Maharishi Markandeshwar University, Haryana, India
Mr. Maniyar Shiraz Ahmed, Najran University, Najran, KSA
Mr. Anand Kumar, AMC Engineering College, Bangalore
Dr. Rakesh Chandra Gangwar, Beant College of Engg. & Tech., Gurdaspur (Punjab) India
Dr. V V Rama Prasad, Sree Vidyanikethan Engineering College, India
Assist. Prof. Neetesh Kumar Gupta, Technocrats Institute of Technology, Bhopal (M.P.), India
Mr. Ashish Seth, Uttar Pradesh Technical University, Lucknow ,UP India
Dr. V V S S S Balaram, Sreenidhi Institute of Science and Technology, India
Mr Rahul Bhatia, Lingaya's Institute of Management and Technology, India
Prof. Niranjan Reddy. P, KITS , Warangal, India
Prof. Rakesh. Lingappa, Vijetha Institute of Technology, Bangalore, India
Dr. Mohammed Ali Hussain, Nimra College of Engineering & Technology, Vijayawada, A.P., India
Dr. A.Srinivasan, MNM Jain Engineering College, Rajiv Gandhi Salai, Thorapakkam, Chennai
Mr. Rakesh Kumar, M.M. University, Mullana, Ambala, India
Dr. Lena Khaled, Zarqa Private University, Aman, Jordon
Ms. Supriya Kapoor, Patni/Lingaya's Institute of Management and Tech., India
Dr. Tossapon Boongoen , Aberystwyth University, UK
Dr . Bilal Alatas, Firat University, Turkey
Assist. Prof. Jyoti Praaksh Singh , Academy of Technology, India
Dr. Ritu Soni, GNG College, India
Dr . Mahendra Kumar , Sagar Institute of Research & Technology, Bhopal, India.
Dr. Binod Kumar, Lakshmi Narayan College of Tech.(LNCT)Bhopal India
Dr. Muzhir Shaban Al-Ani, Amman Arab University Amman – Jordan
Dr. T.C. Manjunath , ATRIA Institute of Tech, India
Mr. Muhammad Zakarya, COMSATS Institute of Information Technology (CIIT), Pakistan
Assist. Prof. Harmunish Taneja, M. M. University, India
Dr. Chitra Dhawale , SICSR, Model Colony, Pune, India
Mrs Sankari Muthukaruppan, Nehru Institute of Engineering and Technology, Anna University, India
Mr. Aaqif Afzaal Abbasi, National University Of Sciences And Technology, Islamabad
Prof. Ashutosh Kumar Dubey, Trinity Institute of Technology and Research Bhopal, India
Mr. G. Appasami, Dr. Pauls Engineering College, India
Mr. M Yasin, National University of Science and Tech, karachi (NUST), Pakistan
Mr. Yaser Miaji, University Utara Malaysia, Malaysia
Mr. Shah Ahsanul Haque, International Islamic University Chittagong (IIUC), Bangladesh

(IJCSIS) International Journal of Computer Science and Information Security, Vol. 10, No. 11, November 2012
Prof. (Dr) Syed Abdul Sattar, Royal Institute of Technology & Science, India
Dr. S. Sasikumar, Roever Engineering College
Assist. Prof. Monit Kapoor, Maharishi Markandeshwar University, India
Mr. Nwaocha Vivian O, National Open University of Nigeria
Dr. M. S. Vijaya, GR Govindarajulu School of Applied Computer Technology, India
Assist. Prof. Chakresh Kumar, Manav Rachna International University, India
Mr. Kunal Chadha , R&D Software Engineer, Gemalto, Singapore
Mr. Mueen Uddin, Universiti Teknologi Malaysia, UTM , Malaysia
Dr. Dhuha Basheer abdullah, Mosul university, Iraq
Mr. S. Audithan, Annamalai University, India
Prof. Vijay K Chaudhari, Technocrats Institute of Technology , India
Associate Prof. Mohd Ilyas Khan, Technocrats Institute of Technology , India
Dr. Vu Thanh Nguyen, University of Information Technology, HoChiMinh City, VietNam
Assist. Prof. Anand Sharma, MITS, Lakshmangarh, Sikar, Rajasthan, India
Prof. T V Narayana Rao, HITAM Engineering college, Hyderabad
Mr. Deepak Gour, Sir Padampat Singhania University, India
Assist. Prof. Amutharaj Joyson, Kalasalingam University, India
Mr. Ali Balador, Islamic Azad University, Iran
Mr. Mohit Jain, Maharaja Surajmal Institute of Technology, India
Mr. Dilip Kumar Sharma, GLA Institute of Technology & Management, India
Dr. Debojyoti Mitra, Sir padampat Singhania University, India
Dr. Ali Dehghantanha, Asia-Pacific University College of Technology and Innovation, Malaysia
Mr. Zhao Zhang, City University of Hong Kong, China
Prof. S.P. Setty, A.U. College of Engineering, India
Prof. Patel Rakeshkumar Kantilal, Sankalchand Patel College of Engineering, India
Mr. Biswajit Bhowmik, Bengal College of Engineering & Technology, India
Mr. Manoj Gupta, Apex Institute of Engineering & Technology, India
Assist. Prof. Ajay Sharma, Raj Kumar Goel Institute Of Technology, India
Assist. Prof. Ramveer Singh, Raj Kumar Goel Institute of Technology, India
Dr. Hanan Elazhary, Electronics Research Institute, Egypt
Dr. Hosam I. Faiq, USM, Malaysia
Prof. Dipti D. Patil, MAEER’s MIT College of Engg. & Tech, Pune, India
Assist. Prof. Devendra Chack, BCT Kumaon engineering College Dwarahat Almora, India
Prof. Manpreet Singh, M. M. Engg. College, M. M. University, India
Assist. Prof. M. Sadiq ali Khan, University of Karachi, Pakistan
Mr. Prasad S. Halgaonkar, MIT - College of Engineering, Pune, India
Dr. Imran Ghani, Universiti Teknologi Malaysia, Malaysia
Prof. Varun Kumar Kakar, Kumaon Engineering College, Dwarahat, India
Assist. Prof. Nisheeth Joshi, Apaji Institute, Banasthali University, Rajasthan, India
Associate Prof. Kunwar S. Vaisla, VCT Kumaon Engineering College, India
Prof Anupam Choudhary, Bhilai School Of Engg.,Bhilai (C.G.),India
Mr. Divya Prakash Shrivastava, Al Jabal Al garbi University, Zawya, Libya

(IJCSIS) International Journal of Computer Science and Information Security, Vol. 10, No. 11, November 2012
Associate Prof. Dr. V. Radha, Avinashilingam Deemed university for women, Coimbatore.
Dr. Kasarapu Ramani, JNT University, Anantapur, India
Dr. Anuraag Awasthi, Jayoti Vidyapeeth Womens University, India
Dr. C G Ravichandran, R V S College of Engineering and Technology, India
Dr. Mohamed A. Deriche, King Fahd University of Petroleum and Minerals, Saudi Arabia
Mr. Abbas Karimi, Universiti Putra Malaysia, Malaysia
Mr. Amit Kumar, Jaypee University of Engg. and Tech., India
Dr. Nikolai Stoianov, Defense Institute, Bulgaria
Assist. Prof. S. Ranichandra, KSR College of Arts and Science, Tiruchencode
Mr. T.K.P. Rajagopal, Diamond Horse International Pvt Ltd, India
Dr. Md. Ekramul Hamid, Rajshahi University, Bangladesh
Mr. Hemanta Kumar Kalita , TATA Consultancy Services (TCS), India
Dr. Messaouda Azzouzi, Ziane Achour University of Djelfa, Algeria
Prof. (Dr.) Juan Jose Martinez Castillo, "Gran Mariscal de Ayacucho" University and Acantelys research
Group, Venezuela
Dr. Jatinderkumar R. Saini, Narmada College of Computer Application, India
Dr. Babak Bashari Rad, University Technology of Malaysia, Malaysia
Dr. Nighat Mir, Effat University, Saudi Arabia
Prof. (Dr.) G.M.Nasira, Sasurie College of Engineering, India
Mr. Varun Mittal, Gemalto Pte Ltd, Singapore
Assist. Prof. Mrs P. Banumathi, Kathir College Of Engineering, Coimbatore
Assist. Prof. Quan Yuan, University of Wisconsin-Stevens Point, US
Dr. Pranam Paul, Narula Institute of Technology, Agarpara, West Bengal, India
Assist. Prof. J. Ramkumar, V.L.B Janakiammal college of Arts & Science, India
Mr. P. Sivakumar, Anna university, Chennai, India
Mr. Md. Humayun Kabir Biswas, King Khalid University, Kingdom of Saudi Arabia
Mr. Mayank Singh, J.P. Institute of Engg & Technology, Meerut, India
HJ. Kamaruzaman Jusoff, Universiti Putra Malaysia
Mr. Nikhil Patrick Lobo, CADES, India
Dr. Amit Wason, Rayat-Bahra Institute of Engineering & Boi-Technology, India
Dr. Rajesh Shrivastava, Govt. Benazir Science & Commerce College, Bhopal, India
Assist. Prof. Vishal Bharti, DCE, Gurgaon
Mrs. Sunita Bansal, Birla Institute of Technology & Science, India
Dr. R. Sudhakar, Dr.Mahalingam college of Engineering and Technology, India
Dr. Amit Kumar Garg, Shri Mata Vaishno Devi University, Katra(J&K), India
Assist. Prof. Raj Gaurang Tiwari, AZAD Institute of Engineering and Technology, India
Mr. Hamed Taherdoost, Tehran, Iran
Mr. Amin Daneshmand Malayeri, YRC, IAU, Malayer Branch, Iran
Mr. Shantanu Pal, University of Calcutta, India
Dr. Terry H. Walcott, E-Promag Consultancy Group, United Kingdom
Dr. Ezekiel U OKIKE, University of Ibadan, Nigeria
Mr. P. Mahalingam, Caledonian College of Engineering, Oman

(IJCSIS) International Journal of Computer Science and Information Security, Vol. 10, No. 11, November 2012
Dr. Mahmoud M. A. Abd Ellatif, Mansoura University, Egypt
Prof. Kunwar S. Vaisla, BCT Kumaon Engineering College, India
Prof. Mahesh H. Panchal, Kalol Institute of Technology & Research Centre, India
Mr. Muhammad Asad, Technical University of Munich, Germany
Mr. AliReza Shams Shafigh, Azad Islamic university, Iran
Prof. S. V. Nagaraj, RMK Engineering College, India
Mr. Ashikali M Hasan, Senior Researcher, CelNet security, India
Dr. Adnan Shahid Khan, University Technology Malaysia, Malaysia
Mr. Prakash Gajanan Burade, Nagpur University/ITM college of engg, Nagpur, India
Dr. Jagdish B.Helonde, Nagpur University/ITM college of engg, Nagpur, India
Professor, Doctor BOUHORMA Mohammed, Univertsity Abdelmalek Essaadi, Morocco
Mr. K. Thirumalaivasan, Pondicherry Engg. College, India
Mr. Umbarkar Anantkumar Janardan, Walchand College of Engineering, India
Mr. Ashish Chaurasia, Gyan Ganga Institute of Technology & Sciences, India
Mr. Sunil Taneja, Kurukshetra University, India
Mr. Fauzi Adi Rafrastara, Dian Nuswantoro University, Indonesia
Dr. Yaduvir Singh, Thapar University, India
Dr. Ioannis V. Koskosas, University of Western Macedonia, Greece
Dr. Vasantha Kalyani David, Avinashilingam University for women, Coimbatore
Dr. Ahmed Mansour Manasrah, Universiti Sains Malaysia, Malaysia
Miss. Nazanin Sadat Kazazi, University Technology Malaysia, Malaysia
Mr. Saeed Rasouli Heikalabad, Islamic Azad University - Tabriz Branch, Iran
Assoc. Prof. Dhirendra Mishra, SVKM's NMIMS University, India
Prof. Shapoor Zarei, UAE Inventors Association, UAE
Prof. B.Raja Sarath Kumar, Lenora College of Engineering, India
Dr. Bashir Alam, Jamia millia Islamia, Delhi, India
Prof. Anant J Umbarkar, Walchand College of Engg., India
Assist. Prof. B. Bharathi, Sathyabama University, India
Dr. Fokrul Alom Mazarbhuiya, King Khalid University, Saudi Arabia
Prof. T.S.Jeyali Laseeth, Anna University of Technology, Tirunelveli, India
Dr. M. Balraju, Jawahar Lal Nehru Technological University Hyderabad, India
Dr. Vijayalakshmi M. N., R.V.College of Engineering, Bangalore
Prof. Walid Moudani, Lebanese University, Lebanon
Dr. Saurabh Pal, VBS Purvanchal University, Jaunpur, India
Associate Prof. Suneet Chaudhary, Dehradun Institute of Technology, India
Associate Prof. Dr. Manuj Darbari, BBD University, India
Ms. Prema Selvaraj, K.S.R College of Arts and Science, India
Assist. Prof. Ms.S.Sasikala, KSR College of Arts & Science, India
Mr. Sukhvinder Singh Deora, NC Institute of Computer Sciences, India
Dr. Abhay Bansal, Amity School of Engineering & Technology, India
Ms. Sumita Mishra, Amity School of Engineering and Technology, India
Professor S. Viswanadha Raju, JNT University Hyderabad, India

(IJCSIS) International Journal of Computer Science and Information Security, Vol. 10, No. 11, November 2012
Mr. Asghar Shahrzad Khashandarag, Islamic Azad University Tabriz Branch, India
Mr. Manoj Sharma, Panipat Institute of Engg. & Technology, India
Mr. Shakeel Ahmed, King Faisal University, Saudi Arabia
Dr. Mohamed Ali Mahjoub, Institute of Engineer of Monastir, Tunisia
Mr. Adri Jovin J.J., SriGuru Institute of Technology, India
Dr. Sukumar Senthilkumar, Universiti Sains Malaysia, Malaysia
Mr. Rakesh Bharati, Dehradun Institute of Technology Dehradun, India
Mr. Shervan Fekri Ershad, Shiraz International University, Iran
Mr. Md. Safiqul Islam, Daffodil International University, Bangladesh
Mr. Mahmudul Hasan, Daffodil International University, Bangladesh
Prof. Mandakini Tayade, UIT, RGTU, Bhopal, India
Ms. Sarla More, UIT, RGTU, Bhopal, India
Mr. Tushar Hrishikesh Jaware, R.C. Patel Institute of Technology, Shirpur, India
Ms. C. Divya, Dr G R Damodaran College of Science, Coimbatore, India
Mr. Fahimuddin Shaik, Annamacharya Institute of Technology & Sciences, India
Dr. M. N. Giri Prasad, JNTUCE,Pulivendula, A.P., India
Assist. Prof. Chintan M Bhatt, Charotar University of Science And Technology, India
Prof. Sahista Machchhar, Marwadi Education Foundation's Group of institutions, India
Assist. Prof. Navnish Goel, S. D. College Of Enginnering & Technology, India
Mr. Khaja Kamaluddin, Sirt University, Sirt, Libya
Mr. Mohammad Zaidul Karim, Daffodil International, Bangladesh
Mr. M. Vijayakumar, KSR College of Engineering, Tiruchengode, India
Mr. S. A. Ahsan Rajon, Khulna University, Bangladesh
Dr. Muhammad Mohsin Nazir, LCW University Lahore, Pakistan
Mr. Mohammad Asadul Hoque, University of Alabama, USA
Mr. P.V.Sarathchand, Indur Institute of Engineering and Technology, India
Mr. Durgesh Samadhiya, Chung Hua University, Taiwan
Dr Venu Kuthadi, University of Johannesburg, Johannesburg, RSA
Dr. (Er) Jasvir Singh, Guru Nanak Dev University, Amritsar, Punjab, India
Mr. Jasmin Cosic, Min. of the Interior of Una-sana canton, B&H, Bosnia and Herzegovina
Dr S. Rajalakshmi, Botho College, South Africa
Dr. Mohamed Sarrab, De Montfort University, UK
Mr. Basappa B. Kodada, Canara Engineering College, India
Assist. Prof. K. Ramana, Annamacharya Institute of Technology and Sciences, India
Dr. Ashu Gupta, Apeejay Institute of Management, Jalandhar, India
Assist. Prof. Shaik Rasool, Shadan College of Engineering & Technology, India
Assist. Prof. K. Suresh, Annamacharya Institute of Tech & Sci. Rajampet, AP, India
Dr . G. Singaravel, K.S.R. College of Engineering, India
Dr B. G. Geetha, K.S.R. College of Engineering, India
Assist. Prof. Kavita Choudhary, ITM University, Gurgaon
Dr. Mehrdad Jalali, Azad University, Mashhad, Iran
Megha Goel, Shamli Institute of Engineering and Technology, Shamli, India

(IJCSIS) International Journal of Computer Science and Information Security, Vol. 10, No. 11, November 2012
Mr. Chi-Hua Chen, Institute of Information Management, National Chiao-Tung University, Taiwan (R.O.C.)
Assoc. Prof. A. Rajendran, RVS College of Engineering and Technology, India
Assist. Prof. S. Jaganathan, RVS College of Engineering and Technology, India
Assoc. Prof. A S N Chakravarthy, Sri Aditya Engineering College, India
Assist. Prof. Deepshikha Patel, Technocrat Institute of Technology, India
Assist. Prof. Maram Balajee, GMRIT, India
Assist. Prof. Monika Bhatnagar, TIT, India
Prof. Gaurang Panchal, Charotar University of Science & Technology, India
Prof. Anand K. Tripathi, Computer Society of India
Prof. Jyoti Chaudhary, High Performance Computing Research Lab, India
Assist. Prof. Supriya Raheja, ITM University, India
Dr. Pankaj Gupta, Microsoft Corporation, U.S.A.
Assist. Prof. Panchamukesh Chandaka, Hyderabad Institute of Tech. & Management, India
Prof. Mohan H.S, SJB Institute Of Technology, India
Mr. Hossein Malekinezhad, Islamic Azad University, Iran
Mr. Zatin Gupta, Universti Malaysia, Malaysia
Assist. Prof. Amit Chauhan, Phonics Group of Institutions, India
Assist. Prof. Ajal A. J., METS School Of Engineering, India
Mrs. Omowunmi Omobola Adeyemo, University of Ibadan, Nigeria
Dr. Bharat Bhushan Agarwal, I.F.T.M. University, India
Md. Nazrul Islam, University of Western Ontario, Canada
Tushar Kanti, L.N.C.T, Bhopal, India
Er. Aumreesh Kumar Saxena, SIRTs College Bhopal, India
Mr. Mohammad Monirul Islam, Daffodil International University, Bangladesh
Dr. Kashif Nisar, University Utara Malaysia, Malaysia
Dr. Wei Zheng, Rutgers Univ/ A10 Networks, USA
Associate Prof. Rituraj Jain, Vyas Institute of Engg & Tech, Jodhpur – Rajasthan
Assist. Prof. Apoorvi Sood, I.T.M. University, India
Dr. Kayhan Zrar Ghafoor, University Technology Malaysia, Malaysia
Mr. Swapnil Soner, Truba Institute College of Engineering & Technology, Indore, India
Ms. Yogita Gigras, I.T.M. University, India
Associate Prof. Neelima Sadineni, Pydha Engineering College, India Pydha Engineering College
Assist. Prof. K. Deepika Rani, HITAM, Hyderabad
Ms. Shikha Maheshwari, Jaipur Engineering College & Research Centre, India
Prof. Dr V S Giridhar Akula, Avanthi's Scientific Tech. & Research Academy, Hyderabad
Prof. Dr.S.Saravanan, Muthayammal Engineering College, India
Mr. Mehdi Golsorkhatabar Amiri, Islamic Azad University, Iran
Prof. Amit Sadanand Savyanavar, MITCOE, Pune, India
Assist. Prof. P.Oliver Jayaprakash, Anna University,Chennai
Assist. Prof. Ms. Sujata, ITM University, Gurgaon, India
Dr. Asoke Nath, St. Xavier's College, India
Mr. Masoud Rafighi, Islamic Azad University, Iran

(IJCSIS) International Journal of Computer Science and Information Security, Vol. 10, No. 11, November 2012
Assist. Prof. RamBabu Pemula, NIMRA College of Engineering & Technology, India
Assist. Prof. Ms Rita Chhikara, ITM University, Gurgaon, India
Mr. Sandeep Maan, Government Post Graduate College, India
Prof. Dr. S. Muralidharan, Mepco Schlenk Engineering College, India
Associate Prof. T.V.Sai Krishna, QIS College of Engineering and Technology, India
Mr. R. Balu, Bharathiar University, Coimbatore, India
Assist. Prof. Shekhar. R, Dr.SM College of Engineering, India
Prof. P. Senthilkumar, Vivekanandha Institue of Engineering And Techology For Woman, India
Mr. M. Kamarajan, PSNA College of Engineering & Technology, India
Dr. Angajala Srinivasa Rao, Jawaharlal Nehru Technical University, India
Assist. Prof. C. Venkatesh, A.I.T.S, Rajampet, India
Mr. Afshin Rezakhani Roozbahani, Ayatollah Boroujerdi University, Iran
Mr. Laxmi chand, SCTL, Noida, India
Dr. Dr. Abdul Hannan, Vivekanand College, Aurangabad
Prof. Mahesh Panchal, KITRC, Gujarat
Dr. A. Subramani, K.S.R. College of Engineering, Tiruchengode
Assist. Prof. Prakash M, Rajalakshmi Engineering College, Chennai, India
Assist. Prof. Akhilesh K Sharma, Sir Padampat Singhania University, India
Ms. Varsha Sahni, Guru Nanak Dev Engineering College, Ludhiana, India
Associate Prof. Trilochan Rout, NM Institute Of Engineering And Technlogy, India
Mr. Srikanta Kumar Mohapatra, NMIET, Orissa, India
Mr. Waqas Haider Bangyal, Iqra University Islamabad, Pakistan
Dr. S. Vijayaragavan, Christ College of Engineering and Technology, Pondicherry, India
Prof. Elboukhari Mohamed, University Mohammed First, Oujda, Morocco
Dr. Muhammad Asif Khan, King Faisal University, Saudi Arabia
Dr. Nagy Ramadan Darwish Omran, Cairo University, Egypt.
Assistant Prof. Anand Nayyar, KCL Institute of Management and Technology, India
Mr. G. Premsankar, Ericcson, India
Assist. Prof. T. Hemalatha, VELS University, India
Prof. Tejaswini Apte, University of Pune, India
Dr. Edmund Ng Giap Weng, Universiti Malaysia Sarawak, Malaysia
Mr. Mahdi Nouri, Iran University of Science and Technology, Iran
Associate Prof. S. Asif Hussain, Annamacharya Institute of technology & Sciences, India
Mrs. Kavita Pabreja, Maharaja Surajmal Institute (an affiliate of GGSIP University), India
Mr. Vorugunti Chandra Sekhar, DA-IICT, India
Mr. Muhammad Najmi Ahmad Zabidi, Universiti Teknologi Malaysia, Malaysia
Dr. Aderemi A. Atayero, Covenant University, Nigeria
Assist. Prof. Osama Sohaib, Balochistan University of Information Technology, Pakistan
Assist. Prof. K. Suresh, Annamacharya Institute of Technology and Sciences, India
Mr. Hassen Mohammed Abduallah Alsafi, International Islamic University Malaysia (IIUM) Malaysia
Mr. Robail Yasrab, Virtual University of Pakistan, Pakistan
Mr. R. Balu, Bharathiar University, Coimbatore, India

(IJCSIS) International Journal of Computer Science and Information Security, Vol. 10, No. 11, November 2012
Prof. Anand Nayyar, KCL Institute of Management and Technology, Jalandhar
Assoc. Prof. Vivek S Deshpande, MIT College of Engineering, India
Prof. K. Saravanan, Anna university Coimbatore, India
Dr. Ravendra Singh, MJP Rohilkhand University, Bareilly, India
Mr. V. Mathivanan, IBRA College of Technology, Sultanate of OMAN
Assoc. Prof. S. Asif Hussain, AITS, India
Assist. Prof. C. Venkatesh, AITS, India
Mr. Sami Ulhaq, SZABIST Islamabad, Pakistan
Dr. B. Justus Rabi, Institute of Science & Technology, India
Mr. Anuj Kumar Yadav, Dehradun Institute of technology, India
Mr. Alejandro Mosquera, University of Alicante, Spain
Assist. Prof. Arjun Singh, Sir Padampat Singhania University (SPSU), Udaipur, India
Dr. Smriti Agrawal, JB Institute of Engineering and Technology, Hyderabad
Assist. Prof. Swathi Sambangi, Visakha Institute of Engineering and Technology, India
Ms. Prabhjot Kaur, Guru Gobind Singh Indraprastha University, India
Mrs. Samaher AL-Hothali, Yanbu University College, Saudi Arabia
Prof. Rajneeshkaur Bedi, MIT College of Engineering, Pune, India
Mr. Hassen Mohammed Abduallah Alsafi, International Islamic University Malaysia (IIUM)
Dr. Wei Zhang, Amazon.com, Seattle, WA, USA
Mr. B. Santhosh Kumar, C S I College of Engineering, Tamil Nadu
Dr. K. Reji Kumar, , N S S College, Pandalam, India
Assoc. Prof. K. Seshadri Sastry, EIILM University, India
Mr. Kai Pan, UNC Charlotte, USA
Mr. Ruikar Sachin, SGGSIET, India
Prof. (Dr.) Vinodani Katiyar, Sri Ramswaroop Memorial University, India
Assoc. Prof., M. Giri, Sreenivasa Institute of Technology and Management Studies, India
Assoc. Prof. Labib Francis Gergis, Misr Academy for Engineering and Technology ( MET ), Egypt
Assist. Prof. Amanpreet Kaur, ITM University, India
Assist. Prof. Anand Singh Rajawat, Shri Vaishnav Institute of Technology & Science, Indore
Mrs. Hadeel Saleh Haj Aliwi, Universiti Sains Malaysia (USM), Malaysia
Dr. Abhay Bansal, Amity University, India
Dr. Mohammad A. Mezher, Fahad Bin Sultan University, KSA
Assist. Prof. Nidhi Arora, M.C.A. Institute, India
Prof. Dr. P. Suresh, Karpagam College of Engineering, Coimbatore, India
Dr. Kannan Balasubramanian, Mepco Schlenk Engineering College, India
Dr. S. Sankara Gomathi, Panimalar Engineering college, India
Prof. Anil kumar Suthar, Gujarat Technological University, L.C. Institute of Technology, India
Assist. Prof. R. Hubert Rajan, NOORUL ISLAM UNIVERSITY, India
Assist. Prof. Dr. Jyoti Mahajan, College of Engineering & Technology
Assist. Prof. Homam Reda El-Taj, College of Network Engineering, Saudi Arabia & Malaysia
Mr. Bijan Paul, Shahjalal University of Science & Technology, Bangladesh
Assoc. Prof. Dr. Ch V Phani Krishna, KL University, India

(IJCSIS) International Journal of Computer Science and Information Security, Vol. 10, No. 11, November 2012
Dr. Vishal Bhatnagar, Ambedkar Institute of Advanced Communication Technologies & Research, India
Dr. Lamri LAOUAMER, Al Qassim University, Dept. Info. Systems & European University of Brittany, Dept.
Computer Science, UBO, Brest, France
Prof. Ashish Babanrao Sasankar, G.H.Raisoni Institute Of Information Technology, India
Prof. Pawan Kumar Goel, Shamli Institute of Engineering and Technology, India
Mr. Ram Kumar Singh, S.V Subharti University, India
Assistant Prof. Sunish Kumar O S, Amaljyothi College of Engineering, India
Dr Sanjay Bhargava, Banasthali University, India
Mr. Pankaj S. Kulkarni, AVEW's Shatabdi Institute of Technology, India
Mr. Roohollah Etemadi, Islamic Azad University, Iran
Mr. Oloruntoyin Sefiu Taiwo, Emmanuel Alayande College Of Education, Nigeria
Mr. Sumit Goyal, National Dairy Research Institute, India
Mr Jaswinder Singh Dilawari, Geeta Engineering College, India
Prof. Raghuraj Singh, Harcourt Butler Technological Institute, Kanpur
Dr. S.K. Mahendran, Anna University, Chennai, India
Dr. Amit Wason, Hindustan Institute of Technology & Management, Punjab
Dr. Ashu Gupta, Apeejay Institute of Management, India
Assist. Prof. D. Asir Antony Gnana Singh, M.I.E.T Engineering College, India
Mrs Mina Farmanbar, Eastern Mediterranean University, Famagusta, North Cyprus
Mr. Maram Balajee, GMR Institute of Technology, India
Mr. Moiz S. Ansari, Isra University, Hyderabad, Pakistan
Mr. Adebayo, Olawale Surajudeen, Federal University of Technology Minna, Nigeria
Mr. Jasvir Singh, University College Of Engg., India

CALL FOR PAPERS International Journal of Computer Science and Information Security
IJCSIS 2013 ISSN: 1947-5500
http://sites.google.com/site/ijcsis/ International Journal Computer Science and Information Security, IJCSIS, is the premier scholarly venue in the areas of computer science and security issues. IJCSIS 2011 will provide a high profile, leading edge platform for researchers and engineers alike to publish state-of-the-art research in the respective fields of information technology and communication security. The journal will feature a diverse mixture of publication articles including core and applied computer science related topics. Authors are solicited to contribute to the special issue by submitting articles that illustrate research results, projects, surveying works and industrial experiences that describe significant advances in the following areas, but are not limited to. Submissions may span a broad range of topics, e.g.: Track A: Security Access control, Anonymity, Audit and audit reduction & Authentication and authorization, Applied cryptography, Cryptanalysis, Digital Signatures, Biometric security, Boundary control devices, Certification and accreditation, Cross-layer design for security, Security & Network Management, Data and system integrity, Database security, Defensive information warfare, Denial of service protection, Intrusion Detection, Anti-malware, Distributed systems security, Electronic commerce, E-mail security, Spam, Phishing, E-mail fraud, Virus, worms, Trojan Protection, Grid security, Information hiding and watermarking & Information survivability, Insider threat protection, Integrity Intellectual property protection, Internet/Intranet Security, Key management and key recovery, Language-based security, Mobile and wireless security, Mobile, Ad Hoc and Sensor Network Security, Monitoring and surveillance, Multimedia security ,Operating system security, Peer-to-peer security, Performance Evaluations of Protocols & Security Application, Privacy and data protection, Product evaluation criteria and compliance, Risk evaluation and security certification, Risk/vulnerability assessment, Security & Network Management, Security Models & protocols, Security threats & countermeasures (DDoS, MiM, Session Hijacking, Replay attack etc,), Trusted computing, Ubiquitous Computing Security, Virtualization security, VoIP security, Web 2.0 security, Submission Procedures, Active Defense Systems, Adaptive Defense Systems, Benchmark, Analysis and Evaluation of Security Systems, Distributed Access Control and Trust Management, Distributed Attack Systems and Mechanisms, Distributed Intrusion Detection/Prevention Systems, Denial-of-Service Attacks and Countermeasures, High Performance Security Systems, Identity Management and Authentication, Implementation, Deployment and Management of Security Systems, Intelligent Defense Systems, Internet and Network Forensics, Large-scale Attacks and Defense, RFID Security and Privacy, Security Architectures in Distributed Network Systems, Security for Critical Infrastructures, Security for P2P systems and Grid Systems, Security in E-Commerce, Security and Privacy in Wireless Networks, Secure Mobile Agents and Mobile Code, Security Protocols, Security Simulation and Tools, Security Theory and Tools, Standards and Assurance Methods, Trusted Computing, Viruses, Worms, and Other Malicious Code, World Wide Web Security, Novel and emerging secure architecture, Study of attack strategies, attack modeling, Case studies and analysis of actual attacks, Continuity of Operations during an attack, Key management, Trust management, Intrusion detection techniques, Intrusion response, alarm management, and correlation analysis, Study of tradeoffs between security and system performance, Intrusion tolerance systems, Secure protocols, Security in wireless networks (e.g. mesh networks, sensor networks, etc.), Cryptography and Secure Communications, Computer Forensics, Recovery and Healing, Security Visualization, Formal Methods in Security, Principles for Designing a Secure Computing System, Autonomic Security, Internet Security, Security in Health Care Systems, Security Solutions Using Reconfigurable Computing, Adaptive and Intelligent Defense Systems, Authentication and Access control, Denial of service attacks and countermeasures, Identity, Route and
Location Anonymity schemes, Intrusion detection and prevention techniques, Cryptography, encryption algorithms and Key management schemes, Secure routing schemes, Secure neighbor discovery and localization, Trust establishment and maintenance, Confidentiality and data integrity, Security architectures, deployments and solutions, Emerging threats to cloud-based services, Security model for new services, Cloud-aware web service security, Information hiding in Cloud Computing, Securing distributed data storage in cloud, Security, privacy and trust in mobile computing systems and applications, Middleware security & Security features: middleware software is an asset on its own and has to be protected, interaction between security-specific and other middleware features, e.g., context-awareness, Middleware-level security monitoring and measurement: metrics and mechanisms for quantification and evaluation of security enforced by the middleware, Security co-design: trade-off and co-design between application-based and middleware-based security, Policy-based management: innovative support for policy-based definition and enforcement of security concerns, Identification and authentication mechanisms: Means to capture application specific constraints in defining and enforcing access control rules, Middleware-oriented security patterns: identification of patterns for sound, reusable security, Security in aspect-based middleware: mechanisms for isolating and enforcing security aspects, Security in agent-based platforms: protection for mobile code and platforms, Smart Devices: Biometrics, National ID cards, Embedded Systems Security and TPMs, RFID Systems Security, Smart Card Security, Pervasive Systems: Digital Rights Management (DRM) in pervasive environments, Intrusion Detection and Information Filtering, Localization Systems Security (Tracking of People and Goods), Mobile Commerce Security, Privacy Enhancing Technologies, Security Protocols (for Identification and Authentication, Confidentiality and Privacy, and Integrity), Ubiquitous Networks: Ad Hoc Networks Security, Delay-Tolerant Network Security, Domestic Network Security, Peer-to-Peer Networks Security, Security Issues in Mobile and Ubiquitous Networks, Security of GSM/GPRS/UMTS Systems, Sensor Networks Security, Vehicular Network Security, Wireless Communication Security: Bluetooth, NFC, WiFi, WiMAX, WiMedia, others This Track will emphasize the design, implementation, management and applications of computer communications, networks and services. Topics of mostly theoretical nature are also welcome, provided there is clear practical potential in applying the results of such work. Track B: Computer Science Broadband wireless technologies: LTE, WiMAX, WiRAN, HSDPA, HSUPA, Resource allocation and interference management, Quality of service and scheduling methods, Capacity planning and dimensioning, Cross-layer design and Physical layer based issue, Interworking architecture and interoperability, Relay assisted and cooperative communications, Location and provisioning and mobility management, Call admission and flow/congestion control, Performance optimization, Channel capacity modeling and analysis, Middleware Issues: Event-based, publish/subscribe, and message-oriented middleware, Reconfigurable, adaptable, and reflective middleware approaches, Middleware solutions for reliability, fault tolerance, and quality-of-service, Scalability of middleware, Context-aware middleware, Autonomic and self-managing middleware, Evaluation techniques for middleware solutions, Formal methods and tools for designing, verifying, and evaluating, middleware, Software engineering techniques for middleware, Service oriented middleware, Agent-based middleware, Security middleware, Network Applications: Network-based automation, Cloud applications, Ubiquitous and pervasive applications, Collaborative applications, RFID and sensor network applications, Mobile applications, Smart home applications, Infrastructure monitoring and control applications, Remote health monitoring, GPS and location-based applications, Networked vehicles applications, Alert applications, Embeded Computer System, Advanced Control Systems, and Intelligent Control : Advanced control and measurement, computer and microprocessor-based control, signal processing, estimation and identification techniques, application specific IC’s, nonlinear and adaptive control, optimal and robot control, intelligent control, evolutionary computing, and intelligent systems, instrumentation subject to critical conditions, automotive, marine and aero-space control and all other control applications, Intelligent Control System, Wiring/Wireless Sensor, Signal Control System. Sensors, Actuators and Systems Integration : Intelligent sensors and actuators, multisensor fusion, sensor array and multi-channel processing, micro/nano technology, microsensors and microactuators, instrumentation electronics, MEMS and system integration, wireless sensor, Network Sensor, Hybrid

Sensor, Distributed Sensor Networks. Signal and Image Processing : Digital signal processing theory, methods, DSP implementation, speech processing, image and multidimensional signal processing, Image analysis and processing, Image and Multimedia applications, Real-time multimedia signal processing, Computer vision, Emerging signal processing areas, Remote Sensing, Signal processing in education. Industrial Informatics: Industrial applications of neural networks, fuzzy algorithms, Neuro-Fuzzy application, bioInformatics, real-time computer control, real-time information systems, human-machine interfaces, CAD/CAM/CAT/CIM, virtual reality, industrial communications, flexible manufacturing systems, industrial automated process, Data Storage Management, Harddisk control, Supply Chain Management, Logistics applications, Power plant automation, Drives automation. Information Technology, Management of Information System : Management information systems, Information Management, Nursing information management, Information System, Information Technology and their application, Data retrieval, Data Base Management, Decision analysis methods, Information processing, Operations research, E-Business, E-Commerce, E-Government, Computer Business, Security and risk management, Medical imaging, Biotechnology, Bio-Medicine, Computer-based information systems in health care, Changing Access to Patient Information, Healthcare Management Information Technology. Communication/Computer Network, Transportation Application : On-board diagnostics, Active safety systems, Communication systems, Wireless technology, Communication application, Navigation and Guidance, Vision-based applications, Speech interface, Sensor fusion, Networking theory and technologies, Transportation information, Autonomous vehicle, Vehicle application of affective computing, Advance Computing technology and their application : Broadband and intelligent networks, Data Mining, Data fusion, Computational intelligence, Information and data security, Information indexing and retrieval, Information processing, Information systems and applications, Internet applications and performances, Knowledge based systems, Knowledge management, Software Engineering, Decision making, Mobile networks and services, Network management and services, Neural Network, Fuzzy logics, Neuro-Fuzzy, Expert approaches, Innovation Technology and Management : Innovation and product development, Emerging advances in business and its applications, Creativity in Internet management and retailing, B2B and B2C management, Electronic transceiver device for Retail Marketing Industries, Facilities planning and management, Innovative pervasive computing applications, Programming paradigms for pervasive systems, Software evolution and maintenance in pervasive systems, Middleware services and agent technologies, Adaptive, autonomic and context-aware computing, Mobile/Wireless computing systems and services in pervasive computing, Energy-efficient and green pervasive computing, Communication architectures for pervasive computing, Ad hoc networks for pervasive communications, Pervasive opportunistic communications and applications, Enabling technologies for pervasive systems (e.g., wireless BAN, PAN), Positioning and tracking technologies, Sensors and RFID in pervasive systems, Multimodal sensing and context for pervasive applications, Pervasive sensing, perception and semantic interpretation, Smart devices and intelligent environments, Trust, security and privacy issues in pervasive systems, User interfaces and interaction models, Virtual immersive communications, Wearable computers, Standards and interfaces for pervasive computing environments, Social and economic models for pervasive systems, Active and Programmable Networks, Ad Hoc & Sensor Network, Congestion and/or Flow Control, Content Distribution, Grid Networking, High-speed Network Architectures, Internet Services and Applications, Optical Networks, Mobile and Wireless Networks, Network Modeling and Simulation, Multicast, Multimedia Communications, Network Control and Management, Network Protocols, Network Performance, Network Measurement, Peer to Peer and Overlay Networks, Quality of Service and Quality of Experience, Ubiquitous Networks, Crosscutting Themes – Internet Technologies, Infrastructure, Services and Applications; Open Source Tools, Open Models and Architectures; Security, Privacy and Trust; Navigation Systems, Location Based Services; Social Networks and Online Communities; ICT Convergence, Digital Economy and Digital Divide, Neural Networks, Pattern Recognition, Computer Vision, Advanced Computing Architectures and New Programming Models, Visualization and Virtual Reality as Applied to Computational Science, Computer Architecture and Embedded Systems, Technology in Education, Theoretical Computer Science, Computing Ethics, Computing Practices & Applications Authors are invited to submit papers through e-mail [email protected]. Submissions must be original and should not have been published previously or be under consideration for publication while being evaluated by IJCSIS. Before submission authors should carefully read over the journal's Author Guidelines, which are located at http://sites.google.com/site/ijcsis/authors-notes .

© IJCSIS PUBLICATION 2012 ISSN 1947 5500
http://sites.google.com/site/ijcsis/
Related Documents