ISSN 0021 -9673 VOL. 478 NO.1 SEPTEMBER 8, 1989 ,J0 U R N A L OF t FIR DW JI ll. TO GRAJPHY f ; .... , I .JO UR N AL ON CHR OM ATO GRAPH Y. ELECTR OPHORESIS AN O RELATED METH60s I . " I' . 0 EDITORS R. W. Giese (Boston, MA) J. K. Haken (Kensington, N.S.W.) K. Macek (Prague) L. R. Snyder (Orinda, CA) EDITOR, SYM POSIUM VOLUM ES, E. Heftm ann (Orinda, CAl EDITORIAL BOA RD D. W. Armstrong (Rolla. MO ) W. A. Aue (Halifax) P. Bocek (Brno) A. A. Bou lton (Sasketoc-i) P. W. Carr (Minneapolis, MN ) N. H. C. Cooke (San Ramo n. CA l v. A. Davankov (Moscow ) Z. Deyl (Prague' S. Dilli (Kensington. N.S.w.) H. Engelhardt (Saarbrucken) F. Ern! ( Basle) M . B. Evans (Hatfield) J. L. Glajch (N. Billerica. MA) G. A. Gu iochon (Knoxville, TN) P R. Haddad (Kensi ngt on. I. M. Hais (Hradec Kralove) W. S. Hancock (San Francisco, CA) S. Hjerten (Uppsala) Cs. Horvath (New Haven, CT) J. F. K. Huber (Vienna) K.·P. Hupe (Waldbronn) T. W. Hutchens (Houston, I X) J. Janak (Brno) P.Jandera (Pardubice) B. L. Karger (Bost on. MA). E. 5 l. Kovats (Lausanne) A. J. P Martin (Cambridge) L. W. M cLaugh lin (Chestn ut Hil l, MA) R. P. Patience (Sunbury-on -Thames) J. D. Pearson (Kalamazoo. MI ) H. Poppe (Amsterdam) F. E. Regnie r (West Lafayette. lN) P. G. Righett i (Milan) P. Schoenmakers (Eindhoven) G. Schomburg (MCrlheim/Ruhr) K Schw-irzcubach (D Cr bendorf) R. E. S!lOUp (We st Lafayette. IN ) A. M. Siouffi (M arseille) D. J. Strydom (Boston, MA) K. K. Unger (Mainz) J .1. Watson (East Lansing, M I) B. D. Westerlund (Uppsala) EGiTOR :, _IBLlOlj J:!, \1 ' 1Y SECTIO N Z. Deyl (Prague), J. Janak (Brno), V. Schwa rz (Prague), K. Ma cek (Prague) ELSEVIER

Welcome message from author
This document is posted to help you gain knowledge. Please leave a comment to let me know what you think about it! Share it to your friends and learn new things together.
Transcript
ISSN 0021 -9673
VOL. 478 NO.1 SEPTEMBER 8, 1989
,J 0 U R N A L O F
t FI R DWJIll.TOGRAJPHYf ;
...., I
I~TE RNAT IO NA L .JO UR N AL O N CHROM ATOGRAPH Y . ELECTROPHORESIS AN O RELATED METH60sI
. "
I' . 0
EDITORSR. W . Giese (Boston , MA)J. K. Haken (Kensington, N.S.W. )K. Macek (Prague)L. R. Snyder (Orinda, CA )
EDITOR, SYM POSIUM VOLUM ES, E. Heftm ann (Orinda , CAl
EDITORIAL BOA RD
D. W . Armstrong ( Rolla. MO )W . A. A ue ( Halifax)P. Bocek ( Brno )A. A . Bou lto n (Sasketo c -i)P. W . Carr ( M inneapolis, MN )N. H. C. Cooke (San Ramo n. CA lv. A. Davankov (M oscow )Z. Deyl (Prague 'S. Dil li ( Kensingt on. N.S.w.)H. Engelhardt (Saarbrucken)F. Ern! ( Basle)M . B. Evans ( Hatfield)J . L. Glajch (N. Bi llerica. MA)G. A. Gu iochon (Knoxvil le, TN)P R. Haddad (Kensi ngt on. N . ~ .w.)
I. M . Hais ( Hradec Kralove)W . S. Han cock (San Franc isco, CA )S. Hjerten ( Uppsala)Cs. Hor vat h (New Haven, CT)J . F. K. Hub er (Vienn a)K.· P. Hup e (W aldbro nn)T. W. Hutche ns (Houston, I X)J . Janak ( Brno)P. J andera (Pardubice)B. L. Karg er ( Bost on. MA) .E. 5l. Kovats (Lausanne)A. J . P M art in (C ambridge)L. W. M cLaugh lin (Chestn ut Hil l, MA)R. P. Pat ience (Sunbury -on -Thames )J. D. Pearson ( Kalamazoo. MI )H. Popp e (A msterdam )F. E. Regnie r (West Lafayette. lN )P. G. Rig hett i ( M ilan)P. Schoen makers ( Eindhoven)G. Schomb urg (MCrlheim/ Ruhr)K Schw-i rzcub ach ( D Cr bendorf )R. E. S!lOUp (We st Lafayette. IN )A. M . Siouffi (M arsei lle)D. J. Strydom (Boston , M A)K. K. Unger ( M ainz )J .1. Wa tson ( East Lansing, M I)B. D. Weste rlund ( Uppsala)
EGiTOR :, _ IBLlOlj J:!, \ 1' 1Y SECTIO NZ. Deyl ( Prague), J. Janak ( Brno), V. Schwarz ( Prag ue ), K. Ma cek ( Prague)
ELSEVIER
JOURNAL OF CHROMATOGRAPHY
Scope . The Journal of Chromatography publ ishes papers on all aspects of chromatography, electrophoresisand related methods. Contributions consist mainly of research papers dealing with chromatographic theory, instrumental development and their applications. The section Biomedical Applications, which is underseparate ed itorship, deals with the following aspects : developments in and applications of chromatograph ic and electrophoretic techniques related to clinical diagnosis or alterati ons c:Jring med ical treatment;screening and profiling of bod y fluids or tissu es w ith speci al reference to metabol ic disorders; results frombasic med ical research wi th dire ct consequences in clinical practi ce; drug level mon itoring and pharmacokinetic studies; clinical to xicol og y; analytical studi es in occu pati onal med ici ne.
Submission of Papers. Papers in Engli sh, French and German may be submitt ed, in thre e copies. Manu scripts should be submitte d to: The Editor of Journal of Chroma tog raphy, P.O. Box 681 , 1000 AR Am sterdam, The Netherland s, or to : The Edito r of Journal of Chromatograp hy, Biomedical Applications, P.O.Box 681 , 1000 AR Am sterdam , Th e Netherlands. Rev iew artic les are invi ted or proposed by lett er to theEd itors. An outl ine of the proposed review should f irst be forw arded to the Editors for preliminary dis cussion prior to preparation . Submission of an article is und erstood to imply that the article is original andun published and is not being considered for publ ication elsewhere. For copyright regulations, see below.
Subscription Orders . Subscription order s should be sent to : Elsevier Science Publishers B.V., P.O. Box211 ,1000 A E Amsterdam, Th e Netherlands, Tel. 580 3911 , Telex 18582 ESPA NL. Th e J ournal of Chro ma tography and th e Biomedical Applications section can be subscribed to separately.
Publicat io n. The Journal of Chromatography ( inc l. Biom edical Applicat ions) has 37 volumes in 1989. Thesubsc ripti on pri ces for 1989 are:
J. Chromatogr. + Biomed. Appl. (Vols. 461 -497) :Of l. 647 5.00 plu s Ofl. 999 .00 (p.p.h.) (total ca. US$ 3429.00 )
J. Chromatogr. only (Vols. 461-486) :Ofl. 5200.00 plus Ofl. 70 2.00 (p.p.h.) (tota l ca. US$ 2708.00)
B iom ed. Appl. onl y (Vols. 48 7-497) :Of l. 2200.00 plu s Ofl. 297.00 (p.p.h.) (total ca. US$ 1146.00 ) .
Ou r p.p.h. (postage, package and handl ing ) ch arge inc ludes surface del ivery of all issues, except to sub scr ibers in Arg ent ina, Au stralia, Brasil , Canada , Chi na, Hong Kong , Ind ia, Israel, Ma laysia, Me xico, NewZealand , Pakistan, Singapore, South Af rica, South Korea, Taiwan, Thai land and the U.S.A. w ho receive allissues by air del ivery (S.A.L. - Surfa ce Air Lifted ) at no extra cost. For Japan, air deliver y requires 50%add it ional charge; for all other countries airma il and S.A.L . charges are avai lable upon request. Back vol umes of the Journal of Chr omatography (Vols. 1-460)are availab le at Ofl. 195.00 (plus postage). Claimsfor missing issues will be honoured , free of charge, with in th ree months after publication of the issue.Custo mers in the U.S.A. and Canada w ishing informat ion on thi s and oth er Elsevier journa ls, please con tac tJournal Information Cent er, Elsevier Science Publishing Co. Inc., 655 Avenue of the Ame ricas, New York ,NY 10010. Tel. (212) 63 3-3750.
Abstracts /Content s Lists published in Ana lyt ical Abstract s, AS CA, Biochemical Abstracts , Biolog icalAbstracts, Chemi cal Ab stracts , Chem ical Tit les, Chromato graphy Ab stracts, Clinical Chemistry Lookout.Current Contents/Physical. Chem ical & Earth Scien ces, Current Contents / LifeScien ces. Deep -Sea Research /Part B: Oceanographi c Literature Review , Excerpta Medi ca, Inde x Medicus, Mass SpectrometryBu lleti n, PAS CA L-CNRS, Pharmaceutical Abstracts, Referati vnyi Zhurnal , Science Citation Inde x andTrend s in Bio techno logy.
See inside back cov er for Publication Schedule, Informat ion for Authors and information on Advertisements.
© ELSEVIER SC IENCE PUBLI SHE RS BV . - 1989 00 21·9673/ 89 /50 3 50
Al l rights reserved. No part of thi s publica tion may be reproduced. stored in a retrieval system or transmitted in any form or by any means,electronic, mechanical, photocopying. recording or otherwise, w ithout the prior written permission of the publisher. Elsevier Science Publishers
B.V., P.O. Box 33 0. 1000 A H Amsterdam. The Netherlands.Upon accepta nce of an article by the journal, the aut hor(s) wi ll be asked to transfer copy right of the artic le to the publi sher. The transfer w ill ensure
the w idest possible dissemin ation of info rmat ion.Subm ission of an article for publication enta ils the authors' irrevocab le and exc lusive authorizat ion of the publi sher to collect any sums orconsiderations for cop ying or reprodu ction payable by th ird parties (as mentioned in article 17 paragraph 2 of the Dutch Copyright Act of 1912and the Royal Decr ee of June 20. 1974 (S. 351 ) pursuant to artic le 16 b of the Dutch Copy right Act of 191 2) and /o r to act in or out of Court in
conn ection therewith.S pec ial re gu lations for readers in the U .S .A . This journal has been registered wi th the Cop yright Clearance Cent er. Inc . Consent is given forcopying of articles for personal or interna l use, or for the personal use of specif ic clients. This consent is given on the condition that the copier paysthrou gh the Cente r the per-copy fee stated in the code on the first page of each article for copying beyond that permitted by Sectio ns 107 or 10 8 ofthe U .S. Copyright Law . The appropriate fee should be forw arded with a copy of the first page of the article to the Copyr ight Clea rance Center,Inc., 27 Congress Street, Salem . M A 0 1970, U.S.A. If no code appears in an article, the author has not given broad consent to copy and permissionto copy must be obtained directly from the author . All artic les published prior to 1980 may be copied for a per -cop y fee of USS 2.25, also payabl ethrough the Cente r. Thi s consent does not extend to other kinds of copying, such as for gene ral distribu tion, resale, advertising and promotion
purposes, or far creating new co llective w orks. Special w ritten permission must be obtained from the publ isher for such copying.No responsibility is assumed by the Publ isher for any injury and/o r dam age to persons or prop erty as a matte r of products liability , negligen ce orotherw ise. or from any use or operation of any metho ds, products. instruct ions or ideas contained in the materials herein. Becau se of rapid
advances in the medical sciences. the Publisher recommends that indepen dent verification of diagnoses and drug dosages should be made.Alth ough all advertising materia l is expected to conform to eth ical (medical) standards. inclusion in this pub lication does not constitute a
guarantee or endorsement of the quality or value of such product or of the cla ims made of it by its manu facturer .Th is issue is printed on acid- free paper.
Printed in The Netherlands
VOL. 478, NO. I JOURNAL OF CHROMATOGRAPHY
CONTENTS
SEPTEMBER 8, 1989
(Abstracts/Contents Lists published in Analytical Abstracts, ASCA, Biochemical Abstracts, Biological Abstracts, Chemical Abstracts, Chemical Titles, Chromatography Abstracts, Current Contents/Physical, Chemical & Earth Sciences, Current Contents/Life Sciences, Deep-Sea Research/Part B: Oceanographic LiteratureReview, Excerpta Medica, Index Medicus, Mass Spectrometry Bulletin, PASCAL-CNRS, ReferativnyiZhurnal and Science Citation Index)
Mathematical modelling of the continuous affinity-recycle extraction purification techniqueby N. B. Afeyan, N. F. Gordon and C. L. Cooney (Cambridge, MA, U.S.A.) (Received May3rd, 1989) . . . . . '" . . . . . . . . . . . . . . . . . . . . . . . . . . . .
Systematic procedure for the determination of the nature of the solutes prior to the selection of themobile phase parameters for optimization of reversed-phase ion-pair chromatographic separationsby G. K.-C. Low (Menai, Australia) and A. Bartha, H. A. H. Billiet and L. de Galan (Delft,The Netherlands) (Received May 3rd, 1989) . . . . . . . . . . . . . . . . . . .. 21
Experimental and theoretical dynamics of isoelectric focusing: III.Transient multi-peak approach toequilibrium of proteins in simple buffersby R. A. Mosher and W. Thormann (Tucson, AZ, U.S.A.) and R. Kuhn and H. Wagner(Saarbriicken, F.R.G.) (Received May 3rd, 1989) . . . . . . . . . . . . . . . ... 39
Indirect determination of O-ethyl S-(2-diisopropylaminoethyl) methylphosphonothioate in air at lowconcentrationsby W. K. Fowler and J. E. Smith, Jr. (Birmingham, AL, U.S.A.) (Received July 3rd, 1989). 51
Minimizing adsorption of proteins on fused silica in capillary zone electrophoresis by the addition ofalkali metal salts to the buffersby J. S. Green and J. W. Jorgenson (Chapel Hill, NC, U.S.A.) (Received May 8th, 1989). 63
Band broadening in high-performance liquid chromatographic separations of enantiomers withswollen microcrystalline cellulose triacetate packings. I. Influence of capacity factor, analytestructure, flow velocity and column loadingby A. M. Rizzi (Vienna, Austria) (Received April 27th, 1989) . . . . . . . . . . . .. 71
Band broadening in high-performance liquid chromatographic separations of enantiomers withswollen microcrystalline cellulose triacetate packings. II. Influence of eluent composition,temperature and pressure .by A. M. Rizzi (Vienna, Austria) (Received April 27th, 1989) . . . . . . . . . . . .. 87
Evaluation of the optimization potential in high-performance liquid chromatographic separations ofoptical isomers with swollen microcrystalline cellulose triacetateby A. M. Rizzi (Vienna, Austria) (Received April 27th, 1989) . . . . . . . . . . . . . 101
Slow isomerization of some proline-containing peptides inducing peak splitting during reversedphase high-performance liquid chromatographyby J. C. Gesquiere and E. Diesis (Lille, France), M. T. Cung (Nancy, France) and A. Tartar(Lille, France) (Received March 20th, 1989) . . . . . . . . . . . . . . . . . . . . 121
Indirect detection of inorganic anions by high-performance liquid chromatography: use of papaveraldinium as an ultraviolet absorbing agentby P. Dorland (Paris, France), M. Tod (Bobigny, France) and E. Posta ire and D. Pradeau(Paris, France) (Received May 9th, 1989) 131
Determination of activity coefficientsof binary liquids by capillary gas chromatography with thermaldesorption modulation for direct headspace samplingby M. Zhang and J. B. Phillips (Carbondale, IL, U.S.A.) (Received March 29th, 1989) . . 141
Sensitive fluorescence labelling.for analysis of carboxylic acids with 4-bromomethyl-6,7-methylenedioxycoumarinby H. Naganuma and Y. Kawahara (Tokyo, Japan) (Received May 17th, 1989) ..... 149
(Continued overleaf)
Contents (continued)
Preparation of adsorbents for affinity chromatography using TSKgel Tresyl-Toyopearl 650Mby K. Nakamura, K. Toyoda and Y. Kato (Yamaguchi, Japan) and K. Shimura and K.-I.Kasai (Kanagawa, Japan) (Received May 23rd, 1989) . . . . . . . . . . . . . . 159
Separation of the four optical isomers of a dihydropyridine calcium channel antagonistby K. D. Ward and L. V. Manes (Palo Alto, CA, U.S.A.) (Received May 17th, 1989) 169
Separation of prepolymers of phenol-formaldehyde resins by supercritical-fluid chromatographyby S. Mori (Mie, Japan) and T. Saito and M. Takeuchi (Tokyo, Japan) (Received March20th, 1989) 181
High-performance liquid chromatographic determination of alkylamidopropyl-N,N-dimethyl-N(2,3-dihydroxypropyl)ammonium chlorides in aqueous solutions and cosmetic formulationsby R. Caesar, H. Weightman and G. R. Minitz (Philadelphia, PA, U.S.A.) (Received April26th, 1989) 191
Monoclonal antibody-mediated clean-up procedure for the high-performance liquid chromatographic analysis of chloramphenicol in milk and eggsby C. van de Water, D. Tebbal and N. Haagsma (Utrecht, The Netherlands) (Received May3rd, 1989) . . . . . . . . . . . . . . . . . . . . . . . . . . . . . . . .. 205
Separation of derivatized black tea thearubigins by high-performance liquid chromatographyby B. L. Wedzicha ~nd T. J. Donovan (Leeds, U.K.) (Received May 23rd, 1989) .. 217
Notes
Model compound sorption by the resins XAD-2, XAD-8 and diethylarninoethylcellulose. An usefulapplication to flavonoids isolationby L. Maggi, R. Stella and M. T. G. Valentini (Pavia, Italy) and P. Pietta (Milan, Italy)(Received March 15th, 1989) . . . . . . . . . . . . . . . . . . . . . . . . . . . 225
Chromatographic behaviour and determination of orellanine, a toxin from the mushroom Cortinarius orellanusby D. Cantin (La Tronche, France), J.-M. Richard (Meylan, France) and J. Alary (LaTronche, France) (Received May 18th, 1989) . . . . . . . . . . . . . . . . . . . . 231
Capillary isotachophoretic separation of phosphate, arsenate, germanata, silicate and molybdateions using complex-forming equilibriaby M. Kan, F. Komatsu, S. Tanaka, H. Yoshida and M. Taga (Sapporo, Japan) (ReceivedMay 8th, 1989) 238
Analytical high-performance liquid chromatography system for separation of components in nonoxynol-9 spermicidal agentsby D. B. Black, B. A. Dawson and G. A. Neville (Ottawa, Canada) (Received May 8th,1989) . . . . . . . . . . . . . . . . . . . . . . . . . . . . . . . . . . . . . 244
Separation of pirimicarb and its metabolites by high-performance liquid chromatographyby P. Cabras, L. Spanedda and C. Tuberoso (Cagliari, Italy) and M. Gennari (Turin, Italy)(Received March 28th, 1989) . . . . . . . . . . . . . . . . . . . . . . . . . . . 250
Isolation of an antimicrobial bromoditerpene from a marine alga aided by improved bioautographyby S. Caccamese, O. Cascio and A. Compagnini (Catania, Italy) (Received April 7th, 1989) 255
High-performance liquid chromatographic analysis of fJ-escinby P. Pietta, P. Mauri, R. M. Facino and M. Carini (Milan, Italy) (Received April 26th,1989) . . . . . . . . . . . . . . . . . . . . . . . . . . . . . . . . . . . . . 259
Separation of DNA restriction fragments by high-performance ion-exchange chromatography on anon-porous ion exchangerby Y. Kato, Y. Yamasaki, A. Onaka, T. Kitamura and T. Hashimoto (Yamaguchi, Japan)and T. Murotsu, S. Fukushige and K. Matsubara (Osaka, Japan)(Received May 11th, 1989). 264
High-performance liquid chromatographic determination of zearalenone and ochratoxin A in cerealsand feedby W. Langseth, Y. Ellingsen, Y. Nymoen and E. M. 0kland (Oslo, Norway) (Received May23rd, 1989) . . . . . . . . . . . . . . . . . . . . . . . . . . . . . . . . . . 269
Chromatographic method for determination of hexuronic acid in dermatan sulphateby H. Uchiyama, A. Ogamo and K. Nagasawa (Tokyo, Japan) (Received May 23rd, 1989) 275
Adsorption chromatographic separation of 12sI-labelled derivatives of 3'-azido-3'-deoxythymidineby 1. Mucha, B. Tanacs and G. T6th (Budapest, Hungary) (Received April 26th, 1989) 280
Book Reviews
Advances in Chromatography, Vol. 28 (edited by J. C. Giddings, E. Grushka and P. R. Brown),reviewed by M. Lederer . . . . . . . . . . . . . . . . . . . . . . . . . . . . . 284
Neuromethods; Vol. 7, Lipids and Related Compounds (edited by A. Boulton, G. Baker and L.Horrocks), reviewed by M. Lederer . . . . . . . . . . . . . . . . . . . . . . . . 285
*.***************************************************************************************** *: In articles with more than one author, the name of the author to whom correspondence should beaddressed is indicated in the :: articleheadingby a 6-pointcdasterisk(.) :
* *******************************************************************************************
I
" ::::::::::::.':::::::::::::::,-::::::::::::::::::,... "I. '::::::'::'::::<::::':':::':':::':':':':::'.<'::::':'::::':' ::.::..:..... :.:.L...--------lii jilFilllml--'-----..I
An Extendable Package of Programs for Data Exploration,Classification and Correlation
Authors: M. Forina, R. Leardi, C. Armanino, and S. Lanteri
No shipping charge if paid in advance
Write to us for further information on ourother programs
or
~00
AVAILABLE FROM:
Elsevier Scientific Software (JIG)655 Avenue of the AmericasNew York, NY 10010, USAPhone: (212) 633 3950Telex: 420643
Elsevier Scientific SoftwareP.O. Box 3301000 AH AmsterdamThe NetherlandsPhone: (020) 5862 828Telex: 18582
o a software package for general patternrecognition
o comprehensive and efficiento can be readily applied to a large range
of problems in data analysiso provides sophisticated statistical
techniques for multivariate data analysiso the programs can be subdivided into
several functional groups:
-data import-data manipulation and
pre-processing- feature selection-data processing-classifying methods- correlation analysis- target factor analysis- regression analysis- nonlinear mapping- graphical presentation-and utilities
o can handle three main groups ofproblems:
- explorative analysis andrepresentation
- classification- correlation
o available for IBM-PC and compatibles ~~~~~o extensive program manualo source code includedo US$ 645.00 I Off. 1325.00
I ~kjRJH~[VI[R ~CI[NTlfIC ~OfTWM[
IBM-PC is a registeredtrademark of IBM
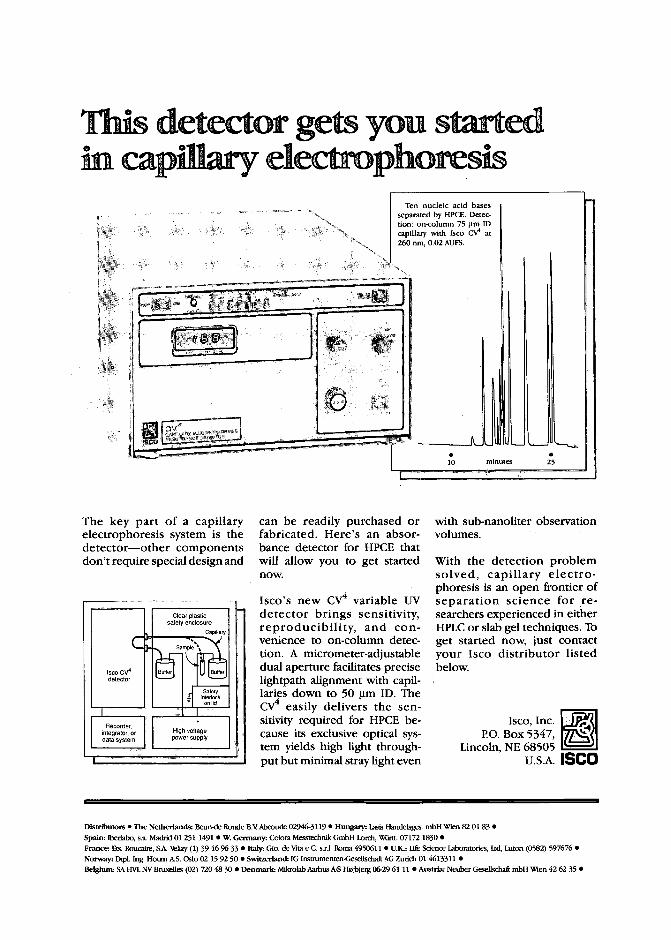
This detector gets you startedin capillary electrophoresis
Ten nucleic acid basesseparated by HPCE. Detection: on-column 75 urn IDcapillary with /SCO cv' at260 run, 0.02 AUFS.
•10 minutes
•25
The key part of a capillaryelectrophoresis system is thedetector-other componentsdon't require special design and
can be readily purchased orfabricated. Here's an absorbance detector for HPCE thatwill allow you to get startednow.
Isco's new cv" variable UVdetector brings sensitivity,reproducibility, and convenience to on-column detection. A micrometer-adjustabledual aperture facilitates preciselightpath alignment with capillaries down to 50 11m 10. Thecv' easily delivers the sensitivity required for HPCE because its exclusive optical system yields high light throughputbut minimal stray light even
with sub-nanoliter observationvolumes.
With the detection problemsolved, capillary electrophoresis is an open frontier ofseparation science for researchers experienced in eitherHPLC or slab gel techniques. Toget started now, just contactyour Isco distributor listedbelow.
lin~~~~5~5 fillu.s.A.ISeD
Disttibutors • The Netherlands: Beun-de Ronde B.YAbcoude 02946-3119 • Hungary: Iasis Handelsges. mbH Wien 82 01 83 •
Spaine lbedabo, s.a. Madrid 01 251 1491 • W. Gennany: Colora Messtecbnik GmbH Lorch, WGrtt. 07172 1830 •France: Ets. Roucaite, SA \elizy (1) 394696 33 • 1taly: Gio. de Vita e C. s.r.!. Roma 4950611 • u.K.: we Sdence Laboratories, Ltd, Luton (0582) 597676 •Norway: Dip!. Ing. Houm AS. Oslo 02 15 92 50 • Switzerland: IG Instrumenten-Gesellschaft AGZOOcb01 4613311 •Belgituru SAHVl. NYBruxeUes (02) 7204830 • Denmark, MikrolabAarhus M Hajbierg 06-29 61 11 • Austria: Neuber GeseUscbaft mbH Wien 42 62 35 •
J"OlUIRNAlL OFCIHrIROlWATOGlRAPIHIY
<C1Ulm1UlnSlltnwce A1Ul1tJh.~Jr
am<ill § 1Ulllij<e<elG TIll1l<illexes
An invaluable tool forlocating published work,the CUMULATIVEAUTHOR AND SUBJECTINDEXES make the vastamount ofinformation inthe journal more easilyaccessible.
Supplied automaticallyto subscribers to theJOURNAL OFCHROMATOGRAPHY,the Indexes are alsoavailable separately fordesk use.
Vols.l- 50 (1972)US$ 87.50/Dfl. 175.00
Vols. 51 - 100 (1975)US$ 112.50/ Dfl. 225.00
Vols.101-150(Published as J. Chromatogr.Vol. 293, 1984)US$ 127.50/ Dfl. 255.00
Vols.151- 250(Published as J. Chromatogr.Vol. 263, 1983)US$ 217.50/00. 435.00
Vols. 251- 350(Published as J. Chromatogr.Vol. 453, 1988)US$ 226.50/ Dfl. 453.00
Vols. 351- 400(Published as J. Chromatogr.Vol. 401, 1987)US$147.50/Dfl.295.ooPRICES QUOTED INCLUDE POSTAGE
Elsevier Science PublishersBack Volumes Journal DepartmentP.O. Box 211, 1000 AE Amsterdam, The Netherlands

JOURNAL OF CHROMATOGRAPHY
VOL. 478 (1989)

JOURNALof
CHROMATOGRAPHYINTERNATIONAL JOURNAL ON CHROMATOGRAPHY,
ELECTROPHORESIS AND RELATED METHODS
EDITORSR. W. GIESE (Boston, MA),J. K. HAKEN (Kensington, N.S.w.), K. MACEK (Prague),
L. R. SNYDER (Orinda, CAl
EDITOR, SYMPOSIUM VOLUMESE. HEFTMANN (Orinda, CAl
EDITORIAL BOARD
D. A. Armstrong (Rolla, MO), W. A. Aue (Halifax), P. Bocek (Brno), A. A. Boulton(Saskatoon), P. W. Carr (Minneapolis, MN), N. C. H. Cooke (San Ramon, CAl, V. A.Davankov (Moscow), Z. Deyl (Prague), S. Dilli (Kensington, N.S.w.), H. Engelhardt(Saarbrucken). F. Erni /Basle). M. B. Evans (Hatfield), J. L. Glajch (Wilmington), DE,G. A. Guiochon (Knoxville, TN), P. R. Haddad (Kensington, N.S.w.), I. M. Hais (Hradec Kralove), W. Hancock (San Francisco, CAl, S. Hjerten (Uppsala). Cs. Horvath(New Haven, CT), J. F. K. Huber (Vienna), K.-P. Hupe (Waldbronn), T. W. Hutchens(Houston, TX), J. Janak (Brno), P. Jandera (Pardubice), B. L. Karger (Boston, MA), E.sz. Kovats (Lausanne), A. J. P. Martin (Cambridge), L. W. McLaughlin (Chestnut Hill,MA), R. P. Patience (Sunbury-on-Thames), J. D. Pearson (Kalamazoo, MI), H. Poppe(Amsterdam), F. E. Regnier (West Lafayette, IN), P. G. Righetti (Milan), P. Schoenmakers (Eindhoven), G. Schomburg (Muhlheirn/Ruhr), R. Schwarzenbach (Dubendorf). R. E. Shoup (West Lafayette, IN), A. M. Siouffi (Marseille), D. J. Strydom (Boston, MA), K. K. Unger (Mainz), J. T. Watson (East Lansing, MI), B. D. Westerlund
(Uppsala)
EDITORS, BIBLIOGRAPHY SECTIONZ. Deyl (Prague), J. Janak (Brno). V. Schwarz (Prague), K. Macek (Prague)
ELSEVIERAMSTERDAM - OXFORD - NEW YORK - TOKYO
J. Chromatogr., Vol. 478 (1989)
© ELSEVIER SCIENCE PUBLISHERS B.V. - 19B9 0021-9673/89/$03.50
All rights reserved. No part of this publication may be reproduced, stored in a retrieval system or transmitted in any form or by any means,electronic, mechanical. photocopying, recording or otherwise. without the prior written permission of the publisher, Elsevier Science Publishers
B.V., P.O. Box 330, 1000 AH Amsterdam, The Netherlands.Upon acceptance of an article by the journal. the author(s) will be asked to transfer copyright of the article to the publisher. The transfer will ensure
the widest possible dissemination of information.Submission of an article for publication entails the authors' irrevocable and exclusive authorization of the publisher to collect any sums orconsiderations for copying or reproduction payable by third parties (as mentioned in article 17 paragraph 2 of the Dutch Copyright Act of 1912and the Royal Decree of June 20, 1974 (S. 351) pursuant to article 16 b of the Dutch Copyright Act of 1912) and/or to act in or out of Court in
connection therewith.Special regulations for readers in the U.S.A. This journal has been registered with the Copyright Clearance Center, Inc. Consent is given forcopying of articles for personal or internal use, or for the personal use of specific clients. This consent is given on the condition that the copier paysthrough the Center the per-copy fee stated in the code on the first page of each article for copying beyond that permitted by Sections 107 or 108 ofthe U.S. Copyright Law. The appropriate fee should be forwarded with a copy of the first page of the article to the Copyright Clearance Center,Inc., 27 Congress Street, Salem, MA 01970, U.S.A. If no code appears in an article, the author has not given broad consent to copy and permissionto copy must be obtained directly from the author. All articles published prior to 1980 may be copied for a per-copy fee of US$ 2.25, also payablethrough the Center. This consent does not extend to other kinds of copying, such as for general distribution, resale, advertising and promotion
purposes, or for creating new collective works. Special written permission must be obtained from the publisher for such copying.No responsibility is assumed by the Publisher for any injury and/or damage to persons or property as a matter of products liability, negligence orotherwise, or from any use or operation of any methods, products, instructions or ideas contained in the materials herein. Because of rapid
advances in the medical sciences, the Publisher recommends that independent verification of diagnoses and drug dosages should be made.Although all advertising material is expected to conform to ethical (medical) standards, inclusion in this publication does not constitute a
guarantee or endorsement of the quality or value of such product or of the claims made of it by its manufacturer.This issue is printed on acid-free paper.
Printed in The Netherlands
Journal of Chromatography, 478 (1989) 1-19Elsevier Science Publishers B.V., Amsterdam - Printed in The Netherlands
CHROM. 21 609
MATHEMATICAL MODELLING OF THE CONTINUOUS AFFINITYRECYCLE EXTRACTION PURIFICATION TECHNIQUE
NOUBAR B. AFEYAN", NEAL F. GORDON" and CHARLES L. COONEY*
Department of Chemical Engineering, Massachusetts Institute of Technology, Cambridge, MA 02139(U.S.A.)
(First received January 19th, 1989; revised manuscript received May 3rd, 1989)
SUMMARY
Continuous affinity-recycle extraction (CARE), a continuous protein purification unit operation, has been designed to address design and optimization criteriarelevant for process scale chromatographic separation of proteins. The developmentand application of a mathematical model describing purification in the CARE processare described. The model incorporates adsorption-desorption kinetics into materialbalance equations describing the operation of two well-mixed reactors operating withrecycle. An accurate mathematical model of CARE has aided in its development asa new unit operation for protein purification, in the assessment of its performancetradeoffs, and in its optimization.
INTRODUCTION
As the biotechnology industry undergoes a transition from research to productcommercialization, cost reductions in process development and large-scale proteinpurification are emerging as key determinants to commercial success.Techniques usedtoday for purification are mainly chromatographic in nature and employ equipmentand material derived directly from the laboratory/bench scale. With these roots, it iscommon to find process chromatograms and adsorbents being evaluated based onresolution alone, with little regard to recovery or throughput. Process-scale chromatographic purification of proteins requires a different set of design and optimizationcriteria than those used for laboratory/research work. For example, final purity isa constraint and not an objective. The ultimate objective is minimum cost of a purifiedproduct that meet specifications which, in turn, implies maximal recovery andthroughput. A different approach to the selection and design of unit operations formanufacturing, is to first consider the entire process at the largest scale, and thenscale-down to an intermediate scale which can simulate, with confidence, the largerscales.
a Present address: PerSeptive Biosystems Inc., 60 Hamilton Street, Cambridge, MA 02139, U.S.A.
0021-9673(89($03.50 © 1989 Elsevier Science Publishers B.V.
2 N.B.AFEYAN,N.F.GORDON,C.L.COONEY
Due to the similarities in the physico-chemical properties of proteins found intypical fermentation or cell culture broth, very high levels of purity (required for mostcurrent commercial applications) can only be achieved by using a series of steps, eachincrementally purifying the product via different separation mechanisms. This entiresequence of steps is often termed Downstream processing (DSP). DSP of a crudefermentation broth typically produces the final product with a very high purity buta correspondingly low recovery yield. In general, an average of 10-20% product lossper separation step is encountered; hence, the final recovery of a process with six DSPsteps can be as low as 30%. This places a great impetus on integration ofDSP steps inorder to achieve the same purification with much higher overall recovery.
Protein purification is most often effected by chromatographic techniques.Adsorptive chromatography, which includes ion-exchange, affinity, reversed-phaseand hydrophobic interaction chromatography, accounts for a large portion of thepreparative chromatography applications. Traditionally, adsorptive chromatographyis carried out using a fixed bed of adsorbent particles (i.e. column chromatography).While for small molecules, the importance ofcolumn length (i.e. number of theoreticalplates) on resolution is well characterized, for macromolecules experimental evidencesuggests a far lesser need for a large number ofplates. Early reports of this observationshowed that in surface mediated separations, columns ofless than 5 em long have 80%of the resolving power onO-cm columna'v'. Among the adsorptive techniques, affinitychromatography, which uses biospecific interactions to purify the desired protein froma mixture, has been termed an "on-off' process", and is little more than solid-liquidextraction, a common unit operation in the chemical process industries. As such,a fixed bed is but one of alternative contactors which have been employed in otherapplications, such as: moving beds, simulated moving beds, counter current stirredcontractors, etc.
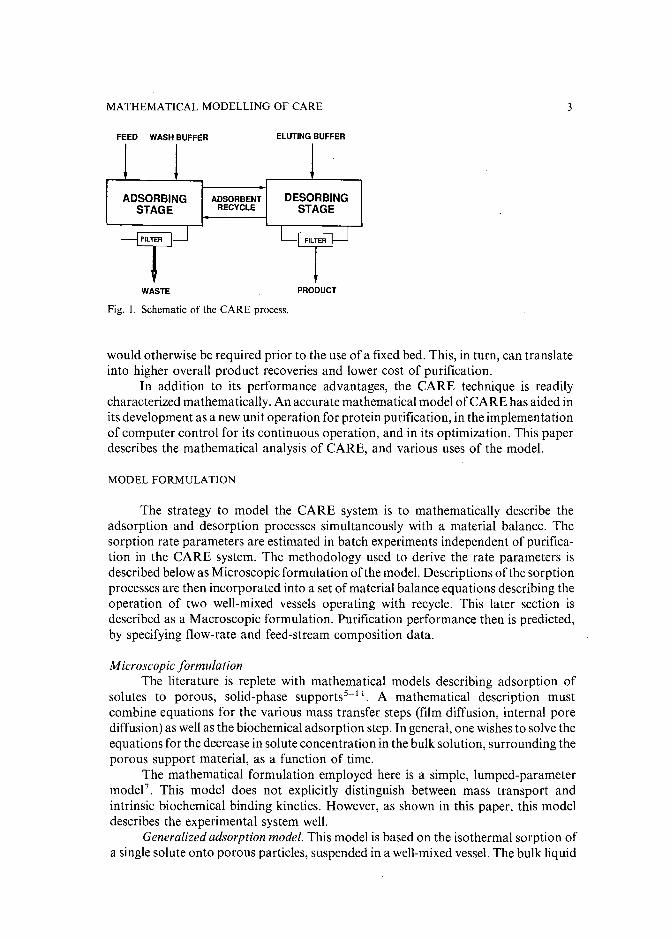
An alternative to fixed bed affinity chromatography was recently proposed asa means of overcoming some of its operational limitations". Continuous affinityrecycle extraction (CARE) was shown to allow continuous separation of anintracellular protein from a crude cell lysate following cell disruption withoutpre-clarification steps; the approach uses conventional chromatographic media.A schematic of the CARE system is shown in Fig. 1. CARE operates as follows. Thesample is fed continuously to the adsorption stage where it contacts the adsorbentbeads containing the affinity ligand. The desired product adsorbs while contaminantsare washed out with wash buffer. The beads, with the adsorbed product, are thenpumped to the desorbing stage where the addition of the desorbing buffer causes thedetachment of the product from the affinity matrix. The bare beads are then recycledto the adsorption stage, while the product is removed with the desorbing buffer stream.Both vessels are well agitated; the sorbent is retained within the two vessels and therecycle loop by macroporous filters. The system can be operated continuously atsteady state.
Initial experiments, where the enzyme fJ-galactosidase was recovered froma turbid liquor of lysed cells with no clarification (i.e. no debris removal), confirmedthe technical feasibility of CARE. From an initial purity of 0.5%, a continuousproduct stream of 14% pure fJ-galactosidase was produced with 70% recovery". Animportant advantage ofCARE over conventional approaches is the early introductionof an affinity-based technique in a DSP train, and the omission of several steps which
MATHEMATICAL MODELLING OF CARE 3
FEED WASH BUFFER
ADSORBINGSTAGE
ADSORBENTRECYCLE
ELUTING BUFFER
DESORBINGSTAGE
WASTE
Fig. 1. Schematic of the CARE process.
PRODUCT
would otherwise be required prior to the use of a fixed bed. This, in turn, can translateinto higher overall product recoveries and lower cost of purification.
In addition to its performance advantages, the CARE technique is readilycharacterized mathematically. An accurate mathematical model of CARE has aided inits development as a new unit operation for protein purification, in the implementationof computer control for its continuous operation, and in its optimization. This paperdescribes the mathematical analysis of CARE, and various uses of the model.
MODEL FORMULATION
The strategy to model the CARE system is to mathematically describe theadsorption and desorption processes simultaneously with a material balance. Thesorption rate parameters are estimated in batch experiments independent of purification in the CARE system. The methodology used to derive the rate parameters isdescribed below as Microscopic formulation of the model. Descriptions of the sorptionprocesses are then incorporated into a set of material balance equations describing theoperation of two well-mixed vessels operating with recycle. This later section isdescribed as a Macroscopic formulation. Purification performance then is predicted,by specifying flow-rate and feed-stream composition data.
Microscopic formulationThe literature is replete with mathematical models describing adsorption of
solutes to porous, solid-phase supports5-
11. A mathematical description must
combine equations for the various mass transfer steps (film diffusion, internal porediffusion) as well as the biochemical adsorption step. Ingeneral, one wishes to solve theequations for the decrease in solute concentration in the bulk solution, surrounding theporous support material, as a function of time.
The mathematical formulation employed here is a simple, lumped-parametermodel? This model does not explicitly distinguish between mass transport andintrinsic biochemical binding kinetics. However, as shown in this paper, this modeldescribes the experimental system well.
Generalized adsorption model. This model is based on the isothermal sorption ofa single solute onto porous particles, suspended in a well-mixed vessel. The bulk liquid
4 N.B.AFEYAN,N.F.GORDON,C.L.COONEY
has a solute concentration, c(t). The particles are spherical, with radius, R. The totalvolume is v, with liquid volume av and adsorbent volume (I - a)v. The sorbateconcentration in the particle is qi(r,t), where r is the radial position within the particle,and the solute concentration within the pore liquid is ci(r,t).
The mass balance for the adsorber is
dc dsa- + (I - a)- = 0
dt dt(I)
where s is the average solute concentration in the particle, which includes soluteadsorbed to ligands at the pore surface as well as solute within the pore liquid. The twoterms in eqn. 1 account for depletion of solute from the bulk liquid and solute uptakewithin the particles.
The rate of solute uptake within the particle is equated to the flux of solute intothe pores, which is driven by a diffusive process described by Fick's Law:
ds = iNo) = 3(Di) (dCi)dt \ R R dt r=R
(2)
where D, is the effective particle diffusion coefficient, and the quantity 3/R is thesurface area per unit volume of particles.
The particle mass balance relates the solute diffusing into the pore with sorbateadsorbing at the pore surface.
Di(d2Ci) + ~(dCi) _ f3(dCi) _ (1 _ a)dqi = 0dr2 r dr dt dt
(3)
The four terms in eqn. 3 represent the flux of solute into the pores, the depletion ofsolute in the pore liquid, and the adsorption of sorbate onto the pore surface,respectively .
The concentration of solute in the particle pores and in the bulk liquid is:
(dC.)k(c - C;)r=R = D; -d1
r r=R(4)
Finally, the rate of binding for affinity adsorption is commonly described by thefollowing equation:
(5)
Adsorption is second order in the forward direction and first order in the reversedirection. This rate equation corresponds to a Langmuir isotherm at equilibrium.
(6)
MATHEMATICAL MODELLING OF CARE 5
(7)
In general, one wishes to solve for the decrease in solute concentration in the bulksolution as a function of time c(t). An analytical solution to the equations developed
. above does not exist, hence one must resort to numerical techniques. Alternatively, onecan lump all resistances to adsorption into a single parameter yielding a simplified andanalytically solvable equation set.
Simplified lumpedparameter adsorption model. The equations describing adsorption to porous solid phase supports, shown above, distinguish among the variousresistances to adsorption. These resistances are: solute diffusion through a thinstagnant film surrounding the adsorbent particles, diffusion within the pores of thesolid support, and the biochemical adsorption step itself.
These three resistances have been combined into the biochemical adsorptionforward rate constant (k r) with eqn. 5 representing the adsorption process. Thesolution for the bulk liquid concentration as a function of time is:
)[2co(N - b) + N 2
- b2]D + 2co(b + N) + b2- N 2
c(t = "--=--':"-_~_-----'=---------=:"":"'-_------=---
[4co + 2b + 2N]D - 4co - 2b + 2N
where b = Qrnax(l - Ci) + 11K - co; N = -j<b2 + 4colK); and D = exp(Nkrt).This form of the solution to the adsorption equations was chosen for
incorporation into the CARE model, because of its simplicity, both in number ofrequired input parameters, and in its incorporation into a material-balance descriptionof the CARE process. This solution requires the input of three adsorption parameters:two equilibrium and one kinetic.
Batch adsorption experiments were conducted with varying initial fJ-galactosidase concentration; bulk-liquid enzyme concentration (c) was measured asa function of time!". Rather than using equilibrium adsorption experiments toindependently estimate the equilibrium adsorption parameters, batch adsorption ratedata were fitted to eqn. 7 through non-linear regression yielding estimates for all threeadsorption parameters. The estimated forward reaction rate constant (kr) is notnecessarily the true, intrinsic reaction rate constant; it is a parameter in which allresistances to adsorption, mass transfer and biochemical binding, have been incorporated. Similarly, the two estimated equilibrium parameters do not necessarily correctlypredict the equilibrium adsorption isotherm, yet when used in conjunction with therate constant yield good model agreement with experimental data.
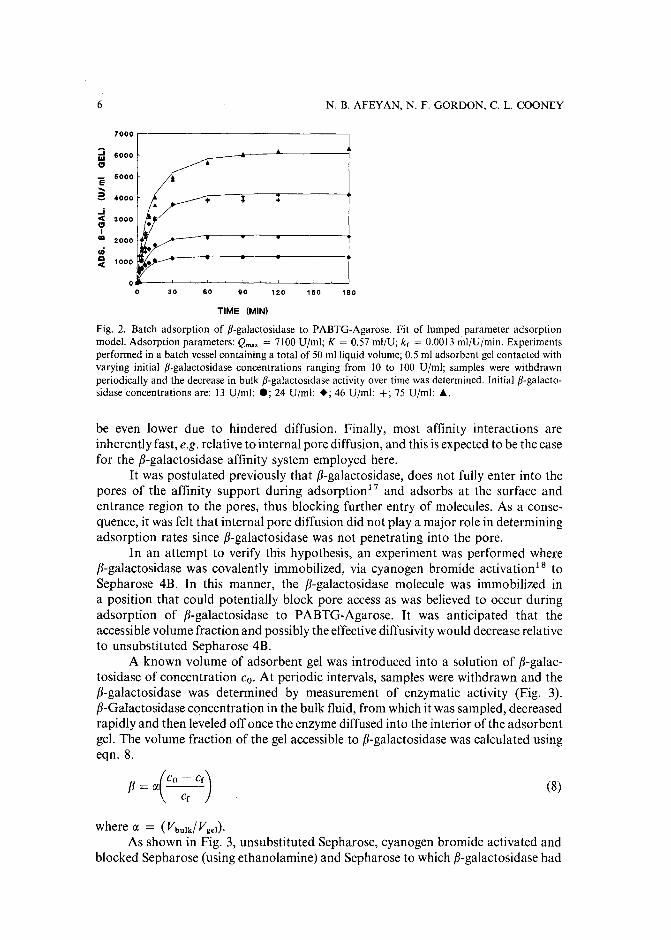
The fit of the lumped parameter model to experimentally determined adsorptionprofiles is shown in Fig. 2. Good model agreement is obtained for both low (200 V Imlgel) and high (7000 Ujrnl gel) adsorbent loading. Although the three adsorptionparameters result from an empirical fit to the data, this simple model predictsexperimental adsorption data over a wide rage of adsorbent loading conditions.
Investigation of adsorption mechanism. Although, the adsorption of fJ-galactosidase to p-aminobenzyl-l-thio-fJ-o-galactopyranoside (PABTG)-Agarose has beensuccessfully described using a lumped parameter approximation, this approach doesnot shed light on the mechanism of adsorption. One would anticipate that the rate ofinternal pore diffusion would control adsorptions.13-ls since the affinity adsorbent isporous and fairly large (100 pm diameter). In addition, fJ-galactosidase is a largeprotein (mol.wt. ca. 460000f; its diffusion coefficient in bulk solution is small(3· 10- 8 em?Is)16, and one would anticipate the effective diffusivity inside the pores to
6
7000
:i 6000wC1
e 5000
....a 4000
..,j-e 3000C1I
co 2000
iiiCl 1000c(
00 30
+
60 90
+
120 150
N. B. AFEYAN, N. F. GORDON, C. L. COONEY
180
(8)
TIME (MINI
Fig. 2. Batch adsorption of fJ-galactosidase to PABTG-Agarose. Fit of lumped parameter adsorptionmodel. Adsorption parameters: Qmax = 7100 Ujml; K = 0.57 ml/U; k, = 0.0013 ml/Umrin. Experimentsperformed in a batch vessel containing a total of 50 mlliquid volume; 0.5 ml adsorbent gel contacted withvarying initial fJ-galactosidase concentrations ranging from 10 to 100 Ujml; samples were withdrawnperiodically and the decrease in bulk fJ-galactosidase activity over time was determined. Initial fJ-galactosidase concentrations are: 13 Uzml: .; 24 Dim]: +; 46 Ujml: +; 75 Ujrnl: ....
be even lower due to hindered diffusion. Finally, most affinity interactions areinherently fast, e.g. relative to internal pore diffusion, and this is expected to be the casefor the fJ-galactosidase affinity system employed here.
It was postulated previously that fJ-galactosidase, does not fully enter into thepores of the affinity support during adsorption 17 and adsorbs at the surface andentrance region to the pores, thus blocking further entry of molecules. As a consequence, it was felt that internal pore diffusion did not playa major role in determiningadsorption rates since fJ-galactosidase was not penetrating into the pore.
In an attempt to verify this hypothesis, an experiment was performed wherefJ-galactosidase was covalently immobilized, via cyanogen bromide activation l" toSepharose 4B. In this manner, the fJ-galactosidase molecule was immobilized ina position that could potentially block pore access as was believed to occur duringadsorption of fJ-galactosidase to PABTG-Agarose. It was anticipated that theaccessible volume fraction and possibly the effective diffusivity would decrease relativeto unsubstituted Sepharose 4B.
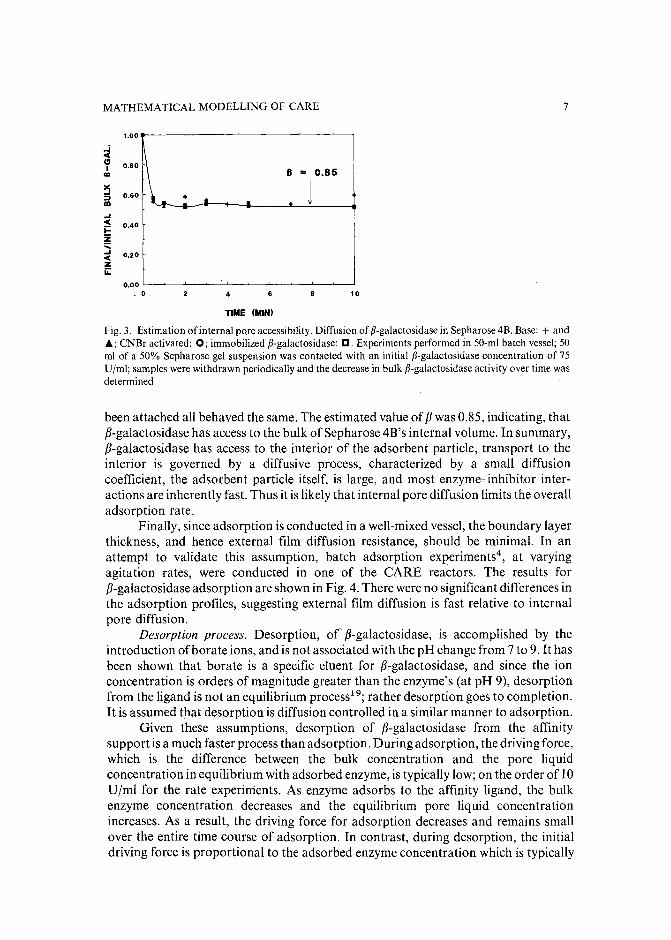
A known volume of adsorbent gel was introduced into a solution of fJ-galactosidase of concentration Co. At periodic intervals, samples were withdrawn and thefJ-galactosidase was determined by measurement of enzymatic activity (Fig. 3).fJ-Galactosidase concentration in the bulk fluid, from which it was sampled, decreasedrapidly and then leveled off once the enzyme diffused into the interior of the adsorbentgel. The volume fraction of the gel accessible to fJ-galactosidase was calculated usingeqn.8.
fJ = a(CO: Cf)
where a = (Vbulk/Vgel).As shown in Fig. 3, unsubstituted Sepharose, cyanogen bromide activated and
blocked Sepharose (using ethanolamine) and Sepharose to which fJ-galactosidase had
MATHEMATICAL MODELLING OF CARE
1.00
..i<C(
~le 0.80I B = 0.85CI:I
Ill: 1.... 0.60 +:;) •lD ..... . +
....<C(
0.40~Z::::.... 0.20<C(ZiL
0.00. 0 4 6 10
TIME (MIN)
7
Fig. 3. Estimation of internal pore accessibility. Diffusion of p-galactosidase in Sepharose 4B. Base: + andj.; CNBr activated: 0; immobilized p-galactosidase: D. Experiments performed in 50-m! batch vessel; 50ml of a 50% Sepharose gel suspension was contacted with an initial p-galactosidase concentration of 75Ujml; samples were withdrawn periodically and the decrease in bulk p-galactosidase activity over time wasdetermined.
been attached all behaved the same. The estimated value of f3 was 0.85, indicating, thatf3-galactosidase has access to the bulk ofSepharose 4B's internal volume. In summary,f3-galactosidase has access to the interior of the adsorbent particle, transport to theinterior is governed by a diffusive process, characterized by a small diffusioncoefficient, the adsorbent particle itself, is large, and most enzyme-inhibitor interactions are inherently fast. Thus it is likely that internal pore diffusion limits the overalladsorption rate.
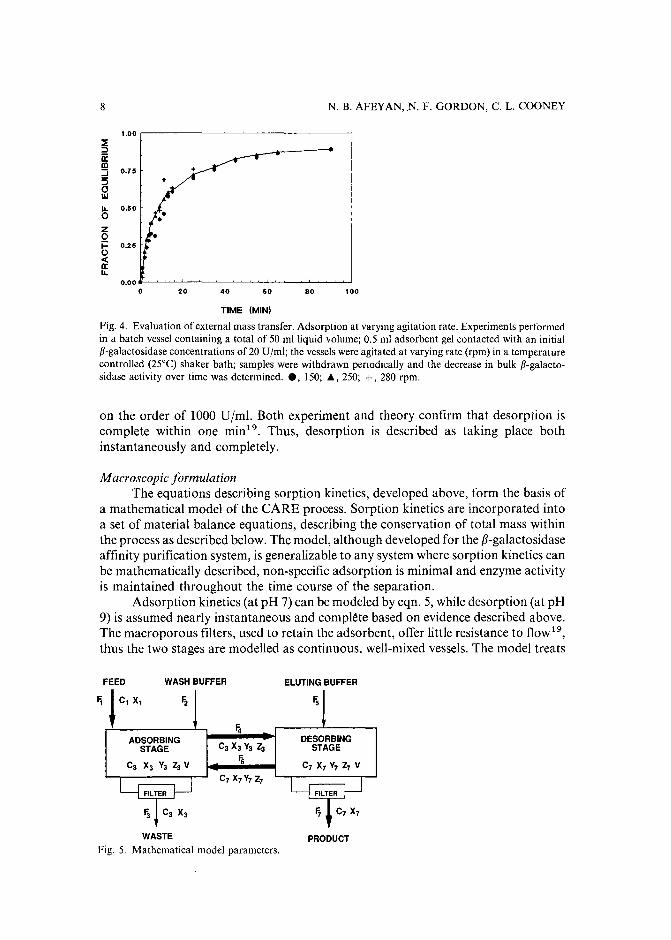
Finally, since adsorption is conducted in a well-mixed vessel, the boundary layerthickness, and hence external film diffusion resistance, should be minimal. In anattempt to validate this assumption, batch adsorption experiments", at varyingagitation rates, were conducted in one of the CARE reactors. The results forf3-galactosidase adsorption are shown in Fig. 4. There were no significant differences inthe adsorption profiles, suggesting external film diffusion is fast relative to internalpore diffusion.
Desorption process. Desorption, of f3-galactosidase, is accomplished by theintroduction of borate ions, and is not associated with the pH change from 7 to 9. It hasbeen shown that borate is a specific eluent for f3-galactosidase, and since the ionconcentration is orders of magnitude greater than the enzyme's (at pH 9), desorptionfrom the ligand is not an equilibrium process 19; rather desorption goes to completion.It is assumed that desorption is diffusion controlled in a similar manner to adsorption.
Given these assumptions, desorption of f3-galactosidase from the affinitysupport is a much faster process than adsorption. During adsorption, the driving force,which is the difference between the bulk concentration and the pore liquidconcentration in equilibrium with adsorbed enzyme, is typically low; on the order of 10Ujml for the rate experiments. As enzyme adsorbs to the affinity ligand, the bulkenzyme concentration decreases and the equilibrium pore liquid concentrationincreases. As a result, the driving force for adsorption decreases and remains smallover the entire time course of adsorption. In contrast, during desorption, the initialdriving force is proportional to the adsorbed enzyme concentration which is typically
8
'.00::E:::JitIII:J 0.75
5 +0W
11. 0.500Z0i= 0.250«II:11.
0.000 20 40 60
TIME (MIN)
N. B. AFEYAN, N. F. GORDON, C. L. COONEY
80 '00
Fig. 4. Evaluation of external mass transfer. Adsorption at varying agitation rate. Experiments performedin a batch vessel containing a total of 50 mlliquid volume; 0.5 ml adsorbent gel contacted with an initiall3-galactosidase concentrations of 20 UIml; the vessels were agitated at varying rate (rpm) in a temperaturecontrolled (25°C) shaker bath; samples were withdrawn periodically and the decrease in bulk l3-galactosidase activity over time was determined.• , 150; .. , 250; +, 280 rpm.
on the order of 1000 Ujrnl. Both experiment and theory confirm that desorption iscomplete within one min!", Thus, desorption is described as taking place bothinstantaneously and completely.
Macroscopic formulationThe equations describing sorption kinetics, developed above, form the basis of
a mathematical model of the CARE process. Sorption kinetics are incorporated intoa set of material balance equations, describing the conservation of total mass withinthe process as described below. The model, although developed for the fJ-galactosidaseaffinity purification system, is generalizable to any system where sorption kinetics canbe mathematically described, non-specific adsorption is minimal and enzyme activityis maintained throughout the time course of the separation.
Adsorption kinetics (at pH 7) can be modeled by eqn. 5, while desorption (at pH9) is assumed nearly instantaneous and complete based on evidence described above.The macroporous filters, used to retain the adsorbent, offer little resistance to flOW 19,
thus the two stages are modelled as continuous, well-mixed vessels. The model treats
FEED WASHBUFFER ELUTINGBUFFER
F, lc, x, ~ Fs
~ADSORBING DESORBING
STAGE c, Xa Va z, STAGE
Ca x, Va ~ V ~ C7 X7 V7 Z7 V
C7 X7 V7 Z7
WASTE
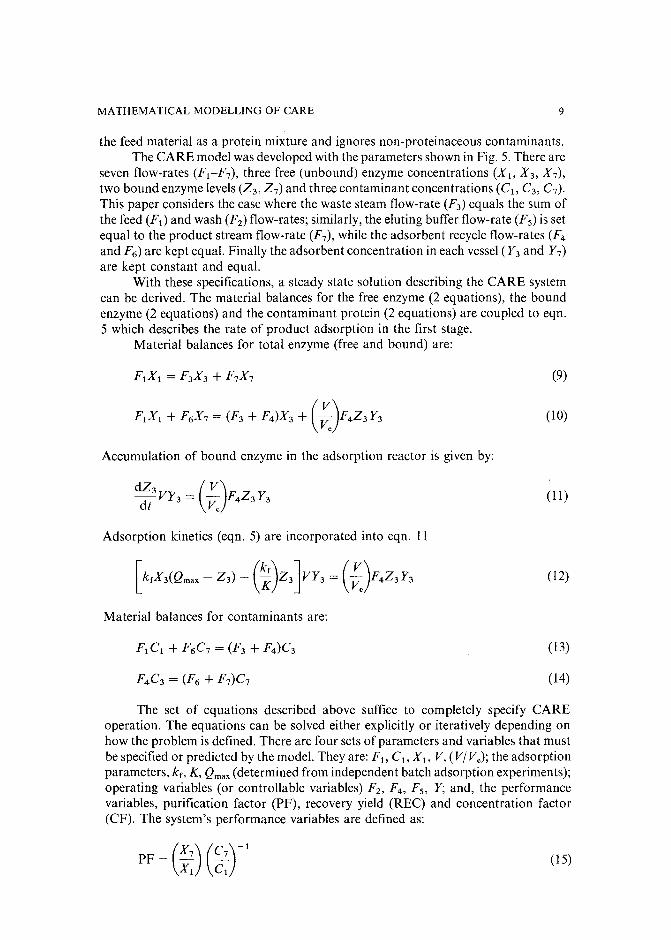
Fig. 5. Mathematical model parameters.PRODUCT
MATHEMATICAL MODELLING OF CARE 9
the feed material as a protein mixture and ignores non-proteinaceous contaminants.The CARE model was developed with the parameters shown in Fig. 5. There are
seven flow-rates (F1-F7) , three free (unbound) enzyme concentrations (Xl. X 3 , X 7) ,
two bound enzyme levels (23 , 2 7) and three contaminant concentrations (Cr, C3 , C 7) .
This paper considers the case where the waste steam flow-rate (F3 ) equals the sum ofthe feed (F 1 ) and wash (F2 ) flow-rates; similarly, the eluting buffer flow-rate (F 5) is setequal to the product stream flow-rate (F7 ) , while the adsorbent recycle flow-rates (F4
and F6 ) are kept equal. Finally the adsorbent concentration in each vessel (Y3 and Y7 )
are kept constant and equal.With these specifications, a steady state solution describing the CARE system
can be derived. The material balances for the free enzyme (2 equations), the boundenzyme (2 equations) and the contaminant protein (2 equations) are coupled to eqn.5 which describes the rate of product adsorption in the first stage.
Material balances for total enzyme (free and bound) are:
(9)
(10)
Accumulation of bound enzyme in the adsorption reactor is given by:
(II)
Adsorption kinetics (eqn. 5) are incorporated into eqn. II
(12)
Material balances for contaminants are:
(13)
(14)
The set of equations described above suffice to completely specify CAREoperation. The equations can be solved either explicitly or iteratively depending onhow the problem is defined. There are four sets of parameters and variables that mustbe specified or predicted by the model. They are: F I. C [, XI, V, (VI Ve) ; the adsorptionparameters, k r, K, Qrnax(determined from independent batch adsorption experiments);operating variables (or controllable variables) F2 , F4 , F 5 , Y; and, the performancevariables, purification factor (PF), recovery yield (REC) and concentration factor(CF). The system's performance variables are defined as:
(15)
10
CF = (~:)
N. B. AFEYAN, N. F. GORDON, C. 1. COONEY
(16)
(17)
The steady-state solution described above is useful in the design and optimization of CARE. In order to model the start-up period and predict system dynamics (e.g.for feedback control), the same equation set can be solved numerically (4th orderRunge-Kutta method) for unsteady state operation.
MODEL USES
The purpose of the mathematical description of CARE, described above, is tohelp elucidate relations between system performance and the operating and designvariables. By investigating these relations and the tradeoffs among the performancevariables, one can gain the insight necessary to incorporate CARE into a proteinrecovery sequence. In this section three model applications are described: e.g. fordesign, parametric sensitivity, and optimization.
DesignThe model may be used to design and specify the operating variables of CARE to
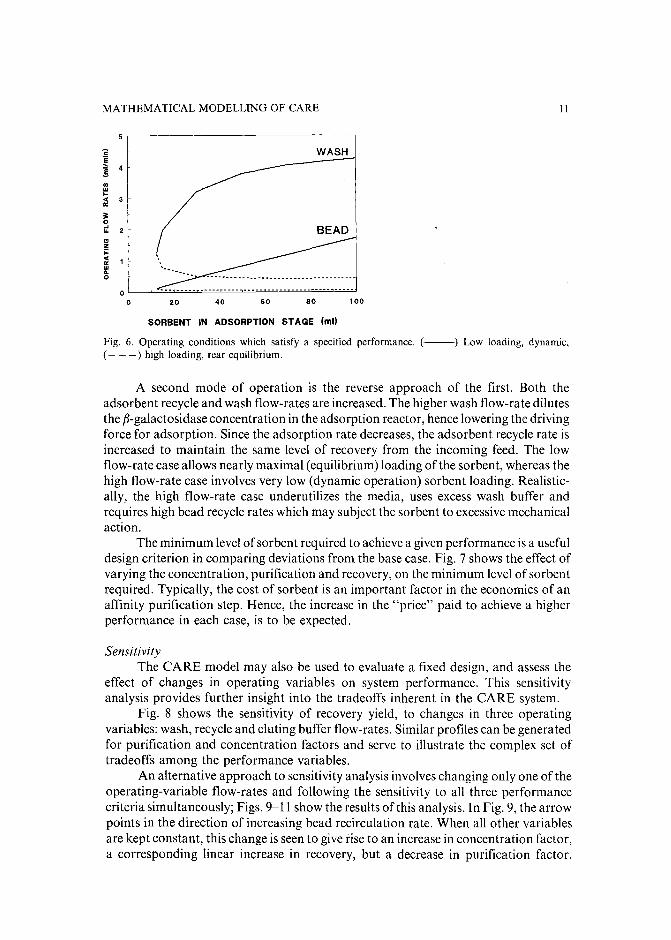
achieve a desired performance. For given feed conditions (enzyme level, contaminantconcentration and flow-rate), a desired level of final purity, recovery and concentration can be achieved by proper selection of flow-rates and amount of adsorbent. Forexample, the CARE model was solved for a base case with the performance measuresspecified as: PF = 30, CF = 5, REC = 90% and feed conditions being: F I =1 ml/rnin, Xl = 100 Ujrnl (ca. 0.2 mg f3-galactosidase) and C I = 10 mg/ml. Aniterative solution of the equation set yields a set of operating conditions to achieve thespecified performance (Fig. 6).
Surprisingly, the model predicts that for a specified level of adsorbent, abovea minimum value, there can be two sets of wash (F2 ) and bead recycle (F4 ) flow-rateswhich satisfy the performance constraints. For the base case in this example, CARE,operated with 12.5m1 of affinity adsorbent beads in the adsorption stage, and F4 = 0.1ml/min and F2 = 1.2 ml/min, is a unique solution. If one uses more beads, anadditional degree offreedom is gained so that according to the model, a combinationof high wash and bead recirculation flow-rates can give identical performance to a casewith low flow-rates.
In order to maintain constant system performance, with the addition of moreadsorbent, two approaches can be used. If the adsorbent recycle flow-rate is decreased,the amount of regenerated gel being returned to the adsorption reactor, per unit time,decreases and thus the amount of f3-galactosidase recovered from the feed woulddecrease. At the same time, the residence time of the adsorbent in the adsorptionreactor increases, and thus, specific adsorbent loading increases. In this manner, therecovery yield can be matched to what it was before the increase in the amount ofadsorbent. Since the recycle flow-rate is lower, the wash flow-rate must be lowered inorder to keep the same purification factor.
MATHEMATICAL MODELLING OF CARE 11
e'iiii 4
cowI-00< 3
'"
WASH
100
BEAD
80604020
oL-~-'=-'-',-,-===..o=~=-'-'-'-'=~===~==-'
o
~oi 2
"z;::: 1wa.o
SORBENT IN ADSORPTION STAGE (mil
Fig. 6. Operating conditions which satisfy a specified performance. (--) Low loading, dynamic,( - - -) high loading, rear equilibrium.
A second mode of operation is the reverse approach of the first. Both theadsorbent recycle and wash flow-rates are increased. The higher wash flow-rate dilutesthe fJ-galactosidase concentration in the adsorption reactor, hence lowering the drivingforce for adsorption. Since the adsorption rate decreases, the adsorbent recycle rate isincreased to maintain the same level of recovery from the incoming feed. The lowflow-rate case allows nearly maximal (equilibrium) loading of the sorbent, whereas thehigh flow-rate case involves very low (dynamic operation) sorbent loading. Realistically, the high flow-rate case underutilizes the media, uses excess wash buffer andrequires high bead recycle rates which may subject the sorbent to excessive mechanicalaction.
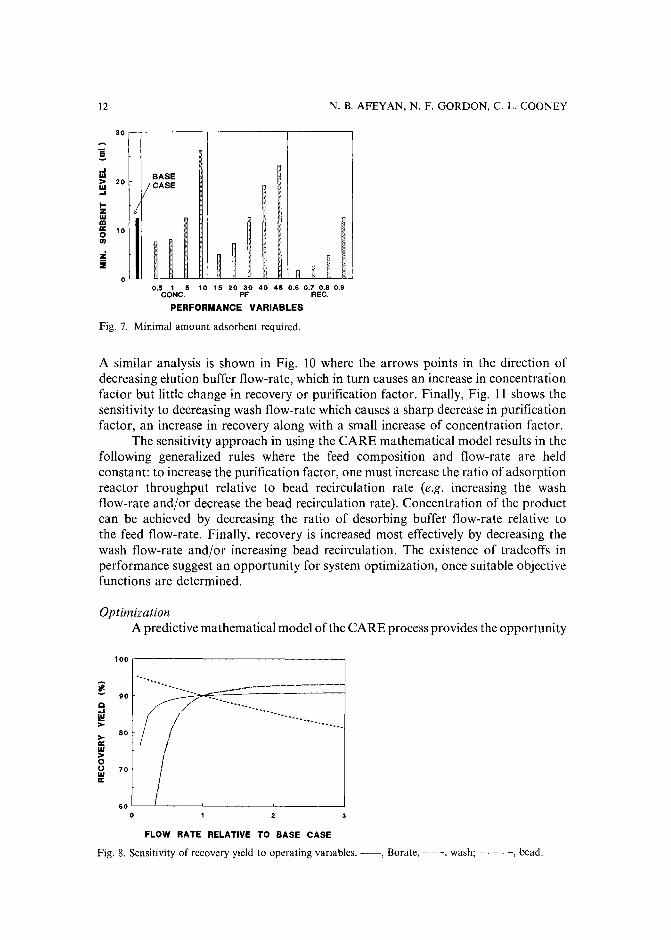
The minimum level of sorbent required to achieve a given performance is a usefuldesign criterion in comparing deviations from the base case. Fig. 7 shows the effect ofvarying the concentration, purification and recovery, on the minimum level of sorbentrequired. Typically, the cost of sorbent is an important factor in the economics of anaffinity purification step. Hence, the increase in the "price" paid to achieve a higherperformance in each case, is to be expected.
SensitivityThe CARE model may also be used to evaluate a fixed design, and assess the
effect of changes in operating variables on system performance. This sensitivityanalysis provides further insight into the tradeoffs inherent in the CARE system.
Fig. 8 shows the sensitivity of recovery yield, to changes in three operatingvariables: wash, recycle and eluting buffer flow-rates. Similar profiles can be generatedfor purification and concentration factors and serve to illustrate the complex set oftradeoffs among the performance variables.
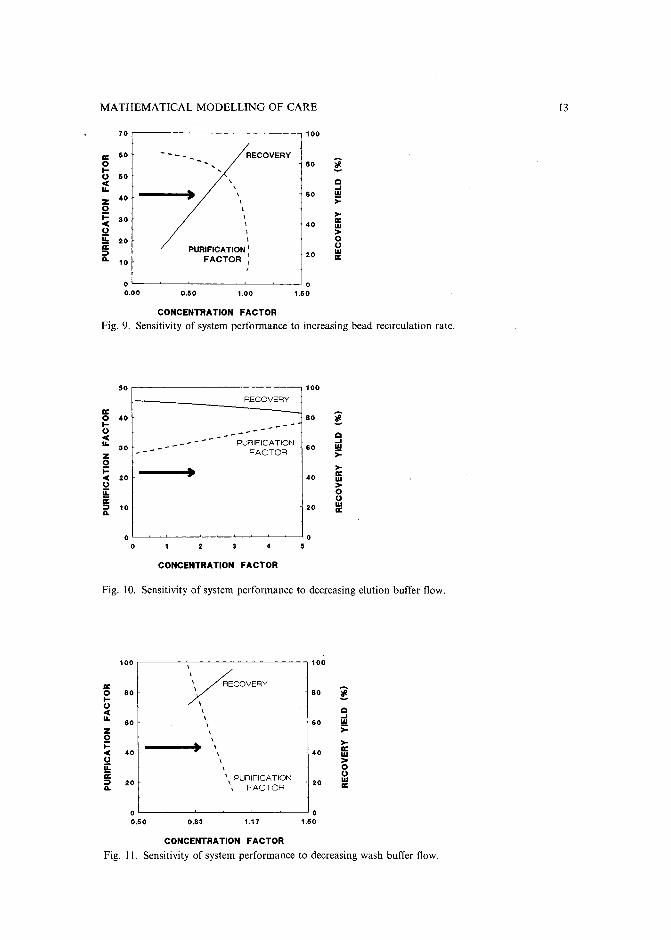
An alternative approach to sensitivity analysis involves changing only one of theoperating-variable flow-rates and following the sensitivity to all three performancecriteria simultaneously; Figs. 9-11 show the results of this analysis. In Fig. 9, the arrowpoints in the direction of increasing bead recirculation rate. When all other variablesare kept constant, this change is seen to give rise to an increase in concentration factor,a corresponding linear increase in recovery, but a decrease in purification factor.
12
30
eoJW> 20WoJ
I-ZWlDa: 100III
Zs
0
N.B.AFEYAN,N.F.GORDON,C.L.COONEY
BASEI CASE
I
~ ~ ~ ,n ~ ~
0.5 1 5 10 15 20 30 40 45 0.6 0.7 0.8 0.9CONC. PF REC.
PERFORMANCE VARIABLES
Fig. 7. Minimal amount adsorbent required.
A similar analysis is shown in Fig. 10 where the arrows points in the direction ofdecreasing elution buffer flow-rate, which in turn causes an increase in concentrationfactor but little change in recovery or purification factor. Finally, Fig. 11 shows thesensitivity to decreasing wash flow-rate which causes a sharp decrease in purificationfactor, an increase in recovery along with a small increase of concentration factor.
The sensitivity approach in using the CARE mathematical model results in thefollowing generalized rules where the feed composition and flow-rate are heldconstant: to increase the purification factor, one must increase the ratio of adsorptionreactor throughput relative to bead recirculation rate (e.g. increasing the washflow-rate and/or decrease the bead recirculation rate). Concentration of the productcan be achieved by decreasing the ratio of desorbing buffer flow-rate relative tothe feed flow-rate. Finally, recovery is increased most effectively by decreasing thewash flow-rate and/or increasing bead recirculation. The existence of tradeoffs inperformance suggest an opportunity for system optimization, once suitable objectivefunctions are determined.
OptimizationA predictive mathematical model of the CARE process provides the opportunity
100
'"
~'" .-.-._.- -'-'- - -'- - -'-'- -_._...........
90 ,.-Q /oJ ./w .I ..........>= I .........
80(
> Ia: Iw I> {0 I0 70W /a: I
!
60I
0
FLOW RATE RELATIVE TO BASE CASE
Fig. 8. Sensitivity of recovery yield to operating variables. --, Borate, - - -, wash; - . - . -, bead.
MATHEMATICAL MODELLING OF CARE I3
70 100
rr: 60 --- RECOVERY0 80 !I-0 50 ,< QIL • , ...., 60 WZ 40
\ ;:0 \
j::: \ >-30 rr:< I 40 W0 I >ii: 20 I 0ii: PURIFICATION I
0::I I 20 WlL FACTOR rr:
10 I
'0 00.00 0.50 1.00 1.50
CONCENTRATION FACTOR
Fig. 9. Sensitivity of system performance to increasing bead recirculation rate.
50 100
RECOVERY
rr: - !0 40 80I- ---0 ------< --- Q
IL --- PURIFICATION ....30 --- 60 W
Z FACTOR ;:0 >-j::: • rr:< 20 40 W0 >ii: 0ii: 0::I 10 20 WlL rr:
4
oL-~~~~~--~--~-_---.Jo
o 5
CONCENTRATION FACTOR
Fig. 10. Sensitivity of system performance to decreasing elution buffer flow.
100\
100
rr: 0COVERY!0 80 80
I-0< \ Q
IL \ ....60 60 w
\ ;:Z \0 \ >-j::: • \ rr:< 40 \ 40 W0 \ >ii: \ 0ii:
\PU~:'~;~~N0
::I 20 20 WlL rr:
0 00.50 0.83 1.17 1.50
CONCENTRATION FACTOR
Fig. II. Sensitivity of system performance to decreasing wash buffer flow.
14 N. B. AFEYAN, N. F. GORDON, C. L. COONEY
for optimization, Optimization requires definition of an objective function. Theoptimum performance of CARE operating as a single step, is described here. Ina broader sense, an entire DSP sequence, in which CARE has been incorporated, canbe optimized to minimize cost for a fixed amount of product. Such work is in progressand will be the subject of subsequent publications.
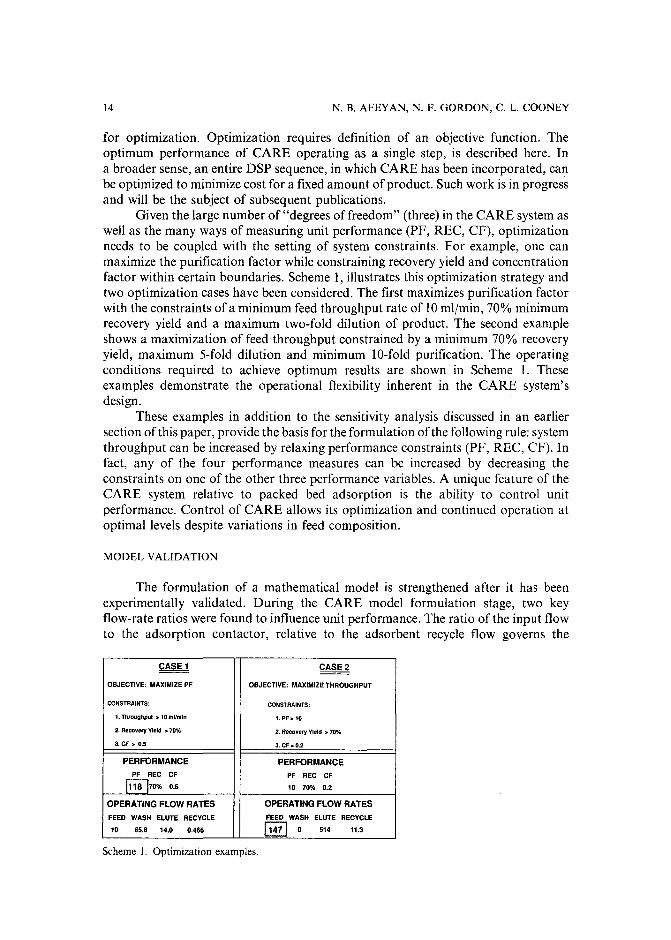
Given the large number of "degrees of freedom" (three) in the CARE system aswell as the many ways of measuring unit performance (PF, REC, CF), optimizationneeds to be coupled with the setting of system constraints. For example, one canmaximize the purification factor while constraining recovery yield and concentrationfactor within certain boundaries. Scheme 1, illustrates this optimization strategy andtwo optimization cases have been considered. The first maximizes purification factorwith the constraints of a minimum feed throughput rate of 10 ml/min, 70% minimumrecovery yield and a maximum two-fold dilution of product. The second exampleshows a maximization of feed throughput constrained by a minimum 70% recoveryyield, maximum 5-fold dilution and minimum lO-fold purification. The operatingconditions required to achieve optimum results are shown in Scheme 1. Theseexamples demonstrate the operational flexibility inherent in the CARE system'sdesign.
These examples in addition to the sensitivity analysis discussed in an earliersection of this paper, provide the basis for the formulation of the following rule: systemthroughput can be increased by relaxing performance constraints (PF, REC, CF). Infact, any of the four performance measures can be increased by decreasing theconstraints on one of the other three performance variables. A unique feature of theCARE system relative to packed bed adsorption is the ability to control unitperformance. Control of CARE allows its optimization and continued operation atoptimal levels despite variations in feed composition.
MODEL VALIDATION
The formulation of a mathematical model is strengthened after it has beenexperimentally validated. During the CARE model formulation stage, two keyflow-rate ratios were found to influence unit performance. The ratio of the input flowto the adsorption contactor, relative to the adsorbent recycle flow governs the
CASE 1 CASE2
OBJECTIVE: MAXIMIZE PF OBJECTIVE: MAXIMIZETHROUGHPUT
CONSTRAINTS: CONSTRAINTS:
1. Throughput> 10 ml/mln 1.PF>10
2. Recovery YIeld > 70% 2. Recovery Yield > 70%
3. CF > 0.5 3. CF> 0.2
PERFORMANCE PERFORMANCEPF REC CF PF REC CF
[1!ii]70% 0.5 10 70% O.Z
OPERATING FLOW RATES OPERATING FLOWRATES
FEED WASH ELUTE RECYCLE FEED WASH ELUTE RECYCLE
10 65.8 14.0 0.466 11471 0 514 11.3
Scheme 1. Optimization examples.
MATHEMATICAL MODELLING OF CARE 15
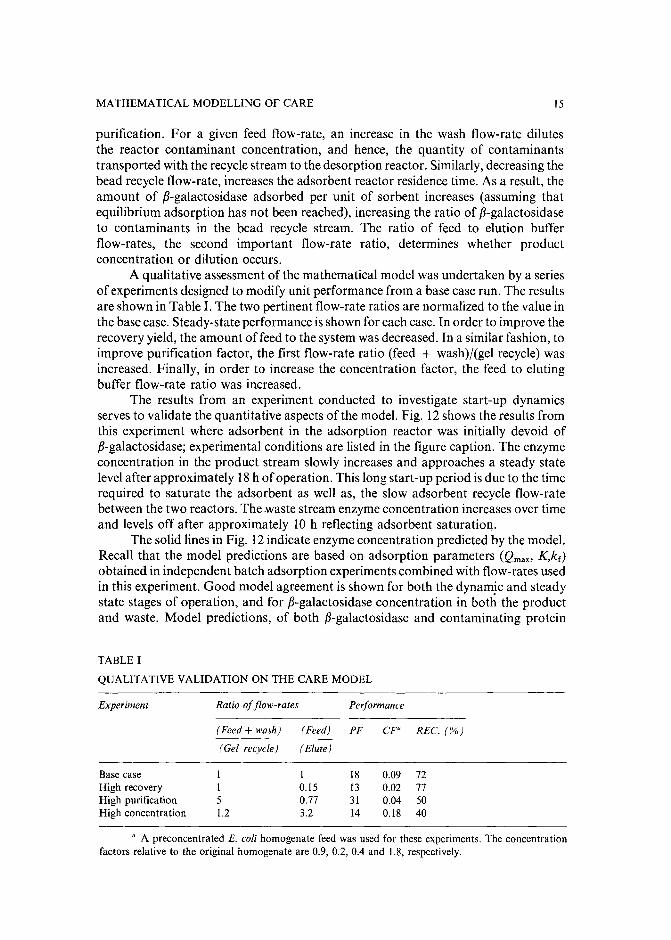
purification. For a given feed flow-rate, an increase in the wash flow-rate dilutesthe reactor contaminant concentration, and hence, the quantity of contaminantstransported with the recyclestream to the desorption reactor. Similarly, decreasing thebead recycle flow-rate, increases the adsorbent reactor residence time. As a result, theamount of p-galactosidase adsorbed per unit of sorbent increases (assuming thatequilibrium adsorption has not been reached), increasing the ratio of p-galactosidaseto contaminants in the bead recycle stream. The ratio of feed to elution bufferflow-rates, the second important flow-rate ratio, determines whether productconcentration or dilution occurs.
A qualitative assessment of the mathematical model was undertaken by a seriesof experiments designed to modify unit performance from a base case run. The resultsare shown in Table I. The two pertinent flow-rate ratios are normalized to the value inthe base case. Steady-state performance is shown for each case. In order to improve therecovery yield, the amount of feed to the system was decreased. In a similar fashion, toimprove purification factor, the first flow-rate ratio (feed + wash)/(gel recycle) wasincreased. Finally, in order to increase the concentration factor, the feed to elutingbuffer flow-rate ratio was increased.
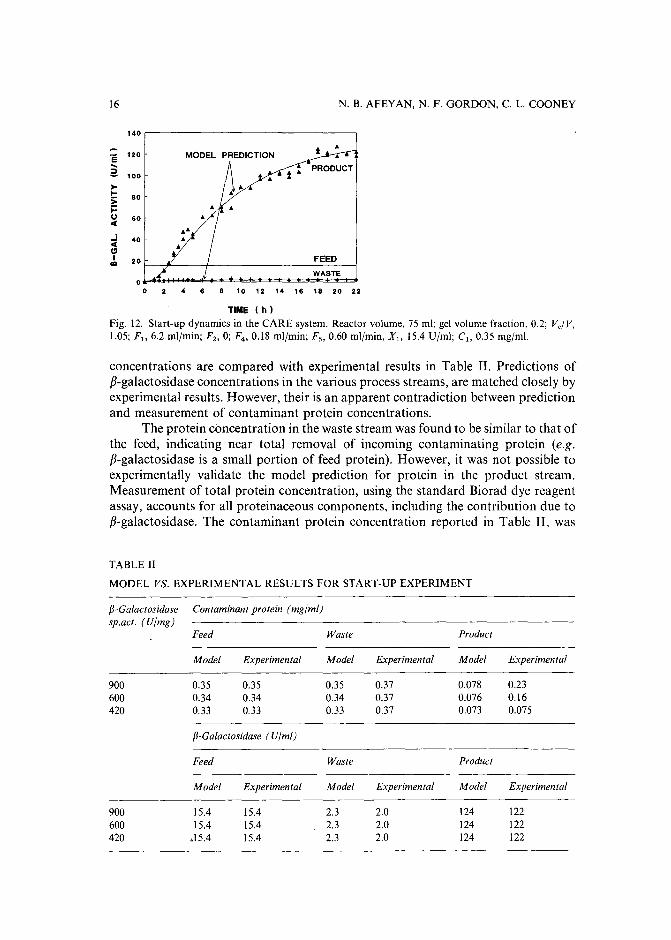
The results from an experiment conducted to investigate start-up dynamicsserves to validate the quantitative aspects of the model. Fig. 12shows the results fromthis experiment where adsorbent in the adsorption reactor was initially devoid ofp-galactosidase; experimental conditions are listed in the figure caption. The enzymeconcentration in the product stream slowly increases and approaches a steady statelevelafter approximately 18h of operation. This long start-up period is due to the timerequired to saturate the adsorbent as well as, the slow adsorbent recycle flow-ratebetween the two reactors. The waste stream enzyme concentration increases over timeand levels off after approximately 10 h reflecting adsorbent saturation.
The solid lines in Fig. 12indicate enzyme concentration predicted by the model.Recall that the model predictions are based on adsorption parameters (Qmax> K,k f )
obtained in independent batch adsorption experiments combined with flow-rates usedin this experiment. Good model agreement is shown for both the dynamic and steadystate stages of operation, and for p-galactosidase concentration in both the productand waste. Model predictions, of both p-galactosidase and contaminating protein
TABLE I
QUALITATIVE VALIDATION ON THE CARE MODEL
Experiment Ratio offlow-rates Performance
(Feed + wash) ( Feed) PF CF" REC. (%)--
(Gel recycle) (Elute)
Base case 1 1 18 0.09 72High recovery 1 0.15 13 0.Q2 77High purification 5 0.77 31 0.04 50High concentration 1.2 3.2 14 0.18 40
u A preconcentrated E. coli homogenate feed was used for these experiments. The concentrationfactors relative to the original homogenate are 0.9, 0.2, 0.4 and 1.8, respectively.
16
140
-e 120...2 100
>-t- 80si=o 60c(
...i 40c(CII 20...
00
N.B.AFEYAN,N.F.GORDON,C.L.COONEY
MODEL PREDICTION
FEED
WASTE
4 6 8 10 12 14 16 18 20 22
TIME (h)
Fig. 12. Start-up dynamics in the CARE system. Reactor volume, 75 ml; gel volume fraction, 0.2; V,/V,1.05; r; 6.2 ml/min; F2 , 0; F4 , 0.18 ml/min: r; 0.60 ml/min, Xl> 15.4 U/ml; Cl> 0.35 mg/ml.
concentrations are compared with experimental results in Table II. Predictions off3-galactosidase concentrations in the various process streams, are matched closely byexperimental results. However, their is an apparent contradiction between predictionand measurement of contaminant protein concentrations.
The protein concentration in the waste stream was found to be similar to that ofthe feed, indicating near total removal of incoming contaminating protein (e.g.f3-galactosidase is a small portion of feed protein). However, it was not possible toexperimentally validate the model prediction for protein in the product stream.Measurement of total protein concentration, using the standard Biorad dye reagentassay, accounts for all proteinaceous components, including the contribution due tof3-galactosidase. The contaminant protein concentration reported in Table II, was
TABLE II
MODEL VS. EXPERIMENTAL RESULTS FOR START-UP EXPERIMENT
f3-Galactosidase Contaminant protein (mgjml)sp.act. (U/mg)
Feed Waste Product
Model Experimental Model Experimental Model Experimental
900 0.35 0.35 0.35 0.37 0.Q78 0.23600 0.34 0.34 0.34 0.37 0.076 0.16420 0.33 0.33 0.33 0.37 0.073 0.Q75
f3-Galactosidase (Ulml)
Feed Waste Product
Model Experimental Model Experimental Model Experimental
900 15.4 15.4 2.3 2.0 124 122600 15.4 15.4 2.3 2.0 124 122420 .15.4 15.4 2.3 2.0 124 122
MATHEMATICAL MODELLING OF CARE 17
estimated by subtracting the contribution of {i-galactosidase to total protein from themeasured total protein concentration. In order to perform this calculation, the{i-galactosidase specific activity must be known. Values of specific activity rangingfrom 600 to 900 Ujmg protein are reported for purified {i-galactosidase preparations,obtained from Sigma.
Model predictions, when contrasted to experimental results in Table II, forSigma's range of specificactivity, show a poor fit. This poor fit can be accounted for inseveral ways. If their is a certain level of non-specific adsorption of contaminatingproteins to PABTG-Agarose, contaminant carry-over between the two reactors wouldbe greater than predicted by the model, and thus account for the discrepany betweenthe predicted and measured contaminant protein concentration in the product stream.However, electrophoretic gels [native polyacrylamide gel electrophoresis (PAGE), notshown] of the components that adsorb, and are subsequantly eluted from theadsorbent, show a single predominant band, corresponding to {i-galactosidase. Thesignificant levelof non-specific adsorption of contaminants, that would be required toaccount for the apparent discrepancy with model predictions, was not detected.
An alternate, and more likely explanation, is that a portion of the {i-galactosidase in the feed is not enzymatically active. Further, if the non-active component canadsorb to the affinity adsorbent, the resulting {i-galactosidase specific activity wouldbe lower than 600 U jmg, and thus, the contribution of {i-galactosidaseto the measuredtotal protein would increase. The results listed in Table II, show that for a specificactivity of 420 Ujmg protein, for {i-galactosidase, model predictions match experimental results. Although contaminant protein concentrations, and hence purificationfactors, cannot be reported with confidence, electrophoretic gels (native PAGE, notshown), have confirmed the high purity of the product stream, as predicted by themathematical model.
ACKNOWLEDGEMENTS
The authors would like to acknowledge the contributions of Rolf Jansen and JeffKolodney during the experimental portion of this work. Project funding was obtainedfrom two sources; the National Science Foundation under the Engineering ResearchCenter, Initiative to the Biotechnology Process Engineering Center (CooperativeAgreement CDR-88-03l4) and Alfa Laval. In addition, both Noubar Afeyan and NealGordon were sponsored by the National Scienceand Engineering Research Council ofCanada.
NOMENCLATURE
C bulk solute concentrationc, pore solute concentrationCr final bulk liquid concentration in diffusivity experimentsCo feed concentrationC1 contaminant concentration in CARE feed streamC3 contaminant concentration in CARE waste streamC7 contaminant concentration in CARE product streamCF concentration factor
18
D i
Fl
F2
F3
F4
FsF6
F7
Kkkrkr
NoPFIfqiqoQrnaxRRECs
vVVe
Vbu 1k
Vge1
XlX 3
X7
Y3Y7
Z3Z7r:x
f3
N. B. AFEYAN, N. F. GORDON, C. L. COONEY
effective particle diffusion coefficientflow-rate of CARE feed streamflow-rate of CARE wash streamflow-rate of CARE waste streamflow-rate of CARE gel recycle streamflow-rate of CARE elution buffer streamflow-rate of CARE gel recycle streamflow-rate of CARE product streamadsorption equilibrium constantfluid film mass transfer coefficientforward reaction rate constantreverse reaction rate constantflux of solute into particlepurification factoraverage particle sorbate concentrationparticle local sorb ate concentrationsorbate concentration in equilibrium with Co
maximum sorbate concentrationsorbent particle radiusrecovery yieldaverage concentration in particle (including pore liquid)timevolumeCARE reactor volumeCARE reactor volume external to retaining screenfluid volume excluding gel volumegel volumesolute concentration in CARE feed streamsolute concentration in CARE waste streamsolute concentration in CARE product streamgel volume fraction in adsorption reactorgel volume fraction in desorption reactorparticle sorbate concentration in adsorption reactorparticle sorbate concentration in desorption reactoradsorbent volume fractionaccessible particle volume fraction
REFERENCES
1 G. Vanecek and F. E. Regnier, Anal. Biochem., 109 (1980) 345.2 J. J. O'Hare, M. W. Capp, E. C. Nice, N. H. C. Cooke and B. G. Archer, in M. T. W. Hearn, F. E.
Regnier and C. T. Wehr (Editors), High-Performance Liquid Chromatography ofProteins and Peptides,Academic Press, New York, NY, 1983, p. 23.
3 P. C. Wankat, Large-Scale Adsorption and Chromatography, Vol. 2, CRC Press, Boca Raton, FL, 1986.4 E. Pungor, Jr., N. B. Afeyan, N. F. Gordon and C. L. Cooney, Bioi Technology, 5 (1987) 604.5 F. H. Arnold, H. W. Blanch and C. R. Wilke, Chem. Eng. J., 30 (1985) B9.6 B. H. Arve and A. I. Liapis, AIChEJ., 33(2) (1987) 179.7 H. A. Chase, J. Chromatogr., 297 (1984) 179.8 C. M. Yang and G. T. Tsao, Adv. Biochem. Eng., 25 (1982) 1.
MATHEMATICAL MODELLING OF CARE 19
9 D. 1. Graves and Y. 1. Wu, Adv. Biochem. Eng., 12 (1979) 219.10 S. Katoh, T. Kambayashi, R. Deguchi and F. Yoshida, Biotech. Bioeng., 20 (1978) 267.II 1. W. Eveleigh and D. E. Levy, 1. Solid-Phase Biochem., 2 (1977) 45.12 G. R. Craven, E. Steers, 1r. and C. B. Afinsen, J. BioI. Chern., 240 (1965) 2468.13 K. Buchholz, Biotech. Lett., 1 (1979) 451.14 S. W. Carleysmith, M. B. L. Eames and M. D. Lilly, Biotechnol. Bioeng., 22 (1980) 957.15 D. D. Do, Biotechnol. Bioeng., 26 (1984) 1032.16 H. A. Sorber, Handbook ofBiochemistry, Selected Data for Molecular Biology, Chemical Rubber Co.,
Cleveland, OH, 1968.17 N. F. Gordon and C. L. Cooney, paper presented at the 1987 AIChE National Meeting, New York, NY,
November 16-20. 1989.18 S. C. March, I. Parikh and P. Cuatrecasas, Anal. Biochem., 60 (1974) 149.19 N. F. Gordon and C. L. Cooney, unpublished results.

Journal of Chromatography, 478 (1989) 21-38Elsevier Science Publishers B.V., Amsterdam - Printed in The Netherlands
CHROM. 21 631
SYSTEMATIC PROCEDURE FOR THE DETERMINATION OF THE NATURE OF THE SOLUTES PRIOR TO THE SELECTION OF THE MOBILEPHASE PARAMETERS FOR OPTIMIZATION OF REVERSED-PHASE IONPAIR CHROMATOGRAPHIC SEPARATIONS
GARY K.-C. LOW*
Centre for Advanced Analytical Chemistry, CSIRO Division of Fuel Technology, Lucas Heights ResearchLaboratories, Private Mail Bag 7, Menai (Australia)
and
AKOS BARTHA", HUGO A. H. BILLIET and LEO DE GALAN
Department of Analytical Chemistry, Delft University of Technology, De Vries van Heystplantsoen 2, 2628RZ Delft (The Netherlands)
(First received September 26th, 1988; revised manuscript received May 3rd, 1989)
SUMMARY
Separation selectivity of ionized solutes in reversed-phase ion-pair chromatography can be varied by manipulating a number of mobile phase variables. From astudy of computer-simulated mixtures of differently charged solutes it became obvious that the selection of the parameter space for systematic solvent optimization isconstrained principally by the nature of the charged species present in the mixture.For most sample mixtures there are preferred combinations of the mobile phasevariables, leading to a significant reduction of the optimization search area, A systematic strategy is shown here for the determination of the charge type and the relativeretention (hydrophobicity) of the components in samples for which this informationis not known. The first part of the strategy identifies the weak acids and bases according to their retention behavior in two gradient separations at pH 2.5 and 7.5, respectively. The second part determines the presence of strong acids and bases by the sametwo gradients but "pulsed" with a negatively and a positively charged ion-pairingreagent, respectively. Solutes are classified according to their characteristic retentionshifts using a sequential-elimination scheme. Solutes without retention shifts are classified as non-charged solutes.
INTRODUCTION
The use of computer-aided procedures for the optimization of separation selectivity in reversed-phase high-performance liquid chromatography (HPLC) has beenextensively studied during the last few years1-5, The efforts of many research groups
a On leave from the University of Chemical Engineering, Veszprem, Hungary.
0021-9673/89/$03.50 © 1989 Elsevier Science Publishers B.V.
22 G. K.-C. LOW et al.
resulted in several commercial software packages'<!". However, the value and success of all these optimization strategies (including the trial-and-error aproaches) critically depends on the number and range of the mobile phase variables, which areselected to vary the retention and selectivity of the separation. The combination ofthese parameters and their limiting values defines the parameter space, in which theoptimum separation conditions should be located. In all presently known HPLCoptimization procedures1-1°, a preselected vector space is used. If the parameterranges are too broad, many experiments may be required to find the optimum, while atoo narrow parameter space often leads to a local (usually unsatisfactory) optimum.
The selection of an appropriate parameter space for sample mixtures containing non-charged solutes is relatively easy in reversed-phase HPLC, and involves almost exclusively the manipulation of either the type and/or the concentration of theorganic modifier(s) in the mobile phase. The retention movement of the non-chargedcomponents is largely predictable with a decrease of solute retention when the organicmodifier concentration is increased in the eluent. Simple isocratic or gradient scoutingexperiments can be used to determine the initial eluent compositions before startingthe binary, ternary or quaternary solvent optimization procedure'v!".
However, a wide range of typical samples such as ionic surfactants, drugs,reaction mixtures, environmental and biological samples often contain both noncharged and ionic or ionizable compounds. The separation of such sample mixturesusually needs the variation of a number of other mobile phase parameters (eluent pH,type and concentration of buffer, ionic strength, charge type, hydrophobicity andconcentration of ion-pairing reagent). The increasing number (and/or range) of themobile phase variables to be optimized necessitates the completion of many morechromatographic experiments and needs more complex instrumentation. Furthermore, most available optimization methods (except Simplex) permit the simultaneousoptimization of only two or three parameters. Therefore, it is essential to reduce theparameter space as much as possible, by including (and varying) only those parameters which have a significant effect on the selectivity of the separation.
A number of recent publications have demonstrated the successful separationof sample mixtures containing solutes of different charge types using a mixture-designstatistical approach along with predictive regression methods 1 3-1 5. Generally, thethree most important eluent parameters considered in these selectivity optimizationsare the organic modifier, pairing ion concentrations and the eluent pH. The experimental designs described in refs. 13-15, depending on their philosophy, select different subspaces of the parameter space, as shown in Fig. 1 using a three-dimensionalrepresentation. However, the parameter space selected by these methods is correct forcertain mixtures" and none of them is generally applicable.
Based on a study of the separations of many computer simulated sample mixtures of differently charged solutes it will be shown here that the optimization parameter space can be selected rationally if the nature (charge type and the relative hydrophobicity) of the sample components is known. A systematic and rapid procedure hasbeen developed to obtain this information for solute mixtures, where it is not available a priori. The method is based on four specifically designed organic modifiergradients according to the unique retention shifts of charged solutes. The felicity ofthe scanning procedure is demonstrated by determining the solute types in complexsynthetic solute mixtures.
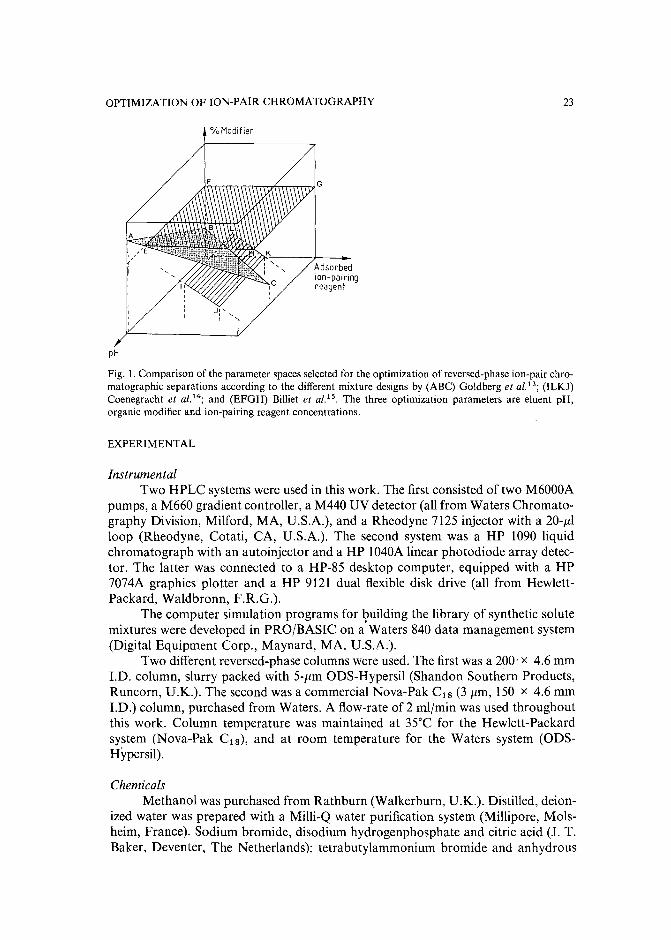
OPTIMIZATION OF ION-PAIR CHROMATOGRAPHY
%Modifier
23
F
Adsorbedion-pairingreagent
pH
Fig. I. Comparison of the parameter spaces selected for the optimization of reversed-phase ion-pair chromatographic separations according to the different mixture designs by (ABC) Goldberg et al.13; (ILKJ)Coenegracht et al.t"; and (EFGH) Billiet et al.": The three optimization parameters are eluent pH,organic modifier and ion-pairing reagent concentrations.
EXPERIMENTAL
InstrumentalTwo HPLC systems were used in this work. The first consisted of two M6000A
pumps, a M660 gradient controller, a M440 UV detector (all from Waters Chromatography Division, Milford, MA, U.S.A.), and a Rheodyne 7125 injector with a 20-fLlloop (Rheodyne, Cotati, CA, U.S.A.). The second system was a HP 1090 liquidchromatograph with an autoinjector and a HP 1040A linear photodiode array detector. The latter was connected to a HP-85 desktop computer, equipped with a HP7074A graphics plotter and a HP 9121 dual flexible disk drive (all from HewlettPackard, Waldbronn, F.R.G.).
The computer simulation programs for building the library of synthetic solutemixtures were developed in PRO/BASIC on a'Waters 840 data management system(Digital Equipment Corp., Maynard, MA, U.S.A.).
Two different reversed-phase columns were used. The first was a 200' x 4.6 mmI.D. column, slurry packed with 5-fLm ODS-Hypersil (Shandon Southern Products,Runcorn, U.K.). The second was a commercial Nova-Pak C 1 S (3 fLm, 150 x 4.6 mmI.D.) column, purchased from Waters. A flow-rate of 2 ml/min was used throughoutthis work. Column temperature was maintained at 35"C for the Hewlett-Packardsystem (Nova-Pak C 1 S) , and at room temperature for the Waters system (ODSHypersil),
ChemicalsMethanol was purchased from Rathburn (Walkerburn, U.K.). Distilled, deion
ized water was prepared with a Milli-Q water purification system (Millipore, Molsheim, France). Sodium bromide, disodium hydrogenphosphate and citric acid (J. T.Baker, Deventer, The Netherlands); tetrabutylammonium bromide and anhydrous
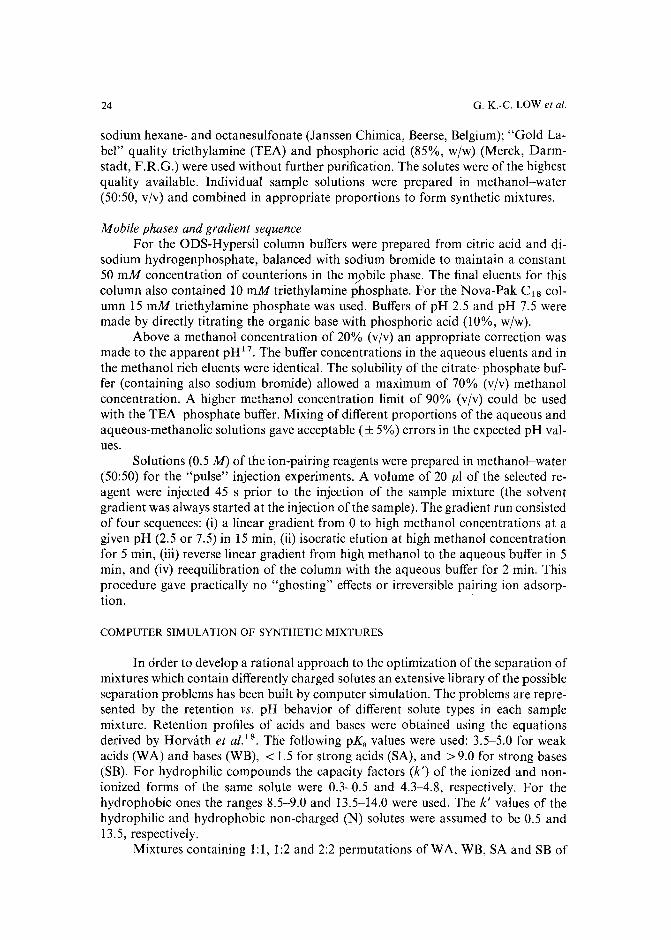
24 G. K.-C. LOW et al.
sodium hexane- and octanesulfonate (Janssen Chimica, Beerse, Belgium); "Gold Label" quality triethylamine (TEA) and phosphoric acid (85%, wjw) (Merck, Darmstadt, F.R.G.) were used without further purification. The solutes were of the highestquality available. Individual sample solutions were prepared in methanol-water(50:50, vjv) and combined in appropriate proportions to form synthetic mixtures.
Mobile phases and gradient sequenceFor the ODS-Hypersil column buffers were prepared from citric acid and di
sodium hydrogenphosphate, balanced with sodium bromide to maintain a constant50 mM concentration of counterions in the mobile phase. The final eluents for thiscolumn also contained 10 mM triethylamine phosphate. For the Nova-Pak C1 S column 15 mM triethylamine phosphate was used. Buffers of pH 2.5 and pH 7.5 weremade by directly titrating the organic base with phosphoric acid (10%, wjw).
Above a methanol concentration of 20% (vjv) an appropriate correction wasmade to the apparent pH l
? The buffer concentrations in the aqueous eluents and inthe methanol rich eluents were identical. The solubility of the citrate-phosphate buffer (containing also sodium bromide) allowed a maximum of 70% (vjv) methanolconcentration. A higher methanol concentration limit of 90% (vjv) could be usedwith the TEA-phosphate buffer. Mixing of different proportions of the aqueous andaqueous-methanolic solutions gave acceptable (± 5%) errors in the expected pH values.
Solutions (0.5 M) of the ion-pairing reagents were prepared in methanol-water(50:50) for the "pulse" injection experiments. A volume of 20 J1l of the selected reagent were injected 45 s prior to the injection of the sample mixture (the solventgradient was always started at the injection of the sample). The gradient run consistedof four sequences: (i) a linear gradient from 0 to high methanol concentrations at agiven pH (2.5 or 7.5) in 15 min, (ii) isocratic elution at high methanol concentrationfor 5 min, (iii) reverse linear gradient from high methanol to the aqueous buffer in 5min, and (iv) reequilibration of the column with the aqueous buffer for 2 min. Thisprocedure gave practically no "ghosting" effects or irreversible pairing ion adsorption.
COMPUTER SIMULATION OF SYNTHETIC MIXTURES
In order to develop a rational approach to the optimization of the separation ofmixtures which contain differently charged solutes an extensive library of the possibleseparation problems has been built by computer simulation. The problems are represented by the retention vs. pH behavior of different solute types in each samplemixture. Retention profiles of acids and bases were obtained using the equationsderived by Horvath et al. l s. The following pKa values were used: 3.5-5.0 for weakacids (WA) and bases (WB), < 1.5 for strong acids (SA), and >9.0 for strong bases(SB). For hydrophilic compounds the capacity factors (k') of the ionized and nonionized forms of the same solute were 0.3-0.5 and 4.3-4.8, respectively. For thehydrophobic ones the ranges 8.5-9.0 and 13.5-14.0 were used. The k' values of thehydrophilic and hydrophobic non-charged (N) solutes were assumed to be 0.5 and13.5, respectively.
Mixtures containing 1:1, 1:2 and 2:2 permutations of WA, WB, SA and SB of
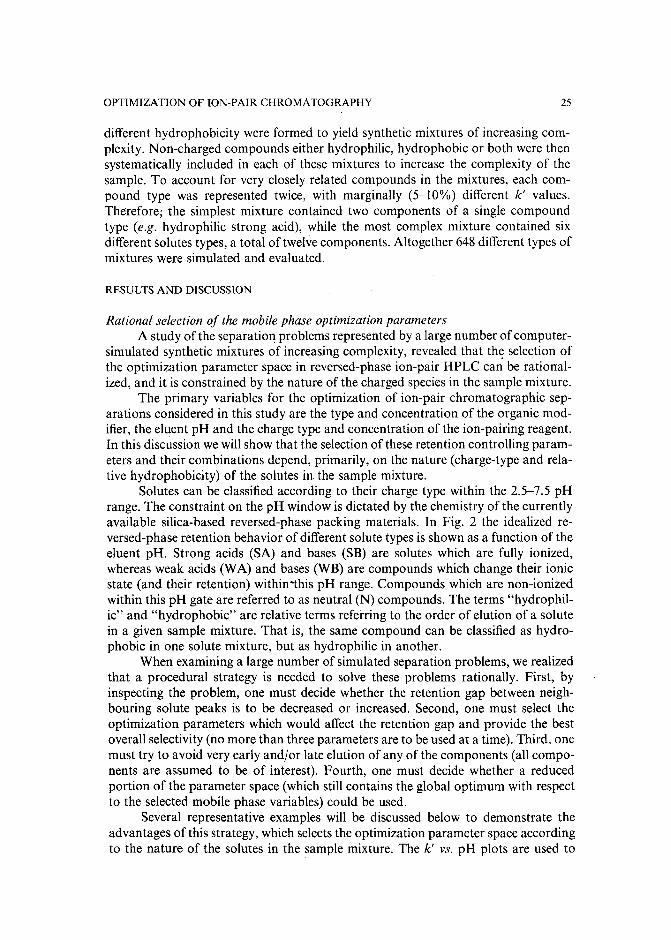
OPTIMIZATION OF ION-PAIR CHROMATOGRAPHY 25
different hydrophobicity were formed to yield synthetic mixtures of increasing complexity. Non-charged compounds either hydrophilic, hydrophobic or both were thensystematically included in each of these mixtures to increase the complexity of thesample. To account for very closely related compounds in the mixtures, each compound type was represented twice, with marginally (5-10%) different k' values.Therefore; the simplest mixture contained two components of a single compoundtype (e.g. hydrophilic strong acid), while the most complex mixture contained sixdifferent solutes types, a total of twelve components. Altogether 648 different types ofmixtures were simulated and evaluated.
RESULTS AND DISCUSSION
Rational selection of the mobile phase optimization parametersA study ofthe separation problems represented by a large number of computer
simulated synthetic mixtures of increasing complexity, revealed that the selection ofthe optimization parameter space in reversed-phase ion-pair HPLC can be rationalized, and it is constrained by the nature of the charged species in the sample mixture.
The primary variables for the optimization of ion-pair chromatographic separations considered in this study are the type and concentration of the organic modifier, the eluent pH and the charge type and concentration of the ion-pairing reagent.In this discussion we will show that the selection of these retention controlling parameters and their combinations depend, primarily, on the nature (charge-type and relative hydrophobicity) of the solutes in the sample mixture.
Solutes can be classified according to their charge type within the 2.5-7.5 pHrange. The constraint on the pH window is dictated by the chemistry of the currentlyavailable silica-based reversed-phase packing materials. In Fig. 2 the idealized reversed-phase retention behavior of different solute types is shown as a function of theeluent pH. Strong acids (SA) and bases (SB) are solutes which are fully ionized,whereas weak acids (WA) and bases (WB) are compounds which change their ionicstate (and their retention) within-this pH range. Compounds which are non-ionizedwithin this pH gate are referred to as neutral (N) compounds. The terms "hydrophilic" and "hydrophobic" are relative terms referring to the order of elution of a solutein a given sample mixture. That is, the same compound can be classified as hydrophobic in one solute mixture, but as hydrophilic in another.
When examining a large number of simulated separation problems, we realizedthat a procedural strategy is needed to solve these problems rationally. First, byinspecting the problem, one must decide whether the retention gap between neighbouring solute peaks is to be decreased or increased. Second, one must select theoptimization parameters which would affect the retention gap and provide the bestoverall selectivity (no more than three parameters are to be used at a time). Third, onemust try to avoid very early and/or late elution of any of the components (all components are assumed to be of interest). Fourth, one must decide whether a reducedportion of the parameter space (which still contains the global optimum with respectto the selected mobile phase variables) could be used.
Several representative examples will be discussed below to demonstrate theadvantages of this strategy, which selects the optimization parameter space accordingto the nature of the solutes in the sample mixture. The k' vs. pH plots are used to
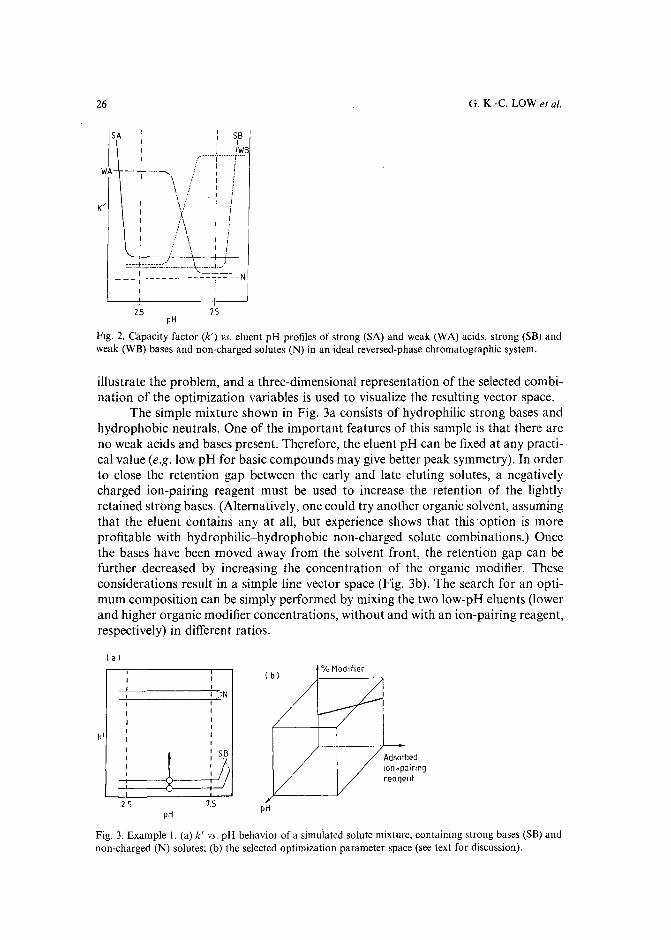
26
/5A
WA _...L_--..,
: \ i, I!, I!I XI !II ! \I ! \, . \
: 5B
: !WB/'---··-r--·····r···
, !I !I I, iI iI i, iI iI iI iI i
G. K.-C. LOW et al.
::":'±''::-.:::::::.._._._\_._.-l.j
- -- ~--- - -- - --':..-=r--=-:'-N, I
2.5 75pH
Fig. 2. Capacity factor (k') vs. eluent pH profiles of strong (SA) and weak (WA) acids, strong (SB) andweak (WB) bases and non-charged solutes (N) in an ideal reversed-phase chromatographic system.
illustrate the problem, and a three-dimensional representation of the selected combination of the optimization variables is used to visualize the resulting vector space.
The simple mixture shown in Fig. 3a consists of hydrophilic strong bases andhydrophobic neutrals. One of the important features of this sample is that there areno weak acids and bases present. Therefore, the eluent pH can be fixed at any practical value (e.g. low pH for basic compounds may give better peak symmetry). In orderto close the retention gap between the early and late eluting solutes, a negativelycharged ion-pairing reagent must be used to increase the retention of the lightlyretained strong bases. (Alternatively, one could try another organic solvent, assumingthat the eluent contains any at all, but experience shows that this option is moreprofitable with hydrophilic-hydrophobic non-charged solute combinations.) Oncethe bases have been moved away from the solvent front, the retention gap can befurther decreased by increasing the concentration of the organic modifier. Theseconsiderations result in a simple line vector space (Fig. 3b). The search for an optimum composition can be simply performed by mixing the two low-pH eluents (lowerand higher organic modifier concentrations, without and with an ion-pairing reagent,respectively) in different ratios.
( a I% Modifier
( b)
<oN
k'
~5B Adsorbed
l) ion-pcirmqreagent
2.5 7.5 pHpH
Fig. 3. Example I. (a) k' vs.pH behavior of a simulated solute mixture, containing strong bases (SB) andnon-charged (N) solutes; (b) the selected optimization parameter space (see text for discussion).
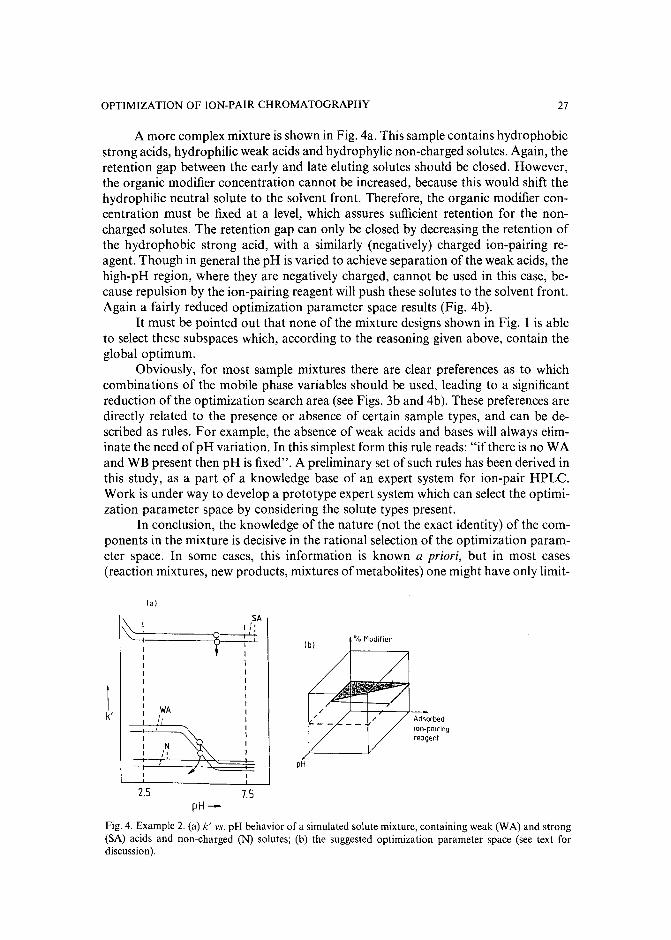
OPTIMIZATION OF ION-PAIR CHROMATOGRAPHY 27
A more complex mixture is shown in Fig. 4a. This sample contains hydrophobicstrong acids, hydrophilic weak acids and hydrophylic non-charged solutes. Again, theretention gap between the early and late eluting solutes should be closed. However,the organic modifier concentration cannot be increased, because this would shift thehydrophilic neutral solute to the solvent front. Therefore, the organic modifier concentration must be fixed at a level, which assures sufficient retention for the noncharged solutes. The retention gap can only be closed by decreasing the retention ofthe hydrophobic strong acid, with a similarly (negatively) charged ion-pairing reagent. Though in general the pH is varied to achieve separation of the weak acids, thehigh-pH region, where they are negatively charged, cannot be used in this case, because repulsion by the ion-pairing reagent will push these solutes to the solvent front.Again a fairly reduced optimization parameter space results (Fig. 4b).
It must be pointed out that none of the mixture designs shown in Fig. 1 is ableto select these subspaces which, according to the reasoning given above, contain theglobal optimum.
Obviously, for most sample mixtures there are clear preferences as to whichcombinations of the mobile phase variables should be used, leading to a significantreduction of the optimization search area (see Figs. 3b and 4b). These preferences aredirectly related to the presence or absence of certain sample types, and can be described as rules. For example, the absence of weak acids and bases will always eliminate the need of pH variation. In this simplest form this rule reads: "if there is no WAand WB present then pH is fixed". A preliminary set of such rules has been derived inthis study, as a part of a knowledge base of an expert system for ion-pair HPLC.Work is under way to develop a prototype expert system which can select the optimization parameter space by considering the solute types present.
In conclusion, the knowledge of the nature (not the exact identity) of the components in the mixture is decisive in the rational selection of the optimization parameter space. In some cases, this information is known a priori, but in most cases(reaction mixtures, new products, mixtures of metabolites) one might have only limit-
(a)
Adsorbedion-pnrrinqreagent
% Modifier
pH
7.5
SA~'\.. I:·'\:-:::+======1 :'i
IIIIIIIIIIII
1 WAk' ,
"
II NI :'-;-
2.5pH-
Fig. 4. Example 2. (a) k' vs. pH behavior of a simulated solute mixture, containing weak (WA) and strong(SA) acids and non-charged (N) solutes; (b) the suggested optimization parameter space (see text fordiscussion).
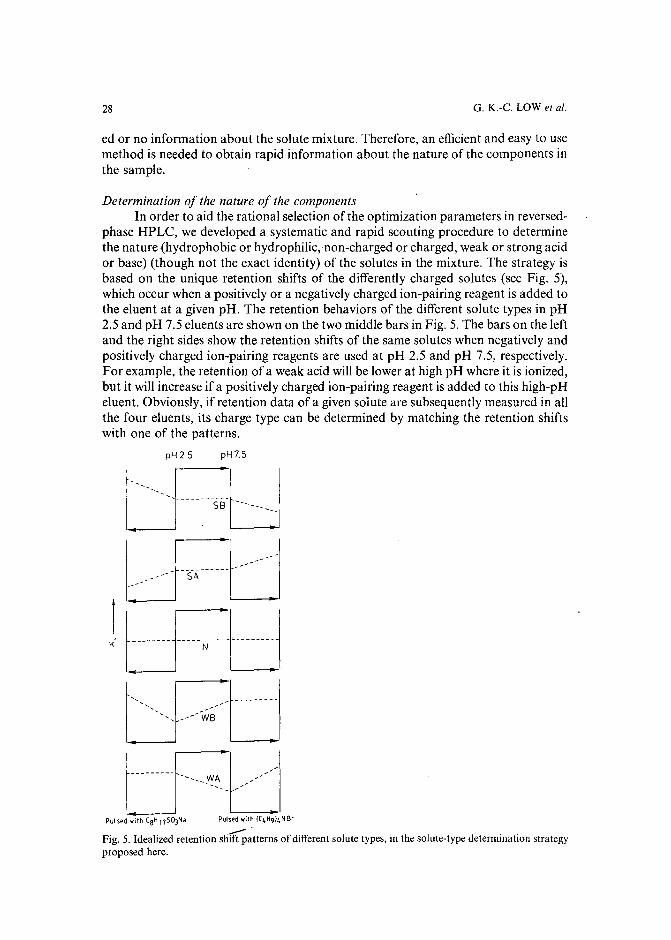
28 G. K.-C. LOW et al.
ed or no information about the solute mixture. Therefore, an efficient and easy to usemethod is needed to obtain rapid information about the nature of the components inthe sample.
Determination of the nature of the componentsIn order to aid the rational selection of the optimization parameters in reversed
phase HPLC, we developed a systematic and rapid scouting procedure to determinethe nature (hydrophobic or hydrophilic, non-charged or charged, weak or strong acidor base) (though not the exact identity) of the solutes in the mixture. The strategy isbased on the unique retention shifts of the differently charged solutes (see Fig. 5),which occur when a positively or a negatively charged ion-pairing reagent is added tothe eluent at a given pH. The retention behaviors of the different solute types in pH2.5 and pH 7.5 eluents are shown on the two middle bars in Fig. 5. The bars on the leftand the right sides show the retention shifts of the same solutes when negatively andpositively charged ion-pairing reagents are used at pH 2.5 and pH 7.5, respectively.For example, the retention of a weak acid will be lower at high pH where it is ionized,but it will increase if a positively charged ion-pairing reagent is added to this high-pHeluent. Obviously, if retention data of a given solute are subsequently measured in allthe four eluents, its charge type can be determined by matching the retention shiftswith one of the patterns.
pH25 pH7.5
·"""".CI... I~----.--SBLj
I J -l/--/t::::::::J --SA------~
J~LJLFt~--------- ",.. yvA I _------I. ""L
Pulsed with CaH 17S03Na Pulsed with ((4 H9'4 NBr-"Fig. 5. Idealized retention shift patterns of different solute types, in the solute-type determination strategyproposed here.
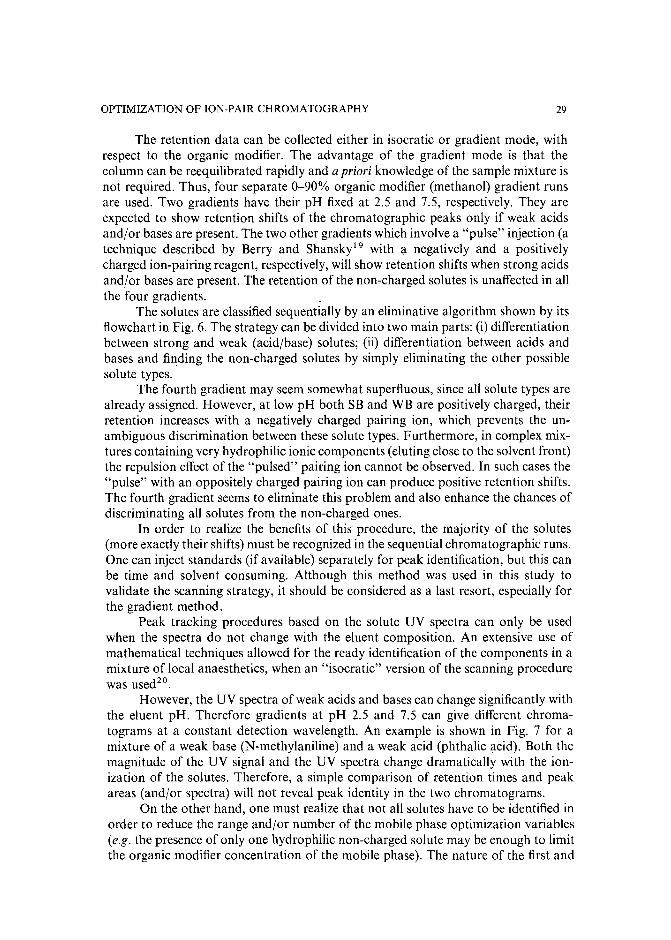
OPTIMIZATION OF ION-PAIR CHROMATOGRAPHY 29
The retention data can be collected either in isocratic or gradient mode, withrespect to the organic modifier. The advantage of the gradient mode is that thecolumn can be reequilibrated rapidly and a priori knowledge of the sample mixture isnot required. Thus, four separate 0-90% organic modifier (methanol) gradient runsare used. Two gradients have their pH fixed at 2.5 and 7.5, respectively. They areexpected to show retention shifts of the chromatographic peaks only if weak acidsand/or bases are present. The two other gradients which involve a "pulse" injection (atechnique described by Berry and Shansky!? with a negatively and a positivelycharged ion-pairing reagent, respectively, will show retention shifts when strong acidsand/or bases are present. The retention of the non-charged solutes is unaffected in allthe four gradients.
The solutes are classified sequentially by an eliminative algorithm shown by itsflowchart in Fig. 6. The strategy can be divided into two main parts: (i) differentiationbetween strong and weak (acid/base) solutes; (ii) differentiation between acids andbases and finding the non-charged solutes by simply eliminating the other possiblesolute types.
The fourth gradient may seem somewhat superfluous, since all solute types arealready assigned. However, at low pH both SB and WB are positively charged, theirretention increases with a negatively charged pairing ion, which prevents the unambiguous discrimination between these solute types. Furthermore, in complex mixtures containing very hydrophilic ionic components (eluting close to the solvent front)the repulsion effect of the "pulsed" pairing ion cannot be observed. In such cases the"pulse" with an oppositely charged pairing ion can produce positive retention shifts.The fourth gradient seems to eliminate this problem and also enhance the chances ofdiscriminating all solutes from the non-charged ones.
In order to realize the benefits of this procedure, the majority of the solutes(more exactly their shifts) must be recognized in the sequential chromatographic runs.One can inject standards (if available) separately for peak identification, but this canbe time and solvent consuming. Although this method was used in this study tovalidate the scanning strategy, it should be considered as a last resort, especially forthe gradient method.
Peak tracking procedures based on the solute UV spectra can only be usedwhen the spectra do not change with the eluent composition. An extensive use ofmathematical techniques allowed for the ready identification of the components in amixture of local anaesthetics, when an "isocratic" version of the scanning procedurewas used?",
However, the UV spectra of weak acids and bases can change significantly withthe eluent pH. Therefore gradients at pH 2.5 and 7.5 can give different chromatograms at a constant detection wavelength. An example is shown in Fig. 7 for amixture of a weak base (N-methylaniline) and a weak acid (phthalic acid). Both themagnitude of the UV signal and the UV spectra change dramatically with the ionization of the solutes. Therefore, a simple comparison of retention times and peakareas (and/or spectra) will not reveal peak identity in the two chromatograms.
On the other hand, one must realize that not all solutes have to be identified inorder to reduce the range and/or number of the mobile phase optimization variables(e.g. the presence of only one hydrophilic non-charged solute may be enough to limitthe organic modifier concentration of the mobile phase). The nature of the first and
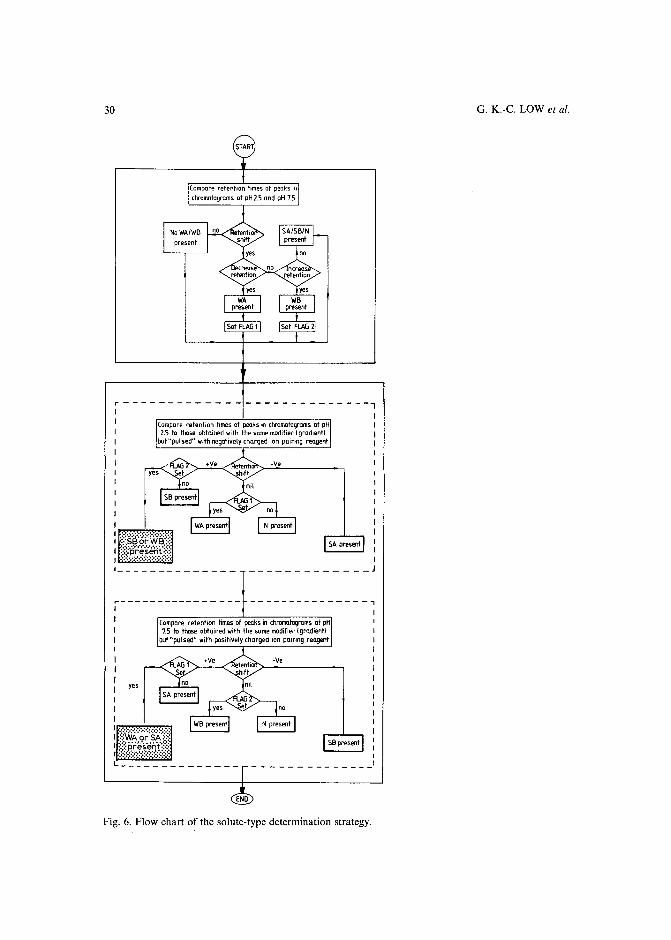
30
Compare retention times of peaks in chromatograms at pH2.5 to those obtained with the same modifier 1gradient)
but"pulsed"withnegatively charged ion pairingreagent
-Ve
I
I
IIIIII1
1_____________ J
r---------------- ---------------,
tempera retention times of peaks inchromo.togrums at pH7.S to those obtained with the same modifier (gradient)
but"pUlsed" withpositively charged ion pairing reagent
-Vo
- - - - - - - - - - - - - _,
END
Fig. 6. Flow chart of the solute-type determination strategy.
G. K.-C. LOW et at.
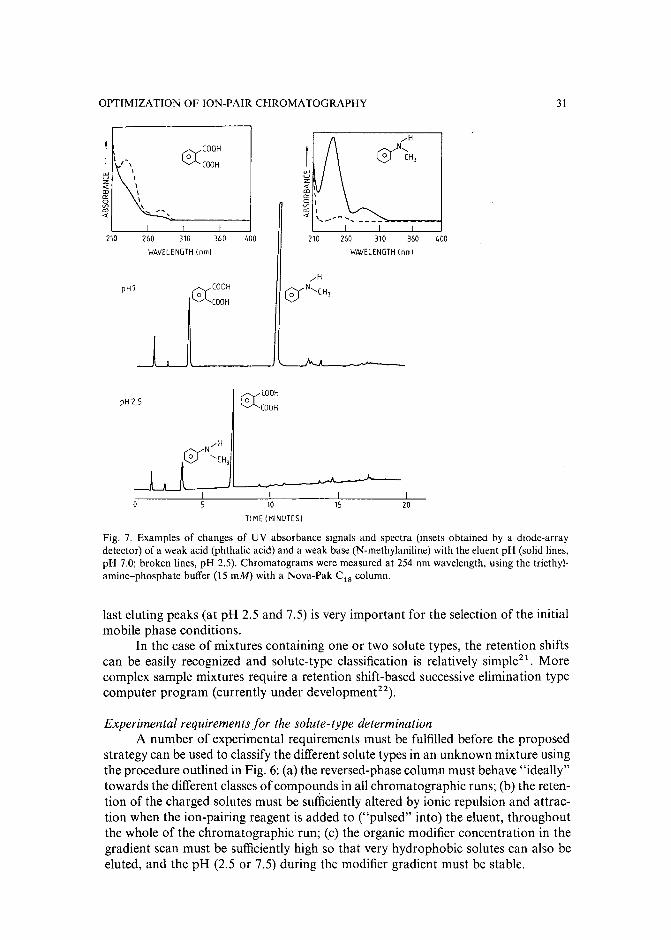
OPTIMIZATION OF ION-PAIR CHROMATOGRAPHY 31
210
C§XCOOH
COOH
260 310 360 400
WAVELENGTH (nml
210 260 310 360 400
WAIIELENGTH (nm)
pH? faYCOOH
~(OOH
pH 2S~COOH
~COOH
201S10
TIME(MINUTESI
Fig. 7. Examples of changes of UV absorbance signals and spectra (insets obtained by a diode-arraydetector) of a weak acid (phthalic acid) and a weak base (N-methylaniline) with the eluent pH (solid lines,pH 7.0; broken lines, pH 2.5). Chromatograms were measured at 254 nm wavelength, using the triethylamine-phosphate buffer (IS mM) with a Nova-Pak C I 8 column.
last eluting peaks (at pH 2.5 and 7.5) is very important for the selection of the initialmobile phase conditions.
In the case of mixtures containing one or two solute types, the retention shiftscan be easily recognized and solute-type classification is relatively simple:". Morecomplex sample mixtures require a retention shift-based successive elimination typecomputer program (currently under development-").
Experimental requirements for the solute-type determinationA number of experimental requirements must be fulfilled before the proposed
strategy can be used to classify the different solute types in an unknown mixture usingthe procedure outlined in Fig. 6: (a) the reversed-phase column must behave "ideally"towards the different classes of compounds in all chromatographic runs; (b) the retention of the charged solutes must be sufficiently altered by ionic repulsion and attraction when the ion-pairing reagent is added to ("pulsed" into) the eluent, throughoutthe whole of the chromatographic run; (c) the organic modifier concentration in thegradient scan must be sufficiently high so that very hydrophobic solutes can also beeluted, and the pH (2.5 or 7.5) during the modifier gradient must be stable.
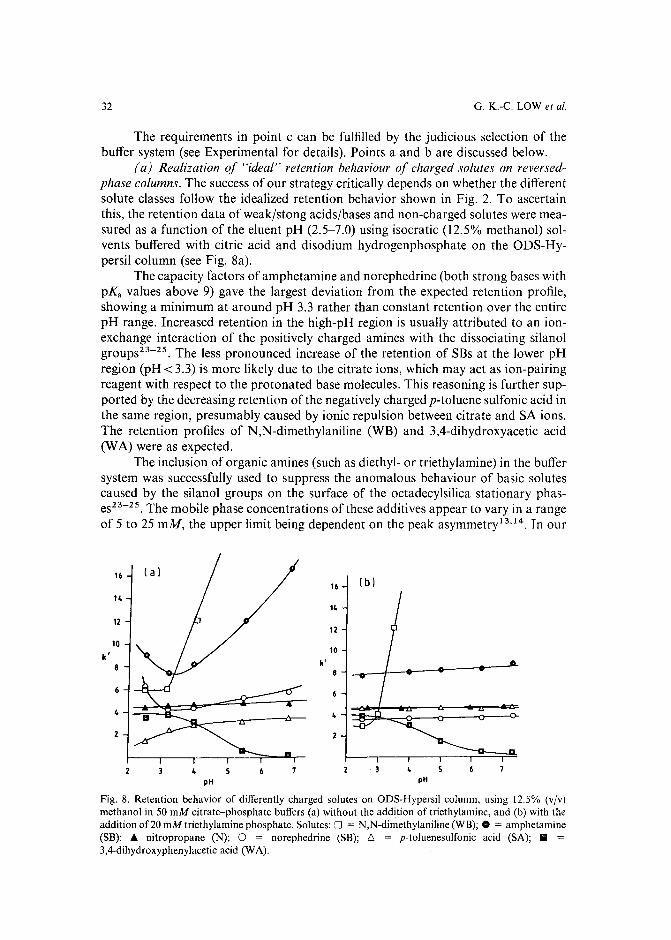
32 G. K.-C. LOW et al.
The requirements in point c can be fulfilled by the judicious selection of thebuffer system (see Experimental for details). Points a and b are discussed below.
(a) Realization of "ideal" retention behaviour of charged solutes on reversedphase columns. The success of our strategy critically depends on whether the differentsolute classes follow the idealized retention behavior shown in Fig. 2. To ascertainthis, the retention data of weak/stong acids/bases and non-charged solutes were measured as a function of the eluent pH (2.5-7.0) using isocratic (12.5% methanol) solvents buffered with citric acid and disodium hydrogenphosphate on the ODS-Hypersil column (see Fig. 8a).
The capacity factors of amphetamine and norephedrine (both strong bases withpKa values above 9) gave the largest deviation from the expected retention profile,showing a minimum at around pH 3.3 rather than constant retention over the entirepH range. Increased retention in the high-pH region is usually attributed to an ionexchange interaction of the positively charged amines with the dissociating silanolgroups23-25. The less pronounced increase of the retention of SBs at the lower pHregion (pH < 3.3) is more likely due to the citrate ions, which may act as ion-pairingreagent with respect to the protonated base molecules. This reasoning is further supported by the decreasing retention of the negatively charged p-toluene sulfonic acid inthe same region, presumably caused by ionic repulsion between citrate and SA ions.The retention profiles of N,N-dimethylaniline (WB) and 3,4-dihydroxyacetic acid(WA) were as expected.
The inclusion of organic amines (such as diethyl- or triethylamine) in the buffersystem was successfully used to suppress the anomalous behaviour of basic solutescaused by the silanol groups on the surface of the octadecylsilica stationary phases23-25. The mobile phase concentrations of these additives appear to vary in a rangeof 5 to 25 mM, the upper limit being dependent on the peak asymmetry'Y'". Tn our
4
16(bl16
1414
1212
10
k'10
k'
pH pH
Fig. 8. Retention behavior of differently charged solutes on ODS-Hypersil column, using 12.5% (vjv)methanol in 50 mM citrate-phosphate buffers (a) without the addition of triethylamine, and (b) with theaddition of20 mM triethylamine phosphate. Solutes: 0 = N,N-dimethylaniline (WB); • = amphetamine(SB); • nitropropane (N); 0 = norephedrine (SB); 6. = p-toluenesulfonic acid (SA); II =3,4-dihydroxyphenylacetic acid (WA).
OPTIMIZATION OF ION-PAIR CHROMATOGRAPHY 33
case, 25 mM triethylamine phosphate completely eliminated the adverse silanol effects. However, it was also found to act as a positively charged ion-pairing reagent,having a serious impact on the second part of our strategy. It considerably toneddown the expected retention shifts of charged solutes, when additional positively ornegatively charged ion-pairing reagents were "pulsed" in the organic modifier gradients. Therefore, a lower (20 mM) triethylamine concentration was used finally, torealize the "ideal" retention behavior of the charged solutes, as shown in Fig. 8b. Thiseluent system, however, occasionally caused band broadening and/or peak splittingin the methanol gradients at pH 2.5, and allowed for the use of "pulsed" injectionsonly at pH 7.0.
A more simple buffer system, prepared from 15 mM triethylamine and phosphoric acid was sufficient to normalize the retention behavior of the charged soluteson the other reversed-phase column (Nova-Pak CIS)' With this organic buffer alone,higher final methanol concentration (90%), v/v) could be achieved in the gradientruns. However, due to the higher organic modifier concentration reduced ionic interactions were observed between the charged solutes and the ion-pairing reagents in thelater part of the gradient. This additional problem will be discussed in section bbelow.
The procedure followed with these two columns can easily be generalized toevaluate whether other columns behave "ideally" in the selected buffer system (andallow for the use of our strategy). The retention of slightly and strongly retainedstrong acids and bases (see Fig. 8) must be determined at three different pH values(2.5, 5.0, 7.5), which could give immediate information on the behavior of the column. It is also advisable to include several non-charged solutes in the set, since theirretention shifts can indicate inaccuracies of eluent preparation.
(b) Ionic attraction and repulsion ofcharged solutes by "pulsed" injection of theion-pairing reagent. The basis of the "pulsed" injection method is to load a concentrated "slug" of ion-pairing reagent on the top of the reversed-phase column beforethe sample is introduced (and the organic modifier gradient is started)!". The ionpairing reagent adsorbs on the hydrophobic surface of the packing material, andalters the retention of the charged solutes through ionic interaction. Bartha andco-workers-v?? have demonstrated previously that the adsorption of the ion-pairingreagent decreases substantially with the increase of the organic modifier concentration of the mobile phase. Therefore, the ionic attraction/repulsion effect of the adsorbed pairing ion drops off significantly in the later part of the gradient, where it isincreasingly removed from the column by methanol rich eluent. This phenomenon isclearly demonstrated by the retention data shown in Table I. For example, a moreretained solute (which elutes also at higher methanol concentrations) such as N-ethylnaphthylamine shows marginal retention shift in the gradient at pH 2.5 when"pulsed" with sodium hexanesulfonate. The retention shift was considerably larger,when a more hydrophobic, more strongly adsorbed ion-pairing reagent, sodium octylsulfonate was used (see Table I). The retention of naphthalenesulfonic acid (SA)was also decidedly more affected in this latter case.
The results in Table I also indicate that even more hydrophobic pairing ionsmight be needed to effect significant retention movements for very highly retainedionic solutes. Work is in progress to explore this possibility'". Higher injection volumes and/or more concentrated solutions of the reagents have been tried with limited
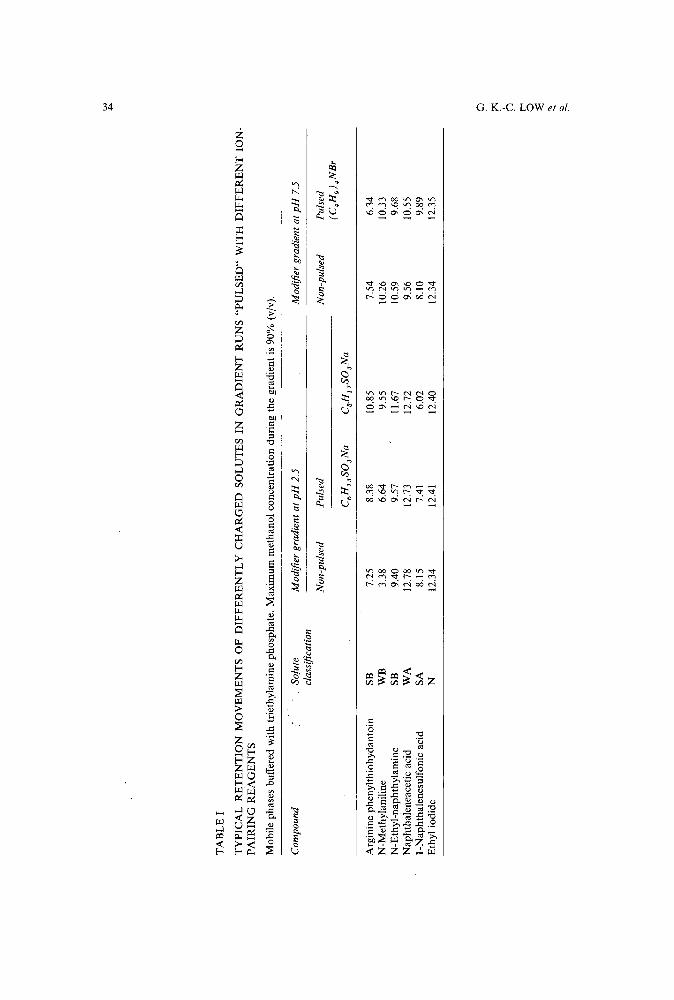
TA
BL
EI
TY
PIC
AL
RE
TE
NT
ION
MO
VE
ME
NT
SO
FD
IFF
ER
EN
TL
YC
HA
RG
ED
SO
LU
TE
SIN
GR
AD
IEN
TR
UN
S"P
UL
SE
D"
WIT
HD
IFF
ER
EN
TIO
N
PA
IRIN
GR
EA
GE
NT
S
Mob
ileph
ases
buff
ered
with
trie
thyl
amin
eph
osph
ate.
Max
imum
met
hano
lco
ncen
trat
ion
duri
ngth
egr
adie
ntis
90%
(vjv
).
w +>-
Mod
ifie
rgr
adie
ntat
pH
7.5
Com
poun
dSo
lute
Mod
ifie
rgr
adie
ntat
pH
2.5
clas
sifi
cati
onN
on-p
ulse
dP
ulse
d
C6
H1
3S
03N
aC
SH
J7S
03
Na
Arg
inin
eph
enyi
thio
hyda
ntoi
nSB
7.25
8.38
10.8
5N
-Met
hyla
nili
neW
B3.
386.
649.
55N
-Eth
yl-n
apht
hyla
min
eSB
9.40
9.57
11.6
7N
apht
hale
neac
etic
acid
WA
12.7
812
.73
12.7
2I-
Nap
htha
lene
sulf
onic
acid
SA8.
157.
416.
02E
thyl
iodi
deN
12.3
412
.41
12.4
0
Non
-pul
sed
7.54
10.2
610
.59
9.56
8.10
12.3
4
Pul
sed
(C4H
9)4N
Br
6.34
10.3
39.
6810
.55
9.89
12.3
5
o ~ o r o ::E ~ '":--
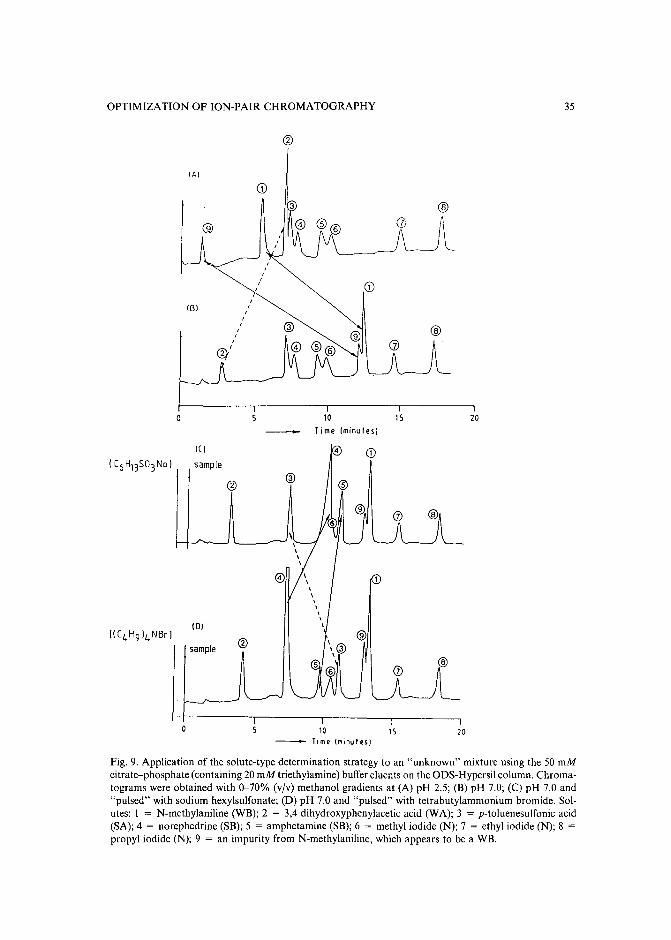
OPTIMIZATION OF ION-PAIR CHROMATOGRAPHY
(AI
lBl
®
35
o 10
Time Iminut esl1S 20
« I
sample
(01
sample
10 15Time lminutes)
,0
Fig. 9. Application of the solute-type determination strategy to an "unknown" mixture using the 50 mMcitrate-phosphate (containing 20 mM triethylamine) buffer eluents on the ODS-Hypersil column. Chromatograms were obtained with 0-70% (vjv) methanol gradients at (A) pH 2.5; (B) pH 7.0; (C) pH 7.0 and"pulsed" with sodium hexylsulfonate; (D) pH 7.0 and "pulsed" with tetrabutylammonium bromide. Solutes: I = N-methylaniline (WB); 2 = 3,4 dihydroxyphenylacetic acid (WA); 3 = p-toluenesulfonic acid(SA); 4 = norephedrine (SB); 5 = amphetamine (SB); 6 = methyl iodide (N); 7 = ethyl iodide (N); 8 =propyl iodide (N); 9 = an impurity from N-methylaniline, which appears to be a WB.
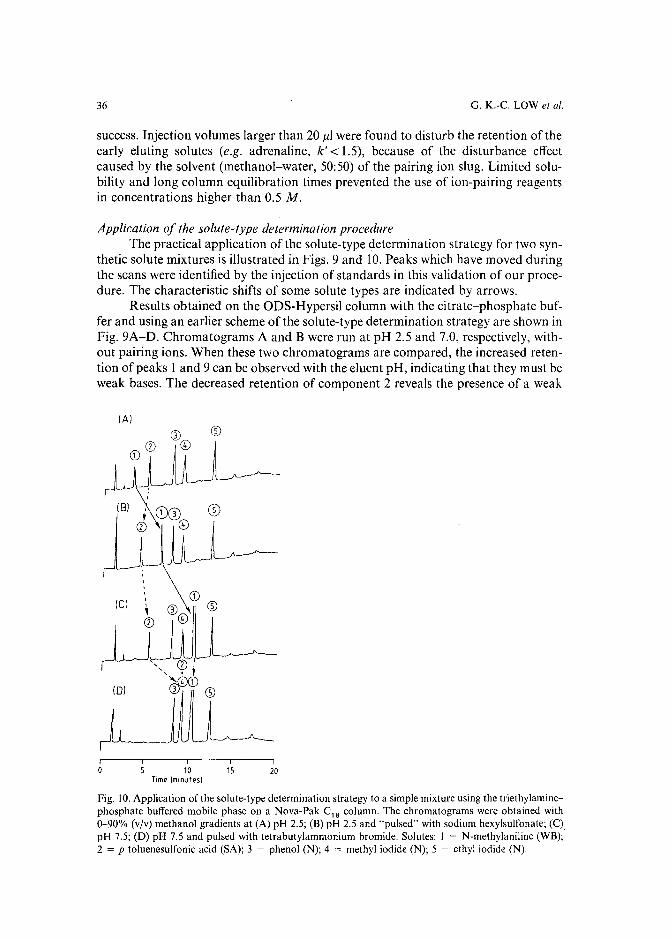
36 G. K.-C. LOW et al.
success. Injection volumes larger than 20 ttl were found to disturb the retention of theearly eluting solutes (e.g. adrenaline, k' < 1.5), because of the disturbance effectcaused by the solvent (methanol-water, 50:50) of the pairing ion slug. Limited solubility and long column equilibration times prevented the use of ion-pairing reagentsin concentrations higher than 0.5 M.
Application of the solute-type determination procedureThe practical application of the solute-type determination strategy for two syn
thetic solute mixtures is illustrated in Figs. 9 and 10.Peaks which have moved duringthe scans were identified by the injection of standards in this validation of our procedure. The characteristic shifts of some solute types are indicated by arrows.
Results obtained on the ODS-Hypersil column with the citrate-phosphate buffer and using an earlier scheme of the solute-type determination strategy are shown inFig. 9A-D. Chromatograms A and B were run at pH 2.5 and 7.0, respectively, without pairing ions. When these two chromatograms are compared, the increased retention of peaks 1 and 9 can be observed with the eluent pH, indicating that they must beweak bases. The decreased retention of component 2 reveals the presence of a weak
(A)
(8) CD
(e)
-, CP.
Jr~10
Time (minutesl
I15 20
Fig. 10. Application of the solute-type determination strategy to a simple mixture using the triethylaminephosphate buffered mobile phase on a Nova-Pak C l 8 column. The chromatograms were obtained with0-90% (vjv) methanol gradients at (A) pH 2.5; (B) pH 2.5 and "pulsed" with sodium hexylsulfonate; (C)pH 7.5; (D) pH 7.5 and pulsed with tetrabutylammonium bromide. Solutes: I = N-methylaniline (WB);2 = p-toluenesulfonic acid (SA); 3 = phenol (N); 4 = methyl iodide (N); 5 = ethyl iodide (N).
OPTIMIZATION OF ION-PAIR CHROMATOGRAPHY 37
acid in this mixture. The remaining solutes do not change their retention with the pHand can be either strong acids/bases or non-charged solutes. A "pulsed" injection of asodium hexanesulfonate in the gradient run at pH 7.0 (see chromatogram C) produced a positive retention shift of peaks 4 arid 5 (compared to pH 7.0 without pulse)indicating that these components are strong bases. Similarly, a "pulsed" injection oftetrabutylammonium bromide at pH 7.0 (see chromatogram D) gave a pronouncedpositive shift for peak 3, indicating that this component is a strong acid. Therefore,out of nine components, two WBs (I, 9) and SBs (4, 5), one WA (2) and SA (3), andthree Ns (6, 7, 8) are in the mixture. The most hydrophobic compound is peak 8 (N),and the least retained solute is either peak 2 (WA) or 9 (WB), depending on the finalpH of the eluent.
Fig. 10A-D show the application of the solute-type determination strategy fora simple mixture, as given by the flowchart of Fig. 6. Triethylamine-phosphate bufferwas used with the Nova-Pak C1 S column. The highest methanol concentration at theend of the gradient is 90% (v/v). The buffer-methanol gradient was pulsed withsodium hexylsulfonate at pH 2.5 (Fig. lOB) and with tetrabutylammonium bromideat pH 7.5 (Fig. 10D). A notable feature of this example is that peak I (N-methylaniline) followed exactly the retention movement pattern of a WB, as outlined in Fig. 5.It is also noted that the confirmation of peak 2 as a SA is not conclusive until thecompletion of the fourth gradient, where a large retention increase occurs. Nevertheless, the consistent trend of the first three chromatograms indicated that peak 2was likely an SA. The remaining solutes (3, 4, 5) in the mixture are non-charged (N)compounds.
Other applications of this solute-type determination strategy along with theextensive discussion of the problems of peak tracking, optimization parameter selection and subsequent mobile phase optimization can be found in refs. 20 and 21.
CONCLUSIONS
From the study of simulated mixtures of differently charged compounds wefound that the nature (i.e. charge-type and relative hydrophobicity) of the components (not their exact identity) is important to decide what combination Ofeluent pH,organic modifier and pairing-ion concentration is to be selected for systematic optimization. Adapting the design of the eluent composition to the nature of the samplemixture often leads to a significant reduction of the optimization search area.
A systematic strategy, along with a sequentially eliminative algorithm was suggested and experimentally realized to determine the nature of the components inmixtures where this information in unavailable. A novel combination of aqueousbuffer-methanol gradients at two different pH (2.5 and 7.5) values with the "pulsed"injection of ion-pairing reagents was used in this method. Since the classification ofsolute types (strong/weak acid/base, non-charged) is based on their "ideal" retentionbehavior in the reversed-phase chromatographic system, certain experimental requirements must be fulfilled for the successful application of this strategy. Both thereversed-phase column and the buffer system must be selected carefully, as shown fortwo commercial C1 S colums of the same generic type.
38
ACKNOWLEDGEMENTS
G. K.-C. LOW et al.
We wish to acknowledge support to G.K.-C. Low by the Dutch Foundation forScience (Nederlandse Organisatie voor Zuiver-Wetenschappelijk Onderzoek). Thework described here was completed at the Delft University of Technology during thisfellowship.
REFERENCES
I J. C. Berridge, Techniques for the Automated Optimization of HPLC Separations, Wiley, Chichester,1985.
2 P. J. Schoenmakers, Optimization of Chromatographic Selectivity - A Guide for Method Development,Elsevier, Amsterdam, 1986.
3 J. L. Glajch and J. J. Kirkland, Anal. Chem., 55 (1983) 319A.4 H. J. G. Debets, J. Liq. Chromatogr., 8 (1985) 2725.5 L. de Galan and H. A. H. Billiet, Adv. Chromatogr., 24 (1984) 35.6 J. L. Glajch, J. J. Kirkland, K. M. Squire and J. M. Minor, J. Chromatogr., 199 (1980) 57.7 L. R. Snyder, J. W. Dolan and M.A. Quarry, Trends Anal. Chem., 6 (1987) 106.8 M. W. Dong, R. D. Conlon and A. F. Poi le, Am. Lab. (Fairfield, Conn.), 20 (5-6) (1988) 50.9 T. O'Dwyer, P. DeLand, R. Smith, Am. Lab. (Fairfield, Conn.), 20 (6) (1988) 40.
10 G. D'Agostino, L. Castagnetta, M. J. O'Hare and F. Mitchell. J. Chromatogr., 338 (1985) I.II L. R. Snyder, J. W. Dolan and J. R. Grant, J. Chromatogr., 165 (1979) 3.12 P. J. Schoenmakers, H. A. H. Billiet and L. de Galan, J. Chromatogr., 205 (1981) 3.13 A. P. Goldberg, E. Nowakowska, P. E. Antle and L. R. Snyder, J. Chromatogr., 316 (1984) 241.14 P. M. J. Coeneggracht, N. V. Tuyen, H. J. Metting and P. M. J. Coenegracht-Lamers, J. Chromatogr.,
389 (1987) 351.15 H. A. H. Billiet, J. Vuik, J. K. Strasters and L. de Galan, J. Chromatogr., 384 (1987) 153.16 A. Bartha, Gy. Vigh, G. K. C. Low, H. A. H. Billiet and L. de Galan, presented at the Pittsburgh
Conference on Analytical Chemistry, Atlanta, GA, March 6-10, 1989, paper P588.17 J. L. M. van de Venne, J. L. H. Hendrikx and R. S. Deelder, J. Chromatogr., 167 (1978) I.18 Cs. Horvath, W. R. Melander and I. Molnar, Anal. Chem., 49 (1977) 142.19 V. V. Berry and R. E. Shansky, J. Chromatogr., 284 (1984) 318.20 J. K. Strasters, F. Cooisaet, A. Bartha, H. A. H. Billiet and L. de Galan, J. Chromatogr., submitted for
publication.21 A. Bartha, H. A. H. Billiet and L. de Galan, J. Chromatogr., 464 (1989) 225.22 A. Bartha and Gy. Vigh, in preparation.23 K. E. Bij, Cs. Horvath, W. R. Melander and A. Nahum, J. Chromatogr., 203 (1981) 65.24 J. S. Kiel, S. L. Morgan and R. K. Abramson, J. Chromatogr., 32 (1985) 313.25 G. B. Cox and R. W. Stout, J. Chromatogr., 384 (1987) 315.26 A. Bartha and Gy. Vigh, J. Chromatogr., 260 (1983) 337.27 A. Bartha, Gy. Vigh, H. A. H. Billiet and L. de Galan, J. Chromatogr., 303 (1984)
Journal of Chromatography, 478 (1989) 39-49Elsevier Science Publishers RV., Amsterdam - Printed in The Netherlands
CHROM. 21 613
EXPERIMENTAL AND THEORETICAL DYNAMICS OF ISOELECTRIC FOCUSING
III. TRANSIENT MULTI-PEAK APPROACH TO EQUILIBRIUM OF PROTEINS IN SIMPLE BUFFERS
RICHARD A. MOSHER* and WOLFGANG THORMANNa
Center for Separation Science, Engineering Building 20, University of Arizona, Tucson, AZ 85721 (U.S.A.)
and
REINHARD KUHW and HORST WAGNER
Institut fur Analytik und Radiochemie, Universitiit des Saarlandes, D-66 Saarbriicken (F.R.G.)
(First received February 2nd, 1989; revised manuscript received May 3rd, 1989)
SUMMARY
Transient states in the isoelectric focusing of proteins in simple three-component buffer systems were examined by (i) analyzing the collected fractions from continuous flow electrophoresis at a range of operating conditions, (ii) photographingthe behavior of colored proteins in capillaries, (iii) monitoring the electric field dynamics along a capillary with a potential gradient array detector and (iv) computersimulation. The good agreement between simulation and experimental data clearlyreveals how the separation dynamics of the buffer system, i.e., the formation of anatural pH gradient, produces the observed peaks and boundaries of protein duringthe approach to the steady state. The protein focusing dynamics are different, butcharacteristic, for each buffer system, with both transient double, and multiple, peaksbeing observed.
INTRODUCTION
Characterization of the transient processes in isoelectric focusing (IEF) is ofinterest in order to establish when the steady state is reached. A variety of procedureshave been developed by a number of investigators for examination of these transientstates. Repetitive optical scanning has been employed with rotating! and densitygradient-stabilized2 free fluid columns as well as gel filled columns". Gels have alsobeen segmented at various times during the course of an experiment and measure-
a Present address: Department of Clinical Pharmacology, University of Bern, CH-301O, Bern,Switzerland.
b Present address, Analytical Research and Development, Pharmaceutical Division, Sandoz Ltd.,Basel, Switzerland.
0021-9673/89/$03.50 © 1989 Elsevier Science Publishers B.V.
40 R. A. MOSHER et al.
ments of pH, conductivity, absorbance, radioactivity and biological activity made onsegment eluates (see ref. 3 for a review). Additionally, Weisset al" have developed atheoretical description of sample behavior in the presence of pre-established, linearpH gradients.
Our prior studies of the dynamics of JEF have employed an amalgam of experimental and computer simulation data. In a first publication on the subject, a generalseparation mechanism was elucidated". It was found that the focusing process proceeds in two phases, a relatively fast separation phase followed by a slow stabilizingphase during which a steady state is reached. The latter phase provides an explanation of the plateau phenomenon in IEF6
. A second paper reported the impact ofvarious electrode assemblies on the focusing process and the decay of the focusingpattern caused by cathodic, anodic or symmetrical drifts 7
. Those studies utilizedlow-molecular-weight components with the experimental investigations conducted infree solution in capillaries. In this third contribution on focusing dynamics, computersimulation and experimental data are employed to describe transient protein distributions during focusing in three-component buffer mixtures. Experiments were carriedout in free solution using both continuous flow and capillary instruments.
MATERIALS AND METHODS
InstrumentationThe CapScan capillary-type apparatus with a linear potential gradient array
detector along the focusing column has been described in detail elsewhere'':". Thisinstrument allows the electric field profile along the focusing axis to be recordedwithin 20 min, fully controlled by a desk top computer. Two different troughs ofrectangular cross-section and 10 cm length were used, which have channel widths of 1or 15 mm and a height of about 0.4 mm (ref. 8). Dialysis membranes with a molecularmass cut-off of 12000-14000 (Spectrapore No. 132709; Spectrum Medical Industries, Los Angeles, CA, U.S.A.), were used to isolate the focusing capillary from theelectrode compartments. Small amounts of NaOH and phosphoric acid, 0.1 M each,were the respective cathodic and anodic electrolytes. A Kepco power supply APH2000 M provided either constant voltage or current. Experiments were performed atroom temperature.
Some of the continuous flow experiments were done with the Elphor YaP 22(Bender and Hobein, Munich, F.R.G.). The instrument has a vertical, rectangularseparation chamber (50 em x 10 em x 0.05 ern). Five buffer and four sample inletsare provided at the top of the chamber. A computer controlled reflectance scannerrecords absorbance at 280 nm along the separation axis just prior to the exit. Ninetyfractions are collected. Experiments were performed at 4°C. Other experiments utilized a laboratory-made continuous flow device with chamber dimensions of 27 ern x22 em x 0.05 cm. Eight inlet ports and ninety outlet ports are provided. Experimentswith this device were also performed at 4°C.
Computer simulationsThe dynamic computer model of Mosher et al" was used to simulate the behav
ior of proteins and buffer constituents. The one-dimensional approach assumes theabsence of convective flows and thermal gradients. The specified initial conditions
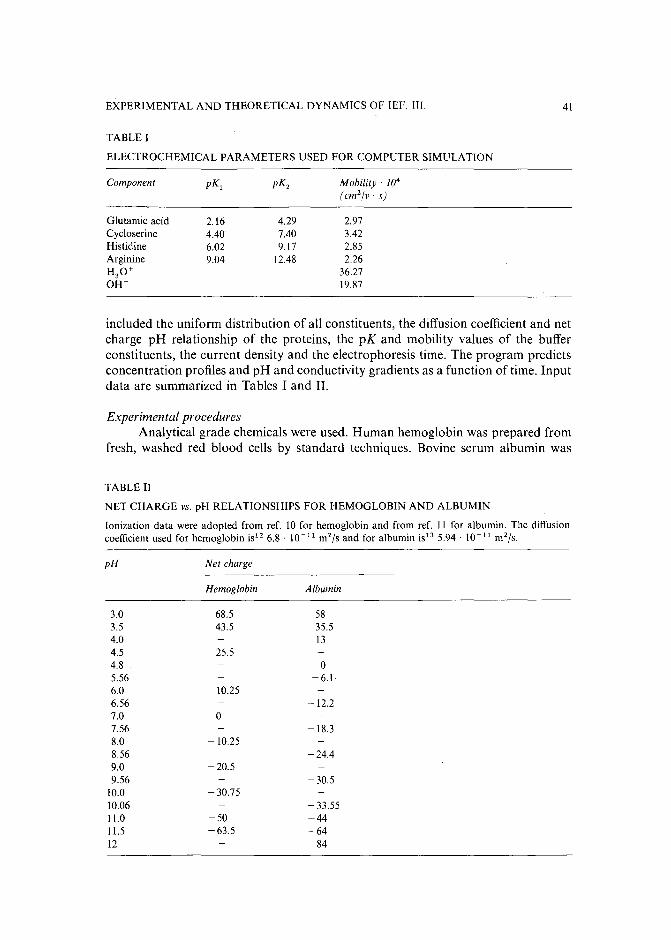
EXPERIMENTAL AND THEORETICAL DYNAMICS OF IEF. III.
TABLE I
ELECTROCHEMICAL PARAMETERS USED FOR COMPUTER SIMULATION
Component pK, pK2 Mobility- 104
(cm'[v . s )
Glutamic acid 2.16 4.29 2.97Cycloserine 4.40 7.40 3.42Histidine 6.02 9.17 2.85Arginine 9.04 12.48 2.26H
3O+ 36.27OW \9.87
4\
included the uniform distribution of all constituents, the diffusion coefficient and netcharge-pH relationship of the proteins, the pK and mobility values of the bufferconstituents, the current density and the electrophoresis time. The program predictsconcentration profiles and pH and conductivity gradients as a function of time. Inputdata are summarized in Tables I and II.
1SxperintentalproceduresAnalytical grade chemicals were used. Human hemoglobin was prepared from
fresh, washed red blood cells by standard techniques. Bovine serum albumin was
TABLE II
NET CHARGE vs, pH RELATIONSHIPS FOR HEMOGLOBIN AND ALBUMIN
Ionization data were adopted from ref. 10 for hemoglobin and from ref. II for albumin. The diffusioncoefficient used for hemoglobin is' 2 6.8,10- 11 m2/s and for albumin is' 3 5.94' \0- 1 1 m2/s.
pH
3.03.54.04.54.85.566.06.567.07.568.08.569.09.56
10.010.0611.011.512
Net charge
Hemoglobin Albumin
68.5 5843.5 35.5
1325.5
0-6.\
10.25-\2.2
0-18.3
-10.25-24.4
-20.5-30.5
- 30.75- 33.55
-50 -44-63.5 -64
-84
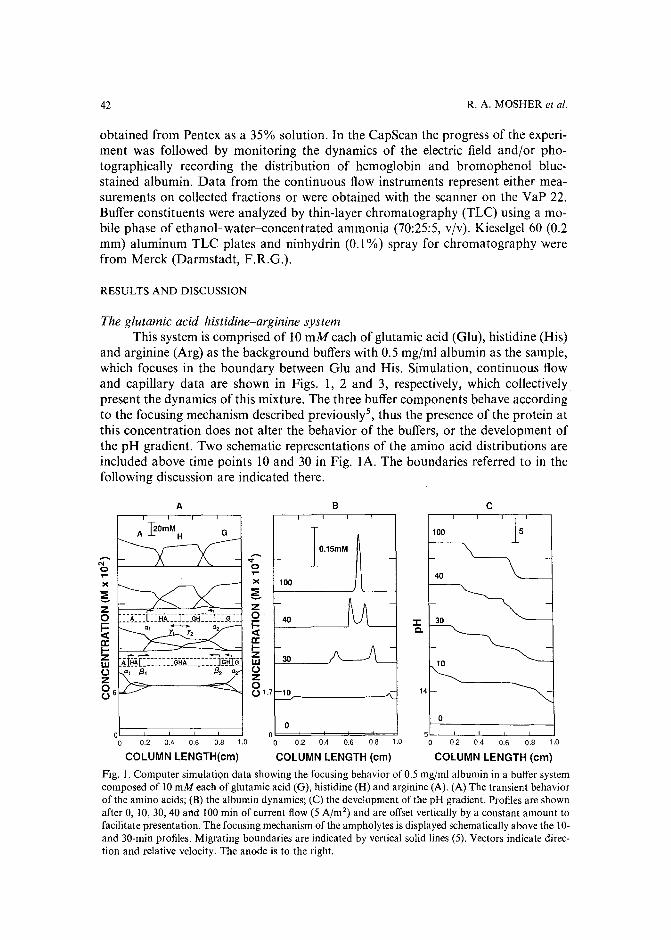
42 R. A. MOSHER et al.
obtained from Pentex as a 35% solution. In the CapScan the progress of the experiment was followed by monitoring the dynamics of the electric field and/or photographically recording the distribution of hemoglobin and bromophenol bluestained albumin. Data from the continuous flow instruments represent either measurements on collected fractions or were obtained with the scanner on the YaP 22.Buffer constituents were analyzed by thin-layer chromatography (TLC) using a mobile phase of ethanol-water-concentrated ammonia (70:25:5, v/v). Kieselgel 60 (0.2mm) aluminum TLC plates and ninhydrin (0.1%) spray for chromatography werefrom Merck (Darmstadt, F.R.G.).
RESULTS AND DISCUSSION
The glutamic acid-histidine-arginine systemThis system is comprised of 10 mM each of glutamic acid (Glu), histidine (His)
and arginine (Arg) as the background buffers with 0.5 mg/ml albumin as the sample,which focuses in the boundary between Glu and His. Simulation, continuous flowand capillary data are shown in Figs. 1, 2 and 3, respectively, which collectivelypresent the dynamics of this mixture. The three buffer components behave accordingto the focusing mechanism described previously', thus the presence of the protein atthis concentration does not alter the behavior of the buffers, or the development ofthe pH gradient. Two schematic representations of the amino acid distributions areincluded above time points 10 and 30 in Fig. IA. The boundaries referred to in thefollowing discussion are indicated there.
A 8 c
0'-------"-----'---_-'---"-_--'o 0.2 0.4 0.6 0.8 1.0
COLUMN LENGTH(em)
°
40
100
J: 30C.
10
14
°5
0 0.2 0.4 0.6 0.8 1.0
COLUMN LENGTH (em)
Io.1smM
40
30
ob:===±==±===,===,==do 0.2 0.4 0.6 0.8 1.0
COLUMN LENGTH (em)
zo~a:IZWoZo() 1.7 10/"- ---''-1
GA EomMH
Fig. 1. Computer simulation data showing the focusing behavior of 0.5 mg/ml albumin in a buffer systemcomposed of 10 mM each of glutamic acid (G), histidine (H) and arginine (A). (A) The transient behaviorof the amino acids; (B) the albumin dynamics; (C) the development of the pH gradient. Profiles are shownafter 0, 10,30,40 and 100 min of current flow (5 A/m 2
) and are offset vertically by a constant amount tofacilitate presentation. The focusing mechanism of the ampholytes is displayed schematically above the 10and 30-min profiles. Migrating boundaries are indicated by vertical solid lines (5). Vectors indicate direction and relative velocity. The anode is to the right.
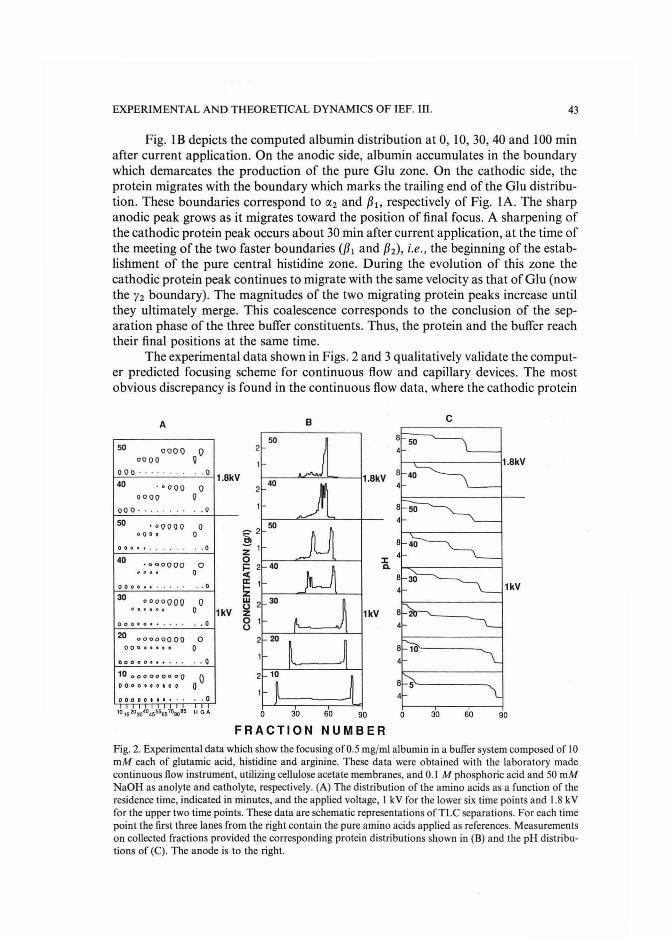
EXPERIMENTAL AND THEORETICAL DYNAMICS OF IEF. III. 43
Fig. IB depicts the computed albumin distribution at 0, 10, 30,40 and 100 minafter current application. On the anodic side, albumin accumul ates in the boundarywhich demarcates the production of the pure Glu zone. On the cathodic side, theprotein migrate s with the boundary which marks the trailing end of the Glu distribution . These boundaries correspond to (X2 and /31, respectively of Fig. IA. The sharpanodic peak grows as it migrates toward the position of final focus. A sharpening ofthe cathodic protein peak occurs about 30 min after current application, at the time ofthe meeting of the two faster boundaries (/31 and /32), i.e., the beginning of the establishment of the pure central histidine zone. During the evolution of this zone thecathodic protein peak continues to migrate with the same velocity as that ofGlu (nowthe Y2 boundary). The magnitudes of the two migratin g protein peaks increase untilthey ultimately merge. This coalescence corresponds to the conclusion of the separation phase of the three buffer constituents. Thu s, the protein and the buffer reachtheir final positions at the same time.
The experimental data shown in Figs. 2 and 3 qualitati vely validate the computer predicted focusing scheme for continuous flow and capilla ry devices. The mostobvious discrepancy is found in the continuous flow data , where the cathodic protein
8 40
J:4
a.
1kV
4
8 104
8 54
0 30 60 90906030o
B C
50 82 4
1.8kV8 404
:=- 2C,ZlS 2r-::c------""-=----"-----let
~ 1J----:-c:-----'_--'_-1
~ 2Z0 1o k---.l::::::==~--l
50 OOOQVO0000
00 0 · ... . . 01.8kV
40 '·000 Q0000 Q
000 · ' " . . , , 0
50 000000 0000 , 0
o 0 0 •• , . , , 0
40~ O Q O O O O 0
, • II I 0
0000 •• ' , , . , . 0
30 0000000 0o 0 • 0 • • 0 1kV
000' 0 • •••• • . . 0
20 00000000 000 0 ••• •• 0
000 0 0 •• • . . . . 0
10 0 0000 0 0 0 0
0°OO OO loo,tO
000001 tt. . 0
A
FRACTION NUMBER
Fig. 2. Experimental data which show the focusing of 0.5 mg/ml albumin in a buffer system composed of 10mM each of glutam ic acid, histidine and arginine. These da ta were obtain ed with the laboratory madecontinuous flow instrument, utilizing cellulose acetate membranes, and 0,1 M phosphoric acid and 50 mMNa OH as ano lyte and catholyte, respectively. (A) The dist ribution of the amino acids as a functio n of theresidence time, indicated in minutes, and the applied voltage, I kV for the lower six time points and 1.8 kVfor the upper two time points . These data are schematic representations ofTLC separations. Fo r each timepoint the first three lanes from the right contain the pure amino acids applied as references. Measurementson collected fractions provided the corresponding protein distributions shown in (8) and the pH dist ributions of (C). The anode is to the right.
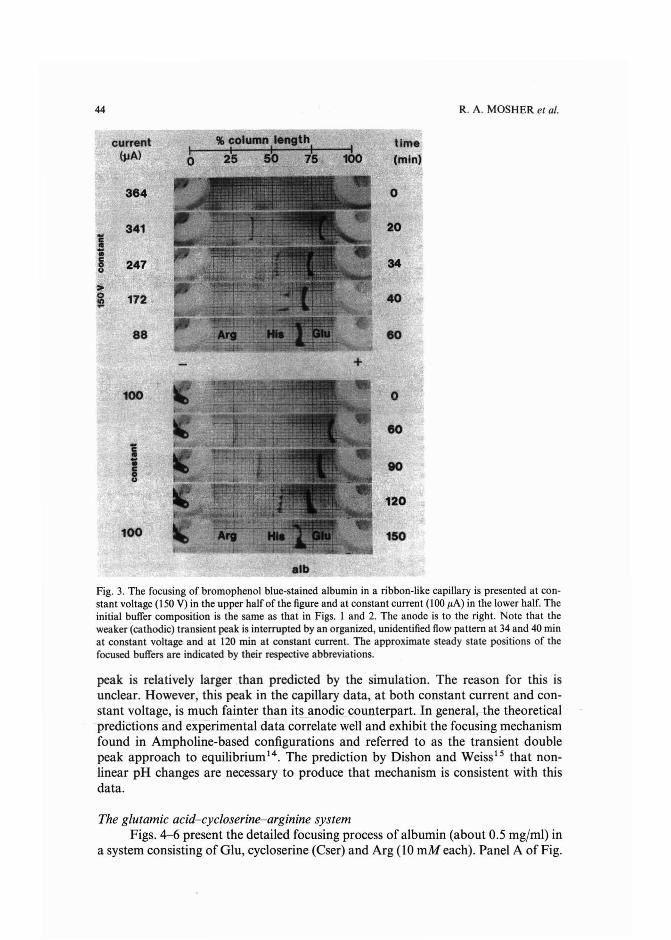
R. A. MOSHER et al.
time(min)
0
20
34
40
eo
+
0
eo
80
120
150
alb
100
100
44
current(PA)
364
341i"Iie 2470Col ,
>0 ' 172III...
88
Fig. 3. The focusing of bromophenol blue-stained albumin in a ribbon-like capillary is presented at constant voltage (150 V) in the upper half of the figure and at constant current (100 JlA) in the lower half. Theinitial buffer composition is the same as that in Figs. I and 2. The anode is to the right. Note that theweaker (cathodic) transient peak is interrupted by an organized, unidentified flow pattern at 34 and 40 minat constant voltage and at 120 min at constant current. The approximate steady state positions of thefocused buffers are indicated by their respective abbreviations.
peak is relatively larger .than predicted by the simulation. The reason for this isunclear. However , this peak in the capillary data, at both constant current and constant voltage , is much fainter than its anodic counterpart. In general, the theoreticalpredictions and experimental data correlate well and exhibit the focusing mechanismfound in Ampholine-based configurations and referred to as the transient doublepeak approach to equilibriurrr'". The prediction by Dishon and Weiss1 5 that nonlinear pH changes are necessary to produce that mechanism is consistent with thisdata.
The glutamic acid-cycloserine-arginine systemFigs. 4-6 present the detailed focusing process of albumin (about 0.5 mgjml) in
a system consisting of Glu, cycloserine (Cser) and Arg (10 mM each). Panel A of Fig.
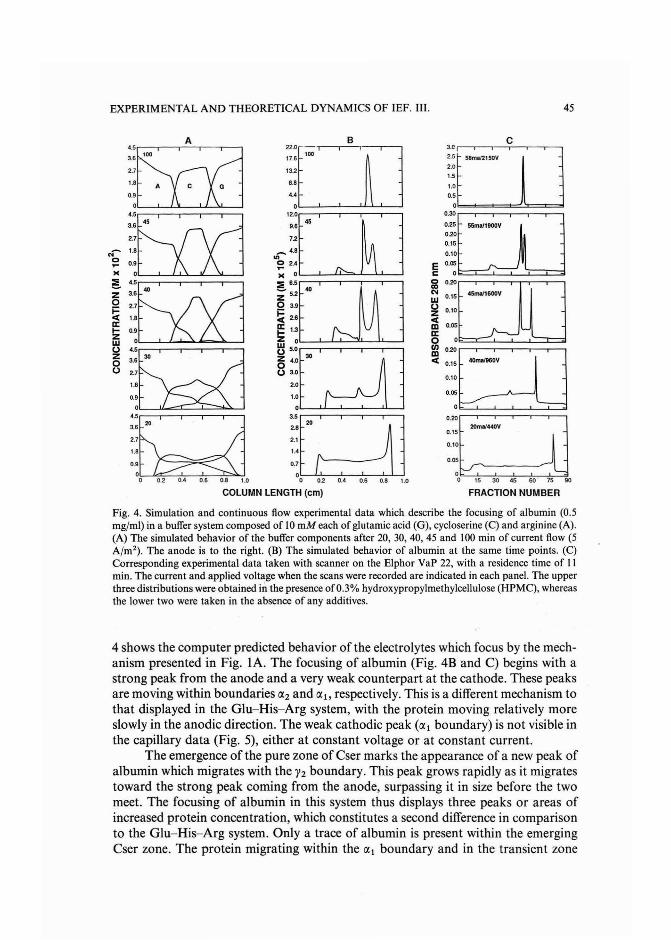
EXPERIMENTAL AND TH EORETIC AL DYNAMICS OF IEF . III. 45
0.15
0.10
2Omaf440V
O.OS
°0.'=---:,5;--:!;30,----47.:5-~*~
~.~LJJmaJ2'50V C2.01.51.00.5
o0.30 r-t-t-r-t-t-r-t-t-r-t-t-r-t-t-r-t-t-t
0.25 55ma11900V
0.20
0.15
0.10
E 0.05
C 0l;;:::==....::::::;L:....~:=;:=I
~ :::WJ5mat1600V~ 0.10<III O.OSa:o 0
~ :::kIJrnaI960V0.10
0.05
o0.20r--.,...----.- -.---.----,r--,
3.5G:dj2.a2.11.4
0.7
oo 0.2 0.4 0.6 0.8 1.0
B
22'ODJ' ,10017.6
13.2
s.s4.4o12'OOJ...
72_ 4.8
'"~ 2.4
>< 0
:E.'5C]]~ 40
Z 52
o 3.'
~ 2.sa: 1.3
~5'~[dJZ 30o 4.0U 3.0
2.0
1.0o
4.55XJ3.6 40
2.7
1.•
D.so
4.5~3.6 30
2.7
1..
D.so
4.5~3.6 20
2.7
,..D.s
oo 0.2 0.4 0.6 0.8 1.0
A
~ :5JG002.7
1.8 A C G
D.so
:~Eill52.7
1.s
D.s>< 0
~Zo~
~WUZoU
.ro...
COLUMN LENGTH (cm) FRACTION NUMBER
Fig. 4. Simulation and continuous flow experimenta l data which describe the focusing of albumin (0.5mgJml) in a buffer system composed of 10 mM each of glutamic acid (G), cycloserine (C) and arginine (A).(A) The simulated behavior of the buffer compon ents after 20, 30, 40, 45 and 100 min of current flow (5AJm2
) . The anode is to the right. (B) The simulated behavior of albumin at the same time point s. (C)Corresponding experimental data taken with scanner on the Elphor YaP 22, with a residence time of IImin. The current and applied voltage when the scans were recorded are indicated in each panel. The upperthree distributions were obta ined in the presence of 0.3% hydroxypropylmethylcellulose (HPMC), whereasthe lower two were taken in the absence of any additives.
4 shows the computer predicted behavior of the electrolytes which focus by the mechanism presented in Fig. lA, The focusing of albumin (Fig. 48 and C) begins with astrong peak from the anode and a very weak counterpart at the cathode. These peaksare moving within boundaries a2 and a ll respectively. This is a different mechanism tothat displayed in the Glu-His-Arg system, with the protein moving relatively moreslowly in the anodic direction. The weak cathodic peak (al boundary) is not visible inthe capillary data (Fig. 5), either at constant voltage or at constant current.
The emergence of the pure zone of Cser mark s the appearance of a new peak ofalbumin which migrates with the Y2 boundary. This peak grows rapidly as it migra testoward the strong peak coming from the anode, surpassing it in size before the twomeet. The focusing of albumin in this system thus displays three peaks or areas ofincreased protein concentration, which constitutes a second difference in comparisonto the Glu-His-Arg system. Only a trace of albumin is present within the emergingCser zone. The protein migrating within the a l boundary and in the transient zone
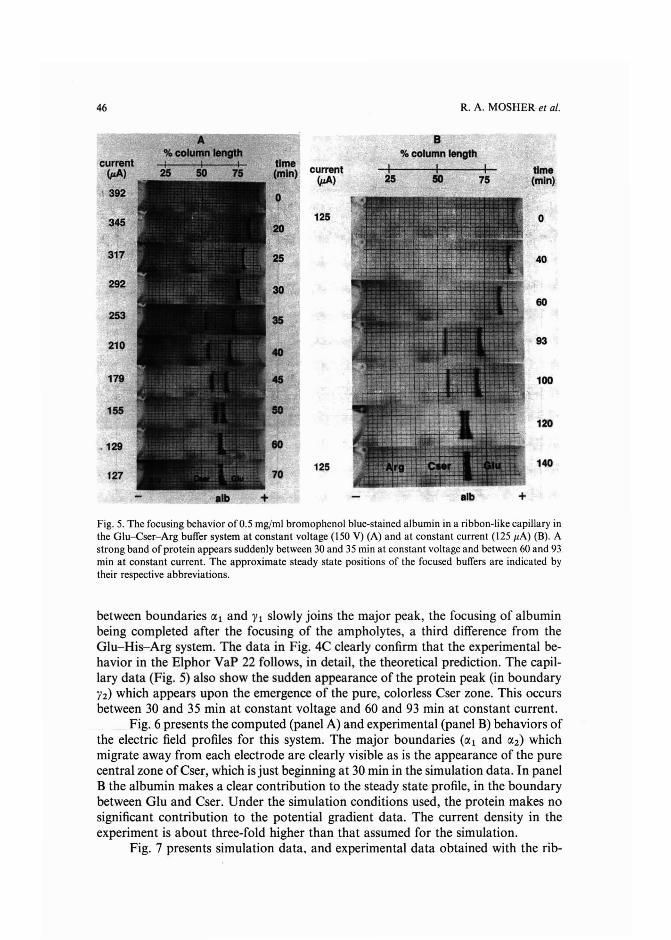
46
A% column lengthI I I
25 _~ 75 current(pA)
125
125
R. A. MOSHER et al.
alb +
Fig. 5. The focusing behavior of 0.5 mg/ml bromophenol blue-stained albumin in a ribbon-like capillary inthe Glu-Cser-Arg buffer system at constant voltage (150 V) (A) and at constant current (125 IlA) (B). Astrong band of protein appears suddenly between 30 and 35 min at constant voltage and between 60 and 93min at constant current. The approximate steady state positions of the focused buffers are indicated bytheir respective abbreviations.
between boundaries (XI and YI slowly joins the major peak, the focusing of albuminbeing completed after the focusing of the ampholytes, a third difference from theGlu-His-Arg system. The data in Fig. 4C clearly confirm that the experimental behavior in the Elphor YaP 22 follows, in detail, the theoretical prediction. The capillary data (Fig. 5) also show the sudden appearance of the protein peak (in boundaryY2) which appears upon the emergence of the pure, colorless Cser zone. This occursbetween 30 and 35 min at constant voltage and 60 and 93 min at constant current.
Fig. 6 presents the computed (panel A) and experimental (panel B) behaviors ofthe electric field profiles for this system. The major boundaries «(XI and (X2) whichmigrate away from each electrode are clearly visible as is the appearance of the purecentral zone ofCser, which is just beginning at 30 min in the simulation data. In panelB the albumin makes a clear contribution to the steady state profile, in the boundarybetween Glu and Cser. Under the simulation conditions used, the protein makes nosignificant contribution to the potential gradient data. The current density in theexperiment is about three-fold higher than that assumed for the simulation.
Fig. 7 presents simulation data, and experimental data obtained with the rib-
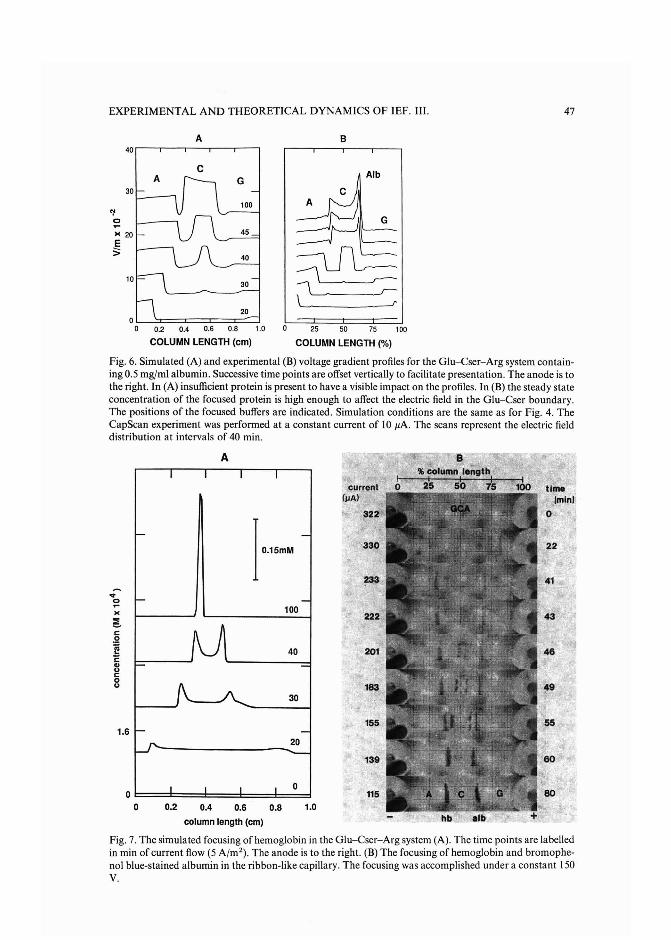
Fig. 6. Simulated (A) and experimental (B) voltage gradient profiles for the Glu-Cser-Arg system containing 0.5 mgjml albumin. Successive time points are offset vertically to facilita te presentatio n. The anode is tothe right. In (A) insufficient protein is present to have a visible impact on the profiles. In (B) the steady stateconcentration of the focused protein is high enough to affect the electric field in the Glu-Cser bounda ry.The positions of the focused buffers are indicated. Simulation conditions are the same as for Fig. 4. TheCapSca n experiment was performed at a constant curre nt of 10 /lA. The scans represent the electric fielddistribution at interva ls of 40 min.
albhb1.00.80.2
o I:::::===ii:::::===:l:==='==d:=do 0.4 0.6
column length (em)
Fig. 7. The simulated focusing of hemoglobin in the Gl u-Cser-Arg system (A). The time points are labelledin min of curre nt flow (5 A jm 2 ) . The anode is to the right. (B)The focusing of hemoglobin and bromophenol blue-stained albumin in the ribbon-like capillary. The focusing was accomp lished under a constan t 150V.
I,·"mM...
0~
100)(
~c0
~ 40ECIluc0u
30
1.620
0
A
48 R. A. MOSHER et al.
bon-like capillary device, which show the focusing behavior of hemoglobin and albumin in the Glu-Cser-Arg system. Hemoglobin behaves much differently than albumin, showing a 'simpler , double-peak approach to equilibrium, as is the case foralbumin in the Glu-His-Arg system. The peak which migrates away from the cathodeis sharper than its counterpart from the anode, and moves within the (Xl boundary.The broad peak which leaves the anode migrates within the faster f32 boundary. Itundergoes a substantial sharpening when the pure zone of cycloserine begins toemerge (the appearance of the y boundaries), after 30 min of current flow. It is clearfrom the simulation data that hemoglobin focuses faster than does albumin in thissystem, reaching its equilibrium position at approximately the same time as do thebackground buffers.
CONCLUSIONS
The model used to represent the electrophoretic behavior of proteins? accurately predicts the IEF behavior of hemoglobin and albumin in two different buffersystems. This model should prove valuable for the continued study of the fundamental behavior of proteins in this electrophoretic mode. It confirms that proteinswill focus as rap idly, or nearl y so, as do the background buffers in free solution.However, this will not be true in gels, because of the sieving effect of even the low %Tgels commonly used for rEF. This means that the focusing mechani sms in gels willlikely be different than those in free solution. The correspondence of the experimentalresults from continuous flow instruments and capillaries indicates the high degree of .fluid stability present in these devices!" and that the mechanisms presented hold forstatic as well as flowing solutions. However, a careful inspection of some of themigrating protein peaks in the capillary results in Figs. 3, 5 and 7 reveals a patterneddisruption, e.g., the fainter albumin line in the l20-min time point in Fig. 3. These areobserved when a system-dependent potential gradient is exceeded, and are presumably due to an organized, non-uniform, electrohydrodynamic flow. This effect hasbeen observed in continuous flow instruments and is a function of the conductivityand dielectric gradients present17 . Electroosmosis can be ruled out as the source ofthe instability because these patterned states can be observed in the presence of a.c.fieldsI 8 •
Focusing mechanisms are dependent upon the protein and the buffer systemand independent of whether the experiment is performed at constant current or constant voltage. Hemoglobin and albumin display completely different focusing mechanisms in the Glu-Cser-Arg system, and albumin focuses differently when cycloserineis replaced with histidine. The multiple transient peaks displayed by albumin in theGlu-Cser-Arg buffer are quite unusual; such multiple peaks are only likely to beobserved in simple buffer systems. More complex buffers will promote the morecommon mechanism characterized by two peaks and called the transient double peakapproach to equilibriuml".
ACKNOWLEDGEMENTS
The authors would like to acknowledge the experimental assistance of Mrs . D.Bard. This work was supported by NASA grant NAGW-693 and the Bundesminister
EXPERIMENTAL AND THEORETICAL DYNAMICS OF IEF. III. 49
fur Forschung und Technologie der Bundesrepublik Deutschland, ForderkenzeichenOI-QV-88208.
REFERENCES
I P. Lundahl and S. Hjerten, Ann. NY Acad. Sci., 209 (1973) 94.2 N. Catsimpoolas, Ann. NY Acad. sa.. 209 (1973) 65.3 P. G. Righetti, Isoelectric Focusing: Theory, Methodology and Applications, Elsevier Biomedical, Am-
sterdam, 1983.4 G. H. Weiss, N. Catsimpoolas and D. Rodbard, Arch. Biochem. Biophys., 163 (1974) 106.5 W. Thormann, R. A. Mosher and M. Bier, J. Chromatogr., 351 (1986) 17.6 R. A. Mosher, W. Thorrnann and M. Bier, J. Chromatogr., 351 (1986) 31.7 R. A. Mosher, W. Thorrnann and M. Bier, J. Chromatogr., 436 (1988) 191.8 W. Thormann, A. Tsai, J. P. Michaud and M. Bier, J. Chromatogr., 389 (1987) 75.9 R. A. Mosher, D. Dewey, W. Thormann, D. A. Saville and M. Bier, Anal. Chem., 61 (1989) 362.
10 E. J. Cohn, A. A. Green and M. H. Blanchard, J. Am. Chern. Soc., 59 (1937) 509.II K. Linderstrom-Lang and S. O. Nielsen, in M. Bier (Editor), Electrophoresis, Vol. I, Academic Press,
New York, 1959, p. 85.12 J. T. Edsall, in H. Neurath and K. Bailey (Editors), The Proteins, Vol. I, Academic Press, New York,
1953, Pt. B, p. 637.13 H. R. Mahler and E. H. Cordes, Biological Chemistry, Harper and Row, New York, 2nd ed., 1971, p.
87.14 J. N. Behnke, S. M. Dagher, T. H. Massey and W. C. Deal, Anal. Biochem., 69 (1975) I.15 M. Dishon and G. H. Weiss, Anal. Biochem., 81 (1977) I.16 R. Kuhn, H. Wagner, R. A. Mosher and W. Thormann, Electrophoresis, 8 (1987) 503.17 P. H. Rhodes, R. S. Snyder and G. O. Roberts, J. Coli. Interface sa., 129 (1989) 78.18 W. Thormann and R. A. Mosher, in C. Schafer-Nielsen (Editor), Electrophoresis '88, VCH Verlags
gesellschaft, Weinheim, 1988, p. 121.

Journal of Chromatography, 478 (1989) 51-61Elsevier Science Publishers B.V., Amsterdam - Printed in The Netherlands
CHROM. 21 735
INDIRECT DETERMINATION OF O-ETHYL S-(2-DIISOPROPYLAMINOETHYL) METHYLPHOSPHONOTHIOATE IN AIR AT LOW CONCENTRATIONS
WILLIAM K. FOWLER* and JOSIAH E. SMITH, Jr.
Southern Research Institute, P.O. Box 55305, Birmingham, AL 35255-5305 (U.S.A.)
(First received March 21st, 1989; revised manuscript received July 3rd, 1989)
SUMMARY
This paper describes an indirect method for the quantification of the toxicmilitary agent O-ethyl S-(2-diisopropylaminoethyl) methylphosphonothioate (VX) inthe vapor state in air or other similar gases at ng/m" levels. The method begins withthe passage of a gaseous sample through a filter impregnated with silver fluoride toconvert the VX vapor to ethyl methylphosphonofluoridate. The latter compound isthen trapped on a bed of Chromosorb 106, transferred to a smaller bed of the samesorbent, and desorbed thermally into a gas chromatograph equipped with a flamephotometric detector. The method is comparable in sensitivity to the principal alternative method, which is based on cholinesterase inhibition, and it is less subject tointerference from common organic solvents and other cholinesterase inhibitors.
The detection limit was found to be limited by, and therefore dependent on, thenature and extent of any background substances that produced a significant chromatographic signal or response at the retention time of the analyte. In the absence ofsuch substances, the instrument provided a response to 0.19 ng ofVX that was thirtytimes larger than the peak-to-peak noise amplitude on the chromatographic base line.Moreover, the method bias (i.e., 100% minus the percent VX recovery) was found todepend on VX concentration, with estimates of agent recovery ranging from 83% at aVX concentration of 0.67 ng/rn" to 104% at a concentration of 0.084 ngjm '. Therelative standard deviation varied with VX concentration and with the nature of thetest that was performed to estimate it. It ranged from 2.1% in one VX vapor-challenge test to 17% in an experiment involving spiked sampling tubes, and it wasgenerally lower at the higher VX test concentrations.
INTRODUCTION
The very high toxicity of O-ethyl S-(2-diisopropylaminoethyl) methylphosphonothioate, also known as VX, mandates the requirement for an analytical methodthat can determine it at exceedingly low concentrations in air. Defense-related research over the past two or three decades has produced numerous analytical methods
0021-9673/89/$03.50 © 1989 Elsevier Science Publishers B.V.
52 W. K. FOWLER, J. E. SMITH, Jr.
for determining VX in a variety of matrices1,2 . But methods based on the Schoenemann reaction 1-3, on enzyme inhibition 1,2.4, and on gas chromatography (GC) witha variety of detectors 1,5-8 are by far the most commonly used approaches to tracelevel determinations of VX in complex matrices.
Because of its very high sensitivity, the enzymatic technique (in conjunctionwith sampling into a glass impinger or bubbler filled with a liquid absorbing medium)has been evaluated for determining very low concentrations of VX vapor. But thistechnique responds rather indiscriminately to any substance that can inhibit or destroy the activity of the enzyme (cholinesterase); such inhibitors include, e.g., manycommon organic solvents 1.
For this reason, a sensitive, yet specific method based on GC was sought.However, VX vapor exhibits a troublesome tendency to adsorb strongly (often irreversibly) on any surface", a phenomenon that places extreme demands on the sampling device and on the gas chromatographic system with respect to inertness. Indeed,we have found that this adsorption problem leads to excessive inaccuracy and imprecision even in the enzymatic method, where the VX presumably adheres to the innersurface of the impinger sampler.
In the method reported here, the adsorption problem is effectively circumventedby first converting the VX to ethyl methylphosphonofluoridate, which is much lessstrongly adsorbed on most surfaces. This compound is frequently referred to as theG-analogue ofVX because of its structural similarity to the G-type chemical agents.The V-to-G conversion reaction involves the use of solid silver fluoride as the reagentand is depicted in Fig. 1. Although this reaction has been widely used for facilitatingdeterminations of VX 1
, its original use occurred in classified military studies thatwere conducted over two decades ago, and the authors have not located the names ofthe original investigators. Nevertheless, it appears probable that V-to-G conversionhas not been used previously in conjunction with solid-sorbent sampling, gas chromatographic determinations, or ppta concentrations of VX vapor in air.
od
CH3 -CH2 -o-~ - F
CH3
G
+
Fig. I. Conversion of VX to its G-analogue (G).
a Throughout this article, the American trillion (101 2) is meant.
DETERMINATION OF VX 53
The method described in this publication entails the pumping of an air samplethrough a felt pad impregnated with silver fluoride, the collection of the G-analogueof VX in a solid-sorbent (Chromosorb 106) sampling tube, the transfer (by thermaldesorption) of the collected G-analogue from the sampling tube to a much smallertransfer tube containing the samesorbent, and the thermal desorption of the Ganalogue from the transfer tube into a gas chromatograph equipped with a flamephotometric detector in the phosphorus-specific mode. The only other method withcomparable sensitivity is the impinger/enzymatic method, which is much more susceptible to interferences from common organic solvents and from other organophosphorus nerve agents than the method given here.
EXPERIMENTAL
The sampling tubes and the transfer tubes were constructed and conditionedessentially as described previously-", However, the glass blank for the sampling tubewas 90 mm x 8 mm O.D. x 6 mm I.D., and the transfer-tube blank was 175 mm x 3mm O.D. x 1.7 mm J.D. Moreover, the tubes were packed with unweighed portionsof 60-80-mesh Chromosorb 106 (Alltech, Deerfield, IL, U.S.A.) to form either a2-cm-Iong bed (ca. 180 mg) or a 5-cm-Iong bed (ca. 450 mg) in the sampling tube anda 1.5-cm-Iong bed (ca. 10 mg) in the transfer tube. Sampling rates up to about 41/mincould be attained with the 8-mm-O.D. sampling tube that was packed with 2 em ofsorbent, whereas the 5-cm sorbent bed in this tube permitted sampling rates only upto about 1.5 l/min.
The V-to-G conversion filters were fabricated in three steps: (I) preparation ofasolution of silver fluoride, (2) deposition of solid silver fluoride onto a felt pad, and (3)assembly of the filter unit at the inlet end of the sampling tube.
The silver fluoride solution was prepared by dissolving 37.5 g of AgN03 (AlfaProducts, Danvers, MA, U.S.A.; purity = 99.9 + %) in 40.0 ml of deionized water. Ina separate container, 12.5 g of KF . 2H zO (Alfa Products; purity not specified) wasdissolved in 44.0 nil of deionized water. The silver nitrate solution was then slowlyadded to the potassium fluoride solution as the latter was stirred. The resulting mixture was turbid and was therefore filtered through Whatman No. 42 filter paperbefore proceeding. A 12.5-ml aliquot of absolute ethanol was added to the filtratewith stirring; this treatment produced a brown precipitate, which was left as a suspension in the mixture. The above steps were carried out entirely with the use of polyethylene vessels. Moreover, the mixture, which was sufficient for the production ofabout 240 conversion filters, was invariably used immediately after its preparationand was thus never stored prior to use.
The reagent mixture was absorbed into the felt (Fiber-Taxis, Bellingham, MA,U.S.A., Type PE-9080 non-woven polyester felt) by pouring the mixture into each oftwo shallow polyethylene trays and immersing a 15 x 13 cm rectangle of felt in thesolution of each tray. After a 30-s soak period, the felt pieces were removed from thereagent mixture, squeezed gently on a polyethylene surface to remove excess solution,placed in dry polyethylene trays, and dried in a forced-air oven at 50°C for 6 h. It wasfound that best results were achieved when the above manipulations leading to thedrying step were performed as rapidly as possible, preferably within 5 min. After thedrying step, circular pads of the impregnated felt were punched from the material
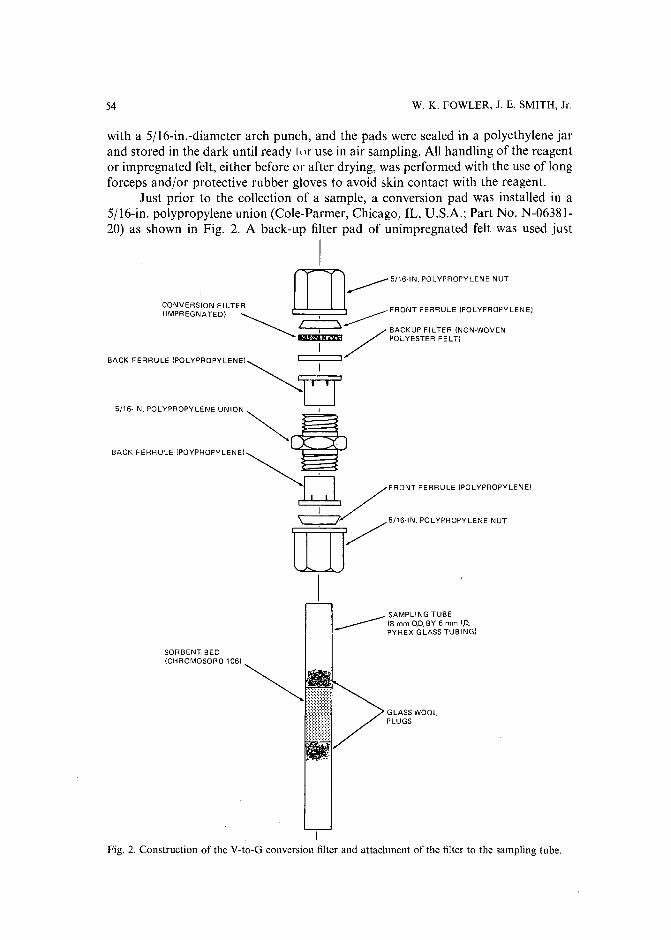
54 W. K. FOWLER, J. E. SMITH, Jr.
with a 5/16-in.-diameter arch punch, and the pads were sealed in a polyethylene jarand stored in the dark until ready II ir use in air sampling. All handling of the reagentor impregnated felt, either before or after drying, was performed with the use of longforceps and/or protective rubber gloves to avoid skin contact with the reagent.
Just prior to the collection of a sample, a conversion pad was installed in a5/16-in. polypropylene union (Cole-Parmer, Chicago, IL, U.S.A.; Part No. N-0638120) as shown in Fig. 2. A back-up filter pad of unimpregnated felt was used just
I
[]»> 5/16·IN. POLYPROPYLENE NUT
CONVERSION FI LTER FRONT FERRULE (POLYPROPYLENE)(IMPREGNATEO) ~ - , ~............... r=;=='/ BACKUP FILTER (NON·WOVEN
emSdfi POLYESTER FELT)
I"""""" ,~,''"'"''''''~65/16-IN. POLYPROPYLENE UNION~ I
"" """",, '""'",""",, 0~ />"'"' """" '"oc""""",,
~y """. ",,,",,m,, ""'
[]I
SAMPLING TUBE_____ (B mm 0.0. BY 6 mm 1.0.
PYREX GLASS TUBING)
GLASS-WOOLPLUGS
IFig. 2. Construction of the V-to-G conversion filter and attachment of the filter to the sampling tube.
DETERMINATION OF VX 55
beneath the impregnated pad to prevent loose particles of the solid silver fluoridereagent from being swept into the sampling tube. The union, with conversion padinstalled, was then fitted onto the inlet end of a sampling tube (Fig. 2). In the apparatus of Fig. 2, the recess between the top of the uppermost polypropylene ferrule andthe upper surface of the conversion pad (ca. 3-4 mm) was intended to be sufficient toprevent significant back-diffusion of spiked VX or G-analogue out of the device butnot deep enough to allow substantial wall contact with incoming VX vapor duringsampling.
The sampling tubes, the transfer tubes, and the V-to-G conversion filters arereusable, but their useful life depends on the conditions under which they are used.For example, chemically harsh gases (such as nitrogen dioxide, chlorine and ozone)and excessively high desorption temperatures will promote the deterioration of theChromosorb 106 sorbent, and strong light will degrade the V-to-G conversion reagent. Although the vendor of the Chromosorb 106 recommends an upper temperature limit of 2500C, we have found that sorbent deterioration is rapid in this application at desorption temperatures above about 220°C.
Prior to the analysis step, the collected vapor samples were passed from thesampling tubes to the smaller transfer tubes by thermal desorption. This step wasperformed by first attaching the transfer tube to the sampling tube (after removal ofthe conversion filter) by means of a 5/16-to-l/8-in. stainless-steel Swagelok reducingunion (Crawford, Solon, OR, U.S.A.) equipped with PTFE ferrules. Next, the freeend of the transfer tube was connected to a vacuum sampling pump, which wasswitched on and adjusted to pump room air at 300 ml/rnin into the sampling tube andout through the transfer tube. With the pump running, the free end of the samplingtube was inserted into a 9-mm-I.D. hole bored through a small aluminum block thatwas maintained at 200°C. The sampling tube was kept inside the heated block for 2min to ensure a quantitative desorption and transfer of G-analogue from the sampling tube to the transfer tube.
The G-analogue that accumulated in the 3-mm-O.D. transfer tube was desorbed thermally inside the hot injection port of a gas chromatograph the injectionport of which had been modified in a manner similar to Method A of the previouspublication1 0
, Also described in this reference is the desorption procedure exceptthat, in the current work, the transfer tube resided in the injection port for 15 s priorto the initiation of carrier gas flow. All desorptions, whether in the transfer step or inthe analysis step, were carried out in the backflush direction. The GC instrumentalconditions are summarized in Table I.
The instrumental response was calibrated by the spiking of sampling tubes withknown amounts ofVX, the thermal desorption of spiked VX (as its G-analogue) intothe gas chromatograph, and the linear regression of response versus VX amount. Thepreviously reported tube-spiking procedure'" was used here except that the solventused in preparing the standard solutions was cyclohexane rather than chloroform, asa matter of convenience. Additionally, the VX solution was deposited directly ontothe V-to-G conversion pad, rather than onto the inner wall of the sampling tube,during the spiking procedure. The VX concentration ranges employed in calibrationswere chosen to bracket the expected sample concentrations. The linear range of theinstrument extended up to about 100 ng of VX per desorption.
Both VX and the G-analogue ofVX in neat liquid form were supplied in several
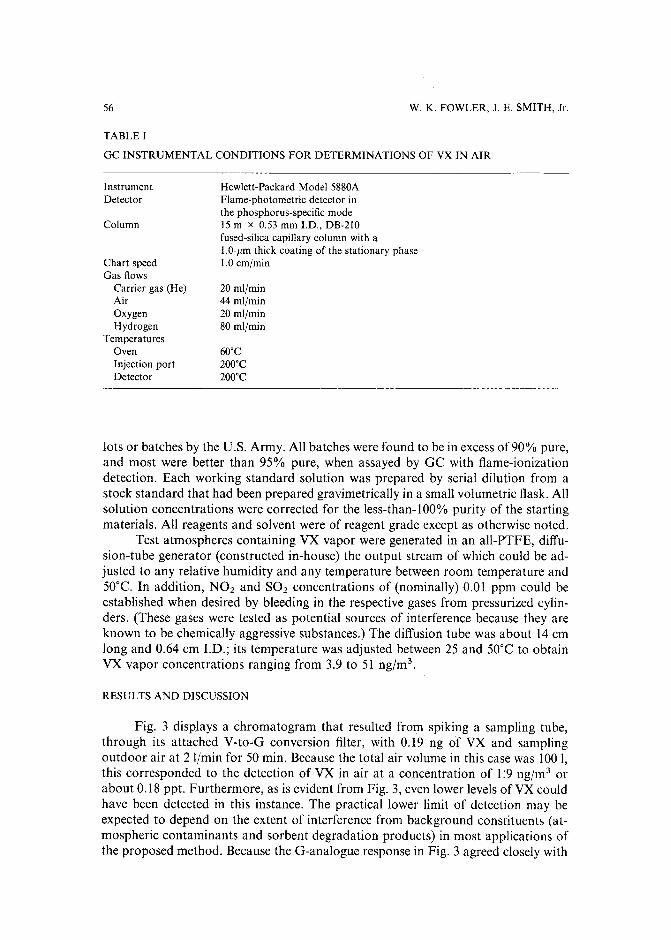
56 W. K. FOWLER, J. E. SMITH, Jr.
TABLE I
GC INSTRUMENTAL CONDITIONS FOR DETERMINATIONS OF VX IN AIR
InstrumentDetector
Column
Chart speedGas flows
Carrier gas (He)AirOxygenHydrogen
TemperaturesOvenInjection portDetector
Hewlett-Packard Model 5880AFlame-photometric detector inthe phosphorus-specific mode15 m x 0.53 mm I.D., DB-21Ofused-silica capillary column with aI.O-jlm thick coating of the stationary phase1.0 em/min
20 rnl/rnin44 rnl/rnin20 ml/rnin80 ml/min
600C200·C2000C
lots or batches by the U.S. Army. All batches were found to be in excess of90% pure,and most were better than 95% pure, when assayed by GC with flame-ionizationdetection. Each working standard solution was prepared by serial dilution from astock standard that had been prepared gravimetrically in a small volumetric flask. Allsolution concentrations were corrected for the less-than-I 00% purity of the startingmaterials. All reagents and solvent were of reagent grade except as otherwise noted.
Test atmospheres containing VX vapor were generated in an all-PTFE, diffusion-tube generator (constructed in-house) the output stream of which could be adjusted to any relative humidity and any temperature between room temperature and50°C. In addition, NO z and SOz concentrations of (nominally) 0.01 ppm could beestablished when desired by bleeding in the respective gases from pressurized cylinders. (These gases were tested as potential sources of interference because they areknown to be chemically aggressive substances.) The diffusion tube was about 14 emlong and 0.64 em J.D.; its temperature was adjusted between 25 and 50·C to obtainVX vapor concentrations ranging from 3.9 to 51 ng/m '.
RESULTS AND DISCUSSION
Fig. 3 displays a chromatogram that resulted from spiking a sampling tube,through its attached V-to-G conversion filter, with 0.19 ng of VX and samplingoutdoor air at 2 I/min for 50 min. Because the total air volume in this case was 100 I,this corresponded to the detection of VX in air at a concentration of 1:9 ng/m' orabout 0.18 ppt. Furthermore, as is evident from Fig. 3, even lower levels ofVX couldhave been detected in this instance. The practical lower limit of detection may beexpected to depend on the extent of interference from background constituents (atmospheric contaminants and sorbent degradation products) in most applications ofthe proposed method. Because the G-analogue response in Fig. 3 agreed closely with
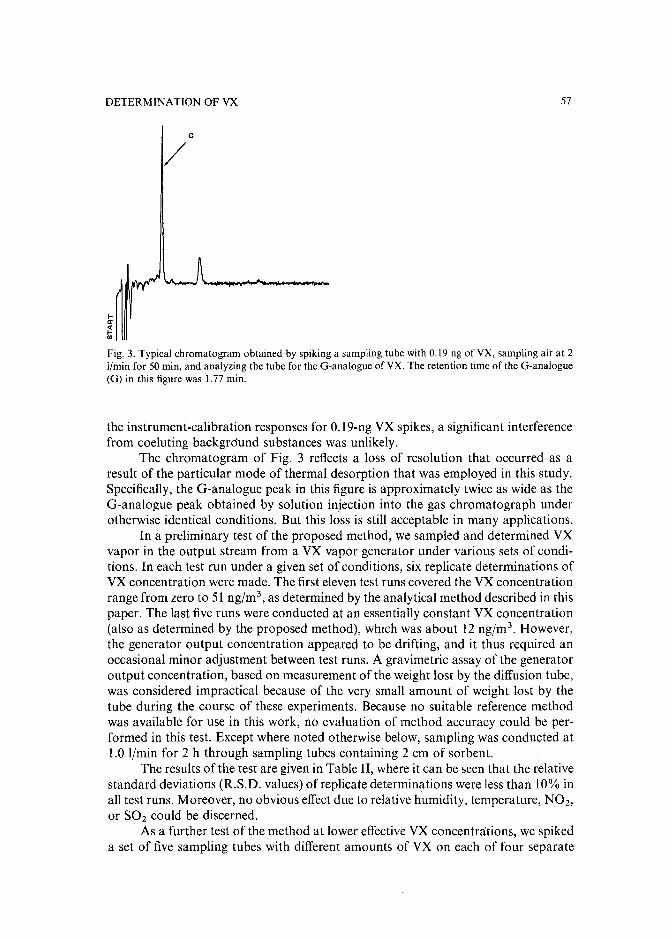
DETERMINAnON OF VX
G
/
lll:
~'"
57
Fig. 3. Typical chromatogram obtained by spiking a sampling tube with 0.19 ng of VX, sampling air at 2l/min for 50 min, and analyzing the tube for the G-analogue of VX. The retention time of the G-analogue(G) in this figure was 1.77 min.
the instrument-calibration responses for 0.19-ng VX spikes, a significant interferencefrom coeluting background substances was unlikely.
The chromatogram of Fig. 3 reflects a loss of resolution that occurred as aresult of the particular mode of thermal desorption that was employed in this study.Specifically, the G-analogue peak in this figure is approximately twice as wide as theG-analogue peak obtained by solution injection into the gas chromatograph underotherwise identical conditions. But this loss is still acceptable in many applications.
In a preliminary test of the proposed method, we sampled and determined VXvapor in the output stream from a VX vapor generator under various sets of conditions. In each test run under a given set of conditions, six replicate determinations ofVX concentration were made. The first eleven test runs covered the VX concentrationrange from zero to 51 ng/m', as determined by the analytical method described in thispaper. The last five runs were conducted at an essentially constant VX concentration(also as determined by the proposed method), which was about 12 ngjm". However,the generator output concentration appeared to be drifting, and it thus required anoccasional minor adjustment between test runs. A gravimetric assay of the generatoroutput concentration, based on measurement of the weight lost by the diffusion tube,was considered impractical because of the very small amount of weight lost by thetube during the course of these experiments. Because no suitable reference methodwas available for use in this work, no evaluation of method accuracy could be performed in this test. Except where noted otherwise below, sampling was conducted at1.0 l/min for 2 h through sampling tubes containing 2 em of sorbent.
The results of the test are given in Table II, where it can be seen that the relativestandard deviations (R.S.D. values) of replicate determinations were less than 10% inall test runs. Moreover, no obvious effect due to relative humidity, temperature, N02,or S02 could be discerned.
As a further test of the method at lower effective VX concentrations, we spikeda set of five sampling tubes with different amounts of VX on each of four separate
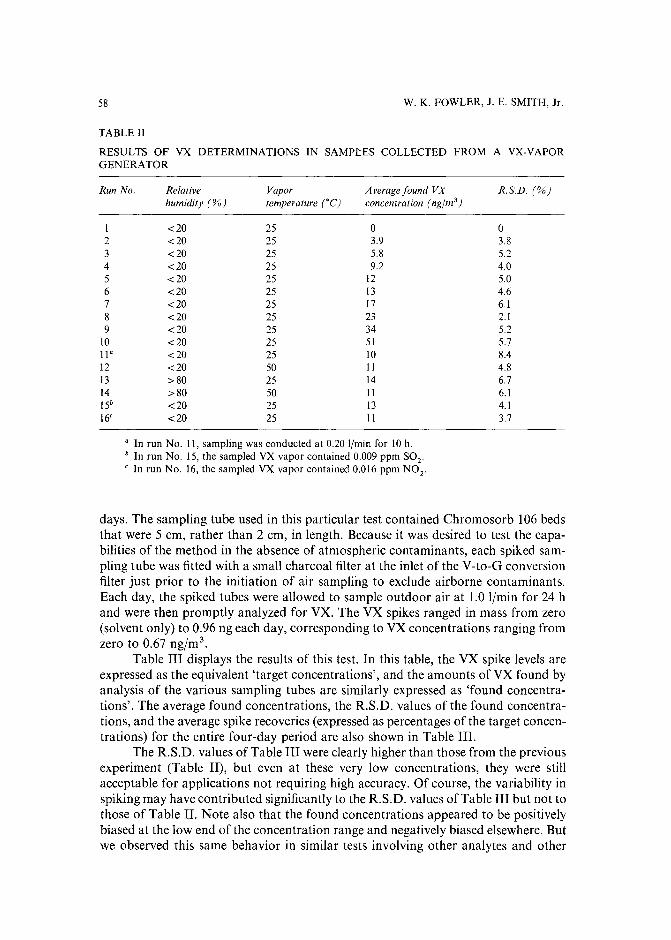
58 W. K. FOWLER, J. E. SMITH, Jr.
TABLE II
RESULTS OF VX DETERMINATIONS IN SAMPtES COLLECTED FROM A VX-VAPORGENERATOR
Run No. Relative Vapor A verage found VX R.S.D. (%)humidity (%) temperature ('C) concentration (nglm'")
I <20 25 0 02 <20 25 3.9 3.83 <20 25 5.8 5.24 <20 25 9.2 4.05 <20 25 12 5.06 <20 25 13 4.67 <20 25 17 6.18 <20 25 23 2.19 <20 25 34 5.2
10 <20 25 51 5.7II a <20 25 10 8.412 <20 50 II 4.813 >80 25 14 6.714 >80 50 II 6.115b <20 25 13 4.116' <20 25 II 3.7
a In run No. II, sampling was conducted at 0.20 I/min for 10 h.b In run No. 15, the sampled VX vapor contained 0.009 ppm SOl'c In run No. 16, the sampled VX vapor contained 0.016 ppm N0 1 .
days. The sampling tube used in this particular test contained Chromosorb 106 bedsthat were 5 em, rather than 2 em, in length. Because it was desired to test the capabilities of the method in the absence of atmospheric contaminants, each spiked sampling tube was fitted with a small charcoal filter at the inlet of the V-to-G conversionfilter just prior to the initiation of air sampling to exclude airborne contaminants.Each day, the spiked tubes were allowed to sample outdoor air at 1.0 l/min for 24 hand were then promptly analyzed for VX. The VX spikes ranged in mass from zero(solvent only) to 0.96 ng each day, corresponding to VX concentrations ranging fromzero to 0.67 ng/m'.
Table III displays the results of this test. In this table, the VX spike levels areexpressed as the equivalent 'target concentrations', and the amounts ofVX found byanalysis of the various sampling tubes are similarly expressed as 'found concentrations'. The average found concentrations, the R.S.D. values of the found concentrations, and the average spike recoveries (expressed as percentages of the target concentrations) for the entire four-day period are also shown in Table III.
The R.S.D. values ofTable III were clearly higher than those from the previousexperiment (Table II), but even at these very low concentrations, they were stillacceptable for applications not requiring high accuracy. Of course, the variability inspiking may have contributed significantly to the R.S.D. values of Table III but not tothose of Table II. Note also that the found concentrations appeared to be positivelybiased at the low end of the concentration range and negatively biased elsewhere. Butwe observed this same behavior in similar tests involving other analytes and other
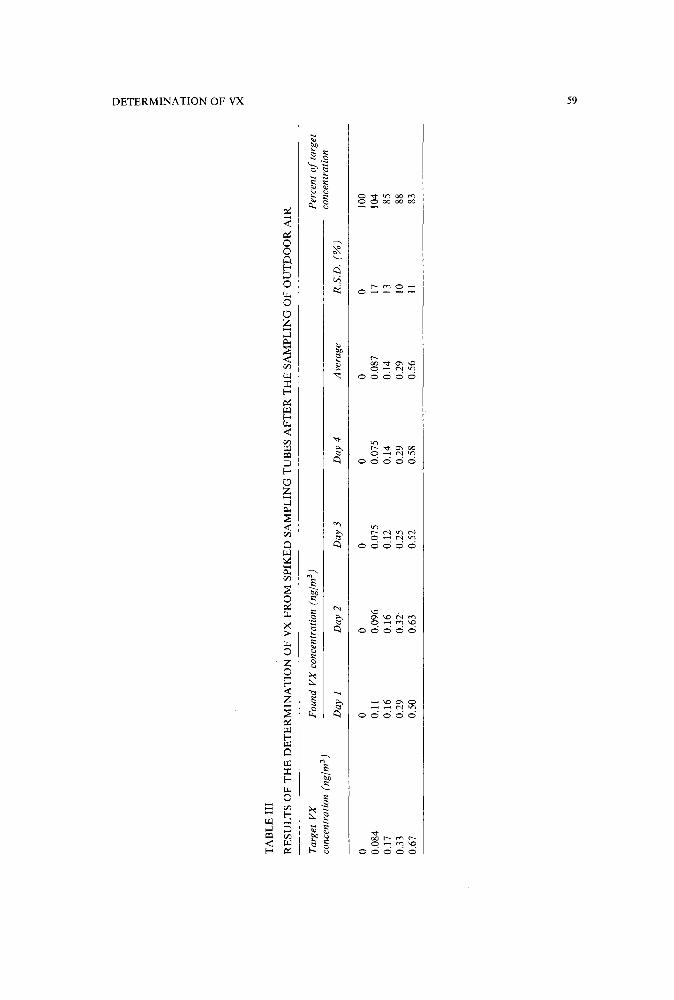
TA
BL
EII
I
RE
SU
LT
SO
FT
HE
DE
TE
RM
INA
TIO
NO
FV
XF
RO
MS
PIK
ED
SA
MP
LIN
GT
UB
ES
AF
TE
RT
HE
SA
MP
LIN
GO
FO
UT
DO
OR
AIR
Tar
get
VX
Fou
ndV
Xco
ncen
trat
ion
(ng/
m3
)P
erce
nto
ftar
get
conc
entr
atio
n(n
g/m
3)
conc
entr
atio
nD
ayJ
Day
2D
ay3
Day
4A
vera
geR
.S.D
.(%
)
00
00
00
010
00.
084
0.11
0.09
60.
075
0.Q
750.
087
1710
40.
170.
160.
160.
120.
140.
1413
850.
330.
290.
320.
250.
290.
2910
880.
670.
500.
630.
520.
580.
5611
83
o ~ t'rI
;:0 a:: Z ~ o z o ", ~ v, '"
60 W. K. FOWLER, J. E. SMITH, Jr.
solid sorbents. Although the source of the bias is currently unknown, its magnitude isacceptably small for many potential applications at these very low concentrationlevels, and its nature suggests that it was an experimental artifact rather than aninherent, unavoidable characteristic of the method.
In any event, it should be understood that the VX-recovery data of Table IIImerely approximate the true total accuracy of the method since these data reflect anunnatural error component (i.e., that due to the error in spiking) and do not reflect acomponent due to the volumetric error in sampling.
The efficiency with which the V-to-G conversion filter converts VX to the Ganalogue was also studied. The theoretical yield from the conversion of 1 ng of VXshould be 0.47 ng of G-analogue. The actual yield from several replicate determinations was about 80% of this value, suggesting a conversion efficiency of 80%. But theresponse of the method to VX has been observed to be virtually constant underwidely varying conditions (e.g., Table II), suggesting that the conversion efficiency islargely unaffected by environmentally significant factors such as temperature andhumidity.
The breakthrough volume of the G-analogue on Chromosorb 106 was notmeasured at room temperature becasue the data ofTable III indicated little or no lossof G-analogue even after sampling 1440 I of air through sampling tubes containing5-cm-long beds (ca. 450 mg) of Chromosorb 106.This implies a breakthrough volumeof not less than 3.2 liters per milligram of Chromosorb 106, which is well above thelimit on sample volume likely to be imposed by sample background concomitantsthat appear as extraneous peaks in the chromatograms. But when the sampling tubewas maintained at 50°C, about 7% of a 1.8-ng VX spike was found, after conversionto the G-analogue, to have broken through a 2-cm-long (ca. 180-mg)bed of Chromosorb 106 (as the G-analogue) following the sampling of 160 1of air. This implies abreakthrough volume, at the 7% breakthrough level, of 0.89 l/mg at 5WC.
In the use of this method, it has been observed that the vapors from either liquidor solid chlorine/hypochlorite bleach will interfere with the method by producing abackground constituent that coelutes with the G-analogue of VX. This constituentwas identified by combined GC-mass spectrometry as p-dichlorobenzene, which isthought to arise from a reaction between Chromosorb 106 (a cross-linked polystyrene) and chlorine gas. In addition, the pesticide malathion appeared to undergo areaction in the V-to-G conversion filter, yielding a phosphorus-containing productthat eluted just before the G-analogue peak with a peak-to-peak retention time difference of 0.35 min between them. At a malathion concentration approaching that ofVX, the peak overlap was significant.
However, the method reported here was found to be insusceptible to interference from milligram amounts of common organic solvents, i.e., chloroform, methanol, ethanol, 2-propanol, n-hexane, cyclohexane, dichloromethane, 1,1,2-trichloro-l,2,2-trifluoroethane, acetone, ethyl acetate, formamide, carbon tetrachloride,benzene and toluene. Moreover, the reported chromatographic conditions were observed to successfully resolve the G-analogue peak from three other organophosphorus nerve agents -GA or tabun (ethyl N,N-dimethylphosphoramidocyanidate), GBor sarin (isopropyl methylphosphonofluoridate) and GD or soman (1,2,2-trimethylpropyl methylphosphonofluoridate). These represent distinct advantages for themethod given here relative to the enzymatic method.
DETERMINATION OF VX 61
Because of the similarity of the G-analogue to the chemical agent GB, it isreasonable to expect that this method may be useful for simultaneous determinationsof both GB and VX. Recent data have suggested that this is true, as GB has beenfound to pass through the V-to-G conversion filter efficiently, and the GB chromatographic peak is baseline-resolved from the G-analogue peak.
CONCLUSION
It was concluded that VX vapor can be determined with high sensitivity byconverting it to a simpler compound (i.e., the G-analogue ofVX) during the samplingstep, by trapping the G-analogue vapor on a Chromosorb 106sampling tube,and bythermally desorbing the G-analogue into a gas chromatograph equipped with aflame-photometric detector. The accuracy and precision of the method were found tobe adequate for many likely applications.
ACKNOWLEDGEMENTS
The work reported here was performed under u.s. Army Contracts DAAKll77-C-0087 and DAAKll-82-C-0162. The authors are grateful to the Army for permission to publish this manuscript.
REFERENCES
1 E. V. Crabtree and E. W. Sarver, Review 0/Analytical Procedures/or GB, VX, and Their DegradationProducts, EC-SP-76021 , Department of the Army, Aberdeen Proving Ground (EA), MD, January1977.
2 S. J. Smith, Talanta, 30 (1983) 725.3 U. Fritsche, Anal. Chim. Acta., 118 (1980) 179.4 H. O. Michel, E. C. Gordon and J. Epstein, Environ, Sci. Technol., 7 (1973) 1045.5 S. Sass and G. A. Parker, J. Chromatogr., 189 (1980) 331.6 S. Sass and T. L. Fisher, Org, Mass Spectrom., 14 (1979) 257.7 P, A. D'Agostino and L. R. Provost, Biomed. Environ. Mass Spectrom., 13 (1986) 231.8 P. A, D'Agostino, L. R. Provost and J. Visentini, J. Chromatogr. 402 (1987) 221.9 1. Lindgren and B. Jansson, J. Chromatogr., 106 (1975) 385.
10 W. K. Fowler, C. H. Duffey and H. C. Miller, Anal. Chern., 51 (1979) 2333,

Journal of Chromatography, 478 (1989) 63-70Elsevier Science Publishers B.Y., Amsterdam - Printed in The Netherlands
CHROM. 21 615
MINIMIZING ADSORPTION OF PROTEINS ON FUSED SILICA IN CAPILLARY ZONE ELECTROPHORESIS BY THE ADDITION OF ALKALI METALSALTS TO THE BUFFERS
JONATHAN S. GREEN" and JAMES W. JORGENSON*
Department of Chemistry, University of North Carolina, Chapel Hill, NC 27599-3290 (U.S.A.)
(First received July 18th, 1988; revised manuscript received May 8th, 1989)
SUMMARY
A method for minimizing the adsorption of proteins on fused-silica capillaries incapillary zone electrophoresis has been devised, involving the use of K + concentrations of 0.3 M and above in the operating buffer. The increased ionic strengthresults in a competition between K + and proteins for cation-exchange sites on the silicasurface. The resulting increase in conductivity requires the use of lower voltages andcapillaries of smaller diameter to allow adequate heat dissipation. With a voltage of5 kV applied to a 50-cm capillary filled with a buffer of pH 9 containing 0.25M potassium sulfate, a separation of five proteins was obtained. Two of these proteinbands adsorbed irreversibly without added salt, but showed no apparent adsorption inthe presence of 0.25 M potassium sulfate.
INTRODUCTION
Silica has been known for many years to possess cation-exchange properties':These properties arise from the acidic nature of the silanol (Si-OH) groups, whichmake up a large proportion of the exposed surfaces of the silica. The groups are weaklyacidic, leaving a negatively charged surface capable of ion exchange.
Proteins consist of numerous amino acids, many of which contain acidic or basicside-chains capable of giving substantial charge to a protein. Proteins can therefore bethought of as large "polyelectrolytes" which can ion exchange either as cations or asanions. Kopaciewicz et al? showed that even at the isoelectric point (pI) of a protein itcan still have regions of localized positive or negative charge. The proteins can orientthemselves such that these regions of charge can make a close approach to an ionexchanger. It is not surprising, therefore, to find that proteins adsorb strongly onsiliceous materials.
As early as 1954,Holt and Bowcott', studying the reactions ofsoluble silicicacidwith proteins and heptadecylamine, suggested the formation of an ionic band betweenthe basic amine functionality on the proteins and the silanoate (Si-O-) on the silicic
a Present address: E.I. DuPont de Nemours and Company, Medical Research Division, BiomedicalProducts Department, Experimental Station, Wilmington, DE 19898, U.S.A.
0021-9673/89/$03.50 © 1989 Elsevier Science Publishers B.Y.
64 J. S. GREEN, J. W. JORGENSON
acid. In 1967, Weldes 4 atributed the interactions between proteins and alkali metalsilicates with hydrogen bonding. Hydrogen bonding alone, however, cannot adequately explain the adsorption, as proteins fail to desorb from the silicates in thepresence of high concentrations of urea5, a reagent that generally disrupts hydrogenbonds. Messing" proposed a combination of the two mechanisms, on the basis thatdesorption of the protein with urea alone does not work, but that a mixture ofurea andeither dilute or concentrated acid results in nearly quantitative desorption. Messing"suggested that the urea breaks hydrogen bonds while the acid protonates thesilanoates. Morrisey and Stromberg" suggested a hydrogen bonding interactionbetween the carbonyls in the proteins and the silica surface, although they failed toexplain how this takes place at higher pH where the silica is highly ionized. Hiatt et al.7
also proposed a hydrogen bonding interaction when they found a rabies virus witha net negative charge adsorbed on silica. Voegel et al.8, and many others, simply referto adsorption in a generic way without offering any proposed mechanism. Regardlessof the exact mechanism(s) involved, much effort has been spent on attempts todeactivate silica to make it non-adsorptive toward proteins.
Initially, the need for surface deactivation in the liquid chromatography (LC) ofbiological macromolecules was circumvented by the use of carbohydrate-basedsupports and stationary phases. The principal advantage of these is their substantialhydrophilicity and the resulting lack of denaturation of the proteins. However,carbohydrate matrices are not well matched with current high-pressure LC systems, asthey have poor mechanical stability and compress or collapse under typical operatingpressures. Silica provides an abundant, easy to manufacture alternative as a support,but suffers from high adsorptivity toward many solutes.
Regnier and Noel9 were among the first to formulate an accetable alternative inthe form ofa "carbohydrate" [3-(glycidoxypropyl)trimethoxysilane; GPTSj bonded toa controlled porosity glass (CPG) support. Chang et al.t" used the GPTS as anintermediate coupling agent to which they bonded various ion-exchange, hydrophobicand hydrophilic groups, making a wide range ofCPG-based packings. Since that time,many researchers have continued to pursue improvements in CPG- and silica-basedpacking materials for protein analyses1 1
, striving for biocompatability (no denaturation) and high recovery.
Our research has centred on the capillary zone electrophoresis (CZE) ofproteinsand peptides in glass and fused-silica capillaries. Short peptides, because of theirlimited number of charged groups, tend to migrate electrophoretically withoutsignificant adsorption. Proteins, however, possess so many ionic sites that adsorptionto the capillary wall becomes significant. Walbroehl 1 2 predicted that capacity factors(k') as small as 0.05 are sufficient to reduce plate numbers for proteins 20-fold, makingit a necessity that steps be taken to eliminate adsorption. The "glycophase" used byRegnier and Noel9 has worked to some extent1 3
, but the efficiencies are still lower thanpredicted by theory, suggesting that some adsorptive sites might remain. Additionalproblems with the glycophase are the time required for column deactivation (severalhours) and the limited lifetime of the deactivated surface (several days). An idealsolution would be one that required no pretreatment at all.
In traditional forms of ion-exchange chromatography, retained compounds canbe eluted by increasing the ionic strength of the mobile phase. Following this line ofreasoning, and assuming that Holt and Bowcotr' were correct in their assertion of
CZE OF PROTEINS ON FUSED-SILICA 65
ionic interaction-based adsorption, it should be possible to prevent adsorption in CZEby operating in buffers with high ionic strength. It is difficult to look at the effects ofionic strength in an electrophoretic system because of the number of possiblecomplications and interferences which can confound data interpretation. DuringCZE, zone broadening and peak asymmetry can be caused by such things as sampleconcentration overloading-" and the thermal effects arising from the joule heating thatoccurs in electrophoretic systems. This paper examines the effects of alkali metalchlorides on protein adsorption in fused-silica capillaries, using a "chromatographic"approach. In this way, the effectiveness of the salts can be examined in a straightforward manner without complications from electrophoretic effects.
EXPERIMENTAL
ColumnsBare fused silica (50 em x 75 /lm J.D.) (Polymicro Technologies, Phoenix, AZ,
U.S.A.) was used for all chromatographic runs, and bare fused silica (50 cm x 25/lmJ.D.) (Scientific Glass Engineering, Austin, TX, U.S.A.) was used for electrophoresis.All columns were pretreated with 1MKOH for 20 min, followed by 45-min rinses witheach of 0.1 M KOH and water, using the method described by Lauer andMcManigill 1 5
. In addition, the column was rinsed for 10 min with 0.1 M KOH,followed by 10 min with water and then 10 min with buffer after each series ofinjections. If protein adsorbed during a run, the column was rinsed for 5 min with 0.1MKOH, followed by 5 min with water and then 5 min with buffer. This procedure willremove any adsorbed protein and provide a fresh surface for each subsequentinjection.
DetectionA variable-wavelength ultraviolet absorption detector constructed in this
laboratory was used. It includes a 30-W deuterium lamp (Hamamatsu, Middlesex, NJ,U.S.A.) as a source and an Instruments SA (Metuchen, NJ, U.S.A.) concaveholographic grating monochromator to select the wavelength of interest. Thewavelength for this work was 193 nm, corresponding to the peak UV absorption ofproteins. Light was detected in the signal and reference paths by two end-onphotomultiplier tubes (R759, Hamamatsu), connected to current amplifiers and to anIBM-PC computer for data acquisition and manipulation. Further details of thedetector design will be published elsewhere.
Electrophoretic and chromatographic apparatusThe basic electrophoretic apparatus has been described in detail elsewherel".
The high-voltage power supply (RHR30PN30jRVCIO, Spellman High-VoltageElectronics, Plainview, NY, U.S.A.) is capable of delivering up to ±30 kV.Electrophoretic injections were carried out by the electromigration technique described previously!". Electrophoresis was done at +5 kV. The chromatographicsystem was set up in a gravity-driven flow mode by placing the inlet buffer reservoir 23em higher than the outlet. Chromatographic injections were made by lowering the inletbuffer reservoir to the level of the outlet reservoir, replacing it with a sample vial, andraising the vial 23 cm for 5 s. The vial was then lowered to the height of the outlet
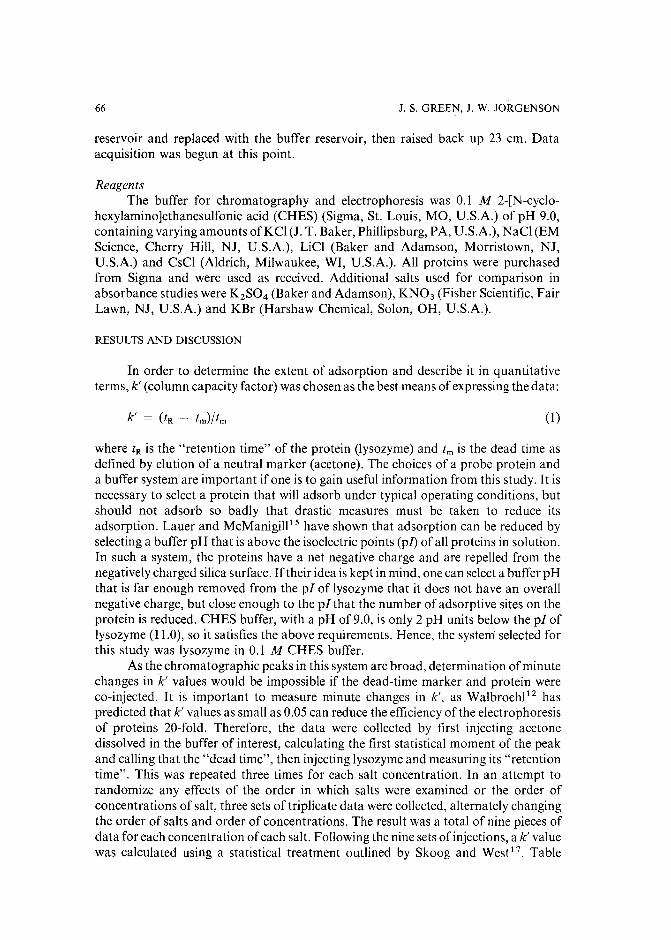
66 J. S. GREEN, J. W. JORGENSON
reservoir and replaced with the buffer reservoir, then raised back up 23 ern. Dataacquisition was begun at this point.
ReagentsThe buffer for chromatography and electrophoresis was 0.1 M 2-[N-cyclo
hexylamino]ethanesulfonic acid (CHES) (Sigma, St. Louis, MO, U.S.A.) of pH 9.0,containing varying amounts ofKCl (J. T. Baker, Phillipsburg, PA, U.S.A.), NaCI (EMScience, Cherry Hill, NJ, U.S.A.), LiCI (Baker and Adamson, Morristown, NJ,U.S.A.) and CsCI (Aldrich, Milwaukee, WI, U.S.A.). All proteins were purchasedfrom Sigma and were used as received. Additional salts used for comparison inabsorbance studies were K 2S04 (Baker and Adamson), KN0 3 (Fisher Scientific, FairLawn, NJ, U.S.A.) and KBr (Harshaw Chemical, Solon, OH, U.S.A.).
RESULTS AND DISCUSSION
In order to determine the extent of adsorption and describe it in quantitativeterms, k' (column capacity factor) was chosen as the best means of expressing the data:
(1)
where tR is the "retention time" of the protein (lysozyme) and t.; is the dead time asdefined by elution of a neutral marker (acetone). The choices of a probe protein anda buffer system are important if one is to gain useful information from this study. It isnecessary to select a protein that will adsorb under typical operating conditions, butshould not adsorb so badly that drastic measures must be taken to reduce itsadsorption. Lauer and McManigill 1 5 have shown that adsorption can be reduced byselecting a buffer pH that is above the isoelectric points (pI) of all proteins in solution.In such a system, the proteins have a net negative charge and are repelled from thenegatively charged silica surface. If their idea is kept in mind, one can select a buffer pHthat is far enough removed from the pI of lysozyme that it does not have an overallnegative charge, but close enough to the pI that the number of adsorptive sites on theprotein is reduced. CHES buffer, with a pH of9.0, is only 2 pH units below the pI oflysozyme (11.0), so it satisfies the above requirements. Hence, the system selected forthis study was lysozyme in 0.1 M CHES buffer.
As the chromatographic peaks in this system are broad, determination ofminutechanges in k' values would be impossible if the dead-time marker and protein wereco-injected. It is important to measure minute changes in k', as Walbroehl V haspredicted that k' values as small as 0.05 can reduce the efficiency of the electrophoresisof proteins 20-fold. Therefore, the data were collected by first injecting acetonedissolved in the buffer of interest, calculating the first statistical moment of the peakand calling that the "dead time", then injecting lysozyme and measuring its "retentiontime". This was repeated three times for each salt concentration. In an attempt torandomize any effects of the order in which salts were examined or the order ofconcentrations of salt, three sets of triplicate data were collected, alternately changingthe order of salts and order of concentrations. The result was a total of nine pieces ofdata for each concentration ofeach salt. Following the nine sets of injections, a k' valuewas calculated using a statistical treatment outlined by Skoog and West 1 ? Table
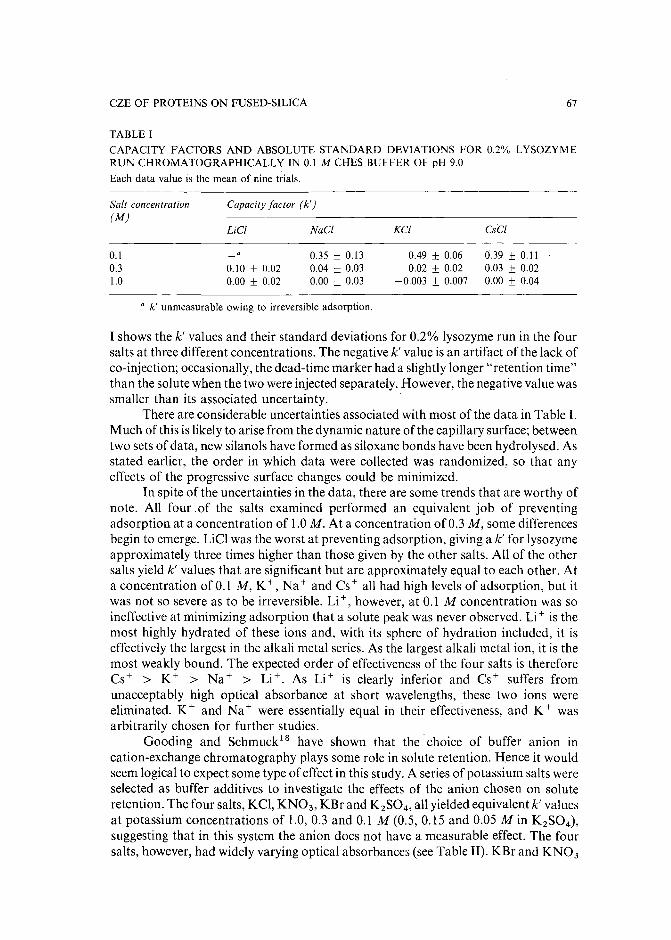
CZE OF PROTEINS ON FUSED-SILICA 67
TABLE I
CAPACITY FACTORS AND ABSOLUTE STANDARD DEVIATIONS FOR 0.2% LYSOZYMERUN CHROMATOGRAPHICALLY IN 0.1 M CHES BUFFER OF pH 9.0
Each data value is the mean of nine trials.
Salt concentration Capacity factor (k')(M)
LiCI NaCI KCI CsCI
0.1 0.35 ± 0.13 0.49 ± 0.06 0.39 ± 0.110.3 0.10 ± 0.02 0.04 ± 0.03 0.02 ± 0.02 0.03 ± 0.021.0 0.00 ± 0.02 0.00 ± 0.03 -0.003 ± 0.007 0.00 ± 0.04
a k' unmeasurable owing to irreversible adsorption.
I shows the k' values and their standard deviations for 0.2% lysozyme run in the foursalts at three different concentrations. The negative k' value is an artifact of the lack ofco-injection; occasionally, the dead-time marker had a slightly longer "retention time"than the solute when the two were injected separately. However, the negative value wassmaller than its associated uncertainty.
There are considerable uncertainties associated with most of the data in Table I.Much of this is likely to arise from the dynamic nature of the capillary surface; betweentwo sets ofdata, new silanols have formed as siloxane bonds have been hydrolysed. Asstated earlier, the order in which data were collected was randomized, so that anyeffects of the progressive surface changes could be minimized.
In spite of the uncertainties in the data, there are some trends that are worthy ofnote. All four of the salts examined performed an equivalent job of preventingadsorption at a concentration of 1.0 M. At a concentration of 0.3 M, some differencesbegin to emerge. LiCI was the worst at preventing adsorption, giving a k' for lysozymeapproximately three times higher than those given by the other salts. All of the othersalts yield k' values that are significant but are approximately equal to each other. Ata concentration of 0.1 M, K + , Na + and Cs + all had high levels of adsorption, but itwas not so severe as to be irreversible. Li +, however, at 0.1 M concentration was soineffective at minimizing adsorption that a solute peak was never observed. Li + is themost highly hydrated of these ions and, with its sphere of hydration included, it iseffectively the largest in the alkali metal series. As the largest alkali metal ion, it is themost weakly bound. The expected order of effectiveness of the four salts is thereforeCs + > K + > Na + > Li +. As Li+ is clearly inferior and Cs + suffers fromunacceptably high optical absorbance at short wavelengths, these two ions wereeliminated. K + and Na + were essentially equal in their effectiveness, and K + wasarbitrarily chosen for further studies.
Gooding and Schmuck '" have shown that the choice of buffer anion incation-exchange chromatography plays some role in solute retention. Hence it wouldseem logical to expect some type ofeffect in this study. A series of potassium salts wereselected as buffer additives to investigate the effects of the anion chosen on soluteretention. The four salts, KCI, KN0 3 , KBr and K ZS04 , all yielded equivalent k' valuesat potassium concentrations of 1.0, 0.3 and 0.1 M (0.5, 0.15 and 0.05 Min K ZS04 ) ,
suggesting that in this system the anion does not have a measurable effect. The foursalts, however, had widely varying optical absorbances (see Table II). KBr and KN03
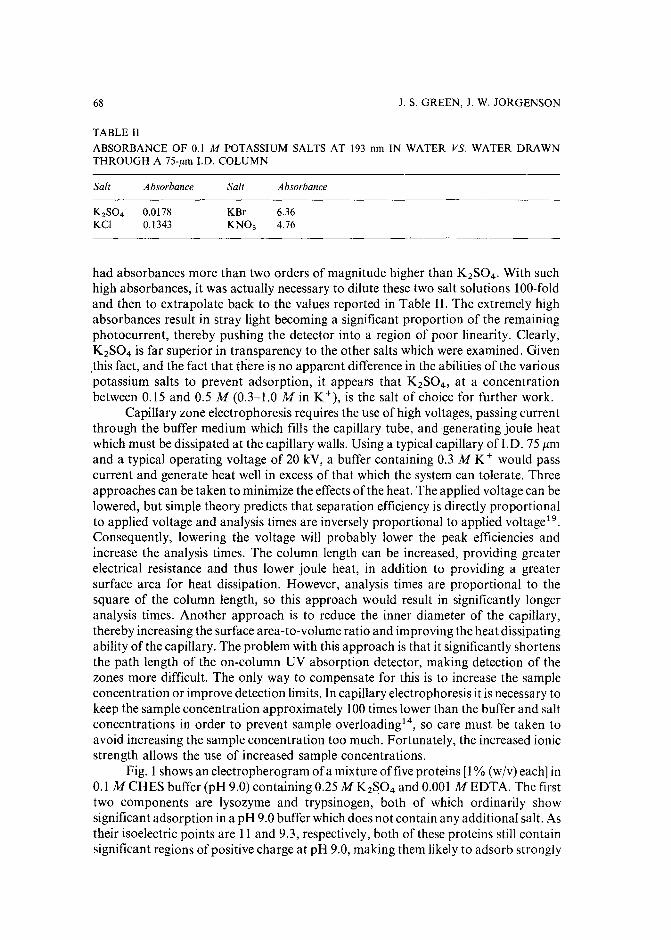
68 J. S. GREEN, 1. W. JORGENSON
TABLE II
ABSORBANCE OF 0.\ M POTASSIUM SALTS AT \93 nm IN WATER VS. WATER DRAWNTHROUGH A 75-J.l.m J.D. COLUMN
Salt Absorbance
K2S04 0.0\ 78KC\ 0.\343
Salt Absorbance
KBr 6.36KN03 4.76
had absorbances more than two orders of magnitude higher than K2S04 . With suchhigh absorbances, it was actually necessary to dilute these two salt solutions 100-foldand then to extrapolate back to the values reported in Table II. The extremely highabsorbances result in stray light becoming a significant proportion of the remainingphotocurrent, thereby pushing the detector into a region of poor linearity. Clearly,K2S04 is far superior in transparency to the other salts which were examined. Given.this fact, and the fact that there is no apparent difference in the abilities of the variouspotassium salts to prevent adsorption, it appears that K2S04 , at a concentrationbetween 0.15 and 0.5 M (0.3-1.0 Min K +), is the salt of choice for further work.
Capillary zone electrophoresis requires the use of high voltages, passing currentthrough the buffer medium which fills the capillary tube, and generating joule heatwhich must be dissipated at the capillary walls. Using a typical capillary of J.D. 75 /lmand a typical operating voltage of 20 kV, a buffer containing 0.3 M K + would passcurrent and generate heat well in excess of that which the system can tolerate. Threeapproaches can be taken to minimize the effects of the heat. The applied voltage can belowered, but simple theory predicts that separation efficiency is directly proportionalto applied voltage and analysis times are inversely proportional to applied voltage'".Consequently, lowering the voltage will probably lower the peak efficiencies andincrease the analysis times. The column length can be increased, providing greaterelectrical resistance and thus lower joule heat, in addition to providing a greatersurface area for heat dissipation. However, analysis times are proportional to thesquare of the column length, so this approach would result in significantly longeranalysis times. Another approach is to reduce the inner diameter of the capillary,thereby increasing the surface area-to-volume ratio and improving the heat dissipatingability of the capillary. The problem with this approach is that it significantly shortensthe path length of the on-column UV absorption detector, making detection of thezones more difficult. The only way to compensate for this is to increase the sampleconcentration or improve detection limits. In capillary electrophoresis it is necessary tokeep the sample concentration approximately 100 times lower than the buffer and saltconcentrations in order to prevent sample overloading!", so care must be taken toavoid increasing the sample concentration too much. Fortunately, the increased ionicstrength allows the use of increased sample concentrations.
Fig. 1 shows an electropherogram ofa mixture offive proteins [I% (w/v) each] in0.1 M CHES buffer (pH 9.0) containing 0.25 M K2S04 and 0.001 M EDTA. The firsttwo components are lysozyme and trypsinogen, both of which ordinarily showsignificant adsorption in a pH 9.0 buffer which does not contain any additional salt. Astheir isoelectric points are 11 and 9.3, respectively, both of these proteins still containsignificant regions of positive charge at pH 9.0, making them likely to adsorb strongly
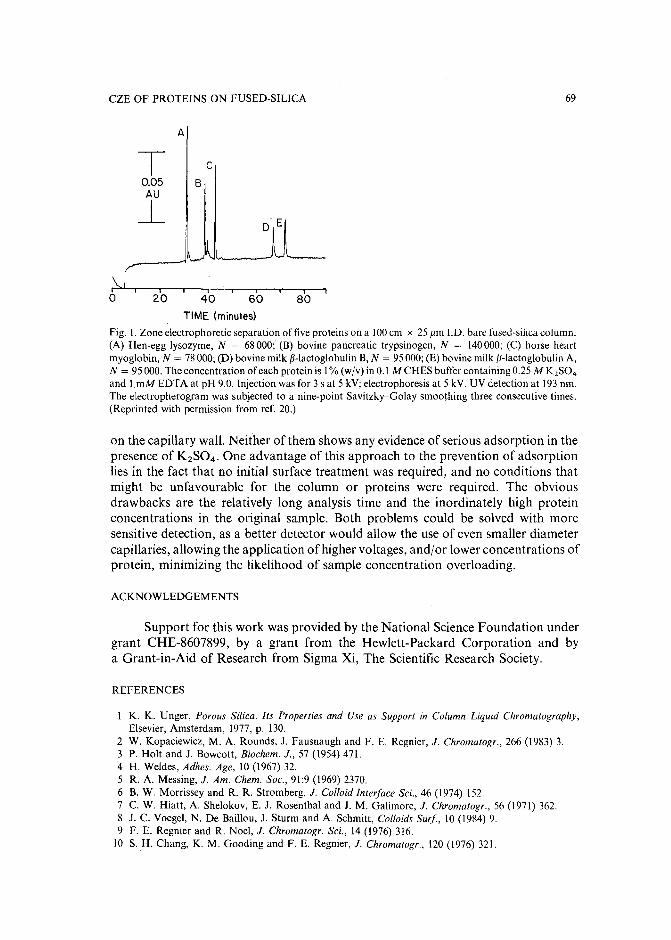
CZE OF PROTEINS ON FUSED-SILICA 69
A
T C0.05 BAU
-l
8020 40 60
TIME (minutes)
Fig. I. Zone electrophoretic separation of five proteins on a 100em x 25 I'm 1.0. bare fused-silica column.(A) Hen-egg lysozyme, N = 68000; (B) bovine pancreatic trypsinogen, N = 140000; (C) horse heartmyoglobin, N = 78000; (D) bovine milk j3-lactoglobulin B, N = 95000; (E) bovine milk j3-lactoglobulin A,N = 95000. The concentration of each protein is 1% (w/v) in 0.1 MCHES buffer containing 0.25 MK2S04
and 1 mM EDT A at pH 9.0. Injection was for 3 sat 5 kV; electrophoresis at 5 kV. UV detection at 193 nm.The electropherogram was subjected to a nine-point Savitzky-Golay smoothing three consecutive times.(Reprinted with permission from ref. 20.)
o
on the capillary wall. Neither of them shows any evidence of serious adsorption in thepresence of K2S04 . One advantage of this approach to the prevention of adsorptionlies in the fact that no initial surface treatment was required, and no conditions thatmight be unfavourable for the column or proteins were required. The obviousdrawbacks are the relatively long analysis time and the inordinately high proteinconcentrations in the original sample. Both problems could be solved with moresensitive detection, as a better detector would allow the use of even smaller diametercapillaries, allowing the application of higher voltages, and/or lower concentrations ofprotein, minimizing the likelihood of sample concentration overloading.
ACKNOWLEDGEMENTS
Support for this work was provided by the National Science Foundation undergrant CHE-8607899, by a grant from the Hewlett-Packard Corporation and bya Grant-in-Aid of Research from Sigma Xi, The Scientific Research Society.
REFERENCES
K. K. Unger, Porous Silica. Its Properties and Use as Support in Column Liquid Chromatography,Elsevier, Amsterdam, 1977, p. 130.
2 W. Kopaciewicz, M. A. Rounds, J. Fausnaugh and F. E. Regnier, J. Chromatogr., 266 (1983) 3.3 P. Holt and J. Bowcott, Biochem. J., 57 (1954) 471.4 H. Weldes, Adhes. Age, 10 (1967) 32.5 R. A. Messing, J. Am. Chern. Soc., 91:9 (1969) 2370.6 B. W. Morrissey and R. R. Stromberg, J. Colloid Interface Sci., 46 (1974) 152.7 C. W. Hiatt, A. Shelokov, E. J. Rosenthal and J. M. Galimore, J. Chromatogr., 56 (1971) 362.8 J. C. Voegel, N. De Baillou, J. Sturm and A. Schmitt, Colloids Surf, 10 (1984) 9.9 F. E. Regnier and R. Noel, J. Chromatogr. Sci., 14 (1976) 316.
to S. H. Chang, K. M. Gooding and F. E. Regnier, J. Chromatogr., 120 (1976) 321.

70 J. S. GREEN, J. W. JORGENSON
11 K. K. Unger, B. Anspach and H. Giesche, J. Pharm. Biomed. Anal., 2 (1984) 139.12 Y. Walbroehl, Ph. D. Dissertation, University of North Carolina, 1986.13 Y. Walbroehl and J. W. Jorgenson, J. Chromatogr., 315 (1984) 135.14 J. W. Jorgenson and K. D. Lukacs, Clin. Chem., 27 (1981) 1551.15 H. H. Lauer and D. McManigill, Anal. Chem., 58 (1986) 166.16 J. W. Jorgenson and K. D. Lukacs, Science (Washington, D.C.), 222 (1983) 266.17 D. A. Skoog and D. M. West, Fundamentals ofAnalytical Chemistry, Holt, Rinehart & Winston, New
York, 3rd ed., 1976, p. 74.18 K. M. Gooding and M. N. Schmuck, J. Chromatogr., 266 (1983) 633.19 J. W. Jorgenson and K. D. Lukacs, Anal. Chem., 53 (1981) 1298.20 H. H. Lauer and D. McManigill, Trends Anal. Chem., 5 (1986) 11.
Journal of Chromatography, 478 (1989) 71-86Elsevier Science Publishers B.V., Amsterdam - Printed in The Netherlands
CHROM. 21 602
BAND BROADENING IN HIGH-PERFORMANCE LIQUID CHROMATOGRAPHIC SEPARATIONS OF ENANTIOMERS WITH SWOLLEN MICROCRYSTALLINE CELLULOSE TRIACETATE PACKINGS
I. INFLUENCE OF CAPACITY FACTOR, ANALYTE STRUCTURE, FLOWVELOCITY AND COLUMN LOADING
ANDREAS M. RIZZI
Institute of Analytical Chemistry, University of Vienna, Wiihringerstrasse38, A-1090 Vienna (Austria)
(First received February 20th, 1989; revised manuscript received April 27th, 1989)
SUMMARY
The peak dispersion in high-performance liquid chromatographic columnspacked with swollen crystalline cellulose triacetate was investigated as a function of thecapacity factors of the analytes and their structures as well as of the flow-rate, columnloading and degree of cross-linking of the adsorbent material. The main contributionto the plate height is attributed to the packed bed, arising from slow adsorption/desorption processes at certain, narrow parts of the surface. The results show theexistence of at least two types of adsorption sites, which differ in the rate of theadsorption/desorption process: "quick"-type and "slow"-type sites. These types ofsites are assumed to differ also in the types of interactions with the analytes. Thenarrow, "slow"-type sites are of decisive importance for chiral recognition.
INTRODUCTION
. Triacetylated cellulose has been known for several years as a useful stationaryphase for the chromatographic separation of optical isomers '"!", Nowadays, twodifferent forms of cellulose triacetate (CTA) ar used in chromatography. First, CTA isused directly in a swollen crystalline state, called swollen microcrystalline cellulosetriacetate (swcrCTA). This material is obtained by heterogeneous acetylation ofmicrocrystalline cellulose and subsequent swelling in boiling alcohol, e.g., ethanol 1
,2 .3 ,8 . It is assumed to form some type of "inclusion complexes" with several typesof analytes 1,2. The strength of the interaction, and therefore the retention on thestationary phase, is determined by the fit of the analyte to the chiral "cavities" of theswollen microcrystalline stationary phase. The geometric arrangement of the chiralenvironment in the "cavities" is determined by the microcrystalline structure of thismaterial.
The second method of using CTA stationary phases is to coat the solved CTAmaterial onto the surface of macroporous silica particles 14.1 7.18. The silica particles
0021-9673/89/$03.50 © 1989 Elsevier Science Publishers B.V.
72 A. M. RIZZI
may be modified by chemically bonded aminopropyl or other groups. Solved andreprecipitated CTA loses its microcrystalline structure. The chiral recognition anddiscrimination properties of solved and reprecipitated CTA are quite different fromthose of the microcrystalline form ll
•14
.
Both materials are commercially available in a pressure-stable form, suitable forhigh-performance liquid chromatography (HPLC). swcrCTA particles are availablewith diameters down to 7-10 flm (refs. 3, 5 and 6) and can be used at pressures above200 atm. These particle sizes are comparable with those of usual silica particles. Silicacoated CTA materials are available in the particle sizes of ground silica and are highlypressure-stable due to the silica backbone.
CTA materials are widely utilized for chromatographic separations of enantiomers on the analytical and preparative scales l - 8 •1 3 . The advantages of swcrCTAmaterials are the high enantioselectivity which can be obtained for many chiralanalytes of different structural types and the high loadability':", A severe drawback isthe large peak broadening often observed with these separations which leads to a lowefficiency. In spite of the given enantioselectivity, in many cases there is insufficientchromatographic resolution, reduced detection limits by high dilution and a reducedpeak capacity of the columns.
The enantioselectivity values obtained with coated CTA materials differ fromthose obtained with swollen crystalline materials. The former are smaller in manycases!", There is much less peak broadening with coated materials, however14 , 1 7 , 1 8 .
The problem of peak broadening on swollen crystalline CTA supports hasbriefly been stressed 1 •2.5, 8 . 1 6 . However, no systematic investigations have beendescribed which deal with the dependence of the peak width on swcrCTA packings onthe capacity. factors of the analytes, the analyte structure, the eluent composition, thetemperature and the pressure. In this paper, quantitative data are reported on thedependence of the theoretical plate height on the capacity factors of the analytes andon their structures, as well as on the flow-rate, the column loading and on the degree ofcross-linking of the CTA material. The dependence on the eluent composition, thetemperature and the pressure forms the subject of another paper1 9
.
THEORETICAL
In the last decade the theory of band spreading in chromatography has reacheda level which allows one to understand and to predict with fair accuracy the peakbroadening behaviour ofanalytes in normal and reversed-phase chromatography. Thetheory describes the dependence of the degree of peak broadening on parameters likethe particle size, diffusion coefficient, solvent viscosity, temperature, flow velocity,capacity factor and the quality of packing (geometric arrangement of the particles inthe packed bed)20-25. Today, it is clear that the plate height, Hi, results from at leastfour contributions, H di , H ci , H fi and Hi; (refs. 20-22, 24, 26 and 27) which havedifferent dependences on the flow velocity, u, the particle size, dp , and the capacityfactor, Ki:
(I)
The index i indicates the solute and the subscripts d, c, f and b indicate the
BAND BROADENING IN HPLC WITH swcrCTA PACKINGS. I. 73
contributions associated with dispersion due to axial diffusion, convection, massexchange in the streaming part of the mobile phase and mass exchange in the fixed bed.H; includes diffusion in the stagnant mobile phase, in the stationary phase and at thesurface.
The following discussion of the band spreading process in swcrCTA packingsstarts from the plate-height equation given by Huber2 2
(2)
where hi is the reduced plate height and Vi is the reduced flow velocity
(3a)
(3b)
where u is the linear flow velocity of the mobile phase, D mi is the diffusion coefficient ofthe solute in the mobile phase, em is the fraction of the column volume occupied by themobile phase and er is the fraction occupied by the flowing part of the mobile phase.The five geometry factors, <Pd, <P~, <P~, <Pr and <Pb, are constants for a given columndepending on the geometry of the particles and the packing. The parameter Kt isdefined as the mass distribution coefficient between the fixed bed, b, and the flowingfluid, f
(4)
where x, is the mass distribution coefficient (capacity factor) between the stationaryphase, s, and the mobile phase, m, and Q being the symbol for quantity.
It should be noted that hr and hb have different dependences on the capacity
factor. Whereas (---!5L)2 is an increasing function with increasing capacity factor, Ki,I +Kt
*Ki 2 is a decreasing function with increasing Kt values greater than one. Eqn.
(l+Kt)2 describes experimental data on silica-based reversed-phase and normal-phasesystems quite welI2 6
-2 8
.
This theoretical approach is, however, incapable of describing the effectsactually observed with swcrCTA packing materials. Therefore eqn. 2 has to beextended. The measurements on swcrCTA, which are presented in detail later, revealfor many analytes dramatically elevated reduced plate heights. These plate heights arenot correlated with the capacity factors of the analytes, but rather with their stericstructures. This indicates that it is the mass exchange term in the chromatographic bed,hb , which is essentially the main source of the increase in the plate height.
It is assumed that in the porous swollen crystalline packing material the motionof the analytes very near to narrow parts of the adsorbent is hindered. These narrow
74 A. M. RIZZI
parts may be of "cavity"-like or channel-like structure, or can be more generallydescribed as adsorption sites where the adsorption/desorption process including thediffusion to these sites and the optimum positioning at these sites is slow.
For the following discussion it is assumed that the slow transport processes in thepacked bed can be taken into account by splitting hb into two contributions, h6uiekandh~low
(5)
where h6uiek is assumed to be the hb contribution observed normally, typical for smallanalytes not sterically hindered in their diffusion and motion near the surface or innarrow channels. It thus accounts mainly for the mass transport in the stagnant mobile
K:t'phase in the large pores of the particles and is described by the term C{JbVi . (I +~n2 in
eqn. 2; its value is expected to be small, as is found usually with porous silicaparticles2 6- 2 9 . The parameter h~oW is an additional contribution accounting for theslow transport and adsorption/desorption process near to or at some of the availableadsorption sites. These sites, at which the entire process of adsorption/desorption isslow, are referred to as "slow"-type sites. (Since these sites are assumed to be narrowthey are assumed to be decisive for chiral recognition in many cases.) The value ofh~oW for a particular analyte can be regarded approximately as the difference betweenits measured h value and that of a small, not sterically hindered molecule, e.g., toluene.
In discussing the dependences of the reduced plate height on the capacity factor,Ki' the temperature, T, the availability of the different types of adsorption sites (whichis determined by the eluent composition) and on the flow velocity, u, in this and in thesubsequent publication 19, respectively, it should be kept in mind that hd , he' h, andh6uiekare also influenced by these parameters. However, the effects on these plateheight contributions will be much smaller compared with that on h~IOW and aretherefore not always seen to have statistical significance within the precision of thedata.
The influence of the particle size is not investigated here. Since M,t°w is assumed toresult predominantly from slow adsorption/desorption processes at the sites, and donot result from a slow diffusion velocity in the whole stagnant zone, the dependence ofh~oW on dp will probably differ from that of h6
uiek, which is known to be linearlydependent on d, (see last term in eqn. 2; vis linearly dependent on dp , therefore h6uiekisalso linearly dependent on dp) .
EXPERIMENTAL
ApparatusChromatographic experiments were carried out using an high-pressure liquid
chromatographic pump (Model L-6200 intelligent pump; Merck-Hitachi, Tokyo,Japan), a syringe-valve injector (Model 7161; Rheodyne, Cotati, CA, U.S.A.)equipped with a 20-,ulloop, a column oven (Model 655A-52, Merck-Hitachi) and anUV detector (Model L-4000, Merck-Hitachi) connected to an integrator (ModelD-2000 chromato-integrator, Merck-Hitachi).
I
BAND BROADENING IN HPLC WITH swcrCTA PACKINGS. 1. 75
ColumnsIf not explicitly indicated otherwise, the data reported in the tables and figures
refer to column I, prepacked with swcrCTA having a mean particle diameter of 10 pm(Hibar'", E. Merck, Darmstadt, F.R.G.), 250 mm x 10 mm J.D. Column II wasprepacked with swcrCTA material of probably enhanced degree of cross-linking,mean particle diameter 7 pm (Macherey Nagel, Duren, F.R.G.), 250 mm x 4 mm J.D.
Reagents and samplesAbsolute ethanol was ofp.a. quality, methanol and cyclohexane of LrChrosolve
quality from E. Merck. Water used for the eluent preparation was distilled twice andpurified by passing through a RP-8 column before eluent preparation. The eluentmixtures were premixed and degassed in an ultrasonic bath. The analyte samples wereof the highest purity grade available or were received in a highly purified state as giftsfrom synthesis laboratories.
ProcedureAll data refer to isocratic elution at constant temperature. After establishment of
the thermal equilibrium, the constancy of retention data was about ± I%. The voidvolume for the 250 mm x 10 mm J.D. column was estimated as 15 ml from theretention volume of the system peaks of water, methanol or propanol injected. All thecalculations of the capacity factors are based on a void volume of 15.00 ml for allsolvent mixtures. UV detection was performed at 254 nm.
RESULTS AND DISCUSSION
The porous structure of the packed bedCrystalline CTA in the swollen state has a certain porosity. A system of
macropores and micropores exists in the particles. Within the microporous system,narrow structured channels and cavities are expected. This results in a size exclusionmechanism for small molecules together with an adsorption mechanism. The porosityof this material is therefore different for different analytes.
The results of the determination of the porosity depend on the type of moleculesused for the measurement. Using solvent components, the porosity will be higher thesmaller are these solvent molecules. In the case of cyclohexane, it is likely in additionthat the available pore volume is determined not only by the size of this molecule butalso by its hydrophobicity, since cyclohexane does not penetrate the near vicinity ofpolar adsorption sites. This is illustrated in Table I, where the column porosity values,em, are evaluated from the system peaks of solvents injected in a mobile phase ofethanol. The usually accepted substance for evaluation of Vo, tri-tert.-butylbenzene, ispartially excluded from the pores available to methanol and water.
This discussion makes clear that a defined particle porosity cannot be given,because this obviously depends on the analyte (and even the solvent) structure. Toavoid uncertainties in the calculation of the capacity factors, in this paper an uniformvalue of 0.76 is chosen for the column porosity, em'
Plate height as a function of the capacity factorIn Fig. I and Table II the reduced plate height, h, is given as a function of the
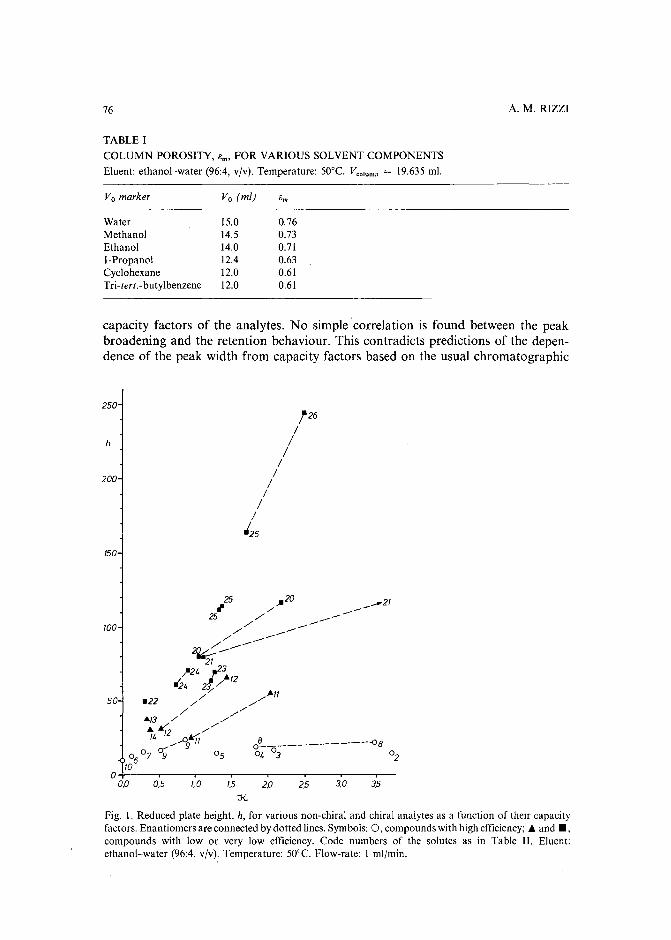
76 A. M. RIZZI
TABLE I
COLUMN POROSITY, 8m, FOR VARIOUS SOLVENT COMPONENTS
Eluent: ethanol-water (96:4, v(v). Temperature: 50°C. V,olumn = 19.635 ml.
Vo marker Vo (ml) 8m
Water 15.0 0.76Methanol 14.5 0.73Ethanol 14.0 0.71I-Propanol 12.4 0.63Cyclohexane 12.0 0.61Tri-tert.-butylbenzene 12.0 0.61
capacity factors of the analytes. No simple correlation is found between the peakbroadening and the retention behaviour. This contradicts predictions of the dependence of the peak width from capacity factors based on the usual chromatographic
25J'
25tOO
50
3.53,02,5/,5 2.0:x
/.00,504----,---.---.------.......,..----r-----.---,--
0.0
Fig. I. Reduced plate height, h, for various non-chiral and chiral analytes as a function of their capacityfactors. Enantiomers are connected by dotted lines.Symbols: 0, compounds with high efficiency; ... and.,compounds with low or very low efficiency. Code numbers of the solutes as in Table II. Eluent:ethanol-water (96:4, v(v). Temperature: 50°C. Flow-rate: I ml(min.
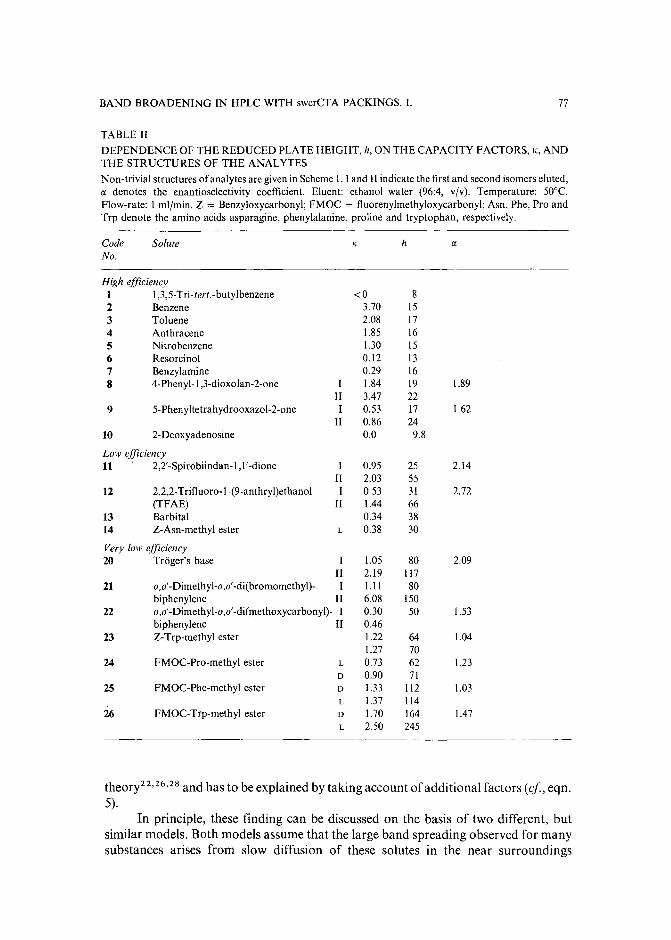
BAND BROADENING IN HPLC WITH swcrCTA PACKINGS. 1. 77
TABLE II
DEPENDENCE OF THE REDUCED PLATE HEIGHT, h, ON THE CAPACITY FACTORS, K, ANDTHE STRUCTURES OF THE ANALYTES
Non-trivial structures of analytes are given in Scheme I. I and II indicate the first and second isomers eluted,IX denotes the enantioselectivity coefficient. Eluent: ethanol-water (96:4, v/v). Temperature: 50°C.Flow-rate: I ml/min. Z = Benzyloxycarbonyl; FMOC = fluorenylmethyloxycarbonyl; Asn, Phe, Pro andTrp denote the amino acids asparagine, phenylalanine, proline and tryptophan, respectively.
Code Solute K h IX
No.
High efficiency1 1,3,5-Tri-tert.-butylbenzene <0 82 Benzene 3.70 153 Toluene 2.08 174 Anthracene 1.85 165 Nitrobenzene 1.30 IS6 Resorcinol 0.12 137 Benzylamine 0.29 168 4-Phenyl-I,3-dioxolan-2-one I 1.84 19 1.89
II 3.47 229 5-Phenyltetrahydrooxazol-2-one I 0.53 17 1.62
II 0.86 2410 2-Deoxyadenosine 0.0 9.8
Low efficiency11 2,2'-Spirobiindan-I,I'-dione I 0.95 25 2.14
II 2.03 5512 2,2,2-Trifluoro-I-(9-anthryl)ethanol I 0.53 31 2.72
(TFAE) II 1.44 6613 Barbital 0.34 3814 Z-Asn-methyl ester L 0.38 30
Very low efficiency20 Trager's base I 1.05 80 2.09
II 2.19 11721 0,0'-Dimethyl-o,o'-di(bromomethyl)- I 1.11 80
biphenylene II 6.08 15022 0,0'-Dimethyl-c.o'-di(methoxycarbonyl)- I 0.30 50 1.53
biphenylene II 0.4623 Z-Trp-methyl ester 1.22 64 1.04
1.27 7024 FMOC-Pro-methyl ester L 0.73 62 1.23
D 0.90 7125 FMOC-Phe-methyl ester D 1.33 112 1.03
L 1.37 11426 FMOC-Trp-methyl ester D 1.70 164 1.47
L 2.50 245
theory2 2 , 26 ,2 8 and has to be explained by taking account of additional factors (cf., eqn.5).
In principle, these finding can be discussed on the basis of two different, butsimilar models. Both models assume that the large band spreading observed for manysubstances arises from slow diffusion of these solutes in the near surroundings
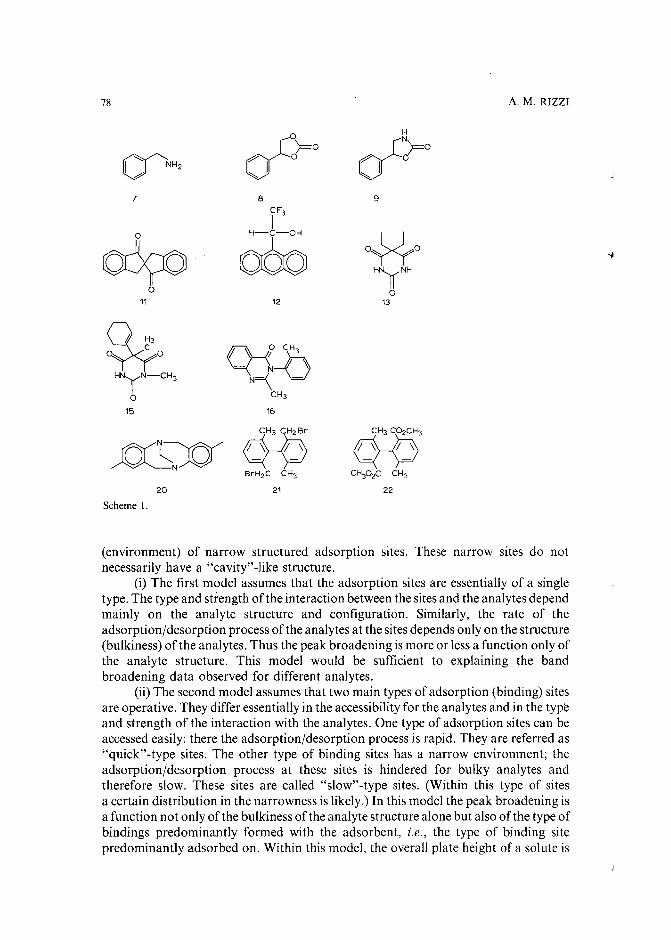
78 A. M. R1ZZl
~oH
U NH2 cI"~,;? 0,;? °"",I "",I
7 8 9CF3
I0 H-C-OH
O~O~ 060 H~NH
0
°11 12 13
~ Q10 CH 3° 0
- N-DHN\(N-CH3 N=\ -
0 CH3
15 16
CH3 CH2Br CH3 C02CH3
~)O( cHJ cHJBrH2C CH3 CHP2C CH3
20 21 22
Scheme 1.
(environment) of narrow structured adsorption sites. These narrow sites do notnecessarily have a "cavity"-like structure.
(i) The first model assumes that the adsorption sites are essentially of a singletype. The type and strength of the interaction between the sites and the analytes dependmainly on the analyte structure and configuration. Similarly, the rate of theadsorption/desorption process of the analytes at the sites depends only on the structure(bulkiness) of the analytes. Thus the peak broadening is more or less a function only ofthe analyte structure. This model would be sufficient to explaining the bandbroadening data observed for different analytes.
(ii) The second model assumes that two main types of adsorption (binding) sitesare operative. They differ essentially in the accessibility for the analytes and in the typeand strength of the interaction with the analytes. One type of adsorption sites can beaccessed easily: there the adsorption/desorption process is rapid. They are referred as"quick"-type sites. The other type of binding sites has a narrow environment; theadsorption/desorption process at these sites is hindered for bulky analytes andtherefore slow. These sites are called "slow"-type sites. (Within this type of sitesa certain distribution in the narrowness is likely.) In this model the peak broadening isa function not only of the bulkiness of the analyte structure alone but also of the type ofbindings predominantly formed with the adsorbent, i.e., the type of binding sitepredominantly adsorbed on. Within this model, the overall plate height of a solute is
BAND BROADENING IN HPLC WITH swcrCTA PACKINGS. I. 79
determined by the relative contribution of the narrow, "slow"-type adsorption sites tothe total retention and by the individual diffusion velocity of the solute at these"slow"-type sites. For both factors the analyte structure is decisive.
Evidence in support of this second model is provided by the finding thatnon-polar aromatic compounds, in spite of their molecular size, always show low plateheight values, and, secondly, by the observed dependence of the plate height andstereoselectivity data on the solvent composition, which is discussed in Part II 1 9
.
A single type of site cannot account for these observations. This model is thus used todiscuss the experimental data given in this paper.
The existence of different adsorption "principles" (generating different degreesof selectivity) for swcrCTA adsorbents'vl? and different adsorption sites in coatedCTA adsorbents'" have been proposed before. It might also be concluded from thedata reported recently by Roussel et al.31 where for some types of racemic analytes theelution order of the enantiomers was found to be dependent on the analyteconcentration. The assumption that in a more or less crystalline arrangement of theadsorbent the steric environment around different binding sites differs in narrownesshas an high degree of probability.
It is clear from this discussion that the large plate height values observed formany solutes arise from the packed bed and can therefore be attributed as beinga contribution to Iu;
Considering the plate height data in greater detail, the following pattern can beobserved from Table II.
Some compounds (No.1 and acidic compounds not included in Table II) areexcluded from parts of the mobile phase volume due to their steric structure(tri-tert.-butylbenzene) or to their charges (organic acids). They are eluted slightlybefore the column void volume. Their h values are between 7 and 10,and thus lie abovethose obtainable with rigid silica particles of mean diameter 10 J..Lm (h = 4-5).Nevertheless, packings of swollen CTA with h values of 7-10 have to be judged asexcellent.
For non-polar aromatic compounds (benzene, toluene, naphthalene, anthracene), the reduced plate height values are found between 15and 18. For these types ofcompounds no significant increase in plate height with increasing capacity factors isobserved. [Such an increase is predicted by the chromatographic theory because of thedependence of hf on the capacity factor, «, tcf., eqn. 2)22,26,27. However, the effectexpected from theory is too small to be observed with statistical significance within thisinvestigation.] It is characteristic for this adsorbent that larger aromatic molecules areadsorbed less strongly than is benzene. No significant correlation between h and thesize of this type of analytes is found. Within the chosen model, it is concluded thatnon-polar aromatic compounds are thus predominantly adsorbed onto adsorptionsites with rapid adsorption kinetics; h~oW is negligible for these compounds.
Similar h values between 10 and 20 are also found for aromatic compounds with(sterically) rather small polar side-functions (compounds 5-10, shown by circles in Fig.1). This means that adsorption occurs either mainly onto the "quick"-type sites or,more probably, that the motion and steric orientation of parts of the molecules at thenarrow sites is little hindered and therefore not slow.
Many analytes in Table II (compounds 11-26, shown by triangles and squares inFig. 1) have strongly increased values of h. Fig. 1 shows that in these cases h and thus
80 A. M. RIZZI
h~OW is not uniquely correlated with the capacity factor but depends on the structures ofthe analytes. It is not completely clear which structural features are decisive for theadsorption kinetics. It seems that the total sizeof the whole molecule is decisive only inthose cases where the molecule has a rigid structure (spirocompounds, Trager's base).In the other cases, it is probably the steric feature of the polar group which is decisive.Planar analytes show relatively low hb values. (Maybe the aromatic ring acts like ananchor at "quick"-type sites.) However, the number of different molecules investigated is too small for a subtle discussion of structure-efficiency relationships. In all cases ofchiral analytes the more strongly retained enantiomer shows an higher value for theplate height. This is evidence in support of the assumption that the hbslow contributionis related to a process of adsorption and is not due to slow diffusion in a bulkenvironment.
Interpretation of these data -which is supported by the dependence of the plateheight on the solvent composition reported in Part II 19-leads to the assumption that"slow"- and "quick"-type sites differ in the type and strength of the interactions withthe analytes, predominantly in the strength of the interaction with polar and non-polargroups of the analytes. These differences may be caused by differences in thepolarizability of the sites and in their ability to undergo hydrogen bonding3 0
, 3 2 ,3 3 . Ifthe adsorption includes the motion into narrow structures, the narrow environmentbuilt by the adsorbent (including the eluent layer) interacts with the analyte and mayrepresent a steric hindrance to the motion of the analyte or parts ofit. Such sites may betherefore of the "slow"-type. Dependent on the steric structure of the analyte, theinteractions are of different strengths (causing chiral separation if the strength differsbetween enantiomeric compounds). In narrow sites, the different strengths ofinteraction may cause differences also in the velocity of motion, and consequently inthe plate height. The slope of the plate height vs. capacity factor is not the same for allanalytes, since (i) the steric hindrance in the narrow, "slow"-type sites is not equallystrong for all compounds and (ii) the contribution of adsorption at the "slow"-typesites relative to that at the "quick"-type sites is dependent on the types of interactionsbeing formed and therefore on the structures of the analytes.
From these data, it has become clear that the loss in efficiency can essentially beattributed to h~ow, which may be influenced to a certain extent by the swelling state ofcrystalline CTA. This point is discussed elsewhere19. The "quality of the packingprocedure" does not influence hb . It usually determines the he and hr contributionswhich result from mixing processes in the streaming part of the mobile phase 2o
- 24 andwhich are predominant in the most frequently used systems with rigid particles2 6 ,2 7 ,29.
Since in swcrCTA packings the hr term is found to contribute to a minor extent formost of the interesting solutes, one has to conclude that the problem oflow efficiencyin swcrCTA separations cannot be solved by improving the quality of the packingprocedure.
Plate height as a function of the flow velocityThe dependence of the plate height on the flow velocity, u, for differentanalytes
is given in Fig. 2. The following patterns can be observed.The flow velocity corresponding to the minimum value of h, Umin, is found to be
very low. Although linear velocities as small as 0.14 mm/s were applied, a realminimum was not seen. In the cases ofTFAE (12) and Trager's base (20) the curves
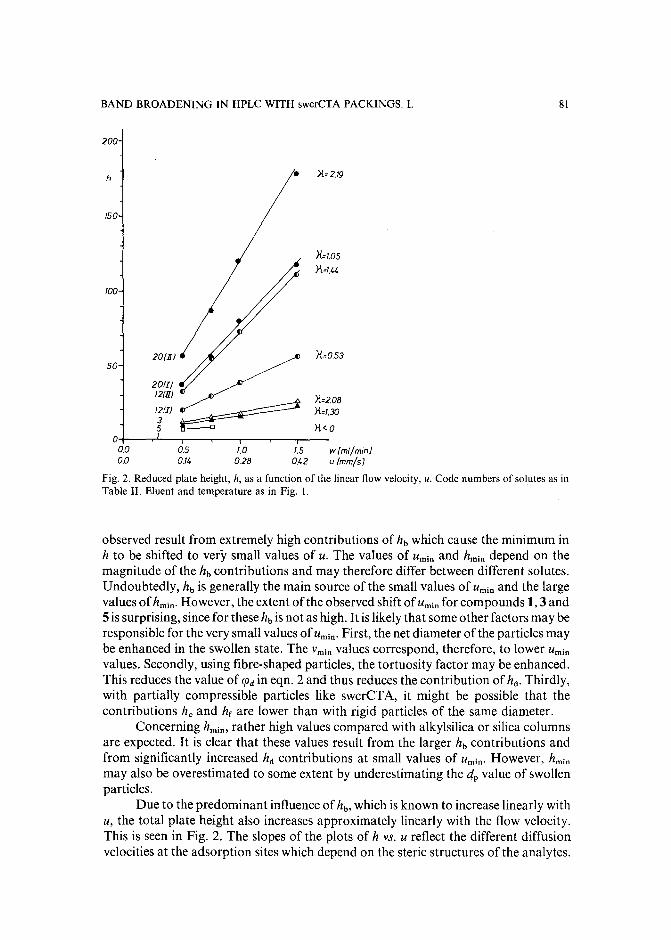
BAND BROADENING IN HPLC WITH swcrCTA PACKINGS. 1.
200
81
h
ISO
• ){=2.19
100
50201JI)
X=1.OS
)\=1.44
H=0.53
20m121JI)
I;(I)~)1=208
>1.=1.30
}{< 0O+----.-'----,------.--r----.,.---r--
0.0 0.5 1.0 1,5 w [ml/m,n]0.0 0.14 0.28 0.42 u [mm/51
Fig. 2. Reduced plate height, h, as a function of the linear flow velocity, u. Code numbers of solutes as inTable II. Eluent and temperature as in Fig. 1.
observed result from extremely high contributions of hb which cause the minimum inh to be shifted to very small values of u. The values of Urnin and hrnin depend on themagnitude of the hb contributions and may therefore differ between different solutes.Undoubtedly, hb is generally the main source of the small values of Urnin and the largevalues ofhrnin . However, the extent of the observed shift of Urnin for compounds 1,3 and5 is surprising, since for these hb is not as high. It is likely that some other factors may beresponsible for the very small values of Urnin' First, the net diameter of the particles maybe enhanced in the swollen state. The Vrnin values correspond, therefore, to lower Urnin
values. Secondly, using fibre-shaped particles, the tortuosity factor may be enhanced.This reduces the value of ({Jd in eqn. 2 and thus reduces the contribution of h«. Thirdly,with partially compressible particles like swcrCTA, it might be possible that thecontributions he and he are lower than with rigid particles of the same diameter.
Concerning hrnin , rather high values compared withalkylsilica or silica columnsare expected. It is clear that these values result from the larger hb contributions andfrom significantly increased hd contributions at small values of Urnin' However, hrnin
may also be overestimated to some extent by underestimating the dp value of swollenparticles.
Due to the predominant influence of hb, which is known to increase linearly withu, the total plate height also increases approximately linearly with the flow velocity.This is seen in Fig. 2. The slopes of the plots of h vs. U reflect the different diffusionvelocities at the adsorption sites which depend on the steric structures of the analytes.
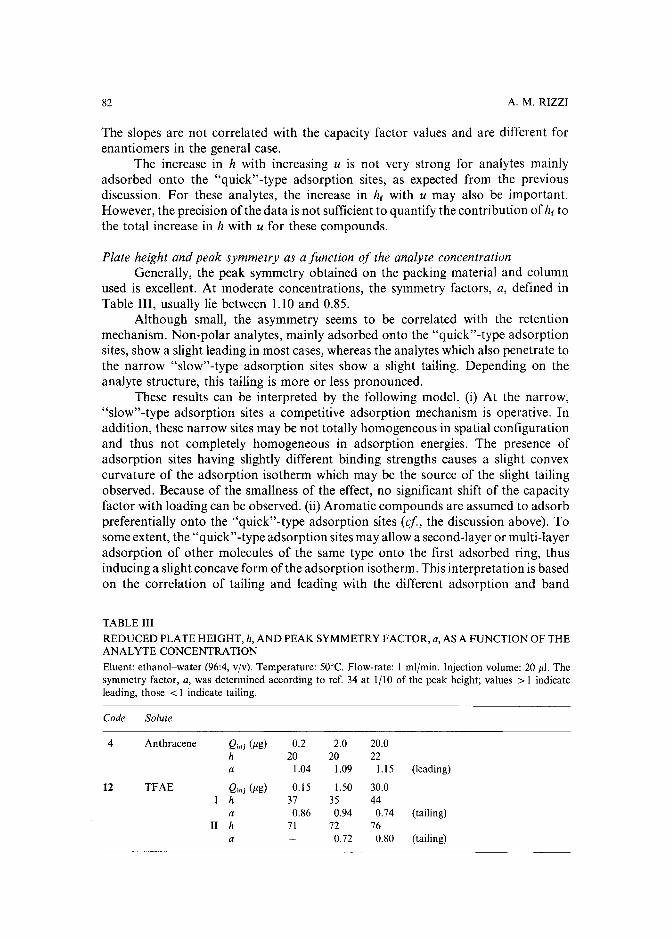
82 A. M. RIZZI
The slopes are not correlated with the capacity factor values and are different forenantiomers in the general case.
The increase in h with increasing u is not very strong foranalytes mainlyadsorbed onto the "quick"-type adsorption sites, as expected from the previousdiscussion. For these analytes, the increase in he with u may also be important.However, the precision of the data is not sufficient to quantify the contribution of he tothe total increase in h with u for these compounds.
Plate height and peak symmetry as a function of the analyte concentrationGenerally, the peak symmetry obtained on the packing material and column
used is excellent. At moderate concentrations, the symmetry factors, a, defined inTable III, usually lie between 1.10 and 0.85.
Although small, the asymmetry seems to be correlated with the retentionmechanism. Non-polar analytes, mainly adsorbed onto the "quick"-type adsorptionsites, show a slight leading in most cases, whereas the analytes which also penetrate tothe narrow "slow"-type adsorption sites show a slight tailing. Depending on theanalyte structure, this tailing is more or less pronounced.
These results can be interpreted by the following model. (i) At the narrow,"slow"-type adsorption sites a competitive adsorption mechanism is operative. Inaddition, these narrow sites may be not totally homogeneous in spatial configurationand thus not completely homogeneous in adsorption energies. The presence ofadsorption sites having slightly different binding strengths causes a slight convexcurvature of the adsorption isotherm which may be the source of the slight tailingobserved. Because of the smallness of the effect, no significant shift of the capacityfactor with loading can be observed. (ii) Aromatic compounds are assumed to adsorbpreferentially onto the "quick"-type adsorption sites (cf, the discussion above). Tosome extent, the "quick"-type adsorption sites may allow a second-layer or multi-layeradsorption of other molecules of the same type onto the first adsorbed ring, thusinducing a slight concave form of the adsorption isotherm. This interpretation is basedon the correlation of tailing and leading with the different adsorption and band
TABLE III
REDUCED PLATE HEIGHT, h, AND PEAK SYMMETRY FACTOR, a, AS A FUNCTION OF THEANAL YTE CONCENTRATION
Eluent: ethanol-water (96:4, v/v). Temperature: 50°C. Flow-rate: I ml/min, Injection volume: 20 )11. Thesymmetry factor, a, was determined according to ref. 34 at 1/10 of the peak height; values > I indicateleading, those < I indicate tailing.
Code Solute
4 Anthracene Qinj ()1g) 0.2 2.0 20.0h 20 20 22a 1.04 1.09 1.15 (leading)
12 TFAE Q'nj ()1g) 0.15 1.50 30.0h 37 35 44a 0.86 0.94 0.74 (tailing)
II h 71 72 76a 0.72 0.80 (tailing)
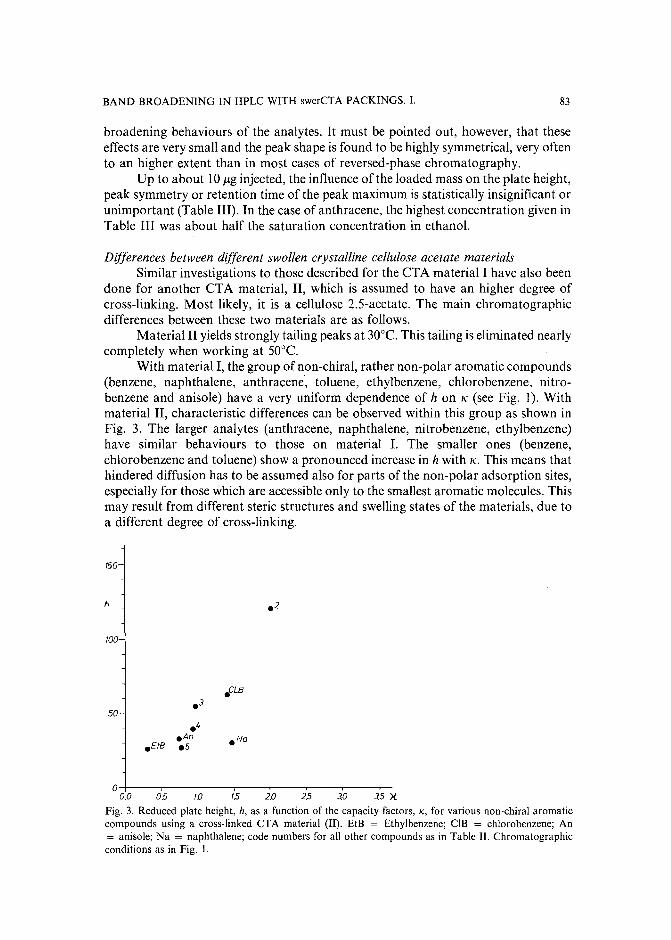
BAND BROADENING IN HPLC WITH swcrCTA PACKINGS. I. 83
broadening behaviours of the analytes. It must be pointed out, however, that theseeffects are very small and the peak shape is found to be highly symmetrical, very oftento an higher extent than in most cases of reversed-phase chromatography.
Up to about 10 /lg injected, the influence of the loaded mass on the plate height,peak symmetry or retention time of the peak maximum is statistically insignificant orunimportant (Table III). In the case of anthracene, the highest concentration given inTable III was about half the saturation concentration in ethanol.
Differences between different swollen crystalline cellulose acetate materialsSimilar investigations to those described for the CTA material I have also been
done for another CT A material, II, which is assumed to have an higher degree ofcross-linking. Most likely, it is a cellulose 2.S-acetate. The main chromatographicdifferences between these two materials are as follows.
Material II yields strongly tailing peaks at 30°C. This tailing is eliminated nearlycompletely when working at SO°C.
With material I, the group of non-chiral, rather non-polar aromatic compounds(benzene, naphthalene, anthracene, toluene, ethylbenzene, chlorobenzene, nitrobenzene and anisole) have a very uniform dependence of h on K (see Fig. 1). Withmaterial II, characteristic differences can be observed within this group as shown inFig. 3. The larger analytes (anthracene, naphthalene, nitrobenzene, ethylbenzene)have similar behaviours to those on material I. The smaller ones (benzene,chlorobenzene and toluene) show a pronounced increase in h with K. This means thathindered diffusion has to be assumed also for parts of the non-polar adsorption sites,especially for those which are accessible only to the smallest aromatic molecules. Thismay result from different steric structures and swelling states of the materials, due toa different degree of cross-linking.
150
h
100
.CLB
.350-
.4.An .No
.EtB .5
O+---,-----,..---.---r--.----.---.-M ~ W ~ W ~ ~ ~x
Fig. 3. Reduced plate height, h, as a function of the capacity factors, K, for various non-chiral aromaticcompounds using a cross-linked CTA material (II). EtB = Ethylbenzene; cm = chlorobenzene; An= anisole; Na = naphthalene; code numbers for all other compounds as in Table II. Chromatographicconditions as in Fig. I.
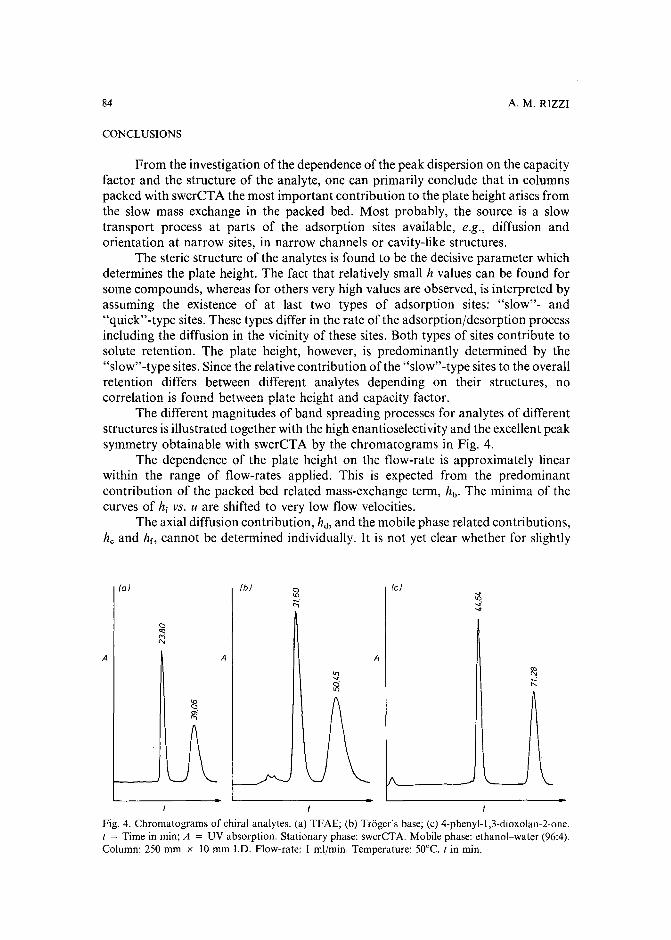
84
CONCLUSIONS
A. M. RIZZI
From the investigation of the dependence of the peak dispersion on the capacityfactor and the structure of the analyte, one can primarily conclude that in columnspacked with swcrCTA the most important contribution to the plate height arises fromthe slow mass exchange in the packed bed. Most probably, the source is a slowtransport process at parts of the adsorption sites available, e.g., diffusion andorientation at narrow sites, in narrow channels or cavity-like structures.
The steric structure of the analytes is found to be the decisive parameter whichdetermines the plate height. The fact that relatively small h values can be found forsome compounds, whereas for others very high values are observed, is interpreted byassuming the existence of at last two types of adsorption sites: "slow"- and"quick"-type sites. These types differ in the rate of the adsorption/desorption processincluding the diffusion in the vicinity of these sites. Both types of sites contribute tosolute retention. The plate height, however, is predominantly determined by the"slow"-type sites. Since the relative contribution of the "slow"-type sites to the overallretention differs between different analytes depending on their structures, nocorrelation is found between plate height and capacity factor.
The different magnitudes of band spreading processes for analytes of differentstructures is illustrated together with the high enantioselectivity and the excellent peaksymmetry obtainable with swcrCTA by the chromatograms in Fig. 4.
The dependence of the plate height on the flow-rate is approximately linearwithin the range of flow-rates applied. This is expected from the predominantcontribution of the packed bed related mass-exchange term, hb • The minima of thecurves of hi VS. u are shifted to very low flow velocities.
The axial diffusion contribution, hd, and the mobile phase related contributions,he and Iu, cannot be determined individually. It is not yet clear whether for slightly
A
(a)
A
(b)
A
f I I
Fig. 4. Chromatograms of chiral analytes. (a) TFAE; (b) Trager's base; (e) 4-phenyl-l,3-dioxolan-2-one.I = Time in min; A = UV absorption. Stationary phase: swerCTA. Mobile phase: ethanol-water (96:4).Column: 250 mm x 10 mm J.D. Flow-rate: 1 ml/rnin. Temperature: 50°C. I in min.
BAND BROADENING IN HPLC WITH swcrCTA PACKINGS. 1. 85
compressible swcrCTA particles with enhanced tortuosity factors these contributionsare strictly comparable with the corresponding terms for rigid silica particles. It isclear, however, that heand hr are little enhanced in comparison to other packings withthe same particle size. Thus, one has to conclude that the columns are well packed andthat a better packing procedure will not decrease the peak broadening dramatically.
The dependence of hb on the particle diameter has not been investigated here;h~uiek is assumed to be linearly dependent on dp, whereas this is not expected for h~ow.
Since h~low is in most cases the predominant plate height contribution, knowledge Oftheinfluence of the particle size on this term will be of considerable practical importance.
The peak symmetry is excellent even at high analyte concentrations. Nosignificant increase in plate height can be observed up to 10J.1.g of analytes injected in 20Ill.
A detailed study of the plate height dependence on the eluent composition, thetemperature and the pressure (which all influence the swelling state of the adsorbent)will be presented in the following paper!",
ACKNOWLEDGEMENTS
This work was made possible by a grant from the Austrian Fond zur Forderungder Wissenschaftlichen Forschung (FWF), Project Number P6300C. The authordeeply appreciates this support and thanks the Institute for Organic Chemistry of theUniversity of Vienna, and Hoechst-AG for kindly donating chiral test substances.
REFERENCES
1 G. Hesse and R. Hagel, Chromatographia, 9 (1976) 62.2 G. Hesse and R. Hagel, Liebigs Ann. Chem., (1976) 996.3 K. R. Lindner and A. Mannschreck, J. Chromatogr., 193 (1980) 308.4 K. Schlegel and M. Widhalm, Chem. Ber., 115 (1982) 3042.5 H. Koller, K.-H. Rimbock and A. Mannschreck, J. Chromatogr., 282 (1983) 89.6 G. Blaschke, H.-P. Kraft and H. Markgraf, Chem. Ber., 116 (1983) 3611.7 K.Schloge1 and M. Widhalm, Monatsh. Chem., 115 (1984) 1113.8 A. Mannschreck, H. Koller and R. Wernicke, Kontakte (Darmstadt), 1985(1 (1985) 40.9 E. Francotte, R. M. Wolf, D. Lohmann and R. Mueller, J. Chromatogr., 347 (1985) 25.
10 E. Francotte, H. Stierlin and J. W. Faigle, J. Chromatogr., 346 (1985) 321.11 K.-H. Rimbock, M. A. Cuyegkeng and A. Mannschreck, Chromatographia, 21 (1986) 223.12 G. Blaschke, J. Liq. Chromatogr., 9 (1986) 341.13 J. Scharf, K. Schlagel, M. Widhalm, J. Lex, W. Tuckmantel, E. Vogel and F. Pertlik, Monatsh. Chem.,
117 (1986) 255.14 T. Shibata, 1. Okamoto and K. Ishii, J. Liq. Chromatogr., 9 (1986) 313.15 A. Hussenius, R. Isaksson and O. Matsson, J. Chromatogr., 405 (1987) 155.16 M. Krause and R. Galensa, J. Chromatogr., 441 (1988) 417.17 Y. Okamoto, M. Kawashima, K. Yamamoto and K. Hatada, Chem. Lett., (1984) 739.18 A. Ichida, T. Shibata, 1. Okamoto, Y. Yuki, H. Namikoshi and Y. Toga, Chromatographia, 19 (1984)
280.19 A. Rizzi, J. Chromatogr., 478 (1989) 87.20 J. C. Giddings, Dynamics of Chromatography, Part I, Marcel Dekker, New York, 1965.21 J. F. K. Huber, J. Chromatogr. Sci., 7 (1969) 85.22 J. F. K. Huber, Ber. Bunsenges. Phys. Chem., 77 (1973) 179.23 G. J. Kennedy and J. H. Knox, J. Chromatogr. Sci., 10 (1972) 549.24 C. Horvath and H. J. Lin, J. Chromatogr., 149 (1978) 43.25 J. H. Knox and H. P. Scott, J. Chromatogr., 282 (1983) 297.

86 A. M. RIZZI
26 J. F. K. Huber, J. Quaadgras and A. Rizzi, 8th Int. Symp. Column Liquid Chromatography, New York,May 1984, Abstract No. 3pG3.
27 J. F. K. Huber, J. Quaadgras and A. Rizzi, in preparation.28 E. Katz, K. L. Ogan and R. P. W. Scott, J. Chromatogr., 270 (1983) 51.29 J. F. K. Huber and A. Rizzi, J. Chromatogr., 384 (1987) 337.30 I. W. Wainer and M. C. Alembik, J. Chromatogr., 358 (1986) 85.31 C. Roussel, J.-L. Stein, F. Beauvais and A. Chemlal, J. Chromatogr., in press.32 I. W. Wainer, M. C. Alembik and E. Smith, J. Chromatogr., 388 (1987) 65.33 I. W. Wainer, R. M. Stiffin and T. Shibata, J. Chromatogr., 411 (1987) 139.34 L. R. Snyder and J. J. Kirkland, Introduction to Modern Liquid Chromatography, Wiley, New York,
1979, p. 222.
Journal of Chromatography, 478 (1989) 87-99Elsevier Science Publishers B.V., Amsterdam - Printed in The Netherlands
CHROM.21 603
BAND BROADENING IN HIGH-PERFORMANCE LIQUID CHROMATOGRAPHIC SEPARATIONS OF ENANTIOMERS WITH SWOLLEN MICROCRYSTALLINE CELLULOSE TRIACETATE PACKINGS
II. INFLUENCE OF ELUENT COMPOSITION, TEMPERATURE AND PRESSURE
ANDREAS M. RIZZI
Institute 0/ Analytical Chemistry, University of Vienna, Wiihringerstrasse 38, A-1090 Vienna (Austria)
(First received February 20th, 1989; revised manuscript received April 27th, 1989)
SUMMARY
The peak dispersion in high-performance liquid chromatographic columnspacked with swollen crystalline cellulose triacetate was investigated as a function ofthe eluent composition, the temperature and the pressure. The results provide supportfor a model which assumes the existence of at least two types of adsorption sites,"quick"-type and "slow"-type sites, which differ with respect to the rate of the adsorption/desorption process. The observed dependence of the peak dispersion on thetemperature and the eluent composition can be understood as resulting from threefactors: (i) changes in the diffusion velocity by changes in the solvent viscosity; (ii)changes in the three-dimensional structure of the adsorbent due to changes in theswelling state of the CTA adsorbent and (iii) changes in the availability and accessibility of the adsorption sites due to differences in the strength of the competitive adsorption of the solvent components.
INTRODUCTION
Swollen microcrystalline cellulose triacetate (swcrCTA) has been widely applied for liquid chromatographic separations of enantiomeric compounds 1,2. Highenantioselectivity for many groups of compounds and high loadability are the mainadvantages of this adsorbent material. However, the large peak broadening usuallyobserved results in reduced efficiencyand limits the use of this material for analyticalpurposes.
In Part I 3 the peak broadening process on swcrCTA was systematically investigated with respect to the capacity factor of the analyte, analyte structure, flowvelocity and column loading. It was concluded that in columns packed with swcrCTAthe most important contribution to the plate height arises from the slow mass exchange in the packed bed. This is attributed to a slow transport process at narrowadsorption sites: slow diffusion and orientation at narrow sites, in narrow channels orin cavity-like structures.
0021-9673/89/$03.50 © 1989 Elsevier Science Publishers B.V.
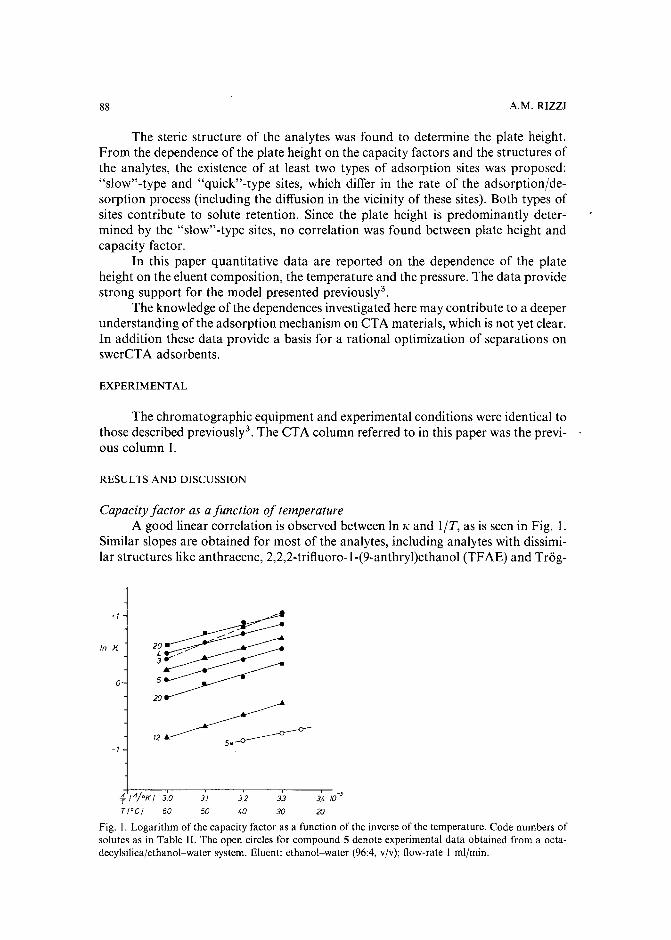
88 A.M. RIZZI
The steric structure of the analytes was found to determine the plate height.From the dependence of the plate height on the capacity factors and the structures ofthe analytes, the existence of at least two types of adsorption sites was proposed:"slow"-type and "quick"-type sites, which differ in the rate of the adsorption/desorption process (including the diffusion in the vicinity of these sites). Both types ofsites contribute to solute retention. Since the plate height is predominantly determined by the "slow"-type sites, no correlation was found between plate height andcapacity factor.
In this paper quantitative data are reported on the dependence of the plateheight on the eluent composition, the temperature and the pressure. The data providestrong support for the model presented previously".
The knowledge of the dependences investigated here may contribute to a deeperunderstanding of the adsorption mechanism on CTA materials, which is not yet clear.In addition these data provide a basis for a rational optimization of separations onswcrCTA adsorbents.
EXPERIMENTAL
The chromatographic equipment and experimental conditions were identical tothose described previously". The CTA column referred to in this paper was the previous column I.
RESULTS AND DISCUSSION
Capacity factor as a function of temperatureA good linear correlation is observed between In K and liT, as is seen in Fig. 1.
Similar slopes are obtained for most of the analytes, including analytes with dissimilar structures like anthracene, 2,2,2-trifluoro-l-(9-anthryl)ethanol (TFAE) and Trog-
+/
In ){
o
-t
4!~/oK! 3.0 3.1 3.2 3,3 3.410-'
rt-ct 60 50 40 30 20
Fig. I. Logarithm of the capacity factor as a function of the inverse of the temperature. Code numbers ofsolutes as in Table II. The open circles for compound 5 denote experimental data obtained from a octadecylsilica/ethanol-watcr system. Eluent: ethanol-water (96:4, v/v); flow-rate I ml/min.
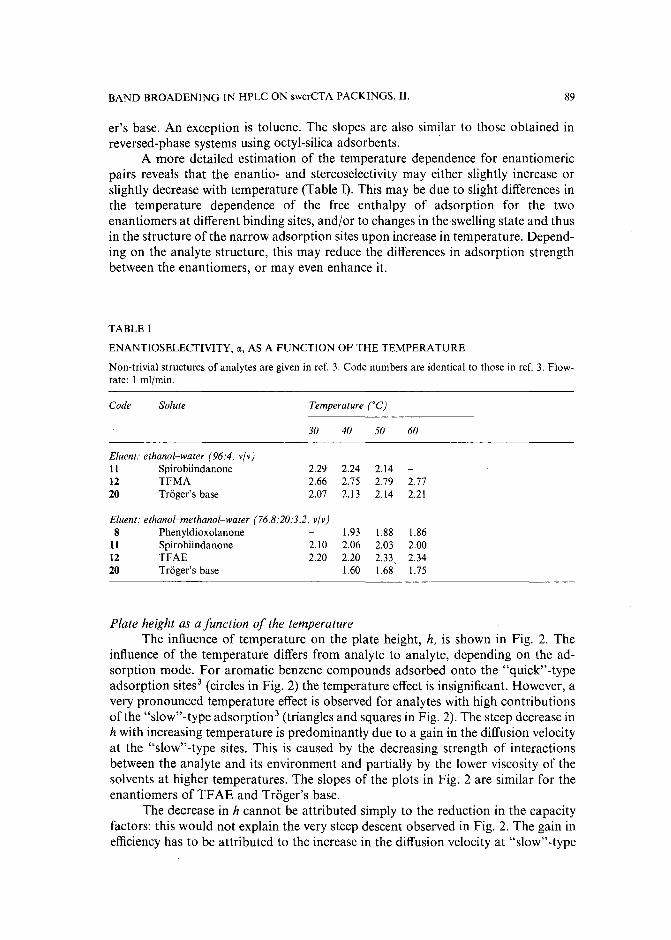
BAND BROADENING IN HPLC ON swcrCTA PACKINGS. II. 89
er's base. An exception is toluene. The slopes are also similar to those obtained inreversed-phase systems using octyl-silica adsorbents. .
A more detailed estimation of the temperature dependence for enantiomericpairs reveals that the enantio- and stereoselectivity may either slightly increase orslightly decrease with temperature (Table I). This may be due to slight differences inthe temperature dependence of the free enthalpy of adsorption for the twoenantiomers at different binding sites, and/or to changes in the swellingstate and thusin the structure of the narrow adsorption sites upon increase in temperature. Depending on the analyte structure, this may reduce the differences in adsorption strengthbetween the enantiomers, or may even enhance it.
TABLE I
ENANTlOSELECTlVITY, rt, AS A FUNCTION OF THE TEMPERATURE
Non-trivial structures of analytes are given in ref. 3. Code numbers are identical to those in ref. 3. Flowrate: I ml(min.
Code Solute Temperature (OC)
30 40 50 60
Eluent: ethanol-water (96:4, v]v}11 Spirobiindanone 2.29 2.24 2.1412 TFMA 2.66 2.75 2.79 2.7720 Troger's base 2.07 2.13 2.14 2.21
Eluent: ethanol-methanal-water (76.8:20:3.2, vlv)8 Phenyldioxolanone 1.93 1.88 1.86
11 Spirobiindanone 2.10 2.06 2.03 2.0012 TFAE 2.20 2.20 2.33 2.3420 Troger's base 1.60 1.68 1.75
Plate height as a function of the temperatureThe influence of temperature on the plate height, h, is shown in Fig. 2. The
influence of the temperature differs from analyte to analyte, depending on the adsorption mode. For aromatic benzene compounds adsorbed onto the "quick"-typeadsorption sites" (circles in Fig. 2) the temperature effect is insignificant. However, avery pronounced temperature effect is observed for analytes with high contributionsof the "slow"-type adsorption.' (triangles and squares in Fig. 2). The steep decrease inh with increasing temperature is predominantly due toa gain in the diffusion velocityat the "slow"-type sites. This is caused by the decreasing strength of interactionsbetween the analyte and its environment and partially by the lower viscosity of thesolvents at higher temperatures. The slopes of the plots in Fig. 2 are similar for theenantiomers of TF AE and Trager's base.
The decrease in h cannot be attributed simply to the reduction in the capacityfactors: this would not explain the very steep descent observed in Fig. 2. The gain inefficiency has to be attributed to the increase in the diffusion velocity at "slow"-type
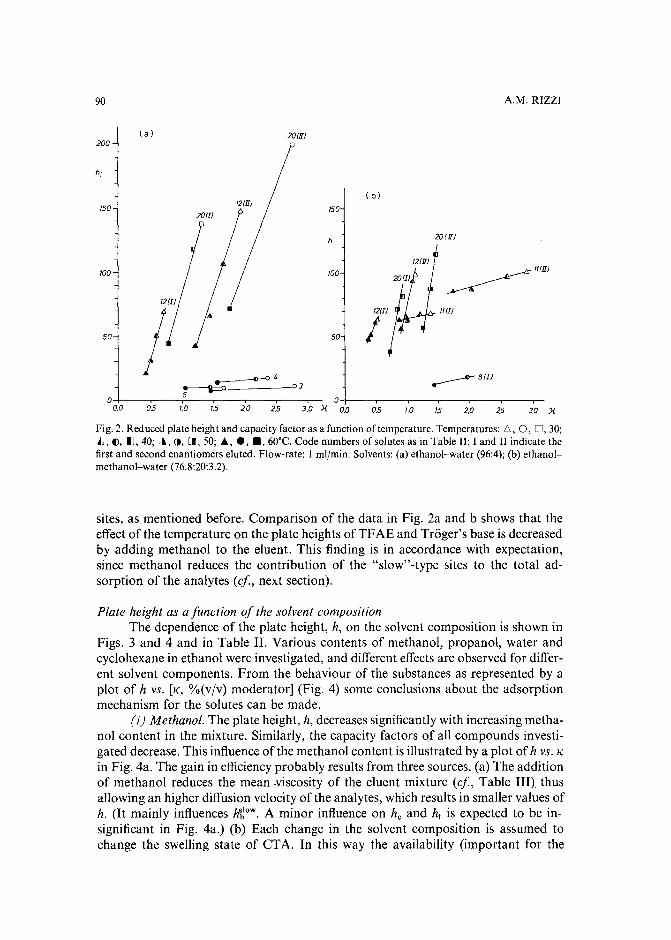
90 A.M. RIZZI
200(a) 201II)
hi
3,0 x25
~"III)
/III!
20 III)
1.5 20
...------ 8(1)
1.00.5
20iI!
l}
( b)
0-1---,----,.--,....---.---...,----,-Of)
50
150
100
3.0 X20 2.5
121II)
1.5
~4~ -03
1.00.50+----,----,,---.---...,-----,.----,
0.0
50
ISO
100
Fig. 2. Reduced plate height and capacity factor as a function of temperature. Temperatures: 6., 0, D, 30;L, (), IJ, 40; c~, (), [1,50; ., ., ., 60"C. Code numbers of solutes as in Table II; I and II indicate thefirst and second enantiomers eluted. Flow-rate: I mlfmin. Solvents: (a) ethanol-water (96:4); (b) ethanolmethanol-water (76.8:20:3.2).
sites, as mentioned before. Comparison of the data in Fig. 2a and b shows that theeffect of the temperature on the plate heights ofTFAE and Trager's base is decreasedby adding methanol to the eluent. This finding is in accordance with expectation,since methanol reduces the contribution of the "slow"-type sites to the total adsorption of the analytes (cf., next section).
Plate height as a function of the solvent compositionThe dependence of the plate height, h, on the solvent composition is shown in
Figs. 3 and 4 and in Table II. Various contents of methanol, propanol, water andcyclohexane in ethanol were investigated, and different effects are observed for different solvent components. From the behaviour of the substances as represented by aplot of h vs. [K, %(vjv) moderator] (Fig. 4) some conclusions about the adsorptionmechanism for the solutes can be made.
(i) Methanol. The plate height, h, decreases significantly with increasing methanol content in the mixture. Similarly, the capacity factors of all compounds investigated decrease. This influence of the methanol content is illustrated by a plot of h vs. K
in Fig. 4a. The gain in efficiencyprobably results from three sources. (a) The additionof methanol reduces the mean viscosity of the eluent mixture icf., Table III) thusallowing an higher diffusion velocity of the analytes, which results in smaller values ofh. (It mainly influences Jf;'ow. A minor influence on he and hr is expected to be insignificant in Fig. 4a.) (b) Each change in the solvent composition is assumed tochange the swelling state of CTA. In this way the availability (important for the
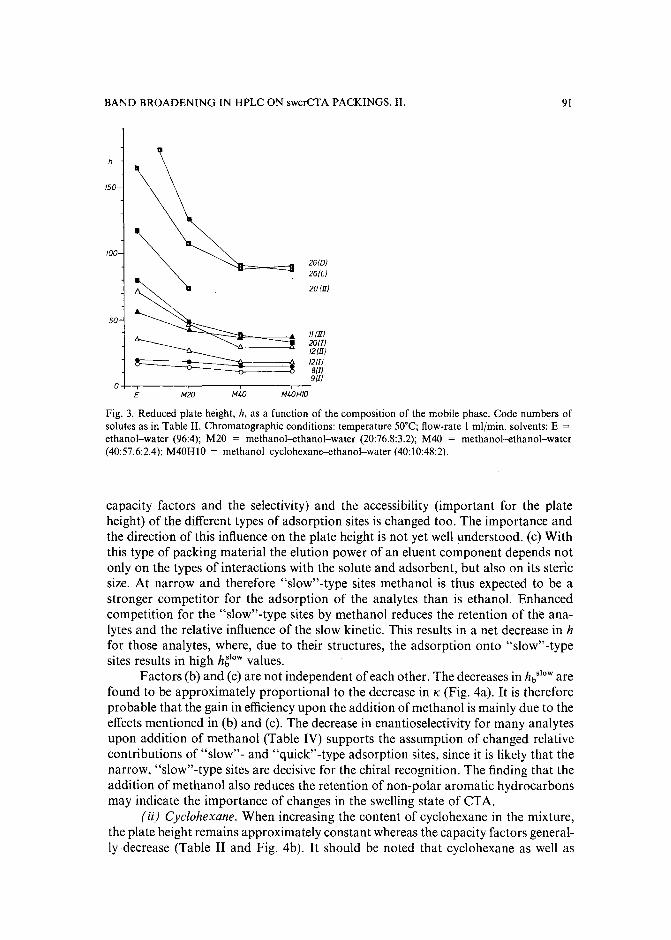
BAND BROADENING IN HPLC ON swcrCTA PACKINGS. II.
h
150
10026(O}
261L}
20 III}
50
II III}201!}121II)12(I}81IJ91!}
aE 1'120 1'140 M40HIO
91
Fig. 3. Reduced plate height, h, as a function of the composition of the mobile phase. Code numbers ofsolutes as in Table II. Chromatographic conditions: temperature SOT; flow-rate 1 ml/min. solvents: E =
ethanol-water (96:4); M20 = methanol-ethanol-water (20:76.8:3.2); M40 = methanol-ethanol-water(40:57.6:2.4): M40HIO = methanol-eyclohexane-ethanol-water (40:10:48:2).
capacity factors and the selectivity) and the accessibility (important for the plateheight) of the different types of adsorption sites is changed too. The importance andthe direction of this influence on the plate height is not yet well understood. (c) Withthis type of packing material the elution power of an eluent component depends notonly on the types of interactions with the solute and adsorbent, but also on its stericsize. At narrow and therefore "slow"-type sites methanol is thus expected to be astronger competitor for the adsorption of the analytes than is ethanol. Enhancedcompetition for the "slow"-type sites by methanol reduces the retention of the analytes and the relative influence of the slow kinetic. This results in a net decrease in hfor those analytes, where, due to their structures, the adsorption onto "slow"-typesites results in high htow values.
Factors (b) and (c) are not independent of each other. The decreases in hbslow arefound to be approximately proportional to the decrease in K (Fig. 4a). It is thereforeprobable that the gain in efficiencyupon the addition of methanol is mainly due to theeffects mentioned in (b) and (c). The decrease in enantioselectivity for many analytesupon addition of methanol (Table IV) supports the assumption of changed relativecontributions of "slow"- and "quick"-type adsorption sites, since it is likely that thenarrow, "slow"-type sites are decisive for the chiral recognition. The finding that theaddition of methanol also reduces the retention of non-polar aromatic hydrocarbonsmay indicate the importance of changes in the swelling state of CTA.
(ii) Cyclohexane. When increasing the content of cyclohexane in the mixture,the plate height remains approximately constant whereas the capacity factors generally decrease (Table II and Fig. 4b). It should be noted that cyclohexane as well as
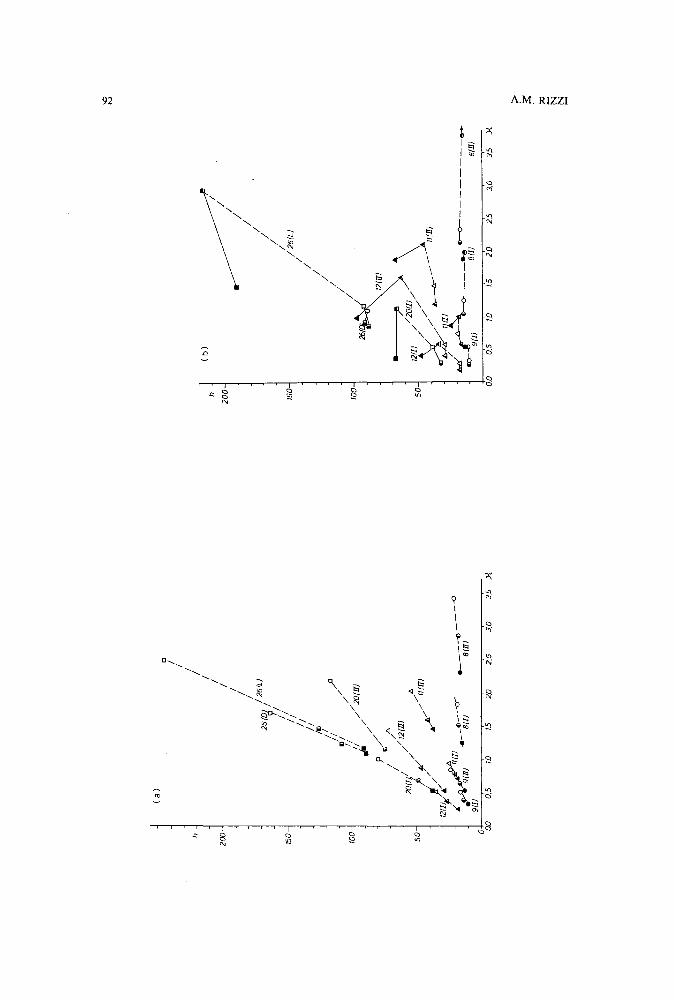
\0 IV
(a
)
(b
)
~/
//
/I
/26
1L
}/
//
//
/
26~~/ 12
1II}
•)!!
l\
/20
{I}//~
12{I
}//
""...
A\"
,,""
»->
IlII
I}6
,/~
~/I
II}
hd
/~~
~------
__
e_
ro--~
-o----~}
81II}
91IJ
00
0.5
101.
52
02.
53.
035
X
50100
150
h
20
0
3.5
X3.
02.
5
e_
----f>
----o
8III
}
20
1.5
o / I I / / / I / / /
261~
/26
IL}
//
/I
1/
1/ If II .i l II II ..
1D
/'/ "
//2
0III
)/ " "
o/
IIJ
"I
/I
/12
III}
//
A20
1I}
///
'III
I)!'~
/'/
}.!-//
-12
II~1
I1IJ
_,,_-0
~..
.-81
IJ91
II}9{
I} -0.5
h 50100
ISO
20
0
;> ~ ;:0 §
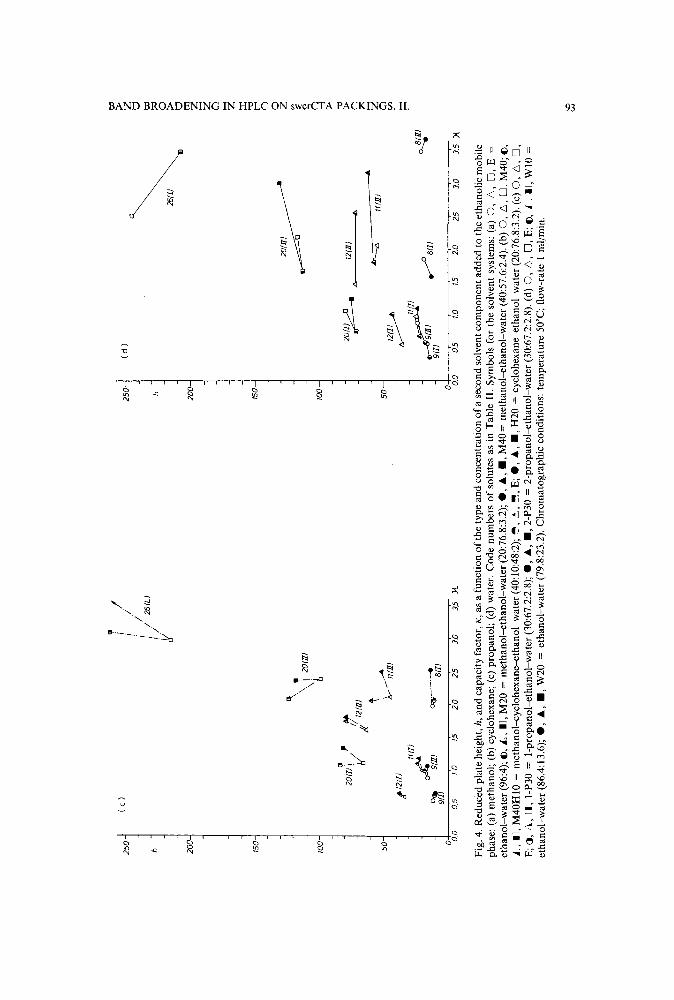
'P/
':'1(d
)
~i
(oJ
i./
25
0-f
./
I/
26IL
JI
.1
./
h
JI20
200-
-1
150
100
50
Il2
0lI
li.~
If/
,f1
21
II
I/II
Itt!
....cr
·"~
91D
I91
I15
/jj
15
'\.
\.i
20lII
1\&
.H
i/'2
IIII
If't .
..-4
J,-
/I/I
DI
_.-
eO
()'-
81I1
iois
3.0
150
i~
100 1
20~
121I
I1i:
>~
k::::
::;;;;
IIII
II5
0-1
~I/
III
~~81I1
~DI
9III
01I
':0':5
2.'0I
II
0.0
05
253.
03.
5x
t:Xl
;J> Z tl t:Xl ~ tl ~ Z o Z ::c -e h o z ~ n -l ;J> ~ o '" Z o !Z' - -
Fig.
4.R
educ
edpl
ate
heig
ht,
h,an
dca
paci
tyfa
ctor
,K
,as
afu
ncti
ono
fthe
type
and
conc
entr
atio
nof
ase
cond
solv
ent
com
pone
ntad
ded
toth
eet
hano
lic
mob
ileph
ase:
(a)
met
hano
l;(b
)cy
cloh
exan
e;(c
)pr
opan
ol;
(d)
wat
er.
Cod
enu
mbe
rso
fso
lute
sas
inT
able
II.
Sym
bols
for
the
solv
ent
syst
ems:
(a)0
,6,
D,
E=
etha
nol-
wat
er(9
6:4)
;o,
L,
IJ,
M20
=m
etha
nol-
etha
nol-
wat
er(2
0:76
.8:3
.2);.,.,.,
M4
0=
met
hano
l-et
hano
l-w
ater
(40:
57.6
:2.4
).(b
)0
,6
,D
,M
40;e,
A.,
II,
M40
HlO
=m
etha
nol-
-<:y
cloh
exan
e--e
than
ol-w
ater
(40:
10:4
8:2)
;e,
~,~,
E;.,.,.,
H20
=cy
cloh
exan
e-et
hano
l-w
ater
(20:
76.8
:3.2
).(c
)0
,6
,0
,E
;o,
L~,
[I,
I-P3
0=
l-pr
opan
ol-e
than
ol-w
ater
(30:
67.2
:2.8
);.,.,.,
2-P3
0=
2-pr
opan
ol--
etha
nol-
wat
er(3
0:67
.2:2
.8).
(d)
0,
6,
D,
E;o,
J,
II,
WIO
=et
hano
l-w
ater
(86.
4:13
.6);
.,.,.,
W20
=et
hano
l-w
ater
(79.
8:23
.2).
Chr
omat
ogra
phic
cond
itio
ns:
tem
pera
ture
50"C
;flo
w-r
ate
Im
l/rni
n.
\0 w
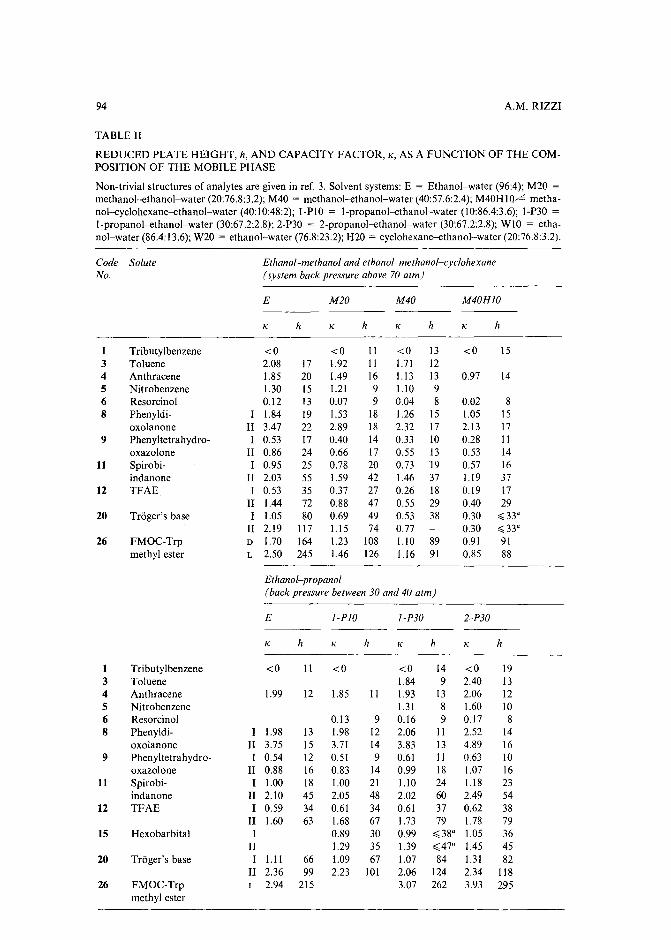
94 A.M. RIZZI
TABLE II
REDUCED PLATE HEIGHT, h, AND CAPACITY FACTOR, K, AS A FUNCTION OF THE COM-POSITION OF THE MOBILE PHASE
Non-trivial structures of analytes are given in ref. 3. Solvent systems: E = Ethanol-water (96:4); M20 =methanol-ethanol-water (20:76.8:3.2); M40 = methanol-ethanol-water (40:57.6:2.4); M40HI0/~ metha-nol-cyclohexane-ethanol-water (40:10:48:2); 1-PIO = l-propanol-ethanol-water (10:86.4:3.6); I-P30 =l-propanol-ethanol-water (30:67.2:2.8); 2-P30 = 2-propanol-ethanol-water (30:67.2:2.8); W10 = etha-nol-water (86.4: I3.6); W20 = ethanol-water (76.8:23.2); H20 = cyclohexane-ethanol-water (20:76.8:3.2).
Code Solute Ethanol-methanol and ethanol-methanol-cyclohexaneNo. (system back pressure above 70 atm)
E M20 M40 M40HlO
K h K h K h K h
1 Tributylbenzene <0 <0 II <0 13 <0 IS3 Toluene 2.08 17 1.92 II 1.71 124 Anthracene 1.85 20 1.49 16 1.13 13 0.97 145 Nitrobenzene 1.30 IS 1.21 9 1.10 96 Resorcinol 0.12 13 0.07 9 0.04 8 0.02 88 Phenyldi- I 1.84 19 1.53 18 1.26 IS 1.05 15
oxolanone II 3.47 22 2.89 18 2.32 17 2.13 179 Phenyltetrahydro- I 0.53 17 0.40 14 0.33 10 0.28 II
oxazolone II 0.86 24 0.66 17 0.55 13 0.53 1411 Spirobi- I 0.95 25 0.78 20 0.73 19 0.57 16
indanone II 2.03 55 1.59 42 1.46 37 1.19 3712 TFAE I 0.53 35 0.37 27 0.26 18 0.19 17
II 1.44 72 0.88 47 0.55 29 0.40 2920 Trager's base I 1.05 80 0.69 49 0.53 38 0.30 :;:; 33"
II 2.19 117 1.15 74 0.77 0.30 :;:; 33"26 FMOC-Trp D 1.70 164 1.23 108 1.10 89 0.91 91
methyl ester L 2.50 245 1.46 126 1.16 91 0.85 88
Ethanol-propanol(back pressure between 30 and 40 atm)
E I-PIO I-P30 2-P30
K h K h K h K h
1 Tributylbenzene <0 11 <0 <0 14 <0 193 Toluene 1.84 9 2.40 134 Anthracene 1.99 12 1.85 II 1.93 13 2.06 125 Nitrobenzene 1.31 8 1.60 106 Resorcinol 0.13 9 0.16 9 0.17 88 Phenyldi- I 1.98 13 1.98 12 2.06 II 2.52 14
oxolanone II 3.75 15 3.71 14 3.83 13 4.89 169 Phenyltetrahydro- I 0.54 12 0.51 9 0.61 11 0.63 10
oxazolone II 0.88 16 0.83 14 0.99 18 1.07 1611 Spirobi- I 1.00 18 1.00 21 1.10 24 1.18 23
indanone II 2.10 45 2.05 48 2.02 60 2.49 5412 TFAE I 0.59 34 0.61 34 0.61 37 0.62 38
II 1.60 63 1.68 67 1.73 79 1.78 7915 Hexobarbital I 0.89 30 0.99 :;:;38" 1.05 36
II 1.29 35 1.39 :;:;47" 1.45 4520 Trager's base I 1.11 66 1.09 67 1.07 84 1.31 82
II 2.36 99 2.23 101 2.06 124 2.34 11826 FMOC-Trp L 2.94 215 3.07 262 3.93 295
methyl ester
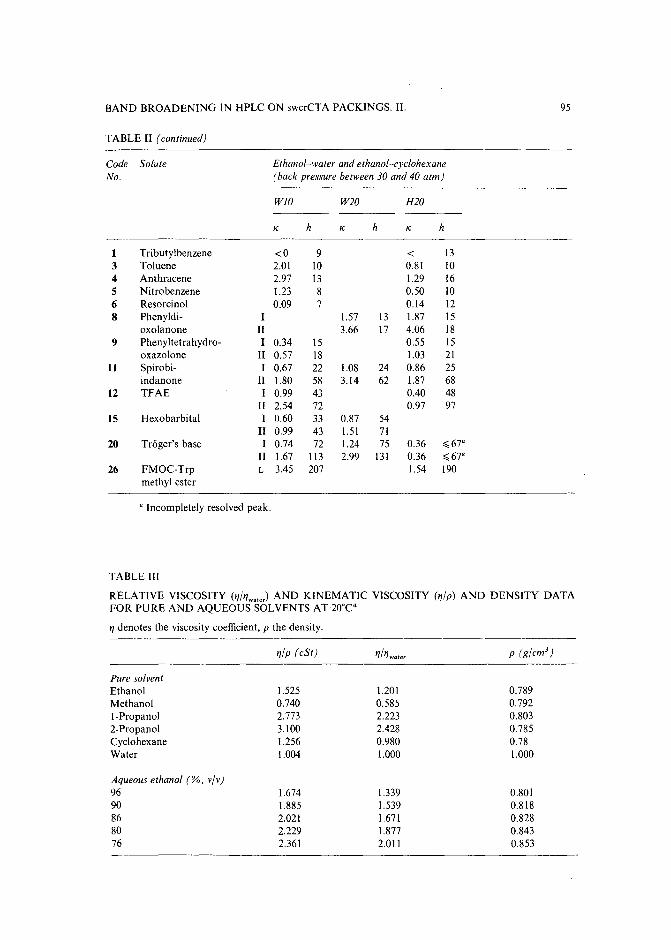
BAND BROADENING IN HPLC ON swcrCTA PACKINGS. II. 95
TABLE II (continued)
Code Solute Ethanol-water and ethanol-cyclohexaneNo. (back pressure between 30 and 40 atm)
WlO W20 H2O
K h K h K h
1 Tributylbenzene <0 9 < l33 Toluene 2.01 10 0.81 104 Anthracene 2.97 13 1.29 165 Nitrobenzene 1.23 8 0.50 106 Resorcinol 0.09 7 0.14 l28 Phenyldi- I 1.57 13 1.87 15
oxolanone II 3.66 17 4.06 189 Phenyltetrahydro- I 0.34 15 0.55 15
oxazolone II 0.57 18 1.03 2111 Spirobi- I 0.67 22 1.08 24 0.86 25
indanone II 1.80 58 3.14 62 1.87 6812 TFAE I 0.99 43 0.40 48
II 2.54 72 0.97 9715 Hexobarbital I 0.60 33 0.87 54
II 0.99 43 1.51 7120 Troger's base I 0.74 72 1.24 75 0.36 ~67"
II 1.67 113 2.99 l31 0.36 ~67"
26 FMOC-Trp L 3.45 207 1.54 190methyl ester
a Incompletely resolved peak.
TABLE III
RELATIVE VISCOSITY (Yf/Yfwotc<) AND KINEMATIC VISCOSITY (Yf/p) AND DENSITY DATAFOR PURE AND AQUEOUS SOLVENTS AT20·C4
n denotes the viscosity coefficient, p the density.
Yf/p (cSt) "ll1water p (g/cm3)
Pure solventEthanol 1.525 1.201 0.789Methanol 0.740 0.585 0.792I-Propanol 2.773 2.223 0.8032-Propanol 3.100 2.428 0.785Cyclohexane 1.256 0.980 0.78Water l.OO4 1.000 1.000
Aqueous ethanol (%, vlv )96 1.674 l.339 0.80190 1.885 1.539 0.81886 2.021 1.671 0.82880 2.229 1.877 0.84376 2.361 2.011 0.853
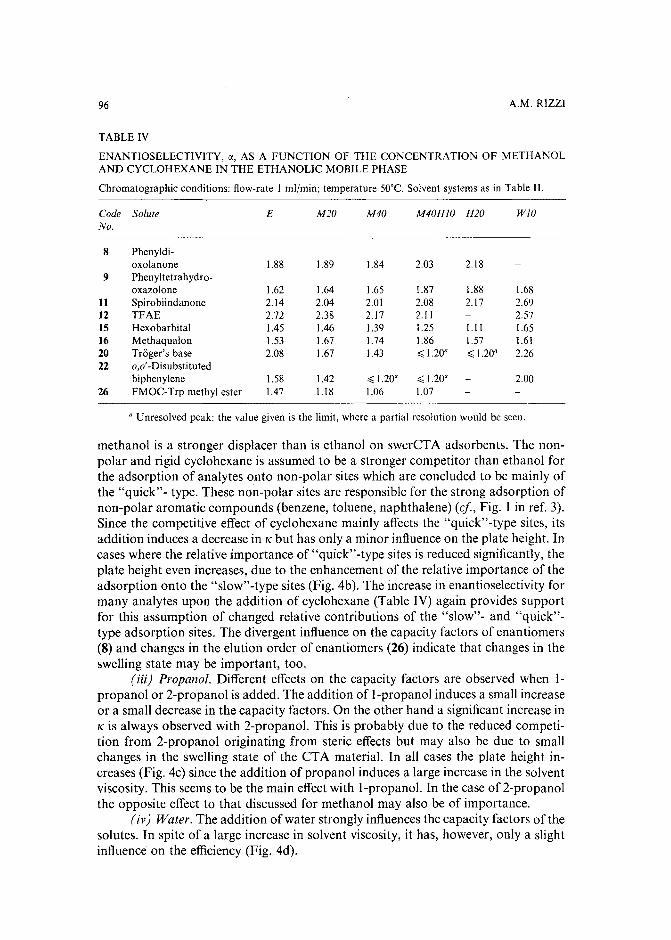
96 A.M. RIZZI
TABLE IV
ENANTIOSELECTIVITY, IX, AS A FUNCTION OF THE CONCENTRATION OF METHANOLAND CYCLOHEXANE IN THE ETHANOLIC MOBILE PHASE
Chromatographic conditions: flow-rate I ml/min; temperature 50·C. Solvent systems as in Table II.
Code SoluteNo.
E M20 M40 M40HlO H20 WIO
8 Phenyldi-oxolanone
9 Phenyltetrahydro-oxazolone
11 Spirobiindanone12 TFAE15 Hexobarbital16 Methaqualon20 Trager's base22 0,0' -Disubstituted
biphenylene26 FMOC-Trp methyl ester
1.88 1.89 1.84 2.03 2.18
1.62 1.64 1.65 1.87 1.88 1.682.14 2.04 2.01 2.08 2.17 2.692.72 2.38 2.17 2.1 I 2.571.45 1.46 1.39 1.25 1.11 1.651.53 1.67 1.74 1.86 1.57 1.612.08 1.67 1.43 :s; 1.20a :s; 1.20a 2.26
1.58 1.42 :s; 1.20" :s; 1.20a 2.001.47 1.18 1.06 1.07
a Unresolved peak: the value given is the limit, where a partial resolution would be seen.
methanol is a stronger displacer than is ethanol on swcrCTA adsorbents. The nonpolar and rigid cyclohexane is assumed to be a stronger competitor than ethanol forthe adsorption of analytes onto non-polar sites which are concluded to be mainly ofthe "quick"- type. These non-polar sites are responsible for the strong adsorption ofnon-polar aromatic compounds (benzene, toluene, naphthalene) tcf., Fig. I in ref. 3).Since the competitive effect of cyclohexane mainly affects the "quick"-type sites, itsaddition induces a decrease in K but has only a minor influence on the plate height. Incases where the relative importance of "quick"-type sites is reduced significantly, theplate height even increases, due to the enhancement of the relative importance of theadsorption onto the "slow"-type sites (Fig. 4b). The increase in enantioselectivity formany analytes upon the addition of cyclohexane (Table IV) again provides supportfor this assumption of changed relative contributions of the "slow"- and "quick"type adsorption sites. The divergent influence on the capacity factors of enantiomers(8) and changes in the elution order of enantiomers (26) indicate that changes in theswelling state may be important, too.
(iii) Propanol. Different effects on the capacity factors are observed when 1propanol or 2-propanol is added. The addition of l-propanol induces a small increaseor a small decrease in the capacity factors. On the other hand a significant increase inK is always observed with 2-propanol. This is probably due to the reduced competition from 2-propanol originating from steric effects but may also be due to smallchanges in the swelling state of the CTA material. In all cases the plate height increases (Fig. 4c) since the addition of propanol induces a large increase in the solventviscosity. This seems to be the main effect with I-propanol. In the case of 2-propanolthe opposite effect to that discussed for methanol may also be of importance.
(iv) Water. The addition of water strongly influences the capacity factors of thesolutes. In spite of a large increase in solvent viscosity, it has, however, only a slightinfluence on the efficiency (Fig. 4d).
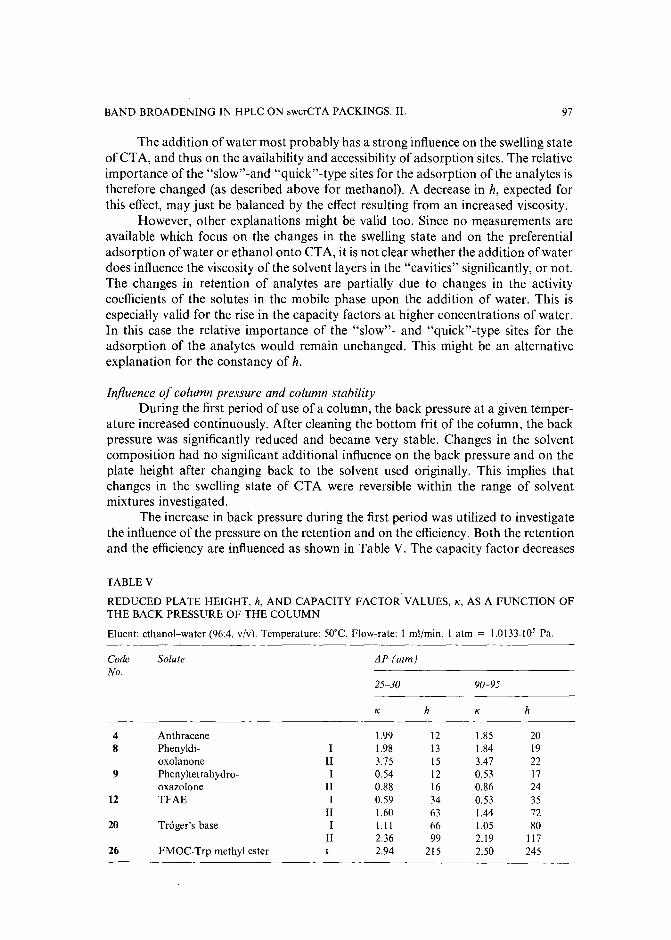
BAND BROADENING IN HPLC ON swcrCTA PACKINGS. II. 97
The addition of water most probably has a strong influence on the swellingstateof CTA, and thus on the availability and accessibility of adsorption sites. The relativeimportance of the "slow"-and "quick"-type sites for the adsorption of the analytes istherefore changed (as described above for methanol). A decrease in h, expected forthis effect, may just be balanced by the effect resulting from an increased viscosity.
However, other explanations might be valid too. Since no measurements areavailable which focus on the changes in the swelling state and on the preferentialadsorption of water or ethanol onto CTA, it is not clear whether the addition of waterdoes influence the viscosity of the solvent layers in the "cavities" significantly, or not.The changes in retention of analytes are partially due to changes in the activitycoefficients of the solutes in the mobile phase upon the addition of water. This isespecially valid for the rise in the capacity factors at higher concentrations of water.In this case the relative importance of the "slow"- and "quick"-type sites for theadsorption of the analytes would remain unchanged. This might be an alternativeexplanation for the constancy of h.
Influence of column pressure and column stabilityDuring the first period of use of a column, the back pressure at a given temper
ature increased continuously. After cleaning the bottom frit of the column, the backpressure was significantly reduced and became very stable. Changes in the solventcomposition had no significant additional influence on the back pressure and on theplate height after changing back to the solvent used originally. This implies thatchanges in the swelling state of CTA were reversible within the range of solventmixtures investigated.
The increase in back pressure during the first period was utilized to investigatethe influence of the pressure on the retention and on the efficiency. Both the retentionand the efficiency are influenced as shown in Table V. The capacity factor decreases
TABLE V
REDUCED PLATE HEIGHT, h, AND CAPACITY FACTOR VALUES, K, AS A FUNCTION OFTHE BACK PRESSURE OF THE COLUMN
Eluent: ethanol-water (96:4. v/v). Temperature: 50"C. Flow-rate: I ml/min. I atm = 1.0133.105 Pa.
Code SoluteNo.
4 Anthracene8 Phenyldi-
oxolanone9 Phenyltetrahydro-
oxazolone12 TFAE
20 Trager's base
26 FMOC-Trp methyl ester
LlP(atm)
25-30 90-95
K h K h
1.99 12 1.85 20I 1.98 13 1.84 19
II 3.75 15 3.47 22I 0.54 12 0.53 17
II 0.88 16 0.86 24I 0.59 34 0.53 35
II 1.60 63 1.44 72I 1.11 66 1.05 80
II 2.36 99 2.19 117L 2.94 215 2.50 245
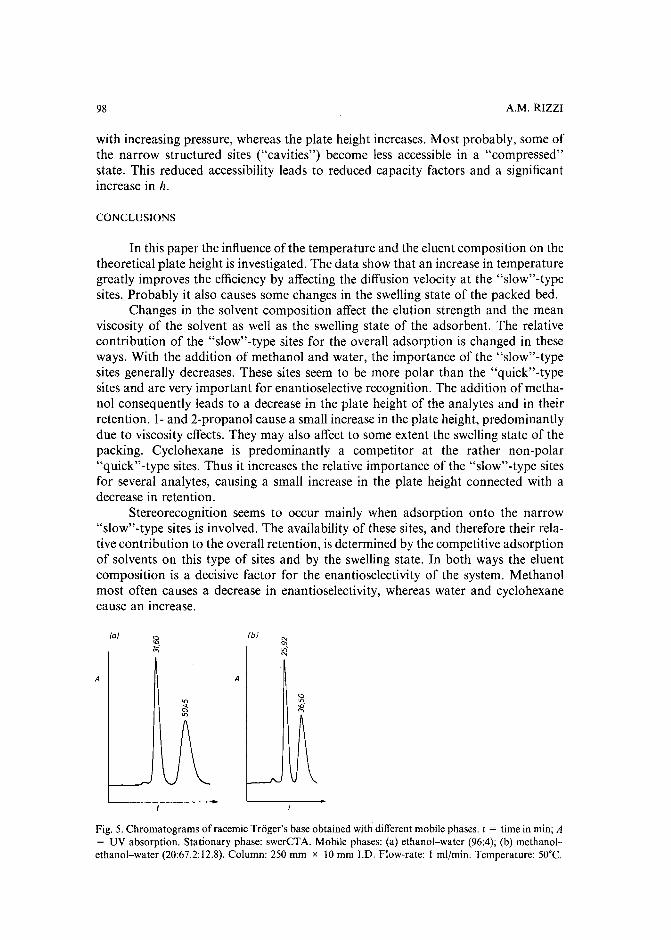
98 A.M. RIZZI
with increasing pressure, whereas the plate height increases. Most probably, some ofthe narrow structured sites ("cavities") become less accessible in a "compressed"state. This reduced accessibility leads to reduced capacity factors and a significantincrease in h.
CONCLUSIONS
In this paper the influence of the temperature and the eluent composition on thetheoretical plate height is investigated. The data show that an increase in temperaturegreatly improves the efficiency by affecting the diffusion velocity at the "slow"-typesites. Probably it also causes some changes in the swelling state of the packed bed.
Changes in the solvent composition affect the elution strength and the meanviscosity of the solvent as well as the swelling state of the adsorbent. The relativecontribution of the "slow"-type sites for the overall adsorption is changed in theseways. With the addition of methanol and water, the importance of the "slow"-typesites generally decreases. These sites seem to be more polar than the "quick"-typesites and are very important for enantioselective recognition. The addition ofmethanol consequently leads to a decrease in the plate height of the analytes and in theirretention. 1- and 2-propanol cause a small increase in the plate height, predominantlydue to viscosity effects. They may also affect to some extent the swelling state of thepacking. Cyclohexane is predominantly a competitor at the rather non-polar"quick"-type sites. Thus it increases the relative importance of the "slow"-type sitesfor several analytes, causing a small increase in the plate height connected with adecrease in retention.
Stereorecognition seems to occur mainly when adsorption onto the narrow"slow"-type sites is involved. The availability of these sites, and therefore their relative contribution to the overall retention, is determined by the competitive adsorptionof solvents on this type of sites and by the swelling state. In both ways the eluentcomposition is a decisive factor for the enantioselectivity of the system. Methanolmost often causes a decrease in enantioselectivity, whereas water and cyclohexanecause an increase.
A
Ial
A
ib]
Fig. 5. Chromatograms of racemic Trager's base obtained with different mobile phases. I = time in min; A= UV absorption. Stationary phase: swcrCTA. Mobile phases: (a) ethanol-water (96:4); (b) methanolethanol-water (20:67.2:12.8). Column: 250 mm x 10 mm J.D. Flow-rate: 1 ml/min. Temperature: 50°C.
BAND BROADENING IN HPLC ON swcrCTA PACKINGS. II. 99
For practical use it is important that changes in the swelling state induced bychanges in the solvent composition are fully reversible within the range of solventcomposition investigated.
There was a certain influence of pressure on the plate height. Obviously thepacked bed is still compressible to a small extent which affects the adsorption kineticsonto the "slow"-type sites.
The chromatograms in Fig. 5 illustrate the influence of the eluent compositionon the peak width and the chromatographic resolution of racemic Trager's base.
The detailed study of the plate height dependence on the four variables structure 3, retention 3, eluent composition and temperature provides interesting information about the mechanisms of adsorption and chiral recognition on swollen crystalline CTA materials. The consequences for the optimization of separations of opticalisomers by choosing an appropriate eluent composition, temperature and flow-ratefor an improvement in the efficiency will be discussed in detail in a forthcomingpaper 5.
ACKNOWLEDGEMENTS
This work was made possible by a grant from the Austrian Fond zur Forderungder Wissenschaftlichen Forschung (FWF), Project Number P6300C. The authordeeply appreciates this support and thanks the Institute for Organic Chemistry of theUniversity of Vienna, and Hoechst-AG for kindly donating chiral test substances.
REFERENCES
I G. Blaschke, J. Liq. Chromatogr., 9 (1986) 341.2 T. Shibata, I. Okamoto and K. Ishii, J. Liq. Chromatogr., 9 (1986) 313.3 A. Rizzi, J. Chromatogr., 478 (1989) 71.4 CRC Handbook of Chemistry and Physics, CRC Press, Boca Raton, FL, 1980.5 A. Rizzi, J. Chromatogr., 478 (1989) 101.

Journal of Chromatography, 478 (1989) 101-119Elsevier Science Publishers B.V., Amsterdam - Printed in The Netherlands
CHROM. 21 601
EVALUATION OF THE OPTIMIZATION POTENTIAL IN HIGH-PERFORMANCE LIQUID CHROMATOGRAPHIC SEPARATIONS OF OPTICALISOMERS WITH SWOLLEN MICROCRYSTALLINE CELLULOSE TRIACETATE
ANDREAS M. RIZZZI
Institute 0/ Analytical Chemistry, University 0/ Vienna, Wiihringerstrasse 38, A-1090 Vienna (Austria)
(First received February 27th, 1989, revised manuscript received April 27th, 1989)
SUMMARY
Quantitative data concerning the effect of temperature, solvent composition andflow-rate on the enantioselectivity, efficiency and retention for optical isomers onswollen crystalline cellulose triacetate are reported. Based on these data, theoptimization potential of the named variables for the separations of optical isomers isdiscussed with respect to the chromatographic resolution as well as to the analysistimes and the detection limits for the analytes. The trends observed can serve asguidelines for the derivation of optimization strategies.
INTRODUCTION
Triacetylated cellulose material has been used for several years as a stationaryphase for the chromatographic separation of optical isomersl"!". Due to the currenthigh interest in the role of optical isomers in biochemical processes, separationtechniques for enantiomeric compounds are developing rapidly. This has led also toa renaissance in the use of cellulose triacetate (CTA). Its chemical structure allowsvarious types of interactions with functional groups commonly encountered in drugs,thus enabling chiral recognition and discrimination for a variety of analytes ofdifferent structural types and sizes.This explains the wide field ofapplications of CTAchromatography to pharmaceutically active substances, which have been reviewedrecently by Blaschke? and Shibata et aU 4
.
CTA can be used either in a swollen microcrystalline state or as a layer coated onporous silica particles. Both types have quite different chromatographic behaviours,especially stereoselectivity and efficiency. The differences in stereoselectivity have beendiscussed by Shibata et al.r",
This paper deals with the evaluation of the optimization potential of differentvariables in chromatography with swollen microcrystalline cellulose triacetate (swcrCTA). The dependence of the plate height, enantioselectivity, capacity factors and theresolution on the eluent composition and on the process variables, temperature andflow velocity, has been investigated systematically. The implications of these findingsare discussed for a rational optimization of the chromatographic separations.
0021-9673/89/$03.50 © 1989 Elsevier Science Publishers B.V.
102 A. M. RIZZI
A thorough optimization of a separation may be of enhanced interest for routineanalysis methods or where preparative scale separations are performed.
EXPERIMENTAL
ApparatusChromatographic experiments were carried out using a high-pressure liquid
chromatographic pump (Model L-6200 intelligent pump; Merck-Hitachi, Tokyo,Japan), a syringe-valve injector (Model 7161; Rheodyne, Cotati, CA, U.S.A.)equipped with a 20-{l1100p, a column oven (Model 655A-52, Merck-Hitachi) and anUV detector (Model L-4000, Merck-Hitachi) connected to an integrator (ModelD-2000 chromato-integrator, Merck-Hitachi).
ColumnA prepacked column (250 mm x 10 mm J.D.) filled with swcrCTA with a mean
particle diameter of 10 {lm was used (Hibarw; E. Merck, Darmstadt, F.R.G.).
Reagents and samplesOrganic solvent components were obtained from E. Merck. Methanol and
hexane were of LrChrosolve quality, absolute ethanol ofp.a. quality. Water used forthe eluent preparation was distilled twice from a quartz apparatus and additionallypurified by passing through a RP-8 column. The eluent mixtures were premixed anddegassed in an ultrasonic bath.
The analyte samples were obtained in the highest purity grade available or werereceived in an highly purified state as gifts from synthesis laboratories.
ProcedureAll the data refer to isocratic elution at the given temperature. After establish
ment of the thermal equilibrium, the constancy ofretention data was about ± 1%. Thevoid volume of the column was estimated from the retention volume of the systempeaks of injected water, methanol or propanol and was approximately 15 m!. All thecalculations of the capacity factors are based on a void volume of 15.00 ml for allsolvent mixtures. UV detection was performed at 254 nm.
BASIC MODEL
Retention mechanism, capacity factor and stereoselectivityswcrCTA differs significantly in its adsorbent characteristics from other packing
materials. As this material provides different types of adsorption sites, differentmechanisms of adsorption seem to exist. The retention of an analyte is determined byits structure in a way which is not completely understood and for which only someempiric rules can be given.
Interactions both between polar structures and between non-polar structuresseem to be important. Obviously, the molecular volume plays an important role in thisrespect. For molecules with sterically large structures, like tert.~butyl groups, anexclusion from most of the adsorption sites is observed, e.g., for tri-zerz.vbutylbenzene.Similarly, in ethanolic eluents, charged organic analytes are eluted before the column
HPLC OF OPTICAL ISOMERS WITH swcrCTA 103
void volume 19. For non-polar aromatic and polyaromatic hydrocarbons the retention
decreases with increasing size of the molecule. Generally, however, the retention is notsimply correlated with the molecular size. Obviously, the configuration of the analytesplays an important role in the retention, otherwise this material would not be of greatuse for enantiomeric separations.
Prior to the presentation of the results a model concerning the adsorptionmechanism is briefly discussed which can serve as a basis for the interpretation anddiscussion of the experimental data in the next section. The model has been derived toa significant extent from peak dispersion data for swcrCTA adsorbents'Pv'". Thoseinvestigations reveal that with respect to the mass-exchange kinetics, at least two (butmaybe more) different types of adsorption sites are operative: "quick"-type and"slow"-type sites. These types differ in the kinetics of the adsorption/desorptionprocess, mainly due to the different diffusion velocities very near to the adsorptionsites. The adsorption sites differ also in their availability for different analytes andprobably in the strength of interaction with polar groups in the analyte molecule, (Theexistence ofa mixed adsorption mechanism, i.e. ofdifferent types of sites with respectto the type and strength of interaction, has been proposed by Scharfet al.13. It is likelythat the differences in the kinetic features and in the types of interactions arecorrelated: the sites which form stronger interactions with polar groups in the analytesseem to be of the "slow't-type!".
Concerning the peak broadening process, the observed plate height is predominantly dependent on the kinetics of the adsorption/desorption proces. Hindereddiffusion to (and at) narrow (maybe "channel"-like or "cavity"-like) structures of theswollen absorbent is probably responsible for the slow kinetics, which is observed formost analytes. The plate height ofan analyte is determined (i) by the accessibility of theadsorption sites which influences the velocity of motion of the analytes to and at thesites, and (ii) by the relative contributions of "slow" (narrow)- and "quick"-type(broad) sites to the retention of the analyte. The most important parameter influencingthe plate height ofthe analytes is therefore their molecular structure, since the structuredetermines the steric sizeand the types of interactions predominantly formed, and thusthe diffusion velocity and the type of sites at which the analyte is preferentiallyadsorbed. The plate height is therefore not simply correlated with the capacity factorsof the analytes. Any change in the accessibility and in the availability of the differenttypes of sites, e.g., by changes in the eluent composition, influ~nces the overall plateheight.
The retention of analytes isdetermined by the activity coefficients of the analytesin the mobile phase, and by the availability of the different adsorption sites. Theavailability depends on the swelling state of CTA and on the strength of thecompetitive adsorption effects of the solvent components at the adsorption sites. Withthe exception of the changes in the swelling state, this behaviour is analogous to othertypes of adsorption chromatography. Since both types of interactions, namely thosebetween polar structures and those between non-polar structures, are operative, polarand non-polar solvent components act as competitors for adsorption. As regards thestrength of the competitive effect, the size of the solvent molecules seems to playa major role. The solvent composition also influences the swelling state of theswcrCTA packing, and thus the number ofdifferent adsorption sites available. Owingto all these facts, no simple dependence of the capacity factors on the "hydro-
104 A. M. RIZZI
phobicity" and the "polarity" parameters of the eluent mixture is found, in contrast toreversed-phase chromatography with alkylsilica adsorbents and aqueous mobilephases.
For the steric discrimination of enantiomers, narrow adsorption sites seem to bedecisive. Most probably these sites are identical with those observed as "slow"-typesites from the point of view of the kinetics of mass exchange. The solvent compositionaffects the availability of these narrow sites either by the competitive adsorption ofsolvent components or by influencing the swelling state of the packing material. Inthese ways the solvent composition has a strong influence on the stereoselectivity.
The dependence of the capacity factor, K, enantioselectivity coefficient, «, andtheoretical plate height, H, on temperature, eluent composition and flow-rate isreported in detail in the following section.
RESULTS AND DISCUSSION
For the optimization of separations of enantiomers in high-performance liquidchromatography (HPLC) the most frequently used criterion is sufficient resolution ofthe optical isomers, obtained in the shortest possible analysis time, with the lowestpossible sample dilution. In this paper the following definition of the chromatographicresolution, Rs, is used
s, = (tI. - 1)' K( JNI + NIl1 + K( 2
(1)
where K denotes the capacity factors of the analytes, the indices I and II refer to the firstand second eluted isomer, respectively, tI.denotes the enantioselectivity coefficient andN the plate number with respect to the indicated enantiomer.
The reason for using the mean value of N in eqn. 1 is the observation that theplate numbers of the two isomers are most often considerably different when usingswcrCT A packings. This allows (i) the correlation to be kept between the numericalvalues of Rs and the separation effect obtained more or less unchanged in the usualmanner (for symmetric peaks of equal height, a Rs value of 6 means approximate"baseline separation"), and (ii) calculation of the minimum plate number, Nmin , whichis necessary to obtain a certain resolution, in a simple way. This would not be as simplewhen applying a more fundamental equation" for the resolution of peaks with strongly
a The chromatographic resolution of two peaks with very different plate numbers is defined ina more appropriate way by
where if is the mean standard deviation of the two peaks. Substituting the retention time and the peakstandard deviation by operational parameters leads to:
HPLC OF OPTICAL ISOMERS WITH swcrCTA 105
different peak widths. However, for the discussion of the trends in resolution andanalysis time, in this paper, the approximation of eqn. I is acceptable.
The minimum analysis time is defined in this context by
(2)
where H denotes the theoretical plate height, L the column length and u the linear flowvelocity.
Optimization of the separation can be carried out by tuning at least one of thethree decisive chromatographic parameters, IX,K, and/or N. Thus, the knowledge of thequantitative dependence of these chromatographic parameters from the variables,eluent composition, temperature and flow-rate, is a prerequisite for any rationaloptimization.
The chiral analytes shown in Table I were used for this investigation.
Optimization potential of the temperatureThe influence of the temperature on the capacity factor, the enantioselectivity
and the plate height is given in Table II. The capacity factors decrease with increasingtemperature for all the analytes investigated. A good linear correlation is obtainedbetween In K and I/T. The slope of this plot is similar to that observed in reversed-phasechromatography-", No effects, specific to CTA, were found with respect to this generaltrend.
Considering the enantioselectivity at different temperatures, a small increase isobserved for some analytes (TFAE, Trager's base), whereas for others (spirobiindanone, phenyldioxolanone) a slight decrease is observed. Probably the temperatureincrease causes some changes in the swelling state. This influences the structure of theadsorbent and thus to a certain degree the accessibility of the adsorption sites. In thisway the enantioselectivity may be enhanced or reduced.
The plate height generally decreases dramatically at higher temperatures (Fig.I), because of the increased diffusion velocity. Exceptions are those solutes where thekinetics of mass exchange is rapid even at low temperatures, e.g., phenyldioxolanon. Inthese cases the decrease is not as dramatic, but comparable to the effects found inreversed-phase chromatography with ODS packings.
The strong influence of the temperature on all of the chromatographicparameters (K, IX, H) means that the temperature is a most important optimizationparameter. The decrease in capacity factors in combination with the increase in platenumber, and sometimes also in enantioselectivity, makes the use of elevatedtemperatures favourable in those cases where no racemization of analytes takes placeat elevated temperatures. It allows reduced analysis times, increased peak heights andthus lower detection limits for the analytes.
The influence of the temperature on the chromatographic resolution may differ,as is seen in Table Ill. At constant enantioselectivity the effect ofa decreasing capacityfactor is by far overcompensated by the increase in N, for most analytes showingmedium or low efficiency. In these cases (TFAE, Trager's base) the resolution istherefore much improved with increasing temperature. Parallel to the improvement inthe chromatographic resolution, the minimum analysis time is reduced significantly(Table Ill). With methanol-ethanol mixed mobile phases the temperature effect is less
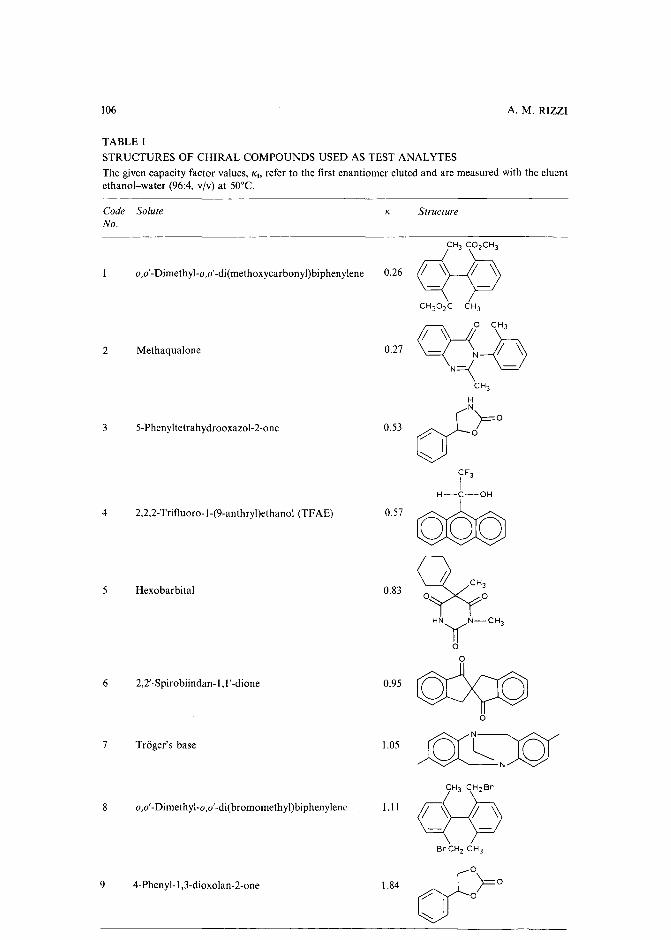
106 A. M. RIZZI
TABLE I
STRUCTURES OF CHIRAL COMPOUNDS USED AS TEST ANAL YTES
The given capacity factor values, K" refer to the first enantiomer eluted and are measured with the eluentethanol-water (96:4, vIv) at 50°C.
Code Solute K StructureNo.
CH3 C02CH 3
o,o'-Dimethyl-o,o'-di(methoxycarbonyl)biphenylene 0.26 cfPCH 302C CH 1Q)0 ,~,
2 Methaqualone 0.27 --0N=<N _
CH 3
H
3 5-Phenyltetrahydrooxazol-2-one 0.53 (/>=0? °0-.
1
CF3
IH-C-OH
4 2,2,2-Trifluoro-I-(9-anthryl)ethanol (TF AE) 0.57 00v5 Hexobarbital 0.83 ~,° °
HNyN-CH3
°°
6 2,2'-Spirobiindan-I, I'-dione 0.95
~°
7 Trager's base 1.05
~~8 0,0'-Dimethyl-o ,0'-di(bromomethyl)biphenylenc 1.11 cRJ
BrCH2 CH 3
9 4-Phenyl-I,3-dioxolan-2-one 1.84 0(>=00-.
1
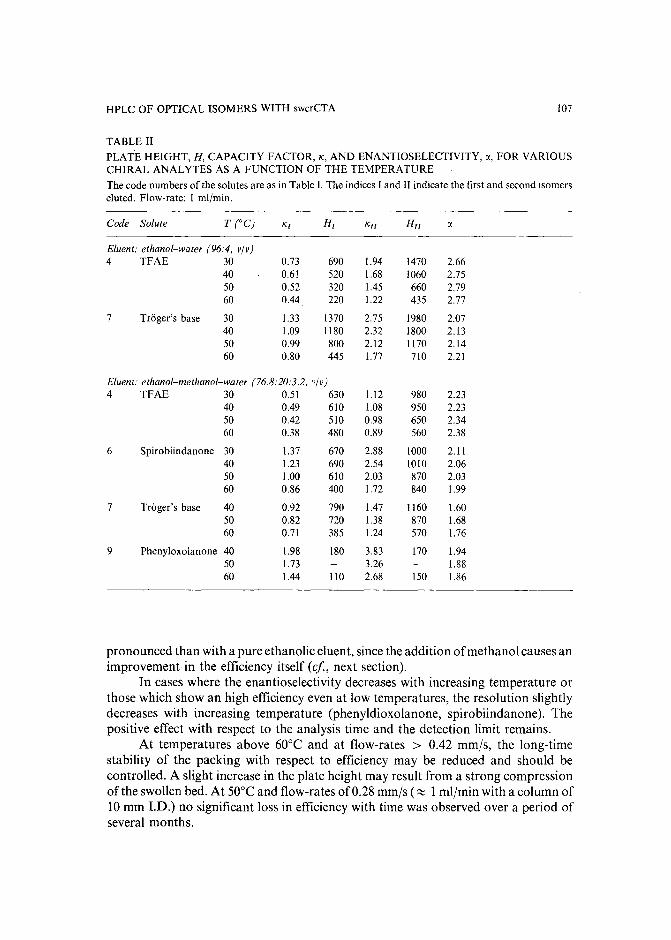
HPLC OF OPTICAL ISOMERS WITH swcrCTA 107
TABLE IIPLATE HEIGHT, H, CAPACITY FACTOR, K, AND ENANTIOSELECTIVITY, IX, FOR VARIOUSCHIRAL ANALYTES AS A FUNCTION OF THE TEMPERATURE
The code numbers of the solutes are as in Table I. The indices I and II indicate the first and second isomerseluted. Flow-rate: I ml/min.
Code Solute T (OC) K[ H[ Ku HIl IX
Eluent: ethanol-water (96:4, vlv)4 TFAE 30 0.73 690 1.94 1470 2.66
40 0.61 520 1.68 1060 2.7550 0.52 320 1.45 660 2.7960 0.44 220 1.22 435 2.77
7 Trager's base 30 1.33 1370 2.75 1980 2.0740 1.09 1180 2.32 1800 2.1350 0.99 800 2.12 /170 2.1460 0.80 445 1.77 710 2.21
Eluent: ethanol-methanol-water (76.8:20:3.2, »l»)4 TFAE 30 0.51 630 1.12 980 2.23
40 0.49 610 1.08 950 2.2350 0.42 510 0.98 650 2.3460 0.38 480 0.89 560 2.38
6 Spirobiindanone 30 1.37 670 2.88 1000 2.1140 1.23 690 2.54 1010 2.0650 1.00 610 2.03 870 2.0360 0.86 400 1.72 840 1.99
7 Trager's base 40 0.92 790 1.47 1160 1.6050 0.82 720 1.38 870 1.6860 0.71 385 1.24 570 1.76
9 Phenyloxolanone 40 1.98 180 3.83 170 1.9450 1.73 3.26 1.8860 1.44 110 2.68 150 1.86
pronounced than with a pure ethanolic eluent, since the addition of methanol causes animprovement in the efficiency itself (ef, next section).
In cases where the enantioselectivity decreases with increasing temperature orthose which show an high efficiency even at low temperatures, the resolution slightlydecreases with increasing temperature (phenyldioxolanone, spirobiindanone). Thepositive effect with respect to the analysis time and the detection limit remains.
At temperatures above 60°C and at flow-rates > 0.42 mm/s, the long-timestability of the packing with respect to efficiency may be reduced and should becontrolled. A slight increase in the plate height may result from a strong compressionof the swollen bed. At 50°C and flow-rates of 0.28 mm/s (~ 1 ml/min with a column of10 mm J.D.) no significant loss in efficiency with time was observed over a period ofseveral months.
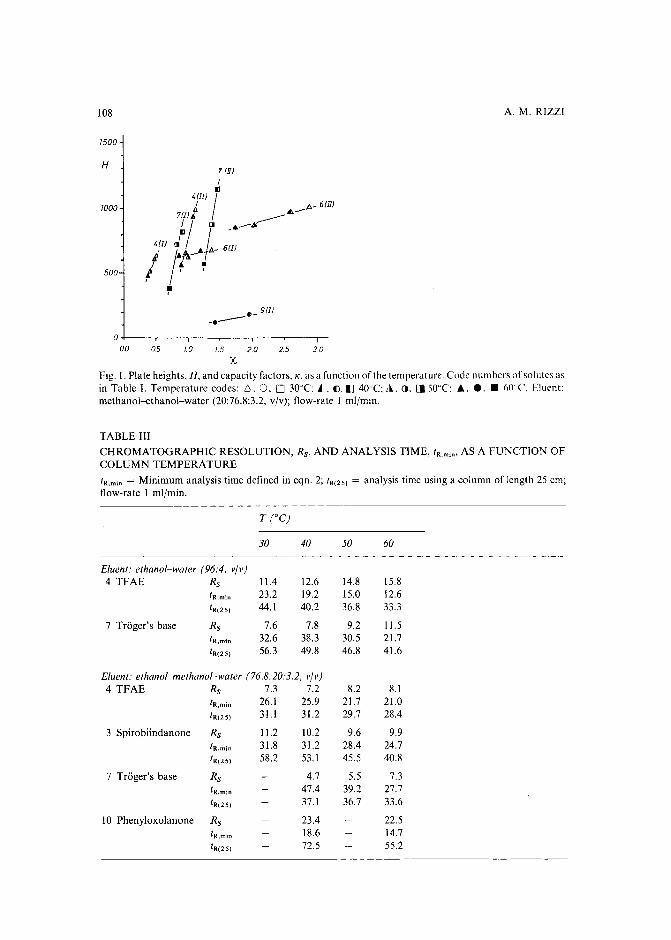
108 A. M. RIZZI
7500
H
7000
500
71IIiI
Il
41IIJ I~ A- 61JI)nu« .____£--II [J ._AIl / -4111 rJ,!... .. A- 61Ii .
f :ara-• •} / I
I
•IC)- 9111.e-
3.02.52.01.51.005O+---r--.,.---r--.,.--~---.
00
XFig. I. Plate heights, H, and capacity factors, K, as a function of the temperature. Code numbers of solutes asin Table I. Temperature codes: 6. o, 0 30vC:
~ , o, IJ 40"C: ,l., o, II 'iOT: A, ., • IiO C'. Eluent:methanol-ethanol-water (20:76.8:3.2, vjv); flow-rate I ml/min.
TABLE III
CHROMATOGRAPHIC RESOLUTION, Rs, AND ANALYSIS TIME, tR,m,", AS A FUNCTION OFCOLUMN TEMPERATURE
tR,m,n = Minimum analysis time defined in eqn. 2; t R(25) = analysis time using a column of length 25 em;flow-rate I ml/min,
T (OC)
30 40 50 60
Eluent: ethanol-water (96:4, vjv)4 TFAE Rs 11.4 12,6 14.8 15.8
(R,min 23.2 19.2 15.0 12.6t R(25) 44.1 40.2 36.8 33.3
7 Trager's base Rs 7,6 7.8 9.2 11.5lR,min 32.6 38.3 30.5 21.7t R(25) 56.3 49.8 46.8 41.6
Eluent: ethanol-methanol-water (76.8:20:3.2, v[v)4 TFAE Rs 7.3 7.2 8.2 8.1
lR,min 26.1 25.9 21.7 21.0t R(25) 31.1 31.2 29.7 28.4
3 .Spirobiindanone Rs 11.2 10.2 9.6 9.9lR,min 31.8 31.2 28.4 24.7t R(25) 58.2 53.1 45.5 40.8
7 Trager's base Rs 4.7 5,5 7.3lR,min 47.4 39.2 27.7t R(25) 37, I 36.7 33.6
10 Phenyloxolanone Rs 23.4 22,5
lR,min 18.6 14,7
t R(25) 72.5 55.2
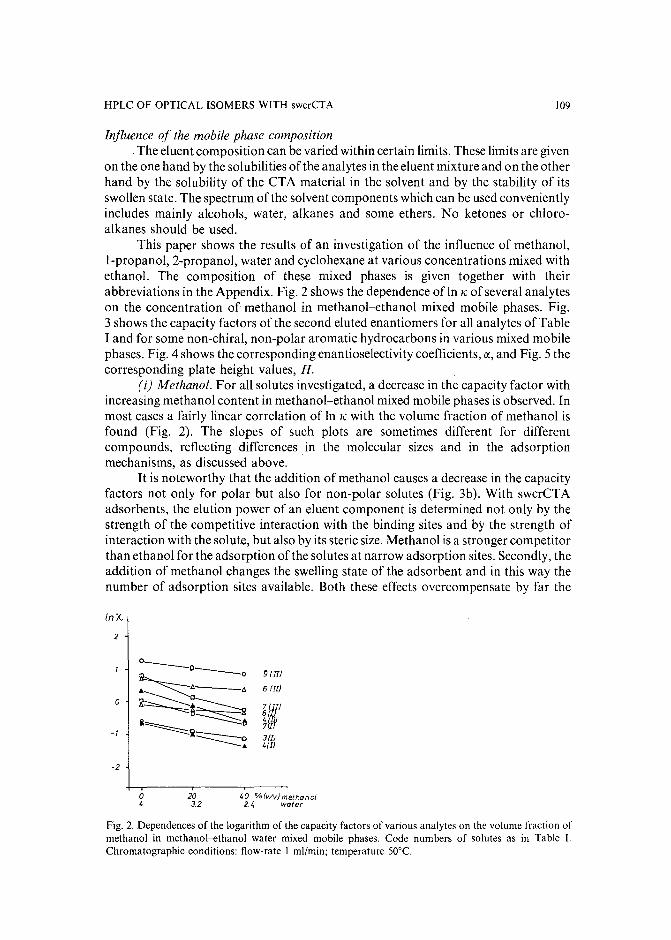
HPLC OF OPTICAL ISOMERS WITH swcrCTA 109
Influence of the mobile phase compositionThe eluent composition can be varied within certain limits. These limits are given
on the one hand by the solubilities ofthe analytes in the eluent mixture and on the otherhand by the solubility of the CTA material in the solvent and by the stability of itsswollen state. The spectrum of the solvent components which can be used convenientlyincludes mainly alcohols, water, alkanes and some ethers. No ketones or chloroalkanes should be used.
This paper shows the results of an investigation of the influence of methanol,I-propanol, 2-propanol, water and cyclohexane at various concentrations mixed withethanol. The composition of these mixed phases is given together with theirabbreviations in the Appendix. Fig. 2 shows the dependence ofln K of several analyteson the concentration of methanol in methanol-ethanol mixed mobile phases. Fig.3 shows the capacity factors of the second eluted enantiomers for all analytes ofTableI and for some non-chiral, non-polar aromatic hydrocarbons in various mixed mobilephases. Fig. 4 shows the corresponding enantioselectivity coefficients, ex, and Fig. 5 thecorresponding plate height values, H.
(i) Methanol. For all solutes investigated, a decrease in the capacity factor withincreasing methanol content in methanol-ethanol mixed mobile phases is observed. Inmost cases a fairly linear correlation of In K with the volume fraction of methanol isfound (Fig. 2). The slopes of such plots are sometimes different for differentcompounds, reflecting differences in the molecular sizes and in the adsorptionmechanisms, as discussed above. .
It is noteworthy that the addition of methanol causes a decrease in the capacityfactors not only for polar but also for non-polar solutes (Fig. 3b). With swcrCTAadsorbents, the elution power of an eluent component is determined not only by thestrength of the competitive interaction with the binding sites and by the strength ofinteraction with the solute, but also by its steric size. Methanol is a stronger competitorthan ethanol for the adsorption of the solutes at narrow adsorption sites. Secondly, theaddition of methanol changes the swelling state of the adsorbent and in this way thenumber of adsorption sites available. Both these effects overcompensate by far the
InX
2
o
-1
-2
!JIJIJ
61JIJ
7.I~J6(I
jfl31114(lJ
o4
203.2
40 %lv/vJmelhanal2.4 waler
Fig. 2. Dependences of the logarithm of the capacity factors of various analytes on the volume fraction ofmethanol in methanol-ethanol-water mixed mobile phases. Code numbers of solutes as in Table I.Chromatographic conditions: flow-rate I ml/rnin; temperature 50°C.
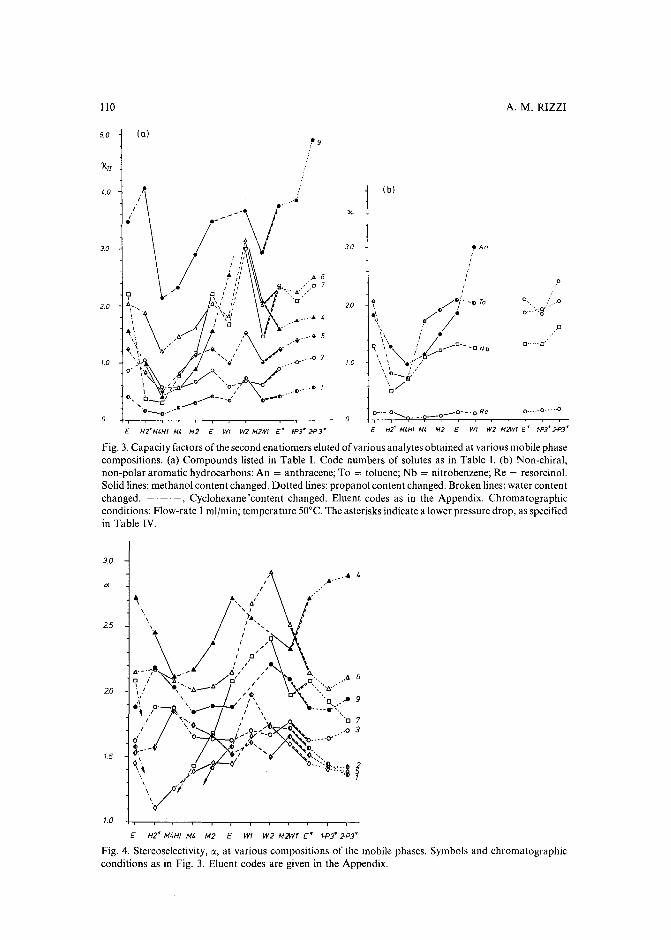
0"---0"
J)
0 •.•.. 0 ...•-0
:,0
o. ,0
o....:····g·,····
0-·-·0-............ _._. _0--0---0 Re
, An,,,,,,,,~ /~f--~ To
fl /11 •
'\ lJ /1.\ .Ii· c-q ~." ,/ c-- -"'CNb
\ \ " ic-:\ \ -,/",>'
".o__~v
't/
1.0
20
30
1.0
3.0
2.0
110 A. M. RIZZI
5.0 (a)
t 9
XII
.. 0 II ( b)I .•
E H2'M.HI M' M2 E WI W2 M2WI e: fP3' 2P 3' E H2' M'HI M4 M2 E WI W2 M2W! E' !-P]' cP3'
Fig. 3. Capacity factors of the second enatiomers eluted of various analytes obtained at various mobile phasecompositions. (a) Compounds listed in Table I. Code numbers of solutes as in Table I. (b) Non-chiral,non-polar aromatic hydrocarbons: An = anthracene; To = toluene; Nb = nitrobenzene; Re = resorcinol.Solid lines: methanol content changed. Dotted lines:propanol content changed. Broken lines:water contentchanged. -' -' -, Cyclohexane 'content changed. Eluent codes as in the Appendix. Chromatographicconditions: Flow-rate I ml/min; temperature 50°C. The asterisks indicate a lower pressure drop, as specifiedin Table IV.
3.0
2.5
2.0
1.5
1.0
E H2< fv14Hl fv14 fv12 E WI W2 fv12WT E< !-P3' 2-P3'
Fig. 4. Stereoselectivity, IX, at various compositions of the mobile phases. Symbols and chromatographicconditions as in Fig. 3. Eluent codes are given in the Appendix.
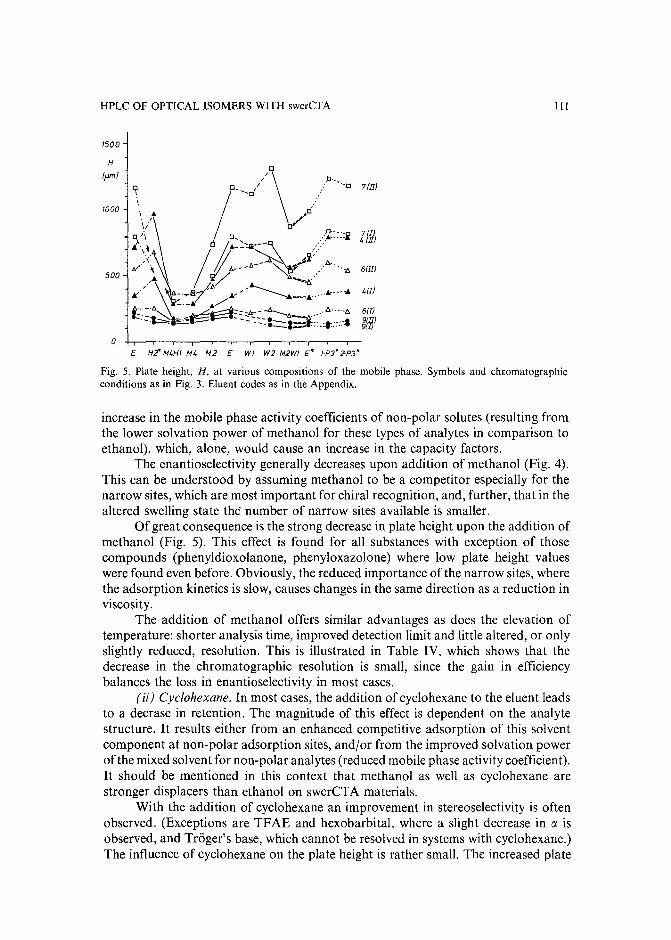
HPLC OF OPTICAL ISOMERS WITH swcrCTA
1500
III
H
lpml
1000
500
aE H2' M4HI M4 M2 E WI W2 M2WI E' I-P]' 2-P] ,
Fig. 5. Plate height, H, at various compositions of the mobile phase. Symbols and chromatographicconditions as in Fig. 3. Eluent codes as in the Appendix.
increase in the mobile phase activity coefficients of non-polar solutes (resulting fromthe lower solvation power of methanol for these types of analytes in comparison toethanol), which, alone, would cause an increase in the capacity factors.
The enantioselectivity generally decreases upon addition of methanol (Fig. 4).This can be understood by assuming methanol to be a competitor especially for thenarrow sites, which are most important for chiral recognition, and, further, that in thealtered swelling state the number of narrow sites available is smaller.
Of great consequence is the strong decrease in plate height upon the addition ofmethanol (Fig. 5). This effect is found for all substances with exception of thosecompounds (phenyldioxolanone, phenyloxazolone) where low plate height valueswere found even before. Obviously, the reduced importance of thenarrow sites, wherethe adsorption kinetics is slow, causes changes in the same direction as a reduction inviscosity.
The addition of methanol offers similar advantages as does the elevation oftemperature: shorter analysis time, improved detection limit and little altered, or onlyslightly reduced, resolution. This is illustrated in Table IV, which shows that thedecrease in the chromatographic resolution is small, since the gain inefficiencybalances the loss in enantioselectivity in most cases.
(ii) Cyclohexane. In most cases, the addition of cyclohexane to the eluent leadsto a decrase in retention. The magnitude of this effect is dependent on the analytestructure. It results either from an enhanced competitive adsorption of this solventcomponent at non-polar adsorption sites, and/or from the improved solvation powerof the mixed solvent for non-polar analytes (reduced mobile phase activity coefficient).It should be mentioned in this context that methanol as well as cyclohexane arestronger displacers than ethanol on swcrCTA materials.
With the addition of cyclohexane an improvement in stereoselectivity is oftenobserved. (Exceptions are TFAE and hexobarbital, where a slight decrease in IX isobserved, and Trager's base, which cannot be resolved in systems with cyclohexane.)The influence of cyclohexane on the plate height is rather small. The increased plate
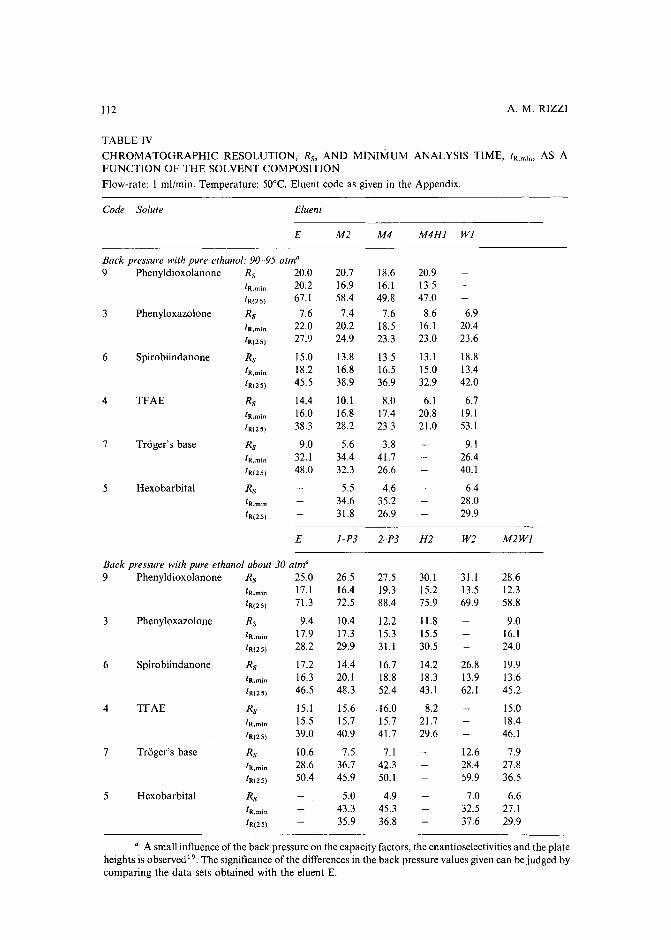
112 A. M. RIZZI
TABLE IV
CHROMATOGRAPHIC RESOLUTION, Rs, AND MINIMUM ANALYS.lS TIME, tR•m i" , AS AFUNCTION OF THE SOLVENT COMPOSIT.lON
Flow-rate: 1 mlfmin. Temperature: 50°C. Eluent code as given in the Appendix.
Code Solute Eluent
E M2 M4 M4HI WI
Back pressure with pure ethanol: 90-95 atm"9 Phenyldioxolanone Rs 20.0 20.7 18.6 20.9
lR,min 20.2 16.9 16.1 13.5tR(25) 67.1 58.4 49.8 47.0
3 Phenyloxazolone Rs 7.6 7.4 7.6 8.6 6.9
lR,min 22.0 20.2 18.5 16.1 20.4tR(25) 27.9 24.9 23.3 23.0 23.6
6 Spirobiindanone Rs 15.0 13.8 13.5 13.1 18.8
lR,min 18.2 16.8 16.5 15.0 13.4tR(25) 45.5 38.9 36.9 32.9 42.0
4 TFAE Rs 14.4 10.1 8.0 6.1 6.7lR,min 16.0 16.8 17.4 20.8 19.1tR(25) 38.3 28.2 23.3 21.0 53.1
7 Troger's base Rs 9.0 5.6 3.8 9.1
lR,min 32.1 34.4 41.7 26.4tR(25) 48.0 32.3 26.6 40.1
5 Hexobarbital Rs 5.5 4.6 6.4
lR,min 34.6 35.2 28.0tR(25) 31.8 26.9 29.9
E I-P3 2-P3 H2 W2 M2WI
Back pressure with pure ethanol about 30 aim"9 Phenyldioxo1anone Rs 25.0 26.5 27.5 30.1 31.1 28.6
IR,min 17.1 16.4 19.3 15.2 13.5 12.3tR(25) 71.3 72.5 88.4 75.9 69.9 58.8
3 Phenyloxazolone Rs 9.4 10.4 12.2 11.8 9.0lR,min 17.9 17.3 15.3 15.5 16.1tR(25) 28.2 29.9 31.1 30.5 24.0
6 Spirobiindanone Rs 17.2 14.4 16.7 14.2 26.8 19.9lR,min 16.3 20.1 18.8 18.3 13.9 13.6tR(25) 46.5 48.3 52.4 43.1 62.1 45.2
4 TFAE Rs 15.1 15.6 16.0 8.2 15.0lR,min 15.5 15.7 15.7 21.7 18.4
tR(2 51 39.0 40.9 41.7 29.6 46.1
7 Troger's base Rs 10.6 7.5 7.1 12.6 7.9
lR,min 28.6 36.7 42.3 28.4 27.8tR(25) 50.4 45.9 50.1 59.9 36.5
5 Hexobarbital Rs 5.0 4.9 7.0 6.6lR,min 43.3 45.3 32.5 27.1tR(25) 35.9 36.8 37.6 29.9
a A small influence of the back pressure on the capacity factors, the enantioselectivities and the plateheights is observed l", The significance of the differences in the back pressure values given can be judged bycomparing the data sets obtained with the eluent E.
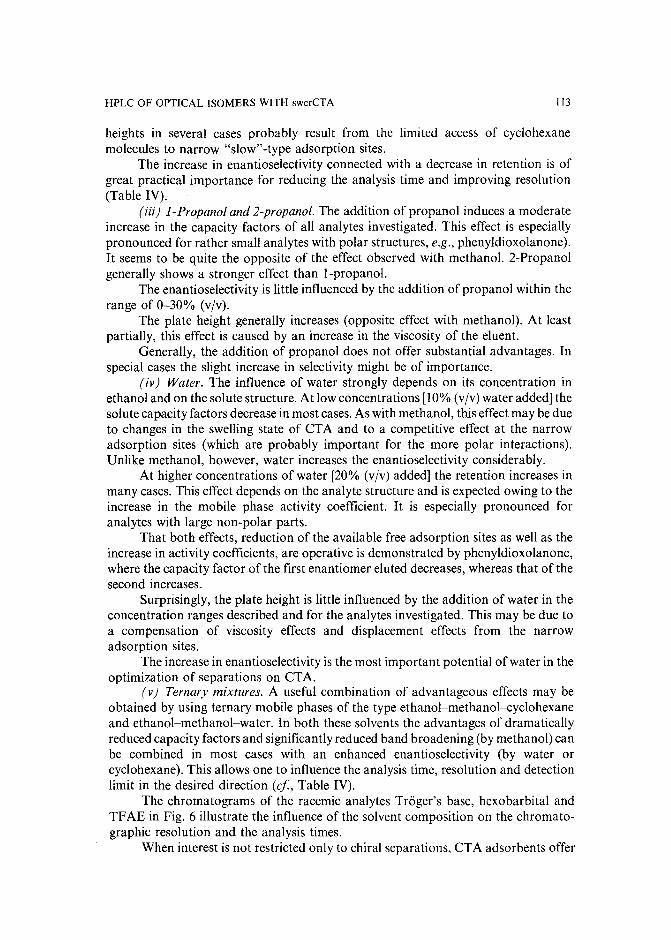
HPLC OF OPTICAL ISOMERS WITH swerCTA 113
heights in several cases probably result from the limited access of cyclohexanemolecules to narrow "slow"-type adsorption sites.
The increase in enantioselectivity connected with a decrease in retention is ofgreat practical importance for reducing the analysis time and improving resolution(Table IV).
(iii) I-Propanol and 2-propanol. The addition of propanol induces a moderateincrease in the capacity factors of all analytes investigated. This effect is especiallypronounced for rather small analytes with polar structures, e.g., phenyldioxolanone).It seems to be quite the opposite of the effect observed with methanol. 2-Propanolgenerally shows a stronger effect than l-propanol.
The enantioselectivity is little influenced by the addition of propanol within therange of 0-30% (vjv).
The plate height generally increases (opposite effect with methanol). At leastpartially, this effect is caused by an increase in the viscosity of the eluent.
Generally, the addition of propanol does not offer substantial advantages. Inspecial cases the slight increase in selectivity might be of importance.
(iv) Water. The influence of water strongly depends on its concentration inethanol and on the solute structure. At low concentrations [10% (vjv) water added] thesolute capacity factors decrease in most cases. As with methanol, this effect may be dueto changes in the swelling state of CTA and to a competitive effect at the narrowadsorption sites (which are probably important for the more polar interactions).Unlike methanol, however, water increases the enantioselectivity considerably.
At higher concentrations of water [20% (vjv) added] the retention increases inmany cases. This effect depends on the analyte structure and is expected owing to theincrease in the mobile phase activity coefficient. It is especially pronounced foranalytes with large non-polar parts.
That both effects, reduction of the available free adsorption sites as well as theincrease in activity coefficients, are operative is demonstrated by phenyldioxolanone,where the capacity factor of the first enantiomer eluted decreases, whereas that of thesecond increases.
Surprisingly, the plate height is little influenced by the addition of water in theconcentration ranges described and for the analytes investigated. This may be due toa compensation of viscosity effects and displacement effects from the narrowadsorption sites.
The increase in enantioselectivity is the most important potential of water in theoptimization of separations on CTA.
(v) Ternary mixtures. A useful combination of advantageous effects may beobtained by using ternary mobile phases of the type ethanol-methanol-cyclohexaneand ethanol-methanol-water. In both these solvents the advantages of dramaticallyreduced capacity factors and significantly reduced band broadening (by methanol) canbe combined in most cases with an enhanced enantioselectivity (by water orcyclohexane), This allows one to influence the analysis time, resolution and detectionlimit in the desired direction (cj, Table IV).
The chromatograms of the racemic analytes Trager's base, hexobarbital andTFAE in Fig. 6 illustrate the influence of the solvent composition on the chromatographic resolution and the analysis times.
When interest is not restricted only to chiral separations, CTA adsorbents offer
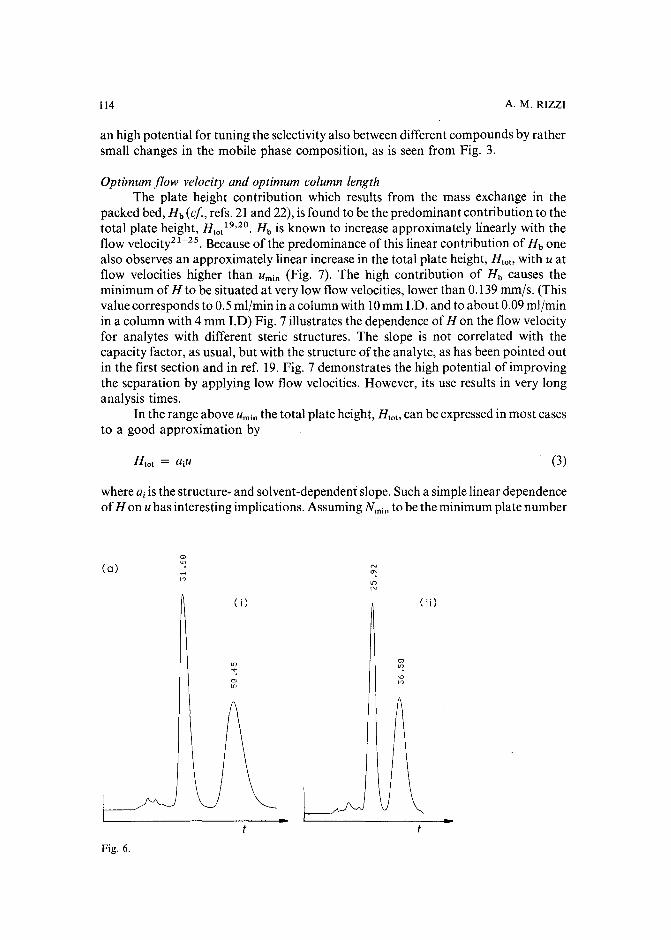
114 A. M. RIZZI
an high potential for tuning the selectivity also between different compounds by rathersmall changes in the mobile phase composition, as is seen from Fig. 3.
Optimum flow velocity and optimum column lengthThe plate height contribution which results from the mass exchange in the
packed bed, Hi, tcf., refs. 21 and 22), is found to be the predominant contribution to thetotal plate height, H to/ 9 ,20 . H; is known to increase approximately linearly with theflow veloci ty2 1- 2 5 . Because of the predominance of this linear contribution of H b onealso observes an approximately linear increase in the total plate height, H to!> with u atflow velocities higher than Umin (Fig. 7). The high contribution of Hi; causes theminimum of H to be situated at very low flow velocities, lower than 0.139 mm/s. (Thisvalue corresponds to 0.5 nil/min in a column with 10mm J.D. and to about 0.09 ml/minin a column with 4 mm J.D) Fig. 7 illustrates the dependence of H on the flow velocityfor analytes with different steric structures. The slope is not correlated with thecapacity factor, as usual, but with the structure of the analyte, as has been pointed outin the first section and in ref. 19. Fig. 7 demonstrates the high potential of improvingthe separation by applying low flow velocities. However, its use results in very longanalysis times.
In the range above Umin the total plate height, Hto!> can be expressed in most casesto a good approximation by
(3)
where a, is the structure- and solvent-dependent slope. Such a simple linear dependenceofH on u has interesting implications. Assuming Nmin to be the minimum plate number
(0)
( i)
In co
" ":'::::.'
,~,
trt,")
(ii)
Fig. 6.
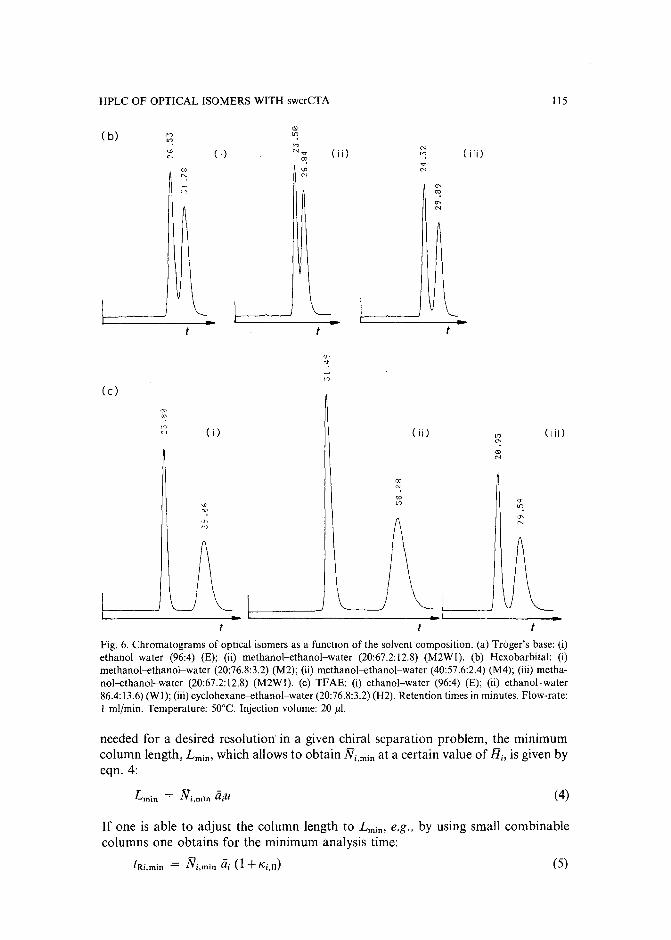
HPLC OF OPTICAL ISOMERS WITH swcrCTA lIS
( b)
( i) ( ii )
'"co
oN
( iii)
co.,J"
(c)
( i)
,.c't::::.
00In
( ii)
,,,N
( iii)
(T'.
t···,'
t•
Fig. 6. Chromatograms of optical isomers as a function of the solvent composition. (a) Trager's base: (i)ethanol-water (96:4) (E); (ii) methanol-ethanol-water (20:67.2:12.8) (M2WI). (b) Hexobarbital: (i)methanol-ethanol-water (20:76.8:3.2) (M2); (ii) methanol-ethanol-water (40:57.6:2.4) (M4); (iii) methanol-ethanol-water (20:67.2:12.8) (M2Wl). (c) TFAE: (i) ethanol-water (96:4) (E); (ii) ethanol-water86.4:13.6)(WI); (iii)cyclohexane-ethanol-water (20:76.8:3.2)(H2). Retention times in minutes. Flow-rate:I ml/min. Temperature: 50°C. Injection volume: 20 jll.
needed for a desired resolution' in a given chiral separation problem, the minimumcolumn length, L min, which allows to obtain Ni,min at a certain value of Hi, is given byeqn.4:
Ni,min iii U (4)
If one is able to adjust the column length to L min, e.g., by using small combinablecolumns one obtains for the minimum analysis time:
(5)
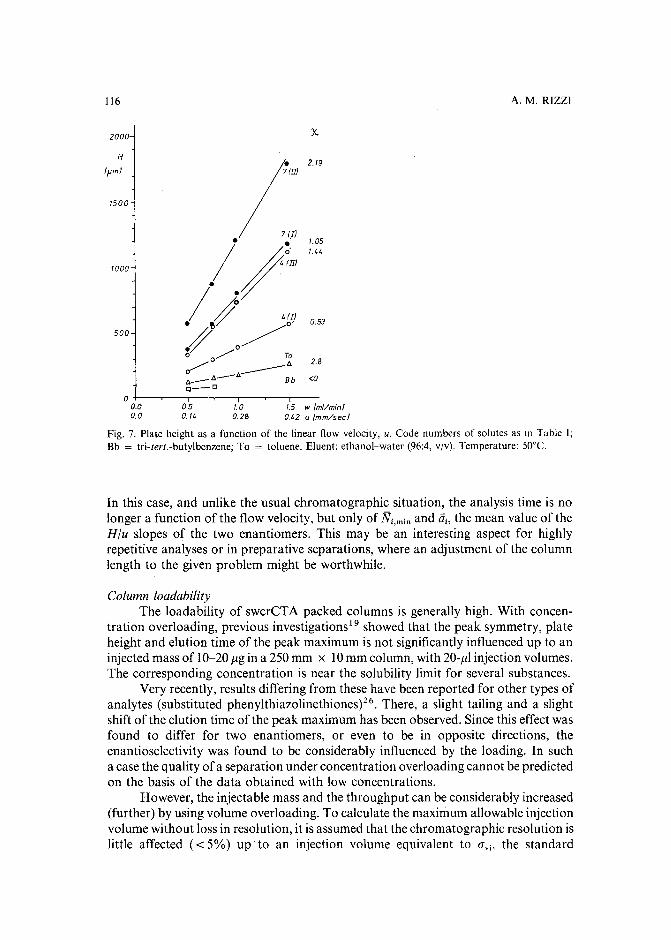
116 A. M. RIZZI
2000 X.
H2./9
[uml I'"/500
!)~1.051.44
1000
/./ '" 0.53
500
/ 0/o 0/ To
280/ ____ 116___ 6---11 Bb <0Q_D
a0.0 0.5 /.0 /.5 w Iml/minJ0.0 0./4 0.28 0.42 u Imm/secJ
Fig. 7. Plate height as a function of the linear flow velocity, u. Code numbers of solutes as in Table I;Bb = tri-tert.-butylbenzene; To = toluene. Eluent: ethanol-water (96:4, v/v). Temperature: SO°e.
In this case, and unlike the usual chromatographic situation, the analysis time is nolonger a function of the flow velocity, but only of Ni,min and iii, the mean value of theHlu slopes of the two enantiomers. This may be an interesting aspect for highlyrepetitive analyses or in preparative separations, where an adjustment of the columnlength to the given problem might be worthwhile.
Column loadabilityThe loadability of swcrCTA packed columns is generally high. With concen
tration overloading, previous investigations" showed that the peak symmetry, plateheight and elution time of the peak maximum is not significantly influenced up to aninjected mass of 10-20 J1g in a 250mm x 10mm column, with 20-J11 injection volumes.The corresponding concentration is near the solubility limit for several substances.
Very recently, results differing from these have been reported for other types ofanalytes (substituted phenylthiazolinethionesj/". There, a slight tailing and a slightshift of the elution time of the peak maximum has been observed. Since this effect wasfound to differ for two enantiomers, or even to be in opposite directions, theenantioselectivity was found to be considerably influenced by the loading. In sucha case the quality of a separation under concentration overloading cannot be predictedon the basis of the data obtained with low concentrations.
However, the injectable mass and the throughput can be considerably increased(further) by using volume overloading. To calculate the maximum allowable injectionvolume without loss in resolution, it is assumed that the chromatographic resolution islittle affected « 5%) up to an injection volume equivalent to O"vi, the standard
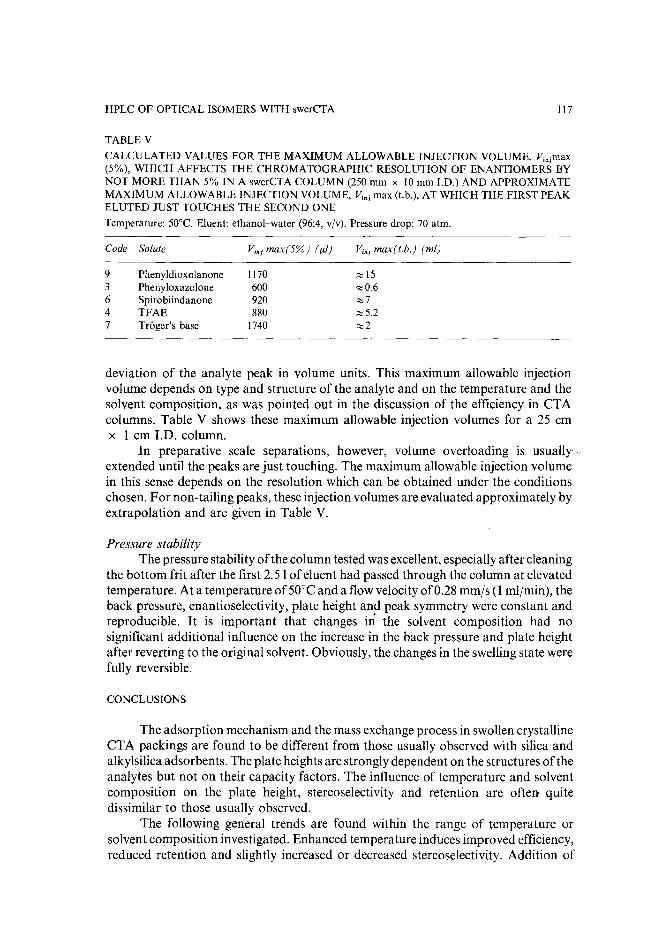
HPLC OF OPTICAL ISOMERS WITH swcrCTA 117
TABLE V
CALCULATED VALUES FOR THE MAXIMUM ALLOWABLE INJECTION VOLUME, V;njmax(5%), WHICH AFFECTS THE CHROMATOGRAPHIC RESOLUTION OF ENANTIOMERS BYNOT MORE THAN 5% IN A swcrCTA COLUMN (250 mm x 10 mm I.D.) AND APPROXIMATEMAXIMUM ALLOWABLE INJECTION VOLUME, V;nj max (t.b.), AT WHICH THE FIRST PEAKELUTED JUST TOUCHES THE SECOND ONE
Temperature: 50°C. Eluent: ethanol-water (96:4, vjv). Pressure drop: 70 atm.
Code Solute V'nj max(5%) (Ill) V inj max ( t.b.) (ml)
9 Phenyldioxolanone 1170 ~15
3 Phenyloxazolone 600 ~0.6
6 Spirobiindanone 920 ~7
4 TFAE 880 ~5.2
7 Trager's base 1740 ~2
deviation of the analyte peak in volume units. This maximum allowable injectionvolume depends on type and structure of the analyte and on the temperature and thesolvent composition, as was pointed out in the discussion of the efficiency in CTAcolumns. Table V shows these maximum allowable injection volumes for a 25 emx 1 em I.D. column.
In preparative scale separations, however, volume overloading is usually-.extended until the peaks are just touching. The maximum allowable injection volumein this sense depends on the resolution which can be obtained under the conditionschosen. For non-tailing peaks, these injection volumes are evaluated approximately byextrapolation and are given in Table V.
Pressure stabilityThe pressure stability of the column tested was excellent, especially after cleaning
the bottom frit after the first 2.51 ofeluent had passed through the column at elevatedtemperature. At a temperature of 50°Cand a flow velocity of0.28 mmjs (1 mljmin), theback pressure, enantioselectivity, plate height and peak symmetry were constant andreproducible. It is important that changes in the solvent composition had nosignificant additional influence on the increase in the back pressure and plate heightafter reverting to the original solvent. Obviously, the changes in the swelling state werefully reversible.
CONCLUSIONS
The adsorption mechanism and the mass exchange process in swollen crystallineCTA packings are found to be different from those usually observed with silica andalkylsilica adsorbents. The plate heights are strongly dependent on the structures oftheanalytes but not on their capacity factors. The influence of temperature and solventcomposition on the plate height, stereoselectivity and retention are often quitedissimilar to those usually observed.
The following general trends are found within the range of temperature orsolvent composition investigated. Enhanced temperature induces improved efficiency,reduced retention and slightly increased or decreased stereoselectivity. Addition of
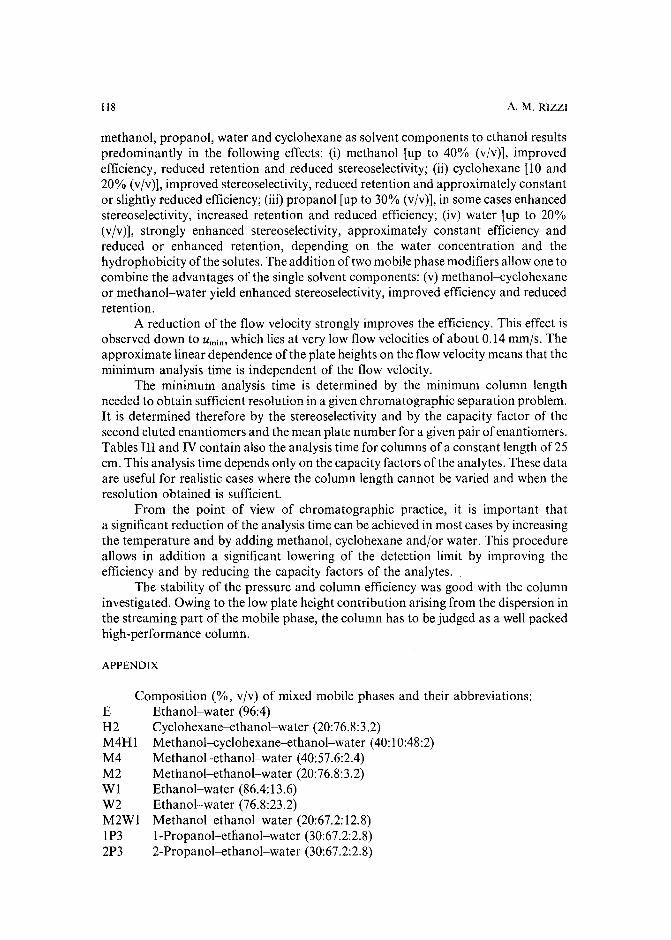
118 A. M. RIZZI
methanol, propanol, water and cyclohexane as solvent components to ethanol resultspredominantly in the following effects: (i) methanol [up to 40% (v/v)], improvedefficiency, reduced retention and reduced stereoselectivity; (ii) cyclohexane [10 and20% (v/v)], improved stereoselectivity, reduced retention and approximately constantor slightly reduced efficiency; (iii) propanol [up to 30% (v/v)], in some cases enhancedstereoselectivity, increased retention and reduced efficiency; (iv) water [up to 20%(v/v)], strongly enhanced stereoselectivity, approximately constant efficiency andreduced or enhanced retention, depending on the water concentration and thehydrophobicity of the solutes. The addition of two mobile phase modifiers allow one tocombine the advantages of the single solvent components: (v) methanol-cyclohexaneor methanol-water yield enhanced stereoselectivity, improved efficiency and reducedretention.
A reduction of the flow velocity strongly improves the efficiency. This effect isobserved down to Umin, which lies at very low flow velocities of about 0.14 mm/s. Theapproximate linear dependence of the plate heights on the flow velocity means that theminimum analysis time is independent of the flow velocity.
The minimum analysis time is determined by the minimum column lengthneeded to obtain sufficient resolution in a given chromatographic separation problem.It is determined therefore by the stereoselectivity and by the capacity factor of thesecond eluted enantiomers and the mean plate number for a given pair of enantiomers.Tables III and IV contain also the analysis time for columns of a constant length of 25cm. This analysis time depends only on the capacity factors of the analytes. These dataare useful for realistic cases where the column length cannot be varied and when theresolution obtained is sufficient.
From the point of view of chromatographic practice, it is important thata significant reduction of the analysis time can be achieved in most cases by increasingthe temperature and by adding methanol, cyclohexane and/or water. This procedureallows in addition a significant lowering of the detection limit by improving theefficiency and by reducing the capacity factors of the analytes.
The stability of the pressure and column efficiency was good with the columninvestigated. Owing to the low plate height contribution arising from the dispersion inthe streaming part of the mobile phase, the column has to be judged as a well packedhigh-performance column.
APPENDIX
Composition (%, v/v) of mixed mobile phases and their abbreviations:Ethanol-water (96:4)Cyclohexane-ethanol-water (20:76.8:3.2)Methanol--eydohexane-ethanol-water (40:10:48:2)Methanol-ethanol-water (40:57.6:2.4)Methanol-ethanol-water (20:76.8:3.2)Ethanol-water (86.4:13.6)Ethanol-water (76.8:23.2)Methanol--ethanol-water (20:67.2:12.8)I-Propanol-ethanol-water (30:67.2:2.8)2-Propanol--ethanol-water (30:67.2:2.8)
EH2M4HlM4M2WIW2M2W1IP32P3
HPLC OF OPTICAL ISOMERS WITH swcrCTA
ACKNOWLEDGEMENTS
119
This work was made possible by a grant from the Austrian Fond zur Forderungder Wissenschaftlichen Forschung (FWF), Project Number P6300C. The authordeeply appreciates this support and thanks the Institute for Organic Chemistry,University of Vienna, and Hoechst-AG for kindly donating chiral test substances.
REFERENCES
I G. Hesse and R. Hagel, Chromatographia, 9 (1976) 62.2 G. Hesse and R. Hagel, Liebigs Ann. Chem., (1976) 996.3 K. R. Lindner and A. Mannschreck, J. Chromatogr., 193 (1980) 308.4 K. Schlagel and M. Widhalm, Chem. Ber., 115 (1982) 3042.5 H. Koller, K.-H. Rimbock and A. Mannschreck, J. Chromatogr., 282 (1983) 89.6 G. Blaschke, H.-P. Kraft and H. Markgraf, Chem. Ber., 116 (1983) 3611.7 K. Schlagel and M. Widhalm, Monatsh. Chem., 115 (1984) 1113.8 A. Mannschreck, H. Koller and R. Wernicke, Kontakte (Darmstadt), 1985/1 (1985) 40.9 E. Francotte, R. M. Wolf, D. Lohmann and R. Mueller, J. Chromatogr., 347 (1985) 25.
10 E. Francotte, H. Stierlin and J. W. Faigle, J. Chromatogr., 346 (1985) 321.II K.-H. Rimbock, M. A. Cuyegkeng and A. Mannschreck, Chromatographia, 21 (1986) 223.12 G. Blaschke, J. Liq. Chromatogr., 9 (1986) 341.13 J. Scharf, K. Schlagel, M. Widhalm, J. Lex, W. Tuckmantel, E. Vogel and F. Pertlik, Monatsh. Chem.,
117 (1986) 255.14 T. Shibata, I. Okamoto and K. Ishii, J. Liq. Chromatogr., 9 (1986) 313.15 A. Hussenius, R. Isaksson and O. Matsson, J. Chromatogr., 405 (1987) ISS.16 M. Krause and R. Galensa, J. Chromatogr., 441 (1988) 417.17 Y. Okamoto, M. Kawashima, K. Yamamoto and K. Hatada, Chem. Lett., (1984) 739.18 A. Ichida, T. Shibata, I. Okamoto, Y. Yuki, H. Namikoshi and Y. Toga, Chromatographia, 19 (1984)
280.19 A. Rizzi, J. Chromatogr., 478 (1989) 71.20 A. Rizzi, J. Chromatogr., 478 (1989) 87.21 J. F. K. Huber, Ber. Bunsenges. Phys. Chem., 77 (1973) 179.22 L. R. Snyder and J. J. Kirkland, Introduction to Modern Liquid Chromatography, Wiley, New York,
1979, p. 222.23 J. C. Giddings, Dynamics of Chromatography, Part I, Marcel Dekker, New York, 1965.24 G. J. Kennedy and J. H. Knox, J. Chromatogr. Sci., 10 (1972) 549.25 C. Horvath and H. J. Lin, J. Chromatogr., 149 (1978) 43.26 C. Roussel, J.-L. Stein, F. Beauvais and A. Chemlal, J. Chromatogr., in press.

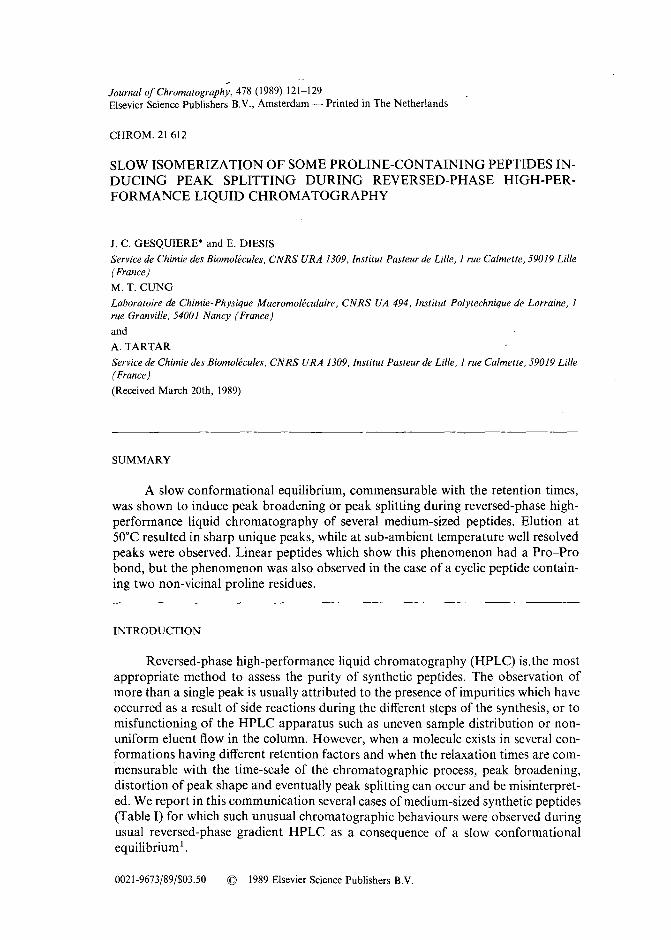
Journal of Chromatography, 478 (1989) 121-129Elsevier Science Publishers B.V., Amsterdam - Printed in The Netherlands
CHROM. 21 612
SLOW ISOMERIZATION OF SOME PROLINE-CONTAINING PEPTIDES INDUCING PEAK SPLITTING DURING REVERSED-PHASE HIGH-PERFORMANCE LIQUID CHROMATOGRAPHY
J. C. GESQUIERE* and E. DIESIS
Service de Chimie des Biomolecules, CNRS URA 1309, Institut Pasteur de Lille, 1 rue Calmette, 59019 Lille(France)
M. T. CUNG
Laboratoire de Chimie-Physique Macromoleculaire, CNRS UA 494, Institut Polytechnique de Lorraine, 1rue Granville, 54001 Nancy (France)
and
A. TARTAR
Service de Chimie des Biomolecules, CNRS URA 1309, Institut Pasteur de Lille, 1 rue Calmette, 59019 Lille(France)
(Received March 20th, 1989)
SUMMARY
A slow conformational equilibrium, commensurable with the retention times,was shown to induce peak broadening or peak splitting during reversed-phase highperformance liquid chromatography of several medium-sized peptides. Elution at50°C resulted in sharp unique peaks, while at sub-ambient temperature wel1 resolvedpeaks were observed. Linear peptides which show this phenomenon had a Pro-Probond, but the phenomenon was also observed in the case of a cyclic peptide containing two non-vicinal proline residues.
INTRODUCTION
Reversed-phase high-performance liquid chromatography (HPLC) is,the mostappropriate method to assess the purity of synthetic peptides. The observation ofmore than a single peak is usual1y attributed to the presence of impurities which haveoccurred as a result of side reactions during the different steps of the synthesis, or tomisfunctioning of the HPLC apparatus such as uneven sample distribution or nonuniform eluent flow in the column. However, when a molecule exists in several conformations having different retention factors and when the relaxation times are commensurable with the time-scale of the chromatographic process, peak broadening,distortion of peak shape and eventual1y peak splitting can occur and be misinterpreted. We report in this communication several cases of medium-sized synthetic peptides(Table I) for which such unusual chromatographic behaviours were observed duringusual reversed-phase gradient HPLC as a consequence of a slow conformationalequilibrium 1 .
0021-9673/89/$03.50 © 1989 Elsevier Science Publishers B.V.
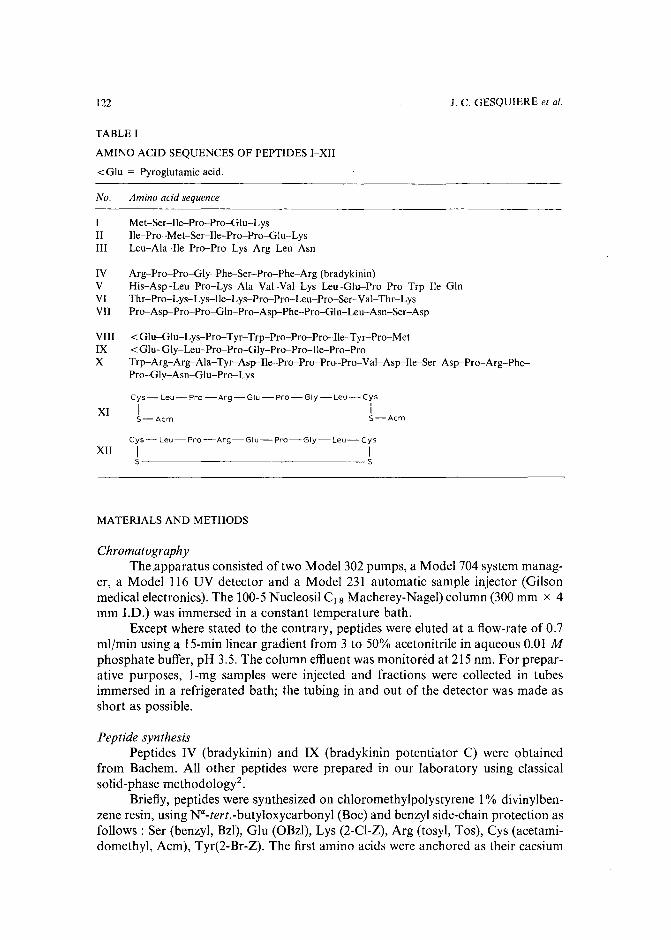
122
TABLE I
AMINO ACID SEQUENCES OF PEPTIDES I-XII
< Glu = Pyroglutamic acid.
J. C. GESQUlERE et al.
No.
IIIIII
IVVVIVII
VIIIIXX
XI
xn
Amino acid sequence
Met-Ser-Ile-Pro-Pro-Glu-LysIle-Pro-Met-Ser-Ile-Pro-Pro-Glu-LysLeu-Ala-Ile-Pro-Pro-Lys-Arg-Leu-Asn
Arg-Pro-Pro-Gly-Phe-Ser-Pro-Phe-Arg (bradykinin)His-Asp-Leu-Pro-Lys-Ala-Val-Val-Lys-Leu-Glu-Pro-Pro-Trp-Ile-GlnThr-Pro-Lys-Lys-Ile-Lys-Pro-Pro-Leu-Pro-Ser-Val-Thr-LysPro-Asp--Pro-Pro-Gln-Pro-Asp--Phe-Pro-Gln-Leu-Asn-Ser-Asp
< Glu-Glu-Lys-Pro-Tyr-Trp-Pro-Pro-Pro-Ile-Tyr-Pro-Met< Glu-Gly-Leu-Pro-Pro-Gly-Pro-Pro-Ile-Pro-ProTrp-Arg-Arg-Ala-Tyr-Asp-Ile-Pro-Pro-Pro-Pro-VaJ-Asp--Ile-Ser-Asp--Pro-Arg-PhePro-Gly-Asn-Glu-Pro-Lys
Cys- Leu- Pro -Arg-Glu - Pro -Gly -Leu-Cys
I IS-Acm S-Acm
Cys-Leu-Pro-Arg-Glu-Pro-Gly-Leu-Cys
I IS S
MATERIALS AND METHODS
ChromatographyThe.apparatus consisted of two Model 302 pumps, a Model 704 system manag
er, a Model 116 UV detector and a Model 231 automatic sample injector (Gilsonmedical electronics). The 100-5 Nucleosil CIS Macherey-Nagel) column (300 mm x 4mm J.D.) was immersed in a constant temperature bath.
Except where stated to the contrary, peptides were eluted at a flow-rate of 0.7mljmin using a 15-min linear gradient from 3 to 50% acetonitrile in aqueous 0.01 Mphosphate buffer, pH 3.5. The column effluent was monitored at 215 nm. For preparative purposes, I-mg samples were injected and fractions were collected in tubesimmersed in a refrigerated bath; the tubing in and out of the detector was made asshort as possible.
Peptide synthesisPeptides IV (bradykinin) and IX (bradykinin potentiator C) were obtained
from Bachem. All other peptides were prepared in our laboratory using classicalsolid-phase methodology".
Briefly, peptides were synthesized on chloromethylpolystyrene 1% divinylbenzene resin, using Na-tert.-butyloxycarbonyl (Boc) and benzyl side-chain protection asfollows: Ser (benzyl, BzI), Glu (OBzI), Lys (2-CI-Z), Arg (tosyl, Tos), Cys (acetamidomethyl, Acm), Tyr(2-Br-Z). The first amino acids were anchored as their caesium
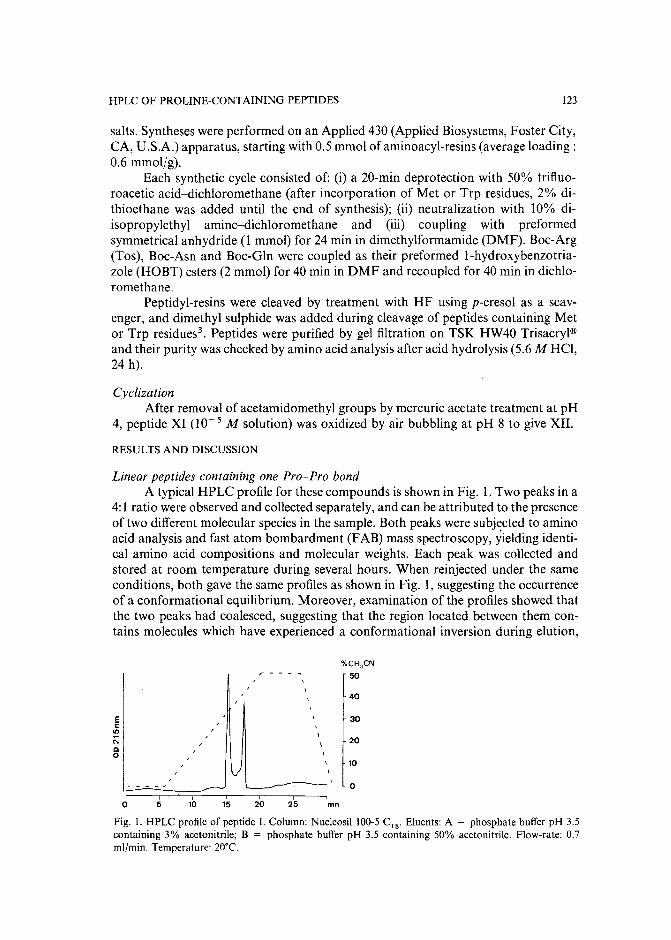
HPLC OF PROLINE-CONTAINING PEPTIDES 123
salts. Syntheses were performed on an Applied 430 (Applied Biosystems, Foster City,CA, U.S.A.) apparatus, starting with 0.5 mmol of aminoacyl-resins (average loading:0.6 mmoljg).
Each synthetic cycle consisted of: (i) a 20-min deprotection with 50% trifluoroacetic acid-dichloromethane (after incorporation of Met or Trp residues, 2% dithioethane was added until the end of synthesis); (ii) neutralization with 10% diisopropylethyl amine-dichloromethane and (iii) coupling with preformedsymmetrical anhydride (l mmol) for 24 min in dimethylformamide (DMF). Boc-Arg(Tos), Boc-Asn and Boc-Gln were coupled as their preformed l-hydroxybenzotriazole (HOBT) esters (2 mmol) for 40 min in DMF and recoupled for 40 min in dichloromethane.
Peptidyl-resins were cleaved by treatment with HF using p-cresol as a scavenger, and dimethyl sulphide was added during cleavage of peptides containing Metor Trp residues". Peptides were purified by gel filtration' on TSK HW40 Trisacryl'sand their purity was checked by amino acid analysis after acid hydrolysis (5.6 M HCI,24 h).
CyclizationAfter removal of acetamidomethyl groups by mercuric acetate treatment at pH
4, peptide XI (10- 5 M solution) was oxidized by air bubbling at pH 8 to give XII.
RESULTS AND DISCUSSION
Linear pep tides containing one Pro-Pro bondA typical HPLC profile for these compounds is shown in Fig. 1. Two peaks in a
4:1 ratio were observed and collected separately, and can be attributed to the presenceof two different molecular species in the sample. Both peaks were subjected to aminoacid analysis and fast atom bombardment (F AB) mass spectroscopy, yielding identical amino acid compositions and molecular weights. Each peak was collected andstored at room temperature during several hours. When reinjected under the sameconditions, both gave the same profiles as shown in Fig. 1, suggesting the occurrenceof a conformational equilibrium. Moreover, examination of the profiles showed thatthe two peaks had coalesced, suggesting that the region located between them contains molecules which have experienced a conformational inversion during elution,
%CH 3CNr - - - - 50
40
E/
30cIII /
'" \20
Q\0
10V
..---- ~ 0I I I I I
0 5 10 15 20 25 mn
Fig. 1. HPLC profile of peptide I. Column: Nucleosil 100-5 CIS' Eluents: A = phosphate buffer pH 3.5containing 3% acetonitrile; B = phosphate buffer pH 3.5 containing 50% acetonitrile. Flow-rate: 0.7ml/min. Temperature: 20'('.
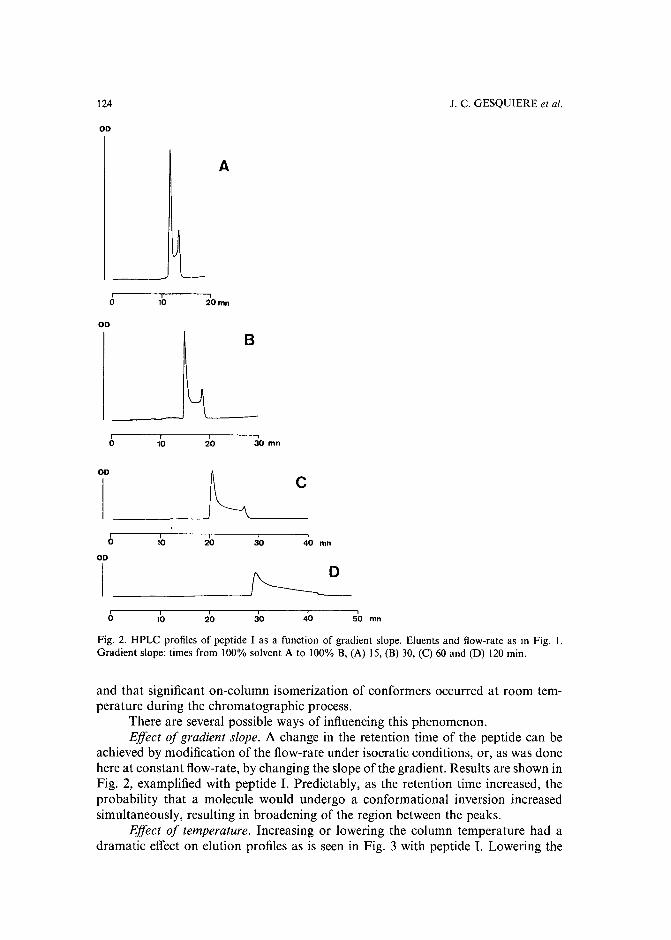
124
00
A
J. C. GESQUIERE et al.
Io
00
B
I r i I0 10 20 30 mn
OD .. C
I I I i ,0 10 20 30 40 mn
OD
ID
I I I r i I0 10 20 30 40 50 mn
Fig. 2. HPLC profiles of peptide I as a function of gradient slope. Eluents and flow-rate as in Fig. I.Gradient slope: times from 100% solvent A to 100% B, (A) 15, (B) 30, (C) 60 and (D) 120 min.
and that significant on-column isomerization of conformers occurred at room temperature during the chromatographic process.
There are several possible ways of influencing this phenomenon.Effect of gradient slope. A change in the retention time of the peptide can be
achieved by modification of the flow-rate under isocratic conditions, or, as was donehere at constant flow-rate, by changing the slope of the gradient. Results are shown inFig. 2, examplified with peptide I. Predictably, as the retention time increased, theprobability that a molecule would undergo a conformational inversion increasedsimultaneously, resulting in broadening of the region between the peaks.
Effect of temperature. Increasing or lowering the column temperature had adramatic effect on elution profiles as is seen in Fig. 3 with peptide I. Lowering the
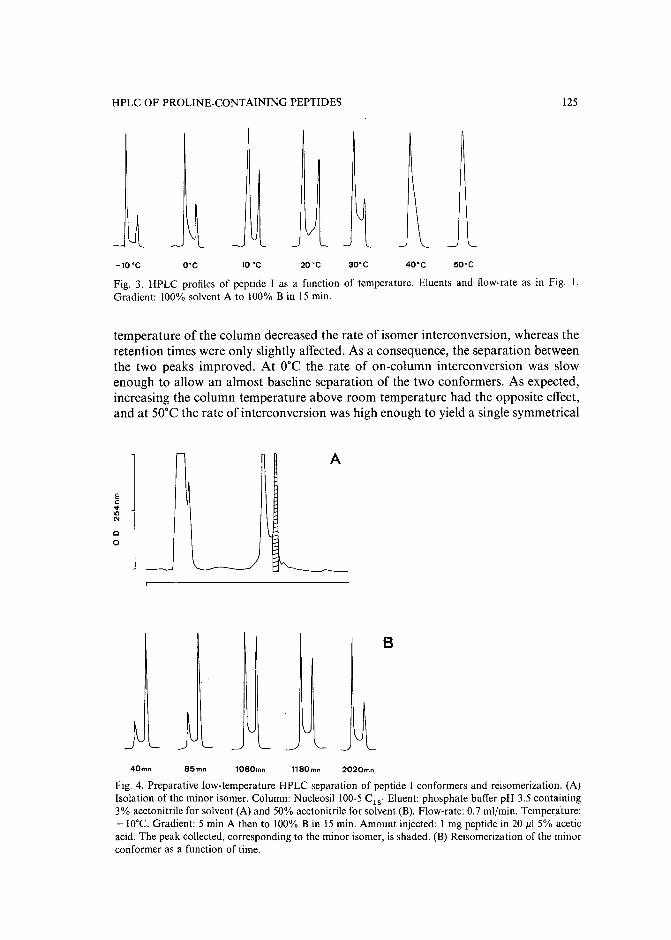
HPLC OF PROLINE-CONTAINING PEPTIDES 125
-lO·C O·C lO·C 20·C 30·C 40·C 50·C
Fig. 3. HPLC profiles of peptide I as a function of temperature. Eluents and flow-rate as in Fig. 1.Gradient: 100% solvent A to 100% Bin 15 min.
temperature of the column decreased the rate of isomer interconversion, whereas theretention times were only slightly affected. As a consequence, the separation betweenthe two peaks improved. At O°C the rate of on-column interconversion was slowenough to allow an almost baseline separation of the two conformers. As expected,increasing the column temperature above room temperature had the opposite effect,and at 50°C the rate of interconversion was high enough to yield a single symmetrical
Ec....III
'"co
A
8
40mn 85mn l080mn l180mn 2020mn
Fig. 4. Preparative low-temperature HPLC separation of peptide I conformers and reisomerization. (A)Isolation of the minor isomer. Column: Nucleosil 100-5CIS' Eluent: phosphate buffer pH 3.5 containing3% acetonitrile for solvent (A) and 50% acetonitrile for solvent (B). Flow-rate: 0.7 ml(min. Temperature:-IO"C. Gradient: 5 min A then to 100% Bin 15 min. Amount injected: I mg peptide in 20 I.d 5% aceticacid. The peak collected, corresponding to the minor isomer, is shaded. (B) Reisomerization of the minorconformer as a function of time.
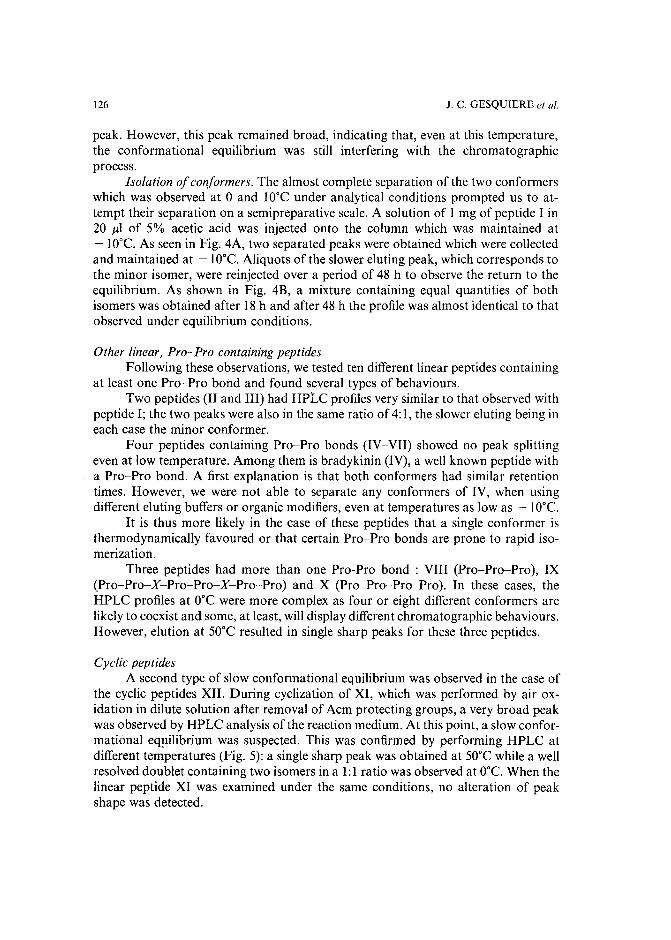
126 J. C. GESQUIERE et al.
peak. However, this peak remained broad, indicating that, even at this temperature,the conformational equilibrium was still interfering with the chromatographicprocess.
Isolation ofconformers. The almost complete separation of the two conformerswhich was observed at 0 and 10°C under analytical conditions prompted us to attempt their separation on a semipreparative scale. A solution of I mg of peptide I in20 J.ll of 5% acetic acid was injected onto the column which was maintained at- IO'C, As seen in Fig. 4A, two separated peaks were obtained which were collectedand maintained at - 10°e. Aliquots of the slower eluting peak, which corresponds tothe minor isomer, were reinjected over a period of 48 h to observe the return to theequilibrium. As shown in Fig. 4B, a mixture containing equal quantities of bothisomers was obtained after 18 h and after 48 h the profile was almost identical to thatobserved under equilibrium conditions.
Other linear, Pro-Pro containing peptidesFollowing these observations, we tested ten different linear peptides containing
at least one Pro-Pro bond and found several types of behaviours.Two peptides (II and III) had HPLC profiles very similar to that observed with
peptide I; the two peaks were also in the same ratio of 4:I, the slower eluting being ineach case the minor conformer.
Four peptides containing Pro-Pro bonds (IV-VII) showed no peak splittingeven at low temperature. Among them is bradykinin (IV), a well known peptide witha Pro-Pro bond. A first explanation is that both conformers had similar retentiontimes. However, we were not able to separate any conformers of IV, when usingdifferent eluting buffers or organic modifiers, even at temperatures as low as -IO°e.
It is thus more likely in the case of these peptides that a single conformer isthermodynamically favoured or that certain Pro-Pro bonds are prone to rapid isomerization.
Three peptides had more than one Pro-Pro bond : VIII (Pro-Pro-Pro), IX(Pro-Pro-X-Pro-Pro-X-Pro-Pro) and X (Pro-Pro-Pro-Pro). In these cases, theHPLC profiles at O°C were more complex as four or eight different conformers arelikely to coexist and some, at least, will display different chromatographic behaviours.However, elution at 50°C resulted in single sharp peaks for these three peptides.
Cyclic pep tidesA second type of slow conformational equilibrium was observed in the case of
the cyclic peptides XII. During cyclization of XI, which was performed by air oxidation in dilute solution after removal of Acm protecting groups, a very broad peakwas observed by HPLC analysis of the reaction medium. At this point, a slow conformational equilibrium was suspected. This was confirmed by performing HPLC atdifferent temperatures (Fig. 5): a single sharp peak was obtained at 50°C while a wellresolved doublet containing two isomers in a 1:1 ratio was observed at O'C. When thelinear peptide XI was examined under the same conditions, no alteration of peakshape was detected.
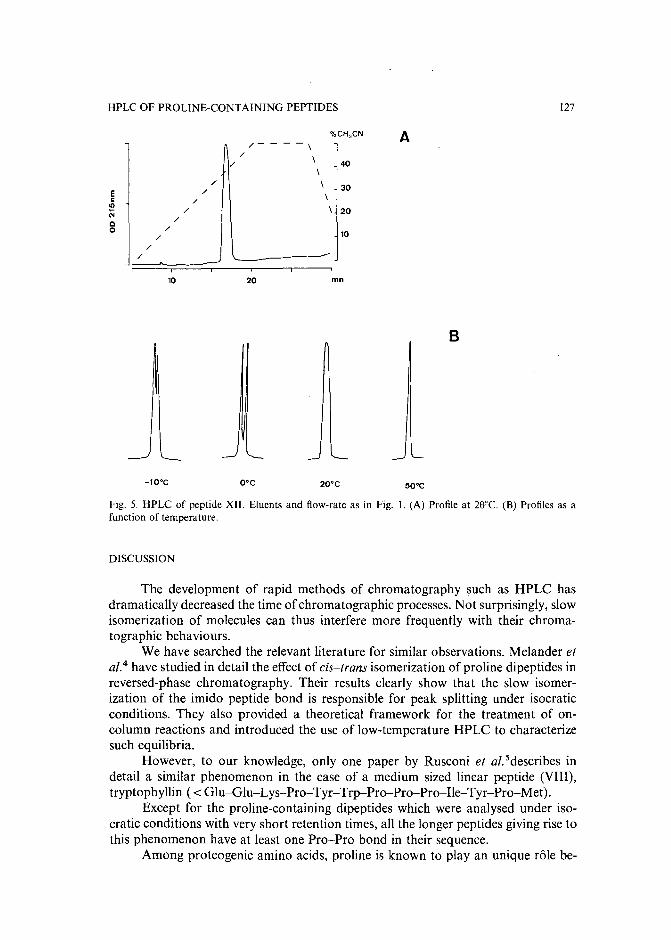
HPLC OF PROLINE-CONTAINING PEPTIDES 127
40
30Ec
I/)
"Qo
//
//
/
//
//
/----,/ / ,,,,
, 20
10
A
10
-10'C
20
O'C
mn
20'C 50'C
B
Fig. 5. HPLC of peptide XII. Eluents and flow-rate as in Fig. I. (A) Profile at 20'C. (B) Profiles as afunction of temperature.
DISCUSSION
The development of rapid methods of chromatography such as HPLC hasdramatically decreased the time of chromatographic processes. Not surprisingly, slowisomerization of molecules can thus interfere more frequently with their chromatographic behaviours.
We have searched the relevant literature for similar observations. Melander etal.4 have studied in detail the effect of cis-trans isomerization of proline dipeptides inreversed-phase chromatography. Their results clearly show that the slow isomerization of the imido peptide bond is responsible for peak splitting under isocraticconditions. They also provided a theoretical framework for the treatment of oncolumn reactions and introduced the use of low-temperature HPLC to characterizesuch equilibria.
However, to our knowledge, only one paper by Rusconi et al.5describes indetail a similar phenomenon in the case of a medium sized linear peptide (VIII),tryptophyllin ( < Glu-Glu-Lys-Pro-Tyr-Trp-Pro-Pro-Pro-Ile-Tyr-Pro-Met).
Except for the proline-containing dipeptides which were analysed under isocratic conditions with very short retention times, all the longer peptides giving rise tothis phenomenon have at least one Pro-Pro bond in their sequence.
Among proteogenic amino acids. proline is known to play an unique role be-
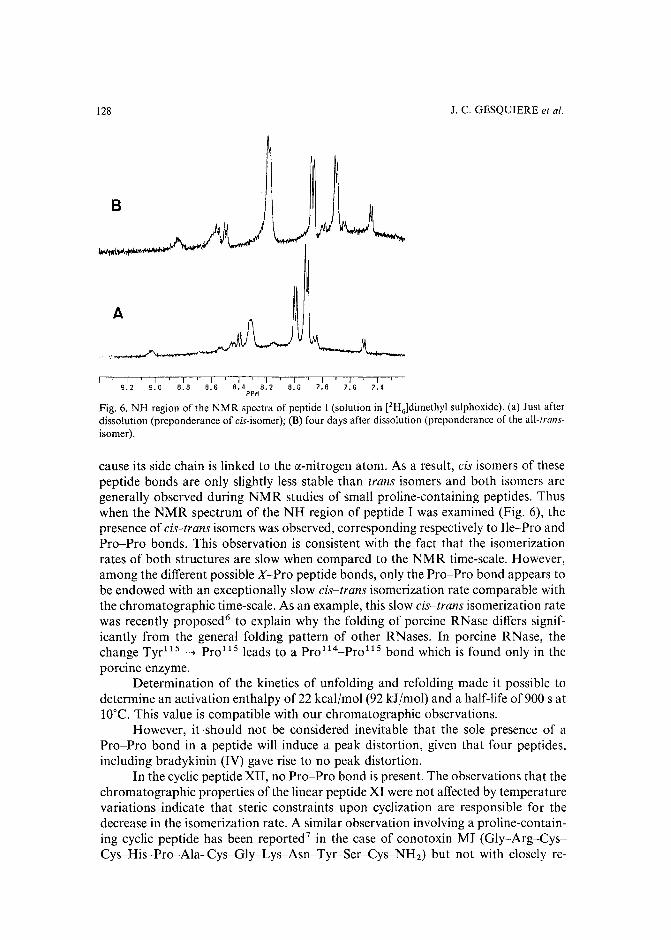
128 J. C. GESQUIERE et al.
iii I iii I iii I iii I iii I i
9.2 9.0 8.8 8.6 8.4 8.2 8.0 7.8 7.6 7.4PPM
Fig. 6. NH region of the NMR spectra of peptide 1 (solution in [2H6]dimethyl sulphoxide). (a) Just afterdissolution (preponderance of cis-isomer); (B) four days after dissolution (preponderance of the all-transisomer).
cause its side chain is linked to the a-nitrogen atom. As a result, cis isomers of thesepeptide bonds are only slightly less stable than trans isomers and both isomers aregenerally observed during NMR studies of small proline-containing peptides. Thuswhen the NMR spectrum of the NH region of peptide I was examined (Fig. 6), thepresence of cis-trans isomers was observed, corresponding respectively to lie-Pro andPro-Pro bonds. This observation is consistent with the fact that the isomerizationrates of both structures are slow when compared to the NMR time-scale. However,among the different possible X-Pro peptide bonds, only the Pro-Pro bond appears tobe endowed with an exceptionally slow cis-trans isomerization rate comparable withthe chromatographic time-scale. As an example, this slow cis-trans isomerization ratewas recently proposed? to explain why the folding of porcine RNase differs significantly from the general folding pattern of other RNases. In porcine RNase, thechange Tyr l 1 5 ~ Pro 11 5 leads to a Pro 11 4_Pro 11 5 bond which is found only in theporcine enzyme.
Determination of the kinetics of unfolding and refolding made it possible todetermine an activation enthalpy of22 kcal/mol (92 kl/rnol) and a half-life of 900 s atIO'C. This value is compatible with our chromatographic observations.
However, it should not be considered inevitable that the sole presence of aPro-Pro bond in a peptide will induce a peak distortion, given that four peptides,including bradykinin (IV) gave rise to no peak distortion.
In the cyclic peptide XII, no Pro-Pro bond is present. The observations that thechromatographic properties of the linear peptide XI were not affected by temperaturevariations indicate that steric constraints upon cyclization are responsible for thedecrease in the isomerization rate. A similar observation involving a proline-containing cyclic peptide has been reported? in the case of conotoxin MJ (Gly-Arg-CysCys-His-Pro-Ala-Cys-Gly-Lys-Asn-Tyr-Ser-Cys-Nl-lj] but not with closely re-
HPLC OF PROLINE-CONTAINING PEPTIDES 129
lated e-conotoxins. In this case also, HPLCat low temperature (O°C) gave a completeseparation of the two possible forms, while a single sharp peak was observed at 60"C.
CONCLUSIONS
Slow cis-trans isomerization of particular peptide bonds such as Pro-Pro bondsor steric constraints induced by cyclization may be responsible for alteration of thechromatographic behaviour of medium-sized peptides.
Increasing the column temperature allows the peptide to be eluted as a singlesharp peak and thus its purity can be assessed while still performing the elution at areasonable speed. Lowering the temperature of the column and using the most rapidelution conditions compatible with isomer separation allows a baseline separation ofthe conformers. It might be of great interest to use this method to study separately thephysicochemical properties of each conformer. Moreover, such peptides may proveto be valuable substrates in a study of the properties of the enzyme peptidyl-prolylcis-trans isomerase discovered and purified from pig kidney, as this enzyme, whichcatalyses the cis-trans isomerization of proline imidic peptide bonds during refoldingof proteins", accepts Pro-Pro-containing chain segments as substrates.
REFERENCES
I J. C. Gesquiere, E. Diesis and A. Tartar, in G. Jung and E. Bayer (Editors), Pep tides 1988, Walter deGruyter, Berlin, New York, 1989, pp. 112-114.
2 R. B. Merrifield, J. Am. Chern. Soc., 85 (1963) 2149-2154.3 J. P.Tam, W. F. Heath and R. B. Merrifield, J. Am. Chern. Soc., 105 (1983) 6442-6455.4 W. R. Melander, J. Jacobson and C. Horvath, J. Chromatogr., 234 (1982) 269-276.5 L. Rusconi, G. Perseo, L. Franzoi and P. C. Montecucchi, J. Chromatogr., 349 (1985) 117-130.6 R. Graft, K. Lang, A. Wrba and F. X. Schmid, J. Mol. BioI., 191 (1986) 281-293.7 W. R. Gray, J. E. Rivier, R. Gaylean, L. J. Cruz and B. M. Olivera, J. Biol. Chern.. 258 (1983)
12247-12251.8 G. Fischer and H. Bang, Biochim. Biophys. Acta, 828 (1985) 39--42.

Journal of Chromatography, 478 (1989) 131-140Elsevier Science Publishers B.V., Amsterdam - Printed in The Netherlands
CHROM. 21 616
INDIRECT DETECTION OF INORGANIC ANIONS BY HIGH-PERFORMANCE LIQUID CHROMATOGRAPHY: USE OF PAPAVERALDINIUM ASAN ULTRAVIOLET ABSORBING AGENT
P. DORLAND
Central Hospital Pharmacy, 7 Rue du Fer aMoulin, 75005 Paris (France)
M.TOD
Avicenne Hospital, 125 Route de Stalingrad, 93009 Bobigny (France)
and
E. POSTAIRE* and D. PRADEAU
Department of Analytical Development, Central Hospital Pharmacy, 7 Rue du Fer aMoulin, 75005 Paris(France)
(First received January 2nd, 1989; revised manuscript received May 9th, 1989)
SUMMARY
An indirect UV detection method, using tetrabutylammonium hydroxide andpapaveraldine perchlorate as counter ion and ion interaction reagent, respectively, isdescribed. Water analysis and drug monitoring in the treatment ofchildhood epilepsywith bromides are presented as possible applications. As a result of analyticaldifficulties, a so-called "overload effect" was studied and a theoretical mechanism forthis is proposed.
INTRODUCTION
Ion chromatography was first used to analyse ionic species". However, thistechnique has the drawbacks of the fragility and cost of the column and the need fora thermostatic system. In addition, in the Dionex system, the suppressor column has tobe regenerated after a few hours of use. Although a very low limit of detection can bereached, ion chromatography needs special apparatus and careful maintenance.
Indirect detection has been used for about 10years. This simple technique allowsthe detection and quantification of compounds that are outside the scope of otherdetection techniques':". An ultraviolet-absorbing ion interaction reagent (IIR) isadded to the mobile phase and then distributed to the stationary phase. This agentforms ion pairs with solutes of opposite charge which are eluted and detected easilythrough absorbance of the IIR4
• The detection mechanism for this kind ofchromatography is complex and has already been described by Stranahan andDemingj".
In this study, ion-pair chromatography with indirect detection was chosenbecause with this method it is possible to assay inorganic anions with conventionalapparatus. C I 8 columns were used because their efficiency and mechanical behaviourare better than those of ion-exchange resins. Many parameters (mobile phase
0021-9673/89/$03.50 © 1989 Elsevier Science Publishers B.V.
132 P. DORLAND et al.
composition, solvent concentration, pH, ionic strength) can be modified when a CISstationary phase is used. Such flexibility allows better optimization of the chromatographic conditions while setting up the assay. Further, the use of each column over anextended period is possible because of the stability of the stationary phase. Two majorapplications were considered: first, water analysis needs a fast, automatable techniquein order to assay several anions simultaneously, and second, this technique allows theassay ofblood bromide. Analytical difficulties appeared in the quantification ofanionsand in the choice of an internal standard, wich led us to study a so-called "overloadeffect" .
EXPERIMENTAL
ReagentsPapaveraldine was synthesized from papaverine-". The perchlorate salt was
obtained by dissolving 353 mg ofpapaveraldine base in 20 ml of 0.7% (wjv) perchloricacid, diluting to 100 ml with distilled water and heating at 90°C until dissolution wascomplete. Crystallization occurred after filtration within 24 h at 4°C (90% yield).
Tetrabutylammonium hydroxide (TBAH) [40% (wjv) aqueous solution] wasobtained from Sigma, (Paris, France), acetonitrile (LiChrosolv, for chromatography)from Merck (Paris, France), mineral anions and citric acid (Normapur quality) fromProlabo (Paris, France) and water [high-performance liquid chromatographic (HPLC)grade] from FSA (Loughborough, U.K.).
Preparation of the mobile phaseA 50-mg amount of papaveraldine perchlorate was added to 850 ml of 7 . 10-3
M sodium citrate buffer (pH 3.2) and dissolved by sonication, then 1.75 g of TBAHwere added and the solution was mixed with 150 ml of acetonitrile. The resultingmobile phase was filtered on a 0.22-,um filter (GWMP; Millipore, France). The finalpH was about 3.5.
Chromatographic proceduresThe column was first washed with acetonitrile-water (50:50, vjv), then loaded
with the mobile phase for I h in order to achieve adsorption of TBAH andpapaveraldine on the CIS stationary phase. The mobile phase used during thisoperation was discarded. The system was then recycled and equilibrated for 24 h.
ApparatusA Model 850 modular system from DuPont (Paris, France) was used, consisting
of an HPLC pump, a thermostatic module set at 3SOC and a variable-wavelengthdetector set at 325 nm. Peak areas and peak heights were determined with a ShimadzuModel CR5A integrator (Touzard et Matignon, France). The column used wasa IO-,um CIS ,uBondapak (250 x 4.6 mm J.D. from Waters (Paris, France).
CalculationsThe number of theoretical plates, N, was calculated using the equation N =
5.54(tR jb)2, where b is the peak width at half-height and tR is the retention time",The displacement ratio (DR) was calculated fromlo,11
HPLC OF INORGANIC ANIONS
papaveraldine peak concentrationDR = =--='-------"------
Cmax
with (from ref. 9):
C = Qinj {Nmax V
RVbe
133
(13)
where Qinj is the amount of anion injected, VR the retention volume and thepapaveraldine peak concentration = peak absorbance/sf (where e = molar absorbance coefficient and I = length of the detector cell).
Study of overload effectResponse factors for internal standards and anions have to be strictly
independent. In order to study this property, weexamined the linearity and parametersof calibration graphs for NaCI with or' without added NaN0 3 . Four calibrationgraphs were prepared in 7 . 10-3 M citrate buffer: (A) 5 . 1O-4~50 . 10-4 M NaCIsolution; (B) 5 . 10-4- 50 . 10-4 M NaCI solution containing 1O~2 M NaN03; (A')5' 10-5- 1 . 10-3 M NaCI solution; and (B') 5 . 10-5- 1 . 10-3 M NaCI solution 10-3
M NaN03 . The different sample concentrations represented by A, B, A' and B' wereinjected alternately to minimize the time-dependent variability of the elutionequilibrium. Two further solutions of 10-2 and 10- 3 M NaN0 3 were injectedalternately with the above solutions in order to study the response to nitrate alone andin the presence of chloride.
Procedures usedfor blood bromide assayThe mobile phase was similar to that described above with papaverinium
fluoride as the detection agent because it is more soluble than perchlorate: 10-4
M papaverinium fluoride was added to 900 ml of7' 10-3 M sodium citrate buffer, then2.5' 1O~3 MTBAH added and the solution was mixed with 100 ml of acetonitrile. Theextraction of bromide from blood (98% yield) was performed on whole blood: I ml ofmethanol was added to 500 ,ul of blood, shaken for 30 s and centrifuged at 1000 g for 10min. A 100-,u1 volume of the supernatant was diluted with 2 ml of distilled water and 20,ul of the mixture were injected. Cl- and Be anions were identified by standardadditions to the samples.
RESULTS AND DISCUSSION
Effects of the solventThe chromatograms show successively a first peak corresponding to the void
volume, either positive or negative depending on the composition of the injectionsolvent; a double system peak, first negative, then positive, the size ofwhich dependson the composition of the injected sample; a positive peak, wich may be used to detectthe injected anion, corresponding to the desorption of the excess IIR previouslyadsorbed during the elution of the anion along the column, and a final negative peakcorresponding to the retention time of the perchlorate anion.
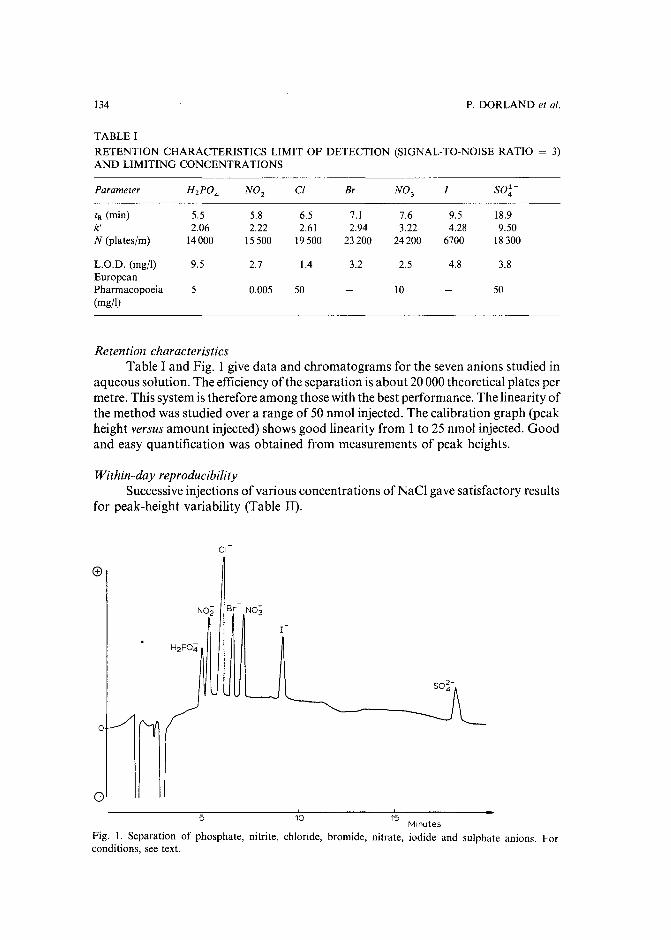
134 P. DORLAND et al.
TABLE I
RETENTION CHARACTERISTICS LIMIT OF DETECTION (SIGNAL-TO-NOISE RATIO = 3)AND LIMITING CONCENTRATIONS
Parameter H2PO;. NO~ cr sr: NO; r sot
tR (min) 5.5 5.8 6.5 7.1 7.6 9.5 18.9k' 2.06 2.22 2.61 2.94 3.22 4.28 9.50N (plates/m) 14000 15500 19500 23200 24200 6700 18300
L.O.D. (mg/l) 9.5 2.7 1.4 3.2 2.5 4.8 3.8EuropeanPharmacopoeia 5 0.005 50 IO 50(mgyl)
Retention characteristicsTable I and Fig. 1 give data and chromatograms for the seven anions studied in
aqueous solution. The efficiency of the separation is about 20 000 theoretical plates permetre. This system is therefore among those with the best performance. The linearity ofthe method was studied over a range of 50 nmol injected. The calibration graph (peakheight versus amount injected) shows good linearity from I to 25 nmol injected. Goodand easy quantification was obtained from measurements of peak heights.
Within-day reproducibilitySuccessive injections of various concentrations ofNaCI gave satisfactory results
for peak-height variability (Table II).
CI
N02 Br- NO;
o
o n10 15
Minutes
Fig. I. Separation of phosphate, nitrite, chloride, bromide, nitrate, iodide and sulphate anions. Forconditions, see text.
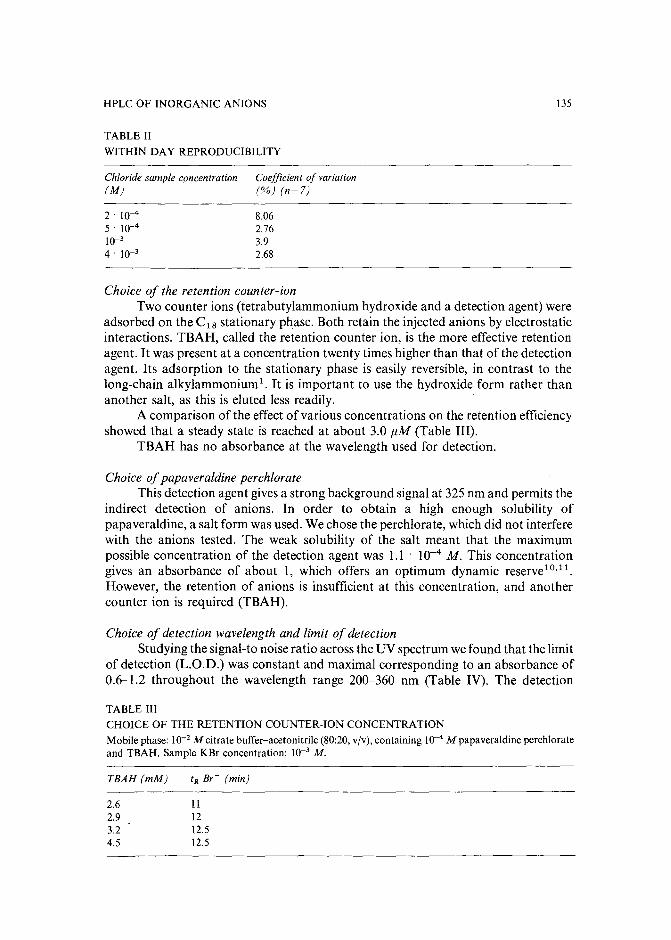
HPLC OF INORGANIC ANIONS
TABLE II
WITHIN DAY REPRODUCIBILITY
135
Chloride sample concentration(M)
2 . 10-4
5 . 10-4
10-3
4' 10-3
Coefficient of variation(%) (n=7)
8.062.763.92.68
Choice of the retention counter-ionTwo counter ions (tetrabutylammonium hydroxide and a detection agent) were
adsorbed on the CIS stationary phase. Both retain the injected anions by electrostaticinteractions. TBAH, called the retention counter ion, is the more effective retentionagent. It was present at a concentration twenty times higher than that of the detectionagent. Its adsorption to the stationary phase is easily reversible, in contrast to thelong-chain alkylammonium", It is important to use the hydroxide form rather thananother salt, as this is eluted less readily.
A comparison of the effect of various concentrations on the retention efficiencyshowed that a steady state is reached at about 3.0 u.M (Table III).
TBAH has no absorbance at the wavelength used for detection.
Choice ofpapaveraldine perchlorateThis detection agent gives a strong background signal at 325 nm and permits the
indirect detection of anions. In order to obtain a high enough solubility ofpapaveraldine, a salt form was used. We chose the perchlorate, which did not interferewith the anions tested. The weak solubility of the salt meant that the maximumpossible concentration of the detection agent was 1.1 . 10-4 M. This concentrationgives an absorbance of about 1, which offers an optimum dynamic reserve I O
•ll
.
However, the retention of anions is insufficient at this concentration, and anothercounter ion is required (TBAH).
Choice of detection wavelength and limit of detectionStudying the signal-to noise ratio across the UV spectrum we found that the limit
of detection (L.O.D.) was constant and maximal corresponding to an absorbance of0.6-1.2 throughout the wavelength range 200-360 nm (Table IV). The detection
TABLE III
CHOICE OF THE RETENTION COUNTER-ION CONCENTRATION
Mobile phase: 10-2 M citrate buffer-acetonitrile (80:20,vjv), containing 10-4 M papaveraldine perchlorateand TBAH. Sample KBr concentration: 10-3 M.
TBAH (mM)
2.62.93.24.5
II1212.512.5
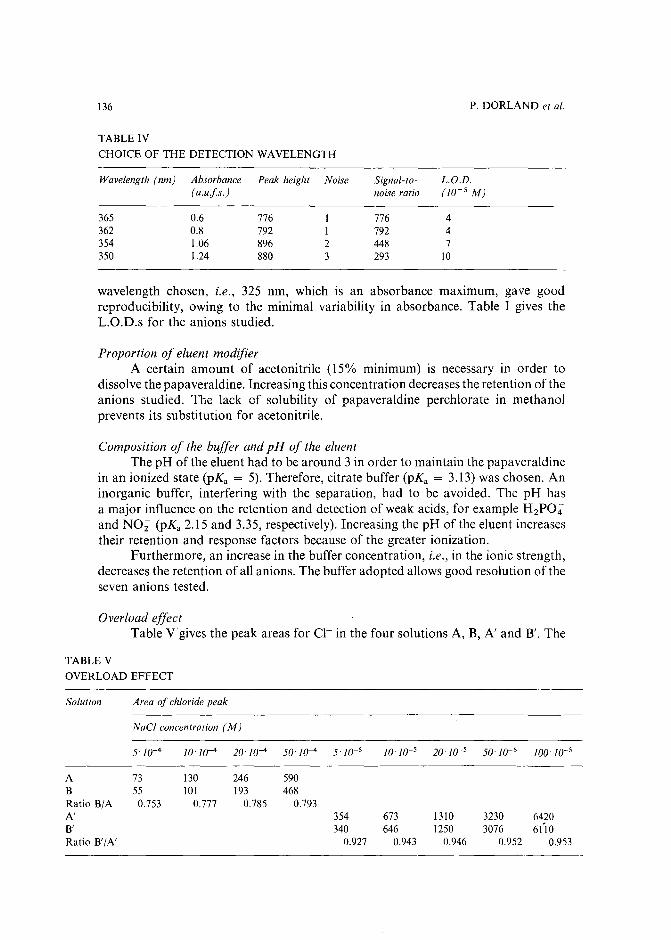
136
TABLE IV
CHOICE OF THE DETECTION WAVELENGTH
P. DORLAND et al.
Wavelength (nm) Absorbance(a.ufs.)
365 0.6362 0.8354 1.06350 1.24
Peak height Noise
776 1792 1896 2880 3
Signal-tonoise ratio
776792448293
L.G.D.iur» M)
447
10
wavelength chosen, i.e., 325 nm, which is an absorbance maximum, gave goodreproducibility, owing to the minimal variability in absorbance. Table I gives theL.O.D.s for the anions studied.
Proportion of eluent modifierA certain amount of acetonitrile (15% minimum) is necessary in order to
dissolve the papaveraldine. Increasing this concentration decreases the retention of theanions studied. The lack of solubility of papaveraldine perchlorate in methanolprevents its substitution for acetonitrile.
Composition of the buffer and pH of the eluentThe pH of the eluent had to be around 3 in order to maintain the papaveraldine
in an ionized state (pKa = 5). Therefore, citrate buffer (pKa = 3.13) was chosen. Aninorganic buffer, interfering with the separation, had to be avoided. The pH hasa major influence on the retention and detection of weak acids, for example HzPOiand NOi (pKa 2.15 and 3.35, respectively). Increasing the pH of the eluent increasestheir retention and response factors because of the greater ionization.
Furthermore, an increase in the buffer concentration, i.e., in the ionic strength,decreases the retention of all anions. The buffer adopted allows good resolution of theseven anions tested.
Overload effectTable V gives the peak areas for Cl- in the four solutions A, B, A' and B'. The
TABLE V
OVERLOAD EFFECT
Solution Area of chloride peak
NaCI concentration (M)
5'10-4 10'10-4 20'10-4 50'10-4 5' lO-s 1O'1O-s 20' J(J-s 50' j(;-s 100 10- 5
A 73 130 246 590B 55 IOl 193 468Ratio BfA 0.753 0.777 0.785 0.793A' 354 673 1310 3230 6420B' 340 646 1250 3076 6(10Ratio B'fA' 0.927 0.943 0.946 0.952 0.953
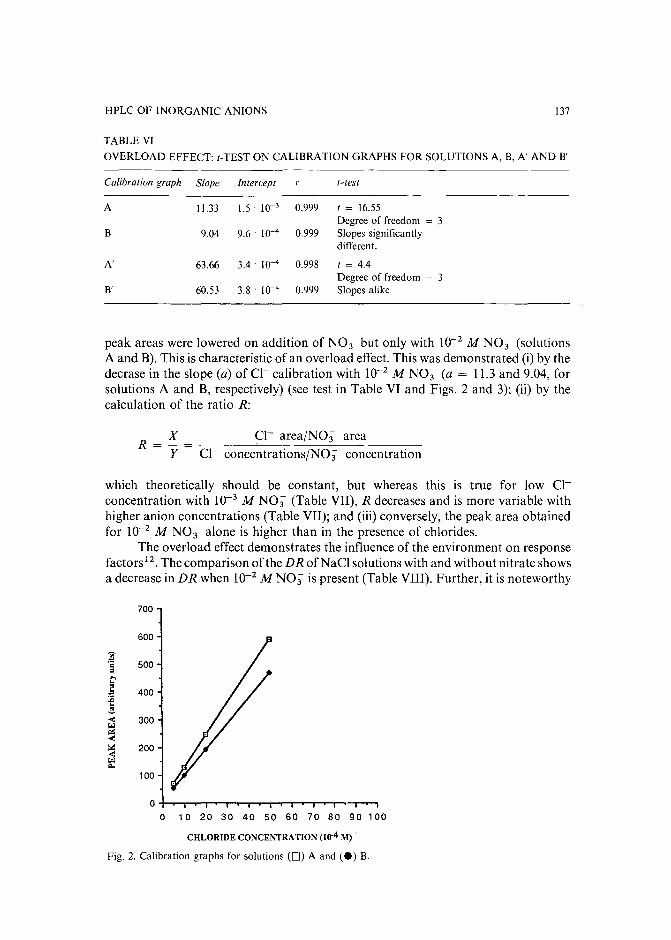
HPLC OF INORGANIC ANIONS 137
TABLE VI
OVERLOAD EFFECT: t-TEST ON CALIBRATION GRAPHS FOR SOLUTIONS A, B, A' AND B'
Calibration graph Slope Intercept t-test
A 11.33 1.5' 10-3 0.999 t = 16.55Degree of freedom = 3
B 9.04 9.6 10-4 0.999 Slopes significantlydifferent.
A' 63.66 3.4 10-4 0.998 t = 4.4Degree of freedom = 3
B' 60.53 3.8 . 10-4 0.999 Slopes alike
peak areas were lowered on addition of NO; but only with 10-2 M NO; (solutionsA and B). This is characteristic of an overload effect. This was demonstrated (i) by thedecrase in the slope (a) of Cl- calibration with 10-2 M NO; (a = 11.3 and 9.04, forsolutions A and B, respectively) (see test in Table VI and Figs. 2 and 3); (ii) by thecalculation of the ratio R:
Rxy
Cl- area/NO; area
Cr concentrations/NO; concentration
which theoretically should be constant, but whereas this is true for low Cl"concentration with 10-3 M NO; (Table VII), R decreases and is more variable withhigher anion concentrations (Table VII); and (iii) conversely, the peak area obtainedfor 10-2 M NO;- alone is higher than in the presence of chlorides.
The overload effect demonstrates the influence of the environment on responsefactors 12
. The comparison ofthe DR ofNaCl solutions with and without nitrate showsa decrease in DR when 10-2 M NO; is present (Table VIII). Further, it is noteworthy
700
600
~500"".......
b 400:;;..~...: 3001.:1..:...:~ 200-e1.:1c..
100
+-.....-y"""'T"-.-.....-y"""'T"-.-..-,r"""....~r""'"--r-'--.-.--,10 20 30 40 50 60 70 80 90 100
CHLORIDE CONCENTRATION (10-4 M) .
Fig. 2. Calibration graphs for solutions (D) A and (e) B.
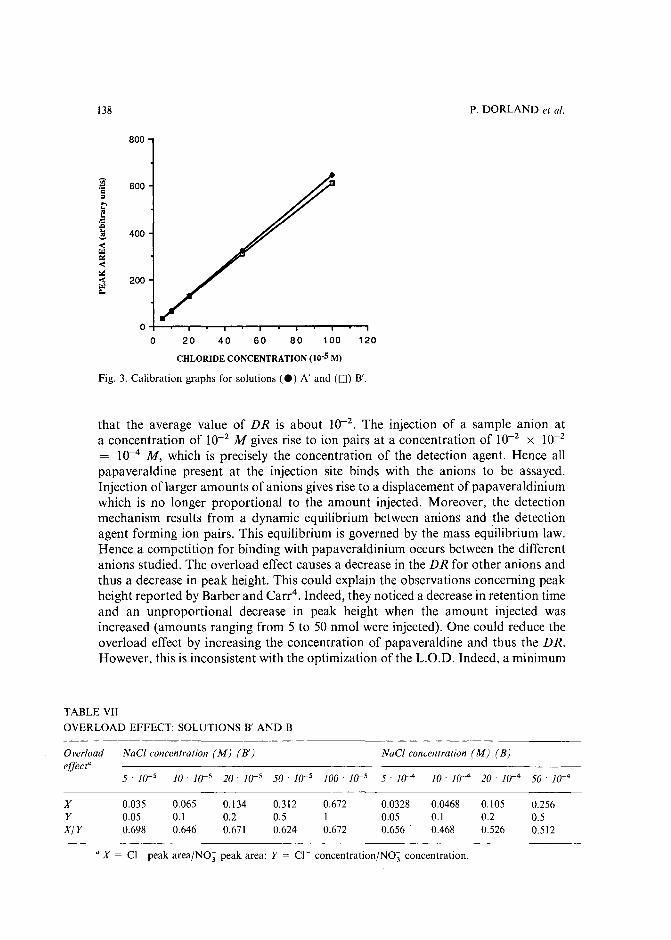
138 P. DORLAND et al.
800
~ 600c
"~l;...;::&>
~ 400-e~I:l:<~< 200~
"'"
20 40 60 80 100 120
CHLORIDE CONCENTRATION (10-5 M)
Fig. 3. Calibration graphs for solutions (e) A' and (0) B'.
that the average value of DR is about 10-2• The injection of a sample anion at
a concentration of 10-2 M gives rise to ion pairs at a concentration of 10-2 x 10-2
= 10-4 M, which is precisely the concentration of the detection agent. Hence allpapaveraldine present at the injection site binds with the anions to be assayed.Injection of larger amounts of anions gives rise to a displacement of papaveraldiniumwhich is no longer proportional to the amount injected. Moreover, the detectionmechanism results from a dynamic equilibrium between anions and the detectionagent forming ion pairs. This equilibrium is governed by the mass equilibrium law.Hence a competition for binding with papaveraldinium occurs between the differentanions studied. The overload effect causes a decrease in the DR for other anions andthus a decrease in peak height. This could explain the observations concerning peakheight reported by Barber and Carr4
. Indeed, they noticed a decrease in retention timeand an unproportional decrease in peak height when the amount injected wasincreased (amounts ranging from 5 to 50 nmol were injected). One could reduce theoverload effect by increasing the concentration of papaveraldine and thus the DR.However, this is inconsistent with the optimization of the L.O.D. Indeed, a minimum
TABLE VII
OVERLOAD EFFECT: SOLUTIONS B' AND B
Overload NaCI concentration (M) (B') NaCI concentration (M) (B)effect"
5 . J()-5 10 . ]()~5 20 . J()-5 50 . J()--5 lOa . 10- 5 5 . 10-4 J() . 10-4 20' J()-4 50 . 10-4
X 0.035 0.065 0.134 0.312 0.672 0.0328 0.0468 0.105 0.256Y 0.05 0.1 0.2 0.5 1 0.05 0.1 0.2 0.5X/Y 0.698 0.646 0.671 0.624 0.672 0.656 0.468 0.526 0.512
u x = CI- peak area/NO; peak area; Y = Cl" concentration/NO; concentration.
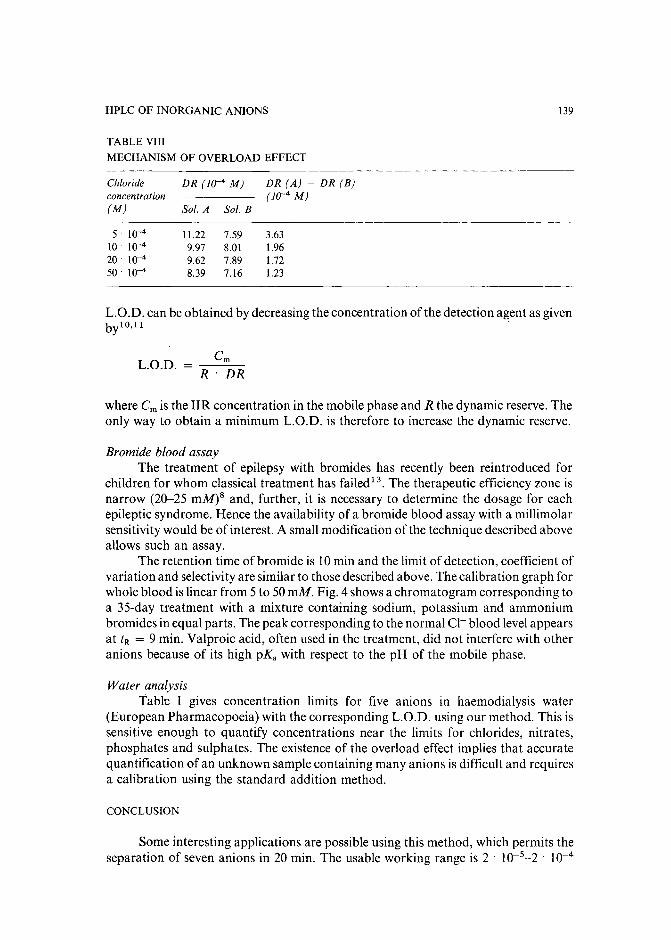
HPLC OF INORGANIC ANIONS
TABLE VIII
MECHANISM OF OVERLOAD EFFECT
Chloride DR 00-4 M) DR (A) - DR (B)concentration 00- 4 M)(M) Sol. A Sol. B
5' 10-4 11.22 7.59 3.6310 10-4 9.97 8.01 1.9620 . 10-4 9.62 7.89 1.7250 . 10-4 8.39 7.16 1.23
139
L.a.D. can be obtained by decreasing the concentration of the detection agent as givenby l 0 , 1 1 .
L.a.D.R'DR
where em is the IIR concentration in the mobile phase and R the dynamic reserve. Theonly way to obtain a minimum L.a.D. is therefore to increase the dynamic reserve.
Bromide blood assayThe treatment of epilepsy with bromides has recently been reintroduced for
children for whom classical treatment has failed 13. The therapeutic efficiency zone isnarrow (20-25 mM)8 and, further, it is necessary to determine the dosage for eachepileptic syndrome. Hence the availability of a bromide blood assay with a millimolarsensitivity would be of interest. A small modification of the technique described aboveallows such an assay.
The retention time of bromide is 10 min and the limit of detection, coefficient ofvariation and selectivity are similar to those described above. The calibration graph forwhole blood is linear from 5 to 50 mM. Fig. 4 shows a chromatogram corresponding toa 35-day treatment with a mixture containing sodium, potassium and ammoniumbromides in equal parts. The peak corresponding to the normal Ct blood level appearsat tR = 9 min. Valproic acid, often used in the treatment, did not interfere with otheranions because of its high pKa with respect to the pH of the mobile phase.
Water analysisTable I gives concentration limits for five anions in haemodialysis water
(European Pharmacopoeia) with the corresponding L.a.D. using our method. This issensitive enough to quantify concentrations near the limits for chlorides, nitrates,phosphates and sulphates. The existence of the overload effect implies that accuratequantification of an unknown sample containing many anions is difficult and requiresa calibration using the standard addition method.
CONCLUSION
Some interesting applications are possible using this method, which permits theseparation of seven anions in 20 min. The usable working range is 2 . 10-5-2 . 10-4
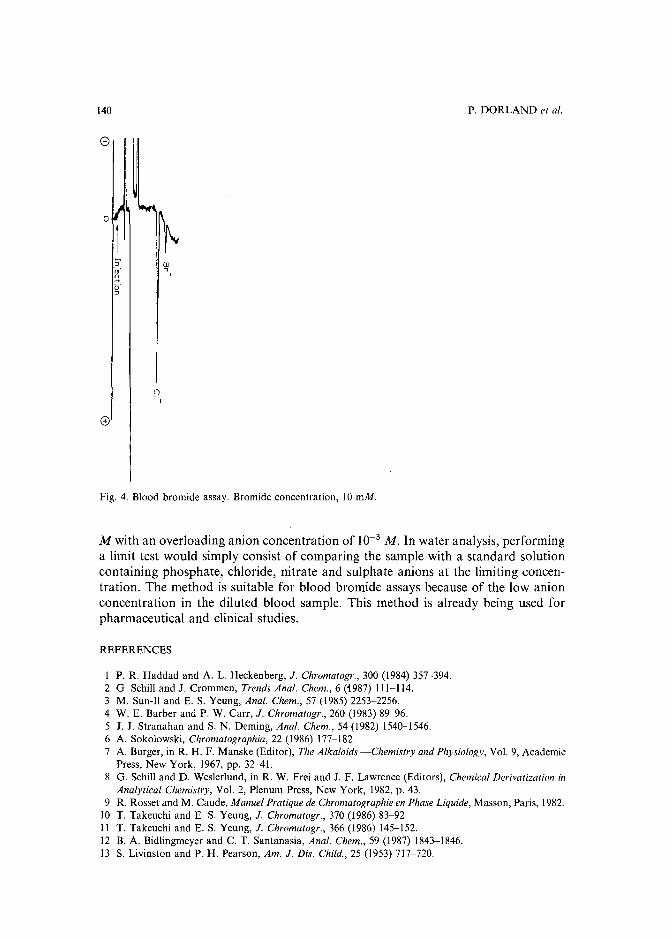
140
e
~0
5' tn
"-,
I:ls:::>
P. DORLAND et al.
()-,
Fig. 4. Blood bromide assay. Bromide concentration, 10 mM.
Mwith an overloading anion concentration of 10-3 M. In water analysis, performinga limit test would simply consist of comparing the sample with a standard solutioncontaining phosphate, chloride, nitrate and sulphate anions at the limiting concentration. The method is suitable for blood bromide assays because of the low anionconcentration in the diluted blood sample. This method is already being used forpharmaceutical and clinical studies.
REFERENCES
P. R. Haddad and A. 1. Heckenberg, J. Chromatogr., 300 (1984) 357-394.2 G. Schill and J. Crommen, Trends Anal. Chem., 6 (1987) 111-114.3 M. Sun-II and E. S. Yeung, Anal. Chem., 57 (1985) 2253-2256.4 W. E. Barber and P. W. Carr, J. Chromatogr., 260 (1983) 89-96.5 J. J. Stranahan and S. N. Deming, Anal. Chem., 54 (1982) 1540-1546.6 A. Sokolowski, Chromatographia, 22 (1986) 177-182.7 A. Burger, in R. H. F. Manske (Editor), The Alkaloids -s-Chemistry and Physiology, Vol. 9, Academic
Press, New York, 1967, pp. 32-41.8 G. Schill and D. Weslerlund, in R. W. Frei and J. F. Lawrence (Editors), Chemical Derivatization in
Analytical Chemistry, Vol. 2, Plenum Press, New York, 1982, p. 43.9 R. Rosset and M. Caude, Manuel Pratique de Chromatographic en Phase Liquide, Masson, Paris, 1982.
10 T. Takeuchi and E. S. Yeung, J. Chromatogr., 370 (1986) 83-92.11 T. Takeuchi and E. S. Yeung, J. Chromatogr., 366 (1986) 145-152.12 B. A. Bidlingmeyer and C. T. Santanasia, Anal. Chem., 59 (1987) 1843-1846.13 S. Livinston and P. H. Pearson, Am. J. Dis. Child., 25 (1953) 717-720.
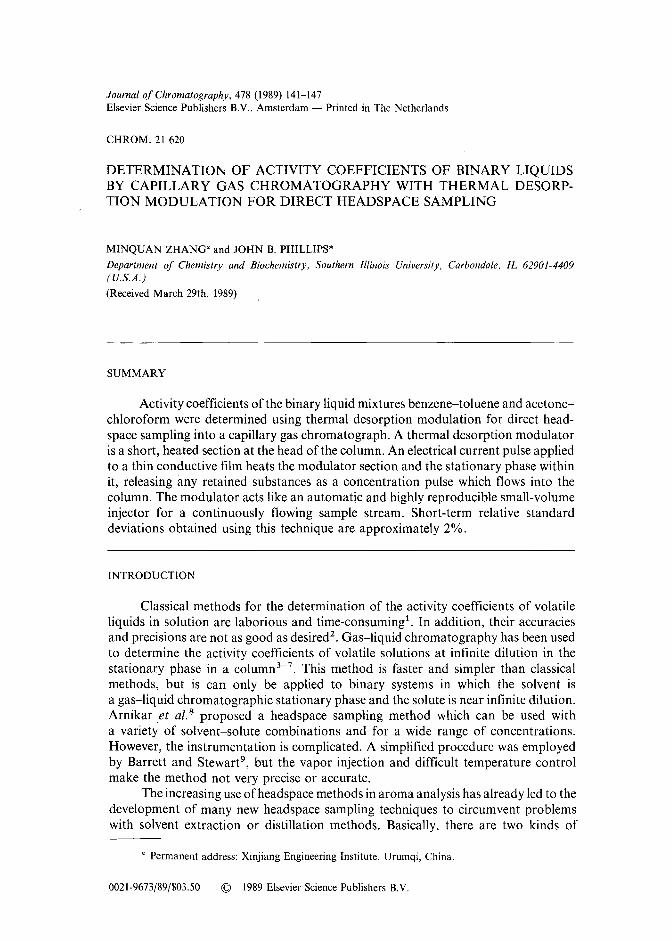
Journal oj Chromatography, 478 (1989) 141-147Elsevier Science Publishers B.V.. Amsterdam - Printed in The Netherlands
CHROM. 21 620
DETERMINATION OF ACTIVITY COEFFICIENTS OF BINARY LIQUIDSBY CAPILLARY GAS CHROMATOGRAPHY WITH THERMAL DESORPTION MODULATION FOR DIRECT HEADSPACE SAMPLING
MINQUAN ZHANG" and JOHN B. PHILLIPS*
Department of Chemistry and Biochemistry, Southern Illinois University, Carbondale, IL 62901-4409(U.S.A.)
(Received March 29th, 1989)
SUMMARY
Activity coefficients of the binary liquid mixtures benzene-toluene and acetonechloroform were determined using thermal desorption modulation for direct headspace sampling into a capillary gas chromatograph. A thermal desorption modulatoris a short, heated section at the head of the column. An electrical current pulse appliedto a thin conductive film heats the modulator section and the stationary phase withinit, releasing any retained substances as a concentration pulse which flows into thecolumn. The modulator acts like an automatic and highly reproducible small-volumeinjector for a continuously flowing sample stream. Short-term relative standarddeviations obtained using this technique are approximately 2%.
INTRODUCTION
Classical methods for the determination of the activity coefficients of volatileliquids in solution are laborious and time-consuming", In addition, their accuraciesand precisions are not as good as desired". Gas-liquid chromatography has been usedto determine the activity coefficients of volatile solutions at infinite dilution in thestationary phase in a column.":". This method is faster and simpler than classicalmethods, but is can only be applied to binary systems in which the solvent isa gas-liquid chromatographic stationary phase and the solute is near infinite dilution.Arnikar et al.8 proposed a headspace sampling method which can be used witha variety of solvent-solute combinations and for a wide range of concentrations.However, the instrumentation is complicated. A simplified procedure was employedby Barrett and Stewart", but the vapor injection and difficult temperature controlmake the method not very precise or accurate.
The increasing use of headspace methods in aroma analysis has already led to thedevelopment of many new headspace sampling techniques to circumvent problemswith solvent extraction or distillation methods. Basically, there are two kinds of
a Permanent address: Xinjiang Engineering Institute, Urumqi, China.
0021-9673/89/$03.50 © 1989 Elsevier Science Publishers B.V.
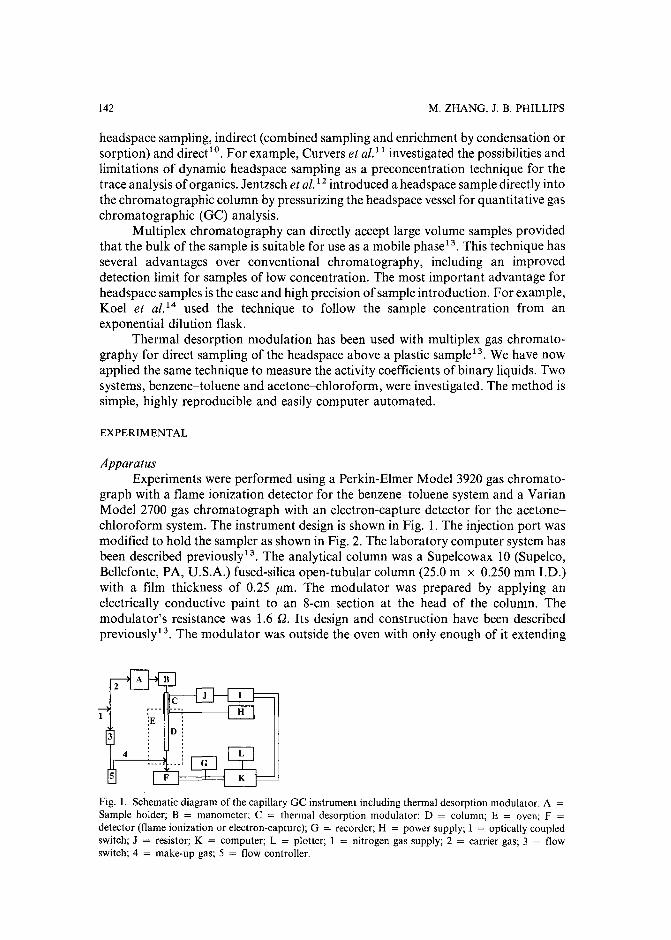
142 M. ZHANG, J. B. PHILLIPS
headspace sampling, indirect (combined sampling and enrichment by condensation orsorption) and direct!", For example, Curvers et al.1 1 investigated the possibilities andlimitations of dynamic headspace sampling as a preconcentration technique for thetrace analysis oforganics. Jentzsch et al.12 introduced a headspace sample directly intothe chromatographic column by pressurizing the headspace vessel for quantitative gaschromatographic (GC) analysis.
Multiplex chromatography can directly accept large volume samples providedthat the bulk of the sample is suitable for use as a mobile phase.':'. This technique hasseveral advantages over conventional chromatography, including an improveddetection limit for samples of low concentration. The most important advantage forheadspace samples is the ease and high precision ofsample introduction. For example,Koel et al.t" used the technique to follow the sample concentration from anexponential dilution flask.
Thermal desorption modulation has been used with multiplex gas chromatography for direct sampling of the headspace above a plastic sample!". We have nowapplied the same technique to measure the activity coefficients of binary liquids. Twosystems, benzene-toluene and acetone-ehloroform, were investigated. The method issimple, highly reproducible and easily computer automated.
EXPERIMENTAL
ApparatusExperiments were performed using a Perkin-Elmer Model 3920 gas chromato
graph with a flame ionization detector for the benzene-toluene system and a VarianModel 2700 gas chromatograph with an electron-capture detector for the acetonechloroform system. The instrument design is shown in Fig. 1. The injection port wasmodified to hold the sampler as shown in Fig. 2. The laboratory computer system hasbeen described previously'". The analytical column was a Supelcowax 10 (Supelco,Bellefonte, PA, U.S.A.) fused-silica open-tubular column (25.0 m x 0.250 mm J.D.)with a film thickness of 0.25 /Lm. The modulator was prepared by applying anelectrically conductive paint to an 8-cm section at the head of the column. Themodulator's resistance was 1.6 Q. Its design and construction have been describedpreviously'P, The modulator was outside the oven with only enough of it extending
Fig. I. Schematic diagram of the capillary GC instrument including thermal desorption modulator. A =
Sample holder; B = manometer; C = thermal desorption modulator; D = column; E = oven; F =detector (flame ionization or electron-capture); G = recorder; H = power supply; 1 = optically coupledswitch; J = resistor; K = computer; L = plotter; I = nitrogen gas supply; 2 = carrier gas; 3 = flowswitch; 4 = make-up gas; 5 = flow controller.
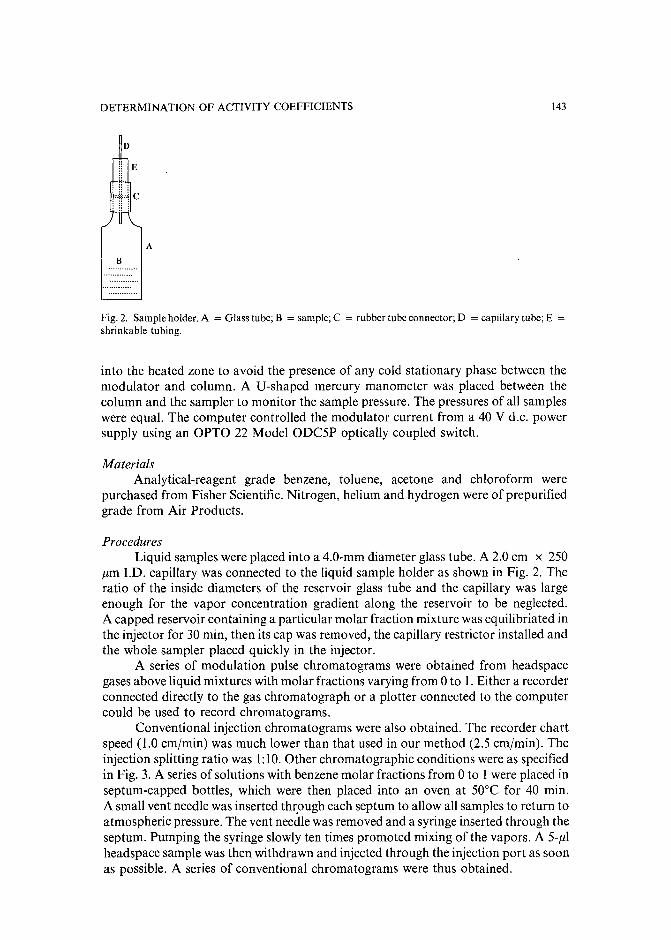
DETERMINAnON OF ACTIVITY COEFFICIENTS
A
B
143
Fig. 2. Sample holder. A = Glass tube; B = sample; C = rubber tube connector; D = capillary tube; E =
shrinkable tubing.
into the heated zone to avoid the presence of any cold stationary phase between themodulator and column. A If-shaped mercury manometer was placed between thecolumn and the sampler to monitor the sample pressure. The pressures of all sampleswere equal. The computer controlled the modulator current from a 40 V d.c. powersupply using an OPTO 22 Model ODC5P optically coupled switch.
MaterialsAnalytical-reagent grade benzene, toluene, acetone and chloroform were
purchased from Fisher Scientific. Nitrogen, helium and hydrogen were of prepurifiedgrade from Air Products.
ProceduresLiquid samples were placed into a 4.0-mm diameter glass tube. A 2.0 em x 250
JIm LD. capillary was connected to the liquid sample holder as shown in Fig. 2. Theratio of the inside diameters of the reservoir glass tube and the capillary was largeenough for the vapor concentration gradient along the reservoir to be neglected.A capped reservoir containing a particular molar fraction mixture was equilibriated inthe injector for 30 min, then its cap was removed, the capillary restrictor installed andthe whole sampler placed quickly in the injector.
A series of modulation pulse chromatograms were obtained from headspacegases above liquid mixtures with molar fractions varying from 0 to 1. Either a recorderconnected directly to the gas chromatograph or a plotter connected to the computercould be used to record chromatograms.
Conventional injection chromatograms were also obtained. The recorder chartspeed (1.0 ern/min) was much lower than that used in our method (2.5 ern/min). Theinjection splitting ratio was 1:10. Other chromatographic conditions were as specifiedin Fig. 3. A series of solutions with benzene molar fractions from 0 to 1 were placed inseptum-capped bottles, which were then placed into an oven at 50°C for 40 min.A small vent needle was inserted through each septum to allow all samples to return toatmospheric pressure. The vent needle was removed and a syringe inserted through theseptum. Pumping the syringe slowly ten times promoted mixing of the vapors. A 5-JIIheadspace sample was then withdrawn and injected through the injection port as soonas possible. A series of conventional chromatograms were thus obtained.
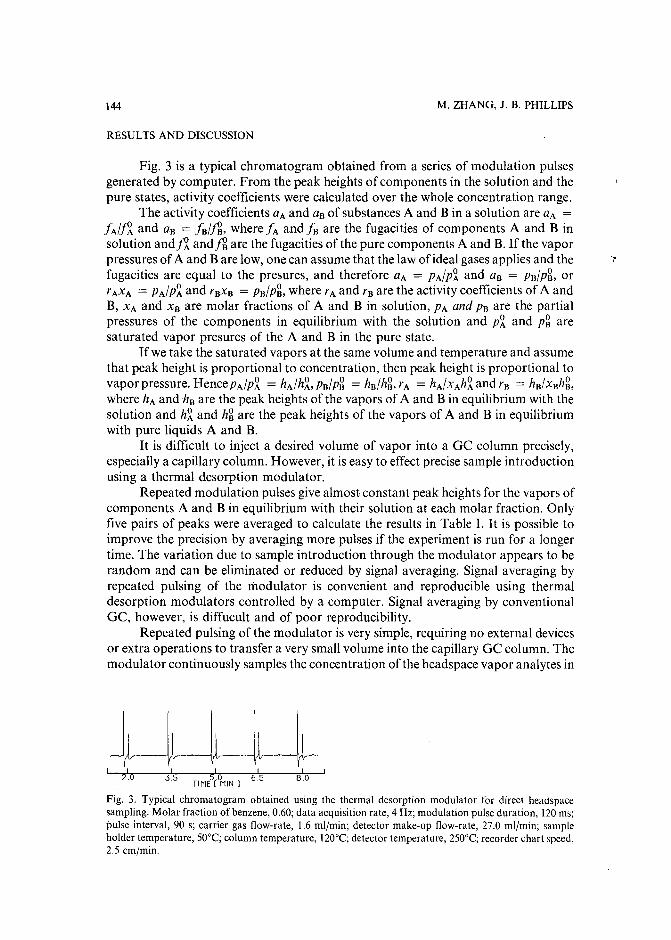
144
RESULTS AND DISCUSSION
M. ZHANG, J. B. PHILLIPS
Fig. 3 is a typical chromatogram obtained from a series of modulation pulsesgenerated by computer. From the peak heights ofcomponents in the solution and thepure states, activity coefficients were calculated over the whole concentration range.
The activity coefficients aAand aB of substances A and B in a solution are aA =
fAlfl and aB = fB/n, where fA and fB are the fugacities of components A and B insolution andfl and.fiJ are the fugacities of the pure components A and B. If the vaporpressures of A and B are low, one can assume that the law of ideal gases applies and the .~
fugacities are equal to the presures, and therefore aA = PAlp~ and aB = PBlpg, or'AXA = PAlp~ and 'BXB = PBlpg, where r, and r, are the activity coefficients of A andB, XA and XB are molar fractions of A and B in solution, PA and PB are the partialpressures of the components in equilibrium with the solution and P~ and pg aresaturated vapor presures of the A and B in the pure state.
Ifwe take the saturated vapors at the same volume and temperature and assumethat peak height is proportional to concentration, then peak height is proportional tovapor pressure. HencepAlp~ = hAlhtPRlpg = hRlhg"A = hAlxAh~ and r; = hHlxRhg,where hA and hB are the peak heights of the vapors of A and B in equilibrium with thesolution and h~ and hg are the peak heights of the vapors of A and B in equilibriumwith pure liquids A and B.
It is difficult to inject a desired volume of vapor into a GC column precisely,especially a capillary column. However, it is easy to effect precise sample introductionusing a thermal desorption modulator.
Repeated modulation pulses give almost constant peak heights for the vapors ofcomponents A and B in equilibrium with their solution at each molar fraction. Onlyfive pairs of peaks were averaged to calculate the results in Table I. It is possible toimprove the precision by averaging more pulses if the experiment is run for a longertime. The variation due to sample introduction through the modulator appears to berandom and can be eliminated or reduced by signal averaging. Signal averaging byrepeated pulsing of the modulator is convenient and reproducible using thermaldesorption modulators controlled by a computer. Signal averaging by conventionalGC, however, is diffucult and of poor reproducibility.
Repeated pulsing of the modulator is very simple, requiring no external devicesor extra operations to transfer a very small volume into the capillary GC column. Themodulator continuously samples the concentration of the headspace vapor analytes in
I I I I I
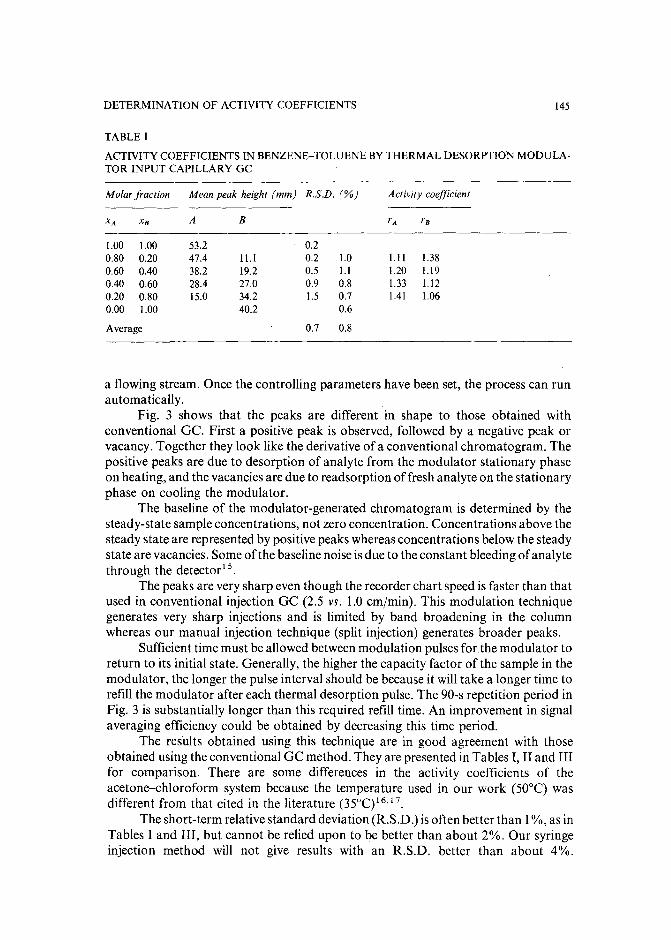
DETERMINATION OF ACTIVITY COEFFICIENTS 145
TABLE I
ACTIVITY COEFFICIENTS IN BENZENE-TOLUENE BY THERMAL DESORPTION MODULA·TOR INPUT CAPILLARY GC
Molar fraction Mean peak height (mm) R.S.D. (%) Activity coefficient
XA XB A B rA rB
1.00 1.00 53.2 0.20.80 0.20 47.4 11.1 0.2 1.0 1.11 1.380.60 0.40 38.2 19.2 0.5 1.1 1.20 1.190.40 0.60 28.4 27.0 0.9 0.8 1.33 1.120.20 0.80 15.0 34.2 1.5 0.7 1.41 1.060.00 1.00 40.2 0.6
Average 0.7 0.8
a flowing stream. Once the controlling parameters have been set, the process can runautomatically.
Fig. 3 shows that the peaks are different in shape to those obtained withconventional Gc. First a positive peak is observed, followed by a negative peak orvacancy. Together they look like the derivative of a conventional chromatogram. Thepositive peaks are due to desorption of analyte from the modulator stationary phaseon heating, and the vacancies are due to readsorption offresh analyte on the stationaryphase on cooling the modulator.
The baseline of the modulator-generated chromatogram is determined by thesteady-state sample concentrations, not zero concentration. Concentrations above thesteady state are represented by positive peaks whereas concentrations below the steadystate are vacancies. Some of the baseline noise is due to the constant bleeding of analytethrough the detector'".
The peaks are very sharp even though the recorder chart speed is faster than thatused in conventional injection GC (2.5 VS. 1.0 em/min). This modulation techniquegenerates very sharp injections and is limited by band broadening in the columnwhereas our manual injection technique (split injection) generates broader peaks.
Sufficient time must be allowed between modulation pulses forthe modulator toreturn to its initial state. Generally, the higher the capacity factor of the sample in themodulator, the longer the pulse interval should be because it will take a longer time torefill the modulator after each thermal desorption pulse. The 90-s repetition period inFig. 3 is substantially longer than this required refill time. An improvement in signalaveraging efficiency could be obtained by decreasing this time period.
The results obtained using this technique are in good agreement with thoseobtained using the conventional GC method. They are presented in Tables I, II and IIIfor comparison. There are some differences in the activity coefficients of theacetone-ehloroform system because the temperature used in our work (50°C) wasdifferent from that cited in the literature (350C)16,17.
The short-term relative standard deviation (R.S.D.) is often better than 1%, as inTables I and III, but cannot be relied upon to be better than about 2%. Our syringeinjection method will not give results with an R.S.D. better than about 4%.
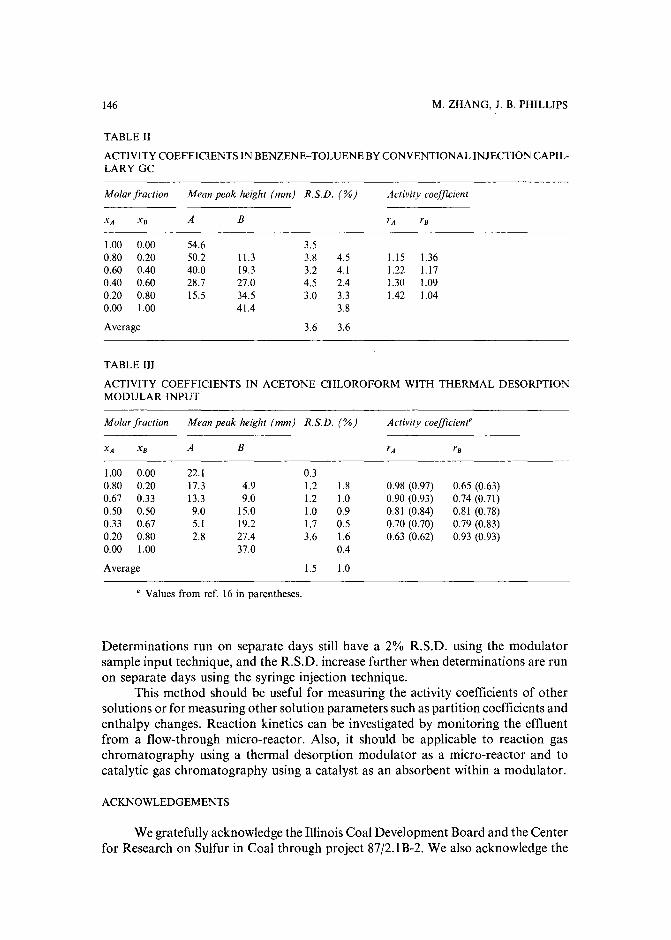
146 M. ZHANG, J. B. PHILLIPS
TABLE II
ACTIVITY COEFFICIENTS IN BENZENE-TOLUENE BY CONVENTIONAL INJECTION CAPILLARY GC
Molar fraction Mean peak height (mm) R.S.D. (%) Activity coefficient
XA XB A B rA rB
1.00 0.00 54.6 3.50.80 0.20 50.2 11.3 3.8 4.5 1.15 1.360.60 0.40 40.0 19.3 3.2 4.1 1.22 1.170.40 0.60 28.7 27.0 4.5 2.4 1.30 1.090.20 0.80 15.5 34.5 3.0 3.3 1.42 1.040.00 1.00 41.4 3.8
Average 3.6 3.6
TABLE III
ACTIVITY COEFFICIENTS IN ACETONE-CHLOROFORM WITH THERMAL DESORPTIONMODULAR INPUT
Molar fraction Mean peak height (mm) R.S.D. (%) Activity coefficient"
XA XB A B rA rB
1.00 0.00 22.1 0.30.80 0.20 17.3 4.9 1.2 1.8 0.98 (0.97) 0.65 (0.63)0.67 0.33 13.3 9.0 1.2 1.0 0.90 (0.93) 0.74 (0.71)0.50 0.50 9.0 15.0 1.0 0.9 0.81 (0.84) 0.81 (0.78)0.33 0.67 5.1 19.2 1.7 0.5 0.70 (0.70) 0.79 (0.83)0.20 0.80 2.8 27.4 3.6 1.6 0.63 (0.62) 0.93 (0.93)0.00 1.00 37.0 0.4
Average 1.5 1.0
a Values from ref. 16 in parentheses.
Determinations run on separate days still have a 2% R.S.D. using the modulatorsample input technique, and the R.S.D. increase further when determinations are runon separate days using the syringe injection technique.
This method should be useful for measuring the activity coefficients of othersolutions or for measuring other solution parameters such as partition coefficients andenthalpy changes. Reaction kinetics can be investigated by monitoring the effluentfrom a flow-through micro-reactor. Also, it should be applicable to reaction gaschromatography using a thermal desorption modulator as a micro-reactor and tocatalytic gas chromatography using a catalyst as an absorbent within a modulator.
ACKNOWLEDGEMENTS
We gratefully acknowledge the Illinois Coal Development Board and the Centerfor Research on Sulfur in Coal through project 87j2.lB-2. We also acknowledge the
DETERMINATION OF ACTIVITY COEFFICIENTS 147
Chinese Education Committee for partial support of M. Z. and the U.S. NationalAeronautics and Space Administration for the loan of gas chromatographic equipment.
REFERENCES
F. Daniels, J. M. Williams, P. Bender, R. Alberty and C. D. Cornwell, Experimental Physical Chemistry,McGraw-Hill, New York, 6th ed., 1962, p. 54.
2 E. R. Adlard, M. A. Khan and B. T. Whitham, in R. P. W. Scott (Editor), Gas Chromatography 1960,Butterworths, London, 1960, p. 252.
3 A. L. M. Keulmans, Gas Chromatography, Reinhold, New York, 1st ed., 1957, p. 171.4 P. E. Porter, C. H. Deal and F. H. Stross, J. Am. Chem. Soc., 78 (1956) 2999.5 A. Kwantes and G. W. A. Rijnders, in D. H. Desty (Editor), Gas Chromatography, Butterworths,
London, 1958, p. 125.6 S. Evered and F. H. Pollard, J. Chromatogr., 4 (1960) 451.7 S. Kenwerthy, J. Miller and D. E. Martire, J. Chem. Educ., 40 (1963) 541.8 H. J. Arnikar, T. S. Rao and A. A. Bodhe, J. Chem. Educ., 47 (1970) 826.9 R. Barrett and T. Stewart, J. Chem. Educ., 49 (1972) 492.
10 H. Hachenberg and A. P. Schmits, Gas Chromatographic Headspace Analysis, Heyden, New York, 1977,p.23.
I I J. Curvers, Th. Noy, C. Cramers and J. Rijks, J. Chromatogr., 289 (1984) 171.12 D. Jentzsch, H. Kruger, G. Lebrecht, G. Dencks and J. Gut, Fresenius Z. Anal. Chem., 236 (1968) 112.13 J. B. Phillips, D. Luu, J. B. Pawliszyn and G. C. Carle, Anal. Chem., 57 (1985) 2779.14 M. Koel, M. Kaljurand and E. Kiillik, in A. Zlatkis (Editor), Advances in Chromatography 1982 (Las
Vegas, NVj. Chromatography Symposium, Houston, TX, 1982. p. 43.15 S. Mitra and J. B. Phillips, J. Chromatogr. Sci., 26 (1988) 620.16 J. V. Zawidzki, Z. Phys. Chem. (Leipzig), 35 (1900) 129.17 R. C. Weast (Editor), Handbook ofChemistry and Physics, Chemical Rubber Company, Cleveland. OR
51st ed., 1970-71, p. 0146.

Journal of Chromatography, 478 (1989) 149-158Elsevier Science Publishers B.V., Amsterdam - Printed in The Netherlands
CHROM. 21 630
SENSITIVE FLUORESCENCE LABELLING FOR ANALYSIS OF CARBOXYLIC ACIDS WITH 4-BROMOMETHYL-6,7-METHYLENEDIOXYCOUMARIN
HIDEO NAGANUMA* and YUKINORI KAWAHARA
Product Development Laboratories, Sankyo Co. Ltd.. 2-58, Hiromachi l-chome, Shinagawa-ku, Tokyo 140(Japan)
(First received December 28th, 1988; revised manuscript received May lZth, 1989)
SUMMARY
A fluorescence labelling reagent, 4-bromomethyl-6,7-methylenedioxycoumarin(BrMDC), was synthesized from sesamol and citric acid by Pechman condensationfollowed by bromination. Nanomole amounts of saturated aliphatic fatty acids wereconverted into the corresponding fluorogenic esters in the presence of anhydrouspotassium carbonate and a crown ether as a catalyst and were separated by reversed-phase high-performance liquid chromatography (HPLC). Quantitative studiesrevealed that n-caproic acid was esterified completely at low temperature and withsufficient reproducibility. The detection limit was just below 15 fmol per injection ata signal-to-noise ratio of 3. The fluorescence quenching of the BrMDC derivative wasthe lowest in conventional mixed solvent systems in comparison with those of twopreviously reported coumarin compounds. BrMDC was also applied to the simultaneous analysis of some acidic non-steroidal anti-inflammatry agents by reversed-phaseHPLC.
INTRODUCTION
A large number of biologically interesting substances contain carboxylicmoieties, both as intermediates and end-products, from endogenous metabolism ofcarbohydrates or lipids. Several xenobiotics represented by drugs also possesscarboxylic groups. In therapeutic drug monitoring to design an individualized dosageregimen or in the investigation of pharmacokinetic-pharmacodynamic relationships,reliable and sensitive analytical methods for the drug itself and/or its active metabolitesin biological specimens are required v". High-performance liquid chromatography(HPLC) is now widely use for the trace analysis of numerous organic substancesbecause it provides rapid and sufficient resolution even when two or more closelyrelated analogues exist homogeneously. In early work, some fatty acids or their methylesters were also successfully separated directly by carbon number using reversed-phasebonded columns-:". With such substances, however, which do not have anychromogenic substituents, detection has to depend on their refraction or weak
0021-9673/89/$03.50 © [989 Elsevier Science Publishers B.V.
150 H. NAGANUMA, Y. KAWAHARA
absorption near the extreme ultraviolet region. This has hindered the application ofHPLC to the trace analysis of carboxylic acids in biological systems".
Chemical derivatization of specific functional groups to give UV-sensitive orstrong fluorogenic probes overcame this disadvantage and improved the detectabilityof the compounds of interest7
• Durst et al.8 first employed p-bromophenacyl bromide(P-BPB) as a labelling reagent for calboxylic acids to achieve sensitive UV detection inHPLC, and this was extended to the resolution diastereomers of some long-chainunsaturated fatty acids", Diinges and co-workers introduced 4-bromomethyl-7methoxycoumarin (BrMMC), a highly sensitive fluorescence labelling reagent, forboth thin-layer chromatography10.11 and HPLC12.13 , and since then various otherfluorescence probes have been developed, e.g., l-bromoacetylpyrene (BAP)14, 4-bromomethyl-6,7-dimethoxycoumarin (BrDMC)lS, 9-anthryldiazomethane (ADAM)1 6
,
4-bromomethyl-7-acetoxycoumarin (BrMAC)l 7, 3-bromomethyl-6,7-dimethoxy-lmethy1-2(1H)-quinoxalinone (BrMQ) 18 and p-(9-anthroyloxy)phenacyl bromide19.Among these, BrMMC and ADAM have been commonly applied to the trace analysisof biologically important acid compounds such as prostaglandins'P-" in enzymaticpreparations.
In this paper, we report the preparation of 4-bromomethyl-6,7-methylenedioxycoumarin (BrMDC), a fluorescence labelling reagent for caboxylic acids, whichpossesses a more fluorogenic 6,7-methylenedioxycoumarin moiety than in previouslyreported coumarin compounds, and its applicability to the simultaneous analysis ofa series of fatty acids and some acidic non-steroidal anti-inflammatry agents(NSAIDs) by reversed-phase HPLC.
EXPERIMENTAL
Materials3,4-Methylenedioxyphenol (sesamol) and 4-bromomethyl-6,7-dimethoxycou
marin (BrDMC) were purchased from Aldrich (Milwaukee, WI, U.S.A.), 4-bromomethyl-7-methoxycoumarin (BrMMC), aspirin, ketoprofen and ibuprofen fromWako (Osaka, Japan) and all CrC19 saturated fatty acids, naproxen, indomethacinand the crown ethers 18-crown-6, dicyclohexano-18-crown-6, dibenzo-18-crown-6and kryptofix 222 from Sigma (St. Louis, MO, U.S.A.). Loxoprofen was prepared andsupplied by the Chemical Research Laboratories of Sankyo (Tokyo, Japan) 22 .
Flurbiprofen was purchased as commercially available tablets (Furoben; KakenPharmaceutical, Tokyo, Japan) and extracted and purified in our laboratories.4-Methyl-6,7-methylenedioxycoumarin for fluorescence spectral studies was preparedaccording to Fukui and Nakayama/:'. All other chemicals for synthesis were ofguaranteed reagent grade and all organic solvents for chromatographic purpose wereof special grade for HPLC, obtained from Wako.
InstrumentsProton nuclear magnetic resonance eH NMR) spectra were measured on
a Model JNM-GX270 spectrometer (Jeol, Tokyo, Japan) at 270 MHz and chemicalshift values (<5) were expressed in parts per million downfield from tetramethylsilane asinternal standard. IR spectra were recorded on a Model 60-SX Fourier transforminfrared spectrometer (Nicolet Japan, Tokyo, Japan). Mass spectra were measured
LABELLING OF CARBOXYLIC ACIDS WITH BrMDC lSI
with a Model DX-300 mass spectrometer (Jeol, Tokyo, Japan). The HPLC systemconsisted of a Model 655 solvent delivery pump unit (Hitachi, Tokyo, Japan) anda Model F-1000 fluorescence spectrophotometer (Hitachi), which was linked toa Model C-R3A chromatographic integrator (Shimadzu, Kyoto, Japan). The samplewas applied to a IlBondapak C1Sreversed-phase packed column (300 mm x 3.9 mmI.D.) (Millipore-Waters, Milford, MA, U.S.A.) by a WISP 710B automatic sampleprocessor (Millipore- Waters).
Determination offluorescence quantum yieldFluorescence spectra of 6,7-substituted 4-methylcoumarins in various solvents
were measured on a Model RF-540 fluorescence spectrophotometer (Shimadzu). Thefluorescence intensity was evaluated as the integrated area under the spectrum and therelative fluorescence quantum yield was calculated according to Weber and Tealez4
using quinine sulphate as a reference.
Synthesis of 4-carboxymethyl-6,7-methylenedioxycoumarin (I)4-Carboxymethyl-6,7-methylenedioxycoumarin (I) was prepared according to
Baker et al.Z5. Finely powdered crystalline citric acid (250 mmol) was poured stepwiseat 70°C into 67.5 ml of sulphuric acid. To the ice-cold solution was added an equalnumber of moles of finely ground sesamol, keeping the temperature below 5°C.A further 29 ml of sulphuric acid were poured in gradually and stirred gently overnight.The reaction mixture, diluted with 50 ml of chilled water, was filtered and theremaining brown material was washed sequently with 0.01 M sulphuric acid,2 M sodium hydroxide solution and 2 Mhydrochloric acid. After being kept stationaryovernight, the ash-coloured precipitate was separated by centrifugation and recrystallized from acetonitrile to give I as faintly white prisms; yield 33-51 %, m.p. 170°C.Analysis: calculated for C12HS0 6 , C 58.07, H 3.25; found, C 57.96, H 3.08%. lHNMR (perdeuterated dimethyl sulphoxide: 3.96 (2H, s, -CHzCOO-), 6.23 (2H, s,-OCHzO-), 6.39 (lH, s, =C=CH-CO-), 7.02 (IH, s, aromatic), 7.26 ppm (lH, s,aromatic). Mass spectrum: m]z 248 (M +),204 (base peak). IR (KBr pellet): 3050, 2920,1720,1410,1280,1040,940 cm- 1.
Synthesis of 4-bromomethyl-6,7-methylenedioxycoumarin (BrMDC, II)To 10 mmol of I suspended in 7.5 ml of acetic acid was gradually added an
equimolar amount of acetic acid containing 10 mmol of bromine, the solution wasrefluxed for 1 h. After cooling, the resulting crude material was subjected to silica gelcolumn chromatography and eluted with acetone. The main fraction was evaporatedto dryness and the residue was recrystallized from methanol to give II as yellow prisms;yield 76%, m.p. 241°C. Analysis: calculated for C llH70 4Br, C 46.46, H 2.47, Br,28.23; found, C 46.93, H 2.34, Br 27.86%.1 H NMR (perdeuterated acetone): 4.79 (2H,s -CHzBr), 6.20 (2H, s, -OCHzO-), 6.50 (lH, s, =C=CH-CO-), 6.94 (lH, s,aromatic), 7.32 ppm (IH, s, aromatic). Mass spectrum: m]z 283 (M+), 175(base peak).IR (KBr pellet): 3070, 2920, 1730, 1450, 1270, 1040, 630 em - 1.
Preparation of n-caproic acid derivatives (III) as fluorescence referenceThe authentic BrMDC derivative of n-caproic acid was synthesized on
a semi-micro preparative scale in order to evaluate its reactivity. To a solution of
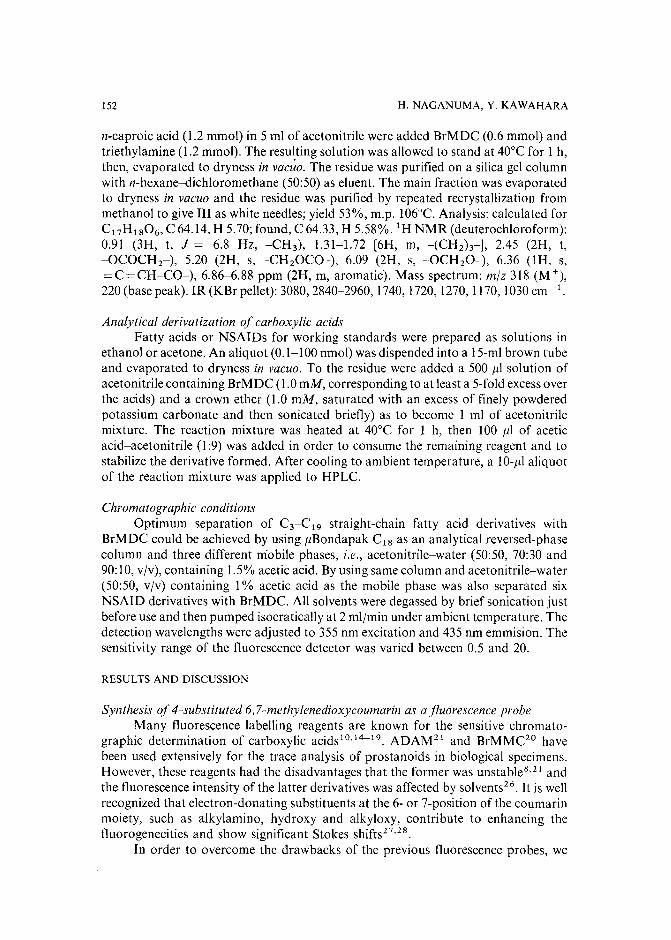
152 H. NAGANUMA,Y. KAWAHARA
n-caproic acid (1.2 mmol) in 5 ml of acetonitrile were added BrMDC (0.6 mmol) andtriethylamine (1.2 mmol). The resulting solution was allowed to stand at 40°C for 1 h,then, evaporated to dryness in vac~o. The residue was purified on a silica gel columnwith n-hexane-dichloromethane (50:50) as eluent. The main fraction was evaporatedto dryness in vacuo and the residue was purified by repeated recrystallization frommethanol to give III as white needles; yield 53%, m.p. 106°C. Analysis: calculated forC17H1806, C 64.14, H 5.70; found, C 64.33, H 5.58%. lH NMR (deuterochloroform):0.91 (3H, t, J = 6.8 Hz, -CH3 ) , 1.31-1.72 [6H, m, -(CHzh-]' 2.45 (2H, t,-OCOCH r ) , 5.20 (2H, s, -CHzOCO-), 6.09 (2H, s, -OCHzO-), 6.36 (lH, s,=C=CH-CO-), 6.86-6.88 ppm (2H, m, aromatic). Mass spectrum: mlz 318 (M+),220 (base peak). IR (KBr pellet): 3080,2840-2960, 1740, 1720, 1270, 1170, 1030cm -1.
Analytical derivatization of carboxylic acidsFatty acids or NSAIDs for working standards were prepared as solutions in
ethanol or acetone. An aliquot (0.1-100 nmol) was dispended into a l5-ml brown tubeand evaporated to dryness in vacuo. To the residue were added a 500 )11 solution ofacetonitrile containing BrMDC (1.0 mM, corresponding to at least a 5-fold excess overthe acids) and a crown ether (1.0 mM, saturated with an excess of finely powderedpotassium carbonate and then sonicated brietly) as to become 1 ml of acetonitrilemixture. The reaction mixture was heated at 40°C for 1 h, then 100 )11 of aceticacid-acetonitrile (l :9) was added in order to consume the remaining reagent and tostabilize the derivative formed. After cooling to ambient temperature, a 10-)11 aliquotof the reaction mixture was applied to HPLC.
Chromatographic conditionsOptimum separation of C3-C19 straight-chain fatty acid derivatives with
BrMDC could be achieved by using )1Bondapak C18 as an analytical reversed-phasecolumn and three different rriobile phases, i.e., acetonitrile-water (50:50, 70:30 and90:10, v/v), containing 1.5% acetic acid. By using same column and acetonitrile-water(50:50, v/v) containing 1% acetic acid as the mobile phase was also separated sixNSAID derivatives with BrMDC. All solvents were degassed by brief sonication justbefore use and then pumped isocratically at 2 ml/min under ambient temperature. Thedetection wavelengths were adjusted to 355 nm excitation and 435 nm emmision. Thesensitivity range of the fluorescence detector was varied between 0.5 and 20.
RESULTS AND DISCUSSION
Synthesis of 4-substituted 6,7-methylenedioxycoumarin as afluorescence probeMany fluorescence labelling reagents are known for the sensitive chromato
graphic determination of carboxylic acids10,14-19. ADAMz1 and BrMMCzo havebeen used extensively for the trace analysis of prostanoids in biological specimens.However, these reagents had the disadvantages that the former was unstablev " andthe tluorescence intensity of the latter derivatives was affected by solvents'". It is wellrecognized that electron-donating substituents at the 6- or 7-position of the coumarinmoiety, such as alkylamino, hydroxy and alkyloxy, contribute to enhancing thetluorogenecities and show significant Stokes shiftsz7.z8.
In order to overcome the drawbacks of the previous fluorescence probes, we
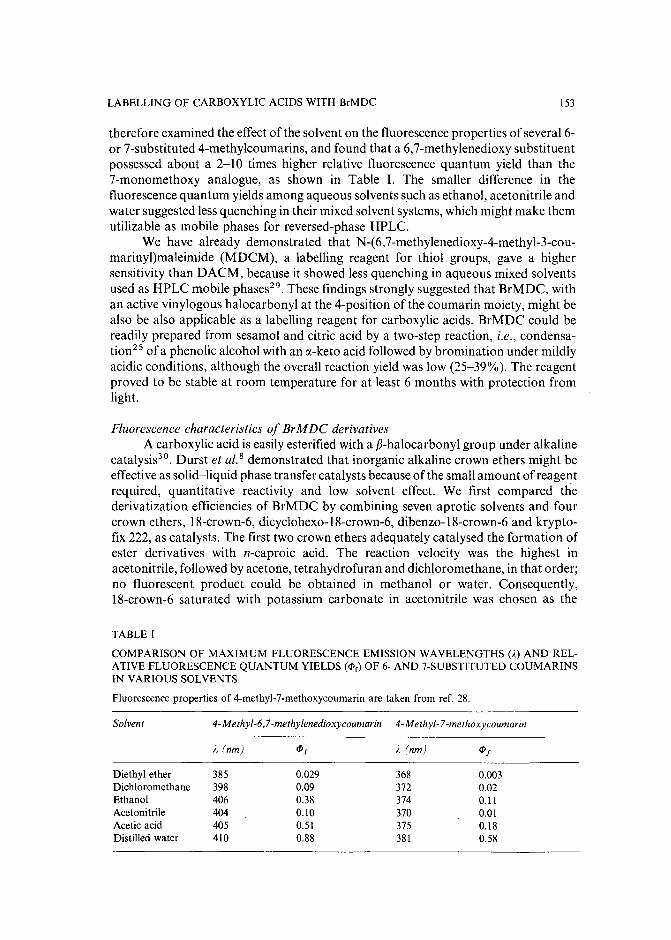
LABELLING OF CARBOXYLIC ACIDS WITH BrMDC 153
therefore examined the effect of the solvent on the fluorescence properties of several 6or 7-substituted 4-methylcoumarins, and found that a 6,7-methylenedioxy substituentpossessed about a 2-10 times higher relative fluorescence quantum yield than the7-monomethoxy analogue, as shown in Table I. The smaller difference in thefluorescence quantum yields among aqueous solvents such as ethanol, acetonitrile andwater suggested less quenching in their mixed solvent systems, which might make themutilizable as mobile phases for reversed-phase HPLC.
We have already demonstrated that N-(6,7-methylenedioxy-4-methyl-3-coumarinyl)maleimide (MDCM), a labelling reagent for thiol groups, gave a highersensitivity than DACM, because it showed less quenching in aqueous mixed solventsused as HPLC mobile phases-", These findings strongly suggested that BrMDC, withan active vinylogous halocarbonyl at the 4-position of the coumarin moiety, might bealso be also applicable as a labelling reagent for carboxylic acids. BrMDC could bereadily prepared from sesamol and citric acid by a two-step reaction, i.e., condensation 2 5 ofa phenolic alcohol with an a-keto acid followed by bromination under mildlyacidic conditions, although the overall reaction yield was low (25-39%). The reagentproved to be stable at room temperature for at least 6 months with protection fromlight.
Fluorescence characteristics of BrMDC derivativesA carboxylic acid is easily esterified with a f3-halocarbonyl group under alkaline
catalysist". Durst et al.8 demonstrated that inorganic alkaline crown ethers might beeffective as solid-liquid phase transfer catalysts because of the small amount of reagentrequired, quantitative reactivity and low solvent effect. We first compared thederivatization efficiencies of BrMDC by combining seven aprotic solvents and fourcrown ethers, 18-crown-6, dicyclohexo-18-crown-6, dibenzo-18-crown-6 and kryptofix 222, as catalysts. The first two crown ethers adequately catalysed the formation ofester derivatives with n-caproic acid. The reaction velocity was the highest inacetonitrile, followed by acetone, tetrahydrofuran and dichloromethane, in that order;no fluorescent product could be obtained in methanol or water. Consequently,18-crown-6 saturated with potassium carbonate in acetonitrile was chosen as the
TABLE I
COMPARISON OF MAXIMUM FLUORESCENCE EMISSION WAVELENGTHS (A) AND RELATIVE FLUORESCENCE QUANTUM YIELDS (<Pc) OF 6- AND 7-SUBSTITUTED COUMARINSIN VARIOUS SOLVENTS
Fluorescence properties of 4-methyl-7-methoxycoumarin are taken from ref. 28.
Solvent 4- M ethyl-6, 7-me thylenedioxycoumarin 4- M ethyl-7-methoxycoumarin
A (nm) <Pf ). (nm) <Pf
Diethyl ether 385 0.029 368 0.003Dichloromethane 398 0.09 372 0.02Ethanol 406 0.38 374 0.11Acetonitrile 404 0.10 370 0.01Acetic acid 405 0.51 375 0.18Distilled water 410 0.88 381 0.58
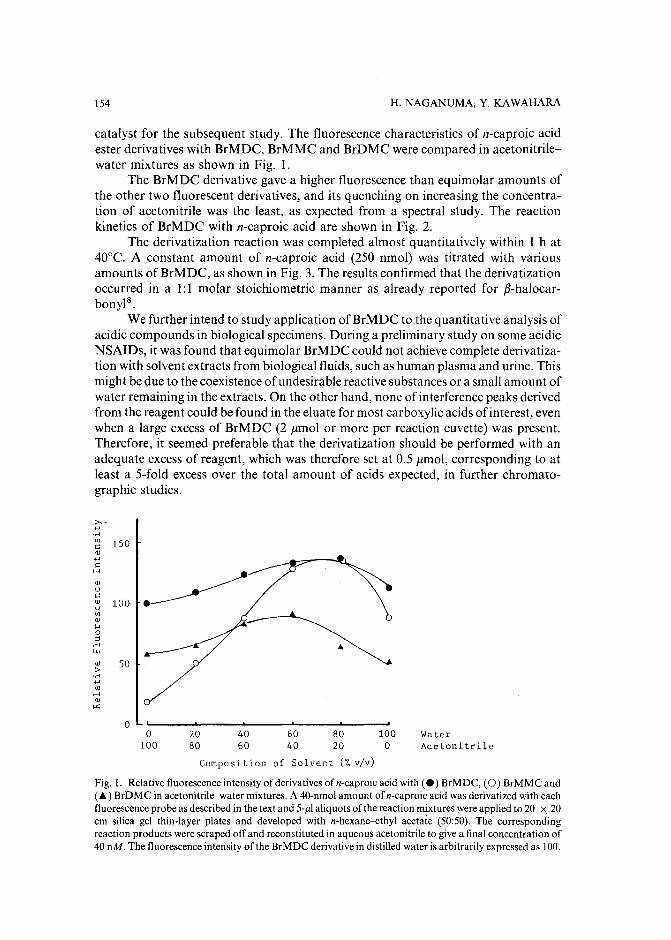
154 H. NAGANUMA,Y. KAWAHARA
catalyst for the subsequent study. The fluorescence characteristics of n-caproic acidester derivatives with BrMDC, BrMMC and BrDMC were compared in acetonitrilewater mixtures as shown in Fig. I.
The BrMDC derivative gave a higher fluorescence than equimolar amounts ofthe other two fluorescent derivatives, and its quenching on increasing the concentration of acetonitrile was the least, as expected from a spectral study. The reactionkinetics of BrMDC with n-caproic acid are shown in Fig. 2.
The derivatization reaction was completed almost quantitatively within I h at40°C. A constant amount of n-caproic acid (250 nmol) was titrated with variousamounts of BrMDC, as shown in Fig. 3. The results confirmed that the derivatizationoccurred in a I: I molar stoichiometric manner as already reported for p-halocarbonyl".
We further intend to study application ofBrMDC to the quantitative analysis ofacidic compounds in biological specimens. During a preliminary study on some acidicNSAIDs, it was found that equimolar BrMDC could not achieve complete derivatization with solvent extracts from biological fluids, such as human plasma and urine. Thismight be due to the coexistence of undesirable reactive substances or a small amount ofwater remaining in the extracts. On the other hand, none of interference peaks derivedfrom the reagent could be found in the eluate for most carboxylic acids ofinterest, evenwhen a large excess of BrMDC (2 ,umol or more per reaction cuvette) was present.Therefore, it seemed preferable that the derivatization should be performed with anadequate excess of reagent, which was therefore set at 0.5 ,umol, corresponding to atleast a 5-fold excess over the total amount of acids expected, in further chromatographic studies.
150
(])
oc::~ 100UJ(])
....o:J....~
~ 50........,
'"....Q)
P':
oWaterAcetonitrile
o100
20 40 60 80 10080 60 40 20 0
Composition of Solvent (% v/v)
Fig. I. Relative fluorescence intensity of derivatives of n-caproic acid with (.) BrMDC, (0) BrMMC and(.;,.) BrDMC in acetonitrile-water mixtures. A 40-nmol amount of n-caproic acid was derivatized with eachfluorescence probe as described in the text and 5-Jll aliquots of the reaction mixtures were applied to 20 x 20ern silica gel thin-layer plates and developed with n-hexane--ethyl acetate (50:50). The correspondingreaction products were scraped off and reconstituted in aqueous acetonitrile to give a final concentration of40 nM. The fluorescence intensity of the BrMDC derivative in distilled water is arbitrarily expressed as 100.
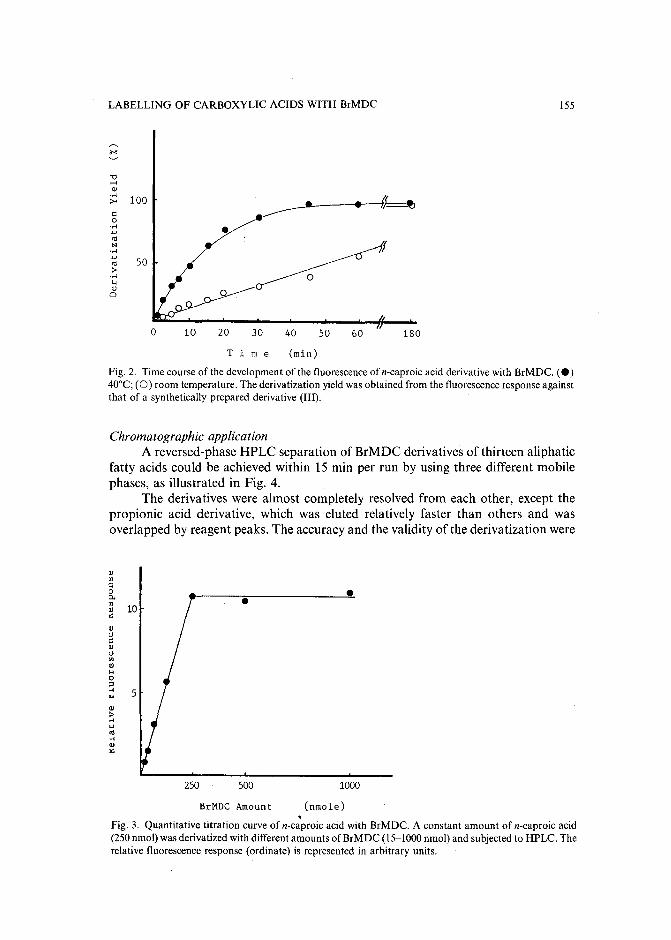
LABELLING OF CARBOXYLIC ACIDS WITH BrMDC 155
~...~
-0......OJ
'M 100:><
c0
'M •'-'<UN
'M'-' 50<U>
'M
'"OJ0
5040302010~---",--....._-------.........,~
60 180o
Tim e (min)
Fig. 2. Time course of the development of the fluorescence of n-caproic acid derivative with BrMDC. (.)40°C; (0) room temperature. The derivatization yield was obtained from the fluorescence response againstthat of a synthetically prepared derivative (III).
Chromatographic applicationA reversed-phase HPLC separation of BrMDC derivatives of thirteen aliphatic
fatty acids could be achieved within 15 min per run by using three different mobilephases, as illustrated in Fig. 4.
The derivatives were almost completely resolved from each other, except thepropionic acid derivative, which was eluted relatively faster than others and wasoverlapped by reagent peaks. The accuracy and the validity of the derivatization were
OJ:n:::o •;:>. •'"OJ<:
OJtJ:::OJtJ
'"OJ
'"0'"... 5..OJ>M....<U...OJ>:
250 500 1000
BrMDC Amount (nmole).Fig. 3. Quantitative titration curve of n-caproic acid with BrMDC. A constant amount of n-caproic acid(250 nmol) was derivatized with different amounts of BrMDC (15-1000 nmol) and subjected to HPLC. Therelative fluorescence response (ordinate) is represented in arbitrary units.
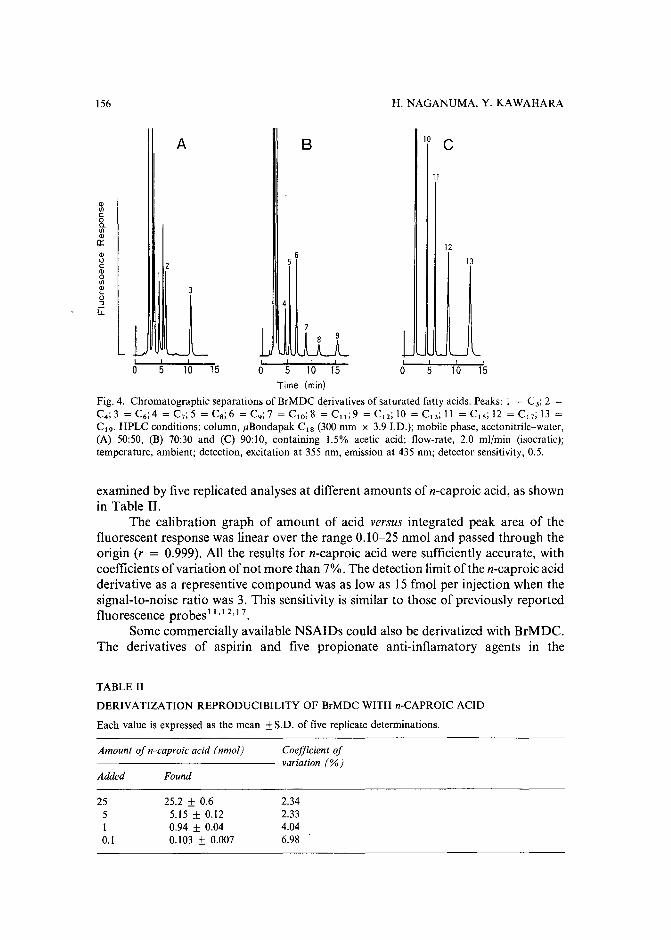
156
A B
H. NAGANUMA, Y. KAWAHARA
10 C
11
QlVlC0a.VlQl0:: 12Q) 6o 5 13cQ)0VJ
~0:J
ii:
o 15Time (min)
Fig. 4. Chromatographic separations of BrMDC derivatives of saturated fatty acids. Peaks: 1 = C3; 2 =C4;3 =C6;4 =C7;5 =Cs;6 =C9;7 =C,o;8 =C, ,;9 =C12;IO =C , 3;11 =C,s;12 =C17;13 =C, 9. HPLC conditions: column, uBondapak C's (300 mm x 3.9 J.D.); mobile phase, acetonitrile-water,(A) 50:50, (B) 70:30 and (C) 90:10, containing 1.5% acetic acid; flow-rate, 2.0 mljmin (isocratic);temperature, ambient; detection, excitation at 355 nm, emission at 435 nm; detector sensitivity, 0.5.
examined by five replicated analyses at different amounts of n-caproic acid, as shownin Table II.
The calibration graph of amount of acid versus integrated peak area of thefluorescent response was linear over the range 0.10-25 nmol and passed through theorigin (r = 0.999). All the results for n-caproic acid were sufficiently accurate, withcoefficients of variation of not more than 7%. The detection limit of the n-caproic acidderivative as a representive compound was as low as 15 fmol per injection when thesignal-to-noise ratio was 3. This sensitivity is similar to those of previously reportedfluorescence probesll.12.17.
Some commercially available NSAIDs could also be derivatized with BrMDC.The derivatives of aspirin and five propionate anti-inflamatory agents in the
TABLE II
DERIVATIZATION REPRODUCIBILITY OF BrMDC WITH n-CAPROIC ACID
Each value is expressed as the mean ±S.D. of five replicate determinations.
Amount of n-caproic acid (nmol)
Added
255I0.1
Found
25.2 ± 0.65.15 ± 0.120.94 ± 0.040.103 ± 0.007
Coefficient ojvariation (%)
2.342.334.046.98
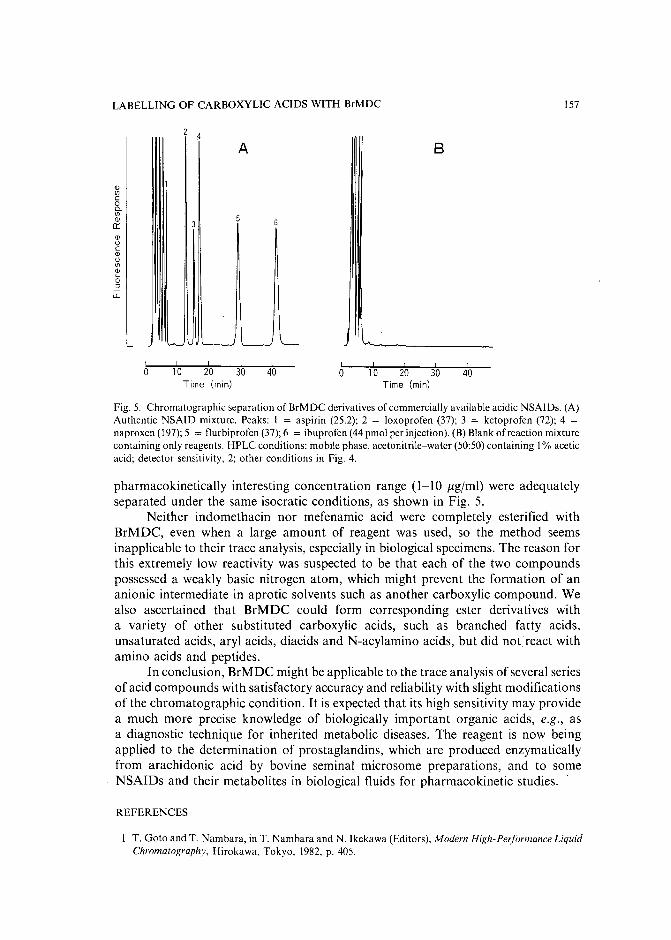
LABELLING OF CARBOXYLIC ACIDS WITH BrMDC 157
<1J11lCoQ.11l<1J0::<ll()C<llo11l<ll(;:J
LL
o
2 4
A
! ! !
10 20 30Time (min)
40 o
B
! ! 1
10 20 30Time (min)
40
Fig. 5. Chromatographic separation of BrMDC derivatives of commercially available acidic NSAIDs. (A)Authentic NSAID mixture. Peaks: I = aspirin (25.2); 2 = loxoprofen (37); 3 = ketoprofen (72); 4 =naproxen (197); 5 = flurbiprofen (37);6 = ibuprofen (44 pmo! per injection). (B) Blank of reaction mixturecontaining only reagents. HPLC conditions: mobile phase, acetonitrile-water (50:50)containing I% aceticacid; detector sensitivity, 2; other conditions in Fig. 4.
pharmacokinetically interesting concentration range (1-10 ,ug/ml) were adequatelyseparated under the same isocratic conditions, as shown in Fig. 5.
Neither indomethacin nor mefenamic acid were completely esterified withBrMDC, even when a large amount of reagent was used, so the method seemsinapplicable to their trace analysis, especially in biological specimens. The reason forthis extremely low reactivity was suspected to be that each of the two compoundspossessed a weakly basic nitrogen atom, which might prevent the formation of ananionic intermediate in aprotic solvents such as another carboxylic compound. Wealso ascertained that BrMDC could form corresponding ester derivatives witha variety of other substituted carboxylic acids, such as branched fatty acids,unsaturated acids, aryl acids, diacids and N-acylamino acids, but did not react withamino acids and peptides.
In conclusion, BrMDC might be applicable to the trace analysis of several seriesof acid compounds with satisfactory accuracy and reliability with slight modificationsof the chromatographic condition. It is expected that its high sensitivity may providea much more precise knowledge of biologically important organic acids, e.g., asa diagnostic technique for inherited metabolic diseases. The reagent is now beingapplied to the determination of prostaglandins, which are produced enzymaticallyfrom arachidonic acid by bovine seminal microsome preparations, and to someNSAIDs and their metabolites in biological fluids for pharmacokinetic studies.
REFERENCES
T. Goto and T. Nambara, in T. Nambara and N. Ikekawa (Editors), Modern High-Performance LiquidChromatography, Hirokawa, Tokyo. 1982, p. 405.
158 H. NAGANUMA, Y. KAWAHARA
2 A. Tsuji, in M. Hanano, K. Umemura and T. 19a (Editors), Applied Pharmacokinetics, Theory andExperiments, Soft Science, Tokyo, 1985, p. 37.
3 P. T. S. Pei, R. S. Henly and S. Ramachandran, Lipids, 10 (1975) 132.4 C. R. Scholfield, J. Am. Oil Chem. Soc., 52 (1975) 36.5 J. D. Warthen, Jr., J. Am. Oil Chem. Soc., 52 (1975) 151.6 R. S. Henly and S. Ramachandran, in K. Tsuji (Editor), GLC and HPLC Determination of Therapeutic
Agents, Part 3, Marcel Dekker, New York, 1979, p. 1341.7 J. F. Lawrence, in R. W. Frei and J. F. Lawrence (Editors), Chemical Derivatization in Analytical
Chemistry, Vol. 2, Plenum Press, New York, 1981, p. 191.8 H. D. Durst, M. Milano, E. J. Kikta, S. A. Connelly and E. Grushka, Anal. Chem., 47 (1975) 1797.9 P. T. Pei, W. C. Kossa, S. Ramachandran and R. S. Henly, Lipids, II (1976) 814.
10 W. Diinges, Chromatographia, 9 (1976) 624.11 W. Diinges, Anal. Chem., 49 (1977) 442.12 W. Diinges and N. Seiler, J. Chromatogr., 145 (1978) 483.13 S. Lam and E. Grushka, J. Chromatogr., 158 (1978) 207.14 S. Kamada, M. Maeda and A. Tsuji, J. Chromatogr., 272 (1983) 29.15 R. Farinotti, Ph. Siard, J. Bouson, S. Kirkiacharian, B. Valeur and G. Mahuzier, J. Chromatogr., 269
(1983) 81.16 N. Nimura and T. Kinoshita, Anal. Lett., 13 (1981) 191.17 H. Tuchiya, T. Hayashi, H. Naruse and N. Takagi, J. Chromatogr., 234 (1982) 121.18 M. Yamaguchi, S. Hara, R. Matsunaga, M. Nakamura and Y. Ohkura, J. Chromatogr., 345 (1985) 227.19 T. A. Stein, L. Angus, E. Borrero, L. J. Auguste and L. Wese, J. Chromatogr., 385 (1987) 377.20 J. Turk, S. J. Weiss, J. E. Davis and P. Needleman, Prostaglandins, 16 (1978) 291.21 K. Kiyomiya, K. Yamaki, N. Nimura, T. Kinoshita and S. Oh-ishi, Prostaglandins, 31 (1986) 7I.22 A. Terada, S. Naruto, K. Wachi, S. Tanaka, Y. Izuka and E. Misaka, J. Med. Chem., 27 (1984) 216.23 K. Fukui and M. Nakayama, J. Sci. Hiroshima Univ., Ser. A-2, 26 (1963) 131.24 G. Weber and F. W. J. Teale, Trans. Faraday Soc., 54 (1958) 640.25 W. Baker, C. N. Haksar and J. F. W. McOmie, J. Chem. Soc., (1950) 170.26 Y. Kawahara, in preparation.27 C. E. Wheelock, J. Am. Chem. Soc., 81 (1959) 1348.28 T. Hinohara, K. Amano and K. Matsui, Nippon Kagaku Kaishi, (1976) 247.29 Y. Kawahara, Y. Yamazaki and H. Naganuma, Abstracts of the 43rd International Congress of
Pharmaceutical Sciences, Montreux, 1983, p. 78.30 L. A. Sternson, in R. W. Frei and J. F. Lawrence (Editors), Chemical Derivatization in Analytical
Chemistry, Vol. I, Plenum Press, New York, 1981, p. 127.
Journal of Chromatography, 478 (1989) 159-167Elsevier Science Publishers B.V., Amsterdam - Printed in The Netherlands
CHROM. 21 636
PREPARATION OF ADSORBENTS FOR AFFINITY CHROMATOGRAPHYUSING TSKGEL TRESYL-TOYOPEARL 650M
KOJI NAKAMURA*, KIYOHIRO TOYODA and YOSHIO KATO
Central Research Laboratory, Tosoh Corporation, Tonda, Shin-nanyo, Yamaguchi (Japan)
and
KIYOHITO SHIMURA and KEN-ICHI KASAl
Faculty of Pharmaceutical Sciences, Teikyo University, Sagamiko, Kanagawa (Japan)
(First received January 24th, 1989; revised manuscript received May 23rd, 1989)
SUMMARY
The optimum conditions for the coupling of proteins were investigated usingTSKgel Tresyl-Toyopearl 650M. They were dependent on the proteins coupled. Forexample, when soybean trypsin inhibitor was coupled at pH 8 the coupling wascompleted within I h and the subsequent adsorption capacity for trypsin was maximal.Longer coupling times decreased the adsorption capacity due to multi-point attachment. The adsorbents obtained were successfully used for affinity chromatography in a short time.
INTRODUCTION
The preparation of adsorbents for affinity chromatography requires suitablematrices and effective coupling methods for attachment of ligands. Beaded agaroseactivated by cyanogen bromide is the most popular and versatile solid support foraffinity matrices. Though the cyanogen bromide method discovered by Axen et al. 1
has contributed to the recent development of affinity chromatography, it has someproblems such as the labile linkage between the ligands and the matrixv" and theintroduction of charged speciesv". In order to overcome these problems, Nilsson andMosbach" developed a procedure using organic sulphonyl chlorides as activatingagents. They activated agarose with tresyl chloride under relatively mild conditions fora short period of time. This yielded predominantly primary hydroxyl activation andthe result was an excellent matrix for coupling proteins and affinity ligands. However,agarose is not a completely satisfactory matrix especially for industrial use andhigh-performance affinity chromatography because of its poor mechanical strength.
Very recently, a new support for affinity chromatography has become commercially available under the trade-name of TSKgel Tresyl-Toyopearl 650M.According to the supplier, it is prepared by introducing tresyl groups into TSKgelToyopearl HW-65 (44-88 !lm), which is a hydrophilic resin-based material of largepore size employed for gel filtration 7
. This paper describes the preparation ofadsorbents for affinity chromatography using TSKgel Tresyl-Toyopearl 650M.
0021-9673/89/$03.50 © 1989 Elsevier Science PublishersB.V.
160
EXPERIMENTAL
K. NAKAMURA et al.
MaterialsSoybean trypsin inhibitor (STI), bovine trypsin, porcine trypsin, concanavalin
A (Con A) and crude peroxidase were from Sigma. Purified peroxidase (RZ:3.48) wasfrom Toyobo (Osaka, Japan). Human immunoglobulin (IgG) and human serum werefrom Miles, protein A from Repligen. TSKgel Tresyl-Toyopearl 650M was fromTosoh.
Coupling of proteins to Tresyl- ToyopearlProteins (5-80 mg) were dissolved in 4 ml of an appropriate coupling buffer at
different pH values (0.1 M phosphate buffer containing 0.5 MNaCI for pH 6 and 7, 0.1M carbonate buffer containing 0.5 MNaCI for pH 8 and 9) and mixed with 0.4 g driedTresyl-Toyopearl (1 g dried Tresyl-Toyopearl gives a final gel volume of about 5 ml) at4 or 25°C for 0.5-16 h. After washing three times with 20 ml of coupling buffer, theunreacted tresyl groups were deactivated by resuspending the gel in 10 ml of 0.1MTris-HCl (pH 8.5) for I h. Protein contents were determined by amino acid analysis.
Determination of adsorption capacityThe adsorption capacity of immobilized STI, Con A and protein A were
determined by passing 10 mg of purified trypsin, peroxidase and human IgG,respectively, through each column (50 mm x 5 mm) equilibrated with the appropriatebuffer [0.05 MTris-HCl buffer containing 0.5 MNaCI and 20 mM caci, (pH 7.5) forthe STIcolumn, 0.1 M acetate buffer containing 0.5 MNaCI and I mMMgClz, MnCl zand CaCl z (pH 6.0) for the Con A column, 0.1 M phosphate buffer (pH 7.0) for theprotein A column]. The excess of protein was removed with the equilibration buffer.Desorption of protein was achieved by an appropriate buffer [0.1 M acetic acidcontaining 0.5 M NaCI (pH 3.0) for the STI column, 0.11 M mannose in equilibrationbuffer for the Con A column, 0.1 M glycine-HCl (pH 2.2) for the protein A column].The amounts of protein were calculated from the volume and absorption at 280 nm(trypsin and human IgG) and 403 nm (peroxidase).
Affinity chromatographyAll chromatographic measurements were performed at 4 or 25°C with a CCPM
pump (Tosoh) equipped with a variable-wavelength UV detector Model UV-8000(Tosoh).
Measurement of trypsin activityTrypsin activity was measured with benzoylarginine ethyl ester as a substrate,
essentially according to the method of Schwert and Takenaka".
Measurement ofperoxidase activityPeroxidase activity was measured by the change in absorbance at 460 nm due to
the oxidation of o-dianisidine in the presence of peroxidase and HzO z as described byShannon et al",
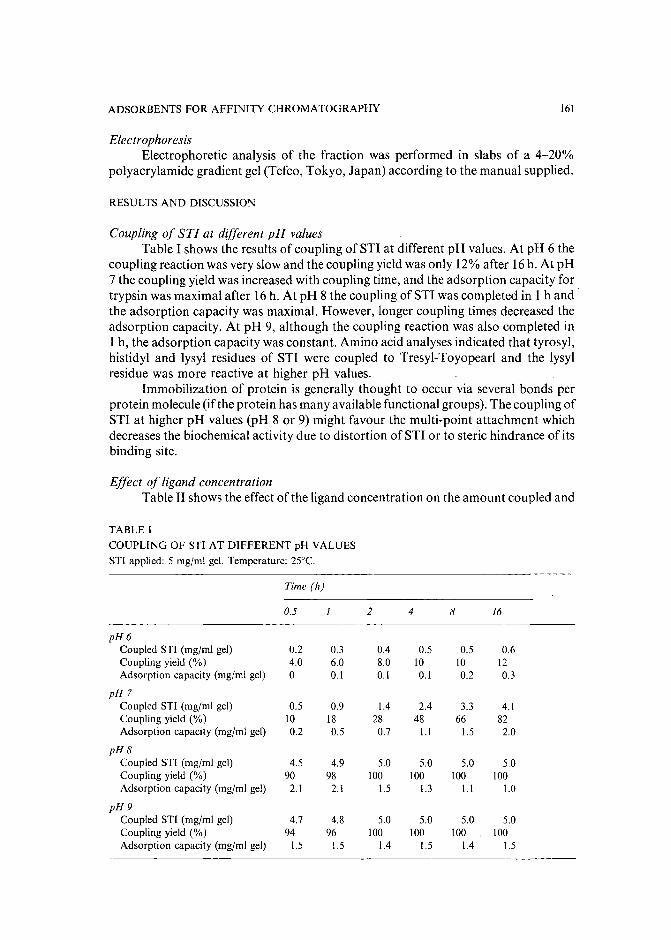
ADSORBENTS FOR AFFINITY CHROMATOGRAPHY 161
ElectrophoresisElectrophoretic analysis of the fraction was performed in slabs of a 4-20%
polyacrylamide gradient gel (Tefco, Tokyo, Japan) according to the manual supplied.
RESULTS AND DISCUSSION
Coupling of STI at different pH valuesTable I shows the results of coupling of STI at different pH values. At pH 6 the
coupling reaction was very slow and the coupling yield was only 12% after 16h. At pH7 the coupling yield was increased with coupling time, and the adsorption capacity fortrypsin was maximal after 16 h. At pH 8 the coupling ofSTI was completed in 1 hand'the adsorption capacity was maximal. However, longer coupling times decreased theadsorption capacity. At pH 9, although the coupling reaction was also completed in1 h, the adsorption capacity was constant. Amino acid analyses indicated that tyrosyl,histidyl and lysyl residues of STI were coupled to Tresyl-Toyopeari and the lysylresidue was more reactive at higher pH values.
Immobilization of protein is generally thought to occur via several bonds perprotein molecule (if the protein has many available functional groups). The coupling ofSTI at higher pH values (pH 8 or 9) might favour the multi-point attachment whichdecreases the biochemical activity due to distortion of STI or to steric hindrance of itsbinding site.
Effect of ligand concentrationTable II shows the effect of the ligand concentration on the amount coupled and
TABLE I
COUPLING OF STI AT DIFFERENT pH VALUES
STI applied: 5 mg/m! gel. Temperature: 25°C.
Time (h)
0.5 2 4 8 16
pH6Coupled STI (mg/ml gel) 0.2 0.3 0.4 0.5 0.5 0.6Coupling yield (%) 4.0 6.0 8.0 LO 10 L2Adsorption capacity (mg/ml gel) 0 0.1 O.L 0.1 0.2 0.3
pH 7Coupled STI (mg/ml gel) 0.5 0.9 1.4 2.4 3.3 4.1Coupling yield (%) LO 18 28 48 66 82Adsorption capacity (mg/ml geL) 0.2 0.5 0.7 l.l 1.5 2.0
pH8Coupled STI (mgjrnl geL) 4.5 4.9 5.0 5.0 5.0 5.0Coupling yieLd (%) 90 98 100 100 100 100Adsorption capacity (mg/ml gel) 2.1 2.1 1.5 1.3 l.l 1.0
pH9Coupled STI (mg/ml gel) 4.7 4.8 5.0 5.0 5.0 5.0CoupLing yieLd (%) 94 96 100 100 100 100Adsorption capacity (mg/ml gel) 1.5 1.5 1.4 1.5 L.4 1.5
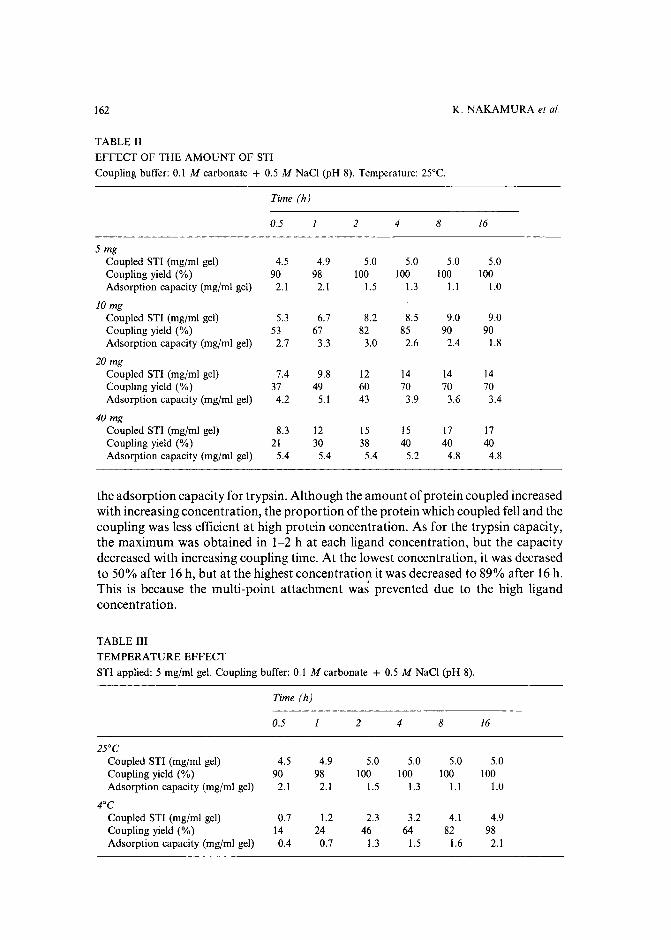
162 K. NAKAMURA et al.
TABLE II
EFFECT OF THE AMOUNT OF STI
Coupling buffer: 0.1 M carbonate + 0.5 M NaCI (pH 8). Temperature: 25°C.
Time (h)
0.5 2 4 8 16
5 mgCoupled STI (mg/rnl gel) 4.5 4.9 5.0 5.0 5.0 5.0Coupling yield (%) 90 98 100 100 100 100Adsorption capacity (mg/ml gel) 2.1 2.1 1.5 1.3 1.1 1.0
10 mgCoupled STI (rng/ml gel) 5.3 6.7 8.2 8.5 9.0 9.0Coupling yield (%) 53 67 82 85 90 90Adsorption capacity (mg/ml gel) 2.7 3.3 3.0 2.6 2.4 1.8
20mgCoupled STI (mg/rnl gel) 7.4 9.8 12 14 14 14Coupling yield (%) 37 49 60 70 70 70Adsorption capacity (mg/ml gel) 4.2 5.1 43 3.9 3.6 3.4
40 mgCoupled STI (mg/ml gel) 8.3 12 15 15 17 17Coupling yield (%) 21 30 38 40 40 40Adsorption capacity (mg/ml gel) 5.4 5.4 5.4 5.2 4.8 4.8
the adsorption capacity for trypsin. Although the amount of protein coupled increasedwith increasing concentration, the proportion of the protein which coupled fell and thecoupling was less efficient at high protein concentration. As for the trypsin capacity,the maximum was obtained in 1-2 h at each ligand concentration, but the capacitydecreased with increasing coupling time. At the lowest concentration, it was decrasedto 50% after 16h, but at the highest concentration it was decreased to 89% after 16h.This is because the multi-point attachment was prevented due to the high ligandconcentration.
TABLE III
TEMPERATURE EFFECT
STI applied: 5 mg/ml gel. Coupling buffer: 0.1 M carbonate + 0.5 M NaCI (pH 8).
Time (h)
0.5 1 2 4 8 16
25°CCoupled STI (mg/ml gel) 4.5 4.9 5.0 5.0 5.0 5.0Coupling yield (%) 90 98 100 100 100 100Adsorption capacity (mg/ml gel) 2.1 2.1 1.5 1.3 l.l 1.0
4°CCoupled STI (mg/ml gel) 0.7 1.2 2.3 3.2 4.1 4.9Coupling yield (%) 14 24 46 64 82 98Adsorption capacity (mg/ml gel) 0.4 0.7 1.3 1.5 1.6 2.1
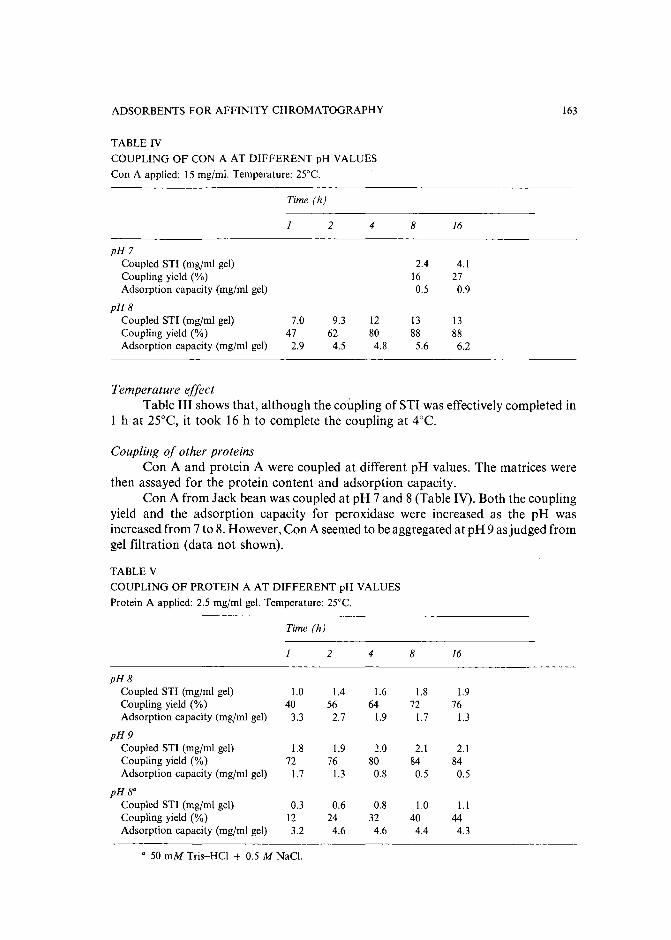
ADSORBENTS FOR AFFINITY CHROMATOGRAPHY 163
TABLE IV
COUPLING OF CON A AT DIFFERENT pH VALUES
Con A applied: 15 mg/ml. Temperature: 25°C.
Time (h)
1 2 4 8 16
pH7Coupled STI (mg/ml gel) 2.4 4.1Coupling yield (%) 16 27Adsorption capacity (mg/ml gel) 0.5 0.9
pH8Coupled STI (mg/ml gel) 7.0 9.3 12 I3 I3Coupling yield (%) 47 62 80 88 88Adsorption capacity (mg/ml gel) 2.9 4.5 4.8 5.6 6.2
Temperature effectTable III shows that, although the coupling of STI was effectively completed in
1 h at 25°C, it took 16 h to complete the coupling at 4°C.
Coupling of other proteinsCon A and protein A were coupled at different pH values. The matrices were
then assayed for the protein content and adsorption capacity.Con A from Jack bean was coupled at pH 7 and 8 (Table IV). Both the coupling
yield and the adsorption capacity for peroxidase were increased as the pH wasincreased from 7 to 8. However, Con A seemed to be aggregated at pH 9 as judged fromgel filtration (data not shown).
TABLE V
COUPLING OF PROTEIN A AT DIFFERENT pH VALUES
Protein A applied: 2.5 mg/ml gel. Temperature: 25°C.
Time (h)
1 2 4 8 16
pH8Coupled STI (mg/ml gel) 1.0 1.4 1.6 1.8 1.9Coupling yield (%) 40 56 64 72 76Adsorption capacity (mg/ml gel) 3.3 2.7 1.9 I.7 1.3
pH9Coupled STI (mg/rnl gel) 1.8 1.9 2.0 2.1 2.1Coupling yield (%) 72 76 80 84 84Adsorption capacity (mg/ml gel) I.7 1.3 0.8 0.5 0.5
pH 8a
Coupled STI (mg/ml gel) 0.3 0.6 0.8 1.0 1.1Coupling yield (%) 12 24 32 40 44Adsorption capacity (mg/ml gel) 3.2 4.6 4.6 4.4 4.3
a 50 mM Tris-HCl + 0.5 M NaCI.
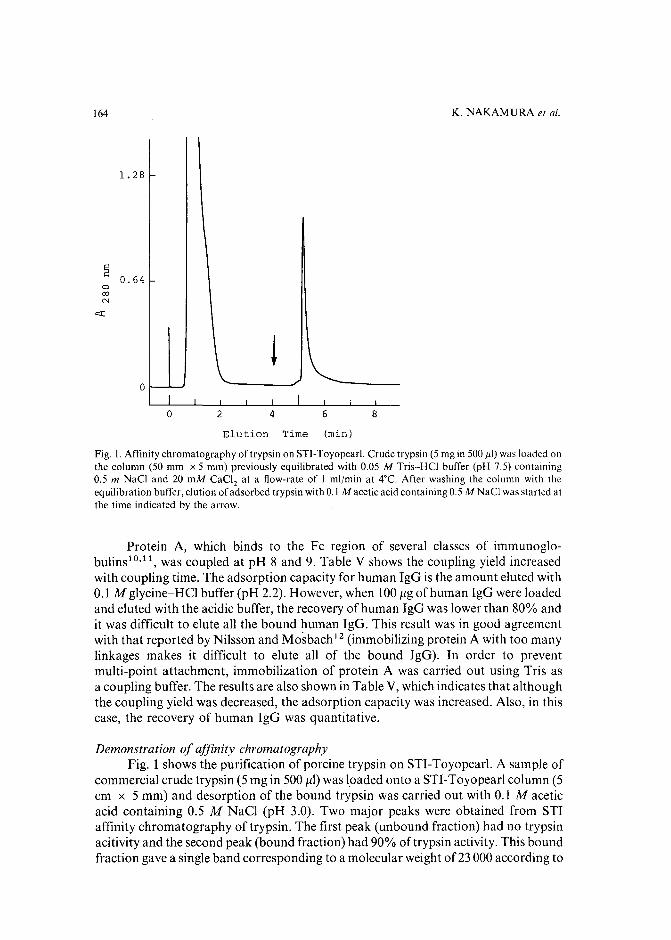
164
1. 28
~0.64
ocoN
o
o 2 4 6 8
K. NAKAMURA et al.
Elution Time (min)
Fig. 1. Affinity chromatography of trypsin on STI-Toyopearl. Crude trypsin (5 mg in 500 JlI) was loaded onthe column (50 mm x 5 mm) previously equilibrated with 0.05 M Tris-HCl buffer (pH 7.5) containing0.5 m NaCI and 20 mM CaCl 2 at a flow-rate of I ml/min at 4°C. After washing the column with theequilibration buffer, elution of adsorbed trypsin with 0.1 M acetic acid containing 0.5 M NaCl was started atthe time indicated by the arrow.
Protein A, which binds to the Fe region of several classes of immunoglobulins 1o , 11 , was coupled at pH 8 and 9. Table V shows the coupling yield increasedwith coupling time. The adsorption capacity for human IgG is the amount eluted with0.1 M glycine-HCl buffer (pH 2.2). However, when 100 j.1.g of human IgG were loadedand eluted with the acidic buffer, the recovery of human IgG was lower than 80% andit was difficult to elute all the bound human IgG. This result was in good agreementwith that reported by Nilsson and Mosbach 12 (immobilizing protein A with too manylinkages makes it difficult to elute all of the bound IgG). In order to preventmulti-point attachment, immobilization of protein A was carried out using Tris asa coupling buffer. The results are also shown in Table V, which indicates that althoughthe coupling yield was decreased, the adsorption capacity was increased. Also, in thiscase, the recovery of human IgG was quantitative.
Demonstration of affinity chromatographyFig. 1 shows the purification of porcine trypsin on STJ-Toyopearl. A sample of
commercial crude trypsin (5 mg in 500 j.1.1) was loaded onto a STI-Toyopearl column (5em x 5 mm) and desorption of the bound trypsin was carried out with 0.1 M aceticacid containing 0.5 M NaCl (pH 3.0). Two major peaks were obtained from STIaffinity chromatography of trypsin. The first peak (unbound fraction) had no trypsinacitivity and the second peak (bound fraction) had 90% of trypsin activity. This boundfraction gave a single band corresponding to a molecular weight of23 000 according to
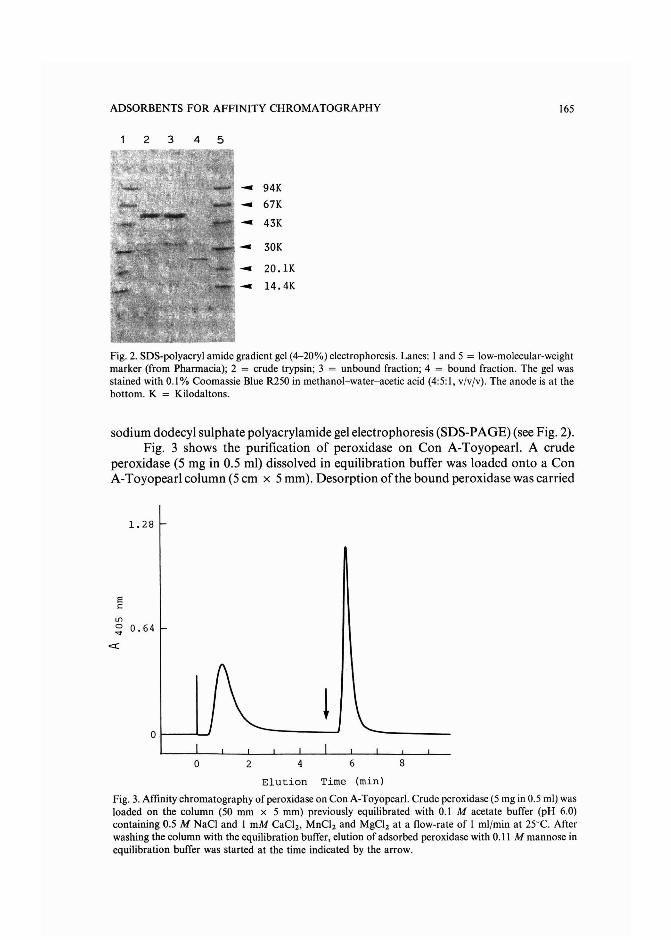
ADSORBENTS FOR AFFINITY CHROMATOGRAPHY 165
2 3 4 5
-94K-67K- 43K- 30K- 20.1K- 14 . 4K
Fig. 2. SDS-polyacryl amide gradient gel (4-20%) electrophoresis . Lanes: I and 5 = low-molecular-weightmarker (from Pharmacia); 2 = crude trypsin; 3 = unbound fraction ; 4 = bound fraction. The gel wasstained with 0.1% Coomassie Blue R250 in methanol -water-acetic acid (4:5:1, v/v/v). The anode is at thebottom. K = Kilodaitons.
sodium dodecyl sulphate polyacrylamide gel electrophoresis (SDS-PAGE) (see Fig. 2).Fig. 3 shows the purification of peroxidase on Con A-To yopearl. A crude
peroxidase (5 mg in 0.5 m!) dissolved in equilibration buffer was loaded onto a ConA-Toyopearl column (5 em x 5 mm). Desorption of the bound peroxidase was carried
1. 28
EcIf)
~ 0.64
Ol-- .J....J
o 2 4 6 8
Elution Ti me (min)
Fig. 3. Affinity chromatography of peroxidase on Con A-Toyopearl. Crude peroxidase (5 mg in 0.5 ml) wasloaded on the column (50 mm x 5 mm) previously equilibrated with 0.1 M acetate buffer (pH 6.0)containing 0.5 M NaCI and I mM CaC12• MnC12 and MgCl2 at a flow-rate of I ml/min at 2YC. Afterwashing the column with the equilibration buffer, elution of adsorbed peroxidase with 0.11 M mannose inequilibration buffer was started at the time indicated by the arrow .
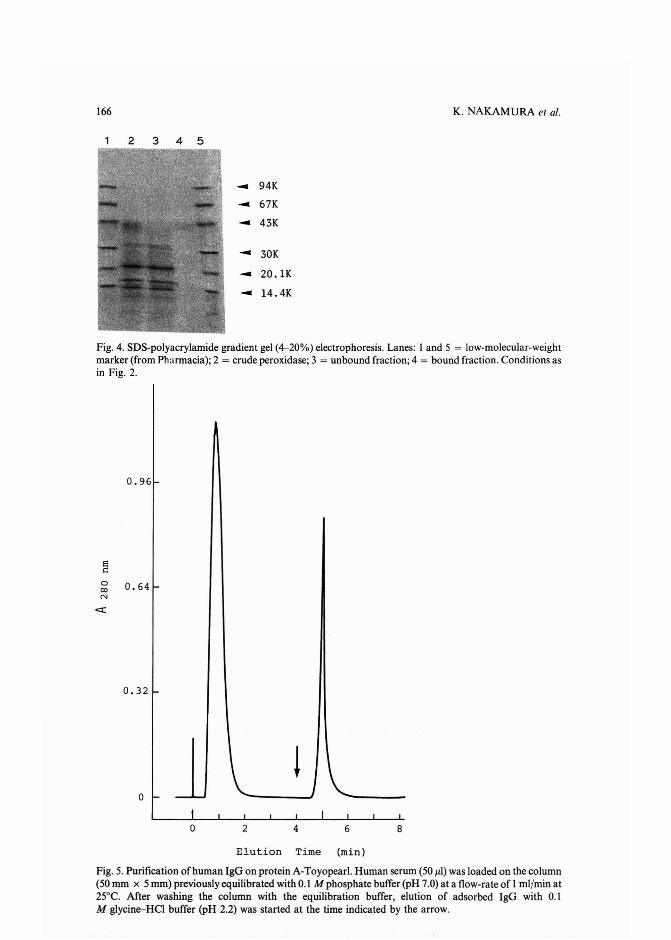
166
2 3 4 5
K. NAKAMURA et al.
_ 94K
- 67K
- 43K
- 30K
- 20 .1K
- 14.4K
Fig. 4. SDS-polyacrylamide gradient gel (4-20 %) electrophoresis. Lanes: I and 5 = low-molecular-weightmarker (from Pharmacia); 2 = crude peroxidas e; 3 = unbound fraction ; 4 = bound fraction . Conditions asin Fig. 2.
0 .96
ecocoN
0.64
0.3 2
o
o 2 4 6 8
Elution Time (min)
Fig. 5. Purification of human IgG on protein A-Toyopearl. Human serum (50 JlI) was loaded on the column(50 mm x 5 mm) previously equilibrated with 0.1 M phosphate butTer(pH 7.0) at a flow-rate of I ml{min at25°C. After washing the column with the equilibration buffer, elution of adsorbed IgG with 0.1M glycine-HCI butTer (pH 2.2) was started at the time indicated by the arrow.
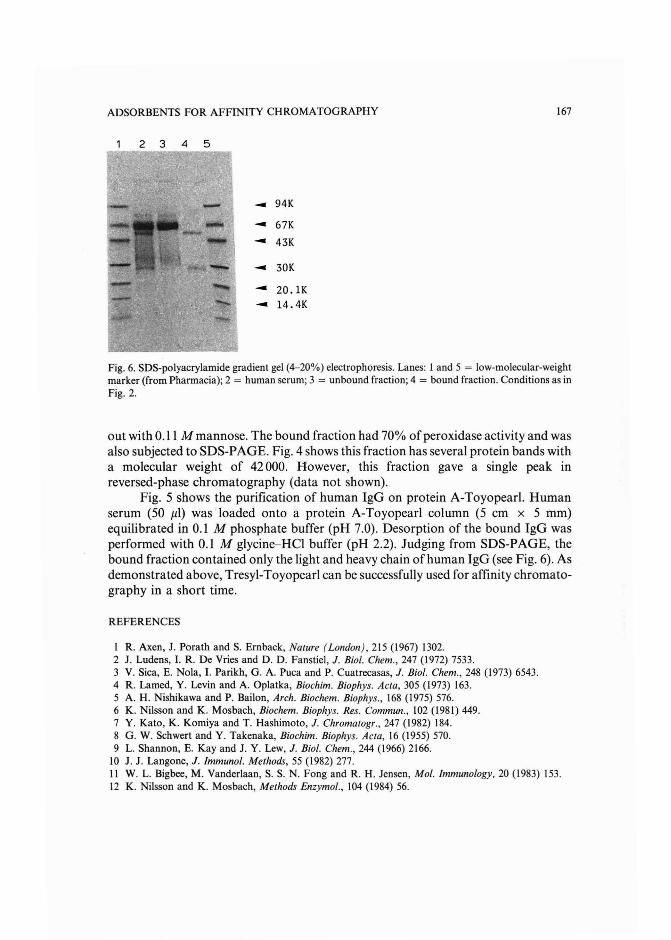
ADSORBENTS FOR AFFINITY CHROMATOGRAPHY
2 3 4 5
167
- 94K-6 7K-43K
-30K-20.1K- 14 . 4K
Fig . 6. SDS-polyacr ylamide gradient gel (4-20%) electro pho resis. Lan es: I and 5 = low-molecular-weightmarker (from Pharmacia); 2 = human serum; 3 = unbound fracti on ; 4 = bound fraction. Conditions as inFig . 2.
out with 0.11 M mannose. The bound fraction had 70% of peroxidase activity and wasalso subjected to SDS-PAGE. Fig. 4 shows this fraction has several protein bands witha molecular weight of 42000 . However, this fraction gave a single peak inreversed-phase chromatography (data not shown) .
Fig. 5 shows the purification of human IgG on protein A-Toyopearl. Humanserum (50 Il l) wasIoaded onto a protein A-Toyopearl column (5 em x 5 mm)equilibrated in 0.1 M pho sphate buffer (pH 7.0). Desorption of the bound IgG wasperformed with 0.1 M glycine-Hell buffer (pH 2.2). Judging from SDS-PAGE, thebound fraction contained only the light and heavy chain of human IgG (see Fig. 6). Asdemonstrated above, Tresyl-Toyopearl can be successfully used for affinity chromatography in a short time.
REFER ENCES
I R. Axen, J . Porath an d S. Ernback, Nature (London), 215 (1967) 1302.2 J. Ludens, I. R. De Vries and D. D. Fan stiel, J. Bioi. Chem., 247 (1972) 7533.3 V. Sica , E. Nola, I. Parikh, G. A. Puca and P. Cuatrecasas, J. Bioi. Chem., 248 (1973) 6543.4 R. Lamed, Y. Levin and A. Oplatk a, Biochim. Biophys. Acta , 305 (1973) 163.5 A. H . Nishikawa and P. Bailon , Arch. Biochem. Biophys., 168 (1975) 576.6 K. Nilsson and K. Mo sbach, Biochem. Biophys. Res. Commun., 102 (1981) 449.7 Y. Kato , K. Komiya and T. Hashim oto, J. Chromatogr., 247 (1982) 184.8 G. W. Schwert and Y. Taken ak a, Biochim. Biophys. Acta, 16 (1955) 570.9 L. Shann on , E. Ka y and J. Y. Lew, J. Bioi. Chem . 244 (1966) 2166.
10 J . J . Langone, J. Immunol. Methods, 55 (1982) 277.II W. L. Bigbee, M. Vanderlaan , S. S. N. Fong and R. H. Jensen, Mol. Immunology , 20 (1983) 153.12 K. Nilsson and K. Mosbach, Methods Enzymol., 104 (1984) 56.

Journal ofChrornatography, 478 (1989) 169-179Elsevier Science Publishers B.V., Amsterdam - Printed in The Netherlands
CHROM. 21629
SEPARATION OF THE FOUR OPTICAL ISOMERS OF A DIHYDROPYRIDINE CALCIUM CHANNEL ANTAGONIST
KAREN D. WARD and LAWRENCE V. MANES*
Analytical and Environmental Research, Syntex USA Inc, 3401 Hillview Avenue, Palo Alto, CA 94304(U.S.A.)
(First received April 5th, 1989; revised manuscript received May 17th, 1989)
SUMMARY
An isocratic high-performance liquid chromatography (HPLC) method is described for the separation of the four optical isomers of RS-93522-004, a racemicdihydropyridine-based drug containing two chiral centers. The drug is derivatizedusing (- )-camphanic acid chloride and the resulting four bis-camphanate diastereomers are separated on an achiral silica gel HPLC column. The precision, accuracy, and linearity of the method has been evaluated as applied to the determinationof the isomer ratio of RS-93522-004. The method has also been evaluated to determine the limit of quantitation for the individual bis-camphanate diastereomers. Determination of the optical purity of the chiral derivatizing agent has also been addressed. No difference in the relative reactivity of the four individual RS-93522-004optical isomers towards ( - )-camphanic acid chloride is observed and the determination of the ratio of the RS-93522-004 bis-camphanate diastereomers has been shownto be unaffected by derivatization reaction yield. Attempts to resolve the opticalisomers of several RS-93522-004 derivatives using various chiral HPLC columns arebriefly discussed.
INTRODUCTION
In recent years, greater emphasis has been placed on the evaluation of differences in pharmacological effects of enantiomeric pharmaceutical compounds and thepotential enantioselective metabolism of single isomers of racemic drug mixtures.This has led to the development of a wide array of chromatographic methods designed to separate and quantitate enantiomeric drug isomers",
Enantiomeric separations using high-performance liquid chromatography(HPLC) have been achieved by a variety of methods, which have led to two frequentlyused approaches. The first utilizes the classical technique of pre-column derivatization of enantiomers with chiral agents and separation of the resulting diastereomerson achiral stationary phases", Inexpensive normal or reversed-phase HPLC columnsare employed for this purpose. However, in this technique, important considerationmust be given to enantiomeric purity of the chiral derivatizing agent and potentialdifferences in reactivity of enantiomers towards the chiral reagent. The second in-
0021-9673/89/$03.50 © 1989 Elsevier Science Publishers B.V.
170 K. D. WARD, L. V. MANES
volves use of chiral stationary phases (CSPS)3. This approach is desirable becauseenantiomeric separations can be made directly, without pre-column derivatizationsteps, and because of the availability of several different types of commercial CSPs.However, commercially available CSP columns are expensive and, in some cases,derivatization of the analyte is still required to improve chromatographic propertiesand enhance enantiomeric selectivity.
RS-93522-004, 2-[4-(2,3-dihydroxypropoxy)phenyl]ethyl methyl 1,4-dihydro-2,6- dimethyl-4-(3-nitrophenyl)-3,5-pyridinedicarboxylate (1), is a synthetic dihydropyridine-based calcium channel antagonist under development for treatment ofhypertension. It contains two chiral centers and is synthesized as a racemic mixture offour isomers consisting of two enantiomeric sets of diastereomers. Results from animal studies have shown the isomers with the (S)-configuration at C-4 of the dihydropyridine moeity display significantly greater pharmacological effects than the (4R)isomers. Thus, the goal was to develop a method to separate and quantitate theindividual isomers of RS-93522-004. Such a method would be of great utility for drugsubstance control, for the determination of the isomeric purity of single isomers, andas a means to probe for enantioselective metabolism of administered racemic drug.
The vast majority of the literature involving the two chromatographic strategiesmentioned above describe separations of enantiomeric compounds containing only asingle asymmetric carbon. Reports of the concurrent separation of both enantiomericand diastereomeric isomers of racemic compounds containing multiple chiral centersare limited":", and involve the separation of diastereomeric derivatives producedfrom derivatization of the optical isomers with chiral agents. Examples utilizing CSPsfor this purpose are rare" and suggest the general inability of CSPs to simultaneouslydistinguish between both enantiomeric and diastereomeric components of isomericmixtures. Column switching has been one approach used for such separations." Thistechnique utilizes conventional reversed-phase HPLC for separation of diastereomeric isomers followed by chiral HPLC separation of the enantiomeric components of anindividual diastereomeric pair. This approach, however, suffers from the necessity forspecialized equipment and still requires the use of costly CSP columns.
Several examples of the enantiomeric separation of dihydropyridine-baseddrugs using CSPs have been reported'rP yet all involve compounds containing onlya single asymmetric carbon. Kern et al,u evaluated several commercially availableCSPs to achieve separation of the four optical isomers of RS-93522-004, withoutsuccess, and has reported a reversed-phase HPLC method which separates the diastereomeric components of RS-93522-004. Attempts, made in this study, to separate theoptical isomers of a number of RS-93522-004 derivatives with the use of CSPs werealso unsuccessful. This work describes the derivatization of RS-93522-004 with (-)camphanic acid chloride and evaluates a normal-phase HPLC system which separatesthe resulting four bis-camphanate diastereomers. To our knowledge, no examples ofenantiomeric resolution for this class of drugs using pre-column derivatization withchiral reagents has been reported.
EXPERIMENTAL
ApparatusA Spectra-Physics (San Jose, CA, U.S.A.) 8100XR chromatograph, equipped
HPLC OF OPTICAL ISOMERS OF RS-93522-004 171
with a Valco (Houston, TX, U.S.A.) 20-/l1fixed-loopinjector, was used with a Kratos(Ramsey, NJ, U.S.A.) Spectroflow 757 UV absorbance detector set at 229 nm and0.02 a.u.f.s. The oven temperature was set at 50°C. The detector output was monitored using a Spectra-Physics SP4270 integrator.
MaterialsRS-93522-004 and its individual optical isomers were synthesized by the In
stitute of Organic Chemistry, Syntex Research, Palo Alto, CA, U.SA.HPLC gradesolvents were obtained from Burdick and Jackson (Muskegon, MI, U.S.A.) Hydrochloric acid was obtained from J. T. Baker (Phillipsburg, NJ, U.S.A.) and pyridinewas obtained from Aldrich (Milwaukee, WI, U.S.A.). ( - )-Camphanic acid chloride(98+ %) was obtained from Aldrich, and (R)-( + )-l-(l-naphthyl)ethylamine(99.9+%) and (S)-("'--)-I-(I-naphthyl)ethylamine (99.9+%) were obtained fromNorse Laboratories (Newbury Park, CA, U.SA.)
Chromatographic conditionsA Nucleosil silica (5-,um, 25 cm x 4.6 mm J.D.) column was purchased from
Alltech Assoc. (Deerfield, IL, U.S.A.) and used with a guard column (20 mm x 2.0mm J.D.) packed with Alltech pellicular silica. The mobile phase consisted of 0.1%acetonitrile and 4% 2-propanol in isooctane (2,2,4-trimethylpentane). The additionof 0.1% acetonitrile is required to improve peak shape and reduce peak tailing. Theflow-rate was maintained at 2.0 ml/min and the column pressure was approximately2000 p.s.i. The sample concentration was approximately 0.3 mg/ml and the sampleloading approximately 6 /lg. HPLC solvents were filtered through 0.45-/lm filters andthe mobile phase was degassed by purging with helium.
Derivatization procedureThe derivatization reaction is shown in Scheme 1. A sample of 20 mg of
RS-93522-004or its single optical isomers and 40 mg of ( - )-camphanic acid chlorideare placed in a dry 12 x 75 mm test tube. The material is dissolved in 1 ml ofanhydrous dichloromethane, and 30 /ll of anhydrous pyridine is added to the solution. The test tube is then stoppered, shaken to mix the solution, and allowed to standfor 10 min at room temperature. A volume of 1 ml of 0.1 M hydrochloric acid isadded to the test tube to quench the reaction. The organic layer is transferred with apasteur pipette to a round bottomed flask and evaporated to dryness. The resultingresidue is dissolved in approximately 5 ml oftetrahydrofuran and diluted with mobilephase to 100 ml to obtain a sample solution of approximately 0.3 mg/ml.
Modified derivatization procedureA modified derivatization procedure was performed as above except the reac
tion was carried out with 30 mg of RS-93522-004 and 80 mg of (- )-camphanic acidchloride dissolved in 8 ml of anhydrous dichloromethane. Aliquots (1 ml) of thereaction mixture were taken at 0.5-min intervals for 5 min, and a final aliquot wastaken at 240 min. Each aliquot was quenched with 0.5 ml of 0.1 M hydrochloric acidat the time of sampling. The HPLC analysis of each aliquot was performed using aSpherisorb ODS II (5 ,urn, 25 em x 4.6 mm J.D.) column purchased from AlltechAssoc. (Deerfield, IL, U.S.A.) with a mobile phase consisting of methanol-water
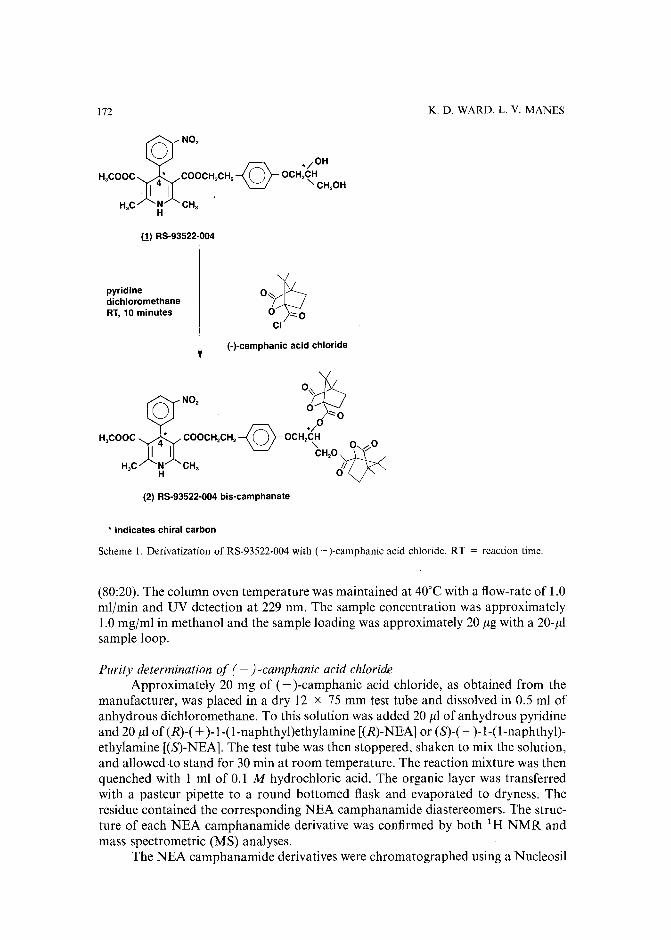
172
Z_N0 2
*/OHH,COOC * COOCH2CH2-/(J'-- OCH2~
141 ~ CH20H
H,C N 'CH, .H
(1) RS·93522·004
K. D. WARD, L. V. MANES
pyridinedichloromethaneRT, 10 minutes
oy'}~O~CI
(·)·camphanic acid chloride
O~ )(;
ZN0 2 m
)""0H,COOC 4* COOCH2CH2!B'-OCH;6~ 0
I I ~"O-y,;-C
H20 ft}<
H,C N 'CH, IIH 0
mRS·93522·004 bis-camphanate
* indicates chiral carbon
Scheme 1. Derivatization of RS-93522-004 with (- )-camphanic acid chloride. RT = reaction time.
(80:20).The column oven temperature was maintained at 40°C with a flow-rate of 1.0ml/min and UV detection at 229 nm. The sample concentration was approximately1.0 mg/ml in methanol and the sample loading was approximately 20 J1g with a 20-J1lsample loop.
Purity determination of t : )-camphanic acid chlorideApproximately 20 mg of (- )-camphanic acid chloride, as obtained from the
manufacturer, was placed in a dry 12 x 75 mm test tube and dissolved in 0.5 ml ofanhydrous dichloromethane. To this solution was added 20 J1l of anhydrous pyridineand 20 J1l of (R)-( +)-l-(l-naphthyl)ethylamine [(R)-NEA] or (S)-( - )-1-(l-naphthyl)ethylamine [(S)-NEA]. The test tube was then stoppered, shaken to mix the solution,and allowed to stand for 30 min at room temperature. The reaction mixture was thenquenched with 1 ml of 0.1 M hydrochloric acid. The organic layer was transferredwith a pasteur pipette to a round bottomed flask and evaporated to dryness. Theresidue contained the corresponding NEA camphanamide diastereomers. The structure of each NEA camphanamide derivative was confirmed by both 1H NMR andmass spectrometric (MS) analyses.
The NEA camphanamide derivatives were chromatographed using a Nucleosil
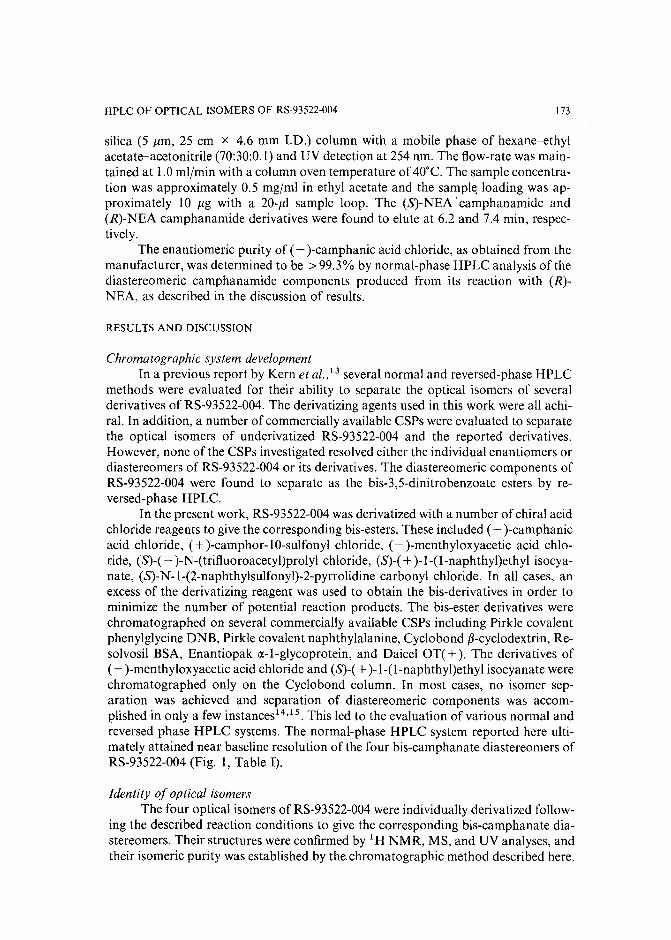
HPLC OF OPTICAL ISOMERS OF RS-93522-004 173
silica (5 ,urn, 25 em x 4.6 mm J.D.) column with a mobile phase of hexane-ethylacetate-acetonitrile (70:30:0.1) and UVdetection at 254 nm. The flow-rate was maintained at 1.0 ml/min with a column oven temperature of 40°C. The sample concentration was approximately 0.5 mg/ml in ethyl acetate and the sample loading was approximately 10 ,ug with a 20-,u1 sample loop. The (S)-NEA' camphanamide and(R)-NEA camphanamide derivatives were found to elute at 6.2 and 7.4 min, respectively.
The enantiomeric purity of (- )-camphanic acid chloride, as obtained from themanufacturer, was determined to be >99.3% by normal-phase HPLC analysis of thediastereomeric camphanamide components produced from its reaction with (R)NEA, as described in the discussion of results.
RESULTS AND DISCUSSION
Chromatographic system developmentIn a previous report by Kern et al.,13 several normal and reversed-phase HPLC
methods were evaluated for their ability to separate the optical isomers of severalderivatives of RS-93522-004. The derivatizing agents used in this work were all achira\. In addition, a number of commercially available CSPs were evaluated to separatethe optical isomers of underivatized RS-93522-004 and the reported derivatives.However, none of the CSPs investigated resolved either the individual enantiomers ordiastereomers of RS-93522-004 or its derivatives. The diastereomeric components ofRS-93522-004 were found to separate as the bis-3,5-dinitrobenzoate esters by reversed-phase HPLC.
In the present work, RS-93522-004 was derivatized with a number ofchiral acidchloride reagents to give the corresponding bis-esters. These included ( - )-camphanicacid chloride, (+ )-camphor-IO-sulfonyl chloride, (- )-menthyloxyacetic acid chloride, (S)-( - )-N-(trifluoroacetyl)prolyl chloride, (S)-(+ )-l-(l-naphthyl)ethyl isocyanate, (S)-N-I-(2-naphthylsulfonyl)-2-pyrrolidine carbonyl chloride. In all cases, anexcess of the derivatizing reagent was used to obtain the bis-derivatives in order tominimize the number of potential reaction products. The bis-ester derivatives werechromatographed on several commercially available CSPs including Pirkle covalentphenylglycine DNB, Pirkle covalent naphthylalanine, Cyclobond ,B-cyclodextrin, Resolvosil BSA, Enantiopak a-I-glycoprotein, and Daicel OT( +). The derivatives of(- )-menthyloxyacetic acid chloride and (S)-(+ )-I-(l-naphthyl)ethyl isocyanate werechromatographed only on the Cyclobond column. In most cases, no isomer separation was achieved and separation of diastereomeric components was accomplished in only a few instances'<-!". This led to the evaluation of various normal andreversed phase HPLC systems. The normal-phase HPLC system reported here ultimately attained near baseline resolution of the four bis-camphanate diastereomers ofRS-93522-004 (Fig. 1, Table I).
Identity of optical isomersThe four optical isomers of RS-93522-004 were individually derivatized follow
ing the described reaction conditions to give the corresponding bis-camphanate diastereomers. Their structures were confirmed by 1H NMR, MS, and UV analyses, andtheir isomeric purity was established by the chromatographic method described here.
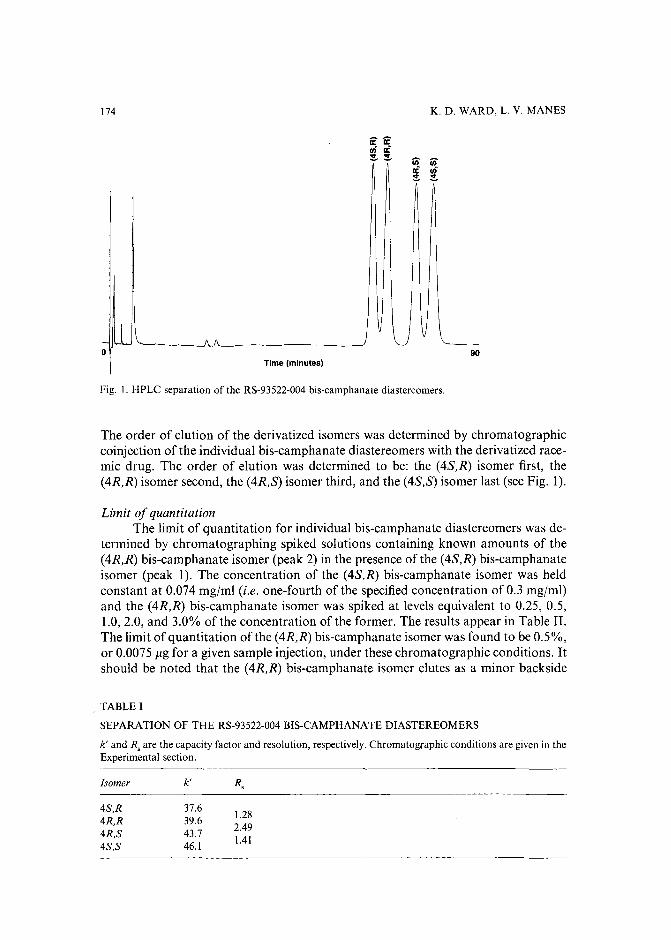
174
oTime (minutes)
K. D. WARD, L. V. MANES
90
Fig. I. HPLC separation of the RS-93522-004 bis-camphanate diastereomers.
The order of elution of the derivatized isomers was determined by chromatographiccoinjection of the individual bis-camphanate diastereomers with the derivatized racemic drug. The order of elution was determined to be: the (4S,R) isomer first, the(4R,R) isomer second, the (4R,S) isomer third, and the (4S,S) isomer last (see Fig. I).
Limit of quantitationThe limit of quantitation for individual bis-camphanate diastereomers was de
termined by chromatographing spiked solutions containing known amounts of the(4R,R) bis-camphanate isomer (peak 2) in the presence of the (4S,R) bis-camphanateisomer (peak I). The concentration of the (4S,R) bis-camphanate isomer was heldconstant at 0.074 mg/ml (i.e. one-fourth of the specified concentration of 0.3 mg/ml)and the (4R,R) bis-camphanate isomer was spiked at levels equivalent to 0.25, 0.5,1.0, 2.0, and 3.0% of the concentration of the former. The results appear in Table II.The limit of quantitation of the (4R,R) bis-camphanate isomer was found to be 0.5%,or 0.0075 J1g for a given sample injection, under these chromatographic conditions. Itshould be noted that the (4R,R) bis-camphanate isomer elutes as a minor backside
. TABLE 1
SEPARATION OF THE RS-93522-004 BIS-CAMPHANATE DlASTEREOMERS
k' and Rs are the capacity factor and resolution, respectively.Chromatographic conditions are given in theExperimental section.
Isomer k' Rs
4S,R 37.61.28
4R,R 39.62.49
4R,S 43.71.41
4S,S 46.1
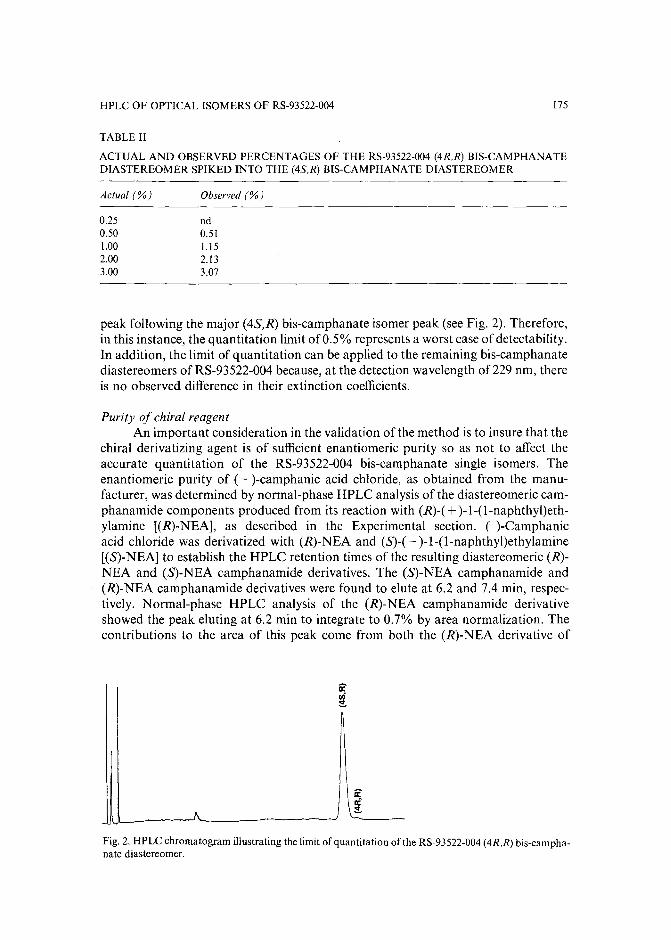
HPLC OF OPTICAL ISOMERS OF RS-93522-004 [75
TABLE II
ACTUAL AND OBSERVED PERCENTAGES OF THE RS-93522-004 (4R,R) BIS-CAMPHANATEDIASTEREOMER SPIKED INTO THE (4S,R) BIS-CAMPHANATE DIASTEREOMER
Actual (%)
0.250.501.002.003.00
Observed (%)
nd0.511.152.133.07
peak following the major (4S,R) bis-camphanate isomer peak (see Fig. 2). Therefore,in this instance, the quantitation limit of 0.5% represents a worst case of detectability.In addition, the limit of quantitation can be applied to the remaining bis-camphanatediastereomers of RS-93522-004because, at the detection wavelength of 229 nm, thereis no observed difference in their extinction coefficients.
Purity of chiral reagentAn important consideration in the validation of the method is to insure that the
chiral derivatizing agent is of sufficient enantiomeric purity so as not to affect theaccurate quantitation of the RS-93522-004 bis-camphanate single isomers. Theenantiomeric purity of (- )-camphanic acid chloride, as obtained from the manufacturer, was determined by normal-phase HPLC analysis of the diastereomeric camphanamide components produced from its reaction with (R)-( + )-l-(l-naphthyl)ethylamine [(R)-NEA], as described in the Experimental section. (-)-Camphanicacid chloride was derivatized with (R)-NEA and (S)-( - )-l-(l-naphthyl)ethylamine[(S)-NEA] to establish the HPLC retention times of the resulting diastereomeric (R)NEA and (S)-NEA camphanamide derivatives. The (S)-NEA camphanamide and(R)-NEA camphanamide derivatives were found to elute at 6.2 and 7.4 min, respectively. Normal-phase HPLC analysis of the (R)-NEA camphanamide derivativeshowed the peak eluting at 6.2 min to integrate to 0.7% by area normalization. Thecontributions to the area of this peak come from both the (R)-NEA derivative of
Fig. 2. HPLC chromatogram illustrating the limit of quantitation of the RS-93522-004(4R,R) bis-carnphanate diastereomer.
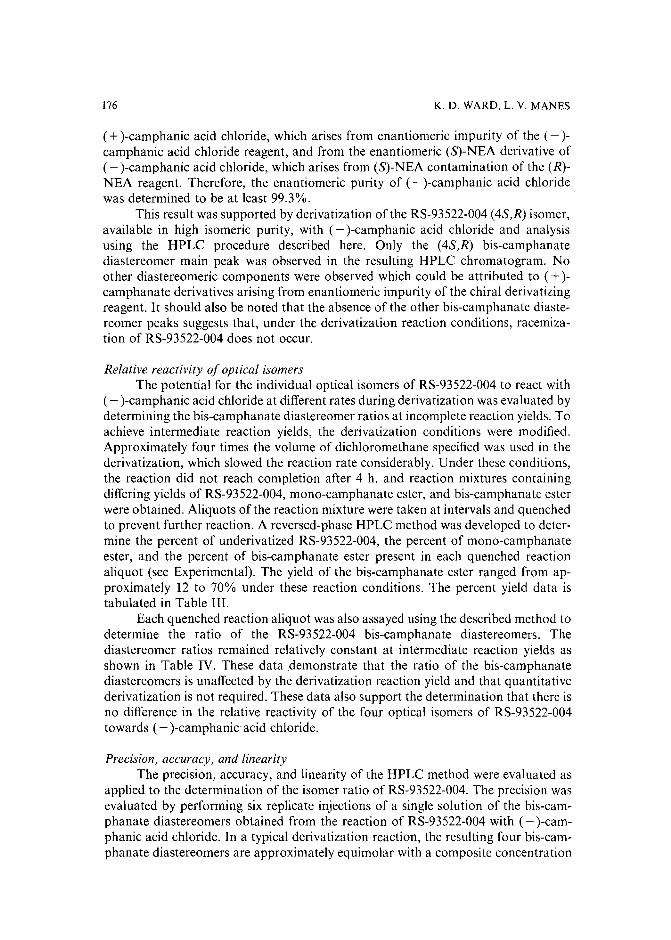
176 K. D. WARD, L. V. MANES
(+ )-camphanic acid chloride, which arises from enantiomeric impurity of the (- )camphanic acid chloride reagent, and from the enantiomeric (S)-NEA derivative of(- )-camphanic acid chloride, which arises from (S)-NEA contamination of the (R)NEA reagent. Therefore, the enantiomeric purity of ( - )-camphanic acid chloridewas determined to be at least 99.3%.
This result was supported by derivatization of the RS-93522-004 (4S,R) isomer,available in high isomeric purity, with (- )-camphanic acid chloride and analysisusing the HPLC procedure described here. Only the (4S,R) bis-camphanatediastereomer main peak was observed in the resulting HPLC chromatogram. Noother diastereomeric components were observed which could be attributed to (+)camphanate derivatives arising from enantiomeric impurity of the chiral derivatizingreagent. It should also be noted that the absence of the other bis-camphanate diastereomer peaks suggests that, under the derivatization reaction conditions, racemization of RS-93522-004 does not occur.
Relative reactivity of optical isomersThe potential for the individual optical isomers of RS-93522-004 to react with
( - )-camphanic acid chloride at different rates during derivatization was evaluated bydetermining the bis-camphanate diastereomer ratios at incomplete reaction yields. Toachieve intermediate reaction yields, the derivatization conditions were modified.Approximately four times the volume of dichloromethane specified was used in thederivatization, which slowed the reaction rate considerably. Under these conditions,the reaction did not reach completion after 4 h, and reaction mixtures containingdiffering yields of RS-93522-004, mono-camphanate ester, and bis-camphanate esterwere obtained. Aliquots of the reaction mixture were taken at intervals and quenchedto prevent further reaction. A reversed-phase HPLC method was developed to determine the percent of underivatized RS-93522-004, the percent of mono-camphanateester, and the percent of bis-camphanate ester present in each quenched reactionaliquot (see Experimental). The yield of the bis-camphanate ester ranged from approximately 12 to 70% under these reaction conditions. The percent yield data istabulated in Table III.
Each quenched reaction aliquot was also assayed using the described method todetermine the ratio of the RS-93522-004 bis-camphanate diastereomers. Thediastereomer ratios remained relatively constant at intermediate reaction yields asshown in Table IV. These data .demonstrate that the ratio of the bis-camphanatediastereomers is unaffected by the derivatization reaction yield and that quantitativederivatization is not required. These data also support the determination that there isno difference in the relative reactivity of the four optical isomers of RS-93522-004towards ( - )-camphanic acid chloride.
Precision, accuracy, and linearityThe precision, accuracy, and linearity of the HPLC method were evaluated as
applied to the determination of the isomer ratio of RS-93522-004. The precision wasevaluated by performing six replicate injections of a single solution of the bis-camphanate diastereomers obtained from the reaction of RS-93522-004 with (- )-camphanic acid chloride. In a typical derivatization reaction, the resulting four bis-carnphanate diastereomers are approximately equimolar with a composite concentration
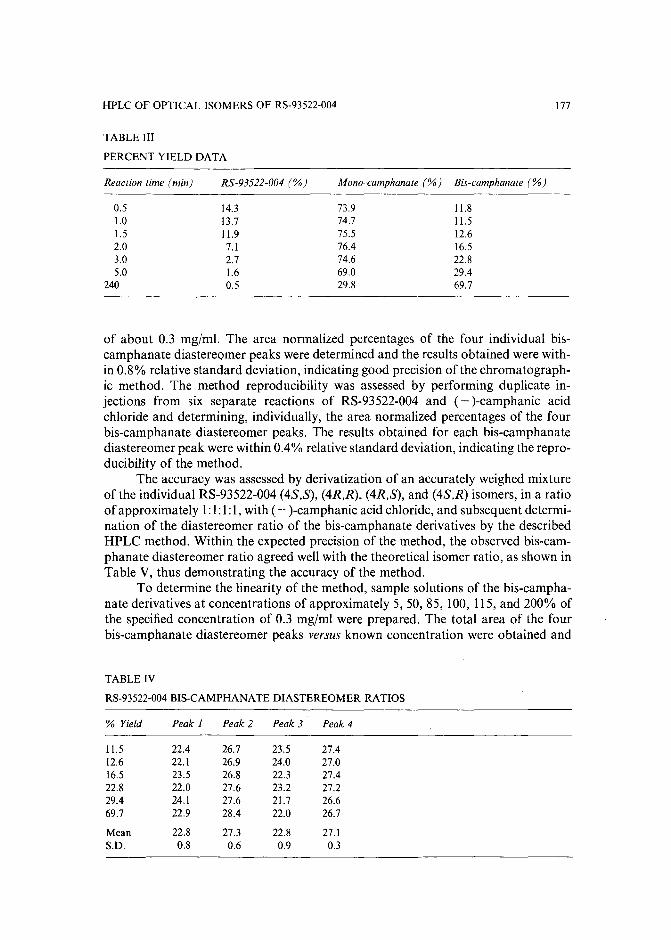
HPLC OF OPTICAL ISOMERS OF RS-93522-004
TABLE III
PERCENT YIELD DATA
177
Reaction time (min)
0.51.01.52.03.05.0
240
RS-93522-004 (%)
14.313.711.97.12.71.60.5
Mono-camphanate (%) Bis-camphanate (%)
73.9 11.874.7 11.575.5 12.676.4 16.574.6 22.869.0 29.429.8 69.7
of about 0.3 mg/ml, The area normalized percentages of the four individual biscamphanate diastereomer peaks were determined and the results obtained were within 0.8% relative standard deviation, indicating good precision of the chromatographic method. The method reproducibility was assessed by performing duplicate injections from six separate reactions of RS-93522-004 and (- )-camphanic acidchloride and determining, individually, the area normalized percentages of the fourbis-camphanate diastereomer peaks. The results obtained for each bis-camphanatediastereomer peak were within 0.4% relative standard deviation, indicating the reproducibility of the method.
The accuracy was assessed by derivatization of an accurately weighed mixtureof the individual RS-93522-004 (48,S), (4R,R), (4R,S), and (48,R) isomers, in a ratioof approximately l: l: l: l, with ( - )-camphanic acid chloride, and subsequent determination of the diastereomer ratio of the bis-camphanate derivatives by the describedHPLC method. Within the expected precision of the method, the observed bis-camphanate diastereomer ratio agreed well with the theoretical isomer ratio, as shown inTable V, thus demonstrating the accuracy of the method.
To determine the linearity of the method, sample solutions of the bis-camphanate derivatives at concentrations of approximately 5, 50, 85, 100, 115, and 200% ofthe specified concentration of 0.3 mg/ml were prepared. The total area of the fourbis-camphanate diastereomer peaks versus known concentration were obtained and
TABLE IV
RS-93522-004 BIS-CAMPHANATE DIASTEREOMER RATIOS
% Yield Peak 1 Peak 2 Peak 3 Peak 4
1l.5 22.4 26.7 23.5 27.412.6 22.1 26.9 24.0 27.016.5 23.5 26.8 22.3 27.422.8 22.0 27.6 23.2 27.229.4 24.1 27.6 21.7 26.669.7 22.9 28.4 22.0 26.7
Mean 22.8 27.3 22.8 27.1S.D. 0.8 0.6 0.9 0.3
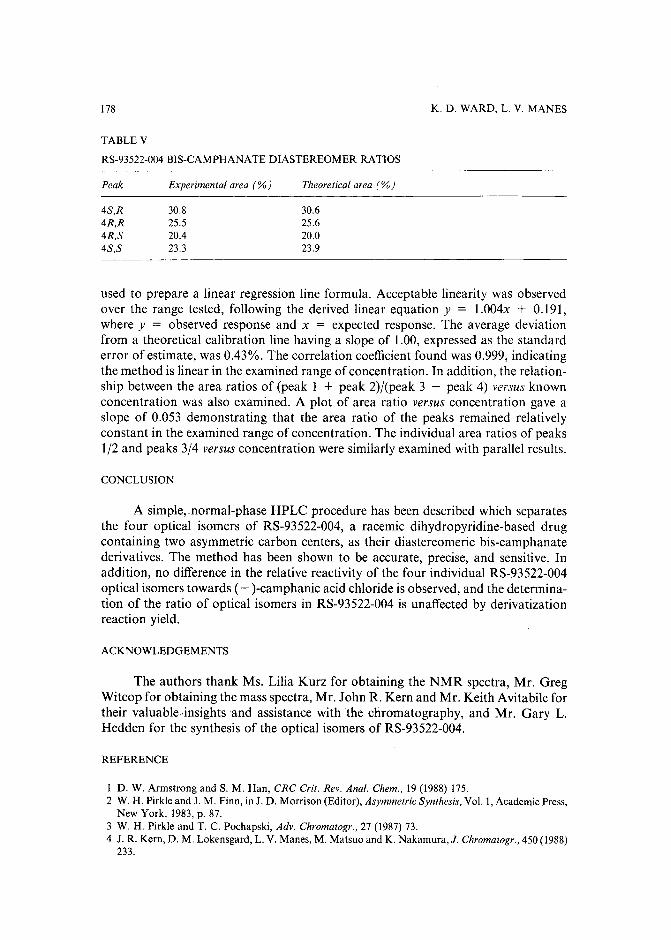
178
TABLE V
RS-93522-004 BIS-CAMPHANATE DIASTEREOMER RAnos
K. D. WARD, L. V. MANES
Peak
4S,R4R,R4R,S4S,S
Experimental area (%)
30.825.520.423.3
Theoretical area (%)
30.625.620.023.9
used to prepare a linear regression line formula. Acceptable linearity was observedover the range tested, following the derived linear equation y = 1.004x + 0.191,where y = observed response and x = expected response. The average deviationfrom a theoretical calibration line having a slope of 1.00, expressed as the standarderror of estimate, was 0.43%. The correlation coefficient found was 0.999, indicatingthe method is linear in the examined range ofconcentration. In addition, the relationship between the area ratios of (peak I + peak 2)/(peak 3 + peak 4) versus knownconcentration was also examined. A plot of area ratio versus concentration gave aslope of 0.053 demonstrating that the area ratio of the peaks remained relativelyconstant in the examined range of concentration. The individual area ratios of peaks1/2 and peaks 3/4 versus concentration were similarly examined with parallel results.
CONCLUSION
A simple,normal-phase HPLC procedure has been described which separatesthe four optical isomers of RS-93522-004, a racemic dihydropyridine-based drugcontaining two asymmetric carbon centers, as their diastereomeric bis-camphanatederivatives. The method has been shown to be accurate, precise, and sensitive. Inaddition, no difference in the relative reactivity of the four individual RS-93522-004optical isomers towards ( - )-camphanic acid chloride is observed, and the determination of the ratio of optical isomers in RS-93522-004 is unaffected by derivatizationreaction yield.
ACKNOWLEDGEMENTS
The authors thank Ms. Lilia Kurz for obtaining the NMR spectra, Mr. GregWitcop for obtaining the mass spectra, Mr. John R. Kern and Mr. Keith Avitabile fortheir valuable-insights and assistance with the chromatography, and Mr. Gary L.Hedden for the synthesis of the optical isomers of RS-93522-004.
REFERENCE
I D. W. Armstrong and S. M. Han, CRC Crit. Rev. Anal. Chem., 19 (1988) 175.2 W. H. Pirkle and J. M. Finn, in J. D. Morrison (Editor), Asymmetric Synthesis, Vol. I, Academic Press,
New York, 1983, p. 87.3 W. H. Pirkle and T. C. Pochapski, Adv. Chromatogr., 27 (1987) 73.4 J. R. Kern, D. M. Lokensgard, L. V. Manes, M. Matsuo and K. Nakamura, J. Chromatogr., 450 (1988)
233.
HPLC OF OPTICAL ISOMERS OF RS-93522-004 179
5 R. Shimizu, T. Kakimoto, K. Ishii, Y. Fujimoto, H. Nishi and N. Tsumagari, J. Chromatogr., 357(1986) 119.
6 R. A. Chapman, J. Chromatogr., 258 (1983) 175.7 D. A. Roston and R. Wijayaratne, Anal. Chem., 60 (1988) 950.8 D. W. Armstrong, T. J. Ward, R. D. Armstrong and T. E. Beesley, Science (Washington, D.C.), 232
(1986) 1132.9 Y. Okamoto, R. Aburatani, T. Fukumoto, K. Hatano and K. Hatada, in preparation.
10 E. Delee, 1. Jullien and L. Le Garrec, J. Chromatogr., 450 (1988) 191.II Daicel Chemical Industries, Ltd., Chiral HPLC Columns for Optical Resolution, company literature
(1988).12 R. J. Bopp and 1. H. Kennedy, LC-GC, Mag. Liq. Gas Chromatogr., 6 (1988) 514.13 J. R. Kern, D. M. Lokensgard and T. Yang, J. Chromatogr., 457 (1988) 309.14 J. R. Kern, unpublished results.15 K. D. Ward, unpublished results.

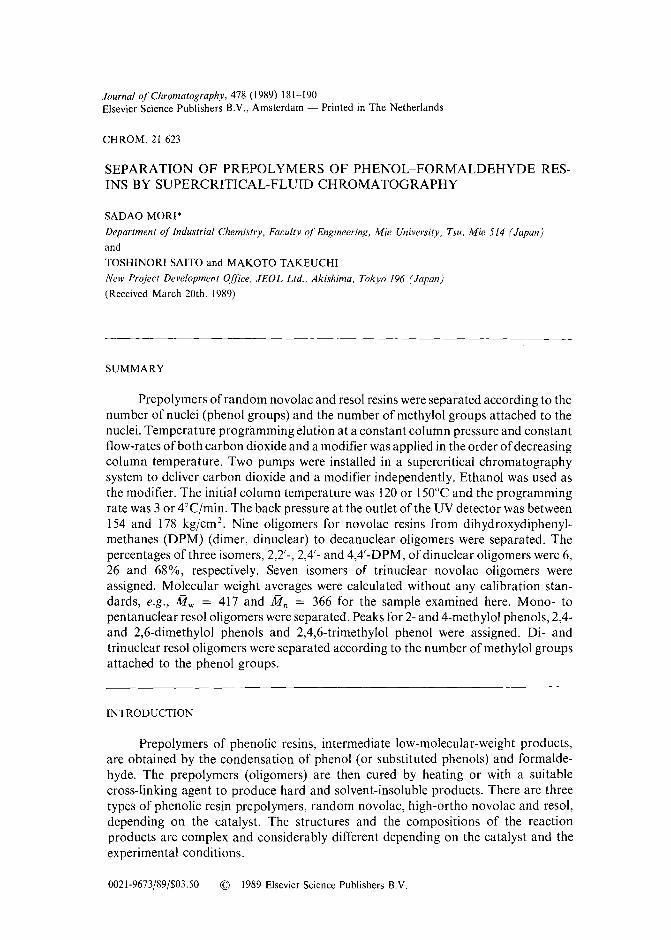
Journal of Chromatography, 478 (1989) 181-190Elsevier Science Publishers B.V., Amsterdam - Printed in The Netherlands
CHROM. 21 623
SEPARATION OF PREPOLYMERS OF PHENOL-FORMALDEHYDE RESINS BY SUPERCRITICAL-FLUID CHROMATOGRAPHY
SADAO MORI"
Department of Industrial Chemistry, Faculty of Engineering, Mie University, Tsu, Mie 514 (Japan)
and
TOSHINORI SAITO and MAKOTO TAKEUCHI
New Project Development Office, JEOL Ltd., Akishima, Tokyo 196 (Japan)
(Received March 20th, 1989)
SUMMARY
Prepolymers of random novolac and resol resins were separated according to thenumber of nuclei (phenol groups) and the number ofmethylol groups attached to thenuclei. Temperature programming elution at a constant column pressure and constantflow-rates of both carbon dioxide and a modifier was applied in the order ofdecreasingcolumn temperature. Two pumps were installed in a supercritical chromatographysystem to deliver carbon dioxide and a modifier independently. Ethanol was used asthe modifier. The initial column temperature was 120 or 150°C and the programmingrate was 3 or 4°Cjmin. The back pressure at the outlet of the UV detector was between154 and 178 kg/em", Nine oligomers for novolac resins from dihydroxydiphenylmethanes (DPM) (dimer, dinuclear) to decanuclear oligomers were separated. Thepercentages of three isomers, 2,2'-, 2,4'- and 4,4'-DPM, of dinuclear oligomers were 6,26 and 68%, respectively. Seven isomers of trinuclear novolac oligomers wereassigned. Molecular weight averages were calculated without any calibration standards, e.g., Mw = 417 and Mn = 366 for the sample examined here. Mono- topentanuclear resol oligomers were separated. Peaks for 2- and 4-methylol phenols, 2,4and 2,6-dimethylol phenols and 2,4,6-trimethylol phenol were assigned. Di- andtrinuclear resol oligomers were separated according to the number ofmethylol groupsattached to the phenol groups.
INTRODUCTION
Prepolymers of phenolic resins, intermediate low-molecular-weight products,are obtained by the condensation of phenol (or substituted phenols) and formaldehyde. The prepolymers (oligomers) are then cured by heating or with a suitablecross-linking agent to produce hard and solvent-insoluble products. There are threetypes of phenolic resin prepolymers, random novolac, high-ortho novolac and resol,depending on the catalyst. The structures and the compositions of the reactionproducts are complex and considerably different depending on the catalyst and theexperimental conditions.
0021-9673/89/$03.50 © 1989 Elsevier Science Publishers B.V.
182 S. MaRl, T. SAITO, M. TAKEUCHI
The determination of the molecular species of these prepolymers often req uiresthe application of several separation techniques, including high-performance liquidchromatography (HPLC), size-exclusion chromatography (SEC), and gas chromatography-mass spectroscopy (GC-MS). Resol resins were separated by SEC and theelution positions of several isomers of mono-, di- and trinuclear resol resins wereestimated1. However, because of the limited separation capacity in SEC, only2-methylol phenol (2-MP), 4-MP, 2,6-dimethylol phenol (2,6-DMP), 2,4-DMP and2,4,6-trimethylol phenol (2,4,6-TMP) were separated by semi-micro HPSEC ina system which had 103000 theoretical plates", Novolac resins were also separated bythe same SEC system and isomers of di-, tri-, tetra- and pentanuclear compounds wereidentified",
HPLC is the most suitable technique for the separation of such complexmaterials because of its high resolution. Reaction products from higher phenols andformaldehyde", ortho-novolac resins", phenol novolac and resol resins" and epoxyresins" were separated by HPLC and several isomers were characterized. However, theidentification of the peaks separated is still a matter of debate. For the identification ofcomplex structures of phenolic resins, the application of at least MS is required.GC-MS is capable of both the separation and identification of complex materials, ifthey can be separated by GC. Silylation of phenolic resins may enable the separation ofthese resins by GC 7
-1 2
. Disadvantages of the silylation of phenolic resins followed byGC-MS are the unreliable silylation and the inability to apply this technique tohigher-molecular-weight (higher nuclei) species because of their low vapour pressures.
Supercritical-fluid chromatography (SFC) has recently attracted serious attention because of its high resolution and its ease of application, similar to GC-MS. Theanalyses of relatively high-molecular-weight compounds have been reviewed 13.
Pressure programming to increase the pressure of the supercritical fluid (and increaseits density) is usually required in the separation of oligomers which contain specieswith widely differing molecular weights. The addition of a polar solvent to the mobilephase is also effective in separating relatively high-molecular-weight materials14 aswell as polar oligomers!".
This paper is concerned with a preliminary experiment on the separation ofphenol-formaldehyde random novo lac and resol resins by SFC. Temperatureprogrammed elution (decreasing temperature) at a constant column pressure wasapplied and ethanol was added to the mobile phase as a modifier.
EXPERIMENTAL
Apparatus and elutionA JEOL supercritical-fluid chromatograph Model JSF-8800 (JEOL, Akishima,
Tokyo, Japan) was used with an ultraviolet (UV) absorption detector ModelCAP-UVOI operated at 210 nm. The volume of the flow cell was 1 ,ul and the pathlength was 5 mm. The pressure of the supercritical fluid was maintained constant at thedetector outlet by using a constant pressure release valve actuated mechanically witha spring, screwdriver and a low-dead volume digital pressure meter. The SFCapparatus consists of two pumps, one for the delivery ofliquefied carbon dioxide as thesupercritical fluid (Model CAP-G03) and the other for the delivery of a modifier(Model CAP-L02). Ethanol was used as a modifier. One or two columns (25 em x 1.7
SFC OF PREPOLYMERS OF PHENOLIC RESINS 183
mm 1.0.) packed with silica-ODS (particle diameter 5 J-lm) were used and stored ina column oven to maintain the column temperature constant. A GC column oven(Hewlett-Packard Model HP 5980) was used after necessary modification forprogramming of descending column temperature.
The flow-rate ofliquefied carbon dioxide was 300J-li/min and that of the modifier100or 50 J-li/min. The initial column temperature was adjusted to 150or 120°Cand thecolumn temperature was lowered at a rate of 3 or 4°C/min to 50 or 60°C. The pressureof the supercritical fluid flowing into a column was monitored at the inlet and recordedon a chart. The back pressure of the SFC system was read at the outlet of the UVdetector.
SamplesRandom novolac resins were prepared using 10 g of phenol, 7.4 g of a 37%
formaldehyde aqueous solution (molar ratio of phenol to formaldehyde, 1:0.85) and0.1 ml of a 3.5% hydrochloric acid solution as a catalyst. The reaction was performedat 85°C for 30 min and the reaction mixture was diluted in water, then allowed to cool.Unreacted phenol and formaldehyde were removed in vacuum together with water.
Resol resins were prepared using 10 g phenol, 15.7 g of a 37% formaldehydeaqueous solution (molar ratio of phenol to formaldehyde, 1:1.8) and 0.5 ml of a 10%sodium hydroxide solution as a catalyst. The reaction was performed at 80°C for1 h and the reaction mixture was treated similarly to that for novolac resins.
These prepolymers were dissolved in tetrahydrofuran at about 5% concentration and the volume of these solutions injected on the column was 0.5 J-ll.
RESULTS AND DISCUSSION
Random novolac resinsFig. 1 shows a typical SFC separation according to the number of nuclei. Nine
oligomers from dihydroxydiphenylmethane (dimer, dinuclear) oligomers to decanuclear novolac oligomers were clearly separated and observed. The structure ofnovolac resins is depicted as polynuclear phenols with a methylene linkage between thearomatic nuclei1 2
. The number of nuclei (the number of phenyl groups) is estimated asin Fig. 1; i.e., peak c is dinuclear (dihydroxydiphenylmethanes), peak d trinuclear,peak e tetranuclear, etc.
According to the results obtained by GC-MS 12, methylol groups were not
attached to each aromatic nucleus of novolac resins and the mass difference betweeneach oligomer was 106 a.m.u. Therefore, molecular weight averages of the prepolymers can be calculated from the peak area of each oligomer and its molecularweight, if the UV response of each oligomer can be assumed to be equal. The molecularweight and relative peak intensity of each oligomer are listed in Table 1. From thesedata, molecular weight averages can be calculated as the number average molecularweight, Mn = 366 and the weight average molecular weight, Mw = 457.
The content of phenol remaining in novolac resins used in this work was about5%. The number average molecular weight calculated by including phenol was 319.The molecular weight obtained by vapour-pressure osmometry was equivalent to thisvalue. Therefore, the method proposed here can calculate both molecular weightaverages, including and excluding phenol. The calculation of molecular weight
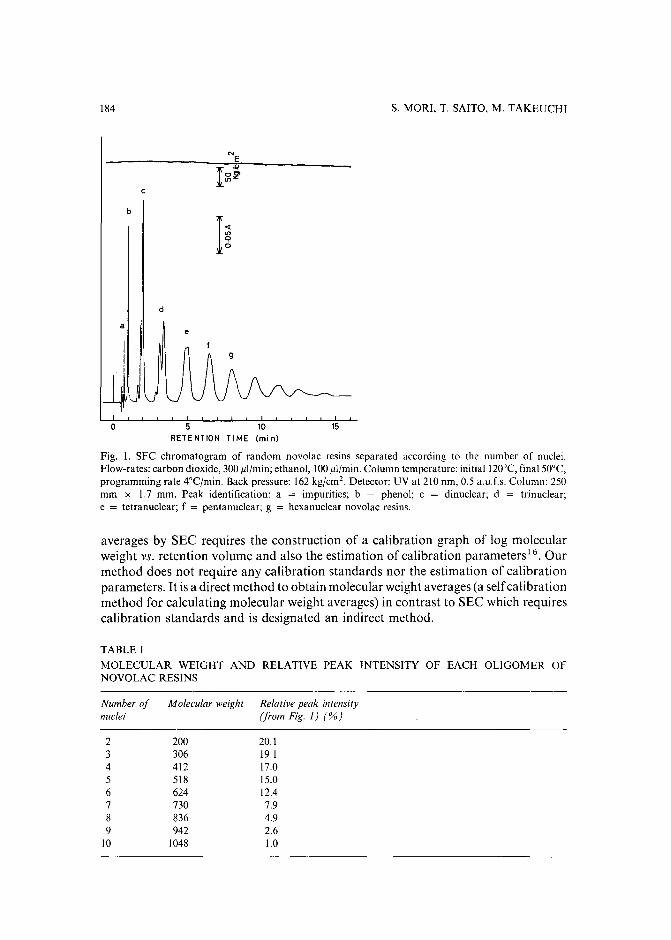
184 S. MORI, T. SAITO, M. TAKEUCHI
b
d
ae
15o 5 10RETENIION TIME (rni n)
Fig. 1. SFC chromatogram of random novolac resins separated according to the number of nuclei.Flow-rates: carbon dioxide, 300 Ill/min; ethanol, 100 Ill/min. Column temperature: initiaI120°C, final 50°C,programming rate 4°Cjmin. Back pressure: 162 kg/ern". Detector: UV at 210 nm, 0.5 a.u.f.s. Column: 250mm x 1.7 mm. Peak identification: a = impurities; b = phenol; c = dinuclear; d = trinuclear;e = tetranuclear; f = pentanuclear; g = hexanuclear novolac resins.
averages by SEC requires the construction of a calibration graph of log molecularweight vs. retention volume and also the estimation of calibration parameters". Ourmethod does not require any calibration standards nor the estimation of calibrationparameters. It is a direct method to obtain molecular weight averages (a selfcalibrationmethod for calculating molecular weight averages) in contrast to SEC which requirescalibration standards and is designated an indirect method.
TABLE I
MOLECULAR WEIGHT AND RELATIVE PEAK INTENSITY OF EACH OLIGOMER OFNOVOLAC RESINS
Number ofnuclei
Molecular weight Relative peak intensity(from Fig. 1) (%)
23456789
10
200 20.1306 19.1412 17.0518 15.0624 12.4730 7.9836 4.9942 2.6
1048 1.0
SFC OF PREPOLYMERS OF PHENOLIC RESINS 185
The initial column temperature in Fig. 1 was l20°C and the column temperatureIS min after the injection of a sample solution was 60°C. The flow-rates ofboth carbondioxide and ethanol were kept constant at 300 and 100 Itl/min, respectively. The backpressure at the detector outlet was also kept constant, at 162 kg/ern". Therefore, themore condensed fluid flowed through the column at lower column temperature. Our(decreasing) temperature programming is a kind of density programming at constantcolumn pressure.
Our SFC system has different features from other SFC systems for densityprogramming and temperature programming. Density programming of other SFCsystems utilizes the increase in flow-rate of a fluid or an increase in back pressure.Density programming in our SFC system arises from the result of temperatureprogramming which is in the order ofdescending column temperature, though in othersystems it is normally in the order of ascending col umn temperature. The cell block ofthe UV detector in this work is cooled to 20-25°C, and thus the fluid from the columnbecomes a liquid in an UV cell. Therefore, as far as the flow-rates at the two pumps andthe back pressure at the outlet of the UV detector are constant, the liquid density at theUV cell is kept constant in spite of the change in column temperature, resulting ina stable baseline.
The column inlet pressure was monitored and recorded on a chart, and is shownat the top of Fig. 1. The initial column inlet pressure was 212 kg/cm2 and the pressure15 min after the sample injection was 220 kg/cm''. The column pressure during theseparation was very stable. As the back pressure in Fig. 1 was 162 kg/ern", the pressuredrop between the column inlet and the detector outlet was 50 kg/crrr' at the start.
The increase in column temperature results in a decrease in the density of thefluid, and therefore in an increase in retention time of a sample solute. In other words,the resolution of lower-molecular-weight solutes may be improved at the lower densityof the fluid. An example is shown in Fig. 2. The initial temperature was 150°C and theback pressure was 178 kg/em". Other experimental conditions were as in Fig. 1. Thecolumn temperature at the retention time of 15 min was 90°C, where hexanuclearnovolac resins appeared. These oligomers appeared at a retention time of 8 min in Fig.1, where the column temperature was 88°C. The column inlet pressure was 214 kg/ern2
at the start and 220 kg/em! 20 min after the sample injection. The pressure dropbetween the column inlet and the detector outlet was 36 kg/crn' at the start.
Besides the increase in retention time of these oligomers, the resolution ofdi- andtrinuclear oligomers was much improved. Three peaks for dinuclear oligomers andmore than three peaks including shoulder peaks were observed for trinuclearoligomers. According to the GC-MS analysis", peak cl can be assigned to2,2'-dihydroxydiphenylmethane (2,2'-DPM), peak c2 to 2,4'-DPM and peak c3 to4,4'-DPM. The percentages of these isomers were calculated from the peak areas as6 (peak 1),26 (peak 2), and 68% (peak 3). Trinuclear novolac oligomers should havemore than three isomers and seven isomers were separated and identified by using theresults of GC-MS8
.
For further improvement of the separation oftrinuclear oligomers the flow-rateof the modifier (ethanol) was decreased from 100 to 50 ,ul/min and two columns wereconnected. The results are shown in Fig. 3. The column inlet pressure at the start was218 kg/em". Five peaks including one shoulder peak were observed. Trinuclearoligomers appear at retention times between 19 and 24 min. Peaks can be assigned by
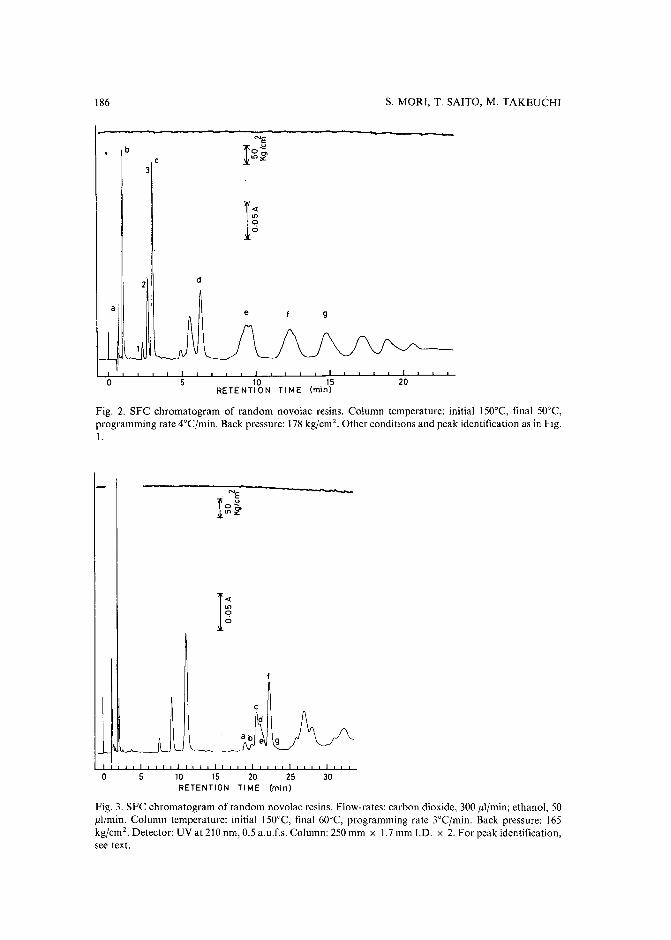
186 S. MaRl, T. SAITO, M. TAKEUCHI
a
b
3
NE
I ~0",
"''''
I~
d
e 9
o 5 10 15RETENTION TIME (min)
20
Fig. 2. SFC chromatogram of random novolac resins. Column temperature: initial 150°C, final 50°C,programming rate 4°Cjmin. Back pressure: 178kg/ern". Other conditions and peak identification as in Fig.\.
30o 10 15 20 25RETENTION TIME (min)
Fig. 3. SFC chromatogram of random novolac resins. Flow-rates: carbon dioxide, 300 ,ul/min;ethanol, 50,ul/min. Column temperature: initial 150°C, final 60°C, programming rate 3°Cjmin. Back pressure: 165kgjcm'. Detector: UV at 210 nm, 0.5 a.u.f.s. Column: 250 mm x 1.7 mm J.D. x 2. For peak identification,see text.
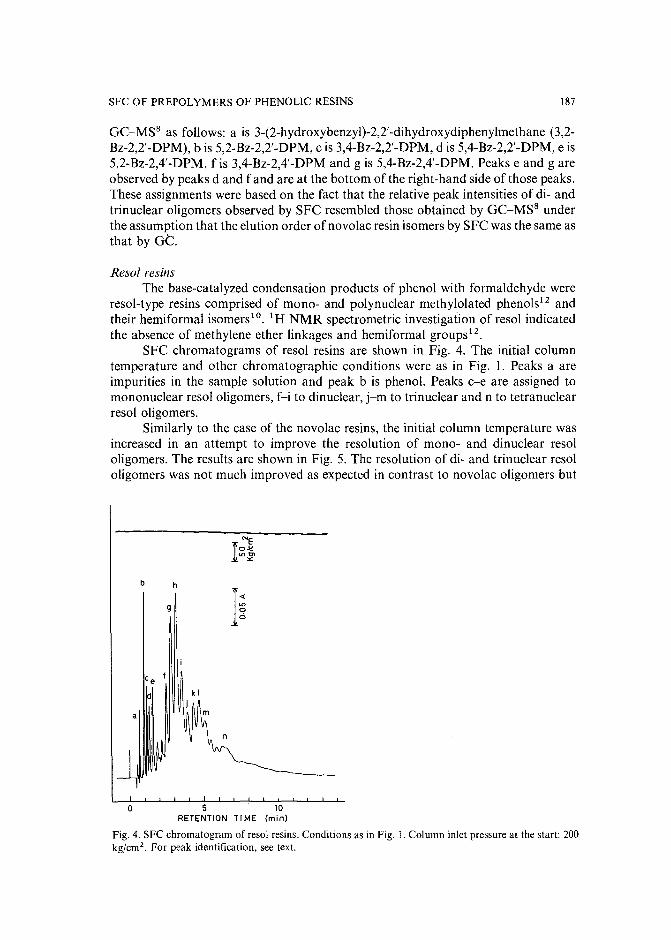
SFC OF PREPOLYMERS OF PHENOLIC RESINS 187
GC-MS8 as follows: a is 3-(2-hydroxybenzyl)-2,2'-dihydroxydiphenylmethane (3,2Bz-2,2'-DPM), b is 5,2-Bz-2,2'-DPM, cis 3,4-Bz-2,2'-DPM, d is 5,4-Bz-2,2'-DPM, e is5,2-Bz-2,4'-DPM, fis 3,4-Bz-2,4'-DPM and g is 5,4-Bz-2,4'-DPM. Peaks e and g areobserved by peaks d and f and are at the bottom of the right-hand side of those peaks.These assignments were based on the fact that the relative peak intensities of di- andtrinuclear oligomers observed by SFC resembled those obtained by GC-MS 8 underthe assumption that the elution order of novo lac resin isomers by SFC was the same asthat by oc
Resol resinsThe base-catalyzed condensation products of phenol with formaldehyde were
resol-type resins comprised of mono- and polynuclear methylolated phenols'f andtheir hemiformal isomers 10. 1H NMR spectrometric investigation of resol indicatedthe absence of methylene ether linkages and hemiformal groups12.
SFC chromatograms of resol resins are shown in Fig. 4. The initial columntemperature and other chromatographic conditions were as in Fig. I. Peaks a areimpurities in the sample solution and peak b is phenol. Peaks c-e are assigned tomononuclear resol oligomers, f-i to dinuclear, j-m to trinuclear and n to tetranuclearresol oligomers.
Similarly to the case of the novolac resins, the initial column temperature wasincreased in an attempt to improve the resolution of mono- and dinuclear resololigomers. The results are shown in Fig. 5. The resolution of di- and trinuclear resololigomers was not much improved as expected in contrast to novo lac oligomers but
"'Elo~
"';!l
b h
9 I~
c fe
o 5 10RETENTION T I ME (min)
Fig. 4. SFC chromatogram ofresol resins. Conditions as in Fig.!. Column inlet pressure at the start: 200kgjcm'. For peak identification, see text.
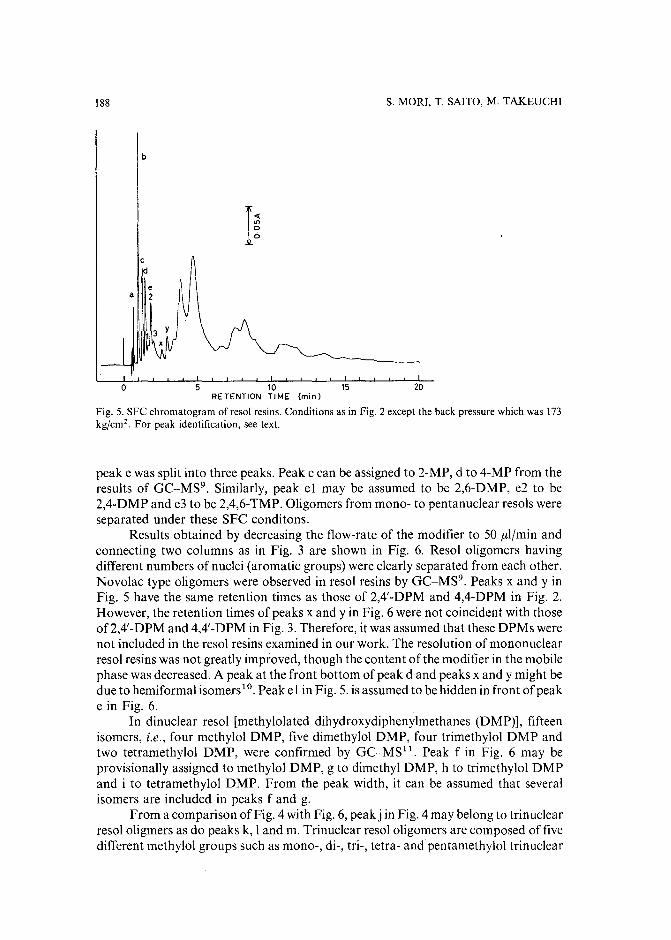
188
b
S. MaRl, T. SAITO, M. TAKEUCHI
o 5 10 15 20RETENTION TIME (min)
Fig. 5. SFC chromatogram of resol resins. Conditions as in Fig. 2 except the back pressure which was 173kg/ern". For peak identification, see text.
peak e was split into three peaks. Peak c can be assigned to 2-MP, d to 4-MP from theresults of GC-MS9 . Similarly, peak el may be assumed to be 2,6-DMP, e2 to be2,4-DMP and e3 to be 2,4,6-TMP. Oligomers from mono- to pentanuclear resols wereseparated under these SFC conditons.
Results obtained by decreasing the flow-rate of the modifier to 50 ,ul/min andconnecting two columns as in Fig. 3 are shown in Fig. 6. Resol oligomers havingdifferent numbers of nuclei (aromatic groups) were clearly separated from each other.Novolac type oligomers were observed in resol resins by GC-MS9
. Peaks x and y inFig. 5 have the same retention times as those of 2,4'-DPM and 4,4-DPM in Fig. 2.However, the retention times of peaks x and y in Fig. 6 were not coincident with thoseof2,4'-DPM and 4,4'-DPM in Fig. 3. Therefore, it was assumed that these DPMs werenot included in the resol resins examined in our work. The resolution of mononuclearresol resins was not greatly improved, though the content ofthe modifier in the mobilephase was decreased. A peak at the front bottom of peak d and peaks x and y might bedue to hemiformal isomers 10. Peak el in Fig. 5. is assumed to be hidden in front of peake in Fig. 6.
In dinuclear resol [methylolated dihydroxydiphenylmethanes (DMP)], fifteenisomers, i.e., four methylol DMP, five dimethylol DMP, four trimethylol DMP andtwo tetramethylol DMP, were confirmed by GC-MS ll
. Peak f in Fig. 6 may beprovisionally assigned to methylol DMP, g to dimethyl DMP, h to trimethylol DMPand i to tetramethylol DMP. From the peak width, it can be assumed that severalisomers are included in peaks f and g.
From a comparison of Fig. 4 with Fig. 6, peakj in Fig. 4may belong to trinuclearresol oligmers as do peaks k, I and m. Trinuclear resol oligomers are composed of fivedifferent methylol groups such as mono-, di-, tri-, tetra- and pentamethylol trinuclear
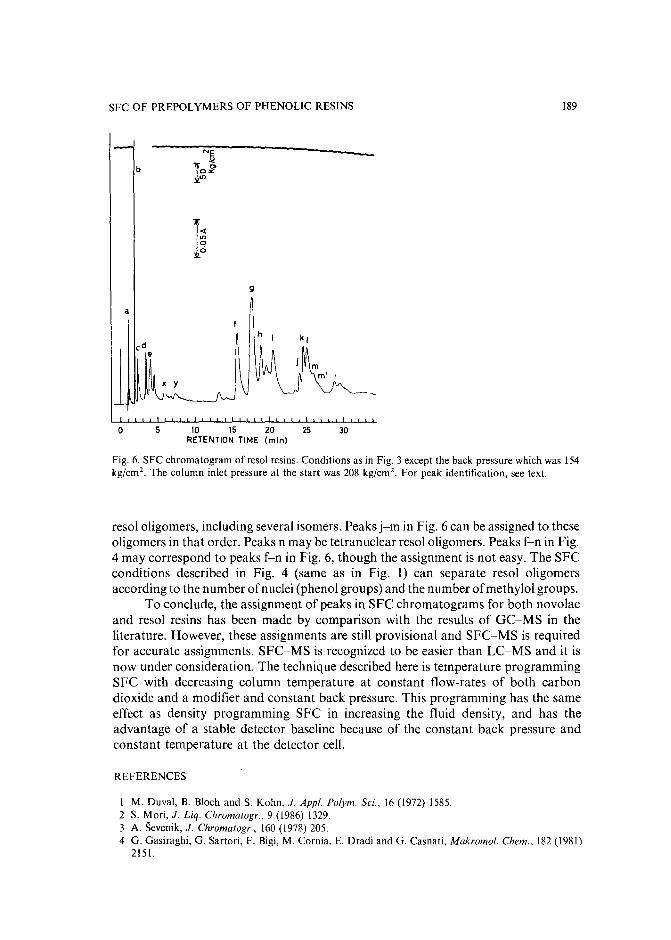
SFC OF PREPOLYMERS OF PHENOLIC RESINS
b
I~9
a
189
o 5 10 15 20 25RETENTION TIME (min)
30
Fig. 6. SFC chromatogram of reso! resins. Conditions as in Fig. 3 except the back pressure which was 154kg/em". The column inlet pressure at the start was 208 kg/ern". For peak identification, see text.
resol oligomers, including several isomers. Peaks j-m in Fig. 6 can be assigned to theseoligomers in that order. Peaks n may be tetranuclear resol oligomers. Peaks f-n in Fig.4 may correspond to peaks f-n in Fig. 6, though the assignment is not easy. The SFCconditions described in Fig. 4 (same as in Fig. 1) can separate resol oligomersaccording to the number of nuclei (phenol groups) and the number ofmethylol groups.
To conclude, the assignment of peaks in SFC chromatograms for both novolacand resol resins has been made by comparison with the results of GC-MS in theliterature. However, these assignments are still provisional and SFC-MS is requiredfor accurate assignments. SFC-MS is recognized to be easier than LC-MS and it isnow under consideration. The technique described here is temperature programmingSFC with decreasing column temperature at constant flow-rates of both carbondioxide and a modifier and constant back pressure. This programming has the sameeffect as density programming SFC in increasing the fluid density, and has theadvantage of a stable detector baseline because of the constant back pressure andconstant temperature at the detector cell.
REFERENCES
I M. Duval, B. Bloch and S. Kahn, J. App/. Po/ym. Sci., 16 (1972) 1585.2 S. Mori, J. Liq. Chromatogr., 9 (1986) 1329.3 A. Sevenik, J. Chromatogr., 160 (1978) 205.4 G. Gasiraghi, G. Sartori, F. Bigi, M. Cornia, E. Dradi and G. Casnati, Makromo/. Chem., 182 (1981)
2151.
190 S. MaRl, T. SAITO, M. TAKEUCHI
5 W. Werner and O. Barber, Chromatographia, 15 (1982) 101.6 S.-T. Lai and L. Sangermano, J. Chromatogr., 321 (1985) 325.7 W. Lindner, J. Chromatogr., 151 (1978) 406.8 L. Prokai, J. Chromatogr., 329 (1985) 290.9 L. Prokai, J. Chromatogr., 331 (1985) 91.
10 L. Prokai, J. Chromatogr., 333 (1985) 161.11 L. Prokai, J. Chromatogr., 356 (1986) 331.12 L. Prokai, J. Appl. Polym. Sci., Polym. Lett., 24 (1986) 223.13 P. Sandra, in R. M. Smith (Editor), Supercritical Fluid Chromatography, Royal Society of Chemistry,
London, 1988, Ch. 5.14 F. P. Schmits and E. Klesper, Polym. Commun., 24 (1983) 142.15 F. P. Schmitz and H. Hilgers, Makromol. Chem., Rapid Commun., 7 (1986) 59.16 S. Mori, Anal. Chem., 53 (1981) 1813.
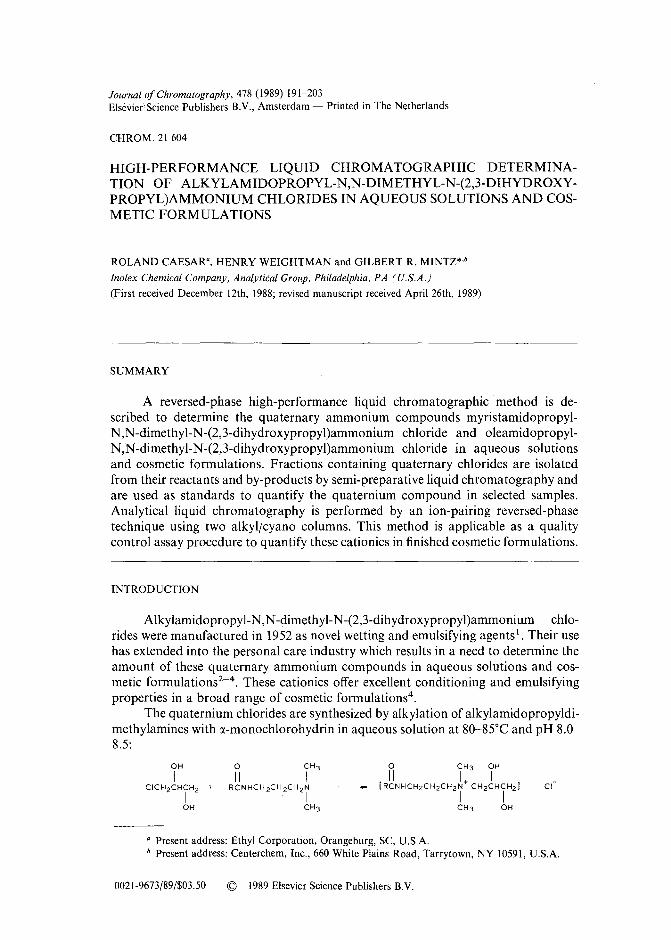
Journal of Chromatography, 478 (1989) 191-203Elsevier Science Publishers B.V., Amsterdam - Printed in The Netherlands
CHROM. 21 604
HIGH-PERFORMANCE LIQUID CHROMATOGRAPHIC DETERMINATION OF ALKYLAMIDOPROPYL-N,N-DIMETHYL-N-(2,3-DIHYDROXYPROPYL)AMMONIUM CHLORIDES IN AQUEOUS SOLUTIONS AND COSMETIC FORMULATIONS
ROLAND CAESAR", HENRY WEIGHTMAN and GILBERT R. MINTZ*,b
lnolex Chemical Company, Analytical Group, Philadelphia, PA (U.S.A.)
(First received December 12th, 1988; revised manuscript received April 26th, 1989)
SUMMARY
A reversed-phase high-performance liquid chromatographic method is described to determine the quaternary ammonium compounds myristamidopropylN,N-dimethyl-N-(2,3-dihydroxypropyl)ammonium chloride and oleamidopropylN,N-dimethyl-N-(2,3-dihydroxypropyl)ammonium chloride in aqueous solutionsand cosmetic formulations. Fractions containing quaternary chlorides are isolatedfrom their reactants and by-products by semi-preparative liquid chromatography andare used as standards to quantify the quaternium compound in selected samples.Analytical liquid chromatography is performed by an ion-pairing reversed-phasetechnique using two alkyljcyano columns. This method is applicable as a qualitycontrol assay procedure to quantify these cationics in finished cosmetic formulations.
INTRODUCTION
Alkylamidopropyl-N,N-dimethyl-N-(2,3-dihydroxypropyl)ammonium chlorides were manufactured in 1952 as novel wetting and emulsifying agents 1. Their usehas extended into the personal care industry which results in a need to determine theamount of these quaternary ammonium compounds in aqueous solutions and cosmetic formulations-:". These cationics offer excellent conditioning and emulsifyingproperties in a broad range of cosmetic formulations".
The quaternium chlorides are synthesized by alkylation of alkylamidopropyldimethylamines with o-monochlorohydrin in aqueous solution at 80-85°C and pH 8.08.5:
CI
a Present address: Ethyl Corporation, Orangeburg, SC, U.S.A.b Present address: Centerchem, Inc., 660 White Plains Road, Tarrytown, NY 10591, U.S.A.
0021-9673/89/$03.50 © 1989 Elsevier Science Publishers B.V.
192 R. CAESAR, H. WEIGHTMAN, G. R. MINTZ
The possible impurities present in the product may be unreacted alkylamidopropyldimethylamine and IX-monochlorohydrin. Other impurities that may bepresent are sodium chloride that results from the neutralization of sodium hydroxidewith hydrochloric acid and glycerol that results from the nucleophilic substitution ofchlorine in IX-monochlorohydrin by hydroxide.
The determination ofquaternary ammonium compounds is classically performed by potentiometric titration with anhydrous perchloric acid in the presence ofmercury(II) acetates. However, the presence of sodium chloride interferes with thedetermination because mercury(II) acetate complexes with chloride to form titratableacetate resulting in a falsely high result. Another classic determination involves titration of a quaternary ammonium chloride with standard sodium lauryl sulfate in a twophase water-ehloroform system using methylene blue as the indicator". Ideally theendpoint is observed when the intensity of the blue color is equally distributed between the two phases. However, with these particular quaternary compounds,the alkylamidopropyl-N,N-dimethyl-N-(2,3-dihydroxypropyl)ammonium-methylene blue complex is not soluble in chloroform and chloroform-alcohol solutionsmaking endpoint detection impossible.
Another determination involves the formation of a water insoluble complexbetween the quaternary ammonium compound and hexacyanoferrate(III) ion". Using this method, we determined the quaternary ammonium chloride concentration inan aqueous solution of Lexquat'" AMG-oa. We found excellent correlation betweenthis method and the quantity of desired product calculated from the amount ofresidual reactants remaining in the product. However, a low value was obtained in acomplex cosmetic formulation containing additional surfactants.
In recent years, several papers have been published on the determination ofquaternary ammonium compounds by high-performance liquid chromatography(HPLC) with reversed-phase packing containing octadecyl and alkylcyano silanegroups chemically bonded to silica geI6
-8
.
Ion-pair reversed-phase chromatography was chosen because without ion-pairing the quaternary ammonium chlorides gave tailing peaks when used with an alkylcyano stationary phase. The ion-pairing technique was also chosen because the capacity factor (k') of the analyte did not change with concentration whentrifluoroacetic acid was used as a counter-ion.
A reversed-phase liquid chromatography method has been developed for quantitation of the surfactant(s) in the Lexquat'" AMG product line. Furthermore, thisprocedure separates the alkylamidopropyl-N,N-dimethyl-N-(2,3-dihydroxypropyl)ammonium chlorides from process impurities and was used to quantify the level ofquaternary ammonium chloride in two cosmetic formulations.
EXPERIMENTAL
Reagents for synthesis of quaternariesMyristic acid is commercially available at greater than 95% purity from Emery
a Lexquat AMG-O is a registered trade name for an aqueous solution of oleamidopropyl-N,Ndimethyl-N-(2,3-dihydroxypropyl)ammonium chloride.
HPLC OF QUATERNARY AMMONIUM CHLORIDES 193
and oleic acid was obtained from Witco with a greater than 70% C I 8 : I content(Industrene 205). o-Monochlorohydrin at greater than 99% purity was obtained fromDixie (Houston, TX, U.S.A.).
Reagents and chemicalsHPLC grade acetonitrile, tetrahydrofuran (THF) and methanol (Burdick and
Jackson Labs., Muskegon, MI, U.S.A.) and trifluoroacetic acid (Aldrich, Milwaukee,WI, U.S.A.) were used as components in various mobile phases.
ApparatusThe instrument employed was a Waters Assoc. high-performance liquid chro
matography Model ALC-201 equipped with a Model 6000A pump and Model 401differential refractometer. Chromatograms were obtained using a Waters Assoc.Model 730 data module. Infrared spectra were obtained using an IBM Model 32 IRspectrometer. NMR spectra were obtained using an Bruker WP 270 SY spectrometerat Betz Labs., Trevose, PA, U.S.A.
Semi-preparative chromatographySeparation of the quaternary ammonium chloride from impurities was accom
plished using a 30 em x 7.8 mm LD.IlBondapak C I 8 column. The mobile phase usedwas water-methanol (25:75, v/v) for Lexquat AMG-O and Lexquat AMG-M". Theflow-rate was 1.5 ml/min. The fraction containing the quaternary ammonium chlorides and mobile phase was allowed to dry by evaporation in a hood overnight toremove the bulk of the remaining solvent, and further dried at 80aC at atmosphericpressure for 8 h. The samples were then placed in a vacuum oven (25 mmHg) for threehours until a constant weight (agreed to between 0.04% of each other) was obtained't-!".
Analytical chromatographyOleamidopropyl-N ,N-dimethyl-N-(2,3-dihydroxypropyl)ammonium chloride
and myristamidopropyl-N,N-dimethyl-N-(2,3-dihydroxypropyl)ammonium chloridein aqueous systems were determined by reversed-phase ion-pairing liquid chromatography. Two alkyl/cyano columns (IlBondapak CN, Waters Assoc.) 15 em x 4 mmJ.D. were used in series. The mobile phase used for the analytical HPLC in assayingthe quaternary ammonium chloride in Lexquat samples was prepared by mixing 1100ml of water, 900 ml of acetonitrile and 2 ml of trifluoroacetic acid. The same mobilephase was used to quantify oleamidopropyl-N,N-dimethyl-N-(2,3-dihydroxypropyl)ammonium chloride in the skin moisturizer formulation containing LexquatAMG-O. The mobile phase used for the determination of myristamidopropyl-N,Ndimethyl-N-(2,3-dihydroxypropyl)ammonium chloride in the clear conditioningshampoo containing Lexquat AMG-M was prepared by mixing 1140 ml of water and840 ml of acetonitrile, 20 ml THF and 2 ml of trifluoroacetic acid.
a Lexquat AMG-M is a registered trade name for an aqueous solution ofmyristamidopropyl-N,Ndimethyl-N-(2,3-dihydroxypropyl)ammonium chloride.
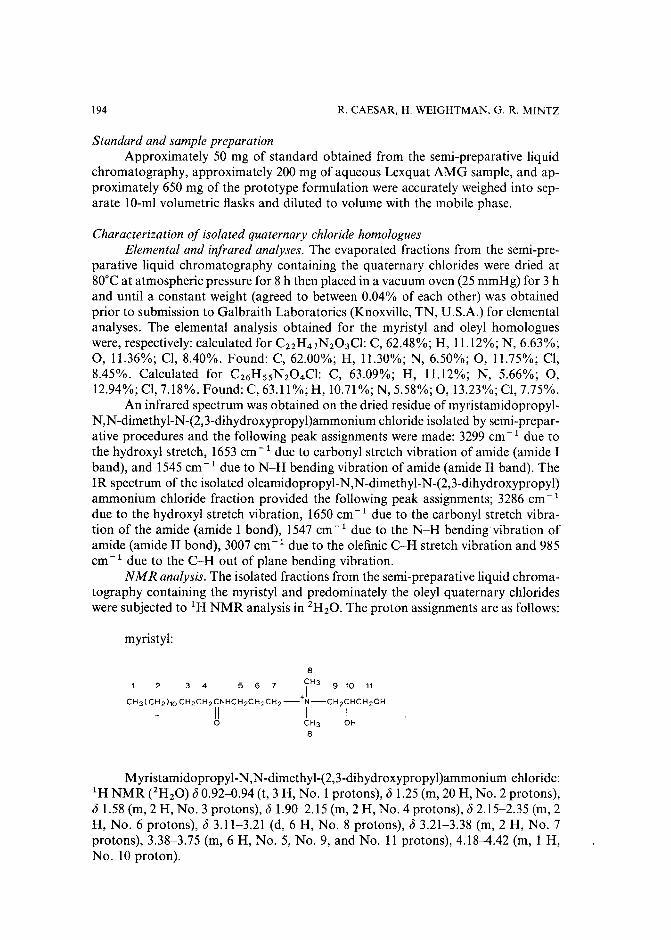
194 R. CAESAR, H. WEIGHTMAN, G. R. MINTZ
Standard and sample preparationApproximately 50 mg of standard obtained from the semi-preparative liquid
chromatography, approximately 200 mg of aqueous Lexquat AMG sample, and approximately 650 mg of the prototype formulation were accurately weighed into separate lO-ml volumetric flasks and diluted to volume with the mobile phase.
Characterization of isolated quaternary chloride homologuesElemental and infrared analyses. The evaporated fractions from the semi-pre
parative liquid chromatography containing the quaternary chlorides were dried at80°Cat atmospheric pressure for 8 h then placed in a vacuum oven (25 mmHg) for 3 hand until a constant weight (agreed to between 0.04% of each other) was obtainedprior to submission to Galbraith Laboratories (Knoxville, TN, U.S.A.) for elementalanalyses. The elemental analysis obtained for the myristyl and oleyl homologueswere, respectively: calculated for C22H47N203Cl: C, 62.48%; H, 11.12%; N, 6.63%;0,11.36%; CI, 8.40%. Found: C, 62.00%; H, 11.30%; N, 6.50%; 0,11.75%; CI,8.45%. Calculated for C26HssN204CI: C, 63.09%; H, 11.12%; N, 5.66%; 0,12.94%; CI, 7.18%. Found: C, 63.11 %; H, 10.71 %; N, 5.58%; 0, 13.23%; CI, 7.75%.
An infrared spectrum was obtained on the dried residue of myristamidopropylN,N-dimethyl-N-(2,3-dihydroxypropyl)ammonium chloride isolated by semi-preparative procedures and the following peak assignments were made: 3299 em-1 due tothe hydroxyl stretch, 1653cm-1 due to carbonyl stretch vibration of amide (amide Iband), and J 545 em-1 due to N-H bending vibration of amide (amide II band). TheIR spectrum of the isolated oleamidopropyl-N,N-dimethyl-N-(2,3-dihydroxypropyl)ammonium chloride fraction provided the following peak assignments; 3286 cm"!
due to the hydroxyl stretch vibration, 1650 em-1 due to the carbonyl stretch vibration of the amide (amide I bond), 1547 cm- 1 due to the N-H bending vibration ofamide (amide II bond), 3007 cm-1 due to the olefinic C-H stretch vibration and 985em-1 due to the C-H out of plane bending vibration.
NMR analysis. The isolated fractions from the semi-preparative liquid chromatography containing the myristyl and predominately the oleyl quaternary chlorideswere subjected to 1H NMR analysis in 2H20. The proton assignments are as follows:
myristyl:
8
1 2 3 4 5 6 7 iH39 10 11
CH3( CH2)1O CH2CH2CNHCH2CH2CH2 -+N-CH2CHCH20H
II I Io CH3 OH
8
Myristamidopropyl-N,N-dimethy1-(2,3-dihydroxypropyl)ammoniurn chioride:1H NMR eH20) 0 0.92-0.94 (t, 3 H, No.1 protons), 01.25 (m, 20 H, No.2 protons),01.58 (m, 2 H, No.3 protons), 01.90-2.15 (m, 2 H, No.4 protons), 0 2.15-2.35 (m, 2H, No.6 protons), 0 3.11-3.21 (d, 6 H, No.8 protons), 0 3.21-3.38 (m, 2 H, No.7protons), 3.38-3.75 (m, 6 H, No.5, No.9, and No. 11 protons), 4.18-4.42 (m, 1 H,No. 10 proton).
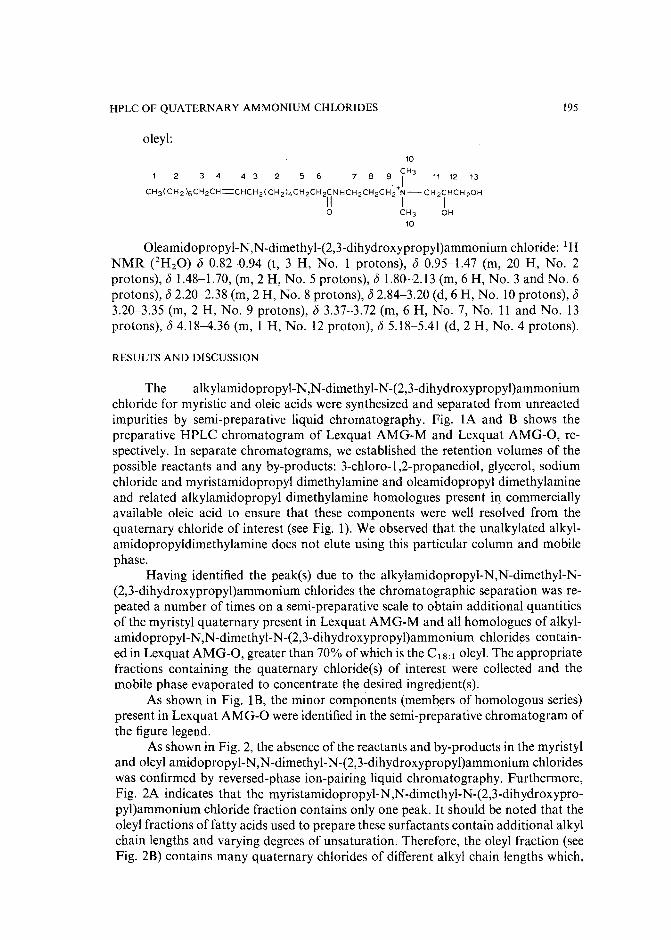
HPLC OF QUATERNARY AMMONIUM CHLORIDES
oleyl:
10
2 3 4 4 3 2 5 6 7 8 9 CH3
11 12 13
JCH3( CH2 )6CH2CH=CHCH2( CH2)4CH2CH2CN HCH 2CH 2CH 2 N - CH 2CHCH 2014
II I I° CH3 01410
195
Oleamidopropyl-N,N-dimethyl-(2,3-dihydroxypropyl)ammonium chloride: 1HNMR eHzO) s 0.82-0.94 (t, 3 H, No.1 protons), s 0.95-1.47 (m, 20 H, No.2protons), b 1.48-1.70, (m, 2 H, No.5 protons), (51.80-2.13 (m, 6 H, No.3 and No.6protons), b 2.20-2.38 (m, 2 H, No.8 protons), b 2.84-3.20 (d, 6 H, No. 10 protons), s3.20-3.35 (m, 2 H, No.9 protons), (5 3.37-3.72 (m, 6 H, No.7, No. 11 and No. 13protons), b 4.18-4.36 (m, 1 H, No. 12 proton), (5 5.18-5.41 (d, 2 H, No.4 protons).
RESULTS AND DISCUSSION
The alkylamidopropyl-N,N-dimethyl-N-(2,3-dihydroxypropyl)ammoniumchloride for myristic and oleic acids were synthesized and separated from unreactedimpurities by semi-preparative liquid chromatography. Fig. lA and B shows thepreparative HPLC chromatogram of Lexquat AMG-M and Lexquat AMG-O, respectively. In separate chromatograms, we established the retention volumes of thepossible reactants and any by-products: 3-chloro-l,2-propanediol, glycerol, sodiumchloride and myristamidopropyl dimethylamine and oleamidopropyl dimethylamineand related alkylamidopropyl dimethylamine homologues present in commerciallyavailable oleic acid to ensure that these components were well resolved from thequaternary chloride of interest (see Fig. 1). We observed that the unalkylated alkylamidopropyldimethylamine does not elute using this particular column and mobilephase.
Having identified the peak(s) due to the alkylamidopropyl-N,N-dimethyl-N(2,3-dihydroxypropyl)ammonium chlorides the chromatographic separation was repeated a number of times on a semi-preparative scale to obtain additional quantitiesof the myristyl quaternary present in Lexquat AMG-M and all homologues of alkylamidopropyl-N,N-dimethyl-N-(2,3-dihydroxypropyl)ammonium chlorides contained in Lexquat AMG-O, greater than 70% of which is the C l 8 : l oleyl. The appropriatefractions containing the quaternary chloride(s) of interest were collected and themobile phase evaporated to concentrate the desired ingredient(s).
As shown in Fig. IB, the minor components (members of homologous series)present in Lexquat AMG-O were identified in the semi-preparative chromatogram ofthe figure legend.
As shown in Fig. 2, the absence of the reactants and by-products in the myristyland oleyl amidopropyl-N,N-dimethyl-N-(2,3-dihydroxypropyl)ammonium chlorideswas confirmed by reversed-phase ion-pairing liquid chromatography. Furthermore,Fig. 2A indicates that the myristamidopropyl-N,N-dimethyl-N-(2,3-dihydroxypropyl)ammonium chloride fraction contains only one peak. It should be noted that theoleyl fractions of fatty acids used to prepare these surfactants contain additional alkylchain lengths and varying degrees of unsaturation. Therefore, the oleyl fraction (seeFig. 2B) contains many quaternary chlorides of different alkyl chain lengths which,
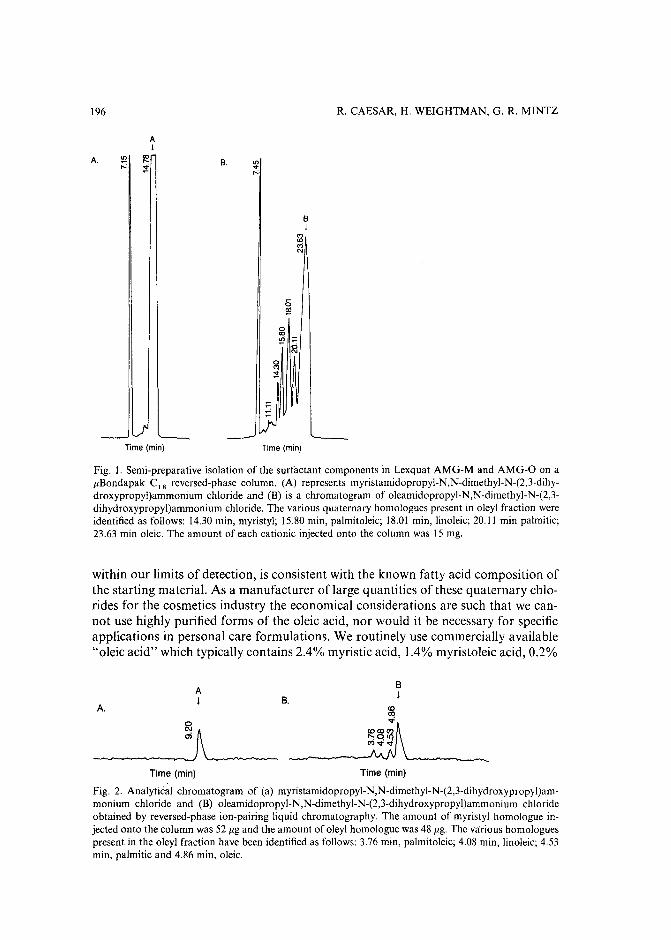
196
AI
A. II) Ie B. II);:; '1. ...""
R. CAESAR, H. WEIGHTMAN, G. R. MINTZ
BI
~C\l
LTime (min) Time (min)
Fig. I. Semi-preparative isolation of the surfactant components in Lexquat AMG-M and AMG-O on a/lBondapak C I 8 reversed-phase column. (A) represents myristamidopropyl-N,N-dimethyl-N-(2,3-dihydroxypropyl)ammonium chloride and (B) is a chromatogram of oleamidopropyl-N,N-dimethyl-N-(2,3dihydroxypropyl)ammonium chloride. The various quaternary homologues present in oleyl fraction wereidentified as follows: 14.30 min, myristyl; 15.80 min, palmitoleic; 18.oI min, linoleic; 20.11 min palmitic;23.63 min oleic. The amount of each cationic injected onto the column was IS mg.
within our limits of detection, is consistent with the known fatty acid composition ofthe starting material. As a manufacturer of large quantities of these quaternary chlorides for the cosmetics industry the economical considerations are such that we cannot use highly purified forms of the oleic acid, nor would it be necessary for specificapplications in personal care formulations. We routinely use commercially available"oleic acid" which typically contains 2.4% myristic acid, 1.4% myristoleic acid, 0.2%
A.
At B.
Bt
coCQ..,.
coco",I'-OLO
"'''''''Time (min) Time (min)
Fig. 2. Analytical chromatogram of (a) myristamidopropyl-N,N-dimethyl-N-(2,3-dihydroxypropyl)ammonium chloride and (B) oleamidopropyl-N,N-dimethyl-N-(2,3-dihydroxypropyl)ammonium chlorideobtained by reversed-phase ion-pairing liquid chromatography. The amount of myristyl homologue injected onto the column was 52 /lg and the amount of oleyl homologue was 48 ug. The various homologuespresent in the oleyl fraction have been identified as follows: 3.76 min, palmitoleic; 4.08 min, linoleic; 4.53min, palmitic and 4.86 min. oleic.
HPLC OF QUATERNARY AMMONIUM CHLORIDES 197
myristolinoleic, 5.2% palmitic acid, 6.4% palmitoleic acid, 1.2% palmitolinoleic acid,2.1% stearic acid, 72.7% oleic acid, 7.6% linoleic acid and 0.7% linolenic acid asdetermined by gas chromatography. The use of fatty acids containing other homologsto prepare the alkyl amidopropyldimethylamines prior to alkylation with a-monochlorohydrin will yield quaternary chlorides that contain various alkyl chain lengths.We have not attempted to identify and/or resolve in our chromatographic system thequaternary chlorides of the fatty acids that comprise less than 5% of the over allcationic species. We manufacture these products using the best available fatty acidswith the highest concentration of alkyl groups of interest (i.e. myristyl and oleic) toprepare products with the desired functional properties. The presence of other alkylhomologues in the final product does not detract from the functional properties ofthese molecules.
Samples of the chromatographically isolated quaternary fractions and driedforms of the myristyl, oleyl and related homologues were subjected to elementalanalysis (see Experimental). The results indicate that the desired compounds wereobtained. Despite rigorous drying the oleyl homologue was dried consistently to themonohydrate as calculated from the elemental analysis.
Additional characterization of the isolated quaternary fractions was done byFourier transform (FT)-IR and NMR (see Experimental). The FT-IR and NMR dataindicate that the absorbances and signals observed from the respective instrumentsare consistent with the structures of the predominant cationic species in both standards. Furthermore, the absence of extraneous absorbances coupled with the expected integration values are consistent with the proposed structures of both standards.
The calibration plot for myristamidopropyl-N,N-dimethyl-N-(2,3-dihydroxypropyl)ammonium chloride is shown in Fig. 3. This calibration curve was obtainedusing acetonitrile-water (45:55) containing 0.1% tritluoroacetic acid as mobile phaseand was used to assay Lexquat AMG-M. A separate calibration curve was generatedusing acetonitrile-water-THF (42:57:1) containing 0.1% tritluoroacetic acid as mobile phase for quantifying the myristyl homologue in the clear conditioning shampooformulation (standard curve not shown). The linearity of response for the myristylstandards was tested between 50-420 flg equivalent to 5-40% for the LexquatAMG-M in aqueous solutions and includes a concentration equivalent to 1-10% incosmetic formulations. The correlation coefficient (r) by peak area was 0.999.
The calibration plot for the 0Ieamidopropyl-N,N-dimethyl-N-(2,3-dihydroxypropyl)ammonium chloride containing fraction is shown in Fig. 4. This calibrationcurve was obtained using acetonitrile-water (45:55) containing 0.1% trifluoroaceticacid as mobile phase and was used to assay both the Lexquat AMG-O and the skinmoisturizer formulation. The linearity of response of the oleyl standards was testedbetween 48-600 flg equivalent to 6-54% for Lexquat AMG-O in aqueous solutionsand a concentration range equivalent to 1-16% in the cosmetic formulations. Thecorrelation coefficient (r) by peak area measurements was 0.992.
As a routine procedure in the laboratory we were interested in establishing theaccuracy and precision for determining alkylamidopropyl-N,N-dimethyl-N-(2,3-dihydroxypropyl) ammonium chloride levels in production batches of the aqueoussolutions of Lexquat AMG-M and AMG-O. Table I summarizes the determinationof each alkylamidopropyl-N,N-dimethyl-N-(2,3-dihydroxypropyl)ammonium chloride using the analytical HPLC methods described in this paper. The Lexquat
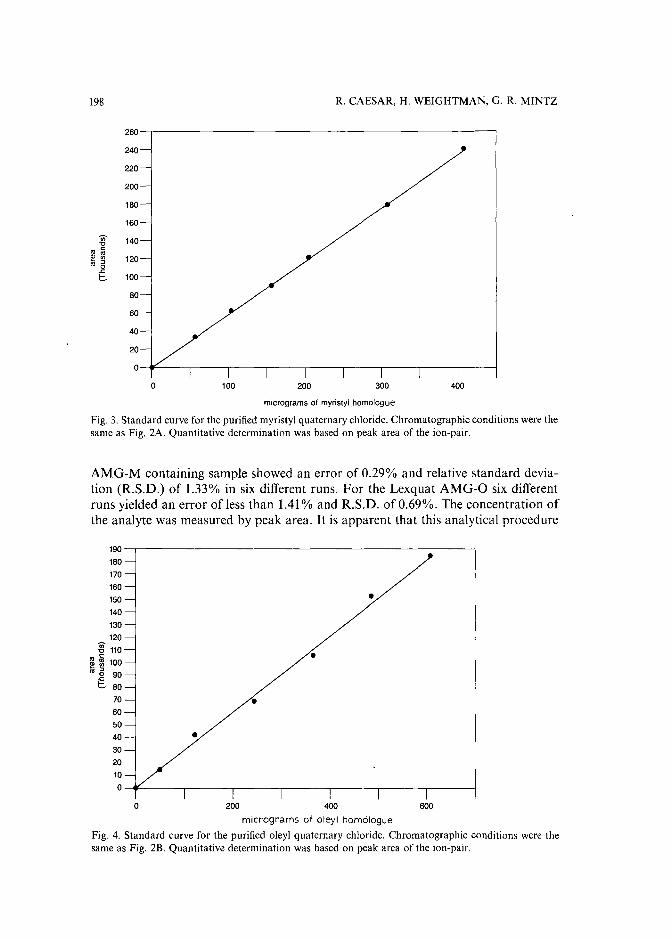
R. CAESAR, H. WEIGHTMAN, G. R. MINTZ198
260
240
220
200
180
160
(i) 140'tJ
ern 120os 15
s:C- 100
80
60
40
20
0
0 100 200 300 400
micrograms of myristyl homologue
Fig. 3. Standard curve for the purified myristyl quaternary chloride. Chromatographic conditions were thesame as Fig. 2A. Quantitative determination was based on peak area of the ion-pair.
AMG-M containing sample showed an error of 0.29% and relative standard deviation (R.S.D.) of 1.33% in six different runs. For the Lexquat AMG-O six differentruns yielded an error of less than 1.41 % and R.S.D. of 0.69%. The concentration ofthe analyte was measured by peak area. It is apparent that this analytical procedure
•
•
•
•
190--,.--------------------------,
180
170
160
150
140
130
120
~ 110
mm100Cis 5 90
~ 80
70
60
50
40
30
20
10
0----.r:-----r---...,----.,----,------,.----,----1
o 200 400 600
micrograms of oleyl homologue
Fig. 4. Standard curve for the purified oleyl quaternary chloride. Chromatographic conditions were thesame as Fig. 2B. Quantitative determination was based on peak area of the ion-pair.
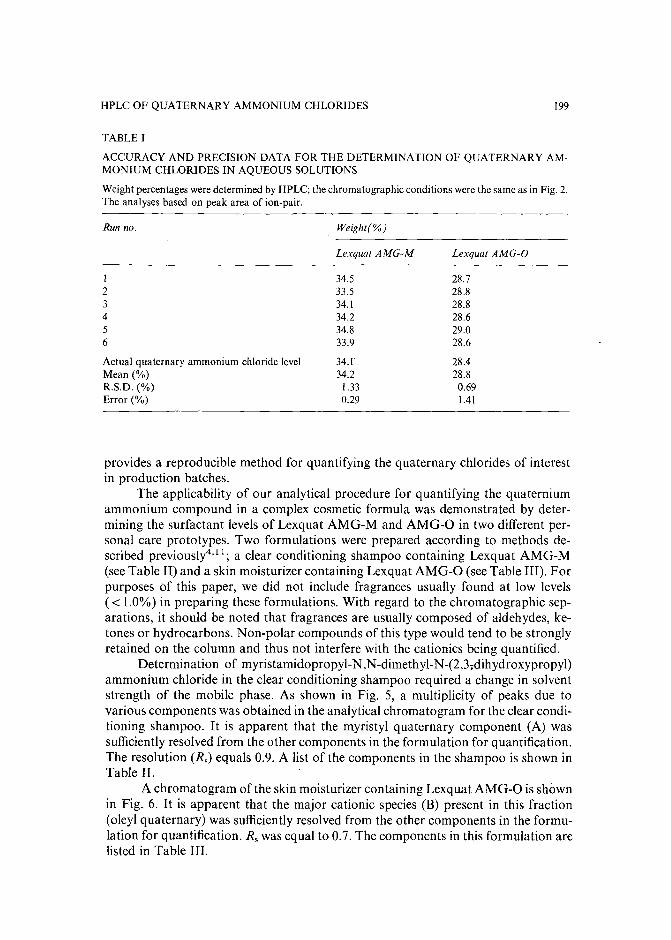
HPLC OF QUATERNARY AMMONIUM CHLORIDES 199
TABLE I
ACCURACY AND PRECISION DATA FOR THE DETERMINATION OF QUATERNARY AMMONIUM CHLORIDES IN AQUEOUS SOLUTIONS
Weight percentages were determined by HPLC; the chromatographic conditions were the same as in Fig. 2.The analyses based on peak area of ion-pair.
Run no.
I23456
Actual quaternary ammonium chloride levelMean (%)R.S.D. (%)Error (%)
Weight(%)
Lexquat AMG-M
34.533.534.134.234.833.9
34.134.2
1.330.29
Lexquat AMG-O
28.728.828.828.629.028.6
28.428.80.691.41
provides a reproducible method for quantifying the quaternary chlorides of interestin production batches.
The applicability of our analytical procedure for quantifying the quaterniumammonium compound in a complex cosmetic formula was demonstrated by determining the surfactant levels of Lexquat AMG-M and AMG-O in two different personal care prototypes. Two formulations were prepared according to methods described previously4,11; a clear conditioning shampoo containing Lexquat AMG-M(see Table II) and a skin moisturizer containing Lexquat AMG-O (see Table III). Forpurposes of this paper, we did not include fragrances usually found at low levels(< 1.0%) in preparing these formulations. With regard to the chromatographic separations, it should be noted that fragrances are usually composed of aldehydes, ketones or hydrocarbons. Non-polar compounds of this type would tend to be stronglyretained on the column and thus not interfere with the cationics being quantified.
Determination of myristamidopropyl-N,N-dimeth yl-N-(2,3;dihydroxypropyl)ammonium chloride in the clear conditioning shampoo required a change in solventstrength of the mobile phase. As shown in Fig. 5, a multiplicity of peaks due tovarious components was obtained in the analytical chromatogram for the clear conditioning shampoo. It is apparent that the myristyl quaternary component (A) wassufficientlyresolved from the other components in the formulation for quantification.The resolution (R,) equals 0.9. A list of the components in the shampoo is shown inTable II.
A chromatogram of the skin moisturizer containing Lexquat AMG-O is shownin Fig. 6. It is apparent that the major cationic species (B) present in this fraction(oleyl quaternary) was sufficiently resolved from the other components in the formulation for quantification. R, was equal to 0.7. The components in this formulation arelisted in Table III.
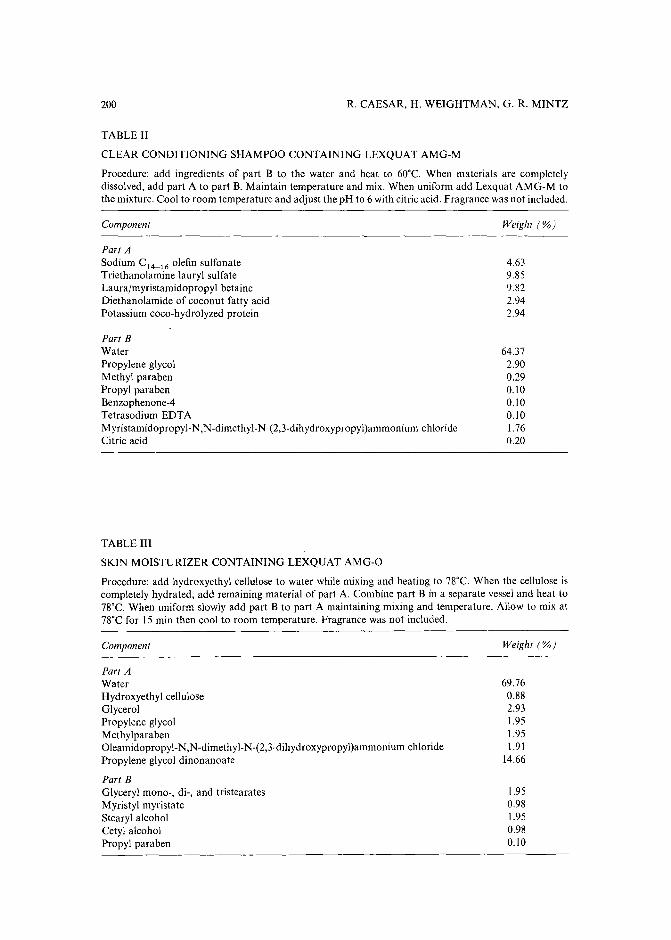
200 R. CAESAR, H. WEIGHTMAN, G. R. MINTZ
TABLE II
CLEAR CONDITIONING SHAMPOO CONTAINING LEXQUAT AMG-M
Procedure: add ingredients of part B to the water and heat to 60T. When materials are completelydissolved, add part A to part B. Maintain temperature and mix. When uniform add Lexquat AMG-M tothe mixture. Cool to room temperature and adjust the pH to 6 with citric acid. Fragrance was not included.
Component
Part ASodium C 14 - 1 6 olefin sulfonateTriethanolamine lauryl sulfateLaurajmyristamidopropyl betaineDiethanolamide of coconut fatty acidPotassium coco-hydrolyzed protein
Part BWaterPropylene glycolMethyl parabenPropyl para benBenzophenone-4Tetrasodium EDT AMyristamidopropyl-N,N-dimethyl-N-(2,3-dihydroxypropyl)ammonium chlorideCitric acid
Weight (%)
4.639.859.822.942.94
64.372.900.290.100.100.101.760.20
TABLE III
SKIN MOISTURIZER CONTAINING LEX QUAT AMG-O
Procedure: add hydroxyethyl cellulose to water while mixing and heating to 78T. When the cellulose iscompletely hydrated, add remaining material of part A. Combine part B in a separate vessel and heat to78'C. When uniform slowly add part B to part A maintaining mixing and temperature. Allow to mix at78'C for 15 min then cool to room temperature. Fragrance was not included.
Componenl
Part AWaterHydroxyethyl celluloseGlycerolPropylene glycolMethylparabenOleamidopropyl-N,N-dimethyl-N-(2,3-dihydroxypropyl)ammonium chloridePropylene glycol dinonanoate
ParI BGlyceryl mono-, di-, and tristearatesMyristyl myristateStearyl alcoholCetyl alcoholPropyl paraben
Weigh I (%)
69.760.882.931.951.951.91
14.66
1.950.981.950.980.10
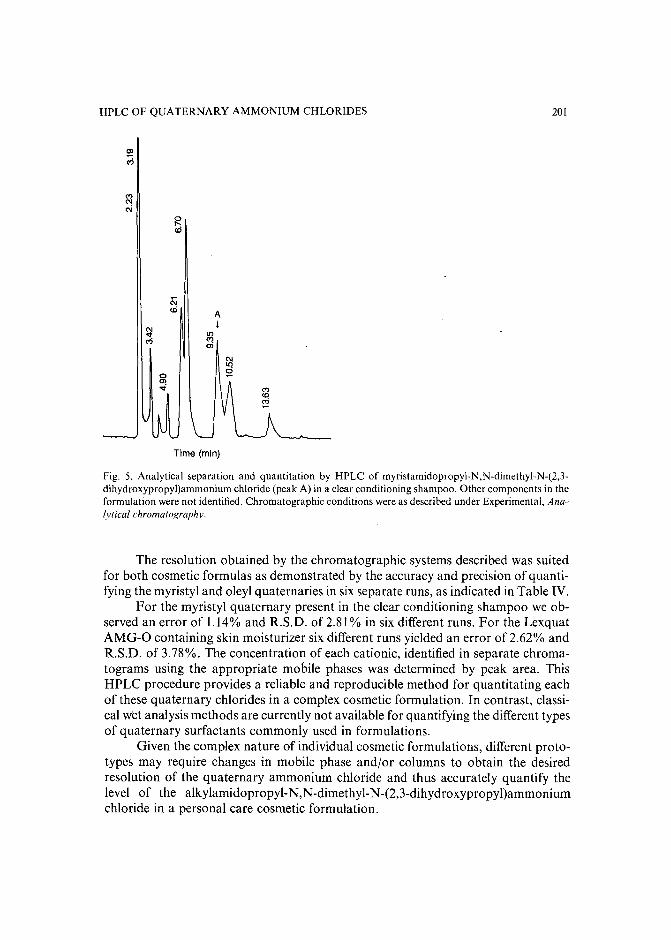
HPLC OF QUATERNARY AMMONIUM CHLORIDES 201
oen<i
Time (min)
Fig. 5. Analytical separation and quantitation by HPLC of myristamidopropyl-N,N-dimethyl-N-(2,3dihydroxypropyl)ammonium chloride (peak A) in a clear conditioning shampoo. Other components in theformulation were not identified. Chromatographic conditions were as described under Experimental, Analytical chromatograph».
The resolution obtained by the chromatographic systems described was suitedfor both cosmetic formulas as demonstrated by the accuracy and precision of quantifying the myristyl and oleyl quaternaries in six separate runs, as indicated in Table IV.
For the myristyl quaternary present in the clear conditioning shampoo we observed an error of 1.14% and R.S.D. of2.8l% in six different runs. For the LexquatAMG-O containing skin moisturizer six different runs yielded an error of 2.62% andR.S.D. of 3.78%. The concentration of each cationic, identified in separate chromatograms using the appropriate mobile phases was determined by peak area. ThisHPLC procedure provides a reliable and reproducible method for quantitating eachof these quaternary chlorides in a complex cosmetic formulation. In contrast, classical wet analysis methods are currently not available for quantifying the different typesof quaternary surfactants commonly used in formulations.
Given the complex nature of individual cosmetic formulations, different prototypes may require changes in mobile phase and/or columns to obtain the desiredresolution of the quaternary ammonium chloride and thus accurately quantify thelevel of the alkylamidopropyl-N,N-dimethyl-N-(2,3-dihydroxypropyl)ammoniumchloride in a personal care cosmetic formulation.
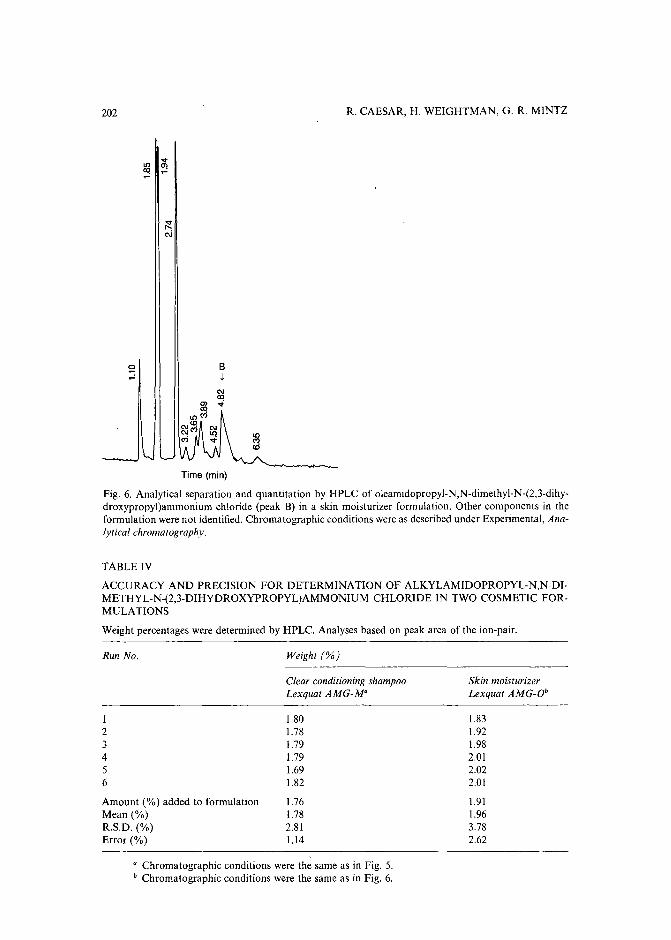
202
B~
R. CAESAR, H. WEIGHTMAN, G. R. MINTZ
Time (min)
Fig. 6. Analytical separation and quantitation by HPLC of 0Ieamidopropyl-N,N-dimethyl-N-(2,3-dihydroxypropyl)ammonium chloride (peak B) in a skin moisturizer formulation. Other components in theformulation were not identified. Chromatographic conditions were as described under Experimental, Analytical chromatography.
TABLE IV
ACCURACY AND PRECISION FOR DETERMINATION OF ALKYLAMIDOPROPYL-N,N-DIMETHYL-N-(2,3-DIHYDROXYPROPYL)AMMONIUM CHLORIDE IN TWO COSMETIC FORMULATIONS
Weight percentages were determined by HPLC. Analyses based on peak area of the ion-pair.
Run No.
I23456
Amount (%) added to formulationMean (%)R.S.D. (%)Error (%)
Weight (%)
Clear conditioning shampooLexquat AMG-M"
1.801.781.791.791.691.82
1.761.782.811.14
Skin moisturizerLexquat AMG-Ob
1.831.921.982.012.022.01
1.911.963.782.62
a Chromatographic conditions were the same as in Fig. 5.b Chromatographic conditions were the same as in Fig. 6.
HPLC OF QUATERNARY AMMONIUM CHLORIDES
CONCLUSIONS
203
The HPLC method described provides an accurate and reproducible procedurefor quantifying the levels of two quaternary alkylamidopropyl-N,N-dimethyl-N-(2,3dihydroxypropyl)ammonium chlorides in aqueous solutions and cosmetic formulations. Classical methods of potentiometric titrations and dye-binding methods werenot suitable for quantitation of these quaternary compounds.
Accordingly, we used reversed-phase liquid chromatography to purify the myristyl and oleyl homologues from production batches of these cosmetic raw materials.Having isolated and identified the components of interest we used analytical ionpairing chromatography to accurately quantify the levels of both quaternaries inproduction batches of the raw materials and two prototype personal care formulations.
ACKNOWLEDGEMENTS
We acknowledge the work of Tom Grebenar and ROCC0 Burgo in preparingLexquat AMG-M and AMG-O. We thank B. Gesslein, L. Smith and T. Grebenar foruseful discussions and for reviewing the manuscript.
REFERENCES
I E. Cook and P. Moss, U.S. Pat., 2,589,674 (1952).2 A. Patel and H. Greenland, U.S, Pat., 4,726,945 (1988)3 D. E. Conner and A, W. Fogel, U.S. Pat., 4,012,398 (1977).4 J. J. Guth, G. M. Reinhart, L. R. Smith, B. W. Gesslein and G, R. Mintz, U.S. Pat" pending (1988).5 M. J. Rosen and H. A. Goldsmith, Systemic Analysis ofSurface-Active Agents, Wiley, New York, 2nd
ed., 1972, p. 445.6 L. J. Cohn, V, J. Greely and D. L. Tibbetts, J. Chromatogr., 321 (1985) 401.7 N. Parris, J. Liq. Chromatogr., 3(1I) (1980) 1743,8 G. Ambrus, L. T. Takahashi and P. A. Marty, J. Pharm. Sci., 76(2) (1987) 174.9 C. Paquot, Standard Methods for the Analysis of Oils. Fats and Derivatives, Part 1, Pergamon Press,
New York, 6th ed., 1978, p. 8.10 H. A. Boekenoogen, Analysis and Characterization of Oils, Fats and Fat Products, Vol. 1, Wiley, New
York, 1964, p. 13.II B. Gesslein and L. Smith, Inolex Technical Bulletin, 1988, personal communication.

Journal of Chromatography, 478 (1989) 205-215Elsevier Science Publishers B.V., Amsterdam - Printed in The Netherlands
CHROM. 21 605
MONOCLONAL ANTIBODY-MEDIATED CLEAN-UP PROCEDURE FORTHE HIGH-PERFORMANCE LIQUID CHROMATOGRAPHIC ANALYSISOF CHLORAMPHENICOL IN MILK AND EGGS
C. VAN DE WATER, D. TEBBAL and N. HAAGSMA*
Faculty of Veterinary Medicine, Department of the Science of Food ofAnimal Origin, University of Utrecht,P.O. Box 80 /75, 3508 TD Utrecht (The Netherlands)
(First received February 13th, 1989; revised manuscript received May 3rd, 1989)
SUMMARY
A simple, rapid and specific sample preparation method based on antibodymediated clean-up for the determination of chloramphenicol (CAP) in milk and eggswas developed. Skimmed milk and centrifuged egg homogenates were filtered anddirectly applied to immunoaffinity columns which were prepared by coupling monoclonal antibodies against CAP to a carbonyldiimidazole-activated support. Using a0.2 M glycine, 0.5 M NaCI (pH 2.8) solution as an eluent, the immunoaffinity columns can be used more than 30 times without a decrease in column capacity. Insubsequent high-performance liquid chromatographic analysis, no matrix interferences were observed. Good recoveries were obtained at spiking levels of 1-100 /lgkg-1
. Due to the high specificity of the clean-up procedure, the limit of detection canbe lowered by increasing the test portion. Concerning milk, the limit of detection wassuccessfully lowered to 20 ng kg:' by increasing the test portion to II (recovery 99%).The method was applied to eggs produced by hens treated with CAP. The results arecompared with those obtained by solid-phase extraction using silica gel.
INTRODUCTION
Various immunological methods for the detection and determination of residues of the broad-spectrum antibiotic chloramphenicol (CAP) have been described !-8. In these methods, antibodies against CAP were used in the final analysis.Recently we have demonstrated that these antibodies can also be used for a veryspecific clean-up and concentration of this compound from aqueous extracts of swinemuscle tissue before high-performance liquid chromatographic (HPLC) analysis",
Usually, immunoaffinity columns are prepared by coupling antibodies to acyanogen bromide (CNBr)-activated support'P'!". However, this procedure has somedisadvantages! 1: charged isourea groups are formed which are responsible for undesirable ion-exchange effects, and the isourea linkage is rather unstable. Thereforeattention was paid, by Bethell et alY and also by Hearn et al.13
, to an alternativecoupling procedure using carbonyldiimidazole (CDI). The urethane linkage formed
0021-9673/89/$03.50 © 1989 Elsevier Science Publishers B.V.
206 C. VAN DE WATER, D. TEBBAL, N. HAAGSMA
by this coupling procedure proved to be much more stable (leak resistant) than theisourea linkage introduced by the cyanogen bromide coupling procedure. Moreover,the urethane linkage is uncharged 11,14. Therefore, non-specific binding due to ionexchange effects does not occur.
In our earlier procedure the immunoaffinity columns were prepared by coupling monoclonal antibodies against CAP to a CNBr-activated support", No decrease in CAP recovery at the 10 j1g kg"! levelwas observed after using these columnseleven times. On closer investigation, however, the column capacity was found to bedecreased. Nevertheless, this capacity was high enough to guarantee good recoveriesat the 10 j1g kg- 1 level. When the immunoaffinity columns were reused more often acontinuous decrease in the column capacity led to lower recoveries. For that reason aCDI-activated support, which is now commercially available, was chosen for thepreparation of the immunoaffinity columns. Other aspects with respect to reuse of thecolumns were also studied, such as the type of eluent and storage of the columns.Moreover, factors influencing the binding of CAP to the immunoaffinity columnssuch as the bed volume and the CAP concentration on the CAP capture efficiencywere also investigated.
This paper describes the modified antibody-mediated clean-up procedure forthe determination of CAP in eggs and milk. The method was also applied to eggs ofhens to which CAP had been administered. The results obtained were compared withthose obtained by a solid-phase extraction (SPE) procedure developed earlierv'.
EXPERIMENTAL
Reagents and chemicalsWater was purified by demineralization (conductivity < I j1S). Glycine and
CAP were from Sigma (St. Louis, MO, U.S.A.), ammonium acetate, hexane, hydrogen chloride, sodium monohydrogenphosphate, potassium chloride, silica gel (average particle diameter 40 j1m, for flash chromatography) and sodium acetate fromBaker (Phillipsburgh, NJ, U.S.A.), ammonium sulphate, boric acid, citric acid monohydrate, isooctane, sodium chloride, sodium hydrogencarbonate, potassium dihydrogenphosphate from Merck (Darmstadt, F.R.G.), acetonitrile and methanol (bothHPLC grade) from Rathburn (Walkerburn, U.K.), sodium azide from BDH (Poole,U.K.) and carbonyldiimidazole (CDI)-activated trisacryl GF-2000 (in acetone slurry)and bicinchoninic acid (BCA) protein assay reagent from Pierce (Rockford, IL,U.S.A.). Filter-paper circles (S&S 589.1, diameter 90 mm; S&S 589.3, diameter 125mm and S&S 589.1/2, diameter 125 mm) were obtained from Schleicher and Schull(Dassel, F.R.G.). The 125-mlpolypropylene beakers were from Sarstedt (Eindhoven,The Netherlands).
A standard solution was prepared by dissolving 25.0 mg of CAP in 10.0 ml ofmethanol. Working standards for HPLC were prepared in the range of 10-1500 ngml" by diluting the standard solution in the HPLC eluent. Spiking solutions containing 0.10, 1.00 and 10.00 j1g mr' of CAP were prepared by diluting the standardsolution in methanol. The mobile phase solvent for HPLC was acetonitrile-0.01 Msodium acetate buffer pH 5.4 (25:75, v/v).
Concentrated phosphate-buffered saline (PBS) was prepared by dissolving 80 gofNaCI, 14.33g ofNazHP04 · 2HzO, 2 g ofKHzP04 , 2 g ofKCI and 2 g ofNaN3 in
HPLC OF CHLORAMPHENICOL IN MILK AND EGGS 207
1 1of demineralized water. The PBS (pH 7.4; 0.1368 M NaCl, 0.0015 M KH 2P04,0.0081 M Na2HP04 . 2H20, 0.0027 M KCI, 0.0031 M NaN3) was prepared bydiluting concentrated PBS 1:10 in demineralized water.
The coupling buffer solution (pH 8.5) was 0.13 M boric acid. The blockingbuffer solution (pH 8.0) contained 0.2 M glycine; the acetate buffer (pH 4.0) contained 0.1 M sodium acetate and 0.5 M sodium chloride. Monoclonal antibodiesagainst CAP are described below. The eluent used in the antibody-mediated clean-lipprocedure was a 0.2 M glycine, 0.5 M sodium chloride (pH 2.8) solution.
ApparatusThe instruments used were a Moulinette homogenizer (Mou1inette, Gouda, The
Netherlands), a spectrophotometer (Uvichem MK2; Rank Hilger, London, U.K.), aPrepspin 50 ultracentrifuge (Measuring and ScientificEquipment, Crawley, U.K.), atable centrifuge (Rotina/S; Hettich, Tuttlingen, F.R.G.), an Ultra-Turrax (Janke andKunkel, Staufen, F.R.G.), a shaking apparatus (Janke and Kunkel, Type S50), aReacti-Vap evaporating unit Model 18780, connected to a Reacti-Therm heatingmodule, Model 18790 (Pierce), a vortex mixer (Scientific Industries, Bohemia, NY;U.S.A.), a magnetic stirrer (Pt 800; Protherm, Etten-Leur, The Netherlands), a sintered-glass funnel, diameter 40 mm, porosity 16-40 flm (P. M. Tamson, Zoetermeer,The Netherlands) and Visking dialysis tubing size 2 18/32 in. (Medicell, London,U.K.).
In order simultaneously to perform the antibody-mediated extractions, a proportioning pump III from a Technicon AutoAnalyzer II system was used in combination with Tygon calibrated flow-rated pump tubes, flow-rate 1.20 ml mur", 0.056 in.J.D. (Technicon, New York, NY, U.S.A.). The pump tubes were connected to immunosorbent packed Econo-columns (No. 737-122, 10 em x 0.7 em; Bio-Rad Labs.,Richmond, CA, U.S.A.). The HPLC system used was the same as that describedearlier 1 5
.
Preparation and purification ofmonoclonal antibodiesThe preparation and production of the monoclonal antibodies against CAP
were performed in the hybridoma laboratory of the Department of Infectious Diseases and Immunology (Faculty of Veterinary Medicine, University of Utrecht, TheNetherlands). These monoclonal antibodies possess the immunoglobulin G 1 (IgG 1)
isotype. They were originally selected for an enzyme-linked immunosorbent assay(ELISA) and purified by ammonium sulphate precipitation as described earlier", butwith the aid of boric acid solution as a coupling buffer. After dialysis the concentration of monoclonal antibodies in the purified solution, expressed as the amount ofIgG per millilitre, was determined spectrophotometrically using the BCA proteindetermination 16.
Preparation of immunoaffinity columnsThe excessof acetone of the CDI-activated support was removed by suction on
a sintered glass funne!. The gel was washed with fivebed volumes of ice-cold water. AlO-ml volume of the drained gel cake was transferred to 20 ml of the purified monoclonal antibody solution containing 5 mg mr ' IgG. In this aqueous medium thelO-mlgel cake was swollen to a volume of 15m!. The gel suspension was gently mixed
208 C. VAN DE WATER, D. TEBBAL, N. HAAGSMA
in a 50-ml polypropylene tube for 24 h at 4°C using a shaking apparatus. The suspension was centrifuged at 300 g for 3 min; the supernatant was used for the determination of the coupling efficiency (see below). The pellet was gently mixed with 20 ml ofblocking buffer for 2 h at room temperature using a shaking apparatus. The gelsuspension was centrifuged at 300 g for 3 min. The pellet was successively washedwith 20 ml of coupling buffer, 20 ml of acetate buffer and 20 ml of coupling buffer.Finally the gel was washed with 50 ml of PBS and transferred to the columns (bedvolume 0.5 ml per column).
The efficiency of the monoclonal antibody conjugation to CDI-activated trisacryl GF-2000 was determined from the concentration of IgG in the diluted purifiedmonoclonal antibody solution before and after the coupling procedure. The concentration of IgG was determined as described above. The dynamic and specificcolumncapacities were determined in an analogous manner to that described earlier". Insteadof elution with methanol, the saturated immunosorbent was eluted with 0.2 M glycine, 0.5 M NaCI (pH 2.8) as described.
SamplesSpiking studies. Full-cream milk and whole eggs were used for spiking studies.
The milk and homogenized egg samples were spiked with CAP at I, 10 and 100 f.lgkg- 1 at least IS min before sample preparation.
Animal studies. Four laying hens (Hubbard golden comet, 25 weeks old) weretreated with CAP through their drinking water during 5 successivedays. The dosageswere 0.05 (group A) and 0.5 g 1-1 (group B) respectively; two animals for each group.Two laying hens served as the control group. The eggs were collected each day. Eggsproduced within one group on the same day were pooled and homogenized using anUltra Turrax for 45 s. Portions were frozen until analysis.
Sample preparation (antibody mediated clean-up)Milk. Approximately 10 g of homogenized milk were accurately weighed in a
20-ml polypropylene tube. The milk sample was centrifuged at 3000g for IS min. Fat(upper layer) was removed. The skimmed milk sample was filtered through S&S595.lf2 filter-paper. The polypropylene tube was rinsed with 5 ml of PBS. The washliquid was filtered through the same filter. The total filtrate was subjected to antibodymediated clean-up.
Eggs. Approximately 10 g of spiked homogenized whole egg were accuratelyweighed in a 14-ml polycarbonate tube. With respect to samples in the animal study,however, smaller test portions must be used in some cases to avoid overloading of theimmunoaffinity columns. For the egg homogenates from day I up to day 12 (groupA), day 13 and day 14 (group A) and day I up to day 9 (group B) the amounts werelower (0.5, 1.0 and 5.0 g respectively). To these samples, blank egg homogenate wasadded up to 109.
The homogenates (spiking study and animal study) were centrifuged at 10000 gfor 10 min. The supernatant was filtered through S&S 589.1 filter-paper. The pelletwas washed with 5 ml of PBS. The wash liquid was filtered through the same filter.The total filtrate was subjected to antibody-mediated clean-up.
Antibody-mediated clean-up. The total sample solution was pumped throughthe immunoaffinity column at a rate of 1.2ml min' using a Technicon proportioning
HPLC OF CHLORAMPHENICOL IN MILK AND EGGS 209
pump. The column was washed with 25 ml of PBS; CAP was eluted subsequently with20 ml of glycine-NaCI eluent at a flow-rate of 1.2 ml min'. The eluate was collectedin a 50-ml polypropylene tube. It was extracted twice with ethyl acetate (1 x IS ml, 1x 10 ml) using a shaking apparatus for 15 min. The upper organic layers weresuccessively evaporated to dryness in a stream of nitrogen at 4SOC using the evaporating unit and heating module (position 3, high). The residue was dissolved in 1 ml ofthe mobile phase solvent using a vortex mixer for 15 s. This solution was used forHPLC analysis.
Before regeneration, the risk ofcross-contamination was minimized by washingthe column with 20 ml of the glycine-NaCI eluent at a flow-rate of 1.2 ml mirr'. Thecolumns were regenerated by washing with 20 ml of PBS at a flow-rate of 1.2 mlmin'. If not in use the columns should be stored in PBS at 4°C. The columns werenot allowed to run dry during the antibody-mediated clean-up and regeneration. Ifair-bubbles are present the immunosorbent should be shaken until a gel suspension isformed. Then the gel was allowed to settle again.
Sample preparation (solid-phase extraction)Approximately 10 g of the homogenized egg sample were subjected to a solid
phase extraction procedure which comprises sonication-aided extraction with ethylacetate, addition of hexane to the extract and cleaning up and concentration of theextract on a small column packed with silica gel. Compared to the solid-phase extraction described earlier for the determination of CAP in swine muscle tissue!", somemodifications were introduced17. After solid-phase extraction, all samples (dissolvedin mobile phase solvent) were extracted three times with I-ml volumes of isooctane.The remainder solution was subjected to HPLC analysis.
ChromatographyThe samples were subjected to HPLC analysis. The HPLC conditions were as
described earlier!", except for the pH of the mobile phase. Aliquots of the sample andstandard solution (40 J.tl) were injected by means of the loop injector. For low concentrations (below 10 J.tg kg- 1
) , 100-J.t1 volumes were injected.
RESULTS AND DISCUSSION
Spiking studiesRecovery experiments were carried out on full-cream milk and eggs at spiking
levels of 1, 10 and 100 J.tg kg- 1. The samples, including the blank samples, were
subjected eight-fold to antibody-mediated clean-up followed by HPLC analysis according to the procedure described. The results are presented in Table I. At thespiking level of I J.tg kg-1 the recoveries are nearly 100%. However, at higher spikinglevels the recoveries are somewhat lower. A logarithmic relationship exists betweenthe spiking level and the recovery found, the coefficient of correlation being 1.0000 formilk and 0.9919 for egg.
The lowest standard deviations were obtained at the spiking level of 10ug kg".The higher standard deviations at 1 J.tg kg-1 may be attributed to the fact that theHPLC analysis was performed quite close to the limit of detection of the CAP standard, being 0.6 ng (signal corresponding three times the noise level). The cause of the
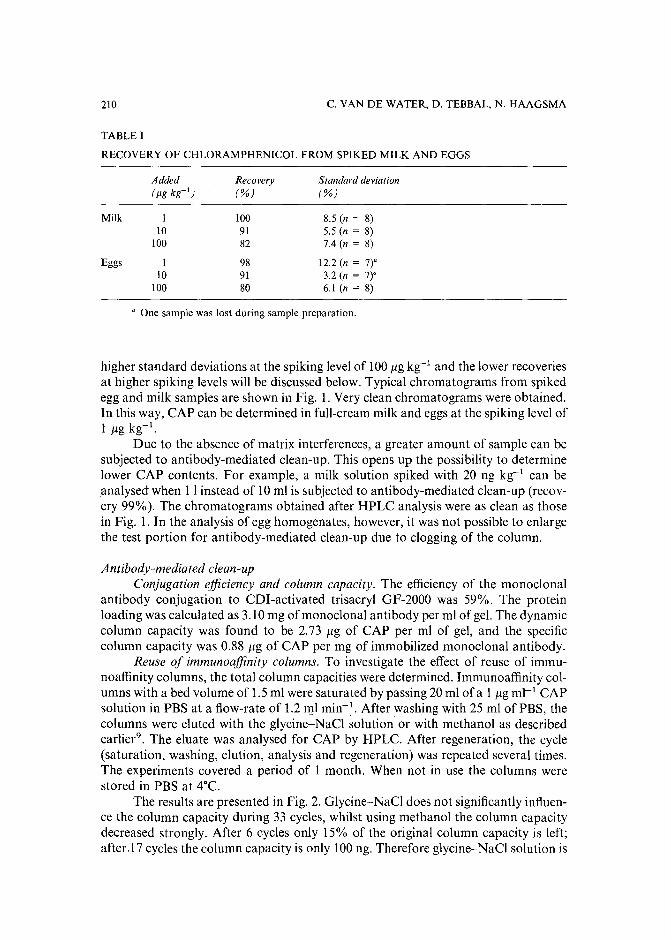
210 C. VAN DE WATER, D. TEBBAL, N. HAAGSMA
TABLE I
RECOVERY OF CHLORAMPHENICOL FROM SPIKED MILK AND EGGS
Milk
Eggs
Added(Jig kg-I)
I10
100
I10
100
Recovery(%)
1009182
989\80
Standard deviation(%)
8.5 (n = 8)5.5 (n = 8)7.4 (n = 8)
\2.2 (n = 7)"3.2 (n = 7)"6.1 (n = 8)
a One sample was lost during sample preparation.
higher standard deviations at the spiking level of 100 J1g kg" and the lower recoveriesat higher spiking levels will be discussed below. Typical chromatograms from spikedegg and milk samples are shown in Fig. 1. Very clean chromatograms were obtained.In this way, CAP can be determined in full-cream milk and eggs at the spiking level of1 J1g kg".
Due to the absence of matrix interferences, a greater amount of sample can besubjected to antibody-mediated clean-up. This opens up the possibility to determinelower CAP contents. For example, a milk solution spiked with 20 ng kg"! can beanalysed when 11 instead of 10 ml is subjected to antibody-mediated clean-up (recovery 99%). The chromatograms obtained after HPLC analysis were as clean as thosein Fig. 1. In the analysis of egg homogenates, however, it was not possible to enlargethe test portion for antibody-mediated clean-up due to clogging of the column.
Antibody-mediated clean-upConjugation efficiency and column capacity. The efficiency of the monoclonal
antibody conjugation to CDl-activated trisacryl GF-2000 was 59%. The proteinloading was calculated as 3.10 mg of monoclonal antibody per ml of gel. The dynamiccolumn capacity was found to be 2.73 J1g of CAP per ml of gel, and the specificcolumn capacity was 0.88 J1g of CAP per mg of immobilized monoclonal antibody.
Reuse of immunoaffinity columns. To investigate the effect of reuse of immunoaffinity columns, the total column capacities were determined. Immunoaffinity columns with a bed volume of 1.5 ml were saturated by passing 20 ml of a 1 J1g ml- l CAPsolution in PBS at a flow-rate of 1.2 ml min", After washing with 25 ml of PBS, thecolumns were eluted with the glycine-NaCl solution or with methanol as describedearlier". The eluate was analysed for CAP by HPLC. After regeneration, the cycle(saturation, washing, elution, analysis and regeneration) was repeated several times.The experiments covered a period of I month. When not in use the columns werestored in PBS at 4°C.
The results are presented in Fig. 2. Glycine-NeCl does not significantly influence the column capacity during 33 cycles, whilst using methanol the column capacitydecreased strongly. After 6 cycles only 15% of the original column capacity is left;after.I 7 cycles the column capacity is only 100 ng. Therefore glycine-NaCI solution is
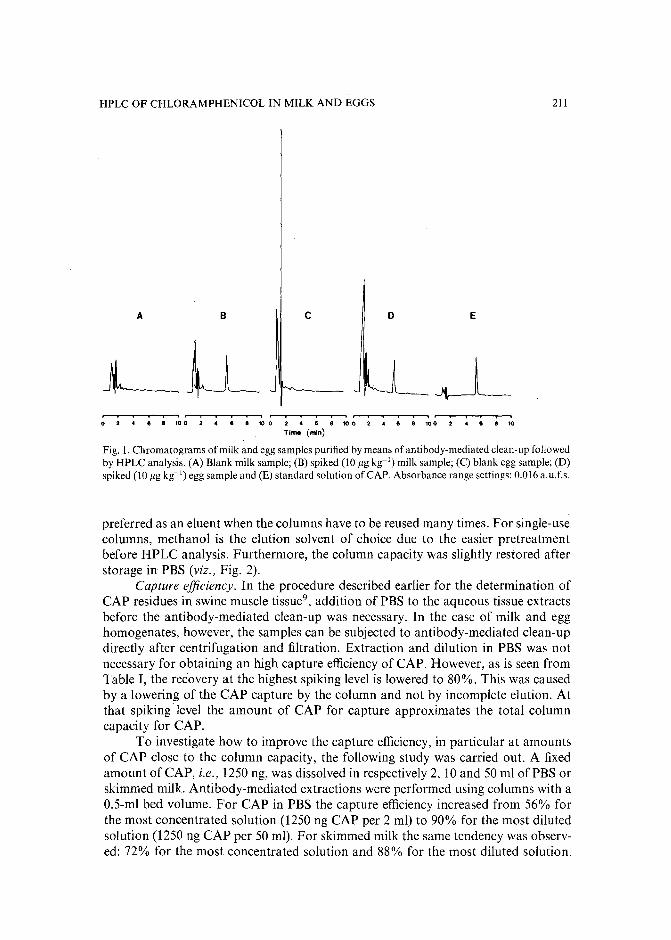
HPLC OF CHLORAMPHENICOL IN MILK AND EGGS
A B C 0 E
L-U- ~, , , , , , , ,
• 2 • • • ,o o 2 • • • ,.. 2 • • • 10. 2 • • ,.. 2 • • • ,oTim. (min)
211
Fig. 1. Chromatograms ofmilk and egg samples purified by means of antibody-mediated clean-up followedby HPLC analysis. (A) Blank milk sample; (B) spiked (10 flg kg-I) milk sample; (C) blank egg sample; (D)spiked (10 flg kg" ') egg sample and (E) standard solution of CAP. Absorbance range settings: 0.016 a.u.f.s.
preferred as an eluent when the columns have to be reused many times. For single-usecolumns, methanol is the elution solvent of choice due to the easier pretreatmentbefore HPLC analysis. Furthermore, the column capacity was slightly restored afterstorage in PBS (viz., Fig. 2).
Capture efficiency. In the procedure described earlier for the determination ofCAP residues in swine muscle tissue", addition of PBS to the aqueous tissue extractsbefore the antibody-mediated clean-up was necessary. In the case of milk and egghomogenates, however, the samples can be subjected to antibody-mediated clean-updirectly after centrifugation and filtration. Extraction and dilution in PBS was notnecessary for obtaining an high capture efficiency of CAP. However,as is seen fromTable I, the recovery at the highest spiking level is lowered to 80%. This was causedby a lowering of the CAP capture by the column and not by incomplete elution. Atthat spiking "level the amount of CAP for capture approximates the total columncapacity for CAP.
To investigate how to improve the capture efficiency, in particular at amountsof CAP close to the column capacity, the following study was carried out. A fixedamount of CAP, i.e., 1250 ng, was dissolved in respectively 2, 10 and 50 ml of PBS orskimmed milk. Antibody-mediated extractions were performed using columns with a0.5-ml bed volume. For CAP in PBS the capture efficiency increased from 56% forthe most concentrated solution (1250 ng CAP per 2 m!) to 90% for the most dilutedsolution (1250 ng CAP per 50 ml). For skimmed milk the same tendency was observed: 72% for the most concentrated solution and 88% for the most diluted solution.
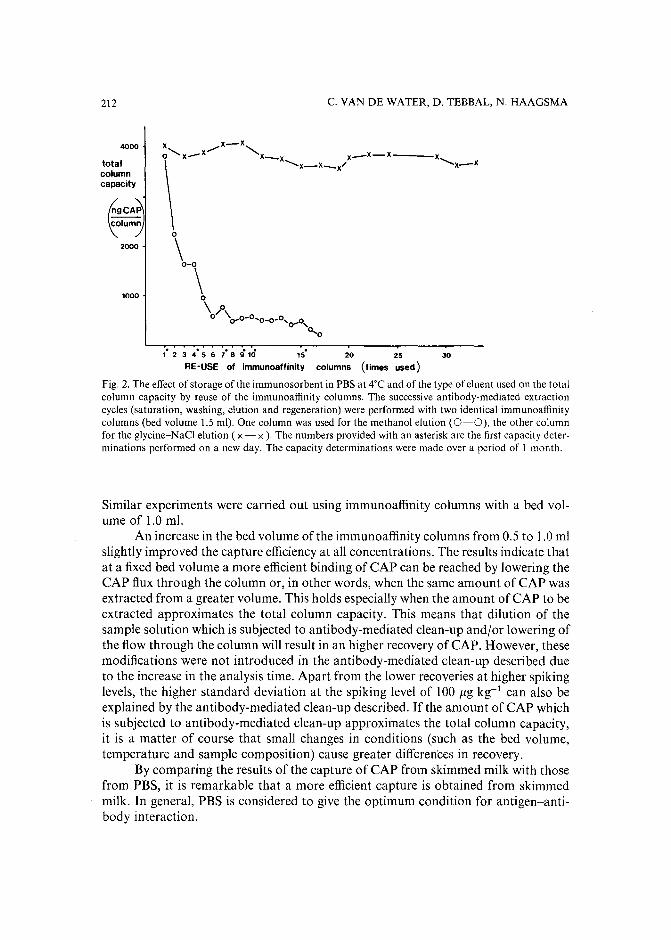
212
4000
totalcolumncapacity
tf9CA~Iz°'umy
2000
1000
C. VAN DE WATER, D. TEBBAL, N. HAAGSMA
1- 2 3 4- 5 6 7- 8 910 15- 20 25 30
RE-USE of immunoaffinity columns (times used)
Fig. 2. The effect of storage of the immunosorbent in PBS at 4'C and of the type of eluent used on the totalcolumn capacity by reuse of the immunoaffinity columns. The successive antibody-mediated extractioncycles (saturation, washing, elution and regeneration) were performed with two identical immunoaffinitycolumns (bed volume 1.5 ml). One column was used for the methanol elution (0-0), the other columnfor the glycine-NaCI elution ( x - x ). The numbers provided with an asterisk are the first capacity determinations performed on a new day. The capacity determinations were made over a period of I month.
Similar experiments were carried out using immunoaffinity columns with a bed volume of 1.0 m!.
An increase in the bed volume of the immunoaffinity columns from 0.5 to 1.0 mlslightly improved the capture efficiencyat all concentrations. The results indicate thatat a fixed bed volume a more efficient binding of CAP can be reached by lowering theCAP flux through the column or, in other words, when the same amount of CAP wasextracted from a greater volume. This holds especially when the amount of CAP to beextracted approximates the total column capacity. This means that dilution of thesample solution which is subjected to antibody-mediated clean-up and/or lowering ofthe flow through the column will result in an higher recovery of CAP. However, thesemodifications were not introduced in the antibody-mediated clean-up described dueto the increase in the analysis time. Apart from the lower recoveries at higher spikinglevels, the higher standard deviation at the spiking level of 100 Ilg kg" can also beexplained by the antibody-mediated clean-up described. If the amount of CAP whichis subjected to antibody-mediated clean-up approximates the total column capacity,it is a matter of course that small changes in conditions (such as the bed volume,temperature and sample composition) cause greater differences in recovery.
By comparing the results of the capture of CAP from skimmed milk with thosefrom PBS, it is remarkable that a more efficient capture is obtained from skimmedmilk. In general, PBS is considered to give the optimum condition for antigen-antibody interaction.
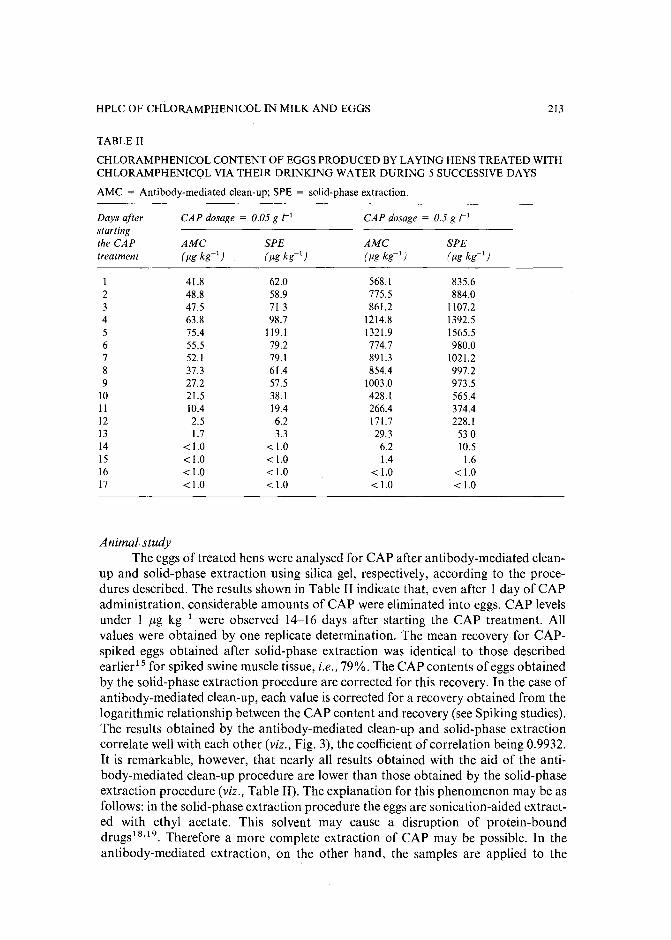
HPLC OF CHLORAMPHENICOL IN MILK AND EGGS
TABLE II
213
CHLORAMPHENICOL CONTENT OF EGGS PRODUCED BY LAYING HENS TREATED WITHCHLORAMPHENICOL VIA THEIR DRINKING WATER DURING 5 SUCCESSIVE DAYS
AMC = Antibody-mediated clean-up; SPE = solid-phase extraction.
Days after CAP dosage = 0.05 g /1 CAP dosage = 0.5 g /1startingthe CAP AMC SPE AMC SPEtreatment (Ji.gkg- I) (Ji.g kg-I) (Ji.g kg-I) (Ji.gkg- I)
1 41.8 62.0 568.[ 835.62 48.8 58.9 775.5 884.03 47.5 71.3 861.2 1107.24 63.8 98.7 1214.8 1392.55 75.4 119.1 1321.9 1565.56 55.5 79.2 774.7 980.07 52.1 79.1 891.3 1021.28 37.3 6l.4 854.4 997.29 27.2 57.5 1003.0 973.5
10 21.5 38.1 428.1 565.411 10.4 19.4 266.4 374.412 2.5 6.2 171.7 228.113 1.7 3.3 29.3 53.014 < 1.0 < 1.0 6.2 10.515 < 1.0 < 1.0 1.4 1.616 < 1.0 < 1.0 < 1.0 < 1.017 < 1.0 < 1.0 < 1.0 < 1.0
Animal studyThe eggs of treated hens were analysed for CAP after antibody-mediated clean
up and solid-phase extraction using silica gel, respectively, according to the procedures described. The results shown in Table II indicate that, even after 1 day of CAPadministration, considerable amounts of CAP were eliminated into eggs. CAP levelsunder 1 /lg kg:' were observed 14-16 days after starting the CAP treatment. Allvalues were obtained by one replicate determination. The mean recovery for CAPspiked eggs obtained after solid-phase extraction was identical to those describedearlier 1 5 for spiked swine muscle tissue, i.e., 79%. The CAP contents of eggs obtainedby the solid-phase extraction procedure are corrected for this recovery. In the case ofantibody-mediated clean-up, each value is corrected for a recovery obtained from thelogarithmic relationship between the CAP content and recovery (see Spiking studies).The results obtained by the antibody-mediated clean-up and solid-phase extractioncorrelate well with each other (viz., Fig. 3), the coefficient of correlation being 0.9932.It is remarkable, however, that nearly all results obtained with the aid of the antibody-mediated clean-up procedure are lower than those obtained by the solid-phaseextraction procedure (viz., Table II). The explanation for this phenomenon may be asfollows: in the solid-phase extraction procedure the eggs are sonication-aided extracted with ethyl acetate. This solvent may cause a disruption of protein-bounddrugs 1 8
, 19 . Therefore a more complete extraction of CAP may be possible. In theantibody-mediated extraction, on the other hand, the samples are applied to the
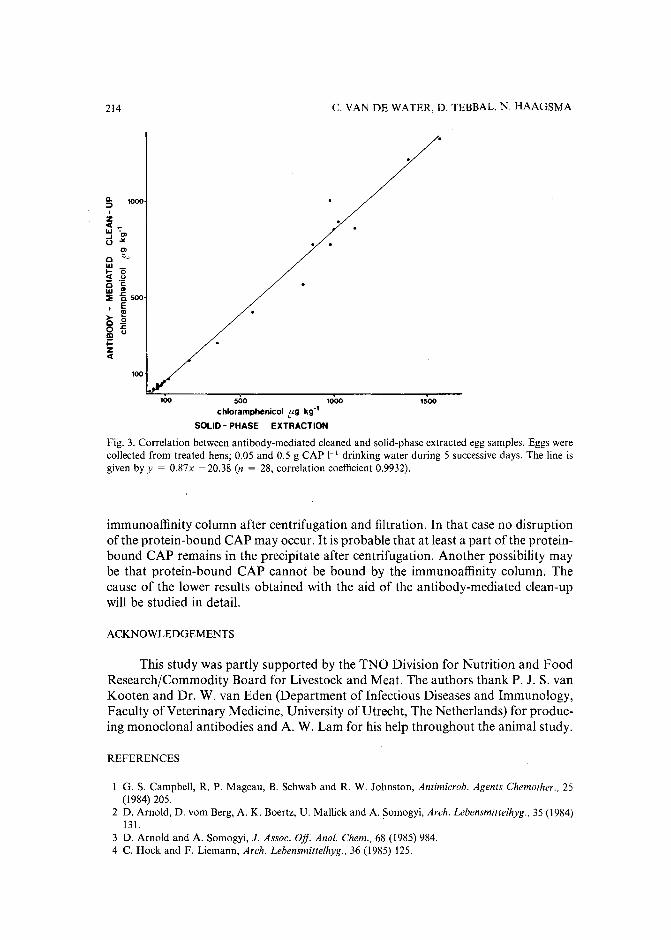
214 C. VAN DE WATER, D. TEBBAL, N. HAAGSMA
100
1500100 500 1000
chloramphenicol fg kg-1
SOLID- PHASE EXTRACTION
Fig. 3. Correlation between antibody-mediated cleaned and solid-phase extracted egg samples. Eggs werecollected from treated hens; 0.05 and 0.5 g CAP 1-1 drinking water during 5 successive days. The line isgiven by y = 0.87x - 20.38 (n = 28, correlation coefficient 0.9932).
immunoaffinity column after centrifugation and filtration. In that case no disruptionof the protein-bound CAP may occur. It is probable that at least a part of the proteinbound CAP remains in the precipitate after centrifugation. Another possibility maybe that protein-bound CAP cannot be bound by the immunoaffinity column. Thecause of the lower results obtained with the aid of the antibody-mediated clean-upwill be studied in detail.
ACKNOWLEDGEMENTS
This study was partly supported by the TNO Division for Nutrition and FoodResearch/Commodity Board for Livestock and Meat. The authors thank P. J. S. vanKooten and Dr. W. van Eden (Department ofInfectious Diseases and Immunology,Faculty of Veterinary Medicine, University of Utrecht, The Netherlands) for producing monoclonal antibodies and A. W. Lam for his help throughout the animal study.
REFERENCES
1 G. S. Campbell, R. P. Mageau, B. Schwab and R. W. Johnston, Antirnicrob. Agents Chernother., 25(1984) 205.
2 D. Arnold, D. vom Berg, A. K. Boertz, U. Mallick and A. Somogyi, Arch. Lebensrnittelhyg., 35 (1984)131. .
3 D. Arnold and A. Somogyi, J. Assoc. Off. Anal. Chern., 68 (1985) 984.4 C. Hock and F. Liemann, Arch. Lebensrnittelhyg., 36 (1985) 125.
HPLC OF CHLORAMPHENICOL IN MILK AND EGGS 215
5 O. Agthe and F. Scherk, Arch. Lebensmittelhyg., 37 (1986) 97.6 M. von Beck, E. Martlbauer and G. Terplan, Arch. Lebensmittelhyg., 38 (1987) 99.7 E. Martlbauer and G. Terplan, Arch. Lebensmittelhyg., 38 (1987) 3.8 C. van de Water, N. Haagsma, P. J. S. van Kooten and W. van Eden, Z. Lebensm-Unters-Forsch., 85
(1987) 202.9 C. van de Water and N. Haagsma, J. Chromatogr., 411 (1987) 415.
10 Affinity Chromatography -s-Principlesand Methods, Pharmacia, Uppsala, 1983.11 P. D. G. Dean, W. S. Johnson and F. A. Middle, Affinity Chromatography, a Practical Approach, IRL
Press, Oxford, 1985.12 G. S. Bethell, J. S. Ayers, M. T. W. Hearn and W. S. Hancock, J. Chromatogr., 219 (1981) 361.13 M. T. W. Hearn, E. L. Harris, G. S. Bethell, W. S. Hancock and J. A. Ayers, J. Chromatogr., 218 (1981)
509.14 M. T. W. Hearn, G. S. Bethell, J. S. Ayers and W. S. Hancock, J. Chromatogr., 185 (1979) 463.15 N. Haagsma, C. Schreuder and E. R. A. Rensen, J. Chromatogr., 363 (1986) 353.16 P. K. Smith, R. 1. Krohn, G. T. Hermanson, A. K. Mallia, F. H. Gartner, M. D. Provenzano, E. K.
Fujimoto, N. M. Goeke, B. J. Olson and D. C. Klenk, Anal. Biochem., 150 (1985) 76.17 N. Haagsma et al., in preparation18 M. von Petz, Dtsch. Lebensm. Rundsch., 78 (1982) 396.19 H. Buning-Pfaue and T. Schmidt, Arch. Lebensmittelhyg., 36 (1985) 87.

Journal of Chromatography, 478 (1989) 217-224Elsevier Science Publishers B.V., Amsterdam - Printed in The Netherlands
CHROM. 21 639
SEPARATION OF DERIVATIZED BLACK TEA THEARUBIGINS BY HIGHPERFORMANCE LIQUID CHROMATOGRAPHY
B. L. WEDZICHA* and T. J. DONOVAN"
Procter Department of Food Science, University of Leeds, Leeds LS2 9JT (U.K.)
(First received April 6th, 1989; revised manuscript received May 23rd, 1989)
SUMMARY
SI thearubigins were extracted from black tea infusions and converted intoacetyl and methyl derivatives. Both derivatives gave rise to discrete components uponthin-layer chromatography on silica and were eluted in high yield from silicahigh-performance liquid chromatographic columns using mixtures of chloroform andmethanol. Acetyl derivatives tended to undergo time-dependent changes in chromatographic behaviour, whilst methyl derivatives appeared to be stable.
INTRODUCTION
Thearubigins play an important role in the quality of black tea infusions.Together with theaflavins, they determine the strength and colour of the infusion1,playa role in its mouthfeel? presumably due to their astringency' and are involved inthe quality-related ability of the infusion to form "tea cream", a precipitate ofcomplexes ofcaffeine with theaflavins and thearubiginsv". Thearubigins are the mostabundant phenolic fraction of black tea.
Thearubigins is the name originally assigned to all the acidic brown pigments ofblack tea 1. A broad classification of these compounds is those extractable into ethylacetate, the SI thearubigins, and those remaining in the aqueous phase, the SIa and SIIthearubigins with the SIa group being more soluble in diethyl ether7
. Other separationsbased on extractability have also been carried out S- 11. Other separation attemptsinclude the use of cellulose column chromatography", Toyopearl chrornatography'F,ion exchange and paper electrophoresis13, reversed-phase high-performance liquidchromatography (H~LC)14and gel chromatography media, e.g., Pharmacia LH20 15.
However, none has proved entirely satisfactory.One problem with the chromatographic systems involving a stationary phase is
the high affinity of the thearubigins for the stationary phase; this can potentially becontrolled by derivatizing the phenolic groups. The purpose of this work was toinvestigate the potential for normal phase HPLC of derivatized SI thearubigins.
a Present address: Lyons Tetley Limited, 325/347, Oldfield Lane, Greenford, Middlesex, UB6 OAZ,U.K.
0021-9673/89/$03.50 © 1989 Elsevier Science Publishers B.V.
218
EXPERIMENTAL
B. L. WEDZICHA, T. J. DONOVAN
Extraction of SI thearubiginsAn infusion of black tea leaf (25 g) in boiling water (II) was maintained at95°C
for 5 min. The infusion was filtered (glass fibre paper) and freeze dried. The tea solids(50 g) obtained from several pooled freeze-dried extracts were dissolved with stirring inhot aqueous methanol (11,25% methanol). The presence of methanol was necessary toprevent the formation of tea cream and to reduce the tendency for emulsion formationon addition of chloroform. The solution was extracted exhaustively with chloroformto remove caffeine in a continuous liquid-liquid extraction apparatus. To test for thesatisfactory removal ofcaffeine, a further extraction of the whole of the aqueous phasewas carried out in a separating funnel containing chloroform (II), the extract was driedover anhydrous MgS04 and its absorbance measured at 276 nm in l-cm silica cells.This procedure was repeated unil the absorbance of the extract was < 0.1. Chloroformremaining in the aqueous phase was removed under reduced presure at 30°C. Thesolution was extracted repeatedly with an equal volume of water-saturated ethylacetate until no more colour was extracted. The ethyl acetate extracts were pooled,dried over MgS04 and evaporated to dryness under reduced pressure at 30°C. Toensure complete removal of ethyl acetate, the solids were dissolved in acetone andevaporated to dryness as before. These solids were dissolved in the minimum volume ofacetone (1 volume) and the solution added dropwise with stirring to chloroform (10volumes) cooled in ice. The precipitate was removed by centrifugation (15000 g, 10min), redissolved in the minimum volume of acetone and reprecipitated in chloroformas before. The precipitate was dissolved in the minimum volume of acetone (1 volume)and precipitated three times by adding to peroxide-free diethyl ether (5, 10 and 15volumes) with stirring in ice. To ensure complete removal of diethyI ether, the finalprecipitate was dissolved in acetone and evaporated to dryness under reduced pressureat 30°C to give the SI thearubigin fraction.
The product was shown to be free from low-molecular-weight impurities bythin-layer chromatography (TLC) and gas chromatography (GC). The TLC methodwas a variation of the paper chromatographic method of Roberts et al.' andRatnaikeP in which the paper was replaced with a O.1-mm cellulose thin layer ona polymer film backing (Polygram Ce1300, 20 em x 20 em; Macherey-Nagel, F.R.G.)sheets. These sheets gave better resolution, shorter development time and easierhandling than the papers. The components were separated by two-dimensionalchromatography with butanol-acetic acid-water (4:1:2.2) in the first direction andaqueous acetic acid (2%) in the second. The components were visualized by sprayingwith an aqueous solution of a mixture of ferric chloride (0.3%, w/w) and potassiumferricyanide (0.3%, w/w). The plates were fixed in dilute acid (HCI) and excess offerricyanide was removed by washing in water. The GC method was as used for theanalysis of tea flavanols as their trimethylsilyl derivatives!".
Acetylation of thearubiginsThe acetylation procedure was a modification of that used by Cattell' s. The
sample (0.1 g) was dissolved in dry pyridine (1 ml), acetic anhydride (6 ml) added andthe mixture warmed at 30°C for 1 h. Water (10 ml) was added with cooling and theprecipitate filtered off. The product was dissolved in chloroform (5 ml) and the
HPLC OF DERIVATIZED THEARUBIGINS 219
solution extracted with aqueous NaHC03 (10%, w]»; 2 x 5 ml) and water (2 x 5 ml)before being evaporated to dryness.
The degree ofacetylation was assessed by carrying out the reaction using halftheamounts of reagents given above and adding the reaction mixture to water (20 ml)followed by pyridine (50 ml). The resulting solution was titrated with 0.5 M NaOH topH 9.2 using a pH meter, and a blank titration was carried out on a solution omittingthe thearubigin sample. In order to check the efficiency of acetylation, a sample of( - )epicatechin (Sigma) was treated similarly.
Methylation of thearubigins.The methylation of thearubigins using diazomethane has been described by
Ratnaike1 3. Diazomethane was prepared as a solution in diethyl ether from
N-methyl-N-nitrosotoluene-p-sulphonamide according to the method described byVogel1
7. The thearubigin sample (20 mg) was dissolved in methanol (2 m!) in anice-bath and excessof diazomethane solution was added. The presence of the excessofreagent was demonstrated by adding a few drops of glacial acetic acid to an aliquot ofthe reaction mixture, when gas was immediately evolved. The reaction mixture wasimmediately evaporated to dryness under reduced pressure at 30°C.
Separation of derivatized thearubiginsA preliminary choice of the solvent system for HPLC separations on silica was
made by means of TLC (silica gel G 60F254,0.25 mm, activated at 110°Cfor 30 min).Components were located under UV light. High-performance liquid chromatographicseparations (ACS liquid chromatography system LC750 with two reciprocatingpumps and a decilinear programmer; Applied Chromatography Systems, Macclesfield, u.K.) werecarried out on a Partisill0 column (HPLC Technology, Macclesfield,Ll.K,; particle size 10 ,urn,. 25 em x 0.46 em) at 1 ml min' with the column effluentmonitored spectrophotometrically (I-em path length cell, ACS 750-11 monitor at 254nm or Cecil CE212A spectrophotometer at 330nm). The recovery of samples from thecolumn was measured by comparing the UV spectrum of the sample applied to thecolumn with that of the eluted mixture, at the same dilutions.
RESULTS AND DISCUSSION
When subjeced to two-dimensional TLC analysis on cellulose the thearubiginpreparation was found as a streak (RF 0.3-0.9) in butanol-acetic acid-water as thesolvent, and no evidence of components showing mobility in both solvents was seen atany level of application of the sample. This is consistent with the chromatographicbehaviour of SI thearubigins 18. Similarly, no evidence of the presence of monomerictea polyphenols was seen from GC analysis of trimethylsilyl derivatives of thethearubigin sample.
The acetyl derivative of the thearubigin preparation formed readily and it wasfound that 20 ± 2% (mean of three determinations ± standard deviation) of the massof the original thearubigin was due to OH groups which became acetylated.Acetylation of ( - )-epicatechin indicated that 28.3 ± 2.3% of its mass was due to OHgroups, compared with the expected value of29.3% corresponding to five OH groupsin the molecule. Whilst it is not possible to use this result to predict the degree of
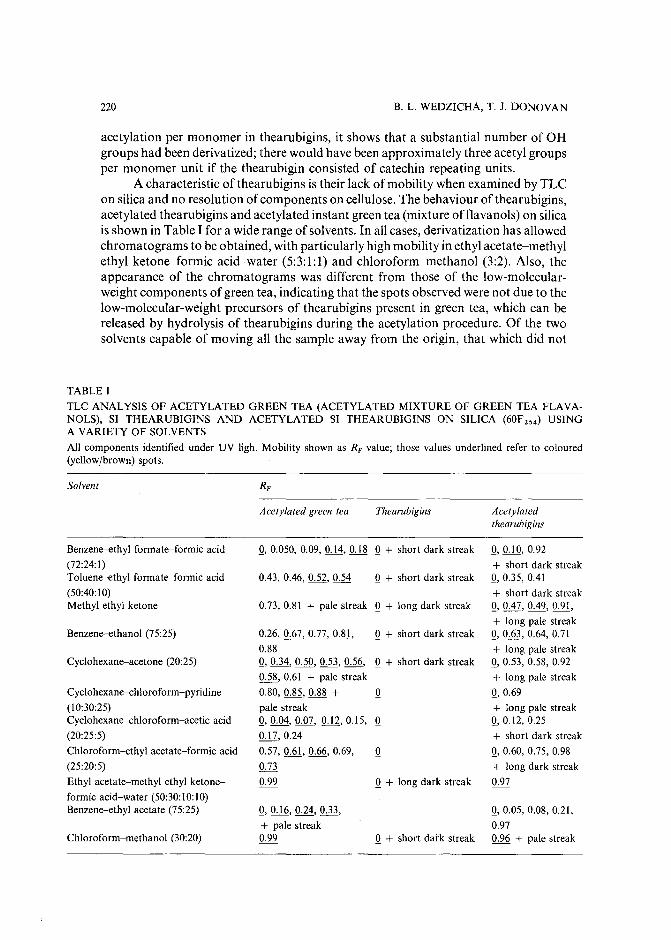
220 B. L. WEDZICHA, T. J. DONOVAN
acetylation per monomer in thearubigins, it shows that a substantial number of OHgroups had been derivatized; there would have been approximately three acetyl groupsper monomer unit if the thearubigin consisted of catechin repeating units.
A characteristic of thearubi gins is their lack of mobility when examined by TLCon silica and no resolution of components on cellulose. The behaviour of thearubigins,acetylated thearubigins and acetylated instant green tea (mixture offlavanols) on silicais shown in Table I for a wide range of solvents. In all cases, derivatization has allowedchromatograms to be obtained, with particularly high mobility in ethyl acetate-methylethyl ketone-formic acid-water (5:3:1:1) and chloroform-methanol (3:2). Also, theappearance of the chromatograms was different from those of the low-molecularweight components of green tea, indicating that the spots observed were not due to thelow-molecular-weight precursors of thearubigins present in green tea, which can bereleased by hydrolysis of thearubigins during the acetylation procedure. Of the twosolvents capable of moving all the sample away from the origin, that which did not
TABLE I
TLC ANALYSIS OF ACETYLATED GREEN TEA (ACETYLATED MIXTURE OF GREEN TEA FLAVANOLS), SI THEARUBIGINS AND ACETYLATED SI THEARUBIGINS ON SILICA (60F2S4) USINGA VARIETY OF SOLVENTS
All components identified under UV ligh. Mobility shown as RF value; those values underlined refer to coloured(yellow/brown) spots.
Solvent
Benzene-ethyl formate-formic acid
(72:24:1)Toluene-ethyl formate-formic acid
(50:40:10)Methyl ethyl ketone
Benzene-ethanol (75:25)
Cyciohexane-acetone (20:25)
Cyciohexane---<:hloroform-pyridine
(10:30:25)Cyclohexane-chloroform-acetic acid
(20:25:5)
Chloroform-ethyl acetate-formic acid
(25:20:5)
Ethyl acetate-methyl ethyl ketone
formic acid-water (50:30:10:10)Benzene-ethyl acetate (75:25)
Chloroform-methanol (30:20)
RF
Acetylated green tea Thearubigins Acetylatedthearubigins
Q, 0.050, 0.09, O. 14,~ Q + short dark streak Q, QlQ, 0.92
+ short dark streak0.43, 0.46, 0.52, 0.54 Q + short dark streak Q, 0.35, 0.41
+ short dark streak0.73, 0.8I + pale streak Q + long dark streak Q, 0.47, 0.49, 0.91,
+ long pale streak0.26, 0.67, 0.77, 0.81, Q + short dark streak Q, 0.63, 0.64, 0.71
0.88 + long pale streakQ, 0.34, 0.50, 0.53, 0.56, Q + short dark streak Q, 0.53, 0.58, 0.92
0.58,0.61 + pale streak + long pale streak
0.80, 0.85, 0.88 + Q Q,0.69
pale streak + long pale streakQ, 0.04, 0.Q7, 0.12,0.15, Q Q, O. I2, 0.25
0.17,0.24 + short dark streak
0.57, 0.61, 0.66, 0.69, Q Q, 0.60, 0.75, 0.98
0.73 + long dark streak
0.99 Q + long dark streak 0.97
Q, 0.16, 0.24, 0.33, Q, 0.05, 0.08, 0.21,
+ pale streak 0.970.99 Q + short dark streak 0.96 + pale streak
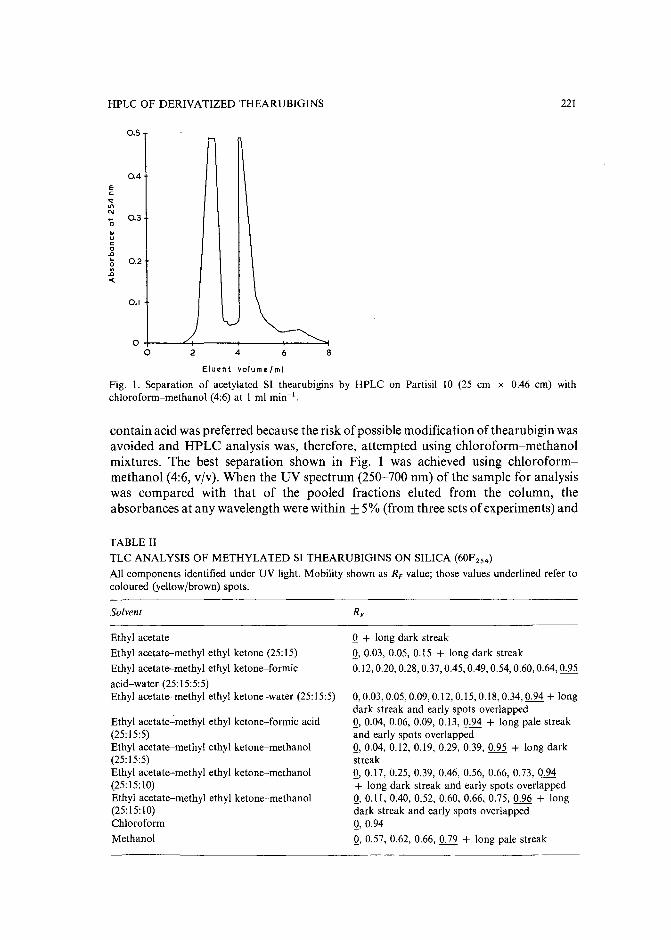
HPLC OF DERIVATIZED THEARUBIGINS
0.5
0.4Es:'t
'"'"~ 0.30..oc:0..,.. 0.2aon..,-c
0.1
00 2 4 6 8
EJu.n t volum e r mt
221
Fig. 1. Separation of acetylated SI thearubigins by HPLC on Partisil 10 (25 em x 0.46 em) withchloroform-methanol (4:6) at I ml min- t .
contain acid was preferred because the risk of possible modification of thearubigin wasavoided and HPLC analysis was, therefore, attempted using chloroform-methanolmixtures. The best separation shown in Fig. 1 was achieved using chloroformmethanol (4:6, v/v). When the UV spectrum (250-700 nm) of the sample for analysiswas compared with that of the pooled fractions eluted from the column, theabsorbances at any wavelength were within ±5% (from three sets ofexperiments) and
TABLE II
TLC ANALYSIS OF METHYLATED SI THEARUBIGINS ON SILICA (60F254)
All components identified under UV light. Mobility shown as RF value; those values underlined refer tocoloured (yellow/brown) spots.
Solvent
Ethyl acetate
Ethyl acetate-methyl ethyl ketone (25:15)
Ethyl acetate-methyl ethyl ketone-formic
acid-water (25:15:5:5)Ethyl acetate-methyl ethyl ketone-water (25:15:5)
Ethyl acetate-methyl ethyl ketone-formic acid(25:15:5)Ethyl acetate-methyl ethyl ketone-methanol(25:15:5)Ethyl acetate-methyl ethyl ketone-methanol(25:15:10)Ethyl acetate-methyl ethyl ketone-methanol(25:15:10)Chloroform
Methanol
Q + long dark streak
Q, 0.03, 0.05, 0.15 + long dark streak
0.12,0.20,0.28,0.37,0.45,0.49,0.54,0.60,0.64, 0.95
0,0.03,0.05,0.09,0.12,0.15,0.18,0.34, 0.94 + longdark streak and early spots overlappedQ, 0.04, 0.06, 0.09, 0.13, 0.94 + long pale streakand early spots overlappedQ, 0.04, 0.12, 0.19, 0.29, 0.39, 0.95 + long darkstreakQ, 0.17, 0.25, 0.39, 0.46, 0.56, 0.66, 0.73, 0.94+ long dark streak and early spots overlappedQ, 0.11, 0.40, 0.52, 0.60, 0.66, 0.75, 0.96 + longdark streak and early spots overlappedQ,0.94
Q, 0.57, 0.62, 0.66, 0.79 + long pale streak
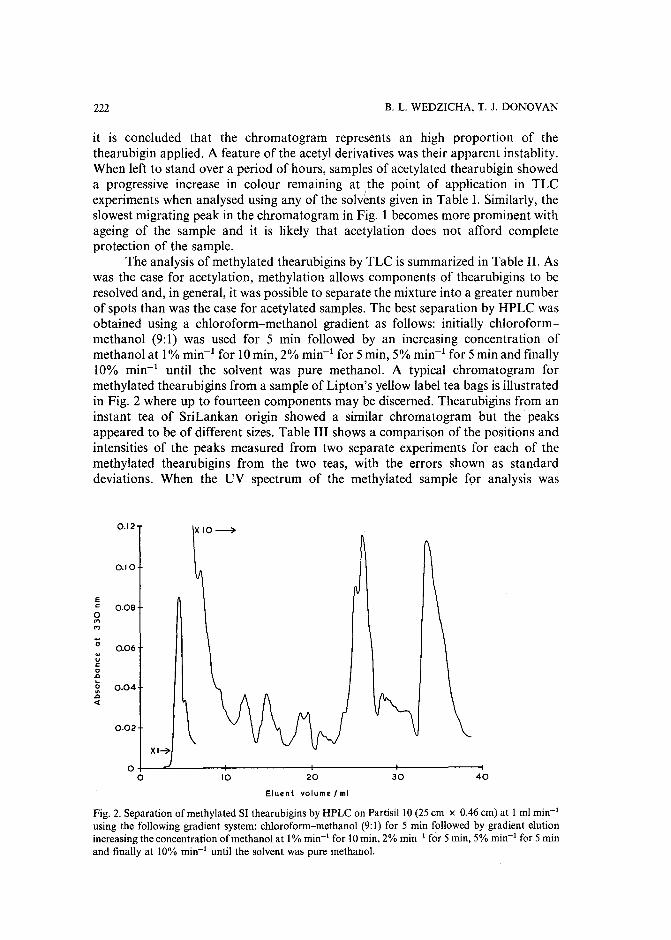
222 B. L. WEDZ1CHA, T. J. DONOVAN
it is concluded that the chromatogram represents an high proportion of thethearubigin applied. A feature of the acetyl derivatives was their apparent instablity.When left to stand over a period of hours, samples of acetylated thearubigin showeda progressive increase in colour remaining at the point of application in TLCexperiments when analysed using any of the solvents given in Table 1. Similarly, theslowest migrating peak in the chromatogram in Fig. I becomes more prominent withageing of the sample and it is likely that acetylation does not afford completeprotection of the sample.
The analysis of methylated thearubigins by TLC is summarized in Table II. Aswas the case for acetylation, methylation allows components of thearubigins to beresolved and, in general, it was possible to separate the mixture into a greater numberof spots than was the case for acetylated samples. The best separation by HPLC wasobtained using a chloroform-methanol gradient as follows: initially chloroformmethanol (9:1) was used for 5 min followed by an increasing concentration ofmethanol at 1% min' for 10min, 2% min' for 5 min, 5% min' for 5 min and finally10% mirr' until the solvent was pure methanol. A typical chromatogram formethylated thearubigins from a sample of Lipton's yellow label tea bags is illustratedin Fig. 2 where up to fourteen components may be discerned. Thearubigins from aninstant tea of SriLankan origin showed a similar chromatogram but the peaksappeared to be of different sizes. Table III shows a comparison of the positions andintensities of the peaks measured from two separate experiments for each of themethylated thearubigins from the two teas, with the errors shown as standarddeviations. When the UV spectrum of the methylated sample for analysis was
0.12
0.10
Ec: 0.080..,..,~
0 0.06..uc:0.a~
0 0.04'".a«
0.02
XI~
00
XIO~
10 20
Elu en t vo lum e J ml
30 40
Fig. 2. Separation of methylated SI thearubigins by HPLC on Partisill 0 (25 em x 0.46 em) at I ml min"using the following gradient system: chloroform-methanol (9:1) for 5 min followed by gradient elutionincreasing the concentration of methanol at I% min-I for 10 min, 2% min-I for 5 min, 5% min-I for 5 minand finally at 10% min-I until the solvent was pure methanol.
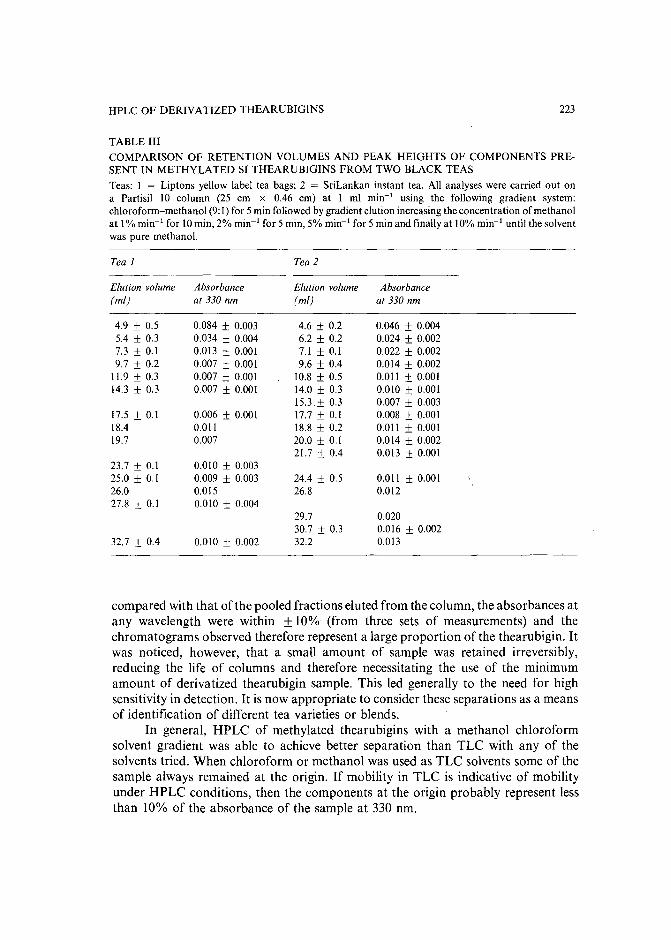
HPLC OF DERIVATIZED THEARUBIGlNS 223
TABLE III
COMPARISON OF RETENTION VOLUMES AND PEAK HEIGHTS OF COMPONENTS PRESENT IN METHYLATED SI THEARUBIGlNS FROM TWO BLACK TEAS
Teas: 1 = Liptons yellow label tea bags; 2 = SriLankan instant tea. All analyses were carried out ona Partisil 10 column (25 cm x 0.46 em) at 1 ml min- t using the following gradient system:chloroform-methanol (9:1)for 5 min followed by gradient elution increasing the concentration of methanolat 1% mirr' for 10min, 2% min- t for 5 min, 5% min- t for 5 min and finally at 10% mirr ' until the solventwas pure methanol.
Tea J Tea 2
Elution volume Absorbance Elution volume Absorbance(ml) at 330 nm (ml) at 330 nm
4.9 ± 0.5 0.084 ± 0.003 4.6 ± 0.2 0.046 ± 0.0045.4 ± 0.3 0.034 ± 0.004 6.2 ± 0.2 0.024 ± 0.0027.3 ± 0.1 0.013 ± 0.001 7.1 ± 0.1 0.022 ± 0.0029.7 ± 0.2 0.007 ± 0.001 9.6 ± 0.4 0.014 ± 0.002
11.9 ± 0.3 0.007 ± 0.001 10.8 ± 0.5 0.011 ± 0.00114.3 ± 0.3 0.007 ± 0.001 14.0 ± 0.3 0.010 ± 0.001
15.3 ± 0.3 0.007 ± 0.00317.5 ± 0.1 0.006 ± 0.001 17.7 ± 0.1 0.008 ± 0.00118.4 0.011 18.8 ± 0.2 0.011 ± 0.00119.7 0.007 20.0 ± 0.1 0.014 ± 0.002
21.7 ± 0.4 0.013 ± 0.00123.7 ± 0.1 0.010 ± 0.00325.0 ± 0.1 0.009 ± 0.003 24.4 ± 0.5 0.011 ± 0.00126.0 0.015 26.8 0.01227.8 ± 0.1 0.010 ± 0.004
29.7 0.02030.7 ± 0.3 0.016 ± 0.002
32.7 ± 0.4 0.010 ± 0.002 32.2 0.013
compared with that of the pooled fractions eluted from the column, the absorbances atany wavelength were within ± 10% (from three sets of measurements) and thechromatograms observed therefore represent a large proportion of the thearubigin. Itwas noticed, however, that a small amount of sample was retained irreversibly,reducing the life of columns and therefore necessitating the use of the minimumamount of derivatized thearubigin sample. This led generally to the need for highsensitivity in detection. It is now appropriate to consider these separations as a meansof identification of different tea varieties or blends.
In general, HPLC of methylated thearubigins with a methanol-chloroformsolvent gradient was able to achieve better separation than TLC with any of thesolvents tried. When chloroform or methanol was used as TLC solvents some of thesample always remained at the origin. If mobility in TLC is indicative of mobilityunder HPLC conditions, then the components at the origin probably represent lessthan 10% of the absorbance of the sample at 330 nm.
224
CONCLUSION
B. L. WEDZICHA, T. 1. DONOVAN
Thearubigins are regarded as polymeric polyphenols and a reason for their highaffinity towards silica which prevents its use for their analysis is likely to include polarinteractions with OH groups on the polymer. This is supported by the observationsmade here that acetylation or methylation of these groups causes thearubigins tobecome mobile on silica in a variety of solvents. We report here the first partialseparation of thearubigins as their derivatives by HPLC which should now form thebasis of a renewed attempt to characterize these polymers.
ACKNOWLEDGEMENTS
We acknowledge support from the Science and Engineering and ResearchCouncil and Unilever pic for a CASE studentship to one of us (T.J.D.). We areparticularly grateful to Peter Collier and Sid Pendlington for continuing interest andadvice throughout the work and the opportunity to carry out some of the experimentalwork in their laboratories at Colworth House.
REFERENCES
I E. A. H. Roberts, J. Sci. Food Agric., 9 (1958) 381.2 D. J. Millin, D. J. Crispin and D. Swaine, J. Agric. Food Chem., 17 (1969) 717.3 G. W. Sanderson, A. S. Ranadive, L. S. Eisenberg, F. J. Farrell, R. Simms, C.H. Manley and P. Coggon,
ACS Symp. Ser., 26 (1976) 14.4 E. A. H. Roberts, J. Sci. Food Agric., 14 (1963) 700.5 R. F. Smith, J. Sci. Food Agric., 19 (1968) 530.6 R. L. Wickremasinghe and K. P. Perera, Tea Q., 37 (1966) 131.7 E. A. H. Roberts, R. A. Cartwright and M. Oldschool, J. Sci. Food Agric., 8 (1957) 72.8 E. A. H. Roberts, D. W. Rustige and C. Randell, Ann. Rep. Toklai Station, (1960) 341.9 L. Vuataz and H. Brandenberger, J. Chromatogr., 5 (1961) 17.
10 A. G. Brown, W. B. Eyton, A. Holmes and W. D. Ollis, Phytochemistry, 8 (1969) 2333.II A. G. Brown, W. B. Eyton, A. Holmes and W. D. Ollis, Nature (London), 221 (1969) 742.12 J. Ozawa, Agric. Bioi. Chem., 46 (1982) 1079.13 S. I. Ratnaike, Ph. D. Thesis, University of Leeds, 1980.14 A. Robertson and D. S. Bendall, Phytochemistry, 22 (1983) 883.15 D. J. Cattell, Ph. D. Thesis, University of Leeds, 1972.16 P. D. Collier and R. Mallows, J. Chromatogr., 57 (1971) 29.17 A. I. Vogel, Practical Organic Chemistry, Longmans, London, 3rd ed., 1957, p. 967.18 E. A. H. Roberts and R. F. Smith, J. Sci. Food Agric., 14 (1963) 689.
Journal of Chromatography, 478 (1989) 225-230Elsevier Science Publishers B.V., Amsterdam - Printed in The Netherlands
CHROM. 21 611
Note
Model compound sorption by the resins XAD-2, XAD-8 and diethylaminoethylcellulose
An useful application to flavonoids isolation
LUIGINO MAGGI, RENA TO STELLA and MARIA T. GANZERLI VALENTINI
Dipartimento di Chimiea Generale e Centro di Radioehimiea e Analisi per Attivazione del CNR, Universita diPavia, Viale Taramelli 12, 27100 Pavia (1taly)
and
PIERGIORGIO PIETTA*
Dipartimento di Scienze e Teenologie Biomediehe, Sezione di Chimiea Organiea, Universita di Milano, ViaCeloria 2, 20133 Milan (italy)
(Received March 15th, 1989)
High recoveries of aromatic acids and phenols from water are possible byadsorption on macroreticular resins such as XAD and diethylaminoethyl (DEAE)cellulose". However, due to the lack of data on the distribution coefficients, KD , asa function of pH, a more systematic study is desirable.
The sorption of model compounds, phenol (P), cinnamic acid (C), benzoic acid(8), 3,5-dihydroxybenzoic acid (DH), 3,5-dimethoxy-4-hydroxybenzoic acid (DM),coumarin (CM), rutin (RU), isoorientine (10) and isovitexine (IV) on XAD-2, XAD-8and DEAE-cel1ulose was then investigated. Among these compounds, rutin, isoorientine and isovitexine belong to the group of flavonoids, which are foundubiquitously in plants and have many pharmacological properties". Standards are notavailable for many of the flavonoids and the traditional methods for their isolation arebased on thin-layer or column chromatography using different supports (silica,cel1ulose, polyamide, Sephadex LH-20) and aqueous organic solvents ':".
In recent years, semipreparative high-performance liquid chromatography(HPLC) has been applied for the purification of flavonoids, mainly using reversedphase columns". Nevertheless, the isolation of flavonoids from crude plant extractsthrough simple column chromatography has potential as confirmed by the resultsdescribed in this paper.
EXPERIMENTAL
MaterialsCoumarin and rutin were obtained from C. Roth (Karlsruhe, F.R.G.). Al1 other
test compounds were from Carlo Erba (Milan, Italy). Isoorientine and isovitexine wereisolated from Passiflora incarnata L. extracts according to the literature", Theseextracts were obtained from different commercial sources. Al1 chemicals used were ofreagent grade.
0021-9673/89/$03.50 © 1989 Elsevier Science Publishers B.V.
226 NOTES
ResinsXAO-2 and XAO-8 macroreticular resins (Rohm & Haas, Philadelphia, PA,
U.S.A.) were thoroughly purified by sequential solvent extraction with methanol,acetonitrile and diethy I ether in a Soxhlet extractor for 8 h per solvent. The purifiedresins were stored under methanol in glass stoppered bottles to maintain their purity.
OEAE-cellulose (Bio-Rad, Richmond, CA, U.S.A.) was pretreated by thefollowing procedure: about 50 g of dry cellulose were mixed in 10 ml of0.5 M HCI for1h. The cellulose was rinsed with deionized water in a Buchner funnel until the pH wasneutral; it was then suspended in 0.5 MNaOH for 1 h and rinsed with deionized wateruntil the pH was neutral. Pretreated OEAE-cellulose was stored in the dark at 4°C.
InstrumentationA Perkin-Elmer scanning spectrophotometer Model 550 SE was used for
standard and eluate analysis.HPLC was performed with a Waters M-501 pump fitted with a jiBondapak CIS
column (25 em x 4.6 mm 1.0.). Peaks were monitored with a Waters M-481absorbance detector at 340 nm: output was measured with a Shimadzu Model CR3Aintegrator, using the external standard quantitation method. The eluent was 2-propanol-tetrahydrofuran-water (5:15:80, v/v/v) at a flow-rate of 0.7 ml/min,
Batch experimentsBatch distribution coefficients, KD
mg material adsorbed per g of resin
KD= mg material in solution per ml solution
were obtained by shaking overnight in stoppered flasks approximately 100 mg of resinwith 25 ml of sample at a fixed pH, adjusted to a value between 2 and 9 by adding 0.1M HCI or 0.1 M NaOH. After equilibration for 24 h at 25°C, suitable aliquots weretaken from the unknown and standard flasks and the concentration of the solute ineach was determined spectrophotometrically.
Column experimentsFor the experiments on artificial samples glass columns (10 mm 1.0.) were
packed by using a water-XAO-2, water-XAO-8 or water-OEAE-cellulose slurryrinsed with 500 ml ofdistilled water to remove methanol. The OEAE-cellulose bed was50 mm, those of the XAOs was 220 mm and the reservoir volume was 250 ml. Theflow-rate was maintained and controlled by a peristaltic pump and was set to I ml/minfor OEAE-cellulose and 5 nil/min for XAOs. The eluting agent was passed through thecolumn and the effluent was collected by a fraction collector and monitored with thePerkin-Elmer spectrophotometer.
The isolation of isovitexine and isoorientine from the Passiflora incarnataextract was performed by loading 2 g of the extract on a OEAE-cellulose column (bedheight 270 mm, 16 mm 1.0.) and eluting with 0.01 MHCI at a flow-rate of 1.2 ml/min.
Final purification was effected by passing the eluates through a column ofXAO-2, same size as that of the OEAE-cellulose, and desorbing the flavonoids withmethanol.
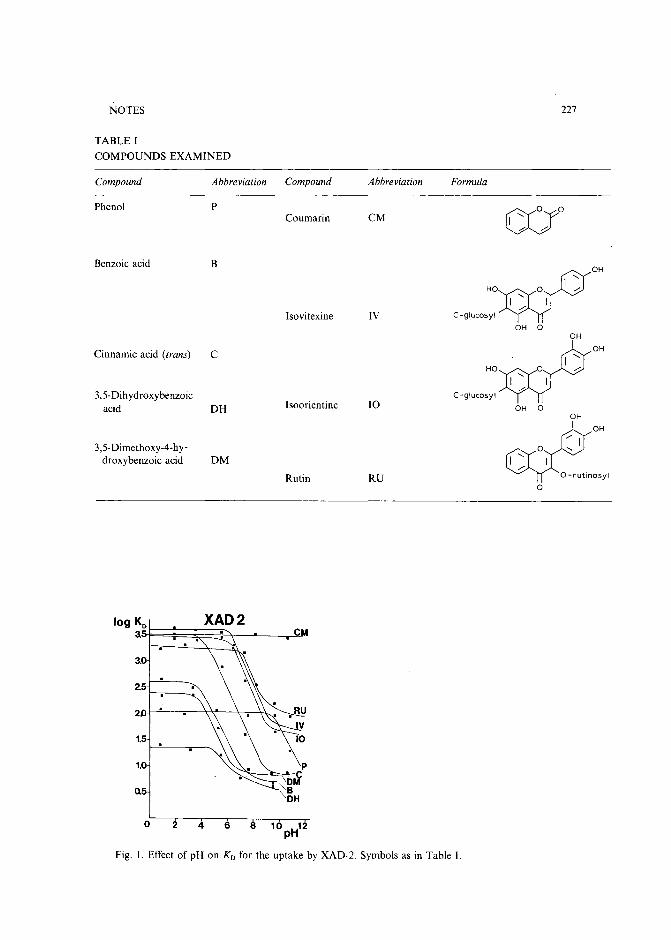
NOTES 227
TABLE I
COMPOUNDS EXAMINED
Compound Abbreviation Compound Abbreviation Formula
Phenol P ceroCoumarin CM/- ./-
Benzoic acid B w O
"HO ° /0<,
I IIsovitexine IV C-glucosyl /0
OH ° OH
Cinnamic acid (trans) C whO>. 1"-HO ° /0
I" I3,5-Dihydroxybenzoic C-glucosyl /-
acid DH Isoorientine 10 OH ° OHOH
/'
3,5-Dimethoxy-4-hy- c:droxybenzoic acid DM
Rutin RU o -rutinosyl
°
log Ko XAD23.
3.0
2.5
2
1.5
1.0
0.5
0 2 4 6
Fig. I. Effect of pH on KD for the uptake by XAD-2. Symbols as in Table L
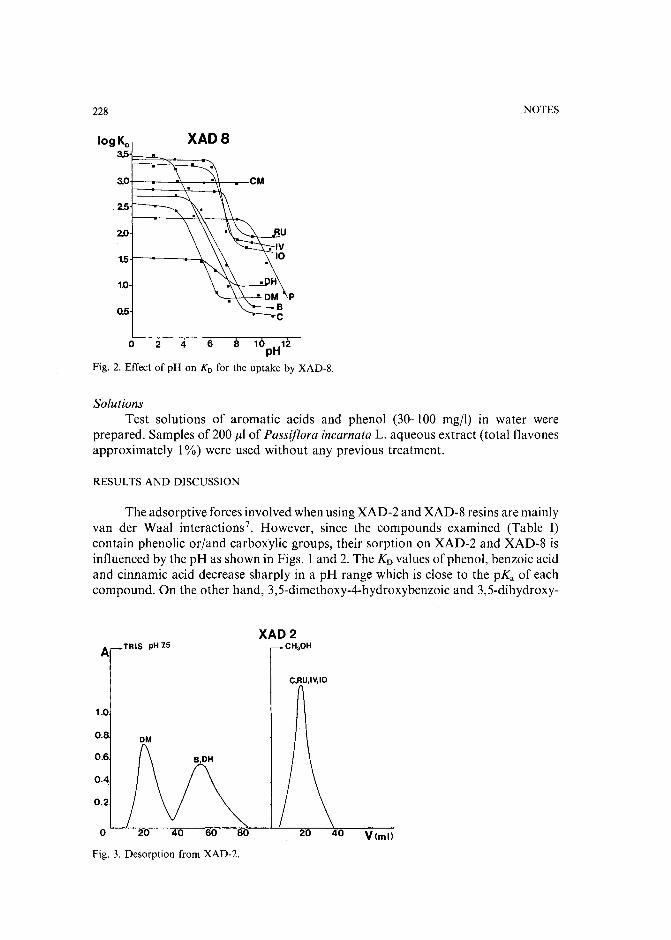
228
logKo XAD83.5
3.0
.2.5
2.0
15
1.0
0.5
NOTES
o 2 4 6 10pH12
Fig. 2. Effect of pH on KD for the uptake by XAD-8.
SolutionsTest solutions of aromatic acids and phenol (30-100 rng/l) in water were
prepared. Samples of 200 III of Passiflora incarnata L. aqueous extract (total flavonesapproximately 1%) were used without any previous treatment.
RESULTS AND DlSCUSSION
The adsorptive forces involved when using XAD-2 and XAD-8 resins are mainlyvan der Waal interactions? However, since the compounds examined (Table I)contain phenolic or/and carboxylic groups, their sorption on XAD-2 and XAD-8 isinfluenced by the pH as shown in Figs. 1 and 2. The K D values of phenol, benzoic acidand cinnamic acid decrease sharply in a pH range which is close to the pKa of eachcompound. On the other hand, 3,5-dimethoxy-4-hydroxybenzoic and 3,5-dihydroxy-
ATRIS pH 7.5
XAD2CH30H
C,RU,IV,IO
1.0
0.8
0.6
0.4
0.2
o Vlml)
Fig. 3. Desorption from XAD-2.
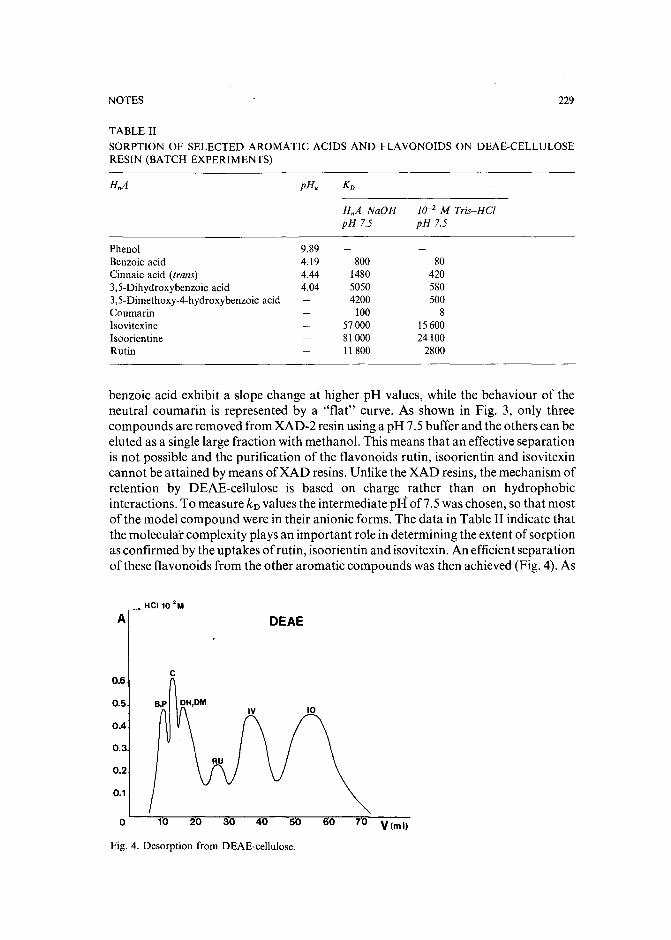
NOTES 229
TABLE II
SORPTION OF SELECTED AROMATIC ACIDS AND FLAVONOIDS ON DEAE-CELLULOSERESIN (BATCH EXPERIMENTS)
Phenol 9.89Benzoic acid 4.19Cinnaic acid (trans) 4.443,5-Dihydroxybenzoic acid 4.043,5-Dimethoxy-4-hydroxybenzoic acidCoumarinIsovitexineIsoorientineRutin
HnA-NaOHpH 7.5
800148050504200
100570008100011800
ur? M Tris-HCIpH 7.5
80420580500
81560024100
2800
benzoic acid exhibit a slope change at higher pH values, while the behaviour of theneutral coumarin is represented by a "flat" curve. As shown in Fig. 3, only threecompounds are removed from XAD-2 resin using a pH 7.5 buffer and the others can beeluted as a single large fraction with methanol. This means that an effective separationis not possible and the purification of the flavonoids rutin, isoorientin and isovitexincannot be attained by means ofXAD resins. Unlike the XAD resins, the mechanism ofretention by DEAE-cellulose is based on charge rather than on hydrophobicinteractions. To measure k D values the intermediate pH
L
of7.5 was chosen, so that mostof the model compound were in their anionic forms. The data in Table II indicate thatthe molecular complexity plays an important role in determining the extent of sorptionas confirmed by the uptakes ofrutin, isoorientin and isovitexin. An efficient separationofthese flavonoids from the other aromatic compounds was then achieved (Fig. 4). As
A
0.6
0.5
0.4
0.3
0.2
0.1
o
DEAE
c
70 Vlml)
Fig. 4. Desorption from DEAE-cellulose.
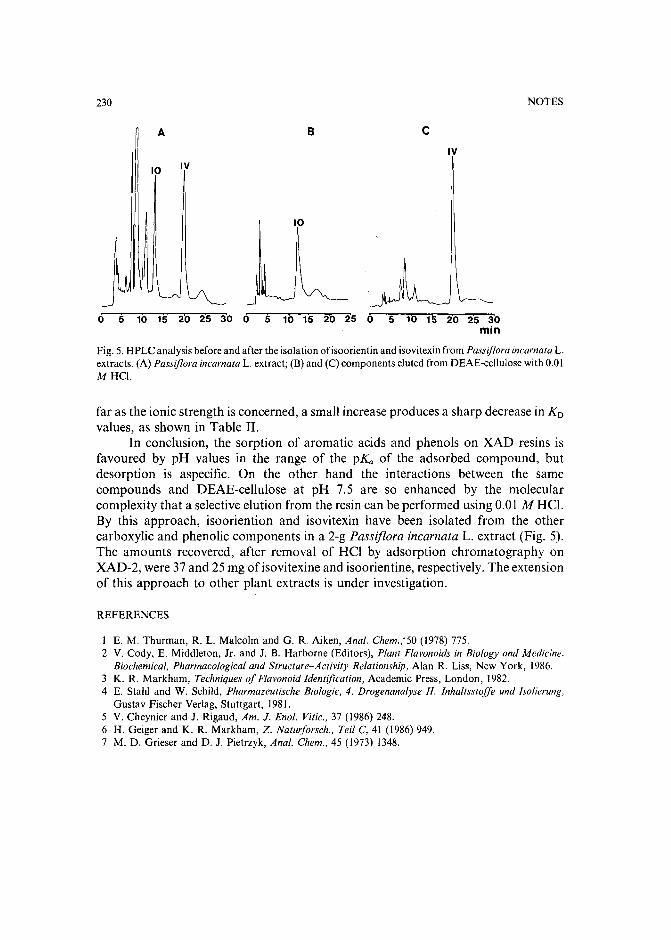
230
A
10 IV
10
B cIV
NOTES
o 5 10 15 20 25 30 0 5 10 15 20 25 0 20 25 30min
Fig. 5. HPLC analysis before and after the isolation ofisoorientin and isovitexin from Passijlora incarnata L.extracts. (A) Passiflora incarnata L. extract; (B) and (C) components eluted from DEAE-cellulose with 0.01MHCI.
far as the ionic strength is concerned, a small increase produces a sharp decrease in K D
values, as shown in Table II.In conclusion, the sorption of aromatic acids and phenols on XAD resins is
favoured by pH values in the range of the pKa of the adsorbed compound, butdesorption is aspecific. On the other hand the interactions between the samecompounds and DEAE-cellulose at pH 7.5 are so enhanced by the molecularcomplexity that a selective elution from the resin can be performed using 0.01 M HCI.By this approach, isooriention and isovitexin have been isolated from the othercarboxylic and phenolic components in a 2-g Passiflora incarnata L. extract (Fig. 5).The amounts recovered, after removal of HCl by adsorption chromatography onXAD-2, were 37 and 25 mg ofisovitexine and isoorientine, respectively. The extensionof this approach to other plant extracts is under investigation.
REFERENCES
I E. M. Thurman, R. L. Malcolm and G. R. Aiken, Anal. Chem.;50 (1978) 775.2 V. Cody, E. Middleton, Jr. and J. B. Harborne (Editors), Plant Flavonoids in Biology and Medicine.
Biochemical, Pharmacological and Structure-Activity Relationship, Alan R. Liss, New York, 1986.3 K. R. Markham, Techniques of Flavonoid Identification, Academic Press, London, 1982.4 E. Stahl and W. Schild, Pharmazeutische Biologie, 4. Drogenanalyse II: Inhaltsstoffe und Isolierung,
Gustav Fischer Verlag, Stuttgart, 1981.5 V. Cheynier and J. Rigaud, Am. J. Enol. Vitic., 37 (1986) 248.6 H. Geiger and K. R. Markham, Z. Naturforsch., Teil C, 41 (1986) 949.7 M. D. Grieser and D. J. Pietrzyk, Anal. Chem., 45 (1973) 1348.
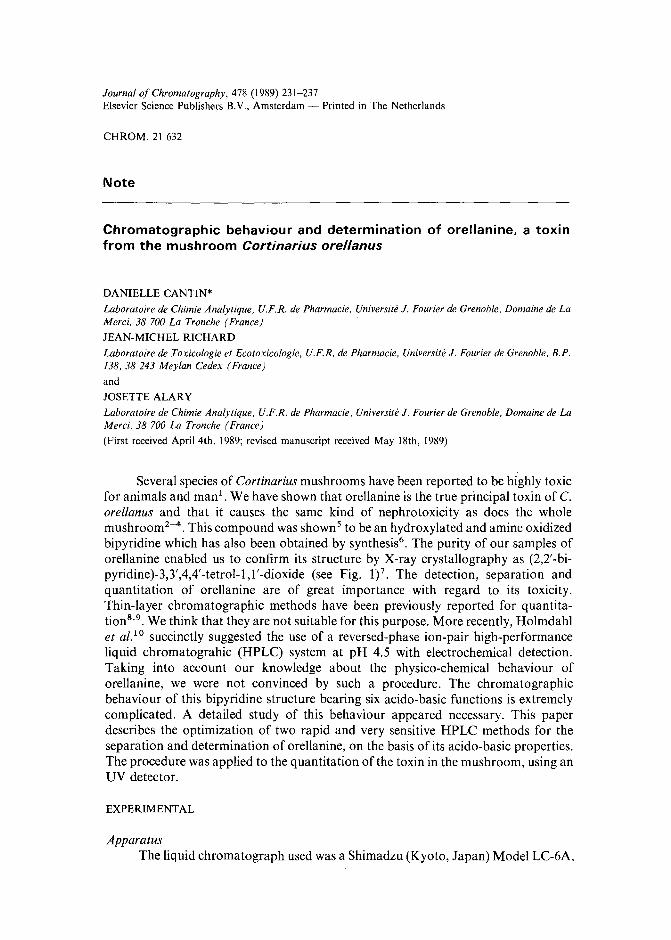
Journal of Chromatography, 478 (1989) 231-237Elsevier Science Publishers RV., Amsterdam - Printed in The Netherlands
CHROM. 21 632
Note
Chromatographic behaviour and determination of orellanine, a toxinfrom the mushroom Cortinarius orel/anus
DANIELLE CANTIN*
Laboratoire de Chimie Analytique, U.F.R. de Pharmacie, Universite J. Fourier de Grenoble, Domaine de LaMerci, 38 700 La Tronche (France)
JEAN-MICHEL RICHARD
Laboratoire de Toxicologie et Ecotoxicologie, U.F.R. de Pharmacie, Universite J. Fourier de Grenoble, B.P.138, 38243 Meylan Cedex (France)
and
JOSETTE ALARY
Laboratoire de Chimie Analytique, U.F.R. de Pharmacie, Universite J. Fourier de Grenoble, Domaine de LaM erci, 38 700 La Tronche (France)
(First received April 4th, 1989; revised manuscript received May 18th, 1989)
Several species of Cortinarius mushrooms have been reported to be highly toxicfor animals and man". We have shown that orellanine is the true principal toxin of C.orel/anus and that it causes the same kind of nephrotoxicity as does the wholemushroomv". This compound was shown" to be an hydroxylated and amine oxidizedbipyridine which has also been obtained by synthesis", The purity of our samples oforellanine enabled us to confirm its structure by X-ray crystallography as (2,2'-bipyridine)-3,3',4,4'-tetrol-I,I'-dioxide (see Fig. 1)7. The detection, separation andquantitation of orellanine are of great importance with regard to its toxicity.Thin-layer chromatographic methods have been previously reported for quantitation":". We think that they are not suitable for this purpose. More recently, Holmdahlet a/. l O succinctly suggested the use of a reversed-phase ion-pair high-performanceliquid chromatograhic (HPLC) system at pH 4.5 with electrochemical detection.Taking into account our knowledge about the physico-chemical behaviour oforeIIanine, we were not convinced by such a procedure. The chromatographicbehaviour of this bipyridine structure bearing six acido-basic functions is extremelycomplicated. A detailed study of this behaviour appeared necessary. This paperdescribes the optimization of two rapid and very sensitive HPLC methods for theseparation and determination of orellanine, on the basis of its acido-basic properties.The procedure was applied to the quantitation of the toxin in the mushroom, using anUV detector.
EXPERIMENTAL
ApparatusThe liquid chromatograph used was a Shimadzu (Kyoto, Japan) Model LC-6A,
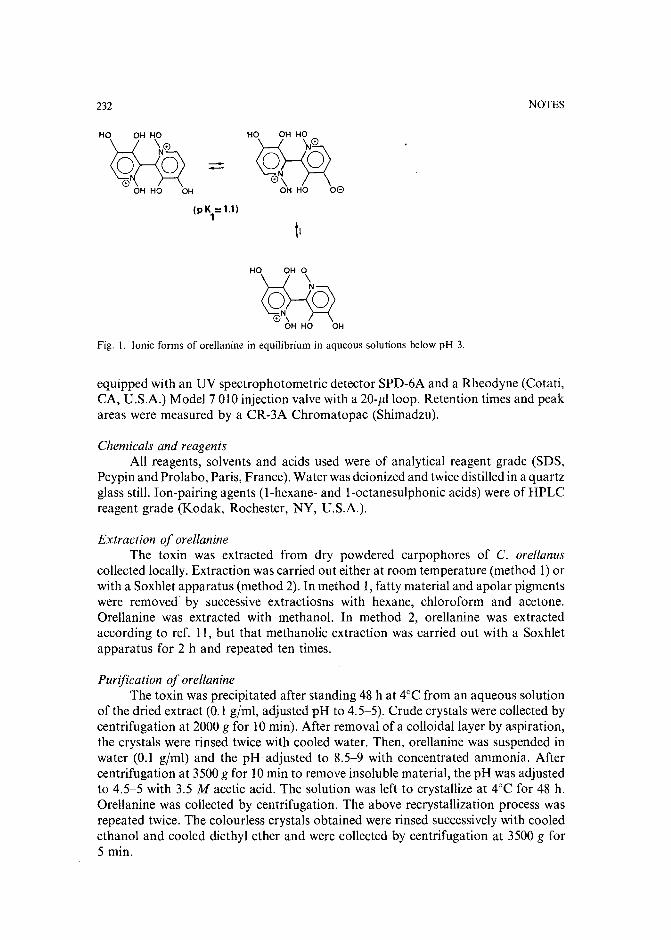
232
--HO OH HO
~~~t( r<
OH HO 08
NOTES
(pK,="')
HO OH 0
~OH HO OH
Fig. 1. Ionic forms of orellanine in equilibrium in aqueous solutions below pH 3.
equipped with an UV spectrophotometric detector SPD-6A and a Rheodyne (Cotati,CA, U.S.A.) Model 7010 injection valve with a 20-111 loop. Retention times and peakareas were measured by a CR-3A Chromatopac (Shimadzu).
Chemicals and reagentsAll reagents, solvents and acids used were of analytical reagent grade (SDS,
Peypin and Prolabo, Paris, France). Water was deionized and twicedistilled in a quartzglass still. Ion-pairing agents (I-hexane- and l-octanesulphonic acids) were of HPLCreagent grade (Kodak, Rochester, NY, U.S.A.).
Extraction of orellanineThe toxin was extracted from dry powdered carpophores of C. orellanus
collected locally. Extraction was carried out either at room temperature (method 1)orwith a Soxhlet apparatus (method 2). In method 1, fatty material and apolar pigmentswere removed by successive extractiosns with hexane, chloroform and acetone.Orellanine was extracted with methanol. In method 2, orellanine was extractedaccording to ref. II, but that methanolic extraction was carried out with a Soxhletapparatus for 2 h and repeated ten times.
Purification of orellanineThe toxin was precipitated after standing 48 h at 4°C from an aqueous solution
of the dried extract (0.1 g/ml, adjusted pH to 4.5-5). Crude crystals were collected bycentrifugation at 2000 g for 10 min). After removal of a colloidal layer by aspiration,the crystals were rinsed twice with cooled water. Then, orellanine was suspended inwater (0.1 g/ml) and the pH adjusted to 8.5-9 with concentrated ammonia. Aftercentrifugation at 3500g for 10 min to remove insoluble material, the pH was adjustedto 4.5-5 with 3.5 M acetic acid. The solution was left to crystallize at 4°C for 48 h.Orellanine was collected by centrifugation. The above recrystallization process wasrepeated twice. The colourless crystals obtained were rinsed successively with cooledethanol and cooled diethyl ether and were collected by centrifugation at 3500 g for5 min.
NOTES 233
Sample handlingStandard solutions of orellanine. These were prepared by dissolving a known
weight in phosphoric acid pH 0, to give a concentration of about 5 . 10- 4 M (126 mg/l)checked by UV spectrophotometry after 1/10 dilution (s = 10 900 I mol- 1 cm -1 at262 nm and 9100 I mol- 1 em -1 at 288 nm at pH 1). Stock solutions of thisphotosensitive and easily oxidable product were stored in the dark at 4°C and used inthe following 2 days. They were diluted in a suitable mobile phase, to givea concentration range of 10- 6-:10- 4 M.
Solutions ofmushroom extracts. Dried methanolic extracts (0.5-1.5 mg/rnl) weredissolved in phosphoric acid pH O. Direct assay solutions were made by 1/10 dilution ina suitable mobile phase (pH 1). For the standard addition method, they were addedwith an equal volume of a solution of orellanine (5 . 10- 5~10 . 10- 5 M), in a suitablemobile phase at pH 1.
For all assays, 20 j.ll were injected into the chromatograph.
Chromatographic conditionsThin-layer chromatography. TLC and HPTLC plates were obtained from Merck
(Darmstadt, F.R.G.). Orellanine is easily detected by its absorption at 254 nm or by theblue fluorescence of its spot after 2 min UV irradiation at 366 nm.
High-performance liquid chromatography. Two chromatographic systems wereused. The first stationary phase was Rosil CN 5 j.lm prepacked in a 150 mm x 4.6 mmstainless-steel cartridge from Alltech (Paris, France). The mobile phase consisted ofphosphoric acid adjusted to pH 1.0 ± 0.1. Elution was at a flow-rate of 0.5 ml/min,Chromatographic peaks were monitored at 260 or 290 nm, the wavelengths of the UVmaxima for orellanine at pH 1.0. The second stationary phase was j.lBondapak CIS5 j.lm (150 mm x 3.9 mm) from Waters (Northwich, U.K.). The mobile phase wasphosphoric acid adjusted to pH 1.0 ± O.l-acetonitrile (94:6, v/v) and l-octanesulphonic acid 2.5 . 10- 3 M. It was pumped at a flow-rate of 0.8 ml/min unless statedotherwise. The ion pair was detected at 290 nm.
The solutions were filtered through a 0.5-j.lm Millipore filter and degassed. Allanalyses were carried out isocratically at room temperature.
RESULTS AND DISCUSSION
Considerable attention has to be paid to sample preparation. Orellanine haspoor solvent solubility and stability. It is better to dissolve the toxin in water. Insolublebetween pH 1 and 8.4, it is largely soluble at pH values above 8.4 and below 1.Nevertheless, we noted the low stability of orellanine at alkaline pH. To overcomethese solubility and stability problems, we propose a number of precautions.Orellanine should be dissolved at pH 0 and diluted at pH 1. Occasionally, additionalspots or peaks were noticed when orellanine solutions were exposed to daylight. Toavoid any photolytic decomposition, we recommended that the chromatography becarried out in a fume cupboard.
The choice of a thin chromatographic layer was very difficult. Prast et al.Srecommended a silica gel layer with a mixed polar solvent added with organic acid. Wehave found that orellanine does not undergo any migration on such a layer. We haveinvestigated many other layers (silica, aluminium oxide, cellulose, silica bonded with
234 NOTES
diol, amino, cyano, methylsilane and octylsilane functionalities) and eluents. Mostsystems tested do not give successful separations. On the generally used polar layers,orellanine does not migrate at all, due to its very high polarity. On the non-polar ones,the toxin migrates with the solvent front or gives a diffuse streak. A cellulose layerallows a separation. Methanolic eluents give hardly reproducible results with diffusespots. Furthermore, orellanine is oflow stability in methanol. Butanolic eluents, addedwith acetic acid, give successful separations with the water-butanol ratio ranging from1:3 to saturation. The RF values obtained with butanol-acetic acid-water (3:1:1 to4:1:5) eluents are between 0.7 and 0.3 respectively. To transpose the chromatographicsystem to HPLC, we have tried Si-CN HPTLC plates, the polarity of which is knownto be medium. Non-polar solvents give no migration at all while highly polar ones giveno compact spots but large diffuse streaks starting from the application point. Toobtain suitable spots, the pH has to be lowered to 1-2. Addition of acetonitrile or
. dioxane reduces the RF value, for instance, RF = 0.5 with dioxane-phosphoric acidpH 2 (1:1). Decreasing the pH value increases the RF value.
The pH was shown to be the key to resolving the chromatographic determination. A study of the ionic species of orellanine and the corresponding different pKvalues was undertaken using electrochemical'? and spectrometric methods13. The firstpKvalue oforellanine is 1.1. At this pH value, contrary to what is observed at pH > 3,only a few ionic forms of the toxin are present in solution (Fig. 1). At lower pH valuesthe fully protonated form is predominant. This bicationic species is hydrophilic thoughit is not so polar as the other ones present at higher pH. Thus the lowest pH valueusable is required to chromatograph that molecule.
For the determination of orellanine, we propose two reversed-phase HPLCsystems using columns with different polarities (Si-CN and Si-C1s). These bondedphases are known to be stripped by strong acids (pH below 2). Nevertheless, they areusable up to pHI if they are rinsed every night with twice distilled water. With theseprecautions, we used these columns for more than 6 months without any change in thenumber of theoretical plates. The precision of the HPLC methods employing an UVdetector was investigated by calculating the coefficient of variation of the peak areafollowing ten injections of a known quantity onto the column. The chromatographiccharacteristics are given in Table I.
First system with Si~CN bonded phaseThis system allows a rapid, acute, sensitive and economical quantitation of the
toxin. With this medium-polar phase, the recommended eluent is phosphoric acid atpH 1. Under these severe conditions, orellanine is swiftly eluted as a very sharp,symmetrical and reproducible peak (retention time, t R = 4.4 min). Addition ofa medium-polar solvent (dioxane) from 5 to 50% only slightly reduces the retentiontime with this reversed-phase system (from 4 to 3.5 min). Increasing the pH results ina lengthening of the retention time (tR = 10 min at pH 2) with a consequent effect onthe peak width. The asymmetry of the trailing peaks obtained probably indicates thepresence of several ionic forms of orellanine. At pH 1, the peak areas are highly stableduring a day and reproducible from day to day. The detector response for orellaninewas linear within a wide concentration range with an excellent correlation coefficient,r, and a low detection limit.
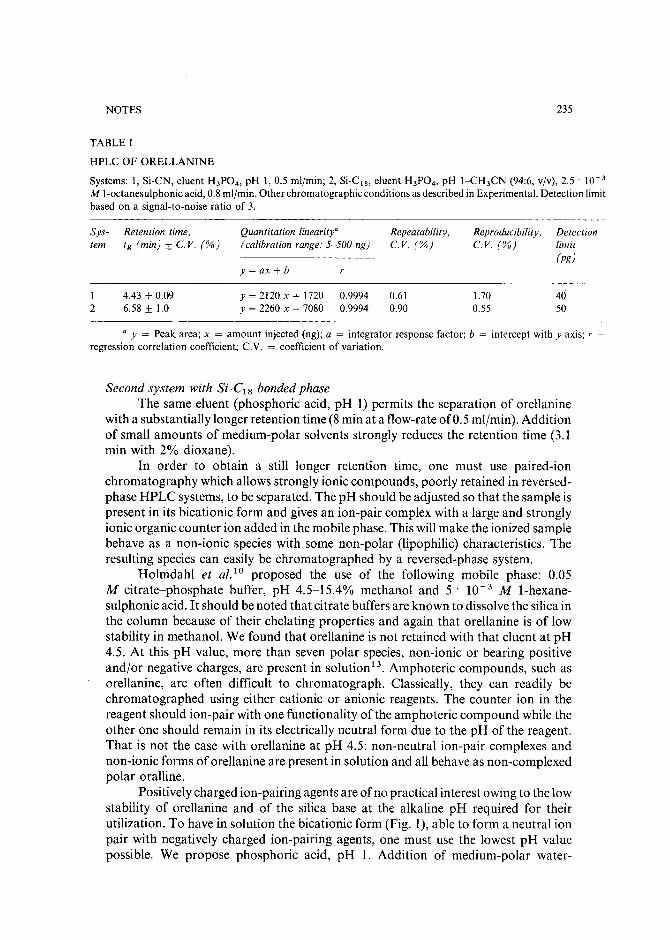
NOTES 235
TABLE I
HPLC OF ORELLANINE
Systems: I, Si-CN, eluent H3P04 , pH 1,0.5 mljmin; 2, Si-C1 S, eluent H3P04 , pH I-eH3CN (94:6, vjv), 2.5 . 10-3
M I-octanesulphonic acid, 0.8 mljmin. Other chromatographic conditions as described in Experimental. Detection limitbased on a signal-to-noise ratio of 3.
Sys- Retention time,tern tR(min)±C.V.(%)
1 4.43 ± 0.092 6.58 ± 1.0
a y = Peak area; x = amount injected (ng); a = integrator response factor; b = intercept with y axis; r =
regression correlation coefficient; C.V. = coefficient of variation.
Second system with Si-C18 bonded phaseThe same eluent (phosphoric acid, pH 1) permits the separation of orellanine
with a substantially longer retention time (8 min at a flow-rate of0.5 nil/min). Additionof small amounts of medium-polar solvents strongly reduces the retention time (3.1min with 2% dioxane).
In order to obtain a still longer retention time, one must use paired-ionchromatography which allows strongly ionic compounds, poorly retained in reversedphase HPLC systems, to be separated. The pH should be adjusted so that the sample ispresent in its bicationic form and gives an ion-pair complex with a large and stronglyionic organic counter ion added in the mobile phase. This will make the ionized samplebehave as a non-ionic species with some non-polar (lipophilic) characteristics. Theresulting species can easily be chromatographed by a reversed-phase system.
Holmdahl et al.:? proposed the use of the following mobile phase: 0.05M citrate-phosphate buffer, pH 4.5-15.4% methanol and 5' 10- 3 M 1-hexanesulphonic acid. It should be noted that citrate buffers are known to dissolve the silica inthe column because of their chelating properties and again that orellanine is of lowstability in methanol. We found that orellanine is not retained with that eluent at pH4.5. At this pH value, more than seven polar species, non-ionic or bearing positiveand/or negative charges, are present in solution13
. Amphoteric compounds, such asorellanine, are often difficult to chromatograph. Classically, they can readily bechromatographed using either cationic or anionic reagents. The counter ion in thereagent should ion-pair with one functionality of the amphoteric compound while theother one should remain in its electrically neutral form due to the pH of the reagent.That is not the case with orellanine at pH 4.5: non-neutral ion-pair complexes andnon-ionic forms of orellanine are present in solution and all behave as non-complexedpolar oralline.
Positively charged ion-pairing agents are of no practical interest owing to the lowstability of orellanine and of the silica base at the alkaline pH required for theirutilization. To have in solution the bicationic form (Fig. 1), able to form a neutral ionpair with negatively charged ion-pairing agents, one must use the lowest pH valuepossible. We propose phosphoric acid, pH 1. Addition of medium-polar water-
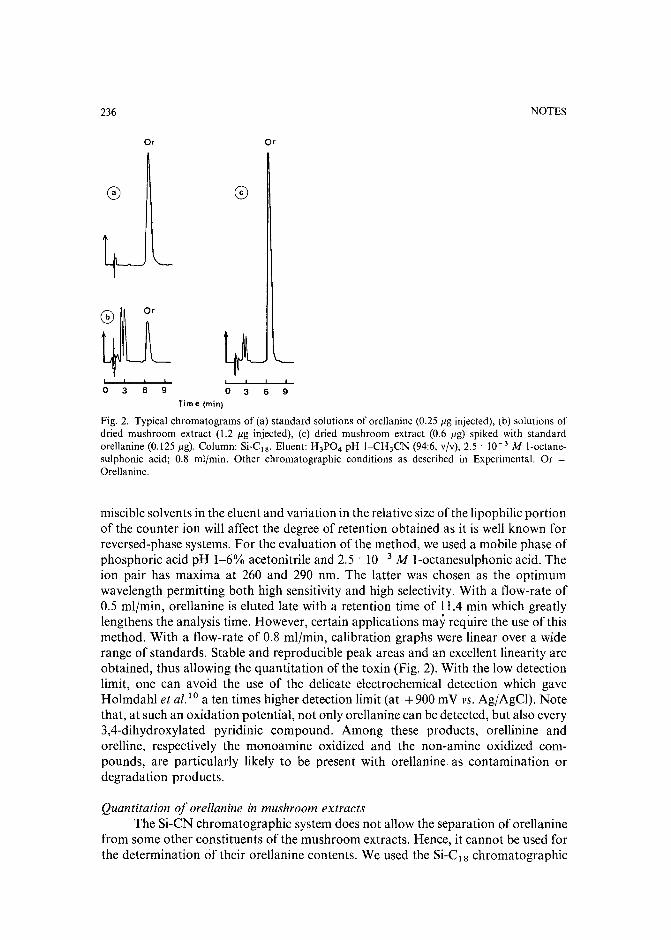
236
Or
4U-, , ! I
o 3 6 9
Time (min)
Or
o 3 6 9
NOTES
Fig. 2. Typical chromatograms of (a) standard solutions of orellanine (0.25 I'g injected), (b) solutions ofdried mushroom extract (1.2 ug injected), (c) dried mushroom extract (0.6 I'g) spiked with standardorellanine (0.125I'g). Column: Si-C1 8 . Eluent: H 3P0 4 pH l-CH3CN (94:6, vjv), 2.5' 10- 3 M l-octanesulphonic acid; 0.8 mljmin. Other chromatographic conditions as described in Experimental. Or =
Orellanine.
miscible solvents in the eluent and variation in the relative size of the lipophilic portionof the counter ion will affect the degree of retention obtained as it is well known forreversed-phase systems. For the evaluation of the method, we used a mobile phase ofphosphoric acid pH 1-6% acetonitrile and 2.5 . 10- 3 M l-octanesulphonic acid. Theion pair has maxima at 260 and 290 nm. The latter was chosen as the optimumwavelength permitting both high sensitivity and high selectivity. With a flow-rate of0.5 mljmin, orellanine is eluted late with a retention time of 11.4 min which greatlylengthens the analysis time. However, certain applications may require the use of thismethod. With a flow-rate of 0.8 mljmin, calibration graphs were linear over a widerange of standards. Stable and reproducible peak areas and an excellent linearity areobtained, thus allowing the quantitation of the toxin (Fig. 2). With the low detectionlimit, one can avoid the use of the delicate electrochemical detection which gaveHolmdahl et at. to a ten times higher detection limit (at +900 mV vs. AgjAgCl). Notethat, at such an oxidation potential, not only orellanine can be detected, but also every3,4-dihydroxylated pyridinic compound. Among these products, orellinine andorelline, respectively the monoamine oxidized and the non-amine oxidized compounds, are particularly likely to be present with orellanine as contamination ordegradation products.
Quantitation of orellanine in mushroom extractsThe Si-CN chromatographic system does not allow the separation of orellanine
from some other constituents of the mushroom extracts. Hence, it cannot be used forthe determination of their orellanine contents. We used the Si-C t 8 chromatographic
NOTES 237
system to quantitate the toxin in several dried mushroom extracts stored for I year(Fig. 2). The same content of 4.0 ± 0.2% (wjw) was assessed either by the directmethod or by the standard addition method in these extracts, corresponding toa content of 1.2% (wjw) in the dried powder of Cortinarius orellanus. The accuracy ofthe determination is 1.8%.
CONCLUSION
Two efficient methods of separation and quantitation are now at our disposal toassess the content of orellanine. With the medium-polar or apolar phases chosen,orellanine, or its ion-pair complex respectively, is eluted either rapidly or withretention times which can be lengthened for the purpose in hand. This allows theseparation of orellanine from molecules with different polarities in different mediawith a low detection limit (40 and 50 pg on column).
ACKNOWLEDGEMENT
This work was supported by a grant from the Fondation pour la RechercheMedicale.
REFERENCES
I T. Schumacher and K. Heiland, Arch. Toxicol., 53 (1983) 87.2 J.-M. Richard, J. Louis and D. Cantin, Arch. Toxicol., 62 (1988) 242.3 G. Klein, J.-M. Richard and M. Satre, Microbiol. Lett., Fed. Eur. Microbiol. Soc., 33 (1986) 19.4 J.-M. Richard, P. Ravanel and D. Cantin, Toxicon, 25 (1987) 350.5 W. Z. Antkowiak and W. P. Gessner, Tetrahedron Lett., 21 (1979) 1931.6 M. Tiecco" M. Tingoli, L. Testaferri, D. Chianelli and E. Wenkert, Tetrahedron, 42 (1986) 1475.7 C. Cohen-Addad, J.-M. Richard and J. C. Guitel, Acta Crystallogr., Sect. c., 43 (1987) 504.8 H. Prast, E. R. Werner, W. Pfaller and M. Moser, Arch. Toxicol., 62 (1988) 81.9 C. Andary, S. Rapior, A. Fruchier and G. Privat, Cryptogamie, Mycol., 7 (1986) 189.
10 J. Holmdahl, J. Ahlmen, S. Bergek, S. Lundberg and S.-A. Persson, Toxicon, 25 (1987) 195.II W. Z. Antkowiak and W. P. Gessner, Bull. Acad. Pol. Sci., Ser. Sci. Chim., 23 (1975) 729.12 D. Cantin, J.-M. Richard, D. Serve and J. Alary, Electrochim. Acta, 33 (1988) 1047.13 J.-M. Richard, D. Cantin and J.-L. Benoit-Guyod, in preparation.
Journal of Chromatography, 478 (1989) 238-243Elsevier Science Publishers B.V., Amsterdam - Printed in The Netherlands
CHROM. 21 607
Note
Capillary isotachophoretic separation of phosphate. arsenate. germanate. silicate and molybdate ions using complex-forming equilibria
MASAHlKO KAN, FUMIO KOMATSU, SHUNITZ TANAKA, HlTOSHl YOSHIDA and MITSUHlKOTAGA*
Department of Chemistry, Faculty of Science, Hokkaido University, Sapporo 060 (Japan)
(First received March 28th, 1989, revised manuscript received May 8th, 1989)
Capillary isotachophoresis (CITP) is an excellent technique for the separationand determination of ionic species, requiring only a short period of time and smallamounts of samples.
In a previous paper", we have shown that CITP in combination with an enrichment technique is useful for the determination of phosphate ion at the I u.M level.Phosphate ion was collected on a membrane filter by a facile and rapid procedure asthe ion pair of molybdophosphate with bis[2-(5-chloro-2-pyridylazo)-5-diethylaminophenolato]cobalt(I1I). The ion pair was dissolved in N,N-dimethylformamideand the solution was injected into the CITP analyzer. In this method, however, theseparation of phosphate ion from arsenate ion, which was also enriched, was notachieved.
Phosphate and arsenate ions resemble each other in chemical properties. Therefore, the determination of one of these ions is often subject to interference by theother ion in some methods, such as spectrophotometry based on the formation of anheteropoly acid with molybdatev". The separation of phosphate and arsenate bychromatographic methods has been reportedv". However, there is no report of theseparation of these ions by CITP. Such a separation is difficult because of the resemblance in chemical properties and, therefore, the similarity in effective mobilities.
Some attempts have been made to improve the separability in CITp6-
9, of
which the use of complex-forming or ion-pairing equilibria is most effective. We havealso developed some migration systems using complex-forming or ion-pairing equilibria for the separation of ionic species whose effectivemobilites were similar l o
-l 3 or
for electrically neutral species such as catechol derivatives!".In the present paper, the separation of phosphate and arsenate as well as of
germanate, silicate and molybdate is described. The complex-forming equilibria ofphosphate and arsenate ions with magnesium ion added to the leading electrolyte areeffective for the separation. The difference in the effective mobilities of phosphate andarsenate ions increases with the difference in stabilities of the complexes.
0021-9673/89/$03.50 © 1989 Elsevier Science Publishers B.V.
NOTES
EXPERIMENTAL
239
ApparatusA Shimadzu Model IP-l B capillary isotachophoretic analyzer with a potential
gradient detector was used. The separation was carried out in a polytetrafluoroethylene isotachophoretic tube consisting of a precapillary tube (50 mm x 1.0 mm I.D.)and a main capillary tube (150 mm x 0.5 mm LD.).
ReagentsThe stock solutions of phosphate, arsenate and molybdate ions were prepared
by dissolving potassium dihydrogenphosphate, disodium hydrogenarsenate and ammonium molybdate in water, respectively. For the stock solutions of germanate andsilicate ions, standard solutions of germanium and silicon (Wako Pure ChemicalIndustries, Osaka, Japan, atomic absorption spectrophotometry grade) were used.The stock solution of germanium was an aqueous solution of germanium(IV) oxideand that of silicon was a 0.02 M sodium carbonate aqueous solution of sodiumsilicate.
The leading electrolyte was prepared by diluting stock solutions of 1 M hydrochloric acid, 1 M magnesium chloride solution and 1% poly(vinyl alcohol), and thepH was adjusted by adding tris(hydroxymethyl)aminomethane (Tris). The pH of theterminating electrolyte was adjusted by adding potassium hydroxide.
The leading and terminating electrolyte systems are listed in Table I.
RESULTS AND DISCUSSION
Selection of electrolyte systemsFor the migration of germanate and silicate ions which are conjugate bases of
weak acids, alkaline electrolyte systems were used. As the buffering counter ions inthese systems, Tris and ammonia were examined. Ammonia was not suitable becausethe difference in the effective mobilities of the leading and terminating ions is small.Tris is useful as a buffering counter ion up to pH ca. 9 and has an adequate migrationvelocity.
In the alkaline solutions, a zone of carbonate ion penetrated from the terminating electrolyte across the sample zones, and therefore the time required for analysis
TABLE I
LEADING AND TERMINATING ELECTROLYTE SYSTEMS
IonCounter ionpHAdditives
Leading electrolyte
10 mM CI- (added as HCI and MgClz)TrisH+8.50.01% poly(vinyl alcohol)3 mM Mg2+ (added as MgClz)5% Methanol
Terminating electrolyte
10mM fJ-alaninateK + (added as KOH)10.4
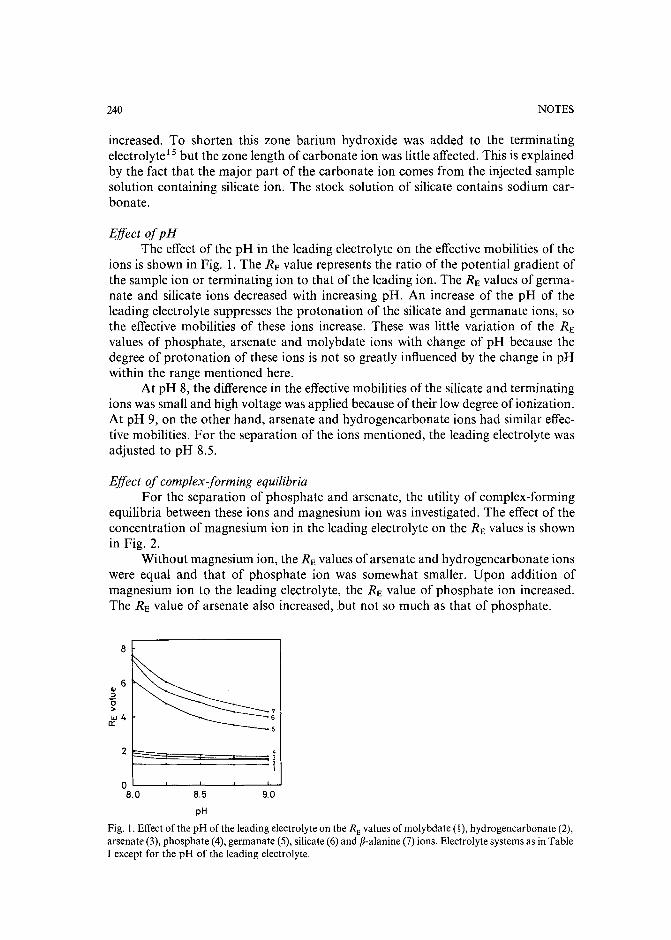
240 NOTES
increased. To shorten this zone barium hydroxide was added to the terminatingelectrolyteP but the zone length of carbonate ion was little affected. This is explainedby the fact that the major part of the carbonate ion comes from the injected samplesolution containing silicate ion. The stock solution of silicate contains sodium carbonate.
Effect ofpHThe effect of the pH in the leading electrolyte on the effective mobilities of the
ions is shown in Fig. 1. The RE value represents the ratio of the potential gradient ofthe sample ion or terminating ion to that of the leading ion. The RE values of germ anate and silicate ions decreased with increasing pH. An increase of the pH of theleading electrolyte suppresses the protonation of the silicate and germanate ions, sothe effective mobilities of these ions increase. These was little variation of the RE
values of phosphate, arsenate and molybdate ions with change of pH because thedegree of protonation of these ions is not so greatly influenced by the change in pHwithin the range mentioned here.
At pH 8, the difference in the effective mobilities of the silicate and terminatingions was small and high voltage was applied because of their low degree of ionization.At pH 9, on the other hand, arsenate and hydrogencarbonate ions had similar effective mobilities. For the separation of the ions mentioned, the leading electrolyte wasadjusted to pH 8.5.
Effect of complex-forming equilibriaFor the separation of phosphate and arsenate, the utility of complex-forming
equilibria between these ions and magnesium ion was investigated. The effect of theconcentration of magnesium ion in the leading electrolyte on the RE values is shownin Fig. 2.
Without magnesium ion, the RE values of arsenate and hydrogencarbonate ionswere equal and that of phosphate ion was somewhat smaller. Upon addition ofmagnesium ion to the leading electrolyte, the RE value of phosphate ion increased.The RE value of arsenate also increased, but not so much as that of phosphate.
9.00'-----'-------'--.........----'--'8.0
8
6CIJ::lo>w4a:
8.5
pH
Fig. I. Effect of the pH of the leading electrolyte on the RE values of molybdate (I), hydrogencarbonate (2),arsenate (3), phosphate (4), germanate (5), silicate (6) and f3-alanine(7) ions. Electrolyte systems as in TableI except for the pH of the leading electrolyte.
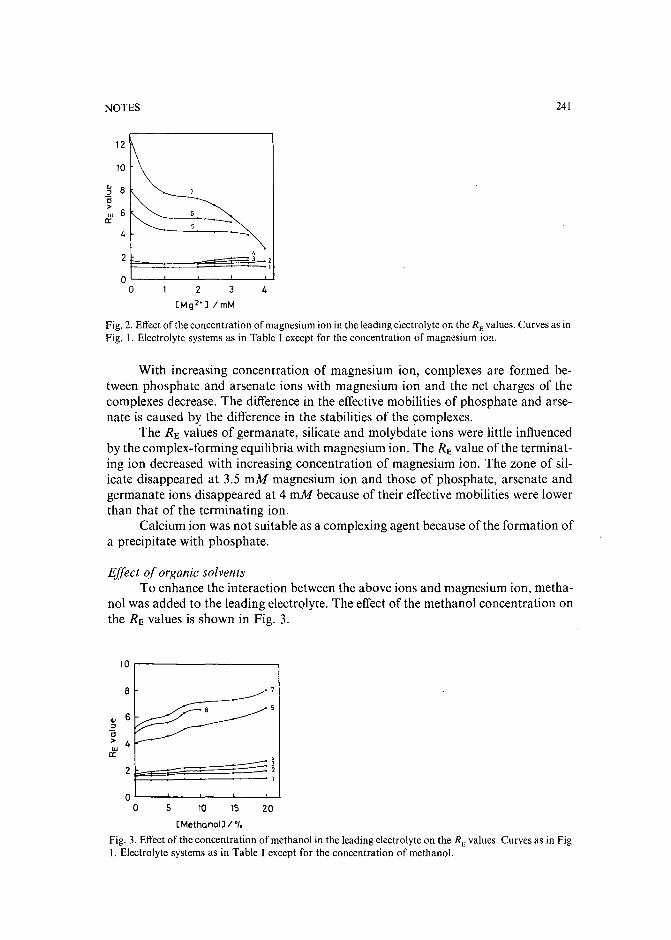
NOTES 241
12
10
.. 8::Jc;>w 6
a:4
2
00 2 3 4
[Mg2'J!mM
Fig. 2. Effect of the concentration of magnesium ion in the leading electrolyte on the RE values. Curves as inFig. I. Electrolyte systems as in Table I except for the concentration of magnesium ion.
With increasing concentration of magnesium ion, complexes are formed between phosphate and arsenate ions with magnesium ion and the net charges of thecomplexes decrease. The difference in the effective mobilities of phosphate and arsenate is caused by the difference in the stabilities of the complexes.
The RE values of germanate, silicate and molybdate ions were little influencedby the complex-forming equilibria with magnesium ion. The RE value of the terminating ion decreased with increasing concentration of magnesium ion. The zone of silicate disappeared at 3.5 mM magnesium ion and those of phosphate, arsenate andgermanate ions disappeared at 4 mM because of their effective mobilities were lowerthan that of the terminating ion.
Calcium ion was not suitable as a complexing agent because of the formation ofa precipitate with phosphate.
Effect of organic solventsTo enhance the interaction between the above ions and magnesium ion, metha
nol was added to the leading electrolyte. The effect of the methanol concentration onthe RE values is shown in Fig. 3.
10
8
.. 6::Jc;> 4wa:
2
00 5 10 15 20
[Methanol]! "10
Fig. 3. Effect of the concentration of methanol in the leading electrolyte on the RE values. Curves as in Fig.I. Electrolyte systems as in Table I except for the concentration of methanol.
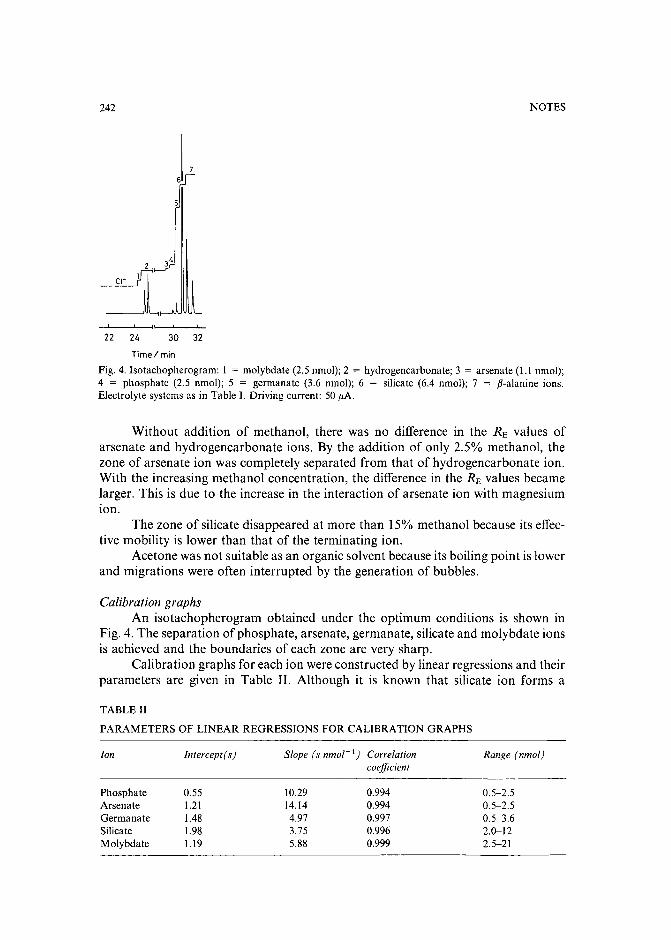
242 NOTES
22 24 30 32
Time/min
Fig. 4. Isotachopherogram: I = molybdate (2.5 nmol); 2 = hydrogencarbonate; 3 = arsenate (1.1 nmol);4 = phosphate (2.5 nmol); 5 = germanate (3.6 nmol); 6 = silicate (6.4 nmol); 7 = p-alanine ions.Electrolyte systems as in Table L Driving current: 50 IJA.
Without addition of methanol, there was no difference in the RE values ofarsenate and hydrogencarbonate ions. By the addition of only 2.5% methanol, thezone of arsenate ion was completely separated from that of hydrogencarbonate ion.With the increasing methanol concentration, the difference in the RE values becamelarger. This is due to the increase in the interaction of arsenate ion with magnesiumion.
The zone of silicate disappeared at more than 15% methanol because its effective mobility is lower than that of the terminating ion.
Acetone was not suitable as an organic solvent because its boiling point is lowerand migrations were often interrupted by the generation of bubbles.
Calibration graphsAn isotachopherogram obtained under the optimum conditions is shown in
Fig. 4. The separation of phosphate, arsenate, germanate, silicate and molybdate ionsis achieved and the boundaries of each zone are very sharp.
Calibration graphs for each ion wereconstructed by linear regressions and theirparameters are given in Table II. Although it is known that silicate ion forms a
TABLE II
PARAMETERS OF LINEAR REGRESSIONS FOR CALIBRATION GRAPHS
Ion Intercept(s) Slope (s nmol: 1) Correlation Range (nmol)coefficient
Phosphate 0.55 10.29 0.994 0.5-2.5Arsenate 1.21 14.14 0.994 0.5-2.5Germanate 1.48 4.97 0.997 0.5-3.6Silicate 1.98 3.75 0.996 2.0-12Molybdate 1.19 5.88 0.999 2.5-21
NOTES
TABLE III
RELATIVE STANDARD DEVIATIONS OF ZONE LENGTHS
Ion R.S.D. (%) Replicate
Phosphate 2.0 9Arsenate 2.6 9Germanate 8.4 10Silicate 3.8 10Molybdate 3.2 10
Amount (nmol)
2.51.13.66.42.5
243
precipitate with magnesium ion, it had no influence within the concentrations studied.Relative standard deviations of the zone lengths for each ion are listed in Table III.The linearities of calibration graphs and the reproducibilities of the zone lengths foreach ion are satisfactory for the determination of these ions.
REFERENCES
1 M. Taga, M. Kan, F. Komatsu, S. Tanaka and H. Yoshida, Anal. Sci., 5 (1989) 219.2 M. Taga and M. Kan, Bull. Chem. Soc. Jpn., 62 (1989) 1482.3 T. Nasu and M. Kan, Analyst (London), 113 (1988) 1683.4 T. Takamatsu, M. Kawashima and M. Koyama, Bunseki Kagaku, 28 (1979) 596.5 R. J. Williams, Anal. Chem., 55 (1983) 851.6 F. M. Everaerts, J. L. Beckers and T.P.E.M. Verheggen, Isotachophoresis, Theory, Instrumentation and
Applications, Elsevier, Amsterdam, 1976, Chs. 16 and 17.7 H. Miyazaki and K. Katoh, Tohsoku Denki Eidoh Hoh, Kohdansha, Tokyo, 1980, Ch. 7.8 P. Bocek, M. Dem!, P. Gebauer and V. Dolnik, Analytical Isotachophoresis, VCH, Weinheim, 1988,
Ch.9.9 P. Bocek, I. Miedziak, M. Deml and J. Janak, J. Chromatogr., 137 (1977) 83.
10 I. Nukatsuka and H. Yoshida, J. Chromatogr., 237 (1982) 506.11 H. Yoshida, M. Hida and M. Taga, J. Chromatogr., 325 (1985) 179.12 Y. Hirama and H. Yoshida, Nippon Kagaku Kaishi, 1986,943.13 S. Tanaka, T. Kaneta and H. Yoshida, J. Chromatogr., 447 (~988) 383.14 S. Tanaka, T. Kaneta and H. Yoshida, Anal. s«, 5 (1989) 217.15 P. Bocek, M. Deml, P. Gebauer and V. Dolnik, Analytical Isotachophoresis, VCH, Weinheim, 1988,
Ch. 10, p. 191.
Journal of Chromatography, 478 (1989) 244-249Elsevier Science Publishers B.V., Amsterdam - Printed in The Netherlands
CHROM. 21 649
Note
Analytical high-performance liquid chromatography system for separation of components in nonoxynol-9spermicidal aqents"
D. BRUCE BLACK, BRIAN A. DAWSON and GEORGE A. NEVILLE*
Bureau ofDrug Research, Health Protection Branch, Health and Welfare Canada, Tunney's Pasture, Ottawa,Ontario KIA OL2 (Canada)
(First received February 6th, 1989; revised manuscript received May 8th, 1989)
Extensive use of high-performance liquid chromatography (HPLC) has beenmade during the past decade to investigate a wide range of ethoxylated non-ionicsurfactants-:" and anionic surfactants'<'r'". HPLC has been particularly valuable foranalysing industrial and domestic waste water for levels and distributions of linearalkylbenzenesulphonates (LASs), alkylphenol polyethoxylates (APEOs), and nonylphenol (NP) for environmental control'{"!", for determination of non-ionic surfactants used in tertiary oil recovery-", and for determining dodecylbenzenesulphonatesand ethoxylated alkylphenols in liquid pesticide forrnulations'".
Nonoxynol-9 (nonylphenoxypolyethoxyethanol, CH3(CH2)sC6H4(OCH2CH2)nOH), as commercially produced, is a complex non-ionic surfactant consisting ofmixtures of oligomers of polyethoxylated nonylphenol. The average value of n is saidto be about 9 (ref. 16), although this value appears to be more coincidental to its namethan the fact its oligomers bear chiefly the nonylphenoxy terminal group as comparedto the diisobutylphenoxy terminus of octoxynol-9, another widely used nonionicsurfactant. In principal, any number of nonoxynol-X mixtures can be produced foreach of which X represents the average number of repeating polyethyleneglycol units,which, in tern, affect the viscosity, solubility, polarity, and dispersant properties of theparticular surfactant formulation 17. In particular, nonoxynols-4, -15, and -30 are usedas pharmaceutical formulating aids (surfactants)!". Our interest in nonoxynol-9 arisesover its use as a spermicidal agent, as found in most vaginal contraceptive jellies,creams, aerosol foams and lubricated (coated) condoms sold over-the-counter in manycountries including Canada. The purpose of this investigation was to characterize theclaimed active spermicidal agent of a new product, a soft polyurethane vaginalcontraceptive sponge containing nonoxynol-9, being prepared for introduction to theCanadian market, and to compare its chemical features with those of other commercialnonoxynol-9 raw samples.
a Presented in part at the 169th Annual Canadian Chemical Conference, Saskatoon, Saskatchewan,Canada, 1-4 June, 1986.
NOTES
EXPERIMENTAL
245
MaterialsA vaginal sponge, known as Today Vaginal Contraceptive Sponge (VLI Corp.,
Irvine, CA, U.S.A.) was trimmed of its string loop and soaked in methanol (200 ml,HPLC grade) with occasional agitation for 3 h after which the extract was reduced toa viscous fluid (almost 100% recovery of product claim) in a rotary evaporator underpumping vacuum. For comparison, a sample of the raw nonoxynol-9 (Lot RM-106522), as used in manufacture of the Today sponge, was obtained from the VLI Corp.and samples ofraw nonoxynol-9 were obtained from Ortho Pharmaceutical (Canada),Don Mills, Ontario, Canada (Lot Tl623) and from Rougier, Chambley, Quebec,Canada (Lot 11A30RR). All materials were examined by -rr NMR spectroscopy andby HPLC analysis.
InstrumentationHPLC analyses of the raw nonoxynol-9 samples, as well as that extracted from
the vaginal sponge, were performed with a Chromatography Sciences Company silicaS5W 5-/lm column (25 em x 4.6 mm 1.0.) employing an ethyl acetate-methanol (1:1,v/v) mobile phase at a flow-rate of 1 ml/rnin. A Spectra-Physics SP8000B liquidchromatograph was used with a Schoeffel 770 UV-VIS detector at 280 nm.
1H NMR spectra were obtained at 80 MHz and ambient temperature (22°C)from the nonoxynol-9 samples in acetone-a, (containing 1% tetramethylsilaneinternal reference) using a Bruker WP-80 spectrometer.
RESULTS AND DISCUSSION
1 H NMR spectral analysisAcetone-a, was found to be the solvent which resulted in the richest 1H NMR
spectra (Fig. 1) of the nonoxynol-9 samples, and all samples, including the materialextracted from the sponge, gave essentially identical proton spectra. By this analysis,no other component appeared to have been extracted from the urethane sponge.Exchange with 2H20 resulted in simplification of the bands near (j 3.6 and suggeststhat the downfield peaks seen here may arise from the various oligomer hydroxyprotons. The integration is supportive of the gross structural features, i.e., on the basisof the low field pattern «(j 7) arising from 4 aromatic protons, the principal band near(j 3.6 accounts surprisingly well for the 36 protons of the archetypal polyethoxy group(OCH 2CH2)n where ii = 9, and likewise the integral for the two high-field patternsaccounts for the 19 protons of the para-nonyl substituent. In dimethyl sulfoxide-z,(DMSO-d6 ) , the sponge extract showed somewhat similar proton spectral featuresfound in acetone-a, except for some loss of band character, probably due to increasedviscosity of the solution. In 2H20 solution (also at ambient temperature), the protonspectrum of the sponge extract suffered serious loss of band character, probably due tothe formation of micellar colloids.
HPLC analysisThe chromatograms obtained from analysis of the sponge extract and the three
raw nonoxynol-9 samples are shown in Fig. 2. Both the sponge extract and the Rougier
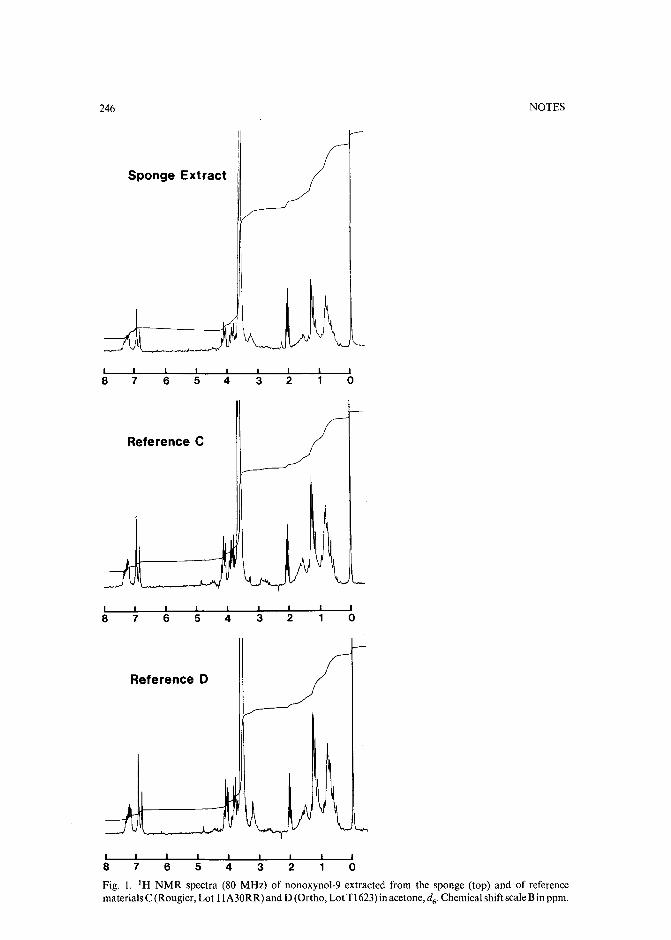
246
Sponge Extract
NOTES
LI I I I I I I I
8 7 6 5 4 3 2 0
Reference C
8 7 6 5 4 3 2 o
Reference 0
8 7 6 5 4 3 2 oFig, 1. IH NMR spectra (80 MHz) of nonoxynol-9 extracted from the sponge (top) and of referencematerials C (Rougier, Lot llA30RR) and D (Ortho, Lot T1623) in acetone, d6 , Chemical shift scale Bin ppm.
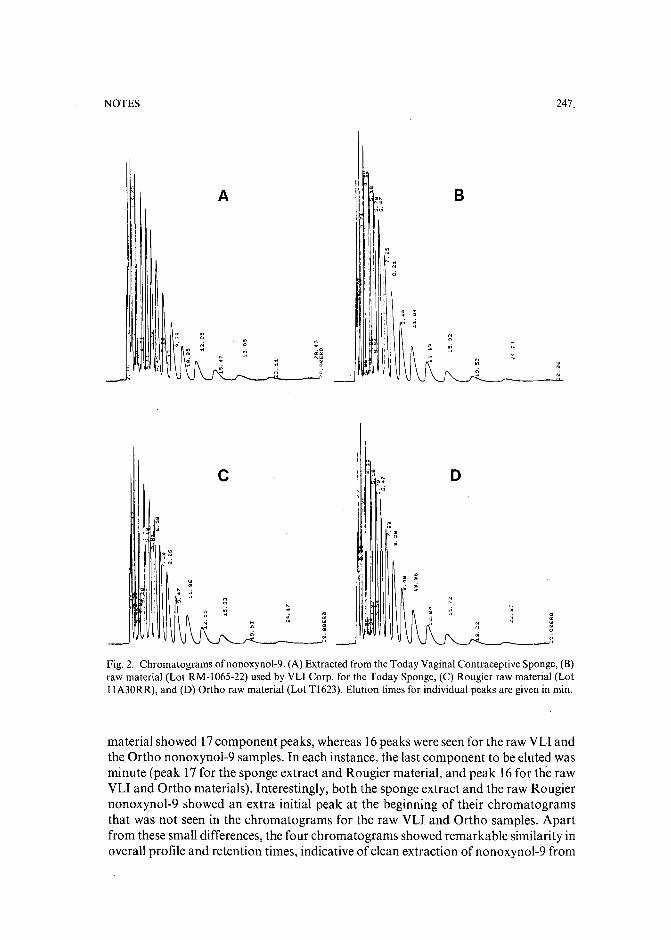
NOTES 247
.;~
A ~, B
~
Ii "I ci
Ii I
II
II I '" ..~ <. I.
"~.Qoo.
NW ".<.
c o
.~
'"
,II
Fig. 2. Chromatograms ofnonoxynol-9. (A) Extracted from the Today Vaginal Contraceptive Sponge, (B)raw material (Lot RM-1065-22) used by VLI Corp. for the Today Sponge, (C) Rougier raw material (LotIIA30RR), and (D) Ortho raw material (Lot Tl623). Elution times for individual peaks are given in min.
material showed 17component peaks, whereas 16peaks were seen for the raw VLl andthe Ortho nonoxynol-9 samples. In each instance, the last component to be eluted wasminute (peak 17 for the sponge extract and Rougier material, and peak 16 for the rawVLI and Ortho materials). Interestingly, both the sponge extract and the raw Rougiernonoxynol-9 showed an extra initial peak at the beginning of their chromatogramsthat was not seen in the chromatograms for the raw VLI and Ortho samples. Apartfrom these small differences, the four chromatograms showed remarkable similarity inoverall profile and retention times, indicative of clean extraction of nonoxynol-9 from
248 NOTES
the sponge with no apparent carryover of other components from the urethanematerial.
The forward phase (normal-phase) non-gradient HPLC system used to obtainthe chromatograms shown in Fig. 2, with near baseline separation, constitutesa simpler and faster HPLC procedure for characterizing the oligomeric composition ofnonoxynol-9 than reported in the literature to date. While Schreuder and Martijrrl?obtained excellent baseline separation of the oligomers of an ICI (U.K.) ethoxylatednonylphenol (NPEO) with an ethoxylation degree (n) of8.5, their procedures requireddouble the time (> 50 min) at the same flow-rate of 1.0 ml/min using an aminopropylmodified silica column (Hypersil APS, 250 mm x 4.6 mm J.D.) with a linear gradientof propan-z-ol-water (90:10) in a mobile solution of hexane-tetrahydrofuran (70:30)with increased ratio of the former to the latter from 0.05 at time 0 to 0.5 in 60 min.Similarly, Marcomini and Giger? separated Marlophen 810, containing NPEOoligomers with an average of 11 and a range of 1-18 ethoxy units, over a 30-mininterval using an aminosilica 3-/lm column (Hypersil APS, 100 mm x 4 mm J.D.)employing initially a 2-min elution of 100% n-hexane-2-propanol mixture (H/IP,98/2) followed by a 25-min linear elution gradient leading to "50% H/IP (98/2) and50% H/IP (98/2)" (erroneously reported - a more polar second solvent mix wouldhave to have been used), at a flow-rate of 1.5 ml/min. Using the same normal-phaseHPLC system, Marcomini and Giger 1 2
, however, were able to separate 16componentsof an NPEO in about 20 min from an unidentified granular laundry detergent ina chromatogram whose peaks were better resolved than those obtained fromMarlophen 810, which they had used as an NPEO standard mixture.
In our HPLC analysis of the nonoxynol-9 spermicidal materials, UV detectionwas effected at 280 nm, very close to the absorption at 277 nm employed by Marcominiand Gigerl? for normal-phase HPLC analyses, because the response factors of NPEOand nonylphenol (NP) were available from the literature!". For investigation of morecomplex detergent systems, Marcomini and Giger 1 2 used UV at 225 nm to benefitfrom about a five-fold increase in intensity of absorption by APEOs and NP in thepresence of LASs. Schreuder and Martijn 15 also employed UV detection at 225 nm;however, polyethylene glycol (PEG), having no absorbance at 225 nm, was notdetected. For HPLC analysis of any of the PEGs, refractometric detection is requiredas demonstrated by Zeman", We chose, instead, to characterize the oligomers,separated under other conditions, using preparative HPLC, by IH NMR and MS2 0 .
In retrospect, simpler, direct forward phase HPLC systems employing silicacolumns for analysis and separation of APEO preparations were undoubtedly tried,but with little apparent success2 1
, 22 . Subsequent analytical development for suchnon-ionic surfactants was directed more towards investigation of properties ofmodified silica columns and gradient elution systems. The better specification andconsistancy of manufacture of silica columns in more recent years, together withgreater exploration of solvent conditions, now make it possible to employ the simpler,direct approach of non-gradient silica HPLC analyses for these substances.
We believe that the analytical HPLC system reported herein constitutesa convenient and rapid, non-gradient method for assessing pharmaceutical nonoxynol-9 preparations.
NOTES
REFERENCES
249
1 J. A. Pile and P. A. Sermon, J. Chromatogr., 398 (1987) 375-380.2 1. Zeman, J. Chromatogr., 363 (1986) 223-230.3 N. Garti, V. R. Kaufman and A. Aserin, Sep. Purif. Methods, 12 (1983) 49-116.4 A. Aserin, N. Garti and M. Frenkel, J. Liq. Chromatogr., 7 (1984) 1545-1557.5 M. Kudoh, J. Chromatogr., 291 (1984)327-330.6 A. Aserin, M. Frenkel and N. Garti, J. Am. Oil Chem. Soc., 61 (1984) 805-809.7 M. Kudoh, S. Fudans and S. Yamaguchi, J. Chromatogr., 205 (1981) 473-477.8 M. C. Allen and D. E. Linder, J. Am. Oil Chem. Soc., (1981) 950-957.9 P. K. G. Hodgson and N. J. Stewart, J. Chromatogr., 387 (1987) 546-550.
10 R. E. A. Escott, S. J. Brinkworth and J. A. Steedman, J. Chromatogr., 282 (1983) 655-661.11 A. Marcomini, S. Capri and W. Giger, J. Chromatogr., 403 (1987) 243-252.12 A. Marcomini and W. Giger, Anal. Chem., 59 (1987) 1709-1715.13 M. S. Holt, E. H. McKerrell, J. Perry and R. J. Watkinson, J. Chromatogr., 362 (1986) 419-424.14 P. L. Desbene, B. Desmazieres, J. J. Basselier and L. Minssieux, Chromatographia, 24 (1987) 588-592.15 R. H. Schreuder and A. Martijn, J. Chromatogr., 435 (1988) 73-82.16 Seventh Supplement 10 U.S. Pharmacopeia XXI and to National Formulary XVI, United States
Pharmacopeial Convention, Rockville, MD, 1988 p. 2811.17 W. B. Satkowski, S. K. Huang and R. L. Liss in M. J. Schick (Editor), Nonionic Surfactants, Vol. 1,
Marcel Dekker, New York, 1967, Ch. 4.18 Merck Index, Merck & Co., Rahway, NJ, 10th ed., 1983, item No. 6518, p. 6522.19 M. Ahe1 and W. Giger, Anal. Chem., 57 (1985) 2584-2590.20 D. B. Black, B. A. Dawson, J.-c. Ethier and G. A. Neville, submitted for publication. .21 K. J. Bombaugh, R. F. Levangie, R. N.King and L. Abrahams,J. Chromatogr. Sci., 8 (1970)'657-663.22 J. F. K. Huber, F. F. M. Kolder and J. M. Miller, Anal. Chem., 44 (\972) 105-110.
Journal of Chromatography, 478 (1989) 250-254Elsevier Science Publishers B.Y., Amsterdam - Printed in The Netherlands
CHROM. 21624
Note
Separation of pirimicarb and its metabolites by high-performanceliquid chromatography
PAOLO CABRAS*, LORENZO SPANEDDA and CARLO TUBEROSO
Istituto di Chimica Farmaceutica, Tossicologica ed Applicata, Viale Diaz 182, 09100 Cagliari (Italy)
and
MARA GENNARI
Istituto di Chimica Agraria, Via P. Giuria 15,10126 Turin (Italy)
(Received March 28th, 1989)
Pirimicarb, 2-dimethylamino-5,6-dimethylpyrimidin-4-yl dimethylcarbamate(I) (Fig. 1)is a selective aphicide with rapid contact and translaminar actions; it is takenup by roots and translocated in the xylem system 1. Its highly selective action makes itespecially suitable for integrated control programmes. A rapid reduction ofpirimicarboccurs in plants after spraying, mainly by volatilization but also by photochemical andmetabolic degradation, the major products being compounds II and III (Fig. 1). Someof the residue cannot be extracted from cabbage leaves (14%) or from lettuce (25%) byconventional techniques",
Pirimicarb is extensively degraded in soil, the principal route being thehydrolysis of the carbamate moiety either by biological or chemical means. Compounds V, VI and III are the major metabolites (Fig. 1); compound V is the majorproduct (84%) of the photochemical degradation on the soil surface".
Even in animals, the principal degradation route of pirimicarb is the hydrolysisof the carbamate moiety: the hydroxypyrimidines V-VII are the major productswhereas the carbamate-containing metabolites are absent or in very low amount(8%)3.
For residue analysis, gas chromatography (GC) has been employed in order todetermine pirimicarb" and its carbamate-containing metabolites II and 1115
. Highperformance liquid chromatography (HPLC) has recently been used with UV-VISdetection'':? and with fluorescence detection"; with this technique, pirimicarb and itsmetabolite desmethyl-pirimicarb (III) were determined in various crops.
In this paper an HPLC separation of pirimicarb and its major metabolites isreported.
EXPERIMENTAL
ApparatusA Varian (Palo Alto, CA, U.S.A.) Model 5020 liquid chromatograph was
employed, equipped. with a variable-wavelength UV-100 UV-VIS detector and
0021-9673/89/$03.50 © 1989 Elsevier Science Publishers B.Y.
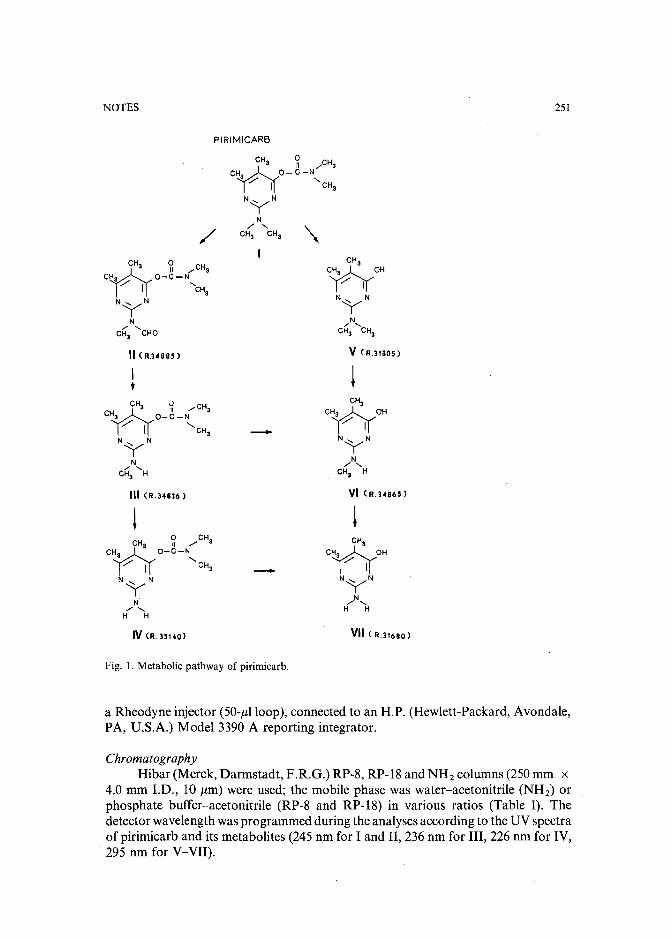
NOTES
PIRIMICARB
251
/
II (R.34885>
It
V (R.31805)
~
III (R.34836)
IV (R.35UO)
-
-
VI (R.3H65>
~
VII (R.31680)
Fig. 1. Metabolic pathway of pirimicarb.
a Rheodyne injector (50-/l1100p), connected to an H.P. (Hewlett-Packard, Avondale,PA, U.S.A.) Model 3390 A reporting integrator.
ChromatographyHibar (Merck, Darmstadt, F.R.G.) RP-8, RP-18 and NH 2 columns (250mm x
4.0 mm 1.0., 10 /lm) were used; the mobile phase was water-acetonitrile (NH 2) orphosphate buffer-acetonitrile (RP-8 and RP-18) in various ratios (Table I). Thedetector wavelength was programmed during the analyses according to the UV spectraofpirimicarb and its metabolites (245 nm for I and II, 236 nm for III, 226 nm for IV,295 nm for V-VII).
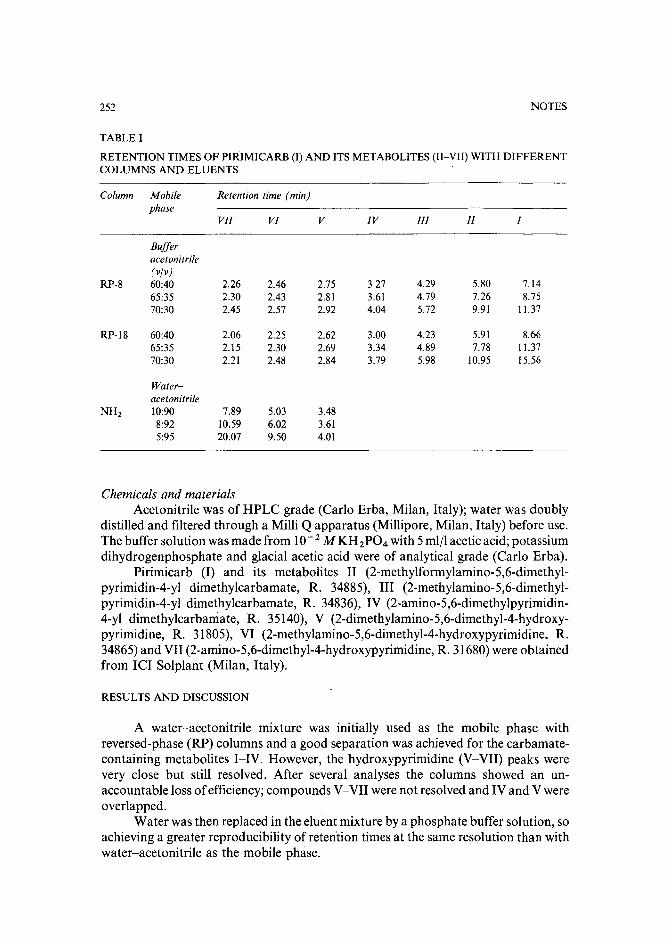
252 NOTES
TABLE I
RETENTION TIMES OF PIRIMICARB (I) AND ITS METABOLITES (II-VII) WITH DIFFERENTCOLUMNS AND ELUENTS
Column Mobile Retention time (min)phase
VII VI V IV III II I
Buffer-acetonitrile(v]v)
RP-8 60:40 2.26 2.46 2.75 3.27 4.29 5.80 7.1465:35 2.30 2.43 2.81 3.61 4.79 7.26 8.7570:30 2.45 2.57 2.92 4.04 5.72 9.91 11.37
RP-18 60:40 2.06 2.25 2.62 3.00 4.23 5.91 8.6665:35 2.15 2.30 2.69 3.34 4.89 7.78 11.3770:30 2.21 2.48 2.84 3.79 5.98 10.95 15.56
Water-acetonitrile
NH2 10:90 7.89 5.03 3.488:92 10.59 6.02 3.615:95 20.07 9.50 4.01
Chemicals and materialsAcetonitrile was of HPLC grade (Carlo Erba, Milan, Italy); water was doubly
distilled and filtered through a Milli Q apparatus (Millipore, Milan, Italy) before use.The buffer solution was made from 10- 2 MKH2P04 with 5mljl acetic acid; potassiumdihydrogenphosphate and glacial acetic acid were of analytical grade (Carlo Erba).
Pirimicarb (I) and its metabolites II (2-methylformylamino-5,6-dimethylpyrimidin-4-yl dimethylcarbamate, R. 34885), III (2-methylamino-5,6-dimethylpyrimidin-4-yl dimethylcarbamate, R. 34836), IV (2-amino-5,6-dimethylpyrimidin4-yl dimethylcarbamate, R. 35140), V (2-dimethylamino-5,6-dimethyl-4-hydroxypyrimidine, R. 31805), VI (2-methylamino-5,6-dimethyl-4-hydroxypyrimidine, R.34865)and VII (2-amino-5,6-dimethyl-4-hydroxypyrimidine, R. 31680)were obtainedfrom ICI Solplant (Milan, Italy).
RESULTS AND DISCUSSION
A water-acetonitrile mixture was initially used as the mobile phase withreversed-phase (RP) columns and a good separation was achieved for the carbamatecontaining metabolites I-IV. However, the hydroxypyrimidine (V-VII) peaks werevery close but still resolved. After several analyses the columns showed an unaccountable loss of efficiency;compounds V-VII were not resolved and IV and V wereoverlapped.
Water was then replaced in the eluent mixture by a phosphate buffer solution, soachieving a greater reproducibility of retention times at the same resolution than withwater-acetonitrile as the mobile phase.
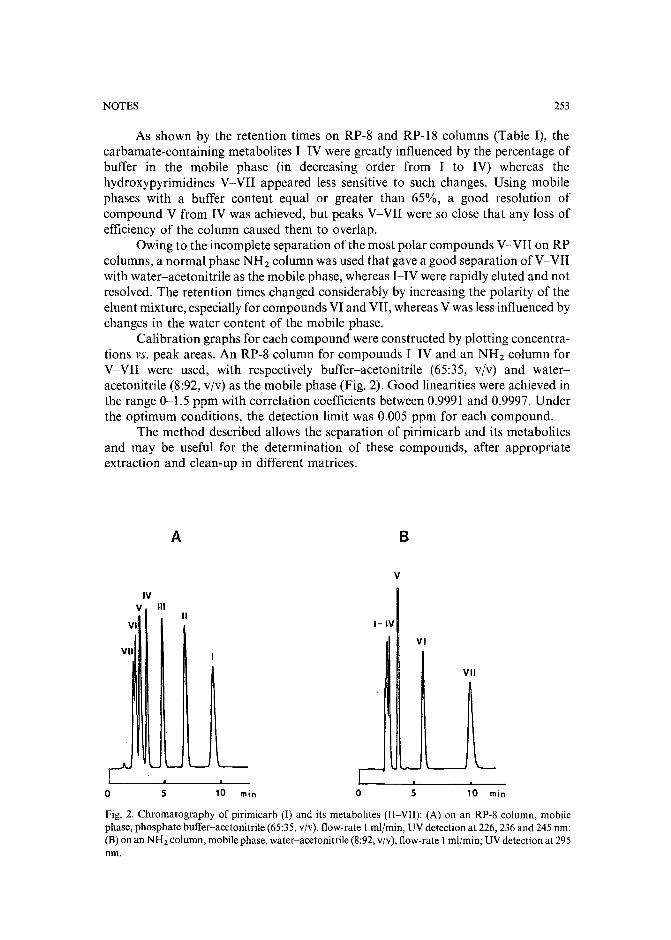
NOTES 253
As shown by the retention times on RP-8 and RP-18 columns (Table I), thecarbamate-containing metabolites I-IV were greatly influenced by the percentage ofbuffer in the mobile phase (in decreasing order from I to IV) whereas thehydroxypyrimidines V-VII appeared less sensitive to such changes. Using mobilephases with a buffer content equal or greater than 65%, a good resolution ofcompound V from IV was achieved, but peaks V-VII were so close that any loss ofefficiency of the column caused them to overlap.
Owing to the incomplete separation of the most polar compounds V-VII on RPcolumns, a normal phase NHzcolumn was used that gave a good separation of V-VIIwith water-acetonitrile as the mobile phase, whereas I-IV were rapidly eluted and notresolved. The retention times changed considerably by increasing the polarity of theeluent mixture, especially for compounds VI and VII, whereas V was less influenced bychanges in the water content of the mobile phase.
Calibration graphs for each compound were constructed by plotting concentrations VS. peak areas. An RP-8 column for compounds I-IV and an NHz column forV-VII were used, with respectively buffer-acetonitrile (65:35, v/v) and wateracetonitrile (8:92, v/v) as the mobile phase (Fig. 2). Good linearities were achieved inthe range 0-1.5 ppm with correlation coefficients between 0.9991 and 0.9997. Underthe optimum conditions, the detection limit was 0.005 ppm for each compound.
The method described allows the separation of pirimicarb and its metabolitesand may be useful for the determination of these compounds, after appropriateextraction and clean-up in different matrices.
IVV 11\
VI
VII
A
\I
B
V
I-IV
VI
VII
o 5 10 min o 5 10 min
Fig. 2. Chromatography of pirimicarb (I) and its metabolites (II-VII): (A) on an RP-8 column, mobilephase, phosphate buffer-acetonitrile (65:35, v(v), flow-rate I ml/rnin, UV detection at 226,236 and 245 nm:(B) on an NH 2 column, mobile phase, water-acetonitrile (8:92, v(v), flow-rate I ml/rnin; UV detection at 295nm.
254
ACKNOWLEDGEMENTS
NOTES
This work was supported by grants from Ministero dell'Agricoltura e Foreste,P.F. "Lotta biologica ed integrata per la difesa delle piante agrarie e forestali"-Gruppo Residui.
REFERENCES
C. R. Worthing (Editor), The Pesticide Manual, The British Crop Protection Council, Lavenham, 8thed., 1987.
2 Pesticides Residues in Food: 1976 Evaluations, FAa/WHO, Rome, 1977, p. 535.3 Pesticides Residues in Food: 1978 Evaluations, FAa/WHO, Rome, 1979, p. 209.4 J. E. Bagness and W. G. Sharples, Analyst (London), 99 (1974) 225.5 D. J. W. Bullock, in G. Zweig (Editor), Analytical Methods for Pesticides, Plant Growth Regulators and
Food Additives, Vol. VII, Academic Press, New York and London, 1973, p. 399.6 M. D. Osselton and R. D. Snelling, J. Chromatogr., 368 (1986) 265.7 P. Cabras, M. G. Lalli, M. Meloni, F. M. Pirisi, F. Cabitza, M. Cubeddu and M. Porcu, Riv, Soc. Ital.
Sci. Alim., 17 (1988) 61.8 J. W. Dornseiffen and W. Verwaal, 6th International Congress ofPesticide Chemistry 1UPAC, Ottawa,
August 10-15, 1986, Abstracts SE-15 (Internal Report of the Governmental Food Inspection Service,Amsterdam).
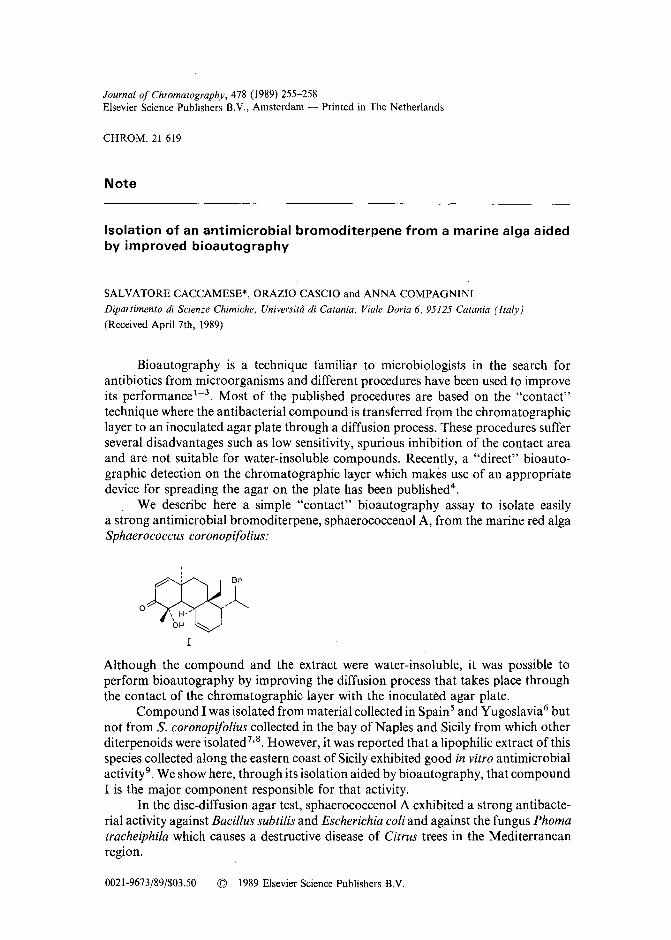
Journal of Chromatography, 478 (1989) 255-258Elsevier Science Publishers B.V., Amsterdam - Printed in The Netherlands
CHROM. 21 619
Note
Isolation of an antimicrobial bromoditerpene from a marine alga aidedby improved bioautography
SALVATORE CACCAMESE*, ORAZIO CASCIO and ANNA COMPAGNINI
Dipartimento di Scienze Chimiche, Universita di Catania, Viale Doria 6, 95125 Catania (Italy)
(Received April 7th, 1989)
Bioautography is a technique familiar to microbiologists in the search forantibiotics from microorganisms and different procedures have been used to improveits performance1-3 . Most of the published procedures are based on the "contact"technique where the antibacterial compound is transferred from the chromatographiclayer to an inoculated agar plate through a diffusion process. These procedures sufferseveral disadvantages such as low sensitivity, spurious inhibition of the contact areaand are not suitable for water-insoluble compounds. Recently, a "direct" bioautographic detection on the chromatographic layer which makes use of an appropriatedevice for spreading the agar on the plate has been published".
We describe here a simple "contact" bioautography assay to isolate easilya strong antimicrobial bromoditerpene, sphaerococcenol A, from the marine red algaSphaerococcus coronopifolius:
I
~! Br
o "~\ H/
OH ::::,...I
Although the compound and the extract were water-insoluble, it was possible toperform bioautography by improving the diffusion process that takes place throughthe contact of the chromatographic layer with the inoculated agar plate.
Compound I was isolated from material collected in Spain" and Yugoslavia" butnot from S. coronopifolius collected in the bay of Naples and Sicily from which otherditerpenoidswere isolatedi:". However, it was reported that a lipophilic extract of thisspecies collected along the eastern coast of Sicily exhibited good in vitro antimicrobialactivity". We show here, through its isolation aided by bioautography, that compoundI is the major component responsible for that activity.
In the disc-diffusion agar test, sphaerococcenol A exhibited a strong antibacterial activity against Bacillus subtilis and Escherichia coli and against the fungus Phomatracheiphila which causes a destructive disease of Citrus trees in the Mediterraneanregion.
0021-9673/89/$03.50 © 1989 Elsevier Science Publishers B.V.
256
EXPERIMENTAL
NOTES
TLC plates and conditionsCommercially available 20 em x 20 em thin-layer chromatographic (TLC)
aluminium sheets (layer thickness 0.2 mm) precoated with silica gel 60 were obtainedfrom Merck (Darmstadt, F.R.G.). They were divided into sizes of 10 em x 5 ern.Before use, the plates were washed with the elution solvent in the developing tank.About 20 or 50 J1g of methanolic solution containing 1 mg/ml of compound I or theextract were applied to the TLC plates to form spots. Camag Microcap micropipetteswere used for sample application. The spot size was minimized by applying the samplevolume in small increments on top of each other, with complete drying of the solventafter each application. Chromatography was effected by using a 10 em x 10 emtwin-trough chamber (Camag, Muttenz, Switzerland), preequilibrating the layer withthe vapours of the elution solvent and then developing up to 9 em. The plates werethoroughly dried in a stream of air.
Preparative TLC was performed on 20 cm x 20 em glass supported plates(thickness 0.5 mm, Merck) precoated with silica gel 60. The extract was applied as anacetone solution using a laboratory-made 2-ml dispenser. The chromatography wasperformed in 20 em x 20 cm twin-trough Camag chambers with the same precautionsas in analytical TLC. All solvents were of analytical grade and mixtures were made upon a v[v basis.
Chemical visualizationA solution of 1% eerie sulphate in 1 M H 2S04 was used. Intensification of the
different colours of the spots was obtained by heating in an oven at 115°C for 10 min.Visualization on the preparative TLC plates was done only at an edge, the remainingsilica layer being protected with a clean glass plate.
Culture medium and microorganismsFor bioautography, antibiotic medium No.1 (Difco, Detroit, MI, U.S.A.) was
dissolved in a phosphate saline buffer at pH 7.3 (ref. 10) and sterilized by autoclavingat 121°C for 15 min. After cooling at 45°C, 1 ml of Bacillus subtilis ATCC 6633 sporesuspension (Difco) or Escherichia coli strain B ATCC 11303 inoculum (Sigma, St.Louis, MO, U.S.A.) was added to 200 ml culture medium. Before congealing,15 ml ofthe inoculated agar were added to sterile 15-cm glassPetri plates, swirling carefully.
In addition to the above bacteria, the fungus Phoma tracheiphila was used in thedisc-diffusion agar plate tests. The microorganism was obtained from the Institute ofPlant Pathology of the University of Catania as a 12-days-old pycnidiosporessuspension.
Plant materialS. coronopifolius (fresh weight 2 kg) was collected at a depth of 4-5 m at
Castelluccio, eastern Sicily in September 1988. A voucher specimen is deposited in theHerbarium of the Algology Laboratory of the Institute of Botany of the University ofCatania.
NOTES
RESULTS AND DISCUSSION
257
The fresh alga was immediately soaked in isopropanol. The solution wasconcentrated to give a residue that was partitioned between aiM sodium nitratesolution and diethyl ether. The ether layer yielded, after desiccation and concentration,1.91 g of deep green semisolid extract which was strongly active against B. subtilis andE. coli in the disc-diffusion agar plate test.
Silica gel TLC [dichloromethane-light petroleum (b.p. 40-70°C), 6:4] of theextract showed, after visualization, about 15 differently coloured spots. However,a much simpler pattern was observed by bioautographic detection. Only the spots atRF 0.32 and 0.44 were antimicrobially active as well as the origin spot. This selectivitywas a guide for the preparative TLC.
However, practical difficulties were encountered using the classical bioautographic procedure. The use of glass-supported TLC plates is not advisable sinceair-bubbles form easily. The interposition of a sheet of lens-tissue paper, as is usual,prevents the bubbles and avoids the detachment of a portion of the silica layer whenthe TLC plate is removed from the agar, but strongly decreases the sensitivity. Thus,the use of aliminium-supported plates is crucial.
These plates can be slightly bent longitudinally in the middle and placed carefullyon the agar layer in the Petri dish. In this way, wetting of the silica gel layer proceedshomogeneously in 20-30 s from the middle to the edge of the plate, avoiding trappingof air-bubbles between the agar surface and the thin-layer plate.
Antibiotic medium No.1 was the culture agar. However, it was prepared ina phosphate saline buffer instead of water. This detail prevents the growth-inhibitingeffect of residual solvent or acidic silica sites that causes an initial diffuse inhibition ofthe contact trace left by the plate on the agar layer. The TLC plate is kept at 4°C for1 h to allow diffusion from the silica gel into the inoculated agar. It is then gentlyremoved and the bioautographic Petri plate is incubated at 25°C for 14-18 h in sealedplastic bags. Antimicrobial substances are visible on the plates as clear zones withoutgrowth of the microorganism.
Although the spaerococcenol A and the extract are insoluble in water, clearinhibition spots have been obtained using moistured agar plates. These, prepared ina few days in advance and stored at 2-8°C, were reequilibrated at 25-30°C to improvetheir wettability before using for bioautography. In this case an efficient diffusionprocess takes place from the TLC plate to the agar layer.
The information gained by bioautography led us to a preparative TLC dedicatedto the isolation of the active compounds from the extract, avoiding collection of theinactive compounds. Thus, 450 mg of the extract were distributed in four silica gelplates and eluted with the same solvent. The band at RF 0.32 when scraped off andeluted with diethy1 ether gave, after crystallization from n-hexane, 35 mg ofsphaerococcenol A identified by comparison of its physical (m.p.) and spectral(infrared, mass and 1H nuclear magnetic resonance) properties with those reported inthe Iiterature-:". The TLC band at RF 0.44 gave instead a mixture (8 mg) of twoinseparable brominated compounds with molecular weight 462.
Sphaerococcenol A is still detectable by bioautography when 10 f.1g of it arespotted and eluted on the TLC plate. Its activity in the diffusion test from a 6-mmantibiotics disc to a Muller-Hinton agar plate is (f.1g applied), mm zone of inhibition:
258 NOTES
against B. subtilis, (l0) 9; streptomycin sulphate as control, (0.15) 15; against E. coli,(10) 8; streptomycin sulphate as control, (1.5) 12; against P. tracheiphila, (10) 9; filipinas control, (20) 11.
ACKNOWLEDGEMENTS
This work has been supported by the Italian Ministero Pubblica Istruzione (60%funds).
REFERENCES
J. C. Touchstone and M. F. Dobbins, Practice of Thin Layer Chromatography, Wiley, New York, 2nded., 1983, pp. 361-365.
2 V. Betina, J. Chromatogr., 78 (1973) 41.3 G. H. Wagman and M. J. Weinstein, Chromatography ofAntibiotics, Elsevier, Amsterdam, 1973,p. 7.4 M. O. Hamburger and G. A. Cordell, J. Nat. Prod., 50 (1987) 19.5 W. Fenica1, J. Finer and J. Clardy, Tetrahedron Lett., (1973) 731.6 S. De Rosa, S. De Stefano, P. Scarpelli and N. Zavodnik, Phytochemistry, 27 (1988) 1875.7 F. Cafieri, 1. De Napoli, E. Fattorusso and C. Santacroce, Phytochemistry, 27(1988)621;and references
cited therein.8 F. Cafieri, 1. De Napoli, E. Fattorusso, M. Piattelli and S. Sciuto, Tetrahedron Lett., (1979) 963; and
references cited therein.9 S. Caccamese and R. Azzolina, Planta Med., 37 (1979) 333.
10 C. H. Collins and P. M. Lyne, Microbiological Methods, Butterworths, London, 1970, pp. 113-153.
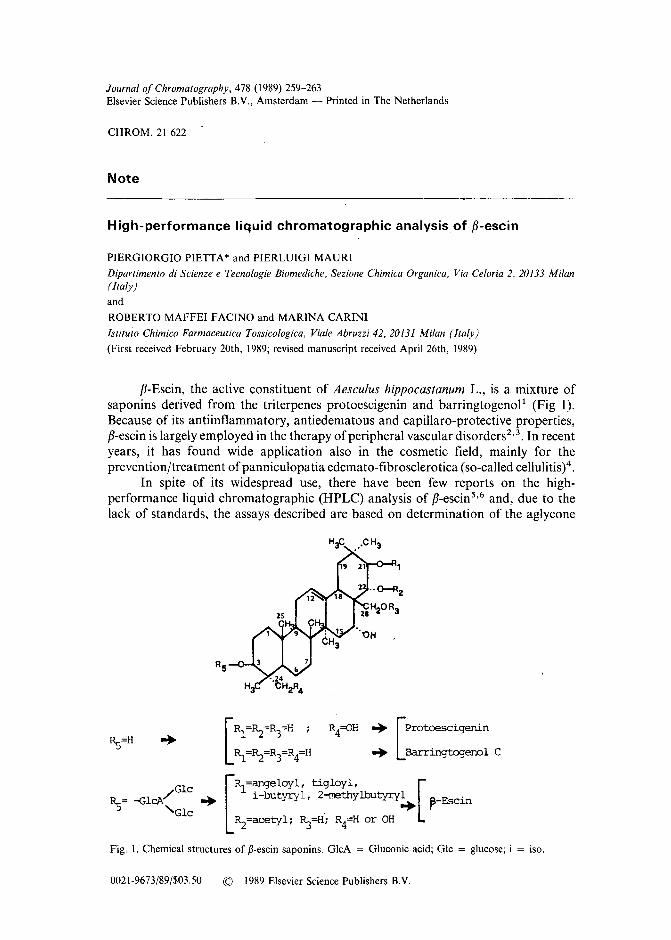
Journal of Chromatography, 478 (1989) 259-263Elsevier Science Publishers B.V., Amsterdam - Printed in The Netherlands
CHROM. 21 622
Note
High-performance liquid chromatographic analysisof fJ-escin
PIERGIORGIO PIETTA* and PIERLUIGI MAURI
Dipartimento di Scienze e Tecnologie Biomediche, Sezione Chimica Organica, Via Celoria 2, 20133 Milan(Italy)
and
ROBERTO MAFFEI FACINO and MARINA CARINI
Istituto Chimica Farmaceutica Tossicologica, Viale Abruzzi 42, 20131 Milan (Italy)
(First received February 20th, 1989; revised manuscript received April 26th, 1989)
fJ-Escin, the active constituent of Aesculus hippocastanum L., is a mixture ofsaponins derived from the triterpenes protoescigenin and barringtogenol ' (Fig 1).Because of its antiinflammatory, antiedematous and capillaro-protective properties,fJ-escin is largely employed in the therapy of peripheral vascular disordersv". In recentyears, it has found wide application also in the cosmetic field, mainly for theprevention/treatment ofpanniculopatia edemato-fibrosclerotica (so-called cellulitis)".
In spite of its widespread use, there have been few reports on the highperformance liquid chromatographic (HPLC) analysis of fJ-escin 5 ,6 and, due to thelack of standards, the assays described are based on determination of the aglycone
Rs=HR4=OH .. [protoescigenin
.. Barringtogenol C
/Gl c
Rs= -GlcA ..'Glc [
RI=~geIOYI ' tigIoyl, [l.-butyryl, 2-methylbutyryl R E .
.. r- scan
~=acetyl; R:3=H'; R4=H or OH
Fig. 1. Chemical structures of fJ-escin saponins. GlcA = Gluconic acid; Glc = glucose; i = iso.
0021-9673(89($03.50 © 1989 Elsevier Science Publishers B.V.
260 NOTES
after alkaline hydrolysis or on relative peak areas. Furthermore, none of the reportedmethods offers a satisfactory separation of the components, to allow their isolation/characterization.
In this work we describe an efficient isocratic HPLC procedure for the isolationof the main saponin 7 3-[2"-(fJ-D-glucopyranosido)-4'-(fJ-D-glucopyranosido)-fJ-D-glucuronopyranosido]-21-fJ-tigloyl-22-a-acetylprotoescigenin (I) and it 21-fJ-angeloylanalogue (II). These compounds have been used as reference standards for the analysisof fJ-escin samples.
EXPERIMENTAL
MaterialsfJ-Escin was obtained from different commercial sources (Fluka-Schrepfer and
Indena, Milan, Italy). Commercial samples were dissolved in water at a concentrationof 0.3 mg/ml and centrifuged at 2500 g for 5 min to remove any particulate material.Acetonitrile and water were ofHPLC grade (J. T. Baker, Deventer, The Netherlands).
Chromatographic conditionsThe liquid chromatograph consisted of a Model U6K universal injector,
a Model 510 pump, a Model Lambda Max 480 UV detector and a Model 990photodiode array detector (Waters Assoc., Milford, MA, U.S.A.) connected toa CR3A integrator (Shimadzu, Kyoto, Japan).
Chromatographic experiments were performed on Spheri-5 RP-18 (100 mmx 4.6 mm, 5 flm; Brownlee Labs., Santa Clara, CA, U.S.A.) and on Microsorb 3-flmSpherical C I 8 (100 mm x 4.6 mm; Rainin, Woburn, MA, U.S.A.). To preserve thecolumn life, precolumns (RP-18, 5 flm, OD-GU, Brownlee Labs.; Microsorb 3 flm CIS,guard No. 80-200-G3, Rainin) were used. The Rainin column and guard-column weresupplied by Biolabo Instrument (Milan, Italy).
The mobile phase was acetonitrile-water-20% phosphoric acid (33.5:66.5:0.1),pH 3.2; the flow-rate was 1.0 ml/min. Samples (20 fll) were applied on the column andthe peaks were monitored at 205 nm (a.uJ.s.=0.032).
Isolation of saponins I and IIAliquots (50 fll) of an aqueous solution of fJ-escin (2 mg/rnl) were repetitively
(four or five times) injected and eluted as described above. The major peaks [14.8 (I)and 18.1 (II) min] were collected by means of a Model 201 fraction collector (Gilson,Biolabo, Milan, Italy) and the corresponding fractions were dried under vacuum.Their purity was confirmed by rechromatography.
Mass spectrometryFast atom bombardment (FAB) mass spectra were obtained on a VG Analytical
Model 70-70 EQ instrument, employing argon atoms with kinetic energy 7 keY.Recordings in the negative ion mode were taken at a resolution of3000, with a speed of20S/decade. Data were processed by a Digital PDP 8/A computer system. Matrix:thioglycerol.
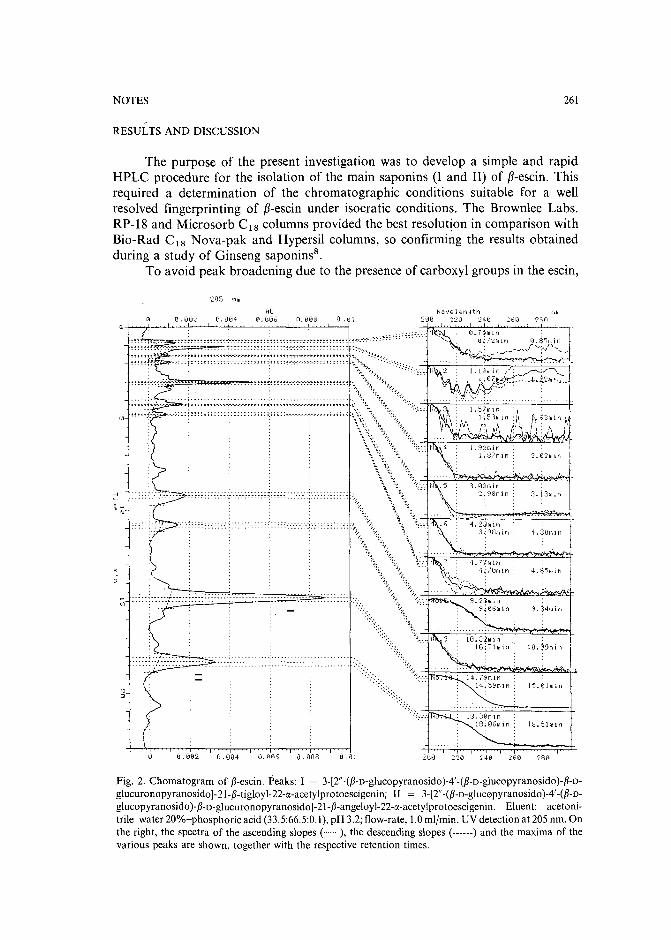
NOTES 261
RESULTS AND DISCUSSION
The purpose of the present investigation was to develop a simple and rapidHPLC procedure for the isolation of the main saponins (1 and II) of f3-escin. Thisrequired a determination of the chromatographic conditions suitable for a wellresolved fingerprinting of f3-escin under isocratic conditions. The Brownlee Labs.RP-l8 and Microsorb C t 8 columns provided the best resolution in comparison withBio-Rad C t 8 Nova-pak and Hypersil columns, so confirming the results obtainedduring a study of Ginseng saponins",
To avoid peak broadening due to the presence of carboxyl groups in the escin,
r1:3.5Imin +15. 01mi n
I10. :19min I
1:3. -3L~fIi i n1:3~06min :
u.sve l ens t h r,r"200 '2:20 240 '.::t:o '2::;0
\\.--=,,~..:S::::=z~=:,~~~~~."\ 4.:)0"'1t1 t
~, l\.--=:_.~Ic..:..:.c;~=~~~C:':i~~lt
f
.--::~~?-._._.-.-._._---.----.
roc
2.02rlllf,
,:;;
e .082 o.0(14 6. (106 .008 0.01
Fig. 2. Chomatogram of {3-escin. Peaks: I = 3-[2"-({3-D-glucopyranosido)-4'-({3-D-glucopyranosido)-{3-Dglucuronopyranosido]-21-{3-tigloyl-22-IX-acetylprotoescigenin; II = 3-[2"-({3-D-glucopyranosido )-4'-({3-Dglucopyranosido)-{3-D-glucuronopyranosido]-21-{3-angeloy1-22-IX-acetylprotoescigenin. Eluent: acetonitrile-water 20%-phosphoric acid (33.5:66.5:0.1), pH 3.2; flow-rate, 1.0 ml/min. UV detection at 205 nm. Onthe right, the spectra of the ascending slopes C· .. ), the descending slopes (------) and the maxima of thevarious peaks are shown, together with the respective retention times.
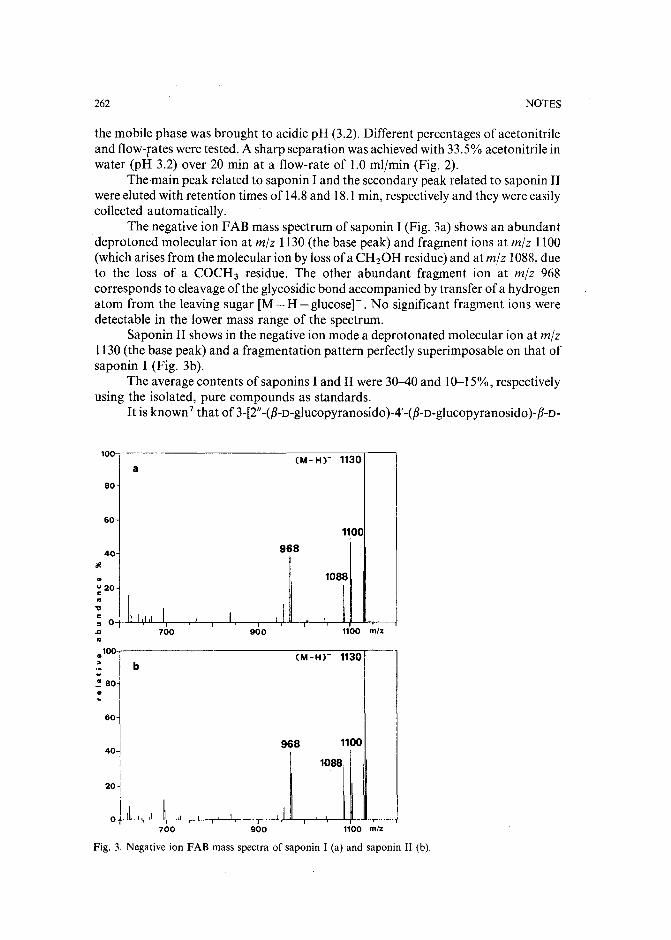
262 NOTES
the mobile phase was brought to acidic pH (3.2). Different percentages of acetonitrileand flow-rates were tested. A sharp separation was achieved with 33.5% acetonitrile inwater (pH 3.2) over 20 min at a flow-rate of 1.0 ml/min (Fig. 2).
Themain peak related to saponin I and the secondary peak related to saponin IIwere eluted with retention times of 14.8 and 18.1 min, respectively and they were easilycollected automatically.
The negative ion FAB mass spectrum of saponin I (Fig. 3a) shows an abundantdeprotoned molecular ion at mlz 1130 (the base peak) and fragment ions at mjz 1100(which arises from the molecular ion by loss ofa CHzOH residue) and at m]z 1088, dueto the loss of a COCH3 residue. The other abundant fragment ion at m]z 968corresponds to cleavage of the glycosidic bond accompanied by transfer of a hydrogenatom from the leaving sugar [M -H - glucose]". No significant fragment ions weredetectable in the lower mass range of the spectrum.
Saponin II shows in the negative ion mode a deprotonated molecular ion at mjz1130 (the base peak) and a fragmentation pattern perfectly superimposable on that ofsaponin I (Fig. 3b).
The average contents of saponins I and II were 30-40 and 10-15%, respectivelyusing the isolated, pure compounds as standards.
It is known 7 that of 3-[2"-(fJ-o-glucopyranosido)-4'-(fJ-o-glucopyranosido)-13-0-
(M- H)- 1130
60
968 1100
J'~~ Tn'1100 m/z
.I900
I' "~ " !I .,
700
1100
968
roilI
---I700 900 '100 m/z
(M -H)- 1130
40
/II.
"u 20e..
."
: °1··J.:...l...,.uL-4--,-l--,-.L,--,--..J,J-JL-T'--4---.J+-..JJL..,.....",00-,.-------------------:-:-=,..,----
~ 80j b
~ 60~
I40-1
ii
2°iO~ II, ", ,I
Fig. 3. Negative ion FAB mass spectra of saponin I (a) and saponin II (b).
NOTES 263
glucuronopyranosido]-21-fJ-tigloyl-22-a-acetylprotoescigenin(I) and 3-[2"-(fJ-D-glucopyranosido)-4'-(fJ-D-glucopyranosido)-fJ-D-glucuronopyranosido]-21-fJ-angeloyl22-a-acetylprotoescigenin the first is the major component. Therefore, on this basisand quantitation data, saponins I and II can be assigned as the tigloyl and angeloylanalogues, respectively.
In conclusion, the results of this study show the effectivenes of the methoddescribed for the separation of fJ-escin saponins. The isolation of the majorconstituents allows a new approach to the assay of fJ-escin in pharmaceutical andcosmetic formulations, and furthermore gives the possibility of a deeper insight intothe pharmacological activity of each component.
REFERENCES
E. Stahl and W. Schild, Pharmazeutische Biologie, 4. Drogenalyse II: Inhaitsstoffe und Isolierung, G.Fischer Verlag, Stuttgart, 1981.
2 V. M. Rothkopf and G. Vogel, Arzneim-Forsch. (Drug Res.), 26 (1976) 225.3 F. Annoni, A. Mauri, F. Marincola, and L. F. Resele, Arzneim-Forsch. (Drug Res.}, 29 (1979) 672.4 G. Proserpio, S. Gatti and P. Genesi, Fitoterapia, 51 (1980) 113.5 H. Wagner, H. Reger and R. Baurer, Dtsch. Apoth.-Ztg., 124 (1985) 1513.6 M. Burnouf-Radosevich and N. E. Delfe!, J. Chromatogr., 368 (1986) 433.7 J. Wagner, W. Schlemmer and H. Hoffman, Arzneim-Forsch. (Drug Res.), 20 (1970) 205.8 P. G. Pietta, P. L. Mauri and A. Rava, J. Chromatogr., 356 (1986) 212.
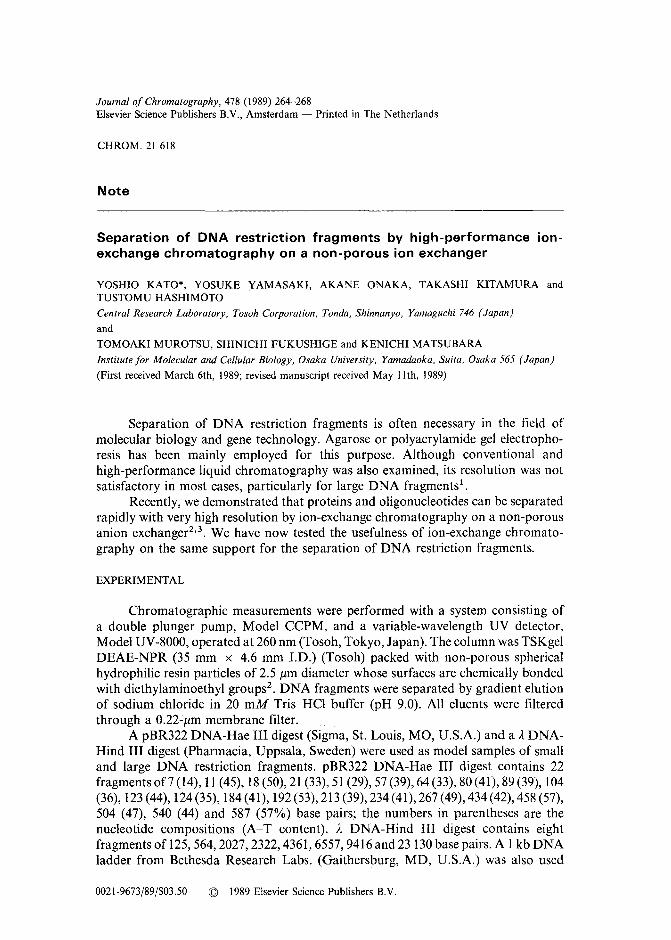
Journal of Chromatography, 478 (1989) 264-268Elsevier Science Publishers B.V., Amsterdam - Printed in The Netherlands
CHROM. 21 618
Note
Separation of DNA restriction fragments by high-performance ionexchange chromatography on a non-porous ion exchanger
YOSHIO KATO*, YOSUKE YAMASAKI, AKANE ONAKA, TAKASHI KITAMURA andTUSTOMU HASHIMOTO
Central Research Laboratory, Tosoh Corporation, Tonda, Shinnanyo, Yamaguchi 746 (Japan)
and
TOMOAKI MUROTSU, SHINICHI FUKUSHIGE and KENICHI MATSUBARA
Institute for Molecular and Cellular Biology, Osaka University, Yamadaoka, Suita, Osaka 565 (Japan)
(First received March 6th, 1989; revised manuscript received May I !th, 1989)
Separation of DNA restriction fragments is often necessary in the field ofmolecular biology and gene technology. Agarose or polyacrylamide gel electrophoresis has been mainly employed for this purpose. Although conventional andhigh-performance liquid chromatography was also examined, its resolution was notsatisfactory in most cases, particularly for large DNA fragments':
Recently, we demonstrated that proteins and oligonucleotides can be separatedrapidly with very high resolution by ion-exchange chromatography on a non-porousanion exchangerv" We have now tested the usefulness of ion-exchange chromatography on the same support for the separation of DNA restriction fragments.
EXPERIMENTAL
Chromatographic measurements were performed with a system consisting ofa double plunger pump, Model CCPM, and a variable-wavelength UV detector,Model UV-8000, operated at 260 nm (Tosoh, Tokyo, Japan). The column was TSKgelDEAE-NPR (35 mm x 4.6 mm J.D.) (Tosoh) packed with non-porous sphericalhydrophilic resin particles of 2.5 Jim diameter whose surfaces are chemically bondedwith diethylaminoethyl groups". DNA fragments were separated by gradient elutionof sodium chloride in 20 mM Tris-RCI buffer (pR 9.0). All eluents were filteredthrough a 0.22-Jim membrane filter.
A pBR322 DNA-Rae III digest (Sigma, St. Louis, MO, U.S.A.) and a ADNARind III digest (Pharmacia, Uppsala, Sweden) were used as model samples of smalland large DNA restriction fragments. pBR322 DNA-Rae III digest contains 22fragments of7 (14), 11(45), 18(50), 21 (33), 51 (29), 57 (39), 64 (33), 80 (41),89 (39), 104(36), 123(44), 124(35), 184(41), 192(53), 213 (39), 234 (41), 267 (49), 434 (42), 458 (57),504 (47), 540 (44) and 587 (57%) base pairs; the numbers in parentheses are thenucleotide compositions (A-T content). A DNA-Rind III digest contains eightfragments of 125,564,2027,2322,4361,6557,9416 and 23130 base pairs. A I kb DNAladder from Bethesda Research Labs. (Gaithersburg, MD, U.S.A.) was also used
0021-9673/89/$03.50 © 1989 Elsevier Science Publishers B.V.
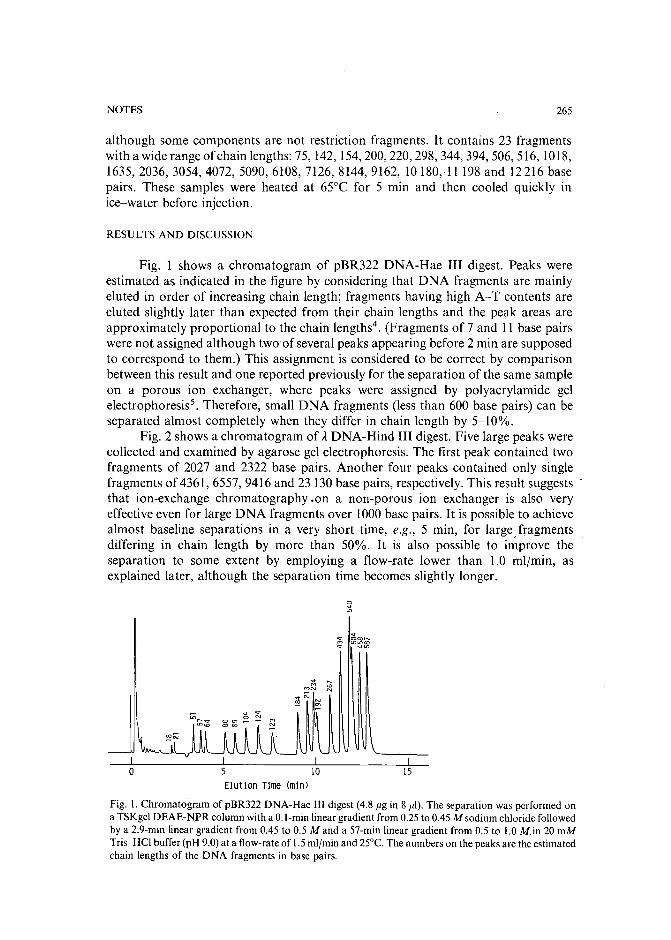
NOTES 265
15
although some components are not restriction fragments. It contains 23 fragmentswith a wide range of chain lengths: 75, 142, 154,200,220,298,344,394,506,516, 1018,1635,2036,3054,4072,5090,6108, 7126, 8144, 9162, 10180, 11198 and 12216 basepairs. These samples were heated at 65°C for 5 min and then cooled quickly inice-water before injection.
RESULTS AND DISCUSSION
Fig. 1 shows a chromatogram of pBR322 DNA-Rae III digest. Peaks wereestimated as indicated in the figure by considering that DNA fragments are mainlyeluted in order of increasing chain length; fragments having high A-T contents areeluted slightly later than expected from their chain lengths and the peak areas areapproximately proportional tothe chain lengths". (Fragments of 7 and 11 base pairswere not assigned although two of several peaks appearing before 2 min are supposedto correspond to them.) This assignment is considered to be correct by comparisonbetween this result and one reported previously for the separation of the same sampleon a porous ion exchanger, where peaks were assigned by polyacrylamide gelelectrophoresis>, Therefore, smal1 DNA fragments (less than 600 base pairs) can beseparated almost completely when they differ in chain length by 5-10%.
Fig. 2 shows a chromatogram of ADNA-Rind III digest. Five large peaks werecol1ected and examined by agarose gel electrophoresis. The first peak contained twofragments of 2027 and 2322 base pairs. Another four peaks contained only singlefragments of 4361,6557,9416 and 23130 base pairs, respectively. This result suggests'that ion-exchange chromatography .on a non-porous ion exchanger is also veryeffective even for large DNA fragments over 1000 base pairs. It is possible to achievealmost baseline separations in a very short time, e.g., 5 min, for large fragmentsdiffering in chain length by more than 50%. It is also possible to improve theseparation to some extent by employing a flow-rate lower than 1.0 ml/min, asexplained later, although the separation time becomes slightly longer.
5 10
Elution TIme (min)
Fig. 1. Chromalogram ofpBR322 DNA-Hae III digest (4.8 ug in 8 Ill). The separation was performed ona TSKgel DEAE-NPR column with a O.l-min linear gradient from 0.25 to 0.45 M sodium chloride followedby a 2.9-min linear gradient from 0.45 to 0.5 M and a 57-min linear gradient from 0.5 to 1.0 Min 20 mMTris-HCl buffer (pH 9.0) at a Dow-rate of 1.5 ml/rnin and 25°C. The numbers on the peaks are the estimatedchain lengths of the DNA fragments in base pairs.
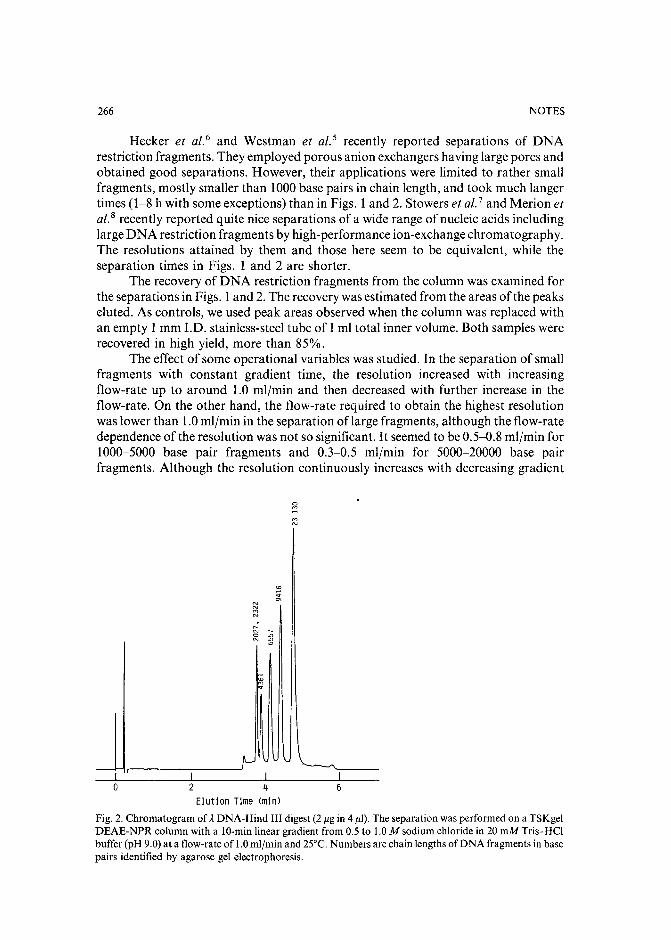
266 NOTES
Hecker et al:" and Westman et al." recently reported separations of DNArestriction fragments. They employed porous anion exchangers having large pores andobtained good separations. However, their applications were limited to rather smallfragments, mostly smaller than 1000 base pairs in chain length, and took much langertimes (1-8 h with some exceptions) than in Figs. I and 2. Stowers et at.7 and Merion etat. 8 recently reported quite nice separations of a wide range of nucleic acids includinglarge DNA restriction fragments by high-performance ion-exchange chromatography.The resolutions attained by them and those here seem to be equivalent, while theseparation times in Figs. 1 and 2 are shorter.
The recovery of DNA restriction fragments from the column was examined forthe separations in Figs. I and 2. The recovery was estimated from the areas of the peakseluted. As controls, we used peak areas observed when the column was replaced withan empty I mm I.D. stainless-steel tube of 1 ml total inner volume. Both samples wererecovered in high yield, more than 85%.
The effect of some operational variables was studied. In the separation of smallfragments with constant gradient time, the resolution increased with increasingflow-rate up to around 1.0 ml/min and then decreased with further increase in theflow-rate. On the other hand, the now-rate required to obtain the highest resolutionwas lower than 1.0 ml/min in the separation of large fragments, although the flow-ratedependence of the resolution was not so significant. It seemed to be 0.5-0.8 ml/rnin for1000-5000 base pair fragments and 0.3-0.5 ml/min for 5000-20000 base pairfragments. Although the resolution continuously increases with decreasing gradient
aM
MN
NNMN
I I Ia 2 4 6
Elution Time (min)
Fig. 2. Chromatogram of.le DNA-Hind III digest (2 f.lg in 4 f.ll). The separation was performed on a TSKgelDEAE-NPR column with a 10-min linear gradient from 0.5 to 1.0 M sodium chloride in 20 mMTris-HCIbuffer (pH 9.0) at a flow-rate of 1.0 ml/min and 25°C. Numbers are chain lengths of DNA fragments in basepairs identified by agarose gel electrophoresis.
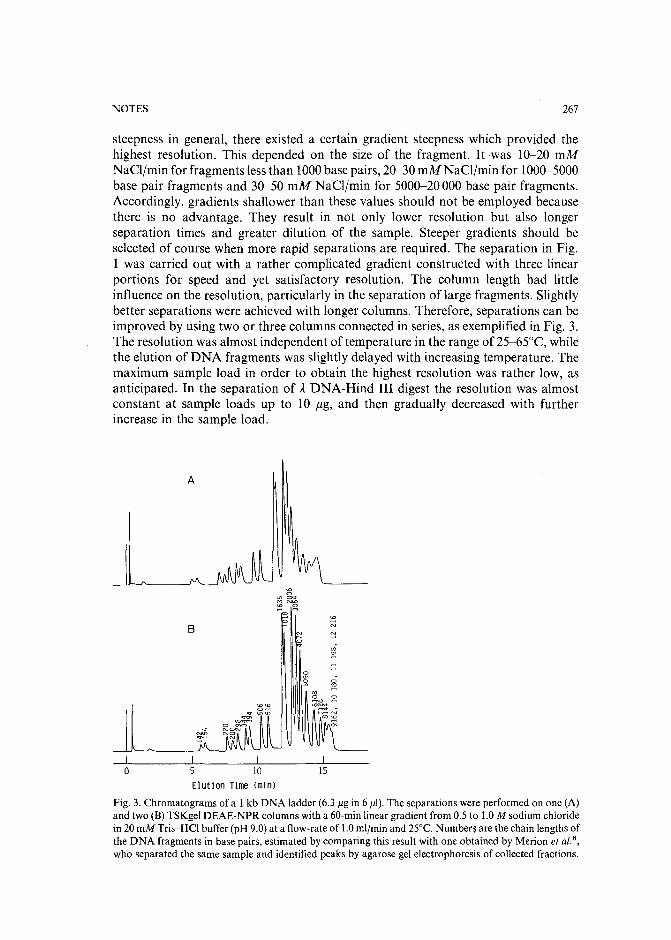
NOTES 267
steepness in general, there existed a certain gradient steepness which provided thehighest resolution. This depended on the size of the fragment. It was 10-20 mMNeCl/min for fragments lessthan 1000base pairs, 20-30 mMNaCI/min for 1000-5000base pair fragments and 30-50 mM NaCI/min for 5000-20000 base pair fragments.Accordingly, gradients shallower than these values should not be employed becausethere is no advantage. They result in not only lower resolution but also longerseparation times and greater dilution of the sample. Steeper gradients should beselected of course when more rapid separations are required. The separation in Fig.1 was carried out with a rather complicated gradient constructed with three linearportions for speed and yet satisfactory resolution. The colump length had littleinfluence on the resolution, particularly in the separation oflarge fragments. Slightlybetter separations were achieved with longer columns. Therefore, separations can beimproved by using two or three columns connected in series, as exemplified in Fig. 3.The resolution was almost independent of temperature in the range of 25-6SOC, whilethe elution of DNA fragments was slightly delayed with increasing temperature. Themaximum sample load in order to obtain the highest resolution was rather low, asanticipated. In the separation of A DNA-Hind III digest the resolution was almostconstant at sample loads up to 10 flg, and then gradually decreased with furtherincrease in the sample load.
A
I I I
8~
N
;:::
~:::
~~ 0
:'3
"'
o 5 10 15
Elution TIme (mtn)
Fig. 3. Chromatograms ofa I kb DNA ladder (6.3 j1.g in 6 j1.1). The separations were performed on one (A)and two (8) TSKgel DEAE-NPR columns with a 60-min linear gradient from 0.5 to 1.0 M sodium chloridein 20 mM Tris-HCI buffer (pH 9.0) at a flow-rate of 1.0ml/rnin and 25°C. Numbers are the chain lengths ofthe DNA fragments in base pairs, estimated by comparing this result with one obtained by Merion et at.8,
who separated the same sample and identified peaks by agarose gel electrophoresis of collected fractions.
268 NOTES
As demonstrated, ion-exchange chromatography on the non-porous anionexchanger, TSKgel DEAE-NPR, is very useful for the separation of DNA restrictionfragments. A wide range of DNA fragments, from small to very large ones, can beseparated in 5-15 min with high resolution. The recovery of DNA fragments was alsohigh (>85%). Although gel electrophoresis is the most common technique used toseparate DNA fragments owing to its high resolution, it has some problems inquantitative measurements of the components, scaling up, recovery of the separatedcomponents, etc. On the other hand, ion-exchange chromatography does not havesuch problems. Accordingly, ion-exchange chromatography on TSKgel DEAE-NPRshould be a good alternative to gel electrophoresis for the analysis and purification ofDNA fragments.
REFERENCES
y. Kato, M. Sasaki, T. Hashimoto, T. Murotsu, S. Fukushige and K. Matsubara, J. Chromatogr., 320(1985) 440.
2 Y. Kato, T. Kitamura, A. Mitsui and T. Hashimoto, J. Chromatogr., 398 (1987) 327.3 Y. Kato, T. Kitamura, A. Mitsui, Y. Yamasaki, T. Hashimoto, T. Murotsu, S. Fukusigc and K.
Matsubara, J. Chromatogr., 447 (1988) 212.4 Y. Kato, M. Sasaki, T. Hashimoto, T. Murotsu, S. Fukushige and K. Matsubara, J. Chromatogr., 265
(1983) 342.5 E. Westman, S. Eriksson, T. Liias, p.-A. Pernemalm and S.-E. Skold, Anal. Biochem., 166 (1987) 158.6 R. Hecker, M. Colpan and D. Riesner, J. Chromatogr., 326 (1985) 251.7 D. J. Stowers, J. M. B. Keirn, P. S. Paul, Y. S. Lyoo, M. Merion and R. M. Benbow,J. Chromatogr., 444
(1988) 47.8 M. Merion, W. Warren, C. Stacey and M. E. Dwyer, BioTechniques, 6 (1988) 246.
Journal oj Chromatography, 478 (1989) 269-274Elsevier Science Publishers B.V., Amsterdam ~ Printed in The Netherlands
CHROM. 21 637
Note
High-performance liquid chromatographic determination of zearalenone and ochratoxin A in cereals and feed
W. LANGSETH*, Y. ELLINGSEN, U. NYMOEN and E. M. 0KLAND
Department oj Pharmacology and Toxicology. National Veterinary InstituejThe Norwegian College ojVeterinary Medicine. P.O. Box 8146 Dep.. 0033 Oslo I (Norway)
(First received February 27th, 1989; revised manuscript received May 23rd, 1989)
Cereals and mixed feed are frequently contaminated with mycotoxins producedby different fungi. Two of the more important ones are ochratoxin A andzearalenone":". In Norway ochratoxins are normally produced by Penicilliumverrucosum and the A type is predominant. Zearalenone is like the trichothecenesa fusarium toxin. The gas chromatographic method normally used for the trichothecenes gives, however, low recovery",
Zearalenone and ochratoxin A can be analyzed by high-performance liquidchromatography (HPLC) under very similar conditions". Howell and Taylor" havedescribed a method for determination of aflatoxins, ochratoxin A and zearalenone infeed. The recoveries of ochratoxin A achieved by using this method are, however,sometimes poor.
In this paper a modified method for the determination of zearalenone andochratoxin A is described. Aflatoxin is omitted because it is of minor importance incereals grown in northerns countries like Norway. Modern solid phase extractioncolumns were used for clean up. These minicolumns are convenient to use and thesolvent consumption is less than Ijl0 of that of traditional columns. The proceduregiven was optimized for different types of cereals and feed.
One hundred samples of wheat, barley, oats and mixed feed have been analyzedby the procedure described. The detection limits were 2-5 /lgjkg for zearalenone,depending on the type of feed, and 0.1-0.3 /lgjkg for ochratoxin A.
EXPERIMENTAL
ReagentsOchratoxin A and zearalenone were obtained from Sigma. The following stock
solutions were made: (a) zearalenone, 20 mgjl in acetonitrile; (b) ochratoxin A, 1 mgjlin toluene-acetic acid (9:1).
Other chemicals were obtained from the following sources: Celite from Supelco;clean-up columns were Bond Elut, SI (silica), 500 mg, from Analytichem International.
All solvents used for the clean-up procedure were of p.A. grade (Merck), whilethe solvents used as the mobile phase for HPLC were of HPLC grade (Rathburn).
0021-9673/89/$03.50 © 1989 Elsevier Science Publishers B.V.
270 NOTES
ApparatusThe flask shaker was a universal shaking machine from Edmund Biihler, Type
SM 2.5. The vacuum manifold used in connection with the clean-up columns wereobtained from Supelco. The HPLC equipment was obtained from Perkin-Elmer, andconsisted of a dual-pump module (Series 2) with a Rheodyne injector (Model 7125) ora Series 10 pump with an ISS-lOI autoinjector. The detector was an LS-4 fluorescencespectrophotometer. The integrator system was either a LC-lOO integrator or anOmega-2 data system.
The analytical column was a Nucleosil Ca, 5 flm reversed-phase column, 125mmx 4 mm J.D. The 50-mm guard column was dry packed with LC-8 pellicular packing,40 flm (Supelco).
Sample preparationThe samples were kept in a deep freezer at -18°C until analyzed. The whole
sample was ground and mixed well before an analytical sample was taken.
Extraction and clean upA 50-g amount of ground sample was mixed with 250 ml chloroform and 25 ml
0.1 M phosphoric acid in a I-I flask. Celite (10 g) was added to wheat and barleysamples. The flask was shaken automatically for 45 min. Wheat and barley sampleswere filtered through folded filters, while the mixture of extraction solvent and solidmaterial ofoat and mixed feed samples was transferred to a 250-ml centrifuge-tube andcentrifuged for 10 min at 9000 g before filtration. The centrifugate was then decantedand filtered through a folded filter containing 2 g Celite.
A 25-ml volume ofthe wheat and barley extracts, and 15ml of the oat and mixedfeed extracts, was transferred to pear-shaped flasks and evaporated almost to drynesson a rotary evaporator. Dichloromethane (10 m1) was added to the residues.
Column clean upThe column was connected to the vacuum manifold after addition of about
2 g dried NaZS04 to the top of it. A 5-ml volume of hexane and 5 ml dichloromethanewere washed through the column before the sample extract was transferred quantitatively to the column. The solvent was drained to the top of the layer ofNazS04 and thecolumn was washed with 10 ml dichloromethane, 10 m1 hexane and 10 ml toluene.Thereafter, zearalenone was eluted with 8 ml toluene-acetone (95:5). OchratoxinA was eluted with 6 ml toluene-acetic acid (9:1). The two fractions were collected inseparate 12-ml conical centrifuge-tubes.
The eluates were evaporated to dryness under a stream of nitrogen. A 250-fllvolume of acetonitrile and 250 fll 0.1 M phosphoric acid were added to each residueand mixed on a Whirlimixer for I min. The samples were then sonicated for 5 min andmixed once more on the Whirlimixer before centrifugation for 10 min at 2000 g. An100-fll volume of the supernatant was transferred to an HPLC sample vial.
HPLC analysisA 20-fll volume of the extract was injected into the chromatograph. Methanol
0.01 M orthophosphoric acid (58:42) was used as the mobile phase. The flow-rate wasI ml/rnin, and the excitation wavelength of the fluorescence detector was set at 270 nm
NOTES 27\
for zearalenone and 340 nm for ochatoxin A, while the emission wavelength in bothcases was 465 nm.
RESULTS AND DISCUSSION
Chloroform-phosphoric acid (250:25) is an effective extraction medium forochratoxin and zearalenone'': 7.
Oat samples and mixed feed samples did not become clear after filtration, noteven after addition of Celite. A clear extract was required for the further clean-upprocedure on the minicolums. Centrifugation of the extract including the feed followedby filtration gave, however, a clear extract.
Minicolumns or solid phase extraction columns were used. Up to twelve sampleswere easily handled at the same time. From wheat and barley samples extractsequivalent to 5 g of cereals can be placed on columns containing 500 mg of packingmaterial. In extracts from oats and mixed feed the amount of contamination is higher,thus extracts equivalent to only 3-g samples can be placed on the columns. Otherwisea reduced recovery was observed, especially for zearalenone.
Sodium sulphate was added to the top of the silica minicolumn to reduce thewater content of the dichloromethane extract, and thereby also the elution strength ofthe solution.
The necessity for each washing step was examined. Omission of the dichloromethane step gave a less clean chromatogram for zearalenone. Washing with toluenecan in some cases be omitted, but not always. The procedure originally containeda washing step with chloroform-methanol (97:3) after the elution of zearalenone asdescribed by Howell and Taylor6. A very low recovery was then occasionally obtainedfor ochratoxin; the toxin had been washed out with the chloroform-methanolsolution.
Of the zearalenone 95% was found in the 2-6 ml fraction when eluted with 10 mltoluene-acetone (95:5), while 95% of the ochratoxin was eluted with 4 ml tolueneacetic acid (9:1). Aflatoxins may at this state be eluted with 10 ml chloroformmethanol (97:3)6.8.
The eluate ofzearalenone was normally coloured, often green. When evaporatedto dryness, green drops were seen which did not dissolve in acetonitrile-phosphoricacid. Sonication and mixing with a Whirlimixer 'ensured the dissolution of zearalenone. By centrifugation a clear extract was obtained which can be injected directlyinto the HPLC system. Filtration of the extract can then be omitted.
Both a reversed-phases-":? and a normal-phase10, l l chromatographic system
have been used for the determination of zearalenone by HPLC, while onlya reversed-phase has been used for ochratoxin A6,7 . Elution of ochratoxin A,containing a carboxylic acid group, requires an acidic mobile phase. Even thoughzearalenone and ochratoxin A cannot be chromatographed at the same time, it ispreferable to use the same mobile phase. Both acetonitrile and methanol can be used asthe organic modifier of the mobile phase. Either methanol-O.Ol M phosphoric acid(58:42) or acetonitrile-Om M phosphoric acid (40:60) was used when the Nucleosil C8column was used. A Supelcosil C 18 column was also tried. This column can be usedwhen the washing step with dichloromethane in the clean-up procedure is not omitted.
Both 275 (ref. 6) and 236 nm (refs. 9-12) have been used as excitation wavelength
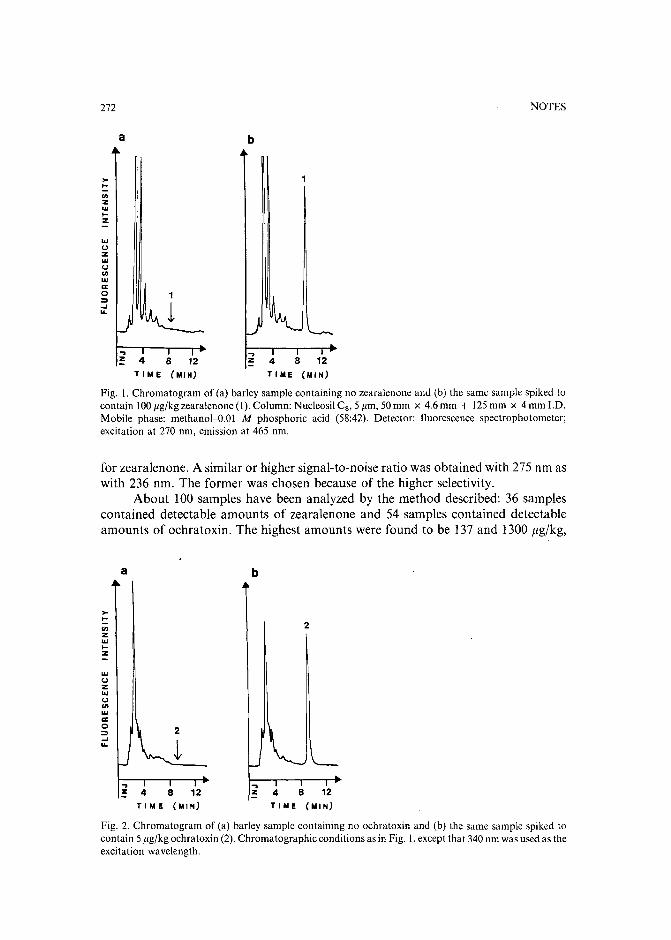
NOTES
b
272
a
>-!:UlzWI-Z
W(.)
ZWo<IlW..0::>~...
..! 4 8 12
TIME (MIN)
..,z 4 8 12
TIME (MIN)
Fig. I. Chromatogram of (a) barley sample containing no zearalenone and (b) the same sample spiked tocontain 100J1g/kg zearalenone (I). Column: Nucleosil Cs, 5 J1m, 50 mm x 4.6 mm + 125mm x 4 mm J.D.Mobile phase: methanol-o.ul M phosphoric acid (58:42). Detector: fluorescence spectrophotometer;excitation at 270 nm, emission at 465 nm.
for zearalenone. A similar or higher signal-to-noise ratio was obtained with 275 nm aswith 236 nm. The former was chosen because of the higher selectivity.
About 100 samples have been analyzed by the method described: 36 samplescontained detectable amounts of zearalenone and 54 samples contained detectableamounts of ochratoxin. The highest amounts were found to be 137 and 1300 j1.g/kg,
2
ba
>-I-
UlZWI-
~
W(.)
Zw(.)enw..0 2::>~
t...
..! 4 8 12
TIM E (MI N)
..,z 4 8 12
TIME (MIN)
Fig. 2. Chromatogram of (a) barley sample containing no ochratoxin and (b) the same sample spiked tocontain 5 J1g/kg ochratoxin (2). Chromatographic conditions as in Fig. I, except that 340 nm was used as theexcitation wavelength.
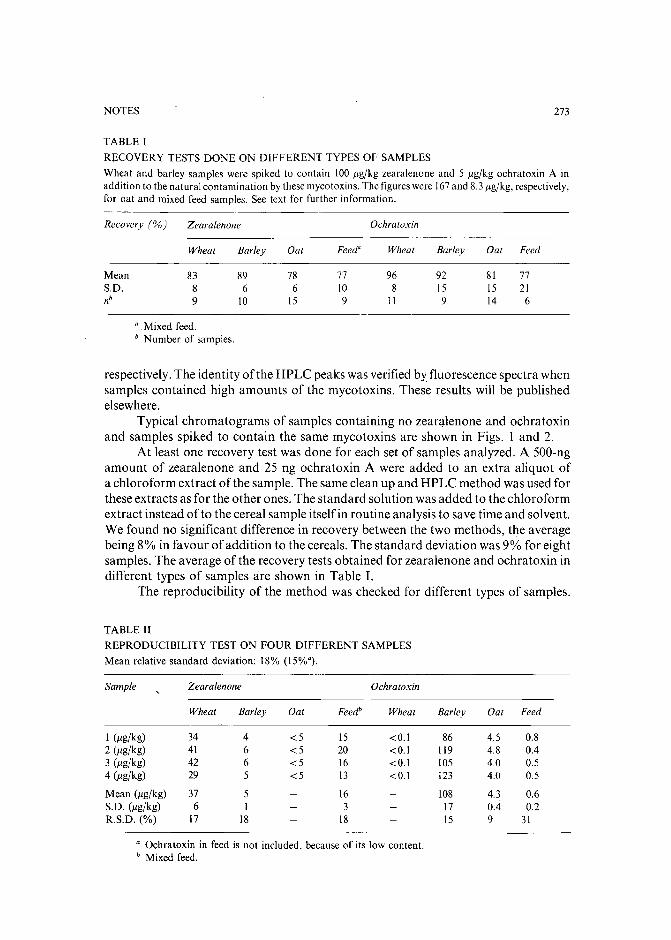
NOTES 273
TABLE I
RECOVERY TESTS DONE ON DIFFERENT TYPES OF SAMPLES
Wheat and barley samples were spiked to contain 100 pg/kg zearalenone and 5 pg/kg ochratoxin A inaddition to the natural contamination by these mycotoxins. The figures were 167and 8.3pg/kg, respectively,for oat and mixed feed samples. See text for further information.
Recovery (%) Zearalenone Ochratoxin
Wheat Barley Oat Feed" Wheat Barley Oat Feed
Mean 83 89 78 77 96 92 81 77S.D. 8 6 6 10 8 IS 15 21nb 9 10 15 9 II 9 14 6
"Mixed feed.b Number of samples.
respectively. The identity of the HPLC peaks was verified by fluorescence spectra whensamples contained high amounts of the mycotoxins. These results will be publishedelsewhere.
Typical chromatograms of samples containing no zearalenone and ochratoxinand samples spiked to contain the same mycotoxins are shown in Figs. I and 2.
At least one recovery test was done for each set of samples analyzed. A 500-ngamount of zearalenone and 25 ng ochratoxin A were added to an extra aliquot ofa chloroform extract of the sample. The same clean up and HPLC method was used forthese extracts as for the other ones. The standard solution was added to the chloroformextract instead of to the cereal sample itself in routine analysis to save time and solvent.We found no significant difference in recovery between the two methods, the averagebeing 8% in favour of addition to the cereals. The standard deviation was 9% for eightsamples. The average of the recovery tests obtained for zearalenone and ochratoxin indifferent types of samples are shown in Table I.
The reproducibility of the method was checked for different types of samples.
TABLE II
REPRODUCIBILITY TEST ON FOUR DIFFERENT SAMPLES
Mean relative standard deviation: 18% (15%").
Sample Zearalenone Ochratoxin
Wheat Barley Oat Feed" Wheat Barley Oat Feed
I (pg/kg) 34 4 <5 15 <0.1 86 4.5 0.82 (pg/kg) 41 6 <5 20 <0.1 119 4.8 0.43 (pg/kg) 42 6 <5 16 <0.1 105 4.0 0.54 (pg/kg) 29 5 <5 13 <0.1 123 4.0 0.5
Mean (pg/kg) 37 5 16 108 4.3 0.6S.D. (pg/kg) 6 I 3 17 0.4 0.2R.S.D. (%) 17 18 18 IS 9 31
a Ochratoxin in feed is not included, because of its low content.b Mixed feed.
274 NOTES
Four samples were analyzed four times each for zearalenone and ochratoxin A. Theresults are given in Table II. The samples were ground especially well before theanalysis, to remove the inhomogeneities that always exist in mycotoxin samples. Somevariations in the results may nevertheless reflect inhomogeneities in the samples.
The detection limit depended on the type ofsample, being highest for mixed feedand oat samples. It was found to vary between 2 and 5 j1g/kg for zearalenone andbetween 0.1 and 0.3 j1g/kg for ochratoxin.
CONCLUSIONS
A rapid, sensitive and selective method for the determination of the importantmycotoxins zearalenone and ochratoxin A is presented.
The clean-up procedure given is optimized for modern solid phase extractioncolumns, which are much easier to handle than conventional columns. The methodinvolves no liquid-liquid extraction or other time-consuming steps. The identificationand quantification is by HPLC. Clean chromatograms are obtained in most cases,making it easy to identify the zearalenone and ochratoxin peaks. Even withcomplicated mixed feed samples, the mycotoxins can be determined without furtherpurification of the eluate from the minicolumn, which is recommended by otherworkers-:".
REFERENCES
R. J. Cole, Modern Methods in the Analyis and Structural Elucidation ofMycotoxins, Academic Press,New York, 1986.
2 J. E. Smith and M. O. Moss, Mycotoxins, Formation, Analysis and Significance, Wiley, New York, 1985.3 P. Krogh, Mycotoxins in Food, Academic Press, London, 1987.4 C. E. Kientz and A. Verweij, J. Chrornatogr., 355 (1986) 229.5 E. Josefsson and T. Moller, J. Assoc. Off. Anal. Chern., 62 (1979) 1165.6 M. V. Howell and P. W. Taylor, J. Assoc. Off. Anal. Chern., 64 (1981) 1356.7 E. Josefsson and T. Moller, J. Assoc. Off. Anal. Chem., 62 (1979) 1165.8 W. Langseth, unpublished results.9 G. A. Bennett, O. L. Shotwell and W. F. Kwolek, J. Assoc. Off. Anal. Chem., 68 (1985) 958.
10 M. E. Olsen, H. I. Pettersson, K. A. Sandholm and K.-H. C. Kiessling, J. Assoc. Off. Anal. Chem., 68(1985) 632.
II T. Tanaka, A. Hasegawa, Y. Matsuki, U.-S. Lee and Y. Ueno, J. Chrornatogr., 328 (1985) 271.12 D. L. Orti, R. H. Hill, J. A. Liddle and L. L. Needham, J. Anal. Toxicol., 10 (1986) 41.
Journal of Chromatography, 478 (1989) 275-279Elsevier Science Publishers B.V., Amsterdam - Printed in The Netherlands
CHROM. 21 638
Note
Chromatographic method for determination of hexuronic acid in dermatan sulphate
HIDEKI UCHIYAMA, AKIRA OGAMO and KINZO NAGASAWA*
School of Pharmaceutical Sciences, Kitasato University, 5-9-/, Shirokane, Minato-ku, Tokyo' 108 (Japan)
(First received March 6th, 1989; revised manuscript received May 23rd, 1989)
A number of dermatan sulphate-ehondroitin sulphate copolymers (so-calleddermatan sulphates) having different hexuronic acid contents, degrees of sulphationand molecular weights, have been reported1. The hexuronic acid contents in thesepolysaccharides were conventionally estimated by the carbazole-orcinol ratio", whichhas been widely used for approximate estimation of the ratio of n-glucuronic acid toL-iduronic acid in glycosaminoglycans containing both hexuronic acids. Later, anenzymatic procedure using chondroitinase AC and ABC3
,4 was frequently utilized formicrodetermination of hexuronic acid in the above-mentioned copolymers.
Recently we required a method to check the reliability of the enzymaticprocedure. The method described herein was devised to satisfy our requirements, but itturned out to be useful as a general method for the chemical assay of the hexuronic acidcontent with the aid of a combination of gel filtration and ion-exchange chromatography.
EXPERIMENTAL
Materials and methodsRooster-comb derrnatan sulphates (sodium salts, RC-20 and RC30 fractions)
were as described previously". Pig-skin dermatan sulphate (sodium salt, M, 20000)was obtained as a 20% ethanol fraction by fractionation with ethanol of the calciumsalt according to the procedure of Meyer et al.5. Derivatives of these dermatansulphates, which had been labelled with a 2-aminoethylamino group at the reducingend of the polysaccharide chain, were as described previously",
Standard N-acetylchondrosine and N-acetyldermosine were as described previously7
• 1,2-Isopropylidene-t-iduronolactone was obtained from Nakarai Chemicals(Kyoto, Japan), and o-glucurono-6,3-lactone from Sigma (St. Louis, MO, U.S.A.).Chondroitinase AC-II from Arthrobacter auresens and chondroitinase ABC fromProteus vulgaris were obtained from Seikagaku Kogyo (Tokyo, Japan). AG l-X4anion-exchange resin (200-400 mesh) and Sephadex G-25 were obtained fromBio-Rad Labs. (Richmond, CA, U.s.A.) and Pharmacia Fine Chemicals (Uppsala,Sweden), respectively.
Hexuronic acid was determined by the method of Bitter and Muir", modified byincreasing the borate concentration to 0.2 M, and by using o-glucurono-6,3-lactoneand 1,2-isopropylidene-L-iduronolactone as standards".
0021-9673/89/$03.50 © 1989 Elsevier Science Publishers B.V.
276 NOTES
Enzymatic determination of hexuronic acid in derma tan sulphates and their Z-aminoethylamino derivatives
To a solution of the sample (100 f.1g in 20 f.11 of water) were added enriched Trisbuffer l", pH 8.0 (10 f.1\) and chondroitinase AC-II (0.5 units in 20 f.11 of water), and themixture was incubated at 37°C for 5 h. To another sample of the material (100 f.1g in 20f.11 of water) were added enriched Tris buffer (10 f.1\) and chondroitinase ABC (0.2 unitsin 20 f.11 ofwater), and the mixture was incubated for 5 h at 37°C. The absorbance at 232nm was measured for each incubation mixture to obtain the ratio of A 2 3 2
(chondroitinase AC-II) to A 2 3 2 (chondroitinase ABC) which gave the proportion ofn-glucuronic acid in the total hexuronic acid content (%?
Determination of hexuronic acid in derma tan sulphates and their 2-aminoethylaminoderivatives
Hydrolysis of the polysaccharide materials with dimethyl sulphoxide containing10% water. A solution of the sample (~ 6 mg per 0.4 ml water) was passed througha column of Dowex 50W-X2 (H+, 50-100 mesh) at 0-4°C. The eluent and washingswere pooled, neutralized (pH 6.0) by the addition of pyridine and lyophilized to givethe pyridinium salt as a white powder. A solution of the pyridinium salt (~ 6 mg) indimethyl sulphoxide containing 10% of water (1.5 ml) was heated in a Pyrex test-tube(10 em x 0.7 cm) fitted with a PTFE screw-cap and stirred with PTFE stirrer (diameter0.5 em) for 30 h at 108 ± 1°C. After cooling in an ice-batch, the contents of thetest-tube were diluted in an equal volume of water and transferred to a distillation flask(volume 20 ml), then neutralized (pH 6.0) with 0.1 M NaOH. The solution obtainedwas evaporated to dryness at 30-35°C under reduced pressure.
Separation on Sephadex G-25 and AG 1-X4 anion-exchange resin, of thehydrolysate into Neacetyldermosine, Nsacetylchondrosine, i-iduronic acid and ts-glucuronic acid, and determination of the ratio ofti-glucuronic acid to total hexuronic acid.The hydrolysate obtained above was dissolved in 0.1 M ammonium hydrogencarbonate (0.5 ml) and loaded on a column (85.5 cm x 1.5 em) of Sephadex G-25prepared in the same solvent. The column was eluted at 20-25°C with the same solventat a flow-rate of 34 ml/h. Each fraction (2 ml) was analyzed for hexuronic acid (theelution diagrams are shown in the insets of Fig. la, b). The fractions corresponding tothe disaccharide and monosaccharide peaks (tube Nos. 46--65of the elution diagramsin the insets of Fig. Ia, b) were pooled and lyophilized. The residue was dissolved inwater (0.5 ml) and loaded on a column (85.5 cm x 1.0 em) of AG I-X4 (HCOi,200-400 mesh) prepared in water. The column was eluted at 40°C with 0.2 M formicacid at a flow-rate of 24 ml/h, Each fraction (3.9 ml) was analyzed for hexuronic acid(Fig. l a, b). The sum of the peak areas due to N-acetylchondrosine and o-glucuronicacid in each elution diagram of Fig. I provides an estimate of the content ofn-glucuronic acid in the sample, and the sum of the peak areas due to N-acetyldermosine and L-iduronic acid affords that of L-iduronic acid in the sample.
RESULTS AND DISCUSSION
One of us reported previously that the reaction of the pyridinium salts ofdermatan sulphates in dimethyl sulphoxide containing 10% of water at 105°C for 30h afforded higher oligosaccharide (~ tetrasaccharide, 18.3%), disaccharide (69.2%)
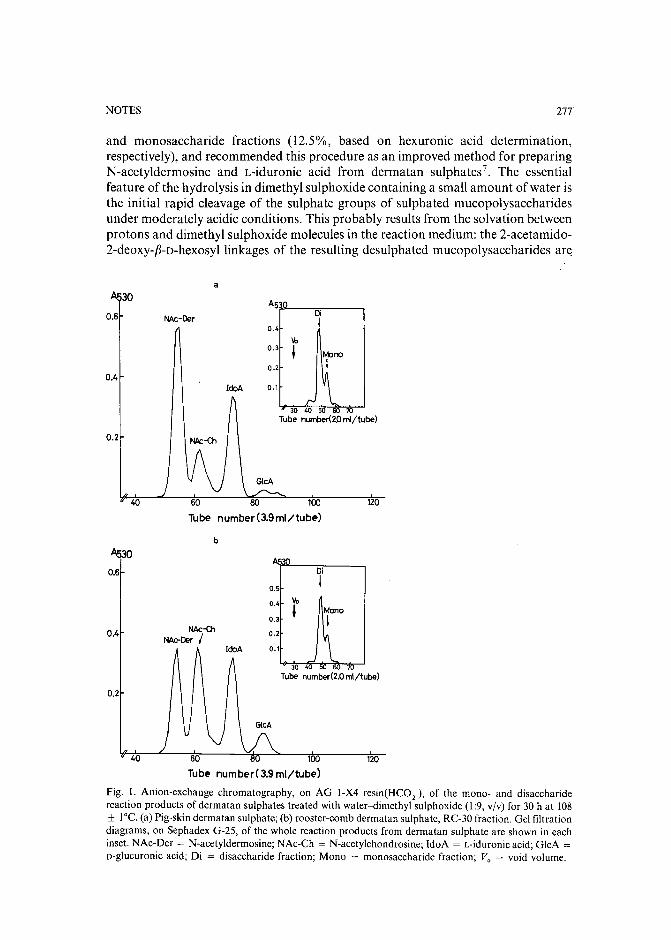
NOTES 277
and monosaccharide fractions (12.5%, based on hexuronic acid determination,respectively), and recommended this procedure as an improved method for preparingN-acetyldermosine and L-iduronic acid from dermatan sulphates7
. The essentialfeature ofthe hydrolysis in dimethyl suiphoxide containing a small amount of water isthe initial rapid cleavage of the sulphate groups of sulphated mucopolysaccharidesunder moderately acidic conditions. This probably results from the solvation betweenprotons and dimethyl sulphoxide molecules in the reaction medium: the 2-acetamido2-deoxy-f3-D-hexosyl linkages of the resulting desulphated mucopolysaccharides are
aA 30
0.6 NAc-Oer0.4
Di,
0.4IdeA
0.3
0.2
0.1
Mono
~\3O~506070
Tube number(2.0ml/tube)
0.2
40 80 100
numbed3.9 ml/tube)
120
120
30Tube number{2.0 ml/tube)
A,i""-_----;::--_---,Oi
0.5I
0.4 Yo
J Mono0.3 I0.2
0.1
b
NAc-ehNAc-Oer I
40
AsJo0.6
0.2
0.4
60 0 100
Tube number( 3.9ml/tube)
Fig. 1. Anion-exchange chromatography, on AG I-X4 resin(HCO;), of the mono- and disaccharidereaction products of derma tan sulphates treated with water-<limethyl sulphoxide (1:9, v/v) for 30 h at 108± 1°C. (a) Pig-skin dermatan sulphate; (b) rooster-comb dermatan sulphate, RC-30 fraction. Gel filtrationdiagrams, on Sephadex G-25, of the whole reaction products from dermatan sulphate are shown in eachinset. NAc-Oer = N-acetyldermosine; NAc-Ch = N-acetylchondrosine; IdoA = L-iduronic acid; GlcA =
n-glucuronic acid; Oi = disaccharide fraction; Mono = monosaccharide fraction; Vo = void volume.
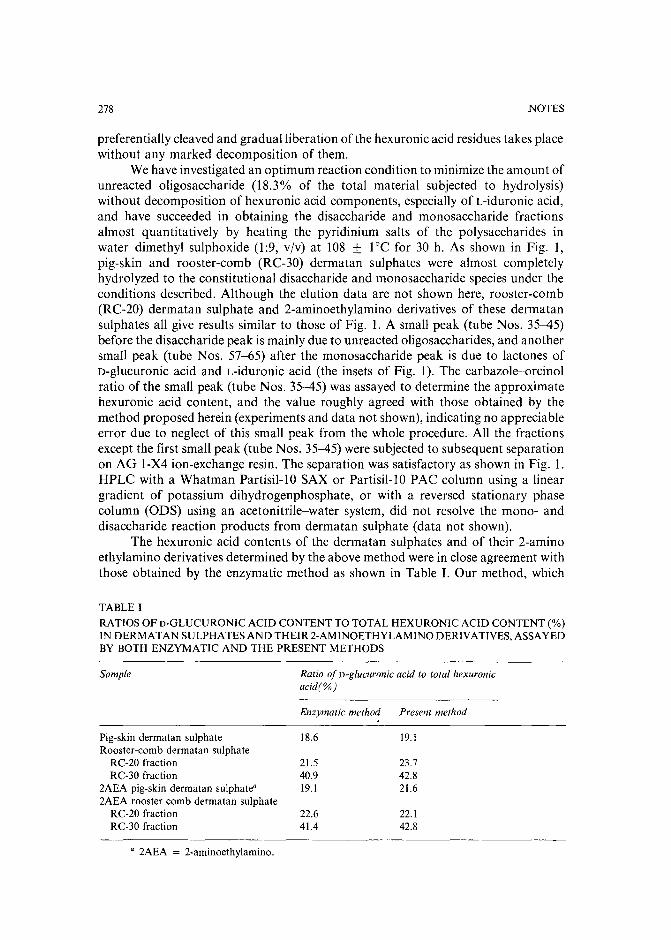
278 NOTES
preferentially cleaved and gradual liberation of the hexuronic acid residues takes placewithout any marked decomposition of them.
We have investigated an optimum reaction condition to minimize the amount ofunreacted oligosaccharide (18.3% of the total material subjected to hydrolysis)without decomposition of hexuronic acid components, especially of L-iduronic acid,and have succeeded in obtaining the disaccharide and monosaccharide fractionsalmost quantitatively by heating the pyridinium salts of the polysaccharides inwater-dimethyl sulphoxide (1:9, v/v) at 108 ± 1°C for 30 h. As shown in Fig. 1,pig-skin and rooster-comb (RC-30) dermatan sulphates were almost completelyhydrolyzed to the constitutional disaccharide and monosaccharide species under theconditions described. Although the elution data are not shown here, rooster-comb(RC-20) dermatan sulphate and 2-aminoethylamino derivatives of these dermatansulphates all give results similar to those of Fig.!. A small peak (tube Nos. 35--45)before the disaccharide peak is mainly due to unreacted oligosaccharides, and anothersmall peak (tube Nos. 57-65) after the monosaccharide peak is due to lactones ofD-glucuronic acid and L-iduronic acid (the insets of Fig. 1). The carbazole-orcinolratio of the small peak (tube Nos. 35--45) was assayed to determine the approximatehexuronic acid content, and the value roughly agreed with those obtained by themethod proposed herein (experiments and data not shown), indicating no appreciableerror due to neglect of this small peak from the whole procedure. All the fractionsexcept the first small peak (tube Nos. 35-45) were subjected to subsequent separationon AG I-X4 ion-exchange resin. The separation was satisfactory as shown in Fig.!.HPLC with a Whatman Partisil-lO SAX or Partisil-lO PAC column using a lineargradient of potassium dihydrogenphosphate, or with a reversed stationary phasecolumn (ODS) using an acetonitrile-water system, did not resolve the mono- anddisaccharide reaction products from dermatan sulphate (data not shown).
The hexuronic acid contents of the derma tan sulphates and of their 2-aminoethylamino derivatives determined by the above method were in close agreement withthose obtained by the enzymatic method as shown in Table I. Our method, which
TABLE I
RATIOS OF D-GLUCURONIC ACID CONTENT TO TOTAL HEXURONIC ACID CONTENT (%)IN DERMATAN SULPHATES AND THEIR 2-AMINOETHYLAMINO DERIVATIVES, ASSAYEDBY BOTH ENZYMATIC AND THE PRESENT METHODS
Sample Ratio of o-glucuronic acid to total hexuronicacid(%)
Enzymatic method Present method.Pig-skin dermatan sulphateRooster-comb dermatan sulphate
RC-20 fractionRC-30 fraction
2AEA pig-skin dermatan sulphate"2AEA rooster comb dermatan sulphate
RC-20 fractionRC-30 fraction
a 2AEA = 2-aminoethylamino.
18.6
21.540.919.1
22.641.4
19.1
23.742.821.6
22.142.8
NOTES 279
consists of acid hydrolysis and chromatographic separation, is necessarily accompanied by some errors due to these two processes. One of them would be a deviationfrom the stoichiometry of the acid hydrolysis, and another would be non-ionicirreversible adsorption on the AG 1 anion-exchange resin. On the other hand, theenzymatic determination using chondroitinase AC and ABC3 has been demonstratedby us (data not shown) to be susceptible to varous factors specific to the enzymaticreactions, such as variance in the structures of the substrates (the existence of a varietyof dermatan sulphate-ehondroitin sulphate copolymers) or in the enzyme source(condroitinase AC-I from Flavobacterium' and AC-II from Arthrobacter':': Accordingly, we thought that the data on the hexuronic acid content obtained by theenzymatic method need to be supported by some other method differing in principlefrom the enzymatic method. However, there was only a semiquantitative methodbased on the carbazole-orcinol ratio". As described above, the method proposed hereis very simple both in principle and practice, and the data in Table I show that thevalues obtained are reliable. Thus, our method is considered to be useful forinvestigators in the biochemical and medical fields as a complement to the existingmethods.
REFERENCES
L.-A. Fransson, in G. O. Aspinall (Editor), The Polysaccharides, Vol. 3, Academic Press, New York,1985, p. 338.
2 P. Hoffman, A. Linker and K. Meyer, Arch. Biochem. Biophys., 69 (1957) 435.3 T. Yamagata, H. Saito, O. Habuchi and S. Suzuki, J. BioI. Chem., 243 (1968) 1523.4 K. Nagasawa, A. Ogamo, H. Ichihara and K. Yoshida, Carbohydr. Res., 131 (1984) 301.5 K. Meyer, E. Davidson, A. Linker and P. Hoffman, Biochim. Biophys. Acta, 21 (1956) 506.6 H. Uchiyama and K. Nagasawa, Carbohydr. Res., 159 (1985) 263.7 Y. Inoue and K. Nagasawa, Carbohydr. Res., 97 (1981) 263.8 T. Bitter and H. M. Muir, Anal. Biochem .. 4 (1962) 330.9 M. Kosakai and Z. Yosizawa, Anal. Biochem., 93 (1979) 295.
10 H. Saito, T. Yamagata and S. Suzuki, J. Bioi. Chem., 243 (1968) 1536.11 K. Hiyama and S. Okada, J. Bioi. Chem., 250 (1975) 1824.
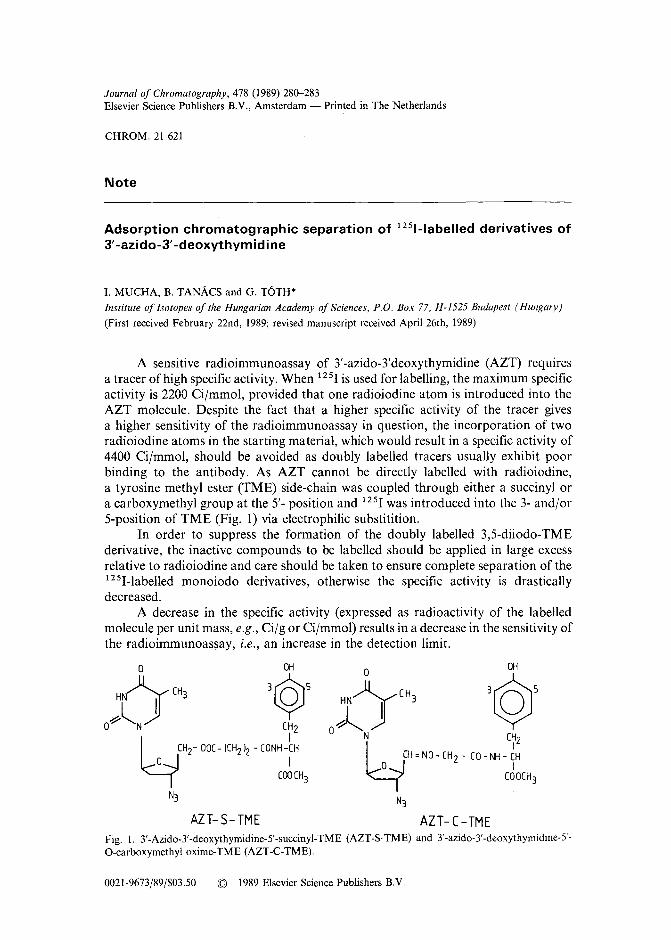
Journal of Chromatography, 478 (1989) 280-283Elsevier Science Publishers B.Y., Amsterdam - Printed in The Netherlands
CHROM. 21 621
Note
Adsorption chromatographic separation of 1251-labelled derivatives of3' -azido-3' -deoxythymid ine
I. MUCHA, B. TANAcs and G. TOTH*
Institute of Isotopes of the Hungarian Academy of Sciences, P.O. Box 77, H-1525 Budapest (Hungary)
(First received February 22nd, 1989; revised manuscript received April 26th, 1989)
A sensitive radioimmunoassay of 3'-azido-3'deoxythymidine (AZT) requiresa tracer of high specific activity. When 1251is used for labelling, the maximum specificactivity is 2200 Ci/mmol, provided that one radioiodine atom is introduced into theAZT molecule. Despite the fact that a higher specific activity of the tracer givesa higher sensitivity of the radioimmunoassay in question, the incorporation of tworadioiodine atoms in the starting material, which would result in a specific activity of4400 Ci/mmol, should be avoided as doubly labelled tracers usually exhibit poorbinding to the antibody. As AZT cannot be directly labelled with radioiodine,a tyrosine methyl ester (TME) side-chain was coupled through either a succinyl ora carboxymethyl group at the 5'- position and 1251 was introduced into the 3- and/or5-position of TME (Fig. I) via electrophilic substitition.
In order to suppress the formation of the doubly labelled 3,5-diiodo-TMEderivative, the inactive compounds to be labelled should be applied in large excessrelative to radioiodine and care should be taken to ensure complete separation of the1251-labelled monoiodo derivatives, otherwise the specific activity is drasticallydecreased.
A decrease in the specific activity (expressed as radioactivity of the labelledmolecule per unit mass, e.g., Ci/g or Ci/rnmol) results in a decrease in the sensitivity ofthe radioimmunoassay, i.e., an increase in the detection limit.
AZT-S- TME
;t~(Hl '~So N
l4C~z
CH=NO-CH Z - CO-NH- CHo I
COOCH3
N3
AZT-C-TMEFig. I. 3'-Azido-3'-deoxythymidine-S'<succinyl-TME (AZT-S-TME) and 3'-azido-3'-deoxythynudine-S>O-carboxymethyl oxime-TME (AZT-C-TME).
0021-9673/89/$03.50 © 1989 Elsevier Science Publishers B.Y.
NOTES 281
Previously, it was shown for several small molecules that the introduction ofiodine substitutent(s) into the phenolic ring gives rise to a considerable increase in theadsorption affinity towards Sephadex LH-20 dextran gel compared with the parentmolecules 1-4. Based on this finding, we report an adsorption chromatographicseparation of 125I-labelled AZT from the inactive parent compounds using SephadexLH-20 as adsorbent.
EXPERIMENTAL
Sample preparationIn order to examine the chromatographic behaviour of AZT-S-TME and
AZT-C-TME (Fig. 1), used for radioiodination, these compounds were synthesizedusing tritium-labelled AZT. The latter was prepared from AZT (Sigma, St. Louis, MO,U.S.A.) according to the method of Hill and Freeman". From tritium-labelled AZTthe carboxymethyl oxime or hemisuccinate derivative was produced by the use ofaminooxyacetic acid (Sigma) and succinic anhydride (Sigma). Tyrosine methyl ester(Sigma) was coupled to these derivatives by the use of the carbodiimide method.
Labelling with 1251The labelling of AZT-S-TME and AZT-C-TME with 1251was performed by the
use of the chloramine T method". To 10-20 Ilg of AZT-S-TME or AZT-C-TME, 1-2mCi of 1251 in slightly alkaline solution were added, followed by 200-300 Ilg ofchloramine T in 50 III of phosphate buffer (pH 7.4). After 30-60 s, the labelling reactionwas quenched with 700 Ilg of sodium metabisulphite in 100 Ill.
ChromatographySephadex LH-20 dextran gel (Pharmacia, Uppsala, Sweden) was swollen in
distilled water prior to being packed in the column (130 x 10 mm I.D.). The height ofthe packing was 100mm. The sample (0.1-0.2 ml) was placed on the top of the columnand allowed to soak in and, 10-20 min later, i.e., when adsorption equilibrium hadbeen attained, elution was performed with ethanol-water (flow-rate 22-24 ml/h),
The pH of the eluent, when not indicated otherwise, was adjusted to 4 with 0.1M citrate buffer so as to suppress the dissociation of the phenolic hydroxyl group ofthetyrosine methyl ester residue. At higher pH ionization of the OH group may take place,which decreases or cancels the adsorption of the TME residue'<".
Radioactivity measurementTo measure the elution volume of tritium-labelled derivatives, the effluent was
collected with a fraction collector (LKB 2211) in 0.5-ml fractions and its radioactivitywas determined by liquid scintillation counting (LKB 1214).
In the case of chromatography of 125I-labelled compounds, the effluent waspassed over a NaI(Tl) scintillation crystal and the count rate was monitored bya ratemeter and registered by an x-y plotter. A peristaltic pump, flow-rate 22-24 ml/h,delivered the eluent.
The distribution coefficient was calculated according to the equation
k = Ve - Vo = Ve - 5.44W 1.46
(1)
282 NOTES
where Ve, Vo and Ware the elution volume, the dead volume and the weight of theadsorbent, respectively.
RESULTS
The elution volume of tritium-labelled AZT-S-TME and AZT-C-TME was10-11 ml and proved to be independent of the ethanol concentration. For 125I-labelledAZT-S-TME and AZT-C-TME the elution volumes obtained for different ethanolconcentrations are given in Table 1.
From the data in Table I, the conclusion can be drawn that at any ethanolconcentration investigated the 3H-labelled compounds are eluted first, followed by the125I-labelled compounds. With 125I-labelled AZT-S-TME and AZT-C-TME theelution volume decreases with increasing ethanol concentration. With the exception ofdilute eluents (10 and 20% ethanol), the distribution coefficient depends on the ethanolconcentration of the eluent as follows:
log k = log k o - n log X (2)
where. k is the distribution coefficient, X is the concentration of the organic solventexpressed as a molar fraction in the binary eluent and koand n are constants for a givenbinary eluent and iodo compound.
log k = 1.33 log X e25I-AZT-S-TME)
log k = 0.004 - 1.24 log X e25I-AZT-C-TM E)
(3)
(4)
The distribution coefficient as a function of the ethanol concentration expressedas a molar fraction is shown in Fig. 2. Comparison of the data in Table I and the elutionvolume of the 3H-labelled AZT-S-TME and AZT-C-TME reveals that the introduction of the radioiodine atom into position 3 of the TME residue considerably increasesthe elution volume. Consequently, the adsorption affinity of the 125I-labelledmolecules towards the LH-20 gel can mainly be attributed to the 125I-labelled TME
TABLE I
ELUTION VOLUME OF 12sI-LABELLED AZT-S-TME AND AZT-C-TME
Eluent: aqueous ethanol (pH 4)
Ethanol concentration Elution volume (ml)
% (v]v} Molar fraction, X (' 2 SI]AZT-S-TME
10 0.032 3520 0.07 3330 0.115 2840 0.166 1950 0.23 1460 0.312 12
524436251714
NOTES
k50
01 05 10 X
283
Fig. 2. Distribution coefficient as a function of ethanol concentration. Eluent: aqueous ethanol (pH 4).x = AZT-S-TME; 0 = AZT-C-TME.
residue and only to a negligible extent to the AZT itself. On the other hand, the linearlog k vs.log X relationship which proved to be valid in the ethanol concentration range30-60% (v/v) (molar fraction 0.115-0.312) makes possible the adjustment of theoptimum distribution coefficient and the complete separation of t25I-labelledAZT-S-TME and AZT-C-TME from the parent molecule.
REFERENCES
1 G. T6th, J. Radioanal. Chern., 46 (1978)201.2 G. T6th, J. Chrornatogr., 238 (1982) 476.3 G. T6th and J. Zsadanyi, J. Radioanal Nucl. Chern. Lett., 86 (1984) 25.4 G. T6th, J. Radioanal. Nucl. Chern., 121 (1988) 17.5 J. A. Hill and G. A. Freeman, J. Labelled Cornpd. Radiopharm., 25 (1988) 278.6 W. M. Hunter and F. C. Greenwood, Nature (London), 194 (1962) 495.
Journal of Chromatography, 478 (1989) 284Elsevier Science Publishers B.V., Amsterdam - Printed in The Netherlands
CHROM. 21 713
Book Review
Advances in chromatography, Vol. 28, edited by J. C. Giddings, E. Grushka and P. R.Brown, Marcel Dekker, New York, Basle, 1989, XVIII + 317 pp., priceUS$ 99.75 (U.S.A. and Canada), US$ 119.50 (rest of world), ISBN 0-82477878-2.
This year's volume of this excellent series is made up of seven reviews:
(I) Theoretical aspects of quantitative affinity chromatography, by Alain Jaulmes and Claire Vidal-Mad-jar;
(2) Column switching in gas chromatography, by Donald E. Willis;(3) The use and properties of mixed stationary phases in gas chromatography, by Gareth 1. Price;(4) On-line small-bore chromatography for neurochemical analysis in the brain, by William H. Church
and Joseph B. Justice, Jr.;(5) The use of dynamically modified silica in HPLC as an alternative in chemically bonded materials, by
Per Helboe, Steen Honore Hansen and Mogens Thomsen;(6) Gas chromatographic analysis of plasma lipids, by Arnis Kuksis and John J. Myher; and(7) HPLC of penicillin antibiotics, by Michel Margosis.
These are all very satisfactory reviews, with only one observation, namely thatsome authors reviewed their field recently in the form of a monograph and thus coverthe same ground here in another form.
Without wanting to carp unduly, it should be noted that in the last review,dealing with penicillin, it is stated: "The application of liquid chromatography to theanalysis of antibiotics was first performed by Fischbach." Now Fischbach's papersdate from 1946-1947, while liquid chromatography was used already in 1942 byAbraham and Chain and by Catch, Cook and Heilbron in purifying penicillins, andby Levi in 1946-1949 for their analysis. This might perhaps have been mentionedhere.
Unfortunately, the reference lists have not been checked; thus, there are numerous typing errors, such as "Syprynowicz", "Guichon", "Di Corcici".
M. LEDERER
Journal of Chromatography, 478 (1989) 285Elsevier Science Publishers B.V., Amsterdam - Printed in The Netherlands
CHROM. 21 714
Book Review
Neuromethods, Vol. 7, lipids and related compounds, edited by A. Boulton, G. Bakerand L. Horrocks, Humana Press, Clifton, NI, 1988, 360 pp., price US$ 64.50(U.S.A.), US$ 74.50 (export).
Volume 7 of this successful series contains ten chapters dealing with
(I) Lipid extraction;(2) Preparation and analysis of acyl and alkenyl groups of glycerophospholipids from brain subcellular
membranes;(3) Quantitative analysis of acyl group composition of brain phospholipids, neutral lipids and free fatty
acids;(4) Steroids and related isoprenoids;(5) Phospholipids;(6) Determination of phospholipases, lipases and Iysophospholipases;(7) Isolation, separation and analysis of phosphoinositides from biological sources;(8) Analysis of prostaglandins, leukotrienes and related compounds in retina and brain;(9) HPLC analysis of neutral glycosphingolipids and sulfatides; and
(l0) Methods to study the biochemistry of gangliosides.
Each chapter was written by a different author (or group of authors). They allseem adequate as a first orientation for neurochemists. But none of them is exhaustive; for example, the chapter on phospholipids lists altogether 41 references and nonelater than 1986. So one can hardly call these chapters reviews nor can the tome becalled a handbook.
In the chapter on "Steroids and related isoprenoids" the main topic is stated as"Cholesterol is quantitatively the major steroid synthesised within neural tissue andmethodologies relating to the metabolism of cholesterol will consequently be a majorfocus of this review". So the reader will certainly not find a coverage of the literatureof steroid chromatography. One has the impression that all chapters are interesting,well written and informative. It is, however, not quite clear whether the authors areaddressing themselves to research workers or to students. For the first the literaturecoverage seems scanty, for the latter the topic is too specialised.
M. LEDERER

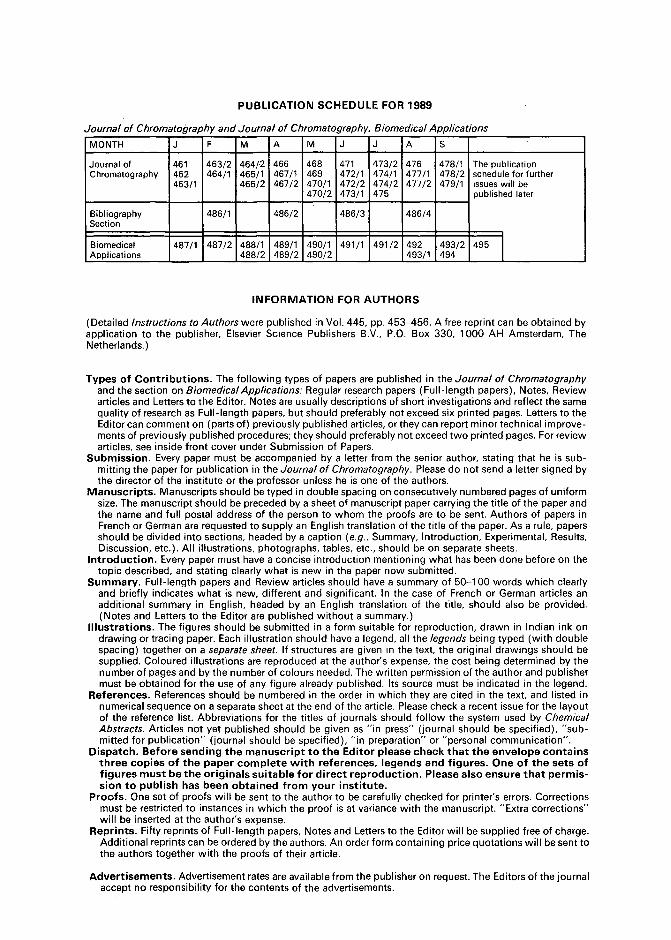
PUBLICATION SCHEDULE FOR 1989
Journal of Chromatography and Journal of Chromatography, Biomedical Applications
MONTH J F M A M J J A S
Journal of 461 463/2 464/2 466 468 471 473/2 476 478/1 The publicationChromatography 462 464/1 465/1 467/1 469 472/1 474/1 477/1 478/2 schedule for further
463/1 465/2 467/2 470/1 472/2 474/2 477/2 479/1 issues will be470/2 473/1 475 published later
Bibliography 486/1 486/2 486/3 486/4Section
Biomedical 487/1 487/2 488/1 489/1 490/1 491/1 491/2 492 493/2 495 IApplications 488/2 489/2 490/2 493/1 494
INFORMATION FOR AUTHORS
(Detailed Instructions to Authors were published in Vol. 445, pp. 453-456. A free reprint can be obtained byapplication to the publisher, Elsevier Science Publishers B.V., P.O. Box 330, 1000 AH Amsterdam, TheNetherlands. )
Types of Contributions. The following types of papers are published in the Journal of Chromatographyand the section on Biomedical App/ications: Regular research papers (Full-length papers), Notes, Reviewarticles and Letters to the Editor. Notes are usually descriptions of short investigations and reflect the samequality of research as Full-length papers, but should preferably not exceed six printed pages. Letters to theEditor can comment on (parts of) previously published articles, or they can report minor technical improvements of previously published procedures; they should preferably not exceed two printed pages. For reviewarticles, see inside front cover under Submission of Papers.
Submission. Every paper must be accompanied by a letter from the senior author, stating that he is submitting the paper for publication in the Journa/ of Chromatography. Pleasedo not send a letter signed bythe director of the institute or the professor unless he is one of the authors.
Manuscripts. Manuscripts should be typed in double spacing on consecutively numbered pages of uniformsize. The manuscript should be preceded by a sheet of manuscript paper carrying the title of the paper andthe name and full postal address of the person to whom the proofs are to be sent. Authors of papers inFrench or German are requested to supply an English translation of the title of the paper. As a rule, papersshould be divided into sections, headed by a caption (e.g., Summary, Introduction, Experimental, Results,Discussion, etc.). All illustrations, photographs, tables, etc.. should be on separate sheets.
Introduction. Every paper must have a concise introduction mentioning what has been done before on thetopic described, and stating clearly what is new in the paper now submitted.
Summary. Full-length papers and Review articles should have a summary of 50-100 words which clearlyand briefly indicates what is new, different and significant. In the case of French or German articles anadditional summary in English, headed by an English translation of the title, should also be provided.(Notes and Letters to the Editor are published without a summary.)
Illustrations. The figures should be submitted in a form suitable for reproduction, drawn in Indian ink ondrawing or tracing paper. Each illustration should have a legend, all the legends being typed (with doublespacing) together on a separate sheet. If structures are given in the text, the original drawings should besupplied. Coloured illustrations are reproduced at the author's expense, the cost being determined by thenumber of pages and by the number of colours needed. The written permission of the author and publishermust be obtained for the use of any figure already published. Its source must be indicated in the legend.
References. References should be numbered in the order in which they are cited in the text, and listed innumerical sequence on a separate sheet at the end of the article. Pleasecheck a recent issue for the layoutof the reference list. Abbreviations for the titles of journals should follow the system used by ChemicalAbstracts. Articles not yet published should be given as "in press" (journal should be specified), "submitted for publication" (journal should be specified), "in preparation" or "personal communication".
Dispatch. Before sending the manuscript to the Editor please check that the envelope containsthree copies of the paper complete with references, legends and figures. One of the sets offigures must be the originals suitable for direct reproduction. Please also ensure that permission to publish has been obtained from your institute.
Proofs. One set of proofs will be sent to the author to be carefully checked for printer's errors. Correctionsmust be restricted to instances in which the proof is at variance with the manuscript. "Extra corrections"will be inserted at the author's expense.
Reprints. Fifty reprints of Full-length papers, Notes and Letters to the Editor will be supplied free of charge.Additional reprints can be ordered by the authors. An order form containing price quotations will be sent tothe authors together with the proofs of their article.
Advertisements. Advertisement rates are available from the publisher on request. The Editors of the journalaccept no responsibility for the contents of the advertisements.
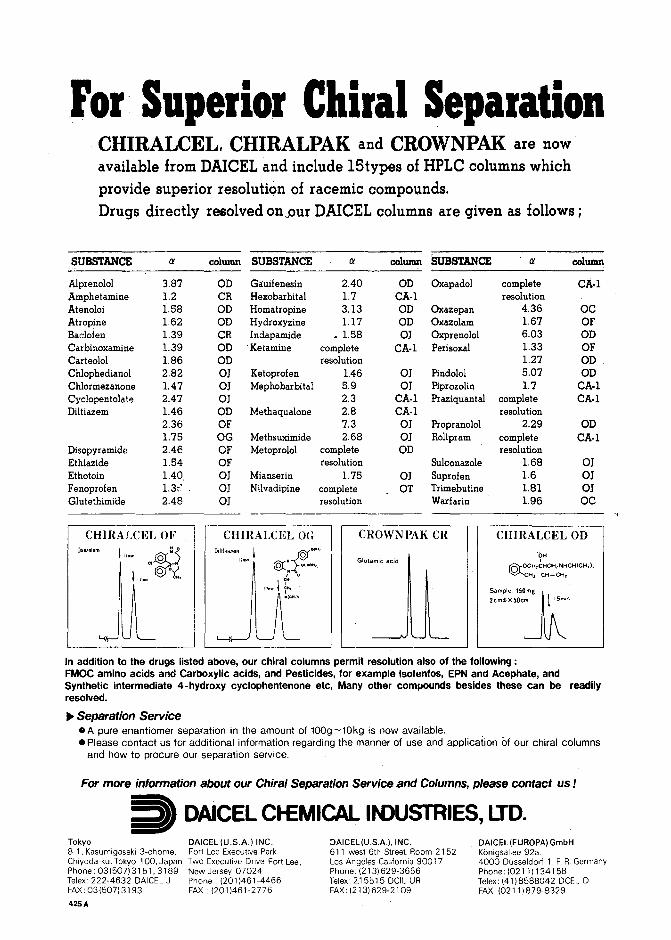
For· Superior Chiral SeparatioDCHIRALCEL, CHIRALPAK and CROWNPAK are nowavailable from DAICEL and include 15types of HPLC columns whichprovide superior resolution of racemic compounds.Drugs directly resolved on.our DAICEL columns are given as follows;
SUBSTANCE IX column SUBSTANCE IX column SUBsTANCE IX column
AlprenololAmphetamineAtenoloiAtropineBaclofenCarbinoxamineCarteololChlophedianolChlormezanoneCyclopentolateDiltiazem
DisopyramideEthiazideEthotoinFenoprofenGlutethimide
3.871.2i.581.621.391.391.862.821.472.471.462.361.752.461.541.401.3~:
2.48
ODCRODODCRODODOJOJOJODOFOGOFOFOJOJOJ
Ga:uifenesinHexobarbitalHomatropineHydroxyzineIndapamide
.Ketamine
KetoprofenMephobarbital
Methaqualone
MethsuximideMetoprolol
MianserinNilvadipine
2.401.73.131.17
• 1.58completeresolution
1.465.92.32.87.32.68
completeresolution
1.75completeresolution
ODCA·1ODODOJ
CA-1
OJOJ
CA·1CA·1OJOJOD
OJOT
Oxapadol
OxazepanOxazolamOxprenololPerisoxal
PindololPiprozolinPraziquantal
Propr anololRolipram
SulconazoleSuprofenTrimebutineWarfarin
completeresolution
4.361.676.031.331.275.071.7
completeresolution
2.29completeresolution
1.681.61.811.96
CA·l
OCOFODOFODOD
CA· 1CA·l
ODCA-l
OJOJOJOC
·9H
©'OCH1CHCHINHCH(CHJ)2
CH2-CH=CH 2
CHiRALCEL OD
Sample: 150mg
"~"O'JA
CROWNPAK CR
Glutamic acid
CHIRALCEL 0(;Dilthi8Zem
l7"",~ flOCH>
©X:-t~"".cit, 0
Z1Jronl ~H'",{eM,},
CHiRALCEL OF
In addition to the drugs listed above, our chiral columns permit resolution also of the following:FMOC amino acids and Carboxylic acids, and Pesticides, for example tsofenfos, EPN and Acephate, andSynthetic intermediate 4-hydroxy cyclophentenone etc, Many other compounds besides these can be readilyresolved.
~ Separation Service• A pure enantiomer separation in the amount of 100g-lOkg is now available .• Please contact us for additional information regarding the manner of use and application of our chiral columns
and how to procure our separation service.
For more information about our Chiral Separation Service and Columns, please contact us !
:'t) DAiCEL Ct-EMICAL IN>USTRIES, LTD.Tokyo DAICEL (U.S.A.) INC.8-1. Kasumigaseki 3-chome. Fort Lee Executive ParkChivcda-ku. Tokyo 100. Japan Two Executive Drive Fort lee.Phone: 03 (507) 3151. 3189 New Jersey 07024Telex: 222-4632 DAICEl J Phone: (201)461-4466FAX:03(50713193 FAX: (201)461-2776
425 A
DAICEL(U.S.A.), INC.611 west 6th Street. Room 2152los Angeles California 90017Phone: (213) 629-3656Telex: 2.15515 DClL URFAX:(213)629-2109
DAICEL(EUROPA) GmbHKbnigsallee 92a.4000 Dusseldorf 1, F.R.GermanyPhone: (0211) 1341 58Telex: (4118588042 DCEl DFAX:(0211)879-8329
Related Documents