Journal #12 If the trend continues, where would the object be at 10 seconds?

Journal #12 / If the trend continues, where would the object be at 10 seconds?
Dec 15, 2015
Welcome message from author
This document is posted to help you gain knowledge. Please leave a comment to let me know what you think about it! Share it to your friends and learn new things together.
Transcript

Journal #12
If the trend continues, where would the object be at 10 seconds?

Chapter 3.1
Acceleration

Velocity-Time Graphs
A graph that plots an object’s velocity versus the time.
The rate at which an object’s velocity is changing is called acceleration and can be found by calculating the slope of the velocity-time graph.
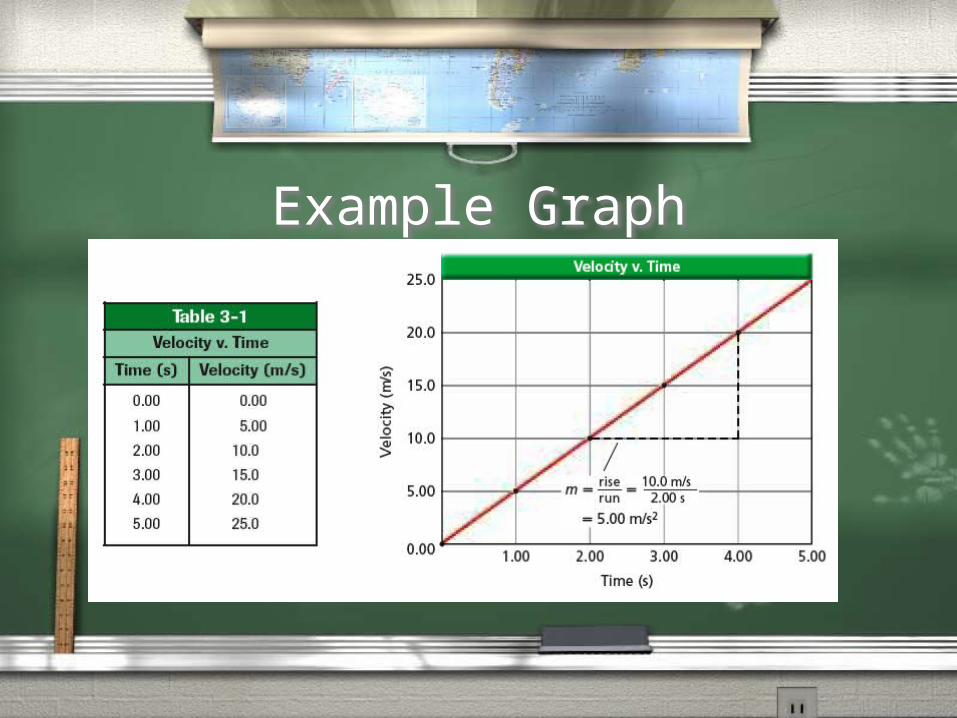
Example Graph

Facts about acceleration: Acceleration is the change in velocity
divided by the time it takes to make that change.
It is possible to have positive or negative acceleration as well as acceleration equal to zero.
Acceleration is a vector quantity with the SI unit of m/s2, pronounced “meters per second squared.”
A change in direction will cause a change in velocity, so it will cause acceleration.

Acceleration Possibilities (there are 9)
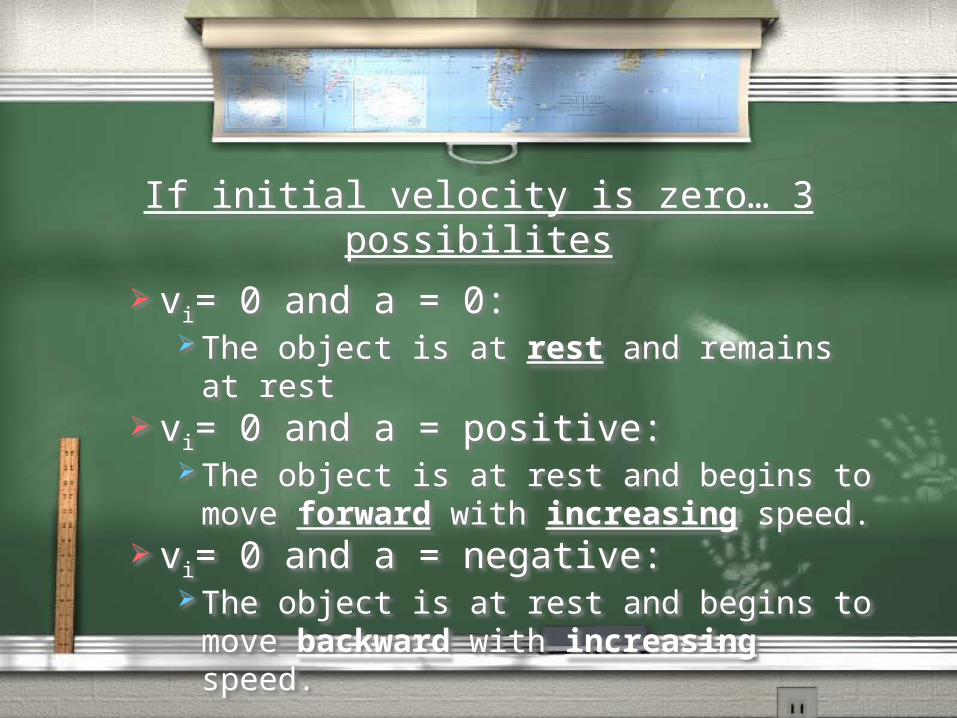
If initial velocity is zero… 3 possibilites
vi= 0 and a = 0: The object is at rest and remains at rest
vi= 0 and a = positive: The object is at rest and begins to move
forward with increasing speed. vi= 0 and a = negative:
The object is at rest and begins to move backward with increasing speed.

vi= positive and a = negative: The object is moving in a forward direction and is
decreasing speed. vi= positive and a = 0:
The object is moving in a forward direction at a constant speed.
vi= positive and a = positive: The object is moving in a forward direction and is
increasing speed.
If initial velocity is positive… 3 possibilities
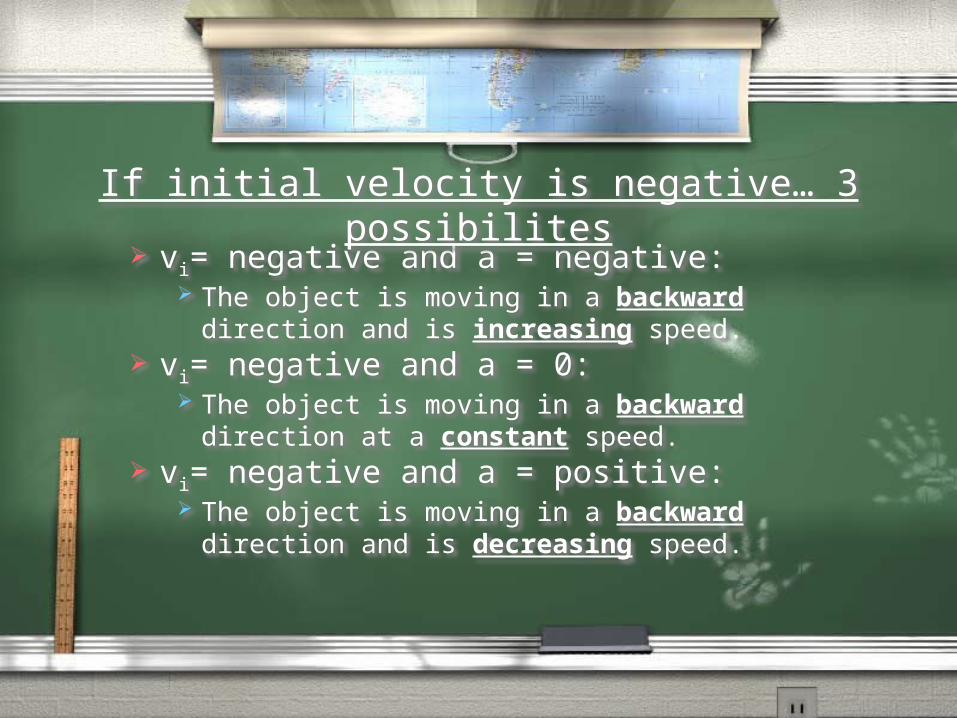
vi= negative and a = negative: The object is moving in a backward direction and
is increasing speed. vi= negative and a = 0:
The object is moving in a backward direction at a constant speed.
vi= negative and a = positive: The object is moving in a backward direction and
is decreasing speed.
If initial velocity is negative… 3 possibilites

Calculating Average Acceleration
avt
(v f v i)
t
This formula is cannot fit into any “magic triangle”, so we have to learn it the regular way.
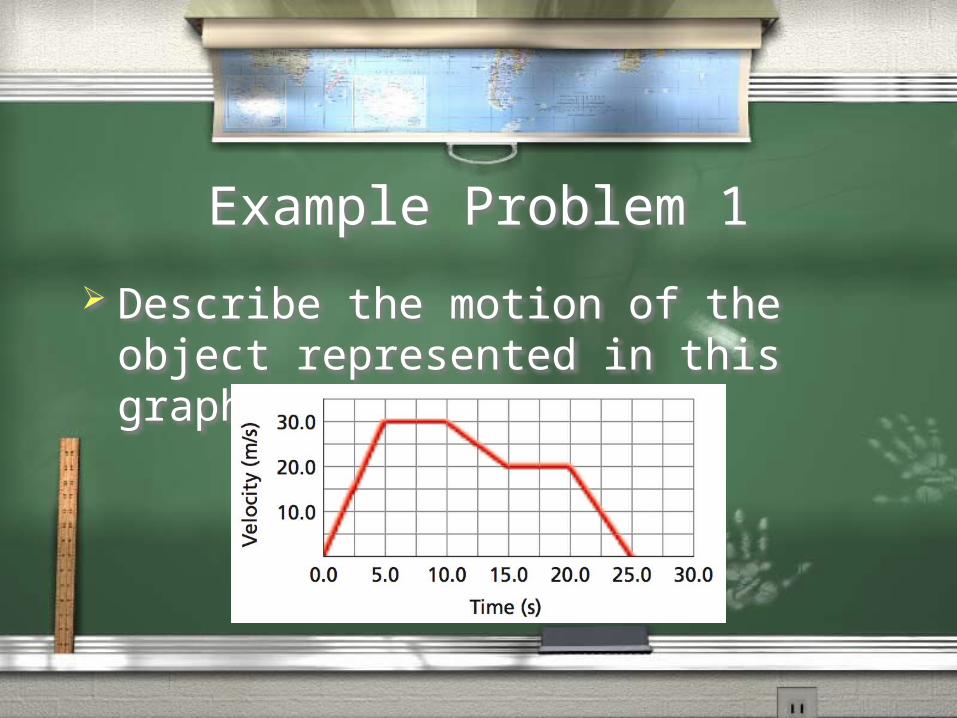
Example Problem 1
Describe the motion of the object represented in this graph:

From 0 to 5.0 s: Speeds up from rest at a constant rate
From 5.0 to 10.0s: Remains at a constant speed of 30.0m/s
From 10.0 to 15.0s: Decreases in speed from 30 to 20m/s
From 15.0 to 20.0s: Remains at a constant speed of 20m/s
From 20.0 to 25.0s: Comes to a stop

Example Problem 2
Find the uniform acceleration that causes a car’s velocity to change from 32 m/s to 96 m/s in an 8.0-s period.

Example Problem 2 Picture
a = ?
t = 8.0s
vi = 32m/s vf = 96m/sNotice how every number in the problem is represented in the picture!

Example Problem 2 work
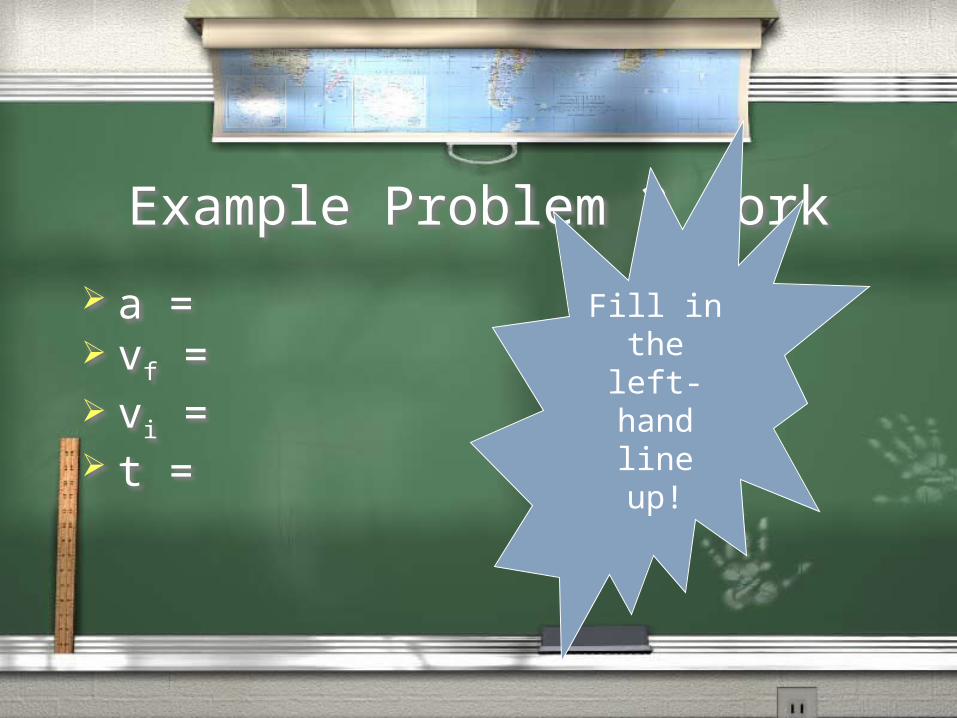
a = vf = vi = t =
Fill in the left-hand line up!

Example Problem 2 work
a = ? vf = 96 m/s vi = 32 m/s t = 8.0s
a(v f v i)
t
a(96m /s 32m /s)
8.0s
a64m /s
8.0s8.0m /s2
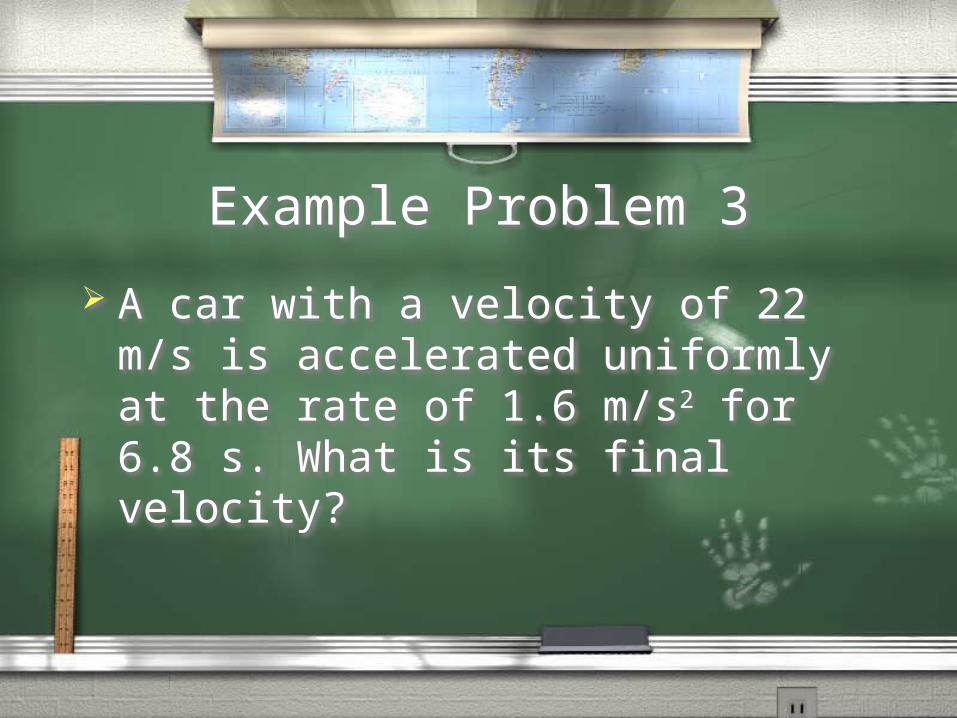
Example Problem 3
A car with a velocity of 22 m/s is accelerated uniformly at the rate of 1.6 m/s2 for 6.8 s. What is its final velocity?

Example Problem 3 picture
a = 1.6m/s2
t = 6.8s
vi = 22m/s vf = ?
Example Problem 3 work
a = vf = vi = t =
Fill in the left-hand line up!

Example Problem 3 work
a = 1.6 m/s2
vf = ? vi = 22 m/s t = 6.8 s
a(v f v i)
t at v i v f
(6.8s)(1.6m /s2) 22m /sv f32.88m /sv f33m /sv f

Homework Problems
p. 61, #3 and 4 p. 64, #6-10

Journal #13 Which graphs show the same movement of a
car?
t
t t
t
graph 1
graph 5
graph 2
graph 4
graph 3
graph 6
t
t
0 0 0
0 0 0
Related Documents