Welcome message from author
This document is posted to help you gain knowledge. Please leave a comment to let me know what you think about it! Share it to your friends and learn new things together.
Transcript
JOSÉ DE MELLO SAÚDE
FINANCIAL STATEMENTS REPORT 20172
Remuneration policy of the members of the management and supervision bodies of the company
Annex To Individual Financial Statements on 31 December 2017
Supervisory Board’s Report For 2017
Statement of Compliance of the Supervisory Board
Individual Financial Statements on 31 December 2017
Legal Accounts Certificate
Consolidated Financial Statements on 31 December 2017
Individual Financial Information
Consolidated financial information
TABLE OF CONTENTS
Management Report
Proposal for the Appropriation of Results
Annex to consolidated financial statements on 31 December 2017
Board of Directors’ Declaration of Compliance
Information on the Shareholder Structure, Organisation and Corporate Governance
Report and Opinion of the Supervisory Board for 2017
Legal Accounts Certificate
Statement of Compliance of the Supervisory Board
84
16
66
77
15
76
03
10
22
73
73
154
160
170
155
162
172
FINANCIAL STATEMENTS REPORT 2017 3
MANAGEMENTREPORT

JOSÉ DE MELLO SAÚDE
FINANCIAL STATEMENTS REPORT 20174
The 2017 financial year was characterised by a strong operating and financial performance, with an emphasis on the following facts:
• Operating income was 637.4 million euros, an increase of 8.7% vis-à-vis 2016; in the private activity, we recorded an increase of 9.9% over the previous year, to 408 million euros. In the public sector, operating income was 227 million euros, growing 4.4% in comparison with the previous year;
• EBITDA was 72.0 million euros, an increase of 5.3% versus 2016, driven by growth in the healthcare activity;
• EBITDA on the private activity grew from 56.6 million euros to 61.5 million euros (+7.5%);
• In the public sector, despite growth in operating income, EBITDA decreased by 1.5 million euros, to 7.8 million euros. EBITDA margin was 3.4%, a decrease of 0.8 pp;
• Consolidated net profit was 22.8 million euros, a decrease of 1.1 million euros in comparison with 2016;
• Total assets increased by 242.5 million euros (+48.2%) compared to the end of 2016, a consequence of the increase in tangible fixed assets (+188.6 million euros);
• José de Mello Saúde’s consolidated investment was of 203 million euros;
• On 31 December 2017, net financial debt1 stood at 338.6 million euros, resulting in a Net Debt to EBITDA ratio of 4.7x.
In 2017, José de Mello Saúde maintained a trajectory of sustained increase across its healthcare activity in the different fields of action. Over 2.4 million appointments were recorded (10.2% increase versus 2016), 92,800 surgeries (+7.5% year-over-year) and approximately 75,200 patients discharged from hospitalisation (+2% more than in the previous year). There was also a slight increase in the number of births , which improved by 0.9% vis-à-vis the previous year.
Operational performance
Does not include patients discharged from MICUs (Multipurpose Intensive Care Units) *Pro-forma values based on the current activity accounting methodology
10.2%
7.5%
1.8%
3.1%
2.0%
0.9%
2,434.1
92.8
470.0
658.2
75.2
7.8
2,208.6
86.3
461.7
638.2
73.8
7.8
(thousands)
Consultations
Patients operated on
Days of hospitalisation
Emergencies
Discharged patients
Births
20172016* Variation %
Healthcare service provision indicators of José de Mello Saúde
Executive summary
1Considers gross financial debt less cash and cash equivalents and other financial instruments.
FINANCIAL STATEMENTS REPORT 2017 5
*Total less depreciation and provisions**Operational results plus depreciation and provisions
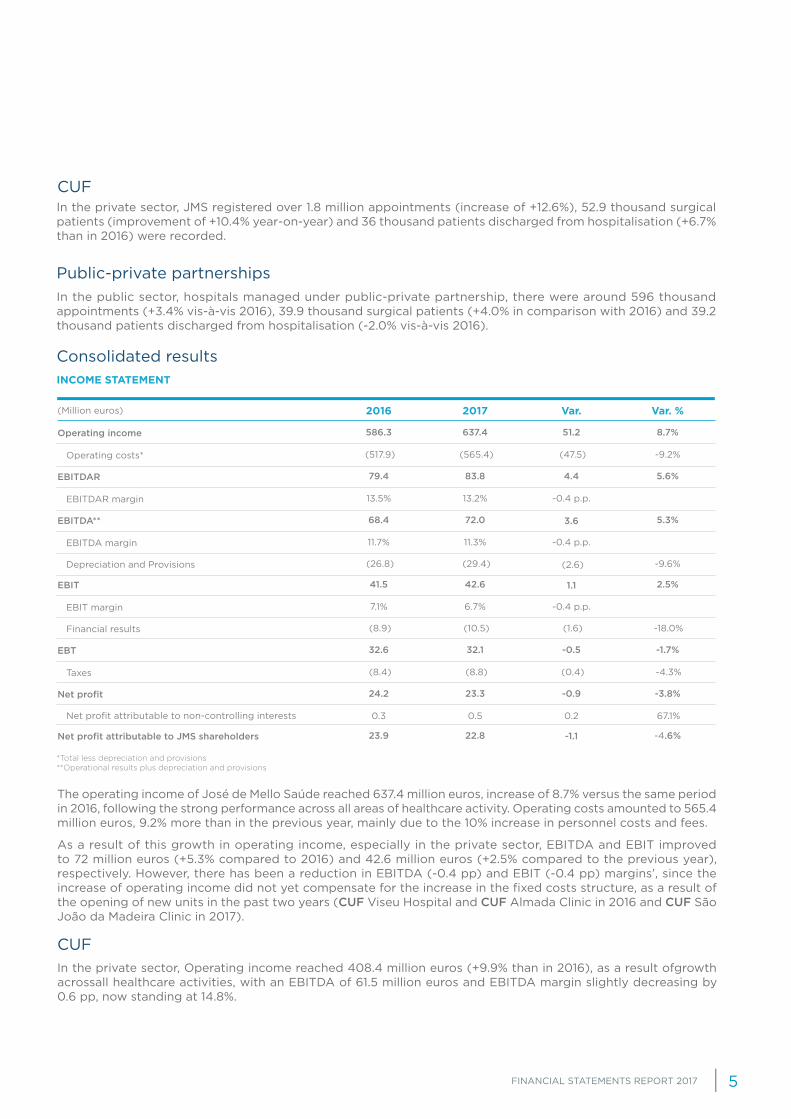
In the private sector, JMS registered over 1.8 million appointments (increase of +12.6%), 52.9 thousand surgical patients (improvement of +10.4% year-on-year) and 36 thousand patients discharged from hospitalisation (+6.7% than in 2016) were recorded.
In the public sector, hospitals managed under public-private partnership, there were around 596 thousand appointments (+3.4% vis-à-vis 2016), 39.9 thousand surgical patients (+4.0% in comparison with 2016) and 39.2 thousand patients discharged from hospitalisation (-2.0% vis-à-vis 2016).
Consolidated results
The operating income of José de Mello Saúde reached 637.4 million euros, increase of 8.7% versus the same period in 2016, following the strong performance across all areas of healthcare activity. Operating costs amounted to 565.4 million euros, 9.2% more than in the previous year, mainly due to the 10% increase in personnel costs and fees.
As a result of this growth in operating income, especially in the private sector, EBITDA and EBIT improved to 72 million euros (+5.3% compared to 2016) and 42.6 million euros (+2.5% compared to the previous year), respectively. However, there has been a reduction in EBITDA (-0.4 pp) and EBIT (-0.4 pp) margins’, since the increase of operating income did not yet compensate for the increase in the fixed costs structure, as a result of the opening of new units in the past two years (CUF Viseu Hospital and CUF Almada Clinic in 2016 and CUF São João da Madeira Clinic in 2017).
In the private sector, Operating income reached 408.4 million euros (+9.9% than in 2016), as a result ofgrowth acrossall healthcare activities, with an EBITDA of 61.5 million euros and EBITDA margin slightly decreasing by 0.6 pp, now standing at 14.8%.
(Million euros)
Operating income
EBITDAR
EBIT
EBT
Net profit
Net profit attributable to JMS shareholders
EBITDA**
Operating costs*
EBITDAR margin
EBIT margin
Taxes
Net profit attributable to non-controlling interests
Financial results
EBITDA margin
Depreciation and Provisions
20172016 Var. %Var.
INCOME STATEMENT
Public-private partnerships
CUF
CUF
8.7%51.2
5.6%
2.5%
-1.7%
-3.8%
-4.6%
4.4
1.1
-0.5
-0.9
-1.1
5.3%3.6
-9.2% (47.5)
-0.4 p.p.
-0.4 p.p.
(0.4)
0.2
-4.3%
67.1%
(1.6) -18.0%
-0.4 p.p.
(2.6) -9.6%
637.4
83.8
42.6
32.1
23.3
22.8
72.0
(565.4)
13.2%
6.7%
(8.8)
0.5
(10.5)
11.3%
(29.4)
586.3
79.4
41.5
32.6
24.2
23.9
68.4
(517.9)
13.5%
7.1%
(8.4)
0.3
(8.9)
11.7%
(26.8)

JOSÉ DE MELLO SAÚDE
FINANCIAL STATEMENTS REPORT 20176
Vila Franca de Xira Hospital maintained its positive operating performance, with a 1.6% growth in operating income vis-à-vis 2016. However, EBITDA decreased 1.4 million euros, as well as the EBITDA margin, which was 7.4% in 2017 (-2.3 pp vis-à-vis 2016).
Operating income of Braga Hospital reached 161 million euros (+5.6% vis-à-vis 2016) whereas the EBITDA margin fell to 1.8% (-0.1 pp vis-à-vis 2016). 2017 was the second consecutive year in which Braga Hospital presented a negative result of around 4 million euros. This situation is driven by ARS North’s non-renewal of the vertical funding programmes for HIV and Multiple Sclerosis, with an approximate value of 7.5 million euros per year. A Request for Financial Recovery was cautiously lodged at the end of 2016 for the purposes of clause 127, paragraph 9, subparagraph (b) of the Management Contract, seeking the beginning of an arbitration process for the settlement of this dispute. We believe a favourable result for Escala Braga is very likely to come from this arbitration process, with our estimate of this contingent asset being 15 million euros.
As a reflection of the strong investment taken place during 2017, and the subsequent increase in financial costs, financial results were negative by 10.5 million euros (1.6 million decrease versus 2016).
Thus, José de Mello Saúde’s net profit was 22.8 million euros, which represented an annual decrease of 1.1 million euros (-4.6%) in comparison with 2016.
The total investment carried out in 2017 was €203 million. The most relevant investment amounted to €143 million and was due to the acquisition of real estate operated by José de Mello Saúde, belonging to the ImoSaúde Closed Real Estate Investment Fund and to the ImoSocial Closed Real Estate Investment Fund. In addition, 16 million euros were invested in the acquisition of four companies that provide healthcare in the regions of Almada, São João da Madeira and Coimbra, and in another company holding a property in the region of Sintra.
The expansion investment, both organic, with the expansion works in CUF Descobertas Hospital, CUF Torres Vedras Hospital and CUF Santarém Hospital, and geographical, with the opening of CUF Almada Clinic and with the construction of CUF Tejo Hospital, totalled 31 million euros.
Recurrent investment, mostly for technological replacement and update, reached €13 million (+0.9 million euros than in 2016).
(Million euros)
Consolidated financial results
Income/costs for financial assets
Financial income
Financial costs
20172016 Var %
Financial results
Public-private partnerships
Investment
-18.0%
10.7%
83.2%
-20.9%
(10.5)
0.7
1.0
(12.2)
(8.9)
0.7
0.5
(10.1)
FINANCIAL STATEMENTS REPORT 2017 7
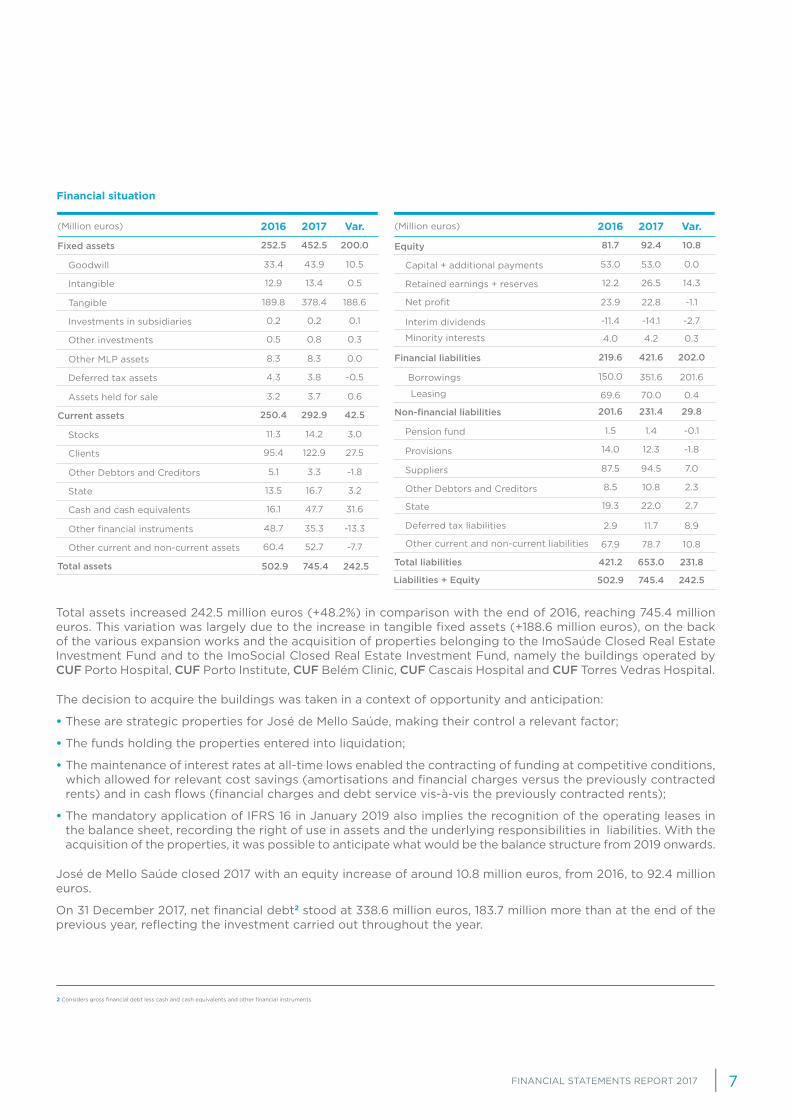
Total assets increased 242.5 million euros (+48.2%) in comparison with the end of 2016, reaching 745.4 million euros. This variation was largely due to the increase in tangible fixed assets (+188.6 million euros), on the back of the various expansion works and the acquisition of properties belonging to the ImoSaúde Closed Real Estate Investment Fund and to the ImoSocial Closed Real Estate Investment Fund, namely the buildings operated by CUF Porto Hospital, CUF Porto Institute, CUF Belém Clinic, CUF Cascais Hospital and CUF Torres Vedras Hospital.
The decision to acquire the buildings was taken in a context of opportunity and anticipation:
• These are strategic properties for José de Mello Saúde, making their control a relevant factor;
• The funds holding the properties entered into liquidation;
• The maintenance of interest rates at all-time lows enabled the contracting of funding at competitive conditions, which allowed for relevant cost savings (amortisations and financial charges versus the previously contracted rents) and in cash flows (financial charges and debt service vis-à-vis the previously contracted rents);
• The mandatory application of IFRS 16 in January 2019 also implies the recognition of the operating leases in the balance sheet, recording the right of use in assets and the underlying responsibilities in liabilities. With the acquisition of the properties, it was possible to anticipate what would be the balance structure from 2019 onwards.
José de Mello Saúde closed 2017 with an equity increase of around 10.8 million euros, from 2016, to 92.4 million euros.
On 31 December 2017, net financial debt2 stood at 338.6 million euros, 183.7 million more than at the end of the previous year, reflecting the investment carried out throughout the year.
(Million euros) (Million euros)
Fixed assets Equity
Current assets
Total assets Total liabilities
Liabilities + Equity
Intangible Retained earnings + reserves
ProvisionsClients
Leasing
Other investments Minority interests
State Cash and cash equivalents
Deferred tax assets
Other current and non-current assets
Goodwill Capital + additional payments
Pension fundStocks
Borrowings
Investments in subsidiaries Interim dividends
Other Debtors and Creditors
Deferred tax liabilities
Other current and non-current liabilities
State
Tangible Net profit
SuppliersOther Debtors and Creditors
Other MLP assets
Other financial instruments
Assets held for sale
2017 20172016 2016Var. Var.
Financial situation
2 Considers gross financial debt less cash and cash equivalents and other financial instruments.
10.8
29.8
202.0
231.8
242.5
14.3
-1.8
0.4
0.3
2.7
10.8
0.0
-0.1
201.6
-2.7
2.3
8.9
-1.1
7.0
92.4
231.4
421.6
653.0
745.4
26.5
12.3
70.0
4.2
22.0
78.7
53.0
1.4
351.6
-14.1
10.8
11.7
22.8
94.5
81.7
201.6
219.6
421.2
502.9
12.2
14.0
69.6
4.0
19.3
67.9
53.0
1.5
150.0
-11.4
8.5
2.9
23.9
87.5
Non-financial liabilities
Financial liabilities
200.0
42.5
242.5
0.5
27.5
0.3
31.6
-0.5
-7.7
10.5
3.0
0.1
3.2
188.6
-1.8
0.0
-13.3
0.6
452.5
292.9
745.4
13.4
122.9
0.8
47.7
3.8
52.7
43.9
14.2
0.2
16.7
378.4
3.3
8.3
35.3
3.7
252.5
250.4
502.9
12.9
95.4
0.5
16.1
4.3
60.4
33.4
11.3
0.2
13.5
189.8
5.1
8.3
48.7
3.2
JOSÉ DE MELLO SAÚDE
FINANCIAL STATEMENTS REPORT 20178
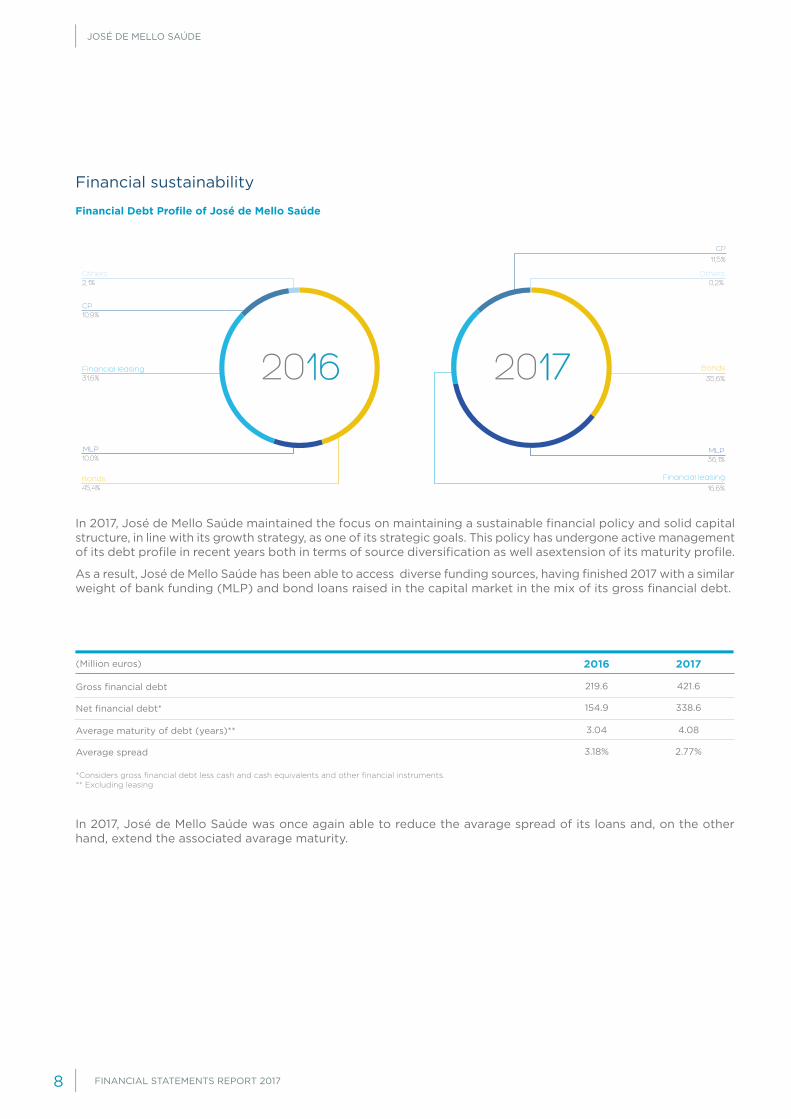
In 2017, José de Mello Saúde maintained the focus on maintaining a sustainable financial policy and solid capital structure, in line with its growth strategy, as one of its strategic goals. This policy has undergone active management of its debt profile in recent years both in terms of source diversification as well asextension of its maturity profile.
As a result, José de Mello Saúde has been able to access diverse funding sources, having finished 2017 with a similar weight of bank funding (MLP) and bond loans raised in the capital market in the mix of its gross financial debt.
In 2017, José de Mello Saúde was once again able to reduce the avarage spread of its loans and, on the other hand, extend the associated avarage maturity.
*Considers gross financial debt less cash and cash equivalents and other financial instruments.** Excluding leasing
Financial Debt Profile of José de Mello Saúde
2016Financial leasing
MLP
31,6%
10,0%MLP36,1%
16,6%
CP10,9%
Bonds45,4%
Bonds
35,6%
Others2,1%
Others0,2%
2017
CP
11,5%
Financial leasing
(Million euros)
Net financial debt*
Gross financial debt
Average maturity of debt (years)**
Average spread
20172016
Financial sustainability
338.6
421.6
4.08
2.77%
154.9
219.6
3.04
3.18%
FINANCIAL STATEMENTS REPORT 2017 9
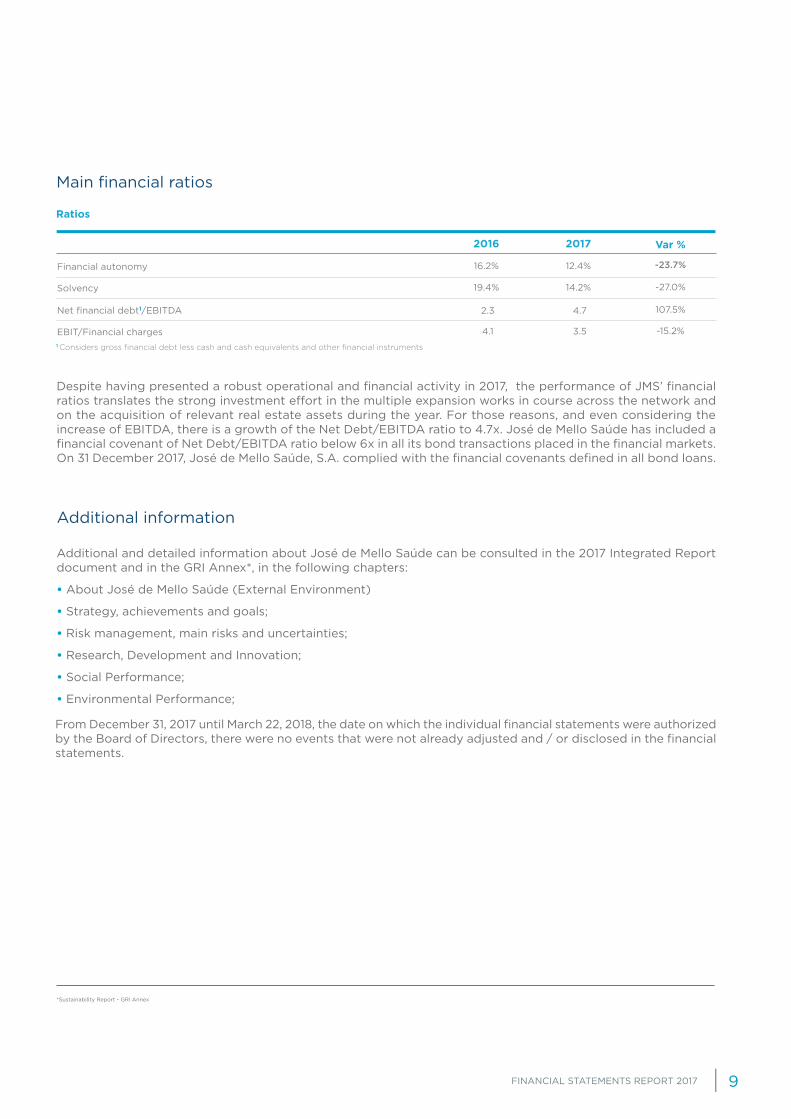
Main financial ratios
1 Considers gross financial debt less cash and cash equivalents and other financial instruments
Ratios
Solvency
Financial autonomy
Net financial debt1/EBITDA
EBIT/Financial charges
20172016 Var %
Despite having presented a robust operational and financial activity in 2017, the performance of JMS’ financial ratios translates the strong investment effort in the multiple expansion works in course across the network and on the acquisition of relevant real estate assets during the year. For those reasons, and even considering the increase of EBITDA, there is a growth of the Net Debt/EBITDA ratio to 4.7x. José de Mello Saúde has included a financial covenant of Net Debt/EBITDA ratio below 6x in all its bond transactions placed in the financial markets. On 31 December 2017, José de Mello Saúde, S.A. complied with the financial covenants defined in all bond loans.
Additional and detailed information about José de Mello Saúde can be consulted in the 2017 Integrated Report document and in the GRI Annex*, in the following chapters:
• About José de Mello Saúde (External Environment)
• Strategy, achievements and goals;
• Risk management, main risks and uncertainties;
• Research, Development and Innovation;
• Social Performance;
• Environmental Performance;
Additional information
From December 31, 2017 until March 22, 2018, the date on which the individual financial statements were authorized by the Board of Directors, there were no events that were not already adjusted and / or disclosed in the financial statements.
14.2%
12.4%
4.7
3.5
19.4%
16.2%
2.3
4.1
-23.7%
107.5%
-27.0%
-15.2%
*Sustainability Report - GRI Annex

JOSÉ DE MELLO SAÚDE
FINANCIAL STATEMENTS REPORT 201710
PROPOSAL FOR THE APPROPRIATION OF RESULTS

FINANCIAL STATEMENTS REPORT 2017 11
The Board of Directors proposes that the net profit of the individual accounts of José de Mello Saúde, S.A. for 2017, in the amount of 29,554,175.64 euros, be appropriated as follows:
• Legal reserve: 1,477,708.78 euros
• Interim dividends: 14,100,000 euros
• Dividends: 13,500,000 euros
• Retained earnings: 476,466.86 euros
The Board of Directors
Lisbon, 22 March 2018
JOSÉ DE MELLO SAÚDE
FINANCIAL STATEMENTS REPORT 201712
MAKE-UP AND POWERS OF THE GOVERNING AND SUPERVISORY BODIES
BOARD OF DIRECTORS
Salvador de MelloChairman of the Board of Directors and CEO
Chairman of the Board of Directors and CEO of José de Mello Saúde (since 2001) and member of the Board of Directors of José de Mello Capital, (he is responsible), is responsible for the strong growth momentum and expansion of the network to its current 19 healthcare units. Salvador de Mello holds a degree in Economics and Business Administration from the University of Neuchâtel, Switzerland.
Pedro de MelloDeputy Chairman of the Board of Directors
Deputy Chairman of the Board of DirectorsPedro de Mello holds a degree in Textile Engineering and he is also Vice-President of José de Mello Capital, member of the Board of Directors of CUF Consultoria and Services and Chairman of the Board of Directors of Monte da Ravasqueira and M Dados.
João Gonçalves da SilveiraDeputy Chairman of the Board of Directors
Deputy Chairman of the Board of Directors of José de Mello Saúde since 2001, João Gonçalves da Silveira holds a degree in Pharmacy from Universidade de Lisboa, Chairman of the Board of MONAF (Montepio Nacional da Farmácia).

FINANCIAL STATEMENTS REPORT 2017 13
Rui DinizDeputy Chairman of the Executive Committee
Deputy Chairman of the Executive Committee of José de Mello Saúde, Rui Diniz holds a degree in Economics from Universidade Católica de Lisboa. He is also an Executive Director of José de Mello, SGPS.
Rui Assoeira RaposoExecutive Director
Rui Assoreira Raposo holds a degree in Pharmacy from Universidade do Porto; he is a Specialist in Pharmacy Industry by the Portuguese Pharmacists’ Association and a Postgraduate degree from IMD-Lausanne/Switzerland and from the AESE Business School – Lisbon/Portugal.
Guilherme MagalhãesExecutive Director
Holds a degree in Mechanical Engineering from Instituto Superior Técnico and an MBA from Universidade Nova de Lisboa; is also the Chairman of the Board of Trustees of Fundação do Gil.
Inácio BritoExecutive Director
Inácio Brito holds a degree in Economics from Universidade Católica de Lisboa, with postgraduate studies in Actuarial Sciences.
Vasco Luís de MelloExecutive Director
Vasco Luís de Mello holds a degree in Mechanical Engineering from the Catholic University of Leuven – Belgium, later obtaining a Master’s Degree in Business Administration from the same University.

JOSÉ DE MELLO SAÚDE
FINANCIAL STATEMENTS REPORT 201714
Paulo Cleto DuarteNon-Executive Director
Paulo Cleto Duarte holds a degree in Pharmaceutical Sciences from the Universityof Lisbon and an MBA in Information Management from Universidade CatólicaPortuguesa. He is Chairman of the Portuguese Association of Pharmacies andCEO of Farminveste, SGPS.
Luís Brito de GoesNon-Executive Director
With a degree in Law by Universidade Católica Portuguesa, Luís Brito de Goes he is also an Executive Director at José de Mello Capital, member of the Board of Diretors of Brisa and CUF Consulting and Services and President of the Board of Directors of MGI Capital.
Raúl Galamba de OliveiraNon-Executive Director
Raúl Galamba de Oliveira holds a degree in Mechanical Engineering from InstitutoSuperior Técnico, an MSc in Systems and an MBA from Nova School of Businessand Economics, is currently a senior partner at McKinsey in Portugal and Spain,and leads McKinsey’s Risk Management area.
Celine Abecassis-MoedasNon-Executive Director
Céline Abecassis-Moedas holds a PhD in Business Strategy, from ÉcolePolytechnique, Paris, a Master’s degree in Management, from École NormaleSupérieure and Université Paris Dauphine and a degree in Economics andManagement from the Sorbonne. She is an Associate Professor in the areas ofStrategy and Innovation at the Universidade Católica Portuguesa. Additionally,she is a member of the Board of Directors of CTT and Europac.
Vera Pires CoelhoNon-Executive Director
Vera Pires Coelho holds a degree and a master’s degree in Economics with anMBA from Universidade Nova de Lisboa and a postgraduate degree in ActuarialSciences from Catholic University of Lisbon; she is currently the ManagingDirector of the subsidiaries of Grupo Vendap in Angola, Mozambique and Brazil,Director of the Serralves Foundation and Deputy Chairman of the GeneralCouncil of Universidade Nova.

FINANCIAL STATEMENTS REPORT 2017 15
INDIVIDUAL FINANCIAL STATEMENTS

JOSÉ DE MELLO SAÚDE
FINANCIAL STATEMENTS REPORT 201716
31-12-2017 31-12-2016Notes
Assets
Non-current liabilities
Liabilities
Current assets
Equity
Equity and Liabilities
Non-current assets held for sale
7
9
14
15
9
9
11
11
9
11
8
9
9
9
9
11
11
9
9
4
10
12
11
5,716,378
158,189,064
15,832,914
874,938
1,627,604
6,864,409
40,012,059
(37,434,593)
(14,100,000)
29,554,176
13,199,329
30,271,560
(37,434,593)
(11,408,000)
29,103,683
13,364,148
5,811,644
20,024,203
4,356,460
122,780
(1,249,145)
1,885,798
(2,288,872)
3,094,216
53,000,000
1,753,134
53,000,000
4,825,114
105,303,388
15,846,938
1,053,852
2,301,120
67,137,753
29,869,000
169,361,037
700,000
3,181,964 2,292,714
64,129,913
-
100,847,068
-
243,090,106
206,218,582
75,594,141
16,500,000
19,398,704
-
10,000,000
1,288,616
-
62,526,220
305,616,326
50,443,794
221,299,740
170,855,946
123,451,447
65,600,238
Shareholders
Other reserves
Retained earnings
Financial assets adjustment
Net profit for the period
Interim dividends
Clients
Share equity
TOTAL ASSETS
Total non-current assets
Total non-current liabilities
Other financial instruments
Cash and bank deposits
Total current assets
TOTAL EQUITY
Tangible fixed assets
Loans obtained
Deferred tax assets
Financial derivative instruments
Non-current assets
Provisions
Other financial assets
Other accounts payable
Other financial assets
Government and other public entities
Legal reserves
Investments in subsidiaries and affiliates
Other financial liabilities
Other Accounts Receivable
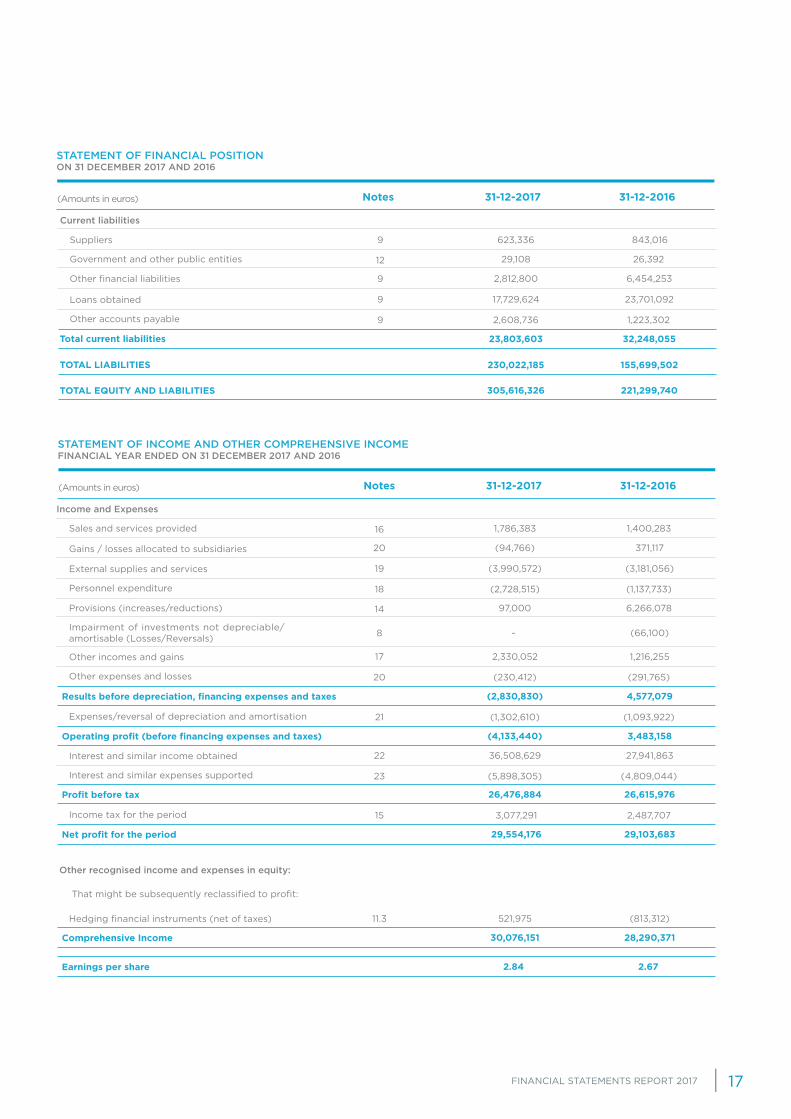
STATEMENT OF FINANCIAL POSITION ON 31 DECEMBER 2017 AND 2016
(Amounts in euros)
FINANCIAL STATEMENTS REPORT 2017 17
Current liabilities
12
9
9
9
9
29,108
623,336
2,608,736
26,392
843,016
1,223,302
2,812,800
17,729,624
6,454,253
23,701,092
23,803,603
230,022,185
305,616,326
32,248,055
155,699,502
221,299,740
Total current liabilities
TOTAL LIABILITIES
TOTAL EQUITY AND LIABILITIES
Government and other public entities
Other accounts payable
Suppliers
Loans obtained
Other financial liabilities
31-12-2017 31-12-2016Notes
STATEMENT OF FINANCIAL POSITION ON 31 DECEMBER 2017 AND 2016
(Amounts in euros)
31-12-2017 31-12-2016Notes
16
14
18
20
23
21
15
20
11.3
8
19
17
22
1,786,383
97,000
(2,728,515)
(230,412)
(5,898,305)
(1,302,610)
3,077,291
1,400,283
6,266,078
(1,137,733)
(291,765)
(4,809,044)
(1,093,922)
2,487,707
(94,766)
521,975
-
(3,990,572)
2,330,052
36,508,629
371,117
(813,312)
(66,100)
(3,181,056)
1,216,255
27,941,863
(2,830,830)
(4,133,440)
29,554,176
30,076,151
2.84
26,476,884
4,577,079
3,483,158
29,103,683
28,290,371
2.67
26,615,976
Results before depreciation, financing expenses and taxes
Operating profit (before financing expenses and taxes)
Net profit for the period
Comprehensive Income
Earnings per share
Profit before tax
Sales and services provided
That might be subsequently reclassified to profit:
Provisions (increases/reductions)
Personnel expenditure
Other expenses and losses
Interest and similar expenses supported
Expenses/reversal of depreciation and amortisation
Income tax for the period
Income and Expenses
Other recognised income and expenses in equity:
External supplies and services
Other incomes and gains
Interest and similar income obtained
Gains / losses allocated to subsidiaries
Hedging financial instruments (net of taxes)
Impairment of investments not depreciable/amortisable (Losses/Reversals)
STATEMENT OF INCOME AND OTHER COMPREHENSIVE INCOME FINANCIAL YEAR ENDED ON 31 DECEMBER 2017 AND 2016
(Amounts in euros)
JOSÉ DE MELLO SAÚDE
FINANCIAL STATEMENTS REPORT 201718
Paid-up capital
(Nota 11.1)
Other equity instruments(Nota 11.3)
Legal reserves(Nota 11.3)NotesDescription
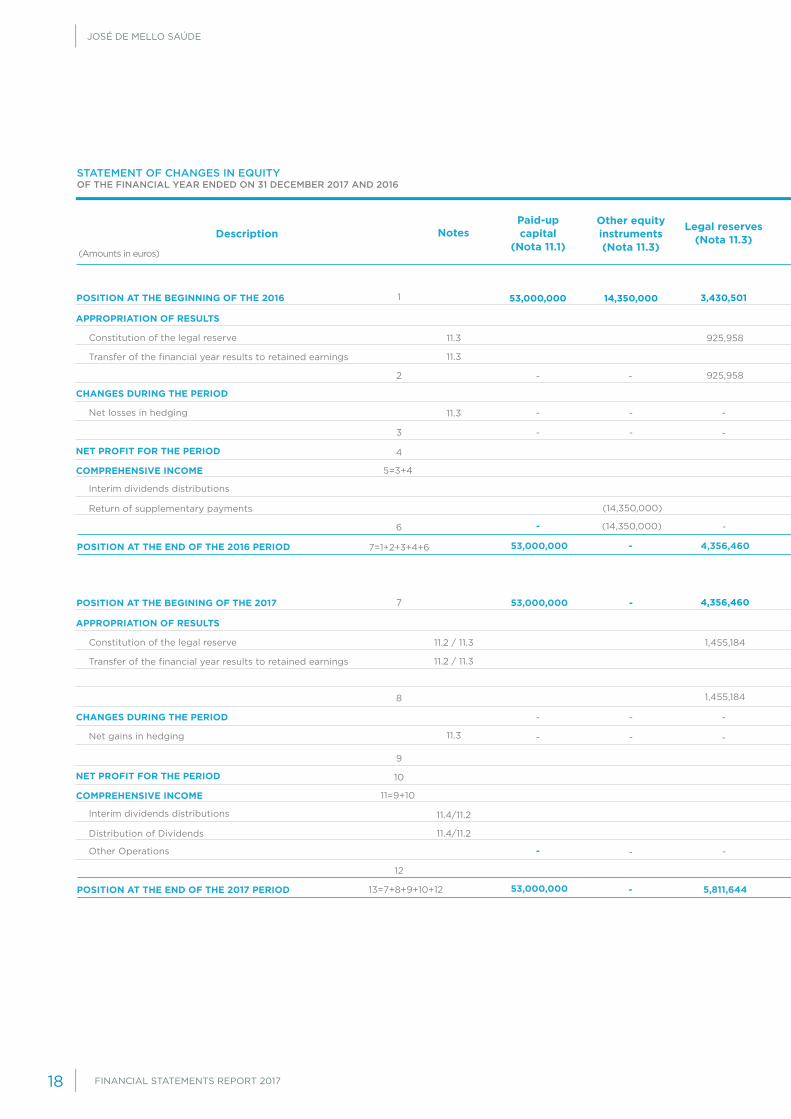
POSITION AT THE BEGINNING OF THE 2016
POSITION AT THE BEGINING OF THE 2017
1
7
8
9
2
3
4
10
5=3+4
11=9+10
6
12
7=1+2+3+4+6
13=7+8+9+10+12
-
53,000,000
53,000,000
14,350,000
-
3,430,501
4,356,460
925,958
1,455,184
1,455,184
925,958
11.3
11.2 / 11.3
11.3
11.2 / 11.3
11.3
11.3
11.4/11.2
11.4/11.2
-
-
-
-
-
(14,350,000)
(14,350,000) -
--
-
-
-
-
-
-
-
-
53,000,000
53,000,000
-
-
-
-
4,356,460
5,811,644
POSITION AT THE END OF THE 2016 PERIOD
POSITION AT THE END OF THE 2017 PERIOD
Constitution of the legal reserve
Constitution of the legal reserve
Interim dividends distributions
Interim dividends distributions
APPROPRIATION OF RESULTS
APPROPRIATION OF RESULTS
CHANGES DURING THE PERIOD
CHANGES DURING THE PERIOD
NET PROFIT FOR THE PERIOD
NET PROFIT FOR THE PERIOD
COMPREHENSIVE INCOME
COMPREHENSIVE INCOME
Transfer of the financial year results to retained earnings
Transfer of the financial year results to retained earnings
Return of supplementary payments
Distribution of Dividends
Other Operations
Net losses in hedging
Net gains in hedging
STATEMENT OF CHANGES IN EQUITY OF THE FINANCIAL YEAR ENDED ON 31 DECEMBER 2017 AND 2016
(Amounts in euros)
FINANCIAL STATEMENTS REPORT 2017 19
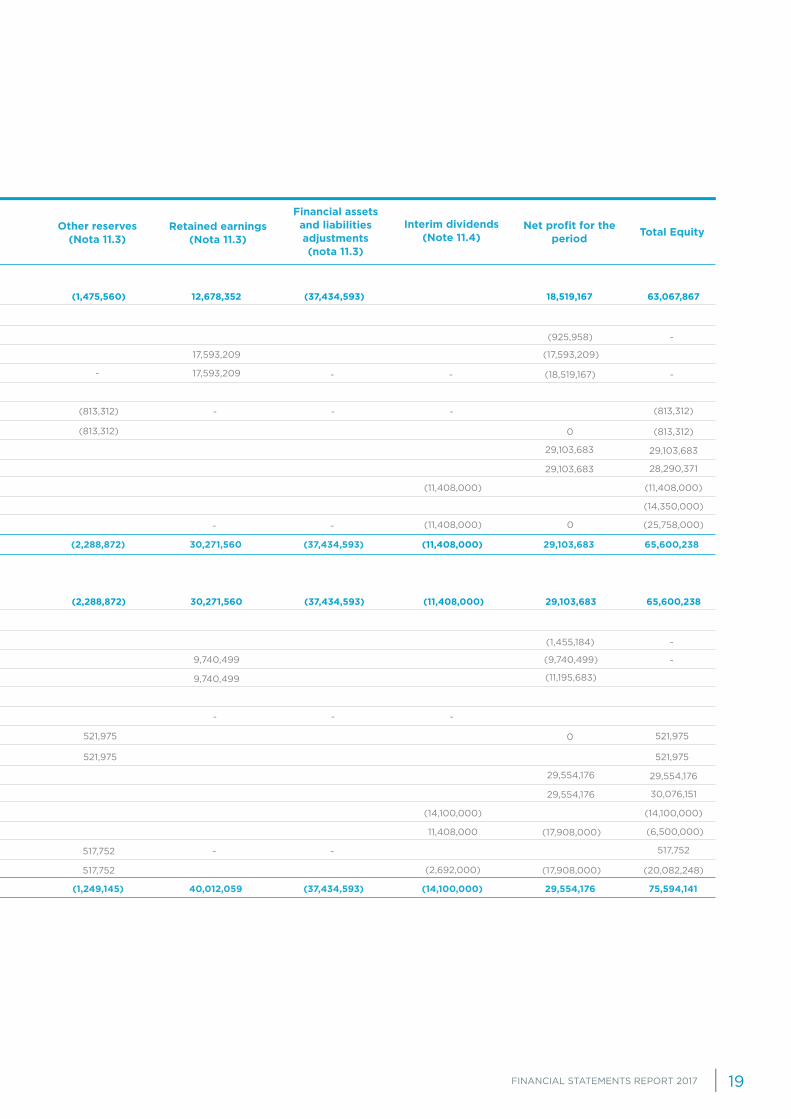
STATEMENT OF CHANGES IN EQUITY OF THE FINANCIAL YEAR ENDED ON 31 DECEMBER 2017 AND 2016
Retained earnings(Nota 11.3)
Other reserves(Nota 11.3)
Financial assets and liabilities adjustments(nota 11.3)
Interim dividends(Note 11.4)
Net profit for the period Total Equity
12,678,352
30,271,560
(1,475,560)
(2,288,872)
(37,434,593)
(37,434,593) (11,408,000)
18,519,167
29,103,683
63,067,867
65,600,238
(11,195,683)
(925,958)
(1,455,184)
-
-
-
- - (18,519,167) -
17,593,209
9,740,499
9,740,499
17,593,209
(17,593,209)
(9,740,499)
-
-
-
-
-
-
-
(14,350,000)
(6,500,000)
(25,758,000)
517,752
(20,082,248)
-
- 517,752
517,752
-
-
29,103,683
29,554,176
29,103,683
29,554,176
29,103,683
29,554,176
28,290,371
30,076,151
(11,408,000)
(14,100,000)
(11,408,000)
11,408,000
(2,692,000)
0
(17,908,000)
(17,908,000)
(11,408,000)
(14,100,000)
(813,312)
521,975 521,975
(813,312)
521,975 521,975
(813,312)
(813,312)0
0
30,271,560
40,012,059
(2,288,872)
(1,249,145)
(37,434,593)
(37,434,593)
(11,408,000)
(14,100,000)
29,103,683
29,554,176
65,600,238
75,594,141

JOSÉ DE MELLO SAÚDE
FINANCIAL STATEMENTS REPORT 201720
FINANCIAL STATEMENTS REPORT 2017 21
31-12-2017 31-12-2016Notes
5,475,520
230,150,000
(6,690,883)
(37,652)
(176,795,634)
(5,282,356)
(193,723,708)
5,615,635
1,708,561
7,573,904
78,800,000
27,829,448
(38,618)
(65,783,489)
(4,491,145)
(83,621,665)
1,116,494
1,594,749
(5,728,209)
159,901,424
(7,905,500)
(1,235,974)
-
(20,600,000)
(20,000,000)
177,666
31,493,755
11,196,924
(1,364,107)
13,500,000
19,392,933
(7,943,152)
38,995,618
(417,637,672)
403,551,424
8.1
11.4
9.5
8.1
2.2
9.5
4
4
(462,530)
(7,890,730)
62,979,176
(9,186,688)
(45,000)
(947,689)
(14,350,000)
(11,408,000)
-
-
24,066,269
(10,853,360)
(1,159,056)
-
(6,690,883)
(83,618)
26,777,512
(180,601,989)
141,779,176
(875,482)
(1,616,796)
9,117,598
31,052,466
(14,086,248)
26,083,816
(1,475,882)
(13,204,724)
26,693,894
(38,822,812)
(25,333,643)
Cash generated by operations
Cash flow from operating activities (1)
Cash flow from investment activities (2)
Cash flow from financing activities(3)
Changes in cash and cash equivalents (1+2+3)
Cash receipts from customers
Bank loans
Cash and cash equivalents at the start of the period
Bank loans
Payments relating to:
Payments relating to:
Cash receipts relating to:
Cash flow from operating activities – direct method
Cash receipts relating to:
Effect of exchange differences
Cash flow from investment activities
Cash paid to employees
Other financial instruments
Cash and cash equivalents at the end of the period
Financial Investments
Amortisation of finance lease contracts
Return of supplementary payments
Dividends
Other financial instruments
Other assets
Dividends
Other cash receipts/payments
Cash paid to suppliers
Other financing operations (loans)
Changes in cash and cash equivalents
Tangible fixed assets
Interest and similar expenses
Other financing operations (loans)
Financial investments
Interest and similar income
Income tax received/paid
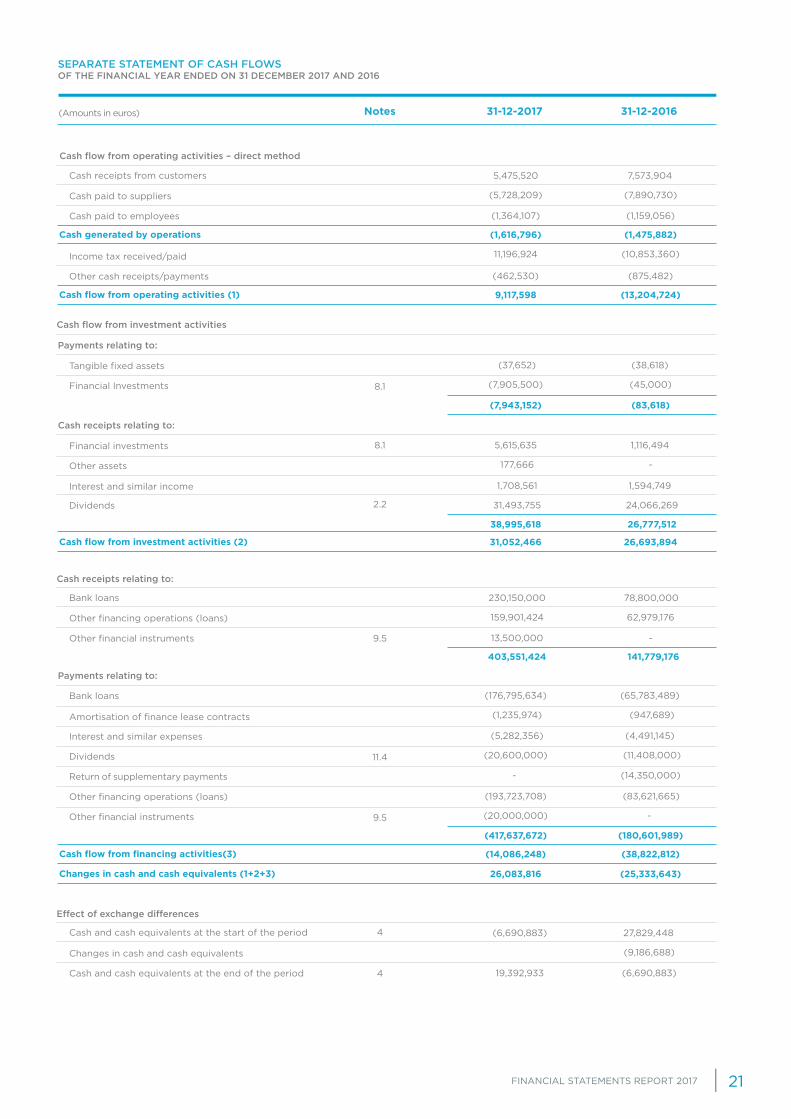
SEPARATE STATEMENT OF CASH FLOWS OF THE FINANCIAL YEAR ENDED ON 31 DECEMBER 2017 AND 2016
(Amounts in euros)

JOSÉ DE MELLO SAÚDE
FINANCIAL STATEMENTS REPORT 201722
1. GENERAL INFORMATION ON THE ENTITY’S ACTIVITY
José de Mello Saúde, S.A. (hereinafter “Company” or “JMS”) is a public limited company, with headquarters in Lisbon, in Av. do Forte, No. 3, Suécia III Building, Floor 2, 2790-073 Carnaxide, incorporated in December 1992.
The Company has as its corporate object the purchase, sale and rental of equipment, the provision of management, consulting, IT, administrative, negotiation/provisioning services, as well as to provide health services.
José de Mello Saúde is the holding company of a group whose main activity is to provide healthcare services, namely in the private healthcare, in the public-private partnerships, services in the field of medicine, occupational hygiene and health as well as home healthcare. The group also develops other secondary activities in the real estate and infrastructure sector.
The Company’s equity is owned by José de Mello Capital, S.A. (65.85%), its parent company, by Fundação Amélia da Silva de Mello (4.15%) and by Farminveste – Investimentos, Participações e Gestão, S.A. (30%).
It should be noted that on 12 December 2017, the companies José de Mello Participações II, SGPS, S.A., Guimarães de Mello Portugal, SGPS, S.A., Guimarães de Mello Investimentos, SGPS, S.A., and José de Mello – Sociedade Gestora de Participações Sociais, S.A. (the former parent company of JMS) were incorporated, via merger, into SOGEFI – Sociedade de Gestão e Financiamentos, SGPS, S.A., which was renamed to José de Mello Capital, S.A. This corporate restructuring jeopardize any commitments made by the intervening Companies, since all of their rights and obligations are now concentrated on José de Mello Capital, S.A.
2. SUMMARY OF THE MAIN ACCOUNTING POLICIES
2.1. BASES OF PREPARATION
The Financial Statements of José de Mello Saúde S.A. were prepared under the assumption of continuity of operations and in accordance with the “International Financial Reporting Standards” (IFRS), as adopted by the European Union, in force for the financial years beginning on or after 1 January 2017. The IFRS issued by the International Accounting Standards Board (IASB), the International Accounting Standards (IAS) issued by the International Accounting Standards Committee (IASC) and respective interpretations – IFRIC and SIC, issued by the International Financial Reporting Interpretation Committee (IFRIC) and Standing Interpretation Committee (SIC), respectively, are deemed to form part of those standards. Hereinafter, this set of standards and interpretations shall be generally referred to as “IFRS”.
The financial statements are presented in euros.
2.1.1. NEW STANDARDS AND INTERPRETATIONS APPLICABLE TO THE 2017 FINANCIAL YEAR
As a result of the endorsement by the European Union (EU), the following issues, revisions, amendments, and improvements of standards and interpretations took effect from 1 January 2017, which were adopted by the Company, when applicable:
Standard Effective date
IAS 12 – Recognition of deferred tax assets for unrealised losses (amendments) 1 January 2017
IAS 7 – Disclosure initiative (amendments)
Improvements concerning the 2014–2016 cycle (IFRS 12 Disclosure of interests in other entities)
1 January 2017
1 January 2017
The adoption of these standards, interpretations and amendments to standards did not have a significant impact on the financial statements.
NOTES ATTACHED TO THE INDIVIDUAL FINANCIAL STATEMENTS ON 31 DECEMBER 2017
FINANCIAL STATEMENTS REPORT 2017 23
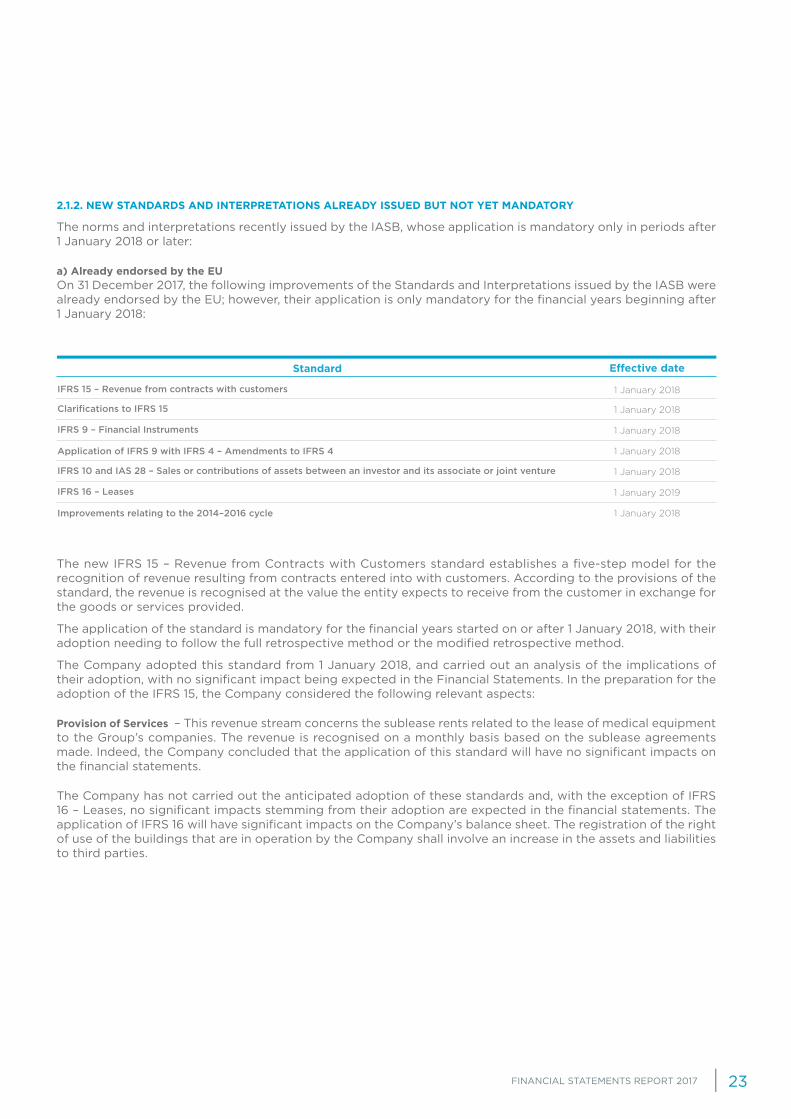
2.1.2. NEW STANDARDS AND INTERPRETATIONS ALREADY ISSUED BUT NOT YET MANDATORY
The norms and interpretations recently issued by the IASB, whose application is mandatory only in periods after 1 January 2018 or later:
a) Already endorsed by the EUOn 31 December 2017, the following improvements of the Standards and Interpretations issued by the IASB were already endorsed by the EU; however, their application is only mandatory for the financial years beginning after 1 January 2018:
The new IFRS 15 – Revenue from Contracts with Customers standard establishes a five-step model for the recognition of revenue resulting from contracts entered into with customers. According to the provisions of the standard, the revenue is recognised at the value the entity expects to receive from the customer in exchange for the goods or services provided.
The application of the standard is mandatory for the financial years started on or after 1 January 2018, with their adoption needing to follow the full retrospective method or the modified retrospective method.
The Company adopted this standard from 1 January 2018, and carried out an analysis of the implications of their adoption, with no significant impact being expected in the Financial Statements. In the preparation for the adoption of the IFRS 15, the Company considered the following relevant aspects:
Provision of Services – This revenue stream concerns the sublease rents related to the lease of medical equipment to the Group’s companies. The revenue is recognised on a monthly basis based on the sublease agreements made. Indeed, the Company concluded that the application of this standard will have no significant impacts on the financial statements.
The Company has not carried out the anticipated adoption of these standards and, with the exception of IFRS 16 – Leases, no significant impacts stemming from their adoption are expected in the financial statements. The application of IFRS 16 will have significant impacts on the Company’s balance sheet. The registration of the right of use of the buildings that are in operation by the Company shall involve an increase in the assets and liabilities to third parties.
Standard Effective date
IFRS 15 – Revenue from contracts with customers
Application of IFRS 9 with IFRS 4 – Amendments to IFRS 4
1 January 2018
1 January 2018
Clarifications to IFRS 15
IFRS 10 and IAS 28 – Sales or contributions of assets between an investor and its associate or joint venture
IFRS 9 – Financial Instruments
IFRS 16 – Leases
Improvements relating to the 2014–2016 cycle
1 January 2018
1 January 2018
1 January 2018
1 January 2019
1 January 2018
JOSÉ DE MELLO SAÚDE
FINANCIAL STATEMENTS REPORT 201724
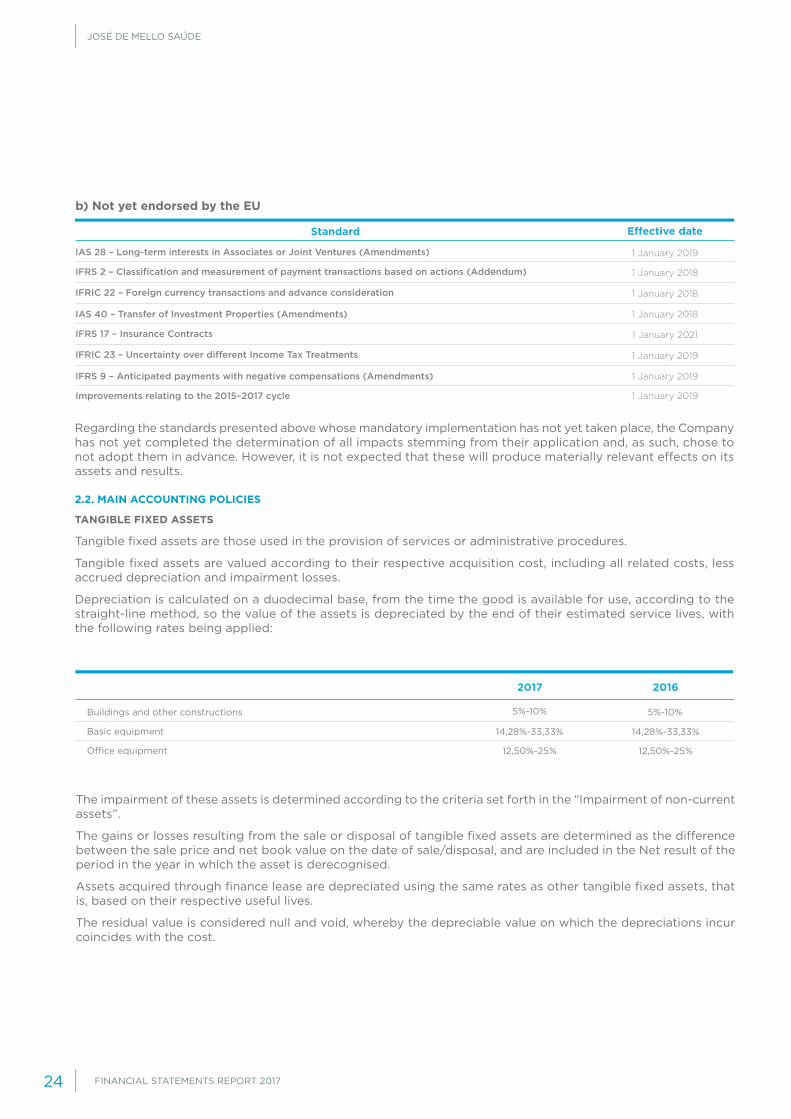
b) Not yet endorsed by the EU
Regarding the standards presented above whose mandatory implementation has not yet taken place, the Company has not yet completed the determination of all impacts stemming from their application and, as such, chose to not adopt them in advance. However, it is not expected that these will produce materially relevant effects on its assets and results.
2.2. MAIN ACCOUNTING POLICIES
TANGIBLE FIXED ASSETS
Tangible fixed assets are those used in the provision of services or administrative procedures.
Tangible fixed assets are valued according to their respective acquisition cost, including all related costs, less accrued depreciation and impairment losses.
Depreciation is calculated on a duodecimal base, from the time the good is available for use, according to the straight-line method, so the value of the assets is depreciated by the end of their estimated service lives, with the following rates being applied:
The impairment of these assets is determined according to the criteria set forth in the “Impairment of non-current assets”.
The gains or losses resulting from the sale or disposal of tangible fixed assets are determined as the difference between the sale price and net book value on the date of sale/disposal, and are included in the Net result of the period in the year in which the asset is derecognised.
Assets acquired through finance lease are depreciated using the same rates as other tangible fixed assets, that is, based on their respective useful lives.
The residual value is considered null and void, whereby the depreciable value on which the depreciations incur coincides with the cost.
Standard Effective date
IAS 28 – Long-term interests in Associates or Joint Ventures (Amendments)
IAS 40 – Transfer of Investment Properties (Amendments)
1 January 2019
1 January 2018
IFRS 2 – Classification and measurement of payment transactions based on actions (Addendum)
IFRS 17 – Insurance Contracts
IFRIC 22 – Foreign currency transactions and advance consideration
IFRIC 23 – Uncertainty over different Income Tax Treatments
IFRS 9 – Anticipated payments with negative compensations (Amendments)
Improvements relating to the 2015–2017 cycle
1 January 2018
1 January 2021
1 January 2018
1 January 2019
1 January 2019
1 January 2019
2017 2016
14,28%-33,33%
12,50%-25%
5%-10% 5%-10%
14,28%-33,33%
12,50%-25%
Basic equipment
Office equipment
Buildings and other constructions
FINANCIAL STATEMENTS REPORT 2017 25
Current maintenance and repair costs are recognised as expenses in the period in which they occur.
Improvements are only recognised as assets when it is demonstrated that these increase their useful life or increase their normal efficiency, resulting in increased future economic benefits.
Tangible fixed assets in progress represent tangible assets still under construction, installation or development and are recorded at cost of acquisition, and only amortised when available for use.
INTANGIBLE ASSETS
Intangible assets acquired separately are measured at their cost price on the date of initial recognition. The cost of the intangible assets acquired in a merger of corporate activities is their fair value at the date of acquisition.
Intangible assets generated internally, excluding capitalised development costs, are not capitalised, and expenses are reflected in the Profit and loss statement and Other Comprehensive Income in the year in which the expenses take place.
After initial recognition, intangible assets are recorded at cost price less accrued amortisations and losses due to subsequent impairment.
The useful lives of intangible assets may be finite or indefinite.
Intangible assets with indefinite useful lives are not amortised but undergo impairment tests regardless of whether or not there are indicators that they may be impaired.
Intangible assets with finite useful lives are amortised during their estimated economic life and evaluated with regard to their impairment whenever there are signs that the asset may be impaired.
The impairment of these assets is determined according to the criteria set forth in the “Impairment of non-current Assets”.
Reversals of impairment are recognised in results and only performed up to the limit verified if the impairment had never been recorded.
For an intangible asset with a finite useful life, the amortisation methods, estimated useful life and residual value are revised at the end of each year, and the effects of the changes made are treated as changes to estimates, i.e., the effect of the changes is treated prospectively.
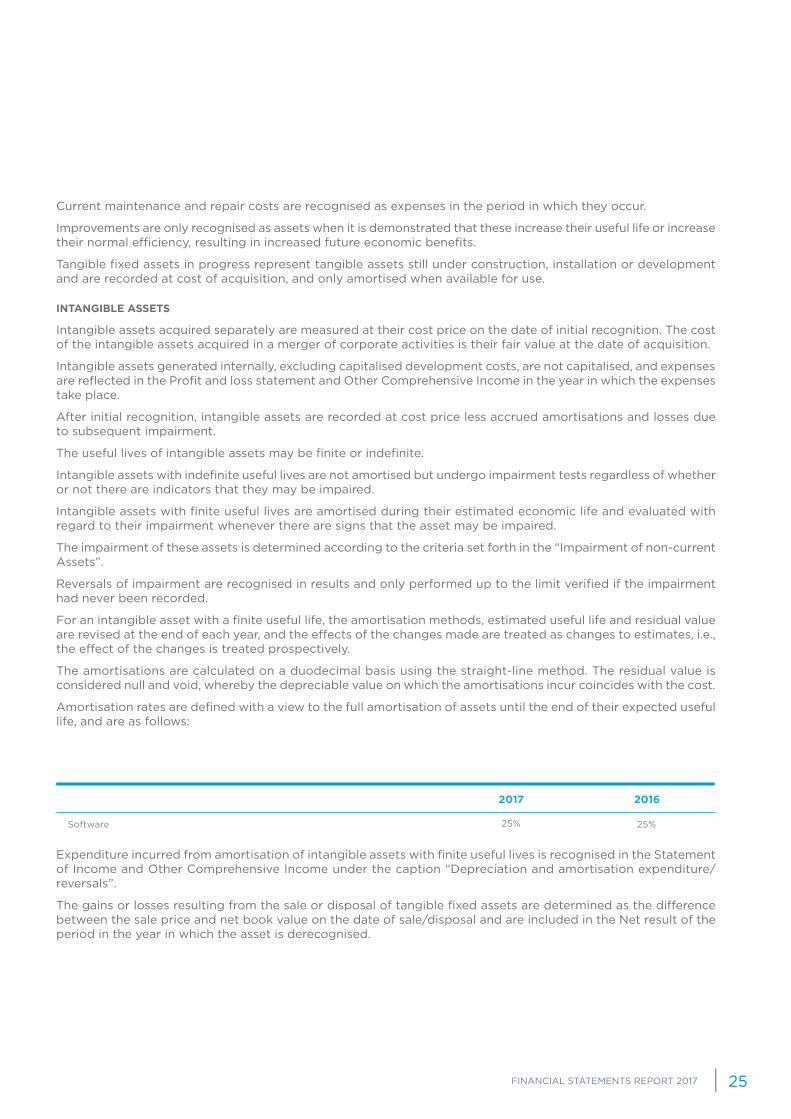
The amortisations are calculated on a duodecimal basis using the straight-line method. The residual value is considered null and void, whereby the depreciable value on which the amortisations incur coincides with the cost.
Amortisation rates are defined with a view to the full amortisation of assets until the end of their expected useful life, and are as follows:
Expenditure incurred from amortisation of intangible assets with finite useful lives is recognised in the Statement of Income and Other Comprehensive Income under the caption “Depreciation and amortisation expenditure/reversals”.
The gains or losses resulting from the sale or disposal of tangible fixed assets are determined as the difference between the sale price and net book value on the date of sale/disposal and are included in the Net result of the period in the year in which the asset is derecognised.
2017 2016
25% 25%Software

JOSÉ DE MELLO SAÚDE
FINANCIAL STATEMENTS REPORT 201726
INVESTMENTS IN SUBSIDIARIES AND AFFILIATES
Financial investments of capital shares in subsidiaries and affiliates are valued according to their respective cost on the IFRS transition date, or rather 1 January 2012. Under this caption are also recorded, at nominal value, the supplementary payments granted to subsidiaries and affiliates.
Capital share dividends are only recognised as income when their respective receipt is guaranteed and interest from securities are accounted for in the period to which they are related.
Goodwill is included in the value of the carrying amount of the investment and is not amortised nor subject to individual impairment testing. However, if signs of impairment are detected in the financial investments, they are subject to impairment testing. The impairment of these assets is determined according to the criteria set forth in the “Impairment of non-current assets”.
IMPAIRMENT OF NON-CURRENT ASSETS
At each reporting date, a review of the recorded amounts of non-current assets is carried out to determine whether there is any indication that they can be impaired. If there areindicators, the recoverable amount of the corresponding assets is estimated to determine the extent of the impairment loss (if any). When it is impossible to determine the recoverable amount of an individual asset, the recoverable amount of the cash-generating unit to which that asset belongs is estimated. The recoverable amount of the asset or cash-generating unit is the largest of (i) the fair value minus costs to sell and (ii) the usage value. In the determination of the usage value, the estimated future cash flows are discounted using a discount rate that reflects the market’s expectations regarding the time value of money and the specific risks of the asset or cash-generating unit for which the future cash flow estimates have not been adjusted. Whenever the recorded amount of the asset or cash-generating unit exceeds its recoverable amount, an impairment loss is recognised. The impairment loss is recorded immediately in the Statement of Income and Other Comprehensive Income, unless if the loss offsets a surplus of revaluation in the equity.
The reversal of impairment losses recognised in prior financial years is recorded when there are indications that the impairment losses no longer exists or has decreased. The reversal of impairment losses is recognised in the Income Statement and Other Comprehensive Income. The reversal would be carried out up to the limit of the amount that would be recognised (net of amortisations) if the previous impairment loss had not been recorded.
FINANCIAL ASSETS (IN ADDITION TO FINANCIAL INVESTMENTS)
Financial assets are recognised in the Company’s Statement of Financial Position at the date of negotiation or contracting, which is the date on which the Company agrees to acquire the asset.
Financial assets are classified as follows, depending on whether or not the Board of Directors intends to acquire them:
• Clients and Other Receivables Accounts
Non-derivative Financial assets, with fixed or determinable payments, are included. The balances for Clients, Other Receivable Accounts and Other Financial Assets are recorded at fair value and subsequently, at amortised cost, minus impairment adjustments, if applicable.
At the end of the year, the company evaluates the impairment of these assets. When there is objective evidence of impairment, the company recognises an impairment loss on the profit and loss statement.

FINANCIAL STATEMENTS REPORT 2017 27
The objective evidence that a financial asset is impaired takes into account the following aspects:
• Debtor’s significant financial difficulty
• Breach of contract, such as failure to pay or non-compliance with interest payments or debt amortisation
• Likelihood that the debtor will become bankrupt.
• Other financial instruments
Financial assets included in this caption concern financial instruments held to maturity, measured at amortised cost, using the effective interest rate method, less impairment.
• Shareholders
Balances with shareholders are presented at their corresponding cost, net of impairment losses, where applicable, determined based on the criteria defined for the remaining accounts receivable.
INCOME TAX
Income tax for the period includes current and deferred costs from the financial year.
Current income tax is calculated based on the taxable income in accordance with the tax rules in force to which the company is subjected.
The Company is taxed according to the Special Corporate Group Tax Regime (RETGS – Regime Especial de Tributação de Grupo de Sociedades).
According to current legislation, tax returns are liable for review and correction by the Tax Authorities for a period of four years.
Accordingly, the tax returns of the Company for the years 2014 to 2017 may still be reviewed, although the Company believes that any adjustments resulting from tax revisions to those tax documents will have no significant impact on the Financial Statements referring to 31 December 2017.
DEFERRED TAX ASSETS AND LIABILITIES
The Company recognises deferred taxes, as established in IAS 12 – Income Tax, as a way of adequately accruing the tax effects of its operations, and to exclude distortions related to the criteria of a fiscal nature that impact on the economic results of certain transactions.
Deferred tax assets are recognised when there is reasonable assurance that future taxable profit may be achieved against which those assets can be deducted. Deferred tax assets are reviewed annually and reduced when it is no longer probable that they may be used.
The value of deferred tax is determined by applying the tax rates (and laws) enacted or substantively enacted at the reporting date and which are expected to apply in the period of realisation of the deferred tax asset or of the deferred tax liability settlement. According to the legislation in force, the corporate income tax rate of 21% was considered and, in the situations not connected to tax losses, a municipal surtax of 1.5% on the temporary differences that led to deferred tax assets and liabilities.
The movement occurring during the financial year, the reconciliation between the nominal tax and effective current tax rate, as well as the decomposition of deferred tax balances, are presented in Note 15.
JOSÉ DE MELLO SAÚDE
FINANCIAL STATEMENTS REPORT 201728
CASH AND BANK DEPOSITS
The amounts included in the Cash and bank deposits caption correspond to cash, bank deposits, term deposits and other short-term investments maturing in less than three months, and which may be immediately redeemed at insignificant risk of changes in value.
For the purposes of the Cash Flow Statement, the caption “Cash and cash equivalents” also includes bank overdrafts included in the “Loans Obtained” item, in the Statement of Financial Position.
NON-CURRENT ASSETS HELD FOR SALE
This caption includes non-current assets (or disposal groups) whose carrying amount will be recovered mostly through a sale transaction, rather than through continued use, and which meet the following conditions:
• They are available for immediate sale in their present condition, subject only to terms that are usual and customary for the sale of this type of assets and
• Their sale is highly probable. That is:
• The appropriate management hierarchy is involved in a plan to sell the assets (or disposal groups);
• A programme was started to locate a buyer and complete the plan;
• The asset was widely advertised for sale at a price that is reasonable in relation to its current fair value;
• The sale will be completed within one year from the date of classification.
The events or circumstances that may extend the period to complete the sale for more than a year do not exclude that an asset is classified as held for sale if the delay is caused by events or circumstances beyond the control of the entity and if there is sufficient evidence that the entity remains committed to its plan to sell the asset.
Immediately before the initial classification of the non-current assets (or disposal groups) as held for sale, the carrying amounts of the assets (or of the group’s assets and liabilities) are measured in accordance with the applicable IFRSs.
On the date of initial recognition, non-current assets (or disposal groups) held for sale are measured at the lower value between their carrying amount and fair value less selling costs or, if purchased as part of a combination of business activities, at fair value less selling costs.
When the sale is expected to occur more than a year later, the selling costs are measured at their present value. Any increase in the present value of the selling costs resulting from the passage of time is recognised in the results as cost of funding.
Any initial or subsequent reduction of the asset (or disposal group) to the fair value less selling costs is recognised as an impairment loss. Any gain resulting from a subsequent increase in the fair value less costs of selling an asset is recognised, but not beyond the previously recognised cumulative impairment loss.
Non-current assets, while classified as held for sale or while they are part of a disposal group classified as held for sale are not depreciated (or amortised).
Interest and other expenses attributable to the liabilities of a disposal group classified as held for sale continue to be recognised.
FINANCIAL LIABILITIES
Financial liabilities are classified according to the substance of the contract, regardless of their legal form, as shown below:
• Bank Loans
Loans are valued at amortised cost, with the received value being net of commissions with the issuing of these Loans. Financial charges are calculated in accordance with the effective interest rate method and accounted for in the Statement of Income and Other Comprehensive Income, based on the financial year specialisation principle.
• Suppliers, Other Payable Accounts and Other Financial Liabilities
Balances of Suppliers, Other Payable Accounts and Other Financial Liabilities are initially recorded at their nominal value, which is understood to correspond to their fair value and, subsequently, whenever applicable, are recorded at their amortised cost, according to the effective interest rate method. The accounts payable are recognised as current liabilities except if their settlement is contracted after twelve months following the date of the Statement of Financial Position.
DERIVATIVE FINANCIAL INSTRUMENTS AND HEDGE ACCOUNTING
The Company’s policy is to contract financial derivative instruments for hedging financial risks to which it is exposed, which are mainly due to interest rate variations.

FINANCIAL STATEMENTS REPORT 2017 29
• Hedging Instruments
The possibility of calling a derivative financial instrument a hedging instrument complies with the provisions of IAS 39, namely, with regard to its respective documentation and effectiveness evaluation.
Financial derivative instruments are recognised for their fair value on the date they are negotiated. Fair value is evaluated on a regular basis, and gains or losses resulting from that evaluation are recorded in the profit and loss statement, except cash flow hedging derivatives, in which the variation is recognised in Equity (“Other financial instrument reserves”).
Accounting is discontinued when the hedging instrument reaches maturity or is sold, or when the hedging relationship ceases to comply with the requirements of IAS 39.
LEASES
• Finance leases
Contracts are considered to be financial leasing if all risks and benefits associated with the possession of the corresponding assets are substantially transferred through them.
Assets acquired under finance lease contracts, as well as the corresponding liabilities, are recorded by the financial method, with the assets, the corresponding accrued amortisations and the debts pending settlement being recorded according to the contracting financial plan. Additionally, the interest included in the value of the rents and the amortisations of the tangible and intangible fixed asset are recognised as costs in the income statement for the period they concern.
• Operating leases
Contracts are considered to be of operational leasing if all risks and benefits associated with the possession of the corresponding assets are not substantially transferred through them. The classification of the leases as financial or operational is made according to the substance and not the form of the contract.
In operating leases, rent payments are recognised as a cost in the income statement during the period of the lease contract.
PROVISIONS
Provisions are established when the Company has a present obligation (legal or constructive) as a result of past actions, or when economic resources may probably be used to meet this obligation and this may be measured reliably.
Provisions are measured according to the best estimate of expenditure required for settling the present obligation on the balance sheet date.
EQUITY CAPTIONS
• Paid-up capital
In compliance with art. 272 of the Portuguese Commercial Companies Code (CSC), the company contract specifies the deadline for paying-up the subscribed and not paid capital at the time of the deed.
• Other equity instruments
Equity instruments are classified in accordance with the contract substance, irrespective of their legal form. Equity instruments issued by the Entity are recorded at their received value, net of issuing costs.
• Legal Reserves
In accordance with art. 295 of the CSC, at least 5% of the result must be used for establishing or strengthening the legal reserve until it represents at least 20% of the company’s share capital. The legal reserve is not distributable unless in case of liquidation, and can only be used to absorb losses after all other reserves are exhausted, or for incorporation in share capital (art. 296 of the CSC).
• Other reserves
This account includes the changes in the fair value of risk-hedging derivatives from variability in the interest rate, currency risk, risk of price of goods within the framework of a commitment or high probability of future transaction that, in accordance with paragraph 2 of article 32 of the CSC, will only be available for distribution when the elements or rights that gave rise to them are disposed, executed, extinguished or settled.
• Retained earnings
This caption includes the realised results available for distribution to shareholders and gains from increases in fair value, financial investments and investment properties that, in accordance with point 2, art. 32 of the CSC, will only be available for distribution when the elements or rights giving rise to them are disposed of, exercised, eliminated or settled.
JOSÉ DE MELLO SAÚDE
FINANCIAL STATEMENTS REPORT 201730
• Net Profit of the Financial Year
This caption includes gains from increases in fair value, financial investments and investment properties that, in accordance with point 2, art. 32 of the CSC, will only be available for distribution when the elements or rights giving rise to them are disposed of, exercised, eliminated or settled.
• Adjustments to financial assets
This account also includes the adjustments connected to the application of the equity method from previous years, namely appropriation of changes in equity of subsidiaries and unallocated profits.
• Interim dividends
This account reflects the advance on profits made in the course of financial year under the provisions of article 297 of the CSC, in the following terms:
• Carried out in the second half of the year;
• Does not exceed half of the amount that would be distributed on the date the mid-term review concerns.
RECOGNITION OF INCOME
Income is recognised as such when it is likely that the Company will receive economic benefits that can be evaluated reliably.
For income to be recognised, the following criteria must also be complied with in full:
• Provision of Services
The provisions of service are measures at the fair value of the compensation received or to be received net of amounts concerning granted discounts.
Income from services supplied is recognised when the outcome of the transaction may be estimated reliably, which occurs when the following conditions are met:
• The amount of income can be measured reliably;
• Economic benefits from the transaction are probably received by the company;
• Costs incurred from the transaction and from its completion can be measured reliably.
• Interest
Income from interest receivable is specialised, so that it is recognised in the period they concern, regardless of whether or not the respective support document is issued.
• Dividends
This income is recognised when, in substance, the obligation to declare dividends is established in the declaring Entity.
RESPONSIBILITY FOR EMPLOYEE BENEFITS
Personal expenses are recognised when the service is provided by the employees regardless of their payment date. Here are some specificities regarding each of the benefits:
• Termination of employment
Benefits for termination of employment are due to be paid when employment ends before the usual retirement date or when an employee accepts to leave voluntarily in exchange for these benefits. The Company recognises these benefits when it can be shown it is committed to a termination of employment of current employees, according to a formal detailed plan for the termination, and there is no realistic possibility of withdrawal or if these benefits are granted to encourage voluntary departure. When the employment termination benefits are due over 12 months after the balance sheet date, they are discounted to their current value.
• Holidays, holiday entitlement and bonuses
According to labour law, employees are entitled to 22 working days of annual leave, as well as a month of holiday entitlement, rights acquired in the year prior to their payment. These liabilities of the Company are recorded when incurred, regardless of the time of their payment, and are reflected in the caption “Other Payable Accounts”.
INTERESTS AND SIMILAR SUPPORTED EXPENSES
The financial costs of loans obtained related to the acquisition, construction or production of assets that necessarily take considerable time before being ready for use or sale, are capitalized and part of the cost of the asset. All other financial costs are spent in the period in which they occur. Financial costs consist of interest and other costs stemming from obtained financing.
STATEMENT OF CASH FLOWS
The statement of cash flows is prepared according to the direct method, through which the cash inflows and outflows in operating, investing and funding activities are disclosed.
FINANCIAL STATEMENTS REPORT 2017 31
CONTINGENT ASSETS AND LIABILITIES
Contingent liabilities are not recognised in Financial Statements but are disclosed in these Notes, unless the possibility of an outflow of resources is remote, in which case they are not subject to disclosure.
Contingent assets are not recognised and only disclosed in circumstances embodying future economic benefits.
SUBSEQUENT EVENTS
Events occurring after the reporting date that provide additional information on conditions existing on the date of issue of the Statement of Financial Position are shown in financial statements. Events occurring after the reporting date that provide additional information on conditions existing on the date of issue of the Statement of Financial Position are disclosed in the Notes to Financial Statements, if material.
2.3. MAIN ESTIMATES AND JUDGMENTS OF THE MANAGEMENT
When preparing Financial Statements according to the IFRS, the Board of Directors uses estimates and assumptions that affect the application of the policies and the reported amounts. Estimates and judgements are continuously evaluated and are based on the experience from past events and other factors, including expectations for future events considered probable in view of the circumstances on which the estimates are based, or as a result from acquired information or experience. The most significant accounting estimates shown in the Financial Statements are as follows:
• Useful Life of Tangible and Intangible Fixed Assets
The useful life of an asset is the period during which the Entity expects that asset to be available for its use and is reviewed at least at the end of each financial year.
The amortisation/depreciation method to apply and the estimated losses stemming from the replacement of equipment before the end of their useful life, for reasons of technological obsolescence, is crucial to determining the effective useful life of an asset.
These parameters are defined according to the management’s best estimate, for the assets and deals in question, also considering the practices adopted by companies from the sectors where the Government operates.
• Recognition and measurement of provisions
The recognition of provisions has associated the determination of the probability of exit of future flows and their reliable measurement.
These factors are often dependent on future events and not always under the control of the Entity and, as such, may lead to significant future adjustments, both via the variation of the assumptions used and via the future recognition of provisions previously disclosed as control liabilities.
• Impairment of receivable accounts
The credit risk of the balances of receivable accountsis assessed at each reporting date, taking into account the historical information of the debtor and its risk profile.
The receivable accounts are adjusted by the evaluation of the estimated risks of collection existing at the balance sheet date, which may come to differ from the actual risk to incur in the future.
• Fair Value of Financial Instruments
When the fair value of the financial assets and liabilities on the balance sheet date is not determinable based on active markets, it is determined based on valuation techniques that include the discounted cash flow model or other suitable models under the circumstances. The inputs for these models are taken, whenever possible, from variables observable in the market; however, when this is not possible, a degree of judgment becomes necessary to determine the fair value, which encompasses considerations on liquidity risk, credit risk and volatility.

JOSÉ DE MELLO SAÚDE
FINANCIAL STATEMENTS REPORT 201732
• Impairment of non-financial assets
The impairment occurs when the accounting value of an asset of cash-generating unit exceeds its recoverable amount, which is the highest between the fair value net of costs of selling and its usage value.
The calculation of fair value net of costs of selling is based on the existing information from contracts already signed in transactions of similar assets with entities which have no relationships among them, or prices observable in the market net of incremental costs of selling the asset.
The value in use is calculated based on a discounted cash flow model that takes into account a budget for the next five years which does not include restructuring activities for which there still is no commitment, or future significant investments seeking to improve the future economic benefits that will arise from the cash-generating unit that is being tested.
The recoverable amount is particularly sensitive to:
• The growth rate used to extrapolate the cash flows beyond five years;
• The discount rates used to discount future cash flows.
• Taxes on income and deferred taxes
The determination of the amounts of income taxes and deferred taxes require the exercise of judgment and is subject to interpretation. Different interpretations could result in a different level of taxes on profits, both current and deferred, recognised in the period.
Only deferred tax assets are recognised to the extent it is likely that there will be taxable profit on which they can be used.
2.5. POLICIES OF FINANCIAL RISK MANAGEMENT
José de Mello Saúde’s Financial Risk Management Policy seeks to ensure the proper identification of risks associated with the businesses undertaken, as well as to adopt and implement the necessary measures to minimise the negative impacts that adverse developments of the factors underlying these risks may have on the financial structure of the Company and on its sustainability.
Under the risk management process, José de Mello Saúde identified a set of risks associated with the company’s financial performance considered materially more relevant, among which stand out the market (exposure to variations of interest rates), credit and liquidity risk.
The Company has a risk management model that seeks to minimise the potential adverse effects, using the instruments suited to cover the risks to which it is exposed.
• Market risk
The market risk is the risk of the changes in market prices, such as interest rates, foreign exchange variations or evolution of the stock markets, affecting the Company’s results and its financial position.
The Company is only exposed to risks stemming from changes in interest rates, thus the management of market risks is mostly focused on monitoring the evolution of the interest rates, which influence the remunerated financial liabilities (contracted on the basis of interest rates indexed to the evolution of the markets) and their impact on Financial Statements.
• Risk of exposure to variations in interest rates
The management of the interest rate risk aims to minimise exposure to changes in interest rates and their impact on the Financial Statements within the established limits.
Through the adopted control policy, the intention is to select the suitable strategies for each business area, seeking to ensure that this risk factor does not negatively affect the corresponding operating capacity. On the other hand, the exposure to interest rate risk is also monitored via the simulation of adverse scenarios with a certain degree of probability which can negatively affect the Group’s results.

FINANCIAL STATEMENTS REPORT 2017 33
Whenever the expectations of evolution of interest rates are justifiable, the Company seeks to contract operations to protect against adverse movements through derivatives. The economic aspects of the instruments are the main factors in their selection.
Currently, the Company has contracted hedging instruments for cash flow risk with the sole intent of setting the interest rates of some of its credit lines. Plain vanilla interest rate swaps were contracted in 2015 covering 100% of the amounts of the bond loans issued in 2014 and 2015 (100 million euros in total). The contracted swaps respect the characteristics of the aforementioned bond loans in order to be considered hedging products (similar indexer, time period and interest-payment deadlines). On the date of interest payment, José de Mello Saúde receives interest indexed to 6-month Euribor for 100% of the capital and pays interest at a fixed rate on the same amount.
In 2017, following its policy to reduce exposure to interest rates, José de Mello Saúde issued a bond loan with a fixed interest rate. Thus, considering the effect of the contracted swaps, at the end of 2017, José de Mello Saúde held 36% of its financial debt contracted at fixed interest rates (46% in 2016).
The table below provides a sensitivity analysis of the impact of a potential increment of Euribor rates in José de Mello Saúde’s financial costs in 2017 and 2016:
+30,904
+6,748
+16,620
+19,233
+13,853
+11,273
+61,377
+37,254
+0.5
+0.5
+0.5
+0.5
+0.5
+0.5
-
-
Non-current loans
Non-current loans
Current and non-current finance leases
Current and non-current finance leases
Current loans
Current loans
Total
Total
Changes in Euribor rates (pp)
Impact in financial costs (euros)
2017
2016

JOSÉ DE MELLO SAÚDE
FINANCIAL STATEMENTS REPORT 201734
Accounts Receivable
The Company’s credit risk is essentially related to the operational and investment activity with its subsidiaries.
The management tracks the activity of all subsidiaries, enabling this risk to be monitored.
Other financial instruments
Other Financial Instruments include bonds issued by José de Mello Capital, S.A. and Farminveste – Investimentos, Participações e Gestão, S.A. Risk monitoring is carried out periodically by the management via the analysis of the accounts of José de Mello Capital, S.A. and Farminveste – Investimentos, Participações e Gestão, S.A.
• Liquidity risk
Liquidity risk stems from the potential inability to finance the Company’s assets, or to meet the contracted liabilities on the expiration dates.
The management of the liquidity risk seeks to permanently track the treasury forecasts in order to ensure the fulfilment of all of the Company’s liabilities toward the entities with which it deals in its activity. Through active management of the business plan and comprehensive mapping of needs or future cash surpluses, it also seeks to reduce the risk of financing by having a permanent relationship with the financial partners.
The table below presents the Company’s liabilities according to intervals of contractual maturity at the end of 2017 and 2016, respectively. The amounts represent the non-discounted cash flows to be paid in the future.
Funding contracted at a fixed rate was excluded, namely the bond loan mentioned previously;
Since the vast majority of the loans contracted by José de Mello Saúde are supported by the application of a floor at zero if Euribor rates are negative, and given that these, in 2017 and 2016, were always negative, a scenario of rate reduction was not simulated.
• Credit risk
The credit risk is the risk of a counterparty failing to comply with its obligations under the cover of a financial instrument, thus resulting in a loss.
The following table presents the Company’s maximum exposure to credit risk:
1,753,134
114,046,398
2,292,714
10,000,000
3,094,216
176,225,446
3,181,964
16,500,000
Clients
Other Financial Assets
Other accounts receivable
Other financial instruments
199,001,626 128,092,245
2017 2016
1,591,858
777,810
104,512,353
52,422,008
50,133,333
50,416,693
-
-
Financial debt* < 1 year 1-3 years 3-5 years > 5 years
2017
2016
* Short-term debt used to support treasury is excluded

FINANCIAL STATEMENTS REPORT 2017 35
3. FAIR VALUE ESTIMATE
The hierarchy for purposes of determining the fair value shall have the following levels and measurement bases:
• Level 1 – market quotes net of assets, which the Company can access at the balance sheet’s date of reference;
• Level 2 – generally accepted evaluation models, based on inputs observable in the market, in alternative to those mentioned in level 1;
• Level 3 – evaluation models whose main inputs are not observable in the market.
The Company has valued at fair value the assets and liabilities listed in the table below, in which their corresponding hierarchy is also specified:
The fair value of the financial derivatives was determined by banking entities, based on inputs observable in the market and according to the generally accepted evaluation models and techniques.
Level 1Market Quotes
Level 1Market Quotes
Level 2Inputs
Observable In The Market
Level 2Inputs
Observable In The Market
Total
Total
Level 3Inputs Non-
Observable In The Market
Level 3Inputs Non-
Observable In The Market
Liabilities Valued at Fair Value
Liabilities Valued at Fair Value
-
-
1,627,604
2,301,120
1,627,604
2,301,120
-
-
1,627,604
2,301,120
-
-
-
-
1,627,604
2,301,120
Financial derivative instruments
Financial derivative instruments
Cash Flow Hedge (note 9.10)
Cash Flow Hedge (note 9.10)
HIERARCHY OF FAIR VALUE
HIERARCHY OF FAIR VALUE
Fair Value at 31 December 2017
Fair Value at 31 December 2016
JOSÉ DE MELLO SAÚDE
FINANCIAL STATEMENTS REPORT 201736
1,097,931
418
200
1,288,616
(6,690,883)
190,067
(7,979,498)
19,398,086
418
200
19,398,704
19,392,933
-
(5,771)
Current accounts
Cash
Other bank deposits
Balance in the Statement of Financial Position
Balance in the Cash Flow Statement
Other Short-term Investments
Bank overdrafts
2017 2016
4. CASH AND BANK DEPOSITS
The caption “Cash and Banks” in the Financial Position Statement and the balance of “Cash and Cash Equivalents” in the Cash Flows Statementis broken down as follows, as of 31 December 2017 and 2016:
The variation in the caption “Other Short-term Investments” is justified by the disposal of the shares in Montepio Geral.
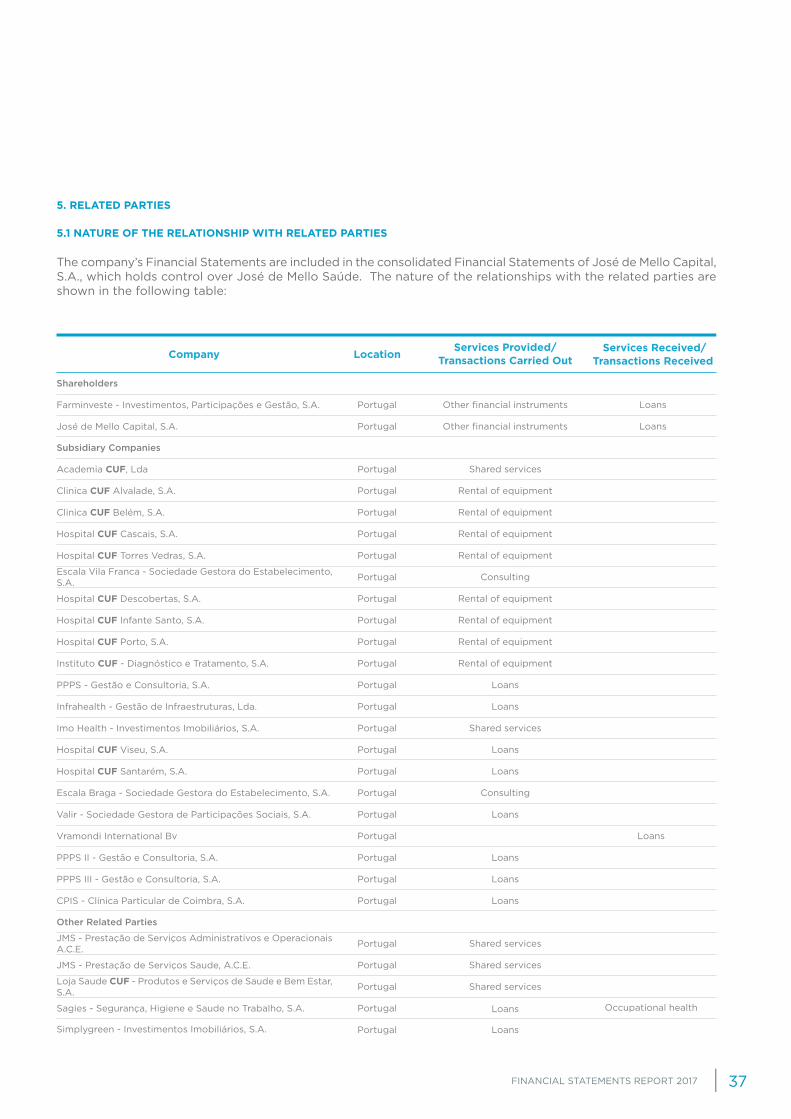
FINANCIAL STATEMENTS REPORT 2017 37
5. RELATED PARTIES
5.1 NATURE OF THE RELATIONSHIP WITH RELATED PARTIES
The company’s Financial Statements are included in the consolidated Financial Statements of José de Mello Capital, S.A., which holds control over José de Mello Saúde. The nature of the relationships with the related parties are shown in the following table:
Services Received/Transactions ReceivedLocation
Services Provided/ Transactions Carried OutCompany
Farminveste - Investimentos, Participações e Gestão, S.A.
Academia CUF, Lda
JMS - Prestação de Serviços Administrativos e Operacionais A.C.E.
Hospital CUF Torres Vedras, S.A.
Hospital CUF Porto, S.A.
Imo Health - Investimentos Imobiliários, S.A.
Valir - Sociedade Gestora de Participações Sociais, S.A.
Clinica CUF Belém, S.A.
Loja Saude CUF - Produtos e Serviços de Saude e Bem Estar, S.A.
Hospital CUF Descobertas, S.A.
PPPS - Gestão e Consultoria, S.A.
Hospital CUF Santarém, S.A.
PPPS II - Gestão e Consultoria, S.A.
José de Mello Capital, S.A.
Clinica CUF Alvalade, S.A.
JMS - Prestação de Serviços Saude, A.C.E.
Escala Vila Franca - Sociedade Gestora do Estabelecimento, S.A.
Instituto CUF - Diagnóstico e Tratamento, S.A.
Hospital CUF Viseu, S.A.
Vramondi International Bv
Hospital CUF Cascais, S.A.
Sagies - Segurança, Higiene e Saude no Trabalho, S.A.
Simplygreen - Investimentos Imobiliários, S.A.
Hospital CUF Infante Santo, S.A.
Infrahealth - Gestão de Infraestruturas, Lda.
Escala Braga - Sociedade Gestora do Estabelecimento, S.A.
PPPS III - Gestão e Consultoria, S.A.
CPIS - Clínica Particular de Coimbra, S.A.
Portugal
Portugal
Portugal
Portugal
Portugal
Portugal
Portugal
Portugal
Portugal
Portugal
Portugal
Portugal
Portugal
Portugal
Portugal
Portugal
Portugal
Portugal
Portugal
Portugal
Portugal
Portugal
Portugal
Portugal
Portugal
Portugal
Portugal
Portugal
Other financial instruments
Shared services
Shared services
Rental of equipment
Rental of equipment
Shared services
Loans
Rental of equipment
Loans
Rental of equipment
Loans
Loans
Loans
Other financial instruments
Rental of equipment
Shared services
Shared services
Consulting
Rental of equipment
Loans
Rental of equipment
Loans
Rental of equipment
Loans
Consulting
Loans
Loans
Loans
Loans
Loans
Occupational health
Shareholders
Subsidiary Companies
Other Related Parties
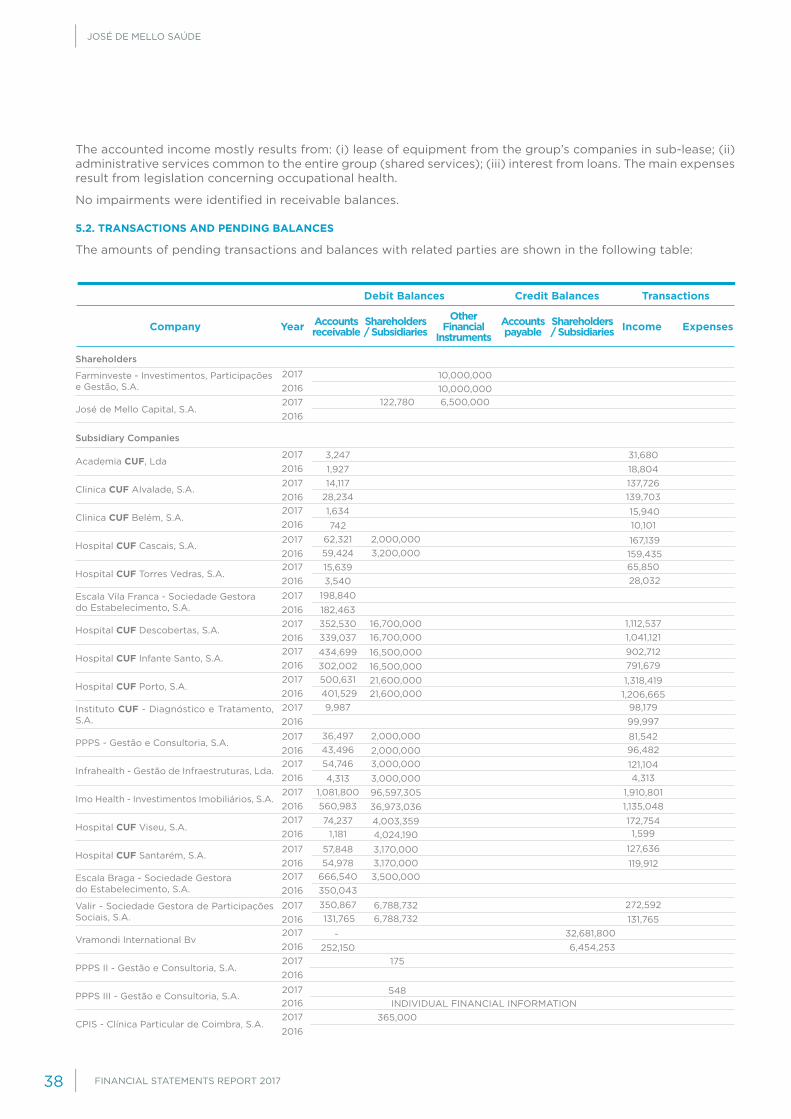
JOSÉ DE MELLO SAÚDE
FINANCIAL STATEMENTS REPORT 201738
Year
Debit Balances Credit Balances Transactions
Accounts receivable
Accounts payable IncomeShareholders
/ SubsidiariesShareholders / Subsidiaries Expenses
Other Financial
InstrumentsCompany
Farminveste - Investimentos, Participações e Gestão, S.A.
Academia CUF, Lda
Hospital CUF Torres Vedras, S.A.
Hospital CUF Porto, S.A.
Imo Health - Investimentos Imobiliários, S.A.
Valir - Sociedade Gestora de Participações Sociais, S.A.
Clinica CUF Belém, S.A.
Hospital CUF Descobertas, S.A.
PPPS - Gestão e Consultoria, S.A.
Hospital CUF Santarém, S.A.
PPPS II - Gestão e Consultoria, S.A.
José de Mello Capital, S.A.
Clinica CUF Alvalade, S.A.
Escala Vila Franca - Sociedade Gestora do Estabelecimento, S.A.
Instituto CUF - Diagnóstico e Tratamento, S.A.
Hospital CUF Viseu, S.A.
Vramondi International Bv
Hospital CUF Cascais, S.A.
Hospital CUF Infante Santo, S.A.
Infrahealth - Gestão de Infraestruturas, Lda.
Escala Braga - Sociedade Gestora do Estabelecimento, S.A.
PPPS III - Gestão e Consultoria, S.A.
CPIS - Clínica Particular de Coimbra, S.A.
2017
2017 3,247
14,117
1,634
62,321
15,639
198,840
352,530
434,699
500,631
16,700,000
16,500,000
21,600,000
1,112,537
902,712
1,318,419
2,000,000
137,726
15,940
167,139
65,850
31,680 1,927
28,234
742
59,424
3,540
182,463
339,037
302,002
401,529
36,497
54,746
1,081,800
74,237
57,848
666,540
350,867
-
9,987
43,496
4,313
560,983
1,181
54,978
350,043
131,765
252,150
98,179 99,997
81,542
121,104
96,482
4,313
1,910,801 1,135,048
172,754 1,599
127,636
119,912
272,592
131,765 32,681,800 6,454,253
16,700,000
16,500,000
21,600,000
2,000,000
2,000,000 3,000,000
3,000,000 96,597,305 36,973,036 4,003,359 4,024,190
3,170,000 3,170,0003,500,000
6,788,732 6,788,732
175
548
365,000
1,041,121
791,679
1,206,665
3,200,000
139,703
10,101
159,435
28,032
18,804 2017
2017
2017
2017
2017
2017
2017
2017
2017
2017
2017
2017
2017
2017
2017
2017
2017
2017
2017
2017
2017 122,780 6,500,000
10,000,000 10,000,000 2016
2016
2016
2016
2016
2016
2016
2016
2016
2016
2016
2016
2016
2016
2016
2016
2016
2016
2016
2016
2016
2016
2016
Shareholders
Subsidiary Companies
INDIVIDUAL FINANCIAL INFORMATION
The accounted income mostly results from: (i) lease of equipment from the group’s companies in sub-lease; (ii) administrative services common to the entire group (shared services); (iii) interest from loans. The main expenses result from legislation concerning occupational health.
No impairments were identified in receivable balances.
5.2. TRANSACTIONS AND PENDING BALANCES
The amounts of pending transactions and balances with related parties are shown in the following table:

FINANCIAL STATEMENTS REPORT 2017 39
Year
Debit Balances Credit Balances Transactions
Accounts receivable
Accounts payable IncomeShareholders
/ SubsidiariesShareholders / Subsidiaries Expenses
Other Financial
InstrumentsCompany
JMS - Prestação de Serviços Administrativos e Operacionais A.C.E.
Loja Saude CUF - Produtos e Serviços de Saude e Bem Estar, S.A.
JMS - Prestação de Serviços Saude, A.C.E.
Sagies - Segurança, Higiene e Saude no Trabalho, S.A.
Simplygreen - Investimentos Imobiliários, S.A.
(126,040) 1,418,351 513,188
5,161 1,635
7,976 48,481
328
401,400
401,400 25,176 15,948
77,818 498 81,421 33,014
206 40,026
2017
2017
2017
2017
2017
2016
2016
2016
2016
2016
Other Related Parties
5.3. WAGES OF KEY MANAGEMENT PERSONNEL
The wages of the Company’s key management personnel are discriminated in the table below:
Remunerations concern wages received by the governing bodies.
The gross carried amount, accrued depreciation and impairment losses at the beginning and end of the period are as follows:
6. INTANGIBLE ASSETS
464,676
464,676
467,975
467,975
Total remuneration paid
2017 2016
71,262
71,262
71,262
71,262
71,262
-
-
-
71,262
71,262
71,262
71,262
71,262
71,262
-
-
-
71,262
At 1 January 2016
At 31 December 2016
At 1 January 2016
At 31 December 2016
At 31 December 2017
Acquisitions
Depreciations for the period
Depreciations for the period
At 31 December 2017
Software Total Intangible Assets
Cost:
Depreciation and impairment losses:
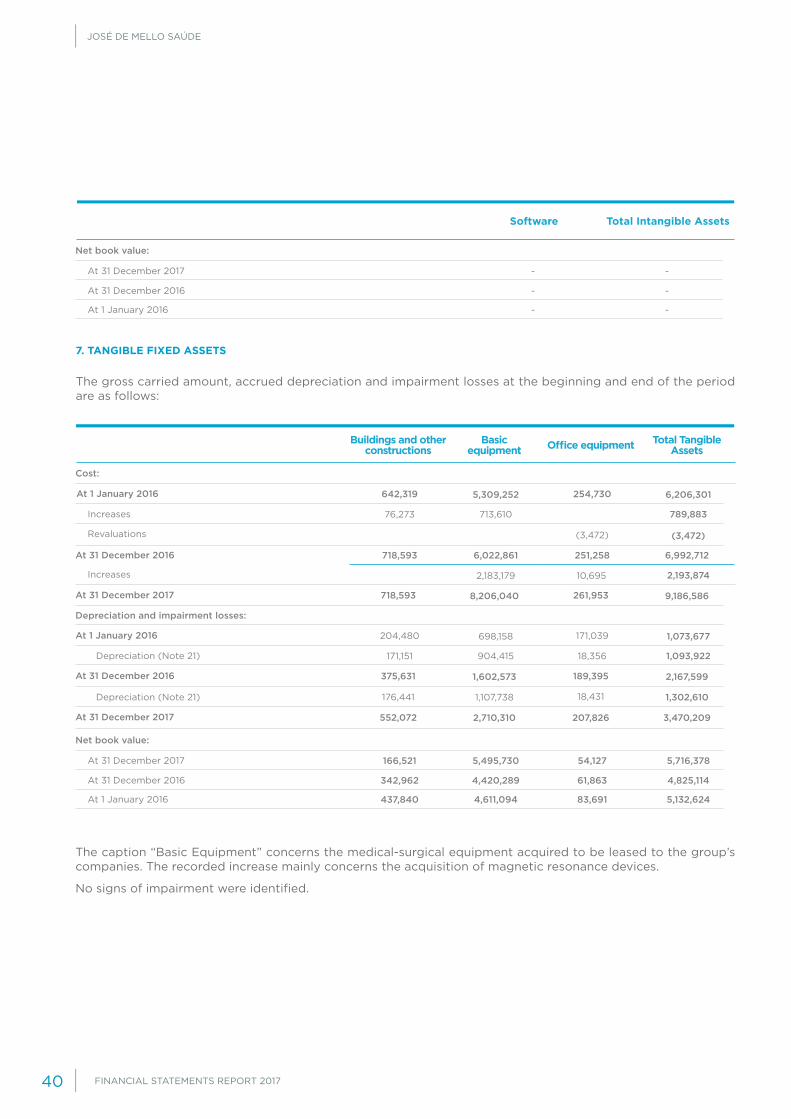
JOSÉ DE MELLO SAÚDE
FINANCIAL STATEMENTS REPORT 201740
-
-
-
-
-
-
Net book value:
At 31 December 2017
At 31 December 2016
At 1 January 2016
Software Total Intangible Assets
The gross carried amount, accrued depreciation and impairment losses at the beginning and end of the period are as follows:
The caption “Basic Equipment” concerns the medical-surgical equipment acquired to be leased to the group’s companies. The recorded increase mainly concerns the acquisition of magnetic resonance devices.
No signs of impairment were identified.
7. TANGIBLE FIXED ASSETS
6,206,301 5,309,252
9,186,5868,206,040
2,183,179 10,695
1,073,677 698,158
2,167,599
1,302,610
3,470,209
1,602,573
2,710,310
1,107,738
(3,472)
789,883 713,610
1,093,922 904,415
5,716,378 5,495,730
4,825,114 4,420,289
5,132,624 4,611,094
6,992,712
2,193,874
6,022,861
254,730 642,319
261,953718,593
171,039 204,480
189,395
207,826
18,431
375,631
552,072
176,441
(3,472)
76,273
18,356 171,151
54,127 166,521
61,863 342,962
83,691 437,840
251,258 718,593
At 1 January 2016
At 31 December 2017
At 1 January 2016
Net book value:
At 31 December 2016
At 31 December 2017
Increases
Increases
Revaluations
Depreciation and impairment losses:
Depreciation (Note 21)
Depreciation (Note 21)
At 31 December 2017
At 31 December 2016
At 1 January 2016
At 31 December 2016
Office equipmentBuildings and other constructions
Total Tangible Assets
Basic equipment
Cost:

FINANCIAL STATEMENTS REPORT 2017 41
8.1. MOVEMENTS OF THE FINANCIAL INVESTMENTS PER SUBSIDIARY
The movement that took place in the current financial year under the caption of financial investments is the one shown in the following table:
8. INVESTMENTS IN SUBSIDIARIES AND AFFILIATES
Total Financial Investments
2016% HoldingRet. Issue
PremiumsIncreases Supplementary
payments Business activity
Total Financial Investments
2017
(1,058,706)
(4,473,953)
50,000
50,000
1
8,440,500
Training
Healthcare service provision
Provision of management services
and consulting in healthcare
Parapharmaceutical
Shareholdings management
Healthcare service provision
Healthcare service provision
Healthcare service provision
Real estate
Provision of management services
and consulting in healthcare
Provision of management services
and consulting in healthcare
Distribution and commercialization of
medication and medical devices
Shareholdings management
Healthcare service provision
Research
Healthcare service provision
Healthcare service provision
Healthcare service provision
5,000
6,357,407
50,000
117,188
0
5,000
6,357,407
50,000
117,188
-
1,164,124
21,536,188
189,958
412,500
50,000
50,000
1
14,454,760
50,000
5,000
12,390,104
8,440,500
1,865,024
100.00%
100.00%
88.00%
100.00%
96.00%
100.00%
100.00%
100.00%
100.00%
100.00%
100.00%
99.00%
100.00%
5.00%
100.00%
100.00%
60.00%
1,164,124
21,536,188
189,958
412,500
-
-
-
18,928,713
50,000
5,000
12,390,104
-
2,923,730
Academia CUF, Lda
Hospital CUF Descobertas, S.A.
Digihealth, S.A.
Loja Saude CUF - Produtos e Serviços de Saude e Bem Estar, S.A.
Valir - Sociedade Gestora de Participações Sociais, Sgps S.A.
Clinica CUF Alvalade, S.A.
Hospital CUF Infante Santo, S.A.
Hospital CUF Porto, S.A.
Imo Health - Investimentos Imobiliários, S.A.
PPPS II - Gestão e Consultoria, S.A.
PPPS III - Gestão e Consultoria, S.A.
Centro Logístico - CUF, Unipessoal, Lda.
Vramondi International Bv
Hospital CUF Viseu, S.A.
IBET -Instituto de Biologia Experimental e Tecnológica
Hospital CUF Santarém, S.A.
CPIS - Clínica Particular de Comibra, S.A.
Escala Vila Franca - Sociedade Gestora do Estabelecimento, S.A.
Subsidiary companies
Associated companies
8,540,501 (1,058,706) (4,473,953) 67,137,75364,129,913
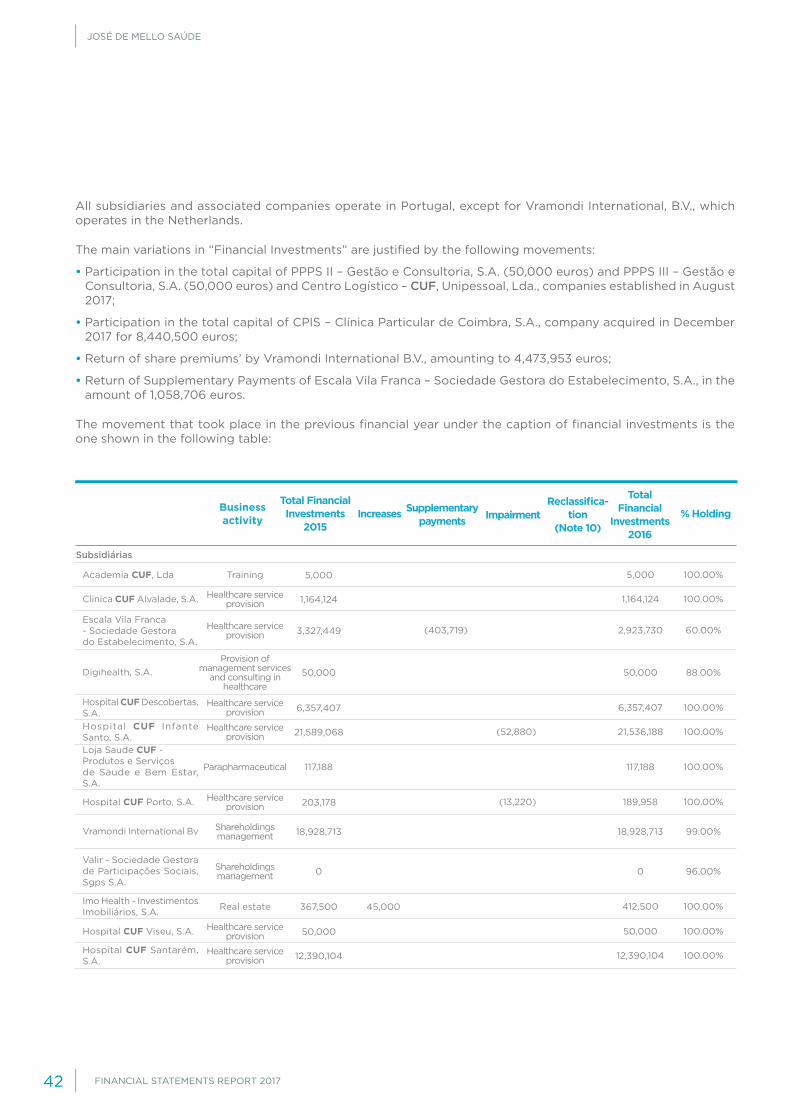
JOSÉ DE MELLO SAÚDE
FINANCIAL STATEMENTS REPORT 201742
All subsidiaries and associated companies operate in Portugal, except for Vramondi International, B.V., which operates in the Netherlands.
The main variations in “Financial Investments” are justified by the following movements:
• Participation in the total capital of PPPS II – Gestão e Consultoria, S.A. (50,000 euros) and PPPS III – Gestão e Consultoria, S.A. (50,000 euros) and Centro Logístico – CUF, Unipessoal, Lda., companies established in August 2017;
• Participation in the total capital of CPIS – Clínica Particular de Coimbra, S.A., company acquired in December 2017 for 8,440,500 euros;
• Return of share premiums’ by Vramondi International B.V., amounting to 4,473,953 euros;
• Return of Supplementary Payments of Escala Vila Franca – Sociedade Gestora do Estabelecimento, S.A., in the amount of 1,058,706 euros.
The movement that took place in the previous financial year under the caption of financial investments is the one shown in the following table:
ImpairmentTotal Financial Investments
2015% Holding
Reclassifica-tion
(Note 10)Increases Supplementary
payments Business activity
Total Financial
Investments 2016
(403,719)
(52,880)
(13,220)
45,000
Training
Healthcare service provision
Provision of management services
and consulting in healthcare
Parapharmaceutical
Shareholdings management
Healthcare service provision
Healthcare service provision
Healthcare service provision
Real estate
Shareholdings management
Healthcare service provision
Healthcare service provision
Healthcare service provision
5,000
6,357,407
50,000
117,188
0
5,000
6,357,407
50,000
117,188
0
1,164,124
21,536,188
189,958
412,500
18,928,713
50,000
12,390,104
2,923,730
100.00%
100.00%
88.00%
100.00%
96.00%
100.00%
100.00%
100.00%
100.00%
99.00%
100.00%
100.00%
60.00%
1,164,124
21,589,068
203,178
367,500
18,928,713
50,000
12,390,104
3,327,449
Academia CUF, Lda
Hospital CUF Descobertas, S.A.
Digihealth, S.A.
Loja Saude CUF - Produtos e Serviços de Saude e Bem Estar, S.A.
Valir - Sociedade Gestora de Participações Sociais, Sgps S.A.
Clinica CUF Alvalade, S.A.
Hospital CUF Infante Santo, S.A.
Hospital CUF Porto, S.A.
Imo Health - Investimentos Imobiliários, S.A.
Vramondi International Bv
Hospital CUF Viseu, S.A.
Hospital CUF Santarém, S.A.
Escala Vila Franca - Sociedade Gestora do Estabelecimento, S.A.
Subsidiárias
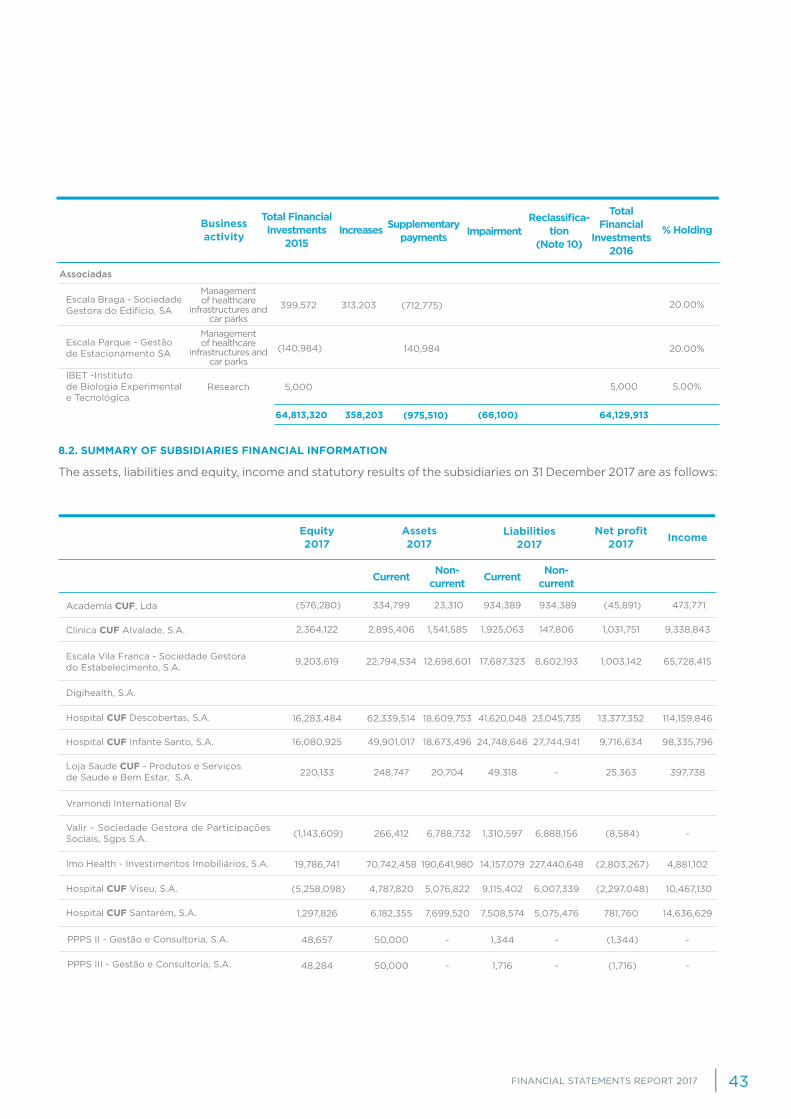
FINANCIAL STATEMENTS REPORT 2017 43
8.2. SUMMARY OF SUBSIDIARIES FINANCIAL INFORMATION
The assets, liabilities and equity, income and statutory results of the subsidiaries on 31 December 2017 are as follows:
Academia CUF, Lda
Hospital CUF Descobertas, S.A.
Digihealth, S.A.
Loja Saude CUF - Produtos e Serviços de Saude e Bem Estar, S.A.
Valir - Sociedade Gestora de Participações Sociais, Sgps S.A.
Clinica CUF Alvalade, S.A.
Hospital CUF Infante Santo, S.A.
Imo Health - Investimentos Imobiliários, S.A.
Vramondi International Bv
Hospital CUF Viseu, S.A.
Hospital CUF Santarém, S.A.
Escala Vila Franca - Sociedade Gestora do Estabelecimento, S.A.
PPPS II - Gestão e Consultoria, S.A.
PPPS III - Gestão e Consultoria, S.A.
Equity 2017
(576,280) 334,799 23,310 934,389 934,389 (45,891) 473,771
2,364,122 2,895,406 1,541,585 1,925,063 147,806 1,031,751 9,338,843
16,283,484 62,339,514 18,609,753 41,620,048 23,045,735 13,377,352 114,159,846
16,080,925 49,901,017 18,673,496 24,748,646 27,744,941 9,716,634 98,335,796
(1,143,609) 266,412 6,788,732 1,310,597 6,888,156 (8,584) -
19,786,741 70,742,458 190,641,980 14,157,079 227,440,648 (2,803,267) 4,881,102
(5,258,098) 4,787,820 5,076,822 9,115,402 6,007,339 (2,297,048) 10,467,130
1,297,826 6,182,355 7,699,520 7,508,574 5,075,476 781,760 14,636,629
48,657 50,000 - 1,344 - (1,344) -
48,284 50,000 - 1,716 - (1,716) -
220,133 248,747 20,704 49,318 - 25,363 397,738
9,203,619 22,794,534 12,698,601 17,687,323 8,602,193 1,003,142 65,728,415
Assets2017
Current CurrentNon-current
Non-current
Liabilities 2017
Net profit2017 Income
(712,775)
140,984
313,203
Research
Management of healthcare
infrastructures and car parks
Management of healthcare
infrastructures and car parks
5,000 5.00%
20.00%
20.00%
5,000
399,572
(140,984)
IBET -Instituto de Biologia Experimental e Tecnológica
Escala Braga - Sociedade Gestora do Edifício, SA
Escala Parque - Gestão de Estacionamento SA
Associadas
358,203 (975,510) (66,100) 64,129,91364,813,320
ImpairmentTotal Financial Investments
2015% Holding
Reclassifica-tion
(Note 10)Increases Supplementary
payments Business activity
Total Financial
Investments 2016
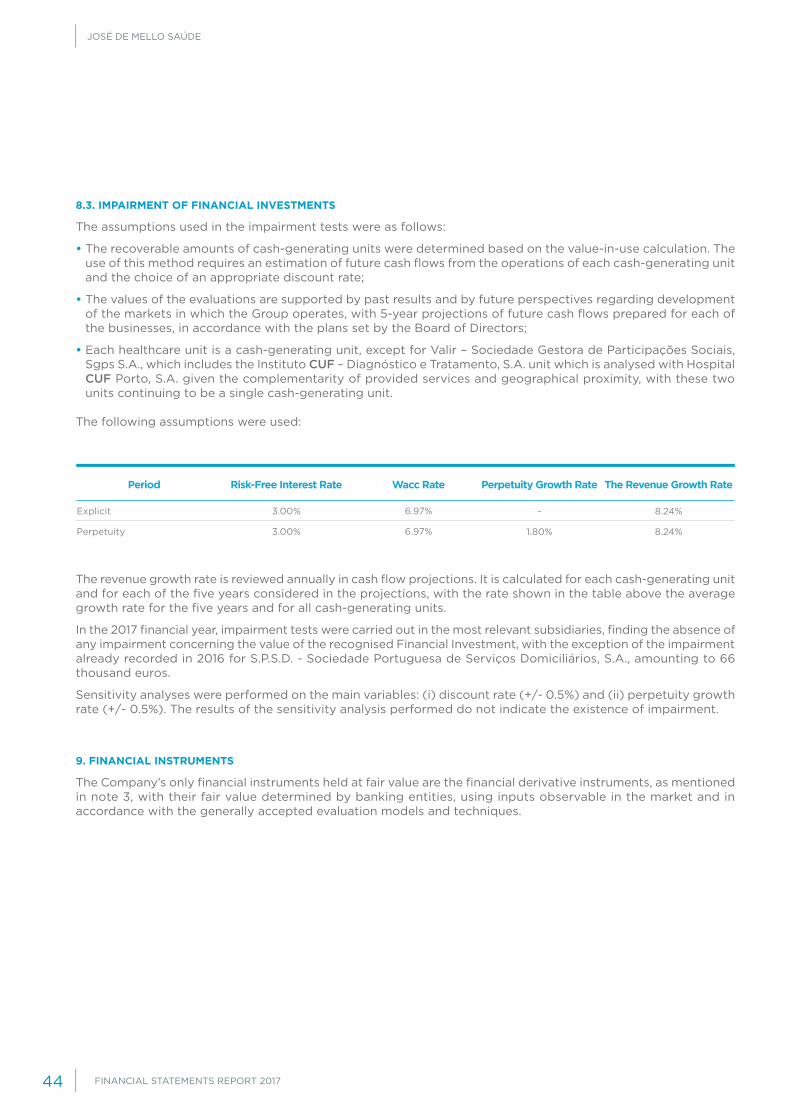
JOSÉ DE MELLO SAÚDE
FINANCIAL STATEMENTS REPORT 201744
8.3. IMPAIRMENT OF FINANCIAL INVESTMENTS
The assumptions used in the impairment tests were as follows:
• The recoverable amounts of cash-generating units were determined based on the value-in-use calculation. The use of this method requires an estimation of future cash flows from the operations of each cash-generating unit and the choice of an appropriate discount rate;
• The values of the evaluations are supported by past results and by future perspectives regarding development of the markets in which the Group operates, with 5-year projections of future cash flows prepared for each of the businesses, in accordance with the plans set by the Board of Directors;
• Each healthcare unit is a cash-generating unit, except for Valir – Sociedade Gestora de Participações Sociais, Sgps S.A., which includes the Instituto CUF – Diagnóstico e Tratamento, S.A. unit which is analysed with Hospital CUF Porto, S.A. given the complementarity of provided services and geographical proximity, with these two units continuing to be a single cash-generating unit.
The following assumptions were used:
The revenue growth rate is reviewed annually in cash flow projections. It is calculated for each cash-generating unit and for each of the five years considered in the projections, with the rate shown in the table above the average growth rate for the five years and for all cash-generating units.
In the 2017 financial year, impairment tests were carried out in the most relevant subsidiaries, finding the absence of any impairment concerning the value of the recognised Financial Investment, with the exception of the impairment already recorded in 2016 for S.P.S.D. - Sociedade Portuguesa de Serviços Domiciliários, S.A., amounting to 66 thousand euros.
Sensitivity analyses were performed on the main variables: (i) discount rate (+/- 0.5%) and (ii) perpetuity growth rate (+/- 0.5%). The results of the sensitivity analysis performed do not indicate the existence of impairment.
9. FINANCIAL INSTRUMENTS
The Company’s only financial instruments held at fair value are the financial derivative instruments, as mentioned in note 3, with their fair value determined by banking entities, using inputs observable in the market and in accordance with the generally accepted evaluation models and techniques.
3.00%
3.00%
6.97%
6.97%
-
1.80%
8.24%
8.24%
Period Risk-Free Interest Rate Wacc Rate Perpetuity Growth Rate The Revenue Growth Rate
Explicit
Perpetuity

FINANCIAL STATEMENTS REPORT 2017 45
FINANCIAL ASSETS
The breakdown of financial assets according to the different categories is indicated in the following tables:
100,847,068
1,753,134
13,199,329
1,885,798
2,292,714
10,000,000
1,288,616
169,361,037
3,094,216
6,864,409
122,780
3,181,964
16,500,000
19,398,704
Other financial assets
Non-current
Current
Other financial assets
Loans (Note 9.1)
Customers (note 9.3)
Loans (Note 9.1)
Shareholders (Note 9.2)
Other accounts receivable (note 9.4)
Other financial instruments (Note 9.5)
Cash and bank deposits (Note 3)
169,361,037
49,162,072
100,847,068
30,419,591
2017 2016

JOSÉ DE MELLO SAÚDE
FINANCIAL STATEMENTS REPORT 201746
9.1. OTHER FINANCIAL ASSETS
On 31 December 2017 and 2016, the caption of other financial assets was broken down as follows::
9.2 SHAREHOLDERS
On 31 December 2017 and 2016, the shareholders caption was broken down as follows:
21,600,000
480,000
2,000,000
12,608,059
16,500,000
20,831
4,003,359
-
24,364,977
-
16,700,000
-
3,200,000
90,440
2,690,000
-
6,788,732
-
3,000,000
-
21,600,000
480,000
2,000,000
2,828,000
16,500,000
-
4,003,359
175
93,769,305
55,359
16,700,000
3,500,000
2,000,000
-
2,690,000
548
6,788,732
328
2,944,642
365,000
Loans to subsidiaries
Non-current assets
Current assets
Hospital CUF Porto, S.A.
Hospital CUF Santarém, S.A.
PPPS - Gestão e Consultoria, S.A
Imohealth - Investimentos Imobiliários, S.A.
Hospital CUF Infante Santo, S.A.
Hospital CUF Viseu, S.A.
Hospital CUF Viseu, S.A.
PPPS II - Gestão e Consultoria, S.A
Imohealth - Investimentos Imobiliários, S.A.
INFRAHEALTH - Gestão de Infraestruturas, Lda
Hospital CUF Descobertas, S.A.
Escala Braga - Sociedade Gestora do Estabelecimento, S.A.
Hospital CUF Cascais, S.A.
Manuel Guimarães, Lda
Hospital CUF Santarém, S.A.
PPPS III - Gestão e Consultoria, S.A
Valir, SGPS, S.A.
Simply Green - Investimentos Imobiliários, S.A.
INFRAHEALTH - Gestão de Infraestruturas, Lda
CPIS - Clínica Particular de Coimbra, S.A.
Loans to subsidiaries
169,361,037
6,864,409
100,847,068
13,199,329
2017 2016
122,780
1,763,018
122,780
-
José de Mello Capital, S.A.
Farminveste - Investimentos, Participações e Gestão, S.A.
122,780 1,885,798
Current assets
2017 2016

FINANCIAL STATEMENTS REPORT 2017 47
9.3. CLIENTSThe total amount written of in relation to clients is broken down in the table below:
9.4. OTHER ACCOUNTS RECEIVABLE
On 31 December 2017 and 2016, the “Other Receivable Accounts” caption is broken down as follows:
Seniority and Impairment of Clients
The seniority of clients is broken down as indicated in the table below:
No impairments were identified in trade payables balances.
1,753,1343,094,216Customers
2017 2016
-
173,577
--
252,150 -
2017 3,094,216 818,258 1,834,830 441,128
1,753,134 562,335 520,444 244,628 2016
Year Total UnexpiredDebt ≤ 180 days
Expired debt
181-365 days 546-730 days366-545 days >730
1,963,238
59,857
31,171
753
195,200
-
35,945
5,199
1,350
2,644,761
63,201
-
663
150,378
272,229
34,518
715
15,498
Debtors from accrued income
Recognising expenses
Personnel
Other debtors
Interest receivable
Rents
IT
Others
Insurances
Interest
Others
2017 2016
3,181,964 2,292,714
The caption “Interest Receivable” concerns the interest of loans and overdrafts charged to the group’s units with which the company has a balance, as well as the interest of bond loans issued by Farminveste – Investimentos, Participações e Gestão, S.A. and José de Mello Capital, S.A. (note 9.5).

JOSÉ DE MELLO SAÚDE
FINANCIAL STATEMENTS REPORT 201748
9.5. OTHER FINANCIAL INSTRUMENTS
The amount of 16.5 million euros concerns bonds issued by Farminveste – Investimentos, Participações e Gestão, S.A. and José de Mello Capital, S.A.:
At 29 December 2017, the bond loans of José de Mello Capital, S.A. (10 million euros) and José de Mello Participações II (10 million euros), until then held by Hospital CUF Descobertas, S.A., were acquired by José de Mello Saúde, S.A. for 20 million euros.
In December, 13.5 million euros were reimbursed, with a remaining debt of 6.5 million euros concerning the original contract with José de Mello Capital, S.A., whose repayment period was changed to June 2022.
These bonds have a put option that gives the Company the right to redeem the amount in question at any time, which is why they are categorised as a current asset.
The sale option was recorded at face value, without any associated derivative.
There are no indications of impairment for the amounts of the bond loans listed above.
16,500,000 10,000,000
10,000,000
-
10,000,0002020
2022 6,500,000
Farminveste - Investimentos, Participações e Gestão, S.A.
José de Mello Capital, S.A.
2017Maturity yearIssuer 2016

FINANCIAL STATEMENTS REPORT 2017 49
FINANCIAL LIABILITIES
The breakdown of financial liabilities according to the different categories is indicated in the following tables:
158,189,064
623,336
190,385,668
17,729,624
23,774,495
105,303,388
843,016
107,604,508
23,701,092
32,221,663
2,970,211
843,016
-
6,454,253
102,333,177
-
2,301,120
1,043,783
777,810
3,456,905
623,336
29,869,000
2,812,800
154,732,159
-
1,627,604
1,431,991
1,591,862
700,000
14,700,000
5,771
2,608,736
13,900,000
7,979,498
1,223,302
Loans Obtained
Suppliers
Loans Obtained
Non-Current
Current
Loans obtained through leases (note 13)
Suppliers, current account
Other financial liabilities (note 9.8)
Other financial liabilities (note 9.8)
Other Financing (Note 9.7)
Suppliers, invoices in reception and under verification
Financial derivative instruments (note 9.10)
Loans obtained through leases (note 13)
Other Financing (Note 9.7)
Other accounts payable (note 9.9)
Commercial paper (Note 9.6)
Bank overdrafts (Note 4)
Other accounts payable (note 9.9)
2017 2016
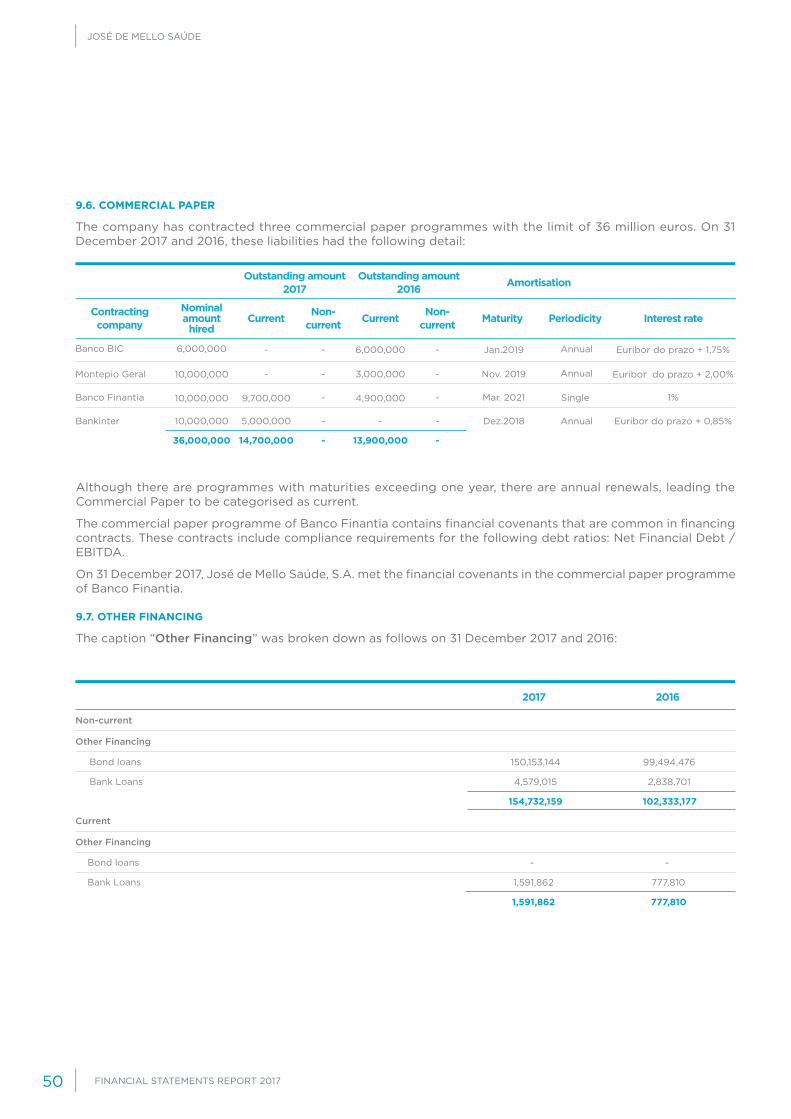
JOSÉ DE MELLO SAÚDE
FINANCIAL STATEMENTS REPORT 201750
9.6. COMMERCIAL PAPER
The company has contracted three commercial paper programmes with the limit of 36 million euros. On 31 December 2017 and 2016, these liabilities had the following detail:
Although there are programmes with maturities exceeding one year, there are annual renewals, leading the Commercial Paper to be categorised as current.
The commercial paper programme of Banco Finantia contains financial covenants that are common in financing contracts. These contracts include compliance requirements for the following debt ratios: Net Financial Debt / EBITDA.
On 31 December 2017, José de Mello Saúde, S.A. met the financial covenants in the commercial paper programme of Banco Finantia.
9.7. OTHER FINANCING
The caption “Other Financing” was broken down as follows on 31 December 2017 and 2016:
Contracting company
Nominal amount
hiredCurrent Current Maturity Non-
currentNon-
current Periodicity
Outstanding amount 2017
Outstanding amount2016 Amortisation
Interest rate
Euribor do prazo + 1,75%
Euribor do prazo + 2,00%
1%
Euribor do prazo + 0,85%
6,000,000
10,000,000
10,000,000 9,700,000 4,900,000
- 3,000,000- - Nov. 2019 Annual
- - Dez.2018 Annual
- 6,000,000- - Jan.2019 Annual
- - Mar. 2021 Single
10,000,000 5,000,000 -
Banco BIC
Banco Finantia
Montepio Geral
Bankinter
36,000,000 14,700,000 - 13,900,000 -
154,732,159 102,333,177
99,494,476
2,838,701
150,153,144
4,579,015
Other Financing
Non-current
Bond loans
Bank Loans
2017 2016
1,591,862 777,810
-
777,810
-
1,591,862
Other Financing
Current
Bond loans
Bank Loans
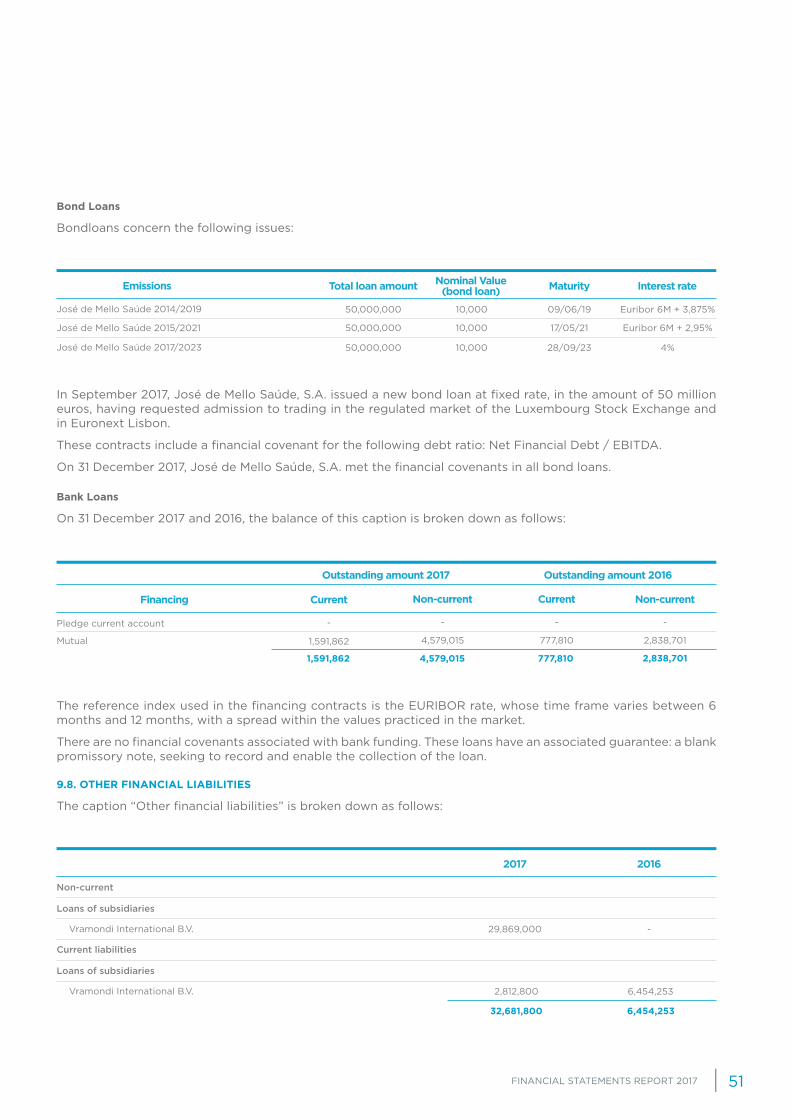
FINANCIAL STATEMENTS REPORT 2017 51
Bond Loans
Bondloans concern the following issues:
In September 2017, José de Mello Saúde, S.A. issued a new bond loan at fixed rate, in the amount of 50 million euros, having requested admission to trading in the regulated market of the Luxembourg Stock Exchange and in Euronext Lisbon.
These contracts include a financial covenant for the following debt ratio: Net Financial Debt / EBITDA.
On 31 December 2017, José de Mello Saúde, S.A. met the financial covenants in all bond loans.
Bank Loans
On 31 December 2017 and 2016, the balance of this caption is broken down as follows:
The reference index used in the financing contracts is the EURIBOR rate, whose time frame varies between 6 months and 12 months, with a spread within the values practiced in the market.
There are no financial covenants associated with bank funding. These loans have an associated guarantee: a blank promissory note, seeking to record and enable the collection of the loan.
9.8. OTHER FINANCIAL LIABILITIES
The caption “Other financial liabilities” is broken down as follows:
1,591,862 4,579,015 777,810 2,838,701
Pledge current account
Mutual
-
2,838,701
--
4,579,015 777,810
-
1,591,862
Financing
Outstanding amount 2016Outstanding amount 2017
Current Current Non-current Non-current
32,681,800 6,454,253
-
6,454,253
29,869,000
2,812,800
Loans of subsidiaries
Loans of subsidiaries
Non-current
Current liabilities
Vramondi International B.V.
Vramondi International B.V.
2017 2016
50,000,000 10,000 09/06/19 Euribor 6M + 3,875%
50,000,000 10,000 17/05/21 Euribor 6M + 2,95%
50,000,000 10,000 28/09/23 4%
José de Mello Saúde 2014/2019
José de Mello Saúde 2015/2021
José de Mello Saúde 2017/2023
Total loan amount Nominal Value (bond loan) Maturity Interest rateEmissions
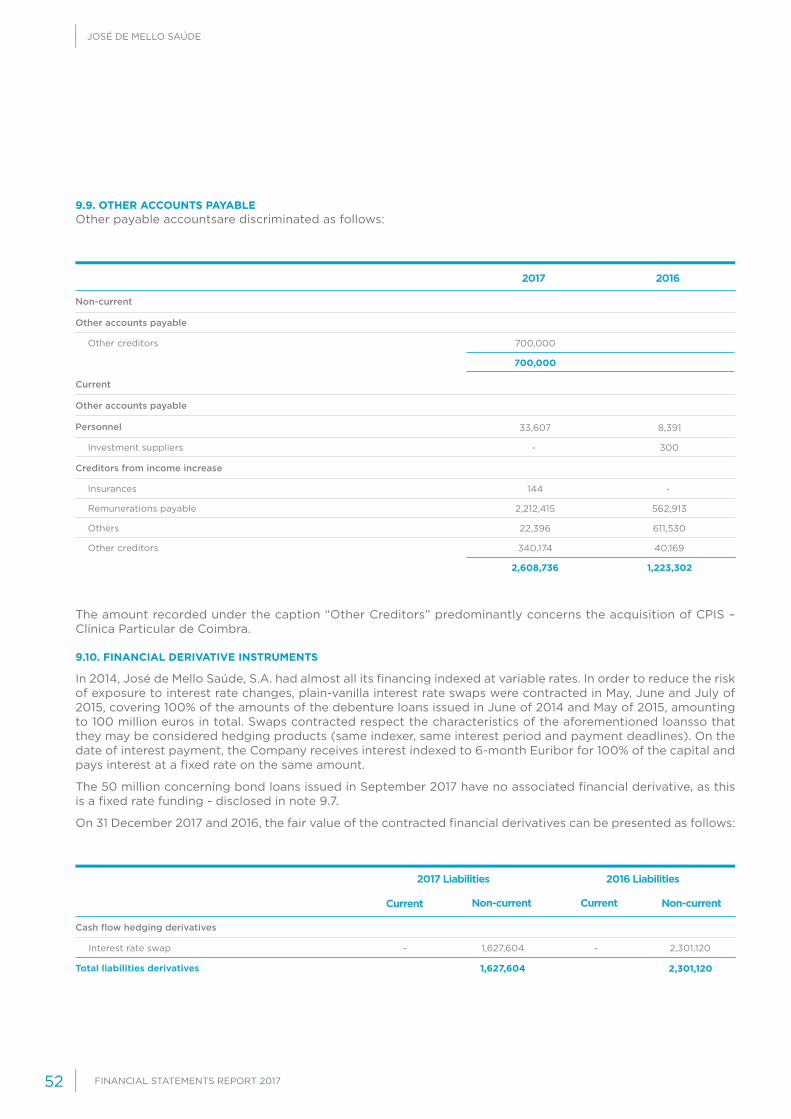
JOSÉ DE MELLO SAÚDE
FINANCIAL STATEMENTS REPORT 201752
9.9. OTHER ACCOUNTS PAYABLEOther payable accountsare discriminated as follows:
The amount recorded under the caption “Other Creditors” predominantly concerns the acquisition of CPIS – Clínica Particular de Coimbra.
9.10. FINANCIAL DERIVATIVE INSTRUMENTS
In 2014, José de Mello Saúde, S.A. had almost all its financing indexed at variable rates. In order to reduce the risk of exposure to interest rate changes, plain-vanilla interest rate swaps were contracted in May, June and July of 2015, covering 100% of the amounts of the debenture loans issued in June of 2014 and May of 2015, amounting to 100 million euros in total. Swaps contracted respect the characteristics of the aforementioned loansso that they may be considered hedging products (same indexer, same interest period and payment deadlines). On the date of interest payment, the Company receives interest indexed to 6-month Euribor for 100% of the capital and pays interest at a fixed rate on the same amount.
The 50 million concerning bond loans issued in September 2017 have no associated financial derivative, as this is a fixed rate funding - disclosed in note 9.7.
On 31 December 2017 and 2016, the fair value of the contracted financial derivatives can be presented as follows:
2,608,736
700,000
1,223,302
300
-
611,530
562,913
40,169
700,000
33,607 8,391
-
144
22,396
2,212,415
340,174
Other accounts payable
Other accounts payable
Personnel
Creditors from income increase
Non-current
Current
Other creditors
Investment suppliers
Insurances
Others
Remunerations payable
Other creditors
2017 2016
- - 1,627,604 2,301,120
Cash flow hedging derivatives
Interest rate swap
2016 Liabilities2017 Liabilities
Current Current Non-current Non-current
1,627,604 2,301,120 Total liabilities derivatives
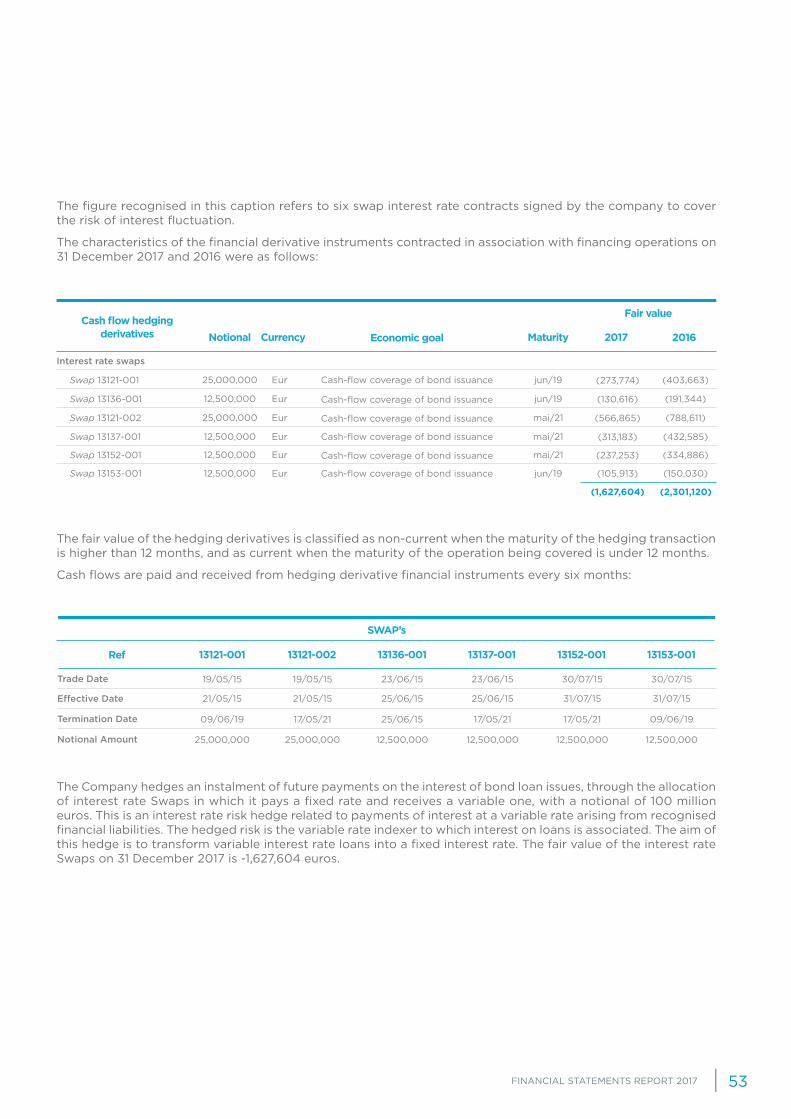
FINANCIAL STATEMENTS REPORT 2017 53
The figure recognised in this caption refers to six swap interest rate contracts signed by the company to cover the risk of interest fluctuation.
The characteristics of the financial derivative instruments contracted in association with financing operations on 31 December 2017 and 2016 were as follows:
The fair value of the hedging derivatives is classified as non-current when the maturity of the hedging transaction is higher than 12 months, and as current when the maturity of the operation being covered is under 12 months.
Cash flows are paid and received from hedging derivative financial instruments every six months:
The Company hedges an instalment of future payments on the interest of bond loan issues, through the allocation of interest rate Swaps in which it pays a fixed rate and receives a variable one, with a notional of 100 million euros. This is an interest rate risk hedge related to payments of interest at a variable rate arising from recognised financial liabilities. The hedged risk is the variable rate indexer to which interest on loans is associated. The aim of this hedge is to transform variable interest rate loans into a fixed interest rate. The fair value of the interest rate Swaps on 31 December 2017 is -1,627,604 euros.
(1,627,604) (2,301,120)
(273,774)
(130,616)
(566,865)
(313,183)
(237,253)
(105,913)
25,000,000
12,500,000
25,000,000
12,500,000
12,500,000
12,500,000
Eur
Eur
Eur
Eur
Eur
Eur
jun/19
jun/19
mai/21
mai/21
mai/21
jun/19
Cash-flow coverage of bond issuance
Cash-flow coverage of bond issuance
Cash-flow coverage of bond issuance
Cash-flow coverage of bond issuance
Cash-flow coverage of bond issuance
Cash-flow coverage of bond issuance
(403,663)
(191,344)
(788,611)
(432,585)
(334,886)
(150,030)
Interest rate swaps
Swap 13121-001
Swap 13136-001
Swap 13121-002
Swap 13137-001
Swap 13152-001
Swap 13153-001
Fair value
Economic goal 2017MaturityCurrencyNotionalCash flow hedging
derivatives 2016
19/05/15 19/05/15 23/06/15 23/06/15 30/07/15 30/07/15
21/05/15 21/05/15 25/06/15 25/06/15 31/07/15 31/07/15
09/06/19 17/05/21 25/06/15 17/05/21 17/05/21 09/06/19
25,000,000 25,000,000 12,500,000 12,500,000 12,500,000 12,500,000
Trade Date
Effective Date
Termination Date
Notional Amount
SWAP’s
13121-001 13121-002 13136-001 13137-001 13152-001 13153-001Ref
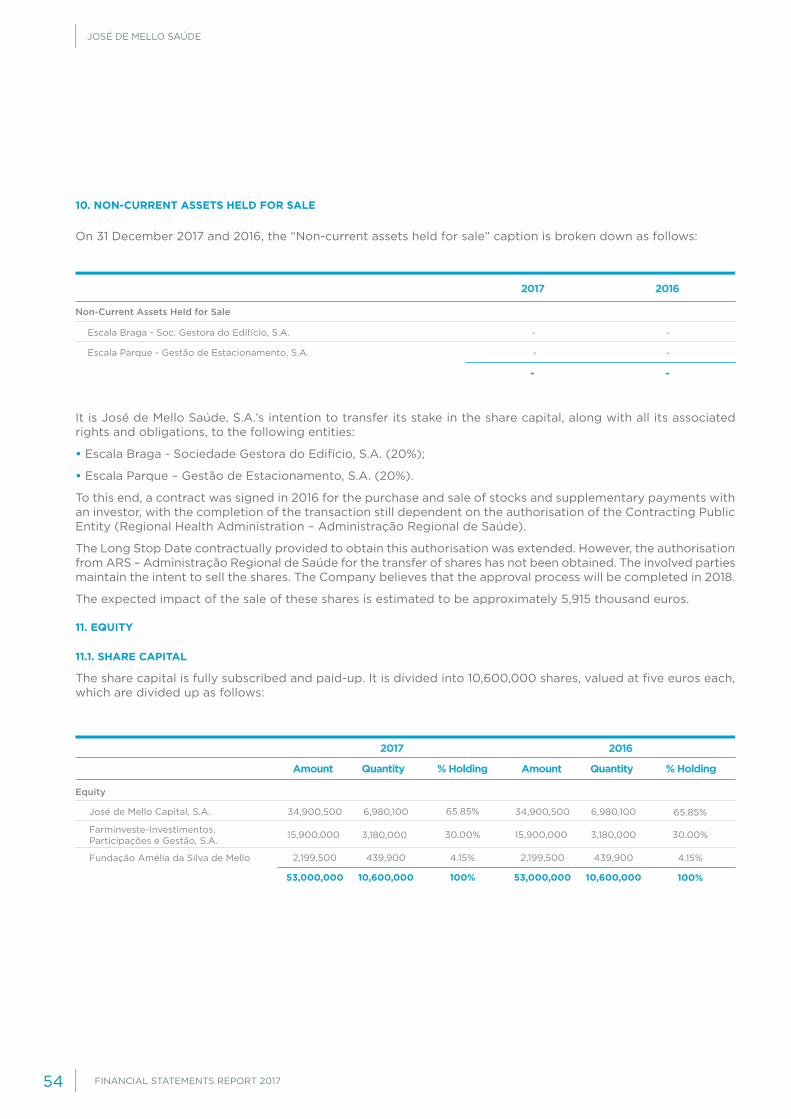
JOSÉ DE MELLO SAÚDE
FINANCIAL STATEMENTS REPORT 201754
Non-Current Assets Held for Sale
On 31 December 2017 and 2016, the “Non-current assets held for sale” caption is broken down as follows:
10. NON-CURRENT ASSETS HELD FOR SALE
It is José de Mello Saúde, S.A.’s intention to transfer its stake in the share capital, along with all its associated rights and obligations, to the following entities:
• Escala Braga - Sociedade Gestora do Edifício, S.A. (20%);
• Escala Parque – Gestão de Estacionamento, S.A. (20%).
To this end, a contract was signed in 2016 for the purchase and sale of stocks and supplementary payments with an investor, with the completion of the transaction still dependent on the authorisation of the Contracting Public Entity (Regional Health Administration – Administração Regional de Saúde).
The Long Stop Date contractually provided to obtain this authorisation was extended. However, the authorisation from ARS – Administração Regional de Saúde for the transfer of shares has not been obtained. The involved parties maintain the intent to sell the shares. The Company believes that the approval process will be completed in 2018.
The expected impact of the sale of these shares is estimated to be approximately 5,915 thousand euros.
11. EQUITY
11.1. SHARE CAPITAL
The share capital is fully subscribed and paid-up. It is divided into 10,600,000 shares, valued at five euros each, which are divided up as follows:
-
-
-
-
Escala Braga - Soc. Gestora do Edifício, S.A.
Escala Parque - Gestão de Estacionamento, S.A.
- -
2017 2016
AmountAmount QuantityQuantity % Holding% Holding
Equity
34,900,500
15,900,000
2,199,500
53,000,000
34,900,500
15,900,000
2,199,500
53,000,000
6,980,100
3,180,000
439,900
10,600,000
6,980,100
3,180,000
439,900
10,600,000
65.85%
30.00%
4.15%
100%
65.85%
30.00%
4.15%
100%
José de Mello Capital, S.A.
Fundação Amélia da Silva de Mello
Farminveste-Investimentos, Participações e Gestão, S.A.
20162017
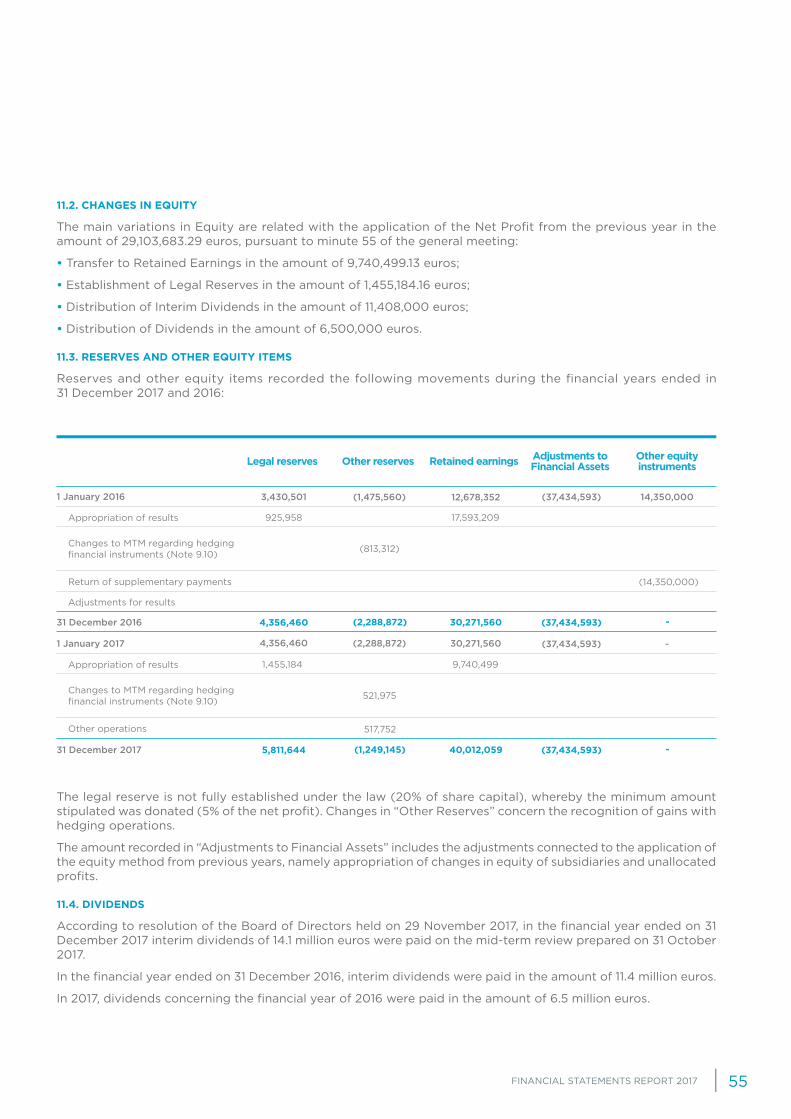
FINANCIAL STATEMENTS REPORT 2017 55
31 December 2017
31 December 2016
11.2. CHANGES IN EQUITY
The main variations in Equity are related with the application of the Net Profit from the previous year in the amount of 29,103,683.29 euros, pursuant to minute 55 of the general meeting:
• Transfer to Retained Earnings in the amount of 9,740,499.13 euros;
• Establishment of Legal Reserves in the amount of 1,455,184.16 euros;
• Distribution of Interim Dividends in the amount of 11,408,000 euros;
• Distribution of Dividends in the amount of 6,500,000 euros.
11.3. RESERVES AND OTHER EQUITY ITEMS
Reserves and other equity items recorded the following movements during the financial years ended in 31 December 2017 and 2016:
The legal reserve is not fully established under the law (20% of share capital), whereby the minimum amount stipulated was donated (5% of the net profit). Changes in “Other Reserves” concern the recognition of gains with hedging operations.
The amount recorded in “Adjustments to Financial Assets” includes the adjustments connected to the application of the equity method from previous years, namely appropriation of changes in equity of subsidiaries and unallocated profits.
11.4. DIVIDENDS
According to resolution of the Board of Directors held on 29 November 2017, in the financial year ended on 31 December 2017 interim dividends of 14.1 million euros were paid on the mid-term review prepared on 31 October 2017.
In the financial year ended on 31 December 2016, interim dividends were paid in the amount of 11.4 million euros.
In 2017, dividends concerning the financial year of 2016 were paid in the amount of 6.5 million euros.
4,356,460
5,811,644
(2,288,872)
(1,249,145)
30,271,560
40,012,059
(37,434,593)
(37,434,593)
-
-
(37,434,593)
(37,434,593)
14,350,000
-
(1,475,560)
(2,288,872)
17,593,209
9,740,499
(14,350,000)
12,678,352
30,271,560
3,430,501
4,356,460
925,958
1,455,184
517,752
(813,312)
521,975
1 January 2016
1 January 2017
Appropriation of results
Appropriation of results
Return of supplementary payments
Other operations
Adjustments for results
Changes to MTM regarding hedging financial instruments (Note 9.10)
Changes to MTM regarding hedging financial instruments (Note 9.10)
Adjustments to Financial AssetsOther reservesLegal reserves Other equity
instruments Retained earnings
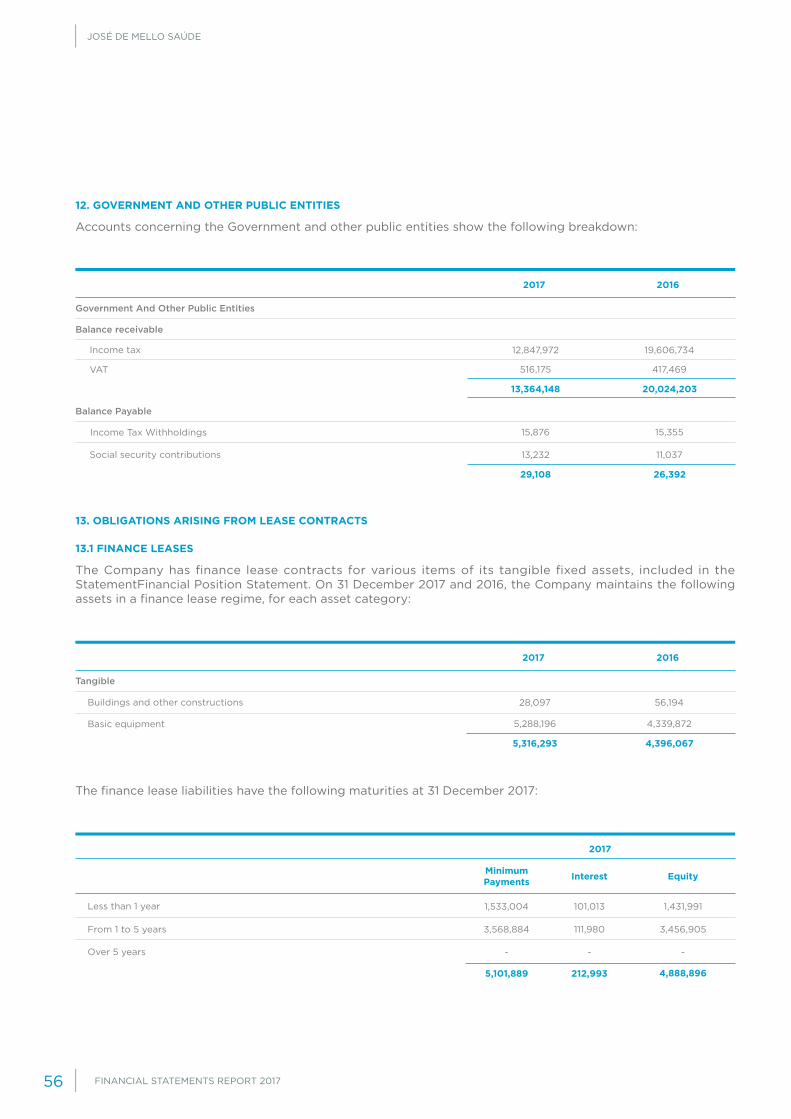
JOSÉ DE MELLO SAÚDE
FINANCIAL STATEMENTS REPORT 201756
The finance lease liabilities have the following maturities at 31 December 2017:
12. GOVERNMENT AND OTHER PUBLIC ENTITIES
Accounts concerning the Government and other public entities show the following breakdown:
13. OBLIGATIONS ARISING FROM LEASE CONTRACTS
13.1 FINANCE LEASES
The Company has finance lease contracts for various items of its tangible fixed assets, included in the StatementFinancial Position Statement. On 31 December 2017 and 2016, the Company maintains the following assets in a finance lease regime, for each asset category:
29,108
13,364,148
26,392
20,024,203
19,606,734
417,469
11,037
15,355
12,847,972
516,175
13,232
15,876
Balance receivable
Income Tax Withholdings
Government And Other Public Entities
Balance Payable
Income tax
VAT
Social security contributions
2017 2016
5,316,293 4,396,067
56,194
4,339,872
28,097
5,288,196
Tangible
Buildings and other constructions
Basic equipment
2017 2016
5,101,889 212,993 4,888,896
1,431,991101,013
3,456,905111,980
--
1,533,004
3,568,884
-
Less than 1 year
From 1 to 5 years
Over 5 years
Minimum Payments Interest Equity
2017

FINANCIAL STATEMENTS REPORT 2017 57
At 31 December 2017
At 31 December 2016
13.2. OPERATING LEASES
On 31 December 2017, the Company’s main liabilities with operating lease contracts concern the lease of the office and vehicles. The total amounts of future minimum payments are as follows:
In the financial year ended on 31 December 2017 and 2016, costs of 760,956 euros and 726,828 euros were respectively recognised, concerning operating lease contracts. The contract concerning the office has a 5-year renewal term.
In 2016 it was impossible to obtain the detail of the minimum payments of the operating and financial leases. However, the recorded operating leases also concerned contracts related to the office, parking and vehicles, and the amounts are similar to those recorded in 2017.
14. PROVISIONS, CONTINGENT LIABILITIES AND CONTINGENT ASSET
Provisions
Transactions occurring in provisions, under each caption, are shown in the table below:
The reduction vis-à-vis 2016, amounting to 97 thousand euros, concerns the sale of the subsidiary Manuel Guimarães, which took place in March 2017.
The recorded value in “Liabilities with Subsidiaries” concerns additional responsibilities in the subsidiary Escala Braga - Sociedade Gestora do Estabelecimento, S.A. This estimate requires the exercise of significant judgment about the costs and income of said subsidiary until the end of the public-private partnership contract in August 2019. The estimate of income includes the co-payment of the vertical programmes for HIV and multiple sclerosis, with the Board being firmly convinced that the result of the arbitration process begun by Escala Braga against the Government – ARS Norte will be favourable.
740,705 1,452,695 -
-43,386
-1,409,309
36,051
704,654
Vehicles
Office
Less than 1 year From 1 to 5 years Over 5 years
2017
22,113,016
15,846,938
342,811
342,811
(6,266,078)
(14,024)
-
-
21,770,205
15,504,127
(6,266,078)
(14,024)
At 1 January 2016
At 1 January 2017
Year’s reversions
Uses in the year
Liabilities with subsidiaries Other provisions TOTAL
15,504,127
15,490,103
342,811
342,811
15,846,938
15,832,914
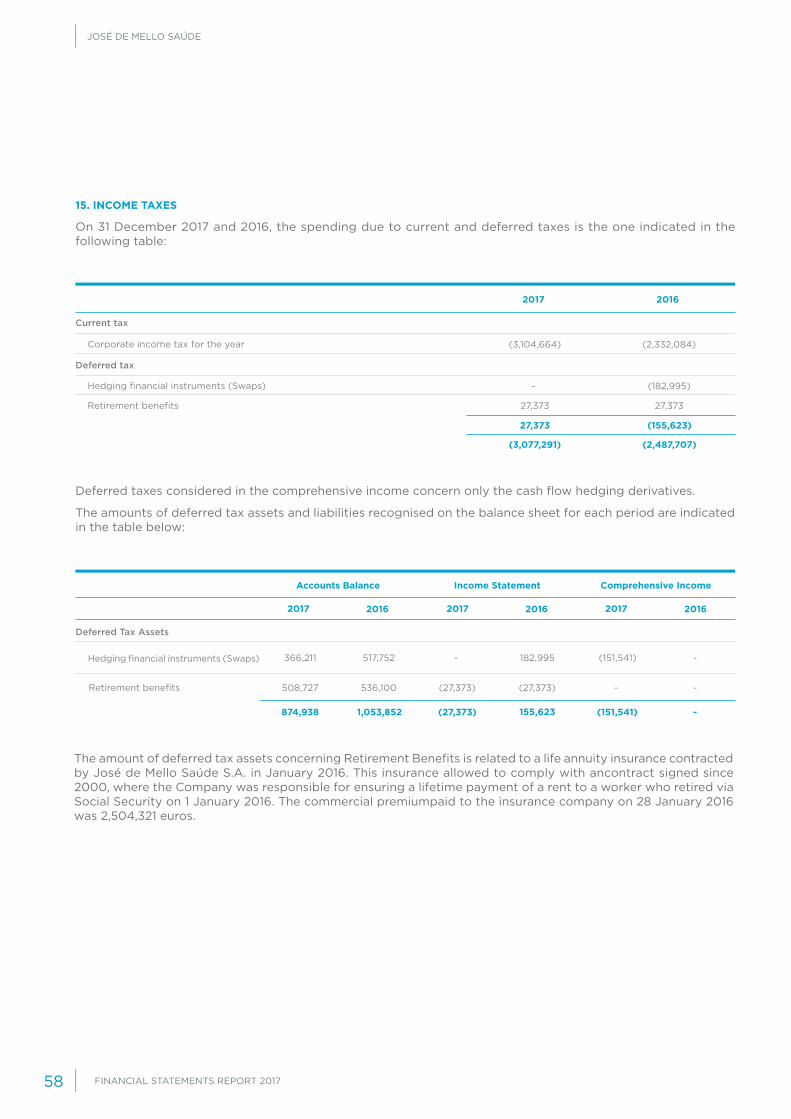
JOSÉ DE MELLO SAÚDE
FINANCIAL STATEMENTS REPORT 201758
Deferred taxes considered in the comprehensive income concern only the cash flow hedging derivatives.
The amounts of deferred tax assets and liabilities recognised on the balance sheet for each period are indicated in the table below:
15. INCOME TAXES
On 31 December 2017 and 2016, the spending due to current and deferred taxes is the one indicated in the following table:
27,373
(3,077,291)
(155,623)
(2,487,707)
(2,332,084)
(182,995)
27,373
(3,104,664)
-
27,373
Current tax
Deferred tax
Corporate income tax for the year
Hedging financial instruments (Swaps)
Retirement benefits
2017 2016
The amount of deferred tax assets concerning Retirement Benefits is related to a life annuity insurance contracted by José de Mello Saúde S.A. in January 2016. This insurance allowed to comply with ancontract signed since 2000, where the Company was responsible for ensuring a lifetime payment of a rent to a worker who retired via Social Security on 1 January 2016. The commercial premiumpaid to the insurance company on 28 January 2016 was 2,504,321 euros.
Comprehensive Income
Deferred Tax Assets
201720172017 201620162016
874,938 1,053,852 (27,373) 155,623 (151,541) -
Hedging financial instruments (Swaps)
Income StatementAccounts Balance
Retirement benefits
366,211
508,727
517,752 - 182,995 (151,541) -
536,100 (27,373) (27,373) - -
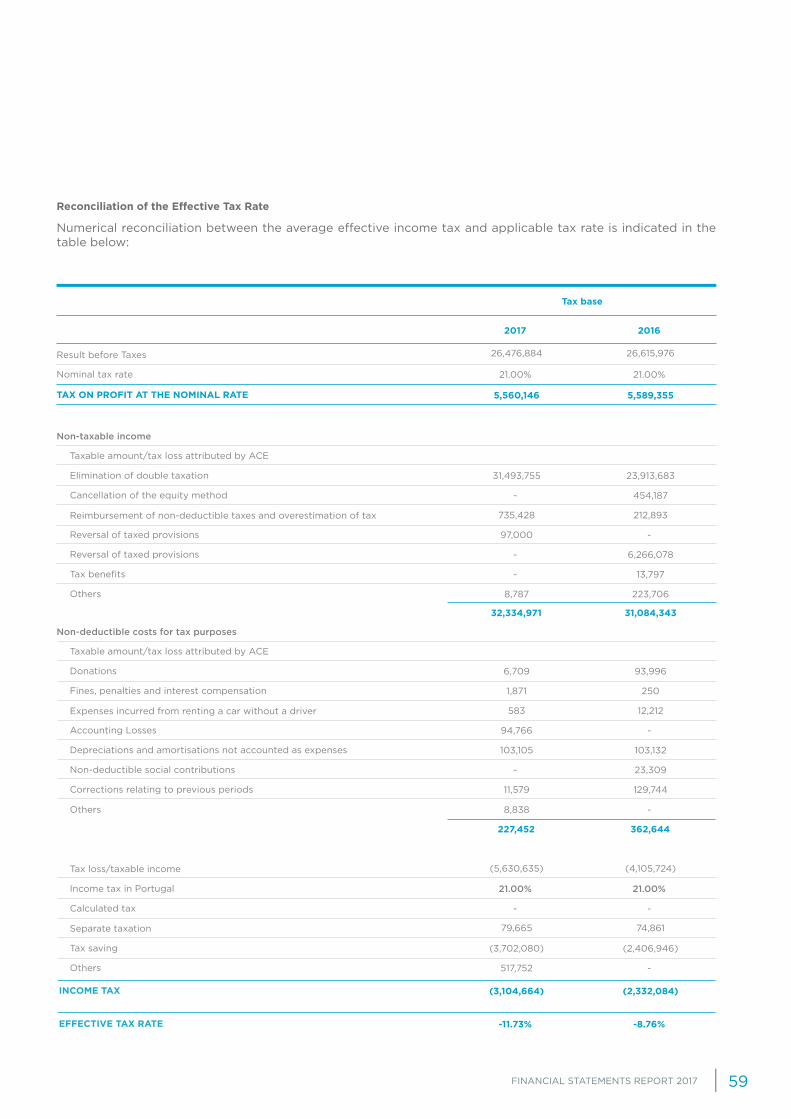
FINANCIAL STATEMENTS REPORT 2017 59
Reconciliation of the Effective Tax Rate
Numerical reconciliation between the average effective income tax and applicable tax rate is indicated in the table below:
21.00%
-
-
23,913,683
93,996
21.00%
(2,406,946)
(4,105,724)
74,861
6,266,078
103,132
454,187
250
-
-
13,797
23,309
212,893
12,212
223,706
129,744
-
5,589,355
(2,332,084)
-8.76%
26,615,976
21.00%
97,000
94,766
31,493,755
6,709
21.00%
(3,702,080)
(5,630,635)
79,665
-
103,105
-
1,871
-
517,752
-
-
735,428
583
8,787
11,579
8,838
5,560,146
(3,104,664)
-11.73%
26,476,884
Nominal tax rate
Taxable amount/tax loss attributed by ACE
Taxable amount/tax loss attributed by ACE
Tax loss/taxable income
Separate taxation
Reversal of taxed provisions
Accounting Losses
Elimination of double taxation
Donations
Income tax in Portugal
Tax saving
Reversal of taxed provisions
Depreciations and amortisations not accounted as expenses
Cancellation of the equity method
Fines, penalties and interest compensation
Calculated tax
Others
Tax benefits
Non-deductible social contributions
Reimbursement of non-deductible taxes and overestimation of tax
Expenses incurred from renting a car without a driver
Others
Corrections relating to previous periods
Others
Result before Taxes
Non-taxable income
Non-deductible costs for tax purposes
2017
Tax base
2016
TAX ON PROFIT AT THE NOMINAL RATE
INCOME TAX
EFFECTIVE TAX RATE
32,334,971
227,452
31,084,343
362,644

JOSÉ DE MELLO SAÚDE
FINANCIAL STATEMENTS REPORT 201760
The provisions of services concern the sublease rents billed to the group’s units, concerning the lease of medical equipment.
17. OTHER INCOME AND GAINS
This caption is broken down as indicated in the table below:
The “Unspecified Others” caption includes the value of the office’s lease, which is re-invoiced to JMS – Prestação de Serviços Saúde, A.C.E., as well as consultancy services provided to group’s companies.
18. PERSONNEL EXPENSES
Details of personnel expenses are indicated in the table below:
There were 19 people working for the company on 31 December 2017 (2016: 14 people).
16. SERVICES SUPPLIED
Income is discriminated as follows:
Services
Service provision
2017 2016
Supplementary income
Income and gains in the Group’s companies and associates
Others
Disposals
Corrections relating to previous periods
Tax refund
Excess of the estimate for taxes
Others not specified
Others
2017 2016
Remunerations
Wages of governing bodies members
Personnel wages
Retirement benefits
Charges on remunerations
Occupational accidents and diseases insurances
Other personnel expenditure
Social welfare expenditure
2017 2016
1,400,283 1,786,383
1,786,383 1,400,283
2,330,052 1,216,255
-
-
82,394
102,050
212,893
818,918
20,000
177,666
43,034
698,136
37,293
1,353,924
2,728,515 1,137,733
464,676
33,633
-
37,000
117,868
481,634
2 922
467,975
-
-
33,808
115,890
2,109,346
1,495

FINANCIAL STATEMENTS REPORT 2017 61
The caption “Specialised Works” predominantly comprises fees concerning consultants and lawyers.
19. EXTERNAL SUPPLIES AND SERVICES
This caption is broken down as indicated in the table below:
Subcontracts
Specialised services
Other services
Specialised work
Rents and leases
Advertising
Communications
Representation expenses
Fees
Insurances
Cleaning, hygiene and comfort
Maintenance and repair
Litigation and notary public fees
Others
Tools and utensils
Office material
Energy and fluids
Travel, accommodation and transport
Books and technical documentation
Articles for free distribution
Electricity
Travel and accommodation
Fuel
Materials
2017 2016
3,663
3,990,572 3,181,056
11,884
793,178
897,249
896,425
31,268
-
922
7,395
236,471
34,794
6,737
-
-
2,228
146,930
55,915
51,949
4,048
23,242
1,045,380
933,103
1,256,724
16,131
12,529
917
2,780
25,002
508,619
41,759
13,233
-
1,585
7,381
1,500
74,049
17,136
9,501

JOSÉ DE MELLO SAÚDE
FINANCIAL STATEMENTS REPORT 201762
Bad debt
Taxes
20. OTHER EXPENSES AND LOSSES
This caption is broken down as indicated in the table below:
21. EXPENSES/REVERSAL OF DEPRECIATION AND AMORTISATION
According to the following chart, expenses on depreciations and amortisations amount to 1,302,610 euros in 2017 and 1,093,922 euros in 2016:
22. INTEREST AND SIMILAR EXPENSES OBTAINED
This caption is broken down as indicated in the table below:
Expenses and losses in the group’s companies and associates
Financial assets adjustment
Expenditure and Losses in Non-Financial Investments
Corrections relating to previous periods
Non-tax fines
Donations
Contributions
Others
Others
Fines and penalties
Other expenses and losses
2017 2016
Expenses of depreciation and amortisation
Tangible Fixed Assets (Note 7)
2017 2016
Interest received
Dividends obtained
From deposits
From other net financial investments
From financing granted to subsidiaries
2017 2016
230,412
94,766
291,765
371,117
371,117
19,823
-
-
129,744
240
5,069
115,000
21,890
94,766
83,147
13
82,656
11,579
188
500
36,000
16,328
1,302,610 1,093,922
1,093,922 1,302,610
36,508,629 27,941,863
42,586
93,838
3,739,170
24,066,269
5,271
93,582
4,916,021
31,493,755
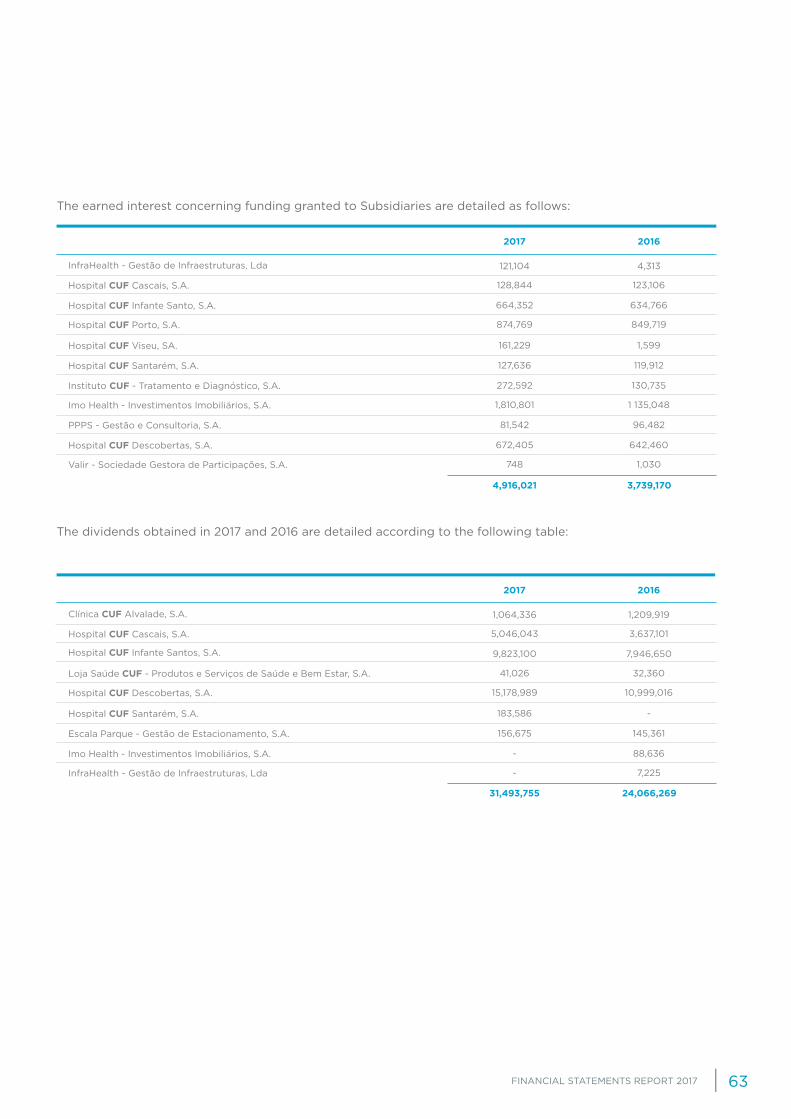
FINANCIAL STATEMENTS REPORT 2017 63
The earned interest concerning funding granted to Subsidiaries are detailed as follows:
The dividends obtained in 2017 and 2016 are detailed according to the following table:
Hospital CUF Cascais, S.A.
Hospital CUF Santarém, S.A.
PPPS - Gestão e Consultoria, S.A.
InfraHealth - Gestão de Infraestruturas, Lda
Hospital CUF Viseu, SA.
Hospital CUF Infante Santo, S.A.
Instituto CUF - Tratamento e Diagnóstico, S.A.
Hospital CUF Descobertas, S.A.
Hospital CUF Porto, S.A.
Imo Health - Investimentos Imobiliários, S.A.
Valir - Sociedade Gestora de Participações, S.A.
2017 2016
Hospital CUF Cascais, S.A.
Hospital CUF Infante Santos, S.A.
Escala Parque - Gestão de Estacionamento, S.A.
Clínica CUF Alvalade, S.A.
Hospital CUF Santarém, S.A.
Loja Saúde CUF - Produtos e Serviços de Saúde e Bem Estar, S.A.
Imo Health - Investimentos Imobiliários, S.A.
Hospital CUF Descobertas, S.A.
InfraHealth - Gestão de Infraestruturas, Lda
2017 2016
4,916,021 3,739,170
123,106
119,912
1,599
4,313
96,482
634,766
130,735
642,460
849,719
1 135,048
1,030
128,844
127,636
161,229
121,104
81,542
664,352
272,592
672,405
874,769
1,810,801
748
31,493,755 24,066,269
3,637,101
7,946,650
145,361
-
1,209,919
32,360
88,636
10,999,016
7,225
5,046,043
9,823,100
156,675
183,586
1,064,336
41,026
-
15,178,989
-

JOSÉ DE MELLO SAÚDE
FINANCIAL STATEMENTS REPORT 201764
The “Other” supported interest regards the interest of the contracted hedging instruments (note 9.10).
24. FINANCIAL COMMITMENTS WITH GUARANTEES
On 31 December 2017 and 31 December 2016, the entity has the following provided guarantees in its portfolio:
23. INTERESTS AND SIMILAR SUPPORTED EXPENSES
This caption is broken down as indicated in the table below:
(a) “Resetting of the original land conditions” for the CUF Descobertas Hospital Expansion.(b) Agreement for capital subscription.(c) Guarantor in the Mutual of Imo Health – Investimentos Imobiliários, S.A.. (d) Guarantor in the leasing of Imo Health – Investimentos Imobiliários, S.A., concerning the building of Travessa do Castro.
25. EVENTS AFTER THE DATE OF THE STATEMENT OF FINANCIAL POSITION
These individual financial statements were authorised for issue by the Board of Directors on 22 March 2018.
From 31 December 2017 until now, no relevant facts have occurred other than those already adjusted and/or disclosed in these consolidated financial statements.
26. DISCLOSURE REQUIRED DUE TO LEGAL INSTRUMENTS
As required by paragraph 5, article 66 of the Portuguese Commercial Companies Code, no operations are excluded from the Statement of Financial Position, whereby the respective nature, commercial objective, financial impact or risks and benefits have to be disclosed.
Interest paid
Other expenses and losses on loans
From loans obtained
From finance leases
Others
Others
2017 2016
Lisbon Municipal Council (a)
Imo Health - Investimentos Imobiliários, S.A. (c)
Imo Health - Investimentos Imobiliários, S.A. (d)
Escala Vila Franca - Sociedade Gestora do Estabelecimento, S.A. (b)
Date of issue2017Beneficiary Date of Expiry2016Bank
Santander Totta
BIC
BIC
Novo Banco
28/06/2025
5,898,305 4,809,044
3,516,061
130,678
685,545
447,057
4,363,719
131,448
828,512
574,626
23,559,195 17,703,195
303,195
5,856,000
15,000,000
2,400,000
303,195
-
15,000,000
2,400,000
24/05/2016
28/06/2017
31/12/2014
19/05/2011
24/05/2020
25/12/2029
-

FINANCIAL STATEMENTS REPORT 2017 65

Sociedade Anónima - Capital Social 1.335.000 euros - Inscrição n.º 178 na Ordem dos Revisores Oficiais de Contas - Inscrição N.º 20161480 na
Comissão do Mercado de Valores Mobiliários
Contribuinte N.º 505 988 283 - C. R. Comercial de Lisboa sob o mesmo número
A member firm of Ernst & Young Global Limited
Ernst&YoungAudit&Associados-SROC,S.A.Avenida da República, 90-6º 1600-206 Lisboa Portugal
Tel: +351 217 912 000 Fax: +351 217 957 586 www.ey.com
(Free Translation from the original in Portuguese)
Statutory and Auditor’s Report
REPORT ON THE AUDIT OF THE FINANCIAL STATEMENTS
Opinion
We have audited the accompanying financial statements of José de Mello Saúde, S.A. (the Entity), which comprise the Statement of Financial Position as at December 31, 2017 (which show a total of 305.616.326 euros and a total equity of 75.594.141 euros, including a net profit for the year of 29.554.176 euros), and the Statement of Comprehensive Income, the Statement of Changes in Equity and the Statement of Cash Flows for the year then ended, and notes to the financial statements, including a summary of significant accounting policies.
In our opinion, the accompanying financial statements present fairly, in all material respects, the financial position of José de Mello Saúde, S.A. as at December 31, 2017, and its financial performance and its cash flows for the year then ended in accordance with International Financial Reporting Standards as endorsed by the European Union.
Basis for opinion
We conducted our audit in accordance with International Standards on Auditing (ISAs) and with other standards and technical directives of the Institute of Statutory Auditors (“Ordem dos Revisores Oficiais de Contas”). Our responsibilities under those standards are further described in the “Auditor’s Responsibilities for the Audit of the Financial Statements” section of our report. We are independent of the Entity in accordance with the law and we comply with the ethical requirements of the Code of Ethics of the Institute of Statutory Auditors.
We believe that the audit evidence we have obtained is sufficient and appropriate to provide a basis for our opinion.
Emphasis of matter
As disclosed in note 14 of the Notes to the Financial Statements, the Public-Private Partnership management agreements of Braga Hospital will end in August 2019. The estimate of the provision to cover the liabilities of this affiliate includes complex and volatile assumptions which, for this reason, involve uncertainty, namely the inflow of the amounts claimed from the vertical programs of HIV and Multiple Sclerosis of which management firmly confirms positive outcome. Our opinion is not modified in respect of this matter.
Key audit matters
Key audit matters are those matters that, in our professional judgment, were of most significance in our audit of the financial statements of the current period. These matters were addressed in the context of our audit of the financial statements as a whole, and in forming our opinion thereon, and we do not provide a separate opinion on these matters.
We describe below the key audit matters of the current period:
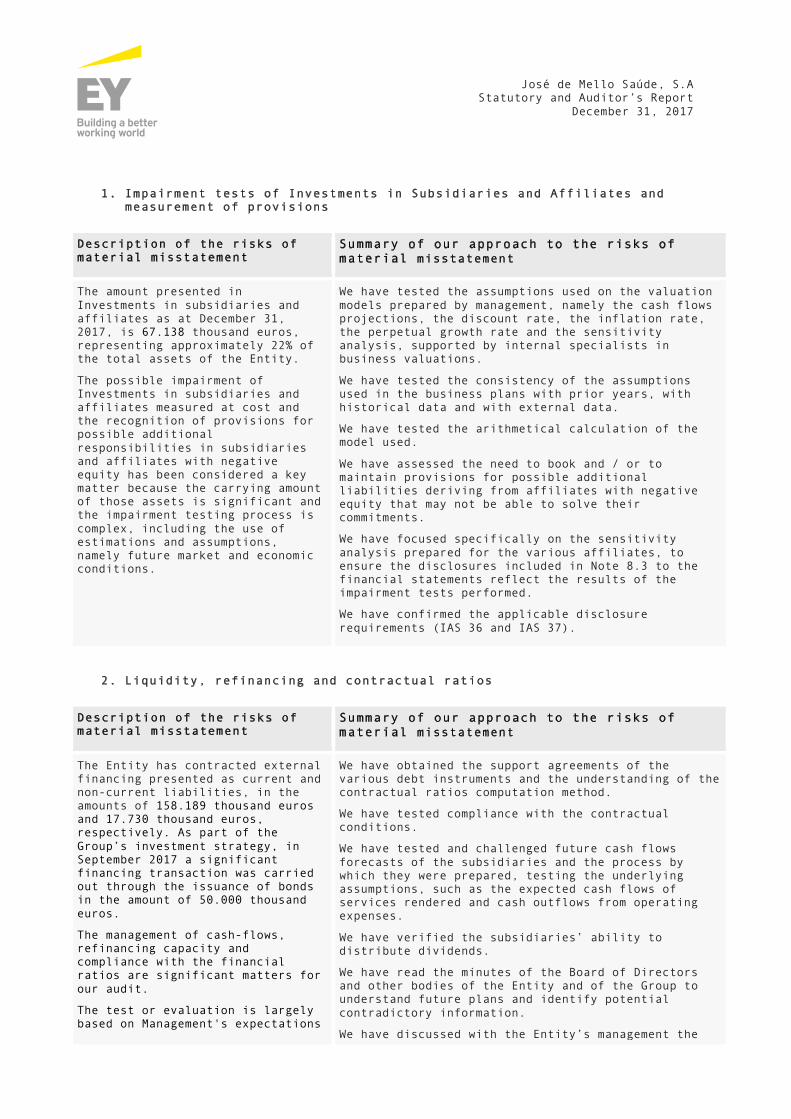
José de Mello Saúde, S.A Statutory and Auditor’s Report
December 31, 2017
1. Impairment tests of Investments in Subsidiaries and Affiliates and measurement of provisions
Description of the risks of material misstatement
Summary of our approach to the risks of material misstatement
The amount presented in Investments in subsidiaries and affiliates as at December 31, 2017, is 67.138 thousand euros, representing approximately 22% of the total assets of the Entity.
The possible impairment of Investments in subsidiaries and affiliates measured at cost and the recognition of provisions for possible additional responsibilities in subsidiaries and affiliates with negative equity has been considered a key matter because the carrying amount of those assets is significant and the impairment testing process is complex, including the use of estimations and assumptions, namely future market and economic conditions.
We have tested the assumptions used on the valuation models prepared by management, namely the cash flows projections, the discount rate, the inflation rate, the perpetual growth rate and the sensitivity analysis, supported by internal specialists in business valuations.
We have tested the consistency of the assumptions used in the business plans with prior years, with historical data and with external data.
We have tested the arithmetical calculation of the model used.
We have assessed the need to book and / or to maintain provisions for possible additional liabilities deriving from affiliates with negative equity that may not be able to solve their commitments.
We have focused specifically on the sensitivity analysis prepared for the various affiliates, to ensure the disclosures included in Note 8.3 to the financial statements reflect the results of the impairment tests performed.
We have confirmed the applicable disclosure requirements (IAS 36 and IAS 37).
2. Liquidity, refinancing and contractual ratios
Description of the risks of material misstatement
Summary of our approach to the risks of material misstatement
The Entity has contracted external financing presented as current and non-current liabilities, in the amounts of 158.189 thousand euros and 17.730 thousand euros, respectively. As part of the Group’s investment strategy, in September 2017 a significant financing transaction was carried out through the issuance of bonds in the amount of 50.000 thousand euros.
The management of cash-flows, refinancing capacity and compliance with the financial ratios are significant matters for our audit.
The test or evaluation is largely based on Management's expectations
We have obtained the support agreements of the various debt instruments and the understanding of the contractual ratios computation method.
We have tested compliance with the contractual conditions.
We have tested and challenged future cash flows forecasts of the subsidiaries and the process by which they were prepared, testing the underlying assumptions, such as the expected cash flows of services rendered and cash outflows from operating expenses.
We have verified the subsidiaries’ ability to distribute dividends.
We have read the minutes of the Board of Directors and other bodies of the Entity and of the Group to understand future plans and identify potential contradictory information.
We have discussed with the Entity’s management the
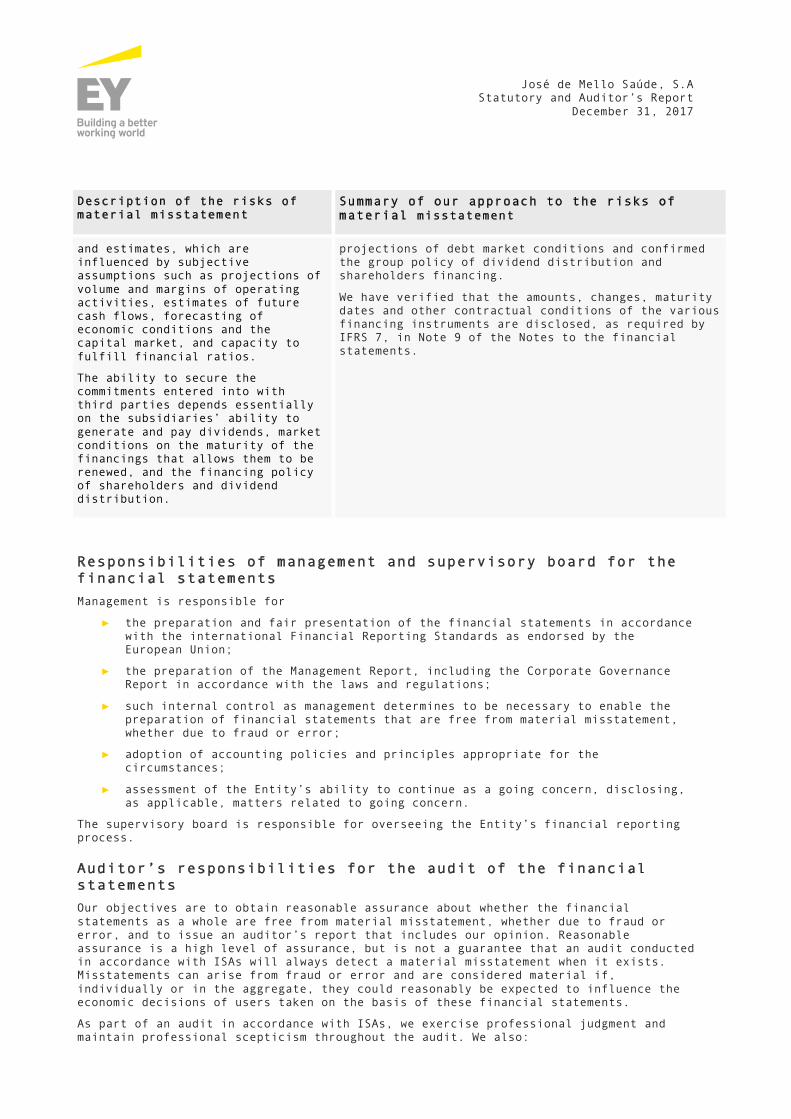
José de Mello Saúde, S.A Statutory and Auditor’s Report
December 31, 2017
Description of the risks of material misstatement
Summary of our approach to the risks of material misstatement
and estimates, which are influenced by subjective assumptions such as projections of volume and margins of operating activities, estimates of future cash flows, forecasting of economic conditions and the capital market, and capacity to fulfill financial ratios.
The ability to secure the commitments entered into with third parties depends essentially on the subsidiaries’ ability to generate and pay dividends, market conditions on the maturity of the financings that allows them to be renewed, and the financing policy of shareholders and dividend distribution.
projections of debt market conditions and confirmed the group policy of dividend distribution and shareholders financing.
We have verified that the amounts, changes, maturity dates and other contractual conditions of the various financing instruments are disclosed, as required by IFRS 7, in Note 9 of the Notes to the financial statements.
Responsibilities of management and supervisory board for the financial statements
Management is responsible for
► the preparation and fair presentation of the financial statements in accordance with the international Financial Reporting Standards as endorsed by the European Union;
► the preparation of the Management Report, including the Corporate Governance Report in accordance with the laws and regulations;
► such internal control as management determines to be necessary to enable the preparation of financial statements that are free from material misstatement, whether due to fraud or error;
► adoption of accounting policies and principles appropriate for the circumstances;
► assessment of the Entity’s ability to continue as a going concern, disclosing, as applicable, matters related to going concern.
The supervisory board is responsible for overseeing the Entity’s financial reporting process.
Auditor’s responsibilities for the audit of the financial statements
Our objectives are to obtain reasonable assurance about whether the financial statements as a whole are free from material misstatement, whether due to fraud or error, and to issue an auditor’s report that includes our opinion. Reasonable assurance is a high level of assurance, but is not a guarantee that an audit conducted in accordance with ISAs will always detect a material misstatement when it exists. Misstatements can arise from fraud or error and are considered material if, individually or in the aggregate, they could reasonably be expected to influence the economic decisions of users taken on the basis of these financial statements.
As part of an audit in accordance with ISAs, we exercise professional judgment and maintain professional scepticism throughout the audit. We also:

José de Mello Saúde, S.A Statutory and Auditor’s Report
December 31, 2017
► identify and assess the risks of material misstatement of the financial statements, whether due to fraud or error, design and perform audit procedures responsive to those risks, and obtain audit evidence that is sufficient and appropriate to provide a basis for our opinion. The risk of not detecting a material misstatement resulting from fraud is higher than for one resulting from error, as fraud may involve collusion, forgery, intentional omissions, misrepresentations, or the override of internal control;
► obtain an understanding of internal control relevant to the audit in order to design audit procedures that are appropriate in the circumstances, but not for the purpose of expressing an opinion on the effectiveness of the Entity’s internal control;
► evaluate the appropriateness of accounting policies used and the reasonableness of accounting estimates and related disclosures made by management;
► conclude on the appropriateness of management’s use of the going concern basis of accounting and, based on the audit evidence obtained, whether a material uncertainty exists related to events or conditions that may cast significant doubt on the Entity’s ability to continue as a going concern. If we conclude that a material uncertainty exists, we are required to draw attention in our auditor’s report to the related disclosures in the financial statements or, if such disclosures are inadequate, to modify our opinion. Our conclusions are based on the audit evidence obtained up to the date of our auditor’s report. However, future events or conditions may cause the Entity to cease to continue as a going concern;
► evaluate the overall presentation, structure and content of the financial statements, including the disclosures, and whether the financial statements represent the underlying transactions and events in a manner that achieves fair presentation;
► communicate with those charged with governance regarding, among other matters, the planned scope and timing of the audit and significant audit findings, including any significant deficiencies in internal control that we identify during our audit;
► from the matters communicated with those charged with governance, including the supervisory board, we determine those matters that were of most significance in the audit of the financial statements of the current period and are therefore the key audit matters. We describe these matters in our auditor’s report unless law or regulation precludes public disclosure about the matter; and
► provide the supervisory board with a statement that we have complied with relevant ethical requirements regarding independence, and to communicate with them all relationships and other matters that may reasonably be thought to bear on our independence, and where applicable, related safeguards.
Our responsibility includes the verification of the consistency of the Management Report with the financial statements, and the verifications under numbers 4 and 5 of article 451º of the Commercial Companies Code.
REPORT ON OTHER LEGAL AND REGULATORY REQUIREMENTS
About the Management Report
Pursuant of article 451º, nº 3, al. e) of the Commercial Companies Code, it is our opinion that the Management Report, that discloses essentially consolidated financial information which includes the company, was prepared in accordance with laws and

José de Mello Saúde, S.A Statutory and Auditor’s Report
December 31, 2017
regulations in force, the information contained therein is in agreement with the audited financial statements and, taking into consideration our assessment and understanding of the Entity, we have not identified any material misstatement.
About the non-financial statement provided for in the article 66-B of the Commercial Companies Code
Pursuant of article 451º, nº 6, of the Commercial Companies Code, we inform that the Entity prepared a separate report of the Management Report, the Integrated Report, which includes non-financial information, as provided for in article 66-B of the Commercial Companies Code, and was published with the Management Report.
About the Corporate Governance Report
Pursuant of article 451º, nº 4, of the Commercial Companies Code, it is our opinion that the Corporate Governance Report (Information of the Shareholders structure, organization and Corporate Governance) includes the items required to the Entity in accordance with article 245º-A of Securities Market Code, no material misstatements were identified in the information contained therein, complying with the provisions of paragraph c), d), f), h), i) and m) of the referred article.
About additional items set out in article 10º of Regulation (EU) nº 537/2014
Pursuant of article 10º of Regulation (EU) nº 537/2014 of the European Parliament and of the Council, of 16 April 2014, and in addition to the key audit matters mentioned above, we report the following:
► We have been appointed as auditors of José de Mello Saúde, S.A. for the first time in the shareholders' general meeting held on October 11, 2007 for the period between 2007 and 2009. We were reappointed in the shareholders' general meeting held on April 29, 2016 for a forth mandate for the period between 2016 and 2018.
► The Management has confirmed that they are not aware of any fraud or fraud suspicion with a material impact in financial statements. In planning and executing our audit in accordance with ISA we maintained our professional scepticism and we designed audit procedures to address the possibility of a material misstatement in financial statements due to fraud. Based on the work performed, we have not identified any material misstatement in the financial statements due to fraud.
► We confirm that our audit opinion is consistent with the additional report that was prepared by us and issued to the supervisory board as of April 9, 2018.
► We declare that we have not provided any prohibited non-audit services referred to in article 77º nº 8 of the Statute of the Institute of Statutory Auditors and we remained independent of the audited Entity in conducting the audit.
Lisbon, April 12, 2018
Ernst & Young Audit & Associados – SROC, S.A. Sociedade de Revisores Oficiais de Contas Represented by: (Signed) Luís Miguel Gonçalves Rosado - ROC nº 1607
José de Mello Saúde, S.A Statutory and Auditor’s Report
December 31, 2017
Registered with the Portuguese Securities Market Commission under licence nr.º 20161217

FINANCIAL STATEMENTS REPORT 201772

FINANCIAL STATEMENTS REPORT 2017 73
REPORT AND OPINION OF THE SUPERVISORY BOARD CONCERNING THE INDIVIDUAL ACCOUNTS
Dear Shareholders,
In accordance with legal and statutory terms, the Supervisory Board of José de Mello Saúde S.A., with headquarters at Av. do Forte, 3 – Edifício Suécia III, Piso 2, 2790-073 Carnaxide, presents its supervisory report and provides an opinion on the report, accounts and proposals submitted by the Board concerning the financial year ended on 31 December 2017.
1. In accordance with legal and statutory terms, we have:
• approved the plan of activities for 2018;
• supervised the actions of the Board, through meetings with the internal audit department, financial department, strategic planning, management and innovation control department, information systems department and organisational development and quality department, obtaining the clarifications and comfort deemed necessary;
• verified compliance with the law and fulfilment of the company’s articles of association;
• evaluated whether the accounting policies and valuation/measuring criteria adopted by the company are in agreement with the generally accepted accounting principles and lead to a proper evaluation of the assets and results;
• evaluated the effectiveness of the internal control system implemented by the Board;
• supervised the process of preparation and disclosure of the financial information;
• verified the accuracy of the Statement of Financial Position, the Statement of Income and Other Comprehensive Income, Statement of Changes in Equity, Statement of Cash Flows and Annex of the financial year of 2017;
• evaluated the Management Report issued by the Board and the proposal for the appropriation of profits it introduced;
• evaluated the work carried out by the Statutory Auditor leading to the legal review and additional services;
• verified the terms of the Legal Accounts Certificate, the Audit Report and the Additional Report to the Supervisory Body issued by Ernst & Young Audit & Associados – SROC, S.A., and concluded that its content merits our agreement.
2. The conducted supervisory action allows us to conclude that:
• the actions of the Board that we have knowledge of safeguard compliance with the law and with the company’s articles of association;
• we are not aware of any situations that can call into question the suitability and effectiveness of the internal control system implemented by the Board in controlling the risk to which the company is exposed;
• the accounting and the accounts comply with the applicable legal, statutory and regulatory provisions, reflect the activity carried out and lead to a correct evaluation of the company’s assets and results;
• the Management Report is in agreement with the accounts presented and faithfully shows the evolution of the activity and of the business during the financial year;
• the published report includes the elements listed in article 245-A of the Securities Code on the structure and practices of corporate governance;
• the Statement of Financial Position, the Statement of Income and Other Comprehensive Income, Statement of Changes in Equity, Statement of Cash Flows and Annex of the financial year of 2017 meet the applicable legal and accounting requirements;
• the audit of the financial statements performed by the Statutory Auditor was suitable to the circumstances, and the additional services did not compromise its independence;
• the proposal for the appropriation of profits is appropriate and is properly grounded.
JOSÉ DE MELLO SAÚDE
FINANCIAL STATEMENTS REPORT 201774
João Filipe de Moura-Braz Corrêa da Silva
(Member)
José Luís Bonifácio Lopes
(Member)
3. We can thus state:
• our agreement with the content of the Legal Accounts Certificate issued by the Statutory Auditor;
• our agreement with the Management Report and accounts for the 2017 financial year presented by the Board of Directors;
• that to the best of our knowledge, the disclosed financial information has been drafted in accordance with current accounting standards and give a true and fair view of the assets and liabilities, financial situation and results of the company, and that the Management Report faithfully describes the business development, financial performance and position of the company, containing a description of the main risks and uncertainties it faces.
4. Accordingly, taking into account the actions carried out, we consider that:
• the Management Report and accounts of the 2017 financial year presented by the Board of Directors should be approved;
• the proposal for the appropriation of profits contained in the Management Report should be approved.
Finally, we would like to thank the Board and all Employees in the service of the Company who we contacted, for all the cooperation we received when performing our duties.
Lisbon, 13 April 2018
The Supervisory Board
José Manuel Gonçalves de Morais Cabral
(Chairman)
FINANCIAL STATEMENTS REPORT 2017 75
STATEMENT OF COMPLIANCE OF THE SUPERVISORY BOARD
In accordance with provisions in Article 245(c)(1) of the Securities Code, José de Mello Saúde, S.A. (“JMS”) Supervisory Board members declare that, to the best of their knowledge, the management report, the individual annual accounts, the legal accounts certificate and the other accounting documents, i) were prepared in accordance with current accounting standards and give a true and fair view of the assets and liabilities, financial situation and results of JMS; ii) they faithfully describe the development, performance and position of JMS; and iii) they contain a description of the main risks JMS faces in its activity.
Lisbon, 13 April 2018
The Supervisory Board
José Manuel Gonçalves de Morais Cabral
(Chairman)
João Filipe de Moura-Braz Corrêa da Silva
(Member)
José Luís Bonifácio Lopes
(Member)

JOSÉ DE MELLO SAÚDE
FINANCIAL STATEMENTS REPORT 201776
CONSOLIDATED FINANCIAL STATEMENTS
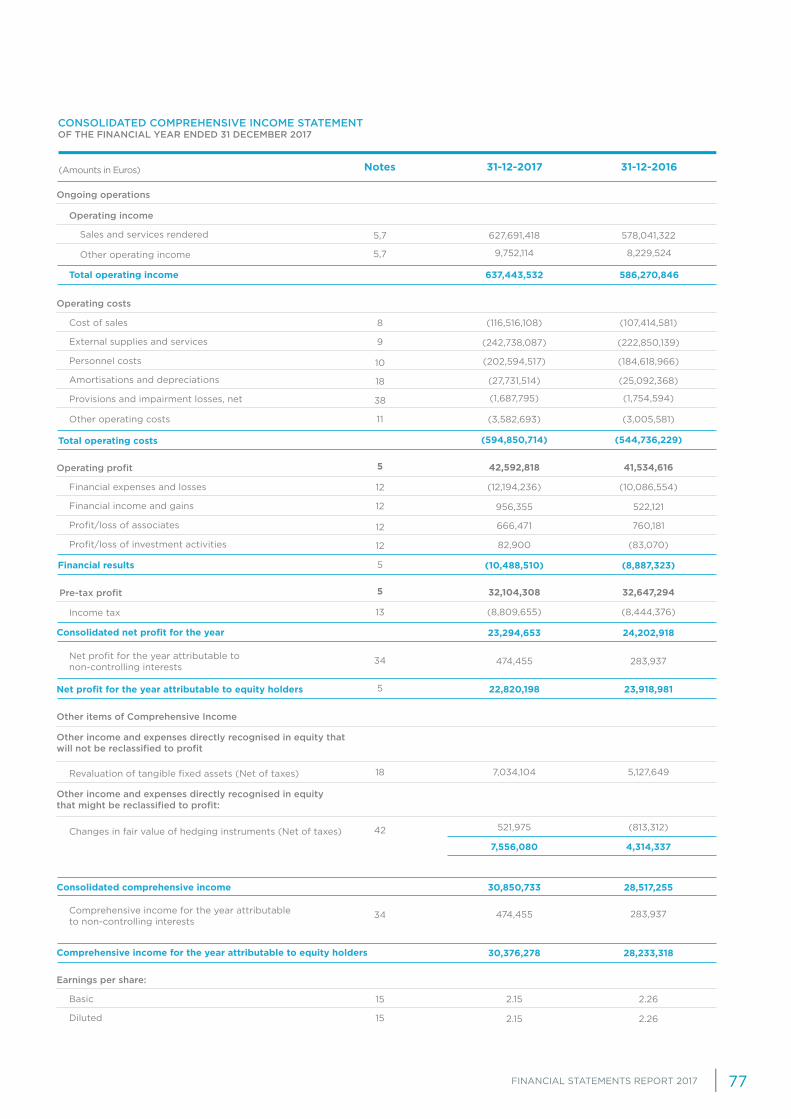
FINANCIAL STATEMENTS REPORT 2017 77
31-12-2017 31-12-2016Notes
Ongoing operations
Operating costs
Operating profit
Earnings per share:
Other items of Comprehensive Income
Pre-tax profit
Consolidated net profit for the year
Other income and expenses directly recognised in equity that will not be reclassified to profit
Consolidated comprehensive income
Other income and expenses directly recognised in equity that might be reclassified to profit:
Net profit for the year attributable to equity holders
5,7
10
12
8
12
15
13
34
18
34
42
5
5,7
18
12
38
5
11
5
5
9
12
15
Operating income
Personnel costs
Profit/loss of associates
Cost of sales
Financial expenses and losses
Basic
Income tax
Net profit for the year attributable tonon-controlling interests
Revaluation of tangible fixed assets (Net of taxes)
Comprehensive income for the year attributable to non-controlling interests
Changes in fair value of hedging instruments (Net of taxes)
Total operating income
Other operating costs
Total operating costs
Sales and services rendered
Amortisations and depreciations
Profit/loss of investment activities
External supplies and services
Financial income and gains
Diluted
Other operating income
Provisions and impairment losses, net
Financial results
CONSOLIDATED COMPREHENSIVE INCOME STATEMENT OF THE FINANCIAL YEAR ENDED 31 DECEMBER 2017
(Amounts in Euros)
Comprehensive income for the year attributable to equity holders
627,691,418
(27,731,514)
82,900
(25,092,368)
(83,070)
(242,738,087)
956,355
2.15
(222,850,139)
522,121
2.26
(202,594,517)
666,471
(184,618,966)
760,181
(116,516,108)
(12,194,236)
2.15
(8,809,655)
474,455
7,034,104
474,455
521,975
30,850,733
30,376,278
28,517,255
28,233,318
7,556,080
(107,414,581)
(10,086,554)
2.26
(8,444,376)
283,937
5,127,649
283,937
(813,312)
4,314,337
578,041,322
9,752,114
(1,687,795)
(10,488,510)
(1,754,594)
(8,887,323)
8,229,524
637,443,532
(3,582,693)
42,592,818
32,104,308
23,294,653
22,820,198
(3,005,581)
41,534,616
32,647,294
24,202,918
23,918,981
(594,850,714) (544,736,229)
586,270,846

JOSÉ DE MELLO SAÚDE
FINANCIAL STATEMENTS REPORT 201778
31-12-2017 31-12-2016Notes
Non-current assets:
Non-current liabilities:
Current assets:
Equity:
Equity attributable to shareholders
Non-current assets held for sale
17
36
16
35
21
40
26
33
8, 24
31
18
37, 38
19
38
22
22
23
42
27
14
34
23
28
29
30
25
32
Other current debtors
Other reserves and retained earnings
Consolidated net income
Interim dividends
Non-controlling interests
Inventories
Share capital
TOTAL ASSETS
Total non-current assets
Non-current liabilities
Other financial instruments
Cash and cash equivalents
Total current assets
Total equity
Intangible assets
Finance lease creditors
Other Investments
Other creditors
Goodwill
Borrowings
Investments in associates
Provisions
State and other public entities
Trade receivables and advances to suppliers
Legal reserve
Tangible fixed assets
Employee benefits
Deferred tax assets
Deferred tax liabilities
Other non-current assets
Other non-current liabilities
Other current assets
CONSOLIDATED STATEMENT OF FINANCIAL POSITION AT 31 DECEMBER 2017
(Amounts in Euros)
13,357,220
60,177,688
43,885,257
295,514,364
770,384
3,358,340
16,737,792
22,820,198
(14,100,000)
4,228,716
88,189,849
13,540,692
23,918,981
(11,408,000)
3,960,796
77,706,743
122,870,558
5,811,644
95,377,577
4,356,460
3,316,536
20,658,007
5,088,234
7,839,302
14,216,580
53,000,000
11,262,856
53,000,000
12,877,217
59,964,427
33,366,429
117,984,922
509,672
-
378,408,792
1,355,216
233,956
12,259,474
3,786,717
11,735,363
8,296,945
1,627,604
52,749,441 60,410,979
189,789,608
1,461,775
168,111
14,021,234
4,291,945
2,857,449
8,296,945
2,301,121
448,739,272
386,028,049
92,418,565
35,150,000
47,894,297
3,735,465
48,650,000
16,067,394
3,168,613
292,935,205
745,409,942
250,397,732
502,866,271
249,299,926
198,590,928
81,667,539
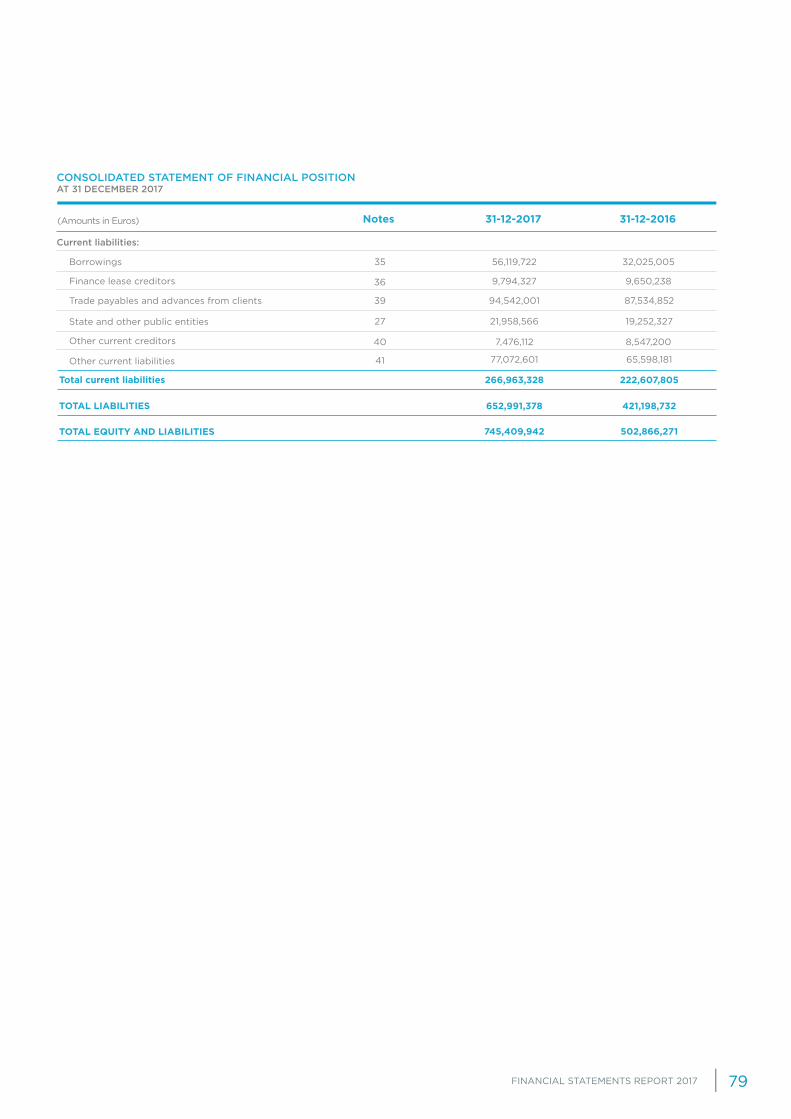
FINANCIAL STATEMENTS REPORT 2017 79
Current liabilities:
36
35
40
39
27
41
Total current liabilities
TOTAL LIABILITIES
TOTAL EQUITY AND LIABILITIES
Finance lease creditors
Other current creditors
Borrowings
State and other public entities
Trade payables and advances from clients
Other current liabilities
31-12-2017 31-12-2016Notes
CONSOLIDATED STATEMENT OF FINANCIAL POSITION AT 31 DECEMBER 2017
(Amounts in Euros)
9,794,327
56,119,722
7,476,112
9,650,238
32,025,005
8,547,200
94,542,001
21,958,566
77,072,601
87,534,852
19,252,327
65,598,181
266,963,328
652,991,378
745,409,942
222,607,805
421,198,732
502,866,271

JOSÉ DE MELLO SAÚDE
FINANCIAL STATEMENTS REPORT 201780
Share Capital Additional capital paid inNotes
Balance at 31 December 2015
Balance at 31 December 2016
Balance at 31 December 2017
14
14
Total comprehensive income for the year
Total comprehensive income for the year
Transfer to retained earnings
Transfer to retained earnings
Repayment of additional capital
Revaluation of tangible fixed assets (Net of taxes)
Revaluation of tangible fixed assets (Net of taxes)
Appropriation of consolidated net profit for 2015:
Appropriation of consolidated net profit for 2016:
Changes resulting from change of equity in associates
Changes resulting from change of equity in associates
Changes in non-controlling interests resulting from changes in consolidation perimeter
Transfer to legal reserve
Transfer to legal reserve
Capital decrease
Changes in fair value of hedging instruments
Changes in fair value of hedging instruments
Consolidated net profit for the year
Consolidated net profit for the year
Dividends paid out
Dividends paid out
Other
Other
Other income and gains recognised in equity:
Other income and gains recognised in equity:
CONSOLIDATED STATEMENT OF CHANGES IN EQUITY OF THE FINANCIAL YEARS ENDED 31 DECEMBER 2017 AND 2016
(Amounts in Euros)
-
-
-
-
-
53,000,000
53,000,000
53,000,000
14,350,000
-
-
-
-
(14,350,000)
-
-
-
-
-
-
-
-
-
-
-
-
-
-
-
-
-
-
-
-
-
-
-
-
-
-
-
-
-
-
-
-
-
-
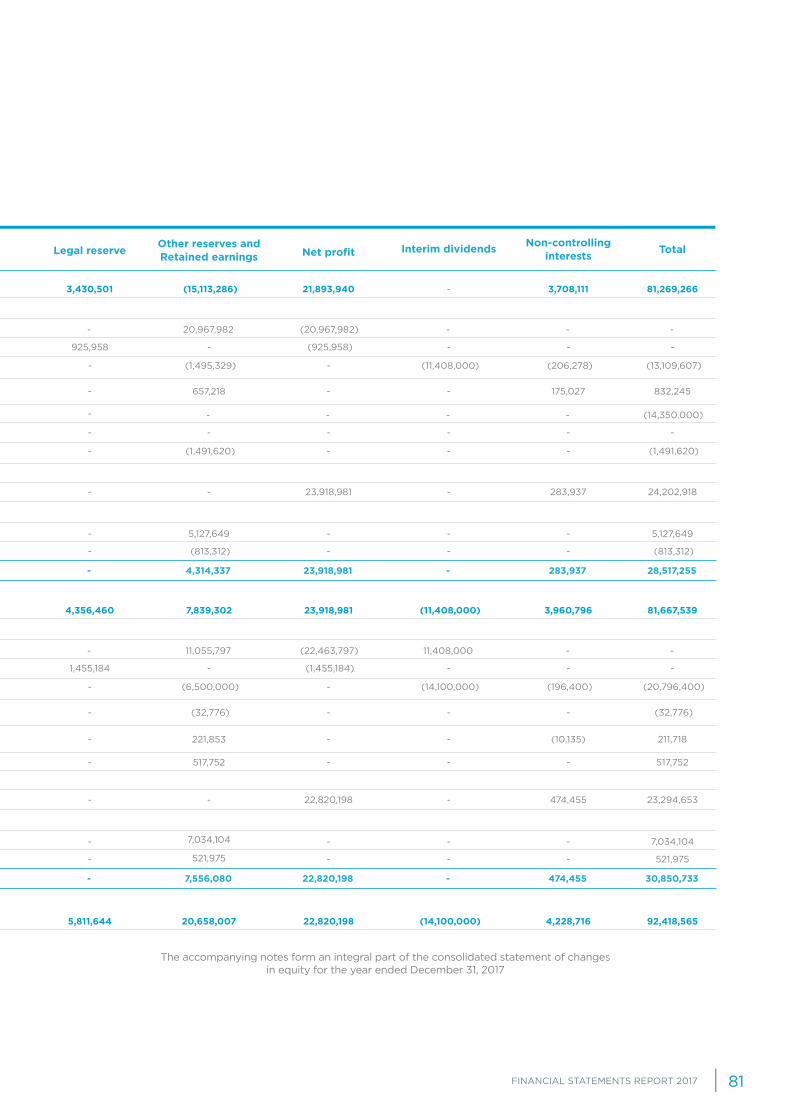
FINANCIAL STATEMENTS REPORT 2017 81
Other reserves and Retained earningsLegal reserve Net profit Interim dividends Non-controlling
interests Total
The accompanying notes form an integral part of the consolidated statement of changes in equity for the year ended December 31, 2017
(15,113,286)3,430,501 21,893,940 - 3,708,111 81,269,266
7,839,3024,356,460 23,918,981 (11,408,000) 3,960,796 81,667,539
20,658,0075,811,644 22,820,198 (14,100,000) 4,228,716 92,418,565
20,967,982- (20,967,982) - - -
11,055,797- (22,463,797) 11,408,000 - -
- - - - (14,350,000)
-925,958 (925,958) - - -
-1,455,184 (1,455,184) - - -
--
-
- - - -
(813,312)- - - - (813,312)
7,034,104
521,975- - - - 521,975
-- 23,918,981 - 283,937 24,202,918
-- 22,820,198 - 474,455 23,294,653
5,127,649- - - - 5,127,649
- - - - 7,034,104
(1,495,329)- - (11,408,000) (206,278) (13,109,607)
(6,500,000)- - (14,100,000) (196,400) (20,796,400)
657,218- - - 175,027 832,245
(32,776)- - - - (32,776)
221,853- - - (10,135) 211,718
(1,491,620)- - - - (1,491,620)
517,752- - - - 517,752
4,314,337- 23,918,981 - 283,937 28,517,255
7,556,080- 22,820,198 - 474,455 30,850,733
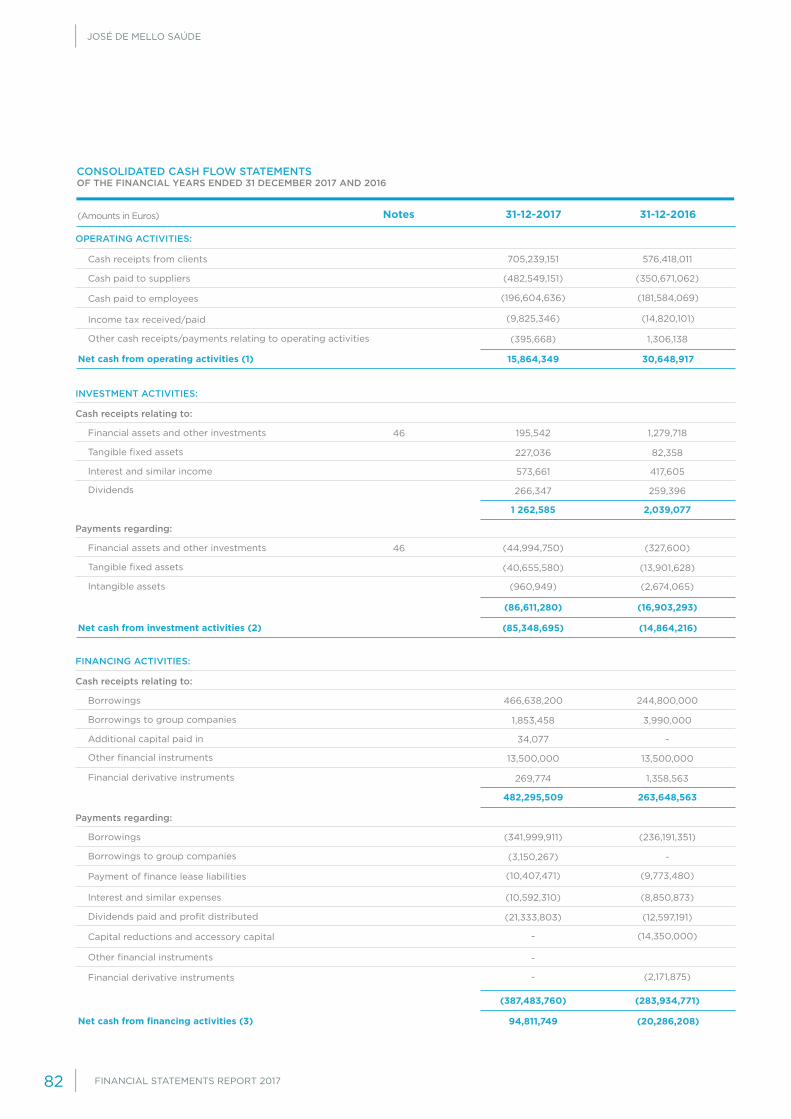
JOSÉ DE MELLO SAÚDE
FINANCIAL STATEMENTS REPORT 201782
31-12-2017 31-12-2016Notes
OPERATING ACTIVITIES:
INVESTMENT ACTIVITIES:
FINANCING ACTIVITIES:
Cash receipts relating to:
Cash receipts relating to:
Payments regarding:
Payments regarding:
46
46
Interest and similar income
Additional capital paid in
Intangible assets
Payment of finance lease liabilities
Capital reductions and accessory capital
Financial derivative instruments
Financial assets and other investments
Borrowings
Financial assets and other investments
Borrowings
Interest and similar expenses
Net cash from operating activities (1)
Net cash from investment activities (2)
Net cash from financing activities (3)
Cash paid to suppliers
Other cash receipts/payments relating to operating activities
Cash receipts from clients
Income tax received/paid
Dividends
Other financial instruments
Financial derivative instruments
Tangible fixed assets
Borrowings to group companies
Tangible fixed assets
Borrowings to group companies
Dividends paid and profit distributed
Other financial instruments
Cash paid to employees
CONSOLIDATED CASH FLOW STATEMENTSOF THE FINANCIAL YEARS ENDED 31 DECEMBER 2017 AND 2016
(Amounts in Euros)
(482,549,151)
705,239,151
(395,668)
266,347
13,500,000
269,774
259,396
13,500,000
1,358,563
227,036
1,853,458
(40,655,580)
(3,150,267)
(21,333,803)
-
82,358
3,990,000
(13,901,628)
-
(12,597,191)
573,661
34,077
(960,949)
(10,407,471)
-
-
417,605
-
(2,674,065)
(9,773,480)
(14,350,000)
(2,171,875)
195,542
466,638,200
(44,994,750)
(341,999,911)
(10,592,310)
1,279,718
244,800,000
(327,600)
(236,191,351)
(8,850,873)
(350,671,062)
576,418,011
1,306,138
(196,604,636)
(9,825,346)
(181,584,069)
(14,820,101)
15,864,349
(85,348,695)
94,811,749
1 262,585
482,295,509
(86,611,280)
(387,483,760)
2,039,077
263,648,563
(16,903,293)
(283,934,771)
30,648,917
(14,864,216)
(20,286,208)
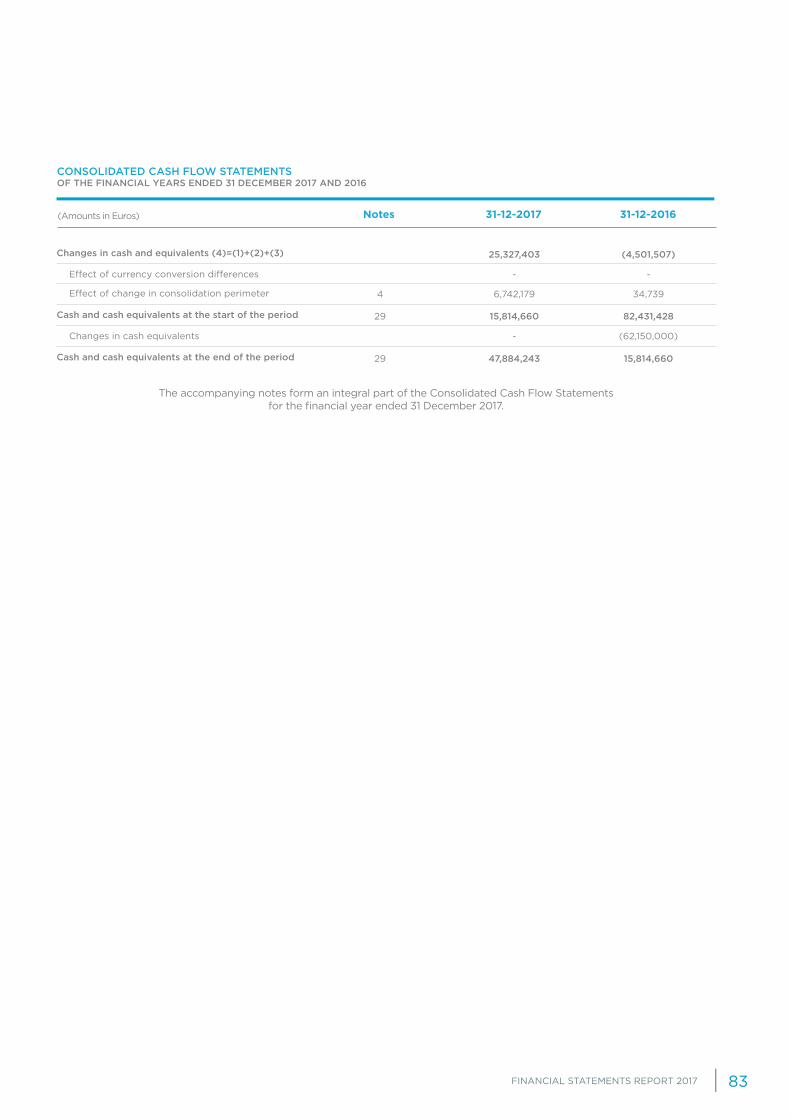
FINANCIAL STATEMENTS REPORT 2017 83
Changes in cash and equivalents (4)=(1)+(2)+(3)
Cash and cash equivalents at the start of the period
Cash and cash equivalents at the end of the period
4
29
29
Effect of currency conversion differences
Changes in cash equivalents
Effect of change in consolidation perimeter
31-12-2017 31-12-2016Notes
CONSOLIDATED CASH FLOW STATEMENTSOF THE FINANCIAL YEARS ENDED 31 DECEMBER 2017 AND 2016
(Amounts in Euros)
The accompanying notes form an integral part of the Consolidated Cash Flow Statements for the financial year ended 31 December 2017.
6,742,179 34,739
-
-
25,327,403
15,814,660
47,884,243
-
(62,150,000)
(4,501,507)
82,431,428
15,814,660

JOSÉ DE MELLO SAÚDE
FINANCIAL STATEMENTS REPORT 201784
NOTES TO THE CONSOLIDATED FINANCIAL STATEMENTS ON 31 DECEMBER 2017
(Amounts in euros)1. INTRODUCTION
José de Mello Saúde, S.A. (“Company” or “JMS”) is a public limited company, with headquarters in Lisbon, in Av. do Forte, No. 3, Suécia III Building, Floor 2, 2790-073 Carnaxide, incorporated in December 1992 The corporate universe of JMS (“Group” or “JMS Group”) is formed of the subsidiaries, associates and jointly controlled entities described in Note 3. Its core business is the provision of healthcare, particularly in the area of private healthcare, public-private partnerships, the provision of services in the area of medicine, occupational health and hygiene, and also providing home-based healthcare.
The Company’s share capital, as stated in Note 31, is majority-owned by José de Mello Capital S.A. its parent company that publishes consolidated financial statements complying with International Financial Reporting Standards (“IFRS”) and, consequently, the operations and transactions of JMS Group (Note 47) are influenced by the decisions of the José de Mello Capital Group.
It should be noted that on 12 December 2017, the companies José de Mello Participações II, SGPS, S.A., Guima-rães de Mello Portugal, SGPS, S.A., Guimarães de Mello Investimentos, SGPS, S.A., and José de Mello – Sociedade Gestora de Participações Sociais, S.A. (the former parent company of JMS) were incorporated, via merger, into SOGEFI – Sociedade de Gestão e Financiamentos, SGPS, S.A., which was renamed to José de Mello Capital, S.A. This corporate restructuring did not call into question any commitments made by the participating companies, since all of their rights and obligations are now concentrated on José de Mello Capital, S.A.
2. ACCOUNTING POLICIES
2.1. BASIS OF PREPARATION
The consolidated financial statements have been prepared on a going concern basis from the accounting books and records of the companies included in the consolidation (Note 3), adjusted in the consolidation process, when necessary, in order to agree with the provisions of the International Financial Reporting Standards (“IFRS”) adopted by the European Union and effective for years beginning on 1 January 2017. The International Financial Reporting Standards (“IFRS”) issued by the International Accounting Standards Board (“IASB”), the International Accounting Standards (“IAS”) issued by the International Accounting Standards Committee (“IASC”) and respective interpre-tations – IFRIC and SIC, issued by the International Financial Reporting Interpretation Committee (“IFRIC”) and Standing Interpretation Committee (“SIC”), respectively, are deemed to form part of those standards. Hereinafter, this set of standards and interpretations shall be generally referred to as “IFRS”.
The financial statements are presented in euros.
2.1.1. NEW STANDARDS, ALTERATIONS AND INTERPRETATIONS APPLYING IN THE 2017 FINANCIAL YEAR
As a result of endorsement by the European Union (EU), the following issues, revisions, amendments, and im-provements of standards and interpretations with effect from 1 January 2017 had with no significant impact on the Group’s financial statements.
The adoption of these standards, interpretations and amendments to standards did not have a significant impact on the financial statements.
Standard Effective date
IAS 12 – Recognition of deferred tax assets for unrealised losses (amendments) 1 January 2017
IAS 7 – Disclosure initiative
Improvements concerning the 2014–2016 cycle (IFRS 12 Disclosure of interests in other entities)
1 January 2017
1 January 2017
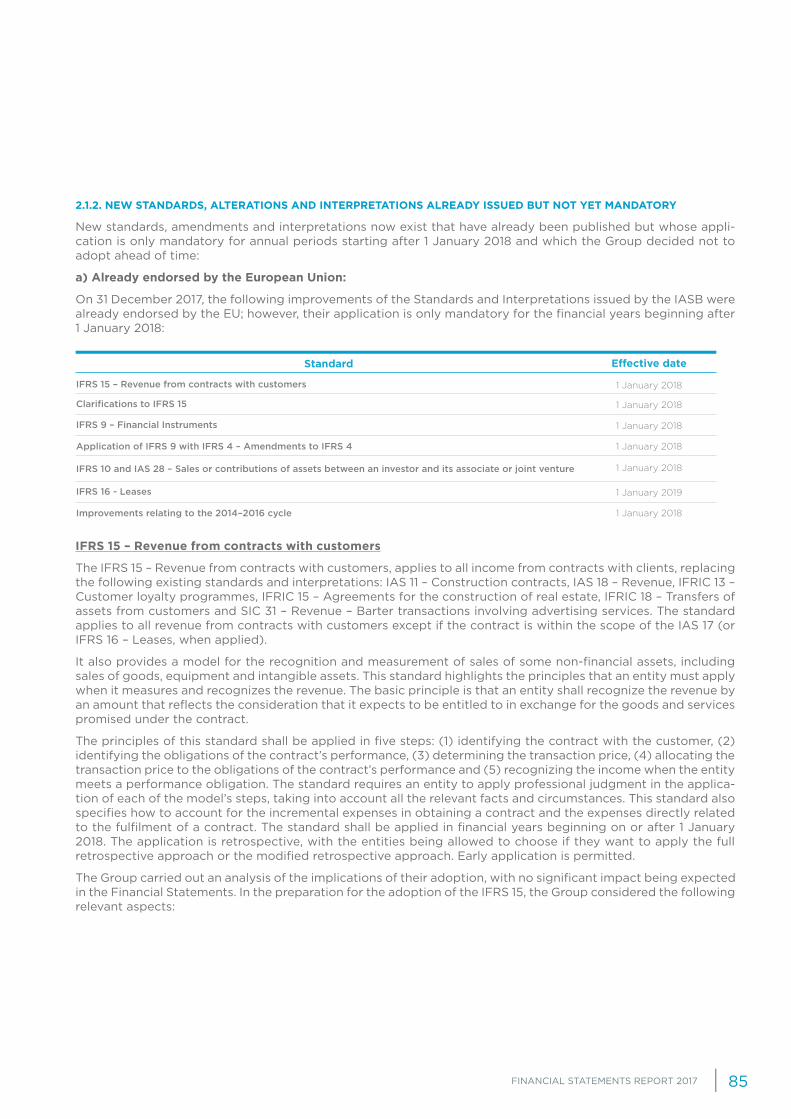
FINANCIAL STATEMENTS REPORT 2017 85
2.1.2. NEW STANDARDS, ALTERATIONS AND INTERPRETATIONS ALREADY ISSUED BUT NOT YET MANDATORY
New standards, amendments and interpretations now exist that have already been published but whose appli-cation is only mandatory for annual periods starting after 1 January 2018 and which the Group decided not to adopt ahead of time:
a) Already endorsed by the European Union:
On 31 December 2017, the following improvements of the Standards and Interpretations issued by the IASB were already endorsed by the EU; however, their application is only mandatory for the financial years beginning after 1 January 2018:
IFRS 15 – Revenue from contracts with customers
The IFRS 15 – Revenue from contracts with customers, applies to all income from contracts with clients, replacing the following existing standards and interpretations: IAS 11 – Construction contracts, IAS 18 – Revenue, IFRIC 13 – Customer loyalty programmes, IFRIC 15 – Agreements for the construction of real estate, IFRIC 18 – Transfers of assets from customers and SIC 31 – Revenue – Barter transactions involving advertising services. The standard applies to all revenue from contracts with customers except if the contract is within the scope of the IAS 17 (or IFRS 16 – Leases, when applied).
It also provides a model for the recognition and measurement of sales of some non-financial assets, including sales of goods, equipment and intangible assets. This standard highlights the principles that an entity must apply when it measures and recognizes the revenue. The basic principle is that an entity shall recognize the revenue by an amount that reflects the consideration that it expects to be entitled to in exchange for the goods and services promised under the contract.
The principles of this standard shall be applied in five steps: (1) identifying the contract with the customer, (2) identifying the obligations of the contract’s performance, (3) determining the transaction price, (4) allocating the transaction price to the obligations of the contract’s performance and (5) recognizing the income when the entity meets a performance obligation. The standard requires an entity to apply professional judgment in the applica-tion of each of the model’s steps, taking into account all the relevant facts and circumstances. This standard also specifies how to account for the incremental expenses in obtaining a contract and the expenses directly related to the fulfilment of a contract. The standard shall be applied in financial years beginning on or after 1 January 2018. The application is retrospective, with the entities being allowed to choose if they want to apply the full retrospective approach or the modified retrospective approach. Early application is permitted.
The Group carried out an analysis of the implications of their adoption, with no significant impact being expected in the Financial Statements. In the preparation for the adoption of the IFRS 15, the Group considered the following relevant aspects:
Standard Effective date
IFRS 15 – Revenue from contracts with customers
Application of IFRS 9 with IFRS 4 – Amendments to IFRS 4
1 January 2018
1 January 2018
Clarifications to IFRS 15
IFRS 10 and IAS 28 – Sales or contributions of assets between an investor and its associate or joint venture
IFRS 9 – Financial Instruments
IFRS 16 - Leases
Improvements relating to the 2014–2016 cycle
1 January 2018
1 January 2018
1 January 2018
1 January 2019
1 January 2018
JOSÉ DE MELLO SAÚDE
FINANCIAL STATEMENTS REPORT 201786
Private healthcare services
Provision of healthcare
This revenue stream represents almost all of the Group’s income. The provision of healthcare in the private segment is based on the recognition of revenue at the time the service is provided to the customer. The Group identified the Payer Mix, and analysed the contracts with the greatest expression. The deter-mination of revenue for these contracts is based on the application of price lists defined for the provided healthcare. Indeed, the Group concluded that the application of this standard will have no significant impacts on the consolidated financial statements.
Occupational health, safety and medicine
Occupational Medicine – This revenue stream consists of carrying out tests agreed with the customer to the employees, during the contractual period. Revenue is recognized during the contract, with no additional obligations. The recognized value is the final one negotiated between the parties, with that being the expected revenue. The Group thus concluded that the application of this standard will have no significant impacts on the consolidated financial statements.
Health and Safety – Risk evaluations are carried out during the contractual period within the scope of this revenue stream. These evaluations seek to identify and qualitatively evaluate risks for the health and safety of the workers in the places of work, proposing preventive and corrective measurements and also to verify the observance of the applicable regulation, internal rules and prevention measures in the places of work. Revenue is recognized during the contrac-tual period, with no additional obligations beyond the contract. The recognized value is the final one negotiated between the parties, with that being the expected revenue. The Group thus concluded that the application of this standard will have no significant impacts on the consolidated financial statements.
Household Services
This business line includes the care provided at the cus-tomer’s home. The contracts concerning this revenue stream are standard and do not include the lease of any equipment, only the provision of healthcare. Revenue is recognized at the time the service is provided to the customer. Indeed, the Group concluded that the application of this standard will have no impact on the consolidated financial statements.
Public healthcare services
Provision of healthcare
Public-Private Partnerships (“PPPs”) invoice the pro-vision of healthcare to the Public Contracting Entity, Insurers and private customers who are not users of the Portuguese National Health Service (NHS).
The provision of healthcare included in the manage-ment contract with the Public Contracting Entity is based on the recognition of revenue at the time the service is provided to the user. The determination of revenue consists of the management contract’s appli-cation. The recognized value is the one negotiated between the parties, with that being the expected revenue.
For the Hospital’s remaining users, the price tables in effect in the NHS are applied. The recognition of revenue takes place at the time the service is provided to the user.
This way, the Group found that the application of this standard does not cause changes to the registration of this stream’s revenue carried out by the companies.
Provision of medicines
This income stream consists of the debt of medicines supported by the Contracting Public Entity under the management contract or ad hoc authorizations. Re-venue is recognized when the product is transferred. Once again, the Group found that the application of this standard does not cause changes to the regis-tration of this stream’s revenue carried out by the companies.
User charges
This revenue stream consists of the invoicing of user charges defined by the NHS to the Hospitals’ users. The recognition of revenue takes place at the time the service is provided to the user. The Group con-cluded that the application of this standard will have no impact on the consolidated financial statements.
Other operating income
Transfer of a holding
This income stream corresponds to contracts for the transfer of holdings between the hospitals and entities that develop activities in the area of Complementary Diagnostic and Treatment Means (“CDTMs”). The re-venue is determined based on the monthly billing of each of the entities to whom the clinical activity ope-ration is transferred, and is recognized monthly. The Group concluded that the application of this standard will have no significant impacts on the consolidated financial statements.

FINANCIAL STATEMENTS REPORT 2017 87
Space rental
This revenue stream concerns the transfer of the commercial areas existing in the hospitals held by the Group, for the operation of non-clinical activities. The revenue is recognized monthly based on the values negotiated between the parties, with that being the expected revenue. The Group concluded that the application of this standard will have no significant impacts on the consolidated financial statements.
Concerning the remaining standards whose application is not yet mandatory, the Group chose to not adopt them in advance. However, the application of IFRS 16 is expected to have significant impacts on the Group’s balance sheet. The registration of the usage right for the current operating leases shall thus imply an increase in third-party assets and liabilities. The Group is now finalizing the quantification of this standard’s impacts.
b) Not yet endorsed by the European Union:
The following standards, interpretations, amendments and revisions have not been approved (endorsed), by the European Union, at the date of approval of these financial statements:
Regarding the standards presented above, whose compulsory entry into force has not yet occurred, the Group is still measuring the impact of these changes and will apply these standards in the financial year in which they become effective, or in advance when allowed.
2.2. CHANGES IN ACCOUNTING POLICIES
During the year ending on 31 December 2017, no voluntary changes occurred to accounting policies, in relation to those considered when preparing financial information for 2016.
2.3. MAIN ESTIMATES AND JUDGMENTS OF THE MANAGEMENT
The preparation of financial statements in accordance with the principles of recognition and measurement of IFRS requires that the Board of Directors make judgments, estimates and assumptions that may affect the value of assets and liabilities presented, in particular amortisation and depreciation, adjustments, impairment losses and provisions, disclosures of contingent assets and liabilities at the date of the financial statements, as well as the income and expenses.
Those estimates are based on the best knowledge available at any time and on the actions that are planned, and they are constantly revised based on the available information. Changes in facts and circumstances may lead to the revision of estimates, so the actual results in the future may differ from those estimates.
Standard Effective date
IAS 28 – Long-term interests in Associates or Joint Ventures (amendments)
IAS 40 – Transfer of Investment Properties (Amendments)
1 January 2019
1 January 2018
IFRS 2 – Classification and measurement of payment transactions based on actions (addendum)
IFRS 17 – Insurance Contracts
IFRIC 22 – Foreign currency transactions and advance consideration
IFRS 17 – Insurance Contracts
IFRS 9 – Anticipated payments with negative compensations (amendments)
Improvements relating to the 2015–2017 cycle
1 January 2018
1 January 2021
1 January 2018
1 January 2019
1 January 2019
1 January 2019

JOSÉ DE MELLO SAÚDE
FINANCIAL STATEMENTS REPORT 201788
The most significant accounting experiences shown in financial statements are as follows:
Goodwill impairment analysis
The Goodwill value is tested annually and whene-ver there is evidence of impairment. The recoverable amounts of cash generating units were determined based on the value-in-use calculation. The use of this method requires the estimate of future cash flows arising from the operations of each cash-generating unit and choice of an appropriate discount rate;
Valuation and Useful Life of Tangible and Intangi-ble Assets
The useful life of an asset is the period during which the Group expects that asset to be available for its use and is reviewed at least at the end of each financial year.
The amortisation/depreciation method to apply and the estimated losses stemming from the replacement of equipment before the end of their useful life, for reasons of technological obsolescence, is crucial to determining the effective useful life of an asset.
These parameters are defined according to the ma-nagement’s best estimate, for the assets and deals in question, also considering the practices adopted by companies from the sectors where the Group operates.
Recognition and Measurement of Provisions
The recognition of provisions has associated to the determination of the probability of exit of future flows and their reliable measurement.
These factors are often dependent on future events and not always under the control of the Group and, as such, may lead to significant future adjustments, both via the variation of the assumptions used and via the future recognition of provisions previously disclosed as control liabilities.
Fair Value of Financial Instruments
When the fair value of the financial assets and liabi-lities on the balance sheet date is not determinable based on active markets, it is determined based on valuation techniques that include the discounted cash flow model or other suitable models under the cir-cumstances. The inputs for these models are taken, whenever possible, from variables observable in the market; however, when this is not possible, a degree of judgment becomes necessary to determine the fair value, which encompasses considerations on liquidity risk, credit risk and volatility.
Impairment of accounts receivable
The credit risk of the balances of accounts receiva-ble is assessed at each reporting date, taking into account the historical information of the debtor and its risk profile.
The accounts receivable are adjusted by the evalua-tion of the estimated risks of collection existing at the balance sheet date, which may come to differ from the actual risk to incur in the future.
Taxes on income and deferred taxes
The determination of the amounts of income taxes and deferred taxes require the exercise of judgment and is subject to interpretation. Different interpretations could result in a different level of taxes on profits, both current and deferred, recognised in the period.
Only deferred tax assets are recognised insofar as it is likely that there will be taxable profit on which they can be used.
Assessment of the activity and revenue of the Pu-blic-Private Partnerships (“PPPs”)
The determination of the activity and revenue in the PPPs is carried out according to the provisions of the Management Contract (“MC”), namely the provisions of Appendix VII – Remuneration of the Establishment’s Managing Entity: the billing of the provided medical acts is carried out monthly, with the remainder being billed in the next financial period after the completion of the process of validating all medical, hospital and cli-nical acts, CDTMs and the provision of medicines; every month, the activity of the month being referenced and of the previous months of the current year is reported, with the activity accumulated until December (annual activity) being reported by the end of January of the next year; this is followed by a reconciliation payment that is determined, by the end of the following year’s first half, based on the actual value of the share to be borne by the Portuguese National Health Service (as specified in subparagraph 1b of Clause 47 of the MC). The actual value of the share under the Portuguese National Health Service is calculated in accordance with paragraph 22 of the abovementioned annex VII to the Management Contract.
Contractual provisions
The Group carries out a detailed assessment of the potential risks associated with the valuation of the share under the Portuguese National Health Servi-ce, in particular regarding the eligibility of clinical acts reported to the public awarding entity, and also regarding the risks associated with the contractual performance parameters.
FINANCIAL STATEMENTS REPORT 2017 89
In the specific case of Vila Franca Hospital, Clause 123 (Reversal of Goods) of the MC provides that the goods subject to revert to the Public Contracting Entity must be in good working order and fully operational, with all conservation, maintenance and renewal operations met. Considering that all medical equipment reaching the end of their service life before the end of the MC must be subject to investment, an investment plan was drafted where the recognition of the future obligation of replacing said equipment by the end of the contract is forecast; as a result, a provision was created in 2013 with a corresponding entry in the Intangible Assets item – this asset is being amortized until May 2021.
Continuity of the operations of subsidiaries and associated companies
The Group considered the results achieved and un-derstand that the existing measures and those that are being taken regarding freeing operational resources (by reducing consumption and increasing producti-vity), are sufficient to ensure the normal operation of the activity and, therefore, no doubt being cast on the continuity of operations. In particular, in the case of the Braga Hospital, the Group is reassessing its Business Plan to ensure the balance of capital until the end of the concession, estimating that on that date, based on the best available information, the net position will be negative at the time of the concession’s termination.
Escala Braga – Sociedade Gestora do Estabeleci-mento, S.A. (“Escala Braga”)
Checking procedures are currently taking place with Regional Health Authority Administração Regional de Saúde do Norte, I.P. (“ARS Norte”), regarding ad-justments made to Braga Hospital accounts in 2014, 2015, 2016 and 2017.
Regarding the settlements for the accounts of 2014, 2015 and 2016, the assessment of the actual produc-tion, which should have been completed in June 2015, June 2016 and June 2017, respectively, is presently being completed.
According to the provisions of the management con-tract, the agreement concerning 2017 shall take place by the end of June 2018.
The Escala Braga Board of Directors believes that it is duly justified to make its wishes known, without resulting in any negative financial impact that has a significant negative effect on the accounts.
Escala Vila Franca – Sociedade Gestora do Estabe-lecimento, S.A. (“Escala Vila Franca”)
Checking procedures are currently taking place with Administração Regional de Saúde de Lisboa e Vale do Tejo, I.P. (“ARSLVT”), regarding adjustments made to Vila Franca de Xira Hospital accounts in 2013, 2014, 2015, 2016 and 2017.
Regarding the settlements for the accounts of 2013, 2014, 2015 and 2016, the assessment of the actual production, which should have been completed in June 2014, June 2015, June 2016 and June 2017, res-pectively, is presently being completed.
According to the provisions of the management con-tract, the agreement concerning 2017 shall take place by the end of June 2018.
The Escala Vila Franca Board of Directors believes that it is duly justified to make its wishes known, without resulting in any negative financial impact that has a significant negative effect on the accounts.
No errors or omissions from previous periods were detected in the current year.
2.4. CONSOLIDATION PRINCIPLES
a) Controlled companies
The consolidation of controlled companies (Note 3.1) in each accounting period was done by the full conso-lidation method. Control is considered to exist when the Group is exposed, or has rights, to variable returns as a result of its involvement with the subsidiary com-pany and it has the capacity to affect those returns through its power over the subsidiary company (i.e., rights that currently give it the capacity to manage the relevant activities of the subsidiary company).
Third party participation in equity and net profit of such companies is reported separately on the Consoli-dated Statement of Financial Position and Consolida-ted Comprehensive Income Statement, respectively, under the “Non-controlling interests” caption.
When the losses attributable to non-controlling inte-rests exceed the non-controlling interest in the sub-sidiary’s equity, the Group absorbs that excess and any further losses, except when the non-controlling interests have an obligation to and are capable of covering such losses. If the subsidiary subsequently reports profits, the Group appropriates all the profits until the minority share of losses previously absorbed by the Group has been recovered.

JOSÉ DE MELLO SAÚDE
FINANCIAL STATEMENTS REPORT 201790
The results of subsidiaries acquired or disposed of during the period are included in the income statements from the date of acquisition to the date of their disposal.
Significant transactions and balances between controlled companies were eliminated in the consolidation process. Capital gains arising from the disposal of subsidiaries within the Group are also eliminated.
Whenever necessary, adjustments are made to the financial statements of subsidiary companies in order to stan-dardise the respective accounting policies with those of the Group.
In situations where the Group has, in substance, control over other entities created for a special purpose, even if it has no direct shareholdings in these entities, these are consolidated by the full consolidation method.
b) Business combinations and Goodwill
Business combinations, in particular the acquisition of subsidiaries, are recorded using the purchase method. The acquisition cost corresponds to the sum of fair values, at the transaction date, of the assets obtained, the liabilities incurred or taken on, and equity instruments issued in exchange for control of the acquiree.
Identifiable assets, liabilities and contingent liabilities of a subsidiary that meet the recognition criteria of IFRS 3 are measured at fair value on the acquisition date, except for non-current assets (or asset groups) that are classified as held for sale.
Any excess of the cost of acquisition over the fair value of the identifiable net assets is recorded as goodwill. Goodwill is recorded as an asset and is not amortised. It is reported separately on the Statement of Financial Position. The goodwill values are annually subject to impairment tests, or whenever there are indications of loss of value. Any impairment loss is immediately registered as an expense on the income statement of the period and it cannot be subsequently reversed.
Where the cost of acquisition may be less than the fair value of the identifiable net assets, the difference is re-corded as a gain in the income statement of the period in which the acquisition occurs.
On disposal of a subsidiary, the related goodwill is included in determining the capital gain or loss.
The interests of shareholders who are not controlled are presented according to their proportion of the fair value of the identified assets and liabilities.
c) Investments in associates
An associate is an entity over which the Group exercises significant influence. Significant influence is the power to join in decisions on operational and financial policies but it is not control or joint control, as defined in the point a) above.
These investments in associates (Notes 3.2 and 19) are accounted for using the equity method, except when they are classified as held for sale, which is when they are initially recorded at the acquisition cost, plus or minus the difference between that cost and the value of the equity of those companies proportionally held, as at the acqui-sition date or the date of first application of the equity method. Goodwill in relation to the associate is included in the value of the financial investment and is not individually tested.
According to the equity method, financial stakes are adjusted periodically for the value corresponding to the Group’s participation in the net profits of the associated companies, against the “Profit related to associated com-panies” caption (Note 12), and for other changes that have occurred in their equity against the “Other reserves”

FINANCIAL STATEMENTS REPORT 2017 91
caption, as well as by the recognition of impairment losses.
Losses in associates in excess of the investment in these entities are not recognised, unless the Group has made commitments to that associate.
Moreover, dividends received from these companies are recorded as a reduction in the value of the investment.
Unrealised gains on transactions with associates are eliminated in proportion to the Group’s interest in the asso-ciate, reported against the investment in that associate. Unrealised losses are similarly eliminated but only to the extent that the loss does not show that the transferred asset is in a situation of impairment.
2.5. REVENUE AND ACCRUALS
Revenue from sales is recognised on the income statement when the following conditions are met:
• The Group has transferred to the buyer the significant risks and rewards of ownership of the assets;
• The Group does not retain continuing managerial involvement to the degree usually associated with ownership nor effective control over the goods sold;
• The amount of revenue can be reliably measured;
• It is probable that the economic benefits associated with the transaction flow to the Group; and,
• The costs incurred or to be incurred in respect of the transaction may be reliably measured.
The revenue from sales is recognised net of taxes, discounts and other costs incurred to realize the fair value of the amount received or receivable.
The income arising from services rendered is recognised in the income statement in the period in which they are provided.
The income stemming from dividends is recognized when, in substance, the obligation to declare dividends was established in the declaring Entity.
Interest and financial income are recognised in accordance with the principle of accruals and according to the effective interest rate applying.
Costs and income are accounted for in the period to which they relate, regardless of the date of payment or receipt. Costs and income for which the actual amounts are not known are estimated.
Costs and income imputable to the current period and which have expenses and revenues that will only occur in future periods, as well as expenses and revenues that have already occurred, but which relate to future periods and which will be attributed to the profit/loss of each of those periods in the corresponding value, are recorded under the “Other current assets” and “Other current liabilities” captions.
2.6. OPERATING PROFIT
The results of operations include all costs and income from operations, whether recurring or not, including those related to restructuring and tangible and intangible assets. They also include gains or losses obtained in the sale of companies consolidated using the full consolidation method. Hence, net financing costs, profits obtained from associates and other financial investments, and income taxes are excluded from the operating profit.

JOSÉ DE MELLO SAÚDE
FINANCIAL STATEMENTS REPORT 201792
2.7. FINANCING COSTS
Borrowing costs are recognised on the income statement of the period in which they occur.
The financial charges on financing directly related to the acquisition, construction or production of tangible fixed assets that take a substantial period of time to be prepared for the intended use are capitalized, forming part of the cost of the asset. The capitalisation of these expenses begins after the start of preparation of the construc-tion activities or development of the asset and is interrupted after the start of the use or end of production or construction of the asset or over periods in which development of the asset is interrupted. Any income generated by loans obtained in advance and which may be allocated to a specific investment is deducted from the financial costs eligible for capitalisation.
2.8. INCOME TAX
Income tax for the period is calculated based on the taxable results of the companies included in the consolidation and it considers deferred taxation.
The current income tax is calculated based on the taxable income (which differs from accounting income) of the companies included in the consolidation, in accordance with the tax rules in force at the registered office of each Group company.
According to current legislation, tax returns are liable for review and correction by the tax authorities for a period of four years (five years for Social Security). Accordingly, the tax returns of the Group companies for the years 2014 to 2017 may still be reviewed, although the Company believes that any adjustments resulting from tax revisions to those tax documents will have no significant impact on the referred financial statements as at 31 December 2017.
2.9. DEFERRED TAX ASSETS AND LIABILITIES
The Group recognises deferred taxes in accordance with the requirements of IAS 12 – Income taxes, as a way of adequately accruing the tax effects of its operations, and to exclude distortions related to the criteria of a fiscal nature that impact on the economic results of certain transactions.
Deferred tax assets are recognised when there is reasonable assurance that future taxable profit may be achieved against which those assets can be deducted. Deferred tax assets are reviewed annually and reduced when it is no longer probable that they may be used. The value of deferred tax is determined by applying the tax rates (and laws) enacted or substantively enacted at the reporting date and which are expected to apply in the period of realisation of the deferred tax asset. According to the legislation in force in Portugal, the corporate income tax rate of 21% was considered and, in the situations not connected to tax losses, a municipal surtax of 1.5% on the temporary differences that led to deferred tax assets and liabilities.
The movement that took place during the financial period and the breakdown of the Deferred Taxes balances are presented in Note 22; the reconciliation between the nominal rate and the actual rate of the current tax is presented in Note 13.
2.10. REVENUE PER SHARE
Basic revenue per share is calculated by dividing the profit attributable to ordinary shareholders of the parent company by the weighted average number of ordinary shares in circulation during the period.
The diluted income per share is equal to the basic income as there is no interest on convertible preference shares nor options on shares.

FINANCIAL STATEMENTS REPORT 2017 93
2.11. INTANGIBLE ASSETS, EXCLUDING GOODWILL
Intangible assets (excluding goodwill) basically comprise the expenses incurred in specific projects with future economic value and are recorded at acquisition cost, less accrued amortisations and impairment losses. Intangi-ble assets are only recognised if it is probable that they will result in future economic benefits for the Group, are controlled by the Group, are identifiable and their value can be reliably measured.
Intangible assets for which the existence of a limited period of future economic benefits cannot be envisaged are called intangible assets with indefinite useful lives. These assets are not amortised but undergo annual im-pairment tests.
Under this caption are reflected, among others:
• Even concession rights corresponding to the right of management and operation of the two hospitals under the Public-Private Partnership arrangement. The amortisation is performed for the period stipulated in the contracts (10 years);
• Responsibility corresponding to the total estimated value of the investments expected until the end of the management and operation contract of the Vila Franca Hospital, stemming from the contractual obligations provided for in its Appendix V, in accordance with the provisions of IAS 37 – Provisions, contingent liabilities and contingent assets, and based on the principles described in IFRIC 12 – Service Concession Arrangements. This asset is to be amortised for the remainder of the contract;
• Surface rights of two properties for the period of 40 years;
• Exploitation right of a car park for the period of 50 years;
• Underground surface rights on a plot of land adjacent to the parking of Descobertas Hospital’s Expansion Building;
• Transfer concerning the facilities of CUF São Domingos de Rana Clinic.
After the beginning of the usage of the goods, amortizations are calculated using the straight-line method from the date when they are available for their intended use in accordance with the following estimated service lives:
2.12. TANGIBLE FIXED ASSETS
Tangible fixed assets used in production, in the provision of services or for administrative purposes are recorded at the cost of acquisition or production, including expenses imputable to the acquisition, less accumulated de-preciation and impairment losses, where applicable.
The premises assigned to healthcare services are carried at the revalued amount, which is their fair value at the date of revaluation. Evaluation of these properties on 31 December 2017 was carried out by an independent spe-cialised company – Ktesios Appraisal – Consultoria e Avaliação Imobiliária, Lda.
Useful life (years)
Software
Total estimated value of the investments
4
10
9
Operation right
Surface rights
Right of entry into hospital management
50
40

JOSÉ DE MELLO SAÚDE
FINANCIAL STATEMENTS REPORT 201794
Tangible fixed assets are depreciated by the straight-line method from the date on which they are available for use as the intended use, according to the following estimated useful lives:
The depreciable amount of tangible fixed assets does not include the residual value estimated at the end of their useful lives, except in cases where it is estimated to be immaterial or uncertainty exists as to its realisation. Mo-reover, the depreciation ceases when the assets are classified as held for sale.
Improvements are only recognised as assets when it is demonstrated that these increase their useful life or in-crease their normal efficiency, resulting in increased future economic benefits.
Tangible fixed assets in progress represent tangible assets still under construction and are registered at cost of acquisition or production, less any impairment losses. These assets are depreciated from the time they are able to be used for their intended purpose.
The gains or losses resulting from the sale or disposal of tangible fixed assets are determined as the difference between the sale price and net book value on the date of sale/disposal. They are recorded at net value on the income statement under “Other operating income” or “Other operating costs”.
2.13. NON-CURRENT ASSETS HELD FOR SALE
Non-current assets (or discontinued operations) are classified as held for sale if their value is realisable through a sale transaction rather than through their continued use. This situation is considered to occur only when: (i) the sale is highly probable and the asset is available for immediate sale in its present condition; (ii) the management is committed to a sales plan; and (iii) it is expected that the sale will take place within a period of twelve months.
The events or circumstances that may extend the period to complete the sale for more than a year do not exclude that an asset is classified as held for sale if the delay is caused by events or circumstances beyond the control of the entity and if there is sufficient evidence that the entity remains committed to its plan to sell the asset.
Non-current assets (or discontinued operations) classified as held for sale are measured at the lower of book value and fair value, less costs to bear in future sales.
On the date of initial recognition, non-current assets (or disposal groups) held for sale are measured at the lower value between their carrying amount and fair value less selling costs or, if purchased as part of a combination of business activities, at fair value less selling costs.
When the sale is expected to occur more than a year later, the selling costs are measured at their present value. Any increase in the present value of the selling costs resulting from the passage of time is recognised in the results as cost of funding.
Useful life (years)
Buildings and other constructions
Other tangible fixed assets
10 - 50
4 - 8
4 - 8
Basic equipment
Transport equipment
Office equipment
3 - 7
4

FINANCIAL STATEMENTS REPORT 2017 95
Any initial or subsequent reduction of the asset (or disposal group) to the fair value less selling costs is recogni-sed as an impairment loss. Any gain resulting from a subsequent increase in the fair value less costs of selling an asset is recognised, but not beyond the previously recognised cumulative impairment loss.
Non-current assets, while classified as held for sale or while they are part of a disposal group classified as held for sale are not depreciated (or amortised).
Interest and other expenses attributable to the liabilities of a disposal group classified as held for sale continue to be recognised.
2.14. IMPAIRMENT OF NON-CURRENT ASSETS, EXCLUDING GOODWILL
An assessment of impairment is performed whenever an event or changes in circumstances are identified that indicate the carrying amount at which an asset is recorded may not be recoverable. If such indications exist, the Group determines the recoverable amount of the asset in order to ascertain any possible extension of the impair-ment loss. In situations where the asset does not individually generate cash flows in a manner independent from other assets, the estimated recoverable amount is made for the cash-generating unit to which the asset belongs.
Intangible assets with indefinite useful lives are subject to annual impairment tests or whenever it appears that there is evidence that such exists.
Whenever the amount at which the asset is recorded is higher than its recoverable amount an impairment loss is recognised, recorded under the “Provisions and impairment losses” caption.
The recoverable amount is the higher of the net sale price (sale price less selling costs) and the value in use. The net sale price is the amount that would be obtained from the sale of the asset in a transaction between knowle-dgeable and independent entities, less the costs directly attributable to the disposal. Value in use is the present value of estimated future cash flows arising from the continued use of the asset and from its disposal at the end of its useful life. The recoverable amount is estimated individually for each asset or, if this is not possible, for the generating unit of cash flows to which the asset belongs.
The reversal of impairment losses recognised in prior years is recorded when there are indications that the impair-ment losses no longer exist or have decreased. The reversal of impairment losses is recognised under “Reversal of amortisation and adjustments” caption. However, the reversal of the impairment loss is done up to the amount that would be recognized (net of amortisation or depreciation) if the impairment loss had not been recognised in prior years.
2.15. INVENTORIES AND COSTS OF GOODS SOLD AND MATERIALS CONSUMED
Goods and raw materials and consumables are valued at cost which is lower than their market value, using ave-rage cost as the costing method.
The cost of inventories includes: (i) purchase costs; (ii) conservation costs; and (iii) other costs incurred to align inventories with the desired conditions.
Whenever their net realisable value (sale price estimated in the ordinary course of business, less respective sales costs) is less than the cost of acquisition, the value of inventories is reduced, which is restored when the reasons that led to such cease to exist.
Sale price estimates take into account the variations related to events taking place after the end of the financial period insofar as those events confirm conditions existing at the end of the period.

JOSÉ DE MELLO SAÚDE
FINANCIAL STATEMENTS REPORT 201796
2.16. LEASES
Lease contracts are classified as: (i) finance leases if all the risks and rewards of ownership of the leased asset are substantially transferred through these; and (ii) operating leases if all the risks and rewards of their ownership are not substantially transferred.
The classification of leases as finance or operating is based on the substance and not the form of the contract.
Finance Leases
Contracts are considered to be of financial leasing if all risks and benefits associated with the possession of the corresponding assets are substantially transferred through them.
Tangible fixed assets acquired under finance leases and the corresponding liabilities are recorded in accounts by the financial method. According to this method, the cost of the asset is recorded as a tangible fixed asset and the corresponding liability is recorded as a liability and the interest included in the value of the rental payments and depreciation of assets, calculated as described above, are recognised as financial expenses on the income statement of the period to which they relate.
Operating Leases
Contracts are considered to be of operational leasing if all risks and benefits associated with the possession of the corresponding assets are not substantially transferred through them. The classification of the leases as financial or operational is made according to the substance and not the form of the contract.
In operating leases, the rental payments are recognised as a cost in the “External supplies and services” caption, on a straight line basis over the period of the lease.
2.17. RESPONSIBILITY FOR EMPLOYEE BENEFITS
Personal expenses are recognised when the service is provided by the employees regardless of their payment date. Here are some specificities regarding each of the benefits:
Termination of employment
Benefits for termination of employment are due to be paid when employment ends before the usual retirement date or when an employee accept to leave voluntarily in exchange for these benefits. The Group recognises these benefits when it can be shown it is committed to a termination of employment of current employees, according to a formal detailed plan for the termination, and there is no realistic possibility of withdrawal or if these benefits are granted to encourage voluntary departure. When the employment termination benefits are due over 12 months after the balance sheet date, they are discounted to their current value.
Holidays, Holiday entitlement and Bonuses
According to labour law, employees are entitled to 22 working days of annual leave, as well as a month of holiday entitlement, rights acquired in the year prior to their payment. These liabilities of the Company are recorded when incurred, regardless of the time of their payment, and are reflected in the caption “Other current liabilities”.
Retirement Pension Benefits
Liability for the payment of retirement, disability and survivors’ pensions is recorded in accordance with the cri-teria established in IAS 19 – Employee benefits.
FINANCIAL STATEMENTS REPORT 2017 97
The costs of awarding these benefits are recognised as the services are rendered by the beneficiary em-ployees.
At the end of each accounting period actuarial stu-dies by independent entities are produced in order to determine the value of the liabilities at that date and the cost of pensions to be recorded in the period, according to the projected credit unit method. These liabilities estimated in this manner are recognised on the Statement of Financial Position under the “Em-ployee benefits” caption.
Pension costs are recorded under the “Personnel ex-penditure” caption as provided for in the referred standard, based on the values determined by actuarial studies and include current service costs (accrued liability), which corresponds to the additional benefits earned by employees during the period and interest costs, which result from the update of past liabilities.
Costs with past services are recognised immediately to the extent that the associated benefits have already been recognised or, otherwise, recognised linearly in the period in which it is estimated that they are obtained.
2.18. PROVISIONS
Provisions are recognised when: (i) the Group has a present obligation (legal or implicit) resulting from past events; (ii) settlement is expected to result in an outflow of resources; and (iii) the amount can be estimated reliably. Provisions are reviewed on the date of each Statement of Financial Position and adjusted in order to reflect the best estimate at that date.
In particular, provisions are set up to meet contrac-tual obligations in order to maintain or replace the equipment operated under the management and operation contract of Vila Franca Hospital, based on the investment plan arising from the obligations envi-saged in Annex V to that contract, as specified in IAS 37 – Provisions, contingent liabilities and contingent assets and in accordance with the principles descri-bed in IFRIC 12 – Service concession arrangements.
2.19. CONTINGENT ASSETS AND LIABILITIES
A contingent liability arises when there is:
• a possible obligation that arises from past events and whose existence will only be confirmed by the occurrence or non-occurrence of one or more un-certain future events not wholly within the control of the Group; or
• a present obligation that arises from past events but is not recognised because:
• it is not probable that an outflow of resources embodying economic benefits will be required to settle the obligation; or
• the amount of the obligation cannot be mea-sured with sufficient reliability.
Contingent liabilities are not recognised in the con-solidated financial statements. They are disclosed in the Notes to the Financial Statements, unless the possibility of an outflow of resources embodying fu-ture economic benefits is remote, in which case they are not subject to disclosure.
A contingent asset is a possible asset that arises from past events and whose existence will be confirmed only by the occurrence or non-occurrence of one or more uncertain future events not wholly under the control of the Group. Contingent assets are not recognised in the Consolidated Financial Statements but disclosed in the notes thereto when a future economic benefit is probable.
2.20. FINANCIAL INSTRUMENTS
Financial assets and financial liabilities are recognised when the Group becomes a party to the contractual relationship.
a) Cash and bank deposits
The amounts included in the Cash and bank deposits caption correspond to cash, bank deposits, term de-posits and other short-term investments maturing in under three months, and which may be immediately redeemed at insignificant risk of changes in value.
For the purposes of the Consolidated Statement of Cash Flows, the caption Cash and cash equivalents

JOSÉ DE MELLO SAÚDE
FINANCIAL STATEMENTS REPORT 201798
also includes bank overdrafts included in the Loans caption, in the Consolidated Statement of Financial Position.
b) Customers, Other Debtors and Other Assets
Accounts receivable have no implicit interest and are initially recorded in the accounts at nominal value and subsequently measured at amortised cost, net of estimated realisation losses. Impairment losses are recorded based on the evaluation of the estimated losses associated with doubtful debts at the date of the Statement of Financial Position. The identified impairment losses are recognised against profit and loss in the “Provisions and impairment losses” caption. They are subsequently reversed through profit and loss under the “Reversal of provisions and impairment losses” caption if a reduction of the estimated loss in a subsequent period is verified. The objective evidence showing that a financial asset is impaired took into account the following aspects: (i) Significant financial difficulty by the debtor; (ii) Contractual breach, such as failure to pay or breach in the payment of interest or amortization of the debt; (iii) Probability that the debtor goes into bankruptcy.
c) Investments
Investments are recognised (and derecognised) on the date all the risks and rewards of ownership are substantially transferred, regardless of the date of settlement.
They are initially measured at their acquisition cost, which is the fair value of the price paid, including transaction costs.
Investments other than those in subsidiaries, associates and joint ventures are classified as follows:
• Held-to-maturity investments;
• Assets measured at fair value through profit or loss;
• Financial assets available for sale;
• Other investments.
Investments held to maturity are investments with predetermined financial flows and defined maturity, which the Group has the intention and capacity to hold up to that date. They are classified as non-current investments, unless the maturity is less than twelve months from the date of the statement of financial position. These investments are recorded at amortised cost using the effective interest rate, less repayments of principal and interest earned. Impairment losses are recognised in profit/loss when the recorded value of the investment is less than the estimated cash flows discounted at the effective interest rate determined at the time of initial recognition. The reversal of im-pairment losses in subsequent periods may only occur when an increase in the recoverable amount of the investment is related to events occurring after the date on which the impairment loss was recognised. In any event, the recognised value of the investment resulting from the reversal of the impairment loss cannot exceed the value corresponding to the respective amortised cost if the impairment loss had not been recognised.
The Group categorizes the “Other Financial Instru-ments” as held until maturity.
Assets measured at fair value through profit or loss are financial instruments held for trading acquired for sale in the short term, and are classified as current investments. Financial instruments that on initial re-cognition are designated by the Company at fair value through profit or loss are also included in this category, provided they have a price listed on an active market or the fair value may be reliably measured.
After initial recognition, the assets measured at fair value through profit or loss and financial assets avai-lable for sale are re-evaluated at their fair values by reference to their market value at the date of the statement of financial position, without any deduc-tion for transaction costs that may occur up to their actual sale. In the situations where the investments are equity instruments not admitted to trading on regulated markets, and for which the fair value cannot be reliably estimated, they are kept at their acquisition cost less any impairment losses.
Financial assets available for sale are financial in-vestments that are available for sale or which do not fit under any of the previous classifications and are classified as non-current assets.
FINANCIAL STATEMENTS REPORT 2017 99
The gains or losses arising from changes in fair value of financial assets available for sale are recognised in equity under the “Other reserves” caption until the investment is sold or otherwise disposed of, or in situations where an impairment loss is believed to exist, then the cumulative gain or loss is recognised on the income statement.
d) Financial liabilities and equity instruments
Financial liabilities and equity instruments issued by the Group are classified according to the substance of the contract, regardless of their legal form. Equity instruments are contracts that demonstrate a residual interest in the Group’s assets after deduction of the liabilities.
The equity instruments issued are recorded at the amount received, net of costs incurred with their is-suance.
e) Bank loans
Loans are initially recorded under liabilities at their nominal value, net of issuing costs, corresponding to their fair value at that date. Loans are subsequently measured by the amortised cost method, calculated according to the effective interest method. The cor-responding financial charges are calculated according to the effective interest rate.
f) Suppliers, Other creditors and Other liabilities
The Balances of Suppliers, Other Creditors and Other Liabilities are initially recorded at their nominal value and later, whenever applicable, are measured by the amortized cost and in accordance with the effective interest rate method. The accounts payable are recog-nised as current liabilities except if their settlement is contracted after twelve months following the date of the consolidated statement of financial position.
g) Derivative financial instruments and hedge ac-counting
The JMS Group’s policy is to contract derivative fi-nancial instruments for hedging of financial risks to which it is exposed, which are mainly due to interest rate variations.
Hedging Instruments
The possibility of calling a derivative financial instru-ment a hedging instrument complies with the provi-sions of IAS 39, namely, with regard to its respective documentation and effectiveness evaluation.
Derivative financial instruments are recognised for their fair value on the date they are negotiated. Fair value is evaluated on a regular basis, and gains or losses resulting from that evaluation are recorded in the income statement, except cash flow hedging derivatives in which the variation is recognised in consolidated equity.
Accounting is discontinued when the hedging instru-ment reaches maturity or is sold, or when the hedging relationship ceases to comply with the requirements of IAS 39.
2.21. CASH FLOWS STATEMENT
The statement of cash flows is prepared according to the direct method, through which the cash inflows and outflows in operating, investing and funding activities are disclosed.
2.22. SUBSEQUENT EVENTS
Events occurring after the date of the Statement of Financial Position and which provide additional infor-mation about situations existing on the date of the Statement of Financial Position are reflected in the Consolidated Financial Statements.
Events occurring after the date of the Statement of Financial Position and which provide information about situations occurring after that date, are disclosed, if material, in the notes to the Consolidated Financial Statements.

JOSÉ DE MELLO SAÚDE
FINANCIAL STATEMENTS REPORT 2017100
Business activityRegistered office
Carnaxide
Lisboa
Carnaxide
Cascais
Carnaxide
Matosinhos
Carnaxide
Viseu
S.J.Madeira
Carnaxide
Lisboa
Viseu
Carnaxide
S.J.Madeira
Carnaxide
Lisboa
Carnaxide
Lisboa
Coimbra
99.9049%
62.8068%
100%
99.9995%
100%
95.9955%
100%
100%
100%
100%
33.6490%
100%
99.9995%
100%
100%
69.9294%
100%
100%
100%
Management and operation of a hospital
Provision of medical and nursing services
Management and operation of a hospital and nursing units
Operation of a diagnosis and radiology medical centre
Management and operation of a hospital and nursing units
Operation of health unit
Management and operation of a hospital
Operation of a diagnosis and radiology medical centre
Operation of a diagnosis and radiology medical centre
Management and operation of a hospital and nursing units
Provision of medical and nursing services
Management and operation of a hospital
Operation of a diagnosis and radiology medical centre
Operation of a diagnosis and radiology medical centre
Management and operation of a hospital and nursing units
Provision of diagnosis services and therapy in the nuclear medicine field
Provision of medical and nursing services
Operation of a diagnosis and radiology medical centre
Provision of medical and nursing services
Effective percentageCompany
Private healthcare services:
Hospital CUF Descobertas, S.A.
Clínica CUF Belém, S.A.
Hospital CUF Cascais, S.A. (c)
Ecografia de Cascais, Lda.
Hospital CUF Porto, S.A. (d)
Instituto CUF - Diagnóstico e Tratamento, S.A.
Hospital CUF Santarém, S.A.
SIM-X - Serviço de Imagem Médica, Lda.
Gabinete de Diagnóstico de Imagem de São João da Madeira, Lda.
Hospital CUF Infante Santo, S.A. (a)
Clínica de Serviços Médicos Computorizados de Belém, S.A. (f)
Hospital CUF Viseu, S.A.
Nova Imagem - Centro Radiodiagnóstico, S.A.
Celso & Santos, S.A.
Hospital CUF Torres Vedras, S.A. (b)
HD Medicina Nuclear, S.A.
Clínica CUF Alvalade, S.A.
Clínica Dr. Luís Álvares, S.A.
CPIS - Clínica Particular de Coimbra, S.A.
3. COMPANIES INCLUDED IN THE CONSOLIDATION
3.1. COMPANIES CONSOLIDATED BY THE FULL CONSOLIDATION METHOD
In 31 December 2017, the consolidation included, through the full consolidation method, the parent company and the following subsidiaries in which control is held:

FINANCIAL STATEMENTS REPORT 2017 101
Braga
Carnaxide
Carnaxide
Carnaxide
Roterdão
V.F. de Xira
Carnaxide
Matosinhos
Carnaxide
Carnaxide
99.9809%
100%
Empresa-mãe
100%
99.9995%
99.9760%
100%
95.9955%
100%
99.0933%
Management and operation of a public hospital
Operation, management and marketing of healthcare infrastructure, commercial areas and car parks
Purchase and sale of equipment and provision of management and consultancy
Buying and selling real estate, exchange and renting property
Management of shareholdings
Management and operation of a public hospital
Buying and selling real estate, exchange and renting property
Management of shareholdings
Execution of real estate projects, namely the purchase and sale of properties, swap and rental of owned properties and of properties belonging to third parties
Provision of IT, operational, administrative and negotiation services
Public healthcare services:
Infrastructures:
Others:
Escala Braga - Sociedade Gestora do Estabelecimento, S.A.
Infrahealth – Gestão de Infraestruturas, Lda.
José de Mello Saúde, S.A.
SIMPLYGREEN - Investimentos Imobiliários, S.A.
Vramondi International BV
Escala Vila Franca – Sociedade Gestora do Estabelecimento, S.A.
Imo health - Investimentos Imobiliários, S.A.
VALIR - Sociedade Gestora de Participações Sociais, S.A.
Hospimob - Imobiliária, S.A.
JMS - Prestação de Serviços Administrativos e Operacionais, ACE
Carnaxide
Carnaxide
Carnaxide
Carnaxide
Carnaxide
Carnaxide
Carnaxide
Carnaxide
Carnaxide
99.2404%
100%
100%
100%
100%
99.1714%
100%
70.4997%
100%
Provision of operational, administrative and health services
Distribution and commercialization of medication and medical devices
Sale of parapharmaceutical products
Provision of training services in the nursing and clinical services field
Provision of management, consultancy, operating and administrative services in the healthcare sector
Provision of operating services (catering, cleaning and maintenance)
Provision of management, consultancy, operating and administrative services in the healthcare sector
Provision of external services of occupational safety, hygiene and health
Provision of management, consultancy, operating and administrative services in the healthcare sector
JMS - Prestação de Serviços de Saúde, ACE
Centro Logístico CUF Unipessoal, Lda. (e)
Loja Saúde CUF - Produtos e Serviços de Saúde e Bem Estar, S.A.
Academia CUF, Sociedade Unipessoal, Lda.
PPPS II - Gestão e Consultoria, S.A.
JMS - Serviços de Logística, ACE
PPPS - Gestão e Consultoria, S.A.
Sagies - Segurança, Higiene e Saúde no Trabalho, S.A.
PPPS III - Gestão e Consultoria, S.A.
Business activityRegistered office
Effective percentageCompany
JOSÉ DE MELLO SAÚDE
FINANCIAL STATEMENTS REPORT 2017102
Company Effective percentageRegistered office Business activity
Centro Gamma Knife-Radiocirurgia, S.A. Operation of radiosurgery treatment unitsLisboa 34.000%
(a) The activity of this company includes domiciliary services (resulting from a division-merger operation of SPSD – Sociedade Portuguesa de Serviços Domiciliários, S.A.), as well as the management of CUF Miraflores Clinic and CUF Almada Clinic, which are clinically and administratively accountable to Hospital CUF Infante Santo, S.A.
(b) The activity of this company also includes the management of CUF Mafra Clinic, which is clinically and administratively accountable to Hospital CUF Torres Vedras, S.A..
(c) The activity of this company also includes the management of CUF São Domingos de Rana Clinic and CUF Sintra Clinic, which are clinically and administratively accountable to Hospital CUF Cascais, S.A..
(d) The activity of this company also includes the management of CUF São João da Madeira Clinic, which is clinically and administratively accountable to Hospital CUF Porto, S.A..
(e) This society was formed at the end of 2017, but it has not yet started its activity.
(f) The percentage of control over this entity, given indirectly through Clínica CUF Belém, S.A. is 53.57%.
3.2. ASSOCIATES
The associates registered through the equity method as of 31 December 2017 (Note 19) are the following:
4. CHANGES IN THE CONSOLIDATION SCOPE
The main changes occurred in the consolidation scope in the financial year ended on 31 December 2017 were essentially the following:
4.1. NEWLY CONSOLIDATED COMPANIES
Company Percentage capital heldRegistered office
Control
100%
100% 100%
100%
100%
100%
100%
100%
100% 100%
100%
100%
100%
100%
Carnaxide
S.J.Madeira
Carnaxide
Carnaxide
S.J.Madeira
Lisboa
Coimbra
Carnaxide
100%
100%
Effective
SIMPLYGREEN - Investimentos Imobiliários, S.A. (“Simplygreen”)
Gabinete de Diagnóstico de Imagem de São João da Madeira, Lda. (“GDI”)
Hospimob - Imobiliária, S.A. (“Hospimob”)
PPPS II - Gestão e Consultoria, S.A. (“PPPS II”)
Celso & Santos, S.A. (“C&S”)
Clínica Dr. Luís Álvares, S.A. (“CLA”)
CPIS - Clínica Particular de Coimbra, S.A. (“CPIS”)
PPPS III - Gestão e Consultoria, S.A. (“PPPS III”)

FINANCIAL STATEMENTS REPORT 2017 103
The entry of these entities into the consolidation scope had the following impact on consolidated financial sta-tements:
The stated values are the estimate of the fair values of these subsidiaries’ assets and liabilities.
In 2016, the Group acquired control of Sim X – Serviços de Imagem Médica, Lda. which resulted in a goodwill of 624 thousand euros.
4.2. OTHER OPERATIONS THAT AFFECTED THE SCOPE IN PREVIOUS PERIODS
Digihealth and Haspac
The Ministry of Health terminated the concession contract with the Hospital Amadora Sintra – Sociedade Gestora, S.A. (“HAS”), currently named Digihealth, S.A., on 6 November 2007. This company had managed the Prof. Dr Fernando Fonseca EPE Hospital. Consequently, the activity of another group company, HASPAC – Patologia Clínica, S.A. (“Haspac”), which operated the Clinical Pathology Department on an exclusive basis of Digihealth was also discontinued.
C&S HospimobGDI CPIS TotalSimplygreen CLA
Net assets acquired:
Tangible fixed assets
Other assets
Inventories
Deferred tax liabilities
Intangible assets
Other debtors
Deferred tax assets
Borrowings
Other investments
Cash and cash equivalents
Trade receivables and advances to suppliers
Trade payables and advances from clients
Goodwill (Note 15)
Other liabilities
Settlement by monetary means (Note 46)
State and other public entities
State and other public entities
Acquisition price
Other creditors
Amount due (Note 40)
4,228,627 760,973
- 14,561
- -
- 8,826
- 7,301
- (132)
- 5,519
250 246,967
- -
(3,152,707) (761,352)
- 157,684
- (63,567)
-
737,293 207,972 41,099 136,913 36,368,360 (468,250)
2,145,867
(8,501) (140,509)
737,293 1 382,780
29,624 12,184
- (11,543)
737,293 2,282,780
(360,000) (100,000)
- 900,000
1,992 76,766,703
186 355,263
- -
370 -
- - -
- - (4,067,924)
6,572 1,352,007
150 417,845
- 13,020 13,020
83,116,875
144,655
78,680
173,636
1,030,976
601,694
869,617
788,005
6,742,179
(43,850,755)
(4,068,056)
(1,213,809)
(912,451)
(2,223,331)
(4,267,547)
1,170 859,250
166,335
-
135,982 -
33,739 6,194,453
- -
-
-
- - (39,850,000)
56,658 11,095
(1,041) -
19,328 -
(1,230) (775,059)
159,992 34,387,465
4,654 388,070
(774) (859,045)
227,300 36,368,360
(22,565) (1,795,196)
67,308 2,988,134
3,154
122,135 144,634
78,680
(86,696)
16,466 789,073
(51,397) (1,097,804)
94,883 8,258,750
- (1,298,032)
n,a, 6,790,500
4,732 162,430
(2,624) (38,465)
135,982 7,790,500
(56,106) (1,933,680)
n,a, 1,000,000
JOSÉ DE MELLO SAÚDE
FINANCIAL STATEMENTS REPORT 2017104
On 12 December 2012, the arbitration tribunal, in the current arbitration process, issued a ruling ordering the Administração Regional de Saúde de Lisboa e Vale do Tejo, I.P. (“ARSLVT”) to pay Digihealth the sum of 18,123,526 euros. Although ordered to and given notice pay, ARSLVT never paid the ordered amount. ARSLVT filed an action to annul the arbitration ruling in the South Administrative Central Court and the decision is still pending.
At the end of the first quarter of 2014, Digihealth noted that the effort put into collecting from the ARSLVT was not producing the desired outcome. Therefore, and with the aim of paying off, even if partially, the liabilities contracted with its creditors, Digihealth sounded out the market and managed to find an entity, Finanfarma – Sociedade de Factoring, S.A., willing to sign a factoring contract and to pay a very large sum for the acquisition of Digihealth’s credit over ARSLVT, expressly envisaging the possibility of appealing to the Special Revitalisation Process (“PER”). The strategy advocated by Digihealth merited the agreement of a large majority of creditors (74.46%), representatives of its liability On 1 August 2014, Digihealth filed the PER process following approval from 84% of creditors, and subsequently ratified by the Commercial Court of Lisbon on 5 March 2015.
Even though it had obtained support from different creditors (47.98%), representatives of the HASPAC liability, the truth is that it was not possible to achieve the qualified majority of 67%, thereby enabling an arrangement with creditors to be made. In this context, HASPAC Management was forced to proceed with a voluntary submission request to insolvency at the Tribunal da Comarca de Lisboa Oeste.
It had been declared insolvent on 19 February 2015, and the respective insolvency administrator was appointed. As in previous years, the Board of Directors of Digihealth carried out its activity according to the framework and to the commitments made with the creditors, including the Special Revitalisation Process. Thus, JMS Group believes that is a very limited control over this subsidiary and, due to its immateriality, it was excluded from the consolidation perimeter.
5. BUSINESS SEGMENTS
As argued in IFRS 8, the Group presents the operating segments based on the internal management information model provided to the main agent responsible for making the Group’s operational decisions, who is responsible for the allocation of resources to the segment and for the evaluation of its performance as well as for making strategic decisions.
The main activities undertaken by the Group are classified into the following business segments:
• Private healthcare services;
• Public healthcare services;
• Infrastructures; and
• Others.
On 31 December 2017, the “private healthcare” business area includes the following units:
• seven hospitals providing a total of 566 inpatient beds; 385 consultation rooms; 41 operating theatres, 6 delivery rooms, and a wide offer of specialty consultations, exams, dental care, check-ups, physical and rehabilitation medicine;
• nine outpatient units, with 229 consultation rooms, and offering specialty consultations, exams, dental care, check-ups, physical and rehabilitation medicine and also the possibility of carrying out minor surgery;
• one high technology diagnosis and treatment unit including 56 specially consultation rooms; and,
• eight clinical imaging units with a wide range of exams (bone densitometry, ultrasound scan, mammography, radiology, magnetic resonance imaging and computed tomography).

FINANCIAL STATEMENTS REPORT 2017 105
The public healthcare business area results from two partnership contracts with the Portuguese State, in which the Group manages two hospitals:
• Braga Hospital – resulting from a public-private partnership (established in December 2008), the Management Contract was initiated with ARS Norte IP on 1 September 2009, for a period of 10 years, i.e., until 31 August 2019. The new Braga Hospital, which is part of the NHS, opened in 9 May 2011 and has a total hospital floor area of 102,000 m2, 705 inpatient beds and 109 consultation rooms, 12 operating theatres and one delivery block, serving a population of 1.2 million inhabitants in the Braga and Viana do Castelo districts; and
• Vila Franca de Xira Hospital – the Escala Vila Franca de Xira Consortium – took over the management of Reynaldo dos Santos Hospital on 1 June 2011, being responsible for the entire operations of this hospital which belongs to the Portuguese National Health Service. The management of the previous hospital infrastructure was assured for a two-year period. In April 2013, the new Vila Franca de Xira Hospital opened, with a gross construction area of 49,000 m2, 233 inpatient beds and 33 consultation rooms, 9 operating theatre and 6 delivery rooms, serving about 235,000 inhabitants of the Alenquer, Arruda dos Vinhos, Azambuja, Benavente and Vila Franca de Xira municipalities. This management contract will be in effect until 31 May 2021.
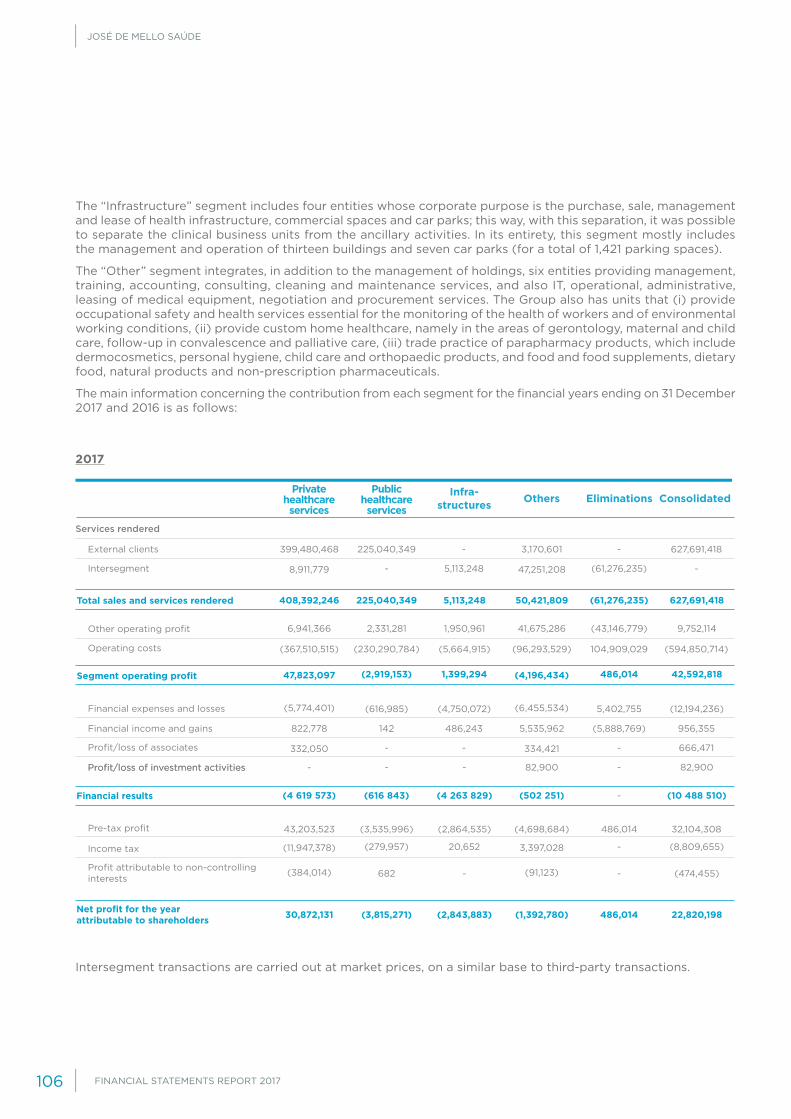
JOSÉ DE MELLO SAÚDE
FINANCIAL STATEMENTS REPORT 2017106
The “Infrastructure” segment includes four entities whose corporate purpose is the purchase, sale, management and lease of health infrastructure, commercial spaces and car parks; this way, with this separation, it was possible to separate the clinical business units from the ancillary activities. In its entirety, this segment mostly includes the management and operation of thirteen buildings and seven car parks (for a total of 1,421 parking spaces).
The “Other” segment integrates, in addition to the management of holdings, six entities providing management, training, accounting, consulting, cleaning and maintenance services, and also IT, operational, administrative, leasing of medical equipment, negotiation and procurement services. The Group also has units that (i) provide occupational safety and health services essential for the monitoring of the health of workers and of environmental working conditions, (ii) provide custom home healthcare, namely in the areas of gerontology, maternal and child care, follow-up in convalescence and palliative care, (iii) trade practice of parapharmacy products, which include dermocosmetics, personal hygiene, child care and orthopaedic products, and food and food supplements, dietary food, natural products and non-prescription pharmaceuticals.
The main information concerning the contribution from each segment for the financial years ending on 31 December 2017 and 2016 is as follows:
2017
Intersegment transactions are carried out at market prices, on a similar base to third-party transactions.
EliminationsInfra-structures Consolidated
Private healthcare services
Others
Services rendered
Intersegment
Profit/loss of associates
Operating costs
Pre-tax profit
External clients
Financial income and gains
Other operating profit
Financial results
Net profit for the year attributable to shareholders
Total sales and services rendered
Profit/loss of investment activities
Segment operating profit
Income tax
Financial expenses and losses
Profit attributable to non-controlling interests
Public healthcare services
8,911,779 47,251,208
332,050 334,421
399,480,468 3,170,601
822,778 5,535,962
(367,510,515) (96,293,529)
43,203,523 (4,698,684)
408,392,246 50,421,809
- 82,900
6,941,366 41,675,286
(4 619 573)
30,872,131
(502 251)
(1,392,780)
47,823,097 (4,196,434)
(11,947,378) 3,397,028
(5,774,401) (6,455,534)
(384,014) (91,123)
- (61,276,235)
- -
225,040,349 -
142 (5,888,769)
(230,290,784) (5,664,915) 104,909,029
(3,535,996) (2,864,535) 486,014
5,113,248 -
- 666,471
- 627,691,418
486,243 956,355
(594,850,714)
32,104,308
225,040,349 (61,276,235)
- -
2,331,281 1,950,961
5,113,248
(43,146,779)
(616 843)
(3,815,271)
(4 263 829)
(2,843,883)
-
486,014
(2,919,153) 486,014
(279,957) -
(616,985) 5,402,755
682 -
627,691,418
- 82,900
9,752,114
(10 488 510)
22,820,198
1,399,294 42,592,818
20,652 (8,809,655)
(4,750,072) (12,194,236)
- (474,455)
Profit/loss of investment activities
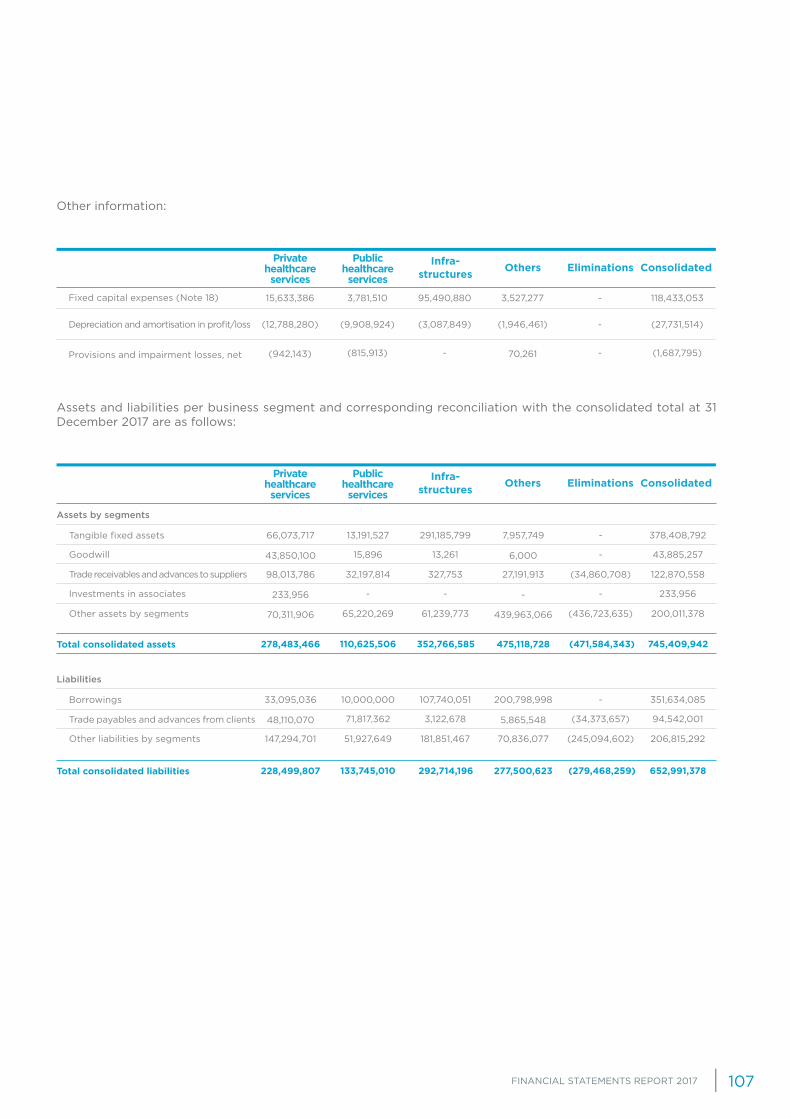
FINANCIAL STATEMENTS REPORT 2017 107
Other information:
Assets and liabilities per business segment and corresponding reconciliation with the consolidated total at 31 December 2017 are as follows:
Provisions and impairment losses, net
Depreciation and amortisation in profit/loss
Fixed capital expenses (Note 18)
Assets by segments
Liabilities
Goodwill
Trade payables and advances from clients
Investments in associates
Other assets by segments
Tangible fixed assets
Borrowings
Trade receivables and advances to suppliers
Other liabilities by segments
Total consolidated assets
Total consolidated liabilities
EliminationsInfra-structures Consolidated
Private healthcare services
OthersPublic
healthcare services
EliminationsInfra-structures Consolidated
Private healthcare services
OthersPublic
healthcare services
(942,143) 70,261
(12,788,280)
15,633,386
(1,946,461)
3,527,277
(815,913) -
(9,908,924)
3,781,510
-
-
- (1,687,795)
(3,087,849)
95,490,880
(27,731,514)
118,433,053
43,850,100
48,110,070
233,956
70,311,906
6,000
5,865,548
-
439,963,066
66,073,717
33,095,036
98,013,786
147,294,701
7,957,749
200,798,998
27,191,913
70,836,077
278,483,466
228,499,807
475,118,728
277,500,623
15,896
71,817,362
-
65,220,269
-
(34,373,657)
-
(436,723,635)
13,191,527
10,000,000
32,197,814
51,927,649
-
-
(34,860,708)
(245,094,602)
13,261
3,122,678
-
61,239,773
43,885,257
94,542,001
233,956
200,011,378
291,185,799
107,740,051
327,753
181,851,467
378,408,792
351,634,085
122,870,558
206,815,292
110,625,506
133,745,010
(471,584,343)
(279,468,259)
352,766,585
292,714,196
745,409,942
652,991,378
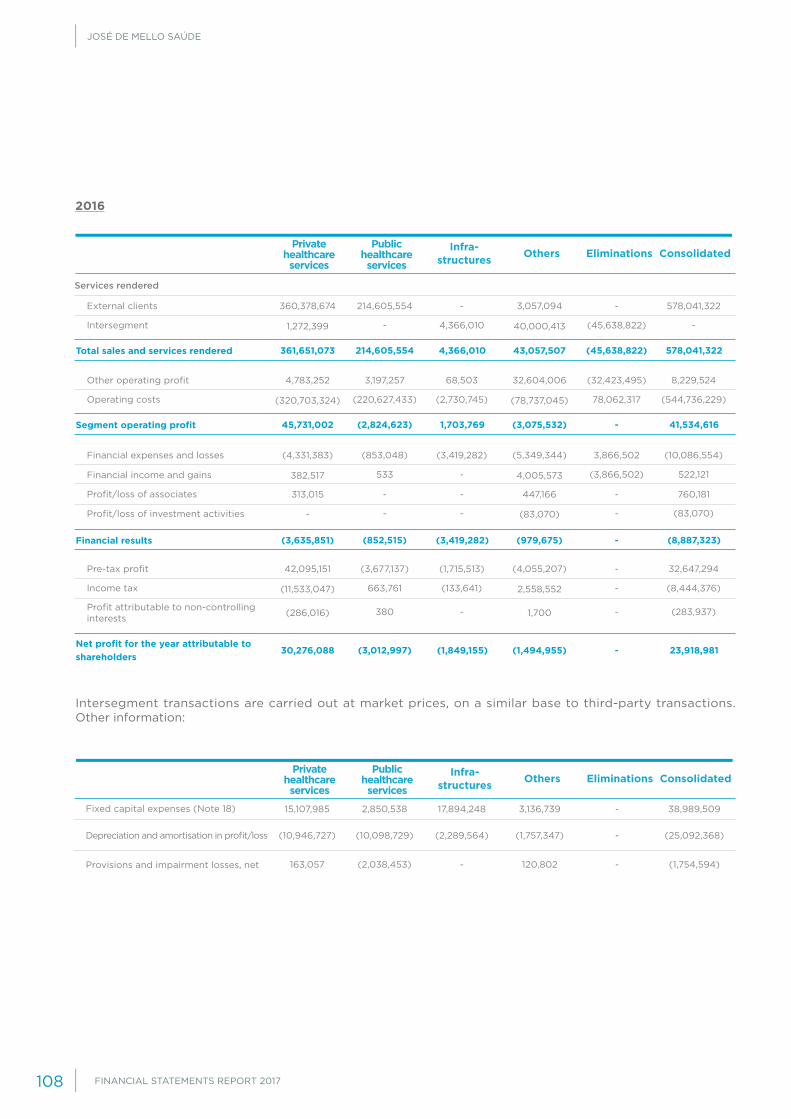
JOSÉ DE MELLO SAÚDE
FINANCIAL STATEMENTS REPORT 2017108
2016
Intersegment transactions are carried out at market prices, on a similar base to third-party transactions. Other information:
Services rendered
Intersegment
Operating costs
Income tax
Profit attributable to non-controlling interests
Financial income and gains
Profit/loss of investment activities
External clients
Other operating profit
Pre-tax profit
Financial expenses and losses
Profit/loss of associates
Total sales and services rendered
Segment operating profit
Financial results
Net profit for the year attributable to shareholders
Provisions and impairment losses, net
Depreciation and amortisation in profit/loss
Fixed capital expenses (Note 18)
EliminationsInfra-structures Consolidated
Private healthcare services
OthersPublic
healthcare services
EliminationsInfra-structures Consolidated
Private healthcare services
OthersPublic
healthcare services
1,272,399
(320,703,324)
(11,533,047)
(286,016)
382,517
-
40,000,413
(78,737,045)
2,558,552
1,700
4,005,573
(83,070)
360,378,674
4,783,252
42,095,151
(4,331,383)
313,015
3,057,094
32,604,006
(4,055,207)
(5,349,344)
447,166
361,651,073
45,731,002
(3,635,851)
30,276,088
43,057,507
(3,075,532)
(979,675)
(1,494,955)
-
(220,627,433)
663,761
380
533
-
(45,638,822)
78,062,317
-
-
(3,866,502)
-
214,605,554
3,197,257
(3,677,137)
(853,048)
-
-
(32,423,495)
-
3,866,502
-
4,366,010
(2,730,745)
(133,641)
-
-
-
-
(544,736,229)
(8,444,376)
(283,937)
522,121
(83,070)
-
68,503
(1,715,513)
(3,419,282)
-
578,041,322
8,229,524
32,647,294
(10,086,554)
760,181
214,605,554
(2,824,623)
(852,515)
(3,012,997)
(45,638,822)
-
-
-
4,366,010
1,703,769
(3,419,282)
(1,849,155)
578,041,322
41,534,616
(8,887,323)
23,918,981
163,057 120,802
(10,946,727)
15,107,985
(1,757,347)
3,136,739
(2,038,453) -
(10,098,729)
2,850,538
-
-
- (1,754,594)
(2,289,564)
17,894,248
(25,092,368)
38,989,509

FINANCIAL STATEMENTS REPORT 2017 109
Assets and liabilities per business segment and corresponding reconciliation with the consolidated total at 31 December 2016 are as follows:
6. CAPITAL MANAGEMENT
The JMS Group actively monitors its capital structure, controlling the share of financing of its assets between equity and debt capital. In this context, the group tracks the gearing ratio, which is the net financial debt over total equity plus net financial debt. The calculation of the net financial debt includes the gross financial debt net of cash and cash equivalents and other financial instruments. The following table presents the details of the calculation of this ratio for 2017 and 2016:
Assets by segments
Liabilities
Goodwill
Trade payables and advances from clients
Investments in associates
Other assets by segments
Tangible fixed assets
Borrowings
Trade receivables and advances to suppliers
Other liabilities by segments
Total consolidated assets
Total consolidated liabilities
Gross financial debt
Cash and cash equivalents
Other financial instruments
Equity + Net Financial Debt (A+B)
Gearing ratio (A/(A + B))
31-12-2017 31-12-2016
Net Financial Debt (A)
Equity (B)
EliminationsInfra-structures Consolidated
Private healthcare services
OthersPublic
healthcare services
33,331,272
35,581,520
168,111
73,784,529
6,000
4,659,104
-
292,697,687
55,849,826
22,971,455
81,681,345
135,322,901
5,888,671
116,912,739
19,148,552
32,369,490
244,815,082
193,875,876
317,740,910
153,941,333
15,896
68,170,882
-
76,858,534
-
(22,260,555)
-
(263,154,615)
17,125,267
10,000,000
16,736,643
50,104,498
-
-
(22,253,322)
(129,082,729)
13,261
1,383,902
-
3,978,412
33,366,429
87,534,852
168,111
184,164,546
110,925,844
125,734
64,359
94,939,793
189,789,608
150,009,928
95,377,577
183,653,952
110,736,339
128,275,379
(285,407,936)
(151,343,285)
114,981,876
96,449,429
502,866,271
421,198,732
421,606,101 219,624,592
47,894,297 16,067,394
35,150,000 48,650,000
88,189,849 77,706,743
426,751,653 232,613,941
79% 67%
154,907,198338,561,804
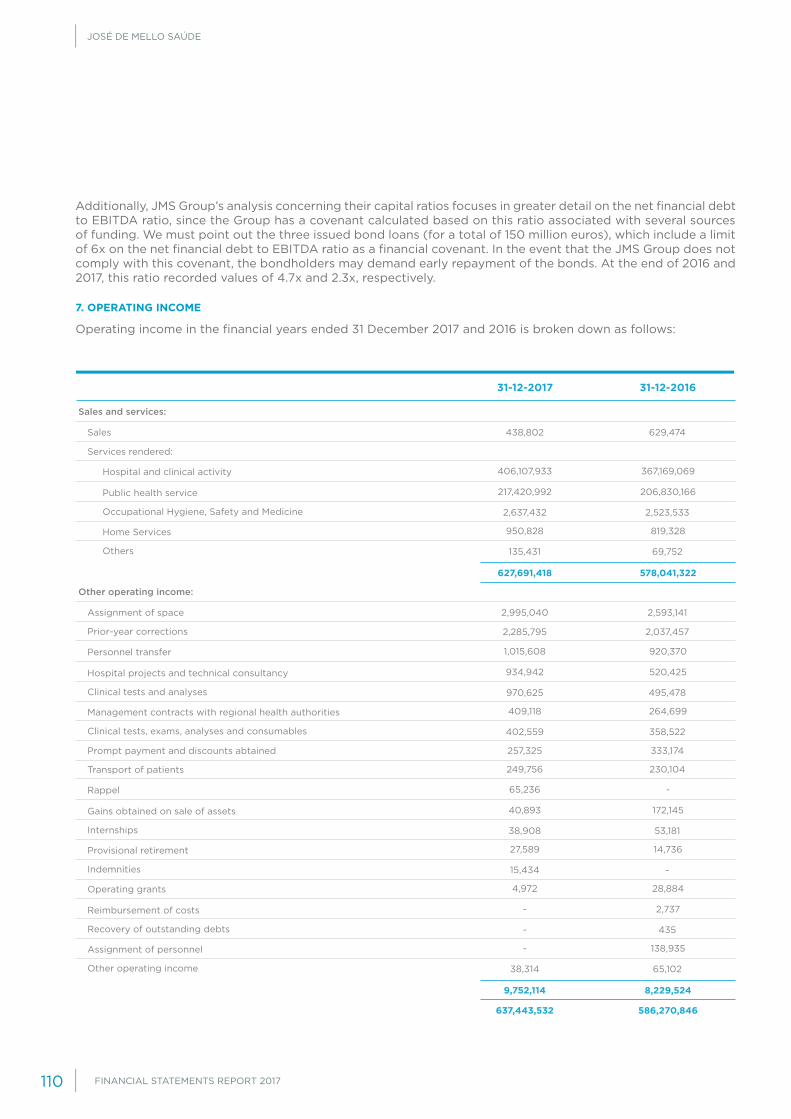
JOSÉ DE MELLO SAÚDE
FINANCIAL STATEMENTS REPORT 2017110
Additionally, JMS Group’s analysis concerning their capital ratios focuses in greater detail on the net financial debt to EBITDA ratio, since the Group has a covenant calculated based on this ratio associated with several sources of funding. We must point out the three issued bond loans (for a total of 150 million euros), which include a limit of 6x on the net financial debt to EBITDA ratio as a financial covenant. In the event that the JMS Group does not comply with this covenant, the bondholders may demand early repayment of the bonds. At the end of 2016 and 2017, this ratio recorded values of 4.7x and 2.3x, respectively.
7. OPERATING INCOME
Operating income in the financial years ended 31 December 2017 and 2016 is broken down as follows:
31-12-2017 31-12-2016
Services rendered:
Prior-year corrections
Transport of patients
Occupational Hygiene, Safety and Medicine
Clinical tests and analyses
Internships
Recovery of outstanding debts
Others
Clinical tests, exams, analyses and consumables
Indemnities
Other operating income
Sales
Assignment of space
Prompt payment and discounts abtained
Public health service
Hospital projects and technical consultancy
Gains obtained on sale of assets
Reimbursement of costs
Home Services
Management contracts with regional health authorities
Provisional retirement
Assignment of personnel
Hospital and clinical activity
Personnel transfer
Rappel
Operating grants
Sales and services:
Other operating income:
438,802
2,995,040
2,285,795
257,325
249,756
2,637,432
970,625
38,908
-
135,431
402,559
15,434
38,314
629,474
2,593,141
2,037,457
333,174
230,104
2,523,533
495,478
53,181
435
69,752
358,522
-
65,102
406,107,933
1,015,608
65,236
4,972
217,420,992
934,942
40,893
-
950,828
409,118
27,589
-
367,169,069
920,370
-
28,884
206,830,166
520,425
172,145
2,737
819,328
264,699
14,736
138,935
627,691,418
9,752,114
637,443,532
578,041,322
8,229,524
586,270,846
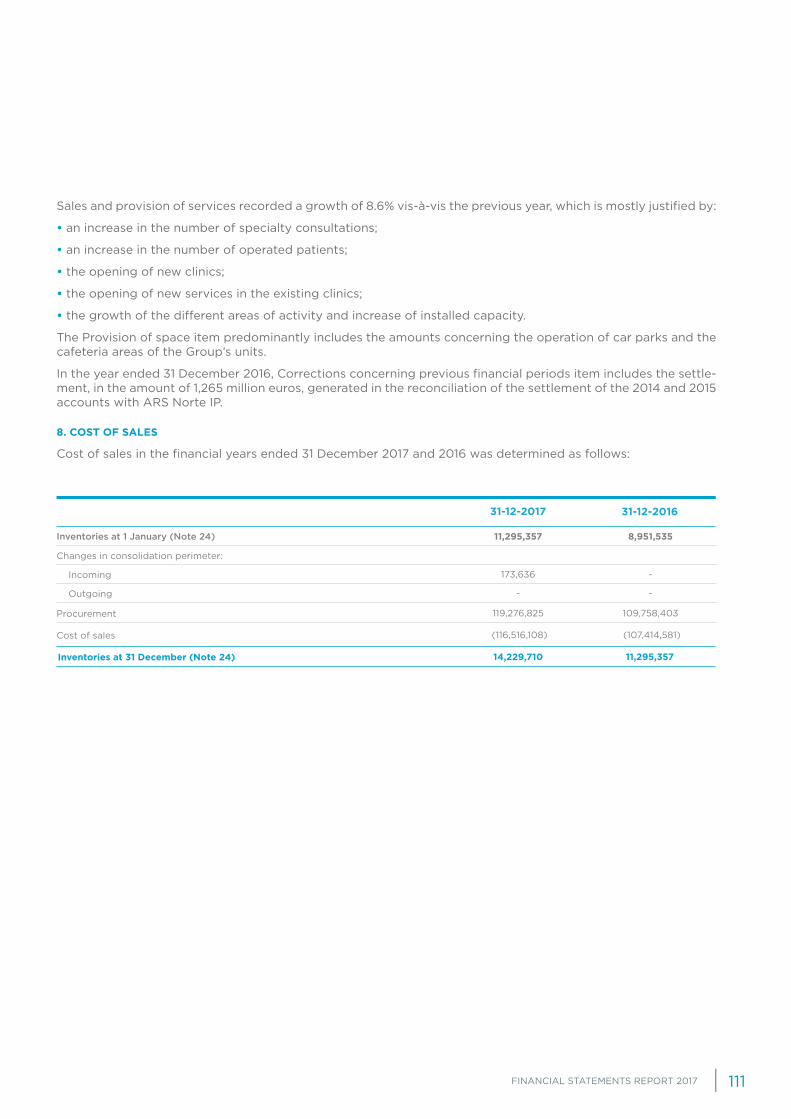
FINANCIAL STATEMENTS REPORT 2017 111
Sales and provision of services recorded a growth of 8.6% vis-à-vis the previous year, which is mostly justified by:
• an increase in the number of specialty consultations;
• an increase in the number of operated patients;
• the opening of new clinics;
• the opening of new services in the existing clinics;
• the growth of the different areas of activity and increase of installed capacity.
The Provision of space item predominantly includes the amounts concerning the operation of car parks and the cafeteria areas of the Group’s units.
In the year ended 31 December 2016, Corrections concerning previous financial periods item includes the settle-ment, in the amount of 1,265 million euros, generated in the reconciliation of the settlement of the 2014 and 2015 accounts with ARS Norte IP.
8. COST OF SALES
Cost of sales in the financial years ended 31 December 2017 and 2016 was determined as follows:
Inventories at 1 January (Note 24)
31-12-2017 31-12-2016
Inventories at 31 December (Note 24)
Changes in consolidation perimeter:
Procurement
Cost of sales
Incoming
Outgoing
11,295,357 8,951,535
119,276,825
(116,516,108)
173,636
-
109,758,403
(107,414,581)
-
-
11,295,35714,229,710

JOSÉ DE MELLO SAÚDE
FINANCIAL STATEMENTS REPORT 2017112
9. EXTERNAL SUPPLIES AND SERVICES
External supplies and services in the financial years ended on 31 December 2017 and 2016 are broken down as follows:
The External Supplies and Services item recorded an increase of about 8.9% vis-à-vis the previous year, which is justified by the Group’s increased activity. Its main subitem concern:
• Fees (59%) – this item includes the amounts paid to healthcare professionals (doctors, nurses, diagnostic technicians and assistants) of the various units within the scope of the Group’s operating activity;
• Specialized Work (11%) – this item mostly concerns clinical works;
• Subcontracts (12%) – includes contracting specific services such as (i) catering, (ii) cleaning, (iii) patient transport and (iv) CDTMs;
31-12-2017 31-12-2016
Specialised work
Communications
Travel and accommodation
Litigation and notary public fees
Fees
Advertising
Tools and utensils
Maintenance and repair
Water
Road tolls
Transport of goods
Electricity
Collection of waste
Office material
Other supplies and services
Subcontracts
Fuel
Air conditioning
Cleaning, hygiene and comfort
Rents and leases
Insurance
Articles for free distribution
Books and technical documentation
9,109,711
1,295,555
254,055
10,238
6,410,667
2,669,667
1,740,070
1,155,539
868,304
588,226
245,154
144,872
260,239
28,924,978
25,850,818
142,234,579
1,537,951
399,284
167,359
17,180,664
1,568,816
54,896
66,443
11,606,045
1,193,224
238,187
8,555
6,260,843
2,191,508
2,049,940
1,118,923
191,996
301,026
22,899,034
42,573,698
110,190,913
1,728,541
450,923
529,599
1,043,124
136,246
154,538
16,279,333
1,400,043
267,843
36,055
222,850,139242,738,087
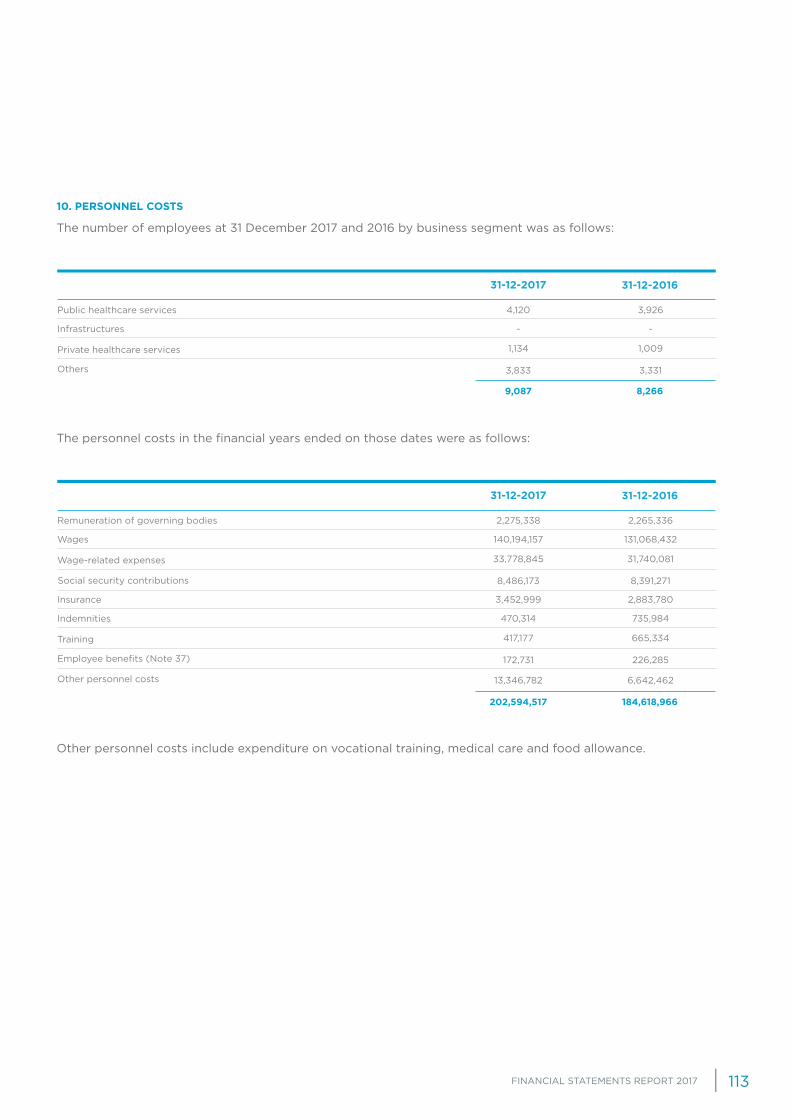
FINANCIAL STATEMENTS REPORT 2017 113
10. PERSONNEL COSTS
The number of employees at 31 December 2017 and 2016 by business segment was as follows:
The personnel costs in the financial years ended on those dates were as follows:
Other personnel costs include expenditure on vocational training, medical care and food allowance.
Public healthcare services
Infrastructures
Private healthcare services
31-12-2017 31-12-2016
Others
Remuneration of governing bodies
Insurance
Wages
Indemnities
Wage-related expenses
Training
31-12-2017 31-12-2016
Social security contributions
Employee benefits (Note 37)
Other personnel costs
4,120 3,926
- -
1,134
3,833
1,009
3,331
8,2669,087
2,275,338
3,452,999
2,265,336
2,883,780
140,194,157
470,314
131,068,432
735,984
33,778,845
417,177
8,486,173
172,731
13,346,782
31,740,081
665,334
8,391,271
226,285
6,642,462
184,618,966202,594,517
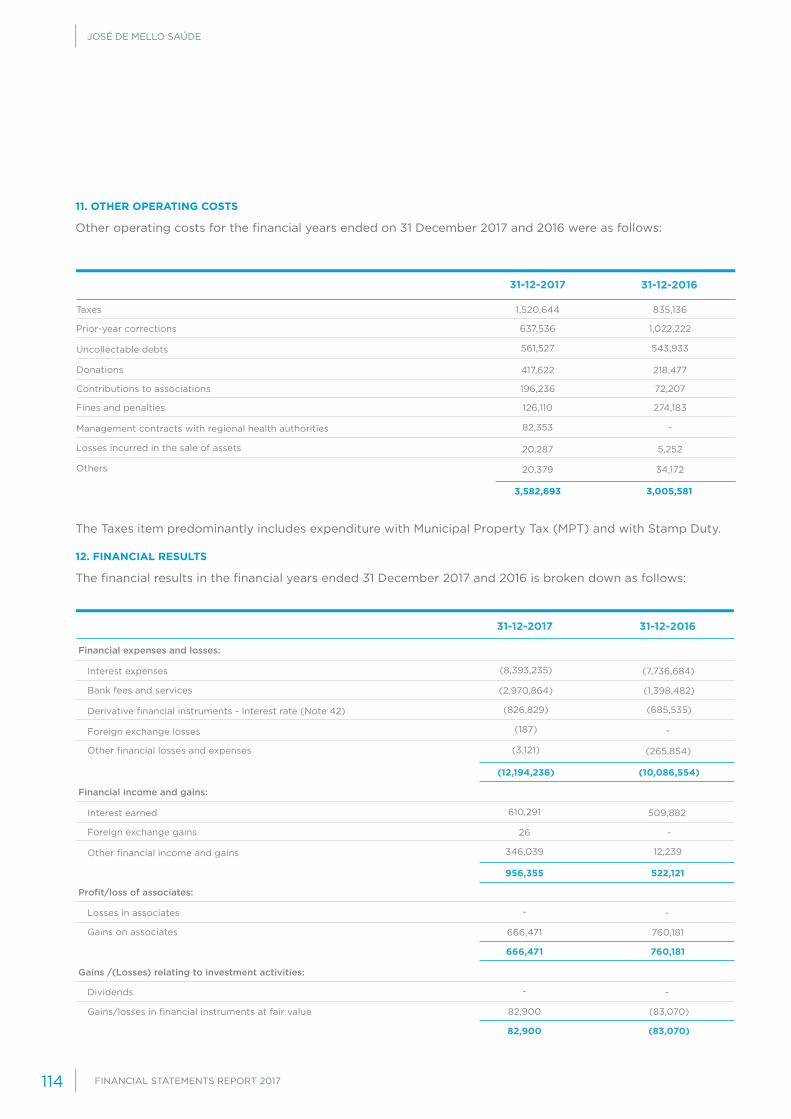
JOSÉ DE MELLO SAÚDE
FINANCIAL STATEMENTS REPORT 2017114
11. OTHER OPERATING COSTS
Other operating costs for the financial years ended on 31 December 2017 and 2016 were as follows:
The Taxes item predominantly includes expenditure with Municipal Property Tax (MPT) and with Stamp Duty.
12. FINANCIAL RESULTS
The financial results in the financial years ended 31 December 2017 and 2016 is broken down as follows:
Taxes
Contributions to associations
Prior-year corrections
Fines and penalties
Uncollectable debts
Management contracts with regional health authorities
31-12-2017 31-12-2016
Donations
Losses incurred in the sale of assets
Others
31-12-2017 31-12-2016
Bank fees and services
Foreign exchange gains
Gains on associates
Gains/losses in financial instruments at fair value
Other financial losses and expenses
Interest expenses
Interest earned
Losses in associates
Dividends
Foreign exchange losses
Derivative financial instruments - Interest rate (Note 42)
Other financial income and gains
Financial expenses and losses:
Financial income and gains:
Profit/loss of associates:
Gains /(Losses) relating to investment activities:
1,520,644
196,236
835,136
72,207
637,536
126,110
1,022,222
274,183
561,527
82,353
417,622
20,287
20,379
543,933
-
218,477
5,252
34,172
3,005,5813,582,693
(2,970,864)
26
666,471
82,900
(826,829)
346,039
(8,393,235)
610,291
-
-
(7,736,684)
509,882
-
-
(265,854)
(187)
(3,121)
(685,535)
12,239
(1,398,482)
-
760,181
(83,070)
-
(12,194,236)
956,355
666,471
82,900
(10,086,554)
522,121
760,181
(83,070)

FINANCIAL STATEMENTS REPORT 2017 115
The detail of the values recognised as results concerning interests in associated companies in the years ending on 31 December 2017 and 2016 is as follows:
The JMS Group and its domestic subsidiaries 75% or more directly or indirectly owned are liable for corporate income tax under the Special Taxation Scheme for Groups of Companies (“STSGC”). The companies included in the RETGS determine and record tax on income as if they were taxed individually; the determined responsibili-ties are, however, recognized as debts to the parent company in the tax group, JMS, which is responsible for the global determination and for the reverse charge of the tax. Concerning the companies not covered by the RETGS, current tax is calculated based on the corresponding taxable bases and on the tax rates in effect, in accordance with the tax rules and schemes applicable in the territory of each company’s headquarters.
13. INCOME TAX
Income tax recognised in the financial years ended on 31 December 2017 and 2016 is as follows:
Company 31-12-201631-12-2017
Gains in associates
Gains in associates
Losses in associates
Losses in associates
Escala Parque – Gestão de Estacionamento, S.A. (note 30)
Centro Gamma Knife-Radiocirurgia, S.A. (note 19)
Escala Braga - Sociedade Gestora do Edifício, S.A. (note 30)
31-12-2017 31-12-2016
In previous financial year
Other transactions
Revaluation of tangible fixed assets
Retirement benefits
Tax losses
In financial year
Temporary difference and reversal
Customer impairments
Provisions not approved for tax purposes
Current tax:
Deferred tax (Note 22):
Tax for the year
260,754 302,691
97,956 -
307,761 457,490
- -
- -
- -
666,471 760,181
(294,608)
-
(510,068)
51,349
57,538
9,182,340
-
99,522
223,582
9,905,474
(282,263)
-
(697,916)
(590,101)
34,793
-
-
74,387
8,887,732
(78,077)
8,809,655
9,315,374
(870,998)
8,444,376
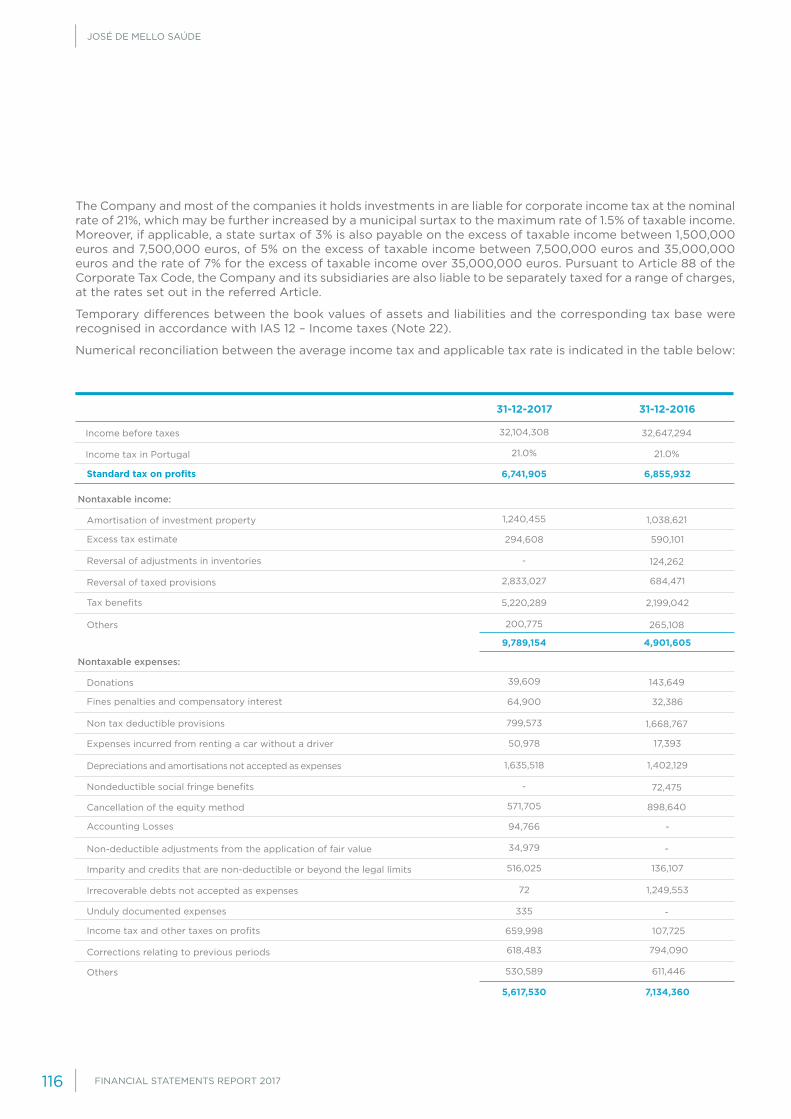
JOSÉ DE MELLO SAÚDE
FINANCIAL STATEMENTS REPORT 2017116
The Company and most of the companies it holds investments in are liable for corporate income tax at the nominal rate of 21%, which may be further increased by a municipal surtax to the maximum rate of 1.5% of taxable income. Moreover, if applicable, a state surtax of 3% is also payable on the excess of taxable income between 1,500,000 euros and 7,500,000 euros, of 5% on the excess of taxable income between 7,500,000 euros and 35,000,000 euros and the rate of 7% for the excess of taxable income over 35,000,000 euros. Pursuant to Article 88 of the Corporate Tax Code, the Company and its subsidiaries are also liable to be separately taxed for a range of charges, at the rates set out in the referred Article.
Temporary differences between the book values of assets and liabilities and the corresponding tax base were recognised in accordance with IAS 12 – Income taxes (Note 22).
Numerical reconciliation between the average income tax and applicable tax rate is indicated in the table below:
31-12-2017 31-12-2016
Standard tax on profits
Excess tax estimate
Fines penalties and compensatory interest
Accounting Losses
Tax benefits
Depreciations and amortisations not accepted as expenses
Irrecoverable debts not accepted as expenses
Others
Reversal of taxed provisions
Expenses incurred from renting a car without a driver
Imparity and credits that are non-deductible or beyond the legal limits
Corrections relating to previous periods
Income tax in Portugal
Amortisation of investment property
Donations
Cancellation of the equity method
Reversal of adjustments in inventories
Non tax deductible provisions
Non-deductible adjustments from the application of fair value
Income tax and other taxes on profits
Others
Nondeductible social fringe benefits
Unduly documented expenses
Income before taxes
Nontaxable income:
Nontaxable expenses:
294,608
64,900
94,766
5,220,289
1,635,518
72
2,833,027
50,978
516,025
21.0%
32,104,308
1,240,455
39,609
571,705
-
799,573
34,979
200,775
-
335
659,998
618,483
530,589
107,725
794,090
611,446
21.0%
32,647,294
1,038,621
143,649
898,640
124,262
1,668,767
-
265,108
72,475
-
590,101
32,386
-
2,199,042
1,402,129
1,249,553
684,471
17,393
136,107
6,741,905
9,789,154
5,617,530
6,855,932
4,901,605
7,134,360

FINANCIAL STATEMENTS REPORT 2017 117
31-12-2017 31-12-2016
Tax loss/Taxable profit
Income tax
Effective tax rate
Calculated tax
Local Tax
Effect of the increase/reversal of deferred taxes
Tax benefits
Income tax in Portugal
Autonomous taxation
Local Government Tax
Effect of insufficiency/excess tax estimate
Others
Losses carried forward
14. DIVIDENDS
In 2017, dividends concerning the financial year of 2016 were paid in the amount of 6.5 million euros.
Additionally, according to resolution of the Board of Directors held on 29 November 2017, in the financial year ending on 31 December 2017 interim dividends of 1.33 euros per share were paid, amounting to 14.1 million euros, on the result of the mid-term review prepared on 31 October 2017.
In the financial year ended on 31 December 2016, interim dividends were paid 1.08 euros per share, in the amount of 11.4 million euros.
15. REVENUE PER SHARE
The basic and diluted earnings per share in the financial years ended 31 December 2017 and 2016 was calculated considering the following amounts:
On 31 December 2017 and 2016 there were no dilutive effects of earnings per share, so the diluted revenue per share is equal to basic revenue per share.
Net basic earnings per share (euro)
31-12-2017 31-12-2016
Weighted average number of shares for calculation of basic earnings per share
Profit for the purpose of calculating basic earnings per share (profit for the period)
Basic earnings per share
749,432
(78,077)
(231,694)
21.0%
262,135
698,983
1,417,465
(294,608)
737,338
21.0%
541,787
729,521
1,410,237
(590,101)
(123,632)
678,314
(870,998)
-
27,932,685
8,809,655
27.4%
2,998,839
5,810,815
34,880,049
8,444,376
25.9%
1,233,341
7,211,035
2.15 2.26
10,600,000
22,820,198 23,918,981
10,600,000

JOSÉ DE MELLO SAÚDE
FINANCIAL STATEMENTS REPORT 2017118
Public healthcare
services
Infra-structures Total
Private healthcare
servicesOthers
Balance at 1 January 2016
Changes in consolidation perimeter:
Changes in consolidation perimeter:
Outgoing
Outgoing
Impairment losses (Note 38)
Incoming
Incoming
Balance at 31 December 2016
Balance at 31 December 2017
16. GOODWILL
The changes in the values of goodwill during the financial years ended 31 December 2017 and 2016 were as follows:
Goodwill in the financial years ended on 31 December 2017 and 2016 was as follows:
31-12-2016Segment (Note 5)
Private healthcare services
Private healthcare services
Private healthcare services
Private healthcare services
Private healthcare services
Private healthcare services
Private healthcare services
Private healthcare services
Private healthcare services
Private healthcare services
Private healthcare services
Private healthcare services
Public healthcare services
Infra-structures
31-12-2017Company
Hospital CUF Infante Santo, S.A.
Hospital CUF Porto, S.A.
VALIR - Sociedade Gestora de Participações Sociais, S.A.
Celso & Santos, S.A.
Nova Imagem - Centro Radiodiagnóstico, S.A.
Hospital CUF Descobertas, S.A.
SIM-X - Serviço de Imagem Médica, Lda.
Imo health - Investimentos Imobiliários, S.A.
CPIS - Clínica Particular de Coimbra, S.A.
Clínica Dr. Luís Álvares, S.A.
Escala Vila Franca – Sociedade Gestora do Estabelecimento, S.A.
Hospital CUF Santarém, S.A.
Gabinete de Diagnóstico de Imagem de São João da Madeira, Lda.
Hospital CUF Cascais, S.A.
-
-
-
-
-
-
-
-
(66,100)
624,000
10,518,828
-
-
-
33,331,272
43,850,100
32,773,372
13,261
13,261
13,261
-
-
-
-
-
-
-
-
-
-
-
-
-
-
-
-
-
-
(66,100)
624,000
10,518,828
15,896
15,896
15,896
6,000
6,000
6,000
33,366,429
43,885,257
32,808,529
- 8,258,750
12,432,81912,432,819
7,269,220 7,269,220
7,035,102 7,035,102
5,220,465 5,220,465
2,145,867
624,000 624,000
482,166 482,166
160,279 160,279
97,265 97,265
94,883 -
-
19,328 -
15,896 15,896
13,261 13,261

FINANCIAL STATEMENTS REPORT 2017 119
31-12-2016Segment (Note 5)
Others
31-12-2017Company
Ecografia de Cascais, Lda.
Clínica de Serviços Médicos e Computorizados de Belém, S.A.
Vramondi International BV
Impairment tests were carried out using the following methods:
• The recoverable amounts of cash generating units were determined based on the value-in-use calculation. The use of this method requires the estimate of future cash flows arising from the operations of each cash-genera-ting unit and choice of an appropriate discount rate;
• The valuations are supported by past results and future prospects of development of the markets in which the Group operates. Five-year projections of future cash flows for each of the businesses have been prepared in accordance with the plans defined by the Board of Directors.
• Each healthcare unit is a cash-generating unit. Valir – Sociedade Gestora de Participações Sociais, SGPS S.A. includes Instituto CUF – Diagnóstico e Tratamento, S.A. unit, which is analysed together with Hospital CUF Porto, S.A., Nova Imagem – Centro Radiodiagnóstico, S.A. and S.P.S.D – Sociedade Portuguesa de Serviços Domiciliá-rios, S.A., given the complementarity of provided services and the geographical proximity;
and using the following assumptions:
The revenue growth rate is reviewed annually in cash flow projections. It is calculated for each cash-generating unit and for each of the five years considered in the projections, with the rate shown in the table above the average growth rate for the five years and for all cash-generating units.
The most significant subsidiaries were reviewed in 2017. This review concluded that there was no evidence of impairment of the value of goodwill that has been recognised.
Sensitivity analyses were performed on the main variables: (i) discount rate (+/- 0.5%) and (ii) perpetuity growth rate (+/- 0.5%). The results of the sensitivity analysis performed do not indicate the existence of impairment.
3%
3%
7%
7%
-
2%
8%
8%
Period Risk-Free Interest Rate Wacc Rate Perpetuity Growth Rate Revenue Growth Rate
Explicit
Perpetuity
Private healthcare services
Private healthcare services
6,0006,000
9,1199,119
837 837
43,885,257 33,366,429
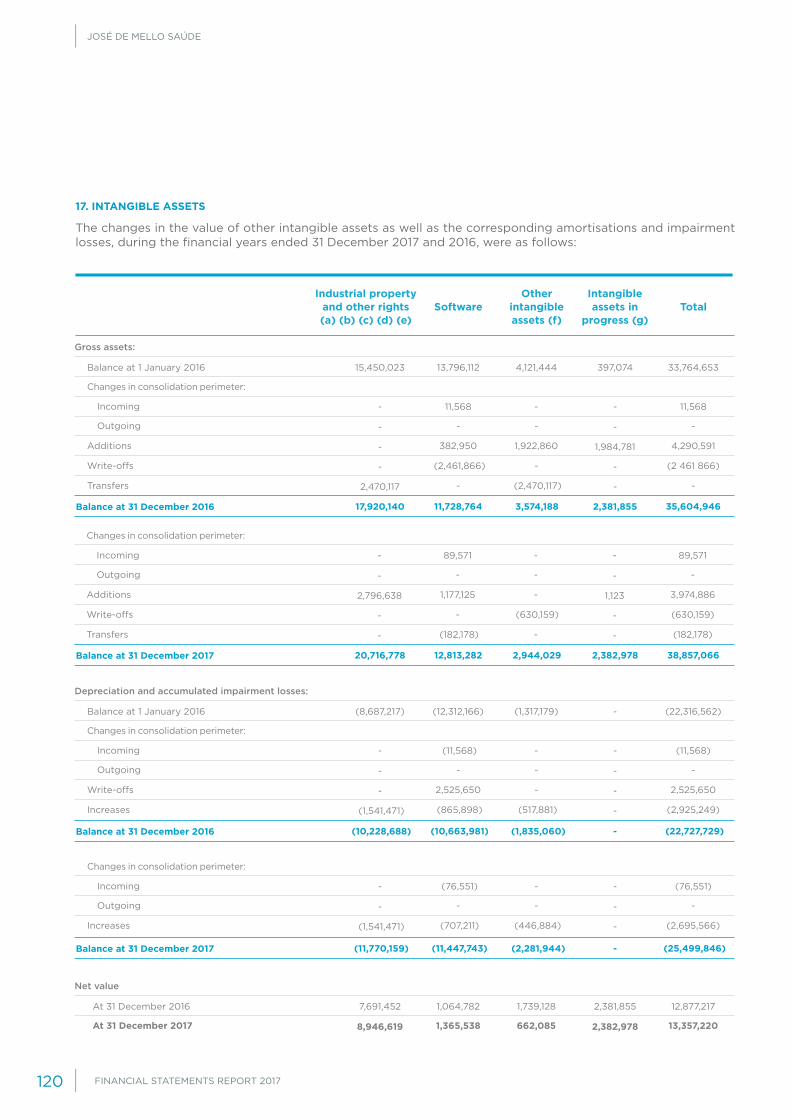
JOSÉ DE MELLO SAÚDE
FINANCIAL STATEMENTS REPORT 2017120
17. INTANGIBLE ASSETS
The changes in the value of other intangible assets as well as the corresponding amortisations and impairment losses, during the financial years ended 31 December 2017 and 2016, were as follows:
Software TotalOther
intangible assets (f)
Industrial property and other rights (a) (b) (c) (d) (e)
Intangible assets in
progress (g)
Gross assets:
Depreciation and accumulated impairment losses:
Net value
Changes in consolidation perimeter:
Changes in consolidation perimeter:
At 31 December 2017
Changes in consolidation perimeter:
Changes in consolidation perimeter:
Outgoing
Outgoing
Outgoing
Outgoing
Additions
Write-offs
Increases
Additions
Write-offs
Increases
Write-offs
Transfers
Transfers
Balance at 1 January 2016
Balance at 1 January 2016
At 31 December 2016
Incoming
Incoming
Incoming
Incoming
Balance at 31 December 2016
Balance at 31 December 2016
Balance at 31 December 2017
Balance at 31 December 2017
8,946,619
-
-
-
-
-
-
(1,541,471)
2,796,638
-
(1,541,471)
-
2,470,117
-
2,382,978
-
-
-
-
1,984,781
-
-
1,123
-
-
-
-
-
15,450,023
(8,687,217)
7,691,452
-
-
-
-
397,074
-
2,381,855
-
-
-
-
17,920,140
(10,228,688)
(11,770,159)
20,716,778
2,381,855
-
-
2,382,978
1,365,538
-
-
-
-
382,950
2,525,650
(707,211)
1,177,125
(2,461,866)
(865,898)
-
-
(182,178)
13,357,220
-
-
-
-
4,290,591
2,525,650
(2,695,566)
3,974,886
(2 461 866)
(2,925,249)
(630,159)
-
(182,178)
13,796,112
(12,312,166)
1,064,782
11,568
(11,568)
(76,551)
89,571
33,764,653
(22,316,562)
12,877,217
11,568
(11,568)
(76,551)
89,571
662,085
-
-
-
-
1,922,860
-
(446,884)
-
-
(517,881)
(630,159)
(2,470,117)
-
4,121,444
(1,317,179)
1,739,128
-
-
-
-
11,728,764
(10,663,981)
(11,447,743)
12,813,282
35,604,946
(22,727,729)
(25,499,846)
38,857,066
3,574,188
(1,835,060)
(2,281,944)
2,944,029

FINANCIAL STATEMENTS REPORT 2017 121
(a) The management contract between ARS Norte and Escala Braga – Sociedade Gestora do Estabelecimento, S.A., which establishes the management and operation of Braga Hospital as a public-private partnership, came into force on 1 September 2009. On the date of transfer, Escala Braga – Sociedade Gestora do Esta-belecimento, S.A. paid the sum of 15 million euros under the hospital management contract, deducted from which was the amount corresponding to inventories and tangible fixed assets, and the remaining amount was called concession rights.
(b) The management contract between the Ministries of Health and Finance and Escala Vila Franca - Sociedade Gestora do Estabelecimento, S.A., which establishes the management and operation of Braga Hospital as a public-private partnership, came into force on 1 June 2011. On the date of transfer, Escala Vila Franca - So-ciedade Gestora do Estabelecimento, S.A. paid the sum of 7.5 million euros under the hospital management contract, deducted from which was the amount corresponding to inventories and tangible fixed assets, and the remaining amount was called concession rights. This amount will be amortised in 10 years, the term of the contract.
(c) This item includes the amount of 2.8 million euros, categorized as “Surface Rights” and which concern a transfer agreement by the City Council of Cascais to CUF Cascais Hospital. This contract concerns the transfer of the surface rights of two properties located in the municipality of Cascais and has a duration of 40 years.
(d) This item includes the amount of 2.4 million euros, corresponding to the right to operate a car park. Initially, a partnership was entered into between Hospital CUF Infante Santo, S.A., ESLI – Parques de Estacionamento, S.A. and the City Council of Lisbon, which awarded the right to operate the car park for a period of 50 years. In 2016, Hospital CUF Infante Santo, S.A. ceded the contractual position to Infrahealth – Gestão de Infraes-truturas, Lda.
(e) This item also includes the amount of 150 thousand euros concerning the transfer of CUF São Domingos de Rana Clinic.
(f) This caption includes the amount of 3,228,817 euros corresponding to the total estimated value of investments expected until the end of the management and operation contract for the Vila Franca de Xira Hospital, arising from the obligations laid down in Annex V of that contract. As specified in IAS 37 – Provisions, contingent liabilities and contingent assets and in accordance with the principles described in IFRIC 12 – Service conces-sion arrangements, this value began to be amortised in April 2013 following the transfer to the new facility, which was when new capacity was acquired and an investment plan was prepared envisaging the recognition of the future liability with the replacement of the referred equipment by the end of the contract. Within the scope of Clause 123 (Reversal of Goods), the goods subject to revert to the Public Contracting Entity must be in good working order and fully operational, with all conservation, maintenance and renewal operations met. Considering that all medical equipment reaching the end of its service life before the end of the management contract shall be the target of investment, a provision was created in 2013 to account for the intangible, with it beginning to be amortized in April of that year following the transfer to the hospital’s new facilities (when the new installed capacity was acquired). To that effect, an investment plan was drafted where the recogni-tion of the future obligation with the replacement of the aforementioned equipment is expected by the end of the contract. During the financial period of 2017, by reviewing the expected purchasing values, this asset was adjusted and reduced by 630 thousand euros, with the corresponding provision adjusted by the same amount (Note 38).
(g) The value recorded in ongoing intangible assets includes the amount of 1.6 million euros concerning the underground surface rights on a plot of land adjacent to the car park of Descobertas Hospital’s Expansion Building, given by the City Council of Lisbon, and which is still under construction.
There are no signs of impairment on the intangible assets.

JOSÉ DE MELLO SAÚDE
FINANCIAL STATEMENTS REPORT 2017122
18. TANGIBLE FIXED ASSETS
The changes in the value of tangible fixed assets as well as the corresponding depreciation and accumulated impairment losses, during the financial years ended 31 December 2017 and 2016, were as follows:
Land and natural
resources
Other tangible assets
Tangible assets in progress
TotalBasic equipment
Land and natural
resources
31-12-2017
Office equipment
Gross assets:
Changes in consolidation perimeter
Changes in consolidation perimeter
Fair value variation
Settlements
Additions
Depreciation
Settlements
Disposals and write-offs
Intangible transfers
Disposals and write-offs
Transfers
Net value
Transfers
Balance at 1 January 2017
Balance at 1 January 2017
Discontinued operations
Discontinued operations
Balance at 31 December 2017
Balance at 31 December 2017
Depreciation and accumulated impairment losses:
-
-
-
-
-
-
-
-
-
-
46,333,640
-
-
3,926
982,762
(1,375,951)
(3,926)
-
-
-
-
2,742,471
713
44,352,024
-
-
-
1,981,616
20,639,128
(17,603,856)
-
-
46,333,640
-
22,427,062
(19,684,591)
8,999,371
8,161
72,586,051
(8,305,287)
(8,161)
29,945
-
(25,695)
-
227,860,627
(6,657,691)
-
-
-
-
8,999,371
(63,732)
-
(13,453)
30,544,164 118,433,053
(25,035,948)
-
-
-
-
-
-
63,732
134,640
- - 182,178
-
-
67,093
-
-
61,074,886
(298,596)
-
378,408,792
- 6,655,361 -
114,742,314
(36,077,226)
-
-
82,655,784
(86,939)
3,967,736
(2,451,219)
808,386
708,710
79,910
(42,076)
134,402
(91,689)
23,875,360 364,590,033
(174,800,425)
-
-
-
-
-
-
-
-
89,493,431
(3,288,945)
-
(75,819)
14,320,076
(15,341,257)
75,819
104,695
182,178
(272,901)
-
40,330,075
1,617
160,846,804
(121,027,654)
-
-
272,291,973
(44,431,346)
214,312
(147,219)
61,074,886
-
581,463,202
(203,054,410)
179,121,330
(138,791,254)
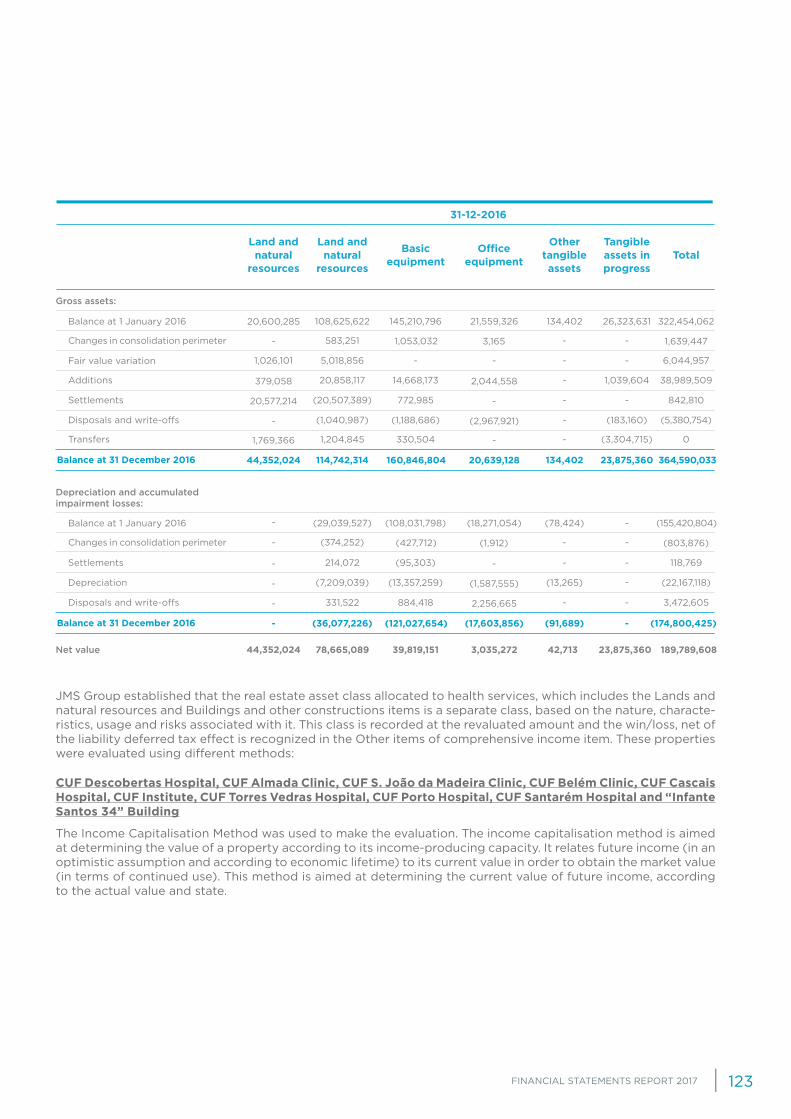
FINANCIAL STATEMENTS REPORT 2017 123
JMS Group established that the real estate asset class allocated to health services, which includes the Lands and natural resources and Buildings and other constructions items is a separate class, based on the nature, characte-ristics, usage and risks associated with it. This class is recorded at the revaluated amount and the win/loss, net of the liability deferred tax effect is recognized in the Other items of comprehensive income item. These properties were evaluated using different methods:
CUF Descobertas Hospital, CUF Almada Clinic, CUF S. João da Madeira Clinic, CUF Belém Clinic, CUF Cascais Hospital, CUF Institute, CUF Torres Vedras Hospital, CUF Porto Hospital, CUF Santarém Hospital and “Infante Santos 34” Building
The Income Capitalisation Method was used to make the evaluation. The income capitalisation method is aimed at determining the value of a property according to its income-producing capacity. It relates future income (in an optimistic assumption and according to economic lifetime) to its current value in order to obtain the market value (in terms of continued use). This method is aimed at determining the current value of future income, according to the actual value and state.
Land and natural
resources
Other tangible assets
Tangible assets in progress
TotalBasic equipment
Land and natural
resources
31-12-2016
Office equipment
Gross assets:
Changes in consolidation perimeter
Changes in consolidation perimeter
Settlements
Additions
Depreciation
Settlements
Disposals and write-offs
Disposals and write-offs
Net value
Transfers
Balance at 1 January 2016
Balance at 1 January 2016
Fair value variation
Balance at 31 December 2016
Balance at 31 December 2016
Depreciation and accumulated impairment losses:
-
-
379,058
-
20,577,214
-
-
44,352,024
1,769,366
-
2,044,558
(1,587,555)
-
2,256,665
(2,967,921)
3,035,272
-
20,600,285
1,026,101
-
-
21,559,326
(18,271,054)
-
44,352,024
-
20,639,128
(17,603,856)
214,072
20,858,117
(7,209,039)
(20,507,389)
331,522
(1,040,987)
78,665,089
1,204,845
- - 118,769
-
(13,265)
1,039,604 38,989,509
(22,167,118)
-
-
-
-
-
-
842,810
3,472,605
-
42,713
(183,160)
23,875,360
(5,380,754)
189,789,608
- (3,304,715) 0
108,625,622
(29,039,527)
5,018,856
583,251
(374,252)
1,053,032
(427,712)
3,165
(1,912)
-
-
134,402
(78,424)
26,323,631 322,454,062
(155,420,804)
- -
-
-
6,044,957
1,639,447
(803,876)
(95,303)
14,668,173
(13,357,259)
772,985
884,418
(1,188,686)
39,819,151
330,504
145,210,796
(108,031,798)
-
114,742,314
(36,077,226)
134,402
(91,689)
23,875,360
-
364,590,033
(174,800,425)
160,846,804
(121,027,654)
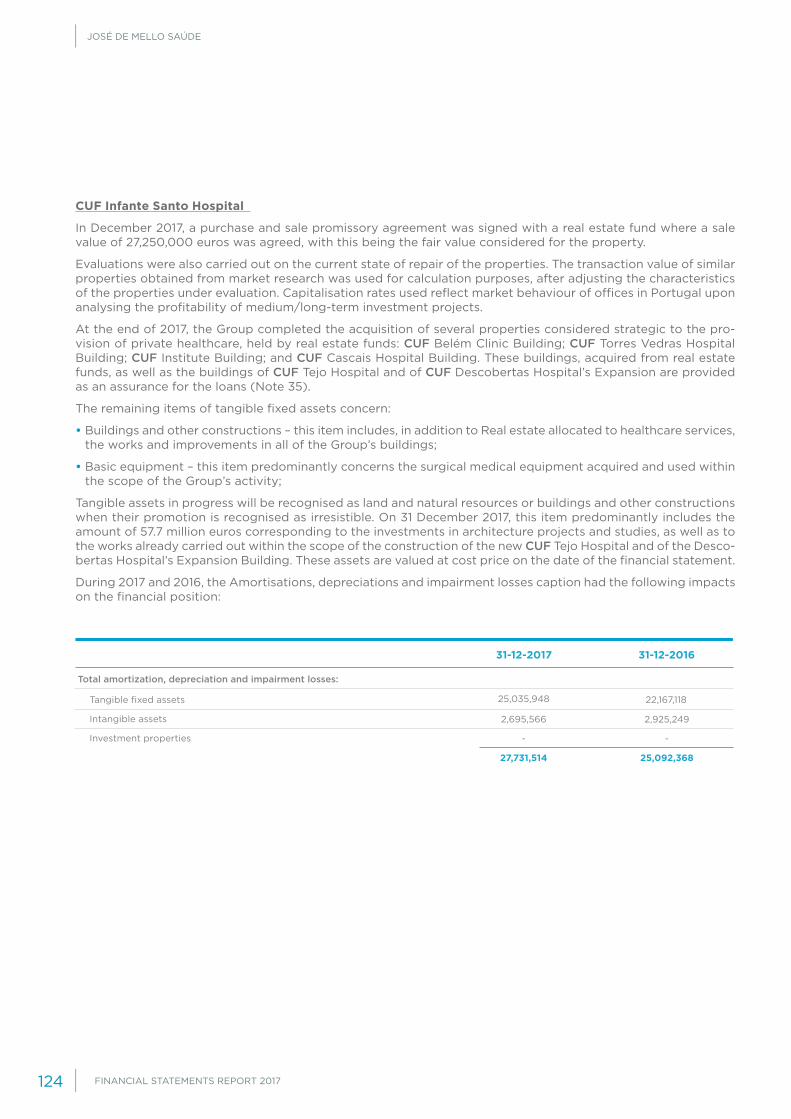
JOSÉ DE MELLO SAÚDE
FINANCIAL STATEMENTS REPORT 2017124
CUF Infante Santo Hospital
In December 2017, a purchase and sale promissory agreement was signed with a real estate fund where a sale value of 27,250,000 euros was agreed, with this being the fair value considered for the property.
Evaluations were also carried out on the current state of repair of the properties. The transaction value of similar properties obtained from market research was used for calculation purposes, after adjusting the characteristics of the properties under evaluation. Capitalisation rates used reflect market behaviour of offices in Portugal upon analysing the profitability of medium/long-term investment projects.
At the end of 2017, the Group completed the acquisition of several properties considered strategic to the pro-vision of private healthcare, held by real estate funds: CUF Belém Clinic Building; CUF Torres Vedras Hospital Building; CUF Institute Building; and CUF Cascais Hospital Building. These buildings, acquired from real estate funds, as well as the buildings of CUF Tejo Hospital and of CUF Descobertas Hospital’s Expansion are provided as an assurance for the loans (Note 35).
The remaining items of tangible fixed assets concern:
• Buildings and other constructions – this item includes, in addition to Real estate allocated to healthcare services, the works and improvements in all of the Group’s buildings;
• Basic equipment – this item predominantly concerns the surgical medical equipment acquired and used within the scope of the Group’s activity;
Tangible assets in progress will be recognised as land and natural resources or buildings and other constructions when their promotion is recognised as irresistible. On 31 December 2017, this item predominantly includes the amount of 57.7 million euros corresponding to the investments in architecture projects and studies, as well as to the works already carried out within the scope of the construction of the new CUF Tejo Hospital and of the Desco-bertas Hospital’s Expansion Building. These assets are valued at cost price on the date of the financial statement.
During 2017 and 2016, the Amortisations, depreciations and impairment losses caption had the following impacts on the financial position:
31-12-2017 31-12-2016
Intangible assets
Investment properties
Tangible fixed assets
Total amortization, depreciation and impairment losses:
2,695,566
-
25,035,948 22,167,118
2,925,249
-
27,731,514 25,092,368

FINANCIAL STATEMENTS REPORT 2017 125
19. INVESTMENTS IN ASSOCIATES
Equity holdings in associates changed as follows in the financial years ended on 31 December 2017 and 2016:
The Investments in associates caption in the financial years ended on 31 December 2017 and 2016 is broken down as follows:
The main aggregated financial information regarding associates at 31 December 2017 is as follows:
31-12-2017 31-12-2016
Loans granted TotalImpairment
lossesEquity
holdings Total
Balance at 1 January
Effect of currency conversion
Effect on results
Effect on equity
Dividends earned
Acquisitions and increases
Transfers
Disposals and write-offs
Changes in consolidation perimeter
Equity method application:
Balance at 31 December
31-12-2017 31-12-2016
Associates Equity holdings Equity holdings
Loans granted
Loans granted
Impairment losses
Impairment losses
Balance sheet value
Balance sheet value
Centro Gamma Knife-Radiocirurgia, S.A.
Associates Assets IncomeLiabilities Net profitEquity Expenses
Centro Gamma Knife-Radiocirurgia, S.A.
Financial information at 31 December 2017
97,956
-
-
-
-
-
133,845
-
-
-
-
-
(68,000)
- -
34,000
- -
168,111
131,956 233,956
-
-
-
-
-
(68,000)
138,459
-
-
-
(3,171,095)
(68,000)
170,000 3,268,747
35,889
-
-
-
-
-
-
-
(35,889)
102,000 168,111-
168,111131,956
131,956 102,000 - 233,956 34,000 170,000 (35,889)
102,000 - 233,956 34,000 170,000 (35,889)
168,111
1,262,319 674,220 588,099 616,456 1,010,116 393,660

JOSÉ DE MELLO SAÚDE
FINANCIAL STATEMENTS REPORT 2017126
20. ESTIMATE OF FAIR VALUE
The hierarchy for purposes of determining the fair value shall have the following levels and measurement bases:
• Level 1 – market quotes net of assets, which the Company can access at the balance sheet’s date of reference;
• Level 2 – generally accepted evaluation models, based on inputs observable in the market, alternative to those mentioned in level 1;
• Level 3 – evaluation models whose main inputs are not observable in the market.
The Group has valued at fair value the assets and liabilities listed in the table below, in which their corresponding hierarchy is also specified:
Fair Value at 31 December 2017
Fair Value at 31 December 2016
Level 1Market Quotes
Level 2Inputs
Observable In The Market
Total31-12-2017
Level 3Inputs Non-Observable
In The Market
Assets valued at fair value
Liabilities valued at fair value
Lands and Buildings (Note 18)
Financial Derivative Instruments
Cash flow hedging (Note 42)
HIERARCHY OF FAIR VALUE
Level 1Market Quotes
Level 2Inputs
Observable In The Market
Total31-12-2016
Level 3Inputs Non-Observable
In The Market
Assets valued at fair value
Liabilities valued at fair value
Lands and Buildings (Note 18)
Financial Derivative Instruments
Cash flow hedging (Note 42)
HIERARCHY OF FAIR VALUE
314,275,866314,275,866
1,627,604
315,903,470 - 1,627,604 314,275,866
- -
- -
1,627,604
131,389,179131,389,179
2,301,121
133,690,299 - 2,301,121 131,389,179
- -
- -
2,301,121

FINANCIAL STATEMENTS REPORT 2017 127
21. OTHER INVESTMENTS
The other investments at 31 December 2017 and 2016 are as follows:
Other investments include non-current financial assets, measured at acquisition cost and adjusted for estimated impairment losses. This caption recorded the following changes in the financial years ended on 31 December 2017 and 2016:
31-12-2017 31-12-2016
Loans granted
Balance sheet value
Impairment lossesEquity holdingsCompany Balance
sheet value
Centro Clínico Académico de Braga
Digihealth, S.A.
Fundo de Compensação do Trabalho e Fundo de Garantia de Compensação do Trabalho
Diagnosticar - Diagnóstico Computorizado, S.A.
Lisgarante
IBET
Other investments
Increases
Increase
Increases
Increase
Balance at 31 December 2016
Balance at 31 December 2016
Balance at 31 December 2017
Balance at 31 December 2017
Balance at 1 January 2016
At 31 December 2016
At 31 December 2017
Balance at 1 January 2016
Gross investment:
Net value:
Impairment losses (Note 33):
5,300 5,300
5,000 5,000 5,000
50,000 50,0001,315,853 50,000
648,884
35,000 35,000 35,000
26,200 26,200 26,200
-
-
648,884
2,036,238 770,384
-
-
-
- 393,472
-
-
-
-
(1,315,853)
-
50,000 509,672(1,315,853)
1,627,481
509,672
770,384
(1,315,853)
260,713
-
198,044
-
1,825,525
(1,315,853)
2,086,237
(1,315,853)
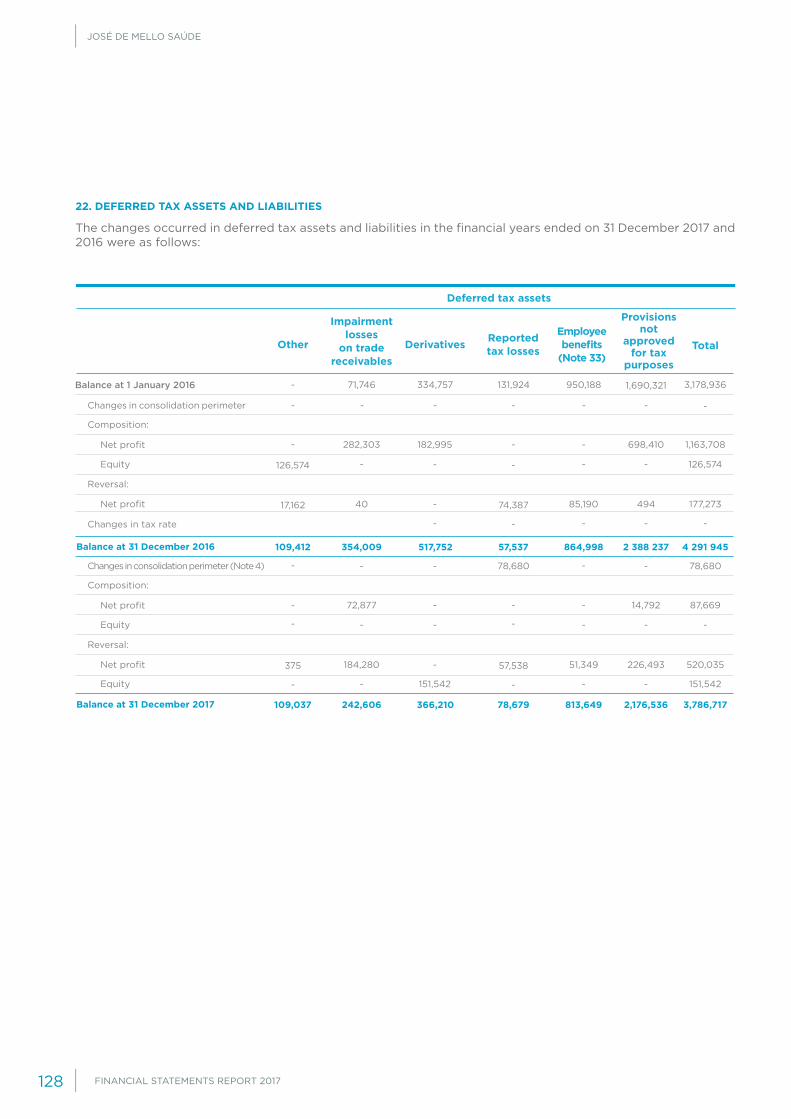
JOSÉ DE MELLO SAÚDE
FINANCIAL STATEMENTS REPORT 2017128
22. DEFERRED TAX ASSETS AND LIABILITIES
The changes occurred in deferred tax assets and liabilities in the financial years ended on 31 December 2017 and 2016 were as follows:
Impairment losses
on trade receivables
Employee benefits
(Note 33)
Provisions not
approved for tax
purposes
TotalDerivativesOther
Deferred tax assets
Reported tax losses
Balance at 1 January 2016
Composition:
Composition:
Equity
Equity
Reversal:
Reversal:
Net profit
Net profit
Changes in tax rate
Equity
Changes in consolidation perimeter
Changes in consolidation perimeter (Note 4)
Net profit
Net profit
Balance at 31 December 2016
Balance at 31 December 2017
126,574
17,162
-
375
-
74,387
57,538
-
-
-
- - -
-
-
-
-
78,680
-
- -
-
-
109,412
109,037
57,537
78,679
-
-
40
184,280
-
-
-
-
-
126,574
-
85,190
51,349
494
226,493
177,273
520,035
-
-
-
-
-
151,542
71,746 334,757 131,924
-
282,303
72,877
-
950,188
- 78,680
-
-
698,410
14,792
- -
3,178,9361,690,321
1,163,708
87,669
-
-
-
-
-
151,542
-
182,995
-
354,009
242,606
864,998
813,649
2 388 237
2,176,536
4 291 945
3,786,717
517,752
366,210

FINANCIAL STATEMENTS REPORT 2017 129
The amount of deferred tax assets concerning the Benefits of employees relates to an annuity insurance con-tracted by JMS in January 2016. This insurance enabled complying with a contracting existing since 2000, where JMS was responsible for ensuring a lifetime payment of a rent to a worker who retired via Social Security on 1 January 2016. The commercial premium was paid to the insurance company on 28 January 2016 and amounted to 2,504,321 euros.
Deferred taxes to be recognised as a result of temporary differences between taxable income and accounting income were evaluated. Where these differences originated deferred tax assets, these were only recorded to the extent considered probable that taxable profits will occur in the future and which can be used to recover the tax losses or deductible tax differences. This evaluation was based on the business plans of the Group companies, which are periodically reviewed and updated, and on the available and identified opportunities for tax optimisation.
Revaluation of tangible fixed
assets
Financial derivative
instrumentsTotal
Balance at 1 January 2016 - - -
Deferred tax liabilities
Composition:
Equity
Reversal:
Net profit
Equity
Net profit
Balance at 31 December 2016
Composition:
Equity
Reversal:
Net profit
Equity
Changes in scope (Note 4)
Net profit
Balance at 31 December 2017 11,735,363
(368,979) (368,979)
(510,443) (510,443)
5,689,281 5,689,281
4,068,056 4,068,056
2,742,013 2,742,013
115,436 115,436
-
-
2,857,449 2 857 449
-
-
- -
- -
-
-
-
- -
-
-
- 11,735,363

JOSÉ DE MELLO SAÚDE
FINANCIAL STATEMENTS REPORT 2017130
23. OTHER CURRENT AND NON-CURRENT ASSETS
On 31 December 2017 and 2016, these captions showed the following breakdown:
The elements recorded as Non-current concern the values calculated for the responsibilities of Holidays, Holiday Allowance and Christmas Allowance for the employees of São Marcos Hospital and Reynaldo dos Santos Hospital, concerning the year when their corresponding contracts began.
The Provision of unbilled medical services item concerns medical acts provided and not yet billed to the custo-mers. These pending bills result, in general, from the following situations: lack of consent forms, billing only at the end of treatment, lack of confirmation of billing codes.
Current CurrentNon-current Non-current
Accrued income:
Deferred costs:
31-12-2017 31-12-2016
Income from production not invoiced
São Marcos Hospital responsibility
Sliding scale income receivable
Insurance
Maintenance and repair costs
Interest earned
Commissions and Stamp duty
Sale price deferral
Official Court of Auditors (Fees)
Assignment of space
Rents and leases
Deferred interest
Other accrued income
Information systems licenses
Other deferred costs
Provision of medical services not invoiced
Reynaldo dos Santos Hospital responsibility
Clinical analyses and consumables
4,157,148
1,207,954
68,527
6,753,463
1,197,484
7,918
342,081
630,400
772,755
52,244
10,983,783
- -
220,812
33,559,905
- -
5,148,355
161,011
43,999,641
103,061
228,334
11,034
78,014
136,288
182,144
21,413
21,816
697,321
36,158
491,073
827,980
56,522
16,278
983,933
5,570
-
6,129,201 6,129,201
-
- -
-
- -
-
2,167,744 2,167,744
-
-
-
-
-
-
-
-
-
-
-
-
-
-
-
-
-
-
-
-
-
49,316,786
3,432,655
52,749,441
56,396,107
4,014,872
60,410,979
-
8,296,945
8,296,945
-
8,296,945
8,296,945
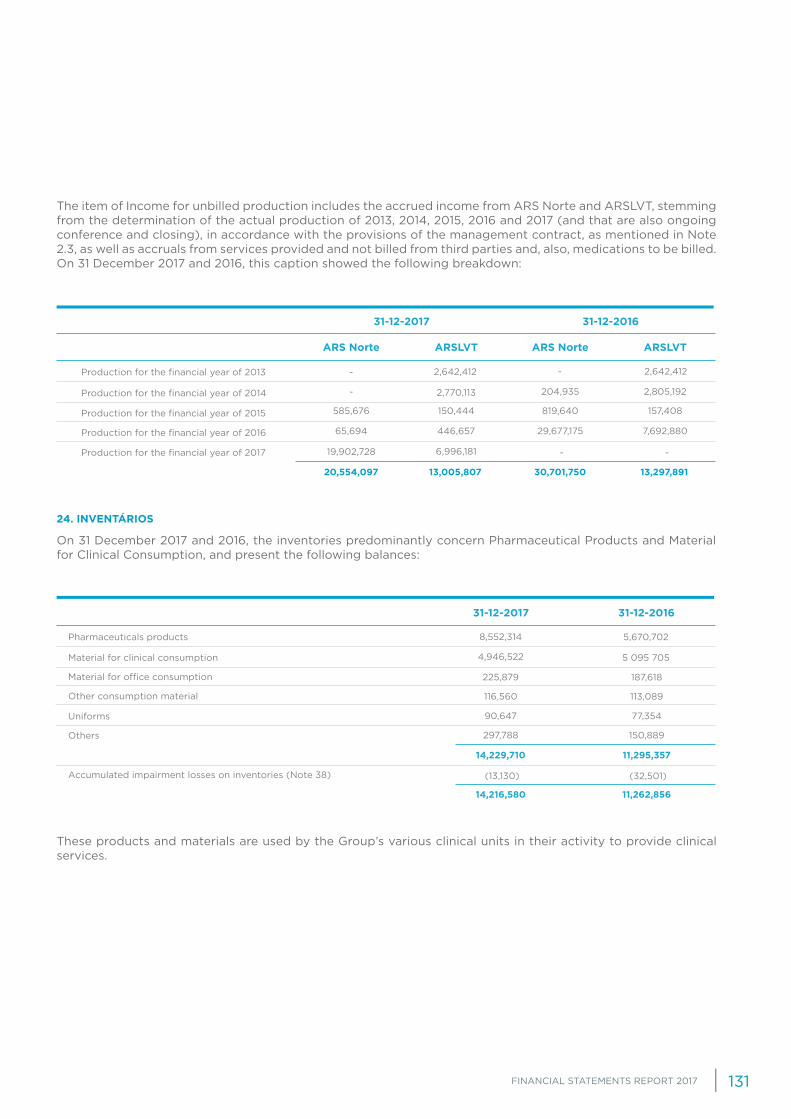
FINANCIAL STATEMENTS REPORT 2017 131
The item of Income for unbilled production includes the accrued income from ARS Norte and ARSLVT, stemming from the determination of the actual production of 2013, 2014, 2015, 2016 and 2017 (and that are also ongoing conference and closing), in accordance with the provisions of the management contract, as mentioned in Note 2.3, as well as accruals from services provided and not billed from third parties and, also, medications to be billed. On 31 December 2017 and 2016, this caption showed the following breakdown:
24. INVENTÁRIOS
On 31 December 2017 and 2016, the inventories predominantly concern Pharmaceutical Products and Material for Clinical Consumption, and present the following balances:
These products and materials are used by the Group’s various clinical units in their activity to provide clinical services.
ARS Norte ARS NorteARSLVT ARSLVT
31-12-2017 31-12-2016
Production for the financial year of 2014
Production for the financial year of 2013
Production for the financial year of 2016
Production for the financial year of 2017
Production for the financial year of 2015
31-12-2017 31-12-2016
Material for office consumption
Uniforms
Other consumption material
Others
Accumulated impairment losses on inventories (Note 38)
Material for clinical consumption
Pharmaceuticals products
65,694 29,677,175
- -
585,676
-
- 2,642,412 - 2,642,412
819,640
204,935
19,902,728
2,770,113
6,996,181
150,444 157,408
2,805,192
446,657 7,692,880
20,554,097 30,701,75013,005,807 13,297,891
225,879
90,647
297,788
(13,130)
116,560
4,946,522
8,552,314
5 095 705
5,670,702
187,618
77,354
150,889
(32,501)
113,089
14,229,710
14,216,580
11,295,357
11,262,856

JOSÉ DE MELLO SAÚDE
FINANCIAL STATEMENTS REPORT 2017132
25. TRADE RECEIVABLES AND ADVANCE PAYMENTS TO SUPPLIERS
The Trade receivables and advances to suppliers caption was broken down as follows at 31 December 2017 and 2016:
The balances in the Statement of Financial Position are net of impairment losses on trade payables balances, which were estimated as described in Note 2.20 (b).
The Board of Directors believes that the carrying value of accounts receivable is close to its fair value.
The Group has no significant concentration of credit risk, as the risk is diluted over a vast range of clients.
The seniority of the caption on “Trade receivables and advance payments to suppliers” is broken down as indi-cated in the table below:
26. OTHER CURRENT DEBTORS
The Other current debtors caption was broken down as follows at 31 December 2017 and 2016:
31-12-2017 31-12-2016
Impairment losses
(Note 38)
Impairment losses
(Note 38)Net value Net valueGross value Gross value
Customers, bills receivable
Trade receivables, current account
Doubtful receivables
Advances to suppliers
Overdue debtYear Total
< 180 days 181-365 days 366-545 days 546-730 days > 730 daysDebt
31-12-2017
31-12-2016
31-12-2017 31-12-2016
Advances on financial investments
Sale of financial investments
Personnel
Re-invoicing
Hospital projects in progress
Service providers
Surety bonds
Other debtors
Bastos Mota Investimentos Imobiliários, Lda.
Seizures and liens
Loans to related entities (Note 41)
22,970
133,023,460
22,855
105,650,818
120,767,384 93,353,001 (1,052,312) (976,496)
47,011 -
12,186,095 12,274,963
- -
(9,100,589) (9,296,745)
-
(10,152,901)
-
(10,273,241) 95,377,577
47,011 -
22,970
122,870,558
22,855
3,085,506 2,978,218
119,715,072 92,376,505
133,023,460
105,650,818
29,528,119
51,570,124
67,149,946
20,935,011
10,852,297
9,521,035
3,789,842
4,219,447
4,401,112
3,250,832
17,302,144
16,154,369
-
132,000
794,132
5,980
152,630
304,715
799,859
11,025
859,250
134,165
122,780
-
134,165
1,885,798
850,000
376,019
732,216
47,895
126,325
237,576
690,891
7,350
3,316,536 5,088,234
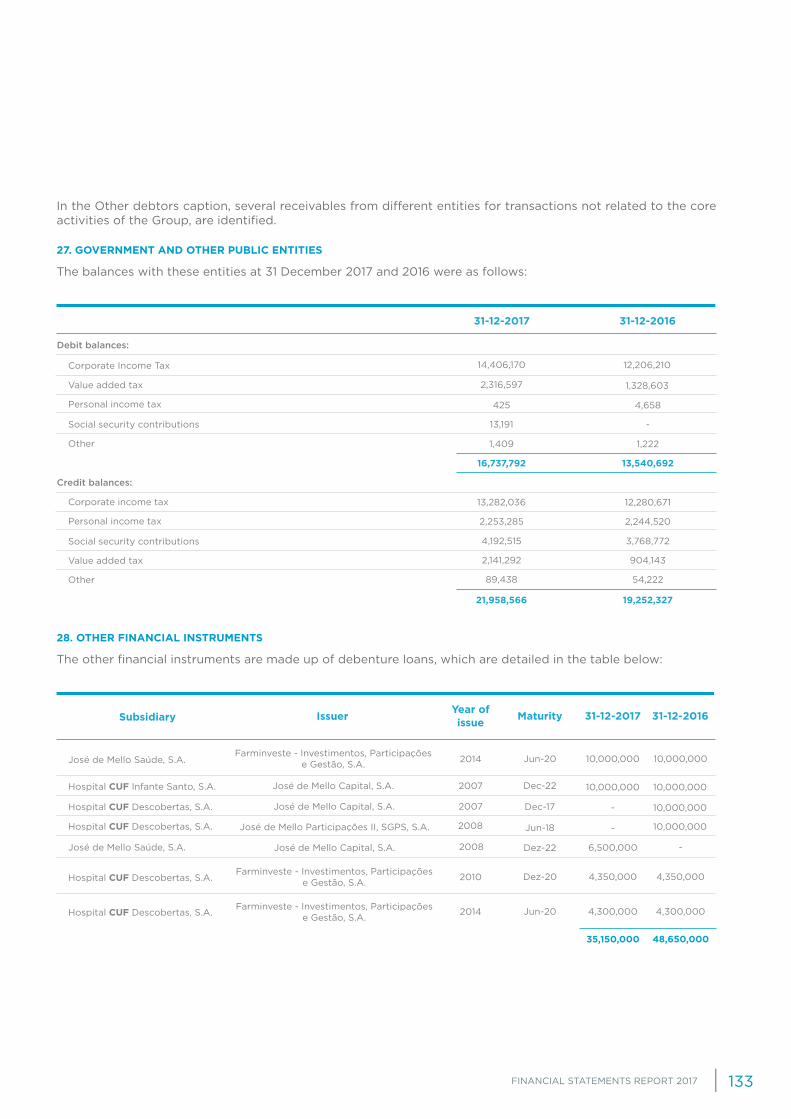
FINANCIAL STATEMENTS REPORT 2017 133
In the Other debtors caption, several receivables from different entities for transactions not related to the core activities of the Group, are identified.
27. GOVERNMENT AND OTHER PUBLIC ENTITIES
The balances with these entities at 31 December 2017 and 2016 were as follows:
28. OTHER FINANCIAL INSTRUMENTS
The other financial instruments are made up of debenture loans, which are detailed in the table below:
31-12-2017 31-12-2016
Value added tax
Corporate income tax
Social security contributions
Social security contributions
Personal income tax
Personal income tax
Other
Value added tax
Other
Corporate Income Tax
Credit balances:
Debit balances:
Year of issue 31-12-2016MaturityIssuerSubsidiary 31-12-2017
José de Mello Participações II, SGPS, S.A.
José de Mello Capital, S.A.
Farminveste - Investimentos, Participações e Gestão, S.A.
Farminveste - Investimentos, Participações e Gestão, S.A.
Farminveste - Investimentos, Participações e Gestão, S.A.
2014
2010
2014
José de Mello Capital, S.A.
José de Mello Capital, S.A.
2007
2007
2008
2008
Dec-22
Dez-22
Jun-18
Dec-17
Jun-20
Dez-20
Jun-20
Hospital CUF Infante Santo, S.A.
José de Mello Saúde, S.A.
Hospital CUF Descobertas, S.A.
Hospital CUF Descobertas, S.A.
Hospital CUF Descobertas, S.A.
Hospital CUF Descobertas, S.A.
José de Mello Saúde, S.A.
425
13,282,036
1,409
4,192,515
2,141,292
89,438
13,191
2,253,285
2,316,597
14,406,170
1,328,603
12,206,210
4,658
12,280,671
1,222
3,768,772
904,143
54,222
-
2,244,520
21,958,566
16,737,792
19,252,327
13,540,692
-
6,500,000 -
10,000,000
4,350,000
4,300,000
10,000,000 10,000,000
10,000,000
10,000,000
10,000,000
4,350,000
4,300,000
-
35,150,000 48,650,000
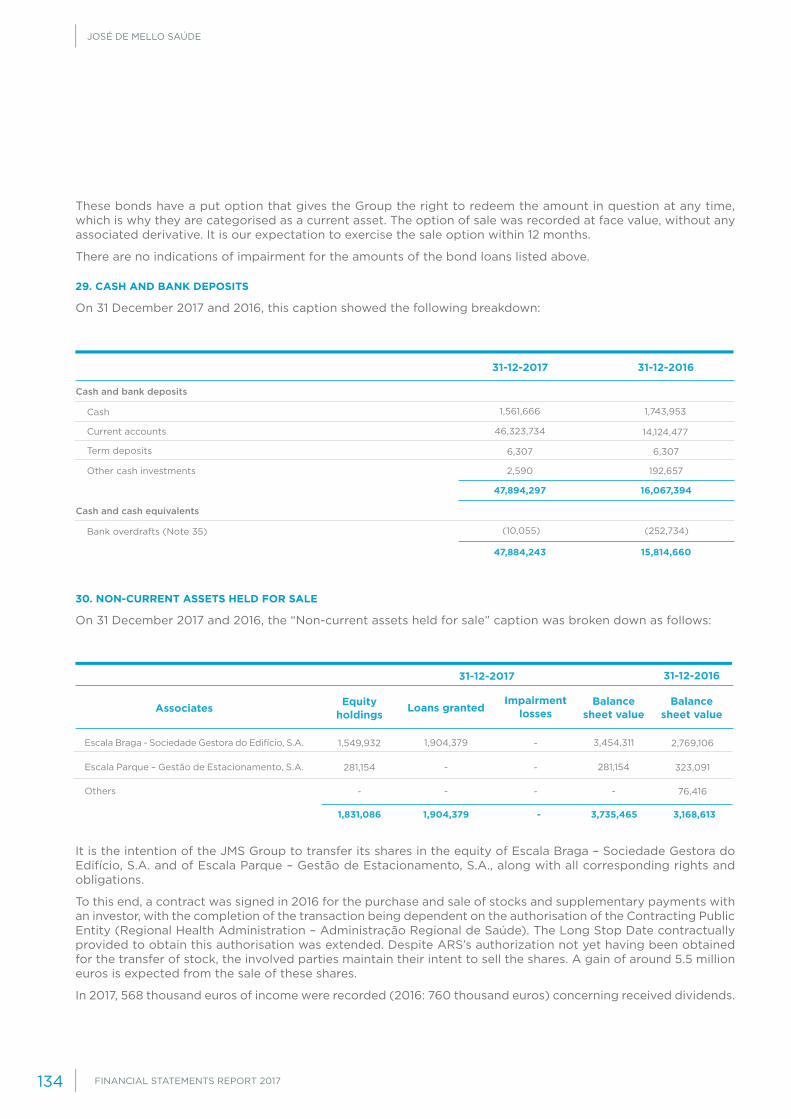
JOSÉ DE MELLO SAÚDE
FINANCIAL STATEMENTS REPORT 2017134
These bonds have a put option that gives the Group the right to redeem the amount in question at any time, which is why they are categorised as a current asset. The option of sale was recorded at face value, without any associated derivative. It is our expectation to exercise the sale option within 12 months.
There are no indications of impairment for the amounts of the bond loans listed above.
29. CASH AND BANK DEPOSITS
On 31 December 2017 and 2016, this caption showed the following breakdown:
30. NON-CURRENT ASSETS HELD FOR SALE
On 31 December 2017 and 2016, the “Non-current assets held for sale” caption was broken down as follows:
It is the intention of the JMS Group to transfer its shares in the equity of Escala Braga – Sociedade Gestora do Edifício, S.A. and of Escala Parque – Gestão de Estacionamento, S.A., along with all corresponding rights and obligations.
To this end, a contract was signed in 2016 for the purchase and sale of stocks and supplementary payments with an investor, with the completion of the transaction being dependent on the authorisation of the Contracting Public Entity (Regional Health Administration – Administração Regional de Saúde). The Long Stop Date contractually provided to obtain this authorisation was extended. Despite ARS’s authorization not yet having been obtained for the transfer of stock, the involved parties maintain their intent to sell the shares. A gain of around 5.5 million euros is expected from the sale of these shares.
In 2017, 568 thousand euros of income were recorded (2016: 760 thousand euros) concerning received dividends.
31-12-2017 31-12-2016
Current accounts
Other cash investments
Term deposits
Cash
Bank overdrafts (Note 35)
Cash and bank deposits
Cash and cash equivalents
Associates Equity holdings Loans granted Balance
sheet value
31-12-2016
Impairment losses
Balance sheet value
Escala Braga - Sociedade Gestora do Edifício, S.A.
Escala Parque – Gestão de Estacionamento, S.A.
Others
31-12-2017
6,307
2,590
46,323,734
1,561,666
(10,055)
14,124,477
1,743,953
(252,734)
6,307
192,657
47,894,297
47,884,243
16,067,394
15,814,660
1,549,932
281,154
-
1,831,086 1,904,379 - 3,735,465 3,168,613
1,904,379
-
-
-
-
-
3,454,311
281,154
-
2,769,106
323,091
76,416

FINANCIAL STATEMENTS REPORT 2017 135
31. SHARE CAPITAL
The share capital at 31 December 2017 amounted to 53,000,000 euros, fully subscribed and paid-up, and it was represented by 10,600,000 shares each with the nominal value of five euros.
The share capital was held by the following entities at 31 December 2017:
32. LEGAL RESERVE
According to legislation in force, the Company must reinforce the legal reserve by at least 5% of the annual net profit until this reserve equals at least 20% of the share capital.
The legal reserve is not yet fully established and, as such, in 2017, the minimum stipulated value was allocated. This reserve is not available for distribution to shareholders, however it may be used to absorb losses once the other reserves have been exhausted, or to increase the share capital.
33. OTHER RESERVES AND RETAINED EARNINGS
Reserve of fair value
This item includes the variations in the fair value in financial investments and tangible fixed assets that, in accor-dance with No. 2 of art. 32 of the CSC, will only be available for distribution when the elements or rights giving rise to them are disposed of, exercised, eliminated or settled.
In accordance with the legislation in force, the increments resulting from the application of the fair value through equity components are only relevant for distribution when the elements that gave rise to them are alienated.
Reserves and Retained earnings
In accordance with Portuguese legislation, the amount of distributable reserves and retained earnings is deter-mined according to the Company’s individual financial statements, presented in accordance with the IAS/IFRS.
Number of shares Ownership percentageEntity
José de Mello Capital, S.A.
Farminveste - Investimentos, Participações e Gestão, S.A.
Fundação Amélia da Silva de Mello
65.85%
4.15%
30.00%
100.00%
6,980,100
439,900
3,180,000
10,600,000

JOSÉ DE MELLO SAÚDE
FINANCIAL STATEMENTS REPORT 2017136
34. NON-CONTROLLING INTERESTS
The changes occurred in this caption in the financial years ended on 31 December 2017 and 2016 were as follows:
The breakdown of the non-controlling interests caption at 31 December 2017, by company, is as follows:
Dividends
Capital decrease
Capital increase
Changes resulting from change of equity in associates
Profit for year attributable to non-controlling interests
Final balance at 31 December
31-12-2017 31-12-2016
Initial balance at 1 January
CompanyProfit/lossProfit/loss
Percentage not owned
4.00%
0.10%
0.00%
37.19%
66.35%
0.00%
29.50%
30.07%
0.02%
0.02%
4.00%
TotalTotal
Non-controlling interestsNon-controlling interests
Hospital CUF Descobertas, S.A.
Vramondi International
HD Medicina Nuclear, S.A.
VALIR - Sociedade Gestora de Participações Sociais, S.A.
Sagies - Segurança, Higiene e Saúde no Trabalho, S.A.
Clínica de Serviços Médicos e Computorizados de Belém, S.A.
Escala Braga - Sociedade Gestora do Estabelecimento, S.A.
Nova Imagem - Centro Radiodiagnóstico, S.A.
Instituto CUF - Diagnóstico e Tratamento, S.A.
Clínica CUF Belém, S.A.
Escala Vila Franca – Sociedade Gestora do Estabelecimento, S.A.
31-12-201631-12-2017
283,937474,455 3,960,7964,228,716
96,27137,455
(577) (923)
22
(39,722) (35,431)
34
(429,561) (464,991)
(603) (344)
-
(1,096)91,467
1,218,6771,218,333
(5) (1) (6)
265,626357,093
152,419261,022
197241
10,62212,709
66,423108,256
1,330,9171,435,244
1,4302,023
18,99923,799
475,601544,241
1,086,8751,124,330
7,765 (11,355)
(206,278)
-
175,027
-
283,937
(196,400)
(10,135)
3,960,796 3,708,111
-
-
474,455
4,228,716 3,960,796
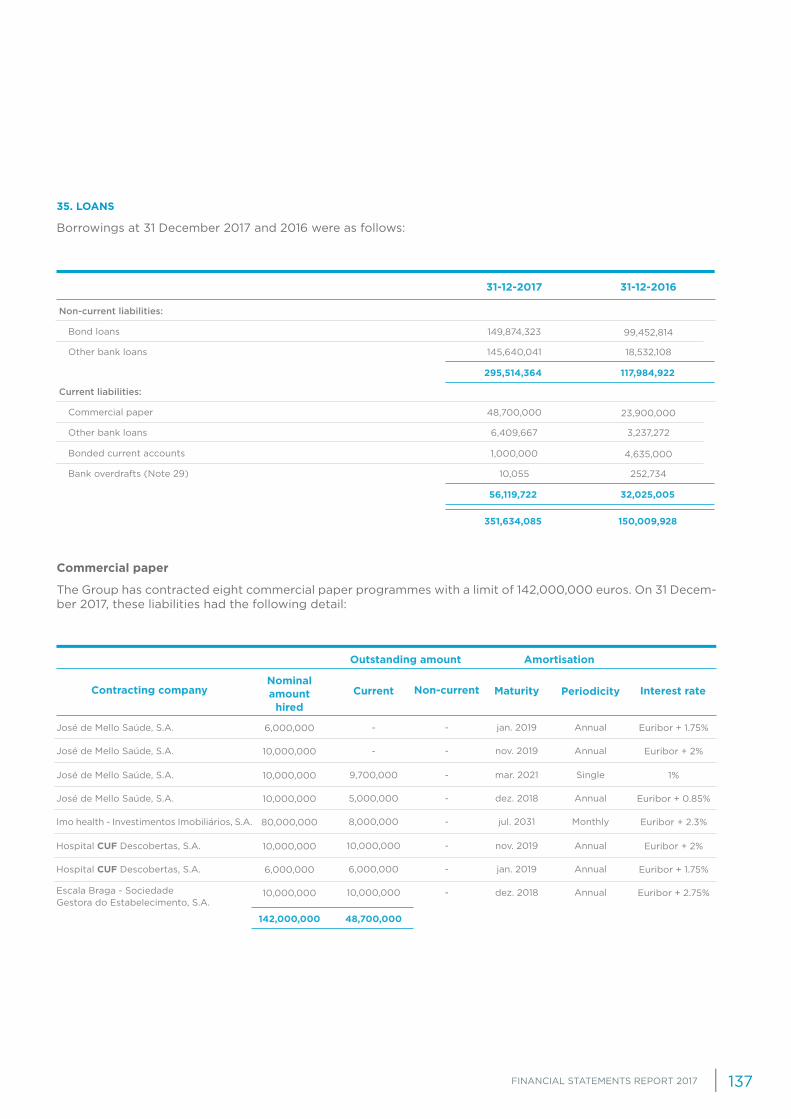
FINANCIAL STATEMENTS REPORT 2017 137
Euribor + 2%
Euribor + 0.85%
Euribor + 1.75%
Euribor + 2.3%
Euribor + 2.75%
Euribor + 1.75%
Euribor + 2%
1%
35. LOANS
Borrowings at 31 December 2017 and 2016 were as follows:
Commercial paper
The Group has contracted eight commercial paper programmes with a limit of 142,000,000 euros. On 31 Decem-ber 2017, these liabilities had the following detail:
Bond loans
Commercial paper
Bonded current accounts
Other bank loans
Other bank loans
Bank overdrafts (Note 29)
31-12-2017 31-12-2016
Non-current liabilities:
Current liabilities:
Contracting companyNominalamount
hired
-
-
-
-
-
-
-
-
jan. 2019
nov. 2019
mar. 2021
nov. 2019
dez. 2018
jan. 2019
jul. 2031
dez. 2018
Annual
Annual
Single
Annual
Annual
Annual
Monthly
Annual
PeriodicityCurrent Interest rateNon-current Maturity
José de Mello Saúde, S.A.
José de Mello Saúde, S.A.
José de Mello Saúde, S.A.
Hospital CUF Descobertas, S.A.
José de Mello Saúde, S.A.
Hospital CUF Descobertas, S.A.
Imo health - Investimentos Imobiliários, S.A.
Escala Braga - Sociedade Gestora do Estabelecimento, S.A.
Outstanding amount Amortisation
99,452,814
23,900,000
4,635,000
18,532,108
3,237,272
252,734
149,874,323
48,700,000
1,000,000
145,640,041
6,409,667
10,055
295,514,364
56,119,722
351,634,085
117,984,922
32,025,005
150,009,928
6,000,000
10,000,000
10,000,000
10,000,000
10,000,000
6,000,000
80,000,000
10,000,000
142,000,000 48,700,000
-
-
9,700,000
10,000,000
5,000,000
6,000,000
8,000,000
10,000,000
JOSÉ DE MELLO SAÚDE
FINANCIAL STATEMENTS REPORT 2017138
Although there are programmes with maturities exceeding one year, there are annual renewals, leading the Com-mercial Paper to be categorised as current.
These commercial paper programmes contain financial covenants that are common in financing contracts. The contracts include compliance requirements for the following debt ratios: Net Financial Debt / EBITDA; Ratio of debt service coverage and financial autonomy. The financial covenants are calculated based on the Group’s values.
On 31 December 2017, the JMS Group met all financial covenants in the commercial paper programmes, except in the Imo Health contract with Caixa de Crédito Agrícola, which is under review.
Debenture loans
Debenture loans concern the following issues:
• “JOSÉ DE MELLO SAÚDE 2014/2019”
• Total loan amount: 50,000,000 euros
• Nominal value: 10,000 euros per bond
• Maturity 9 June 2019
• Interest rate: Interest rate: 6-month Euribor plus 3.875%
• “JOSÉ DE MELLO SAÚDE 2015/2021”
• Total loan amount: 50,000,000 euros
• Nominal value: 10,000 euros per bond
• Maturity 17 May 2021
• Interest rate: Interest rate: 6-month Euribor plus 2.95%
• “JOSÉ DE MELLO SAÚDE 2017/2023”
• Total loan amount: 50,000,000 euros
• Nominal value: 10,000 euros per bond
• Maturity 28 September 2023
• Interest rate: Fixed rate (4%)
These issuances were placed with institutional investors and approved for trading in the regulated market of Euronext Lisbon and Bourse de Luxembourg, except for the last issuance, whose authorization are still pending approval. These contracts include compliance requirements for the “Net Financial Debt / EBITDA” debt ratio. On 31 December 2017, José de Mello Saúde, S.A. met the financial covenants in all debenture loans.
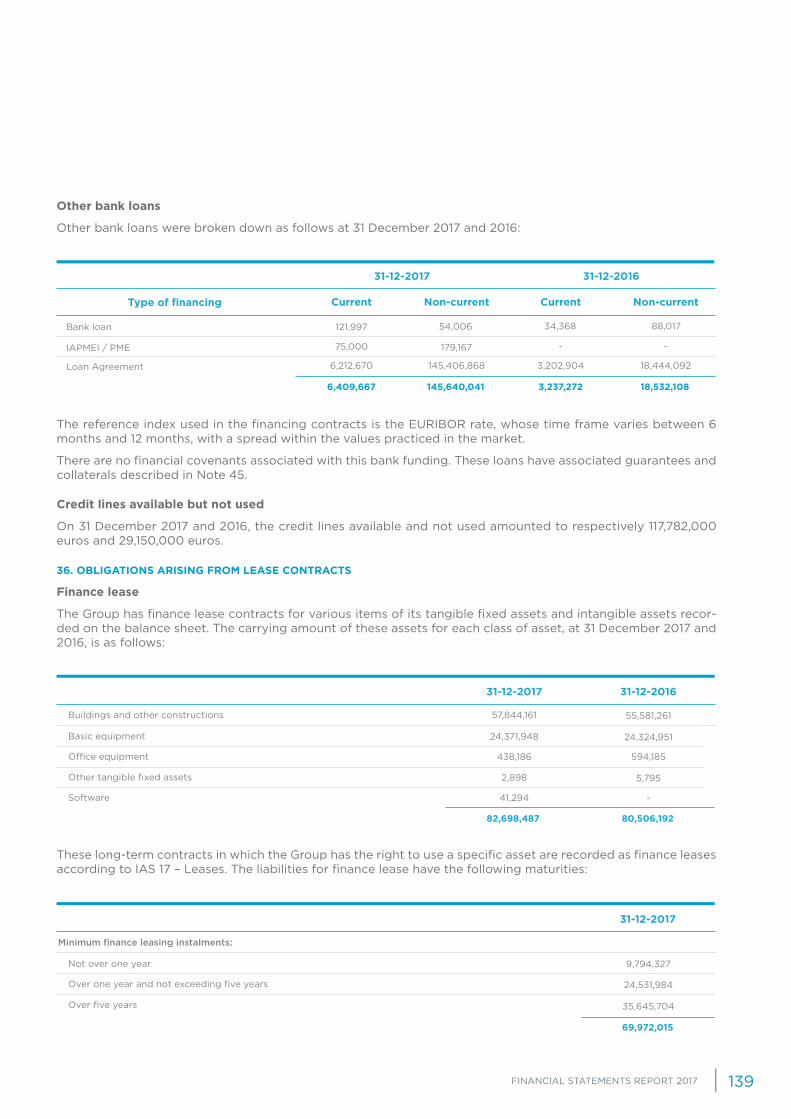
FINANCIAL STATEMENTS REPORT 2017 139
Other bank loans
Other bank loans were broken down as follows at 31 December 2017 and 2016:
The reference index used in the financing contracts is the EURIBOR rate, whose time frame varies between 6 months and 12 months, with a spread within the values practiced in the market.
There are no financial covenants associated with this bank funding. These loans have associated guarantees and collaterals described in Note 45.
Credit lines available but not used
On 31 December 2017 and 2016, the credit lines available and not used amounted to respectively 117,782,000 euros and 29,150,000 euros.
36. OBLIGATIONS ARISING FROM LEASE CONTRACTS
Finance lease
The Group has finance lease contracts for various items of its tangible fixed assets and intangible assets recor-ded on the balance sheet. The carrying amount of these assets for each class of asset, at 31 December 2017 and 2016, is as follows:
These long-term contracts in which the Group has the right to use a specific asset are recorded as finance leases according to IAS 17 – Leases. The liabilities for finance lease have the following maturities:
CurrentType of financing CurrentNon-current Non-current
31-12-2017 31-12-2016
IAPMEI / PME
Bank loan
Loan Agreement
Basic equipment
Other tangible fixed assets
Buildings and other constructions
Office equipment
Software
31-12-2017 31-12-2016
Not over one year
Minimum finance leasing instalments:
Over one year and not exceeding five years
Over five years
31-12-2017
6,212,670
75,000
121,997 54,006 34,368 88,017
3,202,904
-179,167
145,406,868 18,444,092
-
6,409,667 3,237,272145,640,041 18,532,108
24,324,951
55,581,261
5,795
594,185
-
24,371,948
57,844,161
2,898
438,186
41,294
82,698,487 80,506,192
24,531,984
9,794,327
35,645,704
69,972,015

JOSÉ DE MELLO SAÚDE
FINANCIAL STATEMENTS REPORT 2017140
Operating lease
The operating lease contracts in force in JMS Group predominantly concern contracts for computer equipment, buildings and car parks, vehicles and medical and office equipment. The total amounts of future minimum pay-ments are as follows:
Costs of 17,181 thousand euros and 16,279 thousand euros were recognised for the financial years ended on 31 December 2017 and 2016, respectively, relative to operating leasing contracts instalments.
In 2016 it was impossible to obtain the detail of the minimum payments of the operating and financial leases. Howe-ver, the leases concerned these contracts and similar ones, thus the values are similar to those recorded in 2017.
37. EMPLOYEE BENEFITS
The subsidiary Hospital CUF Infante Santo, S.A. (“HCIS”) has the liability of topping-up the retirement pensions of some of its employees with whom this liability was agreed. Although it has not established any fund or insu-rance to cover this liability, a provision has been set up for this purpose, which is updated annually according to an actuarial study conducted by a specialised and independent entity.
The expiry of the Collective Labour Agreement with the Ministry of Labour was formally, and in accordance with legislation in force, applied for in relation to employees still working. This came into effect on 6 February 2013. The law envisages, according to a legal opinion, no change to the “remuneration, category and respective defi-nition, duration of working hours and social protection schemes, whose benefits are substituted by those of the general social security scheme or by substitution protocol of Portuguese National Health Service.” The pension top-up does not fit in with this requirement and ceases to have effect from February 2013. Accordingly, the liability remains in force for retired employees of HCIS.
According to the evaluation report presented by CFPO Consulting – Soluções Actuariais e Financeiras, the current amount of liabilities with retirement pensions for past service, at the date of the statement of financial position, is estimated on 1,355,000 euros (1,462,000 euros in 2016). The adjusted provision for retirement pensions is reported in Note 38.
The actuarial evaluation of pension plan liabilities was performed according to the Projected Unit Credit method, taking into consideration the following assumptions:
Less than 1 year Over five yearsBetween 1 and 5 years
31-12-2017
Vehicles
Medical equipment
Buildings
1.30%1.30%
1.30%1.30%
0.00%0.00%
5554
TV 73/77TV 73/77
7374
TV 88/90TV 88/90
Discount rate (after retirement)
Discount rate (before retirement)
Pensions growth rate
Number of pensioners
For men
Mortality table:
Average age
For women
31-12-201631-12-2017
18,609,139
967,048
1,952,950 4,717,822 9,084
204,790,071
-808,772
82,338,946
21,529,137 204,799,15587,865,540
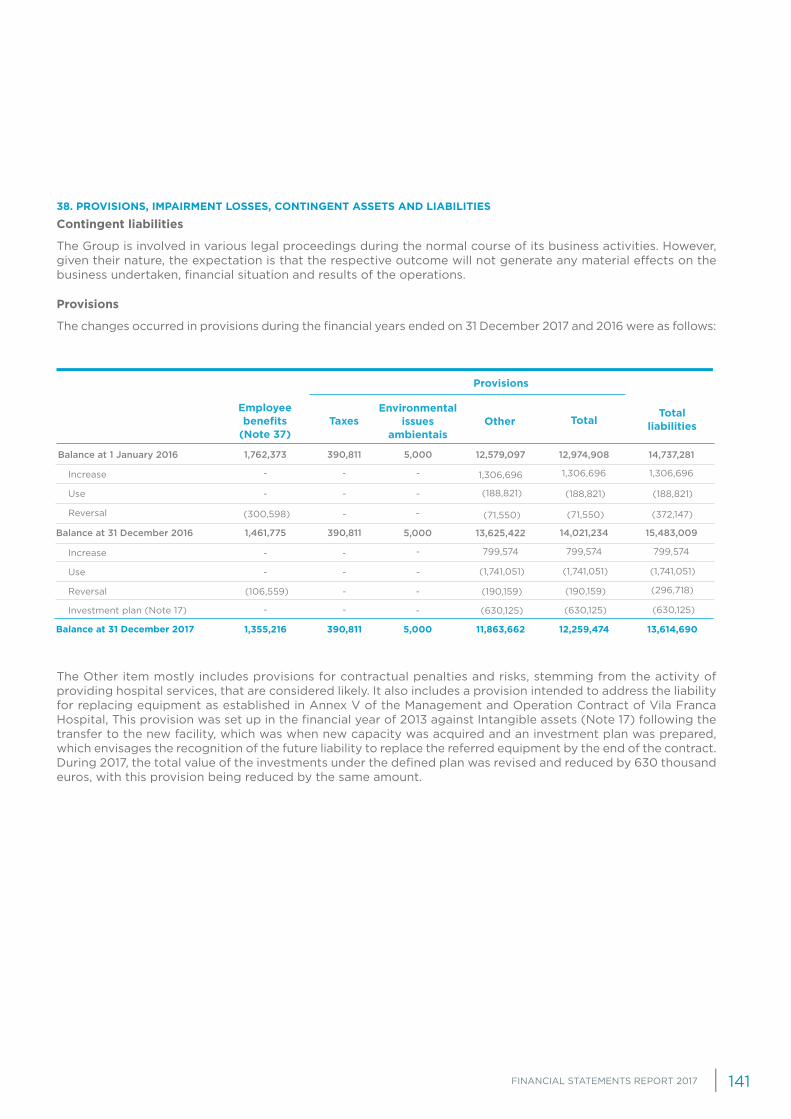
FINANCIAL STATEMENTS REPORT 2017 141
38. PROVISIONS, IMPAIRMENT LOSSES, CONTINGENT ASSETS AND LIABILITIES
Contingent liabilities
The Group is involved in various legal proceedings during the normal course of its business activities. However, given their nature, the expectation is that the respective outcome will not generate any material effects on the business undertaken, financial situation and results of the operations.
Provisions
The changes occurred in provisions during the financial years ended on 31 December 2017 and 2016 were as follows:
The Other item mostly includes provisions for contractual penalties and risks, stemming from the activity of providing hospital services, that are considered likely. It also includes a provision intended to address the liability for replacing equipment as established in Annex V of the Management and Operation Contract of Vila Franca Hospital, This provision was set up in the financial year of 2013 against Intangible assets (Note 17) following the transfer to the new facility, which was when new capacity was acquired and an investment plan was prepared, which envisages the recognition of the future liability to replace the referred equipment by the end of the contract. During 2017, the total value of the investments under the defined plan was revised and reduced by 630 thousand euros, with this provision being reduced by the same amount.
Provisions
Environmentalissues
ambientais
TotalliabilitiesOther
Employeebenefits
(Note 37)Taxes Total
Increase
Increase
Balance at 1 January 2016
Use
Use
Reversal
Reversal
Investment plan (Note 17)
Balance at 31 December 2016
Balance at 31 December 2017
(300,598) -
(106,559) -
- -
1,355,216 390,811
(71,550)
(190,159)
(630,125)
12,259,474
1,461,775 390,811 14,021,234 15,483,009
12,974,908 14,737,2811,762,373 390,811 5,000
- -
- -
1,306,696
799,574
1,306,696
799,574
- -
- -
(188,821)
(1,741,051)
(188,821)
(1,741,051)
-
-
-
-
-
-
-
5,000
5,000
(372,147)
(296,718)
(630,125)
13,614,690
1,306,696
799,574
13,625,422
(71,550)
(190,159)
(630,125)
11,863,662
(188,821)
(1,741,051)
12,579,097
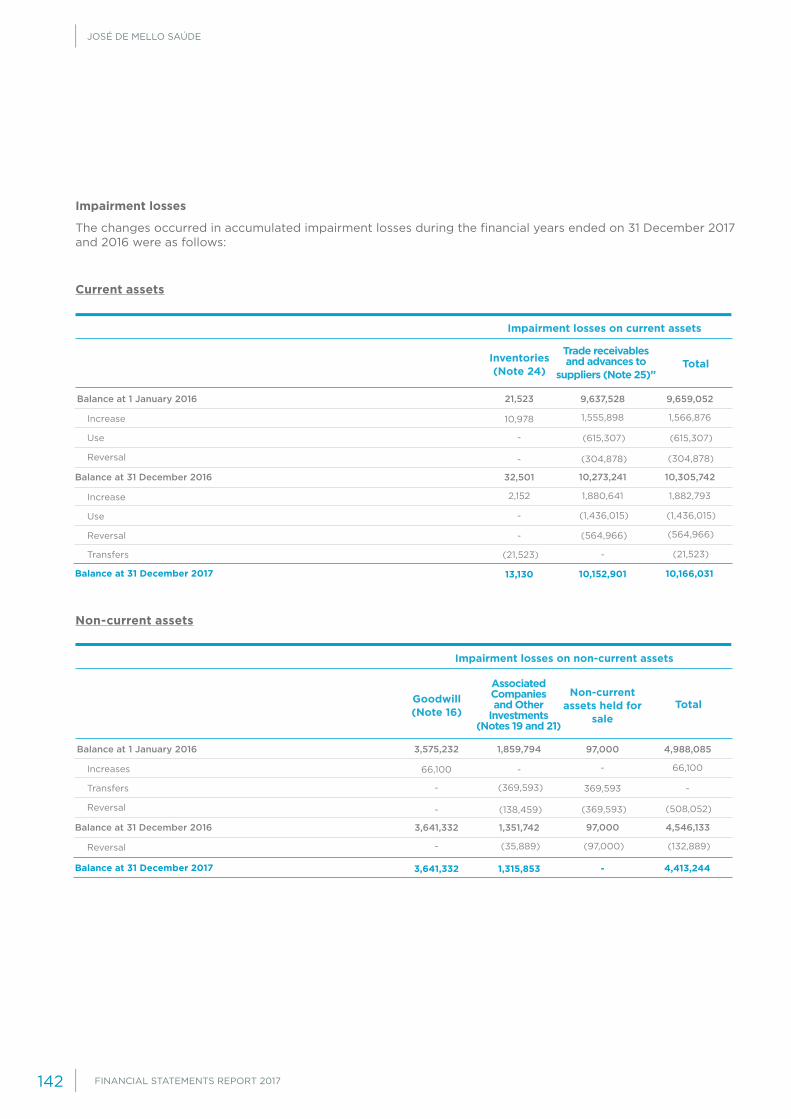
JOSÉ DE MELLO SAÚDE
FINANCIAL STATEMENTS REPORT 2017142
Impairment losses
The changes occurred in accumulated impairment losses during the financial years ended on 31 December 2017 and 2016 were as follows:
Current assets
Non-current assets
Impairment losses on current assets
TotalTrade receivables and advances to
suppliers (Note 25)”Inventories(Note 24)
Increase
Increase
Balance at 1 January 2016
Use
Use
Reversal
Reversal
Transfers
Balance at 31 December 2016
Balance at 31 December 2017
Impairment losses on non-current assets
TotalNon-current
assets held for sale
Associated Companiesand Other
Investments(Notes 19 and 21)
Goodwill(Note 16)
Increases
Reversal
Balance at 1 January 2016
Transfers
Reversal
Balance at 31 December 2016
Balance at 31 December 2017
(304,878)
(564,966)
-
10,152,901
10,273,241 10,305,742
9,637,528 9,659,052
1,555,898
1,880,641
1,566,876
1,882,793
(615,307)
(1,436,015)
(615,307)
(1,436,015)
(304,878)
(564,966)
(21,523)
10,166,031
10,978
2,152
32,501
-
-
(21,523)
13,130
-
-
21,523
(369,593)
-
97,000 4,546,133
97,000 4,988,085
-
(97,000)
66,100
(132,889)
369,593 -
(508,052)
4,413,244
-66,100
(35,889)-
1,351,7423,641,332
(138,459)-
1,315,8533,641,332
(369,593)-
1,859,7943,575,232

FINANCIAL STATEMENTS REPORT 2017 143
During the 2017 and 2016 financial years, the changes occurred in the “Impairment losses” and “Provisions” cap-tions were offset against income:
Contingent assets
2017 was the second consecutive year in which Escala Braga presented a negative result of around 4 million euros. This situation results from the Government not reassessing the vertical funding programmes for HIV and Multiple Sclerosis, with an approximate value of 7.5 million euros for 2016 and 7.9 million euros for 2017. It is our strong belief that this behaviour by the state-owned partner contributed mercilessly to the current financial si-tuation and is a very serious situation of contractual non-compliance. This way, a Request for Financial Recovery was lodged as a protection at the end of 2016 for the purposes of clause 127, paragraph 9, subparagraph (b) of the Management Contract, proposing, in a spirit of loyal cooperation and good faith, an already initiated process of arbitration to settle this dispute.
The JMS Group considers the success of this litigation likely and the best estimate of this contingent asset to amount to 15.4 million euros.
This amount’s consideration in the future projection enables ruling out the possibility of the contract being onerous.
This situation naturally deserves the utmost attention by the hospital’s management team, with the firm expec-tation that it will be reversed by a positive decision of the already formed Arbitration Tribunal in favour of this dispute’s settlement.
39. TRADE PAYABLES AND ADVANCES FROM CLIENTS
On 31 December 2017 and 2016, these captions showed the following breakdown:
31-12-2017 31-12-2016
Reversal ReversalTotal TotalIncreases Increases
Provisions
Employee benefits
Impairment losses on non-current assets
Impairment losses on current assets
Trade payables, invoices pending
Trade payables, current account
Advances from clients
31-12-2017 31-12-2016
1,882,793 1,566,876 (304,878) 1,261,998(564,966) 1,317,827
- - (300,598) (300,598)(106,559) (106,559)
799,574 1,306,696 (71,550) 1,235,147(190,159) 609,415
- 66,100 (508,052) (441,952)(132,889) (132,889)
1,687,795 1,754,594
9,432,203
74,547,613
3,555,036
9,356,007
80,830,747
4,355,247
94,542,001 87,534,852
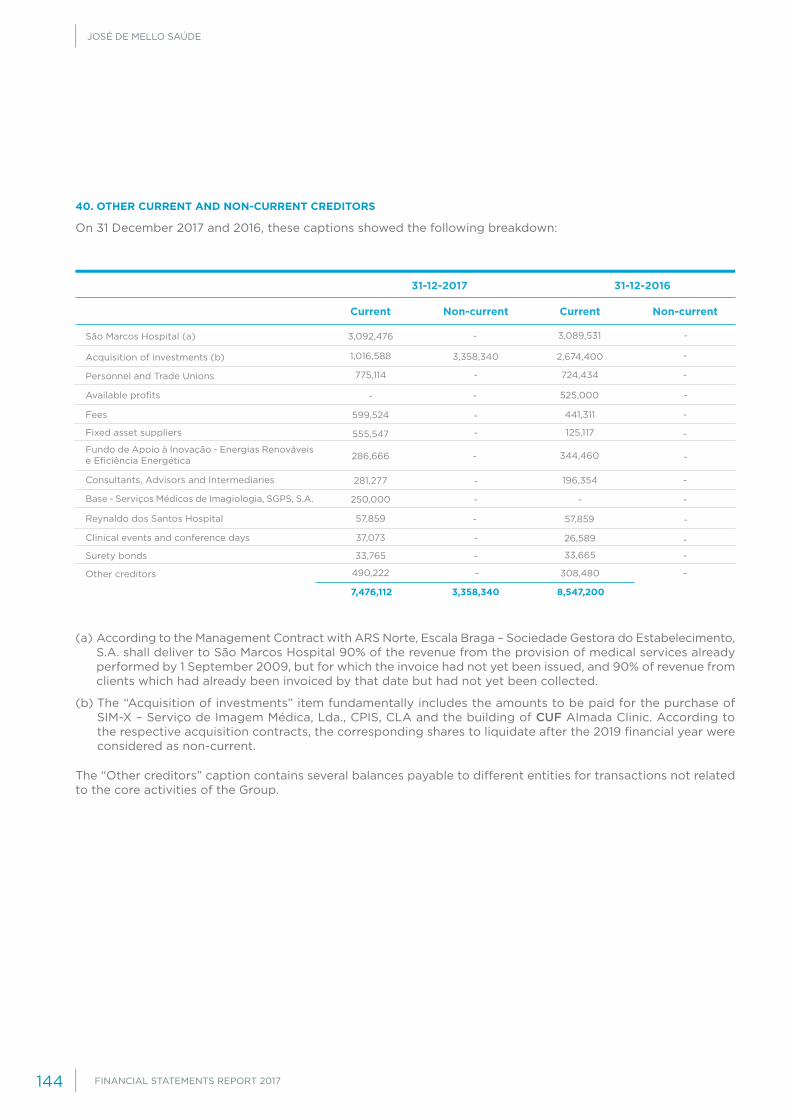
JOSÉ DE MELLO SAÚDE
FINANCIAL STATEMENTS REPORT 2017144
40. OTHER CURRENT AND NON-CURRENT CREDITORS
On 31 December 2017 and 2016, these captions showed the following breakdown:
(a) According to the Management Contract with ARS Norte, Escala Braga – Sociedade Gestora do Estabelecimento, S.A. shall deliver to São Marcos Hospital 90% of the revenue from the provision of medical services already performed by 1 September 2009, but for which the invoice had not yet been issued, and 90% of revenue from clients which had already been invoiced by that date but had not yet been collected.
(b) The “Acquisition of investments” item fundamentally includes the amounts to be paid for the purchase of SIM-X – Serviço de Imagem Médica, Lda., CPIS, CLA and the building of CUF Almada Clinic. According to the respective acquisition contracts, the corresponding shares to liquidate after the 2019 financial year were considered as non-current.
The “Other creditors” caption contains several balances payable to different entities for transactions not related to the core activities of the Group.
Current CurrentNon-current Non-current
31-12-2017 31-12-2016
Acquisition of investments (b)
Consultants, Advisors and Intermediaries
Fees
Clinical events and conference days
São Marcos Hospital (a)
Fundo de Apoio à Inovação - Energias Renováveis e Eficiência Energética
Available profits
Reynaldo dos Santos Hospital
Personnel and Trade Unions
Base - Serviços Médicos de Imagiologia, SGPS, S.A.
Fixed asset suppliers
Surety bonds
Other creditors
775,114
250,000
555,547
33,765
490,222
1,016,588
281,277
599,524
37,073
3,092,476
286,666
-
57,859
-
-
-
-
3,089,531
344,460
525,000
57,859
-
-
-
-
724,434
-
125,117
33,665
308,480
2,674,400
196,354
441,311
26,589
3,358,340
-
-
-
-
-
-
-
-
-
-
-
-
-
-
-
-
-
7,476,112 8,547,2003,358,340
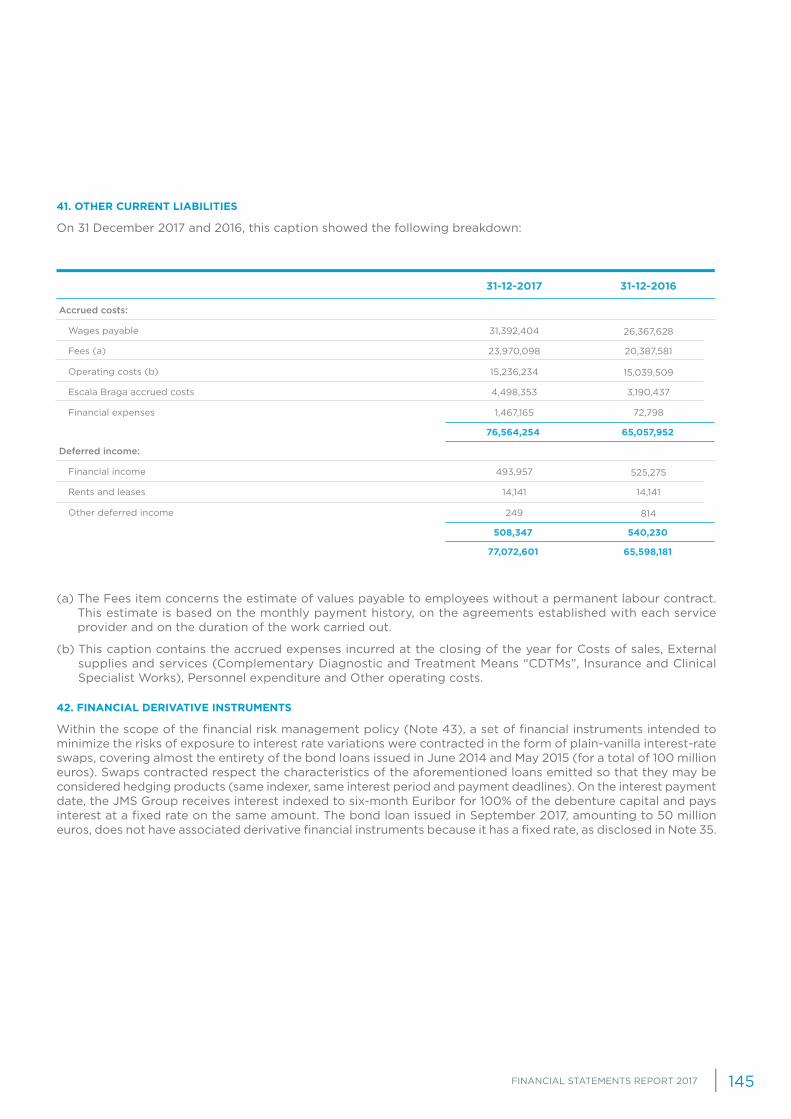
FINANCIAL STATEMENTS REPORT 2017 145
41. OTHER CURRENT LIABILITIES
On 31 December 2017 and 2016, this caption showed the following breakdown:
(a) The Fees item concerns the estimate of values payable to employees without a permanent labour contract. This estimate is based on the monthly payment history, on the agreements established with each service provider and on the duration of the work carried out.
(b) This caption contains the accrued expenses incurred at the closing of the year for Costs of sales, External supplies and services (Complementary Diagnostic and Treatment Means “CDTMs”, Insurance and Clinical Specialist Works), Personnel expenditure and Other operating costs.
42. FINANCIAL DERIVATIVE INSTRUMENTS
Within the scope of the financial risk management policy (Note 43), a set of financial instruments intended to minimize the risks of exposure to interest rate variations were contracted in the form of plain-vanilla interest-rate swaps, covering almost the entirety of the bond loans issued in June 2014 and May 2015 (for a total of 100 million euros). Swaps contracted respect the characteristics of the aforementioned loans emitted so that they may be considered hedging products (same indexer, same interest period and payment deadlines). On the interest payment date, the JMS Group receives interest indexed to six-month Euribor for 100% of the debenture capital and pays interest at a fixed rate on the same amount. The bond loan issued in September 2017, amounting to 50 million euros, does not have associated derivative financial instruments because it has a fixed rate, as disclosed in Note 35.
Wages payable
Financial income
Operating costs (b)
Other deferred income
Fees (a)
Rents and leases
Escala Braga accrued costs
Financial expenses
31-12-2017 31-12-2016
Accrued costs:
Deferred income:
26,367,628
525,275
15,039,509
814
20,387,581
14,141
3,190,437
72,798
31,392,404
493,957
15,236,234
249
23,970,098
14,141
4,498,353
1,467,165
76,564,254
508,347
77,072,601
65,057,952
540,230
65,598,181
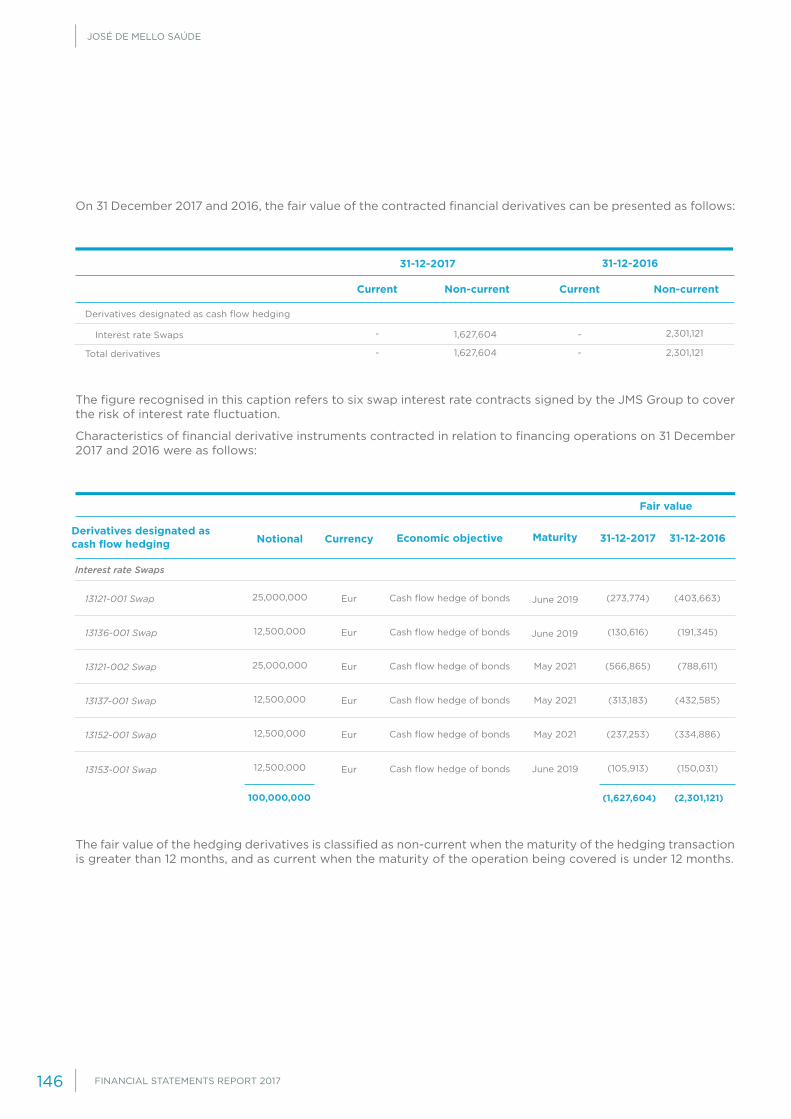
JOSÉ DE MELLO SAÚDE
FINANCIAL STATEMENTS REPORT 2017146
On 31 December 2017 and 2016, the fair value of the contracted financial derivatives can be presented as follows:
The figure recognised in this caption refers to six swap interest rate contracts signed by the JMS Group to cover the risk of interest rate fluctuation.
Characteristics of financial derivative instruments contracted in relation to financing operations on 31 December 2017 and 2016 were as follows:
The fair value of the hedging derivatives is classified as non-current when the maturity of the hedging transaction is greater than 12 months, and as current when the maturity of the operation being covered is under 12 months.
Current Current Non-current Non-current
-
-
31-12-2017 31-12-2016
Interest rate Swaps
Derivatives designated as cash flow hedging
Total derivatives
Derivatives designated as cash flow hedging CurrencyNotional
Eur
Eur
Eur
Eur
Eur
Eur
Cash flow hedge of bonds
Cash flow hedge of bonds
Cash flow hedge of bonds
Cash flow hedge of bonds
Cash flow hedge of bonds
Cash flow hedge of bonds
June 2019
June 2019
May 2021
May 2021
May 2021
June 2019
Economic objective 31-12-2016
Fair value
Maturity 31-12-2017
Interest rate Swaps
13121-001 Swap
13121-002 Swap
13136-001 Swap
13137-001 Swap
13152-001 Swap
13153-001 Swap
(1,627,604) (2,301,121)
(273,774)
(130,616)
(313,183)
(566,865)
(237,253)
(105,913)
(403,663)
(191,345)
(432,585)
(788,611)
(334,886)
(150,031)
25,000,000
12,500,000
12,500,000
25,000,000
12,500,000
12,500,000
100,000,000
-
-1,627,604
1,627,604 2,301,121
2,301,121

FINANCIAL STATEMENTS REPORT 2017 147
Cash flows are paid and received from hedging derivative financial instruments every six months:
The Group hedges an instalment of future payments on the interest of bond loan issues, through the allocation of interest rate Swaps in which it pays a fixed rate and receives a variable one, with a notional of 100 million eu-ros. This is an interest rate risk hedge related to payments of interest at a variable rate arising from recognised financial liabilities. The hedged risk is the variable rate indexer to which interest on loans is associated. The aim of this coverage is to transform variable interest rate loans into a fixed interest rate. The fair value of the interest rate Swaps on 31 December 2017 is -1,627,604 euros.
43. FINANCIAL RISK MANAGEMENT
The Group, like most companies, is exposed to a number of market risks related to changes in interest rates and liquidity risks arising from its financial liabilities, as well as the credit risk resulting from its operational and cash management activity.
All financial risk management operations, in particular those involving the use of financial derivative instruments require the prior approval of the Finance Director or the Executive Committee.
The JMS Group’s Risk Management Policy aims to ensure proper identification of risks associated with the business undertaken as well as to adopt and implement the necessary measures to minimise the negative impacts that adverse developments of the factors underlying these risks may have on the financial structure of the Company and its sustainability.
Under the risk management process, the Group identified a set of risks associated with the financial performance of each company included in the consolidation scope considered materially more relevant, among which stand out the market (exposure to variations of interest rates), credit and liquidity risks.
The Group has a risk management model that seeks to minimize the potential adverse effects, using the instru-ments suited to cover the risks to which it is exposed.
Analysed below in more detail are the main financial risks that the Group is exposed to and the main measures implemented to manage those risks.
SWAP’s
13136-001 13152-001 13121-002 13153-001 13121-001 13137-001
19-may-15 23-jun-15 30-jul-15 30-jul-1519-may-15 23-jun-15
21-may-15 25-jun-15 31-jul-15 31-jul-1521-may-15 25-jun-15
9-jun-19 17-may-21 17-may-21 9-jun-1917-may-21 9-jun-19
Effective Date
Trade Date
Termination Date
Notional Amount 25,000,000 12,500,000 12,500,000 12,500,00025,000,000 12,500,000

JOSÉ DE MELLO SAÚDE
FINANCIAL STATEMENTS REPORT 2017148
Market risk
JMS Group’s market risk is predominantly on the risk of interest-rate variation since the Group has no exposure to variation in exchange rates, prices of raw materials or stock quotes of financial assets.
Risk of exposure to variations in interest rates
The management of the interest rate risk aims to minimise exposure to changes in interest rates and their impact on the Financial Statements within the established limits.
Through control policy adopted, it seeks to select suitable strategies for each business area in order to ensure that this risk factor does not adversely affect the operational capacity. On the other hand, the exposure to interest rate risk is also monitored via the simulation of adverse scenarios with a certain degree of probability which can negatively affect the Group’s results.
In order to reduce the risk of exposure to interest rate changes, plain-vanilla interest rate swaps were contracted in 2015, covering 100% of the amounts of the debenture loans issued in 2014 and 2015 (100 million euros in total). The contracted swaps respect the characteristics of the aforementioned debenture loans in order to be considered hedging products (similar indexer, time period and interest-payment deadlines). On the date of interest payment, José de Mello Saúde Group receives interest indexed to 6-month Euribor for 100% of the capital in the debenture loans and pays interest at a fixed rate on the same amount.
In 2017, following its policy to reduce exposure to interest rates, José de Mello Saúde issued a bond loan with a fixed interest rate. Thus, considering the effect of the contracted swaps, at the end of 2017, José de Mello Saúde held 36% of its financial debt contracted at fixed interest rates (46% in 2016).
The table below provides a sensitivity analysis of the impact of a potential increment of the Euribor rates in José de Mello Saúde Group’s financial costs in 2017 and 2016:
Analysis notes:
• funding contracted at a fixed rate was excluded, namely the debenture loans mentioned previously;
• since the vast majority of the loans contracted by the JMS Group are supported by the application of a floor of zero if Euribor rates are negative, and given that these, in 2017 and 2016, were always negative, a scenario of rate reduction was not simulated.
+0.5
+0.5
+0.5
+0.5
+0.5
+0.5
-
Non-current loans
Non-current loans
Current and non-current finance leases
Current and non-current finance leases
Current loans
Current loans
Total
Total
Changes in Euribor rates (pp)
Impact in financial costs (euros)
2017
2016
+106,586
+88,136
+244,137
+320,432
+39,258
+92,598
+389,981
+501,116
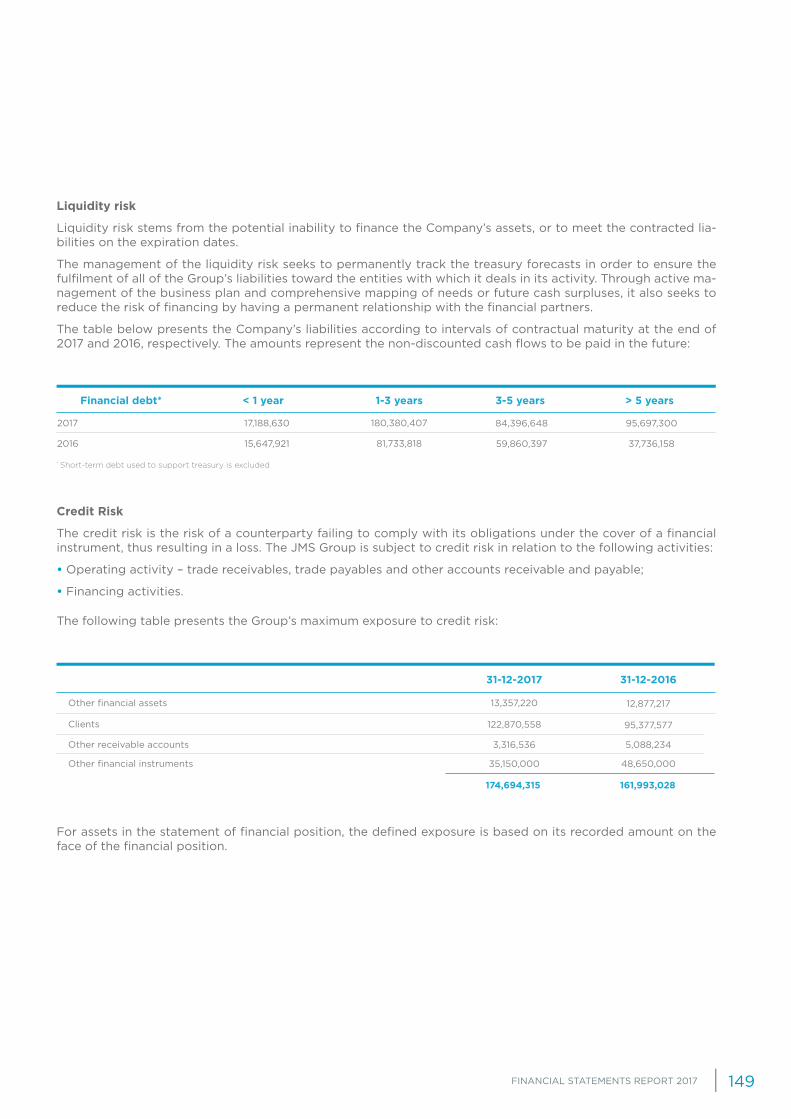
FINANCIAL STATEMENTS REPORT 2017 149
Liquidity risk
Liquidity risk stems from the potential inability to finance the Company’s assets, or to meet the contracted lia-bilities on the expiration dates.
The management of the liquidity risk seeks to permanently track the treasury forecasts in order to ensure the fulfilment of all of the Group’s liabilities toward the entities with which it deals in its activity. Through active ma-nagement of the business plan and comprehensive mapping of needs or future cash surpluses, it also seeks to reduce the risk of financing by having a permanent relationship with the financial partners.
The table below presents the Company’s liabilities according to intervals of contractual maturity at the end of 2017 and 2016, respectively. The amounts represent the non-discounted cash flows to be paid in the future:
Credit Risk
The credit risk is the risk of a counterparty failing to comply with its obligations under the cover of a financial instrument, thus resulting in a loss. The JMS Group is subject to credit risk in relation to the following activities:
• Operating activity – trade receivables, trade payables and other accounts receivable and payable;
• Financing activities.
The following table presents the Group’s maximum exposure to credit risk:
For assets in the statement of financial position, the defined exposure is based on its recorded amount on the face of the financial position.
Financial debt* < 1 year 1-3 years 3-5 years > 5 years
2017
2016
* Short-term debt used to support treasury is excluded
Clients
Other financial assets
Other receivable accounts
Other financial instruments
31-12-2017 31-12-2016
17,188,630
15,647,921
180,380,407
81,733,818
84,396,648
59,860,397
95,697,300
37,736,158
95,377,577
12,877,217
5,088,234
48,650,000
122,870,558
13,357,220
3,316,536
35,150,000
174,694,315 161,993,028

JOSÉ DE MELLO SAÚDE
FINANCIAL STATEMENTS REPORT 2017150
Accounts receivable
Credit risk is mainly related to credits of services provided to customers. This risk is tracked as follows:
• Following previously established policies, procedures and controls;
• Establishing credit limits for the customers, based on internal assessment criteria (average collection period);
• Impairment analyses on the values to be received on a regular basis.
• The amounts owed are regularly monitored and supplies to major clients are normally covered by guarantees;
• The JMS Group has factoring contracts in force, through which it grants credit and transfers the collection risk to the factoring entity.
The Group presents no significant credit risk with any specific customer, insofar as the accounts receivable stem from a high number of customers.
The changes in the impairment losses of accounts receivables are disclosed in Note 38.
It is the understanding of the Board of Directors that, at 31 December 2017, the estimated impairment losses on accounts receivable are adequately reported in the financial statements.
Other financial instruments
Other Financial Instruments include bonds issued by José de Mello Capital, S.A. and Farminveste – Investimentos, Participações e Gestão, S.A. Risk monitoring is carried out periodically by the management via the analysis of the accounts of José de Mello Capital, S.A. and Farminveste – Investimentos, Participações e Gestão, S.A..
44. FAIR VALUE OF FINANCIAL ASSETS AND LIABILITIES
The fair value of financial assets and liabilities is based on market prices, where available. If these are not available, fair value is estimated using internal models based on discounted cash flow techniques.
The nominal value less estimated credit adjustments of trade receivables and payables is assumed to be close to their fair value. The fair value of financial liabilities is estimated by updating the contracted future cash flows, at the current market interest rate available for similar financial instruments.
There are no significant differences between fair values calculated in this manner and the respective book values.
45. GUARANTEES AND COMMITMENTS
Guarantees
On 31 December 2017, the companies of the Group had provided guarantees to third parties in the amount of 28,182 thousand euros (8,076 thousand euros in 2016), detailed as follows:
Equity funding commitment letter
Municipal councils
Contractual obligations compliance
Services rendered to National Health Service
Supply of electricity, water and gas
31-12-201631-12-2017
Financial guarantees provided:
28,181,989 8,075,600
4,000,0004,000,000
1,320,972423,352
2,636,84523,640,854
116,701116,701
1,0821,082
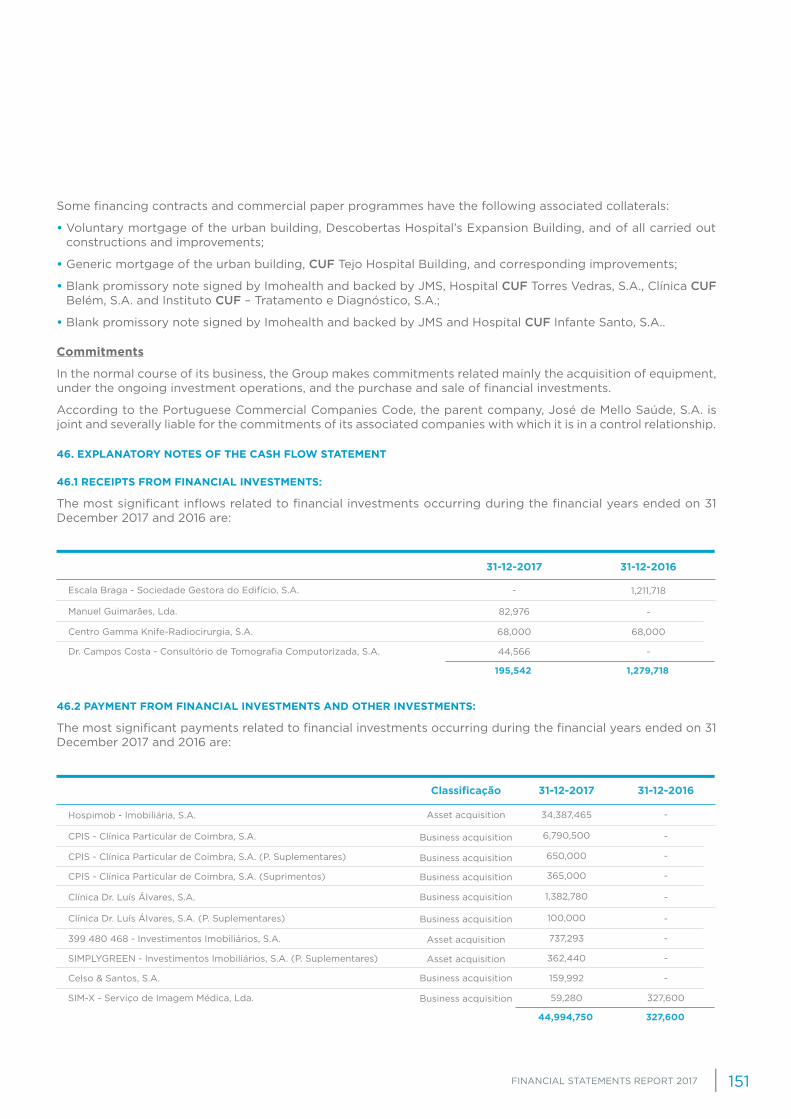
FINANCIAL STATEMENTS REPORT 2017 151
Some financing contracts and commercial paper programmes have the following associated collaterals:
• Voluntary mortgage of the urban building, Descobertas Hospital’s Expansion Building, and of all carried out constructions and improvements;
• Generic mortgage of the urban building, CUF Tejo Hospital Building, and corresponding improvements;
• Blank promissory note signed by Imohealth and backed by JMS, Hospital CUF Torres Vedras, S.A., Clínica CUF Belém, S.A. and Instituto CUF – Tratamento e Diagnóstico, S.A.;
• Blank promissory note signed by Imohealth and backed by JMS and Hospital CUF Infante Santo, S.A..
Commitments
In the normal course of its business, the Group makes commitments related mainly the acquisition of equipment, under the ongoing investment operations, and the purchase and sale of financial investments.
According to the Portuguese Commercial Companies Code, the parent company, José de Mello Saúde, S.A. is joint and severally liable for the commitments of its associated companies with which it is in a control relationship.
46. EXPLANATORY NOTES OF THE CASH FLOW STATEMENT
46.1 RECEIPTS FROM FINANCIAL INVESTMENTS:
The most significant inflows related to financial investments occurring during the financial years ended on 31 December 2017 and 2016 are:
46.2 PAYMENT FROM FINANCIAL INVESTMENTS AND OTHER INVESTMENTS:
The most significant payments related to financial investments occurring during the financial years ended on 31 December 2017 and 2016 are:
Manuel Guimarães, Lda.
Escala Braga - Sociedade Gestora do Edifício, S.A.
Centro Gamma Knife-Radiocirurgia, S.A.
Dr. Campos Costa - Consultório de Tomografia Computorizada, S.A.
31-12-2017 31-12-2016
Asset acquisition
Asset acquisition
Asset acquisition
Business acquisition
Business acquisition
Business acquisition
Business acquisition
Business acquisition
Business acquisition
Business acquisition
CPIS - Clínica Particular de Coimbra, S.A.
Clínica Dr. Luís Álvares, S.A. (P. Suplementares)
Hospimob - Imobiliária, S.A.
Clínica Dr. Luís Álvares, S.A.
CPIS - Clínica Particular de Coimbra, S.A. (P. Suplementares)
399 480 468 - Investimentos Imobiliários, S.A.
Celso & Santos, S.A.
CPIS - Clínica Particular de Coimbra, S.A. (Suprimentos)
SIMPLYGREEN - Investimentos Imobiliários, S.A. (P. Suplementares)
SIM-X - Serviço de Imagem Médica, Lda.
31-12-2017Classificação 31-12-2016
-
1,211,718
68,000
-
82,976
-
68,000
44,566
195,542 1,279,718
-
-
-
-
-
-
-
-
-
327,600
6,790,500
100,000
34,387,465
1,382,780
650,000
737,293
159,992
365,000
362,440
59,280
44,994,750 327,600
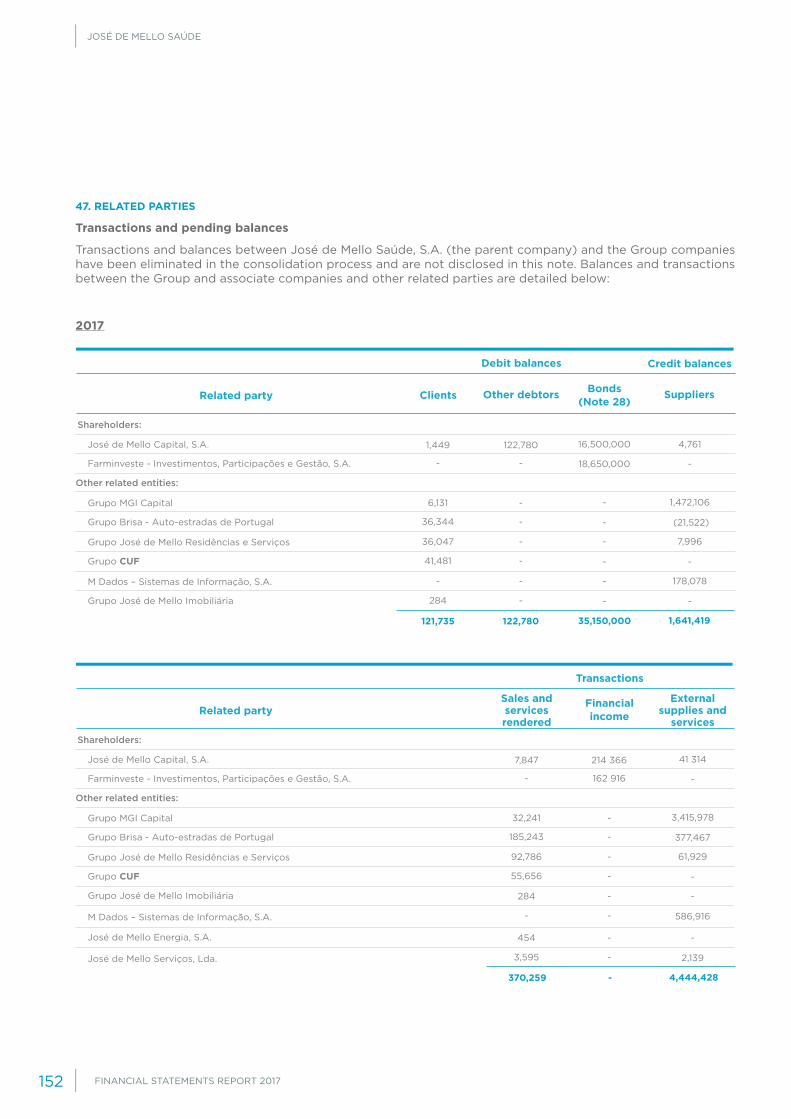
JOSÉ DE MELLO SAÚDE
FINANCIAL STATEMENTS REPORT 2017152
47. RELATED PARTIES
Transactions and pending balances
Transactions and balances between José de Mello Saúde, S.A. (the parent company) and the Group companies have been eliminated in the consolidation process and are not disclosed in this note. Balances and transactions between the Group and associate companies and other related parties are detailed below:
Debit balances Credit balances
SuppliersBonds(Note 28)
Other debtorsClientsRelated party
José de Mello Capital, S.A.
Grupo MGI Capital
Grupo José de Mello Residências e Serviços
M Dados – Sistemas de Informação, S.A.
Shareholders:
Farminveste - Investimentos, Participações e Gestão, S.A.
Grupo Brisa - Auto-estradas de Portugal
Grupo CUF
Grupo José de Mello Imobiliária
Other related entities:
2017
Transactions
External supplies and
services
Financial income
Sales and services rendered
Related party
José de Mello Capital, S.A.
Grupo MGI Capital
Grupo José de Mello Residências e Serviços
M Dados – Sistemas de Informação, S.A.
José de Mello Serviços, Lda.
Shareholders:
Farminveste - Investimentos, Participações e Gestão, S.A.
Grupo Brisa - Auto-estradas de Portugal
Grupo CUF
Grupo José de Mello Imobiliária
José de Mello Energia, S.A.
Other related entities:
35,150,000
16,500,000
-
-
-
4,761
1,472,106
7,996
178,078
18,650,000
-
-
-
-
(21,522)
-
-
1,641,419
122,780
-
-
-
1,449
6,131
36,047
-
122,780121,735
-
-
-
-
-
36,344
41,481
284
4,444,428
41 314
3,415,978
61,929
-
-
-
377,467
-
586,916
2,139
214 366
-
-
-
-
7,847
32,241
92,786
284
454
-370,259
162 916
-
-
-
-
-
185,243
55,656
-
3,595

FINANCIAL STATEMENTS REPORT 2017 153
2016
Debit balances Credit balances
SuppliersBonds(Note 28)
Other debtorsClientsRelated party
José de Mello Capital, S.A.
José de Mello Participações II, SGPS, SA
Grupo Brisa - Auto-estradas de Portugal
Grupo CUF
Shareholders:
Farminveste - Investimentos, Participações e Gestão, S.A.
Grupo MGI Capital
Grupo José de Mello Residências e Serviços
José de Mello Energi, S.A.
M Dados - Sistemas de informação, S.A.
Other related entities:
Transactions
External supplies and
services
Financial income
Sales and services rendered
Related party
José de Mello, SGPS, S.A.
Grupo MGI Capital
José de Mello Participações II, SGPS, S.A.
Grupo José de Mello Imobiliária
José de Mello Energia, S.A.
José de Mello Serviços, Lda.
Shareholders:
Farminveste - Investimentos, Participações e Gestão, S.A.
Grupo Brisa - Auto-estradas de Portugal
Grupo José de Mello Residências e Serviços
Grupo CUF
M Dados – Sistemas de Informação, S.A.
Other related entities:
48,650,000
20,000,000
10,000,000
-
-
7,365
-
4,182
-
18,650,000
-
-
-
-
-
1,713,597
15,450
-
296,895
2,037,489
122,780
-
-
-
1,248
-
21,399
821
1,885,798159,435
1,763,018
-
-
-
-
-
92,590
43,364
13
-
4,896,415
28,383
3,404,798
-
-
1,322,201
33,722
-
87,898
47,795
-
-
195,360
-
-
-
-
-
7,783
318,214
-
39,479
-
-
-607,476
-
-
-
-
-
-
182,814
66,251
251
467
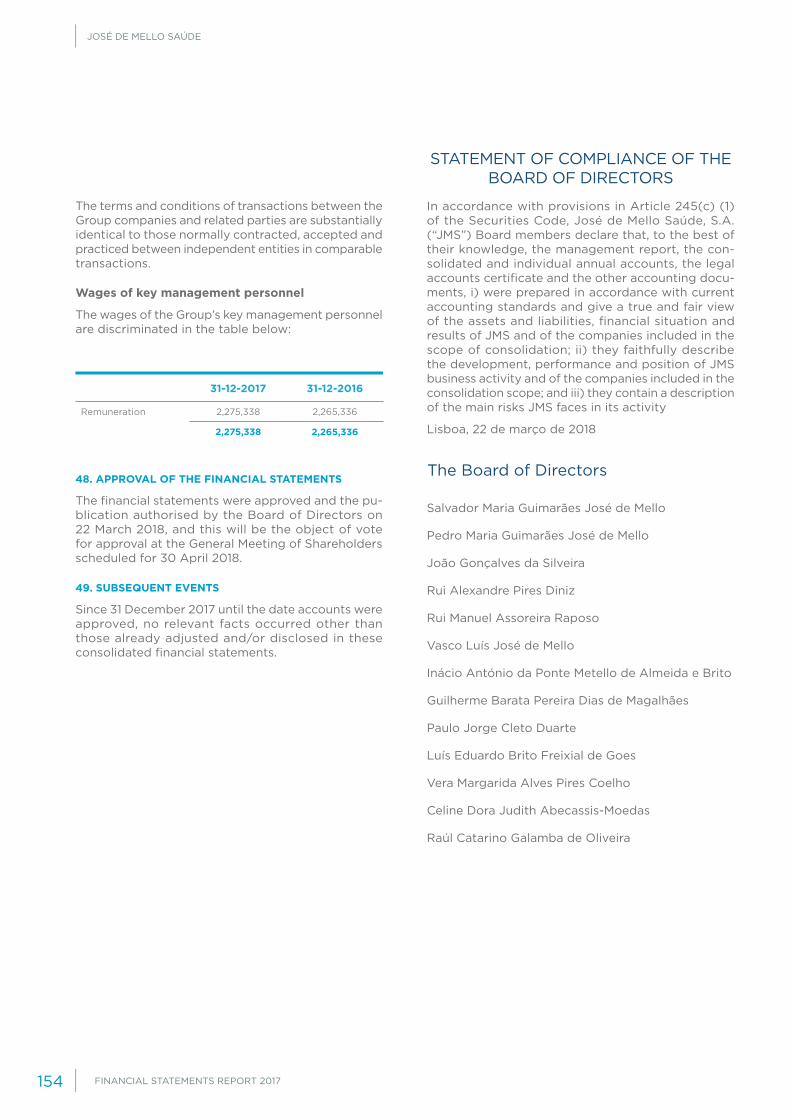
JOSÉ DE MELLO SAÚDE
FINANCIAL STATEMENTS REPORT 2017154
The terms and conditions of transactions between the Group companies and related parties are substantially identical to those normally contracted, accepted and practiced between independent entities in comparable transactions.
Wages of key management personnel
The wages of the Group’s key management personnel are discriminated in the table below:
48. APPROVAL OF THE FINANCIAL STATEMENTS
The financial statements were approved and the pu-blication authorised by the Board of Directors on 22 March 2018, and this will be the object of vote for approval at the General Meeting of Shareholders scheduled for 30 April 2018.
49. SUBSEQUENT EVENTS
Since 31 December 2017 until the date accounts were approved, no relevant facts occurred other than those already adjusted and/or disclosed in these consolidated financial statements.
STATEMENT OF COMPLIANCE OF THE BOARD OF DIRECTORS
In accordance with provisions in Article 245(c) (1) of the Securities Code, José de Mello Saúde, S.A. (“JMS”) Board members declare that, to the best of their knowledge, the management report, the con-solidated and individual annual accounts, the legal accounts certificate and the other accounting docu-ments, i) were prepared in accordance with current accounting standards and give a true and fair view of the assets and liabilities, financial situation and results of JMS and of the companies included in the scope of consolidation; ii) they faithfully describe the development, performance and position of JMS business activity and of the companies included in the consolidation scope; and iii) they contain a description of the main risks JMS faces in its activity
Lisboa, 22 de março de 2018
Salvador Maria Guimarães José de Mello
Pedro Maria Guimarães José de Mello
João Gonçalves da Silveira
Rui Alexandre Pires Diniz
Rui Manuel Assoreira Raposo
Vasco Luís José de Mello
Inácio António da Ponte Metello de Almeida e Brito
Guilherme Barata Pereira Dias de Magalhães
Paulo Jorge Cleto Duarte
Luís Eduardo Brito Freixial de Goes
Vera Margarida Alves Pires Coelho
Celine Dora Judith Abecassis-Moedas
Raúl Catarino Galamba de Oliveira
Remuneration
31-12-2017 31-12-2016
The Board of Directors
2,265,336
2,265,336
2,275,338
2,275,338

FINANCIAL STATEMENTS REPORT 2017 155
a) Qualifying holdings in the company’s share capital.
b) Identification of shareholders with special rights and description of these rights.
There are no special rights granted to any company shareholder.
c) Number of shares and bonds held by members of the administrative and supervisory boards, under the terms and for the effects of provisions in article 447(5) of the Portuguese Commercial Companies Code and article 14 of the Portuguese Securities Market Commission (CMVM) Regulation No. 5/2008.
Members of the Company’s administrative do not hold shares or bonds in José de Mello Saúde S.A., as no transaction has taken place on these bonds during the financial year of 2017.
Members of José de Mello Saúde S.A. administrative board do not hold non-voting preference shares representing the share capital in José de Mello Saúde S.A. Hospital CUF Descobertas, S.A., subscribed on the date and under the following terms:
INFORMATION ON THE SHAREHOLDING STRUCTURE, ORGANIZATION AND CORPORATE GOVERNANCE
65.85%
30.00%
4.15%
100.00%
65.85%
30.00%
4.15%
100.00%
Fundação Amélia da Silva de Mello
José de Mello Capital, S.A.
Farminveste - Investimentos, Participações e Gestão
Total
% CapitalNo. of sharesShareholder % Voting rights
Balance in31-12-2017
Balance at 31-12-2016 DisposalsAcquisitionsSubscriptions
AmountAmount Value €Value €Value € AmountAmountAmount
236
100
100
92
100
200
305
116
137
92
137
327
69
16
37
37
127
5,00
5,00
5,00
5,00
5,00
Hospital CUF Descobertas, S.A.
Hospital CUF Descobertas, S.A.
Hospital CUF Descobertas, S.A.
Hospital CUF Descobertas, S.A.
Hospital CUF Descobertas, S.A.
Hospital CUF Descobertas, S.A.
Salvador Maria Guimarães José de Mello
Vasco Luís José de Mello
Rui Manuel Assoeira Raposo
Inácio António da Ponte Metello de Almeida e Brito
Guilherme Barata Pereira Dias de Magalhães
Rui Alexandre Pires Diniz
6,980,100
3,180,000
439,900
10,600,000
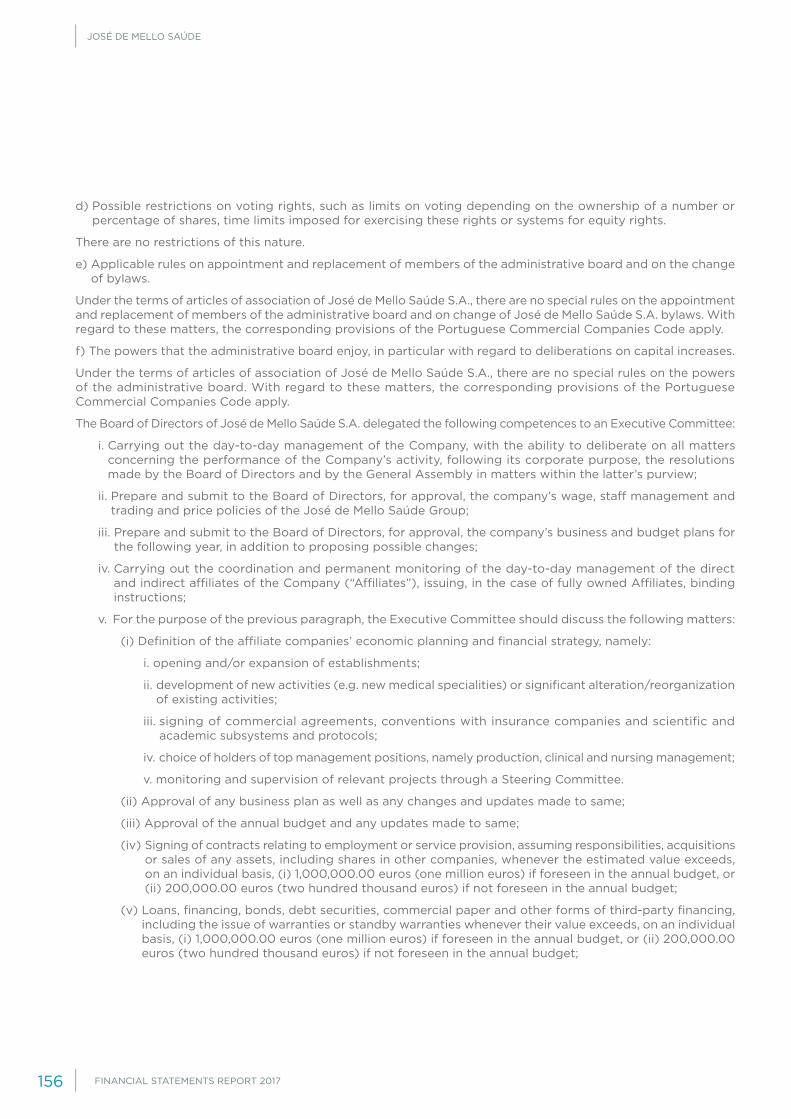
JOSÉ DE MELLO SAÚDE
FINANCIAL STATEMENTS REPORT 2017156
d) Possible restrictions on voting rights, such as limits on voting depending on the ownership of a number or percentage of shares, time limits imposed for exercising these rights or systems for equity rights.
There are no restrictions of this nature.
e) Applicable rules on appointment and replacement of members of the administrative board and on the change of bylaws.
Under the terms of articles of association of José de Mello Saúde S.A., there are no special rules on the appointment and replacement of members of the administrative board and on change of José de Mello Saúde S.A. bylaws. With regard to these matters, the corresponding provisions of the Portuguese Commercial Companies Code apply.
f) The powers that the administrative board enjoy, in particular with regard to deliberations on capital increases.
Under the terms of articles of association of José de Mello Saúde S.A., there are no special rules on the powers of the administrative board. With regard to these matters, the corresponding provisions of the Portuguese Commercial Companies Code apply.
The Board of Directors of José de Mello Saúde S.A. delegated the following competences to an Executive Committee:
i. Carrying out the day-to-day management of the Company, with the ability to deliberate on all matters concerning the performance of the Company’s activity, following its corporate purpose, the resolutions made by the Board of Directors and by the General Assembly in matters within the latter’s purview;
ii. Prepare and submit to the Board of Directors, for approval, the company’s wage, staff management and trading and price policies of the José de Mello Saúde Group;
iii. Prepare and submit to the Board of Directors, for approval, the company’s business and budget plans for the following year, in addition to proposing possible changes;
iv. Carrying out the coordination and permanent monitoring of the day-to-day management of the direct and indirect affiliates of the Company (“Affiliates”), issuing, in the case of fully owned Affiliates, binding instructions;
v. For the purpose of the previous paragraph, the Executive Committee should discuss the following matters:
(i) Definition of the affiliate companies’ economic planning and financial strategy, namely:
i. opening and/or expansion of establishments;
ii. development of new activities (e.g. new medical specialities) or significant alteration/reorganization of existing activities;
iii. signing of commercial agreements, conventions with insurance companies and scientific and academic subsystems and protocols;
iv. choice of holders of top management positions, namely production, clinical and nursing management;
v. monitoring and supervision of relevant projects through a Steering Committee.
(ii) Approval of any business plan as well as any changes and updates made to same;
(iii) Approval of the annual budget and any updates made to same;
(iv) Signing of contracts relating to employment or service provision, assuming responsibilities, acquisitions or sales of any assets, including shares in other companies, whenever the estimated value exceeds, on an individual basis, (i) 1,000,000.00 euros (one million euros) if foreseen in the annual budget, or (ii) 200,000.00 euros (two hundred thousand euros) if not foreseen in the annual budget;
(v) Loans, financing, bonds, debt securities, commercial paper and other forms of third-party financing, including the issue of warranties or standby warranties whenever their value exceeds, on an individual basis, (i) 1,000,000.00 euros (one million euros) if foreseen in the annual budget, or (ii) 200,000.00 euros (two hundred thousand euros) if not foreseen in the annual budget;

FINANCIAL STATEMENTS REPORT 2017 157
vi. Signing all acts and contracts inherent in the company’s activity, providing that their value does not exceed the amount equivalent to 15,000,000.00 euros (fifteen million euros);
vii. Entering into bank loans or similar operations, granting shareholders’ loans and other forms of providing capital to Affiliates, as long as the corresponding amount does not exceed the equivalent to 15,000,000.00 euros (fifteen million euros);
viii. Conducting banking transactions, such as open and operate any credit or debit bank accounts, withdraw and endorse cheques and withdraw, accept and endorse letters, promissory notes and other debt securities;
ix. Making receipts and payments on behalf of the company, grant discharge and issue the required accounting documents;
x. Signing employment or service contracts for company staff, to exercise or be able to discipline and promote, if necessary, the dismissal of any employee, in addition to recruiting employees or special experts, where appropriate;
xi Establishing new companies, in addition to acquiring or disposing of shares in other companies, as long as the respective holding does not exceed the equivalent of 15,000,000.00 euros (fifteen million euros);
xii. Signing any types of insurance contracts inherent to the exercise of the Company’s activity;
xiii. Proposing to the Board of Directors leases whose annual amount exceeds 1,000,000.00 euros (one million euros), disposal, encumbrance or acquisition of immovable assets for the Company, whose value exceeds 15,000,000.00 euros (fifteen million euros);
xiv. Carrying out provision of all movable property and equipment essential for the exercise of the Company’s activity;
xv. Proposing the company’s organigram to the Board of Directors and keep it informed on the subsequent adjustments that prove to be necessary;
xvi. Establishing proxies to represent the company in the execution of specific acts through issuing the appropriate instrument for that purpose;
xvii. Establishing forensic proxies to represent the Company in any litigations in which it may be involved, granting them sufficient powers to acknowledge, desist and compromise;
xviii. Representing the Company in court and in arbitration as well as appointing arbitrators in any litigation in which it may be involved;
xix. Proposing the holders of the governing bodies of the Affiliates on whose Boards of Directors shall participate the entirety or part of the members of the Company’s Executive Committee.
The amounts indicated presumes prior budgeting of respective expenses and/or liabilities. As they are non-budgeted expenses and/or liabilities, these limits are reduced to 40% (forty percent) of the amount indicated.
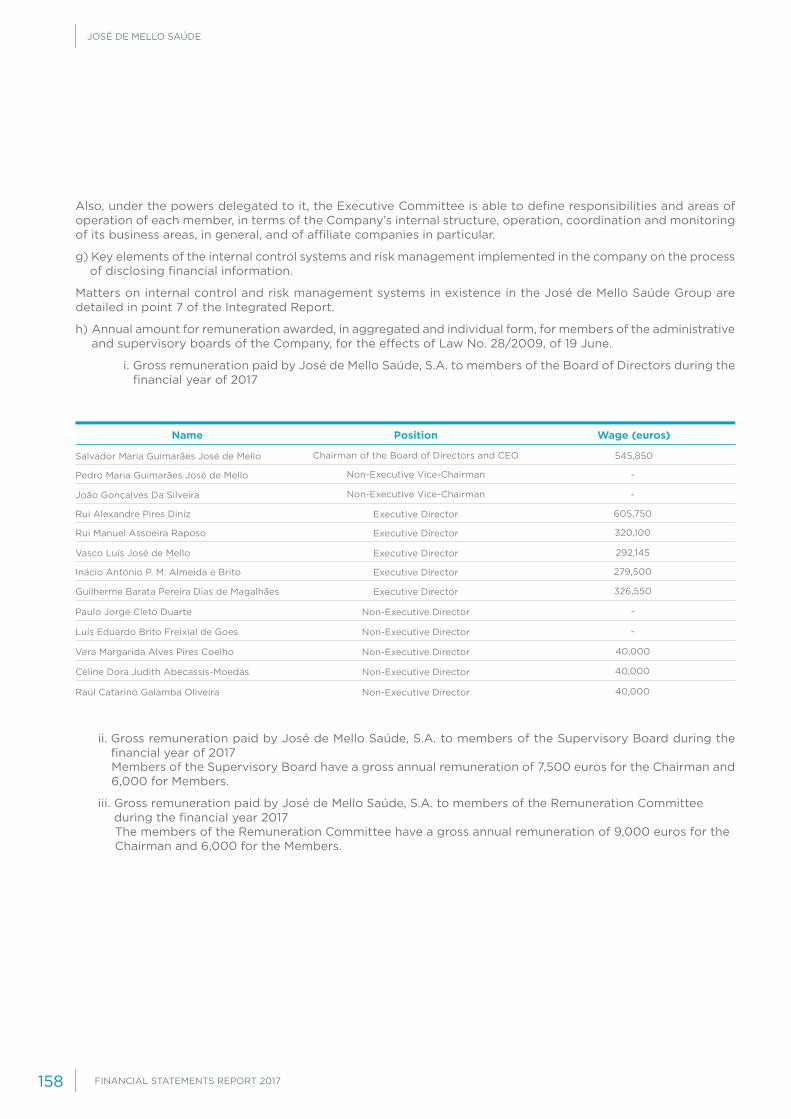
JOSÉ DE MELLO SAÚDE
FINANCIAL STATEMENTS REPORT 2017158
-
605,750
545,850
-
Also, under the powers delegated to it, the Executive Committee is able to define responsibilities and areas of operation of each member, in terms of the Company’s internal structure, operation, coordination and monitoring of its business areas, in general, and of affiliate companies in particular.
g) Key elements of the internal control systems and risk management implemented in the company on the process of disclosing financial information.
Matters on internal control and risk management systems in existence in the José de Mello Saúde Group are detailed in point 7 of the Integrated Report.
h) Annual amount for remuneration awarded, in aggregated and individual form, for members of the administrative and supervisory boards of the Company, for the effects of Law No. 28/2009, of 19 June.
i. Gross remuneration paid by José de Mello Saúde, S.A. to members of the Board of Directors during the financial year of 2017
ii. Gross remuneration paid by José de Mello Saúde, S.A. to members of the Supervisory Board during the financial year of 2017
Members of the Supervisory Board have a gross annual remuneration of 7,500 euros for the Chairman and 6,000 for Members.
iii. Gross remuneration paid by José de Mello Saúde, S.A. to members of the Remuneration Committee during the financial year 2017
The members of the Remuneration Committee have a gross annual remuneration of 9,000 euros for the Chairman and 6,000 for the Members.
320,100
279,500
292,145
326,550
-
-
40,000
40,000
40,000
Chairman of the Board of Directors and CEO
Non-Executive Vice-Chairman
Non-Executive Vice-Chairman
Executive Director
Executive Director
Executive Director
Executive Director
Executive Director
Non-Executive Director
Non-Executive Director
Non-Executive Director
Non-Executive Director
Non-Executive Director
Salvador Maria Guimarães José de Mello
Pedro Maria Guimarães José de Mello
João Gonçalves Da Silveira
Rui Alexandre Pires Diniz
Rui Manuel Assoeira Raposo
Inácio António P. M. Almeida e Brito
Vasco Luís José de Mello
Guilherme Barata Pereira Dias de Magalhães
Paulo Jorge Cleto Duarte
Luís Eduardo Brito Freixial de Goes
Vera Margarida Alves Pires Coelho
Celine Dora Judith Abecassis-Moedas
Raúl Catarino Galamba Oliveira
Wage (euros)Name Position

FINANCIAL STATEMENTS REPORT 2017 159
iv. Amount of annual remuneration paid by the company and/or by legal persons in control or group relationship to the auditor and to other natural or legal persons and specification of the percentage for each type of service.
The value of the tax consultancy is mostly related to services rendered in 2014 and 2015, which were only billed in 2017.
215,700
185,475
19,450
420,625
Cost of statutory audit services
Cost of tax advisory services
Cost of other non-audit services
Description
Total
Amount (euros)

JOSÉ DE MELLO SAÚDE
FINANCIAL STATEMENTS REPORT 2017160
• The members of the Board of Directors shall perform their duties diligently and carefully, in the interests of the company, taking into account the interests of its shareholders, employees and remaining stakeholders;
• It is in the interest of the Company and its shareholders to create the suitable conditions and incentives, enablers of the good performance of duties by the Board of Directors, in accordance with the criteria mentioned above;
• It is also intended that the way the members of the governing body are compensated is a transparent, fair and independent process, which guarantees a balance between the shareholders, the company’s positioning in the market and the need to attract and retain talent;
• In this perspective, the remuneration is an essential management tool for framing and motivating the leaders’ performance at the company level;
• The definition and application of the criteria underlying the setting the Board Members remunerations, submitted to the Remuneration Committee, shall thus be consistent and homogeneous, on the one hand taking into account the level of remuneration currently practiced in similar European companies and, on the other hand, the level of compliance with the strategic objectives defined for José de Mello Saúde Group (JMS), the creation of value for the shareholders and the economic context;
• In this sense, the remuneration shall include a fixed component that seeks to, in the context of the corresponding skills and responsibilities, suitably remunerate the effort and work developed throughout each mandate, applicable to the executive and independent non-executive members of the Board of Directors, and a variable component to be given to the executive members to compensate them for the Company’s performance and, at the same time, align his/her interests with the sustainability interests of the company in longer-term cycles. This alignment will be guaranteed, in particular, through the impact on the calculation of the variable remuneration of the operating and financial performance of the company in each financial year, of the intrinsic quality of the presented results (both recurring and extraordinary), of the compliance with the annual budget and of the business plan, taking into account JMS’s positioning in the healthcare market and the expectation of
REMUNERATION POLICY OF THE MEMBERS OF THE COMPANY’S GOVERNING AND SUPERVISORY BODIES
business evolution in the medium and long term;
• The assignment of the variable component, in addition to what was already mentioned, is also dependent on the evaluation of the fulfilment of collective, annual and multi-annual goals, reviewed annually taking into account, namely, the following indicators: Revenue, EBITDA, EBIT, Net Profit and Customers Security Index, not only in terms of evolution according to JMS’s track record but also taking into account the remuneration level of the main companies in the domestic market according to market studies conducted in Portugal;
• Part of the variable remuneration is paid after the end of each financial year and when the corresponding results are determined, with another significant component deferred for a period of three years, with its payment dependent on the continuation of JMS’s positive performance throughout that period, seeking to foster the maximisation of the performance in the long term and the pursuit of the company’s strategic and structural objectives, and to discourage excessive risk taking;
Regarding the supervisory body, considering the provisions of art. 422-A, along with the provisions of paragraph 1 of art. 399, both from the Portuguese Commercial Companies Code, the remuneration of the members of the Supervisory Board shall be a fixed amount, that shall be defined taking into account the complexity and responsibility of the roles performed, the normal compensation practices and conditions in the performance of similar jobs, as well as the company’s economic condition.
FINANCIAL STATEMENTS REPORT 2017 161
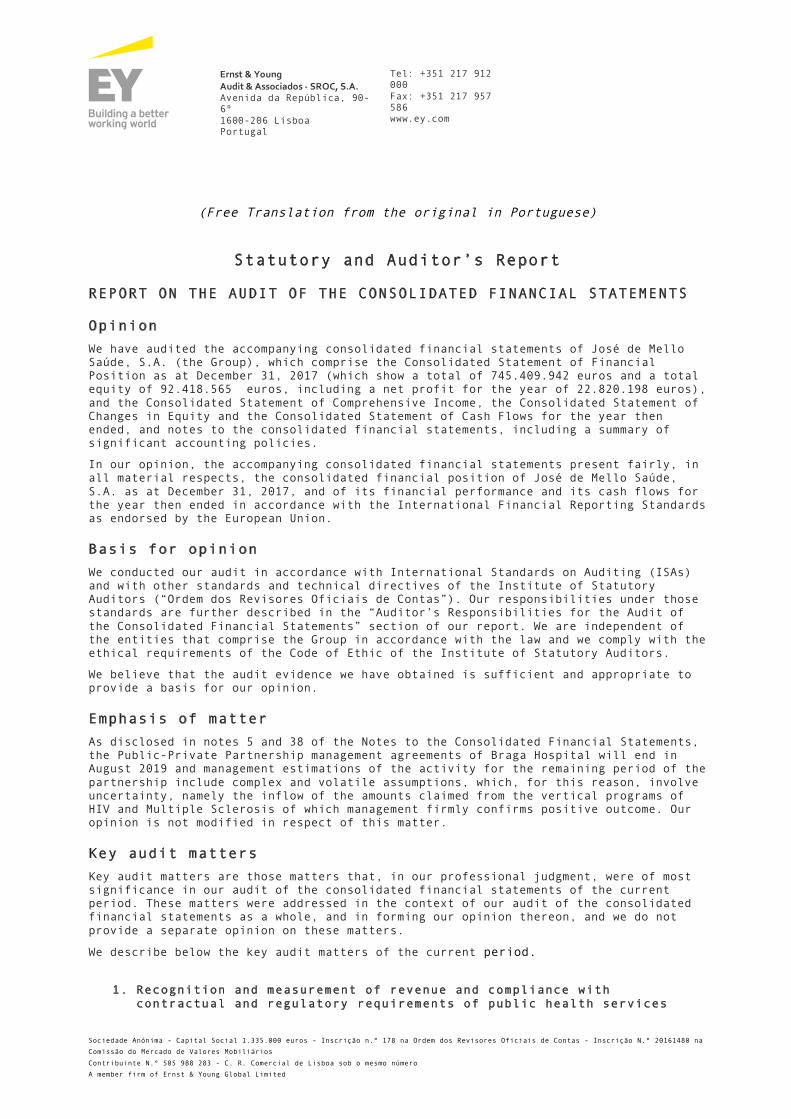
Sociedade Anónima - Capital Social 1.335.000 euros - Inscrição n.º 178 na Ordem dos Revisores Oficiais de Contas - Inscrição N.º 20161480 na
Comissão do Mercado de Valores Mobiliários
Contribuinte N.º 505 988 283 - C. R. Comercial de Lisboa sob o mesmo número
A member firm of Ernst & Young Global Limited
Ernst&YoungAudit&Associados-SROC,S.A.Avenida da República, 90-6º 1600-206 Lisboa Portugal
Tel: +351 217 912 000 Fax: +351 217 957 586 www.ey.com
(Free Translation from the original in Portuguese)
Statutory and Auditor’s Report
REPORT ON THE AUDIT OF THE CONSOLIDATED FINANCIAL STATEMENTS
Opinion
We have audited the accompanying consolidated financial statements of José de Mello Saúde, S.A. (the Group), which comprise the Consolidated Statement of Financial Position as at December 31, 2017 (which show a total of 745.409.942 euros and a total equity of 92.418.565 euros, including a net profit for the year of 22.820.198 euros), and the Consolidated Statement of Comprehensive Income, the Consolidated Statement of Changes in Equity and the Consolidated Statement of Cash Flows for the year then ended, and notes to the consolidated financial statements, including a summary of significant accounting policies.
In our opinion, the accompanying consolidated financial statements present fairly, in all material respects, the consolidated financial position of José de Mello Saúde, S.A. as at December 31, 2017, and of its financial performance and its cash flows for the year then ended in accordance with the International Financial Reporting Standards as endorsed by the European Union.
Basis for opinion
We conducted our audit in accordance with International Standards on Auditing (ISAs) and with other standards and technical directives of the Institute of Statutory Auditors (“Ordem dos Revisores Oficiais de Contas”). Our responsibilities under those standards are further described in the “Auditor’s Responsibilities for the Audit of the Consolidated Financial Statements” section of our report. We are independent of the entities that comprise the Group in accordance with the law and we comply with the ethical requirements of the Code of Ethic of the Institute of Statutory Auditors.
We believe that the audit evidence we have obtained is sufficient and appropriate to provide a basis for our opinion.
Emphasis of matter
As disclosed in notes 5 and 38 of the Notes to the Consolidated Financial Statements, the Public-Private Partnership management agreements of Braga Hospital will end in August 2019 and management estimations of the activity for the remaining period of the partnership include complex and volatile assumptions, which, for this reason, involve uncertainty, namely the inflow of the amounts claimed from the vertical programs of HIV and Multiple Sclerosis of which management firmly confirms positive outcome. Our opinion is not modified in respect of this matter.
Key audit matters
Key audit matters are those matters that, in our professional judgment, were of most significance in our audit of the consolidated financial statements of the current period. These matters were addressed in the context of our audit of the consolidated financial statements as a whole, and in forming our opinion thereon, and we do not provide a separate opinion on these matters.
We describe below the key audit matters of the current period.
1. Recognition and measurement of revenue and compliance with contractual and regulatory requirements of public health services
José de Mello Saúde, S.A Statutory and Auditor’s Report
December 31, 2017
given the complexity of Public-Private Partnership management agreements of Braga and Vila Franca de Xira Hospitals
Description of the risks of material misstatement Summary of our approach to the risks of material misstatement
Sales and services rendered and Other operational revenues of the group are essentially related to two business segments:
► Public health services, that represent 36% of total revenue; and
► Private health services, that represent 64% of total revenue.
The group manages the services rendered by two public hospitals: Braga Hospital and Vila Franca de Xira Hospital. The activity and the revenues of the two Hospitals are determined in accordance with the applicable clauses included in the Public-Private management agreements signed with the Regional Health Administrations, as disclosed in notes 2.3, 2.5 and 5 of the Notes to the Consolidated Financial Statements. The materiality, variety and complexity of the health services rendered, associated with the judgment inherent to the interpretation of the referred agreements represents a significant audit risk. The fact that the production related to prior years is not yet closed, and that changes occurred in the codification of clinical acts, as mentioned in note 2.3 of the Notes to the Consolidated Financial Statements, indicates significant uncertainty about the acceptance of revenues recognized in prior years and in the current year, as detailed in note 23 of the Notes to the Consolidated Financial Statements.
Consequently, the recoverability of the balances related to Braga Hospital (20.554 thousand euros) and Vila Franca de Xira Hospital (13.006 thousand euros) depends on the success of the ongoing negotiations with the Regional Health Administrations for each of the indicated years.
The recognition and measurement of public health revenues involve, as
Our approach to the risks of material misstatement includes: i) a global response with an impact on the way the audit has been performed; and ii) a specific response which translated into a combined approach of assessment of controls and substantive procedures, namely:
► Assessment of the effectiveness of the internal control environment and execution of test of controls and tests related with i) production entitlement, and ii) computation of production based on the assumptions defined in the management agreements;
► Execution of analytical review procedures for all sales and services rendered accounts, including analysis of the significant variances compared to prior year, compared with expectations and with the agreed / budgeted production with the use of data analysis tools (analytics);
► Execution of test of details to validate contractual compliance and eligibility of services rendered related to unbilled production and accrued revenues, including the recalculation of current year revenues in accordance with the incurred production, considering the rules of the different classes, compared with the contracted production;
► Analysis of correspondence / communications between Braga Hospital and Vila Franca de Xira Hospital and the Regional Health Administrations related with the matters that are still under validation for the years that remain under discussion;
► Analysis of the quarterly reports issued by an external independent expert related to the Monitoring and Assessment of Care Assistance Results, which includes the recalculation of the performance factor results and the service performance parameters, and recalculation of the penalties related to those parameters;
► Retrospective analysis of previous years’ settlement agreements, to confirm consistency of the treatment agreed with Braga Hospital and Vila Franca de Xira Hospital and the Regional Health Administrations, for those instances of production not eligible and analysis of coherence for the years that are still under discussion.
Our approach also encompassed the analysis of the disclosures included in notes 2.3, 2.5, 5 and 23 of the Notes to the Consolidated Financial Statements to ensure that those notes are in accordance with the
José de Mello Saúde, S.A Statutory and Auditor’s Report
December 31, 2017
Description of the risks of material misstatement Summary of our approach to the risks of material misstatement
per the above, significant judgement from management as disclosed in note 2.3 of the Notes to the Consolidated Financial Statements, particularly, in what concerns the determination of eligible production and its measurement.
applicable accounting standards.
2. Recognition and measurement of revenues from private health services due to the high volume of transactions, and the variety and complexity of services rendered in the various health units.
Description of the risks of material misstatement Summary of our approach to the risks of material misstatement
As mentioned in the previous Key Audit Matter, consolidated revenues from rendering of private health care services comprise a significant volume of transactions, from various health units that render a variety of complex services. The specificity and complexity of some of the services rendered and the multiplicity of existing agreements with health insurance companies and health subsystems organizations increase significantly the risk of services rendered not being recognized or being incorrectly measured.
Our approach to the risk of material misstatement includes: i) a global response with impact on the way the audit has been performed; and ii) a specific response which translated in a combined approach of assessment of controls and substantive procedures, namely:
► Assessment of the effectiveness of internal control environment and execution of tests of controls related to revenue recognition;
► Perform the reconciliation between the operational invoicing system and the recognition of revenue in the general ledger;
► Execution of analytical review procedures to all sales and services rendered accounts, including analysis of the significant variances compared to prior year, compared with expectations and with the agreed / budgeted production with the use of data analysis tools (analytics);
► Testing of the amounts booked as accrued invoices as at December 31, 2017, through the substantive analysis of the processes that originated the deferral of invoicing, as well as through the subsequent clearance, after the financial year end;
► Execution of data analysis procedures (analytics) to validate the correlation of transactions booked i) between the sales and services rendered accounts and the clients’ accounts and ii) between the clients’ accounts and cash & banks, during the period from January 1, 2017 to December 31, 2017.
Our approach also encompassed the analysis of the disclosures included in notes 2.5, 5 and 23 of the Notes to the Consolidated Financial Statements to validate that the disclosures are in accordance with the applicable accounting standards.

José de Mello Saúde, S.A Statutory and Auditor’s Report
December 31, 2017
3. Impairment of Goodwill
Description of the risks of material misstatement Summary of our approach to the risks of material misstatement
The amount of Goodwill as at December 31, 2017 amounts to 43.885 thousand euros and is related to the business combinations disclosed in note 16 of the Notes to the Consolidated Financial Statements.
An impairment test should be performed in respect of this asset on an annual basis, which involves a high level of subjectivity inherent (i) to the assumptions taken by management in forecasting the business plans of each Cash Generating Unit, as well as (ii) to the remaining assumptions included in the calculation of the value in use, determined in accordance with the discounted cash flows methodology, namely the discount rates and forecast performance, including perpetual growth, as disclosed in note 16 of the Notes to the Consolidated Financial Statements.
Consequently, the potential impairment of goodwill has been considered a relevant matter because the amount booked for this asset is material and the impairment assessment process is complex.
We have tested the assumptions used in the valuation models prepared by management, namely the cash flow projections, the discount rate, the inflation rate, the perpetual growth rate and the sensitivity analysis, supported by internal specialists in business valuations.
We have tested the consistency of the assumptions used in the business plans with prior years, with historical data and with external data.
We have tested the arithmetical calculation of the model used.
We have reviewed the sensitivity analysis of the impairment tests performed on the Cash Generating Units, to validate that the disclosures included in note 16 of the Notes to the Consolidated Financial Statements reflect the outcome of the impairment tests performed.
We have reviewed the requirements of the applicable disclosures (IAS 36) in accordance with notes 2.3, 2.4 b) and 16 of the Notes to the Consolidated Financial Statements.
4. Liquidity, refinancing and contractual ratios
Description of the risks of material misstatement
Summary of our approach to the risks of material misstatement
The Group has contracted external financing presented as current and non-current liabilities, in the amount of 355.692 thousand euros and 65.914 thousand euros, respectively. As part of the Group's investment strategy, significant real estate and other businesses were acquired, as disclosed in notes 4.1, 16, 18 and 46.2 of the Notes to the Consolidated Financial Statements, for which purpose financing was contracted through the issuance of bonds in the amount of 50,000
We have obtained the support agreements of the various debt instruments and the understanding of the contractual ratios computation method.
We have tested compliance with the contractual conditions.
We have tested and challenged cash flows forecasts of the subsidiaries and the process by which they were prepared, testing the underlying assumptions, such as the expected cash flows of services rendered and cash outflows from operating expenses.
We have read the minutes of the Board of Directors and other bodies of the Group to understand future plans and identify potential contradictory

José de Mello Saúde, S.A Statutory and Auditor’s Report
December 31, 2017
Description of the risks of material misstatement
Summary of our approach to the risks of material misstatement
thousand euros and loans with foreign banks in the amount of 30,000 thousand euros, as disclosed in note 35 of the Notes to the Consolidated Financial Statements
The management of cash-flows, refinancing capacity and compliance with the financial ratios are significant matters for our audit.
The test or evaluation is largely based on Management's expectations and estimates, which are influenced by subjective assumptions such as projections of volume and margins of operating activities, estimates of future cash flows, forecasting of economic conditions and the capital market, and capacity to fulfill financial ratios.
The ability to secure the commitments entered into with third parties depends essentially on the subsidiaries’ ability to generate and pay dividends, market conditions on the maturity of the financings that allows them to be renewed, and the financing policy of shareholders and dividend distribution.
information.
We have discussed with Group’s management the projections of debt market conditions and confirmed the group policy of dividend distribution and shareholders financing.
We have verified that the amounts, changes, maturity dates and other contractual conditions of the various financing instruments are disclosed, as required by IFRS 32, in Note 35 of the Notes to the consolidated financial statements.
Responsibilities of management and supervisory board for the consolidated financial statements
Management is responsible for:
► the preparation and fair presentation of the consolidated financial statements in accordance with the International Financial Reporting Standards as endorsed by the European Union;
► the preparation of the Management Report, including the Corporate Governance Report in accordance with the laws and regulations;
► such internal control as management determines is necessary to enable the preparation of financial statements that are free from material misstatement, whether due to fraud or error;
► adoption of appropriate accounting policies and principles for the circumstances;
► assessment of the Group’s ability to continue as a going concern, disclosing, as applicable, matters related to going concern.
The supervisory board is responsible for overseeing the Group’s financial reporting process.
José de Mello Saúde, S.A Statutory and Auditor’s Report
December 31, 2017
Auditor’s responsibilities for the audit of the consolidated financial statements
Our objectives are to obtain reasonable assurance about whether the consolidated financial statements as a whole are free from material misstatement, whether due to fraud or error, and to issue an auditor’s report that includes our opinion. Reasonable assurance is a high level of assurance, but is not a guarantee that an audit conducted in accordance with ISAs will always detect a material misstatement when it exists. Misstatements can arise from fraud or error and are considered material if, individually or in the aggregate, they could reasonably be expected to influence the economic decisions of users taken on the basis of these consolidated financial statements.
As part of an audit in accordance with ISAs, we exercise professional judgment and maintain professional scepticism throughout the audit. We also:
► identify and assess the risks of material misstatement of the consolidated financial statements, whether due to fraud or error, design and perform audit procedures responsive to those risks, and obtain audit evidence that is sufficient and appropriate to provide a basis for our opinion. The risk of not detecting a material misstatement resulting from fraud is higher than for one resulting from error, as fraud may involve collusion, forgery, intentional omissions, misrepresentations, or the override of internal control;
► obtain an understanding of internal control relevant to the audit in order to design audit procedures that are appropriate in the circumstances, but not for the purpose of expressing an opinion on the effectiveness of the Group’s internal control;
► evaluate the appropriateness of accounting policies used and the reasonableness of accounting estimates and related disclosures made by management;
► conclude on the appropriateness of management’s use of the going concern basis of accounting and, based on the audit evidence obtained, whether a material uncertainty exists related to events or conditions that may cast significant doubt on the Group’s ability to continue as a going concern. If we conclude that a material uncertainty exists, we are required to draw attention in our auditor’s report to the related disclosures in the consolidated financial statements or, if such disclosures are inadequate, to modify our opinion. Our conclusions are based on the audit evidence obtained up to the date of our auditor’s report. However, future events or conditions may cause the Group to cease to continue as a going concern;
► evaluate the overall presentation, structure and content of the consolidated financial statements, including the disclosures, and whether the consolidated financial statements represent the underlying transactions and events in a manner that achieves fair presentation;
► obtain sufficient appropriate audit evidence regarding the financial information of the entities or business activities within the Group to express an opinion on the consolidated financial statements. We are responsible for the direction, supervision and performance of the group audit. We remain solely responsible for our audit opinion;
► communicate with those charged with governance regarding, among other matters, the planned scope and timing of the audit and significant audit findings, including any significant deficiencies in internal control that we identify during our audit;
► from the matters communicated with those charged with governance, including the supervisory board, we determine those matters that were of most significance in the audit of the consolidated financial statements of the current period and are therefore the key audit matters. We describe these matters in our auditor’s report unless law or regulation precludes public disclosure about the matter; and
► provide the supervisory board with a statement that we have complied with relevant ethical requirements regarding independence, and to communicate with
José de Mello Saúde, S.A Statutory and Auditor’s Report
December 31, 2017
them all relationships and other matters that may reasonably be thought to bear on our independence, and where applicable, related safeguards.
Our responsibility includes the verification of the consistency of the consolidated Management Report with the consolidated financial statements, and the verifications under numbers 4 and 5 of article 451º of the Commercial Companies Code.
REPORT ON OTHER LEGAL AND REGULATORY REQUIREMENTS
About the Management Report
Pursuant to article 451º, nº 3, al. e) of the Commercial Companies Code, it is our opinion that the consolidated Management Report was prepared in accordance with laws and regulations in force, the information contained therein is in agreement with the audited consolidated financial statements and, taking into consideration our assessment and understanding of the Group, we have not identified any material misstatement.
About the non-financial statement provided for in the article 66-B of the Commercial Companies Code
Pursuant of article 451º, nº 6, of the Commercial Companies Code, we inform that the Group prepared a separate report of the Management Report, the Integrated Report, which includes the non-financial information as provided for in article 66-B of the Commercial Companies Code, and was published with the Management Report.
About the Corporate Governance Report
Pursuant to article 451º, nº 4, of the Commercial Companies Code, it is our opinion that the Corporate Governance Report (Information of the shareholders structure, organization and Corporate governance) includes the items required of the Group in accordance with article 245º-A of Securities Market Code, and no material misstatements were identified in the information contained therein, complying with the provisions of paragraph c), d), f), h), i) and m) of the referred article.
About additional items set out in article 10º of Regulation (EU) nº 537/2014
Pursuant to article 10º of Regulation (EU) nº 537/2014 of the European Parliament and of the Council, of 16 April 2014, and in addition to the key audit matters mentioned above, we report the following:
► We have been appointed as auditors of José de Mello Saúde, S.A. for the first time in the shareholders' general meeting held on October 11, 2007 for the period between 2007 and 2009. We were reappointed in the shareholders' general meeting held on April 29, 2016 for a forth mandate for the period between 2016 and 2018.
► Management has confirmed that they are not aware of any fraud or suspicion of fraud with a material impact on the consolidated financial statements. In planning and executing our audit in accordance with ISA we maintained our professional scepticism and we designed audit procedures to address the possibility of a material misstatement in the consolidated financial statements due to fraud.
► We confirm that our audit opinion is consistent with the additional report that was prepared by us and issued to the supervisory board as of April 9, 2018.
► We declare that we have not provided any prohibited non-audit services referred to in article 77º nº 8 of the Statute of the Institute of Statutory Auditors and we remained independent of the audited Group in conducting the audit.
Lisbon, April 12, 2018

FINANCIAL STATEMENTS REPORT 2017 169
José de Mello Saúde, S.A Statutory and Auditor’s Report
December 31, 2017
Ernst & Young Audit & Associados – SROC, S.A. Sociedade de Revisores Oficiais de Contas Represented by: (Signed) Luís Miguel Gonçalves Rosado - ROC nº 1607 Registered with the Portuguese Securities Market Commission under licence nr.º
20161217
JOSÉ DE MELLO SAÚDE
FINANCIAL STATEMENTS REPORT 2017170
Dear Shareholders,
In accordance with legal and statutory terms, the Supervisory Board of José de Mello Saúde S.A., with headquarters at Av. do Forte, 3 – Edifício Suécia III, Piso 2, 2790-073 Carnaxide, presents its supervisory report and provides an opinion on the management report and on the consolidated accounts submitted by the Board concerning the financial year ended on 31 December 2017.
1. In accordance with legal and statutory terms, we have:
• approved the plan of activities for 2018;
• supervised the actions of the Board, through meetings with the internal audit department, financial department, strategic planning, management and innovation control department, information systems department and organisational development and quality department, and the auditing and risk management committee and obtaining the clarifications and comfort deemed necessary;
• verified compliance with the law and fulfilment of the company’s articles of association;
• evaluated whether the accounting policies and valuation/measuring criteria adopted by the company are in agreement with the generally accepted accounting principles and lead to a proper evaluation of the assets and results;
• evaluated the effectiveness of the internal control system implemented by the Board;
• supervised the process of preparation and disclosure of the financial information;
• verified the accuracy of the Statement of Financial Position, the Statement of Income and Other Comprehensive Income, Statement of Changes in Equity, Statement of Cash Flows and Annex of the financial year of 2017;
• evaluated the Management Report issued by the Board and the proposal for the appropriation of profits it introduced;
• evaluated the work carried out by the Statutory Auditor leading to the legal review and additional services;
REPORT AND OPINION OF THE SUPERVISORY BOARD CONCERNING THE CONSOLIDATED ACCOUNTS
• verified the terms of the Legal Accounts Certificate, the Audit Report and the Additional Report to the Supervisory Body issued by Ernst & Young Audit & Associados – SROC, S.A., and concluded that its content merits our agreement.
2. From our work, we highlight the following:
• The year 2017 presented a very significant operating and financial performance, although with different trends in private and public provision. Consolidated EBITDA grew 5.3% vis-à-vis the previous year, totalling 72.0 million euros. Whereas in the private area it grew from 56.6 million euros to 61.5 million euros, in the public area it decreased by 1.5 million euros to 7.8 million euros. As mentioned in 2016, the non-renewal by the Regional Health Authority North (ARS Norte) of the vertical funding programmes for HIV and Multiple Sclerosis, with an approximate value of 7.5 million euros per year is a penalizing factor for the imbalance of Escala Braga’s accounts. A Request for Financial Recovery was cautiously lodged at the end of 2016 for the purposes of clause 127, paragraph 9, subparagraph (b) of the Management Contract, seeking the beginning of an arbitration process for the settlement of this dispute. Management believes a favourable result for Escala Braga is very likely to come from this arbitration process, with the estimate of this contingent asset’s value being 15 million euros.
• We emphasise the growth of the Company’s balance sheet by 242.5 million euros, exceeding 745.4 million euros. The continuation of the various expansion works and the acquisition of properties belonging to the ImoSaúde Closed Real Estate Investment Fund and to the ImoSocial Closed Real Estate Investment Fund, namely the buildings operated by CUF Porto Hospital, CUF Porto Institute, CUF Belém Clinic, CUF Cascais Hospital and CUF Torres Vedras Hospital are the main reasons for the recorded increase. The operation to acquire real estate thus far belonging to the funds involved a set of assets that are strategic to José de Mello Saúde, making the control of its property a relevant factor.
• In comparison with 2016, gross debt increased by 202.0 million euros and net debt increased by 183.7 million euros, which is justified by the acquisition of real estate from the Investment Funds, by the several expansion works and by the policy of investing in
FINANCIAL STATEMENTS REPORT 2017 171
new units. The financial leverage ratio, namely D/EBITDA, increased to 4.7x (2.3x in 2016). Even with a significant increase in equity, the financial autonomy and solvency ratios showed reductions, reflecting the previously mentioned investment effort.
3. The conducted supervisory action allows us to conclude that:
• the actions of the Board that we have knowledge of safeguard compliance with the law and with the company’s articles of association;
• we are not aware of any situations that can call into question the suitability and effectiveness of the internal control system implemented by the Board in controlling the risk to which the company is exposed;
• the accounting and the accounts comply with the applicable legal, statutory and regulatory provisions, reflect the activity carried out and lead to a correct evaluation of the company’s assets and results;
• the Management Report is in agreement with the accounts presented and faithfully shows the evolution of the activity and of the business during the financial year;
• the published report includes the elements listed in article 245-A of the Securities Code on the structure and practices of corporate governance;
• the Statement of Financial Position, the Statement of Income and Other Comprehensive Income, Statement of Changes in Equity, Statement of Cash Flows and Annex of the financial year of 2017 meet the applicable legal and accounting requirements;
• the audit of the financial statements performed by the Statutory Auditor was suitable to the circumstances, and the additional services did not compromise its independence;
• the proposal for the appropriation of profits is appropriate and is properly grounded.
4. We can thus state:
• our agreement with the content of the Legal Accounts Certificate issued by the Statutory Auditor;
• our agreement with the Management Report and accounts for the 2017 financial year presented by the Board of Directors;
• that to the best of our knowledge, the disclosed financial information has been drafted in accordance with current accounting standards and give a true and fair view of the assets and liabilities, financial situation and results of the company, and that the Management Report faithfully describes the business development, financial performance and position of the company, containing a description of the main risks and uncertainties it faces.
5. Accordingly, taking into account the actions carried out, we consider that:
• the consolidated Management Report and the consolidated accounts of the 2017 financial year presented by the Board of Directors should be approved;
Finally, we would like to thank the Board and all Employees in the service of the Company who we contacted, for all the cooperation we received when performing our duties.
Lisbon, 13 April 2018
The Supervisory Board
José Manuel Gonçalves de Morais Cabral
(Chairman)
João Filipe de Moura-Braz Corrêa da Silva
(Member)
José Luís Bonifácio Lopes
(Member)
JOSÉ DE MELLO SAÚDE
FINANCIAL STATEMENTS REPORT 2017172
In accordance with provisions in Article 245(c)(1) of the Securities Code, José de Mello Saúde, S.A. (“JMS”) Supervisory Board members declare that, to the best of their knowledge, the management report, the consolidated annual accounts, the legal accounts certificate and the other accounting documents, i) were prepared in accordance with current accounting standards and give a true and fair view of the assets and liabilities, financial situation and results of JMS and of the companies included in the scope of consolidation; ii) they faithfully describe the development, performance and position of JMS business activity and of the companies included in the scope of consolidation; and iii) they contain a description of the main risks JMS faces in its activity.
Lisbon, 13 April 2018
The Supervisory Board
José Manuel Gonçalves de Morais Cabral
(Chairman)
João Filipe de Moura-Braz Corrêa da Silva
(Member)
José Luís Bonifácio Lopes
(Member)
STATEMENT OF COMPLIANCE OF THE SUPERVISORY BOARD

FINANCIAL STATEMENTS REPORT 2017 173

Related Documents