1 THE ROLE OF SELF-REGULATION AS A META-COMPETENCY IN DEVELOPING LEADERS: A LONGITUDINAL FIELD EXPERIMENTAL STUDY JOOBEE, YEOW Doctor of Philosophy ASTON UNIVERSITY March 2011 This copy of the thesis has been supplied on condition that anyone who consults it is understood to recognise that its copyright rests with its author and that no quotation from the thesis and no information derived from it may be published without proper acknowledgement.

Welcome message from author
This document is posted to help you gain knowledge. Please leave a comment to let me know what you think about it! Share it to your friends and learn new things together.
Transcript
1
THE ROLE OF SELF-REGULATION AS A META-COMPETENCY IN
DEVELOPING LEADERS: A LONGITUDINAL FIELD EXPERIMENTAL STUDY
JOOBEE, YEOW
Doctor of Philosophy
ASTON UNIVERSITY
March 2011
This copy of the thesis has been supplied on condition that anyone who consults it is understood to recognise that its copyright rests with its author and that no quotation from the thesis and no information derived from it may be published without proper acknowledgement.

2
Aston University
THE ROLE OF META-COMPETENCY IN DEVELOPING LEADERS: A LONGITUDINAL FIELD EXPERIMENTAL STUDY
JooBee, Yeow
Doctor of Philosophy
March 2011
THESIS SUMMARY
The question of how to develop leaders so that they are more effective in a variety of situations, roles and levels has inspired a voluminous amount of research. While leader development programs such as executive coaching and 360-degree feedback have been widely practiced to meet this demand within organisations, the research in this area has only scratched the surface. Drawing from the past literature and leadership practices, the current research conceptualised self-regulation, as a meta-competency that would assist leaders to further develop the specific competencies needed to perform effectively in their leadership role, leading to an increased rating of leader effectiveness and to enhanced group performance. To test this conceptualisation, a longitudinal field experimental study was conducted across ten months with a pre- and two post-test intervention designs with a matched control group. This longitudinal field experimental compared the difference in leader and team performance after receiving self-regulation intervention that was delivered by an executive coach. Leaders in experimental group also received feedback reports from 360-degree feedback at each stage. Participants were 40 leaders, 155 followers and 8 supervisors. Leaders’ performance was measured using a multi-source perceptual measure of leader performance and objective measures of team financial and assessment performance. Analyses using repeated measure of ANCOVA on pre-test and two post-tests responses showed a significant difference between leader and team performance between experimental and control group. Furthermore, leader competencies mediated the relationship between self-regulation and performance. The implications of these findings for the theory and practice of leadership development training programs and the impact on organisational performance are discussed. Keywords: Leadership development, competencies, self-regulation, coaching, self-regulatory intervention

3
Dedication
Firstly, this thesis is dedicated to my family who raised me up to be more than I can be and it is their belief in me that made it possible for me to be where I am. It is with a heavy heart that the man who raised me passed away on the last month of my writing up and the successful completion of this thesis is the least I could do to honour his love. I would like to include an excerpt from my eulogy in his memory:
“It breaks my heart that you could not attend any of my graduations because of your health, but this time, when I graduate for the last time, I know you will be watching me from above, just as you watched me on the first day you took me to school”. Secondly, I would also like to dedicate this thesis to Prof. Mike Grojean for having the faith in me to give me the opportunity to start this PhD. For this, I will be eternally grateful. Finally, I would like to dedicate this thesis to Yusuf Abowath, whose love, support and laughter I cherish, and showed me that good things come to those who persevere and wait.

4
Acknowledgement
This endeavour would not have been possible without the enormous help and guidance from so many individuals. First of all, I would like to thank my supervisor, Prof. Robin Martin, for his commitment, devotion, and patience in supervising my thesis. I am grateful to Prof. Nick Lee in his early guidance during my qualifying report and first year viva. In addition, I would also like to acknowledge Prof. Pawan Budhwar for his constructive feedback during my qualifying viva. I am deeply grateful to Dr. Ann Davis and Dr. Qin Zhou in their support and advice in obtaining the ethical approval for my research. Also, I would like to thank Dr. Gina Herzfeldt who took the time to integrate me into the Work and Organisational Psychology Group when I started my PhD. A special thank you to Prof. Helen Higson and Mr. John Overend for making it possible to conduct my research within the Business Strategy Game module. Chapter Four is made possible with the help of Mr. Jeremy Dawson the statistical genius of our department and Dr. Yves Guillaume for his words of advice. I am also deeply grateful to Jenny Thompson, Lynne Woolley, Sue Rudd and Jeanette Ikuomola for all their administrative help throughout this journey. I am deeply indebted to the friends and colleagues who read drafts of this document (Gareth Hughes, Ria Perkins, Klaus Thiele) and provided guidance throughout the completion of this research (Mariam Shebaya, Dr. Evmorfia Argyriou, Chris Chu, Anna Topakas). There were occasions when motivation was lost and I am grateful to those who spark it back in place. I would like to thank Thomas Bermudez, Stephanie Feiereisen, Kirsten Challinor, Elaine Foley, Jade Goh, Bob Maddox and Naresh Nihalani for their unwavering support. I want to express my gratitude to Dimah Sweis-Gentles, Julia Postnikova, Joanna Agathoklidi, Evelyn Kanda, Michael Ridger, Adam Frost, Pierre Prévot and Robin Ibbotson for the indirect help they gave which meant a lot to me.

5
Many thanks to Work and Organisational Psychology Group, ABS Research Degrees Programme (especially Prof. Sam Aryee) and Overseas Research Students Awards Scheme UK for their generous funding of my PhD in terms of scholarship, conference and research needs. Last but never the least, my eternal thanks to Charmi Patel who propelled me up and over the finish line. I will never forget your saying whilst I was writing up, “Joobee is getting hysterical and her sayings are becoming historical”. You made writing up fun!

6
List of Contents
THESIS SUMMARY ................................................................................................. 2
Dedication ................................................................................................................... 3
Acknowledgement ...................................................................................................... 4
List of Contents .......................................................................................................... 6
List of Tables ............................................................................................................ 10
List of Figures ........................................................................................................... 11
CHAPTER 1 ............................................................................................................. 12
Introduction to the Research .................................................................................. 12
1.1. Introduction ................................................................................................ 12
1.2. Background of the problem ....................................................................... 15
1.3. Purpose of the research .............................................................................. 21
1.3.1. Main research questions ....................................................................... 21
1.4. Nature of the research ................................................................................ 22
1.5. Significance of the research ....................................................................... 23
CHAPTER 2 ............................................................................................................. 29
Literature Review .................................................................................................... 29
2.1. Introduction: Leadership defined ............................................................... 29
2.2. Overview of leadership research ................................................................ 30
2.3. Leader and leadership development .......................................................... 38
2.4. Leadership development programmes ....................................................... 41
2.4.1. Action learning .................................................................................... 41
2.4.2. Mentoring ............................................................................................. 42
2.4.3. Job assignments ................................................................................... 43
2.4.4. Networking .......................................................................................... 44
2.4.5. 360-Degree feedback ........................................................................... 44
2.4.6. Executive coaching .............................................................................. 47

7
2.4.6.1. Why executive coaching? ............................................................. 48
2.4.6.2. The executive coach ..................................................................... 52
2.4.6.3. The executive coaching process ................................................... 56
2.5. Conceptual model ...................................................................................... 59
2.5.1. Creating self-awareness through 360-degree feedback ....................... 59
2.5.2. When you know, do you do it? The application of self-regulation ...... 62
2.5.3. Mechanism of self-regulation .............................................................. 65
2.5.4. Leaders competency model ................................................................. 72
2.5.5. Leader competencies and leader performance ..................................... 77
2.6. Conclusion ................................................................................................. 79
CHAPTER 3 ............................................................................................................. 82
Methodology ............................................................................................................. 82
3.1. Introduction ................................................................................................ 82
3.2. Research paradigm ..................................................................................... 83
3.3. Quantitative versus qualitative approaches ................................................ 85
3.4. Research method and design appropriateness ........................................... 87
3.5. Population and sample ............................................................................... 94
3.6. Data collection process ............................................................................ 100
3.6.1. Pilot .................................................................................................... 100
3.6.2. Pretest ................................................................................................. 101
3.6.3. Intervention ........................................................................................ 104
3.6.4. Posttest 1 ............................................................................................ 106
3.6.5. Posttest 2 ............................................................................................ 107
3.6.6. End of study ....................................................................................... 107
3.7. Scales selection ........................................................................................ 108
3.7.1. Reliability and validity ....................................................................... 108
3.7.2. Constructs measures .......................................................................... 109
3.7.2.1. Self-regulation ............................................................................ 109
3.7.2.2. Leaders’ performance measure ................................................... 110
3.7.2.3. Leaders’ competencies ............................................................... 111

8
3.7.2.4. Self-efficacy ............................................................................... 112
3.7.2.5. Team financial performance indicators ...................................... 112
3.7.2.6. Team assessment ........................................................................ 113
3.8. Data analysis ............................................................................................ 114
3.9. Ethical considerations .............................................................................. 116
3.9.1. Informed consent ............................................................................... 117
3.9.2. Risk and benefit analysis ................................................................... 117
3.9.3. Confidentiality, anonymity and data protection ................................ 118
3.9.4. Safety of researchers .......................................................................... 119
3.9.5. Research involving university staffs or students ............................... 119
3.9.6. Research plan for collection, storage and analysis of data ................ 119
3.10. Conclusion ............................................................................................... 120
CHAPTER 4 ........................................................................................................... 121
Analyses and Research Findings .......................................................................... 121
4.1. Introduction .............................................................................................. 121
4.2. Data screening .......................................................................................... 122
4.3. Reliability and validity of construct ......................................................... 123
4.3.1. Independent variable .......................................................................... 125
4.3.2. Mediator ............................................................................................. 125
4.3.3. Dependent variables ........................................................................... 126
4.3.4. Control variable ................................................................................. 127
4.4. Aggregation to group level ...................................................................... 127
4.5. Descriptive results .................................................................................... 131
4.6. Correlations among outcome variables .................................................... 135
4.7. Manipulation check of intervention ......................................................... 139
4.8. Effects of training condition on leaders performance measures .............. 142
4.8.1. Leadership outcomes ......................................................................... 142
4.8.2. Financial performances ...................................................................... 149
4.8.3. Assessments outcomes ....................................................................... 159
4.9. Effects of training condition on leaders competencies ............................ 163

9
4.10. Leader competencies as mediator of leaders performance ...................... 165
4.10.1. Leadership outcomes ...................................................................... 166
4.10.2. Financial performances .................................................................. 167
4.10.3. Assessments outcomes ................................................................... 170
4.11. Conclusion ............................................................................................... 172
CHAPTER 5 ........................................................................................................... 176
Discussion ............................................................................................................... 176
5.1. Introduction: Key research questions ...................................................... 176
5.2. Interpretation of findings ......................................................................... 180
5.3. Contributions of the research ................................................................... 196
5.3.1. Implications to theory ........................................................................ 196
5.3.2. Implication to practice ....................................................................... 208
5.4. Potential limitations ................................................................................. 213
5.5. Avenues for future research ..................................................................... 217
5.6. Epilogue ................................................................................................... 220
Bibliography ........................................................................................................... 222
Appendix I Pilot questionnaire .......................................................... 247
Appendix II Frequency analysis results from pilot study ................. 249
Appendix III Leader questionnaire ................................................... 250
Appendix IV Follower questionnaire ................................................ 256
Appendix V Tutor questionnaire ....................................................... 262
Appendix VI Intervention invitation email ....................................... 267
Appendix VII Sample of 360-degree feedback report for leaders .... 269
Appendix VIII Intervention invitation email (post-study) ................ 273
Appendix IX Email to prize draw winners ....................................... 275
Appendix X Model for confirmatory factor analysis ........................ 277

10
List of Tables
Table 1: Approaches in leadership research and implications for leadership development ............................................................................................................... 37 Table 2: Stages of executive coaching in comparison to stages of self-regulation ... 69 Table 3: Techniques for controlling external and internal validity of experimental design ......................................................................................................................... 92 Table 4: Role description for team members in the BSG module ............................. 95 Table 5: Weekly schedule and activities for the Business Strategy Game module ... 98 Table 6: Summary of data collection timeline for all variables ............................... 103 Table 7: Mean, standard deviation, rwg, F-values and, ICC values .......................... 129 Table 8: Results of Pearson chi-square and tests independent t-tests ...................... 133 Table 9: Participants’ characteristics ....................................................................... 134 Table 10: Correlation, means, and standard deviation of leaders’ performance (follower’s ratings) .................................................................................................. 136 Table 11: Correlation, means, and standard deviation of leaders’ financial performance ............................................................................................................. 137 Table 12: Correlation, means, and standard deviation of leaders’ assessments ...... 138 Table 13: Results of manipulation checks ............................................................... 139 Table 14: Results of repeated measures analysis of covariance (ANCOVA) for leadership outcomes rated by followers. .................................................................. 148 Table 15: Results of repeated measures analysis of covariance (ANCOVA) for financial performance. ............................................................................................. 158 Table 16: Results of analysis of covariance (ANCOVA) for assessment outcomes. ................................................................................................................................. 160 Table 17: Mediation analysis for the effects of self-regulation training on leadership outcomes, financial performances and assessment outcomes controlling for leader competencies as mediator ........................................................................................ 169 Table 18: Summary of hypotheses testing ............................................................... 175

11
List of Figures
Figure 1: Research design model ............................................................................... 89 Figure 2: Estimated marginal mean for leaders’ self-regulation ............................. 140 Figure 3: Estimated marginal mean for followers’ rating of leader satisfaction ..... 143 Figure 4: Estimated marginal mean for followers’ rating of leader effectiveness ... 145 Figure 5: Estimated marginal mean for extra effort ................................................ 147 Figure 6: Estimated marginal mean for team profit (or loss) .................................. 150 Figure 7: Estimated marginal mean for team ROCE ............................................... 153 Figure 8: Estimated marginal mean for team Gearing ............................................. 155 Figure 9: Estimated marginal mean for team EPS ................................................... 157 Figure 10: Estimated marginal mean for teams’ assessments ................................. 161 Figure 11: Estimated marginal mean for leader competencies ................................ 164
12
CHAPTER 1
Introduction to the Research
This chapter aims to give an overview of the research reported in this thesis. Section 1.1 provides an introduction and background of leadership research and practice. Next, Section 1.2 states the main research problems, and establishes the research questions. Section 1.3 discusses the purpose and Section 1.4 gives an overview of the nature of this study. Finally, Section 1.5 puts forward the significance and contribution of the research to theory, methodology and practice are presented.
1.1. Introduction
Within the context of today’s increasingly competitive organisational environment,
leaders frequently need to confront crucial and relevant real time issues and come up
with the best solutions in the shortest period of the time (Day, 2000; Mumford,
Zaccaro, Harding, Jacobs, & Fleishman, 2000). To do so, leaders need work-related
competencies to develop and implement solutions with followers and senior
managers operating in these complex and dynamic contexts. Within this process,
leaders face complex interactions between them and the social and organisational
environment (Fiedler, 1996). Effective leaders need to have the social skills to
persuade not only followers, but various constituencies involved, to accept and
support their proposed solutions (Conger & Kanungo, 1987). Thus, it is very
important to possess the competencies required to deal with the variety of
interpersonal and organisational problems faced in the workplace (Mumford, Marks,
Connelly, Zaccaro, & Reiter-Palmon, 2000; Ulrich, Brockbank, Yeung, & Lake,

13
1995; Wexley & Baldwin, 1986; Zaccaro, Mumford, Connelly, Marks, & Gilbert,
2000)
Therefore, unsurprisingly, large amounts of money are invested by organisations into
leadership development programmes annually in the hope of developing effective
leaders (Gibler, Carter, & Goldsmith, 2000). For example, Accenture spends US$800
million; McDonalds spends US$480 million; and General Electric spends US$400
million annually on their leadership development programmes (Top 10 best
companies for leadership, 2010). Recently, as the economic condition has gradually
picked up from 2009 to 2010, it is reported that the budget for leadership
development which saw a drop during the recession had bounced back from 8.8% to
a substantial 22% of training resources as presented in Training Industry Report
(2010 Training Industry Report, 2010) of the survey conducted from June to August
of 2010. A budget for leadership development has always been allocated by
organisations because they recognise the return on their investment in cultivating
effective leaders.
To address and provide better leadership development practice, there is a substantial
body of research dedicated to leadership development as demonstrated by the amount
of publications in this field. Leadership development research still continues to gain
momentum as can be seen within the publications of some of the most distinguished
journals such as Leadership Quarterly (e.g., Avolio, Avey, & Quisenberry, 2010; Ely
et al., 2010; Moss, Dowling, & Callanan, 2009; Orvis & Ratwani, 2010; Reichard &
14
Johnson, 2011; Seifert & Yukl, 2010), Journal of Applied Psychology (DeRue &
Morgeson, 2007), and Academy of Management Journal (e.g., Dragoni, Tesluk,
Russell, & Oh, 2009; Hooijberg, 2009).
Among the many leadership development practices, Day (2000) identified six that
are most widely applied and researched; (i) job assignments, (ii) mentoring, (iii)
executive coaching, (iv) action learning, (v) networking and (vi) 360-degree
feedback. These programmes have been widely employed by organisations in the
hope to develop leaders’ effectiveness (Feldman & Lankau, 2005; Hernez-Broome &
Hughes, 2004), however, the pervasiveness of the research and practice gap is still
irrefutable (Avolio & Chan, 2008). This could not be more prominent in the practice
and research of 360-degree feedback and executive coaching. The lag of research in
informing practice could be due to the fact that practitioners tend to approach
leadership problems using ‘trial and error’ techniques, more often than not based on
popular fads (Zaccaro & Horn, 2003). Considering the amount of money, time and
effort invested by organisations into leadership development, transferring validated
scientifically grounded findings from research to organisations would not only bridge
the gap but also inform practitioners to develop leaders in a more efficient and
productive manner. To accomplish this, a brief overview of leadership development
programmes is presented below and the gap between practice and research is
highlighted.
15
1.2. Background of the problem
360-degree feedback, also known as multi-source feedback, has significantly
extended the leadership and leadership development literature since the 1990s
(Atwater & Waldman, 1998). Unlike other developmental programmes that employ
self report evaluation and hence suffer from response bias (Mabe & West, 1982;
Schwarz, 1999), 360-degree feedback extends the evaluation of leader behaviours
from self evaluation to multiple sources of evaluation such as subordinates, peers,
superiors, customers and others (Atwater & Waldman, 1998). Numerous studies have
demonstrated the benefits and effectiveness of 360-degree feedback (e.g., Atwater,
Ostroff, Yammarino, & Fleenor, 1998; Atwater & Yammarino, 1992; Bass &
Yammarino, 1991; Fleenor, McCauley, & Brutus, 1996; Fleenor, Smither, Atwater,
Braddy, & Sturm, 2010; Smither, London, & Reilly, 2005; Walker et al., 2010).
360-degree feedback helps leaders to create awareness of a leader’s strength and
weaknesses, hence helping them to recognise areas for development (Tornow &
London, 1998; Van Velsor, Taylor, & Leslie, 1993). Self-awareness has been
proposed to be the core of leadership development (Avolio & Chan, 2008; Hannah &
Avolio, 2010; Neck & Houghton, 2006; Riggio, 2008). However, the assumption of
self-awareness using 360-degree feedback is that leaders who are aware of the need
for the development of certain competencies in order to overcome their weaknesses
and to perform better, will change their behaviour (McCarthy & Garavan, 1999).
Obviously this is not always the case as there are mixed findings of the effect of 360-
degree feedback on the improvement in leader’s performance (Ghorpade, 2000;
16
Kluger & DeNisi, 1998). A crucial study conducted by Smither, London, Flautt,
Vargas and Kucine (2003), who investigated the effect of executive coaching and
360-degree feedback on leadership behaviour change, brings light to these mixed
findings. Data from the research revealed that, senior managers who worked with an
executive coach were rated higher by others than senior managers who did not work
with an executive coach. The point to note here is, 360-degree feedback did yield an
improvement in ratings, but the improvement was just less when compared to senior
managers who worked with an executive coach. Working with an executive coach
has highlighted the issue where there needs to be a translation from ‘knowing’ to
‘doing.’
Executive coaching, which is a new approach in leadership development, has grown
exponentially over the past 15 years. The practice of executive coaching is far ahead
of its scientific understanding (Ely et al., 2010). Since its conception, professional
publications such as, Consulting Psychology: Practice and Research has dedicated
two special issues in 1996 and 2001 to the understanding of executive coaching.
However, executive coaching still remains a ‘blackbox,’ i.e., when input of leader
and executive coaching are entered into the ‘blackbox,’ positive output is obtained.
Some went as far as claiming that executive coaching brings more than $100,000
average return or 600% return on investment (Fisher, 2001; Poston, Manning, &
Barrow, 2001); productivity rose by 88% for training course participants followed up
by executive coaching versus a 22.4% increase for those who did not receive help
from coaches (Olivero, Bane, & Kopelman, 1997). In another survey among Fortune
17
100 companies, 53% saw higher profitability, 39% experienced lower turnover rates,
and 61% had higher job satisfaction (Savage, 2001). Furthermore, 71% of 170
human resources professionals believe executive coaching is more effective than
traditional courses (Thomas, 2002).
Stimulated by the growth in executive coaching practice, research has been
conducted to investigate the impact of executive coaching and understanding the
phenomena. Executive coaching has been found to improve skills and acquire new
skills, correcting and improving performance, prepare leaders for future role, and
utilised for long term development (Witherspoon & White, 1996). Review of
empirical studies conducted to date have established that executive coaching indeed
brings about positive benefits to facilitate change and development of a leader, as
well as improving the organisation’s performance and value through the
development of human capital (Gegner, 1997; Hall, Otazo, & Hollenbeck, 1999;
Kampa-Kokesch, 2001; Luthans & Peterson, 2003; Olivero, Bane, & Kopelman,
1997; Smither, London, Flautt, Vargas, & Kucine, 2003; Thach, 2002).
Synthesising reports from researchers as well as practitioners (Douglas & Morley,
2000; Olivero, Bane, & Kopelman, 1997; Saporito, 1996; Tobias, 1996; Winum,
2006; Witherspoon & White, 1996), the current research will identify the similarity
of executive coaching process to that of self-regulation stages: (i) receiving relevant
information, (ii) evaluating the information and comparing it to the desired goal, (iii)
triggering change, (iv) searching for options to change, (v) formulating plan(s), (vi)

18
implementing the plan(s), and (vii) assessing the effectiveness of plan(s) (Miller &
Brown, 1991). Self-regulation is the underlying process that drives individuals to
allocate effort and resources into action (Kanfer & Heggestad, 1997; Karoly, 1993).
Hence, 360-degree feedback and executive coaching together reflect the process of
self-regulation. In other words, the executive coach plays the role of ‘regulator’ in
the equation of leader development with the application of 360-degree feedback
during the start of the coaching process.
Self-regulation has been used in clinical psychology to control addictive behaviour
(Karoly, 1993), educational psychology to promote learning (Nenniger, 2005) and
organisational psychology to promote effective work behaviours (Sosik, Potosky, &
Jung, 2002; Tsui & Ashford, 1994; Vancouver & Day, 2005). Within leadership,
self-regulation has been researched within the context of emergence leadership
(Gangestad & Snyder, 1985), trust (Sosik, 2001), and managerial effectiveness
(Atwater, Ostroff, Yammarino, & Fleenor, 1998). There are attempts within the
literature of leadership development to conceptualise the importance of self-
regulation into the development of leaders (Avolio & Gardner, 2005; Gardner,
Avolio, Luthans, May, & Walumbwa, 2005; Ilies, Morgeson, & Nahrgang, 2005;
Mazutis & Slawinski, 2008). However, there is a paucity of research that has
attempted to manipulate leader self-regulation within the context of leadership
training.
19
The current research is grounded in self-regulation theory to rationalise the success
behind executive coaching. As mentioned previously, 360-degree feedback and
executive coaching, together reflect the process of self-regulation. In clinical and
educational psychology, self-regulation has long been applied to equip individuals as
a competency to help individuals to help themselves i.e., to better one self. For
example, in an educational setting, when individuals are trained to self-regulate, it
helps them to self-initiate the formulation of strategies to help them learn in various
subjects such as reading, comprehension, writing, mathematical problem solving,
science and social science (Dignath, Buettner, & Langfeldt, 2008; Paris & Paris,
2001). On the other hand, in clinical psychology where individuals are treated to
change their behaviour such as reducing alcohol consumption or increasing diet of
healthy food; individuals who are trained to self-regulate will formulate strategies to
avoid alcohol consumption or consume healthier food (Nagoshi, 1999; Scholl &
Zimmerman, 2001). This in turn, assists individuals to achieve their goal of
overcoming alcohol abuse or losing weight. Therefore, it is not surprising that
executive coaching which utilises self-regulatory process is achieving successful
results in facilitating change and development of a leader.
The current research will argue that, instead of adopting a myopic view of solving an
immediate problem i.e., by using executive a coach to regulate a leader’s action to
develop a particular competency which is needed at a particular moment in order to
be more effective, leaders should be developing self-regulation competency for long
term development. An intervention where leaders are trained with self-regulation

20
competency will allow leaders to perform effectively by meeting the demands of
various constituencies through awareness of what is needed and proactively engaging
themselves to develop further competencies that are needed.
Meanwhile, it also resolves another concern surrounding executive coaching. The
question of who is the most qualified to deliver this leadership development training
to achieve the desired results (Collins & Holton III, 2004; Ely et al., 2010; Levinson,
1996; Peterson, 1996; Wasylyshyn, 2003). According to Implicit Leadership Theory
(Lord, Foti & DeVader, 1984), the importance or need for a particular leader
attribute depends on the perceiver (leader/follower/group/organisation) within the
context. For instance, a follower who prefers higher guidance and direction in his/her
job would perceive a leader to be effective if the leader were to possess the
competency to guide this follower. However, another follower who is creative would
prefer a leader with competency to coach rather than direct him/her. Hence, it can be
said that competencies needed by leaders “lies in the eye of the followers”. A leader
him/herself will know better what is needed in his or her role to be effective and
meet the demands of the followers. In this case, who would be best to develop the
leaders and know what leader development is needed, but the leaders themselves.
Therefore, leaders should strive to develop themselves rather than just being
developed.

21
1.3. Purpose of the research
The problems stated in the section above, set the platform to conduct the current
research. The current study seeks to examine the effect of self-regulation
intervention, using 360-degree feedback and executive coaching, had on leaders’ and
team’s performance.
1.3.1. Main research questions
The following research questions provide a focus for this research and determined its
methods and validity:
• Do leaders’ competencies increase after receiving an intervention on how to
self-regulate?
• Are there significant differences in followers’ ratings of leaders’
performance and objective team performance between leaders who receive a
self-regulation intervention and leaders who do not receive the intervention?
• After receiving self-regulation intervention, do the relevant competencies
that are needed by the leaders to performance effectively in his/her current
role increases?
• What relationship exists between self-regulatory process, leadership
competencies and leadership outcomes?
To answer the research questions above, a set of hypotheses are established in
Chapter Two after reviewing the literature. Chapter Three presents how the questions
are operationalised and Chapter Five discusses how the present research answers the
above questions.

22
1.4. Nature of the research
The purpose of this quantitative, longitudinal field experimental research is to
evaluate the effects of a self-regulation intervention (independent variable) on
leaders’ and team’s performance (dependent variables). The self-regulation measures
of leaders who participated in the intervention were compared, via a pretest and two
posttest survey questionnaires using carefully selected scales, with leaders who were
assigned to the control group. Forty leaders took part in the study, with twenty-five
acting as a control group. The other fifteen leaders took part in leadership
development workshop (experimental group) to improve their self-regulatory
competency. The intervention was conducted on students in Aston Business School
who were taking the Business Simulation Game (BSG) module as part of their
degree. As part of the module, students are allocated into groups thus providing a
naturally occurring leader-member group structure suitable for this study. Within this
module, their task was to manage a virtual European car manufacturing company that
runs across three virtual years. Within each team, apart from the leader who has the
role of managing director, each team member has a specific task (marketing,
operations, human resource and finance). The work tasks of each team includes the
strategic planning and assessment of the markets and competitors; implementing
marketing, operation, human resource management and financial strategies; and at
the same time, to meet shareholders expectations to generate return on investment.
The intervention for the leaders included a four hour training session and two follow-
up 360-degree feedback reports.
23
The control and experimental groups’ leaders and their followers filled out a pretest
and two posttest surveys across nine months. The leaders performance measures
were divided into three areas; (i) leader performance, measured as leader satisfaction,
leader effectiveness and extra effort, (ii) team’s financial performance, measured as
retained profit, return on capital employed, earnings per share, and gearing (from
BSG simulation) and (iii) team’s assessed performance, measured as presentation,
business plan, group report, simulation performance and reflective report. Leaders’
competencies were also measured. Discussion on research methodology and research
instruments will be presented in greater detail in Chapter three.
1.5. Significance of the research
Theoretical significance. Integrating research and practice in management has
always been a challenge, and could not be more prominent in the field of leadership
development as articulated by Avolio and Chan (2008, p.206), “the practice of
leadership development is far ahead of its scientific understanding”. Practitioners
tend to approach leadership problems using trial and error techniques, more often
than not based on popular fads than validated scientifically grounded findings. On
the other hand, research and empirical studies conducted in leadership development
tends to place high emphasis on understanding constructs that would facilitate
leadership development, which is crucial, but with limited translation to practical
application (Boyce, Zaccaro, & Wisecarver, 2010; Zaccaro & Horn, 2003). One of
the main aims of the current research is to bridge the gap within leadership

24
development where fads have driven the growth in the practice of executive coaching
as a leadership development programme, as well as 360-degree feedback.
This research applied the theory of self-regulation to explain the widely reported
effectiveness of executive coaching in practice (Campbell Quick & Macik-Frey,
2004; Diedrich, 1996; Kampa-kokesch & Anderson, 2001; Kiel, Rimmer, Williams,
& Doyle, 1996; Kilburg, 1997; 2001; Kombarakaran, Yang, Baker, & Fernandes,
2008; Kralj, 2001; Levinson, 1996; Peterson, 1996; Saporito, 1996; Wasylyshyn,
2003; Winum, 2006; Witherspoon & White, 1996). At the same time, the conceptual
model ties in the understanding of why 360-degree feedback is widely applied in
organisations today (Fleenor, Smither, Atwater, Braddy, & Sturm, 2010), yet it has
yielded mixed findings in performance outcomes but demonstrated significant
performance improvement when combined with executive coaching intervention
(Ghorpade, 2000; Kluger & DeNisi, 1998).
Thus, the conceptual derivation of the effectiveness of 360-degree feedback and
executive coaching provides a greater insight into both leadership development
programmes which are based on theory. Bridging the gap between the “trial and
error” and “grounded theory” approach to develop leaders allows a more refined
application of leadership development programmes by practitioners, hence leading to
a more symbiotic relationship between leadership development theory and practice.

25
Methodological significance. Yukl (1998, p.438) raised a perturbing fact when he
stated that “past research on leadership has relied too much on weak research
methods”. A meta-analysis of leadership intervention literature in the past 100 years
looking at studies conducted that were experimental or quasi-experimental revealed
two crucial limitations within the methodologies applied (Reichard & Avolio, 2005).
Firstly, that when leadership is manipulated, the manipulations are conducted in
laboratory settings rather than in field settings. In addition, these manipulations
mainly consist of manipulations through the assignment of leader or by manipulation
of leader expectations, manipulation of leader effects through the use of scenarios,
role play or the use of confederates, rather than manipulating leadership through
leadership training itself. Secondly, most of the manipulations lasted less than a day.
This short term focus in leadership interventions raised concerns with regards to the
long term effect and the durability of the change.
The design of the current research seeks to address the limitations in the methods
used to study a leadership intervention whilst advancing knowledge of leadership
development. A longitudinal field experiment design with control and experiment
groups were employed to study the effect of a self-regulation intervention on leaders’
and team’s performance. The intervention was designed to train and equipped leaders
with self-regulatory competency and was delivered by an external executive coach to
the leaders. Leaders in the experimental group first received a 360-feedback report
during the intervention and then twice after the intervention. Objective and
subjective measures were taken during pretest and twice for posttest.

26
Besides answering to the call by Gardner, Lowe, Moss, Mahoney, and Cogliser
(2010) in their recent review of research published in Leadership Quarterly journal
to apply the underutilised method of field experiments, the current research also
heeds to their suggestions to use computer simulations and to draw upon the
strengths of such methods. The computer simulation, structures and settings, in
which the leaders interacted in this research, reflect an organisational setting. Group
leaders led and influenced their teams in developing a competitive strategy,
developing and managing a virtual company’s portfolio, creating shareholder value,
analysing competitor and creating customer value. In addition to the task, leaders
needed to manage the individuals and relationship between individuals within the
team. The use of a computer simulation is a new methodological aspect within
leadership research, that the Gardner, Lowe, Moss, Mahoney and Cogliser (2010)
review suggests, “will move the science of the field forward (p.951)” over the next
decade.
The significance of the methodology and design of this research are many fold.
Conducting the experiment in a natural setting instead of a contrived artificial one in
a laboratory, allows the transfer of findings to real life settings (Christensen, 2007).
Combined with the longitudinal nature of the experimental design, it allows the
investigation of the causal relationships between constructs as well as evaluating the
long term effect and the durability of the change as a result of the intervention
(Bryman, 2001; Shadish, Cook, & Campbell, 2002).
27
Significance to practice. The use of 360-degree feedback is widely applied in many
organisations, and with the large number of validated 360-degree feedback
instruments available, feedback is an increasingly accessible and inexpensive
leadership development intervention (Atwater, Ostroff, Yammarino, & Fleenor,
1998; Fleenor, Smither, Atwater, Braddy, & Sturm, 2010; Tornow & London, 1998).
Executive coaching interventions are expensive, and the cost is continuing to rise
(Johnson, 2004). If self-regulation intervention is found to be an effective way to
improve leaders’ performance, where the leaders could regulate their own strategies
to develop relevant competencies to be effective rather than needing an executive
coach as the ‘regulator’, then many more leaders and organisations could benefit
from this cost effective leadership development intervention. 360-degree feedback
can be repeated anytime following the intervention to provide feedback to leaders.
Compared to the old saying, “Give a man a fish and you feed him for a day, teach a
man to fish, and you feed him for life;” leader intervention programmes designed to
develop leaders’ self-regulation is, in this case, a way to train leaders ‘to fish’.
Executive coaching, instead of adopting a myopic view of solving the immediate
problem e.g., regulating leaders’ actions to develop a particular competency which is
needed at that moment, should be taken advantage of by developing leaders’ meta-
competency i.e., self-regulation. This will allow leaders to perform effectively by
meeting the demands of various constituencies through awareness of what is needed,
and proactively engaging themselves to develop further competencies that are
needed. Thus, a leadership development intervention designed to increase self-

28
regulation will not only sustain a continuous cycle of leader development but also
reduce cost and expand the benefits of executive coaching to more leaders beyond
the upper echelons.
29
CHAPTER 2
Literature Review
CONTENT: This chapter presents an extensive literature review and a theoretical discussion of the approach used within leadership development. Section 2.1 is an introduction to leadership. This is followed by Section 2.2 which discusses the overview of the evolution of leadership theories. Section 2.3 distinguishes the difference between leader and leadership development. Next, Section 2.4 introduces the six widely practised leadership development programmes. This section focuses on 360-degree feedback and executive coaching, the limitations of current approaches are highlighted and an alternative approach, taking in the self-regulation perspective is discussed. Section 2.5 draws the arguments presented and proposed a set of hypotheses. Finally, Section 2.6 provides a conclusion to this chapter.
2.1. Introduction: Leadership defined
In his book, Rost (1993) discovered from his analysis of research on leadership, that
62% of researchers did not specify a definition of leadership. However, for those
who attempted to define leadership, it is a phenomenon in itself as there are countless
definitions (Yukl, 1989; Yukl, 2005). One notable definition of leadership which has
been cited many times in leadership research and literature stated that leadership is a
process whereby an individual influences a group of individuals to achieve a
common goal (Bass & Bass, 2008; Northouse, 2007; Yukl, 2005). This is a simple
definition of leadership but if we look closely, without (i) individual influencing, (ii)
a group of individuals being influenced or (iii) a common goal, the occurrence of
leadership does not exist. Leadership involves influence, it relates to how the leader
affects the followers. “Influence is the sine qua non of leadership” (Northouse, 2007,

30
p.3). Leadership occurs in groups, which is the context in which leadership takes
place. Leadership involves influencing a group of people who have a common
purpose. Groups can be small or big in size, from a work task group to the whole
organisation. Finally, leadership takes account of goals, whereby leadership involves
directing a group or individuals toward achieving a common objective. Thus,
leadership is a process whereby a shared desired outcome is achieved by a group of
individuals working together with the influence of a leader.
2.2. Overview of leadership research
As per the definition of leadership above, when applied successfully, leadership can
lead to the successful attainment of a goal. It is no wonder, that interest in leadership
can be considered as old as mankind. There are references to the topic in the history
of the majority of civilizations; from the ancient Egyptians and Chinese scriptures, to
the writings of Plato, Caesar and Homer’s Iliad (Bass, 1990). It is only in the early
1930s that systematic empirical research of the topic began (House & Aditya, 1997).
The most notable starting point of leadership research is the ‘Great Man’ approach
(Carlyle, 1907). The trait approach attempted to identify universal personal
characteristics of effective leaders based on the assumption that there are enduring
features that distinguish leaders and non-leaders. It gives rise to research into
personality using the ‘Big Five’ model as a way to interpret and categorise effective
leaders. Traits such as self-confidence, self-esteem, achievement are frequently
found to be correlated to leader effectiveness (Atwater, Dionne, Avolio, Camobreco,
31
& Lau, 1999; Judge, Erez, Bono, & Thoresen, 2002). Considering the long history of
research into leadership traits, only limited consensus has been reached. Recently,
Judge, Bono, Ilies and Gerhardt (2002), in their review, outlined that traits such as
extraversion and conscientiousness contribute to predicting leadership emergence.
Other research in leadership emergence also found self-monitoring, intelligence and
generalised self-efficacy to be contributing factors (Day, Schleicher, Unckless, &
Hiller, 2002; Lord, de Vader, & Alliger, 1986; Smith & Foti, 1998). Even more
recently, with the advancement of technologies such as functional magnetic
resonance imaging (fMRI) to investigate the biological underpinning of an effective
leader, a revival of the trait approach has brought forth again the question of whether
leaders are born or made.
To surmise, one of the main conclusions from the trait approach is that personality
does indeed matter and should be taken into consideration when predicting
leadership emergence. Thus, the accumulated research in this area indicates that there
are certain attributes to take into consideration when making selection decisions to
predict whether a more or less successful candidate will succeed in their current
leadership role within an organisation (McCauley & Van Velsor, 2004). However, as
put pertinently by Avolio and Chan (2008, p.198):
“…evidence of past reviews indicates that if one were to put the made part of
leadership over the born part as a fraction, then the denominator, although
important, would be relatively small compared to the numerator.”

32
The limitation to replicate and identify consistent traits contributing to leader
effectiveness led to the emergence of the behavioural approach to leadership.
Starting in the 1950s, researchers began a series of studies based on the assumption
that effective leaders performed certain identifiable behaviours towards their
followers. Two of the most prominent studies were conducted simultaneously at the
University of Michigan and Ohio State University. Findings from the studies
suggested that leadership behaviour could be divided into two dimensions;
consideration (focus on people) and initiation structure (focus on task). People
focused behaviour is when a leader takes a personal interest in subordinates, and
seeks to nurture strong interpersonal relationships. On the other hand, task focused
behaviour is when a leader is interested in developing a productive work group and
defines a structured work task for subordinates. Again, similar to the trait approach,
the underlying assumption of this approach is that there are universal characteristics
that could identify leaders – only this time, in the form of leaders’ behaviour instead
of leaders’ trait.
Even with the lack of empirical evidence supporting the link between the two
behaviours put forward by both studies (House, 1971), the approach can still be
observed in current leadership literature (House & Aditya, 1997). For instance, even
when the focal point of leadership theories focuses more on the psychological level
within the leader and how they actually think about and influence followers,
behavioural measures are still widely applied to assess leadership behaviour and
styles that are related to performance outcomes (Shamir, House, & Arthur, 1993;
33
Yukl, 2005). Charismatic leadership and transformational leadership are some
examples of leadership theories that were operationalised behaviourally (Bass &
Avolio, 1990; Conger & Kanungo, 1987) even though the focus of the theories is on
emotional appeal. On the other hand, cognitively based leadership theories such as,
attribution models of leadership rely on behavioural observations to explain how
leaders lead (Bresnen, 1995; Calder, 1977).
In addition, leadership development researchers and practitioners contributed to the
attention in behavioural approach through leadership training programmes which
often aimed at having impact on leaders’ behaviours and actions which can
positively impact performance outcomes. To illustrate this, many leadership
development training programmes have regularly combined a behavioural oriented
training focus with the use of feedback tools such as the 360-degree feedback
(Atwater & Waldman, 1998). Instead, the focus should be on changing the leaders’
mindsets in terms of self-awareness (Avolio, 2005).
Around the same time when the leadership field expanded to the behavioural
approach from the trait approach, Stogdill (1948) also agreed for more integration of
situational factors into the trait approach. His call was answered by the emergence of
the contingency approach in leadership research. Fiedler (1964) developed the
Least Preferred Coworker (LPC) Contingency Model, which focuses on the
relationship between a leadership style (determined from the LPC score) and the
situation in which leadership occurs. He proposed to match the most favourable

34
situations for leaders based on their characteristics that will allow leaders to become
more effective. On the other hand, House's (1971) Path-Goal Theory suggests that a
leader’s behaviour will affect followers’ job satisfaction and effort and this is
moderated by the situation characteristics. Similarly, Hersey and Blanchard (1972) in
their Situational Theory, also suggested that leaders should adapt their behaviour to
match the situation and followers’ maturity level. Thus, it is noticeable that
contingency theories converge into three main variables, the interaction between
leader, follower and situation which expand the understanding of leadership beyond
the ‘Great Man’ approach.
Within the contingency approach, Vroom and Yetton (1973) attempted to
conceptualise a model of seven decision-making styles (behaviours) depending on
the nature of the problem (situation) and the characteristic of the people being led
(followers) to identify a decision making style in which the leader could apply to be
more effective. In advertently, this model paved the first step towards the
information-processing approach of leadership because this model took into
consideration how leaders should process information in order to make decisions.
Also, Fiedler and Garcia (1987) in their research to better understand contingency
theory investigated the effect of situation induced stress on leaders and followers as a
form of a situational unfavourableness variable. As a result, they developed the
cognitive resource theory. The theory posits that under low stress, cognitive
capabilities are positively correlated with performance and experience is negatively
correlated with performance. On the contrary, under high stress, cognitive

35
capabilities are negatively correlated, and experience is positively correlated with
performance. Consequently, both perspectives within the contingency approach, have
led to a new direction for leadership research towards cognitive revolution in
leadership research.
Calder (1977) articulated that leadership is not directly observable because an
observer’s perceptions are based in part on attributions. This is put eloquently by
Bresnen (1995) that leadership is in the eye of the beholder. Leadership is a process
perceived by others and then labelled ‘leadership’ (Lord & Maher, 1990). There is
some degree of error or bias when attributing leadership effectiveness by followers
based on the implicit notion of leadership and this is coined Implicit Leadership
Theory (ILT) by Lord and Maher (1991), whose work is associated with the early
development of the cognitive processing approach. For example, an early empirical
study demonstrated that college students exposed to the same experimental
leadership conditions interpreted leadership behaviours differently (Rush, Thomas, &
Lord, 1977). Phillips and Lord (1981) attributed the findings of these differences to a
cognitive categorisation process. This process uses contextual and behavioural cues
to categorise leadership behaviours because each individual has a pre-existing mental
structure, thus when behaviour is observed, they organise these behaviours according
to their own categorisation process.
Perceptions of leadership are based on hierarchically organised categories; each
corresponding to a prototype based on experiences from events or with individuals
36
(Lord, Foti, & DeVader, 1984). A military, political, or religious leader is an
example of a prototypical category. If a follower discerns the resemblance between
salient actions or quality of a so-called-leader with their leader prototype, then they
would classify the person as a leader (Cronshaw & Lord, 1987).
The cognitive processing approach has made a significant impact in leadership
literature in terms of guiding how leaders emerge, are perceived and evaluated (Lowe
& Gardner, 2000). More importantly, work on Implicit Leadership Theories clearly
has implications for leadership development. It highlights that there could be more
than one definition and model of leadership. Thus, when designing a leadership
intervention programme, it is no wonder there are various strategies around for
developing leadership stemming from the implicit theories of leadership in the minds
of a leadership development intervention designer (Avolio & Chan, 2008).
Leadership development practitioners may have a preference for one theory and
approach over another and consequently may not be the most appropriate for the
demands of the leadership being addressed (Collins & Holton III, 2004). Later in the
chapter, implicit leadership theory will be incorporated to discuss how it is relevant
in the leadership development intervention proposed.
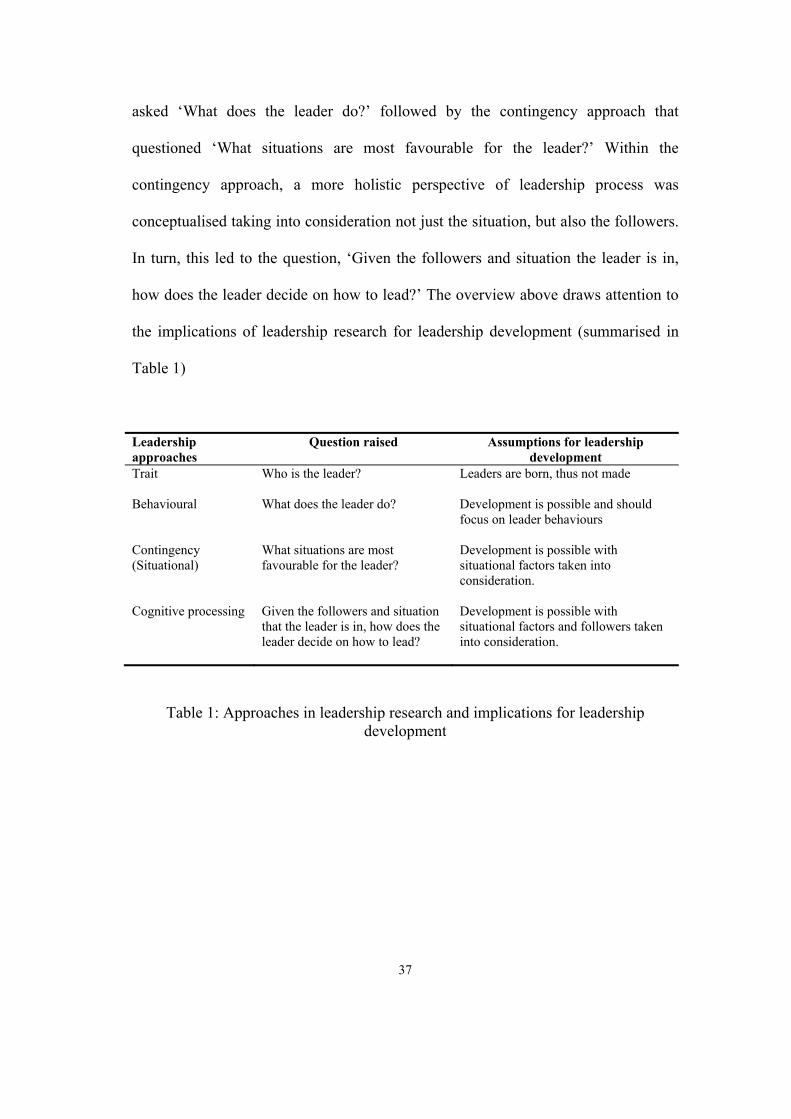
The overview of approaches in leadership above provides the relevant starting point
for the subsequent section which will focus on leadership development. As noted
above, research on leadership started from the focus of the ‘great man’ with the trait
approach, asking the question ‘Who is the leader?’ The behavioural approach then
37
asked ‘What does the leader do?’ followed by the contingency approach that
questioned ‘What situations are most favourable for the leader?’ Within the
contingency approach, a more holistic perspective of leadership process was
conceptualised taking into consideration not just the situation, but also the followers.
In turn, this led to the question, ‘Given the followers and situation the leader is in,
how does the leader decide on how to lead?’ The overview above draws attention to
the implications of leadership research for leadership development (summarised in
Table 1)
Leadership approaches
Question raised Assumptions for leadership development
Trait Who is the leader? Leaders are born, thus not made
Behavioural What does the leader do? Development is possible and should focus on leader behaviours
Contingency (Situational)
What situations are most favourable for the leader?
Development is possible with situational factors taken into consideration.
Cognitive processing Given the followers and situation that the leader is in, how does the leader decide on how to lead?
Development is possible with situational factors and followers taken into consideration.
Table 1: Approaches in leadership research and implications for leadership development

38
2.3. Leader and leadership development
From the previous section, one realises the importance of leadership within
organisations. It is not surprising that there are so many books in the market on
leadership, especially on how to be a good leader. If one were to search the
Amazon.com website for books on leadership, the search would return over 150,000
results. Books such as “Not Bosses but Leaders, How to Lead the Way to Success”
by John Adair (2009), “How to Lead: What You Actually Need to Do to Manage,
Lead and Succeed” by Jo Owen (2009), “The Seven Habits of Highly Effective
People” by Stephen Covey (2004) and the likes often appears in best selling list.
Equally as passionate, within the research arena, there is a substantial body of
research on leadership development aiming to find the answer on how to develop an
effective leader. This is evident in the amount of research conducted in this area and
still continues to snowball. From one of the initial meta-analyses conducted by Burke
and Day (1986), the authors discussed some of the earliest available empirical
findings of leadership development research in organisations. The results from
empirical research conducted between 1952 and 1982 were presented, and a fairly
promising result showing 70% of studies conducted demonstrated effectiveness of
interventions performed. The authors then concluded that while leadership training
was reasonably effective, they proposed that there was still a need for more empirical
research to be conducted before a concrete conclusion could be derived. Hence, from
the literature, we can see that leadership development research continues to grow.
Recently, another meta-analysis study was conducted on the research of leadership

39
development between 1982 and 2001 by Collins and Holton (2004). They found that
in terms of conceptual and methodological approaches taken by researchers between
1952 and 1982, there had been a shift in leadership development compared to when
Burke and Day (1986) conducted their meta-analysis. To name a few, 360-degree
feedback, executive coaching and on the job assignment have been introduced into
the leadership development literature. Still, distinguished journals such as Leadership
Quarterly and Consulting Psychology: Practice and Research are publishing special
issues, with the intent of satiating the gap within leadership development research
on…‘how to develop an effective leader?’
Sometimes the terms ‘leader development’ and ‘leadership development’ are used
interchangeably in the literature, which can cause confusion. In an attempt to fully
understand the concept of leader development, it is essential to distinguish it from
leadership development. Both, Day (2000) and McCauley & Van Velsor (2004)
provided a clear conceptualisation of leader and leadership development.
McCauley & Van Velsor (2004) in their definition described leader development as
focussing on an individual level and “the expansion of a person’s capacity to be
effective in leadership roles and processes” (p.2). Said differently by Day (2000,
2004), when the focus of development is to enhance human capital, which is
individualised-based knowledge, skills and abilities associated with leader’s role, it is
termed leader development. The overarching development strategy is to build the
intrapersonal competencies that allow leaders to form an accurate model of
40
themselves and to use it to perform effectively in various organisational roles and
processes. These competencies facilitate leaders to grow and subsequently be
effective (Day, 2000; McCauley & Van Velsor, 2004).
Leadership development, on the other hand put emphasis on the development of
social capital (Day, 2001) which consist of the relationships that are created from a
complex interaction involving leaders, followers and situations (Fiedler, 1996).
Leadership requires a social context. Interpersonal competencies needed to build
these networked relationships amongst individuals to enhance cooperation and
resource exchange in creating organisational value (Bouty, 2000; Gardner, 1993;
Tsai & Ghoshal, 1998) is the foundation to leadership development strategy.
Developing a leader is critically important to leadership. In leader development, the
leader is equipped with intrapersonal competencies for the demand and challenges of
leadership. Drawing the distinction between leader, leadership development, and its
importance, the current research is interested in developing the intrapersonal
competencies that are the primary step that could facilitate the development of a
leader that transcends situations and sustain this development as a continuous
developmental process as part of leadership development. Therefore, the term leader
and leadership development will be used interchangeably in this thesis.
41
2.4. Leadership development programmes
Leader or leadership development programmes have been widely employed by
organisations in the hope to develop leaders’ competencies (Feldman & Lankau,
2005; Hernez-Broome & Hughes, 2004). These programmes are a process with a
specific, well defined purpose that identifies the leadership behaviours and skills that
are needed to support the business strategy of the organisation (Bracken et al., 1997).
Traditionally, leadership development programmes are classroom based (Hernez-
Broome & Hughes, 2004; Mccall, 2004; Pernick, 2001). In the late 80s and early 90s,
recognition of the importance of experiential development on the job started to
increase and became more influential (Hunt, 1991; Keys & Wolfe, 1988; Mccall,
2004; Wexley & Baldwin, 1986). Currently, six developmental programmes for
leaders that incorporate experiential development that are most commonly practiced
are: (i) job assignments, (ii) mentoring, (iii) executive coaching, (iv) action learning,
(v) networking and (vi) 360-degree feedback (Day, 2000).
2.4.1. Action learning
Action learning can be viewed as the opposite of classroom learning. Within this
developmental method, leaders learn through hands-on, experiential activities in
which leaders work on real time organisational problems (Conger & Toegel, 2003;
Mumford, Hunter, Eubanks, Bedell, & Murphy, 2007). The underlying assumption
of this method is that people learn most effectively when they solve problems or
perform tasks in real-world settings (Revans, 1980) because the situation “pushed
them to the edge of their comfort zones, where learning wasn’t an option but a

42
necessity” (Yost & Plunkett, 2002, p.50). In 2000, in his review of leader and
leadership development programmes, Day (2000) acknowledged the benefits of
action learning but he also cautioned that when selecting this method of
development, it is crucial to match individuals with the appropriate assignment. For
example, recently Skipton Leonard and Lang (2010) demonstrated how action
learning was used successfully in leadership development. Four case examples from
the study (U.S. Department of Commerce, Boeing, the National Institutes of Health
and the U.S. Department of Agriculture) illustrated how action learning built
leadership competencies. The authors argued that action learning provides a learning
environment and problem context which allows the development of leadership skills.
Furthermore, the real life environment also provides real-world practice and
accountability. As Hernez-Broome and Hughes (2004) concluded, there is no doubt
that for the future of leader or leadership development, developmental activities
should be on the job and embedded in a leader’s ongoing work to be most effective.
2.4.2. Mentoring
Mentoring programmes offer participants support and advice from experienced
leaders (Solansky, 2010). Mentors, as defined by Clutterbuck and Megginson (1999),
pass on their personal and professional skills, life experience and knowledge to their
protégées. As a developmental programme, mentoring offers collaborative learning
experiences to ensure support for goal attainment and development by mentors
helping their protégées to understand their own strengths and weaknesses (Pernick,
2001; Solansky, 2010). Mentoring can significantly enhance the development of

43
leaders (Tracey & Nicholl, 2007). Among the main advantages of mentoring, is that
it facilitates communication and the transfer of tacit knowledge, which serves to
foster career development and sustain organisational culture. Moreover, leaders who
have worked with a mentor reported higher levels of satisfaction on their job, pay
and benefits (Pittenger & Heimann, 2000).
2.4.3. Job assignments
Job assignments, also referred to as ‘stretch assignments’, refer to developmental
methods whereby leaders are exposed to new and demanding job-related assignments
(Ohlott, 2004). Some examples of job assignments include job rotation, team
projects, special assignments, new start up businesses, global assignments, or closing
a business. By providing leaders with a variety of challenging job experiences, this
helps to challenge leaders in a way that demonstrates the limitations of their current
skill levels for the kinds of complex tasks they would need to confront at upper levels
of organisational leadership. In other words, job assignments create a talent pool of
competent leaders for future positions in organisations (McCauley & Van Velsor,
2004). Because leaders are required to work outside of their comfort zone, hence the
name stretch assignment, when faced with complex and novel challenges, it is a
make or break moment. Leaders who can adapt to become more effective, grow and
leaders who cannot, derail (Zaccaro & Banks, 2004).

44
2.4.4. Networking
As Day (2000) concisely put it, networking is “to develop leaders beyond merely
knowing what and knowing how, to knowing who in terms of problem-solving
resources” (p.596). The networking developmental programme aims to expand a
leader’s knowledge of how things are done through challenges provided by others to
construct a new understanding and be open to new revenue. This can be seen through
the rapid expansion of networking sites such as LinkedIn.com to more profession
specific site such as Academia.edu for researchers, to promote knowledge sharing
amongst professionals. In conclusion, peer relationship fostered through networking
is a valuable component in the overall leader and leadership development process
(Day, 2000).
2.4.5. 360-Degree feedback
One significant extension of the leader and leadership development literatures since
that of the 1990s, is 360-degree feedback (Atwater & Waldman, 1998), also known
as multi-source feedback. In a recent review of this developmental programme,
Fleenor, Smither, Atwater, Braddy, & Sturm (2010) noted that 360-degree feedback
“continues to be widely used in organisations” (p.1029). Unlike other developmental
programmes that employ self-report evaluation that suffers from response bias (Mabe
& West, 1982; Schwarz, 1999), 360-degree feedback extends the evaluation of leader
behaviours from self-evaluation to multiple sources of evaluation. These sources
include subordinates, peers, superiors, customers and others (Atwater & Waldman,
1998). The main assumption here is that perceptions from the different sources are
45
likely to differ from the leader’s thus discrepancies in these perceptions provide the
leader with valuable feedback to enhance one’s self-awareness (Atwater &
Waldman, 1998; Fleenor, Smither, Atwater, Braddy, & Sturm, 2010; Fleenor,
Mccauley, & Brutus, 1996; Rosti & Shipper, 1998). Thus, the most prevalent and
successful application of 360-degree feedback is for individual leader development
i.e., development of intrapersonal competencies (Atwater, Ostroff, Yammarino, &
Fleenor, 1998; McCarthy & Garavan, 1999).
Recently, Smither, London and Reilly (2005) conducted a meta-analysis on 24
longitudinal multisource feedback studies to uncover whether 360-degree feedback
resulted in performance improvement as evaluated by improved feedback ratings
over a period of time. In their findings, they found, although nearly all the effect
sizes for multiple sources evaluation were positive, the magnitude of improvement
was very small. This led them to deduce that the small effect sizes reflect the fact
that, following 360-degree feedback programmes, some managers improve their
performance while others do not. They suggested that other factors might affect the
large percentage of variance in effect sizes of the improvement in leaders’
performance that was not explained by a sampling error, or the effect of the
mediator.
When studies were conducted where 360-degree feedback is combined with training
or executive coaching, results showed that leaders’ performance improved as
compared to leaders who did not receive training or coaching. Firstly, Rosti and

46
Shipper (1998) conducted a field experimental study comparing the impact of
combined management development training and 360-degree feedback intervention
with that of a 360-degree feedback intervention alone. They found that leaders who
received 360-degree feedback intervention in conjunction with management
development training improved their performance more than leaders who only
received 360-degree feedback intervention. Secondly, Luthans and Peterson (2003)
conducted a longitudinal field study examining the impact of a combined 360-degree
feedback and coaching intervention. In their study, leaders participating in the
intervention showed increased self-awareness and received improved performance
ratings from their followers. Thirdly, Smither, Manuel London, Flautt, Vargas and
Kucin (2003) conducted a field quasi-experimental study comparing the impact of a
combined executive coaching and 360-degree feedback intervention with that of a
360-degree feedback intervention alone. They found that leaders who received 360-
degree feedback intervention in conjunction with executive coaching improved more
in the ratings they received in comparison to leaders who only received 360-degree
feedback intervention. In addition, for both leaders and subordinates, work attitudes
(job satisfaction, organisational commitment and turnover intentions) improved for
leaders who received 360-degree feedback intervention in conjunction with executive
coaching. The three studies above lend support to the notion that training and
coaching following the receipt of 360-degree feedback have a positive impact on the
results of 360-degree feedback interventions, bridging the gap identified by Smither,
London, & Reilly (2005).

47
2.4.6. Executive coaching
In Kilburg's (1996) attempt to understand the fastest growing trend of executive
coaching as a leader development programme over the past fifteen years, he
conducted a review of literature to understand this phenomenon. In his conclusion,
he defined executive coaching as:
“…a helping relationship formed between a client who has managerial authority and
responsibility in an organisation and a consultant who uses a wide variety of
behavioural techniques and methods to help the client achieve a mutually identified
set of goals to improve his or her professional performance and personal satisfaction
and, consequently, to improve the effectiveness of the client's organisation within a
formally defined coaching agreement” (Kilburg, 1996, p.142).
Similarly, in a more recent definition, Centre of Creative Leadership (CCL) defined
executive coaching as:
“…a formal one-on-one relationship between a coach and a client, in which the
coachee and coach collaborate to assess and understand the client and his or her
leadership developmental needs, to challenged current constraints while exploring
new possibilities, and to ensure accountability and support for reaching goals and
sustaining development” (Ting & Hart, 2004, p.116).
48
The above definitions are the staple definitions of executive coaching among
researchers in this field (Ely et al., 2010; Feldman & Lankau, 2005; Kampa-kokesch
& Anderson, 2001; Richard, 2003). In defining executive coaching, this highlights
the basic aims that is, leaders engage in a developmental relationship with an
executive coach to become a better leader.
2.4.6.1. Why executive coaching?
In 1996, Witherspoon and White conceptualised the four essential purposes of
executive coaching. Firstly, executive coaching could be used to improve skills
whereby leaders focussed on acquiring new skills for a specific task or project.
Secondly, executive coaching could improve performance or correcting performance
problems within the leader’s present role. Executive coaching in its initial
application, was to assist leaders who were derailing (Judge & Cowell, 1997).
Currently, as Tapsell (1999) stated, executive coaching “is no longer the survival of
the fittest but the development of the fittest” (p.45). Within the second purpose, the
executive coach targets the change in leaders’ behaviours or to improve their
effectiveness. Thirdly, executive coaching could prepare leaders for a future role or
in other words, succession. Thus, leaders are geared up by strengthening their
leadership skills, focus on long term development need, and possibly to address any
current skill drawbacks. Finally, executive coaching could be utilised for long term
development. Here, as the organisation’s strategies could be broad and evolving,
leaders are coached for comprehensive learning and executive coaching used to tie
leader development to the organisation’s goal. In summary, the central function of

49
executive coaching is to facilitate change and development of a leader, with the
ultimate goal of improving the organisation’s performance and value through the
development of human capital in a change dominated world (Ely et al., 2010;
Hudson, 1999).
One of the earliest empirical researches that were conducted on the outcome of
executive coaching was an unpublished Masters dissertation by Gegner in 1997
(cited in Feldman & Lankau 2005). All of the twenty-five executives who received
an executive coaching intervention that were interviewed confirmed that they were
either more self-aware or gained new skills. 84% of participants reported positive
experiences from the intervention and 32% reported improvement in their
performance. On the other hand, all the participants also reported positive
improvement in their personal lives and 24% reported personal growth in terms of
confidence and openness to change.
Further, Olivero, Bane, & Kopelman (1997) carried out a research study
investigating the effects of executive coaching on productivity in a public sector
municipal agency. Thirty-one managers participated in the study and received
executive coaching for two months after receiving management productivity training.
Statistical analysis showed that there was a significant increase in organisational
outcomes in terms of productivity between management productivity training alone,
as compared to management productivity training with executive coaching.
Productivity increased by 22.4% as a result of management productivity training
50
alone. However, when augmented by executive coaching, productivity increased by
88%. These results put forward the notion that executive coaching does increase
organisational outcomes.
Hall, Otazo, & Hollenbeck (1999) interviewed seventy-five executives from Fortune
100 companies and fifteen executive coaches with the aim to understand the outcome
of executive coaching. Executives participating in this study reported high
satisfaction with the experience. Most importantly, executives stated that they (i)
learned new abilities and skills, (ii) acquired new attitudes and perspectives, and (iii)
are more self-aware with all the above which consequently led to a wide variety of
job performance related outcomes improvement.
In 2001, in her unpublished PhD thesis, Kampa-Kokesch evaluated the impact of
executive coaching on transactional and transformational leadership styles of fifty
executives. She found a statistical significant difference between thirteen executives
in their pre/early stages of executive coaching in comparison to thirty-seven
executives in their post/later executive coaching in upper management and CEO
positions. Leaders were rated higher on charismatic behaviour, ability to impact
followers and inspire followers by clients suggesting executive coaching does impact
leadership style.
Another empirical study was conducted by Thach in 2002, whereby she collected
longitudinal data across three years from 281 executives and high potential managers
51
in mid-size, global telecommunications firm with their head-quarters in the USA. All
participants received 360-degree feedback on their competencies as assessed by
peers, direct reports, managers and self. Also, participants attended a one-day
training session and executive coaching session in which the executive coach assisted
participants in interpreting a 360-degree feedback report. Three more coaching
sessions followed the first for the next six months and a mini survey was conducted
at the end of the six month period. From the results obtained, participants
demonstrated a higher increase in leadership effectiveness in correlation to how
frequently they followed up with the coaching session.
Luthans and Peterson (2003) conducted research to demonstrate the effectiveness in
executive coaching in bridging the gap between leaders’ rating of self and other
ratings when 360-degree feedback programme is implemented. Twenty managers
from a small manufacturing company participated in this study. Besides
demonstrating that executive coaching, when used as a follow up after 360-degree
feedback was administered, reduced the discrepancy between leaders’ rating of self
and self-other ratings but in addition, contributed to positive change in the leaders.
For example, the researchers observed positive leader and follower satisfaction,
commitment, lower intentions to leave and also indirectly, improved company
performance.
Noted as one of the most rigorous empirical studies (Ely et al., 2010; Feldman &
Lankau, 2005), Smither, London, Flautt, Vargas, & Kucine (2003) investigated the
52
effect of executive coaching and feedback on leadership behaviour change. The
authors used a treatment and control group experimental design, and collected data
from 1,361 senior managers in a large global financial services organisation and
tested the assumption that 360-degree feedback supplemented with coaching would
yield better organisational outcomes than the 360-degree feedback alone across
twelve months. All senior managers received 360-degree feedback at the start of the
experiment. Senior managers in the experimental group worked with an executive
coach and the rest of the senior managers did not. After twelve months, another 360-
degree feedback was administered. Data of senior managers who worked with an
executive coach from post experiment revealed that executive coaching had a
significant impact on leaders’ behaviour change suggesting the positive value of
executive coaching.
Such substantiate evidence of the benefits of executive coaching cannot be ignored
when it comes to leader development. Executive coaching is still a buzz word as seen
from studies conducted wherein executive coaching affects leadership style, leaders’
behaviour, leader’s effectiveness, follower’s satisfaction, job performance as well as
organisational performance.
2.4.6.2. The executive coach
With rising evidence of executive coaching as a leader development programme that
accelerates individual learning and skill, as well as dramatically improving
organisation performance, this equally raises the question, who is the most qualified

53
to deliver this training programme to achieve the results desired (Ely et al., 2010;
Feldman & Lankau, 2005; Levinson, 1996; Peterson, 1996; Wasylyshyn, 2003) The
debate is mainly divided into two schools of thought (Kampa-kokesch & Anderson,
2001). Psychologists tend to think that they make better coaches and management
consultants tend to think they make better coaches. The psychologists believe that
with their background in established psychological principles, they are better
equipped to help leaders make the behavioural changes that produce more effective
leadership skills and sustain these behaviours across time (Kilburg, 2001; Sperry,
1997; Tobias, 1996). As quoted from Brotman, Liberi and Wasylyshyn (1998),
“Psychologists have a duty to define the competencies required to achieve sustained
behaviour change through the medium of executive coaching and to proactive in
conveying these standards of competence to the public. Only in this way can this fast-
developing realm within psychology reach its full potential as an invaluable resource
for business executives (p.45)”.
On the other hand, management scholars argue that executive coaches, without
background in business or lacking in industry knowledge, are unable to provide
leaders with practical suggestions (Diedrich & Kilburg, 2001; Thach, 2002). Robert
Mintz, the director of human resources for Time Inc. Magazines, interviewed twenty-
five psychiatrists and psychologists as potential coaches and found them all
''clueless'.' Worst of all, he noticed they were stuck with a 1950s image of how
organisations work (cited in Smith 1993, p.127). Thus, it is critical that an executive

54
coach has a good grasp of industry knowledge of the context in which the client
operates (Ely et al., 2010; Kampa-kokesch & Anderson, 2001; Levinson, 1996;
Saporito, 1996; Tobias, 1996).
Because of the success of executive coaching and the greater demand for executive
coaching within this unregulated arena, executive coaches mushroomed from all
various functional backgrounds such as training, sports, education, drama, clinical
and engineering, to name a few (Feldman & Lankau, 2005; Judge & Cowell, 1997).
Judge and Cowell (1997) conducted research exploring the demographics of people
who call themselves ‘executive coaches’. Demographic findings showed that among
the sixty executive coaches that they interviewed, all were between 35 to 55 years of
age with an average of 24 years working experience. 45% of these executive coaches
reported having a PhD, 90% have a Masters degree in business or social sciences. In
2003, Wasylyshyn conducted a survey looking from the perspective of eighty-seven
executive coaching clients and their opinion of what they look for in a credible
executive coach. Two main criteria emerged from this survey where leaders, as the
client look for an executive coach who has training in psychology and also has
knowledge or experience business. On the other hand, Garman, Whiston and
Zlatoper (2000) conducted a survey looking from the perspective of the media. They
analysed the content of seventy-two articles from popular press and academic
literature and found that less than 33% of articles mentioned training in psychology.
Concluding that, a background in psychology is “neither regularly nor universally
recognised as important or relevant to the practice of executive coaching” (p. 833).

55
Besides the background of the executive coach, another issue is whether the
executive coach should be internal or external to the company. An internal coach has
the advantage that he or she already has knowledge of the company, organisational
culture, history, politics and current situation (Hall, Otazo, & Hollenbeck, 1999).
Also, an internal coach allows an organisation to keep the cost of executive coaching
low and ideally, integrate leaders’ development within the organisation. However,
external coaches are preferred if issues to be resolved involve possibilities where
there might be a conflict of interest or involve highly sensitive or confidential issues
(Bonfield, 2003; Hall, Otazo, & Hollenbeck, 1999; Witherspoon & White, 1996).
External coaches are not employees of the organisation (often self-employed, partner
of a coaching or management consultancy firm), thus allowing clients the ‘safety’ to
explore target issues in depth with the external coach. Nevertheless, the cost of an
external coach is substantial in comparison to an internal coach (Hall, Otazo, &
Hollenbeck, 1999).
According to Implicit Leadership Theory (Lord, Foti & DeVader, 1984), the
importance or need for a particular leader attribute depends on the perceiver
(leader/follower/group/organisation) within the context. For instance, a follower who
prefers higher guidance and direction in his/her job would perceive a leader to be
effective if the leader possess the competency to guide this follower. However,
another follower who is creative would prefer a leader with competency to coach
rather than direct him/her. Thus, it can be said that competencies needed by leaders
“lie in the eyes of the followers”.
56
The real question here is, who knows better of what a leader needs than the leaders
themselves. The leaders should strive to develop themselves rather than just being
developed; this will be elaborated further in Section 2.5.4.
2.4.6.3. The executive coaching process
There are numerous terms used to describe the steps taken by executive coaches in
the process of executive coaching (Douglas & Morley, 2000; Ely et al., 2010;
Feldman & Lankau, 2005; Koonce, 1994; Saporito, 1996; Winum, 2006;
Witherspoon & White, 1996). The framework for the executive coaching process has
been conceptualised since its inception, scholars and practitioners have yet to come
to a consensus. Below, the three most cited frameworks for executive coaching
process are discussed.
The work of Saporito (1996) has been widely quoted in the literature (to name a few:
Cocivera & Cronshaw, 2004; Day, 2000; Douglas & Morley, 2000; Ely et al., 2010;
Feldman & Lankau, 2005; Kilburg, 1997; Orenstein, 2002; Sherin & Caiger, 2004).
He proposed a four stage framework starting with (i) defining the process, followed
by (ii) assessment of the individual, (iii) development planning and finally, (iv)
implementation. In the first stage, the executive coach seeks to gather information of
the challenges the organisation is facing or the outcome expectation of the client
involved that means the success of his/her organisation. Assessment of the individual
would then be conducted to understand the need of the individual but also to assess
the individual itself. A profile of the individual will be gathered through an interview

57
or more objectively, using multisource feedback. This stage allows a comprehensive
assessment of the client’s developmental need and helps identify any issues that need
to be addressed. In the next stage, the coach will provide feedback based on the data
collected and draft an action plan together with the client. Finally, during
implementation stage, the plan is put into action.
Witherspoon and White (1996) also put forward a framework for the coaching
process. The four stage model proposed by them comprised of (i) commitment, (ii)
assessment, (iii) action and (iv) continuous improvement. The first stage involves
commitment to the coaching contract by the organisation, the client and the client’s
superior. In the assessment stage, the problem is defined and goal set based on data
gathered using relevant tools. This is followed by the next stage whereby an action
plan is developed and put into action. In the final stage, the coach provides the client
with ongoing feedback to facilitate continuous improvement.
In their book, “Evaluating leadership coaching: A review and integrated framework”,
Douglas and Morley (2000) discussed that in executive coaching; the process usually
has four parts: (i) goal-setting, (ii) assessment, (iii) awareness and action planning,
and (iv) implementation and monitoring. In the preliminary meeting, goals are set
and the coach forms a contract with the client. Then in the assessment phase, tools
such as 360-degree feedback, interviews, and personality measurements are used to
collect information about the client’s strengths and weaknesses. Next, the coach
provides information gathered from the assessment information to the client to create

58
awareness in the client of how others perceive him or her. The coach will assist the
client in developing a personal action plan for change. This is followed by the client
implementing this action plan with ongoing discussions and monitoring of progress
with the coach.
Other frameworks have also been put forward to capture the stages that occur in the
coaching relationship. For example, steps suggested by Tobias (1996) include
gathering feedback from several sources, identifying strengths and weaknesses of a
leader, planning changes and finally, evaluating progress made by the leader. On the
other hand, Olivero, Bane and Kopelman (1997) outlined the seven phases of
coaching as goal-setting, collaborative problem solving, practice, feedback,
supervisory involvement, evaluation of results and public presentation. The most
recent, Winum (2006) recommended five key components in the delivery of
executive coaching: assessment, feedback, planning, development and integration.
Although, researchers and practitioners have proposed various steps of executive
coaching, the obvious similarity between them is irrefutable. The executive coaching
process starts with the leader receiving feedback from multiple sources such as
subordinates, peers, superiors, customers and others. This is followed by an
evaluation of the feedback, which triggers the search for possible solutions. Once
solutions are identified, leaders will need to formulate and implement the plan to
achieve the desired outcome. Lastly, assessing the outcome from the implementation
completes the cycle of executive coaching.

59
2.5. Conceptual model
2.5.1. Creating self-awareness through 360-degree feedback
Nearly every author mentions that the beginning point of developing leaders starts
with an enhanced sense of self-awareness (Avolio, 2005; Day, 2000; Riggio, 2008).
Within leadership, self-awareness can be broadly defined as a process wherein the
leaders make assessments about themselves and how they are perceived by others
(Atwater & Yammarino, 1992; Church, 1997; Goleman, 1998; Van Velsor, Taylor,
& Leslie, 1993). Simply put, self-awareness is the degree to which individuals
understand their own emotions, strengths, weaknesses, and drives (Goleman, 1998).
A self-aware leader will have a more accurate self-assessment of him- or herself
because he or she is able to incorporate an assessment of how they are perceived by
others into their own self-evaluation (Atwater & Yammarino, 1992). Hence, within
leadership development, to increase self-awareness, leaders need to be open to
feedback from assessment tools which provide feedback from superiors, peers, and
subordinates, and to personally reflect on their leadership (Riggio, 2008).
The conceptualisation of self-awareness is put into operation in the form of self and
other agreement (Van Velsor, Taylor, & Leslie, 1993). The most widely used method
is 360-degree feedback. Self-awareness is operationalised as the congruence between
self and others (supervisor, peer, subordinates, clients etc) ratings, i.e., the extent to
which self and others ratings agree (Fletcher & Baldry, 2000; London & Smither,
1995; Wohlers & London, 1989). Thus, the more congruent the ratings, the more
self-aware the leader is (Atwater & Yammarino, 1992; Church, 1997).

60
Research into self-other agreement in 360-degreefeedback, has found that self-
awareness is related to leadership performance (Atwater, Ostroff, Yammarino, &
Fleenor, 1998; Atwater & Yammarino, 1992; Fleenor, Mccauley, & Brutus, 1996).
For example, in their research Bass and Yammarino (1991) and Atwater and
Yammarino (1992), leaders with higher self-awareness (operationalised as self and
other agreement using 360-degree feedback) were found to be more effective.
Church (1997) further confirmed these findings in his study of 134 high-performing
and 470 average-performing managers where data was obtained from four
independent datasets. Results based on several different approaches to measuring
ratings agreement between leaders and others, demonstrated high-performing
managers are more self-aware in comparison to average-performing managers. This
relationship is consistent across different data sources, organisations or methods of
assessing managerial performance. Thus, a higher level of self-awareness is
positively related to better performance amongst leaders.
On the other hand, the positive impact of 360-degree feedback has been questioned
and there appears to be mixed findings of the benefits of 360-degree feedback
(Ghorpade, 2000). In Kluger and DeNisi's (1996) review of six hundred studies,
found that only one third reported an improvement in performance, one third
reported negative changes in performance and the rest reported no impact. Many
360-degree feedback leadership development programmes fail to improve
performance. This leads us to question why this could be so.

61
A crucial study conducted by Smither, London, Flautt, Vargas, & Kucine (2003) who
investigated the effect of executive coaching and 360-degree feedback on leadership
behaviour change may bring light to these mixed findings. The authors used a
treatment and control group experimental design, and collected data from 1,361
senior managers in a large global financial services organisation and tested the
assumption that 360-degree feedback supplemented with coaching would yield better
organisational outcomes than the 360-degree feedback alone across twelve months.
All senior managers received 360-degree feedback at the start of the experiment.
Senior managers in the experimental group worked with an executive coach and the
rest of the senior managers did not. After twelve months, another 360-degree
feedback was administered. Data of senior managers who worked with executive
coach from post experiment revealed that they were rated higher than senior
managers who did not work with an executive coach. The point to note here is, 360-
degree feedback did yield an improvement in ratings, but the improvement was less
when compared to senior managers who worked with an executive coach.
360-degree feedback helps leaders to identify cognitive discrepancies between how
the leaders sees themselves and how others see them, hence helping them to
recognise areas for development (Tornow & London, 1998; Van Velsor, Taylor, &
Leslie, 1993). However, the assumption here is that leaders who are aware of the
need for the development of certain competencies in order to overcome their
weaknesses and to perform better, will change their behaviour (McCarthy &
Garavan, 1999). Obviously this is not always the case. Working with an executive

62
coach has highlighted the issue where there needs to be a translation from ‘knowing’
to ‘doing’. For example, a leader who is aware that he/she is lacking in delegating
skills, will not be more effective in delegating when the next round of 360-degree
feedback assessment is administered if he/she does not seek to change his/her
behaviour or acquire such competency. He/she is in the state of knowing, or even
very aware of the lacking in such competency. But, without the relevant tool or
competency to bridge that gap, he/she will not be more effective as a leader.
However, as demonstrated by Smither, London, Flautt, Vargas and Kucine (2003),
when a leader works with an executive coach, leaders received better ratings
compared to leaders who only received feedback from raters.
2.5.2. When you know, do you do it? The application of self-regulation
Self-regulation originated from clinical psychology, to answer the question, “how to
help people help themselves?” (Kanfer & Karoly, 1972). Self-regulation has been
used in clinical psychology to control addictive behaviour (Karoly, 1993),
educational psychology to promote learning (Nenniger, 2005) and organisational
psychology to understand effective work behaviour (Sosik, Potosky, & Jung, 2002;
Tsui & Ashford, 1994; Vancouver & Day, 2005). Within leadership, self-regulation
has been researched within the context of emergence leadership (Gangestad &
Snyder, 1985), trust (Sosik, 2001), managerial effectiveness (Atwater, Ostroff,
Yammarino, & Fleenor, 1998) and so on. There are attempts within the literature of
leadership development to conceptualise the importance of self-regulation into the
development of leaders (Avolio & Gardner, 2005; Gardner, Avolio, Luthans, May, &

63
Walumbwa, 2005; Ilies, Morgeson, & Nahrgang, 2005; Mazutis & Slawinski, 2008).
However, leader self-regulation has not been manipulated explicitly within
leadership training itself. If one looks closely at the review from Section 2.4.6.3, the
concept of the regulatory process has been applied widely within leadership
development i.e., executive coaching.
Before moving on, self-regulation needs to be understood. Self-regulation is the
underlying process that drives individuals to allocate effort and resources into action
(Kanfer & Heggestad, 1997; Karoly, 1993). Three theoretical perspectives; Goal-
Setting Theory (Latham & Locke, 1991), Social-Cognitive Theory (Bandura, 1991)
and Control Theory (Carver & Scheier, 1998) provides convergent conceptualisation
of self-regulation. All three theories share the same perspective that is, in order for
the self-regulatory process to be activated, there must be a discrepancy between the
current state and the desired state (Bandura, 1991; Carver & Scheier, 1998; Latham
& Locke, 1991). Central to all three theories is, individuals aim for congruence
between their own and other’s perception of their behaviour or competencies, and
therefore, will allocate resources and effort towards reducing the discrepancies
(Carver & Scheier, 2000).
Latham and Locke (1991) noted that in life’s process, people are naturally self-
regulators but not all people are effective self-regulators. They take the theoretical
perspective where self-regulation is traditionally conceptualised as a personality trait
and as an individual differences (Eisenberg, Fabes, Guthrie, & Reiser, 2000;

64
Koestner, Bernieri, & Zuckerman, 1992). This is a point of view that most current
leadership development advocates; i.e., self-regulation as a trait which could lead to
more effective leadership. An example could be seen in authentic leadership
development. Within authentic leadership, self-regulation is proposed as part of the
underlying component which is associated in the development of an authentic leader
and follower relationship (Avolio & Gardner, 2005). Self-regulation within leader
developmental context here provides the understanding of how a leader’s actions are
guided by a leader’s true self reflecting core values, beliefs, thought and feelings.
The demonstration of this high level of openness is the pertinent component to
developing trust in leader and follower relationships (Gardner, Avolio, Luthans,
May, & Walumbwa, 2005). As leadership development is a strategy to expand a
leader’s capacity to be effective in the leadership role and processes (McCauley &
Van Velsor, 2004), self-regulation has so far been conceptualised as the ‘what’ that
contributes to leader effectiveness but the application of ‘how’ it could be developed
has not been empirically tested in leadership development.
Within this research, the point of view is that self-regulation is an iterative process
(Boekaerts, Maes, & Karoly, 2005; Carver & Scheier, 2000; Zimmerman, 2000).
Three of the theoretical perspectives mentioned above (i.e., Goal-Setting Theory,
Social-Cognitive Theory and Control Theory) endorse the view that self-regulation is
a form of competency and posited that learning and performance outcomes are
affected by self-regulatory processes. Hence, it is argued that self-regulation could
be acquired through training where an individual engages in the self-regulatory

65
processes (Binswanger, 1991; Latham & Locke, 1991) to achieve their desired
outcomes.
Looking back at the mixed findings of 360-degree feedback where individuals are
aware of the discrepancies in their leadership competencies but their awareness does
not always yield an increase in performance after the feedback. One of the reasons
could be, as mentioned by Latham and Locke (1991), people are naturally self-
regulators but not all people are effective self-regulators. Those who have the
predisposition to self-regulate allocate resources and effort to develop themselves
and thus, perform better. On the other hand, there are those who do not go beyond
knowing their weaknesses and translate the feedback received into action to develop
themselves. Thus, it is suggested that self-regulation processes provide the strategies
to allocate resources and effort into action towards reducing these discrepancies. As a
result, bridging the gap between knowing and doing.
2.5.3. Mechanism of self-regulation
One of the first researchers to formulate the processes of self-regulation is Kanfer
(1970), which included self-monitoring, self-evaluation and self-reinforcement.
These stages describe the process in which an individual observes information about
one’s current state and comparing it with the desired goal. More recently, Brown,
Miller and Lawendowski (1999) extended on Kanfer’s model to clarify multiple
processes involved for successful self-regulation. The more comprehensive
framework theorised that self-regulation consists of seven stages: (i) receiving

66
relevant information, (ii) evaluating the information and comparing it to the desired
goal, (iii) triggering change, (iv) searching for options to change, (v) formulating
plan(s), (vi) implementing the plan(s), and (vii) assessing the effectiveness of plan(s).
The stage of receiving relevant information is the attention allocated to information
received (formally or informally) and from this information, individuals will then
self-evaluate by comparing themselves to a standard. After evaluating the
information received, it will then trigger the process of change and consideration of
how to change by searching for alternatives to meet the desired outcome. Next,
individuals will devise a clear plan or plans to change, followed by the implementing
and maintaining the plan(s). Once, the plan(s) has been put into action, the final step
is the evaluation of the achievement of the plan(s). According to Miller and Brown
(1991), interventions can be designed based on these stages to develop self-
regulation within individuals.
In clinical and educational psychology, self-regulation has long been applied to equip
individuals as a competency to help individuals to help themselves through planned
interventions (Boekaerts, Maes, & Karoly, 2005). Empirical evidence supports the
relevance of self-regulation skills for substance use, alcohol abuse, healthier diet
consumption, etc. For example, Wechsler, Dowdall, Davenport and Rimm (1995)
examined the use of self-regulation strategies to overcome alcohol abuse and
alcohol-related consequences. Participants with lower self-regulatory strategies
demonstrated higher levels of total alcohol problems, drinking and driving, and
physical illness. Similarly, Nagoshi (1999) demonstrated that college students with
67
higher levels of self-regulatory skills to strategise and control their alcohol use
displayed lower levels of alcohol-related consequences. For substance abuse, Wills
and Stoolmiller (2002) demonstrated in their longitudinal study that self-regulation is
predictive of an escalation of substance use behaviour. They found that higher self-
regulatory skills were associated with less substance use and a smaller increase in
substance use over time because they were more likely to develop strategies to
control substance use. Another example of self-regulatory skill application was used
for people who are looking to change their diet to incorporate healthier eating.
Participants who incorporated self-regulation strategies consumed a 91% healthier
diet compared to those who did not (Scholl & Zimmerman, 2001). Thus, self-
regulation has been applied in clinical settings to help people develop strategies to
overcome addiction related problem or in general to change their lifestyle for the
better.
Within educational psychology, training in self-regulation strategies to improve
academic achievement is not a new concept. A multitude of research has
demonstrated the value of a self-regulation training programme and there is a
consensus on the effectiveness of such interventions (Chung, 2000; Dignath,
Buettner, & Langfeldt, 2008; Paris & Paris, 2001; Zimmerman & Bandura, 1994).
Providing students with self-regulation training about how to self-regulate helps
them to self-initiate strategies formulation to help them learn in various subjects such
as reading, comprehension, writing, mathematical problem solving, science and
social science (Dignath, Buettner, & Langfeldt, 2008; Paris & Paris, 2001). For

68
example, Zimmerman and Bandura (1994) found that self-regulatory mechanisms
influence writing grade attainment. A more recent study was conducted by Perels,
Gurtler, & Schmitz (2005), where they conducted training on self-regulatory
competences on 249 students in Germany. Their results further confirmed that it is
possible to increase self-regulatory components in students and these self-regulatory
strategies leads to increased learning and mathematical problem solving skills. To
conclude, self-regulation competency can be improved through training as
demonstrated empirically in educational psychology (Dignath, Buettner, &
Langfeldt, 2008). Self-regulatory processes helped students to develop strategies in
order to learn and enhance academic achievements.
Facing such conspicuous empirical evidence from both clinical and educational
psychology, it is no wonder executive coaching has been conveying positive results
when it comes to a leader acquiring relevant competencies to be more effective and
perform better in their role. 360-degree feedback and executive coaching, together
reflect the process of self-regulation as shown in Table 2. In other words, the
executive coach plays the role of the ‘regulator’ in the equation of leader
development with the application of 360-degree feedback during the start of the
coaching process.

69
Saporito (1996) Tobias (1996) Witherspoon & White (1996)
Olivero, Bane & Kopelman (1997)
Douglas and Morley (2000) Winum (2006) Brown, Miller &
Lawendowski (1999) Defining the process Assessment of Individual Development Planning Implementation
Gathering feedback Identify strengths/ weaknesses of leader Plan changes Evaluate progress
Commitment Assessment Action Continuous improvement
Goal-setting Problem solving Practice Feedback Supervisory involvement Evaluation of results presentation
Goal-setting Assessment Awareness Action planning implementation
Assessment Feedback Planning Development integration
Receiving relevant information Evaluating the information &comparing it to the desired goal Triggering change Searching for options to change Formulating plans Implementing plans Assessing the effectiveness of plan
Table 2: Stages of executive coaching in comparison to stages of self-regulation

70
Therefore, leader development, instead of adopting a myopic view of solving the
immediate problem (e.g., by using an executive coach to regulate a leader’s action to
develop a particular competency which is needed at a particular moment in order to
be more effective), should be developing leaders’ self-regulation for long term
development. Interventions where leaders are trained with self-regulation should
allow leaders to perform effectively by meeting the demand of various constituencies
through awareness of what is needed through self-regulation, therefore proactively
engaging themselves to develop further competencies that are needed. Thus, it is
proposed that:
Hypothesis 1: A self-regulation intervention should lead to better leader and team
performance
Hypothesis 1a: A self-regulation intervention should lead to better leader
performance, measured as leader satisfaction, leader effectiveness and extra effort
Hypothesis 1b: A self-regulation intervention should lead to better team’s financial
performance, measured as retained profit, return on capital employed (ROCE),
earnings per share (EPS) and (negative) gearing
Hypothesis 1c: A self-regulation intervention should lead to better team’s assessed
performance, measured as presentation, business plan, group report, simulation
performance and reflective report.
Within the leadership development literature, it is acknowledged that time is crucial
in the study of leader development, ironically the limitation posed by time to conduct
longitudinal studies often prevent this (Gardner, Lowe, Moss, Mahoney, & Cogliser,

71
2010; Lowe & Gardner, 2000). Executive coaching as noted by practitioners as well
as researchers, always works within a time frame to attain change in leaders and
consequently, change in performance (Blattner, 2005; Ely et al., 2010; Feldman &
Lankau, 2005; Joo, 2005; Tobias, 1996).
Based on resource allocation theory (Kanfer & Ackerman, 1989), individuals possess
a limited store of cognitive and attentional resources. Attention will be diverted to a
resource demanding activity, and in contrast, fewer resources are needed if the task is
automated. Therefore, when a leader receives a self-regulation intervention, he or she
is exposed to multiple tasks (e.g., learning to self-regulate, at the same time as being
responsible for his/her regular tasks), and competing demands are likely to take
place. Furthermore, Kanfer and Ackerman (1989) state that a significant amount of
attentional resources are required to self-regulate. However, a study conducted by
DeShon, Brown and Greenis (1996) does not support the notion that self-regulatory
activities use a significant amount of attentional resources.
In congruence with the resource allocation theory, it is expected that after leaders are
trained on how to self-regulate, the leaders will divert attention and resources to
absorb new information, operationalise the new competency learned; lead their team,
and also strive to accomplish the goal expected of them as a leader. As suggested by
DeShon and colleagues, self-regulatory activities do not use up significant amount of
attentional resources and following this logic (DeShon, Brown, & Greenis, 1996), it
is expected that after the intervention, leaders would take some time (but not

72
significant amounts of time) to accumulate attentional resources necessary to
translate self-regulation learned into performance outcomes, and in time, demonstrate
increased performance. As the relationship between self-regulation training and
leader performance becomes more pronounced over time, it is proposed that it is
methodologically needed to measure benefits of self-regulation intervention over
time.
2.5.4. Leaders competency model
Competency models are the predominant approach to leadership development efforts
to identify those relevant competencies required for leading people toward
organizational goals (Wells, 2003, p.46). Competency models are useful for
articulating effective performance standards and aligning individual behaviours and
skills with organizational goals and strategies (Zenger & Folkman, 2002).
It is no wonder researchers and practitioners alike, have jumped onto the bandwagon
of the competency modelling movement to identify the taxonomy of competencies to
which leaders should have to meet such as the demands stated above. For example,
Moran and Riesenberger (1994) suggested that leaders should be able to work with
diversity, have long term vision, manage organisational change, motivate employees,
and manage conflicts. Srinivas (1995) defined eight competencies needed to meet
organisational challenges, they are; curiosity and concern with context, acceptance of
complexity and its contradictions, diversity consciousness and sensitivity, seeking
opportunity in surprises and uncertainties, faith in organizational processes, focus on

73
continual improvement, extended time perspective, and systems thinking.
Rhinesmith (1996), on the other hand, identified six competencies where leaders
need to manage complexity, be competitive, be adaptable, network, value
multicultural teamwork, manage uncertainty and manage learning. Brake (1997) put
forward four competencies in which leaders should have i.e., managing relationship,
business savvy, transformational and persona effectiveness. Jordan and Cartwright
(1998) identified the ability to maintain relational abilities, cultural sensitivity, and
ability to handle stress as some of the crucial competencies for leader effectiveness.
Goldsmith and Walt (1999) suggested that competence to thinking globally,
appreciating cultural diversity, demonstrating technological savvy, building
partnerships, and sharing leadership are all needed for future leaders. Conner (2000)
put forward six competencies; personal influence, business savvy, global perspective,
ability to motivate, entrepreneurship and strong character as needed by a good leader.
Mumford, Zaccaro, Harding, Jacobs and Fleishman (2000) proposed five
competencies that a leader needs to manage change. The first four are social
judgment skills, social skills, creative problem solving skills and knowledge. The
fifth competence is the willingness to exercise all the four competencies proposed.
Judge and Bono (2001) demonstrated that self-esteem and integrity predict
performance and similarly, Bueno and Tubbs (2004) identified communication skills,
motivation to learn, flexibility, open-mindedness, respect for others and sensitivity as
the most important leadership competencies. Battilana, Gilmartin, Sengul, Pache and
Alexander (2010) suggested that leadership competencies such as communicating the
74
need for change, mobilizing others to support the change, and evaluating the change
implementation is needed for leaders to implement change.
Competency models are the predominant approach to the leadership development
effort to identify the leadership competencies that are required for leading people
toward organisational goals (Conger & Benjamin, 1999; Wells, 2003). In addition,
competency models also communicate the attributes that are recognised and
rewarded, providing a benchmark for organisational performance (Zenger &
Folkman, 2002). Despite the benefits, competency modelling has its limitations.
Competencies identified within the model could be numerous (Prewitt, 2003). Also,
there may be unintended consequences where leaders are just ‘checking-off’
competencies in the model systematically, limiting innovation and synergistic growth
of the leader as an individual (Zenger & Folkman, 2002). If rigidly applied, it may
create ‘cookie-cutter’ leaders inside the organisation. The homogeneity, in time will
contradict an organisation’s aim to achieve competitive advantage through its leaders
(Zaccaro & Banks, 2004). Not all competencies are of equal importance,
competencies modelling face the challenge that the competencies needed by leaders
vary from one situation to another; and from one follower to another.
For example, as leaders ascend to higher level positions in an organisation, the
competencies which leaders possess need to be further developed to enable them to
successfully perform the different leadership role requirements (Hooijberg &
Schneider, 2001; Hooijberg, Hunt, & Dodge, 1997). This is explained by Stratified

75
System Theory (Jacobs & Jacque, 1987; 1990) and Interactive Complexity Theory
(Streufert & Nogami, 1989; Streufert & Swezey, 1986), which both stress the need
for different competencies in leaders across different organisational levels. Empirical
findings by Mumford, Marks, Connelly, Zaccaro and Reiter-Palmon (2000) in their
research assessing the competencies across six grade levels of officers in the U.S.
Army, demonstrated an increase in leaders’ competencies in higher grade levels in
comparison to their lower-level counterparts. It is acknowledged that the
competencies measured by Mumford and his colleagues are relevant to military
leadership and leadership knowledge and skills needed for organisation leadership is
arguably different. However, the pertinent point here is that the necessary
competencies increase as the leader ascends into higher level positions within an
organisation. Although competencies modelling may try to capture different
competencies needed in different levels of organisations (Mumford, Campion, &
Morgeson, 2007), specifying this is a specific set of competencies that a leader
should develop may be too rigid an approach. Although it is agreed that
competencies required by leaders are different according to their role, relevant
competencies that are perceived to be important for each follower or organisation
will also differ. According to Implicit Leadership Theory (Lord, Foti, & DeVader,
1984), the importance or need for a particular leader attribute depends on the
perceiver (leader/follower/group/ organisation) within the context. Take the classical
example, followers who prefer higher guidance and direction in their job would
perceive a leader to be effective if the leader possesses the competency to guide
76
them. However, other followers who are creative may prefer a leader with that
competency to coach rather than direct.
The challenges of the complex interaction of leaders with situational and social
variables; to model the best competencies for effective leaders have long tantalised
researchers. On the other hand, practitioners for their part in developing leaders, are
faced with the same challenges in trying to design interventions to develop what is
perceived to be the most effective competencies needed in leaders at that moment. In
view of this, it is suggested that when leaders are trained with self-regulatory
competency, they are able to recognise the competencies that are most relevant to
their current leadership needs and seek to develop those competencies.
Hypothesis 2: Leaders who attended self-regulation training should exhibit greater
improvement in the competencies required in their leadership role compared to
leaders who have not been trained.
Hypothesis 2a: Leaders who attended self-regulation training would exhibit greater
improvement in the competencies required in their leadership role, measured as
promoting teamwork, planning, basic leadership, relationship management and
keeping others informed.
Hypothesis 2b: Leaders who did not attend self-regulation training would exhibit less
improvement in the competencies required in their leadership role, measured as
promoting teamwork, planning, basic leadership, relationship management and
keeping others informed.

77
2.5.5. Leader competencies and leader performance
In order to appreciate why competencies are important and the voluminous amount
of research dedicated to develop leader competencies (as demonstrated in section
2.5.4), one must understand the term ‘competencies’. Ulrich, Brockbank, Yeung and
Lake (1995, p.474) defined competencies as “an individual’s demonstrated
knowledge, skills or abilities” whereas Blancero, Boroski and Dyer (1996, p.387)
termed competencies to be “the knowledge, skills, abilities and other attributes
required to perform desired future behaviour”. On the other hand, McLagan (1996
cited in Shippmann et al., 2000, p.706), argued competencies as “knowledge and
skills that underlie effective performance”, which was also agreed by Mirabile
(1997) to be associated with high performance on a job. As it can be seen,
competencies have been defined in many ways. However, the common denominator
among the many definitions of competencies is that competencies are a group of
related behaviours or required knowledge, skills, abilities and other attributes. These
competencies, when put into operation, contribute to the successful performance of a
certain activity or task (Catona, Cronshaw, Wiesner, Hackett, & Methot, 2001;
Shippmann et al., 2000).
The above definition of competencies paints the picture of why the leader
competency development model has experienced exponential growth as a function of
the competitive organisational environment. Leaders frequently need to confront
crucial and relevant real time issues and come up with best solutions in the shortest
period of the time (Day, 2000; Mumford, Zaccaro, Harding, Jacobs, & Fleishman,

78
2000). To do so, leaders need skills and abilities to develop and implement solutions
with followers, peers or supervisors operating in complex and dynamic contexts.
Within this process, leaders face complex interactions between them and the social
and organisational environment (Fiedler, 1996). Effective leaders need to have the
social skills to persuade followers in these intricate social situations, to accept and
support their proposed solutions (Conger & Kanungo, 1987). It is therefore important
to possess the skills and abilities required to solve this variety of interpersonal and
organisational problems (Mumford, Zaccaro, Harding, Jacobs, & Fleishman, 2000;
Ulrich, Brockbank, Yeung, & Lake, 1995; Wexley & Baldwin, 1986; Zaccaro,
Mumford, Connelly, Marks, & Gilbert, 2000). Moreover, leaders need certain
knowledge sets in order to come to the solutions required in addressing these
challenges (Mumford, Zaccaro, Harding, Jacobs, & Fleishman, 2000). The
knowledge set also serves as a repertoire of behavioural responses from which the
leader can draw to solve problems effectively (Zaccaro, Foti, & Kenny, 1991).
Therefore the KSAO (knowledge, skills, abilities and other attributes) package of
leaders summarised in the form of competencies is crucial for leaders to perform
effectively in their role. Following this logic, it is proposed that:
Hypothesis 3: Leader competencies mediate the effect of training on performance in
that (i) self-regulation training leads to the leader developing relevant competencies
for his/her role and (ii) these competencies positively affects performance.
Hypothesis 3a: Leader competencies mediate the effect of training on performance in
that (i) self-regulation training leads to the leader developing relevant competencies

79
for his/her role and (ii) these competencies positively affects leader performance,
measured as leader satisfaction, leader effectiveness and extra effort.
Hypothesis 3b: Leader competencies mediate the effect of training on performance in
that (i) self-regulation training leads to the leader developing relevant competencies
for his/her role and (ii) these competencies positively affects the team’s financial
performance, measured as retained profit, return on capital employed (ROCE),
earnings per share (EPS) and (negative) gearing
Hypothesis 3c: Leader competencies mediate the effect of training on performance in
that (i) self-regulation training leads to the leader developing relevant competencies
for his/her role and (ii) these competencies positively affects the team’s assessed
performance, measured as presentation, business plan, group report, simulation
performance and reflective report.
2.6. Conclusion
The introduction of this chapter states the importance of leadership and the attempts
of leaders and practitioners to develop effective leaders. Next, the review of the
evolution of leadership theories informed the views and implications on leadership
development. It also highlighted that the practice of leadership development precedes
its scientific understanding (Avolio, 2005; Day, 2000) and there is a need to bridge
this gap.
In particular, the literature reviewed in leader and leadership development has
revealed that the phases of executive coaching reflect the process of self-regulation.
The executive coach plays the role of the ‘regulator’ in the equation of leader
development. Thus, it is not surprising that coaching has proved to be successful
80
especially when it is used to improve or gain specific leader competencies (Tobias,
1996). Looking at self-regulation theory, it explains the underlying mechanism
whereby individuals aim for congruence between their own and other’s perception of
their behaviour or competencies and therefore, will allocate resources and effort
towards reducing the discrepancies (Carver & Scheier, 2002). 360-degree feedback
applied on its own yields mixed positive findings because it only activates the first
stage of self-regulation i.e., it helps leaders to become more aware of cognitive
discrepancies between how the leaders sees themselves and how others see them,
hence helping them to recognise areas for development (Tornow & London, 1998;
Van Velsor, Taylor, & Leslie, 1993). However, the assumption here is, leaders who
are aware of the need for the development of certain competencies in order to
overcome their weaknesses and to perform better will change their behaviour
(McCarthy & Garavan, 1999), resulting in the conflicting findings as stated.
Self-regulation framework theorised that self-regulation consists of seven stages: (i)
receiving relevant information, (ii) evaluating the information and comparing it to
the desired goal, (iii) triggering change, (iv) searching for options to change, (v)
formulating plan(s), (vi) implementing the plan(s), and (vii) assessing the
effectiveness of plan(s) and interventions that can be designed to develop self-
regulation within individuals (Miller & Brown, 1991). Executive coaching when
applied was found to be effective because it completed the framework of self-
regulation, where it followed up from the stage of knowing to the stage of doing.
Following these, the current chapter synthesises a conceptual framework and

81
research hypotheses proposing the notion that self-regulation competency should be
developed in leaders instead, to facilitate development of relevant competencies
needed to be effective in their role, thus fostering a continuous development in
leaders.
The conceptual model theorised that 360-degree feedback and executive coaching,
together reflect the process of self-regulation. In other words, the executive coach
plays the role of the ‘regulator’ in the equation of leader development with the
application of 360-degree feedback during the start of the coaching process. With
this in mind, the author suggests that instead of adopting a myopic view of solving
the immediate problem e.g., using an executive coach to regulate leaders’ action to
develop a particular competency which is needed at a particular moment in order to
be more effective, leaders and organisations should be developing leaders’ self-
regulation for long term development. Interventions where leaders are trained with
self-regulation will allow leaders to perform effectively by meeting the demands of
various constituencies through awareness of what is needed through self-regulation,
and proactively engaging themselves to develop further competencies that are
needed. In turn, the relevant competencies developed will lead to better leader
performance.
The hypotheses proposed will be examined using a field experimental design with
control and experimental groups. Justification for the suitability of the
methodological approach will be discussed and justified in the next chapter.

82
CHAPTER 3
Methodology
CONTENT: This chapter provides a description of the methodological approach used to examine the hypotheses derived from the previous chapter. Section 3.1 is an introduction to the longitudinal field experiment. This is followed by Section 3.2, 3.3 and 3.4 which cover the research paradigm and design selected, as well as providing justifications for the suitability of the approach. Section 3.5 outlines the population and sampling techniques applied. Next, Section 3.6 discusses the steps involved in the data collection process; starting with a pilot study, a pretest, an intervention and lastly, two posttests. This is followed by Section 3.7 with the discussion of scale selection and Section 3.8 on how data will be analysed. Last but not least, Section 3.9 presents consideration of ethical issues involves in the research and, Section 3.10 gives a summary of this chapter.
3.1. Introduction
In the previous chapter, a conceptual model of leadership development, which
consists of a causal relationship between self-regulation training and leader
performance as well as the mediating effect of leadership competencies, was put
forward. In order to establish causal relationships within the model, typically an
experimental design is the most suitable as it allows manipulation and control of the
causality (Shadish, Cook, & Campbell, 2002). The current study will adopt a
longitudinal field experimental design to investigate the hypotheses proposed in
Chapter Two. As such, this chapter will discuss the generic philosophy, and
methodology of experimental designs, with justifications of the design selected.

83
3.2. Research paradigm
The purpose of this chapter is to discuss the research methodology; however, it
would be a gross oversight to ignore the influence of philosophy upon the
development of research design and the research process. Burrell and Morgan (1979)
define ‘paradigm’ as a general way to view the world or social reality. This social
world view is guided by basic theoretical assumptions, which will provide a frame of
reference, a form of theorising and an approach to research. The concept of paradigm
is useful since it allows theories to be grouped by common elements (Burrell &
Morgan, 1979). It further permits us to distinguish between the work of various
theorists and researcher, and allows us to become aware of our own frame of
reference and the implication this carries (Burrell & Morgan, 1979; Kirk, 1999).
Burrell and Morgan (1979) proposed four research paradigms; functionalist,
interpretivist, radical humanist, and radical structuralist. These paradigms are
primarily defined by three of the assumptions that Burrell and Morgan (1979) make;
ontology, epistemology and methodology. These assumptions, according to Gioia
and Pitre (1990) are the best way to characterise the four different paradigms.
Ontology refers to the assumption about the nature of social reality, in other words,
the phenomena being studied. Epistemology refers to the nature of how the
researcher understands the world and how knowledge can be acquired of the social
reality. Lastly, methodology refers to the ways in which to study social reality.
84
The functionalist paradigm underlies the current research. The functionalist paradigm
emphasises the seeking of causal explanation of social phenomenon with the
assumption that the researcher is objective and neglects the subjective state of the
researcher (Hussey & Hussey, 1997; Saunders, Lewis, & Thornhill, 2000). The
functionalist paradigm has a highly structured methodology to facilitate replication
(Saunders, Lewis, & Thornhill, 2000) which reinforces the choice of this paradigm.
Replication is crucial in Organisational Psychology which is an applied discipline,
thus a highly structured methodology provides a logical and rational explanation
(Weick, 1995) in this regard. Since the current research is interested in deducing the
hypotheses generated from the literature, the interpretivist paradigm, which is more
concerned with gaining new insights and building theories from the participant’s
subjective state (Burrell & Morgan, 1979), is less suitable.
However, functionalism is criticised by interpretive researchers who consider it as
being too conservative, and unable to provide important explanations. They believe
that science should be concerned with understanding rather than objectivism and feel
that the scientific method is outdated and inapplicable (Griffiths, 1999). Another
point that functionalists fails to address, includes; people influencing society, the
world is created through social interaction, the disagreement within the paradigm, is
an extreme commitment to functionalism regardless of the nature of phenomena
being studied. Those assumptions have long become taken for granted, and theory
and models are no longer challenged in the way they should be (Burrell & Morgan,
1979; Griffiths, 1999; Weick, 1995), causing the researcher to miss phenomena

85
occurring because of the focus on the theory or hypothesis testing rather than on
theory or hypothesis generation (confirmation bias). As mentioned, each paradigm
and approach has its strengths and limitations and what is the most appropriate
depends on the aim of the research and in this case, the research endorsed the view of
the functionalist paradigm as it is more suited for the research aim and objectives.
3.3. Quantitative versus qualitative approaches
The distinction between qualitative and quantitative methodology has been a
constant debate in the social sciences (Hammersley, 1996). There are two different
ways to follow this argument. One could contend that qualitative and quantitative
methods represent opposing paradigms, which differ fundamentally in their
assumptions about the world. As such, they cannot be consolidated. Others, however,
argue that qualitative and quantitative methodologies are tools for data gathering and
therefore complement each other (Hammersley, 1996). Thus, it is important to
consider the strengths and weaknesses of a variety of research methods in order to
identify those most suited to this research.
Quantitative research is structured, used primarily to confirm theoretical
relationships, produce nomothetic findings, assume social reality to be independent
of the researcher and participants, and produces hard and reliable data (Hammersley,
1996). This is achieved through the measurement of variables from data collected,
which is then analysed through numerical comparisons and statistical inferences
(Minichiello, Aroni, Timewell, & Alexander, 1992). Researchers endorse objectivity
86
by emphasising distance between themselves and their participants and not allowing
themselves to become personally involved in the research.
Quantitative research is deductive and is therefore useful for the testing of theories
(Deshpande, 1983). This approach develops a research question and variables to be
tested from the analysis of the theory and literature which means that quantitative
research answers the precise question that has been asked (Lee, 2008). Although this
is often seen as an advantage of quantitative research, it is possible to assert that the
structured nature of this approach can be restrictive. For exploratory research, an
inductive approach is sometimes preferable where patterns emerge from the data
which may have previously been unaccounted for by theory.
Thus, the qualitative approach, on the other hand, is a way to explore participants’
subjective meaning to understand human behaviour from the perspective of the
individual and assumes a dynamic and negotiated reality exists (Minichiello, Aroni,
Timewell, & Alexander, 1992). Using this research technique, data is collected using
what participants say and do using methods such as interview, focus group or
observation. Therefore, the theory is produced through research, methodology is
generally unstructured, findings are ideographic, the social reality is viewed as a
socially construed process; the data tends to be rich and descriptive and is analysed
thematically (Hammersley, 1996; Minichiello, Aroni, Timewell, & Alexander,
1992). In qualitative research, a close relationship with participants is deemed

87
necessary and researchers generally view their involvement as an integrated part of
the research process (Hammersley, 1996).
Nevertheless, the distinction between quantitative and qualitative methods is not as
clear-cut as it appears. Many researchers have recognised that qualitative and
quantitative methods are not mutually exclusive (Richardson, 1996). Instead they can
be viewed as complementary methods, which address different questions of equal
importance to the field of psychology. Quantitative researchers often use qualitative
methods to explore their research question. Similarly, qualitative researchers may
choose to quantify their data for the purpose of analysis (Hammersley, 1996).
Richardson (1996) argues that, the choice of research methods should always be
informed by philosophical and pragmatic considerations in terms of the specific
research questions that are to be addressed.
3.4. Research method and design appropriateness
As discussed in the previous section, each method has its own strengths and
weaknesses. The choice between qualitative or quantitative methods depends mainly
on; (i) what the research question is, (ii) what the topic of research is, (iii) what
methods can be found in the literature relating to the research, (iv) practical
considerations, (v) which approach will teach us more about what we are trying to
learn, and (vi) the preference for the approach (Punch, 1998).

88
Organisational Psychology research has become well recognised. This is mainly due
to the use of functionalist epistemology and quantitative methods (Creswell, 1994;
King, 2000; Baum, 1995) which allow research to be replicated and generalised.
Quantitative methods allow the researcher to test the theory using hypotheses,
establish causal relationships, make generalisations that lead to understanding, and at
the same time, allow the researcher to remain independent from the research
participants. This in turn, will lead to the most crucial aim of this research, which is
to inform the practice of leader development. Most importantly, the current research
is interested in deducing the hypotheses generated from the literature, the
quantitative approach therefore, which is highly structured and deductive in nature, is
most suitable.
Within quantitative design, researchers reduce experiences and other complex
phenomena into numbers (Baum, 1995; Creswell, 1994). Through the use of
questionnaires (Section 3.7), participants’ answers can be converted into numerical
data which permits statistical analyses to be carried out. The approach is noted to be
highly applied in many researches carried out within this field (e.g., Dvir & Shamir,
2003; Ehrhart & Klein, 2001; Gaudine & Saks, 2004; Hirst, Mann, Bain, Pirola-
Merlo, & Richver, 2004; Judge & Bono, 2000; van Knippenberg, van Knippenberg,
De Cremer, & Hogg, 2004; Seifert & Yukl, 2010).
A longitudinal field experimental design is selected for this research as it is deemed
most suitable as it allows evaluating interventions on leader’s performance as well as

89
its desired results between control and experimental groups. A field study allows the
researcher to conduct the experiment in real life settings (Christensen, 2007). The
Business Strategy Game (BSG) module was selected as a suitable setting for the
experiment. The structures and settings in which students interact in the simulation
program reflect the organisational setting. Group leaders lead and influence their
teams in developing competitive strategy, develop and manage the virtual company’s
portfolio, create a shareholder value, analyse the competitors and create customer
value. In addition to that the task, leaders need to manage the individuals and the
relationships between individuals within the team.
Figure 1: Research design model
All teams competed in the simulation and were graded in their performance for the
game simulation as well as the written assignments. The use of a business simulated
environment has been used previously (Rapp & Mathieu, 2007; Roux & Steyn, 2007)
to conduct experimental research to examine leadership and teamwork. The BSG
Pretest Randomly selected experimental group
Posttest 1
Pretest Randomly selected
control group
Posttest 2
Posttest 1
Posttest 2
Intervention

90
module provides a suitable setting for the current research to explore the relationship
between the independent and dependent variables by comparing between the control
and treatment group.
However, it has to be noted that this research does not fall under quasi-experimental
field design. The main difference between quasi-experiment and experiment is how
participants in the study are selected to receive the intervention. Shadish, Cook and
Campbell (2002) noted that “random assignment is not random sampling”. Within an
experiment, the researcher may use the most appropriate method to select individuals
who are representative and have similar characteristics of the overall population of
interest. However, the participants in the study must be randomly assigned into
control and experimental groups in order to qualify the study as experimental design,
which this study managed to follow (Section 3.6.3).
The field experiment approach is selected over a laboratory experiment because,
even though laboratory experiments allow for higher control of the variable under
investigation, it suffers artificiality and threatens external validity. This is due to the
fact that the highly controlled settings in the laboratory might not be transferable to a
real life context (Bryman, 2001). Thus, a field experiment design is closer to the
dynamics of the real world and inferences of the research findings are transferable
into practice.
91
On the other hand, it is arguable that a field experiment might suffer potential threats
of internal and external validity. Although the field experiment offers a fairly high
control over the study, the question of “did the intervention make the difference in
the outcome or other extraneous or confounding variables that caused the outcome?”
still stands (Shadish, Cook, & Campbell, 2002). Shadish and his colleagues have
identified a number of confounding factors such as history, maturation,
instrumentation, testing instruments, regression artefact, attrition and selection, that
can affect a study’s outcome. History, which are events occurring during the period
of the experiment and maturation, which is due to participants aging, could both
impact the changes at the end of the experiment (Bryman, 2001). However, in this
study, both factors were controlled by including a control group within the
experimental design. If both experimental and control groups are equally exposed,
then both groups are comparable (De Vaus, 2001). Testing instruments was not
applicable within this study as the researcher will use a questionnaire as a
measurement instrument and did not change the instrument selected. Regression
artefact refers to the measurement scores of participants tending to move towards the
mean, even without intervention (Shadish, Cook, & Campbell, 2002). Such incidents
need to be controlled in order to draw valid inferences from research findings. To
avoid this, the researcher used the proposed solution of a randomisation assignment.
Sometimes, some participants in an experimental study could not complete the study
due to certain circumstances and this is fairly common. The researcher controlled for
attrition during the data analysis. Finally, although the experiment randomly
allocated participants into control and experimental groups, there could be the threat

92
of self-selection biases where participants possessing certain characteristics are more
likely to turn up for the intervention. Participants were informed that the intervention
would improve their leadership skills, it is possible that participants who already
posses higher self-regulation are more likely to attend the intervention. Thus,
measurements for self-regulation and other performance measures were taken during
pretest and were analysed for any significant difference between groups. Results are
presented in Chapter Four.
Pretest Control Group Randomisation
Internal validity threats
History
Maturation
Testing instruments
Regression to mean
Attrition
Selection
External validity threats
Interactive effects of testing
Interactive effects of sampling
Table 3: Techniques for controlling external and internal validity of experimental
design
The researcher also considered the potential threats to external validity such as
interactive effects of testing and interactive effects of sampling (Bryman, 2001;
Christensen, 2007; Cooper & Schindler, 2003). As the current research consists of
pretesting, there is a possibility that participants could become more or less sensitive

93
to experiment variable or treatments. However, pretesting is crucial within an
experimental design to make an initial comparison between participants in control
and experimental groups so they are not significantly different on relevant variables.
Pretesting also allows for the control of interactive effects of sampling in case
random assignment of participants into teams showed to be fallible. Finally, Table 3
summarises the techniques by which the researcher applied to control any threats to
external and internal validity of the experimental design.
The use of a quantitative method permits generalisation and wider application of
results through the use of large, representative samples (Baum, 1995). In view of the
research aim, generalisability allows the application of results to the entire
population even though situations do not permit sampling of the entire population.
Furthermore, a quantitative method allows researchers to represent experiences and
other complex phenomena to numbers (Baum, 1995). This simplifies the data and
adds a degree of objectivity to analyses. Numbers are also valuable, since they permit
a range of statistical analyses to be carried out quickly. Doctoral research falls
within the constraint of a time frame and these methods are often not as time-
consuming as qualitative research methods hence allowing researchers to use a larger
sample size in a short period of time.

94
Since the questionnaire is the chosen technique for data collection, several scales
measuring the intended construct will be used. The aim of adopting this method is to
enhance the validity of measurement to produce more robust data for analysis.
3.5. Population and sample
Before proceeding with data collection, it is important to understand and identify the
samples that will be taken. Three basic steps were used in selecting the sample for
this research; (i) defining the population, (ii) specifying the sampling technique and
(iii) determining the sample size.
The first basic step was to define the target population, which refers to the set of
individual units which the research question seeks to find out about (Bryman, 2001).
Therefore, any individuals holding a leadership position was defined as a member of
the population for this research. It is extremely unlikely for a researcher to have the
time or resources to conduct research on the entire population, thus a representative
sample from the population should be selected using the most appropriate sampling
method. This sample allows the researcher to draw inference from the findings of the
sample and generalise the findings to the population (Clark-Carter, 2004).
Within purposive sampling, selected individuals needed to posses characteristics
specified by the researcher. In this case, the purposive sampling technique was
applied in selecting the sample. Using a purposive sampling technique, the researcher
is able to specify the characteristics of the population of interest and locate the

95
individuals who match those characteristics within the Business Strategy Game
(BSG) module. Characteristics such as: (i) participants need to hold the position of a
leader, (ii) participants are fairly new to the particular leadership tasks, position and
role requirements, and (iii) participants need to be leading team members to achieve
specific goals within a time frame, were considered during the selection process.
The BSG module is taken by all second year business degree students in Aston
Business School. Within each class, students were divided into a four- to five-person
team by the Business School programme administrator who balances the relative
ethnicity, gender, country of origin and different disciplines across the groups.
Within a team, apart from the leader, each team member has a specific task
(marketing, operations, human resource and finance) to reflect organisational
functions (see Table 4 for detailed role description of team member).
Role Role description
Managing Director
Managing and integrating strategies from all departments, planning and leading meetings, promote teamwork, manage conflict and relationship in team, lead team to achieve company’s goal
Marketing Director Conduct market research, identify target market, position product, plan promotional strategies, pricing of product
Operations Director Set up manufacturing factory, manage operational strategies, product quality control, reduce cost per car, manage supply chain
Human Resource Director Recruiting employees, manage wage and bonus, training and development, manage Human Resources issues such as motivation
Finance Director Reporting, forecasting, budgeting, control cost, managing company’s cash flow
Table 4: Role description for team members in the BSG module

96
The teams meet each week to manage a virtual European car manufacturing
company that runs across three virtual years. The work tasks include the strategic
planning and assessment of the markets and competitors; implementing marketing,
operation, human resource management and financial strategies; and at the same
time, to meet shareholders expectations to generate return on investment. For
detailed activities of the module, please refer to Table 5.
The selected sampling technique falls under non-probability sampling which has
been criticised for its limitation in representing the population (Clark-Carter, 2004).
However, as noted by Shadish, Cook, & Campbell (2002) within experimental
design, random sampling is uncommon and suffers practical constraints for the
researcher to randomly sample the population. Kish (1987), an advocate for random
sampling also admitted that random sampling is ideal but rarely feasible. Evidence of
this can be seen in previous research conducted using purposive sampling (c.f., Keith
& Frese, 2005; Kozlowski & Bell, 2006; Oettingen, Hönig, & Gollwitzer, 2000;
Rapp & Mathieu, 2007).
However, for this research, based on the principles suggested by Shadish, Cook and
Campbell (2002), the researcher ensured the surface similarity and ruled out
irrelevancies when selecting a sample to ensure construct and external validity of
using purposive sampling. Surface similarity. Team leaders from the BSG modules
were identified to hold the position of a leader; are new to this leadership position

97
WEEK SCHEDULE ACTIVITIES* DATA COLLECTION
1 Lecture1 Overview of the module, learning objectives and learning outcomes
2 Lecture 2 Learning styles Tutorial 1 Team members meeting for the first time and getting to know each other
3 Lecture 3 Overview of car manufacturing industry and Business Plan (BP) proposal
4 Lecture 4 Overview of Business Strategy Game (BSG) simulation software PRESTEST 1 Tutorial 2 Tutorial on strategies of how to enter the car manufacturing industry.
Team members establish roles within the team (e.g. Managing Director, Finance Director, Operations Director, and Human Resource Director) and create brand image (company name, objectives and mission statement, vision to inform strategies, etc.)
5 Lecture 5 Overview of library resources and information system
Simulation 0 Test practice to get familiar with the BSG software
6 Lecture 6 Strategies for working in teams and working in diversity INTERVENTION Tutorial 3 Tutorial on how to give a good presentation. Teams refine strategy and prepare for BP presentation to examiners from the industry
acting as potential investors (from the industry)
7 Lecture 7 Writing styles, focussing on reflective writing Presentation Presentation of BP to examiners from the industry acting as potential investors (from the industry such as Vauxhall, Ford etc.)
8 BP deadline Submission of BP proposal
9 X 10 Tutorial 4 Tutorial provided feedback on presentations and business plan.
Teams refine strategies for the first simulation.
11 Simulation 1 Christmas Break (3 weeks)

98
12 X 13 X 14 Tutorial 5 Tutorial on the requirements for Managing Director’s presentation reflecting on strategies implement
Teams evaluate performance and feedback of first simulation.
15 Simulation 2 16 Tutorial 6 Tutorial on the requirements for Finance Director’s presentation to the first and second Annual General Meeting of the board of
directors (the tutors assumed the role of the board of directors) Managing Director presented performance of the company since its launch Teams evaluate performance and feedback of second simulation
POSTTEST 1
17 Simulation 3 18 Tutorial 7 Tutorial on the requirements for Finance Director’s presentation to the first Annual General Meeting of the board of directors (the
tutors assumed the role of the board of directors) Finance Director presented first year financial performance of the company Teams evaluate performance and feedback of third simulation.
19 Simulation 4 20 Tutorial 8 Tutorial on the requirements for group and reflective assessment report.
Teams evaluate performance and feedback of fourth simulation.
21 Simulation 5 Easter Break (4 weeks)
22 Tutorial 9 Finance Director presented first year financial performance of the company. Teams evaluate performance and feedback of fifth simulation
POSTTEST 2
23 Simulation 6 24 Tutorial 10 Tutorial provided further help on group and reflective report.
Teams evaluate performance and feedback of sixth simulation.
*Teams tend meet outside scheduled sessions at least once every week
Table 5: Weekly schedule and activities for the Business Strategy Game module

99
and role expectation, and they need to lead team members to achieve specific goals
within a specific time frame. Identifying the main characteristics of the participant
and settings allows findings from the study to be generalised to a population with
similar important characteristics. Ruling out irrelevancies. An example of a feature
of the sample that could be argued to be irrelevant is that the sample consists of
students. The study is interested in how self-regulation as a competency affects
leaders’ performance when faced with novel and complex tasks across situations. A
student based sample can be argued to be comparable. Team leaders in the BSG
teams, like leaders in general, were facing new and novel leadership tasks and
expectations in the position which they held. Hence, the use of a student sample has
minimal impact on the size or direction of a cause and effect relationship of the
research question.
Finally, the sample size required for the research depends on many possible
influences (Cooper & Schindler, 2003). The size of the sample needed can be
affected by the nature of the research and analysis, sampling techniques applied, time
constraints, non-response and completion rates, similar research in the past and
resource constraints (Bryman, 2001; Cooper & Schindler, 2003).
The BSG module consists of approximately 52 leaders and 196 team members,
which represent the population size of this study. Comparing to previous studies, this
size is more than sufficient with regards to completion rates, number of variables,
aggregation of levels, and using repeated measure of analysis of covariance (Avolio,

100
2007; Jung & Avolio, 1999; Seifert, Yukl, & McDonald, 2003; Shea & Howell,
1999; Sue-Chan & Latham, 2004). Previous longitudinal field experiment studies
normally reported a sample size between 23 to 54 leaders with a minimum of two
followers per leader. After defining the sample from the population, techniques of
sampling and the size required, the next section will discuss the procedures in which
data was collected.
3.6. Data collection process
3.6.1. Pilot
A pilot study was conducted with thirty-one participants consisting of the BSG
module leader and tutors who taught the module as well as students who had
completed the module in the year prior to when the research and data collection was
conducted. The aim of the pilot study was to identify five competencies perceived to
be highly relevant for the team leaders to perform successfully in the required tasks
of the BSG module (e.g. lead the team as the managing director, managing the
company strategy and completing the module’s assignment, etc.). Each participant
was presented with a questionnaire consisting of twenty-eight competencies from the
360° Professional Quest provider (see Appendix I). They were asked to select five
competencies they perceived to be most important and rank them according to the
order of relevance. A frequency analysis was conducted on the data and the
following five competencies were concluded as the most important for team leaders
within the BSG module to perform effectively; basic leadership skills, relationship
management, planning, promote teamwork and keeping others informed. Results

101
were presented and discussed with the module leader who agreed with the findings
(see Appendix II).
3.6.2. Pretest
A closed-ended questionnaire was selected for the data collection because it offers
the advantage of large-scale sample in a less time consuming method (Saunders,
Lewis, & Thornhill, 2000). Moreover, the main advantage is that this approach
enables the standardisation of the questions ensuring a high level of internal validity
of data. In particular, pre-coded choices enhance the comparability of answers
(Bryman, 2001) which is an essential requirement in this research in order to
compare any change in constructs such as self-regulation and leader’s performance
measures between conditioning and over time. Thereby, closed-ended questionnaires
provide suitable data for statistical analysis which in turn allows the testing of
hypotheses (Barnes, 2001) to generate generalisable results. Considering the amount
of money spent by organisations on leader development programmes, it is
particularly important that findings of this study are generalisable and can inform the
practice in leader development.
While a questionnaire technique has its advantages, at the same time it poses certain
restrictions. Closed-ended questionnaires are criticised for their lack of
exhaustiveness and capability to generate other possible answers (Bryman, 2001)
compared to other method such as, open-ended questionnaires. The current research
being deductive in nature, argues that exploration is not the main requirement during
102
data collection. Based on the hypotheses generated from the literature review, the
research is interested in testing the relationships between the constructs. To be
confident in the answers received before the data analysis, it is important to eliminate
any problems posed by open-ended questions such as the accuracy of post-coding of
answers and be certain that the code is genuinely comparable for data analysis.
Therefore, a close-ended questionnaire is best suited for this study. Another main
drawback of this method is getting a low response rate if the questionnaires are sent
to the participants using email or post. Thus, precautions were taken to overcome this
shortcoming by using a person-administered approach whereby questionnaires were
distributed by the researcher during the first 20 minutes of the class.
The questionnaire consists of two main parts. The first consists of questions to
collect demographic information of participants such as age, gender, and work
experience. The second consists of scales of the measurement for constructs such as,
self-regulation (Diehl, Semegon, & Schwarzer, 2006), self-efficacy (Chen, Gully, &
Eden, 2001), Multifactor Leadership Questionnaire (Bass & Avolio, 1990) and 39
behavioural questions (based on the five core competencies). These core
competencies were identified from the pilot studies conducted with a similar sample
(i.e., students taking the BSG module the year before) which includes basic
leadership skills, relationship management, promote teamwork and keeping others
informed. The whole questionnaire took approximately 20 minutes to complete by
the participants.

103
Variables Tutor Leader Team
member
BSG
software
Stage 1: Pretest Self-regulation
Self-efficacy
Leaders’ performance
Leaders’ competencies
Stage 2: Posttest 2 Self-regulation
Leaders’ performance
Leaders’ competencies
Team financial performance
Team assessment
Stage 3: Posttest 2 Self-regulation
Leaders’ performance
Leaders’ competencies
Team financial performance
Team assessment
Stage 4: Posttest 3* Team financial performance
* Financial data starts at zero at stage 1, thus additional financial data were gathered at Stage 4
Table 6: Summary of data collection timeline for all variables
The questionnaire was distributed at the beginning of the class to all participants,
both team leaders and team members. Participants were informed verbally and in
writing concerning the general purpose of the study and why they were being asked
to participate. Participants were also informed that participation is voluntary and that
their responses would be kept confidential. The wording used for this can be found in
Appendix III and Appendix IV. Participants were asked to give their Student
University Number (not Candidate Number which is only used for assessment
purposes) to ensure the researcher was able to match their responses in the next two
stages of data collection. Those who agreed were asked to give their consent in

104
writing on the second page of the questionnaire (Appendix III and Appendix IV).
The researcher then provided participants with brief instructions to complete the
questionnaire. After giving participants approximately 20 minutes, the researcher
collected the questionnaire. In order to increase the response rate for participants that
were not present during the survey, an electronic questionnaire was sent out to all
students taking the module immediately after the survey. A reminder email was sent
out on the third day and sixth day after the survey to encourage participants to
complete the survey.
3.6.3. Intervention
As the design for the research is a field experiment, an experimental group of
randomly selected leaders were exposed to the intervention and the other half of
participating leaders were not exposed to the intervention. A table of random
numbers was used to ensure every participant who gave consent to take part in the
study had equal chance to be selected into either group, and those who declined were
omitted from the study. Leaders selected to attend the intervention received an email
inviting them to attend a three to four hour training session after the first survey was
conducted1 (see Appendix VI).
The intervention was delivered by a qualified executive coach working with a
leading management consulting company within the UK. The executive coach had
20 years of experience in leadership development field with affiliation to leadership
1 Leaders who received the invitation but declined or could not attend the intervention were omitted from the study.

105
management programmes across 60 countries. The external executive coach was not
a member of university staff and had no influence on participants’ assessment in
class. Furthermore, by using an external coach, reliability of the potential influence
or contamination of the researcher on the treatment delivered was controlled for
(Christensen, 2007). During the intervention, the researcher introduced the executive
and was not present at the intervention after that.
The researcher and executive coach used the self-regulation framework of (Brown,
Miller, & Lawendowski, 1999) to design the intervention.
1. Receiving relevant information
2. Evaluating the information and comparing it
3. Triggering change
4. Searching for options
5. Formulating a plan
6. Implementing the plan
7. Assessing the plan’s effectiveness
As part of receiving relevant information, each participant received a feedback report
generated using 360° Professional Quest software based on pretest data collected.
The feedback reports were compiled based on the response of their team members
assessing each item of the leaders’ competencies from pretest data collection. A
sample of feedback report could be found in Appendix VII. The executive coach

106
started by training the leaders on how to interpret and evaluate the feedback.
Emphasis was placed on the importance of receiving feedback and how to use their
feedback results to assist them in developing their own leadership development plans
in which they set personal goals as part of change. Participants were encouraged to
ask the question if triggering change is needed and how it relates to their
performance as a leader to meet the task and followers’ expectation. Once the need
for change was identified, leaders were encouraged to brainstorm and search for
options available to them to trigger change. This is followed by formulating a plan
and setting goals on how they will implement the change to develop their leadership
skills. Finally, they were informed that they will be given another two feedback
reports in the next six months to assess the effectiveness of the plan they
implemented. Development of leadership skills is an iterative process and they were
informed of the importance of continuous regulation of their own leadership
development using the self-regulatory process.
Three and six months after the intervention, the leaders received similar feedback
reports generated using 360° Professional Quest software. Both feedback reports
were based on data collected from their followers during the first and second posttest
surveys.
3.6.4. Posttest 1
Three months after the intervention, the same questionnaire from Section 3.6.2 was
distributed at the beginning of the class to all participants. Again, participants were

107
informed verbally, and in writing, of the general purpose of the study and why they
are being asked to participate. Participants were also informed that participation is
voluntary and that their responses would be kept confidential (Appendix III and
Appendix IV). Participants were asked to give their Student University Number (not
Candidate Number which is only use for assessment purposes) to ensure the
researcher was able to match their responses with previous survey and also to the
next wave of data collection. Those who agreed were asked to give their consent in
writing on the second page of the questionnaire. The researcher then provided
participants with brief instructions to complete the question are. After giving
participants approximately 20 minutes, the researcher collected the questionnaire. In
order to increase the response rate for participants that were not present during the
survey, an electronic questionnaire was sent out to all students taking the module
immediately after the survey. A reminder email was sent out on the third day and
sixth day of the survey to encourage participants to complete the survey.
3.6.5. Posttest 2
Six months after the intervention, the final stage of survey was conducted using the
same procedures as Posttest 1 (Section 3.6.4).
3.6.6. End of study
All participants (team leader and team members) were invited via email for an
opportunity to attend the leadership training intervention attended by the leaders in
the experimental group on a designated day after all data collection was completed.

108
A sample of the email can be seen in Appendix VIII. All participants were debriefed
on the purpose of the studies and were given an opportunity to ask questions to the
researcher during the leadership development training.
Finally, once all of the three stages of survey were completed, the researcher entered
the data into SPSS to analyse the data. All signed forms and completed survey
responses were secured by the researcher and will be retained for five years for
future research.
3.7. Scales selection
3.7.1. Reliability and validity
The level of reliability and validity of the scale are crucial to determine the
suitability. Within the questionnaire, “a valid question will enable accurate data to be
collected while, one which is reliable, means that the data are collected consistently”
(Saunders, Lewis, & Thornhill, 2000, p.288). Thus, it is very important to know the
reliability and validity of the scales chosen that will be used in the current research
questionnaire. A high level of reliability is determined by its internal consistency
measure such as, test-retest reliability, equivalent forms, split-half and Cronbach
alpha coefficient. Only scales with a minimum of 0.7 Cronbach alpha coefficient will
be selected as recommended by Nunnally (1978). On the other hand, methods such
as assessing content validity, convergent validity, discriminant validity or
numological validity (Saunders, Lewis, & Thornhill, 2000) determines scale validity.
109
In order to measure each construct in this research, previously developed scales were
used. The indicators for the constructs in the conceptual framework were measured
on Likert scales. Likert scales are commonly use in organisational research because it
allows individuals to respond to a series of statements by indicating the extent of
agreement. For examples from “Strongly disagree” to “Strongly agree”. The
statements in this research were about leaders and the scales selected were
constructed in term of a 4-, 5- or 7-point Likert. The sum of this numerical value in
turn indicates the attitude or belief in statements presented. The scale response
format was based on that employed in the original scale developed.
3.7.2. Constructs measures
3.7.2.1. Self-regulation
Diehl, Semegon and Schwarzer (2006) developed a 10-item Self-Regulation Scale
(SRS) to capture this construct. Items included are “If I am distracted from an
activity, I don’t have any problem coming back to the topic quickly”, I stay focused
on my goal and don’t allow anything to distract me from my plan of action,” and
“When I worry about something, I cannot concentrate on an activity (reverse
coded)”. They reported a Cronbach alpha of 0.82 and test re-test reliability of 0.62.
The SRS also showed strong convergent validity.
Diehl, Semegon, & Schwarzer (2006) describe the ability to focus attention on a
given task, to regulate internal thoughts and feelings and external distractions to
work toward a desired outcome or goal as part of the components in self-regulation.

110
The scale includes all these elements of cognitive, emotional and behavioural self-
regulation. With its central leaning to direct behaviour in specifics ways, it is suitable
for assessing the outcome of the leadership intervention on leaders’ self-regulation.
3.7.2.2. Leaders’ performance measure
Leader performance was rated by followers using the 9-item measure of the
Multifactor Leadership Questionnaire for Research (MLQ 5X-Short) (Bass &
Avolio, 1990). Permission was obtained through purchase of the questionnaire from
Mind Garden® Inc, who is the copyright owners of the scale. The nine items
measure followers’ satisfaction with leader and his/her methods, leaders’
effectiveness, and extra effort by followers due to the leaders’ influence.
Leader satisfaction. Followers’ satisfaction of leaders’ performance was measured
using 3-items within the MLQ-5X outcome measure. A sample of the item includes
“Works with me in a satisfactory way”, which was rated on a 5-point scale ranging
from “Not at all” to “Frequently, if not always”. Using Partial Least Squares
analysis, the developers reported a strong convergent validity and the Cronbach
alpha for this scale was 0.88 (Bass & Avolio, 1990; Sosik & Megerian, 1999).
Leader effectiveness. The measure of leader effectiveness was captured using 3-
items within the MLQ-5X outcome measure. An example item includes “Is effective
in meeting organisational requirements” which was rated on a 5-point scale ranging
from “Not at all” to “Frequently, if not always”. Cronbach alpha for this scale was

111
0.83. Using Partial Least Squares analysis, the developers reported a strong
convergent validity (Bass & Avolio, 1990; Sosik & Megerian, 1999).
Follower work motivation. The measure of leaders’ influence on followers’ work
motivation was measured using 3-items within the MLQ-5X outcome measure. This
scale captures the willingness of followers to exert extra motivation as a result of the
influence. A sample of this item includes “Gets me to do more than I expected to
do”, which was rated on a 5-point scale ranging from “Not at all” to “Frequently, if
not always”. The reported Cronbach alpha for this scale was 0.87. Using Partial
Least Squares analysis, the developers reported a strong convergent validity (Bass &
Avolio, 1990; Sosik & Megerian, 1999).
3.7.2.3. Leaders’ competencies
Thirty nine items from the 360° Professional Quest were used to measure leaders’
behaviours, corresponding to five competencies; basic leadership skills, relationship
management, planning, promote teamwork and keeping others informed. The five
competencies selected from a total of twenty-eight competencies listed in the 360-
degree feedback questionnaire. Selection was based on the ratings of importance and
relevance weighed by the module lecturer and tutors who taught the module and
students who had taken the module previously. The five selected competencies were
perceived to be highly relevant to the team leader to perform successfully in the
required tasks within the BSG module. Reliability and validity for this measure is
reported in Chapter Four.

112
3.7.2.4. Self-efficacy
General self-efficacy was measured using Chen, Gully and Eden's (2001) New
General Self-Efficacy (GSE) scale. This scale captures the construct of a person’s
belief in his or her “overall competence to effect requisite performance across a wide
variety of achievement situations” (Eden, 2001, p.75). As self-efficacy within
individual leaders may influence the outcome of leader intervention (Gist, Stevens, &
Baveita, 1991; Judge, Jackson, Shaw, Scott, & Rich, 2007; Tai, 2006), the measure
of self-efficacy was used to control for the effect of individual differences to ensure
that the outcome of the intervention is not influence by the leaders’ initial individual
beliefs in their competence to achieve the desired outcome.
The scale consists of eight items that are rated on a 5-point scale with the indicators
from “Strongly Disagree” to “Strongly Agree”. Examples of these items are; “I will
be able to achieve most of the goals that I have set for myself,” “I will be able to
successfully overcome challenges” and “When facing difficult tasks, I am certain
that I will accomplish them”. Chen, Gully and Eden (2001) reported a Cronbach
alpha of 0.92 and stability coefficients between r = 0.62 to 0.65. This range is
reasonably high for variables capturing individual differences (Crocker & Algina,
1986). The GSE also showed strong convergent validity.
3.7.2.5. Team financial performance indicators
The leaders’ team financial performance was assessed using four financial measures;
retained profit, return on capital employed (ROCE), gearing, and earnings per share
113
(EPS). Data was obtained from the BSG simulation. Firstly, profit is the remaining
profit retained by the team after all deductions have been made (e.g. tax, interest,
dividends, etc.). If the team is not performing well, the team may retain a loss
(negative profit) instead of a profit. The second financial performance indicator,
ROCE is calculated from the profit as a percentage of the capital employed thus
signifying how well the money invested into the business is providing a return to the
investors. Thirdly, gearing is calculated as the ratio that compares the company’s
equity or capital to borrowed funds. In brief, gearing refers to the extent to which the
company is funded by debt. The higher the gearing of the company, the more the
company is considered risky. Finally, EPS is calculated by the total profit of the
company divided by the number of shares. EPS serves as an indicator of a company’s
profitability. All four financial indicators are useful in making comparison across
companies in terms of company performance (Waldman, Javidan, & Varella, 2004).
The financial performances of the team hold high consequence to the module
assessment.
3.7.2.6. Team assessment
Students taking the BSG module undertook five different assessments; writing a
business plan proposal, presentation of the business plan, group report, reflective
report, and simulation performance. All five assessments contributed to one hundred
percent of the module’s marks. The business plan proposal assessed the teams’
strategies and planning for their company based on their research of the market,
application of knowledge from different areas such as marketing, operations, human

114
resource management and financial management to compete with their competitors
and be successful. Next, based on the business plan, the team was assessed by
external examiners on their presentation skills in convincing potential investors to
invest money into their company. After operationalising their strategies into the
computer simulated business environment, teams then produced a report reflecting
upon their strategies. Also, each individual within the team reflected upon their
experience of working as a team the report. Both reports were also assessed. Finally,
the performance of the teams during the simulation was also graded by their tutors.
Each of the assessments was graded based on percentage system.
3.8. Data analysis
The purpose of this study is to analyse how self-regulation is related to outcome
variables of leaders’ performance and team performance and to ascertain whether
leaders trained in self-regulatory process are more effective. To do so, the computer
software program, Statistical Package for Social Science (SPSS) version 16 was
used.
The process used to test the research hypotheses was fourfold. First, Cronbach’s
alphas (Nunally, 1978) were calculated to check for internal consistency and to
determine test-re-test reliability (Zeller & Carmines, 1979), Pearson correlation was
used to compare data collected in three stages. In addition, Confirmatory Factor
Analysis (CFA) using SPSS and AMOS was conducted to measure scale validity

115
(Byrne & Crombie, 2003). Second, descriptive and correlational results were
reviewed for statistically significant relationships between variables.
Third, the data was analysed using a repeated measures ANCOVA (Field & Hole,
2003; Maxwell & Delaney, 2004). The significance of main effects of intervention
leader and team performance measures were used to test the hypotheses with leaders’
and teams’ performance measures as dependent variables. This analysis was
appropriate for three main reasons. Firstly, this study is interested in measuring the
effects of the intervention relative to the control subjects and this method of analysis
permit the researcher to make such comparison. Also, the two groups (experimental
and control) might start off with different scores during pretest thus the analysis
selected allowed the comparison of both groups. Finally, this method allows for the
analysis of the increase in performance captured in the longitudinal measures of the
constructs i.e., repeated measures of the participants and outcomes.
Fourth, a series of analyses were conducted to test for mediating effects of leaders’
competencies on performance. According to Baron & Kenny (1986), three series of
regression analyses need to demonstrate; (i) the independent variable must
significantly predict the mediating variable; (ii) the mediator variable must then
significantly predict the dependent variable; and finally, (iii) the relationship between
the independent variable and dependent variable should be not significant or weaker
when the mediator is controlled for. However, the current study is a field
experimental design, thus the conventional approach to conduct mediation analysis is
116
not the most appropriate. However, in accordance to Yzerbyt, Muller and Judd
(2004), to evaluate the presence of a mediation effect in the current field
experimental study, the mediator variable (i.e., leaders’ competencies) was included
as a covariate in the repeated measure analysis of covariance (ANCOVA). The effect
of the mediating variable must be significantly related to the main effect. At the same
time, the F-value for interaction effect must diminish and become non-significant
when the mediator is included as a covariate. Perfect mediation, as explained by the
authors, occurs when the independent variable has no effect on the dependent
variable when the mediator is controlled. Perhaps more relevant to applied research,
a partial mediating effect becomes tenable when the relationship between the
independent variable and dependent variable is reduced or lessened when the
mediator is controlled. Finally, a Sobel (1982) test was then conducted to further
assess the significance of the mediation.
3.9. Ethical considerations
This research met the ethical requirements of Aston Business School and conformed
to the UK Integrity Research Office (UKRIO) Code of practice for research. Prior to
conducting the study, the methodology and procedures were reviewed by the
Research Ethics Committee (REC). The following issues were considered and
respected when the research was conducted.

117
3.9.1. Informed consent
Signed informed consent was obtained from all of the participants in the study. The
essence of informed consent is to allow participants to make an informed decision
whether to agree or refuse to take part in the current study after being given
comprehensive information regarding the nature of the research (Homan, 1991).
Thus, participants were informed of the purpose of the study, how the research
process would unfold, the length of time they would be required to participate, what
would be expected of each participant, how the data would be collected and treated,
how anonymity of their identity would be maintained when reporting data collected,
and finally, the voluntary nature of the research was also emphasised. A consent
form was provided for participants to sign prior to the start of the research (Appendix
III and Appendix IV).
3.9.2. Risk and benefit analysis
When research is conducted, it is important to predict that the foreseeable risk does
not outweigh the anticipated benefits (Oliver, 2003). A good experimental design
often requires the use of a control group where a group of participants do not receive
the intervention (treatment) while the participants are being studied. This highlights a
specific ethical issue that when the intervention proves to be beneficial, participants
assigned to control group may perceived that they are disadvantaged (Homan, 1991).
As the current research proposed an intervention to improve leaders’ performance
which consequently should lead to better team performance, REC raised this
potential concern. REC stated that there was a potential risk that students in the

118
control group did not receive the potential benefit of the intervention. The researcher
had foreseen such a risk and had therefore integrated a leader training intervention
for all students (not only the leaders from control group, but all students taking the
BSG module) after the study was completed. After rigorous evaluation of the risk
and benefits, the researcher received approval from the REC and the Director of
Undergraduate Programmes (gatekeeper) that the benefits outweigh the risk in the
long run. If the proposed intervention was successful and had positive effects on
students’ performance, it could be integrated within the module in the future.
3.9.3. Confidentiality, anonymity and data protection
In keeping with the Data Protection Act (1998), under which the data handling
procedures at Aston Business School are registered, participants were informed
verbally and in writing on how their confidentiality and anonymity will be upheld.
All electronic data will be kept for 5 years and physical data (questionnaires) will be
kept for 2 years. Homan (1991) suggested that all research materials were kept in
secure and locked setting. Only the researcher has the access to identify the data. All
data collected were sanitised by allocating a unique code to remove all identifying
information of participants. Participants were also informed that they were free to
withdraw their informed consent to participate in this study. Once notified, the
researcher will then delete any relevant data immediately from the database.

119
3.9.4. Safety of researchers
After evaluating any potential risks that the researcher may encounter when
conducting the research, it was concluded that the researcher faced minimal risk of
threat or abuse, psychological trauma as a result of interaction, accusations of
improper behaviour, exposure to risks of everyday life and social interactions, and
causing psychological or physical harm to others.
3.9.5. Research involving university staffs or students
As the research was conducted on Aston Business School students and some
members of staff, it was important to minimise the risks whereby they may perceive
that they were coerced into participating, especially if there is a hierarchical
relationship between researcher and participants (e.g., student-tutor relationship). To
ensure that students participating in the research did not have an academic advantage
compared to students choosing not to participate, any assessment for students that
participated in the study were cross marked by another 2 members of staff. This is to
ensure fairness between participating and non-participating student.
3.9.6. Research plan for collection, storage and analysis of data
As mentioned in Section 3.9.3, all research materials were kept in a secure and
locked setting and only the researcher has the access to identify the data. All data
collected was sanitised by allocating a unique code to remove all identifying
information of participants. Participants were also informed that they were free to

120
withdraw their informed consent to participate in this study. Once they notified the
researcher, their data would be deleted immediately from the database.
3.10. Conclusion
The purpose of this quantitative, field experimental research study was to discover
the effect self-regulation intervention (independent variable) had on leaders’ and
team’s performance (dependent variables). The self-regulation measures of leaders
who participated in the intervention were compared, via a pretest and two posttest
survey questionnaires using carefully selected scale, with leaders who were assigned
to the control group. Forty leaders took part in the study, with twenty-five acting as a
control group. The other fifteen leaders took part in a leadership development
workshop (experimental group) to improve their self-regulatory competency. The
control and experimental groups’ leaders and their followers completed a pretest and
two posttest survey questionnaires to determine each leader’s performance measure.
Also, data from objective measures such as, financial measures generated by BSG
software package and group assessments were obtained.
The raw data collected was recorded on SPSS using all pretest and posttest
information. The demographic data of age, sex, leader experience, and work
experience was gathered from each participant in this study. Chapter Four reports
and analyses the results generated by this research.

121
CHAPTER 4
Analyses and Research Findings
CONTENT: This chapter presents the analyses and findings from the longitudinal field experiment. Section 4.1 is an introduction to the longitudinal field experiment. This is followed by Section 4.2 on data screening, Section 4.3 on reliability and validity of construct and Section 4.4 on aggregating data to group level. Next, Section 4.5 presents the descriptive data of the study and Section 4.6 on the correlation among the study variables. Section 4.7 discusses the manipulation check of the intervention. This is followed by Section 4.8 which reports the analyses of the intervention effects on performance and Section 4.9 reports the analyses of intervention effects on leader competencies. Section 4.10 presents the analyses of mediation relationships and finally, the results are summarised in Section 4.11.
4.1. Introduction
In Chapter Two, a set of hypotheses was put forward about the effect of self-
regulation intervention on leader and team performance. In order to test the
hypotheses empirically, a longitudinal field experimental study was design as
proposed in Chapter Three. In this current chapter, data is analysed and the results
are presented from the study. The longitudinal field experimental study manipulated
the leadership training program to develop self-regulation of the leaders in an
experimental group. The objective of this experiment is to establish whether leaders
trained in self-regulation will yield better leader performance as well as better team
performance. In this experiment, a control group was included where randomly
selected leaders did not receive the intervention. Performance measures were taken
122
across three stages (once before the intervention and twice after the intervention). As
such, the longitudinal field experiment study provides an investigation of the causal
link between self-regulation intervention and leader as well as team performance.
The following sections report this experiment.
4.2. Data screening
Handling of missing data is crucial as it could cause biases in results obtained.
Therefore, missing data was identified prior to statistical analyses. There could be
several reasons for missing data, the main one being participants not answering
several items of questions; to participants not answering the entire section of
questionnaire (Saunders, Lewis, & Thornhill, 2000). The current study treated
missing data with caution, as having to delete an entire case due to missing data
could lead to reduction of effective sample size.
Across the three stages of data collection, all participating tutors completed their
questionnaires without any missing data. There were a total of 52 questionnaires
from participating leaders and 196 for participating followers. Seven out of 52 leader
cases were removed either due to an entire section of the questionnaire not having
been completed or over 5% of data were missing from all three questionnaires
collected during the longitudinal study. Twenty-two cases from the followers’
responses were deleted for similar reasons. Thus, the final sample size of consisted of
45 leaders and 174 of followers.

123
From the remaining cases, rather than eliminating the cases that had less than 5% of
data missing, values were imputed using the Expectation-Maximisation (EM)
algorithm in SPSS. This method was recommended by Hair, Black, Babin, Anderson
and Tatham (2006) for data that are missing randomly. As the values were found to
be randomly missing across both variables and cases, it is assumed, therefore to be
missing completely at random. Most importantly, using this method allows the
preservation of the sample size for both leaders and followers.
4.3. Reliability and validity of construct
Before performing analyses to test proposed hypotheses, a series of preliminary
analyses were conducted to examine the reliability and validity of measures
associated with independent, control, mediating, and dependent variables. The aim of
performing reliability test is to assess the scale reliability and the homogeneity of
items in a multi-item scale to ensure high internal consistency. In other words, the
scale is consistently reflects the construct it is measuring (Field, 2005). A scale that
is high in internal consistency should have a reliability estimate (Cronbach’ alpha, α)
of above .70 as suggested by Nunally (1978).
After ensuring a high level of internal consistency, construct validity was tested
using Confirmatory Factor Analysis (CFA) with AMOS 16. CFA is a theory based
analysis that evaluates the latent variables as identified by measured factors that has
been developed by previous researchers (Byrne, 2001). Factor loading identifies the
latent variables as they could not be directly measured and theory determines how

124
the latent variables are expected to relate to the factors. Several indicators are used to
assess the fit of the model such as, chi-square (χ2) statistic, Comparative Fit Index
(CFI), Root Mean Square Error of Approximation (RMSEA), Normed Fit Index
(NFI) and Goodness of Fit Index (GFI) (Bentler & Bonett, 1980; Byrne, 2001;
Schumacker & Lomax, 2004).
Chi-square is a frequently used as a fit statistic. For a good fit of the model, a lower
value and a non-significant chi-square indicates a better fit of the model to the data
(Byrne, 2001; Schumacker & Lomax, 2004). However, chi-square has a limitation
where it is sensitive to sample size. A large sample size will tend to cause chi-square
to become large and significant and may lead to a rejection of a model with good fit
(Schumacker & Lomax, 2004). Therefore, additional fit statistics are used for
evaluation and support the conclusion drawn for the model to data fit. RMSEA
values of .05 indicate a close fit and also RMSEA values in the range of up .05 to .08
indicate fair fit (Browne & Cudeck, 1989). A CFI value of above .90 indicates a
good model fit to the data (Byrne, 2001; Hu & Bentler, 1999). NFI is an incremental
fit index which measures the improvement of a target model to a more restricted
baseline model and therefore, NFI is indicative of a good model fit when its value
approaches .90 and above (Hu & Bentler, 1999). NFI indicates good fit of the model
to the data when its value approaches 1.0. GFI is based on the ratio of the sum of
squared differences between the observed and reproduced matrices to the observed
variances and does not depend upon the sample size to measure the model fit (Byrne,
125
2001). GFI equal or exceeding a value of .90 is an indication of good fit of the model
(Hu & Bentler, 1999).
Based on the above, the following section evaluates and reports the reliability and
validity of the independent, control, mediating, and dependent variables.
4.3.1. Independent variable
Self-regulation. Leaders in both control and experimental groups were asked to
complete a 10-item questionnaire on self-regulation once before and twice after the
intervention. The reliability (Cronbach alpha, α) for self-regulation was .75,
exceeding the recommended reliability estimates recommended by Nunally (1978).
The confirmatory factor analysis showed that the one-factor model of self-regulation
provided acceptable fit to the data, χ2 (33, N = 79) = 38.63, p > .05, CFI = .95,
RMSEA = .05, NFI = .76 and GFI = .91.
4.3.2. Mediator
Leader competencies. Next, the reliability analysis was conducted on the mediator,
i.e., leader competencies. The 39-item scale for leader competencies, which was
completed by team members and tutors (supervisors), yielded a Cronbach alpha of
.97, which is above the threshold of .70. Examining the fit indices suggests that the
five-factor model (χ2 (685, N = 411) = 1891.68.00, p < .05, CFI = .91, RMSEA =
.06, NFI = .86 and GFI = .90) provided an adequate fit for the leader competencies
data. The chi-square for the model is significant. However, the chi-square value is

126
sensitive to sample size (Schumacker & Lomax, 2004). Medsker, Larry and Gina
(1994) recommended the use of CFI value which is less sensitive to sample size to
determine the quality of the model fit. In this case, the CFI is above the
recommended value, therefore the model is concluded to be a good fit.
4.3.3. Dependent variables
Team members in both, control and experimental groups were asked to complete a 9-
item questionnaire on leader performance once before and twice after the
intervention. Leader performance is a three factor scale consisting of leader
satisfaction, leader effectiveness and extra effort (3-items for each respective factor).
The Cronbach’ alpha (α) for leader satisfaction was .81, leader effectiveness was .85
and extra effort was .73, all exceeding the recommended reliability estimates. The
confirmatory factor analysis showed a significant chi-square value (χ2 (24, N = 286)
= 47.00, p < .05) as chi-square value is sensitive to sample size (Schumacker &
Lomax, 2004). Therefore, CFI value which is less sensitive to sample size is used to
determine the quality of the fit of the model (Medsker Larry & Gina, 1994).
Examining the rest of the fit indices (CFI = .98, RMSEA = .05, NFI = .96 and GFI =
.97), suggests an adequate fit for the leader performance data. Thus, the results
support the discriminant validity of the leader satisfaction, leader effectiveness and
extra effort measures.

127
4.3.4. Control variable
Self-efficacy. Next, the reliability analysis was conducted on the control variable,
self-efficacy. The 8-item scale for self-efficacy yielded a Cronbach alpha of .90,
which is above the threshold of .70. Fit indices (χ2 (18, N = 79) = 24.63, p > .05, CFI
= .98, RMSEA = .06, NFI = .93 and GFI = .93) for the five-factor model of leader
performance provided acceptable fit to the data. These results support the
discriminant validity of the leader satisfaction, leader effectiveness and extra effort
measures.
4.4. Aggregation to group level
From a theoretical point of view, this study was designed at a leader level. However,
some of the measures of leader’s performances (dependent variables) were collected
at the follower’s (team member) level. The number of followers providing ratings for
each leader ranged from three to four. To ensure the congruency of the level of
theory, measurement and statistical analyses (Klein, Dansereau, & Hall, 1994), it is
necessary first to aggregate the data in order to obtain the leader’s level construct by
taking the average of followers’ ratings of the leaders. The aggregated followers’
ratings will subsequent hypothesis testing to tap into the shared followers’ perception
of leaders’ performance.
To justify aggregating followers’ ratings for each leader, James, Demaree, and
Wolf's (1984) agreement index (rwg) of within-group interrater agreement was
calculated for each dependent variable and rwg values above .70 indicate acceptable

128
consensual validity. Then, the intraclass correlation coefficients (ICCs) were
examined. ICC(1)2 assesses the reliability of individual ratings. A one-way ANOVA
with the leader’s team as the independent variable and the followers’ rating for each
the dependent variable was conducted. If ANOVA’s results displayed that within-
group variances are homogeneous while variances across groups are significantly
different, this would indicate that aggregation is appropriate (Dansereau, Alutto, &
Yammarino, 1984). ICC(2)3 assesses the reliability of the leader’s group average
rating and ICC(2) values above .50 are suggestive of acceptable discriminant validity
(Klein, Conn, Smith, & Sorra, 2001). However, ICC(2) value is strongly proportional
to team size (Bliese, 2000). Hence, in this study, the decision to aggregate followers’
ratings mainly depended upon ICC(1). Statistics of agreement (rwg) and reliabilities
(ICCs) of ratings by followers are reported in Table 7.
Leader satisfaction. Initial examination of rwg index showed five teams’ scores were
unacceptable and they were excluded from further analyses. The mean rwg index
before intervention was .726, and after intervention was .763 and .745 respectively.
One-way ANOVA detected significant leader level effects in all three measurements
(F(40,84) = 1.787; p < .05), (F(40,72) = 2.164; p < .01) and F(40,75) = 2.103; p < .01)
2 The ICC(1)s were determined by using the following: Level 1 variance component/intercept variance component + Level 1 variance component. 3 The ICC(2)s were determined by using the following: Level 1 variance component/mean square between groups

129
Time 1 (Pretest) Time 2 (Posttest 1) Time 3 (Posttest 2)
Variable Mean
(SD)
Mean
rwg F (40,84) ICC(1) ICC(2)
Mean
(SD)
Mean
rwg F (40,72) ICC(1) ICC(2)
Mean
(SD)
Mean
rwg F (40,75) ICC(1) ICC(2)
Leader Competencies 5.328
(.754) .808 4.146** .522 .758
5.480
(582) .753 2.010** .280 .502
5.631
(.624) .732 1.856* .245 .461
Leader performance
Leader satisfaction 3.662
(.609) .726 1.787* .218 .440
4.011
(.544) .763 2.164** .312 0.538
4.163
(.571) .745 2.103** .295 .524
Leader effectiveness 3.677
(.644) .703 2.131** .286 .531
4.048
(.512) .769 1.325† .113 0.246
4.080
(.543) .708 1.475* .153 .322
Leader extra effort 3.280
(.719) .715
2.031**
.267 .508
3.616
(.672) .714 1.441* .147 0.306
3.769
(.665) .750 1.316† .107 .240
Note. N = 40 leaders; n = 155 followers. † p < .10 *p < .05 **p < .01
Table 7: Mean, standard deviation, rwg, F-values and, ICC values
130
as shown in Table 7. The ICC(1) was .218, .312 and .295 in the first, second and
third measurements, indicating that 78%, 69% and 70% of the variability in the
leader satisfaction score existed in intra-individual level, respectively. This can be
concluded that leader satisfaction ratings by followers can be aggregated to leader
level.
Leader effectiveness. Across all three measurement times, average rating agreement
(rwg) of followers on leader effectiveness were .703, .769 and .708, respectively.
Similar to the above, five teams were omitted as they did not achieve acceptable
team level rwg index. One-way ANOVA detected significant leader level effects in all
three measurements (F(40,84) = 2.131; p < .01), (F(40,72) = 1.326; p < .10) and (F(40,75)
= 1.475; p < .05). In the first, second and third time measurements, the ICC(1) was
.286, .113 and .153, indicating that 71%, 89% and 85% of the variability in leader
effectiveness score existed in intra-individual level. All results are shown in Table 7.
Given these sufficient levels of agreement, it is justifiable to compute average
follower ratings for each leader.
Extra effort. rwg index, F-value and ICCs(1) were calculated for followers’
agreement on leader’s influence on the extra effort they had put into team
performance. The team level rwg index showed five teams’ scores to be unacceptable
and they were excluded from further analyses. The mean rwg index for pre
intervention was .715, and for post intervention were .714 and .750. One-way
ANOVA detected significant leader level effects in all three measurements (F(40,84) =

131
2.031; p < .01), (F(40,72) = 1.441; p < .05) and (F(40,75) = 1.316; p < .10) as shown in
Table 7. ICC(1) was .267, .147 and .107 in the first, second and third measurements,
indicating that 75%, 85% and 89% of the variability in extra effort score existed in
intra-individual level, respectively. Aggregation of dependent variables for the
followers' ratings of leadership was justified based on results demonstrated.
Leader competencies. Across all three measurement times, average rating agreement
(rwg) of followers and tutors (supervisors) on leader effectiveness were .808, .753 and
.732. Similar to the above, five teams were omitted as they did not achieve
acceptable team level rwg index. One-way ANOVA detected significant leader level
effects in all of the three measurements (F(40,84) = 4.146; p < .01), (F(40,72) = 2.010; p
< .01) and (F(40,75) = 1.856; p < .05) as shown in Table 7. ICC(1) were .522, .280 and
.245 in the first, second and third measurements, indicating that 48%, 72% and 75%
of the variability in leader competencies score existed in intra-individual level,
respectively. As such, it was concluded that leader competency ratings by followers
and tutors (supervisors) can be aggregated to leader level.
4.5. Descriptive results
The data collected consisted of second-year business degree students taking the
Business Strategy Game (BSG) simulation. In the BSG simulation, students are
divided in teams of four to five with one student appointed as the team leader. This
sample was selected because the structures and settings in which students would be
interacting in the simulation program reflect the organisational setting. Team leaders

132
lead and influence their teams in developing a competitive strategy, developing and
managing virtual company’s portfolio, creating shareholder value, analysing
competitor, managing company’s manufacturing operations, and creating customer
value.
In the natural setting of the BSG module, when students were divided into teams, the
relative gender, background and majors were balanced as part of the learning
objective of the module. Students were required to work in a diverse team. Leaders
then were randomly allocated to control and experimental conditions for this study.
However, it is still crucial to ensure that the demographics in the experimental and
control groups were similar.
Firstly, an independent t-test was used to evaluate differences in the mean between
the two groups (Field, 2005), i.e., the control and experimental groups. As gender is
a categorical data, a Pearson chi-square test was performed to compare if there is any
differences in gender between the control and experimental group (Field, 2005).
Both, the t-test and chi-square test conducted between the 40 leaders in both
conditions revealed no significant difference in terms of age, gender, leader
experience and work experience (see Table 8). In the experimental group, 53.3 % of
leaders were male and 46.7 % of leaders were female and within the control group,
59.3 % of leaders were male and 40.7 % of leaders were female. The average age for
leaders in the study is 19.98 years (SD = .701) with a mean of 2.83 (SD = 1.63) years
of work experience and a mean of 1.50 (SD = 1.73) years of leadership experience.

133
In the leaders sample, an additional comparison of general self-efficacy between
control and experimental were conducted because individual differences between
leaders who have higher general self-efficacy may influence the outcome of the
intervention due to their initial beliefs in their competence to achieve the desired
outcome (Gist, Stevens, & Baveita, 1991; Judge, Jackson, Shaw, Scott, & Rich,
2007; Tai, 2006). As such, leaders with higher self-efficacy may be more likely to be
able to self-regulate their behaviours to achieve their goals. In order to eliminate any
potential effect of general self-efficacy on self-regulatory process, this study included
self-efficacy as a covariate for examining differences between the trained and control
groups. There was, however, no significant difference between the two groups in
terms of average general self-efficacy ratings, t(40) = .606, p = ns. These could be
attributed to an effective randomisation process where leaders were randomly split
into control and experimental groups.
Leadera Followerb
Exp. Control Exp. Control
M M M M
Pearson chi-square χ2 χ2
Gender .617 (ns) 1.824 (ns)
Independent t-test t-value t-value
Age 19.95 19.96 .038 (ns) 20.61 18.97 .707(ns)
Leader experience 1.62 1.44 .842 (ns) 1.74 1.39 .886 (ns)
Work experience 2.54 2.99 .334 (ns) 4.17 3.41 1.065 (ns)
General self-efficacy 5.66 5.48 .606 (ns)
Note. an = 40; bn = 155; cn = 8
Table 8: Results of Pearson chi-square and tests independent t-tests

134
Secondly, when comparing the 155 follower sample for both experimental and
control groups, t-test revealed no significant different in terms of age, leader
experience of followers and work experience. Chi-square test also revealed no
significant difference between genders in both groups (see Table 9). The
experimental group comprised of 46.2 % of male followers and 53.8 % of female
followers and within the control group, 51.3 % of male followers and 48.7 % of
female followers. The average age for followers in the study is 18.02 years (SD =
6.53) with a mean of 2.20 (SD = 1.95) years of work experience and a mean of 1.06
(SD = 1.68) years of leadership experience.
Leader a Follower b Tutor c
Gender
Male 54.8 % 51.5 % 23.3 %
Female 45.2 % 48.5 % 76.7 %
Age 19.98 (.701) 18.02 (6.53) 24.78 (19.76)
Leader experience 2.83 (1.63) 2.20 (1.95) 9.98 (13.02)
Work experience 1.50 (1.73) 1.06 (1.68) 3.19 (4.41)
Note. SD shown in parentheses. an = 40; bn = 155; cn = 8
Table 9: Participants’ characteristics
135
Finally, the demographics for the eight tutors (i.e. supervisors) who provided ratings
for leaders were also examined. 23.3 % of tutors were male and 76.7 % of tutors
were female. On average, they were 24.78 (SD = 19.76) years old, with 9.98 (SD =
13.02) years of work experience and a mean of 3.19 (SD = 4.41) years of leadership
experience.
Full descriptive statistics showing the means and standard deviations for each of the
variables discussed for the leaders, followers and tutors (supervisor) are presented in
Table 9.
4.6. Correlations among outcome variables
A correlation analysis allows an initial understanding of the variables within the
research. It is a measure of the linear relationship between variables (Field, 2005).
The analysis used was Pearson correlation coefficient, which ranges between -1 to +1
indicating the degree of association between two variables. A positive value implies
a positive association and a negative value indicates negative or inverse association.
Correlations among the outcome variables across three times are presented in Table
10, Table 11 and Table 12. The relationship showed a strong positive relationship
between variables as expected, except gearing ratio in Table 11. This negative
relationship is consistent with expectation because of its inverse relationship with
other performance measures.
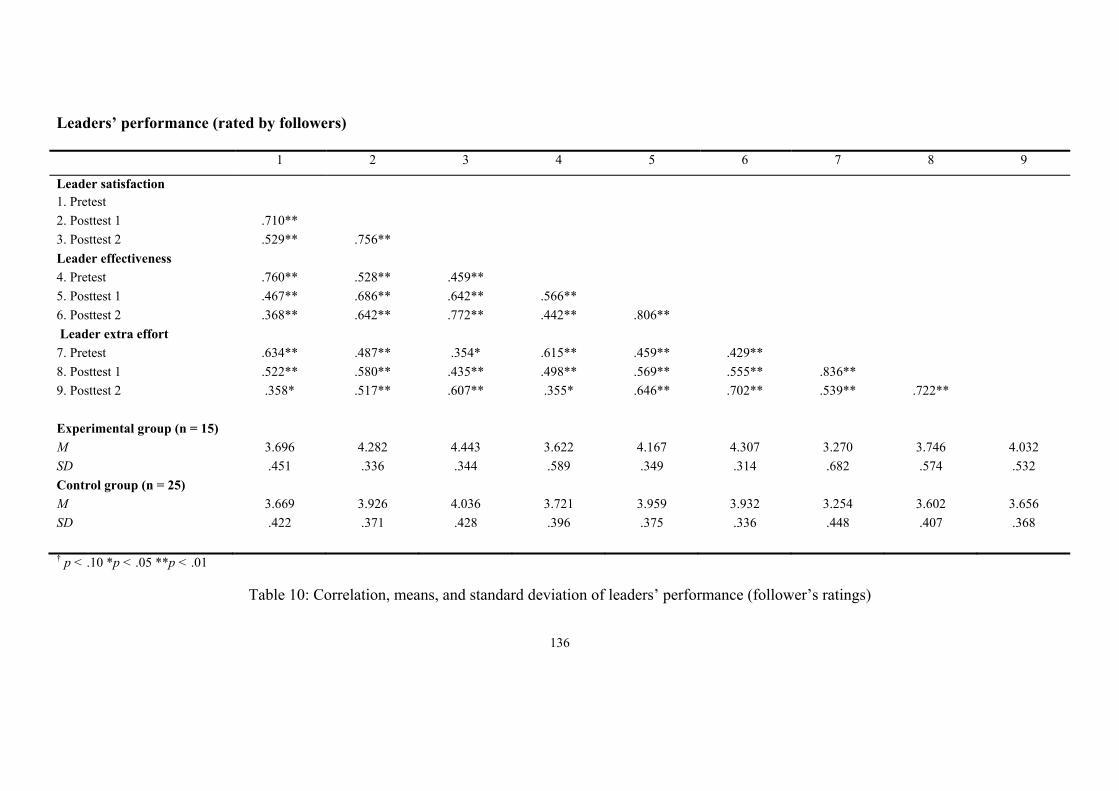
136
Leaders’ performance (rated by followers)
1 2 3 4 5 6 7 8 9
Leader satisfaction 1. Pretest 2. Posttest 1 .710** 3. Posttest 2 .529** .756** Leader effectiveness 4. Pretest .760** .528** .459** 5. Posttest 1 .467** .686** .642** .566** 6. Posttest 2 .368** .642** .772** .442** .806** Leader extra effort 7. Pretest .634** .487** .354* .615** .459** .429** 8. Posttest 1 .522** .580** .435** .498** .569** .555** .836** 9. Posttest 2 .358* .517** .607** .355* .646** .702** .539** .722** Experimental group (n = 15) M 3.696 4.282 4.443 3.622 4.167 4.307 3.270 3.746 4.032 SD .451 .336 .344 .589 .349 .314 .682 .574 .532 Control group (n = 25) M 3.669 3.926 4.036 3.721 3.959 3.932 3.254 3.602 3.656 SD .422 .371 .428 .396 .375 .336 .448 .407 .368 † p < .10 *p < .05 **p < .01
Table 10: Correlation, means, and standard deviation of leaders’ performance (follower’s ratings)
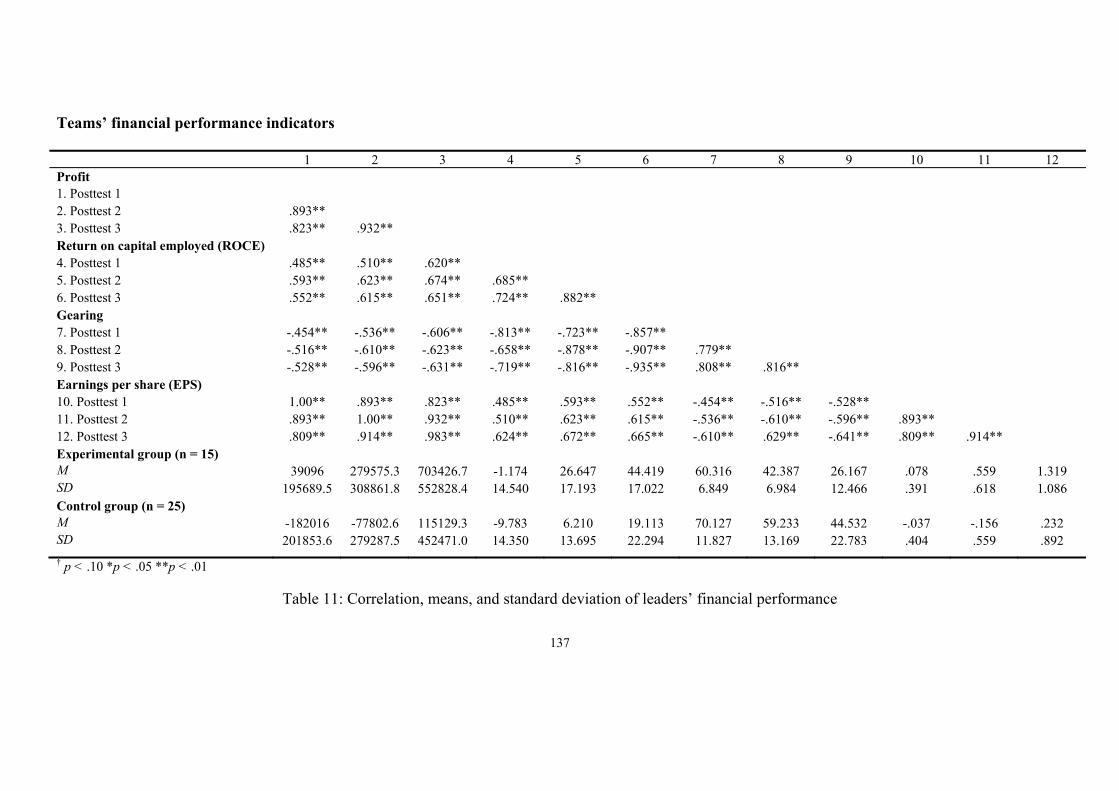
137
Teams’ financial performance indicators
1 2 3 4 5 6 7 8 9 10 11 12 Profit 1. Posttest 1 2. Posttest 2 .893** 3. Posttest 3 .823** .932** Return on capital employed (ROCE) 4. Posttest 1 .485** .510** .620** 5. Posttest 2 .593** .623** .674** .685** 6. Posttest 3 .552** .615** .651** .724** .882** Gearing 7. Posttest 1 -.454** -.536** -.606** -.813** -.723** -.857** 8. Posttest 2 -.516** -.610** -.623** -.658** -.878** -.907** .779** 9. Posttest 3 -.528** -.596** -.631** -.719** -.816** -.935** .808** .816** Earnings per share (EPS) 10. Posttest 1 1.00** .893** .823** .485** .593** .552** -.454** -.516** -.528** 11. Posttest 2 .893** 1.00** .932** .510** .623** .615** -.536** -.610** -.596** .893** 12. Posttest 3 .809** .914** .983** .624** .672** .665** -.610** .629** -.641** .809** .914** Experimental group (n = 15) M 39096 279575.3 703426.7 -1.174 26.647 44.419 60.316 42.387 26.167 .078 .559 1.319 SD 195689.5 308861.8 552828.4 14.540 17.193 17.022 6.849 6.984 12.466 .391 .618 1.086 Control group (n = 25) M -182016 -77802.6 115129.3 -9.783 6.210 19.113 70.127 59.233 44.532 -.037 -.156 .232 SD 201853.6 279287.5 452471.0 14.350 13.695 22.294 11.827 13.169 22.783 .404 .559 .892
† p < .10 *p < .05 **p < .01
Table 11: Correlation, means, and standard deviation of leaders’ financial performance

138
Teams’ assessment
1 2 3 4 5
1. Presentation
2. Business plan .406**
3. Group report .430** .681**
4. Simulation performance .253* .333* .574**
5. Reflective report .428** .694** .730** .506**
Experimental group (n= 25)
M 69.8 67.6 73.73 7.53 70.33
SD 5.506 3.481 8.439 1.06 5.219
Control group (n= 15)
M 63.48 62.3 63.19 6.56 64.52
SD 6.875 10.611 9.845 1.281 5.543
† p < .10 *p < .05 **p < .01
Table 12: Correlation, means, and standard deviation of leaders’ assessments

139
4.7. Manipulation check of intervention
To provide a check of the leaders’ self-regulation intervention training, leaders’ self-
regulation prior to intervention and after intervention was assessed. If the
intervention was successfully implemented, then the experimental group is expected
to demonstrate higher self-regulatory process in comparison to the control group
after receiving intervention. Leaders rated the accuracy of ten statements each
describing self-regulation (from Schwarzer, Diehl, & Schmitz, 1999) on a four-point
Likert scale, ranging from “not at all true” to “very true”. Responses were taken at
pretest (prior to intervention), posttest 1 and posttest 2 (after intervention). Sample
items included: “I stay focused on my goal and don’t allow anything to distract me
from my plan of action” and “When I worry about something, I cannot concentrate
on an activity (reverse scored)”. Cronbach’s alpha was .75 for this scale, exceeding
the .70 criterion.
F ŋ2 M Control Group b M Experimental Groupb
Within group 5.943(1,74) ** .159
Between group 2.886(1,37) † .069
Pretest .817(1,37) .021 2.841 (.392) 2.781 (.435)
Posttest 1 2.854(1,37) † .068 2.901 (.327) 3.091 (.332)
Posttest 2 8.938(1,37)* .186 3.302 (.418) 3.420 (.353)
Note. df for F shown in parentheses; SD for M shown in parentheses a n = 25. b n = 15. c Pre-intervention measurement was used a covariate to eliminate confounds † p < .10 *p < .05 **p < .01
Table 13: Results of manipulation checks
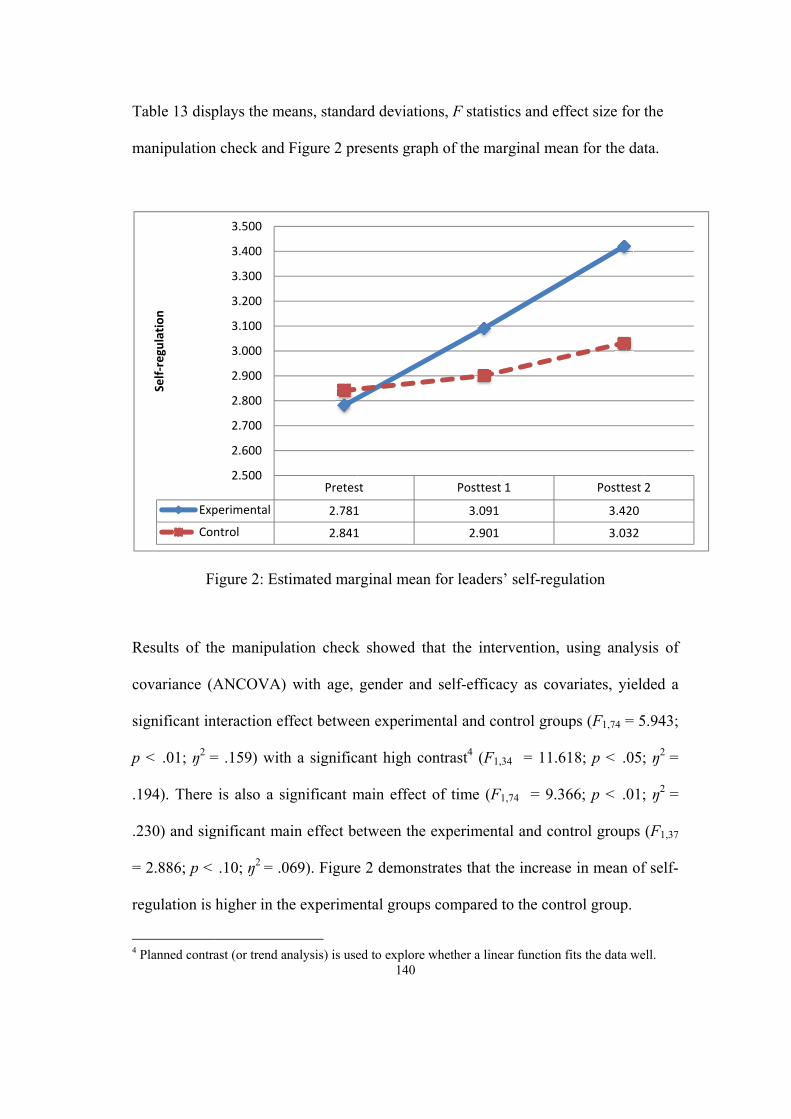
Ta
m
R
co
si
p
.1
.2
=
re
4 P
able 13 disp
manipulation
F
esults of th
ovariance (A
gnificant in
< .01; ŋ2 =
94). There
230) and sig
2.886; p <
egulation is
Planned contra
Exp
Con
Self‐regulation
plays the me
n check and
igure 2: Est
he manipula
ANCOVA)
nteraction ef
= .159) with
is also a si
gnificant ma
.10; ŋ2 = .0
higher in th
ast (or trend a
perimental
ntrol
2.500
2.600
2.700
2.800
2.900
3.000
3.100
3.200
3.300
3.400
3.500
eans, standa
Figure 2 pr
timated mar
ation check
with age,
ffect betwee
h a signific
ignificant m
ain effect be
069). Figure
he experime
analysis) is use
Pretes
2.781
2.841
140
ard deviatio
resents grap
rginal mean
k showed th
gender and
en experime
ant high co
main effect
etween the
e 2 demonst
ental groups
ed to explore w
st
1
1
ons, F statist
ph of the ma
n for leaders
hat the inte
d self-effica
ental and co
ontrast4 (F1,
of time (F
experiment
trates that th
s compared
whether a line
Posttest
3.091
2.901
tics and effe
arginal mean
s’ self-regul
ervention, u
acy as cova
ontrol group
,34 = 11.61
F1,74 = 9.36
tal and cont
he increase
to the contr
ear function fi
t 1
ect size for
n for the da
lation
using analys
ariates, yield
ps (F1,74 = 5
18; p < .05;
66; p < .01;
trol groups
in mean of
rol group.
its the data we
Posttest
3.420
3.032
the
ata.
sis of
ded a
5.943;
; ŋ2 =
; ŋ2 =
(F1,37
f self-
ell.
2

141
In order to interpret the significant effects of training on self-regulation in detail (see
Table 13), the pretest and posttest means were compared at each three measurement
point. Results show that there is no significant difference between control and
experimental group (F1,37 = .817; p > .05) during pretest. As expected, after
receiving the intervention, the results in posttest 1 revealed a statistical significant
difference (F1,37 = 2.854; p < .10) between the control and experimental groups. At
posttest 2, leaders who received the intervention scored significantly higher (F1,37 =
8.938; p < .01) in self-regulation in comparison to those who did not receive
intervention.
A Tukey HSD (Honestly Significant Difference) test was conducted for both
experimental and control groups to compare if the increase in self-regulation between
pretest and posttest 1 as well as posttest 1 and posttest 2 is significant. This test is
generally considered a more robust test to compare all possible pairs of means while
controlling for Type I error (Pagano, 1994). Analyses for the experimental group
demonstrated that the increase from pretest to posttest 1 (2.781 vs. 3.091,
respectively, p < .05) and posttest 1 and posttest 2 (3.091 vs. 3.420, respectively, p <
.05) are significant. On the contrary, the control group demonstrated a non-
significant increase from pretest to posttest 1 (2.841 vs. 2.901, respectively, p > .05)
and posttest 1 to posttest 2 (2.901 vs. 3.032, respectively, p > .05).
Although the main effect between self-regulation training and self-regulation was
significant at p < .10, the results for the comparisons at each time point for gearing
142
between the two groups still supports that self-regulation over the three times.
Overall, the results showed that both groups possessed a similar level of self-
regulation during pretest and that there is an increase in self-regulation for
experimental and control groups. However, there is a significantly higher increase in
leaders’ self-regulation for the leaders in the experimental group after receiving the
intervention when compared to the control group, leading to the conclusion that the
manipulation was successful.
4.8. Effects of training condition on leaders performance measures
4.8.1. Leadership outcomes
Effects for leader satisfaction
The influence of self-regulation training on leader satisfaction was tested using
repeated measures analysis of covariance (ANCOVA) with age, gender and self-
efficacy as covariates. Leader satisfaction ratings by followers was the dependant
variable. The leaders that received self-regulation intervention versus those that did
not represented the between-group factor, and the rating of leader satisfaction taken
at three different intervals was the within-group measures. Consistent with
Hypothesis 1a, the analysis yielded a significant main effect for differences between
experimental and control groups (F1,37 = 4.343; p < .05; ŋ2 = .110). The within
subject results did not reveal a significant overall effect of time (See Table 14).
However, a significant interaction effect (F1,74 = 6.401; p < .01; ŋ2 = .155) with a
high contrast of (F1,37 = 7.472; p < .01; ŋ2 = .76) was evident. This effect

de
si
Fi
In
po
sa
fr
to
le
1
1
emonstrated
gnificantly
igure 3).
n addition,
osttest 1 as
atisfaction b
om pretest
o posttest 2
eader satisfa
(3.669 vs. 3
to posttest 2
Figure 3:
Exp
Con
Satisfaction
d that follow
different to
a Tukey H
s well as p
by follower
to posttest
(4.282 vs. 4
action by fo
3.926, respe
2 (3.926 vs.
Estimated
perimental
ntrol
3.400
3.600
3.800
4.000
4.200
4.400
4.600
wers of the
o those leade
HSD test fo
posttest 1 a
rs in the ex
1 (3.696 vs
4.443, respe
llowers sho
ectively, p <
. 4.036, resp
marginal m
Pretes
3.696
3.669
143
leaders wh
ers who did
for each gr
and posttest
xperimental
s. 4.282, res
ectively, p <
owed a sign
< .05) but a
pectively, p
mean for foll
st
6
9
ho received
d not receive
oup to com
t 2 was co
l group sho
spectively, p
< .05). For t
ificant incre
a non-signif
p > .05).
lowers’ ratin
Posttest
4.282
3.926
the interve
e the interve
mpare betw
nducted. R
owed a sign
p < .05) and
the control
ease from p
ficant increa
ng of leader
t 1
ention were
ention (show
ween pretest
Ratings of l
nificant inc
d from post
group, ratin
pretest to po
ase from po
r satisfactio
Posttest
4.443
4.036
rated
wn in
t and
leader
crease
ttest 1
ngs of
osttest
osttest
on
2
144
Additionally, in order to interpret the significant interaction of self-regulation
training on leader satisfaction in details (see Table 14), the pretest and posttest means
were compared for each three measurement points. As demonstrated in Figure 3,
there was no significant difference between leaders in the trained and untrained
groups at pretest. However, starting in posttest 1, leaders that received intervention
were rated significantly higher (F1,37 = 8.559; p < .01; ŋ2 = .189) than the leaders
who were in the control group, and continued to receive significantly higher ratings
in posttest 2 measurement (F1,37 = 8.932; p < .01; ŋ2 = .194).
Consistent to expectation, the results demonstrated that followers are more satisfied
with leaders’ performance across time in the experimental group, as compared to the
control group. This result is attributable to leaders who had a higher level of self-
regulation and therefore use methods of leadership which are more satisfying than
leaders who had a lower level of self-regulation.
Effects for leader effectiveness
A repeated measures analysis of covariance (ANCOVA) with age, gender and self-
efficacy as covariates was performed on the leader effectiveness data. Leaders who
received self-regulation intervention versus those that did not represented the
between-subjects factors and the follower ratings of leaders’ effectiveness taken at
three different intervals were the within-subject factor. There was a significant
interaction effect (F1,37 = 9.198; p < .01; ŋ2 = .208) with a highly significant contrast
of (F1,37 = 13.204; p < .01; ŋ2 = .274). However, no main effect of time was obtained
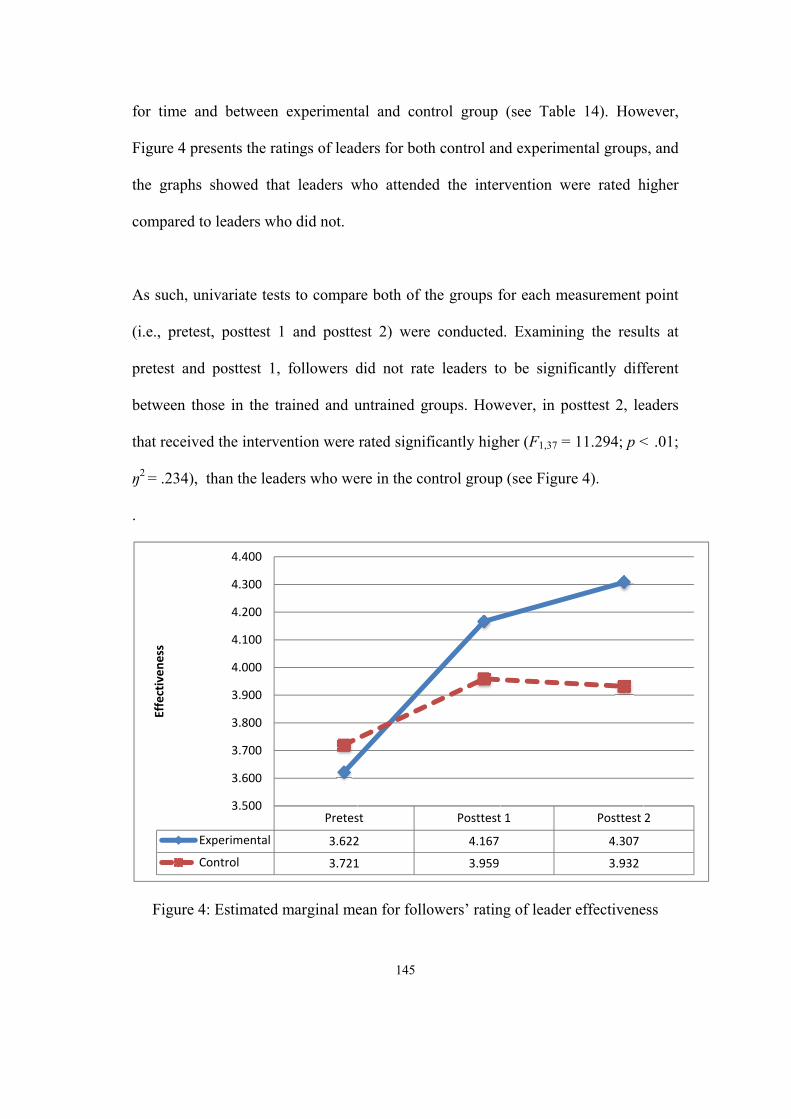
fo
Fi
th
co
A
(i
pr
be
th
ŋ2
.
or time and
igure 4 pres
he graphs s
ompared to
As such, univ
.e., pretest,
retest and p
etween thos
hat received
2 = .234), th
Figure 4:
Exp
Con
Effectiven
ess
d between
sents the rat
showed that
leaders who
variate tests
posttest 1
posttest 1,
se in the tra
the interve
han the lead
Estimated m
perimental
ntrol
3.500
3.600
3.700
3.800
3.900
4.000
4.100
4.200
4.300
4.400
experiment
tings of lead
t leaders w
o did not.
s to compar
and postte
followers d
ained and u
ention were
ders who we
marginal me
Pretes
3.622
3.721
145
tal and con
ders for both
who attende
re both of t
est 2) were
did not rate
untrained gr
rated signif
ere in the co
ean for follo
st
2
1
ntrol group
h control an
ed the inter
he groups f
e conducted
e leaders to
roups. How
ficantly high
ontrol group
owers’ ratin
Posttest
4.167
3.959
(see Table
nd experime
rvention we
for each me
d. Examinin
o be signif
wever, in po
her (F1,37 =
p (see Figure
ng of leader
t 1
e 14). How
ental groups
ere rated h
easurement
ng the resu
ficantly diff
osttest 2, le
11.294; p <
e 4).
effectivene
Posttest
4.307
3.932
wever,
s, and
higher
point
ults at
ferent
eaders
< .01;
ess
2

146
In addition, Tukey HSD analyses were also conducted for each group independently
to test for a significant increase in leader effectiveness ratings between pretest and
posttest 1 as well as posttest 1 and posttest 2. The test revealed that leader
effectiveness, as rated by followers in the experimental group, showed a significant
increase from pretest to posttest 1 (3.622 vs. 4.167, respectively, p < .05) but was not
significantly different from posttest 1 to posttest 2 (4.167 vs. 4.307, respectively, p >
.05). On the contrary, ratings of leader effectiveness by followers in the control
group showed a significant increase from pretest to posttest 1 (3.721 vs. 3.959,
respectively, p < .05) but a slight decrease from posttest 1 to posttest 2 that is not
statistically significant (3.959 vs. 3.932, respectively, p > .05).
To summarise, the results of receiving self-regulation training caused leaders to be
perceived as more effective across time as rated by their followers. Leaders in the
intervention training group self regulate more in comparison to leaders in the control
group, which ultimately resulted in them being more effective.
Effects for extra effort
Next, an examination of whether leaders with higher self-regulatory competency
(after receiving intervention) relate significantly with leadership outcome in
increasing followers’ effort to try harder to perform. A repeated measures analysis of
covariance (ANCOVA) with age, gender and self-efficacy as covariates was
conducted. The analysis did not yield a significant main effect between the
experimental and control groups and time (see Table 14). However, a significant

ef
by
de
ex
In
co
po
an
in
th
ffect for inte
y the contra
emonstrated
xperimental
n view of th
ontrol group
osttest 1 yie
nd untraine
ntervention
he leaders w
Exp
Con
Extra Effort
eraction (F1
ast test whic
d that follow
l group com
he results a
ps were con
elded signi
ed groups
were rated
who were in
Figure
perimental
ntrol
3.100
3.200
3.300
3.400
3.500
3.600
3.700
3.800
3.900
4.000
4.100
1,74 = 4.507;
ch was signi
wers’ willin
mpared to the
above, univ
nducted at
ficant diffe
(See Figur
significantl
the control
5: Estimate
Pretes
3.270
3.254
147
; p < .05; ŋ2
ificant (F1,37
ngness to e
e control gr
variate comp
each of the
erences betw
re 5). Duri
ly higher (F
group.
ed marginal
st
0
4
2 = .114) wa
7 = 5.386; p
exert extra
roup.
parison bet
e three time
ween rating
ing posttes
F1,37 = 6.864
l mean for e
Posttest
3.746
3.602
as evident. T
p < .05; ŋ2 =
motivation
ween the e
e points. Ne
gs for leade
st 2, leader
4; p < .01;
extra effort
t 1
This is supp
= .133). Fig
is higher i
experimenta
either pretes
ers in the tr
rs that rec
ŋ2 = .156)
Posttest
4.032
3.656
ported
gure 5
in the
al and
st nor
rained
ceived
than
2

148
Main and interaction effects (F) a Between subject effect (F) a
Group effect b Time effect c Interaction effect c Contrast b Pretest b Posttest 1 b Posttest 2 b
Leadership outcome
Leader satisfaction 4.343 (.110)* .391 (.011) 6.401 (.155)** 7.472 (.176)** .020 (.001) 8.559** (.188) 8.932** (.194)
Leader effectiveness 1.622 (.044) .543 (.015) 9.198 (.208)** 13.204 (.274)** .484 (.013) 2.755 (.069) 11.294** (.234)
Extra effort 1.433 (.039) 1.518 (.042) 4.507 (.114)* 5.386 (.133)* .000 (.000) .817 (.022) 6.864** (.156)
Note. n = 15 (experimental group), n = 25 (control group). Partial ŋ2 shown in parentheses. a Self efficacy was used a covariate to eliminate confounds b df = 1,37; c df = 1,74 † p < .10 *p < .05 **p < .01
Table 14: Results of repeated measures analysis of covariance (ANCOVA) for leadership outcomes rated by followers.

149
Next, a Tukey HSD test for the control and experiment groups to compare follower
ratings of extra effort between pretest and posttest 1 as well as posttest 1 and posttest
2 was conducted. Ratings of extra effort by followers in the experimental group
showed a significant increase from pretest to posttest 1(3.270 vs. 3.746, respectively,
p < .05 and from posttest 1 to posttest 2 (3.746 vs. 4.032, respectively, p < .05. For
the control group, ratings of extra effort by followers showed a significant increase
from pretest to posttest 1 (3.254 vs. 3.602, respectively, p < .05) but no significant
increase from posttest 1 to posttest 2 (3.602 vs. 3.656, respectively, p > .05).
In summary, contrary to the expectations that leaders would receive higher ratings
from followers after the intervention in posttest 1, the results revealed a lag in the
effect of training. However, overall these results still support that leaders with higher
self-regulation yield higher leadership outcomes in increasing followers’ effort to try
harder to perform, as demonstrated during posttest 2.
4.8.2. Financial performances5
Effects for profit
The impact of self-regulation training on the financial outcome of the leaders’ team
was tested using repeated measures analysis of covariance (ANCOVA) treating age,
gender and self-efficacy as covariates. Profit, which is the remaining profit retained
by the team after all deductions have been made (e.g. tax, interest, dividends, etc.)
was obtained from the Business Strategy simulation software. This was the
5 All financial measures were measured at yearly intervals (in virtual time line) corresponding to subjective measures collected for followers and supervisors ratings

de
th
ta
H
co
in
.0
R
sh
in
ependant v
hose that did
aken at thre
Hypothesis 1
ontrol group
nteraction be
01; ŋ2 = .17
esults did n
hows that
ntervention i
Exp
Con
‐30
‐20
‐10
10
20
30
40
50
60
70
80
Profit (£
)
ariable. Th
d not repre
ee different
1b, a signif
ps was evid
etween self-
1) with high
not reveal a
the profit
is higher co
Figure 6: E
perimental
ntrol
00000.00
00000.00
00000.00
0.00
00000.00
00000.00
00000.00
00000.00
00000.00
00000.00
00000.00
00000.00
he leaders t
esented the
t intervals w
ficant main
dent (F1,37 =
f-regulation
h significan
a significan
of the te
ompared to l
Estimated m
Posttest
39096.0
‐182015
150
that receive
between gr
was the wi
effect for
= 12.992; p <
training and
nt contrast t
nt effect for
am where
leaders who
marginal mea
t 1
00
.93
ed self-regu
roup factor
ithin-group
differences
< .01; ŋ2 =
d profit was
test (F1,37 =
r time (see
the leader
o did not.
an for team
Posttest
279575.3
‐77802.5
ulation inte
and the me
measures.
between e
.260). Mor
s evident (F
= 7.472; p
Table 15).
rs attended
profit (or lo
t 2
33
59
ervention v
easures of p
Consistent
experimenta
reover, a po
F1,74 = 7.610
< .01; ŋ2 =
Figure 6 cl
d self-regul
oss)
Posttest
703426.6
115129.2
versus
profit
with
al and
ositive
0; p <
= .76).
learly
lation
3
67
26

151
Next, a Tukey HSD test for each group to compare profit between posttest 1 and
posttest 2 as well as posttest 2 and posttest 3 was conducted. Profit for the
experimental group showed a significant increase from posttest 1 to posttest 2
(39096.00 vs. 279575.33, respectively, p < .05) and from posttest 2 to posttest 3
(279575.33 vs. 703426.67, respectively, p < .05). The control group showed a
significant increase from posttest 1 to posttest 2 (-182015.93 vs. -77802.59,
respectively, p < .05) but not a significant increase from posttest 2 to posttest 3 (-
77802.59 vs. 115129.26, respectively, p < .05).
Additionally, in order to interpret the significant interaction of self-regulation
training and profit in detail (see Table 15), the three posttest means6 were compared
for each of the three time points. As demonstrated in Figure 6, there was a significant
difference between profit achieved by leaders in trained and untrained groups, in
comparison to the leaders who were in the control group during posttest 1 (F1,37 =
10.081; p < .01; ŋ2 = .214), posttest 2 (F1,37 = 13.113; p < .01; ŋ2 = .262), and posttest
3 (F1,37 = 11.821; p < .01; ŋ2 = .242).
As predicted, the results demonstrated that leaders in the experimental group who
received intervention training were able to lead their teams to achieve higher profit
across time, as compared to the control group. This result is attributable to leaders
who had a higher level of self-regulation and there use of methods of leadership
which are more effective in attaining higher profit than leaders who did not receive
the intervention. 6 There is no pretest financial measure as all teams started at the same level

152
Effects for return on capital employed (ROCE)
ROCE signifies how well the money invested into the business is providing a return
to the investors. A repeated measures analysis of covariance (ANCOVA) with age,
gender and self-efficacy as covariates was performed on the ROCE data, with
experimental and control groups as the between-subjects factors and the measure of
ROCE at three different intervals as a within-subject factor. As predicted (see Table
15), a significant main effect between self-regulation training and ROCE emerged
(F1,37 = 13.212; p < .01; ŋ2 = .263). Interaction effect was significant (F1,74 = 9.741; p
< .01; ŋ2 = .208) with significant high contrast (F1,37 = 15.066; p < .01; ŋ2 = .289).
Results did not reveal a significant effect for time (see Table 15). Figure 7 presents
the ROCE for both, control and experimental group, and the graph showed that
leaders who attended the intervention achieved higher ROCE compared to leaders
who did not.
The groups were also compared independently between posttest 1 and posttest 2 as
well as posttest 2 and posttest 3 using a Tukey HSD test. Results showed that ROCE
for the experimental group showed a significant increase from posttest 1 to posttest 2
(-1.740 vs. 26.647, respectively, p < .05) and from posttest 2 to posttest 3 (26.647 vs.
44.420, respectively, p < .05). On the contrary, ratings of leader satisfaction by
followers in the control group showed a significant increase from posttest 1 to
posttest 2 (-9.783 vs. 6.210, respectively, p < .05) but a slight decrease from posttest
2 to posttest 3 that is not statistically significant (6.210 vs. 19.113, respectively, p <
.05).

Fu
Ex
be
at
re
ŋ2
te
H
fo
in
urther univ
xamining th
etween team
ttend the in
eceived inte
2 = .328) an
eams where
Hence, the re
or teams led
n the control
Exp
Con
ROCE
Figure
variate insp
he results o
ms where l
ntervention.
rvention we
nd posttest
the leaders
esults of re
d by leaders
l group. Par
perimental
ntrol
‐2.000
‐1.500
‐1.000
‐0.500
0.000
0.500
1.000
1.500
7: Estimate
pections w
of posttest
leaders atte
However,
ere significa
3 (F1,37 =
were in the
ceiving self
s who were
rticipants in
Posttest
‐1.740
‐0.364
153
ed marginal
were condu
1, there wa
ended the i
the mean fo
antly higher
14.452; p <
e control gro
f-regulation
in the expe
n the training
t 1
0
4
mean for te
ucted for
as no signi
intervention
for ROCE f
r in posttest
< .01; ŋ2 =
oup (see Fig
n training le
erimental gr
g group self
Posttest
0.559
‐0.156
eam ROCE
each meas
ificant diffe
n and leade
for teams w
t 2 (F1,37 =
= .281), as c
gure 4).
ead to a bet
roup than le
f regulate th
t 2
6
surement p
erence in R
ers who did
where the le
18.080; p <
compared t
tter ROCE
eaders who
heir perform
Posttest
1.319
0.232
point.
ROCE
d not
eaders
< .01;
to the
score
were
mance
3

154
as a leader better which ultimately resulted in leading their team to manage the
capital employed in the business more effectively to yield a higher return.
Effects for gearing
Gearing ratio is calculated as the ratio that compares the company’s equity or capital
to borrowed funds. In brief, gearing refers to the extent to which the company is
funded by debt. The higher the gearing of the company, the more the company is
considered risky. To test Hypothesis 1b an examination of whether leaders with
higher self-regulation (after receiving intervention) relate significantly with the
leaders’ team gearing ratio, was conducted using a repeated measures analysis of
covariance (ANCOVA) with age, gender and self-efficacy as covariates. Consistent
with Hypothesis 1c which predicted an inverse relationship between self-regulation
training and gearing ratio, the analysis demonstrated a significant difference between
group effect (F1,37 = 11.851; p < .01; ŋ2 = .243) and a significant interaction effect
(F1,74 = 2.906; p < .10; ŋ2 = .073). This is supported by the fact that the contrast test
is significant (F1,37 = 3.216; p < .10; ŋ2 = .080). Results did not reveal a significant
effect for time (see Table 15). Figure 8 demonstrates that gearing ratio is lower in the
experimental group compared to the control group.
Next, a Tukey HSD test for each group to compare gearing between posttest 1 and
posttest 2 as well as posttest 2 and posttest 3 was conducted. Gearing for teams in
which leaders were allocated into the experimental group showed a significant
decrease from posttest 1 to posttest 2 (60.316 vs. 42.387, respectively, p < .05) and
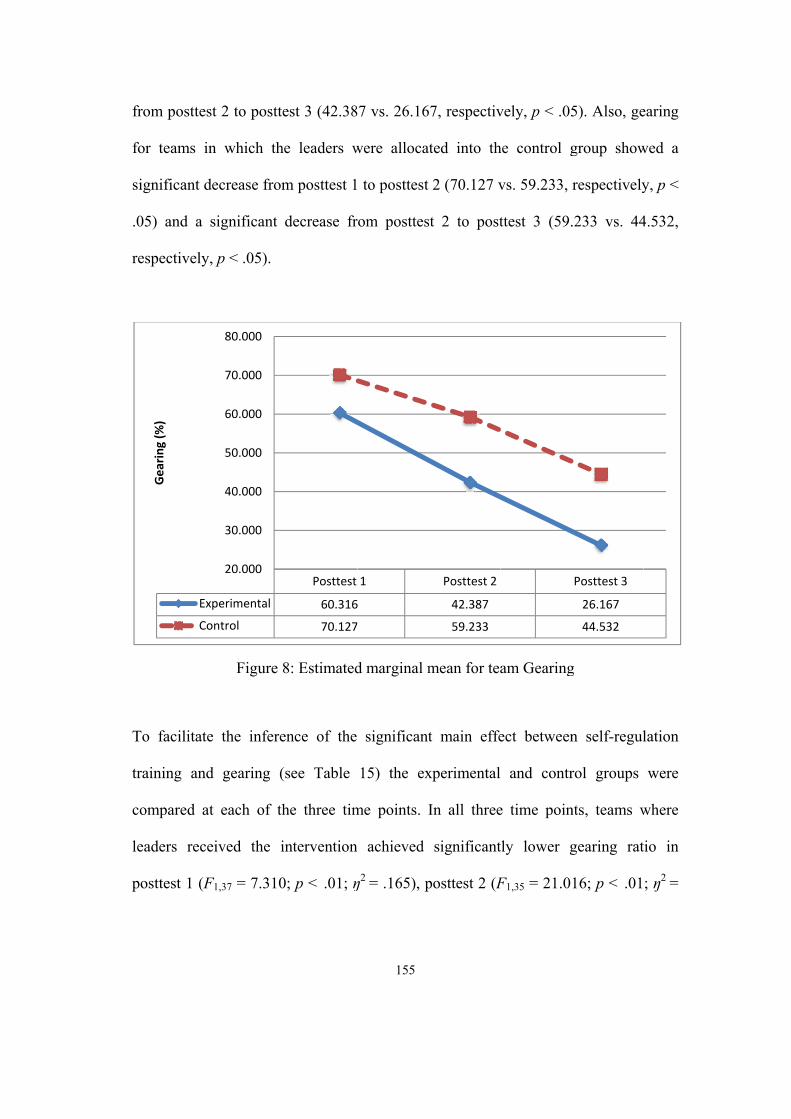
fr
fo
si
.0
re
To
tra
co
le
po
om posttest
or teams in
gnificant de
05) and a s
espectively,
o facilitate
aining and
ompared at
eaders recei
osttest 1 (F
Exp
Con
Gearing
(%)
t 2 to postte
n which the
ecrease from
significant d
p < .05).
Figure 8
the infere
gearing (s
each of th
ived the in
1,37 = 7.310
perimental
ntrol
20.000
30.000
40.000
50.000
60.000
70.000
80.000
est 3 (42.38
e leaders w
m posttest 1
decrease fr
8: Estimated
nce of the
see Table
he three tim
ntervention
; p < .01; ŋ
Posttest
60.316
70.127
155
7 vs. 26.16
were alloca
to posttest
rom posttes
d marginal m
significant
15) the ex
me points. I
achieved
ŋ2 = .165), p
1
6
7, respectiv
ted into th
2 (70.127 v
st 2 to post
mean for tea
t main effe
xperimental
In all three
significant
posttest 2 (F
Posttest 2
42.387
59.233
vely, p < .05
he control g
vs. 59.233,
ttest 3 (59.
am Gearing
ect between
and contr
e time poin
tly lower g
F1,35 = 21.0
5). Also, ge
group show
respectively
.233 vs. 44
g
n self-regul
rol groups
nts, teams w
gearing rat
16; p < .01
Posttest 3
26.167
44.532
earing
wed a
y, p <
4.532,
lation
were
where
tio in
; ŋ2 =
156
.362), and posttest 3 (F1,37 = 7.012; p < .01; ŋ2 = .159), in contrast to the teams
where leaders were in the control group. Refer to Figure 8.
Although the main effect between self-regulation training and gearing ratio was
significant at p < .10, the results for the comparisons at each time point for gearing
between the two groups still supports Hypothesis 1c. Leaders with higher self-
regulation lead their team to perform better financially as demonstrated in the
reduction of gearing ratio within the company which in turn reduces their company’s
financial risk.
Effects for earnings per share (EPS)
EPS is calculated by the total profit of the company divided by the number of shares.
EPS serves as an indicator of a company’s profitability. The effect of self-regulation
training on the financial outcome of the leaders’ team was tested using repeated
measures analysis of covariance (ANCOVA) including age, gender and self-efficacy
as covariates. The EPS measure was used as the dependant variable. Groups that
received self-regulation intervention versus groups that did not represent the
between-group factor, and the EPS at three different time interval were the within-
group measures. There was a significant main effect of training between
experimental and control groups (F1,37 = 12.385; p < .01; ŋ2 = .251). Also, a
significant effect for interaction (F1,74 = 5.562; p < .05; ŋ2 = .131) was observed with
highly significant contrast (F1,37 = 6.380; p <.01; ŋ2 = .147). However, results did
not reveal a significant effect for time (see Table 15). This result demonstrates that
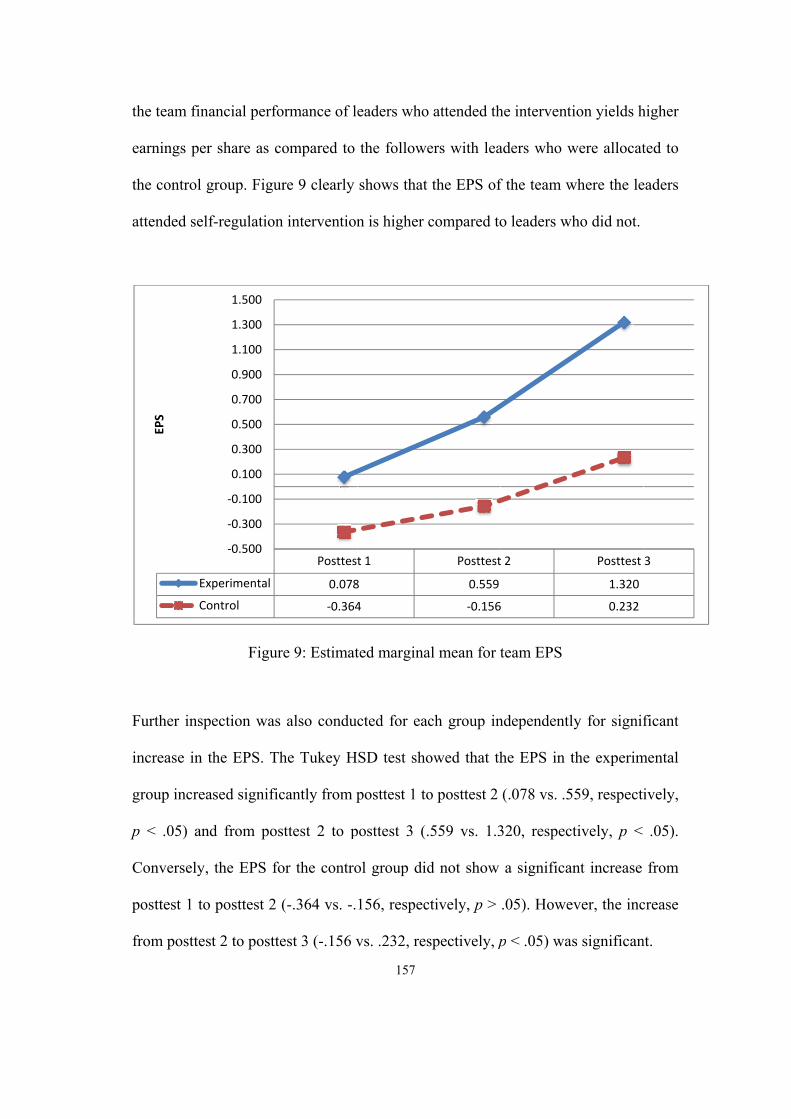
th
ea
th
at
Fu
in
gr
p
C
po
fr
he team fina
arnings per
he control gr
ttended self-
urther inspe
ncrease in th
roup increas
< .05) and
onversely, t
osttest 1 to
om posttest
Exp
Con
EPS
ancial perfor
share as co
roup. Figur
f-regulation
Figure
ection was
he EPS. Th
sed signific
d from post
the EPS for
posttest 2 (
t 2 to postte
perimental
ntrol
‐0.500
‐0.300
‐0.100
0.100
0.300
0.500
0.700
0.900
1.100
1.300
1.500
rmance of le
ompared to
re 9 clearly
intervention
e 9: Estimat
also conduc
he Tukey H
antly from p
ttest 2 to p
r the contro
(-.364 vs. -.
st 3 (-.156 v
Posttest
0.078
‐0.364
157
eaders who
the followe
shows that
n is higher c
ted margina
cted for eac
SD test sho
posttest 1 to
posttest 3 (.
ol group did
156, respec
vs. .232, res
t 1
8
4
attended th
ers with lea
the EPS of
compared to
al mean for t
ch group in
owed that th
o posttest 2
559 vs. 1.3
d not show
ctively, p >
spectively, p
Posttest
0.559
‐0.156
he interventi
aders who w
f the team w
o leaders wh
team EPS
ndependentl
he EPS in t
(.078 vs. .5
320, respec
a significa
.05). Howe
p < .05) wa
t 2
6
ion yields h
were allocat
where the le
ho did not.
ly for signif
the experim
559, respecti
tively, p <
ant increase
ever, the inc
s significan
Posttest
1.320
0.232
higher
ted to
eaders
ficant
mental
ively,
.05).
from
crease
nt.
3

158
Main and interaction effects (F) a, b Between subject effect (F) a, b
Group effect b Time effect c Interaction effect c Contrast b Posttest 1 Posttest 2 Posttest 3
Financial performance
Profit 12.992 (.260)** 1.625 (.059) 7.610 (.171)** 8.435 (.186)** 10.081 (.214)** 13.114 (.262)** 11.821 (.242)**
ROCE 13.212 (.263)** 1.137 (.030) 9.741 (.208)** 15.066 (.289)** 2.28 (.56) 18.08 (.328)** 14.452 (.281)**
Gearing 11.851 (.243)** .192 (.005) 2.906 (.073) † 3.216 (.080) † 7.310 (.165)** 21.016 (.362)** 7.012 (.159)*
EPS 12.385 (.251)** 1.912 (.049) 5.562 (.131)* 6.380 (.147)* 10.081 (.214)** 13.114 (.262)** 10.349 (.219)**
Note. n = 15 (experimental group), n = 25 (control group). Partial ŋ2 shown in parentheses. a Self efficacy was used a covariate to eliminate confounds b df = 1,37; c df = 1,74 † p < .10 *p < .05 **p < .01
Table 15: Results of repeated measures analysis of covariance (ANCOVA) for financial performance.
159
In order to interpret the significant main effect of self-regulation intervention on the
EPS (see Table 15), the three posttest means were contrasted for each of the three
measurement points. As demonstrated in Figure 9, there was a significant difference
between profit achieved by leaders in the trained group in comparison to the leaders
who were in the control group shown in posttest 1 (F1,37 = 10.081; p < .01; ŋ2 =
.214), posttest 2 (F1,37 = 13.113; p < .01; ŋ2 = .262), and posttest 3 (F1,37 = 10.349; p
< .01; ŋ2 = .219).
As predicted, the results demonstrated that leaders in the experimental group who
received the intervention training were able to lead their teams to achieve higher
profit across time, as compared to the control group. This result is attributable to
leaders who had a higher level of self-regulation (in comparison to leaders who did
not receive the intervention) and therefore used methods of leadership which are
more effective in not just attaining higher profit, but also focus on satisfying
shareholders.
4.8.3. Assessments outcomes
Testing for differences in means for self-regulation was carried out initially using
multivariate analysis of covariance (MANCOVA) with leaders in groups who
received self-regulation intervention and leaders in control groups as the independent
variables, the five assessment outcomes as the dependent variables, and treating age,
gender and self-efficacy as covariates. Specifying age, gender and self-efficacy in
this way filters out variance in the dependent variables that is attributable to these

160
variables. Also, a MANCOVA is performed prior to univariate analysis of
covariance ANCOVA to control for inflated Type I error rates and takes into account
the correlations among the dependent variables (Stevens, 2002) as the five
assessment measures are part of the 100% overall final assessment. A significant
effect for Group (Wilks’s λ = .644; F1,37 = 3.651; p < .01; ŋ2 = .356) established that
any differences due to self-regulation should be regarded as consistent across the five
assessment measured.
F a, b p ŋ2
Presentation 8.831 .005 .193
Business plan 2.665 .111 .067
Group report 10.330 .003 .218
Simulation performance 5.018 .031 .119
Reflective report 10.076 .003 .214
Note. n = 15 (experimental group), n = 25 (control group). Wilk’s Lambda = .644 a Self efficacy was used a covariate to eliminate confounds b df = 1,37
Table 16: Results of analysis of covariance (ANCOVA) for assessment outcomes.
Given the significant main effects of leaders in the experimental and control group,
further univariate testing was undertaken with each assessment outcome compared.
Results from ANCOVA are reported in Table 16.

161
Effects for the Presentation assessment
Examination of whether leaders who attended self-regulation training related
significantly to Presentation marks obtained by the team using ANCOVA with age,
gender and self-efficacy as covariates. The main effect demonstrates a significant
difference (F1,37 = 8.831 ; p < .01; ŋ2 = .193) in the higher Presentation marks for
teams where leaders attended the training as shown in Figure 10. This result provides
support for Hypothesis 1c, which suggests that leaders who were trained would
exhibit competency to lead their team to achieve higher Presentation marks than
leaders who were not trained.
Figure 10: Estimated marginal mean for teams’ assessments
Presentation Business PlanGame
PerformanceGroup Report
Reflective Report
Experimental 69.80 67.60 7.53 73.73 70.33
Control 63.48 62.30 6.56 63.19 64.52
0.00
10.00
20.00
30.00
40.00
50.00
60.00
70.00
80.00
Experimental Control

162
Effects for the Business Plan assessment
The effects of the intervention on self-regulation on Business Plan marks was tested
using ANCOVA treating age, gender and self-efficacy as covariates. Although the
mean for Business Plan marks were higher (see Figure 10) for the experimental
group compared to the control group, the effect was not significant. Thus, no support
was found for the predicted effect suggested by Hypothesis 1c.
Effects for the Game Simulation Performance
Next, using the Game Simulation Performance mark as the dependant variable, the
effect of whether leaders who attended self-regulation training was tested using
ANCOVA, specifying age, gender and self-efficacy as covariates. The ANCOVA
yielded a significant main effect for training on the Game Simulation Performance
marks (F1,37 = 10.330 ; p < .01; ŋ2 = .218). This analysis revealed that leaders who
were trained in self-regulation (compared to leaders who were not trained) are able to
lead their teams to achieve notably higher Game Simulation Performance marks as
shown in Figure 10.
Effects for the Group Report assessment
The effect of whether leaders who attended self-regulation training related
significantly to the Group Report marks was analysed using ANCOVA with age,
gender and self-efficacy as covariates. The main effect demonstrates a significant
difference (F1,37 = 5.018; p < .05; ŋ2 = .119) in the higher Group Report marks for
team whose leaders attended the training as shown in Figure 10. This result provides

163
support for Hypothesis 1c, which suggested that leaders who were trained would
exhibit competency to lead their team to achieve higher Group Report marks than
leaders who were not trained.
Effects for the Reflective Report assessment
To test Hypothesis 1c, an examination of whether leaders with higher self-regulation
(after receiving intervention) relate significantly with their team’s average Reflective
Report marks was carried out using an ANCOVA with age, gender and self-efficacy
as covariates. As predicted, the analysis demonstrated that leaders in the
experimental group, who received intervention training, were able to lead their teams
to achieve significantly higher Reflective Report marks (F1,37 = 10.076; p < .01; ŋ2 =
.214), as compared to the control group as shown in Figure 10. Support for the
hypothesis above is confirmed.
4.9. Effects of training condition on leaders competencies
A repeated measures analysis of covariance (ANCOVA) with age, gender and self-
efficacy as covariates was performed on the leader competencies data. The
experimental and control groups served as the between-subjects factors and the
measure of followers ratings of leaders’ competencies at three different interval was
the within-subject factor. There was no main effect of leader competencies (F1,37 =
.509; p > .05; ŋ2 = .014). However, Figure 11 presents the ratings of leaders for both,
control and experimental groups, and the graphs showed that leaders who attended
the intervention were rated higher compared to leaders who did not.

A
m
pr
2.
tra
in
th
In
to
as
th
F
As such, the
measurement
retest (F1,37
342), leade
ained and
ntervention w
he leaders w
n addition, T
o test for a s
s well as po
he experime
Exp
Con
Lead
er com
petencies
Figure 11: E
e experime
t point at p
= 1.045; p
ers were no
untrained g
were rated
who were in
Tukey HSD
ignificant in
osttest 1 and
ental group
perimental
ntrol
5.000
5.100
5.200
5.300
5.400
5.500
5.600
5.700
5.800
5.900
6.000
Estimated m
ental and c
pretest, pos
p > .05; ŋ2 =
ot rated to
groups. Ho
significantl
the control
D analyses w
ncrease in l
d posttest 2
p showed a
Pretest
5.058
5.222
164
marginal me
control grou
sttest 1 and
= .029) and
be significa
owever, in
ly higher (F
group (see
were also co
eader comp
2. The resul
a significan
t
an for leade
ups were f
d posttest 2
d posttest 1
antly differ
posttest 2,
F1,37 = 4.419
Figure 11).
onducted fo
petencies be
lts showed
nt increase
Posttest 1
5.726
5.439
er competen
further com
2. Examinin
(F1,37 = .06
rent betwee
, leaders th
9; p < .05;
.
or each grou
etween prete
that leader
from prete
ncies
mpared for
ng the resu
63; p > .05
en leaders i
hat received
ŋ2 = .112),
up independ
est and post
competenc
est to postt
Posttest 2
5.859
5.523
each
ults at
; ŋ2 =
in the
d the
than
dently
ttest 1
ies in
test 1

165
(5.058 vs. 5.726, respectively, p < .05) but not from posttest 1 to posttest 2 (5.726 vs.
5.859, respectively, p > .05). Ratings of leader competencies in the control group
showed a significant increase from pretest to posttest (5.222 vs. 5.439, respectively, p
< .05) but not a significant increase from posttest 1 to posttest 2 (5.439 vs. 5.522,
respectively, p > .05).
To summarise, the results of receiving self-regulation training caused leaders to be
perceived as possessing the relevant competencies for their roles across time as rated
by their followers and tutors. Participants in the intervention developed relevant
competencies which were needed to perform in their role, which ultimately resulted
in them developing their competencies from pretest to posttest 1 and 2.
4.10. Leader competencies as mediator of leaders performance
The current study is a field experimental design, thus the conventional approach to
conduct mediation analysis is not the most appropriate. According to Baron and
Kenny (1986), three series of regression analyses to demonstrate; (i) the independent
variable must significantly predict the mediating variable; (ii) the mediator variable
must then significantly predict the dependent variable; and finally, (iii) the
relationship between the independent variable and dependent variable should be not
significant or weaker when the mediator is controlled for.
However, in accordance to Yzerbyt, Muller, and Judd (2004), to evaluate the
presence of a mediation effect in the current experimental study, the mediator
166
variable was included as a covariate in the repeated measure analysis of covariance
(ANCOVA). The effect of the mediating variable must be significantly related to the
interaction effect. At the same time, the F-value for the main effect must diminish
and become non-significant when the mediator is included as a covariate. Finally, a
Sobel (1982) test was then conducted to further assess the significance of the
mediation.
4.10.1. Leadership outcomes
Mediation analysis for leader satisfaction
To investigate whether leader competencies mediated the effect of self-regulation
training on leader satisfaction, the mediating variable was controlled for by adding it
as covariate in the analysis. Results of the analysis are show in Table 17. The effect
of the leader competencies was significant (F1,37 = 13.591; p < .01; ŋ2 = .286).
Moreover, the interaction effect of self-regulation training on leader satisfaction
diminished (F1,37 = 5.119; p < .05; ŋ2 = .131), although it stayed significant. The
Sobel test conducted, confirmed the reduction in the significance level was reliable
of the mediation (z = 1.833, p < .01).
Mediation analysis for leader effectiveness
For leader effectiveness, including the leader competencies as covariate, reduced the
previously significant effect to F1,37 = 8.869; p < .01; ŋ2 = .204 as shown in Table 17.
The effect of the mediating variable was significant on leader effectiveness (F1,37 =

167
5.299; p < .05; ŋ2 = .135). The Sobel test conducted, confirmed the reduction in
significance level was reliable of the mediation (z = 2.253, p < .05).
Mediation analysis for extra effort
The examination of the main effect of whether leaders with higher self-regulatory
competency (after receiving intervention) relate significantly with leadership
outcomes in increasing followers’ effort to try harder to perform, when leader
competencies were controlled for as a covariate, revealed a significant effect a p <
.10 (F1,37 = 3.450; p < .10; ŋ2 = .092). Although the effect of leader competencies on
followers’ rating that leader influenced followers to increase their effort to try harder
to perform is significant (F1,37 = 8.447; p < .01; ŋ2 = .199), the Sobel test did not
reveal a significant mediation effect.
4.10.2. Financial performances7
Mediation analysis for profit
An ANCOVA analysis of profit, with leader competencies as covariate, revealed a
significant effect for the covariate (F1,37 = 16.966; p < .01; ŋ2 = .326), showing that
leader competencies relate to profit. Importantly, the analysis also showed that the
effect of intervention on profit reduced (F1,37 = 3.170; p > .05; ŋ2 = .083) as shown in
Table 17. This reduction is significant (z = 2.865, p < .01), suggesting that the effect
on profit was mediated by leader competencies.
7All financial measures are measured at yearly intervals (in virtual time line) corresponding to subjective measures collected for followers ratings

168
Mediation analysis for return on capital employed (ROCE)
For ROCE, adding the leader competencies as a covariate, reduced the previously
significant effect to F1,37 = 16.076; p < .01; ŋ2 = .315 as demonstrated in Table 17.
The effect of the mediating variable was significant on ROCE (F1,37 = 131.146; p <
.01; ŋ2 = .789). The Sobel test confirmed that leader competencies significantly
mediated the effect of self-regulation on leader effectiveness (z = 2.581, p < .01).
Mediation analysis for gearing
When leader competencies is added as a covariate in an ANCOVA analysis of
gearing, the analysis revealed a significant effect for the covariate (F1,37 = 75.758; p
< .01; ŋ2 = .684), showing that leader competencies related to gearing. Essentially,
the analysis also showed that the effect of the intervention on gearing reduced (F1,37
= 24.506; p < .01; ŋ2 = .412) as shown in Table 17. This reduction is significant (z = -
.3.366, p < .01), suggesting that the effect on gearing was mediated by leader
competencies.
Mediation analysis for earnings per share (EPS)
The examination of the main effect of whether leaders with a higher self-regulatory
competency (after receiving intervention) related significantly with EPS, when leader
competencies were controlled for as a covariate, revealed a significant effect at p <
.10 (F1,37 = 3.170; p < .10; ŋ2 = .083). Although the effect of leader competencies on
EPS is significant (F1,37 = 16.966; p < .01; ŋ2 = .326), the Sobel test did not reveal a
significant mediation effect.
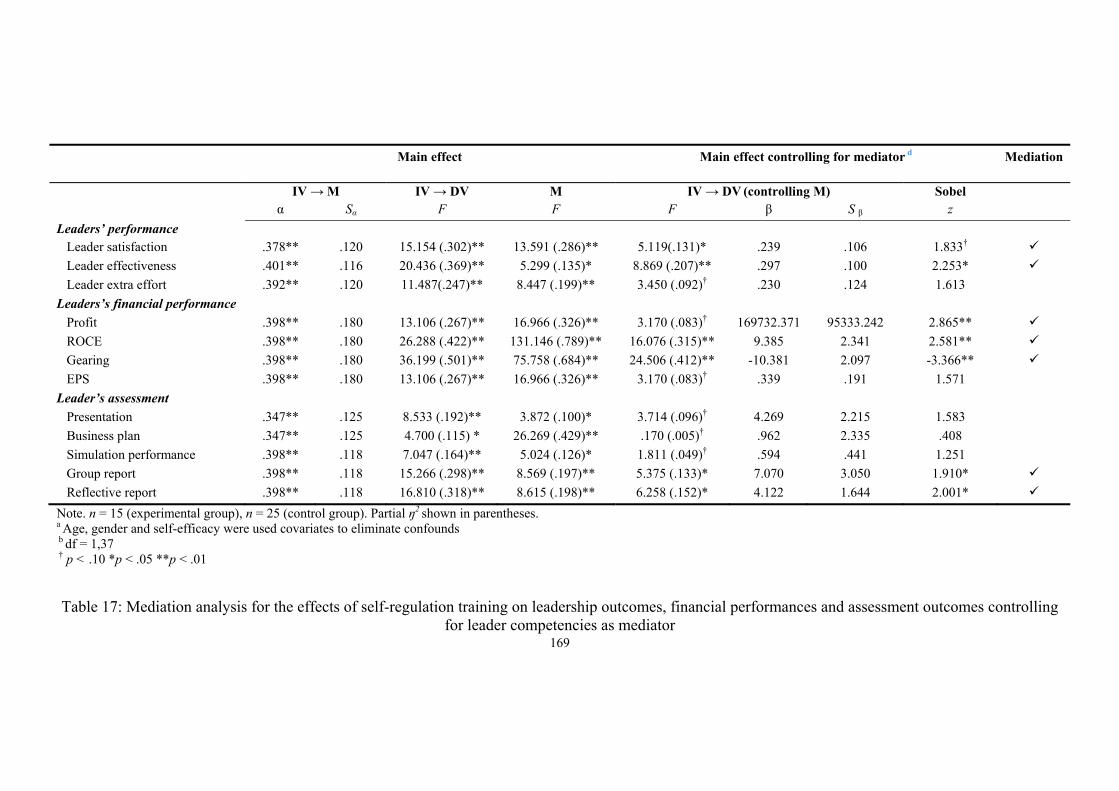
169
Main effect Main effect controlling for mediator d Mediation
IV → M IV → DV M IV → DV (controlling M) Sobel α Sα F F F β S β z Leaders’ performance Leader satisfaction .378** .120 15.154 (.302)** 13.591 (.286)** 5.119(.131)* .239 .106 1.833† Leader effectiveness .401** .116 20.436 (.369)** 5.299 (.135)* 8.869 (.207)** .297 .100 2.253* Leader extra effort .392** .120 11.487(.247)** 8.447 (.199)** 3.450 (.092)† .230 .124 1.613 Leaders’s financial performance Profit .398** .180 13.106 (.267)** 16.966 (.326)** 3.170 (.083)† 169732.371 95333.242 2.865** ROCE .398** .180 26.288 (.422)** 131.146 (.789)** 16.076 (.315)** 9.385 2.341 2.581** Gearing .398** .180 36.199 (.501)** 75.758 (.684)** 24.506 (.412)** -10.381 2.097 -3.366** EPS .398** .180 13.106 (.267)** 16.966 (.326)** 3.170 (.083)† .339 .191 1.571 Leader’s assessment Presentation .347** .125 8.533 (.192)** 3.872 (.100)* 3.714 (.096)† 4.269 2.215 1.583 Business plan .347** .125 4.700 (.115) * 26.269 (.429)** .170 (.005)† .962 2.335 .408 Simulation performance .398** .118 7.047 (.164)** 5.024 (.126)* 1.811 (.049)† .594 .441 1.251 Group report .398** .118 15.266 (.298)** 8.569 (.197)** 5.375 (.133)* 7.070 3.050 1.910* Reflective report .398** .118 16.810 (.318)** 8.615 (.198)** 6.258 (.152)* 4.122 1.644 2.001* Note. n = 15 (experimental group), n = 25 (control group). Partial ŋ2 shown in parentheses. a Age, gender and self-efficacy were used covariates to eliminate confounds b df = 1,37 † p < .10 *p < .05 **p < .01
Table 17: Mediation analysis for the effects of self-regulation training on leadership outcomes, financial performances and assessment outcomes controlling for leader competencies as mediator

170
4.10.3. Assessments outcomes
Assessment outcomes were not measured repeatedly, but one time after intervention.
Univariate testing was undertaken with each assessment outcome as the dependent
variable and leader competencies as the covariate. The effect of the covariate must be
significantly related to the interaction effect to indicate the covariate is a mediator.
Simultaneously, the F-value for the interaction effect must reduce and become non-
significant when the mediator is included as a covariate. Finally, a Sobel (1982) test
was then conducted to further assess the significance of the mediation.
Mediation analysis for Presentation assessment
For Presentation marks, adding the leader competencies as covariate, led the
previously significant effect to disappear (F1,37 = 3.714; p > .05; ŋ2 = .096) as
demonstrated in Table 17. The effect of the mediating variable was significant on
presentation assessment (F1,37 = 3.872; p < .05; ŋ2 = .100). In spite of this, the Sobel
test did not confirm that leader competencies significantly mediated the effect of
self-regulation training on presentation marks (z = 1.583, p > .10).
Mediation analysis for Business Plan assessment
When leader competencies were added as a covariate in an ANCOVA analysis on
Business Plan marks, the analysis revealed a significant effect for the covariate (F1,37
= 26.269; p < .01; ŋ2 = .126), showing that leader competencies relate to Business
Plan marks. Although, the analysis also showed that the interaction between group
and business plan marks diminished (F1,37 = .170; p > .05; ŋ2 = .005) as shown in
171
Table 17, this reduction was not significant (z = .408, p > .10), suggesting that the
effect on Business Plan marks was not significantly mediated by leader
competencies.
Mediation analysis for Simulation Performance assessment
The examination of the main effect of whether leaders with higher self-regulatory
competency relate significantly with Simulation Performance assessment marks,
when leader competencies were controlled for as a covariate, revealed a significant
main effect at p < .10 (F1,37 = 1.811; p < .10; ŋ2 = .049). Although there is a
significant effect of leader competencies on Simulation Performance assessment
marks (F1,37 = 5.204; p < .05; ŋ2 = .126), the Sobel test did not reveal a significant
mediation effect.
Mediation analysis for Group Report assessment
An ANCOVA analysis on the Group Report marks, with leader competencies as a
covariate, revealed a significant effect for the covariate (F1,37 = 8.569; p < .01; ŋ2 =
.197), showing that leader competencies relate to the Group Report marks. In
addition, the analysis also showed that the effect of self-regulation on the Group
Report marks reduced (F1,37 = 5.375; p < .05; ŋ2 = .133) as shown in Table 17. This
reduction is significant (z = 1.910, p < .05), suggesting that the effect on Group
Report was mediated by leader competencies.
172
Mediation analysis for Reflective Report assessment
To investigate whether leader competencies mediated the interaction effect of self-
regulation training on leader’s team Reflective Report marks, the mediating variable
was controlled for by adding it to the analysis as a covariate. Results of the analysis
are shown in Table 17. The effect of leader competencies was significant (F1,37 =
8.615; p < .01; ŋ2 = .198). Moreover, the interaction effect of self-regulation training
on Reflective Report marks reduced (F1,37 = 6.258; p < .05; ŋ2 = .152), although it
remained significant. The Sobel test conducted confirmed the significance of the
mediation (z = 2.001, p < .05).
4.11. Conclusion
The current chapter has analysed and presented results from the longitudinal field
experimental study that tested the influence of self-regulation on leader and team
performances. The field study, which manipulated self-regulation training, randomly
allocated leaders to an experimental or control group and were trained in self-
regulatory process by an executive coach. As expected, the results demonstrated that
leaders who attended the intervention yield better performance as rated by followers
in terms of leader satisfaction, leader effectiveness and followers’ willingness to
exert extra effort. The results also suggest that team performance measured by the
four financial indicators (i.e., profit, ROCE, gearing ratio, EPS) were significantly
affected by the intervention. Four out of five measures (i.e., presentation, business
plan, group report, simulation performance) of team assessments were significantly
related to the self-regulation intervention. In addition, the intervention also
173
significantly contributed to the increase in leaders’ competencies within the
experimental group as compared to the control group. Finally, the analyses also
showed that leader competencies mediated the leaders’ performance (leader
satisfaction, leader effectiveness), teams’ financial performance (profit, ROCE,
gearing ratio) and teams’ assessments (group report, reflective report). Table 18
summarises the results of the hypotheses tested. Next, Chapter Five interprets the
results of this chapter and discusses the implications of the findings.

174
Hypotheses
H1: A self-regulation intervention should lead to better leader and team performance
H1a: A self-regulation intervention should lead to better leader performance, measured as:
• leader satisfaction Supported • leader effectiveness Supported • extra effort Supported
H1b: A self-regulation intervention should lead to better team’s financial performance, measured as:
• retain profit Supported • return on capital employed (ROCE) Supported • earnings per share (EPS) Supported • gearing (negative relationship) Supported
H1c: A self-regulation intervention should lead to better team’s assessed performance, measured as
• presentation Supported • business plan Not supported • group report Supported • simulation performance and Supported • reflective report Supported
H2: Leaders who attended self-regulation training would exhibit greater improvement in the competencies required in their leadership role compared to leaders who have not been trained.
H2a: Leaders who attended self-regulation training would exhibit greater improvement in the competencies required in their leadership role, measured as promoting teamwork, planning, basic leadership, relationship management and keeping others informed. Supported
H2b: Leaders who did not attend self-regulation training would exhibit less improvement in the competencies required in their leadership role, measured as promoting teamwork, planning, basic leadership, relationship management and keeping others informed. Supported

175
H3: Leader competencies mediate the effect of training on performance in that (i) self-regulation training leads to the leader developing relevant competencies for his/her role and (ii) these competencies positively affects performance.
H3a: Leader competencies mediate the effect of training on performance in that (i) self-regulation training leads to the leader developing relevant competencies for his/her role and (ii) these competencies positively affects leader performance, measured as leader satisfaction, leader effectiveness and extra effort.
• leader satisfaction Supported • leader effectiveness Supported • extra effort Not supported
H3b: Leader competencies mediate the effect of training on performance in that (i) self-regulation training leads to the leader developing relevant competencies for his/her role and (ii) these competencies positively affects the team’s financial performance, measured as retain profit, return on capital employed (ROCE), earnings per share (EPS), and (negative) gearing
• retain profit, Supported • return on capital employed (ROCE) Supported • earnings per share (EPS) Not supported • gearing (negative relationship) Supported
H3c: Leader competencies mediate the effect of training on performance in that (i) self-regulation training leads to the leader developing relevant competencies for his/her role and (ii) these competencies positively affects the team’s assessed performance, measured as presentation, business plan, group report, simulation performance and reflective report.
• presentation Not supported • business plan Not supported • group report Not supported • simulation performance and Supported • reflective report Supported
Table 18: Summary of hypotheses testing

176
CHAPTER 5
Discussion
This chapter discusses the findings and the implications of this research. Section 5.1 presents a summary of the research questions, data collection and methodology of the study. Next, Section 5.2 discusses the findings of analysis and Section 5.3 outlines the implications of the findings in terms of contribution to theory, methods and practice. Limitations of the research are discussed in Section 5.4, followed by recommendations for future research in Section 5.5. Last but not least, Section 5.6 provides a conclusion to this thesis.
5.1. Introduction: Key research questions
The current research seeks to examine the effect of a self-regulation intervention on
leaders’ and their team’s performance. The main research questions in this research
were; (i) does leaders’ self-regulation increase after receiving an intervention on how
to self-regulate, (ii) are there significant differences in followers’ ratings of leaders’
performance and objectives team performance between leaders who receive a self-
regulation intervention and leaders who do not receive the intervention, (iii) after
receiving a self-regulation intervention, does it increase relevant competencies that
are needed by the leader in order to perform effectively in his/her current role and
finally, (iv) what relationship exists between self-regulatory processes, leadership
competencies and leadership outcomes.

177
The first hypothesis of this research was that, a self-regulation intervention should
lead to better leader and team performance. This hypothesis was further divided into
three sub-hypotheses as stated below:
Hypothesis 1a: A self-regulation intervention should lead to better leader
performance, measured as leader satisfaction, leader effectiveness and extra effort.
Hypothesis 1b: A self-regulation intervention should lead to better team’s financial
performance, measured as retained profit, return on capital employed (ROCE),
earnings per share (EPS) and (negative) gearing.
Hypothesis 1c: A self-regulation intervention should lead to better team’s assessed
performance, measured as presentation, business plan, group report, simulation
performance and reflective report.
The second hypothesis of this research posited that leaders who attend self-regulation
training would exhibit greater improvement in the competencies required in their
leadership role compared to leaders who have did not have the training. This
hypothesis was further divided into two sub-hypotheses as stated below:
Hypothesis 2a: Leaders who attended self-regulation training would exhibit greater
improvement in competencies required in their leadership role, measured as
promoting teamwork, planning, basic leadership, relationship management and
keeping others informed.
Hypothesis 2b: Leaders who did not attend self-regulation training would exhibit less
improvement in competencies required in their leadership role, measured as

178
promoting teamwork, planning, basic leadership, relationship management and
keeping others informed.
Finally, the third hypothesis of this research was that, leader competencies should
mediate the effect of self-regulation training on performance in that (i) self-
regulation training leads to leader developing relevant competencies for his/her role
and (ii) these competencies positively affect performance. This hypothesis was
further divided into three sub-hypotheses as stated below:
Hypothesis 3a: Leader competencies mediate the effect of training on performance in
that (i) self-regulation training leads to leader developing relevant competencies for
his/her role and (ii) these competencies positively affect leader performance,
measured as leader satisfaction, leader effectiveness and extra effort.
Hypothesis 3b: Leader competencies mediate the effect of training on performance in
that (i) self-regulation training leads to leader developing relevant competencies for
his/her role and (ii) these competencies positively affect team’s financial
performance, measured as retained profit, return on capital employed (ROCE),
earnings per share (EPS) and (negative) gearing.
Hypothesis 3c: Leader competencies mediate the effect of training on performance in
that (i) self-regulation training leads to leader developing relevant competencies for
his/her role and (ii) these competencies positively affect team’s assessed
performance, measured as presentation, business plan, group report, simulation
performance and reflective report.
Longitudinal field experimental research was conducted to compare the effects of the
self-regulation intervention on leaders’ and team’s performance. Forty leaders and

179
their teams took part in this research; fifteen leaders attended the self-regulation
intervention (experimental group) while twenty-five leaders did not attend the self-
regulation intervention (control group). The intervention trained leaders on self-
regulation strategies. All leaders in the experimental group were provided with a
360-degree feedback report (generated from ratings of their followers and
supervisors) during the intervention, and twice after the intervention (three and six
months after the intervention).
The control and experimental groups’ leaders and their followers filled out a pretest
and two posttest survey across nine months. The leaders performance measures were
divided into three areas; (i) leader performance, measured as leader satisfaction,
leader effectiveness and extra effort, (ii) team’s financial performance, measured as
retained profit, return on capital employed, earnings per share, and gearing (from
BSG simulation) and (iii) team’s assessed performance, measured as presentation,
business plan, group report, simulation performance and reflective report. Leaders’
competencies were also measured. Leaders’ self-regulation was measured at all three
time points to act as manipulation checks. The next section will evaluate and
interpret the findings from the data analyses performed in Chapter Four.

180
5.2. Interpretation of findings
The intervention led to an increase in leaders’ self-regulation
The results from the manipulation check showed that prior to intervention, there was
no significant difference in self-regulation between leaders who attended the
intervention and those who did not. Although the experiment study randomly
allocated leaders into control and experimental groups, it is still important to
establish that there was no difference in self-regulation between the two groups at
pre-test. The analyses yielded a non-significant difference when comparing both
groups during pre-test which indicated that there is no difference in the level of self-
regulation prior to the leader receiving the intervention and leaders in both groups.
The level of self-regulation for leaders in both groups increased over the three time
measures taken, as one might expect when individuals mature across a period of time
in longitudinal design. However, as expected, the leaders who attended the
intervention demonstrated a greater increase in self-regulation at both posttests, when
compared to leaders in the control group. It is thus concluded that, self-regulation
training was successful and positively improved leaders’ self-regulation competency.
181
The self-regulation intervention led to better leader and team performance
Hypothesis 1a: A self-regulation intervention should lead to better leader
performance, measured as leader satisfaction, leader effectiveness and extra effort.
Leader satisfaction. For the change over time in the ratings of leaders’ satisfaction,
there was a significant difference between the ratings for leaders who attended the
intervention and those that did not. An initial comparison between the ratings of
followers prior to the intervention yielded a non-significant difference between both
groups indicating that followers were similar in their satisfaction ratings towards
their leaders. Ratings for leaders who attended the intervention increased from
pretest to posttest 1 and posttest 2. Consistent with Hypothesis 1a, this effect
demonstrated that followers of leaders who attended the intervention were more
satisfied with the leaders’ performance as compared to the followers with leaders
who were in the control group. The findings indicated that, leaders who attended the
intervention met the expectations of their followers, used methods of leadership that
are satisfactory and work with their followers in a satisfying way thus supporting
Hypothesis 1a.
Leader effectiveness. The results showed that the followers of leaders who attended
the intervention perceived their leaders as significantly higher on effectiveness at
meeting task demands, resolving task problems and effective at leading the team than
followers of leaders who did not attend the intervention. The results from the

182
analyses of leader effectiveness overtime between leaders in the experimental and
control groups, suggests that leaders who are trained in self-regulation strategies are
able to regulate their behaviour to be more effective in their role.
Extra effort. The outcome of the data analyses supported the fact that followers of
leaders who attended the intervention were able to get their followers to work harder
than they expected, increase their desire to succeed on task and makes them more
willing to try harder as a result of the influence of their leaders than followers of
leader who was in the control group. Although contrary to expectations that after the
intervention, leaders would receive higher ratings from followers in posttest 1,
posttest 1 yielded no significant difference between ratings of followers between
leaders in experimental and control groups. The data suggests there was a lag in the
effect of training. Extra effort measures the construct of whether leaders were able to
motivate followers to perform above and beyond their normal work level in their
current task. The initial causal change from the intervention training should be on the
leader, which is why leaders’ performance (satisfaction and effectiveness) in the
previous two sections was observed to have increased significantly. However, it is
not surprising that to influence change in the followers, once the leaders received the
intervention would need time to be manifested upon the followers, as demonstrated
in the lag within these findings. Hence, the results still support the view that leaders
with higher self-regulation yield higher leadership outcome in increasing followers’
effort to try harder to perform as demonstrated during posttest 2.
183
Overall, Hypothesis 1a which predicted that a self-regulation intervention should
lead to better leader performance was supported. The three facets of leader
performance, measured as leader satisfaction, leader effectiveness and extra effort,
significantly increase for leaders who attended the intervention as compared to
leaders who did not. Followers were more satisfied with leaders who attended the
intervention because the leaders displayed behaviours that met their expectations,
used methods of leadership that were satisfactory and worked with their followers in
a satisfying way. In addition, followers of leaders who attended the intervention
perceived their leaders as significantly higher on effectiveness at meeting task
demands, resolving task problems and effective at leading the team than followers of
leaders who did not receive the intervention. Finally, although there was a lag in the
effect of the intervention on extra effort, leaders were still able to get their followers
to work harder than they expected, increase their followers’ desire to succeed on task
and make them more willing to try harder as a result of the influence of their leaders.
Hypothesis 1b: A self-regulation intervention should lead to better team’s financial
performance, measured as retained profit, return on capital employed (ROCE),
earnings per share (EPS) and (negative) gearing.
Profit. Consistent with Hypothesis 1b which predicted a positive relationship
between self-regulation training and profit, the results from the analyses
demonstrated that leaders in the experimental group who received intervention
training were able to lead their teams to achieve higher profit across time, as
184
compared to the control group. This result is attributable to leaders who have higher
level of self-regulation uses methods of leadership which are more effective in
attaining higher profit than leaders who did not receive the intervention.
Return on capital employed (ROCE). The results of receiving self-regulation
training lead to a higher ROCE measure for teams led by a leader who was in the
experimental group than leaders who were in the control group. Participants in the
training group self regulate their performance as a leader better, which ultimately
resulted in leading their team to manage the money invested into the business
efficiently which in turn provides a higher return to the investors.
Gearing. For the change over time in the measure of gearing ratio, results yielded a
significant difference at p < 0.1 between teams where leaders attended the
intervention and those that did not. Although the significant level was at p = 0.052, it
is closely approaching the level of significance at p < 0.05. Gearing ratio is
calculated as the ratio that compares the company’s equity or capital to borrowed
funds. In brief, gearing refers to the extent to which the company is funded by debt.
The fact that the companies have only been in operation for three (virtual) years, the
companies are still in the earlier stages of growth and hence, still funded by debt
such as loan. It is not unexpected for car manufacturing companies, that have been
operating in the industry for a while such as BMW, Peugeot, Daimler, Renault and
Volkswagen, to have a gearing ratio between 20% to 70% (BMW annual report,
2009; Daimler annual report, 2010; Peugeot annual report, 2009; Renault annual

185
report, 2009; Volkswagen annual report, 2009). Comparisons at each time point in
the current study, demonstrated that there is still support that leaders with higher self-
regulation lead their teams to perform better financially as demonstrated in the
reduction of gearing ratio within the company which in turn reduces their company’s
financial risk, thus supporting Hypothesis 1b.
Earnings per share (EPS). The increase in earnings per share (EPS) for teams where
leaders attended the intervention was as predicted. Both the experimental and control
groups saw an increase in EPS from posttest1 to posttest3, however the increase for
teams in which the leaders were in the experimental condition were significantly
higher than the increase for teams where the leader was in the control condition. As
predicted, the results supported Hypothesis 1b and is attributable to leaders who had
higher level of self-regulation were able to lead their teams to use their company’s
capital to generate income more efficiently.
To surmise, Hypothesis 1b, predicting that a self-regulation intervention should lead
to better team financial performance, was supported. Data analyses revealed that
teams whose leaders attended the intervention made higher profit, effectively
invested money into the business and provided a healthier return to the investors,
managed debt efficiently thus bringing the risk of the company down, and finally
generated greater income through efficient use of company’s capital than teams
whose leaders who did not attend the intervention.

186
Hypothesis 1c: A self-regulation intervention should lead to better team’s assessed
performance, measured as presentation, business plan, group report, simulation
performance and reflective report.
Presentation assessment. The examination of whether a self-regulation intervention
related significantly to the mark attained for the Presentation assessment
demonstrated a significant difference between teams in which leaders attended the
training and teams in which leaders did not. This result provides support for
Hypothesis 1c, suggesting that leaders who were trained in self-regulation were able
to lead their team to present their Business Plan more convincingly to potential
investors and was assessed significantly higher by external examiners than leaders
who did not receive the training.
Business Plan assessment. The results showed that, although the mean for Business
Plan marks were higher for the experimental group compared to the control group,
the size of the difference was not significant. The Business Plan and Presentation
were assessed within the same week and also fairly soon after the intervention.
Firstly, it is to be expected that the training effects takes time to be translated into
team performance and therefore might not be evident on measure taken soon after the
intervention. Secondly, another possible explanation for a significant result for
Presentation and a not for Business Plan could be that students may have allocated
more effort towards the Presentation because it was assessed by external examiners
from the industry (e.g., Ford, Vauxhall, Ernst and Young and the likes) from whom it

187
might be possible to be offered an internship. Therefore, Hypothesis 1c which
predicted that self-regulation intervention should lead to better Business Plan
assessment outcome was not supported.
Simulation Performance. The difference between Simulation Performance marks
was found to be significantly different between the experimental and control groups.
These findings revealed that leaders who were trained in self-regulation (as
compared to leaders who were not trained) were able to lead their teams to achieve
notably higher Simulation Performance marks.
Group Report assessment. There was a significantly higher Group Report mark for
team whose leaders attended the intervention than for those teams whose leader did
not attend the intervention. This result provides support for Hypothesis 1c. Leaders
who were trained in self-regulation strategies exhibited competencies to lead their
team to achieve a higher Group Report marks than leaders who were not trained.
Reflective Report assessment. Hypothesis 1c was supported. The data analysis
confirmed that leaders in the experimental group who received intervention training
were able to lead their teams to achieve significantly higher Reflective Report marks,
as compared to the control group.
In summary, Hypothesis 1c predicting that self-regulation intervention should lead to
better teams’ assessment was supported for all assessments (Presentation, Simulation

188
Performance, Group Report, Reflective Report), except for the Business Plan.
Leaders trained in self-regulation were able to regulate their behaviour to lead their
team to achieve higher performance in marked assignments as assessed by various
external and internal examiners.
Leaders who attended self-regulation training would exhibit greater
improvement in competencies required in their leadership role compared to
leaders who have not been trained.
Hypothesis 2a: Leaders who attended self-regulation training would exhibit greater
improvement in competencies required in their leadership role, measured as
promoting teamwork, planning, basic leadership, relationship management and
keeping others informed.
Hypothesis 2b: Leaders who did not attend self-regulation training would exhibit
less improvement in competencies required in their leadership role, measured as
promoting teamwork, planning, basic leadership, relationship management and
keeping others informed.
The examination of whether the self-regulation intervention led to an increase in
relevant leader competencies to perform in their role demonstrated a significant
difference between teams in which leaders attended the training and teams in which
leaders did not. The result obtained provided support for Hypothesis 2a and 2b,
suggesting that leaders who were trained in self-regulation strategies developed other

189
relevant leader competencies (e.g., promoting teamwork, planning, basic leadership,
relationship management and keeping others informed) that they need to perform
effectively in their current leadership role, as compared to leaders who were not
trained with self-regulation strategies. Leaders in the experimental group received a
360-degree feedback report and were trained on how to evaluate themselves when
they receive this feedback. Based on their own evaluation, it would trigger the
process of change and consideration of how to change or improve themselves as a
leader by searching for alternatives to achieve this. Next, leaders would devise a
clear plan to change, followed by the implementation of the plan. Once the plan had
been put into action, they would evaluate the achievement of the plan. Based on
these strategies, it is apparent in the current findings that leaders in the experimental
group were rated higher by others (followers and supervisors) as having improved
their leader competencies as an outcome of the self-regulation intervention.
Leader competencies mediate the effect of training on performance in that (i)
self-regulation training leads to leader developing relevant competencies for
his/her role and (ii) these competencies positively affect performance.
Hypothesis 3a: Leader competencies mediate the effect of training on performance
in that (i) self-regulation training leads to a leader developing relevant competencies
for his/her role and (ii) these competencies positively affect leader performance,
measured as leader satisfaction, leader effectiveness and extra effort.
190
Leader satisfaction. Examination of whether leader competencies mediate the effect
of self-regulation training on leader satisfaction was supported by the analysis
conducted. The results provide support for Hypothesis 3a, suggesting that leaders
who were trained, gained relevant competencies which in turn allow them to meet
the expectations of their followers. They were able to use methods of leadership that
are satisfactory and work with their followers in a satisfying way.
Leader effectiveness. The leader competencies were also found to mediate the effect
of self-regulation training on followers’ ratings of leader effectiveness. These
findings revealed that leaders who were trained in self-regulation (as compared to
leaders who were not trained) were able develop relevant competencies needed to
meet task demands, to resolve task problems and to effectively lead the team.
Extra effort.
For the analysis of whether leader competencies mediate the relationship between
self-regulation and leadership outcome in increasing followers’ effort to try harder to
perform, yielded a significant result at p < 0.1. The main effect of training was
significant on leader competencies but only approaching significant when it is
mediating the relationship between the intervention and extra effort. A possible
explanation for this is that, the results did demonstrate that self-regulation
significantly affected the change in leader competencies, however to put the effect
into influencing change in followers’ motivation, there is a time lag. This could also
be seen in Section 4.8.1 where the effect of self-regulation training was observed to

191
effect followers’ motivation with a time lag when compared to leader satisfaction
ratings and leader effectiveness. Thus, it is possible that if the measurement of
follower’s motivation to exert extra effort is taken again at a later time, it would yield
a significant mediation relationship.
In summary, Hypothesis 3a which suggested that leader competencies mediate the
relationship between self-regulation intervention and leader performance was
supported, except for extra effort which could be caused by time a lag in the effect of
the intervention. Self-regulation strategies help leaders develop relevant leader
competencies that helped them meet the expectations of the followers, used methods
of leadership that were satisfactory and worked with their followers in a satisfying
way. Similarly, the self-regulation intervention also facilitated leaders to develop
relevant competencies to meet task demands, to resolve task problems and
effectively lead the team. However, with regards to influencing followers to work
harder than they expected, increase their desire to succeed on task and make them
more willing to try harder, time needs to be taken into account for leaders to achieve
these after developing themselves.
Hypothesis 3b: Leader competencies mediate the effect of self-regulation training
on performance in that (i) self-regulation training leads to leader developing relevant
competencies for his/her role and (ii) these competencies positively affects team’s
financial performance, measured as retained profit, return on capital employed
(ROCE), earnings per share (EPS) and (negative) gearing.

192
Profit. The mediation analysis demonstrated that leader competencies mediate the
relationship between the self-regulation intervention and profit. This result is
attributable to self-regulation strategies helping leaders to develop relevant
leadership competencies to lead their teams to attain higher profit, thus supporting
Hypothesis 3b.
Return on capital employed (ROCE). The results from the data analysis showed that
the relationship between self-regulation training and ROCE is mediated by leader
competencies. In consistent with Hypothesis 3b, this effect demonstrated that the
self-regulation strategies assist the regulation of leaders’ competencies within leaders
to lead the team to utilise the money invested into the business efficiently which in
turn provides a higher return to the investors.
Gearing. The outcome of the data mediation analysis supported the fact that leader
competencies mediate the relationship between self-regulation and gearing. In
parallel with Hypothesis 3b, self-regulation led to leaders developing relevant
competencies for their role and these competencies positively affect the management
of the company’s gearing ratio, which is the extent to which the company is funded
by debt (indicating high or low risk company).
Earnings per share (EPS). The mediation effect of leader competencies between
self-regulation and EPS was not as expected. Data analyses did not reveal a
significant mediation effect, thus Hypothesis 1c was not supported. EPS is a market
193
performance indicator as compared to profit, ROCE and gearing ratio which indicate
company’s performance. EPS is therefore more susceptible to market environment
changes (Bender & Ward, 2008) which could be a possible reason why the mediation
analysis did not yield a significant finding. Looking at profit, ROCE and gearing
ratio, leader competencies as a result of self-regulation training led to better company
performance. Company performance is more directly impacted by leaders’ action
whereas market environment is complex and more often than not, is out of the
leaders’ control. Therefore, EPS is possibly not a good indicator when it comes to
predicting the relationship between self-regulation intervention, leader competencies
and EPS as financial performance.
Overall, Hypothesis 3b which predicted the relationship between self-regulation
intervention and teams’ financial performance was supported, except for the EPS
measure. Data analyses revealed that teams of leaders who attended the intervention
developed relevant leader competencies lead their team to make higher profit, to
effectively invest money into the business and provide a healthier return to the
investors, and also to manage debt efficiently thus bringing the risk of the company
down. In contrast to predicting company’s performance, EPS which predicts market
performance was concluded to be not as effective to predict this relationship.
Hypothesis 3c: Leader competencies mediate the effect of self-regulation training on
performance in that (i) self-regulation training leads to leader developing relevant
competencies for his/her role and (ii) these competencies positively affects better

194
team’s assessed performance, measured as presentation, business plan, group report,
simulation performance and reflective report.
Presentation assessment. The mediation effect of leader competencies between self-
regulation and Presentation assessment was not as predicted. Data analyses did not
reveal a significant mediation effect, thus Hypothesis 3c was not supported. A
possible explanation for this could be that the Presentation was assessed very soon
after the intervention. Consequently, it could be too short a time for leaders to for
leaders to convert the strategies gained into leader competencies which in turn lead to
improved performance.
Business Plan assessment. Data analyses did not reveal that the relationship between
self-regulation and Business Plan assessment was mediated by leader competencies.
Therefore, Hypothesis 3c was not supported. Similar to above, Business Plan and
Presentation were assessed within the same week and also fairly soon after the
intervention. Under this circumstance, a possible explanation for the finding could be
that the Business Plan was assessed too soon after the intervention for its benefits to
be manifested on team performance. Therefore, it could be too short a time interval
for leaders to implement the strategies learned from the self-regulation intervention
into leader competencies that could improve performance.
Simulation Performance assessment. The mediation effect of leader competencies
between self-regulation and Simulation Performance assessment was not as

195
expected. Data analyses did not reveal a significant mediation effect, thus Hypothesis
3c was not supported. The Simulation Performance was assessed mainly based on the
share price of the company. The share price of the company is highly dependent on
the market environment and shareholders’ interest in the company (Bender & Ward,
2008). For example, a company may be performing well in terms of high market
shares in the segment they are operating, generating consistent profit and this profit
is reinvested into low-risk long term strategies, but some shareholders may prefer to
invest in other companies which are generating immediate returns at each quarter.
Therefore, Simulation Performance assessment which is highly dependent on the
team’s share price, is possibly not a good indicator when it comes to predicting the
relationship between self-regulation intervention, leader competencies and
Simulation Performance as a team assessment performance.
Group Report assessment. Examination of whether leader competencies mediate the
effect of self-regulation training on Group Report assessment was supported by the
analysis conducted. The result obtained provides support for Hypothesis 3c,
suggesting that leaders who were trained, gained relevant competencies which in turn
allows them to lead their team to meet the expectations of the Group Report and
achieve the relevant marks for the assignment.
Reflective Report assessment. The results from the data analysis showed that the
relationship between self-regulation and Reflective Report was mediated by leader
competencies. Consistent with Hypothesis 3c, this effect demonstrated self-

196
regulation led to leaders developing relevant competencies for their role to meet the
expectations of the Reflective Report and achieve the relevant marks for the
assignment, thus these competencies positively affect the Reflective Report marks.
To surmise, Hypothesis 3c predicted that leaders who were trained in self-regulation,
gained relevant leadership competencies which in turn allows them to lead their team
to achieve better team assessed performance was partly supported. The relationship
between intervention and Presentation, Business Plan and Simulation Performance
was not mediated by leader competencies. On the other hand, the relationship
between the self-regulation intervention and Group Report and Reflective Report
was mediated by leader competencies.
5.3. Contributions of the research
5.3.1. Implications to theory
The findings of the current research have several theoretical implications that extend
existing knowledge and establish an agenda for future research in leadership
development.
First, this research provides a theoretical conceptualisation of how 360-degree
feedback and executive coaching, when used together as a form of leadership
development approach, can work effectively. This was achieved by theorising and
providing empirical evidence in support of a self-regulation process model. In

197
particular, the current conceptual model suggested that the process of 360-degree
feedback and executive coaching reflects the process of self-regulation.
The current theoretical conceptualisation provides an understanding of why (i) 360-
degree feedback yielded mixed findings in the improvement of leaders’ performance
(Kluger & DeNisi, 1996) and (ii) why 360-degree feedback combined with executive
coaching produced higher leader improvement in leaders’ performance (Smither,
London, Flautt, Vargas, & Kucine, 2003). 360-degree feedback as a leader
developmental programme aims to increase self-awareness within the leader through
identifying cognitive discrepancies between how the leader sees themselves and how
others see them (Atwater & Yammarino, 1992; Church, 1997). However, the
assumption here is that leaders, who are aware of the need for the development of
certain competencies in order to overcome their weaknesses and to perform better,
will change their behaviour (McCarthy & Garavan, 1999). Obviously this is not
always the case.
Looking at the most comprehensive self-regulation framework which is comprised of
seven stages (receiving relevant information, evaluating the information and
comparing it to the desired goal, triggering change, searching for options to change,
formulating a plan, implementing the plan and assessing the effectiveness of the
plan), 360-degree feedback triggers the first stage of the self-regulation process. The
current research outlined that leaders who inherently possess a high self-regulation as
a trait, are possibly the leaders who demonstrated improvement in performance when
198
360-degree is implemented. However, for leaders who do not, the benefit of 360-
degree ends at leaders being aware of their need for development i.e., the state of
knowing. Therefore, from the literature review on executive coaching (Chapter Two),
the current thesis revealed that the phases of executive coaching reflect the
subsequent process of self-regulation. From the stage of self-awareness, the
executive coach helps leaders to evaluate their feedback and compare themselves to
a standard (expectations from followers, supervisors, etc.). Next, the executive coach
will trigger change by searching for ways of improvements. This is then followed by
the formulating of a clear plan to change, followed by the implementation of the
plan. Lastly, the outcome and achievement are evaluated against the plan (Douglas &
Morley, 2000; Olivero, Bane, & Kopelman, 1997; Saporito, 1996; Tobias, 1996;
Winum, 2006; Witherspoon & White, 1996). Thus, it is not surprising when 360-
degree feedback is combined with executive coaching as a leadership developmental
programme, it was found to be effective (Olivero, Bane, & Kopelman, 1997;
Smither, London, Flautt, Vargas, & Kucine, 2003) because the executive coach plays
the role of ‘regulator’ and this completed the framework of self-regulation process.
360-degree feedback forms the state of knowing and an executive coach translates
the knowing state by doing, i.e., putting into action the need of development. The
theoretical framework suggested by this thesis begins to shed light on the
effectiveness of the practice of 360-degree feedback and executive coaching, where
currently both of their practical application and success is far ahead of its theoretical
understanding.

199
Second, the current research extends its contribution by integrating and converting
the construct of self-regulation to understand the role of self-regulation processes
within the context of leadership development. Current leadership development
research advocates self-regulation as a construct which could lead to more effective
leadership, an example could be seen in authentic leadership development. Within
authentic leadership, self-regulation is proposed as part of the underlying component
which is associated in the development of an authentic leader (Avolio & Gardner,
2005; Avolio, Walumbwa, & Weber, 2009b). Within this conceptualisation, self-
regulation provides an understanding of how a leader’s actions are guided by a
leader’s true self in reflecting core values, beliefs, thought and feelings. The
demonstration of this high level of openness is a pertinent component to developing
trust in leader and follower relationships (Gardner, Avolio, Luthans, May, &
Walumbwa, 2005). As leadership development is a strategy to expand a leader’s
capacity to be effective in the leadership role and processes (McCauley & Van
Velsor, 2004), self-regulation has so far been conceptualised as the ‘what’ that
contributes to leader effectiveness but the current research extended the application
of self-regulation as a construct of ‘how’ it could be developed. It is the latter aspect
that has not been empirically tested in leadership development.
The use of self-regulation strategies has long been applied in clinical and educational
psychology as a form of competency to help individuals help themselves through
planned interventions (Boekaerts, Maes, & Karoly, 2005). Drawing on this, the
current thesis provided an empirical contribution to the successful development of

200
self-regulation strategies in leaders within the leadership context, to increase leader
performance as well as their team’s performance. Leaders who are trained in self-
regulation strategies were rated by their followers to be more satisfactory in meeting
their demands, more effective and eventually, increased the followers’ motivation to
exert extra effort in their tasks. In addition, performance measures obtained by
leaders’ performance in leading their team to run a virtual company, and assessment
of their performance in doing so, also provided support that leaders trained in self-
regulation strategies were able to lead their team to perform better. Thus, the
empirical findings of this research contributed to integration and conversion of the
self-regulation construct to self-regulation process within leadership development.
Third, the results from this research have significant implications for competency
modelling within leadership development effort to identify the leadership
competencies that are required for leading people towards organisational goals.
Leaders trained in self-regulation strategies were able to develop relevant
competencies needed in the role they were performing. Within traditional methods of
leader competency modelling, there are several limitations despite the benefits that
come with it. For example, the long and numerous list of competencies identified
(Prewitt, 2003) may have unintended consequences where leaders are just ‘checking-
off’ competencies in the model systematically, which could limit the innovation and
synergistic growth of the leader as an individual (Zenger & Folkman, 2002). If
rigidly applied, it may create ‘cookie-cutter’ leaders inside the organisation. The high
homogeneity, in time, will contradict the organisation’s aim of achieving competitive

201
advantage through leaders (Zaccaro & Banks, 2004). In addition, not all
competencies are of equal importance, competency modelling faces the challenge
that the competencies needed by leaders vary from one situation to another; and from
one follower to another. Competencies required by leaders are different according to
their role and levels (Hooijberg, Hunt, & Dodge, 1997; Hooijberg & Schneider,
2001; Mumford, Marks, Connelly, Zaccaro, & Reiter-Palmon, 2000; Streufert &
Nogami, 1989; Streufert & Swezey, 1986) and also relevant competencies that are
perceived to be important for each follower or organisation, will also differ.
According to Implicit Leadership Theory (Lord, Foti, & DeVader, 1984), the
importance or need for a particular leader attribute depends on the perceiver
(leader/follower/group/ organisation) within the context. Take the following classic
example, followers who prefer higher guidance and direction in their job would
perceive a leader to be effective if the leader possesses the competency to guide
them. However, other followers who are creative may prefer a leader with the
competency to coach rather than direct. On the other hand, practitioners for their part
in developing leaders are faced with the same challenges in trying to design
interventions to develop what is perceived to be the most effective competencies
needed in leaders at that moment.
The current research acknowledges the challenges of the complex interaction of
leaders with situational and social variables, as well as the limitations to leadership
development practitioners designing and identifying competencies in which the
leaders need. As Boyatzis (1999) pointed, “competencies, even those empirically

202
determined to lead or related to outstanding job performance, are necessary but not
sufficient to predict performance” (p. 16). Instead of just ‘fitting’ a leader into his/her
role, leaders need to be trained to develop themselves within their role. Theoretical
conceptualisation and empirical results from this study make a distinct contribution
in view of this limitation. The results suggest that when leaders are trained with self-
regulatory strategies, they are able to recognise the competencies that are most
relevant to their current leadership role and followers’ needs, and seek to develop
those competencies.
Fourth, adding to the leader competencies literature, the findings of the current
research supported the notion that leader competencies mediate the relationship
between self-regulation and leader performance. Drawing from the findings above
where self-regulation training leads to the successful acquisition of relevant leader
competencies and when these competencies are put into operation, contributes to the
successful performance of tasks. In the context of leadership development, these
tasks are goals that a leader seeks to achieve and lead the team to achieve them. As
previously mentioned in the literature review, leaders frequently need to confront
crucial and relevant real-time issues and come up with best solutions in the shortest
period of time (Day, 2000; Mumford, Zaccaro, Harding, Jacobs, & Fleishman,
2000). To do so, leaders need skills and abilities to develop and implement solutions
with followers, peers or supervisors operating in complex and dynamic contexts.
Within this process, leaders face the complex interactions between them and the
social and organisational environment (Fiedler, 1996). Effective leaders need to have

203
the social skills and abilities required to solve a variety of interpersonal and
organisational problems (Mumford, Zaccaro, Harding, Jacobs, & Fleishman, 2000;
Ulrich, Brockbank, Yeung, & Lake, 1995; Wexley & Baldwin, 1986; Zaccaro,
Mumford, Connelly, Marks, & Gilbert, 2000). In addition, leaders also need certain
knowledge sets in order to generate solutions required in addressing these challenges
(Mumford, Zaccaro, Harding, Jacobs, & Fleishman, 2000). This knowledge set also
serves as a repertoire of behavioural responses from which the leader can draw to
solve problems effectively (Zaccaro, Foti, & Kenny, 1991). Therefore the KSAO
(knowledge, skills, abilities and other attributes) package of leaders summarised in
the form of competencies is crucial for leaders to perform effectively in their role.
Results from the subjective (followers ratings) and objective (team financial
performance and teams assessment) data of this research, provides strong support
that leaders equipped with self-regulation strategies lead to the development of
relevant skills which in turn lead to leader effectiveness and successful performance
of tasks. Therefore, drawing from these findings, this thesis put forward the unique
contribution of conceptualising self-regulation as a meta-competency that will allow
leaders to be aware of what competencies are required to perform effectively and
regulate their behaviour into developing the relevant competencies to achieve the
desired results.
Fifth, this research sought to remedy the methodological gap raised by Reichard and
Avolio (2005) that not all research that claimed to investigate leadership
development manipulated leadership itself. Based on a meta-analysis study

204
conducted to evaluate the leadership intervention (experimental or quasi-
experimental studies) in the past 100 years, the study identified that when leadership
is manipulated, the manipulations are conducted in laboratory settings rather than in
field settings (Avolio, Reichard, Hannah, et al., 2009a). In addition, out of 138
studies, only 37 studies manipulated leadership through intervention through training
or development of the leader. These studies truly aimed to enhance a leader’s
knowledge, skills, ability or motivation which will enable leaders to implement
positive influence in the leadership context. In contrast, the rest of the 101 studies
were considered non-developmental interventions. These studies mainly consist of
manipulations of leader’s behaviour through assignment, role play, scripts and
similar approaches. The intervention conducted within this research was specifically
designed to develop leader’s self-regulation. Consistent with the meta-analytic
findings of Avolio and his colleagues, research that is developmental has a stronger
effect for leadership interventions which is observed in the findings of the self-
regulation intervention.
Sixth, focussing on the development of the leader, this study also overcomes the
limitations of other leadership development studies whereby leaders were developed
across a period of at least six months, versus interventions that lasted less than a day.
Leaders were initially coached by an executive coach for a minimum of 4 hours and
they also received an initial 360-degree feedback report. After 3 months, they
received an updated feedback report and after 6 months of the intervention, another
updated feedback report. The long term focus of this study, contributes findings that
205
counteract the short term limitations in short term leadership interventions which
raised concerns with regards to the long term effect and the durability of the change
(Avolio, Reichard, Hannah, et al., 2009a).
Seventh, the current study measured the effect of the intervention across a period of
nine months to evaluate lasting effects of the leadership intervention. The current
study contributes to the call for longitudinal designs within leadership research which
has fallen on deaf ears. In the 1990s, 82% of studies used a cross-sectional design as
compared to 18% with a longitudinal design (Lowe & Gardner, 2000). Between 2000
and 2010, the percentage for longitudinal designs only increased by 3.7% after a
decade of calls for more longitudinal designs within leadership research (Gardner,
Lowe, Moss, Mahoney, & Cogliser, 2010). Drawing from the resource allocation
theory (Kanfer & Ackerman, 1989), a longitudinal design is imperative for research
examining an intervention because it is proposed that after leaders are trained on how
to self-regulate, the leaders will divert attention and resources to absorb new
information, operationalise the new competencies learned, lead their team, and also
strive to accomplish the goal expected of them as a leader. As suggested by DeShon
and colleagues, self-regulatory activities do not use up a significant amount of
attentional resources and following this logic (DeShon, Brown, & Greenis, 1996), it
is expected that after the intervention, leaders would take some time (but not a
significant amount of time) to accumulate attentional resources necessary to translate
self-regulation learned into performance outcomes, and in time, demonstrate
increased actual performance. As the relationship between self-regulation training

206
and leader performance will become more pronounced over time, thus it is crucial to
investigate the effect of an intervention using a longitudinal design.
Eighth, the significance of the longitudinal field experimental design of this research,
are many fold. Conducting the experiment in a natural setting instead of a contrived
artificial one in a laboratory, allows the transfer of findings to real life settings
(Christensen, 2007). The study was conducted in a setting where participants hold
the position of a leader, they were new to the particular leadership tasks, position and
role requirements, and they needed to lead team members to achieve a specific goals
within a set time frame. On the other hand, followers worked in highly diverse teams
to complete work tasks such as strategic planning and assessment of the markets and
competitors; implementing marketing, operation, human resource management and
financial strategies; and at the same time, to meet shareholders expectations to
generate returns on investment. The level of performance held a high consequence to
the leaders’ as well as the followers’ in terms of the degree they were studying. The
field setting, combined with the longitudinal nature of the experimental design,
allowed the investigation of the causal relationships of constructs as well as
evaluating the long term effect and the durability of the change as a result of the
intervention (Bryman, 2001; Shadish, Cook, & Campbell, 2002).
Ninth, by using a longitudinal design with data collected from different sources
(followers, supervisors, external raters, computer simulation) to investigate and
support the hypotheses proposed, the contribution of the findings cannot be fully
207
accounted for by the effect of common method variance. Common method variance
is one of the main problems when research design collects data from one source and
could lead to a systematic measurement error and further bias the relationship among
the variables of interest (Podsakoff, MacKenzie, Lee, & Podsakoff, 2003). Therefore,
the different measurement methods used in the current research provide a more
robust test for the hypotheses and controlled for the threats of Type I and Type II
errors due to inflated or deflated relationships amongst the observed variables.
Tenth, the present study also adds to a growing line of research by applying
computer simulations (Gardner, Lowe, Moss, Mahoney, & Cogliser, 2010) and
draws upon the strength of such a method. The current research was conducted in a
naturally occurring setting in which students take the Business Strategy Game (BSG)
module performing an interactive computer simulation. The computer simulations,
structures and settings, in which the leaders and followers interacted, reflected an
organisational setting. Group leaders led and influenced their teams in developing a
competitive strategy, developing and managing a virtual company’s portfolio,
creating a shareholder value, analysing competitors and creating customer value. In
addition to the task, leaders needed to manage the followers and relationships
between the followers within their team. The use of a computer simulation is a new
methodological aspect within leadership research, which Gardner, Lowe, Moss,
Mahoney and Cogliser (2010) suggest in their review; “will move the science of the
field forward” (p.951) over the next decade.

208
5.3.2. Implication to practice
Findings from the current research have several noteworthy implications for
leadership development practice in organisations as well as for the leadership
process.
First and foremost, the current research emphasises the importance of the
development of self-regulation strategies to enable leaders to help themselves, i.e.,
help leaders to develop relevant competencies to enhance their own effectiveness as
well as improving team performance. 360-degree feedback is widely applied in many
organisations and with the large number of validated 360-degree feedback
instruments available, feedback is an increasingly accessible and inexpensive
leadership development intervention (Atwater, Ostroff, Yammarino, & Fleenor,
1998; Fleenor, Smither, Atwater, Braddy, & Sturm, 2010; Tornow & London, 1998).
However, the current research highlighted the incompleteness in the application of
360-degree feedback as a form of leadership developmental programme when
applied independently. To facilitate effective utilisation of 360-degree feedback, the
findings from this research suggested that incorporating a self-regulation intervention
allows leaders to translate the state of knowing from feedback obtained via 360-
degree to the state of doing via self-regulation strategies.
Second, although references were often made to the limitations of leader competency
modelling (Prewitt, 2003; Zenger & Folkman, 2002), the assertion has been lacking
in answer as to how those involved in the work of leadership could solve these
209
limitations. Leaders in organisation, frequently need to confront crucial and relevant
real time issues (Day, 2000; Mumford, Zaccaro, Harding, Jacobs, & Fleishman,
2000) and at the same time, need to have the social skills and abilities required to
solve a variety of interpersonal and organisational problems (Mumford, Zaccaro,
Harding, Jacobs, & Fleishman, 2000; Ulrich, Brockbank, Yeung, & Lake, 1995;
Wexley & Baldwin, 1986; Zaccaro, Mumford, Connelly, Marks, & Gilbert, 2000).
Besides the different competencies perceived to be important for a leader by the
followers, there could also be a difference in perception amongst practitioners when
they try to model these relevant competencies that need to be developed. The current
research proposed that leaders would be the best person to identify the competencies
needed within their own role and when equipped with self-regulation strategies, they
would be able to seek means to improve the relevant competencies needed. Thus, it
is suggested that organisations can facilitate this experience-based leadership
competency development by providing self-regulatory training to leaders to enhance
their continuous development.
Third, although executive coaching has been proven to be effective in ensuring
improved performance after 360-degree feedback was conducted (Olivero, Bane, &
Kopelman, 1997; Smither, London, Flautt, Vargas, & Kucine, 2003), it is very
expensive and can cost from US$300 to US$1500 monthly for one leader (Douglas
& Morley, 2000). Because of its high cost, executive coaching is usually only
available for upper levels of management. The current research identified that
executive coaching plays the role of ‘regulator’ in the equation of leader

210
development. 360-degree feedback and executive coaching, together reflect the
process of self-regulation. The empirical findings from this research demonstrated
positive leader and team outcomes when 360-degree feedback and self-regulation
training were implemented. The practical implication of this finding is that many
more leaders and organisations could benefit from this cost effective leadership
development intervention. 360-degree feedback is already widely applied within
organisations, almost 90% of Fortune 500 companies (Bracken, Timmereck, &
Church, 2001; Edwards & Ewen, 1996), and is increasingly inexpensive (Fleenor,
Smither, Atwater, Braddy, & Sturm, 2010). Group coaching on self-regulation
strategies is more cost efficient compared to executive coaching and could be used
by organisations along with 360-degree feedback to harvest its full benefits. Thus, a
leadership development intervention designed to increase self-regulation will not
only sustain a continuous cycle of leader development but also reduce cost and
expand the benefits of executive coaching to more leaders beyond the upper
echelons.
Fourth, organisations invest in leadership development programmes with the aim to
improve performance of the leader, however, research tends to measure leader’s
performance in terms of subjective or perceptual outcomes (e.g., followers ratings of
leader satisfaction or leader effectiveness) (Koene, Vogelaar, & Soeters, 2002). It is
no wonder, without objective measures such as financial outcomes, organisations
perceived leadership development interventions as something “nice to have” (Avolio,
2005) instead of a requirement. Only relatively few studies have linked a leadership

211
development intervention with objective financial outcomes (Avolio, Avey, &
Quisenberry, 2010; Bradley, Nicol, Charbonneau, & Meyer, 2002; Howell & Avolio,
1993; Koene, Vogelaar, & Soeters, 2002; Mumford, Hunter, Eubanks, Bedell, &
Murphy, 2007; Schlosser, Steinbrenner, Kumata, & Hunt, 2006). Measures of
objective performance increases the organisations confidence of a return in their
investment and that organisational resource are well spent on leadership
developmental effort. Findings from the current research, demonstrated that a
leadership intervention has an impact on the company’s financial performance
through increase profit, higher return in capital employed and effective management
of debt which in turn, led to a higher return for the investors.
Fifth, as mentioned above, the use of 360-degree feedback and an intervention to
increase self-regulation strategies facilitated experience-based leadership
competency development and enhanced leaders’ continuous development. This form
of leadership developmental intervention is beneficial for organisations to prevent
derailments among leaders. For example, research in 360-degree feedback found that
leaders who are less self-aware are more likely to derail in their career progression
(Bass & Yammarino, 1991; McCall & Lombardo, 1983). In addition, examples of
executive coaching development case studies have been to support derailed executive
(Hall, Otazo, & Hollenbeck, 1999; McDermott & Levenson, 2007; Velsor & Leslie,
1995; Wasylyshyn, 2008; Winum, 2006). Mumford, Campion and Morgeson (2007)
in their leadership skill strataplex model put forward that as leaders ascend to higher
levels in an organisation or across organisations, they would need different

212
competencies and these competencies are more cumulative rather than exclusive.
Furthermore, empirical findings by Mumford, Marks, Connelly, Zaccaro and Reiter-
Palmon (2000) in assessing the competencies across six grade levels of officers in the
U.S. Army, demonstrated an increase in leaders’ competencies in higher grade levels
in comparison to their lower counterparts. It is acknowledged that the competencies
measured by Mumford and his colleagues are relevant to military leadership and
leadership competencies needed for organisational leadership is arguably different.
The pertinent point here is that competencies increase as a leader ascends into higher
level positions within an organisation and leaders derail if they are not able to
develop new relevant skills to meet the new demands. Therefore, the current research
findings of 360-degree feedback and self-regulation training have individual
relevance as well as organisational implications by providing a pragmatic solution to
problems stated above by: (i) developing relevant competencies for leader’s role and
(ii) preventing leaders from derailing as they progress in their career.
To surmise, comparing with the old saying of, “Give a man a fish and you feed him
for today, teach a man to fish, and you feed him for life”; leader intervention
programmes designed to develop leaders’ self-regulation is similar to training the
leaders ‘to fish’. Instead of adopting a myopic view of solving an immediate problem
using executive coaching (e.g., regulating leaders’ action to develop a particular
competency which is needed at that moment), leadership development programmes
should develop leaders’ meta-competency i.e., self-regulation. Meta-competency in
the form of self-regulation will allow leaders to perform effectively by meeting the
213
demands of various constituencies through awareness of what is needed, and
proactively engaging themselves to develop further competencies that are needed.
Thus, a leadership development intervention designed to increase self-regulation will
not only sustain a continuous cycle of leader development but also reduce cost and
expand the benefits of executive coaching to more leaders within the organisation.
5.4. Potential limitations
Notwithstanding the previously mentioned contributions, there are several potential
limitations to this research that should be kept in mind when interpreting the research
findings. Issues concerning both research design and methodological concerns are
explored within this section.
There are two potential limitations to the field experimental design for this research,
internal and external validity. History, maturation, instrumentation, regression
artefact, attrition and self-selection biases were potential threats to internal validity.
History, which is events that occur during the period of the experiment and
maturation, which is due to participants aging, could impact the changes at the end of
the experiment (Bryman, 2001). However, in this study, both factors were controlled
for by including a control group within the experimental design. Therefore, if there
was any event or change during the study that might impact on the findings, both
experimental and control groups were equally exposed to these and were concluded
to be comparable (De Vaus, 2001). Next, instrumentation was not an issue in this
study as the researcher used the questionnaire as the main measurement instrument
214
and the same questionnaire was used throughout the study. Another form of threat to
internal validity was regression artefacts which refer to the measurement scores of
participants tending to move towards the mean, even without intervention (Shadish,
Cook, & Campbell, 2002). Such potential incidents were controlled in the study in
order to draw valid inferences from the findings. The researcher used the proposed
solution of randomisation assignment, where participants were randomly allocated to
the experimental and control groups. An independent t-test was also conducted to
compare the characteristics of both the experimental and control groups and results
demonstrated that there was no significant difference. Sometimes, some participants
in experimental study could not complete the study due to certain circumstances and
this is fairly common. This threat to internal validity is called attrition or mortality.
The current experimental design of pretest-posttest with a control group is the best
method to control for such a threat. However, such occurrence may not be totally
controlled for unless the attrition rate is equal in both, experimental and control
group (Shadish, Cook, & Campbell, 2002). Finally, although the experiment
randomly allocated participants into control and experimental groups, there could be
the threat of self-selection biases when participants possessing certain characteristics
are more likely to turn up for the intervention. Participants were informed that the
intervention would improve their leadership skills, it was possible that participants
who already posses higher self-regulation are more likely to attend the intervention.
Thus, measurements for self-regulation and all performance measures were taken
during pretest and were analysed for any significant difference between groups.
215
Results in Chapter Four confirmed that there were no significant differences between
those in experimental and control groups.
On the other hand, there are two potential threats to external validity such as
interactive effects of testing and interactive effects of sampling (Bryman, 2001;
Christensen, 2007; Cooper & Schindler, 2003). As the current research consists of
pretesting, there is the likelihood that participants could become more or less
sensitive to the experiment variable or treatments. The method to reduce this threat is
to utilise an experimental design without pretest. However, pretesting was crucial
within an experimental design, particularly for the current research, to make an initial
comparison between participants in the control and experimental groups are not
significantly different on relevant variables. Pretesting also allowed for the control of
the potential threat of interactive effects of sampling in the event of random
assignment of participants into teams which showed to be fallible.
The sample size of the participants was lower than expected, which could pose as a
potential limitation and decrease the generalisability of the current findings. In
addition, due to the relatively small sample size, it was not possible to use statistical
analysis such as Structural Equation Modelling that could have tested the model as a
whole. Given this potential limitation, the intervention was successful and the
findings were promising. It is recommended to replicate the findings with a larger
sample to provide further support.
216
The sample of the research consisted of Business School undergraduate students in
the Business Strategy Game (BSG) module performing an interactive computer
simulation. Although student samples are widely employed (c.f., Anderson &
Schneier, 1978; DeRue & Morgeson, 2007; Rapp & Mathieu, 2007; Stam, van
Knippenberg, & Wisse, 2010; Vancouver, More, & Yoder, 2008), there was still a
potential limitation of generalisability of the findings to organisational contexts and
this needs to be considered. However, the BSG module served as a backdrop for this
study as it shared a number of characteristics that would be found in organisational
settings. For example, the teams worked in a diverse group to complete work tasks
such as strategic planning and assessment of the markets and competitors;
implementing marketing, operation, human resource management and financial
strategies; and at the same time, to meet shareholders expectation to generate return
on investment. Also, the team leader shared characteristics such as; they hold the
position of a leader, they were fairly new to the particular leadership tasks, position
and role requirements, and they needed to lead team members to achieve a specific
goals within a time frame. The module was completed over a ten month period, and
the level of performance holds high consequence to their degree result. The intention
of these carefully selected characteristics is to make it more probable that the current
findings will generalise to other contexts. The next step suggested would be to
replicate these findings with non-student sample to provide further support.

217
5.5. Avenues for future research
The current research serves as a solid foundation for future inquiries that could
further advance the understanding on leadership development. Within this section,
the additional possibilities for future research, to add to the depth and breadth of the
present findings will be discussed.
While the successful manipulation of self-regulation as a form of meta-competency
allows individual leaders to be aware of what competencies are required to perform
effectively and regulate their behaviour into developing the relevant competencies to
achieve the desired results, organisational support may enhance or decrease the
effectiveness of the relationship. As such, it is recommended for future research to
examine if organisational support moderates this relationship. Organisational support
in the form of resources made available by the organisation could reinforce
development amongst individuals (Tracey, Tannenbaum, & Kavanagh, 1995) and
foster a continuous learning environment (Noe & Wilk, 1993). Previous research has
demonstrated a link between organisational support practices and performance
(Baldwin, Magjuka, & Loher, 1991; Tharenou, 2001). Thus, further research could
investigate the effect of organisational level support on the leaders’ tendency to
develop relevant competencies after self-regulation training and inform how
organisation could facilitate leader developments.
In addition, research is also needed to identify individual characteristics that predict
leaders’ readiness for development and understand how these characteristics affect

218
the success of the self-regulation intervention. Certain traits are proposed to promote
how leaders develop from experience. For example, Tesluk and Jacobs (1998)
suggested that traits such as ‘openness to experience’ and ‘risk tolerance’ can
influence the likelihood that leaders will accept developmental interventions (Tesluk
& Jacobs, 1998). More recently, an individual difference in terms of ‘developmental
readiness’ was put forward as a potential moderator that could serve to accelerate
leadership development (Hannah & Avolio, 2010). Individuals with higher
developmental readiness are proposed to develop quicker and more efficiently
(Shebaya, 2010). Identifying the moderators between the leadership development
intervention and outcomes would provide more a holistic insight to the current
findings as to how much individual differences influence the success of leader
developmental effort.
One-on-one coaching is the most commonly practiced method in the leadership field
compared to group coaching (Manfred & Kets, 2005). However, group coaching is
the fastest growing segment of the coaching profession. According to the research
conducted by Manfred and Kets (2005), group coaching yields a higher pay-off.
Future research should examine the relative effectiveness of group versus one-on-one
coaching by including both these two modalities in the experimental design. Besides
extending knowledge on which method yields the most effective coaching process
and outcomes, it will also be beneficial to inform practice if group coaching is equal
or more effective compared to one-on-one coaching because group coaching will
incur less cost and time.

219
The sample in this research study was students in the Business School who take the
Business Strategy Game (BSG) module performing an interactive computer
simulation. Future research needs to continue exploring the effects of a self-
regulation intervention using other samples from organisations. Although the
characteristics of the sample and field settings were carefully selected to make it
more probable that the current findings will generalise to other contexts, a replication
of the findings from this research in the context of organisations could provide
further support. In addition, researchers are often advised to use multiple methods to
confirm data and understand the data further (Smith, 1996). Therefore, methods such
as interviews with participants or others (e.g., followers, supervisors, clients, etc.),
observation of team meetings, or tracking of action plans could provide additional
information to confirm pretest/posttest scores and lead to an enriched explanation of
the research problem (Martineau, 2004).

220
5.6. Epilogue
The present research compared a leadership development intervention based on self-
regulation training and its impact on leader performance. Specifically, it examined
the intervention’s effect on followers’ perceptual measures of leader effectiveness as
well as objective measures of teams’ financial performance and independent
assessment measures. Leader competencies were also tested as a mediator. Overall,
the empirical findings revealed that the self-regulation intervention had a positive
impact on leader and team performance. Leaders trained in self-regulation developed
relevant competencies for their role and these competencies positively affected
performance.
This thesis adds to the growing line of leadership development research in terms of
theory and practical implications. The conceptual framework suggested in this thesis
begins to shed lights on the underlying mechanism of why the practice of 360-degree
feedback and executive coaching are successful because the practice of both, has far
preceded its theoretical understanding. Additionally, this thesis puts forward the
unique contribution of conceptualising self-regulation as a meta-competency that
allows leaders to be aware of what competencies are required to perform effectively
and regulate their behaviour into developing relevant competencies to achieve the
desired results to meet the complex demands of leadership. Furthermore, the robust
design of the longitudinal field experimental study advocates the change that has
been called for in leadership developmental research. The findings also highlight
several important implications for organisations and practitioners of leadership

221
development, in which the intervention designed to increase self-regulation, will not
only sustain a continuous cycle of leader development but also reduce costs and
expand the benefits of executive coaching to more leaders beyond the upper
echelons.
To conclude, and return to the saying in the introduction of this thesis, instead of
saying “Give a man a fish and you feed him for today, teach a man to fish and you
feed him for life”, this research suggests “Give a leader an executive coach and you
solve his problem for today, teach a leader to self-regulate and you develop him for
life”.

222
Bibliography
2010 Training industry report. (2010). Training, 47(6), 18-31.
Adair, J. (2009). Not Bosses but leaders, how to lead the way to success (pp. 1-208). Guildford: Kogan Page Limited.
Anderson, C. R., & Schneier, C. E. (1978). Locus of Control, Leader Behavior and Leader Performance among Management Students. Academy of Management Journal, 21(4), 690-698.
Atwater, L. E., Dionne, S. D., Avolio, B. J., Camobreco, J. F., & Lau, A. W. (1999). A longitudinal study of the leadership development process: Individual differences predicting leader effectiveness. Human Relations, 52(12), 1543–1562.
Atwater, L. E., Ostroff, C., Yammarino, F. J., & Fleenor, J. W. (1998). Self-other agreement: Does it really matter? Personnel Psychology, 51, 577-598.
Atwater, L. E., & Waldman, D. A. (1998). 360 degree feedback and leadership development. Leadership Quarterly, 9(4), 423-426.
Atwater, L. E., & Yammarino, F. J. (1992). Does self-other agreement on leadership perceptions moderate the validity of leadership and performance predictions. Personnel Psychology, 45, 141-165.
Avolio, B. J. (2005). Leadership development in balance: Made / Born. New Jersey: Lawrence Erlbaum Associates.
Avolio, B. J. (2007). Promoting more integrative strategies for leadership theory-building. American Psychologist, 62(1), 25-33.
Avolio, B. J., Avey, J. B., & Quisenberry, D. (2010). Estimating return on leadership development investment. Leadership Quarterly, 21(4), 633-644.
Avolio, B. J., & Chan, A. (2008). The dawning of a new era for genuine leadership development. In G. P. Hodgkinson & J. K. Ford (Eds.), International Review of Industrial and Organizational Psychology (23rd ed., pp. 197-238). Wiley-Blackwell.
Avolio, B. J., & Gardner, W. L. (2005). Authentic leadership development: Getting to the root of positive forms of leadership. Leadership Quarterly, 16(3), 315-338.

223
Avolio, B. J., Reichard, R. J., Hannah, S. T., Walumbwa, F., & Chan, Adrian. (2009). A meta-analytic review of leadership impact research: Experimental and quasi-experimental studies. Leadership Quarterly, 20(5), 764-784.
Avolio, B. J., Walumbwa, F., & Weber, T. J. (2009). Leadership: Current theories, research, and future directions. Annual Review Psychology, 60, 421-49.
Baldwin, T. T., Magjuka, R. J., & Loher, B. T. (1991). The perils of participation: Effects of choice of training on trainee motivation and learning. Personnel Psychology, 44(1), 51-65.
Bandura, A. (1991). Social cognitive theory of self-regulation. Organizational Behavior and Human Decision Processes, 50, 248-287.
Barnes, D. (2001). Research methods for the empirical investigation of the process of formation of operations strategy. International Journal, 21(8), 1076-1096.
Baron, R. M., & Kenny, D. (1986). The moderator-mediator variable distinction in social psychological research: conceptual, strategic, and statistical considerations. Journal of Personality and Social Psychology, 51(6), 1173-1182.
Bass, B. M. (1990). Bass & Stogdill’s handbook of leadership: Theory, research, and managerial application (3rd ed.). New York: Free Press.
Bass, B. M., & Avolio, B. J. (1990). Transformational leadership development: Manual for multifactor leadership questionnaire. Consulting Psychologists Press. CA: Palo Alto.
Bass, B. M., & Bass, R. (2008). The Bass handbook of leadership: Theory, research, and managerial applications (4th ed.). New York: Free Press.
Bass, B. M., & Yammarino, F. J. (1991). Congruence of self and othersʼ leadership ratings of naval officers for understanding successful performance. Applied Psychology: An International Review, 40(4), 437-454.
Battilana, J., Gilmartin, M., Sengul, M., Pache, A., & Alexander, J. (2010). Leadership competencies for implementing planned organizational change. Leadership Quarterly, 21(3), 422-438.
Baum, F. (1995). Researching public health: Behind the qualitative-quantitative methodological debate. Social Science & Medicine, 40(4), 459-468.
Bender, R., & Ward, K. (2008). Corporate financial strategy (3rd ed., pp. 1-408). Oxford: Elsevier Butterworth-Heinemann.

224
Bentler, P. M., & Bonett, D. G. (1980). Significance tests and goodness of fit in the analysis of covariance structures. Psychological Bulletin, 88(3), 588-606.
Binswanger, H. (1991). Volition as cognitive self-regulation. Organizational Behavior and Human Decision Processes, 50, 154-178.
Blancero, D., Boroski, J., & Dyer, L. (1996). Key competencies for a transformed human resource organization: Results of a field study. Human Resource Management, 35(3), 383-403.
Blattner, J. (2005). Coaching: The successful adventure of a downwardly mobile executive. Consulting Psychology Journal: Practice and Research, 57(1), 3-13.
Bliese, P. D. (2000). Within-group agreement, non-independence, and reliability: Implications for data aggregation and analysis. In K. J. Klein & S. W. J. Kozlowski (Eds.), Multilevel theory, research, and methods in organizations (p. 349−381). San Francisco: Jossey- Bass.
BMW annual report. (2009). BMW Group.
Boekaerts, M., Maes, S., & Karoly, P. (2005). Self-regulation across domains of applied psychology: Is there an emerging consensus? Applied Psychology: An International Review, 54(2), 149-154.
Bonfield, H. (2003). Executive coaching is not just for big companies. British Journal of Administrative Management, 36, 18-20.
Bouty, I. (2000). Interpersonal and interaction influences on informal resource exchanges between R&D researchers across organizational boundaries. Academy of Management Journal, 43(1), 50-66.
Boyatzis, R. E. (1999). Self-directed change and learning as a necessary meta-competency for success and effectiveness in the 21st century. In R. Sims & J. G. Veres (Eds.), Keys to Employee Success in the Coming Decades (pp. 15-31). Westport, CT: Greenwood Publishing.
Boyce, L. a, Zaccaro, S. J., & Wisecarver, M. Z. (2010). Propensity for self-development of leadership attributes: Understanding, predicting, and supporting performance of leader self-development. Leadership Quarterly, 21(1), 159-178.
Bracken, D. W., Timmereck, C. W., & Church, A. H. (2001). The handbook of multisource feedback. San Francisco: Jossey-Bass.
Bracken, David W, Dalton, M. A., Jako, R. A., McCauley, C. D., Pollman, V. A., & Degree, S. H. (1997). Should 360-degree feedback be used only for

225
developmental purposed? Victoria. North Carolina: Center for Creative Leadership.
Bradley, J., Nicol, A., Charbonneau, D., & Meyer, J. (2002). Personality correlates of leadership development in Canadian Forces officer candidates. Canadian Journal of Behavioural Science, (1993), 92-103.
Brake, T. (1997). The global leader: Critical factors for creating the world class organization. Chicago: Irwin Professional Publishing.
Bresnen, M. (1995). All things to all people? Perceptions, attributions, and constructions of leadership. Leadership Quarterly, 6(4), 495-513.
Brotman, L. E., Liberi, W. P., & Wasylyshyn, K. M. (1998). Executive coaching: The need for standards of competence. Consulting Psychology Journal: Practice and Research, 50(1), 40-46.
Brown, J. M., Miller, W. R., & Lawendowski, L. A. (1999). The self-regulation questionnaire. In L. VandeCreek & T. L. Jackson (Eds.), Innovations in clinical practice: A source book (Vol 17) (pp. 281-289). Sarasota: Professional Resource Press.
Brown, J. M., Miller, W. R., & Lawendowski, L. A. (1999). Innovations in clinical practice: A sourcebook. (L. VandeCreek & T. L. Jackson, Eds.). Sarasota: Professional Resource Press.
Browne, M. W., & Cudeck, R. (1989). Single sample cross-validation indices for covariance structures. Multivariate Behavioral Research, 24(4), 445–455.
Bryman, A. (2001). Social research methods. Bath: Oxford University Press.
Bueno, C., & Tubbs, S. (2004). Identifying global leadership competencies: An exploratory study. Journal of American Academy of Business, (September), 80-88.
Burke, M. J., & Day, R. R. (1986). A cumulative study of the effectiveness of managerial training. Journal of Applied Psychology, 71(2), 232-245.
Burrell, G., & Morgan, G. (1979). Sociological paradigm and organisational analysis. London: Heinemann Educational Books Ltd.
Byrne, B. (2001). Structural equation modeling with AMOS: Basic concepts, applications and programming. Mahwah, New Jersey: Lawrence Erlbaum.
Byrne, B., & Crombie, G. (2003). Modeling and testing change: An introduction to the latent growth curve model. Understanding Statistics, 2(3), 177-203.
226
Calder, B. J. (1977). An attribution theory of leadership. In B. Staw & G. Salancik (Eds.), New directions in organizational behavior (pp. 179-204). Chicago: Clair Press.
Campbell Quick, J., & Macik-Frey, M. (2004). Behind the mask coaching through deep interpersonal communication. Consulting Psychology Journal: Practice and Research, 56(2), 67-74.
Carlyle, T. (1907). Heroes and hero worship. Boston: Adams.
Carver, C. S., & Scheier, M. F. (1998). On self-regulation of behaviour. New York: Cambridge University Press.
Carver, C. S., & Scheier, M. F. (2000). Scaling back goals and recalibration of the affect system are processes in normal adaptive self-regulation: Understanding “response shift” phenomena. Social Science and Medicine, 50(12), 1715-22.
Carver, C. S., & Scheier, M. F. (2002). Control processes and self-organization as complementary principles underlying behavior. Personality and Social Psychology Review, 6(4), 304-315.
Catona, V. M., Cronshaw, S. F., Wiesner, W. H., Hackett, R. D., & Methot, L. L. (2001). Recruitment and selection in Canada (2nd ed.). Scarborough: Nelson.
Chen, G., Gully, S. M., & Eden, D. (2001). Validation of a new general self-efficacy scale. Organizational Research Methods, 4(1), 62-83.
Christensen, L. B. (2007). Experimental methodology (10th ed.). USA: Pearson.
Chung, M.-K. (2000). The development of self-regulated learning. Asia Pacific Education Review, 1(1), 55-66.
Church, A. (1997). Managerial self-awareness in high-performing individuals in organizations. Journal of Applied Psychology, 82(2), 281-292.
Clark-Carter, D. (2004). Quantitative psychological research: A studentʼs handbook. Hove: Psychology Press.
Clutterbuck, D., & Megginson, D. (1999). Mentoring executives and directors. Oxford: Butterworth Heinemann.
Cocivera, T., & Cronshaw, S. F. (2004). Action frame theory as a practical framework for the executive coaching process. Consulting Psychology Journal: Practice and Research, 56(4), 234-245.

227
Collins, D. B., & Holton III, E. (2004). The Effectiveness of managerial leadership development programs: A meta-analysis of studies from 1982 to 2001. Human Resource Development Quarterly, 15(2), 217-248.
Conger, J., & Benjamin, B. (1999). Building leaders: How successful companies develop the next generation. Building. San Francisco: Jossey-Bass.
Conger, J., & Kanungo, R. (1987). Toward a behavioral theory of charismatic leadership in organizational settings. Academy of Management Review, 12(4), 637-649.
Conger, J., & Toegel, G. (2003). Action learning and multi-rater feedback as leadership development interventions: Popular but poorly deployed. Journal of Change Management, 3(4), 332-348.
Conner, J. (2000). Developing the global leaders of tomorrow. Human Resource Management, 39(23), 147-157.
Cooper, D. R., & Schindler, P. S. (2003). Business research methods. Singapore: McGraw Hill.
Covey, S. (2004). The seven habits of highly effective people. London: Simon & Schuster UK Ltd.
Creswell, J. (1994). Research design: Quanlitative and quatitative approaches. Thousand Oaks, CA: SAGE publications.
Crocker, L., & Algina, J. (1986). Introduction to classical and modern test theory. NewYork: Rinehart & Winston.
Cronshaw, S. F., & Lord, R. G. (1987). Effects of categorization, attribution, and encoding processes on leadership perceptions. Journal of Applied Psychology, 72(1), 97-106.
Daimler annual report. (2010). Daimler Group.
Dansereau, F., Alutto, J., & Yammarino, F. J. (1984). Theory testing in organizational behavior: The varient approach. Englewood Cliffs, NJ: Prentice Hall.
Day, D. (2000). Leadership development: A review in context. Leadership Quarterly, 11(4), 581-613.
Day, D., Schleicher, D., Unckless, A., & Hiller, N. (2002). Self-monitoring personality at work: A meta-analytic investigation of construct validity. Journal of Applied Psychology, 87(2), 390 - 401.

228
De Vaus, D. (2001). Research design in social research. Surrey: SAGE publications.
DeRue, D. S., & Morgeson, F. P. (2007). Stability and change in person-team and person-role fit over time: The effects of growth satisfaction, performance, and general self-efficacy. Journal of Applied Psychology, 92(5), 1242-1253.
DeShon, R. P., Brown, K. G., & Greenis, J. L. (1996). Does self-regulation require cognitive resources? Evaluation of resource allocation models of goal setting. Journal of Applied Psychology, 81(5), 595-608.
Deshpande, R. (1983). "Paradigms lost": On theory and method in research in marketing. Journal of Marketing, 47(4), 101-111.
Diedrich, R. C. (1996). An iterative approach to executive coaching. Consulting Psychology Journal: Practice and Research, 48(2), 61-66.
Diedrich, R. C., & Kilburg, R. R. (2001). Further consideration of executive coaching as an emerging competency. Consulting Psychology Journal: Practice and Research, 53(4), 203-204.
Diehl, M., Semegon, A. B., & Schwarzer, R. (2006). Assessing attention control in goal pursuit: A component of dispositional self-regulation. Journal of Personality Assessment, 86(3), 306-317.
Dignath, C., Buettner, G., & Langfeldt, H. (2008). How can primary school students learn self-regulated learning strategies most effectively?A meta-analysis on self-regulation training programmes. Educational Research Review, 3(2), 101-129.
Douglas, C. A., & Morley, W. H. (2000). Executive coaching: An annotated bibliography (pp. 1-60). Greensboro, NC: Center for Creative Leadership.
Dragoni, L., Tesluk, P.E., Russell, J. E. A., & Oh, I. S. (2009). Understanding managerial development: Integrating developmental assignments, learning orientation, and access to developmental opportunities in predicting managerial competencies. Academy of Management Journal, 52(4), 731–743.
Dvir, T., & Shamir, B. (2003). Follower developmental characteristics as predicting transformational leadership: A longitudinal field study. Leadership Quarterly, 14(3), 327-344.
Eden, D. (2001). Means efficacy: External sources of general and specific efficacy. In M. Erez, U. Kleinbeck, & H. Thierry (Eds.), Work motivation in the context of a globalizing economy (pp. 73-85). New Jersey: Lawrence Erlbaum.

229
Edwards, M. R., & Ewen, A. J. (1996). 360° Feedback: The powerful new model for employee assessment & performance improvement. New York: AMACOM American Management Association.
Ehrhart, M., & Klein, K. (2001). Predicting followersʼ preferences for charismatic leadership: The influence of follower values and personality. Leadership Quarterly, 12(2), 153-179.
Eisenberg, N., Fabes, R., Guthrie, I., & Reiser, M. (2000). Dispositional emotionality and regulation: Their role in predicting quality of social functioning. Journal of Personality and Social Psychology, 78(1), 136-157.
Ely, K., Boyce, L. a, Nelson, J. K., Zaccaro, S. J., Hernez-Broome, G., & Whyman, W. (2010). Evaluating leadership coaching: A review and integrated framework. Leadership Quarterly, 21(4), 585-599.
Feldman, D. C., & Lankau, M. J. (2005). Executive coaching: A review and agenda for future research. Journal of Management, 31(6), 829-848.
Fiedler, F. E. (1964). A contingency model of leadership effectiveness. In L. Berkowitz (Ed.), Advances in experimental social psychology (Vol 1). New York: Academic Press.
Fiedler, F. E., & Garcia, J. E. (1987). New approaches to leadership effectiveness. New York: John Wiley & Sons.
Fiedler, P. E. (1996). Research on leadership selection and training: One view of the future. Administrative Science Quarterly, 41, 241-250.
Field, A. P. (2005). Discovering statistics using SPSS (2nd ed.). London: SAGE publications Ltd.
Field, A. P., & Hole, G. (2003). How to design and report experiments. Wiltshire: Sage Thousand Oaks.
Fisher, A. (2001). Executive coaching-With returns a CFO could love. Fortune, 250.
Fleenor, J. W., McCauley, C. D., & Brutus, S. (1996). Self-other rating agreement and leader effectiveness. Leadership Quarterly, 7(4), 487-506.
Fleenor, J. W., Smither, J. W., Atwater, L. E., Braddy, P. W., & Sturm, R. E. (2010). Self–other rating agreement in leadership: A review. Leadership Quarterly, 21(6), 1005-1034.

230
Fletcher, C., & Baldry, C. (2000). A study of individual differences and self-awareness in the context of multi-source feedback. Journal of Occupational and Organizational Psychology, 73(3), 303-319.
Gangestad, S., & Snyder, M. (1985). "To carve nature at its joints": On the existence of discrete classes in personality. Psychological Review, 92(3), 317-349.
Gardner, H. (1993). Multiple intelligences: The theory in practice. New York: Basic Books.
Gardner, W. L., Avolio, B. J., Luthans, F., May, D., & Walumbwa, F. (2005). “Can you see the real me?” A self-based model of authentic leader and follower development. Leadership Quarterly, 16(3), 343-372.
Gardner, W. L., Lowe, K. B., Moss, T. W., Mahoney, K. T., & Cogliser, C. C. (2010). Scholarly leadership of the study of leadership: A review of The Leadership Quarterlyʼs second decade, 2000–2009. Leadership Quarterly, 21(6), 922-958.
Garman, A. N., Whiston, D. L., & Zlatoper, K. W. (2000). Media perceptions of executive coaching and the formal preparation of coaches. Consulting Psychology Journal: Practice and Research, 52(3), 201-205.
Gaudine, A. P., & Saks, A. M. (2004). A longitudinal quasi-experiment on the effects of posttraining transfer interventions. Human Resource Development Quarterly, 15(1), 57-76.
Gegner, C. (1997). Coaching: Theory and practice. PhD Thesis. University of California.
Ghorpade, J. (2000). Managing five paradoxes of 360-degree feedback. Academy of Management Executive, 14(1), 140-152.
Gibler, D., Carter, L., & Goldsmith, M. (2000). Best practices in leadership development handbook. San Francisco: Jossey-Bass.
Gioia, D. A., & Pitre, E. (1990). Multiparadigm perspectives on theory building. Academy of Management Review, 15(4), 584-602.
Gist, M. E., Stevens, C. K., & Baveita, A. G. (1991). Effects of self-efficacy and post-training intervention on the acquisition and maintenance of complex interpersonal skills. Personnel Psychology, 44, 837-861.
Goleman, D. (1998). Working with emotional intelligence. London: Bloomsbury.

231
Griffiths, A. (1999). Organizational interventions: facing the limits of the natural science paradigm. Scandinavian Journal of Work, Environment & Health, 25(6), 589-596.
Hair, J., Black, B., Babin, B., Anderson, R., & Tatham, R. (2006). Multivariate data analysis (6th ed.). Upper Saddle River: Prentice Hall.
Hall, D. T., Otazo, K. L., & Hollenbeck, G. (1999). What Really Happens in Executive Coaching. Organizational Dynamics, Winter, 39-53.
Hammersley, M. (1996). The relationship between qualitative and quantitative research: Paradigm loyalty versus methodological eclecticism. In J. T. E. Richardson (Ed.), Handbook of qualitative research methods for psychology and the social sciences (pp. 159-174). Leicester: BPS Books.
Hannah, S. T., & Avolio, B. J. (2010). Ready or not: How do we accelerate the developmental readiness of leaders? Journal of Organizational Behavior, 31(March), 1181-1187.
Hernez-Broome, G., & Hughes, R. L. (2004). Leadership Development: Past, present, and future. Human Resource Planning, 27(1), 24–33.
Hersey, P., & Blanchard, K. H. (1972). Management of organizational behavior: Utilizing human resources. Englewood Cliffs, NJ: Prentice-Hall.
Hirst, G., Mann, L., Bain, P., Pirola-Merlo, A., & Richver, A. (2004). Learning to lead: The development and testing of a model of leadership learning. Leadership Quarterly, 15(3), 311-327.
Homan, R. (1991). The ethics of social research. New York: Longman.
Hooijberg, R. J. (2009). Using multisource feedback coaching effectively in executive education. Academy of Management Learning and Education, 8(4), 483-494.
Hooijberg, R. J., Hunt, J. G., & Dodge, G. E. (1997). Leadership complexity and development of the leaderplex model. Journal of Management, 23(3), 375-408.
Hooijberg, R. J., & Schneider, M. (2001). Behavioural complexity and social intelligence: How executive leaders use stakeholders to form a system perspective. In S. Zaccaro & R. Klimoski (Eds.), The nature of organisational leadership (p. 104-131). (pp. 104-131). San Francisco, CA: Jossey-Bass.
House, R. (1971). A path goal theory of leader effectiveness. Administrative Science Quarterly, 16(3), 321-341.
232
House, R., & Aditya, R. (1997). The social scientific study of leadership: Quo vadis? Journal of management, 23(3), 409-473.
Howell, J., & Avolio, B. J. (1993). Transformational leadership, transactional leadership, locus of control, and support for innovation: Key predictors of consolidated-business-unit performance. Journal of Applied Psychology, 78(6), 891-902. doi: 10.1037/0021-9010.78.6.891.
Hu, L. T., & Bentler, P. M. (1999). Cutoff criteria for fit indexes in covariance structure analysis: Conventional criteria versus new alternatives. Structural Equation Modeling: A Multidisciplinary Journal, 6(1), 1-55.
Hudson, F. M. (1999). The handbook of coaching: A resource guide to effective coaching with individuals and organisations. San Francisco: Jossey-Bass.
Hunt, J. G. (1991). Leadership: A new synthesis. Newbury Park: SAGE publications.
Hussey, J., & Hussey, R. (1997). Business Research: A practical guide for undergraduate and postgraduate students. Chippenham: Antony Rowe Ltd.
Ilies, R., Morgeson, F., & Nahrgang, J. (2005). Authentic leadership and eudaemonic well-being: Understanding leader–follower outcomes. Leadership Quarterly, 16(3), 373-394.
Jacobs, T. O., & Jacque, E. (1987). Leadership in complex systems. In J. A. Zeidner (Ed.), Human productivity enhancement (pp. 7-65). New York: Praeger.
Jacobs, T. O., & Jacque, E. (1990). Military executive leadership. In E. K. Clark & M. B. Clark (Eds.), Measures of leadership (pp. 281-295). Greensboro, NC: Center for Creative Leadership.
James, L. R., Demaree, R. G., & Wolf, G. (1984). Estimating within-group interrater reliability with and without response bias. Journal of Applied Psychology, 69(1), 85-98.
Johnson, H. (2004). The ins and outs of executive coaching. Training, 41(May), 36-42.
Joo, B. K. (2005). Executive coaching: A conceptual framework from an integrative review of practice and research. Human Resource Development Review, 4(4), 462-488.
Jordan, J., & Cartwright, S. (1998). Selecting expatriate managers: Key traits and competencies. Leadership & Organization Development Journal, 19(2), 89-96.

233
Judge, T., & Bono, J. E. (2000). Five-factor model of personality and transformational leadership. Journal of Applied Psychology, 85(5), 751-765.
Judge, T., & Bono, J. E. (2001). Relationship of core self-evaluations traits — self-esteem, generalized self-efficacy, locus of control , and emotional stability — with job satisfaction and job performance: A meta-analysis. Journal of Applied Psychology, 86(1), 80-92.
Judge, T., Bono, J. E., Ilies, R., & Gerhardt, M. (2002a). Personality and leadership: A qualitative and quantitative review. Journal of Applied Psychology, 87(4), 765-780.
Judge, T., Erez, A., Bono, J. E., & Thoresen, C. J. (2002b). Are Measures of self-esteem, neuroticism, locus of control, and generalized self-efficacy indicators of a common core construct? Journal of Personality and Social Psychology, 83(3), 693-710.
Judge, T., Jackson, C. L., Shaw, J. C., Scott, B. A., & Rich, B. L. (2007). Self-efficacy and work-related performance: The integral role of individual differences. Journal of Applied Psychology, 92(1), 107-127.
Judge, W. Q., & Cowell, J. (1997). The brave new world of executive coaching. Business Horizons, 40(4), 71–77.
Jung, D. I., & Avolio, B. J. (1999). Effects of leadership style and followersʼ cultural orientation on performance in group and individual task conditions. Academy of Management Journal, 42(2), 208-218.
Kampa-Kokesch, S. (2001). Executive coaching as an individually tailored consultation intervention: Does it increase leadership? PhD Thesis. Western Michigan University.
Kampa-kokesch, S., & Anderson, M. Z. (2001). Executive coaching: A comprehensive review of the literature. Consulting Psychology Journal: Practice and Research, 53(4), 205-228.
Kanfer, F., & Karoly, P. (1972). Self-Control: A behavioristic excursion into the lionʼs den. Behavior Therapy, 3(3), 398-416.
Kanfer, F. H. (1970). Self-monitoring: Methodological limitations and clinical applications. Journal of Consulting and Clinical Psychology, 35(2), 148-152.
Kanfer, R., & Ackerman, P. (1989). Motivation and cognitive abilities: An integrative/aptitude-treatment interaction approach to skill acquisition. Journal of Applied Psychology, 74(4), 657-690.

234
Kanfer, R., & Heggestad, E. (1997). Motivational traits and skills: A person-centered approach to work motivation. Research in Organizational Behavior, 19, 1-56.
Karoly, P. (1993). Mechanism of self-regulation: A systems view. Annual Review Psychology, 44, 23-52.
Keith, N., & Frese, M. (2005). Self-regulation in error management training: Emotion control and metacognition as mediators of performance effects. Journal of Applied Psychology, 90(4), 677-691.
Keys, B., & Wolfe, J. (1988). Management education and development: Current issues and emerging trends. Journal of Management, 14(2), 205-229.
Kiel, F., Rimmer, E., Williams, K., & Doyle, M. (1996). Coaching at the top. Consulting Psychology Journal: Practice and Research, 48(2), 67-77.
Kilburg, R. R. (1996). Toward a conceptual understanding and definition of executive coaching. Consulting Psychology Journal: Practice and Research, 48(2), 134-144.
Kilburg, R. R. (1997). Coaching and executive character: Core problems and basic approaches. Consulting Psychology Journal: Practice and Research, 49(4), 281-299.
Kilburg, R. R. (2001). Facilitating intervention adherence in executive coaching model and methods. Consulting Psychology Journal: Practice and Research, 53(4), 251-267.
King, N. (2000). Marking ourselves heard: The challenges facing advocates of qualitative research in work and organizational psychology. European Journal of Work and Organizational Psychology, 9(4), 589-596.
Kirk, R. (1999). Relativism and reality: A contemporary introduction. London: Routledge.
Kish, L. (1987). Statistical design for research. New York: Wiley.
Klein, K. J., Conn, A. B., Smith, D. B., & Sorra, J. S. (2001). Is everyone in agreement? An exploration of within-group agreement in employee perceptions of the work environment. Journal of Applied Psychology, 86(1), 3–16.
Kluger, A. N., & DeNisi, A. (1996). Effects of feedback intervention on performance: A historical review, a meta-analysis, and a preliminary feedback intervention theory. Psychological Bulletin, 119(2), 254-284.

235
Kluger, A. N., & DeNisi, A. (1998). Feedback interventions: Toward the understanding of a double-edged sword. Current Directions in Psychological Science, 7(3), 67-72.
Knippenberg, D. van, Knippenberg, B. van, De Cremer, D., & Hogg, M. A. (2004). Leadership, self, and identity: A review and research agenda. Leadership Quarterly, 15(6), 825-856.
Koene, B., Vogelaar, A. L. W., & Soeters, J. L. (2002). Leadership effects on organizational climate and financial performance: Local leadership effect in chain organizations. Leadership Quarterly, 13(3), 193-215.
Koestner, R., Bernieri, F., & Zuckerman, M. (1992). Self-regulation and consistency between attitudes, traits, and behaviors. Personality and Social Psychology Bulletin, 18(1), 52–59.
Kombarakaran, F. a, Yang, J. a, Baker, M. N., & Fernandes, P. B. (2008). Executive coaching: It works! Consulting Psychology Journal: Practice and Research, 60(1), 78-90.
Koonce, R. (1994). One on one. Training and Development, February, 34-42.
Kozlowski, S. W. J., & Bell, B. S. (2006). Disentangling achievement orientation and goal setting: Effects on self-regulatory processes. Journal of Applied Psychology, 91(4), 900-916.
Kralj, M. M. (2001). Coaching at the top : Assisting a chief executive and his team. Consulting Psychology Journal: Practice and Research, 53(2), 108-116.
Latham, G. P., & Locke, E. A. (1991). Self-regulation through goal-setting. Organizational Behavior and Human Decision Processes, 50, 212-247.
Lee, N. (2008). Doing business research: A guide to theory and practice. Cornwall: SAGE publications.
Levinson, H. (1996). Executive coaching. Taking leadership development to the next level. Consulting Psychology Journal: Practice and Research, 22(1), 115-123.
London, M., & Smither, J. W. (1995). Can multi-source feedback change Perceptions of goal accomplishment, self-evaluations, and performance-related outcomes? Theory-based applications and directions for research. Personnel Psychology, 48(4), 803-839.
Lord, R. D., & Maher, K. J. (1991). Leadership and information processing: Linking perceptions and performance. Boston: Unwind Hyman.

236
Lord, R. G., Foti, R. J., & DeVader, C. L. (1984). A test of leadership categorization theory: Internal structure, information processing, and leadership perceptions. Organizational Behavior and Human Performance, 34, 343–378.
Lord, R. G., & Maher, K. J. (1990). Alternative information-processing models and their implications for theory, research, and practice. Academy of Management Review, 15(1), 9-28.
Lord, R. G., Vader, C. L. de, & Alliger, G. M. (1986). A meta-analysis of the relation between personality traits and leadership perceptions: An application of validity generalization procedures. Journal of Applied Psychology, 71(3), 402-410.
Lowe, K. B., & Gardner, W. L. (2000). Ten years of The leadership quarterly: Contributions and challenges for the future. Leadership Quarterly, 11(4), 459-514.
Luthans, F., & Peterson, S. J. (2003). 360-degree feedback with systematic coaching: Empirical analysis suggests a winning combination. Human Resource Management, 42(3), 243-256.
Mabe, P. A., & West, S. G. (1982). Validity of self-evaluation of ability : A review and meta-analysis. Journal of Applied Psychology, 67(3), 280-296.
Manfred, F. R., & Kets, D. V. (2005). Leadership group coaching in action : The Zen of creating high performance teams. Academy of Management Executive, 19(1), 61-78.
Martineau, J. W. (2004). Evaluating the impact of leader development. In C. D. McCauley & E. Van Velsor (Eds.), The Center for Creative Leadership handbook for leadership development (2nd ed., pp. 234-267). San Francisco: Jossey-Bass.
Maxwell, S., & Delaney, H. D. (2004). Designing experiments and analyzing data: A model comparison perspective. Mahwah, New Jersey: Laurence Erlbaum Associates.
Mazutis, D., & Slawinski, N. (2008). Leading organizational learning through authentic dialogue. Management Learning, 39(4), 437-456.
McCall, M., & Lombardo, M. (1983). Off the track: Why and how successful executives get derailed. Greensboro: Center for Creative Leadership.
Mccall, M. W. (2004). Leadership development through experience. Academy of Management Executive, 18(3), 127-132.
237
McCarthy, A. M., & Garavan, T. N. (1999). Developing self-awareness in the managerial career development process: the value of 360-degree feedback and the MBTI. Journal of European Industrial Training, 23(9), 437-445.
McCauley, C. D., & Van Velsor, E. (2004). The center for creative leadership handbook of leadership development. Leadership (2nd ed., pp. 1-10). San Francisco: Jossey-Bass.
McDermott, M., & Levenson, A. (2007). What coaching can and cannot do for your organization. Human Resource Planning, 30(2), 30-37.
McLagan, P. (1996). Competency system in the new world of work mclagan. Third International Linkage Inc., conference on Using Competency-Based Tools and Applications to Drive Organizational Performance. Chicago.
Medsker Larry, J., & Gina, J. (1994). A review of current practices for evaluating causal models in organizational behavior and human resources management research. Journal of Management, 20(2), 439–464.
Miller, W. R., & Brown, J. M. (1991). Self-regulation as a conceptual basis for the prevention and treatment of addictive behaviors. In N. Heather, W. R. Miller, & J. Greely (Eds.), Self-control and the addictive behaviours (pp. 3-79). Sydney: Maxwell Macmillan.
Minichiello, V., Aroni, R., Timewell, E., & Alexander, L. (1992). In-depth interviewing: Researching people. Melbourne: Longman.
Mirabile, R. J. (1997). Everything you wanted to know about competency modeling. Training and development, 51(8), 73–77.
Moran, R. T., & Riesenberger, J. R. (1994). The global challenge: Building the new worldwide enterprise. London: McGraw-Hill Book Company.
Moss, S., Dowling, N., & Callanan, J. (2009). Towards an integrated model of leadership and self regulation. Leadership Quarterly, 20(2), 162-176.
Mumford, M., Hunter, S. T., Eubanks, D. L., Bedell, K. E., & Murphy, S. T. (2007). Developing leaders for creative efforts : A domain-based approach to leadership development. Human Resource Management Review, 17, 402 - 417.
Mumford, M., Marks, M., Connelly, M., Zaccaro, S. J., & Reiter-Palmon, R. (2000). Development of leadership skills: Experience and timing. Leadership Quarterly, 11(1), 87-114.

238
Mumford, M., Zaccaro, S. J., Harding, F., Jacobs, T., & Fleishman, E. (2000). Leadership skills for a changing world: Solving complex social problems. Leadership Quarterly, 11(1), 11-35.
Mumford, T., Campion, M., & Morgeson, F. (2007). The leadership skills strataplex: Leadership skill requirements across organizational levels. Leadership Quarterly, 18(2), 154-166.
Nagoshi, C. T. (1999). Perceived control of drinking and other predictors of alcohol use and problems in a college student sample. Addiction Research & Theory, 7(4), 291–306.
Neck, C. P., & Houghton, J. D. (2006). Two decades of self-leadership theory and research: Past developments, present trends, and future possibilities. Journal of Managerial Psychology, 21(4), 270-295.
Nenniger, P. (2005). Commentary on self-regulation in the classroom: A perspective on assessment and intervention. Applied Psychology: An International Review, 54(2), 239-244.
Noe, R. A., & Wilk, S. L. (1993). Investigation of the factors that influence employeesʼ participation in development activities. Journal of Applied Psychology, 78(2), 291-302.
Northouse, P. G. (2007). Leadership: Theory and practice (4th ed.). Thousand Oaks, CA: SAGE publications.
Nunally, J. (1978). Psychometric theory. New York: McGraw-Hill.
Oettingen, G., Hönig, G., & Gollwitzer, P. (2000). Effective self-regulation of goal attainment. International Journal of Educational, 33(7-8), 705-732.
Ohlott, P. J. (2004). Job assignments. In C. D. Mccauley & E. Van Velsor (Eds.), The Center for Creative Leadership handbook of leadership development (2nd ed., p. 151–182). San Francisco: Wiley.
Oliver, P. (2003). The studentʼs guide to research ethics. Glasgow: Open University Press.
Olivero, G., Bane, K. D., & Kopelman, R. E. (1997). Executive coaching as a transfer of training tool: Effects on productivity in a public agency. Public Personnel Management, 26(4), 461-469.
Orenstein, R. L. (2002). Executive coaching: Itʼs not just about the executive. The Journal of Applied Behavioral Science, 38(3), 355-374.
239
Orvis, K. A., & Ratwani, K. L. (2010). Leader self-development: A contemporary context for leader development evaluation. Leadership Quarterly, 21(4), 657-674.
Owen, J. (2009). How to lead: What you actually need to do to manage, lead and succeed. Harlow: Pearson Education Limited.
Pagano, R. (1994). Understanding statistics in the behavioral sciences. USA: West publishing company.
Paris, S., & Paris, A. (2001). Classroom applications of research on self-regulated learning. Educational Psychologist, 36(2), 89-101.
Perels, F., Gurtler, T., & Schmitz, B. (2005). Training of self-regulatory and problem-solving competence. Learning and Instruction, 15(2), 123-139.
Pernick, R. (2001). Creating a leadership development program: Nine essential tasks. Public Personnel Psychology, 30(4), 429-445.
Peterson, D. B. (1996). Executive coaching at work: The art of one-on-one change. Consulting Psychology Journal: Practice and Research, 48(2), 78-86.
Peugeot annual report. (2009). PSA Peugeot Citroën.
Phillips, J. S., & Lord, R. G. (1981). Causal attributions and perceptions of leadership. Organizational Behavior and Human Performance, 28, 143–163.
Pittenger, K. K. S., & Heimann, B. A. (2000). Building effective mentoring relationships. Review of Business, 21(1/2), 38-43.
Podsakoff, P. M., MacKenzie, S. B., Lee, J., & Podsakoff, N. P. (2003). Common method biases in behavioral research: A critical review of the literature and recommended remedies. Journal of Applied Psychology, 88(5), 879-903. doi: 10.1037/0021-9010.88.5.879.
Poston, S., Manning, S., & Barrow, S. (2001). Do you need an executive coach? American Gas, 8, 15-18.
Prewitt, V. (2003). Leadership development for learning organizations. Leadership & Organization Development Journal, 24(2), 58-61.
Rapp, T. L., & Mathieu, J. E. (2007). Evaluating an Individually Self-Administered Generic Teamwork Skills Training Program Across Time and Levels. Small Group Research, 38(4), 532-555.

240
Reichard, R. J., & Avolio, B. J. (2005). Where are we? The status of leadership intervention research: A metaanalytic summary. In W. L. Gardner, B. J. Avolio, & F. OWalumbwa (Eds.), In Authentic Leadership and Practice: Origins, Effects, and Development (p. 203–226). Oxford, UK: Elsevier.
Reichard, R. J., & Johnson, S. K. (2011). Leader self-development as organizational strategy. Leadership Quarterly, 22(1), 33-42.
Renault annual report. (2009). Renault Group.
Revans, R. W. (1980). Action learning. London: Blond & Briggs.
Rhinesmith, S. H. (1996). A manager’s guide to globalization: Six skills for success in a changing world (2nd ed.). New York: McGraw-Hill.
Richard, J. T. (2003). Ideas on fostering creative problem solving in executive coaching. Consulting Psychology Journal: Practice and Research, 55(4), 249-256.
Richardson, J. T. E. (1996). Handbook of qualitative research methods for psychology and the social sciences. Leicester: BPS Books.
Riggio, R. E. (2008). Leadership development: The current state and future expectations. Consulting Psychology Journal: Practice and Research, 60(4), 383-392.
Rost, J. C. (1993). Leadership for the twenty-first century. London: Praeger.
Rosti, R. T., & Shipper, F. (1998). A study of the impact of training in a management development program based on 360 feedback. Journal of Managerial Psychology, 13(1), 77-89.
Roux, I., & Steyn, B. (2007). Experiential learning and critical reflection as a tool for transfer of business knowledge: An empirical case study of a start-up simulation intervention for nascent entrepreneurs. SAJEMS NS, 10(3), 330-347.
Rush, M. C., Thomas, J. C., & Lord, R. G. (1977). Implicit leadership theory: A potential threat to the internal validity of leader behaviors. Organizational Behavior and Human Performance, 20, 93–110.
Saporito, T. J. (1996). Business-linked executive development: Coaching senior executives. Consulting Psychology Journal: Practice and Research, 48(2), 96-103.
Saunders, M., Lewis, P., & Thornhill, A. (2000). Research methods for business students (2nd ed.). England: Prentice Hall.

241
Savage, C. M. (2001). Executive coaching: Professional self-care for nursing leaders. Nursing Economics, 4, 178-182.
Schlosser, B., Steinbrenner, D., Kumata, E., & Hunt, J. (2006). The coaching impact study: Measuring the value of executive coaching. International Journal of Coaching in Organizations, 4(3), 8-26.
Scholl, R., & Zimmerman, B. J. (2001). Self-regulation training enhances dietary self-efficacy and dietary fiber consumption. RESEARCH, 101(9), 1006-1011.
Schumacker, R. E., & Lomax, R. G. (2004). A beginnerʼs guide to structural equation modeling (2nd ed.). Mahwah, New Jersey: Lawerence Earlbaum Associates.
Schwarz, N. (1999). How the questions shape the answers. American Psychologist, 54(2), 93-106.
Seifert, C. F., & Yukl, G. A. (2010). Effects of repeated multi-source feedback on the influence behavior and effectiveness of managers: A field experiment. Leadership Quarterly, 21(5), 856-866.
Seifert, C. F., Yukl, G. A., & McDonald, R. A. (2003). Effects of multisource feedback and a feedback facilitator on the influence behavior of managers toward subordinates. Journal of Applied Psychology, 88(3), 561-569.
Shadish, W., Cook, T., & Campbell, D. (2002). Experimental and quasi-experimental designs for generalized causal inference (2nd ed.). Berkeley: Houghton Mifflin Company.
Shamir, B., House, R., & Arthur, M. B. (1993). The motivational effects of charismatic leadership: A self-concept based theory. Organization Science, 4(4), 577-594.
Shea, C., & Howell, J. (1999). Charismatic leadership and task feedback: A laboratory study of their effects on self-efficacy and task performance. Leadership Quarterly, 10(3), 375-396.
Shebaya, M. (2010). Leadership development: How can developmental readiness explain and influence outcomes? Academy of Management Annual Conference (pp. 1-33). Montreal, Canada.
Sherin, J., & Caiger, L. (2004). Rational-emotive behavior therapy: A behavioral change model for executive coaching? Consulting Psychology Journal: Practice and Research, 56(4), 225-233.

242
Shippmann, J. S., Ash, R. A., Batjtsta, M., Carr, L., Eyde, L. D., Hesketh, B., et al. (2000). The practice of competency modeling. Personnel Psychology, 53(3), 703-740.
Skipton Leonard, H., & Lang, F. (2010). Leadership development via action learning. Advances in Developing Human Resources, 12(2), 225-240.
Smith, A. (1996). Evolving issues for qualitative psychology. In J. T. E. Richardson (Ed.), Handbook of qualitative research methods for psychology and the social sciences (pp. 289-202). Leicester: BPS Books.
Smith, J., & Foti, R. J. (1998). A pattern approach to the study of leader emergence. Leadership Quarterly, 9(2), 147-160.
Smith, L. (1993). The executiveʼs new coach: Believe it or not , he (or often she) can help cure those little behavioral defects you suffer from and make you a better manager. Smart companies pay the bill gladly. Fortune, 126-134.
Smither, J. W., London, M., Flautt, R., Vargas, Y., & Kucine, I. (2003). Can working with an executive coach improve multisource feedback ratings over time? A quasi-experimental field study. Personnel Psychology, 56(1), 23–44. John Wiley & Sons.
Smither, J. W., London, M., & Reilly, R. R. (2005). Does performance improve following multisource feedback? A theoretical model, meta-analysis, and review of empirical findings. Personnel Psychology, 58(1), 33-66.
Sobel, M. E. (1982). Asymptotic confidence intervals for indirect effects in structural equation models. In S. Leinhart (Ed.), Sociological methodology (p. 290–312). San Francisco: Jossey-Bass.
Solansky, S. T. (2010). The evaluation of two key leadership development program components: Leadership skills assessment and leadership mentoring. Leadership Quarterly, 21(4), 675-681.
Sosik, J. J. (2001). Self-other agreement on charismatic leadership: Relationships with work attitudes and managerial performance. Group & Organization Management, 26(4), 484-511.
Sosik, J. J., & Megerian, L. E. (1999). Understanding leader emotional intelligence and performance: The role of self-other agreement on transformational leadership perceptions. Group & Organization Management, 24(3), 367-390.
Sosik, J. J., Potosky, D., & Jung, D. I. (2002). Adaptive self-regulation: Meeting othersʼ expectations of leadership and performance. Journal of Social Psychology, 142(2), 211-32.

243
Sperry, L. (1997). Leadership dynamics: Character and character structure in executives. Consulting Psychology Journal: Practice and Research, 49(4), 268-280.
Srinivas, K. M. (1995). Globalization of business and the Third World Challenge of expanding the mindsets. Journal of Management Development, 14(3), 26-49.
Stam, D., Knippenberg, D. van, & Wisse, B. (2010). Focusing on followers: The role of regulatory focus and possible selves in visionary leadership. Leadership Quarterly, 21(3), 457-468.
Stevens, J. (2002). Applied multivariate statistics for the social sciences (4th ed.). Mahwah, New Jersey: Lawerence Earlbaum Associates.
Stogdill, R. M. (1948). Personal factors associated with leadership: A survey of the literature. The Journal of Psychology, 25, 35-71.
Streufert, S., & Nogami, G. (1989). Cognitive style and complexity: Implications for I/O psychology. In C. L. Cooper & I. Robertson (Eds.), International review of industrial and organizational psychology (pp. 93-143). England: Wiley.
Streufert, S., & Swezey, R. W. (1986). Complexity, managers and organizations. Orlando: Academic Press.
Sue-Chan, C., & Latham, G. P. (2004). The relative effectiveness of external, peer, and self-coaches. Applied Psychology: An International Review, 53(2), 260-278.
Tai, W. T. (2006). Effects of training framing, general self-efficacy and training motivation on traineesʼ training effectiveness. Personnel Review, 35(1), 51-65.
Tapsell, S. (1999). With a little help from my friend. New Zealand Management, 46(2), 45-48.
Tesluk, P E, & Jacobs, R. R. (1998). Toward an Integrated Model of Work Experience. Personnel Psychology, 51(2), 321-355.
Thach, E. C. (2002). The impact of executive coaching and 360 feedback on leadership effectiveness. Leadership & Organization Development Journal, 23(4), 205-214.
Tharenou, P. (2001). The relationship of training motivation to participation in training and development. Journal of Occupational and Organizational Psychology, 74(5), 599-621. doi: 10.1348/096317901167541.
Thomas, A. (2002). Seeking direction. Personnel Today, June(1), 22-23.

244
Ting, S., & Hart, E. W. (2004). Formal coaching. In C. D. Mccauley & E. Van Velsor (Eds.), The Center for Creative Leadership handbook of leadership development (pp. 116-150). San Francisco: John Wiley & Sons.
Tobias, L. L. (1996). Coaching executives. Consulting Psychology Journal: Practice and Research, 48(2), 87-95.
Top 10 best companies for leadership. (2010). Popular Something. Retrieved February 21, 2010, from http://www.popularsomething.com/2010/02/top-10-best-companies-for-leadership.html.
Tornow, W. W., & London, M. (1998). Maximizing the value of 360-degree feedback. San Francisco: Jossey-Bass.
Tracey, C., & Nicholl, H. (2007). The multifaceted influence of gender in career progress in nursing. Journal of Nursing Management, 15(7), 677-82.
Tracey, J. B., Tannenbaum, S., & Kavanagh, M. J. (1995). Applying trained skills on the job: The importance of the work environment. Journal of Applied Psychology, 80(2), 239-252.
Tsai, W., & Ghoshal, S. (1998). Social capital and value creation: The role of intrafirm networks. Academy of Management Journal, 41(4), 464-477.
Tsui, A. S., & Ashford, S. J. (1994). Adaptive self-regulation: A process view of managerial effectiveness. Journal of Management, 20(1), 93–121.
Ulrich, D., Brockbank, W., Yeung, A. K., & Lake, D. G. (1995). Human resource competencies: An empirical assessment. Human Resource Management, 34(4), 473-495.
Van Velsor, E., Taylor, S., & Leslie, Jean B. (1993). An examination of the relationships among self-perception accuracy, self-awareness, gender, and leader effectiveness. Human Resource Management, 32(2-3), 249-263.
Vancouver, J. B., & Day, D. (2005). Industrial and organisation research on self-regulation: From constructs to applications. Applied Psychology: An International Review, 54(2), 155-185.
Vancouver, J. B., More, K. M., & Yoder, R. J. (2008). Self-efficacy and resource allocation: Support for a nonmonotonic, discontinuous model. Journal of Applied Psychology, 93(1), 35-47.
Velsor, E. V., & Leslie, J. B. (1995). Why executives derail: Perspectives across time and cultures. Academy of Management Executive, 9(4), 62-72.

245
Volkswagen annual report. (2009). Volkswagen Group.
Vroom, V. H., & Yetton, P. W. (1973). Leadership and decision-making. New York: John Wiley & Sons.
Waldman, D. A., Javidan, M., & Varella, P. (2004). Charismatic leadership at the strategic level: A new application of upper echelons theory. Leadership Quarterly, 15(3), 355-380.
Walker, A. G., Smither, J. W., Atwater, L. E., Dominick, P. G., Brett, J. F., & Reilly, R. R. (2010). Personality and multisource feedback improvement: A longitudinal investigation. Institute of Behavioral and Applied Management, 175-204.
Wasylyshyn, K. M. (2003). Executive coaching: An outcome study. Consulting Psychology Journal: Practice and Research, 55(2), 94-106.
Wasylyshyn, K. M. (2008). Behind the door: Keeping business leaders focused on how they lead. Consulting Psychology Journal: Practice and Research, 60(4), 314-330.
Wechsler, H., Dowdall, G. W., Davenport, A., & Rimm, E. B. (1995). A gender-specific measure of binge drinking among college students. American Journal of Public Health, 85(7), 982-985.
Weick, K. E. (1995). What theory is not, theorizing is. Administrative Science Quarterly, 40(3), 385–390.
Wells, S. J. (2003). Who’s next? HRMagazine, 44-50.
Wexley, K. N., & Baldwin, T. T. (1986). Management development. Journal of Management, 12(2), 277-294.
Wills, T. A., & Stoolmiller, M. (2002). The role of self-control in early escalation of substance use: A time-varying analysis. Journal of Consulting and Clinical Psychology, 70(4), 986-997.
Winum, P. C. (2006). Effectiveness of a high-potential African American executive: The anatomy of a coaching engagement. Consulting Psychology Journal: Practice and Research, 57(1), 71–89.
Witherspoon, R., & White, R. P. (1996). Executive coaching: A continuum of roles. Consulting Psychology Journal: Practice and Research, 48(2), 124-133.

246
Wohlers, A. I., & London, M. (1989). Ratings of managerial characteristics: Evaluation difficulty, co-worker agreement, and self-awareness. Personnel Psychology, 42(2), 235-261.
Yost, P. R., & Plunkett, M. M. (2002). Turn business strategy into leadership development. Training and Development, 56(3), 49-51.
Yukl, G. A. (1989). Managerial leadership: A review of theory and research. Journal of Management, 15(2), 251-289.
Yukl, G. A. (1998). Leadership in organizations (4th ed.). London: Prentice Hall.
Yukl, G. A. (2005). Leadership in organizations (6th ed.). London: Prentice Hall.
Yzerbyt, V. Y., Muller, D., & Judd, C. (2004). Adjusting researchersʼs approach to adjustment: On the use of covariates when testing interactions. Journal of Experimental Social, 40(3), 424-431.
Zaccaro, S. J., & Banks, D. (2004). Leader visioning and adaptability: Bridging the gap between research and practice on developing the ability to manage change. Human Resource Management, 43(4), 367-380.
Zaccaro, S. J., Foti, R. J., & Kenny, D. (1991). Self-monitoring and trait-based variance in leadership: An investigation of leader flexibility across multiple group situations. Journal of Applied Psychology, 76(2), 308-315.
Zaccaro, S. J., & Horn, Z. (2003). Leadership theory and practice: Fostering an effective symbiosis. Leadership Quarterly, 14(6), 769-806.
Zaccaro, S. J., Mumford, M., Connelly, M., Marks, M., & Gilbert, J. A. (2000). Assessment of leader problem-solving capabilities. Leadership Quarterly, 11(1), 37–64.
Zeller, R. A., & Carmines, E. G. (1979). Reliability and validity assessment. Newbury Park, CA: Sage.
Zenger, J. H., & Folkman, J. (2002). The extraordinary leader: Turning good managers into great leaders. New York: McGraw-Hill.
Zimmerman, B. J. (2000). Self-regulatory cycles of learning. In G. A. Straka (Ed.), Conceptions of self-directed learning (pp. 221-234). Muster, Germany: Waxmann.
Zimmerman, B. J., & Bandura, A. (1994). Impact of self-regulatory influences on writing course attainment. American Educational Research Journal, 31(4), 845-863. Sage Publications.

247
Appendix I Pilot questionnaire
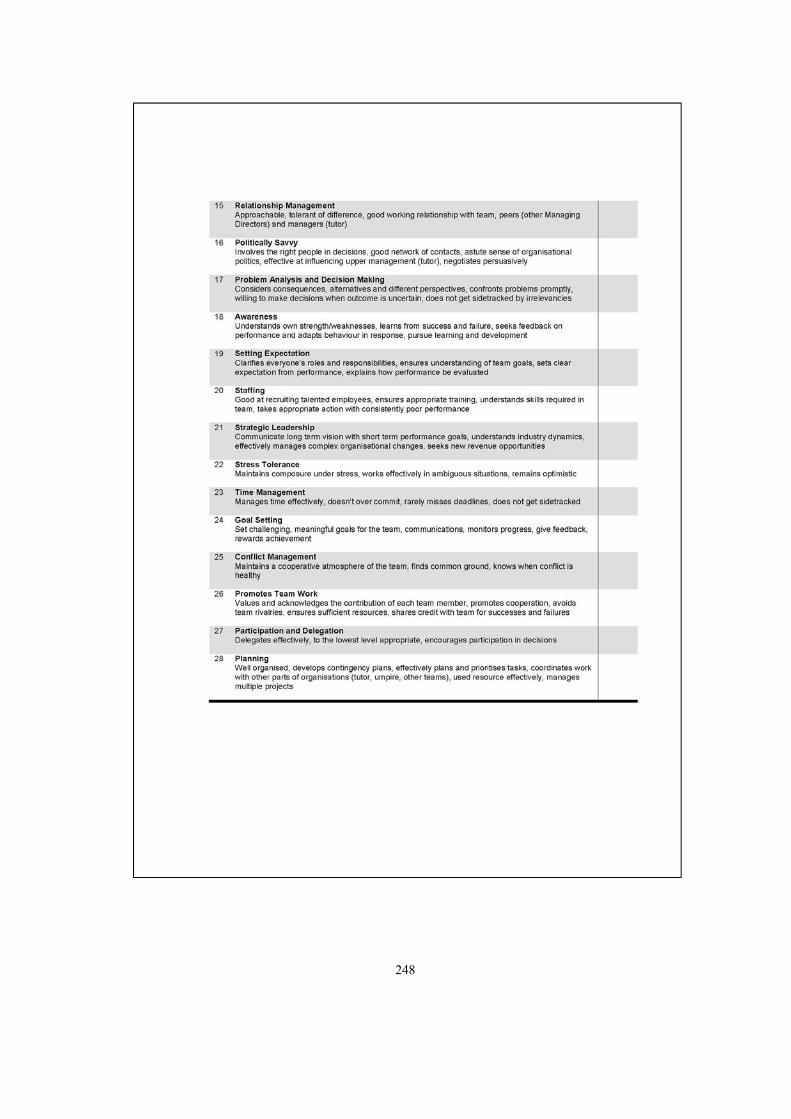
248

249
Appendix II Frequency analysis results from pilot study
0
10
20
30
40
50
60
70
Freq
uencies in percentages (%
)
Leader competencies

250
Appendix III Leader questionnaire

251

252

253

254
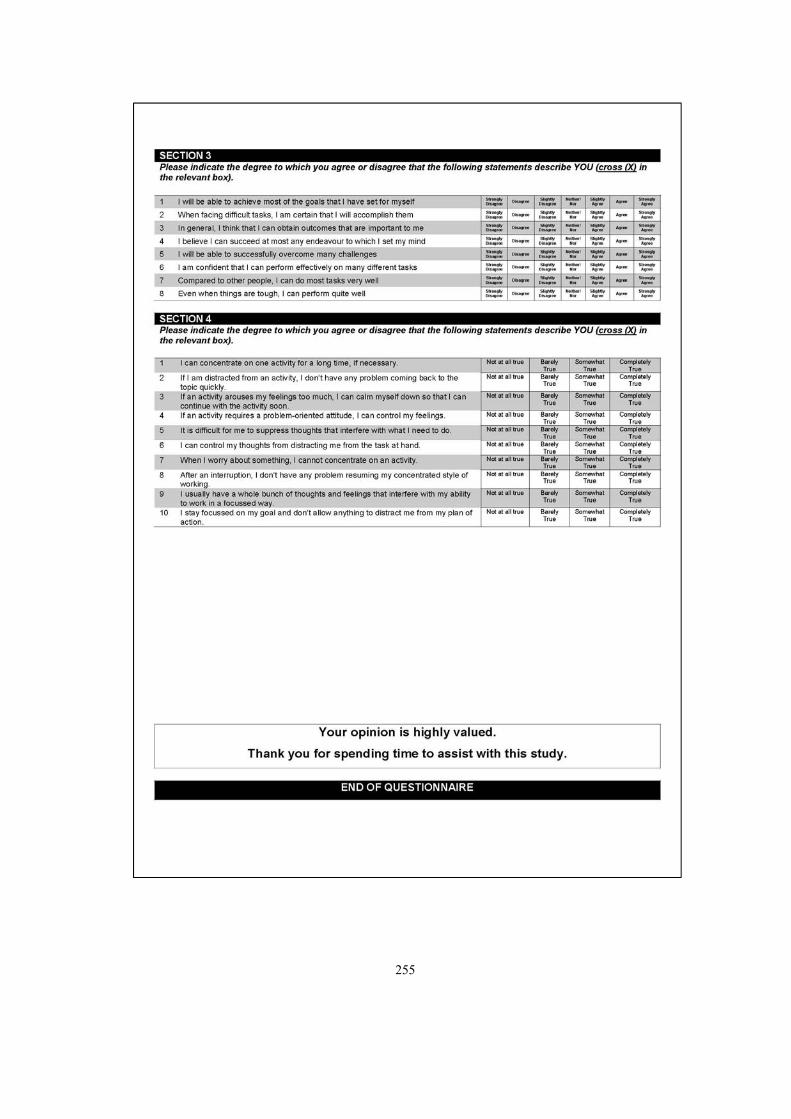
255

256
Appendix IV Follower questionnaire

257

258

259

260

261

262
Appendix V Tutor questionnaire
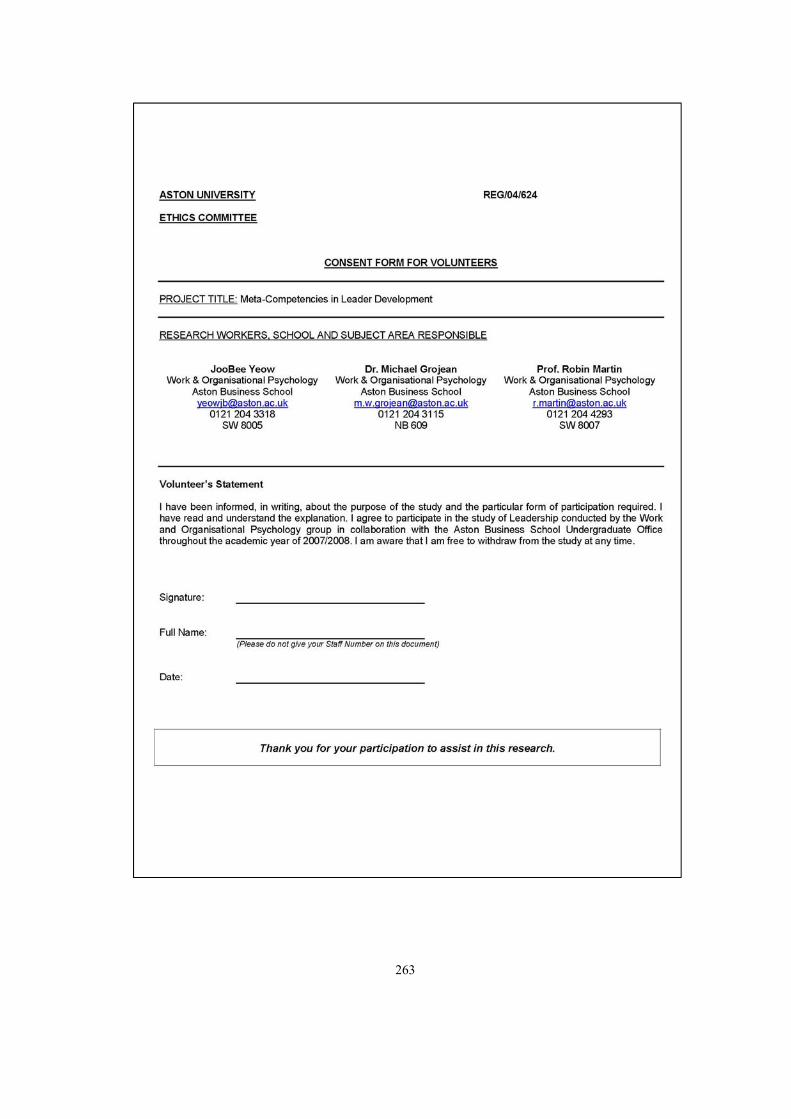
263

264

265
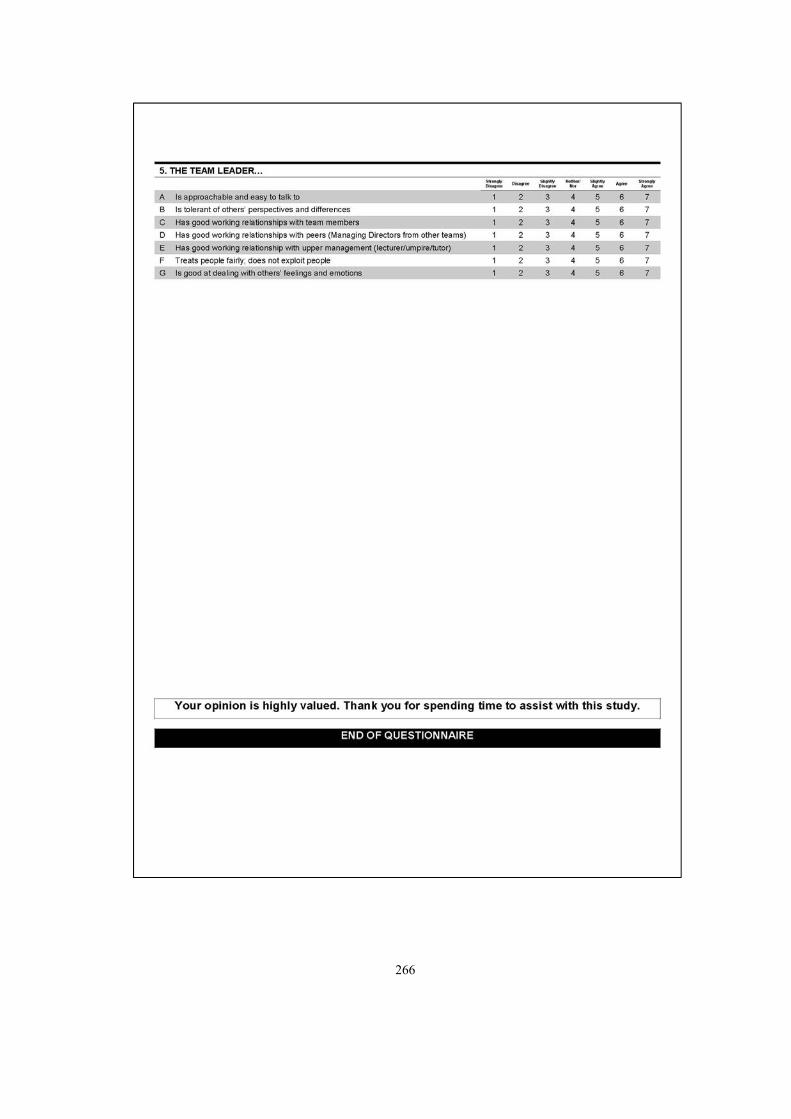
266
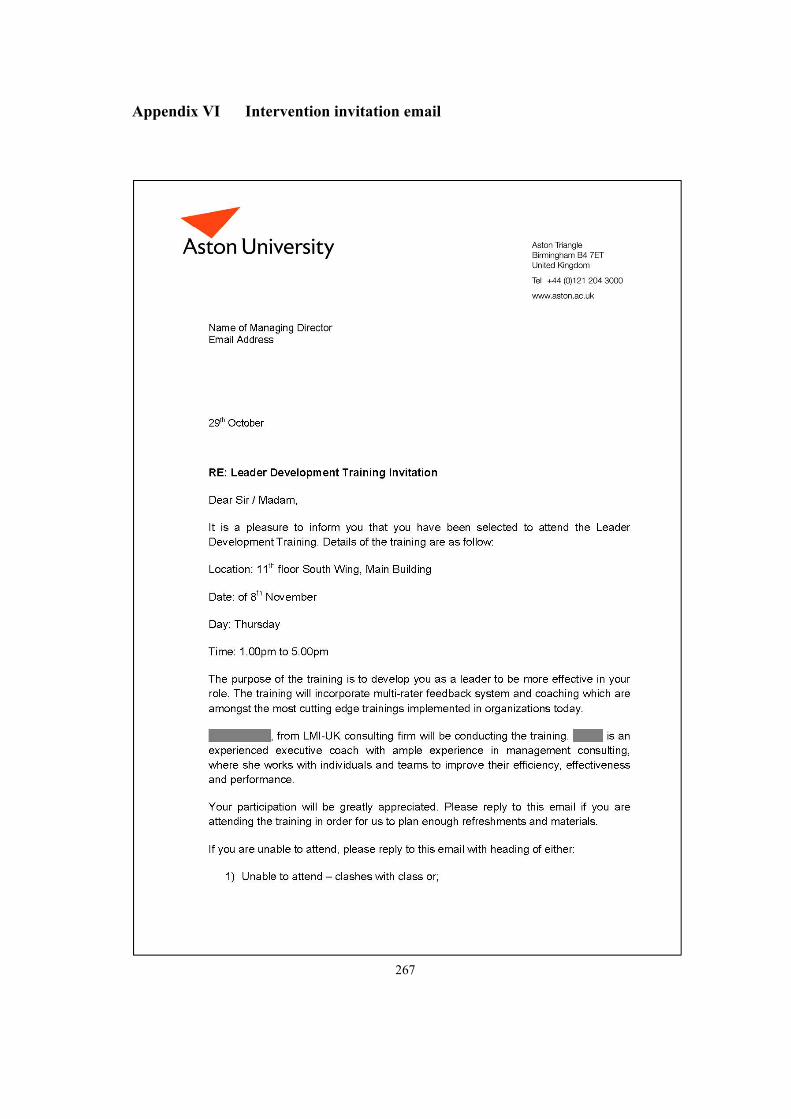
267
Appendix VI Intervention invitation email

268

269
Appendix VII Sample of 360-degree feedback report for leaders

270

271

272

273
Appendix VIII Intervention invitation email (post-study)
274

275
Appendix IX Email to prize draw winners

276

277
Appendix X Model for confirmatory factor analysis
Self-regulation
SRS110err_sr10
1
1
SRS109err_sr91
SRS108err_sr81
SRS107err_sr71
SRS106err_sr61
SRS105err_sr51
SRS104err_sr41
SRS103err_sr31
SRS102err_sr21
SRS101err_sr11
Self-regulation

278
0,Basic
leadership
BLEAD109
0,
err_blead91
BLEAD107
0,
err_blead71
BLEAD106
0,
err_blead61
BLEAD105
0,
err_blead51
BLEAD104
0,
err_blead41
BLEAD103
0,
err_blead31
BLEAD102
0,
err_blead21
0,
Planning
PLAN19
0,
err_plan9
PLAN18
0,
err_plan8
PLAN17
0,
err_plan7
PLAN16
0,
err_plan6
PLAN15
0,
err_plan5
PLAN14
0,
err_plan4
PLAN13
0,
err_plan3
PLAN12
0,
err_plan2
PLAN11
0,
err_plan1
1
1
1
1
1
1
1
1
1
1
0,Relationshipmanagement
RSMAN17
0,
err_rsman7
RSMAN16
0,
err_rsman6
RSMAN14
0,
err_rsman4
RSMAN13
0,
err_rsman3RSMAN12
0,
err_rsman2
RSMAN11
0,
err_rsman1
11
1
11
1
1
0,Keeping
others informed
KEEP16
0,
err_keep6
KEEP15
0,
err_keep5
KEEP14
0,
err_keep4
KEEP13
0,
err_keep3
KEEP12
0,
err_keep2
KEEP11
0,
err_keep1
0,
Promoting
PROMT17
0,
err_promt7
PROMT16
0,
err_promt6
PROMT15
0,
err_promt5
PROMT14
0,
err_promt4
PROMT13
0,
err_promt3
PROMT12
0,
err_promt2
PROMT11
0,
err_promt1
11
1
1
1
1
1
11
1
1
1
1
1
1
Leader Competencies
BLEAD110
0,
err_blead101
1
0,
err_rsman5 RSMAN151
BLEAD101
0,
err_blead11
BLEAD108
0,
err_blead81

279
Leader Eff
LSAT13err_leff3
11
LSAT12err_leff21
LSAT11err_leff11
Leader Sat
LEFF13err_lsat3
11
LEFF12err_lsat21
LEFF11err_lsat11
Extra Effort
EXEFF13err_exeff3
11
EXEFF12err_exeff21
EXEFF11err_exeff11
Leader performance

280
GSE
GSE18err_gse8
1
1
GSE17err_gse71
GSE16err_gse61
GSE15err_gse51
GSE14err_gse41
GSE13err_gse31
GSE12err_gse21
GSE11err_gse11
Self-efficacy
Related Documents