Student Report 49 Characterising resilience and resource-use efficiency traits from Scots Bere and additional landraces for development of stress tolerant barley Jonathan Cope BSc (Hons) from the University of St Andrews MSc from the University of East Anglia Supervised by: Adrian C Newton (James Hutton Institute) Timothy S George (James Hutton Institute) Gareth Norton (University of Aberdeen) This is the final report of a PhD project (2140011109) that ran from October 2015 to September 2018. Funded by AHDB with a contract for £54,000, the total project cost was £93,000. While the Agriculture and Horticulture Development Board seeks to ensure that the information contained within this document is accurate at the time of printing, no warranty is given in respect thereof and, to the maximum extent permitted by law, the Agriculture and Horticulture Development Board accepts no liability for loss, damage or injury howsoever caused (including that caused by negligence) or suffered directly or indirectly in relation to information and opinions contained in or omitted from this document. Reference herein to trade names and proprietary products without stating that they are protected does not imply that they may be regarded as unprotected and thus free for general use. No endorsement of named products is intended, nor is any criticism implied of other alternative, but unnamed, products. October 2019

Welcome message from author
This document is posted to help you gain knowledge. Please leave a comment to let me know what you think about it! Share it to your friends and learn new things together.
Transcript

Student Report 49
Characterising resilience and resource-use efficiency traits from Scots Bere and additional landraces for development of stress
tolerant barley
Jonathan Cope
BSc (Hons) from the University of St Andrews MSc from the University of East Anglia
Supervised by: Adrian C Newton (James Hutton Institute) Timothy S George (James Hutton Institute)
Gareth Norton (University of Aberdeen)
This is the final report of a PhD project (2140011109) that ran from October 2015 to September 2018. Funded by AHDB with a contract for £54,000, the total project cost was £93,000.
While the Agriculture and Horticulture Development Board seeks to ensure that the information contained within this document is accurate at the time of printing, no warranty is given in respect thereof and, to the maximum extent permitted by law, the Agriculture and Horticulture Development Board accepts no liability for loss, damage or injury howsoever caused (including that caused by negligence) or suffered directly or indirectly in relation to information and opinions contained in or omitted from this document.
Reference herein to trade names and proprietary products without stating that they are protected does not imply that they may be regarded as unprotected and thus free for general use. No endorsement of named products is intended, nor is any criticism implied
of other alternative, but unnamed, products.
October 2019

Abstract
With a growing population, it is important to increase crop yield. However, there is a low priority in
breeding for increased tolerance to low input or marginal environments. Potential sources of viable
resilience and resource-use efficiency traits are landraces local to areas of marginal land, such as
the Scots Bere from the Highlands and Islands of Scotland. Bere barley is a deeply historically
rooted landrace of barley that has been grown on predominately marginal land for the last half
millennia. The landrace yields well in these conditions. The project aim was to assess and
genetically characterise traits associated with enhanced resistance/tolerance, and to identify
contributing genomic regions.
The JHI spring barley collection, consisting of a number of Bere lines, was screened for biotic stress
resistance to Rhynchosporium commune and abiotic stress resistance to the conditions of
manganese (Mn) deficiency and salt stress. Additionally, the interaction of these stresses was
assessed. The results identify a number of Bere lines that show an increased resistance/
tolerance to each of the three stresses, compared to elite cultivars. The Bere population, as a
whole, showed an inherent enhanced Mn-use efficiency, correlating to increased accumulation of
Mn in the shoots. These results suggest that Bere landraces have unique abilities to cope with
stress. Interaction studies revealed complex line-specific interactions, along with an overall
adverse effect of salt on rhynchosporium symptoms.
Several genomic regions for Mn-use efficiency, salt tolerance, and rhynchosporium resistance
traits, originating from the Bere lines, were identified, along with potential candidate genes.
Further examination and validation of these regions should be undertaken for future breeding for
marginal lands. By introgression into elite cultivar backgrounds, they may contribute biotic and
abiotic stress-tolerance genes. This could create novel cultivars to efficiently and resiliently yield
under low input and marginal environments.

General Introduction
1
General Introduction
Barley Crop
The diploid species Hordeum vulgare is the most widely spread Hordeum sp., comprised of all
genotypes of cultivated barley and its wild ancestor which is still abundant in Southwest Asia.
Originally H. vulgare was split into three separate species; the wild form H. spontaneum, the cultivated
two-row form H. distichon/distichum, and the cultivated six-row form H. hexastichon/hexastichum.
However, based on several factors (including successful interbreeding to produce fertile offspring),
these Hordeum spp are now classified into two different subspecies within the same species; H.
vulgare ssp. spontaneum, and H. vulgare ssp. vulgare. The cultivated form, H. vulgare ssp. vulgare,
further separates into two taxonomical varieties to distinguish between two-row and six-row; var.
distichon, and var. hexastichon, respectively (von Bothmer et al., 2003; Khodayari et al., 2012; Zohary
et al., 2012).
Whilst the location of origin for the Hordeum genus is currently attributed to a large area, H. vulgare
ssp. spontaneum is widely regarded to originate in the fertile crescent, an area of Southwest Asia that
stretches from the Persian Gulf to Northern Egypt which is widely regarded as the birthplace of
agriculture (Mark, 2009; Dai et al., 2012). Recent archaeological evidence from a hunter gatherer
camp site on the shore of the Sea of Galilee, Israel, points to the use of wild barley as a human food
source as far back as 21,000 BCE; it was also shown that humans had developed tools to process
the grains (Nadel et al., 2012; Snir et al., 2015). The Fertile Crescent is home to multiple wild species,
including wild wheat (Brown et al., 2009). It was in this area that the origins of cereal crop
domestication began with the domestication of barley, along with early wheat, creating H. vulgare ssp.
vulgare. This domestication event is thought to have occurred approximately 8,000 BCE from
evidence of domesticated barley remains in archaeological sites from that period. The presence of
early wheat was also found but in smaller numbers, indicating that Barley was more common in
Neolithic agriculture (Newman and Newman, 2006; Dai et al., 2012).

General Introduction
2
Archaeological evidence has shown that both two-row and six-row cultivated barley have been grown
in large quantities since 5,000-6,000 BCE in the Fertile Crescent (Renfrew, 1969; Newman and
Newman, 2006; Cocks, 2013). It is widely accepted that the domestication of barley establishes it as
one of the founder crops in the development of agriculture, and the principle crop in the spread of
agriculture from South-west Asia outwards. Originally, in the Mesopotamian region, barley was
established as the main crop over wheat, partially due to the ability of barley to adapt to more extreme
regions (von Bothmer et al., 2003; von Bothmer and Komatsuda, 2010; Zohary et al., 2012). This
period is known as the Neolithic Revolution, where mankind transitioned from nomadism to sedentary
communities. During this era of growing cultivated barley on a large scale the production of fermented
barley, beer, was developed. The earliest evidence of a fermented beer-like beverage has been found
in China 8,000 BCE (McGovern et al., 2004; Pires and Brányik, 2015). However, it is thought that
beer has been made with barley (along with other grains) for 6,000-11,500 years (Hornsey, 2003;
Haaland, 2007; Stordeur and Willcox, 2009; Sicard and Legras, 2011; Hayden et al., 2012). It has
also been proposed that the act of discovering the process of fermentation led to the increased
demand of cereal crops like barley, causing the Neolithic Revolution and thus creating primary
civilisations (Braidwood et al., 1953; Katz and Maytag, 1991; Joffe, 1998; Damerow, 2012).
Currently, worldwide production of barley ranks it as the 12th most popular crop in terms of tonnage
produced. In the UK barley is the 2nd most highly produced crop with a production of over 6.5 million
tonnes in 2016, worth a net production value of over $350 million making it the UK’s 4th most valuable
crop (FAOSTAT). Of the barley produced worldwide approximately 5-7% is saved as seed for farming
or research, the remainder has three main uses; feed (60-70%), malting (20-33%), and food for
human consumption (2-5%). However, this is greatly variable between countries as some countries
with extreme climates and marginal agricultural environments, such as Ethiopia and Morocco, use
barley as a principal food source (Ceccarelli et al., 2007; Baik and Ullrich, 2008; Newman and
Newman, 2008). In wealthier countries malting barley is heavily produced due to the higher value, in
the UK 35% of all barley is used for malting (NFU and BBPA, 2013).

General Introduction
3
Genetic Diversity
Harlan and de Wet (1971) proposed a method of gene pool classification which assigns taxa related
to a crop to a primary, secondary, or tertiary gene pool. The primary gene pool is defined by the
species of the crop, containing all subspecies within, making crossing easy and with the majority of
hybrids produced fertile. The secondary gene pool contains all species that will cross with the crop
producing some offspring with fertility, but that may be difficult to achieve. The tertiary gene pool
includes closely related species that will cross with the crop, but produce no fertile offspring so that
gene transfer from this group cannot be achieved through conventional breeding. von Bothmer et al.
(2003) outline what this classification is for the barley crop (Figure 1). The primary gene pool includes
all commercial cultivars, breeding lines, landraces, and wild barley (H. vulgare ssp. spontaneum). The
secondary gene pool includes H. bulbosum, the other Hordeum sp. that contains the H genome similar
to barley. H. bulbosum is used to create hybrid double haploids with H. vulgare in the “Hordeum
bulbosum method” (Devaux, 2003). The Tertiary gene pool includes all the other Hordeum spp.
Figure 1) Distribution of the barley breeding gene pools in the method outlined by Harlan and de Wet (1971). Figure adapted from von Bothmer et al. (2003).

General Introduction
4
1.1.1.1. Landraces
Landraces are distinct but heterogeneous populations that are maintained through continuous
multiplication within a specific regional environment, which include climate and soil conditions along
with cultivation techniques. These practices subject the cultivars to both natural and artificial selection,
and so they are often more locally adapted than other cultivars. Barley landraces were established in
all areas where barley was grown and, due to the minimal transfer and the practice of farm saved
seed, the local populations diversified (Poets et al., 2015). The use of these landraces was universal
until the 19th century where, in the UK, ‘improved’ seed cultivars were chosen in favour. These were
bred using landraces from other regions to develop elite cultivars such as Archer, Spratt, and
Chevalier. The development of modern plant breeding in the 20th century saw the rise of elite cultivars
that were selected, usually from a single genotype, for improvements in traits such as yield, seed
quality, and biotic resistance. These new elite cultivars replaced many of the landraces in Europe
during the 1920’s leaving only landraces in poor agricultural environments or remote areas, thus much
genotypic material was lost (Fischbeck, 2003; Leino and Hagenblad, 2010; Bellucci et al., 2013).
Recently there has been an effort to preserve the genotypic diversity held in the population of
landraces. In recent years efforts have been made to calculate the total number of accessions held
between all the institutes around the world, these estimations are between 370,796 – 466,531
accessions in total, making barley the third most populace ex situ genebank collection, after wheat
and rice (van Hintum and Menting, 2003; FAO, 2010). However, whilst this gene bank saves genetic
data that could otherwise be lost, it is not completely effective. Parzies et al. (2000) have shown that,
due to the necessity of accession rejuvenation approximately every 5 years causing genetic drift,
there is a very significant decline in genetic diversity with time.
The variation between landraces shows a distinct geographic structure, with four main groups
identified: Coastal Mediterranean, Central European, East African, and Asian (Poets et al., 2015). In
areas where there is a concentrated representation of landraces, the variation between them has
shown localised geographic structures, as shown in the landrace material from the Himalayas
(Pandey et al., 2006), Spain (Yahiaoui et al., 2007), and Sweden (Leino and Hagenblad, 2010). A

General Introduction
5
study by Bellucci et al. (2013) demonstrated that the landrace populations are variable populations
containing a large number of different genotypes.
The diversity of landraces is due to their local adaptation via natural and artificial selection, with likely
evolutionary contributions from H. vulgare ssp. spontaneum. They are currently often confined to
marginal lands, where the elite cultivars cannot outperform them and thus it is not economically
favourable to replace them (Abera, 2009; Yahiaoui et al., 2014). It is due to this diversity of genetic
material that landraces offer a substantial genetic potential for breeders. The germplasm offers a
potential for increased nutrient uptake and efficiency traits, improved nutrition (particularly
antioxidants), a bank of resistance mechanism to both biotic and abiotic stress, and characters useful
for low input agriculture. Thus this material is being favoured for breeding to increase yield in the
harsh agro-ecological and climatic conditions of marginal land (Newton et al., 2010).
A common biotic resistance trait that developed in barley landraces, and can be used in breeding
programs, is resistance to powdery mildew. The most highly used resistance gene for powdery
mildew, and one of the most successful durable resistances to any important crop pathogen, is mlo
that was identified in Ethiopian landrace material collected in the 1930’s (Jørgensen, 1992). Newer
resistance genes to this fungal pathogen have also been identified in Spanish (Silvar et al., 2011),
Libyan (Czembor and Czembor, 2002), Jordanian (Abdel-Ghani et al., 2008), Moroccan (Czembor,
2000b), Egyptian (Czembor, 2000a), Tibetan (Zeng et al., 2014), Czech, and Slovakian (Dreiseitl and
Jørgensen, 2000) landraces. Resistance genes to multiple other pathogens have also been identified,
including: 1) Scald pathogen (Rhynchosporium commune) – found in landraces from Ethiopia
(Yitbarek et al., 1998; Bjørnstad et al., 2004), Syria, and Jordan (van Leur et al., 1989) and particularly
high levels of resistance found in lines derived from Spanish landraces (Hofmann et al., 2013). 2)
Leaf Rust pathogen (Puccinia hordei) – found in landraces from Ethiopia (Alemayehu and Parlevliet,
1996), former Yugoslavia (König et al., 2012), and the Southern Mediterranean region (Czembor and
Czembor, 2007). 3) Fusarium diseases – with resistance to Fusarium Crown Rot found in a landrace
from Japan (Chen et al., 2013), and Fusarium Head Blight Resistance identified in landraces from
Ethiopia and Eritrea (Mamo and Steffenson, 2015). 4) Stem Rust pathogen (Puccinia graminis f.sp.

General Introduction
6
tritici) – much of the resistance to this pathogen was overcome by a Ugandan lineage, Ug99 (Race
TTKSK), that has broad spectrum resistance; recently landraces from Switzerland have been
identified with high levels of resistance to this Stem Rust race that has become a serious threat to
barley, and wheat, production (Mamo et al., 2015).
Due to the continuous growth of landraces on marginal soils, they can potentially be a valuable source
of genetic material for tolerances against abiotic stresses. One of the most common abiotic constraints
is drought, affecting large regions of low rainfall areas that depend on rain-fed water application, in
both more and less economically developed countries. Landraces have been a large source of
drought tolerance in arid regions such as Ethiopia (Abera, 2009), Namibia (Ben Naceur et al., 2012),
and particularly in the region of the fertile crescent such as Syria (Grando et al., 2001), Iran (Pour
Aboughadareh et al., 2013), and Jordan (Haddadin, 2015). A study showed that in arid and semi-arid
environments, adaptation to excessive irradiance was an important factor in drought tolerance, this
study indicated that a Syrian landrace has this adaption (Tardy et al., 1998). Prolonged drought stress
events in otherwise water adequate environments is an alternative, but related, water deficient stress;
landraces from the Mediterranean region have shown a tolerance that could be utilised (Comadran
et al., 2007). Like drought, salt stress is an osmotic stress, and thus likely has overlapping
mechanisms of tolerance. Similarly landraces that express tolerance have been identified in
populations from Morocco (El Madidi et al., 2004), Oman (Jaradat et al., 2004), and Syria (Kalaji et
al., 2011), along with an Algerian landrace that has also been shown to have boron tolerance and
cereal cyst nematode resistance (Karakousis et al., 2003; Hayes and Reid, 2004; Widodo et al.,
2009). In other agricultural areas, often in the most northerly/southerly regions or at high altitudes,
frost is a major abiotic stress. Major frost tolerance genes from landraces found in the Turkish highland
regions have been widely used in winter barley breeding programs (Akar et al., 2009; Newton et al.,
2010). Other landraces that display frost tolerance have been found in the Ethiopian highlands (Eticha
et al., 2010; Shewayrga and Sopade, 2011; Fetene et al., 2012).

General Introduction
7
1.1.1.2. Scots Bere
The Scottish landrace ‘Bere’ has been grown on predominately marginal land for, at least, the last
half millennia, and currently is grown on the highlands and islands of Scotland. It is thought that this
landrace was first introduced to the northern areas of Scotland around the 8th century by Danish and
Norse invaders, with the name ‘Bere’ coming from the Old Norse word ‘Bygg’ meaning barley
(Jarman, 1996). Bere barley may also have been one of the first barley varieties introduced to the
Pacific Northwest during the European colonisation of North America (Scheuerman and McGregor,
2013). Bere is of the hexastichon variety, 6-row, and is a spring barley that is traditionally sown in late
spring, with rapid growth allowing harvest in just 90 days. However, this later sowing is thought to be
established due to work prioritisation and has continued as tradition. It has been shown that a
significant yield advantage can be acquired by planting the Bere barley earlier, towards the end of
April (Martin et al., 2010). Historically, it was Scotland’s main barley crop and was used for all the
barley uses of that time; including food, feed, and malting, with the straw being used for animal
bedding and thatching (Martin et al., 2009).
Current uses are much more limited with much of the Bere cultivation being replaced with higher
yielding and shorter straw cultivars in much of the Highlands and Islands, with grass pastures for
cattle grazing in Orkney (Martin et al., 2008a), and recently in the Shetlands much of the remaining
Bere barley was replaced by sheep farming (SASA, 2015). The cultivation of Bere barley in Orkney
has been sustained due to the association with a traditional water mill, Barony Mill. This mill processes
the grain to produce Bere meal, a type of flour similar to what would have been produced in historic
times. This Bere meal is used around the island to make products such as bread, biscuits and the
traditional Bere meal bannock, a type of traditional scone (Martin et al., 2008b).
The main concerns of growing Bere barley, as noted by farmers interviewed in 2003, is lodging and
the low yielding aspects. Yields for Bere barley are typically half that of commercial elite varieties
grown in similar climatic conditions (in Orkney) with optimum applications, but Bere populations are
showing limited yield response to applications of N, P, or K fertilisers (Martin et al., 2008a). Yields for
Bere populations were able to be increased by 47% one year by a combination of earlier planting

General Introduction
8
date, highlighted above, along with both fungicide and growth regulator (Martin et al., 2009),
suggesting the low yields of Bere barley may be improved slightly with altered agronomic practices.
Emphasising the low yielding aspects of Bere outside its native location is an organic spring barley
trials in Washington state undertaken by Jones and Lyon (2012). Grown with organic fertilizer
applications, this trial showed the yield of the single Bere barley variety tested was the lowest yielding
of all varieties tested, with less than one third of the highest performing variety (Brouwer et al., 2015).
However, Bere, like other landraces and rare breed products, can sell for a premium due to a
combination of rarity/novelty, promotion of local products and practices, heritage appeal, and
generation of ecosystem services (ES) (Riu-Bosoms et al., 2014; Villa et al., 2006; Ovaska and Soini,
2016; Heinonen and Veteläinen, 2011). This value-adding trait, along with potential government
subsidies to promote agrobiodiversity, makes the production of Bere barley economical; but in limited
cases at present, with possible further cases if the production costs could be reduced. Examples of
the commercial products that include specialist whiskies and beers made with Bere barley. This
allowed the products to sell for a premium, negating the extra costs accrued due to the higher cost of
the lower yielding grain, higher cost of malting smaller quantities of grain, and the need for a higher
quantity of grain per bottle produced. The latter effect is due to the reduced sugar extraction from the
Bere malt, caused by a larger protein content resulting in a reduction in available starch compared to
elite malting varieties (Martin and Chang, 2008; Martin and Wishart, 2015) estimated to be a 15-20%
lower yield of sugars in the wort (Martin et al., 2008a). This premium, however, is limited to local
markets due to the lack of historical and cultural ties to the crop in other regions (Mahon et al., 2016).
Within the literature Bere barley is generally referred to as a single variety and is often shown to have
different, sometimes conflicting, phenotypes. This diversity is due to the isolated nature of the islands
where Bere is still grown. A study undertaken by Southworth (2007) using 29 microsatellite markers
shows that there is significant genetic variance between the 3 island groups of the Shetland, Orkney,
and Western Isles. It was suggested that this clustering is due to the lack of historical seed trade
between the island groups, but also suggested that it could be due to adaptation to the differing
environments between the islands. This diversity was compared with the diversity of 134 cultivars on

General Introduction
9
the national list, over 5 loci, and showed that the Bere lines have similar levels of diversity as found
in the pool of elite cultivars. Whilst this diversity between island groups was high, over two-thirds of
the total diversity was found within the island group clusters. The Western Isles displayed the greatest
genetic diversity potentially due to similar geological constraints as between the island clusters.
As stated, this diversity manifests as differing phenotypic traits with regards to both biotic and abiotic
stresses, potentially differing due to unique nutrient deficiencies and toxicities found in the different
environments of the islands farming area. Some Bere lines have been shown to be tolerant to acidic
soils (Wright et al., 2002; Ellis, 2004), found to be regulated by a single gene on chromosome 4H and
possibly indicating aluminium tolerance (Stølen and Andersen, 1978; Wright et al., 2002). Local
farmers also noted that Bere barley was able to grow well on the poorly drained peat soils found in
the Shetlands, possibly due to the low pH tolerance (Mahon et al., 2016). Work by George et al.
(2014) and Schmidt et al. (2018) has shown that other Bere lines maintain optimal growth in alkaline
soils, such as the Machair in the Western Isles, and the associated manganese deficiency. Therefore
these, and potentially other Bere landraces, offer a promising source of Mn use efficiency genes that
can be used in breeding. Southern Australian barley breeding programs, for example, have used a
group of two RFLPs on the short arm of chromosome 4 (4HS), linked to a locus of manganese
efficiency designated Mel1. The Mel1 locus was found in a Mn-efficient variety called Amagi Nijo and
assessed using bulk segregant analysis (Pallotta et al., 2000; Pallotta et al., 2003; Poulsen and Lance,
2010). With regard to biotic stresses, it has been observed that Bere barley has an increased
susceptibility to powdery mildew (Blumeria graminis f.sp. hordei), and possibly other foliar diseases
(Wright et al., 2002) such as barley leaf strip (Pyrenophora graminea), when compared to other
Scottish barley seed (Cockerell, 2002). However, in an interview in 2003 with farmers who grew Bere
barley in Orkney, the susceptibility to powdery mildew was not noted by most as a concern (Martin et
al., 2009). Later interviews with farmers by Mahon et al. (2016) suggest that Bere are more resistant
to other foliar diseases, in particular barley leaf scald (Rhynchosporium commune) AKA barley leaf
blotch. This difference in reported and observed susceptibility could be due to differences within the
Bere population.

General Introduction
10
Biotic Stresses in Barley
Biotic stress is defined as the stress caused by independent organisms or pseudo-organisms,
including: a) macroscopic organisms such as insects, grazing animals, weeds, and competing crops,
b) microscopic agents such as fungus, bacteria, nematodes, and protists/protozoa, and c) pseudo-
organisms including viruses and sub-viral agents such as viroids (Agrios, 2005; Schumann and
D'Arcy, 2006; Newton et al., 2011a). Crop losses for the six major crops were compared by Oerke
(2005) showing that weeds displayed the biggest potential for losses in all crops, but due to effective
management the actual crop loss due to pathogenic microbes were bigger and/or the biggest for most
crops (Table 1). These microscopic organisms along with viruses are the primary causal agents
responsible for diseases in plants (Gimenez et al., 2018), which is estimated to be responsible for the
loss of at least 10% of food production globally (Strange and Scott, 2005) and a potential of 18.1%
loss in wheat (Table 1), a comparable crop to barley. Of these plant diseases, fungal pathogens are
prominent as causal agents of economically important diseases in cereal crops such as wheat
(Figueroa et al., 2018), rice (Gnanamanickam, 2009), and barley (Newton et al., 2011a).
Table 1) Comparison of potential and actual global crop loss worldwide in six major crops, broken down by type of biotic stress, for the 2001-2003 period. Table adapted from Oerke (2005).
Crop Wheat Rice Maize Potatoes Soybeans Cotton
Attainable production [Mt] 785 933.1 890.8 517.7 244.8 78.5**
Cro
p losses*
(%)
due t
o: Weeds
Potential 23.0 (18–29) 37.1 (34–47) 40.3 (37–44) 30.2 (29–33) 37.0 (35–40) 35.9 (35–39)
Actual 7.7 (3–13) 10.2 (6–16) 10.5 (5–19) 8.3 (4–14) 7.5 (5–16) 8.6 (3–13)
Animal Pests Potential 8.7 (7–10) 24.7 (13–26) 15.9 (12–19) 15.3 (14–20) 10.7 (4–16) 36.8 (35–41)
Actual 7.9 (5–10) 15.1 (7–18) 9.6 (6–19) 10.9 (7–13) 8.8 (3–16) 12.3 (5–22)
Pathogens Potential 15.6 (12–20) 13.5 (10–15) 9.4 (8–13) 21.2 (20–23) 11.0 (7–16) 8.5 (7–10)
Actual 10.2 (5–14) 10.8 (7–16) 8.5 (4–14) 14.5 (7–24) 8.9 (3–16) 7.2 (5–13)
Viruses Potential 2.5 (2–3) 1.7 (1–2) 2.9 (2–6) 8.1 (7–10) 1.4 (0–2) 0.8 (0–2)
Actual 2.4 (2–4) 1.4 (1–3) 2.7 (2–6) 6.6 (5–9) 1.2 (0–2) 0.7 (0–2)
Total Potential 49.8 (44–54) 77.0 (64–80) 68.5 (58–75) 74.9 (73–80) 60.0 (49–69) 82.0 (76–85)
Actual 28.2 (14–40) 37.4 (22–51) 31.2 (18–58) 40.3 (24–59) 26.3 (11–49) 28.8 (12–48)
* Figures in parentheses indicate variation among 19 regions.
** Seedcotton.
Fungal pathogens are grouped into three broad categories depending on the state of the plant host
tissue that the fungus feeds on. Biotrophs are fungi that feed on the living host tissue whilst
necrotrophs kill and feed on the dead tissue, the third category are hemi-biotrophs that behave as
both a biotroph and necrotroph depending on their environment and/or stage in their lifecycle
(Glazebrook, 2005; Vleeshouwers and Oliver, 2014). Infection of plant material for most pathogenic
fungi starts with adherence to the plant surface cells, growth of germ tubes, and then penetration into

General Introduction
11
the plant using various infection structures. After penetration, necrotrophic fungi tend to grow sub-
cuticularly whilst releasing toxic proteins and metabolites that kill the cells around them, allowing the
fungal hyphae to replace the cells. Biotroph hyphae can grow both inter- and intracellularly, the latter
of which often encases its hyphae in the hosts plasma membrane and can grow dedicated feeding
structures within the cells; some biotrophic fungi are exclusive intercellular colonizers. Within the
biotrophic grouping there are obligate biotrophs that rely solely on the host for nutrients, and
facultative biotrophs that use the host as an alternative source of nutrients. Hemibiotrphic fungi tend
to have larger intracellular hyphae during their biotrophic phase, and then develop into thin hyphae
for the necrotic phase (Lo Presti et al., 2015).
Fungal diseases are particularly prevalent in monoculture farming techniques, commonly practiced,
providing an increased selection pressure allowing pathogens to overcome resistances within the
crop more easily (Oerke, 2005). Resistance can also be affected by abiotic stresses, either
temporarily or permanently. For example, the temporary compromise of barley’s resistance to
powdery mildew, via the mlo resistance gene, caused by the rapid relief of drought (Newton and
Young, 1996). Changes in climate will add additional problems with fungal pathogens as differing
environments could change the pathogens behaviour and shift the patterns of infection so that
diseases move into new regions with the susceptible host crops. Together these show a current and
future threat of fungal pathogens and need to address them through means such as breeding
programmes and agronomic practices (Newton et al., 2011a; Chakraborty and Newton, 2011).
Plant innate immune system consists of two layers: PAMP-triggered immunity (PTI), and effector-
triggered immunity (ETI). Pathogen-associated molecular patterns (PAMPs) are molecular patterns
that are conserved in the pathogen that can have the potential to be recognised in a plant system by
pattern recognition receptors (PRRs), triggering a broad but weak host resistance. The second layer
of immunity is ETI that induced by recognition, direct or indirect, of pathogen avirulence effectors by
host disease-resistance (R) proteins produced by R genes (Wang et al., 2014b; Franco-Orozco et al.,
2017).

General Introduction
12
Abiotic Stresses in Barley
Abiotic stresses are the environmental stresses not caused by an external organism but by physical
or chemical environmental pressures. Physical elements include light, water, and temperature.
Chemical elements include phytotoxic compounds, and nutrients such as sodium in the form of salinity
(Shinozaki et al., 2015). These stresses can cause detrimental changes in the metabolism, growth,
and development of plants reducing the usable crop yield and, in extreme cases, causing plant death
(Sha Valli Khan et al., 2014). Thus, understanding the method of stress sensing and response is
critical in protecting plants against these conditions (Cramer et al., 2011; Zhu, 2016). Mechanisms of
adaptation to stress are usually subdivided into two general categories: avoidance mechanisms like
long roots to avoid drought, and tolerance mechanisms such as increased ion transporters in rice to
sequester excess sodium into the vacuole (Gao et al., 2007; Shinozaki et al., 2015).
Many abiotic stresses are found in conjunction with other abiotic and biotic stresses. An example of
this is the combination of heat and drought stress that has been shown to have specific plant
responses separate from the responses to the individual stresses (Mittler, 2006). The combination of
abiotic stress can also be antagonistic in terms of tolerance mechanisms. An example of this is that
of heavy metal toxicity and drought stress, where the mechanism for tolerance to one exacerbates
the effect of the other (Barceló and Poschenrieder, 1990). As these mechanisms of tolerance to
abiotic stresses require increased resources, such as key micronutrients for defence enzymes,
nutrient deficiency is an additional concern when using and breeding for abiotic tolerant plants (Mittler,
2006). Biological interactions also play a key role in abiotic stress, such as the biotic-abiotic stress
interactions detailed in the next sections, as well as interactions with the rhizosphere microbiome such
as the role of plant-growth-promoting rhizobacteria in prompting an ‘induced systemic tolerance’ to
salt and drought (Yang et al., 2009), and the suggested role of mycorrhizal in drought stress tolerance
(Grover et al., 2011).
Climate change holds a particular challenge regarding abiotic stress as changing and increasingly
variable environments will cause new abiotic stresses to develop in different regions. These include

General Introduction
13
fluctuations in temperature, light, water, carbon dioxide and nutrient availability (Sinclair, 1992; Koski,
1996; Newton et al., 2011b; Hatfield et al., 2014). This is compounded by the increased crop demand
to feed the increasing population, and thus the estimated average reduction in crop productivity of 65-
87% caused by abiotic and biotic stress needs to be addressed (Shinozaki et al., 2015). Varieties that
are able to overcome these challenges need to be developed (Wheeler and von Braun, 2013), and
genetic mapping poses to be a great tool in identifying stress tolerant loci that can be used in this
development (Pereira, 2016).
Nutrient Stress
Nutrient stress in plants can be a result of either a deficiency or excess of micro- or macro-nutrients.
Limitation of nutrients in a plant system can often cause permanent damage causing the plant to use
other resources less efficiently, resulting in loss of yield (van Maarschalkerweerd and Husted, 2015;
Schmidt et al., 2016a). The eight essential micronutrients needed for plant growth are chlorine (Cl),
boron (B), iron (Fe), manganese (Mn), copper (Cu), zinc (Zn), nickel (Ni) and molybdenum (Mo), along
with six essential macronutrients nitrogen (N), phosphorus (P), potassium (K), calcium (Ca),
magnesium (Mg) and sulphur (S) (White and Brown, 2010). Toxicity occurs when the concentration
of one or more nutrients is too high, so that the subcellular compartmentalization and chelation of
these minerals is ineffective, allowing the nutrients to disturb vital systems. Common nutrient toxicities
include sodium (Na) and heavy metal toxicity. Common heavy metals that are toxic at high
concentrations to plants include cadmium (Cd), mercury (Hg), chromium (Cr), cobalt (Co), lead (Pb),
Zn, Fe, Cu, Al, Ni, and Mn, many of these are mainly found in toxic concentrations due to
anthropogenic activity (Foy et al., 1978; Maathuis and Amtmann, 1999; Fageria, 2001; Yadav, 2010;
Kronzucker et al., 2013).
Interactions with other nutrients may enhance or decrease the level of sensitivity to toxic or deficient
nutrient levels. The reason for this positive or negative interaction is dependent on the nutrients
involved and can be direct or indirect. An example of an indirect negative interaction is that of N and
micronutrients, which is due to increased growth stimulated by N availability causing higher demand
on limited micronutrients (Fageria, 2001). An example of a direct effect is the antagonistic effect found

General Introduction
14
between Mn and Al, with the effect of the toxic concentrations of both together being less than that of
the same level individually (Muhammad et al., 2016).
Environmental conditions also play a crucial role in the deficient and toxic effect on nutrients, notably
due to differing water levels and pH values in the soils. Waterlogging stress has been shown to cause
a deficiency in nutrients such as N, P, K, Mn, Cu, and Zn due to limited oxygen causing inhibition of
ATP (Steffens et al., 2005), it has also been shown to cause toxicity to Mn and Fe due to a change in
available ion concentration (Mengel and Kirkby, 2001). Ion solubility is also affected by the presence
or absence of H+ ions. Increased levels of H+ ions, low pH, causes an increase in the solubility of Al,
Mn, and Fe resulting in toxicity. Corresponding deficiencies occur at high pH. H+ ions can also
outcompete Ca2+ ions at concentrated levels, causing a deficiency in Ca (Alam et al., 1999; Horneck
et al., 2011).
Barley Breeding
Barley is one of the most heavily produced crops in the world, with current global production at over
140 M tonnes as of 2016. Global average barley yield has more than doubled in the last 50 years,
1,328 to 3,011 kg/Ha between 1961 and 2016, but the total production has remained similar due to a
decline in land area used for barley. This yield increase is also seen in the UK where the harvest area
reduced by over 50% since the high in 1966, but with less than a 25% drop in production (FAOSTAT).
This average yield increase is partially due to classical breeding techniques of the 20th century. During
this time commercial plant breeding of crops was established and used targeted selective breeding
coupled with techniques such as new statistical methods, cytoplasmic male sterility, embryo rescue,
mutagenesis (chemical, radiation and transposons), and backcrossing – creating new high-yielding
varieties (HYVs) (Sneep et al., 1979; Borém and Milach, 1998; van de Wiel et al., 2010; Shu et al.,
2012). The HYVs of maize, wheat and rice from the International Maize and Wheat Improvement
Centre (CIMMYT) in Mexico and the International Rice Research Institute (IRRI) in the Philippines,
developed during the period in and around world wars, resulted in large yield increases that then
spread around the world in the 1960s, along with other innovative farming techniques, creating the

General Introduction
15
Green Revolution (Davies, 2003; Evenson and Gollin, 2003). However, HYVs of barley were not
commercially bred until the late 1970s, as barley was often grown under harsh, low rainfall
environments by poorer farmers (Aw-hassan et al., 2003).
Current breeding targets to increase barley yield encompasses a wide range of traits, directly and
indirectly related to grain production (Friedt et al., 2010). In the UK, lines are assessed by the
Agriculture and Horticulture Development Board (AHDB) on up to 13 different characteristics for
spring barley, in addition to the assessment of yield – which itself is subdivided by the growth region
(AHDB, 2018). These characteristics become breeding targets for companies in a drive to achieve
varieties that make it onto the AHDB recommended list, thus focusing the breeding for growing on
favourable lands and possibly away from the development of robust crops for less favourable lands
and conditions, both of which are likely to increase with climate change. Due to the varying
environments around the world, different countries breed for different traits. Abiotic stress is a big
concern, thus the Grains Research and Development Corporation in Australia have outlined tolerance
to drought, salinity, manganese deficiency, and aluminium toxicity as targets (Friedt et al., 2010).
Agricultural practices rely on healthy and vigorous crops to provide economic productivity. Ongoing
global climate change is causing changes in the local environments that threaten the optimum health
and vigour of many crops, and thus the food security of nations (Nelson et al., 2010). Robust crops
that can adapt to the changing environments need to be developed to be able to cope with fluctuations
in temperature, light, water, carbon dioxide and nutrient availability, along with the fluctuation in
associated pests and diseases (Sinclair, 1992; Koski, 1996; Newton et al., 2011b; Hatfield et al.,
2014). The need to breed pre-emptively for these situations is being highlighted, with traits and lines
of interest being identified (Newton et al., 2011b; Ingvordsen et al., 2015; Atlin et al., 2017).
Modern plant breeding, to breed for the future varieties, encompasses a wide range of molecular
biological and genomic techniques including; reverse breeding using double haploidy, genetic
modification, and marker assisted selection (Barabaschi et al., 2016; Glenn et al., 2017).

General Introduction
16
Marker-assisted Breeding
Classical breeding works by breeding individuals selected based on the phenotypic data, this was
aided with the use of phenotypic and protein markers in the beginning of the 20th century (Lammerts
van Bueren et al., 2010). These phenotypes may be based on genetic variations. Regions in the
genome that correspond with these phenotypes are called quantitative trait loci (QTLs) and may be
associated with genes, or clusters of genes, which are responsible for this change in phenotype. In
the 1980’s DNA markers were developed, which are regions of genetic difference between individuals
being tested and can be selected based on the similarity e.g. between species, cultivars, or individuals
(Collard et al., 2005).
The use of multiple markers allows a linkage map to be developed to help identify chromosomal
regions containing QTLs controlling variation in the trait of interest. The use of linkage maps aids the
identification of QTLs associated with Mendelian traits but is less effective for traits with multiple genes
and polyploid crops. Fine mapping addresses some of these problems and is commonly undertaken
using a genome-wide association study (GWAS). Typically, the markers used in this are single
nucleotide polymorphisms (SNPs), using a diverse population which will have a large number of
historical recombination events. Such analyses uses the principle of linkage disequilibrium (LD),
meaning unmapped causative SNP and indels (insertions or deletions of base pairs) will be closely
associated with the SNP markers nearby compared to those further away (Visscher et al., 2012; Xiao
et al., 2017). Recent developments in high-throughput sequencing and genotyping has allowed for
the identification of a vast number of SNPs in the elite cereal crops such as maize (Huang and Han,
2014), wheat (Rimbert et al., 2018), and barley (Bayer et al., 2017), this allows a greater detail in
identifying the position of the associated loci. Markers that are highly associated with a certain trait
can then be used in MAS as mentioned above. The technique MAS uses markers associated with
certain traits to select the progeny that are most likely to contain suitable alleles from a segregating
breeding population, allowing the removal of unfavourable lines without the wasted resources of
growing them until a visible phenotype is seen (Nadeem et al., 2018).

General Introduction
17
Project Focus
The soil conditions in the regions that Bere barley grows varies widely, with many areas supporting
crops on highly alkaline soils (Martin et al., 2008b) with associated manganese deficiency. Other
regions such as North-east Caithness and the Northern Isles of Scotland, where Bere lines grow, can
experience salt-laden winds year-round causing salt stress (Dry and Robertson, 1982). Material
collected from these areas, by the University of the Highlands and Islands and kept in the James
Hutton Institute Spring Barley Landrace Collection (JHI-SBLC), thus offers a promising genetic
potential in the breeding resistance/tolerance to biotic and abiotic stress in barley plants for
commercial growth. The main aim of this investigation is to identify novel stress resistance/tolerance
in Bere lines, other landraces and old cultivars (Table 2), for both abiotic and biotic stresses, and to
identify the regions of the genome contributing to the control of this. This will be done by the adaption
and implementation of methods to screen individual lines within the landrace collection, isolating
genotypes that could provide breeding material for developing elite cultivars that have increased
resistance to biotic and abiotic stresses.
The two abiotic stresses that will be tested are Manganese (Mn) and salt. The tests of Mn stress will
be looking for lines that have high Mn use-efficiency in a hydroponic system. Alongside this the effect
of environmental Mn on the concentration of Mn in the shoot tissue for different lines/cultivars will be
analysed. The tests of salt stress will be looking for lines that have a high tolerance to elevated salt
levels, specifically sodium, assessing the immediate affects via the rate and early growth during the
germination phase, and the longer-term effects based on the growth and development of more mature
plants. The biotic stress that will be tested is the diseased caused by the infection with
Rhynchosporium commune. Assessing the symptoms via the spread of the lesion, alongside the
further assessment of rhynchosporium in field trials. This aim will be aided by using genotypic data to
perform GWAS’ that can be used to isolate molecular markers associated and identify candidate
genes of interest. The secondary aim is to identify how these stresses interact and how these
interactions differ between the lines/cultivars, this will be undertaken using the selected lines from the
previous aim.

General Introduction
18
Table 2) Lines/cultivars from the JHI-SBLC that were grown up to collect seed from. Bere lines are highlighted in bold, old cultivars are highlighted in italics and underlined, as identified in the JIC-GRU SeedStor (Horler et al., 2017).
Afghan 1169 Binder-M08 Hen Gymro-163 Padstow-189
Aramir-M08 Bonus-127 Hen Gymro-164 Pembroke-190
Archer-M08 Bowman Hen Gymro-165 Plumage Archer Selection-M08
Aurore-107 Burtons Malting-128 Hen Gymro-166 Plumage-192
Balder-108 BW 902 Hen Gymro-167 Plumage-193
Bavaria Camton-129 Hen Haidd Enlli Plumage-M08
Beavans 35/51-110 Carslberg-M08 Hen Haidd Eulii-168 Prior-195
Beavans 35-109 Chevalier D10-130 Hen Hardd Eulii 78 A Prize Prolific-196
Bere (Mr SO)-121 Chevalier-M08 Hen Hardd Eulii 78 B Proctor
Bere (Scots)-122 China Huang Yen Hen Hardd Eulii 78 C Proctor-M08
Bere 23 A Common-132 Hindukusch Rene Guillemart-197
Bere 23 B Common-218 HSX07-15 Rigel-198
Bere 23 C Cornish-133 HSX07-20 Rigel-199
Bere 24268 A 71 Craigs Triumph (SSRPB)-135 HSX07-26 SASA 27 A Bere North Uist
Bere 25 A Craigs Triumph B8(8)-136 Irish Archer-169 Scotch Annat 4812
Bere 2962 (AB) Craigs Triumph-134 Irish Goldthorpe-170 Scotch Annat-200
Bere 37 A 14 D.K.S. Binder-137 Irish Goldthorpe-171 Scotch Common-M08
Bere 39 A 16 Berneray Danubia Irish Goldthorpe-172 Scottish Annat 8585
Bere 43 A 21 Donegal landrace-138 Irish Goldthorpe-222 Scottish Annat-202
Bere 44 A 22 Earl-139 Isaria Scottish Common 28303
Bere 45 A 23 Earl-140 Japan Kitagawa Chobo Scottish Common 3584
Bere 47 A 25 Early Welsh-141 Kenia-M08 Scottish Common 7083
Bere 4828 A 63 Early Welsh-142 L92-174 Scottish Common 7683
Bere 49 A 27 Shetland Eire Six Row-143 Laevigatum-175 Skadu Local ''Oldings''
Bere 52 A 30 Eire Six Row-220 Lawina Spratt Archer 37/6/3-205
Bere 53 A 31 Floye Lenta-176 Spratt Archer-M08
Bere 55 A 33 Gartons Archer-144 Long Eared Nottingham-177 Spratt-M08
Bere 55C 33 Glasnevin 1-145 Long John Grant-178 St Davids-206
Bere 58 A 36 Eday Gold-146 Maja-179 Standwell-207
Bere 59 A 37 Uist Golden Archer-147 Millenium-219 Standwell-208
Bere 60 A Golden Drop-148 Morayshire Gold 7009 Stat -Old 14
Bere 7045 (AB) Golden Melon-149 Morayshire Gold-180 Streatly-209
Bere 8-125 Golden Pheasant-150 Morex Swanneck-210
Bere A 3962 62 Golden Promise-M08 Nepal 92 BN-1 Swanneck-211
Bere-112 Goldfield-151 New Cross-181 Swannek-212
Bere-113 Goldfield-152 NFC Tipple Swannek-213
Bere-114 Goldthorpe-153 Northumberland Rogue-182 Tibet37
Bere-115 Goldthorpe-154 Old Cromarty-183 Tiree six row 12 (AB)
Bere-116 Gotlands-156 Old Irish-184 Tiree six row 12 A
Bere-118 Gull-158 Old Irish-221 Vollkorngerste-214
Bere-119 Haidd Garw-159 Old Wilts Archer-185 Webbs Binder-215
Bere-120 Hanna-M08 Old Wiltshire Archer-187 Webbs Burton Malting-216
Bere-155 Heines Hanna Old Wiltshire-186 Webbs Naked 2-Row-217
Bere-223 Hen Gymro-161 Opal-188 Westminster
Bere-M08 Hen Gymro-162 Optic Zephyr-M08

Manganese Efficiency
19
Assessing the variation in manganese use efficiency traits in Scottish barley landrace Bere
(Hordeum vulgare L.)
Introduction
Whilst barley has displayed a greater Mn use efficiency than other temperate cereal crops (Marcar
and Graham, 1987) a lack of available Mn still causes major problems in barley agronomy worldwide
including areas with: a) high organic matter such as peaty soils in the UK (Jiang and Ireland, 2005)
and the Great lakes area of the USA (Adriano, 2001), or loam soils in Alberta and Ontario in Canada
(Reid and Webster, 1969); b) poorly draining and coarse textured soils in Sweden, the Atlantic Coastal
Plains of the USA, Scotland in the UK (Goldberg et al., 1983), and the Netherlands, the latter also
containing poorly draining clay soils (Henkens, 1958); and c) calcareous soils of Northern China and
Australia, causing up to 75% yield reduction in Southern Australia (Graham et al., 1982). These
conditions are found in combination in Danish soils in Northern and Western Jutland, further affected
by over-liming (Steenbjerg, 1935; Reuter et al., 1988). Alkaline and calcareous soils can have a
reduced Mn availability as the nutrient is in the Mn(III) and Mn(IV) forms, bound and precipitated as
oxides and dioxides (Tisdale and Nelson, 1956; White and Greenwood, 2013). This conversion takes
place because Mn availability is controlled by H+ concentrations (pH) and redox potential. The high
pH of the alkaline soils (low H+) drives the reverse reaction of MnO2 + 4H+ + 2e- ⇄ Mn2+ + 2H2O,
limiting the amount of available Mn (Blake et al., 1999; Porter et al., 2004; Aciego Pietri and Brookes,
2008).
Manganese is found in multiple forms based on its oxidation state, with three main states being
associated with biological systems. The most stable state, Mn(II), is the most soluble in soil and exists
as Mn2+. Manganese (III) and Mn (IV) are insoluble species often present bound in the forms of Mn(III)
oxide (Mn2O3) and Mn dioxide (MnO2), respectively (Millaleo et al., 2010). In plant systems Mn plays
an important role in the function of multiple enzymes and other proteins. Manganese has a key and
crucial role as a catalytically active metal in the photosystem II (PSII) oxygen evolving complex (OEC)
within chlorophyll, where it catalyses the water-splitting reaction (Schmidt et al., 2015). Other

Manganese Efficiency
20
important biological uses for Mn include its role in NAD-malic enzymes, oxalate oxidase enzymes,
glycosyl transferase, and proteins involved in the shikimic acid pathway, occurring in approximately
35 enzymes in total (Hänsch and Mendel, 2009; Williams and Pittman, 2010). Of these enzymes,
three cannot replace the Mn component (Burnell, 1988), including: Mn superoxide dismutase (Bowler
et al., 1991; Poage et al., 2011), oxalate oxidase (Requena and Bornemann, 1999), and as a
catalytical Mn cluster (Schmidt et al., 2016b) in the OEC of PSII mentioned above (Ono et al., 1992;
Barber, 2004). Manganese deficiency has been shown to cause a considerable reduction in PSII
supercomplex quantity (Schmidt et al., 2015), whilst retaining OEC protein sub-units such as PsbP
and PsbQ (Schmidt et al., 2016b).
Manganese-deficiency is a large problem to global crop production, as is Mn-toxicity (White and
Greenwood, 2013). When the soil is acidic the forward reaction of MnO2 + 4H+ + 2e- ⇄ Mn2+ + 2H2O
is driven and the Mn in the soil becomes available (Porter et al., 2004). In soils rich in organic matter,
coupled with a low pH, the availability of Mn2+ is in excess and can cause toxicity in the plant. This
excess causes an inhibition of respiration & photosynthetic functions, as well as a reduction in
chlorophyll content and synthesis of nitrogen and protein (Demirevska-Kepova et al., 2004). The
problem of Mn-toxicity in acidic soils can be corrected by increasing the soil pH via the application of
Ca and Mg rich materials, such as chalk or limestone (White and Greenwood, 2013). As stated
previously, the redox potential also affects the availability of Mn in the soil. When the reducing
processes dominate during anaerobic conditions, such as waterlogged or flooded soils, the reaction
is driven as it is in acidic environments, causing large levels of available Mn. This large concentration
of Mn2+ has the same effect as in acidic soils, thus waterlogged plants often exhibit Mn-toxicity. This
available Mn often rapidly becomes unavailable once the soil is aerated upon draining (Mengel and
Kirkby, 2001; Huang et al., 2015).
The symptoms of this deficiency are indicated first by inter-veinal bleaching of the middle leaves,
followed by a spread of this bleaching and development of brown rimmed blotches (Figure 2). The
leaves eventually die off, with substantial tiller death. Affected plants will produce fewer and smaller
heads, thus reducing yield; long periods of deficiency can cause plant death (Department of

Manganese Efficiency
21
Agriculture and Food Western Australia, 2015). The visual symptoms of this deficiency are usually
quite delayed and thus a timely rectification cannot always be achieved. One method of early
detection by analysing the Chlorophyll a fluorescence induction kinetics has been discovered which
will aid in the treatment of this deficiency (Schmidt et al., 2013). The deficiency of Mn in a plant
subsequently affects pathogens, often increasing susceptibility. Barley grown with adequate Mn,
compared to those grown under Mn-deficiency, have been shown to have an increased resistance to
a range of pathogens including B. sorokiniana – leaf spot, Fusarium spp., Pyrenophora gramineacan
– barley stripe (Gleń et al., 2013), Blumeria graminis – mildew; with further diseases found in other
cereals (Huber and Wilhelm, 1988) such as Gaeumannomyces graminis in wheat – Take-all (Pallotta
et al., 2000).
Figure 2) Symptoms of Mn deficiency in barley showing; a) early symptoms of interveinal chlorosis, and b) later symptoms of necrotic brown spots. Sourced from Schmidt et al. (2016a).
Chemical correction of Mn deficiency is limited as Mn supplemented fertiliser is inefficient due to the
conversion of the applied Mn in soil into Mn oxides. Foliar application has been shown to be more
effective, but has a significant financial cost that makes it expensive to many farmers growing on
deficient soils (Schmidt et al., 2013). The best results of fertilisation are seen when both soil and foliar
fertilisers are used in combination (Reuter et al., 1973; Pallotta et al., 2000). Manganese-
(A) (B) (C)

Manganese Efficiency
22
supplemented soil fertiliser can have increased efficiency in calcareous soils when combined with soil
acidification, using sulphur fertiliser or urea (Shuman, 1998; Fageria, 2008; White and Greenwood,
2013).
Pedas et al. (2005) observed considerable variability in high-affinity Mn influx kinetics between barley
genotypes resulting in differing Mn efficiencies. No differences were observed in the low-affinity Mn
influx kinetics in the same study. To date only one plasma membrane-localised Mn2+ transporter
protein encoding gene has been identified in barley, Iron Regulated Transporter 1 (HvIRT1). Pedas
et al. (2008) demonstrated that the HvIRT1 gene was up-regulated in Mn deficient soils, with up to
40% greater expression than in Fe-deficient soils, thus it could be an important factor in breeding for
Mn efficient barley. Differences in IRT have been shown between species highlighting regions of little
to no conservation, these differences could explain the dissimilarities in uptake efficiency such as the
differences in Zn uptake between the Arabidopsis and barley IRT1 (Pedas et al., 2008). Whilst the
differences in the high-affinity Mn influx kinetics observed by Pedas et al. (2005) have been shown
not to be due to genetic differences in the IRT1, it has been suggested that they could still be due to
different isoforms of the Mn transporters rather than the level of expression (Pedas et al., 2008).
Schmidt et al. (2016a) also suggested that plants do not rely on a single mechanism of Mn transport
for uptake. Additionally, an early maturing Japanese cultivar Amagi Nijo (Tsuda et al., 1979), has two
further loci identified that are associated with an increase Mn use efficiency; Mn Efficiency Locus 1
(Mel1) identified by Pallotta et al. (2000) and a putative second locus around the RFLP marker
Xwg645 (Lloyd, 2000; McDonald et al., 2001). Physiological difference may also help account for
increased Mn use efficiency as it is possible that root length and architecture, together with the
rhizosphere, effect Mn accumulation due to an increase in fine root hairs triggered by exudate release
as seen in Alfalfa (Gherardi and Rengel, 2004) and suggested in barley (George et al., 2014).
The aims of this study were to confirm if there is an inherent Mn use efficiency in the Bere lines, as
well as identifying individual lines that have high use efficiency. This data was used to identify
differences in Mn accumulation in the leaf tissue and identify genomic regions associated with this
trait and speculate on any candidate genes in these regions.

Manganese Efficiency
23
Results
Landrace Screen
1.1.1.3. Sub-category Score Analysis
There were significant differences in chlorophyll fluorescence between the Mn concentrations,
lines/cultivars, and interaction of these variates (all p<0.001) when lines were grouped by
subcategory. The Bere lines had a greater chlorophyll fluorescence in low Mn concentrations
compared to the other landraces & elites (Figure 3).
Figure 3) Chlorophyll fluorescence for 140 lines/cultivars of barley divided into three subcategories Bere, other landraces and elites (n=36, n=94, and n=10, respectively) over five differing Mn concentrations. Error bars represent the standard errors in positive and negative directions.
The FR showed the extent to which the three sub-categories were affected over these Mn
concentrations. The Beres showed the smallest FR, the other landraces had approximately 50%
greater reduction and the elites the largest reduction of over 80%, compared with the Bere lines
(Figure 4).
Figure 4) Chlorophyll Fluorescence Reduction for 140 lines/cultivars of barley divided into three, unequal, sub-divisions to compare the relative Mn deficiency in each; with a low FR indicating less change of Chlorophyll Fluorescence from the optimum. Error bars represent the standard errors in positive and negative directions. The number of lines/cultivars collated is noted at the base of each bar.
0.4
0.5
0.6
0.7
0.8
0.9
0 0.2 0.4 0.6 0.8 1
Chlo
rophyl
l F
luore
scence (
Fv/
Fm
)
Mn Concentration in Hydroponic Solution (µM)
Bere
Landrace
Elite
0
0.05
0.1
0.15
0.2
0.25
0.3
0.35
Bere Landrace Elite
Chlo
rophyl
l F
luore
scence
Reduction (
FR
) w
ith L
imited M
n
in m
ultip
le c
oncentr
ations
36 94 10

Manganese Efficiency
24
1.1.1.4. Individual Fluorescence Reduction Analysis
Separating the groups into their individual lines, there were significant differences between the Mn
concentrations, lines/cultivars and interaction of these treatments (p<0.001). The FR shows the extent
to which the 140 lines/cultivars were affected over the range of Mn concentrations (Figure 5). The
greatest FR, or the lowest Mn use efficiency, was for the elite cultivar Scholar with a FR of 0.35. As
noted above, the elite cultivars had amongst the greatest FR within the population tested, the smallest
FR in an elite cultivar was Westminster at 0.27, still in the upper third of the population in terms of FR.
The smallest FR overall was Bere 24268 A 71 at 0.07, 80% less than Scholar. The 19 smallest FRs
were all Bere lines with FRs less than 0.17. The Bere lines with the greatest FR were Bere 8-125 and
Bere 2962 (AB), each having a FR of 0.31 making them comparable to some of the elite cultivars.
The lines in the landrace sub-category had the greatest range of FR. The line Stat -Old 14 had the
second greatest FR at 0.34, comparable to the elite cultivar Scholar. The line with the smallest FR
was Webbs Burton Malting-216, 20th lowest scoring line, with a FR of 0.17, half that of Scholar, and
the only non-Bere line in the top 20 lines with the smallest FR.
Figure 5) Chlorophyll Fluorescence Reduction 140 lines/cultivars of barley, colour coded for the sub-divisions, comparing Mn deficiency in each the– with a low FR indicating less change of Chlorophyll Fluorescence from the optimum. The arrows indicate the lines selected to be used to measure the Mn concentration in the leaf tissue below. Error bars represent the standard errors in positive and negative directions.
0
0.05
0.1
0.15
0.2
0.25
0.3
0.35
0.4
0.45
Ch
loro
ph
yll F
luo
resce
nce
Re
du
ctio
n w
ith
Lim
ite
d
Mn
ove
r m
ultip
le c
on
ce
ntr
ation
s (
Fv/
Fm
)
Landrace Elite Bere

Manganese Efficiency
25
1.1.1.5. Genotype Individual Mean Analysis
Analysis of the mean fluorescence data (not shown) showed a trend of increasing fluorescence with
increasing Mn concentration in the hydroponic solution for each line/cultivar as expected from the FR
results, but showed some divergence. Bere 47 A 25 and Bere 58 A 36 Eday show large increases in
chlorophyll fluorescence but had a smaller fluorescence at 0 µM Mn, with fluorescence measurements
becoming comparable to the smallest FR Bere lines at an Mn concentration of 0.03 µM. The worst
performing Bere lines at 0 µM – Bere-118, Bere A 3962 62, and Bere 58 A 36 Eday – had smaller
chlorophyll fluorescence measurements, but greater increases in chlorophyll fluorescence with
increases in Mn concentration. Similar differences in chlorophyll fluorescence with changing Mn can
be seen between elite cultivars. Optic had the smallest differences in chlorophyll fluorescence with
increased Mn of the elites, but Waggon never gets to optimal chlorophyll fluorescence within the 0-1
µM range tested, not passing 0.72 at 0.3 µM, despite having the greatest chlorophyll fluorescence for
an elite cultivar at 0 µM.
1.1.1.6. Genome-Wide Association Study (GWAS) Analysis
From the 37242 markers used, 10725 were removed as having low minor allele frequency and a
further 32 because of a low call rate. Of the 142 lines used 13 were excluded due to high
heterozygosity, and a further 10 due to being identical by state.
The QQ plots showed that the MLM model for the 0 µM mean had the smallest deviation from the
expected null distribution. The Manhattan MLM plot for the 0 µM mean (Figure 6a) displayed multiple
loci of interest, the most statistically significant association was on the distal end of chromosome 2HL
along with other associations at 5HL. Two additional associations at the distal end of 5HS and the
proximal end of 6HL were identified in the Manhattan MLM plot for FR and area under the curve (AUC)
(Figure 6b & c).

Manganese Efficiency
26
a)
b)
c)
Figure 6) Manhattan plots of a Genome-Wide Association Study undertaken using a Mixed Linear Model on the a) 0µM Mn average, b) FR and c) AUC data generated using an ANOVA. Depressions in marker significance observed in the centre of each chromosome are due to reduced marker density around the centromere of the physical map.
5
10
7
Manganese Efficiency
27
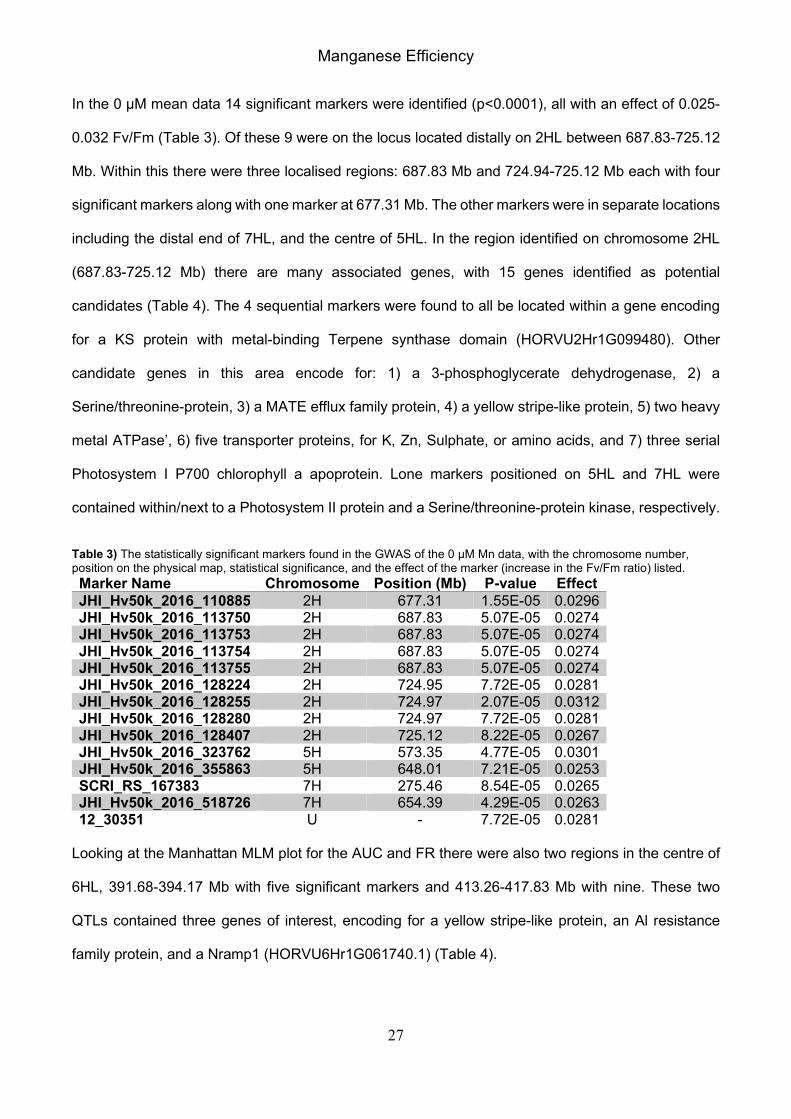
In the 0 µM mean data 14 significant markers were identified (p<0.0001), all with an effect of 0.025-
0.032 Fv/Fm (Table 3). Of these 9 were on the locus located distally on 2HL between 687.83-725.12
Mb. Within this there were three localised regions: 687.83 Mb and 724.94-725.12 Mb each with four
significant markers along with one marker at 677.31 Mb. The other markers were in separate locations
including the distal end of 7HL, and the centre of 5HL. In the region identified on chromosome 2HL
(687.83-725.12 Mb) there are many associated genes, with 15 genes identified as potential
candidates (Table 4). The 4 sequential markers were found to all be located within a gene encoding
for a KS protein with metal-binding Terpene synthase domain (HORVU2Hr1G099480). Other
candidate genes in this area encode for: 1) a 3-phosphoglycerate dehydrogenase, 2) a
Serine/threonine-protein, 3) a MATE efflux family protein, 4) a yellow stripe-like protein, 5) two heavy
metal ATPase’, 6) five transporter proteins, for K, Zn, Sulphate, or amino acids, and 7) three serial
Photosystem I P700 chlorophyll a apoprotein. Lone markers positioned on 5HL and 7HL were
contained within/next to a Photosystem II protein and a Serine/threonine-protein kinase, respectively.
Table 3) The statistically significant markers found in the GWAS of the 0 µM Mn data, with the chromosome number, position on the physical map, statistical significance, and the effect of the marker (increase in the Fv/Fm ratio) listed.
Marker Name Chromosome Position (Mb) P-value Effect
JHI_Hv50k_2016_110885 2H 677.31 1.55E-05 0.0296 JHI_Hv50k_2016_113750 2H 687.83 5.07E-05 0.0274 JHI_Hv50k_2016_113753 2H 687.83 5.07E-05 0.0274 JHI_Hv50k_2016_113754 2H 687.83 5.07E-05 0.0274 JHI_Hv50k_2016_113755 2H 687.83 5.07E-05 0.0274 JHI_Hv50k_2016_128224 2H 724.95 7.72E-05 0.0281 JHI_Hv50k_2016_128255 2H 724.97 2.07E-05 0.0312 JHI_Hv50k_2016_128280 2H 724.97 7.72E-05 0.0281 JHI_Hv50k_2016_128407 2H 725.12 8.22E-05 0.0267 JHI_Hv50k_2016_323762 5H 573.35 4.77E-05 0.0301 JHI_Hv50k_2016_355863 5H 648.01 7.21E-05 0.0253 SCRI_RS_167383 7H 275.46 8.54E-05 0.0265 JHI_Hv50k_2016_518726 7H 654.39 4.29E-05 0.0263 12_30351 U - 7.72E-05 0.0281
Looking at the Manhattan MLM plot for the AUC and FR there were also two regions in the centre of
6HL, 391.68-394.17 Mb with five significant markers and 413.26-417.83 Mb with nine. These two
QTLs contained three genes of interest, encoding for a yellow stripe-like protein, an Al resistance
family protein, and a Nramp1 (HORVU6Hr1G061740.1) (Table 4).

Manganese Efficiency
28
Table 4) A list of the identified genes of interest with regards to manganese use efficiency, along with their position, and the genetic annotation.
Gene Name Chr Position (Mb) Annotation
HORVU2Hr1G096930.1 2HL 677.16 Heavy metal ATPase 5 HORVU2Hr1G097010.8 2HL 677.26 Copper-transporting ATPase 1 HORVU2Hr1G099170.1 2HL 686.91 Photosystem I P700 chlorophyll a apoprotein A1 HORVU2Hr1G099180.1 2HL 686.91 Photosystem I P700 chlorophyll a apoprotein A1 HORVU2Hr1G099190.1 2HL 687.03 Photosystem I P700 chlorophyll a apoprotein A1 HORVU2Hr1G099480.13 2HL 687.83 KS protein with a metal-binding Terpene synthase domain HORVU2Hr1G099530.1 2HL 687.96 Cationic amino acid transporter 8 HORVU2Hr1G099680.1 2HL 688.06 Amino acid transporter 1 HORVU2Hr1G099810.14 2HL 688.52 Potassium transporter family protein HORVU2Hr1G099860.1 2HL 688.60 YELLOW STRIPE like 7 HORVU2Hr1G112090.3 2HL 724.96 Serine/threonine-protein kinase HORVU2Hr1G112150.1 2HL 725.00 MATE efflux family protein HORVU2Hr1G112230.2 2HL 725.23 Zinc transporter 8 HORVU2Hr1G113050.1 2HL 727.21 Sulphate transporter 91 HORVU2Hr1G113180.3 2HL 727.57 D-3-phosphoglycerate dehydrogenase HORVU5Hr1G084800.1 5HL 573.35 Photosystem II protein N HORVU6Hr1G059420.2 6HL 392.46 YELLOW STRIPE like 7 HORVU6Hr1G061740.1 6HL 413.26 Metal transporter Nramp1 HORVU6Hr1G061880.1 6HL 414.17 Aluminium resistance family protein HORVU7Hr1G121690.1 7HL 654.38 Protein kinase superfamily protein
Of the genes identified the photosystem associated proteins are common, comprising of 0.28% of the
73586 genes listed in BARLEX the barley genome explorer (Colmsee et al., 2015) at 76 and 130
genes genome-wide associated with photosystem I and II, respectively. The protein kinases are the
most common, as expected, with genes annotated as Serine/threonine-protein kinases and Protein
kinase superfamily proteins representing 0.45 and 0.78% of genes at 328 and 572, respectively. The
specific transporters identified here range from MATE efflux family proteins at 0.13% (94 genes) to
Nramp proteins at only 0.01% (8 genes): with Amino acid, Potassium, Zinc, and Sulphate transporters
in-between with 59, 38, 32, and 22 genes each, respectively. The ATPases identified in this study,
Heavy metal and copper-transporting, are less common with only 3 and 14 genes, respectively. The
other KS proteins are a very common annotation, but only 35 genes have a Terpene synthase metal-
binding domain, representing 0.05% of genes. Yellow Stripe protein encoding genes are also
relatively uncommon with only 29 genome wide, or 0.04%. The remaining identified genes – D-3-
phosphoglycerate dehydrogenase and Aluminium resistance family protein – are amongst the least
common with only 5 and 3 genes each, respectively.
Manganese Efficiency
29
Manganese Quantification in Shoot
The mineral concentration for the 14 lines/cultivars selected from the screen above (identified by
arrows in Figure 5) showed significant differences (p<0.005) between lines/cultivars for all elements
tested, with the exception of nickel. The element 55Mn was the only element that had significant
differences between different Mn concentrations (p=0.003) the interaction between Mn concentrations
and lines/cultivars (p<0.001). Two other elements also had interactions of note: 139K and 24Mg
(p=0.037 and 0.053, respectively).
Based on the differences seen in the Mn concentrations, when grown at 0 and 1 µM MnCl2, and the
chlorophyll fluorescence of plants grown in 0 µM MnCl2 (Figure 7), three separate groups can be
identified in the subset of lines/cultivars analysed, diverging broadly along the criteria that they were
selected on. The group with greatest Mn use efficiency – Bere 24268 A 71, Bere 45 A 23, Bere 47 A
25, and Bere 59 A 37 Uist – showed Mn concentration between 175-270 mg kg-1 DW when grown in
1 µM MnCl2 hydroponic solution and 15-22 mg kg-1 DW when grown in 0 µM MnCl2 hydroponic
solution. They also showed the greatest chlorophyll fluorescence, retaining more than 95% of the
maximum quantum yield of photosynthesis of 0.83. The second group had moderate Mn use
efficiency and had Mn concentrations between 130-170 and 9-12 mg kg-1 DW when grown in 1 and
0 µM MnCl2 hydroponic solutions, respectively, and maintained >75% of the maximum quantum yield
of photosynthesis. This group consisted of Bere-155, Bere 25 A, Bere 58 A 36 Eday, and the landrace
with the smallest FR, Webbs Burton Malting-216. The last group were Mn inefficient with Mn
concentrations between 60-85 and 7-7.5 mg kg-1 DW when grown in 1 and 0 µM MnCl2 hydroponic
solutions, respectively, and retained less than two-thirds of the maximum quantum yield of
photosynthesis. This last group contained the elite cultivars, along with the other landraces and Bere
line (Bere A 3962 62) with the greatest FR.

Manganese Efficiency
30
Figure 7) A subset of the population representing Bere, landrace, and elite lines/cultivars over a range in FR. The columns (primary axis) display the mean 55Mn concentrations in the dry weight of the shoot biomass for plants grown in a hydroponic solution of 0 µM MnCl2 (blue) and 1 µM MnCl2 (red); the black dotted line indicate the specified critical deficiency threshold concentration of Mn in leaf tissue of 17 mg kg-1 DW as outlined by Reuter et al. (1997). The green data points (secondary axis) display the mean chlorophyll fluorescence of the plants grown in a hydroponic solution of 0 µM MnCl2. Error bars represent the standard errors in positive and negative directions.
The 14 selected lines/cultivars grown in a 0 µM MnCl2 concentration had small concentrations of Mn
in the biomass, with small but significant differences between the lines/cultivars (p<0.001). When the
shoot Mn concentration for each individual was compared against the corresponding weight of the
shoot biomass it can be seen that there is a weak correlation of decreasing shoot Mn levels with
increasing shoot biomass (Figure 8). Statistical analysis of the data with shoot weight as a co-factor
shows that this effect does not change the result. The data of the shoot Mn concentrations and the
chlorophyll fluorescence of plants grown in 0 µM MnCl2 hydroponic solution were highly correlated,
with a significant correlation coefficient of 0.93 (Figure 9a; p<0.001). This was greater than the
correlation of the shoot Mn concentration of plants grown in 1 µM MnCl2 with the chlorophyll
fluorescence of plants grown in 0 µM MnCl2 (with a coefficient of 0.91; Figure 9b), and the correlation
of the shoot Mn concentrations of plants grown in the two MnCl2 concentrations (with a coefficient of
0.85; Figure 9c) – both of which were still highly corelated, though the latter was found not to be
significant (p=0.277).
0.3
0.4
0.5
0.6
0.7
0.8
0.9
0
0.05
0.1
0.15
0.2
0.25
0.3
Ch
loro
ph
yll f
luo
recen
ce a
t 0µ
M M
n
Co
ncetr
ati
on
s (
Fv
/Fm
)
55M
n c
on
cen
trati
on
in
dry
weig
ht
ab
ov
e s
oil
bio
mass (
mg
/g)
0µM1µMFv/Fm
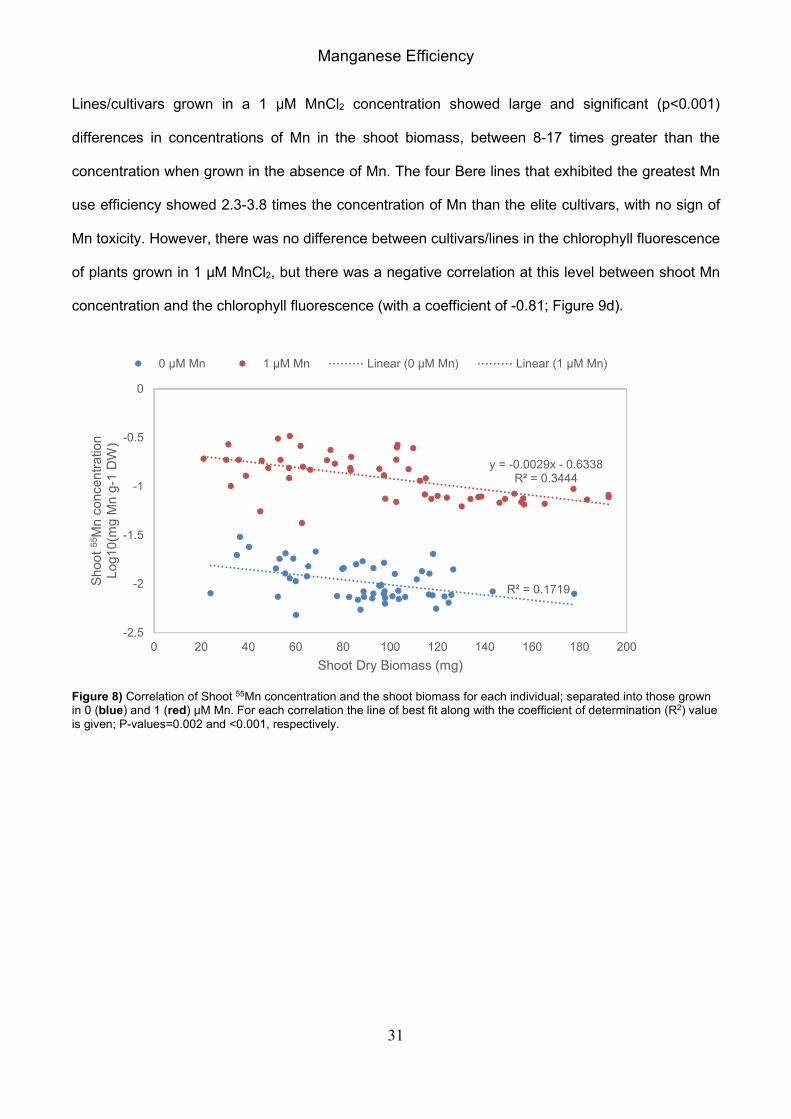
Manganese Efficiency
31
Lines/cultivars grown in a 1 µM MnCl2 concentration showed large and significant (p<0.001)
differences in concentrations of Mn in the shoot biomass, between 8-17 times greater than the
concentration when grown in the absence of Mn. The four Bere lines that exhibited the greatest Mn
use efficiency showed 2.3-3.8 times the concentration of Mn than the elite cultivars, with no sign of
Mn toxicity. However, there was no difference between cultivars/lines in the chlorophyll fluorescence
of plants grown in 1 µM MnCl2, but there was a negative correlation at this level between shoot Mn
concentration and the chlorophyll fluorescence (with a coefficient of -0.81; Figure 9d).
Figure 8) Correlation of Shoot 55Mn concentration and the shoot biomass for each individual; separated into those grown in 0 (blue) and 1 (red) µM Mn. For each correlation the line of best fit along with the coefficient of determination (R2) value is given; P-values=0.002 and <0.001, respectively.
R² = 0.1719
y = -0.0029x - 0.6338R² = 0.3444
-2.5
-2
-1.5
-1
-0.5
0
0 20 40 60 80 100 120 140 160 180 200
Shoot
55M
n c
oncentr
atio
n
Log10(m
g M
n g
-1 D
W)
Shoot Dry Biomass (mg)
0 µM Mn 1 µM Mn Linear (0 µM Mn) Linear (1 µM Mn)

Manganese Efficiency
32
R² = 0.8737
0.4
0.5
0.6
0.7
0.8
0.9
0 0.005 0.01 0.015 0.02 0.025
Chlo
rophyl
l F
luore
scence
(Fv/
Fm
)-
gro
wn in 0
µM
M
nC
l 2
Shoot 55Mn Concentration (mg Mn g-1 DW) - grown in 0 µM MnCl2
R² = 0.8317
0.4
0.5
0.6
0.7
0.8
0.9
0 0.05 0.1 0.15 0.2 0.25 0.3
Chlo
rophyl
l F
luore
scence
(Fv/
Fm
) -
gro
wn in 0
µM
M
nC
l 2
Shoot 55Mn Concentration (mg Mn g-1 DW) - grown in 1 µM MnCl2
R² = 0.7201
0
0.05
0.1
0.15
0.2
0.25
0.3
0 0.005 0.01 0.015 0.02 0.025
Sh
oo
t 5
5M
n C
on
ce
ntr
atio
n
gro
wn
in
1 µ
M M
nC
l 2(m
g M
n
g-1
DW
)
Shoot 55Mn Concentration (mg Mn g-1 DW) - grown in 0 µM MnCl2
R² = 0.6501
0.7750.78
0.7850.79
0.7950.8
0.8050.81
0.8150.82
0 0.05 0.1 0.15 0.2 0.25 0.3
Chlo
rophyl
l F
luore
scence
(Fv/
Fm
) -
gro
wn in 1
µM
M
nC
l 2
Shoot 55Mn Concentration (mg Mn g-1 DW) - grown in 1 µM MnCl2
a)
b)
c)
d)
Figure 9) Correlation of averages of the14 lines/cultivars, between the chlorophyll fluorescence when grown in 0 µM MnCl2 and Shoot 55Mn Concentration of plants grown in a) 0 µM MnCl2 and b) 1 µM MnCl2. As well as the correlation between c) the Shoot 55Mn Concentration of plants grown in 0 and 1 µM MnCl2, and d) the chlorophyll fluorescence and Shoot 55Mn Concentration of plants grown in 1 µM MnCl2. For each correlation the line of best fit along with the coefficient of determination (R2) value is given; P-values<0.001 for all bar graph c for which =0.277.

Manganese Efficiency
33
Discussion
Manganese deficiency is a problem for marginal lands worldwide, reducing the yield and area of
effective crop production (Schmidt et al., 2013). One method of improving the sustainability of plant
production, on agricultural soils with limited Mn availability, is by incorporating Mn use efficiency traits
into elite crop cultivars. Sources of such Mn-efficiency traits may come from landraces of barley that
have developed on marginal soils over many generations (Schmidt et al., 2018). This study validates
that Bere lines are a good source of genetic variation in Mn-efficiency and shows that Beres, in
general, are superior to other landraces and elite lines in this regard. The study then goes on to
identify particular lines and loci associated with this superior Mn-efficiency trait.
Effect on Chlorophyll Fluorescence
The landrace screen provides sufficient evidence to suggest that the majority of the Bere barley lines
tested have increased Mn efficiency, compared to the elite cultivars and other landraces tested, in
low and no Mn hydroponic systems. This supports and expands on the work undertaken by George
et al. (2014), Leplat (2015), Brown et al. (2017), and Schmidt et al. (2018), further identifying Bere
lines of interest in regards to Mn use efficiency, including Bere lines that do not show this Mn use
efficiency and Bere lines that show Mn use efficiency only at low levels (but not Mn devoid). The
investigation also indicates that the elite spring barley cultivars that were included had extreme levels
of latent Mn deficiency, thus indicating a need for Mn use efficiency traits within the UK breeding
populations. However, other elite cultivars have been shown to have Mn-efficiency such as the
Australian Weeah barley cultivar (Huang, 1996).
Particular lines of interest with regards to Mn use efficiency identified here include Bere 24268 A 71,
Bere 45 A 23, and Bere 47 A 25. Lines such as Bere 2962 (AB) and Bere 8-125 are also of interest
as they are genetically similar but have a comparably low Mn use efficiency. These two lines have
been shown to group away from the main Bere cluster in the genotyping data along with Bere A 3962
62, that has a low chlorophyll fluorescence at 0 µM but average fluorescence with low amounts of

Manganese Efficiency
34
Mn. This suggests that this group may come from a more isolated region of the highlands and islands
where Mn deficiency is not a major selective pressure, possibly due to selection on acidic soils.
Effect on Shoot Manganese Concentration
Analysis of the Mn concentration in the shoot biomass showed that an increased level of accumulation
of Mn in the biomass corresponded to an increased Mn use efficiency, and that this occurred when
there was an adequate supply of Mn in the environment. This accumulation reached a concentration
that could be considered above the specified critical toxicity threshold concentration for the highly to
moderately Mn efficient lines. The four Bere lines with the greatest Mn use efficiency, along with Bere
25A, rose above the 150 mg kg-1 DW critical limit outlined in Reuter et al. (1997), and the remaining
moderately Mn efficient lines rose above the 120 mg kg-1 DW critical limit for Mn toxicity, outlined in
MacNicol and Beckett (1985). However, no lines showed toxicity symptoms at the early stages of
growth, thus indicating a decreased sensitivity to toxic Mn concentrations in addition to Mn-efficiency
under limited Mn conditions.
All lines/cultivars showed large decreases in Mn content when grown in Mn deficient conditions, but
Mn efficient Bere lines built up a concentration large enough to avoid the specified critical deficiency
threshold concentration of Mn in leaf tissue, which ranges from 11 to 20 mg kg-1 DW, and marked on
Figure 7 at 17 mg kg-1 DW (Reuter et al., 1997; Husted et al., 2009; Schmidt et al., 2013; Schmidt et
al., 2016a), unlike the elite cultivars that had Mn concentrations that fell well below this value. As there
is no additional Mn added to this hydroponic solution, it is thought that the increase in Mn in the leaf
tissue is due to an increase in Mn in the seed and subsequent relocation of the Mn from other parts
of the plant. It is also possible that there was recycling of Mn between plants within the hydroponics
system, but this is unlikely due to the short time frame of the experiment. Further analysis of the Mn
concentration in the seed before germination and the root Mn concentration is needed to identify
whether efficient lines have more Mn inherent at germination. Additionally, investigations as to
whether an increase Mn concentration in the shoot translates to increased concentration in the seed
produced. Both tests could be undertaken using ICP-MS as with the shoot tissue in this study.

Manganese Efficiency
35
These Mn efficient Bere lines also retained almost all their maximum quantum yield of photosynthesis.
Other Bere lines, and the landrace Webbs Burton Malting-216, displayed signs of some Mn use
efficiency by retaining more of the maximum quantum yield of photosynthesis than the elite lines, but
not as much as the highly Mn efficient Bere lines identified, whilst falling below the specified critical
deficiency threshold concentration when grown in Mn deficient conditions. The Bere line selected for
its reduced efficiency, as identified by the chlorophyll fluorescence, showed no significant difference
in Mn leaf concentration from the elite cultivars, displaying that not all Bere lines have high Mn use
efficiency. This difference was shown not to be due to a dilution effect, often seen when comparing
large and small plants (Jarrell and Beverly, 1981), as the correlation between Mn concentration and
shoot biomass was weak and did not have any significant difference. Together these results suggest
that there is a range of Mn use efficiency in Bere lines due to adaptation to different environmental
pressures found with a range of soil pH within and between the islands. It also indicates that the trait
of increased Mn accumulation is not solely responsible for the increases in the Mn use efficiency,
highlighting the complexity of pathways with multiple methods of transport (Socha and Guerinot,
2014).
Genotyping and GWAS
Between cultivars there was a large genotypic variation in Mn use efficiency, causing differential Mn2+
uptake. A number of studies have been performed to isolate genomic regions associated with
increased Mn use efficiency in barley. The first identified plasma membrane-localised metal transport
protein capable of transporting Mn2+ in barley was HvIRT1, located on 4H and 6H when the sequence
from Pedas et al. (2008) was used in a BLAST search. Two studies have identified loci using RFLP
markers from populations crossed with the Mn efficient line Amagi Nijo. The first associated locus,
labelled Mel1, was identified by Pallotta et al. (2000) located on the distal end of chromosome 4HS
(Pallotta et al., 2003). The second locus, Xwg645, controlling shoot Mn concentration, was found on
chromosome 2HL (Lloyd, 2000; McDonald et al., 2001). The locus of most interest in this study was
located on 2HL, this corresponds with the Xwg645 locus identified in Lloyd (2000), further isolating
potential QTLs within the locus.

Manganese Efficiency
36
The candidate genes identified in this study had a range of different roles that could contribute to Mn
use efficiency and were selected based on:
1) Terpene synthase – produces terpene compounds that act as antioxidants in response to oxidative stress
(Rodziewicz et al., 2014), and have been shown to be activated by Mn. Manganese has also been shown to
induce ROS production that is corrected with antioxidants (Farzadfar et al., 2016).
2) 3-phosphoglycerate dehydrogenase – found to be associated with the serine biosynthesis in
photosynthetic cells (Okamura and Hirai, 2017).
3) Serine/threonine-protein kinase – for their roles in stress signalling (País et al., 2009).
4) MATE efflux family protein – found to be associated with increased Mn uptake in the shoot of Arabidopsis
(Rogers and Guerinot, 2002).
5) Yellow stripe-like protein – shown to be involved in increased Mn uptake in Arabidopsis (Waters et al.,
2006), rice (Socha and Guerinot, 2014), and thought to be in barley (Zheng et al., 2011).
6) Heavy metal ATPase’ – with Cu-transporting shown to be involved in transport of heavy metals such as
Mn (Hall and Williams, 2003; Dučić and Polle, 2005) and Cu-ATPase shown to be involved in the transport
of other heavy metals into the chloroplast (Seigneurin-Berny et al., 2006).
7) Transporter proteins, for: a) K – shown to play an adverse role in Mn uptake in barley (Alam et al., 2005),
b) Zn – identified as a ZnT (found in animal) the plant homologue would be in the CDF transporter family
that are associated with metal tolerance (Manara, 2012), and Zn transporters in mammalian cells have been
shown to be involved in Mn transport (Kambe, 2012), c) Sulphate – which have been shown to be involved
in the transport of heavy metals such as molybdenum (Fitzpatrick et al., 2008) and in abiotic stress response
(Gallardo et al., 2014), and d) amino acids – due to the chelation of metals with amino acids that can be
transported (Haydon and Cobbett, 2007; Rentsch et al., 2007; Zemanová et al., 2014).
8) Photosystem I P700 chlorophyll a apoprotein – as PSI interacts with PSII, but can also operate
independently (Allen, 2002).
9) Aluminium resistance family protein – with Al having been shown to interact with Mn uptake (Wang et al.,
2015) with Al-resistance genes conferring tolerance to alkaline soils (Silva et al., 2018).
10) Metal transporter Nramp1 proteins – that are known to be essential for Arabidopsis growth in low Mn
conditions (Cailliatte et al., 2010), are similar to Nramp5 that has be shown to mediate Mn uptake in barley
(Wu et al., 2016) and rice (Ishimaru et al., 2012). Nramp1 has also been shown to co-operate with ITR1 in
iron transport in Arabidopsis (Castaings et al., 2016).

Manganese Efficiency
37
Future Work and Implications
Upon validation of candidate genes and traits, these regions identified could be introgressed into elite
cultivars. The goal of this would be to select for the regions of interest identified in this study to transfer
them into an elite background, to reduce the negative traits from the Bere line such as low yield and
lodging due to its height and weak straw (Martin et al., 2010). This would aid in the focusing and
identification of the position of the gene(s) of interest that convey this Mn use efficiency. It would also
indicate if there are negative effects or costs associated with the regions of interest. Further validation
of the appropriate candidates can be undertaken through methods of positional cloning and genetic
transformation to overexpress or suppress the candidate gene (Pflieger et al., 2001; Hu et al., 2008;
Aghnoum et al., 2010), allowing further characterisation. The most promising candidates identified in
this study for validation would be the metal transporter Nramp1 proteins and the MATE efflux family
protein. Selecting for these characterised alleles/genes in the elite population will go towards
increasing the Mn use efficiency in the elite cultivars, which this study has shown is limited.
The increase of Mn use efficiency in an elite background without compromising the yield quantity or
quality would allow the growth of elite barley in marginal lands, which would not normally economically
support the growth of elite cultivars. Further it would provide a buffer to changing environments,
preventing deficiencies without the need for routine blanket spraying of Mn foliar fertilizer, thus saving
money on purchase and deployment of the chemical. Finally, it will reduce the cases of hidden
deficiency that could lead to increased disease (Wilhelm et al., 1988; Marschner et al., 1991; Brennan,
1992), increase susceptibility to drought (Hebbern et al., 2009) and salinity (Pandya et al., 2005), and
sub optimal use of other minerals such as phosphorus (Allen et al., 2007; Schmidt et al., 2016a). This
is due in part to the role of Manganese Superoxide Dismutase, one of the three enzymes for which
Mn is essential in barley, that is involved in the response to oxidative stress caused by different abiotic
stresses (Szőllősi, 2014; Kaouthar et al., 2016; Landi et al., 2017). Together this will help satisfy the
increasing demand for food, maintain yields in an increasingly changing climate, and reduce pollution
due to chemical runoff.

Salt Tolerance
38
Evaluating variation in biomass accumulation under salt stress in Scottish barley landrace Bere
(Hordeum vulgare L.)
Introduction
Salt stress is in the form of sodium (Na) toxicity and salt toxicity, found in sodic and saline soils,
respectively. Saline soils are soils that have accumulated salt beyond a critical level, sodic soils are
soils with high levels of exchangeable sodium ions and can be accompanied with excess salt (Osman,
2018). The FAO (2015) estimate that 6.5% of land around the world are salt-affected (Figure 10), of
which over half are sodic soils. One cause of salinity in soil is the practice of irrigation with brackish
waters, causing a steady build-up of salt through evaporation (Umali, 1993; Ayars et al., 1993; Wei et
al., 2018). Salt build up in non-irrigated soils is called dryland salinity, occurring through wind dispersal
or rising saline groundwater tables leaving deposits of salt that cannot be washed away by leaching
and runoff. Dryland salinity can be due to natural fluctuations (primary salinity) or manmade through
vegetation clearing (secondary salinity) (Akter, 2017; Pannell and Ewing, 2006; McFarlane et al.,
2016). Both of these causes of salinity are likely to increase with manmade climate change due to the
increase in need of irrigation and rising sea levels, respectively (Paranychianakis and Chartzoulakis,
2005; Rengasamy, 2006).
Figure 10) An overview map representing the areas of land that are affected by salt; in terms of saline (red), sodic (blue) and saline-sodic (purple) soils (Wicke et al., 2011).

Salt Tolerance
39
High levels of soil salinity have a dual negative effect in plants, like most elements there is an ionic
effect, but in addition there is an osmotic effect in soils that makes it harder for roots to take up water,
simulating aspects of osmotic stresses found due to drought. Osmotic stress occurs when the
concentration of salt in the soils reaches a threshold level, usually 40 mM NaCl for most plants, which
causes an osmotic pressure on the roots. Though the stress is thought to be mainly due to this osmotic
pressure, there is evidence for a non-water potential related effect (Munns and Tester, 2008). This is
a rapid effect, occurring within minutes, and results in the decreased growth of new shoots, along with
slower emergence of leaves and lateral buds. The ionic toxicity is caused when salt accumulates in
the plant tissue to a toxic extent. This is a slower effect, occurring over multiple days, and causes an
increased rate of senescence in the older leaves. As ionic stress takes a longer time to manifest, and
can only occur at high levels of salinity, osmotic stress has the dominant effect on most plants at most
saline levels (Munns, 2002; Munns and Tester, 2008; Roy et al., 2014). Whilst there is some overlap
in the plant response, in terms of gene regulation, there is a differential expression of genes between
the osmotic and ionic stress (Ueda et al., 2004).
The ionic toxicity plays a role in the interaction with other nutrients due to specific ion toxicity. This is
where increased levels of ions, such as Na+, compete with essential nutrients for uptake and
metabolism in the plant, potentially causing a deficiency in nutrients such as P, N, Ca, and K (Parihar
et al., 2015). The latter (K) in particular has shared transporters with Na ions such as the AKT1 (aka
RAC-alpha serine/threonine-protein kinase) and HKT1 (High-affinity Potassium Transporter 1) co-
transporters that use the high K+/Na+ ratio, maintained during ordinary physiological conditions, to
transport both ions (Blumwald et al., 2000). Saline and sodic soils are also associated with limited
micronutrient solubility, resulting in an interaction that increases the deficiency of micronutrients such
as Cu, Fe, Zn, Mo and Mn (Grattan and Grieve, 1998). The latter (Mn) has been shown in barley
causing a reduction in photosynthesis, and thus yield, but can be corrected by foliar spray of Mn
(Cramer and Nowak, 1992; Pandya et al., 2005). Boron toxicity is also a concern in saline soils as
salinity has been shown to have a negative interaction with boron tolerance, thus increasing the
sensitivity to boron toxicity in numerous species including wheat (Wimmer et al., 2003).

Salt Tolerance
40
Due to the different types of stresses produced by saline conditions, there are different mechanisms
of resistance. The three broad categories of resistance are: the exclusion of Na ions from the leaf
tissue to prevent ionic stress, the tolerance of osmotic stress, and the tolerance of ionic stress, such
as Na ions build-up in the leaf tissue, through methods such as compartmentalisation (Munns and
Tester, 2008). An example of the latter in barley is from the Widodo et al. (2009) study on the salt
tolerant barley cultivar Sahara that showed high levels of salt concentrations in the leaf tissue without
apparent damage. This lack of damage was suggested to be due to the ability of the plant to sequester
Na ions into the vacuole, maintaining the K+:Na+ ratio in the cytoplasm. The other broad category
mentioned to deal with ionic stress is an avoidance mechanism using ion exclusion, where ion
transporters actively efflux sodium ions from the root tissue before they can diffuse into the xylem -
High-affinity Potassium Transporters (HKTs) are thought to be an important gene family in this
process. An example of this in action is shown in Figure 11 in which wild type barley with diminished
biomass on the left, and the healthy transgenic barley encoding for a vacuolar proton pump on the
right, when grown in a field site with saline soil (Schilling et al., 2014). The last resistance mechanism
category is the poorly understood category of osmotic tolerance (Munns et al., 2006; Munns and
Tester, 2008; Roy et al., 2014). This mechanism is often associated with drought tolerance, an
example of this is the ari-e dwarfing gene found in Golden Promise that conveys a greater water use
efficiency accounting for tolerance to salt stress and implies a tolerance to drought (Forster, 2001).
Additionally Widodo et al. (2009) also suggested that the increased salt tolerance noted in their study
could be due to increased metabolite production to cope with increased osmotic potential.
Figure 11) Overhead view of transgenic barley (right) that had been encoded to produce a vascular proton pump to successfully alleviate salt stress, compared to the wild type (left) that exhibits diminished biomass growth due to salt stress (Schilling et al., 2014).

Salt Tolerance
41
Due to lack of economically practical screening methods, and the fact that salinity tolerance is a highly
complex trait composed of resistance to both ionic and osmotic stress, conventional breeding in barley
is limited. Additional problems arise in the differential result, and possibly mechanism, of resistance
between salt tolerance in seedling and germination, and between hydroponic and soil systems.
Recent advancements in genotyping have allowed for the identification of QTLs and the use of marker
assisted breeding (Mano and Takeda, 1997; Tavakkoli et al., 2010; Zhou et al., 2012a; Ashraf and
Foolad, 2013). These tools have the potential to identify regions associated with salinity tolerance
from sources such as tolerant landraces (Newton et al., 2010; Allel et al., 2016; Dwivedi et al., 2016).
One identified tolerance mechanism in barley that could be used in breeding programs are HKTs
(Hamamoto et al., 2015). In particular HvHKT2;1 from barley that causes an increased sodium ion
uptake, but with an associated increase in Na+ translocation that correlates with an increased
tolerance to salt (Mian et al., 2011). Alternatively, HvHKT1;5 has shown differential expression
between tissues in salt tolerant lines. The salt tolerant lines show increased expression of HvHKT1;5
in the roots and a decrease in expression in the leaf sheaths compared to the salt sensitive lines when
exposed to salt. This causes an increased exclusion of sodium ions from the roots, and reduction of
Na transport to the leaf tissue (Hazzouri et al., 2018). Additionally, proteome studies between a salt
tolerant and sensitive barley line by Mostek et al. (2015) have shown a differential expression of
proteins involved in a number of different functions such as signal transduction, detoxification, protein
folding processes, and cell wall metabolism. The latter of which has often been associated with abiotic
stress response, with one main response including cell wall thickening (Le Gall et al., 2015), and
differential composition has been shown to influence the passage of sodium ions (Byrt et al., 2018).
The aims of this study were to identify Bere and other landrace lines that are able to maintain biomass
when grown in saline and sodic growth media. This data was used along with the genotypic data to
identify genomic regions associated with this trait using a GWAS. This region can then be searched
for encoded candidate genes that are speculated to have a putative function associated with salt
tolerance. The goal of this project would be to identify candidate genes for future characterisation and
possible incorporation into commercial breeding programs to breed for salt tolerant barley crops.

Salt Tolerance
42
Results
Landrace Screen
1.1.1.7. Raw Data Analysis
When comparing the data of the different sub-categories for each of the variates – dry weight, fresh
weight, tiller number, and height – the difference in salt concentrations and sub-category type was
significant (p<0.001), with the exception of the sub-category difference in dry weight (p=0.056). No
significant difference for the interaction of these treatments was seen for any variate (p-values=0.051-
0.660). The elite cultivars produced the most fresh weight, with an average of 80 g, with the Bere lines
producing the least at only 67 g on average. No height difference was seen between the Beres and
elites at approximately 71 cm, but the other landraces were significantly different at 65 cm. No tiller
differences between landraces and elites were seen with approximately 12.3, but the Beres were
significantly different with 9.6.
Individual analysis of the same varieties shows similar results. Highly significant differences are seen
in all variates between differing salt concentrations and between lines/cultivars (p<0.001). It is also
seen that there is no significant difference for the interaction between the sub-category type and the
salt concentration (p-values 0.206-0.587).
1.1.1.8. Fitted Line Data Analysis
Using the slope integer from the fitted linear equation there was a significant difference between the
three sub-categories for dry weight (p=0.028) and tiller number (p=0.007), but not for fresh weight
(p=0.239) and height (p=0.127). As a percentage of the control, this significance in dry weight and
tiller number is not preserved, though in the former there was a trend towards significance (p=0.051),
and became significant for height (p=0.020). The loss in dry weight with increased salt (Figure 12) in
the elite cultivars is approximately double that of the Bere lines at 0.07 g per mmol/kg of NaCl (or
0.39%) compared to 0.04 g per mmol/kg of NaCl (or 0.17%).

Salt Tolerance
43
Figure 12) The average change in dry weight with increasing salt concentration for 146 lines/cultivars of barley divided into three groups, Bere, Landraces and elites (n= 37, n=104, and n=5,respectively). Error bars represent the standard errors in positive and negative directions.
When the slope integer data for the individual lines/cultivars was compared, a significant difference
was found between dry weight (p<0.001) and fresh weight (p=0.011), and when comparing the slope
data calculated as a percentage of the control (p-values =0.040 and 0.010, respectively). Height and
tiller number were not significantly different. Seventeen lines had slope integers that showed an
increase in dry weight with increased salt levels (Figure 13), four of these were Bere lines. Three of
these lines showed significantly positive levels: Prize Prolific-196, Bere-118, and Bere 49 A 27
Shetland, with increases of 0.043, 0.040, and 0.032 g per mmol/kg, respectively (and increases of
0.35, 0.45, and 0.4% per mmol/kg, respectively). Swannek-213 had a small increase of 0.016 g per
mmol/kg, but due to its small nature was 0.98% per mmol/kg. Fifteen lines had large weight reductions
of 0.1 g per mmol/kg (and over 0.5% per mmol/kg), including elite cultivar Waggon and Bere 39 A 16
Berneray. The remainder were other landraces, with Skadu Local ''Oldings'', and Old Irish-184,
showing the largest decreases of 0.169, 0.157, and 0.149 g per mmol/kg, respectively (0.57, 0.65,
and 0.85% per mmol/kg, respectively).
-0.09
-0.08
-0.07
-0.06
-0.05
-0.04
-0.03
-0.02
-0.01
0
Bere Landrace Elite
Change in d
ry w
eig
ht
with
salt
concentr
atio
n (
gra
ms p
er
mm
ol/k
g N
aC
l)

Salt Tolerance
44
Figure 13) The average change in dry weight with increasing salt concentration for 146 lines/cultivars of barley grown for approximately 70 days in universal compost. Error bars represent the standard errors in positive and negative directions.
-0.2 -0.15 -0.1 -0.05 0 0.05 0.1
Change in dry weight with salt concentration (grams per mmol/kg NaCl)
Bere Elite Landrace

Salt Tolerance
45
1.1.1.9. Genome-Wide Association Study (GWAS) Analysis
From the 37,242 markers used, 10,593 were removed as having low (<10%) minor allele frequency
and a further 30 because of a low call rate. Of the 140 lines used, 13 were excluded because their
heterozygosity was too high and nine due to being identical by state (IBS).
The QQ plots showed that the MLM approach for the mean fluorescence score when grown in 0 µM
Mn had the smallest deviation from the expected null distribution, but with little difference from the EG
model. The Manhattan MLM plot for both the slope integer data (Figure 14; weight (a) and percentage
(b)) identified one region of significance on the distal end of chromosome 5HL. Only six markers with
p-values of <0.001 in both analyses were identified (others were identified in only one analysis), four
of these were the only markers with p-values of <0.0001. One was found at the distal end of 3HL, the
other five were found in the distal end of 5HL, three at 651.49-651.52 Mb and two at 651.20 Mb. The
five markers identified in 5HL were amongst the largest negative effects, with decreases of 0.023-
0.028 g per mmol/kg and 0.155-0.185% per mmol/kg. The marker identified on 3HL was shown to
have the 2nd/3rd highest positive effect, with an increase of 0.029 g per mmol/kg and 0.169% per
mmol/kg.
a)
5

Salt Tolerance
46
b)
Figure 14) A Manhattan plot of a Genome-Wide Association Study undertaken using a Mixed Linear Model on the average change in dry weight with increasing salt concentration as a) weight, b) percentage of the average control weight; data generated using an ANOVA. Depressions in marker significance observed in the centre of each chromosome are due to reduced marker density around the centromere of the physical map.
Within the region 651.10-651.60 Mb of 5HL there were a total of 29 associated genes, of which four
were identified as candidate genes (listed in Table 5) that encode for: a Lysine-specific demethylase
REF6, an Actin 7, a Ferredoxin 3, and an Acyl-CoA-binding domain-containing protein 4, the latter of
which contains the two most significant markers for data sets, but the former of which is a low
confidence gene. The marker at 670.25 Mb on 3HL is positioned with a gene encoding for an Amino-
acid permease BAT1 homolog (Table 5), no other candidates were identified around this marker.
Table 5) Candidate genes identified in relation to salt tolerance in regards to biomass growth, with the chromosome and position on the physical map listed.
Gene Name Chr Position Annotation
HORVU3Hr1G105920.6 3HL 670.25 Amino-acid permease BAT1 homolog HORVU5Hr1G117860.5 5HL 651.33 Lysine-specific demethylase REF6 HORVU5Hr1G117900.1 5HL 651.48 actin 7 HORVU5Hr1G117910.3 5HL 651.49 ferredoxin 3 HORVU5Hr1G117970.2 5HL 651.52 Acyl-CoA-binding domain-containing protein 4
Of these, actin is the most common annotation representing 0.23% of the 73586 genes listed in
BARLEX the barley genome explorer (Colmsee et al., 2015), at 172 genes genome-wide. The
remaining annotations – Lysine-specific demethylases, ferredoxins, Acyl-CoA-binding proteins, and
Amino-acid permeases – are less common representing ≤0.08% of the genome each, at 59, 30, 23,
and 5 genes, respectively.
5

Salt Tolerance
47
Discussion
The problem of salt toxicity is limited to localised regions, though affects a large area, 6.5% of lands
worldwide (FAO, 2015), and is becoming an increasing problem with the irrigation of land with
brackish water (Umali, 1993; Ayars et al., 1993; Wei et al., 2018) and increasing dryland salinity due
to climate change (Rengasamy, 2006) and deforestation in temperate zones (Sahagian, 2000). There
is need to increase production on more marginal lands where it is already a problem and to preserve
yields on lands that are being degraded by increasing salt concentrations. One method of elevating
yield on these lands would be to increase the tolerance of the crops to salinity through breeding
(Munns et al., 2006). For this to be successful salt tolerance genes need to be identified, and a viable
source of these genes could be from landraces that grow in marginal soils that contain elevated salt
levels. This study has assessed landrace lines for their ability to maintain biomass, and other
indicators, in saline conditions. This allowed for the identification of differences between lines, which
follow overarching differences between sub-categories, as well as genomic regions associated with
the maintenance of biomass in saline conditions, along with a number of genes with putative functions
associated with salinity tolerance.
Effect on Biomass
A screening of the landrace collection showed that there were no differences in the way that the two
treatments interacted with each other. However, when this data was fitted to a linear model to see
how the different weights, height, and tiller number changed with increasing salt concentration it could
be seen that there was a significant difference between the dry weight when comparing both sub-
categories and individual lines/cultivars. This revealed that the elite cultivars lose approximately twice
as much dry biomass with increasing salt concentrations as the landrace lines, at a loss of 0.39% per
mmol/kg, showing that the elite cultivars are less tolerant to salt concentrations in the compost. This
is comparable to the effect of salt on dry weight from Long et al. (2013) that showed an average (of
192 genotypes) decrease in shoot dry weight of 67% from 0-200 mM NaCl (equivalent to 0-200
mmol/kg) in a hydroponic system, or 0.34% per mM. In this study the most salt tolerant elite genotype
lost 48% over the same range, or 0.24% per mM, which is more than the average of the Bere lines at

Salt Tolerance
48
0.17%. However, it is possible that there was decreased levels of salt in the compost of this study due
to decreased salt concentrations through leaching. A similar experiment using gravel with nutrient
solution with increasing salt concentrations from Rawson et al. (1988) showed similar levels of
decrease, with the most tolerant barley line showing a 38% average loss in salt conditions (averaged
175-250 mM), or 0.18% per mM (Munns et al., 1995). When these results are shown individually it
can be seen that the spread of the landrace lines, both Bere and non-Bere, is large, with the elite
cultivars all above average. From these it was possible to identify a number of Bere and non-Bere
landraces that have no or positive changes in dry weight with increasing salt levels, suggesting that
they are very salt tolerant. This positive change in dry weight could be due to the effect of salt
concentrations on the availability of nutrients (Grattan and Grieve, 1992), providing a nutrient profile
to which the lines are more adapted to. It is also possible to find Bere and non-Bere landraces that
have very large negative changes, equal to the elite cultivars most affected by salt – suggesting that
the tolerance is not a uniform trait across all landraces.
Genotyping and GWAS
The GWAS undertaken in this investigation identified one significant QTL of interest at 5HL, and
another possible peak with strong markers at 3HL. Within the region at 5HL there are a number of
genes encoding for proteins of interest such as a) Lysine-specific demethylase REF6 – selected as it
has a histone demethylase domain and over expression of a histone demethylase gene in Arabidopsis
has been shown to improve salt tolerance (Shen et al., 2014); b) Actin 7 – selected as salt stress has
been shown to affect actin filament assembly and has shown to be necessary in salt tolerance in
Arabidopsis (Wang et al., 2011); c) Ferredoxin 3 – selected as salt stress has been associated with
an increase in ferredoxin‐dependent glutamate synthase activity (Berteli et al., 1995) and ferredoxin-
thioredoxin-reductase (Zhou et al., 2009); and d) Acyl-CoA-binding domain-containing protein 4 –
selected as Acyl-CoA-binding proteins have been shown to interact with other proteins in response
to abiotic stresses (Raboanatahiry et al., 2015), with overexpression in Arabidopsis shown to improve
drought tolerance (Du et al., 2016). One candidate gene was identified around the markers on 3HL,
encoding for an Amino-acid permease BAT1 homolog – selected as Amino-acid permeases have
Salt Tolerance
49
been shown to increase proline accumulation under salt stress conditions (Wang et al., 2017). As
mentioned previously, HKT genes are the most recognised genes for salt tolerance (Hamamoto et
al., 2015; Hazzouri et al., 2018), however none were identified in the regions identified in this study,
indicating different mechanisms like those listed above through either tissue tolerance or different
methods of exclusion (Munns, 2009).
Future Work and Implications
Further testing of the identified lines should be undertaken to gain a greater understanding into the
nature and extent of the salt tolerance. This could include assessing the root growth in compost or
soil of differing salinities, assessing the Na concentrations within the leaves grown in these
concentrations, testing the biomass of selected lines in a more complete range of salt concentrations,
and assessing the yield when grown in these concentrations. These lines, such as Prize Prolific-196,
Bere-118, and Bere 49 A 27 Shetland, could be used directly for soils that are highly salt affected
such as coastal soils and areas irrigated with poor quality water. Additionally, further testing on these
lines with ratios of differing salts is necessary as whilst sodium salts are the most common, salts such
as chlorides and sulphates of calcium and magnesium are also found in soils (Abrol et al., 1988). This
is particularly necessary as the ratio of sodium salt to other salts is much lower in costal saline soils
that are sea influenced (Mugai, 2004), such as some Scottish islands where Bere barley is grown
(Dry and Robertson, 1982; Dry, 2016). This will allow us to determine if the improved growth is a
tolerance to saline or sodic soils, or a combination of both.
Once a more detailed understanding of the salt tolerance has been attained, the regions that have
been identified in the biomass growth study can then be introgressed into elite cultivars. Introgressed
lines would help further isolate the gene(s) associated with the identified resistance, that could then
be bred into an elite background. The benefit of having an elite line with additional tolerance to salt
conditions would include the ability to grow elite lines on more marginal land, and to increase the
robustness of the elite crops to seen and unseen salination e.g. floods, or irrigation with brackish
waters to maintain and increase production (Ismail and Horie, 2017). Salt stress is also highly related
to drought stress, both having similar or identical effect on water deficiency and osmotic effect (Hu

Salt Tolerance
50
and Schmidhalter, 2005; Katerji et al., 2009), thus the identified mechanisms that offer an increase in
salt tolerance should be assessed for drought stress tolerance.
Identification and introgression of regions that are able to alleviate both saline and drought stress
would be of importance particularly in poorer regions as the most common reason for the necessity
of watering with brackish water is the prevalence of drought (Hillel, 2000). This is of increased
importance as areas of salinity and drought are expected to increase over the upcoming years (Wang
et al., 2003), exacerbated by climate change causing unpredictable weather and rising water tables
(Munns and Gilliham, 2015). Additionally, increased resistance to saline conditions allows for the use
brackish water to alleviate water stress during periods of extreme drought in areas relying on rain
water as the primary water source such as the Mediterranean (Hamdy et al., 2005).

Rhynchosporium commune Resistance
51
Evaluating the infection variation of the foliar disease ‘Scald’ (Rhynchosporium commune) in the
Scottish barley landrace Bere (Hordeum vulgare L.)
Introduction
The Rhynchosporium genus comprises of haploid hemibiotrophic fungi that infect grasses such as
rye, triticale, and barley. Originally the pathogens of these three crops were classified as pathotypes
of R. secalis. A study by Zaffarano et al. (2011) identified that the pathotype infecting barley was a
separate species, and it was subsequently labelled as Rhynchosporium commune. This host
adaptation is mediated through effector proteins that stall the development of the fungi in planta in
order to extend the biotrophic phase (Clark et al., 2008; Penselin et al., 2016). The disease is found
in all areas where barley is grown but is especially prevalent in areas of cooler climate. Yield losses
have been reported ranging from 10% to 45%, and economic yield is reduced due to inferior quality
grain for products such as malting barley. In the UK this equates to an estimated £7.2 million worth
of losses in barley after fungicide treatments (Avrova and Knogge, 2012; Paveley et al., 2016).
Whilst the fungus can be seed-borne, the majority of infection comes from the spread of the fungus
originating on crop debris of the previous season, or from volunteer plants that host the fungus over
winter. This spread is usually via rain splash which causes dispersal of spores to new hosts, air-borne
transfer of spores may also transmit the pathogen but is thought to be much more limited. Seed-borne
infection is thought to remain symptomless in planta for several months (Clark et al., 2008; Fountaine
et al., 2010; Avrova and Knogge, 2012). Infection via the more common rain splash dispersal can also
remain symptomless as the biotic phase does not produce the characteristic symptoms of scald
shown (Figure 15) (Zhan et al., 2008). The typical symptoms signal the necrotic phase of leaf scald
and start with a paling of an oval-shaped lesion, later surrounded by a necrotic ring of tissue often
with leaf yellowing around it. The lesions look like scald marks and can coalesce into larger regions
causing general necrosis and potential death of the leaf. Symptoms usually occur on the leaves, leaf
sheaths and ears (Clark et al., 2008; Avrova and Knogge, 2012). The current strategies to reduce the

Rhynchosporium commune Resistance
52
number of rhynchosporium outbreaks include: agronomic practices such as crop rotations, cultivar
mixtures, and fungicide use, as well as genetic resistance through breeding. However, due to rapid
adaptation of the pathogen populations, individual treatments are often inadequate by themselves
(Zhan et al., 2008). This rapid adaptation of pathotypes – in response to changing environments,
resistant cultivars, and fungicide treatments – is thought to be caused, in part, by the sexual
recombination of the pathogens, which is identified to have occurred in all field populations
(McDonald, 2015). This causes selective pressures that account for approximately three quarters of
the global R. commune species diversity being found in the field (McDonald, 2015) and an increasing
race complexity with time (Zhan et al., 2012). Additionally, the prohibition of fungicides due to safety
and political reasons exhibit a flaw in the reliance on chemical treatment as the sole form of control.
An example of this is the European Union’s imminent ban of the most commonly used fungicide in
the USA and UK – chlorothalonil (Hillocks, 2012; European Commission, 2019). Chlorothalonil is a
broad-spectrum fungicide used to control a range of fungal pathogens including R. commune, but has
been reported to cause a reduction in biodiversity and a change in ecosystem function (McMahon et
al., 2012; Creissen et al., 2016). Together these shows a need for the development of ever more
genetic resistance to R. commune.
Figure 15) Images showing the characteristic scald pattern of infection of barley with Rhynchosporium commune. Sourced from Hofmann (2014).
Resistance genes against R. commune infection previously had different naming methods with allelic
differences and duplicates having different unrelated names. Work to make the nomenclature unified

Rhynchosporium commune Resistance
53
was undertaken by Bjørnstad et al. (2002), assigning the Rrs prefix to almost all, consolidating down
to: Rrs1 with 11 alleles, Rrs2 with two, Rrs3 with one, Rrs4 with two, Rrs12-14 each with one, and
four unconfirmed R genes. Other resistance genes against R. commune that were not mentioned or
that have been since identified include: Rrs5, rrs6-8, Rrs9, Rrs10, rrs11 (Takeuchi and Fukuyama,
2009), Rrs15 (Genger et al., 2005), Rrs16 (Pickering et al., 2006), a second Rrs15 found in a different
location (Wagner et al., 2008) which has been suggested to be changed to Rrs17 by Zhan et al.
(2008), and the latest gene labelled to date, Rrs18, found on 6HS by Hofmann (2014) and confirmed
by Coulter et al. (2018) (Figure 16). A number of these resistance genes originate from landraces
(Bjørnstad et al., 2004; Hofmann et al., 2013; Hanemann et al., 2010). It has been suggested that
Scandinavian and other northern European landraces might be a prime source for resistance to
rhynchosporium as it is speculated that R. commune originated in this area providing diverse R.
commune populations and the longest period of landrace selection for rhynchosporium resistance
(McDonald, 2015), suggesting Bere barley is a suitable candidate. Other sources of resistance could
come from the alternate, broad-based, PAMP triggered immunity (PTI). An example on how this could
be used is the identification of a R. commune PAMP by Franco-Orozco et al. (2017) that induces PTI
in solanaceous species, but not monocots. By replicating this pattern recognition receptor (PRR),
through identification or induction of mutations, a new resistance mechanism may be transferred
between plant families. Study of landrace material may provide a resource of novel PRRs that could
offer broad-based resistance.
Figure 16) The location, or approximate location for Rrs3, of mapped a selection of resistance genes for Rhynchosporium commune on the barley bin map, with associated markers. Chromosome 5H is not depicted as there are no associated markers at present. The references are as follows; 1) Bjørnstad et al. (2002), 2) Takeuchi and Fukuyama (2009), 3) Genger et al. (2005), 4) Pickering et al. (2006), 5) Wagner et al. (2008), 6) Zhan et al. (2008), 7) Hofmann (2014), and 8) Coulter et al. (2018). Figure adapted from Zhan et al. (2008) and Hanemann (2009).

Rhynchosporium commune Resistance
54
The aims of this study were to identify if the Bere lines have an inherent resistance to rhynchosporium
as suggested by anecdotal evidence (Mahon et al., 2016), as well as identifying individual lines that
have high resistance. To then use this data to identify genomic regions associated with this trait, and
any candidate genes in this region.
Results
Controlled Landrace Screen
1.1.1.10. Sub-category Analysis
There were significant differences in infection lesion area between the sub-categories (p<0.001),
isolates (p<0.001), and interaction of these treatments (p=0.043). There were significant differences
also in lesion severity between the: isolates (p<0.001) and the isolate sub-category interaction
(p=0.048), but not between sub-categories (p=0.066). Comparison of the lesion area (Figure 17a)
indicated that lesions in Bere lines are smaller. Lesions from isolates 13-13, L73A, and L77 caused
smaller lesions in Beres than the other landrace lines, the latter two isolates in Beres also caused
smaller lesions compared with the elite cultivars. Isolate L2A showed no significant difference
between sub-categories. The isolates also showed differences between each other in size in all sub-
categories, with isolates L73A, L77, 13-13, and L2A causing average lesions of 33, 30, 19, and 13
mm2, respectively. Comparison of lesion severity (Figure 17b) showed the opposite trend to that of
the area, with lesions in Bere lines showing greater lesion severity. Lesion severity from isolates 13-
13 and L2A, that caused minimal differences in the lesion area, showed greater lesion severity in the
Bere lines than both elite cultivars and other landraces. The latter also showed less lesion severity in
the elite cultivars compared to the other landrace lines. Conversely, isolate L77 caused greater lesion
severity in the other landrace lines than in elite cultivars and Bere lines. Isolate L73A showed no
differential interaction with the sub-categories.

Rhynchosporium commune Resistance
55
0
5
10
15
20
25
30
35
40
13-13 (1) L2A (3) L73A L77 (2)
Are
a o
f in
fectio
n (
mm
2)
Bere Elite Landrace
0
0.5
1
1.5
2
2.5
3
13-13 (1) L2A (3) L73A L77 (2)
Seve
rity
of
infe
ctio
n (
scale
0-4
)
Bere Elite Landrace
a)
b)
Figure 17) Comparison of the R. commune infection for 132 lines/cultivars of barley divided into three, unequal, sub-divisions (35, 87, and 10 for the Bere, other landraces, and elites respectively) with four different isolates, looking at a) area of infection, and b) lesion severity of infection. Error bars represent the standard errors.
1.1.1.11. Individual Line/Cultivar Analysis
Individual analysis also shows significant differences between the: lines/cultivars, isolates, and
interaction of these treatments (p<0.001), for both lesion area and lesion severity. Mean isolate data
for the lesion area (Figure 18a) shows a spread of each sub-category. Most Bere lines are amongst
the smaller lesions, with nine of the ten smallest being Beres. The elite cultivars similarly show a
spread of lesion sizes, with two being of similar size to the smallest of the Beres. Mean lesion severity
data (Figure 18b) similarly shows the majority of the Bere lines with high lesion severity, with the
highest three being Beres. However, the line/cultivar with the lowest lesion severity is also a Bere line.

Rhynchosporium commune Resistance
56
0
10
20
30
40
50
60
Ave
rage R
hynchosporium
Lesio
n A
rea
(mm
2)
Bere Elite Landrace
0
0.5
1
1.5
2
2.5
3
3.5
4
Ave
rage R
hynchosporium
Seve
rity
(S
cale
0-4
)
Bere Elite Landrace
Elite cultivars show most lesions having low lesion severity, many comparable to the lowest Bere line,
but elite cultivar Concerto has high lesion severity comparable to the highest Bere lines.
a)
b)
Figure 18) Comparison of rhynchosporium symptoms for 132 lines/cultivars of barley, averaging the four different isolates, looking at a) area of infection, and b) lesion severity of infection. Error bars represent the standard errors.
Comparison between lesion size and lesion severity, for both the averaged data of all isolates (Figure
19) and within the individual isolates, show no correlation. Likewise, no correlation was found
comparing all the individual isolates against each other for both lesion area and lesion severity.

Rhynchosporium commune Resistance
57
From the comparison between separate isolates, individuals with consistently small lesion size and
lesion severity can be identified. Bere 55 A 33 has the smallest lesion size of all the Beres with all
four isolates, amongst the ten smallest lines/cultivars with three isolates. Other Bere lines include
Bere 45 A 23, Bere 58 A 36 Eday, and Bere 8-125, all produce no lesion with L77 and have small
lesions with another two isolates, but have average sized lesions with isolate 13-13. The lines/cultivars
with the largest average lesion size were all non-Bere landraces (Figure 18a), but only two – Spratt
Archer 37/6/3-205 and Irish Goldthorpe-222 – had above average lesion sizes in all isolates. Kenia-
M08, Binder-M08, and Scotch Common-M08 had amongst the largest lesions, but had the smallest
lesions with isolate L2A.
The Bere line with the smallest overall lesions, Bere 55 A 33, has amongst the greatest lesion severity,
fitting the pattern of inverse lesion size and lesion severity seen in the sub-category analysis.
However, this pattern is not seen in the other lines with small lesion sizes as Bere 45 A 23, Bere 58
A 36 Eday, and Bere 8-125 all have amongst the least lesion severity. The two elite cultivars with the
least lesion severity (Figure 18b) are KWS Irina and Westminster. Of the lines identified above with
large lesions, nearly all also had high average lesion severity, the exception to this was Scotch
Common-M08 but that did have high lesion severity with half the isolates.
Figure 19) Correlation between the average rhynchosporium lesion size vs the lesion severity in 132 lines/cultivars compared with the mean of all four isolates. For the correlation the line of best fit along with the coefficient of determination (R2) value is given, p=0.061.
R² = 0.0267
0
0.5
1
1.5
2
2.5
3
3.5
0 10 20 30 40 50 60
Ave
rage R
hynchosporium
Seve
rity
(S
cale
0-4
)
Average Rhynchosporium Lesion Area (mm2)
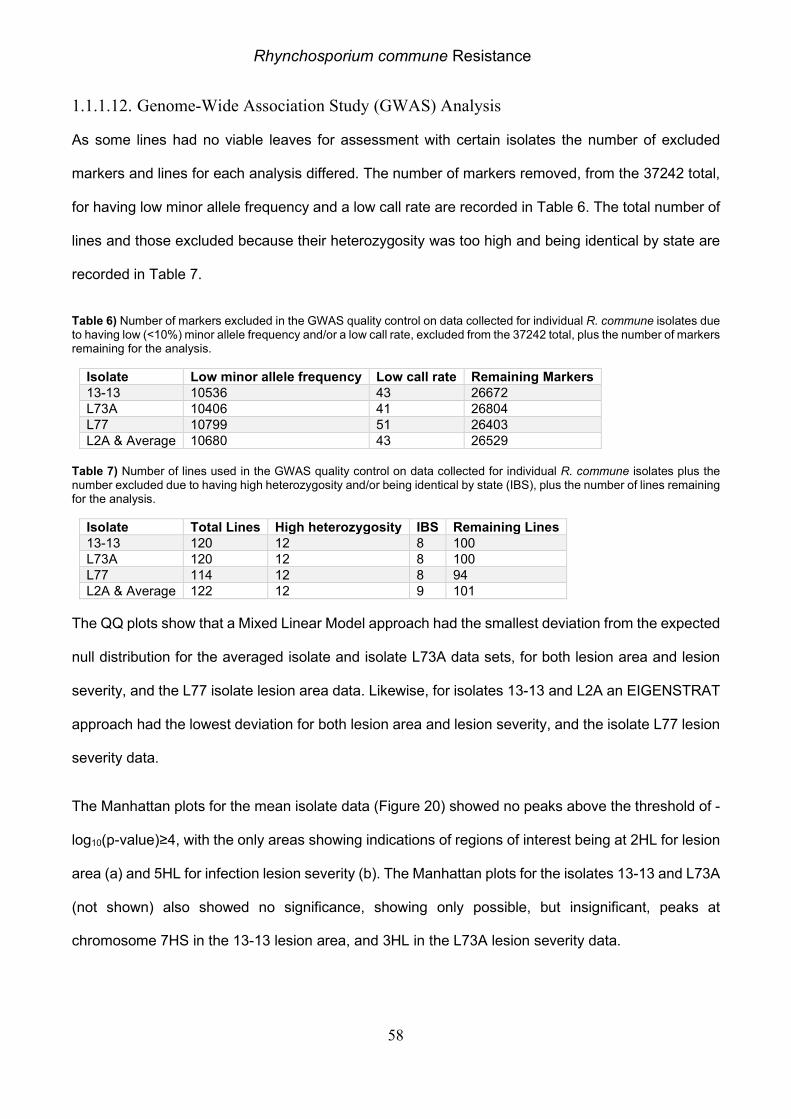
Rhynchosporium commune Resistance
58
1.1.1.12. Genome-Wide Association Study (GWAS) Analysis
As some lines had no viable leaves for assessment with certain isolates the number of excluded
markers and lines for each analysis differed. The number of markers removed, from the 37242 total,
for having low minor allele frequency and a low call rate are recorded in Table 6. The total number of
lines and those excluded because their heterozygosity was too high and being identical by state are
recorded in Table 7.
Table 6) Number of markers excluded in the GWAS quality control on data collected for individual R. commune isolates due to having low (<10%) minor allele frequency and/or a low call rate, excluded from the 37242 total, plus the number of markers remaining for the analysis.
Isolate Low minor allele frequency Low call rate Remaining Markers
13-13 10536 43 26672 L73A 10406 41 26804 L77 10799 51 26403 L2A & Average 10680 43 26529
Table 7) Number of lines used in the GWAS quality control on data collected for individual R. commune isolates plus the number excluded due to having high heterozygosity and/or being identical by state (IBS), plus the number of lines remaining for the analysis.
Isolate Total Lines High heterozygosity IBS Remaining Lines
13-13 120 12 8 100 L73A 120 12 8 100 L77 114 12 8 94 L2A & Average 122 12 9 101
The QQ plots show that a Mixed Linear Model approach had the smallest deviation from the expected
null distribution for the averaged isolate and isolate L73A data sets, for both lesion area and lesion
severity, and the L77 isolate lesion area data. Likewise, for isolates 13-13 and L2A an EIGENSTRAT
approach had the lowest deviation for both lesion area and lesion severity, and the isolate L77 lesion
severity data.
The Manhattan plots for the mean isolate data (Figure 20) showed no peaks above the threshold of -
log10(p-value)≥4, with the only areas showing indications of regions of interest being at 2HL for lesion
area (a) and 5HL for infection lesion severity (b). The Manhattan plots for the isolates 13-13 and L73A
(not shown) also showed no significance, showing only possible, but insignificant, peaks at
chromosome 7HS in the 13-13 lesion area, and 3HL in the L73A lesion severity data.
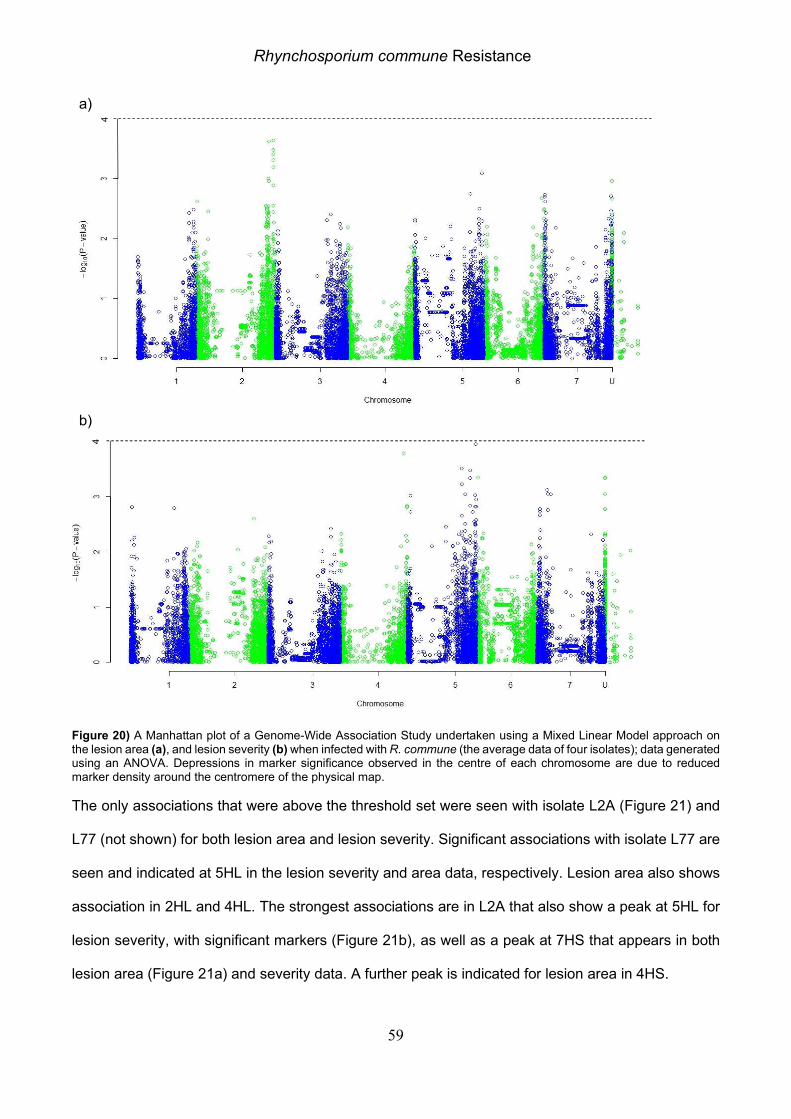
Rhynchosporium commune Resistance
59
a)
b)
Figure 20) A Manhattan plot of a Genome-Wide Association Study undertaken using a Mixed Linear Model approach on the lesion area (a), and lesion severity (b) when infected with R. commune (the average data of four isolates); data generated using an ANOVA. Depressions in marker significance observed in the centre of each chromosome are due to reduced marker density around the centromere of the physical map.
The only associations that were above the threshold set were seen with isolate L2A (Figure 21) and
L77 (not shown) for both lesion area and lesion severity. Significant associations with isolate L77 are
seen and indicated at 5HL in the lesion severity and area data, respectively. Lesion area also shows
association in 2HL and 4HL. The strongest associations are in L2A that also show a peak at 5HL for
lesion severity, with significant markers (Figure 21b), as well as a peak at 7HS that appears in both
lesion area (Figure 21a) and severity data. A further peak is indicated for lesion area in 4HS.
4
4

Rhynchosporium commune Resistance
60
a)
b)
Figure 21) A Manhattan plot of a Genome-Wide Association Study undertaken using an EIGENSTRAT approach on the lesion area (a), and lesion severity (b) when infected with R. commune isolate L2A; data generated using an ANOVA. Depressions in marker significance observed in the centre of each chromosome are due to reduced marker density around the centromere of the physical map.
5
6

Rhynchosporium commune Resistance
61
Within chromosome 5HL the regions identified do not overlap, the significant markers from isolate
L2A lesion severity, L77 lesion area, and L77 lesion severity were positioned between 667.34-667.59
Mb, 621.89-622.53 Mb, and 556.49-570.02 Mb, respectively - the latter along with markers from
isolate L73, isolate L2A and the mean lesion severity. Within the region identified with the isolate L77
area data there were a number of genes of interest based on their putative function (Table 8):
encoding for a BED zinc finger family protein, and a Bax inhibitor-1 family protein. The most significant
region at 667.34-667.59 Mb had only one gene of interest, with the putative function of a receptor
kinase with a domain homologous to Ginkbilobin-2 (Gnk2) – an antifungal protein found in Ginkgo
biloba (Miyakawa et al., 2014). Of these, zinc finger domains are relatively common comprising 1.2%
of all annotated genes with known functions in barley, at 902 of the 73586, as listed in BARLEX the
barley genome explorer (Colmsee et al., 2015). The Bax inhibitors and Gnk2 domain containing
proteins conversely represent <0.1% of genes combined, with 13 and 68 genes found across the
genome, respectively.
Table 8) The name of the candidate genes identified in relation to rhynchosporium lesions in detached leaf assays, with the chromosome and position on the physical map listed.
Gene Name Chr Position Annotation
HORVU5Hr1G105590.1 chr5H 621.83 BED zinc finger family protein, expressed HORVU5Hr1G105760.4 chr5H 622.13 Bax inhibitor-1 family protein HORVU5Hr1G124810.4 chr5H 667.43 Receptor kinase 1 (Gnk2 domain) HORVU2Hr1G102740.3 chr2H 697.86 WRKY DNA-binding protein 35
Similarly, chromosome 7HS had two regions: one from the 13-13 area data that had markers, but not
significant at 10.15-10.94 Mb, and the other from the L2A lesion severity data with five significant
markers at 16.67-16.92 Mb. These could possibly correlate to Rrs2 and Rrs12, respectively. Likewise,
the markers identifying a significant region on 4HS in the L2A area data possibly correlate with the
location of Rrs16, and the large region on chromosome 4HL between 572.61-596.53 Mb, could co-
locate with Rrs3.
The significant marker on 2HL in the isolate L77 area data at 697.86 Mb, possibly correlates to a QTL
found by Backes et al. (1995) that associated with rhynchosporium and that greatly affected barley
kernel yield. The maker is located in a WRKY DNA-binding protein (Table 8) which comprises 77
genes genome wide representing 0.1% of the genome.

Rhynchosporium commune Resistance
62
Field Trials
The 2016 field trial used a selection of 50 lines of the Bere and other landrace lines available and
showed a significant difference in RAUDPC between lines (p-value=0.038). The RAUDPC of the Bere
sub-category was approximately 60% of the landrace subcategory. No significant difference between
individual lines was identified using the transformed data (p=0.103). However, the untransformed data
and the transformed data when the lines were collated both show significant differences (p=0.039 and
0.023, respectively). Individual lines varied greatly, and sub-category ranges overlapped (Figure 22).
This allowed for identification of lines that have large levels of infection, such as Bere 23 B and Nepal
92 BN-1, and lines with effectively no infection, such as Bere 8-125 with 0.4% of the RAUDPC of the
most infected lines.
Figure 22) Comparison of rhynchosporium recorded as the Relative Area Under Disease Progress Curve (RAUDPC) during a field trial in 2016 for 50 lines of barley. Error bars represent the standard errors.
Analysis of the transformed 2017 field trial data showed significant differences in the RAUDPC
between the sub-categories (p<0.001). The difference between the Beres and other landraces is seen
again, with the other landraces showing 50% higher RAUDPC than the Bere lines. However, the elite
cultivars (absent in the 2016 field trial) showed an even higher RAUDPC, approximately four times
that of the Bere lines (Figure 23).
0
200
400
600
800
1000
1200
1400
Rela
tive A
rea U
nder
Dis
ease P
rogre
ss
Curv
e (
RA
UD
PC
)
Bere Landrace

Rhynchosporium commune Resistance
63
Figure 23) Comparison of rhynchosporium recorded as the Relative Area Under Disease Progress Curve (RAUDPC) during a field trial in 2017 for 140 lines/cultivars of barley divided into three, unequal, sub-divisions (37, 93, and 10 for the Bere, other landraces, and elites respectively). Error bars represent the standard errors.
Analysis of the individual data similarly showed a significant difference between the lines/cultivars
(p<0.001). The Bere line, Bere 8-125, identified with a low RAUDPC value in the previous field trial
similarly performs well in this trial. One Bere line had a smaller value than this line, Bere 25 A, but this
had an average value for a Bere line in the 2016 trial. This difference between field trial years is also
found with other Bere lines such as Bere 58 A 36 Eday, Bere 53 A 31, Bere-223, and Bere 37 A 14.
A larger spread of the other landraces can be seen, in part because there is a greater number with
both high and low RAUDPC values. The three landraces with the smallest RAUDPC value were
Danubia, Isaria, and Burtons Malting-128, comparable to that of Bere 8-125 but none of these lines
were in the 2016 trial to compare. As identified in the sub-category analysis the elite cultivars are
amongst those with the highest RAUDPC value, with all elite cultivars above the median (Figure 24).
0
20
40
60
80
100
120
140
Bere Elite Landrace
Rela
tive A
rea U
nder
Dis
ease P
rogre
ss C
urv
e
(RA
UD
PC
)
37 10 93

Rhynchosporium commune Resistance
64
Figure 24) Comparison of rhynchosporium recorded as the Relative Area Under Disease Progress Curve (RAUDPC) during a field trial in 2017 for 140 lines/cultivars of barley. Error bars represent the standard errors.
A comparison of the lines over the two field trials (Figure 25) shows no correlation between the two
years (correlation coefficient>0.26). However, this allowed for identification of lines that had low
RAUDPC in both years. Of these Bere 8-125 stood out clearly, other included Bere (Mr SO)-121 and
Bere-155.
Figure 25) Correlation of rhynchosporium recorded as the Relative Area Under Disease Progress Curve (RAUDPC) between field trials in 2016 and 2017, for the 49 line in common split into two sub-categories of Bere and other landraces (with 35 and 14 line respectively). For each sub-category the line of best fit along with the coefficient of determination (R2) value is given; P-values= 0.063 (Landrace) and 0.981 (Bere).
0
50
100
150
200
250
300
350
400
Rela
tive A
rea U
nder
Dis
ease P
rogre
ss
Curv
e (
RA
UD
PC
)
Bere Elite Landrace
R² = 0.26
R² = 2E-05
0
20
40
60
80
100
120
140
0 100 200 300 400 500 600 700 800 900
Rela
tive A
rea U
nder
Dis
ease P
rogre
ss
Curv
e (
RA
UD
PC
) in
year
2017
Relative Area Under Disease Progress Curve (RAUDPC) in year 2016
Landrace Bere Linear (Landrace) Linear (Bere)

Rhynchosporium commune Resistance
65
R² = 0.0106
0
100
200
300
400
500
600
700
800
900
0 20 40 60Re
lative
Are
a U
nd
er
Dis
ea
se
Pro
gre
ss
Cu
rve
(R
AU
DP
C)
in y
ea
r 2
01
6 fo
r R
hyn
ch
osp
ori
um
DLA Average Rhynchosporiumlesion area (mm2)
R² = 0.003
0
50
100
150
200
250
300
0 20 40 60Re
lative
Are
a U
nd
er
Dis
ea
se
Pro
gre
ss
Cu
rve
(R
AU
DP
C)
in y
ea
r 2
01
7 fo
r R
hyn
ch
osp
ori
um
DLA Average Rhynchosporiumlesion area (mm2)
R² = 0.023
0
100
200
300
400
500
600
700
800
900
0 1 2 3 4Re
lative
Are
a U
nd
er
Dis
ea
se
Pro
gre
ss
Cu
rve
(R
AU
DP
C)
in y
ea
r 2
01
6 fo
r R
hyn
ch
osp
ori
um
DLA Average Rhynchosporiumlesion severity (Scale 0-4)
R² = 0.0044
0
50
100
150
200
250
300
0 1 2 3 4Re
lative
Are
a U
nd
er
Dis
ea
se
Pro
gre
ss
Cu
rve
(R
AU
DP
C)
in y
ea
r 2
01
7 fo
r R
hyn
ch
osp
ori
um
DLA Average Rhynchosporiumlesion severity (Scale 0-4)
1.1.1.13. Comparison with Controlled Study
Comparison of the field trial data from both years with the detached leaf assay average lesion area
and lesion severity (Figure 26) shows no significant correlations between the datasets. However, from
these correlations three Bere lines were identified as having consistently low levels of infection: Bere
45 A 23, Bere 58 A 36 Eday, and Bere 8-125.
a) b)
c) d)
Figure 26) Correlation between the DLA average lesion area (a & b) or lesion severity (c & d) with the field trial RAUDPC from the years 2016 (a & c) or 2017 (b & d) with the respective 50 or 140 lines/cultivars used. The three lines – Bere 45 A 23, Bere 58 A 36 Eday, and Bere 8-125 – that were shown to have consistently low infection are circled in red. For each correlation the line of best fit along with the coefficient of determination (R2) value is given. P-values= 0.497, 0.534, 0.314, and 0.45, respectively.

Rhynchosporium commune Resistance
66
1.1.1.14. Genome-Wide Association Study (GWAS) Analysis
Of the 37242 markers used with the 2017 field trial data, 10718 were removed as having low minor
allele frequency and a further 42 because of a low call rate. Of the 130 lines used 13 were excluded
because their heterozygosity was too high, and a further eight due to being identical by state. The QQ
plot showed the Mixed Linear Model approach had the lowest deviation from the expected null
distribution. The Manhattan showed one peak that stands out significantly on the distal end of
chromosome 3HS in the region of 44.46-45.33 Mb (Figure 27).
Within this region there were no genes with a putative function that, to date, is known to affect
pathogen infection. However, next to this region – at 44.42 Mb, less than 0.5 cM – is a Cysteine-rich
receptor-like protein kinase with a domain homologous to Gnk2 mentioned above
(HORVU3Hr1G017430.1). One significant marker, with the highest effect, is found on chromosome
2HL at 713.11 Mb (not in the same area as found the DLA data) within a gene encoding for a disease
resistance protein with leucine rich repeats (HORVU2Hr1G108000.2).
Figure 27) A Manhattan plot of a Genome-Wide Association Study undertaken using a Mixed Linear Model approach on Relative Area Under Disease Progress Curve (RAUDPC) of rhynchosporium during a 2017 field trial; data generated using an ANOVA. Depressions in marker significance observed in the centre of each chromosome are due to reduced marker density around the centromere of the physical map.
5
Rhynchosporium commune Resistance
67
Discussion
Barley scald caused by the fungal pathogen Rhynchosporium commune is a global disease, and a
major problem in most parts of the UK (Avrova and Knogge, 2012). It is important to find new sources
of resistance as resistance genes cause a selective pressure on the pathogen to develop a
mechanism to break the resistance of the plant (Bergelson et al., 2001). Resistance genes that have
developed in secluded populations, such as landraces, pose a potential source of novel resistance
genes that can be bred into the elite cultivars (Silvar et al., 2010). This project assessed landrace
lines for rhynchosporium symptoms in both detached leaf assays and field trials. This allowed for
identification of a number of Bere lines that showed signs of resistance, as well as identifying regions
within the genome that correlated to reductions in infection symptoms, along with a number of genes
with putative functions associated with disease resistance.
Controlled Study Symptoms
The detached leaf assays performed on the JHI-SBLC showed that there is a range of infection for
all sub-categories, with overall the Bere lines showing smaller lesions, but with more necrotic tissue
in the lesion. These are comparable to the study from Coulter et al. (2018) that shows identified
resistant lines with lesions reduced by 45% compared to the most susceptible line Morex. This study
also identified Morex as one of the most susceptible lines, with the largest lesions, and identified many
other lines with similar levels of lesion size reduction as found in the Coulter et al. (2018) study when
compared to Morex. The smallest lesions in this study were reduced by 78% compared to Morex, with
the three lines identified for consistent resistance – Bere 45 A 23, Bere 58 A 36 Eday, and Bere 8-
125 – reduced by 71-76% compared to Morex. This supports the anecdotal claims of farmers working
with Bere populations that they were more resistant to rhynchosporium (Mahon et al., 2016). However,
these results show that there is a large difference between how different isolates interact with
individual lines, this is highlighted by the isolate 13-13 that interacts with lines/cultivars in a differential
manner from the remainder of the isolates. Difference seen in the lesion severity are possibly due to
differences in reaction/susceptibility to necrosis inducing peptides from the pathogen, as R. commune
has not been shown to induce a hypersensitive response (Wevelsiep et al., 1991; Hahn et al., 1993).

Rhynchosporium commune Resistance
68
Currently there are multiple rhynchosporium resistance genes that are spread across all barley
chromosomes, except 5H (Hanemann, 2009). The identification of new resistance genes that can be
introgressed into elite lines will help make a more robust resistance. This study identified several
regions across multiple chromosomes that are associated with one or more of the isolates with
regards to lesion area and/or lesion severity. In the DLA this included regions that are near the location
of previously identified Rrs genes, including: two peaks on chromosome 7HS from the isolate 13-13
lesion area data and the L2A lesion severity data that could correlate with Rrs2 and Rrs12,
respectively (Abbott et al., 1992; Hanemann, 2009), one peak on 4HS from the isolate L2A lesion
area data possibly correlating with Rrs16 (Pickering et al., 2006), and one peak on chromosome 4HL
also from the isolate L2A lesion area data close to the estimated region of Rrs3 (Bjørnstad et al.,
2002). The two regions of interest identified on chromosome 2HL and 5HL, the latter of which has not
had a Rrs gene identified on that chromosome before and the former has not had one identified in
that region (Zhan et al., 2008).
Within the region on chromosome 5HL there were three proteins with putative functions that were
identified as potentially responsible for the reduction in symptoms included: a) BED zinc finger family
protein – selected as this type of zinc finger has been associated with R genes in barley (Gupta et al.,
2012), b) Bax inhibitor-1 (BI-1) family protein – selected as it has been shown that a wheat BI-1 gene,
that was shown to be differentially expressed when the wheat was inoculated with Fusarium
graminearum, and caused increase resistance to a pathogen when expressed in Arabidopsis (Lu et
al., 2018), and c) a receptor kinase with a domain homologous to Ginkbilobin-2 (Gnk2) – selected as
Gnk2 is an antifungal protein found in Ginkgo biloba causing the inhibition of the growth of fungal
pathogens such as Fusarium oxysporum (Miyakawa et al., 2014).
The marker identified on chromosome 2HL was located within a WRKY DNA-binding protein that have
been shown to be involved in the defence against both biotic and abiotic stresses (Agarwal et al.,
2011; Zhu et al., 2013) such as the suggested response to powdery mildew in barley (Wang et al.,
2014a).

Rhynchosporium commune Resistance
69
Field Trial Symptoms
The field trial results corroborated that Bere lines showed diminished symptoms. The spread of the
lines/cultivars shows that there were large amounts of variation within each sub-category with regards
to resistance to rhynchosporium, with individual Bere and other landrace lines being identified in both
years as having both low and high levels of disease. Whilst visual scores are not directly numerically
comparable to scores done by others, they can still be generally compared. A similar experiment,
from Looseley et al. (2018), undertook trials in the same fields over three years with common elite
cultivars to assess European spring barley germplasm. As in this study, Propino consistently showed
amongst the lowest infection of the common elite cultivars, though in contrast so did Belgravia. The
most resistant lines from each year of the Looseley et al. (2018) showed up to a 54% reduction in
RAUDPC compared to Propino. In contrast, the most resistant line in the 2017 trial showed a reduction
of 84% compared to Propino, with the three lines identified for consistent resistance mentioned above
showing 67-83% reduction compared to Propino. This variation could be due in part to the different
environmental conditions found between the origins of the lines, with some coming from heterogenous
populations (Ceccarelli et al., 1987; Yitbarek et al., 1998). However, the elite cultivars showed much
higher levels of infection than the DLA suggests. This could be explained by the difference in height,
as the effect of the dwarfing genes in elite lines give smaller distances between the leaf nodes making
it more likely for the spores to spread by splash up onto higher leaves (von Korff et al., 2005; Looseley
et al., 2012). Additionally, there was no correlation between the same lines when grown in 2016 and
2017 when comparing infection levels, possibly due to different environmental conditions and/or
different R. commune isolates in the field (Looseley et al., 2015; Looseley et al., 2018). This could
highlight the need for increased discovery of resistance mechanisms to provide a broad protection to
the unpredicted annual changes in infection and infecting isolates in the same field.
Using the data from the 2017 trial, one genomic region was found to be significantly associated with
the difference in symptoms on chromosome 3HS, along with a significant marker on chromosome
2HL. Neither region has any known Rrs gene, and thus may be evidence of potential sources of novel
resistance genes. The region found in 3HS was next to a Cysteine-rich receptor-like protein kinase

Rhynchosporium commune Resistance
70
with a domain homologous to Gnk2, the marker at 2HL was located in a disease resistance protein
with LRRs – these were selected for the reasons mentioned above (Hammond-Kosack and Jones,
1997; Miyakawa et al., 2014). This region was less than 0.5 cM away from the significant markers,
within the minimum distance of 4 cM in which linkage disequilibrium has a low rate of decay in elite
barley (Bengtsson et al., 2017; Zhou et al., 2012b).
No correlation was found between the DLA and field data, again possibly due to architectural
differences of the whole plant influencing the number of spores able to splash up the plant (von Korff
et al., 2005; Looseley et al., 2012), or due to differences in environmental conditions. Other possible
explanations could be that the isolates found in the nursery were dissimilar to those used in the DLA
experiment. However, three Bere lines were identified as having consistently low levels of infection:
Bere 45 A 23, Bere 58 A 36 Eday, and Bere 8-125. As these lines had low infection in the DLA it
shows that it is more than a plant architecture difference that is causing the low infection scores in the
field for these lines. Thus, these lines show potential for novel sources of resistance.
Future Work and Implications
Proposed future work would be to test these lines in a fully replicated large plot field trial along with
DLAs with additional isolates, to further assess the level of resistance of these lines. Further analysis
is also necessary to identify whether the resistance exhibited in these lines is, in part or in whole,
caused by the identified chromosomal regions of interest in 2HL, 3HS and/or 5HL, with emphasis on
the candidate genes identified. This could be achieved by creating a bi-parental mapping population
to fine map the regions of interest. If these regions are the cause of this increased resistance, they
could continue to be introgressed into elite breeding lines to develop new cultivars. This would help
protect the elite crops from rhynchosporium infection by providing an additional form of resistance
that the pathogen would need to overcome. The development of cultivars with a robust resistance to
all isolates of rhynchosporium is important especially with the potential of ongoing human caused
climate change resulting in differing selective pressures on both the crop and the pathogen, that may
promote the evolution of R. commune to break resistance or that may weaken the crop making it more
susceptible (Stefansson et al., 2013; Velásquez et al., 2018).

Dual Interaction Studies
71
Assessment of the interaction of dual biotic and abiotic stresses in the Scottish barley landrace
Bere (Hordeum vulgare L.)
Introduction
Abiotic and biotic stresses do not occur independently as plants will experience near constant
exposure to both types of stress in both natural environments and agricultural environments.
Therefore, common pathways for multiple stresses have developed. Prime examples of this are the
hormone signalling pathways such as abscisic acid (Mauch-Mani and Mauch, 2005; Asselbergh et
al., 2008) and jasmonic acid, along with the associated pathways of ethylene and salicylic acid
(Lorenzo and Solano, 2005) that all have an associated role in response to and limitation of both biotic
and abiotic stress, allowing them to respond to multiple stresses concurrently (Bostock, 2005). This
is thought to be due to the fact that responses to stress often overlap, encoding for similar sets of
transcription factors, and thus there is the need for cross-talk between the different signalling
pathways (Figure 28) (Fujita et al., 2006).
Figure 28) A representation of the convergence points in abiotic and biotic stress signalling pathways that formulate a common stress response. Sourced from Fujita et al. (2006).

Dual Interaction Studies
72
Stress responses, however, are often antagonistic to one another, with different pathways being
involved in both increases in susceptibility or resistance (Anderson et al., 2004). This is well
represented in the trade-off between biotrophic and necrotrophic fungi, with pathways involved in
increased resistance to one causing an increased susceptibility to the other. This can be caused by
the hypersensitive response (HR) manifest through the salicylic acid pathway causing the reduction
of biotrophic pathogens, but providing resources for necrotrophic pathogens, whereas the
antagonistic jasmonic acid pathway causes the opposite to happen (Kliebenstein and Rowe, 2008;
Robert-Seilaniantz et al., 2011). Similarly, the Mlo gene has been shown to negatively regulate plant
defences, and the loss of function mutation has provided a widely used resistance to powdery mildew.
This resistance, however, comes at a cost of increasing susceptibility to necrotrophs such as
Ramularia collo-cygni, the causal agent of ramularia leaf spot (McGrann et al., 2014). Another
example of antagonist effects in combined stresses is seen in the semi-dwarfing ‘uzu’ barley, the
mutation causes a disruption to the Brassinosteroid hormone. This disruption results in an increased
resistance to a range of pathogens, but also results in an intolerance to certain abiotic stresses such
as cold and drought (Ali et al., 2014; Goddard et al., 2014). There is also evidence that the plant
response to stress combinations is different from the combination of the individual plant stresses,
resulting in different transcriptome patterns being produced (Rizhsky et al., 2004).
Interaction of stresses also occurs when the effect of one stress causes an impact on the effect of
another stress. This is commonly seen in plants that are abiotically stressed having weakened
defence mechanisms becoming more susceptible to pathogen infection (Suzuki et al., 2014). The
study of abiotic stress effects on biotic stress has been shown to be both positive and negative
(Atkinson and Urwin, 2012). Commonly, temperature stress has a negative effect by increasing
susceptibility to pathogens, this is seen in the example from Sharma et al. (2007) that showed an
increase in the fungal disease spot blotch in wheat with elevated night time temperatures. Other
abiotic stresses have been shown to increase the resistance of a plant to particular pathogens. The
study from Wiese et al. (2004) showed that increasing levels of salt correlated with increasing
resistance to the powdery mildew disease in barley even at low salt stress levels and remained for
Dual Interaction Studies
73
some time after the stress was relieved. The study showed that the salt stress induced a papilla-
mediated resistance that blocked the fungus, similar to that mediated by the mlo gene. This will
change in less predictable ways as a result of climate change. Differences in the climate change
associated stresses carbon dioxide levels, ozone levels, and temperature will cause changes in the
metabolome of the plants resulting in differences in pathogen infection. These stresses will occur in
conjunction with each other and may result in altered reactions from those found when assessing the
stresses individually. Mikkelsen et al. (2015a) showed increased resistance to powdery mildew when
grown with increased stress of the individual climate change associated stresses, but not when these
stresses where applied in conjunction. Similarly, the reverse is shown for spot blotch disease (Newton
et al., 2011b; Newton et al., 2012; Mikkelsen et al., 2015b).
Metals play a role in the response to biotic stresses in plants, being both essential for attack and
defence mechanism. Thus, it is apparent that metal stresses influence how biotic stress is manifest
within the plant system. However, it becomes more complex as metal ion concentration affect both
the plant susceptibility and the pathogen virulence (Poschenrieder et al., 2006). This is also seen in
reverse, with the pathogen having an effect on the plant system, triggering either increases or
decreases in metal absorption (Tamás et al., 1997). An example of the former is seen in the difference
in interaction of manganese and plant pathogens in a number of different species. The review by
Huber and Wilhelm (1988) showed increase Mn in barley causes increases in leaf spot disease,
decreases in aphid infection, and both in different mildew infection studies. The metalloid silicon (Si)
has shown to have particular importance in stress resistance, causing increased resistance to both
biotic and abiotic stresses. This has been demonstrated by the increased susceptibility to other
stresses when deficient, such as the increase in powdery mildew in Si deficient barley and wheat, and
reversely the increase in resistance when supplemental Si was applied (Ma, 2004).
Clearly it is important to study stresses together and how they interact in the environment. This is
critical in the development of stress resistant crops, as there may be hidden costs associated with the
resistance when in conjunction with other stresses. Additionally, breeding for resistance to one stress
could result in resistance to a further stress. Together these provide both concern and opportunity to
Dual Interaction Studies
74
breeders to breed robust crops that are able to maintain yield under adverse environmental
conditions. This is especially important with respect to climate change as the associated fluctuations
in abiotic conditions – such as temperature, light, water, carbon dioxide and nutrient availability – will
not only cause a change in the levels of biotic stresses, but will also change how these stresses
interact potentially causing an unpredictable level of damage (Atkinson and Urwin, 2012). As stated
above, these changes will be more unpredictable due to the complex interaction of the abiotic stresses
producing differing metabolomes with different resistances and susceptibilities to the different
pathogens (Newton et al., 2012; Mikkelsen et al., 2015b).
The aim of this study was to assess the interaction of the stresses analysed in previous sections,
using one abiotic stress (salinity or manganese deficiency) to stress the plant tissue and to then apply
a biotic stress (rhynchosporium) and observe how these symptoms differ from the unstressed
controls. This was undertaken with a number of different lines showing contrasting levels of resilience
to one or more of these stresses. It was suspected that there would be differences in rhynchosporium
symptoms between the different applications of the two abiotic stresses as both manganese (Huber
and Wilhelm, 1988) and salt stress (Wiese et al., 2004) have been shown to affect fungal infections.
It was unclear as to whether these abiotic stresses would increase or decrease symptoms as the
differences between the pathogens tested and R. commune could cause differences in reaction, such
as the difference between biotrophic and necrotrophic pathogens.
Results
Mn-Rhynchosporium Interaction
The analysis of the lesion area, after transformation, shows a significant difference between the soil
types (p=0.007), lines/cultivars (p<0.001), and interaction of the treatments (p<0.001). This data
(Figure 29) revealed that almost all the Bere lines that had significant differences in lesion size
between the two soils had larger lesions in the Bullion soil, with the exception of Bere 59 A 3 Uist that
had larger lesions in the soil from Orkney. A similar trend was found in the elite cultivars, with Scholar
and Propino having the largest lesions in the Bullion soil but some of the smallest in the soil from

Dual Interaction Studies
75
Orkney, and the opposite for the cultivar Westminster. The only other landrace lines that showed
differences were Prior-195 and Scottish Annat-202 that both, along with Bere 59 A 37 Uist, had the
three largest lesion size in the Orkney soil but small lesion sizes when grown in Bullion soil. However,
there was no correlation with the lesion size, in plants grown in either of the soils, and the lesion size
from 13-13 inoculation in the single interaction DLA study in the Mn landrace screen. There is also no
correlation with the lesion sizes from either soil or either of the chlorophyll fluorescence
measurements.
Figure 29) Comparison of the rhynchosporium lesion area for 30 lines/cultivars of barley, using isolate 13-13, grown in two different soil type: Orkney soil that is Mn limited, and Bullion soil that has adequate Mn (displayed as red and blue bars respectively on the primary axis). The secondary axis displays the mean chlorophyll fluorescence of the plants grown the two soil types (displayed as purple and green points). Error bars represent the standard errors in positive and negative directions.
The analysis of the lesion severity did not show a significant difference between the soil types
(p=0.542), but did between the: lines/cultivars (p=0.001), and their interaction (p<0.001). Comparison
of the lesion severity data (Figure 30) shows fewer differences between the two soil types, with only
the Bere lines Bere 59 A 37 Uist, Bere 60 A and Bere 7045 (AB) showing differences, the former of
which was also the Bere with the largest lesions in Orkney soil. Bere 60 A and Bere 59 A 37 Uist
0
0.1
0.2
0.3
0.4
0.5
0.6
0.7
0.8
0.9
0
5
10
15
20
25
Be
re 7
045
(A
B)
Be
re 2
426
8 A
71
Be
re 5
8 A
36
Eda
y
Be
re 2
3 A
Be
re 4
3 A
21
Sp
ratt
Arc
he
r 37
/6/3
-20
5
Elit
e -
Con
cert
o
Elit
e -
Sch
ola
r
Elit
e -
Pro
pin
o
Be
re 4
5 A
23
Be
re 6
0 A
Be
re 2
962
(A
B)
Be
re 3
9 A
16
Bern
era
y
Bo
wm
an
Bu
rton
s M
altin
g-1
28
St
Da
vids-2
06
Be
re 4
9 A
27
She
tlan
d
Len
ta-1
76
Elit
e -
We
stm
inste
r
Be
re 3
7 A
14
Be
re 8
-125
Be
re 2
3 B
Be
re 2
5 A
Sta
t -O
ld 1
4
We
bb
s B
urt
on M
altin
g-2
16
Eir
e S
ix R
ow
-14
3
Elit
e -
KW
S I
rina
Pri
or-
19
5
Be
re 5
9 A
37
Uis
t
Scott
ish
Ann
at-
20
2
Flu
ore
scence (
Fv/
Fm
)
Rhyn
chosporium
Lesio
n A
rea (
mm
2)
Bullion Orkney Bullion Orkney

Dual Interaction Studies
76
showed more severe lesions when grown in Orkney soil, whilst Bere 7045 (AB) showed the opposite.
Again, a similar pattern is seen with the elite cultivars, Scholar and Concerto having more severe
lesions in Bullion soil and KWS Irina showing the opposite. The landrace Prior-195, but not Scottish
Annat-202, showed increased lesion severity when in Orkney soil, as seen in the lesion area data.
As with the lesion area, there was no correlation with the lesion severity in plants grown in either of
the soils, and the lesion severity from 13-13 inoculation in the single interaction study in the Mn
landrace screen. However, there was a weak positive correlation (R2 = 0.42) between the lesion
severity and chlorophyll fluorescence of plants grown in soil from Orkney. This is not seen in the other
comparisons of lesion severity and chlorophyll fluorescence.
Figure 30) Comparison of the rhynchosporium lesion severity for 30 lines/cultivars of barley, using isolate 13-13, grown in two different soil type: Orkney soil that is Mn limited, and Bullion soil that has adequate Mn (displayed as red and blue bars respectively on the primary axis). The secondary axis displays the mean chlorophyll fluorescence of the plants grown the two soil types (displayed as purple and green points). Error bars represent the standard errors in positive and negative directions.
0
0.1
0.2
0.3
0.4
0.5
0.6
0.7
0.8
0.9
0
0.5
1
1.5
2
2.5
3
3.5
4
4.5
Sp
ratt
Arc
he
r 37
/6/3
-20
5
St
Da
vids-2
06
Be
re 2
962
(A
B)
Elit
e -
Sch
ola
r
Elit
e -
Con
cert
o
Be
re 7
045
(A
B)
Bu
rton
s M
altin
g-1
28
Eir
e S
ix R
ow
-14
3
Be
re 5
8 A
36
Eda
y
Elit
e -
Pro
pin
o
Bo
wm
an
Elit
e -
KW
S I
rina
Len
ta-1
76
Be
re 8
-125
Be
re 3
9 A
16
Bern
era
y
Elit
e -
We
stm
inste
r
We
bb
s B
urt
on M
altin
g-2
16
Scott
ish
Ann
at-
20
2
Be
re 2
3 A
Be
re 2
426
8 A
71
Pri
or-
19
5
Be
re 4
5 A
23
Be
re 5
9 A
37
Uis
t
Be
re 2
3 B
Be
re 4
9 A
27
She
tlan
d
Be
re 4
3 A
21
Sta
t -O
ld 1
4
Be
re 3
7 A
14
Be
re 2
5 A
Be
re 6
0 A
Flu
ore
scence (
Fv/
Fm
)
Rhyncosporium
Lesio
n S
eve
rity
(S
cale
0-4
)
Orkney Bullion Bullion Orkney

Dual Interaction Studies
77
Salt-Rhynchosporium Interaction
The analysis of the lesion area, after transformation, show significant differences between the salt
concentrations, line/cultivar, and interaction of the treatments (p<0.001). Comparisons of the
averages show lesion sizes of 11.6 and 16.1 mm2 for the plants grown on control and the salt treated
compost, respectively – an increase of over a third when grown in salt treatments. Analysis of
individual lines (Figure 31) reveal that for those that show differences in lesion size between the salt
concentration most have an increased lesion size when grown in compost with salt, this includes the
two elite cultivars, Bere-118, and other landraces such as Scottish Common-M08 that had nearly
triple the size of an already comparatively large lesion size when grown in salted compost. The only
two lines to show a significant decrease in lesion size when grown in salted compost were the lines
BW 902 and Aramir-M08, that both had amongst the smallest lesions in saline conditions, but the
largest lesion sizes when grown in the control compost. However, there was no correlations between
the lesion size from 13-13 inoculation in the single interaction study in the Mn landrace screen and
the lesion size for each of the salt concentrations, nor a correlation between the lesion sizes of the
two concentrations or between the change in dry weight with increasing salt concentrations in the
single interaction study in salt landrace screen and the lesion size for each of the salt concentrations.
Figure 31) Comparison of the rhynchosporium lesion area for 20 lines/cultivars of barley, using isolate 13-13, grown in universal compost with two different salt concentrations. Error bars represent the standard errors in positive and negative directions.
0
10
20
30
40
50
60
70
80
90
Rhyn
chosporium
Lesio
n A
rea (
mm
2)
0 mmol/kg 100 mmol/kg
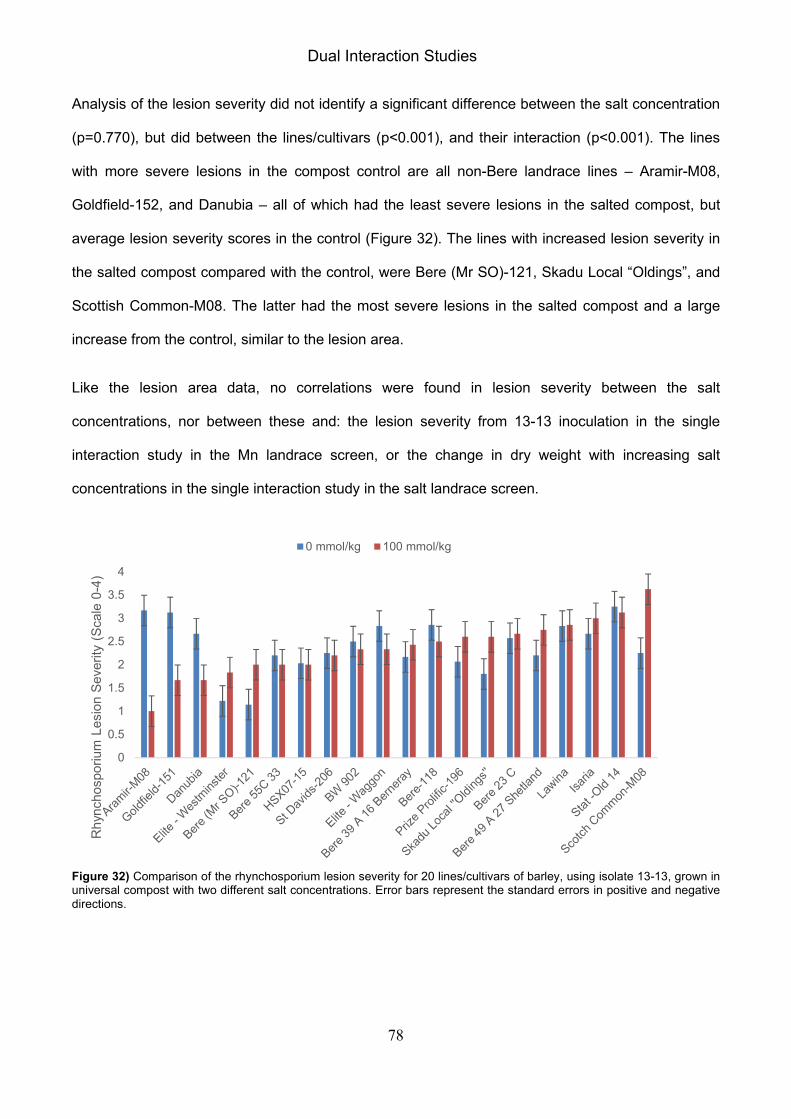
Dual Interaction Studies
78
Analysis of the lesion severity did not identify a significant difference between the salt concentration
(p=0.770), but did between the lines/cultivars (p<0.001), and their interaction (p<0.001). The lines
with more severe lesions in the compost control are all non-Bere landrace lines – Aramir-M08,
Goldfield-152, and Danubia – all of which had the least severe lesions in the salted compost, but
average lesion severity scores in the control (Figure 32). The lines with increased lesion severity in
the salted compost compared with the control, were Bere (Mr SO)-121, Skadu Local “Oldings”, and
Scottish Common-M08. The latter had the most severe lesions in the salted compost and a large
increase from the control, similar to the lesion area.
Like the lesion area data, no correlations were found in lesion severity between the salt
concentrations, nor between these and: the lesion severity from 13-13 inoculation in the single
interaction study in the Mn landrace screen, or the change in dry weight with increasing salt
concentrations in the single interaction study in the salt landrace screen.
Figure 32) Comparison of the rhynchosporium lesion severity for 20 lines/cultivars of barley, using isolate 13-13, grown in universal compost with two different salt concentrations. Error bars represent the standard errors in positive and negative directions.
0
0.5
1
1.5
2
2.5
3
3.5
4
Rhyn
chosporium
Lesio
n S
eve
rity
(S
cale
0-4
)
0 mmol/kg 100 mmol/kg

Dual Interaction Studies
79
Discussion
The effects of abiotic stresses have been shown to both increase and decrease the susceptibility of
plants to a range of different pathogens. This is also seen when prior abiotic stress has occurred,
resulting in a predisposition due to weakened defence systems, or an enhanced tolerance to stress
due to transcriptomics, biochemical, or epigenetic changes (Pandey et al., 2017). This study has
demonstrated the complexities of the interaction between one abiotic stress (salinity or Mn deficiency)
and one biotic stress (rhynchosporium). The abiotic stresses both caused line dependant changes
compared with the control environment, showing clear differences in rhynchosporium symptoms when
the stress was applied. Salt stress showed a clear average increase in symptoms when grown in salt,
with most lines demonstrating this but some breaking the trend.
Mn-Rhynchosporium Interaction
The inoculation of R. commune on detached leaves from selected lines that had been grown in either
Mn sufficient or deficient soils showed individual lines/cultivars could be identified as having increased
and decreased resistance to rhynchosporium in response to changes in Mn. However, this could not
be linked with Mn stress as there was no correlation with the chlorophyll fluorescence data, an
indicator of Mn stress. Previously, Huber and Wilhelm (1988) highlighted differences in Mn causing
both increases and decreases, both between and within different diseases in barley and other crops.
The lack of correlation with the DLA of the single interaction rhynchosporium study, using isolate 13-
13, suggests that these data may also be too variable to get meaningful comparisons from. However,
this could be a reflection of the large difference in disease expression on leaves grown in hydroponics
and leaves grown in soil. Similar results were seen in the lesion severity data, with the key exception
of a weak correlation between the lesion severity and the chlorophyll fluorescence when grown in the
Mn deficient soil from Orkney. This correlation could suggest that the lesion severity is positively
correlated with Mn-tolerance, showing increased tolerance to Mn resulting in an increase in lesion
severity. This is the opposite of what was been indicated as the overall trend in Huber and Wilhelm
(1988) that suggests that tissues with reduced Mn are more susceptible, but this was a generalisation
with many exceptions. Further, these differences could be due to other differences between the two

Dual Interaction Studies
80
soils that impact plant performance and/or rhynchosporium infection. However, like the area data,
there was no correlation with the lesion severity data of the single interaction rhynchosporium DLA
study.
Salt-Rhynchosporium Interaction
The experiment using selected lines subjected to salt stress, and how that caused differentiation of
the symptoms of rhynchosporium, showed a strong increase in average lesion size when grown in
salt-amended compost. This suggests that salt stress causes a predisposition to the biotic stress of
rhynchosporium. This is not analogous to that seen in the Wiese et al. (2004) where decreases in
powdery mildew infection with increased salt concentrations were seen. However, Blumeria graminis
is a biotrophic pathogen which often shows opposite responses to those of necrotrophic pathogens,
or hemibiotrophic pathogens in the necrotrophic feeding stage such as R. commune (Oliver and Ipcho,
2004; Glazebrook, 2005; Kliebenstein and Rowe, 2008; Mosher et al., 2013). It has been shown that
certain genes, such as Botrytis SUSCEPTIBLE 1 (BOS1) in Arabidopsis, are involved in both salt
tolerance and necrotroph resistance, showing a connection between these stresses (Mengiste et al.,
2003; Atkinson and Urwin, 2012). It can also be seen that this is highly line/cultivar dependant, with a
number of lines/cultivars, including the two elite cultivars used, being more susceptible under salt
stress conditions. Two lines, however, showed a clear trend in the opposite direction, implying a
tolerance to rhynchosporium gained from the salt stress. Both these lines, BW 902 and Aramir-M08,
were selected from the complete collection due to their maintenance of dry weight in the landrace
trials in 0, thus suggesting a difference in response mechanisms in reaction to increased salt levels
that has an effect on rhynchosporium. This could be due to differences in the reaction to saline stress,
as stresses such as salinity have been shown to cause cultivar-specific changes such as in the
proteome of the shoots (Ramagopal, 1987) and the roots (Börner et al., 2009) of barley. However,
again it is seen that there is no correlation with lesion area in the single interaction rhynchosporium
DLA study, nor the dry weight measurements in the single interaction salt compost study. The lesion
severity data does not show a difference overall between the salt levels, but does when looking at the
individual lines/cultivars. There is no obvious pattern to this (and, like the area data, there is no

Dual Interaction Studies
81
correlations with the single interaction studies) but there is a large decrease in lesion severity for
Aramir-M08 when grown in salt, supporting the conclusion from the lesion area data suggesting that
there is a difference in response mechanism in this line.
Future Work and Implications
These results show the complexity of working with dual interactions that are highlighted in Suzuki et
al. (2014), identifying that there is an overall trend only in the interaction of one abiotic stress (salinity)
but not the other (Mn deficiency). It can be concluded that there seems to be no differences between
the different sub-categories in how the stresses interact, with only individual lines having distinct
differences. What this study has shown is that there are potential differences in these individual lines
selected and how they interact with combined abiotic and biotic stresses. Specifically, identifying lines
that show differences in the interaction with salt, and reduced lesion size in both Mn deficient and
adequate systems. Further work is needed to validate the consistency of these variant line behaviours
before mechanistic studies are pursued. Once fully validated, additional experimentation on the
interaction of these stresses should also be done in vivo to assess the effects of the stresses occurring
simultaneously. Other future trials could also build on the work by Pandya et al. (2005) that showed
Mn supply reduced the stress caused by salt in barley seedlings, to gain an understanding in how this
differs in the Bere lines that accumulate more Mn and that have greater Mn use efficiency. Once
known, the differences in how these abiotic stresses interact with rhynchosporium can be further
quantified. In addition, interactions of these abiotic stresses with other pathogens can be performed
to assess the breadth of the effects on other biotic stresses, this was started in part with P. teres in
subsequent work.

General Discussion
82
Identification and application of stress adaptation of the Scottish barley landrace Bere (Hordeum
vulgare L.)
Identification of stress resistance/tolerance in the Bere barley population
Crop stress, both biotic and abiotic, causes large amounts of yield loss world-wide (Mittler, 2006;
Paulitz and Steffenson, 2010). This loss of yield is highly variable, depending on certain environmental
factors, ranging from low levels of stress causing minor percentages of loss to the extreme stresses
that cause complete failure of the crop (Samarah, 2005), or complete economic loss in cases where
it is impractical to harvest or no longer food safe. Preventative measures of stress, such as chemical
control, can often take up a large amounts of money, time, and resources (Rai et al., 2011) and do
not completely prevent loss due to stress. Breeding for stress resistance is one effective method of
preventing damage from biotic and abiotic stresses. However, current breeding programs currently
focus of yielding in favourable conditions. This is reflected in the recommended lists for cultivars that
is a useful guide when growing in reduced stress environments but is lacking in area that may be
affected, potentially providing the users with unsuitable recommendations. With climate change these
stresses will potentially occur in areas previously unaffected and could cause more frequent
occurrences and/or more extreme levels (Ceccarelli et al., 2010), highlighting the importance of robust
crop breeding. Changes in environmental conditions will also change the habitable and prolific regions
of different pathogens, causing a shift of pathogens to new areas, and increasing levels of disease in
others (Seherm and Coakley, 2003; Duveiller et al., 2007) with corresponding shifts away from other
areas and reductions in susceptibility (Skelsey and Newton, 2015). This is likely to be exacerbated
due to the mechanistic interconnectivity of the necrotrophic and biotrophic fungal defence in the plant
systems, shifting pathogens to crops that have susceptibility inadvertently bred into them as a defence
to pathogens of the other feeding mechanism (Glazebrook, 2005). This level of change is highly
unpredictable when interactions are considered, for example different changes in the metabolome
when multiple stresses are applied cause alternate changes in the resistance/susceptibility compared

General Discussion
83
to when the stresses are assessed independently (Newton et al., 2012; Mikkelsen et al., 2015a;
Mikkelsen et al., 2015b).
Landrace lines have consistently been shown to be a viable reservoir of genetic resistance to biotic
and abiotic stresses in numerous different important crop species such as beans (Miklas et al., 2003;
Muñoz-Perea et al., 2006), potato (Cabello et al., 2013; Limantseva et al., 2014; Pérez et al., 2014),
sweet potato (Gibson et al., 2000; Gibson et al., 2004), tomatoes (Agong et al., 1997; Ji et al., 2007;
García-Martínez et al., 2011; Moles et al., 2016; Conicella et al., 2017), and various different cereals
(Blum and Sullivan, 1986; Arnason et al., 1993; Xiao et al., 2013). This is often found in the literature
with barley landraces repeatedly showing an increased resistance or tolerance to a particular stress
(Newton et al., 2010). Examples of abiotic stresses include heat stress in Mediterranean landraces
(Yahiaoui et al., 2014; Cantalapiedra et al., 2017), salinity stress in Syrian landraces (Weltzien and
Fischbeck, 1990), and drought stress in the former two, Ethiopian and Jordanian landraces (Ceccarelli
et al., 1987; Al-Abdallat et al., 2017; Abera, 2009). Examples of biotic stresses include: Mlo variants
for resistance to mildew found in Ethiopian landraces (Jørgensen, 1992), multiple pathogens in
Spanish landraces (Silvar et al., 2010), and to the Ug99 stem rust race in Swiss landraces (Steffenson
and Jin, 2006). A good source of resistance to biotic stresses are landraces in the local environment
in which that stress is most prevalent, as landrace resistance to biotic stresses has been shown to be
highly eco-geographically specific (Endresen et al., 2011).
The Bere population tested in this thesis is a diverse set of lines of landraces collected from and
grown in marginal lands across the highlands and islands of Scotland, having become adapted to
many differing environments. This study has identified differences, within the Bere populations and
between the Bere, other landrace lines and elite cultivars, looking at how they react to different
stresses of both a biotic and abiotic nature. These studies revealed the clear advantage of particular
landrace lines in tolerating particular stresses that affect elite cultivars. A portion of the
resistance/tolerance to both the biotic and abiotic stresses was identified in genomic regions that do
not have associated resistance/tolerance that are currently in use, suggesting that what was identified
in these Bere lines were novel sources. This highlights the potential of the Bere population in breeding

General Discussion
84
for biotic and abiotic stresses. This potential is thought to be caused by the diversity in the marginal
environmental conditions between and within the different highland and island areas that Bere barley
has been selected on and become adapted to. The current population of landraces held in germplasm
collections is much reduced due to the social-economic changes in the 20th century causing the
replacement of traditional landrace lines with genetically narrow elite cultivars (Negri et al., 2009;
Dwivedi et al., 2016). Whilst this reduction is an important loss, there is still a large potential for
landraces to be used due to the increase level of diversity compared to the elite breeding population
(Newton et al., 2010; Langridge and Waugh, 2019; Monteagudo et al., 2019).
The reason for selecting the three stresses tested in this thesis was due to a combination of different
factors. One selecting factor was the variability of these stresses in the geographical region in which
the Bere barley grows. The islands of Scotland have regions that are affected by salt due to year-
round salt-laden winds (Dry and Robertson, 1982), and have highly alkaline soils that show Mn
deficiency (Martin et al., 2008b), with Bere lines having been shown to have improved growth on the
latter (George et al., 2014; Schmidt et al., 2018). Similarly, one of the selecting factors of
rhynchosporium stress was the anecdotal evidence of reduced infection of R. commune in Bere lines
from interviews with farmers by Mahon et al. (2016). A secondary selection factor was the importance
of these stresses in a Northern European, and/or a global context. Figure 33 shows that all three
stresses have large economic importance over at least four different continents. It can be seen also
that two economically influential countries, USA and Australia, are impacted by all three stresses,
Australia having all stresses occurring in overlapping regions. Worldwide it can be seen that salt stress
affects the widest ranging of regions, with all habitable continents bar Europe being directly affected.
Within the Northern European context, the rhynchosporium and Mn-deficiency stresses are the most
important of those tested. The UK has regions that are affected by both, with regions overlapping.
Similarly, this is shown for Denmark.

General Discussion
85
Salin
ity
is
a
larg
e
econ
om
ic
pro
ble
m a
ll acro
ss A
ustr
alia
[1] .
Mang
an
ese d
efic
iency d
ue
to
calc
are
ous s
oils
affects
larg
e
are
as o
f A
ustr
alia
, especia
lly
in t
he S
outh
ern
regio
n[1
4] .
Rhynchospori
um
causes
com
merc
ial dam
age t
o b
arl
ey
all
acro
ss A
ustr
ala
sia
[12,1
3] .
West
Asia
is the
larg
est
regio
n a
ffecte
d b
y s
alin
ity,
with
extr
em
e s
alin
e a
nd s
odic
soils
in th
e s
outh
of
the
A
rab
ian P
enin
sula
an
d
Centr
al A
sia
[1] .
Afr
ica h
as larg
e s
alt
affecte
d a
reas
in t
he N
ort
h a
nd S
ou
th.
Extr
em
e
Sod
ic a
nd S
alin
e c
ond
itio
ns c
an b
e
foun
d in S
outh
Afr
ica,
Bots
wana
and t
he c
entr
al S
ahe
l reg
ion
[1] .
Salin
ity is
fo
und
in th
e
Soth
ern
reg
ions o
f both
A
meri
can
contine
nts
, w
ith
extr
em
ely
sa
line
and s
odic
so
ils i
n N
ort
h
Chile
/SW
B
oliv
ia,
Nort
h
Mexic
o,
an
d
Wyom
ing/
Monta
na
[1] .
Rhynchospori
um
is a
majo
r pro
ble
m in m
any c
ounties in
Nort
hern
Euro
pe –
th
e
suggeste
d m
odern
orig
in o
f th
e f
ung
us
[9] .
In t
he N
W
regio
ns o
f B
rita
in it
is th
oug
ht
to b
e the
most
dam
ag
ing
barley d
isease
[10] .
Rhynchospori
um
is a
n
econom
ic p
roble
m
acro
ss the w
hole
of
Nort
h A
meri
ca
[2-4
] , especia
lly in t
he p
rairie
s
of C
anad
a[4
] .
Nort
hern
reg
ions o
f C
hin
a a
re
Mang
an
ese
deficie
ncy
from
th
e c
alc
are
ous s
oils
[11] .
Mang
an
ese d
efic
iency o
ccurs
in
Sca
ndin
avia
and t
he B
ritish
Isle
s f
or
a n
um
ber
of
reaso
ns.
It is
esp
ecia
lly p
revale
nt
in t
he
Is
les of
Sco
tland
du
e to
th
e
alk
alin
e s
oils
[7] ,
an
d t
he p
oor
dra
inin
g
calc
are
ous
soils
of
NW
Jutlan
d in D
enm
ark
[8] .
Mang
an
ese d
efic
iency o
ccurs
in
are
as o
f N
ort
h A
meri
ca w
ith
hig
h org
anic
m
att
er
such
as
peaty
so
ils in
th
e gre
at
lake
are
as
[5]
and l
oam
so
ils o
f B
C
and O
nta
rio
in C
anad
a[6
] .
Fig
ure
33
) A
wo
rld
ma
p h
ighlig
htin
g k
ey r
eg
ion
s a
ffecte
d b
y t
he
th
ree
str
esses i
nvestig
ate
d i
n t
his
th
esis
; salin
ity (
Red
), m
ang
an
ese
de
ficie
ncy
(G
ree
n),
an
d r
hyn
cho
spo
rium
(B
lue
). R
egio
ns t
ha
t h
ave
pa
rtic
ula
rity
hig
h leve
ls o
f o
ne
str
ess a
re c
olo
ure
d in t
he c
orr
esp
on
din
g c
olo
ur.
Re
fere
nces n
um
be
red
as 1
) W
icke e
t a
l. (
201
1),
2)
Ca
ldw
ell
(19
37
), 3
) W
eb
ste
r (1
980
), 4
) T
eka
uz
(199
1),
5)
Ad
rian
o (
20
01
), 6
) R
eid
and
We
bst
er
(19
69
), 7
) G
old
be
rg e
t a
l. (
198
3),
8)
Ste
en
bje
rg (
193
5),
9)
Bru
nne
r e
t a
l. (
20
07
), 1
0)
Hen
ley
(20
15
), 1
1)
To
ng
et a
l. (
199
7),
12
) M
urr
ay a
nd
Bre
nn
an (
20
10
), 1
3)
Cro
me
y (
19
87
), 1
4)
Gra
ha
m e
t al. (
19
82
), 1
5)
Ro
bb
ert
se
et a
l. (
2000
), 1
6)
Ca
rmon
a e
t a
l. (
199
7),
an
d 1
7)
Río
s e
t a
l. (
20
07
).
In t
he W
este
rn C
ape o
f S
outh
A
fric
a
Barl
ey
Scald
is
an
econom
ica
lly
import
ant
dis
ease
due
to
its
in
fection
of
susceptib
le m
altin
g b
arley
[15] .
Incre
asin
gly
over
the
past deca
des s
cald
has
becom
e o
ne o
f th
e m
ost
imp
ort
ant
barl
ey
dis
eases in c
en
tral
Arg
en
tina d
ue t
o
incre
ased
ma
lting
barley p
roduction
[16,1
7] .

General Discussion
86
Manganese use efficiency
The breeding of Mn use efficiency will allow increased production of areas with Mn deficiency that is
a common problem in cereals across the UK (Neilsen et al., 1992; Chalmers et al., 1999) and
particularly in certain soils of the Scottish Isles (Dry and Robertson, 1982; Scholten et al., 2004; Dry,
2016), as well as areas around the world with major issues in Southern Australia (Graham et al.,
1982).
Manganese deficiency tolerance showed the clearest evidence of a mechanism of use efficiency
common to the majority of the Bere lines. It could clearly be seen that the Bere lines, as a whole, were
able to better retain the maximum quantum yield of photosynthesis under Mn deficiency indicating
better Mn use efficiency, whilst the elite lines showed large effects of Mn deficiency. This is supported
by the mineral concentration results that showed that the Bere lines had significantly greater Mn
content in their shoots under Mn deficient conditions. This allowed for identification of individual Bere
lines that were the most Mn use efficient lines tested, including: Bere 24268 A 71, Bere 45 A 23, and
Bere 47 A 25. Genome-wide association analysis also enabled the identification of many genes that
could be associated with increased Mn acquisition and utilisation. These included promising
candidates that encoded for proteins such as a MATE efflux family protein and a Nramp1 metal
transporter, both of which have been associated with increased Mn acquisition and related tolerances
to other nutrient deficiencies (Rogers and Guerinot, 2002; Cailliatte et al., 2010; Ishimaru et al., 2012;
Castaings et al., 2016; Wu et al., 2016).
Mapping of the currently identified Mn efficiency locus (Mel1) from a Japanese cultivar has identified
the position to a 1.4 cM region on 4HS and confirmed the role in Mn use efficiency (Pallotta et al.,
2000; McDonald et al., 2001; Pallotta et al., 2003), allowing it to be used in breeding programmes to
breed for Mn use efficient elite cultivars. Similar work could be performed using the chromosomal
region in 2HL identified in this study and in Lloyd (2000), to provide additional targets for the breeding
programmes and to possibly compliment the use efficiency traits provided by Mel1. Allowing for
greater use efficiency will allow for greater yields on these marginal lands, as well as reduced need
for the use of costly Mn foliar supplements (White and Greenwood, 2013; Leplat et al., 2016).
General Discussion
87
Salinity tolerance
The breeding of salt tolerance is similarly important with an estimated 6.5% of land globally being salt-
affected (FAO, 2015). This is expected to increase with the use of salt contaminated water for irrigation
and the change in climate (Ayars et al., 1993; Umali, 1993; Rengasamy, 2006; Wei et al., 2018).
When assessing salt tolerance with regards to biomass accumulation under salt stress the Bere lines
were, on average, no more tolerant than the other landrace lines. However, it was apparent that the
rate of biomass reduction with increasing salt stress in the elite cultivars was, on average, double that
of the landrace lines including the Bere lines. This shows the need for increased salt tolerance in the
elite cultivars as well as the potential of landrace lines to provide that tolerance. Salt tolerant
individuals that increased biomass with increasing salt levels were identified, including: Prize Prolific-
196, Bere-118, and Bere 49 A 27 Shetland. The GWAS identified a region associated with maintained
biomass in increasing salt conditions on chromosome 5HL, along with an additional marker on 3HL.
Within these associated regions there were five candidate genes that encoded for proteins associated
with increased salt resistance, including an Acyl-CoA-binding domain-containing protein which is
associated with an increased drought tolerance (Raboanatahiry et al., 2015; Du et al., 2016).
Due to the scale of the problem of salinity, much research has been undertaken to study its tolerance,
hence a number of associated loci have been identified in barley (Miyazaki et al., 2010; Siahsar and
Narouei, 2010; Shavrukov et al., 2010; Xue et al., 2010; Zhou et al., 2012a; Fan et al., 2016; Saade
et al., 2016; Xue et al., 2017). This includes the region on chromosome 5H identified in this study, but
not that which was identified on chromosome 3H. Within these, the gene HKT1;5 in barley has been
located to a 0.5 Mb region, characterised and identified for potential use in breeding programmes
(Hazzouri et al., 2018), similar processes could be used to refine and incorporate the regions identified
in this study. The mechanisms of salt-stress are complex, with multiple different effects, hence the
mechanisms of tolerance need to be varied, identifying the need for multiple loci associated with a
superior trait. Allowing for greater salt tolerance in elite cultivars will increase the yield in marginal
lands with reduced quality water resources, and will help maintain yields in areas where salt stress
will or might increase (Ashraf and Foolad, 2013).

General Discussion
88
Rhynchosporium resistance
Development of rhynchosporium resistant cultivars is also of benefit as it is considered the major
economic barley disease in the UK (Fitt et al., 2012; Havis et al., 2015) and amongst the most
important worldwide (Zhan et al., 2008). Currently there are a number of R-genes that provide
resistance to rhynchosporium (Zhan et al., 2008), but due to the pathogens ability to readily remove
or modify certain targeted effectors there is a constant need for new genes to replace them and to
bolster the resistance (Avrova and Knogge, 2012).
Trials that inoculated lines with rhynchosporium showed that with some isolates the Bere lines had
greater resistance than the other landraces and the elite cultivars. This is further supported by the
field trials that showed the four-fold relative average increase in observed disease in the elite cultivars
compared to the Bere lines, showing the need for increased resistance in the elite populations and
the potential of the Bere lines to provide this. From these studies, lines including Bere 45 A 23, Bere
58 A 36 Eday, and Bere 8-125 were consistently disease resistant in both field trials and the DLA
experiments, thus eliminating any resistance due to unusable structural changes such as increased
height. Analysis with the genotypic data identified regions in both data sets that had not previously
been identified, including a region on chromosome 5H that previously has not been associated with
a Rrs gene. This suggests unique methods of disease limitation that could be identified and used in
breeding programmes. A number of genes with putative functions associated with disease resistance
were identified in these regions, such as the aptly named disease resistance proteins and proteins
with anti-fungal domains such as the Gnk2 homologue. Identification of the gene(s) associated with
the reduced disease should allow the transfer into elite backgrounds and provide potential.
Development of lines that are resistant to rhynchosporium would help alleviate some of the estimated
£7.2 million worth of losses, as well as reducing the need for fungicide treatments (Avrova and
Knogge, 2012; Paveley et al., 2016). Additionally, these genes may have further implications for other
pathogens, such as accounting for the reduced foliar disease associated with Bere lines observed by
farmers in Orkney (Mahon et al., 2016), or an associated negative effect on biotrophic or necrotrophic
pathogens due to the common inverse relationship between the two lifestyles (Glazebrook, 2005).

General Discussion
89
Reaction to dual stresses
Further complications with regards to the changing climate would be the increased incidence of
interaction of the stresses, which have been rarely studied. Examples of this would be the negative
interaction between saline and drought stresses (Ahmed et al., 2013), or the inverse relationship
between biotic and abiotic stresses in a stress response gene in rice (Xiong and Yang, 2003) and
barley (Ali et al., 2014) . Though, conversely, examples of positive stress interactions have been
shown, as in the examples from Wiese et al. (2004) that showed an enhanced resistance of barley to
powdery mildew when exposed to abiotic stresses such as salinity. The interactions between the
stresses used in this study were selected due to the occurrence of all three in the regions where the
Bere lines originate from. Thus, it was thought that these lines could show resistance mechanisms
that better accommodate for the interaction of these stresses.
Dual interaction studies from this thesis highlighted the complexity of working with and measuring
multiple stresses in conjunction. Of the two abiotic stresses tested with rhynchosporium, only high
salt levels caused a consistent change to the infection level, with the added salt stress causing an
increase in rhynchosporium lesion area. Differences were seen within lines/cultivars for both salt
stress and manganese deficiency, but with no correlation with each other or with previous data (or
with stress measurements for the Mn), possibly indicating independent mechanisms of
resistance/susceptibility. However, this allowed for identification of lines that performed differentially
with stress, including lines that went against the trend and performed better with salt stress.
Identifying the interaction of different stresses has been pursued in this thesis, showing the differences
in the interaction of biotic and abiotic stresses between different lines, the importance of which has
been identified in multiple studies (Atkinson and Urwin, 2012; Suzuki et al., 2014; Pandey et al., 2017).
However, it should be noted that the study of dual interactions is incomplete as additional stresses
could change the metabolome profile of the plant giving a different response to that seen in dual
interactions (Mikkelsen et al., 2015a; Mikkelsen et al., 2015b).
General Discussion
90
Role of Bere barley in breeding for climate change
Breeding for stress resistance is of particular importance due to climate change causing a change in
interrelated stresses. Developing crops that are protected against climate change due to robust
defence to increased stress is critical for future agricultural sustainability.
One commonly referenced example is that climate change is expected to increase the areas of salinity
and drought in future by causing weather patterns to shift and raising water tables (Wang et al., 2003;
Munns and Gilliham, 2015). Salinity, in particular, is becoming an increasing problem with the
irrigation of land using brackish water under drought conditions (Umali, 1993; Ayars et al., 1993; Wei
et al., 2018). Additionally increasing dryland salinity is becoming a problem due to sea level rise
causing elevated saline groundwater tables thus affecting a large amount of coastal lands that have
previously been unaffected (Rengasamy, 2006), which could further be affected by rising water tables
due to deforestation in temperate zones (Sahagian, 2000). Breeding for tolerance of micronutrient
deficiencies and toxicities, such as Mn use efficiency, is crucial as shifts in temperature and rain
patterns may make growing barley on more marginal lands an option or necessity (Morton et al., 2015;
Mizyed, 2009; Berglund, 2003). Climate change induced changes in the rhizosphere can cause
additional problems, such as warming reducing the heterotrophy and water-availability reducing the
soil respiration, that will affect the availability of Mn and other micronutrients (Rengel, 2011; Rengel,
2015). Finally this is of greater importance with regards to climate change as the Rhynchosporium
commune fungus is highly adaptive under stress and could spread with changing climates
(Stefansson et al., 2013), or become more severe in different seasons (Newton et al., 2008).
Changes in one stress due to climate change could result in an unpredicted change in the level of
another separate stress (Prasad et al., 2011; Ramegowda and Senthil-Kumar, 2015; Pandey et al.,
2017). Breeding for increased resistance will allow for protection from unpredictable stress increases
as a result of changes in an interacting stresses, giving an improved yield stability for changing
environments (Mickelbart et al., 2015). This highlights the importance of breeding climate change
resistant crops to be able to maintain yield overall and on affected lands.

General Discussion
91
As shown, landraces play a potentially important role in the development of crops that are able to
withstand stress, thus they could play a pivotal role in the development of crop that are able to
withstand their combined effects. The work from this thesis has shown the potential of the Bere barley
landrace to provide some of the resistance traits needed to be able to develop these robust crops
(Table 9). This will help allow for the better maintenance of yield in areas of land quality deterioration
and areas in which pathogenicity increases, as well as allowing the growth on current marginal lands
that will help protect and increase global production. Additionally, certain lines may contribute a
general resistance to a number of different stresses due to the interconnectivity of the stresses
through shared physiological and molecular responses that are found over a number of stress
responses (Pastori and Foyer, 2002; Mithöfer et al., 2004; Fujita et al., 2006; George et al., 2017). Of
the lines identified in this thesis (Table 9) most only perform well in one of the stresses measured.
The exception to this was line Bere 45 A 23 that showed increased Mn use efficiency as well as
increased rhynchosporium resistance, indicating possible mechanisms of a general or connected
stress resistance. Similarly, Bere 47 A 25 showed moderate to high stress resistance in the two
stresses tested, but there were no results for rhynchosporium due to limited seed stock. However, as
noted above, interactions of stresses can be unpredictable, especially when in conjunction with more
than two due to differing reactions in the metabolome (Newton et al., 2012; Mikkelsen et al., 2015a;
Mikkelsen et al., 2015b). Some of the lines were included in the dual interaction study but none were
identified as having a unique interaction.
Table 9) The nine landrace lines that have been identified as a good source of stress resistance to one of the stresses tested, along with information on the performance of those lines, in relation to the other lines tested in the screen, when the other stresses were applied.
Landrace Lines Manganese Use
Efficiency Salinity
Tolerance Rhynchosporium
Resistance
Bere 24268 A 71 High Med Med Bere 45 A 23 High Med High Bere 47 A 25 High Med-High Not Screened Bere 49 A 27 Shetland Med-High High Med-Low Bere 58 A 36 Eday Med-High Med High Bere 59 A 37 Uist High Med Med-High Bere 8-125 Low Not Screened High Bere-118 Med-Low High Med-Low Prize Prolific-196 Med High Low

General Discussion
92
Challenges associated with breeding for stress resistance in barley
As shown, breeding for resistance to stresses will aid in the protection of crop yields, as climates
change and become more unpredictable, by increasing the robustness of the cropping system
(Ceccarelli et al., 2010). Stress resistant cultivars will also increase future production by making
previously unusable lands productive and increase sustainability of yield on more marginal lands.
Additionally, these cultivars would help create more sustainable agriculture due to the reduced need
for preventative measures such as fungicide and nutrient additions that are both costly and potentially
damaging to the environment (Humphreys, 2007; Witcombe et al., 2008).
Once genetic regions of interest have been identified in landraces of crops such as Bere barley, the
main challenge is the integration of these traits into an elite background. This is highlighted well with
multi-gene traits such as salt tolerance that has had little success in integration via conventional
breeding programmes (Flowers and Flowers, 2005), though this is likely to improve with
advancements in genetics (Ismail and Horie, 2017) as has been seen with rice (Negrão et al., 2011)
and wheat, but with few examples in barley (Shahbaz and Ashraf, 2013). For simpler traits this is
easier, but there are still challenges when crossing non-adapted germplasm such as landraces. One
challenge is that often the region of interest is closely linked with traits that can have a negative impact
on the plants and reduce the quality or yield by linkage drag. This makes these undesirable traits
more likely to be incorporated into the elite plant along with the desired trait as they are harder to
separate, resulting in poorly performing crops that are not economically competitive (Muñoz-Amatriaín
et al., 2014) . Additionally, the genes of interest could be within a region with little to no cross-over,
such as the pericentromeric regions, making transfer from the landrace background using traditional
breeding practices unfeasible (Künzel et al., 2000; Mascher et al., 2017). To aid in the breaking of
these linked regions the steps to identify the causal gene can be undertaken. This can be done by
first fine mapping to reduce the targeted location by using homozygous descendants, of crosses
between the resistant/tolerant line and a susceptible elite cultivar, that are fixed for known regions of
resistance/tolerance and segregating in the region of interest. By comparing the resistant/tolerant

General Discussion
93
lines to the near isogenic lines (NILs) using a higher concentration of markers in the smaller region it
is possible to isolate the region of interest further. Coupled with RNA sequencing, to identify which
genes are differentially expressed, the candidate genes can be significantly reduced to a number able
to identify the causal gene through sequencing (Liller et al., 2017).
Before introgression into the elite lines there may be further problems associated with the identified
regions, including negative aspects inherent in the trait of interest. An example of this would be in
disease resistance, as the mechanisms of resistance would need to be separated from similar
mechanisms of disease avoidance and disease tolerance, all of which would cause a reduction in
disease. One method of avoidance would be from genes associated with plant height in
rhynchosporium reduction. These are identified as rhynchosporium reduction genes due to the
associated increase in disease escape via the decreased transmission of spores through splash
dispersal (Zhan et al., 2008), thus avoiding the disease. These traits are unusable as the inherent
negative trait, such as increased height diverting resources away from yield and increasing lodging,
cannot be broken as it is the cause of the reduced disease, and cannot be incorporated as it would
heavily reduce the economic effectiveness of the elite cultivars. Additionally, traits can come with
associated costs with the mechanisms of stress resistance/tolerance due to the diversion of energy
into the implementation of the effect, resulting in a yield penalty. This is commonly seen with disease
resistance (Brown, 2002; Walters and Boyle, 2005; Ning and Wang, 2018), but also with abiotic
stresses (Wilson, 1988; Knight and Knight, 2001; Minhas et al., 2017).
Future breeding methods, outlined below, could be implemented to incorporate the identified genes,
allowing easier breaking of linked undesirable genes from non-adapted germplasm. These could
include transgenic approaches to transfer genes involved in stress resistance into the elite host, or
through modification of the elite host gene to replicate the differences found in the landraces, using
technologies such as the CRISPR/Cas9 system (Bhatnagar-Mathur et al., 2008; Zhang et al., 2014).
Whilst this does not account for changes that may occur in the interaction of such genes in the elite
background, it does hold potential to make transfer of most traits more rapid.
General Discussion
94
Further work
These studies identify that in all three of the stresses tested the Bere group, as a whole or individual
Bere lines, have a superior resistance/tolerance. Due to the diversity of the different environments
where Bere lines grow and have become adapted, and the diverse range in the levels of stress
adaption shown in the Bere lines for the stresses tested, such germplasm resource potentially holds
resistant traits to a number of other different stresses that could be tested for. This testing can be
aided by the number of existing crosses that are available between Bere lines and elite cultivars.
Only one pathogen (but multiple isolates) was tested in this study, R. commune, a hemibiotrophic
foliar fungus. Therefore, a compliment of other foliar fungi could be tested to see the effect of different
interactions in Bere lines, and this has been started in a study with the use of the necrotrophic leaf
fungi Pyrenophora teres. Results from this, whilst incomplete, indicate intermediate resistance in
some Bere lines, including one found to also be resistant to rhynchosporium. Similarly, resistance to
P. teres has been identified in Turkish landraces (Çelik Oğuz et al., 2017), though the related
hemibiotrophic fungi Pyrenophora graminea showed high levels of susceptibility in a Bere line, but
only one line was tested (Cockerell, 2002). Biotrophic foliar fungi should also be tested on the Bere
landraces, though anecdotal evidence suggest that Bere barley in general is susceptible to powdery
mildew infection (Wright et al., 2002). In addition to foliar fungal pathogens, fungi that infect the roots
should also be assessed such as the hemibiotrophic fungus Cochliobolus sativus. This affects both
root and shoot tissue, causing the diseases common root rot and spot blotch, respectively, and has
been shown by Whittle (1977) to have reduced seedling infection in a Bere line compared to elite
cultivars. Resistance to the root disease take-all by the fungal agent Gaeumannomyces graminis may
also be of interest to screen for in the Bere collection due to the positive association of Mn use
efficiency and resistance in wheat (Wilhelm et al., 1988), though this connection was unable to be
identified in barley (Lloyd, 2000).
Other pathogens could also be tested in this Bere population, identifying additional sources of
resistance to diseases such as to barley yellow mosaic virus in a Chinese landrace (Konishi et al.,

General Discussion
95
1997), to barley yellow dwarf virus and Barley mild mosaic virus in Spanish landraces (Silvar et al.,
2010), bacterial leaf streak in wheat landraces (Adhikari et al., 2012), cereal cyst nematodes from a
landrace derived Australian cultivar (Barr et al., 1998), and resistance to greenbug (Schizaphis
graminum) in a Korean winter barley landrace (Porter et al., 1998).
Large differences in the soil pH between the different environments where Bere lines grow, suggest
a large difference in micronutrient accumulation ability. This is further suggested in the mineral
analysis data from the Mn study that indicates greater levels of accumulation of calcium, copper, and
phosphorus in Bere lines compared with elite cultivars, as well as a number of Bere lines that
accumulate increased levels of zinc verses the elite cultivars. The accumulation of calcium and
phosphorus is of particular interest as alkaline soils cause a reaction of these two elements making
the latter unavailable to the crop (Hopkins and Ellsworth, 2005; Shen et al., 2011). Additionally, Bere
lines that were not included in this analysis may show other differences due to the different location
of origin. Lines adapted to more acidic environments would not perform well in Mn deficient
environments, but may have large differences in phosphorus, iron, and aluminium (Ladouceur et al.,
2006; Zheng, 2010) such as the Al-toxicity/low pH tolerance association found in one Bere line by
Stølen and Andersen (1978).
Other abiotic stresses should also be explored, in particular drought stress. This study identified a
number of Bere lines that are salt tolerant, which is often associated with a tolerance to drought
(Golldack et al., 2014; Zhu, 2002), and thus may have increased drought tolerance. However, Brown
(2017) shows that Scotland has high levels of soil wetness vulnerability, especially in the highlands
and islands where Bere grows, indicating that these soils are more prone to waterlogging (Lilly and
Matthews, 1994). Traits related to improved waterlogging tolerance, such as reduced leaf chlorosis,
are important as barley is one of the most susceptible cereal crops to this stress, and can be screened
in a similar manner to that for Mn use-efficiency undertaken in this study (Bertholdsson, 2013),
allowing for whole plant stage screening that has been shown to be a more effective indicator (Setter
and Waters, 2003).

General Discussion
96
Concluding remarks
Together these results show the positive traits of stress resistance/tolerance in the Bere barley
collection, along with other landrace lines, and the potential that they have in breeding for these
stresses, as well as identifying that there is a large possibility of potential resistance/tolerance in other
stresses. This would be further amplified if one of these traits was a general resistance/tolerance to
multiple stresses, this would increase the breeding potential of this trait due to the reduced complexity
compared with the need to incorporate multiple traits to provide the same benefit, thus widening the
potential marketability.
This thesis has also highlighted the implications of how these stress resistance/tolerance traits will
benefit breeding for crops with improved robustness for improving yield on marginal lands, protect
from minor and sudden stresses, reduce the need for chemical input to increase sustainability in
farming, and protect future crops from the changing environment caused by climate change. But the
thesis has further highlighted the complexities involved when assessing the impact of interacting
stress and plants response to that.

References
97
References Abbott, D.C., Brown, A.H.D. & Burdon, J.J. (1992). Genes for scald resistance from wild barley (Hordeum vulgare ssp spontaneum) and their linkage to isozyme markers. Euphytica 61, 225-231. Abdel-Ghani, A.H., Al-Ameiri, N.S. & Karajeh, M.R. (2008). Resistance of barley landraces and wild barley populations to powdery mildew in Jordan. Phytopathologia Mediterranea 47, 92-97. Abera, K.T. (2009). Agronomic evaluation of Ethiopian barley (Hordeum vulgare L.) landrace populations under drought stress conditions in low-rainfall areas of Ethiopia. MSc, Swedish University of
Agricultural Sciences. Abrol, I.P., Yadav, J.S.P. & Massoud, F.I. (1988). Saline soils and their management. Salt-affected soils and their management, 13-46. Rome, Italy: Food and Agriculture Organization. Aciego Pietri, J.C. & Brookes, P.C. (2008). Relationships between soil pH and microbial properties in a UK arable soil. Soil Biology and Biochemistry 40, 1856-1861. Adhikari, T.B., Gurung, S., Hansen, J.M., Jackson, E.W. & Bonman, J.M. (2012). Association mapping of quantitative trait loci in spring wheat landraces conferring resistance to Bacterial Leaf Streak and
Spot Blotch. The Plant Genome 5, 1-16. Adriano, D.C. (2001). Manganese. In: Adriano, D.C., (ed.) Trace elements in terrestrial environments: Biogeochemistry, bioavailability, and risks of metals, 547-585. New York, NY: Springer New York. Agarwal, P., Reddy, M.P. & Chikara, J. (2011). WRKY: its structure, evolutionary relationship, DNA-binding selectivity, role in stress tolerance and development of plants. Molecular Biology Reports 38,
3883-3896. Aghnoum, R., Marcel, T.C., Johrde, A., Pecchioni, N., Schweizer, P. & Niks, R.E. (2010). Basal host resistance of barley to powdery mildew: Connecting quantitative trait loci and candidate genes.
Molecular Plant-Microbe Interactions 23, 91-102. Agong, S.G., Schittenhelm, S. & Friedt, W. (1997). Assessment of tolerance to salt stress in Kenyan tomato germplasm. Euphytica 95, 57-66. Agrios, G.N. (2005). Plant pathology fifth edition, Burlington, Massachusetts, USA, Elsevier Academic Press. AHDB (2018). AHDB recommended lists 2018/19. Warwickshire, UK: Agriculture and Horticulture Development Board. Ahmed, I.M., Dai, H., Zheng, W., Cao, F., Zhang, G., Sun, D. & Wu, F. (2013). Genotypic differences in physiological characteristics in the tolerance to drought and salinity combined stress between
Tibetan wild and cultivated barley. Plant Physiology and Biochemistry 63, 49-60. Akar, T., Francia, E., Tondelli, A., Rizza, F., Stanca, A.M. & Pecchioni, N. (2009). Marker-assisted characterization of frost tolerance in barley (Hordeum vulgare L.). Plant Breeding 128, 381-386. Akter, F. (2017). Groundwater salinity and interaction with surface water near Cootamundra, NSW, Australia. PhD, University of Sydney. Al-Abdallat, A.M., Karadsheh, A., Hadadd, N.I., Akash, M.W., Ceccarelli, S., Baum, M., Hasan, M., Jighly, A. & Abu Elenein, J.M. (2017). Assessment of genetic diversity and yield performance in
Jordanian barley (Hordeum vulgare L.) landraces grown under rainfed conditions. BMC Plant Biology 17, 191. Alam, S., Akiha, F., Kamei, S., Imamul Huq, S.M. & Kawai, S. (2005). Mechanism of potassium alleviation of manganese phytotoxicity in barley. Journal of Plant Nutrition 28, 889-901. Alam, S.M., Naqvi, S.S.M. & Ansari, R. (1999). Impact of soil pH on nutrient uptake by crop plants. In: Pessarakli, M., (ed.) Handbook of plant and crop stress, 51-60. Boca Raton, Florida, USA: CRC Press. Alemayehu, F. & Parlevliet, J.E. (1996). Variation for resistance to Puccinia hordei in Ethiopian barley landraces. Euphytica 90, 365-370. Ali, S.S., Gunupuru, L.R., Kumar, G.B.S., Khan, M., Scofield, S., Nicholson, P. & Doohan, F.M. (2014). Plant disease resistance is augmented in uzu barley lines modified in the brassinosteroid receptor
BRI1. BMC Plant Biology 14, 227. Allel, D., Ben-Amar, A., Badri, M. & Abdelly, C. (2016). Salt tolerance in barley originating from harsh environment of North Africa. Australian Journal of Crop Science 10, 438-451. Allen, J.F. (2002). Photosynthesis of ATP—electrons, proton pumps, rotors, and poise. Cell 110, 273-276. Allen, M.D., Kropat, J., Tottey, S., Del Campo, J.A. & Merchant, S.S. (2007). Manganese deficiency in chlamydomonas results in loss of photosystem II and MnSOD function, sensitivity to peroxides, and
secondary phosphorus and iron deficiency. Plant Physiology 143, 263-277. Anderson, J.P., Badruzsaufari, E., Schenk, P.M., Manners, J.M., Desmond, O.J., Ehlert, C., Maclean, D.J., Ebert, P.R. & Kazan, K. (2004). Antagonistic interaction between abscisic acid and jasmonate-
ethylene signaling pathways modulates defense gene expression and disease resistance in Arabidopsis. The Plant Cell 16, 3460-3479. Arnason, J.T., Baum, B., Gale, J., Lambert, J.D.H., Bergvinson, D., Philogene, B.J.R., Serratos, J.A., Mihm, J. & Jewell, D.C. (1993). Variation in resistance of Mexican landraces of maize to maize weevil
Sitophilus zeamais, in relation to taxonomic and biochemical parameters. Euphytica 74, 227-236. Ashraf, M. & Foolad, M.R. (2013). Crop breeding for salt tolerance in the era of molecular markers and marker-assisted selection. Plant Breeding 132, 10-20. Asselbergh, B., de Vleesschauwe, D. & Höfte, M. (2008). Global switches and fine-tuning—ABA modulates plant pathogen defense. Molecular Plant-Microbe Interactions 21, 709-719. Atkinson, N.J. & Urwin, P.E. (2012). The interaction of plant biotic and abiotic stresses: From genes to the field. Journal of Experimental Botany 63, 3523-3543. Atlin, G.N., Cairns, J.E. & Das, B. (2017). Rapid breeding and varietal replacement are critical to adaptation of cropping systems in the developing world to climate change. Global Food Security 12, 31-
37. Avrova, A. & Knogge, W. (2012). Rhynchosporium commune: a persistent threat to barley cultivation. Molecular Plant Pathology 13, 986-997. Aw-hassan, A., Shideed, K., Ceccarelli, S., Erskine, W., Grando, S. & Tutwiler, R. (2003). The impact of international and national investment in barley germplasm improvement in the developing
countries. In: Evenson, R.E. & Gollin, D., (eds.) Crop variety improvement and its effect on productivity - The impact of international agricultural research, 241-256. UK: CABI Publishing. Ayars, J.E., Hutmacher, R.B., Schoneman, R.A., Vail, S.S. & Pflaum, T. (1993). Long term use of saline water for irrigation. Irrigation Science 14, 27-34. Backes, G., Graner, A., Foroughi-Wehr, B., Fischbeck, G., Wenzel, G. & Jahoor, A. (1995). Localization of quantitative trait loci (QTL) for agronomic important characters by the use of a RFLP map in
barley (Hordeum vulgare L.). Theoretical and Applied Genetics 90, 294-302. Baik, B.-K. & Ullrich, S.E. (2008). Barley for food: Characteristics, improvement, and renewed interest. Journal of Cereal Science 48, 233-242. Barabaschi, D., Tondelli, A., Desiderio, F., Volante, A., Vaccino, P., Valè, G. & Cattivelli, L. (2016). Next generation breeding. Plant Science 242, 3-13. Barber, J. (2004). Towards a full understanding of water splitting in photosynthesis. International Journal of Photoenergy 6, 43-51. Barceló, J. & Poschenrieder, C. (1990). Plant water relations as affected by heavy metal stress: A review. Journal of Plant Nutrition 13, 1-37. Barr, A.R., Chalmers, K.J., Karakousis, A., Kretschmer, J.M., Manning, S., Lance, R.C.M., Lewis, J., Jeffries, S.P. & Langridge, P. (1998). RFLP mapping of a new cereal cyst nematode resistance locus in
barley. Plant Breeding 117, 185-187. Bayer, M.M., Rapazote-Flores, P., Ganal, M., Hedley, P.E., Macaulay, M., Plieske, J., Ramsay, L., Russell, J.R., Shaw, P.D., Thomas, W.T.B. & Waugh, R. (2017). Development and evaluation of a barley
50k iSelect SNP array. Frontiers in Plant Science 8. DOI: 10.3389/fpls.2017.01792. Bellucci, E., Bitocchi, E., Rau, D., Nanni, L., Ferradini, N., Giardini, A., Rodriguez, M., Attene, G. & Papa, R. (2013). Population structure of barley landrace populations and gene-flow with modern
varieties. PLoS ONE 8, e83891. Ben Naceur, A., Chaabane, R., El-Faleh, M., Abdelly, C., Ramla, D., Nada, A., Sakr, M. & Ben Naceur, M.b. (2012). Genetic diversity analysis of North Africa’s barley using SSR markers. Journal of Genetic
Engineering and Biotechnology 10, 13-21. Bengtsson, T., Åhman, I., Bengtsson, T., Manninen, O., Veteläinen, M., Reitan, L., Alsheikh, M., Gertsson, B., Tuvesson, S., Jalli, M., Jahoor, A., Jensen, J.D., Orabi, J., Backes, G., Krusell, L., Hjortshøj, R.L.,
Helgadóttir, Á., Göransson, M., Sveinsson, S., Manninen, O., Jahoor, A., Orabi, J. & Consortium, T.P.B. (2017). Genetic diversity, population structure and linkage disequilibrium in Nordic spring barley (Hordeum vulgare L. subsp. vulgare). Genetic Resources and Crop Evolution 64, 2021-2033.
Bergelson, J., Kreitman, M., Stahl, E.A. & Tian, D. (2001). Evolutionary dynamics of plant R-genes. Science 292, 2281-2285. Berglund, B.E. (2003). Human impact and climate changes—synchronous events and a causal link? Quaternary International 105, 7-12. Berteli, F., Corrales, E., Guerrero, C., Ariza, M.J., Pliego, F. & Valpuesta, V. (1995). Salt stress increases ferredoxin-dependent glutamate synthase activity and protein level in the leaves of tomato.
Physiologia Plantarum 93, 259-264. Bertholdsson, N.-O. (2013). Screening for barley waterlogging tolerance in Nordic barley cultivars (Hordeum vulgare L.) using chlorophyll fluorescence on hydroponically-grown plants. Agronomy 3,
376-390. Bhatnagar-Mathur, P., Vadez, V. & Sharma, K.K. (2008). Transgenic approaches for abiotic stress tolerance in plants: retrospect and prospects. Plant Cell Reports 27, 411-424. Bjørnstad, Å., Grønnerød, S., Mac Key, J., Tekauz, A., Crossa, J. & Martens, H. (2004). Resistance to barley scald (Rhynchosporium secalis) in the Ethiopian donor lines ‘Steudelli’ and ‘Jet’, analyzed by
partial least squares regression and interval mapping. Hereditas 141, 166-179. Bjørnstad, Å., Patil, V., Tekauz, A., Marøy, A.G., Skinnes, H., Jensen, A., Magnus, H. & MacKey, J. (2002). Resistance to scald (Rhynchosporium secalis) in barley (Hordeum vulgare) studied by near-
isogenic lines: I. Markers and differential isolates. Phytopathology 92, 710-720. Blake, L., Goulding, K.W.T., Mott, C.J.B. & Johnston, A.E. (1999). Changes in soil chemistry accompanying acidification over more than 100 years under woodland and grass at Rothamsted Experimental
Station, UK. European Journal of Soil Science 50, 401-412. Blum, A. & Sullivan, C.Y. (1986). The comparative drought resistance of landraces of sorghum and millet from dry and humid regions. Annals of Botany 57, 835-846. Blumwald, E., Aharon, G.S. & Apse, M.P. (2000). Sodium transport in plant cells. Biochimica et Biophysica Acta (BBA) - Biomembranes 1465, 140-151. Borém, A. & Milach, S.C.K. (1998). Plant breeding in the turn of the millennium. Brazilian Archives of Biology and Technology 41. DOI: 10.1590/S1516-89131998000300001. Börner, A., Weidner, A., Surabhi, G.-K., Witzel, K. & Mock, H.-P. (2009). Salt stress-induced alterations in the root proteome of barley genotypes with contrasting response towards salinity. Journal of
Experimental Botany 60, 3545-3557. Bostock, R.M. (2005). Signal crosstalk and induced resistance: Straddling the line between cost and benefit. Annual Review of Phytopathology 43, 545-580. Bowler, C., Slooten, L., Vandenbranden, S., De Rycke, R., Botterman, J., Sybesma, C., Van Montagu, M. & Inzé, D. (1991). Manganese superoxide dismutase can reduce cellular damage mediated by
oxygen radicals in transgenic plants. The EMBO Journal 10, 1723-1732. Braidwood, R.J., Sauer, J.D., Helbaek, H., Mangelsdorf, P.C., Cutler, H.C., Coon, C.S., Linton, R., Steward, J. & Oppenheim, A.L. (1953). Symposium: Did man once live by beer alone? American
Anthropologist 55, 515-526. Brennan, R.F. (1992). The role of manganese and nitrogen nutrition in the susceptibility of wheat plants to take-all in Western Australia. Fertilizer research 31, 35-41. Brouwer, B.O., Murphy, K.M. & Jones, S.S. (2015). Plant breeding for local food systems: A contextual review of end-use selection for small grains and dry beans in Western Washington. Renewable
Agriculture and Food Systems 31, 172-184. Brown, I. (2017). Climate change and soil wetness limitations for agriculture: Spatial risk assessment framework with application to Scotland. Geoderma 285, 173-184. Brown, J.K.M. (2002). Yield penalties of disease resistance in crops. Current Opinion in Plant Biology 5, 339-344.

References
98
Brown, L.K., Schmidt, S.B., Wishart, J., Booth, A., Russell, J., Husted, S., Martin, P. & George, T.S. (2017) Published. Back to the future : Identifying micronutrient efficiencies in heritage barley lines for improved agricultural sustainability. In: Carstensen, A., Laursen, K.H. & Schjoerring, J.K., eds. Proceedings of the XVIII International Plant Nutrition Colloquium with Boron and Manganese Satellite Meetings, 2017 University of Copenhagen, Copenhagen, Denmark. 488-489.
Brown, T.A., Jones, M.K., Powell, W. & Allaby, R.G. (2009). The complex origins of domesticated crops in the Fertile Crescent. Trends in Ecology & Evolution 24, 103-109. Brunner, P.C., Schürch, S. & McDonald, B.A. (2007). The origin and colonization history of the barley scald pathogen Rhynchosporium secalis. Journal of Evolutionary Biology 20, 1311-1321. Burnell, J.N. (1988). The biochemistry of manganese in plants. In: Graham, R.D., Hannam, R.J. & Uren, N.C., (eds.) Manganese in soils and plants: Developments in plant and soil sciences, 113-124.
Dordrecht, Netherlands: Springer. Byrt, C.S., Munns, R., Burton, R.A., Gilliham, M. & Wege, S. (2018). Root cell wall solutions for crop plants in saline soils. Plant Science 269, 47-55. Cabello, R., Monneveux, P., De Mendiburu, F. & Bonierbale, M. (2013). Comparison of yield based drought tolerance indices in improved varieties, genetic stocks and landraces of potato (Solanum
tuberosum L.). Euphytica 193, 147-156. Cailliatte, R., Schikora, A., Briat, J.-F., Mari, S. & Curie, C. (2010). High-affinity Manganese uptake by the metal transporter NRAMP1 is essential for Arabidopsis growth in low manganese conditions.
The Plant Cell 22, 904-917. Caldwell, R.L. (1937). Rhynchosporium scald of barley, rye, and other grasses. Journal of Agricultural Research 55, 175-198. Cantalapiedra, C.P., García-Pereira, M.J., Gracia, M.P., Igartua, E., Casas, A.M. & Contreras-Moreira, B. (2017). Large differences in gene expression responses to drought and heat stress between elite
barley cultivar Scarlett and a Spanish landrace. Frontiers in Plant Science 8. DOI: 10.3389/fpls.2017.00647. Carmona, M.A., Carmona, M., Moschini, R.C. & Conti, H.A. (1997). Meteorological factors influencing the incidence of barley scald and its spatial distribution over the Argentine Pampas region. Journal
of Plant Pathology 79, 203-209. Castaings, L., Caquot, A., Loubet, S. & Curie, C. (2016). The high-affinity metal transporters NRAMP1 and IRT1 team up to take up iron under sufficient metal provision. Scientific Reports 6, 37222. Ceccarelli, S., Grando, S., Capettini, F. & Baum, M. (2007). Barley breeding for sustainable production. In: Kang, M.S. & Priyadarshan, P.M., (eds.) Breeding major food staples, 193-227. Oxford, UK:
Blackwell Publishing Ltd. Ceccarelli, S., Grando, S., Maatougui, M., Michael, M., Slash, M., Haghparast, R., Rahmanian, M., Taheri, A., Al-Yassin, A., Benbelkacem, A., Labdi, M., Mimoun, H. & Nachit, M. (2010). Plant breeding
and climate changes. The Journal of Agricultural Science 148, 627-637. Ceccarelli, S., Grando, S. & Van Leur, J.A.G. (1987). Genetic diversity in barley landraces from Syria and Jordan. Euphytica 36, 389-405. Çelik Oğuz, A., Karakaya, A., Ergün, N. & Sayím, İ. (2017). Turkish barley landraces resistant to net and spot forms of Pyrenophora teres. Chakraborty, S. & Newton, A.C. (2011). Climate change, plant diseases and food security: An overview. Plant Pathology 60, 2-14. Chalmers, A.G., Sinclair, A.H. & Carver, M. (1999). Nutrients other than NPK for cereals: A review HGCA Cereals Research Review No 41. Warwickshire, UK: Agriculture and Horticulture Development
Board. Chen, G.D., Liu, Y.X., Wei, Y.M., McIntyre, C.L., Zhou, M.X., Zheng, Y.L. & Liu, C.J. (2013). Major QTL for Fusarium crown rot resistance in a barley landrace. Theoretical and Applied Genetics 126, 2511-
2520. Clark, B., Kelly, C., Bryson, R., Jellis, G. & Tonguç, L. (2008). The encyclopaedia of cereal diseases. Warwickshire, UK: AHDB Cereals & Oilseeds. Cockerell, V. (2002) Published. Seed treatment according to need in Scotland: Barley net blotch. Proceedings of the Crop Protection in Northern Britain, 2002 Dundee, UK. 121-126. Cocks, D. (2013). Global overshoot: contemplating the world's converging problems, Berlin, Germany, Springer Science & Business Media. Collard, B.C.Y., Jahufer, M.Z.Z., Brouwer, J.B. & Pang, E.C.K. (2005). An introduction to markers, quantitative trait loci (QTL) mapping and marker-assisted selection for crop improvement: The basic
concepts. Euphytica 142, 169-196. Colmsee, C., Beier, S., Himmelbach, A., Schmutzer, T., Stein, N., Scholz, U. & Mascher, M. (2015). BARLEX – the barley draft genome explorer. Molecular Plant 8, 964-966. Comadran, J., Romagosa, I., van Eeuwijk, F.Á., Hackett, C.A., Russell, J.R. & Thomas, W.T.B. (2007). Drought tolerance in Mediterranean barley: An association genetics approach [Online]. Available:
http://www.scri.ac.uk/scri/file/annualreports/2007/03_1_drought_tolerance.pdf [Accessed 15 September 2015]. Conicella, C., Consiglio, F., Batelli, G., Cammareri, M., De Palma, M., Termolino, P., Palombieri, S., Grandillo, S., Landi, S., Tranchida-Lombardo, V., Grillo, S., Tucci, M., Anzar, I., Aiese Cigliano, R.,
Sanseverino, W., Di Matteo, A., Colantuono, C., Carputo, D., Bostan, H., Chiusano, M.L., Aversano, R. & D’Agostino, N. (2017). Whole-genome re-sequencing of two Italian tomato landraces reveals sequence variations in genes associated with stress tolerance, fruit quality and long shelf-life traits. DNA Research 25, 149-160.
Coulter, M., Büttner, B., Hofmann, K., Bayer, M., Ramsay, L., Schweizer, G., Waugh, R., Looseley, M.E. & Avrova, A. (2018). Characterisation of barley resistance to rhynchosporium on chromosome 6HS. Theoretical and Applied Genetics, 1-19.
Cramer, G.R. & Nowak, R.S. (1992). Supplemental manganese improves the relative growth, net assimilation and photosynthetic rates of salt-stressed barley. Physiologia Plantarum 84, 600-605. Cramer, G.R., Urano, K., Delrot, S., Pezzotti, M. & Shinozaki, K. (2011). Effects of abiotic stress on plants: a systems biology perspective. BMC Plant Biology 11, 163-163. Creissen, H.E., Jorgensen, T.H. & Brown, J.K.M. (2016). Increased yield stability of field-grown winter barley (Hordeum vulgare L.) varietal mixtures through ecological processes. Crop Protection 85, 1-
8. Cromey, M.G. (1987). Pathogenic variation in Rhynchosporium secalis on barley in New Zealand. New Zealand Journal of Agricultural Research 30, 95-99. Czembor, J.H. (2000a). Resistance to powdery mildew in barley (Hordeum vulgare L.) landraces from Egypt. Plant Genetic Resources Newsletter 123, 52-60. Czembor, J.H. (2000b). Resistance to powdery mildew in barley landraces from Morocco. Journal of Plant Pathology 82, 187-200. Czembor, J.H. & Czembor, H.J. (2002). Selections from barley landrace collected in Libya as new sources of effective resistance to powdery mildew (Blumeria graminis f. sp. hordei). Rostlinná Výroba
48, 217-223. Czembor, J.H. & Czembor, H.J. (2007). Screening for leaf rust resistance in collections of barley landraces from southern Mediterranean region. Plant Breeding And Seed Science 56, 57-72. Dai, F., Nevo, E., Wu, D., Comadran, J., Zhou, M., Qiu, L., Chen, Z., Beiles, A., Chen, G. & Zhang, G. (2012). Tibet is one of the centers of domestication of cultivated barley. Proceedings of the National
Academy of Sciences 109, 16969-16973. Damerow, P. (2012). Sumerian beer: The origins of brewing technology in ancient Mesopotamia. Cuneiform Digital Library Journal 2. Davies, W.P. (2003). An historical perspective from the green revolution to the gene revolution. Nutrition Reviews 61, S124-S134. Demirevska-Kepova, K., Simova-Stoilova, L., Stoyanova, Z., Hölzer, R. & Feller, U. (2004). Biochemical changes in barley plants after excessive supply of copper and manganese. Environmental and
Experimental Botany 52, 253-266. Department of Agriculture and Food Western Australia. (2015). Diagnosing manganese deficiency in barley [Online]. Available: https://www.agric.wa.gov.au/mycrop/diagnosing-manganese-
deficiency-barley [Accessed 04 September 2015]. Devaux, P. (2003). The Hordeum bulbosum (L.) method. Doubled haploid production in crop plants: A manual, 15-19. Dordrecht, The Netherlands: Kluwer Academic Publishing. Dreiseitl, A. & Jørgensen, J.H. (2000). Powdery mildew resistance in Czech and Slovak barley cultivars. Plant Breeding 119, 203-209. Dry, F.T. (2016). The soils of Orkney, Aberdeen, Scotland, UK, The James Hutton Institute. Dry, F.T. & Robertson, J.S. (1982). Soil and land capability for agriculture Orkney and Shetland, Aberdeen, Scotland, UK, The Macaulay Institute for Soil Research. Du, Z.-Y., Arias, T., Meng, W. & Chye, M.-L. (2016). Plant acyl-CoA-binding proteins: An emerging family involved in plant development and stress responses. Progress in Lipid Research 63, 165-181. Dučić, T. & Polle, A. (2005). Transport and detoxification of manganese and copper in plants. Brazilian Journal of Plant Physiology 17, 103-112. Duveiller, E., Singh, R.P. & Nicol, J.M. (2007). The challenges of maintaining wheat productivity: Pests, diseases, and potential epidemics. Euphytica 157, 417-430. Dwivedi, S.L., Ceccarelli, S., Blair, M.W., Upadhyaya, H.D., Are, A.K. & Ortiz, R. (2016). Landrace germplasm for improving yield and abiotic stress adaptation. Trends in Plant Science 21, 31-42. El Madidi, S., Diani, Z. & Aameur, F.B. (2004). Effects of salinity on germination and early growth of barley (Hordeum vulgare L.) cultivars. International Journal of Agriculture & Biology 6, 767-770. Ellis, R.P. (2004). Barley crop development. In: Hillman, J.R. (ed.) Scottish Crop Research Institute Annual Report 2002/2003. Scotland, UK: Scottish Crop Research Institute. Endresen, D.T.F., Street, K., MacKay, M., Bari, A. & Pauw, E.d. (2011). Predictive association between biotic stress traits and eco-geographic data for wheat and barley landraces. Crop Science 51, 2036-
2055. Eticha, F., Sinebo, W. & Grausgruber, H. (2010). On-farm diversity and characterization of barley (Hordeum vulgare L.) landraces in the highlands of West Shewa, Ethiopia. Ethnobotany Research &
Applications 8, 25-34. European Commission (2019). Final Renewal report for the active substance chlorothalonil. Brussel, Belgium: Directorate-General for Health and Food Safety. Evenson, R.E. & Gollin, D. (2003). Assessing the impact of the green revolution, 1960 to 2000. Science 300, 758-762. Fageria, N.K. (2008). The use of nutrients in crop plants, Boca Raton, Florida, CRC Press. Fageria, V.D. (2001). Nutrient interactions in crop plants. Journal of Plant Nutrition 24, 1269-1290. Fan, Y., Zhou, G., Shabala, S., Chen, Z.-H., Cai, S., Li, C. & Zhou, M. (2016). Genome-Wide Association Study reveals a new QTL for salinity tolerance in barley (Hordeum vulgare L.). Frontiers in Plant
Science 7. DOI: 10.3389/fpls.2016.00946. FAO (2010). The second report on the state of the world’s plant genetic resources for food and agriculture. Rome, Italy.
FAO. (2015). Salt-affected soils [Online]. Available: http://www.fao.org/soils-portal/soil-management/management-of-some-problem-soils/salt-affected-soils/more-information-on-salt-affected-soils/en/ [Accessed 08 October 2018].
FAOSTAT. (n.d.). Food and Agriculture Organization of the United Nations - FAOSTAT [Online]. Available: http://www.fao.org/faostat/en [Accessed 14 Sept 2018]. Farzadfar, S., Zarinkamar, F., Behmanesh, M. & Hojati, M. (2016). Magnesium and manganese interactively modulate parthenolide accumulation and the antioxidant defense system in the leaves of
Tanacetum parthenium. Journal of Plant Physiology 202, 10-20. Fetene, M., Gebre-Egziabher, Y. & Beck, E. (2012). Comparison of the frost resistance of barley (Hordeum vulgare L.) landraces of upland Ethiopia using electrolyte-leakage and chlorophyll
fluorescence. Ethiopian Journal of Science 35, 41-50. Figueroa, M., Hammond-Kosack, K.E. & Solomon, P.S. (2018). A review of wheat diseases—a field perspective. Molecular Plant Pathology 19, 1523-1536. Fischbeck, G. (2003). Diversification through breeding. In: Von Bothmer, R., Van Hintum, T., Knüpffer, H. & Sato, K., (eds.) Diversity in barley (Hordeum vulgare), 29-52. Amsterdam, Netherlands:
Elsevier Science. Fitt, B.D.L., Atkins, S.D., Fraaije, B.A., Lucas, J.A., Newton, A.C., Looseley, M., Werner, P., Harrap, D., Ashworth, M., Southgate, J., Phillips, H. & Gilchrist, A. (2012). Role of inoculum sources in
rhynchosporium population dynamics and epidemics on barley. HGCA Project Report No. 486. Warwickshire, UK: Agriculture and Horticulture Development Board. Fitzpatrick, K.L., Tyerman, S.D. & Kaiser, B.N. (2008). Molybdate transport through the plant sulfate transporter SHST1. FEBS Letters 582, 1508-1513. Flowers, T.J. & Flowers, S.A. (2005). Why does salinity pose such a difficult problem for plant breeders? Agricultural Water Management 78, 15-24.

References
99
Forster, B.P. (2001). Mutation genetics of salt tolerance in barley: An assessment of Golden Promise and other semi-dwarf mutants. Euphytica 120, 317-328. Fountaine, J.M., Shaw, M.W., Ward, E. & Fraaije, B.A. (2010). The role of seeds and airborne inoculum in the initiation of leaf blotch (Rhynchosporium secalis) epidemics in winter barley. Plant
Pathology 59, 330-337. Foy, C.D., Chaney, R.L. & White, M.C. (1978). The physiology of metal toxicity in plants. Annual Review of Plant Physiology 29, 511-566. Franco-Orozco, B., Berepiki, A., Ruiz, O., Gamble, L., Griffe, L.L., Wang, S., Birch, P.R.J., Kanyuka, K. & Avrova, A. (2017). A new proteinaceous pathogen-associated molecular pattern (PAMP) identified
in Ascomycete fungi induces cell death in Solanaceae. New Phytologist 214, 1657-1672. Friedt, W., Horsley, R.D., Harvey, B.L., Poulsen, D.M.E., Lance, R.C.M., Ceccarelli, S., Grando, S. & Capettini, F. (2010). Barley breeding history, progress, objectives, and technology. In: Ullrich, S.E., (ed.)
Barley: Production, improvement and uses, 160-220. Hoboken, New Jersey, United States: Blackwell Publishing Ltd. Fujita, M., Fujita, Y., Noutoshi, Y., Takahashi, F., Narusaka, Y., Yamaguchi-Shinozaki, K. & Shinozaki, K. (2006). Crosstalk between abiotic and biotic stress responses: A current view from the points of
convergence in the stress signaling networks. Current Opinion in Plant Biology 9, 436-442. Gallardo, K., Courty, P.-E., Le Signor, C., Wipf, D. & Vernoud, V. (2014). Sulfate transporters in the plant's response to drought and salinity: Regulation and possible functions. Frontiers in plant science
5, 580-580. Gao, J.-P., Chao, D.-Y. & Lin, H.-X. (2007). Understanding abiotic stress tolerance mechanisms: Recent studies on stress response in rice. Journal of Integrative Plant Biology 49, 742-750. García-Martínez, S., Grau, A., Alonso, A., Rubio, F., Valero, M. & Ruiz, J.J. (2011). UMH 1200, a breeding line within the muchamiel tomato type resistant to three viruses. 46, 1054. Genger, R.K., Nesbitt, K., Brown, A.H.D., Abbott, D.C. & Burdon, J.J. (2005). A novel barley scald resistance gene: genetic mapping of the Rrs15 scald resistance gene derived from wild barley, Hordeum
vulgare ssp. spontaneum. Plant Breeding 124, 137-141. George, T.S., French, A.S., Brown, L.K., Karley, A.J., White, P.J., Ramsay, L. & Daniell, T.J. (2014). Genotypic variation in the ability of landraces and commercial cereal varieties to avoid manganese
deficiency in soils with limited manganese availability: Is there a role for root-exuded phytases? Physiologia Plantarum 151, 243-256. George, T.S., Taylor, M.A., Dodd, I.C. & White, P.J. (2017). Climate change and consequences for potato production: A review of tolerance to emerging abiotic stress. Potato Research 60, 239-268. Gherardi, M.J. & Rengel, Z. (2004). The effect of manganese supply on exudation of carboxylates by roots of lucerne (Medicago sativa). Plant and Soil 260, 271-282. Gibson, R.W., Aritua, V., Byamukama, E., Mpembe, I. & Kayongo, J. (2004). Control strategies for sweet potato virus disease in Africa. Virus Research 100, 115-122. Gibson, R.W., Jeremiah, S.C., Aritua, V., Msabaha, R.P., Mpembe, I. & Ndunguru, J. (2000). Sweet Potato Virus Disease in Sub-Saharan Africa: Evidence that neglect of seedlings in the traditional
farming system hinders the development of superior resistant landraces. Journal of Phytopathology 148, 441-447. Gimenez, E., Salinas, M. & Manzano-Agugliaro, F. (2018). Worldwide research on plant defense against biotic stresses as improvement for sustainable agriculture. Sustainability 10, 391. Glazebrook, J. (2005). Contrasting mechanisms of defense against biotrophic and necrotrophic pathogens. Annual Review of Phytopathology 43, 205-227. Gleń, K., Boligłowa, E. & Znój, K. (2013). Evaluation of manganese seed dressings effect on healthiness of spring barley. Proceedings of ECOpole 7, 59-65. Glenn, K.C., Alsop, B., Bell, E., Goley, M., Jenkinson, J., Liu, B., Martin, C., Parrott, W., Souder, C., Sparks, O., Urquhart, W., Ward, J.M. & Vicini, J.L. (2017). Bringing new plant varieties to market: plant
breeding and selection practices advance beneficial characteristics while minimizing unintended changes. Crop Science 57, 2906-2921. Gnanamanickam, S.S. (2009). Major diseases of rice. Biological control of rice diseases, 13-42. Dordrecht: Springer Netherlands. Goddard, R., Peraldi, A., Ridout, C. & Nicholson, P. (2014). Enhanced disease resistance caused by BRI1 mutation is conserved between Brachypodium distachyon and barley (Hordeum vulgare).
Molecular Plant-Microbe Interactions 27, 1095-1106. Goldberg, S.P., Smith, K.A. & Holmes, J.C. (1983). The effects of soil compaction, form of nitrogen fertiliser, and fertiliser placement on the availability of manganese to barley. Journal of the Science of
Food and Agriculture 34, 657-670. Golldack, D., Li, C., Mohan, H. & Probst, N. (2014). Tolerance to drought and salt stress in plants: Unraveling the signaling networks. Frontiers in Plant Science 5. DOI: 10.3389/fpls.2014.00151. Graham, R.D., Davies, W.J., Sparrow, D.H.B. & Ascher, J.S. (1982). Tolerance of barley and other cereals to manganese-deficient calcareous soils of South Australia. In: Saric, M.R. & Loughman, B.C.,
(eds.) Genetic Aspects of Plant Nutrition: Proceedings of the First International Symposium on Genetic Aspects of Plant Nutrition, Organized by the Serbian Academy of Sciences and Arts,
Belgrade, August 30–September 4, 1982, 339-345. The Hague, Netherlands: Dr. W. Junk Publishers. Grando, S., Von Bothmer, R. & Ceccarelli, S. (2001). Genetic diversity of barley: Use of locally adapted germplasm to enhance yield and yield stability of barley in dry areas. In: Cooper, H.D., Spillane, C.
& Hodgkin, T., (eds.) Broadening the genetic base of crop production, 351-371. Wallingford, UK: CABI Publishing. Grattan, S.R. & Grieve, C.M. (1992). Mineral element acquisition and growth response of plants grown in saline environments. Agriculture, Ecosystems & Environment 38, 275-300. Grattan, S.R. & Grieve, C.M. (1998). Salinity–mineral nutrient relations in horticultural crops. Scientia Horticulturae 78, 127-157. Grover, M., Ali, S.Z., Sandhya, V., Rasul, A. & Venkateswarlu, B. (2011). Role of microorganisms in adaptation of agriculture crops to abiotic stresses. World Journal of Microbiology and Biotechnology
27, 1231-1240. Gupta, S.K., Rai, A.K., Kanwar, S.S. & Sharma, T.R. (2012). Comparative analysis of zinc finger proteins involved in plant disease resistance. PloS one 7, e42578-e42578. Haaland, R. (2007). Porridge and pot, bread and oven: Food ways and symbolism in Africa and the Near East from the Neolithic to the present. Cambridge Archaeological Journal 17, 165-182. Haddadin, M.a.F. (2015). Assessment of drought tolerant barley varieties under water stress. International Journal of Agriculture and Forestry 5, 131-137. Hahn, M., Jüngling, S. & Knogge, W. (1993). Cultivar-specific elicitation of barley defense reactions by the phytotoxic peptide NIP1 from Rhynchosporium secalis. Molecular Plant-Microbe Interactions
6, 745-754. Hall, J.L. & Williams, L.E. (2003). Transition metal transporters in plants. Journal of Experimental Botany 54, 2601-2613. Hamamoto, S., Horie, T., Hauser, F., Deinlein, U., Schroeder, J.I. & Uozumi, N. (2015). HKT transporters mediate salt stress resistance in plants: from structure and function to the field. Current Opinion
in Biotechnology 32, 113-120. Hamdy, A., Sardo, V. & Ghanem, K.A.F. (2005). Saline water in supplemental irrigation of wheat and barley under rainfed agriculture. Agricultural Water Management 78, 122-127. Hammond-Kosack, K.E. & Jones, J.D.G. (1997). Plant disease resistance genes. Annual Review of Plant Physiology and Plant Molecular Biology 48, 575-607. Hanemann, A. (2009). Fine mapping and marker development for the resistance gene Rrs2 against Rhynchosporium secalis in barley. PhD, Technische Universität München. Hanemann, A., Schweizer, G.F. & Röder, M.S. (2010) Development and validation of diagnostic markers for the Rrs2 gene in barley conferring resistance to Rhynchosporium secalis. 2010 St. Pölten.
Vereinigung der Pflanzenzüchter und Saatgutkaufleute Österreichs, 151-154. Hänsch, R. & Mendel, R.R. (2009). Physiological functions of mineral micronutrients (Cu, Zn, Mn, Fe, Ni, Mo, B, Cl). Current Opinion in Plant Biology 12, 259-266. Harlan, J.R. & de Wet, J.M.J. (1971). Toward a rational classification of cultivated plants. Taxon 20, 509-517. Hatfield, J., Takle, G., Grotjahn, R., Holden, P., Izaurralde, R.C., Mader, T., Marshall, E. & Liverman, D. (2014). Agriculture. In: Melillo, J.M., Richmond, T.T.C. & Yohe, G.W. (eds.) Climate Change Impacts
in the United States: The Third National Climate Assessment. USA: U.S. Global Change Research Program. Havis, N., Fountaine, J., Gorniak, K., Paterson, L. & Taylor, J. (2015). Diagnosis of Ramularia collo-cygni and Rhynchosporium spp. in barley. In: Lacomme, C., (ed.) Plant pathology: Techniques and
protocols, 29-36. New York, NY: Springer New York. Hayden, B., Canuel, N. & Shanse, J. (2012). What was brewing in the Natufian? An archaeological assessment of brewing technology in the Epipaleolithic. Journal of Archaeological Method and Theory
20, 102-150. Haydon, M.J. & Cobbett, C.S. (2007). Transporters of ligands for essential metal ions in plants. New Phytologist 174, 499-506. Hayes, J.E. & Reid, R.J. (2004). Boron tolerance in barley is mediated by efflux of boron from the roots. Plant Physiology 136, 3376-3382. Hazzouri, K.M., Khraiwesh, B., Amiri, K.M.A., Pauli, D., Blake, T., Shahid, M., Mullath, S.K., Nelson, D., Mansour, A.L., Salehi-Ashtiani, K., Purugganan, M. & Masmoudi, K. (2018). Mapping of HKT1;5
gene in barley using GWAS approach and its implication in salt tolerance mechanism. Frontiers in Plant Science 9. DOI: 10.3389/fpls.2018.00156. Hebbern, C.A., Laursen, K.H., Ladegaard, A.H., Schmidt, S.B., Pedas, P., Bruhn, D., Schjoerring, J.K., Wulfsohn, D. & Husted, S. (2009). Latent manganese deficiency increases transpiration in barley
(Hordeum vulgare). Physiologia Plantarum 135, 307-316. Heinonen, M. & Veteläinen, M. (2011). Cereal landrace farmers in Finland and their motivation to on-farm conservation. Nordic Association of Agricultural Scientists (NJF) Report. Stockholm, Sweden:
Nordic Association of Agricultural Scientists. Henkens, C.H.H. (1958). The trace element manganese the state of research in the Netherlands. Netherlands Journal of Agricultural Science 6, 191-203. Henley, S. (2015). Researchers tackle top UK barley disease. Research in Focus. Warwickshire, UK: HGCA. Hillel, D. (2000). Salinity management for sustainable irrigation: Integrating science, environment, and economics, Washington DC, USA, World Bank Publications. Hillocks, R.J. (2012). Farming with fewer pesticides: EU pesticide review and resulting challenges for UK agriculture. Crop Protection 31, 85-93. Hofmann, K. (2014). Phenotypic assessment and genetic mapping of genes conferring resistance to leaf scald (Rhynchosporium commune) in barley (Hordeum vulgare). PhD, Justus-Liebig-Universität
Gießen. Hofmann, K., Silvar, C., Casas, A.M., Herz, M., Büttner, B., Gracia, M.P., Contreras-Moreira, B., Wallwork, H., Igartua, E. & Schweizer, G. (2013). Fine mapping of the Rrs1 resistance locus against scald in
two large populations derived from Spanish barley landraces. Theoretical and Applied Genetics 126, 3091-3102. Hopkins, B. & Ellsworth, J. (2005) Phosphorus availability with alkaline/calcareous soil. Western Nutrient Management Conference, 2005 Salt Lake City, UT, USA. 88-93. Horler, R., Turner, A., Fretter, P. & Ambrose, M. (2017). SeedStor: A Germplasm Information Management System and Public Database. Plant and Cell Physiology 59, e5-e5. Horneck, D.A., Sullivan, D.M., Owen, J.S. & Hart, J.M. (2011). Soil test interpretation guide. Corvallis, Oregon, USA: Oregon State University Extension Service. Hornsey, I.S. (2003). A history of beer and brewing, London, UK, Royal Society of Chemistry. Hu, K.-M., Qiu, D.-Y., Shen, X.-L., Li, X.-H. & Wang, S.-P. (2008). Isolation and manipulation of Quantitative Trait Loci for disease resistance in rice using a candidate gene approach. Molecular Plant 1,
786-793. Hu, Y. & Schmidhalter, U. (2005). Drought and salinity: A comparison of their effects on mineral nutrition of plants. Journal of Plant Nutrition and Soil Science 168, 541-549. Huang, C. (1996). Mechanisms of Mn efficiency in barley. PhD, University of Adelaide. Huang, X. & Han, B. (2014). Natural variations and genome-wide association studies in crop plants. Annual Review of Plant Biology 65, 531-551. Huang, X., Shabala, S., Shabala, L., Rengel, Z., Wu, X., Zhang, G. & Zhou, M. (2015). Linking waterlogging tolerance with Mn2+ toxicity: A case study for barley. Plant Biology 17, 26-33. Huber, D.M. & Wilhelm, N.S. (1988). The Role of Manganese in Resistance to Plant Diseases. In: Graham, R.D., Hannam, R.J. & Uren, N.C., (eds.) Manganese in Soils and Plants: Proceedings of the
International Symposium on ‘Manganese in Soils and Plants’ held at the Waite Agricultural Research Institute, The University of Adelaide, Glen Osmond, South Australia, August 22–26,
1988 as an Australian Bicentennial Event, 155-173. Dordrecht: Springer Netherlands. Humphreys, M.O. (2007). Utilization of plant genetic resources in breeding for sustainability. Plant Genetic Resources 1, 11-18.

References
100
Husted, S., Laursen, K.H., Hebbern, C.A., Schmidt, S.B., Pedas, P., Haldrup, A. & Jensen, P.E. (2009). Manganese deficiency leads to genotype-specific changes in fluorescence induction kinetics and state transitions. Plant Physiology 150, 825-833.
Ingvordsen, C.H., Backes, G., Lyngkjær, M.F., Peltonen-Sainio, P., Jensen, J.D., Jalli, M., Jahoor, A., Rasmussen, M., Mikkelsen, T.N., Stockmarr, A. & Jørgensen, R.B. (2015). Significant decrease in yield under future climate conditions: Stability and production of 138 spring barley accessions. European Journal of Agronomy 63, 105-113.
Ishimaru, Y., Takahashi, R., Bashir, K., Shimo, H., Senoura, T., Sugimoto, K., Ono, K., Yano, M., Ishikawa, S., Arao, T., Nakanishi, H. & Nishizawa, N.K. (2012). Characterizing the role of rice NRAMP5 in manganese, iron and cadmium transport. Scientific Reports 2, 286.
Ismail, A.M. & Horie, T. (2017). Genomics, physiology, and molecular Breeding approaches for improving salt tolerance. Annual Review of Plant Biology 68, 405-434. Jaradat, A.A., Shahid, M. & Al-Maskri, A. (2004). Genetic diversity in the Batini barley landrace from Oman: II Response to salinity stress. Crop Science 44, 997-1007. Jarman, R.J. (1996). Bere barley: A living link with the 8th century. Plant Varieties and Seeds 9, 191-196. Jarrell, W.M. & Beverly, R.B. (1981). The dilution effect in plant nutrition studies. In: Brady, N.C., (ed.) Advances in agronomy, 197-224. Cambridge, Massachusetts, United States: Academic Press. Ji, Y., Scott, J.W., Hanson, P., Graham, E. & Maxwell, D.P. (2007). Sources of resistance, inheritance, and location of genetic loci conferring resistance to members of the tomato-infecting
Begomoviruses. In: Czosnek, H., (ed.) Tomato Yellow Leaf Curl Virus disease: Management, molecular biology, breeding for resistance, 343-362. Dordrecht: Springer Netherlands. Jiang, W.Z. & Ireland, C.R. (2005). Characterization of manganese use efficiency in UK wheat cultivars grown in a solution culture system and in the field. The Journal of Agricultural Science 143, 151-
160. Joffe, A.H. (1998). Alcohol and social complexity in ancient Western Asia. Current Anthropology 39, 297-322. Jones, S.S. & Lyon, S.R. (2012). Western Washington: Organic spring barley variety trial 2012. The Bread Lab. Washington State University. Jørgensen, J.H. (1992). Discovery, characterization and exploitation of Mlo powdery mildew resistance in barley. Euphytica 63, 141-152. Kalaji, H.M., Govindjee, Bosa, K., Kościelniak, J. & Żuk-Gołaszewska, K. (2011). Effects of salt stress on photosystem II efficiency and CO2 assimilation of two Syrian barley landraces. Environmental and
Experimental Botany 73, 64-72. Kambe, T. (2012). Chapter Eight - Molecular architecture and function of ZnT transporters. In: Argüello, J.M. & Lutsenko, S., (eds.) Current topics in membranes, 199-220. Academic Press. Kaouthar, F., Ameny, F.-K., Yosra, K., Walid, S., Ali, G. & Faiçal, B. (2016). Responses of transgenic Arabidopsis plants and recombinant yeast cells expressing a novel durum wheat manganese
superoxide dismutase TdMnSOD to various abiotic stresses. Journal of Plant Physiology 198, 56-68. Karakousis, A., Barr, A.R., Kretschmer, J.M., Manning, S., Jefferies, S.P., Chalmers, K.J., Islam, A.K.M. & Langridge, P. (2003). Mapping and QTL analysis of the barley population Clipper × Sahara.
Australian Journal of Agricultural Research 54, 1137-1140. Katerji, N., Mastrorilli, M., van Hoorn, J.W., Lahmer, F.Z., Hamdy, A. & Oweis, T. (2009). Durum wheat and barley productivity in saline–drought environments. European Journal of Agronomy 31, 1-9. Katz, S.H. & Maytag, F. (1991). Brewing an ancient beer. Archaeology 44, 24-33. Khodayari, H., Saeidi, H., Roofigar, A.A., Rahiminejad, M.R., Pourkheirandish, M. & Komatsuda, T. (2012). Genetic diversity of cultivated barley landraces in Iran measured using microsatellites.
International Journal of Bioscience, Biochemistry and Bioinformatics 2, 287-290. Kliebenstein, D.J. & Rowe, H.C. (2008). Ecological costs of biotrophic versus necrotrophic pathogen resistance, the hypersensitive response and signal transduction. Plant Science 174, 551-556. Knight, H. & Knight, M.R. (2001). Abiotic stress signalling pathways: Specificity and cross-talk. Trends in Plant Science 6, 262-267. König, J., Kopahnke, D., Steffenson, B.J., Przulj, N., Romeis, T., Röder, M.S., Ordon, F. & Perovic, D. (2012). Genetic mapping of a leaf rust resistance gene in the former Yugoslavian barley landrace
MBR1012. Molecular Breeding 30, 1253-1264. Konishi, T., Ban, T., Iida, Y. & Yoshimi, R. (1997). Genetic analysis of disease resistance to all strains of BaYMV in a Chinese barley landrace, Mokusekko 3. Theoretical and Applied Genetics 94, 871-877. Koski, V. (1996). Breeding plans in case of global warming. Euphytica 92, 235-239. Kronzucker, H.J., Coskun, D., Schulze, L.M., Wong, J.R. & Britto, D.T. (2013). Sodium as nutrient and toxicant. Plant and Soil 369, 1-23. Künzel, G., Korzun, L. & Meister, A. (2000). Cytologically integrated physical restriction fragment length polymorphism maps for the barley genome based on translocation breakpoints. Genetics 154,
397-412. Ladouceur, A., Tozawa, S., Alam, S., Kamei, S. & Kawai, S. (2006). Effect of low phosphorus and iron-deficient conditions on phytosiderophore release and mineral nutrition in barley. Soil Science and
Plant Nutrition 52, 203-210. Lammerts van Bueren, E.T., Backes, G., de Vriend, H. & Østergård, H. (2010). The role of molecular markers and marker assisted selection in breeding for organic agriculture. Euphytica 175, 51-64. Landi, S., Hausman, J.-F., Guerriero, G. & Esposito, S. (2017). Poaceae vs. abiotic stress: Focus on drought and salt stress, recent insights and perspectives. Frontiers in Plant Science 8. DOI:
10.3389/fpls.2017.01214. Langridge, P. & Waugh, R. (2019). Harnessing the potential of germplasm collections. Nature Genetics 51, 200-201. Le Gall, H., Philippe, F., Domon, J.-M., Gillet, F., Pelloux, J. & Rayon, C. (2015). Cell wall metabolism in response to abiotic stress. Plants 4, 112-166. Leino, M.W. & Hagenblad, J. (2010). Nineteenth century seeds reveal the population genetics of landrace barley (Hordeum vulgare). Molecular Biology and Evolution 27, 964-973. Leplat, F. (2015). Genetic study of the manganese use efficiency trait in winter barley. PhD, University of Copenhagen. Leplat, F., Pedas, P.R., Rasmussen, S.K. & Husted, S. (2016). Identification of manganese efficiency candidate genes in winter barley (Hordeum vulgare) using genome wide association mapping. BMC
Genomics 17, 775. Liller, C.B., Walla, A., Boer, M.P., Hedley, P., Macaulay, M., Effgen, S., von Korff, M., van Esse, G.W. & Koornneef, M. (2017). Fine mapping of a major QTL for awn length in barley using a multiparent
mapping population. Theoretical and Applied Genetics 130, 269-281. Lilly, A. & Matthews, K.B. (1994). A soil wetness class map for Scotland: New assessments of soil and climate data for land evaluation. Geoforum 25, 371-379. Limantseva, L., Mironenko, N., Shuvalov, O., Antonova, O., Khiutti, A., Novikova, L., Afanasenko, O., Spooner, D. & Gavrilenko, T. (2014). Characterization of resistance to Globodera rostochiensis
pathotype Ro1 in cultivated and wild potato species accessions from the Vavilov Institute of Plant Industry. Plant Breeding 133, 660-665. Lloyd, J.M. (2000). Manganese nutrition status and resistance in barley (Hordeum vulgare L.) to take-all (Gaeumannomyces graminis var. tritici). PhD, Adelaide University. Lo Presti, L., Lanver, D., Schweizer, G., Tanaka, S., Liang, L., Tollot, M., Zuccaro, A., Reissmann, S. & Kahmann, R. (2015). Fungal effectors and plant susceptibility. Annual Review of Plant Biology 66, 513-
545. Long, N.V., Dolstra, O., Malosetti, M., Kilian, B., Graner, A., Visser, R.G.F. & van der Linden, C.G. (2013). Association mapping of salt tolerance in barley (Hordeum vulgare L.). Theoretical and Applied
Genetics 126, 2335-2351. Looseley, M.E., Griffe, L.L., Büttner, B., Wright, K.M., Middlefell-Williams, J., Bull, H., Shaw, P.D., Macaulay, M., Booth, A., Schweizer, G., Russell, J.R., Waugh, R., Thomas, W.T.B. & Avrova, A. (2018).
Resistance to Rhynchosporium commune in a collection of European spring barley germplasm. Theoretical and Applied Genetics 131, 2513-2528. Looseley, M.E., Keith, R., Guy, D., Barral-Baron, G., Thirugnanasambandam, A., Harrap, D., Werner, P. & Newton, A.C. (2015). Genetic mapping of resistance to Rhynchosporium commune and
characterisation of early infection in a winter barley mapping population. Euphytica 203, 337-347. Looseley, M.E., Newton, A.C., Atkins, S.D., Fitt, B.D.L., Fraaije, B.A., Thomas, W.T.B., Keith, R., Macaulay, M., Lynott, J. & Harrap, D. (2012). Genetic basis of control of Rhynchosporium secalis infection
and symptom expression in barley. Euphytica 184, 47-56. Lorenzo, O. & Solano, R. (2005). Molecular players regulating the jasmonate signalling network. Current Opinion in Plant Biology 8, 532-540. Lu, P.-P., Yu, T.-F., Zheng, W.-J., Chen, M., Zhou, Y.-B., Chen, J., Ma, Y.-Z., Xi, Y.-J. & Xu, Z.-S. (2018). The wheat Bax Inhibitor-1 Protein interacts with an Aquaporin TaPIP1 and enhances disease
resistance in Arabidopsis. Frontiers in Plant Science 9. DOI: 10.3389/fpls.2018.00020. Ma, J.F. (2004). Role of silicon in enhancing the resistance of plants to biotic and abiotic stresses. Soil Science and Plant Nutrition 50, 11-18. Maathuis, F.J.M. & Amtmann, A. (1999). K+ Nutrition and Na+ Toxicity: The Basis of Cellular K+/Na+ Ratios. Annals of Botany 84, 123-133. MacNicol, R.D. & Beckett, P.H.T. (1985). Critical tissue concentrations of potentially toxic elements. Plant and Soil 85, 107-129. Mahon, N., McGuire, S. & Islam, M.M. (2016). Why bother with Bere? An investigation into the drivers behind the cultivation of a landrace barley. Journal of Rural Studies 45, 54-65. Mamo, B.E., Smith, K.P., Brueggeman, R.S. & Steffenson, B.J. (2015). Genetic characterization of resistance to wheat stem rust race TTKSK in landrace and wild barley accessions identifies the
rpg4/Rpg5 locus. Phytopathology 105, 99-109. Mamo, B.E. & Steffenson, B.J. (2015). Genome-wide association mapping of fusarium head blight resistance and agromorphological traits in barley landraces from Ethiopia and Eritrea. Crop Science 55,
1494-1512. Manara, A. (2012). Plant responses to heavy metal toxicity. In: Furini, A., (ed.) Plants and heavy metals, 27-53. Dordrecht: Springer Netherlands. Mano, Y. & Takeda, K. (1997). Mapping quantitative trait loci for salt tolerance at germination and the seedling stage in barley (Hordeum vulgare L.). Euphytica 94, 263-272. Marcar, N.E. & Graham, R.D. (1987). Tolerance of wheat, barley, triticale and rye to manganese deficiency during seedling growth. Australian Journal of Agricultural Research 38, 501-511. Mark, J.J. (2009). Fertile crescent [Online]. Ancient History Encyclopedia. Available: http://www.ancient.eu/Fertile_Crescent/ [Accessed 05 August 2015]. Marschner, P., Ascher, J.S. & Graham, R.D. (1991). Effect of manganese-reducing rhizosphere bacteria on the growth of Gaeumannomyces graminis var. tritici and on manganese uptake by wheat
(Triticum aestivum L.). Biology and Fertility of Soils 12, 33-38. Martin, P. & Chang, X. (2008). Bere Whisky – rediscovering the spirit of an old barley. Brewer & Distiller International 4, 41-43. Martin, P., Chang, X. & Wishart, J. (2010). Yield response of Bere, a Scottish barley landrace, to cultural practices and agricultural inputs. Journal of Agriculture and Environment for International
Development 104, 39-60. Martin, P. & Wishart, J. (2015). Just here for the Bere. Brewer & Distiller International 11, 28-29. Martin, P., Wishart, J., Cromarty, A. & Chang, X. (2008a). Orkney Bere - developing new markets for an old crop. In: Smartt, J. & Haq, N., (eds.) New crops and uses: Their role in a rapidly changing
world, 359-372. Southampton, UK: Centre for Underutilised Crops. Martin, P., Wishart, J., Cromarty, A. & Chang, X. (2009). New markets and supply chains for Scottish Bere barley. In: Veteläinen, M., Negri, V. & Maxted, N., (eds.) European landraces: On-farm
conservation, management and use, 251-263. Rome, Italy: Bioversity International. Martin, P., Wishart, J., Cromarty, A., Chang, X. & Shah, S. (2008b) Developing new markets and supply chains for Bere, a Scottish barley landrace. Plant Genetic Resources for Food & Agriculture
Conference, 2008b The Warwick Enterprise Park, Warwick, UK. AAB, 359-372. Mascher, M., Gundlach, H., Himmelbach, A., Beier, S., Twardziok, S.O., Wicker, T., Radchuk, V., Dockter, C., Hedley, P.E., Russell, J., Bayer, M., Ramsay, L., Liu, H., Haberer, G., Zhang, X.-Q., Zhang, Q.,
Barrero, R.A., Li, L., Taudien, S., Groth, M., Felder, M., Hastie, A., Šimková, H., Staňková, H., Vrána, J., Chan, S., Muñoz-Amatriaín, M., Ounit, R., Wanamaker, S., Bolser, D., Colmsee, C., Schmutzer, T., Aliyeva-Schnorr, L., Grasso, S., Tanskanen, J., Chailyan, A., Sampath, D., Heavens, D., Clissold, L., Cao, S., Chapman, B., Dai, F., Han, Y., Li, H., Li, X., Lin, C., McCooke, J.K., Tan, C., Wang, P., Wang, S., Yin, S., Zhou, G., Poland, J.A., Bellgard, M.I., Borisjuk, L., Houben, A., Doležel, J., Ayling, S., Lonardi, S., Kersey, P., Langridge, P., Muehlbauer, G.J., Clark, M.D.,

References
101
Caccamo, M., Schulman, A.H., Mayer, K.F.X., Platzer, M., Close, T.J., Scholz, U., Hansson, M., Zhang, G., Braumann, I., Spannagl, M., Li, C., Waugh, R. & Stein, N. (2017). A chromosome conformation capture ordered sequence of the barley genome. Nature 544, 427.
Mauch-Mani, B. & Mauch, F. (2005). The role of abscisic acid in plant–pathogen interactions. Current Opinion in Plant Biology 8, 409-414. McDonald, B.A. (2015). How can research on pathogen population biology suggest disease management strategies? The example of barley scald (Rhynchosporium commune). Plant Pathology 64,
1005-1013. McDonald, G.K., Graham, R.D., Lloyd, J., Lewis, J., Lonergan, P. & Khabaz-Saberi, H. (2001) Breeding for improved zinc and manganese efficiency in wheat and barley. 10th Australian Agronomy
Conference, 2001 Glen Osmond, Hobart, Australia. Department of Plant Science, Waite Institute. McFarlane, D.J., George, R.J., Barrett-Lennard, E.G. & Gilfedder, M. (2016). Salinity in dryland agricultural systems: Challenges and opportunities. In: Farooq, M. & Siddique, K.H.M., (eds.) Innovations in
dryland agriculture, 521-547. Cham: Springer International Publishing. McGovern, P.E., Zhang, J., Tang, J., Zhang, Z., Hall, G.R., Moreau, R.A., Nunez, A., Butrym, E.D., Richards, M.P., Wang, C.s., Cheng, G., Zhao, Z. & Wang, C. (2004). Fermented beverages of pre- and
proto-historic China. Proceedings of the National Academy of Sciences 101, 17593-17598. McGrann, G.R.D., Stavrinides, A., Russell, J., Corbitt, M.M., Booth, A., Chartrain, L., Thomas, W.T.B. & Brown, J.K.M. (2014). A trade off between mlo resistance to powdery mildew and increased
susceptibility of barley to a newly important disease, Ramularia leaf spot. Journal of Experimental Botany 65, 1025-1037. McMahon, T.A., Halstead, N.T., Johnson, S., Raffel, T.R., Romansic, J.M., Crumrine, P.W. & Rohr, J.R. (2012). Fungicide-induced declines of freshwater biodiversity modify ecosystem functions and
services. Ecology Letters 15, 714-722. Mengel, K. & Kirkby, E.A. (2001). Principles of plant nutrition, Berlin, Germany, Springer Science & Business Media. Mengiste, T., Chen, X., Salmeron, J. & Dietrich, R. (2003). The BOTRYTIS SUSCEPTIBLE1 gene encodes an R2R3MYB transcription factor protein that is required for biotic and abiotic stress responses in
Arabidopsis. The Plant Cell 15, 2551-2565. Mian, A., Oomen, R.J.F.J., Isayenkov, S., Sentenac, H., Maathuis, F.J.M. & Véry, A.-A. (2011). Over-expression of an Na+- and K+-permeable HKT transporter in barley improves salt tolerance. The Plant
Journal 68, 468-479. Mickelbart, M.V., Hasegawa, P.M. & Bailey-Serres, J. (2015). Genetic mechanisms of abiotic stress tolerance that translate to crop yield stability. Nature Reviews Genetics 16, 237. Mikkelsen, B.L., Jørgensen, R.B. & Lyngkjær, M.F. (2015a). Complex interplay of future climate levels of CO2, ozone and temperature on susceptibility to fungal diseases in barley. Plant Pathology 64,
319-327. Mikkelsen, B.L., Olsen, C.E. & Lyngkjær, M.F. (2015b). Accumulation of secondary metabolites in healthy and diseased barley, grown under future climate levels of CO2, ozone and temperature.
Phytochemistry 118, 162-173. Miklas, P.N., Coyne, D.P., Grafton, K.F., Mutlu, N., Reiser, J., Lindgren, D.T. & Singh, S.P. (2003). A major QTL for common bacterial blight resistance derives from the common bean great northern
landrace cultivar Montana No.5. Euphytica 131, 137-146. Millaleo, R., Reyes- Diaz, M., Ivanov, A.G., Mora, M.L. & Alberdi, M. (2010). Manganese as essential and toxic element or plants: transport, accumulation and resistance mechanisms. Journal of Soil
Science and Plant Nutrition 10, 476-494. Minhas, P.S., Rane, J. & Pasala, R.K. (2017). Abiotic stresses in agriculture: An overview. In: Minhas, P.S., Rane, J. & Pasala, R.K., (eds.) Abiotic stress management for resilient agriculture, 3-8.
Singapore: Springer Singapore. Mithöfer, A., Schulze, B. & Boland, W. (2004). Biotic and heavy metal stress response in plants: Evidence for common signals. FEBS Letters 566, 1-5. Mittler, R. (2006). Abiotic stress, the field environment and stress combination. Trends in Plant Science 11, 15-19. Miyakawa, T., Hatano, K.-i., Miyauchi, Y., Suwa, Y.-i., Sawano, Y. & Tanokura, M. (2014). A secreted protein with plant-specific Cysteine-Rich Motif functions as a Mannose-Binding Lectin that exhibits
antifungal activity. Plant Physiology 166, 766-778. Miyazaki, J., Rivandi, J., Hrmova, M., Pallotta, M., Tester, M. & Collins, N.C. (2010). A SOS3 homologue maps to HvNax4, a barley locus controlling an environmentally sensitive Na+ exclusion trait.
Journal of Experimental Botany 62, 1201-1216. Mizyed, N. (2009). Impacts of climate change on water resources availability and agricultural water demand in the West Bank. Water Resources Management 23, 2015-2029. Moles, T.M., Pompeiano, A., Huarancca Reyes, T., Scartazza, A. & Guglielminetti, L. (2016). The efficient physiological strategy of a tomato landrace in response to short-term salinity stress. Plant
Physiology and Biochemistry 109, 262-272. Monteagudo, A., Casas, A.M., Cantalapiedra, C.P., Contreras-Moreira, B., Gracia, M.P. & Igartua, E. (2019). Harnessing novel diversity from landraces to improve an elite barley variety. Frontiers in
Plant Science 10. DOI: 10.3389/fpls.2019.00434. Morton, L.W., Hobbs, J., Arbuckle, J.G. & Loy, A. (2015). Upper Midwest climate variations: Farmer responses to excess water risks. Journal of Environmental Quality 44, 810-822. Mosher, S., Seybold, H., Rodriguez, P., Stahl, M., Davies, K.A., Dayaratne, S., Morillo, S.A., Wierzba, M., Favery, B., Keller, H., Tax, F.E. & Kemmerling, B. (2013). The tyrosine-sulfated peptide receptors
PSKR1 and PSY1R modify the immunity of Arabidopsis to biotrophic and necrotrophic pathogens in an antagonistic manner. The Plant Journal 73, 469-482. Mostek, A., Börner, A., Badowiec, A. & Weidner, S. (2015). Alterations in root proteome of salt-sensitive and tolerant barley lines under salt stress conditions. Journal of Plant Physiology 174, 166-176. Mugai, E.N. (2004). Salinity characterization of the Kenyan saline soils. Soil Science and Plant Nutrition 50, 181-188. Muhammad, N., Cai, S., Shah, J.M. & Zhang, G. (2016). The combined treatment of Mn and Al alleviates the toxicity of Al or Mn stress alone in barley. Acta Physiologiae Plantarum 38, 277. Munns, R. (2002). Comparative physiology of salt and water stress. Plant, Cell & Environment 25, 239-250. Munns, R. (2009). Strategies for crop improvement in saline soils. In: Ashraf, M., Ozturk, M. & Athar, H.R., (eds.) Salinity and water stress: Improving crop efficiency, 99-110. Dordrecht: Springer
Netherlands. Munns, R. & Gilliham, M. (2015). Salinity tolerance of crops – what is the cost? New Phytologist 208, 668-673. Munns, R., James, R.A. & Läuchli, A. (2006). Approaches to increasing the salt tolerance of wheat and other cereals. Journal of Experimental Botany 57, 1025-1043. Munns, R., Schachtman, D.P. & Condon, A.G. (1995). The significance of a two-phase growth response to salinity in wheat and barley. Australian Journal of Plant Physiology 22, 561-569. Munns, R. & Tester, M. (2008). Mechanisms of salinity tolerance. Annual Review of Plant Biology 59, 651-681. Muñoz-Amatriaín, M., Cuesta-Marcos, A., Hayes, P.M. & Muehlbauer, G.J. (2014). Barley genetic variation: Implications for crop improvement. Briefings in Functional Genomics 13, 341-350. Muñoz-Perea, C.G., Terán, H., Allen, R.G., Wright, J.L., Westermann, D.T. & Singh, S.P. (2006). Selection for drought resistance in dry bean landraces and cultivars. Crop Science 46, 2111-2120. Murray, G.M. & Brennan, J.P. (2010). Estimating disease losses to the Australian barley industry. Australasian Plant Pathology 39, 85-96. Nadeem, M.A., Nawaz, M.A., Shahid, M.Q., Doğan, Y., Comertpay, G., Yıldız, M., Hatipoğlu, R., Ahmad, F., Alsaleh, A., Labhane, N., Özkan, H., Chung, G. & Baloch, F.S. (2018). DNA molecular markers in
plant breeding: Current status and recent advancements in genomic selection and genome editing. Biotechnology & Biotechnological Equipment 32, 261-285. Nadel, D., Piperno, D.R., Holst, I., Snir, A. & Weiss, E. (2012). New evidence for the processing of wild cereal grains at Ohalo II, a 23000-year-old campsite on the shore of the Sea of Galilee, Israel.
Antiquity 86, 990-1003. Negrão, S., Courtois, B., Ahmadi, N., Abreu, I., Saibo, N. & Oliveira, M.M. (2011). Recent updates on salinity stress in rice: From physiological to molecular responses. Critical Reviews in Plant Sciences
30, 329-377. Negri, V., Maxted, N. & Veteläinen, M. (2009). European landrace conservation: An introduction. In: Veteläinen, M., Negri, V. & Maxted, N., (eds.) European landraces: On-farm conservation,
management and use, 1-23. Rome, Italy: Bioversity International. Neilsen, D., Neilsen, G.H., Sinclair, A.H. & Linehan, D.J. (1992). Soil phosphorus status, pH and the manganese nutrition of wheat. Plant and Soil 145, 45-50. Nelson, G.C., Rosegrant, M.W., Palazzo, A., Gray, I., Ingersoll, C., Robertson, R.D., Tokgoz, S., Zhu, T., Sulser, T.B., Ringler, C., Msangi, S. & You, L. (2010). Food security, farming, and climate change to
2050, Washington, D.C., USA, International Food Policy Research Institute (IFPRI). Newman, C.W. & Newman, R.K. (2006). A Brief History of Barley Foods. Cereal Foods World 51, 4-7. Newman, R.K. & Newman, C.W. (2008). Barley for food and health: Science, technology, and products, Hoboken, NJ, Wiley-Blackwell. Newton, A.C., Akar, T., Baresel, J.P., Bebeli, P.J., Bettencourt, E., Bladenopoulos, K.V., Czembor, J.H., Fasoula, D.A., Katsiotis, A., Koutis, K., Koutsika-Sotiriou, M., Kovacs, G., Larsson, H., de Carvalho,
M.A.A.P., Rubiales, D., Russell, J., Dos Santos, T.M.M. & Vaz Patto, M.C. (2010). Cereal landraces for sustainable agriculture, a review. Agronomy for Sustainable Development 30, 237-269.
Newton, A.C., Flavell, A.J., George, T.S., Leat, P., Mullholland, B., Ramsay, L., Revoredo-Giha, C., Russell, J., Steffenson, B.J., Swanston, J.S., Thomas, W.T.B., Waugh, R., White, P.J. & Bingham, I.J. (2011a). Crops that feed the world 4. Barley: a resilient crop? Strengths and weaknesses in the context of food security. Food Security 3, 141.
Newton, A.C., Johnson, S.N. & Gregory, P.J. (2011b). Implications of climate change for diseases, crop yields and food security. Euphytica 179, 3-18. Newton, A.C., Johnson, S.N., Lyon, G.D., Hopkins, D.W. & Gregory, P.J. (2008) Impacts of climate change on arable crops – adaptation challenges. Crop Protection in Northern Britain, 2008 Dundee,
Scotland. Newton, A.C., Torrance, L., Holden, N., Toth, I.K., Cooke, D.E.L., Blok, V. & Gilroy, E.M. (2012). Climate change and defense against pathogens in plants. In: Gadd, G.M. & Sariaslani, S., (eds.) Advances in
applied microbiology, 89-132. Academic Press. Newton, A.C. & Young, I.M. (1996). Temporary partial breakdown of Mlo-resistance in spring barley by the sudden relief of soil water stress. Plant Pathology 45, 973-977. NFU & BBPA. (2013). Grain to glass: Beer and Britain’s rural economy [Online]. NFU Online. Available: https://www.nfuonline.com/grain-to-glass-report/ [Accessed 18 August 2015]. Ning, Y. & Wang, G.-L. (2018). Breeding plant broad-spectrum resistance without yield penalties. Proceedings of the National Academy of Sciences 115, 2859-2861. Oerke, E.C. (2005). Crop losses to pests. The Journal of Agricultural Science 144, 31-43. Okamura, E. & Hirai, M.Y. (2017). Novel regulatory mechanism of serine biosynthesis associated with 3-phosphoglycerate dehydrogenase in Arabidopsis thaliana. Scientific Reports 7, 3533. Oliver, R.P. & Ipcho, S.V.S. (2004). Arabidopsis pathology breathes new life into the necrotrophs-vs.-biotrophs classification of fungal pathogens. Molecular Plant Pathology 5, 347-352. Ono, T.-a., Noguchi, T., Inoue, Y., Kusunoki, M., Matsushita, T. & Oyanagi, H. (1992). X-ray detection of the period-four cycling of the manganese cluster in photosynthetic water oxidizing enzyme.
Science 258, 1335-1337. Osman, K.T. (2018). Saline and sodic soils. In: Osman, K.T., (ed.) Management of soil problems, 255-298. Cham: Springer International Publishing. Ovaska, U. & Soini, K. (2016). Local breeds – Rural heritage or new market opportunities? Colliding views on the conservation and sustainable use of landraces. Sociologia Ruralis, 709-729. País, S.M., Téllez-Iñón, M.T. & Capiati, D.A. (2009). Serine/threonine protein phosphatases type 2A and their roles in stress signaling. Plant Signaling & Behavior 4, 1013-1015. Pallotta, M.A., Asayama, S., Reinheimer, J.M., Davies, P.A., Barr, A.R., Jefferies, S.P., Chalmers, K.J., Lewis, J., Collins, H.M., Roumeliotis, S., Logue, S.J., Coventry, S.J., Lance, R.C.M., Karakousis, A., Lim,
P., Verbyla, A.P. & Eckermann, P.J. (2003). Mapping and QTL analysis of the barley population Amagi Nijo× WI2585. Australian Journal of Agricultural Research 54, 1141-1144. Pallotta, M.A., Graham, R.D., Langridge, P., Sparrow, D.H.B. & Barker, S.J. (2000). RFLP mapping of manganese efficiency in barley. Theoretical and Applied Genetics 101, 1100-1108.

References
102
Pandey, M., Wagner, C., Friedt, W. & Ordon, F. (2006). Genetic relatedness and population differentiation of Himalayan hulless barley (Hordeum vulgare L.) landraces inferred with SSRs. Theoretical
and Applied Genetics 113, 715-729. Pandey, P., Irulappan, V., Bagavathiannan, M.V. & Senthil-Kumar, M. (2017). Impact of combined abiotic and biotic stresses on plant growth and avenues for crop improvement by exploiting physio-
morphological traits. Frontiers in Plant Science 8. DOI: 10.3389/fpls.2017.00537. Pandya, D.H., Mer, R.K., Prajith, P.K. & Pandey, A.N. (2005). Effect of salt stress and manganese supply on growth of barley seedlings. Journal of Plant Nutrition 27, 1361-1379. Pannell, D.J. & Ewing, M.A. (2006). Managing secondary dryland salinity: Options and challenges. Agricultural Water Management 80, 41-56. Paranychianakis, N.V. & Chartzoulakis, K.S. (2005). Irrigation of Mediterranean crops with saline water: From physiology to management practices. Agriculture, Ecosystems & Environment 106, 171-
187. Parihar, P., Singh, S., Singh, R., Singh, V.P. & Prasad, S.M. (2015). Effect of salinity stress on plants and its tolerance strategies: A review. Environmental Science and Pollution Research 22, 4056-4075. Parzies, H.K., Spoor, W. & Ennos, R.A. (2000). Genetic diversity of barley landrace accessions (Hordeum vulgare ssp. vulgare) conserved for different lengths of time in ex situ gene banks. Heredity 84,
476-486. Pastori, G.M. & Foyer, C.H. (2002). Common components, networks, and pathways of cross-tolerance to stress. The central role of “Redox” and abscisic acid-mediated controls. Plant Physiology 129,
460-468. Paulitz, T.C. & Steffenson, B.J. (2010). Biotic stress in barley: Disease problems and solutions. In: Ullrich, S.E., (ed.) Barley: Production, improvement and uses, 307-354. Hoboken, NJ: Wiley-Blackwell. Paveley, N., Fitt, B., Oxley, S.J.P., Bingham, I.J., Cockerell, V., Edwards, C., Dodgson, G., Gosling, P., Nicholls, C., Watts, J., Boys, E. & Geary, F. (2016). Barley disease management guide. In: AHDB (ed.).
Warwickshire, UK: Agriculture and Horticulture Development Board Cereals & Oilseeds. Pedas, P., Hebbern, C.A., Schjoerring, J.K., Holm, P.E. & Husted, S. (2005). Differential capacity for high-affinity manganese uptake contributes to differences between barley genotypes in tolerance to
low manganese availability. Plant Physiology 139, 1411-1420. Pedas, P., Ytting, C.K., Fuglsang, A.T., Jahn, T.P., Schjoerring, J.K. & Husted, S. (2008). Manganese efficiency in barley: identification and characterization of the metal ion transporter HvIRT1. Plant
Physiology 148, 455-466. Penselin, D., Münsterkötter, M., Kirsten, S., Felder, M., Taudien, S., Platzer, M., Ashelford, K., Paskiewicz, K.H., Harrison, R.J., Hughes, D.J., Wolf, T., Shelest, E., Graap, J., Hoffmann, J., Wenzel, C.,
Wöltje, N., King, K.M., Fitt, B.D.L., Güldener, U., Avrova, A. & Knogge, W. (2016). Comparative genomics to explore phylogenetic relationship, cryptic sexual potential and host specificity of Rhynchosporium species on grasses. BMC Genomics 17, 953.
Pereira, A. (2016). Plant abiotic stress challenges from the changing environment. Frontiers in Plant Science 7, 1123. Pérez, W., Ñahui, M., Ellis, D. & Forbes, G.A. (2014). Wide phenotypic diversity for resistance to Phytophthora infestans found in potato landraces from Peru. Plant Disease 98, 1530-1533. Pflieger, S., Lefebvre, V. & Causse, M. (2001). The candidate gene approach in plant genetics: A review. Molecular Breeding 7, 275-291. Pickering, R., Ruge-Wehling, B., Johnston, P.A., Schweizer, G., Ackermann, P. & Wehling, P. (2006). The transfer of a gene conferring resistance to scald (Rhynchosporium secalis) from Hordeum
bulbosum into H. vulgare chromosome 4HS. Plant Breeding 125, 576-579. Pires, E. & Brányik, T. (2015). Biochemistry of beer fermentation, Cham, Switzerland, Springer International Publishing. Poage, M., Le Martret, B., Jansen, M.A.K., Nugent, G.D. & Dix, P.J. (2011). Modification of reactive oxygen species scavenging capacity of chloroplasts through plastid transformation. Plant Molecular
Biology 76, 371-384. Poets, A.M., Fang, Z., Clegg, M.T. & Morrell, P.L. (2015). Barley landraces are characterized by geographically heterogeneous genomic origins. Genome Biology 16, 173. Porter, D.R., Mornhinweg, D.W. & Webster, J.A. (1998). Insect resistance in barley germplasm. In: Clement, S.L. & Quisenberry, S.S., (eds.) Global plant genetic resources for insect-resistant crops, 51-
62. Boca Raton, Florida, United States: CRC Press. Porter, G.S., Bajita-Locke, J.B., Hue, N.V. & Strand, D. (2004). Manganese solubility and phytotoxicity affected by soil moisture, oxygen levels, and green manure additions. Communications in Soil
Science and Plant Analysis 35, 99-116. Poschenrieder, C., Tolrà, R. & Barceló, J. (2006). Can metals defend plants against biotic stress? Trends in Plant Science 11, 288-295. Poulsen, D.M.E. & Lance, R.C.M. (2010). Barley Breeding History, Progress, Objectives, and technology - Australia. In: Ullrich, S.E., (ed.) Barley: production, improvement and uses, 186-210. Hoboken,
NJ: Wiley-Blackwell. Pour Aboughadareh, A., Naghavi, M.R. & Khalili, M. (2013). Water deficit stress tolerance in some of barley genotypes and landraces under field conditions. Notulae Scientia Biologicae 5, 249-255. Prasad, P.V.V., Pisipati, S.R., Momčilović, I. & Ristic, Z. (2011). Independent and combined effects of high temperature and drought stress during grain filling on plant yield and chloroplast EF-Tu
expression in spring wheat. Journal of Agronomy and Crop Science 197, 430-441. Raboanatahiry, N.H., Lu, G. & Li, M. (2015). Computational prediction of acyl-coA binding proteins structure in Brassica napus. PloS one 10, e0129650-e0129650. Rai, M.K., Kalia, R.K., Singh, R., Gangola, M.P. & Dhawan, A.K. (2011). Developing stress tolerant plants through in vitro selection—An overview of the recent progress. Environmental and Experimental
Botany 71, 89-98. Ramagopal, S. (1987). Salinity stress induced tissue-specific proteins in barley seedlings. Plant Physiology 84, 324-331. Ramegowda, V. & Senthil-Kumar, M. (2015). The interactive effects of simultaneous biotic and abiotic stresses on plants: Mechanistic understanding from drought and pathogen combination. Journal
of Plant Physiology 176, 47-54. Rawson, H.M., Richards, R.A. & Munns, R. (1988). An examination of selection criteria for salt tolerance in wheat, barley and triticale genotypes. Australian Journal of Agricultural Research 39, 759-
772. Reid, A.S.J. & Webster, G.R. (1969). The Manganese status of some Alberta soils. Canadian Journal of Soil Science 49, 143-150. Renfrew, J.M. (1969). The archaeological evidence for the domestication of plants: Methods and problems. In: Ucko, P.J. & Dimbleby, G.W., (eds.) The domestication and exploitation of plants and
animals, 149-172. Piscataway, NJ: Transaction Publishers. Rengasamy, P. (2006). World salinization with emphasis on Australia. Journal of Experimental Botany 57, 1017-1023. Rengel, Z. (2011). Soil pH, soil health and climate change. In: Pal Singh, B., Cowie, A.L. & Chan, K.Y., (eds.) Soil health and climate change, 69-85. Berlin, Germany: Springer. Rengel, Z. (2015). Availability of Mn, Zn and Fe in the rhizosphere. Journal of soil science and plant nutrition 15, 397-409. Rentsch, D., Schmidt, S. & Tegeder, M. (2007). Transporters for uptake and allocation of organic nitrogen compounds in plants. FEBS Letters 581, 2281-2289. Requena, L. & Bornemann, S. (1999). Barley (Hordeum vulgare) oxalate oxidase is a manganese-containing enzyme. Biochemical Journal 343, 185-190. Reuter, D.J., Alston, A.M. & McFarlane, J.D. (1988). Occurrence and correction of manganese deficiency in plants. In: Graham, R.D., Hannam, R.J. & Uren, N.C., (eds.) Manganese in Soils and Plants:
Proceedings of the International Symposium on ‘Manganese in Soils and Plants’ held at the Waite Agricultural Research Institute, The University of Adelaide, Glen Osmond, South
Australia, August 22–26, 1988 as an Australian Bicentennial Event, 205-224. Dordrecht: Springer Netherlands. Reuter, D.J., Edwards, D.G. & Wilhelm, N.S. (1997). Temperate and tropical crops. In: Reuter, D.J. & Robinson, J.B., (eds.) Plant analysis: An interpretation manual, 81-279. Victoria, Australia: CSIRO
Publishing. Reuter, D.J., Heard, T.G. & Alston, A.M. (1973). Correction of manganese deficiency in barley crops on calcareous soils. 1. Manganous sulphate applied at sowing and as foliar sprays. Australian Journal
of Experimental Agriculture and Animal Husbandry 13, 434-439. Rimbert, H., Darrier, B., Navarro, J., Kitt, J., Choulet, F., Leveugle, M., Duarte, J., Rivière, N., Eversole, K., on behalf of The International Wheat Genome Sequencing, C., Le Gouis, J., on behalf The
BreedWheat, C., Davassi, A., Balfourier, F., Le Paslier, M.-C., Berard, A., Brunel, D., Feuillet, C., Poncet, C., Sourdille, P. & Paux, E. (2018). High throughput SNP discovery and genotyping in hexaploid wheat. PLOS ONE 13, e0186329.
Ríos, M.O., Fernández, P. & Carmona, M. (2007). Detection of Rhynchosporium secalis in barley seeds from Argentina through polymerase chain reaction technique. Fitopatologia Brasileira 32, 415-418.
Riu-Bosoms, C., Calvet-Mir, L. & Reyes-García, V. (2014). Factors enhancing landrace in Situ conservation in home gardens and fields in Vall De Go´ Sol, Catalan Pyrenees, Iberian Peninsula. Journal of
Ethnobiology and Ethnomedicine 34, 175–194. Rizhsky, L., Liang, H., Shuman, J., Shulaev, V., Davletova, S. & Mittler, R. (2004). When defense pathways collide. The response of Arabidopsis to a combination of drought and heat stress. Plant
Physiology 134, 1683-1696. Robbertse, B., Lennox, C.L., van Jaarsveld, A.B., Crous, P.W. & van der Rijst, M. (2000). Pathogenicity of the Rhynchosporium secalis population in the Western Cape province of South Africa. Euphytica
115, 75-82. Robert-Seilaniantz, A., Grant, M. & Jones, J.D.G. (2011). Hormone crosstalk in plant disease and defense: More than just jasmonate-salicylate antagonism. Annual Review of Phytopathology 49, 317-
343. Rodziewicz, P., Swarcewicz, B., Chmielewska, K., Wojakowska, A. & Stobiecki, M. (2014). Influence of abiotic stresses on plant proteome and metabolome changes. Acta Physiologiae Plantarum 36, 1-
19. Rogers, E.E. & Guerinot, M.L. (2002). FRD3, a member of the multidrug and toxin efflux family, controls Iron deficiency responses in Arabidopsis. The Plant Cell 14, 1787-1799. Roy, S.J., Negrão, S. & Tester, M. (2014). Salt resistant crop plants. Current Opinion in Biotechnology 26, 115-124. Saade, S., Maurer, A., Shahid, M., Oakey, H., Schmöckel, S.M., Negrão, S., Pillen, K. & Tester, M. (2016). Yield-related salinity tolerance traits identified in a nested association mapping (NAM)
population of wild barley. Scientific Reports 6, 32586. Sahagian, D. (2000). Global physical effects of anthropogenic hydrological alterations: sea level and water redistribution. Global and Planetary Change 25, 39-48. Samarah, N.H. (2005). Effects of drought stress on growth and yield of barley. Agronomy for Sustainable Development 25, 145-149. SASA. (2015). Bere barley [Online]. The Scottish Government. Available: http://www.sasa.gov.uk/plant-variety-testing/scottish-landraces/scottish-landrace-protection-scheme-slps/bere-barley
[Accessed 21 September 2015]. Scheuerman, R.D. & McGregor, A.C. (2013). Harvest heritage: Agricultural origins and heirloom crops of the Pacific Northwest, Pullman, WA, Washington State University Press. Schilling, R.K., Marschner, P., Shavrukov, Y., Berger, B., Tester, M., Roy, S.J. & Plett, D.C. (2014). Expression of the Arabidopsis vacuolar H+-pyrophosphatase gene (AVP1) improves the shoot biomass of
transgenic barley and increases grain yield in a saline field. Plant Biotechnology Journal 12, 378-386. Schmidt, S.B., George, T.S., Brown, L.K., Booth, A., Wishart, J., Hedley, P.E., Martin, P., Russell, J. & Husted, S. (2018). Ancient barley landraces adapted to marginal soils demonstrate exceptional
tolerance to micronutrient limitation. Annals of Botany 123, 831-843. Schmidt, S.B., Jensen, P.E. & Husted, S. (2016a). Manganese deficiency in plants: The impact on photosystem II. Trends in Plant Science 21, 622-632.
References
103
Schmidt, S.B., Pedas, P., Laursen, K.H., Schjoerring, J.K. & Husted, S. (2013). Latent manganese deficiency in barley can be diagnosed and remediated on the basis of chlorophyll a fluorescence measurements. Plant Soil 372, 417-429.
Schmidt, S.B., Persson, D.P., Powikrowska, M., Frydenvang, J., Schjoerring, J.K., Jensen, P.E. & Husted, S. (2015). Metal binding in Photosystem II super- and subcomplexes from barley thylakoids. Plant
Physiology 168, 1490-1502. Schmidt, S.B., Powikrowska, M., Krogholm, K.S., Naumann-Busch, B., Schjoerring, J.K., Husted, S., Jensen, P.E. & Pedas, P.R. (2016b). Photosystem II functionality in barley responds dynamically to
changes in leaf manganese status. Frontiers in Plant Science 7, 1772. Scholten, M., Maxted, N. & Ford-Lloyd, B. (2004). UK national inventory of plant genetic resources for food and agriculture. Birmingham, UK: School of Biosciences, University of Birmingham. Schumann, G.L. & D'Arcy, C.J. (2006). Essential plant pathology, St. Paul, American Phytopathological Society (APS Press). Seherm, H. & Coakley, S.M. (2003). Plant pathogens in a changing world. Australasian Plant Pathology 32, 157-165. Seigneurin-Berny, D., Gravot, A., Auroy, P., Mazard, C., Kraut, A., Finazzi, G., Grunwald, D., Rappaport, F., Vavasseur, A., Joyard, J., Richaud, P. & Rolland, N. (2006). HMA1, a new Cu-ATPase of the
chloroplast envelope, is essential for growth under adverse light conditions. Journal of Biological Chemistry 281, 2882-2892. Setter, T.L. & Waters, I. (2003). Review of prospects for germplasm improvement for waterlogging tolerance in wheat, barley and oats. Plant and Soil 253, 1-34. Sha Valli Khan, P.S., Nagamallaiah, G.V., Dhanunjay Rao, M., Sergeant, K. & Hausman, J.F. (2014). Chapter 2 - Abiotic Stress tolerance in plants: Insights from proteomics. In: Ahmad, P. & Rasool, S.,
(eds.) Emerging technologies and management of crop stress tolerance, 23-68. San Diego: Academic Press. Shahbaz, M. & Ashraf, M. (2013). Improving salinity tolerance in cereals. Critical Reviews in Plant Sciences 32, 237-249. Sharma, R.C., Duveiller, E. & Ortiz-Ferrara, G. (2007). Progress and challenge towards reducing wheat spot blotch threat in the Eastern Gangetic Plains of South Asia: Is climate change already taking its
toll? Field Crops Research 103, 109-118. Shavrukov, Y., Gupta, N.K., Miyazaki, J., Baho, M.N., Chalmers, K.J., Tester, M., Langridge, P. & Collins, N.C. (2010). HvNax3—a locus controlling shoot sodium exclusion derived from wild barley
(Hordeum vulgare ssp. spontaneum). Functional & Integrative Genomics 10, 277-291. Shen, J., Yuan, L., Zhang, J., Li, H., Bai, Z., Chen, X., Zhang, W. & Zhang, F. (2011). Phosphorus dynamics: From soil to plant. Plant physiology 156, 997-1005. Shen, Y., Conde E Silva, N., Audonnet, L., Servet, C., Wei, W. & Zhou, D.-X. (2014). Over-expression of histone H3K4 demethylase gene JMJ15 enhances salt tolerance in Arabidopsis. Frontiers in plant
science 5, 290-290. Shewayrga, H. & Sopade, P.A. (2011). Ethnobotany, diverse food uses, claimed health benefits and implications on conservation of barley landraces in North Eastern Ethiopia highlands. Journal of
Ethnobiology and Ethnomedicine 7, 19. Shinozaki, K., Uemura, M., Bailey-Serres, J., Bray, E.A. & Weretilnyk, E. (2015). Responses to abiotic stress. In: Buchanan, B.B., Gruissem, W. & Jones, R.L., (eds.) Biochemistry and molecular biology of
plants, 2 ed, 1051-1100. Hoboken, New Jersey, USA: John Wiley & Sons. Shu, Q.Y., Forster, B.P. & Nakagawa, H. (2012). Plant mutation breeding and biotechnology, Oxfordshire, UK, CAB International. Shuman, L. (1998). Micronutrient fertilizers. Journal of Crop Production 1, 165-195. Siahsar, b.a. & Narouei, M. (2010). Mapping QTLs of physiological traits associated with salt tolerance in 'Steptoe'×'Morex'doubled haploid lines of barley at seedling stage. Journal of Food Agriculture
and Environment 88, 751-759. Sicard, D. & Legras, J.-L. (2011). Bread, beer and wine: Yeast domestication in the Saccharomyces sensu stricto complex. Comptes Rendus Biologies 334, 229-236. Silva, C.M.S., Zhang, C., Habermann, G., Delhaize, E. & Ryan, P.R. (2018). Does the major aluminium-resistance gene in wheat, TaALMT1, also confer tolerance to alkaline soils? Plant and Soil 424, 451-
462. Silvar, C., Casas, A.M., Igartua, E., Ponce-Molina, L.J., Gracia, M.P., Schweizer, G., Herz, M., Flath, K., Waugh, R., Kopahnke, D. & Ordon, F. (2011). Resistance to powdery mildew in Spanish barley
landraces is controlled by different sets of quantitative trait loci. Theoretical and Applied Genetics 123, 1019-1028. Silvar, C., Casas, A.M., Kopahnke, D., Habekuß, A., Schweizer, G., Gracia, M.P., Lasa, J.M., Ciudad, F.J., Molina-Cano, J.L., Igartua, E. & Ordon, F. (2010). Screening the Spanish barley core collection for
disease resistance. Plant Breeding 129, 45-52. Sinclair, T.R. (1992). Mineral nutrition and plant growth response to climate change. Journal of Experimental Botany 43, 1141-1146. Skelsey, P. & Newton, A.C. (2015). Future environmental and geographic risks of Fusarium head blight of wheat in Scotland. European Journal of Plant Pathology 142, 133-147. Sneep, J., Hendriksen, A.J.T. & Holbek, O. (1979). Plant breeding perspectives: Centennial publication of Koninklijk Kweekbedrijf en Zaadhandel D. J. van der Have 1879-1979, Wageningen, Centre for
Agricultural Publishing and Documentation. Snir, A., Nadel, D., Groman-Yaroslavski, I., Melamed, Y., Sternberg, M., Bar-Yosef, O. & Weiss, E. (2015). The origin of cultivation and proto-weeds, long before neolithic farming. PLoS ONE 10,
e0131422. Socha, A. & Guerinot, M.L. (2014). Mn-euvering manganese: the role of transporter gene family members in manganese uptake and mobilization in plants. Frontiers in Plant Science 5. DOI:
10.3389/fpls.2014.00106. Southworth, C.L. (2007). The use of microsatellite markers to differentiate UK barley (Hordeum vulgare) varieties and in the population genetic analysis of bere barley from the Scottish islands. PhD,
Heriot Watt University & The Scottish Agricultural Science Agency. Steenbjerg, F. (1935) Published. The exchangeable manganese in Danish soils and its relation to plant growth. Proceedings of the Third International Congress of Soil Science, 1935 Oxford, UK. 198-
201. Stefansson, T.S., McDonald, B.A. & Willi, Y. (2013). Local adaptation and evolutionary potential along a temperature gradient in the fungal pathogen Rhynchosporium commune. Evolutionary
Applications 6, 524-534. Steffens, D., Hütsch, B.W., Eschholz, T., Lošák, T. & Schubert, S. (2005). Water logging may inhibit plant growth primarily by nutrient deficiency rather than nutrient toxicity. Plant, Soil and Environment
51, 545–552. Steffenson, B.J. & Jin, Y. (2006). Resistance to race TTKS of Puccinia graminis f. sp. tritici in barley. Phytopathology 96, S110. Stølen, O. & Andersen, S. (1978). Inheritance of tolerance to low soil pH in barley. Hereditas 88, 101-105. Stordeur, D. & Willcox, G. (2009). Indices de culture et d’utilisation des céréales à Jerf el Ahmar. In: Guilaine, J., (ed.) De Méditerranée et d’Ailleurs: Mélanges Offerts à Jean Guilaine, 693-710.
Toulouse, France: Archives d’Ecologie Préhistorique. Strange, R.N. & Scott, P.R. (2005). Plant disease: A threat to global food security. Annual Review of Phytopathology 43, 83-116. Suzuki, N., Rivero, R.M., Shulaev, V., Blumwald, E. & Mittler, R. (2014). Abiotic and biotic stress combinations. New Phytologist 203, 32-43. Szőllősi, R. (2014). Chapter 3 - Superoxide Dismutase (SOD) and abiotic stress tolerance in plants: An overview. In: Ahmad, P., (ed.) Oxidative damage to plants, 89-129. San Diego: Academic Press. Takeuchi, K. & Fukuyama, T. (2009). Microsatellite fingerprinting of barley scald pathogen, Rhynchosporium secalis, from the Hokuriku and Tohoku districts in Japan and genetic resources of barley
breeding for resistance to its pathogen population. Breeding Science 59, 67-75. Tamás, L., Huttová, J. & Žigová, Z. (1997). Accumulation of stress-proteins in intercellular spaces of barley leaves induced by biotic and abiotic factors. Biologia Plantarum 39, 387-394. Tardy, F., Créach, A. & Havaux, M. (1998). Photosynthetic pigment concentration, organization and interconversions in a pale green Syrian landrace of barley (Hordeum vulgare L., Tadmor) adapted to
harsh climatic conditions. Plant, Cell and Environment 21, 479-489. Tavakkoli, E., Rengasamy, P. & McDonald, G.K. (2010). The response of barley to salinity stress differs between hydroponic and soil systems. Functional Plant Biology 37, 621-633. Tekauz, A. (1991). Pathogenic variation in Rhynchosporium secalis on barley in Canada. Canadian Journal of Plant Pathology 13, 298-304. Tisdale, S.L. & Nelson, W.L. (1956). Soil fertility and fertilizers, New York, USA, The MacMillan Company. Tong, Y., Rengel, Z. & Graham, R.D. (1997). Interactions between nitrogen and manganese nutrition of barley genotypes differing in manganese efficiency. Annals of Botany 79, 53-58. Tsuda, Y., Matsuo, M., Egawa, M., Agematsu, J. & Osada, T. (1979). Breeding of a new malting barley cultivar Amagi Nijo. Takasaki, Japan: Research Laboratory of Kirin Brewery Co Ltd. Ueda, A., Kathiresan, A., Inada, M., Narita, Y., Nakamura, T., Shi, W., Takabe, T. & Bennett, J. (2004). Osmotic stress in barley regulates expression of a different set of genes than salt stress does.
Journal of Experimental Botany 55, 2213-2218. Umali, D.L. (1993). Irrigation induced salinity: A growing problem for development and the environment. World Bank technical paper ; no. WTP 215. Washington, DC, USA: TheWorld Bank. van de Wiel, C., Schaart, J., Niks, R. & Visser, R. (2010). Traditional plant breeding methods. Wageningen, Netherlands: Wageningen UR Plant Breeding. van Hintum, T. & Menting, F. (2003). Diversity in ex situ genebank collections of barley. In: von Bothmer, R., van Hintum, T., Knüpffer, H. & Sato, K., (eds.) Diversity in Barley (Hordeum vulgare), 247-
257. Elsevier BV. van Leur, J.A.G., Ceccarelli, S. & Grando, S. (1989). Diversity for disease resistance in barley landraces from Syria and Jordan. Plant Breeding 103, 324-335. van Maarschalkerweerd, M. & Husted, S. (2015). Recent developments in fast spectroscopy for plant mineral analysis. Frontiers in Plant Science 6, 169. Velásquez, A.C., Castroverde, C.D.M. & He, S.Y. (2018). Plant–pathogen warfare under changing climate conditions. Current Biology 28, R619-R634. Villa, T.C.C., Maxted, N., Scholten, M. & Ford-Lloyd, B. (2006). Defining and identifying crop landraces. Plant Genetic Resources 3, 373 –384. Visscher, Peter M., Brown, Matthew A., McCarthy, Mark I. & Yang, J. (2012). Five years of GWAS discovery. The American Journal of Human Genetics 90, 7-24. Vleeshouwers, V.G.A.A. & Oliver, R.P. (2014). Effectors as tools in disease resistance breeding against biotrophic, hemibiotrophic, and necrotrophic plant pathogens. Molecular Plant-Microbe
Interactions 27, 196-206. von Bothmer, R. & Komatsuda, T. (2010). Barley origin and related species. In: Ullrich, S.E., (ed.) Barley: Production, improvement and uses, 14-62. Hoboken, NJ: Wiley-Blackwell. von Bothmer, R., Sato, K., Komatsuda, T., Yasuda, S. & Fischbeck, G. (2003). The domestication of cultivated barley. In: Von Bothmer, R., van Hintum, T., Knüpffer, H. & Sato, K., (eds.) Diversity in barley
(Hordeum vulgare), 9-27. Amsterdam, Netherlands: Elsevier Science. von Korff, M., Wang, H., Léon, J. & Pillen, K. (2005). AB-QTL analysis in spring barley. I. Detection of resistance genes against powdery mildew, leaf rust and scald introgressed from wild barley.
Theoretical and Applied Genetics 111, 583-590. Wagner, C., Schweizer, G., Krämer, M., Dehmer-Badani, A.G., Ordon, F. & Friedt, W. (2008). The complex quantitative barley–Rhynchosporium secalis interaction: Newly identified QTL may represent
already known resistance genes. Theoretical and Applied Genetics 118, 113. Walters, D.R. & Boyle, C. (2005). Induced resistance and allocation costs: What is the impact of pathogen challenge? Physiological and Molecular Plant Pathology 66, 40-44. Wang, C., Zhang, L.-J. & Huang, R.-D. (2011). Cytoskeleton and plant salt stress tolerance. Plant signaling & behavior 6, 29-31. Wang, L., Zhu, W., Fang, L., Sun, X., Su, L., Liang, Z., Wang, N., Londo, J.P., Li, S. & Xin, H. (2014a). Genome-wide identification of WRKY family genes and their response to cold stress in Vitis vinifera.
BMC Plant Biology 14, 103.

References
104
Wang, T., Chen, Y., Zhang, M., Chen, J., Liu, J., Han, H. & Hua, X. (2017). Arabidopsis AMINO ACID PERMEASE1 contributes to salt stress-induced proline uptake from exogenous sources. Frontiers in
Plant Science 8. DOI: 10.3389/fpls.2017.02182. Wang, W., Vinocur, B. & Altman, A. (2003). Plant responses to drought, salinity and extreme temperatures: Towards genetic engineering for stress tolerance. Planta 218, 1-14. Wang, W., Zhao, X.Q., Hu, Z.M., Shao, J.F., Che, J., Chen, R.F., Dong, X.Y. & Shen, R.F. (2015). Aluminium alleviates manganese toxicity to rice by decreasing root symplastic Mn uptake and reducing
availability to shoots of Mn stored in roots. Annals of Botany 116, 237-246. Wang, X., Jiang, N., Liu, J., Liu, W. & Wang, G.-L. (2014b). The role of effectors and host immunity in plant-necrotrophic fungal interactions. Virulence 5, 722-732. Waters, B.M., Chu, H.-H., DiDonato, R.J., Roberts, L.A., Eisley, R.B., Lahner, B., Salt, D.E. & Walker, E.L. (2006). Mutations in Arabidopsis Yellow Stripe-Like1 and Yellow Stripe-Like3 reveal their roles in
metal ion homeostasis and loading of metal ions in seeds. Plant Physiology 141, 1446-1458. Webster, R.K. (1980). Sources of resistance in barley to Rhynchosporium secalis. Plant Disease (formerly Plant Disease Reporter) 64, 88-90.
Wei, Q., Xu, J., Liao, L., Li, Y., Wang, H. & Rahim, S.F. (2018). Water salinity should be reduced for irrigation to minimize its risk of increased soil N₂O emissions. International journal of environmental
research and public health 15, 2114. Weltzien, E. & Fischbeck, G. (1990). Performance and variability of local barley landraces in Near-Eastern environments. Plant Breeding 104, 58-67. Wevelsiep, L., Kogel, K.-H. & Knogge, W. (1991). Purification and characterization of peptides from Rhynchosporium secalis inducing necrosis in barley. Physiological and Molecular Plant Pathology 39,
471-482.Wheeler, T. & von Braun, J. (2013). Climate change impacts on global food security. Science 341, 508-513. White, P.J. & Brown, P.H. (2010). Plant nutrition for sustainable development and global health. Annals of Botany 105, 1073-1080. White, P.J. & Greenwood, D.J. (2013). Properties and management of cationic elements for crop growth. In: Gregory, P.J. & Nortcliff, S., (eds.) Soil conditions and plant growth, 160-194. Hoboken, NJ:
Wiley-Blackwell. Whittle, A.M. (1977). Cochliobolus sativus on barley in Scotland. Plant Pathology 26, 67-74. Wicke, B., Smeets, E., Dornburg, V., Vashev, B., Gaiser, T., Turkenburg, W. & Faaij, A. (2011). The global technical and economic potential of bioenergy from salt-affected soils. Energy & Environmental
Science 4, 2669-2681. Widodo, Patterson, J.H., Newbigin, E., Tester, M., Bacic, A. & Roessner, U. (2009). Metabolic responses to salt stress of barley (Hordeum vulgare L.) cultivars, Sahara and Clipper, which differ in salinity
tolerance. Journal of Experimental Botany 60, 4089-4103. Wiese, J., Kranz, T. & Schubert, S. (2004). Induction of pathogen resistance in barley by abiotic stress. Plant Biology 6, 529-536. Wilhelm, N., Graham, R. & Rovira, A. (1988). Application of different sources of manganese sulfate decreases take-all (Gaeumannomyces graminis var. tritici) of wheat grown in a manganese deficient
soil. Australian Journal of Agricultural Research 39, 1-10. Williams, L.E. & Pittman, J.K. (2010). Dissecting pathways involved in manganese homeostasis and stress in higher plant cells. In: Hell, R. & Mendel, R.-R., (eds.) Cell biology of metals and nutrients, 95-
117. Springer Science + Business Media. Wilson, J.B. (1988). The cost of heavy-metal tolerance: An example. Evolution 42, 408-413. Wimmer, M.A., Mühling, K.H., Läuchli, A., Brown, P.H. & Goldbach, H.E. (2003). The interaction between salinity and boron toxicity affects the subcellular distribution of ions and proteins in wheat
leaves. Plant, Cell & Environment 26, 1267-1274. Witcombe, J.R., Hollington, P.A., Howarth, C.J., Reader, S. & Steele, K.A. (2008). Breeding for abiotic stresses for sustainable agriculture. Philosophical Transactions of the Royal Society B: Biological
Sciences 363, 703-716. Wright, I.A., Dalziel, A.J.I., Ellis, R.P. & Hall, S.J.G. (2002). The status of traditional Scottish animal breeds and plant varieties and the implications for biodiversity, Edinburgh, UK, Scottish Executive
Environment and Rural Affairs Department. Wu, D., Yamaji, N., Yamane, M., Kashino-Fujii, M., Sato, K. & Feng Ma, J. (2016). The HvNramp5 transporter mediates uptake of cadmium and manganese, but not iron. Plant Physiology 172, 1899-
1910. Xiao, J., Jin, X., Jia, X., Wang, H., Cao, A., Zhao, W., Pei, H., Xue, Z., He, L., Chen, Q. & Wang, X. (2013). Transcriptome-based discovery of pathways and genes related to resistance against Fusarium
head blight in wheat landrace Wangshuibai. BMC Genomics 14, 197. Xiao, Y., Liu, H., Wu, L., Warburton, M. & Yan, J. (2017). Genome-wide association studies in maize: Praise and stargaze. Molecular Plant 10, 359-374. Xiong, L. & Yang, Y. (2003). Disease resistance and abiotic stress tolerance in rice are inversely modulated by an Abscisic Acid–Inducible Mitogen-Activated Protein Kinase. The Plant Cell 15, 745-759. Xue, D.-w., Zhou, M.-x., Zhang, X.-q., Chen, S., Wei, K., Zeng, F.-r., Mao, Y., Wu, F.-b. & Zhang, G.-p. (2010). Identification of QTLs for yield and yield components of barley under different growth
conditions. Journal of Zhejiang University SCIENCE B 11, 169-176. Xue, W., Yan, J., Zhao, G., Jiang, Y., Cheng, J., Cattivelli, L. & Tondelli, A. (2017). A major QTL on chromosome 7HS controls the response of barley seedling to salt stress in the Nure × Tremois
population. BMC Genetics 18, 79. Yadav, S.K. (2010). Heavy metals toxicity in plants: An overview on the role of glutathione and phytochelatins in heavy metal stress tolerance of plants. South African Journal of Botany 76, 167-179. Yahiaoui, S., Cuesta-Marcos, A., Gracia, M.P., Medina, B., Lasa, J.M., Casas, A.M., Ciudad, F.J., Montoya, J.L., Moralejo, M., Molina-Cano, J.L. & Igartua, E. (2014). Spanish barley landraces outperform
modern cultivars at low-productivity sites. Plant Breeding 133, 218-226. Yahiaoui, S., Igartua, E., Moralejo, M., Ramsay, L., Molina-Cano, J.L., Ciudad, F.J., Lasa, J.M., Gracia, M.P. & Casas, A.M. (2007). Patterns of genetic and eco-geographical diversity in Spanish barleys.
Theoretical and Applied Genetics 116, 271-282. Yang, J., Kloepper, J.W. & Ryu, C.-M. (2009). Rhizosphere bacteria help plants tolerate abiotic stress. Trends in Plant Science 14, 1-4. Yitbarek, S., Berhane, L., Fikadu, A., van Leur, J.A.G., Grando, S. & Ceccarelli, S. (1998). Variation in Ethiopian barley landrace populations for resistance to barley leaf scald and netblotch. Plant
Breeding 117, 419-423. Zaffarano, P.L., McDonald, B.A. & Linde, C.C. (2011). Two new species of rhynchosporium. Mycologia 103, 195-202. Zemanová, V., Pavlík, M., Pavlíková, D. & Tlustoš, P. (2014). The significance of methionine, histidine and tryptophan in plant responses and adaptation to cadmium stress. Plant, Soil and Environment
60, 426-432. Zeng, X.-Q., Luo, X.-M., Wang, Y.-L., Xu, Q.-J., Bai, L.-J., Yuan, H.-J. & Tashi, N. (2014). Transcriptome sequencing in a Tibetan barley landrace with high resistance to powdery mildew. The Scientific
World Journal 2014, 1-9. Zhan, J., Fitt, B.D.L., Pinnschmidt, H.O., Oxley, S.J.P. & Newton, A.C. (2008). Resistance, epidemiology and sustainable management of Rhynchosporium secalis populations on barley. Plant Pathology
57, 1-14. Zhan, J., Yang, L., Zhu, W., Shang, L. & Newton, A.C. (2012). Pathogen populations evolve to greater race complexity in agricultural systems – Evidence from analysis of Rhynchosporium secalis
virulence data. PLOS ONE 7, e38611. Zhang, H., Zhang, J., Wei, P., Zhang, B., Gou, F., Feng, Z., Mao, Y., Yang, L., Zhang, H., Xu, N. & Zhu, J.-K. (2014). The CRISPR/Cas9 system produces specific and homozygous targeted gene editing in rice
in one generation. Plant Biotechnology Journal 12, 797-807. Zheng, L., Fujii, M., Yamaji, N., Sasaki, A., Yamane, M., Sakurai, I., Sato, K. & Ma, J.F. (2011). Isolation and characterization of a barley Yellow Stripe-Like gene, HvYSL5. Plant and Cell Physiology 52, 765-
774. Zheng, S.J. (2010). Crop production on acidic soils: Overcoming aluminium toxicity and phosphorus deficiency. Annals of Botany 106, 183-184. Zhou, G., Johnson, P., Ryan, P.R., Delhaize, E. & Zhou, M. (2012a). Quantitative trait loci for salinity tolerance in barley (Hordeum vulgare L.). Molecular Breeding 29, 427-436. Zhou, H., Muehlbauer, G. & Steffenson, B. (2012b). Population structure and linkage disequilibrium in elite barley breeding germplasm from the United States. Journal of Zhejiang University. Science. B
13, 438-451. Zhou, S., Sauve, R., Fish, T. & Thannhauser, T.W. (2009). Salt-induced and salt-suppressed proteins in tomato leaves. Journal of the American Society for Horticultural Science 134, 289-294. Zhu, J.-K. (2002). Salt and drought stress signal transduction in plants. Annual Review of Plant Biology 53, 247-273. Zhu, J.-K. (2016). Abiotic stress signaling and responses in plants. Cell 167, 313-324. Zhu, X., Liu, S., Meng, C., Qin, L., Kong, L. & Xia, G. (2013). WRKY Transcription Factors in Wheat and Their Induction by Biotic and Abiotic Stress. Plant Molecular Biology Reporter 31, 1053-1067. Zohary, D., Hopf, M. & Weiss, E. (2012). Domestication of plants in the old world: The origin and spread of domesticated plants in southwest Asia, Europe, and the Mediterranean basin, Amsterdam,
Netherlands, Elsevier Science.
Related Documents


