COMPUTERS AND BIOMEDICAL RESEARCH 31, 209–229 (1998) ARTICLE NO. CO981476 Joint Time and Time-Frequency Optimal Detection of K-Complexes in Sleep EEG Ce ´ dric Richard and Re ´ gis Lengelle Laboratoire LM2S, Universite ´ de Technologie de Troyes, 12 rue Maire Curie, BP 2060, F 10010 Troyes Cedex, France Received July 31, 1997 Automated detection of waveforms such as delta and K-complex in the EEG is an important component of sleep stage monitoring. The K-complex is a key feature that contributes to sleep stages assessment. However, its automated detection is still difficult due to the stochastic nature of the EEG. In this paper, we propose a detection structure which can be interpreted as joint linear filtering operations in time and time-frequency domains. We also introduce a method of obtaining the optimum detector from training data, and we show that the resulting receiver offers better performances than the one obtained via the Fisher criterion maximiza- tion. The efficiency of this approach for K-complexes detector design is explored. It results from this study that the obtained receiver is potentially the best one which can be found in the literature. Finally, it is emphasized that this methodology can be advantageously used to solve many other detection problems. 1998 Academic Press I. INTRODUCTION In the past 50 years, polygraphic sleep techniques have allowed human sleep understanding to be greatly improved (1). Unfortunately, the visual scoring of whole nights EEG, EOG, and EMG records is still time-consuming and expen- sive, playing the role of a limiting factor in sleep studies development. This justifies the growing interest for automated sleep data analyzers. In the past two decades, significant advances have been made in this domain, starting with hybrid systems as in (2). Recently, in addition to the latter heuristic approaches, a large number of algorithms based on statistical pattern recognition techniques (3) and some expert systems have been proposed (4). Automated detection of waveforms such as alpha, delta, and K-complex waves in the EEG is an important component of sleep stage monitoring. K-complex is one of the key features that contributes to sleep stages assessment. It can occur both spontaneously or as an evoked response to an auditory stimuli and seems to be associated with arousal during sleep. This transient EEG pattern has a total duration of between 500 and 1500 ms and is characterized by a sharp upward 209 0010-4809/98 $25.00 Copyright 1998 by Academic Press All rights of reproduction in any form reserved.

Welcome message from author
This document is posted to help you gain knowledge. Please leave a comment to let me know what you think about it! Share it to your friends and learn new things together.
Transcript
COMPUTERS AND BIOMEDICAL RESEARCH 31, 209–229 (1998)ARTICLE NO. CO981476
Joint Time and Time-Frequency Optimal Detection ofK-Complexes in Sleep EEG
Cedric Richard and Regis Lengelle
Laboratoire LM2S, Universite de Technologie de Troyes, 12 rue Maire Curie, BP 2060,F 10010 Troyes Cedex, France
Received July 31, 1997
Automated detection of waveforms such as delta and K-complex in the EEG is an importantcomponent of sleep stage monitoring. The K-complex is a key feature that contributes tosleep stages assessment. However, its automated detection is still difficult due to the stochasticnature of the EEG. In this paper, we propose a detection structure which can be interpretedas joint linear filtering operations in time and time-frequency domains. We also introduce amethod of obtaining the optimum detector from training data, and we show that the resultingreceiver offers better performances than the one obtained via the Fisher criterion maximiza-tion. The efficiency of this approach for K-complexes detector design is explored. It resultsfrom this study that the obtained receiver is potentially the best one which can be found inthe literature. Finally, it is emphasized that this methodology can be advantageously used tosolve many other detection problems. 1998 Academic Press
I. INTRODUCTION
In the past 50 years, polygraphic sleep techniques have allowed human sleepunderstanding to be greatly improved (1). Unfortunately, the visual scoring ofwhole nights EEG, EOG, and EMG records is still time-consuming and expen-sive, playing the role of a limiting factor in sleep studies development. Thisjustifies the growing interest for automated sleep data analyzers. In the past twodecades, significant advances have been made in this domain, starting with hybridsystems as in (2). Recently, in addition to the latter heuristic approaches, a largenumber of algorithms based on statistical pattern recognition techniques (3) andsome expert systems have been proposed (4).
Automated detection of waveforms such as alpha, delta, and K-complex wavesin the EEG is an important component of sleep stage monitoring. K-complex isone of the key features that contributes to sleep stages assessment. It can occurboth spontaneously or as an evoked response to an auditory stimuli and seemsto be associated with arousal during sleep. This transient EEG pattern has atotal duration of between 500 and 1500 ms and is characterized by a sharp upward
209
0010-4809/98 $25.00Copyright 1998 by Academic Press
All rights of reproduction in any form reserved.
RICHARD AND LENGELLE210
wave followed by a downward one, orientating the y-axis from top to bottomas is electrophysiologists’ convention. Its amplitude is three times backgroundactivity and is generally larger than 75 eV (5). However, due to the highlynonstationary nature of the superimposed EEG background activity, theK-complex morphology can vary drastically and no complete descriptions areavailable (6). The automated detection of K-complexes is a challenging proposi-tion which has been the purpose of numerous published efforts. In (7) for exam-ple, Da Rosa et al. proposed a detector based on a K-complex model. Theresultant good detection and false alarm rates are, respectively, 89 and 49%. Amultilayer neural net is involved in (8), and the integrated responses of twoband-pass filters were used as input. This approach produces a detection rateranging from 55 to 67%. Bankman et al. also used a neural net with 14 featuresextracted from EEG as input. Around 90% true positives are obtained for a 8%false positives rate (6). Finally, Tang and Ishii successfully introduced a newapproach based on the discrete wavelet transform in (9), obtaining, respectively,87 and 10% true and false positives. However, they considered the K-complexto be always overridden by a spindle whereas Jansen et al. (5) stated that therewas no fixed relationship between these two events. This emphasizes that detectorperformances proposed in the literature strongly depend on the training and testsets composition.
Time-frequency (TF) representations have been extensively used for detectionin applications ranging from radar to machine fault diagnostics, due to the needfor dealing with nonstationary signals. These representations are parameterizedin terms of time and frequency, and describe the nonstationary signal characteris-tics via their time-varying spectral content. Most of the TF-based detectionschemes which have been proposed are based on Moyal’s relationship (10) andimplement classical optimum receptors equivalently in the TF domain (11).Recently, Sayeed and Jones identified several scenarios in which TF detectorsare optimum and fully exploit the many degrees of freedom available in the TFrepresentations (12). It is stated that invertible bilinear TF representations arepromising only for situations in which the optimum detector is a quadratic func-tion of the observations. This justifies, for example, the TF matched filter subopti-mality for known deterministic signal detection in the presence of white Gaussiannoise. Finally, it is noteworthy that all those approaches require substantialknowledge on signals whereas phenomena are complex and poorly understoodin many applications. However, the collection of substancial amounts of labeleddata is often feasible. In (13), Jones and Sayeed adopted this approach andderived near-optimum TF detectors directly from training data by maximizingthe Fisher linear criterion. It should be noticed that Fisher discriminants can bearbitrarily bad: there are distributions such that even though the two classes arelinearly separable, the Fisher linear discriminant has a probability of error closeto one (14). In (15), Richard and Lengelle developed an original method ofobtaining optimum TF detectors (probability of error minimum) from trainingdata sets and showed the suboptimality of the approach proposed by Jones andSayeed (13).
AUTOMATED K-COMPLEXES DETECTION IN SLEEP EEG 211
In this paper, we introduce a new detection structure which can be interpretedas joint linear filtering operations in the time and TF domains. We also identifya scenario for which this statistic naturally appears. Then, we extend the methodof obtaining optimum TF detectors from training data introduced in (15) to thestudied detection structure. This original approach is used to define a newK-complexes detector. The paper is organized as follows. In Section II, we startwith a brief review of Cohen’s class quadratic TF distributions, followed by adescription of the usual time and TF approaches to decision problems. Then,we introduce the new concept of joint time and time-frequency (T-TF) detection,and we identify a scenario for which the considered statistic is optimal. In SectionIII, we expose our method of obtaining optimum linear detector in the T-TFdomain, and we show the suboptimality of any receiver derived from the Fishercriterion maximization. A simple example illustrates the efficiency of our ap-proach. In Section IV, our procedure is applied to a set of EEG events(K-complexes and delta waves), and the performances of the obtained T-TFreceptor are evaluated. Finally, we present some conclusions regarding our ap-proach in Section V.
II. TIME-FREQUENCY APPROACH TO DECISION PROBLEMS
1. Cohen’s Class Time-Frequency Representations Review
(i) Definition. The Wigner–Ville distribution, which has been extensively stud-ied in recent years, is defined as (10)
Wx(t, f ) 5 E1y
2yRx(t, t) exp(22jfft) dt, [1]
where Rx(t, t) 5 x(t 1 t/2)x*(t 2 t/2) is the instantaneous autocorrelationfunction of the signal x.
This distribution is well known for its high resolution in the TF plane and thelarge number of properties it satisfies (10). Unfortunately, its use in practicalapplications is limited due to the numerous nonnegligible cross-componentsgenerated by its bilinear structure. To get around this difficulty, one can applya bidimensional filter F to the instantaneous autocorrelation function Rx . Thisoperation leads to the following definition of Cohen’s class TF distributions(CTFD) (10) (16),
CFx(t, f ) 5 E E1y
2yF(t9, t)Rx(t 1 t9, t) exp(22jfft) dt9 dt, [2]
where F is called the autocorrelation-domain kernel (17).One can also show that all members of Cohen’s class can be equivalently
represented as filtered versions of the Wigner–Ville distribution by
CFx(t, f ) 5 E E1y
2yP(t9 2 t, f 9 2 f )Wx(t9, f 9) dt9 df 9, [3]
where
RICHARD AND LENGELLE212
P(t, f ) 5 E1y
2yF(t, t) exp(2jfft) dt. [4]
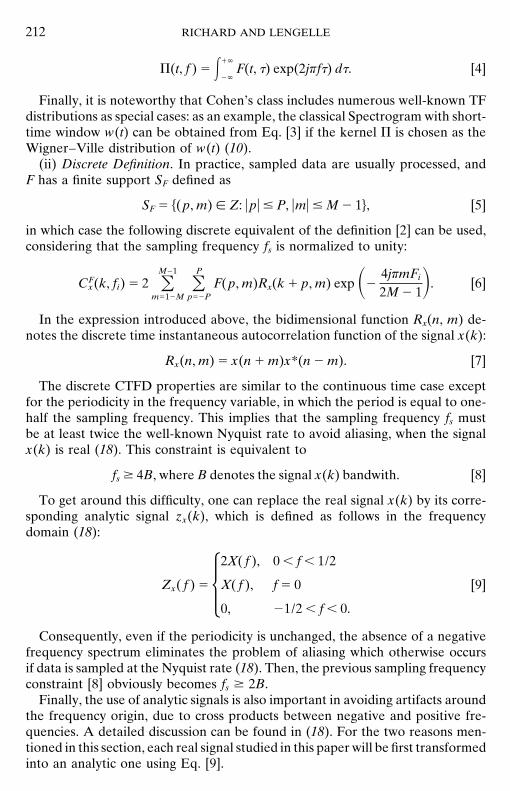
Finally, it is noteworthy that Cohen’s class includes numerous well-known TFdistributions as special cases: as an example, the classical Spectrogram with short-time window w(t) can be obtained from Eq. [3] if the kernel P is chosen as theWigner–Ville distribution of w(t) (10).
(ii) Discrete Definition. In practice, sampled data are usually processed, andF has a finite support SF defined as
SF 5 h(p, m) [ Z: upu # P, umu # M 2 1j, [5]
in which case the following discrete equivalent of the definition [2] can be used,considering that the sampling frequency fs is normalized to unity:
CFx(k, fi) 5 2 OM21
m512MOP
p52PF(p, m)Rx(k 1 p, m) exp S2
4jfmFi
2M 2 1D. [6]
In the expression introduced above, the bidimensional function Rx(n, m) de-notes the discrete time instantaneous autocorrelation function of the signal x(k):
Rx(n, m) 5 x(n 1 m)x*(n 2 m). [7]
The discrete CTFD properties are similar to the continuous time case exceptfor the periodicity in the frequency variable, in which the period is equal to one-half the sampling frequency. This implies that the sampling frequency fs mustbe at least twice the well-known Nyquist rate to avoid aliasing, when the signalx(k) is real (18). This constraint is equivalent to
fs $ 4B, where B denotes the signal x(k) bandwith. [8]
To get around this difficulty, one can replace the real signal x(k) by its corre-sponding analytic signal zx(k), which is defined as follows in the frequencydomain (18):
Zx( f ) 5 52X( f ), 0 , f , 1/2
X( f ), f 5 0
0, 21/2 , f , 0.
[9]
Consequently, even if the periodicity is unchanged, the absence of a negativefrequency spectrum eliminates the problem of aliasing which otherwise occursif data is sampled at the Nyquist rate (18). Then, the previous sampling frequencyconstraint [8] obviously becomes fs $ 2B.
Finally, the use of analytic signals is also important in avoiding artifacts aroundthe frequency origin, due to cross products between negative and positive fre-quencies. A detailed discussion can be found in (18). For the two reasons men-tioned in this section, each real signal studied in this paper will be first transformedinto an analytic one using Eq. [9].
AUTOMATED K-COMPLEXES DETECTION IN SLEEP EEG 213
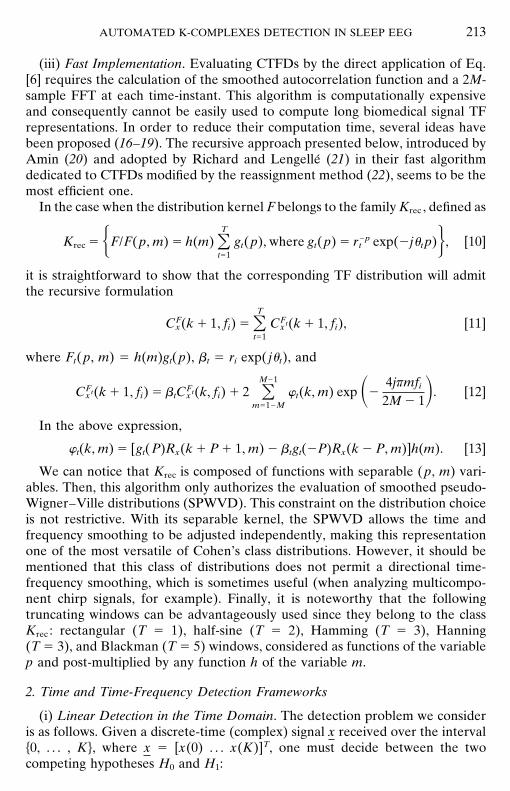
(iii) Fast Implementation. Evaluating CTFDs by the direct application of Eq.[6] requires the calculation of the smoothed autocorrelation function and a 2M-sample FFT at each time-instant. This algorithm is computationally expensiveand consequently cannot be easily used to compute long biomedical signal TFrepresentations. In order to reduce their computation time, several ideas havebeen proposed (16–19). The recursive approach presented below, introduced byAmin (20) and adopted by Richard and Lengelle (21) in their fast algorithmdedicated to CTFDs modified by the reassignment method (22), seems to be themost efficient one.
In the case when the distribution kernel F belongs to the family Krec , defined as
Krec 5 HF/F(p, m) 5 h(m) OTt51
gt(p), where gt(p) 5 r2pt exp(2jut p)J, [10]
it is straightforward to show that the corresponding TF distribution will admitthe recursive formulation
CFx(k 1 1, fi) 5 OT
t51CFtx (k 1 1, fi), [11]
where Ft(p, m) 5 h(m)gt(p), bt 5 ri exp( jut), and
CFtx (k 1 1, fi) 5 btCFtx (k, fi) 1 2 OM21
m512Mwt(k, m) exp S2
4jfmfi
2M 2 1D. [12]
In the above expression,
wt(k, m) 5 [gt(P)Rx(k 1 P 1 1, m) 2 btgt(2P)Rx(k 2 P, m)]h(m). [13]
We can notice that Krec is composed of functions with separable (p, m) vari-ables. Then, this algorithm only authorizes the evaluation of smoothed pseudo-Wigner–Ville distributions (SPWVD). This constraint on the distribution choiceis not restrictive. With its separable kernel, the SPWVD allows the time andfrequency smoothing to be adjusted independently, making this representationone of the most versatile of Cohen’s class distributions. However, it should bementioned that this class of distributions does not permit a directional time-frequency smoothing, which is sometimes useful (when analyzing multicompo-nent chirp signals, for example). Finally, it is noteworthy that the followingtruncating windows can be advantageously used since they belong to the classKrec : rectangular (T 5 1), half-sine (T 5 2), Hamming (T 5 3), Hanning(T 5 3), and Blackman (T 5 5) windows, considered as functions of the variablep and post-multiplied by any function h of the variable m.
2. Time and Time-Frequency Detection Frameworks
(i) Linear Detection in the Time Domain. The detection problem we consideris as follows. Given a discrete-time (complex) signal x received over the intervalh0, . . . , Kj, where x 5 [x(0) . . . x(K)]T, one must decide between the twocompeting hypotheses H0 and H1:
RICHARD AND LENGELLE214
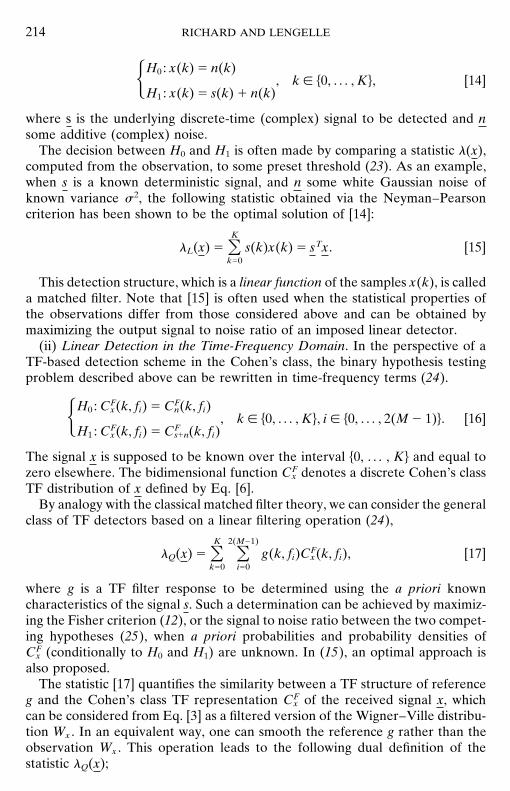
HH0 : x(k) 5 n(k)
H1 : x(k) 5 s(k) 1 n(k), k [ h0, . . . , Kj, [14]
where s is the underlying discrete-time (complex) signal to be detected and nsome additive (complex) noise.
The decision between H0 and H1 is often made by comparing a statistic l(x),computed from the observation, to some preset threshold (23). As an example,when s is a known deterministic signal, and n some white Gaussian noise ofknown variance s 2, the following statistic obtained via the Neyman–Pearsoncriterion has been shown to be the optimal solution of [14]:
lL(x) 5 OKk50
s(k)x(k) 5 sTx. [15]
This detection structure, which is a linear function of the samples x(k), is calleda matched filter. Note that [15] is often used when the statistical properties ofthe observations differ from those considered above and can be obtained bymaximizing the output signal to noise ratio of an imposed linear detector.
(ii) Linear Detection in the Time-Frequency Domain. In the perspective of aTF-based detection scheme in the Cohen’s class, the binary hypothesis testingproblem described above can be rewritten in time-frequency terms (24).
HH0 : CFx(k, fi) 5 CF
n(k, fi)
H1 : CFx(k, fi) 5 CF
s1n(k, fi), k [ h0, . . . , Kj, i [ h0, . . . , 2(M 2 1)j. [16]
The signal x is supposed to be known over the interval h0, . . . , Kj and equal tozero elsewhere. The bidimensional function CF
x denotes a discrete Cohen’s classTF distribution of x defined by Eq. [6].
By analogy with the classical matched filter theory, we can consider the generalclass of TF detectors based on a linear filtering operation (24),
lQ(x) 5 OKk50
O2(M21)
i50g(k, fi)CF
x(k, fi), [17]
where g is a TF filter response to be determined using the a priori knowncharacteristics of the signal s. Such a determination can be achieved by maximiz-ing the Fisher criterion (12), or the signal to noise ratio between the two compet-ing hypotheses (25), when a priori probabilities and probability densities ofCF
x (conditionally to H0 and H1) are unknown. In (15), an optimal approach isalso proposed.
The statistic [17] quantifies the similarity between a TF structure of referenceg and the Cohen’s class TF representation CF
x of the received signal x, whichcan be considered from Eq. [3] as a filtered version of the Wigner–Ville distribu-tion Wx . In an equivalent way, one can smooth the reference g rather than theobservation Wx . This operation leads to the following dual definition of thestatistic lQ(x);
AUTOMATED K-COMPLEXES DETECTION IN SLEEP EEG 215
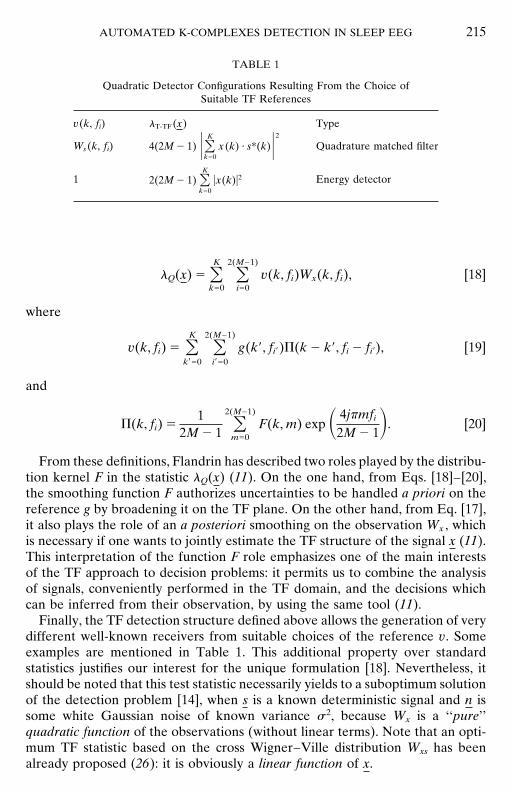
TABLE 1
Quadratic Detector Configurations Resulting From the Choice ofSuitable TF References
v(k, fi) lT-TF (x) Type
Ws (k, fi) Quadrature matched filter4(2M 2 1) UOKk50
x(k) ? s*(k)U2
1 Energy detector2(2M 2 1) OKk50
ux(k)u2
lQ(x) 5 OKk50
O2(M21)
i50v(k, fi)Wx(k, fi), [18]
where
v(k, fi) 5 OKk950
O2(M21)
i950
g(k9, fi9)P(k 2 k9, fi 2 fi9), [19]
and
P(k, fi) 51
2M 2 1 O2(M21)
m50F(k, m) exp S 4jfmfi
2M 2 1D. [20]
From these definitions, Flandrin has described two roles played by the distribu-tion kernel F in the statistic lQ(x) (11). On the one hand, from Eqs. [18]–[20],the smoothing function F authorizes uncertainties to be handled a priori on thereference g by broadening it on the TF plane. On the other hand, from Eq. [17],it also plays the role of an a posteriori smoothing on the observation Wx , whichis necessary if one wants to jointly estimate the TF structure of the signal x (11).This interpretation of the function F role emphasizes one of the main interestsof the TF approach to decision problems: it permits us to combine the analysisof signals, conveniently performed in the TF domain, and the decisions whichcan be inferred from their observation, by using the same tool (11).
Finally, the TF detection structure defined above allows the generation of verydifferent well-known receivers from suitable choices of the reference v. Someexamples are mentioned in Table 1. This additional property over standardstatistics justifies our interest for the unique formulation [18]. Nevertheless, itshould be noted that this test statistic necessarily yields to a suboptimum solutionof the detection problem [14], when s is a known deterministic signal and n issome white Gaussian noise of known variance s 2, because Wx is a ‘‘pure’’quadratic function of the observations (without linear terms). Note that an opti-mum TF statistic based on the cross Wigner–Ville distribution Wxs has beenalready proposed (26): it is obviously a linear function of x.
RICHARD AND LENGELLE216
3. Joint Time and Time-Frequency Approach to Decision Problems
(i) Problem. The optimum solution of some detection problems combineslinear and quadratic statistics lL and lQ . As an example, consider the discrete-time binary hypothesis testing problem
HH0 : x(k) 5 s0(k) 1 n0(k)
H1 : x(k) 5 s1(k) 1 n1(k), k [ h0, . . . , Kj, [21]
where n0 (resp. n1) is a zero-mean colored Gaussian noise, with known covariancematrix o
0(resp. o
1). The deterministic signals s0 and s1 are supposed to be known.
(ii) Resolution and Interpretation. It is straightforward to show that the optimalstatistic corresponding to [21], in the sense of the Neyman–Pearson criterion, isgiven by the log-likelihood ratio (23)
l(x) 5 AsxT [o21
02 o21
1]x 1 [sT
1 o21
02 sT
0 o21
0]x
1 As ln(uo0u/uo
1u) 1 sT
0 o21
0s0 2 sT
1 o21
1s1] [22]
5 lQ(x) 1 lL(x) 1 C,
which must be compared to a threshold n0 .The statistic l(x) consists in a linear combination of a ‘‘pure’’ quadratic function
lQ(x) of the observations and a linear one lL(x). Consequently, as it has beenintroduced in Section II.2, the detection problem [21] can be solved by jointlinear filtering operations in the time and time-frequency domains:
lT2TF(x) 5 OKk50
O2(M21)
i50g(k, fi)Wx(k, fi) 1 OK
k50h(k)x(k) 5 lQ(x) 1 lL(x). [23]
As a conclusion, the approach proposed above allows the combination of theanalysis of signals, conveniently performed in the T-TF domain, and the problem[21] decision stage. In Section III, we propose a method to design the optimumlinear T-TF detector [23], which minimizes the error probability, via the optimiza-tion of the references g and h from training data.
III. OPTIMUM DETECTOR DESIGN FROM TRAINING DATA
1. Linear Detector Design Procedure
(i) Problem Formulation and Resolution. Linear receivers are optimum, in thesense of the Neyman–Pearson criterion, for Gaussian distributions with equalcovariance matrices, conditionally to the hypotheses H0 and H1 . However, evenif these assumptions on probability density functions are not reasonable in manyapplications, the simplicity and robustness of this approach often compensatethe loss in performance. In this way, we discuss now how to design optimumlinear detectors from training data, regardless of the signal distributions. This
AUTOMATED K-COMPLEXES DETECTION IN SLEEP EEG 217
method was introduced by Fukunaga to design linear discriminants in the contextof pattern recognition (27) and used by Richard and Lengelle to automaticallydesign optimum TF detectors from training data (15).
Using the expression of the statistic introduced in Eq. [23], the detectionproblem [21] can be rewritten as
Hif lT2TF(Y) 5 VTY $ n0 , then H1
else H0
, [24]
where
Y 5 [Wx(0, f0) . . . Wx(0, f2(M21))Wx(1, f0) . . . Wx(1, f2(M21)). . . Wx(K, f2(M21))x(0) . . . X(K)]T,
V 5 [g(0, f0) . . . g(0, f2(M21))g(1, f0) . . . g(1, f2(M21)) . . . g(K, f2(M21))h(0) . . . h(K)]T,
and n0 is a threshold to be determined.Our design work consists in finding the optimum vector V and threshold value
n0 in the sense of a preselected criterion and for a given data set. Using a minimala priori knowledge, the statistic lT2TF can be characterized by the expected valuesand variances
hi 5 EhlT2TF(Y)uHij 5 VTMi 1 n0 , s 2i 5 VarhlT2TF(Y)uHij 5 VT o
iV,
where Mi 5 EhYuHij, oi5 Eh(Y 2 Mi)(Y 2 Mi)T uHij.
Let f(h0 , h1 , s 02 , s 1
2) be any measure (depending only on these parameters)of H0 and H1 separability in the lT2TF-space. This criterion must be maximizedso that the following derivatives of f, with respect to V and n0 , are equated to zero:
5fV
5f
s 21
s 21
V1
fs 2
2
s 22
V1
fh1
h1
V1
fh2
h2
V5 0
fn0
5f
s 21
s 21
n01
fs 2
2
s 22
n01
fh1
h1
n01
fh2
h2
n05 0.
[25]
The resolution of [25] provides a particularly interesting analytical solutionfor the detector [23] design:
[a o0
1 (1 2 a) o1]Vopt 5 M1 2 M0, where a 5
f/s 20
f/s 20 1 f/s 2
1. [26]
Thus, the optimum Vopt has the form [26] regardless of the selection of f : thecriterion effect only appears in the parameter a (0 # a # 1). In our case, wechoose the a value which minimizes the probability of error. This operation, whichis described in Section III.2, can be carried out by using an iterative procedure.
As a conclusion, this method allows us to determine the optimal T-TF detector[23] (probability of error minimum) in the sense of the best criterion f(h0 , h1 ,s 0
2 , s 12), without setting it up. Note that this procedure can also be used to design
RICHARD AND LENGELLE218
linear time or time-frequency detectors directly from training data, as it is shownin (15).
(ii) Fisher Linear Discriminant Suboptimality. The Fisher linear discriminantis obtained by maximizing the criterion (14)
fFisher(h0 , h1 , s20 , s 2
1) 5(h0 2 h1)2
P0s20 1 (1 2 P0)s 2
1, [27]
where Pi denotes the a priori probability of the hypothesis Hi .The derivatives of fFisher(h0 , h1 , s 0
2 , s 12), with respect to s 0
2 and s 12 , are
fFisher(h0 , h1 , s 20 , s 2
1)s 2
i5 2Pi
(h0 2 h1)2
(P0s20 1 P1s
21)
, i [ h0, 1j.
Therefore, a 5 P0 and the optimum VFisher is given by
VFisher 5 [P0 o0
1 (1 2 P0) o1]21(M1 2 M0). [28]
In this way, we show that the Fisher linear discriminant is a particular case of[26], where a is equal to P0 . Consequently, it does not guarantee a minimalprobability of error for all criteria which belong to the class f(h0 , h1 , s 0
2 , s 12).
It is also stated in (14) that Fisher discriminants can be arbitrarely bad: thereare distributions such as even though the two classes are linearly separable, theFisher linear discriminant has a probability of error close to one.
2. Algorithm
Assuming that Ni samples are available from each hypothesis Hi , the iterativealgorithm mentioned in Section III.1.i to design the optimum T-TF detector isas follows.
(i) Declaration of the Variables used in the Algorithm.x j
i j th observation, conditionally to the hypothesis Hi , j [ [1, . . . , Ni],i [ h0, 1j.
Y ji T-TF representation of x j
i (cf. notation in Section (III.1.i)).Mi estimate of Yi expected value conditionally to the hypothesis Hi ,
i [ h0, 1j.oi estimate of Yi covariance matrix conditionally to the hypothesis Hi ,
i [ h0, 1j.a variable which belongs to the interval [0, 1] (cf. definition in Eq. [26]).
Da variable a increment.(ii) Iterative Procedure to Find a.
(1) Initializations:● for each realization x j
i , evaluate the vector Y ji .
● compute Mi and oi , i [ h0, 1j.● set the variable a to 0.
(2) While (a # 1) repeat:● compute V a using: [a o0 1 (1 2 a) o1]V a 5 M1 2 M0.
AUTOMATED K-COMPLEXES DETECTION IN SLEEP EEG 219
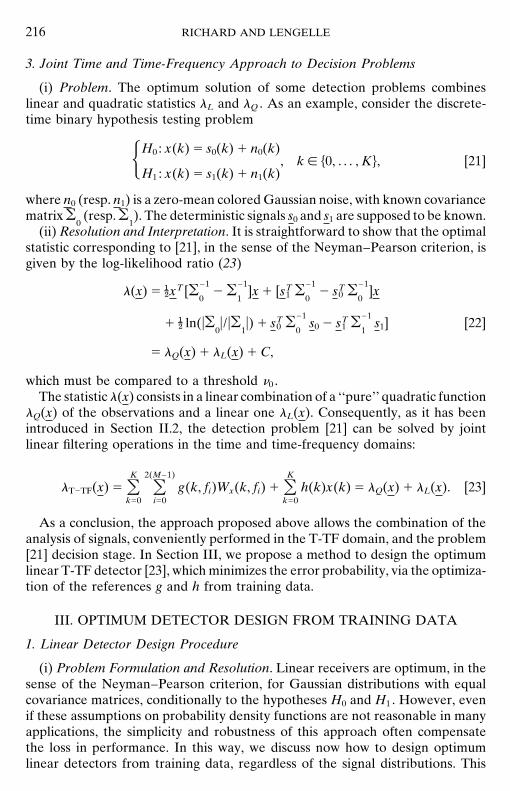
FIG. 1. Representation of the transient signal s embedded in white gaussian noise to be detectedfrom training data.
● find the threshold n a0 which minimizes the estimate of the error proba-
bility Pae .
● change the variable a by a r a 1 Da.(3) Select the detector (Va, n a
0) which minimizes Pae .
Finally, it should be remembered that in this process, no assumption is madeon the distribution of the observations. The procedure is only based on ourknowledge that Vopt must have the form of Eq. [26] and depends on one parametera. Then, an estimate of the error probability is used to select this parameter andto adjust the threshold n0 .
3. Experiment on Simulated Data
The following application illustrates the proposed method. Consider the detec-tion problem of a deterministic transient signal s(k) embedded in a zero-meanwhite Gaussian noise n(k),
HH0 ; x(k) 5 r . n(k)
H1 : x(k) 5 s(k) 1 n(k), k [ h0, . . . , 14j, [29]
where s(k) 5 e2(k27)2/32 cos(0.50fk). Its representation is shown in Fig. 1. The
RICHARD AND LENGELLE220
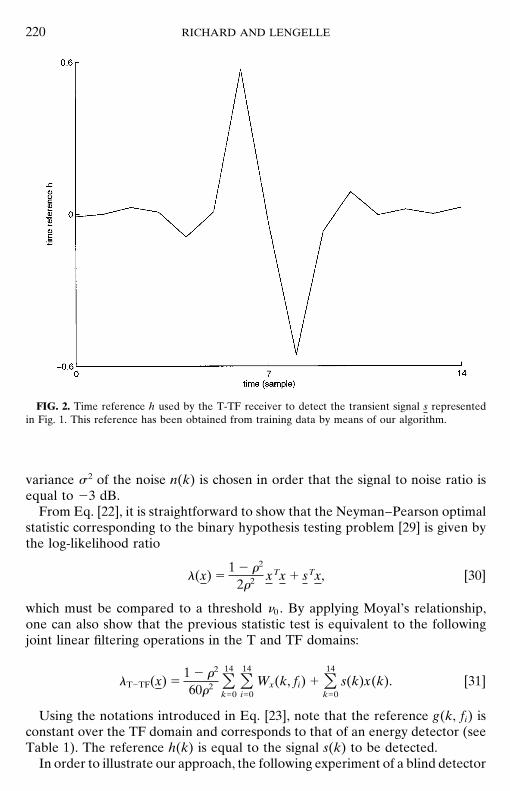
FIG. 2. Time reference h used by the T-TF receiver to detect the transient signal s representedin Fig. 1. This reference has been obtained from training data by means of our algorithm.
variance s 2 of the noise n(k) is chosen in order that the signal to noise ratio isequal to 23 dB.
From Eq. [22], it is straightforward to show that the Neyman–Pearson optimalstatistic corresponding to the binary hypothesis testing problem [29] is given bythe log-likelihood ratio
l(x) 51 2 r2
2r2 xTx 1 sTx, [30]
which must be compared to a threshold n0 . By applying Moyal’s relationship,one can also show that the previous statistic test is equivalent to the followingjoint linear filtering operations in the T and TF domains:
lT2TF(x) 51 2 r2
60r2 O14
k50O14
i50Wx(k, fi) 1 O14
k50s(k)x(k). [31]
Using the notations introduced in Eq. [23], note that the reference g(k, fi) isconstant over the TF domain and corresponds to that of an energy detector (seeTable 1). The reference h(k) is equal to the signal s(k) to be detected.
In order to illustrate our approach, the following experiment of a blind detector
AUTOMATED K-COMPLEXES DETECTION IN SLEEP EEG 221
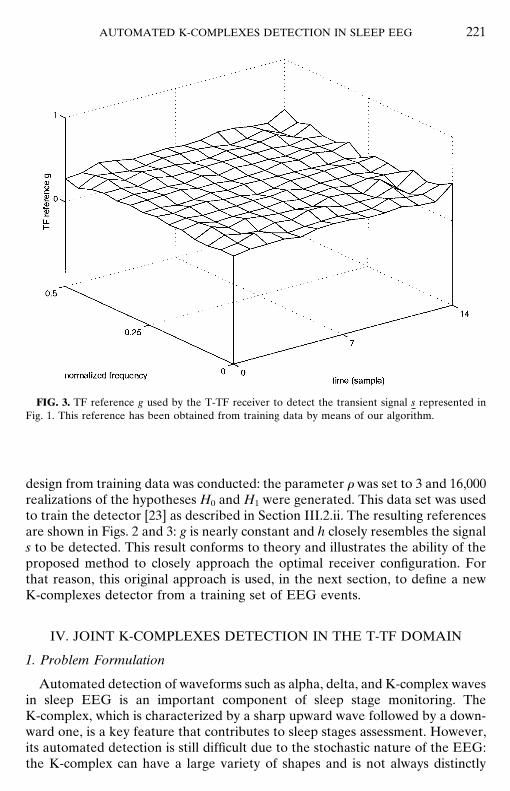
FIG. 3. TF reference g used by the T-TF receiver to detect the transient signal s represented inFig. 1. This reference has been obtained from training data by means of our algorithm.
design from training data was conducted: the parameter r was set to 3 and 16,000realizations of the hypotheses H0 and H1 were generated. This data set was usedto train the detector [23] as described in Section III.2.ii. The resulting referencesare shown in Figs. 2 and 3: g is nearly constant and h closely resembles the signals to be detected. This result conforms to theory and illustrates the ability of theproposed method to closely approach the optimal receiver configuration. Forthat reason, this original approach is used, in the next section, to define a newK-complexes detector from a training set of EEG events.
IV. JOINT K-COMPLEXES DETECTION IN THE T-TF DOMAIN
1. Problem Formulation
Automated detection of waveforms such as alpha, delta, and K-complex wavesin sleep EEG is an important component of sleep stage monitoring. TheK-complex, which is characterized by a sharp upward wave followed by a down-ward one, is a key feature that contributes to sleep stages assessment. However,its automated detection is still difficult due to the stochastic nature of the EEG:the K-complex can have a large variety of shapes and is not always distinctly
RICHARD AND LENGELLE222
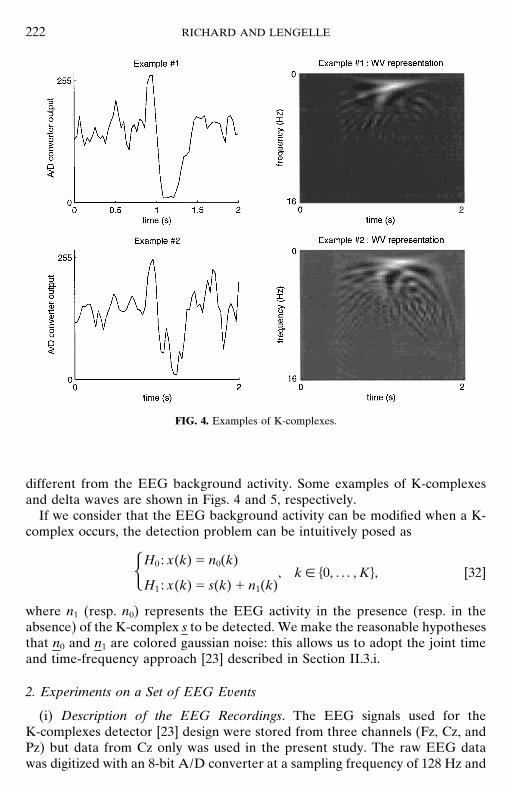
FIG. 4. Examples of K-complexes.
different from the EEG background activity. Some examples of K-complexesand delta waves are shown in Figs. 4 and 5, respectively.
If we consider that the EEG background activity can be modified when a K-complex occurs, the detection problem can be intuitively posed as
HH0 : x(k) 5 n0(k)
H1 : x(k) 5 s(k) 1 n1(k), k [ h0, . . . , Kj, [32]
where n1 (resp. n0) represents the EEG activity in the presence (resp. in theabsence) of the K-complex s to be detected. We make the reasonable hypothesesthat n0 and n1 are colored gaussian noise: this allows us to adopt the joint timeand time-frequency approach [23] described in Section II.3.i.
2. Experiments on a Set of EEG Events
(i) Description of the EEG Recordings. The EEG signals used for theK-complexes detector [23] design were stored from three channels (Fz, Cz, andPz) but data from Cz only was used in the present study. The raw EEG datawas digitized with an 8-bit A/D converter at a sampling frequency of 128 Hz and
AUTOMATED K-COMPLEXES DETECTION IN SLEEP EEG 223
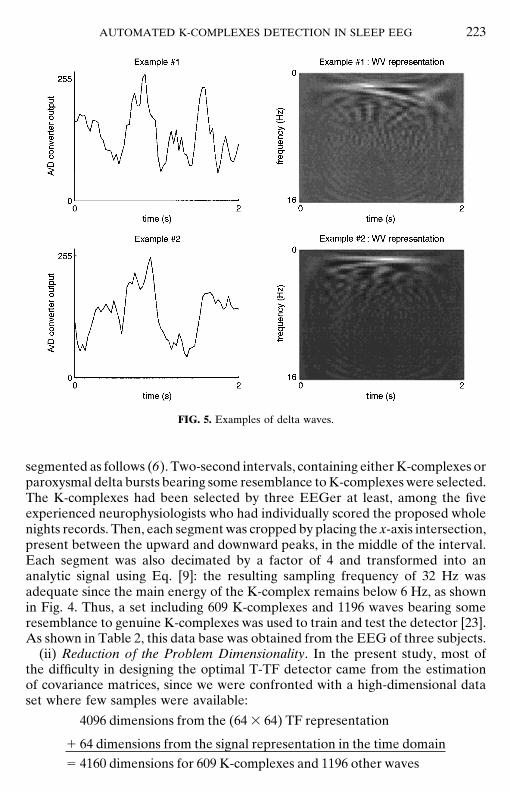
FIG. 5. Examples of delta waves.
segmented as follows (6). Two-second intervals, containing either K-complexes orparoxysmal delta bursts bearing some resemblance to K-complexes were selected.The K-complexes had been selected by three EEGer at least, among the fiveexperienced neurophysiologists who had individually scored the proposed wholenights records. Then, each segment was cropped by placing the x-axis intersection,present between the upward and downward peaks, in the middle of the interval.Each segment was also decimated by a factor of 4 and transformed into ananalytic signal using Eq. [9]: the resulting sampling frequency of 32 Hz wasadequate since the main energy of the K-complex remains below 6 Hz, as shownin Fig. 4. Thus, a set including 609 K-complexes and 1196 waves bearing someresemblance to genuine K-complexes was used to train and test the detector [23].As shown in Table 2, this data base was obtained from the EEG of three subjects.
(ii) Reduction of the Problem Dimensionality. In the present study, most ofthe difficulty in designing the optimal T-TF detector came from the estimationof covariance matrices, since we were confronted with a high-dimensional dataset where few samples were available:
4096 dimensions from the (64 3 64) TF representation
1 64 dimensions from the signal representation in the time domain
5 4160 dimensions for 609 K-complexes and 1196 other waves
RICHARD AND LENGELLE224
TABLE 2
Number of K-Complexes and Delta Waves perSubject Used to Train the Detector
K-complexes Delta waves
Subject 1 263 397Subject 2 162 399Subject 3 184 400
Total 609 1196
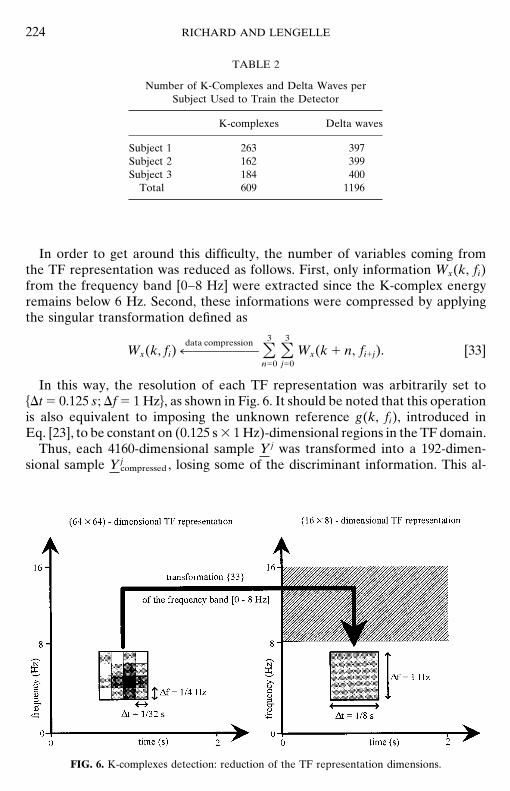
In order to get around this difficulty, the number of variables coming fromthe TF representation was reduced as follows. First, only information Wx(k, fi)from the frequency band [0–8 Hz] were extracted since the K-complex energyremains below 6 Hz. Second, these informations were compressed by applyingthe singular transformation defined as
Wx(k, fi) r—————data compression O3
n50O3j50
Wx(k 1 n, fi1j). [33]
In this way, the resolution of each TF representation was arbitrarily set tohDt 5 0.125 s; Df 5 1 Hzj, as shown in Fig. 6. It should be noted that this operationis also equivalent to imposing the unknown reference g(k, fi), introduced inEq. [23], to be constant on (0.125 s 3 1 Hz)-dimensional regions in the TF domain.
Thus, each 4160-dimensional sample Y j was transformed into a 192-dimen-sional sample Y j
compressed , losing some of the discriminant information. This al-
FIG. 6. K-complexes detection: reduction of the TF representation dimensions.
AUTOMATED K-COMPLEXES DETECTION IN SLEEP EEG 225
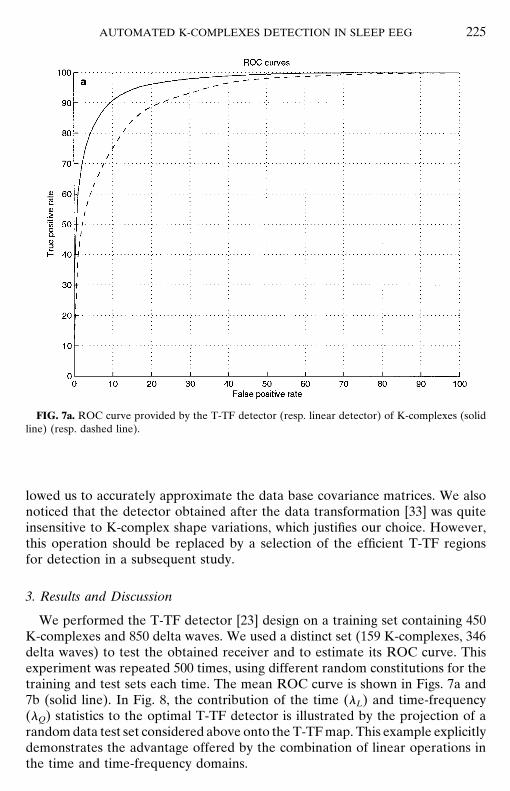
FIG. 7a. ROC curve provided by the T-TF detector (resp. linear detector) of K-complexes (solidline) (resp. dashed line).
lowed us to accurately approximate the data base covariance matrices. We alsonoticed that the detector obtained after the data transformation [33] was quiteinsensitive to K-complex shape variations, which justifies our choice. However,this operation should be replaced by a selection of the efficient T-TF regionsfor detection in a subsequent study.
3. Results and Discussion
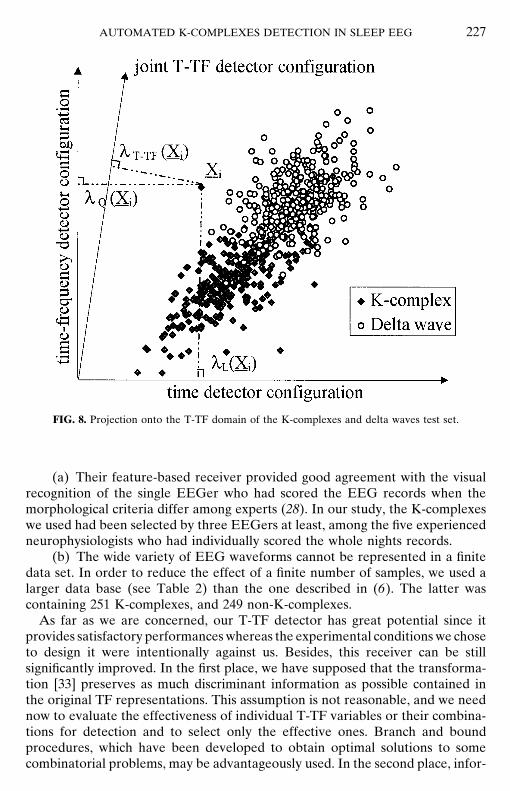
We performed the T-TF detector [23] design on a training set containing 450K-complexes and 850 delta waves. We used a distinct set (159 K-complexes, 346delta waves) to test the obtained receiver and to estimate its ROC curve. Thisexperiment was repeated 500 times, using different random constitutions for thetraining and test sets each time. The mean ROC curve is shown in Figs. 7a and7b (solid line). In Fig. 8, the contribution of the time (lL) and time-frequency(lQ) statistics to the optimal T-TF detector is illustrated by the projection of arandom data test set considered above onto the T-TF map. This example explicitlydemonstrates the advantage offered by the combination of linear operations inthe time and time-frequency domains.
RICHARD AND LENGELLE226
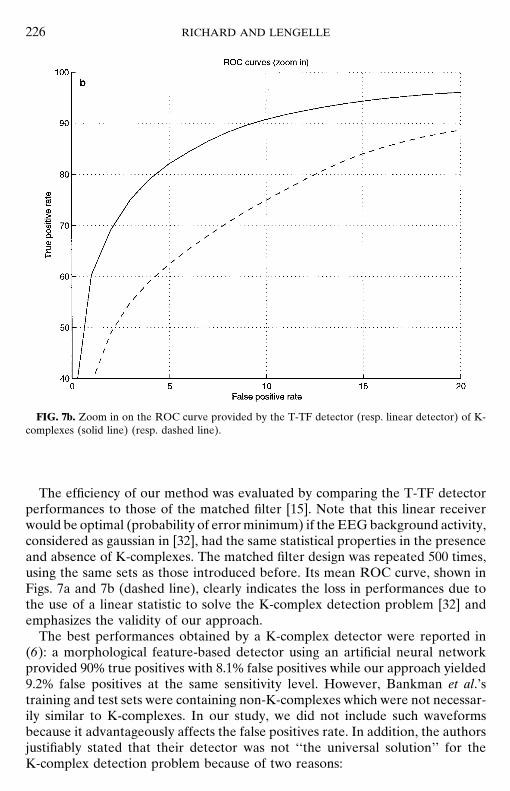
FIG. 7b. Zoom in on the ROC curve provided by the T-TF detector (resp. linear detector) of K-complexes (solid line) (resp. dashed line).
The efficiency of our method was evaluated by comparing the T-TF detectorperformances to those of the matched filter [15]. Note that this linear receiverwould be optimal (probability of error minimum) if the EEG background activity,considered as gaussian in [32], had the same statistical properties in the presenceand absence of K-complexes. The matched filter design was repeated 500 times,using the same sets as those introduced before. Its mean ROC curve, shown inFigs. 7a and 7b (dashed line), clearly indicates the loss in performances due tothe use of a linear statistic to solve the K-complex detection problem [32] andemphasizes the validity of our approach.
The best performances obtained by a K-complex detector were reported in(6): a morphological feature-based detector using an artificial neural networkprovided 90% true positives with 8.1% false positives while our approach yielded9.2% false positives at the same sensitivity level. However, Bankman et al.’straining and test sets were containing non-K-complexes which were not necessar-ily similar to K-complexes. In our study, we did not include such waveformsbecause it advantageously affects the false positives rate. In addition, the authorsjustifiably stated that their detector was not ‘‘the universal solution’’ for theK-complex detection problem because of two reasons:
AUTOMATED K-COMPLEXES DETECTION IN SLEEP EEG 227
FIG. 8. Projection onto the T-TF domain of the K-complexes and delta waves test set.
(a) Their feature-based receiver provided good agreement with the visualrecognition of the single EEGer who had scored the EEG records when themorphological criteria differ among experts (28). In our study, the K-complexeswe used had been selected by three EEGers at least, among the five experiencedneurophysiologists who had individually scored the whole nights records.
(b) The wide variety of EEG waveforms cannot be represented in a finitedata set. In order to reduce the effect of a finite number of samples, we used alarger data base (see Table 2) than the one described in (6). The latter wascontaining 251 K-complexes, and 249 non-K-complexes.
As far as we are concerned, our T-TF detector has great potential since itprovides satisfactory performances whereas the experimental conditions we choseto design it were intentionally against us. Besides, this receiver can be stillsignificantly improved. In the first place, we have supposed that the transforma-tion [33] preserves as much discriminant information as possible contained inthe original TF representations. This assumption is not reasonable, and we neednow to evaluate the effectiveness of individual T-TF variables or their combina-tions for detection and to select only the effective ones. Branch and boundprocedures, which have been developed to obtain optimal solutions to somecombinatorial problems, may be advantageously used. In the second place, infor-
RICHARD AND LENGELLE228
mation from only the channel Cz were used in the present study. The decisionregarding the detection of K-complexes may need to be corroborated by theirpresence in other channels.
V. CONCLUSION
In this paper, we have introduced the new concept of joint time and time-frequency optimal detection. As for classical time-frequency approaches to deci-sion problems, this method allows us to combine the analysis of signals, conve-niently performed in the time-frequency domain, and the decisions which canbe inferred from their observation. Furthermore, the proposed statistic has beenshown to be the solution of a general class of detection problems.
Unfortunately all these methods require substantial knowledge of signals,whereas phenomena are complex and poorly understood in many applications(i.e., detection in EEG signals). To improve the detector design phase in thesesituations, we have developed a method to determine the optimum detector,which minimizes the error probability, directly from labeled training data. Theresulting detector theoretically offers better performances than the one obtainedvia the maximization of the Fisher criterion (13) as has been shown in (15).
Finally, our joint time and time-frequency detection structure, designed bythe method described in Section III.2, has been validated with the problem ofK-complexes detection in sleep EEG. It results from the present study that theobtained receiver is potentially the best one which can be found in the literature.Besides, it can be significantly improved by using, for example, a branch andbound procedure to select the efficient T-TF regions for detection. The decisionregarding the detection of K-complexes also may need to be corroborated bytheir presence in other channels. Finally, it should be emphasized that the meth-odology we have introduced in this paper can be advantageously used to solvemany other transient signals detection problems (i.e., sharp vertex waves).
ACKNOWLEDGMENTS
The EEG data was obtained from the Foundation for Applied Neuroscience Research in Psychiatry,Centre Hospitalier Specialise of Rouffach, 68250 Rouffach, France, through the cooperation of Drs.Jacqmin, Schaltenbrand and Macher. This institution is gratefully acknowledged.
REFERENCES
1. Reynolds, C., Kupfer, C. F., Houck, D. J., Stack, C. C., Berman, S. R., and Zimer, B. Sleepresearch in affective illness: State of the art. Sleep 10, 189 (1987).
2. Gaillard, J. M., and Tissot, R. Principles of automatic analysis of sleep records with hybridsystem. Comput. Biomed. Res. 6, 1 (1973).
3. Schaltenbrand, N., Lengelle, R., and Macher, J.-P. Neural network model: Application to auto-matic analysis of human sleep. Comput. Biomed. Res. 26, 157 (1993).
4. Ray, S., Lee, W. D., Morgan, C. D., and Airth-Kindree, W. Computer sleep stage scoring. Anexpert system approach. Int. J. Bio-Med. Comput. 19, 43 (1986).
5. Jansen, B. H., and Desai, P. R. K-complex Detection using multi-layer perceptron and recurrentnetwork. Int. J. Bio-Med. Comput. 37, 249 (1994).
AUTOMATED K-COMPLEXES DETECTION IN SLEEP EEG 229
6. Bankman, I. N., Sigillito, V. G., Wise, R. A., and Smith, P. L. Feature-based detection ofK-complex wave in the human electroencephalogram using neural networks. IEEE Trans. Bio-med. Eng. 39, 1605 (1992).
7. Da Rosa, A. C., Kemp, B., and Paiva, T. A model-based detector of vertex sharp waves andK-complexes in sleep electroencephalogram. Electroencephalogr. Clin. Neurophysio. 78, 71(1991).
8. Jansen, B. H. Artificial neural nets for K-complex detection. IEEE Eng. Med. Biol. 9, 50 (1990).9. Tang, Z., and Ishii, N. Detection of the K-complex using a new method of recognizing waveform
based on the discret wavelet transform. IEICE Trans. Inf. Syst. 78, 77 (1995).10. Flandrin, P. ‘‘Temps-Frequence.’’ Hermes, Paris, 1993.11. Flandrin, P. A time-frequency formulation of optimum detection. IEEE Trans. Acoust. Speech
Signal Process. 36, 1377 (1988).12. Sayeed, A. M., and Jones, D. L. Optimal detection using bilinear time-frequency and time-scale
representations. IEEE Trans. Signal Process. 43, 2872 (1995).13. Jones, D. L., and Sayeed, A. M. Blind quadratic and time-frequency based detectors from
training data. In ‘‘Proceedings, IEEE International Conference on Acoustics, Speech and SignalProcessing,’’ 1995.
14. Devroye, L., Gyorfi, L., and Lugosi, G. ‘‘A Probabilistic Theory of Pattern Recognition.’’Springer-Verlag, New York, 1996.
15. Richard, C., and Lengelle, R. Une nouvelle approche pour la detection lineaire optimale dansle plan temps-frequence. In ‘‘Proceedings, Seizieme Colloque GRETSI sur le Traitement duSignal et des Images,’’ 1997.
16. Martin, W., and Flandrin, P. Wigner–Ville spectral analysis of nonstationary processes. IEEETrans. Acoust. Speech Signal Process. 33, 1461 (1985).
17. Cunningham, G. S., and Williams, W. J. Fast implementations of generalized discrete time-frequency distributions. IEEE Trans. Signal Process. 42, 1496 (1994).
18. Boashash, B., and Black, P. J. An efficient real-time implementation of the Wigner–Ville distribu-tion. IEEE Trans. Acoust. Speech Signal Process. 35, 1611 (1987).
19. Cunningham, G. S., and Williams, W. J. Fast computation of the Wigner distribution for finitelength signal. In ‘‘Proceedings, IEEE International Conference on Acoustics, Speech and SignalProcessing,’’ 1992.
20. Amin, M. G. Computationally lag-invariant recursive spectrum estimator. IEEE Trans. Acoust.Speech Signal Process. 35, 1713 (1987).
21. Richard, C., and Lengelle, R. Joint recursive implementation of time-frequency representationsand their modified version by the reassignment method. Signal Process. 60, (1997).
22. Auger, F., and Flandrin, P. Improving the readability of time-frequency and time-scale representa-tions by the reassignment method. IEEE Trans. Signal Process. 43, 1068 (1995).
23. Poor, H. V. ‘‘An Introduction to Signal Detection in Noise.’’ Springer-Verlag, New York, 1994.24. Flandrin, P. Signal detection in the time-frequency plane. In ‘‘Proceedings, Processing in Auto-
matic Control,’’ 1989.25. Sammy, B., Rizzoni, G., Sayeed, A. M., and Jones, D. L. Design of training data-based quadratic
detectors with application to mechanical systems. In ‘‘Proceedings, IEEE International Confer-ence on Acoustics, Speech and Signal Processing,’’ 1996.
26. Kumar, B. V. K. V., and Carroll, C. W. Performance of the Wigner distribution based detectionmethods. Opt. Eng. 23, 732 (1984).
27. Fukunaga, K. ‘‘Introduction to Statistical Pattern Recognition.’’ Academic Press, London, 1990.28. Bremer, G., Smith, J. R., and Karacan, I. Automatic detection of the K-complex in sleep electroen-
cephalograms. IEEE Trans. Biomed. Eng. 17, 314 (1970).
Related Documents