Welcome message from author
This document is posted to help you gain knowledge. Please leave a comment to let me know what you think about it! Share it to your friends and learn new things together.
Transcript

JOINT RADIO PULPIT / BROADCOM / SENTECH DRM30 TRIAL - Final Report
SEN_RFN_REP_MEASM_DRM30_RADIO_PULPIT_V1_03 Page 1 of 109
EXECUTIVE SUMMARY
Radio Pulpit initiated a DRM30 trial broadcast with support from Broadcom International cc and Sentech Ltd. The DRM test transmission was conducted in Pretoria South Arica during the period September 2014 up to October 2015. DRM Measurements were conducted successfully on 1440 kHz using a 10 kW DRM30 transmitter. Two low profile antennas were used in the trial and both were capable to provide good signal coverage. Performance differences between the antennas highlighted the importance of the AM antenna as part of the DRM station design.
Field strength measurement indicated that the propagated ground-wave does not radiate equally in all horizontal directions due to ground conductivity, nature of the topographical terrain, man-made noise etc.
The DRM30 coverage performance is not only a factor or received signal strength but is also a factor of the signal to noise ratio in the reception area
Modulation configuration selection had a direct impact on signal coverage area and data throughput. The 16QAM modulation configuration setting provided a more robust signal resulting in a larger signal coverage area compared to the 64QAM modulated signal which provided a higher data rate and a smaller signal coverage area.
The DRM30 signal performed better than the analogue AM signal with regard to coverage area for the same transmitter power. DRM30 demonstrated a substantial reduction in energy consumption compared to analogue AM broadcast to cover the same area. DRM30 demonstrated improved spectrum usage in that in our study DRM30 was capable of transmitting two good audio services on the same AM frequency and bandwidth.
Added to the audio service text messages and a Journaline service were also transmitted which was seen on the receiver end; demonstrating the added value offered by DRM30 in addition to the normal audio program being broadcasted.
The report contains the measurement results and the findings on the Radio Pulpit DRM30 Trial.
JOINT RADIO PULPIT / BROADCOM / SENTECH DRM30 TRIAL - Final Report
SEN_RFN_REP_MEASM_DRM30_RADIO_PULPIT_V1_03 Page 2 of 109
TABLE OF CONTENTS Page No.
I ABBREVIATIONS, ACRONYMS AND DEFINITIONS .................................................................................................................................... 3
II RELEVANT AND APPLICABLE DOCUMENTS ............................................................................................................................................. 4
III CONTRIBUTION ............................................................................................................................................................................................... 4
IV DOCUMENT CHANGE HISTORY .................................................................................................................................................................... 5
1. INTRODUCTION ............................................................................................................................................................................................... 6
2. BACKGROUND INFORMATION ..................................................................................................................................................................... 7
3. OBJECTIVES .................................................................................................................................................................................................... 8
4. POTENTIAL BENEFITS OF THE DRM30 TECHNOLOGY ............................................................................................................................. 8
5. TECHNICAL INFORMATION ON DRM30 SYSTEM ....................................................................................................................................... 9
5.1. TRANSMITTER ................................................................................................................................................................................................. 9
5.2. BROADCOM ANTENNA SYSTEM ................................................................................................................................................................ 10
5.3. KINSTAR ANTENNA SYSTEM ...................................................................................................................................................................... 12
6. MEASUREMENTS .......................................................................................................................................................................................... 14
6.1. INITIATION OF MEASUREMENT EXERCISE .............................................................................................................................................. 14
6.2. MEASUREMENT TOOLS ............................................................................................................................................................................... 15
6.3. MEASUREMENT METHOD ........................................................................................................................................................................... 16
6.4. MEASUREMENT DATA ................................................................................................................................................................................. 16
6.5. MEASURED PARAMETERS ......................................................................................................................................................................... 17
6.6. DRM30 CONFIGURATION PARAMETERS .................................................................................................................................................. 17
6.7. ANTENNA MEASUREMENT TEST POINTS ................................................................................................................................................ 18
6.8. DRIVE-BY MEASUREMENT ROUTES .......................................................................................................................................................... 23
7. MEASUREMENT ANALYSIS ......................................................................................................................................................................... 25
7.1. CORRECTION FACTOR ................................................................................................................................................................................ 25
7.2. BASIC ANTENNA RADIATION ANALYSIS .................................................................................................................................................. 26
7.3. COVERAGE ANALYSIS ................................................................................................................................................................................ 29
7.3.1. BACKGROUND ON GROUND-WAVE AND SKY-WAVE PROPAGATION ................................................................................................ 29
7.3.2. GROUND-WAVE AND SKY-WAVE PREDICTIONS ..................................................................................................................................... 31
7.3.3. GROUND CONDUCTIVITY DATA ................................................................................................................................................................. 31
7.3.4. PREDICTED GROUND-WAVE COVERAGE AREA ..................................................................................................................................... 32
7.3.5. GROUND-WAVE ANALYSIS ......................................................................................................................................................................... 35
7.3.5.1. MEASUREMENT CORRELATIONS – GROUND-WAVE .............................................................................................................................. 37
7.3.5.2. GROUND-WAVE PERFORMANCE ANALYSIS (DRM30) ............................................................................................................................ 41
7.3.6. PREDICTED SKY-WAVE COVERAGE AREA .............................................................................................................................................. 50
7.3.7. SKY-WAVE ANALYSIS .................................................................................................................................................................................. 51
7.3.7.1. MEASUREMENT CORRELATIONS – SKY-WAVE ...................................................................................................................................... 52
7.3.7.2. SKY-WAVE PERFORMANCE ANALYSIS .................................................................................................................................................... 54
7.3.7.2.1. SKY-WAVE IMPACT ON BROADCOM ANTENNA ................................................................................................................ 54
7.3.7.2.2. SKY-WAVE IMPACT ON KINSTAR ANTENNA ...................................................................................................................... 58
7.3.7.2.3. SKY-WAVE IMPACT DIFFERENCES...................................................................................................................................... 62
7.4. SIGNAL PERFORMANCE FINDINGS ........................................................................................................................................................... 66
7.4.1. GROUND-WAVE SIGNAL PERFORMANCE FINDINGS .............................................................................................................................. 66
7.4.1.1. 16QAM MODULATED SIGNAL ..................................................................................................................................................................... 66
7.4.1.2. 64QAM MODULATED SIGNAL ..................................................................................................................................................................... 67
7.4.2. SKY-WAVE SIGNAL PERFORMANCE FINDINGS ...................................................................................................................................... 69
7.4.3. FACTORS IMPACTING NEGATIVELY ON SIGNAL PERFORMANCE....................................................................................................... 70
6.5. PERFORMANCE OF COMMERCIAL RECEIVERS ...................................................................................................................................... 73
7. CONCLUSIONS .............................................................................................................................................................................................. 80
8. REFERENCES ................................................................................................................................................................................................ 82
ANNEXURE A ............................................................................................................................................................................................................. 83
ANNEXURE B ............................................................................................................................................................................................................. 85
ANNEXURE C ............................................................................................................................................................................................................. 92
ANNEXURE D ............................................................................................................................................................................................................. 99
ANNEXURE E ........................................................................................................................................................................................................... 102
ANNEXURE F ............................................................................................................................................................................................................ 104
ANNEXURE G ........................................................................................................................................................................................................... 106
JOINT RADIO PULPIT / BROADCOM / SENTECH DRM30 TRIAL - Final Report
SEN_RFN_REP_MEASM_DRM30_RADIO_PULPIT_V1_03 Page 3 of 109
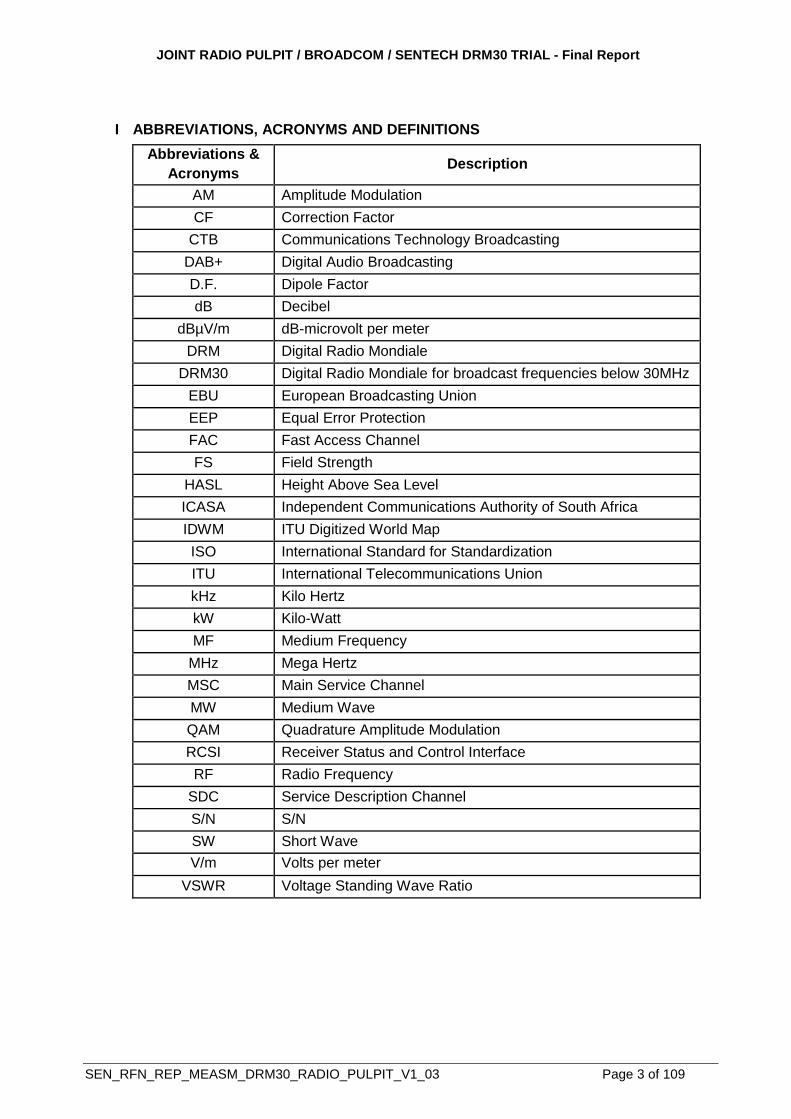
I ABBREVIATIONS, ACRONYMS AND DEFINITIONS
Abbreviations &
Acronyms Description
AM Amplitude Modulation
CF Correction Factor
CTB Communications Technology Broadcasting
DAB+ Digital Audio Broadcasting
D.F. Dipole Factor
dB Decibel
dBµV/m dB-microvolt per meter
DRM Digital Radio Mondiale
DRM30 Digital Radio Mondiale for broadcast frequencies below 30MHz
EBU European Broadcasting Union
EEP Equal Error Protection
FAC Fast Access Channel
FS Field Strength
HASL Height Above Sea Level
ICASA Independent Communications Authority of South Africa
IDWM ITU Digitized World Map
ISO International Standard for Standardization
ITU International Telecommunications Union
kHz Kilo Hertz
kW Kilo-Watt
MF Medium Frequency
MHz Mega Hertz
MSC Main Service Channel
MW Medium Wave
QAM Quadrature Amplitude Modulation
RCSI Receiver Status and Control Interface
RF Radio Frequency
SDC Service Description Channel
S/N S/N
SW Short Wave
V/m Volts per meter
VSWR Voltage Standing Wave Ratio
JOINT RADIO PULPIT / BROADCOM / SENTECH DRM30 TRIAL - Final Report
SEN_RFN_REP_MEASM_DRM30_RADIO_PULPIT_V1_03 Page 4 of 109
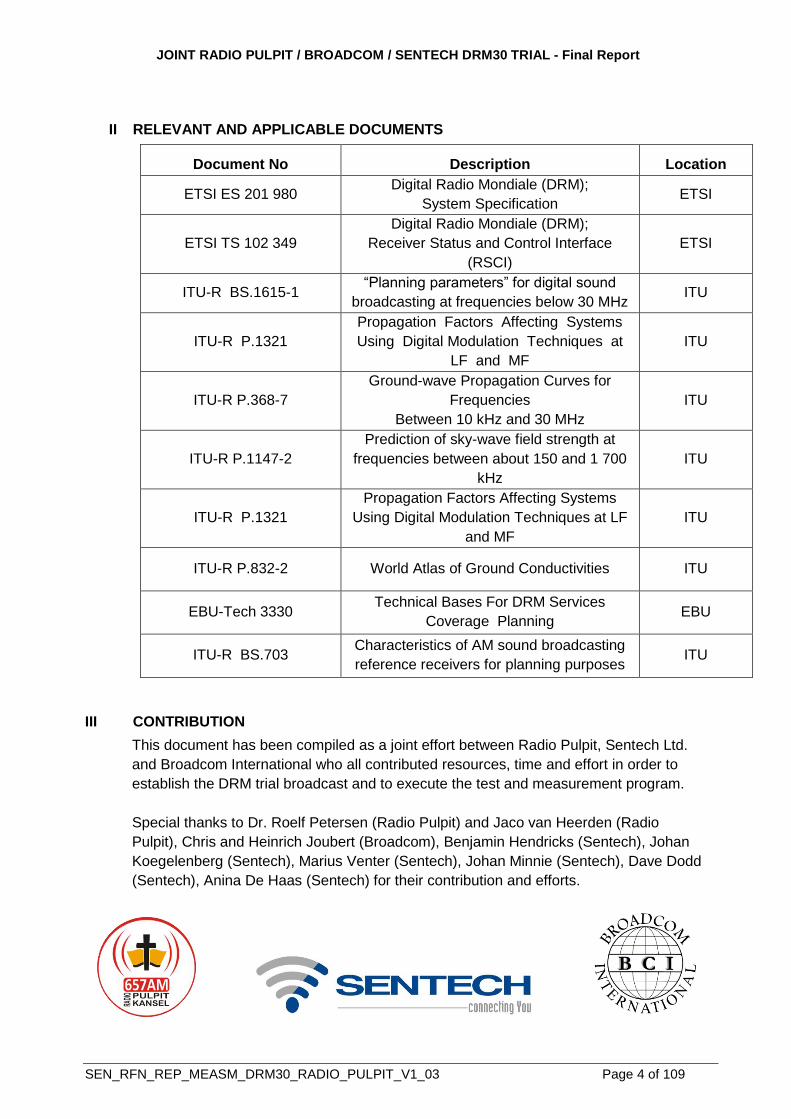
II RELEVANT AND APPLICABLE DOCUMENTS
Document No Description Location
ETSI ES 201 980 Digital Radio Mondiale (DRM);
System Specification ETSI
ETSI TS 102 349
Digital Radio Mondiale (DRM);
Receiver Status and Control Interface
(RSCI)
ETSI
ITU-R BS.1615-1 “Planning parameters” for digital sound
broadcasting at frequencies below 30 MHz ITU
ITU-R P.1321
Propagation Factors Affecting Systems
Using Digital Modulation Techniques at
LF and MF
ITU
ITU-R P.368-7
Ground-wave Propagation Curves for
Frequencies
Between 10 kHz and 30 MHz
ITU
ITU-R P.1147-2
Prediction of sky-wave field strength at
frequencies between about 150 and 1 700
kHz
ITU
ITU-R P.1321
Propagation Factors Affecting Systems
Using Digital Modulation Techniques at LF
and MF
ITU
ITU-R P.832-2 World Atlas of Ground Conductivities ITU
EBU-Tech 3330 Technical Bases For DRM Services
Coverage Planning EBU
ITU-R BS.703 Characteristics of AM sound broadcasting
reference receivers for planning purposes ITU
III CONTRIBUTION
This document has been compiled as a joint effort between Radio Pulpit, Sentech Ltd.
and Broadcom International who all contributed resources, time and effort in order to
establish the DRM trial broadcast and to execute the test and measurement program.
Special thanks to Dr. Roelf Petersen (Radio Pulpit) and Jaco van Heerden (Radio
Pulpit), Chris and Heinrich Joubert (Broadcom), Benjamin Hendricks (Sentech), Johan
Koegelenberg (Sentech), Marius Venter (Sentech), Johan Minnie (Sentech), Dave Dodd
(Sentech), Anina De Haas (Sentech) for their contribution and efforts.
JOINT RADIO PULPIT / BROADCOM / SENTECH DRM30 TRIAL - Final Report
SEN_RFN_REP_MEASM_DRM30_RADIO_PULPIT_V1_03 Page 5 of 109
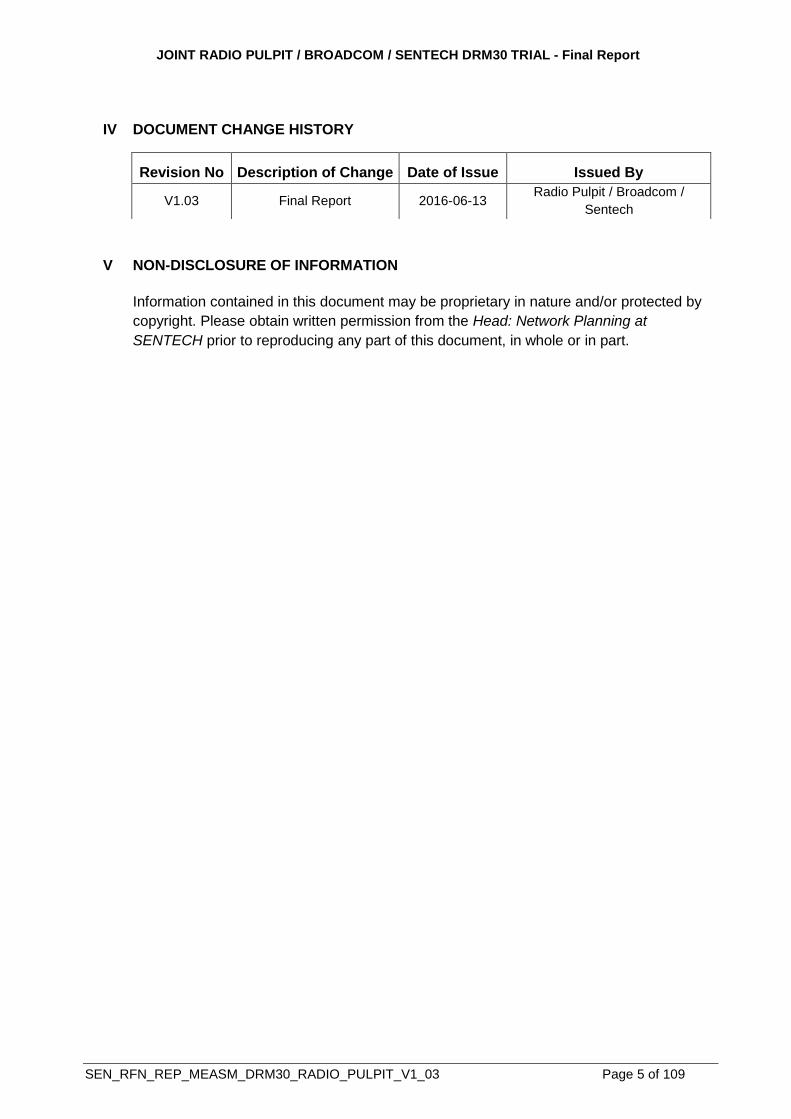
IV DOCUMENT CHANGE HISTORY
V NON-DISCLOSURE OF INFORMATION
Information contained in this document may be proprietary in nature and/or protected by
copyright. Please obtain written permission from the Head: Network Planning at
SENTECH prior to reproducing any part of this document, in whole or in part.
Revision No Description of Change Date of Issue Issued By
V1.03 Final Report 2016-06-13 Radio Pulpit / Broadcom /
Sentech
JOINT RADIO PULPIT / BROADCOM / SENTECH DRM30 TRIAL - Final Report
SEN_RFN_REP_MEASM_DRM30_RADIO_PULPIT_V1_03 Page 6 of 109
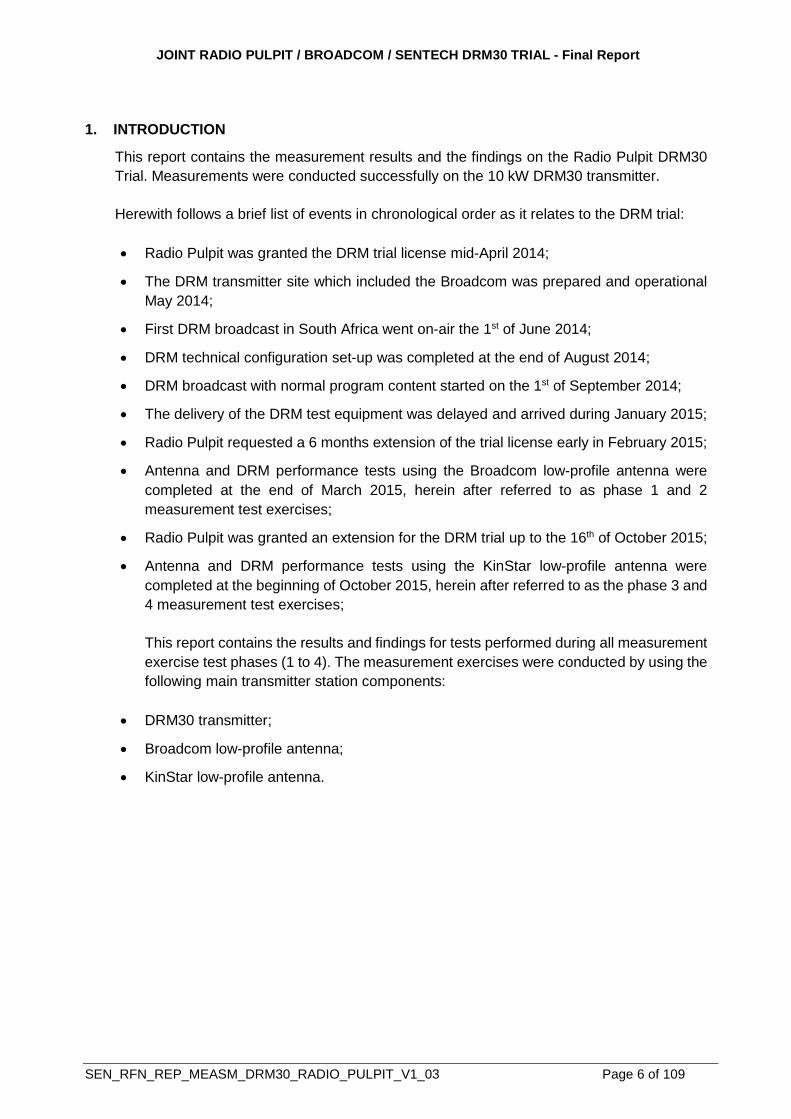
1. INTRODUCTION
This report contains the measurement results and the findings on the Radio Pulpit DRM30
Trial. Measurements were conducted successfully on the 10 kW DRM30 transmitter.
Herewith follows a brief list of events in chronological order as it relates to the DRM trial:
Radio Pulpit was granted the DRM trial license mid-April 2014;
The DRM transmitter site which included the Broadcom was prepared and operational
May 2014;
First DRM broadcast in South Africa went on-air the 1st of June 2014;
DRM technical configuration set-up was completed at the end of August 2014;
DRM broadcast with normal program content started on the 1st of September 2014;
The delivery of the DRM test equipment was delayed and arrived during January 2015;
Radio Pulpit requested a 6 months extension of the trial license early in February 2015;
Antenna and DRM performance tests using the Broadcom low-profile antenna were
completed at the end of March 2015, herein after referred to as phase 1 and 2
measurement test exercises;
Radio Pulpit was granted an extension for the DRM trial up to the 16th of October 2015;
Antenna and DRM performance tests using the KinStar low-profile antenna were
completed at the beginning of October 2015, herein after referred to as the phase 3 and
4 measurement test exercises;
This report contains the results and findings for tests performed during all measurement
exercise test phases (1 to 4). The measurement exercises were conducted by using the
following main transmitter station components:
DRM30 transmitter;
Broadcom low-profile antenna;
KinStar low-profile antenna.
JOINT RADIO PULPIT / BROADCOM / SENTECH DRM30 TRIAL - Final Report
SEN_RFN_REP_MEASM_DRM30_RADIO_PULPIT_V1_03 Page 7 of 109
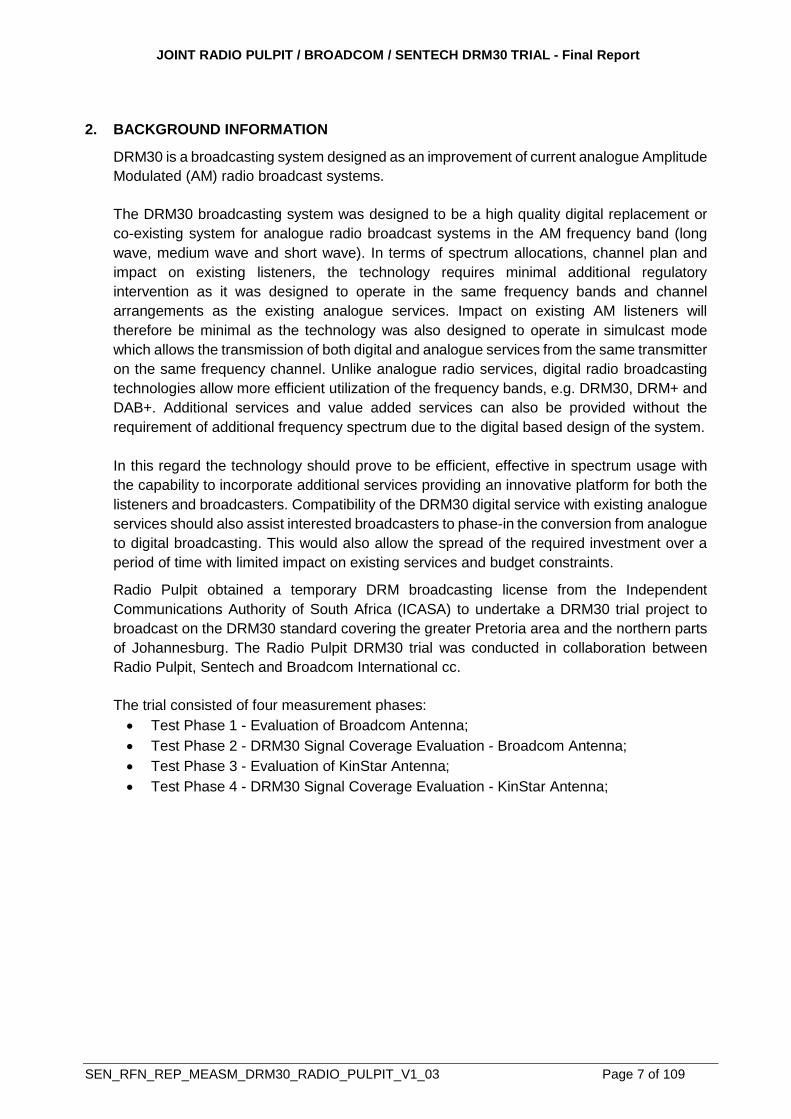
2. BACKGROUND INFORMATION
DRM30 is a broadcasting system designed as an improvement of current analogue Amplitude
Modulated (AM) radio broadcast systems.
The DRM30 broadcasting system was designed to be a high quality digital replacement or
co-existing system for analogue radio broadcast systems in the AM frequency band (long
wave, medium wave and short wave). In terms of spectrum allocations, channel plan and
impact on existing listeners, the technology requires minimal additional regulatory
intervention as it was designed to operate in the same frequency bands and channel
arrangements as the existing analogue services. Impact on existing AM listeners will
therefore be minimal as the technology was also designed to operate in simulcast mode
which allows the transmission of both digital and analogue services from the same transmitter
on the same frequency channel. Unlike analogue radio services, digital radio broadcasting
technologies allow more efficient utilization of the frequency bands, e.g. DRM30, DRM+ and
DAB+. Additional services and value added services can also be provided without the
requirement of additional frequency spectrum due to the digital based design of the system.
In this regard the technology should prove to be efficient, effective in spectrum usage with
the capability to incorporate additional services providing an innovative platform for both the
listeners and broadcasters. Compatibility of the DRM30 digital service with existing analogue
services should also assist interested broadcasters to phase-in the conversion from analogue
to digital broadcasting. This would also allow the spread of the required investment over a
period of time with limited impact on existing services and budget constraints.
Radio Pulpit obtained a temporary DRM broadcasting license from the Independent
Communications Authority of South Africa (ICASA) to undertake a DRM30 trial project to
broadcast on the DRM30 standard covering the greater Pretoria area and the northern parts
of Johannesburg. The Radio Pulpit DRM30 trial was conducted in collaboration between
Radio Pulpit, Sentech and Broadcom International cc.
The trial consisted of four measurement phases:
Test Phase 1 - Evaluation of Broadcom Antenna;
Test Phase 2 - DRM30 Signal Coverage Evaluation - Broadcom Antenna;
Test Phase 3 - Evaluation of KinStar Antenna;
Test Phase 4 - DRM30 Signal Coverage Evaluation - KinStar Antenna;

JOINT RADIO PULPIT / BROADCOM / SENTECH DRM30 TRIAL - Final Report
SEN_RFN_REP_MEASM_DRM30_RADIO_PULPIT_V1_03 Page 8 of 109
3. OBJECTIVES
The main objectives of the DRM30 measurement trial are listed as follow:
Confirm the potential benefits of the DRM30 technology as a radio broadcast platform;
Evaluation of actual coverage versus predicted coverage (for both Ground and Sky-
wave propagation modes);
Evaluation of two different low-profile AM antenna systems (herein after referred to as
the Broadcom & KinStar antennas respectively);
Obtain sufficient measurement data for analysis to assist in reaching a conclusion on
the overall performance of the technology;
Determine if, how and where the technology could be applied to benefit broadcasters;
Evaluation of available commercial radio receivers in both fixed and mobile conditions.
4. POTENTIAL BENEFITS OF THE DRM30 TECHNOLOGY
Potential benefits of the DRM30 technology in the MW broadcast band are as follow:
Exploit some unique signal propagation qualities which are only available in the MW
frequency band, more specific wide area coverage and sky-wave propagation;
Allows select-ability between various capacity and robustness modes for optimum
performance, depending on the broadcaster’s requirements with regard to area
coverage and audio quality;
Enhanced audio compression which improves efficient utilization of the digital channel;
Good audio quality;
Ability to enhance listener’s experience;
Provide additional features, such as Electronic Program Guide, Journaline, News
Feeds and Slideshow (pictures);
Emergency Warning Feature (EWF);
Single-Frequency-Network (SFN) operation which allows more efficient use of limited
spectrum;
Hand-over capability between different radio platforms or networks (between DRM,
DAB+ and FM);
Capability to operate in current existing analogue Medium Wave (MW) frequency
bands;
Capability to operate in simulcast mode (i.e. broadcasting analogue and digital
simultaneously).
JOINT RADIO PULPIT / BROADCOM / SENTECH DRM30 TRIAL - Final Report
SEN_RFN_REP_MEASM_DRM30_RADIO_PULPIT_V1_03 Page 9 of 109
5. TECHNICAL INFORMATION ON DRM30 SYSTEM
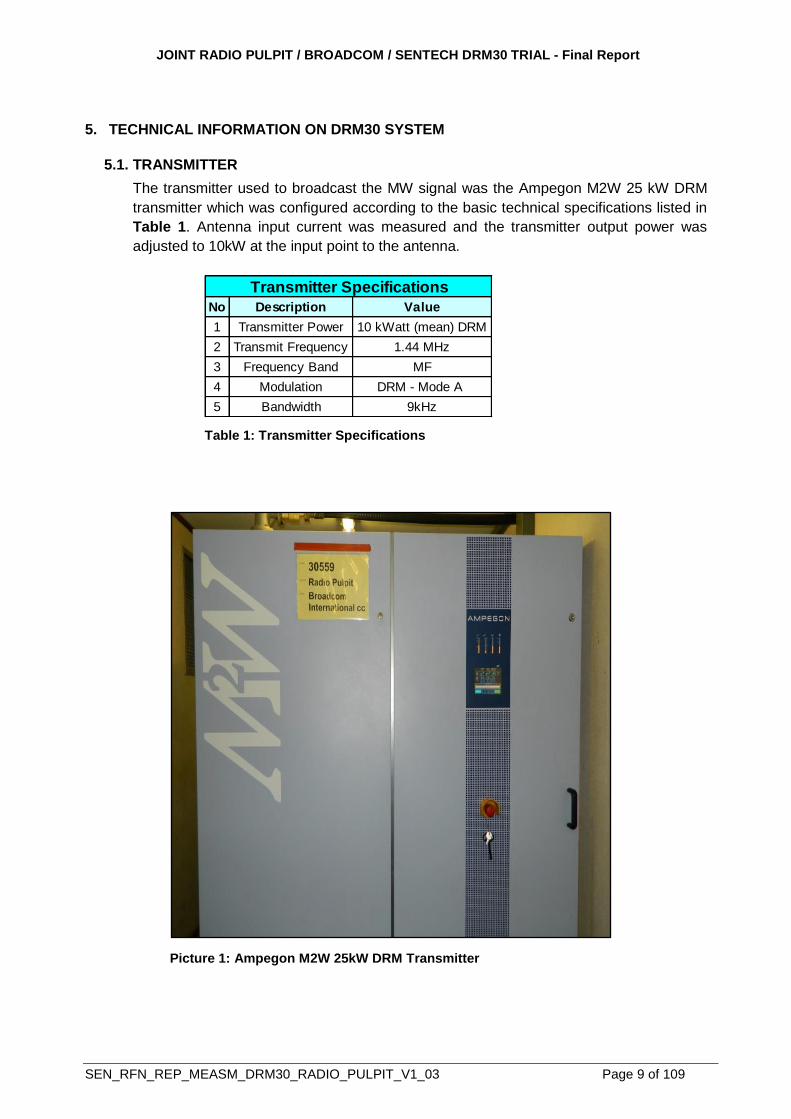
5.1. TRANSMITTER
The transmitter used to broadcast the MW signal was the Ampegon M2W 25 kW DRM
transmitter which was configured according to the basic technical specifications listed in
Table 1. Antenna input current was measured and the transmitter output power was
adjusted to 10kW at the input point to the antenna.
Table 1: Transmitter Specifications
Picture 1: Ampegon M2W 25kW DRM Transmitter
No Description Value
1 Transmitter Power 10 kWatt (mean) DRM
2 Transmit Frequency 1.44 MHz
3 Frequency Band MF
4 Modulation DRM - Mode A
5 Bandwidth 9kHz
Transmitter Specifications
JOINT RADIO PULPIT / BROADCOM / SENTECH DRM30 TRIAL - Final Report
SEN_RFN_REP_MEASM_DRM30_RADIO_PULPIT_V1_03 Page 10 of 109
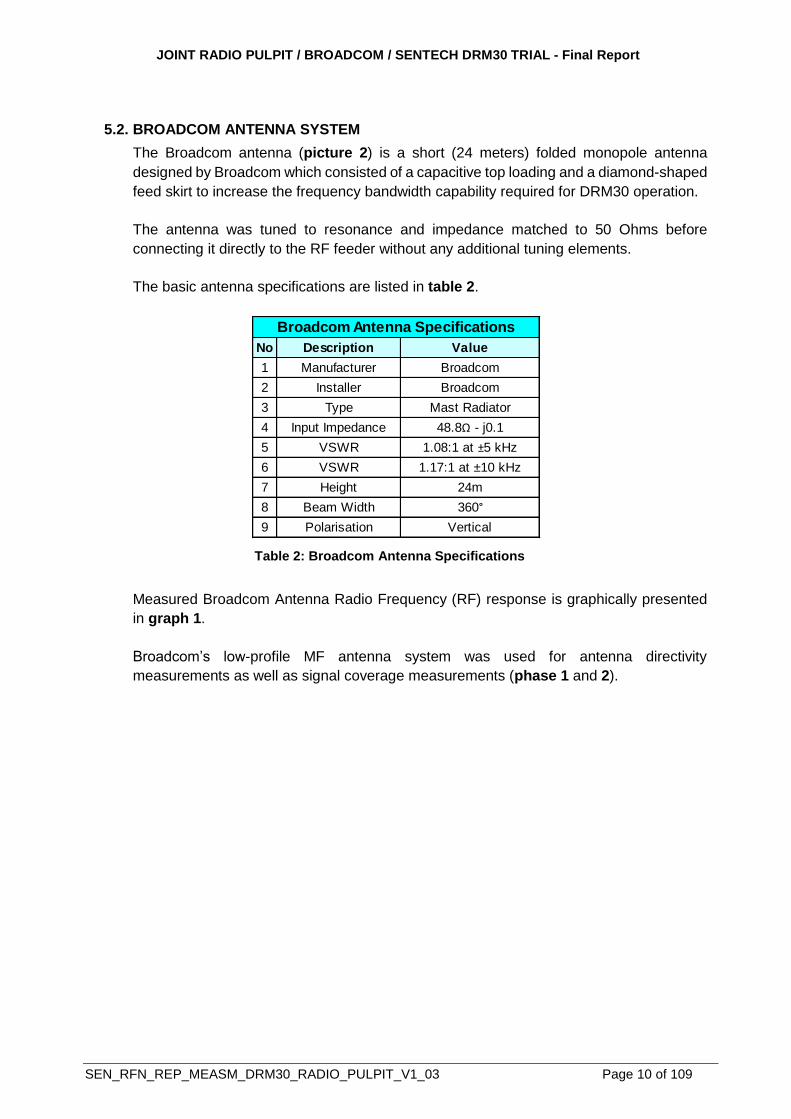
5.2. BROADCOM ANTENNA SYSTEM
The Broadcom antenna (picture 2) is a short (24 meters) folded monopole antenna
designed by Broadcom which consisted of a capacitive top loading and a diamond-shaped
feed skirt to increase the frequency bandwidth capability required for DRM30 operation.
The antenna was tuned to resonance and impedance matched to 50 Ohms before
connecting it directly to the RF feeder without any additional tuning elements.
The basic antenna specifications are listed in table 2.
Table 2: Broadcom Antenna Specifications
Measured Broadcom Antenna Radio Frequency (RF) response is graphically presented
in graph 1.
Broadcom’s low-profile MF antenna system was used for antenna directivity
measurements as well as signal coverage measurements (phase 1 and 2).
No Description Value
1 Manufacturer Broadcom
2 Installer Broadcom
3 Type Mast Radiator
4 Input Impedance 48.8Ω - j0.1
5 VSWR 1.08:1 at ±5 kHz
6 VSWR 1.17:1 at ±10 kHz
7 Height 24m
8 Beam Width 360°
9 Polarisation Vertical
Broadcom Antenna Specifications

JOINT RADIO PULPIT / BROADCOM / SENTECH DRM30 TRIAL - Final Report
SEN_RFN_REP_MEASM_DRM30_RADIO_PULPIT_V1_03 Page 11 of 109
Picture 2: Broadcom Short Vertical Antenna
Graph 1: Measured Broadcom Antenna RF Response
JOINT RADIO PULPIT / BROADCOM / SENTECH DRM30 TRIAL - Final Report
SEN_RFN_REP_MEASM_DRM30_RADIO_PULPIT_V1_03 Page 12 of 109
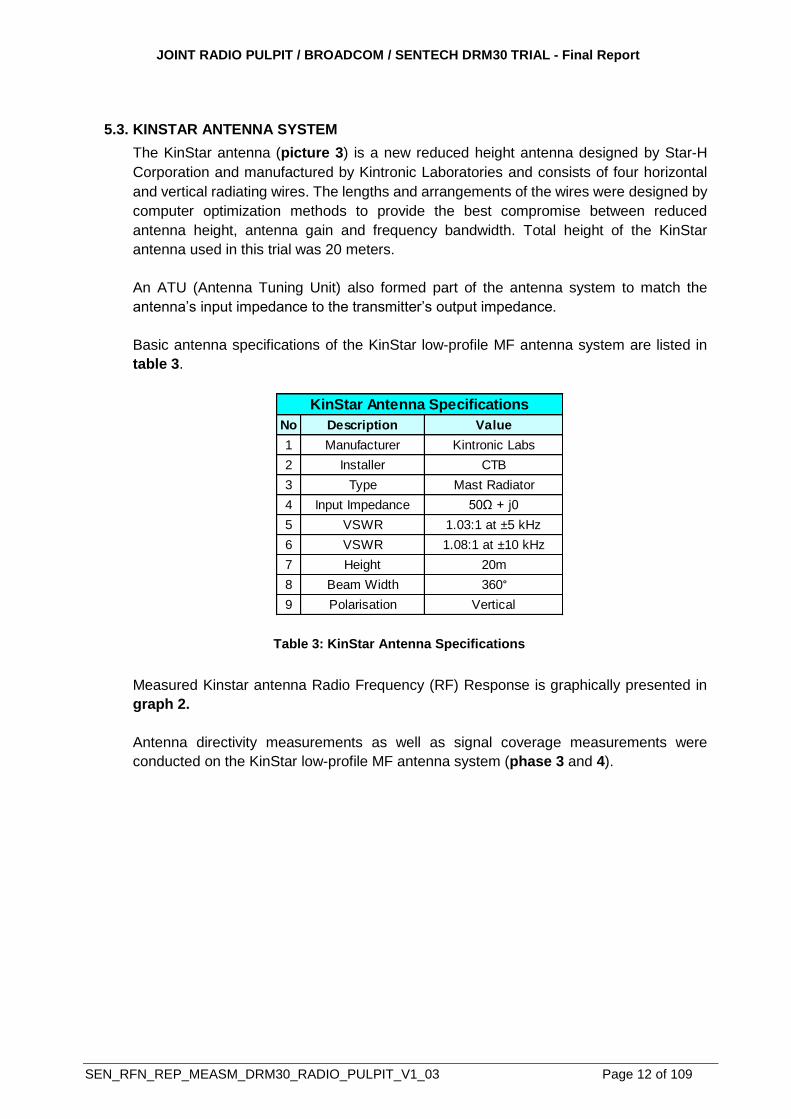
5.3. KINSTAR ANTENNA SYSTEM
The KinStar antenna (picture 3) is a new reduced height antenna designed by Star-H
Corporation and manufactured by Kintronic Laboratories and consists of four horizontal
and vertical radiating wires. The lengths and arrangements of the wires were designed by
computer optimization methods to provide the best compromise between reduced
antenna height, antenna gain and frequency bandwidth. Total height of the KinStar
antenna used in this trial was 20 meters.
An ATU (Antenna Tuning Unit) also formed part of the antenna system to match the
antenna’s input impedance to the transmitter’s output impedance.
Basic antenna specifications of the KinStar low-profile MF antenna system are listed in
table 3.
Table 3: KinStar Antenna Specifications
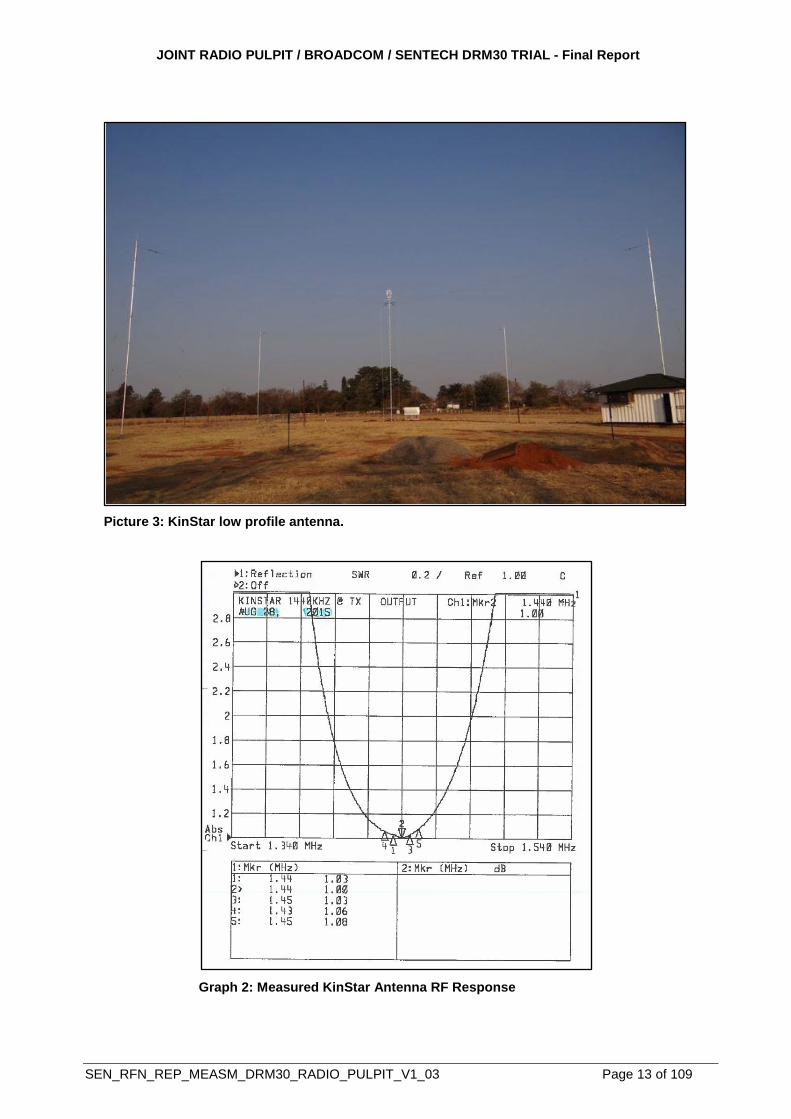
Measured Kinstar antenna Radio Frequency (RF) Response is graphically presented in
graph 2.
Antenna directivity measurements as well as signal coverage measurements were
conducted on the KinStar low-profile MF antenna system (phase 3 and 4).
No Description Value
1 Manufacturer Kintronic Labs
2 Installer CTB
3 Type Mast Radiator
4 Input Impedance 50Ω + j0
5 VSWR 1.03:1 at ±5 kHz
6 VSWR 1.08:1 at ±10 kHz
7 Height 20m
8 Beam Width 360°
9 Polarisation Vertical
KinStar Antenna Specifications
JOINT RADIO PULPIT / BROADCOM / SENTECH DRM30 TRIAL - Final Report
SEN_RFN_REP_MEASM_DRM30_RADIO_PULPIT_V1_03 Page 13 of 109
Picture 3: KinStar low profile antenna.
Graph 2: Measured KinStar Antenna RF Response
JOINT RADIO PULPIT / BROADCOM / SENTECH DRM30 TRIAL - Final Report
SEN_RFN_REP_MEASM_DRM30_RADIO_PULPIT_V1_03 Page 14 of 109
6. MEASUREMENTS
6.1. INITIATION OF MEASUREMENT EXERCISE
Radio Pulpit and Broadcom International established a DRM30 trial broadcast platform
and Sentech agreed to participate in the DRM30 trial by providing an alternative antenna
(KinStar), as well as support in terms of conducting measurement exercises with the main
objective to determine the functional capacity and capability of the DRM30 technology.
An alternative antenna was purchased from Kintronic Laboratories and installed by CTB
(Communications Technology Broadcasting) in the later stage of the DRM30 trial. This
antenna was constructed on the exact same location as the previous antenna (previous
Broadcom antenna was dismantled).
Measurements exercises were planned in different phases (Phase 1 to 4) and scheduled
accordingly.
Phase 1 measurement exercise focused on the Broadcom antenna’s performance which
was scheduled over a period of two days and conducted from the 17th to the 18th of
September 2014. A preliminary measurement report for phase 1 was completed on the
30th of September 2014 of which the findings are also included in this report.
Phase 2 measurement exercise focused on DRM signal coverage measurement of the
signal broadcasted using the Broadcom antenna was scheduled over a period of eight
days and conducted from the 16th to the 26th of March 2015. Measurement data was
analysed and the results and findings were also compiled in this report.
Phase 3 measurement exercise focused on the KinStar antenna performance which was
scheduled over a period of three days and conducted from the 15th to the 17th of
September 2015. Measurement data was analysed and the results and findings also
compiled in this report.
Phase 4 measurement exercise focused on DRM signal coverage measurement of the
signal broadcasted using the KinStar antenna was scheduled over a period of eight days,
conducted from the 22th of September 2015 to the 2nd of October 2015. Measurement data
was analysed and the results and findings were also compiled in this report.
Additional measurements were also conducted on the KinStar antenna which focused on
the analogue AM signal coverage which was also scheduled over a period of two days
and conducted from the 5th to the 6th of October 2015. Analysis and findings are also
compiled in this report.
JOINT RADIO PULPIT / BROADCOM / SENTECH DRM30 TRIAL - Final Report
SEN_RFN_REP_MEASM_DRM30_RADIO_PULPIT_V1_03 Page 15 of 109
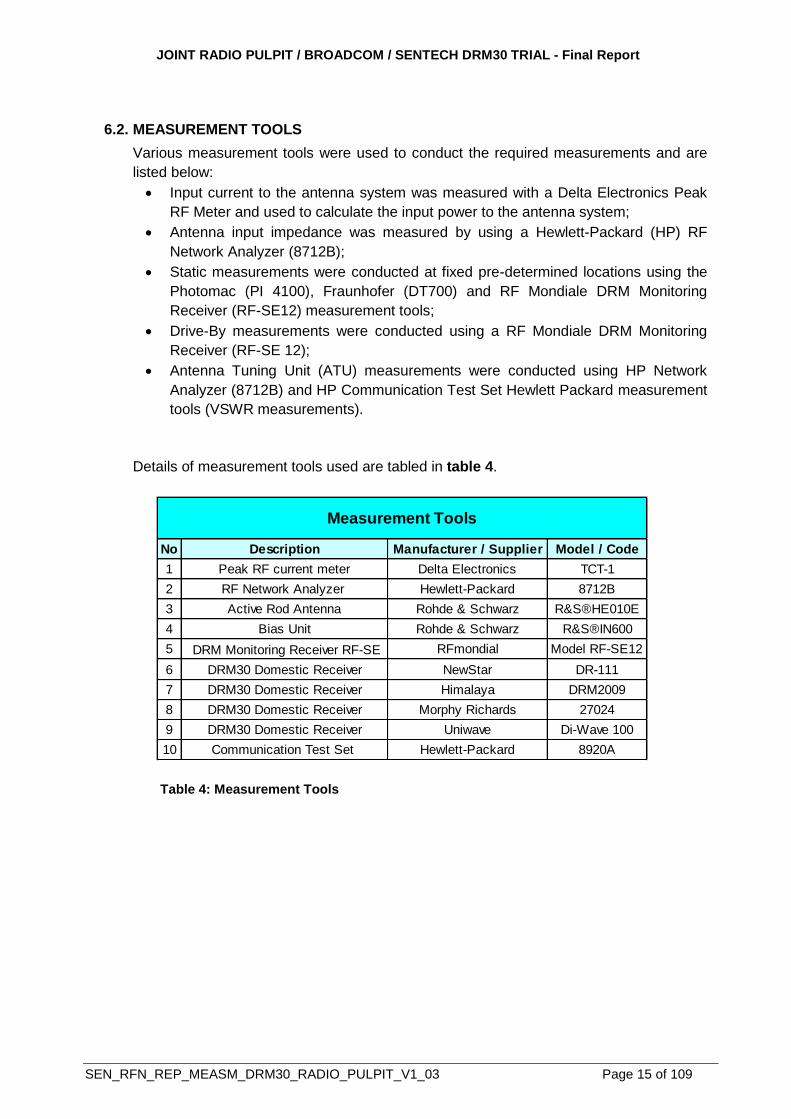
6.2. MEASUREMENT TOOLS
Various measurement tools were used to conduct the required measurements and are
listed below:
Input current to the antenna system was measured with a Delta Electronics Peak
RF Meter and used to calculate the input power to the antenna system;
Antenna input impedance was measured by using a Hewlett-Packard (HP) RF
Network Analyzer (8712B);
Static measurements were conducted at fixed pre-determined locations using the
Photomac (PI 4100), Fraunhofer (DT700) and RF Mondiale DRM Monitoring
Receiver (RF-SE12) measurement tools;
Drive-By measurements were conducted using a RF Mondiale DRM Monitoring
Receiver (RF-SE 12);
Antenna Tuning Unit (ATU) measurements were conducted using HP Network
Analyzer (8712B) and HP Communication Test Set Hewlett Packard measurement
tools (VSWR measurements).
Details of measurement tools used are tabled in table 4.
Table 4: Measurement Tools
No Description Manufacturer / Supplier Model / Code
1 Peak RF current meter Delta Electronics TCT-1
2 RF Network Analyzer Hewlett-Packard 8712B
3 Active Rod Antenna Rohde & Schwarz R&S®HE010E
4 Bias Unit Rohde & Schwarz R&S®IN600
5 DRM Monitoring Receiver RF-SE RFmondial Model RF-SE12
6 DRM30 Domestic Receiver NewStar DR-111
7 DRM30 Domestic Receiver Himalaya DRM2009
8 DRM30 Domestic Receiver Morphy Richards 27024
9 DRM30 Domestic Receiver Uniwave Di-Wave 100
10 Communication Test Set Hewlett-Packard 8920A
Measurement Tools

JOINT RADIO PULPIT / BROADCOM / SENTECH DRM30 TRIAL - Final Report
SEN_RFN_REP_MEASM_DRM30_RADIO_PULPIT_V1_03 Page 16 of 109
6.3. MEASUREMENT METHOD
Measurements were conducted on planned locations and routes which consisted of both
static measurements as well as Drive-By measurements. Static measurement results
were mainly used to determine antenna performance and Drive-By measurement results
used to conduct signal coverage verification. Static measurements on the routes were
identified based on incident findings (e.g. Audio loss, audio recovery etc.)
Only the static point measurement method was used to conduct basic antenna
performance measurements. Measurements were conducted at a height of approximately
1.5 meters above ground level and consisted of one measurement per static point.
Measurements were conducted at distances of 0.5km, 1km, 2km and 5km from the
transmitter station in 8 main predetermined radial directions (0º, 45º, 90º, 135º, 180º, 225º,
270º and 315º). The transmitter was configured to provide an analogue pilot signal during
the antenna measurement exercises.
Drive-By measurements were conducted at a height of two meters at a measurement
sampling rate of four measurements per second at a maximum speed of 90 km/h. These
measurements were conducted on eight pre-planned radial routes over a period of eight
days. Measurements were conducted by driving outwards on each radial with the MSC
(Main Service Channel) configured on a lower modulation setting (16QAM) up to the point
where complete audio failure occurred. Once audio failure detection was confirmed, the
same route was measured in the opposite direction back to the transmitter, with the MSC
configured to a higher modulation setting (64QAM). This measurement sequence was
repeated for all eight planned radial routes. The transmitter was configured to transmit a
DRM30 signal during the coverage measurement exercises.
Static measurements were conducted at fixed locations on the planned routes by using
the Drive-By measurement tool. These static measurement points were either located at
pre-identified measurement test point locations (e.g. major towns), or incident point
locations (where audio failure or recovery occurred) identified during the Drive-By
measurement exercise. Static measurements were conducted at a height of
approximately two meters above ground level at predetermined and incident locations.
Limited analogue AM measurements were also conducted for comparison purposes
between analogue (AM) and digital (DRM30). Drive-By and static measurements for AM
and DRM30 comparison purposes were conducted only on the northern and southern
radial routes.
Services were monitored and measured on all the planned routes. Whenever
measurement incidents (e.g. loss of audio, decode-ability, recovery of audio etc.) were
experienced the coordinates, measurement parameters and incident details were logged
and noted.
6.4. MEASUREMENT DATA
Drive-By measurement data measured by the DRM Monitoring Receiver (RF-SE12) was
logged, downloaded and converted to the appropriate format for coverage and statistical
analysis purposes.
JOINT RADIO PULPIT / BROADCOM / SENTECH DRM30 TRIAL - Final Report
SEN_RFN_REP_MEASM_DRM30_RADIO_PULPIT_V1_03 Page 17 of 109
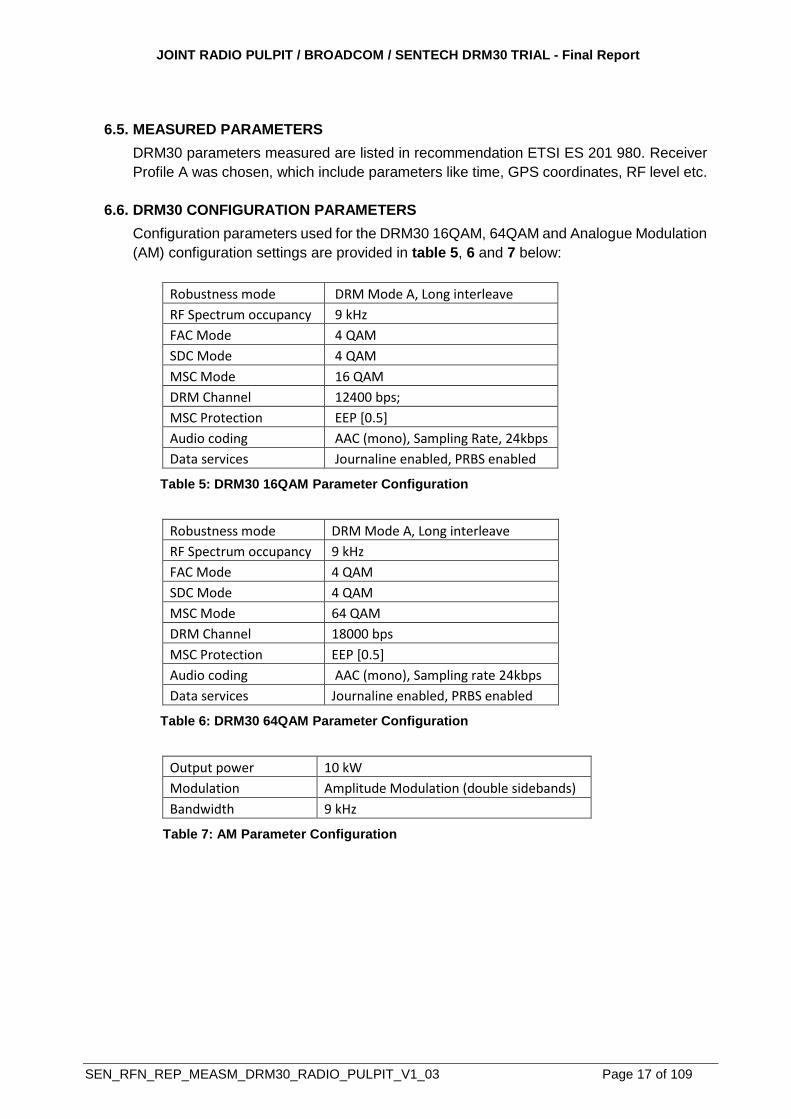
6.5. MEASURED PARAMETERS
DRM30 parameters measured are listed in recommendation ETSI ES 201 980. Receiver
Profile A was chosen, which include parameters like time, GPS coordinates, RF level etc.
6.6. DRM30 CONFIGURATION PARAMETERS
Configuration parameters used for the DRM30 16QAM, 64QAM and Analogue Modulation
(AM) configuration settings are provided in table 5, 6 and 7 below:
Robustness mode DRM Mode A, Long interleave
RF Spectrum occupancy 9 kHz
FAC Mode 4 QAM
SDC Mode 4 QAM
MSC Mode 16 QAM
DRM Channel 12400 bps;
MSC Protection EEP [0.5]
Audio coding AAC (mono), Sampling Rate, 24kbps
Data services Journaline enabled, PRBS enabled
Table 5: DRM30 16QAM Parameter Configuration
Robustness mode DRM Mode A, Long interleave
RF Spectrum occupancy 9 kHz
FAC Mode 4 QAM
SDC Mode 4 QAM
MSC Mode 64 QAM
DRM Channel 18000 bps
MSC Protection EEP [0.5]
Audio coding AAC (mono), Sampling rate 24kbps
Data services Journaline enabled, PRBS enabled
Table 6: DRM30 64QAM Parameter Configuration
Output power 10 kW
Modulation Amplitude Modulation (double sidebands)
Bandwidth 9 kHz
Table 7: AM Parameter Configuration
JOINT RADIO PULPIT / BROADCOM / SENTECH DRM30 TRIAL - Final Report
SEN_RFN_REP_MEASM_DRM30_RADIO_PULPIT_V1_03 Page 18 of 109
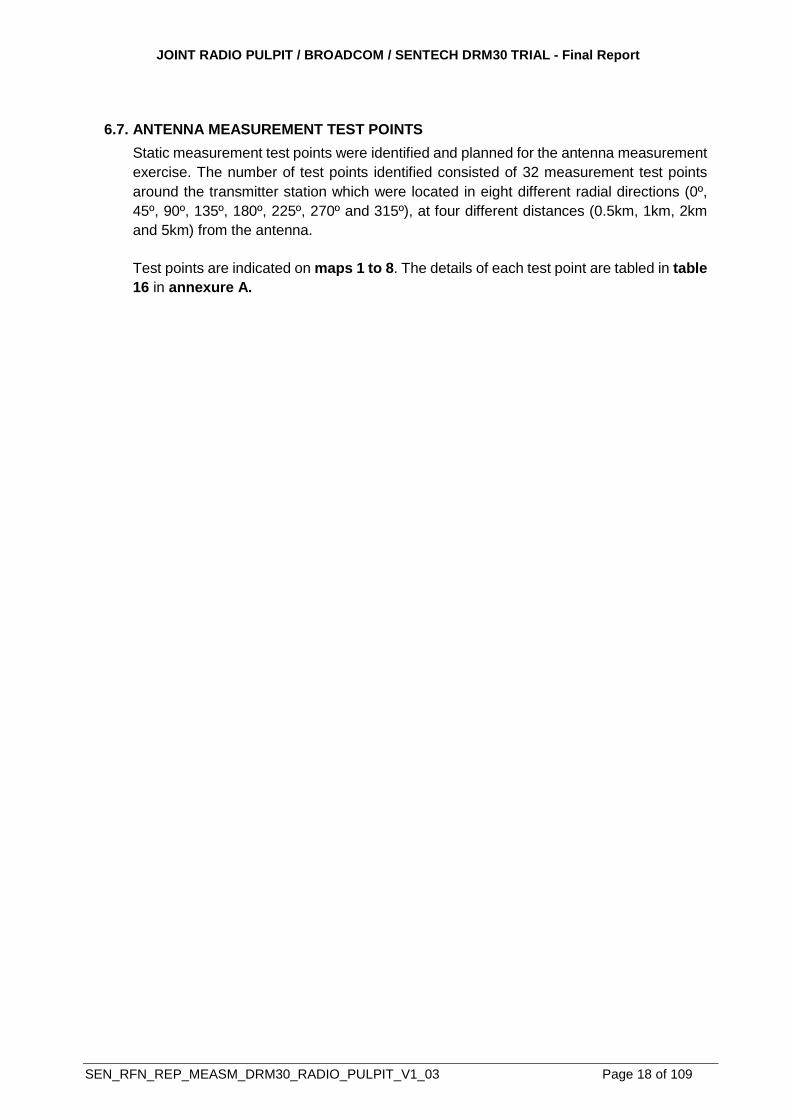
6.7. ANTENNA MEASUREMENT TEST POINTS
Static measurement test points were identified and planned for the antenna measurement
exercise. The number of test points identified consisted of 32 measurement test points
around the transmitter station which were located in eight different radial directions (0º,
45º, 90º, 135º, 180º, 225º, 270º and 315º), at four different distances (0.5km, 1km, 2km
and 5km) from the antenna.
Test points are indicated on maps 1 to 8. The details of each test point are tabled in table
16 in annexure A.
JOINT RADIO PULPIT / BROADCOM / SENTECH DRM30 TRIAL - Final Report
SEN_RFN_REP_MEASM_DRM30_RADIO_PULPIT_V1_03 Page 19 of 109
Map 1: Test points (TP01 to TP08) in 8 radial directions located at a distance of 1km from the
transmitter site. (ATDI ICS Telecom map)
Map 2: Test points (TP01 to TP08) in 8 radial directions located at a distance of 1km from the
transmitter site. (Google Earth Map)
Transmitter Station
TP01 TP02
TP03
TP04
TP05
TP06
TP07
TP08
JOINT RADIO PULPIT / BROADCOM / SENTECH DRM30 TRIAL - Final Report
SEN_RFN_REP_MEASM_DRM30_RADIO_PULPIT_V1_03 Page 20 of 109
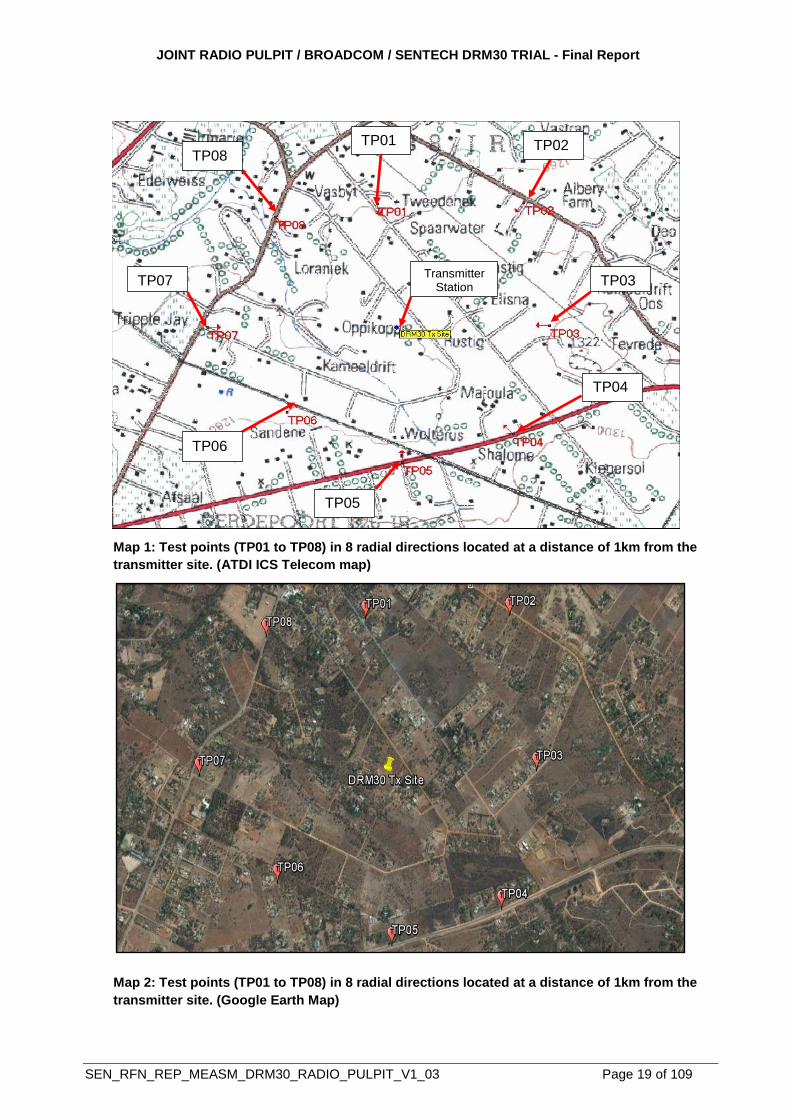
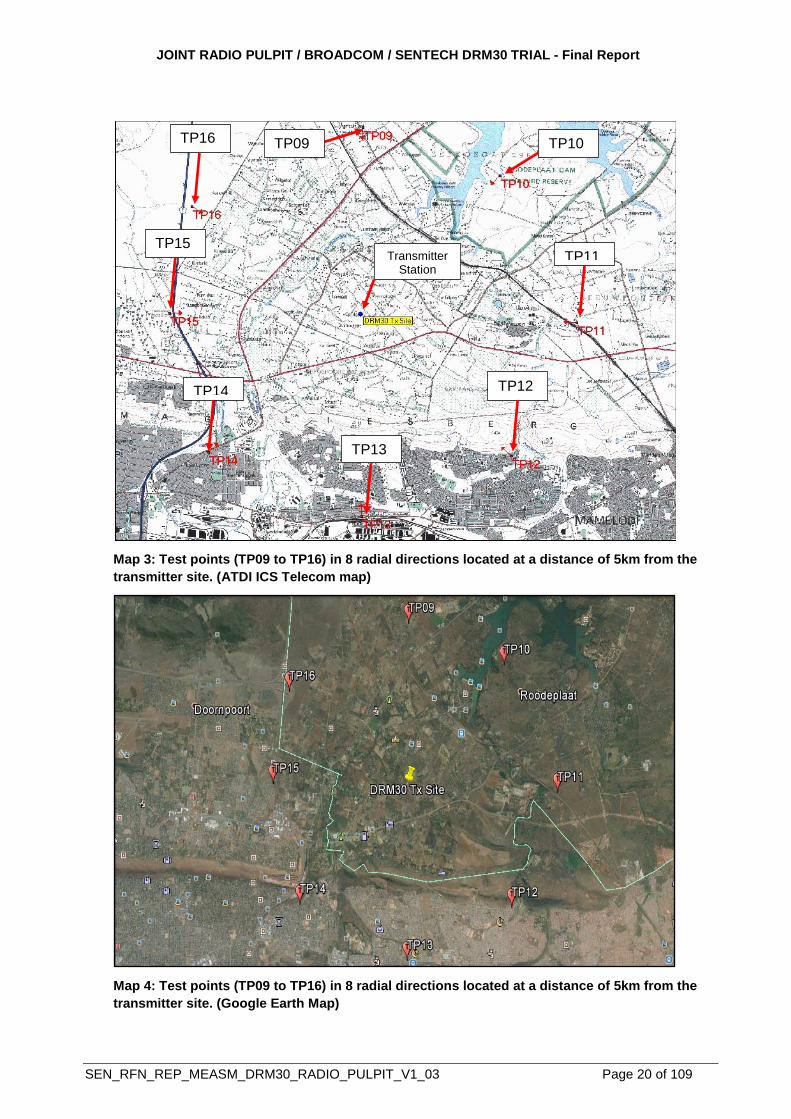
Map 3: Test points (TP09 to TP16) in 8 radial directions located at a distance of 5km from the
transmitter site. (ATDI ICS Telecom map)
Map 4: Test points (TP09 to TP16) in 8 radial directions located at a distance of 5km from the
transmitter site. (Google Earth Map)
Transmitter Station
TP16 TP09 TP10
TP11
TP12
TP13
TP14
TP15
JOINT RADIO PULPIT / BROADCOM / SENTECH DRM30 TRIAL - Final Report
SEN_RFN_REP_MEASM_DRM30_RADIO_PULPIT_V1_03 Page 21 of 109
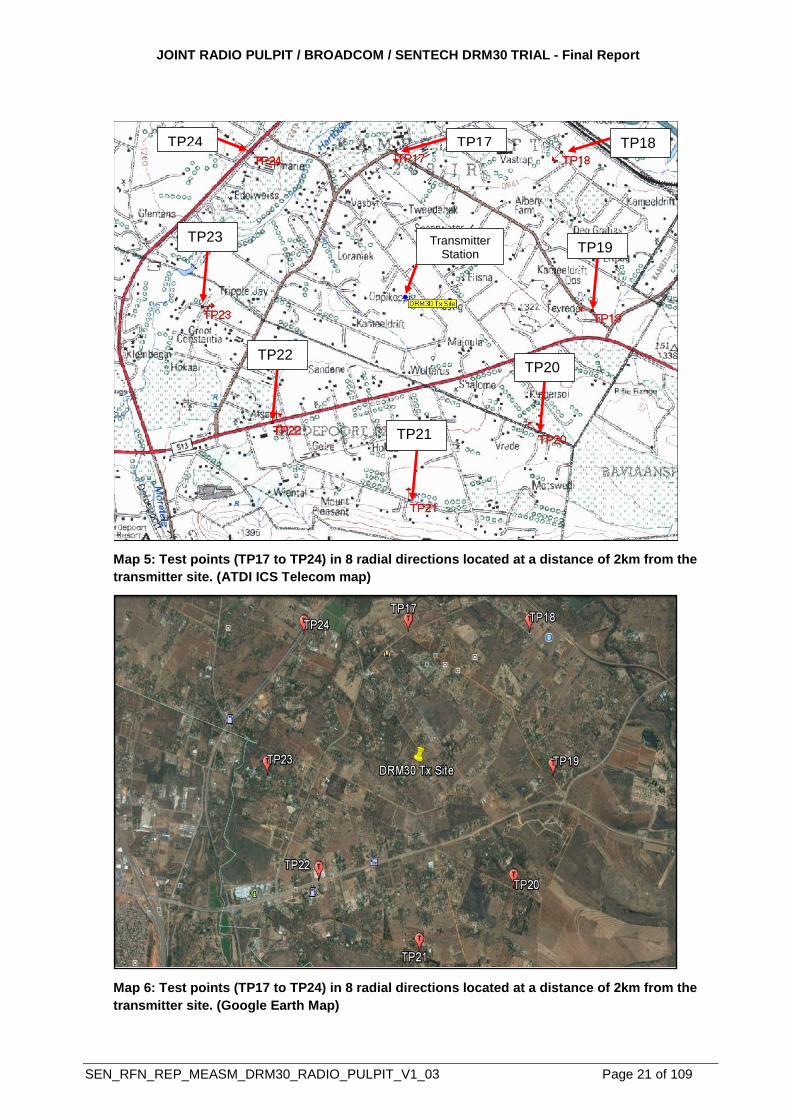
Map 5: Test points (TP17 to TP24) in 8 radial directions located at a distance of 2km from the
transmitter site. (ATDI ICS Telecom map)
Map 6: Test points (TP17 to TP24) in 8 radial directions located at a distance of 2km from the
transmitter site. (Google Earth Map)
TP23
TP22
TP21
TP20
TP19
TP18 TP17 TP24
Transmitter Station
JOINT RADIO PULPIT / BROADCOM / SENTECH DRM30 TRIAL - Final Report
SEN_RFN_REP_MEASM_DRM30_RADIO_PULPIT_V1_03 Page 22 of 109
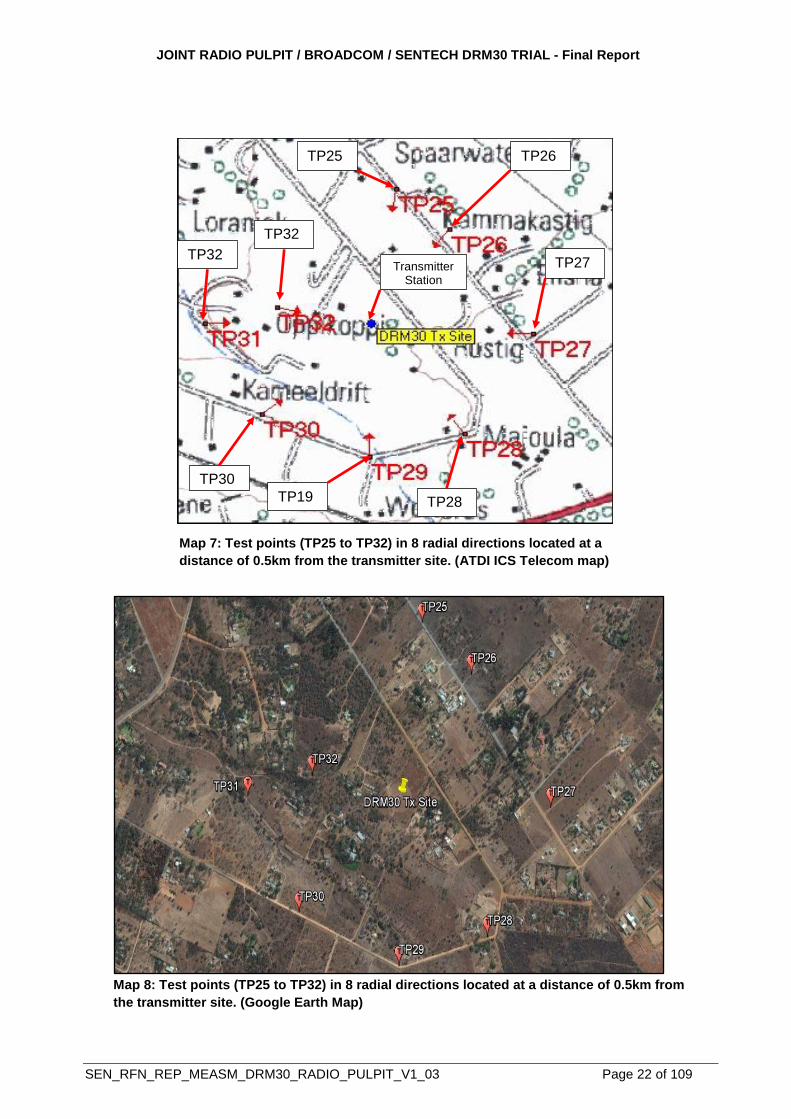
Map 7: Test points (TP25 to TP32) in 8 radial directions located at a
distance of 0.5km from the transmitter site. (ATDI ICS Telecom map)
Map 8: Test points (TP25 to TP32) in 8 radial directions located at a distance of 0.5km from
the transmitter site. (Google Earth Map)
Transmitter Station
TP25
TP32
TP32
TP30
TP19 TP28
TP27
TP26
JOINT RADIO PULPIT / BROADCOM / SENTECH DRM30 TRIAL - Final Report
SEN_RFN_REP_MEASM_DRM30_RADIO_PULPIT_V1_03 Page 23 of 109
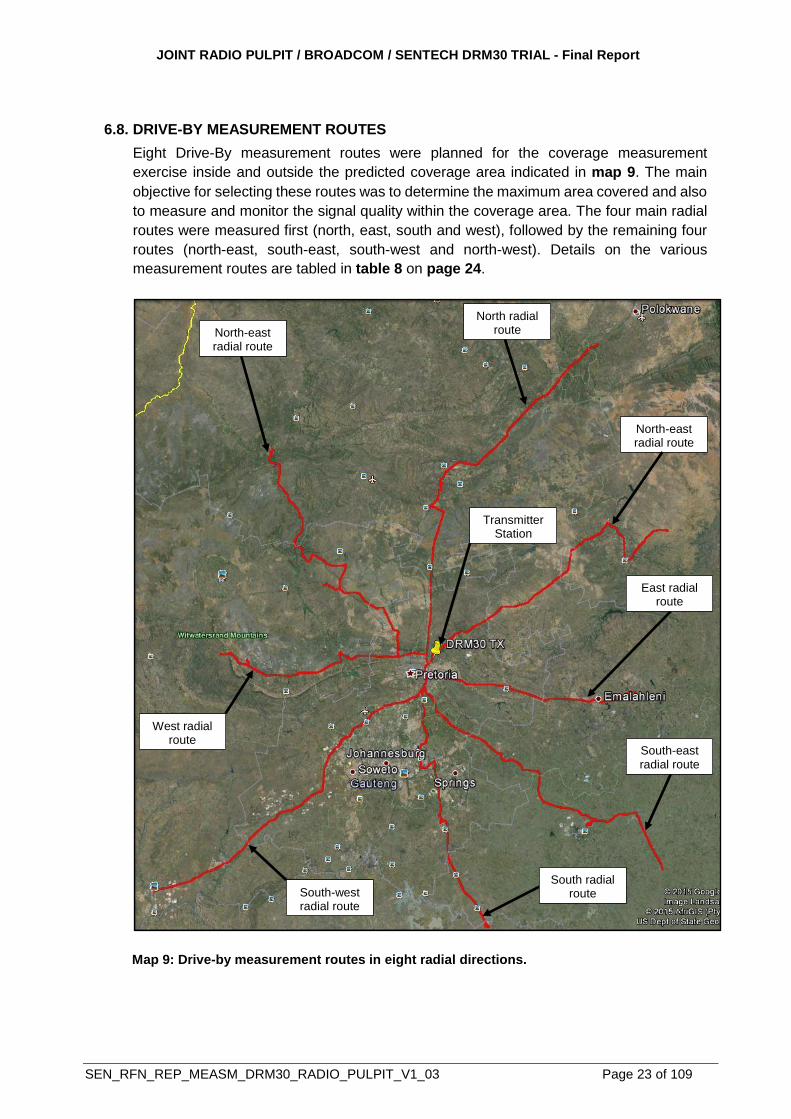
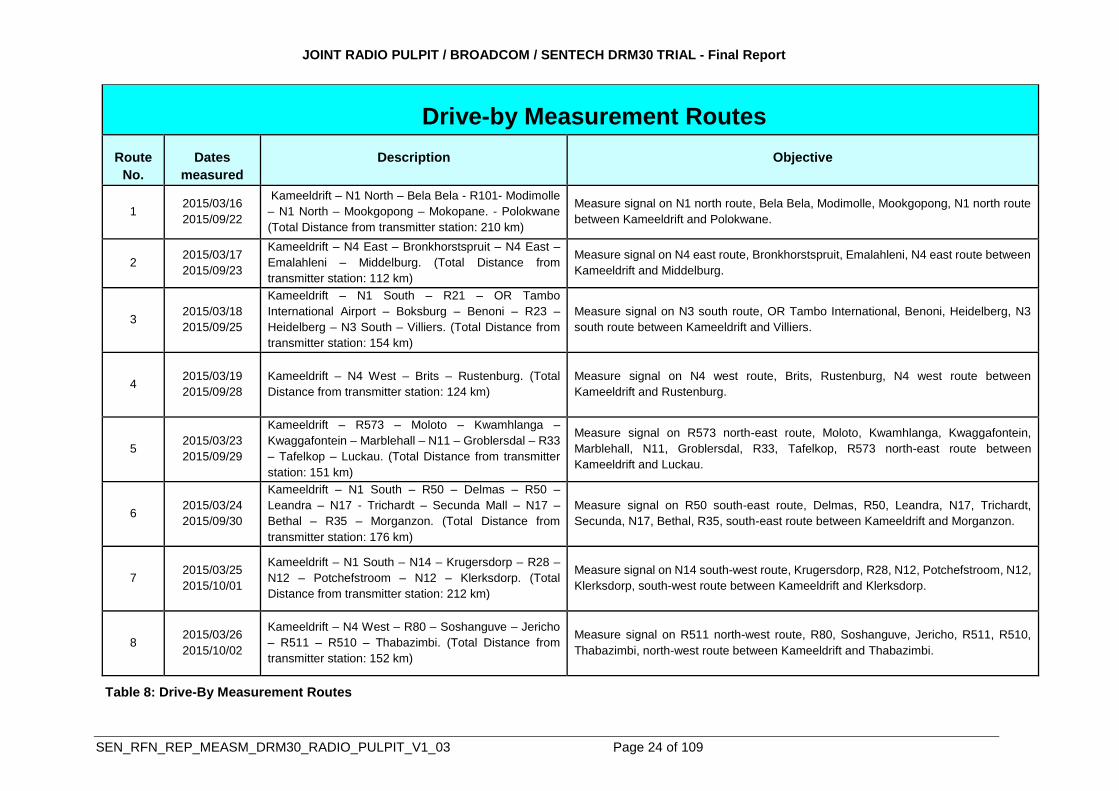
6.8. DRIVE-BY MEASUREMENT ROUTES
Eight Drive-By measurement routes were planned for the coverage measurement
exercise inside and outside the predicted coverage area indicated in map 9. The main
objective for selecting these routes was to determine the maximum area covered and also
to measure and monitor the signal quality within the coverage area. The four main radial
routes were measured first (north, east, south and west), followed by the remaining four
routes (north-east, south-east, south-west and north-west). Details on the various
measurement routes are tabled in table 8 on page 24.
Map 9: Drive-by measurement routes in eight radial directions.
Transmitter Station
North radial route
North-east radial route
East radial route
South-east radial route
South radial route South-west
radial route
North-east radial route
West radial route
JOINT RADIO PULPIT / BROADCOM / SENTECH DRM30 TRIAL - Final Report
SEN_RFN_REP_MEASM_DRM30_RADIO_PULPIT_V1_03 Page 24 of 109
Drive-by Measurement Routes
Route
No.
Dates
measured
Description
Objective
1 2015/03/16
2015/09/22
Kameeldrift – N1 North – Bela Bela - R101- Modimolle
– N1 North – Mookgopong – Mokopane. - Polokwane
(Total Distance from transmitter station: 210 km)
Measure signal on N1 north route, Bela Bela, Modimolle, Mookgopong, N1 north route
between Kameeldrift and Polokwane.
2 2015/03/17
2015/09/23
Kameeldrift – N4 East – Bronkhorstspruit – N4 East –
Emalahleni – Middelburg. (Total Distance from
transmitter station: 112 km)
Measure signal on N4 east route, Bronkhorstspruit, Emalahleni, N4 east route between
Kameeldrift and Middelburg.
3
2015/03/18
2015/09/25
Kameeldrift – N1 South – R21 – OR Tambo
International Airport – Boksburg – Benoni – R23 –
Heidelberg – N3 South – Villiers. (Total Distance from
transmitter station: 154 km)
Measure signal on N3 south route, OR Tambo International, Benoni, Heidelberg, N3
south route between Kameeldrift and Villiers.
4
2015/03/19
2015/09/28
Kameeldrift – N4 West – Brits – Rustenburg. (Total
Distance from transmitter station: 124 km)
Measure signal on N4 west route, Brits, Rustenburg, N4 west route between
Kameeldrift and Rustenburg.
5
2015/03/23
2015/09/29
Kameeldrift – R573 – Moloto – Kwamhlanga –
Kwaggafontein – Marblehall – N11 – Groblersdal – R33
– Tafelkop – Luckau. (Total Distance from transmitter
station: 151 km)
Measure signal on R573 north-east route, Moloto, Kwamhlanga, Kwaggafontein,
Marblehall, N11, Groblersdal, R33, Tafelkop, R573 north-east route between
Kameeldrift and Luckau.
6
2015/03/24
2015/09/30
Kameeldrift – N1 South – R50 – Delmas – R50 –
Leandra – N17 - Trichardt – Secunda Mall – N17 –
Bethal – R35 – Morganzon. (Total Distance from
transmitter station: 176 km)
Measure signal on R50 south-east route, Delmas, R50, Leandra, N17, Trichardt,
Secunda, N17, Bethal, R35, south-east route between Kameeldrift and Morganzon.
7
2015/03/25
2015/10/01
Kameeldrift – N1 South – N14 – Krugersdorp – R28 –
N12 – Potchefstroom – N12 – Klerksdorp. (Total
Distance from transmitter station: 212 km)
Measure signal on N14 south-west route, Krugersdorp, R28, N12, Potchefstroom, N12,
Klerksdorp, south-west route between Kameeldrift and Klerksdorp.
8
2015/03/26
2015/10/02
Kameeldrift – N4 West – R80 – Soshanguve – Jericho
– R511 – R510 – Thabazimbi. (Total Distance from
transmitter station: 152 km)
Measure signal on R511 north-west route, R80, Soshanguve, Jericho, R511, R510,
Thabazimbi, north-west route between Kameeldrift and Thabazimbi.
Table 8: Drive-By Measurement Routes
JOINT RADIO PULPIT / BROADCOM / SENTECH DRM30 TRIAL - Final Report
SEN_RFN_REP_MEASM_DRM30_RADIO_PULPIT_V1_03 Page 25 of 109
7. MEASUREMENT ANALYSIS
Measurement analyses were conducted with the objective to determine and verify the
potential benefits of the DRM30 technology as a potential radio broadcast platform. The
measurement analysis and findings described in this section include both the analysis and
findings on both the antenna systems (Broadcom and KinStar) as well as coverage
measurement results measured on both antenna systems.
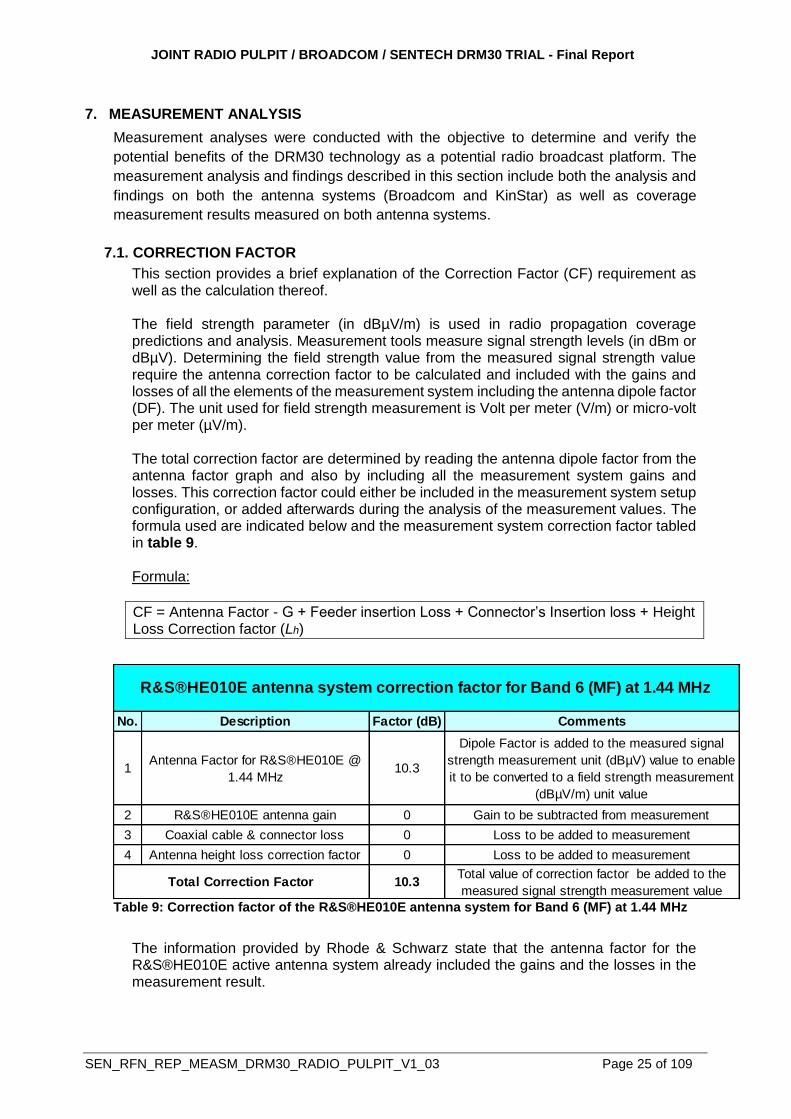
7.1. CORRECTION FACTOR
This section provides a brief explanation of the Correction Factor (CF) requirement as well as the calculation thereof. The field strength parameter (in dBµV/m) is used in radio propagation coverage predictions and analysis. Measurement tools measure signal strength levels (in dBm or dBµV). Determining the field strength value from the measured signal strength value require the antenna correction factor to be calculated and included with the gains and losses of all the elements of the measurement system including the antenna dipole factor (DF). The unit used for field strength measurement is Volt per meter (V/m) or micro-volt per meter (µV/m). The total correction factor are determined by reading the antenna dipole factor from the antenna factor graph and also by including all the measurement system gains and losses. This correction factor could either be included in the measurement system setup configuration, or added afterwards during the analysis of the measurement values. The formula used are indicated below and the measurement system correction factor tabled in table 9. Formula:
CF = Antenna Factor - G + Feeder insertion Loss + Connector’s Insertion loss + Height Loss Correction factor (Lh)
Table 9: Correction factor of the R&S®HE010E antenna system for Band 6 (MF) at 1.44 MHz
The information provided by Rhode & Schwarz state that the antenna factor for the R&S®HE010E active antenna system already included the gains and the losses in the measurement result.
No. Description Factor (dB) Comments
1Antenna Factor for R&S®HE010E @
1.44 MHz10.3
Dipole Factor is added to the measured signal
strength measurement unit (dBµV) value to enable
it to be converted to a field strength measurement
(dBµV/m) unit value
2 R&S®HE010E antenna gain 0 Gain to be subtracted from measurement
3 Coaxial cable & connector loss 0 Loss to be added to measurement
4 Antenna height loss correction factor 0 Loss to be added to measurement
10.3Total value of correction factor be added to the
measured signal strength measurement value
R&S®HE010E antenna system correction factor for Band 6 (MF) at 1.44 MHz
Total Correction Factor
JOINT RADIO PULPIT / BROADCOM / SENTECH DRM30 TRIAL - Final Report
SEN_RFN_REP_MEASM_DRM30_RADIO_PULPIT_V1_03 Page 26 of 109
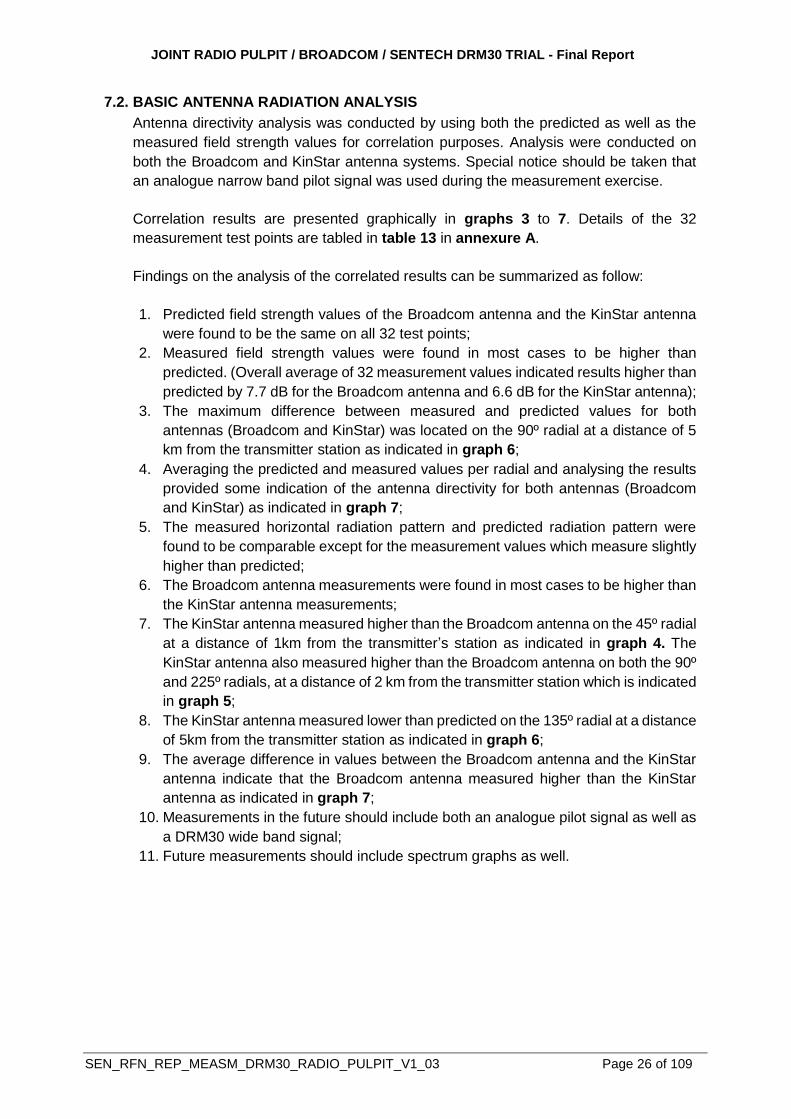
7.2. BASIC ANTENNA RADIATION ANALYSIS
Antenna directivity analysis was conducted by using both the predicted as well as the
measured field strength values for correlation purposes. Analysis were conducted on
both the Broadcom and KinStar antenna systems. Special notice should be taken that
an analogue narrow band pilot signal was used during the measurement exercise.
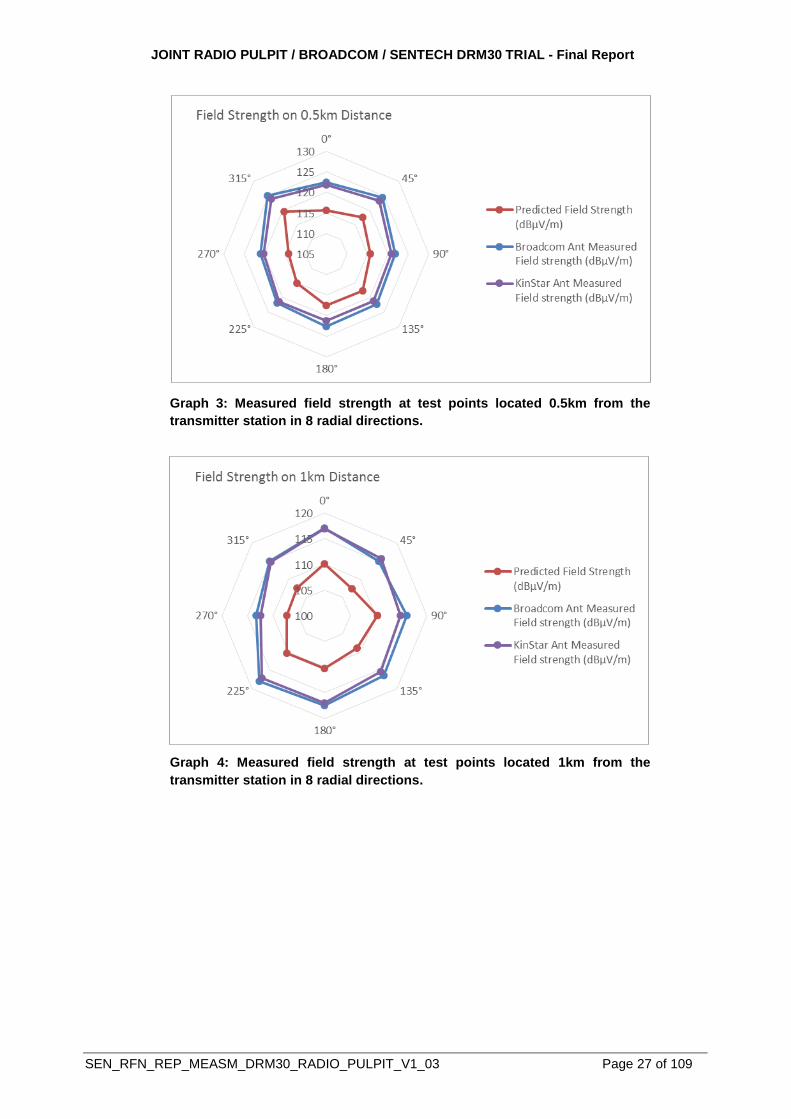
Correlation results are presented graphically in graphs 3 to 7. Details of the 32
measurement test points are tabled in table 13 in annexure A.
Findings on the analysis of the correlated results can be summarized as follow:
1. Predicted field strength values of the Broadcom antenna and the KinStar antenna
were found to be the same on all 32 test points;
2. Measured field strength values were found in most cases to be higher than
predicted. (Overall average of 32 measurement values indicated results higher than
predicted by 7.7 dB for the Broadcom antenna and 6.6 dB for the KinStar antenna);
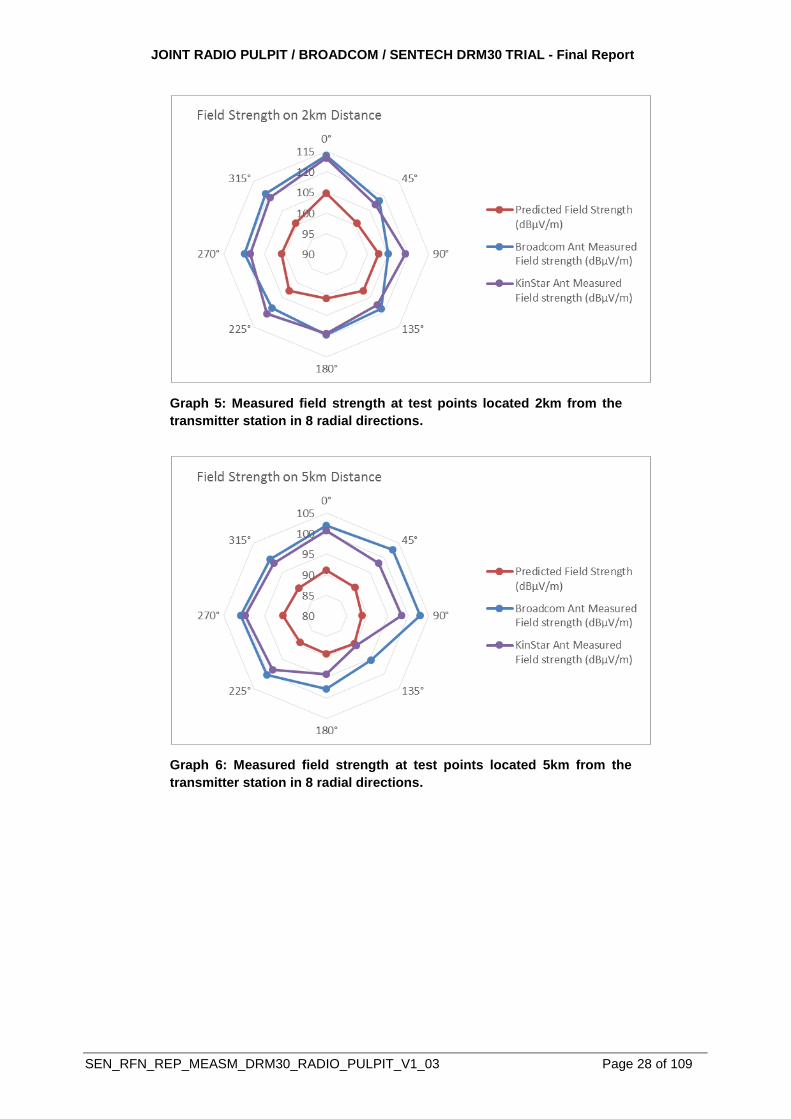
3. The maximum difference between measured and predicted values for both
antennas (Broadcom and KinStar) was located on the 90º radial at a distance of 5
km from the transmitter station as indicated in graph 6;
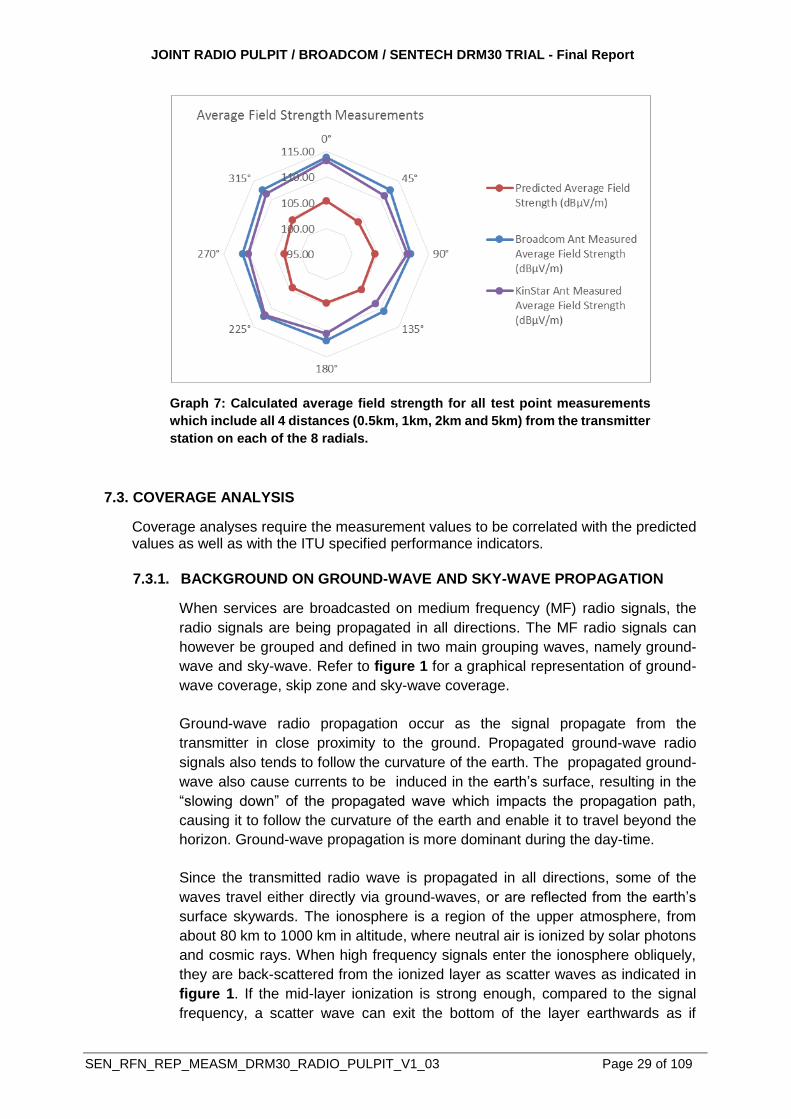
4. Averaging the predicted and measured values per radial and analysing the results
provided some indication of the antenna directivity for both antennas (Broadcom
and KinStar) as indicated in graph 7;
5. The measured horizontal radiation pattern and predicted radiation pattern were
found to be comparable except for the measurement values which measure slightly
higher than predicted;
6. The Broadcom antenna measurements were found in most cases to be higher than
the KinStar antenna measurements;
7. The KinStar antenna measured higher than the Broadcom antenna on the 45º radial
at a distance of 1km from the transmitter’s station as indicated in graph 4. The
KinStar antenna also measured higher than the Broadcom antenna on both the 90º
and 225º radials, at a distance of 2 km from the transmitter station which is indicated
in graph 5;
8. The KinStar antenna measured lower than predicted on the 135º radial at a distance
of 5km from the transmitter station as indicated in graph 6;
9. The average difference in values between the Broadcom antenna and the KinStar
antenna indicate that the Broadcom antenna measured higher than the KinStar
antenna as indicated in graph 7;
10. Measurements in the future should include both an analogue pilot signal as well as
a DRM30 wide band signal;
11. Future measurements should include spectrum graphs as well.
JOINT RADIO PULPIT / BROADCOM / SENTECH DRM30 TRIAL - Final Report
SEN_RFN_REP_MEASM_DRM30_RADIO_PULPIT_V1_03 Page 27 of 109
Graph 3: Measured field strength at test points located 0.5km from the
transmitter station in 8 radial directions.
Graph 4: Measured field strength at test points located 1km from the
transmitter station in 8 radial directions.
JOINT RADIO PULPIT / BROADCOM / SENTECH DRM30 TRIAL - Final Report
SEN_RFN_REP_MEASM_DRM30_RADIO_PULPIT_V1_03 Page 28 of 109
Graph 5: Measured field strength at test points located 2km from the
transmitter station in 8 radial directions.
Graph 6: Measured field strength at test points located 5km from the
transmitter station in 8 radial directions.
JOINT RADIO PULPIT / BROADCOM / SENTECH DRM30 TRIAL - Final Report
SEN_RFN_REP_MEASM_DRM30_RADIO_PULPIT_V1_03 Page 29 of 109
Graph 7: Calculated average field strength for all test point measurements
which include all 4 distances (0.5km, 1km, 2km and 5km) from the transmitter
station on each of the 8 radials.
7.3. COVERAGE ANALYSIS
Coverage analyses require the measurement values to be correlated with the predicted values as well as with the ITU specified performance indicators.
7.3.1. BACKGROUND ON GROUND-WAVE AND SKY-WAVE PROPAGATION
When services are broadcasted on medium frequency (MF) radio signals, the
radio signals are being propagated in all directions. The MF radio signals can
however be grouped and defined in two main grouping waves, namely ground-
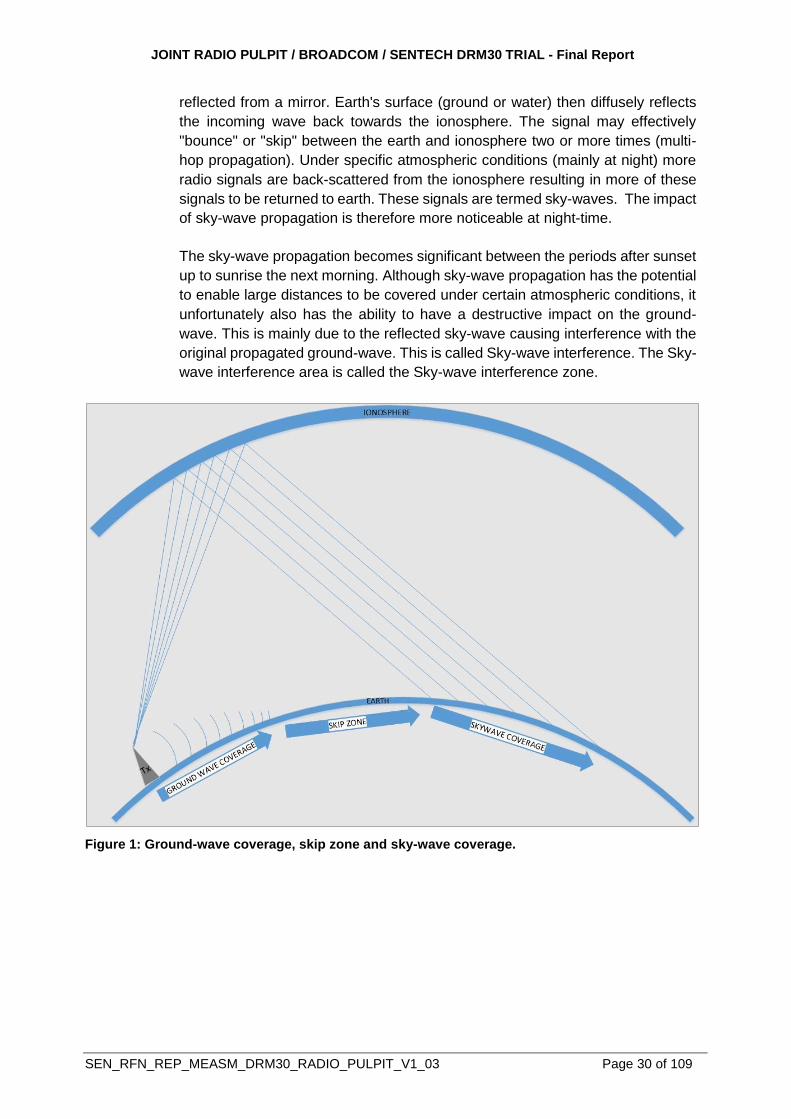
wave and sky-wave. Refer to figure 1 for a graphical representation of ground-
wave coverage, skip zone and sky-wave coverage.
Ground-wave radio propagation occur as the signal propagate from the
transmitter in close proximity to the ground. Propagated ground-wave radio
signals also tends to follow the curvature of the earth. The propagated ground-
wave also cause currents to be induced in the earth’s surface, resulting in the
“slowing down” of the propagated wave which impacts the propagation path,
causing it to follow the curvature of the earth and enable it to travel beyond the
horizon. Ground-wave propagation is more dominant during the day-time.
Since the transmitted radio wave is propagated in all directions, some of the
waves travel either directly via ground-waves, or are reflected from the earth’s
surface skywards. The ionosphere is a region of the upper atmosphere, from
about 80 km to 1000 km in altitude, where neutral air is ionized by solar photons
and cosmic rays. When high frequency signals enter the ionosphere obliquely,
they are back-scattered from the ionized layer as scatter waves as indicated in
figure 1. If the mid-layer ionization is strong enough, compared to the signal
frequency, a scatter wave can exit the bottom of the layer earthwards as if
JOINT RADIO PULPIT / BROADCOM / SENTECH DRM30 TRIAL - Final Report
SEN_RFN_REP_MEASM_DRM30_RADIO_PULPIT_V1_03 Page 30 of 109
reflected from a mirror. Earth's surface (ground or water) then diffusely reflects
the incoming wave back towards the ionosphere. The signal may effectively
"bounce" or "skip" between the earth and ionosphere two or more times (multi-
hop propagation). Under specific atmospheric conditions (mainly at night) more
radio signals are back-scattered from the ionosphere resulting in more of these
signals to be returned to earth. These signals are termed sky-waves. The impact
of sky-wave propagation is therefore more noticeable at night-time.
The sky-wave propagation becomes significant between the periods after sunset
up to sunrise the next morning. Although sky-wave propagation has the potential
to enable large distances to be covered under certain atmospheric conditions, it
unfortunately also has the ability to have a destructive impact on the ground-
wave. This is mainly due to the reflected sky-wave causing interference with the
original propagated ground-wave. This is called Sky-wave interference. The Sky-
wave interference area is called the Sky-wave interference zone.
Figure 1: Ground-wave coverage, skip zone and sky-wave coverage.
JOINT RADIO PULPIT / BROADCOM / SENTECH DRM30 TRIAL - Final Report
SEN_RFN_REP_MEASM_DRM30_RADIO_PULPIT_V1_03 Page 31 of 109
7.3.2. GROUND-WAVE AND SKY-WAVE PREDICTIONS
The prediction of field strength for digital sound broadcasting systems is covered in Recommendation ITU-R P.1321. This recommendation also refer to two other recommendations, recommendation ITU-R P.368-7 for ground-wave predictions and recommendation ITU-R P. 1147 for Sky-Wave predictions. Recommendation ITU-R P.368-7 is a calculation model that is specifically used to calculate ground-wave propagation which are used for ground-wave coverage predictions. Recommendation ITU-R P. 1147 is a calculation model that is specifically used to calculate sky-wave propagation which are used to predict sky-wave coverage.
7.3.3. GROUND CONDUCTIVITY DATA
Ground conductivity data (.sol file) was obtained by using the ITU Digitized World
Map (IDWM2Raster) software. The conductivity and permittivity values were
imported into an ICS Telecom planning tool in a clutter file (.sol) format and used
as a clutter layer. This enabled the planning tool to simulate ground-conductivity
to ensure it is also included as a variable in coverage predictions.
JOINT RADIO PULPIT / BROADCOM / SENTECH DRM30 TRIAL - Final Report
SEN_RFN_REP_MEASM_DRM30_RADIO_PULPIT_V1_03 Page 32 of 109
7.3.4. PREDICTED GROUND-WAVE COVERAGE AREA
Notice should be taken that the ground-wave predictions on both antennas were
conducted by using the antenna patterns of an isotropic antenna.
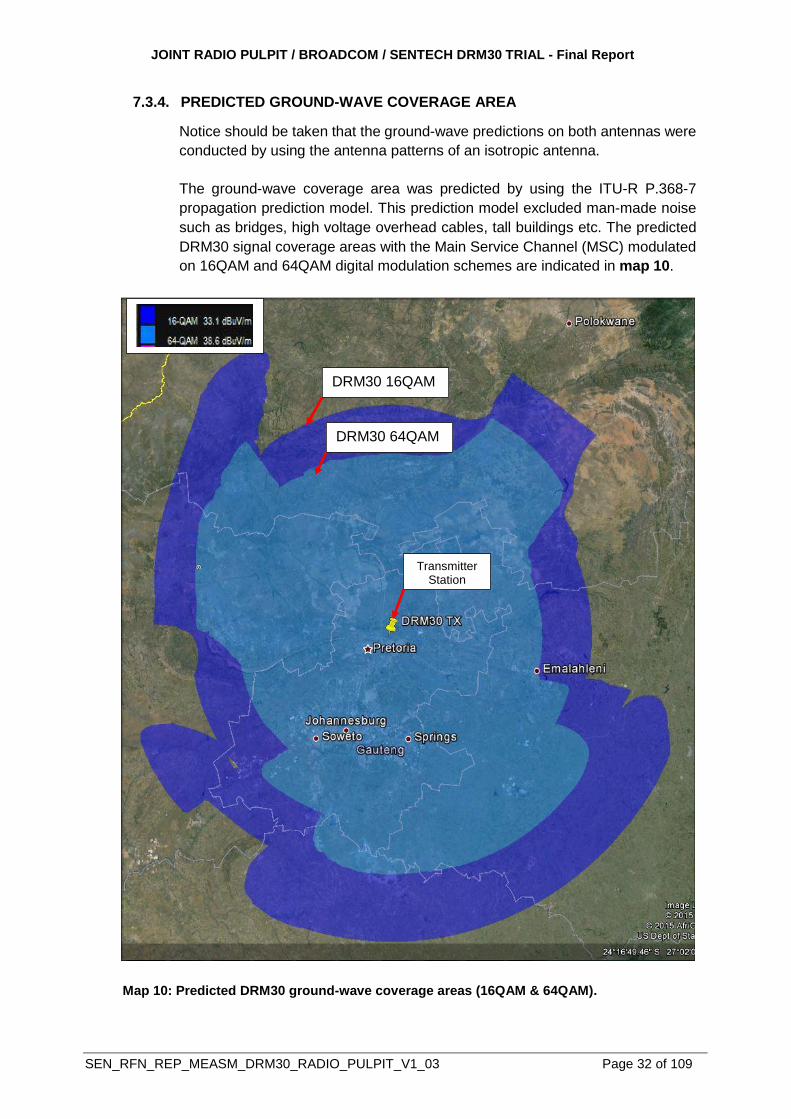
The ground-wave coverage area was predicted by using the ITU-R P.368-7
propagation prediction model. This prediction model excluded man-made noise
such as bridges, high voltage overhead cables, tall buildings etc. The predicted
DRM30 signal coverage areas with the Main Service Channel (MSC) modulated
on 16QAM and 64QAM digital modulation schemes are indicated in map 10.
Map 10: Predicted DRM30 ground-wave coverage areas (16QAM & 64QAM).
DRM30 16QAM
DRM30 64QAM
Transmitter Station
JOINT RADIO PULPIT / BROADCOM / SENTECH DRM30 TRIAL - Final Report
SEN_RFN_REP_MEASM_DRM30_RADIO_PULPIT_V1_03 Page 33 of 109
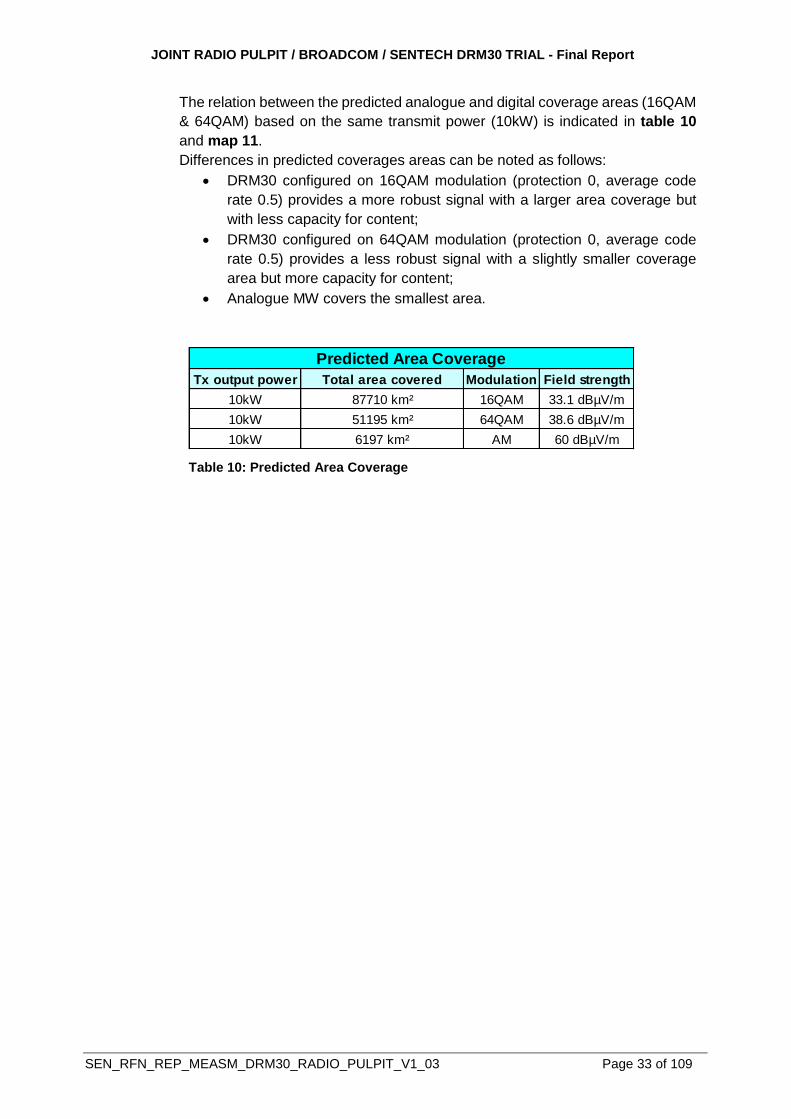
The relation between the predicted analogue and digital coverage areas (16QAM
& 64QAM) based on the same transmit power (10kW) is indicated in table 10
and map 11.
Differences in predicted coverages areas can be noted as follows:
DRM30 configured on 16QAM modulation (protection 0, average code
rate 0.5) provides a more robust signal with a larger area coverage but
with less capacity for content;
DRM30 configured on 64QAM modulation (protection 0, average code
rate 0.5) provides a less robust signal with a slightly smaller coverage
area but more capacity for content;
Analogue MW covers the smallest area.
Table 10: Predicted Area Coverage
Tx output power Total area covered Modulation Field strength
10kW 87710 km² 16QAM 33.1 dBµV/m
10kW 51195 km² 64QAM 38.6 dBµV/m
10kW 6197 km² AM 60 dBµV/m
Predicted Area Coverage
JOINT RADIO PULPIT / BROADCOM / SENTECH DRM30 TRIAL - Final Report
SEN_RFN_REP_MEASM_DRM30_RADIO_PULPIT_V1_03 Page 34 of 109
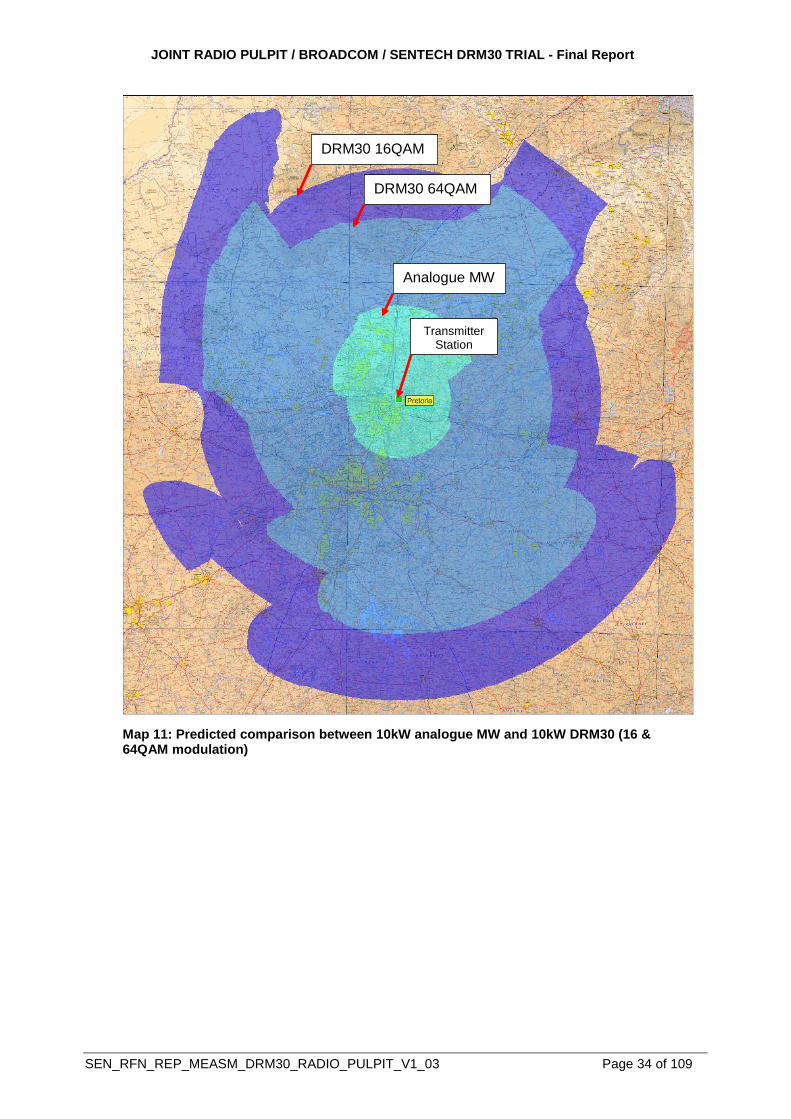
Map 11: Predicted comparison between 10kW analogue MW and 10kW DRM30 (16 & 64QAM modulation)
Analogue MW
DRM30 64QAM
DRM30 16QAM
Transmitter Station
JOINT RADIO PULPIT / BROADCOM / SENTECH DRM30 TRIAL - Final Report
SEN_RFN_REP_MEASM_DRM30_RADIO_PULPIT_V1_03 Page 35 of 109
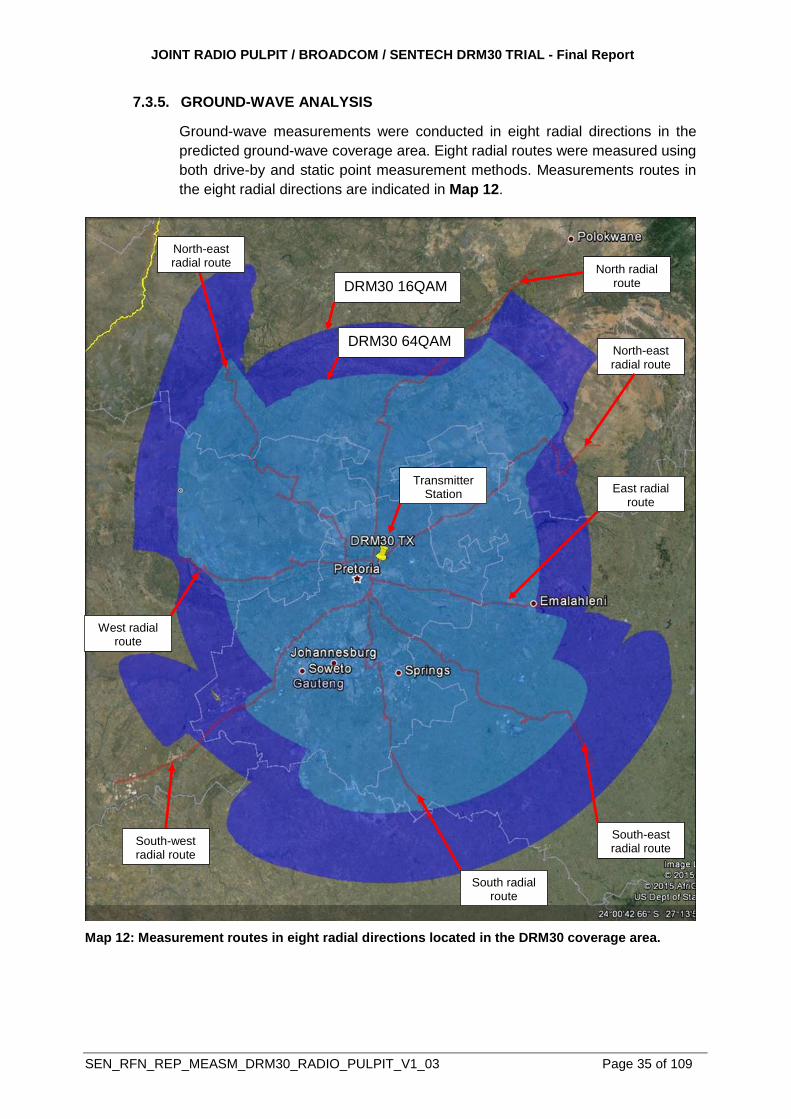
7.3.5. GROUND-WAVE ANALYSIS
Ground-wave measurements were conducted in eight radial directions in the
predicted ground-wave coverage area. Eight radial routes were measured using
both drive-by and static point measurement methods. Measurements routes in
the eight radial directions are indicated in Map 12.
Map 12: Measurement routes in eight radial directions located in the DRM30 coverage area.
DRM30 16QAM
DRM30 64QAM
Transmitter Station
North radial route
North-east radial route
East radial route
South-east radial route
South radial route
South-west radial route
North-east radial route
West radial route
JOINT RADIO PULPIT / BROADCOM / SENTECH DRM30 TRIAL - Final Report
SEN_RFN_REP_MEASM_DRM30_RADIO_PULPIT_V1_03 Page 36 of 109
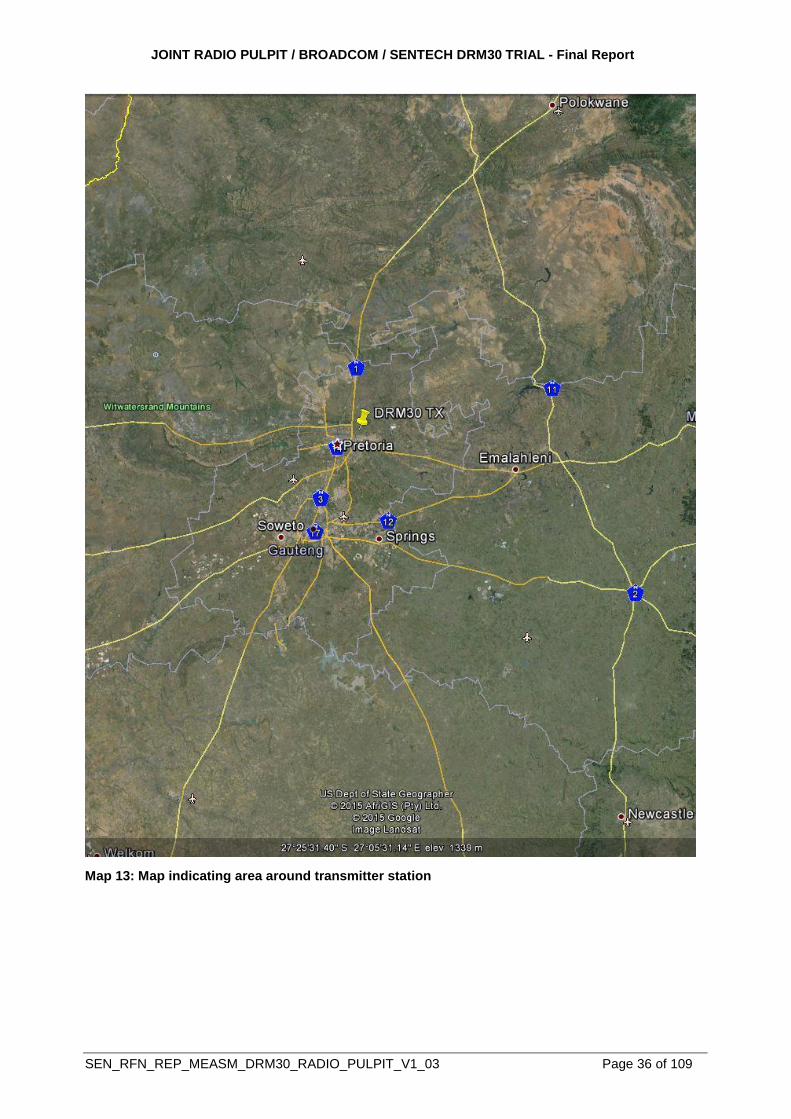
Map 13: Map indicating area around transmitter station
JOINT RADIO PULPIT / BROADCOM / SENTECH DRM30 TRIAL - Final Report
SEN_RFN_REP_MEASM_DRM30_RADIO_PULPIT_V1_03 Page 37 of 109
7.3.5.1. MEASUREMENT CORRELATIONS – GROUND-WAVE
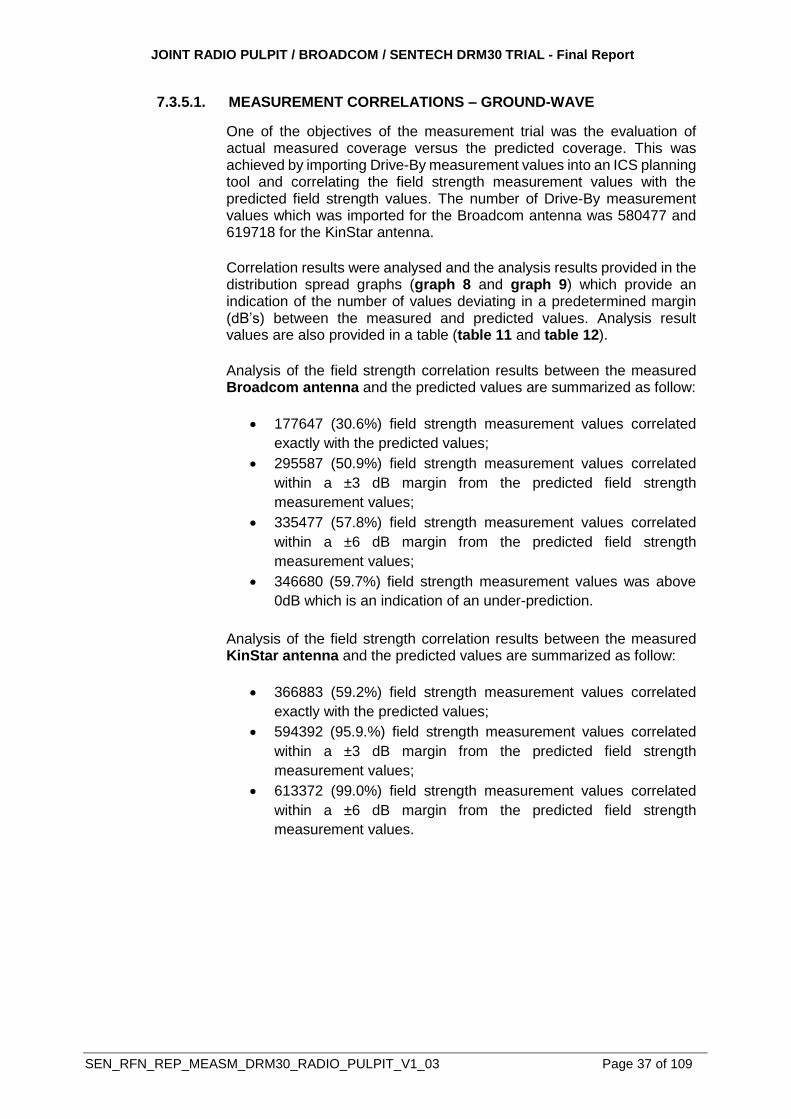
One of the objectives of the measurement trial was the evaluation of actual measured coverage versus the predicted coverage. This was achieved by importing Drive-By measurement values into an ICS planning tool and correlating the field strength measurement values with the predicted field strength values. The number of Drive-By measurement values which was imported for the Broadcom antenna was 580477 and 619718 for the KinStar antenna.
Correlation results were analysed and the analysis results provided in the distribution spread graphs (graph 8 and graph 9) which provide an indication of the number of values deviating in a predetermined margin (dB’s) between the measured and predicted values. Analysis result values are also provided in a table (table 11 and table 12).
Analysis of the field strength correlation results between the measured Broadcom antenna and the predicted values are summarized as follow:
177647 (30.6%) field strength measurement values correlated
exactly with the predicted values;
295587 (50.9%) field strength measurement values correlated
within a ±3 dB margin from the predicted field strength
measurement values;
335477 (57.8%) field strength measurement values correlated
within a ±6 dB margin from the predicted field strength
measurement values;
346680 (59.7%) field strength measurement values was above
0dB which is an indication of an under-prediction.
Analysis of the field strength correlation results between the measured KinStar antenna and the predicted values are summarized as follow:
366883 (59.2%) field strength measurement values correlated
exactly with the predicted values;
594392 (95.9.%) field strength measurement values correlated
within a ±3 dB margin from the predicted field strength
measurement values;
613372 (99.0%) field strength measurement values correlated
within a ±6 dB margin from the predicted field strength
measurement values.
JOINT RADIO PULPIT / BROADCOM / SENTECH DRM30 TRIAL - Final Report
SEN_RFN_REP_MEASM_DRM30_RADIO_PULPIT_V1_03 Page 38 of 109
Comparison of the field strength correlation results between the Broadcom antenna and the KinStar antenna can be summarized as follow:
The total Drive-By measurements conducted on the Broadcom
antenna was 580477 which are 39098 measurements less
(6.34%) than the 619718 measurement values measured on the
KinStar antenna;
The number of the measurement values which correlated exactly
with the predicted values on the Broadcom antenna was 177647
(30.6%) measurement values and for the KinStar antenna •
366883 (59.2%) measurement values;
Comparison of the distribution graphs (graph 8 and graph 9)
provide a clear indication that the measurement values of the
KinStar antenna correlated better with the predicted values
compared to correlations conducted on the Broadcom antenna.
Studying the correlated field strength distribution graphs (graph 8 and graph 9) and the tabled results (table 11 and table 12) findings can be summarized as follow:
The planning tool was capable to conduct field strength coverage
predictions more accurately on the KinStar antenna compared to
predictions conducted on the Broadcom antenna;
The planning tool indicated an under-prediction on the Broadcom
antenna;
Planning of the DRM30 transmitter technology can be conducted
successfully with the aid of the ATDI ICS TELECOM planning tool.
JOINT RADIO PULPIT / BROADCOM / SENTECH DRM30 TRIAL - Final Report
SEN_RFN_REP_MEASM_DRM30_RADIO_PULPIT_V1_03 Page 39 of 109
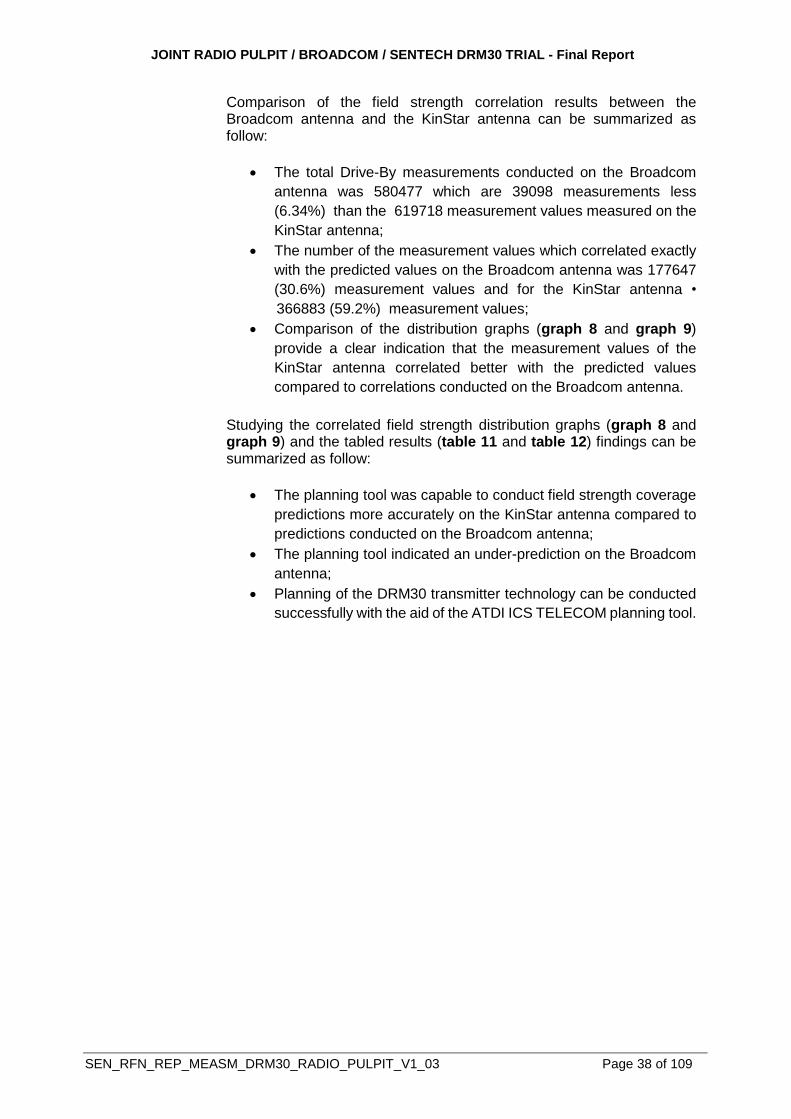
Graph 8: Correlation distribution graph indicating deviation between predicted and measured field strength values for Broadcom antenna.
Table 11: Deviation from prediction for the Broadcom antenna.
No. Measurements = 0dB 177647 30.6 %
No. Measurements < 0dB 56150 9.7 %
No. Measurements > 0dB 346680 59.7 %
No. Measurements within 1dB 256425 44.2 %
No. Measurements within 2dB 283240 48.8 %
No. Measurements within 3dB 295587 50.9 %
No. Measurements within 4dB 311292 53.6 %
No. Measurements within 5dB 320231 55.2 %
No. Measurements within 6dB 335477 57.8 %
No. Measurements <>6dB 245000 42.2 %
No. Measurements within 30dB 580435 100.0 %
No. Measurements <>20dB 42 0.0 %
No. Total Measurements 580477 100.0 %
Deviation from Predicted summary
JOINT RADIO PULPIT / BROADCOM / SENTECH DRM30 TRIAL - Final Report
SEN_RFN_REP_MEASM_DRM30_RADIO_PULPIT_V1_03 Page 40 of 109
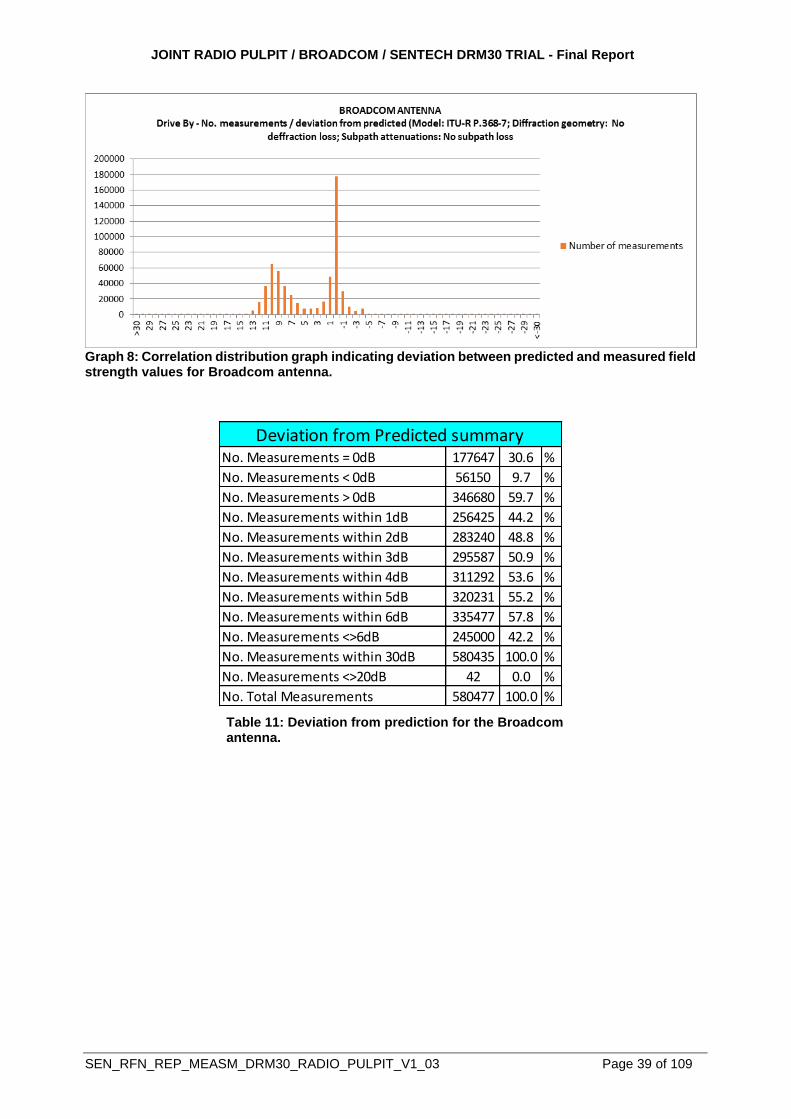
Graph 9: Correlation distribution graph indicating deviation between predicted and measured field strength values for KinStar antenna.
Table 12: Deviation from prediction for the KinStar antenna.
No. Measurements = 0dB 366883 59.2 %
No. Measurements < 0dB 112201 18.1 %
No. Measurements > 0dB 140634 22.7 %
No. Measurements within 1dB 527451 85.1 %
No. Measurements within 2dB 577434 93.2 %
No. Measurements within 3dB 594392 95.9 %
No. Measurements within 4dB 601969 97.1 %
No. Measurements within 5dB 611674 98.7 %
No. Measurements within 6dB 613372 99.0 %
No. Measurements <>6dB 6346 1.0 %
No. Measurements within 30dB 619674 100.0 %
No. Measurements <>20dB 44 0.0 %
No. Total Measurements 619718 100.0 %
Deviation from Predicted summary
JOINT RADIO PULPIT / BROADCOM / SENTECH DRM30 TRIAL - Final Report
SEN_RFN_REP_MEASM_DRM30_RADIO_PULPIT_V1_03 Page 41 of 109
7.3.5.2. GROUND-WAVE PERFORMANCE ANALYSIS (DRM30)
Ground-wave measurements for Broadcom antenna and KinStar antenna were conducted in eight radial directions and the measured parameters statistically analysed per distance from the transmitter, which ranged between 114 km to 207 km, depending on the service quality reception experienced on the relevant route. Statistical measurement results are graphically presented in graphs 25 to 40 (Broadcom antenna) for the which are included in Annexure B and graphs 41 to 56 (KinStar antenna) which are included in Annexure C. Graphical presentation of the results include measurements conducted on all radial directional routes and on two different modulation settings (16QAM & 64QAM). This was achieved by conducting measurements on a lower modulation setting (16QAM) driving in a direction away from the transmitter and when returning to the transmitter, conducting measurements on a higher modulation setting (64QAM). Measurement results on the eight radial routes on the Broadcom antenna are indicated in graphs 25 to graphs 40 in Annexure B and the results on the KinStar antenna in graphs 41 to 56 in Annexure C. Analogue AM measurements were also conducted on two radial routes (north radial and south radial) on the KinStar antenna, this was done by only driving in a direction away from the transmitter station. The graphical representation of the measurement results on the two radial routes are indicated in graphs 61 to graph 62 in Annexure E. Describing each one of the radial routes in detail would become quite diffusive which therefore resulted in the detailed explanation on the analysis of one of the routes measured (north radial route). The other graphs could then be studied as required to obtain an indication of the ground-wave performance on the specific selected route. The route (north radial route) which was chosen to discuss the ground-wave analysis is the route from the transmitter station (located in Pretoria) to Polokwane (16 QAM modulation) and back to the transmitter station (64QAM modulation). Graphical presentation of the measured parameter values on the Broadcom antenna measurement route are indicated in graph 10 (16QAM) and graph 11 (64QAM). Graphical representation of the measured parameter values on the KinStar antenna measurement route are indicated in graph 12 and graph 13. The analogue AM measurements are presented in graph 14 and were only conducted on the KinStar antenna.
JOINT RADIO PULPIT / BROADCOM / SENTECH DRM30 TRIAL - Final Report
SEN_RFN_REP_MEASM_DRM30_RADIO_PULPIT_V1_03 Page 42 of 109
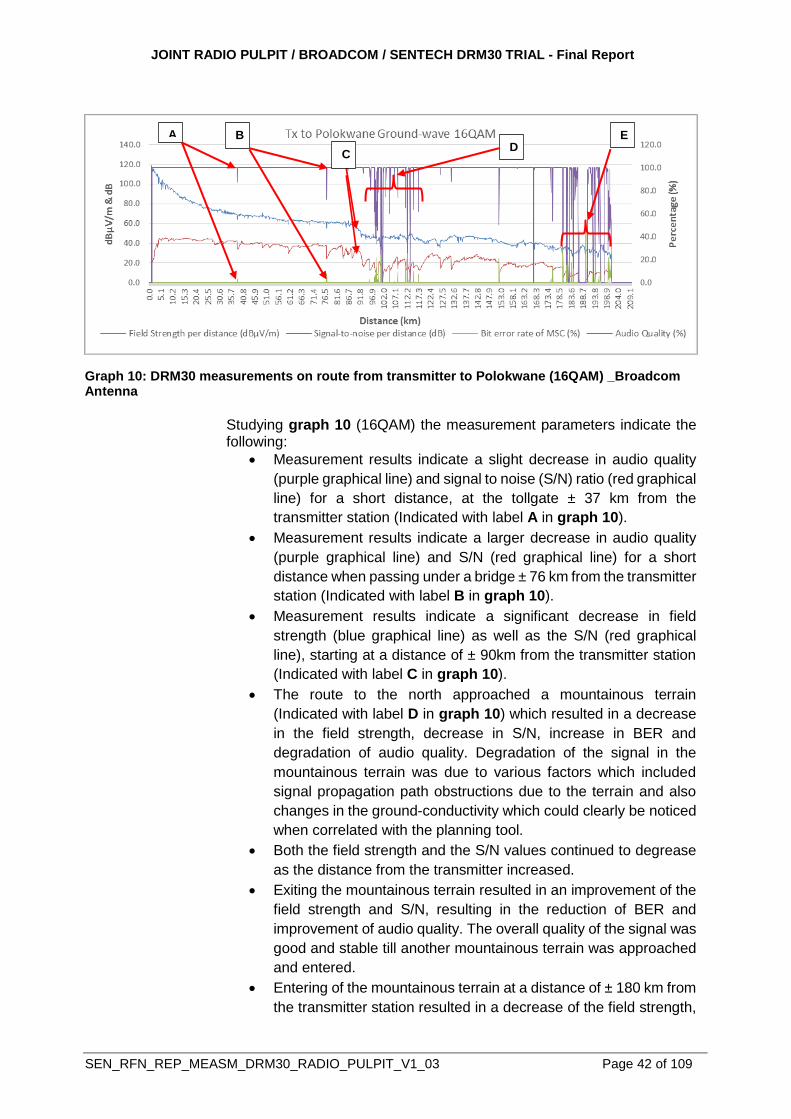
Studying graph 10 (16QAM) the measurement parameters indicate the following:
Measurement results indicate a slight decrease in audio quality
(purple graphical line) and signal to noise (S/N) ratio (red graphical
line) for a short distance, at the tollgate ± 37 km from the
transmitter station (Indicated with label A in graph 10).
Measurement results indicate a larger decrease in audio quality
(purple graphical line) and S/N (red graphical line) for a short
distance when passing under a bridge ± 76 km from the transmitter
station (Indicated with label B in graph 10).
Measurement results indicate a significant decrease in field
strength (blue graphical line) as well as the S/N (red graphical
line), starting at a distance of ± 90km from the transmitter station
(Indicated with label C in graph 10).
The route to the north approached a mountainous terrain
(Indicated with label D in graph 10) which resulted in a decrease
in the field strength, decrease in S/N, increase in BER and
degradation of audio quality. Degradation of the signal in the
mountainous terrain was due to various factors which included
signal propagation path obstructions due to the terrain and also
changes in the ground-conductivity which could clearly be noticed
when correlated with the planning tool.
Both the field strength and the S/N values continued to degrease
as the distance from the transmitter increased.
Exiting the mountainous terrain resulted in an improvement of the
field strength and S/N, resulting in the reduction of BER and
improvement of audio quality. The overall quality of the signal was
good and stable till another mountainous terrain was approached
and entered.
Entering of the mountainous terrain at a distance of ± 180 km from
the transmitter station resulted in a decrease of the field strength,
C D
E A B
Graph 10: DRM30 measurements on route from transmitter to Polokwane (16QAM) _Broadcom Antenna

JOINT RADIO PULPIT / BROADCOM / SENTECH DRM30 TRIAL - Final Report
SEN_RFN_REP_MEASM_DRM30_RADIO_PULPIT_V1_03 Page 43 of 109
decrease in S/N, increase in BER and decrease of the audio
quality (Indicated with label E in graph 10). This was as a result
of a combination of factors which included the distance from the
transmitter, change in ground-conductivity and propagation path
obstruction by mountains. The quality of the signal kept on
changing till complete signal failure a few kilometers before the
Polokwane town which is located at a distance ±200 km from the
transmitter station.
Graph 11: Route from Polokwane to transmitter (64QAM) _Broadcom Antenna
Studying graph 11 (64QAM) the measurement parameters indicate the following:
When the route measurement from Pretoria to Polokwane was
completed the modulation setting was changed from the rugged
16QAM modulation setting, to the less-rugged 64QAM modulation
setting. Measurements were then conducted on the same route in
an opposite direction from Polokwane to the transmitter station
located in Pretoria;
Although the field strength did not change significantly on the
64QAM setting (compared to the 16QAM setting) the reduction on
the S/N levels was significant, resulting in an increase of the BER
and decrease in the audio quality (Indicated with label G in graph
11);
The route from the north approached a mountainous terrain
(Indicated with label G in graph 11) which resulted in a decrease
in the field strength, decrease in S/N, increase in BER and
degradation of audio quality. Degradation of the signal in the
mountainous terrain was due to various factors which included
signal propagation path obstructions due to the terrain and also
changes in the ground-conductivity which could clearly be noticed
in the planning tool;
Measurement results indicate a slight decrease in audio quality
(purple graphical line) and S/N (red graphical line) for a short
distance, at tollgates and when passing under a bridges (Indicated
with label F in graph 11);
G F
JOINT RADIO PULPIT / BROADCOM / SENTECH DRM30 TRIAL - Final Report
SEN_RFN_REP_MEASM_DRM30_RADIO_PULPIT_V1_03 Page 44 of 109
All measurement parameters improved when the mountainous
terrain changed to non-mountainous terrain on the route towards
the transmitter station.
Comparison between the 16QAM and 64QAM Broadcom antenna measurement results indicated the following:
Comparisons between the measurement results on 16QAM
modulation (graph 10) and 64QAM (graph 11) indicate the field
strength to be more-or-less similar on both graphs, but with a
significant decrease in S/N values, increase in BER and the
degradation of the audio quality, especially in the area marked “G”
on graph 11;
The less rugged modulation setting resulted in a severe
degradation of the signal on the route located between ± 97 km to
200 km from the transmitter station. Recovery of a stable signal
was only measured ±97 km from the transmitter station.
The combination of a less-rugged modulation setting (64QAM),
mountainous terrain and poor ground-conductivity resulted in
signal failure between Polokwane and Bela-Bela;
Although the quality of the measurement parameters improved
south of Bela-Bela, the measurement parameters indicate the
signal to be more susceptible to interference from external
elements (marker F in graph 11), compared to the 16QAM
modulated signal (marked A,B and C in graph 11);
The effective coverage area will therefore reduce significantly
when configured on a higher modulation scheme (64QAM)
compared to a lower modulation scheme (16QAM).
JOINT RADIO PULPIT / BROADCOM / SENTECH DRM30 TRIAL - Final Report
SEN_RFN_REP_MEASM_DRM30_RADIO_PULPIT_V1_03 Page 45 of 109
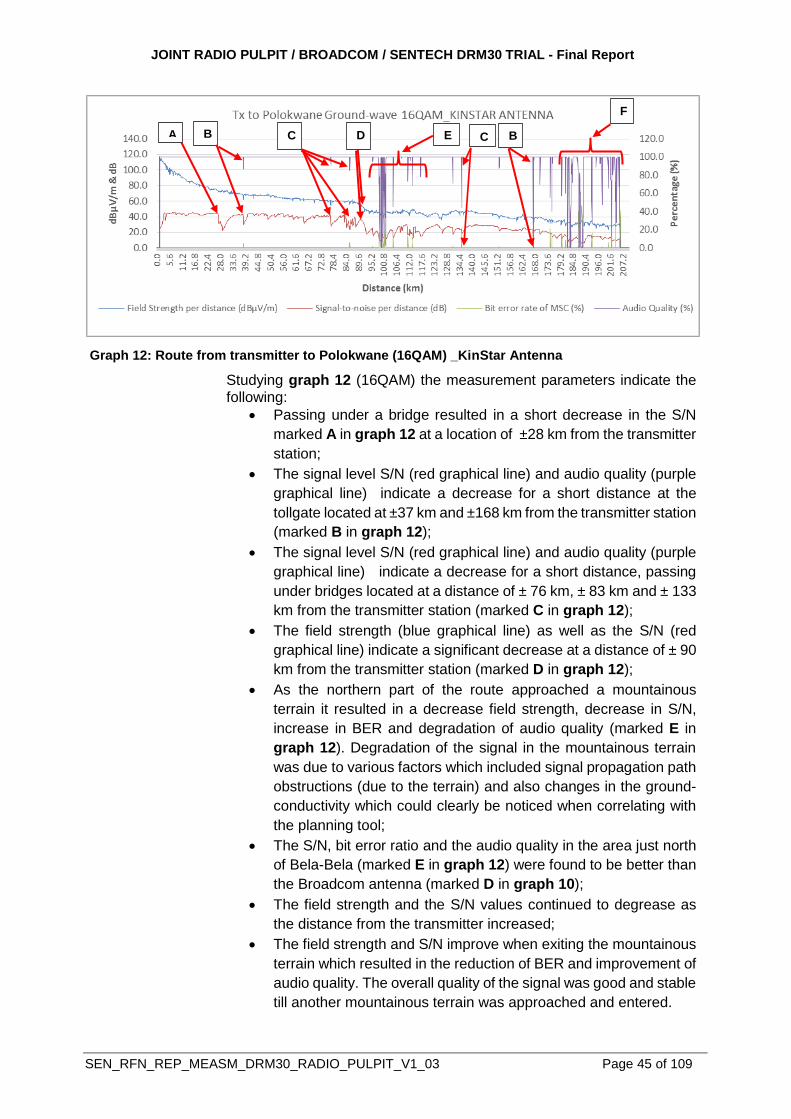
Studying graph 12 (16QAM) the measurement parameters indicate the following:
Passing under a bridge resulted in a short decrease in the S/N
marked A in graph 12 at a location of ±28 km from the transmitter
station;
The signal level S/N (red graphical line) and audio quality (purple
graphical line) indicate a decrease for a short distance at the
tollgate located at ±37 km and ±168 km from the transmitter station
(marked B in graph 12);
The signal level S/N (red graphical line) and audio quality (purple
graphical line) indicate a decrease for a short distance, passing
under bridges located at a distance of ± 76 km, ± 83 km and ± 133
km from the transmitter station (marked C in graph 12);
The field strength (blue graphical line) as well as the S/N (red
graphical line) indicate a significant decrease at a distance of ± 90
km from the transmitter station (marked D in graph 12);
As the northern part of the route approached a mountainous
terrain it resulted in a decrease field strength, decrease in S/N,
increase in BER and degradation of audio quality (marked E in
graph 12). Degradation of the signal in the mountainous terrain
was due to various factors which included signal propagation path
obstructions (due to the terrain) and also changes in the ground-
conductivity which could clearly be noticed when correlating with
the planning tool;
The S/N, bit error ratio and the audio quality in the area just north
of Bela-Bela (marked E in graph 12) were found to be better than
the Broadcom antenna (marked D in graph 10);
The field strength and the S/N values continued to degrease as
the distance from the transmitter increased;
The field strength and S/N improve when exiting the mountainous
terrain which resulted in the reduction of BER and improvement of
audio quality. The overall quality of the signal was good and stable
till another mountainous terrain was approached and entered.
Graph 12: Route from transmitter to Polokwane (16QAM) _KinStar Antenna
D E
F
A B C C B
JOINT RADIO PULPIT / BROADCOM / SENTECH DRM30 TRIAL - Final Report
SEN_RFN_REP_MEASM_DRM30_RADIO_PULPIT_V1_03 Page 46 of 109
The field strength, S/N and audio quality decrease while the BER
increase (marked F in graph 12) due to the mountainous terrain
at a distance of ± 180 km from the transmitter station. This was as
a result of a combination of factors which included the distance
from the transmitter, change in ground-conductivity and
propagation path obstruction by the mountainous terrain. The
quality of the signal kept on changing till complete signal failure
occurred a few kilometers before the Polokwane town, located at
a distance ±200 km from the transmitter. On this radial route
(graph 12) the degradation on the audio was found to be less
severe when compared to the Broadcom antenna measurement
exercise on the same radial route (graph 10).
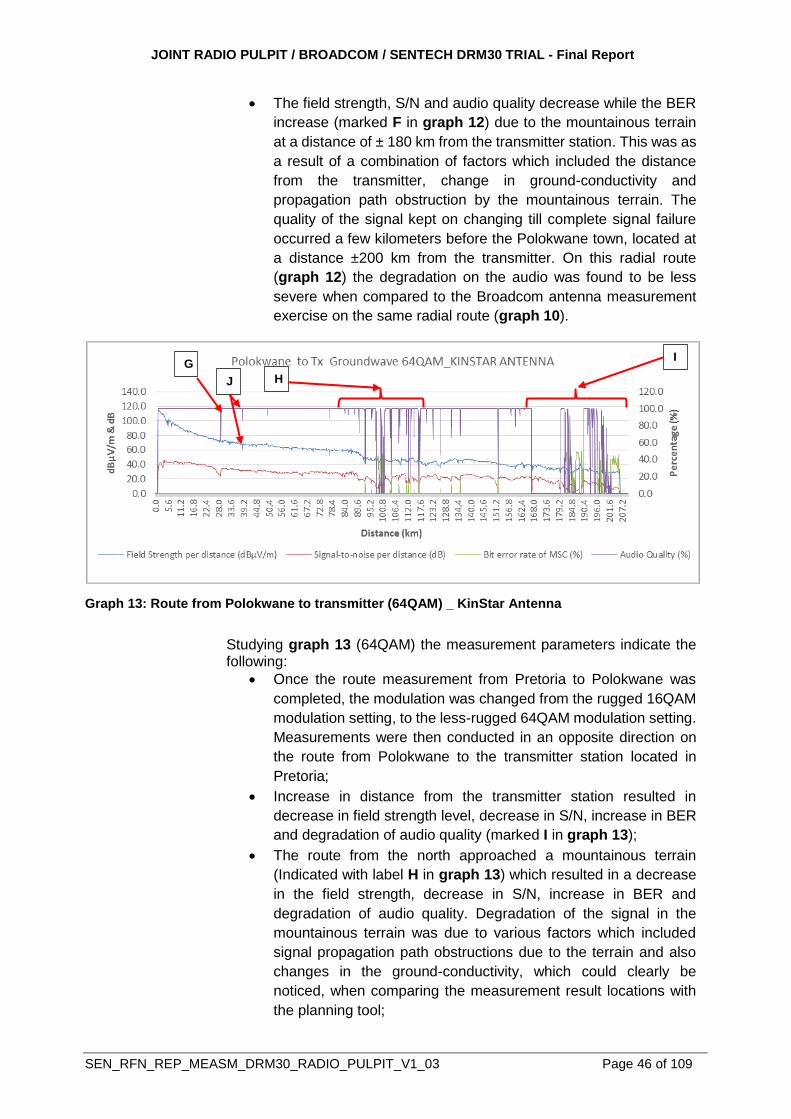
Graph 13: Route from Polokwane to transmitter (64QAM) _ KinStar Antenna
Studying graph 13 (64QAM) the measurement parameters indicate the following:
Once the route measurement from Pretoria to Polokwane was
completed, the modulation was changed from the rugged 16QAM
modulation setting, to the less-rugged 64QAM modulation setting.
Measurements were then conducted in an opposite direction on
the route from Polokwane to the transmitter station located in
Pretoria;
Increase in distance from the transmitter station resulted in
decrease in field strength level, decrease in S/N, increase in BER
and degradation of audio quality (marked I in graph 13);
The route from the north approached a mountainous terrain
(Indicated with label H in graph 13) which resulted in a decrease
in the field strength, decrease in S/N, increase in BER and
degradation of audio quality. Degradation of the signal in the
mountainous terrain was due to various factors which included
signal propagation path obstructions due to the terrain and also
changes in the ground-conductivity, which could clearly be
noticed, when comparing the measurement result locations with
the planning tool;
H
G I
J
JOINT RADIO PULPIT / BROADCOM / SENTECH DRM30 TRIAL - Final Report
SEN_RFN_REP_MEASM_DRM30_RADIO_PULPIT_V1_03 Page 47 of 109
Although the signal level and the BER remained unchanged, the
S/N and audio quality (red and purple graphical lines) decreased
(marked G in graph 13). The decrease in the S/N was caused by
passing under a bridge at a distance of ±28 km from the
transmitter station;
Measurement results indicate a slight decrease in signal level and
audio quality (Blue and purple graphical lines) for a short period of
time at the tollgate located ± 37 km from the transmitter station
(marked J in graph 13);
All measurement parameters improved as the distance from
transmitter station decreased (driving back from Polokwane
towards Pretoria).
Comparison between the 16QAM and 64QAM KinStar antenna measurement results indicated the following:
Comparisons between the measurement results in graph 12 and
13 indicate the field strength to be more-or less similar on both
graphs but with a significant decrease in S/N, increase in BER and
the degradation of the audio quality, especially in the area marked
by “H” on graph 13. The less rugged modulation setting resulted
in a severe degradation of the signal on the route located between
±166 km to 207 km from the transmitter station. Recovery of a
stable signal was only detected ±97 km from the transmitter
station. The combination of a less-rugged modulation setting,
mountainous terrain and less ground-conductivity resulted in
signal failure between Polokwane and Bela-Bela;
Although the quality of the measurement parameters improved
south of Bela-Bela, the measurement parameters indicate the
signal to be more susceptible to interference from external
elements (marked G and J in Graph 13), compared to the 16QAM
modulated signal (graph 12).
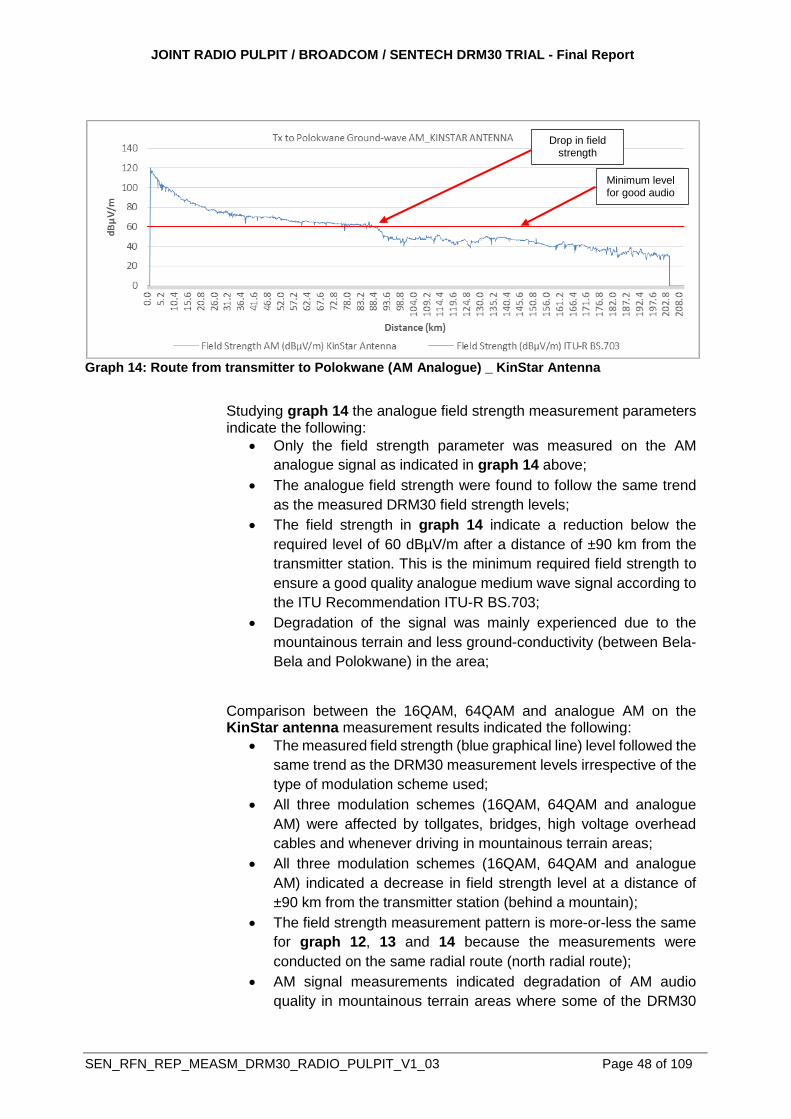
JOINT RADIO PULPIT / BROADCOM / SENTECH DRM30 TRIAL - Final Report
SEN_RFN_REP_MEASM_DRM30_RADIO_PULPIT_V1_03 Page 48 of 109
Graph 14: Route from transmitter to Polokwane (AM Analogue) _ KinStar Antenna
Studying graph 14 the analogue field strength measurement parameters indicate the following:
Only the field strength parameter was measured on the AM
analogue signal as indicated in graph 14 above;
The analogue field strength were found to follow the same trend
as the measured DRM30 field strength levels;
The field strength in graph 14 indicate a reduction below the
required level of 60 dBµV/m after a distance of ±90 km from the
transmitter station. This is the minimum required field strength to
ensure a good quality analogue medium wave signal according to
the ITU Recommendation ITU-R BS.703;
Degradation of the signal was mainly experienced due to the
mountainous terrain and less ground-conductivity (between Bela-
Bela and Polokwane) in the area;
Comparison between the 16QAM, 64QAM and analogue AM on the KinStar antenna measurement results indicated the following:
The measured field strength (blue graphical line) level followed the
same trend as the DRM30 measurement levels irrespective of the
type of modulation scheme used;
All three modulation schemes (16QAM, 64QAM and analogue
AM) were affected by tollgates, bridges, high voltage overhead
cables and whenever driving in mountainous terrain areas;
All three modulation schemes (16QAM, 64QAM and analogue
AM) indicated a decrease in field strength level at a distance of
±90 km from the transmitter station (behind a mountain);
The field strength measurement pattern is more-or-less the same
for graph 12, 13 and 14 because the measurements were
conducted on the same radial route (north radial route);
AM signal measurements indicated degradation of AM audio
quality in mountainous terrain areas where some of the DRM30
Drop in field strength
Minimum level for good audio

JOINT RADIO PULPIT / BROADCOM / SENTECH DRM30 TRIAL - Final Report
SEN_RFN_REP_MEASM_DRM30_RADIO_PULPIT_V1_03 Page 49 of 109
measurements (16QAM and 64QAM) indicated a slight
improvement in decode-ability and audio quality;
According to ITU recommendation (ITU-R BS.703) the minimum
field strength of 60 dBµV/m is required for analogue commercial
receivers to provide good audio quality;
According to ITU recommendation (ITU-R BS.1615-1) the
minimum field strength required for good audio quality on 16QAM
and 64QAM DRM30 modulated signals are 33.1 dBµV/m and 38.6
dBµV/m respectively. Field measurements however indicated that
a good DRM30 audio quality (100%) was only achieved at a field
strength level of 56.2 dBµV/m for a 16QAM signal and 57.5
dBµV/m for a 64QAM signal. Based on these measurement
findings it would therefore be preferable to consider to include an
additional margin of 23.1dB and 18.9dB respectively to the
recommended ITU field strength values for 16QAM and 64QAM
DRM30 modulated signals to compensate for potential decode-
ability constrains of the DRM30 modulated signal. Including these
additional margins would have a direct impact on the decode-able
DRM30 coverage area. Coverage predictions based on these
additional margins are presented in map 22 under annexure G
which provide an indication on how decode-ability constrains of
the DRM30 signal could impact the predicted coverage area which
are based on the ITU recommended field strengths;
DRM30 measurements on the more-rugged 16QAM modulation
signal indicated that a decodable signal was measured at an
average omnidirectional distance of 78 km from the transmitter
station. The less-rugged 64QAM modulation signal indicated that
a decodable signal was measured at an average omnidirectional
distance of 68 km from the transmitter station. Changing the
modulation from a less-rugged modulation scheme (64QAM) to a
more-rugged modulation scheme (16QAM) indicate that the
average coverage distance from the transmitter could be improved
which would result in larger area coverage;
The ground-wave signal is affected by various ground conditions
which include ground conductivity, terrain roughness and
dielectric constant. The planning tool include a ground
conductivity layer to assist in ground-wave predictions. According
to the planning tool predictions there are different ground
conductivity layers located in the areas where measurements
where conducted. These different conductivity layers are
presented in map 21 under annexure F. Changes in signal
strength measurements correlated with the predicted conductivity
information which indicate that ground conductivity has a direct
impact on the signal strength measurement values.
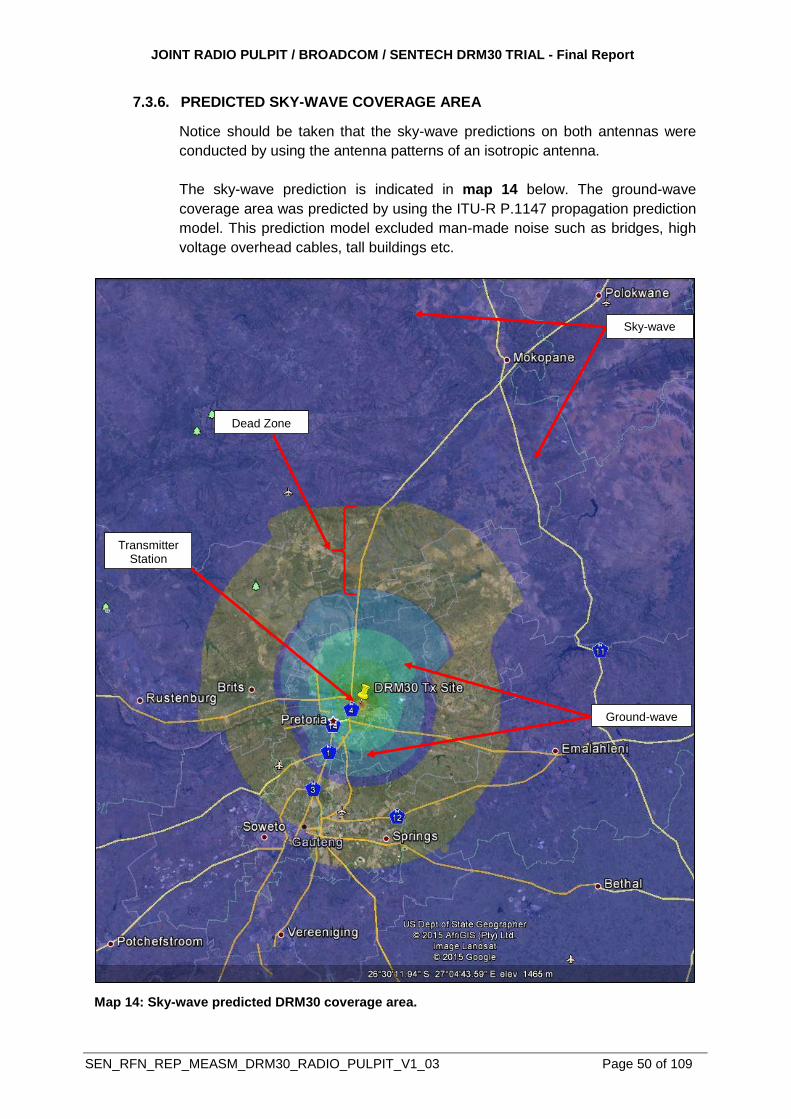
JOINT RADIO PULPIT / BROADCOM / SENTECH DRM30 TRIAL - Final Report
SEN_RFN_REP_MEASM_DRM30_RADIO_PULPIT_V1_03 Page 50 of 109
7.3.6. PREDICTED SKY-WAVE COVERAGE AREA
Notice should be taken that the sky-wave predictions on both antennas were
conducted by using the antenna patterns of an isotropic antenna.
The sky-wave prediction is indicated in map 14 below. The ground-wave
coverage area was predicted by using the ITU-R P.1147 propagation prediction
model. This prediction model excluded man-made noise such as bridges, high
voltage overhead cables, tall buildings etc.
Map 14: Sky-wave predicted DRM30 coverage area.
Transmitter Station
Sky-wave
Ground-wave
Dead Zone
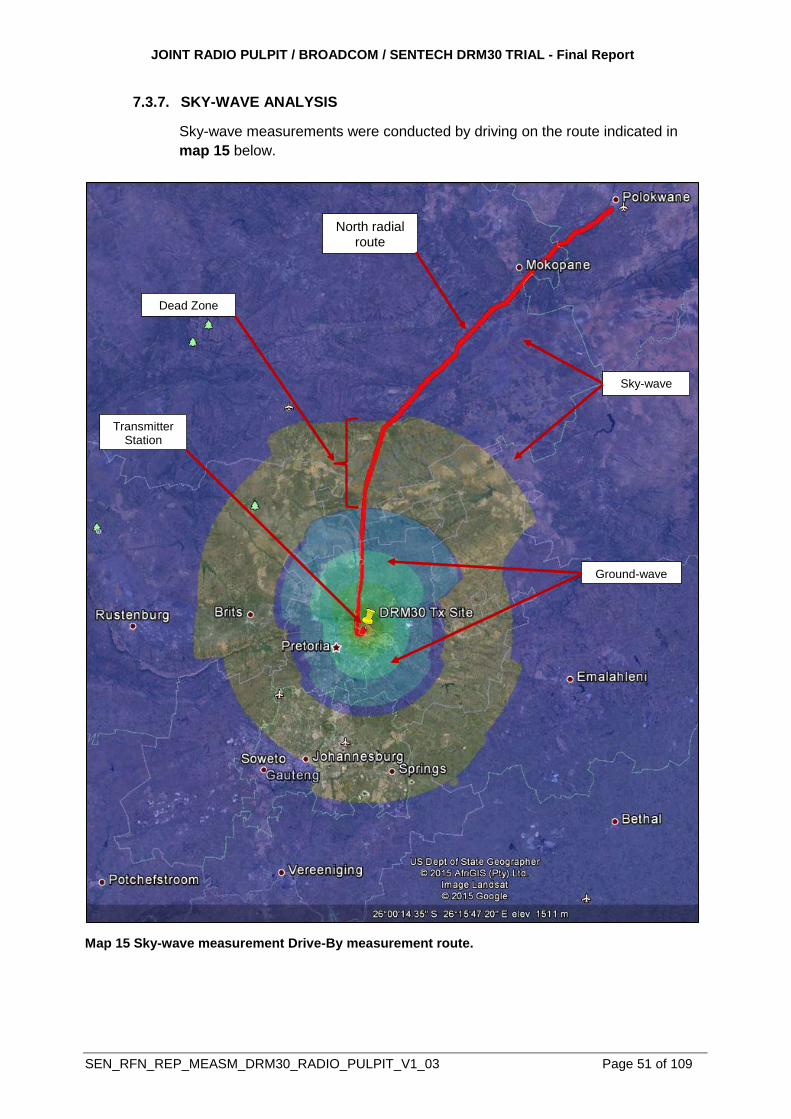
JOINT RADIO PULPIT / BROADCOM / SENTECH DRM30 TRIAL - Final Report
SEN_RFN_REP_MEASM_DRM30_RADIO_PULPIT_V1_03 Page 51 of 109
7.3.7. SKY-WAVE ANALYSIS
Sky-wave measurements were conducted by driving on the route indicated in
map 15 below.
Map 15 Sky-wave measurement Drive-By measurement route.
Transmitter Station
North radial route
Sky-wave
Ground-wave
Dead Zone
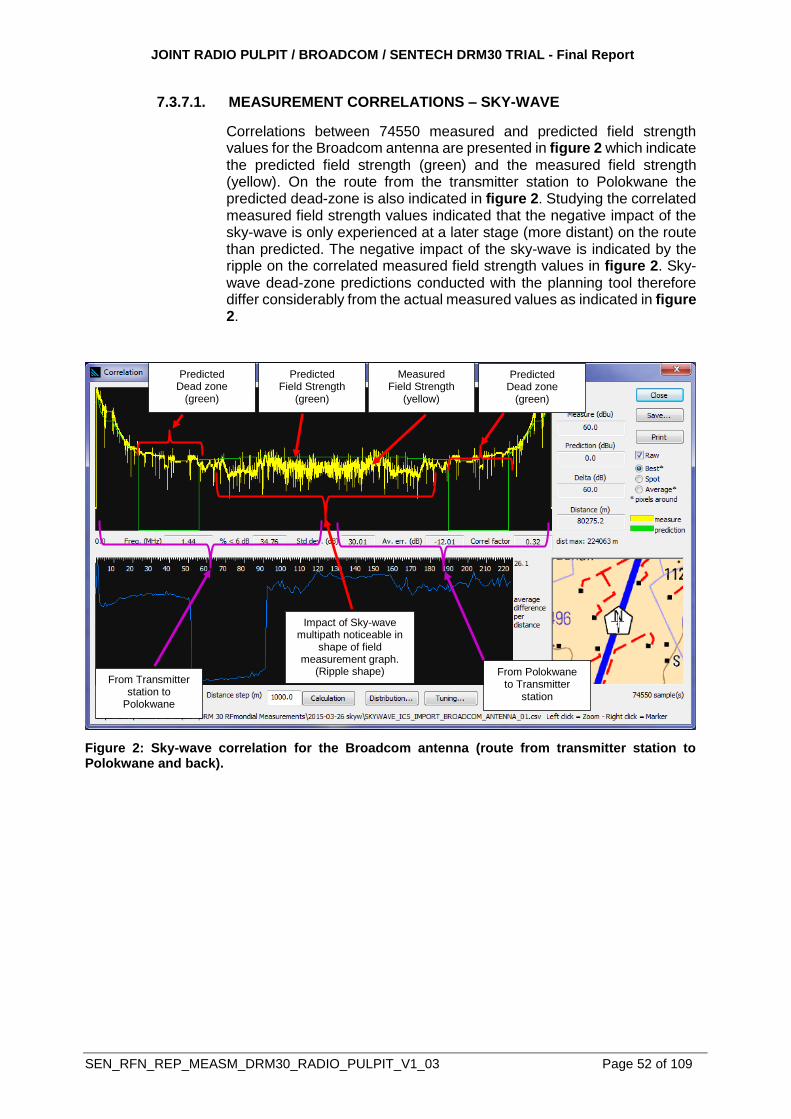
JOINT RADIO PULPIT / BROADCOM / SENTECH DRM30 TRIAL - Final Report
SEN_RFN_REP_MEASM_DRM30_RADIO_PULPIT_V1_03 Page 52 of 109
7.3.7.1. MEASUREMENT CORRELATIONS – SKY-WAVE
Correlations between 74550 measured and predicted field strength values for the Broadcom antenna are presented in figure 2 which indicate the predicted field strength (green) and the measured field strength (yellow). On the route from the transmitter station to Polokwane the predicted dead-zone is also indicated in figure 2. Studying the correlated measured field strength values indicated that the negative impact of the sky-wave is only experienced at a later stage (more distant) on the route than predicted. The negative impact of the sky-wave is indicated by the ripple on the correlated measured field strength values in figure 2. Sky-wave dead-zone predictions conducted with the planning tool therefore differ considerably from the actual measured values as indicated in figure 2.
Figure 2: Sky-wave correlation for the Broadcom antenna (route from transmitter station to Polokwane and back).
Measured Field Strength
(yellow)
Predicted Field Strength
(green)
Predicted Dead zone
(green)
Impact of Sky-wave multipath noticeable in
shape of field measurement graph.
(Ripple shape) From Transmitter
station to Polokwane
From Polokwane to Transmitter
station
Predicted Dead zone
(green)

JOINT RADIO PULPIT / BROADCOM / SENTECH DRM30 TRIAL - Final Report
SEN_RFN_REP_MEASM_DRM30_RADIO_PULPIT_V1_03 Page 53 of 109
Correlations between 74207 measured and predicted field strength values for the KinStar antenna are presented in figure 3 which indicate the predicted field strength (green) and the measured field strength (yellow) on the route from the transmitter station to Polokwane. The predicted dead-zone is also indicated in figure 3. Studying the correlated measured field strength values indicate that the negative impact of the sky-wave is only experienced at a later stage (more distant location) on the route than predicted. The negative impact of the sky-wave is indicated by the ripple on the correlated measured field strength values in figure 3. Sky-wave dead-zone predictions by the planning tool therefore differ considerably from the actual measured values as indicated in figure 3.
Figure 3: Sky-wave correlation for the KinStar antenna (route from transmitter station to Polokwane and back).
Comparison between the Broadcom antenna and the KinStar antenna sky-wave correlations indicate the following:
Studying the “ripple effect” on the sky-wave multipath impact area
between the two antenna’s clearly indicate more severe sky-wave
multipath interference on the Broadcom antenna compared to the
KinStar antenna.
Predicted Dead zone
(green)
Predicted Field Strength
(green)
Measured Field Strength
(yellow)
Impact of Sky-wave multipath noticeable in
shape of field measurement graph.
(Ripple shape)
From Polokwane to Transmitter
station From Transmitter
station to Polokwane
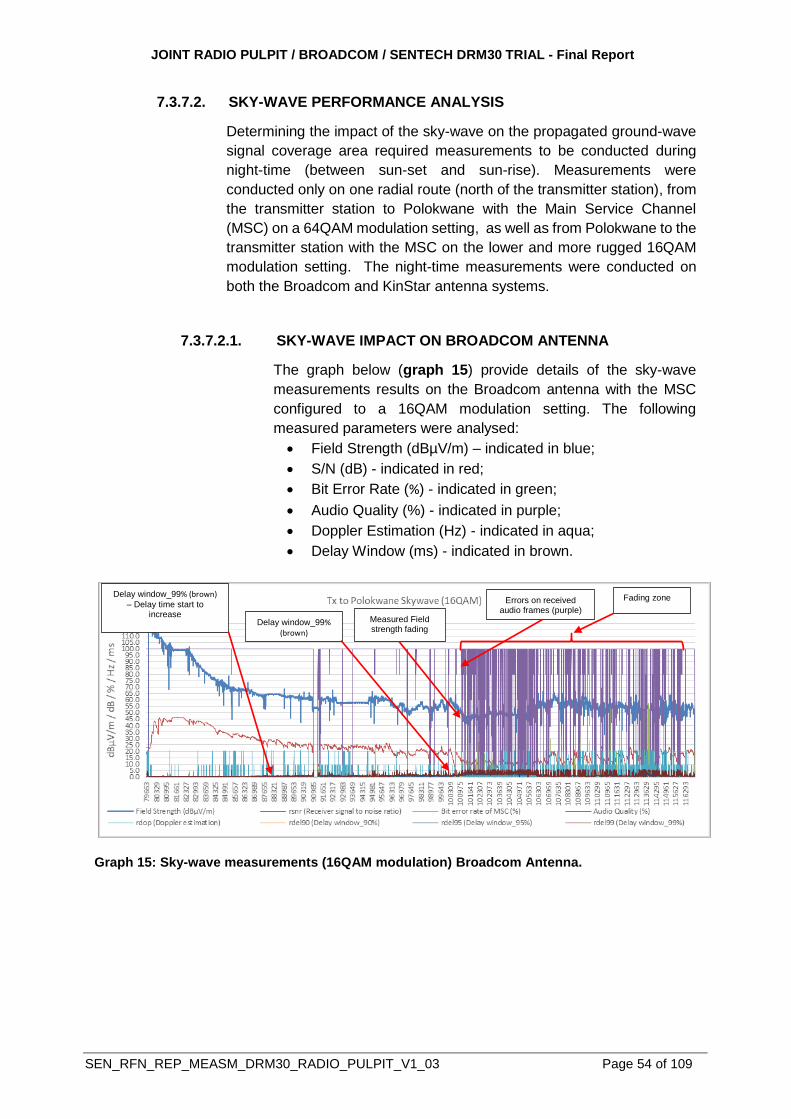
JOINT RADIO PULPIT / BROADCOM / SENTECH DRM30 TRIAL - Final Report
SEN_RFN_REP_MEASM_DRM30_RADIO_PULPIT_V1_03 Page 54 of 109
7.3.7.2. SKY-WAVE PERFORMANCE ANALYSIS
Determining the impact of the sky-wave on the propagated ground-wave
signal coverage area required measurements to be conducted during
night-time (between sun-set and sun-rise). Measurements were
conducted only on one radial route (north of the transmitter station), from
the transmitter station to Polokwane with the Main Service Channel
(MSC) on a 64QAM modulation setting, as well as from Polokwane to the
transmitter station with the MSC on the lower and more rugged 16QAM
modulation setting. The night-time measurements were conducted on
both the Broadcom and KinStar antenna systems.
7.3.7.2.1. SKY-WAVE IMPACT ON BROADCOM ANTENNA
The graph below (graph 15) provide details of the sky-wave
measurements results on the Broadcom antenna with the MSC
configured to a 16QAM modulation setting. The following
measured parameters were analysed:
Field Strength (dBµV/m) – indicated in blue;
S/N (dB) - indicated in red;
Bit Error Rate (%) - indicated in green;
Audio Quality (%) - indicated in purple;
Doppler Estimation (Hz) - indicated in aqua;
Delay Window (ms) - indicated in brown.
Graph 15: Sky-wave measurements (16QAM modulation) Broadcom Antenna.
Delay window_99% (brown) – Delay time start to
increase Delay window_99%
(brown) Max. Time increase
Errors on received audio frames (purple)
Fading zone
Measured Field strength fading
JOINT RADIO PULPIT / BROADCOM / SENTECH DRM30 TRIAL - Final Report
SEN_RFN_REP_MEASM_DRM30_RADIO_PULPIT_V1_03 Page 55 of 109
Studying the measured parameter values provide a clear
indication of how the sky-wave impacted negatively on the ground-
wave .The Delay window parameter trend line on the graph (graph
15) provide a clear indication of the impulse response of the
delayed sky-wave signal which started to interfere with the ground-
wave. The Delay window measurement clearly indicate that a
delayed signal was received (sky-wave) resulting in a delayed
multipath effect starting at a location ±53 km north of the
transmitter station. This correlated well with the predicted sky-
wave fading zone, which predicted the severity of the sky-wave to
start at a distance of ±55 km (maps 14 and 15). Although the
Delay window parameter and predicted starting point of the sky-
wave was calculated and measured at a distance of ±53 km from
the transmitter station, the degradation impact thereof on the
ground-wave signal was only noted 47 km further north on this
route, at a distance of ±100 km from the transmitter station. The
impact of the sky-wave on the ground-wave increased slowly
(increase in Delay window at 53 km from transmitter station) as
the distance from the transmitter station increased. This resulted
in a slow decrease of the S/N between the ground-wave and sky-
wave till the point was reached where the sky-wave multipath
caused the S/N to be too low to ensure good decode-ability (at a
distance of ±100 km). At this point the Delay window, Doppler
estimation, and BER increased rapidly resulting in a decrease in
audio quality and which resulted in total audio failure.
Both the ground-wave and sky-wave signals were not decode-
able till ±116 km from the transmitter station. The sky-wave started
to become the more dominant signal after ±116 km from the
transmitter station. The sky-wave S/N, BER and audio quality
improved, resulting in pure sky-wave reception from this point until
the end of the measurement route with clear audio reception.
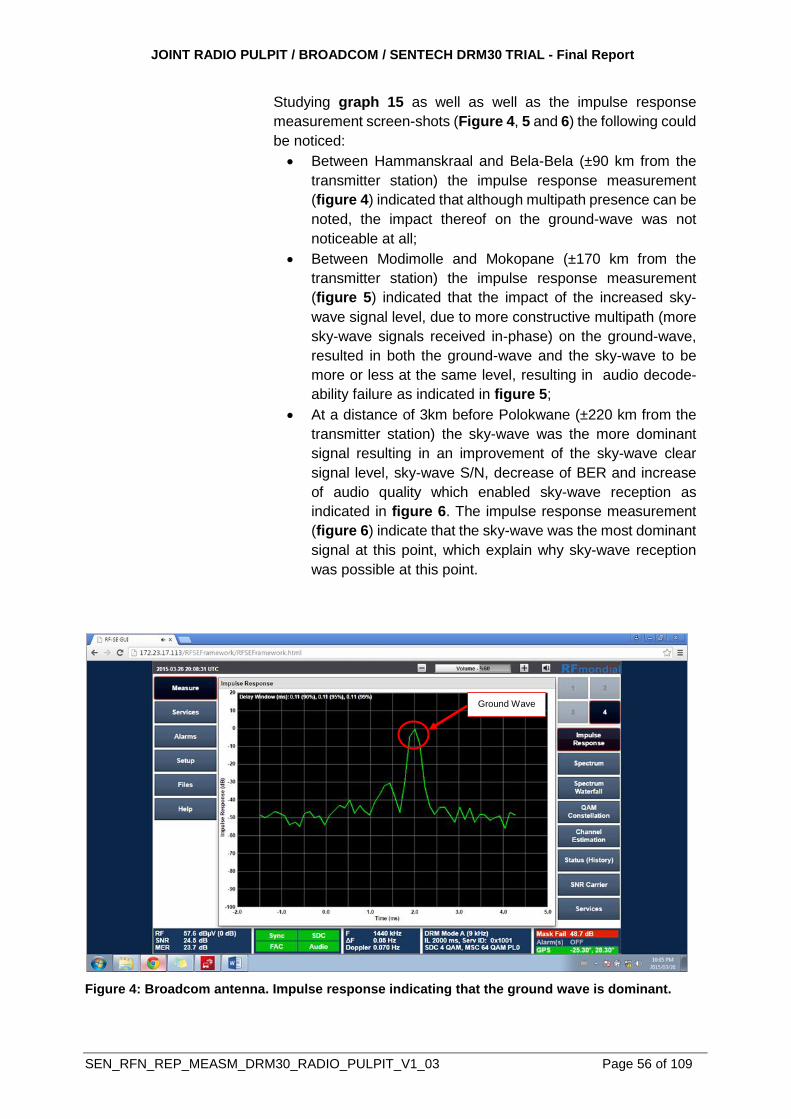
JOINT RADIO PULPIT / BROADCOM / SENTECH DRM30 TRIAL - Final Report
SEN_RFN_REP_MEASM_DRM30_RADIO_PULPIT_V1_03 Page 56 of 109
Studying graph 15 as well as well as the impulse response
measurement screen-shots (Figure 4, 5 and 6) the following could
be noticed:
Between Hammanskraal and Bela-Bela (±90 km from the
transmitter station) the impulse response measurement
(figure 4) indicated that although multipath presence can be
noted, the impact thereof on the ground-wave was not
noticeable at all;
Between Modimolle and Mokopane (±170 km from the
transmitter station) the impulse response measurement
(figure 5) indicated that the impact of the increased sky-
wave signal level, due to more constructive multipath (more
sky-wave signals received in-phase) on the ground-wave,
resulted in both the ground-wave and the sky-wave to be
more or less at the same level, resulting in audio decode-
ability failure as indicated in figure 5;
At a distance of 3km before Polokwane (±220 km from the
transmitter station) the sky-wave was the more dominant
signal resulting in an improvement of the sky-wave clear
signal level, sky-wave S/N, decrease of BER and increase
of audio quality which enabled sky-wave reception as
indicated in figure 6. The impulse response measurement
(figure 6) indicate that the sky-wave was the most dominant
signal at this point, which explain why sky-wave reception
was possible at this point.
Figure 4: Broadcom antenna. Impulse response indicating that the ground wave is dominant.
Ground Wave
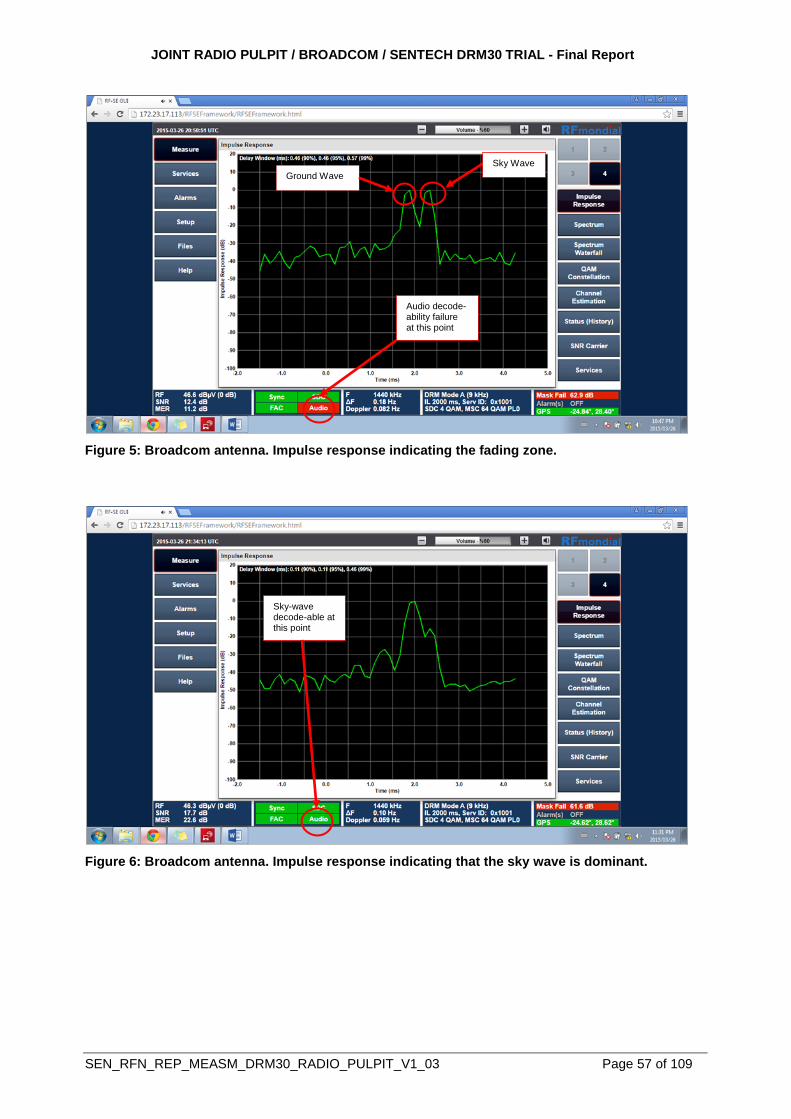
JOINT RADIO PULPIT / BROADCOM / SENTECH DRM30 TRIAL - Final Report
SEN_RFN_REP_MEASM_DRM30_RADIO_PULPIT_V1_03 Page 57 of 109
Figure 5: Broadcom antenna. Impulse response indicating the fading zone.
Figure 6: Broadcom antenna. Impulse response indicating that the sky wave is dominant.
Ground Wave
Sky Wave
Sky-wave decode-able at this point
Audio decode-ability failure at this point
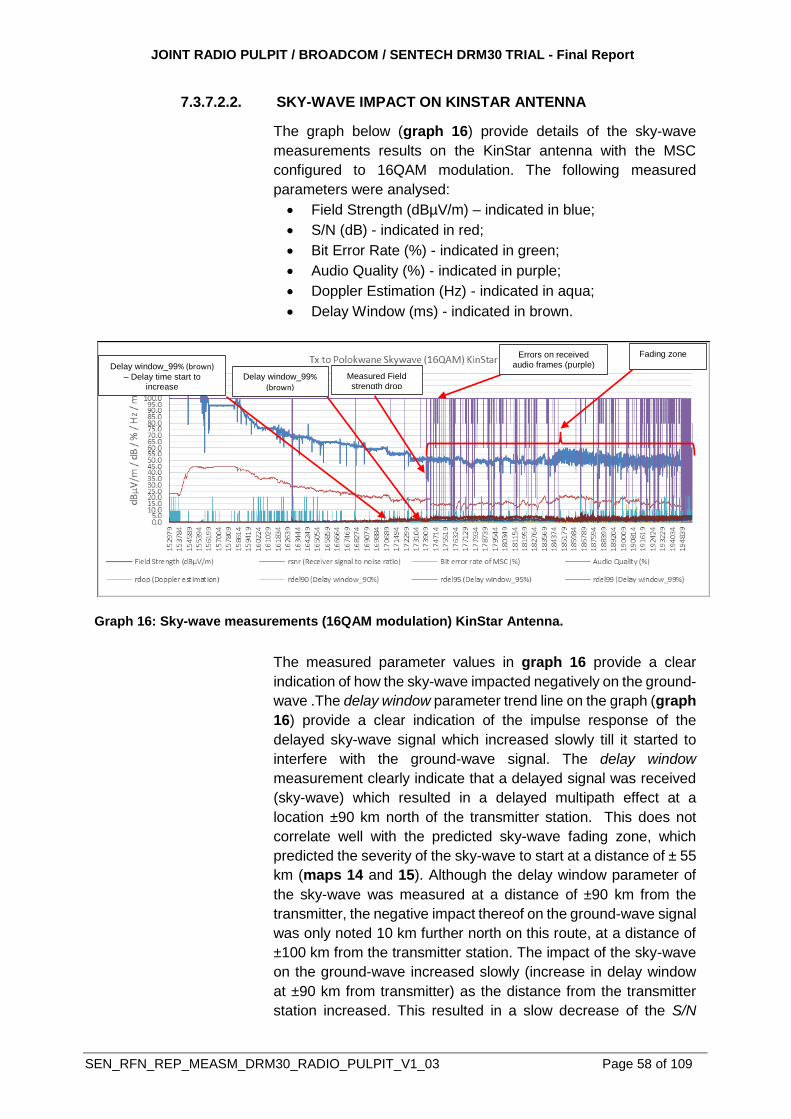
JOINT RADIO PULPIT / BROADCOM / SENTECH DRM30 TRIAL - Final Report
SEN_RFN_REP_MEASM_DRM30_RADIO_PULPIT_V1_03 Page 58 of 109
7.3.7.2.2. SKY-WAVE IMPACT ON KINSTAR ANTENNA
The graph below (graph 16) provide details of the sky-wave
measurements results on the KinStar antenna with the MSC
configured to 16QAM modulation. The following measured
parameters were analysed:
Field Strength (dBµV/m) – indicated in blue;
S/N (dB) - indicated in red;
Bit Error Rate (%) - indicated in green;
Audio Quality (%) - indicated in purple;
Doppler Estimation (Hz) - indicated in aqua;
Delay Window (ms) - indicated in brown.
Graph 16: Sky-wave measurements (16QAM modulation) KinStar Antenna.
The measured parameter values in graph 16 provide a clear
indication of how the sky-wave impacted negatively on the ground-
wave .The delay window parameter trend line on the graph (graph
16) provide a clear indication of the impulse response of the
delayed sky-wave signal which increased slowly till it started to
interfere with the ground-wave signal. The delay window
measurement clearly indicate that a delayed signal was received
(sky-wave) which resulted in a delayed multipath effect at a
location ±90 km north of the transmitter station. This does not
correlate well with the predicted sky-wave fading zone, which
predicted the severity of the sky-wave to start at a distance of ± 55
km (maps 14 and 15). Although the delay window parameter of
the sky-wave was measured at a distance of ±90 km from the
transmitter, the negative impact thereof on the ground-wave signal
was only noted 10 km further north on this route, at a distance of
±100 km from the transmitter station. The impact of the sky-wave
on the ground-wave increased slowly (increase in delay window
at ±90 km from transmitter) as the distance from the transmitter
station increased. This resulted in a slow decrease of the S/N
Delay window_99% (brown) – Delay time start to
increase Delay window_99%
(brown) Max. Time increase
Errors on received audio frames (purple)
Fading zone
Measured Field strength drop
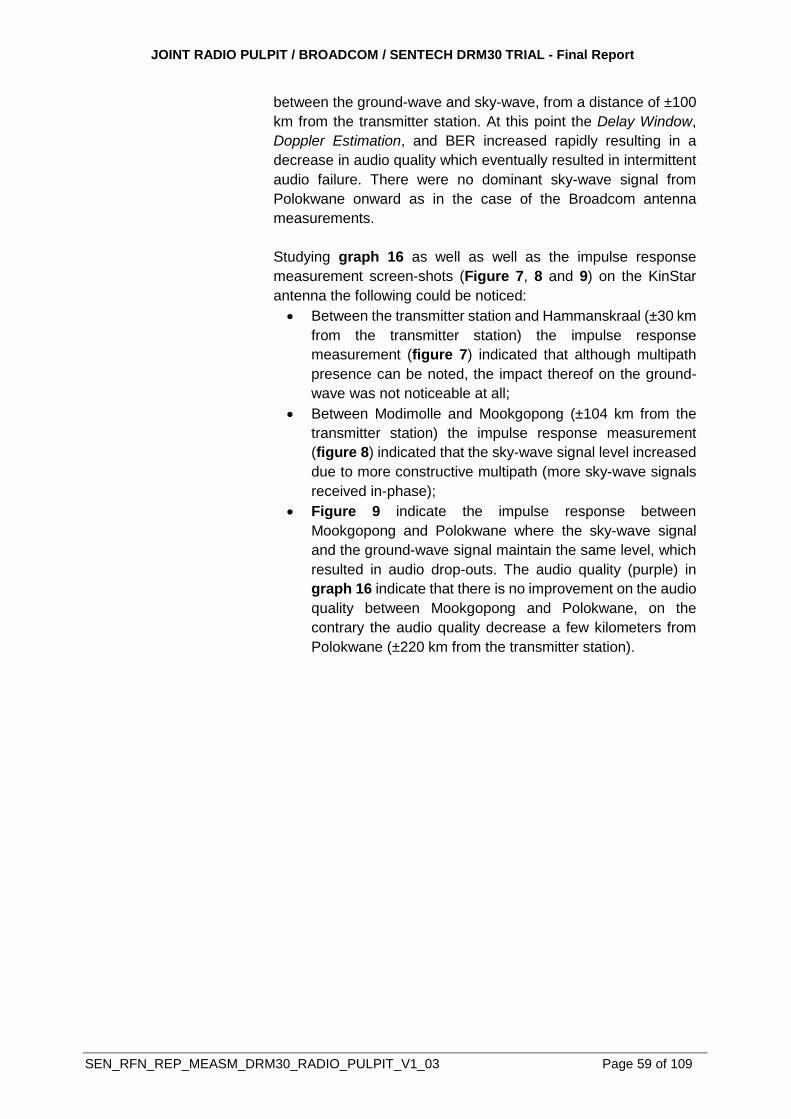
JOINT RADIO PULPIT / BROADCOM / SENTECH DRM30 TRIAL - Final Report
SEN_RFN_REP_MEASM_DRM30_RADIO_PULPIT_V1_03 Page 59 of 109
between the ground-wave and sky-wave, from a distance of ±100
km from the transmitter station. At this point the Delay Window,
Doppler Estimation, and BER increased rapidly resulting in a
decrease in audio quality which eventually resulted in intermittent
audio failure. There were no dominant sky-wave signal from
Polokwane onward as in the case of the Broadcom antenna
measurements.
Studying graph 16 as well as well as the impulse response
measurement screen-shots (Figure 7, 8 and 9) on the KinStar
antenna the following could be noticed:
Between the transmitter station and Hammanskraal (±30 km
from the transmitter station) the impulse response
measurement (figure 7) indicated that although multipath
presence can be noted, the impact thereof on the ground-
wave was not noticeable at all;
Between Modimolle and Mookgopong (±104 km from the
transmitter station) the impulse response measurement
(figure 8) indicated that the sky-wave signal level increased
due to more constructive multipath (more sky-wave signals
received in-phase);
Figure 9 indicate the impulse response between
Mookgopong and Polokwane where the sky-wave signal
and the ground-wave signal maintain the same level, which
resulted in audio drop-outs. The audio quality (purple) in
graph 16 indicate that there is no improvement on the audio
quality between Mookgopong and Polokwane, on the
contrary the audio quality decrease a few kilometers from
Polokwane (±220 km from the transmitter station).
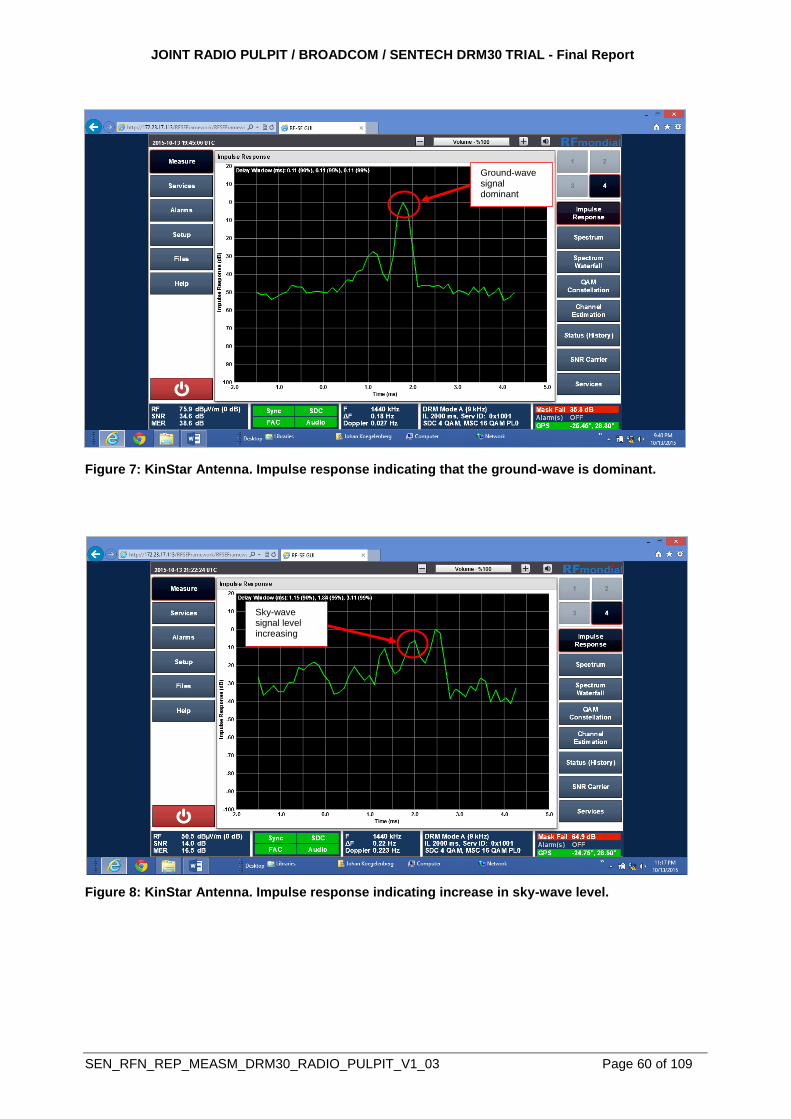
JOINT RADIO PULPIT / BROADCOM / SENTECH DRM30 TRIAL - Final Report
SEN_RFN_REP_MEASM_DRM30_RADIO_PULPIT_V1_03 Page 60 of 109
Figure 8: KinStar Antenna. Impulse response indicating increase in sky-wave level.
Figure 7: KinStar Antenna. Impulse response indicating that the ground-wave is dominant.
Sky-wave signal level increasing
Ground-wave signal dominant
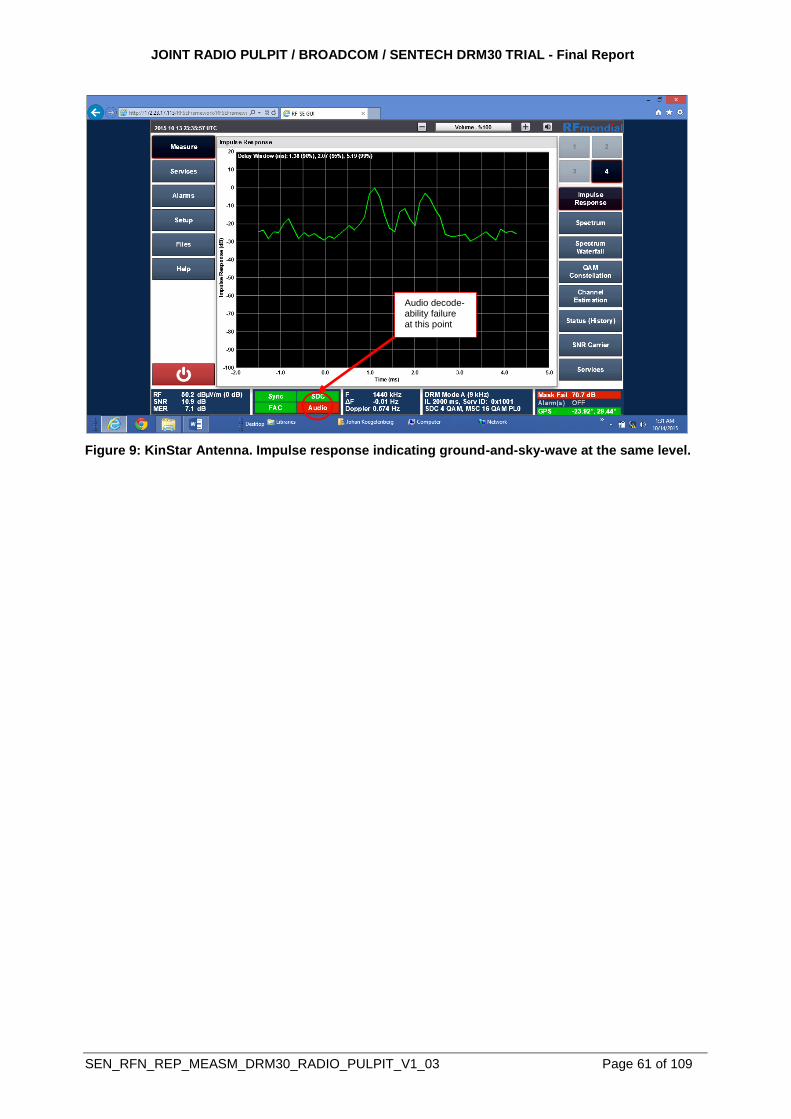
JOINT RADIO PULPIT / BROADCOM / SENTECH DRM30 TRIAL - Final Report
SEN_RFN_REP_MEASM_DRM30_RADIO_PULPIT_V1_03 Page 61 of 109
Figure 9: KinStar Antenna. Impulse response indicating ground-and-sky-wave at the same level.
Audio decode-ability failure at this point
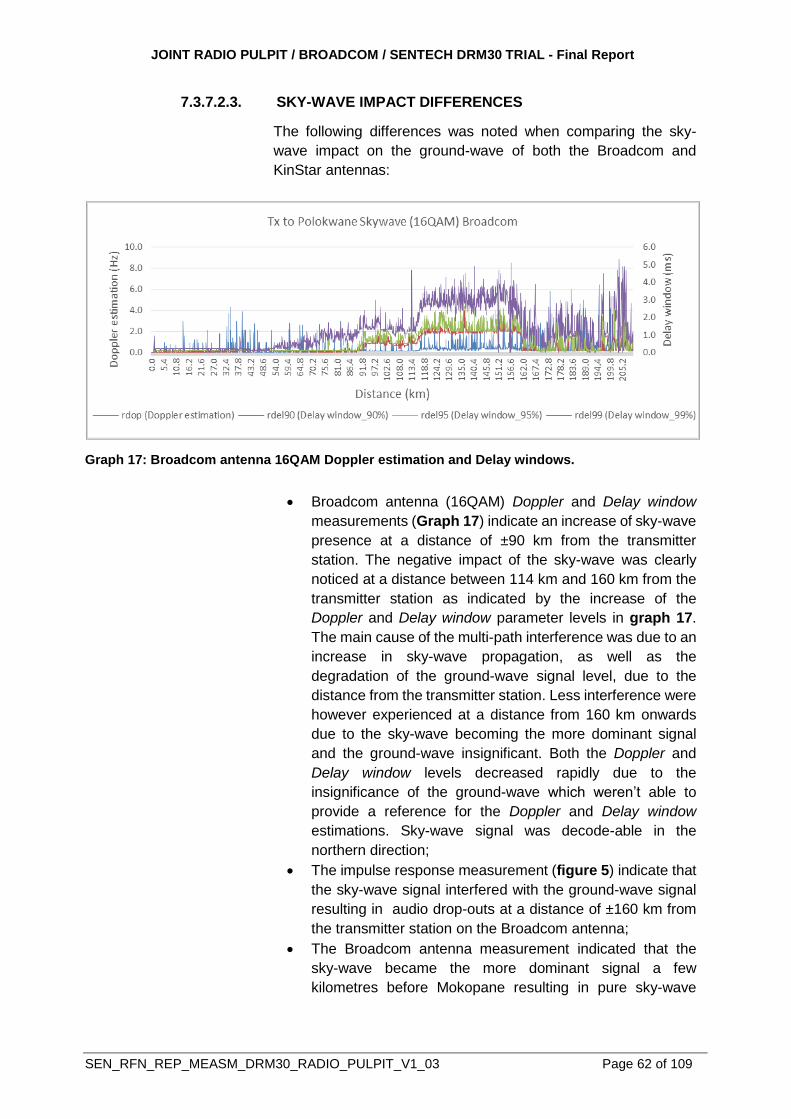
JOINT RADIO PULPIT / BROADCOM / SENTECH DRM30 TRIAL - Final Report
SEN_RFN_REP_MEASM_DRM30_RADIO_PULPIT_V1_03 Page 62 of 109
7.3.7.2.3. SKY-WAVE IMPACT DIFFERENCES
The following differences was noted when comparing the sky-
wave impact on the ground-wave of both the Broadcom and
KinStar antennas:
Graph 17: Broadcom antenna 16QAM Doppler estimation and Delay windows.
Broadcom antenna (16QAM) Doppler and Delay window
measurements (Graph 17) indicate an increase of sky-wave
presence at a distance of ±90 km from the transmitter
station. The negative impact of the sky-wave was clearly
noticed at a distance between 114 km and 160 km from the
transmitter station as indicated by the increase of the
Doppler and Delay window parameter levels in graph 17.
The main cause of the multi-path interference was due to an
increase in sky-wave propagation, as well as the
degradation of the ground-wave signal level, due to the
distance from the transmitter station. Less interference were
however experienced at a distance from 160 km onwards
due to the sky-wave becoming the more dominant signal
and the ground-wave insignificant. Both the Doppler and
Delay window levels decreased rapidly due to the
insignificance of the ground-wave which weren’t able to
provide a reference for the Doppler and Delay window
estimations. Sky-wave signal was decode-able in the
northern direction;
The impulse response measurement (figure 5) indicate that
the sky-wave signal interfered with the ground-wave signal
resulting in audio drop-outs at a distance of ±160 km from
the transmitter station on the Broadcom antenna;
The Broadcom antenna measurement indicated that the
sky-wave became the more dominant signal a few
kilometres before Mokopane resulting in pure sky-wave

JOINT RADIO PULPIT / BROADCOM / SENTECH DRM30 TRIAL - Final Report
SEN_RFN_REP_MEASM_DRM30_RADIO_PULPIT_V1_03 Page 63 of 109
reception until the end of the measurement route (±220 km
from the transmitter station) as indicated in figure 6.
Graph 18: KinStar antenna 16QAM Doppler estimation and Delay windows.
KinStar antenna (16QAM) Doppler estimation and Delay
window measurements (Graph 18) indicate an increase of
sky-wave presence at a distance of ±30 km from the
transmitter station. The negative impact of the sky-wave was
clearly noticed at a distance between 90 km and 210 km
from the transmitter station, as indicated by the increase of
the Doppler and Delay window parameter levels in graph
18. The main cause of the multi-path interference was due
to an increase in sky-wave propagation levels, as well as the
degradation of the ground-wave signal levels, due to the
distance from the transmitter station. There was no pure sky-
wave propagation from 160 km onwards;
The KinStar antenna impulse response measurement
(figure 8) indicated that the sky-wave interfered with the
ground-wave at a distance of ±104 km from the transmitter
station;
The KinStar antenna measurements indicate the impulse
response (Figure 9) between Mookgopong and Polokwane
that the sky-wave signal and the ground-wave signal
maintained more or less the same level which resulted in
intermittent audio reception. The audio quality (purple) in
graph 18 indicate severe audio drop-outs between
Mookgopong and Polokwane. Audio drop-outs increased in
an area located a few kilometers from Polokwane (±220 km
from the transmitter station) and no sky-wave reception was
possible at all.
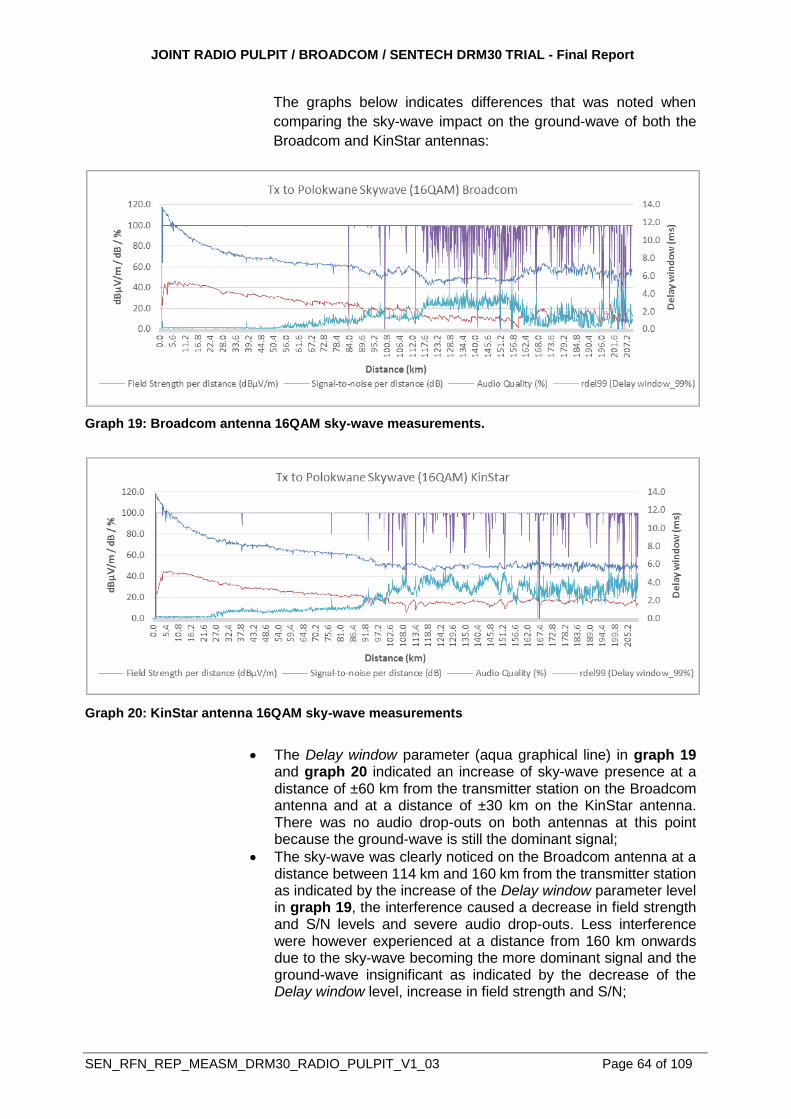
JOINT RADIO PULPIT / BROADCOM / SENTECH DRM30 TRIAL - Final Report
SEN_RFN_REP_MEASM_DRM30_RADIO_PULPIT_V1_03 Page 64 of 109
The graphs below indicates differences that was noted when
comparing the sky-wave impact on the ground-wave of both the
Broadcom and KinStar antennas:
Graph 19: Broadcom antenna 16QAM sky-wave measurements.
Graph 20: KinStar antenna 16QAM sky-wave measurements
The Delay window parameter (aqua graphical line) in graph 19 and graph 20 indicated an increase of sky-wave presence at a distance of ±60 km from the transmitter station on the Broadcom antenna and at a distance of ±30 km on the KinStar antenna. There was no audio drop-outs on both antennas at this point because the ground-wave is still the dominant signal;
The sky-wave was clearly noticed on the Broadcom antenna at a distance between 114 km and 160 km from the transmitter station as indicated by the increase of the Delay window parameter level in graph 19, the interference caused a decrease in field strength and S/N levels and severe audio drop-outs. Less interference were however experienced at a distance from 160 km onwards due to the sky-wave becoming the more dominant signal and the ground-wave insignificant as indicated by the decrease of the Delay window level, increase in field strength and S/N;
JOINT RADIO PULPIT / BROADCOM / SENTECH DRM30 TRIAL - Final Report
SEN_RFN_REP_MEASM_DRM30_RADIO_PULPIT_V1_03 Page 65 of 109
The sky-wave was clearly noticed on the KinStar antenna at a distance between 90 km and 210 km from the transmitter station, as indicated by the increase of the Delay window parameter level in graph 20, the interference caused a decrease in field strength and S/N levels and audio drop-outs. Audio drop-outs remained constant until the measurements was stopped at a distance of 210 km, this indicated that no dominant sky-wave was present on the measurement route.
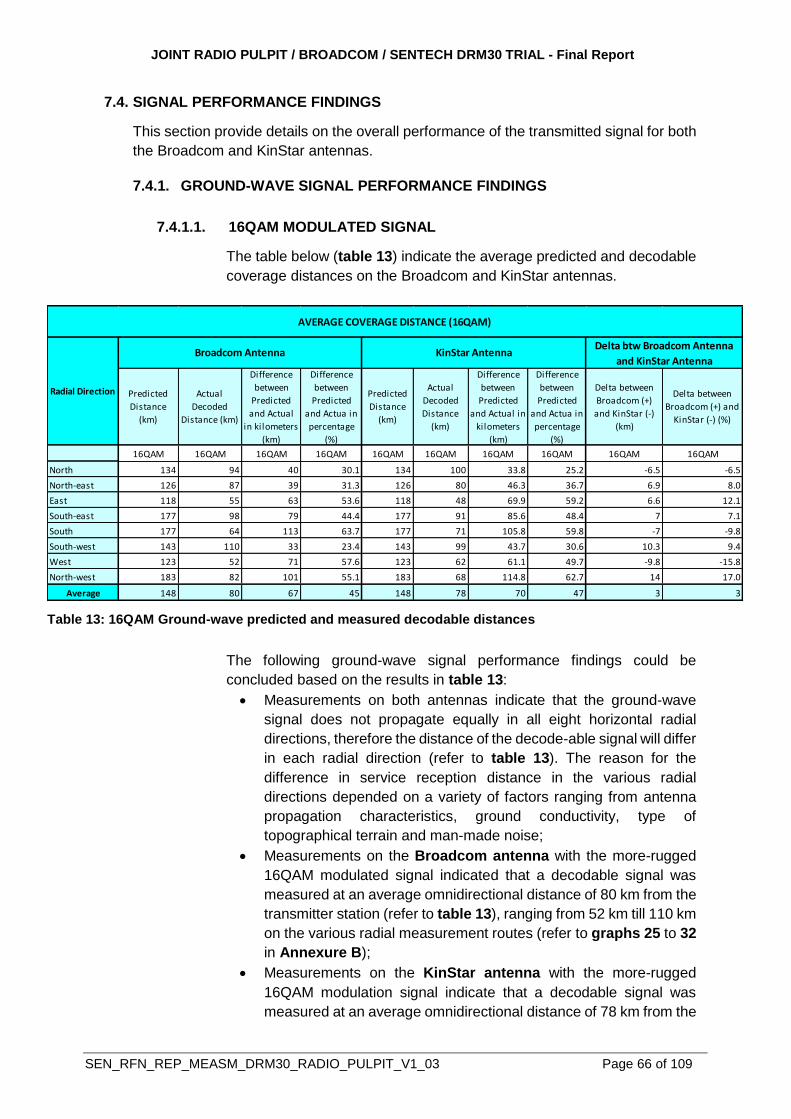
JOINT RADIO PULPIT / BROADCOM / SENTECH DRM30 TRIAL - Final Report
SEN_RFN_REP_MEASM_DRM30_RADIO_PULPIT_V1_03 Page 66 of 109
7.4. SIGNAL PERFORMANCE FINDINGS
This section provide details on the overall performance of the transmitted signal for both
the Broadcom and KinStar antennas.
7.4.1. GROUND-WAVE SIGNAL PERFORMANCE FINDINGS
7.4.1.1. 16QAM MODULATED SIGNAL
The table below (table 13) indicate the average predicted and decodable
coverage distances on the Broadcom and KinStar antennas.
Table 13: 16QAM Ground-wave predicted and measured decodable distances
The following ground-wave signal performance findings could be
concluded based on the results in table 13:
Measurements on both antennas indicate that the ground-wave
signal does not propagate equally in all eight horizontal radial
directions, therefore the distance of the decode-able signal will differ
in each radial direction (refer to table 13). The reason for the
difference in service reception distance in the various radial
directions depended on a variety of factors ranging from antenna
propagation characteristics, ground conductivity, type of
topographical terrain and man-made noise;
Measurements on the Broadcom antenna with the more-rugged
16QAM modulated signal indicated that a decodable signal was
measured at an average omnidirectional distance of 80 km from the
transmitter station (refer to table 13), ranging from 52 km till 110 km
on the various radial measurement routes (refer to graphs 25 to 32
in Annexure B);
Measurements on the KinStar antenna with the more-rugged
16QAM modulation signal indicate that a decodable signal was
measured at an average omnidirectional distance of 78 km from the
16QAM 16QAM 16QAM 16QAM 16QAM 16QAM 16QAM 16QAM 16QAM 16QAM
North 134 94 40 30.1 134 100 33.8 25.2 -6.5 -6.5
North-east 126 87 39 31.3 126 80 46.3 36.7 6.9 8.0
East 118 55 63 53.6 118 48 69.9 59.2 6.6 12.1
South-east 177 98 79 44.4 177 91 85.6 48.4 7 7.1
South 177 64 113 63.7 177 71 105.8 59.8 -7 -9.8
South-west 143 110 33 23.4 143 99 43.7 30.6 10.3 9.4
West 123 52 71 57.6 123 62 61.1 49.7 -9.8 -15.8
North-west 183 82 101 55.1 183 68 114.8 62.7 14 17.0
Average 148 80 67 45 148 78 70 47 3 3
AVERAGE COVERAGE DISTANCE (16QAM)
Radial Direction
Broadcom Antenna KinStar AntennaDelta btw Broadcom Antenna
and KinStar Antenna
Actual
Decoded
Distance (km)
Difference
between
Predicted
and Actual
in kilometers
(km)
Difference
between
Predicted
and Actua in
percentage
(%)
Predicted
Distance
(km)
Actual
Decoded
Distance
(km)
Difference
between
Predicted
and Actual in
kilometers
(km)
Difference
between
Predicted
and Actua in
percentage
(%)
Delta between
Broadcom (+)
and KinStar (-)
(km)
Delta between
Broadcom (+) and
KinStar (-) (%)
Predicted
Distance
(km)
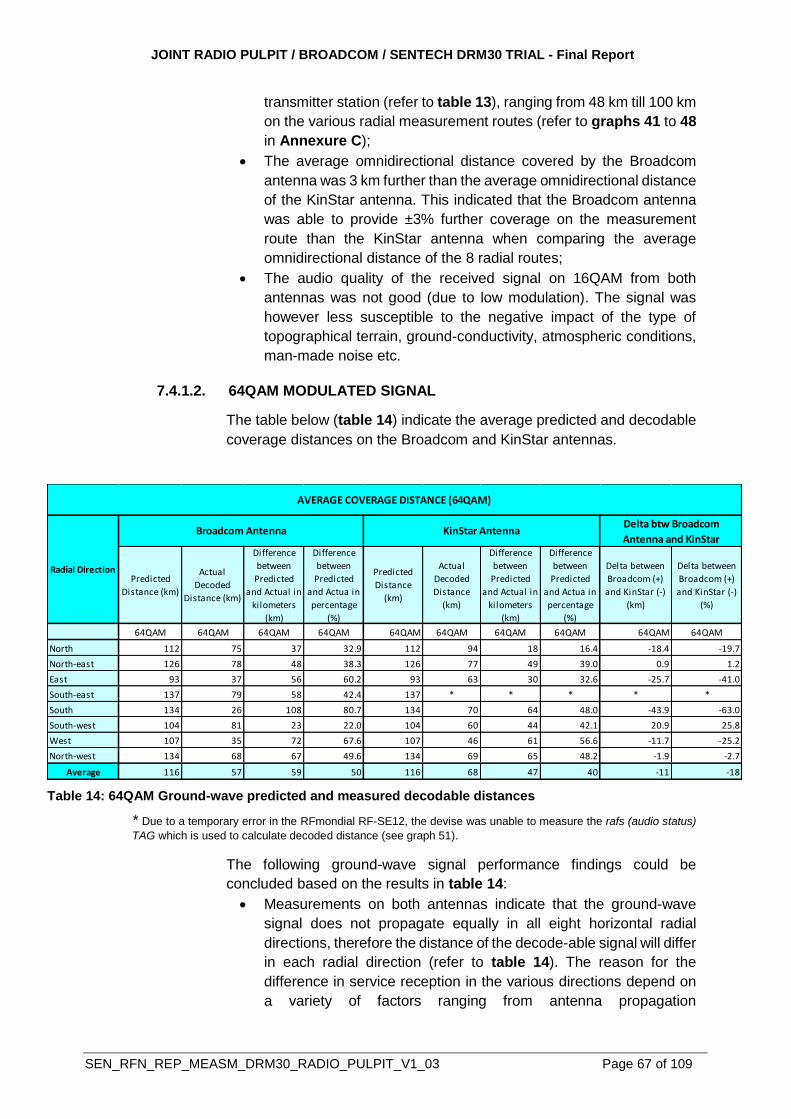
JOINT RADIO PULPIT / BROADCOM / SENTECH DRM30 TRIAL - Final Report
SEN_RFN_REP_MEASM_DRM30_RADIO_PULPIT_V1_03 Page 67 of 109
transmitter station (refer to table 13), ranging from 48 km till 100 km
on the various radial measurement routes (refer to graphs 41 to 48
in Annexure C);
The average omnidirectional distance covered by the Broadcom
antenna was 3 km further than the average omnidirectional distance
of the KinStar antenna. This indicated that the Broadcom antenna
was able to provide ±3% further coverage on the measurement
route than the KinStar antenna when comparing the average
omnidirectional distance of the 8 radial routes;
The audio quality of the received signal on 16QAM from both
antennas was not good (due to low modulation). The signal was
however less susceptible to the negative impact of the type of
topographical terrain, ground-conductivity, atmospheric conditions,
man-made noise etc.
7.4.1.2. 64QAM MODULATED SIGNAL
The table below (table 14) indicate the average predicted and decodable
coverage distances on the Broadcom and KinStar antennas.
Table 14: 64QAM Ground-wave predicted and measured decodable distances
* Due to a temporary error in the RFmondial RF-SE12, the devise was unable to measure the rafs (audio status)
TAG which is used to calculate decoded distance (see graph 51).
The following ground-wave signal performance findings could be
concluded based on the results in table 14:
Measurements on both antennas indicate that the ground-wave
signal does not propagate equally in all eight horizontal radial
directions, therefore the distance of the decode-able signal will differ
in each radial direction (refer to table 14). The reason for the
difference in service reception in the various directions depend on
a variety of factors ranging from antenna propagation
64QAM 64QAM 64QAM 64QAM 64QAM 64QAM 64QAM 64QAM 64QAM 64QAM
North 112 75 37 32.9 112 94 18 16.4 -18.4 -19.7
North-east 126 78 48 38.3 126 77 49 39.0 0.9 1.2
East 93 37 56 60.2 93 63 30 32.6 -25.7 -41.0
South-east 137 79 58 42.4 137 * * * * *
South 134 26 108 80.7 134 70 64 48.0 -43.9 -63.0
South-west 104 81 23 22.0 104 60 44 42.1 20.9 25.8
West 107 35 72 67.6 107 46 61 56.6 -11.7 -25.2
North-west 134 68 67 49.6 134 69 65 48.2 -1.9 -2.7
Average 116 57 59 50 116 68 47 40 -11 -18
AVERAGE COVERAGE DISTANCE (64QAM)
Radial Direction
Broadcom Antenna KinStar AntennaDelta btw Broadcom
Antenna and KinStar
Delta between
Broadcom (+)
and KinStar (-)
(km)
Delta between
Broadcom (+)
and KinStar (-)
(%)
Difference
between
Predicted
and Actual in
kilometers
(km)
Difference
between
Predicted
and Actua in
percentage
(%)
Predicted
Distance
(km)
Actual
Decoded
Distance
(km)
Difference
between
Predicted
and Actual in
kilometers
(km)
Difference
between
Predicted
and Actua in
percentage
(%)
Predicted
Distance (km)
Actual
Decoded
Distance (km)
JOINT RADIO PULPIT / BROADCOM / SENTECH DRM30 TRIAL - Final Report
SEN_RFN_REP_MEASM_DRM30_RADIO_PULPIT_V1_03 Page 68 of 109
characteristics, ground conductivity, type of topographical terrain
and man-made noise;
Measurements on the Broadcom antenna with the less-rugged
64QAM modulated signal indicated that a decodable signal was
measured at an average omnidirectional distance of 60 km from the
transmitter station (refer to table 14), ranging from 26 km till 81 km
on the various radial measurement routes (refer graphs 33 to 40 in
Annexure B);
Measurements on the KinStar antenna with the less-rugged
64QAM modulation signal indicated that a decodable signal was
measured at an average omnidirectional distance of 68 km from the
transmitter station (refer to table 14), ranging from 46 km till 94 km
on the various radial measurement routes (refer to graphs 49 to 56
in Annexure C);
The average omnidirectional distance of the KinStar antenna was
11 km further than the average omnidirectional distance of the
Broadcom antenna. This indicated that the KinStar provide ±18%
improvement in average coverage distance compared to the
Broadcom antenna;
Although the audio quality of the received signal on 64QAM for both
antennas was good, it was more susceptible to the negative impact
of the type of topographical terrain, ground-conductivity,
atmospheric conditions, man-made noise due to the higher
modulation setting.
The type of modulation setting (16QAM vs 64QAM) had a major impact on the
decode-ability of the signal, which had a direct impact on the coverage area in
which the receivers were able to decode the signal. Changing the modulation
from a higher modulation (64QAM) to a lower modulation (16QAM) the average
coverage distance (from the transmitter) could be improved. The negative
aspect of configuring to the low, more robust 16QAM configuration is that the
audio quality is not as good as the 64QAM modulated signal. Another negative
aspect was that only one audio service could be carried by the 16QAM
modulation setting in comparison to the two services on the 64QAM modulation
setting.
The type of antenna (Broadcom vs KinStar) had an impact on the average
omnidirectional distance in which the DRM30 signal was decodable. The
Broadcom antenna had a 3 km further average omnidirectional distance than
the KinStar antenna on the 16QAM modulation scheme. The KinStar antenna
had an 11 km further average omnidirectional distance than the Broadcom
antenna on the 64QAM modulation scheme.
JOINT RADIO PULPIT / BROADCOM / SENTECH DRM30 TRIAL - Final Report
SEN_RFN_REP_MEASM_DRM30_RADIO_PULPIT_V1_03 Page 69 of 109
7.4.2. SKY-WAVE SIGNAL PERFORMANCE FINDINGS
The following sky-wave signal performance findings could be made based on the
measurement analysis:
Measurement results on both antennas indicated that the interference
from the sky-wave did not negatively impact the DRM30 ground-wave
coverage area during the night;
Measurements on the Broadcom antenna indicated that the sky-wave
became the more dominant carrier at a distance of ±116 km from the
transmitter station;
Measurements results indicated that the KinStar antenna had less sky-
wave interference on the ground-wave compared to Broadcom antenna
and that the sky-wave propagation was almost non-existent beyond the
ground-wave coverage area on the KinStar antenna.
JOINT RADIO PULPIT / BROADCOM / SENTECH DRM30 TRIAL - Final Report
SEN_RFN_REP_MEASM_DRM30_RADIO_PULPIT_V1_03 Page 70 of 109
7.4.3. FACTORS IMPACTING NEGATIVELY ON SIGNAL PERFORMANCE
Several factors have been identified to have negative impact on the performance of the signal with regard to signal reception which include the following:
Passing through toll-gates impacted negatively on both the received field
strength and the S/N levels which reduced and recovered rapidly
whenever the measurement vehicle passed through tollgates. This
resulted in an increase of BER and the reduction of audio quality for a
short time period (indicated in graph 21);
Driving underneath high voltage overhead cables also caused the
received field strength and the S/N levels to reduce and recover rapidly
which also resulted in an increase of BER and reduction of audio quality
for a short time period (indicated in graph 22);
Mountainous terrains impacted negatively on S/N, BER and Audio
Quality. Poor ground conductivity in mountainous terrains seem to have
a negative impact on signal propagation (refer to measurement analysis
graph 23);
Driving underneath bridges caused the received field strength and the S/N
levels reduce rapidly which resulted in an increase of BER and reduction
of audio quality (refer to measurement analysis graph 24);
Night-Time sky-wave interference (refer to measurement analysis graph
15 and graph 16);
Antenna design has an enormous impact on signal performance. This
was clearly noticeable when the Broadcom antenna measurement results
was compared with the measurement results on the KinStar antenna. One
of the most important aspects noticed was the importance of the antenna
to produce a good broadband signal (good overall in band). Providing
good transmit signal levels to most of the digital signal carriers were found
to be essential. One of the other antenna requirement findings was that
by providing an antenna with the capability to propagate more energy in
the ground-wave resulted in an improved signal in the coverage area
resulting in larger area coverage. The other positive aspect with regard to
more concentrated energy in the direction of the ground-wave was that
less energy is propagated skywards which means that there is less sky-
wave interference impact on the ground-wave coverage during the night
time.
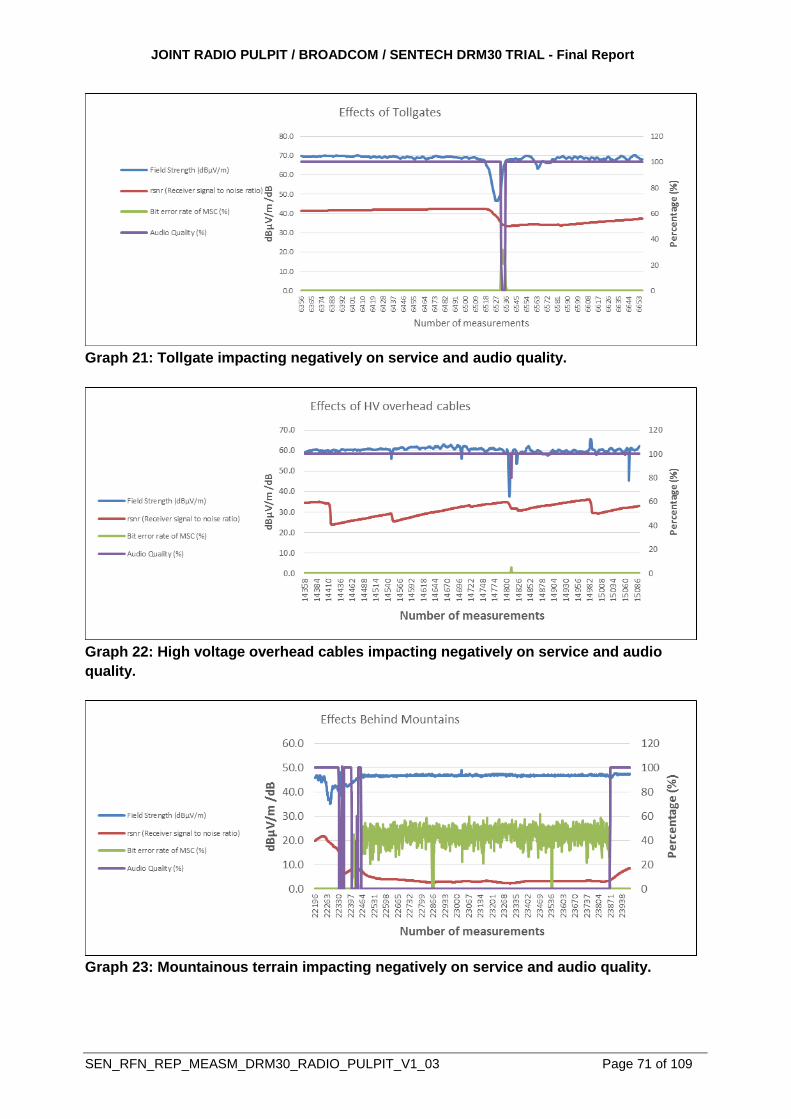
JOINT RADIO PULPIT / BROADCOM / SENTECH DRM30 TRIAL - Final Report
SEN_RFN_REP_MEASM_DRM30_RADIO_PULPIT_V1_03 Page 71 of 109
Graph 21: Tollgate impacting negatively on service and audio quality.
Graph 22: High voltage overhead cables impacting negatively on service and audio
quality.
Graph 23: Mountainous terrain impacting negatively on service and audio quality.
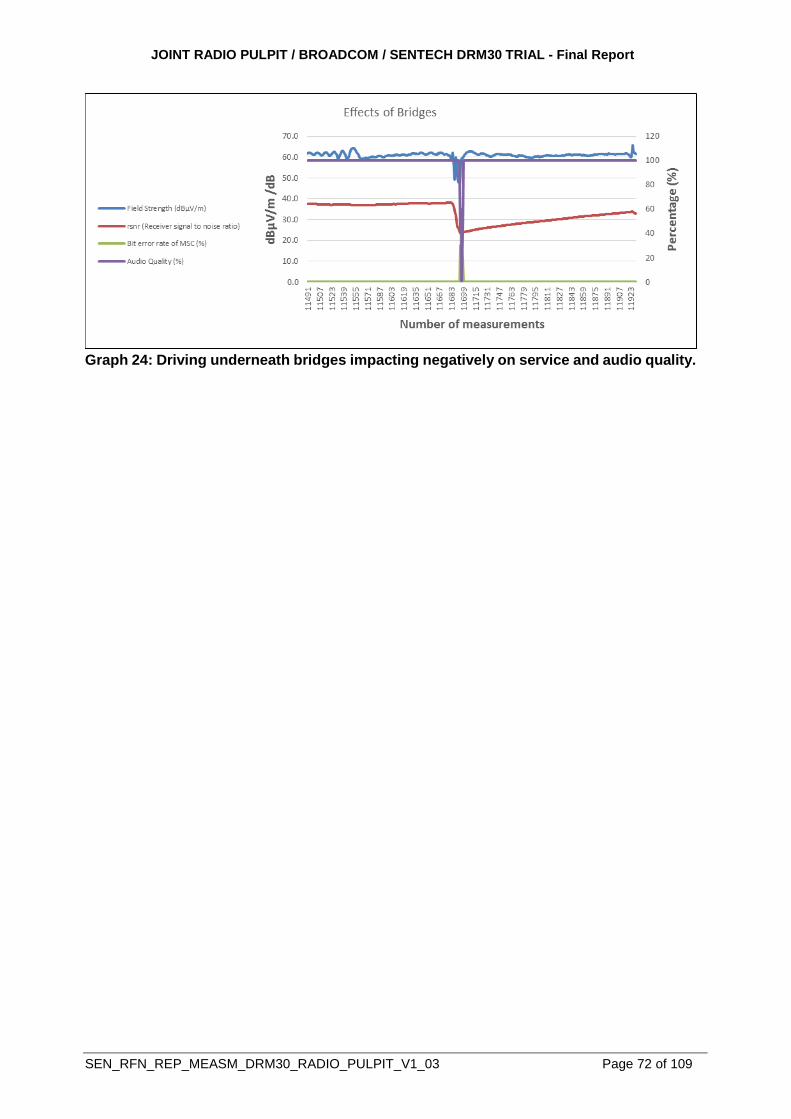
JOINT RADIO PULPIT / BROADCOM / SENTECH DRM30 TRIAL - Final Report
SEN_RFN_REP_MEASM_DRM30_RADIO_PULPIT_V1_03 Page 72 of 109
Graph 24: Driving underneath bridges impacting negatively on service and audio quality.
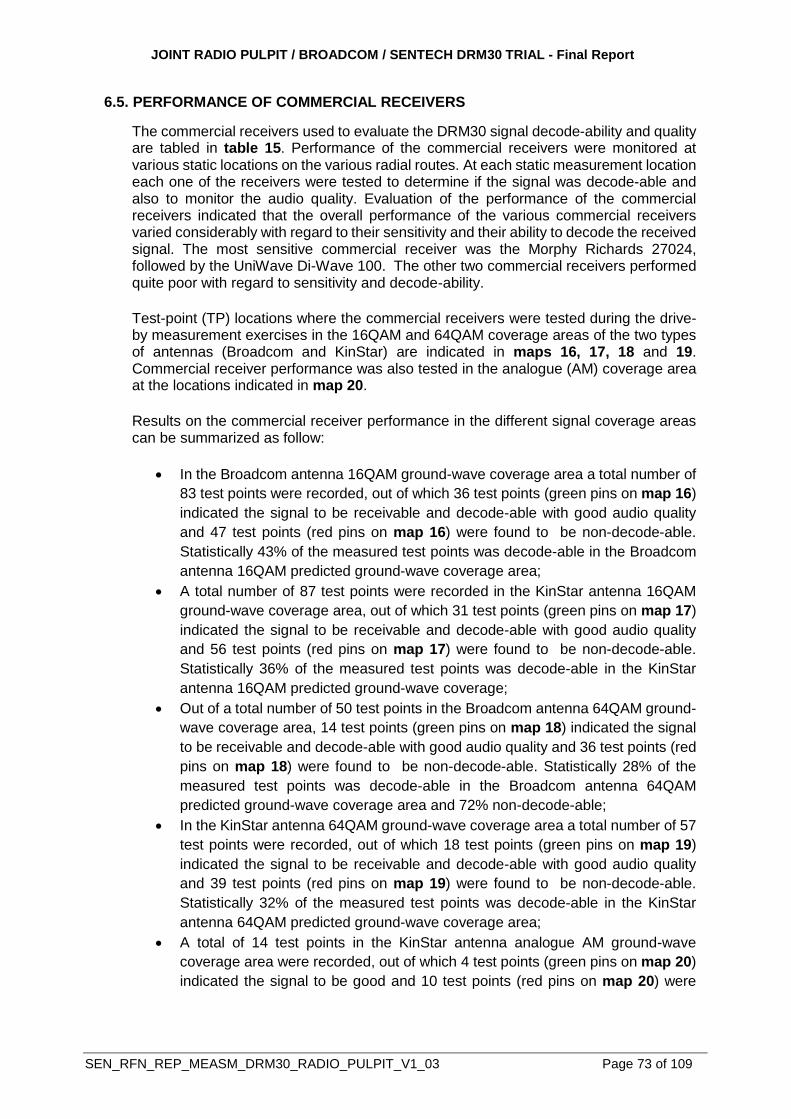
JOINT RADIO PULPIT / BROADCOM / SENTECH DRM30 TRIAL - Final Report
SEN_RFN_REP_MEASM_DRM30_RADIO_PULPIT_V1_03 Page 73 of 109
6.5. PERFORMANCE OF COMMERCIAL RECEIVERS
The commercial receivers used to evaluate the DRM30 signal decode-ability and quality are tabled in table 15. Performance of the commercial receivers were monitored at various static locations on the various radial routes. At each static measurement location each one of the receivers were tested to determine if the signal was decode-able and also to monitor the audio quality. Evaluation of the performance of the commercial receivers indicated that the overall performance of the various commercial receivers varied considerably with regard to their sensitivity and their ability to decode the received signal. The most sensitive commercial receiver was the Morphy Richards 27024, followed by the UniWave Di-Wave 100. The other two commercial receivers performed quite poor with regard to sensitivity and decode-ability.
Test-point (TP) locations where the commercial receivers were tested during the drive-by measurement exercises in the 16QAM and 64QAM coverage areas of the two types of antennas (Broadcom and KinStar) are indicated in maps 16, 17, 18 and 19. Commercial receiver performance was also tested in the analogue (AM) coverage area at the locations indicated in map 20.
Results on the commercial receiver performance in the different signal coverage areas can be summarized as follow:
In the Broadcom antenna 16QAM ground-wave coverage area a total number of
83 test points were recorded, out of which 36 test points (green pins on map 16)
indicated the signal to be receivable and decode-able with good audio quality
and 47 test points (red pins on map 16) were found to be non-decode-able.
Statistically 43% of the measured test points was decode-able in the Broadcom
antenna 16QAM predicted ground-wave coverage area;
A total number of 87 test points were recorded in the KinStar antenna 16QAM
ground-wave coverage area, out of which 31 test points (green pins on map 17)
indicated the signal to be receivable and decode-able with good audio quality
and 56 test points (red pins on map 17) were found to be non-decode-able.
Statistically 36% of the measured test points was decode-able in the KinStar
antenna 16QAM predicted ground-wave coverage;
Out of a total number of 50 test points in the Broadcom antenna 64QAM ground-
wave coverage area, 14 test points (green pins on map 18) indicated the signal
to be receivable and decode-able with good audio quality and 36 test points (red
pins on map 18) were found to be non-decode-able. Statistically 28% of the
measured test points was decode-able in the Broadcom antenna 64QAM
predicted ground-wave coverage area and 72% non-decode-able;
In the KinStar antenna 64QAM ground-wave coverage area a total number of 57
test points were recorded, out of which 18 test points (green pins on map 19)
indicated the signal to be receivable and decode-able with good audio quality
and 39 test points (red pins on map 19) were found to be non-decode-able.
Statistically 32% of the measured test points was decode-able in the KinStar
antenna 64QAM predicted ground-wave coverage area;
A total of 14 test points in the KinStar antenna analogue AM ground-wave
coverage area were recorded, out of which 4 test points (green pins on map 20)
indicated the signal to be good and 10 test points (red pins on map 20) were
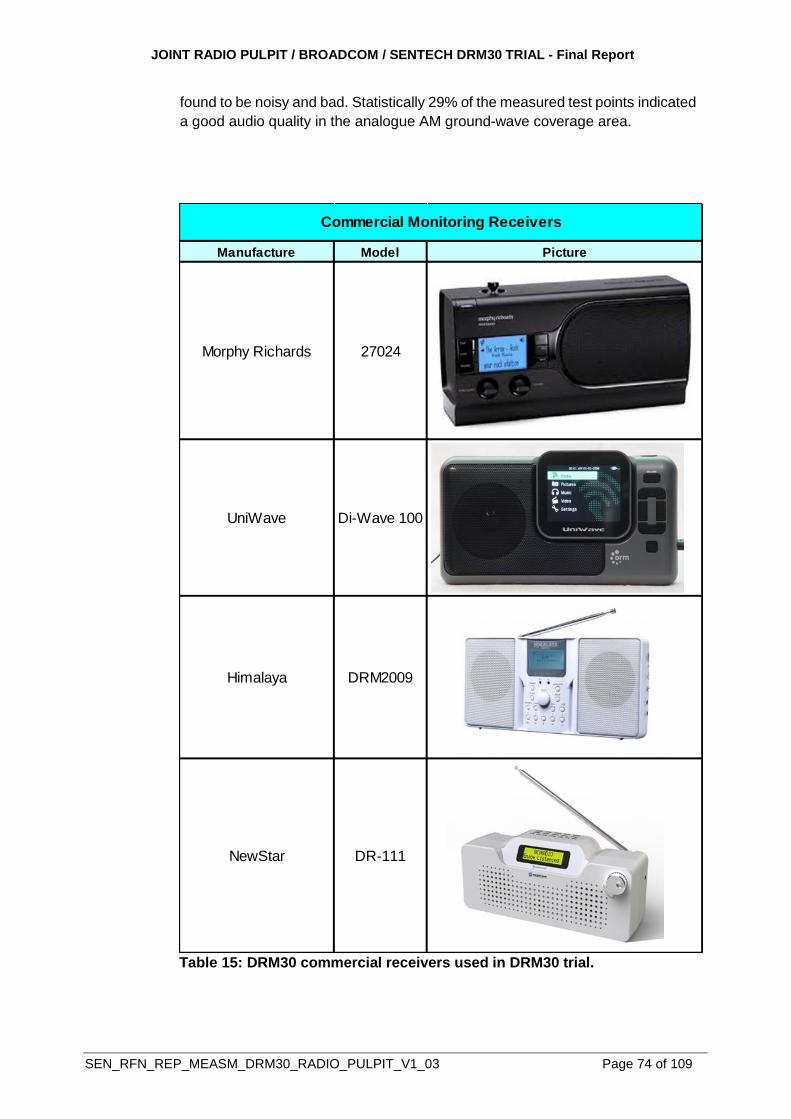
JOINT RADIO PULPIT / BROADCOM / SENTECH DRM30 TRIAL - Final Report
SEN_RFN_REP_MEASM_DRM30_RADIO_PULPIT_V1_03 Page 74 of 109
found to be noisy and bad. Statistically 29% of the measured test points indicated
a good audio quality in the analogue AM ground-wave coverage area.
Table 15: DRM30 commercial receivers used in DRM30 trial.
Manufacture Model Picture
Himalaya DRM2009
NewStar DR-111
Commercial Monitoring Receivers
Morphy Richards 27024
UniWave Di-Wave 100
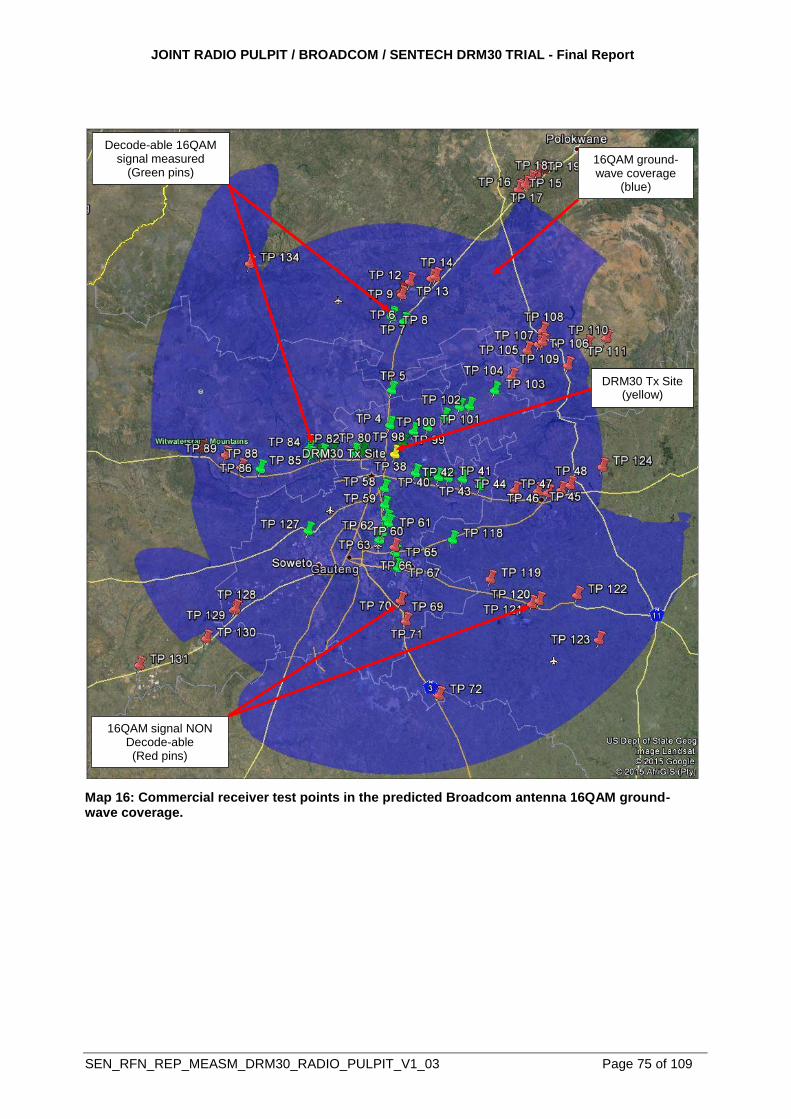
JOINT RADIO PULPIT / BROADCOM / SENTECH DRM30 TRIAL - Final Report
SEN_RFN_REP_MEASM_DRM30_RADIO_PULPIT_V1_03 Page 75 of 109
Map 16: Commercial receiver test points in the predicted Broadcom antenna 16QAM ground-wave coverage.
16QAM ground-wave coverage
(blue)
Decode-able 16QAM signal measured
(Green pins)
16QAM signal NON Decode-able (Red pins)
DRM30 Tx Site (yellow)
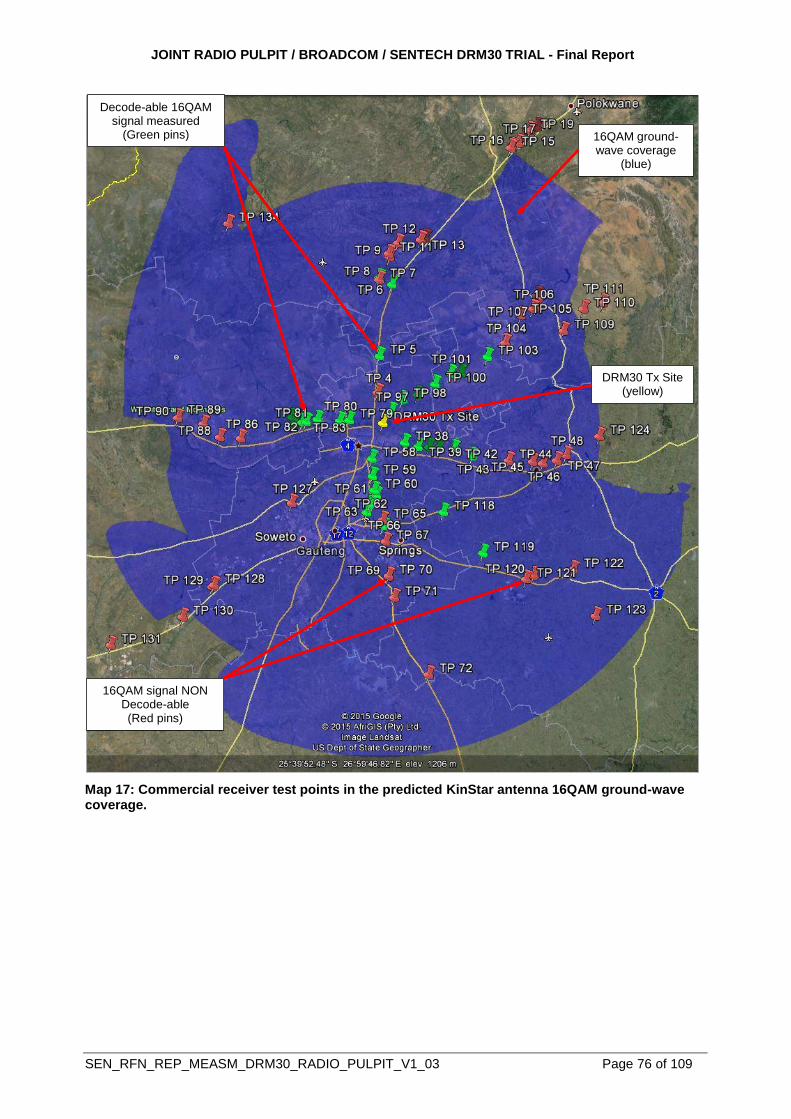
JOINT RADIO PULPIT / BROADCOM / SENTECH DRM30 TRIAL - Final Report
SEN_RFN_REP_MEASM_DRM30_RADIO_PULPIT_V1_03 Page 76 of 109
Map 17: Commercial receiver test points in the predicted KinStar antenna 16QAM ground-wave coverage.
16QAM ground-wave coverage
(blue)
Decode-able 16QAM signal measured
(Green pins)
16QAM signal NON Decode-able (Red pins)
DRM30 Tx Site (yellow)
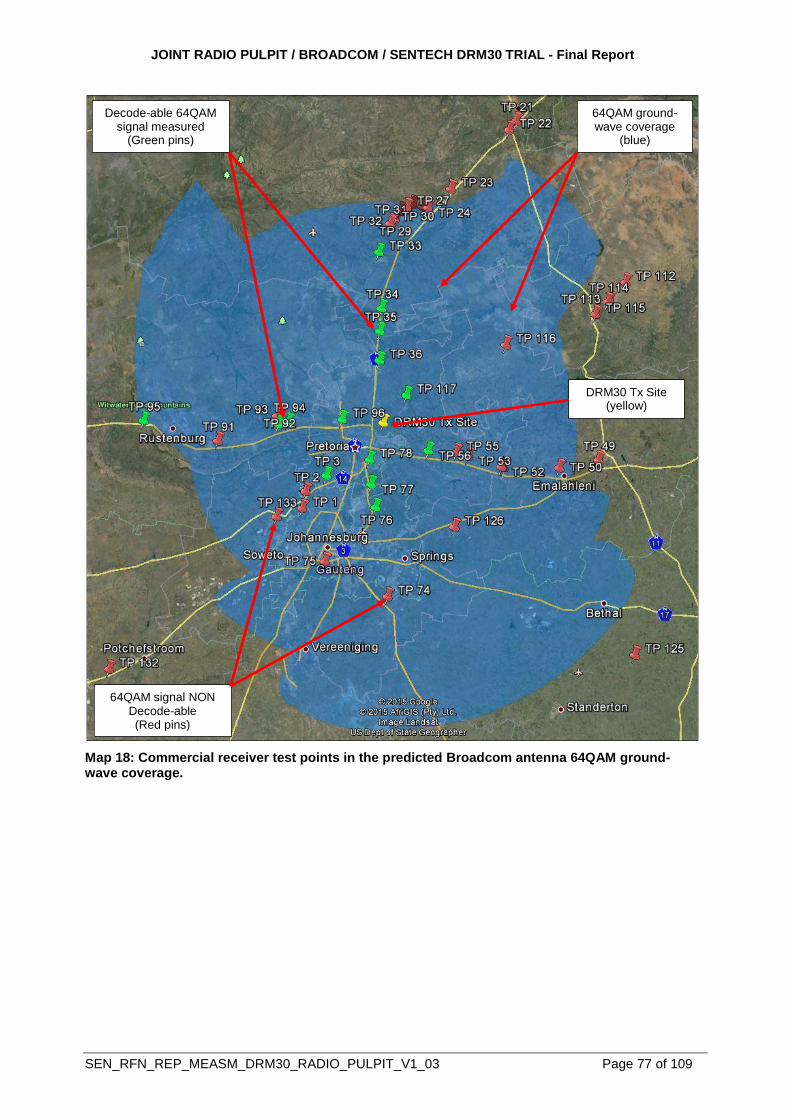
JOINT RADIO PULPIT / BROADCOM / SENTECH DRM30 TRIAL - Final Report
SEN_RFN_REP_MEASM_DRM30_RADIO_PULPIT_V1_03 Page 77 of 109
Map 18: Commercial receiver test points in the predicted Broadcom antenna 64QAM ground-wave coverage.
Decode-able 64QAM signal measured
(Green pins)
64QAM ground-wave coverage
(blue)
64QAM signal NON Decode-able (Red pins)
DRM30 Tx Site (yellow)
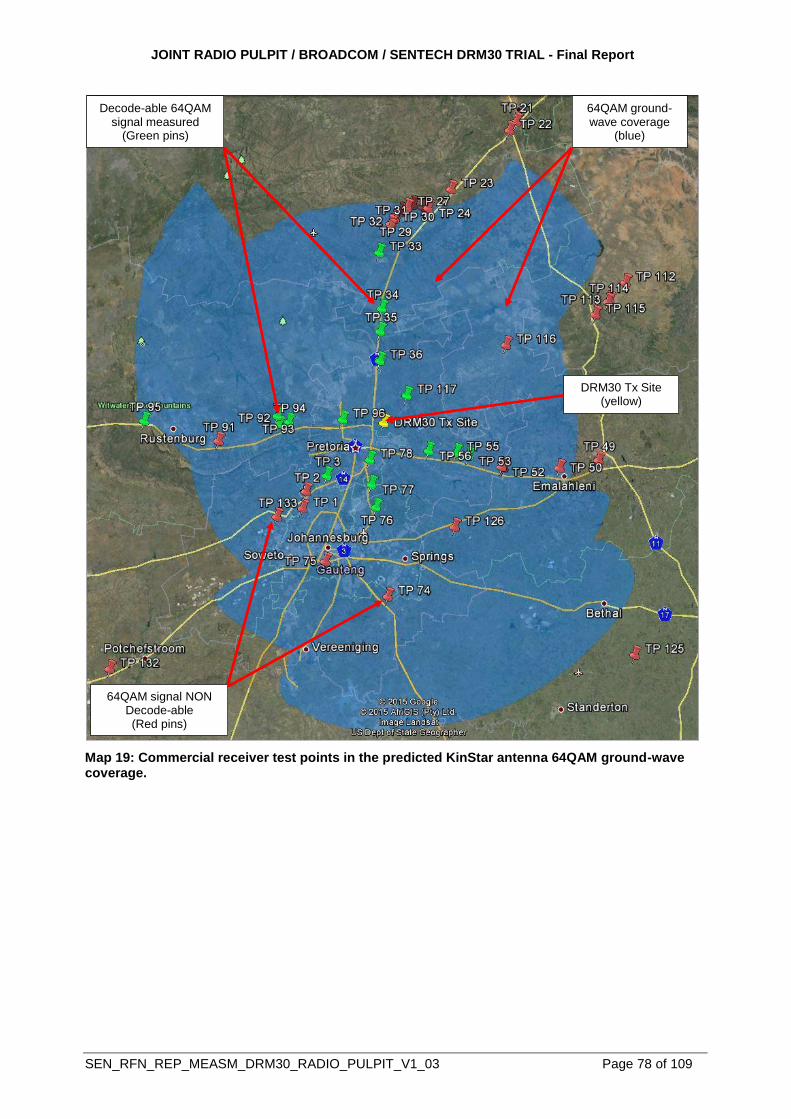
JOINT RADIO PULPIT / BROADCOM / SENTECH DRM30 TRIAL - Final Report
SEN_RFN_REP_MEASM_DRM30_RADIO_PULPIT_V1_03 Page 78 of 109
Map 19: Commercial receiver test points in the predicted KinStar antenna 64QAM ground-wave coverage.
Decode-able 64QAM signal measured
(Green pins)
64QAM ground-wave coverage
(blue)
64QAM signal NON Decode-able (Red pins)
DRM30 Tx Site (yellow)

JOINT RADIO PULPIT / BROADCOM / SENTECH DRM30 TRIAL - Final Report
SEN_RFN_REP_MEASM_DRM30_RADIO_PULPIT_V1_03 Page 79 of 109
Map 20: Commercial receiver test points in the predicted KinStar antenna analogue AM ground-wave coverage.
AM Tx Site (Yellow pin)
Analogue AM ground-wave
coverage (light blue)
Good audio quality Analogue AM signal
(Green pins)
Bad audio quality Analogue AM signal
(Red pins)
JOINT RADIO PULPIT / BROADCOM / SENTECH DRM30 TRIAL - Final Report
SEN_RFN_REP_MEASM_DRM30_RADIO_PULPIT_V1_03 Page 80 of 109
7. CONCLUSIONS
Sufficient measurement data was obtained for analysis purposes which assisted in reaching
a conclusion on the overall performance of the DRM30 technology. The following
conclusions could be made based on the DRM30 trial:
Both Low profile MW antennas (Broadcom and KinStar) were capable to provide good
signal coverage;
The KinStar antenna have a better VSWR over the 9 kHz bandwidth;
Measurement tools were easily obtainable and the overall performance of the tools
were found to be satisfactory;
The measurement method selected by allocating routes per radial proved to be
successful since it provided a good indication of the area coverage;
Configuration of the DRM30 modulation (16QAM and 64QAM) during the
measurement exercise provided sufficient information to determine the differences in
performance between the two modulation schemes (16QAM and 64QAM);
Both antenna system’s (Broadcom and KinStar) measured horizontal radiation
patterns indicated performance results which were better than predicted;
Measurements with the analogue test signal (no modulation, narrow band signal)
indicated that the Broadcom antenna have slightly higher gain than the KinStar
antenna;
Field strength correlation results between predicted and measured values indicate
the predictions to be fairly accurate (50.9% of measured values within ±3dB on the
Broadcom antenna and 95.9% of measured values within ±3dB on the KinStar
antenna). Coverage predictions on the KinStar antenna were therefore found to be
much more accurate;
Field strength measurement results indicated that the propagated ground-wave does
not radiate equally in all horizontal directions due to ground conductivity, nature of the
topographical terrain, man-made noise etc.;
Modulation configuration selection had a direct impact on signal coverage area and
data throughput (data rate). The 16QAM modulation configuration setting provided a
more robust signal resulting in a larger signal coverage area compared to the 64QAM
modulated signal which provided a higher data rate and a smaller signal coverage
area;
DRM30 indicated improved spectrum usage in that DRM30 was capable of
transmitting two audio services on the same AM frequency and bandwidth;
Added to the audio service text messages and Journaline were also transmitted which
was seen on the receiver end;
The Broadcom antenna provided slightly better DRM30 ground-wave coverage than
the KinStar antenna when the decode-ability of the 16QAM signal were compared.
The Broadcom antenna have slightly higher gain than the KinStar antenna;
The KinStar antenna provided slightly better DRM30 ground-wave coverage than the
Broadcom antenna when the decode-ability of the 64QAM signal were compared.
This was due to the better VSWR over the 9 kHz bandwidth on the KinStar antenna
compared to the Broadcom antenna;
The measured DRM30 signal performed better than the measured analogue AM
signal with regard to area coverage;
JOINT RADIO PULPIT / BROADCOM / SENTECH DRM30 TRIAL - Final Report
SEN_RFN_REP_MEASM_DRM30_RADIO_PULPIT_V1_03 Page 81 of 109
Both the DRM30 signal and analogue AM signal were susceptible to signal
degradation caused by man-made noise (tollgates, bridges, high voltage overhead
cables etc.);
Sky-wave field strength measurements indicated that the Broadcom antenna had
more interference caused by the sky-wave compared to the KinStar antenna. This
was noticeable when measurement results indicated more sky-wave reflections
caused by the Broadcom antenna compared to the KinStar antenna. The sky-wave
interference occurred outside the daytime ground-wave coverage area which confirm
that it should not have a negative impact on the daytime ground-wave coverage area;
Services cannot be guaranteed in the sky-wave coverage areas;
DRM30 measurement results indicated that all commercial receivers performed
poorly with regard to signal reception when compared to the DRM30 measurement
test results and the ITU recommendations;
Performance between the different DRM30 commercial receiver manufacturer
models differed quite significantly, indicating quite a vast difference with regard to
sensitivity;
The evaluated DRM30 commercial receivers were also found to be quite power
intensive resulting in regular battery changes. This was also an indication of poor
power efficiency which might be a problem in areas where no electricity is available;
Availability of affordable and good quality DRM30 receivers as well as the limited
number of manufacturers should be taken into consideration before selecting DRM30
as a broadcast medium;
DRM30 broadcast can be considered as a greener technology due to 40% reduction
in electricity consumption compared to the AM broadcast when covering the same
area;
DRM30 provides better audio quality and larger area coverage compared to analogue
AM.
Due to time limitations not all tests were conducted, it is therefore recommended that the
following could be conducted in future measurement trials:
Antenna pattern measurements (Airborne measurements);
Single frequency network (SFN) operation using the DRM30 system;
Receiver evaluation;
Emergency warning feature (EWF);
Alternative frequency signaling (analogue AM, FM and DAB);
Additional features (DRM Text messages and Journaline text information service).
JOINT RADIO PULPIT / BROADCOM / SENTECH DRM30 TRIAL - Final Report
SEN_RFN_REP_MEASM_DRM30_RADIO_PULPIT_V1_03 Page 82 of 109
8. REFERENCES
1. ETSI ES 201 980, Digital Radio Mondiale (DRM); System Specification;
2. ETSI TS 102 349, Digital Radio Mondiale (DRM); Receiver Status and Control Interface (RSCI);
3. ITU-R BS.1615-1, “Planning parameters” for digital sound broadcasting at frequencies below 30 MHz;
4. EBU-Tech 3330, Technical Base For DRM Services Coverage Planning;
5. DRM Introduction and Implementation Guide, Revision 2, September 2013;
6. ITU-R P.1321, Propagation factors affecting systems using digital modulation techniques at LF and MF;
7. ITU-R P.386-7, Ground-wave propagation curves for frequencies between 10 kHz and 30 MHz;
8. ITU-R P.1147-2, Prediction of sky-wave field strength at frequencies between 150 kHz and 1700 kHz;
9. ITU-R P.832-2, World Atlas of Ground Conductivities;
10. ITU-R BS.703, Characteristics of AM sound broadcasting reference receivers for planning purposes;
11. ITU Radio communication Study Groups, Document 6E/175-E, 18 March 2005.
JOINT RADIO PULPIT / BROADCOM / SENTECH DRM30 TRIAL - Final Report
SEN_RFN_REP_MEASM_DRM30_RADIO_PULPIT_V1_03 Page 83 of 109
ANNEXURE A
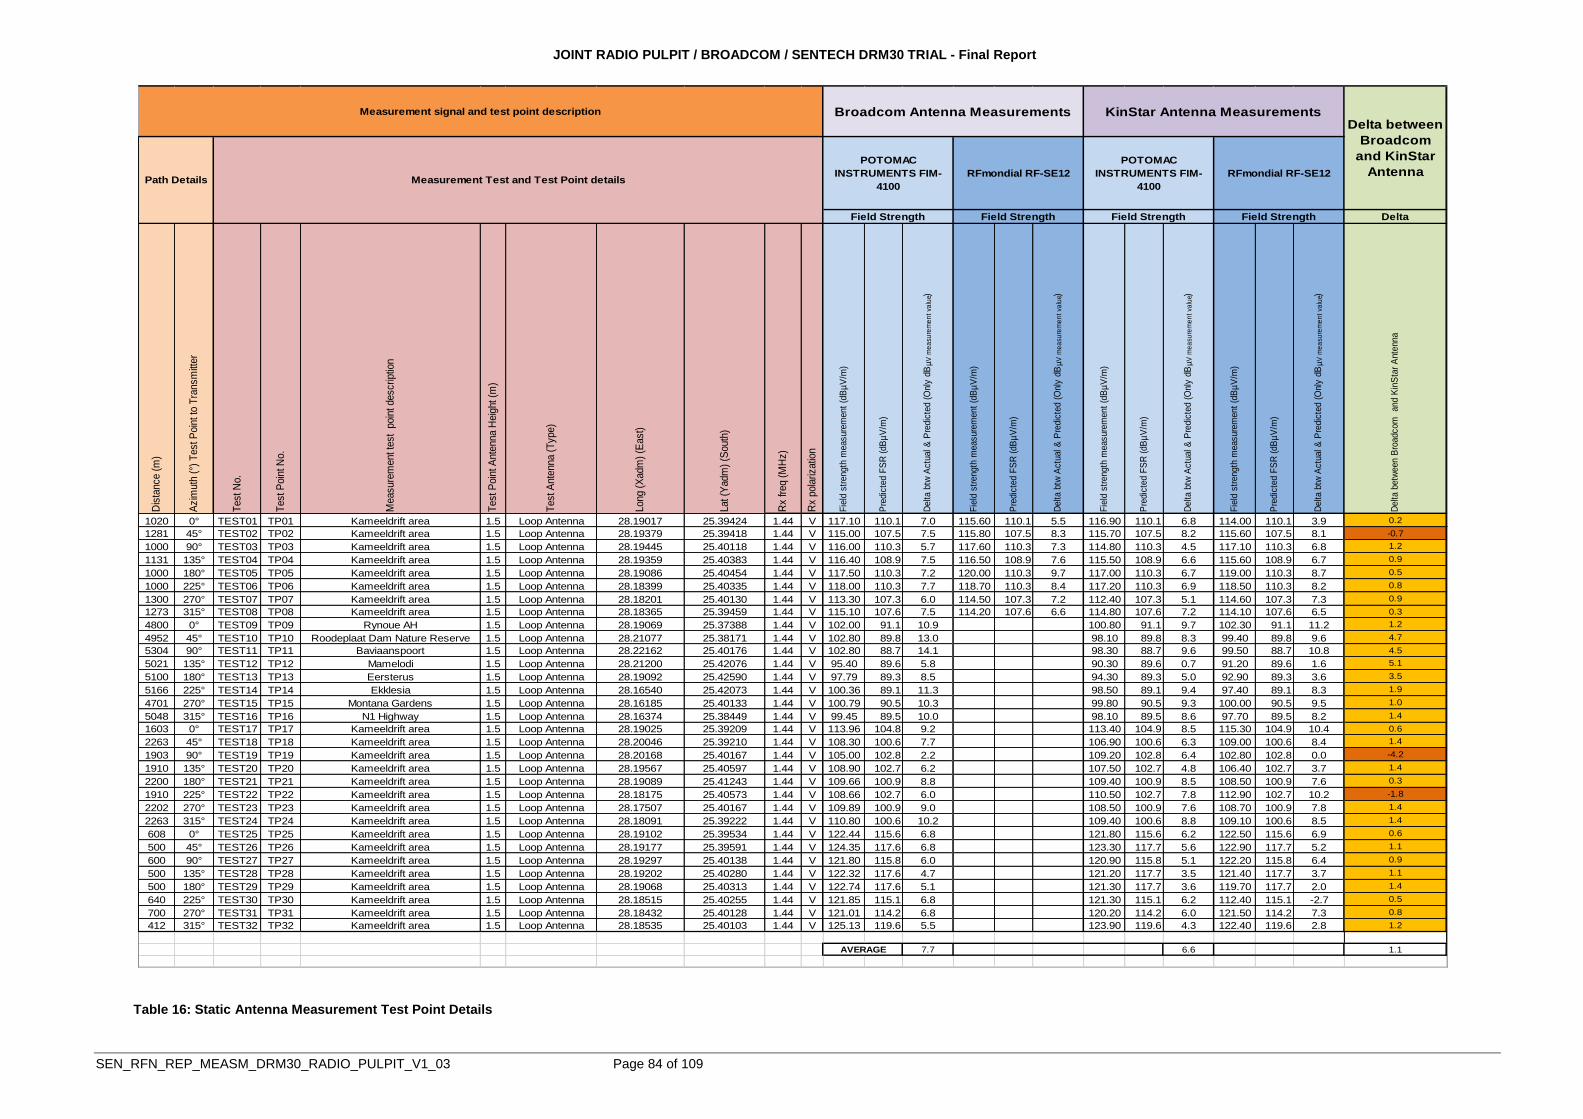
JOINT RADIO PULPIT / BROADCOM / SENTECH DRM30 TRIAL - Final Report
SEN_RFN_REP_MEASM_DRM30_RADIO_PULPIT_V1_03 Page 84 of 109
Table 16: Static Antenna Measurement Test Point Details
Delta
Dis
tance (
m)
Azim
uth
(°)
Test P
oin
t to
Tra
nsm
itter
Test N
o.
Test P
oin
t N
o.
Measure
ment te
st p
oin
t descriptio
n
Test P
oin
t A
nte
nna H
eig
ht (m
)
Test A
nte
nna (
Type)
Long (
Xadm
) (E
ast)
Lat (Y
adm
) (S
outh
)
Rx fre
q (
MH
z)
Rx p
ola
rizatio
n
Fie
ld s
trength
measure
ment
(dB
µV
/m)
Pre
dic
ted F
SR
(dB
µV
/m)
Delta b
tw A
ctu
al &
Pre
dic
ted (
Only
dB
µV m
ea
sure
me
nt
valu
e)
Fie
ld s
trength
measure
ment
(dB
µV
/m)
Pre
dic
ted F
SR
(dB
µV
/m)
Delta b
tw A
ctu
al &
Pre
dic
ted (
Only
dB
µV m
ea
sure
me
nt
valu
e)
Fie
ld s
trength
measure
ment
(dB
µV
/m)
Pre
dic
ted F
SR
(dB
µV
/m)
Delta b
tw A
ctu
al &
Pre
dic
ted (
Only
dB
µV m
ea
sure
me
nt
valu
e)
Fie
ld s
trength
measure
ment
(dB
µV
/m)
Pre
dic
ted F
SR
(dB
µV
/m)
Delta b
tw A
ctu
al &
Pre
dic
ted (
Only
dB
µV m
ea
sure
me
nt
valu
e)
Delta b
etw
een B
roadcom
and K
inS
tar
Ante
nna
1020 0° TEST01 TP01 Kameeldrift area 1.5 Loop Antenna 28.19017 25.39424 1.44 V 117.10 110.1 7.0 115.60 110.1 5.5 116.90 110.1 6.8 114.00 110.1 3.9 0.2
1281 45° TEST02 TP02 Kameeldrift area 1.5 Loop Antenna 28.19379 25.39418 1.44 V 115.00 107.5 7.5 115.80 107.5 8.3 115.70 107.5 8.2 115.60 107.5 8.1 -0.7
1000 90° TEST03 TP03 Kameeldrift area 1.5 Loop Antenna 28.19445 25.40118 1.44 V 116.00 110.3 5.7 117.60 110.3 7.3 114.80 110.3 4.5 117.10 110.3 6.8 1.2
1131 135° TEST04 TP04 Kameeldrift area 1.5 Loop Antenna 28.19359 25.40383 1.44 V 116.40 108.9 7.5 116.50 108.9 7.6 115.50 108.9 6.6 115.60 108.9 6.7 0.9
1000 180° TEST05 TP05 Kameeldrift area 1.5 Loop Antenna 28.19086 25.40454 1.44 V 117.50 110.3 7.2 120.00 110.3 9.7 117.00 110.3 6.7 119.00 110.3 8.7 0.5
1000 225° TEST06 TP06 Kameeldrift area 1.5 Loop Antenna 28.18399 25.40335 1.44 V 118.00 110.3 7.7 118.70 110.3 8.4 117.20 110.3 6.9 118.50 110.3 8.2 0.8
1300 270° TEST07 TP07 Kameeldrift area 1.5 Loop Antenna 28.18201 25.40130 1.44 V 113.30 107.3 6.0 114.50 107.3 7.2 112.40 107.3 5.1 114.60 107.3 7.3 0.9
1273 315° TEST08 TP08 Kameeldrift area 1.5 Loop Antenna 28.18365 25.39459 1.44 V 115.10 107.6 7.5 114.20 107.6 6.6 114.80 107.6 7.2 114.10 107.6 6.5 0.3
4800 0° TEST09 TP09 Rynoue AH 1.5 Loop Antenna 28.19069 25.37388 1.44 V 102.00 91.1 10.9 100.80 91.1 9.7 102.30 91.1 11.2 1.2
4952 45° TEST10 TP10 Roodeplaat Dam Nature Reserve 1.5 Loop Antenna 28.21077 25.38171 1.44 V 102.80 89.8 13.0 98.10 89.8 8.3 99.40 89.8 9.6 4.7
5304 90° TEST11 TP11 Baviaanspoort 1.5 Loop Antenna 28.22162 25.40176 1.44 V 102.80 88.7 14.1 98.30 88.7 9.6 99.50 88.7 10.8 4.5
5021 135° TEST12 TP12 Mamelodi 1.5 Loop Antenna 28.21200 25.42076 1.44 V 95.40 89.6 5.8 90.30 89.6 0.7 91.20 89.6 1.6 5.1
5100 180° TEST13 TP13 Eersterus 1.5 Loop Antenna 28.19092 25.42590 1.44 V 97.79 89.3 8.5 94.30 89.3 5.0 92.90 89.3 3.6 3.5
5166 225° TEST14 TP14 Ekklesia 1.5 Loop Antenna 28.16540 25.42073 1.44 V 100.36 89.1 11.3 98.50 89.1 9.4 97.40 89.1 8.3 1.9
4701 270° TEST15 TP15 Montana Gardens 1.5 Loop Antenna 28.16185 25.40133 1.44 V 100.79 90.5 10.3 99.80 90.5 9.3 100.00 90.5 9.5 1.0
5048 315° TEST16 TP16 N1 Highway 1.5 Loop Antenna 28.16374 25.38449 1.44 V 99.45 89.5 10.0 98.10 89.5 8.6 97.70 89.5 8.2 1.4
1603 0° TEST17 TP17 Kameeldrift area 1.5 Loop Antenna 28.19025 25.39209 1.44 V 113.96 104.8 9.2 113.40 104.9 8.5 115.30 104.9 10.4 0.6
2263 45° TEST18 TP18 Kameeldrift area 1.5 Loop Antenna 28.20046 25.39210 1.44 V 108.30 100.6 7.7 106.90 100.6 6.3 109.00 100.6 8.4 1.4
1903 90° TEST19 TP19 Kameeldrift area 1.5 Loop Antenna 28.20168 25.40167 1.44 V 105.00 102.8 2.2 109.20 102.8 6.4 102.80 102.8 0.0 -4.2
1910 135° TEST20 TP20 Kameeldrift area 1.5 Loop Antenna 28.19567 25.40597 1.44 V 108.90 102.7 6.2 107.50 102.7 4.8 106.40 102.7 3.7 1.4
2200 180° TEST21 TP21 Kameeldrift area 1.5 Loop Antenna 28.19089 25.41243 1.44 V 109.66 100.9 8.8 109.40 100.9 8.5 108.50 100.9 7.6 0.3
1910 225° TEST22 TP22 Kameeldrift area 1.5 Loop Antenna 28.18175 25.40573 1.44 V 108.66 102.7 6.0 110.50 102.7 7.8 112.90 102.7 10.2 -1.8
2202 270° TEST23 TP23 Kameeldrift area 1.5 Loop Antenna 28.17507 25.40167 1.44 V 109.89 100.9 9.0 108.50 100.9 7.6 108.70 100.9 7.8 1.4
2263 315° TEST24 TP24 Kameeldrift area 1.5 Loop Antenna 28.18091 25.39222 1.44 V 110.80 100.6 10.2 109.40 100.6 8.8 109.10 100.6 8.5 1.4
608 0° TEST25 TP25 Kameeldrift area 1.5 Loop Antenna 28.19102 25.39534 1.44 V 122.44 115.6 6.8 121.80 115.6 6.2 122.50 115.6 6.9 0.6
500 45° TEST26 TP26 Kameeldrift area 1.5 Loop Antenna 28.19177 25.39591 1.44 V 124.35 117.6 6.8 123.30 117.7 5.6 122.90 117.7 5.2 1.1
600 90° TEST27 TP27 Kameeldrift area 1.5 Loop Antenna 28.19297 25.40138 1.44 V 121.80 115.8 6.0 120.90 115.8 5.1 122.20 115.8 6.4 0.9
500 135° TEST28 TP28 Kameeldrift area 1.5 Loop Antenna 28.19202 25.40280 1.44 V 122.32 117.6 4.7 121.20 117.7 3.5 121.40 117.7 3.7 1.1
500 180° TEST29 TP29 Kameeldrift area 1.5 Loop Antenna 28.19068 25.40313 1.44 V 122.74 117.6 5.1 121.30 117.7 3.6 119.70 117.7 2.0 1.4
640 225° TEST30 TP30 Kameeldrift area 1.5 Loop Antenna 28.18515 25.40255 1.44 V 121.85 115.1 6.8 121.30 115.1 6.2 112.40 115.1 -2.7 0.5
700 270° TEST31 TP31 Kameeldrift area 1.5 Loop Antenna 28.18432 25.40128 1.44 V 121.01 114.2 6.8 120.20 114.2 6.0 121.50 114.2 7.3 0.8
412 315° TEST32 TP32 Kameeldrift area 1.5 Loop Antenna 28.18535 25.40103 1.44 V 125.13 119.6 5.5 123.90 119.6 4.3 122.40 119.6 2.8 1.2
7.7 6.6 1.1
Field Strength Field Strength
POTOMAC
INSTRUMENTS FIM-
4100
AVERAGE
RFmondial RF-SE12
POTOMAC
INSTRUMENTS FIM-
4100
RFmondial RF-SE12
Field Strength Field Strength
Path Details Measurement Test and Test Point details
Measurement signal and test point description Broadcom Antenna Measurements KinStar Antenna MeasurementsDelta between
Broadcom
and KinStar
Antenna
JOINT RADIO PULPIT / BROADCOM / SENTECH DRM30 TRIAL - Final Report
SEN_RFN_REP_MEASM_DRM30_RADIO_PULPIT_V1_03 Page 85 of 109
ANNEXURE B
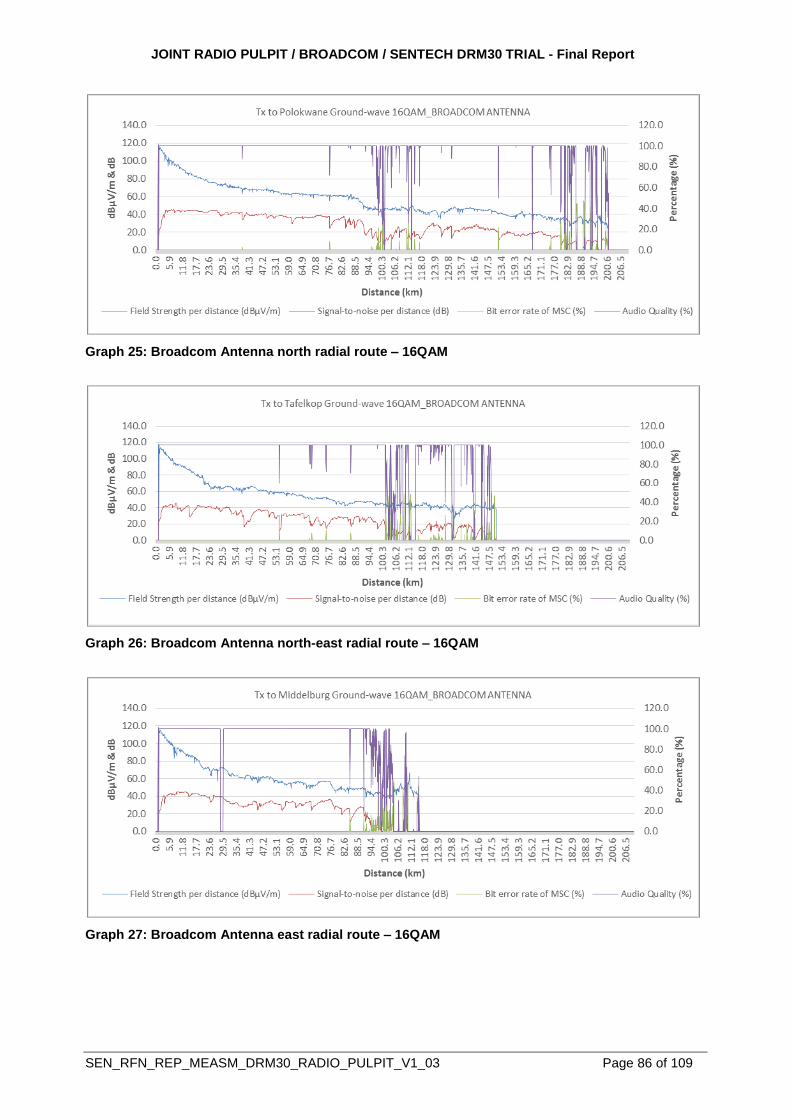
JOINT RADIO PULPIT / BROADCOM / SENTECH DRM30 TRIAL - Final Report
SEN_RFN_REP_MEASM_DRM30_RADIO_PULPIT_V1_03 Page 86 of 109
Graph 25: Broadcom Antenna north radial route – 16QAM
Graph 26: Broadcom Antenna north-east radial route – 16QAM
Graph 27: Broadcom Antenna east radial route – 16QAM
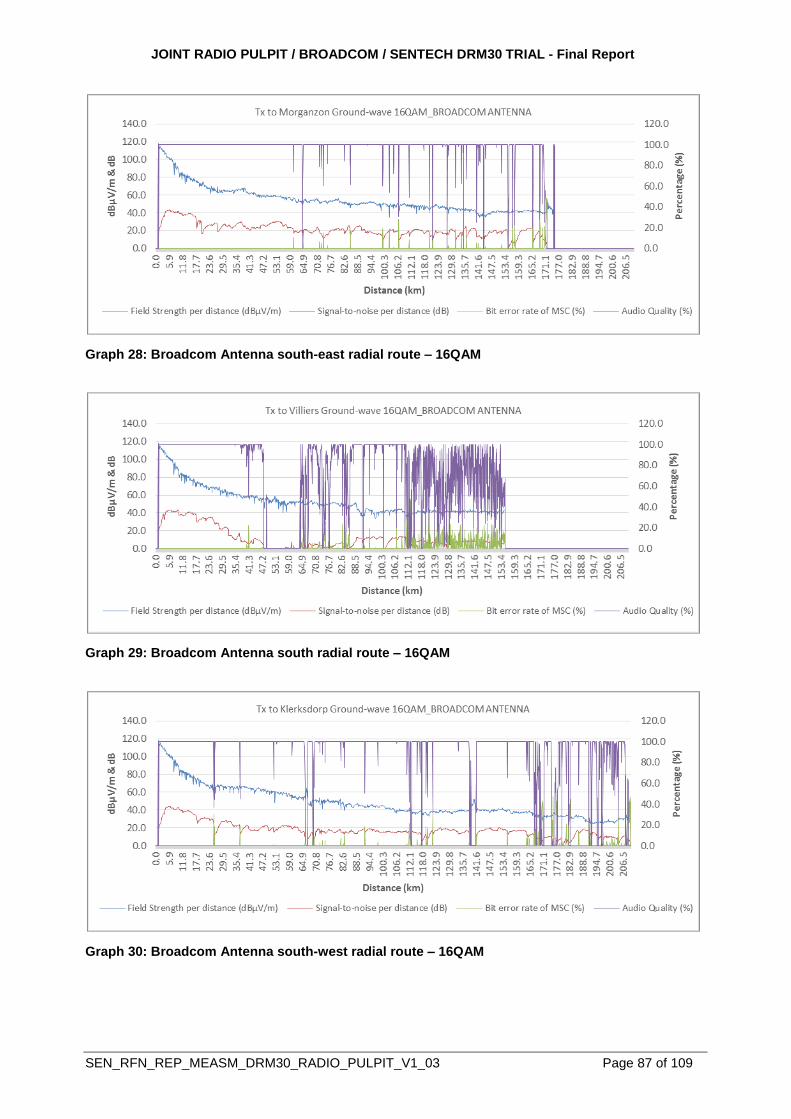
JOINT RADIO PULPIT / BROADCOM / SENTECH DRM30 TRIAL - Final Report
SEN_RFN_REP_MEASM_DRM30_RADIO_PULPIT_V1_03 Page 87 of 109
Graph 28: Broadcom Antenna south-east radial route – 16QAM
Graph 29: Broadcom Antenna south radial route – 16QAM
Graph 30: Broadcom Antenna south-west radial route – 16QAM
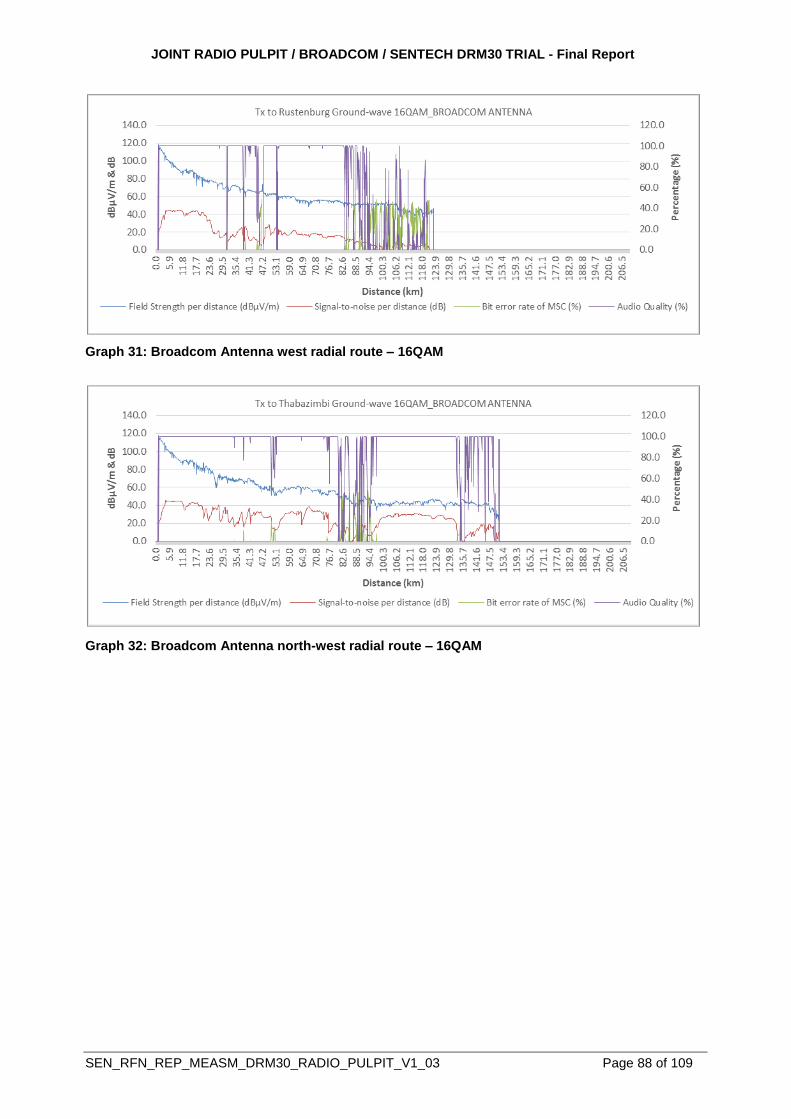
JOINT RADIO PULPIT / BROADCOM / SENTECH DRM30 TRIAL - Final Report
SEN_RFN_REP_MEASM_DRM30_RADIO_PULPIT_V1_03 Page 88 of 109
Graph 31: Broadcom Antenna west radial route – 16QAM
Graph 32: Broadcom Antenna north-west radial route – 16QAM
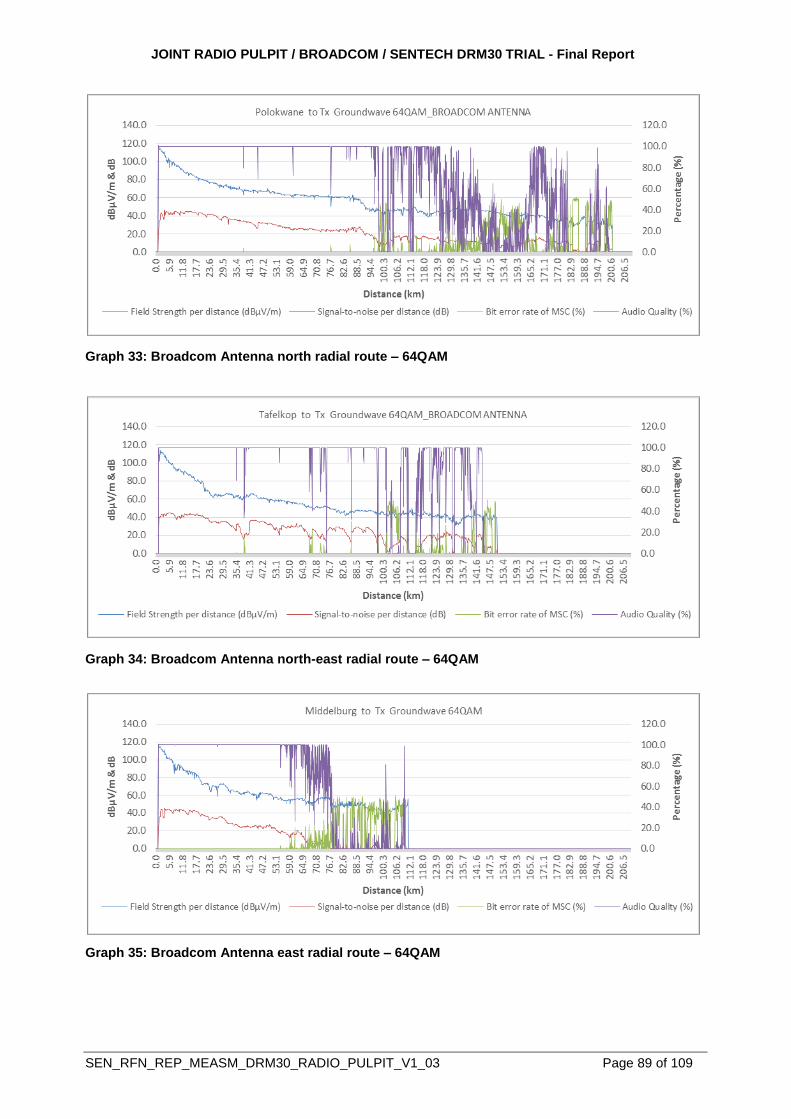
JOINT RADIO PULPIT / BROADCOM / SENTECH DRM30 TRIAL - Final Report
SEN_RFN_REP_MEASM_DRM30_RADIO_PULPIT_V1_03 Page 89 of 109
Graph 33: Broadcom Antenna north radial route – 64QAM
Graph 34: Broadcom Antenna north-east radial route – 64QAM
Graph 35: Broadcom Antenna east radial route – 64QAM
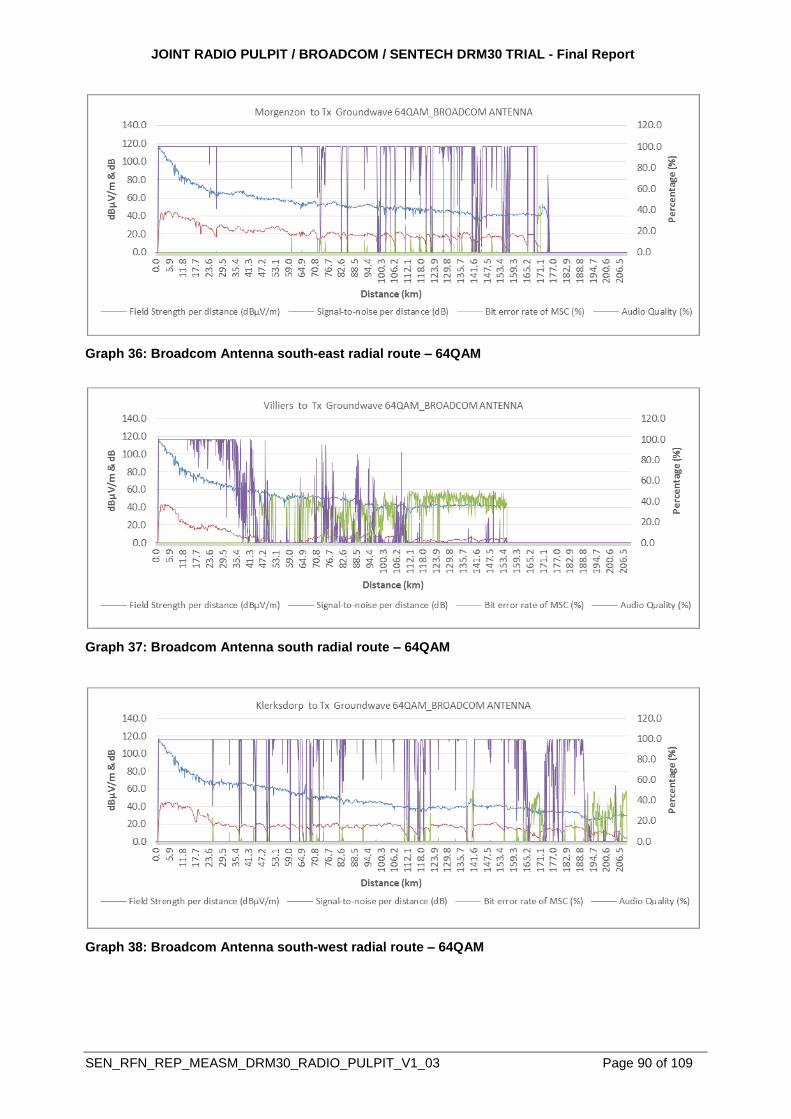
JOINT RADIO PULPIT / BROADCOM / SENTECH DRM30 TRIAL - Final Report
SEN_RFN_REP_MEASM_DRM30_RADIO_PULPIT_V1_03 Page 90 of 109
Graph 36: Broadcom Antenna south-east radial route – 64QAM
Graph 37: Broadcom Antenna south radial route – 64QAM
Graph 38: Broadcom Antenna south-west radial route – 64QAM
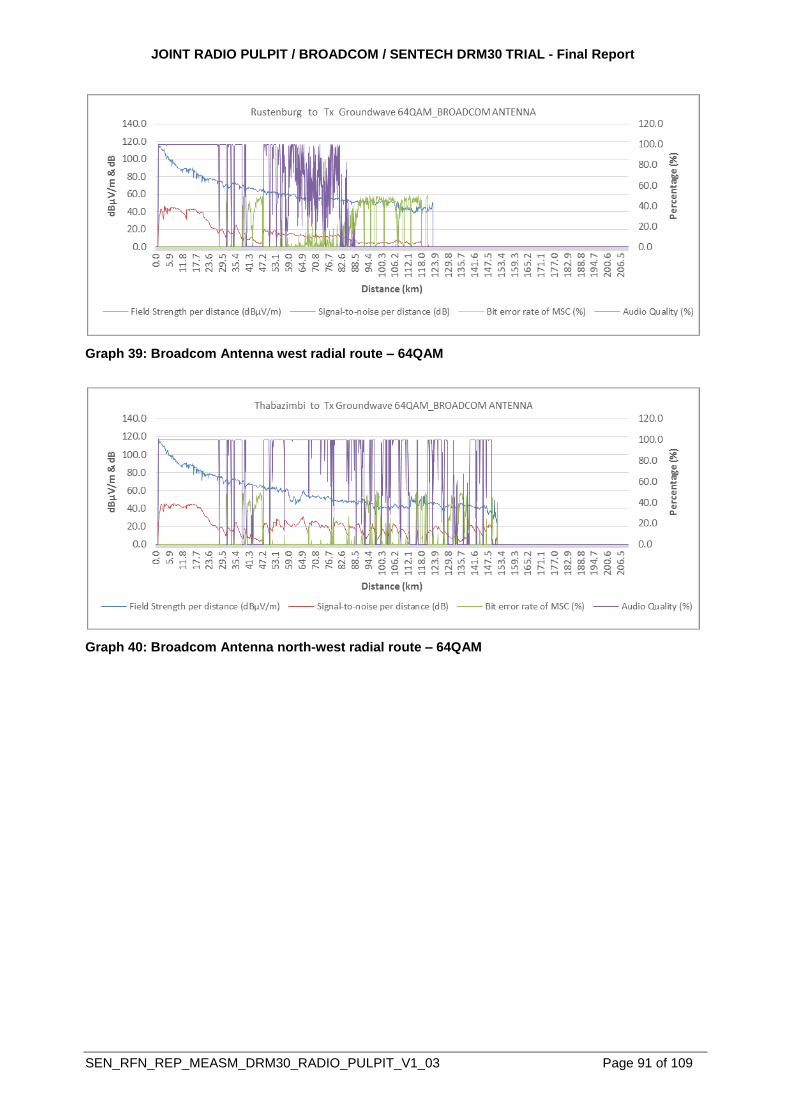
JOINT RADIO PULPIT / BROADCOM / SENTECH DRM30 TRIAL - Final Report
SEN_RFN_REP_MEASM_DRM30_RADIO_PULPIT_V1_03 Page 91 of 109
Graph 39: Broadcom Antenna west radial route – 64QAM
Graph 40: Broadcom Antenna north-west radial route – 64QAM
JOINT RADIO PULPIT / BROADCOM / SENTECH DRM30 TRIAL - Final Report
SEN_RFN_REP_MEASM_DRM30_RADIO_PULPIT_V1_03 Page 92 of 109
ANNEXURE C
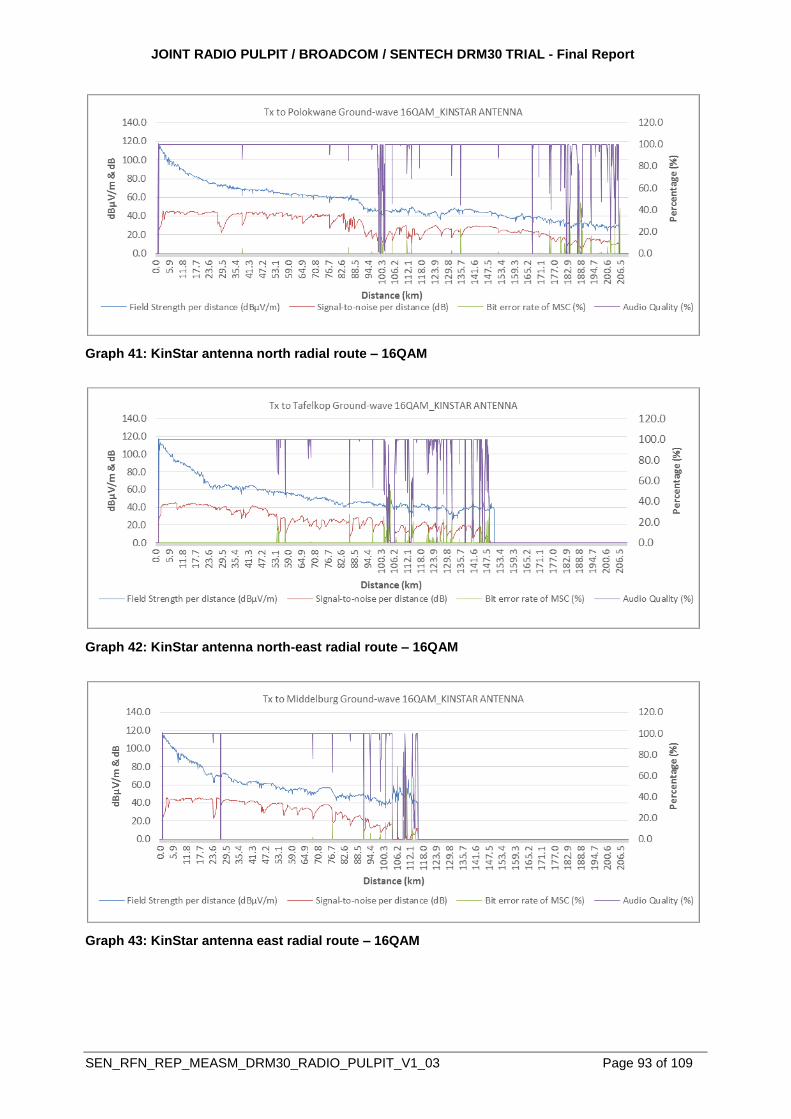
JOINT RADIO PULPIT / BROADCOM / SENTECH DRM30 TRIAL - Final Report
SEN_RFN_REP_MEASM_DRM30_RADIO_PULPIT_V1_03 Page 93 of 109
Graph 41: KinStar antenna north radial route – 16QAM
Graph 42: KinStar antenna north-east radial route – 16QAM
Graph 43: KinStar antenna east radial route – 16QAM
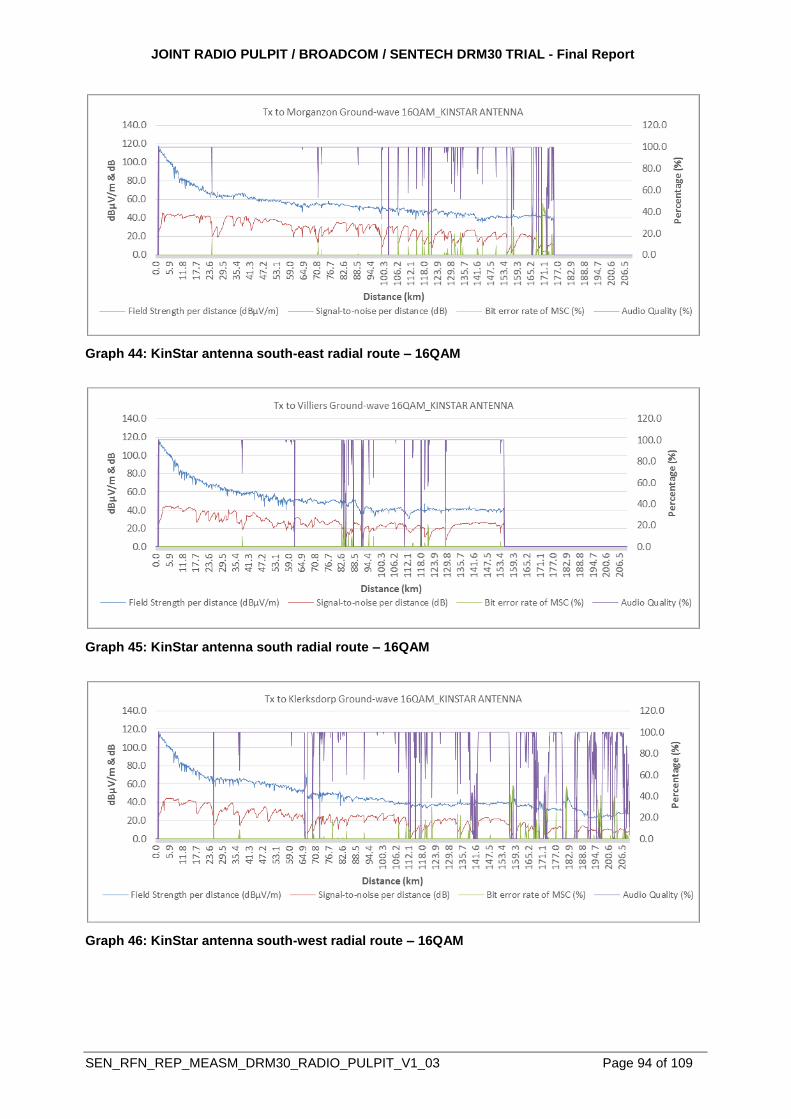
JOINT RADIO PULPIT / BROADCOM / SENTECH DRM30 TRIAL - Final Report
SEN_RFN_REP_MEASM_DRM30_RADIO_PULPIT_V1_03 Page 94 of 109
Graph 44: KinStar antenna south-east radial route – 16QAM
Graph 45: KinStar antenna south radial route – 16QAM
Graph 46: KinStar antenna south-west radial route – 16QAM
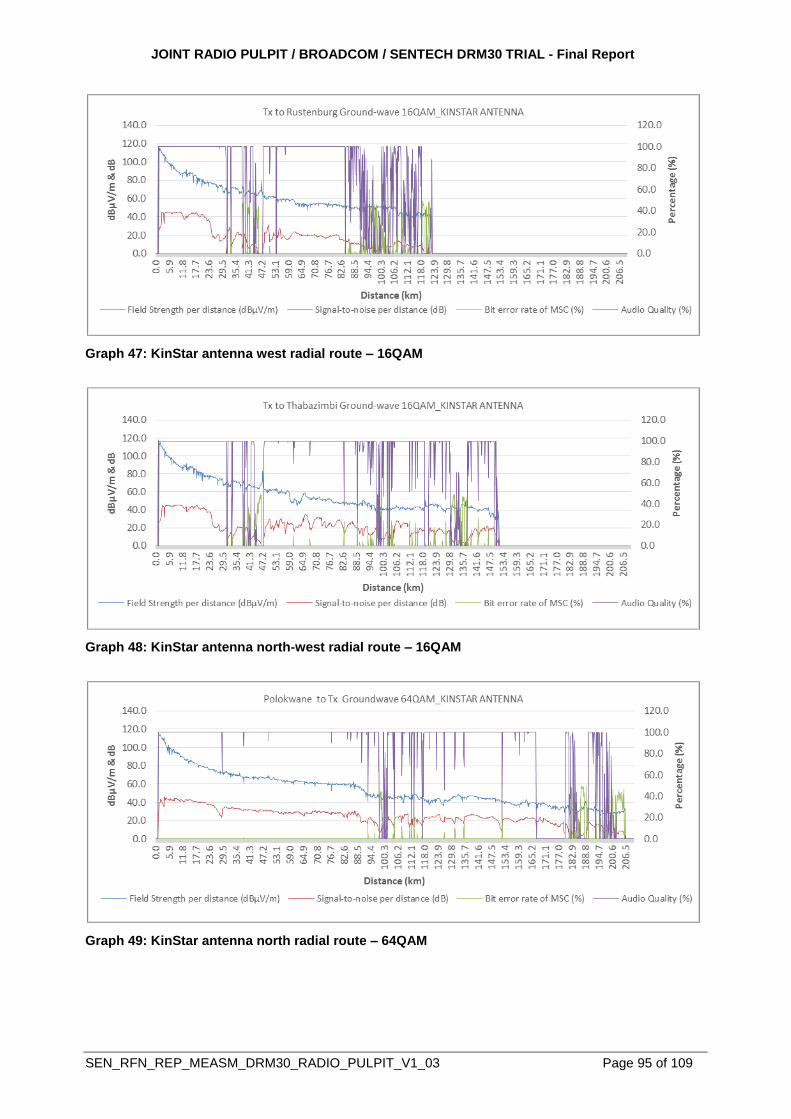
JOINT RADIO PULPIT / BROADCOM / SENTECH DRM30 TRIAL - Final Report
SEN_RFN_REP_MEASM_DRM30_RADIO_PULPIT_V1_03 Page 95 of 109
Graph 47: KinStar antenna west radial route – 16QAM
Graph 48: KinStar antenna north-west radial route – 16QAM
Graph 49: KinStar antenna north radial route – 64QAM
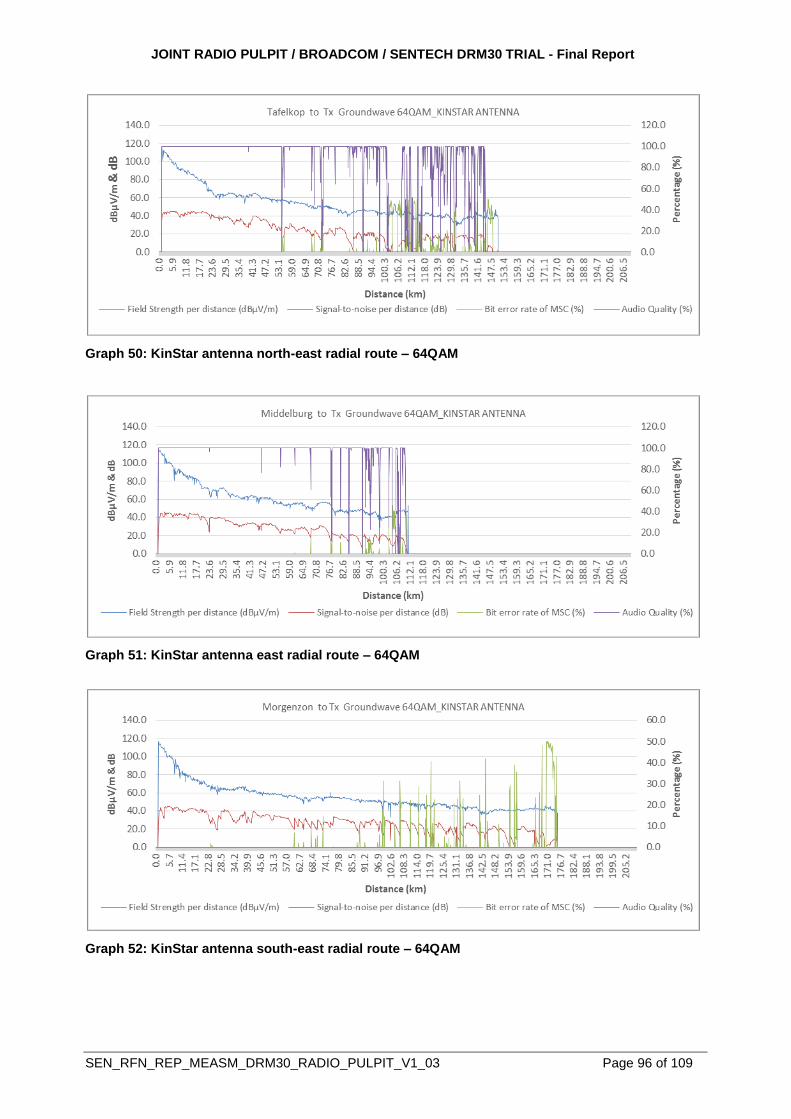
JOINT RADIO PULPIT / BROADCOM / SENTECH DRM30 TRIAL - Final Report
SEN_RFN_REP_MEASM_DRM30_RADIO_PULPIT_V1_03 Page 96 of 109
Graph 50: KinStar antenna north-east radial route – 64QAM
Graph 51: KinStar antenna east radial route – 64QAM
Graph 52: KinStar antenna south-east radial route – 64QAM
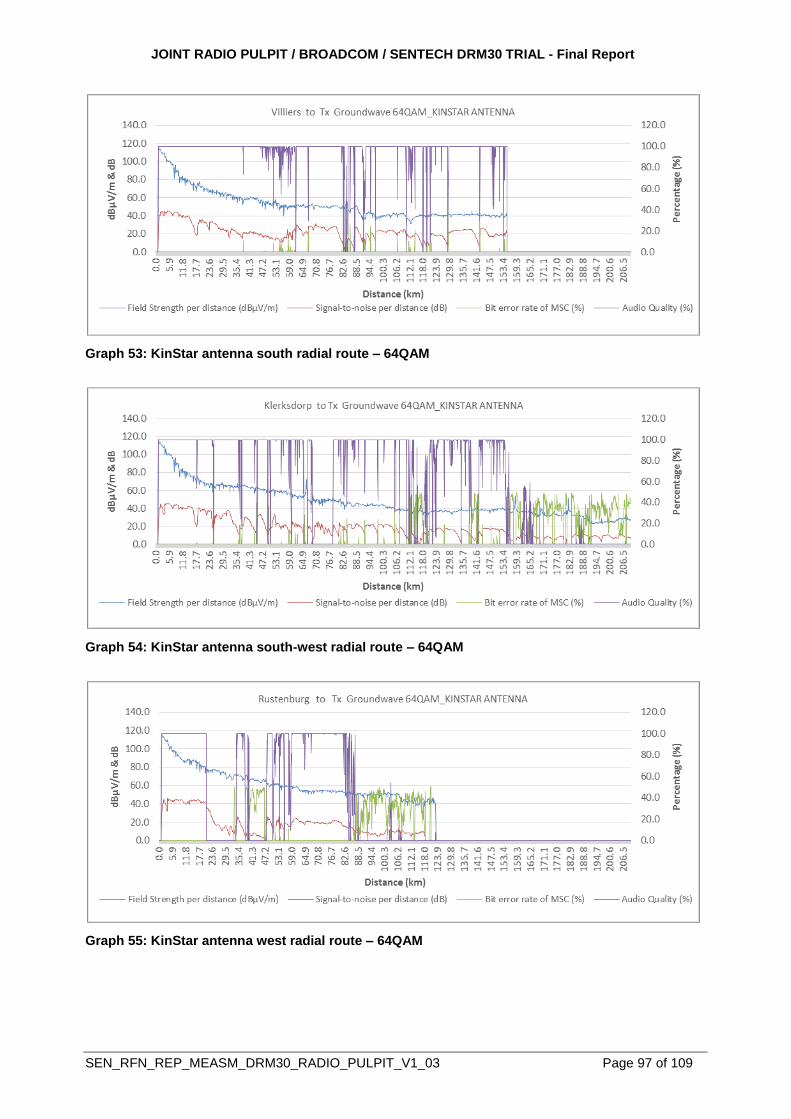
JOINT RADIO PULPIT / BROADCOM / SENTECH DRM30 TRIAL - Final Report
SEN_RFN_REP_MEASM_DRM30_RADIO_PULPIT_V1_03 Page 97 of 109
Graph 53: KinStar antenna south radial route – 64QAM
Graph 54: KinStar antenna south-west radial route – 64QAM
Graph 55: KinStar antenna west radial route – 64QAM
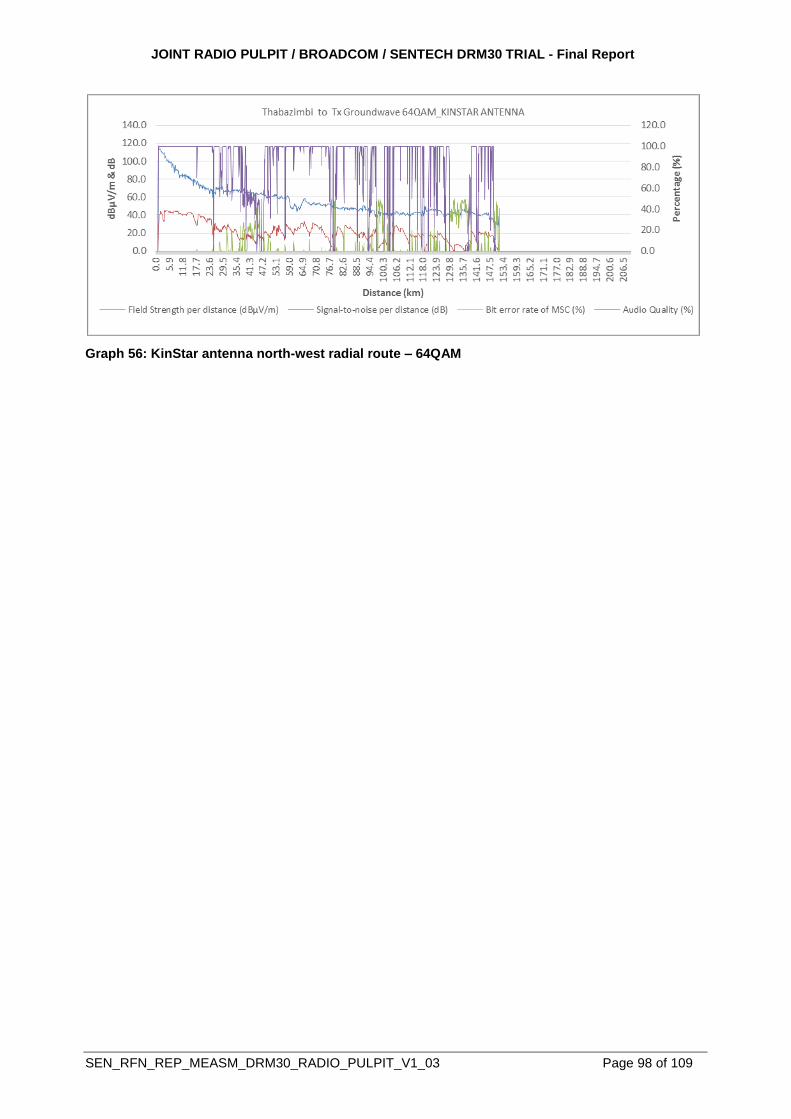
JOINT RADIO PULPIT / BROADCOM / SENTECH DRM30 TRIAL - Final Report
SEN_RFN_REP_MEASM_DRM30_RADIO_PULPIT_V1_03 Page 98 of 109
Graph 56: KinStar antenna north-west radial route – 64QAM
JOINT RADIO PULPIT / BROADCOM / SENTECH DRM30 TRIAL - Final Report
SEN_RFN_REP_MEASM_DRM30_RADIO_PULPIT_V1_03 Page 99 of 109
ANNEXURE D
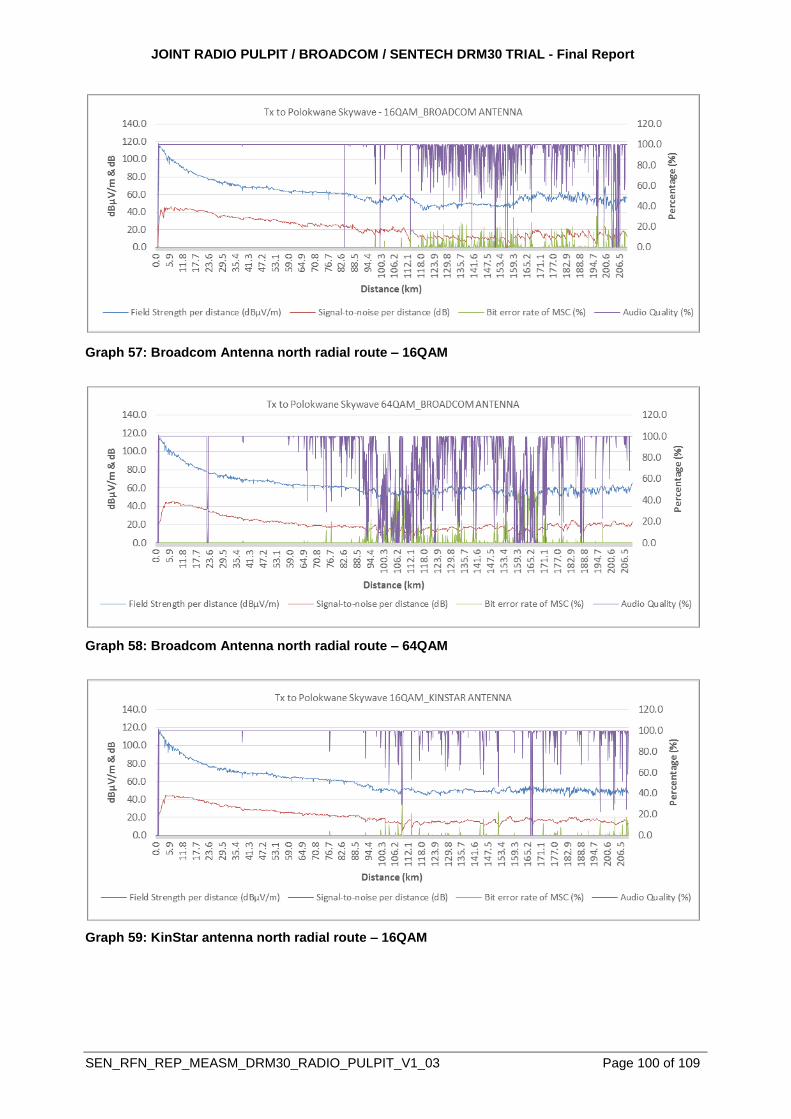
JOINT RADIO PULPIT / BROADCOM / SENTECH DRM30 TRIAL - Final Report
SEN_RFN_REP_MEASM_DRM30_RADIO_PULPIT_V1_03 Page 100 of 109
Graph 57: Broadcom Antenna north radial route – 16QAM
Graph 58: Broadcom Antenna north radial route – 64QAM
Graph 59: KinStar antenna north radial route – 16QAM
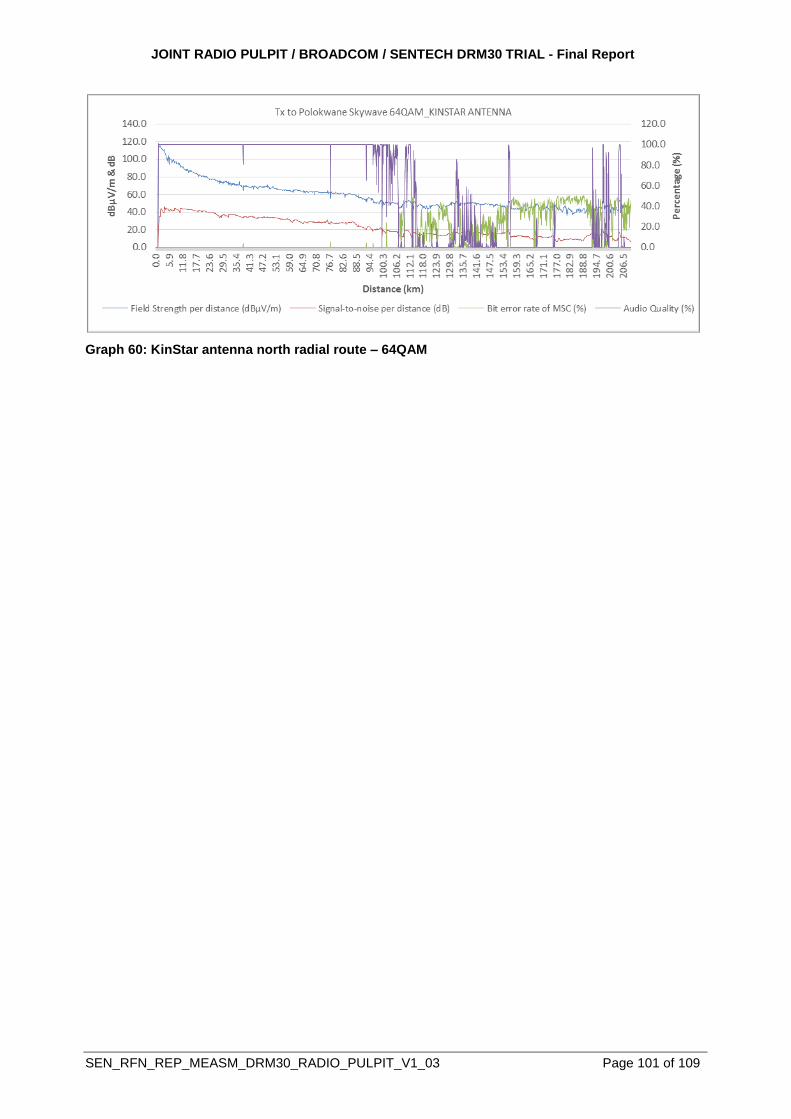
JOINT RADIO PULPIT / BROADCOM / SENTECH DRM30 TRIAL - Final Report
SEN_RFN_REP_MEASM_DRM30_RADIO_PULPIT_V1_03 Page 101 of 109
Graph 60: KinStar antenna north radial route – 64QAM
JOINT RADIO PULPIT / BROADCOM / SENTECH DRM30 TRIAL - Final Report
SEN_RFN_REP_MEASM_DRM30_RADIO_PULPIT_V1_03 Page 102 of 109
ANNEXURE E
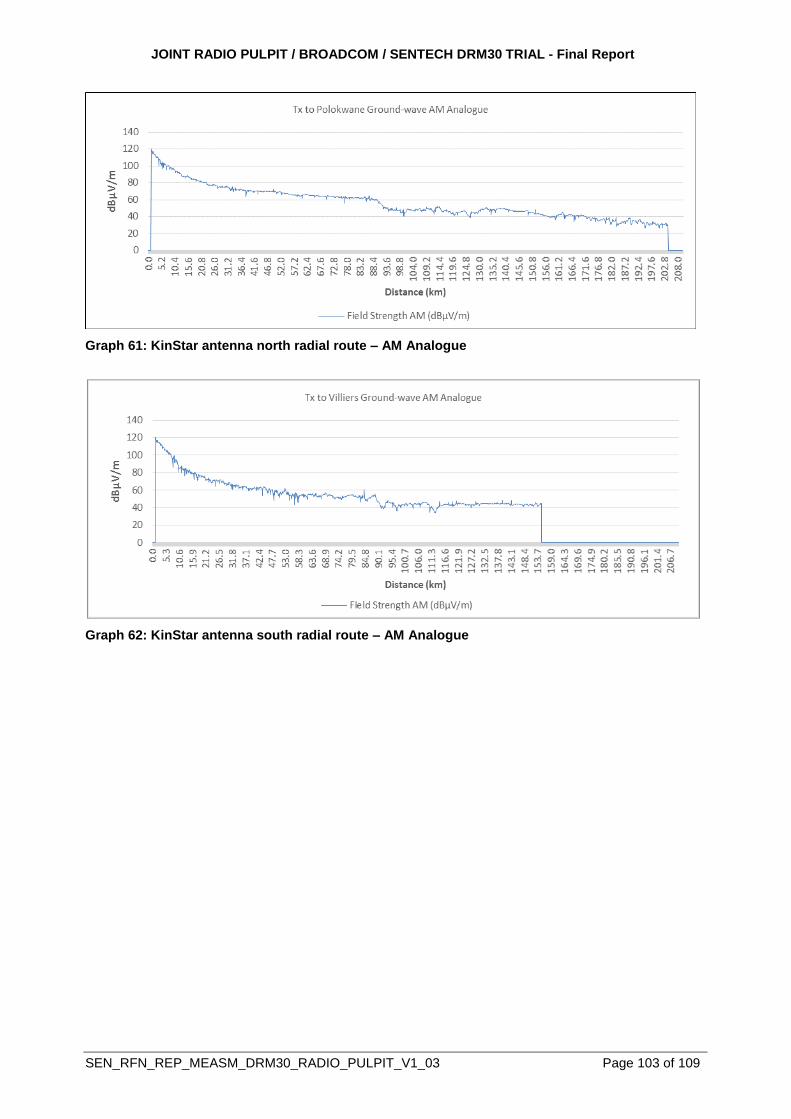
JOINT RADIO PULPIT / BROADCOM / SENTECH DRM30 TRIAL - Final Report
SEN_RFN_REP_MEASM_DRM30_RADIO_PULPIT_V1_03 Page 103 of 109
Graph 61: KinStar antenna north radial route – AM Analogue
Graph 62: KinStar antenna south radial route – AM Analogue
JOINT RADIO PULPIT / BROADCOM / SENTECH DRM30 TRIAL - Final Report
SEN_RFN_REP_MEASM_DRM30_RADIO_PULPIT_V1_03 Page 104 of 109
ANNEXURE F
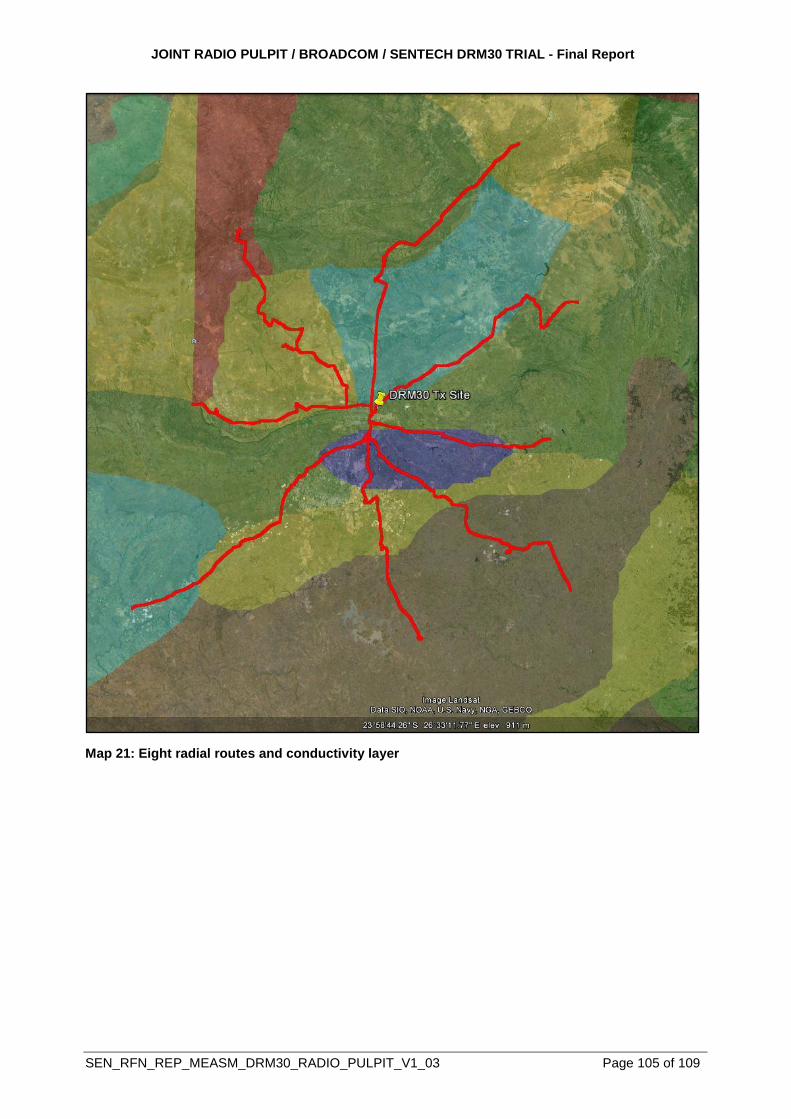
JOINT RADIO PULPIT / BROADCOM / SENTECH DRM30 TRIAL - Final Report
SEN_RFN_REP_MEASM_DRM30_RADIO_PULPIT_V1_03 Page 105 of 109
Map 21: Eight radial routes and conductivity layer
JOINT RADIO PULPIT / BROADCOM / SENTECH DRM30 TRIAL - Final Report
SEN_RFN_REP_MEASM_DRM30_RADIO_PULPIT_V1_03 Page 106 of 109
ANNEXURE G
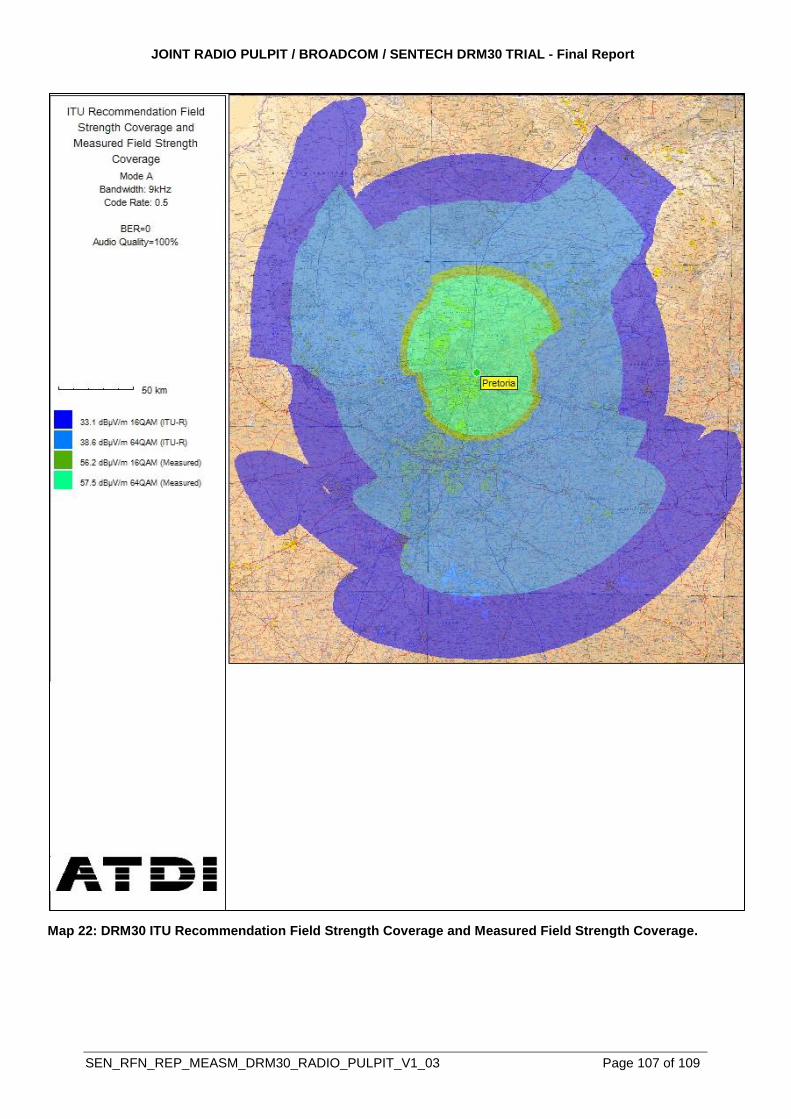
JOINT RADIO PULPIT / BROADCOM / SENTECH DRM30 TRIAL - Final Report
SEN_RFN_REP_MEASM_DRM30_RADIO_PULPIT_V1_03 Page 107 of 109
Map 22: DRM30 ITU Recommendation Field Strength Coverage and Measured Field Strength Coverage.

JOINT RADIO PULPIT / BROADCOM / SENTECH DRM30 TRIAL - Final Report
SEN_RFN_REP_MEASM_DRM30_RADIO_PULPIT_V1_03 Page 108 of 109
END OF DOCUMENT
Related Documents