JOINT ANALYSIS OF DNA COPY NUMBERS AND GENE EXPRESSION LEVELS Derek Aguiar Topics in Computational Biology 13-11-2008

Welcome message from author
This document is posted to help you gain knowledge. Please leave a comment to let me know what you think about it! Share it to your friends and learn new things together.
Transcript

JOINT ANALYSIS OF DNA COPY
NUMBERS AND GENE
EXPRESSION LEVELS
Derek Aguiar
Topics in Computational Biology
13-11-2008
DNA COPY NUMBER
Alterations in DCN are causal influences of many
types of cancer
COMPARATIVE GENOMIC HYBRIDIZATION
(CGH)
Genome wide technique widely used for
identification of DCN in cancer
Tumor and normal DNA differentially labeled
Hybridized
Ratio of florescence
level allow detection
of DCN
Major Problem
Resolution is
around 10-20 Mbp Institute of Pathology Charite Humboldt-University Berlin
Germany
CGH ndash Small cell lung carcinoma
ARRAY COMPARATIVE GENOMIC
HYBRIDIZATION (ACGH)
Clone thousands of BAC cDNA or
oligonucleotides and attach to an array
Oligonucleotides can produce a resolution finer
than single genes in exchange of coverage
PURPOSE
Many authors have previously tried to correlate
DCN with mRNA expression levels (largely used
CGH)
The authors of this paper provide algorithmic
and statistical methods for studying the
relationships between DCN and transcription
specifically in aCGH
OUTLINE
Background and Introduction
Methods
Correlation Scoring Methods
Regional Analysis
Results
Genomic-Continuous Submatrices
Max-hypergeometric Algorithm
CCA ndash Consistent Correlation Algorithm
Results
Conclusion and Discussion
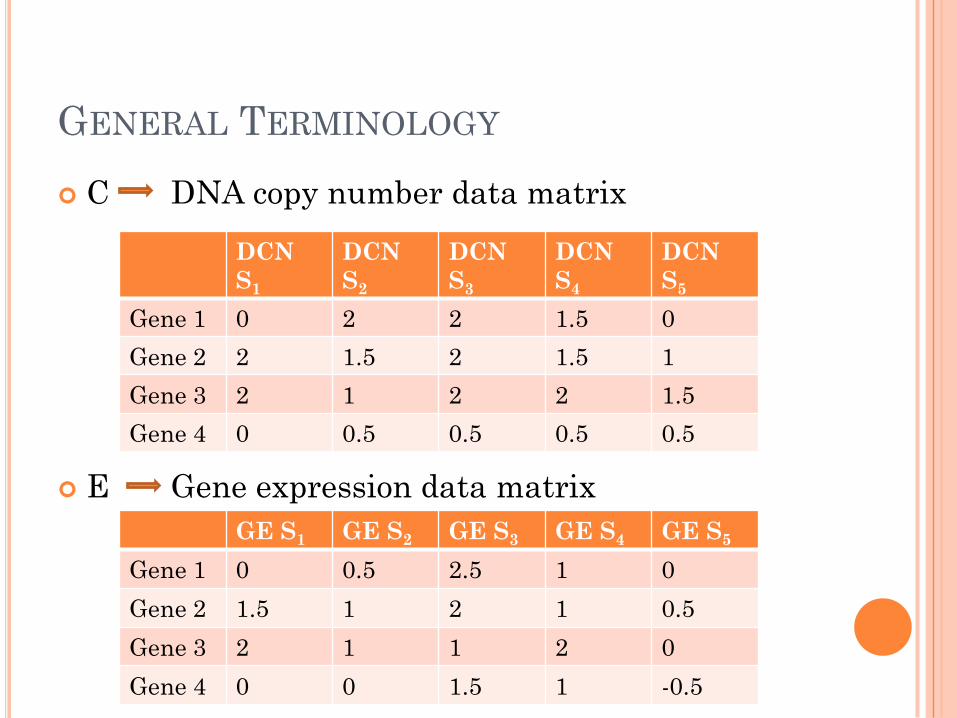
GENERAL TERMINOLOGY
C DNA copy number data matrix
E Gene expression data matrix
DCN
S1
DCN
S2
DCN
S3
DCN
S4
DCN
S5
Gene 1 0 2 2 15 0
Gene 2 2 15 2 15 1
Gene 3 2 1 2 2 15
Gene 4 0 05 05 05 05
GE S1 GE S2 GE S3 GE S4 GE S5
Gene 1 0 05 25 1 0
Gene 2 15 1 2 1 05
Gene 3 2 1 1 2 0
Gene 4 0 0 15 1 -05
GENERAL TERMINOLOGY
C(ij) DNA copy number (DCN) data for the ith
gene in the jth sample
E(ij) Gene expression (GE) data for the ith
gene in the jth sample
Data used is from two separate breast cancer
datasets measured on cDNA microarrays
PEARSON PRODUCT MOMENT
CORRELATION
Let u = ug denote the DCN data vector of gene g
Let v = vg denote the GE data vector of gene g
Most commonly used measure of dependence
DCN1 DCN2 DCN3 DCN4 DCN5
Gene 1 0 2 2 15 0
GE1 GE2 GE3 GE4 GE5
Gene 1 0 05 25 1 0
PEARSON PRODUCT MOMENT
CORRELATION
r(uv)=4
What is wrong with the PPMC for this
relationship
DCN1 DCN2 DCN3 DCN4 DCN5
Gene 1 0 2 2 15 0
GE1 GE2 GE3 GE4 GE5
Gene 1 0 05 25 1 0
PEARSON PRODUCT MOMENT
CORRELATION
r(uv)=4
What is wrong with the PPMC for this
relationship
Ans r measures a linear relationship between u
and v
DCN1 DCN2 DCN3 DCN4 DCN5
Gene 1 0 2 2 15 0
GE1 GE2 GE3 GE4 GE5
Gene 1 0 05 25 1 0
SEPARATING-CROSS CORRELATION
Threshold-based analysis of the dependence of u
and v ndash highly dependant on threshold selections
We view the two vectors u and v as n points (uivi)
in the plain
We place an axis parallel
cross centered at (xy)
partitioning the plain into
four quadrants At Bt Ct Dt
Let at bt ct dt equal
the quadrant counts
SEPARATING-CROSS CORRELATION
They are interested in the separating cross score
function
Let π τ denote the samples permutation induced
by u and v respectively Our cross and score
functions now depend only on quadrant counts
and no longer on location of points In other
words we have F(uv) = F(πτ)
SEPARATING-CROSS CORRELATION
We can now compute F(πτ) for every function
f(πτt) by examining at most all (n-1)2 possible
crosses
0
05
1
15
2
25
3
0 05 1 15 2 25 3
0
05
1
15
2
25
3
0 05 1 15 2 25 3
0
05
1
15
2
25
3
0 05 1 15 2 25 3
At=2
At=2
At=2
Dt=1Dt=2 Dt=3
Ct=0 Ct=0
Ct=0
Bt=2
Bt=1
Bt=0
SEPARATING-CROSS CORRELATION
The Diagonal Product DP(πτt) = at dt
One cross score function that they are particular
interested in is the Maximal Diagonal Product
Distinguishes between
samples that contribute
to the MDP (points in
quadrants AtDt) and
those that do not
(points in quadrants BtCt)0
05
1
15
2
25
3
0 05 1 15 2 25 3
At=2
Dt=3Ct=0
Bt=0
OUTLINE
Background and Introduction
Methods
Correlation Scoring Methods
Regional Analysis
Results
Genomic-Continuous Submatrices
Max-hypergeometric Algorithm
CCA ndash Consistent Correlation Algorithm
Results
Conclusion and Discussion
REGIONAL ANALYSIS
Previous studiesrsquo models only consider correlation
between GE levels of single genes and their
respective DNA copy number
This paperrsquos model also considers regional effects
Genes that are close together are likely to be
perturbed in the same fashion
Since DCN events are likely to span more than one
gene
REGIONAL ANALYSIS
Given a gene gi we define its k-neighborhood as
the continuous sequence of genes surrounding it
Straightforward method of quantifying
correlation between GE and DCN of a given gene
is to calculate average correlation
r(ij) is a correlation measure between E(i) and
C(j)
REGIONAL ANALYSIS - EXAMPLE
1-neighborhood around gene 3
We get the average correlation of gene irsquos
expression vector with neighboring genes DCN
vectors
)432()3(1
4333233
133 1 rrrr
REGIONAL ANALYSIS - RESULTS
They test whether or not regional effects are dependent on the original chromosomal ordering using simulations from data in JR Pollack et al PNAS 99(20)12963ndash8 20022
Null hypothesis neighboring genes are independent of each other
p-values are computed as follows Let L be the size of the simulation
Randomly draw L-1 expression vectors E[i1]hellipE[iL-1]
For each E[i1]hellipE[iL-1] compute rl = r(ilΓk(i))
We now compute r= r(iΓk(i))
We assign the rank of r amongst r1r2helliprL-1r the value ρ
The p-value for the region correlation observed at i is pV(i)=ρL
REGIONAL ANALYSIS - RESULTS
Key notes
Randomly permuting the dataset yields a straight line
Significant correlations for single genes and regional areas
Using region-based analysis delivers almost 80 more loci
where DCN-GE correlation may be identified with high
confidence
OUTLINE
Background and Introduction
Methods
Correlation Scoring Methods
Regional Analysis
Results
Genomic-Continuous Submatrices
Max-hypergeometric Algorithm
CCA ndash Consistent Correlation Algorithm
Results
Conclusion and Discussion
GENOMIC-CONTINUOUS SUBMATRICES
This part of the paper is concerned with detecting
the genomic segments in which an aberration has
occurred the affected samples and the
transcriptional effect
Genomic alterations
are often localized to
a subset of samples
as well as specific
chromosome
segments
GENOMIC-CONTINUOUS SUBMATRICES
DEFINITIONS
C and E are DCN and GE matrices (rows = genes columns = samples)
G is the ordered set of genes
Grsquo is a continuous segment of genes
S is the set of samples
Srsquo is a subset of samples
The genomic-continuous submatrix (GCSM) is M=Grsquo x Srsquo
M=Grsquo x S-Srsquo
C(M) and E(M) are the projections of matrices C and E on the subsets Grsquo and Srsquo In other words the submatrices formed by Grsquo and Srsquo of
DNA copy number and gene expression
GENOMIC-CONTINUOUS SUBMATRICES
Remember that the model states a genomic
alteration in a given sample will effect DCN
measurements in the segment but only some of
the GE measurements
A GCSM matrix is significantly amplified if
Most DNA copy values in the set C(M) are positive
Some genes gi in Grsquo have higher expression values in
the samples in Srsquo compared to the samples not in Srsquo
GENOMIC-CONTINUOUS SUBMATRICES
Formallyhellip
Define the score F(MC) that measures
overabundance of positive values in C(M) compared
to C(M)
They use the hypergeometric distribution to test for
significance
Definitions
N=number of values in C(M U M)
n=number of values in C(M)
K=number of positive values in C(M U M)
k=number of positive values in C(M)
GENOMIC-CONTINUOUS SUBMATRICES ndash
HYPERGEOMETRIC SCORE
Then the probability of finding k or more positive
values in C(M) is
Choose i values from number of values in Grsquo
Choose from the complement of Grsquo
the remaining number of positive values
Total ways we can pick positive values
GENOMIC-CONTINUOUS SUBMATRICES ndash
HYPERGEOMETRIC SCORE
Positive DCN
Non-positive DCN
C(M) C(M)N=10
n=6
K=6
k=5
012
6
10
0
4
6
6
6
10
1
4
5
6
CMF
Thus the probability of selecting 5 or 6 positive DCN is 012
GENOMIC-CONTINUOUS SUBMATRICES
A threshold number of misclassifications score
may be assigned to each gene according to its
performance as a Srsquo versus S ndash Srsquo classifier
If the probability for a single gene of obtaining a
score of s or better under the null model is p(s)
then the number of genes
with scores s or better
amongst the |Grsquo|
genes examined is
Binomial(np(s))
distributed
GENOMIC-CONTINUOUS SUBMATRICES
Under the null model DCN and GE vectors are
completely uncorrelated
A total score for an amplification is
where F(ME) is defined to be the maximum
ndashlog(σ(s)) for 0lesleSrsquo and σ(s) is the tail probability
of B(np(s))
The basic idea here is F(MCE) reflects the
overabundance of genes in Grsquo that are
significantly expressed (comparing Srsquo with S-Srsquo)
MAX-HYPERGEOMETRIC ALGORITHM
Heuristic approach to find Srsquo that maximizes
F((Grsquo x Srsquo)CE) for a given Grsquo
Note Since Grsquo is continuous the total number of
permutations = )( 2
1
nin
i
MAX-HYPERGEOMETRIC ALGORITHM
Iterate through all permutations of Grsquo of length le l
For each sample pi = of positive entries in
C(Grsquosample)
Order samples decreasing order
Find the maximum score out of a prefix of ordered
samples
If the maximum score is above threshold add M=(GrsquoArsquo)
to L
CONSISTENT CORRELATION ALGORITHM
Attempts to account for DCN and GE patterns to
locate partitions of Srsquo
Uses
CONSISTENT CORRELATION ALGORITHM
The sample MDP or SMDP is defined as follows
for all input genes
for each sample calculate pi=SMDP(samplei)
order samples decreasing order
For all segments in G of length less than l
Calculate maximum score over all prefixes of samples in the
ordered set ndash F((GrsquoSamplePrefix)CE)
if the maximum score gt threshold then add M=(GrsquoSrsquo) to L
Main difference here is the calculation of pi
ANALYSIS
MHA will produce good fitting GCSMs when
F(MC) is the dominant factor
CCA will produce good fitting GCSMs when there
is a strong correlation between E(M) and C(M)
When F(ME) is the dominant factor neither
algorithm performs well
Not within the scope of this study
OUTLINE
Background and Introduction
Methods
Results
Conclusion and Discussion
RESULTS
Using threshold F(MCE)gt25 they applied both
algorithms on two sets of breast tumor data
Genes affected by
GCSMs included
TP53 FGFR1 and
ERBB2 all known to
be involved in breast
cancer
RESULTS
RESULTS
Genomic locations of significant aberrations
Pink marks are significantly altered GCSM a yellow mark inside
denotes significantly differentially expressed genes
Genes with significant regional correlation scores are shown
above with yellow marks and surrounded teal boxes depict the
genomic intervals against which the max regional correlation
was attained
OUTLINE
Background and Introduction
Methods
Results
Conclusion and Discussion
CONCLUSION AND DISCUSSION
Combining DCN and GE data sets can help
understand cancer pathogenesis mechanisms
better
High scoring GCSMs are found even when no
transcriptional effect is detectedhellip
Unsure as to why a threshold gt 25 was selected ndash
not explained in results

DNA COPY NUMBER
Alterations in DCN are causal influences of many
types of cancer
COMPARATIVE GENOMIC HYBRIDIZATION
(CGH)
Genome wide technique widely used for
identification of DCN in cancer
Tumor and normal DNA differentially labeled
Hybridized
Ratio of florescence
level allow detection
of DCN
Major Problem
Resolution is
around 10-20 Mbp Institute of Pathology Charite Humboldt-University Berlin
Germany
CGH ndash Small cell lung carcinoma
ARRAY COMPARATIVE GENOMIC
HYBRIDIZATION (ACGH)
Clone thousands of BAC cDNA or
oligonucleotides and attach to an array
Oligonucleotides can produce a resolution finer
than single genes in exchange of coverage
PURPOSE
Many authors have previously tried to correlate
DCN with mRNA expression levels (largely used
CGH)
The authors of this paper provide algorithmic
and statistical methods for studying the
relationships between DCN and transcription
specifically in aCGH
OUTLINE
Background and Introduction
Methods
Correlation Scoring Methods
Regional Analysis
Results
Genomic-Continuous Submatrices
Max-hypergeometric Algorithm
CCA ndash Consistent Correlation Algorithm
Results
Conclusion and Discussion
GENERAL TERMINOLOGY
C DNA copy number data matrix
E Gene expression data matrix
DCN
S1
DCN
S2
DCN
S3
DCN
S4
DCN
S5
Gene 1 0 2 2 15 0
Gene 2 2 15 2 15 1
Gene 3 2 1 2 2 15
Gene 4 0 05 05 05 05
GE S1 GE S2 GE S3 GE S4 GE S5
Gene 1 0 05 25 1 0
Gene 2 15 1 2 1 05
Gene 3 2 1 1 2 0
Gene 4 0 0 15 1 -05
GENERAL TERMINOLOGY
C(ij) DNA copy number (DCN) data for the ith
gene in the jth sample
E(ij) Gene expression (GE) data for the ith
gene in the jth sample
Data used is from two separate breast cancer
datasets measured on cDNA microarrays
PEARSON PRODUCT MOMENT
CORRELATION
Let u = ug denote the DCN data vector of gene g
Let v = vg denote the GE data vector of gene g
Most commonly used measure of dependence
DCN1 DCN2 DCN3 DCN4 DCN5
Gene 1 0 2 2 15 0
GE1 GE2 GE3 GE4 GE5
Gene 1 0 05 25 1 0
PEARSON PRODUCT MOMENT
CORRELATION
r(uv)=4
What is wrong with the PPMC for this
relationship
DCN1 DCN2 DCN3 DCN4 DCN5
Gene 1 0 2 2 15 0
GE1 GE2 GE3 GE4 GE5
Gene 1 0 05 25 1 0
PEARSON PRODUCT MOMENT
CORRELATION
r(uv)=4
What is wrong with the PPMC for this
relationship
Ans r measures a linear relationship between u
and v
DCN1 DCN2 DCN3 DCN4 DCN5
Gene 1 0 2 2 15 0
GE1 GE2 GE3 GE4 GE5
Gene 1 0 05 25 1 0
SEPARATING-CROSS CORRELATION
Threshold-based analysis of the dependence of u
and v ndash highly dependant on threshold selections
We view the two vectors u and v as n points (uivi)
in the plain
We place an axis parallel
cross centered at (xy)
partitioning the plain into
four quadrants At Bt Ct Dt
Let at bt ct dt equal
the quadrant counts
SEPARATING-CROSS CORRELATION
They are interested in the separating cross score
function
Let π τ denote the samples permutation induced
by u and v respectively Our cross and score
functions now depend only on quadrant counts
and no longer on location of points In other
words we have F(uv) = F(πτ)
SEPARATING-CROSS CORRELATION
We can now compute F(πτ) for every function
f(πτt) by examining at most all (n-1)2 possible
crosses
0
05
1
15
2
25
3
0 05 1 15 2 25 3
0
05
1
15
2
25
3
0 05 1 15 2 25 3
0
05
1
15
2
25
3
0 05 1 15 2 25 3
At=2
At=2
At=2
Dt=1Dt=2 Dt=3
Ct=0 Ct=0
Ct=0
Bt=2
Bt=1
Bt=0
SEPARATING-CROSS CORRELATION
The Diagonal Product DP(πτt) = at dt
One cross score function that they are particular
interested in is the Maximal Diagonal Product
Distinguishes between
samples that contribute
to the MDP (points in
quadrants AtDt) and
those that do not
(points in quadrants BtCt)0
05
1
15
2
25
3
0 05 1 15 2 25 3
At=2
Dt=3Ct=0
Bt=0
OUTLINE
Background and Introduction
Methods
Correlation Scoring Methods
Regional Analysis
Results
Genomic-Continuous Submatrices
Max-hypergeometric Algorithm
CCA ndash Consistent Correlation Algorithm
Results
Conclusion and Discussion
REGIONAL ANALYSIS
Previous studiesrsquo models only consider correlation
between GE levels of single genes and their
respective DNA copy number
This paperrsquos model also considers regional effects
Genes that are close together are likely to be
perturbed in the same fashion
Since DCN events are likely to span more than one
gene
REGIONAL ANALYSIS
Given a gene gi we define its k-neighborhood as
the continuous sequence of genes surrounding it
Straightforward method of quantifying
correlation between GE and DCN of a given gene
is to calculate average correlation
r(ij) is a correlation measure between E(i) and
C(j)
REGIONAL ANALYSIS - EXAMPLE
1-neighborhood around gene 3
We get the average correlation of gene irsquos
expression vector with neighboring genes DCN
vectors
)432()3(1
4333233
133 1 rrrr
REGIONAL ANALYSIS - RESULTS
They test whether or not regional effects are dependent on the original chromosomal ordering using simulations from data in JR Pollack et al PNAS 99(20)12963ndash8 20022
Null hypothesis neighboring genes are independent of each other
p-values are computed as follows Let L be the size of the simulation
Randomly draw L-1 expression vectors E[i1]hellipE[iL-1]
For each E[i1]hellipE[iL-1] compute rl = r(ilΓk(i))
We now compute r= r(iΓk(i))
We assign the rank of r amongst r1r2helliprL-1r the value ρ
The p-value for the region correlation observed at i is pV(i)=ρL
REGIONAL ANALYSIS - RESULTS
Key notes
Randomly permuting the dataset yields a straight line
Significant correlations for single genes and regional areas
Using region-based analysis delivers almost 80 more loci
where DCN-GE correlation may be identified with high
confidence
OUTLINE
Background and Introduction
Methods
Correlation Scoring Methods
Regional Analysis
Results
Genomic-Continuous Submatrices
Max-hypergeometric Algorithm
CCA ndash Consistent Correlation Algorithm
Results
Conclusion and Discussion
GENOMIC-CONTINUOUS SUBMATRICES
This part of the paper is concerned with detecting
the genomic segments in which an aberration has
occurred the affected samples and the
transcriptional effect
Genomic alterations
are often localized to
a subset of samples
as well as specific
chromosome
segments
GENOMIC-CONTINUOUS SUBMATRICES
DEFINITIONS
C and E are DCN and GE matrices (rows = genes columns = samples)
G is the ordered set of genes
Grsquo is a continuous segment of genes
S is the set of samples
Srsquo is a subset of samples
The genomic-continuous submatrix (GCSM) is M=Grsquo x Srsquo
M=Grsquo x S-Srsquo
C(M) and E(M) are the projections of matrices C and E on the subsets Grsquo and Srsquo In other words the submatrices formed by Grsquo and Srsquo of
DNA copy number and gene expression
GENOMIC-CONTINUOUS SUBMATRICES
Remember that the model states a genomic
alteration in a given sample will effect DCN
measurements in the segment but only some of
the GE measurements
A GCSM matrix is significantly amplified if
Most DNA copy values in the set C(M) are positive
Some genes gi in Grsquo have higher expression values in
the samples in Srsquo compared to the samples not in Srsquo
GENOMIC-CONTINUOUS SUBMATRICES
Formallyhellip
Define the score F(MC) that measures
overabundance of positive values in C(M) compared
to C(M)
They use the hypergeometric distribution to test for
significance
Definitions
N=number of values in C(M U M)
n=number of values in C(M)
K=number of positive values in C(M U M)
k=number of positive values in C(M)
GENOMIC-CONTINUOUS SUBMATRICES ndash
HYPERGEOMETRIC SCORE
Then the probability of finding k or more positive
values in C(M) is
Choose i values from number of values in Grsquo
Choose from the complement of Grsquo
the remaining number of positive values
Total ways we can pick positive values
GENOMIC-CONTINUOUS SUBMATRICES ndash
HYPERGEOMETRIC SCORE
Positive DCN
Non-positive DCN
C(M) C(M)N=10
n=6
K=6
k=5
012
6
10
0
4
6
6
6
10
1
4
5
6
CMF
Thus the probability of selecting 5 or 6 positive DCN is 012
GENOMIC-CONTINUOUS SUBMATRICES
A threshold number of misclassifications score
may be assigned to each gene according to its
performance as a Srsquo versus S ndash Srsquo classifier
If the probability for a single gene of obtaining a
score of s or better under the null model is p(s)
then the number of genes
with scores s or better
amongst the |Grsquo|
genes examined is
Binomial(np(s))
distributed
GENOMIC-CONTINUOUS SUBMATRICES
Under the null model DCN and GE vectors are
completely uncorrelated
A total score for an amplification is
where F(ME) is defined to be the maximum
ndashlog(σ(s)) for 0lesleSrsquo and σ(s) is the tail probability
of B(np(s))
The basic idea here is F(MCE) reflects the
overabundance of genes in Grsquo that are
significantly expressed (comparing Srsquo with S-Srsquo)
MAX-HYPERGEOMETRIC ALGORITHM
Heuristic approach to find Srsquo that maximizes
F((Grsquo x Srsquo)CE) for a given Grsquo
Note Since Grsquo is continuous the total number of
permutations = )( 2
1
nin
i
MAX-HYPERGEOMETRIC ALGORITHM
Iterate through all permutations of Grsquo of length le l
For each sample pi = of positive entries in
C(Grsquosample)
Order samples decreasing order
Find the maximum score out of a prefix of ordered
samples
If the maximum score is above threshold add M=(GrsquoArsquo)
to L
CONSISTENT CORRELATION ALGORITHM
Attempts to account for DCN and GE patterns to
locate partitions of Srsquo
Uses
CONSISTENT CORRELATION ALGORITHM
The sample MDP or SMDP is defined as follows
for all input genes
for each sample calculate pi=SMDP(samplei)
order samples decreasing order
For all segments in G of length less than l
Calculate maximum score over all prefixes of samples in the
ordered set ndash F((GrsquoSamplePrefix)CE)
if the maximum score gt threshold then add M=(GrsquoSrsquo) to L
Main difference here is the calculation of pi
ANALYSIS
MHA will produce good fitting GCSMs when
F(MC) is the dominant factor
CCA will produce good fitting GCSMs when there
is a strong correlation between E(M) and C(M)
When F(ME) is the dominant factor neither
algorithm performs well
Not within the scope of this study
OUTLINE
Background and Introduction
Methods
Results
Conclusion and Discussion
RESULTS
Using threshold F(MCE)gt25 they applied both
algorithms on two sets of breast tumor data
Genes affected by
GCSMs included
TP53 FGFR1 and
ERBB2 all known to
be involved in breast
cancer
RESULTS
RESULTS
Genomic locations of significant aberrations
Pink marks are significantly altered GCSM a yellow mark inside
denotes significantly differentially expressed genes
Genes with significant regional correlation scores are shown
above with yellow marks and surrounded teal boxes depict the
genomic intervals against which the max regional correlation
was attained
OUTLINE
Background and Introduction
Methods
Results
Conclusion and Discussion
CONCLUSION AND DISCUSSION
Combining DCN and GE data sets can help
understand cancer pathogenesis mechanisms
better
High scoring GCSMs are found even when no
transcriptional effect is detectedhellip
Unsure as to why a threshold gt 25 was selected ndash
not explained in results

OUTLINE
Background and Introduction
Methods
Correlation Scoring Methods
Regional Analysis
Results
Genomic-Continuous Submatrices
Max-hypergeometric Algorithm
CCA ndash Consistent Correlation Algorithm
Results
Conclusion and Discussion
GENERAL TERMINOLOGY
C DNA copy number data matrix
E Gene expression data matrix
DCN
S1
DCN
S2
DCN
S3
DCN
S4
DCN
S5
Gene 1 0 2 2 15 0
Gene 2 2 15 2 15 1
Gene 3 2 1 2 2 15
Gene 4 0 05 05 05 05
GE S1 GE S2 GE S3 GE S4 GE S5
Gene 1 0 05 25 1 0
Gene 2 15 1 2 1 05
Gene 3 2 1 1 2 0
Gene 4 0 0 15 1 -05
GENERAL TERMINOLOGY
C(ij) DNA copy number (DCN) data for the ith
gene in the jth sample
E(ij) Gene expression (GE) data for the ith
gene in the jth sample
Data used is from two separate breast cancer
datasets measured on cDNA microarrays
PEARSON PRODUCT MOMENT
CORRELATION
Let u = ug denote the DCN data vector of gene g
Let v = vg denote the GE data vector of gene g
Most commonly used measure of dependence
DCN1 DCN2 DCN3 DCN4 DCN5
Gene 1 0 2 2 15 0
GE1 GE2 GE3 GE4 GE5
Gene 1 0 05 25 1 0
PEARSON PRODUCT MOMENT
CORRELATION
r(uv)=4
What is wrong with the PPMC for this
relationship
DCN1 DCN2 DCN3 DCN4 DCN5
Gene 1 0 2 2 15 0
GE1 GE2 GE3 GE4 GE5
Gene 1 0 05 25 1 0
PEARSON PRODUCT MOMENT
CORRELATION
r(uv)=4
What is wrong with the PPMC for this
relationship
Ans r measures a linear relationship between u
and v
DCN1 DCN2 DCN3 DCN4 DCN5
Gene 1 0 2 2 15 0
GE1 GE2 GE3 GE4 GE5
Gene 1 0 05 25 1 0
SEPARATING-CROSS CORRELATION
Threshold-based analysis of the dependence of u
and v ndash highly dependant on threshold selections
We view the two vectors u and v as n points (uivi)
in the plain
We place an axis parallel
cross centered at (xy)
partitioning the plain into
four quadrants At Bt Ct Dt
Let at bt ct dt equal
the quadrant counts
SEPARATING-CROSS CORRELATION
They are interested in the separating cross score
function
Let π τ denote the samples permutation induced
by u and v respectively Our cross and score
functions now depend only on quadrant counts
and no longer on location of points In other
words we have F(uv) = F(πτ)
SEPARATING-CROSS CORRELATION
We can now compute F(πτ) for every function
f(πτt) by examining at most all (n-1)2 possible
crosses
0
05
1
15
2
25
3
0 05 1 15 2 25 3
0
05
1
15
2
25
3
0 05 1 15 2 25 3
0
05
1
15
2
25
3
0 05 1 15 2 25 3
At=2
At=2
At=2
Dt=1Dt=2 Dt=3
Ct=0 Ct=0
Ct=0
Bt=2
Bt=1
Bt=0
SEPARATING-CROSS CORRELATION
The Diagonal Product DP(πτt) = at dt
One cross score function that they are particular
interested in is the Maximal Diagonal Product
Distinguishes between
samples that contribute
to the MDP (points in
quadrants AtDt) and
those that do not
(points in quadrants BtCt)0
05
1
15
2
25
3
0 05 1 15 2 25 3
At=2
Dt=3Ct=0
Bt=0
OUTLINE
Background and Introduction
Methods
Correlation Scoring Methods
Regional Analysis
Results
Genomic-Continuous Submatrices
Max-hypergeometric Algorithm
CCA ndash Consistent Correlation Algorithm
Results
Conclusion and Discussion
REGIONAL ANALYSIS
Previous studiesrsquo models only consider correlation
between GE levels of single genes and their
respective DNA copy number
This paperrsquos model also considers regional effects
Genes that are close together are likely to be
perturbed in the same fashion
Since DCN events are likely to span more than one
gene
REGIONAL ANALYSIS
Given a gene gi we define its k-neighborhood as
the continuous sequence of genes surrounding it
Straightforward method of quantifying
correlation between GE and DCN of a given gene
is to calculate average correlation
r(ij) is a correlation measure between E(i) and
C(j)
REGIONAL ANALYSIS - EXAMPLE
1-neighborhood around gene 3
We get the average correlation of gene irsquos
expression vector with neighboring genes DCN
vectors
)432()3(1
4333233
133 1 rrrr
REGIONAL ANALYSIS - RESULTS
They test whether or not regional effects are dependent on the original chromosomal ordering using simulations from data in JR Pollack et al PNAS 99(20)12963ndash8 20022
Null hypothesis neighboring genes are independent of each other
p-values are computed as follows Let L be the size of the simulation
Randomly draw L-1 expression vectors E[i1]hellipE[iL-1]
For each E[i1]hellipE[iL-1] compute rl = r(ilΓk(i))
We now compute r= r(iΓk(i))
We assign the rank of r amongst r1r2helliprL-1r the value ρ
The p-value for the region correlation observed at i is pV(i)=ρL
REGIONAL ANALYSIS - RESULTS
Key notes
Randomly permuting the dataset yields a straight line
Significant correlations for single genes and regional areas
Using region-based analysis delivers almost 80 more loci
where DCN-GE correlation may be identified with high
confidence
OUTLINE
Background and Introduction
Methods
Correlation Scoring Methods
Regional Analysis
Results
Genomic-Continuous Submatrices
Max-hypergeometric Algorithm
CCA ndash Consistent Correlation Algorithm
Results
Conclusion and Discussion
GENOMIC-CONTINUOUS SUBMATRICES
This part of the paper is concerned with detecting
the genomic segments in which an aberration has
occurred the affected samples and the
transcriptional effect
Genomic alterations
are often localized to
a subset of samples
as well as specific
chromosome
segments
GENOMIC-CONTINUOUS SUBMATRICES
DEFINITIONS
C and E are DCN and GE matrices (rows = genes columns = samples)
G is the ordered set of genes
Grsquo is a continuous segment of genes
S is the set of samples
Srsquo is a subset of samples
The genomic-continuous submatrix (GCSM) is M=Grsquo x Srsquo
M=Grsquo x S-Srsquo
C(M) and E(M) are the projections of matrices C and E on the subsets Grsquo and Srsquo In other words the submatrices formed by Grsquo and Srsquo of
DNA copy number and gene expression
GENOMIC-CONTINUOUS SUBMATRICES
Remember that the model states a genomic
alteration in a given sample will effect DCN
measurements in the segment but only some of
the GE measurements
A GCSM matrix is significantly amplified if
Most DNA copy values in the set C(M) are positive
Some genes gi in Grsquo have higher expression values in
the samples in Srsquo compared to the samples not in Srsquo
GENOMIC-CONTINUOUS SUBMATRICES
Formallyhellip
Define the score F(MC) that measures
overabundance of positive values in C(M) compared
to C(M)
They use the hypergeometric distribution to test for
significance
Definitions
N=number of values in C(M U M)
n=number of values in C(M)
K=number of positive values in C(M U M)
k=number of positive values in C(M)
GENOMIC-CONTINUOUS SUBMATRICES ndash
HYPERGEOMETRIC SCORE
Then the probability of finding k or more positive
values in C(M) is
Choose i values from number of values in Grsquo
Choose from the complement of Grsquo
the remaining number of positive values
Total ways we can pick positive values
GENOMIC-CONTINUOUS SUBMATRICES ndash
HYPERGEOMETRIC SCORE
Positive DCN
Non-positive DCN
C(M) C(M)N=10
n=6
K=6
k=5
012
6
10
0
4
6
6
6
10
1
4
5
6
CMF
Thus the probability of selecting 5 or 6 positive DCN is 012
GENOMIC-CONTINUOUS SUBMATRICES
A threshold number of misclassifications score
may be assigned to each gene according to its
performance as a Srsquo versus S ndash Srsquo classifier
If the probability for a single gene of obtaining a
score of s or better under the null model is p(s)
then the number of genes
with scores s or better
amongst the |Grsquo|
genes examined is
Binomial(np(s))
distributed
GENOMIC-CONTINUOUS SUBMATRICES
Under the null model DCN and GE vectors are
completely uncorrelated
A total score for an amplification is
where F(ME) is defined to be the maximum
ndashlog(σ(s)) for 0lesleSrsquo and σ(s) is the tail probability
of B(np(s))
The basic idea here is F(MCE) reflects the
overabundance of genes in Grsquo that are
significantly expressed (comparing Srsquo with S-Srsquo)
MAX-HYPERGEOMETRIC ALGORITHM
Heuristic approach to find Srsquo that maximizes
F((Grsquo x Srsquo)CE) for a given Grsquo
Note Since Grsquo is continuous the total number of
permutations = )( 2
1
nin
i
MAX-HYPERGEOMETRIC ALGORITHM
Iterate through all permutations of Grsquo of length le l
For each sample pi = of positive entries in
C(Grsquosample)
Order samples decreasing order
Find the maximum score out of a prefix of ordered
samples
If the maximum score is above threshold add M=(GrsquoArsquo)
to L
CONSISTENT CORRELATION ALGORITHM
Attempts to account for DCN and GE patterns to
locate partitions of Srsquo
Uses
CONSISTENT CORRELATION ALGORITHM
The sample MDP or SMDP is defined as follows
for all input genes
for each sample calculate pi=SMDP(samplei)
order samples decreasing order
For all segments in G of length less than l
Calculate maximum score over all prefixes of samples in the
ordered set ndash F((GrsquoSamplePrefix)CE)
if the maximum score gt threshold then add M=(GrsquoSrsquo) to L
Main difference here is the calculation of pi
ANALYSIS
MHA will produce good fitting GCSMs when
F(MC) is the dominant factor
CCA will produce good fitting GCSMs when there
is a strong correlation between E(M) and C(M)
When F(ME) is the dominant factor neither
algorithm performs well
Not within the scope of this study
OUTLINE
Background and Introduction
Methods
Results
Conclusion and Discussion
RESULTS
Using threshold F(MCE)gt25 they applied both
algorithms on two sets of breast tumor data
Genes affected by
GCSMs included
TP53 FGFR1 and
ERBB2 all known to
be involved in breast
cancer
RESULTS
RESULTS
Genomic locations of significant aberrations
Pink marks are significantly altered GCSM a yellow mark inside
denotes significantly differentially expressed genes
Genes with significant regional correlation scores are shown
above with yellow marks and surrounded teal boxes depict the
genomic intervals against which the max regional correlation
was attained
OUTLINE
Background and Introduction
Methods
Results
Conclusion and Discussion
CONCLUSION AND DISCUSSION
Combining DCN and GE data sets can help
understand cancer pathogenesis mechanisms
better
High scoring GCSMs are found even when no
transcriptional effect is detectedhellip
Unsure as to why a threshold gt 25 was selected ndash
not explained in results
GENERAL TERMINOLOGY
C DNA copy number data matrix
E Gene expression data matrix
DCN
S1
DCN
S2
DCN
S3
DCN
S4
DCN
S5
Gene 1 0 2 2 15 0
Gene 2 2 15 2 15 1
Gene 3 2 1 2 2 15
Gene 4 0 05 05 05 05
GE S1 GE S2 GE S3 GE S4 GE S5
Gene 1 0 05 25 1 0
Gene 2 15 1 2 1 05
Gene 3 2 1 1 2 0
Gene 4 0 0 15 1 -05
GENERAL TERMINOLOGY
C(ij) DNA copy number (DCN) data for the ith
gene in the jth sample
E(ij) Gene expression (GE) data for the ith
gene in the jth sample
Data used is from two separate breast cancer
datasets measured on cDNA microarrays
PEARSON PRODUCT MOMENT
CORRELATION
Let u = ug denote the DCN data vector of gene g
Let v = vg denote the GE data vector of gene g
Most commonly used measure of dependence
DCN1 DCN2 DCN3 DCN4 DCN5
Gene 1 0 2 2 15 0
GE1 GE2 GE3 GE4 GE5
Gene 1 0 05 25 1 0
PEARSON PRODUCT MOMENT
CORRELATION
r(uv)=4
What is wrong with the PPMC for this
relationship
DCN1 DCN2 DCN3 DCN4 DCN5
Gene 1 0 2 2 15 0
GE1 GE2 GE3 GE4 GE5
Gene 1 0 05 25 1 0
PEARSON PRODUCT MOMENT
CORRELATION
r(uv)=4
What is wrong with the PPMC for this
relationship
Ans r measures a linear relationship between u
and v
DCN1 DCN2 DCN3 DCN4 DCN5
Gene 1 0 2 2 15 0
GE1 GE2 GE3 GE4 GE5
Gene 1 0 05 25 1 0
SEPARATING-CROSS CORRELATION
Threshold-based analysis of the dependence of u
and v ndash highly dependant on threshold selections
We view the two vectors u and v as n points (uivi)
in the plain
We place an axis parallel
cross centered at (xy)
partitioning the plain into
four quadrants At Bt Ct Dt
Let at bt ct dt equal
the quadrant counts
SEPARATING-CROSS CORRELATION
They are interested in the separating cross score
function
Let π τ denote the samples permutation induced
by u and v respectively Our cross and score
functions now depend only on quadrant counts
and no longer on location of points In other
words we have F(uv) = F(πτ)
SEPARATING-CROSS CORRELATION
We can now compute F(πτ) for every function
f(πτt) by examining at most all (n-1)2 possible
crosses
0
05
1
15
2
25
3
0 05 1 15 2 25 3
0
05
1
15
2
25
3
0 05 1 15 2 25 3
0
05
1
15
2
25
3
0 05 1 15 2 25 3
At=2
At=2
At=2
Dt=1Dt=2 Dt=3
Ct=0 Ct=0
Ct=0
Bt=2
Bt=1
Bt=0
SEPARATING-CROSS CORRELATION
The Diagonal Product DP(πτt) = at dt
One cross score function that they are particular
interested in is the Maximal Diagonal Product
Distinguishes between
samples that contribute
to the MDP (points in
quadrants AtDt) and
those that do not
(points in quadrants BtCt)0
05
1
15
2
25
3
0 05 1 15 2 25 3
At=2
Dt=3Ct=0
Bt=0
OUTLINE
Background and Introduction
Methods
Correlation Scoring Methods
Regional Analysis
Results
Genomic-Continuous Submatrices
Max-hypergeometric Algorithm
CCA ndash Consistent Correlation Algorithm
Results
Conclusion and Discussion
REGIONAL ANALYSIS
Previous studiesrsquo models only consider correlation
between GE levels of single genes and their
respective DNA copy number
This paperrsquos model also considers regional effects
Genes that are close together are likely to be
perturbed in the same fashion
Since DCN events are likely to span more than one
gene
REGIONAL ANALYSIS
Given a gene gi we define its k-neighborhood as
the continuous sequence of genes surrounding it
Straightforward method of quantifying
correlation between GE and DCN of a given gene
is to calculate average correlation
r(ij) is a correlation measure between E(i) and
C(j)
REGIONAL ANALYSIS - EXAMPLE
1-neighborhood around gene 3
We get the average correlation of gene irsquos
expression vector with neighboring genes DCN
vectors
)432()3(1
4333233
133 1 rrrr
REGIONAL ANALYSIS - RESULTS
They test whether or not regional effects are dependent on the original chromosomal ordering using simulations from data in JR Pollack et al PNAS 99(20)12963ndash8 20022
Null hypothesis neighboring genes are independent of each other
p-values are computed as follows Let L be the size of the simulation
Randomly draw L-1 expression vectors E[i1]hellipE[iL-1]
For each E[i1]hellipE[iL-1] compute rl = r(ilΓk(i))
We now compute r= r(iΓk(i))
We assign the rank of r amongst r1r2helliprL-1r the value ρ
The p-value for the region correlation observed at i is pV(i)=ρL
REGIONAL ANALYSIS - RESULTS
Key notes
Randomly permuting the dataset yields a straight line
Significant correlations for single genes and regional areas
Using region-based analysis delivers almost 80 more loci
where DCN-GE correlation may be identified with high
confidence
OUTLINE
Background and Introduction
Methods
Correlation Scoring Methods
Regional Analysis
Results
Genomic-Continuous Submatrices
Max-hypergeometric Algorithm
CCA ndash Consistent Correlation Algorithm
Results
Conclusion and Discussion
GENOMIC-CONTINUOUS SUBMATRICES
This part of the paper is concerned with detecting
the genomic segments in which an aberration has
occurred the affected samples and the
transcriptional effect
Genomic alterations
are often localized to
a subset of samples
as well as specific
chromosome
segments
GENOMIC-CONTINUOUS SUBMATRICES
DEFINITIONS
C and E are DCN and GE matrices (rows = genes columns = samples)
G is the ordered set of genes
Grsquo is a continuous segment of genes
S is the set of samples
Srsquo is a subset of samples
The genomic-continuous submatrix (GCSM) is M=Grsquo x Srsquo
M=Grsquo x S-Srsquo
C(M) and E(M) are the projections of matrices C and E on the subsets Grsquo and Srsquo In other words the submatrices formed by Grsquo and Srsquo of
DNA copy number and gene expression
GENOMIC-CONTINUOUS SUBMATRICES
Remember that the model states a genomic
alteration in a given sample will effect DCN
measurements in the segment but only some of
the GE measurements
A GCSM matrix is significantly amplified if
Most DNA copy values in the set C(M) are positive
Some genes gi in Grsquo have higher expression values in
the samples in Srsquo compared to the samples not in Srsquo
GENOMIC-CONTINUOUS SUBMATRICES
Formallyhellip
Define the score F(MC) that measures
overabundance of positive values in C(M) compared
to C(M)
They use the hypergeometric distribution to test for
significance
Definitions
N=number of values in C(M U M)
n=number of values in C(M)
K=number of positive values in C(M U M)
k=number of positive values in C(M)
GENOMIC-CONTINUOUS SUBMATRICES ndash
HYPERGEOMETRIC SCORE
Then the probability of finding k or more positive
values in C(M) is
Choose i values from number of values in Grsquo
Choose from the complement of Grsquo
the remaining number of positive values
Total ways we can pick positive values
GENOMIC-CONTINUOUS SUBMATRICES ndash
HYPERGEOMETRIC SCORE
Positive DCN
Non-positive DCN
C(M) C(M)N=10
n=6
K=6
k=5
012
6
10
0
4
6
6
6
10
1
4
5
6
CMF
Thus the probability of selecting 5 or 6 positive DCN is 012
GENOMIC-CONTINUOUS SUBMATRICES
A threshold number of misclassifications score
may be assigned to each gene according to its
performance as a Srsquo versus S ndash Srsquo classifier
If the probability for a single gene of obtaining a
score of s or better under the null model is p(s)
then the number of genes
with scores s or better
amongst the |Grsquo|
genes examined is
Binomial(np(s))
distributed
GENOMIC-CONTINUOUS SUBMATRICES
Under the null model DCN and GE vectors are
completely uncorrelated
A total score for an amplification is
where F(ME) is defined to be the maximum
ndashlog(σ(s)) for 0lesleSrsquo and σ(s) is the tail probability
of B(np(s))
The basic idea here is F(MCE) reflects the
overabundance of genes in Grsquo that are
significantly expressed (comparing Srsquo with S-Srsquo)
MAX-HYPERGEOMETRIC ALGORITHM
Heuristic approach to find Srsquo that maximizes
F((Grsquo x Srsquo)CE) for a given Grsquo
Note Since Grsquo is continuous the total number of
permutations = )( 2
1
nin
i
MAX-HYPERGEOMETRIC ALGORITHM
Iterate through all permutations of Grsquo of length le l
For each sample pi = of positive entries in
C(Grsquosample)
Order samples decreasing order
Find the maximum score out of a prefix of ordered
samples
If the maximum score is above threshold add M=(GrsquoArsquo)
to L
CONSISTENT CORRELATION ALGORITHM
Attempts to account for DCN and GE patterns to
locate partitions of Srsquo
Uses
CONSISTENT CORRELATION ALGORITHM
The sample MDP or SMDP is defined as follows
for all input genes
for each sample calculate pi=SMDP(samplei)
order samples decreasing order
For all segments in G of length less than l
Calculate maximum score over all prefixes of samples in the
ordered set ndash F((GrsquoSamplePrefix)CE)
if the maximum score gt threshold then add M=(GrsquoSrsquo) to L
Main difference here is the calculation of pi
ANALYSIS
MHA will produce good fitting GCSMs when
F(MC) is the dominant factor
CCA will produce good fitting GCSMs when there
is a strong correlation between E(M) and C(M)
When F(ME) is the dominant factor neither
algorithm performs well
Not within the scope of this study
OUTLINE
Background and Introduction
Methods
Results
Conclusion and Discussion
RESULTS
Using threshold F(MCE)gt25 they applied both
algorithms on two sets of breast tumor data
Genes affected by
GCSMs included
TP53 FGFR1 and
ERBB2 all known to
be involved in breast
cancer
RESULTS
RESULTS
Genomic locations of significant aberrations
Pink marks are significantly altered GCSM a yellow mark inside
denotes significantly differentially expressed genes
Genes with significant regional correlation scores are shown
above with yellow marks and surrounded teal boxes depict the
genomic intervals against which the max regional correlation
was attained
OUTLINE
Background and Introduction
Methods
Results
Conclusion and Discussion
CONCLUSION AND DISCUSSION
Combining DCN and GE data sets can help
understand cancer pathogenesis mechanisms
better
High scoring GCSMs are found even when no
transcriptional effect is detectedhellip
Unsure as to why a threshold gt 25 was selected ndash
not explained in results

PEARSON PRODUCT MOMENT
CORRELATION
r(uv)=4
What is wrong with the PPMC for this
relationship
DCN1 DCN2 DCN3 DCN4 DCN5
Gene 1 0 2 2 15 0
GE1 GE2 GE3 GE4 GE5
Gene 1 0 05 25 1 0
PEARSON PRODUCT MOMENT
CORRELATION
r(uv)=4
What is wrong with the PPMC for this
relationship
Ans r measures a linear relationship between u
and v
DCN1 DCN2 DCN3 DCN4 DCN5
Gene 1 0 2 2 15 0
GE1 GE2 GE3 GE4 GE5
Gene 1 0 05 25 1 0
SEPARATING-CROSS CORRELATION
Threshold-based analysis of the dependence of u
and v ndash highly dependant on threshold selections
We view the two vectors u and v as n points (uivi)
in the plain
We place an axis parallel
cross centered at (xy)
partitioning the plain into
four quadrants At Bt Ct Dt
Let at bt ct dt equal
the quadrant counts
SEPARATING-CROSS CORRELATION
They are interested in the separating cross score
function
Let π τ denote the samples permutation induced
by u and v respectively Our cross and score
functions now depend only on quadrant counts
and no longer on location of points In other
words we have F(uv) = F(πτ)
SEPARATING-CROSS CORRELATION
We can now compute F(πτ) for every function
f(πτt) by examining at most all (n-1)2 possible
crosses
0
05
1
15
2
25
3
0 05 1 15 2 25 3
0
05
1
15
2
25
3
0 05 1 15 2 25 3
0
05
1
15
2
25
3
0 05 1 15 2 25 3
At=2
At=2
At=2
Dt=1Dt=2 Dt=3
Ct=0 Ct=0
Ct=0
Bt=2
Bt=1
Bt=0
SEPARATING-CROSS CORRELATION
The Diagonal Product DP(πτt) = at dt
One cross score function that they are particular
interested in is the Maximal Diagonal Product
Distinguishes between
samples that contribute
to the MDP (points in
quadrants AtDt) and
those that do not
(points in quadrants BtCt)0
05
1
15
2
25
3
0 05 1 15 2 25 3
At=2
Dt=3Ct=0
Bt=0
OUTLINE
Background and Introduction
Methods
Correlation Scoring Methods
Regional Analysis
Results
Genomic-Continuous Submatrices
Max-hypergeometric Algorithm
CCA ndash Consistent Correlation Algorithm
Results
Conclusion and Discussion
REGIONAL ANALYSIS
Previous studiesrsquo models only consider correlation
between GE levels of single genes and their
respective DNA copy number
This paperrsquos model also considers regional effects
Genes that are close together are likely to be
perturbed in the same fashion
Since DCN events are likely to span more than one
gene
REGIONAL ANALYSIS
Given a gene gi we define its k-neighborhood as
the continuous sequence of genes surrounding it
Straightforward method of quantifying
correlation between GE and DCN of a given gene
is to calculate average correlation
r(ij) is a correlation measure between E(i) and
C(j)
REGIONAL ANALYSIS - EXAMPLE
1-neighborhood around gene 3
We get the average correlation of gene irsquos
expression vector with neighboring genes DCN
vectors
)432()3(1
4333233
133 1 rrrr
REGIONAL ANALYSIS - RESULTS
They test whether or not regional effects are dependent on the original chromosomal ordering using simulations from data in JR Pollack et al PNAS 99(20)12963ndash8 20022
Null hypothesis neighboring genes are independent of each other
p-values are computed as follows Let L be the size of the simulation
Randomly draw L-1 expression vectors E[i1]hellipE[iL-1]
For each E[i1]hellipE[iL-1] compute rl = r(ilΓk(i))
We now compute r= r(iΓk(i))
We assign the rank of r amongst r1r2helliprL-1r the value ρ
The p-value for the region correlation observed at i is pV(i)=ρL
REGIONAL ANALYSIS - RESULTS
Key notes
Randomly permuting the dataset yields a straight line
Significant correlations for single genes and regional areas
Using region-based analysis delivers almost 80 more loci
where DCN-GE correlation may be identified with high
confidence
OUTLINE
Background and Introduction
Methods
Correlation Scoring Methods
Regional Analysis
Results
Genomic-Continuous Submatrices
Max-hypergeometric Algorithm
CCA ndash Consistent Correlation Algorithm
Results
Conclusion and Discussion
GENOMIC-CONTINUOUS SUBMATRICES
This part of the paper is concerned with detecting
the genomic segments in which an aberration has
occurred the affected samples and the
transcriptional effect
Genomic alterations
are often localized to
a subset of samples
as well as specific
chromosome
segments
GENOMIC-CONTINUOUS SUBMATRICES
DEFINITIONS
C and E are DCN and GE matrices (rows = genes columns = samples)
G is the ordered set of genes
Grsquo is a continuous segment of genes
S is the set of samples
Srsquo is a subset of samples
The genomic-continuous submatrix (GCSM) is M=Grsquo x Srsquo
M=Grsquo x S-Srsquo
C(M) and E(M) are the projections of matrices C and E on the subsets Grsquo and Srsquo In other words the submatrices formed by Grsquo and Srsquo of
DNA copy number and gene expression
GENOMIC-CONTINUOUS SUBMATRICES
Remember that the model states a genomic
alteration in a given sample will effect DCN
measurements in the segment but only some of
the GE measurements
A GCSM matrix is significantly amplified if
Most DNA copy values in the set C(M) are positive
Some genes gi in Grsquo have higher expression values in
the samples in Srsquo compared to the samples not in Srsquo
GENOMIC-CONTINUOUS SUBMATRICES
Formallyhellip
Define the score F(MC) that measures
overabundance of positive values in C(M) compared
to C(M)
They use the hypergeometric distribution to test for
significance
Definitions
N=number of values in C(M U M)
n=number of values in C(M)
K=number of positive values in C(M U M)
k=number of positive values in C(M)
GENOMIC-CONTINUOUS SUBMATRICES ndash
HYPERGEOMETRIC SCORE
Then the probability of finding k or more positive
values in C(M) is
Choose i values from number of values in Grsquo
Choose from the complement of Grsquo
the remaining number of positive values
Total ways we can pick positive values
GENOMIC-CONTINUOUS SUBMATRICES ndash
HYPERGEOMETRIC SCORE
Positive DCN
Non-positive DCN
C(M) C(M)N=10
n=6
K=6
k=5
012
6
10
0
4
6
6
6
10
1
4
5
6
CMF
Thus the probability of selecting 5 or 6 positive DCN is 012
GENOMIC-CONTINUOUS SUBMATRICES
A threshold number of misclassifications score
may be assigned to each gene according to its
performance as a Srsquo versus S ndash Srsquo classifier
If the probability for a single gene of obtaining a
score of s or better under the null model is p(s)
then the number of genes
with scores s or better
amongst the |Grsquo|
genes examined is
Binomial(np(s))
distributed
GENOMIC-CONTINUOUS SUBMATRICES
Under the null model DCN and GE vectors are
completely uncorrelated
A total score for an amplification is
where F(ME) is defined to be the maximum
ndashlog(σ(s)) for 0lesleSrsquo and σ(s) is the tail probability
of B(np(s))
The basic idea here is F(MCE) reflects the
overabundance of genes in Grsquo that are
significantly expressed (comparing Srsquo with S-Srsquo)
MAX-HYPERGEOMETRIC ALGORITHM
Heuristic approach to find Srsquo that maximizes
F((Grsquo x Srsquo)CE) for a given Grsquo
Note Since Grsquo is continuous the total number of
permutations = )( 2
1
nin
i
MAX-HYPERGEOMETRIC ALGORITHM
Iterate through all permutations of Grsquo of length le l
For each sample pi = of positive entries in
C(Grsquosample)
Order samples decreasing order
Find the maximum score out of a prefix of ordered
samples
If the maximum score is above threshold add M=(GrsquoArsquo)
to L
CONSISTENT CORRELATION ALGORITHM
Attempts to account for DCN and GE patterns to
locate partitions of Srsquo
Uses
CONSISTENT CORRELATION ALGORITHM
The sample MDP or SMDP is defined as follows
for all input genes
for each sample calculate pi=SMDP(samplei)
order samples decreasing order
For all segments in G of length less than l
Calculate maximum score over all prefixes of samples in the
ordered set ndash F((GrsquoSamplePrefix)CE)
if the maximum score gt threshold then add M=(GrsquoSrsquo) to L
Main difference here is the calculation of pi
ANALYSIS
MHA will produce good fitting GCSMs when
F(MC) is the dominant factor
CCA will produce good fitting GCSMs when there
is a strong correlation between E(M) and C(M)
When F(ME) is the dominant factor neither
algorithm performs well
Not within the scope of this study
OUTLINE
Background and Introduction
Methods
Results
Conclusion and Discussion
RESULTS
Using threshold F(MCE)gt25 they applied both
algorithms on two sets of breast tumor data
Genes affected by
GCSMs included
TP53 FGFR1 and
ERBB2 all known to
be involved in breast
cancer
RESULTS
RESULTS
Genomic locations of significant aberrations
Pink marks are significantly altered GCSM a yellow mark inside
denotes significantly differentially expressed genes
Genes with significant regional correlation scores are shown
above with yellow marks and surrounded teal boxes depict the
genomic intervals against which the max regional correlation
was attained
OUTLINE
Background and Introduction
Methods
Results
Conclusion and Discussion
CONCLUSION AND DISCUSSION
Combining DCN and GE data sets can help
understand cancer pathogenesis mechanisms
better
High scoring GCSMs are found even when no
transcriptional effect is detectedhellip
Unsure as to why a threshold gt 25 was selected ndash
not explained in results

PEARSON PRODUCT MOMENT
CORRELATION
r(uv)=4
What is wrong with the PPMC for this
relationship
Ans r measures a linear relationship between u
and v
DCN1 DCN2 DCN3 DCN4 DCN5
Gene 1 0 2 2 15 0
GE1 GE2 GE3 GE4 GE5
Gene 1 0 05 25 1 0
SEPARATING-CROSS CORRELATION
Threshold-based analysis of the dependence of u
and v ndash highly dependant on threshold selections
We view the two vectors u and v as n points (uivi)
in the plain
We place an axis parallel
cross centered at (xy)
partitioning the plain into
four quadrants At Bt Ct Dt
Let at bt ct dt equal
the quadrant counts
SEPARATING-CROSS CORRELATION
They are interested in the separating cross score
function
Let π τ denote the samples permutation induced
by u and v respectively Our cross and score
functions now depend only on quadrant counts
and no longer on location of points In other
words we have F(uv) = F(πτ)
SEPARATING-CROSS CORRELATION
We can now compute F(πτ) for every function
f(πτt) by examining at most all (n-1)2 possible
crosses
0
05
1
15
2
25
3
0 05 1 15 2 25 3
0
05
1
15
2
25
3
0 05 1 15 2 25 3
0
05
1
15
2
25
3
0 05 1 15 2 25 3
At=2
At=2
At=2
Dt=1Dt=2 Dt=3
Ct=0 Ct=0
Ct=0
Bt=2
Bt=1
Bt=0
SEPARATING-CROSS CORRELATION
The Diagonal Product DP(πτt) = at dt
One cross score function that they are particular
interested in is the Maximal Diagonal Product
Distinguishes between
samples that contribute
to the MDP (points in
quadrants AtDt) and
those that do not
(points in quadrants BtCt)0
05
1
15
2
25
3
0 05 1 15 2 25 3
At=2
Dt=3Ct=0
Bt=0
OUTLINE
Background and Introduction
Methods
Correlation Scoring Methods
Regional Analysis
Results
Genomic-Continuous Submatrices
Max-hypergeometric Algorithm
CCA ndash Consistent Correlation Algorithm
Results
Conclusion and Discussion
REGIONAL ANALYSIS
Previous studiesrsquo models only consider correlation
between GE levels of single genes and their
respective DNA copy number
This paperrsquos model also considers regional effects
Genes that are close together are likely to be
perturbed in the same fashion
Since DCN events are likely to span more than one
gene
REGIONAL ANALYSIS
Given a gene gi we define its k-neighborhood as
the continuous sequence of genes surrounding it
Straightforward method of quantifying
correlation between GE and DCN of a given gene
is to calculate average correlation
r(ij) is a correlation measure between E(i) and
C(j)
REGIONAL ANALYSIS - EXAMPLE
1-neighborhood around gene 3
We get the average correlation of gene irsquos
expression vector with neighboring genes DCN
vectors
)432()3(1
4333233
133 1 rrrr
REGIONAL ANALYSIS - RESULTS
They test whether or not regional effects are dependent on the original chromosomal ordering using simulations from data in JR Pollack et al PNAS 99(20)12963ndash8 20022
Null hypothesis neighboring genes are independent of each other
p-values are computed as follows Let L be the size of the simulation
Randomly draw L-1 expression vectors E[i1]hellipE[iL-1]
For each E[i1]hellipE[iL-1] compute rl = r(ilΓk(i))
We now compute r= r(iΓk(i))
We assign the rank of r amongst r1r2helliprL-1r the value ρ
The p-value for the region correlation observed at i is pV(i)=ρL
REGIONAL ANALYSIS - RESULTS
Key notes
Randomly permuting the dataset yields a straight line
Significant correlations for single genes and regional areas
Using region-based analysis delivers almost 80 more loci
where DCN-GE correlation may be identified with high
confidence
OUTLINE
Background and Introduction
Methods
Correlation Scoring Methods
Regional Analysis
Results
Genomic-Continuous Submatrices
Max-hypergeometric Algorithm
CCA ndash Consistent Correlation Algorithm
Results
Conclusion and Discussion
GENOMIC-CONTINUOUS SUBMATRICES
This part of the paper is concerned with detecting
the genomic segments in which an aberration has
occurred the affected samples and the
transcriptional effect
Genomic alterations
are often localized to
a subset of samples
as well as specific
chromosome
segments
GENOMIC-CONTINUOUS SUBMATRICES
DEFINITIONS
C and E are DCN and GE matrices (rows = genes columns = samples)
G is the ordered set of genes
Grsquo is a continuous segment of genes
S is the set of samples
Srsquo is a subset of samples
The genomic-continuous submatrix (GCSM) is M=Grsquo x Srsquo
M=Grsquo x S-Srsquo
C(M) and E(M) are the projections of matrices C and E on the subsets Grsquo and Srsquo In other words the submatrices formed by Grsquo and Srsquo of
DNA copy number and gene expression
GENOMIC-CONTINUOUS SUBMATRICES
Remember that the model states a genomic
alteration in a given sample will effect DCN
measurements in the segment but only some of
the GE measurements
A GCSM matrix is significantly amplified if
Most DNA copy values in the set C(M) are positive
Some genes gi in Grsquo have higher expression values in
the samples in Srsquo compared to the samples not in Srsquo
GENOMIC-CONTINUOUS SUBMATRICES
Formallyhellip
Define the score F(MC) that measures
overabundance of positive values in C(M) compared
to C(M)
They use the hypergeometric distribution to test for
significance
Definitions
N=number of values in C(M U M)
n=number of values in C(M)
K=number of positive values in C(M U M)
k=number of positive values in C(M)
GENOMIC-CONTINUOUS SUBMATRICES ndash
HYPERGEOMETRIC SCORE
Then the probability of finding k or more positive
values in C(M) is
Choose i values from number of values in Grsquo
Choose from the complement of Grsquo
the remaining number of positive values
Total ways we can pick positive values
GENOMIC-CONTINUOUS SUBMATRICES ndash
HYPERGEOMETRIC SCORE
Positive DCN
Non-positive DCN
C(M) C(M)N=10
n=6
K=6
k=5
012
6
10
0
4
6
6
6
10
1
4
5
6
CMF
Thus the probability of selecting 5 or 6 positive DCN is 012
GENOMIC-CONTINUOUS SUBMATRICES
A threshold number of misclassifications score
may be assigned to each gene according to its
performance as a Srsquo versus S ndash Srsquo classifier
If the probability for a single gene of obtaining a
score of s or better under the null model is p(s)
then the number of genes
with scores s or better
amongst the |Grsquo|
genes examined is
Binomial(np(s))
distributed
GENOMIC-CONTINUOUS SUBMATRICES
Under the null model DCN and GE vectors are
completely uncorrelated
A total score for an amplification is
where F(ME) is defined to be the maximum
ndashlog(σ(s)) for 0lesleSrsquo and σ(s) is the tail probability
of B(np(s))
The basic idea here is F(MCE) reflects the
overabundance of genes in Grsquo that are
significantly expressed (comparing Srsquo with S-Srsquo)
MAX-HYPERGEOMETRIC ALGORITHM
Heuristic approach to find Srsquo that maximizes
F((Grsquo x Srsquo)CE) for a given Grsquo
Note Since Grsquo is continuous the total number of
permutations = )( 2
1
nin
i
MAX-HYPERGEOMETRIC ALGORITHM
Iterate through all permutations of Grsquo of length le l
For each sample pi = of positive entries in
C(Grsquosample)
Order samples decreasing order
Find the maximum score out of a prefix of ordered
samples
If the maximum score is above threshold add M=(GrsquoArsquo)
to L
CONSISTENT CORRELATION ALGORITHM
Attempts to account for DCN and GE patterns to
locate partitions of Srsquo
Uses
CONSISTENT CORRELATION ALGORITHM
The sample MDP or SMDP is defined as follows
for all input genes
for each sample calculate pi=SMDP(samplei)
order samples decreasing order
For all segments in G of length less than l
Calculate maximum score over all prefixes of samples in the
ordered set ndash F((GrsquoSamplePrefix)CE)
if the maximum score gt threshold then add M=(GrsquoSrsquo) to L
Main difference here is the calculation of pi
ANALYSIS
MHA will produce good fitting GCSMs when
F(MC) is the dominant factor
CCA will produce good fitting GCSMs when there
is a strong correlation between E(M) and C(M)
When F(ME) is the dominant factor neither
algorithm performs well
Not within the scope of this study
OUTLINE
Background and Introduction
Methods
Results
Conclusion and Discussion
RESULTS
Using threshold F(MCE)gt25 they applied both
algorithms on two sets of breast tumor data
Genes affected by
GCSMs included
TP53 FGFR1 and
ERBB2 all known to
be involved in breast
cancer
RESULTS
RESULTS
Genomic locations of significant aberrations
Pink marks are significantly altered GCSM a yellow mark inside
denotes significantly differentially expressed genes
Genes with significant regional correlation scores are shown
above with yellow marks and surrounded teal boxes depict the
genomic intervals against which the max regional correlation
was attained
OUTLINE
Background and Introduction
Methods
Results
Conclusion and Discussion
CONCLUSION AND DISCUSSION
Combining DCN and GE data sets can help
understand cancer pathogenesis mechanisms
better
High scoring GCSMs are found even when no
transcriptional effect is detectedhellip
Unsure as to why a threshold gt 25 was selected ndash
not explained in results

SEPARATING-CROSS CORRELATION
The Diagonal Product DP(πτt) = at dt
One cross score function that they are particular
interested in is the Maximal Diagonal Product
Distinguishes between
samples that contribute
to the MDP (points in
quadrants AtDt) and
those that do not
(points in quadrants BtCt)0
05
1
15
2
25
3
0 05 1 15 2 25 3
At=2
Dt=3Ct=0
Bt=0
OUTLINE
Background and Introduction
Methods
Correlation Scoring Methods
Regional Analysis
Results
Genomic-Continuous Submatrices
Max-hypergeometric Algorithm
CCA ndash Consistent Correlation Algorithm
Results
Conclusion and Discussion
REGIONAL ANALYSIS
Previous studiesrsquo models only consider correlation
between GE levels of single genes and their
respective DNA copy number
This paperrsquos model also considers regional effects
Genes that are close together are likely to be
perturbed in the same fashion
Since DCN events are likely to span more than one
gene
REGIONAL ANALYSIS
Given a gene gi we define its k-neighborhood as
the continuous sequence of genes surrounding it
Straightforward method of quantifying
correlation between GE and DCN of a given gene
is to calculate average correlation
r(ij) is a correlation measure between E(i) and
C(j)
REGIONAL ANALYSIS - EXAMPLE
1-neighborhood around gene 3
We get the average correlation of gene irsquos
expression vector with neighboring genes DCN
vectors
)432()3(1
4333233
133 1 rrrr
REGIONAL ANALYSIS - RESULTS
They test whether or not regional effects are dependent on the original chromosomal ordering using simulations from data in JR Pollack et al PNAS 99(20)12963ndash8 20022
Null hypothesis neighboring genes are independent of each other
p-values are computed as follows Let L be the size of the simulation
Randomly draw L-1 expression vectors E[i1]hellipE[iL-1]
For each E[i1]hellipE[iL-1] compute rl = r(ilΓk(i))
We now compute r= r(iΓk(i))
We assign the rank of r amongst r1r2helliprL-1r the value ρ
The p-value for the region correlation observed at i is pV(i)=ρL
REGIONAL ANALYSIS - RESULTS
Key notes
Randomly permuting the dataset yields a straight line
Significant correlations for single genes and regional areas
Using region-based analysis delivers almost 80 more loci
where DCN-GE correlation may be identified with high
confidence
OUTLINE
Background and Introduction
Methods
Correlation Scoring Methods
Regional Analysis
Results
Genomic-Continuous Submatrices
Max-hypergeometric Algorithm
CCA ndash Consistent Correlation Algorithm
Results
Conclusion and Discussion
GENOMIC-CONTINUOUS SUBMATRICES
This part of the paper is concerned with detecting
the genomic segments in which an aberration has
occurred the affected samples and the
transcriptional effect
Genomic alterations
are often localized to
a subset of samples
as well as specific
chromosome
segments
GENOMIC-CONTINUOUS SUBMATRICES
DEFINITIONS
C and E are DCN and GE matrices (rows = genes columns = samples)
G is the ordered set of genes
Grsquo is a continuous segment of genes
S is the set of samples
Srsquo is a subset of samples
The genomic-continuous submatrix (GCSM) is M=Grsquo x Srsquo
M=Grsquo x S-Srsquo
C(M) and E(M) are the projections of matrices C and E on the subsets Grsquo and Srsquo In other words the submatrices formed by Grsquo and Srsquo of
DNA copy number and gene expression
GENOMIC-CONTINUOUS SUBMATRICES
Remember that the model states a genomic
alteration in a given sample will effect DCN
measurements in the segment but only some of
the GE measurements
A GCSM matrix is significantly amplified if
Most DNA copy values in the set C(M) are positive
Some genes gi in Grsquo have higher expression values in
the samples in Srsquo compared to the samples not in Srsquo
GENOMIC-CONTINUOUS SUBMATRICES
Formallyhellip
Define the score F(MC) that measures
overabundance of positive values in C(M) compared
to C(M)
They use the hypergeometric distribution to test for
significance
Definitions
N=number of values in C(M U M)
n=number of values in C(M)
K=number of positive values in C(M U M)
k=number of positive values in C(M)
GENOMIC-CONTINUOUS SUBMATRICES ndash
HYPERGEOMETRIC SCORE
Then the probability of finding k or more positive
values in C(M) is
Choose i values from number of values in Grsquo
Choose from the complement of Grsquo
the remaining number of positive values
Total ways we can pick positive values
GENOMIC-CONTINUOUS SUBMATRICES ndash
HYPERGEOMETRIC SCORE
Positive DCN
Non-positive DCN
C(M) C(M)N=10
n=6
K=6
k=5
012
6
10
0
4
6
6
6
10
1
4
5
6
CMF
Thus the probability of selecting 5 or 6 positive DCN is 012
GENOMIC-CONTINUOUS SUBMATRICES
A threshold number of misclassifications score
may be assigned to each gene according to its
performance as a Srsquo versus S ndash Srsquo classifier
If the probability for a single gene of obtaining a
score of s or better under the null model is p(s)
then the number of genes
with scores s or better
amongst the |Grsquo|
genes examined is
Binomial(np(s))
distributed
GENOMIC-CONTINUOUS SUBMATRICES
Under the null model DCN and GE vectors are
completely uncorrelated
A total score for an amplification is
where F(ME) is defined to be the maximum
ndashlog(σ(s)) for 0lesleSrsquo and σ(s) is the tail probability
of B(np(s))
The basic idea here is F(MCE) reflects the
overabundance of genes in Grsquo that are
significantly expressed (comparing Srsquo with S-Srsquo)
MAX-HYPERGEOMETRIC ALGORITHM
Heuristic approach to find Srsquo that maximizes
F((Grsquo x Srsquo)CE) for a given Grsquo
Note Since Grsquo is continuous the total number of
permutations = )( 2
1
nin
i
MAX-HYPERGEOMETRIC ALGORITHM
Iterate through all permutations of Grsquo of length le l
For each sample pi = of positive entries in
C(Grsquosample)
Order samples decreasing order
Find the maximum score out of a prefix of ordered
samples
If the maximum score is above threshold add M=(GrsquoArsquo)
to L
CONSISTENT CORRELATION ALGORITHM
Attempts to account for DCN and GE patterns to
locate partitions of Srsquo
Uses
CONSISTENT CORRELATION ALGORITHM
The sample MDP or SMDP is defined as follows
for all input genes
for each sample calculate pi=SMDP(samplei)
order samples decreasing order
For all segments in G of length less than l
Calculate maximum score over all prefixes of samples in the
ordered set ndash F((GrsquoSamplePrefix)CE)
if the maximum score gt threshold then add M=(GrsquoSrsquo) to L
Main difference here is the calculation of pi
ANALYSIS
MHA will produce good fitting GCSMs when
F(MC) is the dominant factor
CCA will produce good fitting GCSMs when there
is a strong correlation between E(M) and C(M)
When F(ME) is the dominant factor neither
algorithm performs well
Not within the scope of this study
OUTLINE
Background and Introduction
Methods
Results
Conclusion and Discussion
RESULTS
Using threshold F(MCE)gt25 they applied both
algorithms on two sets of breast tumor data
Genes affected by
GCSMs included
TP53 FGFR1 and
ERBB2 all known to
be involved in breast
cancer
RESULTS
RESULTS
Genomic locations of significant aberrations
Pink marks are significantly altered GCSM a yellow mark inside
denotes significantly differentially expressed genes
Genes with significant regional correlation scores are shown
above with yellow marks and surrounded teal boxes depict the
genomic intervals against which the max regional correlation
was attained
OUTLINE
Background and Introduction
Methods
Results
Conclusion and Discussion
CONCLUSION AND DISCUSSION
Combining DCN and GE data sets can help
understand cancer pathogenesis mechanisms
better
High scoring GCSMs are found even when no
transcriptional effect is detectedhellip
Unsure as to why a threshold gt 25 was selected ndash
not explained in results

OUTLINE
Background and Introduction
Methods
Correlation Scoring Methods
Regional Analysis
Results
Genomic-Continuous Submatrices
Max-hypergeometric Algorithm
CCA ndash Consistent Correlation Algorithm
Results
Conclusion and Discussion
REGIONAL ANALYSIS
Previous studiesrsquo models only consider correlation
between GE levels of single genes and their
respective DNA copy number
This paperrsquos model also considers regional effects
Genes that are close together are likely to be
perturbed in the same fashion
Since DCN events are likely to span more than one
gene
REGIONAL ANALYSIS
Given a gene gi we define its k-neighborhood as
the continuous sequence of genes surrounding it
Straightforward method of quantifying
correlation between GE and DCN of a given gene
is to calculate average correlation
r(ij) is a correlation measure between E(i) and
C(j)
REGIONAL ANALYSIS - EXAMPLE
1-neighborhood around gene 3
We get the average correlation of gene irsquos
expression vector with neighboring genes DCN
vectors
)432()3(1
4333233
133 1 rrrr
REGIONAL ANALYSIS - RESULTS
They test whether or not regional effects are dependent on the original chromosomal ordering using simulations from data in JR Pollack et al PNAS 99(20)12963ndash8 20022
Null hypothesis neighboring genes are independent of each other
p-values are computed as follows Let L be the size of the simulation
Randomly draw L-1 expression vectors E[i1]hellipE[iL-1]
For each E[i1]hellipE[iL-1] compute rl = r(ilΓk(i))
We now compute r= r(iΓk(i))
We assign the rank of r amongst r1r2helliprL-1r the value ρ
The p-value for the region correlation observed at i is pV(i)=ρL
REGIONAL ANALYSIS - RESULTS
Key notes
Randomly permuting the dataset yields a straight line
Significant correlations for single genes and regional areas
Using region-based analysis delivers almost 80 more loci
where DCN-GE correlation may be identified with high
confidence
OUTLINE
Background and Introduction
Methods
Correlation Scoring Methods
Regional Analysis
Results
Genomic-Continuous Submatrices
Max-hypergeometric Algorithm
CCA ndash Consistent Correlation Algorithm
Results
Conclusion and Discussion
GENOMIC-CONTINUOUS SUBMATRICES
This part of the paper is concerned with detecting
the genomic segments in which an aberration has
occurred the affected samples and the
transcriptional effect
Genomic alterations
are often localized to
a subset of samples
as well as specific
chromosome
segments
GENOMIC-CONTINUOUS SUBMATRICES
DEFINITIONS
C and E are DCN and GE matrices (rows = genes columns = samples)
G is the ordered set of genes
Grsquo is a continuous segment of genes
S is the set of samples
Srsquo is a subset of samples
The genomic-continuous submatrix (GCSM) is M=Grsquo x Srsquo
M=Grsquo x S-Srsquo
C(M) and E(M) are the projections of matrices C and E on the subsets Grsquo and Srsquo In other words the submatrices formed by Grsquo and Srsquo of
DNA copy number and gene expression
GENOMIC-CONTINUOUS SUBMATRICES
Remember that the model states a genomic
alteration in a given sample will effect DCN
measurements in the segment but only some of
the GE measurements
A GCSM matrix is significantly amplified if
Most DNA copy values in the set C(M) are positive
Some genes gi in Grsquo have higher expression values in
the samples in Srsquo compared to the samples not in Srsquo
GENOMIC-CONTINUOUS SUBMATRICES
Formallyhellip
Define the score F(MC) that measures
overabundance of positive values in C(M) compared
to C(M)
They use the hypergeometric distribution to test for
significance
Definitions
N=number of values in C(M U M)
n=number of values in C(M)
K=number of positive values in C(M U M)
k=number of positive values in C(M)
GENOMIC-CONTINUOUS SUBMATRICES ndash
HYPERGEOMETRIC SCORE
Then the probability of finding k or more positive
values in C(M) is
Choose i values from number of values in Grsquo
Choose from the complement of Grsquo
the remaining number of positive values
Total ways we can pick positive values
GENOMIC-CONTINUOUS SUBMATRICES ndash
HYPERGEOMETRIC SCORE
Positive DCN
Non-positive DCN
C(M) C(M)N=10
n=6
K=6
k=5
012
6
10
0
4
6
6
6
10
1
4
5
6
CMF
Thus the probability of selecting 5 or 6 positive DCN is 012
GENOMIC-CONTINUOUS SUBMATRICES
A threshold number of misclassifications score
may be assigned to each gene according to its
performance as a Srsquo versus S ndash Srsquo classifier
If the probability for a single gene of obtaining a
score of s or better under the null model is p(s)
then the number of genes
with scores s or better
amongst the |Grsquo|
genes examined is
Binomial(np(s))
distributed
GENOMIC-CONTINUOUS SUBMATRICES
Under the null model DCN and GE vectors are
completely uncorrelated
A total score for an amplification is
where F(ME) is defined to be the maximum
ndashlog(σ(s)) for 0lesleSrsquo and σ(s) is the tail probability
of B(np(s))
The basic idea here is F(MCE) reflects the
overabundance of genes in Grsquo that are
significantly expressed (comparing Srsquo with S-Srsquo)
MAX-HYPERGEOMETRIC ALGORITHM
Heuristic approach to find Srsquo that maximizes
F((Grsquo x Srsquo)CE) for a given Grsquo
Note Since Grsquo is continuous the total number of
permutations = )( 2
1
nin
i
MAX-HYPERGEOMETRIC ALGORITHM
Iterate through all permutations of Grsquo of length le l
For each sample pi = of positive entries in
C(Grsquosample)
Order samples decreasing order
Find the maximum score out of a prefix of ordered
samples
If the maximum score is above threshold add M=(GrsquoArsquo)
to L
CONSISTENT CORRELATION ALGORITHM
Attempts to account for DCN and GE patterns to
locate partitions of Srsquo
Uses
CONSISTENT CORRELATION ALGORITHM
The sample MDP or SMDP is defined as follows
for all input genes
for each sample calculate pi=SMDP(samplei)
order samples decreasing order
For all segments in G of length less than l
Calculate maximum score over all prefixes of samples in the
ordered set ndash F((GrsquoSamplePrefix)CE)
if the maximum score gt threshold then add M=(GrsquoSrsquo) to L
Main difference here is the calculation of pi
ANALYSIS
MHA will produce good fitting GCSMs when
F(MC) is the dominant factor
CCA will produce good fitting GCSMs when there
is a strong correlation between E(M) and C(M)
When F(ME) is the dominant factor neither
algorithm performs well
Not within the scope of this study
OUTLINE
Background and Introduction
Methods
Results
Conclusion and Discussion
RESULTS
Using threshold F(MCE)gt25 they applied both
algorithms on two sets of breast tumor data
Genes affected by
GCSMs included
TP53 FGFR1 and
ERBB2 all known to
be involved in breast
cancer
RESULTS
RESULTS
Genomic locations of significant aberrations
Pink marks are significantly altered GCSM a yellow mark inside
denotes significantly differentially expressed genes
Genes with significant regional correlation scores are shown
above with yellow marks and surrounded teal boxes depict the
genomic intervals against which the max regional correlation
was attained
OUTLINE
Background and Introduction
Methods
Results
Conclusion and Discussion
CONCLUSION AND DISCUSSION
Combining DCN and GE data sets can help
understand cancer pathogenesis mechanisms
better
High scoring GCSMs are found even when no
transcriptional effect is detectedhellip
Unsure as to why a threshold gt 25 was selected ndash
not explained in results

REGIONAL ANALYSIS
Given a gene gi we define its k-neighborhood as
the continuous sequence of genes surrounding it
Straightforward method of quantifying
correlation between GE and DCN of a given gene
is to calculate average correlation
r(ij) is a correlation measure between E(i) and
C(j)
REGIONAL ANALYSIS - EXAMPLE
1-neighborhood around gene 3
We get the average correlation of gene irsquos
expression vector with neighboring genes DCN
vectors
)432()3(1
4333233
133 1 rrrr
REGIONAL ANALYSIS - RESULTS
They test whether or not regional effects are dependent on the original chromosomal ordering using simulations from data in JR Pollack et al PNAS 99(20)12963ndash8 20022
Null hypothesis neighboring genes are independent of each other
p-values are computed as follows Let L be the size of the simulation
Randomly draw L-1 expression vectors E[i1]hellipE[iL-1]
For each E[i1]hellipE[iL-1] compute rl = r(ilΓk(i))
We now compute r= r(iΓk(i))
We assign the rank of r amongst r1r2helliprL-1r the value ρ
The p-value for the region correlation observed at i is pV(i)=ρL
REGIONAL ANALYSIS - RESULTS
Key notes
Randomly permuting the dataset yields a straight line
Significant correlations for single genes and regional areas
Using region-based analysis delivers almost 80 more loci
where DCN-GE correlation may be identified with high
confidence
OUTLINE
Background and Introduction
Methods
Correlation Scoring Methods
Regional Analysis
Results
Genomic-Continuous Submatrices
Max-hypergeometric Algorithm
CCA ndash Consistent Correlation Algorithm
Results
Conclusion and Discussion
GENOMIC-CONTINUOUS SUBMATRICES
This part of the paper is concerned with detecting
the genomic segments in which an aberration has
occurred the affected samples and the
transcriptional effect
Genomic alterations
are often localized to
a subset of samples
as well as specific
chromosome
segments
GENOMIC-CONTINUOUS SUBMATRICES
DEFINITIONS
C and E are DCN and GE matrices (rows = genes columns = samples)
G is the ordered set of genes
Grsquo is a continuous segment of genes
S is the set of samples
Srsquo is a subset of samples
The genomic-continuous submatrix (GCSM) is M=Grsquo x Srsquo
M=Grsquo x S-Srsquo
C(M) and E(M) are the projections of matrices C and E on the subsets Grsquo and Srsquo In other words the submatrices formed by Grsquo and Srsquo of
DNA copy number and gene expression
GENOMIC-CONTINUOUS SUBMATRICES
Remember that the model states a genomic
alteration in a given sample will effect DCN
measurements in the segment but only some of
the GE measurements
A GCSM matrix is significantly amplified if
Most DNA copy values in the set C(M) are positive
Some genes gi in Grsquo have higher expression values in
the samples in Srsquo compared to the samples not in Srsquo
GENOMIC-CONTINUOUS SUBMATRICES
Formallyhellip
Define the score F(MC) that measures
overabundance of positive values in C(M) compared
to C(M)
They use the hypergeometric distribution to test for
significance
Definitions
N=number of values in C(M U M)
n=number of values in C(M)
K=number of positive values in C(M U M)
k=number of positive values in C(M)
GENOMIC-CONTINUOUS SUBMATRICES ndash
HYPERGEOMETRIC SCORE
Then the probability of finding k or more positive
values in C(M) is
Choose i values from number of values in Grsquo
Choose from the complement of Grsquo
the remaining number of positive values
Total ways we can pick positive values
GENOMIC-CONTINUOUS SUBMATRICES ndash
HYPERGEOMETRIC SCORE
Positive DCN
Non-positive DCN
C(M) C(M)N=10
n=6
K=6
k=5
012
6
10
0
4
6
6
6
10
1
4
5
6
CMF
Thus the probability of selecting 5 or 6 positive DCN is 012
GENOMIC-CONTINUOUS SUBMATRICES
A threshold number of misclassifications score
may be assigned to each gene according to its
performance as a Srsquo versus S ndash Srsquo classifier
If the probability for a single gene of obtaining a
score of s or better under the null model is p(s)
then the number of genes
with scores s or better
amongst the |Grsquo|
genes examined is
Binomial(np(s))
distributed
GENOMIC-CONTINUOUS SUBMATRICES
Under the null model DCN and GE vectors are
completely uncorrelated
A total score for an amplification is
where F(ME) is defined to be the maximum
ndashlog(σ(s)) for 0lesleSrsquo and σ(s) is the tail probability
of B(np(s))
The basic idea here is F(MCE) reflects the
overabundance of genes in Grsquo that are
significantly expressed (comparing Srsquo with S-Srsquo)
MAX-HYPERGEOMETRIC ALGORITHM
Heuristic approach to find Srsquo that maximizes
F((Grsquo x Srsquo)CE) for a given Grsquo
Note Since Grsquo is continuous the total number of
permutations = )( 2
1
nin
i
MAX-HYPERGEOMETRIC ALGORITHM
Iterate through all permutations of Grsquo of length le l
For each sample pi = of positive entries in
C(Grsquosample)
Order samples decreasing order
Find the maximum score out of a prefix of ordered
samples
If the maximum score is above threshold add M=(GrsquoArsquo)
to L
CONSISTENT CORRELATION ALGORITHM
Attempts to account for DCN and GE patterns to
locate partitions of Srsquo
Uses
CONSISTENT CORRELATION ALGORITHM
The sample MDP or SMDP is defined as follows
for all input genes
for each sample calculate pi=SMDP(samplei)
order samples decreasing order
For all segments in G of length less than l
Calculate maximum score over all prefixes of samples in the
ordered set ndash F((GrsquoSamplePrefix)CE)
if the maximum score gt threshold then add M=(GrsquoSrsquo) to L
Main difference here is the calculation of pi
ANALYSIS
MHA will produce good fitting GCSMs when
F(MC) is the dominant factor
CCA will produce good fitting GCSMs when there
is a strong correlation between E(M) and C(M)
When F(ME) is the dominant factor neither
algorithm performs well
Not within the scope of this study
OUTLINE
Background and Introduction
Methods
Results
Conclusion and Discussion
RESULTS
Using threshold F(MCE)gt25 they applied both
algorithms on two sets of breast tumor data
Genes affected by
GCSMs included
TP53 FGFR1 and
ERBB2 all known to
be involved in breast
cancer
RESULTS
RESULTS
Genomic locations of significant aberrations
Pink marks are significantly altered GCSM a yellow mark inside
denotes significantly differentially expressed genes
Genes with significant regional correlation scores are shown
above with yellow marks and surrounded teal boxes depict the
genomic intervals against which the max regional correlation
was attained
OUTLINE
Background and Introduction
Methods
Results
Conclusion and Discussion
CONCLUSION AND DISCUSSION
Combining DCN and GE data sets can help
understand cancer pathogenesis mechanisms
better
High scoring GCSMs are found even when no
transcriptional effect is detectedhellip
Unsure as to why a threshold gt 25 was selected ndash
not explained in results

REGIONAL ANALYSIS - RESULTS
Key notes
Randomly permuting the dataset yields a straight line
Significant correlations for single genes and regional areas
Using region-based analysis delivers almost 80 more loci
where DCN-GE correlation may be identified with high
confidence
OUTLINE
Background and Introduction
Methods
Correlation Scoring Methods
Regional Analysis
Results
Genomic-Continuous Submatrices
Max-hypergeometric Algorithm
CCA ndash Consistent Correlation Algorithm
Results
Conclusion and Discussion
GENOMIC-CONTINUOUS SUBMATRICES
This part of the paper is concerned with detecting
the genomic segments in which an aberration has
occurred the affected samples and the
transcriptional effect
Genomic alterations
are often localized to
a subset of samples
as well as specific
chromosome
segments
GENOMIC-CONTINUOUS SUBMATRICES
DEFINITIONS
C and E are DCN and GE matrices (rows = genes columns = samples)
G is the ordered set of genes
Grsquo is a continuous segment of genes
S is the set of samples
Srsquo is a subset of samples
The genomic-continuous submatrix (GCSM) is M=Grsquo x Srsquo
M=Grsquo x S-Srsquo
C(M) and E(M) are the projections of matrices C and E on the subsets Grsquo and Srsquo In other words the submatrices formed by Grsquo and Srsquo of
DNA copy number and gene expression
GENOMIC-CONTINUOUS SUBMATRICES
Remember that the model states a genomic
alteration in a given sample will effect DCN
measurements in the segment but only some of
the GE measurements
A GCSM matrix is significantly amplified if
Most DNA copy values in the set C(M) are positive
Some genes gi in Grsquo have higher expression values in
the samples in Srsquo compared to the samples not in Srsquo
GENOMIC-CONTINUOUS SUBMATRICES
Formallyhellip
Define the score F(MC) that measures
overabundance of positive values in C(M) compared
to C(M)
They use the hypergeometric distribution to test for
significance
Definitions
N=number of values in C(M U M)
n=number of values in C(M)
K=number of positive values in C(M U M)
k=number of positive values in C(M)
GENOMIC-CONTINUOUS SUBMATRICES ndash
HYPERGEOMETRIC SCORE
Then the probability of finding k or more positive
values in C(M) is
Choose i values from number of values in Grsquo
Choose from the complement of Grsquo
the remaining number of positive values
Total ways we can pick positive values
GENOMIC-CONTINUOUS SUBMATRICES ndash
HYPERGEOMETRIC SCORE
Positive DCN
Non-positive DCN
C(M) C(M)N=10
n=6
K=6
k=5
012
6
10
0
4
6
6
6
10
1
4
5
6
CMF
Thus the probability of selecting 5 or 6 positive DCN is 012
GENOMIC-CONTINUOUS SUBMATRICES
A threshold number of misclassifications score
may be assigned to each gene according to its
performance as a Srsquo versus S ndash Srsquo classifier
If the probability for a single gene of obtaining a
score of s or better under the null model is p(s)
then the number of genes
with scores s or better
amongst the |Grsquo|
genes examined is
Binomial(np(s))
distributed
GENOMIC-CONTINUOUS SUBMATRICES
Under the null model DCN and GE vectors are
completely uncorrelated
A total score for an amplification is
where F(ME) is defined to be the maximum
ndashlog(σ(s)) for 0lesleSrsquo and σ(s) is the tail probability
of B(np(s))
The basic idea here is F(MCE) reflects the
overabundance of genes in Grsquo that are
significantly expressed (comparing Srsquo with S-Srsquo)
MAX-HYPERGEOMETRIC ALGORITHM
Heuristic approach to find Srsquo that maximizes
F((Grsquo x Srsquo)CE) for a given Grsquo
Note Since Grsquo is continuous the total number of
permutations = )( 2
1
nin
i
MAX-HYPERGEOMETRIC ALGORITHM
Iterate through all permutations of Grsquo of length le l
For each sample pi = of positive entries in
C(Grsquosample)
Order samples decreasing order
Find the maximum score out of a prefix of ordered
samples
If the maximum score is above threshold add M=(GrsquoArsquo)
to L
CONSISTENT CORRELATION ALGORITHM
Attempts to account for DCN and GE patterns to
locate partitions of Srsquo
Uses
CONSISTENT CORRELATION ALGORITHM
The sample MDP or SMDP is defined as follows
for all input genes
for each sample calculate pi=SMDP(samplei)
order samples decreasing order
For all segments in G of length less than l
Calculate maximum score over all prefixes of samples in the
ordered set ndash F((GrsquoSamplePrefix)CE)
if the maximum score gt threshold then add M=(GrsquoSrsquo) to L
Main difference here is the calculation of pi
ANALYSIS
MHA will produce good fitting GCSMs when
F(MC) is the dominant factor
CCA will produce good fitting GCSMs when there
is a strong correlation between E(M) and C(M)
When F(ME) is the dominant factor neither
algorithm performs well
Not within the scope of this study
OUTLINE
Background and Introduction
Methods
Results
Conclusion and Discussion
RESULTS
Using threshold F(MCE)gt25 they applied both
algorithms on two sets of breast tumor data
Genes affected by
GCSMs included
TP53 FGFR1 and
ERBB2 all known to
be involved in breast
cancer
RESULTS
RESULTS
Genomic locations of significant aberrations
Pink marks are significantly altered GCSM a yellow mark inside
denotes significantly differentially expressed genes
Genes with significant regional correlation scores are shown
above with yellow marks and surrounded teal boxes depict the
genomic intervals against which the max regional correlation
was attained
OUTLINE
Background and Introduction
Methods
Results
Conclusion and Discussion
CONCLUSION AND DISCUSSION
Combining DCN and GE data sets can help
understand cancer pathogenesis mechanisms
better
High scoring GCSMs are found even when no
transcriptional effect is detectedhellip
Unsure as to why a threshold gt 25 was selected ndash
not explained in results

OUTLINE
Background and Introduction
Methods
Correlation Scoring Methods
Regional Analysis
Results
Genomic-Continuous Submatrices
Max-hypergeometric Algorithm
CCA ndash Consistent Correlation Algorithm
Results
Conclusion and Discussion
GENOMIC-CONTINUOUS SUBMATRICES
This part of the paper is concerned with detecting
the genomic segments in which an aberration has
occurred the affected samples and the
transcriptional effect
Genomic alterations
are often localized to
a subset of samples
as well as specific
chromosome
segments
GENOMIC-CONTINUOUS SUBMATRICES
DEFINITIONS
C and E are DCN and GE matrices (rows = genes columns = samples)
G is the ordered set of genes
Grsquo is a continuous segment of genes
S is the set of samples
Srsquo is a subset of samples
The genomic-continuous submatrix (GCSM) is M=Grsquo x Srsquo
M=Grsquo x S-Srsquo
C(M) and E(M) are the projections of matrices C and E on the subsets Grsquo and Srsquo In other words the submatrices formed by Grsquo and Srsquo of
DNA copy number and gene expression
GENOMIC-CONTINUOUS SUBMATRICES
Remember that the model states a genomic
alteration in a given sample will effect DCN
measurements in the segment but only some of
the GE measurements
A GCSM matrix is significantly amplified if
Most DNA copy values in the set C(M) are positive
Some genes gi in Grsquo have higher expression values in
the samples in Srsquo compared to the samples not in Srsquo
GENOMIC-CONTINUOUS SUBMATRICES
Formallyhellip
Define the score F(MC) that measures
overabundance of positive values in C(M) compared
to C(M)
They use the hypergeometric distribution to test for
significance
Definitions
N=number of values in C(M U M)
n=number of values in C(M)
K=number of positive values in C(M U M)
k=number of positive values in C(M)
GENOMIC-CONTINUOUS SUBMATRICES ndash
HYPERGEOMETRIC SCORE
Then the probability of finding k or more positive
values in C(M) is
Choose i values from number of values in Grsquo
Choose from the complement of Grsquo
the remaining number of positive values
Total ways we can pick positive values
GENOMIC-CONTINUOUS SUBMATRICES ndash
HYPERGEOMETRIC SCORE
Positive DCN
Non-positive DCN
C(M) C(M)N=10
n=6
K=6
k=5
012
6
10
0
4
6
6
6
10
1
4
5
6
CMF
Thus the probability of selecting 5 or 6 positive DCN is 012
GENOMIC-CONTINUOUS SUBMATRICES
A threshold number of misclassifications score
may be assigned to each gene according to its
performance as a Srsquo versus S ndash Srsquo classifier
If the probability for a single gene of obtaining a
score of s or better under the null model is p(s)
then the number of genes
with scores s or better
amongst the |Grsquo|
genes examined is
Binomial(np(s))
distributed
GENOMIC-CONTINUOUS SUBMATRICES
Under the null model DCN and GE vectors are
completely uncorrelated
A total score for an amplification is
where F(ME) is defined to be the maximum
ndashlog(σ(s)) for 0lesleSrsquo and σ(s) is the tail probability
of B(np(s))
The basic idea here is F(MCE) reflects the
overabundance of genes in Grsquo that are
significantly expressed (comparing Srsquo with S-Srsquo)
MAX-HYPERGEOMETRIC ALGORITHM
Heuristic approach to find Srsquo that maximizes
F((Grsquo x Srsquo)CE) for a given Grsquo
Note Since Grsquo is continuous the total number of
permutations = )( 2
1
nin
i
MAX-HYPERGEOMETRIC ALGORITHM
Iterate through all permutations of Grsquo of length le l
For each sample pi = of positive entries in
C(Grsquosample)
Order samples decreasing order
Find the maximum score out of a prefix of ordered
samples
If the maximum score is above threshold add M=(GrsquoArsquo)
to L
CONSISTENT CORRELATION ALGORITHM
Attempts to account for DCN and GE patterns to
locate partitions of Srsquo
Uses
CONSISTENT CORRELATION ALGORITHM
The sample MDP or SMDP is defined as follows
for all input genes
for each sample calculate pi=SMDP(samplei)
order samples decreasing order
For all segments in G of length less than l
Calculate maximum score over all prefixes of samples in the
ordered set ndash F((GrsquoSamplePrefix)CE)
if the maximum score gt threshold then add M=(GrsquoSrsquo) to L
Main difference here is the calculation of pi
ANALYSIS
MHA will produce good fitting GCSMs when
F(MC) is the dominant factor
CCA will produce good fitting GCSMs when there
is a strong correlation between E(M) and C(M)
When F(ME) is the dominant factor neither
algorithm performs well
Not within the scope of this study
OUTLINE
Background and Introduction
Methods
Results
Conclusion and Discussion
RESULTS
Using threshold F(MCE)gt25 they applied both
algorithms on two sets of breast tumor data
Genes affected by
GCSMs included
TP53 FGFR1 and
ERBB2 all known to
be involved in breast
cancer
RESULTS
RESULTS
Genomic locations of significant aberrations
Pink marks are significantly altered GCSM a yellow mark inside
denotes significantly differentially expressed genes
Genes with significant regional correlation scores are shown
above with yellow marks and surrounded teal boxes depict the
genomic intervals against which the max regional correlation
was attained
OUTLINE
Background and Introduction
Methods
Results
Conclusion and Discussion
CONCLUSION AND DISCUSSION
Combining DCN and GE data sets can help
understand cancer pathogenesis mechanisms
better
High scoring GCSMs are found even when no
transcriptional effect is detectedhellip
Unsure as to why a threshold gt 25 was selected ndash
not explained in results

GENOMIC-CONTINUOUS SUBMATRICES
Formallyhellip
Define the score F(MC) that measures
overabundance of positive values in C(M) compared
to C(M)
They use the hypergeometric distribution to test for
significance
Definitions
N=number of values in C(M U M)
n=number of values in C(M)
K=number of positive values in C(M U M)
k=number of positive values in C(M)
GENOMIC-CONTINUOUS SUBMATRICES ndash
HYPERGEOMETRIC SCORE
Then the probability of finding k or more positive
values in C(M) is
Choose i values from number of values in Grsquo
Choose from the complement of Grsquo
the remaining number of positive values
Total ways we can pick positive values
GENOMIC-CONTINUOUS SUBMATRICES ndash
HYPERGEOMETRIC SCORE
Positive DCN
Non-positive DCN
C(M) C(M)N=10
n=6
K=6
k=5
012
6
10
0
4
6
6
6
10
1
4
5
6
CMF
Thus the probability of selecting 5 or 6 positive DCN is 012
GENOMIC-CONTINUOUS SUBMATRICES
A threshold number of misclassifications score
may be assigned to each gene according to its
performance as a Srsquo versus S ndash Srsquo classifier
If the probability for a single gene of obtaining a
score of s or better under the null model is p(s)
then the number of genes
with scores s or better
amongst the |Grsquo|
genes examined is
Binomial(np(s))
distributed
GENOMIC-CONTINUOUS SUBMATRICES
Under the null model DCN and GE vectors are
completely uncorrelated
A total score for an amplification is
where F(ME) is defined to be the maximum
ndashlog(σ(s)) for 0lesleSrsquo and σ(s) is the tail probability
of B(np(s))
The basic idea here is F(MCE) reflects the
overabundance of genes in Grsquo that are
significantly expressed (comparing Srsquo with S-Srsquo)
MAX-HYPERGEOMETRIC ALGORITHM
Heuristic approach to find Srsquo that maximizes
F((Grsquo x Srsquo)CE) for a given Grsquo
Note Since Grsquo is continuous the total number of
permutations = )( 2
1
nin
i
MAX-HYPERGEOMETRIC ALGORITHM
Iterate through all permutations of Grsquo of length le l
For each sample pi = of positive entries in
C(Grsquosample)
Order samples decreasing order
Find the maximum score out of a prefix of ordered
samples
If the maximum score is above threshold add M=(GrsquoArsquo)
to L
CONSISTENT CORRELATION ALGORITHM
Attempts to account for DCN and GE patterns to
locate partitions of Srsquo
Uses
CONSISTENT CORRELATION ALGORITHM
The sample MDP or SMDP is defined as follows
for all input genes
for each sample calculate pi=SMDP(samplei)
order samples decreasing order
For all segments in G of length less than l
Calculate maximum score over all prefixes of samples in the
ordered set ndash F((GrsquoSamplePrefix)CE)
if the maximum score gt threshold then add M=(GrsquoSrsquo) to L
Main difference here is the calculation of pi
ANALYSIS
MHA will produce good fitting GCSMs when
F(MC) is the dominant factor
CCA will produce good fitting GCSMs when there
is a strong correlation between E(M) and C(M)
When F(ME) is the dominant factor neither
algorithm performs well
Not within the scope of this study
OUTLINE
Background and Introduction
Methods
Results
Conclusion and Discussion
RESULTS
Using threshold F(MCE)gt25 they applied both
algorithms on two sets of breast tumor data
Genes affected by
GCSMs included
TP53 FGFR1 and
ERBB2 all known to
be involved in breast
cancer
RESULTS
RESULTS
Genomic locations of significant aberrations
Pink marks are significantly altered GCSM a yellow mark inside
denotes significantly differentially expressed genes
Genes with significant regional correlation scores are shown
above with yellow marks and surrounded teal boxes depict the
genomic intervals against which the max regional correlation
was attained
OUTLINE
Background and Introduction
Methods
Results
Conclusion and Discussion
CONCLUSION AND DISCUSSION
Combining DCN and GE data sets can help
understand cancer pathogenesis mechanisms
better
High scoring GCSMs are found even when no
transcriptional effect is detectedhellip
Unsure as to why a threshold gt 25 was selected ndash
not explained in results
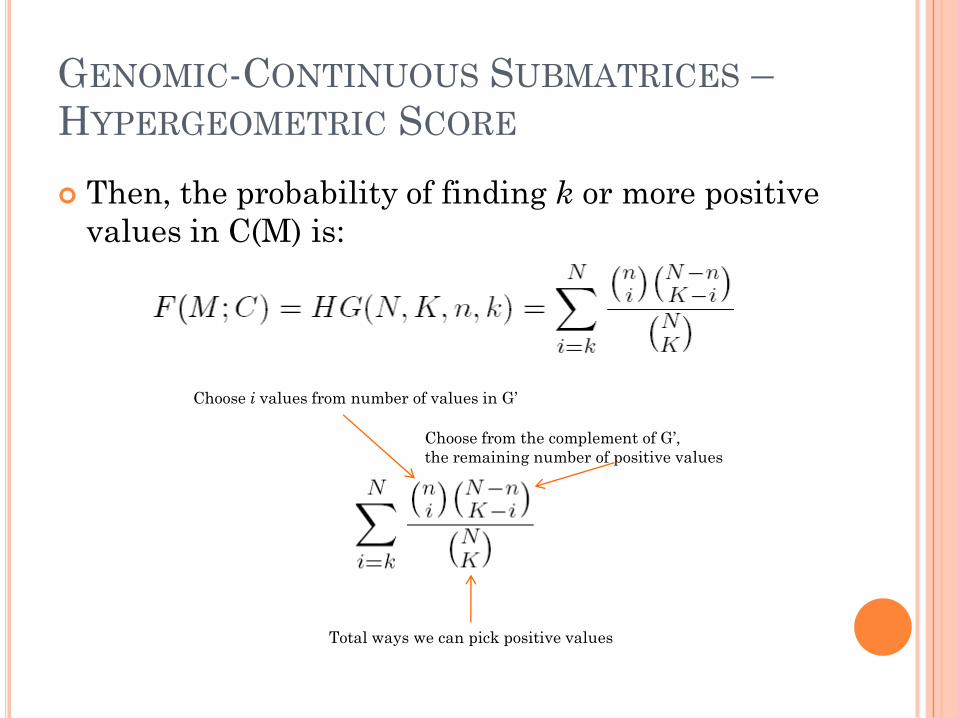
GENOMIC-CONTINUOUS SUBMATRICES ndash
HYPERGEOMETRIC SCORE
Positive DCN
Non-positive DCN
C(M) C(M)N=10
n=6
K=6
k=5
012
6
10
0
4
6
6
6
10
1
4
5
6
CMF
Thus the probability of selecting 5 or 6 positive DCN is 012
GENOMIC-CONTINUOUS SUBMATRICES
A threshold number of misclassifications score
may be assigned to each gene according to its
performance as a Srsquo versus S ndash Srsquo classifier
If the probability for a single gene of obtaining a
score of s or better under the null model is p(s)
then the number of genes
with scores s or better
amongst the |Grsquo|
genes examined is
Binomial(np(s))
distributed
GENOMIC-CONTINUOUS SUBMATRICES
Under the null model DCN and GE vectors are
completely uncorrelated
A total score for an amplification is
where F(ME) is defined to be the maximum
ndashlog(σ(s)) for 0lesleSrsquo and σ(s) is the tail probability
of B(np(s))
The basic idea here is F(MCE) reflects the
overabundance of genes in Grsquo that are
significantly expressed (comparing Srsquo with S-Srsquo)
MAX-HYPERGEOMETRIC ALGORITHM
Heuristic approach to find Srsquo that maximizes
F((Grsquo x Srsquo)CE) for a given Grsquo
Note Since Grsquo is continuous the total number of
permutations = )( 2
1
nin
i
MAX-HYPERGEOMETRIC ALGORITHM
Iterate through all permutations of Grsquo of length le l
For each sample pi = of positive entries in
C(Grsquosample)
Order samples decreasing order
Find the maximum score out of a prefix of ordered
samples
If the maximum score is above threshold add M=(GrsquoArsquo)
to L
CONSISTENT CORRELATION ALGORITHM
Attempts to account for DCN and GE patterns to
locate partitions of Srsquo
Uses
CONSISTENT CORRELATION ALGORITHM
The sample MDP or SMDP is defined as follows
for all input genes
for each sample calculate pi=SMDP(samplei)
order samples decreasing order
For all segments in G of length less than l
Calculate maximum score over all prefixes of samples in the
ordered set ndash F((GrsquoSamplePrefix)CE)
if the maximum score gt threshold then add M=(GrsquoSrsquo) to L
Main difference here is the calculation of pi
ANALYSIS
MHA will produce good fitting GCSMs when
F(MC) is the dominant factor
CCA will produce good fitting GCSMs when there
is a strong correlation between E(M) and C(M)
When F(ME) is the dominant factor neither
algorithm performs well
Not within the scope of this study
OUTLINE
Background and Introduction
Methods
Results
Conclusion and Discussion
RESULTS
Using threshold F(MCE)gt25 they applied both
algorithms on two sets of breast tumor data
Genes affected by
GCSMs included
TP53 FGFR1 and
ERBB2 all known to
be involved in breast
cancer
RESULTS
RESULTS
Genomic locations of significant aberrations
Pink marks are significantly altered GCSM a yellow mark inside
denotes significantly differentially expressed genes
Genes with significant regional correlation scores are shown
above with yellow marks and surrounded teal boxes depict the
genomic intervals against which the max regional correlation
was attained
OUTLINE
Background and Introduction
Methods
Results
Conclusion and Discussion
CONCLUSION AND DISCUSSION
Combining DCN and GE data sets can help
understand cancer pathogenesis mechanisms
better
High scoring GCSMs are found even when no
transcriptional effect is detectedhellip
Unsure as to why a threshold gt 25 was selected ndash
not explained in results

GENOMIC-CONTINUOUS SUBMATRICES
Under the null model DCN and GE vectors are
completely uncorrelated
A total score for an amplification is
where F(ME) is defined to be the maximum
ndashlog(σ(s)) for 0lesleSrsquo and σ(s) is the tail probability
of B(np(s))
The basic idea here is F(MCE) reflects the
overabundance of genes in Grsquo that are
significantly expressed (comparing Srsquo with S-Srsquo)
MAX-HYPERGEOMETRIC ALGORITHM
Heuristic approach to find Srsquo that maximizes
F((Grsquo x Srsquo)CE) for a given Grsquo
Note Since Grsquo is continuous the total number of
permutations = )( 2
1
nin
i
MAX-HYPERGEOMETRIC ALGORITHM
Iterate through all permutations of Grsquo of length le l
For each sample pi = of positive entries in
C(Grsquosample)
Order samples decreasing order
Find the maximum score out of a prefix of ordered
samples
If the maximum score is above threshold add M=(GrsquoArsquo)
to L
CONSISTENT CORRELATION ALGORITHM
Attempts to account for DCN and GE patterns to
locate partitions of Srsquo
Uses
CONSISTENT CORRELATION ALGORITHM
The sample MDP or SMDP is defined as follows
for all input genes
for each sample calculate pi=SMDP(samplei)
order samples decreasing order
For all segments in G of length less than l
Calculate maximum score over all prefixes of samples in the
ordered set ndash F((GrsquoSamplePrefix)CE)
if the maximum score gt threshold then add M=(GrsquoSrsquo) to L
Main difference here is the calculation of pi
ANALYSIS
MHA will produce good fitting GCSMs when
F(MC) is the dominant factor
CCA will produce good fitting GCSMs when there
is a strong correlation between E(M) and C(M)
When F(ME) is the dominant factor neither
algorithm performs well
Not within the scope of this study
OUTLINE
Background and Introduction
Methods
Results
Conclusion and Discussion
RESULTS
Using threshold F(MCE)gt25 they applied both
algorithms on two sets of breast tumor data
Genes affected by
GCSMs included
TP53 FGFR1 and
ERBB2 all known to
be involved in breast
cancer
RESULTS
RESULTS
Genomic locations of significant aberrations
Pink marks are significantly altered GCSM a yellow mark inside
denotes significantly differentially expressed genes
Genes with significant regional correlation scores are shown
above with yellow marks and surrounded teal boxes depict the
genomic intervals against which the max regional correlation
was attained
OUTLINE
Background and Introduction
Methods
Results
Conclusion and Discussion
CONCLUSION AND DISCUSSION
Combining DCN and GE data sets can help
understand cancer pathogenesis mechanisms
better
High scoring GCSMs are found even when no
transcriptional effect is detectedhellip
Unsure as to why a threshold gt 25 was selected ndash
not explained in results

MAX-HYPERGEOMETRIC ALGORITHM
Iterate through all permutations of Grsquo of length le l
For each sample pi = of positive entries in
C(Grsquosample)
Order samples decreasing order
Find the maximum score out of a prefix of ordered
samples
If the maximum score is above threshold add M=(GrsquoArsquo)
to L
CONSISTENT CORRELATION ALGORITHM
Attempts to account for DCN and GE patterns to
locate partitions of Srsquo
Uses
CONSISTENT CORRELATION ALGORITHM
The sample MDP or SMDP is defined as follows
for all input genes
for each sample calculate pi=SMDP(samplei)
order samples decreasing order
For all segments in G of length less than l
Calculate maximum score over all prefixes of samples in the
ordered set ndash F((GrsquoSamplePrefix)CE)
if the maximum score gt threshold then add M=(GrsquoSrsquo) to L
Main difference here is the calculation of pi
ANALYSIS
MHA will produce good fitting GCSMs when
F(MC) is the dominant factor
CCA will produce good fitting GCSMs when there
is a strong correlation between E(M) and C(M)
When F(ME) is the dominant factor neither
algorithm performs well
Not within the scope of this study
OUTLINE
Background and Introduction
Methods
Results
Conclusion and Discussion
RESULTS
Using threshold F(MCE)gt25 they applied both
algorithms on two sets of breast tumor data
Genes affected by
GCSMs included
TP53 FGFR1 and
ERBB2 all known to
be involved in breast
cancer
RESULTS
RESULTS
Genomic locations of significant aberrations
Pink marks are significantly altered GCSM a yellow mark inside
denotes significantly differentially expressed genes
Genes with significant regional correlation scores are shown
above with yellow marks and surrounded teal boxes depict the
genomic intervals against which the max regional correlation
was attained
OUTLINE
Background and Introduction
Methods
Results
Conclusion and Discussion
CONCLUSION AND DISCUSSION
Combining DCN and GE data sets can help
understand cancer pathogenesis mechanisms
better
High scoring GCSMs are found even when no
transcriptional effect is detectedhellip
Unsure as to why a threshold gt 25 was selected ndash
not explained in results

CONSISTENT CORRELATION ALGORITHM
The sample MDP or SMDP is defined as follows
for all input genes
for each sample calculate pi=SMDP(samplei)
order samples decreasing order
For all segments in G of length less than l
Calculate maximum score over all prefixes of samples in the
ordered set ndash F((GrsquoSamplePrefix)CE)
if the maximum score gt threshold then add M=(GrsquoSrsquo) to L
Main difference here is the calculation of pi
ANALYSIS
MHA will produce good fitting GCSMs when
F(MC) is the dominant factor
CCA will produce good fitting GCSMs when there
is a strong correlation between E(M) and C(M)
When F(ME) is the dominant factor neither
algorithm performs well
Not within the scope of this study
OUTLINE
Background and Introduction
Methods
Results
Conclusion and Discussion
RESULTS
Using threshold F(MCE)gt25 they applied both
algorithms on two sets of breast tumor data
Genes affected by
GCSMs included
TP53 FGFR1 and
ERBB2 all known to
be involved in breast
cancer
RESULTS
RESULTS
Genomic locations of significant aberrations
Pink marks are significantly altered GCSM a yellow mark inside
denotes significantly differentially expressed genes
Genes with significant regional correlation scores are shown
above with yellow marks and surrounded teal boxes depict the
genomic intervals against which the max regional correlation
was attained
OUTLINE
Background and Introduction
Methods
Results
Conclusion and Discussion
CONCLUSION AND DISCUSSION
Combining DCN and GE data sets can help
understand cancer pathogenesis mechanisms
better
High scoring GCSMs are found even when no
transcriptional effect is detectedhellip
Unsure as to why a threshold gt 25 was selected ndash
not explained in results
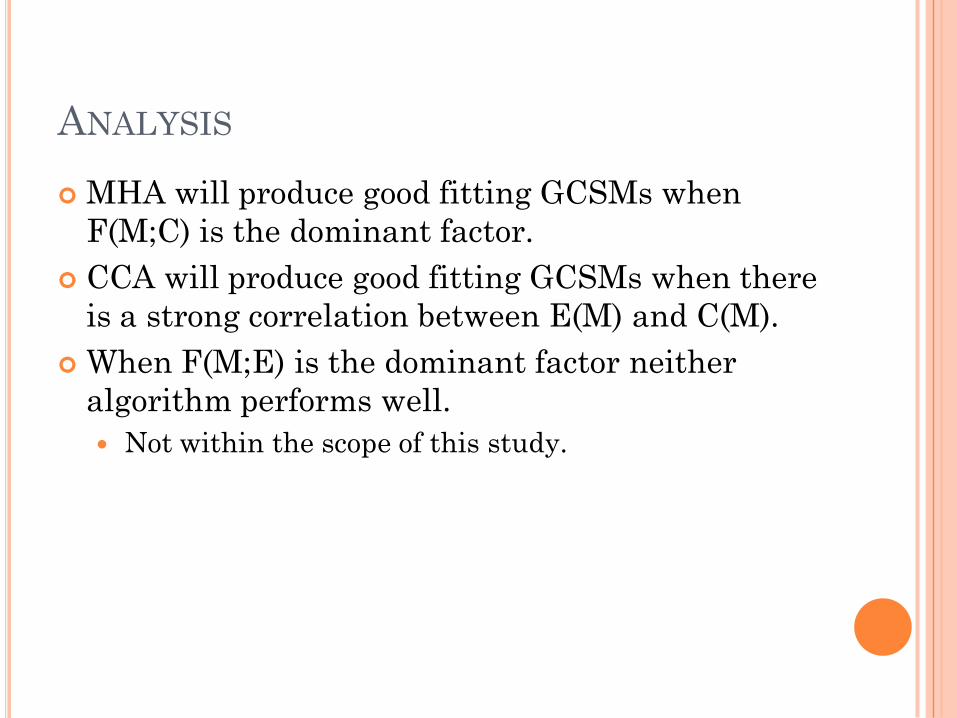

OUTLINE
Background and Introduction
Methods
Results
Conclusion and Discussion
RESULTS
Using threshold F(MCE)gt25 they applied both
algorithms on two sets of breast tumor data
Genes affected by
GCSMs included
TP53 FGFR1 and
ERBB2 all known to
be involved in breast
cancer
RESULTS
RESULTS
Genomic locations of significant aberrations
Pink marks are significantly altered GCSM a yellow mark inside
denotes significantly differentially expressed genes
Genes with significant regional correlation scores are shown
above with yellow marks and surrounded teal boxes depict the
genomic intervals against which the max regional correlation
was attained
OUTLINE
Background and Introduction
Methods
Results
Conclusion and Discussion
CONCLUSION AND DISCUSSION
Combining DCN and GE data sets can help
understand cancer pathogenesis mechanisms
better
High scoring GCSMs are found even when no
transcriptional effect is detectedhellip
Unsure as to why a threshold gt 25 was selected ndash
not explained in results

RESULTS
RESULTS
Genomic locations of significant aberrations
Pink marks are significantly altered GCSM a yellow mark inside
denotes significantly differentially expressed genes
Genes with significant regional correlation scores are shown
above with yellow marks and surrounded teal boxes depict the
genomic intervals against which the max regional correlation
was attained
OUTLINE
Background and Introduction
Methods
Results
Conclusion and Discussion
CONCLUSION AND DISCUSSION
Combining DCN and GE data sets can help
understand cancer pathogenesis mechanisms
better
High scoring GCSMs are found even when no
transcriptional effect is detectedhellip
Unsure as to why a threshold gt 25 was selected ndash
not explained in results

RESULTS
Genomic locations of significant aberrations
Pink marks are significantly altered GCSM a yellow mark inside
denotes significantly differentially expressed genes
Genes with significant regional correlation scores are shown
above with yellow marks and surrounded teal boxes depict the
genomic intervals against which the max regional correlation
was attained
OUTLINE
Background and Introduction
Methods
Results
Conclusion and Discussion
CONCLUSION AND DISCUSSION
Combining DCN and GE data sets can help
understand cancer pathogenesis mechanisms
better
High scoring GCSMs are found even when no
transcriptional effect is detectedhellip
Unsure as to why a threshold gt 25 was selected ndash
not explained in results

CONCLUSION AND DISCUSSION
Combining DCN and GE data sets can help
understand cancer pathogenesis mechanisms
better
High scoring GCSMs are found even when no
transcriptional effect is detectedhellip
Unsure as to why a threshold gt 25 was selected ndash
not explained in results
Related Documents