Chapter 2. How to evaluate fiscal terms? David Johnston Abstract This chapter provides guidelines for evaluating fiscal terms. Contrary to popular belief, we show here that the type of system used is of minor importance relative to other design concerns. Governments can achieve their fiscal objectives with whichever fiscal system they choose as long as the system is designed properly. Improper design can translate into money-left-on-the-table. Different types of systems are discussed and the few substantial differences that exist between them are identified. Moving beyond our discussion of the type of system we consider different ways to study the design of a deal when evaluating its merits. Government Take is the most popular statistic. The statistic is of some benefit but is often subject to misinterpretation and cannot tell the full story. In addition to Government Take we describe a statistic—the Effective Royalty Rate—that is better at capturing how governments receive rent during accounting periods when no taxes are collected. We then consider five further features that matter to governments and companies—the degree of government participation, which comes at some benefit to governments but at a cost to companies, the “savings index” which gives a sense of the

Welcome message from author
This document is posted to help you gain knowledge. Please leave a comment to let me know what you think about it! Share it to your friends and learn new things together.
Transcript
Chapter 2. How to evaluate fiscal terms?David Johnston
AbstractThis chapter provides guidelines for evaluating fiscal terms. Contrary to popular belief, we show here that the type of system used is of minor importance relative to other design concerns. Governments can achieve their fiscal objectives with whichever fiscal system they choose as long as the system is designed properly. Improper design can translate into money-left-on-the-table. Different types of systems are discussed and the few substantial differences that exist between them are identified. Moving beyond our discussion of the type of system we consider different ways to study the design of a deal when evaluating its merits. Government Take is the most popular statistic. The statistic is of some benefit but is often subject to misinterpretation and cannot tell the full story. In addition to Government Take we describe a statistic—the Effective Royalty Rate—that is better at capturing how governments receive rent during accounting periods when no taxes are collected. We then consider five further features that matter to governments and companies—the degree of government participation, which comes at some benefit to governments but at a cost to companies, the “savings index” which gives a sense of the incentives facing companies to keep costs down, responsiveness of the deal to changing economic conditions, provisions for minimizing risk, and provisions that allow companies to “book barrels.” We conclude with some observations on the options available to governments as they decide how to allocate acreage.
IntroductionOil is the world’s number one strategic commodity. It is of vital interest to developed and developing nations that rely more and more on imported oil and gas. It is also vitally important to exporting nations, many of them among the poorest countries in the world—the Middle East aside. For countries with petroleum resources the contribution from the petroleum sector to the nation’s budget is often dramatically greater than the contribution to the country’s gross national product (GNP). For example if the petroleum sector were to represent say 10% of GNP it would likely represent from 30 to 40% of the nation’s budget. There are two reasons for this: first, relative to most other industries, petroleum is very profitable; second, the effective tax rate (Government Take) for the petroleum industry relative to other industries is usually about double or more.
Numerous dynamics influence today’s industry. Oil demand continues to grow, and at a faster rate than was expected. Consumption went from 79 million barrels a day in 2002 to 84.5 million in 2004, leaping by 2 to 3 million BOPD each year, for a period for which expectations had been on the order of 1 to 1.5 million BOPD growth per year. Much of the new demand comes from the Asian giants India and China. But supply of oil and gas is a function of exploration and production. There is now every indication that exploration and the resultant discoveries, have ‘peaked,’ although we do not know for sure when production will peak (production peaks lag exploration peaks, sometimes by as much as 30 years). Gas is becoming more and more important but, because of the higher transportation and management costs, gas discoveries are still often characterized (although this will likely have to change) as being ‘worse than a dry hole’ in many
regions of the world. Gas is simply much more difficult to transport than oil and is still flared in many parts of the world—nearly 10 billion cubic feet of gas per day. Nigeria flares almost 2 billion cubic feet per day in their Niger Delta oil fields—not far from some of the poorest people in the world. And in many other parts of the world gas discoveries are simply ‘shut in.’
As these features change there are also changes in relations between the main players in the industry: the countries and National Oil Companies (NOCs) that control the bulk of the available oil and gas reserves, and the International Oil Companies (IOCs) that provide much of the financial, technical, organizational, and marketing needs of exporting and importing countries. On the side of the producing countries there are economic and political complexities associated with managing oil and gas. These issues are important for countries, but also affect the way these relate to private oil companies. Many of the problems associated with oil and gas exploration and production, particularly in low-income countries, can be associated with corruption. But in some cases the problems stem from misunderstandings and poor communication. In these cases, the government, NOC, and the International Oil Companies are suspected of stealing a nation’s wealth. Indigenous peoples of the world no longer sit idly by. The results are usually not healthy.
While relations may be fraught with political difficulties, they are also important from a practical point of view. There is increasing competition among countries for the limited resources of the IOCs. The ability of countries to attract IOC investment depends on prospectivity, stability, and their marketing skills. IOCs want to reduce risk in an inherently risky business.
This is the subject of this chapter: How do governments, NOCs, and IOCs work together and what types of contractual relations are likely to lead to better outcomes than we have seen in the past?
This question is often examined by focusing more on the broad differences between the “families” or types of systems that exist. In fact, although there are myriad ways to structure business relationships in the petroleum sector, the first observation is that in fact, for all practical purposes, there are only two main families of Petroleum Fiscal Regime: “concessionary” systems and the “contractual based” systems; although differences exist between them, from a mechanical and financial point of view the differences are not significant. Instead, in order to work out the merits of a particular agreement, what is needed is a deeper understanding of how the different systems operate and particularly what the core fiscal elements are? These issues are discussed in Section II.
In Section III we provide a framework for analyzing the properties of different agreements, identifying what is at stake with different provisions in an oil contract, no matter what family of agreement is used. We examine two measures, beginning with the most commonly cited— “Government Take.” Government Take is an important statistic, but while commonly used, the Government Take statistic is flawed. For this reason companion statistics and other features of agreements are examined. We describe a companion statistic, the “Effective Royalty Rate” and show how it is calculated. Beyond this more careful consideration of particular provisions are required. We consider five features that matter for governments and companies—the degree of government participation, which comes at some benefit to governments but at a cost to companies, the “savings index” which gives a sense of the incentives facing companies to keep costs down,
responsiveness of the deal to changing economic conditions, provisions for minimizing risk and provisions that allow companies to “book barrels.” We conclude with some observations on the options available to governments as they decide how to allocate acreage
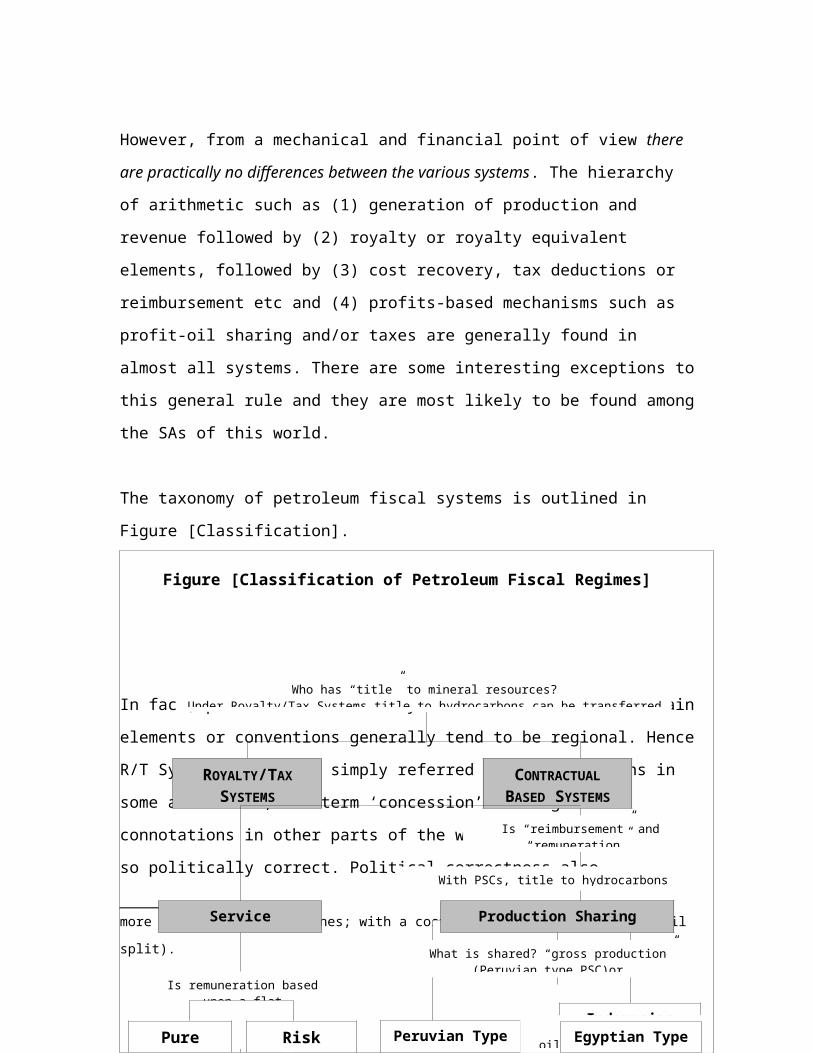
II Fiscal SystemThe two main families of fiscal system are “concessionary” systems (more commonly known these days as royalty/tax (R/T) systems) and “contractual based” systems (which include both production sharing contracts (PSCs) and service agreements (SAs)).
The distinguishing characteristic of each is where, when, and if ownership of the hydrocarbons transfers to the international oil company. Numerous variations and twists are found under both the royalty/tax (concessionary) systems and the contractual-based approaches.1
However, from a mechanical and financial point of view there are practically no differences between the various systems. The hierarchy of arithmetic such as (1) generation of production and revenue followed by (2) royalty or royalty equivalent elements, followed by (3) cost recovery, tax deductions or reimbursement etc and (4) profits-based mechanisms such as profit-oil sharing and/or taxes are generally found in almost all systems. There are some interesting exceptions to this general rule and they are most likely to be found among the SAs of this world.
1 Although these distinctions are not always clear. There are some risk service agreements that appear to have more of the characteristics of a royalty/tax system (Venezuela; with royalties and taxes), and some look more like a PSC (Philippines; with a cost recovery limit and profit oil split).

The taxonomy of petroleum fiscal systems is outlined in Figure [Classification].
Figure [Classification of Petroleum Fiscal Regimes]
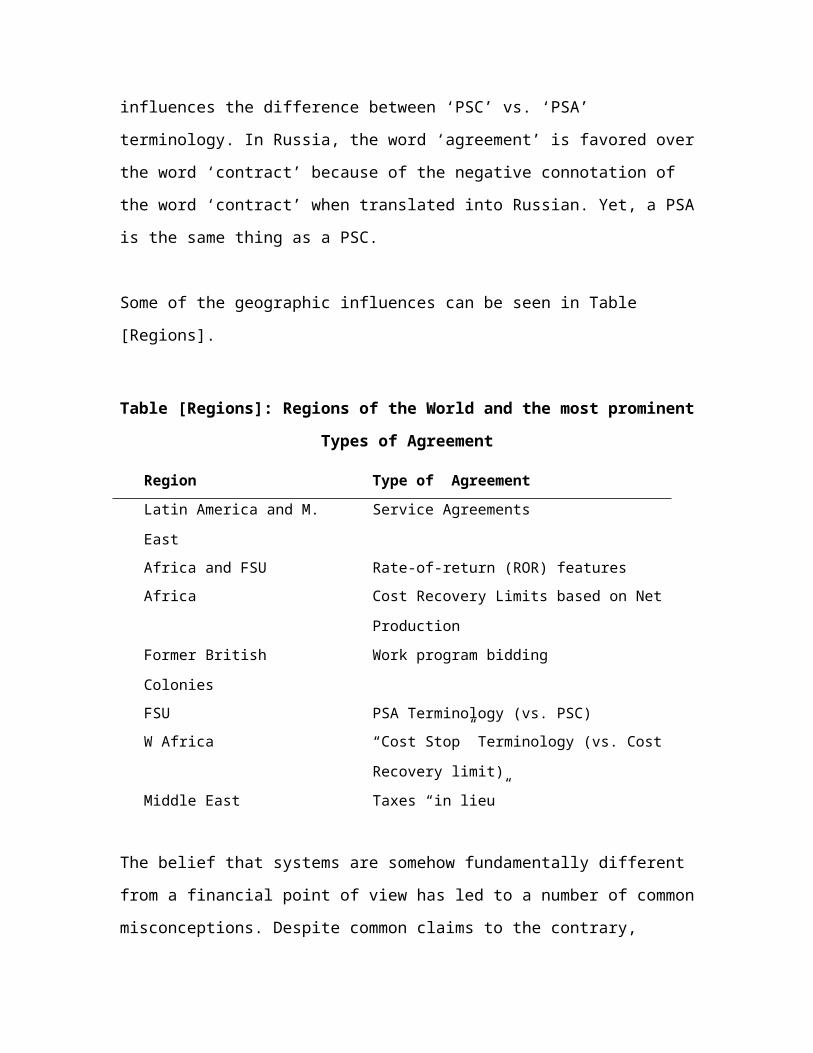
In fact, preferences for one system over another and certain elements or conventions generally tend to be regional. Hence R/T Systems are often simply referred to as Concessions in some areas. But, the term ‘concession’ has negative connotations in other parts of the world. It is simply not so politically correct. Political correctness also influences the difference between ‘PSC’ vs. ‘PSA’ terminology. In Russia, the word ‘agreement’ is favored over the word ‘contract’ because of the negative connotation of the word ‘contract’ when translated into Russian. Yet, a PSA is the same thing as a PSC.
Some of the geographic influences can be seen in Table [Regions].
Table [Regions]: Regions of the World and the most prominent Types of Agreement
Region Type of AgreementLatin America and M. East
Service Agreements
Africa and FSU Rate-of-return (ROR) features Africa Cost Recovery Limits based on Net
Production Former British Colonies Work program bidding FSU PSA Terminology (vs. PSC) W Africa “Cost Stop” Terminology (vs. Cost
Who has “title” to mineral resources?Under Royalty/Tax Systems title to hydrocarbons can be transferred at the
Is “reimbursement” and “remuneration”
With PSCs, title to hydrocarbons transfers at the export point.
ROYALTY/TAXSYSTEMS
CONTRACTUALBASED
SYSTEMS
Service Agreements
Indonesian Type
Peruvian Type PSC
Unused cost oil“ullage” treated
as a separate category of
Is remuneration based upon a flat
Egyptian Type PSC
Risk Service
Pure Service
Production Sharing Contracts
What is shared? “gross production” (Peruvian type PSC)or
Recovery limit)Middle East Taxes “in lieu”
The belief that systems are somehow fundamentally different from a financial point of view has led to a number of common misconceptions. Despite common claims to the contrary, neither R/T systems nor PSCs are inherently more likely to allocate more risk to either the NOC or the IOC. Similarly, it is not the case that PSC’s “allow the IOCs to get their costs back faster ” or even that they get them back at all. Nor is it necessarily true that PSC’s are more stable than R/T Systems or that PSA’s (PSC’s) are unsustainable.
However, there are differences. We discuss these below, but first we consider the different systems in more detail in turn.
II.1 Royalty Tax Systems (R/T)Prior to the late 1960s R/T Systems, or Concessionary Systems were, for all practical purposes, the only arrangements available. R/T systems are characterized by a number of features:
Oil companies are contracted for the right to explore for hydrocarbons
If a discovery is deemed to be commercial, the international oil company has the right to develop and produce the hydrocarbons
When hydrocarbons are produced the international oil company will take title to its share—gross production less the royalty—at the wellhead
Entitlement – Gross production less Royalty. If the royalty is 10% the international oil company can ‘lift’ 90% of production. If the royalty is paid in cash, then the IOC can ‘lift’ 100% of production
Exploration and production equipment is owned by the IOC The IOCs pay taxes on profits from the sale of the oil
Sample CalculationThe following example demonstrates the arithmetic performed to
calculate Contractor and Government Take, and Entitlement. Even though this analysis is “full cycle” the hierarchy of arithmetic that would be expected in any given accounting period is the same. In this particular case $20.00/BBL is assumed to represent average gross revenue per barrel over the life of the field (full cycle).
In this example of an R/T System, we calculate Government Take over the full cycle of the project, which includes exploration and early development through to field decline and abandonment. We use one barrel of oil, or $20, to represent average full cycle revenues (per barrel) and show how that barrel of oil is divided between the Government and the Contractor.
Of the $20, the Government gets a 10% royalty = $2. Assumed costs are deducted from the $18 left after the royalty is taken, leaving a

taxable income of $12.35. Two layers of taxes are levied against the taxable income, first a 60% tax on the $12.35 gives the Government $7.41 leaving $4.94. The second layer of tax, 30%, is levied against the $4.94 giving the Government an additional $1.48 leaving the contractor with $3.46.
Take statistics are a function of cash flow (gross revenue – costs). And in this particular example Government Take = Government cash flow/total cash flow or $10.89/($20.00 -$5.65) or 76%.
II.2 Production Sharing Contracts (PSCs)The concept of production sharing is ancient and widespread. Farmers in the USA have been familiar with the concept for decades. The concept of the PSC as far as the oil and gas industry is concerned was conceived in Venezuela in the mid 1960s (per a Permina brochure dated 2000). The first modern Production Sharing Contract was signed in 1966 between IIAPCO and Permina, Indonesia’s National Oil Company at the time. The characteristic features of this pioneering agreement included (Also see Chapter [Radon]):
Title to the hydrocarbons remained with the State (Indonesia) Permina maintained management control (Indeed, putting
management control in the hands of Permina is what really distinguished the PSC from the Indonesian predecessors)
Contractor submitted work programs and budgets for approval Profit Oil Split (P/O) 65%/35% in favor of Permina Contractor bore the risk Cost Recovery Limit was 40% Taxes paid in lieu (i.e. taxes paid for and on behalf of the IOC by
Permina)

Purchased equipment became property of Permina Company Entitlement = Cost Oil + Profit Oil
Sample CalculationThe following example demonstrates the arithmetic performed to calculate Contractor and Government Take, and Entitlement. In this case, like the example R/T above, we use the revenue from one barrel of oil—$20 to represent average (per barrel) gross revenue over the life of the field (full cycle).

This example is mathematically identical to the previous R/T System example—with the obvious exception of lifting entitlement—here the company cannot claim to book as many barrels. The terminology however is different. In the R/T System we use the term deductions, whereas with PSCs the term ‘cost recovery’ is used, and instead of a 60% tax, there is a 60/40 Profit Oil Split in favor of the Government. Still, the math is the same and Government and contractor take calculations are identical to the R/T System take calculations. This
illustrates that from a mathematical/mechanical point of view the differences between R/T systems and PSCs are by far outweighed by the similarities.
Note that from a mechanical point of view the Cost Recovery Limit is the only difference between R/Ts and PSCs. In this case this difference did not matter because the cost recovery limit was not reached. Note also, as signaled above, the difference between the entitlements in the two systems is dramatic.
II.3 Service Agreements (SA)Service contracts or service agreements generally use a simple formula: the contractor is paid a cash fee for performing the service of producing mineral resources (Also see Chapter [Radon]). All production belongs to the state. The contractor is usually responsible for providing all capital associated with exploration and development (just like with R/T systems and PSCs). In return, if exploration efforts are successful, the contractor recovers costs through the sale of oil or gas plus a fee. The fee is often taxable. These agreements can be quite similar to PSCs or R/T systems except for the issue of entitlement. As mentioned earlier, other than the issue of entitlement, the Venezuelan terms from the 1996 round look and sound just like a R/T system—it has a royalty and taxes. But the Philippine SA uses the terminology and structure of a PSC with a cost recovery limit and profit oil split.
Following are examples of various Service Agreement fee structures.
II.3.1 Fixed Fee - $/BBL
A $/BBL fee-based formula is used in the Joint Ventures in Nigeria, a few contracts in Abu Dhabi, and as part of Kuwait’s proposed Operating Service Agreement (OSA). A simplified example is as follows: First, the IOC conducts operations in much the same way it would in virtually any fiscal system. For performing these services (in this example) the IOC is able to recover its costs (assumed to average $4.00/BBL) out of revenues and is also paid a $2.00/BBL fee for conducting operations. The example below shows how this simple arrangement looks at $20.00/BBL and $60.00/BBL oil prices.
Scenario 1($20 / BBL)
Scenario 2($60 / BBL)
A Gross Revenues ($/BBL) $20.00 $60.00B Fee $2.00/BBL - 2.00 - 2.00C Net Revenue 18.00 58.00D Assumed Costs - 4.00 - 4.00E Government Profit (Cash
Flow) 14.00 54.00
Company Cash Flow [B] 2.00 2.00
Government Take [E/(A-D)]
87.5% 96.4%
Company Take [B/(A-D)] 12.5% 3.6%
Notice with this structure the system is “progressive,” as oil prices go up (or as profitability goes up) Government Take also goes up.
II.3.2 Fixed Fee – % of Costs—Uplift
Another type of fee-based approach like that found in Iran under the “buy-backs” and proposed in Iraq under what is called a “squeeze PSC” provides the IOC a means of recovering costs plus a fixed fee that is a function of the anticipated costs. The example here assumes the IOC will be reimbursed for costs of $4.00/BBL plus an uplift of say
50% (of those costs). This is a simple example but it serves our purposes. The IOC would conduct operations in much the same way as with other petroleum operations. The example here shows how this arrangement would look with oil prices of $20.00/BBL and $60.00/BBL. A difference is that for a given % higher costs translate into a higher percentage for the oil company.
Scenario 1($20 / BBL)
Scenario 2($60 / BBL)
A Gross Revenues ($/BBL) $20.00 $60.00B IOC cost recovery
(Reimbursement) - 4.00 - 4.00
C IOC Fee 50% of costs (Remuneration)
- 2.00 - 2.00
D Government Profit (Cash Flow) 14.00 54.00C Company Cash Flow 2.00 2.00
Government Take [D/(A-B)] 87.5% 96.4%Company Take [C/(A-B)] 12.5% 3.6%
Notice this system is also “progressive,” as oil prices go up (or as profitability goes up) Government Take goes up.
II.3.3 Variable Fee – Percentage of Gross Revenues
Another type of fee-based approach (very rare) provides the IOC with a direct share of revenues from which, hopefully, it would be able to recover its costs and make a profit. This type of arrangement in its classic form would be referred to as the “Peruvian model.” Another variation is the Filipino Participation Incentive Allowance (FPIA) which allows the contractor group a 7.5% “incentive” if there is sufficient “Filipino Participation.” This 7.5% allowance is based on gross revenues. A simple example here assumes the IOC will receive 25% of gross revenues. The IOC conducts operations in much the same way it would under almost all petroleum systems. The example
below shows how this simple arrangement looks at $20.00/BBL and $60.00/BBL oil prices.
Scenario 1
($20 / BBL)
Scenario 2
($60 / BBL)
A Gross Revenues ($/BBL) $20.00 $60.00B IOC Fee 25% of Gross
Revenues - 5.00 - 15.00
C Government Profit (Cash Flow)
15.00 45.00
D Assumed Costs - 4.00 - 4.00 F Company Cash Flow (B-D) 1.00 11.00
Government Take [C/(A-D)] 93.75% 80.4%Company Take [F/(A-D)] 6.25% 19.6%
Notice with this structure the system is “regressive.” As oil price or profitability goes up, Government Take goes down. This is because while the IOC is guaranteed 25% of gross revenues (almost like a negative royalty) the Government is guaranteed 75%, like a large royalty. Royalties are notorious for being regressive, especially large royalties.
II.4 Comparing SystemsThere are numerous sources or references that make little distinction between PSCs and SAs other than differences regarding the transfer of title to hydrocarbons (discussed earlier). This difference in ownership structure—where, when, and if ownership of the hydrocarbons is transferred to the IOC—is one of the distinguishing characteristics of petroleum fiscal systems. With an R/T system title transfers to the IOC at the wellhead; the IOC takes title to gross production less royalty oil. For a PSC title transfers at the export

point or fiscalization point. The IOC takes title to cost oil and profit oil. With Service Agreements (by definition) there is no transfer of title to hydrocarbons. This directly impacts an IOC’s ability to book barrels.
Title to facilities remains with the oil company under R/T Systems, but under PSCs and Service Agreements title to facilities transfers to the NOC or government. There is some variation to when title to facilities (production facilities, pipelines and other associated facilities) transfers to the NOC or government but usually it transfers upon commissioning of the facilities. For example, in Nigeria title to facilities transfers to the Nigerian National Oil Corporation (NNPC) when the equipment is landed in-country. Some countries will wait until the facilities have achieved “payout” at which point title transfers to the NOC. From a financial point of view as far as normal production operations are concerned, there is little difference to the IOC whether or not they own the facilities or the government owns the facilities. The significant difference involves the abandonment/site-restoration liability. The important legal implication however is that the obligation for site restoration, abandonment, and cleanup is held by the owner in the absence of clear and well-crafted abandonment provisions.
Another, less evident difference between the systems, is with respect to how they handle entitlement. In the examples we worked through above we saw how a PSC and an R/T System over the full cycle can be identical from a financial point of view yet contractor entitlement in the PSC system may be about half that of the R/T System. Below we describe in more detail the role entitlement plays in contract negotiation.

Finally, there may be difference based on project costs. Government Take is likely to be much higher for a PSC for low profitability projects. To see this, consider Graph [Take vs. Profitability]. The graph shows how the PSC in this particular case is more front-end-loaded than the example R/T System. It is the cost recovery limit that makes the PSC more front-end-loaded (or regressive) than the R/T System. In early years, Government revenue is guaranteed for both systems because of the royalty. The PSC however also has the cost recovery limit that guarantees the Government additional revenue. In fact the Government Take for sub-marginal fields can be extremely high, so graphs like this are usually capped at 101% —showing takes in the 100%+ range is relatively meaningless. Note that once the costs are lower the two systems are the same.
Government Take vs. Project ProfitabilityTypical PSC:
10% Royalty50% Cost Recovery Limit 60% Government P/O Share30% Corporate Income Tax (CIT)
Typical R/T System:10% RoyaltyNo Cost Recovery Limit 60% Tax (1st Layer)30% Tax (2nd Layer)
Government Take
80%
60%
100%
100%
80%
60%
40%
20%
0%Total Costs as a Percentage of Gross Revenues
PSC R/T
Cost Recovery Limit (50%)
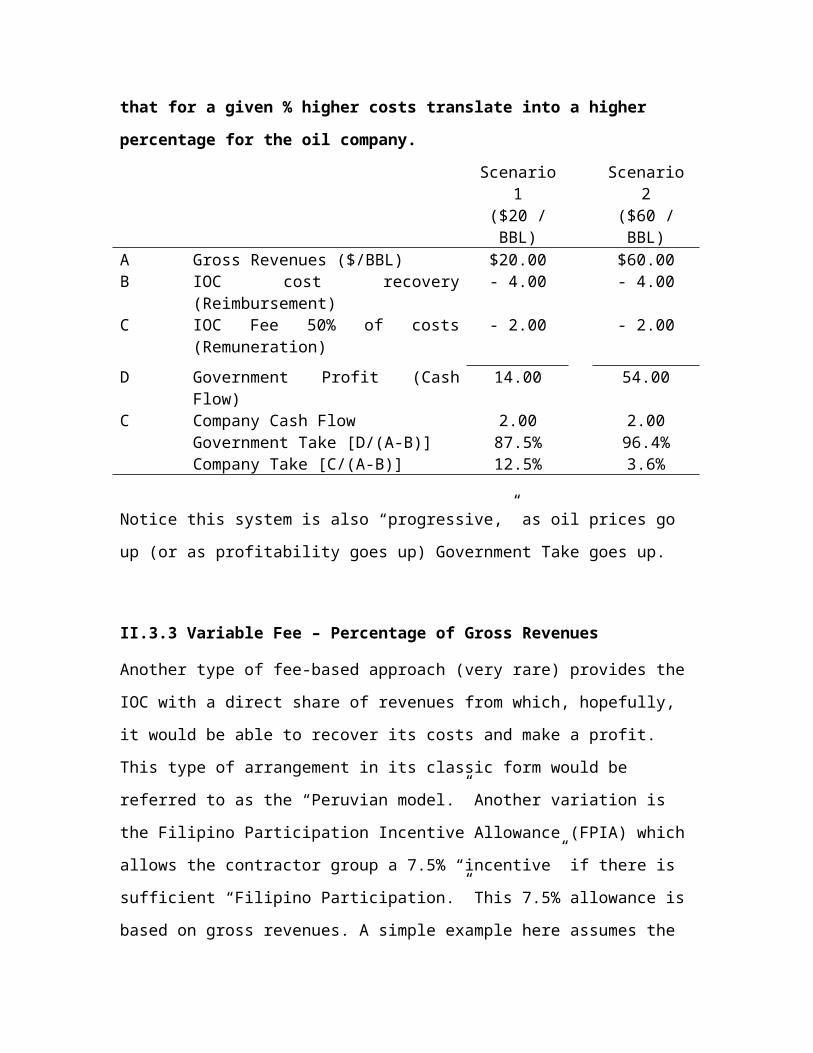
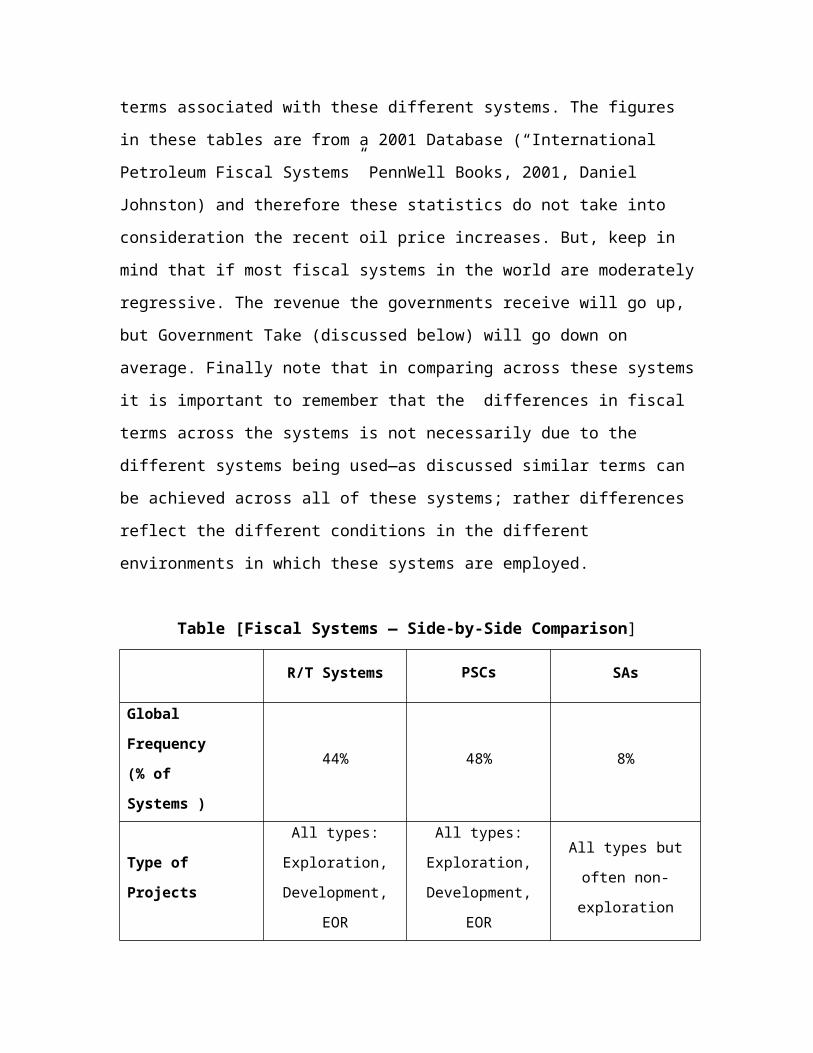
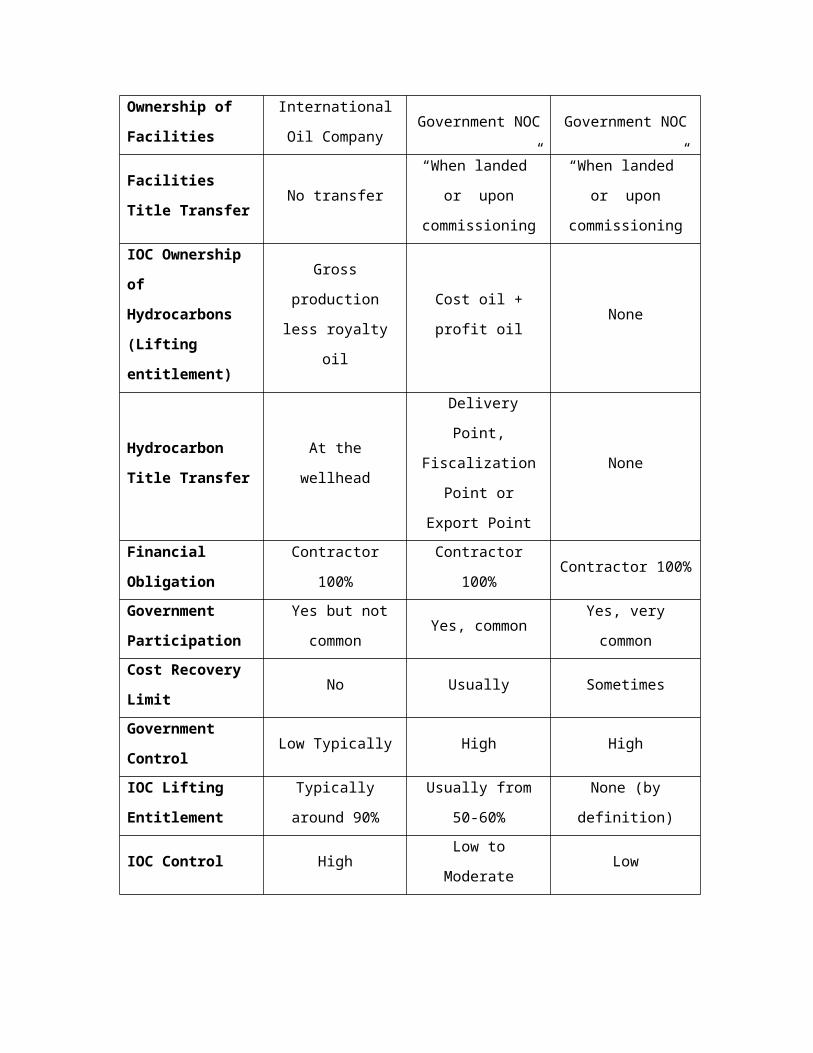
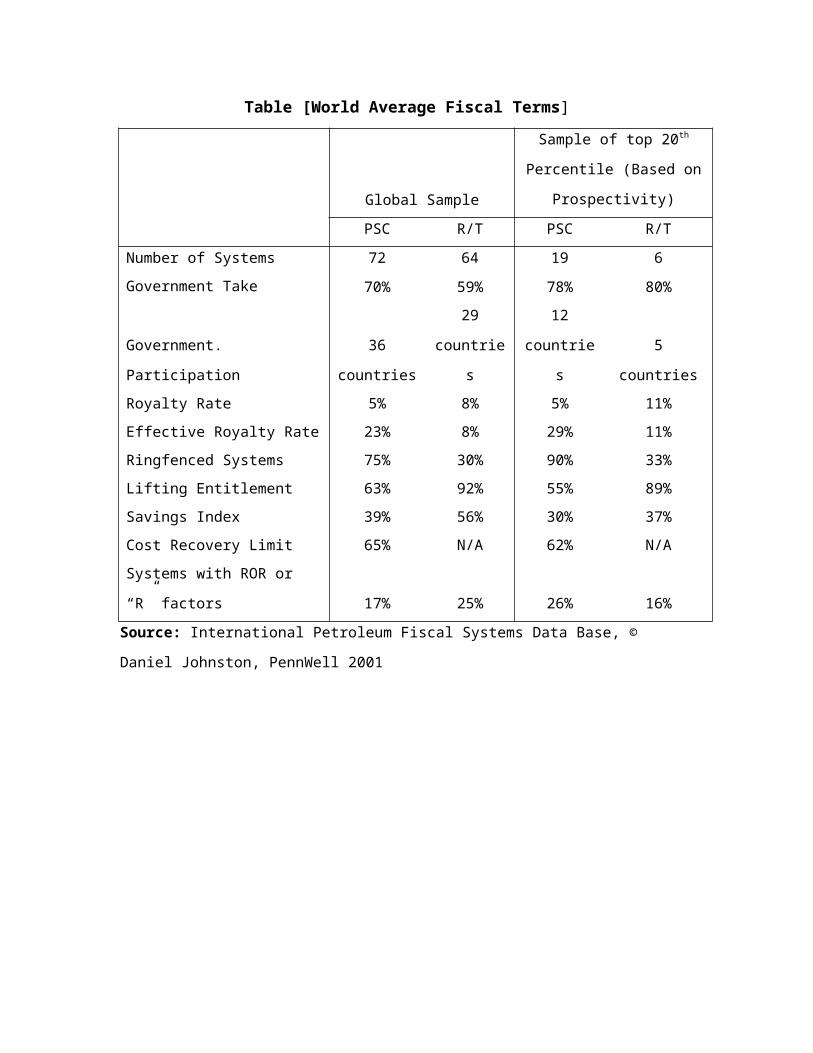
Table [Fiscal Systems — Side-by-Side Comparison] summarizes the differences between systems. While the statistics in Table [World Average Fiscal Terms] summarize the fiscal terms associated with these different systems. The figures in these tables are from a 2001 Database (“International Petroleum Fiscal Systems” PennWell Books, 2001, Daniel Johnston) and therefore these statistics do not take into consideration the recent oil price increases. But, keep in mind that if most fiscal systems in the world are moderately regressive. The revenue the governments receive will go up, but Government Take (discussed below) will go down on average. Finally note that in comparing across these systems it is important to remember that the differences in fiscal terms across the systems is not necessarily due to the different systems being used—as discussed similar terms can be achieved across all of these systems; rather differences reflect the different conditions in the different environments in which these systems are employed.
Table [Fiscal Systems — Side-by-Side Comparison]
R/T Systems PSCs SAs
Global Frequency(% of Systems )
44% 48% 8%
Type of Projects
All types: Exploration,
Development, EOR
All types: Exploration,
Development, EOR
All types but often non-exploration
Ownership of Facilities
International Oil Company
Government NOC
Government NOC
Facilities Title Transfer
No transfer “When landed” or upon
“When landed” or upon
commissioning commissioning IOC Ownership of Hydrocarbons (Lifting entitlement)
Gross production less royalty oil
Cost oil + profit oil
None
Hydrocarbon Title Transfer
At the wellhead
Delivery Point, Fiscalization
Point or Export Point
None
Financial Obligation
Contractor 100% Contractor 100% Contractor 100%
Government Participation
Yes but not common
Yes, common Yes, very common
Cost Recovery Limit
No Usually Sometimes
Government Control
Low Typically High High
IOC Lifting Entitlement
Typically around 90%
Usually from 50-60%
None (by definition)
IOC Control High Low to Moderate Low
Table [World Average Fiscal Terms]
Global Sample
Sample of top 20th
Percentile (Based on Prospectivity)
PSC R/T PSC R/TNumber of Systems 72 64 19 6Government Take 70% 59% 78% 80%Government. Participation
36 countries
29 countries
12 countries 5 countries
Royalty Rate 5% 8% 5% 11%Effective Royalty Rate 23% 8% 29% 11%Ringfenced Systems 75% 30% 90% 33%Lifting Entitlement 63% 92% 55% 89%Savings Index 39% 56% 30% 37%Cost Recovery Limit 65% N/A 62% N/ASystems with ROR or “R” factors 17% 25% 26% 16%
Source: International Petroleum Fiscal Systems Data Base, © Daniel Johnston, PennWell 2001

III Beneath the surface: Evaluating key elements of an oil contractWith the exception of the United States, Canada, and a very few old Spanish land grants in Colombia, mineral rights belong to the State. And, in most countries the nation’s mineral wealth is considered a ‘Gift from God.’ The result is that managing a country’s mineral wealth is considered a ‘sacred trust’ even though, in many situations, the Nation’s mineral wealth benefits only a few people.
Countries with limited proven mineral wealth are seeking exploration activity and have limited leeway attracting it. Still, they want the best ‘terms’ they can get. All countries have their own unique boundary conditions, concerns, and objectives. And, needs, traditions, perspectives, perceptions, and politics differ as well. But in general the major concerns facing a country are:
1. Getting a large (and fair) share of the profits (Take) while keeping costs down
2. Guaranteeing a certain share each accounting period (Effective Royalty Rate and/or Minimum Government Take)
3. Obtaining, but not exceeding the Maximum Efficient Production Rate (MEPR)
4. Maintaining a high degree of Control over the country’s resources
5. Attracting investment and the right kind of company even if the financial conditions appear not as good. (Trinidad awarded a block to BHP even though Talisman submitted a higher bid. The government was familiar and comfortable with BHP)

Oil companies meanwhile want to explore in regions where there is a reasonable chance of finding oil and gas. They want to deal with stable governments, and prefer contract ‘terms’ that will provide a potential return-on-investment that is commensurate with the associated risks. They are also interested in (or rather obsessive about) “booking barrels.” Indeed in the eyes of Wall Street, oil companies are measured by their ability to replace production and by finding costs. If they can book more barrels their ‘reserve-replacement-ratio’ benefits and their finding costs go down. And they are measured on finding and lifting costs and reserve replacement. This can be confusing and frustrating since the ability to book barrels and the amount of barrels a company can book strongly depends on the type of system and various other illogical elements. We look at some determinants of a company’s ability to book barrels towards the end of this section
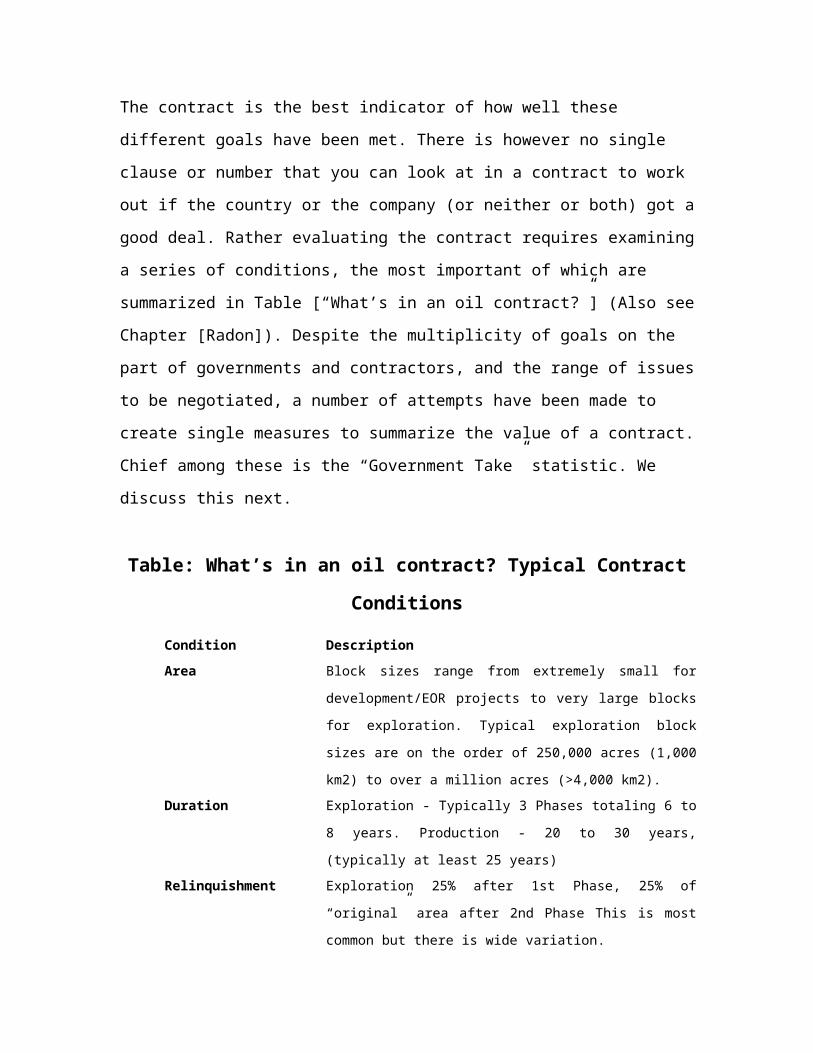
The contract is the best indicator of how well these different goals have been met. There is however no single clause or number that you can look at in a contract to work out if the country or the company (or neither or both) got a good deal. Rather evaluating the contract requires examining a series of conditions, the most important of which are summarized in Table [“What’s in an oil contract?”] (Also see Chapter [Radon]). Despite the multiplicity of goals on the part of governments and contractors, and the range of issues to be negotiated, a number of attempts have been made to create single measures to summarize the value of a contract. Chief among these is the “Government Take” statistic. We discuss this next.
Table: What’s in an oil contract? Typical Contract Conditions
Condition DescriptionArea Block sizes range from extremely small for
development/EOR projects to very large blocks for exploration. Typical exploration block sizes are on the order of 250,000 acres (1,000 km2) to over a million acres (>4,000 km2).
Duration Exploration - Typically 3 Phases totaling 6 to 8 years. Production - 20 to 30 years, (typically at least 25 years)
Relinquishment Exploration 25% after 1st Phase, 25% of “original” area after 2nd Phase This is most common but there is wide variation.
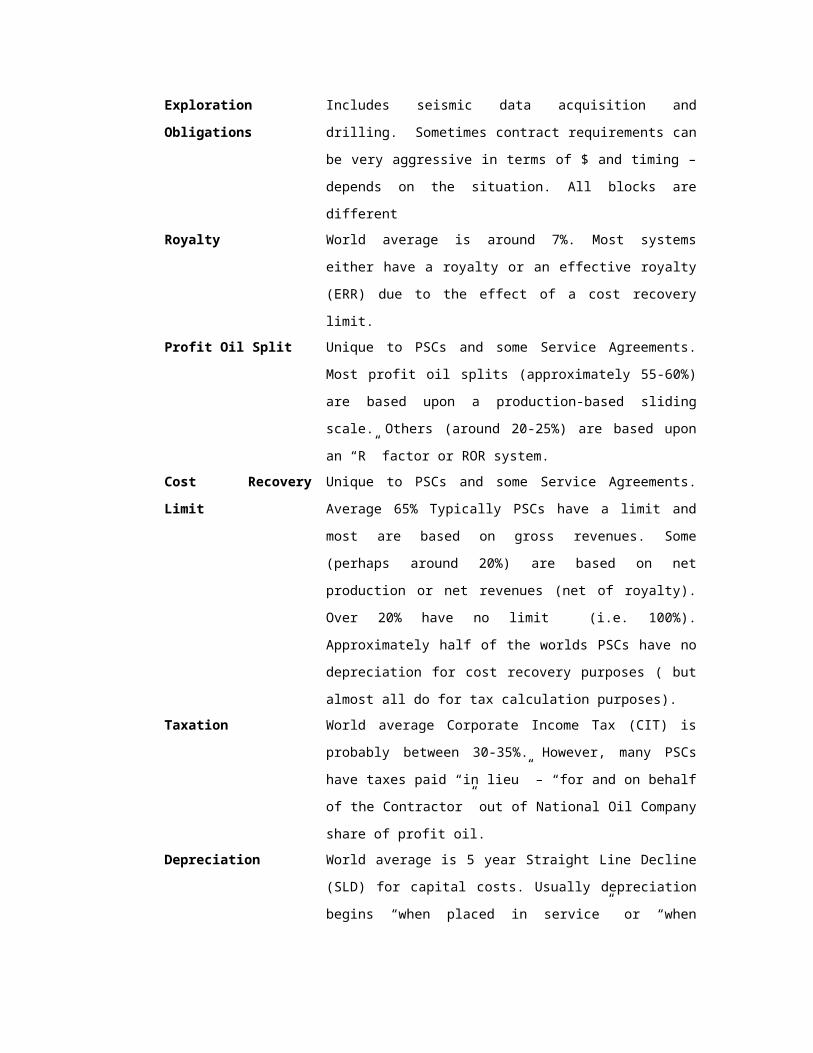
Exploration Obligations
Includes seismic data acquisition and drilling. Sometimes contract requirements can be very aggressive in terms of $ and timing – depends on the situation. All blocks are different
Royalty World average is around 7%. Most systems either have a royalty or an effective royalty (ERR) due to the effect of a cost recovery limit.
Profit Oil Split Unique to PSCs and some Service Agreements. Most profit oil splits (approximately 55-60%) are based upon a production-based sliding scale. Others (around 20-25%) are based upon an “R” factor or ROR system.
Cost Recovery Limit
Unique to PSCs and some Service Agreements. Average 65% Typically PSCs have a limit and most are based on gross revenues. Some (perhaps around 20%) are based on net production or net revenues (net of royalty). Over 20% have no limit (i.e. 100%). Approximately half of the worlds PSCs have no depreciation for cost recovery purposes ( but almost all do for tax calculation purposes).
Taxation World average Corporate Income Tax (CIT) is probably between 30-35%. However, many PSCs have taxes paid “in lieu” – “for and on behalf of the Contractor” out of National Oil Company share of profit oil.
Depreciation World average is 5 year Straight Line Decline (SLD)
for capital costs. Usually depreciation begins “when placed in service” or “when production begins” whichever occurs later..
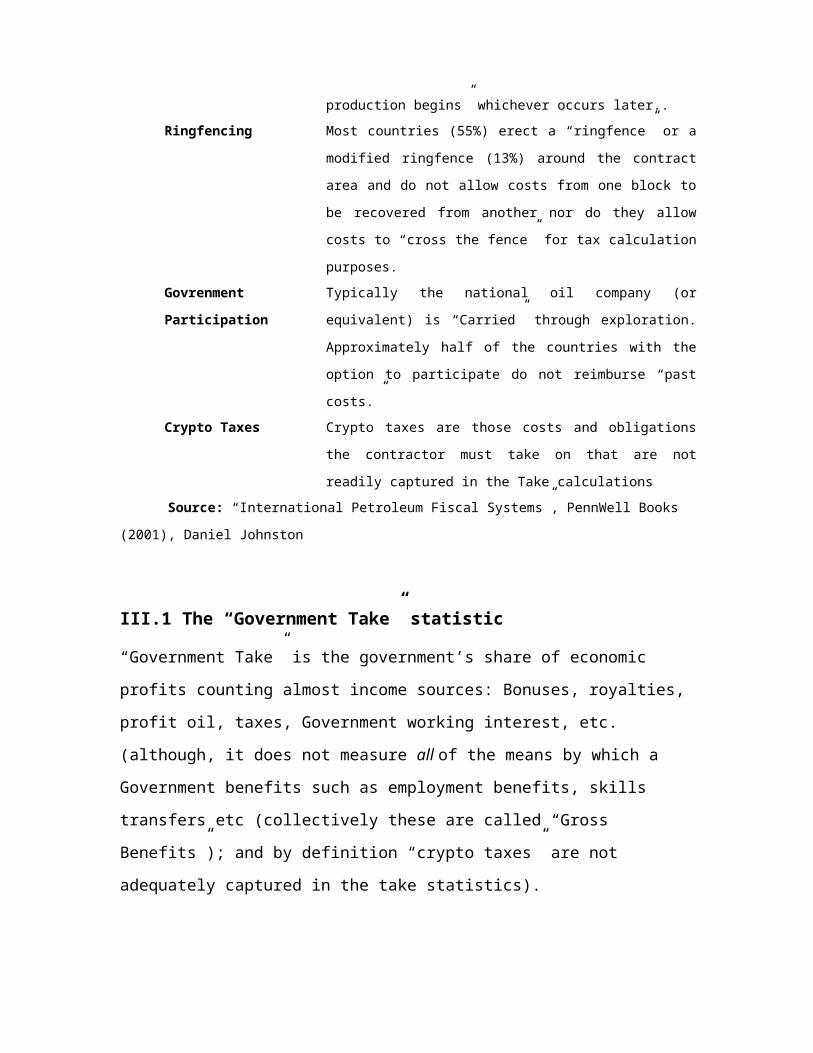
Ringfencing Most countries (55%) erect a “ringfence” or a modified ringfence (13%) around the contract area and do not allow costs from one block to be recovered from another nor do they allow costs to “cross the fence” for tax calculation purposes.
Govrenment Participation
Typically the national oil company (or equivalent) is “Carried” through exploration. Approximately half of the countries with the option to participate do not reimburse “past costs.”
Crypto Taxes Crypto taxes are those costs and obligations the contractor must take on that are not readily captured in the Take calculations
Source: “International Petroleum Fiscal Systems”, PennWell Books (2001), Daniel Johnston
III.1 The “Government Take” statistic“Government Take” is the government’s share of economic profits counting almost income sources: Bonuses, royalties, profit oil, taxes, Government working interest, etc. (although, it does not measure all of the means by which a Government benefits such as employment benefits, skills transfers etc (collectively these are called “Gross Benefits”); and by definition “crypto taxes” are not adequately captured in the take statistics).
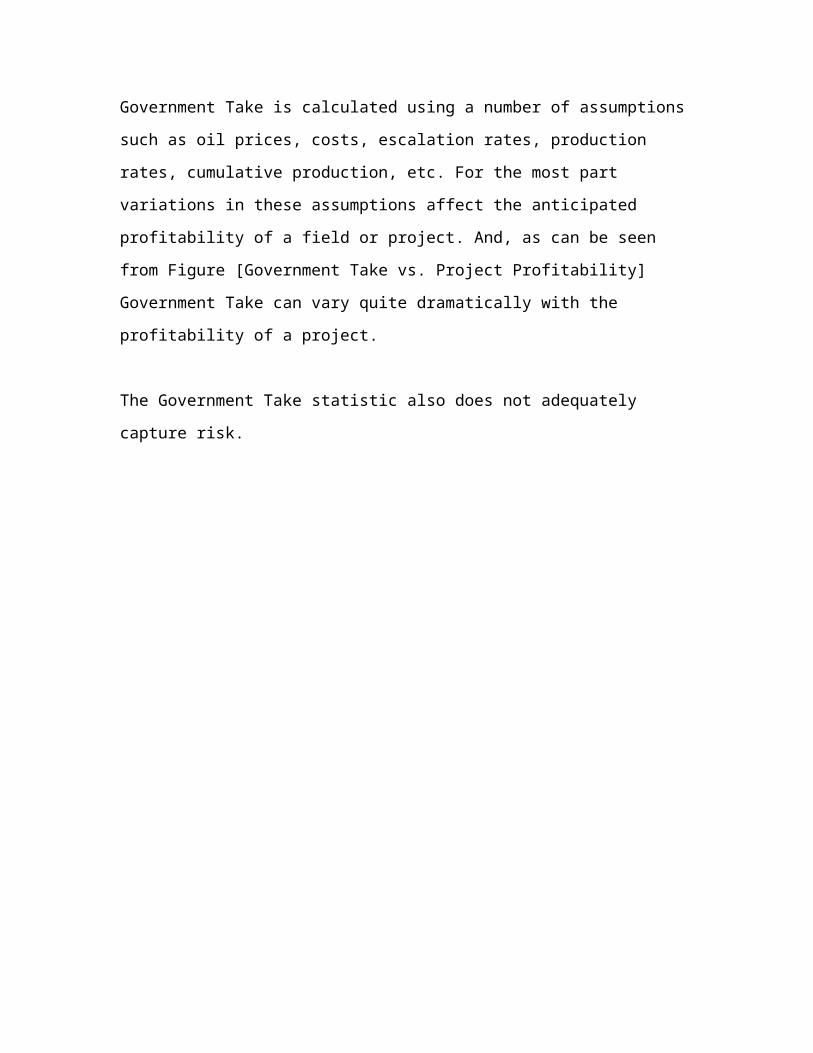
Government Take is calculated using a number of assumptions such as oil prices, costs, escalation rates, production rates, cumulative production, etc. For the most part variations in these assumptions affect the anticipated profitability of a field or project. And, as can be seen from Figure [Government Take vs. Project Profitability]

Government Take can vary quite dramatically with the profitability of a project.
The Government Take statistic also does not adequately capture risk.
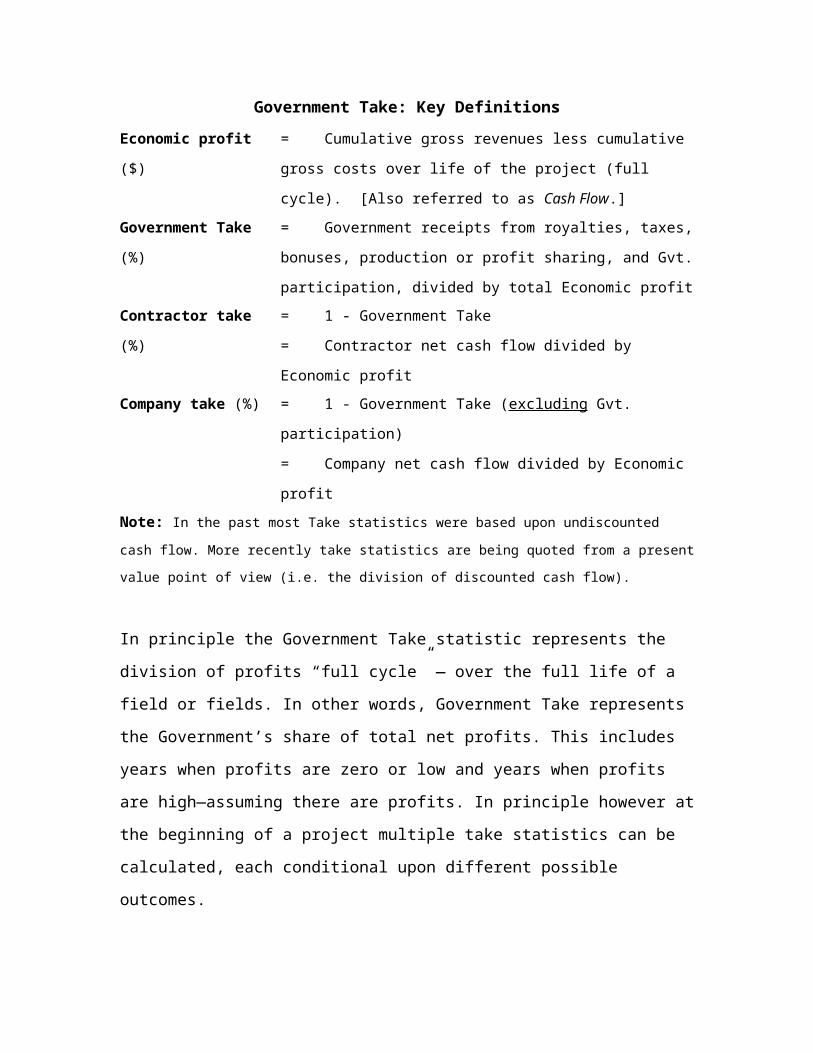
Government Take: Key DefinitionsEconomic profit ($)
= Cumulative gross revenues less cumulative gross costs over life of the project (full cycle). [Also referred to as Cash Flow.]
Government Take (%)
= Government receipts from royalties, taxes, bonuses, production or profit sharing, and Gvt. participation, divided by total Economic profit
Contractor take (%)
= 1 - Government Take= Contractor net cash flow divided by Economic profit
Company take (%)
= 1 - Government Take (excluding Gvt. participation)= Company net cash flow divided by Economic profit
Note: In the past most Take statistics were based upon undiscounted cash flow. More recently take statistics are being quoted from a present value point of view (i.e. the division of discounted cash flow).
In principle the Government Take statistic represents the division of profits “full cycle” — over the full life of a field or fields. In other words, Government Take represents the Government’s share of total net profits. This includes years when profits are zero or low and years when profits are high—assuming there are profits. In principle however at the beginning of a project multiple take statistics can be calculated, each conditional upon different possible outcomes.
The Government Take statistic, being a single number, fails to provide information about the timing of payments. Yet this can be an issue of central concern to governments. For example, after Bolivia’s first Gas War in 2003, a new fiscal system was proposed. The new system would increase the share revenue to the Bolivian Government in the early years of production from their newly discovered gas fields. The proposed system left Government Take virtually unchanged but they would get their share of profits earlier rather than later. The proposed

system attempted to keep the revolutionaries happy without completely alienating the oil companies that risked capital exploring for and finding Bolivia’s vast gas reservoirs. Bolivia needed money sooner rather than later. But a comparison of the proposed system with the previously designed systems using undiscounted Government Take would not have shown a difference.
Few developing countries are able or willing to wait for profits to be generated from a developing field before they get a share. That is why we see signature bonuses, and other front-end-loaded elements like royalties and cost recovery limits. As discussed in other chapters [Stiglitz; Cramton], this decision may or may not be wise in different circumstances. But in any case the Government Take statistic does not provide guidance on how front-end-loaded a payment schedule is. In fact unless it incorporates discounting it may not say anything at all about the time value of money. For this you need companion statistics (below we discuss the “Effective Royalty Rate” which is a companion statistic that helps show ‘how’ a Government takes).
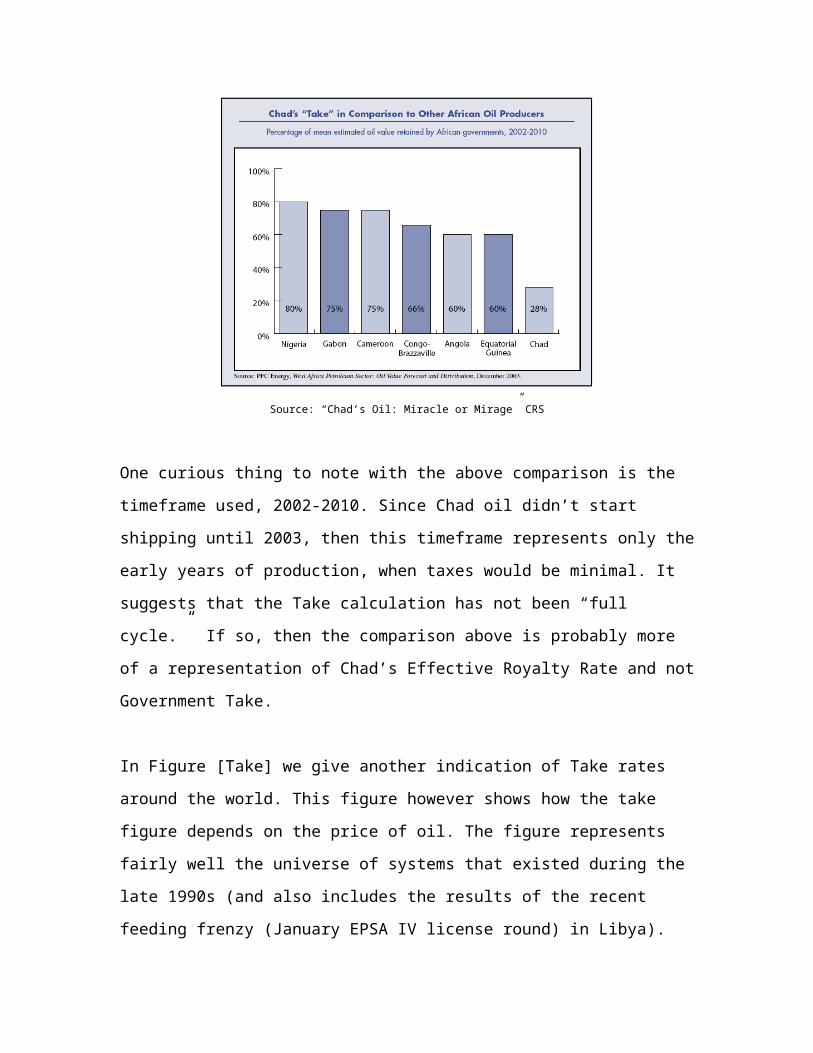
Other key elements are left out altogether. For example, the take statistic says nothing about ringfencing; it does not measure contract or system stability and is silent on reserve/lifting entitlements; and “ownership” is not accounted for. These difficulties make comparisons of Government Take especially difficult. For example, country fiscal systems are often compared to those of neighboring countries. In one common comparison Chad’s take is compared to other West African countries (see for example Figure 3). The graph appears to indicate that the government of Chad got a particularly bad deal, due, according to some accounts, to its lack of experience in negotiation. But unfortunately this comparison is misleading. Such low rates can

be due to many other factors such as the quality of the oil or transportation costs.
Figure [Take Comparisons]
Source: “Chad’s Oil: Miracle or Mirage” CRS
One curious thing to note with the above comparison is the timeframe used, 2002-2010. Since Chad oil didn’t start shipping until 2003, then this timeframe represents only the early years of production, when taxes would be minimal. It suggests that the Take calculation has not been “full cycle.” If so, then the comparison above is probably more of a representation of Chad’s Effective Royalty Rate and not Government Take.
In Figure [Take] we give another indication of Take rates around the world. This figure however shows how the take figure depends on the price of oil. The figure represents fairly well the universe of systems that existed during the late 1990s (and also includes the results of the recent feeding frenzy (January EPSA IV license round) in Libya). For each country the white bar indicates the take statistic when oil prices are at $20 a barrel. Some of the bars on the graph are wider than
others because some countries have fixed terms (narrow bars) but many countries have either “bid” or “negotiated” terms and there is more variation and diversity found in the country’s agreements. Also systems with “R factors” or “rate-of-return” (ROR) features can have greater range of financial outcomes than more conventional systems. The universe of systems represented in the figure were forged in an era when oil prices averaged a little over $18.00/BBL and around 90% of the time ranged between $16.00 to $20.00/BBL. The natural question is “How do terms change with $60.00/BBL oil?” The answer is given by the colored bars that are marked for each country. Note that in some cases the colored bars are to the left of the white bars; in other cases they are to the right. In very many of the cases the systems are regressive—Government Take goes down (colored bars are to the right of the white bars). Notice that with most of these systems the take only changes by a few points (2% to 3%). But some systems, such as in Azerbaijan or Malaysia, are progressive and Government Take goes up and typically by more than just a few points (colored bars are to the left of the white bars). The progressive systems are those with either an “R factor,” a ROR feature, or a price-cap-formula. Many countries around the world right now wish they had structured their systems to adjust their take upward. In fact the scope for increasing the take as prices go up is dramatic. The dotted line on the left hand side gives an indication of the take, at $60.00/BBL, that would in fact yield the same economic benefits to oil companies as the terms original $20.00/BBL take would. The figure shows that for an international oil company to achieve the same economic benefits or values (including risked values such as “Expected Value”) Government Take can be quite high. For example, from an international oil company point of view an average Government Take of 67% during the late 1990s at $20.00/BBL is roughly equivalent to a Government Take of 92% at $60.00/BBL.
US (OCS) Deepwater UK New Zealand Falkland Islands Argentina (Shallow) US (OCS) South Africa Trinidad (Deepwater) Mongolia Philippines Pakistan (Offshore) Australia (ROR) Ecuador Pakistan II Cambodia Gabon Morocco Peru Mozambique Azerbaijan (AIOC) ROR Congo Z. Malaysia (Deepwater) Angola (Price Cap Formula) Colombia (R) Yemen Late 1990s (ROR) Indonesia 3rd Gen (Frontier) Egypt Offshore Azerbaijan EDPSA (R) Russia Sakhalin II (ROR) Timor Gap ZOCA Norway Libya Block 59, 2005 Egypt Onshore Myanmar early 1990s Qatar RDPSA (R) Nigeria Shelf Malaysia R/C (R) UAE “Opec Terms” Syria 1994 Model Indonesia Std.3rd Gen Libya Average 2005 Venezuela 1996 (R) Libya Block 54, 2005 Iran 1st Buyback Libya Block 124, 2005
70% 50% 90% 80% 60% 40%
Royalty/ Tax System
PSA
Service Agreement
R “R” Factor Rate of Return Feature ROR
Government Take
ERR %
Gvt. Partic’n
%
0 0 5 9
14.6 16.7 2.4 25+ 30
13.5 4 0
25 12.5 22 22 10 23 19 0
12.5 13 7.5 8
31 5
40 0 6 0
30 61 38 46
16-20 18 18
12.5 60 14
81.5 16.7 87.6 30 89
Libya EPSA IV Jan., 2005
0 0 0 0 0 0 20
0-25 0 0 0 0 0 20 0 10 25 0 0 10 20 15 20 30
12.5 10 0 50 0 0 30 61 0 15 0 0 15 60 0 10
81.5 35
87.6 100 89
100% 30%
$20 $60 Oil Price Scenario
Government Take Around the World $20/BBL and $60/BBL
Source: Oil & Gas Journal 18 April, 2005 / Daniel Johnson and Co. Inc.
III.2 Effective Royalty Rate (ERR)The Effective Royalty Rate (ERR) is a companion statistic to Government Take that shows how front-end-loaded the system is (although as we will see, it does not measure all aspects of “front-end-loadedness”). It gives a feel for how quickly a contractor can get its money back.
The effective royalty rate (ERR) is the minimum share of gross revenues a government will receive in any given accounting period for a field. It typically does not include the National Oil Company (NOC) or Oil Minister’s working interest share of production. This index, developed by Daniel Johnston in the mid 1990s, has become a standard metric in the industry. Wood Mackenzie refers to this sometimes as “Minimum Government Take.” It is an important index that adds dimension to the "take" statistics.
The complement of ERR, “access to gross revenues” (AGR) provides an important international oil company perspective. AGR is the maximum share of revenues a company or consortium can receive relative to their working interest in any given accounting period. It is limited by government royalties, and/or cost recovery limits and profit oil split (i.e. the ERR).
In a royalty/tax system with no cost recovery limit, the royalty is the only government guarantee. The ERR is the royalty rate. AGR is limited only by the royalty. In most royalty/tax systems in any given accounting period there is no limit to the amount of deductions a company may take and companies can be in a no-tax-paying position (although this can occur with a PSC as well).
Production sharing contracts with cost recovery limits guarantee the NOC a share of profit oil because a certain percentage of production is always forced through the profit oil split. Thus both royalties and cost recovery limits guarantee the government a share of production or revenues regardless of whether or not true economic profits are generated.
The ERR/AGR calculations require a simple assumption—that expenditures and/or deductions in a given accounting period relative to gross revenues are unlimited. Therefore cost recovery is at its maximum (saturation) and deductions for tax calculation purposes yield zero taxable income. Situations like this can occur in the early stages of production, with marginal or sub-marginal fields, or at the end of the life of a field. The object of the exercise is to test the limits of the system. This provides the ERR/AGR indices.
One key weakness of the ERR index is that it does not measure the effects of depreciation or amortization. And it does not include the effects of the guarantee provided by government participation if and where it exists.
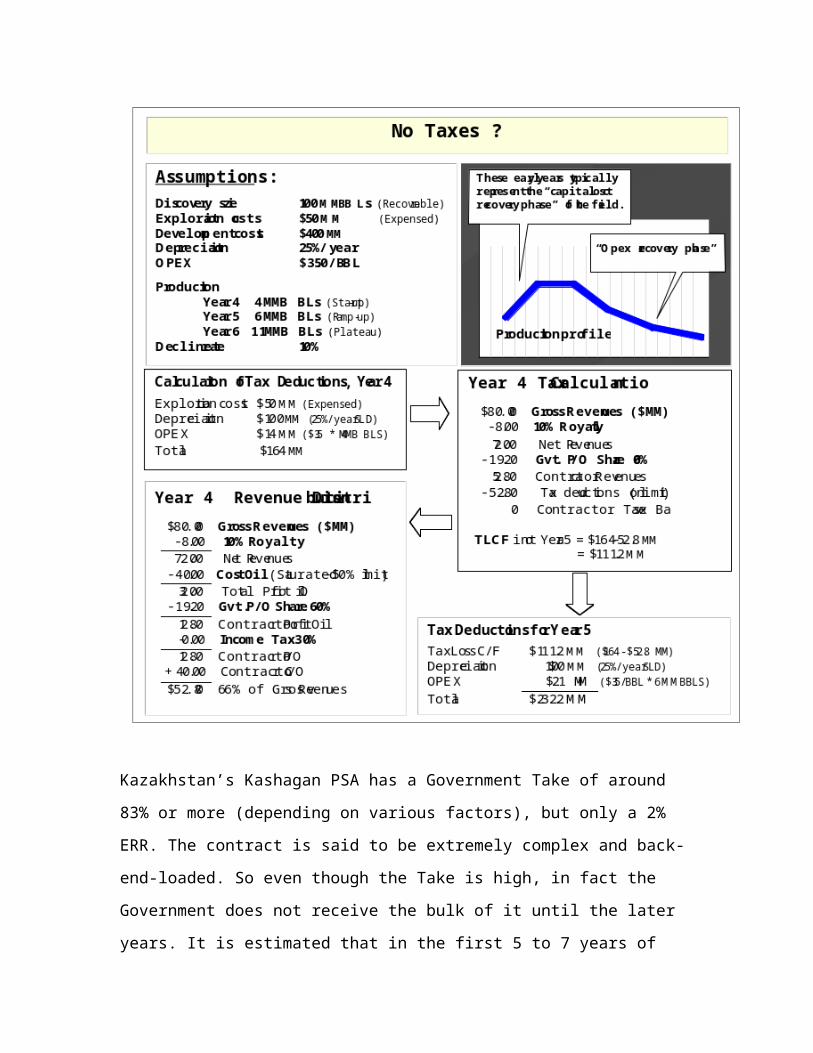
Huge problems can arise if the Effective Royalty Rate is not taken into consideration when designing a fiscal system. Depending on costs and production, contractors could go years where they are in a no-tax-paying position. This can cause cash flow problems for governments as well as lopsided misperceptions. This was the case in Ecuador in the mid 1990s because the ERR under their service agreement was zero (0%). In fact, although it may seem surprising, it is not hard to create a situation where no taxes are paid for many years. Consider the example shown in Figure [No Taxes]. The example shows an accounting period early in the development phase of a project where
costs are high. In this example because of tax deductions on operating expenses, exploration costs and depreciation, no taxes are paid by the contractor either in year 4 or even in year 5. (Although this does not mean the government isn’t receiving revenue, as royalties and shares of profit oil can still be received.)
Kazakhstan’s Kashagan PSA has a Government Take of around 83% or more (depending on various factors), but only a 2% ERR. The contract

is said to be extremely complex and back-end-loaded. So even though the Take is high, in fact the Government does not receive the bulk of it until the later years. It is estimated that in the first 5 to 7 years of production, the Government will only receive 2% of gross revenues. Imagine being the Government or NOC Official that has to paint that picture for legislatures, the press, or the citizens?
So how do you calculate the Effective Royalty Rate? The following figure calculates the Effective Royalty Rate of an Indonesian-Type PSC. Again one barrel of oil is used to represent revenues for a single accounting period. Typically this would be an early accounting period following production start-up when accumulated costs are high and production is relatively low.
In this example the Contractor is in a no-tax paying position, as in the example discussed above, still the Government receives a 10% royalty, and because of the Cost Recovery Limit, the Government is also guaranteed a percentage of the profit oil. The 34% ERR in this example is high by world standards.
Table [Sample Calculation of ERR]
III.3 The Government Participation FigureMany systems provide an option for the national oil company to participate in development projects. Under most government participation arrangements, the contractor bears the cost and risk of exploration and if there is a discovery the government backs-in for a percentage. Government participation typically is the result of a government option (through the National Oil Company) to take up a working interest in the event of a commercial discovery. In other words the government is carried through exploration.
Technically the government through the NOC is “carried” up to the “commerciality” point— usually downstream by a well or two from the actual discovery well. The contract clause that deals with the requirement for delineation/appraisal wells following a discovery is referred to as the “commerciality clause.” The government agent, usually the NOC, must decide whether to exercise their right to “back-in” once the “commerciality point” has been reached. Once the government exercises the option it then ‘pays-its-way’ for development and operating costs from the commerciality point forward just like any other working interest partner. Thus the government is ‘carried’ through the exploration and appraisal phase.
Over half of the countries worldwide have this option. Contractors prefer no government participation. This is not totally selfish, but stems from a desire for efficiency as well as economy. Joint operations of any sort, especially between diverse cultures can have a negative impact on operational efficiency. On the other hand if done right such joint operations can be beneficial for governments, both because of the financial benefits (more on this below) and for building capacity.
But they vary in how they are structured. The key aspects of government participation are:
What percentage participation? Most range from 10% to 50%. In Colombia the government has the right to take up to 50% working interest and will reimburse the contractor up to 50% of any successful exploratory wells. In China, the government participation is 51%. This usually defines the upper limit of direct government working interest involvement. The average is around 30%.
When does the government back in? This normally happens at

commerciality. How much does the Government participate? This varies
considerably from case to case. What costs will the government bear? Usually they bear their
pro rata share of costs. However there is variation in whether governments reimburse “Past Costs” 2; about half do and half do not.
How does government fund its share of costs? Often out of up to a certain % of the Government’s share of production)
The financial effect of a government partner is similar to that of any working interest partner with a few important exceptions. First, as noted above, the government is usually carried through the exploration phase and may or may not reimburse the contractor for past exploration costs. Second, the government contribution to capital and operating costs is often paid out of production. Finally, the government is seldom a silent partner.
A key question surrounding the calculation of government benefits from a contract is whether or not government participation should be included in the Take calculation. That is, is this process truly a “rent extraction” mechanism?
Some analysts believe it is not appropriate to view this element of a system as a rent extraction mechanism on the grounds that such returns are just standard economic returns on investments made.3 2 ‘Past costs’ are defined as those costs incurred by the IOC after the ‘effective date’ of the contract up to the ‘commerciality date’ when the NOC ‘backs-in’.3 One World Bank study for a Latin American country (July, 2003) argues: “Government Take as a result of equity participation by government is really a government equity return, directly paid for by government, rather than a form of Government Take. Hence, comparing Government Take statistics by excluding

However this approach contradicts some basic economic laws. And, it is easy to check by asking a simple question: “Does the “back-in” cause the foreign investor financial pain?” The answer is a certainly “Yes.” And the pain is multidimensional. First of all the value of a discovery to an explorer will be reduced by almost exactly the amount of the “carry” and secondly, the companies will not be able to “book” as many barrels.
A back-in option of 50% is not as costly to the company as a 50% tax on profits (both of which will guarantee the government an added 50% share of profits); but just how different the financial impact depends on profitability and timing. As profitability increases the back-in or participation element takes on more of the characteristics of a pure tax or a royalty depending on the point at which the Government takes its share of production. While it is conceptually a bit abstract, as costs relative to gross revenues approach zero (the ultimate in profitability) the back-in begins to take on all of the characteristics of a tax. Thus, the less profitable a venture is, the less painful the government participation element is. Either way though, both taxes and/or participation options cause the contractor financial pain to various degrees.4
As we saw, comparing two fiscal systems on the basis of Government Take alone is not a perfect comparison if one system has participation and the other does not. However, to simply ignore the participation element would be a greater misrepresentation. When comparing fiscal terms for exploration rights it is not appropriate to exclude or ignore government equity participation is probably a more accurate representation of levels of take.” [REF]4 Note however that from a project cash flow point of view, companies will certainly prefer 50% government participation to a 50% tax because at least with participation, after the NOC backs-in, it “pays its way.”

the participation element. Participation should be considered as a part of the take for governments.
III.4 The Savings Index: A measure of contractor incentive to saveThe savings index is a measure (from an undiscounted point of view) of how much a company gets to keep if it saves $1.00. Because of the great concern on the part of both Governments and companies about reducing costs, this statistic can be used to quantify to some extent the incentives companies have to keep costs down. Only the profits-based fiscal elements influence this statistic. Royalties (based on production not profits) have no influence.
The example given above of an R/T system has two profits-based mechanisms. A 60% Special Petroleum Tax and a 30% Income Tax. Therefore, if the company saves one dollar then there will be an added dollar of taxable income. The Government gets 60% of that. The company therefore has 40¢ on the dollar saved prior to implementation of the Income Tax. With a 30% Income Tax the company only gets to keep 70% of the 40¢. The savings index then is 28¢ on the dollar (saved), or 28%.
Under a PSC a dollar saved means an extra dollar of profit oil and hence a saving that corresponds to the contractors share of profit oil.
Note that the savings index described above does not take into account present value discounting. The present value effect can be interesting and it often magnifies the IOC’s incentive to keep costs down.

III.5 Responsiveness to Changing Conditions: Regressive Systems and Sliding ScalesA regressive system is one where Government Take goes down as profitability goes up. For a system to be regressive it must have at least one regressive fiscal element. Conversely, for a system to be progressive it must have at least one progressive element. Today, oil prices are more than double what they were when most of the existing fiscal systems were designed or negotiated. With the higher oil prices came higher profitability, but with most systems a lower Government Take. Governments are benefiting from the higher oil prices, total revenue does increase. But, their percentage share of net profit decreased for most of them as seen earlier in Figure 6. And, this is simply a function of system design.
Many systems have sliding scales built into them to take advantage of the possibility of increased production (“production based sliding scales”) but few systems were designed to take advantage of the increased oil prices. The elements of a fiscal system that determine whether the system will be regressive or progressive are described in Table [Progressive]:
Table [Progressive]: The Progressiveness of Different Provisions of an Oil Contract
Element Effect
Bonuses Extremely Regressive
Royalties Very RegressiveTaxes NeutralGovernment Participation
Neutral
“R” Factors ProgressiveROR systems ProgressiveDepletion Allowances Very ProgressiveUplifts & Investment Credits
Slightly Progressive
Given the great volatility of oil prices it would be wise for countries negotiating contracts to estimate the returns to them (and to private sector partners) under a range of different price scenarios.
III.6 Factors that Affect Exposure to Exploration Risk (Block Size, Reliniquishment and Ringfencing)Most governments go to a lot of effort to distance themselves as much as possible from exploration risk. This can be done through management of block sizes, through relinquishment and through ringfencing.
Block size and configurations
Block sizes range from small to huge. Typically, block sizes will be smaller in proven geological provinces and much larger in frontier regions. The choice of block size and configuration is an important consideration. A challenge is to configure the blocks or licenses in order to provide interesting tracts instead of having just a few highly prospective blocks and others that will attract little interest. The larger regions can require considerable exploration expense. However, the IOC may be able to recover dry hole and other exploration costs in one part of a block against a production in another part of the block.
However, from the government’s perspective, with larger blocks there is the likelihood of a greater accumulation of exploration sunk costs prior to discovery. These expenses are typically cost recoverable and/or tax deductible and because of this with larger accumulations of sunk costs governments will receive fewer taxes. With smaller blocks governments can minimize or mitigate their exposure.
Relinquishment provisions
Relinquishment options are diverse and there is a full spectrum of methods employed ranging from almost no relinquishment (in the ordinary sense) to very aggressive relinquishment requirements like we see in the Middle East. For example, in some of these countries only a discovery will be retained and all other acreage will be surrendered at the end of the final exploration stage. In Indonesia for many years oil companies could keep more than just development areas (discoveries) at the end of the final official stage of exploration. This meant that if a company made an economic discovery it could enjoy the opportunity to continue exploration in their remaining acreage while they pursued development of their discovery.
Ringfencing
Ringfencing is the practice of disallowing companies to “consolidate” their operations from one license area to another. It means that each license (typically) is treated as a separate cost center for cost recovery and tax calculation purposes. Thus, ringfencing limits cost recovery or deductions that can be taken against production to the activity inside the ringfence. A number of countries will automatically ringfence a discovery once a discovery is made. This would disallow
deductions for exploration activity outside the initial discovery area. This kind of treatment is becoming more and more common.
Ringfencing can protect a government from what might otherwise be a marginal or sub-marginal discovery, by limiting the costs that can be cost recovered and/or deducted against revenues generated by the discovery. However, it can be a negative incentive to the exploration companies.
III.7 Booking Barrels: Lifting Entitlement and Reserves Reporting As a general rule oil companies will “book” barrels according to (1) their working interest and (2) their lifting entitlement. However there are two main exceptions to this rule: (1) even though by definition under a service agreement there is no entitlement, companies do book barrels, (2) with systems where taxes are “in lieu” companies “gross-up” their actual entitlement and book the barrels they would have been entitled to lift had they paid taxes directly in cash. This is common with “Egyptian type PSCs.” R/T Systems would be much preferred by an IOC wanting to ‘Book Barrels’ because they can typically book about twice as many barrels as they would with a PSC.
In general, PSC Entitlements typically go up with falling oil prices and down with increasing oil prices. Because a company’s entitlement with a PSC is based on its share of cost oil and profit oil when oil prices went from $20.00/BBL to $60.00/BBL the typical entitlement under a PSC went down by around 15%. This is because with higher prices it does not take as much cost oil to recover costs and thus entitlement goes down. This is not an issue for R/T Systems.
For most companies the reserves they book will correspond to the reserves they are entitled to “lift.” However, this is not a critical requirement. So naturally, there are some interesting exceptions: Under Royalty Tax Systems, entitlement equals gross production less royalty oil. However, many governments take their royalty “in cash” instead of “in kind.” In this case many companies are booking those barrels as well. In PSCs, entitlement equals profit oil + cost oil. However, with the Egyptian-type systems where taxes are “in lieu” the companies are calculating what their profit oil share would have been (dividing their share by 1 minus the tax rate) and booking these “imputed barrels.” Also some companies are booking gas or oil consumed on-site, fuel for operations.
ConclusionsWe conclude with some comments about how deals between governments and contractors should be made, issues that are taken up again in Chapters [Radon] and [Cramton]. Fiscal design elements discussed above are important, but so are the means by which governments choose to allocate acreage or projects.
As in the past, there is significant competition for a limited amount of exploration capital. At the same time, exciting acreage is hard to come by. If Governments want to increase exploration activity in their countries, they have to offer terms commensurate with their geological potential, location, and political situation. Acreage has begun to take on more of the characteristics of a global commodity. There is over 3 times as much acreage available today as there was 25 years ago. In the past 2 decades the Soviet Union became the “former” Soviet Union (FSU) and much of Africa and the Eastern-
block Countries have opened up. Furthermore, with more aggressive and specific relinquishment provisions in contracts the market for acreage or projects is more dynamic and robust.
The means by which Governments determine how to award licenses are extremely varied. Some governments (approximately 30 to 40 each year) have official “block offerings” or “license rounds” where blocks are awarded on the basis of competitive bids.
In competitive systems there can be a lot of variation over what in fact is bid for (elements that become part of a contract or a system are usually either negotiated, statutory, or bid items and working out which way to do it is of huge concern to many governments). Libya for example let companies “bid the terms.” By allocating licenses in a competitive bid round it was ultimately the IOCs who determined what the market could bear for the Libyan blocks. This takes the burden of fiscal “design” off of the NOC personnel and places it on the IOCs. This is possible—and profitable—because oil companies will suffer just about anything for highly prospective acreage or projects (referring back to Figure [Terms] we see that in the Libyan license rounds companies appear to have “bid” terms consistent with nearly $50.00/BBL expectations). Venezuela used a somewhat different approach. Venezuela launched its exploration round in 1996, putting 10 blocks up for bid. However, for all practical purposes Venezuela had 10 separate license rounds, block-by-block. On Monday morning January 22nd, 1996, bids were opened for the first block only (the La Cieba block). These licenses were awarded on the basis of a single-parameter bid—a profits-based tax known as the “PEG.” Companies were to bid from 0 to a maximum of 50%. Royalty and other fiscal elements were “fixed” (i.e. neither bidable nor negotiable). Ties were to be broken by a subsequent bonus bid round to follow the opening of
the PEG bids within a couple of hours. On the first block, La Ceiba, 11 companies bid and 9 tied with a full 50% PEG bid. The tie was broken with a bonus of $103,999,999 from the Mobil/Veba/Nippon consortium. That afternoon the next license (Paria West) was awarded to Conoco under the same rules. This kind of approach magnified the already intense competition by awarding licenses individually—one-at-a-time. With each “round” the pool of bidders would potentially be reduced by perhaps only one group if any at all. This approach greatly reduced the chance that less-prospective blocks would receive no bid. There were however, two blocks that did not receive a bid. The resulting government “takes” were around 92%. Finally, on the other end of the spectrum, in the United States Gulf of Mexico, licenses are awarded solely on the basis of a bonus bid (in practice however, few countries worldwide extract such a large portion of rent through bonuses).
These are examples of competitive bidding systems. But other countries negotiate exploration rights one-on-one with companies. While companies typically prefer negotiated deals, these situations can be just as competitive as an official tender. But it all depends on the prospectivity of a block or area. When governments have good geology they are more likely able to allow companies to “bid the terms.” Sealed bid license rounds (auctions) can be very beneficial for a government with highly sought-after acreage or projects.
There is considerable pressure these days from the World Bank, the International Monetary Fund and bodies such as the Extractive Industry Transparency Initiative (EITI) for oil companies and governments to be more open and disclose more information. With these initiatives there is a strong push for governments to allocate acreage on the basis of public auctions similar to the highly publicized
EPSA IV rounds in Libya recently. This probably makes sense for interesting acreage. The problem is that unless the acreage is particularly interesting, the industry has been relatively unwilling to face the kind of magnified “head-on” competition that a “sealed bid” type license round (like Libya) provokes. It is somewhat unrealistic to expect all governments to allocate all acreage and projects on the basis of sealed bids. Many countries, even Nigeria and Kazakhstan, have some acreage and some projects that are not quite as exciting as others. When it comes to attracting IOC investment, allocation of such acreage becomes much more important with less-than-exciting prospects. One of the most difficult things for IOCs to contemplate is a direct “heads-on” competitive sealed-bid license round for non-spectacular acreage or projects and countries are likely to find that with less exciting prospectivity they will likely have to design terms themselves and allocate licenses in a user-friendly way. In such cases a government may have no choice—negotiated deals may be the only option. Otherwise they are likely to be disappointed with the level of exploration activity in their country—a common complaint. In such cases allocating licenses through “negotiated deals” can have its own advantages. Government officials (Energy Ministry or NOC) become aware of what the market can bear as they entertain various proposals and offers. Likewise the lack of interest provides information too. There is nothing worse than a “failed license round” for a NOC official.
These considerations tend however to differ somewhat for different types of project. As summarized in Table [Situations], competitive bidding tends to be more viable for frontier acreage or exploration acreage than for development projects or enhanced oil recovery projects. The greater the risk the greater the range of bids possible,
as risk diminishes, such as in the case of development projects, the terms tend to be fairly fixed.
Different Situations — Different Considerations
Enhanced Oil Recovery
Development
Projects
Exploration
AcreageFrontierAcreage
Degree of Risk Med - High Low High Highest
Block SizeAcres (km2)
Field4,000 or so
(16)
Smaller3,000 - 5,000
(12 - 20)
Large1-2 MM+(8,000)
Very Large3-4 MM+ (16,000)
Work Program (s)
1) Feasibility Study
2) Pilot Program
3) Development
1) Appraisal2)
Development
Exploration Program
Exploration Program
Focus of Negotiations/
AnalysisIRR IRR Take Take
Most Common Allocation Strategy
Negotiated deals
Negotiated deals
Competitive Bidding and other
means
Competitive Bidding and other means
Beyond this, which method is best then depends to a large extent on the bargaining power of countries and what they can expect IOCs to accept. IOCs prefer Negotiated Deals (such as are employed in Colombia, Trinidad and Tobago, or Indonesia), after this Fixed Terms with Work Program Bidding are preferred (as in UK, Norway, Australia, or New Zealand). Fixed Terms with Bonus Bidding (as in the US, Nigeria, or Burma) causes more pain to IOCs and the least preferred form of bidding is the Sealed Bid Round with Terms Bid: (as in Venezuela, Libya). As described in Chapter [Cramton] in situations in which prospects are good, competitive bidding may be optimal and much care should go into auction design. However in situations in which governments are in a weak bargaining position, negotiated
deals may be required. These raise special challenges for negotiators, as discussed in Chapter [Radon], and they risk raising political economy concerns: In such situations it can be difficult for Governments to simultaneously keep the oil companies and the citizens happy and it is easy to raise suspicions of foul play. This is where transparency can have a dramatic impact. It is part of the education process and one of the best ways to control expectations and promote a healthy business environment.

ReferencesConsidine, Jennifer I., William A. Kerr. 2002. “The Russian Oil
Economy” Edward Elgar Publishing Ltd
Considine, Jennifer I., et al. 2005. EP Energy Politics Issue VII (Fall).
Johnston, Daniel. 1994. “International Petroleum Fiscal Systems and Production Sharing Contracts” Daniel Johnston, PennWell Books.
Johnston, Daniel. 2003. “International Exploration Economics, Risk, and Contract Analysis.” PennWell Books
Tsalik, Svetlana. 2003. “Caspian Oil Windfalls: Who Will Benefit?” Open Society Institute.
Related Documents