JOHNSON & JOHNSON FORM 10-K (Annual Report) Filed 02/21/18 for the Period Ending 12/31/17 Address ONE JOHNSON & JOHNSON PLZ NEW BRUNSWICK, NJ, 08933 Telephone 732-524-2455 CIK 0000200406 Symbol JNJ SIC Code 2834 - Pharmaceutical Preparations Industry Pharmaceuticals Sector Healthcare Fiscal Year 01/01 http://www.edgar-online.com © Copyright 2018, EDGAR Online, a division of Donnelley Financial Solutions. All Rights Reserved. Distribution and use of this document restricted under EDGAR Online, a division of Donnelley Financial Solutions, Terms of Use.

Welcome message from author
This document is posted to help you gain knowledge. Please leave a comment to let me know what you think about it! Share it to your friends and learn new things together.
Transcript

JOHNSON & JOHNSON
FORM 10-K(Annual Report)
Filed 02/21/18 for the Period Ending 12/31/17
Address ONE JOHNSON & JOHNSON PLZ
NEW BRUNSWICK, NJ, 08933Telephone 732-524-2455
CIK 0000200406Symbol JNJ
SIC Code 2834 - Pharmaceutical PreparationsIndustry Pharmaceuticals
Sector HealthcareFiscal Year 01/01
http://www.edgar-online.com© Copyright 2018, EDGAR Online, a division of Donnelley Financial Solutions. All Rights Reserved.
Distribution and use of this document restricted under EDGAR Online, a division of Donnelley Financial Solutions, Terms of Use.

UNITED STATESSECURITIES AND EXCHANGE COMMISSION
Washington, D.C. 20549
FORM 10-K
ANNUAL REPORT PURSUANT TO SECTION 13 OFTHE SECURITIES EXCHANGE ACT OF 1934
For the fiscal year ended December 31, 2017 Commission file number 1-3215
JOHNSON & JOHNSON(Exact name of registrant as specified in its charter)
New Jersey 22-1024240(State of incorporation) (I.R.S. Employer Identification No.)
One Johnson & Johnson PlazaNew Brunswick, New Jersey 08933
(Address of principal executive offices) (Zip Code)Registrant’s telephone number, including area code: (732) 524-0400
SECURITIES REGISTERED PURSUANT TO SECTION 12(b) OF THE ACT
Title of each class Name of each exchange on which registeredCommon Stock, Par Value $1.00 New York Stock Exchange
4.75% Notes Due November 2019 New York Stock Exchange
0.250% Notes Due January 2022 New York Stock Exchange0.650% Notes Due May 2024 New York Stock Exchange
5.50% Notes Due November 2024 New York Stock Exchange1.150% Notes Due November 2028 New York Stock Exchange
1.650% Notes Due May 2035 New York Stock Exchange
Indicate by check mark if the registrant is a well-known seasoned issuer, as defined in Rule 405 of the Securities Act. Yes þ No oIndicate by check mark if the registrant is not required to file reports pursuant to Section 13 or Section 15(d) of the Exchange Act. Yes o No þIndicate by check mark whether the registrant (1) has filed all reports required to be filed by Section 13 or 15(d) of the Exchange Act during the preceding
12 months (or for such shorter period that the registrant was required to file such reports), and (2) has been subject to such filing requirements for the past90 days. Yes þ No o
Indicate by check mark whether the registrant has submitted electronically and posted on its corporate website, if any, every Interactive Data File required tobe submitted and posted pursuant to Rule 405 of Regulation S-T during the preceding 12 months (or for such shorter period that the registrant was required tosubmit and post such files). Yes þ No o
Indicate by check mark if disclosure of delinquent filers pursuant to Item 405 of Regulation S-K is not contained herein, and will not be contained, to the bestof registrant’s knowledge, in definitive proxy or information statements incorporated by reference in Part III of this Form 10-K or any amendment to this Form 10-K. o
Indicate by check mark whether the registrant is a large accelerated filer, an accelerated filer, a non-accelerated filer, a smaller reporting company, oremerging growth company. See the definitions of “large accelerated filer,” “accelerated filer”, “smaller reporting company," and "emerging growth company" inRule 12b-2 of the Exchange Act.
Large accelerated filer þ Accelerated filer o Non-accelerated filer o (Do not check if a smaller reporting company) Smaller reporting company o Emerging growth company o
If an emerging growth company, indicate by check mark if the registrant has elected not to use the extended transition period for complying with any new orrevised financial accounting standards provided pursuant to Section 13(a) of the Exchange Act. o
Indicate by check mark whether the registrant is a shell company (as defined in Rule 12b-2 of the Exchange Act). Yes o No þ

The aggregate market value of the Common Stock held by non-affiliates computed by reference to the price at which the Common Stock was last sold as ofthe last business day of the registrant’s most recently completed second fiscal quarter was approximately $355 billion.
On February 16, 2018, there were 2,682,901,553 shares of Common Stock outstanding.DOCUMENTS INCORPORATED BY REFERENCE
Parts I andIII:
Portions of registrant’s proxy statement for its 2018 annual meeting of shareholders filed within 120 days after the close of the registrant’s fiscal year (the"Proxy Statement"), are incorporated by reference to this report on Form 10-K (this "Report").

Item Page
PART I
1 Business 1 General 1 Segments of Business 1 Geographic Areas 2 Raw Materials 2 Patents 2 Trademarks 3 Seasonality 3 Competition 3 Research and Development 3 Environment 3 Regulation 4 Available Information 41A. Risk Factors 51B. Unresolved Staff Comments 102 Properties 103 Legal Proceedings 114 Mine Safety Disclosures 11 Executive Officers of the Registrant 11
PART II5 Market for Registrant’s Common Equity, Related Stockholder Matters and Issuer Purchases of Equity Securities 136 Selected Financial Data 147 Management’s Discussion and Analysis of Results of Operations and Financial Condition 157A. Quantitative and Qualitative Disclosures About Market Risk 338 Financial Statements and Supplementary Data 349 Changes in and Disagreements With Accountants on Accounting and Financial Disclosure 929A. Controls and Procedures 929B. Other Information 92
PART III10 Directors, Executive Officers and Corporate Governance 9211 Executive Compensation 9312 Security Ownership of Certain Beneficial Owners and Management and Related Stockholder Matters 9313 Certain Relationships and Related Transactions, and Director Independence 9314 Principal Accountant Fees and Services 93
PART IV15 Exhibits and Financial Statement Schedules 9416 Form 10-K Summary 94 Signatures 95 Exhibit Index 97

CAUTIONARY NOTE REGARDING FORWARD-LOOKING STATEMENTS
This Annual Report on Form 10-K and Johnson & Johnson's other publicly available documents contain "forward-looking statements" within the meaning ofthe safe harbor provisions of the U.S. Private Securities Litigation Reform Act of 1995. Management and representatives of Johnson & Johnson and its subsidiaries(the "Company") also may from time to time make forward-looking statements. Forward-looking statements do not relate strictly to historical or current facts andreflect management’s assumptions, views, plans, objectives and projections about the future. Forward-looking statements may be identified by the use of wordssuch as “plans,” “expects,” “will,” “anticipates,” “estimates” and other words of similar meaning in conjunction with, among other things: discussions of futureoperations; expected operating results and financial performance; impact of planned acquisitions and dispositions; the Company’s strategy for growth; productdevelopment; regulatory approvals; market position and expenditures.
Because forward-looking statements are based on current beliefs, expectations and assumptions regarding future events, they are subject to uncertainties, risksand changes that are difficult to predict and many of which are outside of the Company's control. Investors should realize that if underlying assumptions proveinaccurate, or known or unknown risks or uncertainties materialize, the Company’s actual results and financial condition could vary materially from expectationsand projections expressed or implied in its forward-looking statements. Investors are therefore cautioned not to rely on these forward-looking statements. Risks anduncertainties include, but are not limited to:
Risks Related to Product Development, Market Success and Competition• Challenges and uncertainties inherent in innovation and development of new and improved products and technologies on which the Company’s continued
growth and success depend, including uncertainty of clinical outcomes, obtaining regulatory approvals, health plan coverage and customer access, and initialand continued commercial success;
• Challenges to the Company’s ability to obtain and protect adequate patent and other intellectual property rights for new and existing products and technologiesin the U.S. and other important markets;
• The impact of patent expirations, typically followed by the introduction of competing biosimilars and generics and resulting revenue and market share losses;
• Increasingly aggressive and frequent challenges to the Company’s patents by competitors and others seeking to launch competing generic, biosimilar or otherproducts, and increased receptivity of courts, the United States Patent and Trademark Office and other decision makers to such challenges, potentiallyresulting in loss of market exclusivity and rapid decline in sales for the relevant product;
• Competition in research and development of new and improved products, processes and technologies, which can result in product and process obsolescence;
• Competition to reach agreement with third parties for collaboration, licensing, development and marketing agreements for products and technologies;
• Competition on the basis of cost-effectiveness, product performance, technological advances and patents attained by competitors; and
• Allegations that the Company’s products infringe the patents and other intellectual property rights of third parties, which could adversely affect theCompany’s ability to sell the products in question and require the payment of money damages and future royalties.
Risks Related to Product Liability, Litigation and Regulatory Activity• Product efficacy or safety concerns, whether or not based on scientific evidence, potentially resulting in product withdrawals, recalls, regulatory action on the
part of the U.S. Food and Drug Administration (or international counterparts), declining sales and reputational damage;
• Impact of significant litigation or government action adverse to the Company, including product liability claims and allegations related to pharmaceuticalmarketing practices and contracting strategies;
• Increased scrutiny of the health care industry by government agencies and state attorneys general resulting in investigations and prosecutions, which carry therisk of significant civil and criminal penalties, including, but not limited to, debarment from government business;
• Failure to meet compliance obligations in the McNEIL-PPC, Inc. Consent Decree or the Corporate Integrity Agreements of the Johnson & JohnsonPharmaceutical Affiliates, or any other compliance agreements with governments or government agencies, which could result in significant sanctions;

• Potential changes to applicable laws and regulations affecting U.S. and international operations, including relating to: approval of new products; licensing andpatent rights; sales and promotion of health care products; access to, and reimbursement and pricing for, health care products and services; environmentalprotection and sourcing of raw materials;
• Changes in tax laws and regulations, increasing audit scrutiny by tax authorities around the world and exposures to additional tax liabilities potentially inexcess of reserves; and
• Issuance of new or revised accounting standards by the Financial Accounting Standards Board and the Securities and Exchange Commission.
Risks Related to the Company’s Strategic Initiatives and Health Care Market Trends• Pricing pressures resulting from trends toward health care cost containment, including the continued consolidation among health care providers, trends toward
managed care, the shift toward governments increasingly becoming the primary payers of health care expenses, and significant new entrants to the health caremarkets seeking to reduce costs;
• Restricted spending patterns of individual, institutional and governmental purchasers of health care products and services due to economic hardship andbudgetary constraints;
• Challenges to the Company’s ability to realize its strategy for growth including through externally sourced innovations, such as development collaborations,strategic acquisitions, licensing and marketing agreements, and the potential heightened costs of any such external arrangements due to competitive pressures;
• The potential that the expected strategic benefits and opportunities from any planned or completed acquisition or divestiture by the Company, including theintegration of Actelion Ltd., may not be realized or may take longer to realize than expected; and
• The potential that the expected benefits and opportunities related to past and future restructuring actions may not be realized or may take longer to realize thanexpected, including due to any required consultation procedures relating to restructuring of workforce.
Risks Related to Economic Conditions, Financial Markets and Operating Internationally• Impact of inflation and fluctuations in interest rates and currency exchange rates and the potential effect of such fluctuations on revenues, expenses and
resulting margins;
• Potential changes in export/import and trade laws, regulations and policies of the U.S., U.K. and other countries, including any increased trade restrictions andpotential drug reimportation legislation;
• The impact on international operations from financial instability in international economies, sovereign risk, possible imposition of governmental controls andrestrictive economic policies, and unstable international governments and legal systems;
• Changes to global climate, extreme weather and natural disasters that could affect demand for the Company's products and services, cause disruptions inmanufacturing and distribution networks, alter the availability of goods and services within the supply chain, and affect the overall design and integrity of theCompany's products and operations; and
• The impact of armed conflicts and terrorist attacks in the U.S. and other parts of the world including social and economic disruptions and instability offinancial and other markets.
Risks Related to Supply Chain and Operations• Difficulties and delays in manufacturing, internally or within the supply chain, that may lead to voluntary or involuntary business interruptions or shutdowns,
product shortages, withdrawals or suspensions of products from the market, and potential regulatory action;
• Interruptions and breaches of the Company's information technology systems, and those of the Company's vendors, could result in reputational, competitive,operational or other business harm as well as financial costs and regulatory action; and
• Reliance on global supply chains and production and distribution processes that are complex and subject to increasing regulatory requirements that mayadversely affect supply, sourcing and pricing of materials used in the Company’s products.
Investors also should carefully read the Risk Factors described in Item 1A of this Annual Report on Form 10-K for a description of certain risks that could,among other things, cause the Company’s actual results to differ materially from those expressed in its forward-looking statements. Investors should understandthat it is not possible to predict or identify all such factors and should not consider the risks described above and in Item 1A to be a complete statement of allpotential risks and uncertainties. The Company does not undertake to publicly update any forward-looking statement that may be made from time to time, whetheras a result of new information or future events or developments.
PART I
Item 1. BUSINESS
General
Johnson & Johnson and its subsidiaries (the Company) have approximately 134,000 employees worldwide engaged in the research and development,manufacture and sale of a broad range of products in the health care field. Johnson & Johnson is a holding company, which has more than 260 operating companiesconducting business in virtually all countries of the world. The Company’s primary focus is products related to human health and well-being. Johnson & Johnsonwas incorporated in the State of New Jersey in 1887.
The Executive Committee of Johnson & Johnson is the principal management group responsible for the strategic operations and allocation of theresources of the Company. This Committee oversees and coordinates the activities of the Company's three business segments: Consumer, Pharmaceutical andMedical Devices. Within the strategic parameters provided by the Committee, senior management groups at U.S. and international operating companies are eachresponsible for their own strategic plans and the day-to-day operations of those companies. Each subsidiary within the business segments is, with limitedexceptions, managed by residents of the country where located.
Segments of Business
The Company is organized into three business segments: Consumer, Pharmaceutical and Medical Devices. Additional information required by this item isincorporated herein by reference to the narrative and tabular descriptions of segments and operating results under: “Item 7. Management’s Discussion and Analysisof Results of Operations and Financial Condition” of this Report; and Note 18 “Segments of Business and Geographic Areas” of the Notes to ConsolidatedFinancial Statements included in Item 8 of this Report.
Consumer
The Consumer segment includes a broad range of products used in the baby care, oral care, beauty, over-the-counter pharmaceutical, women’s health andwound care markets. Baby Care includes the JOHNSON’S ® line of products. Oral Care includes the LISTERINE ® product line. Major brands in Beauty includethe AVEENO ® ; CLEAN & CLEAR ® ; DABAO ™ ; JOHNSON’S ® Adult; LE PETITE MARSEILLAIS ® ; NEUTROGENA ® ; RoC ® and OGX ® product lines.Over-the-counter medicines include the broad family of TYLENOL ® acetaminophen products; SUDAFED ® cold, flu and allergy products; BENADRYL ® andZYRTEC ® allergy products; MOTRIN ® IB ibuprofen products; and the PEPCID ® line of acid reflux products. Major brands in Women’s Health outside of NorthAmerica are STAYFREE ® and CAREFREE ® sanitary pads and o.b. ® tampon brands. Wound Care brands include the BAND-AID ® Brand Adhesive Bandagesand NEOSPORIN ® First Aid product lines. These products are marketed to the general public and sold both to retail outlets and distributors throughout the world.
Pharmaceutical
The Pharmaceutical segment is focused on six therapeutic areas: Immunology (e.g., rheumatoid arthritis, inflammatory bowel disease and psoriasis),Infectious Diseases and Vaccines (e.g., HIV/AIDS), Neuroscience (e.g., mood disorders and schizophrenia), Oncology (e.g., prostate cancer and hematologicmalignancies), Cardiovascular and Metabolism (e.g., thrombosis and diabetes) and Pulmonary Hypertension (e.g., Pulmonary Arterial Hypertension), a newtherapeutic area, which was established with the acquisition of Actelion in June 2017. Medicines in this segment are distributed directly to retailers, wholesalers,hospitals and health care professionals for prescription use. Key products in the Pharmaceutical segment include: REMICADE ® (infliximab), a treatment for anumber of immune-mediated inflammatory diseases; SIMPONI ® (golimumab), a subcutaneous treatment for adults with moderate to severe rheumatoid arthritis,active psoriatic arthritis, active ankylosing spondylitis and moderately active to severely active ulcerative colitis; SIMPONI ARIA ® (golimumab), an intravenoustreatment for adults with moderate to severe rheumatoid arthritis; STELARA ® (ustekinumab), a treatment for adults with moderate to severe plaque psoriasis andactive psoriatic arthritis, and for adults with moderately to severely active Crohn's disease; EDURANT ® (rilpivirine) and PREZISTA ® (darunavir) andPREZCOBIX ® /REZOLSTA ® (darunavir/cobicistat), antiretroviral medicines for the treatment of human immunodeficiency virus (HIV-1) in combination withother antiretroviral products; CONCERTA ® (methylphenidate HCl) extended-release tablets CII, a treatment for attention deficit hyperactivity disorder; INVEGASUSTENNA ® /XEPLION ® (paliperidone palmitate), for the treatment of schizophrenia and schizoaffective disorder in adults; INVEGA TRINZA ® /TREVICTA® (paliperidone palmitate), for the treatment of schizophrenia in patients after they have been adequately treated with INVEGA SUSTENNA ® for at least fourmonths; RISPERDAL CONSTA ® (risperidone long-acting injection), for the treatment of schizophrenia and the maintenance treatment of Bipolar 1 Disorder inadults; VELCADE ® (bortezomib), a treatment for multiple myeloma and for use in combination with rituximab, cyclophosphamide, doxorubicin and prednisonefor the treatment of adult patients with previously untreated mantle cell lymphoma; ZYTIGA ® (abiraterone
1

acetate), used in combination with prednisone as a treatment for metastatic castration-resistant prostate cancer; IMBRUVICA ® (ibrutinib), an oral, once-dailytherapy approved for use in treating certain B-cell malignancies, or blood cancers, and Waldenström's Macroglobulinemia; DARZALEX ® (daratumumab), for thetreatment of relapsed/refractory multiple myeloma; PROCRIT ®/ EPREX ® , to stimulate red blood cell production; XARELTO ® (rivaroxaban), an oralanticoagulant for the prevention of deep vein thrombosis (DVT), which may lead to pulmonary embolism (PE) in patients undergoing hip or knee replacementsurgery, to reduce the risk of stroke and systemic embolism in patients with nonvalvular atrial fibrillation, and for the treatment and reduction of risk of recurrenceof DVT and PE; INVOKANA ® (canagliflozin), for the treatment of adults with type 2 diabetes; INVOKAMET ® /VOKANAMET ® (canagliflozin/metforminHCl), a combination therapy of fixed doses of canagliflozin and metformin hydrochloride for the treatment of adults with type 2 diabetes; and INVOKAMET ® XR(canagliflozin/metformin hydrochloride extended-release), a once-daily, fixed-dose combination therapy of canagliflozin and metformin hydrochloride extended-release, for the treatment of adults with type 2 diabetes; OPSUMIT ® (macitentan) as monotherapy or in combination, indicated for the long-term treatment ofpulmonary arterial hypertension (PAH); UPTRAVI ® (selexipag), the only approved oral, selective IP receptor agonist targeting a prostacyclin pathway in PAH.Many of these medicines were developed in collaboration with strategic partners or are licensed from other companies and maintain active lifecycle developmentprograms.
Medical Devices
The Medical Devices segment includes a broad range of products used in the orthopaedic, surgery, cardiovascular, diabetes care and eye health fields.These products are distributed to wholesalers, hospitals and retailers, and used principally in the professional fields by physicians, nurses, hospitals, eye careprofessionals and clinics. They include orthopaedic products; general surgery, biosurgical, endomechanical and energy products; electrophysiology products totreat cardiovascular disease; sterilization and disinfection products to reduce surgical infection; diabetes care products, such as blood glucose monitoring; andvision care products such as disposable contact lenses and ophthalmic products related to cataract and laser refractive surgery.
Geographic Areas
The business of Johnson & Johnson is conducted by more than 260 operating companies located in more than 60 countries, including the U.S., which sellproducts in virtually all countries throughout the world. The products made and sold in the international business include many of those described above under “– Segments of Business – Consumer,” “– Pharmaceutical” and “– Medical Devices.” However, the principal markets, products and methods of distribution in theinternational business vary with the country and the culture. The products sold in international business include those developed in the U.S. and by subsidiariesabroad.
Investments and activities in some countries outside the U.S. are subject to higher risks than comparable U.S. activities because the investment andcommercial climate may be influenced by financial instability in international economies, restrictive economic policies and political and legal system uncertainties.
Raw Materials
Raw materials essential to the Company's business are generally readily available from multiple sources. Where there are exceptions, the temporaryunavailability of those raw materials would not likely have a material adverse effect on the financial results of the Company.
Patents
The Company's subsidiaries have made a practice of obtaining patent protection on their products and processes where possible. They own, or arelicensed under, a significant number of patents in the U.S. and other countries relating to their products, product uses, formulations and manufacturing processes,which in the aggregate are believed to be of material importance to the Company in the operation of its businesses. The Company’s subsidiaries face patentchallenges from third parties, including challenges seeking to manufacture and market generic and biosimilar versions of the Company's key pharmaceuticalproducts prior to expiration of the applicable patents covering those products. Significant legal proceedings and claims involving the Company's patent and otherintellectual property are described in Note 21, “Legal Proceedings—Intellectual Property” of the Notes to Consolidated Financial Statements included in Item 8 ofthis Report.
Sales of the Company’s largest product, REMICADE ® (infliximab), accounted for approximately 8.3% of the Company's total net trade sales for fiscal2017.
There are two sets of patents related specifically to REMICADE ® . The first set of patents is co-owned by Janssen Biotech, Inc., a wholly-ownedsubsidiary of Johnson & Johnson, and NYU Langone Medical Center (NYU). Janssen Biotech, Inc. has an exclusive license to NYU's interests in the patents.These patents have expired in all countries outside the United States. In the United States, the one remaining patent, which expires in September 2018, standsrejected following
2

reexamination proceedings instituted by a third party in the United States Patent and Trademark Office (USPTO). The patent has also been held invalid by theFederal District Court in the District of Massachusetts. In January 2018, the U.S. Court of Appeals for the Federal Circuit affirmed the invalidity of the remainingpatent.
The second set of patents specifically related to REMICADE ® was granted to The Kennedy Institute of Rheumatology in Europe, Canada, Australia andthe United States. Janssen Biotech, Inc. has licenses (exclusive for human anti-TNF antibodies and semi-exclusive for non-human anti-TNF antibodies) to thesepatents, which expired in 2017 outside of the United States and will expire in August 2018 in the United States. Certain of these patents have been successfullychallenged and invalidated, and others are under review in various patent offices around the world and are also subject to litigation in Canada.
The Company does not expect that any extensions will be available for the above described patents specifically related to REMICADE ® . In the UnitedStates, a biosimilar version of REMICADE ® was introduced in 2016, and additional competitors continue to enter the market. For a more extensive description oflegal matters regarding the patents related to REMICADE ® , see Note 21 “Legal Proceedings – Intellectual Property – Pharmaceutical – REMICADE ® RelatedCases” of the Notes to Consolidated Financial Statements included in Item 8 of this Report.
In addition to competing in the immunology market with REMICADE ® , the Company is currently marketing STELARA ® (ustekinumab), SIMPONI ®(golimumab), SIMPONI ARIA ® (golimumab) and TREMFYA ® (guselkumab), next generation immunology products with remaining patent lives of up to sixyears.
Trademarks
The Company’s subsidiaries have made a practice of selling their products under trademarks and of obtaining protection for these trademarks by allavailable means. These trademarks are protected by registration in the U.S. and other countries where such products are marketed. The Company considers thesetrademarks in the aggregate to be of material importance in the operation of its businesses.
Seasonality
Worldwide sales do not reflect any significant degree of seasonality; however, spending has been heavier in the fourth quarter of each year than in otherquarters. This reflects increased spending decisions, principally for advertising and research and development activity.
Competition
In all of their product lines, the Company's subsidiaries compete with companies both locally and globally. Competition exists in all product lines withoutregard to the number and size of the competing companies involved. Competition in research, both internally and externally sourced, involving the developmentand the improvement of new and existing products and processes, is particularly significant. The development of new and innovative products, as well asprotecting the underlying intellectual property of the Company’s product portfolio, is important to the Company's success in all areas of its business. Thecompetitive environment requires substantial investments in continuing research. In addition, the development and maintenance of customer demand for theCompany’s consumer products involve significant expenditures for advertising and promotion.
Research and Development
Research activities represent a significant part of the Company’s businesses. Research and development expenditures relate to the processes ofdiscovering, testing and developing new products, upfront payments and milestones, improving existing products, as well as demonstrating product efficacy andregulatory compliance prior to launch. The Company remains committed to investing in research and development with the aim of delivering high quality andinnovative products. Worldwide costs of research and development activities amounted to $10.6 billion, $9.1 billion and $9.0 billion for fiscal years 2017, 2016and 2015, respectively. Research facilities are located in the United States, Belgium, Brazil, Canada, China, France, Germany, Israel, Japan, the Netherlands,Switzerland and the United Kingdom with additional R&D support in over 30 other countries.
Environment
The Company is subject to a variety of U.S. and international environmental protection measures. The Company believes that its operations comply in allmaterial respects with applicable environmental laws and regulations. The Company’s compliance with these requirements did not change during the past year, andis not expected to have a material effect upon its capital expenditures, cash flows, earnings or competitive position.
3

Regulation
The Company’s businesses are subject to varying degrees of governmental regulation in the countries in which operations are conducted, and the generaltrend is toward increasingly stringent regulation. In the U.S., the drug, device and cosmetic industries have long been subject to regulation by various federal andstate agencies, primarily as to product safety, efficacy, manufacturing, advertising, labeling and safety reporting. The exercise of broad regulatory powers by theU.S. Food and Drug Administration (the FDA) continues to result in increases in the amounts of testing and documentation required for FDA approval of newdrugs and devices and a corresponding increase in the expense of product introduction. Similar trends are also evident in major markets outside of the U.S. Thenew medical device regulatory framework and the new privacy regulations in Europe are examples of such increased regulation.
The costs of human health care have been and continue to be a subject of study, investigation and regulation by governmental agencies and legislativebodies around the world. In the U.S., attention has been focused on drug prices and profits and programs that encourage doctors to write prescriptions for particulardrugs, or to recommend, use or purchase particular medical devices. Payers have become a more potent force in the market place and increased attention is beingpaid to drug and medical device pricing, appropriate drug and medical device utilization and the quality and costs of health care generally.
U.S. government agencies continue to implement the extensive requirements of the Patient Protection and Affordable Care Act (the ACA). These haveboth positive and negative impacts on the U.S. healthcare industry with much remaining uncertain as to how various provisions of the ACA, and potentialmodification or repeal of ACA provisions, will ultimately affect the industry.
The regulatory agencies under whose purview the Company operates have administrative powers that may subject it to actions such as productwithdrawals, recalls, seizure of products and other civil and criminal sanctions. In some cases, the Company’s subsidiaries may deem it advisable to initiateproduct recalls.
In addition, business practices in the health care industry have come under increased scrutiny, particularly in the United States, by government agenciesand state attorneys general, and resulting investigations and prosecutions carry the risk of significant civil and criminal penalties.
Further, the Company relies on global supply chains, and production and distribution processes, that are complex, are subject to increasing regulatoryrequirements, and may be faced with unexpected changes such as those resulting from Brexit, that may affect sourcing, supply and pricing of materials used in theCompany's products. These processes also are subject to lengthy regulatory approvals.
Available Information
The Company’s main corporate website address is www.jnj.com. Copies of the Company’s Quarterly Reports on Form 10-Q, Annual Report on Form 10-K and Current Reports on Form 8-K filed or furnished to the U.S. Securities and Exchange Commission (the SEC), and any amendments to the foregoing, will beprovided without charge to any shareholder submitting a written request to the Secretary at the principal executive offices of the Company or by calling 1-800-950-5089. All of the Company’s SEC filings are also available on the Company’s website at www.investor.jnj.com/sec.cfm , as soon as reasonably practicable afterhaving been electronically filed or furnished to the SEC. All SEC filings are also available at the SEC’s website at www.sec.gov . In addition, the written chartersof the Audit Committee, the Compensation & Benefits Committee, the Nominating & Corporate Governance Committee, the Regulatory, Compliance &Government Affairs Committee and the Science, Technology & Sustainability Committee of the Board of Directors and the Company’s Principles of CorporateGovernance, Code of Business Conduct (for employees), Code of Business Conduct & Ethics for Members of the Board of Directors and Executive Officers, andother corporate governance materials, are available at www.investor.jnj.com/gov.cfm on the Company's website and will be provided without charge to anyshareholder submitting a written request, as provided above. The information on the Company’s website is not, and will not be deemed, a part of this Report orincorporated into any other filings the Company makes with the SEC.
4

Item 1A. RISK FACTORS
The Company faces a number of uncertainties and risks that are difficult to predict and many of which are outside of the Company's control. In addition to theother information in this report and the Company’s other filings with the SEC, investors should consider carefully the factors set forth below. Investors should beaware that it is not possible to predict or identify all such factors and that the following is not meant to be a complete discussion of all potential risks oruncertainties. If known or unknown risks or uncertainties materialize, the Company’s business, results of operations or financial condition could be adverselyaffected, potentially in a material way.
The Company’s largest product, REMICADE ® (infliximab), is experiencing biosimilar competition, which will result in a reduction in U.S. sales ofREMICADE ® .
The Company has experienced significant challenges to patents covering its largest product, REMICADE ® (infliximab) (accounting for approximately 8.3% of theCompany’s total net trade sales for fiscal 2017), and continues to assert certain patents related to the product. In the United States, a biosimilar version ofREMICADE ® was introduced in 2016, and additional competitors continue to enter the market. Sales of infliximab biosimilars in the U.S. market will result in acontinued reduction in U.S. sales of REMICADE ® .
Global sales in the Company’s pharmaceutical and medical devices segments may be negatively impacted by healthcare reforms and increasing pricingpressures.
Sales of the Company’s pharmaceutical and medical device products are significantly affected by reimbursements by third-party payers such as governmenthealthcare programs, private insurance plans and managed care organizations. As part of various efforts to contain healthcare costs, these payers are puttingdownward pressure on prices at which products will be reimbursed. In the United States, increased purchasing power of entities that negotiate on behalf ofMedicare, Medicaid, and private sector beneficiaries, in part due to continued consolidation among health care providers, could result in further pricing pressures.In addition, increased political scrutiny could result in additional pricing pressures. Outside the United States, numerous major markets, including the EU andJapan, have pervasive government involvement in funding healthcare and, in that regard, directly or indirectly impose price controls, limit access to, orreimbursement for, the Company’s products, or reduce the value of its intellectual property protection.
The Company is subject to significant legal proceedings that can result in significant expenses, fines and reputational damage.
In the ordinary course of business, Johnson & Johnson and its subsidiaries are subject to numerous claims and lawsuits involving various issues such as patentdisputes, product liability and claims that their product sales, marketing and pricing practices violate various antitrust, unfair trade practices and/or consumerprotection laws. The most significant of these proceedings are described in Note 21, “Legal Proceedings” under Notes to the Consolidated Financial Statementsincluded in Item 8 of this Report. While the Company believes it has substantial defenses in these matters, it is not feasible to predict the ultimate outcome oflitigation. The Company could in the future be required to pay significant amounts as a result of settlements or judgments in these matters, potentially in excess ofaccruals. The resolution of, or increase in accruals for, one or more of these matters in any reporting period could have a material adverse effect on the Company'sresults of operations and cash flows for that period. Furthermore, as a result of cost and availability factors, effective November 1, 2005, the Company ceasedpurchasing third-party product liability insurance.
Product reliability, safety and effectiveness concerns can have significant negative impacts on sales and results of operations, lead to litigation and causereputational damage.
Concerns about product safety, whether raised internally or by litigants, regulators or consumer advocates, and whether or not based on scientific evidence, canresult in safety alerts, product recalls, governmental investigations, regulatory action on the part of the FDA (or its counterpart in other countries), private claimsand lawsuits, payment of fines and settlements, declining sales and reputational damage. These circumstances can also result in damage to brand image, brandequity and consumer trust in the Company’s products. Product recalls have in the past, and could in the future, prompt government investigations and inspections,the shutdown of manufacturing facilities, continued product shortages and related sales declines, significant remediation costs, reputational damage, possible civilpenalties and criminal prosecution.
Changes in tax laws or exposures to additional tax liabilities could negatively impact the Company’s operating results.
Changes in tax laws or regulations could negatively impact the Company’s effective tax rate and results of operations. On December 22, 2017, the U.S. enactedThe Tax Cuts and Jobs Act (the TCJA), which resulted in the revaluation of the Company’s U.S. related deferred tax assets and liabilities and had an impact on theCompany’s Consolidated Statement of Earnings. The TCJA introduces significant changes to U.S. corporate income tax law that will have a meaningful impact onthe
5

Company’s provision for income taxes. Accounting for the income tax effects of the TCJA requires significant judgments to be made in interpreting its provisions.Due to the timing of the enactment and the complexity involved in applying the provisions of the TCJA, the Company made reasonable estimates of the effects andrecorded provisional amounts in the financial statements for fiscal year 2017. These provisional amounts are based on the Company’s initial analysis of the TCJAas of January 18, 2018. Anticipated guidance from the U.S. Treasury about implementing the TCJA, and the potential for additional guidance from the Securitiesand Exchange Commission or the Financial Accounting Standards Board related to the TCJA, may result in adjustments to these estimates which could materiallyaffect the Company’s financial position and results of operations as well as the effective tax rate in the period in which the adjustments are made.
The government in Switzerland is currently considering tax reform legislation, which could have a material impact on the Company’s effective tax rate if enactedinto law.
The Company conducts business and files tax returns in numerous countries and is addressing tax audits and disputes with many tax authorities. In connection withthe Organization for Economic Cooperation and Development Base Erosion and Profit Shifting (BEPS) project, companies are required to disclose moreinformation to tax authorities on operations around the world, which may lead to greater audit scrutiny of profits earned in other countries. The Company regularlyassesses the likely outcomes of its tax audits and disputes to determine the appropriateness of its tax reserves. However, any tax authority could take a position ontax treatment that is contrary to the Company’s expectations, which could result in tax liabilities in excess of reserves.
The Company may not be able to successfully secure and defend intellectual property rights essential to the Company’s businesses.
The Company owns or licenses a significant number of patents and other proprietary rights, determined by patent offices, courts and lawmakers in variouscountries, relating to its products and manufacturing processes. These rights are essential to the Company’s businesses and materially important to the Company’sresults of operations. Public policy, both within and outside the U.S., has become increasingly unfavorable toward intellectual property rights. The Companycannot be certain that it will obtain adequate patent protection for new products and technologies in the U.S. and other important markets or that such protections,once granted, will last as long as originally anticipated.
Competitors routinely challenge the validity or extent of the Company’s owned or licensed patents and proprietary rights through litigation, interferences,oppositions and other proceedings. These proceedings absorb resources and can be protracted as well as unpredictable. In addition, challenges that the Company’sproducts infringe the patents of third parties could result in the need to pay past damages and future royalties and adversely affect the competitive position andsales of the products in question.
The Company has faced increasing patent challenges from third parties seeking to manufacture and market generic and biosimilar versions of the Company's keypharmaceutical products prior to expiration of the applicable patents covering those products. In the United States, manufacturers of generic versions of innovativehuman pharmaceutical products may challenge the validity, or claim non-infringement, of innovator products through the Abbreviated New Drug Application, orANDA, process with the FDA. The Biologics Price Competition and Innovation Act (BPCIA), enacted in 2010, which created a new regulatory pathway for theapproval by the FDA of biosimilar alternatives to innovator-developed biological products, also created mechanisms for biosimilar applicants to challenge thepatents on the innovator biologics. The inter partes review (IPR) process with the USPTO, created under the 2011 America Invents Act, is also being used bycompetitors to challenge patents held by the Company’s subsidiaries. For example, the key patent for ZYTIGA ® is currently subject to patent litigation, and theUSPTO has issued a decision invalidating that patent in a related IPR action.
In the event the Company is not successful in defending its patents against such challenges, or upon the “at-risk” launch (despite pending patent infringementlitigation) by the generic or biosimilar firm of its product, the Company can lose a major portion of revenues for the referenced product in a very short period oftime. Current legal proceedings involving the Company’s patents and other intellectual property rights are described in Note 21, “Legal Proceedings—IntellectualProperty” of the Notes to the Consolidated Financial Statements included in Item 8 of this Report.
The Company’s businesses operate in highly competitive product markets and competitive pressures could adversely affect the Company’s earnings.
The Company faces substantial competition in all three operating segments and in all geographic markets. The Company’s businesses compete with companies ofall sizes on the basis of cost-effectiveness, technological innovations, intellectual property rights, product performance, real or perceived product advantages,pricing and availability and rate of reimbursement. The Company also competes with other market participants in securing rights to acquisitions, collaborations andlicensing
6

agreements with third parties. Competition for rights to product candidates and technologies may result in significant investment and acquisition costs and onerousagreement terms for the Company. Competitors’ development of more effective or less costly products, and/or their ability to secure patent and other intellectualproperty rights and successfully market products ahead of the Company, could negatively impact sales of the Company’s existing products as well as its ability tobring new products to market despite significant prior investment in the related product development.
For the Company’s pharmaceutical businesses, loss of patent exclusivity for a product often is followed by a substantial reduction in sales as competitors gainregulatory approval for generic and other competing products and enter the market. Similar competition can be triggered by the loss of exclusivity for a biologicalproduct. For the Company’s medical device businesses, technological innovation, product quality, reputation and customer service are especially important tocompetitiveness. Development by other companies of new or improved products, processes and technologies could threaten to make the Company’s products ortechnologies less desirable, less economical or obsolete. The Company’s consumer businesses face intense competition from other branded products and retailers’private-label brands. If the Company fails to sufficiently differentiate and market its brand name consumer products, this could adversely affect revenues andprofitability of those products.
Significant challenges or delays in the Company’s innovation and development of new products, technologies and indications could have an adverseimpact on the Company’s long-term success.
The Company’s continued growth and success depends on its ability to innovate and develop new and differentiated products and services that address theevolving health care needs of patients, providers and consumers. Development of successful products and technologies is also necessary to offset revenue losseswhen the Company’s existing products lose market share due to various factors such as competition and loss of patent exclusivity. New products introduced withinthe past five years accounted for approximately 22% of 2017 sales. The Company cannot be certain when or whether it will be able to develop, license or otherwiseacquire companies, products and technologies, whether particular product candidates will be granted regulatory approval, and, if approved, whether the productswill be commercially successful.
The Company pursues product development through internal research and development as well as through collaborations, acquisitions, joint ventures and licensingor other arrangements with third parties. In all of these contexts, developing new products, particularly pharmaceutical and biotechnology products and medicaldevices, requires significant investment of resources over many years. Only a very few biopharmaceutical research and development programs result incommercially viable products. The process depends on many factors including the ability to discern patients’ and health care providers’ future needs; developpromising new compounds, strategies and technologies; achieve successful clinical trial results; secure effective intellectual property protection; obtain regulatoryapprovals on a timely basis; and, if and when they reach the market, successfully differentiate the Company’s products from competing products and approaches totreatment. New products or enhancements to existing products may not be accepted quickly or significantly in the marketplace due to product and pricecompetition, changes in customer preferences or healthcare purchasing patterns, resistance by healthcare providers or uncertainty over third-party reimbursement.Even following initial regulatory approval, the success of a product can be adversely impacted by safety and efficacy findings in larger real world patientpopulations, as well as market entry of competitive products.
The Company faces increasing regulatory scrutiny which imposes significant compliance costs and exposes the Company to government investigations,legal actions and penalties.
Like other companies in the healthcare industry, the Company is subject to extensive regulation, investigations and legal action, by national, state and localgovernment agencies in the United States and other countries in which they operate. Regulatory issues regarding compliance with Good Manufacturing Practices(cGMP) (and comparable quality regulations in foreign countries) by manufacturers of drugs, devices and consumer products can lead to fines and penalties,product recalls, product shortages, interruptions in production, delays in new product approvals and litigation. In addition, the marketing, pricing and sale of theCompany’s products are subject to regulation, investigations and legal actions including under the Federal Food, Drug, and Cosmetic Act, the Medicaid RebateProgram, federal and state false claims acts, state unfair trade practices acts and consumer protection laws. Increased scrutiny of health care industry businesspractices in recent years by government agencies and state attorneys general in the U.S., and any resulting investigations and prosecutions, carry risk of significantcivil and criminal penalties including, but not limited to, debarment from participation in government healthcare programs. Any such debarment could have amaterial adverse effect on the Company’s business and results of operations. The most significant current investigations and litigation brought by governmentagencies are described in Note 21, “Legal Proceedings-Government Proceedings” under Notes to the Consolidated Financial Statements included in Item 8 of thisReport.
7

The Company faces a variety of risks associated with conducting business internationally.
The Company’s extensive operations and business activity outside the U.S. are accompanied by certain financial, economic and political risks, including thoselisted below.
Foreign Currency Exchange : In fiscal 2017, approximately 48% of the Company’s sales occurred outside of the U.S., with approximately 22% in Europe, 8% inthe Western Hemisphere, excluding the U.S., and 18% in the Asia-Pacific and Africa region. Changes in non-U.S. currencies relative to the U.S. dollar impact theCompany’s revenues and expenses. While the Company uses financial instruments to mitigate the impact of fluctuations in currency exchange rates on its cashflows, unhedged exposures continue to be subject to currency fluctuations. In addition, the weakening or strengthening of the U.S. dollar may result in significantfavorable or unfavorable translation effects when the operating results of the Company’s non-U.S. business activity are translated into U.S. dollars.
Inflation and Currency Devaluation Risks : The Company faces challenges in maintaining profitability of operations in economies experiencing high inflationrates. The Company has accounted for operations in Venezuela as highly inflationary, as the prior three-year cumulative inflation rate surpassed 100%. While theCompany strives to maintain profit margins in these areas through cost reduction programs, productivity improvements and periodic price increases, it mightexperience operating losses as a result of continued inflation. In addition, the impact of currency devaluations in countries experiencing high inflation rates orsignificant currency exchange fluctuations could negatively impact the Company’s operating results.
Illegal Importation of Pharmaceutical Products : The illegal importation of pharmaceutical products from countries where government price controls or othermarket dynamics result in lower prices may adversely affect the Company’s sales and profitability in the U.S. and other countries in which the Company operates.With the exception of limited quantities of prescription drugs for personal use, foreign imports of pharmaceutical products are illegal under current U.S. law.However, the volume of illegal imports continues to rise as the ability of patients and other customers to obtain the lower-priced imports has grown significantly.
Anti-Bribery and Other Regulations: The Company is subject to various federal and foreign laws that govern its international business practices with respect topayments to government officials. Those laws include the U.S. Foreign Corrupt Practices Act (FCPA), which prohibits U.S. publicly traded companies frompromising, offering, or giving anything of value to foreign officials with the corrupt intent of influencing the foreign official for the purpose of helping theCompany obtain or retain business or gain any improper advantage. The Company’s business is heavily regulated and therefore involves significant interactionwith foreign officials. Also, in many countries outside the U.S., the health care providers who prescribe human pharmaceuticals are employed by the governmentand the purchasers of human pharmaceuticals are government entities; therefore, the Company’s interactions with these prescribers and purchasers are subject toregulation under the FCPA. In addition to the U.S. application and enforcement of the FCPA, various jurisdictions in which the Company operates have laws andregulations, including the U.K Bribery Act 2010, aimed at preventing and penalizing corrupt and anticompetitive behavior. Enforcement activities under these lawscould subject the Company to additional administrative and legal proceedings and actions, which could include claims for civil penalties, criminal sanctions, andadministrative remedies, including exclusion from health care programs.
Other Legal, Social and Political Risks . Other risks inherent in conducting business globally include:
• protective economic policies taken by governments such as trade protection measures and import/export licensing requirements;• compliance with local regulations and laws including, in some countries, regulatory requirements restricting the Company’s ability to manufacture or sell
its products in the relevant market;• diminished protection of intellectual property and contractual rights in certain jurisdictions;• potential nationalization or expropriation of the Company’s foreign assets; and• disruptions to markets due to war, armed conflict, terrorism, social upheavals or pandemics.
Interruptions and delays in manufacturing operations could adversely affect the Company’s business, sales and reputation.
The Company’s manufacture of products requires the timely delivery of sufficient amounts of complex, high-quality components and materials. The Company'ssubsidiaries operate 125 manufacturing facilities as well as sourcing from hundreds of suppliers around the world. The Company has in the past, and may in thefuture, face unanticipated interruptions and delays in manufacturing through its internal or external supply chain. Manufacturing disruptions can occur for manyreasons including regulatory action, production quality deviations or safety issues, labor disputes, site-specific incidents (such as fires), natural disasters such ashurricanes and other severe weather events, raw material shortages, political unrest and terrorist attacks. Such
8

delays and difficulties in manufacturing can result in product shortages, declines in sales and reputational impact as well as significant remediation and relatedcosts associated with addressing the shortage.
An information security incident, including a cybersecurity breach, could have a negative impact to the Company’s business or reputation
To meet business objectives, the Company relies on both internal information technology (IT) systems and networks, and those of third parties and their vendors,to process and store sensitive data, including confidential research, business plans, financial information, intellectual property, and personal data that may besubject to legal protection. The extensive information security and cybersecurity threats, which affect companies globally, pose a risk to the security andavailability of these IT systems and networks, and the confidentiality, integrity, and availability of the Company’s sensitive data. The Company continuallyassesses these threats and makes investments to increase internal protection, detection, and response capabilities, as well as ensure the Company’s third partyproviders have required capabilities and controls, to address this risk. To date, the Company has not experienced any material impact to the business or operationsresulting from information or cybersecurity attacks; however, because of the frequently changing attack techniques, along with the increased volume andsophistication of the attacks, there is the potential for the Company to be adversely impacted. This impact could result in reputational, competitive, operational orother business harm as well as financial costs and regulatory action.
9

Item 1B. UNRESOLVED STAFF COMMENTS
Not applicable.
Item 2. PROPERTIES
The Company's subsidiaries operate 125 manufacturing facilities occupying approximately 21.9 million square feet of floor space. The manufacturingfacilities are used by the industry segments of the Company’s business approximately as follows:
Segment Square Feet
(in thousands)
Consumer 6,787Pharmaceutical 7,304Medical Devices 7,782
Worldwide Total 21,873
Within the United States, seven facilities are used by the Consumer segment, six by the Pharmaceutical segment and 27 by the Medical Devices segment.Outside of the United States, 30 facilities are used by the Consumer segment, 16 by the Pharmaceutical segment and 39 by the Medical Devices segment.
The locations of the manufacturing facilities by major geographic areas of the world are as follows:
Geographic Area Number of Facilities Square Feet
(in thousands)
United States 40 6,300Europe 37 7,939Western Hemisphere, excluding U.S. 14 2,800Africa, Asia and Pacific 34 4,834
Worldwide Total 125 21,873
In addition to the manufacturing facilities discussed above, the Company maintains numerous office and warehouse facilities throughout the world.Research facilities are also discussed in Item 1 of this Report under “Business – Research and Development.”
The Company's subsidiaries generally seek to own their manufacturing facilities, although some, principally in non-U.S. locations, are leased. Office andwarehouse facilities are often leased. The Company also engages contract manufacturers.
The Company is committed to maintaining all of its properties in good operating condition.
McNEIL-PPC, Inc. (now Johnson & Johnson Consumer Inc.) (McNEIL-PPC) continues to operate under a consent decree, signed in 2011 with the FDA,which governs certain McNeil Consumer Healthcare manufacturing operations, and requires McNEIL-PPC to remediate the facilities it operates in Lancaster,Pennsylvania, Fort Washington, Pennsylvania, and Las Piedras, Puerto Rico (the "Consent Decree"). Following FDA inspections in 2015, McNEIL-PPC receivednotifications from the FDA that all three manufacturing facilities are in conformity with applicable laws and regulations, and commercial production has restarted.
Under the Consent Decree, after receiving notice from the FDA of being in compliance with applicable laws and regulations, each of the three facilities issubject to a five-year audit period by a third-party cGMP expert. Thus, a third-party expert will continue to reassess the sites at various times until at least 2020.
For information regarding lease obligations, see Note 16 “Rental Expense and Lease Commitments” of the Notes to Consolidated Financial Statementsincluded in Item 8 of this Report. Segment information on additions to property, plant and equipment is contained in Note 18 “Segments of Business andGeographic Areas” of the Notes to Consolidated Financial Statements included in Item 8 of this Report.
10

Item 3. LEGAL PROCEEDINGS
The information called for by this item is incorporated herein by reference to the information set forth in Note 21 “Legal Proceedings” of the Notes toConsolidated Financial Statements included in Item 8 of this Report.
In addition, Johnson & Johnson and its subsidiaries are from time to time party to government investigations, inspections or other proceedings relatingto environmental matters, including their compliance with applicable environmental laws.
Item 4. MINE SAFETY DISCLOSURES
Not applicable.
EXECUTIVE OFFICERS OF THE REGISTRANT
Listed below are the executive officers of the Company. There are no family relationships between any of the executive officers, and there is noarrangement or understanding between any executive officer and any other person pursuant to which the executive officer was selected. At the annual meeting ofthe Board of Directors, the executive officers are elected by the Board to hold office for one year and until their respective successors are elected and qualified, oruntil earlier resignation or removal.
Information with regard to the directors of the Company, including information for Alex Gorsky, who is also an executive officer, is incorporated hereinby reference to the material captioned “Item 1. Election of Directors” in the Proxy Statement.
Name Age Position
Dominic J. Caruso 60 Member, Executive Committee; Executive Vice President; Chief Financial Officer (a)
Joaquin Duato
55
Member, Executive Committee; Executive Vice President, Worldwide Chairman,Pharmaceuticals (b)
Peter M. Fasolo 55 Member, Executive Committee; Executive Vice President, Chief Human Resources Officer (c)
Alex Gorsky 57 Chairman, Board of Directors; Chairman, Executive Committee; Chief Executive OfficerJorge Mesquita 56 Member, Executive Committee; Executive Vice President, Worldwide Chairman, Consumer (d)
Sandra E. Peterson 59 Member, Executive Committee; Executive Vice President, Group Worldwide Chairman (e)
Paulus Stoffels 56 Member, Executive Committee; Executive Vice President, Chief Scientific Officer (f)
Michael H. Ullmann 59 Member, Executive Committee; Executive Vice President, General Counsel (g)
(a) Mr. D. J. Caruso joined the Company in 1999 when the Company acquired Centocor, Inc., where he was Senior Vice President, Finance. Mr. Caruso wasnamed Vice President, Finance of Ortho-McNeil Pharmaceutical, Inc., a subsidiary of the Company, in 2001, and Vice President, Group Finance of theCompany’s Medical Devices and Diagnostics Group in 2003. In 2005, Mr. Caruso was named Vice President of the Company’s Group Financeorganization. Mr. Caruso became a member of the Executive Committee and Vice President, Finance and Chief Financial Officer in 2007. In April 2016,he was named Executive Vice President, Chief Financial Officer. Mr. Caruso has responsibility for financial and investor relations activities, as well asthe Company’s procurement organization.
(b) Mr. J. Duato joined the Company in 1989 with Janssen-Farmaceutica S.A. (Spain) and in 1997 became Managing Director of Janssen-Cilag S.p.A. (Italy).In 2000, he led Ortho Biotech Europe before relocating to the United States in 2002 to serve as Vice President, and, in 2005, President of Ortho BiotechInc. In 2008, he was named Company Group Chairman, Ortho-Clinical Diagnostics, and in 2009, Company Group Chairman, Pharmaceuticals, where heoversaw pharmaceutical product launches and the major therapeutic franchises in Canada, the United States and Latin America. In 2011, he was namedWorldwide Chairman, Pharmaceuticals, responsible for the global commercial businesses of the Janssen Pharmaceutical Companies, including functionalsupport for the research & development organizations. In April 2016, Mr. Duato became a member of the Executive Committee and was named ExecutiveVice President, Worldwide Chairman, Pharmaceuticals.
11

(c) Dr. P. M. Fasolo joined the Company in 2004 as Vice President, Worldwide Human Resources for Cordis Corporation, a subsidiary of the Company, andwas subsequently named Vice President, Global Talent Management for the Company. He left Johnson & Johnson in 2007 to join Kohlberg KravisRoberts & Co. as Chief Talent Officer. Dr. Fasolo returned to the Company in 2010 as the Vice President, Global Human Resources, and in 2011, hebecame a member of the Executive Committee. In April 2016, he was named Executive Vice President, Chief Human Resources Officer. Mr. Fasolo hasresponsibility for global talent, recruiting, diversity, compensation, benefits, employee relations and all aspects of human resources for the Company.
(d) Mr. J. Mesquita joined the Company in 2014 as Worldwide Chairman, Consumer. Prior to joining the Company, he served in various marketing andleadership capacities across Latin America, including roles in Oral Care and Beauty at The Procter & Gamble Company from 1984 to 2013. In April2016, Mr. Mesquita became a member of the Executive Committee and was named as Executive Vice President, Worldwide Chairman, Consumer.
(e) Ms. S. E. Peterson joined the Company in 2012 as Group Worldwide Chairman and a member of the Executive Committee. Prior to joining the Company,Ms. Peterson was Chairman and Chief Executive Officer of Bayer CropScience AG in Germany, previously serving as President and Chief ExecutiveOfficer of Bayer Medical Care and President of Bayer HealthCare AG's Diabetes Care Division. Before joining Bayer in 2005, Ms. Peterson held anumber of leadership roles at Medco Health Solutions (previously known as Merck-Medco). In April 2016, Ms. Peterson was named Executive VicePresident, Group Worldwide Chairman of Johnson & Johnson. Ms. Peterson is responsible for the Company’s consumer-facing businesses, including theconsumer family of companies and the consumer medical device businesses; the Company’s medical device businesses; and for supply chain, quality,information technology, and design across the enterprise.
(f) Dr. P. Stoffels joined the Company in 2002 with the acquisition of Tibotec Virco NV, where he was Chief Executive Officer of Virco NV and Chairmanof Tibotec NV. In 2005, he was appointed Company Group Chairman, Global Virology. In 2006, he assumed the role of Company Group Chairman,Pharmaceuticals, with responsibility for worldwide research and development for the Central Nervous System and Internal Medicine Franchises. Dr.Stoffels was appointed Global Head, Research & Development, Pharmaceuticals in 2009, and in 2011, became Worldwide Chairman, Pharmaceuticals,with responsibility for the Company's therapeutic pipeline through global research and development and strategic business development. In 2012, Dr.Stoffels was appointed Chief Scientific Officer, with responsibility for enterprise-wide innovation and product safety, and became a member of theExecutive Committee. In April 2016, Dr. Stoffels was named Executive Vice President, Chief Scientific Officer. He is responsible for the Company’sinnovation pipeline across the pharmaceutical, medical devices and consumer segments and steers the Company’s global public health strategy.
(g) Mr. M. H. Ullmann joined the Company in 1989 as a corporate attorney in the Law Department. He was appointed Corporate Secretary in 1999 andserved in that role until 2006. During that time, he also held various management positions in the Law Department. In 2006, he was named GeneralCounsel, Medical Devices and Diagnostics and was appointed Vice President, General Counsel and became a member of the Executive Committee in2012. In April 2016, Mr. Ullmann was named Executive Vice President, General Counsel. Mr. Ullmann has worldwide responsibility for legal,government affairs & policy, global security, aviation and health care compliance & privacy.
12
PART II
Item 5. MARKET FOR REGISTRANT’S COMMON EQUITY, RELATED STOCKHOLDER MATTERS AND ISSUER PURCHASES OFEQUITY SECURITIES
As of February 16, 2018, there were 147,484 record holders of common stock of the Company. Additional information called for by this item isincorporated herein by reference to the following sections of this Report: “Item 7. Management’s Discussion and Analysis of Results of Operations and FinancialCondition – Liquidity and Capital Resources – Dividends” and “— Other Information — Common Stock Market Prices”; Note 17 “Common Stock, Stock OptionPlans and Stock Compensation Agreements” of the Notes to Consolidated Financial Statements included in Item 8; and Item 12 “Security Ownership of CertainBeneficial Owners and Management and Related Stockholder Matters – Equity Compensation Plan Information”.
Issuer Purchases of Equity Securities
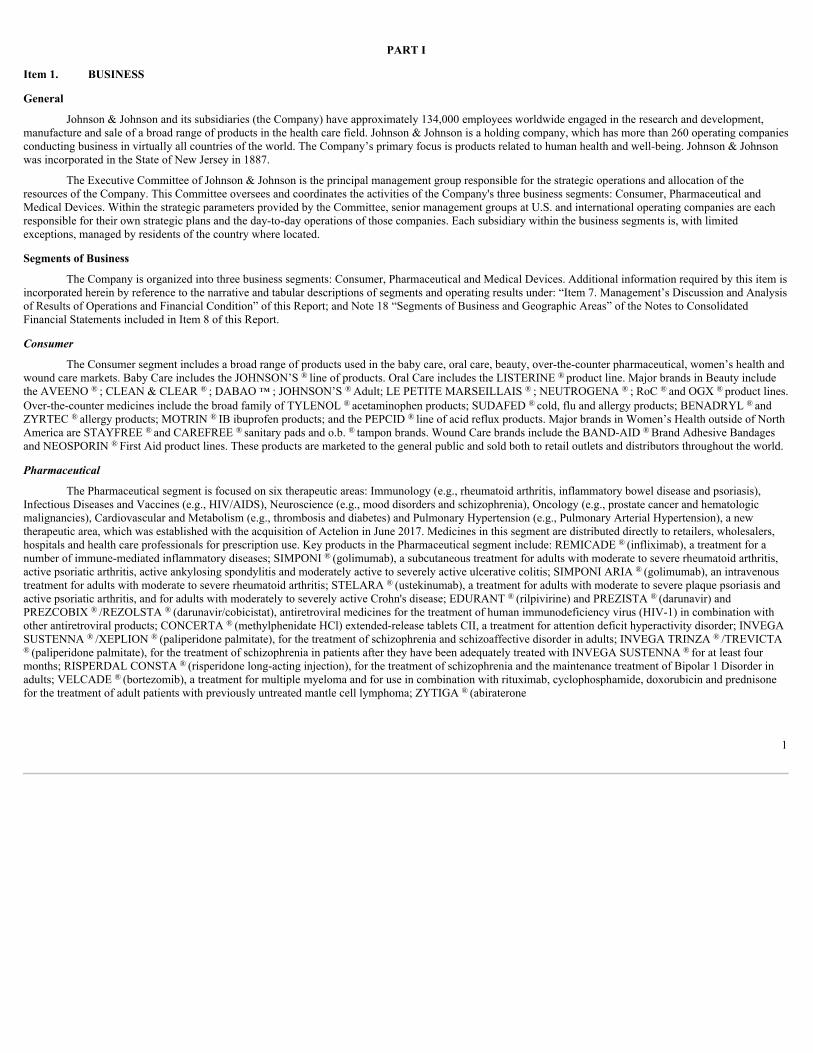
On October 13, 2015, the Company announced that its Board of Directors approved a share repurchase program, authorizing the Company to purchase upto $10.0 billion of the Company's Common Stock. Share repurchases take place on the open market from time to time based on market conditions. As of July 2,2017, $10.0 billion was repurchased under the program and the program was completed.
The following table provides information with respect to common stock purchases by the Company during the fiscal fourth quarter of 2017. Commonstock purchases on the open market are made as part of a systematic plan to meet the needs of the Company’s compensation programs. The repurchases below alsoinclude the stock-for-stock option exercises that settled in the fiscal fourth quarter.
Period
Total Numberof Shares
Purchased (1) Avg. Price
Paid Per Share
Total Number ofShares (or Units)
Purchased as Part ofPublicly AnnouncedPlans or Programs (2)
Maximum Number (orApproximate Dollar Value) of
Shares (or Units) that MayYet Be Purchased Under the
Plans or ProgramsOctober 2, 2017 through October 29, 2017 335,583 $ 141.89 - -October 30, 2017 through November 26, 2017 2,139,701 139.98 - -November 27, 2017 through December 31, 2017 3,318,630 141.06 - -Total 5,793,914 (1)During the fiscal fourth quarter of 2017, the Company repurchased an aggregate of 5,793,914 shares of Johnson & Johnson Common Stock in open-market
transactions as part of a systematic plan to meet the needs of the Company’s compensation programs.(2) As of July 2, 2017, the share repurchase program was completed with an aggregate of 86,592,946 shares purchased for a total of $10.0 billion since the
inception of the repurchase program announced on October 13, 2015.
13

Item 6. SELECTED FINANCIAL DATA
Summary of Operations and Statistical Data 2007-2017
(Dollars in Millions Except Per ShareAmounts) 2017 2016 2015 2014 2013 2012 2011 2010 2009 2008 2007
Sales to customers — U.S. $39,863 37,811 35,687 34,782 31,910 29,830 28,908 29,450 30,889 32,309 32,444
Sales to customers — International 36,587 34,079 34,387 39,549 39,402 37,394 36,122 32,137 31,008 31,438 28,651
Total sales 76,450 71,890 70,074 74,331 71,312 67,224 65,030 61,587 61,897 63,747 61,095
Cost of products sold 25,354 21,685 21,536 22,746 22,342 21,658 20,360 18,792 18,447 18,511 17,751Selling, marketing and administrativeexpenses 21,420 19,945 21,203 21,954 21,830 20,869 20,969 19,424 19,801 21,490 20,451
Research and development expense 10,554 9,095 9,046 8,494 8,183 7,665 7,548 6,844 6,986 7,577 7,680
In-process research and development 408 29 224 178 580 1,163 — — — 181 807
Interest income (385) (368) (128) (67) (74) (64) (91) (107) (90) (361) (452)
Interest expense, net of portion capitalized 934 726 552 533 482 532 571 455 451 435 296
Other (income) expense, net 183 484 (2,064) (70) 2,498 1,626 2,743 (768) (526) (1,015) 534
Restructuring 309 491 509 — — — 569 — 1,073 — 745
58,777 52,087 50,878 53,768 55,841 53,449 52,669 44,640 46,142 46,818 47,812Earnings before provision for taxes onincome $17,673 19,803 19,196 20,563 15,471 13,775 12,361 16,947 15,755 16,929 13,283
Provision for taxes on income 16,373 3,263 3,787 4,240 1,640 3,261 2,689 3,613 3,489 3,980 2,707
Net earnings 1,300 16,540 15,409 16,323 13,831 10,514 9,672 13,334 12,266 12,949 10,576Add: Net loss attributable to noncontrollinginterest — — — — — 339 — — — — —Net earnings attributable to Johnson &Johnson 1,300 16,540 15,409 16,323 13,831 10,853 9,672 13,334 12,266 12,949 10,576
Percent of sales to customers 1.7% 23.0 22.0 22.0 19.4 16.1 14.9 21.7 19.8 20.3 17.3Diluted net earnings per share of commonstock (1) $0.47 5.93 5.48 5.70 4.81 3.86 3.49 4.78 4.40 4.57 3.63Percent return on average shareholders’equity 2.0% 23.4 21.9 22.7 19.9 17.8 17.0 24.9 26.4 30.2 25.6Percent increase (decrease) overprevious year:
Sales to customers 6.3% 2.6 (5.7) 4.2 6.1 3.4 5.6 (0.5) (2.9) 4.3 14.6
Diluted net earnings per share (92.1)% 8.2 (3.9) 18.5 24.6 10.6 (27.0) 8.6 (3.7) 25.9 (2.7)
Supplementary balance sheet data:
Property, plant and equipment, net 17,005 15,912 15,905 16,126 16,710 16,097 14,739 14,553 14,759 14,365 14,185
Additions to property, plant and equipment 3,279 3,226 3,463 3,714 3,595 2,934 2,893 2,384 2,365 3,066 2,942
Total assets 157,303 141,208 133,411 130,358 131,754 121,347 113,644 102,908 94,682 84,912 80,954
Long-term debt 30,675 22,442 12,857 15,122 13,328 11,489 12,969 9,156 8,223 8,120 7,074
Operating cash flow 21,056 18,767 19,569 18,710 17,414 15,396 14,298 16,385 16,571 14,972 15,022
Common stock information
Dividends paid per share $3.32 3.15 2.95 2.76 2.59 2.40 2.25 2.11 1.93 1.795 1.62
Shareholders’ equity per share 22.43 26.02 25.82 25.06 26.25 23.33 20.95 20.66 18.37 15.35 15.25
Market price per share (year-end close) $139.72 115.21 102.72 105.06 92.35 69.48 65.58 61.85 64.41 58.56 67.38Average shares outstanding (millions)
— basic 2,692.0 2,737.3 2,771.8 2,815.2 2,809.2 2,753.3 2,736.0 2,751.4 2,759.5 2,802.5 2,882.9
— diluted 2,745.3 2,788.9 2,812.9 2,863.9 2,877.0 2,812.6 2,775.3 2,788.8 2,789.1 2,835.6 2,910.7
Employees (thousands) 134.0 126.4 127.1 126.5 128.1 127.6 117.9 114.0 115.5 118.7 119.2(1) Attributable to Johnson & Johnson
14

Item 7. MANAGEMENT’S DISCUSSION AND ANALYSIS OF RESULTS OF OPERATIONS AND FINANCIAL CONDITION
Organization and Business SegmentsDescription of the Company and Business SegmentsJohnson & Johnson and its subsidiaries (the Company) have approximately 134,000 employees worldwide engaged in the research and development, manufactureand sale of a broad range of products in the health care field. The Company conducts business in virtually all countries of the world with the primary focus onproducts related to human health and well-being.
The Company is organized into three business segments: Consumer, Pharmaceutical and Medical Devices. The Consumer segment includes a broad range ofproducts used in the baby care, oral care, beauty, over-the-counter pharmaceutical, women’s health and wound care markets. These products are marketed to thegeneral public and sold both to retail outlets and distributors throughout the world. The Pharmaceutical segment is focused on six therapeutic areas, includingimmunology, infectious diseases, neuroscience, oncology, pulmonary hypertension, and cardiovascular and metabolic diseases. Products in this segment aredistributed directly to retailers, wholesalers, hospitals and health care professionals for prescription use. The Medical Devices segment includes a broad range ofproducts used in the orthopaedic, surgery, cardiovascular, diabetes care and vision care fields which are distributed to wholesalers, hospitals and retailers, and usedprincipally in the professional fields by physicians, nurses, hospitals, eye care professionals and clinics.
The Executive Committee of Johnson & Johnson is the principal management group responsible for the strategic operations and allocation of the resources ofthe Company. This Committee oversees and coordinates the activities of the Consumer, Pharmaceutical and Medical Devices business segments.
In all of its product lines, the Company competes with companies both locally and globally, throughout the world. Competition exists in all product lineswithout regard to the number and size of the competing companies involved. Competition in research, involving the development and the improvement of new andexisting products and processes, is particularly significant. The development of new and innovative products, as well as protecting the underlying intellectualproperty of the Company's product portfolio, is important to the Company’s success in all areas of its business. The competitive environment requires substantialinvestments in continuing research. In addition, the development and maintenance of customer demand for the Company’s consumer products involves significantexpenditures for advertising and promotion.
Management’s ObjectivesWith “Our Credo” as the foundation, the Company’s purpose is to blend heart, science and ingenuity to profoundly change the trajectory of health for humanity.The Company is committed to bringing its full breadth and depth to ensure health for people today and for future generations. United around this commonambition, the Company is poised to fulfill its purpose and successfully meet the demands of the rapidly evolving markets in which it competes.
The Company is broadly based in human healthcare, and is committed to creating value by developing accessible, high quality, innovative products andservices. New products introduced within the past five years accounted for approximately 22% of 2017 sales. In 2017, $10.6 billion was invested in research anddevelopment and $35.2 billion spent on acquisitions, reflecting management’s commitment to create life-enhancing innovations and to create value throughpartnerships that will profoundly change the trajectory of health for humanity.
A critical driver of the Company’s success, is the 134,000 diverse employees that work across more than 260 operating companies, which are located in morethan 60 countries. Employees are empowered and inspired to lead with the Company’s Our Credo and purpose as guides. This allows every employee to use theCompany’s reach and size to advance the Company's purpose, and to also lead with agility and urgency. Leveraging the extensive resources across the enterprise,enables the Company to innovate and execute with excellence. This ensures the Company can remain focused on addressing the unmet needs of society every dayand invest for an enduring impact, ultimately delivering value to its patients, consumers and healthcare professionals, employees, communities and shareholders.
15

Results of OperationsAnalysis of Consolidated SalesIn 2017, worldwide sales increased 6.3% to $76.5 billion, compared to an increase of 2.6% in 2016 and a decrease of 5.7% in 2015. These sales changes consistedof the following:
Sales increase/(decrease) due to: 2017 2016 2015
Volume 8.0 % 3.2% 1.2 %Price (2.0) 0.7 0.6Currency 0.3 (1.3) (7.5)
Total 6.3 % 2.6% (5.7)%
In 2017, the net impact of acquisitions and divestitures on the worldwide sales growth was a positive impact of 3.6%. In 2016, acquisitions and divestitures had anegative impact of 1.1% on the worldwide sales growth and competitive products to the Company's Hepatitis C products, OLYSIO ® /SOVRIAD ® (simeprevir)and INCIVO ® (telaprevir), had a negative impact of 0.8% on the worldwide sales growth. Operations in Venezuela negatively impacted the worldwide salesgrowth 0.3%. In 2015, the introduction of competitive products to the Company's Hepatitis C products, OLYSIO ® /SOVRIAD ® (simeprevir) and INCIVO ®(telaprevir), had a negative impact of 2.7% on the worldwide sales growth. In 2015, the impact of acquisitions and divestitures on the worldwide sales growth wasnegative 2.0%.
Sales by U.S. companies were $39.9 billion in 2017, $37.8 billion in 2016 and $35.7 billion in 2015. This represents increases of 5.4% in 2017, 6.0% in 2016and 2.6% in 2015. Sales by international companies were $36.6 billion in 2017, $34.1 billion in 2016 and $34.4 billion in 2015. This represents an increase of 7.4%in 2017, and decreases of 0.9% in 2016, and 13.1% in 2015.
The five-year compound annual growth rates for worldwide, U.S. and international sales were 2.6%, 6.0% and (0.4)%, respectively. The ten-year compoundannual growth rates for worldwide, U.S. and international sales were 2.3%, 2.1% and 2.5%, respectively.
In 2017, sales by companies in Europe achieved growth of 8.6% as compared to the prior year, including operational growth of 7.2% and a positive currencyimpact of 1.4%. Sales by companies in the Western Hemisphere (excluding the U.S.) achieved growth of 5.4% as compared to the prior year, including operationalgrowth of 2.8% and a positive currency impact of 2.6%. Sales by companies in the Asia-Pacific, Africa region achieved growth of 6.7% as compared to the prioryear, including operational growth of 7.5% partially offset by a negative currency impact of 0.8%.
The 2016 sales growth percentage as compared to the prior year was negatively impacted by approximately 1.3% from additional shipping days in 2015. (SeeNote 1 to the Consolidated Financial Statements for Annual Closing Date details). While the additional week in 2015 added a few days to sales, it also added a fullweek's worth of operating costs; therefore, the net earnings impact was negligible.
In 2017, the Company had two wholesalers distributing products for all three segments that represented approximately 14.0% and 10.0% of the totalconsolidated revenues. In 2016, the Company had two wholesalers distributing products for all three segments that represented approximately 13.5% and 10.7% ofthe total consolidated revenues. In 2015, the Company had one wholesaler distributing products for all three segments that represented approximately 12.5% of thetotal consolidated revenues.
16

Analysis of Sales by Business SegmentsConsumer SegmentConsumer segment sales in 2017 were $13.6 billion, an increase of 2.2% from 2016, which included 1.3% operational growth and a positive currency impact of0.9%. U.S. Consumer segment sales were $5.6 billion, an increase of 2.7%. International sales were $8.0 billion, an increase of 1.9%, which included 0.4%operational growth and a positive currency impact of 1.5%. In 2017, acquisitions and divestitures had a net positive impact of 1.8% on the operational sales growthof the worldwide Consumer segment.
Major Consumer Franchise Sales:
% Change
(Dollars in Millions) 2017 2016 2015 ’17 vs. ’16 ’16 vs. ’15Beauty $ 4,200 3,897 3,633 7.8 % 7.3OTC 4,126 3,977 3,895 3.7 2.1Baby Care 1,916 2,001 2,157 (4.2) (7.2)Oral Care 1,531 1,568 1,580 (2.4) (0.8)Women’s Health 1,050 1,067 1,200 (1.6) (11.1)Wound Care/Other 779 797 1,042 (2.3) (23.5)
Total Consumer Sales $ 13,602 13,307 13,507 2.2 % (1.5)
The Beauty franchise sales of $4.2 billion increased 7.8% as compared to the prior year. Growth was primarily driven by the inclusion of sales from the recentacquisitions, Vogue International LLC and Dr. Ci: Labo, as well as sales growth of NEUTROGENA ® products.
The Over-the-Counter (OTC) franchise sales of $4.1 billion increased 3.7% as compared to the prior year. Growth was primarily driven by analgesic productsin the U.S., upper respiratory products outside the U.S., sales from the recent acquisition of Rhinocort and anti-smoking aids.
The Baby Care franchise sales were $1.9 billion in 2017, a decrease of 4.2% compared to the prior year, primarily due to competitive pressure.The Oral Care franchise sales were $1.5 billion in 2017, a decrease of 2.4% as compared to the prior year, primarily driven by category declines and
competitive pressure partially offset by new product launches outside the U.S.The Women’s Health franchise sales were $1.1 billion in 2017, a decrease of 1.6% as compared to the prior year, primarily due to category declines in EMEA
and share loss in Brazil.The Wound Care/Other franchise sales were $0.8 billion in 2017, a decrease of 2.3% as compared to the prior year, primarily due to private label competitive
pressure in the U.S. partially offset by BAND-AID ® new product launches outside the U.S.Consumer segment sales in 2016 were $13.3 billion, a decrease of 1.5% from 2015, which included 1.5% operational growth offset by a negative currency
impact of 3.0%. U.S. Consumer segment sales were $5.4 billion, an increase of 3.8%. International sales were $7.9 billion, a decrease of 4.8%, which included0.1% operational growth offset by a negative currency impact of 4.9%. In 2016, the impact of acquisitions and divestitures on the Consumer segment operationalsales growth was negative 0.5%. In 2016, the Consumer segment operational sales growth was negatively impacted 1.2% by operations in Venezuela andnegatively impacted by 1.1% due to additional shipping days in 2015.
17

Pharmaceutical SegmentPharmaceutical segment sales in 2017 were $36.3 billion, an increase of 8.3% from 2016, which included operational growth of 8.0% and a positive currencyimpact of 0.3%. U.S. sales were $21.5 billion, an increase of 6.7%. International sales were $14.8 billion, an increase of 10.8%, which included 10.1% operationalgrowth and a positive currency impact of 0.7%. In 2017, acquisitions and divestitures had a net positive impact of 3.8% on the operational sales growth of theworldwide Pharmaceutical segment. Adjustments to previous reserve estimates, as compared to the prior year, negatively impacted the reported Pharmaceuticalsegment operational growth by approximately 1.8%, primarily in the Immunology and Cardiovascular/Metabolism/Other therapeutic areas.
Major Pharmaceutical Therapeutic Area Sales: *
% Change
(Dollars in Millions) 2017 2016 2015 ’17 vs. ’16 ’16 vs. ’15Total Immunology $ 12,244 11,968 10,402 2.3 % 15.1 REMICADE ® 6,315 6,966 6,561 (9.3) 6.2 SIMPONI ® /SIMPONI ARIA ® 1,833 1,745 1,328 5.0 31.4 STELARA ® 4,011 3,232 2,474 24.1 30.6 Other Immunology 85 25 39 ** (35.9)Total Infectious Diseases 3,154 3,208 3,656 (1.7) (12.3) EDURANT ® /rilpivirine 714 573 410 24.6 39.8 PREZISTA ® / PREZCOBIX ® /REZOLSTA ® /SYMTUZA ® 1,821 1,851 1,810 (1.6) 2.3 Other Infectious Diseases 619 784 1,436 (21.0) (45.4)Total Neuroscience 5,986 6,085 6,259 (1.6) (2.8) CONCERTA ® /methylphenidate 791 863 821 (8.3) 5.1 INVEGA SUSTENNA ® /XEPLION ® /TRINZA ® /TREVICTA ® 2,569 2,214 1,830 16.0 21.0 RISPERDAL CONSTA ® 805 893 970 (9.9) (7.9) Other Neuroscience 1,821 2,115 2,638 (13.9) (19.8)Total Oncology 7,258 5,807 4,695 25.0 23.7 DARZALEX ® 1,242 572 20 ** ** IMBRUVICA ® 1,893 1,251 689 51.3 81.6 VELCADE ® 1,114 1,224 1,333 (9.0) (8.2) ZYTIGA ® 2,505 2,260 2,231 10.8 1.3 Other Oncology 504 500 422 0.8 18.5Pulmonary Hypertension 1,327 — — *** *** OPSUMIT ® 573 — — *** *** TRACLEER ® 403 — — *** *** UPTRAVI ® 263 — — *** *** Other 88 — — *** ***Cardiovascular / Metabolism / Other 6,287 6,396 6,418 (1.7) (0.3) XARELTO ® 2,500 2,288 1,868 9.3 22.5 INVOKANA ® / INVOKAMET ® 1,111 1,407 1,308 (21.0) 7.6 PROCRIT ® /EPREX ® 972 1,105 1,068 (12.0) 3.5 Other 1,704 1,596 2,174 6.8 (26.6)
Total Pharmaceutical Sales $ 36,256 33,464 31,430 8.3 % 6.5* Prior year amounts have been reclassified to conform to current year presentation.** Percentage greater than 100% or not meaningful***Products acquired from Actelion on June 16, 2017
18

Immunology products achieved sales of $12.2 billion in 2017, representing an increase of 2.3% as compared to the prior year. Growth was driven by stronguptake of STELARA ® (ustekinumab), the launch of TREMFYA ® (guselkumab) and sales growth of SIMPONI ® /SIMPONI ARIA ® (golimumab) outside theU.S. Lower sales of REMICADE ® (infliximab) were due to increased discounts/rebates and biosimilar competition.
The patents for REMICADE ® (infliximab) in certain countries in Europe expired in February 2015. Biosimilar versions of REMICADE ® have beenintroduced in certain markets outside the United States, resulting in a reduction in sales of REMICADE ® in those markets. Additional biosimilar competition willlikely result in a further reduction in REMICADE ® sales in markets outside the United States. In the United States, a biosimilar version of REMICADE ® wasintroduced in 2016, and additional competitors continue to enter the market. Continued infliximab biosimilar competition in the U.S. market will result in a furtherreduction in U.S. sales of REMICADE ® . The Company continues to assert REMICADE ® related patent rights. See Note 21 to the Consolidated FinancialStatements for a description of legal matters regarding the REMICADE ® patents.
Infectious disease products sales were $3.2 billion, a decline of 1.7% from 2016. Lower sales of OLYSIO ® (simeprevir), vaccines and PREZISTA ®(darunavir/cobicistat) were partially offset by sales growth of EDURANT ® /rilpivirine, PREZCOBIX ® /REZOLSTA ® and the launch of SYMTUZA ® .
Neuroscience products sales were $6.0 billion, a decrease of 1.6% from 2016. Lower sales of RISPERDAL CONSTA ® (risperidone) and CONCERTA ®/methylphenidate as well as the impact of divestitures were partially offset by strong sales of INVEGA SUSTENNA ® /XEPLION ® / TRINZA ® /TREVICTA ®(paliperidone palmitate) long-acting injectables.
Oncology products achieved sales of $7.3 billion in 2017, representing an increase of 25.0% as compared to the prior year. Contributors to the growth ofOncology products were strong sales of DARZALEX ® (daratumumab) and IMBRUVICA ® (ibrutinib) driven by market share and market growth and sales ofZYTIGA ® (abiraterone acetate) driven by market growth. Several generic companies are challenging the remaining patent for ZYTIGA ® in the USPTO and in theUnited States District Court for the District of New Jersey. The Company is appealing a decision by the USPTO invalidating this patent, and the parties areawaiting a decision on a motion for summary judgment of non-infringement filed by the generic companies. In the event that the rulings are unfavorable to theCompany, a generic launch is expected to follow. If there is a launch of a generic version of ZYTIGA ® following FDA approval, it will result in a reduction inU.S. sales, and such reduction could occur in a short period of time. In 2017, the Company reported U.S. sales of $1.2 billion for ZYTIGA ® . See Note 21 to theConsolidated Financial Statements for a description of legal matters regarding ZYTIGA ® .
Pulmonary Hypertension is a new therapeutic area which was established with the acquisition of Actelion Ltd on June 16, 2017. See Note 20 to theConsolidated Financial Statements for additional details regarding the acquisition.
Cardiovascular/Metabolism/Other products sales were $6.3 billion, a decline of 1.7% as compared to the prior year attributable to lower sales of INVOKANA® /INVOKAMET ® (canagliflozin) in the U.S. primarily due to an increase in price discounts and market share decline driven by competitive pressure. This waspartially offset by sales growth of XARELTO ® (rivaroxaban) due to increased market growth and market share, as well as sales of non-PAH (pulmonary arterialhypertension) products from the Actelion acquisition.
19
During 2017, the Company advanced its pipeline with several regulatory submissions and approvals for new drugs and additional indications for existing drugs asfollows:
Product Name (ChemicalName) Indication US Approv EU Approv US Filing EU Filing apalutamide An oral androgen receptor inhibitor for men with non-metastatic castration-
resistant prostate cancer ü DARZALEX ® (daratumumab) In combination with lenalidomide and dexamethasone, or bortezomib and
dexamethasone, for the treatment of patients with multiple myeloma who havereceived at least one prior therapy
ü
In combination with pomalidomide and dexamethasone, or bortezomib anddexamethasone, for the treatment of patients with multiple myeloma who havereceived at least two prior therapies
ü
Frontline multiple myeloma transplant ineligible patients in combination withbortezomib, melphalan, and prednisone ü ü
IMBRUVICA ® (ibrutinib) Treatment for adult patients with chronic graft-versus-host-disease after failureof one or more lines of systemic therapy ü
Marginal zone lymphoma ü INVOKANA ® (canagliflozin) Reduce the risk of death in type 2 diabetes with established, or risk for,
cardiovascular disease. (CANVAS/CANVAS-R ) ü ü
JULUCA ® (rilpivirine anddolutegravir)
Single-tablet, two-drug regimen of dolutegravir and rilpivirine for themaintenance treatment of HIV-1 infection ü ü
SIMPONI ARIA ® (golimumab)
Treatment of adults living with active psoriatic arthritis and the treatment ofadults living with active ankylosing spondylitis ü
STELARA ® (ustekinumab) Treatment of adolescents (12 to 17 years of age) with moderate to severe plaquepsoriasis ü
SYMTUZA ® (darunavir/cobicistat/emtricitabine/tenofoviralafenamide)
Single tablet regimen for HIV in treatment naïve patients and treatmentexperienced patients
ü ü
TREMFYA ® (guselkumab) Treatment of adults living with moderate to severe plaque psoriasis ü ü XARELTO ® (rivaroxaban) A 10 mg once-daily dose for reducing the continued risk for recurrent venous
thromboembolism after completing at least six months of initial anticoagulationtherapy
ü
For two new vascular indications: reducing the risk of major cardiovascularevents and reducing the risk of acute limb ischemia in patients with PAD ü
ZYTIGA ® (abirateroneacetate)
Prostate Cancer Newly Diagnosed Hormone Naïve Metastatic ü ü
Pharmaceutical segment sales in 2016 were $33.5 billion, an increase of 6.5% from 2015, which included operational growth of 7.4% partially offset by anegative currency impact of 0.9%. U.S. sales were $20.1 billion, an increase of 9.8%. International sales were $13.3 billion, an increase of 1.8%, which included4.0% operational growth partially offset by a negative currency impact of 2.2%. In 2016, acquisitions, divestitures and competitive products to the Company'sHepatitis C products, OLYSIO ® /SOVRIAD ® (simeprevir) and INCIVO ® (telaprevir), had a negative impact of 2.5% on the operational growth of thePharmaceutical segment. In 2016, the Pharmaceutical segment operational growth was negatively impacted by 1.5% due to additional shipping days in 2015. ThePharmaceutical segment operational growth for 2016, as compared to the prior year, was not impacted by adjustments to previous reserve estimates as both periodsincluded approximately $0.5 billion of adjustments.
20

Medical Devices SegmentThe Medical Devices segment sales in 2017 were $26.6 billion, an increase of 5.9% from 2016, which included an operational increase of 5.7% and a positivecurrency impact of 0.2%. U.S. sales were $12.8 billion, an increase of 4.5% as compared to the prior year. International sales were $13.8 billion, an increase of7.1% as compared to the prior year, with an operational increase of 6.7% and a positive currency impact of 0.4%. In 2017, acquisitions and divestitures had a netpositive impact of 4.2% on the worldwide operational sales growth of the Medical Devices segment as compared to 2016.
Major Medical Devices Franchise Sales:
% Change
(Dollars in Millions) 2017 2016 2015 ’17 vs. ’16 ’16 vs. ’15Surgery $ 9,559 9,296 9,217 2.8 % 0.9 Advanced 3,756 3,517 3,275 6.8 7.4 General 4,463 4,362 4,482 2.3 (2.7) Specialty 1,340 1,417 1,460 (5.4) (2.9)Orthopaedics 9,258 9,334 9,262 (0.8) 0.8 Hips 1,394 1,361 1,332 2.4 2.2 Knees 1,523 1,524 1,496 (0.1) 1.9 Trauma 2,616 2,569 2,528 1.8 1.6 Spine & Other 3,725 3,880 3,906 (4.0) (0.7)Vision Care 4,063 2,785 2,608 45.9 6.8 Contact Lenses/Other 3,036 2,785 2,608 9.0 6.8 Surgical 1,027 — — * *Cardiovascular 2,096 1,849 2,036 13.4 (9.2)Diabetes Care 1,615 1,789 1,928 (9.7) (7.2)Diagnostics 1 66 86 ** **Total Medical Devices Sales $ 26,592 $ 25,119 25,137 5.9 % (0.1)*Products acquired from Abbott Medical Optics (AMO) on February 27, 2017** On June 30, 2014, the Company divested the Ortho-Clinical Diagnostics business (the Diagnostics Franchise)
The Surgery franchise sales were $9.6 billion in 2017, an increase of 2.8% from 2016. Growth in Advanced Surgery was primarily driven by endocutter,energy, including the acquisition of Megadyne Medical Products, Inc., and biosurgery products. Growth in General Surgery was primarily driven by sutures andsales from the acquisition of Torax Medical, Inc. The sales decline in Specialty Surgery was primarily due to lower sales of aesthetic, Advanced Sterilization andSterilmed products.
The Orthopaedics franchise sales were $9.3 billion in 2017, a decrease of 0.8% from 2016. The decline in Spine & Other was primarily due to the CodmanNeurosurgery divestiture, share loss in U.S. Spine, pricing and competitive pressures. This was partially offset by sales growth of trauma, sports medicine productsand U.S. hips.
The Vision Care franchise achieved sales of $4.1 billion in 2017, an increase of 45.9% from 2016. Growth was driven by sales from the acquisition of AMO,with the majority of AMO sales in the surgical category, and new product launches in the contact lenses category.
The Cardiovascular franchise sales were $2.1 billion, an increase of 13.4% from 2016. Strong growth in the electrophysiology business was driven by marketgrowth and continued uptake of the THERMOCOOL SMARTTOUCH ® Contact Force Sensing Catheter.
The Diabetes Care franchise sales were $1.6 billion, a decrease of 9.7% from 2016. The decline was primarily due to price declines and competitive pressures.Additionally, in the fourth quarter of 2017, the Company announced its decision to exit the Animas insulin pump business. Animas has selected Medtronic plc tofacilitate a seamless transition for patients, caregivers and healthcare providers. The Company is continuing to evaluate potential strategic options for LifeScan,Inc. and determine the best opportunity to drive future growth and maximize shareholder value.
The Medical Devices segment sales in 2016 were $25.1 billion, a decrease of 0.1% from 2015, which included an operational increase of 0.9% and a negativecurrency impact of 1.0%. U.S. sales were $12.3 billion, an increase of 1.1% as compared to the prior year. International sales were $12.9 billion, a decrease of1.2% as compared to the prior year, with an operational increase of 0.7% and a negative currency impact of 1.9%. In 2016, acquisitions and divestitures had anegative
21

impact of 1.8% on the worldwide operational growth of the Medical Devices segment as compared to 2015. In 2016, the Medical Devices segment operationalgrowth was negatively impacted by 0.9% due to additional shipping days in 2015.
Analysis of Consolidated Earnings Before Provision for Taxes on IncomeConsolidated earnings before provision for taxes on income decreased to $17.7 billion in 2017, as compared to $19.8 billion in 2016, a decrease of 10.8%. Thedecrease was primarily attributable to higher amortization expense and other charges related to recent acquisitions, higher selling, marketing and administrativecosts due to investments in new product launches and higher research and development costs due to general portfolio progression and collaborations.
Consolidated earnings before provision for taxes on income increased to $19.8 billion in 2016, as compared to $19.2 billion in 2015, an increase of 3.2%. Theincrease was primarily attributable to higher sales volume, favorable mix in the business and lower selling, marketing and administrative costs. This was partiallyoffset by higher net litigation expense of $0.7 billion and a higher restructuring charge of $0.1 billion as compared to 2015. Additionally, the fiscal year 2015included higher gains on the sale of assets/businesses as compared to 2016.
As a percent to sales, consolidated earnings before provision for taxes on income in 2017 was 23.1% versus 27.5% in 2016.
Cost of Products Sold and Selling, Marketing and Administrative Expenses: Cost of products sold and selling, marketing and administrative expenses as apercent to sales were as follows:
% of Sales 2017 2016 2015
Cost of products sold 33.2% 30.2% 30.7Percent point increase/(decrease) over the prior year 3.0 (0.5) 0.1Selling, marketing and administrative expenses 28.0% 27.7% 30.3Percent point increase/(decrease) over the prior year 0.3 (2.6) 0.8
In 2017, cost of products sold as a percent to sales increased to 33.2% from 30.2% as compared to the same period a year ago. The unfavorable increase wasprimarily driven by $2.3 billion of higher amortization expense and charges for inventory step-up related to the recent acquisitions, primarily Actelion. Intangibleasset amortization expense of $3.0 billion was included in cost of products sold for 2017 as compared to $1.2 billion in 2016. There was an increase in the percentto sales of selling, marketing and administrative expenses in 2017 as compared to the prior year, primarily due to investments in new product launches partiallyoffset by favorable mix.
In 2016, cost of products sold as a percent to sales decreased to 30.2% from 30.7% as compared to the same period a year ago. Favorable mix in the businessand cost improvement programs was partially offset by the unfavorable impact of transactional currency. Intangible asset amortization expense of $1.2 billion wasincluded in cost of products sold for 2016 and 2015. There was a decrease in the percent to sales of selling, marketing and administrative expenses in 2016compared to the prior year, primarily due to cost management in all the segments and favorable mix.
Research and Development Expense: Research and development expense by segment of business was as follows:
2017 2016 2015
(Dollars in Millions) Amount % of Sales* Amount % of Sales* Amount % of Sales*
Consumer $ 584 4.3% $ 580 4.4% 625 4.6Pharmaceutical 8,360 23.1 6,967 20.8 6,821 21.7Medical Devices 1,610 6.1 1,548 6.2 1,600 6.4Total research and development expense $ 10,554 13.8% $ 9,095 12.7% 9,046 12.9Percent increase/(decrease) over the prior year 16.0% 0.5% 6.5
* As a percent to segment sales
Research and development activities represent a significant part of the Company's business. These expenditures relate to the processes of discovering, testing anddeveloping new products, upfront payments and milestones, improving existing products, as well as ensuring product efficacy and regulatory compliance prior tolaunch. The Company remains committed to investing in research and development with the aim of delivering high quality and innovative products. In 2017,worldwide costs of research and development activities increased by 16.0% compared to 2016. The increase as a percent of sales was primarily in thepharmaceutical segment due to general portfolio progression as well as collaborative agreements entered into with Idorsia Ltd. and Legend Biotech. In 2016,worldwide costs of research and development activities increased by 0.5% compared to
22

2015 but decreased as a percent of sales. The decrease as a percent of sales was attributable to higher overall sales in the Pharmaceutical segment. The increaseddollar spend in the Pharmaceutical segment was for investment spending to advance the pipeline.
In-Process Research and Development (IPR&D): In 2017, the Company recorded an IPR&D charge of $0.4 billion primarily for the discontinuation of certaindevelopment projects related to Novira which was acquired in 2015. The product development was canceled due to safety concerns. In 2016, the Companyrecorded an IPR&D charge of $29 million for the discontinuation of a development program related to Crucell. In 2015, the Company recorded an IPR&D chargeof $0.2 billion primarily for the discontinuation of certain development projects related to Covagen.
Other (Income) Expense, Net: Other (income) expense, net is the account where the Company records gains and losses related to the sale and write-down ofcertain investments in equity securities held by Johnson & Johnson Innovation - JJDC, Inc. (JJDC), gains and losses on divestitures, transactional currency gainsand losses, acquisition-related costs, litigation accruals and settlements, as well as royalty income. The change in other (income) expense, net for the fiscal year2017 was a favorable change of $0.3 billion due to higher gains of $0.7 billion on the sale of assets/businesses, primarily the Codman Neurosurgery andCOMPEED ® divestitures, a gain of $0.2 billion related to monetization of future royalty receivables and a higher gain of $0.3 billion related to the sale of certaininvestments in equity securities as compared to the prior year. This was partially offset by higher litigation expense of $0.4 billion, $0.3 billion of acquisition costsrelated to Actelion and AMO, an asset impairment charge of $0.2 billion primarily related to the insulin pump business and a higher restructuring related charge of$0.2 billion as compared to the fiscal year 2016.
The change in other (income) expense, net for the fiscal year 2016 was an unfavorable change of $2.5 billion as compared to the prior year primarily due tohigher gains on the sale of assets/businesses in the fiscal year 2015 as compared to 2016. The fiscal year of 2016 included gains of $0.6 billion from thedivestitures of the controlled substance raw material and API business, certain anesthetic products in Europe and certain non-strategic Consumer brands versusgains of $2.6 billion recorded in 2015 primarily from the divestiture of the Cordis business, the U.S. divestiture of NUCYNTA ® and the SPLENDA ® brand.Additionally, the fiscal year of 2016 included higher litigation expense of $0.7 billion as compared to 2015. This was partially offset by a $0.3 billion intangibleasset write-down related to Acclarent included in the fiscal year 2015.
Interest (Income) Expense: Interest income in 2017 increased slightly as compared to 2016 due to higher average interest rates partially offset by lower cash,cash equivalents and marketable securities balances during the period. Cash, cash equivalents and marketable securities totaled $18.3 billion at the end of 2017,and averaged $30.1 billion as compared to the $40.1 billion average cash balance in 2016. The decrease in the balance of cash, cash equivalents and marketablesecurities was due to the use of cash for general corporate purposes including acquisitions, primarily the Actelion acquisition for $29.6 billion, net of cash acquired.
Interest expense in 2017 was higher as compared to 2016. The average debt balance was $30.9 billion in 2017 versus $23.5 billion in 2016. The total debtbalance at the end of 2017 was $34.6 billion as compared to $27.1 billion at the end of 2016. The higher debt balance of approximately $7.5 billion was primarilydue to increased borrowings. The Company increased borrowings in February and November of 2017, capitalizing on favorable terms in the capital markets. Theproceeds of the borrowings were used for general corporate purposes, including the completion of the stock repurchase program.
Interest income in 2016 increased by $0.2 billion as compared to 2015 due to a higher average balance of cash, cash equivalents and marketable securities andhigher interest rates. Cash, cash equivalents and marketable securities totaled $41.9 billion at the end of 2016, and averaged $40.1 billion as compared to the$35.7 billion average cash balance in 2015.
Interest expense in 2016 was higher as compared to 2015. The average debt balance was $23.5 billion in 2016 versus $19.3 billion in 2015. The total debtbalance at the end of 2016 was $27.1 billion as compared to $19.9 billion at the end of 2015. The higher debt balance of approximately $7.2 billion was primarilydue to increased borrowings in February and May of 2016. The Company increased borrowings, capitalizing on favorable terms in the capital markets. Theproceeds of the borrowings were used for general corporate purposes, primarily the stock repurchase program.
23

Income Before Tax by SegmentIncome before tax by segment of business were as follows:
Income Before Tax Segment Sales Percent of Segment Sales
(Dollars in Millions) 2017 2016 2017 2016 2017 2016
Consumer $ 2,524 2,441 $ 13,602 13,307 18.6% 18.3Pharmaceutical 11,083 12,827 36,256 33,464 30.6 38.3Medical Devices 5,392 5,578 26,592 25,119 20.3 22.2Total (1) 18,999 20,846 76,450 71,890 24.9 29.0Less: Expenses not allocated to segments (2) 1,326 1,043
Earnings before provision for taxes on income $ 17,673 19,803 $ 76,450 71,890 23.1% 27.5
(1) See Note 18 to the Consolidated Financial Statements for more details.(2) Amounts not allocated to segments include interest (income) expense and general corporate (income) expense.
Increase in 2017 was primarily due to higher interest expense of $0.2 billion on higher debt balance.
Consumer Segment: In 2017, the Consumer segment income before tax as a percent to sales was 18.6%, versus 18.3% in 2016. The increase in the income beforetax as a percent of sales in 2017 as compared to 2016 was attributable to higher gains on divestitures, primarily the divestiture of COMPEED ® in 2017. This waspartially offset by higher selling, marketing and administrative expenses as compared to the prior year due to increased advertising and promotional spending andslightly higher amortization expense in 2017 related to acquisitions. Additionally, the fiscal year 2016 was negatively impacted by operations in Venezuela.
In 2016, the Consumer segment income before tax as a percent to sales was 18.3%, versus 13.2% in 2015, primarily driven by favorable selling, marketingand administrative expenses due to cost management and higher gross profit margins from cost improvement projects and favorable mix. This was partially offsetby higher gains in 2015 related to divestitures, primarily the divestiture of the SPLENDA ® brand. Additionally, operations in Venezuela negatively impacted theConsumer segment income before tax in 2016 as compared to 2015.
Pharmaceutical Segment: In 2017, the Pharmaceutical segment income before tax as a percent to sales was 30.6% versus 38.3% in 2016. The decrease in theincome before tax as a percent of sales was primarily due to $2.3 billion of higher amortization expense and other costs related to the Actelion acquisition, higherresearch and development expense, a higher IPR&D charge of $0.4 billion related to Novira and lower gains on divestitures as compared to the prior year.Additionally, the fiscal year 2016 included a positive adjustment of $0.5 billion to previous reserve estimates. This was partially offset by a gain of $0.2 billionrelated to monetization of future royalty receivables, a higher gain of $0.2 billion related to the sale of certain investments in equity securities and favorableproduct mix in 2017.
In 2016, the Pharmaceutical segment income before tax as a percent to sales was 38.3% versus 37.3% in 2015. The increase in income before tax wasprimarily due to strong sales volume growth and favorable selling, marketing and administrative expenses due to cost management. Additionally, the fiscal year2015, had higher gains of $0.7 billion related to divestitures partially offset by a higher IPR&D charge of $0.2 billion as compared to 2016. The fiscal year of 2016included the gains from the divestitures of the controlled substance raw material and API business and certain anesthetic products in Europe versus the gainsrecorded in 2015 from the U.S. divestiture of NUCYNTA ® .
Medical Devices Segment: In 2017, the Medical Devices segment income before tax as a percent to sales was 20.3% versus 22.2% in 2016. The decrease in theincome before tax as a percent to sales was primarily due to $0.3 billion of higher amortization expense and other acquisition costs related to AMO, $0.3 billion ofhigher litigation, an asset impairment charge of $0.2 billion primarily related to the insulin pump business, $0.1 billion of higher restructuring and investments innew product launches as compared to the fiscal year 2016. This was partially offset by $0.8 billion higher gains in 2017 related to divestitures, primarily thedivestiture of Codman Neurosurgery.
In 2016, the Medical Devices segment income before tax as a percent to sales was 22.2% versus 27.2% in 2015. The decrease in the income before tax as apercent to sales was primarily due to lower gains of $1.4 billion related to divestitures, higher litigation expense of $0.8 billion and a higher restructuring charge of$0.1 billion as compared to 2015. This was partially offset by an intangible asset write-down of $0.3 billion related to Acclarent in 2015 and favorable selling,marketing and administrative expenses in 2016.
24
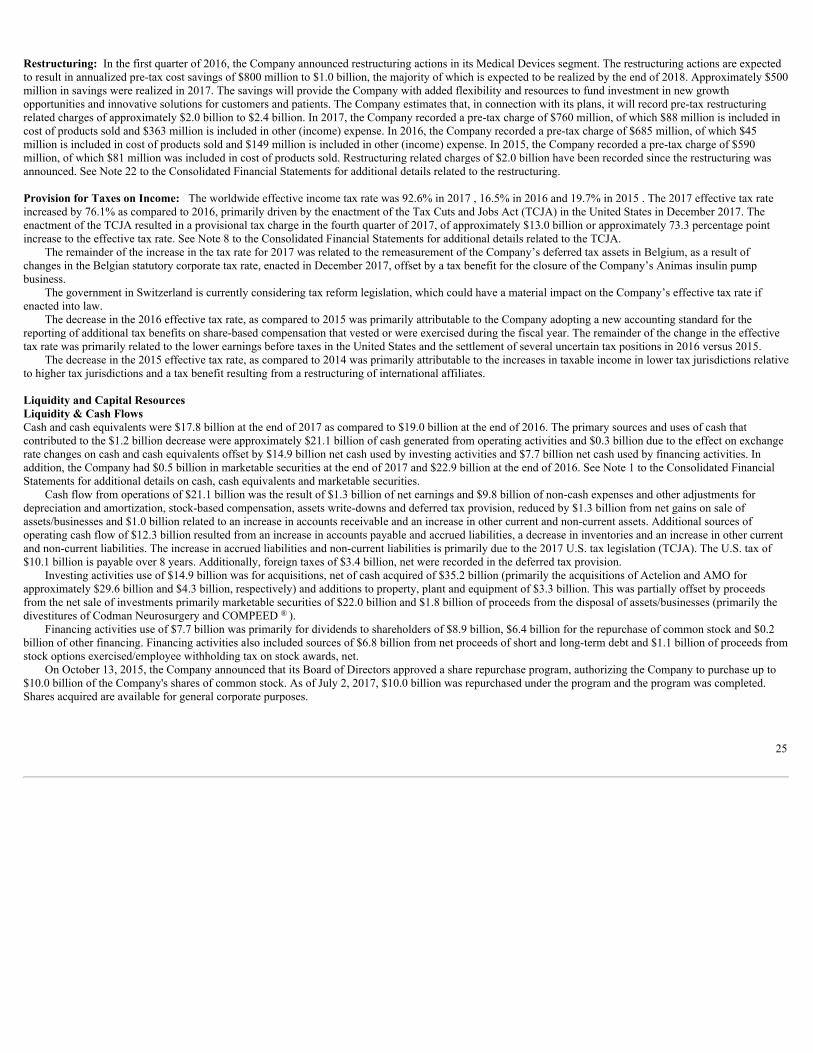
Restructuring: In the first quarter of 2016, the Company announced restructuring actions in its Medical Devices segment. The restructuring actions are expectedto result in annualized pre-tax cost savings of $800 million to $1.0 billion, the majority of which is expected to be realized by the end of 2018. Approximately $500million in savings were realized in 2017. The savings will provide the Company with added flexibility and resources to fund investment in new growthopportunities and innovative solutions for customers and patients. The Company estimates that, in connection with its plans, it will record pre-tax restructuringrelated charges of approximately $2.0 billion to $2.4 billion. In 2017, the Company recorded a pre-tax charge of $760 million, of which $88 million is included incost of products sold and $363 million is included in other (income) expense. In 2016, the Company recorded a pre-tax charge of $685 million, of which $45million is included in cost of products sold and $149 million is included in other (income) expense. In 2015, the Company recorded a pre-tax charge of $590million, of which $81 million was included in cost of products sold. Restructuring related charges of $2.0 billion have been recorded since the restructuring wasannounced. See Note 22 to the Consolidated Financial Statements for additional details related to the restructuring.
Provision for Taxes on Income: The worldwide effective income tax rate was 92.6% in 2017 , 16.5% in 2016 and 19.7% in 2015 . The 2017 effective tax rateincreased by 76.1% as compared to 2016, primarily driven by the enactment of the Tax Cuts and Jobs Act (TCJA) in the United States in December 2017. Theenactment of the TCJA resulted in a provisional tax charge in the fourth quarter of 2017, of approximately $13.0 billion or approximately 73.3 percentage pointincrease to the effective tax rate. See Note 8 to the Consolidated Financial Statements for additional details related to the TCJA.
The remainder of the increase in the tax rate for 2017 was related to the remeasurement of the Company’s deferred tax assets in Belgium, as a result ofchanges in the Belgian statutory corporate tax rate, enacted in December 2017, offset by a tax benefit for the closure of the Company’s Animas insulin pumpbusiness.
The government in Switzerland is currently considering tax reform legislation, which could have a material impact on the Company’s effective tax rate ifenacted into law.
The decrease in the 2016 effective tax rate, as compared to 2015 was primarily attributable to the Company adopting a new accounting standard for thereporting of additional tax benefits on share-based compensation that vested or were exercised during the fiscal year. The remainder of the change in the effectivetax rate was primarily related to the lower earnings before taxes in the United States and the settlement of several uncertain tax positions in 2016 versus 2015.
The decrease in the 2015 effective tax rate, as compared to 2014 was primarily attributable to the increases in taxable income in lower tax jurisdictions relativeto higher tax jurisdictions and a tax benefit resulting from a restructuring of international affiliates.
Liquidity and Capital ResourcesLiquidity & Cash FlowsCash and cash equivalents were $17.8 billion at the end of 2017 as compared to $19.0 billion at the end of 2016. The primary sources and uses of cash thatcontributed to the $1.2 billion decrease were approximately $21.1 billion of cash generated from operating activities and $0.3 billion due to the effect on exchangerate changes on cash and cash equivalents offset by $14.9 billion net cash used by investing activities and $7.7 billion net cash used by financing activities. Inaddition, the Company had $0.5 billion in marketable securities at the end of 2017 and $22.9 billion at the end of 2016. See Note 1 to the Consolidated FinancialStatements for additional details on cash, cash equivalents and marketable securities.
Cash flow from operations of $21.1 billion was the result of $1.3 billion of net earnings and $9.8 billion of non-cash expenses and other adjustments fordepreciation and amortization, stock-based compensation, assets write-downs and deferred tax provision, reduced by $1.3 billion from net gains on sale ofassets/businesses and $1.0 billion related to an increase in accounts receivable and an increase in other current and non-current assets. Additional sources ofoperating cash flow of $12.3 billion resulted from an increase in accounts payable and accrued liabilities, a decrease in inventories and an increase in other currentand non-current liabilities. The increase in accrued liabilities and non-current liabilities is primarily due to the 2017 U.S. tax legislation (TCJA). The U.S. tax of$10.1 billion is payable over 8 years. Additionally, foreign taxes of $3.4 billion, net were recorded in the deferred tax provision.
Investing activities use of $14.9 billion was for acquisitions, net of cash acquired of $35.2 billion (primarily the acquisitions of Actelion and AMO forapproximately $29.6 billion and $4.3 billion, respectively) and additions to property, plant and equipment of $3.3 billion. This was partially offset by proceedsfrom the net sale of investments primarily marketable securities of $22.0 billion and $1.8 billion of proceeds from the disposal of assets/businesses (primarily thedivestitures of Codman Neurosurgery and COMPEED ® ).
Financing activities use of $7.7 billion was primarily for dividends to shareholders of $8.9 billion, $6.4 billion for the repurchase of common stock and $0.2billion of other financing. Financing activities also included sources of $6.8 billion from net proceeds of short and long-term debt and $1.1 billion of proceeds fromstock options exercised/employee withholding tax on stock awards, net.
On October 13, 2015, the Company announced that its Board of Directors approved a share repurchase program, authorizing the Company to purchase up to$10.0 billion of the Company's shares of common stock. As of July 2, 2017, $10.0 billion was repurchased under the program and the program was completed.Shares acquired are available for general corporate purposes.
25

As of December 31, 2017, the Company's notes payable and long-term debt was in excess of cash, cash equivalents and marketable securities. In 2017, theCompany continued to have access to liquidity through the commercial paper market. Additionally, as a result of the TCJA, the Company has access to its cashoutside the U.S. at a significantly reduced cost. The Company anticipates that operating cash flows, the ability to raise funds from external sources, borrowingcapacity from existing committed credit facilities and access to the commercial paper markets will continue to provide sufficient resources to fund operating needsfor the next twelve months. The Company monitors the global capital markets on an ongoing basis and from time to time may raise capital when market conditionsare favorable. The Company filed a new shelf registration on February 27, 2017 which will enable it to issue debt securities on a timely basis. In the fiscal first andfourth quarters of 2017, the Company issued bonds for a total of $9.0 billion for general corporate purposes, including the completion of the stock repurchaseprogram. For additional details on borrowings, see Note 7 to the Consolidated Financial Statements.
Financing and Market RiskThe Company uses financial instruments to manage the impact of foreign exchange rate changes on cash flows. Accordingly, the Company enters into forwardforeign exchange contracts to protect the value of certain foreign currency assets and liabilities and to hedge future foreign currency transactions primarily relatedto product costs. Gains or losses on these contracts are offset by the gains or losses on the underlying transactions. A 10% appreciation of the U.S. Dollar from theDecember 31, 2017 market rates would increase the unrealized value of the Company’s forward contracts by $167 million. Conversely, a 10% depreciation of theU.S. Dollar from the December 31, 2017 market rates would decrease the unrealized value of the Company’s forward contracts by $197 million. In either scenario,the gain or loss on the forward contract would be offset by the gain or loss on the underlying transaction, and therefore, would have no impact on future anticipatedearnings and cash flows.
The Company hedges the exposure to fluctuations in currency exchange rates, and the effect on certain assets and liabilities in foreign currency, by enteringinto currency swap contracts. A 1% change in the spread between U.S. and foreign interest rates on the Company’s interest rate sensitive financial instrumentswould either increase or decrease the unrealized value of the Company’s swap contracts by approximately $69 million. In either scenario, at maturity, the gain orloss on the swap contract would be offset by the gain or loss on the underlying transaction, and therefore, would have no impact on future anticipated cash flows.
The Company does not enter into financial instruments for trading or speculative purposes. Further, the Company has a policy of only entering into contractswith parties that have at least an investment grade credit rating. The counter-parties to these contracts are major financial institutions and there is no significantconcentration of exposure with any one counter-party. Management believes the risk of loss is remote.
The Company invests in both fixed rate and floating rate interest earning securities which carry a degree of interest rate risk. The fair market value of fixedrate securities may be adversely impacted due to a rise in interest rates, while floating rate securities may produce less income than predicted if interest rates fall. A1% (100 basis points) change in spread on the Company’s interest rate sensitive investments would either increase or decrease the unrealized value of cashequivalents and current marketable securities by approximately $8 million.
The Company has access to substantial sources of funds at numerous banks worldwide. In September 2017, the Company secured a new 364-day CreditFacility. Total credit available to the Company approximates $10 billion, which expires on September 13, 2018. Interest charged on borrowings under the creditline agreement is based on either bids provided by banks, the prime rate or London Interbank Offered Rates (LIBOR), plus applicable margins. Commitment feesunder the agreement are not material.
Total borrowings at the end of 2017 and 2016 were $34.6 billion and $27.1 billion, respectively. The increase in borrowings between 2017 and 2016 was aresult of financing for the Company's share repurchase program and general corporate purposes. In 2017, net debt (cash and current marketable securities, net ofdebt) was $16.3 billion compared to net cash of $14.8 billion in 2016. Total debt represented 36.5% of total capital (shareholders’ equity and total debt) in 2017and 27.8% of total capital in 2016. Shareholders’ equity per share at the end of 2017 was $22.43 compared to $26.02 at year-end 2016 , a decrease of 13.8%.
A summary of borrowings can be found in Note 7 to the Consolidated Financial Statements.
26

Contractual Obligations and CommitmentsThe Company’s contractual obligations are primarily for the recently enacted tax legislation, leases, debt and unfunded retirement plans. There are no othersignificant obligations. To satisfy these obligations, the Company will use cash from operations. The following table summarizes the Company’s contractualobligations and their aggregate maturities as of December 31, 2017 (see Notes 7, 8, 10 and 16 to the Consolidated Financial Statements for further details):
(Dollars in Millions) Tax Legislation
(TCJA) Debt Obligations Interest on
Debt Obligations Unfunded
Retirement Plans Operating Leases Total
2018 $ 1,614 1,499 1,002 88 227 4,4302019 807 2,752 949 89 184 4,7812020 807 1,105 883 94 143 3,0322021 807 1,797 840 100 106 3,6502022 1,513 2,189 796 108 76 4,682After 2022 4,538 22,832 9,659 651 103 37,783
Total $ 10,086 32,174 14,129 1,130 839 58,358
For tax matters, see Note 8 to the Consolidated Financial Statements. For other retirement plan and post-employment medical benefit information, see Note 10 tothe Consolidated Financial Statements. The table does not include activity related to business combinations.
DividendsThe Company increased its dividend in 2017 for the 55th consecutive year. Cash dividends paid were $3.32 per share in 2017 compared with dividends of $3.15per share in 2016 , and $2.95 per share in 2015 . The dividends were distributed as follows:
2017 2016 2015
First quarter $ 0.80 0.75 0.70Second quarter 0.84 0.80 0.75Third quarter 0.84 0.80 0.75Fourth quarter 0.84 0.80 0.75
Total $ 3.32 3.15 2.95
On January 2, 2018, the Board of Directors declared a regular quarterly cash dividend of $0.84 per share, payable on March 13, 2018, to shareholders of record asof February 27, 2018. The Company expects to continue the practice of paying regular cash dividends.
27

Other InformationCritical Accounting Policies and EstimatesManagement’s discussion and analysis of results of operations and financial condition are based on the Company’s consolidated financial statements that havebeen prepared in accordance with accounting principles generally accepted in the U.S. (GAAP). The preparation of these financial statements requires thatmanagement make estimates and assumptions that affect the amounts reported for revenues, expenses, assets, liabilities and other related disclosures. Actual resultsmay or may not differ from these estimates. The Company believes that the understanding of certain key accounting policies and estimates are essential inachieving more insight into the Company’s operating results and financial condition. These key accounting policies include revenue recognition, income taxes,legal and self-insurance contingencies, valuation of long-lived assets, assumptions used to determine the amounts recorded for pensions and other employee benefitplans and accounting for stock based awards.
Revenue Recognition: The Company recognizes revenue from product sales when goods are shipped or delivered, and title and risk of loss pass to the customer.Provisions for certain rebates, sales incentives, trade promotions, coupons, product returns and discounts to customers are accounted for as reductions in sales inthe same period the related sales are recorded. See Note 1 to the Consolidated Financial Statements for the Accounting Standards Update related to revenue whichwill be adopted in 2018.
Product discounts granted are based on the terms of arrangements with direct, indirect and other market participants, as well as market conditions, includingprices charged by competitors. Rebates, which include the Medicaid rebate provision, are estimated based on contractual terms, historical experience, patientoutcomes, trend analysis and projected market conditions in the various markets served. The Company evaluates market conditions for products or groups ofproducts primarily through the analysis of wholesaler and other third-party sell-through and market research data, as well as internally generated information.
Sales returns are estimated and recorded based on historical sales and returns information. Products that exhibit unusual sales or return patterns due to dating,competition or other marketing matters are specifically investigated and analyzed as part of the accounting for sales return accruals.
Sales returns allowances represent a reserve for products that may be returned due to expiration, destruction in the field, or in specific areas, product recall.The returns reserve is based on historical return trends by product and by market as a percent to gross sales. In accordance with the Company’s accounting policies,the Company generally issues credit to customers for returned goods. The Company’s sales returns reserves are accounted for in accordance with the U.S. GAAPguidance for revenue recognition when right of return exists. Sales returns reserves are recorded at full sales value. Sales returns in the Consumer andPharmaceutical segments are almost exclusively not resalable. Sales returns for certain franchises in the Medical Devices segment are typically resalable but arenot material. The Company infrequently exchanges products from inventory for returned products. The sales returns reserve for the total Company has beenapproximately 1.0% of annual net trade sales during the fiscal reporting years 2017 , 2016 and 2015 .
Promotional programs, such as product listing allowances and cooperative advertising arrangements, are recorded in the year incurred. Continuingpromotional programs include coupons and volume-based sales incentive programs. The redemption cost of consumer coupons is based on historical redemptionexperience by product and value. Volume-based incentive programs are based on estimated sales volumes for the incentive period and are recorded as products aresold. The Company also earns service revenue for co-promotion of certain products. For all years presented, service revenues were approximately 1% or less of thetotal revenues and are included in sales to customers. These arrangements are evaluated to determine the appropriate amounts to be deferred or recorded as areduction of revenue.
In addition, the Company enters into collaboration arrangements that contain multiple revenue generating activities. Amounts due from collaborative partnersfor these arrangements are recognized as each activity is performed or delivered, based on the relative selling price. Upfront fees received as part of thesearrangements are deferred and recognized over the performance period. See Note 1 to the Consolidated Financial Statements for additional disclosures oncollaborations.
Reasonably likely changes to assumptions used to calculate the accruals for rebates, returns and promotions are not anticipated to have a material effect on thefinancial statements. The Company currently discloses the impact of changes to assumptions in the quarterly or annual filing in which there is a material financialstatement impact.
28

Below are tables that show the progression of accrued rebates, returns, promotions, reserve for doubtful accounts and reserve for cash discounts by segment ofbusiness for the fiscal years ended December 31, 2017 and January 1, 2017 .
Consumer Segment
(Dollars in Millions) Balance at
Beginning of Period Accruals Payments/Credits Balance at
End of Period
2017 Accrued rebates (1) $ 136 638 (588) 186Accrued returns 65 128 (125) 68Accrued promotions 358 2,148 (2,025) 481Subtotal $ 559 2,914 (2,738) 735Reserve for doubtful accounts 24 10 (3) 31Reserve for cash discounts 25 205 (207) 23
Total $ 608 3,129 (2,948) 789
2016 Accrued rebates (1) $ 139 615 (618) 136Accrued returns 54 111 (100) 65Accrued promotions 412 1,908 (1,962) 358Subtotal $ 605 2,634 (2,680) 559Reserve for doubtful accounts 18 12 (6) 24Reserve for cash discounts 17 209 (201) 25
Total $ 640 2,855 (2,887) 608(1) Includes reserve for customer rebates of $48 million at December 31, 2017 and $37 million at January 1, 2017 , recorded as a contra asset.
Pharmaceutical Segment
(Dollars in Millions) Balance at
Beginning of Period Accruals Payments/Credits (2) Balance at
End of Period
2017 Accrued rebates (1) $ 3,420 16,447 (15,005) 4,862Accrued returns 334 256 (228) 362Accrued promotions — 69 (34) 35Subtotal $ 3,754 16,772 (15,267) 5,259Reserve for doubtful accounts 38 40 (1) 77Reserve for cash discounts 58 714 (717) 55
Total $ 3,850 17,526 (15,985) 5,391
2016 Accrued rebates (1) $ 3,451 12,306 (12,337) 3,420Accrued returns 404 140 (210) 334Accrued promotions 11 10 (21) —Subtotal $ 3,866 12,456 (12,568) 3,754Reserve for doubtful accounts 46 2 (10) 38Reserve for cash discounts 63 613 (618) 58
Total $ 3,975 13,071 (13,196) 3,850(1) Includes reserve for customer rebates of $90 million at December 31, 2017 and $102 million at January 1, 2017 , recorded as a contra asset.(2) Includes adjustments
29
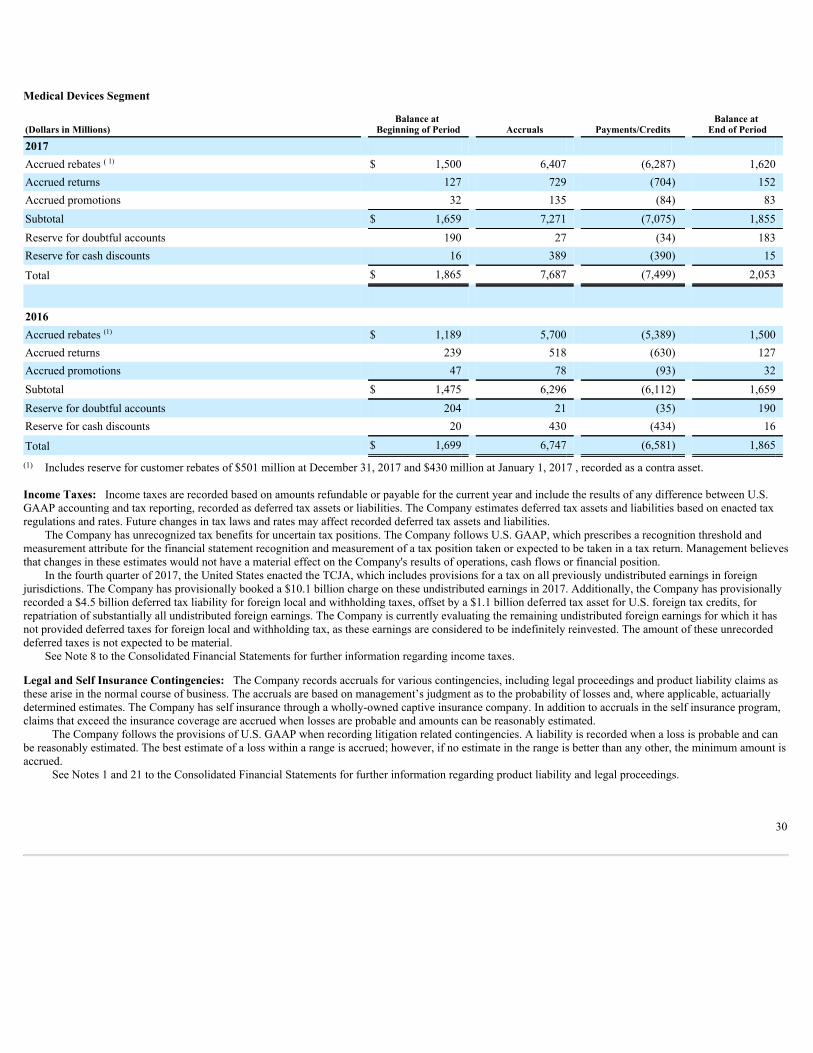
Medical Devices Segment
(Dollars in Millions) Balance at
Beginning of Period Accruals Payments/Credits Balance at
End of Period
2017 Accrued rebates ( 1) $ 1,500 6,407 (6,287) 1,620Accrued returns 127 729 (704) 152Accrued promotions 32 135 (84) 83Subtotal $ 1,659 7,271 (7,075) 1,855Reserve for doubtful accounts 190 27 (34) 183Reserve for cash discounts 16 389 (390) 15
Total $ 1,865 7,687 (7,499) 2,053
2016 Accrued rebates (1) $ 1,189 5,700 (5,389) 1,500Accrued returns 239 518 (630) 127Accrued promotions 47 78 (93) 32Subtotal $ 1,475 6,296 (6,112) 1,659Reserve for doubtful accounts 204 21 (35) 190Reserve for cash discounts 20 430 (434) 16
Total $ 1,699 6,747 (6,581) 1,865(1) Includes reserve for customer rebates of $501 million at December 31, 2017 and $430 million at January 1, 2017 , recorded as a contra asset.
Income Taxes: Income taxes are recorded based on amounts refundable or payable for the current year and include the results of any difference between U.S.GAAP accounting and tax reporting, recorded as deferred tax assets or liabilities. The Company estimates deferred tax assets and liabilities based on enacted taxregulations and rates. Future changes in tax laws and rates may affect recorded deferred tax assets and liabilities.
The Company has unrecognized tax benefits for uncertain tax positions. The Company follows U.S. GAAP, which prescribes a recognition threshold andmeasurement attribute for the financial statement recognition and measurement of a tax position taken or expected to be taken in a tax return. Management believesthat changes in these estimates would not have a material effect on the Company's results of operations, cash flows or financial position.
In the fourth quarter of 2017, the United States enacted the TCJA, which includes provisions for a tax on all previously undistributed earnings in foreignjurisdictions. The Company has provisionally booked a $10.1 billion charge on these undistributed earnings in 2017. Additionally, the Company has provisionallyrecorded a $4.5 billion deferred tax liability for foreign local and withholding taxes, offset by a $1.1 billion deferred tax asset for U.S. foreign tax credits, forrepatriation of substantially all undistributed foreign earnings. The Company is currently evaluating the remaining undistributed foreign earnings for which it hasnot provided deferred taxes for foreign local and withholding tax, as these earnings are considered to be indefinitely reinvested. The amount of these unrecordeddeferred taxes is not expected to be material.
See Note 8 to the Consolidated Financial Statements for further information regarding income taxes.
Legal and Self Insurance Contingencies: The Company records accruals for various contingencies, including legal proceedings and product liability claims asthese arise in the normal course of business. The accruals are based on management’s judgment as to the probability of losses and, where applicable, actuariallydetermined estimates. The Company has self insurance through a wholly-owned captive insurance company. In addition to accruals in the self insurance program,claims that exceed the insurance coverage are accrued when losses are probable and amounts can be reasonably estimated.
The Company follows the provisions of U.S. GAAP when recording litigation related contingencies. A liability is recorded when a loss is probable and canbe reasonably estimated. The best estimate of a loss within a range is accrued; however, if no estimate in the range is better than any other, the minimum amount isaccrued.
See Notes 1 and 21 to the Consolidated Financial Statements for further information regarding product liability and legal proceedings.
30

Long-Lived and Intangible Assets: The Company assesses changes in economic conditions and makes assumptions regarding estimated future cash flows inevaluating the value of the Company’s property, plant and equipment, goodwill and intangible assets. As these assumptions and estimates may change over time, itmay or may not be necessary for the Company to record impairment charges.
Employee Benefit Plans: The Company sponsors various retirement and pension plans, including defined benefit, defined contribution and terminationindemnity plans, which cover most employees worldwide. These plans are based on assumptions for the discount rate, expected return on plan assets, mortalityrates, expected salary increases, health care cost trend rates and attrition rates. See Note 10 to the Consolidated Financial Statements for further details on theserates and the effect a rate change to the health care cost trend would have on the Company’s results of operations.
Stock Based Compensation: The Company recognizes compensation expense associated with the issuance of equity instruments to employees for their services.Based on the type of equity instrument, the fair value is estimated on the date of grant using either the Black-Scholes option valuation model or a combination ofboth the Black-Scholes option valuation model and Monte Carlo valuation model, and is expensed in the financial statements over the service period. The inputassumptions used in determining fair value are the expected life, expected volatility, risk-free rate and expected dividend yield. For performance share units the fairmarket value is calculated for each of the three component goals at the date of grant. The fair values for the sales and earnings per share goals of each performanceshare unit were estimated on the date of grant using the fair market value of the shares at the time of the award, discounted for dividends, which are not paid on theperformance share units during the vesting period. The fair value for the relative total shareholder return goal of each performance share unit was estimated on thedate of grant using the Monte Carlo valuation model. See Note 17 to the Consolidated Financial Statements for additional information.
New Accounting PronouncementsRefer to Note 1 to the Consolidated Financial Statements for recently adopted accounting pronouncements and recently issued accounting pronouncements not yetadopted as of December 31, 2017 .
Economic and Market FactorsThe Company is aware that its products are used in an environment where, for more than a decade, policymakers, consumers and businesses have expressedconcerns about the rising cost of health care. In response to these concerns, the Company has a long-standing policy of pricing products responsibly. For the period2007 - 2017, in the United States, the weighted average compound annual growth rate of the Company’s net price increases for health care products (prescriptionand over-the-counter drugs, hospital and professional products) was below the U.S. Consumer Price Index (CPI).
The Company operates in certain countries where the economic conditions continue to present significant challenges. The Company continues to monitorthese situations and take appropriate actions. Inflation rates continue to have an effect on worldwide economies and, consequently, on the way companies operate.The Company has accounted for operations in Venezuela as highly inflationary, as the prior three-year cumulative inflation rate surpassed 100%. In the face ofincreasing costs, the Company strives to maintain its profit margins through cost reduction programs, productivity improvements and periodic price increases.
In June 2016, the United Kingdom (U.K.) held a referendum in which voters approved an exit from the European Union (E.U.), commonly referred to as“Brexit” and in March 2017 the U.K. formally started the process for the U.K. to leave the E.U. Given the lack of comparable precedent, it is unclear whatfinancial, trade, regulatory and legal implications the withdrawal of the U.K. from the E.U. will have. Brexit creates global political and economic uncertainty,which may cause, among other consequences, volatility in exchange rates and interest rates, additional cost containment by third-party payors and changes inregulations. However, the Company currently does not believe that these and other related effects will have a material impact on the Company’s consolidatedfinancial position or operating results. As of December 31, 2017, the business of the Company’s U.K. subsidiaries represented less than 3% of both the Company’sconsolidated assets and fiscal twelve months revenues, respectively.
The Company is exposed to fluctuations in currency exchange rates. A 1% change in the value of the U.S. Dollar as compared to all foreign currencies inwhich the Company had sales, income or expense in 2017 would have increased or decreased the translation of foreign sales by approximately $360 million andincome by $105 million.
Governments around the world consider various proposals to make changes to tax laws, which may include increasing or decreasing existing statutory taxrates. A change in statutory tax rate in any country would result in the revaluation of the Company’s deferred tax assets and liabilities related to that particularjurisdiction in the period in which the new tax law is enacted. This change would result in an expense or benefit recorded to the Company’s ConsolidatedStatement of Earnings. The Company closely monitors these proposals as they arise in the countries where it operates. Changes to the statutory tax rate may occurat any time, and any related expense or benefit recorded may be material to the fiscal quarter and year in which the law change is enacted.
31

The Company faces various worldwide health care changes that may continue to result in pricing pressures that include health care cost containment andgovernment legislation relating to sales, promotions and reimbursement of health care products.
Changes in the behavior and spending patterns of purchasers of health care products and services, including delaying medical procedures, rationingprescription medications, reducing the frequency of physician visits and foregoing health care insurance coverage, as a result of the current global economicdownturn, may continue to impact the Company’s businesses.
The Company also operates in an environment increasingly hostile to intellectual property rights. Firms have filed Abbreviated New Drug Applications orBiosimilar Biological Product Applications with the FDA or otherwise challenged the coverage and/or validity of the Company's patents, seeking to market genericor biosimilar forms of many of the Company’s key pharmaceutical products prior to expiration of the applicable patents covering those products. In the event theCompany is not successful in defending the patent claims challenged in the resulting lawsuits, generic or biosimilar versions of the products at issue will beintroduced to the market, resulting in the potential for substantial market share and revenue losses for those products, and which may result in a non-cashimpairment charge in any associated intangible asset. There is also a risk that one or more competitors could launch a generic or biosimilar version of the productat issue following regulatory approval even though one or more valid patents are in place. For further information, see the discussion on “REMICADE ® RelatedCases” and “Litigation Against Filers of Abbreviated New Drug Applications” in Note 21 to the Consolidated Financial Statements.
Legal ProceedingsJohnson & Johnson and certain of its subsidiaries are involved in various lawsuits and claims regarding product liability, intellectual property, commercial andother matters; governmental investigations; and other legal proceedings that arise from time to time in the ordinary course of business.
The Company records accruals for loss contingencies associated with these legal matters when it is probable that a liability will be incurred and the amount ofthe loss can be reasonably estimated. The Company has accrued for certain litigation matters and continues to monitor each related legal issue and adjust accrualsfor new information and further developments in accordance with Accounting Standards Codification (ASC) 450-20-25. For these and other litigation andregulatory matters currently disclosed for which a loss is probable or reasonably possible, the Company is unable to estimate the possible loss or range of lossbeyond the amounts already accrued. Amounts accrued for legal contingencies often result from a complex series of judgments about future events anduncertainties that rely heavily on estimates and assumptions. The ability to make such estimates and judgments can be affected by various factors, includingwhether damages sought in the proceedings are unsubstantiated or indeterminate; scientific and legal discovery has not commenced or is not complete; proceedingsare in early stages; matters present legal uncertainties; there are significant facts in dispute; or there are numerous parties involved.
In the Company's opinion, based on its examination of these matters, its experience to date and discussions with counsel, the ultimate outcome of legalproceedings, net of liabilities accrued in the Company's balance sheet, is not expected to have a material adverse effect on the Company's financial position.However, the resolution of, or increase in accruals for, one or more of these matters in any reporting period may have a material adverse effect on the Company'sresults of operations and cash flows for that period.
See Note 21 to the Consolidated Financial Statements for further information regarding legal proceedings.
Common Stock Market PricesThe Company’s Common Stock is listed on the New York Stock Exchange under the symbol JNJ. As of February 16, 2018, there were 147,484 record holders ofCommon Stock of the Company. The composite market price ranges for Johnson & Johnson Common Stock during 2017 and 2016 were:
2017 2016
High Low High Low
First quarter $ 129.00 110.76 $ 109.56 94.28Second quarter 137.00 120.95 121.54 107.88Third quarter 137.08 129.05 126.07 117.04Fourth quarter 144.35 130.02 122.50 109.32Year-end close $139.72 $115.21
32

Item 7A. QUANTITATIVE AND QUALITATIVE DISCLOSURES ABOUT MARKET RISK
The information called for by this item is incorporated herein by reference to “Item 7. Management’s Discussion and Analysis of Results of Operationsand Financial Condition - Liquidity and Capital Resources - Financing and Market Risk” of this Report; and Note 1 “Summary of Significant Accounting Policies -Financial Instruments” of the Notes to Consolidated Financial Statements included in Item 8 of this Report.
33

Item 8. FINANCIAL STATEMENTS AND SUPPLEMENTARY DATA
Index to Audited Consolidated Financial Statements35 Consolidated Balance Sheets36 Consolidated Statements of Earnings37 Consolidated Statements of Comprehensive Income38 Consolidated Statements of Equity39 Consolidated Statements of Cash Flows41 Notes to Consolidated Financial Statements88 Report of Independent Registered Public Accounting Firm90 Management’s Report on Internal Control Over Financial Reporting
34

JOHNSON & JOHNSON AND SUBSIDIARIESCONSOLIDATED BALANCE SHEETS
At December 31, 2017 and January 1, 2017(Dollars in Millions Except Share and Per Share Amounts) (Note 1)
2017 2016Assets Current assets Cash and cash equivalents (Notes 1 and 2) $ 17,824 18,972Marketable securities (Notes 1 and 2) 472 22,935Accounts receivable trade, less allowances for doubtful accounts $291 ( 2016, $252) 13,490 11,699Inventories (Notes 1 and 3) 8,765 8,144Prepaid expenses and other receivables 2,537 3,282
Total current assets 43,088 65,032
Property, plant and equipment, net (Notes 1 and 4) 17,005 15,912Intangible assets, net (Notes 1 and 5) 53,228 26,876Goodwill (Notes 1 and 5) 31,906 22,805Deferred taxes on income (Note 8) 7,105 6,148Other assets 4,971 4,435
Total assets $ 157,303 141,208
Liabilities and Shareholders’ Equity Current liabilities Loans and notes payable (Note 7) $ 3,906 4,684Accounts payable 7,310 6,918Accrued liabilities 7,304 5,635Accrued rebates, returns and promotions 7,210 5,403Accrued compensation and employee related obligations 2,953 2,676Accrued taxes on income (Note 8) 1,854 971
Total current liabilities 30,537 26,287
Long-term debt (Note 7) 30,675 22,442Deferred taxes on income (Note 8) 8,368 2,910Employee related obligations (Notes 9 and 10) 10,074 9,615Long-term taxes payable (Note 8) 8,472 —Other liabilities 9,017 9,536
Total liabilities 97,143 70,790
Shareholders’ equity Preferred stock — without par value (authorized and unissued 2,000,000 shares) — —Common stock — par value $1.00 per share (Note 12) (authorized 4,320,000,000 shares; issued 3,119,843,000 shares) 3,120 3,120Accumulated other comprehensive income (loss) (Note 13) (13,199) (14,901)Retained earnings 101,793 110,551 91,714 98,770Less: common stock held in treasury, at cost (Note 12) (437,318,000 shares and 413,332,000 shares) 31,554 28,352
Total shareholders’ equity 60,160 70,418
Total liabilities and shareholders’ equity $ 157,303 141,208
See Notes to Consolidated Financial Statements
35

JOHNSON & JOHNSON AND SUBSIDIARIESCONSOLIDATED STATEMENTS OF EARNINGS
(Dollars and Shares in Millions Except Per Share Amounts) (Note 1)
2017 2016 2015Sales to customers $ 76,450 71,890 70,074Cost of products sold 25,354 21,685 21,536Gross profit 51,096 50,205 48,538Selling, marketing and administrative expenses 21,420 19,945 21,203Research and development expense 10,554 9,095 9,046In-process research and development 408 29 224Interest income (385) (368) (128)Interest expense, net of portion capitalized (Note 4) 934 726 552Other (income) expense, net 183 484 (2,064)Restructuring (Note 22) 309 491 509Earnings before provision for taxes on income 17,673 19,803 19,196Provision for taxes on income (Note 8) 16,373 3,263 3,787
Net earnings $ 1,300 16,540 15,409
Net earnings per share (Notes 1 and 15) Basic $ 0.48 6.04 5.56 Diluted $ 0.47 5.93 5.48Cash dividends per share $ 3.32 3.15 2.95Average shares outstanding (Notes 1 and 15) Basic 2,692.0 2,737.3 2,771.8 Diluted 2,745.3 2,788.9 2,812.9
See Notes to Consolidated Financial Statements
36

JOHNSON & JOHNSON AND SUBSIDIARIESCONSOLIDATED STATEMENTS OF COMPREHENSIVE INCOME
(Dollars in Millions) (Note 1)
2017 2016 2015Net earnings $ 1,300 16,540 15,409
Other comprehensive income (loss), net of tax Foreign currency translation 1,696 (612) (3,632)
Securities: Unrealized holding gain (loss) arising during period 159 (52) 471 Reclassifications to earnings (338) (141) (124) Net change (179) (193) 347
Employee benefit plans: Prior service credit (cost), net of amortization 2 21 (60) Gain (loss), net of amortization 29 (862) 931 Effect of exchange rates (201) 159 148 Net change (170) (682) 1,019
Derivatives & hedges: Unrealized gain (loss) arising during period (4) (359) (115) Reclassifications to earnings 359 110 (62) Net change 355 (249) (177)
Other comprehensive income (loss) 1,702 (1,736) (2,443)
Comprehensive income $ 3,002 14,804 12,966
The tax effects in other comprehensive income for the fiscal years ended 2017, 2016 and 2015 respectively: Securities; $96 million, $104 million and$187 million, Employee Benefit Plans; $83 million, $346 million and $519 million, Derivatives & Hedges; $191 million, $134 million and $95 million.
See Notes to Consolidated Financial Statements
37
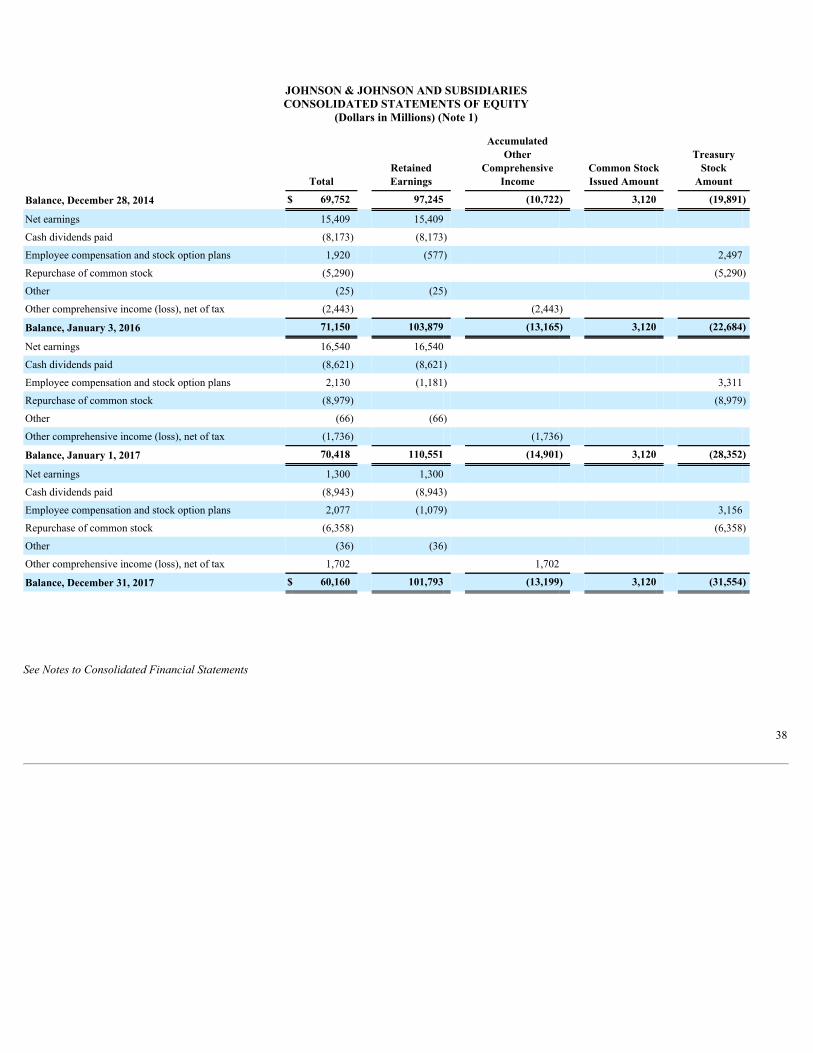
JOHNSON & JOHNSON AND SUBSIDIARIESCONSOLIDATED STATEMENTS OF EQUITY
(Dollars in Millions) (Note 1)
Total RetainedEarnings
AccumulatedOther
ComprehensiveIncome
Common StockIssued Amount
TreasuryStock
Amount
Balance, December 28, 2014 $ 69,752 97,245 (10,722) 3,120 (19,891)
Net earnings 15,409 15,409
Cash dividends paid (8,173) (8,173)
Employee compensation and stock option plans 1,920 (577) 2,497
Repurchase of common stock (5,290) (5,290)
Other (25) (25) Other comprehensive income (loss), net of tax (2,443) (2,443)
Balance, January 3, 2016 71,150 103,879 (13,165) 3,120 (22,684)
Net earnings 16,540 16,540
Cash dividends paid (8,621) (8,621)
Employee compensation and stock option plans 2,130 (1,181) 3,311
Repurchase of common stock (8,979) (8,979)
Other (66) (66) Other comprehensive income (loss), net of tax (1,736) (1,736)
Balance, January 1, 2017 70,418 110,551 (14,901) 3,120 (28,352)
Net earnings 1,300 1,300
Cash dividends paid (8,943) (8,943)
Employee compensation and stock option plans 2,077 (1,079) 3,156
Repurchase of common stock (6,358) (6,358)
Other (36) (36) Other comprehensive income (loss), net of tax 1,702 1,702
Balance, December 31, 2017 $ 60,160 101,793 (13,199) 3,120 (31,554)
See Notes to Consolidated Financial Statements
38
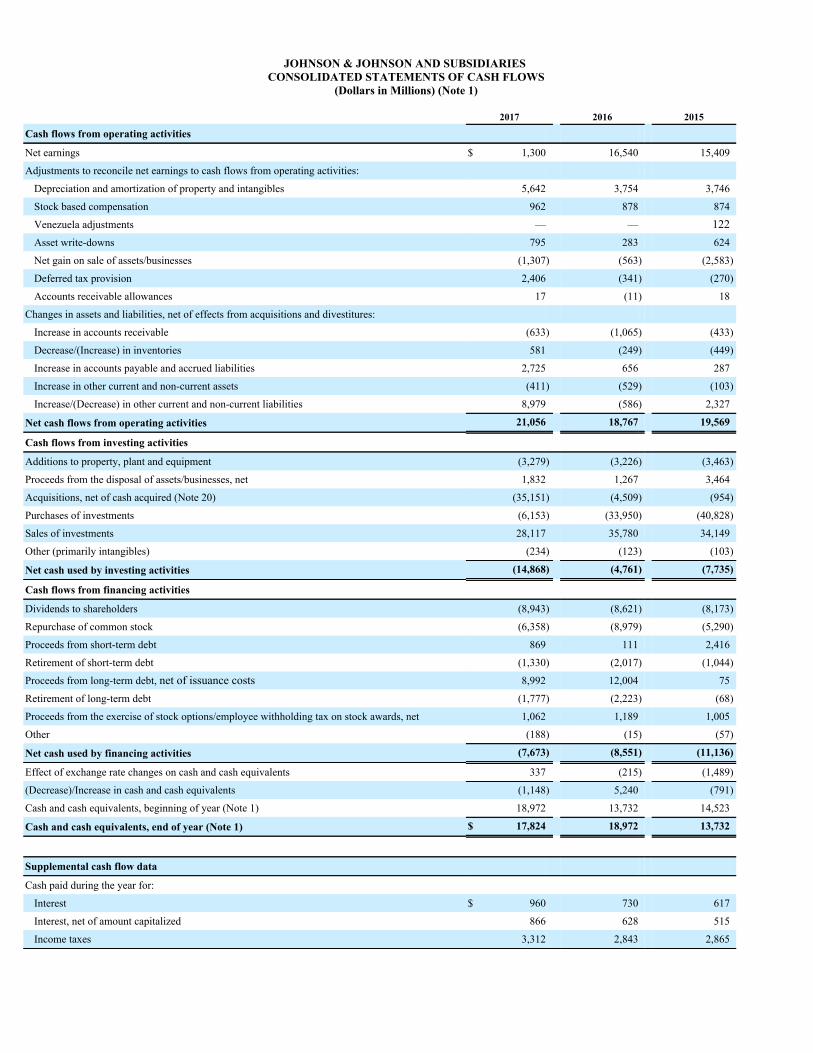
JOHNSON & JOHNSON AND SUBSIDIARIES CONSOLIDATED STATEMENTS OF CASH FLOWS
(Dollars in Millions) (Note 1)
2017 2016 2015
Cash flows from operating activities Net earnings $ 1,300 16,540 15,409
Adjustments to reconcile net earnings to cash flows from operating activities: Depreciation and amortization of property and intangibles 5,642 3,754 3,746
Stock based compensation 962 878 874
Venezuela adjustments — — 122Asset write-downs 795 283 624
Net gain on sale of assets/businesses (1,307) (563) (2,583)
Deferred tax provision 2,406 (341) (270)
Accounts receivable allowances 17 (11) 18
Changes in assets and liabilities, net of effects from acquisitions and divestitures: Increase in accounts receivable (633) (1,065) (433)
Decrease/(Increase) in inventories 581 (249) (449)
Increase in accounts payable and accrued liabilities 2,725 656 287
Increase in other current and non-current assets (411) (529) (103)
Increase/(Decrease) in other current and non-current liabilities 8,979 (586) 2,327
Net cash flows from operating activities 21,056 18,767 19,569
Cash flows from investing activities Additions to property, plant and equipment (3,279) (3,226) (3,463)
Proceeds from the disposal of assets/businesses, net 1,832 1,267 3,464
Acquisitions, net of cash acquired (Note 20) (35,151) (4,509) (954)
Purchases of investments (6,153) (33,950) (40,828)
Sales of investments 28,117 35,780 34,149
Other (primarily intangibles) (234) (123) (103)
Net cash used by investing activities (14,868) (4,761) (7,735)
Cash flows from financing activities Dividends to shareholders (8,943) (8,621) (8,173)
Repurchase of common stock (6,358) (8,979) (5,290)
Proceeds from short-term debt 869 111 2,416
Retirement of short-term debt (1,330) (2,017) (1,044)
Proceeds from long-term debt, net of issuance costs 8,992 12,004 75
Retirement of long-term debt (1,777) (2,223) (68)
Proceeds from the exercise of stock options/employee withholding tax on stock awards, net 1,062 1,189 1,005
Other (188) (15) (57)
Net cash used by financing activities (7,673) (8,551) (11,136)
Effect of exchange rate changes on cash and cash equivalents 337 (215) (1,489)
(Decrease)/Increase in cash and cash equivalents (1,148) 5,240 (791)
Cash and cash equivalents, beginning of year (Note 1) 18,972 13,732 14,523
Cash and cash equivalents, end of year (Note 1) $ 17,824 18,972 13,732
Supplemental cash flow data
Cash paid during the year for:
Interest $ 960 730 617
Interest, net of amount capitalized 866 628 515
Income taxes 3,312 2,843 2,865

39

Supplemental schedule of non-cash investing and financing activities
Treasury stock issued for employee compensation and stock option plans, net of cash proceeds/employee withholding tax on stock awards $ 2,062 2,043 1,486
Conversion of debt 16 35 16
Acquisitions
Fair value of assets acquired $ 36,937 4,586 1,174
Fair value of liabilities assumed and noncontrolling interests (1,786) (77) (220)
Net cash paid for acquisitions $ 35,151 4,509 954
See Notes to Consolidated Financial Statements
40
NOTES TO CONSOLIDATED FINANCIAL STATEMENTS
1. Summary of Significant Accounting PoliciesPrinciples of ConsolidationThe consolidated financial statements include the accounts of Johnson & Johnson and its subsidiaries (the Company). Intercompany accounts and transactions areeliminated.
Description of the Company and Business SegmentsThe Company has approximately 134,000 employees worldwide engaged in the research and development, manufacture and sale of a broad range of products inthe health care field. The Company conducts business in virtually all countries of the world and its primary focus is on products related to human health and well-being.
The Company is organized into three business segments: Consumer, Pharmaceutical and Medical Devices. The Consumer segment includes a broad range ofproducts used in the baby care, oral care, beauty, over-the-counter pharmaceutical, women’s health and wound care markets. These products are marketed to thegeneral public and sold both to retail outlets and distributors throughout the world. The Pharmaceutical segment is focused on six therapeutic areas, includingimmunology, infectious diseases, neuroscience, oncology, pulmonary hypertension, and cardiovascular and metabolic diseases. Products in this segment aredistributed directly to retailers, wholesalers, hospitals and health care professionals for prescription use. The Medical Devices segment includes a broad range ofproducts used in the orthopaedic, surgery, cardiovascular, diabetes care and vision care fields, which are distributed to wholesalers, hospitals and retailers, and usedprincipally in the professional fields by physicians, nurses, hospitals, eye care professionals and clinics.
Accounting Standard adopted in 2016During the fiscal second quarter of 2016, the Company adopted Accounting Standards Update (ASU) 2016-09 Compensation - Stock Compensation:Improvements to Employee Share Based Payment Accounting for the reporting of additional tax benefits on share-based compensation that vested or wereexercised during the fiscal year. The update requires all excess tax benefits and deficiencies to be recognized as a reduction or an increase to the provision for taxeson income. Previously, the Company recorded these benefits directly to Retained Earnings. The tax benefit for the Company was $353 million for the fiscal year2016. The standard does not permit retroactive presentation of this benefit to prior fiscal years on the Consolidated Statement of Earnings.
New Accounting StandardsRecently Adopted Accounting StandardsASU 2016-07: Simplifying the Transition to the Equity Method of AccountingThe amendments in the update eliminate the requirement that when an investment qualifies for the use of the equity method as a result of an increase in the level ofownership interest or degree of influence, an investor must adjust the investment, results of operations, and retained earnings retroactively on a step by step basis asif the equity method had been in effect during all previous periods that the investment had been held. The amendments in this update are effective for all entitiesfor fiscal years, and interim periods within those fiscal years, beginning after December 15, 2016. The amendments should be applied prospectively upon theireffective date to increases in the level of ownership interest or degree of influence that result in the application of the equity method. The adoption of this standarddid not have a material impact on the presentation of the Company's consolidated financial statements.
ASU 2015-11: Simplifying the Measurement of InventoryThis update requires inventory to be measured at the lower of cost or net realizable value. Net realizable value is the estimated selling prices in the ordinary courseof business, less reasonably predictable costs of completion, disposal and transportation. This update is effective for the Company for all annual and interimperiods beginning after December 15, 2016. The amendments in this update should be applied prospectively. This update did not have any material impact on theCompany’s consolidated financial statements.
Recently Issued Accounting StandardsNot Adopted as of December 31, 2017ASU 2018-02: Reclassification of Certain Tax Effects from Accumulated Other Comprehensive IncomeThis update allows a reclassification from accumulated other comprehensive income to retained earnings for stranded tax effects resulting from the Tax Cuts andJob Act enacted in December 2017. This update will be effective for the Company for fiscal years beginning after December 15, 2018 and interim periods withinthose fiscal years. Early adoption is permitted. The Company does not expect this standard to have a material impact on the Company's consolidated financialstatements.
41

ASU 2017-12: Targeted Improvements to Accounting for Hedging ActivitiesThis update makes more financial and nonfinancial hedging strategies eligible for hedge accounting. It also amends the presentation and disclosure requirementsand changes how companies assess effectiveness. This update will be effective for the Company for fiscal years beginning after December 15, 2018, and interimperiods within those fiscal years. Early adoption is permitted upon its issuance. The Company is currently assessing the impact of the future adoption of thisstandard on its financial statements.
ASU 2017-07: Improving the Presentation of Net Periodic Pension Cost and Net Periodic Postretirement Benefit CostThis update requires that an employer disaggregate the service cost component from the other components of net periodic benefit cost (“NPBC”). In addition, onlythe service cost component will be eligible for capitalization. This update is effective for the Company for all annual and interim periods beginning after December15, 2017. Early adoption is permitted as of the beginning of an annual period for which financial statements (interim or annual) have not been issued or madeavailable for issuance. The amendments in this Update should be applied retrospectively for the presentation of the service cost component and the othercomponents of NPBC in the income statement and prospectively, on and after the effective date, for the capitalization of the service cost component of NPBC inassets. The Company is assessing the retroactive restatement methodology and impact to the individual line items on Consolidated Statement of Earnings. TheCompany does not expect there to be a material impact to net earnings.
ASU 2017-01: Clarifying the Definition of a BusinessThis update narrows the definition of a business by providing a screen to determine when an integrated set of assets and activities is not a business. The screenspecifies that an integrated set of assets and activities is not a business if substantially all of the fair value of the gross assets acquired or disposed of is concentratedin a single or a group of similar identifiable assets. This update will be effective for the Company for annual periods beginning after December 15, 2017, includinginterim periods within those annual periods. Early adoption is permitted. This update should be applied prospectively. The Company does not expect this standardto have a material impact on the Company's consolidated financial statements.
ASU 2016-16: Income Taxes: Intra-Entity Transfers of Assets Other Than InventoryThis update removes the current exception in US GAAP prohibiting entities from recognizing current and deferred income tax expenses or benefits related totransfer of assets, other than inventory, within the consolidated entity. The current exception to defer the recognition of any tax impact on the transfer of inventorywithin the consolidated entity until it is sold to a third party remains unaffected. The amendments in this update are effective for public entities for annual reportingperiods beginning after December 15, 2017. The results from a preliminary assessment indicate that the adoption of the standard will not have a significant impacton the Company’s financial results. The Company expects to record net adjustments to deferred taxes of approximately $2.0 billion , a decrease to Other Assets ofapproximately $0.7 billion and an increase to retained earnings of approximately $1.3 billion .
ASU 2016-02: LeasesThis update requires the recognition of lease assets and lease liabilities on the balance sheet for all lease obligations and disclosing key information about leasingarrangements. This update requires the recognition of lease assets and lease liabilities by lessees for those leases classified as operating leases under currentgenerally accepted accounting principles. This update will be effective for the Company for all annual and interim periods beginning after December 15, 2018,including interim periods within those fiscal years. Early application is permitted. The Company anticipates that most of its operating leases will result in therecognition of additional assets and the corresponding liabilities on its Consolidated Balance Sheets, however does not expect the standard to have a materialimpact on the financial position. The actual impact will depend on the Company's lease portfolio at the time of adoption. The Company continues to assess allimplications of the standard and related financial disclosures.
ASU 2016-01: Financial Instruments: Recognition and Measurement of Financial Assets and Financial LiabilitiesThe amendments in this update supersede the guidance to classify equity securities with readily determinable fair values into different categories (that is, trading oravailable-for-sale) and require equity securities to be measured at fair value with changes in the fair value recognized through net income. The standard amendsfinancial reporting by providing relevant information about an entity’s equity investments and reducing the number of items that are recognized in othercomprehensive income. This update will be effective for the Company for annual periods beginning after December 15, 2017, and interim periods within thoseannual periods. The adoption of this standard will not have a material impact on the Company's consolidated financial statements.
ASU 2014-09: Revenue from Contracts with CustomersThe amendments replace substantially all current U.S. GAAP guidance on this topic and eliminate industry-specific guidance. Early adoption of this standard ispermitted but not before the original effective date for all annual periods and interim reporting
42

periods beginning after December 15, 2017. The Company will adopt the standard using the modified retrospective method. The adoption of this standard will nothave a material impact on the Company's consolidated financial statements including the additional disclosure requirements.
Cash EquivalentsThe Company classifies all highly liquid investments with stated maturities of three months or less from date of purchase as cash equivalents and all highly liquidinvestments with stated maturities of greater than three months from the date of purchase as current marketable securities. The Company has a policy of makinginvestments only with commercial institutions that have at least an investment grade credit rating. The Company invests its cash primarily in government securitiesand obligations, corporate debt securities, money market funds and reverse repurchase agreements (RRAs).
RRAs are collateralized by deposits in the form of Government Securities and Obligations for an amount not less than 102% of their value. The Company doesnot record an asset or liability as the Company is not permitted to sell or repledge the associated collateral. The Company has a policy that the collateral has at leastan A (or equivalent) credit rating. The Company utilizes a third party custodian to manage the exchange of funds and ensure that collateral received is maintainedat 102% of the value of the RRAs on a daily basis. RRAs with stated maturities of greater than three months from the date of purchase are classified as marketablesecurities.
InvestmentsInvestments classified as held to maturity investments are reported at amortized cost and realized gains or losses are reported in earnings. Investments classified asavailable-for-sale are carried at estimated fair value with unrealized gains and losses recorded as a component of accumulated other comprehensive income.Available-for-sale securities available for current operations are classified as current assets otherwise, they are classified as long term. Management determines theappropriate classification of its investment in debt and equity securities at the time of purchase and re-evaluates such determination at each balance sheet date. TheCompany periodically reviews its investments in equity securities for impairment and adjusts these investments to their fair value when a decline in market value isdeemed to be other than temporary. If losses on these securities are considered to be other than temporary, the loss is recognized in earnings.
Property, Plant and Equipment and DepreciationProperty, plant and equipment are stated at cost. The Company utilizes the straight-line method of depreciation over the estimated useful lives of the assets:
Building and building equipment 20 - 30 yearsLand and leasehold improvements 10 - 20 yearsMachinery and equipment 2 - 13 years
The Company capitalizes certain computer software and development costs, included in machinery and equipment, when incurred in connection withdeveloping or obtaining computer software for internal use. Capitalized software costs are amortized over the estimated useful lives of the software, whichgenerally range from 3 to 8 years.
The Company reviews long-lived assets to assess recoverability using undiscounted cash flows. When certain events or changes in operating or economicconditions occur, an impairment assessment may be performed on the recoverability of the carrying value of these assets. If the asset is determined to be impaired,the loss is measured based on the difference between the asset’s fair value and its carrying value. If quoted market prices are not available, the Company willestimate fair value using a discounted value of estimated future cash flows.
Revenue RecognitionThe Company recognizes revenue from product sales when the goods are shipped or delivered and title and risk of loss pass to the customer. Provisions for certainrebates, sales incentives, trade promotions, coupons, product returns and discounts to customers are accounted for as reductions in sales in the same period therelated sales are recorded.
Product discounts granted are based on the terms of arrangements with direct, indirect and other market participants, as well as market conditions, includingprices charged by competitors. Rebates, which include Medicaid, are estimated based on contractual terms, historical experience, patient outcomes, trend analysisand projected market conditions in the various markets served. The Company evaluates market conditions for products or groups of products primarily through theanalysis of wholesaler and other third-party sell-through and market research data, as well as internally generated information.
Sales returns are generally estimated and recorded based on historical sales and returns information. Products that exhibit unusual sales or return patterns dueto dating, competition or other marketing matters are specifically investigated and analyzed as part of the accounting for sales returns accruals.
Sales returns allowances represent a reserve for products that may be returned due to expiration, destruction in the field, or in specific areas, product recall.The returns reserve is based on historical return trends by product and by market as a percent to gross sales. In accordance with the Company’s accounting policies,the Company generally issues credit to customers for
43
returned goods. The Company’s sales returns reserves are accounted for in accordance with U.S. GAAP guidance for revenue recognition when right of returnexists. Sales returns reserves are recorded at full sales value. Sales returns in the Consumer and Pharmaceutical segments are almost exclusively not resalable.Sales returns for certain franchises in the Medical Devices segment are typically resalable but are not material. The Company infrequently exchanges productsfrom inventory for returned products. The sales returns reserve for the total Company has been approximately 1.0% of annual sales to customers during the fiscalreporting years 2017 , 2016 and 2015 .
Promotional programs, such as product listing allowances and cooperative advertising arrangements, are recorded in the year incurred. Continuingpromotional programs include coupons and volume-based sales incentive programs. The redemption cost of consumer coupons is based on historical redemptionexperience by product and value. Volume-based incentive programs are based on the estimated sales volumes for the incentive period and are recorded as productsare sold. The Company also earns service revenue for co-promotion of certain products and includes it in sales to customers. These arrangements are evaluated todetermine the appropriate amounts to be deferred or recorded as a reduction of revenue.
Shipping and HandlingShipping and handling costs incurred were $1,042 million , $974 million and $996 million in 2017 , 2016 and 2015 , respectively, and are included in selling,marketing and administrative expense. The amount of revenue received for shipping and handling is less than 0.5% of sales to customers for all periods presented.
InventoriesInventories are stated at the lower of cost or net realizable value determined by the first-in, first-out method.
Intangible Assets and GoodwillThe authoritative literature on U.S. GAAP requires that goodwill and intangible assets with indefinite lives be assessed annually for impairment. The Companycompleted the annual impairment test for 2017 in the fiscal fourth quarter. Future impairment tests will be performed annually in the fiscal fourth quarter, or soonerif warranted. Purchased in-process research and development is accounted for as an indefinite lived intangible asset until the underlying project is completed, atwhich point the intangible asset will be accounted for as a definite lived intangible asset, or abandoned, at which point the intangible asset will be written off orpartially impaired.
Intangible assets that have finite useful lives continue to be amortized over their useful lives, and are reviewed for impairment when warranted by economicconditions. See Note 5 for further details on Intangible Assets and Goodwill.
Financial InstrumentsAs required by U.S. GAAP, all derivative instruments are recorded on the balance sheet at fair value. Fair value is the exit price that would be received to sell anasset or paid to transfer a liability. Fair value is a market-based measurement determined using assumptions that market participants would use in pricing an assetor liability. The authoritative literature establishes a three-level hierarchy to prioritize the inputs used in measuring fair value, with Level 1 having the highestpriority and Level 3 having the lowest. Changes in the fair value of derivatives are recorded each period in current earnings or other comprehensive income,depending on whether the derivative is designated as part of a hedge transaction, and if so, the type of hedge transaction.
The Company documents all relationships between hedged items and derivatives. The overall risk management strategy includes reasons for undertakinghedge transactions and entering into derivatives. The objectives of this strategy are: (1) minimize foreign currency exposure’s impact on the Company’s financialperformance; (2) protect the Company’s cash flow from adverse movements in foreign exchange rates; (3) ensure the appropriateness of financial instruments; and(4) manage the enterprise risk associated with financial institutions. See Note 6 for additional information on Financial Instruments.
Product LiabilityAccruals for product liability claims are recorded, on an undiscounted basis, when it is probable that a liability has been incurred and the amount of the liability canbe reasonably estimated based on existing information and actuarially determined estimates where applicable. The accruals are adjusted periodically as additionalinformation becomes available. The Company accrues an estimate of the legal defense costs needed to defend each matter when those costs are probable and canbe reasonably estimated.
As a result of cost and availability factors, effective November 1, 2005, the Company ceased purchasing third-party product liability insurance. The Companyhas self insurance through a wholly-owned captive insurance company. In addition to accruals in the self insurance program, claims that exceed the insurancecoverage are accrued when losses are probable and amounts can be reasonably estimated.
Research and DevelopmentResearch and development expenses are expensed as incurred. Upfront and milestone payments made to third parties in connection with research and developmentcollaborations are expensed as incurred up to the point of regulatory approval.
44

Payments made to third parties subsequent to regulatory approval are capitalized and amortized over the remaining useful life of the related product. Amountscapitalized for such payments are included in other intangibles, net of accumulated amortization.
The Company enters into collaborative arrangements, typically with other pharmaceutical or biotechnology companies, to develop and commercialize drugcandidates or intellectual property. These arrangements typically involve two (or more) parties who are active participants in the collaboration and are exposed tosignificant risks and rewards dependent on the commercial success of the activities. These collaborations usually involve various activities by one or more parties,including research and development, marketing and selling and distribution. Often, these collaborations require upfront, milestone and royalty or profit sharepayments, contingent upon the occurrence of certain future events linked to the success of the asset in development. Amounts due from collaborative partnersrelated to development activities are generally reflected as a reduction of research and development expense because the performance of contract developmentservices is not central to the Company’s operations. In general, the income statement presentation for these collaborations is as follows:
Nature/Type of Collaboration Statement of Earnings Presentation
Third-party sale of product Sales to customersRoyalties/milestones paid to collaborative partner (post-regulatory approval)* Cost of products soldRoyalties received from collaborative partner Other income (expense), netUpfront payments & milestones paid to collaborative partner (pre-regulatoryapproval)
Research and development expense
Research and development payments to collaborative partner Research and development expenseResearch and development payments received from collaborative partner Reduction of Research and development expense
* Milestones are capitalized as intangible assets and amortized to cost of products sold over the useful life.For all years presented, there was no individual project that represented greater than 5% of the total annual consolidated research and development expense.
The Company has a number of products and compounds developed in collaboration with strategic partners including XARELTO ® , co-developed with BayerHealthCare AG and IMBRUVICA ® , developed in collaboration and co-marketed with Pharmacyclics LLC, an AbbVie company. AdvertisingCosts associated with advertising are expensed in the year incurred and are included in selling, marketing and administrative expenses. Advertising expensesworldwide, which comprised television, radio, print media and Internet advertising, were $2.5 billion , $2.4 billion and $2.5 billion in 2017 , 2016 and 2015 ,respectively.
Income TaxesIncome taxes are recorded based on amounts refundable or payable for the current year and include the results of any difference between U.S. GAAP accountingand tax reporting, recorded as deferred tax assets or liabilities. The Company estimates deferred tax assets and liabilities based on enacted tax regulations and rates.Future changes in tax laws and rates may affect recorded deferred tax assets and liabilities in the future.
The Company has unrecognized tax benefits for uncertain tax positions. The Company follows U.S. GAAP which prescribes a recognition threshold andmeasurement attribute for the financial statement recognition and measurement of a tax position taken or expected to be taken in a tax return. Management believesthat changes in these estimates would not have a material effect on the Company's results of operations, cash flows or financial position.
In the fourth quarter of 2017, the United States enacted the TCJA, which includes provisions for a tax on all previously undistributed earnings in foreignjurisdictions. The Company has provisionally booked a $10.1 billion charge on these undistributed earnings in 2017. Additionally, the Company has provisionallyrecorded a $4.5 billion deferred tax liability for foreign local and withholding taxes, offset by a $1.1 billion deferred tax asset for U.S. foreign tax credits, forrepatriation of substantially all undistributed foreign earnings. The Company is currently evaluating the remaining undistributed foreign earnings for which it hasnot provided deferred taxes for foreign local and withholding tax, as these earnings are considered to be indefinitely reinvested. The amount of these unrecordeddeferred taxes is not expected to be material.
See Note 8 for further information regarding income taxes.
45

Net Earnings Per ShareBasic earnings per share is computed by dividing net earnings available to common shareholders by the weighted average number of common shares outstandingfor the period. Diluted earnings per share reflects the potential dilution that could occur if securities were exercised or converted into common stock using thetreasury stock method.
Use of EstimatesThe preparation of consolidated financial statements in conformity with accounting principles generally accepted in the U.S. requires management to makeestimates and assumptions that affect the amounts reported. Estimates are used when accounting for sales discounts, rebates, allowances and incentives, productliabilities, income taxes, withholding taxes, depreciation, amortization, employee benefits, contingencies and intangible asset and liability valuations. Actual resultsmay or may not differ from those estimates.
The Company follows the provisions of U.S. GAAP when recording litigation related contingencies. A liability is recorded when a loss is probable and can bereasonably estimated. The best estimate of a loss within a range is accrued; however, if no estimate in the range is better than any other, the minimum amount isaccrued.
Annual Closing DateThe Company follows the concept of a fiscal year, which ends on the Sunday nearest to the end of the month of December. Normally each fiscal year consists of52 weeks, but every five or six years the fiscal year consists of 53 weeks , and therefore includes additional shipping days, as was the case in 2015, and will be thecase again in 2020.
ReclassificationCertain prior period amounts have been reclassified to conform to current year presentation.
2. Cash, Cash Equivalents and Current Marketable SecuritiesAt the end of 2017 and 2016 , cash, cash equivalents and current marketable securities were comprised of:
(Dollars in Millions) 2017
CarryingAmount
Estimated FairValue
Cash & CashEquivalents
CurrentMarketableSecurities
Cash $ 2,929 2,929 $ 2,929 —U.S. Gov't Securities (1) — — — —Other Sovereign Securities (1) 279 279 219 60U.S. Reverse repurchase agreements 4,025 4,025 4,025 —Other Reverse repurchase agreements — — — —Corporate debt securities (1) 289 289 244 45Money market funds 4,288 4,288 4,288 —Time deposits (1) 1,176 1,176 1,175 1 Subtotal $ 12,986 12,986 12,880 106
Gov't Securities $ 4,864 4,864 4,833 31Other Sovereign Securities 186 186 80 106Corporate debt securities 260 260 31 229 Subtotal available for sale (2) $ 5,310 5,310 4,944 366 Total cash, cash equivalents and current marketablesecurities $ 17,824 472
In 2017, the carrying amount was the same as the estimated fair value.
46

(Dollars in Millions) 2016
CarryingAmount
UnrecognizedGain Unrecognized Loss
Estimated FairValue Cash Equivalents
CurrentMarketableSecurities
Cash $ 1,979 — — 1,979 1,979 —U.S. Gov't Securities (1) 10,832 — (1) 10,831 2,249 8,583Other Sovereign Securities (1) 1,299 — — 1,299 120 1,179U.S. Reverse repurchase agreements 6,103 — — 6,103 6,103 —Other Reverse repurchase agreements 240 — — 240 240 —Corporate debt securities (1) 754 — — 754 — 754Money market funds 7,187 — — 7,187 7,187 —Time deposits (1) 1,094 — — 1,094 1,094 — Subtotal $ 29,488 — (1) 29,487 18,972 10,516 Unrealized Gain Unrealized Loss Gov't Securities $ 10,277 5 (51) 10,231 — 10,231Other Sovereign Securities 90 — — 90 90Corporate debt securities 1,777 1 (12) 1,766 — 1,766Equity investments 34 298 — 332 332 Subtotal available for sale (2) $ 12,178 304 (63) 12,419 — 12,419 Total cash, cash equivalents andcurrent marketable securities $ 18,972 22,935
(1) Held to maturity investments are reported at amortized cost and realized gains or losses are reported in earnings.(2) Available for sale securities are reported at fair value with unrealized gains and losses reported net of taxes in other comprehensive income.
Fair value of government securities and obligations and corporate debt securities were estimated using quoted broker prices and significant other observableinputs.
The contractual maturities of the available for sale debt securities at December 31, 2017 are as follows:
(Dollars in Millions) Cost Basis Fair ValueDue within one year $ 5,214 5,214Due after one year through five years 96 96Due after five years through ten years — —Total debt securities $ 5,310 5,310
The Company invests its excess cash in both deposits with major banks throughout the world and other high-quality money market instruments. The Companyhas a policy of making investments only with commercial institutions that have at least an investment grade credit rating.
47

3. InventoriesAt the end of 2017 and 2016 , inventories were comprised of:
(Dollars in Millions) 2017 2016Raw materials and supplies $ 1,140 952Goods in process 2,317 2,185Finished goods 5,308 5,007Total inventories $ 8,765 8,144
4. Property, Plant and Equipment
At the end of 2017 and 2016 , property, plant and equipment at cost and accumulated depreciation were:
(Dollars in Millions) 2017 2016Land and land improvements $ 829 753Buildings and building equipment 11,240 10,112Machinery and equipment 25,949 23,554Construction in progress 3,448 3,354Total property, plant and equipment, gross $ 41,466 37,773Less accumulated depreciation 24,461 21,861Total property, plant and equipment, net $ 17,005 15,912
The Company capitalizes interest expense as part of the cost of construction of facilities and equipment. Interest expense capitalized in 2017 , 2016 and 2015 was$94 million , $102 million and $102 million , respectively.
Depreciation expense, including the amortization of capitalized interest in 2017 , 2016 and 2015 was $2.6 billion , $2.5 billion and $2.5 billion , respectively.Upon retirement or other disposal of property, plant and equipment, the costs and related amounts of accumulated depreciation or amortization are eliminated
from the asset and accumulated depreciation accounts, respectively. The difference, if any, between the net asset value and the proceeds are recorded in earnings.
5. Intangible Assets and GoodwillAt the end of 2017 and 2016 , the gross and net amounts of intangible assets were:
(Dollars in Millions) 2017 2016Intangible assets with definite lives: Patents and trademarks — gross $ 36,427 10,521Less accumulated amortization 7,223 5,076Patents and trademarks — net $ 29,204 5,445Customer relationships and other intangibles — gross $ 20,204 17,615Less accumulated amortization 7,463 6,515Customer relationships and other intangibles — net $ 12,741 11,100Intangible assets with indefinite lives: Trademarks $ 7,082 6,888Purchased in-process research and development 4,201 3,443Total intangible assets with indefinite lives $ 11,283 10,331Total intangible assets — net $ 53,228 26,876
48

Goodwill as of December 31, 2017 and January 1, 2017 , as allocated by segment of business, was as follows:
(Dollars in Millions) Consumer Pharmaceutical Medical Devices Total
Goodwill at January 3, 2016 $ 7,240 2,889 11,500 21,629Goodwill, related to acquisitions 1,362 — 210 1,572Goodwill, related to divestitures (63) (12) — (75)Currency translation/other (276) (37) (8) (321)Goodwill at January 1, 2017 $ 8,263 2,840 11,702 22,805Goodwill, related to acquisitions 102 6,161 2,200 8,463Goodwill, related to divestitures (74) (1) (102) (177)Currency translation/other 584 109 122 815
Goodwill at December 31, 2017 $ 8,875 9,109 13,922 31,906
The weighted average amortization periods for patents and trademarks and customer relationships and other intangible assets are 12 years and 23 years ,respectively. The amortization expense of amortizable assets included in cost of products sold was $3.0 billion , $1.2 billion and $1.2 billion before tax, for thefiscal years ended December 31, 2017 , January 1, 2017 and January 3, 2016 , respectively. The estimated amortization expense for the five succeeding yearsapproximates $4.4 billion before tax, per year. Intangible asset write-downs are included in Other (income) expense, net.
The primary driver of the increase to intangible assets and goodwill is related to the Actelion acquisition in the fiscal second quarter of 2017, which resulted in therecording of $25.0 billion to intangible assets and $6.2 billion to goodwill. The intangible assets and goodwill amounts related to the Actelion acquisition are basedon the preliminary purchase price allocation. Additionally, the Abbott Medical Optics (AMO) acquisition in the fiscal first quarter of 2017, resulted in therecording of $2.3 billion to intangible assets and $1.7 billion to goodwill. The intangible assets and goodwill amounts related to the AMO acquisition are based onthe final purchase price allocation.
See Note 20 to the Consolidated Financial Statements for additional details related to acquisitions and divestitures.
6. Fair Value MeasurementsThe Company uses forward foreign exchange contracts to manage its exposure to the variability of cash flows, primarily related to the foreign exchange ratechanges of future intercompany products and third-party purchases of materials denominated in a foreign currency. The Company uses cross currency interest rateswaps to manage currency risk primarily related to borrowings. The Company also uses equity collar contracts to manage exposure to market risk associated withcertain equity investments. All three types of derivatives are designated as cash flow hedges.
Additionally, the Company uses interest rate swaps as an instrument to manage interest rate risk related to fixed rate borrowings. These derivatives aredesignated as fair value hedges. The Company uses forward foreign exchange contracts designated as net investment hedges. Additionally, the Company usesforward foreign exchange contracts to offset its exposure to certain foreign currency assets and liabilities. These forward foreign exchange contracts are notdesignated as hedges and therefore, changes in the fair values of these derivatives are recognized in earnings, thereby offsetting the current earnings effect of therelated foreign currency assets and liabilities.
The Company does not enter into derivative financial instruments for trading or speculative purposes, or that contain credit risk related contingent features.During the fiscal second quarter of 2017, the Company entered into credit support agreements (CSA) with certain derivative counterparties establishing collateralthresholds based on respective credit ratings and netting agreements. As of December 31, 2017 , the total amount of collateral paid under the credit supportagreements (CSA) amounted to $162 million net. For equity collar contracts, the Company pledged the underlying hedged marketable equity securities to thecounter-party as collateral. On an ongoing basis, the Company monitors counter-party credit ratings. The Company considers credit non-performance risk to below, because the Company primarily enters into agreements with commercial institutions that have at least an investment grade credit rating. Refer to the table onsignificant financial assets and liabilities measured at fair value contained in this footnote for receivables and payables with these commercial institutions. As ofDecember 31, 2017 , the Company had notional amounts outstanding for forward foreign exchange contracts, cross currency interest rate swaps and interest rateswaps of $34.5 billion , $2.3 billion , and $1.1 billion respectively. As of January 1, 2017, the Company had notional amounts outstanding for forward foreignexchange contracts, cross currency interest rate swaps, interest rate swaps and equity collar contracts of $36.0 billion , $2.3 billion , $1.8 billion , and $0.3 billionrespectively.
49

All derivative instruments are recorded on the balance sheet at fair value. Changes in the fair value of derivatives are recorded each period in current earningsor other comprehensive income, depending on whether the derivative is designated as part of a hedge transaction, and if so, the type of hedge transaction.
The designation as a cash flow hedge is made at the entrance date of the derivative contract. At inception, all derivatives are expected to be highly effective.Changes in the fair value of a derivative that is designated as a cash flow hedge and is highly effective are recorded in accumulated other comprehensive incomeuntil the underlying transaction affects earnings, and are then reclassified to earnings in the same account as the hedged transaction. Gains and losses associatedwith interest rate swaps and changes in fair value of hedged debt attributable to changes in interest rates are recorded to interest expense in the period in which theyoccur. Gains and losses on net investment hedges are accounted for through the currency translation account. On an ongoing basis, the Company assesses whethereach derivative continues to be highly effective in offsetting changes of hedged items. If and when a derivative is no longer expected to be highly effective, hedgeaccounting is discontinued. Hedge ineffectiveness, if any, is included in current period earnings in Other (income) expense, net for forward foreign exchangecontracts, cross currency interest rate swaps, net investment hedges and equity collar contracts. For interest rate swaps designated as fair value hedges, hedgeineffectiveness, if any, is included in current period earnings within interest expense. For the current reporting period, hedge ineffectiveness associated withinterest rate swaps was not material.
During the fiscal second quarter of 2016, the Company designated its Euro denominated notes issued in May 2016 with due dates ranging from 2022 to 2035as a net investment hedge of the Company's investments in certain of its international subsidiaries that use the Euro as their functional currency in order to reducethe volatility caused by changes in exchange rates.The change in the carrying value due to remeasurement of these Euro notes resulted in a $597 million unrealized pretax loss for the fiscal year ended December 31,2017, reflected in foreign currency translation adjustment, within the Consolidated Statements of Comprehensive Income. The change in the carrying value due toremeasurement of these Euro notes resulted in a cumulative $222 million unrealized pretax loss from hedge inception through the fiscal year ended December 31,2017, reflected in foreign currency translation adjustment, within the Consolidated Statements of Comprehensive Income.
As of December 31, 2017 , the balance of deferred net gains on derivatives included in accumulated other comprehensive income was $70 million after-tax.For additional information, see the Consolidated Statements of Comprehensive Income and Note 13. The Company expects that substantially all of the amountsrelated to forward foreign exchange contracts will be reclassified into earnings over the next 12 months as a result of transactions that are expected to occur overthat period. The maximum length of time over which the Company is hedging transaction exposure is 18 months , excluding interest rate contracts, net investmenthedges and equity collar contracts. The amount ultimately realized in earnings may differ as foreign exchange rates change. Realized gains and losses areultimately determined by actual exchange rates at maturity of the derivative.
The following table is a summary of the activity related to derivatives designated as cash flow hedges for the fiscal years ended December 31, 2017 andJanuary 1, 2017 :
(Dollars in Millions)
Gain/(Loss) Recognized In
Accumulated OCI (1)
Gain/(Loss) ReclassifiedFrom
Accumulated OCI IntoIncome (1)
Gain/(Loss) Recognized In Other Income/Expense (2)
Cash Flow Hedges by Income Statement Caption 2017 2016 2017 2016 2017 2016
Sales to customers (3) $ 49 (65) (31) (47) (1) (1)Cost of products sold (3) 96 (212) (159) (3) (10) (15)Research and development expense (3) (199) (76) (165) (90) 5 —Interest (income)/Interest expense, net (4) 110 66 83 37 — —Other (income) expense, net (3) (5) (60) (72) (87) (7) — 2Total $ (4) (359) (359) (110) (6) (14)
All amounts shown in the table above are net of tax.(1) Effective portion(2) Ineffective portion(3) Forward foreign exchange contracts(4) Cross currency interest rate swaps (5) Includes equity collar contracts
50
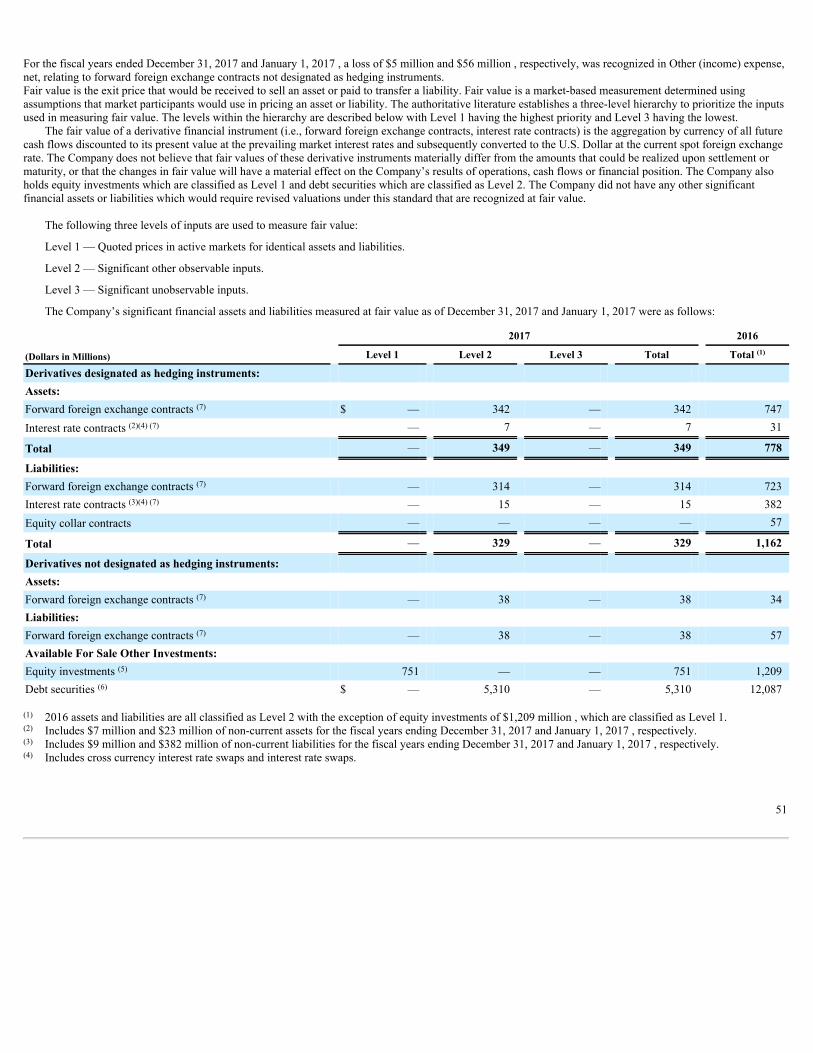
For the fiscal years ended December 31, 2017 and January 1, 2017 , a loss of $5 million and $56 million , respectively, was recognized in Other (income) expense,net, relating to forward foreign exchange contracts not designated as hedging instruments.Fair value is the exit price that would be received to sell an asset or paid to transfer a liability. Fair value is a market-based measurement determined usingassumptions that market participants would use in pricing an asset or liability. The authoritative literature establishes a three-level hierarchy to prioritize the inputsused in measuring fair value. The levels within the hierarchy are described below with Level 1 having the highest priority and Level 3 having the lowest.
The fair value of a derivative financial instrument (i.e., forward foreign exchange contracts, interest rate contracts) is the aggregation by currency of all futurecash flows discounted to its present value at the prevailing market interest rates and subsequently converted to the U.S. Dollar at the current spot foreign exchangerate. The Company does not believe that fair values of these derivative instruments materially differ from the amounts that could be realized upon settlement ormaturity, or that the changes in fair value will have a material effect on the Company’s results of operations, cash flows or financial position. The Company alsoholds equity investments which are classified as Level 1 and debt securities which are classified as Level 2. The Company did not have any other significantfinancial assets or liabilities which would require revised valuations under this standard that are recognized at fair value.
The following three levels of inputs are used to measure fair value:
Level 1 — Quoted prices in active markets for identical assets and liabilities.
Level 2 — Significant other observable inputs.
Level 3 — Significant unobservable inputs.
The Company’s significant financial assets and liabilities measured at fair value as of December 31, 2017 and January 1, 2017 were as follows:
2017 2016
(Dollars in Millions) Level 1 Level 2 Level 3 Total Total (1)
Derivatives designated as hedging instruments: Assets: Forward foreign exchange contracts (7) $ — 342 — 342 747Interest rate contracts (2)(4) (7) — 7 — 7 31
Total — 349 — 349 778
Liabilities: Forward foreign exchange contracts (7) — 314 — 314 723Interest rate contracts (3)(4) (7) — 15 — 15 382Equity collar contracts — — — — 57
Total — 329 — 329 1,162
Derivatives not designated as hedging instruments: Assets: Forward foreign exchange contracts (7) — 38 — 38 34Liabilities: Forward foreign exchange contracts (7) — 38 — 38 57Available For Sale Other Investments: Equity investments (5) 751 — — 751 1,209Debt securities (6) $ — 5,310 — 5,310 12,087
(1) 2016 assets and liabilities are all classified as Level 2 with the exception of equity investments of $1,209 million , which are classified as Level 1.(2) Includes $7 million and $23 million of non-current assets for the fiscal years ending December 31, 2017 and January 1, 2017 , respectively.(3) Includes $9 million and $382 million of non-current liabilities for the fiscal years ending December 31, 2017 and January 1, 2017 , respectively.(4) Includes cross currency interest rate swaps and interest rate swaps.
51

(5) Classified as non-current other assets. The carrying amount of the equity investments were $394 million and $520 million as of December 31, 2017 andJanuary 1, 2017 , respectively. The unrealized gains were $367 million and $757 million as of December 31, 2017 and January 1, 2017 , respectively. Theunrealized losses were $10 million and $68 million as of December 31, 2017 and January 1, 2017 , respectively.
(6) Classified as cash equivalents and current marketable securities.(7) Includes collateral exchanged on the credit support agreements on derivatives.
See Notes 2 and 7 for financial assets and liabilities held at carrying amount on the Consolidated Balance Sheet.
52
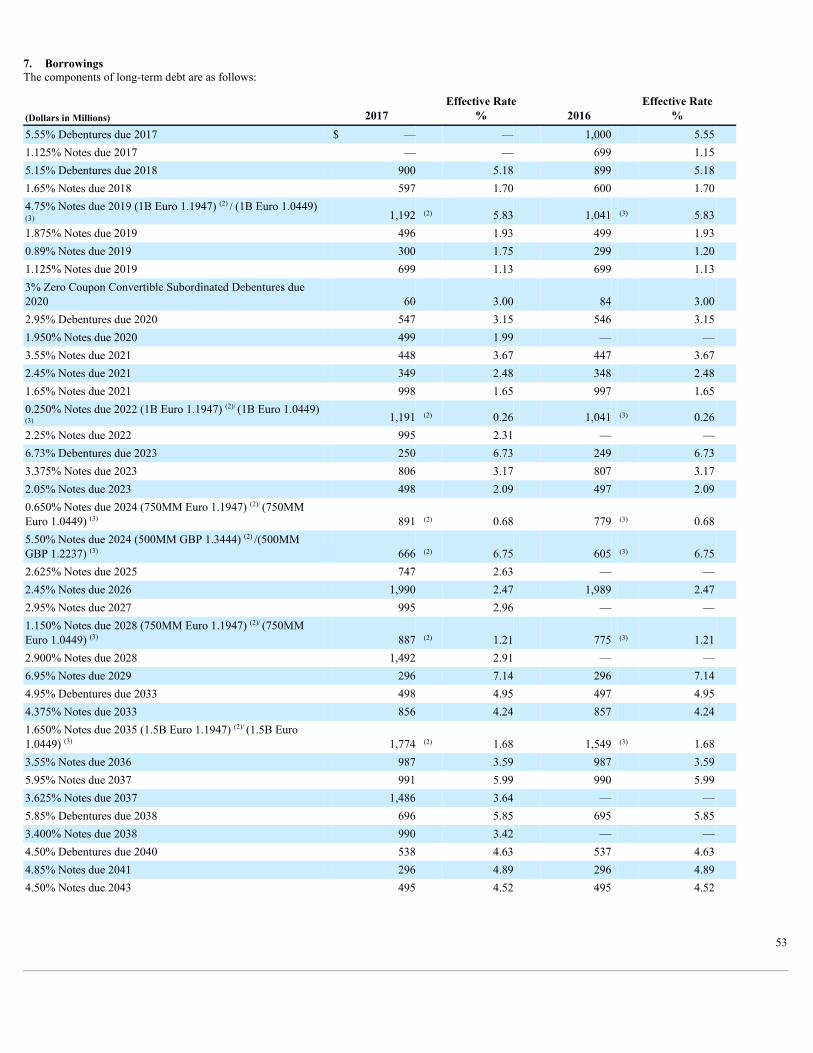
7. BorrowingsThe components of long-term debt are as follows:
(Dollars in Millions) 2017 Effective Rate
% 2016 Effective Rate
% 5.55% Debentures due 2017 $ — — 1,000 5.55 1.125% Notes due 2017 — — 699 1.15 5.15% Debentures due 2018 900 5.18 899 5.18 1.65% Notes due 2018 597 1.70 600 1.70 4.75% Notes due 2019 (1B Euro 1.1947) (2) / (1B Euro 1.0449)(3) 1,192 (2) 5.83 1,041 (3) 5.83 1.875% Notes due 2019 496 1.93 499 1.93 0.89% Notes due 2019 300 1.75 299 1.20 1.125% Notes due 2019 699 1.13 699 1.13 3% Zero Coupon Convertible Subordinated Debentures due2020 60 3.00 84 3.00 2.95% Debentures due 2020 547 3.15 546 3.15 1.950% Notes due 2020 499 1.99 — — 3.55% Notes due 2021 448 3.67 447 3.67 2.45% Notes due 2021 349 2.48 348 2.48 1.65% Notes due 2021 998 1.65 997 1.65 0.250% Notes due 2022 (1B Euro 1.1947) (2)/ (1B Euro 1.0449)(3) 1,191 (2) 0.26 1,041 (3) 0.26 2.25% Notes due 2022 995 2.31 — — 6.73% Debentures due 2023 250 6.73 249 6.73 3.375% Notes due 2023 806 3.17 807 3.17 2.05% Notes due 2023 498 2.09 497 2.09 0.650% Notes due 2024 (750MM Euro 1.1947) (2)/ (750MMEuro 1.0449) (3) 891 (2) 0.68 779 (3) 0.68 5.50% Notes due 2024 (500MM GBP 1.3444) (2) /(500MMGBP 1.2237) (3) 666 (2) 6.75 605 (3) 6.75 2.625% Notes due 2025 747 2.63 — — 2.45% Notes due 2026 1,990 2.47 1,989 2.47 2.95% Notes due 2027 995 2.96 — — 1.150% Notes due 2028 (750MM Euro 1.1947) (2)/ (750MMEuro 1.0449) (3) 887 (2) 1.21 775 (3) 1.21 2.900% Notes due 2028 1,492 2.91 — — 6.95% Notes due 2029 296 7.14 296 7.14 4.95% Debentures due 2033 498 4.95 497 4.95 4.375% Notes due 2033 856 4.24 857 4.24 1.650% Notes due 2035 (1.5B Euro 1.1947) (2)/ (1.5B Euro1.0449) (3) 1,774 (2) 1.68 1,549 (3) 1.68 3.55% Notes due 2036 987 3.59 987 3.59 5.95% Notes due 2037 991 5.99 990 5.99 3.625% Notes due 2037 1,486 3.64 — — 5.85% Debentures due 2038 696 5.85 695 5.85 3.400% Notes due 2038 990 3.42 — — 4.50% Debentures due 2040 538 4.63 537 4.63 4.85% Notes due 2041 296 4.89 296 4.89 4.50% Notes due 2043 495 4.52 495 4.52
53

3.70% Notes due 2046 1,971 3.74 1,970 3.74 3.75% Notes due 2047 990 3.76 — — 3.500% Notes due 2048 742 3.52 — — Other 75 — 77 —
Subtotal 32,174 (4) 3.19% (1) 24,146 (4) 3.33 (1 )
Less current portion 1,499 1,704
Total long-term debt $ 30,675 22,442
(1) Weighted average effective rate.(2) Translation rate at December 31, 2017 .(3) Translation rate at January 1, 2017 .(4) The excess of the fair value over the carrying value of debt was $2.0 billion in 2017 and $1.6 billion in 2016 .
Fair value of the long-term debt was estimated using market prices, which were corroborated by quoted broker prices and significant other observable inputs.The Company has access to substantial sources of funds at numerous banks worldwide. In September 2017 , the Company secured a new 364-day Credit
Facility. Total credit available to the Company approximates $10 billion , which expires on September 13, 2018 . Interest charged on borrowings under the creditline agreements is based on either bids provided by banks, the prime rate or London Interbank Offered Rates (LIBOR), plus applicable margins. Commitment feesunder the agreements are not material.
Throughout 2017 , the Company continued to have access to liquidity through the commercial paper market. Short-term borrowings and the current portion oflong-term debt amounted to approximately $3.9 billion at the end of 2017 , of which $2.3 billion was borrowed under the Commercial Paper Program, $1.5 billionis the current portion of the long term debt, and the remainder principally represents local borrowing by international subsidiaries.
Throughout 2016, the Company continued to have access to liquidity through the commercial paper market. Short-term borrowings and the current portion oflong-term debt amounted to approximately $4.7 billion at the end of 2016, of which $2.7 billion was borrowed under the Commercial Paper Program, $1.7 billionis the current portion of the long term debt, and the remainder principally represents local borrowing by international subsidiaries.
Aggregate maturities of long-term obligations commencing in 2018 are:
(Dollars in Millions) 2018 2019 2020 2021 2022 After 2022
$1,499 2,752 1,105 1,797 2,189 22,832
8. Income TaxesTax Cuts and Jobs Act (TCJA) and SEC Staff Accounting Bulletin 118 (SAB 118)On December 22, 2017, the United States enacted into law new U.S. tax legislation, referred to as the TCJA. This law includes provisions for a comprehensiveoverhaul of the corporate income tax code, including a reduction of the statutory corporate tax rate from 35% to 21%, effective on January 1, 2018. This newlegislation also eliminated or reduced certain corporate income tax deductions as well as introduced new provisions that taxed certain foreign income notpreviously taxed by the United States. The TCJA also includes a provision for a tax on all previously undistributed earnings of U.S. companies located in foreignjurisdictions. Undistributed earnings in the form of cash and cash equivalents is taxed at a rate of 15.5% and all other earnings are taxed at a rate of 8.0%. This taxis payable over 8 years and will not accrue interest.
In December 2017, the SEC provided regulatory guidance for accounting of the impacts of the TCJA, referred to as SAB 118. Under the guidance in SAB 118,the income tax effects, which the accounting under ASC 740 is incomplete, are reported as a provisional amount based on a reasonable estimate. The reasonableestimate is subject to adjustment during a "measurement period", not to exceed one year, until the accounting is complete. The estimate is also subject to thefinalization of management’s analysis related to certain matters, such as developing interpretations of the provision of the TCJA, changes to certain estimates andamounts related to the earnings and profits of certain subsidiaries and the filing of tax returns.
As a result of the enactment of the TCJA, the Company recorded a provisional tax cost of $13.0 billion in the fourth quarter of 2017. This provisional chargewas assessed as of January 18, 2018 and consisted of:
• a $10.1 billion charge on previously undistributed foreign earnings as of December 31, 2017• a $4.5 billion deferred tax liability for foreign local and withholding taxes, offset by a $1.1 billion deferred tax asset for U.S. foreign tax credits, for
repatriation of substantially all those earnings
54

• a $0.6 billion tax benefit relating to the remeasurement of U.S. deferred tax assets and liabilities and the impact of the TCJA on tax reserves, and• a $0.1 billion charge for U.S. state and local taxes on the repatriation of these foreign earnings.
In determining this charge, the Company utilized the most recent information and guidance available related to the calculation of the tax liability and the impact toits deferred tax assets and liabilities, including those recorded for foreign local and withholding taxes that the Company assessed as of January 18, 2018. Theprovisional charge may require further adjustments and changes to the Company’s estimates as new guidance is made available. Revisions to the provisionalcharge may be material to the Company's financial results.
The TCJA also includes provisions for a tax on global intangible low-taxed income (GILTI). GILTI is described as the excess of a U.S. shareholder’s total netforeign income over a deemed return on tangible assets, as provided by the TCJA. In January 2018, in response to inquiries by companies, the FASB issuedguidance that allows companies to elect as an accounting policy whether to treat the GILTI tax as a period cost or to recognize deferred tax assets and liabilitieswhen basis differences exist that are expected to affect the amount of GILTI inclusion upon reversal. The Company has provisionally elected to treat GILTI as aperiod expense pending further analysis of this new tax provision.
The provision for taxes on income consists of:
(Dollars in Millions) 2017 2016 2015
Currently payable: U.S. taxes $ 11,969 1,896 2,748International taxes 1,998 1,708 1,309Total currently payable 13,967 3,604 4,057Deferred: U.S. taxes (1,956) 294 37International taxes 4,362 (635) (307)Total deferred 2,406 (341) (270)Provision for taxes on income $ 16,373 3,263 3,787
A comparison of income tax expense at the U.S. statutory rate of 35% in 2017 , 2016 and 2015 , to the Company’s effective tax rate is as follows:
(Dollars in Millions) 2017 2016 2015
U.S. $ 4,865 7,457 8,179International 12,808 12,346 11,017Earnings before taxes on income: $ 17,673 19,803 19,196Tax rates: U.S. statutory rate 35.0 % 35.0 35.0International operations (1) (12.8) (17.2) (15.4)Research and orphan drug tax credits (0.4) (0.4) (0.2)U.S. state and local 0.6 (0.1) 0.4U.S. manufacturing deduction (0.8) (0.6) (0.6)U.S. tax on international income 0.7 1.3 0.2Tax benefits on share based compensation (2.1) (1.8) —U.S. tax benefit on asset/business disposals (0.8) — —All other (0.1) 0.3 0.3TCJA impact 73.3 (2) — —Effective Rate 92.6 % 16.5 % 19.7 %
(1) For all periods presented the Company has subsidiaries operating in Puerto Rico under various tax incentives. In 2017, International operations reflects the impacts of operations injurisdictions with statutory tax rates different than the United States, particularly Ireland, Switzerland and Puerto Rico, which is a
55

favorable impact on the effective tax rate as compared with the 35.0% U.S. statutory rate. The 2017 amount also includes tax cost related to the revaluation of deferred tax balances related to thechange in the Belgian statutory tax rate increasing the tax provision by approximately 3.4% .(2) Includes U.S. state and local taxes provisionally recorded as part TCJA provisional charge which was approximately 0.6% of the total effective tax rate
The 2017 effective tax rate increased by 76.1% as compared to 2016, primarily driven by the enactment of the TCJA in the United States in December 2017. Theenactment of the TCJA resulted in a provisional tax charge in the fourth quarter of 2017, of approximately $13.0 billion or approximately 73.3 percentage pointincrease to the effective tax rate.
The remainder of the increase in the tax rate for 2017 was related to the remeasurement of the Company’s deferred tax assets in Belgium, as a result ofchanges in the Belgian statutory corporate tax rate enacted in December 2017, offset by a tax benefit for the closure of the Company’s Animas insulin pumpbusiness.
The decrease in the 2016 effective tax rate, as compared to 2015 was primarily attributable to the Company adopting a new accounting standard for thereporting of additional tax benefits on share-based compensation that vested or were exercised during the fiscal year. The remainder of the change in the effectivetax rate was primarily related to the lower earnings before taxes in the United States and the settlement of several uncertain tax positions in 2016 versus 2015.
The decrease in the 2015 effective tax rate, as compared to 2014 was primarily attributable to the increases in taxable income in lower tax jurisdictions relativeto higher tax jurisdictions and a tax benefit resulting from a restructuring of international affiliates.
The items noted above reflect the key drivers of the rate reconciliation.
Temporary differences and carryforwards for 2017 and 2016 were as follows:
2017 Deferred Tax 2016 Deferred Tax
(Dollars in Millions) Asset Liability Asset Liability
Employee related obligations $ 2,259 2,958 Stock based compensation 507 749 Depreciation (9) (219)Non-deductible intangibles (6,506) (6,672)International R&D capitalized for tax 1,307 1,264 Reserves & liabilities 1,718 1,857 Income reported for tax purposes 1,316 1,309 Net operating loss carryforward international 762 717 Undistributed foreign earnings 1,101 (4,457) Miscellaneous international 755 (194) 1,135 (15)Miscellaneous U.S. 177 155 Total deferred income taxes $ 9,902 (11,166) 10,144 (6,906)
The Company has wholly-owned international subsidiaries that have cumulative net losses. The Company believes that it is more likely than not that thesesubsidiaries will realize future taxable income sufficient to utilize these deferred tax assets.The following table summarizes the activity related to unrecognized tax benefits:
(Dollars in Millions) 2017 2016 2015
Beginning of year $ 3,041 3,080 2,465Increases related to current year tax positions 332 348 570Increases related to prior period tax positions 232 11 182Decreases related to prior period tax positions (416) (1) (338) (79)Settlements (2) (37) (4)Lapse of statute of limitations (36) (23) (54)End of year $ 3,151 3,041 3,080(1) $347 million of this decrease is related to the TCJA
The unrecognized tax benefits of $3.2 billion at December 31, 2017 , if recognized, would affect the Company’s annual effective tax rate. The Company conductsbusiness and files tax returns in numerous countries and currently has tax audits in progress with a number of tax authorities. The IRS has completed its audit forthe tax years through 2009 and is currently auditing the tax years 2010-2012. In other major jurisdictions where the Company conducts business, the years remainopen generally back to the year 2004. The Company believes it is possible that audits may be completed by tax authorities in some
56

jurisdictions over the next twelve months. However, the Company is not able to provide a reasonably reliable estimate of the timing of any other future taxpayments relating to uncertain tax positions.
The Company classifies liabilities for unrecognized tax benefits and related interest and penalties as long-term liabilities. Interest expense and penalties relatedto unrecognized tax benefits are classified as income tax expense. The Company recognized after tax interest expense of $60 million , $7 million and $44 million in2017 , 2016 and 2015 , respectively. The total amount of accrued interest was $436 million and $344 million in 2017 and 2016 , respectively.
9. Employee Related Obligations
At the end of 2017 and 2016 , employee related obligations recorded on the Consolidated Balance Sheets were:
(Dollars in Millions) 2017 2016Pension benefits $ 5,343 4,710Postretirement benefits 2,331 2,733Postemployment benefits 2,250 2,050Deferred compensation 475 534Total employee obligations 10,399 10,027Less current benefits payable 325 412Employee related obligations — non-current $ 10,074 9,615
Prepaid employee related obligations of $526 million and $227 million for 2017 and 2016 , respectively, are included in Other assets on the Consolidated BalanceSheets.
10. Pensions and Other Benefit PlansThe Company sponsors various retirement and pension plans, including defined benefit, defined contribution and termination indemnity plans, which cover mostemployees worldwide. The Company also provides post-retirement benefits, primarily health care, to all eligible U.S. retired employees and their dependents.
Many international employees are covered by government-sponsored programs and the cost to the Company is not significant.Retirement plan benefits for employees are primarily based on the employee’s compensation during the last three to five years before retirement and the
number of years of service. Due to an amendment of the formula used to calculate benefits of the U.S. Defined Benefit Plan that occurred in 2014, benefits foremployees hired on or after January 1, 2015, are primarily calculated using employee compensation over total years of service.
International subsidiaries have plans under which funds are deposited with trustees, annuities are purchased under group contracts, or reserves are provided.The Company does not typically fund retiree health care benefits in advance, but may do so at its discretion. The Company also has the right to modify these
plans in the future.In 2017 and 2016 the Company used December 31, 2017 and December 31, 2016 , respectively, as the measurement date for all U.S. and international
retirement and other benefit plans.Net periodic benefit costs for the Company’s defined benefit retirement plans and other benefit plans for 2017 , 2016 and 2015 include the following
components:
Retirement Plans Other Benefit Plans
(Dollars in Millions) 2017 2016 2015 2017 2016 2015Service cost $ 1,080 949 1,037 247 224 257Interest cost 927 927 988 159 158 186Expected return on plan assets (2,041) (1,962) (1,809) (6) (6) (7)Amortization of prior service cost (credit) 2 1 2 (30) (34) (33)Recognized actuarial losses 609 496 745 138 135 201Curtailments and settlements 17 11 8 — — —
Net periodic benefit cost $ 594 422 971 508 477 604
57
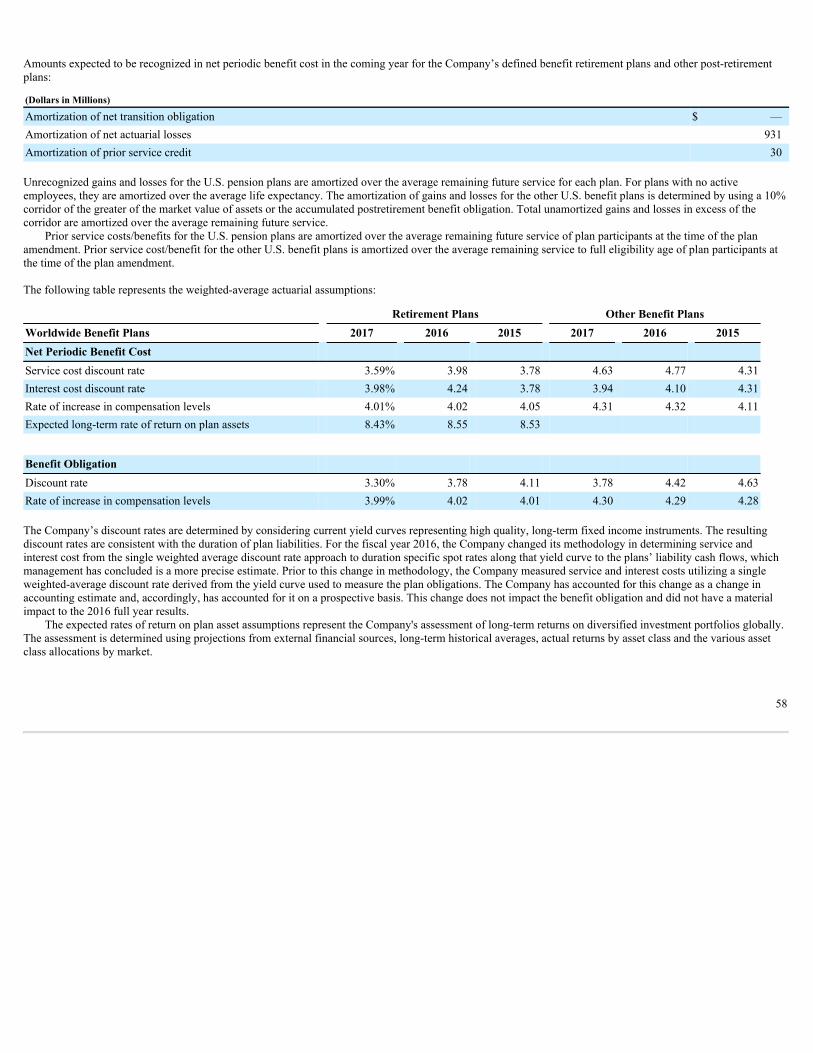
Amounts expected to be recognized in net periodic benefit cost in the coming year for the Company’s defined benefit retirement plans and other post-retirementplans:
(Dollars in Millions)
Amortization of net transition obligation $ —Amortization of net actuarial losses 931Amortization of prior service credit 30
Unrecognized gains and losses for the U.S. pension plans are amortized over the average remaining future service for each plan. For plans with no activeemployees, they are amortized over the average life expectancy. The amortization of gains and losses for the other U.S. benefit plans is determined by using a 10%corridor of the greater of the market value of assets or the accumulated postretirement benefit obligation. Total unamortized gains and losses in excess of thecorridor are amortized over the average remaining future service.
Prior service costs/benefits for the U.S. pension plans are amortized over the average remaining future service of plan participants at the time of the planamendment. Prior service cost/benefit for the other U.S. benefit plans is amortized over the average remaining service to full eligibility age of plan participants atthe time of the plan amendment.
The following table represents the weighted-average actuarial assumptions:
Retirement Plans Other Benefit PlansWorldwide Benefit Plans 2017 2016 2015 2017 2016 2015Net Periodic Benefit Cost Service cost discount rate 3.59% 3.98 3.78 4.63 4.77 4.31Interest cost discount rate 3.98% 4.24 3.78 3.94 4.10 4.31Rate of increase in compensation levels 4.01% 4.02 4.05 4.31 4.32 4.11Expected long-term rate of return on plan assets 8.43% 8.55 8.53
Benefit Obligation Discount rate 3.30% 3.78 4.11 3.78 4.42 4.63Rate of increase in compensation levels 3.99% 4.02 4.01 4.30 4.29 4.28
The Company’s discount rates are determined by considering current yield curves representing high quality, long-term fixed income instruments. The resultingdiscount rates are consistent with the duration of plan liabilities. For the fiscal year 2016, the Company changed its methodology in determining service andinterest cost from the single weighted average discount rate approach to duration specific spot rates along that yield curve to the plans’ liability cash flows, whichmanagement has concluded is a more precise estimate. Prior to this change in methodology, the Company measured service and interest costs utilizing a singleweighted-average discount rate derived from the yield curve used to measure the plan obligations. The Company has accounted for this change as a change inaccounting estimate and, accordingly, has accounted for it on a prospective basis. This change does not impact the benefit obligation and did not have a materialimpact to the 2016 full year results.
The expected rates of return on plan asset assumptions represent the Company's assessment of long-term returns on diversified investment portfolios globally.The assessment is determined using projections from external financial sources, long-term historical averages, actual returns by asset class and the various assetclass allocations by market.
58

The following table displays the assumed health care cost trend rates, for all individuals:
Health Care Plans 2017 2016Health care cost trend rate assumed for next year 6.33% 6.32%Rate to which the cost trend rate is assumed to decline (ultimate trend) 4.55% 4.50%Year the rate reaches the ultimate trend rate 2038 2038
A one-percentage-point change in assumed health care cost trend rates would have the following effect:
One-Percentage- One-Percentage-
(Dollars in Millions) Point Increase Point Decrease
Health Care Plans Total interest and service cost $ 29 (23)Post-retirement benefit obligation $ 355 (291)
59

The following table sets forth information related to the benefit obligation and the fair value of plan assets at year-end 2017 and 2016 for the Company’s definedbenefit retirement plans and other post-retirement plans:
Retirement Plans Other Benefit Plans
(Dollars in Millions) 2017 2016 2017 2016Change in Benefit Obligation Projected benefit obligation — beginning of year $ 28,116 25,855 4,605 4,669Service cost 1,080 949 247 224Interest cost 927 927 159 158Plan participant contributions 60 54 — —Amendments (7) (48) (17) —Actuarial (gains) losses 2,996 2,302 (166) (73)Divestitures & acquisitions 201 (24) 88 —Curtailments, settlements & restructuring (35) (25) 2 —Benefits paid from plan* (1,050) (1,210) (351) (378)Effect of exchange rates 933 (664) 15 5
Projected benefit obligation — end of year $ 33,221 28,116 4,582 4,605
Change in Plan Assets Plan assets at fair value — beginning of year $ 23,633 22,254 75 74Actual return on plan assets 4,274 2,286 12 7Company contributions 664 838 545 372Plan participant contributions 60 54 — —Settlements (32) (25) — —Divestitures & acquisitions 173 (24) — —Benefits paid from plan assets* (1,050) (1,210) (351) (378)Effect of exchange rates 682 (540) — —
Plan assets at fair value — end of year $ 28,404 23,633 281 75
Funded status — end of year $ (4,817) (4,483) (4,301) (4,530)Amounts Recognized in the Company’s Balance Sheet consist ofthe following: Non-current assets $ 526 227 — —Current liabilities (92) (86) (228) (315)Non-current liabilities (5,251) (4,624) (4,073) (4,215)
Total recognized in the consolidated balance sheet — end of year $ (4,817) (4,483) (4,301) (4,530)Amounts Recognized in Accumulated Other ComprehensiveIncome consist of the following: Net actuarial loss $ 8,140 7,749 1,500 1,804Prior service cost (credit) (25) (12) (137) (150)Unrecognized net transition obligation — — — —
Total before tax effects $ 8,115 7,737 1,363 1,654
Accumulated Benefit Obligations — end of year $ 29,793 25,319
*In 2016, the Company offered a voluntary lump-sum payment option below a pre-determined threshold for certain eligible former employees who are vested participants of theU.S. Qualified Defined Benefit Pension Plan. The distribution of the lump-sums was completed by the end of fiscal 2017. The amounts distributed in 2017 and 2016 wereapproximately $127 million and $420 million, respectively. These distributions from the plan did not have a material impact on the Company’s financial position.
60

Retirement Plans Other Benefit Plans
(Dollars in Millions) 2017 2016 2017 2016
Amounts Recognized in Net Periodic Benefit Cost and OtherComprehensive Income Net periodic benefit cost $ 594 422 508 477Net actuarial (gain) loss 740 1,965 (169) (72)Amortization of net actuarial loss (609) (496) (138) (135)Prior service cost (credit) (7) (48) (17) —Amortization of prior service (cost) credit (2) (1) 30 34Effect of exchange rates 256 (218) 3 (1)Total loss/(income) recognized in other comprehensive income, beforetax $ 378 1,202 (291) (174)Total recognized in net periodic benefit cost and other comprehensiveincome $ 972 1,624 217 303
The Company plans to continue to fund its U.S. Qualified Plans to comply with the Pension Protection Act of 2006. International Plans are funded in accordancewith local regulations. Additional discretionary contributions are made when deemed appropriate to meet the long-term obligations of the plans. For certain plans,funding is not a common practice, as funding provides no economic benefit. Consequently, the Company has several pension plans that are not funded.
In 2017 , the Company contributed $72 million and $592 million to its U.S. and international pension plans, respectively.
The following table displays the funded status of the Company's U.S. Qualified & Non-Qualified pension plans and international funded and unfunded pensionplans at December 31, 2017 and December 31, 2016, respectively:
U.S. Plans International Plans
Qualified Plans Non-Qualified Plans Funded Plans Unfunded Plans
(Dollars in Millions) 2017 2016 2017 2016 2017 2016 2017 2016
Plan Assets $ 18,681 16,057 — — 9,723 7,576 — —Projected Benefit Obligation 19,652 16,336 2,257 1,905 10,863 9,502 449 373Accumulated Benefit Obligation 17,654 14,759 1,849 1,568 9,893 8,663 397 329Over (Under) Funded Status Projected Benefit Obligation $ (971) (279) (2,257) (1,905) (1,140) (1,926) (449) (373)Accumulated Benefit Obligation 1,027 1,298 (1,849) (1,568) (170) (1,087) (397) (329)
Plans with accumulated benefit obligations in excess of plan assets have an accumulated benefit obligation, projected benefit obligation and plan assets of $3.8billion , $4.6 billion and $0.7 billion , respectively, at the end of 2017 , and $8.8 billion , $9.9 billion and $5.6 billion , respectively, at the end of 2016 .
The following table displays the projected future benefit payments from the Company’s retirement and other benefit plans:
(Dollars in Millions) 2018 2019 2020 2021 2022 2023-2027
Projected future benefit payments Retirement plans $ 970 1,007 1,057 1,131 1,190 7,062Other benefit plans $ 322 312 306 301 297 1,395
The following table displays the projected future minimum contributions to the unfunded retirement plans. These amounts do not include any discretionarycontributions that the Company may elect to make in the future.
(Dollars in Millions) 2018 2019 2020 2021 2022 2023-2027
Projected future contributions $ 88 89 94 100 108 651
61

Each pension plan is overseen by a local committee or board that is responsible for the overall administration and investment of the pension plans. In determininginvestment policies, strategies and goals, each committee or board considers factors including, local pension rules and regulations; local tax regulations;availability of investment vehicles (separate accounts, commingled accounts, insurance funds, etc.); funded status of the plans; ratio of actives to retirees; durationof liabilities; and other relevant factors including: diversification, liquidity of local markets and liquidity of base currency. A majority of the Company’s pensionfunds are open to new entrants and are expected to be on-going plans. Permitted investments are primarily liquid and/or listed, with little reliance on illiquid andnon-traditional investments such as hedge funds.
The Company’s retirement plan asset allocation at the end of 2017 and 2016 and target allocations for 2018 are as follows:
Percent of
Plan Assets Target
Allocation
2017 2016 2018
Worldwide Retirement Plans Equity securities 76% 75% 73%Debt securities 24 25 27Total plan assets 100% 100% 100%
Determination of Fair Value of Plan AssetsThe Plan has an established and well-documented process for determining fair values. Fair value is based upon quoted market prices, where available. If listedprices or quotes are not available, fair value is based upon models that primarily use, as inputs, market-based or independently sourced market parameters,including yield curves, interest rates, volatilities, equity or debt prices, foreign exchange rates and credit curves.
While the Plan believes its valuation methods are appropriate and consistent with other market participants, the use of different methodologies or assumptionsto determine the fair value of certain financial instruments could result in a different estimate of fair value at the reporting date.
Valuation HierarchyThe authoritative literature establishes a three-level hierarchy to prioritize the inputs used in measuring fair value. The levels within the hierarchy are described inthe table below with Level 1 having the highest priority and Level 3 having the lowest.
A financial instrument’s categorization within the valuation hierarchy is based upon the lowest level of input that is significant to the fair value measurement.
Following is a description of the valuation methodologies used for the investments measured at fair value.
• Short-term investment funds — Cash and quoted short-term instruments are valued at the closing price or the amount held on deposit by the custodianbank. Other investments are through investment vehicles valued using the Net Asset Value (NAV) provided by the administrator of the fund. The NAV isbased on the value of the underlying assets owned by the fund, minus its liabilities, and then divided by the number of shares outstanding. The NAV is aquoted price in a market that is not active and classified as Level 2.
• Government and agency securities — A limited number of these investments are valued at the closing price reported on the major market on which theindividual securities are traded. Where quoted prices are available in an active market, the investments are classified within Level 1 of the valuationhierarchy. If quoted market prices are not available for the specific security, then fair values are estimated by using pricing models, quoted prices ofsecurities with similar characteristics or discounted cash flows. When quoted market prices for a security are not available in an active market, they areclassified as Level 2.
• Debt instruments — A limited number of these investments are valued at the closing price reported on the major market on which the individualsecurities are traded. Where quoted prices are available in an active market, the investments are classified as Level 1. If quoted market prices are notavailable for the specific security, then fair values are estimated by using pricing models, quoted prices of securities with similar characteristics ordiscounted cash flows and are classified as Level 2. Level 3 debt instruments are priced based on unobservable inputs.
• Equity securities — Equity securities are valued at the closing price reported on the major market on which the individual securities are traded.Substantially all common stock is classified within Level 1 of the valuation hierarchy.
• Commingled funds — These investment vehicles are valued using the NAV provided by the fund administrator. The NAV is based on the value of theunderlying assets owned by the fund, minus its liabilities, and then divided by the number of shares outstanding. Assets in the Level 2 category have aquoted market price.
62

• Insurance contracts — The instruments are issued by insurance companies. The fair value is based on negotiated value and the underlying investmentsheld in separate account portfolios as well as considering the credit worthiness of the issuer. The underlying investments are government, asset-backedand fixed income securities. In general, insurance contracts are classified as Level 3 as there are no quoted prices nor other observable inputs for pricing.
• Other assets — Other assets are represented primarily by limited partnerships and real estate investments, as well as commercial loans and commercialmortgages that are not classified as corporate debt. Other assets that are exchange listed and actively traded are classified as Level 1, while inactivelytraded assets are classified as Level 2.
The following table sets forth the Retirement Plans' investments measured at fair value as of December 31, 2017 and December 31, 2016:
Quoted Pricesin Active
Markets forIdentical Assets
SignificantOther
ObservableInputs
SignificantUnobservable
Inputs (a) Investments Measured
at Net Asset Value
(Level 1) (Level 2) (Level 3) Total Assets
(Dollars in Millions) 2017 2016 2017 2016 2017 2016 2017 2016 2017 2016
Short-term investment funds $ 429 145 427 652 — — — — 856 797Government and agencysecurities — — 3,094 2,655 — — — — 3,094 2,655Debt instruments — — 2,013 1,237 — — — — 2,013 1,237Equity securities 13,848 11,433 — 12 — — — — 13,848 11,445Commingled funds — — 1,780 1,316 57 — 6,158 5,767 7,995 7,083Insurance contracts — — — — 199 24 — — 199 24Other assets — — 121 — — — 278 392 399 392
Investments at fair value $ 14,277 11,578 7,435 5,872 256 24 6,436 6,159 28,404 23,633
(a) The activity for the Level 3 assets is not significant for all years presented.
The Company's Other Benefit Plans are unfunded except for U.S. commingled funds (Level 2) of $81 million and $75 million and U.S. short-term investmentfunds (Level 2) of $200 million and $0 at December 31, 2017 and December 31, 2016, respectively.
The fair value of Johnson & Johnson Common Stock directly held in plan assets was $938 million ( 3.3% of total plan assets) at December 31, 2017 and $847million ( 3.6% of total plan assets) at December 31, 2016.
11. Savings PlanThe Company has voluntary 401(k) savings plans designed to enhance the existing retirement programs covering eligible employees. The Company matches apercentage of each employee’s contributions consistent with the provisions of the plan for which he/she is eligible. Total Company matching contributions to theplans were $214 million , $191 million and $187 million in 2017 , 2016 and 2015 , respectively.
63

12. Capital and Treasury StockChanges in treasury stock were:
Treasury Stock
(Amounts in Millions Except Treasury Stock Shares in Thousands) Shares Amount
Balance at December 28, 2014 336,620 $ 19,891Employee compensation and stock option plans (24,413) (2,497)Repurchase of common stock 52,474 5,290Balance at January 3, 2016 364,681 22,684Employee compensation and stock option plans (30,839) (3,311)Repurchase of common stock 79,490 8,979Balance at January 1, 2017 413,332 28,352Employee compensation and stock option plans (25,508) (3,156)Repurchase of common stock 49,494 6,358
Balance at December 31, 2017 437,318 $ 31,554
Aggregate shares of common stock issued were approximately 3,119,843,000 shares at the end of 2017 , 2016 and 2015 .
Cash dividends paid were $3.32 per share in 2017 , compared with dividends of $3.15 per share in 2016 , and $2.95 per share in 2015 .On October 13, 2015, the Company announced that its Board of Directors approved a share repurchase program, authorizing the Company to purchase up to
$10.0 billion of the Company's shares of common stock. This share repurchase program was completed as of July 2, 2017.On July 21, 2014, the Company announced that its Board of Directors approved a share repurchase program, authorizing the Company to purchase up to $5.0
billion of the Company's shares of common stock. This share repurchase program was completed on April 28, 2015.
13. Accumulated Other Comprehensive Income (Loss)Components of other comprehensive income (loss) consist of the following:
(Dollars in Millions)
Foreign Currency
Translation Gain/(Loss) On
Securities Employee Benefit
Plans
Gain/ (Loss) On
Derivatives &Hedges
Total Accumulated
Other Comprehensive Income
(Loss)
December 28, 2014 $ (4,803) 257 (6,317) 141 (10,722)Net 2015 changes (3,632) 347 1,019 (177) (2,443)January 3, 2016
(8,435) 604 (5,298) (36) (13,165)Net 2016 changes (612) (193) (682) (249) (1,736)January 1, 2017
(9,047) 411 (5,980) (285) (14,901)Net 2017 changes 1,696 (179) (170) 355 1,702December 31, 2017 $ (7,351) 232 (6,150) 70 (13,199)
Amounts in accumulated other comprehensive income are presented net of the related tax impact. Foreign currency translation is not adjusted for income taxeswhere it relates to permanent investments in international subsidiaries. For additional details on comprehensive income see the Consolidated Statements ofComprehensive Income.
Details on reclassifications out of Accumulated Other Comprehensive Income:Gain/(Loss) On Securities - reclassifications released to Other (income) expense, net.Employee Benefit Plans - reclassifications are included in net periodic benefit cost. See Note 10 for additional details.Gain/(Loss) On Derivatives & Hedges - reclassifications to earnings are recorded in the same account as the hedged transaction. See Note 6 for additionaldetails.
64

14. International Currency TranslationFor translation of its subsidiaries operating in non-U.S. Dollar currencies, the Company has determined that the local currencies of its international subsidiaries arethe functional currencies except those in highly inflationary economies, which are defined as those which have had compound cumulative rates of inflation of100% or more during the past three years , or where a substantial portion of its cash flows are not in the local currency. For the majority of the Company'ssubsidiaries the local currency is the functional currency.
In consolidating international subsidiaries, balance sheet currency effects are recorded as a component of accumulated other comprehensive income. Thisequity account includes the results of translating certain balance sheet assets and liabilities at current exchange rates and some accounts at historical rates, exceptfor those located in highly inflationary economies. The translation of balance sheet accounts for highly inflationary economies are reflected in the operating results.
A rollforward of the changes during 2017 , 2016 and 2015 for foreign currency translation adjustments is included in Note 13.Net currency transaction gains and losses included in Other (income) expense were losses of $216 million , $289 million and $104 million in 2017 , 2016 and
2015 , respectively.
15. Earnings Per ShareThe following is a reconciliation of basic net earnings per share to diluted net earnings per share for the fiscal years ended December 31, 2017 , January 1, 2017and January 3, 2016 :
(In Millions Except Per Share Amounts) 2017 2016 2015Basic net earnings per share $ 0.48 6.04 5.56Average shares outstanding — basic 2,692.0 2,737.3 2,771.8Potential shares exercisable under stock option plans 139.7 142.4 141.5Less: shares repurchased under treasury stock method (87.3) (92.1) (102.6)Convertible debt shares 0.9 1.3 2.2Adjusted average shares outstanding — diluted 2,745.3 2,788.9 2,812.9Diluted net earnings per share $ 0.47 5.93 5.48
The diluted net earnings per share calculation included the dilutive effect of convertible debt that is offset by the related reduction in interest expense of $1 millionafter-tax for year 2017, $2 million for year 2016 and $3 million for year 2015.
The diluted net earnings per share calculation for 2017, 2016 and 2015 included all shares related to stock options, as the exercise price of all options was lessthan the average market value of the Company's stock. 16. Rental Expense and Lease CommitmentsRentals of space, vehicles, manufacturing equipment and office and data processing equipment under operating leases were approximately $372 million , $330million and $316 million in 2017 , 2016 and 2015 , respectively.
The approximate minimum rental payments required under operating leases that have initial or remaining non-cancelable lease terms in excess of one year atDecember 31, 2017 are:
(Dollars in Millions)
2018 2019 2020 2021 2022 After 2022 Total$227 184 143 106 76 103 839
Commitments under capital leases are not significant.
17. Common Stock, Stock Option Plans and Stock Compensation AgreementsAt December 31, 2017 , the Company had 2 stock-based compensation plans. The shares outstanding are for contracts under the Company's 2005 Long-TermIncentive Plan and the 2012 Long-Term Incentive Plan. The 2005 Long-Term Incentive Plan expired April 26, 2012. All options and restricted shares grantedsubsequent to that date were under the 2012 Long-Term Incentive Plan. Under the 2012 Long-Term Incentive Plan, the Company may issue up to 650 millionshares of common stock, plus any shares canceled, expired, forfeited, or not issued from the 2005 Long-Term Incentive Plan subsequent to April 26, 2012. Sharesavailable for future grants under the 2012 Long-Term Incentive Plan were 389 million at the end of 2017 .
The compensation cost that has been charged against income for these plans was $962 million , $878 million and $874 million for 2017 , 2016 and 2015 ,respectively. The total income tax benefit recognized in the income statement for share-based compensation costs was $275 million , $256 million and $253million for 2017 , 2016 and 2015 , respectively. An additional tax
65
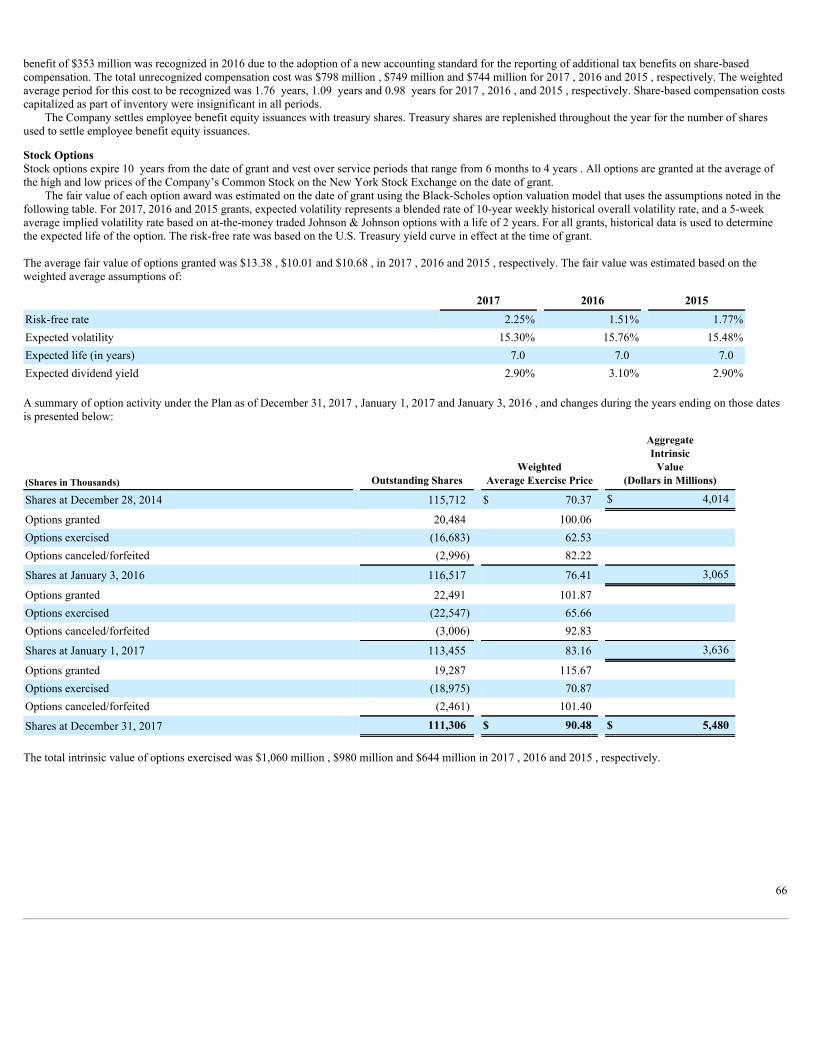
benefit of $353 million was recognized in 2016 due to the adoption of a new accounting standard for the reporting of additional tax benefits on share-basedcompensation. The total unrecognized compensation cost was $798 million , $749 million and $744 million for 2017 , 2016 and 2015 , respectively. The weightedaverage period for this cost to be recognized was 1.76 years, 1.09 years and 0.98 years for 2017 , 2016 , and 2015 , respectively. Share-based compensation costscapitalized as part of inventory were insignificant in all periods.
The Company settles employee benefit equity issuances with treasury shares. Treasury shares are replenished throughout the year for the number of sharesused to settle employee benefit equity issuances.
Stock OptionsStock options expire 10 years from the date of grant and vest over service periods that range from 6 months to 4 years . All options are granted at the average ofthe high and low prices of the Company’s Common Stock on the New York Stock Exchange on the date of grant.
The fair value of each option award was estimated on the date of grant using the Black-Scholes option valuation model that uses the assumptions noted in thefollowing table. For 2017, 2016 and 2015 grants, expected volatility represents a blended rate of 10-year weekly historical overall volatility rate, and a 5-weekaverage implied volatility rate based on at-the-money traded Johnson & Johnson options with a life of 2 years. For all grants, historical data is used to determinethe expected life of the option. The risk-free rate was based on the U.S. Treasury yield curve in effect at the time of grant.
The average fair value of options granted was $13.38 , $10.01 and $10.68 , in 2017 , 2016 and 2015 , respectively. The fair value was estimated based on theweighted average assumptions of:
2017 2016 2015Risk-free rate 2.25% 1.51% 1.77%Expected volatility 15.30% 15.76% 15.48%Expected life (in years) 7.0 7.0 7.0Expected dividend yield 2.90% 3.10% 2.90%
A summary of option activity under the Plan as of December 31, 2017 , January 1, 2017 and January 3, 2016 , and changes during the years ending on those datesis presented below:
(Shares in Thousands) Outstanding Shares Weighted
Average Exercise Price
AggregateIntrinsic
Value(Dollars in Millions)
Shares at December 28, 2014 115,712 $ 70.37 $ 4,014
Options granted 20,484 100.06 Options exercised (16,683) 62.53 Options canceled/forfeited (2,996) 82.22
Shares at January 3, 2016 116,517 76.41 3,065
Options granted 22,491 101.87 Options exercised (22,547) 65.66 Options canceled/forfeited (3,006) 92.83
Shares at January 1, 2017 113,455 83.16 3,636
Options granted 19,287 115.67 Options exercised (18,975) 70.87 Options canceled/forfeited (2,461) 101.40
Shares at December 31, 2017 111,306 $ 90.48 $ 5,480
The total intrinsic value of options exercised was $1,060 million , $980 million and $644 million in 2017 , 2016 and 2015 , respectively.
66
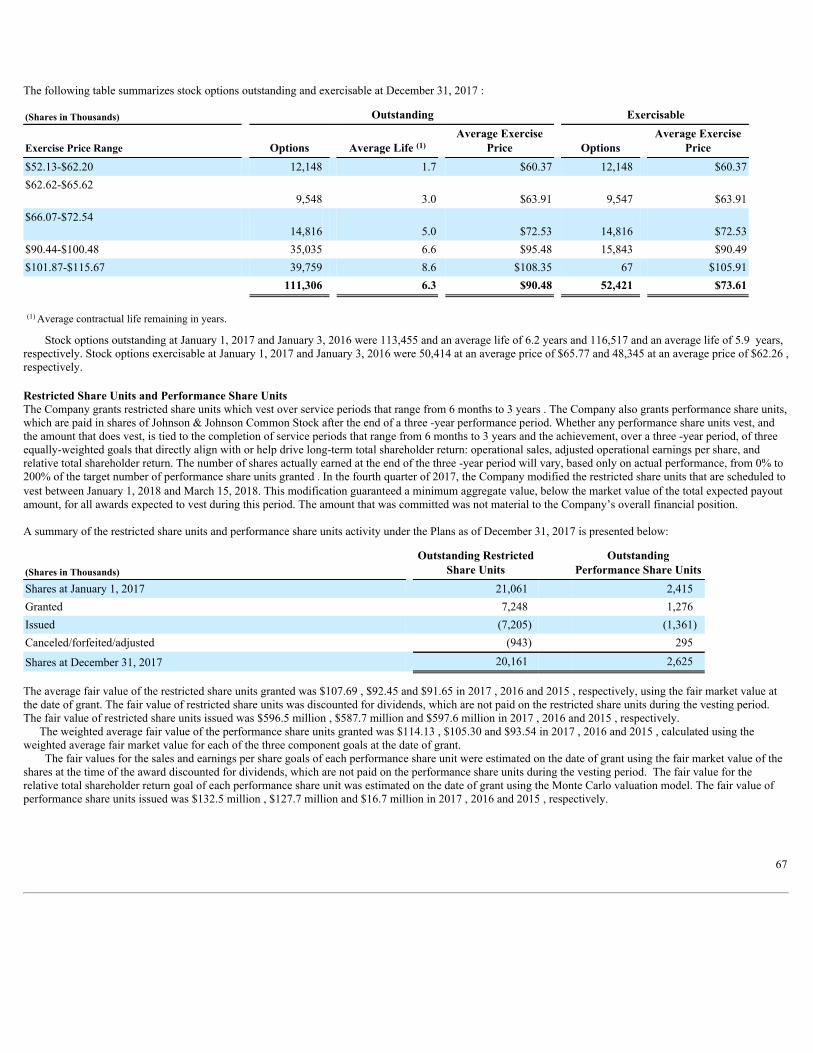
The following table summarizes stock options outstanding and exercisable at December 31, 2017 :
(Shares in Thousands) Outstanding Exercisable
Exercise Price Range Options Average Life (1) Average Exercise
Price Options Average Exercise
Price$52.13-$62.20 12,148 1.7 $60.37 12,148 $60.37$62.62-$65.62
9,548 3.0 $63.91 9,547 $63.91$66.07-$72.54
14,816 5.0 $72.53 14,816 $72.53$90.44-$100.48 35,035 6.6 $95.48 15,843 $90.49$101.87-$115.67 39,759 8.6 $108.35 67 $105.91 111,306 6.3 $90.48 52,421 $73.61
(1) Average contractual life remaining in years.
Stock options outstanding at January 1, 2017 and January 3, 2016 were 113,455 and an average life of 6.2 years and 116,517 and an average life of 5.9 years,respectively. Stock options exercisable at January 1, 2017 and January 3, 2016 were 50,414 at an average price of $65.77 and 48,345 at an average price of $62.26 ,respectively.
Restricted Share Units and Performance Share UnitsThe Company grants restricted share units which vest over service periods that range from 6 months to 3 years . The Company also grants performance share units,which are paid in shares of Johnson & Johnson Common Stock after the end of a three -year performance period. Whether any performance share units vest, andthe amount that does vest, is tied to the completion of service periods that range from 6 months to 3 years and the achievement, over a three -year period, of threeequally-weighted goals that directly align with or help drive long-term total shareholder return: operational sales, adjusted operational earnings per share, andrelative total shareholder return. The number of shares actually earned at the end of the three -year period will vary, based only on actual performance, from 0% to200% of the target number of performance share units granted . In the fourth quarter of 2017, the Company modified the restricted share units that are scheduled tovest between January 1, 2018 and March 15, 2018. This modification guaranteed a minimum aggregate value, below the market value of the total expected payoutamount, for all awards expected to vest during this period. The amount that was committed was not material to the Company’s overall financial position.
A summary of the restricted share units and performance share units activity under the Plans as of December 31, 2017 is presented below:
(Shares in Thousands) Outstanding Restricted
Share Units Outstanding
Performance Share UnitsShares at January 1, 2017 21,061 2,415Granted 7,248 1,276Issued (7,205) (1,361)Canceled/forfeited/adjusted (943) 295
Shares at December 31, 2017 20,161 2,625
The average fair value of the restricted share units granted was $107.69 , $92.45 and $91.65 in 2017 , 2016 and 2015 , respectively, using the fair market value atthe date of grant. The fair value of restricted share units was discounted for dividends, which are not paid on the restricted share units during the vesting period.The fair value of restricted share units issued was $596.5 million , $587.7 million and $597.6 million in 2017 , 2016 and 2015 , respectively.
The weighted average fair value of the performance share units granted was $114.13 , $105.30 and $93.54 in 2017 , 2016 and 2015 , calculated using theweighted average fair market value for each of the three component goals at the date of grant.
The fair values for the sales and earnings per share goals of each performance share unit were estimated on the date of grant using the fair market value of theshares at the time of the award discounted for dividends, which are not paid on the performance share units during the vesting period. The fair value for therelative total shareholder return goal of each performance share unit was estimated on the date of grant using the Monte Carlo valuation model. The fair value ofperformance share units issued was $132.5 million , $127.7 million and $16.7 million in 2017 , 2016 and 2015 , respectively.
67

18. Segments of Business and Geographic Areas
Sales to Customers
(Dollars in Millions) 2017 2016 2015
Consumer — United States $ 5,565 5,420 5,222International 8,037 7,887 8,285Total 13,602 13,307 13,507Pharmaceutical — United States 21,474 20,125 18,333International 14,782 13,339 13,097Total 36,256 33,464 31,430Medical Devices — United States 12,824 12,266 12,132International 13,768 12,853 13,005Total 26,592 25,119 25,137
Worldwide total $ 76,450 71,890 70,074
Income Before Tax Identifiable Assets
(Dollars in Millions) 2017 (3) 2016 (4) 2015 (5) 2017 2016
Consumer $ 2,524 2,441 1,787 $ 25,030 23,971Pharmaceutical 11,083 12,827 11,734 59,450 27,477Medical Devices 5,392 5,578 6,826 45,413 39,773Total 18,999 20,846 20,347 129,893 91,221Less: Expense not allocated to segments (1) 1,326 1,043 1,151 General corporate (2) 27,410 49,987
Worldwide total $ 17,673 19,803 19,196 $ 157,303 141,208
Additions to Property,
Plant & Equipment Depreciation and
Amortization
(Dollars in Millions) 2017 2016 2015 2017 2016 2015
Consumer $ 485 486 544 $ 674 608 559Pharmaceutical 936 927 1,063 2,416 886 929Medical Devices 1,566 1,472 1,631 2,216 1,928 1,945Segments total 2,987 2,885 3,238 5,306 3,422 3,433General corporate 292 341 225 336 332 313
Worldwide total $ 3,279 3,226 3,463 $ 5,642 3,754 3,746
Sales to Customers Long-Lived Assets (6)
(Dollars in Millions) 2017 2016 2015 2017 2016
United States $ 39,863 37,811 35,687 $ 38,556 36,934Europe 17,126 15,770 15,995 56,677 21,996Western Hemisphere excluding U.S. 6,041 5,734 6,045 2,990 2,961Asia-Pacific, Africa 13,420 12,575 12,347 2,773 2,512Segments total 76,450 71,890 70,074 100,996 64,403General corporate 1,143 1,190Other non long-lived assets 55,164 75,615
Worldwide total $ 76,450 71,890 70,074 $ 157,303 141,208
68

See Note 1 for a description of the segments in which the Company operates.Export sales are not significant. In 2017, the Company had two wholesalers distributing products for all three segments that represented approximately 14.0% and10.0% of the total consolidated revenues. In 2016, the Company had two wholesalers distributing products for all three segments that represented approximately13.5% and 10.7% of the total consolidated revenues. In 2015, the Company had one wholesaler distributing products for all three segments that representedapproximately 12.5% of the total consolidated revenues.
(1) Amounts not allocated to segments include interest (income) expense and general corporate (income) expense.(2) General corporate includes cash, cash equivalents and marketable securities.(3) The Pharmaceutical segment includes $797 million for Actelion acquisition related costs, an in-process research and development expense of $396 million and
net litigation expense of $117 million . The Medical Devices segment includes net litigation expense of $1,139 million , a restructuring related charge of $760million , an asset impairment of $215 million primarily related to the insulin pump business and $140 million for AMO acquisition related costs. The MedicalDevices segment includes a gain of $0.7 billion from the divestiture of Codman Neurosurgery. The Consumer segment includes a gain of $0.5 billion from thedivestiture of COMPEED ® .
(4) Includes net litigation expense of $806 million and a restructuring related charge of $685 million in the Medical Devices segment. The Pharmaceuticalsegment includes a positive adjustment of $0.5 billion to previous reserve estimates, an in-process research and development expense of $29 million , andgains from the divestitures of the controlled substance raw material and active pharmaceutical ingredient (API) business and certain anesthetic products inEurope.
(5) The Medical Devices segment includes a restructuring related charge of $590 million , an intangible asset write-down of $346 million related to Acclarent,Synthes integration costs of $196 million and $148 million expense for the cost associated with the DePuy ASR TM Hip program. Includes $224 million of in-process research and development expense, comprised of $214 million and $10 million in the Pharmaceutical and Medical Devices segments, respectively.Includes net litigation expense of $141 million comprised of $136 million in the Pharmaceutical segment and $5 million in the Medical Devices segment,which included the gain from the litigation settlement agreement with Guidant for $600 million . The Medical Devices Segment includes a gain of $1.3 billionfrom the divestiture of the Cordis business. The Pharmaceutical segment includes a gain of $981 million from the U.S. divestiture of NUCYNTA ® and apositive adjustment of $0.5 billion to previous reserve estimates, including Managed Medicaid rebates. The Consumer segment includes a gain of $229 millionfrom the divestiture of SPLENDA ® brand.
(6) Long-lived assets include property, plant and equipment, net for 2017 , and 2016 of $17,005 and $15,912 , respectively, and intangible assets and goodwill, netfor 2017 and 2016 of $85,134 and $49,681 , respectively.
69

19. Selected Quarterly Financial Data (unaudited)Selected unaudited quarterly financial data for the years 2017 and 2016 are summarized below:
2017 2016
(Dollars in Millions Except Per Share Data) First Quarter(1)
SecondQuarter (2) Third Quarter
(3) Fourth
Quarter (4) First
Quarter (5) Second
Quarter (6) Third
Quarter (7) Fourth
Quarter (8)
Segment sales to customers Consumer $ 3,228 3,478 3,356 3,540 3,195 3,419 3,261 3,432Pharmaceutical 8,245 8,635 9,695 9,681 8,178 8,654 8,400 8,232Medical Devices 6,293 6,726 6,599 6,974 6,109 6,409 6,159 6,442
Total sales 17,766 18,839 19,650 20,195 17,482 18,482 17,820 18,106
Gross profit 12,380 13,016 12,748 12,952 12,153 13,146 12,334 12,572Earnings before provision for taxes onincome 5,575 4,748 4,790 2,560 5,294 4,904 5,281 4,324Net earnings (loss) 4,422 3,827 3,764 (10,713) 4,457 3,997 4,272 3,814
Basic net earnings (loss) per share $ 1.63 1.42 1.40 (3.99) 1.62 1.46 1.56 1.41
Diluted net earnings (loss) per share $ 1.61 1.40 1.37 (3.99) 1.59 1.43 1.53 1.38
(1) The first quarter of 2017 includes a restructuring charge of $121 million after-tax ( $161 million before-tax) and an AMO acquisition related cost of $251million after-tax ( $38 million before-tax).
(2) The second quarter of 2017 includes a net litigation expense of $352 million after-tax ( $493 million before-tax), Actelion acquisition related costs of $199million after-tax ( $213 million before-tax) a restructuring charge of $101 million after-tax ( $128 million before-tax) and an asset impairment charge of $125million after-tax ( $182 million before-tax).
(3) The third quarter of 2017 includes a net litigation expense of $97 million after-tax ( $118 million before-tax), Actelion acquisition related costs of $255million after-tax ( $367 million before-tax) and a restructuring charge of $136 million after-tax ( $187 million before-tax).
(4) The fourth quarter of 2017 includes a net litigation expense of $506 million after-tax ( $645 million before-tax), Actelion acquisition related costs of $313million after-tax ( $217 million before-tax), a restructuring charge of $237 million after-tax ( $284 million before-tax), an in-process research and developmentexpense of $266 million after-tax ( $408 million before-tax) and an after-tax benefit of $116 million related to the insulin pump business. Additionally, thefourth quarter of 2017 includes a provisional charge of $13.6 billion for recently enacted tax legislation.
(5) The first quarter of 2016 includes a restructuring charge of $120 million after-tax ( $137 million before-tax) and net litigation expense of $56 million after-tax( $66 million before-tax).
(6) The second quarter of 2016 includes a restructuring charge of $97 million after-tax ( $141 million before-tax) and net litigation expense of $493 million after-tax ( $600 million before-tax).
(7) The third quarter of 2016 includes a restructuring charge of $76 million after-tax ( $109 million before-tax) and net litigation expense of $46 million after-tax ($55 million before-tax).
(8) The fourth quarter of 2016 includes a restructuring charge of $251 million after-tax ( $298 million before-tax) and net litigation expense of $80 million after-tax ( $96 million before-tax).
70

20. Business Combinations and DivestituresCertain businesses were acquired for $35,151 million in cash and $1,786 million of liabilities assumed during 2017. These acquisitions were accounted for usingthe acquisition method and, accordingly, results of operations have been included in the financial statements from their respective dates of acquisition.
The 2017 acquisitions primarily included: Actelion Ltd an established leading franchise of differentiated, innovative products for pulmonary arterialhypertension (PAH); Abbott Medical Optics (AMO), a wholly-owned subsidiary of Abbott Laboratories, which included ophthalmic products related to: cataractsurgery, laser refractive surgery and consumer eye health; Neuravi Limited, a privately-held medical device company that develops and markets medical devicesfor neurointerventional therapy; TearScience Inc., a manufacturer of products dedicated to treating meibomian gland dysfunction; Sightbox, Inc., a privately-heldcompany that developed a subscription vision care service that connects consumers with eye care professionals and a supply of contact lenses; Torax Medical, Inc.,a privately-held medical device company that manufactures and markets the LINX™ Reflux Management System for the surgical treatment of gastroesophagealreflux disease and Megadyne Medical Products, Inc., a privately-held medical device company that develops, manufactures and markets electrosurgical tools.
The excess of purchase price over the estimated fair value of tangible assets acquired amounted to $34,379 million and has been assigned to identifiableintangible assets, with any residual recorded to goodwill. Of this amount, approximately $1,139 million has been identified as the value of IPR&D primarilyassociated with the acquisition of Actelion Ltd. The value of the IPR&D was calculated using cash flow projections discounted for the inherent risk in the projects.
During 2017, the Company completed the acquisition of Actelion Ltd through an all cash tender offer in Switzerland for $280 per share, amounting to $29.6billion , net of cash acquired. As part of the transaction, immediately prior to the completion of the acquisition, Actelion spun out its drug discovery operations andearly-stage clinical development assets into a newly created Swiss biopharmaceutical company, Idorsia Ltd. The shares of Idorsia are listed on the SIX SwissExchange (SIX). The Company currently holds 9.9% of the shares of Idorsia and has rights to an additional 22.1% of Idorsia equity through a convertible loan witha principal amount of approximately $0.5 billion . The convertible loan may be converted into Idorsia shares as follows: (i) up to an aggregate shareholding of 16%of Idorsia shares as a result of certain shareholders holding more than 20% of the issued Idorsia shares, and (ii) up to the balance of the remaining amount within20 business days of the maturity date of the convertible loan, which has a 10 year term, or if Idorsia undergoes a change of control transaction. The investment inIdorsia was recorded as a cost method investment in Other assets in the Company's consolidated Balance Sheet. The Company also exercised the option acquiredon ACT-132577, a product within Idorsia being developed for resistant hypertension currently in phase 2 of clinical development. The Company has also enteredinto an agreement to provide Idorsia with a Swiss franc denominated credit facility of approximately $250 million . As of December 31, 2017, Idorsia has not madeany draw-downs under the credit facility. Actelion has entered into a transitional services agreement with Idorsia. Actelion has established a leading franchise ofdifferentiated, innovative products for pulmonary arterial hypertension (PAH) that are highly complementary to the existing portfolio of the Company. Theaddition of Actelion’s specialty in-market medicines and late-stage products is consistent with the Company's efforts to grow in attractive and complementarytherapeutic areas and serve patients with serious illnesses and significant unmet medical need.
The Company is still finalizing the allocation of the purchase price to the individual assets acquired and liabilities assumed. The allocation of the purchaseprice included in the current period balance sheet is based on the best estimate of management and is preliminary and subject to change. To assist management inthe allocation, the Company engaged valuation specialists to prepare appraisals. The Company will finalize the amounts recognized as the information necessary tocomplete the analysis is obtained. The Company expects to finalize these amounts as soon as possible but no later than one year from the acquisition date.
71
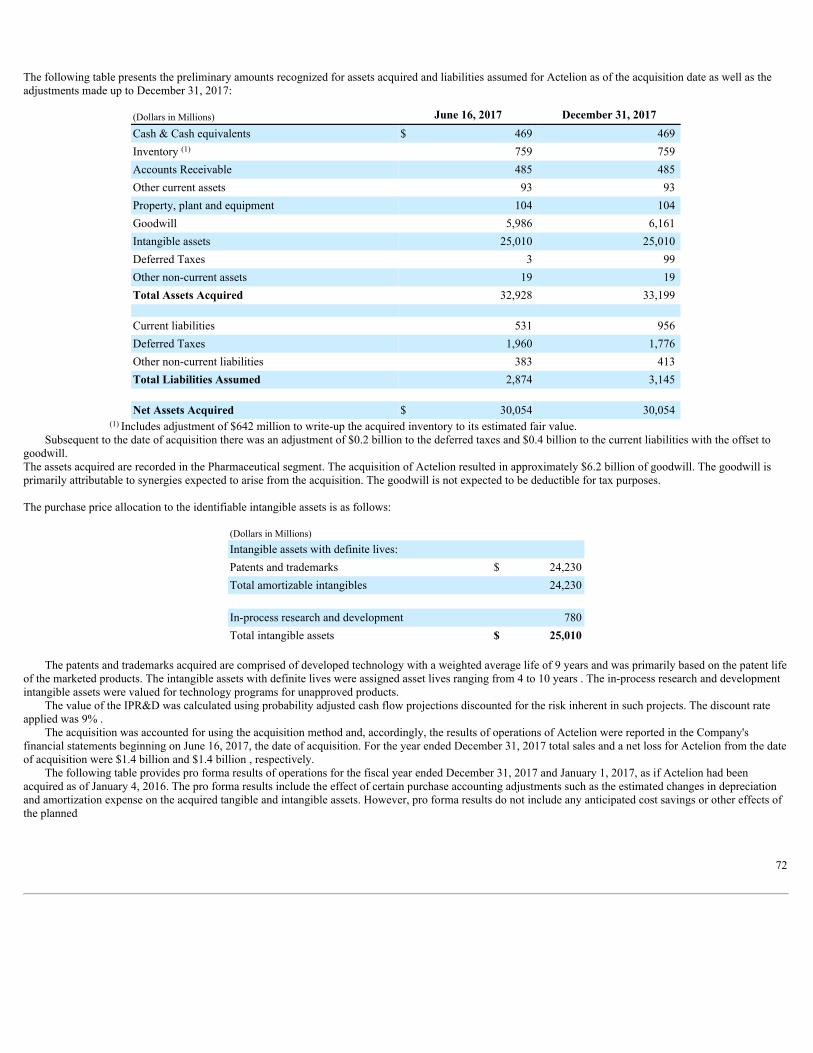
The following table presents the preliminary amounts recognized for assets acquired and liabilities assumed for Actelion as of the acquisition date as well as theadjustments made up to December 31, 2017:
(Dollars in Millions) June 16, 2017 December 31, 2017Cash & Cash equivalents $ 469 469Inventory (1) 759 759Accounts Receivable 485 485Other current assets 93 93Property, plant and equipment 104 104Goodwill 5,986 6,161Intangible assets 25,010 25,010Deferred Taxes 3 99Other non-current assets 19 19Total Assets Acquired 32,928 33,199 Current liabilities 531 956Deferred Taxes 1,960 1,776Other non-current liabilities 383 413Total Liabilities Assumed 2,874 3,145 Net Assets Acquired $ 30,054 30,054
(1) Includes adjustment of $642 million to write-up the acquired inventory to its estimated fair value.Subsequent to the date of acquisition there was an adjustment of $0.2 billion to the deferred taxes and $0.4 billion to the current liabilities with the offset to
goodwill.The assets acquired are recorded in the Pharmaceutical segment. The acquisition of Actelion resulted in approximately $6.2 billion of goodwill. The goodwill isprimarily attributable to synergies expected to arise from the acquisition. The goodwill is not expected to be deductible for tax purposes.
The purchase price allocation to the identifiable intangible assets is as follows:
(Dollars in Millions) Intangible assets with definite lives: Patents and trademarks $ 24,230Total amortizable intangibles 24,230 In-process research and development 780Total intangible assets $ 25,010
The patents and trademarks acquired are comprised of developed technology with a weighted average life of 9 years and was primarily based on the patent lifeof the marketed products. The intangible assets with definite lives were assigned asset lives ranging from 4 to 10 years . The in-process research and developmentintangible assets were valued for technology programs for unapproved products.
The value of the IPR&D was calculated using probability adjusted cash flow projections discounted for the risk inherent in such projects. The discount rateapplied was 9% .
The acquisition was accounted for using the acquisition method and, accordingly, the results of operations of Actelion were reported in the Company'sfinancial statements beginning on June 16, 2017, the date of acquisition. For the year ended December 31, 2017 total sales and a net loss for Actelion from the dateof acquisition were $1.4 billion and $1.4 billion , respectively.
The following table provides pro forma results of operations for the fiscal year ended December 31, 2017 and January 1, 2017, as if Actelion had beenacquired as of January 4, 2016. The pro forma results include the effect of certain purchase accounting adjustments such as the estimated changes in depreciationand amortization expense on the acquired tangible and intangible assets. However, pro forma results do not include any anticipated cost savings or other effects ofthe planned
72

integration of Actelion. Accordingly, such amounts are not necessarily indicative of the results if the acquisition had occurred on the dates indicated or which mayoccur in the future.
Unaudited Pro forma Consolidated Results(Dollars in Millions Except Per Share Data) 2017 2016 Net Sales 77,681 74,339Net Earnings 1,509 13,916Diluted Net Earnings per Common Share 0.55 4.99
In 2017, the Company recorded Actelion acquisition related costs before tax of approximately $0.8 billion , which was recorded in Other (income)/expenseand Cost of products sold.
During 2017, the Company acquired Abbott Medical Optics (AMO), a wholly-owned subsidiary of Abbott Laboratories, for $4.3 billion , net of cash acquired.The acquisition included ophthalmic products related to: cataract surgery, laser refractive surgery and consumer eye health. The net purchase price was primarilyrecorded as amortizable intangible assets for $2.3 billion and goodwill for $1.7 billion . The weighted average life of total amortizable intangibles, the majoritybeing customer relationships, is approximately 14.4 years . The goodwill is primarily attributable to synergies expected to arise from the business acquisition and isnot deductible for tax purposes. The intangible assets and goodwill amounts are based on the final purchase price allocation. The assets acquired were recorded inthe Medical Devices segment.
Certain businesses were acquired for $4,509 million in cash and $77 million of liabilities assumed during 2016. These acquisitions were accounted for usingthe acquisition method and, accordingly, results of operations have been included in the financial statements from their respective dates of acquisition.
The 2016 acquisitions primarily included: Vogue International LLC, a privately-held company focused on the marketing, development and distribution ofsalon-influenced and nature inspired hair care and other personal products; NeuWave Medical, Inc., a privately-held medical device company that manufacturesand markets minimally invasive soft tissue microwave ablation systems; NeoStrata Company, Inc., a global leader in dermocosmetics, and the global rights for thecommercialization of RHINOCORT ® allergy spray outside the United States.
The excess of purchase price over the estimated fair value of tangible assets acquired amounted to $4,077 million and has been assigned to identifiableintangible assets, with any residual recorded to goodwill.
The net purchase price for Vogue International LLC of $3.3 billion was primarily recorded as amortizable intangible assets for $2.3 billion and goodwill for$1.1 billion . The weighted average life for the $2.3 billion of total amortizable intangibles is approximately 22 years . The trademark asset values were determinedto have definite lives ranging from 10 to 22 years, with the majority being 22 years. The goodwill is primarily attributable to synergies expected to arise from thebusiness acquisition and is expected to be deductible for tax purposes. The assets acquired were recorded in the Consumer segment.
Certain businesses were acquired for $954 million in cash and $220 million of liabilities assumed during 2015. The assumed liabilities primarily represent thefair value of the contingent consideration of $210 million . These acquisitions were accounted for using the acquisition method and, accordingly, results ofoperations have been included in the financial statements from their respective dates of acquisition.
The 2015 acquisitions primarily included: XO1 Limited, a privately-held biopharmaceutical company developing an anti-thrombin antibody and NoviraTherapeutics, Inc., a privately held clinical-stage biopharmaceutical company developing innovative therapies for curative treatment of chronic hepatitis B virusinfection.
The excess of purchase price over the estimated fair value of tangible assets acquired amounted to $1,173 million and has been assigned to identifiableintangible assets, with any residual recorded to goodwill. Of this amount, approximately $839 million has been identified as the value of IPR&D primarilyassociated with the acquisitions of XO1 Limited and Novira Therapeutics, Inc. The value of the IPR&D was calculated using cash flow projections discounted forthe inherent risk in the projects.
The IPR&D related to the acquisition of XO1 Limited of $360 million is associated with a recombinant human antibody developed to mimic the activity of ahuman antibody which appears to produce an anticoagulated state without predisposition to bleeding. A probability of success factor of 36.0% was used to reflectinherent clinical and regulatory risk. The discount rate applied was 11.75% .
The IPR&D related to the acquisition of Novira Therapeutics, Inc. of $396 million is associated with its lead candidate NVR 3-778 which is an investigationalsmall molecule, direct-acting antiviral, for oral administration in patients with HBV that inhibits the HBV core or capsid protein. A probability of success factor of51.0% was used to reflect inherent clinical and regulatory risk. The discount rate applied was 16.0% . During 2017, the Company recorded a charge for theimpairment of the IPR&D related to the acquisition of Novira Therapeutics, Inc. The impairment was the result of the cancellation of product development due tosafety concerns.
73

In 2012, the Company completed the acquisition of Synthes, Inc. for a purchase price of $20.2 billion in cash and stock. In connection with the acquisition ofSynthes, Inc. the Company entered into two accelerated share repurchase (ASR) agreements. In 2013, the Company settled the remaining liabilities under the ASRagreements. While the Company believes that the transactions under each ASR agreement and a series of related internal transactions were consummated in a taxefficient manner in accordance with applicable law, it is possible that the Internal Revenue Service could assert one or more contrary positions to challenge thetransactions from a tax perspective. If challenged, an amount up to the total purchase price for the Synthes shares could be treated as subject to applicable U.S. taxat approximately the statutory rate to the Company, plus interest.
With the exception of the Actelion Ltd acquisition, supplemental pro forma information for 2017, 2016 and 2015 in accordance with U.S. GAAP standardsrelated to business combinations, and goodwill and other intangible assets, is not provided, as the impact of the aforementioned acquisitions did not have a materialeffect on the Company’s results of operations, cash flows or financial position.
During the fiscal first quarter of 2017, the Company announced it is engaging in a process to evaluate potential strategic options for the Johnson & JohnsonDiabetes Care Companies, specifically LifeScan, Inc., Animas Corporation, and Calibra Medical, Inc. Strategic options may include the formation of operatingpartnerships, joint ventures or strategic alliances, a sale of the businesses, or other alternatives either separately or together. During the fiscal second quarter of2017, the Company recorded an impairment charge of $0.2 billion , primarily related to the insulin pump business. During the fiscal fourth quarter of 2017, theCompany announced its decision to exit the Animas insulin pump business. The Company is continuing to evaluate potential strategic options for LifeScan, Inc.and determine the best opportunity to drive future growth and maximize shareholder value. There were no assets held for sale as of December 31, 2017 related tothe announcement.
During 2017, the Company divestitures primarily included: the Codman Neurosurgery business, to Integra LifeSciences Holdings Corporation and thedivestiture of COMPEED ® to HRA Pharma. In 2017, the pre-tax gains on the divestitures were approximately $1.3 billion .
During 2016, the Company divestitures included: the controlled substance raw material and active pharmaceutical ingredient (API) business; certain anestheticproducts in Europe; and certain non-strategic Consumer brands. In 2016, the pre-tax gains on the divestitures were approximately $0.6 billion .
During 2015, the Company divestitures included: the Cordis business to Cardinal Health; the SPLENDA ® brand to Heartland Food Products Group; and theU.S. license rights to NUCYNTA ® (tapentadol), NUCYNTA ® ER (tapentadol extended-release tablets), and NUCYNTA ® (tapentadol) oral solution. In 2015, thepre-tax gains on the divestitures were approximately $2.6 billion .
21. Legal ProceedingsJohnson & Johnson and certain of its subsidiaries are involved in various lawsuits and claims regarding product liability, intellectual property, commercial andother matters; governmental investigations; and other legal proceedings that arise from time to time in the ordinary course of their business.
The Company records accruals for loss contingencies associated with these legal matters when it is probable that a liability will be incurred and the amount of theloss can be reasonably estimated. As of December 31, 2017 , the Company has determined that the liabilities associated with certain litigation matters are probableand can be reasonably estimated. The Company has accrued for these matters and will continue to monitor each related legal issue and adjust accruals as might bewarranted based on new information and further developments in accordance with ASC 450-20-25. For these and other litigation and regulatory matters discussedbelow for which a loss is probable or reasonably possible, the Company is unable to estimate the possible loss or range of loss beyond the amounts alreadyaccrued. Amounts accrued for legal contingencies often result from a complex series of judgments about future events and uncertainties that rely heavily onestimates and assumptions. The ability to make such estimates and judgments can be affected by various factors, including whether damages sought in theproceedings are unsubstantiated or indeterminate; scientific and legal discovery has not commenced or is not complete; proceedings are in early stages; matterspresent legal uncertainties; there are significant facts in dispute; or there are numerous parties involved.
In the Company's opinion, based on its examination of these matters, its experience to date and discussions with counsel, the ultimate outcome of legalproceedings, net of liabilities accrued in the Company's balance sheet, is not expected to have a material adverse effect on the Company's financial position.However, the resolution of, or increase in accruals for, one or more of these matters in any reporting period may have a material adverse effect on the Company'sresults of operations and cash flows for that period.
PRODUCT LIABILITY
Johnson & Johnson and certain of its subsidiaries are involved in numerous product liability claims and lawsuits involving multiple products. Claimants in thesecases seek substantial compensatory and, where available, punitive damages. While the Company believes it has substantial defenses, it is not feasible to predictthe ultimate outcome of litigation. The Company has
74

established accruals for product liability claims and lawsuits in compliance with ASC 450-20 based on currently available information, which in some cases maybe limited. The Company accrues an estimate of the legal defense costs needed to defend each matter when those costs are probable and can be reasonablyestimated. For certain of these matters, the Company has accrued additional amounts such as estimated costs associated with settlements, damages and other losses.To the extent adverse verdicts have been rendered against the Company, the Company does not record an accrual until a loss is determined to be probable and canbe reasonably estimated. Product liability accruals can represent projected product liability for thousands of claims around the world, each in different litigationenvironments and with different fact patterns. Changes to the accruals may be required in the future as additional information becomes available.
The most significant of these cases include: the DePuy ASR™ XL Acetabular System and DePuy ASR™ Hip Resurfacing System; the PINNACLE ® AcetabularCup System; pelvic meshes; RISPERDAL ® ; XARELTO ® ; body powders containing talc, primarily JOHNSONS ® Baby Powder; and INVOKANA ® . As ofDecember 31, 2017 , in the U.S. there were approximately 2,000 plaintiffs with direct claims in pending lawsuits regarding injuries allegedly due to the DePuyASR™ XL Acetabular System and DePuy ASR™ Hip Resurfacing System, 10,000 with respect to the PINNACLE ® Acetabular Cup System, 53,600 with respectto pelvic meshes, 13,700 with respect to RISPERDAL ® , 22,900 with respect to XARELTO ® , 6,610 with respect to body powders containing talc; and 1,100 withrespect to INVOKANA ® .
In August 2010, DePuy Orthopaedics, Inc. (DePuy) announced a worldwide voluntary recall of its ASR ™ XL Acetabular System and DePuy ASR ™ HipResurfacing System used in hip replacement surgery. Claims for personal injury have been made against DePuy and Johnson & Johnson. The number of pendinglawsuits is expected to fluctuate as certain lawsuits are settled or dismissed and additional lawsuits are filed. Cases filed in federal courts in the United States havebeen organized as a multi-district litigation in the United States District Court for the Northern District of Ohio. Litigation has also been filed in countries outsideof the United States, primarily in the United Kingdom, Canada, Australia, Ireland, Germany and Italy. In November 2013, DePuy reached an agreement with aCourt-appointed committee of lawyers representing ASR Hip System plaintiffs to establish a program to settle claims with eligible ASR Hip patients in the UnitedStates who had surgery to replace their ASR Hips, known as revision surgery, as of August 31, 2013. DePuy reached additional agreements in February 2015 andMarch 2017, which further extended the settlement program to include ASR Hip patients who had revision surgeries after August 31, 2013 and prior to February15, 2017. This settlement program has resolved more than 10,000 claims, with more expected from the recent extension, therefore bringing to resolution significantASR Hip litigation activity in the United States. However, lawsuits in the United States remain, and the settlement program does not address litigation outside ofthe United States. In Australia, a class action settlement was reached that resolved the claims of the majority of ASR Hip patients in that country. The Companycontinues to receive information with respect to potential additional costs associated with this recall on a worldwide basis. The Company has established accrualsfor the costs associated with the United States settlement program and DePuy ASR ™ Hip-related product liability litigation.
Claims for personal injury have also been made against DePuy Orthopaedics, Inc. and Johnson & Johnson relating to the PINNACLE ® Acetabular Cup Systemused in hip replacement surgery. The number of pending product liability lawsuits continues to increase, and the Company continues to receive information withrespect to potential costs and the anticipated number of cases. Cases filed in federal courts in the United States have been organized as a multi-district litigation inthe United States District Court for the Northern District of Texas. Litigation has also been filed in some state courts and in countries outside of the United States,primarily in the United Kingdom. In the United Kingdom, a trial is ongoing regarding common issues of liability and a decision is expected in the first half of2018. The Company has established an accrual for defense costs in connection with product liability litigation associated with the PINNACLE ® Acetabular CupSystem.
Claims for personal injury have been made against Ethicon, Inc. (Ethicon) and Johnson & Johnson arising out of Ethicon's pelvic mesh devices used to treat stressurinary incontinence and pelvic organ prolapse. The Company continues to receive information with respect to potential costs and additional cases. Cases filed infederal courts in the United States have been organized as a multi-district litigation in the United States District Court for the Southern District of West Virginia.The Company has settled or otherwise resolved a majority of the United States cases and the costs associated with these settlements are reflected in the Company'saccruals. In addition, class actions and individual personal injury cases or claims have been commenced in various countries outside of the United States, includingclaims and cases in the United Kingdom, the Netherlands and Belgium, and class actions in Israel, Australia and Canada, seeking damages for alleged injuryresulting from Ethicon's pelvic mesh devices. In Australia, a trial of class action issues is ongoing and a decision is expected in 2018. The Company has establishedaccruals with respect to product liability litigation associated with Ethicon's pelvic mesh products.
Claims for personal injury have been made against Janssen Pharmaceuticals, Inc. and Johnson & Johnson arising out of the use of RISPERDAL ® , indicated forthe treatment of schizophrenia, acute manic or mixed episodes associated with bipolar I disorder and irritability associated with autism, and related compounds.Lawsuits have been primarily filed in state courts in Pennsylvania, California, and Missouri. Other actions are pending in various courts in the United States andCanada. Product
75
liability lawsuits continue to be filed, and the Company continues to receive information with respect to potential costs and the anticipated number of cases. TheCompany has established an accrual with respect to product liability litigation associated with RISPERDAL ® .
Claims for personal injury arising out of the use of XARELTO ® , an oral anticoagulant, have been made against Janssen Pharmaceuticals, Inc. (JPI); Johnson &Johnson; and JPI's collaboration partner for XARELTO ® Bayer AG and certain of its affiliates. The number of pending product liability lawsuits continues toincrease, and the Company continues to receive information with respect to potential costs and the anticipated number of cases. Cases filed in federal courts in theUnited States have been organized as a multi-district litigation in the United States District Court for the Eastern District of Louisiana. In addition, cases have beenfiled in state courts across the United States. Many of these cases have been consolidated into a state mass tort litigation in Philadelphia, Pennsylvania; and thereare coordinated proceedings in Delaware, California and Missouri. Class action lawsuits also have been filed in Canada. The Company has established an accrualfor defense costs in connection with product liability litigation associated with XARELTO ® .
Claims for personal injury have been made against Johnson & Johnson Consumer Inc. and Johnson & Johnson arising out of the use of body powders containingtalc, primarily JOHNSONS ® Baby Powder. The number of pending product liability lawsuits continues to increase, and the Company continues to receiveinformation with respect to potential costs and the anticipated number of cases. Lawsuits have been primarily filed in state courts in Missouri, New Jersey andCalifornia. Cases filed in federal courts in the United States have been organized as a multi-district litigation in the United States District Court for the District ofNew Jersey. The Company has established an accrual for defense costs in connection with product liability litigation associated with body powders containingtalc.
Claims for personal injury have been made against a number of Johnson & Johnson companies, including Janssen Pharmaceuticals, Inc. and Johnson & Johnson,arising out of the use of INVOKANA ® , a prescription medication indicated to improve glycemic control in adults with Type 2 diabetes. The number of pendingproduct liability lawsuits continues to increase, and the Company continues to receive information with respect to potential costs and the anticipated number ofcases. Cases filed in federal courts in the United States have been organized as a multi-district litigation in the United States District Court for the District of NewJersey. Cases have also been filed in state courts in Pennsylvania, California and New Jersey. Class action lawsuits have been filed in Canada. The Company hasestablished an accrual with respect to product liability litigation associated with INVOKANA ® .
INTELLECTUAL PROPERTY
Certain subsidiaries of Johnson & Johnson are subject, from time to time, to legal proceedings and claims related to patent, trademark and other intellectualproperty matters arising out of their businesses. Many of these matters involve challenges to the coverage and/or validity of the patents on various products andallegations that certain of the Company’s products infringe the patents of third parties. Although these subsidiaries believe that they have substantial defenses tothese challenges and allegations with respect to all significant patents, there can be no assurance as to the outcome of these matters. A loss in any of these casescould adversely affect the ability of these subsidiaries to sell their products, result in loss of sales due to loss of market exclusivity, require the payment of pastdamages and future royalties, and may result in a non-cash impairment charge for any associated intangible asset. The most significant of these matters aredescribed below.
Medical Devices
In June 2009, Rembrandt Vision Technologies, L.P. (Rembrandt) filed a patent infringement lawsuit against Johnson & Johnson Vision Care, Inc. (JJVCI) in theUnited States District Court for the Eastern District of Texas alleging that JJVCI's manufacture and sale of its ACUVUE ® ADVANCE and ACUVUE OASYS ®Hydrogel Contact Lenses infringed Rembrandt’s United States Patent No. 5,712,327 and seeking monetary relief. The case was transferred to the United StatesDistrict Court for the Middle District of Florida, where a trial in May 2012 resulted in a verdict of non-infringement that was subsequently upheld on appeal. InJuly 2014, Rembrandt sought a new trial based on alleged new evidence, which the District Court denied. In April 2016, the Court of Appeals overturned thatruling and remanded the case to the District Court for a new trial. A new trial was held in August 2017, and the jury returned a verdict of non-infringement in favorof JJVCI. Rembrandt has appealed the verdict to the United States Court of Appeals for the Federal Circuit.
In March 2013, Medinol Ltd. (Medinol) filed a patent infringement lawsuit against Cordis Corporation (Cordis) and Johnson & Johnson in the United StatesDistrict Court for the Southern District of New York alleging that Cordis’s sales of the CYPHER ™ and CYPHER SELECT ™ stents made in the United Statessince 2005 willfully infringed four of Medinol's patents directed to the geometry of articulated stents. Medinol is seeking damages and attorneys’ fees. After trial inJanuary 2014, the District Court dismissed the case, finding Medinol unreasonably delayed bringing its claims (the laches defense). In September 2014,
76

the District Court denied a motion by Medinol to vacate the judgment and grant it a new trial. Medinol appealed the decision to the United States Court of Appealsfor the Federal Circuit, then dismissed the appeal in order to file a petition for review with the United States Supreme Court. In March 2017, the United StatesSupreme Court held that the laches defense is not available in patent cases and remanded this case to the United States Court of Appeals for the Federal Circuit toconsider Medinol's appeal of whether Medinol is entitled to seek a new trial. Cordis was divested in 2015, and the Company retained any liability that may resultfrom this case.
In November 2016, MedIdea, L.L.C. (MedIdea) filed a patent infringement lawsuit against DePuy Orthopaedics, Inc. in the United States District Court for theNorthern District of Illinois alleging infringement by the ATTUNE ® Knee System. MedIdea alleges infringement of United States Patent Nos. 6,558,426 (’426);8,273,132; 8,721,730 and 9,492,280 relating to posterior stabilized knee systems. Specifically, MedIdea alleges that the SOFCAM TM Contact feature of theATTUNE ® posterior stabilized knee products infringes the patents-in-suit. MedIdea is seeking monetary damages and injunctive relief. In June 2017, the case wastransferred to the United States District Court for the District of Massachusetts. In December 2017, DePuy Synthes Products, Inc. filed a Petition for Inter PartesReview with the United States Patent and Trademark Office, seeking to invalidate the ’426 patent.
In December 2016, Ethicon Endo-Surgery, Inc. and Ethicon Endo-Surgery, LLC (now known as Ethicon LLC) sued Covidien, Inc. in the United States DistrictCourt for the District of Massachusetts seeking a declaration that United States Patent Nos. 6,585,735 (the ’735 patent); 7,118,587; 7,473,253; 8,070,748 and8,241,284 (the ’284 patent), are either invalid or not infringed by Ethicon’s ENSEAL ® X1 Large Jaw Tissue Sealer product. In April 2017, Covidien LP, CovidienSales LLC, and Covidien AG (collectively, Covidien) answered and counterclaimed, denying the allegations, asserting willful infringement of the ’735 patent, the’284 patent and United States Patent Nos. 8,323,310; 9,084,608; 9,241,759 and 9,113,882, and seeking damages and an injunction. Covidien filed a motion forpreliminary injunction, which was denied in October 2017. Trial is scheduled for September, 2019.
In November 2017, Board of Regents, The University of Texas System and Tissuegen, Inc. filed a lawsuit in the United States District Court for the WesternDistrict of Texas against Ethicon, Inc. and Ethicon US, LLC alleging the manufacture and sale of VICRYL ® Plus Antibacterial Sutures and MONOCRYL ® PlusAntibacterial Sutures infringe plaintiffs’ United States Patent Nos. 6,596,296 and 7,033,603 directed to implantable polymer drug releasing biodegradable fiberscontaining a therapeutic agent.
Pharmaceutical
In April 2016, MorphoSys AG, a German biotech company, filed a patent infringement lawsuit against Janssen Biotech, Inc. (JBI), Genmab U.S. Inc. and GenmabA/S (collectively, Genmab) in the United States District Court for the District of Delaware. MorphoSys alleges that JBI’s manufacture and sale of DARZALEX ®(daratumumab) willfully infringes MorphoSys’ United States Patent Nos. 8,263,746, 9,200,061 and 9,785,590. MorphoSys is seeking money damages. JBI licensespatents and the commercial rights to DARZALEX ® from Genmab. Trial in the case is scheduled to commence in February 2019.
In August 2016, Sandoz Ltd and Hexal AG (collectively, Sandoz) filed a lawsuit in the English High Court against G.D. Searle LLC (a Pfizer company) andJanssen Sciences Ireland UC (JSI) alleging that Searle’s supplementary protection certificate SPC/GB07/038 (SPC), which is exclusively licensed to JSI, is invalidand should be revoked. Janssen-Cilag Limited sells PREZISTA ® (darunavir) in the United Kingdom pursuant to this license. In October 2016, Searle and JSIcounterclaimed against Sandoz for threatened infringement of the SPC based on statements of its plans to launch generic darunavir in the United Kingdom. Sandozadmitted that its generic darunavir product would infringe the SPC if it is found valid. Searle and JSI are seeking an order enjoining Sandoz from marketing itsgeneric darunavir before the expiration of the SPC. Following a trial in April 2017, the Court entered a decision holding that the SPC is valid and granting a finalinjunction. Sandoz has appealed the Court’s decision and the injunction will be stayed pending the appeal. In January 2018, the Court referred the issue on appealto the Court of Justice for the European Union (CJEU) and stayed the proceedings pending the CJEU’s ruling on the issue.
REMICADE ® Related Cases
United States ProceedingsIn September 2013, Janssen Biotech, Inc. (JBI) and NYU Langone Medical Center (NYU) received an Office Action from the United States Patent and TrademarkOffice (USPTO) rejecting the claims in United States Patent No. 6,284,471 relating to REMICADE ® (infliximab) (the ’471 patent) in a reexamination proceedinginstituted by a third party. The ’471 patent expires in September 2018 and is co-owned by JBI and NYU, with NYU having granted JBI an exclusive license toNYU’s rights under the patent. Following several office actions by the patent examiner, including two further rejections, and responses by
77
JBI, the USPTO issued a further action maintaining its rejection of the ’471 patent. JBI filed a notice of appeal to the USPTO’s Patent Trial and Appeal Board (theBoard), which issued a decision in November 2016 upholding the examiner's rejection. In January 2018, the United States Court of Appeals for the Federal Circuitaffirmed the Board's decision.
In August 2014, Celltrion Healthcare Co. Ltd. and Celltrion Inc. (collectively, Celltrion) filed an application with the United States Food and Drug Administration(FDA) for approval to make and sell its own infliximab biosimilar. In March 2015, JBI filed a lawsuit in the United States District Court for the District ofMassachusetts against Celltrion and Hospira Healthcare Corporation (Hospira), which has exclusive marketing rights for Celltrion's infliximab biosimilar in theUnited States, seeking, among other things, a declaratory judgment that their biosimilar product infringes or potentially infringes several JBI patents, including the’471 patent and United States Patent No. 7,598,083 (the ’083 patent). In August 2016, the District Court granted both Celltrion's and Hospira's motions forsummary judgment of invalidity of the ’471 patent. JBI appealed those decisions to the United States Court of Appeals for the Federal Circuit. In January 2018, theFederal Circuit dismissed the appeal as moot based on its affirmance of the Board’s reexamination decision.
In June 2016, JBI filed two additional patent infringement lawsuits asserting the ’083 patent, one against Celltrion and Hospira in the United States District Courtfor the District of Massachusetts and the other against HyClone Laboratories, Inc., the manufacturer of the cell culture media that Celltrion uses to make itsbiosimilar product, in the United States District Court for the District of Utah. Although the ’083 patent is already asserted in the existing lawsuit against Celltrion,the additional lawsuit expands the claims to include the sale in the United States of Celltrion's biosimilar product manufactured with cell culture media made in theUnited States. This additional lawsuit against Celltrion has been consolidated with the existing lawsuit discussed above. Hospira has moved to dismiss all counts ofthe lawsuit related to the ’083 patent as to it. Celltrion's motion to dismiss all counts of the lawsuit related to the ’083 patent for failure to join all the co-owners ofthe '083 patent as plaintiffs was denied in October 2017. Trial is scheduled to begin in July 2018. The litigation against HyClone in Utah is stayed pending theoutcome of the Massachusetts actions.
The FDA approved Celltrion’s infliximab biosimilar for sale in the United States in April 2016. Hospira's parent company, Pfizer Inc., launched Celltrion'sinfliximab biosimilar in the United States in late 2016.
In April 2017, JBI received notice that the FDA approved a marketing application submitted by Samsung Bioepis Co. Ltd. (Samsung) for the sale of its infliximabbiosimilar in the United States. In May 2017, JBI filed a patent infringement lawsuit against Samsung in the United States District Court for the District of NewJersey alleging that the sale of its biosimilar product may infringe three of JBI’s patents. In July 2017, Samsung launched its biosimilar product (commercializedby Merck) in the United States. In November 2017, JBI voluntarily dismissed this lawsuit.
Litigation Against Filers of Abbreviated New Drug Applications (ANDAs)
The following summarizes lawsuits pending against generic companies that have filed Abbreviated New Drug Applications (ANDAs) with the FDA, or undertakensimilar regulatory processes outside of the United States, seeking to market generic forms of products sold by various subsidiaries of Johnson & Johnson prior toexpiration of the applicable patents covering those products. These ANDAs typically include allegations of non-infringement, invalidity and unenforceability of theapplicable patents. In the event the subsidiaries are not successful in these actions, or the statutory 30-month stays of the ANDAs expire before the United StatesDistrict Court rulings are obtained, the third-party companies involved will have the ability, upon approval of the FDA, to introduce generic versions of theproducts at issue to the market, resulting in the potential for substantial market share and revenue losses for those products, and which may result in a non-cashimpairment charge in any associated intangible asset. In addition, from time to time, subsidiaries may settle these actions and such settlements can involve theintroduction of generic versions of the products at issue to the market prior to the expiration of the relevant patents. The inter partes review (IPR) process with theUnited States Patent and Trademark Office (USPTO), created under the 2011 America Invents Act, is also being used by generic companies in conjunction withthese ANDAs and lawsuits to challenge patents held by the Company’s subsidiaries.
ZYTIGA ®
In July 2015, Janssen Biotech, Inc., Janssen Oncology, Inc. and Janssen Research & Development, LLC (collectively, Janssen) and BTG International Ltd. (BTG)initiated a patent infringement lawsuit in the United States District Court for the District of New Jersey against a number of generic companies (and certain of theiraffiliates and/or suppliers) who filed ANDAs seeking approval to market a generic version of ZYTIGA ® 250mg before the expiration of United States Patent No.8,822,438 (the ’438 patent). The generic companies currently include Amneal Pharmaceuticals, LLC and Amneal Pharmaceuticals of New York, LLC(collectively, Amneal); Apotex Inc. and Apotex Corp. (collectively, Apotex); Citron Pharma LLC (Citron); Dr. Reddy’s Laboratories, Ltd. and Dr. Reddy’sLaboratories, Inc. (collectively, Dr. Reddy’s); Mylan Pharmaceuticals Inc. and Mylan Inc.
78

(collectively, Mylan); Par Pharmaceuticals, Inc. and Par Pharmaceutical Companies, Inc. (collectively, Par); Sun Pharmaceutical Industries Ltd. and SunPharmaceuticals Industries, Inc. (collectively, Sun); Teva Pharmaceuticals USA, Inc. (Teva); Wockhardt Bio A.G.; Wockhardt USA LLC and Wockhardt Ltd.(collectively, Wockhardt); West-Ward Pharmaceutical Corp. (West-Ward) and Hikma Pharmaceuticals, LLC (Hikma). In February 2018, the court heard oralarguments on a motion for summary judgment of non-infringement filed by certain defendants. The parties await a decision. If the decision is unfavorable, the staycould be lifted and a generic version of ZYTIGA ® could enter the market.
Janssen and BTG also initiated patent infringement lawsuits in the United States District Court for the District of New Jersey against Amerigen PharmaceuticalsLimited (Amerigen) in May 2016, and Glenmark Pharmaceuticals, Inc. in June 2016, each of whom filed an ANDA seeking approval to market its generic versionof ZYTIGA ® before the expiration of the ’438 patent. In August 2015, Janssen and BTG filed an additional jurisdictional protective lawsuit against the Mylan defendants in the United States District Court for theNorthern District of West Virginia, which has been stayed.
In August 2017, Janssen and BTG initiated a patent infringement lawsuit in the United States District Court for the District of New Jersey against Teva, who filedan ANDA seeking approval to market a generic version of ZYTIGA ® 500mg before the expiration of the ’438 patent.
In January 2018, Janssen dismissed its lawsuit against Sun after it withdrew its ANDA.
In each of the above lawsuits, Janssen is seeking an order enjoining the defendants from marketing their generic versions of ZYTIGA ® before the expiration of the’438 patent.
Several generic companies including Amerigen, Argentum Pharmaceuticals LLC (Argentum), Mylan, Wockhardt, Actavis, Amneal, Dr. Reddy’s, Sun, Teva,West-Ward and Hikma filed Petitions for Inter Partes Review (IPR) with the USPTO, seeking to invalidate the ’438 patent. In January 2018, the USPTO issueddecisions invalidating the '438 patent, and Janssen is appealing this decision. The IPR decisions are not binding on the district court in the pending litigation.
In October 2017, Janssen Inc. and Janssen Oncology, Inc. (collectively, Janssen) initiated two Notices of Application under Section 6 of the Patented Medicines(Notice of Compliance) Regulations against Teva Canada Limited (Teva) and the Minister of Health in Canada in response to Teva's filing Abbreviated New DrugSubmissions (ANDS) and seeking approval to market generic versions of ZYTIGA ® 250mg and ZYTIGA ® 500mg before the expiration of Canadian Patent No.2,661,422.
In November 2017, Janssen initiated a Notice of Application under Section 6 of the Patented Medicines (Notice of Compliance) Regulations against Apotex Inc.(Apotex) and the Minister of Health in Canada in response to Apotex’s filing of an Abbreviated New Drug Submission (ANDS) seeking approval to market ageneric version of ZYTIGA ® before the expiration of Canadian Patent No. 2,661,422.
In each of these Notices of Application, Janssen is seeking an order prohibiting the Minister of Health from issuing a Notice of Compliance with respect to Teva'sand Apotex's ANDS before the expiration of Janssen's patent. COMPLERA ®
In August and September 2015, Janssen Pharmaceutica NV and Janssen Sciences Ireland UC (collectively, Janssen) and Gilead Sciences, Inc. and Gilead SciencesIreland UC (collectively, Gilead) initiated patent infringement lawsuits in the United States District Courts for the District of Delaware and the District of WestVirginia, respectively, against Mylan, Inc. and Mylan Pharmaceuticals, Inc. (collectively, Mylan), who filed an ANDA seeking approval to market a genericversion of COMPLERA ® before the expiration of United States Patent Nos. 8,841,310, 7,125,879 and 8,101,629. In July 2017, the West Virginia lawsuit wasdismissed without prejudice by stipulation of the parties.
In the Delaware lawsuit, Janssen and Gilead amended their complaint to add claims for patent infringement with respect to United States Patent Nos. 8,080,551;7,399,856; 7,563,922; 8,101,752 and 8,618,291. In November 2017, the parties entered into a settlement agreement.
XARELTO ®
B eginning in October 2015, Janssen Pharmaceuticals, Inc. (JPI) and Bayer Pharma AG and Bayer Intellectual Property GmbH (collectively, Bayer) filed patentinfringement lawsuits in the United States District Court for the District of Delaware against a number of generic companies who filed ANDAs seeking approval tomarket generic versions of XARELTO ® before expiration
79

of Bayer’s United States Patent Nos. 7,157,456 , 7,585,860 and 7,592,339 relating to XARELTO ® . JPI is the exclusive sublicensee of the asserted patents. Thefollowing generic companies are named defendants: Aurobindo Pharma Limited and Aurobindo Pharma USA, Inc. (collectively, Aurobindo); BreckenridgePharmaceutical, Inc. (Breckenridge); InvaGen Pharmaceuticals Inc. (InvaGen); Micro Labs USA Inc. and Micro Labs Ltd (collectively, Micro); MylanPharmaceuticals Inc. (Mylan); Prinston Pharmaceuticals, Inc.; Sigmapharm Laboratories, LLC (Sigmapharm); Torrent Pharmaceuticals, Limited and TorrentPharma Inc. (collectively, Torrent). All defendants except Mylan and Sigmapharm have agreed to have their cases stayed and to be bound by the outcome of anyfinal judgment rendered against any of the other defendants. Trial is scheduled for March 2018.
Beginning in April 2017, JPI and Bayer Intellectual Property GmbH and Bayer AG (collectively, Bayer AG) filed patent infringement lawsuits in the United StatesDistrict Court for the District of Delaware against a number of generic companies who filed ANDAs seeking approval to market generic versions of XARELTO ®before expiration of Bayer AG’s United States Patent No. 9,539,218 (’218) relating to XARELTO ® . The following generic companies are named defendants:Alembic Pharmaceuticals Limited, Alembic Global Holding SA and Alembic Pharmaceuticals, Inc.; Aurobindo; Breckenridge; InvaGen; Lupin Limited and LupinPharmaceuticals, Inc. (collectively, Lupin); Micro; Mylan; Sigmapharm; Taro Pharmaceutical Industries Ltd. and Taro Pharmaceuticals U.S.A., Inc. (collectively,Taro) and Torrent. Lupin has counterclaimed for a declaratory judgment of noninfringement and invalidity of United States Patent No. 9,415,053, but Lupindismissed its counterclaims after it was provided a covenant not to sue on that patent. Aurobindo, Taro, Torrent and Micro have agreed to have their cases stayedand to be bound by the outcome of any final judgment rendered against any of the other defendants. The ’218 cases have been consolidated for discovery and trial,and are currently set for trial in April 2019.
In each of these lawsuits, JPI is seeking an order enjoining the defendants from marketing their generic versions of XARELTO ® before the expiration of therelevant patents.
PREZISTA ®
In September 2017, Janssen Sciences Ireland UC and Janssen Products, L.P. (collectively, Janssen) initiated a patent infringement lawsuit in the United StatesDistrict Court for the District of New Jersey against Aurobindo Pharma Ltd. and Aurobindo Pharma USA Inc. (collectively, Aurobindo), who filed an ANDAseeking approval to market a generic version of PREZISTA ® before the expiration of United States Patent Nos. 8,518,987; 7,700,645; 7,126,015; and 7,595,408.In January 2018, the parties entered into a settlement agreement.
In November 2017, Janssen Inc. initiated Notices of Application under Section 6 of the Patented Medicines (Notice of Compliance) Regulations against ApotexInc. (Apotex) and the Minister of Health in Canada in response to Apotex’s filing of an Abbreviated New Drug Submission (ANDS) seeking approval to market ageneric version of PREZISTA ® before the expiration of Canadian Patent Nos. 2,485,834 and 2,336,160, which is owned by the United States and the Board ofTrustees of the University of Illinois. Janssen is seeking an order prohibiting the Minister of Health from issuing a Notice of Compliance with respect to Apotex'sANDS before the expiration of the relevant patents.
RISPERDAL CONSTA ®
In November 2016, the United States Patent and Trademark Office (USPTO) instituted an Inter Partes Review filed by Luye Pharma Group Ltd., Luye Pharma(USA) Ltd., Sandong Luye Pharmaceutical Co., Ltd. and Nanjing Luye Pharmaceutical Co., Ltd., seeking to invalidate United States Patent No. 6,667,061 relatingto RISPERDAL CONSTA ® . Janssen Pharmaceuticals, Inc. markets RISPERDAL CONSTA ® pursuant to a license from Alkermes Pharma Ireland Ltd. InNovember 2017, the USPTO issued a decision upholding the validity of the patent.
80

INVOKANA ® /INVOKAMET ®
Beginning in July 2017, Janssen Pharmaceuticals, Inc., Janssen Research & Development, LLC, Cilag GmbH International and Janssen Pharmaceutica NV(collectively, Janssen) and Mitsubishi Tanabe Pharma Corporation (MTPC) filed patent infringement lawsuits in the United States District Court for the District ofNew Jersey, the United States District Court for the District of Colorado and the United States District Court for the District of Delaware against a number ofgeneric companies who filed ANDAs seeking approval to market generic versions of INVOKANA ® and/or INVOKAMET ® before expiration of MTPC’s UnitedStates Patent Nos. 7,943,582 and/or 8,513,202 relating to INVOKANA ® and INVOKAMET ® . Janssen is the exclusive licensee of the asserted patents. Thefollowing generic companies are named defendants: Apotex Inc. and Apotex Corp. (Apotex); Aurobindo Pharma USA Inc. (Aurobindo); MacleodsPharmaceuticals Ltd. and MacLeods Pharma USA, Inc.; InvaGen Pharmaceuticals, Inc. (InvaGen); Prinston Pharmaceuticals Inc.; Dr. Reddy’s Laboratories, Inc.and Dr. Reddy’s Laboratories Ltd; Hetero USA, Inc., Hetero Labs Limited Unit-V and Hetero Labs Limited; MSN Laboratories Private Ltd. and MSNPharmaceuticals, Inc.; Laurus Labs Ltd.; Indoco Remedies Ltd.; Zydus Pharmaceuticals (USA) Inc. (Zydus); Sandoz, Inc. (Sandoz); Teva Pharmaceuticals USA,Inc.; and Lupin Ltd. and Lupin Pharmaceuticals, Inc.
Beginning in July 2017, Janssen and MTPC filed patent infringement lawsuits in the United States District Court for the District of New Jersey and the UnitedStates District Court for the District of Colorado against Sandoz and InvaGen, who filed ANDAs seeking approval to market generic versions of INVOKANA ®and/or INVOKAMET ® before expiration of MTPC’s United States Patent No. 7,943,788 (the '788 patent) relating to INVOKANA ® and INVOKAMET ® andagainst Zydus, who filed ANDAs seeking approval to market generic versions of INVOKANA ® and INVOKAMET ® before expiration of the '788 patent, MTPC'sUnited States Patent No. 8,222,219 relating to INVOKANA ® and INVOKAMET ® and MTPC’s United States Patent No. 8,785,403 relating to INVOKAMET ® ,and against Aurobindo, who filed an ANDA seeking approval to market a generic version of INVOKANA ® before expiration of the ’788 patent and the ’219patent relating to INVOKANA ® . Janssen is the exclusive licensee of the asserted patents. In October 2017, the Colorado lawsuits against Sandoz were dismissed.In December 2017, the Delaware lawsuits against Apotex and Teva were dismissed.
In each of these lawsuits, Janssen and MTPC are seeking an order enjoining the defendants from marketing their generic versions of INVOKANA ® and/orINVOKAMET ® before the expiration of the relevant patents.
VELETRI ®
In July 2017, Actelion Pharmaceuticals Ltd. (Actelion) initiated a patent infringement lawsuit in the United States District Court for the District of New Jerseyagainst Sun Pharmaceutical Industries, Inc. and Sun Pharmaceutical Industries Limited (collectively, Sun Pharmaceutical), who filed an ANDA seeking approvalto market a generic version of VELETRI ® before the expiration of United States Patent No. 8,598,227. Actelion is seeking an order enjoining Sun Pharmaceuticalfrom marketing its generic version of VELETRI ® before the expiration of the patent. Trial is scheduled to commence in June 2019.
OPSUMIT ®
In January 2018, Actelion Pharmaceuticals Ltd (Actelion) initiated a patent infringement lawsuit in the United States District Court for the District of New Jerseyagainst Zydus Pharmaceuticals (USA) Inc. (Zydus) and Amneal Pharmaceuticals LLC (Amneal), who filed an ANDA seeking approval to market a generic versionof OPSUMIT ® before the expiration of United States Patent No. 7,094,781. In the lawsuit, Actelion is seeking an order enjoining Zydus and Amneal frommarketing generic versions of OPSUMIT ® before the expiration of the patent.
INVEGA SUSTENNA ®
In January 2018, Janssen Pharmaceutica NV and Janssen Pharmaceuticals, Inc. (collectively, Janssen) initiated a patent infringement lawsuit in the United StatesDistrict Court for the District of New Jersey against Teva Pharmaceuticals USA, Inc. (Teva), who filed an ANDA seeking approval to market a generic version ofINVEGA SUSTENNA ® before the expiration of United States Patent No. 9,439,906. In the lawsuit, Janssen is seeking an order enjoining Teva from marketing ageneric version of INVEGA SUSTENNA ® before the expiration of the patent.
81

IMBRUVICA ®
Beginning in January 2018, Pharmacyclics LLC (Pharmacyclics) and Janssen Biotech, Inc. (Janssen) filed patent infringement lawsuits in the United States DistrictCourt for the District of Delaware against a number of generic companies who filed ANDAs seeking approval to market generic versions of IMBRUVICA ® beforeexpiration of Pharmacyclics’ United States Patent Nos. 8,008,309, 7,514,444, 8,697,711, 8,735,403, 8,957,079, 9,181,257, 8,754,091, 8,497,277, 8,925,015,8,476,284, 8,754,090, 8,999,999, 9,125,889, 9,801,881, 9,801,883, 9,814,721, 9,795,604, 9,296,753, 9,540,382, 9,713,617 and/or 9,725,455 relating toIMBRUVICA ® . Janssen is the exclusive licensee of the asserted patents. The following generic companies are named defendants: Cipla Limited and Cipla USAInc. (Cipla); Fresenius Kabi USA, LLC, Fresenius Kabi USA, Inc., and Fresenius Kabi Oncology Limited (Fresenius Kabi); Sandoz Inc. and Lek Pharmaceuticalsd.d. (Sandoz); Shilpa Medicare Limited (Shilpa); Sun Pharma Global FZE and Sun Pharmaceutical Industries Limited (Sun); Teva Pharmaceuticals USA, Inc. andTeva Pharmaceutical Industries Limited (Teva); and Zydus Worldwide DMCC and Cadila Healthcare Limited (Zydus).In each of the lawsuits, Pharmacyclics and Janssen are seeking an order enjoining the defendants from marketing generic versions of IMBRUVICA ® before theexpiration of the relevant patents.
GOVERNMENT PROCEEDINGS
Like other companies in the pharmaceutical and medical devices industries, Johnson & Johnson and certain of its subsidiaries are subject to extensive regulation bynational, state and local government agencies in the United States and other countries in which they operate. As a result, interaction with government agencies isongoing. The most significant litigation brought by, and investigations conducted by, government agencies are listed below. It is possible that criminal charges andsubstantial fines and/or civil penalties or damages could result from government investigations or litigation.
Average Wholesale Price (AWP) Litigation
Johnson & Johnson and several of its pharmaceutical subsidiaries (the J&J AWP Defendants), along with numerous other pharmaceutical companies, were namedas defendants in a series of lawsuits in state and federal courts involving allegations that the pricing and marketing of certain pharmaceutical products amounted tofraudulent and otherwise actionable conduct because, among other things, the companies allegedly reported an inflated Average Wholesale Price (AWP) for thedrugs at issue. Payors alleged that they used those AWPs in calculating provider reimbursement levels. The plaintiffs in these cases included three classes ofprivate persons or entities that paid for any portion of the purchase of the drugs at issue based on AWP, and state government entities that made Medicaidpayments for the drugs at issue based on AWP. Many of these cases, both federal actions and state actions removed to federal court, were consolidated for pre-trialpurposes in a multi-district litigation in the United States District Court for the District of Massachusetts, where all claims against the J&J AWP Defendants wereultimately dismissed. The J&J AWP Defendants also prevailed in a case brought by the Commonwealth of Pennsylvania. Other AWP cases have been resolvedthrough court order or settlement. Two cases remain pending. In a case brought by Illinois, the parties are awaiting assignment of a trial date. In New Jersey, aputative class action based upon AWP allegations is pending against Centocor, Inc. and Ortho Biotech Inc. (both now Janssen Biotech, Inc.), Johnson & Johnsonand ALZA Corporation.
Opioids Litigation
Beginning in 2014 and continuing to the present, Johnson & Johnson and Janssen Pharmaceuticals, Inc. (JPI), along with other pharmaceutical companies, havebeen named in numerous lawsuits brought by certain state and local governments related to the marketing of opioids, including DURAGESIC ® , NUCYNTA ® andNUCYNTA ® ER. To date, complaints against pharmaceutical companies, including Johnson & Johnson and JPI, have been filed in state court by the stateAttorneys General in Louisiana, Mississippi, Missouri, New Mexico, Ohio and Oklahoma. Complaints against the manufacturers also have been filed in state orfederal court by city, county and local government agencies in the following states: Arkansas; California; Connecticut; Florida; Georgia; Illinois; Kentucky;Louisiana; Mississippi; Missouri; Nevada; New Hampshire; New Jersey; New Mexico; New York; Ohio; Oklahoma; Oregon; Pennsylvania; Tennessee; Texas;Washington and West Virginia. These actions allege a variety of claims related to opioids marketing practices, including false advertising, unfair competition,public nuisance, consumer fraud violations, deceptive acts and practices, false claims and unjust enrichment. The suits generally seek penalties and/or injunctiveand monetary relief. These cases are in early stages of litigation. In October 2017, Johnson & Johnson and JPI were both served with a motion to consolidate 66pending matters into a federal Multi District Litigation in the Southern District of Ohio. In December 2017, the MDL was approved in the Northern District ofOhio and there are approximately 190 cases that have been transferred to the MDL.
82
Johnson & Johnson, JPI and other pharmaceutical companies have also received subpoenas or requests for information related to opioids marketing practices fromthe following state Attorneys General: Alaska, Indiana, New Hampshire, New Jersey, Tennessee and Washington. In September 2017, Johnson & Johnson and JPIwere contacted by the Texas and Colorado Attorney General’s Offices on behalf of approximately 38 states regarding a multi-state Attorney General investigation.The multi-state coalition served Johnson & Johnson and JPI with subpoenas as part of the investigation. Johnson & Johnson and JPI have also received requests forinformation from the ranking minority member of the United States Senate Committee on Homeland Security and Governmental Affairs regarding the sales,marketing, and educational strategies related to the promotion of opioids use.
Other
In August 2012, DePuy Orthopaedics, Inc., DePuy, Inc. (now DePuy Synthes, Inc.), and Johnson & Johnson Services, Inc. received an informal request from theUnited States Attorney's Office for the District of Massachusetts and the Civil Division of the United States Department of Justice (the United States) for theproduction of materials relating to the DePuy ASR™ XL Hip device. In July 2014, the United States notified the United States District Court for the District ofMassachusetts that it had declined to intervene in a qui tam case filed pursuant to the False Claims Act against the companies. In February 2016, the District Courtgranted the companies’ motion to dismiss with prejudice, unsealed the qui tam complaint, and denied the qui tam relators’ request for leave to file a furtheramended complaint. The qui tam relators appealed the case to the United States Court of Appeals for the First Circuit. In July 2017, the First Circuit affirmed theDistrict Court’s dismissal in part, reversed in part, and affirmed the decision to deny the relators’ request to file a third amended complaint. The relators’ remainingclaims are now pending before the District Court.
Since October 2013, a group of State Attorneys General have issued Civil Investigative Demands relating to the development, sales and marketing of several ofDePuy Orthopaedics, Inc.'s hip products. The states are seeking monetary and injunctive relief, and DePuy Orthopaedics, Inc. has entered into a tolling agreementwith the states. In July 2014, the Oregon Department of Justice, which was investigating these matters independently of the other states, announced a settlement ofits ASR™ XL Hip device investigation with the State of Oregon.
In October 2012, Johnson & Johnson was contacted by the California Attorney General's office regarding a multi-state Attorney General investigation of themarketing of surgical mesh products for hernia and urogynecological purposes by Johnson & Johnson's subsidiary, Ethicon, Inc. (Ethicon). Johnson & Johnson andEthicon have since entered into a series of tolling agreements with the 47 states and the District of Columbia participating in the multi-state investigation and haveresponded to Civil Investigative Demands served by certain of the participating states. The states are seeking monetary and injunctive relief. In May 2016,California and Washington filed civil complaints against Johnson & Johnson, Ethicon Inc. and Ethicon US, LLC alleging violations of their consumer protectionstatutes. Similar complaints were filed against the companies by Kentucky in August 2016 and by Mississippi in October 2017. Johnson & Johnson and Ethiconhave entered into a new tolling agreement with the remaining 43 states and the District of Columbia.
In December 2012, Therakos, Inc. (Therakos), formerly a subsidiary of Johnson & Johnson and part of the Ortho-Clinical Diagnostics, Inc. (OCD) franchise,received a letter from the civil division of the United States Attorney's Office for the Eastern District of Pennsylvania informing Therakos that the United StatesAttorney's Office was investigating the sales and marketing of Uvadex ® (methoxsalen) and the Uvar Xts ® and Cellex ® Systems during the period 2000 to thepresent. The United States Attorney's Office requested that OCD and Johnson & Johnson preserve documents that could relate to the investigation. Therakos wassubsequently acquired by an affiliate of Gores Capital Partners III, L.P. in January 2013, and OCD was divested in June 2014. Following the divestiture of OCD,Johnson & Johnson retains OCD’s portion of any liability that may result from the investigation for activity that occurred prior to the sale of Therakos. In March2014 and March 2016, the United States Attorney’s Office requested that Johnson & Johnson produce certain documents, and Johnson & Johnson is cooperatingwith those requests.
In June 2014, the Mississippi Attorney General filed a complaint in Chancery Court of The First Judicial District of Hinds County, Mississippi against Johnson &Johnson and Johnson & Johnson Consumer Companies, Inc. (now Johnson & Johnson Consumer Inc.) (JJCI). The complaint alleges that defendants failed todisclose alleged health risks associated with female consumers' use of talc contained in JOHNSON'S ® Baby Powder and JOHNSON'S ® Shower to Shower (aproduct no longer sold by JJCI) and seeks injunctive and monetary relief. The parties have agreed to adjourn the trial date and currently expect the trial to be re-scheduled to the fall of 2018.
In March 2016, Janssen Pharmaceuticals, Inc. (JPI) received a Civil Investigative Demand from the United States Attorney’s Office for the Southern District ofNew York related to JPI’s contractual relationships with pharmacy benefit managers over the
83
period from January 1, 2006 to the present with regard to certain of JPI's pharmaceutical products. The demand was issued in connection with an investigationunder the False Claims Act.
In January 2017, Janssen Pharmaceuticals, Inc. (JPI) received a Civil Investigative Demand from the United States Department of Justice relating to allegationsconcerning the sales and marketing practices of OLYSIO ® . In December 2017, Johnson & Johnson and JPI were served with a whistleblower lawsuit filed in theUnited States District Court for the Central District of California alleging the off-label promotion of OLYSIO ® and additional products, including NUCYNTA ® ,XARELTO ® , LEVAQUIN ® and REMICADE ® . At this time, the federal and state governments have declined to intervene and the lawsuit, which is related tothe Civil Investigative Demand, is being prosecuted by a former company employee. JPI filed a motion to dismiss in the United States District Court for theCentral District of California in January 2018.
In February 2017, Johnson & Johnson received a subpoena from the United States Attorney's Office for the District of Massachusetts seeking the production ofrecords pertaining to payments to any 501(c)(3) charitable organization that provides financial assistance to Medicare patients. Multiple pharmaceutical companieshave publicly reported receipt of subpoenas and ongoing inquiries similar to this one and the one described below.
Actelion Pharmaceuticals US, Inc. (Actelion US), received a subpoena in May 2016, with follow-up requests in June and December 2016, from the United StatesAttorney's Office for the District of Massachusetts. The subpoena seeks the production of records pertaining to Actelion US’ payments to 501(c)(3) charitableorganizations that provide financial assistance to Medicare patients.
In March 2017, Janssen Biotech, Inc. received a Civil Investigative Demand from the United States Department of Justice regarding a False Claims Actinvestigation concerning management and advisory services provided to rheumatology and gastroenterology practices that purchased REMICADE ® or SIMPONIARIA ® .
In April and September 2017, Johnson & Johnson received subpoenas from the United States Attorney for the District of Massachusetts seeking documentsbroadly relating to pharmaceutical copayment support programs for DARZALEX ® , OLYSIO ® , REMICADE ® , SIMPONI ® , STELARA ® and ZYTIGA ® . Thesubpoenas also seek documents relating to Average Manufacturer Price and Best Price reporting to the Center for Medicare and Medicaid Services related to thoseproducts, as well as rebate payments to state Medicaid agencies.
In June 2017, Johnson & Johnson received a subpoena from the United States Attorney's Office for the District of Massachusetts seeking information regardingpractices pertaining to the sterilization of DePuy Synthes, Inc. spinal implants at three hospitals in Boston as well as interactions of Company employees withphysicians at these hospitals. Johnson & Johnson is producing documents in response to this subpoena.
From time to time, Johnson & Johnson has received requests from a variety of United States Congressional Committees to produce information relevant to ongoingcongressional inquiries. It is the policy of Johnson & Johnson to cooperate with these inquiries by producing the requested information.
GENERAL LITIGATION
In June 2009, following the public announcement that Ortho-Clinical Diagnostics, Inc. (OCD) had received a grand jury subpoena from the United StatesDepartment of Justice, Antitrust Division, in connection with an investigation that has since been closed, multiple class action complaints were filed against OCDby direct purchasers seeking damages for alleged price fixing. These cases were consolidated for pre-trial purposes in the United States District Court for theEastern District of Pennsylvania as In re Blood Reagent Antitrust Litigation. Following the appeal and reversal of its initial grant of a motion for class certification,on remand, the District Court in October 2015 again granted a motion by the plaintiffs for class certification. In July 2017, the Court issued an opinion granting inpart and denying in part OCD's motion for summary judgment. The Court granted summary judgment concerning allegations of price fixing in 2005 and 2008, anddenied summary judgment concerning allegations of price fixing in 2001. Trial has been set for June 2018. OCD was divested in 2014 and Johnson & Johnsonretained any liability that may result from these cases.
In June 2011, DePuy Orthopaedics, Inc. (DePuy) filed suit against Orthopaedic Hospital (OH) in the United States District Court for the Northern District ofIndiana seeking a declaratory judgment that DePuy did not owe OH royalties under a 1999 development agreement. In January 2012, OH filed a breach of contractcase in California federal court, which was later consolidated with the Indiana case. In February 2014, OH brought suit for patent infringement relating to the sametechnology, and that action was also consolidated with the Indiana case. In August 2017, the court denied DePuy’s motions for summary judgment. A trial date hasnot been set.
84

In September 2011, Johnson & Johnson, Johnson & Johnson Inc. and McNeil Consumer Healthcare Division of Johnson & Johnson Inc. received a Notice of CivilClaim filed by Nick Field in the Supreme Court of British Columbia, Canada (the BC Civil Claim). The BC Civil Claim is a putative class action brought on behalfof persons who reside in British Columbia and who purchased during the period between September 20, 2001 and in or about December 2010 one or more variousMcNeil infants' or children's over-the-counter medicines that were manufactured at the Fort Washington, Pennsylvania facility. The BC Civil Claim alleges that thedefendants violated the BC Business Practices and Consumer Protection Act, and other Canadian statutes and common laws, by selling medicines that wereallegedly not safe and/or effective or did not comply with Canadian Good Manufacturing Practices. The class certification hearing scheduled for October 2015 wasadjourned, and the Court entered a Consent Order of Dismissal in November 2017 concluding this action. In addition, in April 2016, a putative class action wasfiled against Johnson & Johnson, Johnson & Johnson Sales and Logistics Company, LLC and McNeil PPC, Inc. (now known as Johnson & Johnson Consumer,Inc.) in New Jersey Superior Court, Camden County on behalf of persons who reside in the state of New Jersey who purchased various McNeil over-the-counterproducts from December 2008 through the present. The complaint alleges violations of the New Jersey Consumer Fraud Act. Following the grant of a motion todismiss and the filing of an amended complaint, in May 2017, the Court denied a motion to dismiss the amended complaint. Discovery is underway.
In May 2014, two purported class actions were filed in federal court, one in the United States District Court for the Central District of California and one in theUnited States District Court for the Southern District of Illinois, against Johnson & Johnson and Johnson & Johnson Consumer Companies, Inc. (now Johnson &Johnson Consumer Inc.) (JJCI) alleging violations of state consumer fraud statutes based on nondisclosure of alleged health risks associated with talc contained inJOHNSON'S ® Baby Powder and JOHNSON'S ® Shower to Shower (a product no longer sold by JJCI). Both cases seek injunctive relief and monetary damages;neither includes a claim for personal injuries. In October 2016, both cases were transferred to the United States District Court for the District Court of New Jerseyas part of a newly created federal multi-district litigation. In July 2017, the Court granted Johnson & Johnson's and JJCI’s motion to dismiss one of the cases. Theplaintiff has appealed. In September 2017, the plaintiff in the second case voluntarily dismissed their complaint.
In August 2014, United States Customs and Border Protection (US CBP) issued a Penalty Notice against Janssen Ortho LLC (Janssen Ortho), assessing penaltiesfor the alleged improper classification of darunavir ethanolate (the active pharmaceutical ingredient in PREZISTA ® ) in connection with its importation into theUnited States. In October 2014, Janssen Ortho submitted a Petition for Relief in response to the Penalty Notice. In May 2015, US CBP issued an Amended PenaltyNotice assessing substantial penalties and Janssen Ortho filed a Petition for Relief in July 2015.
In March and April 2015, over 30 putative class action complaints were filed by contact lens patients in a number of courts around the United States againstJohnson & Johnson Vision Care, Inc. (JJVCI) and other contact lens manufacturers, distributors, and retailers, alleging vertical and horizontal conspiracies to fixthe retail prices of contact lenses. The complaints allege that the manufacturers reached agreements with each other and certain distributors and retailers concerningthe prices at which some contact lenses could be sold to consumers. The plaintiffs are seeking damages and injunctive relief. All of the class action cases weretransferred to the United States District Court for the Middle District of Florida in June 2015. The plaintiffs filed a consolidated class action complaint inNovember 2015. In June 2016, the Court denied motions to dismiss filed by JJVCI and other defendants. Discovery is ongoing. In March 2017, the plaintiffs fileda motion for class certification.
In August 2015, two third-party payors filed a purported class action in the United States District Court for the Eastern District of Louisiana against JanssenResearch & Development, LLC, Janssen Ortho LLC, Janssen Pharmaceuticals, Inc., Ortho-McNeil-Janssen Pharmaceuticals, Inc. and Johnson & Johnson (as wellas certain Bayer entities), alleging that the defendants improperly marketed and promoted XARELTO ® as safer and more effective than less expensive alternativemedications while failing to fully disclose its risks. The complaint seeks damages.
In May 2017, a purported class action was filed in the United States District Court for the Western District of Washington against Lifescan Inc., Johnson &Johnson, other diabetes test strip manufacturers and certain Pharmacy Benefit Managers (PBMs). The complaint alleges that consumers paid inflated prices forglucose monitor test strips as a consequence of undisclosed rebates and other incentives paid by manufacturers to PBMs. The complaint includes RICO, ERISA,and state consumer protection claims. The complaint seeks equitable relief and damages. In November 2017, the case was ordered transferred to United StatesDistrict Court for the District of New Jersey.
In May 2017, Lonza Sales AG (Lonza) filed a Request for Arbitration with the London Court of International Arbitration against Janssen Research &Development, LLC (Janssen). Lonza alleges that Janssen breached a 2005 agreement between the parties by sublicensing certain Lonza technology used in themanufacture of daratumumab without Lonza’s consent. Lonza seeks monetary damages.
85
In September 2017, Strategic Products Group, Inc. (SPG) filed an antitrust complaint against Lifescan, Inc. and Lifescan Scotland, Ltd. (collectively, Lifescan) inthe United States District Court for the Northern District of Florida (Pensacola Division). SPG, the exclusive distributor of Unistrip blood glucose meter test strips,alleges that Lifescan has monopolized or is attempting to monopolize the market for blood glucose meter test strips compatible with certain Lifescan meters. Thecomplaint seeks damages.
In September 2017, Pfizer, Inc. (Pfizer) filed an antitrust complaint against Johnson & Johnson and Janssen Biotech, Inc. (collectively Janssen) in United StatesDistrict Court for the Eastern District of Pennsylvania. Pfizer alleges that Janssen has violated federal antitrust laws through its contracting strategies forREMICADE ® . The complaint seeks damages and injunctive relief. In November 2017, Janssen moved to dismiss the complaint.
Beginning in September 2017, multiple purported class actions were filed against Johnson & Johnson and Janssen Biotech, Inc. (collectively Janssen) alleging thatJanssen’s REMICADE ® contracting strategies violated federal and state antitrust and consumer laws and seeking damages and injunctive relief. In November2017, the cases were consolidated for pre-trial purposes in United States District Court for the Eastern District of Pennsylvania as In re Remicade AntitrustLitigation.
In October 2017, certain United States service members and their families brought a complaint against a number of pharmaceutical and medical devicescompanies, including Johnson & Johnson and certain of its subsidiaries, alleging that the defendants violated the United States Anti-Terrorism Act. The complaintalleges that the defendants provided funding for terrorist organizations through their sales practices pursuant to pharmaceutical and medical device contracts withthe Iraqi Ministry of Health.
Andover Healthcare, Inc. filed a Lanham act case against Johnson & Johnson Consumer Inc. in April 2017 in the United Stated District Court for the District ofMassachusetts. Andover asserts that the claim “not made with natural rubber latex” on COACH ® Sports Wrap, BAND-AID ® Brand SECURE-FLEX ® Wrap andBAND-AID ® Brand HURT-FREE ® Wrap is false. Andover seeks actual damages and pre-judgment interest thereon, disgorgement of profits, treble damages,attorney’s fees and injunctive relief. The Court denied a motion to dismiss, an answer was filed and discovery is underway.
In February 2018, a securities class action lawsuit was filed against Johnson & Johnson in the United States District Court for the District of New Jersey allegingthat Johnson & Johnson violated the federal Securities laws by failing to adequately disclose the alleged asbestos contamination in body powders containing talc,primarily JOHNSONS ® Baby Powder. The lawsuit was assigned to the District Court Judge managing the personal injury multi-district litigation.
Johnson & Johnson or its subsidiaries are also parties to a number of proceedings brought under the Comprehensive Environmental Response, Compensation, andLiability Act, commonly known as Superfund, and comparable state, local or foreign laws in which the primary relief sought is the cost of past and/or futureremediation.
86

22. RestructuringThe Company announced restructuring actions in its Medical Devices segment to better serve the needs of patients and customers in today’s evolving healthcaremarketplace. The Company is undertaking actions to strengthen its go-to-market model, accelerate the pace of innovation, further prioritize key platforms andgeographies, and streamline operations while maintaining high quality standards.
The Company estimates that, in connection with its plans, it will record pre-tax restructuring related charges of approximately $2.0 billion to $2.4 billion . In2017, the Company recorded a pre-tax charge of $760 million , of which $88 million was included in cost of products sold and $363 million was included in other(income) expense. See table below for additional details. Total project costs of $2.0 billion have been recorded since the restructuring has been announced.
Additionally, as part of the plan, the Company expects that the restructuring actions will result in position eliminations of approximately 4 to 6 percent of theMedical Devices segment’s global workforce over the next 15 months . Approximately 2,400 positions have been eliminated of which 1,700 received separationpayments since the restructuring announcement.
The Company estimates that approximately one-half of the cumulative pre-tax costs will result in cash outlays, including approximately $400 million ofemployee severance. Approximately one half of the cumulative pre-tax costs are non-cash, relating primarily to facility rationalization, inventory write-offs andintangible asset write-offs.
The following table summarizes the severance charges and the associated spending under this initiative through the fiscal year ended 2017:
(Dollars in Millions) Severance Asset Write-offs Other** Total
2015 restructuring charge $ 484 86 20 590 2015 activity (86) (3) (89) Reserve balance, January 3, 2016 484 — 17 501 2016 activity (104) — (16) (120) Reserve balance, January 1, 2017 380 — 1 381 Current year activity: Charges 194 656 850 Cash payments (61) (619) (680) Settled non cash (194) (194) Accrual adjustment (90) (90) Reserve balance, December 31, 2017* $ 229 — 38 267 *Cash outlays for severance are expected to be substantially paid out over the next 18 months in accordance with the Company's plans and local laws.**Other includes project expense such as salaries for employees supporting the initiative and consulting expenses.
87

Report of Independent Registered Public Accounting Firm
To the Shareholders and Board of Directors of Johnson & Johnson
Opinions on the Financial Statements and Internal Control over Financial Reporting
We have audited the accompanying consolidated balance sheets of Johnson & Johnson and its subsidiaries as of December 31, 2017 and January 1, 2017, and therelated consolidated statements of earnings, of comprehensive income, of equity, and of cash flows for each of the three years in the period ended December 31,2017, including the related notes (collectively referred to as the “consolidated financial statements”). We also have audited the Company's internal control overfinancial reporting as of December 31, 2017, based on criteria established in Internal Control - Integrated Framework (2013) issued by the Committee ofSponsoring Organizations of the Treadway Commission (COSO).
In our opinion, the consolidated financial statements referred to above present fairly, in all material respects, the financial position of the Company as of December31, 2017 and January 1, 2017 , and the results of its operations and its cash flows for each of the three years in the period ended December 31, 2017 in conformitywith accounting principles generally accepted in the United States of America. Also in our opinion, the Company maintained, in all material respects, effectiveinternal control over financial reporting as of December 31, 2017 based on criteria established in Internal Control - Integrated Framework (2013) issued by theCOSO.
Change in Accounting Principle
As discussed in Note 1 to the consolidated financial statements, the Company changed the manner in which it accounts for and presents certain elements of sharebased payments in 2016.
Basis for Opinions
The Company's management is responsible for these consolidated financial statements, for maintaining effective internal control over financial reporting, and forits assessment of the effectiveness of internal control over financial reporting, included in the accompanying Management's Report on Internal Control overFinancial Reporting. Our responsibility is to express opinions on the Company’s consolidated financial statements and on the Company's internal control overfinancial reporting based on our audits. We are a public accounting firm registered with the Public Company Accounting Oversight Board (United States)("PCAOB") and are required to be independent with respect to the Company in accordance with the U.S. federal securities laws and the applicable rules andregulations of the Securities and Exchange Commission and the PCAOB.
We conducted our audits in accordance with the standards of the PCAOB. Those standards require that we plan and perform the audits to obtain reasonableassurance about whether the consolidated financial statements are free of material misstatement, whether due to error or fraud, and whether effective internalcontrol over financial reporting was maintained in all material respects.
Our audits of the consolidated financial statements included performing procedures to assess the risks of material misstatement of the consolidated financialstatements, whether due to error or fraud, and performing procedures that respond to those risks. Such procedures included examining, on a test basis, evidenceregarding the amounts and disclosures in the consolidated financial statements. Our audits also included evaluating the accounting principles used and significantestimates made by management, as well as evaluating the overall presentation of the consolidated financial statements. Our audit of internal control over financialreporting included obtaining an understanding of internal control over financial reporting, assessing the risk that a material weakness exists, and testing andevaluating the design and operating effectiveness of internal control based on the assessed risk. Our audits also included performing such other procedures as weconsidered necessary in the circumstances. We believe that our audits provide a reasonable basis for our opinions.
As described in Management’s Report on Internal Control over Financial Reporting, management has excluded Abbott Medical Optics and Actelion Ltd. from itsassessment of internal control over financial reporting as of December 31, 2017, because they were acquired by the Company in purchase business combinationsduring 2017. We have also excluded Abbott Medical Optics and Actelion Ltd. from our audit of internal control over financial reporting. Abbott Medical Opticsand Actelion Ltd. are wholly-owned subsidiaries whose total assets and total revenues excluded from management’s assessment and our audit of internal controlover financial reporting represent approximately 1% and 1% of total assets, respectively and approximately 1% and 2% of total revenues, respectively, of therelated consolidated financial statement amounts as of and for the year ended December 31, 2017.
88
Definition and Limitations of Internal Control over Financial Reporting
A company’s internal control over financial reporting is a process designed to provide reasonable assurance regarding the reliability of financial reporting and thepreparation of financial statements for external purposes in accordance with generally accepted accounting principles. A company’s internal control over financialreporting includes those policies and procedures that (i) pertain to the maintenance of records that, in reasonable detail, accurately and fairly reflect the transactionsand dispositions of the assets of the company; (ii) provide reasonable assurance that transactions are recorded as necessary to permit preparation of financialstatements in accordance with generally accepted accounting principles, and that receipts and expenditures of the company are being made only in accordance withauthorizations of management and directors of the company; and (iii) provide reasonable assurance regarding prevention or timely detection of unauthorizedacquisition, use, or disposition of the company’s assets that could have a material effect on the financial statements.
Because of its inherent limitations, internal control over financial reporting may not prevent or detect misstatements. Also, projections of any evaluation ofeffectiveness to future periods are subject to the risk that controls may become inadequate because of changes in conditions, or that the degree of compliance withthe policies or procedures may deteriorate.
/s/ PricewaterhouseCoopers LLP
Florham Park, New JerseyFebruary 21, 2018
We have served as the Company’s auditor since at least 1920. We have not determined the specific year we began serving as auditor of the Company.
89

Management’s Report on Internal Control Over Financial Reporting
Under Section 404 of the Sarbanes-Oxley Act of 2002, management is required to assess the effectiveness of the Company’s internal control over financialreporting as of the end of each fiscal year and report, based on that assessment, whether the Company’s internal control over financial reporting is effective.
Management of the Company is responsible for establishing and maintaining adequate internal control over financial reporting. The Company’s internalcontrol over financial reporting is designed to provide reasonable assurance as to the reliability of the Company’s financial reporting and the preparation ofexternal financial statements in accordance with generally accepted accounting principles.
Internal controls over financial reporting, no matter how well designed, have inherent limitations. Therefore, internal control over financial reportingdetermined to be effective can provide only reasonable assurance with respect to financial statement preparation and may not prevent or detect all misstatements.Moreover, projections of any evaluation of effectiveness to future periods are subject to the risk that controls may become inadequate because of changes inconditions, or that the degree of compliance with the policies or procedures may deteriorate.
The Company’s management has assessed the effectiveness of the Company’s internal control over financial reporting as of December 31, 2017. In makingthis assessment, the Company used the criteria established by the Committee of Sponsoring Organizations of the Treadway Commission (COSO) in “InternalControl-Integrated Framework (2013).” These criteria are in the areas of control environment, risk assessment, control activities, information and communication,and monitoring. The Company’s assessment included extensive documenting, evaluating and testing the design and operating effectiveness of its internal controlsover financial reporting.
The Company acquired Abbott Medical Optics (AMO), a wholly-owned subsidiary of Abbott Laboratories and Actelion Ltd. and its consolidated subsidiaries(Actelion) in February and June 2017, respectively. Actelion's total assets, excluding intangible assets and goodwill, and total revenues represented approximately1% and 2%, respectively, of the related consolidated financial statements as of and for the period ended December 31, 2017. AMO's total assets, excludingintangible assets and goodwill, and total revenues represented approximately 1% and 1%, respectively, of the related consolidated financial statements as of and forthe period ended December 31, 2017. As the acquisitions occurred in the fiscal year 2017, the scope of the Company's assessment of the design and effectivenessof internal control over financial reporting for the fiscal year 2017 excluded the above mentioned acquisitions. This exclusion is in accordance with the SEC'sgeneral guidance that an assessment of a recently acquired business may be omitted from the scope in the year of acquisition.
Based on the Company’s processes and assessment, as described above, management has concluded that, as of December 31, 2017, the Company’s internalcontrol over financial reporting was effective.
The effectiveness of the Company’s internal control over financial reporting as of December 31, 2017 has been audited by PricewaterhouseCoopers LLP, anindependent registered public accounting firm, as stated in their report, which appears herein.
/s/ Alex Gorsky /s/ Dominic J. CarusoAlex Gorsky Dominic J. CarusoChairman, Board of Directors Executive Vice President, Chief Financial OfficerChief Executive Officer
90
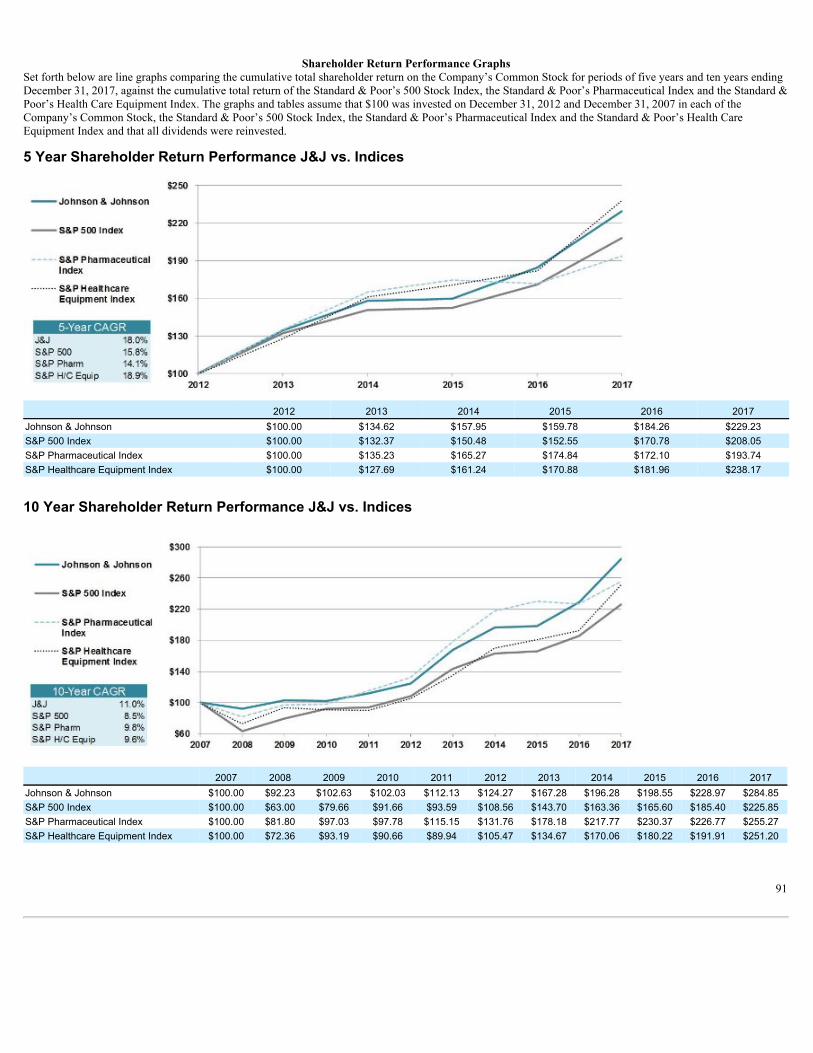
Shareholder Return Performance GraphsSet forth below are line graphs comparing the cumulative total shareholder return on the Company’s Common Stock for periods of five years and ten years endingDecember 31, 2017, against the cumulative total return of the Standard & Poor’s 500 Stock Index, the Standard & Poor’s Pharmaceutical Index and the Standard &Poor’s Health Care Equipment Index. The graphs and tables assume that $100 was invested on December 31, 2012 and December 31, 2007 in each of theCompany’s Common Stock, the Standard & Poor’s 500 Stock Index, the Standard & Poor’s Pharmaceutical Index and the Standard & Poor’s Health CareEquipment Index and that all dividends were reinvested.
5 Year Shareholder Return Performance J&J vs. Indices
2012 2013 2014 2015 2016 2017Johnson & Johnson $100.00 $134.62 $157.95 $159.78 $184.26 $229.23S&P 500 Index $100.00 $132.37 $150.48 $152.55 $170.78 $208.05S&P Pharmaceutical Index $100.00 $135.23 $165.27 $174.84 $172.10 $193.74S&P Healthcare Equipment Index $100.00 $127.69 $161.24 $170.88 $181.96 $238.17
10 Year Shareholder Return Performance J&J vs. Indices
2007 2008 2009 2010 2011 2012 2013 2014 2015 2016 2017Johnson & Johnson $100.00 $92.23 $102.63 $102.03 $112.13 $124.27 $167.28 $196.28 $198.55 $228.97 $284.85S&P 500 Index $100.00 $63.00 $79.66 $91.66 $93.59 $108.56 $143.70 $163.36 $165.60 $185.40 $225.85S&P Pharmaceutical Index $100.00 $81.80 $97.03 $97.78 $115.15 $131.76 $178.18 $217.77 $230.37 $226.77 $255.27S&P Healthcare Equipment Index $100.00 $72.36 $93.19 $90.66 $89.94 $105.47 $134.67 $170.06 $180.22 $191.91 $251.20
91

Item 9. CHANGES IN AND DISAGREEMENTS WITH ACCOUNTANTS ON ACCOUNTING AND FINANCIAL DISCLOSURE
Not applicable.
Item 9A. CONTROLS AND PROCEDURES
Disclosure Controls and Procedures. At the end of the period covered by this Report, the Company evaluated the effectiveness of the design andoperation of its disclosure controls and procedures. The Company’s disclosure controls and procedures are designed to ensure that information required to bedisclosed by the Company in the reports that it files or submits under the Exchange Act is recorded, processed, summarized and reported within the time periodsspecified in the SEC’s rules and forms. Disclosure controls and procedures include, without limitation, controls and procedures designed to ensure that informationrequired to be disclosed by the Company in the reports that it files or submits under the Exchange Act is accumulated and communicated to the Company’smanagement, including its principal executive and principal financial officers, or persons performing similar functions, as appropriate to allow timely decisionsregarding required disclosure. Alex Gorsky, Chairman and Chief Executive Officer, and Dominic J. Caruso, Executive Vice President, Chief Financial Officer,reviewed and participated in this evaluation. Based on this evaluation, Messrs. Gorsky and Caruso concluded that, as of the end of the period covered by thisReport, the Company’s disclosure controls and procedures were effective
Reports on Internal Control Over Financial Reporting. The information called for by this item is incorporated herein by reference to "Management’sReport on Internal Control Over Financial Reporting", and the attestation regarding internal controls over financial reporting included in the "Report ofIndependent Registered Public Accounting Firm" included in Item 8 of this Report.
Changes in Internal Control Over Financial Reporting. During the fiscal quarter ended December 31, 2017, there were no changes in the Company’sinternal control over financial reporting identified in connection with the evaluation required under Rules 13a-15 and 15d-15 under the Exchange Act that havematerially affected, or are reasonably likely to materially affect, the Company’s internal control over financial reporting.
The Company is implementing a multi-year, enterprise-wide initiative to integrate, simplify and standardize processes and systems for the humanresources, information technology, procurement, supply chain and finance functions. These are enhancements to support the growth of the Company’s financialshared service capabilities and standardize financial systems. This initiative is not in response to any identified deficiency or weakness in the Company’s internalcontrol over financial reporting. In response to this initiative, the Company has and will continue to align and streamline the design and operation of its financialcontrol environment.
Item 9B. OTHER INFORMATION
Not applicable.
PART III
Item 10. DIRECTORS, EXECUTIVE OFFICERS AND CORPORATE GOVERNANCE The information called for by this item is incorporated herein by reference to the discussion of the Audit Committee under the caption “Item 1. Election of
Directors - Board Committees”; and the material under the captions “Item 1. Election of Directors” and “Stock Ownership and Section 16 Compliance –Section 16(a) Beneficial Ownership Reporting Compliance” in the Proxy Statement; and the material under the caption “Executive Officers of the Registrant” inPart I of this Report.
The Company’s Code of Business Conduct, which covers all employees (including the Chief Executive Officer, Chief Financial Officer and Controller),meets the requirements of the SEC rules promulgated under Section 406 of the Sarbanes-Oxley Act of 2002. The Code of Business Conduct is available on theCompany’s website at www.jnj.com/code-of-business-conduct , and copies are available to shareholders without charge upon written request to the Secretary at theCompany’s principal executive offices. Any substantive amendment to the Code of Business Conduct or any waiver of the Code granted to the Chief ExecutiveOfficer, the Chief Financial Officer or the Controller will be posted on the Company’s website at www.investor.jnj.com/gov.cfm within five business days (andretained on the website for at least one year).
In addition, the Company has adopted a Code of Business Conduct & Ethics for Members of the Board of Directors and Executive Officers. The Code ofBusiness Conduct & Ethics for Members of the Board of Directors and Executive Officers is available on the Company’s website atwww.investor.jnj.com/gov/boardconduct.cfm , and copies are available to shareholders without charge upon written request to the Secretary at the Company’sprincipal executive offices. Any substantive amendment to the Code or any waiver of the Code granted to any member of the Board of Directors or any executiveofficer will be posted
92

on the Company’s website at www.investor.jnj.com/gov.cfm within five business days (and retained on the website for at least one year).
Item 11. EXECUTIVE COMPENSATION
The information called for by this item is incorporated herein by reference to the material under the captions “Item 1. Election of Directors – DirectorCompensation,” “Compensation Committee Report,” “Compensation Discussion and Analysis” and “Executive Compensation Tables” in the Proxy Statement.
The material incorporated herein by reference to the material under the caption “Compensation Committee Report” in the Proxy Statement shall bedeemed furnished, and not filed, in this Report and shall not be deemed incorporated by reference into any filing under the Securities Act of 1933, as amended, orthe Securities Exchange Act of 1934, as amended, as a result of this furnishing, except to the extent that the Company specifically incorporates it by reference.
Item 12. SECURITY OWNERSHIP OF CERTAIN BENEFICIAL OWNERS AND MANAGEMENT AND RELATED STOCKHOLDERMATTERS
The information called for by this item is incorporated herein by reference to the material under the caption “Item 1. Stock Ownership and Section 16Compliance” in the Proxy Statement; and Note 17 “Common Stock, Stock Option Plans and Stock Compensation Agreements” of the Notes to ConsolidatedFinancial Statements in Item 8 of this Report.
Equity Compensation Plan Information
The following table provides certain information as of December 31, 2017 concerning the shares of the Company’s Common Stock that may be issuedunder existing equity compensation plans.
Plan Category
Number ofSecurities to
be Issued UponExercise of
Outstanding Optionsand Rights
Weighted AverageExercise Price of
OutstandingOptions and Rights
Number of SecuritiesRemaining Available for
Future Issuance Under EquityCompensation Plans (2)(3)
Equity Compensation Plans Approved by Security Holders (1) 134,091,342 $75.11 389,083,761Equity Compensation Plans Not Approved by Security Holders - - -Total 134,091,342 $75.11 389,083,761
(1) Included in this category are the following equity compensation plans which have been approved by the Company’s shareholders: 2005 Long-Term IncentivePlan and 2012 Long-Term Incentive Plan.
(2) This column excludes shares reflected under the column “Number of Securities to be Issued Upon Exercise of Outstanding Options and Rights.”(3) The 2005 Long-Term Incentive Plan expired April 26, 2012. All options and restricted shares granted subsequent to that date were under the 2012 Long-Term
Incentive Plan.
Item 13. CERTAIN RELATIONSHIPS AND RELATED TRANSACTIONS, AND DIRECTOR INDEPENDENCE
The information called for by this item is incorporated herein by reference to the material under the captions “Item 1. Election of Directors - DirectorIndependence” and “Related Person Transactions” in the Proxy Statement.
Item 14. PRINCIPAL ACCOUNTANT FEES AND SERVICES
The information called for by this item is incorporated herein by reference to the material under the caption “Item 3. Ratification of Appointment ofIndependent Registered Public Accounting Firm” in the Proxy Statement.
93

PART IV
Item 15. EXHIBITS AND FINANCIAL STATEMENT SCHEDULES
The following documents are filed as part of this report:1. Financial Statements
Consolidated Balance Sheets at end of Fiscal Years 2017 and 2016Consolidated Statements of Earnings for Fiscal Years 2017, 2016 and 2015 Consolidated Statements of Comprehensive Income for Fiscal Years 2017, 2016 and 2015Consolidated Statements of Equity for Fiscal Years 2017, 2016 and 2015Consolidated Statements of Cash Flows for Fiscal Years 2017, 2016 and 2015Notes to Consolidated Financial StatementsReport of Independent Registered Public Accounting Firm
All schedules are omitted because they are not applicable or the required information is included in the financial statements or notes.2. Exhibits Required to be Filed by Item 60l of Regulation S-K
The information called for by this item is incorporated herein by reference to the Exhibit Index in this Report.
Item 16. FORM 10-K SUMMARY
Registrants may voluntarily include a summary of information required by Form 10-K under this Item 16. The Company has elected not to include such summaryinformation.
94

SIGNATURES
Pursuant to the requirements of Section 13 of the Securities Exchange Act of 1934, the registrant has duly caused this Report to be signed on its behalf by theundersigned, thereunto duly authorized.
Date: February 21, 2018
JOHNSON & JOHNSON(Registrant)
By /s/ A. Gorsky
A. Gorsky, Chairman, Board of Directors,
and Chief Executive Officer
Pursuant to the requirements of the Securities Exchange Act of 1934, this report has been signed below by the following persons on behalf of the registrantand in the capacities and on the dates indicated.
Signature Title Date
/s/ A. Gorsky Chairman, Board of Directors February 21, 2018
A. Gorsky
Chief Executive Officer(Principal Executive Officer)
/s/ D. J. Caruso Chief Financial Officer February 21, 2018
D. J. Caruso (Principal Financial Officer)
/s/ R. A. Kapusta Controller and Chief Accounting Officer February 21, 2018R. A. Kapusta (Principal Accounting Officer)
/s/ M. C. Beckerle Director February 21, 2018
M. C. Beckerle
/s/ D. S. Davis Director February 21, 2018D. S. Davis
/s/ I. E. L. Davis Director February 21, 2018
I. E. L. Davis
95
Signature Title Date
/s/ M. B. McClellan
Director
February 21, 2018
M. B. McClellan
/s/ A. M. Mulcahy Director
February 21, 2018
A. M. Mulcahy
/s/ W. D. Perez Director
February 21, 2018
W. D. Perez
/s/ C. Prince Director
February 21, 2018
C. Prince
/s/ A. E. Washington Director
February 21, 2018
A. E. Washington
/s/ R. A. Williams Director
February 21, 2018
R. A. Williams
96

EXHIBIT INDEX
Reg. S-K
Exhibit Table Description
Item No. of Exhibit
3(i)
Restated Certificate of Incorporation effective February 19, 2016 — Incorporated herein by reference to Exhibit 3(i) of the Registrant’s Form10-K Annual Report for the fiscal year ended January 3, 2016.
3(ii)
By-Laws of the Company, as amended effective January 26, 2016 — Incorporated herein by reference to Exhibit 3.1 the Registrant’s Form 8-K Current Report filed January 26, 2016.
4(a)
Upon the request of the Securities and Exchange Commission, the Registrant will furnish a copy of all instruments defining the rights ofholders of long-term debt of the Registrant.
10(a) 2005 Long-Term Incentive Plan — Incorporated herein by reference to Exhibit 4 of the Registrant’s S-8 Registration Statement filed with theCommission on May 10, 2005 (file no. 333-124785).*
10(b)
Form of Stock Option Certificate under the 2005 Long-Term Incentive Plan — Incorporated herein by reference to Exhibit 10.1 of theRegistrant’s Form 8-K Current Report filed January 13, 2012.*
10(c)
2012 Long-Term Incentive Plan — Incorporated herein by reference to Appendix A of the Registrant’s Proxy Statement filed with theCommission on March 15, 2017 .*
10(d)
Form of Stock Option Certificate, Restricted Share Unit Certificate and Performance Share Unit Certificate under the 2012 Long-TermIncentive Plan — Incorporated herein by reference to Exhibits 10.2, 10.3 and 10.4 of the Registrant’s Form 10-Q Quarterly Report filed May7, 2012.*
10(e)
Johnson & Johnson Executive Incentive Plan (as amended) — Incorporated herein by reference to Exhibit 10(f) of the Registrant’s Form 10-K Annual Report for the fiscal year ended December 31, 2000.*
10(f)
Domestic Deferred Compensation (Certificate of Extra Compensation) Plan — Incorporated herein by reference to Exhibit 10(g) of theRegistrant’s Form 10-K Annual Report for the year ended December 28, 2003.*
10(g)
Amendments to the Certificate of Extra Compensation Plan effective as of January 1, 2009 — Incorporated herein by reference to Exhibit10(j) of the Registrant’s Form 10-K Annual Report for the year ended December 28, 2008.*
10(h)
2009 Certificates of Long-Term Performance Plan — Incorporated herein by reference to Exhibit 10.1 of the Registrant’s Form 10-QQuarterly Report for the quarter ended September 27, 2009.*
10(i)
Amended and Restated Deferred Fee Plan for Directors — Incorporated herein by reference to Exhibit 10(k) of the Registrant's Form 10-KAnnual Report for the fiscal year ended January 1, 2012.*
10(j)
The Johnson & Johnson Executive Income Deferral Plan (Amended and Restated) — Incorporated herein by reference to Exhibit 10.1 of theRegistrant’s Form 10-Q Quarterly Report for the quarter ended September 30, 2012.*
10(k)
Excess Savings Plan — Incorporated herein by reference to Exhibit 10(j) of the Registrant’s Form 10-K Annual Report for the fiscal yearended December 29, 1996.*
10(l)
Amendments to the Johnson & Johnson Excess Savings Plan effective as of January 1, 2009 — Incorporated herein by reference to Exhibit10(p) of the Registrant’s Form 10-K Annual Report for the fiscal year ended December 28, 2008.*
10(m)**
Excess Benefit Plan (Supplemental Retirement Plan) — Incorporated herein by reference to Exhibit 10(h) of the Registrant’s Form 10-KAnnual Report for the fiscal year ended January 3, 1993.*
10(n)
Amendments to the Excess Benefit Plan of Johnson & Johnson and Affiliated Companies effective as of January 1, 2009 — Incorporatedherein by reference to Exhibit 10(r) of the Registrant’s Form 10-K Annual Report for the fiscal year ended December 28, 2008.*
10(o)
Amendment to the Excess Benefit Plan of Johnson & Johnson and Affiliated Companies, effective as of January 1, 2015 — Incorporatedherein by reference to Exhibit 10(q) of the Registrant’s Form 10-K Annual Report for the fiscal year ended December 28, 2014.*
10(p)**
Executive Life Plan Agreement — Incorporated herein by reference to Exhibit 10(i) of the Registrant’s Form 10-K Annual Report for thefiscal year ended January 3, 1993.*
10(q)
Executive Life Plan Agreement Closure Letter — Incorporated herein by reference to Exhibit 10.1 of the Registrant’s Form 10-Q QuarterlyReport for the quarter ended March 29, 2015.*
10(r)
Employment Agreement for Dr. Paulus Stoffels - Incorporated herein by reference to Exhibit 10.2 of the Registrant’s Form 10-Q QuarterlyReport for the quarter ended September 30, 2012.*
10(s)
Summary of Employment Arrangements for Sandra E. Peterson — Incorporated herein by reference to Exhibit 10(t) of the Registrant's Form10-K Annual Report for the year ended December 30, 2012.*
10(t)
Severance Pay Plan of Johnson & Johnson and U.S. Affiliated Companies, Amended and Restated as of October 1, 2014 — Incorporatedherein by reference to Exhibit 10.1 of the Registrant's Form 10-Q Quarterly Report for the quarter ended September 28, 2014.*
97

Reg. S-K
Exhibit Table Description
Item No. of Exhibit
10(u)
First Amendment to the Severance Pay Plan of Johnson & Johnson and U.S. Affiliated Companies (as amended and restated effective October1, 2014) — Incorporated herein by reference to Exhibit 10.1 of the Registrant's Form 10-Q Quarterly Report for the quarter ended June 28,2015.*
10(v)
Second Amendment to the Severance Pay Plan of Johnson & Johnson and U.S. Affiliated Companies (as amended and restated effectiveOctober 1, 2014) — Incorporated herein by reference to Exhibit 10(x) of the Registrant's Form 10-K Annual Report for the fiscal year endedJanuary 3, 2016.*
12 Statement of Computation of Ratio of Earnings to Fixed Charges — Filed with this document.21 Subsidiaries - Filed with this document.23 Consent of Independent Registered Public Accounting Firm — Filed with this document.31.1 Certification of Chief Executive Officer Pursuant to Section 302 of the Sarbanes-Oxley Act — Filed with this document.31.2 Certification of Chief Financial Officer Pursuant to Section 302 of the Sarbanes-Oxley Act — Filed with this document.32.1 Certification of Chief Executive Officer Pursuant to Section 906 of the Sarbanes-Oxley Act — Furnished with this document.32.2 Certification of Chief Financial Officer Pursuant to Section 906 of the Sarbanes-Oxley Act — Furnished with this document.101
XBRL (Extensible Business Reporting Language) The following materials from this Report for the fiscal year ended December 31, 2017,formatted in Extensive Business Reporting Language (XBRL): (i) Consolidated Balance Sheets, (ii) Consolidated Statements of Earnings,(iii) Consolidated Statements of Comprehensive Income, (iv) Consolidated Statements of Equity, (v) Consolidated Statements of CashFlows, and (vi) Notes to the Consolidated Financial Statements.
* Management contract or compensatory plan.** Paper filing.
A copy of any of the Exhibits listed above will be provided without charge to any shareholder submitting a written request specifying the desired exhibit(s)to the Secretary at the principal executive offices of the Company.
98

EXHIBIT 12
JOHNSON & JOHNSON AND SUBSIDIARIES
STATEMENT OF COMPUTATION OF RATIO OF EARNINGS TO FIXED CHARGES (1) (Dollars in Millions)
December 31, 2017 January 1, 2017 January 3, 2016 December 28, 2014 December 29, 2013 Determination of Earnings:
Earnings Before Provision for Taxes onIncome $ 17,673 $ 19,803 $ 19,196 $ 20,563 $ 15,471 Fixed Charges, less Capitalized Interest 1,058 836 657 647 603
Total Earnings as Defined $ 18,731 $ 20,639 $ 19,853 $ 21,210 $ 16,074 Fixed Charges:
Estimated Interest Portion of RentExpense 124 110 105 114 121 Interest Expense before Capitalizationof Interest 1,028 828 654 648 587
Total Fixed Charges $ 1,152 $ 938 $ 759 $ 762 $ 708 Ratio of Earnings to Fixed Charges 16.26 22.00 26.16 27.83 22.70
(1) The ratio of earnings to fixed charges is computed by dividing the sum of earnings before provision for taxes on income and fixed charges by fixedcharges. Fixed charges represent interest expense (before interest is capitalized), amortization of debt discount and an appropriate interest factor onoperating leases.

EXHIBIT 21SUBSIDIARIES
Johnson & Johnson, a New Jersey corporation, had the U.S. and international subsidiaries shown below as ofDecember 31, 2017. Certain U.S. subsidiaries and international subsidiaries are not named because they were not significant in the aggregate. Johnson & Johnsonis not a subsidiary of any other entity.
Name of SubsidiaryJurisdiction ofOrganization
U.S. Subsidiaries: Abbott Medical Optics, Inc. DelawareAcclarent, Inc. DelawareActelion Pharmaceuticals US, Inc. DelawareActelion US Holding Company DelawareAdvanced Sterilization Products Services Inc. New JerseyAlios BioPharma, Inc. DelawareALZA Corporation DelawareAMO Development, LLC DelawareAMO Holdings, Inc. DelawareAMO Manufacturing USA, LLC DelawareAMO Sales and Service, Inc. DelawareAMO USA, LLC DelawareAMO USA Sales Holdings, Inc. DelawareAMO US Holdings, Inc. DelawareAragon Pharmaceuticals, Inc. DelawareBioMedical Enterprises, Inc. TexasBiosense Webster, Inc. CaliforniaCentocor Research & Development, Inc. PennsylvaniaCodman & Shurtleff, Inc. New JerseyCoherex Medical, Inc. DelawareCordis LLC DelawareCoTherix Inc. DelawareDePuy Mitek, LLC MassachusettsDePuy Products, Inc. IndianaDePuy Spine, LLC OhioDePuy Synthes Products, Inc. DelawareDePuy Synthes Sales, Inc. MassachusettsDePuy Synthes, Inc. DelawareDiabetes Diagnostics, Inc. DelawareEthicon Endo-Surgery, Inc. OhioEthicon Endo-Surgery, LLC DelawareEthicon LLC DelawareEthicon US, LLC TexasEthicon, Inc. New JerseyHeartport, Inc. DelawareJanssen Biotech, Inc. PennsylvaniaJanssen Global Services, LLC New JerseyJanssen Oncology, Inc. DelawareJanssen Ortho LLC Delaware

Name of SubsidiaryJurisdiction ofOrganization
Janssen Pharmaceuticals, Inc. PennsylvaniaJanssen Products, LP New JerseyJanssen Research & Development, LLC New JerseyJanssen Scientific Affairs, LLC New JerseyJanssen Supply Group, LLC PennsylvaniaJanssen-Cilag Manufacturing, LLC DelawareJohnson & Johnson (Middle East) Inc. New JerseyJohnson & Johnson Consumer Inc. New JerseyJohnson & Johnson Finance Corporation New JerseyJohnson & Johnson Health and Wellness Solutions, Inc. MichiganJohnson & Johnson Health Care Systems Inc. New JerseyJohnson & Johnson Innovation - JJDC, Inc. New JerseyJohnson & Johnson International New JerseyJohnson & Johnson Japan Inc. New JerseyJohnson & Johnson Services, Inc. New JerseyJohnson & Johnson Urban Renewal Associates New JerseyJohnson & Johnson Vision Care, Inc. FloridaJOM Pharmaceutical Services, Inc. DelawareLifeScan, Inc. CaliforniaLifeScan LLC DelawareLifeScan Products LLC DelawareMcNeil Consumer Pharmaceuticals Co. New JerseyMcNeil Healthcare LLC DelawareMedical Device Business Services, Inc. IndianaMegaDyne Medical Products, Inc. UtahMentor Texas L.P. DelawareMentor Worldwide LLC DelawareMicrus Endovascular LLC DelawareNeoStrata Company, Inc. DelawareNeuWave Medical, Inc. DelawareNovira Therapeutics, Inc. DelawareOrtho Biologics LLC DelawareOrtho Biotech Holding LLC DelawarePatriot Pharmaceuticals, LLC PennsylvaniaPulsar Vascular, Inc. DelawareRutan Realty LLC New JerseySterilMed, Inc. MinnesotaSynthes USA Products, LLC DelawareSynthes USA, LLC DelawareSynthes, Inc. DelawareTearScience, Inc. DelawareThe Anspach Effort, LLC FloridaTorax Medical, Inc. DelawareVogue International LLC Delaware

Name of SubsidiaryJurisdiction ofOrganization
International Subsidiaries: Actelion Ltd SwitzerlandApsis FranceApsis Germany GmbH GermanyBeijing Dabao Cosmetics Co., Ltd. ChinaBerna Rhein B.V. NetherlandsBiosense Webster (Israel) Ltd. IsraelCilag AG SwitzerlandCilag GmbH International SwitzerlandCilag Holding AG SwitzerlandCilag Holding Finance Unlimited Company IrelandCNA Development GmbH SwitzerlandCordis de Mexico, S.A. de C.V. MexicoCovagen AG SwitzerlandCrucell N.V. NetherlandsDePuy France FranceDePuy International Limited United KingdomDePuy Ireland Unlimited Company IrelandDePuy Synthes Eos Limited IrelandDePuy Synthes Gorgan Limited IrelandDePuy Synthes Jason Limited IrelandDePuy Synthes Leto S.A.R.L. LuxembourgEES, S.A. de C.V. MexicoEthicon Ireland Unlimited Company IrelandEthicon PR Holdings Unlimited Company IrelandEthnor del Istmo, S.A. PanamaGlobal Investment Participation B.V. NetherlandsGMED Healthcare BVBA BelgiumJ.C. General Services CVBA BelgiumJanssen Biologics (Ireland) IrelandJanssen Biologics B.V. NetherlandsJanssen Cilag Farmaceutica S.A. ArgentinaJanssen Egypt EgyptJanssen Holding GmbH SwitzerlandJanssen Inc. CanadaJanssen Irish Finance Company UC IrelandJanssen Korea Ltd. Korea, Republic ofJanssen Pharmaceutica NV BelgiumJanssen Pharmaceutica (Proprietary) Limited South AfricaJanssen Pharmaceutical IrelandJanssen Pharmaceutical K.K. JapanJanssen Pharmaceutical Sciences Unlimited Company IrelandJanssen R&D Ireland IrelandJanssen Sciences Ireland UC Ireland

Name of SubsidiaryJurisdiction ofOrganization
Janssen Vaccines & Prevention B.V. NetherlandsJanssen Vaccines AG SwitzerlandJanssen Vaccines Corp. KoreaJanssen-Cilag FranceJanssen-Cilag A/S DenmarkJanssen-Cilag AB SwedenJanssen-Cilag AG SwitzerlandJanssen-Cilag B.V. NetherlandsJanssen-Cilag de Mexico S. de R.L. de C.V. MexicoJanssen-Cilag Farmaceutica Ltda. BrazilJanssen-Cilag Farmaceutica, Lda. PortugalJanssen-Cilag GmbH GermanyJanssen-Cilag Kft. HungaryJanssen-Cilag Limited ThailandJanssen-Cilag Limited United KingdomJanssen-Cilag NV BelgiumJanssen-Cilag OY FinlandJanssen-Cilag Pharma GmbH AustriaJanssen-Cilag Pty Ltd AustraliaJanssen-Cilag S.A. ColombiaJanssen-Cilag S.p.A. ItalyJanssen-Cilag, C.A. VenezuelaJanssen-Cilag, S.A. SpainJanssen-Cilag, S.A. de C.V. MexicoJJC Acquisition Company B.V. NetherlandsJohnson & Johnson (China) Investment Ltd. ChinaJohnson & Johnson (Ireland) Limited IrelandJohnson & Johnson (New Zealand) Limited New ZealandJohnson & Johnson (Philippines), Inc. PhilippinesJohnson & Johnson (Proprietary) Limited South AfricaJohnson & Johnson (Thailand) Ltd. ThailandJohnson & Johnson AB SwedenJohnson & Johnson AG SwitzerlandJohnson & Johnson Belgium Finance Company BelgiumJohnson & Johnson Consumer Holdings France FranceJohnson & Johnson Consumer NV BelgiumJohnson & Johnson Consumer Services EAME Ltd. United KingdomJohnson & Johnson de Argentina S.A.C. e. I. ArgentinaJohnson & Johnson de Chile S.A. ChileJohnson & Johnson de Colombia S.A. ColombiaJohnson & Johnson de Venezuela, S.A. VenezuelaJohnson & Johnson del Ecuador S.A. EcuadorJohnson & Johnson del Peru S.A. PeruJohnson & Johnson do Brasil Industria E Comercio de Produtos Para Saude Ltda. Brazil

Name of SubsidiaryJurisdiction ofOrganization
Johnson & Johnson European Treasury Company IrelandJohnson & Johnson Finance Limited United KingdomJohnson & Johnson Financial Services GmbH GermanyJohnson & Johnson for Export & Import LLC EgyptJohnson & Johnson Gesellschaft m.b.H. AustriaJohnson & Johnson GmbH GermanyJohnson & Johnson Group Holdings GmbH AustriaJohnson & Johnson Hellas Commercial and Industrial S.A. GreeceJohnson & Johnson Hellas Consumer Products Commercial Societe Anonyme GreeceJohnson & Johnson Holding GmbH GermanyJohnson & Johnson Holdings K.K. JapanJohnson & Johnson Inc. CanadaJohnson & Johnson Industrial Ltda. BrazilJohnson & Johnson Innovation Limited United KingdomJohnson & Johnson International Financial Services Company IrelandJohnson & Johnson K.K. JapanJohnson & Johnson Korea Selling & Distribution Limited Liability Company Korea, Republic ofJohnson & Johnson Limitada PortugalJohnson & Johnson Limited United KingdomJohnson & Johnson LLC Russian FederationJohnson & Johnson Luxembourg Finance Company Sarl LuxembourgJohnson & Johnson Management Limited United KingdomJohnson & Johnson Medical FranceJohnson & Johnson Medical (Shanghai) Ltd. ChinaJohnson & Johnson Medical B.V. NetherlandsJohnson & Johnson Medical GmbH GermanyJohnson & Johnson Medical Korea Limited Korea, Republic ofJohnson & Johnson Medical Limited United KingdomJohnson & Johnson Medical Mexico, S.A. de C.V. MexicoJohnson & Johnson Medical NV BelgiumJohnson and Johnson Medical (Pty) Ltd South AfricaJohnson & Johnson Medical Pty Ltd AustraliaJohnson & Johnson Medical S.A. ArgentinaJohnson & Johnson Medical S.p.A. ItalyJohnson & Johnson Medical Taiwan Ltd. TaiwanJohnson & Johnson Medical, S.C.S. VenezuelaJohnson & Johnson Medikal Sanayi ve Ticaret Limited Sirketi TurkeyJohnson & Johnson Middle East FZ-LLC United Arab Emirates
Johnson & Johnson Nordic AB SwedenJohnson & Johnson Pacific Pty. Limited AustraliaJohnson & Johnson Poland Sp. z o.o. PolandJohnson & Johnson Private Limited IndiaJohnson & Johnson Pte. Ltd. SingaporeJohnson & Johnson Pty. Limited AustraliaJohnson & Johnson Romania S.R.L. Romania

Name of SubsidiaryJurisdiction ofOrganization
Johnson & Johnson S.p.A. ItalyJohnson & Johnson Sante Beaute France FranceJohnson & Johnson Sihhi Malzeme Sanayi Ve Ticaret Limited Sirketi TurkeyJohnson & Johnson Swiss Finance Company Limited United KingdomJohnson & Johnson Taiwan Ltd. TaiwanJohnson & Johnson UK Treasury Company Limited United KingdomJohnson & Johnson Vision Care (Ireland) IrelandJohnson & Johnson, S.A. SpainJohnson & Johnson, S.A. de C.V. MexicoJohnson & Johnson, s.r.o. Czech RepublicJohnson & Johnson, s.r.o. SlovakiaLatam International Investment Company Unlimited Company IrelandLatam Properties Holdings Unlimited Company IrelandLifescan FranceLifeScan Scotland Limited United KingdomMcNeil AB SwedenMcNeil Denmark APS DenmarkMcNeil Healthcare (UK) Limited United KingdomMcNeil Sweden AB SwedenMedos International Sarl SwitzerlandMedos Sarl SwitzerlandMentor B.V. NetherlandsMentor Holding PP FranceMentor Medical Systems B.V. NetherlandsOBTECH Medical Sarl SwitzerlandOMJ Ireland Unlimited Company IrelandOMJ PR Holdings Limited IrelandOmrix Biopharmaceuticals Ltd. IsraelOptiMedica Corporation DelawareShanghai Johnson & Johnson Limited ChinaShanghai Johnson & Johnson Pharmaceuticals, Ltd. ChinaSynthes GmbH SwitzerlandSynthes Holding AG SwitzerlandSYNTHES Medical Immobilien GmbH GermanySynthes Produktions GmbH SwitzerlandTurnbuckle Investment Unlimited Company IrelandXian-Janssen Pharmaceutical Ltd. China

EXHIBIT 23
CONSENT OF INDEPENDENT REGISTERED PUBLIC ACCOUNTING FIRM
We hereby consent to the incorporation by reference in the Registration Statements on Form S-8 (Nos. 333-211250, 333-181092, 333-163857, 333-129542and 333-124785) and Form S-3 (Nos. 333-216285 and 333-67020) of Johnson & Johnson of our report dated February 21, 2018 relating to the financial statementsand the effectiveness of internal control over financial reporting, which appears in this Form 10-K.
/s/ PricewaterhouseCoopers LLP
Florham Park, New JerseyFebruary 21, 2018

Exhibit 31.1CERTIFICATION OF CHIEF EXECUTIVE OFFICER
PURSUANT TO SECTION 302 OF THE SARBANES-OXLEY ACT
I, Alex Gorsky, certify that:
1. I have reviewed this Annual Report on Form 10-K for the fiscal year ended December 31, 2017 (the “report”) of Johnson & Johnson (the “Company”);
2. Based on my knowledge, this report does not contain any untrue statement of a material fact or omit to state a material fact necessary to make the statementsmade, in light of the circumstances under which such statements were made, not misleading with respect to the period covered by this report;
3. Based on my knowledge, the financial statements, and other financial information included in this report, fairly present in all material respects the financialcondition, results of operations and cash flows of the Company as of, and for, the periods presented in this report;
4. The Company’s other certifying officer(s) and I are responsible for establishing and maintaining disclosure controls and procedures (as defined in ExchangeAct Rules 13a-15(e) and 15d-15(e)) and internal control over financial reporting (as defined in Exchange Act Rules 13a-15(f) and 15d-15(f)) for the Company andhave:
(a) Designed such disclosure controls and procedures, or caused such disclosure controls and procedures to be designed under our supervision, toensure that material information relating to the Company, including its consolidated subsidiaries, is made known to us by others within those entities,particularly during the period in which this report is being prepared;
(b) Designed such internal control over financial reporting, or caused such internal control over financial reporting to be designed under oursupervision, to provide reasonable assurance regarding the reliability of financial reporting and the preparation of financial statements for external purposes inaccordance with generally accepted accounting principles;
(c) Evaluated the effectiveness of the Company’s disclosure controls and procedures and presented in this report our conclusions about theeffectiveness of the disclosure controls and procedures, as of the end of the period covered by this report based on such evaluation; and
(d) Disclosed in this report any change in the Company’s internal control over financial reporting that occurred during the Company’s most recentfiscal quarter (the Company’s fourth fiscal quarter in the case of an annual report) that has materially affected, or is reasonably likely to materially affect, theCompany’s internal control over financial reporting; and
5. The Company’s other certifying officer(s) and I have disclosed, based on our most recent evaluation of internal control over financial reporting, to theCompany’s auditors and the audit committee of the Company’s board of directors (or persons performing the equivalent functions):
(a) All significant deficiencies and material weaknesses in the design or operation of internal control over financial reporting which are reasonablylikely to adversely affect the Company’s ability to record, process, summarize and report financial information; and
(b) Any fraud, whether or not material, that involves management or other employees who have a significant role in the Company’s internal controlover financial reporting.
/s/ Alex Gorsky Alex Gorsky Chief Executive Officer
Date: February 21, 2018

Exhibit 31.2CERTIFICATION OF CHIEF FINANCIAL OFFICER
PURSUANT TO SECTION 302 OF THE SARBANES-OXLEY ACT
I, Dominic J. Caruso, certify that:
1. I have reviewed this Annual Report on Form 10-K for the fiscal year ended December 31, 2017 (the “report”) of Johnson & Johnson (the “Company”);
2. Based on my knowledge, this report does not contain any untrue statement of a material fact or omit to state a material fact necessary to make the statementsmade, in light of the circumstances under which such statements were made, not misleading with respect to the period covered by this report;
3. Based on my knowledge, the financial statements, and other financial information included in this report, fairly present in all material respects the financialcondition, results of operations and cash flows of the Company as of, and for, the periods presented in this report;
4. The Company’s other certifying officer(s) and I are responsible for establishing and maintaining disclosure controls and procedures (as defined in ExchangeAct Rules 13a-15(e) and 15d-15(e)) and internal control over financial reporting (as defined in Exchange Act Rules 13a-15(f) and 15d-15(f)) for the Company andhave:
(a) Designed such disclosure controls and procedures, or caused such disclosure controls and procedures to be designed under our supervision, toensure that material information relating to the Company, including its consolidated subsidiaries, is made known to us by others within those entities,particularly during the period in which this report is being prepared;
(b) Designed such internal control over financial reporting, or caused such internal control over financial reporting to be designed under oursupervision, to provide reasonable assurance regarding the reliability of financial reporting and the preparation of financial statements for external purposes inaccordance with generally accepted accounting principles;
(c) Evaluated the effectiveness of the Company’s disclosure controls and procedures and presented in this report our conclusions about theeffectiveness of the disclosure controls and procedures, as of the end of the period covered by this report based on such evaluation; and
(d) Disclosed in this report any change in the Company’s internal control over financial reporting that occurred during the Company’s most recentfiscal quarter (the Company’s fourth fiscal quarter in the case of an annual report) that has materially affected, or is reasonably likely to materially affect, theCompany’s internal control over financial reporting; and
5. The Company’s other certifying officer(s) and I have disclosed, based on our most recent evaluation of internal control over financial reporting, to theCompany’s auditors and the audit committee of the Company’s board of directors (or persons performing the equivalent functions):
(a) All significant deficiencies and material weaknesses in the design or operation of internal control over financial reporting which are reasonablylikely to adversely affect the Company’s ability to record, process, summarize and report financial information; and
(b) Any fraud, whether or not material, that involves management or other employees who have a significant role in the Company’s internal controlover financial reporting.
/s/ Dominic J. Caruso Dominic J. Caruso Chief Financial Officer
Date: February 21, 2018

Exhibit 32.1CERTIFICATION OF CHIEF EXECUTIVE OFFICER
PURSUANT TO SECTION 906 OF THE SARBANES-OXLEY ACT
The undersigned, Alex Gorsky, the Chief Executive Officer of Johnson & Johnson, a New Jersey corporation (the “Company”), pursuant to 18 U.S.C. 1350, asadopted pursuant to Section 906 of the Sarbanes-Oxley Act of 2002, hereby certifies that, to the best of my knowledge:
(1) the Company's Annual Report on Form 10-K for the fiscal year ended December 31, 2017 (the “Report”) fully complies with the requirements of Section13(a) of the Securities Exchange Act of 1934; and
(2) the information contained in the Report fairly presents, in all material respects, the financial condition and results of operations of the Company.
/s/ Alex Gorsky Alex Gorsky Chief Executive Officer
Dated: February 21, 2018
This certification is being furnished to the SEC with this Report on Form 10-K pursuant to Section 906 of the Sarbanes-Oxley Act of 2002 and shall not, exceptto the extent required by such Act, be deemed filed by the Company for purposes of Section 18 of the Securities Exchange Act of 1934, as amended, or otherwisesubject to the liability of that section.

Exhibit 32.2CERTIFICATION OF CHIEF FINANCIAL OFFICER
PURSUANT TO SECTION 906 OF THE SARBANES-OXLEY ACT
The undersigned, Dominic J. Caruso, the Chief Financial Officer of Johnson & Johnson, a New Jersey corporation (the “Company”), pursuant to 18 U.S.C.1350, as adopted pursuant to Section 906 of the Sarbanes-Oxley Act of 2002, hereby certifies that, to the best of my knowledge:
(1) the Company's Annual Report on Form 10-K for the fiscal year ended December 31, 2017 (the “Report") fully complies with the requirements of Section13(a) of the Securities Exchange Act of 1934; and
(2) the information contained in the Report fairly presents, in all material respects, the financial condition and results of operations of the Company.
/s/ Dominic J. Caruso Dominic J. Caruso Chief Financial Officer
Dated: February 21, 2018
This certification is being furnished to the SEC with this Report on Form 10-K pursuant to Section 906 of the Sarbanes-Oxley Act of 2002 and shall not, exceptto the extent required by such Act, be deemed filed by the Company for purposes of Section 18 of the Securities Exchange Act of 1934, as amended, or otherwisesubject to the liability of that section.
Related Documents