Business Address C/O JOHN HANCOCK FUNDS 200 BERKELEY STREET BOSTON MA 02116 617-663-3000 Mailing Address C/O JOHN HANCOCK FUNDS 200 BERKELEY STREET BOSTON MA 02116 SECURITIES AND EXCHANGE COMMISSION FORM NPORT-P Filing Date: 2021-05-28 | Period of Report: 2021-03-31 SEC Accession No. 0001145549-21-032792 (HTML Version on secdatabase.com) FILER JOHN HANCOCK VARIABLE INSURANCE TRUST CIK:756913| IRS No.: 000000000 | State of Incorp.:MA | Fiscal Year End: 0630 Type: NPORT-P | Act: 40 | File No.: 811-04146 | Film No.: 21976439 Copyright © 2021 www.secdatabase.com . All Rights Reserved. Please Consider the Environment Before Printing This Document

Welcome message from author
This document is posted to help you gain knowledge. Please leave a comment to let me know what you think about it! Share it to your friends and learn new things together.
Transcript
Business AddressC/O JOHN HANCOCK FUNDS200 BERKELEY STREETBOSTON MA 02116617-663-3000
Mailing AddressC/O JOHN HANCOCK FUNDS200 BERKELEY STREETBOSTON MA 02116
SECURITIES AND EXCHANGE COMMISSION
FORM NPORT-P
Filing Date: 2021-05-28 | Period of Report: 2021-03-31SEC Accession No. 0001145549-21-032792
(HTML Version on secdatabase.com)
FILERJOHN HANCOCK VARIABLE INSURANCE TRUSTCIK:756913| IRS No.: 000000000 | State of Incorp.:MA | Fiscal Year End: 0630Type: NPORT-P | Act: 40 | File No.: 811-04146 | Film No.: 21976439
Copyright © 2021 www.secdatabase.com. All Rights Reserved.Please Consider the Environment Before Printing This Document
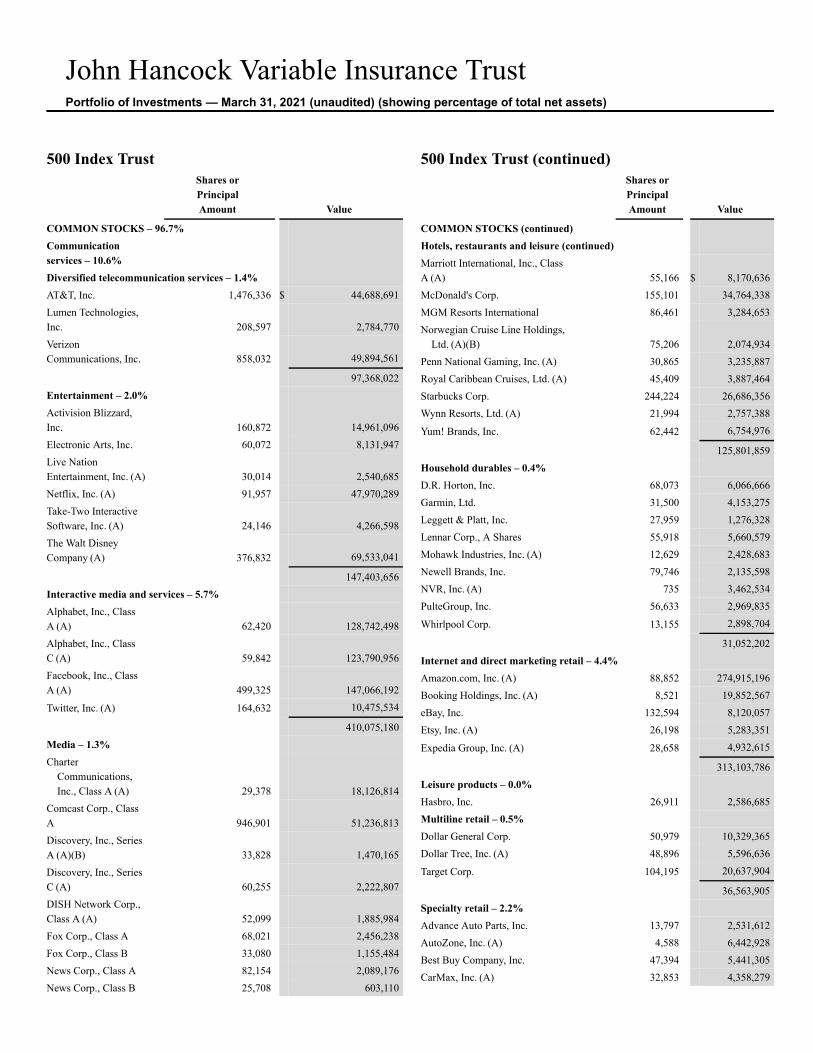
John Hancock Variable Insurance TrustPortfolio of Investments — March 31, 2021 (unaudited) (showing percentage of total net assets)
500 Index TrustShares orPrincipalAmount Value
COMMON STOCKS – 96.7%Communicationservices – 10.6%Diversified telecommunication services – 1.4%AT&T, Inc. 1,476,336 $ 44,688,691Lumen Technologies,Inc. 208,597 2,784,770VerizonCommunications, Inc. 858,032 49,894,561
97,368,022Entertainment – 2.0%Activision Blizzard,Inc. 160,872 14,961,096Electronic Arts, Inc. 60,072 8,131,947Live NationEntertainment, Inc. (A) 30,014 2,540,685Netflix, Inc. (A) 91,957 47,970,289Take-Two InteractiveSoftware, Inc. (A) 24,146 4,266,598The Walt DisneyCompany (A) 376,832 69,533,041
147,403,656Interactive media and services – 5.7%Alphabet, Inc., ClassA (A) 62,420 128,742,498Alphabet, Inc., ClassC (A) 59,842 123,790,956Facebook, Inc., ClassA (A) 499,325 147,066,192
Twitter, Inc. (A) 164,632 10,475,534
410,075,180Media – 1.3%Charter
Communications,Inc., Class A (A) 29,378 18,126,814
Comcast Corp., ClassA 946,901 51,236,813Discovery, Inc., SeriesA (A)(B) 33,828 1,470,165Discovery, Inc., SeriesC (A) 60,255 2,222,807DISH Network Corp.,Class A (A) 52,099 1,885,984Fox Corp., Class A 68,021 2,456,238Fox Corp., Class B 33,080 1,155,484News Corp., Class A 82,154 2,089,176News Corp., Class B 25,708 603,110
500 Index Trust (continued)Shares orPrincipalAmount Value
COMMON STOCKS (continued)Hotels, restaurants and leisure (continued)Marriott International, Inc., ClassA (A) 55,166 $ 8,170,636McDonald's Corp. 155,101 34,764,338MGM Resorts International 86,461 3,284,653Norwegian Cruise Line Holdings,
Ltd. (A)(B) 75,206 2,074,934Penn National Gaming, Inc. (A) 30,865 3,235,887Royal Caribbean Cruises, Ltd. (A) 45,409 3,887,464Starbucks Corp. 244,224 26,686,356Wynn Resorts, Ltd. (A) 21,994 2,757,388
Yum! Brands, Inc. 62,442 6,754,976
125,801,859Household durables – 0.4%D.R. Horton, Inc. 68,073 6,066,666Garmin, Ltd. 31,500 4,153,275Leggett & Platt, Inc. 27,959 1,276,328Lennar Corp., A Shares 55,918 5,660,579Mohawk Industries, Inc. (A) 12,629 2,428,683Newell Brands, Inc. 79,746 2,135,598NVR, Inc. (A) 735 3,462,534PulteGroup, Inc. 56,633 2,969,835
Whirlpool Corp. 13,155 2,898,704
31,052,202Internet and direct marketing retail – 4.4%Amazon.com, Inc. (A) 88,852 274,915,196Booking Holdings, Inc. (A) 8,521 19,852,567eBay, Inc. 132,594 8,120,057Etsy, Inc. (A) 26,198 5,283,351
Expedia Group, Inc. (A) 28,658 4,932,615
313,103,786Leisure products – 0.0%Hasbro, Inc. 26,911 2,586,685Multiline retail – 0.5%Dollar General Corp. 50,979 10,329,365Dollar Tree, Inc. (A) 48,896 5,596,636
Target Corp. 104,195 20,637,904
36,563,905Specialty retail – 2.2%Advance Auto Parts, Inc. 13,797 2,531,612AutoZone, Inc. (A) 4,588 6,442,928Best Buy Company, Inc. 47,394 5,441,305CarMax, Inc. (A) 32,853 4,358,279
1
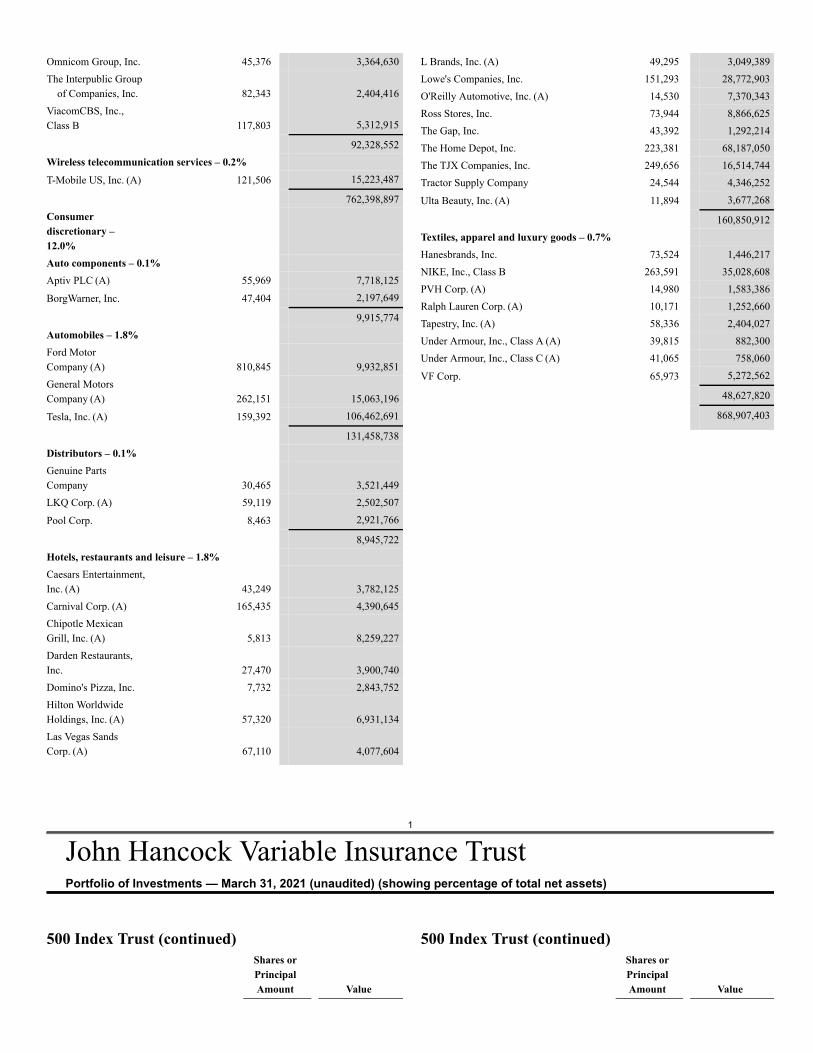
John Hancock Variable Insurance TrustPortfolio of Investments — March 31, 2021 (unaudited) (showing percentage of total net assets)
Omnicom Group, Inc. 45,376 3,364,630The Interpublic Group
of Companies, Inc. 82,343 2,404,416ViacomCBS, Inc.,Class B 117,803 5,312,915
92,328,552Wireless telecommunication services – 0.2%T-Mobile US, Inc. (A) 121,506 15,223,487
762,398,897Consumerdiscretionary –12.0%Auto components – 0.1%Aptiv PLC (A) 55,969 7,718,125
BorgWarner, Inc. 47,404 2,197,649
9,915,774Automobiles – 1.8%Ford MotorCompany (A) 810,845 9,932,851General MotorsCompany (A) 262,151 15,063,196
Tesla, Inc. (A) 159,392 106,462,691
131,458,738Distributors – 0.1%Genuine PartsCompany 30,465 3,521,449LKQ Corp. (A) 59,119 2,502,507
Pool Corp. 8,463 2,921,766
8,945,722Hotels, restaurants and leisure – 1.8%Caesars Entertainment,Inc. (A) 43,249 3,782,125Carnival Corp. (A) 165,435 4,390,645Chipotle MexicanGrill, Inc. (A) 5,813 8,259,227Darden Restaurants,Inc. 27,470 3,900,740Domino's Pizza, Inc. 7,732 2,843,752Hilton WorldwideHoldings, Inc. (A) 57,320 6,931,134Las Vegas SandsCorp. (A) 67,110 4,077,604
L Brands, Inc. (A) 49,295 3,049,389Lowe's Companies, Inc. 151,293 28,772,903O'Reilly Automotive, Inc. (A) 14,530 7,370,343Ross Stores, Inc. 73,944 8,866,625The Gap, Inc. 43,392 1,292,214The Home Depot, Inc. 223,381 68,187,050The TJX Companies, Inc. 249,656 16,514,744Tractor Supply Company 24,544 4,346,252
Ulta Beauty, Inc. (A) 11,894 3,677,268
160,850,912Textiles, apparel and luxury goods – 0.7%Hanesbrands, Inc. 73,524 1,446,217NIKE, Inc., Class B 263,591 35,028,608PVH Corp. (A) 14,980 1,583,386Ralph Lauren Corp. (A) 10,171 1,252,660Tapestry, Inc. (A) 58,336 2,404,027Under Armour, Inc., Class A (A) 39,815 882,300Under Armour, Inc., Class C (A) 41,065 758,060
VF Corp. 65,973 5,272,562
48,627,820
868,907,403
500 Index Trust (continued)Shares orPrincipalAmount Value
500 Index Trust (continued)Shares orPrincipalAmount Value
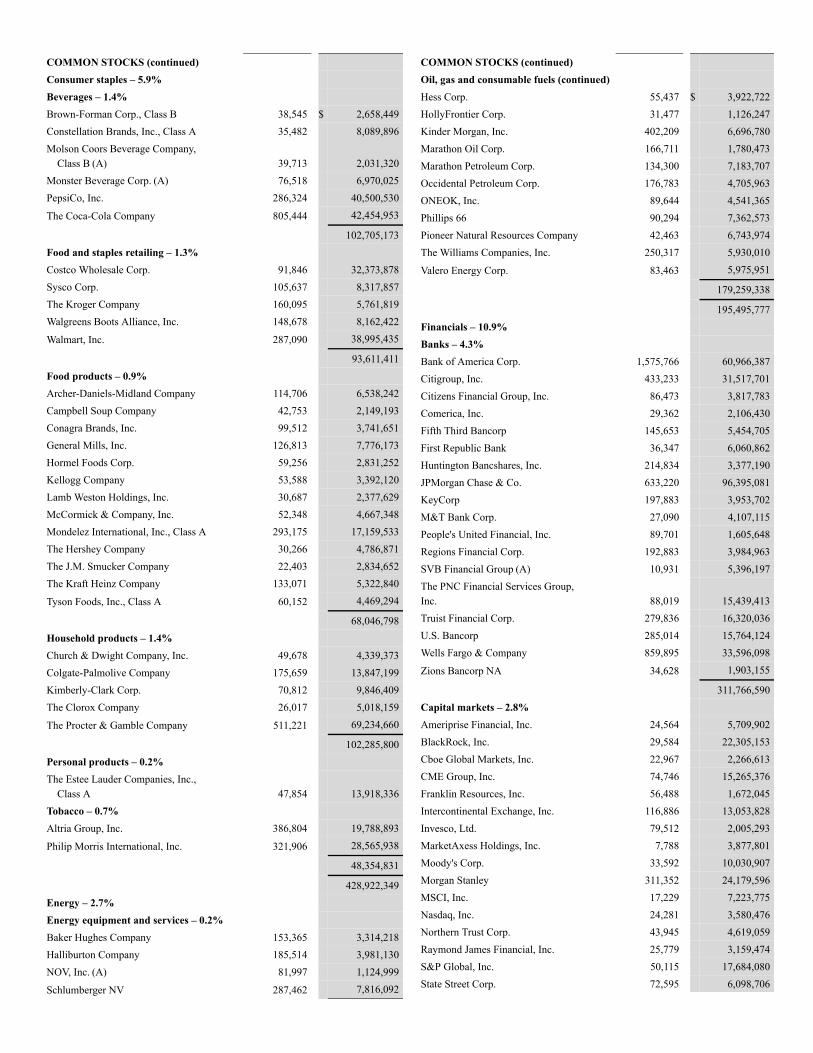
COMMON STOCKS (continued)Consumer staples – 5.9%Beverages – 1.4%Brown-Forman Corp., Class B 38,545 $ 2,658,449Constellation Brands, Inc., Class A 35,482 8,089,896Molson Coors Beverage Company,
Class B (A) 39,713 2,031,320Monster Beverage Corp. (A) 76,518 6,970,025PepsiCo, Inc. 286,324 40,500,530
The Coca-Cola Company 805,444 42,454,953
102,705,173Food and staples retailing – 1.3%Costco Wholesale Corp. 91,846 32,373,878Sysco Corp. 105,637 8,317,857The Kroger Company 160,095 5,761,819Walgreens Boots Alliance, Inc. 148,678 8,162,422
Walmart, Inc. 287,090 38,995,435
93,611,411Food products – 0.9%Archer-Daniels-Midland Company 114,706 6,538,242Campbell Soup Company 42,753 2,149,193Conagra Brands, Inc. 99,512 3,741,651General Mills, Inc. 126,813 7,776,173Hormel Foods Corp. 59,256 2,831,252Kellogg Company 53,588 3,392,120Lamb Weston Holdings, Inc. 30,687 2,377,629McCormick & Company, Inc. 52,348 4,667,348Mondelez International, Inc., Class A 293,175 17,159,533The Hershey Company 30,266 4,786,871The J.M. Smucker Company 22,403 2,834,652The Kraft Heinz Company 133,071 5,322,840
Tyson Foods, Inc., Class A 60,152 4,469,294
68,046,798Household products – 1.4%Church & Dwight Company, Inc. 49,678 4,339,373Colgate-Palmolive Company 175,659 13,847,199Kimberly-Clark Corp. 70,812 9,846,409The Clorox Company 26,017 5,018,159
The Procter & Gamble Company 511,221 69,234,660
102,285,800Personal products – 0.2%The Estee Lauder Companies, Inc.,
Class A 47,854 13,918,336Tobacco – 0.7%Altria Group, Inc. 386,804 19,788,893
Philip Morris International, Inc. 321,906 28,565,938
48,354,831
428,922,349Energy – 2.7%Energy equipment and services – 0.2%Baker Hughes Company 153,365 3,314,218Halliburton Company 185,514 3,981,130NOV, Inc. (A) 81,997 1,124,999
Schlumberger NV 287,462 7,816,092
COMMON STOCKS (continued)Oil, gas and consumable fuels (continued)Hess Corp. 55,437 $ 3,922,722HollyFrontier Corp. 31,477 1,126,247Kinder Morgan, Inc. 402,209 6,696,780Marathon Oil Corp. 166,711 1,780,473Marathon Petroleum Corp. 134,300 7,183,707Occidental Petroleum Corp. 176,783 4,705,963ONEOK, Inc. 89,644 4,541,365Phillips 66 90,294 7,362,573Pioneer Natural Resources Company 42,463 6,743,974The Williams Companies, Inc. 250,317 5,930,010
Valero Energy Corp. 83,463 5,975,951
179,259,338
195,495,777Financials – 10.9%Banks – 4.3%Bank of America Corp. 1,575,766 60,966,387Citigroup, Inc. 433,233 31,517,701Citizens Financial Group, Inc. 86,473 3,817,783Comerica, Inc. 29,362 2,106,430Fifth Third Bancorp 145,653 5,454,705First Republic Bank 36,347 6,060,862Huntington Bancshares, Inc. 214,834 3,377,190JPMorgan Chase & Co. 633,220 96,395,081KeyCorp 197,883 3,953,702M&T Bank Corp. 27,090 4,107,115People's United Financial, Inc. 89,701 1,605,648Regions Financial Corp. 192,883 3,984,963SVB Financial Group (A) 10,931 5,396,197The PNC Financial Services Group,Inc. 88,019 15,439,413Truist Financial Corp. 279,836 16,320,036U.S. Bancorp 285,014 15,764,124Wells Fargo & Company 859,895 33,596,098
Zions Bancorp NA 34,628 1,903,155
311,766,590Capital markets – 2.8%Ameriprise Financial, Inc. 24,564 5,709,902BlackRock, Inc. 29,584 22,305,153Cboe Global Markets, Inc. 22,967 2,266,613CME Group, Inc. 74,746 15,265,376Franklin Resources, Inc. 56,488 1,672,045Intercontinental Exchange, Inc. 116,886 13,053,828Invesco, Ltd. 79,512 2,005,293MarketAxess Holdings, Inc. 7,788 3,877,801Moody's Corp. 33,592 10,030,907Morgan Stanley 311,352 24,179,596MSCI, Inc. 17,229 7,223,775Nasdaq, Inc. 24,281 3,580,476Northern Trust Corp. 43,945 4,619,059Raymond James Financial, Inc. 25,779 3,159,474S&P Global, Inc. 50,115 17,684,080State Street Corp. 72,595 6,098,706
2
John Hancock Variable Insurance TrustPortfolio of Investments — March 31, 2021 (unaudited) (showing percentage of total net assets)
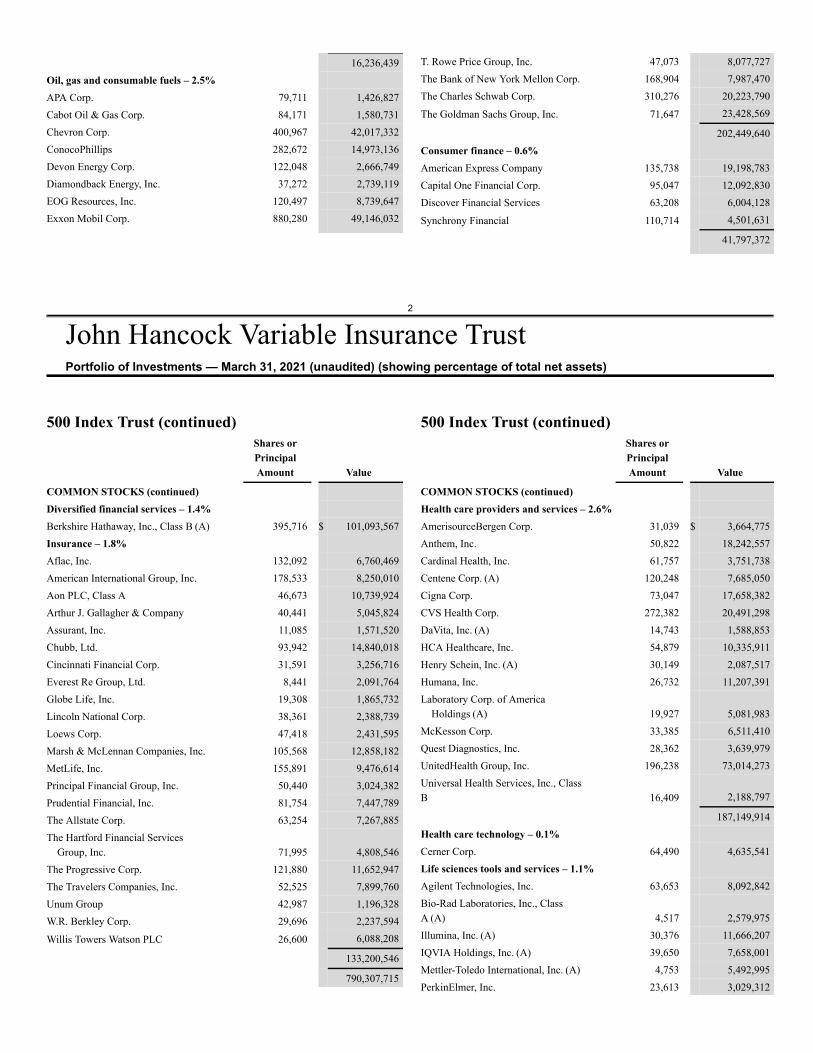
16,236,439Oil, gas and consumable fuels – 2.5%APA Corp. 79,711 1,426,827Cabot Oil & Gas Corp. 84,171 1,580,731Chevron Corp. 400,967 42,017,332ConocoPhillips 282,672 14,973,136Devon Energy Corp. 122,048 2,666,749Diamondback Energy, Inc. 37,272 2,739,119EOG Resources, Inc. 120,497 8,739,647Exxon Mobil Corp. 880,280 49,146,032
T. Rowe Price Group, Inc. 47,073 8,077,727The Bank of New York Mellon Corp. 168,904 7,987,470The Charles Schwab Corp. 310,276 20,223,790
The Goldman Sachs Group, Inc. 71,647 23,428,569
202,449,640Consumer finance – 0.6%American Express Company 135,738 19,198,783Capital One Financial Corp. 95,047 12,092,830Discover Financial Services 63,208 6,004,128
Synchrony Financial 110,714 4,501,631
41,797,372
500 Index Trust (continued)Shares orPrincipalAmount Value
COMMON STOCKS (continued)Diversified financial services – 1.4%Berkshire Hathaway, Inc., Class B (A) 395,716 $ 101,093,567Insurance – 1.8%Aflac, Inc. 132,092 6,760,469American International Group, Inc. 178,533 8,250,010Aon PLC, Class A 46,673 10,739,924Arthur J. Gallagher & Company 40,441 5,045,824Assurant, Inc. 11,085 1,571,520Chubb, Ltd. 93,942 14,840,018Cincinnati Financial Corp. 31,591 3,256,716Everest Re Group, Ltd. 8,441 2,091,764Globe Life, Inc. 19,308 1,865,732Lincoln National Corp. 38,361 2,388,739Loews Corp. 47,418 2,431,595Marsh & McLennan Companies, Inc. 105,568 12,858,182MetLife, Inc. 155,891 9,476,614Principal Financial Group, Inc. 50,440 3,024,382Prudential Financial, Inc. 81,754 7,447,789The Allstate Corp. 63,254 7,267,885The Hartford Financial Services
Group, Inc. 71,995 4,808,546The Progressive Corp. 121,880 11,652,947The Travelers Companies, Inc. 52,525 7,899,760Unum Group 42,987 1,196,328W.R. Berkley Corp. 29,696 2,237,594
Willis Towers Watson PLC 26,600 6,088,208
133,200,546
790,307,715
500 Index Trust (continued)Shares orPrincipalAmount Value
COMMON STOCKS (continued)Health care providers and services – 2.6%AmerisourceBergen Corp. 31,039 $ 3,664,775Anthem, Inc. 50,822 18,242,557Cardinal Health, Inc. 61,757 3,751,738Centene Corp. (A) 120,248 7,685,050Cigna Corp. 73,047 17,658,382CVS Health Corp. 272,382 20,491,298DaVita, Inc. (A) 14,743 1,588,853HCA Healthcare, Inc. 54,879 10,335,911Henry Schein, Inc. (A) 30,149 2,087,517Humana, Inc. 26,732 11,207,391Laboratory Corp. of America
Holdings (A) 19,927 5,081,983McKesson Corp. 33,385 6,511,410Quest Diagnostics, Inc. 28,362 3,639,979UnitedHealth Group, Inc. 196,238 73,014,273Universal Health Services, Inc., ClassB 16,409 2,188,797
187,149,914Health care technology – 0.1%Cerner Corp. 64,490 4,635,541Life sciences tools and services – 1.1%Agilent Technologies, Inc. 63,653 8,092,842Bio-Rad Laboratories, Inc., ClassA (A) 4,517 2,579,975Illumina, Inc. (A) 30,376 11,666,207IQVIA Holdings, Inc. (A) 39,650 7,658,001Mettler-Toledo International, Inc. (A) 4,753 5,492,995PerkinElmer, Inc. 23,613 3,029,312
3
John Hancock Variable Insurance TrustPortfolio of Investments — March 31, 2021 (unaudited) (showing percentage of total net assets)
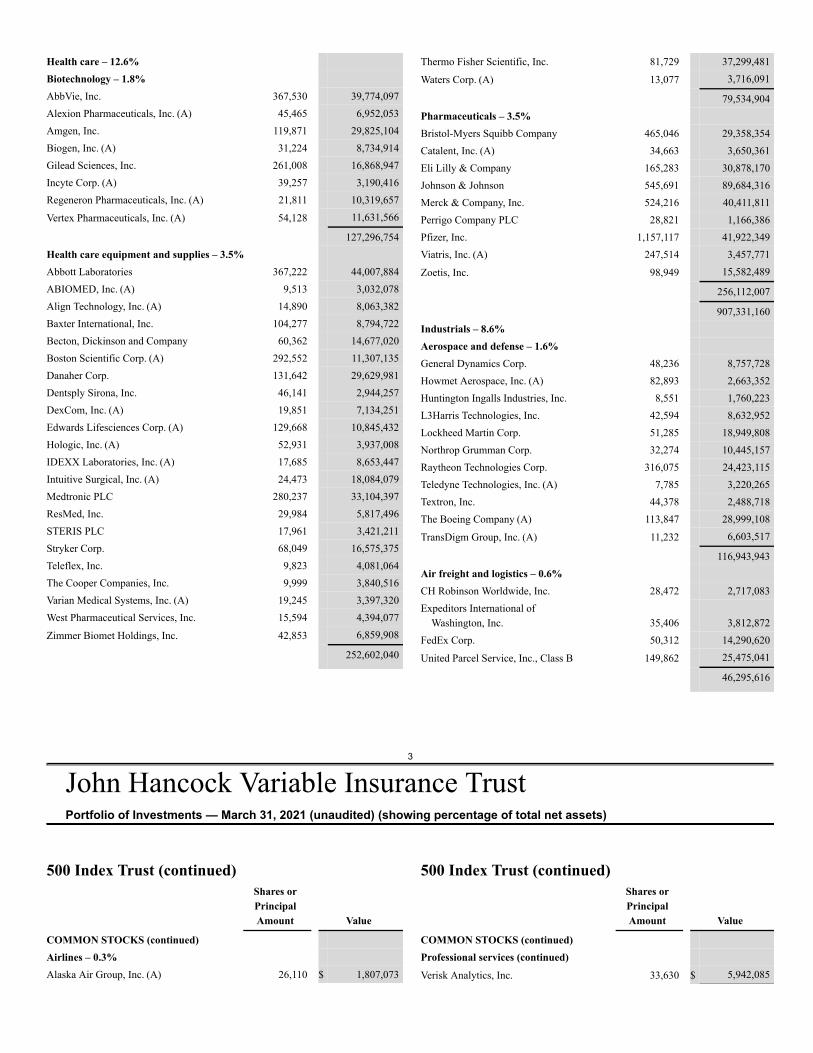
Health care – 12.6%Biotechnology – 1.8%AbbVie, Inc. 367,530 39,774,097Alexion Pharmaceuticals, Inc. (A) 45,465 6,952,053Amgen, Inc. 119,871 29,825,104Biogen, Inc. (A) 31,224 8,734,914Gilead Sciences, Inc. 261,008 16,868,947Incyte Corp. (A) 39,257 3,190,416Regeneron Pharmaceuticals, Inc. (A) 21,811 10,319,657
Vertex Pharmaceuticals, Inc. (A) 54,128 11,631,566
127,296,754Health care equipment and supplies – 3.5%Abbott Laboratories 367,222 44,007,884ABIOMED, Inc. (A) 9,513 3,032,078Align Technology, Inc. (A) 14,890 8,063,382Baxter International, Inc. 104,277 8,794,722Becton, Dickinson and Company 60,362 14,677,020Boston Scientific Corp. (A) 292,552 11,307,135Danaher Corp. 131,642 29,629,981Dentsply Sirona, Inc. 46,141 2,944,257DexCom, Inc. (A) 19,851 7,134,251Edwards Lifesciences Corp. (A) 129,668 10,845,432Hologic, Inc. (A) 52,931 3,937,008IDEXX Laboratories, Inc. (A) 17,685 8,653,447Intuitive Surgical, Inc. (A) 24,473 18,084,079Medtronic PLC 280,237 33,104,397ResMed, Inc. 29,984 5,817,496STERIS PLC 17,961 3,421,211Stryker Corp. 68,049 16,575,375Teleflex, Inc. 9,823 4,081,064The Cooper Companies, Inc. 9,999 3,840,516Varian Medical Systems, Inc. (A) 19,245 3,397,320West Pharmaceutical Services, Inc. 15,594 4,394,077
Zimmer Biomet Holdings, Inc. 42,853 6,859,908
252,602,040
Thermo Fisher Scientific, Inc. 81,729 37,299,481
Waters Corp. (A) 13,077 3,716,091
79,534,904Pharmaceuticals – 3.5%Bristol-Myers Squibb Company 465,046 29,358,354Catalent, Inc. (A) 34,663 3,650,361Eli Lilly & Company 165,283 30,878,170Johnson & Johnson 545,691 89,684,316Merck & Company, Inc. 524,216 40,411,811Perrigo Company PLC 28,821 1,166,386Pfizer, Inc. 1,157,117 41,922,349Viatris, Inc. (A) 247,514 3,457,771
Zoetis, Inc. 98,949 15,582,489
256,112,007
907,331,160Industrials – 8.6%Aerospace and defense – 1.6%General Dynamics Corp. 48,236 8,757,728Howmet Aerospace, Inc. (A) 82,893 2,663,352Huntington Ingalls Industries, Inc. 8,551 1,760,223L3Harris Technologies, Inc. 42,594 8,632,952Lockheed Martin Corp. 51,285 18,949,808Northrop Grumman Corp. 32,274 10,445,157Raytheon Technologies Corp. 316,075 24,423,115Teledyne Technologies, Inc. (A) 7,785 3,220,265Textron, Inc. 44,378 2,488,718The Boeing Company (A) 113,847 28,999,108
TransDigm Group, Inc. (A) 11,232 6,603,517
116,943,943Air freight and logistics – 0.6%CH Robinson Worldwide, Inc. 28,472 2,717,083Expeditors International of
Washington, Inc. 35,406 3,812,872FedEx Corp. 50,312 14,290,620
United Parcel Service, Inc., Class B 149,862 25,475,041
46,295,616
500 Index Trust (continued)Shares orPrincipalAmount Value
COMMON STOCKS (continued)Airlines – 0.3%Alaska Air Group, Inc. (A) 26,110 $ 1,807,073
500 Index Trust (continued)Shares orPrincipalAmount Value
COMMON STOCKS (continued)Professional services (continued)Verisk Analytics, Inc. 33,630 $ 5,942,085
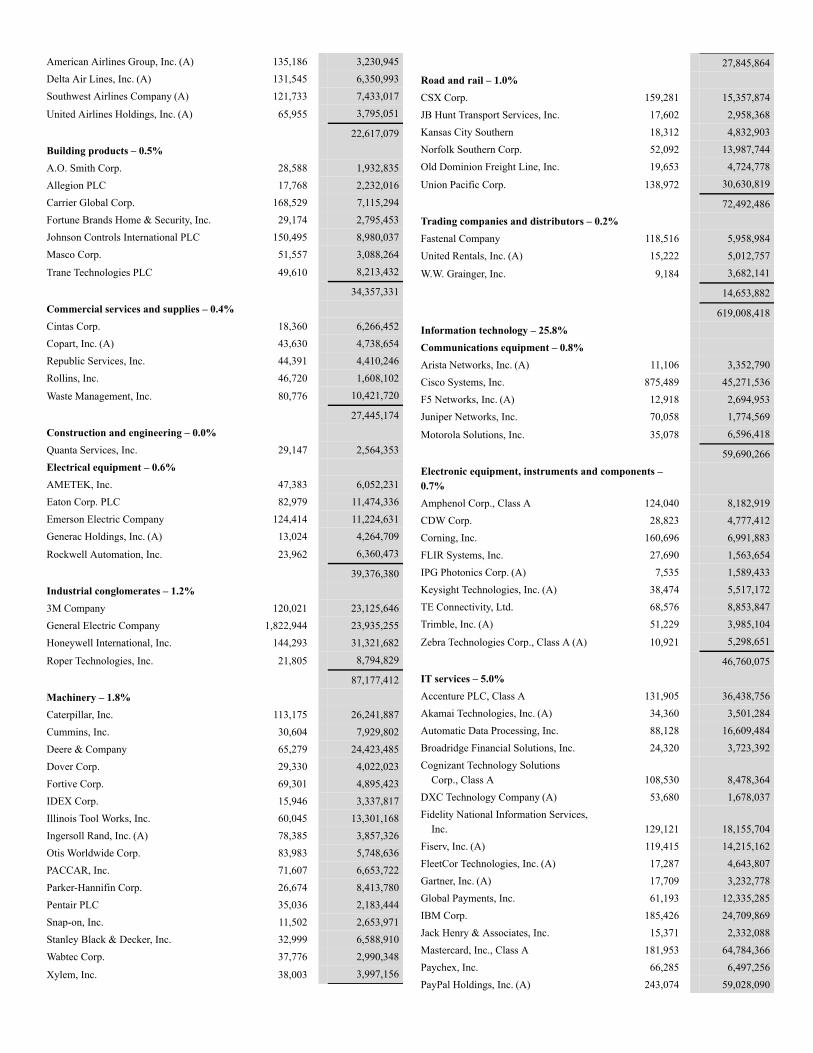
American Airlines Group, Inc. (A) 135,186 3,230,945Delta Air Lines, Inc. (A) 131,545 6,350,993Southwest Airlines Company (A) 121,733 7,433,017
United Airlines Holdings, Inc. (A) 65,955 3,795,051
22,617,079Building products – 0.5%A.O. Smith Corp. 28,588 1,932,835Allegion PLC 17,768 2,232,016Carrier Global Corp. 168,529 7,115,294Fortune Brands Home & Security, Inc. 29,174 2,795,453Johnson Controls International PLC 150,495 8,980,037Masco Corp. 51,557 3,088,264
Trane Technologies PLC 49,610 8,213,432
34,357,331Commercial services and supplies – 0.4%Cintas Corp. 18,360 6,266,452Copart, Inc. (A) 43,630 4,738,654Republic Services, Inc. 44,391 4,410,246Rollins, Inc. 46,720 1,608,102
Waste Management, Inc. 80,776 10,421,720
27,445,174Construction and engineering – 0.0%Quanta Services, Inc. 29,147 2,564,353Electrical equipment – 0.6%AMETEK, Inc. 47,383 6,052,231Eaton Corp. PLC 82,979 11,474,336Emerson Electric Company 124,414 11,224,631Generac Holdings, Inc. (A) 13,024 4,264,709
Rockwell Automation, Inc. 23,962 6,360,473
39,376,380Industrial conglomerates – 1.2%3M Company 120,021 23,125,646General Electric Company 1,822,944 23,935,255Honeywell International, Inc. 144,293 31,321,682
Roper Technologies, Inc. 21,805 8,794,829
87,177,412Machinery – 1.8%Caterpillar, Inc. 113,175 26,241,887Cummins, Inc. 30,604 7,929,802Deere & Company 65,279 24,423,485Dover Corp. 29,330 4,022,023Fortive Corp. 69,301 4,895,423IDEX Corp. 15,946 3,337,817Illinois Tool Works, Inc. 60,045 13,301,168Ingersoll Rand, Inc. (A) 78,385 3,857,326Otis Worldwide Corp. 83,983 5,748,636PACCAR, Inc. 71,607 6,653,722Parker-Hannifin Corp. 26,674 8,413,780Pentair PLC 35,036 2,183,444Snap-on, Inc. 11,502 2,653,971Stanley Black & Decker, Inc. 32,999 6,588,910Wabtec Corp. 37,776 2,990,348
Xylem, Inc. 38,003 3,997,156
27,845,864Road and rail – 1.0%CSX Corp. 159,281 15,357,874JB Hunt Transport Services, Inc. 17,602 2,958,368Kansas City Southern 18,312 4,832,903Norfolk Southern Corp. 52,092 13,987,744Old Dominion Freight Line, Inc. 19,653 4,724,778
Union Pacific Corp. 138,972 30,630,819
72,492,486Trading companies and distributors – 0.2%Fastenal Company 118,516 5,958,984United Rentals, Inc. (A) 15,222 5,012,757
W.W. Grainger, Inc. 9,184 3,682,141
14,653,882
619,008,418Information technology – 25.8%Communications equipment – 0.8%Arista Networks, Inc. (A) 11,106 3,352,790Cisco Systems, Inc. 875,489 45,271,536F5 Networks, Inc. (A) 12,918 2,694,953Juniper Networks, Inc. 70,058 1,774,569
Motorola Solutions, Inc. 35,078 6,596,418
59,690,266Electronic equipment, instruments and components –0.7%Amphenol Corp., Class A 124,040 8,182,919CDW Corp. 28,823 4,777,412Corning, Inc. 160,696 6,991,883FLIR Systems, Inc. 27,690 1,563,654IPG Photonics Corp. (A) 7,535 1,589,433Keysight Technologies, Inc. (A) 38,474 5,517,172TE Connectivity, Ltd. 68,576 8,853,847Trimble, Inc. (A) 51,229 3,985,104
Zebra Technologies Corp., Class A (A) 10,921 5,298,651
46,760,075IT services – 5.0%Accenture PLC, Class A 131,905 36,438,756Akamai Technologies, Inc. (A) 34,360 3,501,284Automatic Data Processing, Inc. 88,128 16,609,484Broadridge Financial Solutions, Inc. 24,320 3,723,392Cognizant Technology Solutions
Corp., Class A 108,530 8,478,364DXC Technology Company (A) 53,680 1,678,037Fidelity National Information Services,
Inc. 129,121 18,155,704Fiserv, Inc. (A) 119,415 14,215,162FleetCor Technologies, Inc. (A) 17,287 4,643,807Gartner, Inc. (A) 17,709 3,232,778Global Payments, Inc. 61,193 12,335,285IBM Corp. 185,426 24,709,869Jack Henry & Associates, Inc. 15,371 2,332,088Mastercard, Inc., Class A 181,953 64,784,366Paychex, Inc. 66,285 6,497,256PayPal Holdings, Inc. (A) 243,074 59,028,090
4
John Hancock Variable Insurance TrustPortfolio of Investments — March 31, 2021 (unaudited) (showing percentage of total net assets)
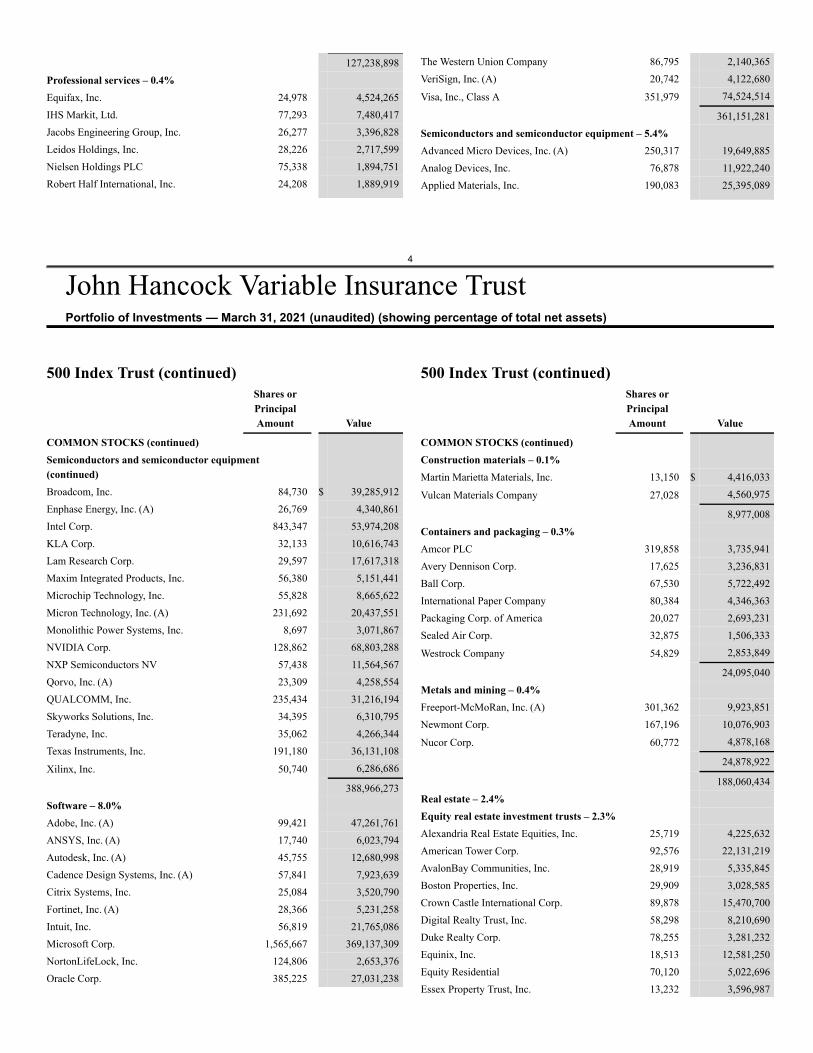
127,238,898Professional services – 0.4%Equifax, Inc. 24,978 4,524,265IHS Markit, Ltd. 77,293 7,480,417Jacobs Engineering Group, Inc. 26,277 3,396,828Leidos Holdings, Inc. 28,226 2,717,599Nielsen Holdings PLC 75,338 1,894,751Robert Half International, Inc. 24,208 1,889,919
The Western Union Company 86,795 2,140,365VeriSign, Inc. (A) 20,742 4,122,680
Visa, Inc., Class A 351,979 74,524,514
361,151,281Semiconductors and semiconductor equipment – 5.4%Advanced Micro Devices, Inc. (A) 250,317 19,649,885Analog Devices, Inc. 76,878 11,922,240Applied Materials, Inc. 190,083 25,395,089
500 Index Trust (continued)Shares orPrincipalAmount Value
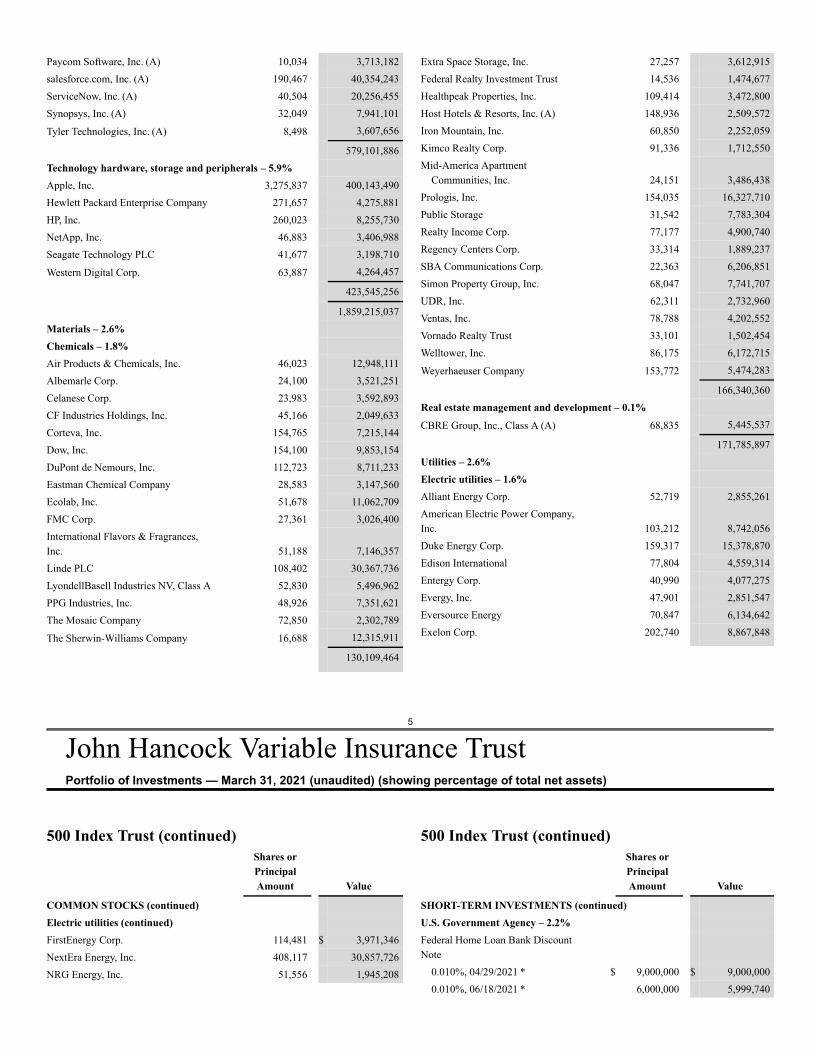
COMMON STOCKS (continued)Semiconductors and semiconductor equipment(continued)Broadcom, Inc. 84,730 $ 39,285,912Enphase Energy, Inc. (A) 26,769 4,340,861Intel Corp. 843,347 53,974,208KLA Corp. 32,133 10,616,743Lam Research Corp. 29,597 17,617,318Maxim Integrated Products, Inc. 56,380 5,151,441Microchip Technology, Inc. 55,828 8,665,622Micron Technology, Inc. (A) 231,692 20,437,551Monolithic Power Systems, Inc. 8,697 3,071,867NVIDIA Corp. 128,862 68,803,288NXP Semiconductors NV 57,438 11,564,567Qorvo, Inc. (A) 23,309 4,258,554QUALCOMM, Inc. 235,434 31,216,194Skyworks Solutions, Inc. 34,395 6,310,795Teradyne, Inc. 35,062 4,266,344Texas Instruments, Inc. 191,180 36,131,108
Xilinx, Inc. 50,740 6,286,686
388,966,273Software – 8.0%Adobe, Inc. (A) 99,421 47,261,761ANSYS, Inc. (A) 17,740 6,023,794Autodesk, Inc. (A) 45,755 12,680,998Cadence Design Systems, Inc. (A) 57,841 7,923,639Citrix Systems, Inc. 25,084 3,520,790Fortinet, Inc. (A) 28,366 5,231,258Intuit, Inc. 56,819 21,765,086Microsoft Corp. 1,565,667 369,137,309NortonLifeLock, Inc. 124,806 2,653,376Oracle Corp. 385,225 27,031,238
500 Index Trust (continued)Shares orPrincipalAmount Value
COMMON STOCKS (continued)Construction materials – 0.1%Martin Marietta Materials, Inc. 13,150 $ 4,416,033
Vulcan Materials Company 27,028 4,560,975
8,977,008Containers and packaging – 0.3%Amcor PLC 319,858 3,735,941Avery Dennison Corp. 17,625 3,236,831Ball Corp. 67,530 5,722,492International Paper Company 80,384 4,346,363Packaging Corp. of America 20,027 2,693,231Sealed Air Corp. 32,875 1,506,333
Westrock Company 54,829 2,853,849
24,095,040Metals and mining – 0.4%Freeport-McMoRan, Inc. (A) 301,362 9,923,851Newmont Corp. 167,196 10,076,903
Nucor Corp. 60,772 4,878,168
24,878,922
188,060,434Real estate – 2.4%Equity real estate investment trusts – 2.3%Alexandria Real Estate Equities, Inc. 25,719 4,225,632American Tower Corp. 92,576 22,131,219AvalonBay Communities, Inc. 28,919 5,335,845Boston Properties, Inc. 29,909 3,028,585Crown Castle International Corp. 89,878 15,470,700Digital Realty Trust, Inc. 58,298 8,210,690Duke Realty Corp. 78,255 3,281,232Equinix, Inc. 18,513 12,581,250Equity Residential 70,120 5,022,696Essex Property Trust, Inc. 13,232 3,596,987
5
John Hancock Variable Insurance TrustPortfolio of Investments — March 31, 2021 (unaudited) (showing percentage of total net assets)
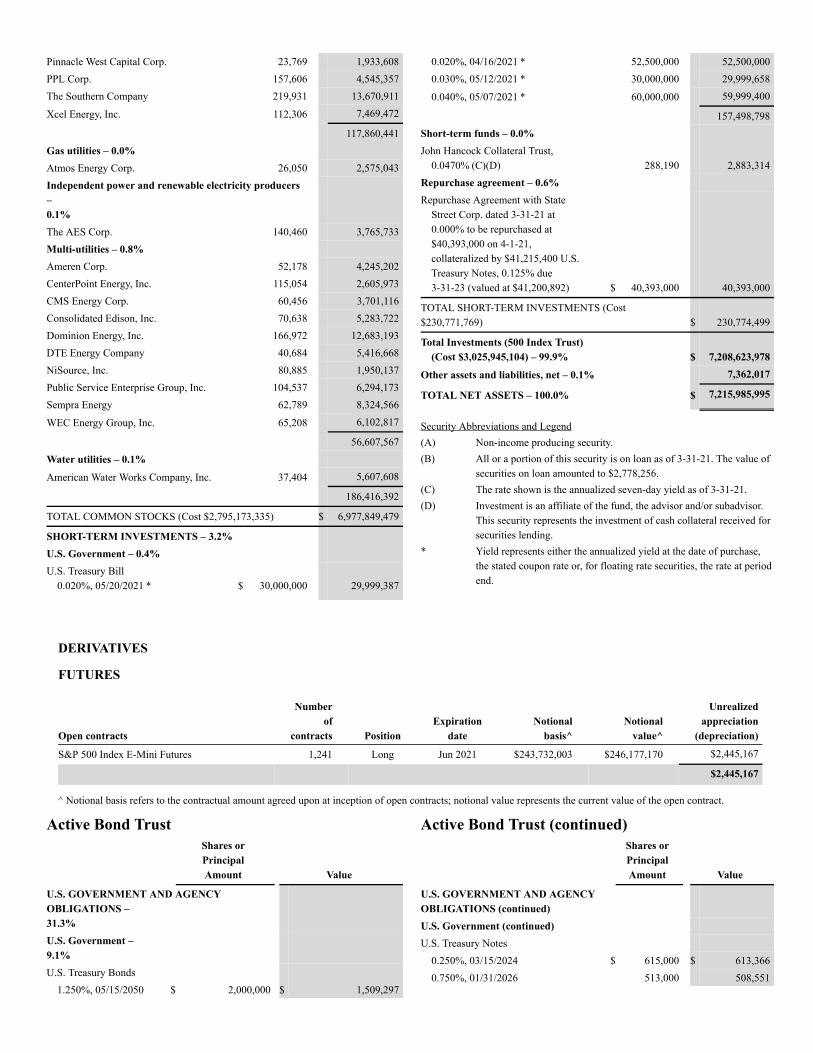
Paycom Software, Inc. (A) 10,034 3,713,182salesforce.com, Inc. (A) 190,467 40,354,243ServiceNow, Inc. (A) 40,504 20,256,455Synopsys, Inc. (A) 32,049 7,941,101
Tyler Technologies, Inc. (A) 8,498 3,607,656
579,101,886Technology hardware, storage and peripherals – 5.9%Apple, Inc. 3,275,837 400,143,490Hewlett Packard Enterprise Company 271,657 4,275,881HP, Inc. 260,023 8,255,730NetApp, Inc. 46,883 3,406,988Seagate Technology PLC 41,677 3,198,710
Western Digital Corp. 63,887 4,264,457
423,545,256
1,859,215,037Materials – 2.6%Chemicals – 1.8%Air Products & Chemicals, Inc. 46,023 12,948,111Albemarle Corp. 24,100 3,521,251Celanese Corp. 23,983 3,592,893CF Industries Holdings, Inc. 45,166 2,049,633Corteva, Inc. 154,765 7,215,144Dow, Inc. 154,100 9,853,154DuPont de Nemours, Inc. 112,723 8,711,233Eastman Chemical Company 28,583 3,147,560Ecolab, Inc. 51,678 11,062,709FMC Corp. 27,361 3,026,400International Flavors & Fragrances,Inc. 51,188 7,146,357Linde PLC 108,402 30,367,736LyondellBasell Industries NV, Class A 52,830 5,496,962PPG Industries, Inc. 48,926 7,351,621The Mosaic Company 72,850 2,302,789
The Sherwin-Williams Company 16,688 12,315,911
130,109,464
Extra Space Storage, Inc. 27,257 3,612,915Federal Realty Investment Trust 14,536 1,474,677Healthpeak Properties, Inc. 109,414 3,472,800Host Hotels & Resorts, Inc. (A) 148,936 2,509,572Iron Mountain, Inc. 60,850 2,252,059Kimco Realty Corp. 91,336 1,712,550Mid-America Apartment
Communities, Inc. 24,151 3,486,438Prologis, Inc. 154,035 16,327,710Public Storage 31,542 7,783,304Realty Income Corp. 77,177 4,900,740Regency Centers Corp. 33,314 1,889,237SBA Communications Corp. 22,363 6,206,851Simon Property Group, Inc. 68,047 7,741,707UDR, Inc. 62,311 2,732,960Ventas, Inc. 78,788 4,202,552Vornado Realty Trust 33,101 1,502,454Welltower, Inc. 86,175 6,172,715
Weyerhaeuser Company 153,772 5,474,283
166,340,360Real estate management and development – 0.1%CBRE Group, Inc., Class A (A) 68,835 5,445,537
171,785,897Utilities – 2.6%Electric utilities – 1.6%Alliant Energy Corp. 52,719 2,855,261American Electric Power Company,Inc. 103,212 8,742,056Duke Energy Corp. 159,317 15,378,870Edison International 77,804 4,559,314Entergy Corp. 40,990 4,077,275Evergy, Inc. 47,901 2,851,547Eversource Energy 70,847 6,134,642Exelon Corp. 202,740 8,867,848
500 Index Trust (continued)Shares orPrincipalAmount Value
COMMON STOCKS (continued)Electric utilities (continued)FirstEnergy Corp. 114,481 $ 3,971,346NextEra Energy, Inc. 408,117 30,857,726NRG Energy, Inc. 51,556 1,945,208
500 Index Trust (continued)Shares orPrincipalAmount Value
SHORT-TERM INVESTMENTS (continued)U.S. Government Agency – 2.2%Federal Home Loan Bank DiscountNote
0.010%, 04/29/2021 * $ 9,000,000 $ 9,000,0000.010%, 06/18/2021 * 6,000,000 5,999,740
DERIVATIVES
FUTURES
Open contracts
Numberof
contracts PositionExpiration
dateNotional
basis^Notional
value^
Unrealizedappreciation
(depreciation)
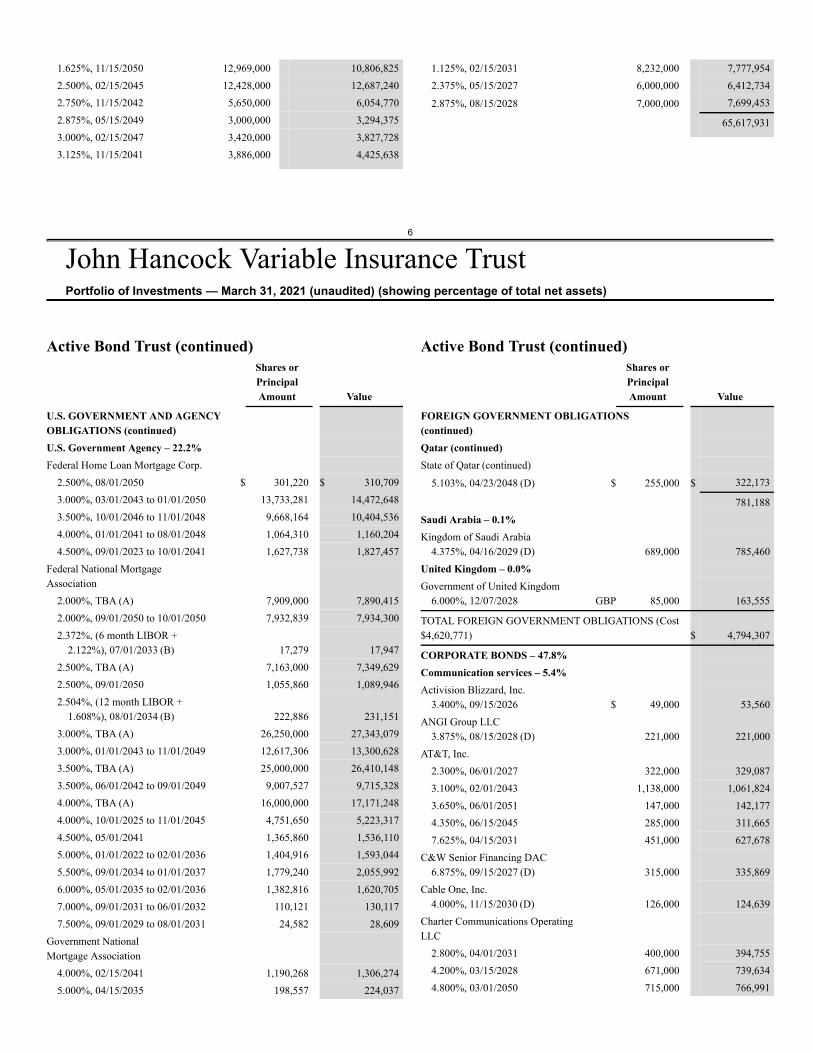
S&P 500 Index E-Mini Futures 1,241 Long Jun 2021 $243,732,003 $246,177,170 $2,445,167
$2,445,167
^ Notional basis refers to the contractual amount agreed upon at inception of open contracts; notional value represents the current value of the open contract.
Pinnacle West Capital Corp. 23,769 1,933,608PPL Corp. 157,606 4,545,357The Southern Company 219,931 13,670,911
Xcel Energy, Inc. 112,306 7,469,472
117,860,441Gas utilities – 0.0%Atmos Energy Corp. 26,050 2,575,043Independent power and renewable electricity producers–0.1%The AES Corp. 140,460 3,765,733Multi-utilities – 0.8%Ameren Corp. 52,178 4,245,202CenterPoint Energy, Inc. 115,054 2,605,973CMS Energy Corp. 60,456 3,701,116Consolidated Edison, Inc. 70,638 5,283,722Dominion Energy, Inc. 166,972 12,683,193DTE Energy Company 40,684 5,416,668NiSource, Inc. 80,885 1,950,137Public Service Enterprise Group, Inc. 104,537 6,294,173Sempra Energy 62,789 8,324,566
WEC Energy Group, Inc. 65,208 6,102,817
56,607,567Water utilities – 0.1%American Water Works Company, Inc. 37,404 5,607,608
186,416,392
TOTAL COMMON STOCKS (Cost $2,795,173,335) $ 6,977,849,479
SHORT-TERM INVESTMENTS – 3.2%U.S. Government – 0.4%U.S. Treasury Bill
0.020%, 05/20/2021 * $ 30,000,000 29,999,387
0.020%, 04/16/2021 * 52,500,000 52,500,0000.030%, 05/12/2021 * 30,000,000 29,999,658
0.040%, 05/07/2021 * 60,000,000 59,999,400
157,498,798Short-term funds – 0.0%John Hancock Collateral Trust,
0.0470% (C)(D) 288,190 2,883,314Repurchase agreement – 0.6%Repurchase Agreement with State
Street Corp. dated 3-31-21 at0.000% to be repurchased at$40,393,000 on 4-1-21,collateralized by $41,215,400 U.S.Treasury Notes, 0.125% due3-31-23 (valued at $41,200,892) $ 40,393,000 40,393,000
TOTAL SHORT-TERM INVESTMENTS (Cost$230,771,769) $ 230,774,499
Total Investments (500 Index Trust)(Cost $3,025,945,104) – 99.9% $ 7,208,623,978
Other assets and liabilities, net – 0.1% 7,362,017
TOTAL NET ASSETS – 100.0% $ 7,215,985,995
Security Abbreviations and Legend(A) Non-income producing security.(B) All or a portion of this security is on loan as of 3-31-21. The value of
securities on loan amounted to $2,778,256.(C) The rate shown is the annualized seven-day yield as of 3-31-21.(D) Investment is an affiliate of the fund, the advisor and/or subadvisor.
This security represents the investment of cash collateral received forsecurities lending.
* Yield represents either the annualized yield at the date of purchase,the stated coupon rate or, for floating rate securities, the rate at periodend.
Active Bond TrustShares orPrincipalAmount Value
U.S. GOVERNMENT AND AGENCYOBLIGATIONS –31.3%U.S. Government –9.1%U.S. Treasury Bonds
1.250%, 05/15/2050 $ 2,000,000 $ 1,509,297
Active Bond Trust (continued)Shares orPrincipalAmount Value
U.S. GOVERNMENT AND AGENCYOBLIGATIONS (continued)U.S. Government (continued)U.S. Treasury Notes
0.250%, 03/15/2024 $ 615,000 $ 613,3660.750%, 01/31/2026 513,000 508,551
6
John Hancock Variable Insurance TrustPortfolio of Investments — March 31, 2021 (unaudited) (showing percentage of total net assets)
1.625%, 11/15/2050 12,969,000 10,806,8252.500%, 02/15/2045 12,428,000 12,687,2402.750%, 11/15/2042 5,650,000 6,054,7702.875%, 05/15/2049 3,000,000 3,294,3753.000%, 02/15/2047 3,420,000 3,827,7283.125%, 11/15/2041 3,886,000 4,425,638
1.125%, 02/15/2031 8,232,000 7,777,9542.375%, 05/15/2027 6,000,000 6,412,734
2.875%, 08/15/2028 7,000,000 7,699,453
65,617,931
Active Bond Trust (continued)Shares orPrincipalAmount Value
U.S. GOVERNMENT AND AGENCYOBLIGATIONS (continued)U.S. Government Agency – 22.2%Federal Home Loan Mortgage Corp.
2.500%, 08/01/2050 $ 301,220 $ 310,7093.000%, 03/01/2043 to 01/01/2050 13,733,281 14,472,6483.500%, 10/01/2046 to 11/01/2048 9,668,164 10,404,5364.000%, 01/01/2041 to 08/01/2048 1,064,310 1,160,2044.500%, 09/01/2023 to 10/01/2041 1,627,738 1,827,457
Federal National MortgageAssociation
2.000%, TBA (A) 7,909,000 7,890,4152.000%, 09/01/2050 to 10/01/2050 7,932,839 7,934,3002.372%, (6 month LIBOR +
2.122%), 07/01/2033 (B) 17,279 17,9472.500%, TBA (A) 7,163,000 7,349,6292.500%, 09/01/2050 1,055,860 1,089,9462.504%, (12 month LIBOR +
1.608%), 08/01/2034 (B) 222,886 231,1513.000%, TBA (A) 26,250,000 27,343,0793.000%, 01/01/2043 to 11/01/2049 12,617,306 13,300,6283.500%, TBA (A) 25,000,000 26,410,1483.500%, 06/01/2042 to 09/01/2049 9,007,527 9,715,3284.000%, TBA (A) 16,000,000 17,171,2484.000%, 10/01/2025 to 11/01/2045 4,751,650 5,223,3174.500%, 05/01/2041 1,365,860 1,536,1105.000%, 01/01/2022 to 02/01/2036 1,404,916 1,593,0445.500%, 09/01/2034 to 01/01/2037 1,779,240 2,055,9926.000%, 05/01/2035 to 02/01/2036 1,382,816 1,620,7057.000%, 09/01/2031 to 06/01/2032 110,121 130,1177.500%, 09/01/2029 to 08/01/2031 24,582 28,609
Government NationalMortgage Association
4.000%, 02/15/2041 1,190,268 1,306,2745.000%, 04/15/2035 198,557 224,037
Active Bond Trust (continued)Shares orPrincipalAmount Value
FOREIGN GOVERNMENT OBLIGATIONS(continued)Qatar (continued)State of Qatar (continued)
5.103%, 04/23/2048 (D) $ 255,000 $ 322,173
781,188Saudi Arabia – 0.1%Kingdom of Saudi Arabia
4.375%, 04/16/2029 (D) 689,000 785,460United Kingdom – 0.0%Government of United Kingdom
6.000%, 12/07/2028 GBP 85,000 163,555
TOTAL FOREIGN GOVERNMENT OBLIGATIONS (Cost$4,620,771) $ 4,794,307
CORPORATE BONDS – 47.8%Communication services – 5.4%Activision Blizzard, Inc.
3.400%, 09/15/2026 $ 49,000 53,560ANGI Group LLC
3.875%, 08/15/2028 (D) 221,000 221,000AT&T, Inc.
2.300%, 06/01/2027 322,000 329,0873.100%, 02/01/2043 1,138,000 1,061,8243.650%, 06/01/2051 147,000 142,1774.350%, 06/15/2045 285,000 311,6657.625%, 04/15/2031 451,000 627,678
C&W Senior Financing DAC6.875%, 09/15/2027 (D) 315,000 335,869
Cable One, Inc.4.000%, 11/15/2030 (D) 126,000 124,639
Charter Communications OperatingLLC
2.800%, 04/01/2031 400,000 394,7554.200%, 03/15/2028 671,000 739,6344.800%, 03/01/2050 715,000 766,991
7
John Hancock Variable Insurance TrustPortfolio of Investments — March 31, 2021 (unaudited) (showing percentage of total net assets)
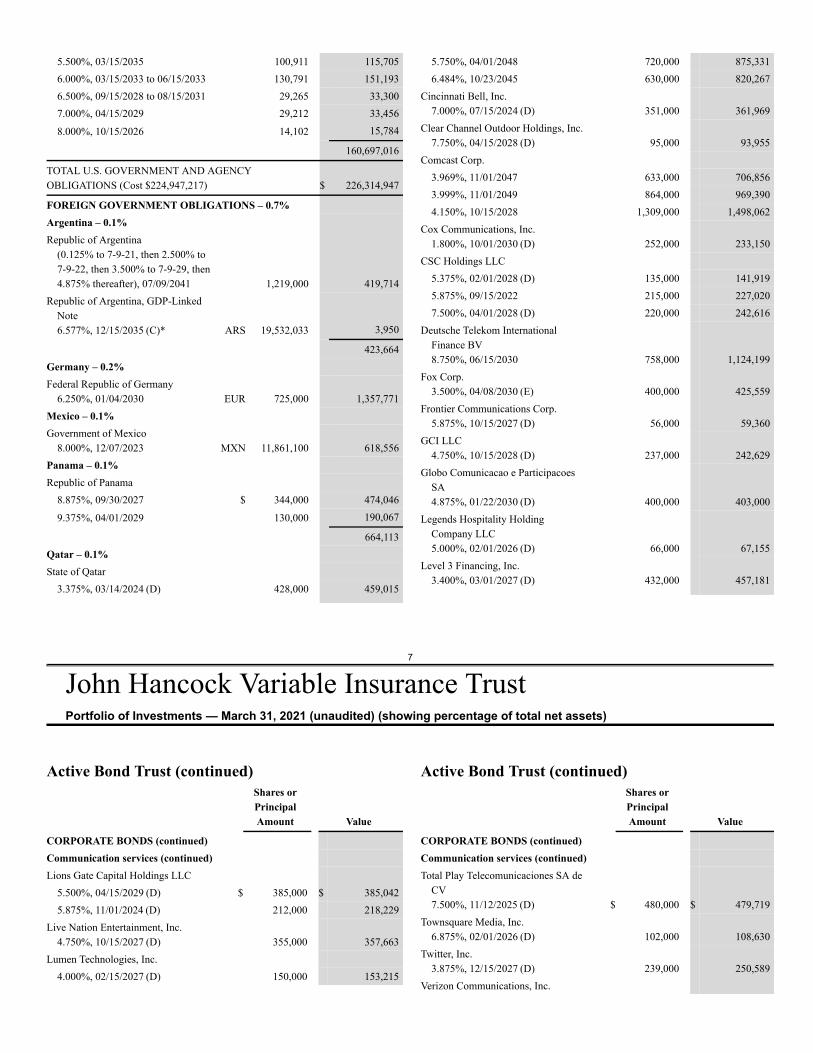
5.500%, 03/15/2035 100,911 115,7056.000%, 03/15/2033 to 06/15/2033 130,791 151,1936.500%, 09/15/2028 to 08/15/2031 29,265 33,3007.000%, 04/15/2029 29,212 33,456
8.000%, 10/15/2026 14,102 15,784
160,697,016
TOTAL U.S. GOVERNMENT AND AGENCYOBLIGATIONS (Cost $224,947,217) $ 226,314,947
FOREIGN GOVERNMENT OBLIGATIONS – 0.7%Argentina – 0.1%Republic of Argentina
(0.125% to 7-9-21, then 2.500% to7-9-22, then 3.500% to 7-9-29, then4.875% thereafter), 07/09/2041 1,219,000 419,714
Republic of Argentina, GDP-LinkedNote6.577%, 12/15/2035 (C)* ARS 19,532,033 3,950
423,664Germany – 0.2%Federal Republic of Germany
6.250%, 01/04/2030 EUR 725,000 1,357,771Mexico – 0.1%Government of Mexico
8.000%, 12/07/2023 MXN 11,861,100 618,556Panama – 0.1%Republic of Panama
8.875%, 09/30/2027 $ 344,000 474,046
9.375%, 04/01/2029 130,000 190,067
664,113Qatar – 0.1%State of Qatar
3.375%, 03/14/2024 (D) 428,000 459,015
5.750%, 04/01/2048 720,000 875,3316.484%, 10/23/2045 630,000 820,267
Cincinnati Bell, Inc.7.000%, 07/15/2024 (D) 351,000 361,969
Clear Channel Outdoor Holdings, Inc.7.750%, 04/15/2028 (D) 95,000 93,955
Comcast Corp.3.969%, 11/01/2047 633,000 706,8563.999%, 11/01/2049 864,000 969,3904.150%, 10/15/2028 1,309,000 1,498,062
Cox Communications, Inc.1.800%, 10/01/2030 (D) 252,000 233,150
CSC Holdings LLC5.375%, 02/01/2028 (D) 135,000 141,9195.875%, 09/15/2022 215,000 227,0207.500%, 04/01/2028 (D) 220,000 242,616
Deutsche Telekom InternationalFinance BV8.750%, 06/15/2030 758,000 1,124,199
Fox Corp.3.500%, 04/08/2030 (E) 400,000 425,559
Frontier Communications Corp.5.875%, 10/15/2027 (D) 56,000 59,360
GCI LLC4.750%, 10/15/2028 (D) 237,000 242,629
Globo Comunicacao e ParticipacoesSA4.875%, 01/22/2030 (D) 400,000 403,000
Legends Hospitality HoldingCompany LLC5.000%, 02/01/2026 (D) 66,000 67,155
Level 3 Financing, Inc.3.400%, 03/01/2027 (D) 432,000 457,181
Active Bond Trust (continued)Shares orPrincipalAmount Value
CORPORATE BONDS (continued)Communication services (continued)Lions Gate Capital Holdings LLC
5.500%, 04/15/2029 (D) $ 385,000 $ 385,0425.875%, 11/01/2024 (D) 212,000 218,229
Live Nation Entertainment, Inc.4.750%, 10/15/2027 (D) 355,000 357,663
Lumen Technologies, Inc.4.000%, 02/15/2027 (D) 150,000 153,215
Active Bond Trust (continued)Shares orPrincipalAmount Value
CORPORATE BONDS (continued)Communication services (continued)Total Play Telecomunicaciones SA de
CV7.500%, 11/12/2025 (D) $ 480,000 $ 479,719
Townsquare Media, Inc.6.875%, 02/01/2026 (D) 102,000 108,630
Twitter, Inc.3.875%, 12/15/2027 (D) 239,000 250,589
Verizon Communications, Inc.
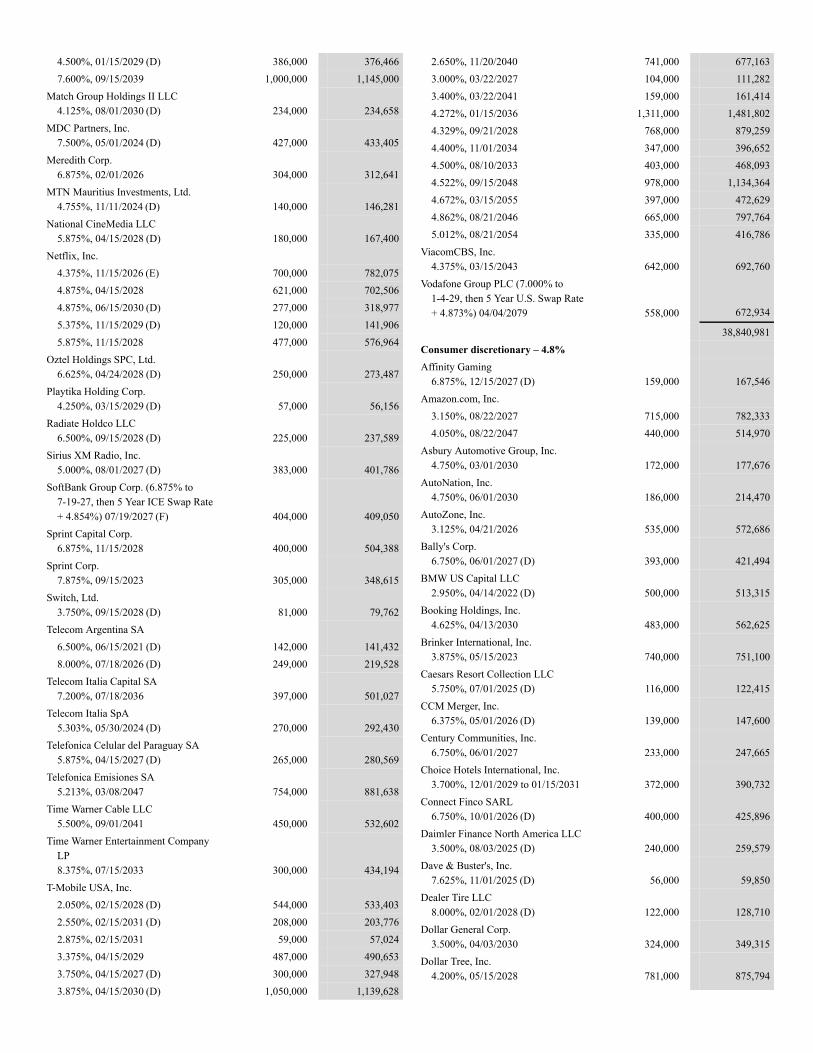
4.500%, 01/15/2029 (D) 386,000 376,4667.600%, 09/15/2039 1,000,000 1,145,000
Match Group Holdings II LLC4.125%, 08/01/2030 (D) 234,000 234,658
MDC Partners, Inc.7.500%, 05/01/2024 (D) 427,000 433,405
Meredith Corp.6.875%, 02/01/2026 304,000 312,641
MTN Mauritius Investments, Ltd.4.755%, 11/11/2024 (D) 140,000 146,281
National CineMedia LLC5.875%, 04/15/2028 (D) 180,000 167,400
Netflix, Inc.4.375%, 11/15/2026 (E) 700,000 782,0754.875%, 04/15/2028 621,000 702,5064.875%, 06/15/2030 (D) 277,000 318,9775.375%, 11/15/2029 (D) 120,000 141,9065.875%, 11/15/2028 477,000 576,964
Oztel Holdings SPC, Ltd.6.625%, 04/24/2028 (D) 250,000 273,487
Playtika Holding Corp.4.250%, 03/15/2029 (D) 57,000 56,156
Radiate Holdco LLC6.500%, 09/15/2028 (D) 225,000 237,589
Sirius XM Radio, Inc.5.000%, 08/01/2027 (D) 383,000 401,786
SoftBank Group Corp. (6.875% to7-19-27, then 5 Year ICE Swap Rate+ 4.854%) 07/19/2027 (F) 404,000 409,050
Sprint Capital Corp.6.875%, 11/15/2028 400,000 504,388
Sprint Corp.7.875%, 09/15/2023 305,000 348,615
Switch, Ltd.3.750%, 09/15/2028 (D) 81,000 79,762
Telecom Argentina SA6.500%, 06/15/2021 (D) 142,000 141,4328.000%, 07/18/2026 (D) 249,000 219,528
Telecom Italia Capital SA7.200%, 07/18/2036 397,000 501,027
Telecom Italia SpA5.303%, 05/30/2024 (D) 270,000 292,430
Telefonica Celular del Paraguay SA5.875%, 04/15/2027 (D) 265,000 280,569
Telefonica Emisiones SA5.213%, 03/08/2047 754,000 881,638
Time Warner Cable LLC5.500%, 09/01/2041 450,000 532,602
Time Warner Entertainment CompanyLP8.375%, 07/15/2033 300,000 434,194
T-Mobile USA, Inc.2.050%, 02/15/2028 (D) 544,000 533,4032.550%, 02/15/2031 (D) 208,000 203,7762.875%, 02/15/2031 59,000 57,0243.375%, 04/15/2029 487,000 490,6533.750%, 04/15/2027 (D) 300,000 327,9483.875%, 04/15/2030 (D) 1,050,000 1,139,628
2.650%, 11/20/2040 741,000 677,1633.000%, 03/22/2027 104,000 111,2823.400%, 03/22/2041 159,000 161,4144.272%, 01/15/2036 1,311,000 1,481,8024.329%, 09/21/2028 768,000 879,2594.400%, 11/01/2034 347,000 396,6524.500%, 08/10/2033 403,000 468,0934.522%, 09/15/2048 978,000 1,134,3644.672%, 03/15/2055 397,000 472,6294.862%, 08/21/2046 665,000 797,7645.012%, 08/21/2054 335,000 416,786
ViacomCBS, Inc.4.375%, 03/15/2043 642,000 692,760
Vodafone Group PLC (7.000% to1-4-29, then 5 Year U.S. Swap Rate+ 4.873%) 04/04/2079 558,000 672,934
38,840,981Consumer discretionary – 4.8%Affinity Gaming
6.875%, 12/15/2027 (D) 159,000 167,546Amazon.com, Inc.
3.150%, 08/22/2027 715,000 782,3334.050%, 08/22/2047 440,000 514,970
Asbury Automotive Group, Inc.4.750%, 03/01/2030 172,000 177,676
AutoNation, Inc.4.750%, 06/01/2030 186,000 214,470
AutoZone, Inc.3.125%, 04/21/2026 535,000 572,686
Bally's Corp.6.750%, 06/01/2027 (D) 393,000 421,494
BMW US Capital LLC2.950%, 04/14/2022 (D) 500,000 513,315
Booking Holdings, Inc.4.625%, 04/13/2030 483,000 562,625
Brinker International, Inc.3.875%, 05/15/2023 740,000 751,100
Caesars Resort Collection LLC5.750%, 07/01/2025 (D) 116,000 122,415
CCM Merger, Inc.6.375%, 05/01/2026 (D) 139,000 147,600
Century Communities, Inc.6.750%, 06/01/2027 233,000 247,665
Choice Hotels International, Inc.3.700%, 12/01/2029 to 01/15/2031 372,000 390,732
Connect Finco SARL6.750%, 10/01/2026 (D) 400,000 425,896
Daimler Finance North America LLC3.500%, 08/03/2025 (D) 240,000 259,579
Dave & Buster's, Inc.7.625%, 11/01/2025 (D) 56,000 59,850
Dealer Tire LLC8.000%, 02/01/2028 (D) 122,000 128,710
Dollar General Corp.3.500%, 04/03/2030 324,000 349,315
Dollar Tree, Inc.4.200%, 05/15/2028 781,000 875,794
8
John Hancock Variable Insurance TrustPortfolio of Investments — March 31, 2021 (unaudited) (showing percentage of total net assets)
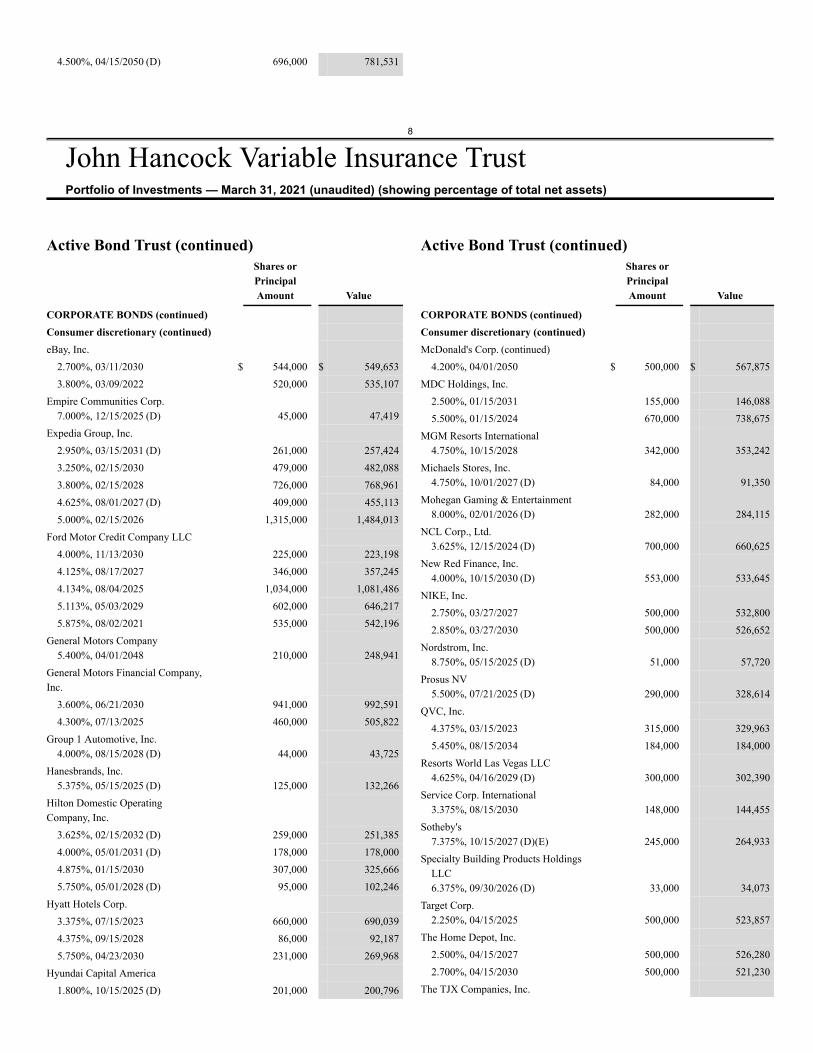
4.500%, 04/15/2050 (D) 696,000 781,531
Active Bond Trust (continued)Shares orPrincipalAmount Value
CORPORATE BONDS (continued)Consumer discretionary (continued)eBay, Inc.
2.700%, 03/11/2030 $ 544,000 $ 549,6533.800%, 03/09/2022 520,000 535,107
Empire Communities Corp.7.000%, 12/15/2025 (D) 45,000 47,419
Expedia Group, Inc.2.950%, 03/15/2031 (D) 261,000 257,4243.250%, 02/15/2030 479,000 482,0883.800%, 02/15/2028 726,000 768,9614.625%, 08/01/2027 (D) 409,000 455,1135.000%, 02/15/2026 1,315,000 1,484,013
Ford Motor Credit Company LLC4.000%, 11/13/2030 225,000 223,1984.125%, 08/17/2027 346,000 357,2454.134%, 08/04/2025 1,034,000 1,081,4865.113%, 05/03/2029 602,000 646,2175.875%, 08/02/2021 535,000 542,196
General Motors Company5.400%, 04/01/2048 210,000 248,941
General Motors Financial Company,Inc.
3.600%, 06/21/2030 941,000 992,5914.300%, 07/13/2025 460,000 505,822
Group 1 Automotive, Inc.4.000%, 08/15/2028 (D) 44,000 43,725
Hanesbrands, Inc.5.375%, 05/15/2025 (D) 125,000 132,266
Hilton Domestic OperatingCompany, Inc.
3.625%, 02/15/2032 (D) 259,000 251,3854.000%, 05/01/2031 (D) 178,000 178,0004.875%, 01/15/2030 307,000 325,6665.750%, 05/01/2028 (D) 95,000 102,246
Hyatt Hotels Corp.3.375%, 07/15/2023 660,000 690,0394.375%, 09/15/2028 86,000 92,1875.750%, 04/23/2030 231,000 269,968
Hyundai Capital America1.800%, 10/15/2025 (D) 201,000 200,796
Active Bond Trust (continued)Shares orPrincipalAmount Value
CORPORATE BONDS (continued)Consumer discretionary (continued)McDonald's Corp. (continued)
4.200%, 04/01/2050 $ 500,000 $ 567,875MDC Holdings, Inc.
2.500%, 01/15/2031 155,000 146,0885.500%, 01/15/2024 670,000 738,675
MGM Resorts International4.750%, 10/15/2028 342,000 353,242
Michaels Stores, Inc.4.750%, 10/01/2027 (D) 84,000 91,350
Mohegan Gaming & Entertainment8.000%, 02/01/2026 (D) 282,000 284,115
NCL Corp., Ltd.3.625%, 12/15/2024 (D) 700,000 660,625
New Red Finance, Inc.4.000%, 10/15/2030 (D) 553,000 533,645
NIKE, Inc.2.750%, 03/27/2027 500,000 532,8002.850%, 03/27/2030 500,000 526,652
Nordstrom, Inc.8.750%, 05/15/2025 (D) 51,000 57,720
Prosus NV5.500%, 07/21/2025 (D) 290,000 328,614
QVC, Inc.4.375%, 03/15/2023 315,000 329,9635.450%, 08/15/2034 184,000 184,000
Resorts World Las Vegas LLC4.625%, 04/16/2029 (D) 300,000 302,390
Service Corp. International3.375%, 08/15/2030 148,000 144,455
Sotheby's7.375%, 10/15/2027 (D)(E) 245,000 264,933
Specialty Building Products HoldingsLLC6.375%, 09/30/2026 (D) 33,000 34,073
Target Corp.2.250%, 04/15/2025 500,000 523,857
The Home Depot, Inc.2.500%, 04/15/2027 500,000 526,2802.700%, 04/15/2030 500,000 521,230
The TJX Companies, Inc.
9
John Hancock Variable Insurance TrustPortfolio of Investments — March 31, 2021 (unaudited) (showing percentage of total net assets)
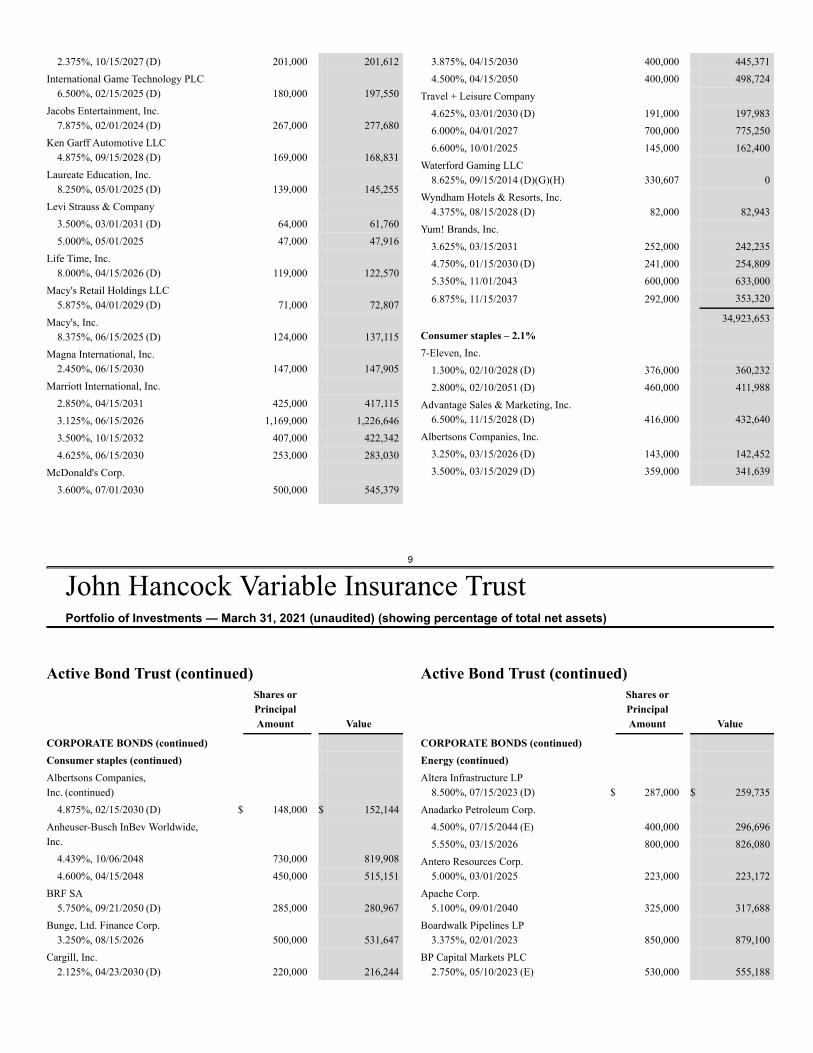
2.375%, 10/15/2027 (D) 201,000 201,612International Game Technology PLC
6.500%, 02/15/2025 (D) 180,000 197,550Jacobs Entertainment, Inc.
7.875%, 02/01/2024 (D) 267,000 277,680Ken Garff Automotive LLC
4.875%, 09/15/2028 (D) 169,000 168,831Laureate Education, Inc.
8.250%, 05/01/2025 (D) 139,000 145,255Levi Strauss & Company
3.500%, 03/01/2031 (D) 64,000 61,7605.000%, 05/01/2025 47,000 47,916
Life Time, Inc.8.000%, 04/15/2026 (D) 119,000 122,570
Macy's Retail Holdings LLC5.875%, 04/01/2029 (D) 71,000 72,807
Macy's, Inc.8.375%, 06/15/2025 (D) 124,000 137,115
Magna International, Inc.2.450%, 06/15/2030 147,000 147,905
Marriott International, Inc.2.850%, 04/15/2031 425,000 417,1153.125%, 06/15/2026 1,169,000 1,226,6463.500%, 10/15/2032 407,000 422,3424.625%, 06/15/2030 253,000 283,030
McDonald's Corp.3.600%, 07/01/2030 500,000 545,379
3.875%, 04/15/2030 400,000 445,3714.500%, 04/15/2050 400,000 498,724
Travel + Leisure Company4.625%, 03/01/2030 (D) 191,000 197,9836.000%, 04/01/2027 700,000 775,2506.600%, 10/01/2025 145,000 162,400
Waterford Gaming LLC8.625%, 09/15/2014 (D)(G)(H) 330,607 0
Wyndham Hotels & Resorts, Inc.4.375%, 08/15/2028 (D) 82,000 82,943
Yum! Brands, Inc.3.625%, 03/15/2031 252,000 242,2354.750%, 01/15/2030 (D) 241,000 254,8095.350%, 11/01/2043 600,000 633,000
6.875%, 11/15/2037 292,000 353,320
34,923,653Consumer staples – 2.1%7-Eleven, Inc.
1.300%, 02/10/2028 (D) 376,000 360,2322.800%, 02/10/2051 (D) 460,000 411,988
Advantage Sales & Marketing, Inc.6.500%, 11/15/2028 (D) 416,000 432,640
Albertsons Companies, Inc.3.250%, 03/15/2026 (D) 143,000 142,4523.500%, 03/15/2029 (D) 359,000 341,639
Active Bond Trust (continued)Shares orPrincipalAmount Value
CORPORATE BONDS (continued)Consumer staples (continued)Albertsons Companies,Inc. (continued)
4.875%, 02/15/2030 (D) $ 148,000 $ 152,144Anheuser-Busch InBev Worldwide,Inc.
4.439%, 10/06/2048 730,000 819,9084.600%, 04/15/2048 450,000 515,151
BRF SA5.750%, 09/21/2050 (D) 285,000 280,967
Bunge, Ltd. Finance Corp.3.250%, 08/15/2026 500,000 531,647
Cargill, Inc.2.125%, 04/23/2030 (D) 220,000 216,244
Active Bond Trust (continued)Shares orPrincipalAmount Value
CORPORATE BONDS (continued)Energy (continued)Altera Infrastructure LP
8.500%, 07/15/2023 (D) $ 287,000 $ 259,735Anadarko Petroleum Corp.
4.500%, 07/15/2044 (E) 400,000 296,6965.550%, 03/15/2026 800,000 826,080
Antero Resources Corp.5.000%, 03/01/2025 223,000 223,172
Apache Corp.5.100%, 09/01/2040 325,000 317,688
Boardwalk Pipelines LP3.375%, 02/01/2023 850,000 879,100
BP Capital Markets PLC2.750%, 05/10/2023 (E) 530,000 555,188
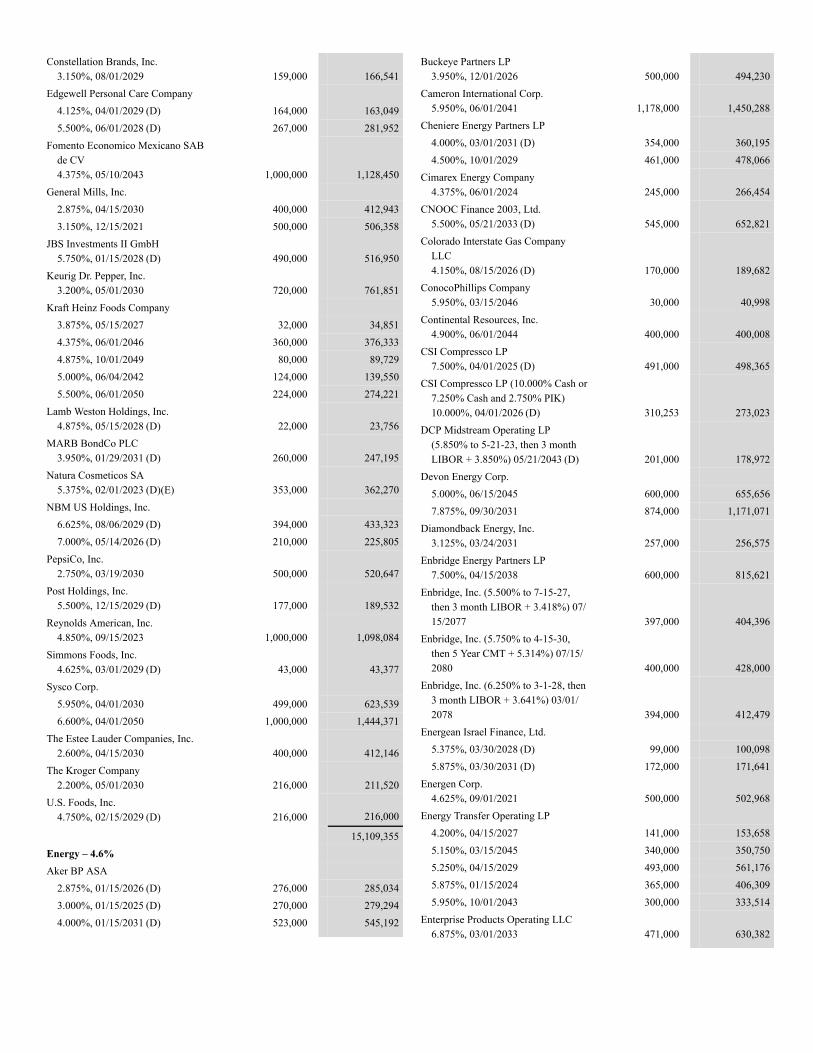
Constellation Brands, Inc.3.150%, 08/01/2029 159,000 166,541
Edgewell Personal Care Company4.125%, 04/01/2029 (D) 164,000 163,0495.500%, 06/01/2028 (D) 267,000 281,952
Fomento Economico Mexicano SABde CV4.375%, 05/10/2043 1,000,000 1,128,450
General Mills, Inc.2.875%, 04/15/2030 400,000 412,9433.150%, 12/15/2021 500,000 506,358
JBS Investments II GmbH5.750%, 01/15/2028 (D) 490,000 516,950
Keurig Dr. Pepper, Inc.3.200%, 05/01/2030 720,000 761,851
Kraft Heinz Foods Company3.875%, 05/15/2027 32,000 34,8514.375%, 06/01/2046 360,000 376,3334.875%, 10/01/2049 80,000 89,7295.000%, 06/04/2042 124,000 139,5505.500%, 06/01/2050 224,000 274,221
Lamb Weston Holdings, Inc.4.875%, 05/15/2028 (D) 22,000 23,756
MARB BondCo PLC3.950%, 01/29/2031 (D) 260,000 247,195
Natura Cosmeticos SA5.375%, 02/01/2023 (D)(E) 353,000 362,270
NBM US Holdings, Inc.6.625%, 08/06/2029 (D) 394,000 433,3237.000%, 05/14/2026 (D) 210,000 225,805
PepsiCo, Inc.2.750%, 03/19/2030 500,000 520,647
Post Holdings, Inc.5.500%, 12/15/2029 (D) 177,000 189,532
Reynolds American, Inc.4.850%, 09/15/2023 1,000,000 1,098,084
Simmons Foods, Inc.4.625%, 03/01/2029 (D) 43,000 43,377
Sysco Corp.5.950%, 04/01/2030 499,000 623,5396.600%, 04/01/2050 1,000,000 1,444,371
The Estee Lauder Companies, Inc.2.600%, 04/15/2030 400,000 412,146
The Kroger Company2.200%, 05/01/2030 216,000 211,520
U.S. Foods, Inc.4.750%, 02/15/2029 (D) 216,000 216,000
15,109,355Energy – 4.6%Aker BP ASA
2.875%, 01/15/2026 (D) 276,000 285,0343.000%, 01/15/2025 (D) 270,000 279,2944.000%, 01/15/2031 (D) 523,000 545,192
Buckeye Partners LP3.950%, 12/01/2026 500,000 494,230
Cameron International Corp.5.950%, 06/01/2041 1,178,000 1,450,288
Cheniere Energy Partners LP4.000%, 03/01/2031 (D) 354,000 360,1954.500%, 10/01/2029 461,000 478,066
Cimarex Energy Company4.375%, 06/01/2024 245,000 266,454
CNOOC Finance 2003, Ltd.5.500%, 05/21/2033 (D) 545,000 652,821
Colorado Interstate Gas CompanyLLC4.150%, 08/15/2026 (D) 170,000 189,682
ConocoPhillips Company5.950%, 03/15/2046 30,000 40,998
Continental Resources, Inc.4.900%, 06/01/2044 400,000 400,008
CSI Compressco LP7.500%, 04/01/2025 (D) 491,000 498,365
CSI Compressco LP (10.000% Cash or7.250% Cash and 2.750% PIK)10.000%, 04/01/2026 (D) 310,253 273,023
DCP Midstream Operating LP(5.850% to 5-21-23, then 3 monthLIBOR + 3.850%) 05/21/2043 (D) 201,000 178,972
Devon Energy Corp.5.000%, 06/15/2045 600,000 655,6567.875%, 09/30/2031 874,000 1,171,071
Diamondback Energy, Inc.3.125%, 03/24/2031 257,000 256,575
Enbridge Energy Partners LP7.500%, 04/15/2038 600,000 815,621
Enbridge, Inc. (5.500% to 7-15-27,then 3 month LIBOR + 3.418%) 07/15/2077 397,000 404,396
Enbridge, Inc. (5.750% to 4-15-30,then 5 Year CMT + 5.314%) 07/15/2080 400,000 428,000
Enbridge, Inc. (6.250% to 3-1-28, then3 month LIBOR + 3.641%) 03/01/2078 394,000 412,479
Energean Israel Finance, Ltd.5.375%, 03/30/2028 (D) 99,000 100,0985.875%, 03/30/2031 (D) 172,000 171,641
Energen Corp.4.625%, 09/01/2021 500,000 502,968
Energy Transfer Operating LP4.200%, 04/15/2027 141,000 153,6585.150%, 03/15/2045 340,000 350,7505.250%, 04/15/2029 493,000 561,1765.875%, 01/15/2024 365,000 406,3095.950%, 10/01/2043 300,000 333,514
Enterprise Products Operating LLC6.875%, 03/01/2033 471,000 630,382
10
John Hancock Variable Insurance TrustPortfolio of Investments — March 31, 2021 (unaudited) (showing percentage of total net assets)
Active Bond Trust (continued)Shares orPrincipalAmount Value
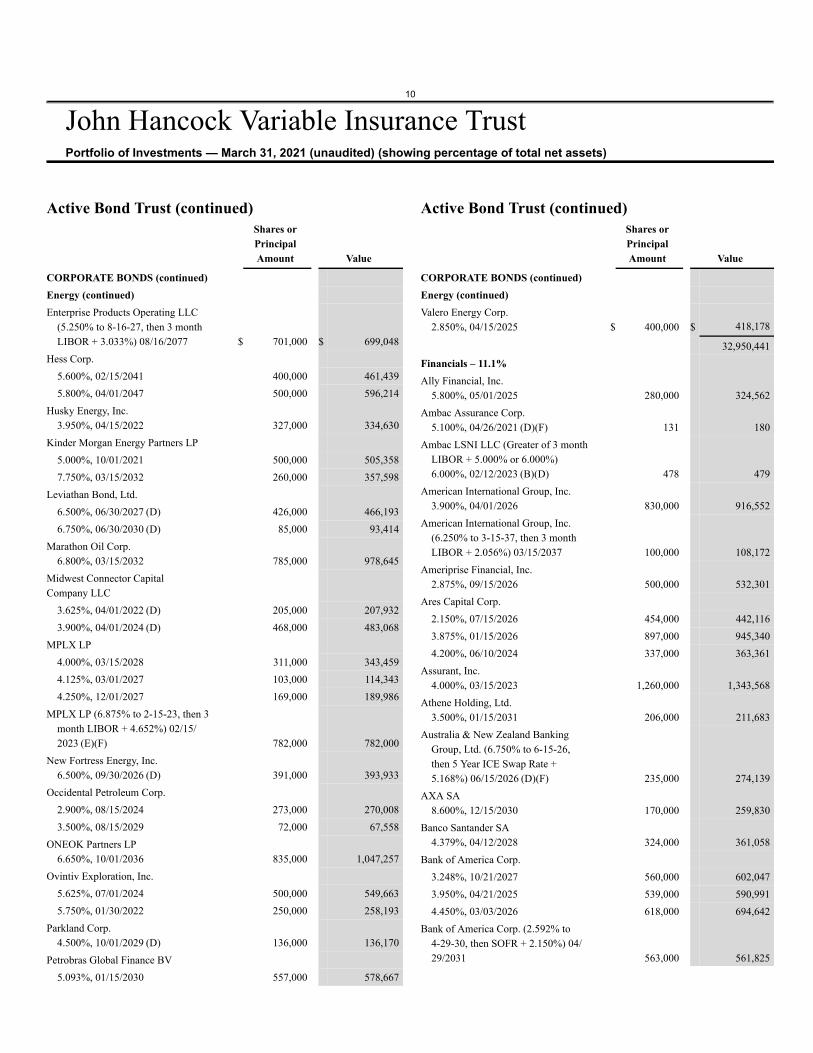
CORPORATE BONDS (continued)Energy (continued)Enterprise Products Operating LLC
(5.250% to 8-16-27, then 3 monthLIBOR + 3.033%) 08/16/2077 $ 701,000 $ 699,048
Hess Corp.5.600%, 02/15/2041 400,000 461,4395.800%, 04/01/2047 500,000 596,214
Husky Energy, Inc.3.950%, 04/15/2022 327,000 334,630
Kinder Morgan Energy Partners LP5.000%, 10/01/2021 500,000 505,3587.750%, 03/15/2032 260,000 357,598
Leviathan Bond, Ltd.6.500%, 06/30/2027 (D) 426,000 466,1936.750%, 06/30/2030 (D) 85,000 93,414
Marathon Oil Corp.6.800%, 03/15/2032 785,000 978,645
Midwest Connector CapitalCompany LLC
3.625%, 04/01/2022 (D) 205,000 207,9323.900%, 04/01/2024 (D) 468,000 483,068
MPLX LP4.000%, 03/15/2028 311,000 343,4594.125%, 03/01/2027 103,000 114,3434.250%, 12/01/2027 169,000 189,986
MPLX LP (6.875% to 2-15-23, then 3month LIBOR + 4.652%) 02/15/2023 (E)(F) 782,000 782,000
New Fortress Energy, Inc.6.500%, 09/30/2026 (D) 391,000 393,933
Occidental Petroleum Corp.2.900%, 08/15/2024 273,000 270,0083.500%, 08/15/2029 72,000 67,558
ONEOK Partners LP6.650%, 10/01/2036 835,000 1,047,257
Ovintiv Exploration, Inc.5.625%, 07/01/2024 500,000 549,6635.750%, 01/30/2022 250,000 258,193
Parkland Corp.4.500%, 10/01/2029 (D) 136,000 136,170
Petrobras Global Finance BV5.093%, 01/15/2030 557,000 578,667
Active Bond Trust (continued)Shares orPrincipalAmount Value
CORPORATE BONDS (continued)Energy (continued)Valero Energy Corp.
2.850%, 04/15/2025 $ 400,000 $ 418,178
32,950,441Financials – 11.1%Ally Financial, Inc.
5.800%, 05/01/2025 280,000 324,562Ambac Assurance Corp.
5.100%, 04/26/2021 (D)(F) 131 180Ambac LSNI LLC (Greater of 3 month
LIBOR + 5.000% or 6.000%)6.000%, 02/12/2023 (B)(D) 478 479
American International Group, Inc.3.900%, 04/01/2026 830,000 916,552
American International Group, Inc.(6.250% to 3-15-37, then 3 monthLIBOR + 2.056%) 03/15/2037 100,000 108,172
Ameriprise Financial, Inc.2.875%, 09/15/2026 500,000 532,301
Ares Capital Corp.2.150%, 07/15/2026 454,000 442,1163.875%, 01/15/2026 897,000 945,3404.200%, 06/10/2024 337,000 363,361
Assurant, Inc.4.000%, 03/15/2023 1,260,000 1,343,568
Athene Holding, Ltd.3.500%, 01/15/2031 206,000 211,683
Australia & New Zealand BankingGroup, Ltd. (6.750% to 6-15-26,then 5 Year ICE Swap Rate +5.168%) 06/15/2026 (D)(F) 235,000 274,139
AXA SA8.600%, 12/15/2030 170,000 259,830
Banco Santander SA4.379%, 04/12/2028 324,000 361,058
Bank of America Corp.3.248%, 10/21/2027 560,000 602,0473.950%, 04/21/2025 539,000 590,9914.450%, 03/03/2026 618,000 694,642
Bank of America Corp. (2.592% to4-29-30, then SOFR + 2.150%) 04/29/2031 563,000 561,825
11
John Hancock Variable Insurance TrustPortfolio of Investments — March 31, 2021 (unaudited) (showing percentage of total net assets)
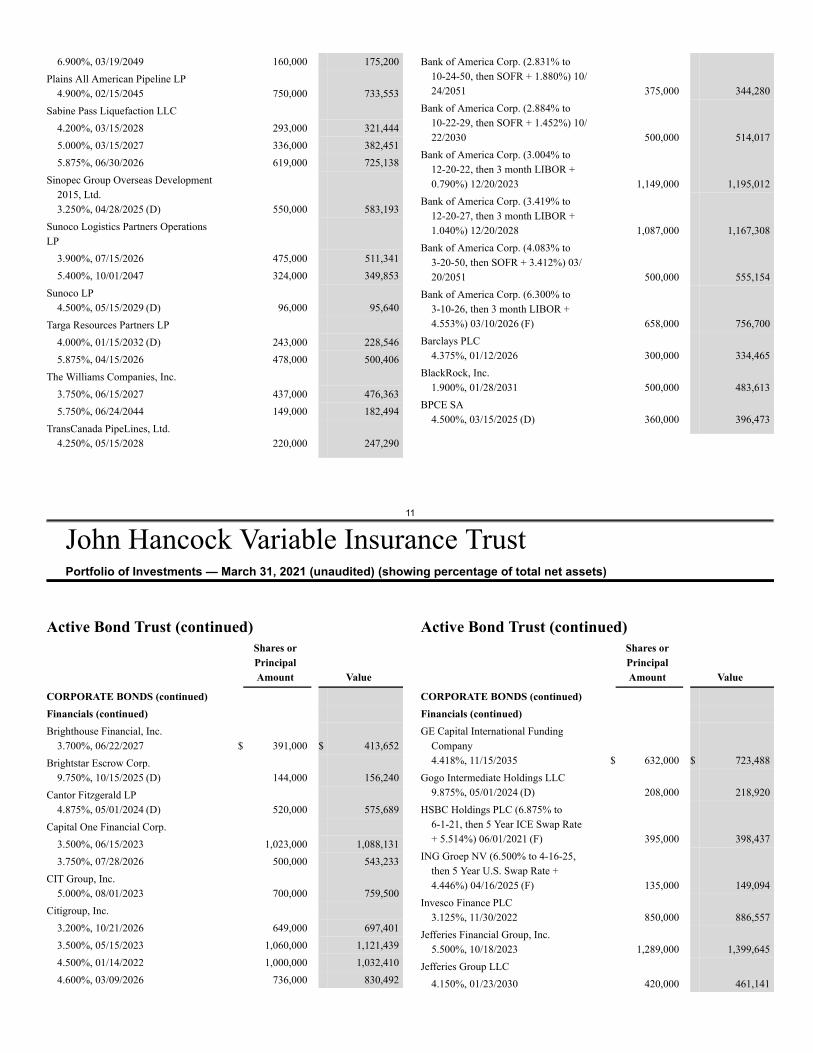
6.900%, 03/19/2049 160,000 175,200Plains All American Pipeline LP
4.900%, 02/15/2045 750,000 733,553Sabine Pass Liquefaction LLC
4.200%, 03/15/2028 293,000 321,4445.000%, 03/15/2027 336,000 382,4515.875%, 06/30/2026 619,000 725,138
Sinopec Group Overseas Development2015, Ltd.3.250%, 04/28/2025 (D) 550,000 583,193
Sunoco Logistics Partners OperationsLP
3.900%, 07/15/2026 475,000 511,3415.400%, 10/01/2047 324,000 349,853
Sunoco LP4.500%, 05/15/2029 (D) 96,000 95,640
Targa Resources Partners LP4.000%, 01/15/2032 (D) 243,000 228,5465.875%, 04/15/2026 478,000 500,406
The Williams Companies, Inc.3.750%, 06/15/2027 437,000 476,3635.750%, 06/24/2044 149,000 182,494
TransCanada PipeLines, Ltd.4.250%, 05/15/2028 220,000 247,290
Bank of America Corp. (2.831% to10-24-50, then SOFR + 1.880%) 10/24/2051 375,000 344,280
Bank of America Corp. (2.884% to10-22-29, then SOFR + 1.452%) 10/22/2030 500,000 514,017
Bank of America Corp. (3.004% to12-20-22, then 3 month LIBOR +0.790%) 12/20/2023 1,149,000 1,195,012
Bank of America Corp. (3.419% to12-20-27, then 3 month LIBOR +1.040%) 12/20/2028 1,087,000 1,167,308
Bank of America Corp. (4.083% to3-20-50, then SOFR + 3.412%) 03/20/2051 500,000 555,154
Bank of America Corp. (6.300% to3-10-26, then 3 month LIBOR +4.553%) 03/10/2026 (F) 658,000 756,700
Barclays PLC4.375%, 01/12/2026 300,000 334,465
BlackRock, Inc.1.900%, 01/28/2031 500,000 483,613
BPCE SA4.500%, 03/15/2025 (D) 360,000 396,473
Active Bond Trust (continued)Shares orPrincipalAmount Value
CORPORATE BONDS (continued)Financials (continued)Brighthouse Financial, Inc.
3.700%, 06/22/2027 $ 391,000 $ 413,652Brightstar Escrow Corp.
9.750%, 10/15/2025 (D) 144,000 156,240Cantor Fitzgerald LP
4.875%, 05/01/2024 (D) 520,000 575,689Capital One Financial Corp.
3.500%, 06/15/2023 1,023,000 1,088,1313.750%, 07/28/2026 500,000 543,233
CIT Group, Inc.5.000%, 08/01/2023 700,000 759,500
Citigroup, Inc.3.200%, 10/21/2026 649,000 697,4013.500%, 05/15/2023 1,060,000 1,121,4394.500%, 01/14/2022 1,000,000 1,032,4104.600%, 03/09/2026 736,000 830,492
Active Bond Trust (continued)Shares orPrincipalAmount Value
CORPORATE BONDS (continued)Financials (continued)GE Capital International Funding
Company4.418%, 11/15/2035 $ 632,000 $ 723,488
Gogo Intermediate Holdings LLC9.875%, 05/01/2024 (D) 208,000 218,920
HSBC Holdings PLC (6.875% to6-1-21, then 5 Year ICE Swap Rate+ 5.514%) 06/01/2021 (F) 395,000 398,437
ING Groep NV (6.500% to 4-16-25,then 5 Year U.S. Swap Rate +4.446%) 04/16/2025 (F) 135,000 149,094
Invesco Finance PLC3.125%, 11/30/2022 850,000 886,557
Jefferies Financial Group, Inc.5.500%, 10/18/2023 1,289,000 1,399,645
Jefferies Group LLC4.150%, 01/23/2030 420,000 461,141
12
John Hancock Variable Insurance TrustPortfolio of Investments — March 31, 2021 (unaudited) (showing percentage of total net assets)
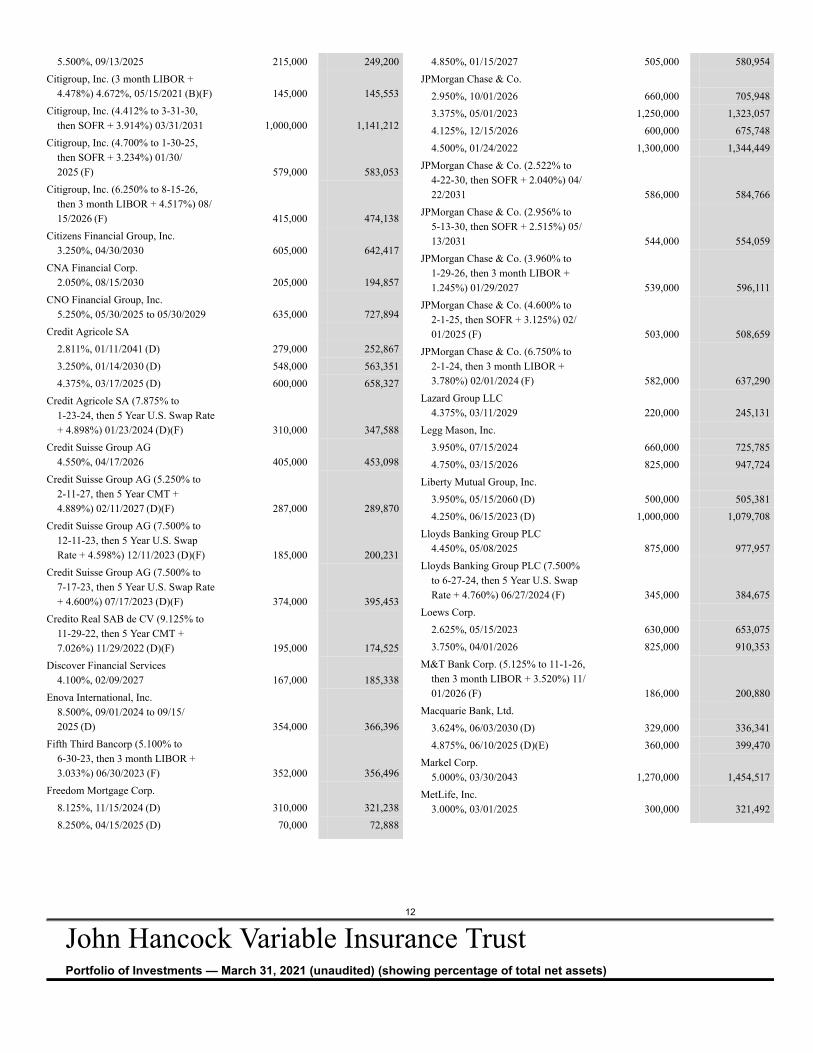
5.500%, 09/13/2025 215,000 249,200Citigroup, Inc. (3 month LIBOR +
4.478%) 4.672%, 05/15/2021 (B)(F) 145,000 145,553Citigroup, Inc. (4.412% to 3-31-30,
then SOFR + 3.914%) 03/31/2031 1,000,000 1,141,212Citigroup, Inc. (4.700% to 1-30-25,
then SOFR + 3.234%) 01/30/2025 (F) 579,000 583,053
Citigroup, Inc. (6.250% to 8-15-26,then 3 month LIBOR + 4.517%) 08/15/2026 (F) 415,000 474,138
Citizens Financial Group, Inc.3.250%, 04/30/2030 605,000 642,417
CNA Financial Corp.2.050%, 08/15/2030 205,000 194,857
CNO Financial Group, Inc.5.250%, 05/30/2025 to 05/30/2029 635,000 727,894
Credit Agricole SA2.811%, 01/11/2041 (D) 279,000 252,8673.250%, 01/14/2030 (D) 548,000 563,3514.375%, 03/17/2025 (D) 600,000 658,327
Credit Agricole SA (7.875% to1-23-24, then 5 Year U.S. Swap Rate+ 4.898%) 01/23/2024 (D)(F) 310,000 347,588
Credit Suisse Group AG4.550%, 04/17/2026 405,000 453,098
Credit Suisse Group AG (5.250% to2-11-27, then 5 Year CMT +4.889%) 02/11/2027 (D)(F) 287,000 289,870
Credit Suisse Group AG (7.500% to12-11-23, then 5 Year U.S. SwapRate + 4.598%) 12/11/2023 (D)(F) 185,000 200,231
Credit Suisse Group AG (7.500% to7-17-23, then 5 Year U.S. Swap Rate+ 4.600%) 07/17/2023 (D)(F) 374,000 395,453
Credito Real SAB de CV (9.125% to11-29-22, then 5 Year CMT +7.026%) 11/29/2022 (D)(F) 195,000 174,525
Discover Financial Services4.100%, 02/09/2027 167,000 185,338
Enova International, Inc.8.500%, 09/01/2024 to 09/15/2025 (D) 354,000 366,396
Fifth Third Bancorp (5.100% to6-30-23, then 3 month LIBOR +3.033%) 06/30/2023 (F) 352,000 356,496
Freedom Mortgage Corp.8.125%, 11/15/2024 (D) 310,000 321,2388.250%, 04/15/2025 (D) 70,000 72,888
4.850%, 01/15/2027 505,000 580,954JPMorgan Chase & Co.
2.950%, 10/01/2026 660,000 705,9483.375%, 05/01/2023 1,250,000 1,323,0574.125%, 12/15/2026 600,000 675,7484.500%, 01/24/2022 1,300,000 1,344,449
JPMorgan Chase & Co. (2.522% to4-22-30, then SOFR + 2.040%) 04/22/2031 586,000 584,766
JPMorgan Chase & Co. (2.956% to5-13-30, then SOFR + 2.515%) 05/13/2031 544,000 554,059
JPMorgan Chase & Co. (3.960% to1-29-26, then 3 month LIBOR +1.245%) 01/29/2027 539,000 596,111
JPMorgan Chase & Co. (4.600% to2-1-25, then SOFR + 3.125%) 02/01/2025 (F) 503,000 508,659
JPMorgan Chase & Co. (6.750% to2-1-24, then 3 month LIBOR +3.780%) 02/01/2024 (F) 582,000 637,290
Lazard Group LLC4.375%, 03/11/2029 220,000 245,131
Legg Mason, Inc.3.950%, 07/15/2024 660,000 725,7854.750%, 03/15/2026 825,000 947,724
Liberty Mutual Group, Inc.3.950%, 05/15/2060 (D) 500,000 505,3814.250%, 06/15/2023 (D) 1,000,000 1,079,708
Lloyds Banking Group PLC4.450%, 05/08/2025 875,000 977,957
Lloyds Banking Group PLC (7.500%to 6-27-24, then 5 Year U.S. SwapRate + 4.760%) 06/27/2024 (F) 345,000 384,675
Loews Corp.2.625%, 05/15/2023 630,000 653,0753.750%, 04/01/2026 825,000 910,353
M&T Bank Corp. (5.125% to 11-1-26,then 3 month LIBOR + 3.520%) 11/01/2026 (F) 186,000 200,880
Macquarie Bank, Ltd.3.624%, 06/03/2030 (D) 329,000 336,3414.875%, 06/10/2025 (D)(E) 360,000 399,470
Markel Corp.5.000%, 03/30/2043 1,270,000 1,454,517
MetLife, Inc.3.000%, 03/01/2025 300,000 321,492
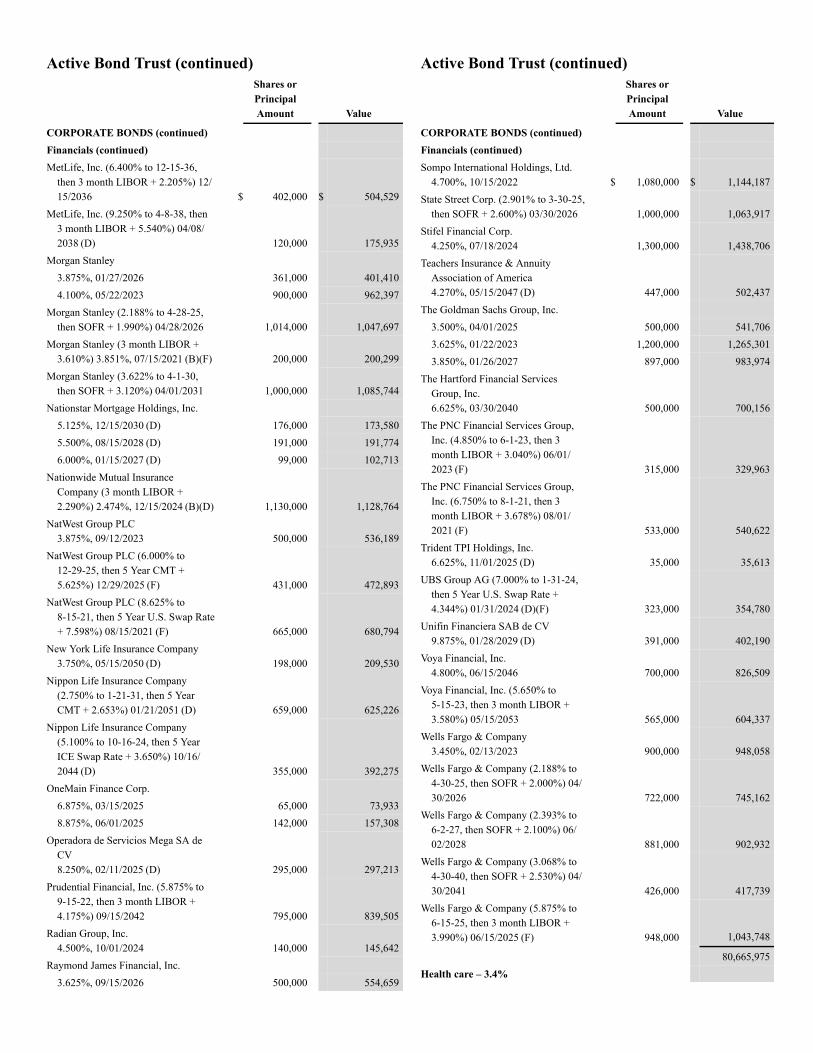
Active Bond Trust (continued)Shares orPrincipalAmount Value
CORPORATE BONDS (continued)Financials (continued)MetLife, Inc. (6.400% to 12-15-36,
then 3 month LIBOR + 2.205%) 12/15/2036 $ 402,000 $ 504,529
MetLife, Inc. (9.250% to 4-8-38, then3 month LIBOR + 5.540%) 04/08/2038 (D) 120,000 175,935
Morgan Stanley3.875%, 01/27/2026 361,000 401,4104.100%, 05/22/2023 900,000 962,397
Morgan Stanley (2.188% to 4-28-25,then SOFR + 1.990%) 04/28/2026 1,014,000 1,047,697
Morgan Stanley (3 month LIBOR +3.610%) 3.851%, 07/15/2021 (B)(F) 200,000 200,299
Morgan Stanley (3.622% to 4-1-30,then SOFR + 3.120%) 04/01/2031 1,000,000 1,085,744
Nationstar Mortgage Holdings, Inc.5.125%, 12/15/2030 (D) 176,000 173,5805.500%, 08/15/2028 (D) 191,000 191,7746.000%, 01/15/2027 (D) 99,000 102,713
Nationwide Mutual InsuranceCompany (3 month LIBOR +2.290%) 2.474%, 12/15/2024 (B)(D) 1,130,000 1,128,764
NatWest Group PLC3.875%, 09/12/2023 500,000 536,189
NatWest Group PLC (6.000% to12-29-25, then 5 Year CMT +5.625%) 12/29/2025 (F) 431,000 472,893
NatWest Group PLC (8.625% to8-15-21, then 5 Year U.S. Swap Rate+ 7.598%) 08/15/2021 (F) 665,000 680,794
New York Life Insurance Company3.750%, 05/15/2050 (D) 198,000 209,530
Nippon Life Insurance Company(2.750% to 1-21-31, then 5 YearCMT + 2.653%) 01/21/2051 (D) 659,000 625,226
Nippon Life Insurance Company(5.100% to 10-16-24, then 5 YearICE Swap Rate + 3.650%) 10/16/2044 (D) 355,000 392,275
OneMain Finance Corp.6.875%, 03/15/2025 65,000 73,9338.875%, 06/01/2025 142,000 157,308
Operadora de Servicios Mega SA deCV8.250%, 02/11/2025 (D) 295,000 297,213
Prudential Financial, Inc. (5.875% to9-15-22, then 3 month LIBOR +4.175%) 09/15/2042 795,000 839,505
Radian Group, Inc.4.500%, 10/01/2024 140,000 145,642
Raymond James Financial, Inc.3.625%, 09/15/2026 500,000 554,659
Active Bond Trust (continued)Shares orPrincipalAmount Value
CORPORATE BONDS (continued)Financials (continued)Sompo International Holdings, Ltd.
4.700%, 10/15/2022 $ 1,080,000 $ 1,144,187State Street Corp. (2.901% to 3-30-25,
then SOFR + 2.600%) 03/30/2026 1,000,000 1,063,917Stifel Financial Corp.
4.250%, 07/18/2024 1,300,000 1,438,706Teachers Insurance & Annuity
Association of America4.270%, 05/15/2047 (D) 447,000 502,437
The Goldman Sachs Group, Inc.3.500%, 04/01/2025 500,000 541,7063.625%, 01/22/2023 1,200,000 1,265,3013.850%, 01/26/2027 897,000 983,974
The Hartford Financial ServicesGroup, Inc.6.625%, 03/30/2040 500,000 700,156
The PNC Financial Services Group,Inc. (4.850% to 6-1-23, then 3month LIBOR + 3.040%) 06/01/2023 (F) 315,000 329,963
The PNC Financial Services Group,Inc. (6.750% to 8-1-21, then 3month LIBOR + 3.678%) 08/01/2021 (F) 533,000 540,622
Trident TPI Holdings, Inc.6.625%, 11/01/2025 (D) 35,000 35,613
UBS Group AG (7.000% to 1-31-24,then 5 Year U.S. Swap Rate +4.344%) 01/31/2024 (D)(F) 323,000 354,780
Unifin Financiera SAB de CV9.875%, 01/28/2029 (D) 391,000 402,190
Voya Financial, Inc.4.800%, 06/15/2046 700,000 826,509
Voya Financial, Inc. (5.650% to5-15-23, then 3 month LIBOR +3.580%) 05/15/2053 565,000 604,337
Wells Fargo & Company3.450%, 02/13/2023 900,000 948,058
Wells Fargo & Company (2.188% to4-30-25, then SOFR + 2.000%) 04/30/2026 722,000 745,162
Wells Fargo & Company (2.393% to6-2-27, then SOFR + 2.100%) 06/02/2028 881,000 902,932
Wells Fargo & Company (3.068% to4-30-40, then SOFR + 2.530%) 04/30/2041 426,000 417,739
Wells Fargo & Company (5.875% to6-15-25, then 3 month LIBOR +3.990%) 06/15/2025 (F) 948,000 1,043,748
80,665,975Health care – 3.4%
13
John Hancock Variable Insurance TrustPortfolio of Investments — March 31, 2021 (unaudited) (showing percentage of total net assets)
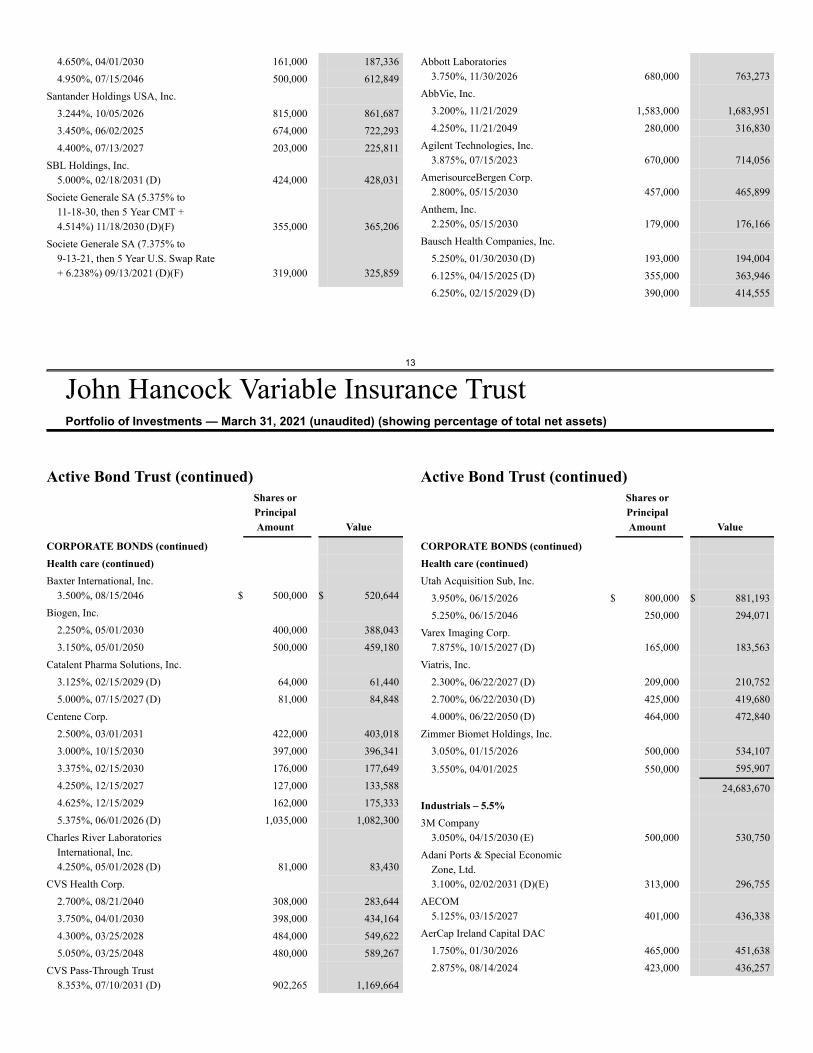
4.650%, 04/01/2030 161,000 187,3364.950%, 07/15/2046 500,000 612,849
Santander Holdings USA, Inc.3.244%, 10/05/2026 815,000 861,6873.450%, 06/02/2025 674,000 722,2934.400%, 07/13/2027 203,000 225,811
SBL Holdings, Inc.5.000%, 02/18/2031 (D) 424,000 428,031
Societe Generale SA (5.375% to11-18-30, then 5 Year CMT +4.514%) 11/18/2030 (D)(F) 355,000 365,206
Societe Generale SA (7.375% to9-13-21, then 5 Year U.S. Swap Rate+ 6.238%) 09/13/2021 (D)(F) 319,000 325,859
Abbott Laboratories3.750%, 11/30/2026 680,000 763,273
AbbVie, Inc.3.200%, 11/21/2029 1,583,000 1,683,9514.250%, 11/21/2049 280,000 316,830
Agilent Technologies, Inc.3.875%, 07/15/2023 670,000 714,056
AmerisourceBergen Corp.2.800%, 05/15/2030 457,000 465,899
Anthem, Inc.2.250%, 05/15/2030 179,000 176,166
Bausch Health Companies, Inc.5.250%, 01/30/2030 (D) 193,000 194,0046.125%, 04/15/2025 (D) 355,000 363,9466.250%, 02/15/2029 (D) 390,000 414,555
Active Bond Trust (continued)Shares orPrincipalAmount Value
CORPORATE BONDS (continued)Health care (continued)Baxter International, Inc.
3.500%, 08/15/2046 $ 500,000 $ 520,644Biogen, Inc.
2.250%, 05/01/2030 400,000 388,0433.150%, 05/01/2050 500,000 459,180
Catalent Pharma Solutions, Inc.3.125%, 02/15/2029 (D) 64,000 61,4405.000%, 07/15/2027 (D) 81,000 84,848
Centene Corp.2.500%, 03/01/2031 422,000 403,0183.000%, 10/15/2030 397,000 396,3413.375%, 02/15/2030 176,000 177,6494.250%, 12/15/2027 127,000 133,5884.625%, 12/15/2029 162,000 175,3335.375%, 06/01/2026 (D) 1,035,000 1,082,300
Charles River LaboratoriesInternational, Inc.4.250%, 05/01/2028 (D) 81,000 83,430
CVS Health Corp.2.700%, 08/21/2040 308,000 283,6443.750%, 04/01/2030 398,000 434,1644.300%, 03/25/2028 484,000 549,6225.050%, 03/25/2048 480,000 589,267
CVS Pass-Through Trust8.353%, 07/10/2031 (D) 902,265 1,169,664
Active Bond Trust (continued)Shares orPrincipalAmount Value
CORPORATE BONDS (continued)Health care (continued)Utah Acquisition Sub, Inc.
3.950%, 06/15/2026 $ 800,000 $ 881,1935.250%, 06/15/2046 250,000 294,071
Varex Imaging Corp.7.875%, 10/15/2027 (D) 165,000 183,563
Viatris, Inc.2.300%, 06/22/2027 (D) 209,000 210,7522.700%, 06/22/2030 (D) 425,000 419,6804.000%, 06/22/2050 (D) 464,000 472,840
Zimmer Biomet Holdings, Inc.3.050%, 01/15/2026 500,000 534,107
3.550%, 04/01/2025 550,000 595,907
24,683,670Industrials – 5.5%3M Company
3.050%, 04/15/2030 (E) 500,000 530,750Adani Ports & Special Economic
Zone, Ltd.3.100%, 02/02/2031 (D)(E) 313,000 296,755
AECOM5.125%, 03/15/2027 401,000 436,338
AerCap Ireland Capital DAC1.750%, 01/30/2026 465,000 451,6382.875%, 08/14/2024 423,000 436,257
14
John Hancock Variable Insurance TrustPortfolio of Investments — March 31, 2021 (unaudited) (showing percentage of total net assets)
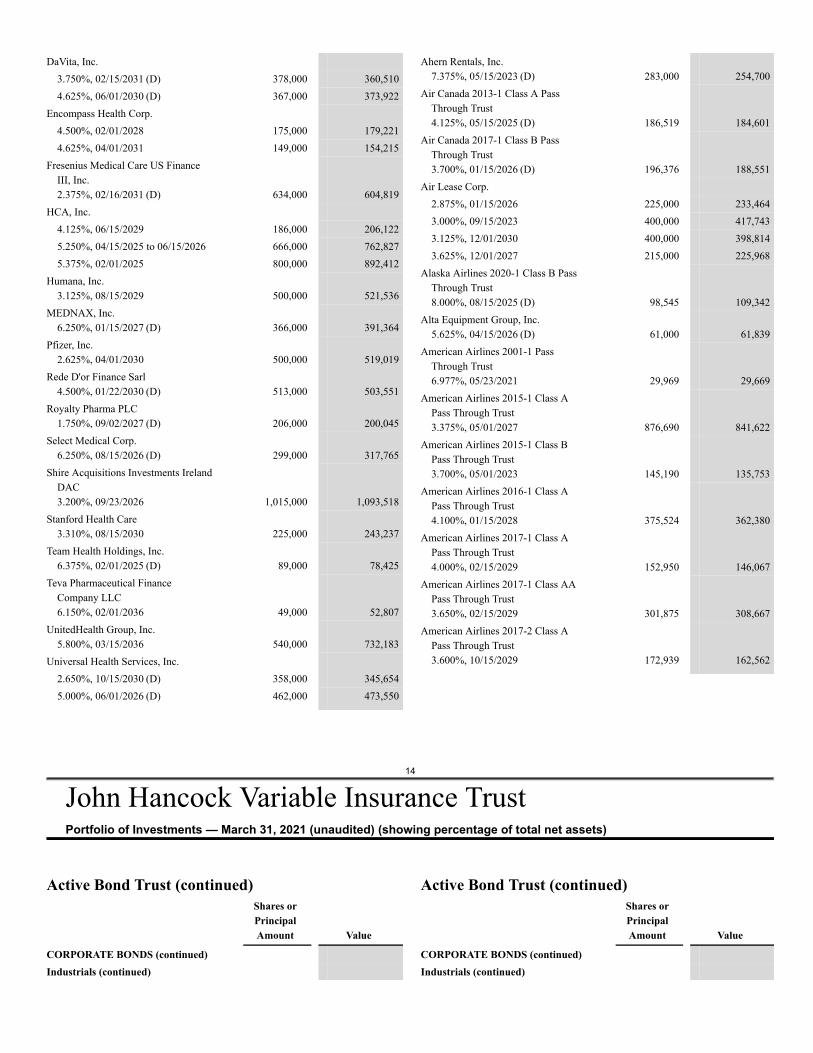
DaVita, Inc.3.750%, 02/15/2031 (D) 378,000 360,5104.625%, 06/01/2030 (D) 367,000 373,922
Encompass Health Corp.4.500%, 02/01/2028 175,000 179,2214.625%, 04/01/2031 149,000 154,215
Fresenius Medical Care US FinanceIII, Inc.2.375%, 02/16/2031 (D) 634,000 604,819
HCA, Inc.4.125%, 06/15/2029 186,000 206,1225.250%, 04/15/2025 to 06/15/2026 666,000 762,8275.375%, 02/01/2025 800,000 892,412
Humana, Inc.3.125%, 08/15/2029 500,000 521,536
MEDNAX, Inc.6.250%, 01/15/2027 (D) 366,000 391,364
Pfizer, Inc.2.625%, 04/01/2030 500,000 519,019
Rede D'or Finance Sarl4.500%, 01/22/2030 (D) 513,000 503,551
Royalty Pharma PLC1.750%, 09/02/2027 (D) 206,000 200,045
Select Medical Corp.6.250%, 08/15/2026 (D) 299,000 317,765
Shire Acquisitions Investments IrelandDAC3.200%, 09/23/2026 1,015,000 1,093,518
Stanford Health Care3.310%, 08/15/2030 225,000 243,237
Team Health Holdings, Inc.6.375%, 02/01/2025 (D) 89,000 78,425
Teva Pharmaceutical FinanceCompany LLC6.150%, 02/01/2036 49,000 52,807
UnitedHealth Group, Inc.5.800%, 03/15/2036 540,000 732,183
Universal Health Services, Inc.2.650%, 10/15/2030 (D) 358,000 345,6545.000%, 06/01/2026 (D) 462,000 473,550
Ahern Rentals, Inc.7.375%, 05/15/2023 (D) 283,000 254,700
Air Canada 2013-1 Class A PassThrough Trust4.125%, 05/15/2025 (D) 186,519 184,601
Air Canada 2017-1 Class B PassThrough Trust3.700%, 01/15/2026 (D) 196,376 188,551
Air Lease Corp.2.875%, 01/15/2026 225,000 233,4643.000%, 09/15/2023 400,000 417,7433.125%, 12/01/2030 400,000 398,8143.625%, 12/01/2027 215,000 225,968
Alaska Airlines 2020-1 Class B PassThrough Trust8.000%, 08/15/2025 (D) 98,545 109,342
Alta Equipment Group, Inc.5.625%, 04/15/2026 (D) 61,000 61,839
American Airlines 2001-1 PassThrough Trust6.977%, 05/23/2021 29,969 29,669
American Airlines 2015-1 Class APass Through Trust3.375%, 05/01/2027 876,690 841,622
American Airlines 2015-1 Class BPass Through Trust3.700%, 05/01/2023 145,190 135,753
American Airlines 2016-1 Class APass Through Trust4.100%, 01/15/2028 375,524 362,380
American Airlines 2017-1 Class APass Through Trust4.000%, 02/15/2029 152,950 146,067
American Airlines 2017-1 Class AAPass Through Trust3.650%, 02/15/2029 301,875 308,667
American Airlines 2017-2 Class APass Through Trust3.600%, 10/15/2029 172,939 162,562
Active Bond Trust (continued)Shares orPrincipalAmount Value
CORPORATE BONDS (continued)Industrials (continued)
Active Bond Trust (continued)Shares orPrincipalAmount Value
CORPORATE BONDS (continued)Industrials (continued)
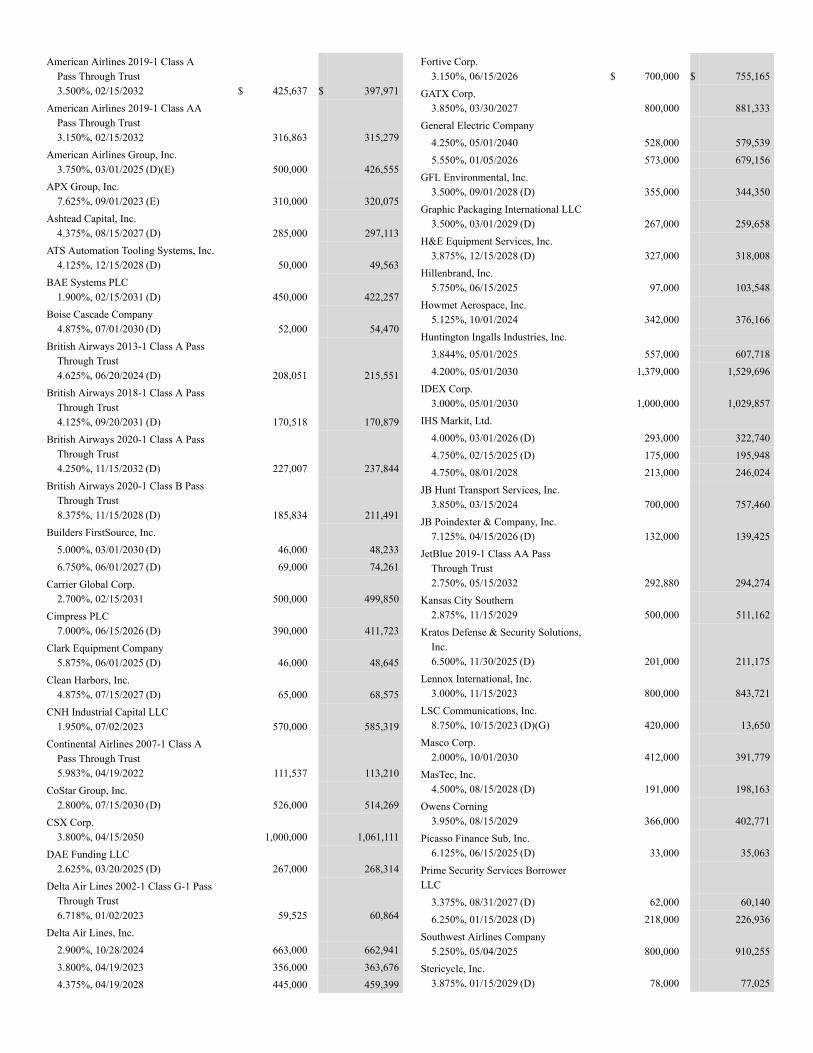
American Airlines 2019-1 Class APass Through Trust3.500%, 02/15/2032 $ 425,637 $ 397,971
American Airlines 2019-1 Class AAPass Through Trust3.150%, 02/15/2032 316,863 315,279
American Airlines Group, Inc.3.750%, 03/01/2025 (D)(E) 500,000 426,555
APX Group, Inc.7.625%, 09/01/2023 (E) 310,000 320,075
Ashtead Capital, Inc.4.375%, 08/15/2027 (D) 285,000 297,113
ATS Automation Tooling Systems, Inc.4.125%, 12/15/2028 (D) 50,000 49,563
BAE Systems PLC1.900%, 02/15/2031 (D) 450,000 422,257
Boise Cascade Company4.875%, 07/01/2030 (D) 52,000 54,470
British Airways 2013-1 Class A PassThrough Trust4.625%, 06/20/2024 (D) 208,051 215,551
British Airways 2018-1 Class A PassThrough Trust4.125%, 09/20/2031 (D) 170,518 170,879
British Airways 2020-1 Class A PassThrough Trust4.250%, 11/15/2032 (D) 227,007 237,844
British Airways 2020-1 Class B PassThrough Trust8.375%, 11/15/2028 (D) 185,834 211,491
Builders FirstSource, Inc.5.000%, 03/01/2030 (D) 46,000 48,2336.750%, 06/01/2027 (D) 69,000 74,261
Carrier Global Corp.2.700%, 02/15/2031 500,000 499,850
Cimpress PLC7.000%, 06/15/2026 (D) 390,000 411,723
Clark Equipment Company5.875%, 06/01/2025 (D) 46,000 48,645
Clean Harbors, Inc.4.875%, 07/15/2027 (D) 65,000 68,575
CNH Industrial Capital LLC1.950%, 07/02/2023 570,000 585,319
Continental Airlines 2007-1 Class APass Through Trust5.983%, 04/19/2022 111,537 113,210
CoStar Group, Inc.2.800%, 07/15/2030 (D) 526,000 514,269
CSX Corp.3.800%, 04/15/2050 1,000,000 1,061,111
DAE Funding LLC2.625%, 03/20/2025 (D) 267,000 268,314
Delta Air Lines 2002-1 Class G-1 PassThrough Trust6.718%, 01/02/2023 59,525 60,864
Delta Air Lines, Inc.2.900%, 10/28/2024 663,000 662,9413.800%, 04/19/2023 356,000 363,6764.375%, 04/19/2028 445,000 459,399
Fortive Corp.3.150%, 06/15/2026 $ 700,000 $ 755,165
GATX Corp.3.850%, 03/30/2027 800,000 881,333
General Electric Company4.250%, 05/01/2040 528,000 579,5395.550%, 01/05/2026 573,000 679,156
GFL Environmental, Inc.3.500%, 09/01/2028 (D) 355,000 344,350
Graphic Packaging International LLC3.500%, 03/01/2029 (D) 267,000 259,658
H&E Equipment Services, Inc.3.875%, 12/15/2028 (D) 327,000 318,008
Hillenbrand, Inc.5.750%, 06/15/2025 97,000 103,548
Howmet Aerospace, Inc.5.125%, 10/01/2024 342,000 376,166
Huntington Ingalls Industries, Inc.3.844%, 05/01/2025 557,000 607,7184.200%, 05/01/2030 1,379,000 1,529,696
IDEX Corp.3.000%, 05/01/2030 1,000,000 1,029,857
IHS Markit, Ltd.4.000%, 03/01/2026 (D) 293,000 322,7404.750%, 02/15/2025 (D) 175,000 195,9484.750%, 08/01/2028 213,000 246,024
JB Hunt Transport Services, Inc.3.850%, 03/15/2024 700,000 757,460
JB Poindexter & Company, Inc.7.125%, 04/15/2026 (D) 132,000 139,425
JetBlue 2019-1 Class AA PassThrough Trust2.750%, 05/15/2032 292,880 294,274
Kansas City Southern2.875%, 11/15/2029 500,000 511,162
Kratos Defense & Security Solutions,Inc.6.500%, 11/30/2025 (D) 201,000 211,175
Lennox International, Inc.3.000%, 11/15/2023 800,000 843,721
LSC Communications, Inc.8.750%, 10/15/2023 (D)(G) 420,000 13,650
Masco Corp.2.000%, 10/01/2030 412,000 391,779
MasTec, Inc.4.500%, 08/15/2028 (D) 191,000 198,163
Owens Corning3.950%, 08/15/2029 366,000 402,771
Picasso Finance Sub, Inc.6.125%, 06/15/2025 (D) 33,000 35,063
Prime Security Services BorrowerLLC
3.375%, 08/31/2027 (D) 62,000 60,1406.250%, 01/15/2028 (D) 218,000 226,936
Southwest Airlines Company5.250%, 05/04/2025 800,000 910,255
Stericycle, Inc.3.875%, 01/15/2029 (D) 78,000 77,025
15
John Hancock Variable Insurance TrustPortfolio of Investments — March 31, 2021 (unaudited) (showing percentage of total net assets)
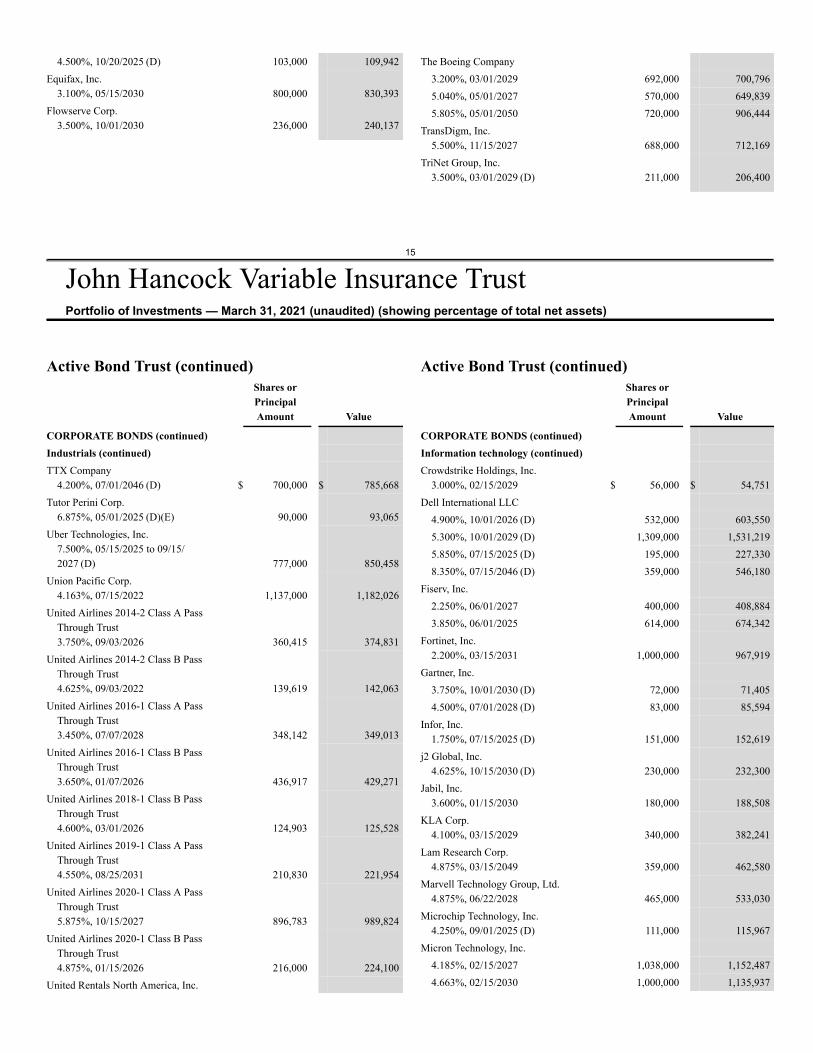
4.500%, 10/20/2025 (D) 103,000 109,942Equifax, Inc.
3.100%, 05/15/2030 800,000 830,393Flowserve Corp.
3.500%, 10/01/2030 236,000 240,137
The Boeing Company3.200%, 03/01/2029 692,000 700,7965.040%, 05/01/2027 570,000 649,8395.805%, 05/01/2050 720,000 906,444
TransDigm, Inc.5.500%, 11/15/2027 688,000 712,169
TriNet Group, Inc.3.500%, 03/01/2029 (D) 211,000 206,400
Active Bond Trust (continued)Shares orPrincipalAmount Value
CORPORATE BONDS (continued)Industrials (continued)TTX Company
4.200%, 07/01/2046 (D) $ 700,000 $ 785,668Tutor Perini Corp.
6.875%, 05/01/2025 (D)(E) 90,000 93,065Uber Technologies, Inc.
7.500%, 05/15/2025 to 09/15/2027 (D) 777,000 850,458
Union Pacific Corp.4.163%, 07/15/2022 1,137,000 1,182,026
United Airlines 2014-2 Class A PassThrough Trust3.750%, 09/03/2026 360,415 374,831
United Airlines 2014-2 Class B PassThrough Trust4.625%, 09/03/2022 139,619 142,063
United Airlines 2016-1 Class A PassThrough Trust3.450%, 07/07/2028 348,142 349,013
United Airlines 2016-1 Class B PassThrough Trust3.650%, 01/07/2026 436,917 429,271
United Airlines 2018-1 Class B PassThrough Trust4.600%, 03/01/2026 124,903 125,528
United Airlines 2019-1 Class A PassThrough Trust4.550%, 08/25/2031 210,830 221,954
United Airlines 2020-1 Class A PassThrough Trust5.875%, 10/15/2027 896,783 989,824
United Airlines 2020-1 Class B PassThrough Trust4.875%, 01/15/2026 216,000 224,100
United Rentals North America, Inc.
Active Bond Trust (continued)Shares orPrincipalAmount Value
CORPORATE BONDS (continued)Information technology (continued)Crowdstrike Holdings, Inc.
3.000%, 02/15/2029 $ 56,000 $ 54,751Dell International LLC
4.900%, 10/01/2026 (D) 532,000 603,5505.300%, 10/01/2029 (D) 1,309,000 1,531,2195.850%, 07/15/2025 (D) 195,000 227,3308.350%, 07/15/2046 (D) 359,000 546,180
Fiserv, Inc.2.250%, 06/01/2027 400,000 408,8843.850%, 06/01/2025 614,000 674,342
Fortinet, Inc.2.200%, 03/15/2031 1,000,000 967,919
Gartner, Inc.3.750%, 10/01/2030 (D) 72,000 71,4054.500%, 07/01/2028 (D) 83,000 85,594
Infor, Inc.1.750%, 07/15/2025 (D) 151,000 152,619
j2 Global, Inc.4.625%, 10/15/2030 (D) 230,000 232,300
Jabil, Inc.3.600%, 01/15/2030 180,000 188,508
KLA Corp.4.100%, 03/15/2029 340,000 382,241
Lam Research Corp.4.875%, 03/15/2049 359,000 462,580
Marvell Technology Group, Ltd.4.875%, 06/22/2028 465,000 533,030
Microchip Technology, Inc.4.250%, 09/01/2025 (D) 111,000 115,967
Micron Technology, Inc.4.185%, 02/15/2027 1,038,000 1,152,4874.663%, 02/15/2030 1,000,000 1,135,937
16
John Hancock Variable Insurance TrustPortfolio of Investments — March 31, 2021 (unaudited) (showing percentage of total net assets)
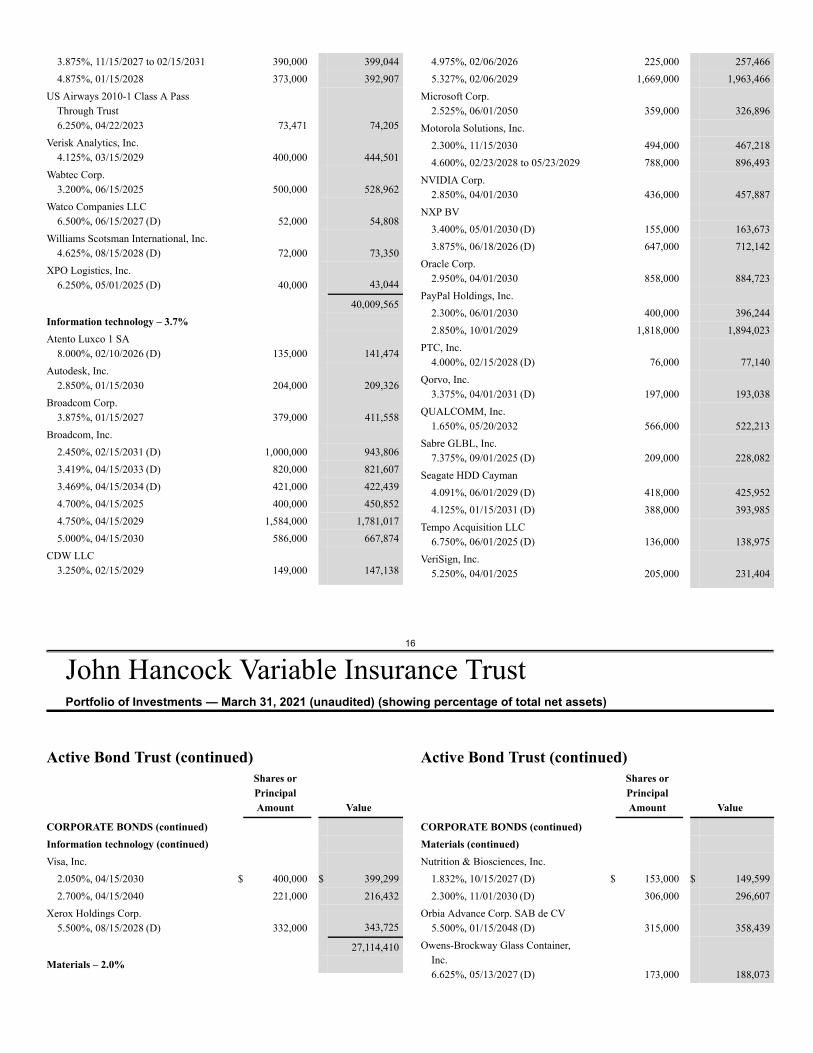
3.875%, 11/15/2027 to 02/15/2031 390,000 399,0444.875%, 01/15/2028 373,000 392,907
US Airways 2010-1 Class A PassThrough Trust6.250%, 04/22/2023 73,471 74,205
Verisk Analytics, Inc.4.125%, 03/15/2029 400,000 444,501
Wabtec Corp.3.200%, 06/15/2025 500,000 528,962
Watco Companies LLC6.500%, 06/15/2027 (D) 52,000 54,808
Williams Scotsman International, Inc.4.625%, 08/15/2028 (D) 72,000 73,350
XPO Logistics, Inc.6.250%, 05/01/2025 (D) 40,000 43,044
40,009,565Information technology – 3.7%Atento Luxco 1 SA
8.000%, 02/10/2026 (D) 135,000 141,474Autodesk, Inc.
2.850%, 01/15/2030 204,000 209,326Broadcom Corp.
3.875%, 01/15/2027 379,000 411,558Broadcom, Inc.
2.450%, 02/15/2031 (D) 1,000,000 943,8063.419%, 04/15/2033 (D) 820,000 821,6073.469%, 04/15/2034 (D) 421,000 422,4394.700%, 04/15/2025 400,000 450,8524.750%, 04/15/2029 1,584,000 1,781,0175.000%, 04/15/2030 586,000 667,874
CDW LLC3.250%, 02/15/2029 149,000 147,138
4.975%, 02/06/2026 225,000 257,4665.327%, 02/06/2029 1,669,000 1,963,466
Microsoft Corp.2.525%, 06/01/2050 359,000 326,896
Motorola Solutions, Inc.2.300%, 11/15/2030 494,000 467,2184.600%, 02/23/2028 to 05/23/2029 788,000 896,493
NVIDIA Corp.2.850%, 04/01/2030 436,000 457,887
NXP BV3.400%, 05/01/2030 (D) 155,000 163,6733.875%, 06/18/2026 (D) 647,000 712,142
Oracle Corp.2.950%, 04/01/2030 858,000 884,723
PayPal Holdings, Inc.2.300%, 06/01/2030 400,000 396,2442.850%, 10/01/2029 1,818,000 1,894,023
PTC, Inc.4.000%, 02/15/2028 (D) 76,000 77,140
Qorvo, Inc.3.375%, 04/01/2031 (D) 197,000 193,038
QUALCOMM, Inc.1.650%, 05/20/2032 566,000 522,213
Sabre GLBL, Inc.7.375%, 09/01/2025 (D) 209,000 228,082
Seagate HDD Cayman4.091%, 06/01/2029 (D) 418,000 425,9524.125%, 01/15/2031 (D) 388,000 393,985
Tempo Acquisition LLC6.750%, 06/01/2025 (D) 136,000 138,975
VeriSign, Inc.5.250%, 04/01/2025 205,000 231,404
Active Bond Trust (continued)Shares orPrincipalAmount Value
CORPORATE BONDS (continued)Information technology (continued)Visa, Inc.
2.050%, 04/15/2030 $ 400,000 $ 399,2992.700%, 04/15/2040 221,000 216,432
Xerox Holdings Corp.5.500%, 08/15/2028 (D) 332,000 343,725
27,114,410Materials – 2.0%
Active Bond Trust (continued)Shares orPrincipalAmount Value
CORPORATE BONDS (continued)Materials (continued)Nutrition & Biosciences, Inc.
1.832%, 10/15/2027 (D) $ 153,000 $ 149,5992.300%, 11/01/2030 (D) 306,000 296,607
Orbia Advance Corp. SAB de CV5.500%, 01/15/2048 (D) 315,000 358,439
Owens-Brockway Glass Container,Inc.6.625%, 05/13/2027 (D) 173,000 188,073
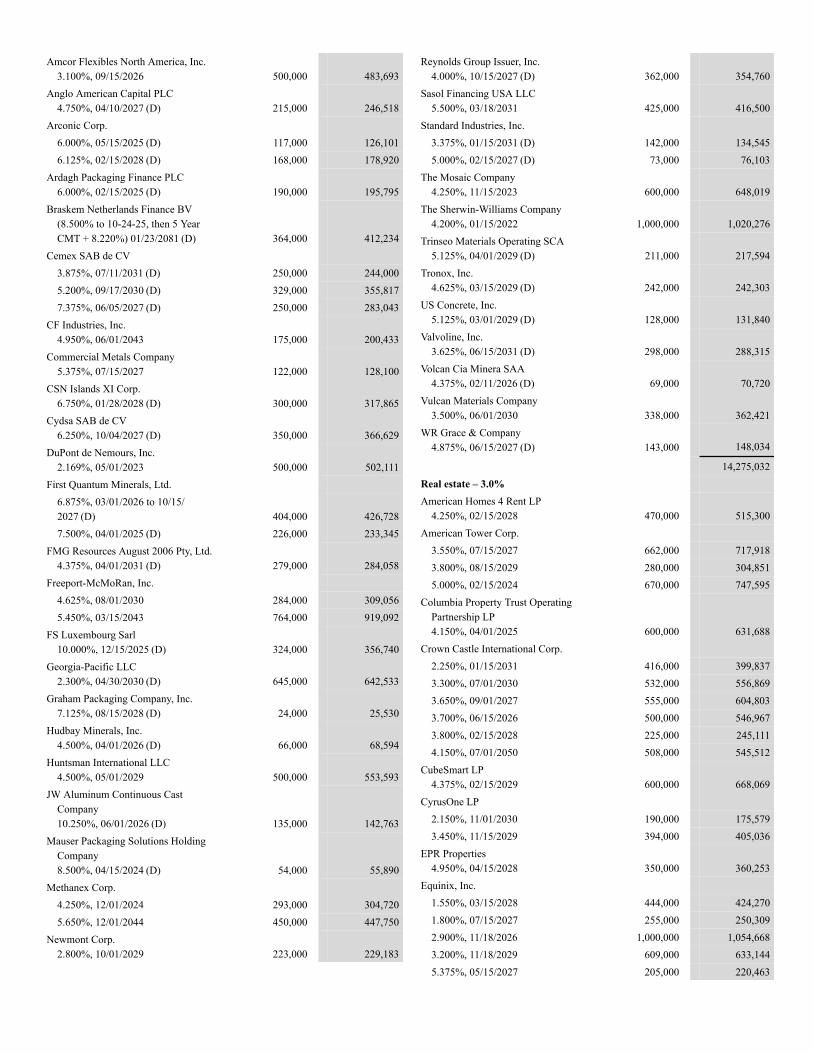
Amcor Flexibles North America, Inc.3.100%, 09/15/2026 500,000 483,693
Anglo American Capital PLC4.750%, 04/10/2027 (D) 215,000 246,518
Arconic Corp.6.000%, 05/15/2025 (D) 117,000 126,1016.125%, 02/15/2028 (D) 168,000 178,920
Ardagh Packaging Finance PLC6.000%, 02/15/2025 (D) 190,000 195,795
Braskem Netherlands Finance BV(8.500% to 10-24-25, then 5 YearCMT + 8.220%) 01/23/2081 (D) 364,000 412,234
Cemex SAB de CV3.875%, 07/11/2031 (D) 250,000 244,0005.200%, 09/17/2030 (D) 329,000 355,8177.375%, 06/05/2027 (D) 250,000 283,043
CF Industries, Inc.4.950%, 06/01/2043 175,000 200,433
Commercial Metals Company5.375%, 07/15/2027 122,000 128,100
CSN Islands XI Corp.6.750%, 01/28/2028 (D) 300,000 317,865
Cydsa SAB de CV6.250%, 10/04/2027 (D) 350,000 366,629
DuPont de Nemours, Inc.2.169%, 05/01/2023 500,000 502,111
First Quantum Minerals, Ltd.6.875%, 03/01/2026 to 10/15/2027 (D) 404,000 426,7287.500%, 04/01/2025 (D) 226,000 233,345
FMG Resources August 2006 Pty, Ltd.4.375%, 04/01/2031 (D) 279,000 284,058
Freeport-McMoRan, Inc.4.625%, 08/01/2030 284,000 309,0565.450%, 03/15/2043 764,000 919,092
FS Luxembourg Sarl10.000%, 12/15/2025 (D) 324,000 356,740
Georgia-Pacific LLC2.300%, 04/30/2030 (D) 645,000 642,533
Graham Packaging Company, Inc.7.125%, 08/15/2028 (D) 24,000 25,530
Hudbay Minerals, Inc.4.500%, 04/01/2026 (D) 66,000 68,594
Huntsman International LLC4.500%, 05/01/2029 500,000 553,593
JW Aluminum Continuous CastCompany10.250%, 06/01/2026 (D) 135,000 142,763
Mauser Packaging Solutions HoldingCompany8.500%, 04/15/2024 (D) 54,000 55,890
Methanex Corp.4.250%, 12/01/2024 293,000 304,7205.650%, 12/01/2044 450,000 447,750
Newmont Corp.2.800%, 10/01/2029 223,000 229,183
Reynolds Group Issuer, Inc.4.000%, 10/15/2027 (D) 362,000 354,760
Sasol Financing USA LLC5.500%, 03/18/2031 425,000 416,500
Standard Industries, Inc.3.375%, 01/15/2031 (D) 142,000 134,5455.000%, 02/15/2027 (D) 73,000 76,103
The Mosaic Company4.250%, 11/15/2023 600,000 648,019
The Sherwin-Williams Company4.200%, 01/15/2022 1,000,000 1,020,276
Trinseo Materials Operating SCA5.125%, 04/01/2029 (D) 211,000 217,594
Tronox, Inc.4.625%, 03/15/2029 (D) 242,000 242,303
US Concrete, Inc.5.125%, 03/01/2029 (D) 128,000 131,840
Valvoline, Inc.3.625%, 06/15/2031 (D) 298,000 288,315
Volcan Cia Minera SAA4.375%, 02/11/2026 (D) 69,000 70,720
Vulcan Materials Company3.500%, 06/01/2030 338,000 362,421
WR Grace & Company4.875%, 06/15/2027 (D) 143,000 148,034
14,275,032Real estate – 3.0%American Homes 4 Rent LP
4.250%, 02/15/2028 470,000 515,300American Tower Corp.
3.550%, 07/15/2027 662,000 717,9183.800%, 08/15/2029 280,000 304,8515.000%, 02/15/2024 670,000 747,595
Columbia Property Trust OperatingPartnership LP4.150%, 04/01/2025 600,000 631,688
Crown Castle International Corp.2.250%, 01/15/2031 416,000 399,8373.300%, 07/01/2030 532,000 556,8693.650%, 09/01/2027 555,000 604,8033.700%, 06/15/2026 500,000 546,9673.800%, 02/15/2028 225,000 245,1114.150%, 07/01/2050 508,000 545,512
CubeSmart LP4.375%, 02/15/2029 600,000 668,069
CyrusOne LP2.150%, 11/01/2030 190,000 175,5793.450%, 11/15/2029 394,000 405,036
EPR Properties4.950%, 04/15/2028 350,000 360,253
Equinix, Inc.1.550%, 03/15/2028 444,000 424,2701.800%, 07/15/2027 255,000 250,3092.900%, 11/18/2026 1,000,000 1,054,6683.200%, 11/18/2029 609,000 633,1445.375%, 05/15/2027 205,000 220,463
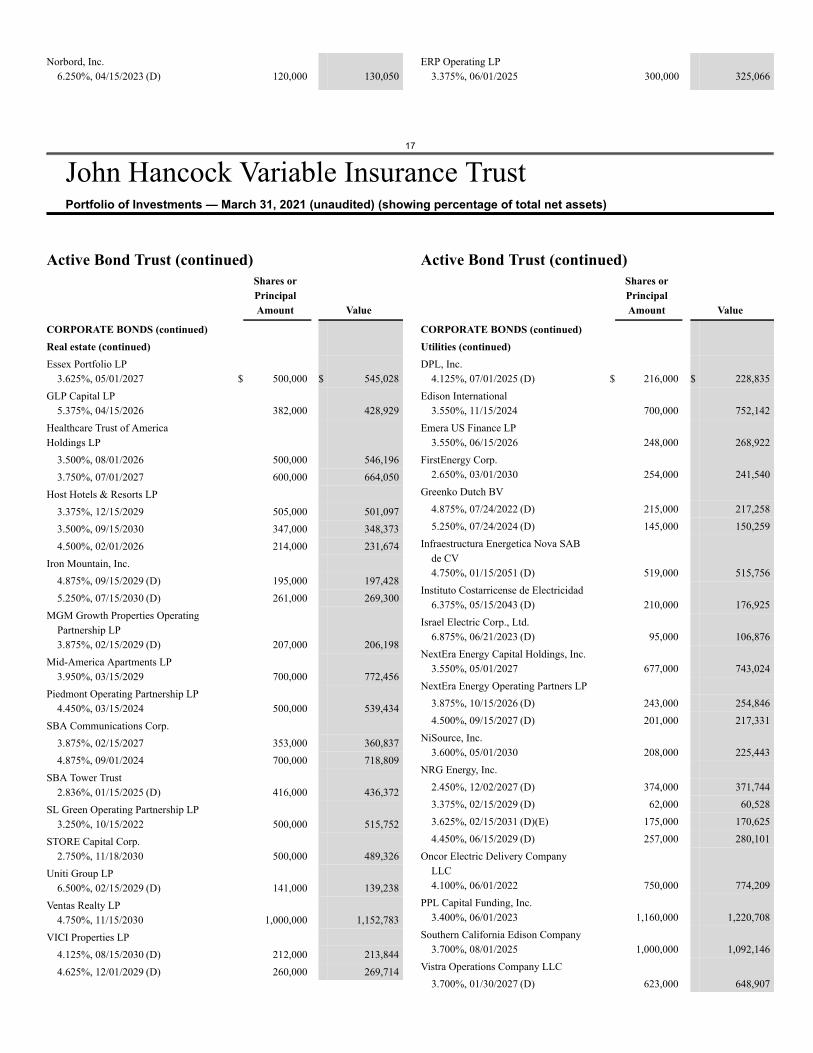
17
John Hancock Variable Insurance TrustPortfolio of Investments — March 31, 2021 (unaudited) (showing percentage of total net assets)
Norbord, Inc.6.250%, 04/15/2023 (D) 120,000 130,050
ERP Operating LP3.375%, 06/01/2025 300,000 325,066
Active Bond Trust (continued)Shares orPrincipalAmount Value
CORPORATE BONDS (continued)Real estate (continued)Essex Portfolio LP
3.625%, 05/01/2027 $ 500,000 $ 545,028GLP Capital LP
5.375%, 04/15/2026 382,000 428,929Healthcare Trust of AmericaHoldings LP
3.500%, 08/01/2026 500,000 546,1963.750%, 07/01/2027 600,000 664,050
Host Hotels & Resorts LP3.375%, 12/15/2029 505,000 501,0973.500%, 09/15/2030 347,000 348,3734.500%, 02/01/2026 214,000 231,674
Iron Mountain, Inc.4.875%, 09/15/2029 (D) 195,000 197,4285.250%, 07/15/2030 (D) 261,000 269,300
MGM Growth Properties OperatingPartnership LP3.875%, 02/15/2029 (D) 207,000 206,198
Mid-America Apartments LP3.950%, 03/15/2029 700,000 772,456
Piedmont Operating Partnership LP4.450%, 03/15/2024 500,000 539,434
SBA Communications Corp.3.875%, 02/15/2027 353,000 360,8374.875%, 09/01/2024 700,000 718,809
SBA Tower Trust2.836%, 01/15/2025 (D) 416,000 436,372
SL Green Operating Partnership LP3.250%, 10/15/2022 500,000 515,752
STORE Capital Corp.2.750%, 11/18/2030 500,000 489,326
Uniti Group LP6.500%, 02/15/2029 (D) 141,000 139,238
Ventas Realty LP4.750%, 11/15/2030 1,000,000 1,152,783
VICI Properties LP4.125%, 08/15/2030 (D) 212,000 213,8444.625%, 12/01/2029 (D) 260,000 269,714
Active Bond Trust (continued)Shares orPrincipalAmount Value
CORPORATE BONDS (continued)Utilities (continued)DPL, Inc.
4.125%, 07/01/2025 (D) $ 216,000 $ 228,835Edison International
3.550%, 11/15/2024 700,000 752,142Emera US Finance LP
3.550%, 06/15/2026 248,000 268,922FirstEnergy Corp.
2.650%, 03/01/2030 254,000 241,540Greenko Dutch BV
4.875%, 07/24/2022 (D) 215,000 217,2585.250%, 07/24/2024 (D) 145,000 150,259
Infraestructura Energetica Nova SABde CV4.750%, 01/15/2051 (D) 519,000 515,756
Instituto Costarricense de Electricidad6.375%, 05/15/2043 (D) 210,000 176,925
Israel Electric Corp., Ltd.6.875%, 06/21/2023 (D) 95,000 106,876
NextEra Energy Capital Holdings, Inc.3.550%, 05/01/2027 677,000 743,024
NextEra Energy Operating Partners LP3.875%, 10/15/2026 (D) 243,000 254,8464.500%, 09/15/2027 (D) 201,000 217,331
NiSource, Inc.3.600%, 05/01/2030 208,000 225,443
NRG Energy, Inc.2.450%, 12/02/2027 (D) 374,000 371,7443.375%, 02/15/2029 (D) 62,000 60,5283.625%, 02/15/2031 (D)(E) 175,000 170,6254.450%, 06/15/2029 (D) 257,000 280,101
Oncor Electric Delivery CompanyLLC4.100%, 06/01/2022 750,000 774,209
PPL Capital Funding, Inc.3.400%, 06/01/2023 1,160,000 1,220,708
Southern California Edison Company3.700%, 08/01/2025 1,000,000 1,092,146
Vistra Operations Company LLC3.700%, 01/30/2027 (D) 623,000 648,907
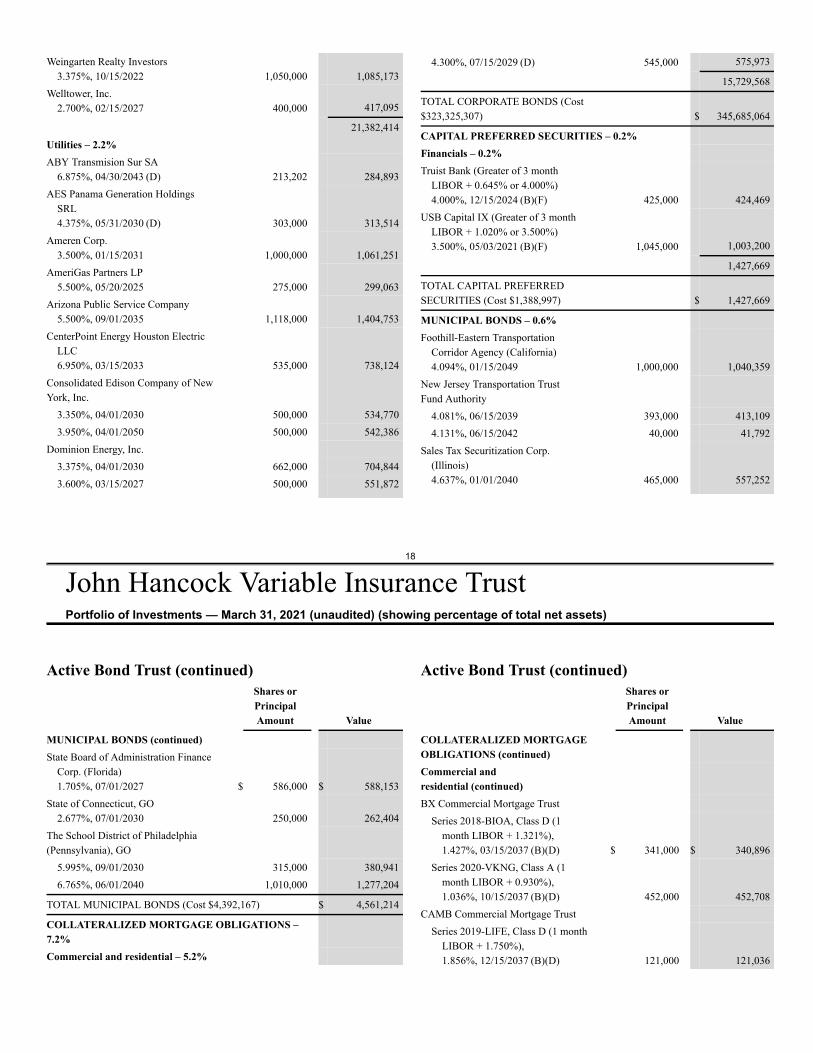
18
John Hancock Variable Insurance TrustPortfolio of Investments — March 31, 2021 (unaudited) (showing percentage of total net assets)
Weingarten Realty Investors3.375%, 10/15/2022 1,050,000 1,085,173
Welltower, Inc.2.700%, 02/15/2027 400,000 417,095
21,382,414Utilities – 2.2%ABY Transmision Sur SA
6.875%, 04/30/2043 (D) 213,202 284,893AES Panama Generation Holdings
SRL4.375%, 05/31/2030 (D) 303,000 313,514
Ameren Corp.3.500%, 01/15/2031 1,000,000 1,061,251
AmeriGas Partners LP5.500%, 05/20/2025 275,000 299,063
Arizona Public Service Company5.500%, 09/01/2035 1,118,000 1,404,753
CenterPoint Energy Houston ElectricLLC6.950%, 03/15/2033 535,000 738,124
Consolidated Edison Company of NewYork, Inc.
3.350%, 04/01/2030 500,000 534,7703.950%, 04/01/2050 500,000 542,386
Dominion Energy, Inc.3.375%, 04/01/2030 662,000 704,8443.600%, 03/15/2027 500,000 551,872
4.300%, 07/15/2029 (D) 545,000 575,973
15,729,568
TOTAL CORPORATE BONDS (Cost$323,325,307) $ 345,685,064
CAPITAL PREFERRED SECURITIES – 0.2%Financials – 0.2%Truist Bank (Greater of 3 month
LIBOR + 0.645% or 4.000%)4.000%, 12/15/2024 (B)(F) 425,000 424,469
USB Capital IX (Greater of 3 monthLIBOR + 1.020% or 3.500%)3.500%, 05/03/2021 (B)(F) 1,045,000 1,003,200
1,427,669
TOTAL CAPITAL PREFERREDSECURITIES (Cost $1,388,997) $ 1,427,669
MUNICIPAL BONDS – 0.6%Foothill-Eastern Transportation
Corridor Agency (California)4.094%, 01/15/2049 1,000,000 1,040,359
New Jersey Transportation TrustFund Authority
4.081%, 06/15/2039 393,000 413,1094.131%, 06/15/2042 40,000 41,792
Sales Tax Securitization Corp.(Illinois)4.637%, 01/01/2040 465,000 557,252
Active Bond Trust (continued)Shares orPrincipalAmount Value
MUNICIPAL BONDS (continued)State Board of Administration Finance
Corp. (Florida)1.705%, 07/01/2027 $ 586,000 $ 588,153
State of Connecticut, GO2.677%, 07/01/2030 250,000 262,404
The School District of Philadelphia(Pennsylvania), GO
5.995%, 09/01/2030 315,000 380,9416.765%, 06/01/2040 1,010,000 1,277,204
TOTAL MUNICIPAL BONDS (Cost $4,392,167) $ 4,561,214
COLLATERALIZED MORTGAGE OBLIGATIONS –7.2%Commercial and residential – 5.2%
Active Bond Trust (continued)Shares orPrincipalAmount Value
COLLATERALIZED MORTGAGEOBLIGATIONS (continued)Commercial andresidential (continued)BX Commercial Mortgage Trust
Series 2018-BIOA, Class D (1month LIBOR + 1.321%),1.427%, 03/15/2037 (B)(D) $ 341,000 $ 340,896
Series 2020-VKNG, Class A (1month LIBOR + 0.930%),1.036%, 10/15/2037 (B)(D) 452,000 452,708
CAMB Commercial Mortgage TrustSeries 2019-LIFE, Class D (1 month
LIBOR + 1.750%),1.856%, 12/15/2037 (B)(D) 121,000 121,036
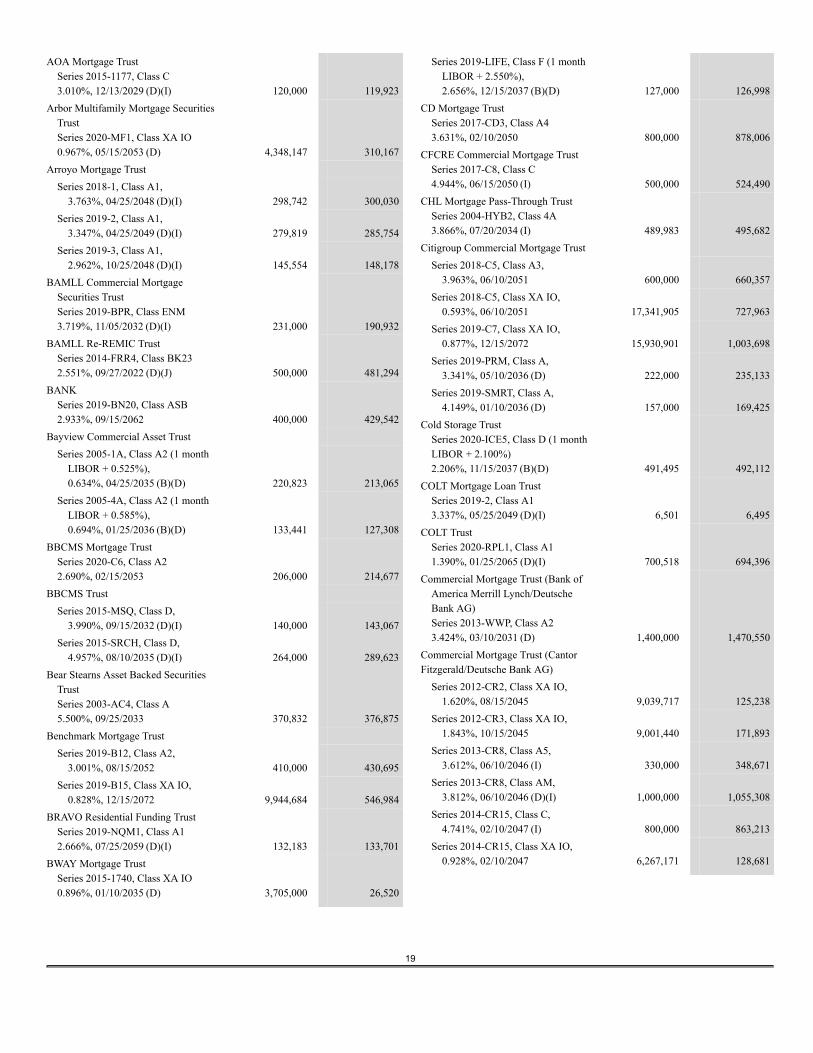
19
AOA Mortgage TrustSeries 2015-1177, Class C3.010%, 12/13/2029 (D)(I) 120,000 119,923
Arbor Multifamily Mortgage SecuritiesTrustSeries 2020-MF1, Class XA IO0.967%, 05/15/2053 (D) 4,348,147 310,167
Arroyo Mortgage TrustSeries 2018-1, Class A1,
3.763%, 04/25/2048 (D)(I) 298,742 300,030Series 2019-2, Class A1,
3.347%, 04/25/2049 (D)(I) 279,819 285,754Series 2019-3, Class A1,
2.962%, 10/25/2048 (D)(I) 145,554 148,178BAMLL Commercial Mortgage
Securities TrustSeries 2019-BPR, Class ENM3.719%, 11/05/2032 (D)(I) 231,000 190,932
BAMLL Re-REMIC TrustSeries 2014-FRR4, Class BK232.551%, 09/27/2022 (D)(J) 500,000 481,294
BANKSeries 2019-BN20, Class ASB2.933%, 09/15/2062 400,000 429,542
Bayview Commercial Asset TrustSeries 2005-1A, Class A2 (1 month
LIBOR + 0.525%),0.634%, 04/25/2035 (B)(D) 220,823 213,065
Series 2005-4A, Class A2 (1 monthLIBOR + 0.585%),0.694%, 01/25/2036 (B)(D) 133,441 127,308
BBCMS Mortgage TrustSeries 2020-C6, Class A22.690%, 02/15/2053 206,000 214,677
BBCMS TrustSeries 2015-MSQ, Class D,
3.990%, 09/15/2032 (D)(I) 140,000 143,067Series 2015-SRCH, Class D,
4.957%, 08/10/2035 (D)(I) 264,000 289,623Bear Stearns Asset Backed Securities
TrustSeries 2003-AC4, Class A5.500%, 09/25/2033 370,832 376,875
Benchmark Mortgage TrustSeries 2019-B12, Class A2,
3.001%, 08/15/2052 410,000 430,695Series 2019-B15, Class XA IO,
0.828%, 12/15/2072 9,944,684 546,984BRAVO Residential Funding Trust
Series 2019-NQM1, Class A12.666%, 07/25/2059 (D)(I) 132,183 133,701
BWAY Mortgage TrustSeries 2015-1740, Class XA IO0.896%, 01/10/2035 (D) 3,705,000 26,520
Series 2019-LIFE, Class F (1 monthLIBOR + 2.550%),2.656%, 12/15/2037 (B)(D) 127,000 126,998
CD Mortgage TrustSeries 2017-CD3, Class A43.631%, 02/10/2050 800,000 878,006
CFCRE Commercial Mortgage TrustSeries 2017-C8, Class C4.944%, 06/15/2050 (I) 500,000 524,490
CHL Mortgage Pass-Through TrustSeries 2004-HYB2, Class 4A3.866%, 07/20/2034 (I) 489,983 495,682
Citigroup Commercial Mortgage TrustSeries 2018-C5, Class A3,
3.963%, 06/10/2051 600,000 660,357Series 2018-C5, Class XA IO,
0.593%, 06/10/2051 17,341,905 727,963Series 2019-C7, Class XA IO,
0.877%, 12/15/2072 15,930,901 1,003,698Series 2019-PRM, Class A,
3.341%, 05/10/2036 (D) 222,000 235,133Series 2019-SMRT, Class A,
4.149%, 01/10/2036 (D) 157,000 169,425Cold Storage Trust
Series 2020-ICE5, Class D (1 monthLIBOR + 2.100%)2.206%, 11/15/2037 (B)(D) 491,495 492,112
COLT Mortgage Loan TrustSeries 2019-2, Class A13.337%, 05/25/2049 (D)(I) 6,501 6,495
COLT TrustSeries 2020-RPL1, Class A11.390%, 01/25/2065 (D)(I) 700,518 694,396
Commercial Mortgage Trust (Bank ofAmerica Merrill Lynch/DeutscheBank AG)Series 2013-WWP, Class A23.424%, 03/10/2031 (D) 1,400,000 1,470,550
Commercial Mortgage Trust (CantorFitzgerald/Deutsche Bank AG)
Series 2012-CR2, Class XA IO,1.620%, 08/15/2045 9,039,717 125,238
Series 2012-CR3, Class XA IO,1.843%, 10/15/2045 9,001,440 171,893
Series 2013-CR8, Class A5,3.612%, 06/10/2046 (I) 330,000 348,671
Series 2013-CR8, Class AM,3.812%, 06/10/2046 (D)(I) 1,000,000 1,055,308
Series 2014-CR15, Class C,4.741%, 02/10/2047 (I) 800,000 863,213
Series 2014-CR15, Class XA IO,0.928%, 02/10/2047 6,267,171 128,681
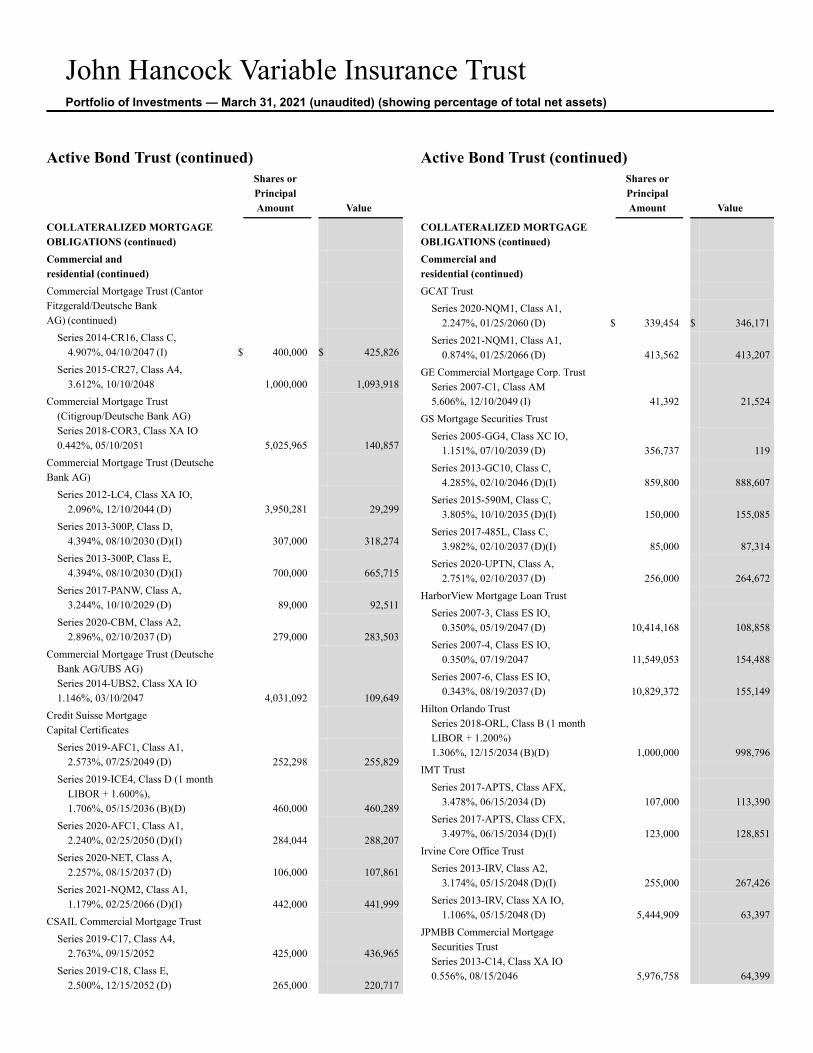
John Hancock Variable Insurance TrustPortfolio of Investments — March 31, 2021 (unaudited) (showing percentage of total net assets)
Active Bond Trust (continued)Shares orPrincipalAmount Value
COLLATERALIZED MORTGAGEOBLIGATIONS (continued)Commercial andresidential (continued)Commercial Mortgage Trust (CantorFitzgerald/Deutsche BankAG) (continued)
Series 2014-CR16, Class C,4.907%, 04/10/2047 (I) $ 400,000 $ 425,826
Series 2015-CR27, Class A4,3.612%, 10/10/2048 1,000,000 1,093,918
Commercial Mortgage Trust(Citigroup/Deutsche Bank AG)Series 2018-COR3, Class XA IO0.442%, 05/10/2051 5,025,965 140,857
Commercial Mortgage Trust (DeutscheBank AG)
Series 2012-LC4, Class XA IO,2.096%, 12/10/2044 (D) 3,950,281 29,299
Series 2013-300P, Class D,4.394%, 08/10/2030 (D)(I) 307,000 318,274
Series 2013-300P, Class E,4.394%, 08/10/2030 (D)(I) 700,000 665,715
Series 2017-PANW, Class A,3.244%, 10/10/2029 (D) 89,000 92,511
Series 2020-CBM, Class A2,2.896%, 02/10/2037 (D) 279,000 283,503
Commercial Mortgage Trust (DeutscheBank AG/UBS AG)Series 2014-UBS2, Class XA IO1.146%, 03/10/2047 4,031,092 109,649
Credit Suisse MortgageCapital Certificates
Series 2019-AFC1, Class A1,2.573%, 07/25/2049 (D) 252,298 255,829
Series 2019-ICE4, Class D (1 monthLIBOR + 1.600%),1.706%, 05/15/2036 (B)(D) 460,000 460,289
Series 2020-AFC1, Class A1,2.240%, 02/25/2050 (D)(I) 284,044 288,207
Series 2020-NET, Class A,2.257%, 08/15/2037 (D) 106,000 107,861
Series 2021-NQM2, Class A1,1.179%, 02/25/2066 (D)(I) 442,000 441,999
CSAIL Commercial Mortgage TrustSeries 2019-C17, Class A4,
2.763%, 09/15/2052 425,000 436,965Series 2019-C18, Class E,
2.500%, 12/15/2052 (D) 265,000 220,717
Active Bond Trust (continued)Shares orPrincipalAmount Value
COLLATERALIZED MORTGAGEOBLIGATIONS (continued)Commercial andresidential (continued)GCAT Trust
Series 2020-NQM1, Class A1,2.247%, 01/25/2060 (D) $ 339,454 $ 346,171
Series 2021-NQM1, Class A1,0.874%, 01/25/2066 (D) 413,562 413,207
GE Commercial Mortgage Corp. TrustSeries 2007-C1, Class AM5.606%, 12/10/2049 (I) 41,392 21,524
GS Mortgage Securities TrustSeries 2005-GG4, Class XC IO,
1.151%, 07/10/2039 (D) 356,737 119Series 2013-GC10, Class C,
4.285%, 02/10/2046 (D)(I) 859,800 888,607Series 2015-590M, Class C,
3.805%, 10/10/2035 (D)(I) 150,000 155,085Series 2017-485L, Class C,
3.982%, 02/10/2037 (D)(I) 85,000 87,314Series 2020-UPTN, Class A,
2.751%, 02/10/2037 (D) 256,000 264,672HarborView Mortgage Loan Trust
Series 2007-3, Class ES IO,0.350%, 05/19/2047 (D) 10,414,168 108,858
Series 2007-4, Class ES IO,0.350%, 07/19/2047 11,549,053 154,488
Series 2007-6, Class ES IO,0.343%, 08/19/2037 (D) 10,829,372 155,149
Hilton Orlando TrustSeries 2018-ORL, Class B (1 monthLIBOR + 1.200%)1.306%, 12/15/2034 (B)(D) 1,000,000 998,796
IMT TrustSeries 2017-APTS, Class AFX,
3.478%, 06/15/2034 (D) 107,000 113,390Series 2017-APTS, Class CFX,
3.497%, 06/15/2034 (D)(I) 123,000 128,851Irvine Core Office Trust
Series 2013-IRV, Class A2,3.174%, 05/15/2048 (D)(I) 255,000 267,426
Series 2013-IRV, Class XA IO,1.106%, 05/15/2048 (D) 5,444,909 63,397
JPMBB Commercial MortgageSecurities TrustSeries 2013-C14, Class XA IO0.556%, 08/15/2046 5,976,758 64,399
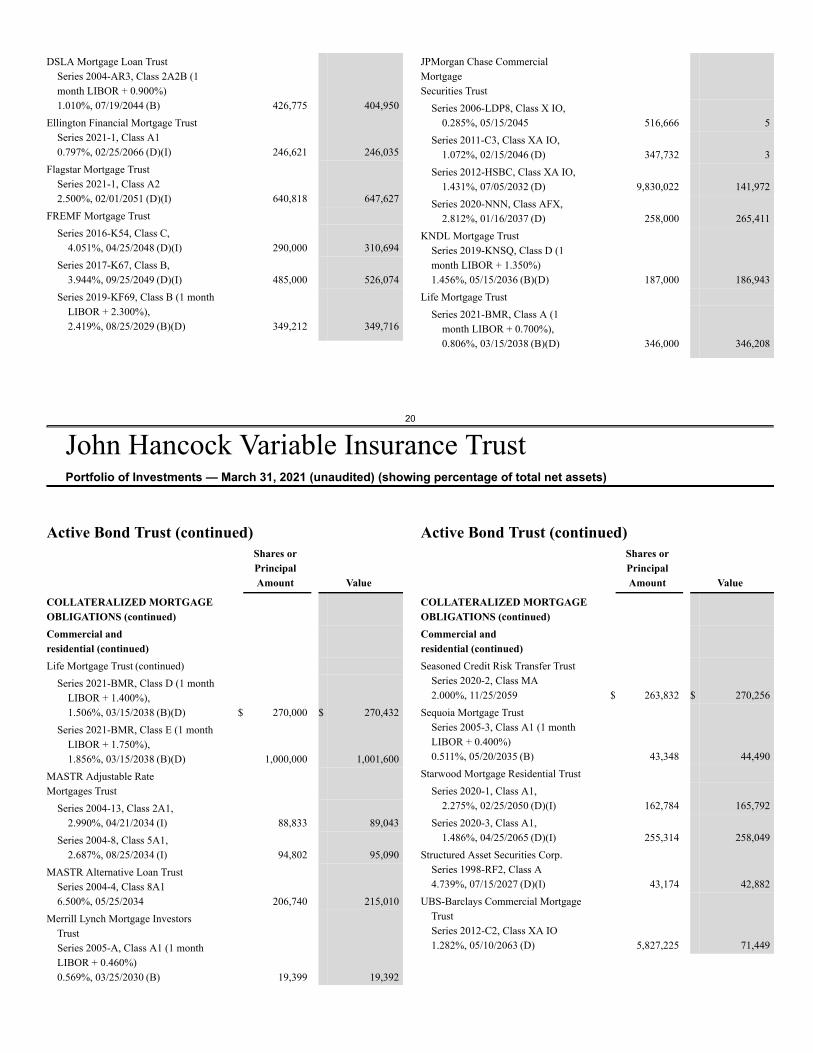
20
John Hancock Variable Insurance TrustPortfolio of Investments — March 31, 2021 (unaudited) (showing percentage of total net assets)
DSLA Mortgage Loan TrustSeries 2004-AR3, Class 2A2B (1month LIBOR + 0.900%)1.010%, 07/19/2044 (B) 426,775 404,950
Ellington Financial Mortgage TrustSeries 2021-1, Class A10.797%, 02/25/2066 (D)(I) 246,621 246,035
Flagstar Mortgage TrustSeries 2021-1, Class A22.500%, 02/01/2051 (D)(I) 640,818 647,627
FREMF Mortgage TrustSeries 2016-K54, Class C,
4.051%, 04/25/2048 (D)(I) 290,000 310,694Series 2017-K67, Class B,
3.944%, 09/25/2049 (D)(I) 485,000 526,074Series 2019-KF69, Class B (1 month
LIBOR + 2.300%),2.419%, 08/25/2029 (B)(D) 349,212 349,716
JPMorgan Chase CommercialMortgageSecurities Trust
Series 2006-LDP8, Class X IO,0.285%, 05/15/2045 516,666 5
Series 2011-C3, Class XA IO,1.072%, 02/15/2046 (D) 347,732 3
Series 2012-HSBC, Class XA IO,1.431%, 07/05/2032 (D) 9,830,022 141,972
Series 2020-NNN, Class AFX,2.812%, 01/16/2037 (D) 258,000 265,411
KNDL Mortgage TrustSeries 2019-KNSQ, Class D (1month LIBOR + 1.350%)1.456%, 05/15/2036 (B)(D) 187,000 186,943
Life Mortgage TrustSeries 2021-BMR, Class A (1
month LIBOR + 0.700%),0.806%, 03/15/2038 (B)(D) 346,000 346,208
Active Bond Trust (continued)Shares orPrincipalAmount Value
COLLATERALIZED MORTGAGEOBLIGATIONS (continued)Commercial andresidential (continued)Life Mortgage Trust (continued)
Series 2021-BMR, Class D (1 monthLIBOR + 1.400%),1.506%, 03/15/2038 (B)(D) $ 270,000 $ 270,432
Series 2021-BMR, Class E (1 monthLIBOR + 1.750%),1.856%, 03/15/2038 (B)(D) 1,000,000 1,001,600
MASTR Adjustable RateMortgages Trust
Series 2004-13, Class 2A1,2.990%, 04/21/2034 (I) 88,833 89,043
Series 2004-8, Class 5A1,2.687%, 08/25/2034 (I) 94,802 95,090
MASTR Alternative Loan TrustSeries 2004-4, Class 8A16.500%, 05/25/2034 206,740 215,010
Merrill Lynch Mortgage InvestorsTrustSeries 2005-A, Class A1 (1 monthLIBOR + 0.460%)0.569%, 03/25/2030 (B) 19,399 19,392
Active Bond Trust (continued)Shares orPrincipalAmount Value
COLLATERALIZED MORTGAGEOBLIGATIONS (continued)Commercial andresidential (continued)Seasoned Credit Risk Transfer Trust
Series 2020-2, Class MA2.000%, 11/25/2059 $ 263,832 $ 270,256
Sequoia Mortgage TrustSeries 2005-3, Class A1 (1 monthLIBOR + 0.400%)0.511%, 05/20/2035 (B) 43,348 44,490
Starwood Mortgage Residential TrustSeries 2020-1, Class A1,
2.275%, 02/25/2050 (D)(I) 162,784 165,792Series 2020-3, Class A1,
1.486%, 04/25/2065 (D)(I) 255,314 258,049Structured Asset Securities Corp.
Series 1998-RF2, Class A4.739%, 07/15/2027 (D)(I) 43,174 42,882
UBS-Barclays Commercial MortgageTrustSeries 2012-C2, Class XA IO1.282%, 05/10/2063 (D) 5,827,225 71,449
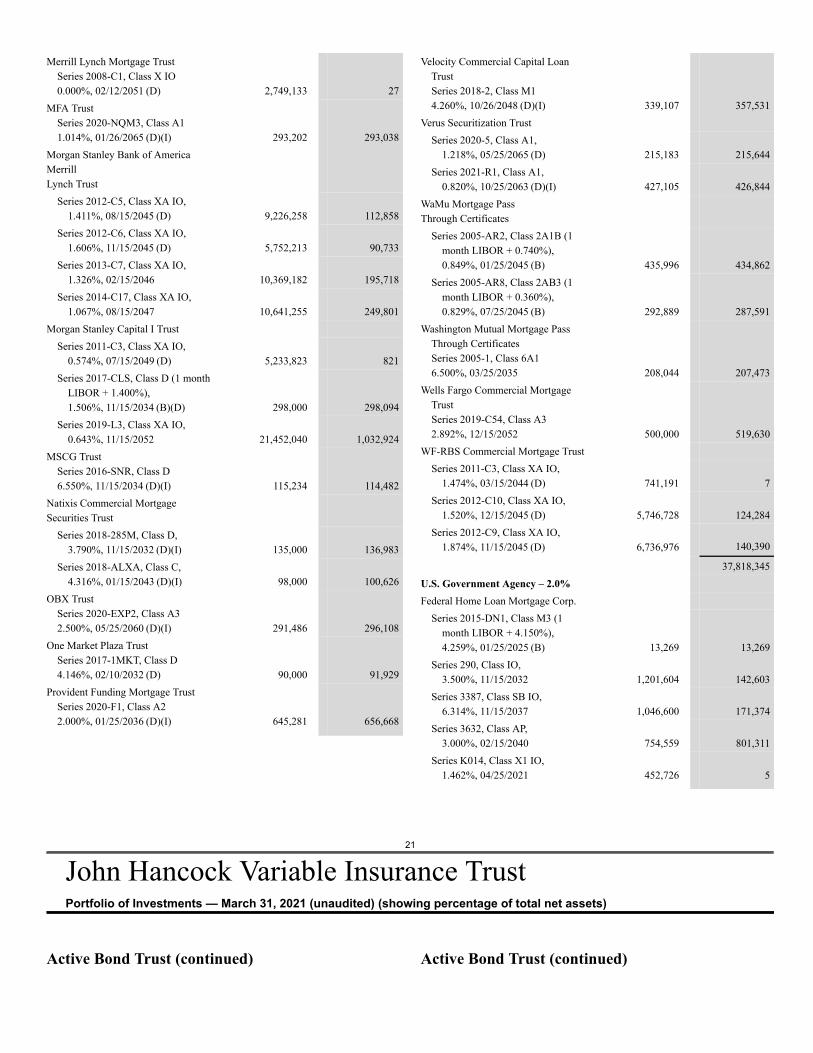
21
John Hancock Variable Insurance TrustPortfolio of Investments — March 31, 2021 (unaudited) (showing percentage of total net assets)
Merrill Lynch Mortgage TrustSeries 2008-C1, Class X IO0.000%, 02/12/2051 (D) 2,749,133 27
MFA TrustSeries 2020-NQM3, Class A11.014%, 01/26/2065 (D)(I) 293,202 293,038
Morgan Stanley Bank of AmericaMerrillLynch Trust
Series 2012-C5, Class XA IO,1.411%, 08/15/2045 (D) 9,226,258 112,858
Series 2012-C6, Class XA IO,1.606%, 11/15/2045 (D) 5,752,213 90,733
Series 2013-C7, Class XA IO,1.326%, 02/15/2046 10,369,182 195,718
Series 2014-C17, Class XA IO,1.067%, 08/15/2047 10,641,255 249,801
Morgan Stanley Capital I TrustSeries 2011-C3, Class XA IO,
0.574%, 07/15/2049 (D) 5,233,823 821Series 2017-CLS, Class D (1 month
LIBOR + 1.400%),1.506%, 11/15/2034 (B)(D) 298,000 298,094
Series 2019-L3, Class XA IO,0.643%, 11/15/2052 21,452,040 1,032,924
MSCG TrustSeries 2016-SNR, Class D6.550%, 11/15/2034 (D)(I) 115,234 114,482
Natixis Commercial MortgageSecurities Trust
Series 2018-285M, Class D,3.790%, 11/15/2032 (D)(I) 135,000 136,983
Series 2018-ALXA, Class C,4.316%, 01/15/2043 (D)(I) 98,000 100,626
OBX TrustSeries 2020-EXP2, Class A32.500%, 05/25/2060 (D)(I) 291,486 296,108
One Market Plaza TrustSeries 2017-1MKT, Class D4.146%, 02/10/2032 (D) 90,000 91,929
Provident Funding Mortgage TrustSeries 2020-F1, Class A22.000%, 01/25/2036 (D)(I) 645,281 656,668
Velocity Commercial Capital LoanTrustSeries 2018-2, Class M14.260%, 10/26/2048 (D)(I) 339,107 357,531
Verus Securitization TrustSeries 2020-5, Class A1,
1.218%, 05/25/2065 (D) 215,183 215,644Series 2021-R1, Class A1,
0.820%, 10/25/2063 (D)(I) 427,105 426,844WaMu Mortgage PassThrough Certificates
Series 2005-AR2, Class 2A1B (1month LIBOR + 0.740%),0.849%, 01/25/2045 (B) 435,996 434,862
Series 2005-AR8, Class 2AB3 (1month LIBOR + 0.360%),0.829%, 07/25/2045 (B) 292,889 287,591
Washington Mutual Mortgage PassThrough CertificatesSeries 2005-1, Class 6A16.500%, 03/25/2035 208,044 207,473
Wells Fargo Commercial MortgageTrustSeries 2019-C54, Class A32.892%, 12/15/2052 500,000 519,630
WF-RBS Commercial Mortgage TrustSeries 2011-C3, Class XA IO,
1.474%, 03/15/2044 (D) 741,191 7Series 2012-C10, Class XA IO,
1.520%, 12/15/2045 (D) 5,746,728 124,284Series 2012-C9, Class XA IO,
1.874%, 11/15/2045 (D) 6,736,976 140,390
37,818,345U.S. Government Agency – 2.0%Federal Home Loan Mortgage Corp.
Series 2015-DN1, Class M3 (1month LIBOR + 4.150%),4.259%, 01/25/2025 (B) 13,269 13,269
Series 290, Class IO,3.500%, 11/15/2032 1,201,604 142,603
Series 3387, Class SB IO,6.314%, 11/15/2037 1,046,600 171,374
Series 3632, Class AP,3.000%, 02/15/2040 754,559 801,311
Series K014, Class X1 IO,1.462%, 04/25/2021 452,726 5
Active Bond Trust (continued) Active Bond Trust (continued)
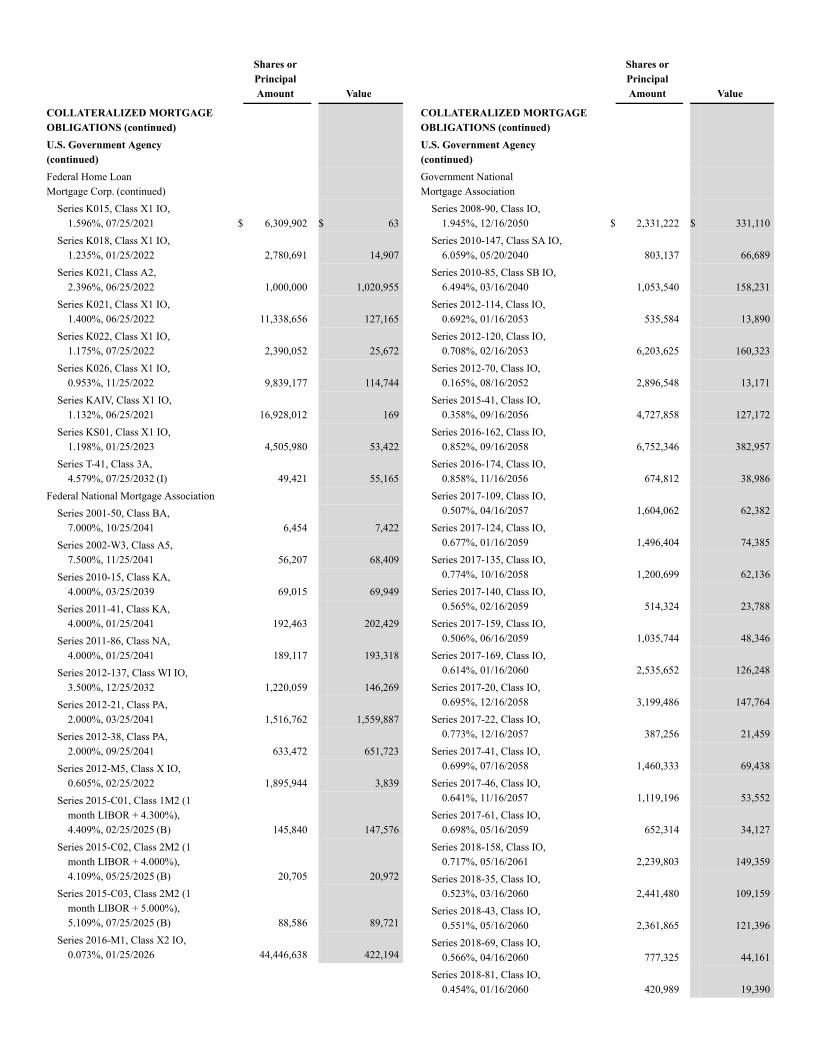
Shares orPrincipalAmount Value
COLLATERALIZED MORTGAGEOBLIGATIONS (continued)U.S. Government Agency(continued)Federal Home LoanMortgage Corp. (continued)
Series K015, Class X1 IO,1.596%, 07/25/2021 $ 6,309,902 $ 63
Series K018, Class X1 IO,1.235%, 01/25/2022 2,780,691 14,907
Series K021, Class A2,2.396%, 06/25/2022 1,000,000 1,020,955
Series K021, Class X1 IO,1.400%, 06/25/2022 11,338,656 127,165
Series K022, Class X1 IO,1.175%, 07/25/2022 2,390,052 25,672
Series K026, Class X1 IO,0.953%, 11/25/2022 9,839,177 114,744
Series KAIV, Class X1 IO,1.132%, 06/25/2021 16,928,012 169
Series KS01, Class X1 IO,1.198%, 01/25/2023 4,505,980 53,422
Series T-41, Class 3A,4.579%, 07/25/2032 (I) 49,421 55,165
Federal National Mortgage AssociationSeries 2001-50, Class BA,
7.000%, 10/25/2041 6,454 7,422Series 2002-W3, Class A5,
7.500%, 11/25/2041 56,207 68,409Series 2010-15, Class KA,
4.000%, 03/25/2039 69,015 69,949Series 2011-41, Class KA,
4.000%, 01/25/2041 192,463 202,429Series 2011-86, Class NA,
4.000%, 01/25/2041 189,117 193,318Series 2012-137, Class WI IO,
3.500%, 12/25/2032 1,220,059 146,269Series 2012-21, Class PA,
2.000%, 03/25/2041 1,516,762 1,559,887Series 2012-38, Class PA,
2.000%, 09/25/2041 633,472 651,723Series 2012-M5, Class X IO,
0.605%, 02/25/2022 1,895,944 3,839Series 2015-C01, Class 1M2 (1
month LIBOR + 4.300%),4.409%, 02/25/2025 (B) 145,840 147,576
Series 2015-C02, Class 2M2 (1month LIBOR + 4.000%),4.109%, 05/25/2025 (B) 20,705 20,972
Series 2015-C03, Class 2M2 (1month LIBOR + 5.000%),5.109%, 07/25/2025 (B) 88,586 89,721
Series 2016-M1, Class X2 IO,0.073%, 01/25/2026 44,446,638 422,194
Shares orPrincipalAmount Value
COLLATERALIZED MORTGAGEOBLIGATIONS (continued)U.S. Government Agency(continued)Government NationalMortgage Association
Series 2008-90, Class IO,1.945%, 12/16/2050 $ 2,331,222 $ 331,110
Series 2010-147, Class SA IO,6.059%, 05/20/2040 803,137 66,689
Series 2010-85, Class SB IO,6.494%, 03/16/2040 1,053,540 158,231
Series 2012-114, Class IO,0.692%, 01/16/2053 535,584 13,890
Series 2012-120, Class IO,0.708%, 02/16/2053 6,203,625 160,323
Series 2012-70, Class IO,0.165%, 08/16/2052 2,896,548 13,171
Series 2015-41, Class IO,0.358%, 09/16/2056 4,727,858 127,172
Series 2016-162, Class IO,0.852%, 09/16/2058 6,752,346 382,957
Series 2016-174, Class IO,0.858%, 11/16/2056 674,812 38,986
Series 2017-109, Class IO,0.507%, 04/16/2057 1,604,062 62,382
Series 2017-124, Class IO,0.677%, 01/16/2059 1,496,404 74,385
Series 2017-135, Class IO,0.774%, 10/16/2058 1,200,699 62,136
Series 2017-140, Class IO,0.565%, 02/16/2059 514,324 23,788
Series 2017-159, Class IO,0.506%, 06/16/2059 1,035,744 48,346
Series 2017-169, Class IO,0.614%, 01/16/2060 2,535,652 126,248
Series 2017-20, Class IO,0.695%, 12/16/2058 3,199,486 147,764
Series 2017-22, Class IO,0.773%, 12/16/2057 387,256 21,459
Series 2017-41, Class IO,0.699%, 07/16/2058 1,460,333 69,438
Series 2017-46, Class IO,0.641%, 11/16/2057 1,119,196 53,552
Series 2017-61, Class IO,0.698%, 05/16/2059 652,314 34,127
Series 2018-158, Class IO,0.717%, 05/16/2061 2,239,803 149,359
Series 2018-35, Class IO,0.523%, 03/16/2060 2,441,480 109,159
Series 2018-43, Class IO,0.551%, 05/16/2060 2,361,865 121,396
Series 2018-69, Class IO,0.566%, 04/16/2060 777,325 44,161
Series 2018-81, Class IO,0.454%, 01/16/2060 420,989 19,390
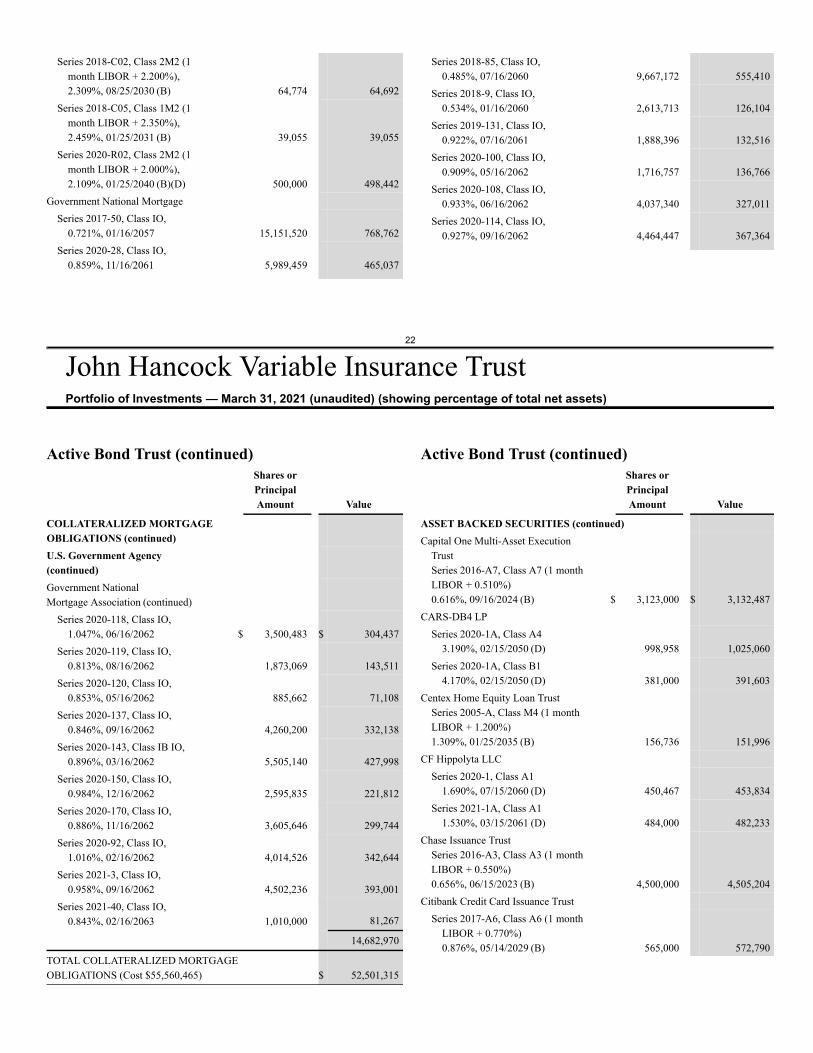
22
John Hancock Variable Insurance TrustPortfolio of Investments — March 31, 2021 (unaudited) (showing percentage of total net assets)
Series 2018-C02, Class 2M2 (1month LIBOR + 2.200%),2.309%, 08/25/2030 (B) 64,774 64,692
Series 2018-C05, Class 1M2 (1month LIBOR + 2.350%),2.459%, 01/25/2031 (B) 39,055 39,055
Series 2020-R02, Class 2M2 (1month LIBOR + 2.000%),2.109%, 01/25/2040 (B)(D) 500,000 498,442
Government National MortgageSeries 2017-50, Class IO,
0.721%, 01/16/2057 15,151,520 768,762Series 2020-28, Class IO,
0.859%, 11/16/2061 5,989,459 465,037
Series 2018-85, Class IO,0.485%, 07/16/2060 9,667,172 555,410
Series 2018-9, Class IO,0.534%, 01/16/2060 2,613,713 126,104
Series 2019-131, Class IO,0.922%, 07/16/2061 1,888,396 132,516
Series 2020-100, Class IO,0.909%, 05/16/2062 1,716,757 136,766
Series 2020-108, Class IO,0.933%, 06/16/2062 4,037,340 327,011
Series 2020-114, Class IO,0.927%, 09/16/2062 4,464,447 367,364
Active Bond Trust (continued)Shares orPrincipalAmount Value
COLLATERALIZED MORTGAGEOBLIGATIONS (continued)U.S. Government Agency(continued)Government NationalMortgage Association (continued)
Series 2020-118, Class IO,1.047%, 06/16/2062 $ 3,500,483 $ 304,437
Series 2020-119, Class IO,0.813%, 08/16/2062 1,873,069 143,511
Series 2020-120, Class IO,0.853%, 05/16/2062 885,662 71,108
Series 2020-137, Class IO,0.846%, 09/16/2062 4,260,200 332,138
Series 2020-143, Class IB IO,0.896%, 03/16/2062 5,505,140 427,998
Series 2020-150, Class IO,0.984%, 12/16/2062 2,595,835 221,812
Series 2020-170, Class IO,0.886%, 11/16/2062 3,605,646 299,744
Series 2020-92, Class IO,1.016%, 02/16/2062 4,014,526 342,644
Series 2021-3, Class IO,0.958%, 09/16/2062 4,502,236 393,001
Series 2021-40, Class IO,0.843%, 02/16/2063 1,010,000 81,267
14,682,970
TOTAL COLLATERALIZED MORTGAGEOBLIGATIONS (Cost $55,560,465) $ 52,501,315
Active Bond Trust (continued)Shares orPrincipalAmount Value
ASSET BACKED SECURITIES (continued)Capital One Multi-Asset Execution
TrustSeries 2016-A7, Class A7 (1 monthLIBOR + 0.510%)0.616%, 09/16/2024 (B) $ 3,123,000 $ 3,132,487
CARS-DB4 LPSeries 2020-1A, Class A4
3.190%, 02/15/2050 (D) 998,958 1,025,060Series 2020-1A, Class B1
4.170%, 02/15/2050 (D) 381,000 391,603Centex Home Equity Loan Trust
Series 2005-A, Class M4 (1 monthLIBOR + 1.200%)1.309%, 01/25/2035 (B) 156,736 151,996
CF Hippolyta LLCSeries 2020-1, Class A1
1.690%, 07/15/2060 (D) 450,467 453,834Series 2021-1A, Class A1
1.530%, 03/15/2061 (D) 484,000 482,233Chase Issuance Trust
Series 2016-A3, Class A3 (1 monthLIBOR + 0.550%)0.656%, 06/15/2023 (B) 4,500,000 4,505,204
Citibank Credit Card Issuance TrustSeries 2017-A6, Class A6 (1 month
LIBOR + 0.770%)0.876%, 05/14/2029 (B) 565,000 572,790
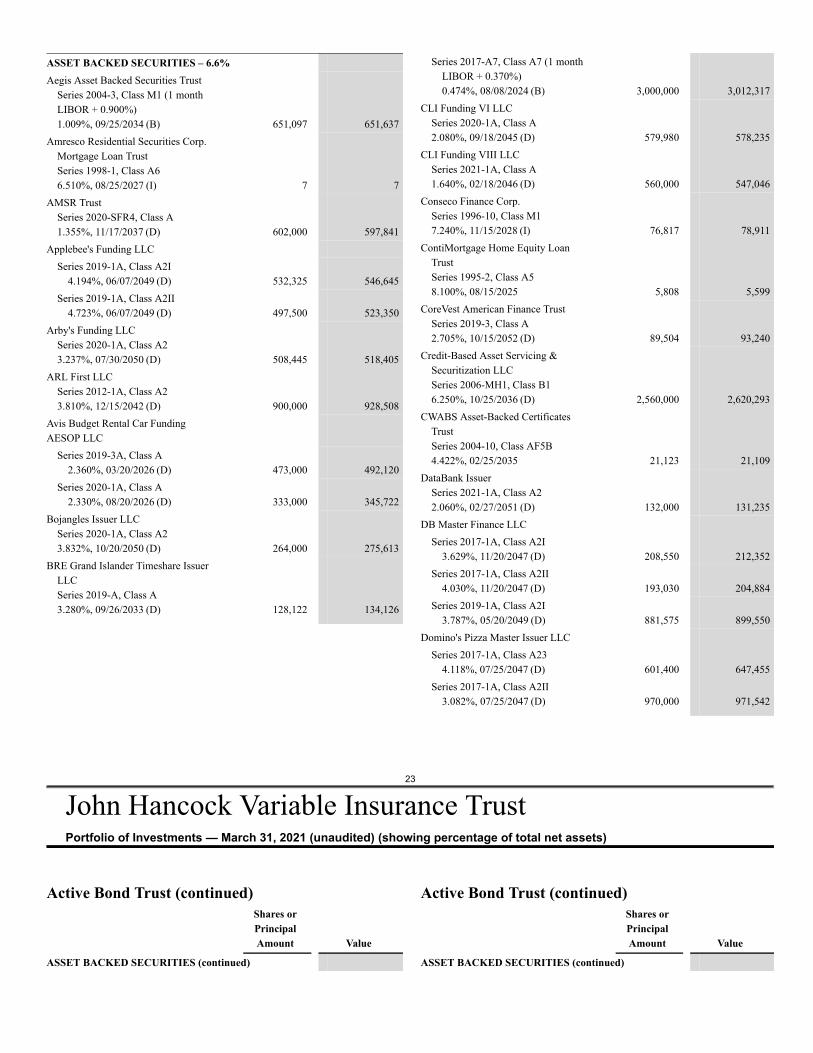
23
John Hancock Variable Insurance TrustPortfolio of Investments — March 31, 2021 (unaudited) (showing percentage of total net assets)
ASSET BACKED SECURITIES – 6.6%Aegis Asset Backed Securities Trust
Series 2004-3, Class M1 (1 monthLIBOR + 0.900%)1.009%, 09/25/2034 (B) 651,097 651,637
Amresco Residential Securities Corp.Mortgage Loan TrustSeries 1998-1, Class A66.510%, 08/25/2027 (I) 7 7
AMSR TrustSeries 2020-SFR4, Class A1.355%, 11/17/2037 (D) 602,000 597,841
Applebee's Funding LLCSeries 2019-1A, Class A2I
4.194%, 06/07/2049 (D) 532,325 546,645Series 2019-1A, Class A2II
4.723%, 06/07/2049 (D) 497,500 523,350Arby's Funding LLC
Series 2020-1A, Class A23.237%, 07/30/2050 (D) 508,445 518,405
ARL First LLCSeries 2012-1A, Class A23.810%, 12/15/2042 (D) 900,000 928,508
Avis Budget Rental Car FundingAESOP LLC
Series 2019-3A, Class A2.360%, 03/20/2026 (D) 473,000 492,120
Series 2020-1A, Class A2.330%, 08/20/2026 (D) 333,000 345,722
Bojangles Issuer LLCSeries 2020-1A, Class A23.832%, 10/20/2050 (D) 264,000 275,613
BRE Grand Islander Timeshare IssuerLLCSeries 2019-A, Class A3.280%, 09/26/2033 (D) 128,122 134,126
Series 2017-A7, Class A7 (1 monthLIBOR + 0.370%)0.474%, 08/08/2024 (B) 3,000,000 3,012,317
CLI Funding VI LLCSeries 2020-1A, Class A2.080%, 09/18/2045 (D) 579,980 578,235
CLI Funding VIII LLCSeries 2021-1A, Class A1.640%, 02/18/2046 (D) 560,000 547,046
Conseco Finance Corp.Series 1996-10, Class M17.240%, 11/15/2028 (I) 76,817 78,911
ContiMortgage Home Equity LoanTrustSeries 1995-2, Class A58.100%, 08/15/2025 5,808 5,599
CoreVest American Finance TrustSeries 2019-3, Class A2.705%, 10/15/2052 (D) 89,504 93,240
Credit-Based Asset Servicing &Securitization LLCSeries 2006-MH1, Class B16.250%, 10/25/2036 (D) 2,560,000 2,620,293
CWABS Asset-Backed CertificatesTrustSeries 2004-10, Class AF5B4.422%, 02/25/2035 21,123 21,109
DataBank IssuerSeries 2021-1A, Class A22.060%, 02/27/2051 (D) 132,000 131,235
DB Master Finance LLCSeries 2017-1A, Class A2I
3.629%, 11/20/2047 (D) 208,550 212,352Series 2017-1A, Class A2II
4.030%, 11/20/2047 (D) 193,030 204,884Series 2019-1A, Class A2I
3.787%, 05/20/2049 (D) 881,575 899,550Domino's Pizza Master Issuer LLC
Series 2017-1A, Class A234.118%, 07/25/2047 (D) 601,400 647,455
Series 2017-1A, Class A2II3.082%, 07/25/2047 (D) 970,000 971,542
Active Bond Trust (continued)Shares orPrincipalAmount Value
ASSET BACKED SECURITIES (continued)
Active Bond Trust (continued)Shares orPrincipalAmount Value
ASSET BACKED SECURITIES (continued)
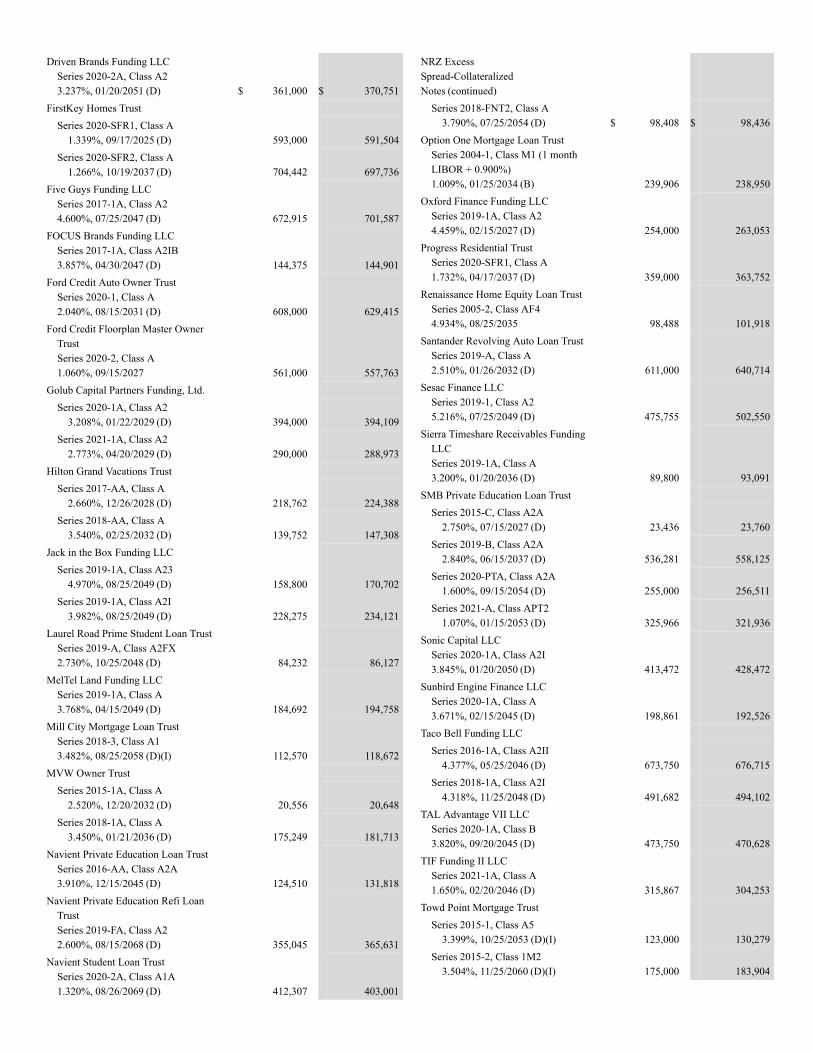
Driven Brands Funding LLCSeries 2020-2A, Class A23.237%, 01/20/2051 (D) $ 361,000 $ 370,751
FirstKey Homes TrustSeries 2020-SFR1, Class A
1.339%, 09/17/2025 (D) 593,000 591,504Series 2020-SFR2, Class A
1.266%, 10/19/2037 (D) 704,442 697,736Five Guys Funding LLC
Series 2017-1A, Class A24.600%, 07/25/2047 (D) 672,915 701,587
FOCUS Brands Funding LLCSeries 2017-1A, Class A2IB3.857%, 04/30/2047 (D) 144,375 144,901
Ford Credit Auto Owner TrustSeries 2020-1, Class A2.040%, 08/15/2031 (D) 608,000 629,415
Ford Credit Floorplan Master OwnerTrustSeries 2020-2, Class A1.060%, 09/15/2027 561,000 557,763
Golub Capital Partners Funding, Ltd.Series 2020-1A, Class A2
3.208%, 01/22/2029 (D) 394,000 394,109Series 2021-1A, Class A2
2.773%, 04/20/2029 (D) 290,000 288,973Hilton Grand Vacations Trust
Series 2017-AA, Class A2.660%, 12/26/2028 (D) 218,762 224,388
Series 2018-AA, Class A3.540%, 02/25/2032 (D) 139,752 147,308
Jack in the Box Funding LLCSeries 2019-1A, Class A23
4.970%, 08/25/2049 (D) 158,800 170,702Series 2019-1A, Class A2I
3.982%, 08/25/2049 (D) 228,275 234,121Laurel Road Prime Student Loan Trust
Series 2019-A, Class A2FX2.730%, 10/25/2048 (D) 84,232 86,127
MelTel Land Funding LLCSeries 2019-1A, Class A3.768%, 04/15/2049 (D) 184,692 194,758
Mill City Mortgage Loan TrustSeries 2018-3, Class A13.482%, 08/25/2058 (D)(I) 112,570 118,672
MVW Owner TrustSeries 2015-1A, Class A
2.520%, 12/20/2032 (D) 20,556 20,648Series 2018-1A, Class A
3.450%, 01/21/2036 (D) 175,249 181,713Navient Private Education Loan Trust
Series 2016-AA, Class A2A3.910%, 12/15/2045 (D) 124,510 131,818
Navient Private Education Refi LoanTrustSeries 2019-FA, Class A22.600%, 08/15/2068 (D) 355,045 365,631
Navient Student Loan TrustSeries 2020-2A, Class A1A1.320%, 08/26/2069 (D) 412,307 403,001
NRZ ExcessSpread-CollateralizedNotes (continued)
Series 2018-FNT2, Class A3.790%, 07/25/2054 (D) $ 98,408 $ 98,436
Option One Mortgage Loan TrustSeries 2004-1, Class M1 (1 monthLIBOR + 0.900%)1.009%, 01/25/2034 (B) 239,906 238,950
Oxford Finance Funding LLCSeries 2019-1A, Class A24.459%, 02/15/2027 (D) 254,000 263,053
Progress Residential TrustSeries 2020-SFR1, Class A1.732%, 04/17/2037 (D) 359,000 363,752
Renaissance Home Equity Loan TrustSeries 2005-2, Class AF44.934%, 08/25/2035 98,488 101,918
Santander Revolving Auto Loan TrustSeries 2019-A, Class A2.510%, 01/26/2032 (D) 611,000 640,714
Sesac Finance LLCSeries 2019-1, Class A25.216%, 07/25/2049 (D) 475,755 502,550
Sierra Timeshare Receivables FundingLLCSeries 2019-1A, Class A3.200%, 01/20/2036 (D) 89,800 93,091
SMB Private Education Loan TrustSeries 2015-C, Class A2A
2.750%, 07/15/2027 (D) 23,436 23,760Series 2019-B, Class A2A
2.840%, 06/15/2037 (D) 536,281 558,125Series 2020-PTA, Class A2A
1.600%, 09/15/2054 (D) 255,000 256,511Series 2021-A, Class APT2
1.070%, 01/15/2053 (D) 325,966 321,936Sonic Capital LLC
Series 2020-1A, Class A2I3.845%, 01/20/2050 (D) 413,472 428,472
Sunbird Engine Finance LLCSeries 2020-1A, Class A3.671%, 02/15/2045 (D) 198,861 192,526
Taco Bell Funding LLCSeries 2016-1A, Class A2II
4.377%, 05/25/2046 (D) 673,750 676,715Series 2018-1A, Class A2I
4.318%, 11/25/2048 (D) 491,682 494,102TAL Advantage VII LLC
Series 2020-1A, Class B3.820%, 09/20/2045 (D) 473,750 470,628
TIF Funding II LLCSeries 2021-1A, Class A1.650%, 02/20/2046 (D) 315,867 304,253
Towd Point Mortgage TrustSeries 2015-1, Class A5
3.399%, 10/25/2053 (D)(I) 123,000 130,279Series 2015-2, Class 1M2
3.504%, 11/25/2060 (D)(I) 175,000 183,904
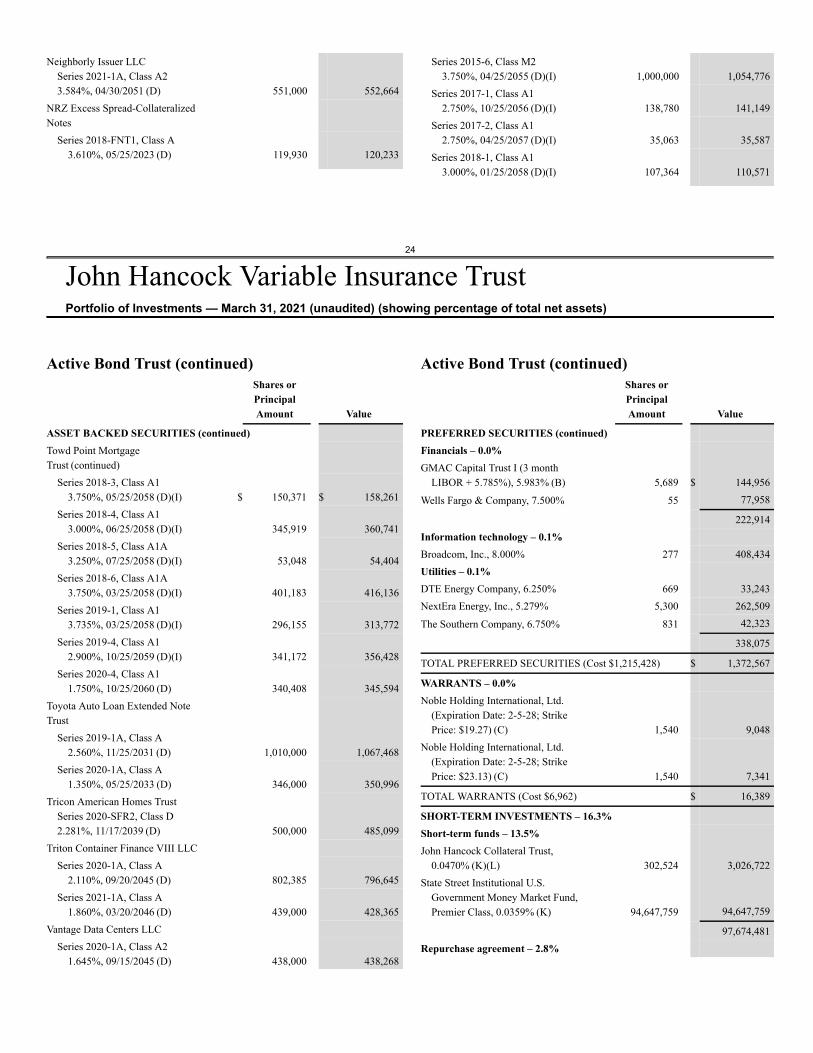
24
John Hancock Variable Insurance TrustPortfolio of Investments — March 31, 2021 (unaudited) (showing percentage of total net assets)
Neighborly Issuer LLCSeries 2021-1A, Class A23.584%, 04/30/2051 (D) 551,000 552,664
NRZ Excess Spread-CollateralizedNotes
Series 2018-FNT1, Class A3.610%, 05/25/2023 (D) 119,930 120,233
Series 2015-6, Class M23.750%, 04/25/2055 (D)(I) 1,000,000 1,054,776
Series 2017-1, Class A12.750%, 10/25/2056 (D)(I) 138,780 141,149
Series 2017-2, Class A12.750%, 04/25/2057 (D)(I) 35,063 35,587
Series 2018-1, Class A13.000%, 01/25/2058 (D)(I) 107,364 110,571
Active Bond Trust (continued)Shares orPrincipalAmount Value
ASSET BACKED SECURITIES (continued)Towd Point MortgageTrust (continued)
Series 2018-3, Class A13.750%, 05/25/2058 (D)(I) $ 150,371 $ 158,261
Series 2018-4, Class A13.000%, 06/25/2058 (D)(I) 345,919 360,741
Series 2018-5, Class A1A3.250%, 07/25/2058 (D)(I) 53,048 54,404
Series 2018-6, Class A1A3.750%, 03/25/2058 (D)(I) 401,183 416,136
Series 2019-1, Class A13.735%, 03/25/2058 (D)(I) 296,155 313,772
Series 2019-4, Class A12.900%, 10/25/2059 (D)(I) 341,172 356,428
Series 2020-4, Class A11.750%, 10/25/2060 (D) 340,408 345,594
Toyota Auto Loan Extended NoteTrust
Series 2019-1A, Class A2.560%, 11/25/2031 (D) 1,010,000 1,067,468
Series 2020-1A, Class A1.350%, 05/25/2033 (D) 346,000 350,996
Tricon American Homes TrustSeries 2020-SFR2, Class D2.281%, 11/17/2039 (D) 500,000 485,099
Triton Container Finance VIII LLCSeries 2020-1A, Class A
2.110%, 09/20/2045 (D) 802,385 796,645Series 2021-1A, Class A
1.860%, 03/20/2046 (D) 439,000 428,365Vantage Data Centers LLC
Series 2020-1A, Class A21.645%, 09/15/2045 (D) 438,000 438,268
Active Bond Trust (continued)Shares orPrincipalAmount Value
PREFERRED SECURITIES (continued)Financials – 0.0%GMAC Capital Trust I (3 month
LIBOR + 5.785%), 5.983% (B) 5,689 $ 144,956
Wells Fargo & Company, 7.500% 55 77,958
222,914Information technology – 0.1%Broadcom, Inc., 8.000% 277 408,434Utilities – 0.1%DTE Energy Company, 6.250% 669 33,243NextEra Energy, Inc., 5.279% 5,300 262,509
The Southern Company, 6.750% 831 42,323
338,075
TOTAL PREFERRED SECURITIES (Cost $1,215,428) $ 1,372,567
WARRANTS – 0.0%Noble Holding International, Ltd.
(Expiration Date: 2-5-28; StrikePrice: $19.27) (C) 1,540 9,048
Noble Holding International, Ltd.(Expiration Date: 2-5-28; StrikePrice: $23.13) (C) 1,540 7,341
TOTAL WARRANTS (Cost $6,962) $ 16,389
SHORT-TERM INVESTMENTS – 16.3%Short-term funds – 13.5%John Hancock Collateral Trust,
0.0470% (K)(L) 302,524 3,026,722State Street Institutional U.S.
Government Money Market Fund,Premier Class, 0.0359% (K) 94,647,759 94,647,759
97,674,481Repurchase agreement – 2.8%
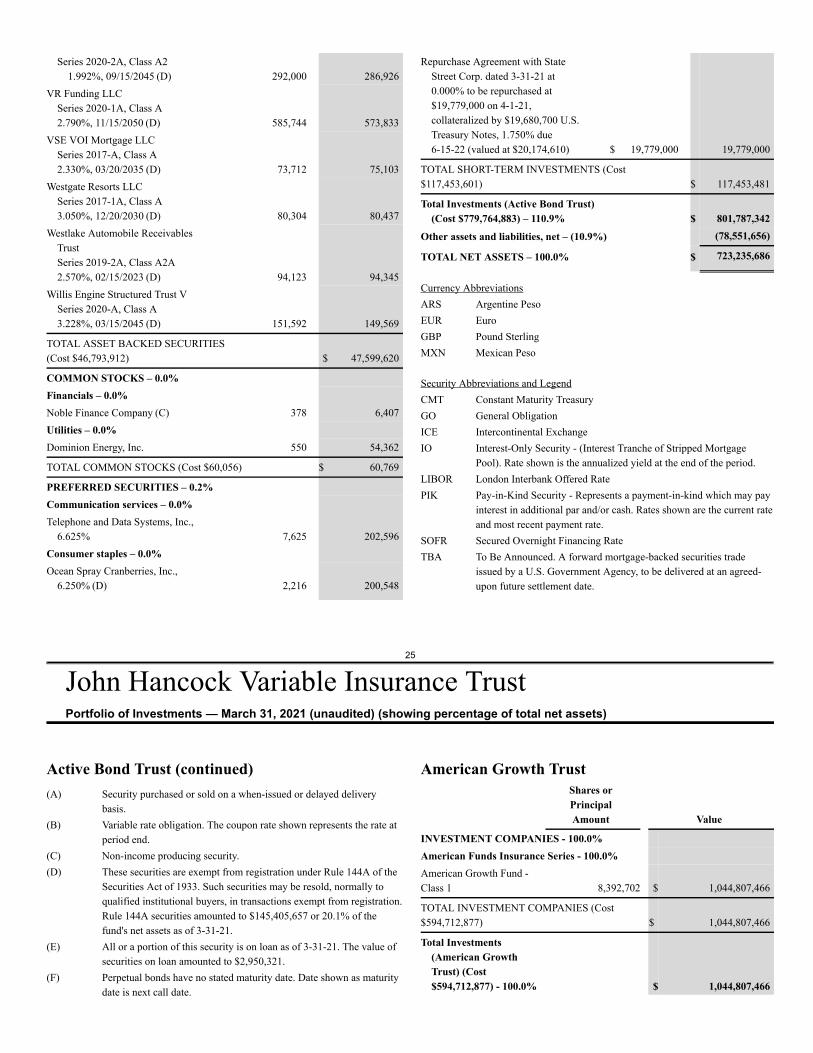
25
John Hancock Variable Insurance TrustPortfolio of Investments — March 31, 2021 (unaudited) (showing percentage of total net assets)
Series 2020-2A, Class A21.992%, 09/15/2045 (D) 292,000 286,926
VR Funding LLCSeries 2020-1A, Class A2.790%, 11/15/2050 (D) 585,744 573,833
VSE VOI Mortgage LLCSeries 2017-A, Class A2.330%, 03/20/2035 (D) 73,712 75,103
Westgate Resorts LLCSeries 2017-1A, Class A3.050%, 12/20/2030 (D) 80,304 80,437
Westlake Automobile ReceivablesTrustSeries 2019-2A, Class A2A2.570%, 02/15/2023 (D) 94,123 94,345
Willis Engine Structured Trust VSeries 2020-A, Class A3.228%, 03/15/2045 (D) 151,592 149,569
TOTAL ASSET BACKED SECURITIES(Cost $46,793,912) $ 47,599,620
COMMON STOCKS – 0.0%Financials – 0.0%Noble Finance Company (C) 378 6,407Utilities – 0.0%Dominion Energy, Inc. 550 54,362
TOTAL COMMON STOCKS (Cost $60,056) $ 60,769
PREFERRED SECURITIES – 0.2%Communication services – 0.0%Telephone and Data Systems, Inc.,
6.625% 7,625 202,596Consumer staples – 0.0%Ocean Spray Cranberries, Inc.,
6.250% (D) 2,216 200,548
Repurchase Agreement with StateStreet Corp. dated 3-31-21 at0.000% to be repurchased at$19,779,000 on 4-1-21,collateralized by $19,680,700 U.S.Treasury Notes, 1.750% due6-15-22 (valued at $20,174,610) $ 19,779,000 19,779,000
TOTAL SHORT-TERM INVESTMENTS (Cost$117,453,601) $ 117,453,481
Total Investments (Active Bond Trust)(Cost $779,764,883) – 110.9% $ 801,787,342
Other assets and liabilities, net – (10.9%) (78,551,656)
TOTAL NET ASSETS – 100.0% $ 723,235,686
Currency AbbreviationsARS Argentine PesoEUR EuroGBP Pound SterlingMXN Mexican Peso
Security Abbreviations and LegendCMT Constant Maturity TreasuryGO General ObligationICE Intercontinental ExchangeIO Interest-Only Security - (Interest Tranche of Stripped Mortgage
Pool). Rate shown is the annualized yield at the end of the period.LIBOR London Interbank Offered RatePIK Pay-in-Kind Security - Represents a payment-in-kind which may pay
interest in additional par and/or cash. Rates shown are the current rateand most recent payment rate.
SOFR Secured Overnight Financing RateTBA To Be Announced. A forward mortgage-backed securities trade
issued by a U.S. Government Agency, to be delivered at an agreed-upon future settlement date.
Active Bond Trust (continued)(A) Security purchased or sold on a when-issued or delayed delivery
basis.(B) Variable rate obligation. The coupon rate shown represents the rate at
period end.(C) Non-income producing security.(D) These securities are exempt from registration under Rule 144A of the
Securities Act of 1933. Such securities may be resold, normally toqualified institutional buyers, in transactions exempt from registration.Rule 144A securities amounted to $145,405,657 or 20.1% of thefund's net assets as of 3-31-21.
(E) All or a portion of this security is on loan as of 3-31-21. The value ofsecurities on loan amounted to $2,950,321.
(F) Perpetual bonds have no stated maturity date. Date shown as maturitydate is next call date.
American Growth TrustShares orPrincipalAmount Value
INVESTMENT COMPANIES - 100.0%American Funds Insurance Series - 100.0%American Growth Fund -Class 1 8,392,702 $ 1,044,807,466
TOTAL INVESTMENT COMPANIES (Cost$594,712,877) $ 1,044,807,466
Total Investments(American GrowthTrust) (Cost$594,712,877) - 100.0% $ 1,044,807,466
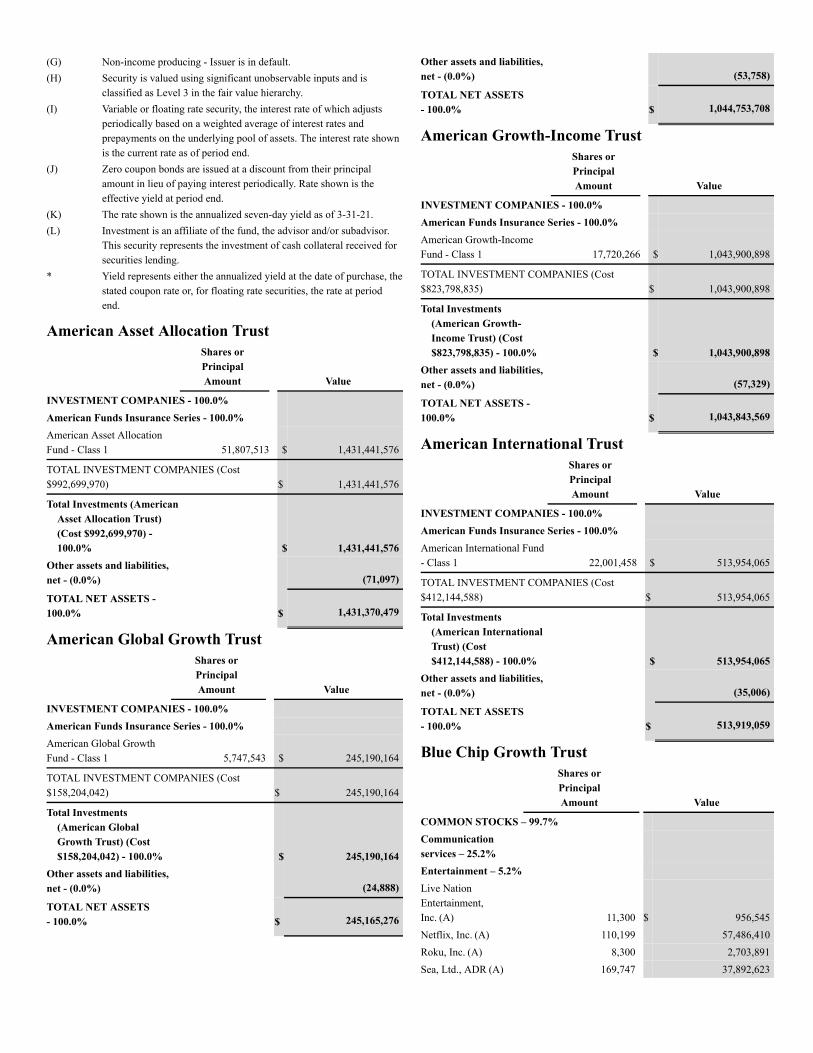
(G) Non-income producing - Issuer is in default.(H) Security is valued using significant unobservable inputs and is
classified as Level 3 in the fair value hierarchy.(I) Variable or floating rate security, the interest rate of which adjusts
periodically based on a weighted average of interest rates andprepayments on the underlying pool of assets. The interest rate shownis the current rate as of period end.
(J) Zero coupon bonds are issued at a discount from their principalamount in lieu of paying interest periodically. Rate shown is theeffective yield at period end.
(K) The rate shown is the annualized seven-day yield as of 3-31-21.(L) Investment is an affiliate of the fund, the advisor and/or subadvisor.
This security represents the investment of cash collateral received forsecurities lending.
* Yield represents either the annualized yield at the date of purchase, thestated coupon rate or, for floating rate securities, the rate at periodend.
American Asset Allocation TrustShares orPrincipalAmount Value
INVESTMENT COMPANIES - 100.0%American Funds Insurance Series - 100.0%American Asset AllocationFund - Class 1 51,807,513 $ 1,431,441,576
TOTAL INVESTMENT COMPANIES (Cost$992,699,970) $ 1,431,441,576
Total Investments (AmericanAsset Allocation Trust)(Cost $992,699,970) -100.0% $ 1,431,441,576
Other assets and liabilities,net - (0.0%) (71,097)
TOTAL NET ASSETS -100.0% $ 1,431,370,479
American Global Growth TrustShares orPrincipalAmount Value
INVESTMENT COMPANIES - 100.0%American Funds Insurance Series - 100.0%American Global GrowthFund - Class 1 5,747,543 $ 245,190,164
TOTAL INVESTMENT COMPANIES (Cost$158,204,042) $ 245,190,164
Total Investments(American GlobalGrowth Trust) (Cost$158,204,042) - 100.0% $ 245,190,164
Other assets and liabilities,net - (0.0%) (24,888)
TOTAL NET ASSETS- 100.0% $ 245,165,276
Other assets and liabilities,net - (0.0%) (53,758)
TOTAL NET ASSETS- 100.0% $ 1,044,753,708
American Growth-Income TrustShares orPrincipalAmount Value
INVESTMENT COMPANIES - 100.0%American Funds Insurance Series - 100.0%American Growth-IncomeFund - Class 1 17,720,266 $ 1,043,900,898
TOTAL INVESTMENT COMPANIES (Cost$823,798,835) $ 1,043,900,898
Total Investments(American Growth-Income Trust) (Cost$823,798,835) - 100.0% $ 1,043,900,898
Other assets and liabilities,net - (0.0%) (57,329)
TOTAL NET ASSETS -100.0% $ 1,043,843,569
American International TrustShares orPrincipalAmount Value
INVESTMENT COMPANIES - 100.0%American Funds Insurance Series - 100.0%American International Fund- Class 1 22,001,458 $ 513,954,065
TOTAL INVESTMENT COMPANIES (Cost$412,144,588) $ 513,954,065
Total Investments(American InternationalTrust) (Cost$412,144,588) - 100.0% $ 513,954,065
Other assets and liabilities,net - (0.0%) (35,006)
TOTAL NET ASSETS- 100.0% $ 513,919,059
Blue Chip Growth TrustShares orPrincipalAmount Value
COMMON STOCKS – 99.7%Communicationservices – 25.2%Entertainment – 5.2%Live NationEntertainment,Inc. (A) 11,300 $ 956,545Netflix, Inc. (A) 110,199 57,486,410Roku, Inc. (A) 8,300 2,703,891Sea, Ltd., ADR (A) 169,747 37,892,623
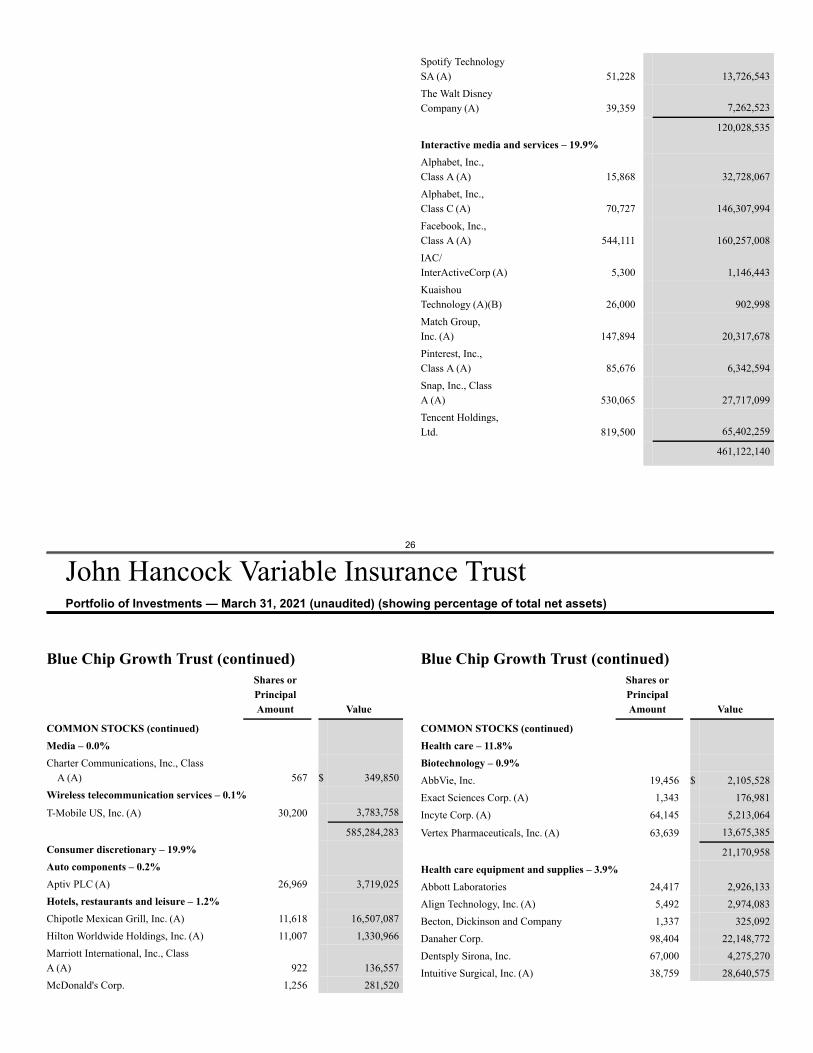
26
John Hancock Variable Insurance TrustPortfolio of Investments — March 31, 2021 (unaudited) (showing percentage of total net assets)
Spotify TechnologySA (A) 51,228 13,726,543The Walt DisneyCompany (A) 39,359 7,262,523
120,028,535Interactive media and services – 19.9%Alphabet, Inc.,Class A (A) 15,868 32,728,067Alphabet, Inc.,Class C (A) 70,727 146,307,994Facebook, Inc.,Class A (A) 544,111 160,257,008IAC/InterActiveCorp (A) 5,300 1,146,443KuaishouTechnology (A)(B) 26,000 902,998Match Group,Inc. (A) 147,894 20,317,678Pinterest, Inc.,Class A (A) 85,676 6,342,594Snap, Inc., ClassA (A) 530,065 27,717,099Tencent Holdings,Ltd. 819,500 65,402,259
461,122,140
Blue Chip Growth Trust (continued)Shares orPrincipalAmount Value
COMMON STOCKS (continued)Media – 0.0%Charter Communications, Inc., Class
A (A) 567 $ 349,850Wireless telecommunication services – 0.1%T-Mobile US, Inc. (A) 30,200 3,783,758
585,284,283Consumer discretionary – 19.9%Auto components – 0.2%Aptiv PLC (A) 26,969 3,719,025Hotels, restaurants and leisure – 1.2%Chipotle Mexican Grill, Inc. (A) 11,618 16,507,087Hilton Worldwide Holdings, Inc. (A) 11,007 1,330,966Marriott International, Inc., ClassA (A) 922 136,557McDonald's Corp. 1,256 281,520
Blue Chip Growth Trust (continued)Shares orPrincipalAmount Value
COMMON STOCKS (continued)Health care – 11.8%Biotechnology – 0.9%AbbVie, Inc. 19,456 $ 2,105,528Exact Sciences Corp. (A) 1,343 176,981Incyte Corp. (A) 64,145 5,213,064
Vertex Pharmaceuticals, Inc. (A) 63,639 13,675,385
21,170,958Health care equipment and supplies – 3.9%Abbott Laboratories 24,417 2,926,133Align Technology, Inc. (A) 5,492 2,974,083Becton, Dickinson and Company 1,337 325,092Danaher Corp. 98,404 22,148,772Dentsply Sirona, Inc. 67,000 4,275,270Intuitive Surgical, Inc. (A) 38,759 28,640,575
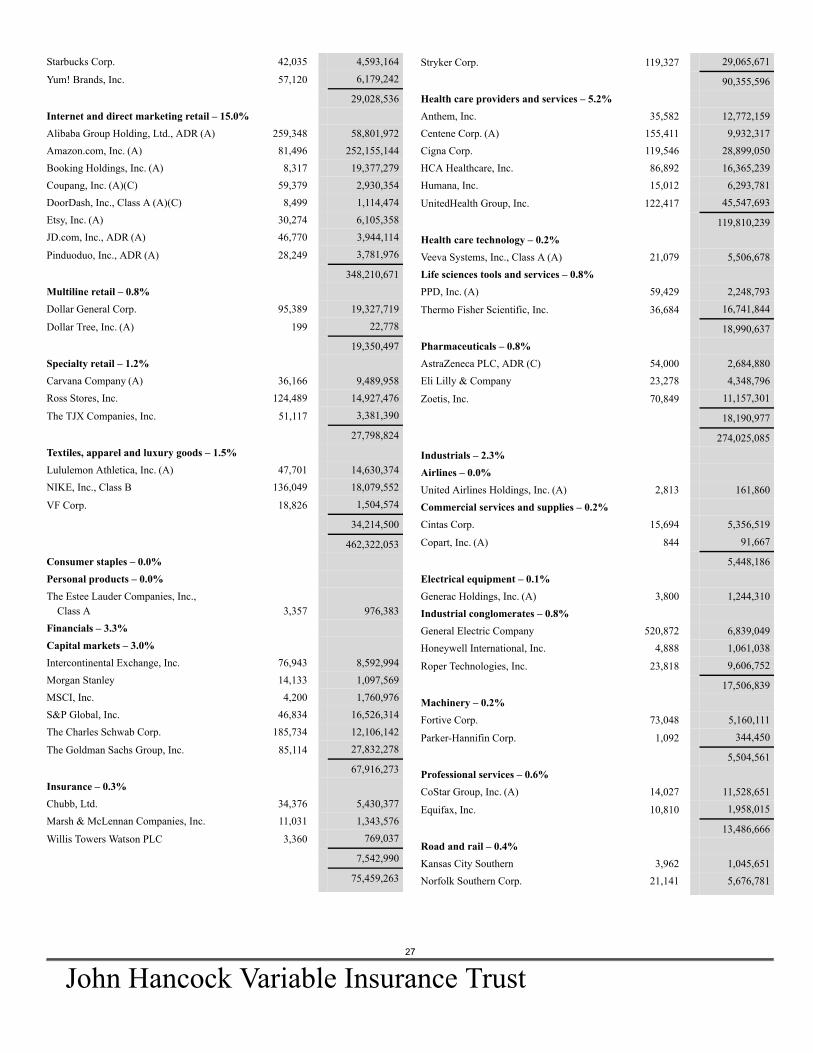
27
John Hancock Variable Insurance Trust
Starbucks Corp. 42,035 4,593,164
Yum! Brands, Inc. 57,120 6,179,242
29,028,536Internet and direct marketing retail – 15.0%Alibaba Group Holding, Ltd., ADR (A) 259,348 58,801,972Amazon.com, Inc. (A) 81,496 252,155,144Booking Holdings, Inc. (A) 8,317 19,377,279Coupang, Inc. (A)(C) 59,379 2,930,354DoorDash, Inc., Class A (A)(C) 8,499 1,114,474Etsy, Inc. (A) 30,274 6,105,358JD.com, Inc., ADR (A) 46,770 3,944,114
Pinduoduo, Inc., ADR (A) 28,249 3,781,976
348,210,671Multiline retail – 0.8%Dollar General Corp. 95,389 19,327,719
Dollar Tree, Inc. (A) 199 22,778
19,350,497Specialty retail – 1.2%Carvana Company (A) 36,166 9,489,958Ross Stores, Inc. 124,489 14,927,476
The TJX Companies, Inc. 51,117 3,381,390
27,798,824Textiles, apparel and luxury goods – 1.5%Lululemon Athletica, Inc. (A) 47,701 14,630,374NIKE, Inc., Class B 136,049 18,079,552
VF Corp. 18,826 1,504,574
34,214,500
462,322,053Consumer staples – 0.0%Personal products – 0.0%The Estee Lauder Companies, Inc.,
Class A 3,357 976,383Financials – 3.3%Capital markets – 3.0%Intercontinental Exchange, Inc. 76,943 8,592,994Morgan Stanley 14,133 1,097,569MSCI, Inc. 4,200 1,760,976S&P Global, Inc. 46,834 16,526,314The Charles Schwab Corp. 185,734 12,106,142
The Goldman Sachs Group, Inc. 85,114 27,832,278
67,916,273Insurance – 0.3%Chubb, Ltd. 34,376 5,430,377Marsh & McLennan Companies, Inc. 11,031 1,343,576
Willis Towers Watson PLC 3,360 769,037
7,542,990
75,459,263
Stryker Corp. 119,327 29,065,671
90,355,596Health care providers and services – 5.2%Anthem, Inc. 35,582 12,772,159Centene Corp. (A) 155,411 9,932,317Cigna Corp. 119,546 28,899,050HCA Healthcare, Inc. 86,892 16,365,239Humana, Inc. 15,012 6,293,781
UnitedHealth Group, Inc. 122,417 45,547,693
119,810,239Health care technology – 0.2%Veeva Systems, Inc., Class A (A) 21,079 5,506,678Life sciences tools and services – 0.8%PPD, Inc. (A) 59,429 2,248,793
Thermo Fisher Scientific, Inc. 36,684 16,741,844
18,990,637Pharmaceuticals – 0.8%AstraZeneca PLC, ADR (C) 54,000 2,684,880Eli Lilly & Company 23,278 4,348,796
Zoetis, Inc. 70,849 11,157,301
18,190,977
274,025,085Industrials – 2.3%Airlines – 0.0%United Airlines Holdings, Inc. (A) 2,813 161,860Commercial services and supplies – 0.2%Cintas Corp. 15,694 5,356,519
Copart, Inc. (A) 844 91,667
5,448,186Electrical equipment – 0.1%Generac Holdings, Inc. (A) 3,800 1,244,310Industrial conglomerates – 0.8%General Electric Company 520,872 6,839,049Honeywell International, Inc. 4,888 1,061,038
Roper Technologies, Inc. 23,818 9,606,752
17,506,839Machinery – 0.2%Fortive Corp. 73,048 5,160,111
Parker-Hannifin Corp. 1,092 344,450
5,504,561Professional services – 0.6%CoStar Group, Inc. (A) 14,027 11,528,651
Equifax, Inc. 10,810 1,958,015
13,486,666Road and rail – 0.4%Kansas City Southern 3,962 1,045,651Norfolk Southern Corp. 21,141 5,676,781
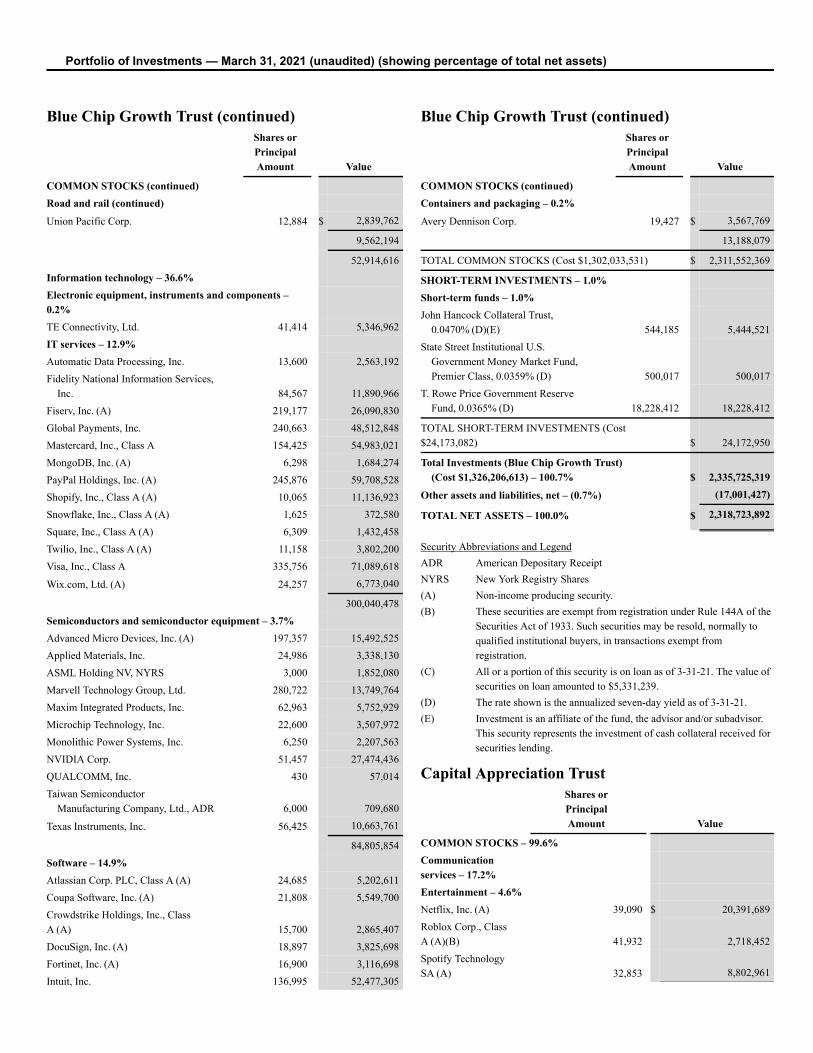
Portfolio of Investments — March 31, 2021 (unaudited) (showing percentage of total net assets)
Blue Chip Growth Trust (continued)Shares orPrincipalAmount Value
COMMON STOCKS (continued)Road and rail (continued)Union Pacific Corp. 12,884 $ 2,839,762
9,562,194
52,914,616Information technology – 36.6%Electronic equipment, instruments and components –0.2%TE Connectivity, Ltd. 41,414 5,346,962IT services – 12.9%Automatic Data Processing, Inc. 13,600 2,563,192Fidelity National Information Services,
Inc. 84,567 11,890,966Fiserv, Inc. (A) 219,177 26,090,830Global Payments, Inc. 240,663 48,512,848Mastercard, Inc., Class A 154,425 54,983,021MongoDB, Inc. (A) 6,298 1,684,274PayPal Holdings, Inc. (A) 245,876 59,708,528Shopify, Inc., Class A (A) 10,065 11,136,923Snowflake, Inc., Class A (A) 1,625 372,580Square, Inc., Class A (A) 6,309 1,432,458Twilio, Inc., Class A (A) 11,158 3,802,200Visa, Inc., Class A 335,756 71,089,618
Wix.com, Ltd. (A) 24,257 6,773,040
300,040,478Semiconductors and semiconductor equipment – 3.7%Advanced Micro Devices, Inc. (A) 197,357 15,492,525Applied Materials, Inc. 24,986 3,338,130ASML Holding NV, NYRS 3,000 1,852,080Marvell Technology Group, Ltd. 280,722 13,749,764Maxim Integrated Products, Inc. 62,963 5,752,929Microchip Technology, Inc. 22,600 3,507,972Monolithic Power Systems, Inc. 6,250 2,207,563NVIDIA Corp. 51,457 27,474,436QUALCOMM, Inc. 430 57,014Taiwan Semiconductor
Manufacturing Company, Ltd., ADR 6,000 709,680
Texas Instruments, Inc. 56,425 10,663,761
84,805,854Software – 14.9%Atlassian Corp. PLC, Class A (A) 24,685 5,202,611Coupa Software, Inc. (A) 21,808 5,549,700Crowdstrike Holdings, Inc., ClassA (A) 15,700 2,865,407DocuSign, Inc. (A) 18,897 3,825,698Fortinet, Inc. (A) 16,900 3,116,698Intuit, Inc. 136,995 52,477,305
Blue Chip Growth Trust (continued)Shares orPrincipalAmount Value
COMMON STOCKS (continued)Containers and packaging – 0.2%Avery Dennison Corp. 19,427 $ 3,567,769
13,188,079
TOTAL COMMON STOCKS (Cost $1,302,033,531) $ 2,311,552,369
SHORT-TERM INVESTMENTS – 1.0%Short-term funds – 1.0%John Hancock Collateral Trust,
0.0470% (D)(E) 544,185 5,444,521State Street Institutional U.S.
Government Money Market Fund,Premier Class, 0.0359% (D) 500,017 500,017
T. Rowe Price Government ReserveFund, 0.0365% (D) 18,228,412 18,228,412
TOTAL SHORT-TERM INVESTMENTS (Cost$24,173,082) $ 24,172,950
Total Investments (Blue Chip Growth Trust)(Cost $1,326,206,613) – 100.7% $ 2,335,725,319
Other assets and liabilities, net – (0.7%) (17,001,427)
TOTAL NET ASSETS – 100.0% $ 2,318,723,892
Security Abbreviations and LegendADR American Depositary ReceiptNYRS New York Registry Shares(A) Non-income producing security.(B) These securities are exempt from registration under Rule 144A of the
Securities Act of 1933. Such securities may be resold, normally toqualified institutional buyers, in transactions exempt fromregistration.
(C) All or a portion of this security is on loan as of 3-31-21. The value ofsecurities on loan amounted to $5,331,239.
(D) The rate shown is the annualized seven-day yield as of 3-31-21.(E) Investment is an affiliate of the fund, the advisor and/or subadvisor.
This security represents the investment of cash collateral received forsecurities lending.
Capital Appreciation TrustShares orPrincipalAmount Value
COMMON STOCKS – 99.6%Communicationservices – 17.2%Entertainment – 4.6%Netflix, Inc. (A) 39,090 $ 20,391,689Roblox Corp., ClassA (A)(B) 41,932 2,718,452Spotify TechnologySA (A) 32,853 8,802,961
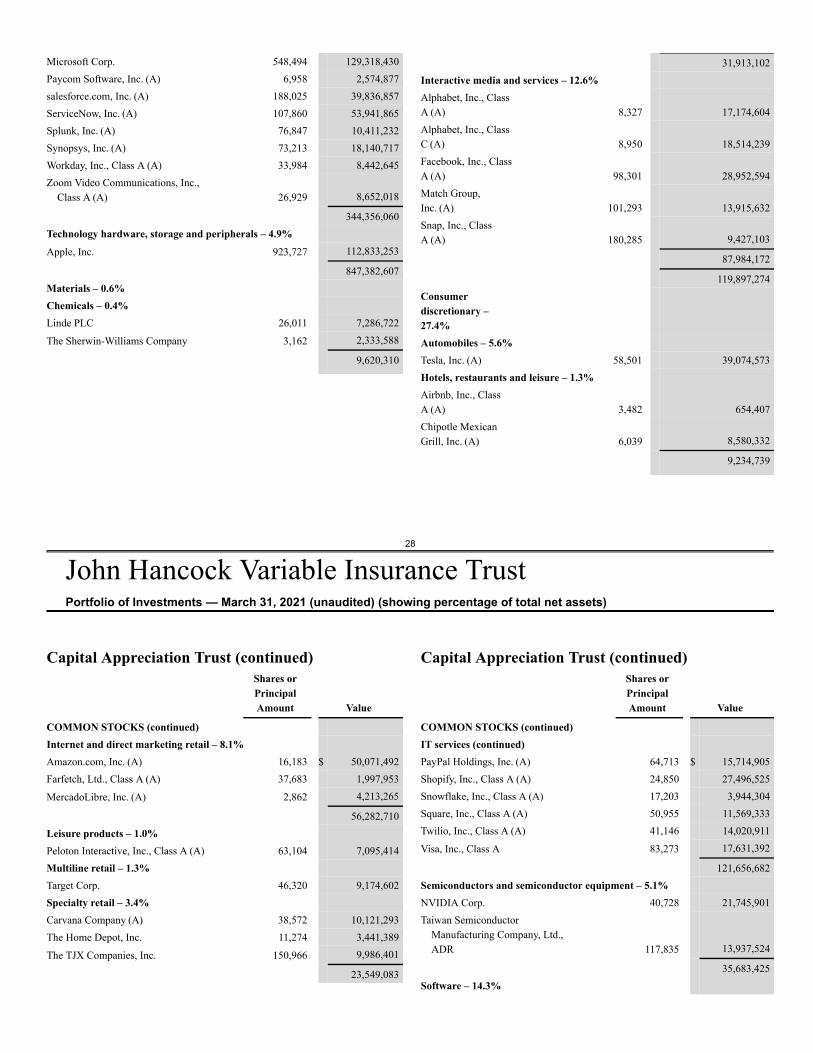
28
John Hancock Variable Insurance TrustPortfolio of Investments — March 31, 2021 (unaudited) (showing percentage of total net assets)
Microsoft Corp. 548,494 129,318,430Paycom Software, Inc. (A) 6,958 2,574,877salesforce.com, Inc. (A) 188,025 39,836,857ServiceNow, Inc. (A) 107,860 53,941,865Splunk, Inc. (A) 76,847 10,411,232Synopsys, Inc. (A) 73,213 18,140,717Workday, Inc., Class A (A) 33,984 8,442,645Zoom Video Communications, Inc.,
Class A (A) 26,929 8,652,018
344,356,060Technology hardware, storage and peripherals – 4.9%Apple, Inc. 923,727 112,833,253
847,382,607Materials – 0.6%Chemicals – 0.4%Linde PLC 26,011 7,286,722
The Sherwin-Williams Company 3,162 2,333,588
9,620,310
31,913,102Interactive media and services – 12.6%Alphabet, Inc., ClassA (A) 8,327 17,174,604Alphabet, Inc., ClassC (A) 8,950 18,514,239Facebook, Inc., ClassA (A) 98,301 28,952,594Match Group,Inc. (A) 101,293 13,915,632Snap, Inc., ClassA (A) 180,285 9,427,103
87,984,172
119,897,274Consumerdiscretionary –27.4%Automobiles – 5.6%Tesla, Inc. (A) 58,501 39,074,573Hotels, restaurants and leisure – 1.3%Airbnb, Inc., ClassA (A) 3,482 654,407Chipotle MexicanGrill, Inc. (A) 6,039 8,580,332
9,234,739
Capital Appreciation Trust (continued)Shares orPrincipalAmount Value
COMMON STOCKS (continued)Internet and direct marketing retail – 8.1%Amazon.com, Inc. (A) 16,183 $ 50,071,492Farfetch, Ltd., Class A (A) 37,683 1,997,953
MercadoLibre, Inc. (A) 2,862 4,213,265
56,282,710Leisure products – 1.0%Peloton Interactive, Inc., Class A (A) 63,104 7,095,414Multiline retail – 1.3%Target Corp. 46,320 9,174,602Specialty retail – 3.4%Carvana Company (A) 38,572 10,121,293The Home Depot, Inc. 11,274 3,441,389
The TJX Companies, Inc. 150,966 9,986,401
23,549,083
Capital Appreciation Trust (continued)Shares orPrincipalAmount Value
COMMON STOCKS (continued)IT services (continued)PayPal Holdings, Inc. (A) 64,713 $ 15,714,905Shopify, Inc., Class A (A) 24,850 27,496,525Snowflake, Inc., Class A (A) 17,203 3,944,304Square, Inc., Class A (A) 50,955 11,569,333Twilio, Inc., Class A (A) 41,146 14,020,911
Visa, Inc., Class A 83,273 17,631,392
121,656,682Semiconductors and semiconductor equipment – 5.1%NVIDIA Corp. 40,728 21,745,901Taiwan Semiconductor
Manufacturing Company, Ltd.,ADR 117,835 13,937,524
35,683,425Software – 14.3%
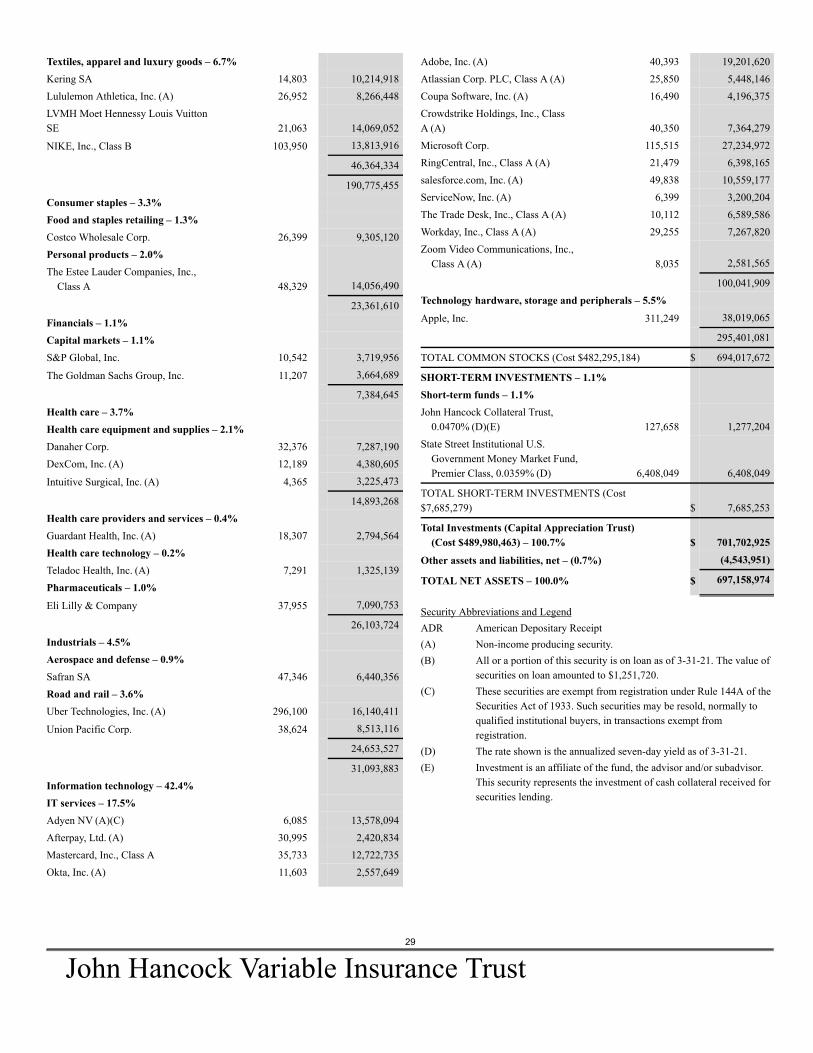
29
John Hancock Variable Insurance Trust
Textiles, apparel and luxury goods – 6.7%Kering SA 14,803 10,214,918Lululemon Athletica, Inc. (A) 26,952 8,266,448LVMH Moet Hennessy Louis VuittonSE 21,063 14,069,052
NIKE, Inc., Class B 103,950 13,813,916
46,364,334
190,775,455Consumer staples – 3.3%Food and staples retailing – 1.3%Costco Wholesale Corp. 26,399 9,305,120Personal products – 2.0%The Estee Lauder Companies, Inc.,
Class A 48,329 14,056,490
23,361,610Financials – 1.1%Capital markets – 1.1%S&P Global, Inc. 10,542 3,719,956
The Goldman Sachs Group, Inc. 11,207 3,664,689
7,384,645Health care – 3.7%Health care equipment and supplies – 2.1%Danaher Corp. 32,376 7,287,190DexCom, Inc. (A) 12,189 4,380,605
Intuitive Surgical, Inc. (A) 4,365 3,225,473
14,893,268Health care providers and services – 0.4%Guardant Health, Inc. (A) 18,307 2,794,564Health care technology – 0.2%Teladoc Health, Inc. (A) 7,291 1,325,139Pharmaceuticals – 1.0%Eli Lilly & Company 37,955 7,090,753
26,103,724Industrials – 4.5%Aerospace and defense – 0.9%Safran SA 47,346 6,440,356Road and rail – 3.6%Uber Technologies, Inc. (A) 296,100 16,140,411
Union Pacific Corp. 38,624 8,513,116
24,653,527
31,093,883Information technology – 42.4%IT services – 17.5%Adyen NV (A)(C) 6,085 13,578,094Afterpay, Ltd. (A) 30,995 2,420,834Mastercard, Inc., Class A 35,733 12,722,735Okta, Inc. (A) 11,603 2,557,649
Adobe, Inc. (A) 40,393 19,201,620Atlassian Corp. PLC, Class A (A) 25,850 5,448,146Coupa Software, Inc. (A) 16,490 4,196,375Crowdstrike Holdings, Inc., ClassA (A) 40,350 7,364,279Microsoft Corp. 115,515 27,234,972RingCentral, Inc., Class A (A) 21,479 6,398,165salesforce.com, Inc. (A) 49,838 10,559,177ServiceNow, Inc. (A) 6,399 3,200,204The Trade Desk, Inc., Class A (A) 10,112 6,589,586Workday, Inc., Class A (A) 29,255 7,267,820Zoom Video Communications, Inc.,
Class A (A) 8,035 2,581,565
100,041,909Technology hardware, storage and peripherals – 5.5%Apple, Inc. 311,249 38,019,065
295,401,081
TOTAL COMMON STOCKS (Cost $482,295,184) $ 694,017,672
SHORT-TERM INVESTMENTS – 1.1%Short-term funds – 1.1%John Hancock Collateral Trust,
0.0470% (D)(E) 127,658 1,277,204State Street Institutional U.S.
Government Money Market Fund,Premier Class, 0.0359% (D) 6,408,049 6,408,049
TOTAL SHORT-TERM INVESTMENTS (Cost$7,685,279) $ 7,685,253
Total Investments (Capital Appreciation Trust)(Cost $489,980,463) – 100.7% $ 701,702,925
Other assets and liabilities, net – (0.7%) (4,543,951)
TOTAL NET ASSETS – 100.0% $ 697,158,974
Security Abbreviations and LegendADR American Depositary Receipt(A) Non-income producing security.(B) All or a portion of this security is on loan as of 3-31-21. The value of
securities on loan amounted to $1,251,720.(C) These securities are exempt from registration under Rule 144A of the
Securities Act of 1933. Such securities may be resold, normally toqualified institutional buyers, in transactions exempt fromregistration.
(D) The rate shown is the annualized seven-day yield as of 3-31-21.(E) Investment is an affiliate of the fund, the advisor and/or subadvisor.
This security represents the investment of cash collateral received forsecurities lending.
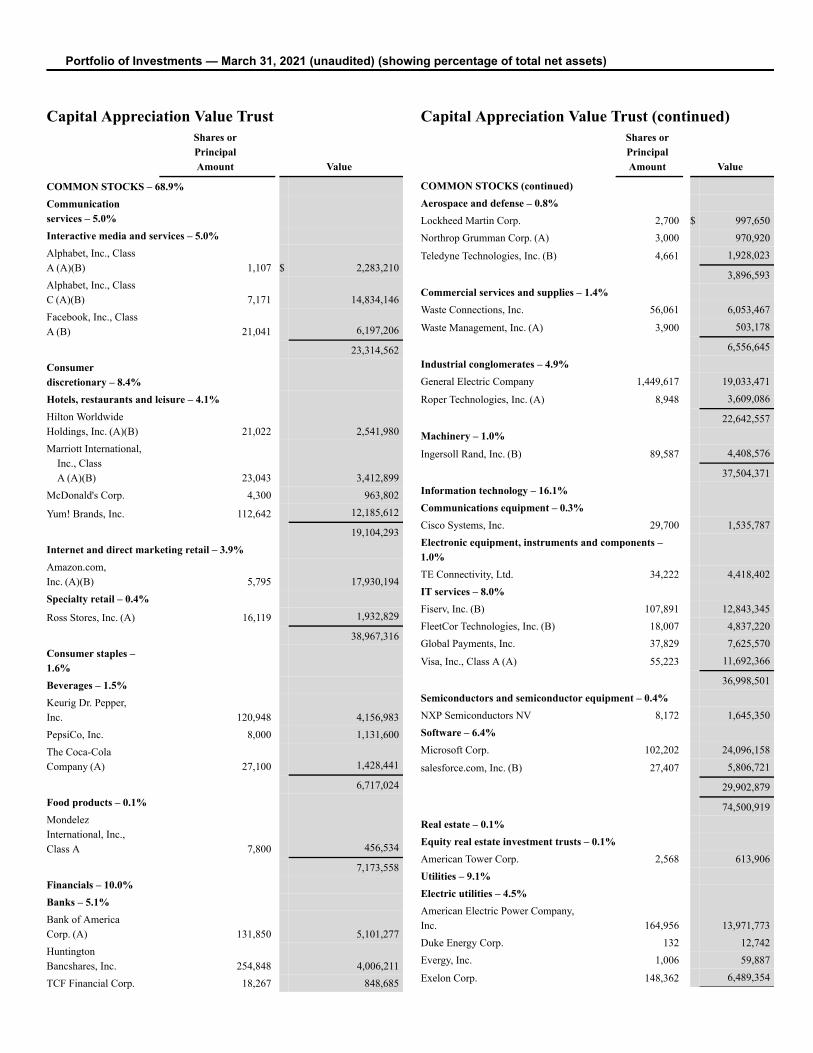
Portfolio of Investments — March 31, 2021 (unaudited) (showing percentage of total net assets)
Capital Appreciation Value TrustShares orPrincipalAmount Value
COMMON STOCKS – 68.9%Communicationservices – 5.0%Interactive media and services – 5.0%Alphabet, Inc., ClassA (A)(B) 1,107 $ 2,283,210Alphabet, Inc., ClassC (A)(B) 7,171 14,834,146Facebook, Inc., ClassA (B) 21,041 6,197,206
23,314,562Consumerdiscretionary – 8.4%Hotels, restaurants and leisure – 4.1%Hilton WorldwideHoldings, Inc. (A)(B) 21,022 2,541,980Marriott International,
Inc., ClassA (A)(B) 23,043 3,412,899
McDonald's Corp. 4,300 963,802
Yum! Brands, Inc. 112,642 12,185,612
19,104,293Internet and direct marketing retail – 3.9%Amazon.com,Inc. (A)(B) 5,795 17,930,194Specialty retail – 0.4%
Ross Stores, Inc. (A) 16,119 1,932,829
38,967,316Consumer staples –1.6%Beverages – 1.5%Keurig Dr. Pepper,Inc. 120,948 4,156,983PepsiCo, Inc. 8,000 1,131,600The Coca-ColaCompany (A) 27,100 1,428,441
6,717,024Food products – 0.1%MondelezInternational, Inc.,Class A 7,800 456,534
7,173,558Financials – 10.0%Banks – 5.1%Bank of AmericaCorp. (A) 131,850 5,101,277HuntingtonBancshares, Inc. 254,848 4,006,211TCF Financial Corp. 18,267 848,685
Capital Appreciation Value Trust (continued)Shares orPrincipalAmount Value
COMMON STOCKS (continued)Aerospace and defense – 0.8%Lockheed Martin Corp. 2,700 $ 997,650Northrop Grumman Corp. (A) 3,000 970,920
Teledyne Technologies, Inc. (B) 4,661 1,928,023
3,896,593Commercial services and supplies – 1.4%Waste Connections, Inc. 56,061 6,053,467
Waste Management, Inc. (A) 3,900 503,178
6,556,645Industrial conglomerates – 4.9%General Electric Company 1,449,617 19,033,471
Roper Technologies, Inc. (A) 8,948 3,609,086
22,642,557Machinery – 1.0%Ingersoll Rand, Inc. (B) 89,587 4,408,576
37,504,371Information technology – 16.1%Communications equipment – 0.3%Cisco Systems, Inc. 29,700 1,535,787Electronic equipment, instruments and components –1.0%TE Connectivity, Ltd. 34,222 4,418,402IT services – 8.0%Fiserv, Inc. (B) 107,891 12,843,345FleetCor Technologies, Inc. (B) 18,007 4,837,220Global Payments, Inc. 37,829 7,625,570
Visa, Inc., Class A (A) 55,223 11,692,366
36,998,501Semiconductors and semiconductor equipment – 0.4%NXP Semiconductors NV 8,172 1,645,350Software – 6.4%Microsoft Corp. 102,202 24,096,158
salesforce.com, Inc. (B) 27,407 5,806,721
29,902,879
74,500,919Real estate – 0.1%Equity real estate investment trusts – 0.1%American Tower Corp. 2,568 613,906Utilities – 9.1%Electric utilities – 4.5%American Electric Power Company,Inc. 164,956 13,971,773Duke Energy Corp. 132 12,742Evergy, Inc. 1,006 59,887
Exelon Corp. 148,362 6,489,354
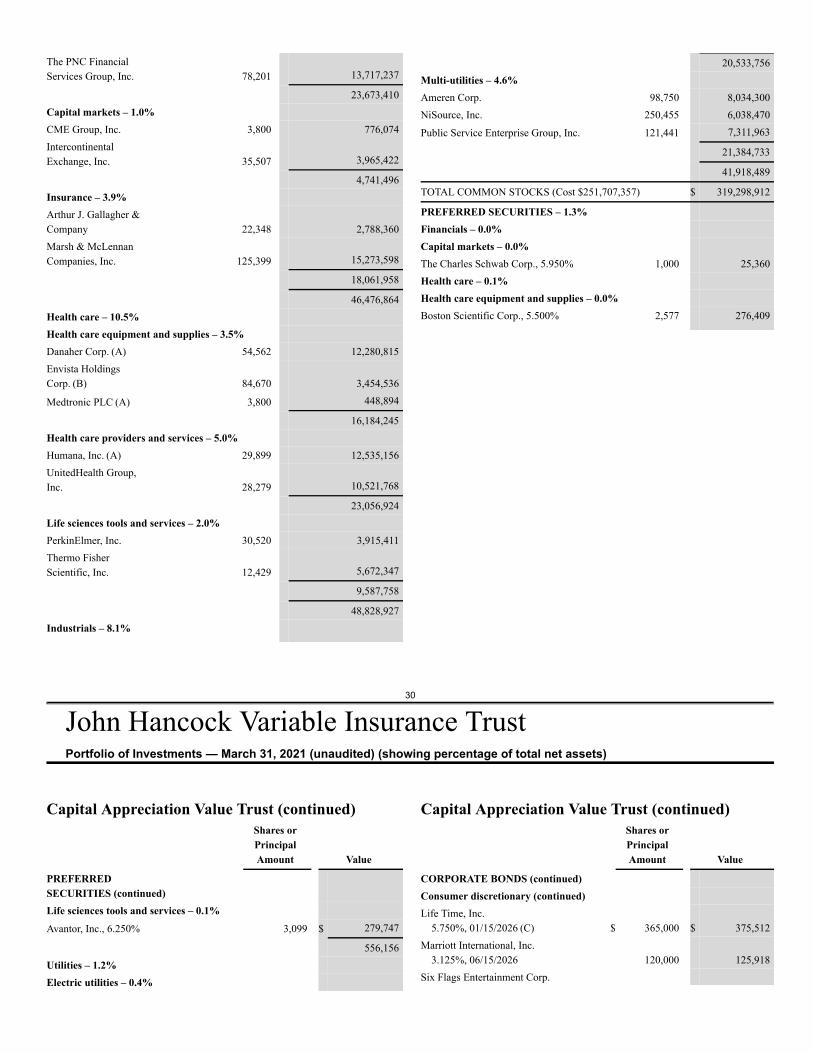
30
John Hancock Variable Insurance TrustPortfolio of Investments — March 31, 2021 (unaudited) (showing percentage of total net assets)
The PNC FinancialServices Group, Inc. 78,201 13,717,237
23,673,410Capital markets – 1.0%CME Group, Inc. 3,800 776,074IntercontinentalExchange, Inc. 35,507 3,965,422
4,741,496Insurance – 3.9%Arthur J. Gallagher &Company 22,348 2,788,360Marsh & McLennanCompanies, Inc. 125,399 15,273,598
18,061,958
46,476,864Health care – 10.5%Health care equipment and supplies – 3.5%Danaher Corp. (A) 54,562 12,280,815Envista HoldingsCorp. (B) 84,670 3,454,536
Medtronic PLC (A) 3,800 448,894
16,184,245Health care providers and services – 5.0%Humana, Inc. (A) 29,899 12,535,156UnitedHealth Group,Inc. 28,279 10,521,768
23,056,924Life sciences tools and services – 2.0%PerkinElmer, Inc. 30,520 3,915,411Thermo FisherScientific, Inc. 12,429 5,672,347
9,587,758
48,828,927Industrials – 8.1%
20,533,756Multi-utilities – 4.6%Ameren Corp. 98,750 8,034,300NiSource, Inc. 250,455 6,038,470
Public Service Enterprise Group, Inc. 121,441 7,311,963
21,384,733
41,918,489
TOTAL COMMON STOCKS (Cost $251,707,357) $ 319,298,912
PREFERRED SECURITIES – 1.3%Financials – 0.0%Capital markets – 0.0%The Charles Schwab Corp., 5.950% 1,000 25,360Health care – 0.1%Health care equipment and supplies – 0.0%Boston Scientific Corp., 5.500% 2,577 276,409
Capital Appreciation Value Trust (continued)Shares orPrincipalAmount Value
PREFERREDSECURITIES (continued)Life sciences tools and services – 0.1%Avantor, Inc., 6.250% 3,099 $ 279,747
556,156Utilities – 1.2%Electric utilities – 0.4%
Capital Appreciation Value Trust (continued)Shares orPrincipalAmount Value
CORPORATE BONDS (continued)Consumer discretionary (continued)Life Time, Inc.
5.750%, 01/15/2026 (C) $ 365,000 $ 375,512Marriott International, Inc.
3.125%, 06/15/2026 120,000 125,918Six Flags Entertainment Corp.
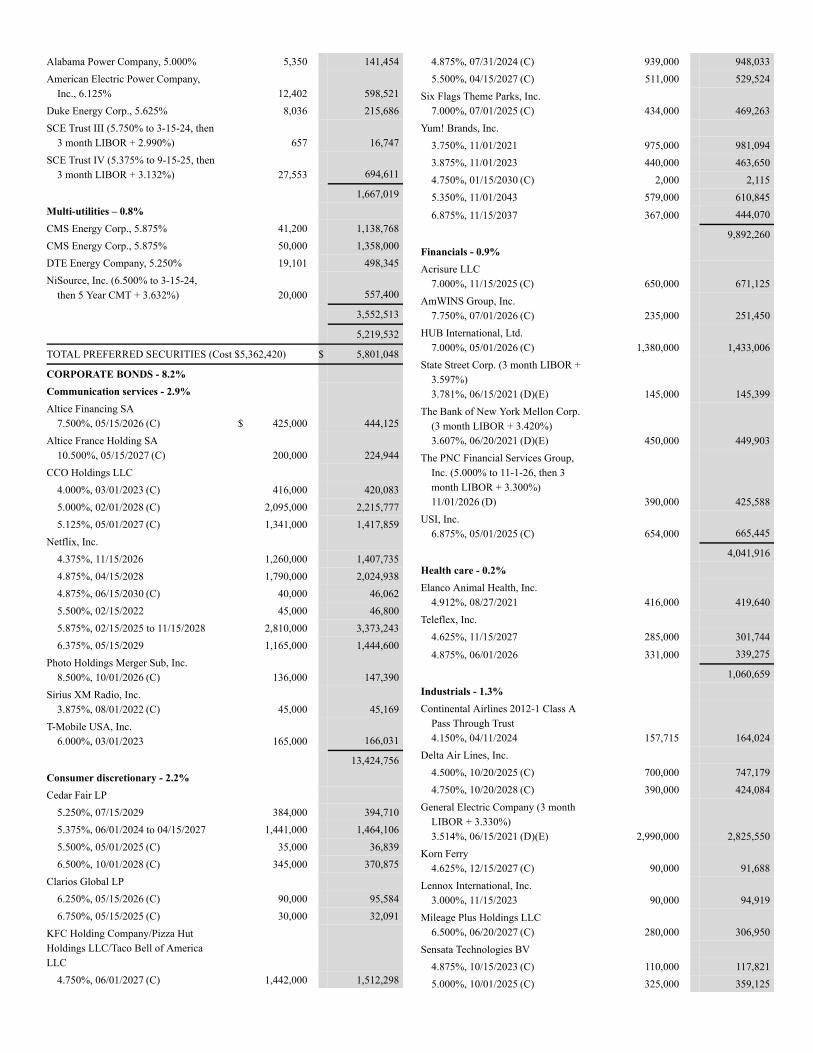
Alabama Power Company, 5.000% 5,350 141,454American Electric Power Company,
Inc., 6.125% 12,402 598,521Duke Energy Corp., 5.625% 8,036 215,686SCE Trust III (5.750% to 3-15-24, then
3 month LIBOR + 2.990%) 657 16,747SCE Trust IV (5.375% to 9-15-25, then
3 month LIBOR + 3.132%) 27,553 694,611
1,667,019Multi-utilities – 0.8%CMS Energy Corp., 5.875% 41,200 1,138,768CMS Energy Corp., 5.875% 50,000 1,358,000DTE Energy Company, 5.250% 19,101 498,345NiSource, Inc. (6.500% to 3-15-24,
then 5 Year CMT + 3.632%) 20,000 557,400
3,552,513
5,219,532
TOTAL PREFERRED SECURITIES (Cost $5,362,420) $ 5,801,048
CORPORATE BONDS - 8.2%Communication services - 2.9%Altice Financing SA
7.500%, 05/15/2026 (C) $ 425,000 444,125Altice France Holding SA
10.500%, 05/15/2027 (C) 200,000 224,944CCO Holdings LLC
4.000%, 03/01/2023 (C) 416,000 420,0835.000%, 02/01/2028 (C) 2,095,000 2,215,7775.125%, 05/01/2027 (C) 1,341,000 1,417,859
Netflix, Inc.4.375%, 11/15/2026 1,260,000 1,407,7354.875%, 04/15/2028 1,790,000 2,024,9384.875%, 06/15/2030 (C) 40,000 46,0625.500%, 02/15/2022 45,000 46,8005.875%, 02/15/2025 to 11/15/2028 2,810,000 3,373,2436.375%, 05/15/2029 1,165,000 1,444,600
Photo Holdings Merger Sub, Inc.8.500%, 10/01/2026 (C) 136,000 147,390
Sirius XM Radio, Inc.3.875%, 08/01/2022 (C) 45,000 45,169
T-Mobile USA, Inc.6.000%, 03/01/2023 165,000 166,031
13,424,756Consumer discretionary - 2.2%Cedar Fair LP
5.250%, 07/15/2029 384,000 394,7105.375%, 06/01/2024 to 04/15/2027 1,441,000 1,464,1065.500%, 05/01/2025 (C) 35,000 36,8396.500%, 10/01/2028 (C) 345,000 370,875
Clarios Global LP6.250%, 05/15/2026 (C) 90,000 95,5846.750%, 05/15/2025 (C) 30,000 32,091
KFC Holding Company/Pizza HutHoldings LLC/Taco Bell of AmericaLLC
4.750%, 06/01/2027 (C) 1,442,000 1,512,298
4.875%, 07/31/2024 (C) 939,000 948,0335.500%, 04/15/2027 (C) 511,000 529,524
Six Flags Theme Parks, Inc.7.000%, 07/01/2025 (C) 434,000 469,263
Yum! Brands, Inc.3.750%, 11/01/2021 975,000 981,0943.875%, 11/01/2023 440,000 463,6504.750%, 01/15/2030 (C) 2,000 2,1155.350%, 11/01/2043 579,000 610,845
6.875%, 11/15/2037 367,000 444,070
9,892,260Financials - 0.9%Acrisure LLC
7.000%, 11/15/2025 (C) 650,000 671,125AmWINS Group, Inc.
7.750%, 07/01/2026 (C) 235,000 251,450HUB International, Ltd.
7.000%, 05/01/2026 (C) 1,380,000 1,433,006State Street Corp. (3 month LIBOR +
3.597%)3.781%, 06/15/2021 (D)(E) 145,000 145,399
The Bank of New York Mellon Corp.(3 month LIBOR + 3.420%)3.607%, 06/20/2021 (D)(E) 450,000 449,903
The PNC Financial Services Group,Inc. (5.000% to 11-1-26, then 3month LIBOR + 3.300%)11/01/2026 (D) 390,000 425,588
USI, Inc.6.875%, 05/01/2025 (C) 654,000 665,445
4,041,916Health care - 0.2%Elanco Animal Health, Inc.
4.912%, 08/27/2021 416,000 419,640Teleflex, Inc.
4.625%, 11/15/2027 285,000 301,744
4.875%, 06/01/2026 331,000 339,275
1,060,659Industrials - 1.3%Continental Airlines 2012-1 Class A
Pass Through Trust4.150%, 04/11/2024 157,715 164,024
Delta Air Lines, Inc.4.500%, 10/20/2025 (C) 700,000 747,1794.750%, 10/20/2028 (C) 390,000 424,084
General Electric Company (3 monthLIBOR + 3.330%)3.514%, 06/15/2021 (D)(E) 2,990,000 2,825,550
Korn Ferry4.625%, 12/15/2027 (C) 90,000 91,688
Lennox International, Inc.3.000%, 11/15/2023 90,000 94,919
Mileage Plus Holdings LLC6.500%, 06/20/2027 (C) 280,000 306,950
Sensata Technologies BV4.875%, 10/15/2023 (C) 110,000 117,8215.000%, 10/01/2025 (C) 325,000 359,125
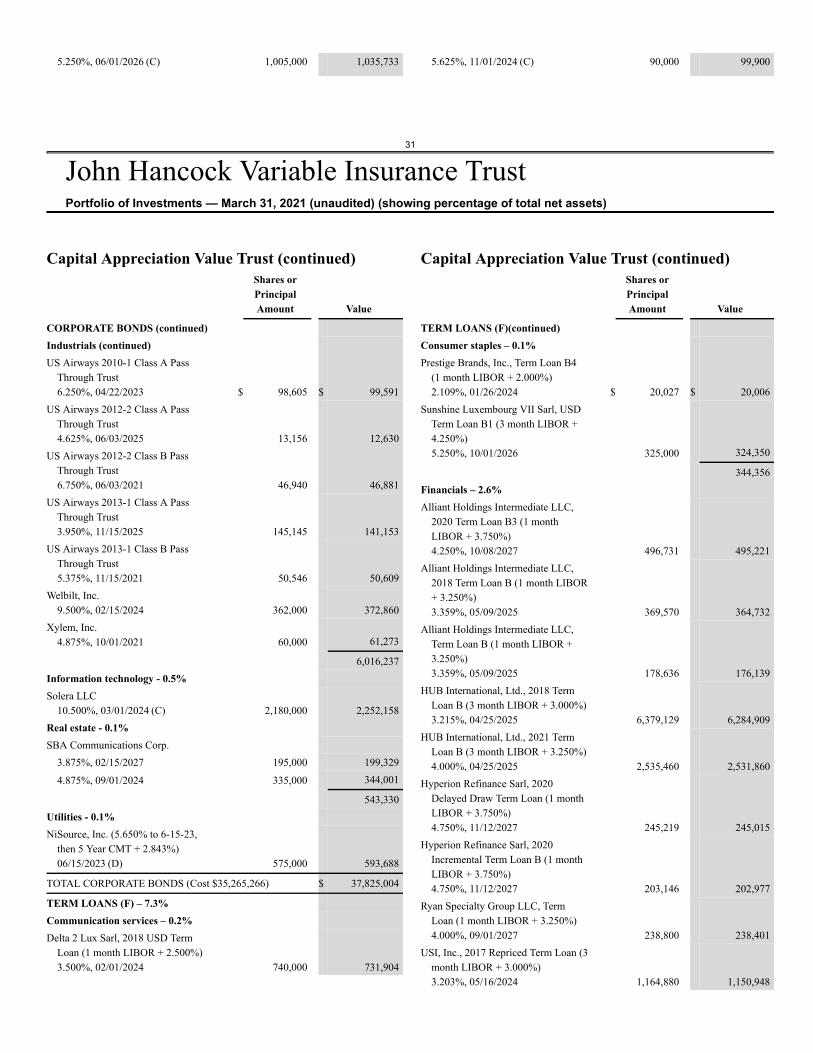
31
John Hancock Variable Insurance TrustPortfolio of Investments — March 31, 2021 (unaudited) (showing percentage of total net assets)
5.250%, 06/01/2026 (C) 1,005,000 1,035,733 5.625%, 11/01/2024 (C) 90,000 99,900
Capital Appreciation Value Trust (continued)Shares orPrincipalAmount Value
CORPORATE BONDS (continued)Industrials (continued)US Airways 2010-1 Class A Pass
Through Trust6.250%, 04/22/2023 $ 98,605 $ 99,591
US Airways 2012-2 Class A PassThrough Trust4.625%, 06/03/2025 13,156 12,630
US Airways 2012-2 Class B PassThrough Trust6.750%, 06/03/2021 46,940 46,881
US Airways 2013-1 Class A PassThrough Trust3.950%, 11/15/2025 145,145 141,153
US Airways 2013-1 Class B PassThrough Trust5.375%, 11/15/2021 50,546 50,609
Welbilt, Inc.9.500%, 02/15/2024 362,000 372,860
Xylem, Inc.4.875%, 10/01/2021 60,000 61,273
6,016,237Information technology - 0.5%Solera LLC
10.500%, 03/01/2024 (C) 2,180,000 2,252,158Real estate - 0.1%SBA Communications Corp.
3.875%, 02/15/2027 195,000 199,329
4.875%, 09/01/2024 335,000 344,001
543,330Utilities - 0.1%NiSource, Inc. (5.650% to 6-15-23,
then 5 Year CMT + 2.843%)06/15/2023 (D) 575,000 593,688
TOTAL CORPORATE BONDS (Cost $35,265,266) $ 37,825,004
TERM LOANS (F) – 7.3%Communication services – 0.2%Delta 2 Lux Sarl, 2018 USD Term
Loan (1 month LIBOR + 2.500%)3.500%, 02/01/2024 740,000 731,904
Capital Appreciation Value Trust (continued)Shares orPrincipalAmount Value
TERM LOANS (F)(continued)Consumer staples – 0.1%Prestige Brands, Inc., Term Loan B4
(1 month LIBOR + 2.000%)2.109%, 01/26/2024 $ 20,027 $ 20,006
Sunshine Luxembourg VII Sarl, USDTerm Loan B1 (3 month LIBOR +4.250%)5.250%, 10/01/2026 325,000 324,350
344,356Financials – 2.6%Alliant Holdings Intermediate LLC,
2020 Term Loan B3 (1 monthLIBOR + 3.750%)4.250%, 10/08/2027 496,731 495,221
Alliant Holdings Intermediate LLC,2018 Term Loan B (1 month LIBOR+ 3.250%)3.359%, 05/09/2025 369,570 364,732
Alliant Holdings Intermediate LLC,Term Loan B (1 month LIBOR +3.250%)3.359%, 05/09/2025 178,636 176,139
HUB International, Ltd., 2018 TermLoan B (3 month LIBOR + 3.000%)3.215%, 04/25/2025 6,379,129 6,284,909
HUB International, Ltd., 2021 TermLoan B (3 month LIBOR + 3.250%)4.000%, 04/25/2025 2,535,460 2,531,860
Hyperion Refinance Sarl, 2020Delayed Draw Term Loan (1 monthLIBOR + 3.750%)4.750%, 11/12/2027 245,219 245,015
Hyperion Refinance Sarl, 2020Incremental Term Loan B (1 monthLIBOR + 3.750%)4.750%, 11/12/2027 203,146 202,977
Ryan Specialty Group LLC, TermLoan (1 month LIBOR + 3.250%)4.000%, 09/01/2027 238,800 238,401
USI, Inc., 2017 Repriced Term Loan (3month LIBOR + 3.000%)3.203%, 05/16/2024 1,164,880 1,150,948
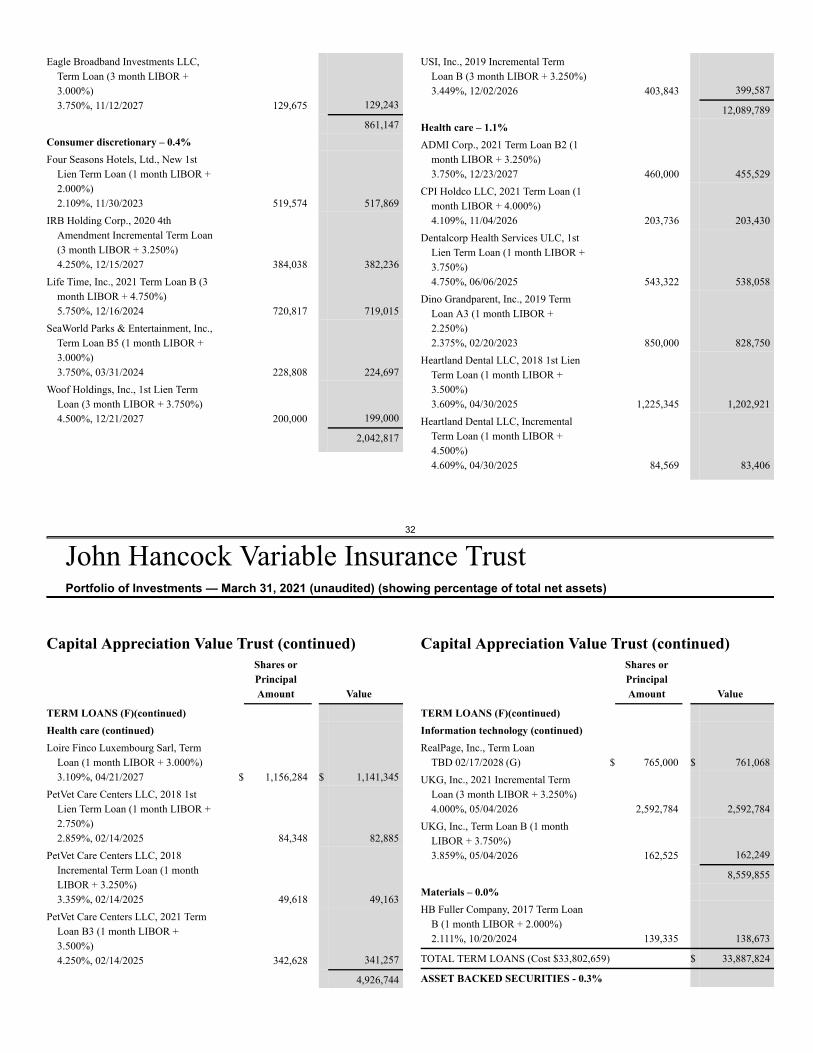
32
John Hancock Variable Insurance TrustPortfolio of Investments — March 31, 2021 (unaudited) (showing percentage of total net assets)
Eagle Broadband Investments LLC,Term Loan (3 month LIBOR +3.000%)3.750%, 11/12/2027 129,675 129,243
861,147Consumer discretionary – 0.4%Four Seasons Hotels, Ltd., New 1st
Lien Term Loan (1 month LIBOR +2.000%)2.109%, 11/30/2023 519,574 517,869
IRB Holding Corp., 2020 4thAmendment Incremental Term Loan(3 month LIBOR + 3.250%)4.250%, 12/15/2027 384,038 382,236
Life Time, Inc., 2021 Term Loan B (3month LIBOR + 4.750%)5.750%, 12/16/2024 720,817 719,015
SeaWorld Parks & Entertainment, Inc.,Term Loan B5 (1 month LIBOR +3.000%)3.750%, 03/31/2024 228,808 224,697
Woof Holdings, Inc., 1st Lien TermLoan (3 month LIBOR + 3.750%)4.500%, 12/21/2027 200,000 199,000
2,042,817
USI, Inc., 2019 Incremental TermLoan B (3 month LIBOR + 3.250%)3.449%, 12/02/2026 403,843 399,587
12,089,789Health care – 1.1%ADMI Corp., 2021 Term Loan B2 (1
month LIBOR + 3.250%)3.750%, 12/23/2027 460,000 455,529
CPI Holdco LLC, 2021 Term Loan (1month LIBOR + 4.000%)4.109%, 11/04/2026 203,736 203,430
Dentalcorp Health Services ULC, 1stLien Term Loan (1 month LIBOR +3.750%)4.750%, 06/06/2025 543,322 538,058
Dino Grandparent, Inc., 2019 TermLoan A3 (1 month LIBOR +2.250%)2.375%, 02/20/2023 850,000 828,750
Heartland Dental LLC, 2018 1st LienTerm Loan (1 month LIBOR +3.500%)3.609%, 04/30/2025 1,225,345 1,202,921
Heartland Dental LLC, IncrementalTerm Loan (1 month LIBOR +4.500%)4.609%, 04/30/2025 84,569 83,406
Capital Appreciation Value Trust (continued)Shares orPrincipalAmount Value
TERM LOANS (F)(continued)Health care (continued)Loire Finco Luxembourg Sarl, Term
Loan (1 month LIBOR + 3.000%)3.109%, 04/21/2027 $ 1,156,284 $ 1,141,345
PetVet Care Centers LLC, 2018 1stLien Term Loan (1 month LIBOR +2.750%)2.859%, 02/14/2025 84,348 82,885
PetVet Care Centers LLC, 2018Incremental Term Loan (1 monthLIBOR + 3.250%)3.359%, 02/14/2025 49,618 49,163
PetVet Care Centers LLC, 2021 TermLoan B3 (1 month LIBOR +3.500%)4.250%, 02/14/2025 342,628 341,257
4,926,744
Capital Appreciation Value Trust (continued)Shares orPrincipalAmount Value
TERM LOANS (F)(continued)Information technology (continued)RealPage, Inc., Term Loan
TBD 02/17/2028 (G) $ 765,000 $ 761,068UKG, Inc., 2021 Incremental Term
Loan (3 month LIBOR + 3.250%)4.000%, 05/04/2026 2,592,784 2,592,784
UKG, Inc., Term Loan B (1 monthLIBOR + 3.750%)3.859%, 05/04/2026 162,525 162,249
8,559,855Materials – 0.0%HB Fuller Company, 2017 Term Loan
B (1 month LIBOR + 2.000%)2.111%, 10/20/2024 139,335 138,673
TOTAL TERM LOANS (Cost $33,802,659) $ 33,887,824
ASSET BACKED SECURITIES - 0.3%
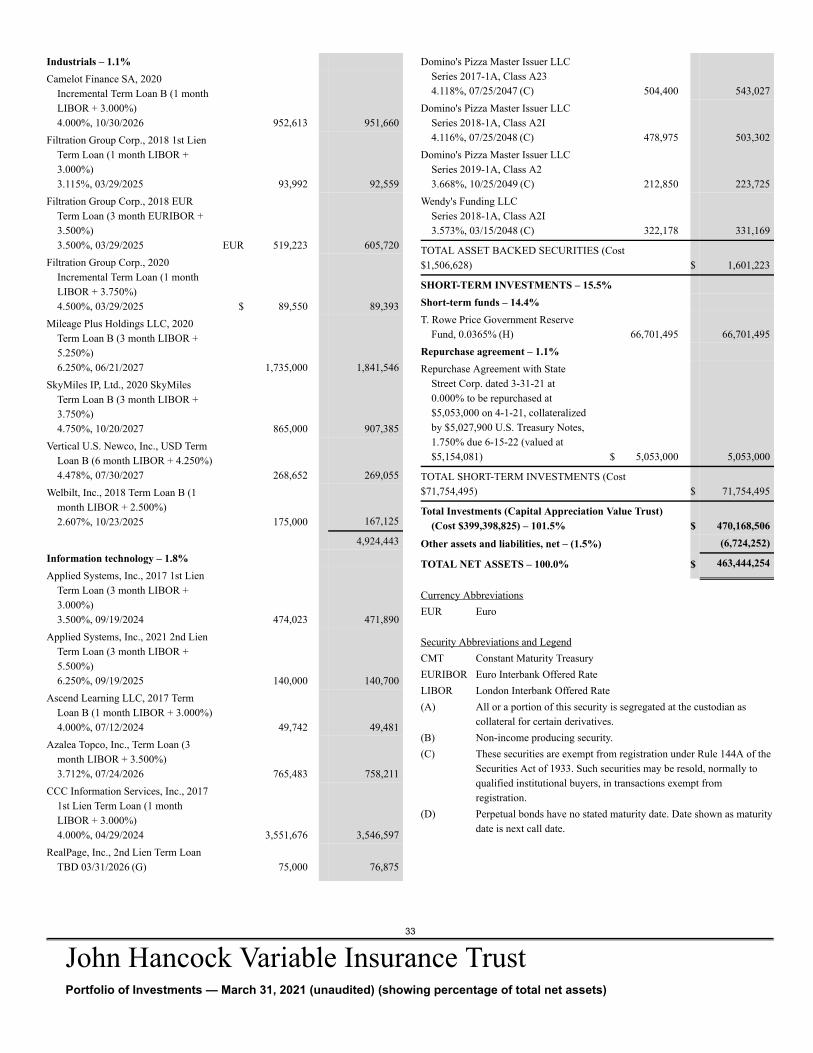
33
John Hancock Variable Insurance TrustPortfolio of Investments — March 31, 2021 (unaudited) (showing percentage of total net assets)
Industrials – 1.1%Camelot Finance SA, 2020
Incremental Term Loan B (1 monthLIBOR + 3.000%)4.000%, 10/30/2026 952,613 951,660
Filtration Group Corp., 2018 1st LienTerm Loan (1 month LIBOR +3.000%)3.115%, 03/29/2025 93,992 92,559
Filtration Group Corp., 2018 EURTerm Loan (3 month EURIBOR +3.500%)3.500%, 03/29/2025 EUR 519,223 605,720
Filtration Group Corp., 2020Incremental Term Loan (1 monthLIBOR + 3.750%)4.500%, 03/29/2025 $ 89,550 89,393
Mileage Plus Holdings LLC, 2020Term Loan B (3 month LIBOR +5.250%)6.250%, 06/21/2027 1,735,000 1,841,546
SkyMiles IP, Ltd., 2020 SkyMilesTerm Loan B (3 month LIBOR +3.750%)4.750%, 10/20/2027 865,000 907,385
Vertical U.S. Newco, Inc., USD TermLoan B (6 month LIBOR + 4.250%)4.478%, 07/30/2027 268,652 269,055
Welbilt, Inc., 2018 Term Loan B (1month LIBOR + 2.500%)2.607%, 10/23/2025 175,000 167,125
4,924,443Information technology – 1.8%Applied Systems, Inc., 2017 1st Lien
Term Loan (3 month LIBOR +3.000%)3.500%, 09/19/2024 474,023 471,890
Applied Systems, Inc., 2021 2nd LienTerm Loan (3 month LIBOR +5.500%)6.250%, 09/19/2025 140,000 140,700
Ascend Learning LLC, 2017 TermLoan B (1 month LIBOR + 3.000%)4.000%, 07/12/2024 49,742 49,481
Azalea Topco, Inc., Term Loan (3month LIBOR + 3.500%)3.712%, 07/24/2026 765,483 758,211
CCC Information Services, Inc., 20171st Lien Term Loan (1 monthLIBOR + 3.000%)4.000%, 04/29/2024 3,551,676 3,546,597
RealPage, Inc., 2nd Lien Term LoanTBD 03/31/2026 (G) 75,000 76,875
Domino's Pizza Master Issuer LLCSeries 2017-1A, Class A234.118%, 07/25/2047 (C) 504,400 543,027
Domino's Pizza Master Issuer LLCSeries 2018-1A, Class A2I4.116%, 07/25/2048 (C) 478,975 503,302
Domino's Pizza Master Issuer LLCSeries 2019-1A, Class A23.668%, 10/25/2049 (C) 212,850 223,725
Wendy's Funding LLCSeries 2018-1A, Class A2I3.573%, 03/15/2048 (C) 322,178 331,169
TOTAL ASSET BACKED SECURITIES (Cost$1,506,628) $ 1,601,223
SHORT-TERM INVESTMENTS – 15.5%Short-term funds – 14.4%T. Rowe Price Government Reserve
Fund, 0.0365% (H) 66,701,495 66,701,495Repurchase agreement – 1.1%Repurchase Agreement with State
Street Corp. dated 3-31-21 at0.000% to be repurchased at$5,053,000 on 4-1-21, collateralizedby $5,027,900 U.S. Treasury Notes,1.750% due 6-15-22 (valued at$5,154,081) $ 5,053,000 5,053,000
TOTAL SHORT-TERM INVESTMENTS (Cost$71,754,495) $ 71,754,495
Total Investments (Capital Appreciation Value Trust)(Cost $399,398,825) – 101.5% $ 470,168,506
Other assets and liabilities, net – (1.5%) (6,724,252)
TOTAL NET ASSETS – 100.0% $ 463,444,254
Currency AbbreviationsEUR Euro
Security Abbreviations and LegendCMT Constant Maturity TreasuryEURIBOR Euro Interbank Offered RateLIBOR London Interbank Offered Rate(A) All or a portion of this security is segregated at the custodian as
collateral for certain derivatives.(B) Non-income producing security.(C) These securities are exempt from registration under Rule 144A of the
Securities Act of 1933. Such securities may be resold, normally toqualified institutional buyers, in transactions exempt fromregistration.
(D) Perpetual bonds have no stated maturity date. Date shown as maturitydate is next call date.
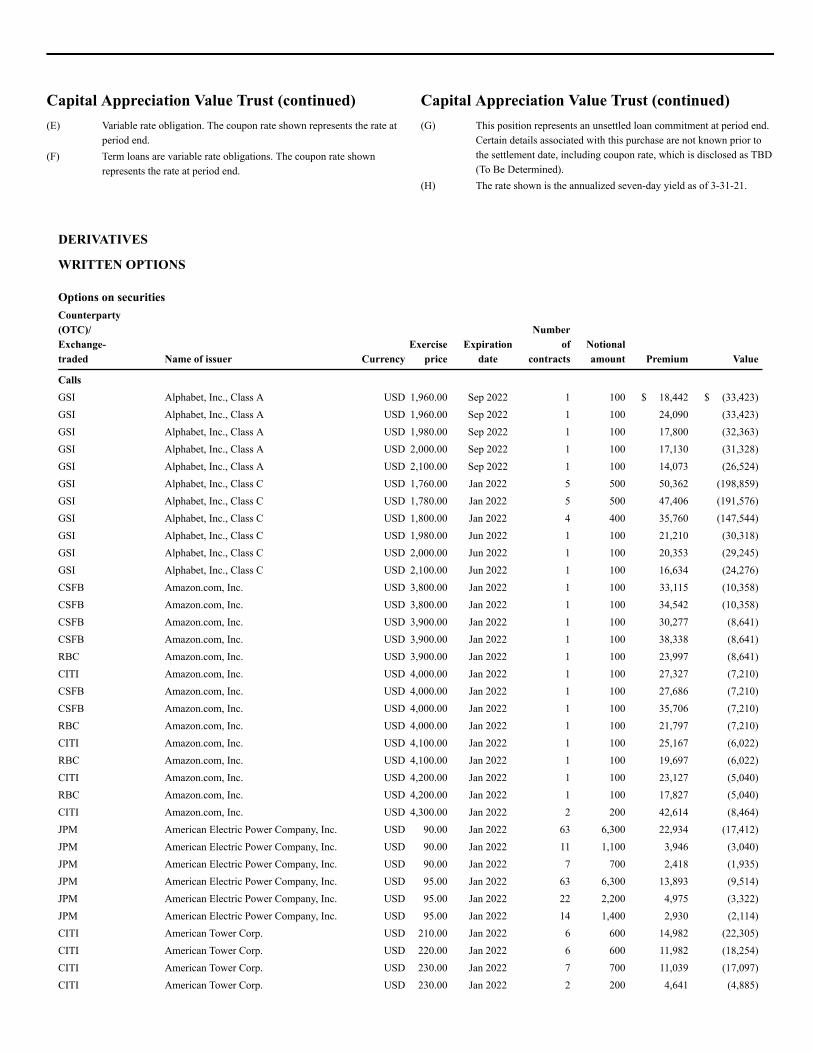
DERIVATIVES
WRITTEN OPTIONS
Options on securitiesCounterparty(OTC)/Exchange-traded Name of issuer Currency
Exerciseprice
Expirationdate
Numberof
contractsNotionalamount Premium Value
CallsGSI Alphabet, Inc., Class A USD 1,960.00 Sep 2022 1 100 $ 18,442 $ (33,423)GSI Alphabet, Inc., Class A USD 1,960.00 Sep 2022 1 100 24,090 (33,423)GSI Alphabet, Inc., Class A USD 1,980.00 Sep 2022 1 100 17,800 (32,363)GSI Alphabet, Inc., Class A USD 2,000.00 Sep 2022 1 100 17,130 (31,328)GSI Alphabet, Inc., Class A USD 2,100.00 Sep 2022 1 100 14,073 (26,524)GSI Alphabet, Inc., Class C USD 1,760.00 Jan 2022 5 500 50,362 (198,859)GSI Alphabet, Inc., Class C USD 1,780.00 Jan 2022 5 500 47,406 (191,576)GSI Alphabet, Inc., Class C USD 1,800.00 Jan 2022 4 400 35,760 (147,544)GSI Alphabet, Inc., Class C USD 1,980.00 Jun 2022 1 100 21,210 (30,318)GSI Alphabet, Inc., Class C USD 2,000.00 Jun 2022 1 100 20,353 (29,245)GSI Alphabet, Inc., Class C USD 2,100.00 Jun 2022 1 100 16,634 (24,276)CSFB Amazon.com, Inc. USD 3,800.00 Jan 2022 1 100 33,115 (10,358)CSFB Amazon.com, Inc. USD 3,800.00 Jan 2022 1 100 34,542 (10,358)CSFB Amazon.com, Inc. USD 3,900.00 Jan 2022 1 100 30,277 (8,641)CSFB Amazon.com, Inc. USD 3,900.00 Jan 2022 1 100 38,338 (8,641)RBC Amazon.com, Inc. USD 3,900.00 Jan 2022 1 100 23,997 (8,641)CITI Amazon.com, Inc. USD 4,000.00 Jan 2022 1 100 27,327 (7,210)CSFB Amazon.com, Inc. USD 4,000.00 Jan 2022 1 100 27,686 (7,210)CSFB Amazon.com, Inc. USD 4,000.00 Jan 2022 1 100 35,706 (7,210)RBC Amazon.com, Inc. USD 4,000.00 Jan 2022 1 100 21,797 (7,210)CITI Amazon.com, Inc. USD 4,100.00 Jan 2022 1 100 25,167 (6,022)RBC Amazon.com, Inc. USD 4,100.00 Jan 2022 1 100 19,697 (6,022)CITI Amazon.com, Inc. USD 4,200.00 Jan 2022 1 100 23,127 (5,040)RBC Amazon.com, Inc. USD 4,200.00 Jan 2022 1 100 17,827 (5,040)CITI Amazon.com, Inc. USD 4,300.00 Jan 2022 2 200 42,614 (8,464)JPM American Electric Power Company, Inc. USD 90.00 Jan 2022 63 6,300 22,934 (17,412)JPM American Electric Power Company, Inc. USD 90.00 Jan 2022 11 1,100 3,946 (3,040)JPM American Electric Power Company, Inc. USD 90.00 Jan 2022 7 700 2,418 (1,935)JPM American Electric Power Company, Inc. USD 95.00 Jan 2022 63 6,300 13,893 (9,514)JPM American Electric Power Company, Inc. USD 95.00 Jan 2022 22 2,200 4,975 (3,322)JPM American Electric Power Company, Inc. USD 95.00 Jan 2022 14 1,400 2,930 (2,114)CITI American Tower Corp. USD 210.00 Jan 2022 6 600 14,982 (22,305)CITI American Tower Corp. USD 220.00 Jan 2022 6 600 11,982 (18,254)CITI American Tower Corp. USD 230.00 Jan 2022 7 700 11,039 (17,097)CITI American Tower Corp. USD 230.00 Jan 2022 2 200 4,641 (4,885)
Capital Appreciation Value Trust (continued)(E) Variable rate obligation. The coupon rate shown represents the rate at
period end.(F) Term loans are variable rate obligations. The coupon rate shown
represents the rate at period end.
Capital Appreciation Value Trust (continued)(G) This position represents an unsettled loan commitment at period end.
Certain details associated with this purchase are not known prior tothe settlement date, including coupon rate, which is disclosed as TBD(To Be Determined).
(H) The rate shown is the annualized seven-day yield as of 3-31-21.
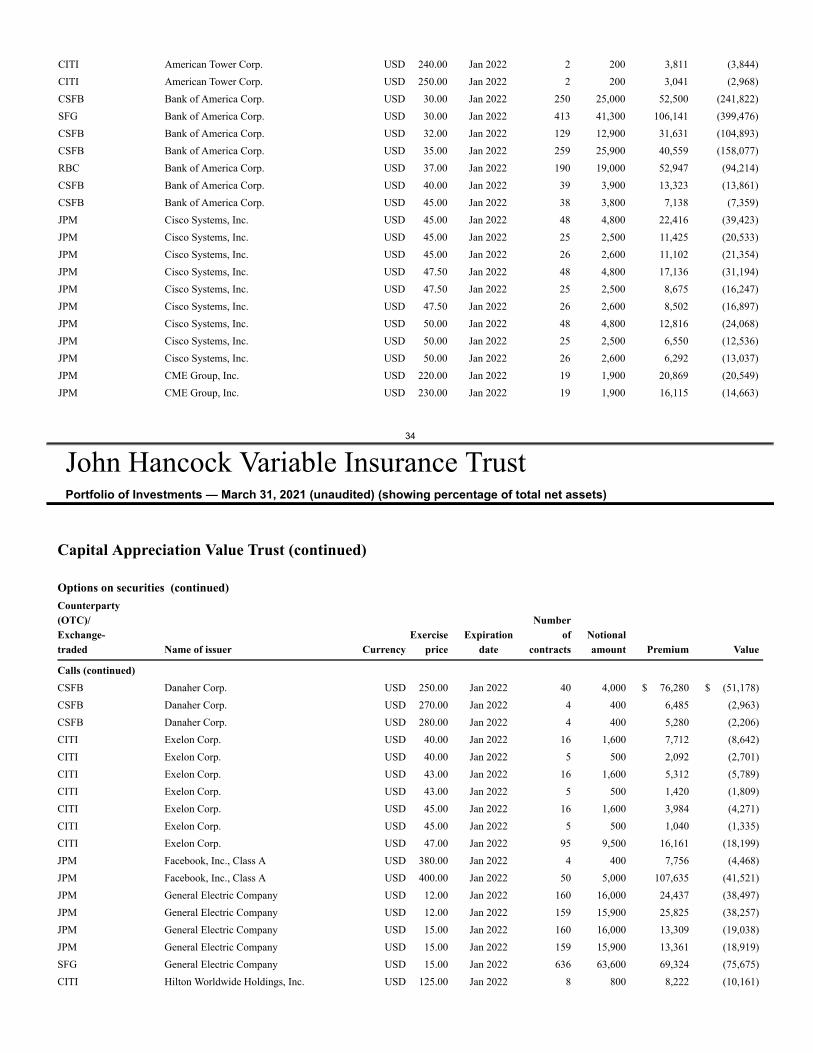
CITI American Tower Corp. USD 240.00 Jan 2022 2 200 3,811 (3,844)CITI American Tower Corp. USD 250.00 Jan 2022 2 200 3,041 (2,968)CSFB Bank of America Corp. USD 30.00 Jan 2022 250 25,000 52,500 (241,822)SFG Bank of America Corp. USD 30.00 Jan 2022 413 41,300 106,141 (399,476)CSFB Bank of America Corp. USD 32.00 Jan 2022 129 12,900 31,631 (104,893)CSFB Bank of America Corp. USD 35.00 Jan 2022 259 25,900 40,559 (158,077)RBC Bank of America Corp. USD 37.00 Jan 2022 190 19,000 52,947 (94,214)CSFB Bank of America Corp. USD 40.00 Jan 2022 39 3,900 13,323 (13,861)CSFB Bank of America Corp. USD 45.00 Jan 2022 38 3,800 7,138 (7,359)JPM Cisco Systems, Inc. USD 45.00 Jan 2022 48 4,800 22,416 (39,423)JPM Cisco Systems, Inc. USD 45.00 Jan 2022 25 2,500 11,425 (20,533)JPM Cisco Systems, Inc. USD 45.00 Jan 2022 26 2,600 11,102 (21,354)JPM Cisco Systems, Inc. USD 47.50 Jan 2022 48 4,800 17,136 (31,194)JPM Cisco Systems, Inc. USD 47.50 Jan 2022 25 2,500 8,675 (16,247)JPM Cisco Systems, Inc. USD 47.50 Jan 2022 26 2,600 8,502 (16,897)JPM Cisco Systems, Inc. USD 50.00 Jan 2022 48 4,800 12,816 (24,068)JPM Cisco Systems, Inc. USD 50.00 Jan 2022 25 2,500 6,550 (12,536)JPM Cisco Systems, Inc. USD 50.00 Jan 2022 26 2,600 6,292 (13,037)JPM CME Group, Inc. USD 220.00 Jan 2022 19 1,900 20,869 (20,549)JPM CME Group, Inc. USD 230.00 Jan 2022 19 1,900 16,115 (14,663)
34
John Hancock Variable Insurance TrustPortfolio of Investments — March 31, 2021 (unaudited) (showing percentage of total net assets)
Capital Appreciation Value Trust (continued)
Options on securities (continued)Counterparty(OTC)/Exchange-traded Name of issuer Currency
Exerciseprice
Expirationdate
Numberof
contractsNotionalamount Premium Value
Calls (continued)CSFB Danaher Corp. USD 250.00 Jan 2022 40 4,000 $ 76,280 $ (51,178)CSFB Danaher Corp. USD 270.00 Jan 2022 4 400 6,485 (2,963)CSFB Danaher Corp. USD 280.00 Jan 2022 4 400 5,280 (2,206)CITI Exelon Corp. USD 40.00 Jan 2022 16 1,600 7,712 (8,642)CITI Exelon Corp. USD 40.00 Jan 2022 5 500 2,092 (2,701)CITI Exelon Corp. USD 43.00 Jan 2022 16 1,600 5,312 (5,789)CITI Exelon Corp. USD 43.00 Jan 2022 5 500 1,420 (1,809)CITI Exelon Corp. USD 45.00 Jan 2022 16 1,600 3,984 (4,271)CITI Exelon Corp. USD 45.00 Jan 2022 5 500 1,040 (1,335)CITI Exelon Corp. USD 47.00 Jan 2022 95 9,500 16,161 (18,199)JPM Facebook, Inc., Class A USD 380.00 Jan 2022 4 400 7,756 (4,468)JPM Facebook, Inc., Class A USD 400.00 Jan 2022 50 5,000 107,635 (41,521)JPM General Electric Company USD 12.00 Jan 2022 160 16,000 24,437 (38,497)JPM General Electric Company USD 12.00 Jan 2022 159 15,900 25,825 (38,257)JPM General Electric Company USD 15.00 Jan 2022 160 16,000 13,309 (19,038)JPM General Electric Company USD 15.00 Jan 2022 159 15,900 13,361 (18,919)SFG General Electric Company USD 15.00 Jan 2022 636 63,600 69,324 (75,675)CITI Hilton Worldwide Holdings, Inc. USD 125.00 Jan 2022 8 800 8,222 (10,161)
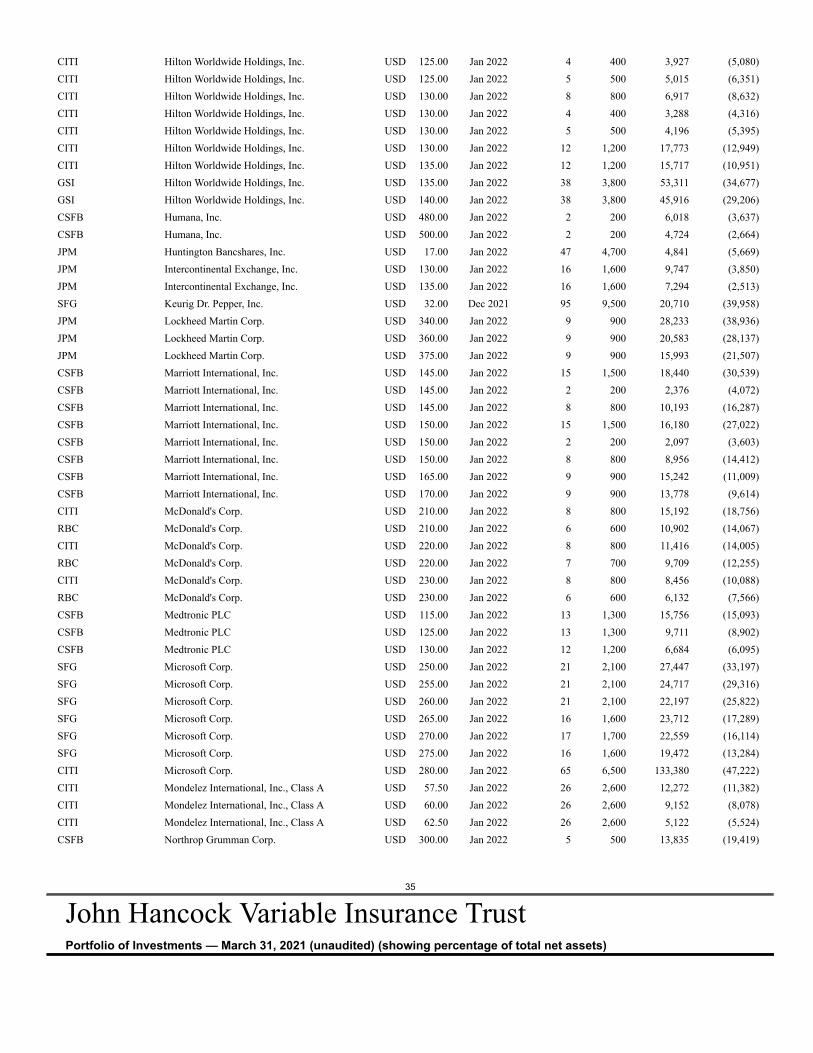
CITI Hilton Worldwide Holdings, Inc. USD 125.00 Jan 2022 4 400 3,927 (5,080)CITI Hilton Worldwide Holdings, Inc. USD 125.00 Jan 2022 5 500 5,015 (6,351)CITI Hilton Worldwide Holdings, Inc. USD 130.00 Jan 2022 8 800 6,917 (8,632)CITI Hilton Worldwide Holdings, Inc. USD 130.00 Jan 2022 4 400 3,288 (4,316)CITI Hilton Worldwide Holdings, Inc. USD 130.00 Jan 2022 5 500 4,196 (5,395)CITI Hilton Worldwide Holdings, Inc. USD 130.00 Jan 2022 12 1,200 17,773 (12,949)CITI Hilton Worldwide Holdings, Inc. USD 135.00 Jan 2022 12 1,200 15,717 (10,951)GSI Hilton Worldwide Holdings, Inc. USD 135.00 Jan 2022 38 3,800 53,311 (34,677)GSI Hilton Worldwide Holdings, Inc. USD 140.00 Jan 2022 38 3,800 45,916 (29,206)CSFB Humana, Inc. USD 480.00 Jan 2022 2 200 6,018 (3,637)CSFB Humana, Inc. USD 500.00 Jan 2022 2 200 4,724 (2,664)JPM Huntington Bancshares, Inc. USD 17.00 Jan 2022 47 4,700 4,841 (5,669)JPM Intercontinental Exchange, Inc. USD 130.00 Jan 2022 16 1,600 9,747 (3,850)JPM Intercontinental Exchange, Inc. USD 135.00 Jan 2022 16 1,600 7,294 (2,513)SFG Keurig Dr. Pepper, Inc. USD 32.00 Dec 2021 95 9,500 20,710 (39,958)JPM Lockheed Martin Corp. USD 340.00 Jan 2022 9 900 28,233 (38,936)JPM Lockheed Martin Corp. USD 360.00 Jan 2022 9 900 20,583 (28,137)JPM Lockheed Martin Corp. USD 375.00 Jan 2022 9 900 15,993 (21,507)CSFB Marriott International, Inc. USD 145.00 Jan 2022 15 1,500 18,440 (30,539)CSFB Marriott International, Inc. USD 145.00 Jan 2022 2 200 2,376 (4,072)CSFB Marriott International, Inc. USD 145.00 Jan 2022 8 800 10,193 (16,287)CSFB Marriott International, Inc. USD 150.00 Jan 2022 15 1,500 16,180 (27,022)CSFB Marriott International, Inc. USD 150.00 Jan 2022 2 200 2,097 (3,603)CSFB Marriott International, Inc. USD 150.00 Jan 2022 8 800 8,956 (14,412)CSFB Marriott International, Inc. USD 165.00 Jan 2022 9 900 15,242 (11,009)CSFB Marriott International, Inc. USD 170.00 Jan 2022 9 900 13,778 (9,614)CITI McDonald's Corp. USD 210.00 Jan 2022 8 800 15,192 (18,756)RBC McDonald's Corp. USD 210.00 Jan 2022 6 600 10,902 (14,067)CITI McDonald's Corp. USD 220.00 Jan 2022 8 800 11,416 (14,005)RBC McDonald's Corp. USD 220.00 Jan 2022 7 700 9,709 (12,255)CITI McDonald's Corp. USD 230.00 Jan 2022 8 800 8,456 (10,088)RBC McDonald's Corp. USD 230.00 Jan 2022 6 600 6,132 (7,566)CSFB Medtronic PLC USD 115.00 Jan 2022 13 1,300 15,756 (15,093)CSFB Medtronic PLC USD 125.00 Jan 2022 13 1,300 9,711 (8,902)CSFB Medtronic PLC USD 130.00 Jan 2022 12 1,200 6,684 (6,095)SFG Microsoft Corp. USD 250.00 Jan 2022 21 2,100 27,447 (33,197)SFG Microsoft Corp. USD 255.00 Jan 2022 21 2,100 24,717 (29,316)SFG Microsoft Corp. USD 260.00 Jan 2022 21 2,100 22,197 (25,822)SFG Microsoft Corp. USD 265.00 Jan 2022 16 1,600 23,712 (17,289)SFG Microsoft Corp. USD 270.00 Jan 2022 17 1,700 22,559 (16,114)SFG Microsoft Corp. USD 275.00 Jan 2022 16 1,600 19,472 (13,284)CITI Microsoft Corp. USD 280.00 Jan 2022 65 6,500 133,380 (47,222)CITI Mondelez International, Inc., Class A USD 57.50 Jan 2022 26 2,600 12,272 (11,382)CITI Mondelez International, Inc., Class A USD 60.00 Jan 2022 26 2,600 9,152 (8,078)CITI Mondelez International, Inc., Class A USD 62.50 Jan 2022 26 2,600 5,122 (5,524)CSFB Northrop Grumman Corp. USD 300.00 Jan 2022 5 500 13,835 (19,419)
35
John Hancock Variable Insurance TrustPortfolio of Investments — March 31, 2021 (unaudited) (showing percentage of total net assets)
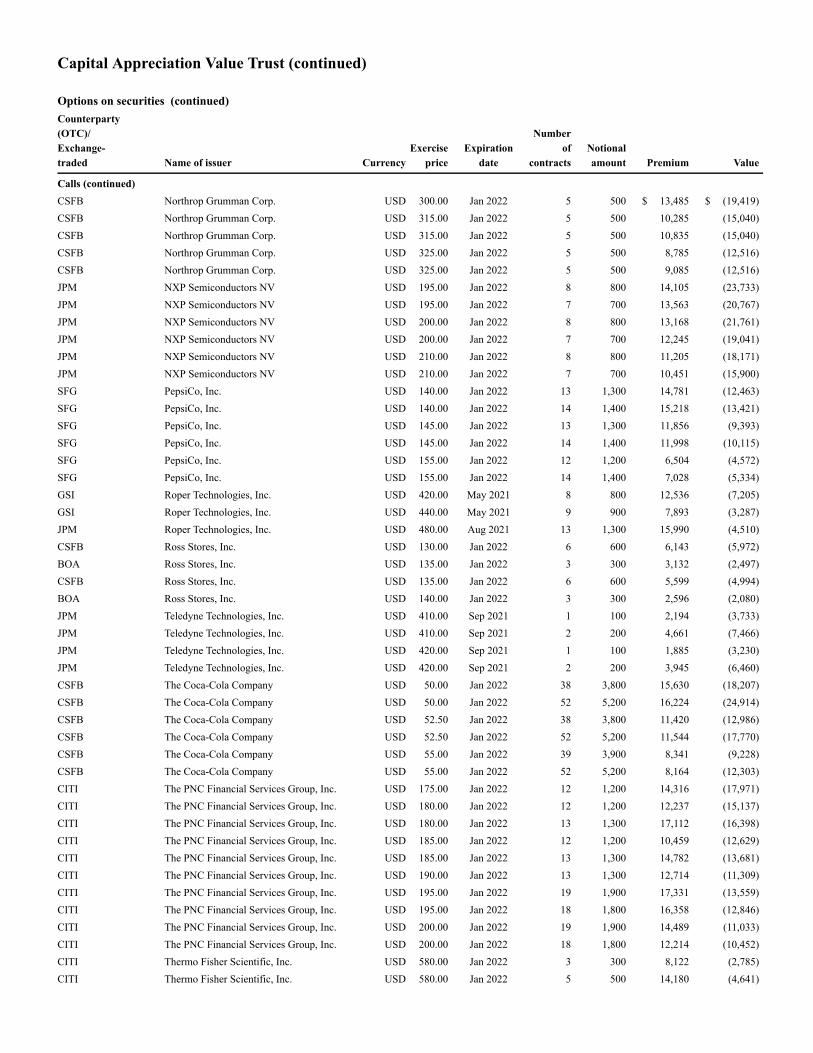
Capital Appreciation Value Trust (continued)
Options on securities (continued)Counterparty(OTC)/Exchange-traded Name of issuer Currency
Exerciseprice
Expirationdate
Numberof
contractsNotionalamount Premium Value
Calls (continued)CSFB Northrop Grumman Corp. USD 300.00 Jan 2022 5 500 $ 13,485 $ (19,419)CSFB Northrop Grumman Corp. USD 315.00 Jan 2022 5 500 10,285 (15,040)CSFB Northrop Grumman Corp. USD 315.00 Jan 2022 5 500 10,835 (15,040)CSFB Northrop Grumman Corp. USD 325.00 Jan 2022 5 500 8,785 (12,516)CSFB Northrop Grumman Corp. USD 325.00 Jan 2022 5 500 9,085 (12,516)JPM NXP Semiconductors NV USD 195.00 Jan 2022 8 800 14,105 (23,733)JPM NXP Semiconductors NV USD 195.00 Jan 2022 7 700 13,563 (20,767)JPM NXP Semiconductors NV USD 200.00 Jan 2022 8 800 13,168 (21,761)JPM NXP Semiconductors NV USD 200.00 Jan 2022 7 700 12,245 (19,041)JPM NXP Semiconductors NV USD 210.00 Jan 2022 8 800 11,205 (18,171)JPM NXP Semiconductors NV USD 210.00 Jan 2022 7 700 10,451 (15,900)SFG PepsiCo, Inc. USD 140.00 Jan 2022 13 1,300 14,781 (12,463)SFG PepsiCo, Inc. USD 140.00 Jan 2022 14 1,400 15,218 (13,421)SFG PepsiCo, Inc. USD 145.00 Jan 2022 13 1,300 11,856 (9,393)SFG PepsiCo, Inc. USD 145.00 Jan 2022 14 1,400 11,998 (10,115)SFG PepsiCo, Inc. USD 155.00 Jan 2022 12 1,200 6,504 (4,572)SFG PepsiCo, Inc. USD 155.00 Jan 2022 14 1,400 7,028 (5,334)GSI Roper Technologies, Inc. USD 420.00 May 2021 8 800 12,536 (7,205)GSI Roper Technologies, Inc. USD 440.00 May 2021 9 900 7,893 (3,287)JPM Roper Technologies, Inc. USD 480.00 Aug 2021 13 1,300 15,990 (4,510)CSFB Ross Stores, Inc. USD 130.00 Jan 2022 6 600 6,143 (5,972)BOA Ross Stores, Inc. USD 135.00 Jan 2022 3 300 3,132 (2,497)CSFB Ross Stores, Inc. USD 135.00 Jan 2022 6 600 5,599 (4,994)BOA Ross Stores, Inc. USD 140.00 Jan 2022 3 300 2,596 (2,080)JPM Teledyne Technologies, Inc. USD 410.00 Sep 2021 1 100 2,194 (3,733)JPM Teledyne Technologies, Inc. USD 410.00 Sep 2021 2 200 4,661 (7,466)JPM Teledyne Technologies, Inc. USD 420.00 Sep 2021 1 100 1,885 (3,230)JPM Teledyne Technologies, Inc. USD 420.00 Sep 2021 2 200 3,945 (6,460)CSFB The Coca-Cola Company USD 50.00 Jan 2022 38 3,800 15,630 (18,207)CSFB The Coca-Cola Company USD 50.00 Jan 2022 52 5,200 16,224 (24,914)CSFB The Coca-Cola Company USD 52.50 Jan 2022 38 3,800 11,420 (12,986)CSFB The Coca-Cola Company USD 52.50 Jan 2022 52 5,200 11,544 (17,770)CSFB The Coca-Cola Company USD 55.00 Jan 2022 39 3,900 8,341 (9,228)CSFB The Coca-Cola Company USD 55.00 Jan 2022 52 5,200 8,164 (12,303)CITI The PNC Financial Services Group, Inc. USD 175.00 Jan 2022 12 1,200 14,316 (17,971)CITI The PNC Financial Services Group, Inc. USD 180.00 Jan 2022 12 1,200 12,237 (15,137)CITI The PNC Financial Services Group, Inc. USD 180.00 Jan 2022 13 1,300 17,112 (16,398)CITI The PNC Financial Services Group, Inc. USD 185.00 Jan 2022 12 1,200 10,459 (12,629)CITI The PNC Financial Services Group, Inc. USD 185.00 Jan 2022 13 1,300 14,782 (13,681)CITI The PNC Financial Services Group, Inc. USD 190.00 Jan 2022 13 1,300 12,714 (11,309)CITI The PNC Financial Services Group, Inc. USD 195.00 Jan 2022 19 1,900 17,331 (13,559)CITI The PNC Financial Services Group, Inc. USD 195.00 Jan 2022 18 1,800 16,358 (12,846)CITI The PNC Financial Services Group, Inc. USD 200.00 Jan 2022 19 1,900 14,489 (11,033)CITI The PNC Financial Services Group, Inc. USD 200.00 Jan 2022 18 1,800 12,214 (10,452)CITI Thermo Fisher Scientific, Inc. USD 580.00 Jan 2022 3 300 8,122 (2,785)CITI Thermo Fisher Scientific, Inc. USD 580.00 Jan 2022 5 500 14,180 (4,641)
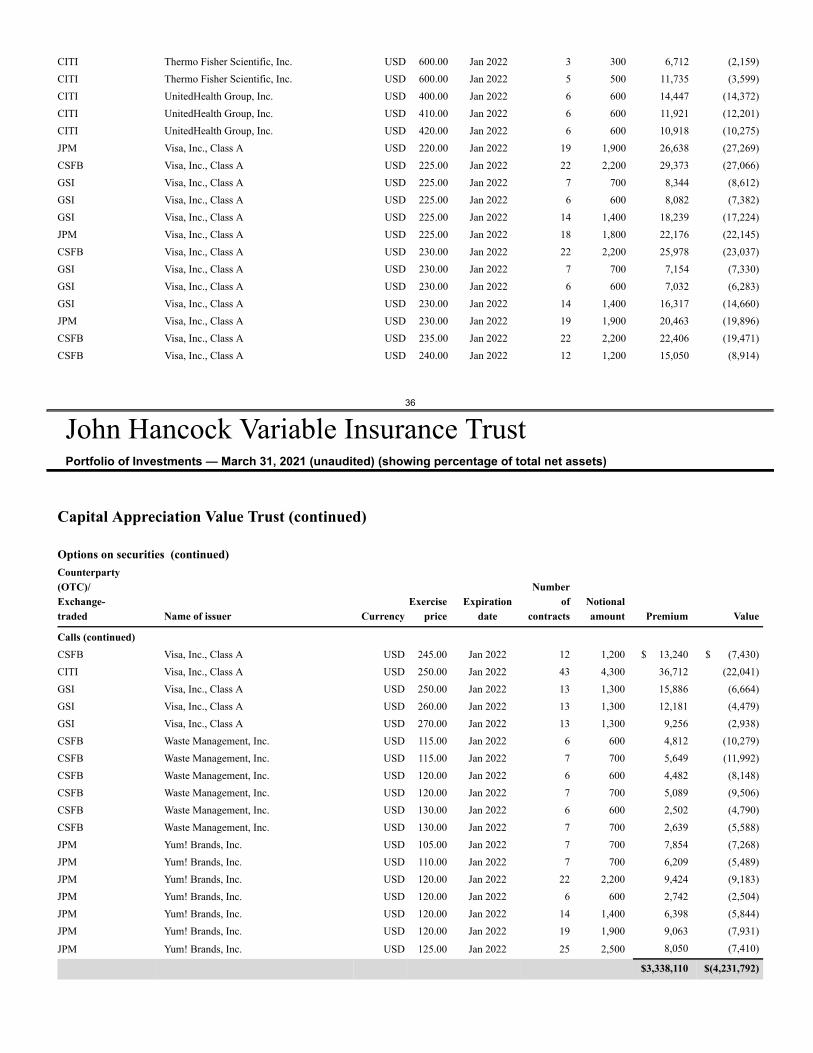
CITI Thermo Fisher Scientific, Inc. USD 600.00 Jan 2022 3 300 6,712 (2,159)CITI Thermo Fisher Scientific, Inc. USD 600.00 Jan 2022 5 500 11,735 (3,599)CITI UnitedHealth Group, Inc. USD 400.00 Jan 2022 6 600 14,447 (14,372)CITI UnitedHealth Group, Inc. USD 410.00 Jan 2022 6 600 11,921 (12,201)CITI UnitedHealth Group, Inc. USD 420.00 Jan 2022 6 600 10,918 (10,275)JPM Visa, Inc., Class A USD 220.00 Jan 2022 19 1,900 26,638 (27,269)CSFB Visa, Inc., Class A USD 225.00 Jan 2022 22 2,200 29,373 (27,066)GSI Visa, Inc., Class A USD 225.00 Jan 2022 7 700 8,344 (8,612)GSI Visa, Inc., Class A USD 225.00 Jan 2022 6 600 8,082 (7,382)GSI Visa, Inc., Class A USD 225.00 Jan 2022 14 1,400 18,239 (17,224)JPM Visa, Inc., Class A USD 225.00 Jan 2022 18 1,800 22,176 (22,145)CSFB Visa, Inc., Class A USD 230.00 Jan 2022 22 2,200 25,978 (23,037)GSI Visa, Inc., Class A USD 230.00 Jan 2022 7 700 7,154 (7,330)GSI Visa, Inc., Class A USD 230.00 Jan 2022 6 600 7,032 (6,283)GSI Visa, Inc., Class A USD 230.00 Jan 2022 14 1,400 16,317 (14,660)JPM Visa, Inc., Class A USD 230.00 Jan 2022 19 1,900 20,463 (19,896)CSFB Visa, Inc., Class A USD 235.00 Jan 2022 22 2,200 22,406 (19,471)CSFB Visa, Inc., Class A USD 240.00 Jan 2022 12 1,200 15,050 (8,914)
36
John Hancock Variable Insurance TrustPortfolio of Investments — March 31, 2021 (unaudited) (showing percentage of total net assets)
Capital Appreciation Value Trust (continued)
Options on securities (continued)Counterparty(OTC)/Exchange-traded Name of issuer Currency
Exerciseprice
Expirationdate
Numberof
contractsNotionalamount Premium Value
Calls (continued)CSFB Visa, Inc., Class A USD 245.00 Jan 2022 12 1,200 $ 13,240 $ (7,430)CITI Visa, Inc., Class A USD 250.00 Jan 2022 43 4,300 36,712 (22,041)GSI Visa, Inc., Class A USD 250.00 Jan 2022 13 1,300 15,886 (6,664)GSI Visa, Inc., Class A USD 260.00 Jan 2022 13 1,300 12,181 (4,479)GSI Visa, Inc., Class A USD 270.00 Jan 2022 13 1,300 9,256 (2,938)CSFB Waste Management, Inc. USD 115.00 Jan 2022 6 600 4,812 (10,279)CSFB Waste Management, Inc. USD 115.00 Jan 2022 7 700 5,649 (11,992)CSFB Waste Management, Inc. USD 120.00 Jan 2022 6 600 4,482 (8,148)CSFB Waste Management, Inc. USD 120.00 Jan 2022 7 700 5,089 (9,506)CSFB Waste Management, Inc. USD 130.00 Jan 2022 6 600 2,502 (4,790)CSFB Waste Management, Inc. USD 130.00 Jan 2022 7 700 2,639 (5,588)JPM Yum! Brands, Inc. USD 105.00 Jan 2022 7 700 7,854 (7,268)JPM Yum! Brands, Inc. USD 110.00 Jan 2022 7 700 6,209 (5,489)JPM Yum! Brands, Inc. USD 120.00 Jan 2022 22 2,200 9,424 (9,183)JPM Yum! Brands, Inc. USD 120.00 Jan 2022 6 600 2,742 (2,504)JPM Yum! Brands, Inc. USD 120.00 Jan 2022 14 1,400 6,398 (5,844)JPM Yum! Brands, Inc. USD 120.00 Jan 2022 19 1,900 9,063 (7,931)
JPM Yum! Brands, Inc. USD 125.00 Jan 2022 25 2,500 8,050 (7,410)
$3,338,110 $(4,231,792)
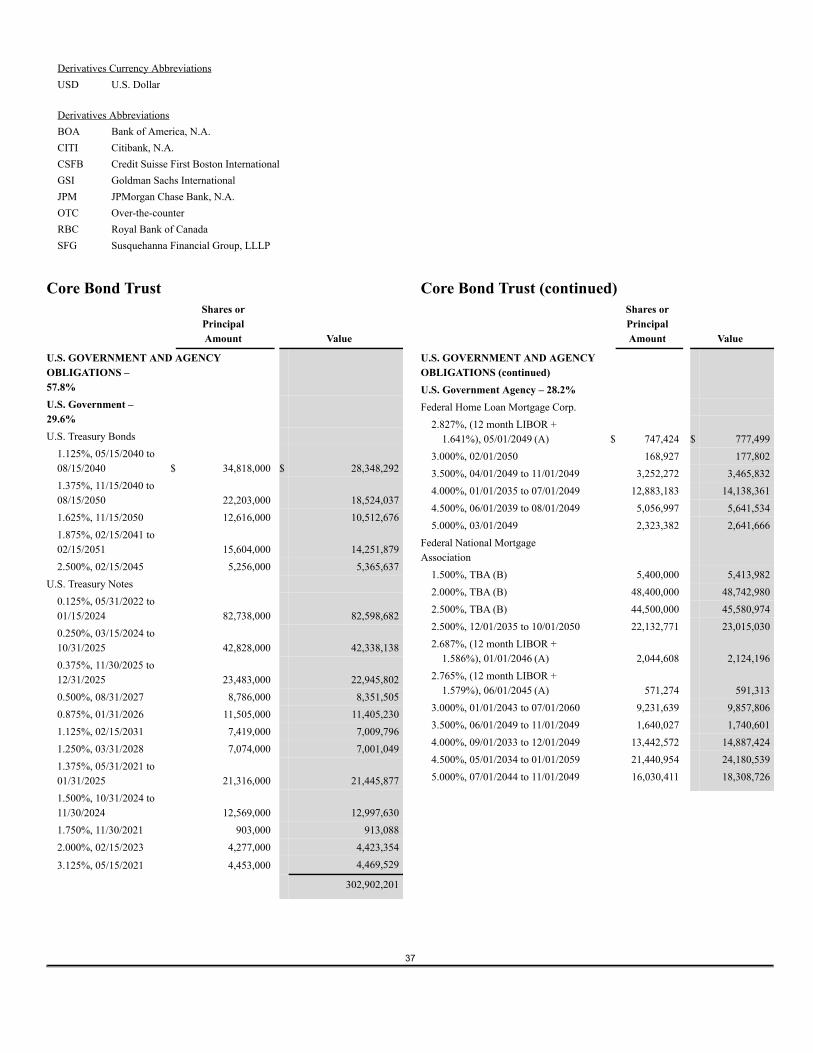
Derivatives Currency AbbreviationsUSD U.S. Dollar
Derivatives AbbreviationsBOA Bank of America, N.A.CITI Citibank, N.A.CSFB Credit Suisse First Boston InternationalGSI Goldman Sachs InternationalJPM JPMorgan Chase Bank, N.A.OTC Over-the-counterRBC Royal Bank of CanadaSFG Susquehanna Financial Group, LLLP
37
Core Bond TrustShares orPrincipalAmount Value
U.S. GOVERNMENT AND AGENCYOBLIGATIONS –57.8%U.S. Government –29.6%U.S. Treasury Bonds
1.125%, 05/15/2040 to08/15/2040 $ 34,818,000 $ 28,348,2921.375%, 11/15/2040 to08/15/2050 22,203,000 18,524,0371.625%, 11/15/2050 12,616,000 10,512,6761.875%, 02/15/2041 to02/15/2051 15,604,000 14,251,8792.500%, 02/15/2045 5,256,000 5,365,637
U.S. Treasury Notes0.125%, 05/31/2022 to01/15/2024 82,738,000 82,598,6820.250%, 03/15/2024 to10/31/2025 42,828,000 42,338,1380.375%, 11/30/2025 to12/31/2025 23,483,000 22,945,8020.500%, 08/31/2027 8,786,000 8,351,5050.875%, 01/31/2026 11,505,000 11,405,2301.125%, 02/15/2031 7,419,000 7,009,7961.250%, 03/31/2028 7,074,000 7,001,0491.375%, 05/31/2021 to01/31/2025 21,316,000 21,445,8771.500%, 10/31/2024 to11/30/2024 12,569,000 12,997,6301.750%, 11/30/2021 903,000 913,0882.000%, 02/15/2023 4,277,000 4,423,354
3.125%, 05/15/2021 4,453,000 4,469,529
302,902,201
Core Bond Trust (continued)Shares orPrincipalAmount Value
U.S. GOVERNMENT AND AGENCYOBLIGATIONS (continued)U.S. Government Agency – 28.2%Federal Home Loan Mortgage Corp.
2.827%, (12 month LIBOR +1.641%), 05/01/2049 (A) $ 747,424 $ 777,499
3.000%, 02/01/2050 168,927 177,8023.500%, 04/01/2049 to 11/01/2049 3,252,272 3,465,8324.000%, 01/01/2035 to 07/01/2049 12,883,183 14,138,3614.500%, 06/01/2039 to 08/01/2049 5,056,997 5,641,5345.000%, 03/01/2049 2,323,382 2,641,666
Federal National MortgageAssociation
1.500%, TBA (B) 5,400,000 5,413,9822.000%, TBA (B) 48,400,000 48,742,9802.500%, TBA (B) 44,500,000 45,580,9742.500%, 12/01/2035 to 10/01/2050 22,132,771 23,015,0302.687%, (12 month LIBOR +
1.586%), 01/01/2046 (A) 2,044,608 2,124,1962.765%, (12 month LIBOR +
1.579%), 06/01/2045 (A) 571,274 591,3133.000%, 01/01/2043 to 07/01/2060 9,231,639 9,857,8063.500%, 06/01/2049 to 11/01/2049 1,640,027 1,740,6014.000%, 09/01/2033 to 12/01/2049 13,442,572 14,887,4244.500%, 05/01/2034 to 01/01/2059 21,440,954 24,180,5395.000%, 07/01/2044 to 11/01/2049 16,030,411 18,308,726
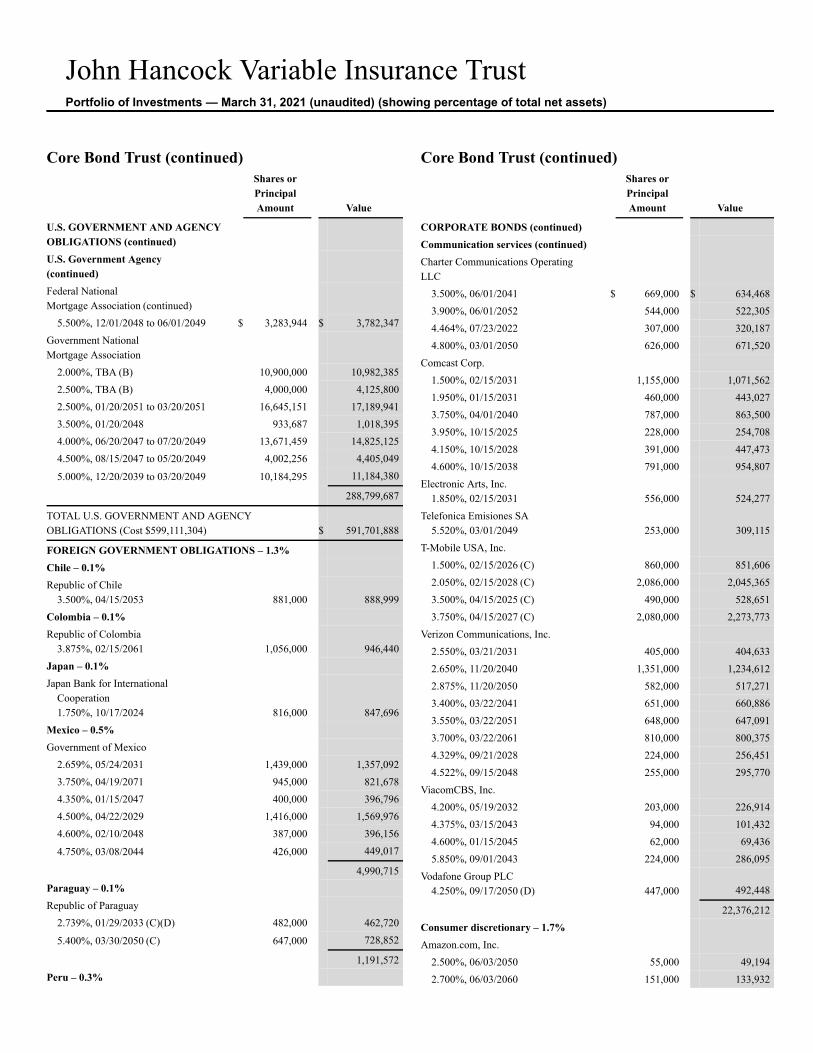
John Hancock Variable Insurance TrustPortfolio of Investments — March 31, 2021 (unaudited) (showing percentage of total net assets)
Core Bond Trust (continued)Shares orPrincipalAmount Value
U.S. GOVERNMENT AND AGENCYOBLIGATIONS (continued)U.S. Government Agency(continued)Federal NationalMortgage Association (continued)
5.500%, 12/01/2048 to 06/01/2049 $ 3,283,944 $ 3,782,347Government NationalMortgage Association
2.000%, TBA (B) 10,900,000 10,982,3852.500%, TBA (B) 4,000,000 4,125,8002.500%, 01/20/2051 to 03/20/2051 16,645,151 17,189,9413.500%, 01/20/2048 933,687 1,018,3954.000%, 06/20/2047 to 07/20/2049 13,671,459 14,825,1254.500%, 08/15/2047 to 05/20/2049 4,002,256 4,405,049
5.000%, 12/20/2039 to 03/20/2049 10,184,295 11,184,380
288,799,687
TOTAL U.S. GOVERNMENT AND AGENCYOBLIGATIONS (Cost $599,111,304) $ 591,701,888
FOREIGN GOVERNMENT OBLIGATIONS – 1.3%Chile – 0.1%Republic of Chile
3.500%, 04/15/2053 881,000 888,999Colombia – 0.1%Republic of Colombia
3.875%, 02/15/2061 1,056,000 946,440Japan – 0.1%Japan Bank for International
Cooperation1.750%, 10/17/2024 816,000 847,696
Mexico – 0.5%Government of Mexico
2.659%, 05/24/2031 1,439,000 1,357,0923.750%, 04/19/2071 945,000 821,6784.350%, 01/15/2047 400,000 396,7964.500%, 04/22/2029 1,416,000 1,569,9764.600%, 02/10/2048 387,000 396,156
4.750%, 03/08/2044 426,000 449,017
4,990,715Paraguay – 0.1%Republic of Paraguay
2.739%, 01/29/2033 (C)(D) 482,000 462,720
5.400%, 03/30/2050 (C) 647,000 728,852
1,191,572Peru – 0.3%
Core Bond Trust (continued)Shares orPrincipalAmount Value
CORPORATE BONDS (continued)Communication services (continued)Charter Communications OperatingLLC
3.500%, 06/01/2041 $ 669,000 $ 634,4683.900%, 06/01/2052 544,000 522,3054.464%, 07/23/2022 307,000 320,1874.800%, 03/01/2050 626,000 671,520
Comcast Corp.1.500%, 02/15/2031 1,155,000 1,071,5621.950%, 01/15/2031 460,000 443,0273.750%, 04/01/2040 787,000 863,5003.950%, 10/15/2025 228,000 254,7084.150%, 10/15/2028 391,000 447,4734.600%, 10/15/2038 791,000 954,807
Electronic Arts, Inc.1.850%, 02/15/2031 556,000 524,277
Telefonica Emisiones SA5.520%, 03/01/2049 253,000 309,115
T-Mobile USA, Inc.1.500%, 02/15/2026 (C) 860,000 851,6062.050%, 02/15/2028 (C) 2,086,000 2,045,3653.500%, 04/15/2025 (C) 490,000 528,6513.750%, 04/15/2027 (C) 2,080,000 2,273,773
Verizon Communications, Inc.2.550%, 03/21/2031 405,000 404,6332.650%, 11/20/2040 1,351,000 1,234,6122.875%, 11/20/2050 582,000 517,2713.400%, 03/22/2041 651,000 660,8863.550%, 03/22/2051 648,000 647,0913.700%, 03/22/2061 810,000 800,3754.329%, 09/21/2028 224,000 256,4514.522%, 09/15/2048 255,000 295,770
ViacomCBS, Inc.4.200%, 05/19/2032 203,000 226,9144.375%, 03/15/2043 94,000 101,4324.600%, 01/15/2045 62,000 69,4365.850%, 09/01/2043 224,000 286,095
Vodafone Group PLC4.250%, 09/17/2050 (D) 447,000 492,448
22,376,212Consumer discretionary – 1.7%Amazon.com, Inc.
2.500%, 06/03/2050 55,000 49,1942.700%, 06/03/2060 151,000 133,932
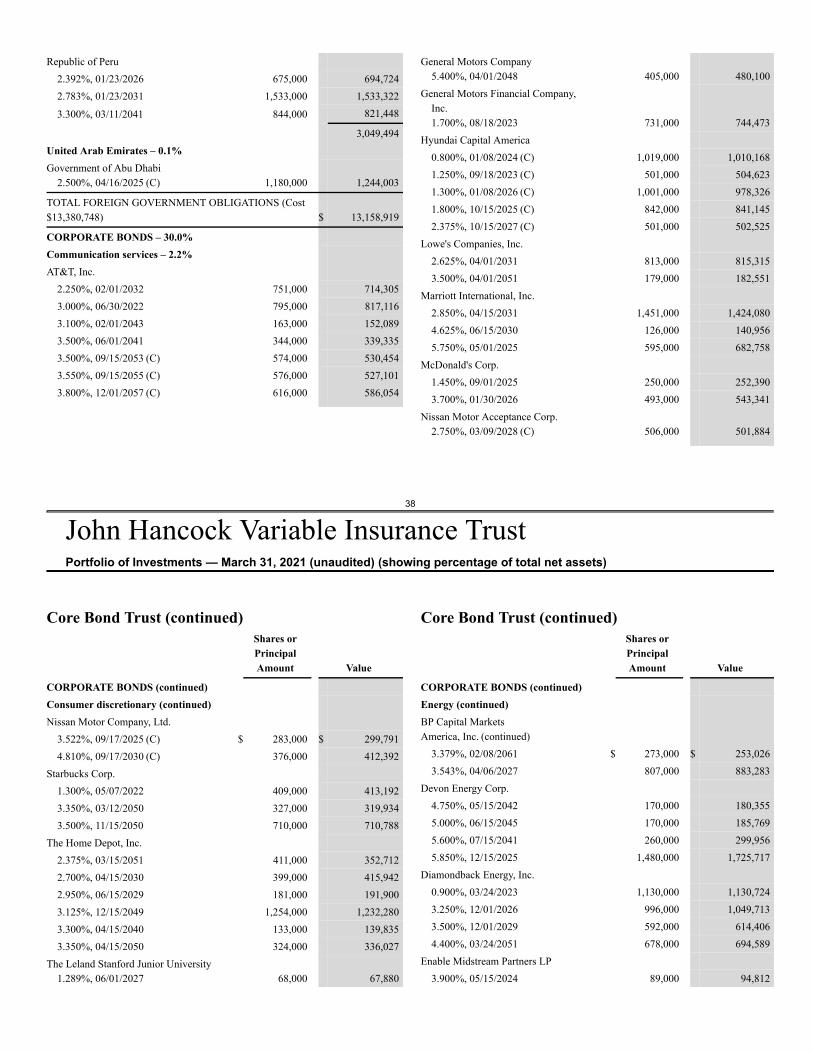
38
John Hancock Variable Insurance TrustPortfolio of Investments — March 31, 2021 (unaudited) (showing percentage of total net assets)
Republic of Peru2.392%, 01/23/2026 675,000 694,7242.783%, 01/23/2031 1,533,000 1,533,322
3.300%, 03/11/2041 844,000 821,448
3,049,494United Arab Emirates – 0.1%Government of Abu Dhabi
2.500%, 04/16/2025 (C) 1,180,000 1,244,003
TOTAL FOREIGN GOVERNMENT OBLIGATIONS (Cost$13,380,748) $ 13,158,919
CORPORATE BONDS – 30.0%Communication services – 2.2%AT&T, Inc.
2.250%, 02/01/2032 751,000 714,3053.000%, 06/30/2022 795,000 817,1163.100%, 02/01/2043 163,000 152,0893.500%, 06/01/2041 344,000 339,3353.500%, 09/15/2053 (C) 574,000 530,4543.550%, 09/15/2055 (C) 576,000 527,1013.800%, 12/01/2057 (C) 616,000 586,054
General Motors Company5.400%, 04/01/2048 405,000 480,100
General Motors Financial Company,Inc.1.700%, 08/18/2023 731,000 744,473
Hyundai Capital America0.800%, 01/08/2024 (C) 1,019,000 1,010,1681.250%, 09/18/2023 (C) 501,000 504,6231.300%, 01/08/2026 (C) 1,001,000 978,3261.800%, 10/15/2025 (C) 842,000 841,1452.375%, 10/15/2027 (C) 501,000 502,525
Lowe's Companies, Inc.2.625%, 04/01/2031 813,000 815,3153.500%, 04/01/2051 179,000 182,551
Marriott International, Inc.2.850%, 04/15/2031 1,451,000 1,424,0804.625%, 06/15/2030 126,000 140,9565.750%, 05/01/2025 595,000 682,758
McDonald's Corp.1.450%, 09/01/2025 250,000 252,3903.700%, 01/30/2026 493,000 543,341
Nissan Motor Acceptance Corp.2.750%, 03/09/2028 (C) 506,000 501,884
Core Bond Trust (continued)Shares orPrincipalAmount Value
CORPORATE BONDS (continued)Consumer discretionary (continued)Nissan Motor Company, Ltd.
3.522%, 09/17/2025 (C) $ 283,000 $ 299,7914.810%, 09/17/2030 (C) 376,000 412,392
Starbucks Corp.1.300%, 05/07/2022 409,000 413,1923.350%, 03/12/2050 327,000 319,9343.500%, 11/15/2050 710,000 710,788
The Home Depot, Inc.2.375%, 03/15/2051 411,000 352,7122.700%, 04/15/2030 399,000 415,9422.950%, 06/15/2029 181,000 191,9003.125%, 12/15/2049 1,254,000 1,232,2803.300%, 04/15/2040 133,000 139,8353.350%, 04/15/2050 324,000 336,027
The Leland Stanford Junior University1.289%, 06/01/2027 68,000 67,880
Core Bond Trust (continued)Shares orPrincipalAmount Value
CORPORATE BONDS (continued)Energy (continued)BP Capital MarketsAmerica, Inc. (continued)
3.379%, 02/08/2061 $ 273,000 $ 253,0263.543%, 04/06/2027 807,000 883,283
Devon Energy Corp.4.750%, 05/15/2042 170,000 180,3555.000%, 06/15/2045 170,000 185,7695.600%, 07/15/2041 260,000 299,9565.850%, 12/15/2025 1,480,000 1,725,717
Diamondback Energy, Inc.0.900%, 03/24/2023 1,130,000 1,130,7243.250%, 12/01/2026 996,000 1,049,7133.500%, 12/01/2029 592,000 614,4064.400%, 03/24/2051 678,000 694,589
Enable Midstream Partners LP3.900%, 05/15/2024 89,000 94,812
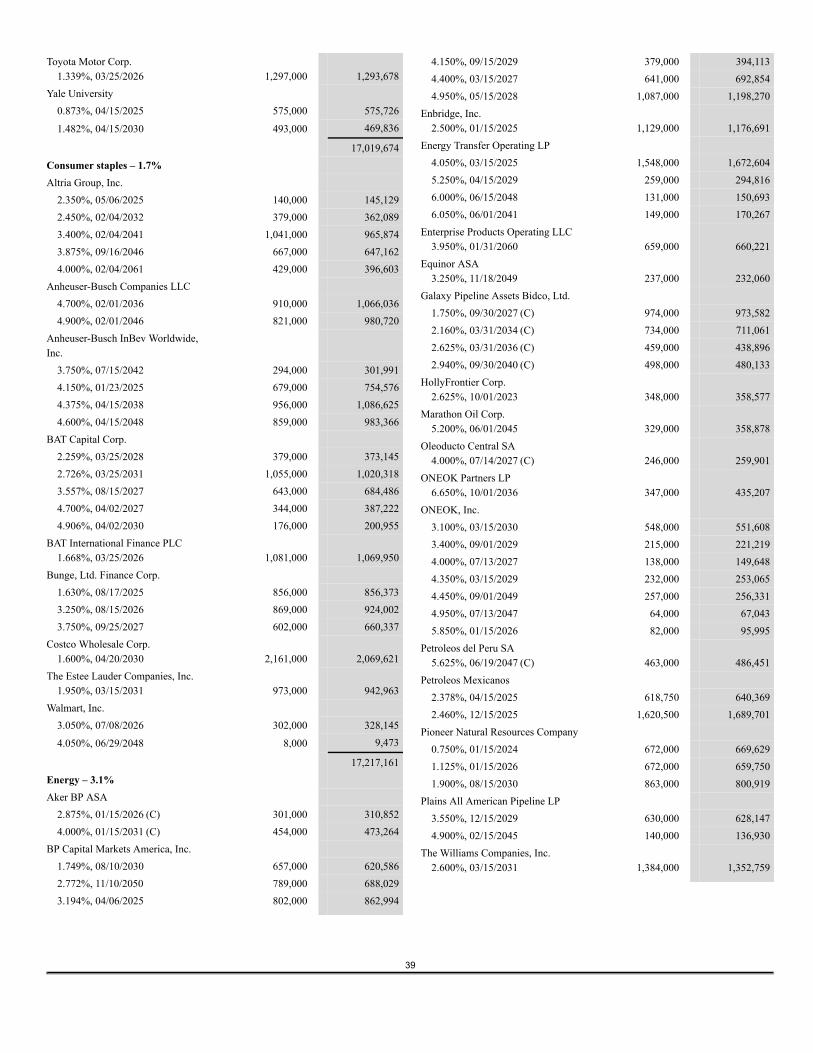
39
Toyota Motor Corp.1.339%, 03/25/2026 1,297,000 1,293,678
Yale University0.873%, 04/15/2025 575,000 575,726
1.482%, 04/15/2030 493,000 469,836
17,019,674Consumer staples – 1.7%Altria Group, Inc.
2.350%, 05/06/2025 140,000 145,1292.450%, 02/04/2032 379,000 362,0893.400%, 02/04/2041 1,041,000 965,8743.875%, 09/16/2046 667,000 647,1624.000%, 02/04/2061 429,000 396,603
Anheuser-Busch Companies LLC4.700%, 02/01/2036 910,000 1,066,0364.900%, 02/01/2046 821,000 980,720
Anheuser-Busch InBev Worldwide,Inc.
3.750%, 07/15/2042 294,000 301,9914.150%, 01/23/2025 679,000 754,5764.375%, 04/15/2038 956,000 1,086,6254.600%, 04/15/2048 859,000 983,366
BAT Capital Corp.2.259%, 03/25/2028 379,000 373,1452.726%, 03/25/2031 1,055,000 1,020,3183.557%, 08/15/2027 643,000 684,4864.700%, 04/02/2027 344,000 387,2224.906%, 04/02/2030 176,000 200,955
BAT International Finance PLC1.668%, 03/25/2026 1,081,000 1,069,950
Bunge, Ltd. Finance Corp.1.630%, 08/17/2025 856,000 856,3733.250%, 08/15/2026 869,000 924,0023.750%, 09/25/2027 602,000 660,337
Costco Wholesale Corp.1.600%, 04/20/2030 2,161,000 2,069,621
The Estee Lauder Companies, Inc.1.950%, 03/15/2031 973,000 942,963
Walmart, Inc.3.050%, 07/08/2026 302,000 328,145
4.050%, 06/29/2048 8,000 9,473
17,217,161Energy – 3.1%Aker BP ASA
2.875%, 01/15/2026 (C) 301,000 310,8524.000%, 01/15/2031 (C) 454,000 473,264
BP Capital Markets America, Inc.1.749%, 08/10/2030 657,000 620,5862.772%, 11/10/2050 789,000 688,0293.194%, 04/06/2025 802,000 862,994
4.150%, 09/15/2029 379,000 394,1134.400%, 03/15/2027 641,000 692,8544.950%, 05/15/2028 1,087,000 1,198,270
Enbridge, Inc.2.500%, 01/15/2025 1,129,000 1,176,691
Energy Transfer Operating LP4.050%, 03/15/2025 1,548,000 1,672,6045.250%, 04/15/2029 259,000 294,8166.000%, 06/15/2048 131,000 150,6936.050%, 06/01/2041 149,000 170,267
Enterprise Products Operating LLC3.950%, 01/31/2060 659,000 660,221
Equinor ASA3.250%, 11/18/2049 237,000 232,060
Galaxy Pipeline Assets Bidco, Ltd.1.750%, 09/30/2027 (C) 974,000 973,5822.160%, 03/31/2034 (C) 734,000 711,0612.625%, 03/31/2036 (C) 459,000 438,8962.940%, 09/30/2040 (C) 498,000 480,133
HollyFrontier Corp.2.625%, 10/01/2023 348,000 358,577
Marathon Oil Corp.5.200%, 06/01/2045 329,000 358,878
Oleoducto Central SA4.000%, 07/14/2027 (C) 246,000 259,901
ONEOK Partners LP6.650%, 10/01/2036 347,000 435,207
ONEOK, Inc.3.100%, 03/15/2030 548,000 551,6083.400%, 09/01/2029 215,000 221,2194.000%, 07/13/2027 138,000 149,6484.350%, 03/15/2029 232,000 253,0654.450%, 09/01/2049 257,000 256,3314.950%, 07/13/2047 64,000 67,0435.850%, 01/15/2026 82,000 95,995
Petroleos del Peru SA5.625%, 06/19/2047 (C) 463,000 486,451
Petroleos Mexicanos2.378%, 04/15/2025 618,750 640,3692.460%, 12/15/2025 1,620,500 1,689,701
Pioneer Natural Resources Company0.750%, 01/15/2024 672,000 669,6291.125%, 01/15/2026 672,000 659,7501.900%, 08/15/2030 863,000 800,919
Plains All American Pipeline LP3.550%, 12/15/2029 630,000 628,1474.900%, 02/15/2045 140,000 136,930
The Williams Companies, Inc.2.600%, 03/15/2031 1,384,000 1,352,759
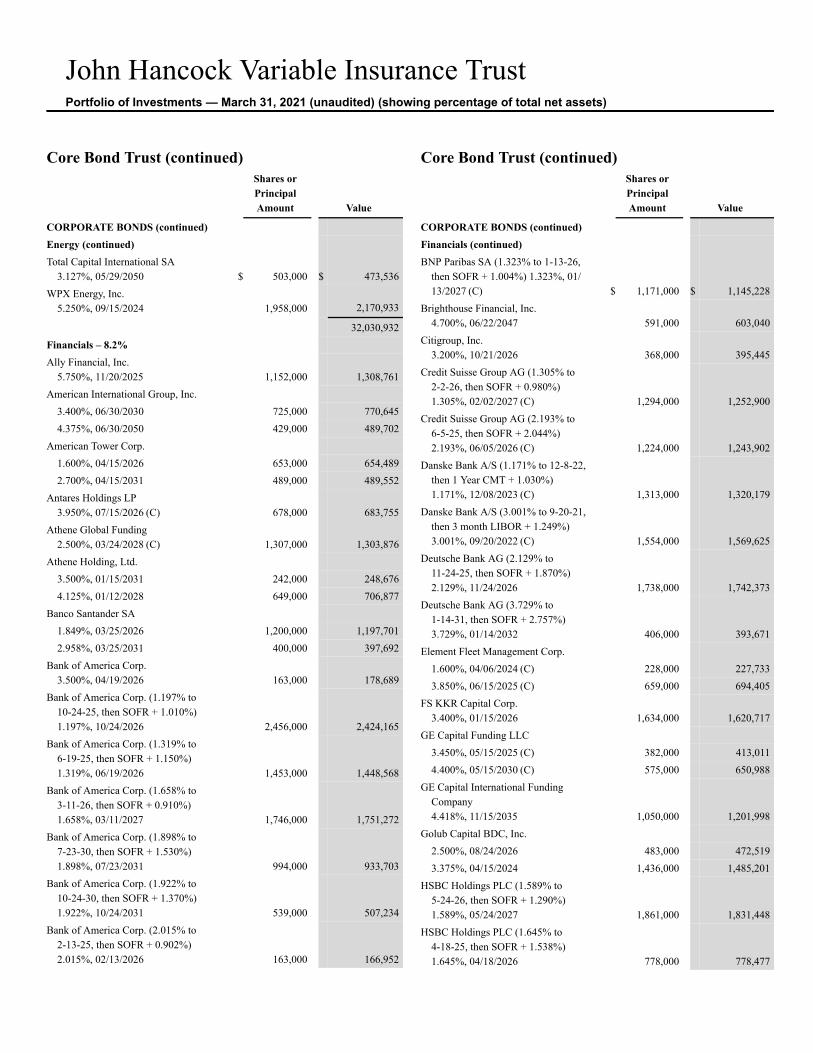
John Hancock Variable Insurance TrustPortfolio of Investments — March 31, 2021 (unaudited) (showing percentage of total net assets)
Core Bond Trust (continued)Shares orPrincipalAmount Value
CORPORATE BONDS (continued)Energy (continued)Total Capital International SA
3.127%, 05/29/2050 $ 503,000 $ 473,536WPX Energy, Inc.
5.250%, 09/15/2024 1,958,000 2,170,933
32,030,932Financials – 8.2%Ally Financial, Inc.
5.750%, 11/20/2025 1,152,000 1,308,761American International Group, Inc.
3.400%, 06/30/2030 725,000 770,6454.375%, 06/30/2050 429,000 489,702
American Tower Corp.1.600%, 04/15/2026 653,000 654,4892.700%, 04/15/2031 489,000 489,552
Antares Holdings LP3.950%, 07/15/2026 (C) 678,000 683,755
Athene Global Funding2.500%, 03/24/2028 (C) 1,307,000 1,303,876
Athene Holding, Ltd.3.500%, 01/15/2031 242,000 248,6764.125%, 01/12/2028 649,000 706,877
Banco Santander SA1.849%, 03/25/2026 1,200,000 1,197,7012.958%, 03/25/2031 400,000 397,692
Bank of America Corp.3.500%, 04/19/2026 163,000 178,689
Bank of America Corp. (1.197% to10-24-25, then SOFR + 1.010%)1.197%, 10/24/2026 2,456,000 2,424,165
Bank of America Corp. (1.319% to6-19-25, then SOFR + 1.150%)1.319%, 06/19/2026 1,453,000 1,448,568
Bank of America Corp. (1.658% to3-11-26, then SOFR + 0.910%)1.658%, 03/11/2027 1,746,000 1,751,272
Bank of America Corp. (1.898% to7-23-30, then SOFR + 1.530%)1.898%, 07/23/2031 994,000 933,703
Bank of America Corp. (1.922% to10-24-30, then SOFR + 1.370%)1.922%, 10/24/2031 539,000 507,234
Bank of America Corp. (2.015% to2-13-25, then SOFR + 0.902%)2.015%, 02/13/2026 163,000 166,952
Core Bond Trust (continued)Shares orPrincipalAmount Value
CORPORATE BONDS (continued)Financials (continued)BNP Paribas SA (1.323% to 1-13-26,
then SOFR + 1.004%) 1.323%, 01/13/2027 (C) $ 1,171,000 $ 1,145,228
Brighthouse Financial, Inc.4.700%, 06/22/2047 591,000 603,040
Citigroup, Inc.3.200%, 10/21/2026 368,000 395,445
Credit Suisse Group AG (1.305% to2-2-26, then SOFR + 0.980%)1.305%, 02/02/2027 (C) 1,294,000 1,252,900
Credit Suisse Group AG (2.193% to6-5-25, then SOFR + 2.044%)2.193%, 06/05/2026 (C) 1,224,000 1,243,902
Danske Bank A/S (1.171% to 12-8-22,then 1 Year CMT + 1.030%)1.171%, 12/08/2023 (C) 1,313,000 1,320,179
Danske Bank A/S (3.001% to 9-20-21,then 3 month LIBOR + 1.249%)3.001%, 09/20/2022 (C) 1,554,000 1,569,625
Deutsche Bank AG (2.129% to11-24-25, then SOFR + 1.870%)2.129%, 11/24/2026 1,738,000 1,742,373
Deutsche Bank AG (3.729% to1-14-31, then SOFR + 2.757%)3.729%, 01/14/2032 406,000 393,671
Element Fleet Management Corp.1.600%, 04/06/2024 (C) 228,000 227,7333.850%, 06/15/2025 (C) 659,000 694,405
FS KKR Capital Corp.3.400%, 01/15/2026 1,634,000 1,620,717
GE Capital Funding LLC3.450%, 05/15/2025 (C) 382,000 413,0114.400%, 05/15/2030 (C) 575,000 650,988
GE Capital International FundingCompany4.418%, 11/15/2035 1,050,000 1,201,998
Golub Capital BDC, Inc.2.500%, 08/24/2026 483,000 472,5193.375%, 04/15/2024 1,436,000 1,485,201
HSBC Holdings PLC (1.589% to5-24-26, then SOFR + 1.290%)1.589%, 05/24/2027 1,861,000 1,831,448
HSBC Holdings PLC (1.645% to4-18-25, then SOFR + 1.538%)1.645%, 04/18/2026 778,000 778,477
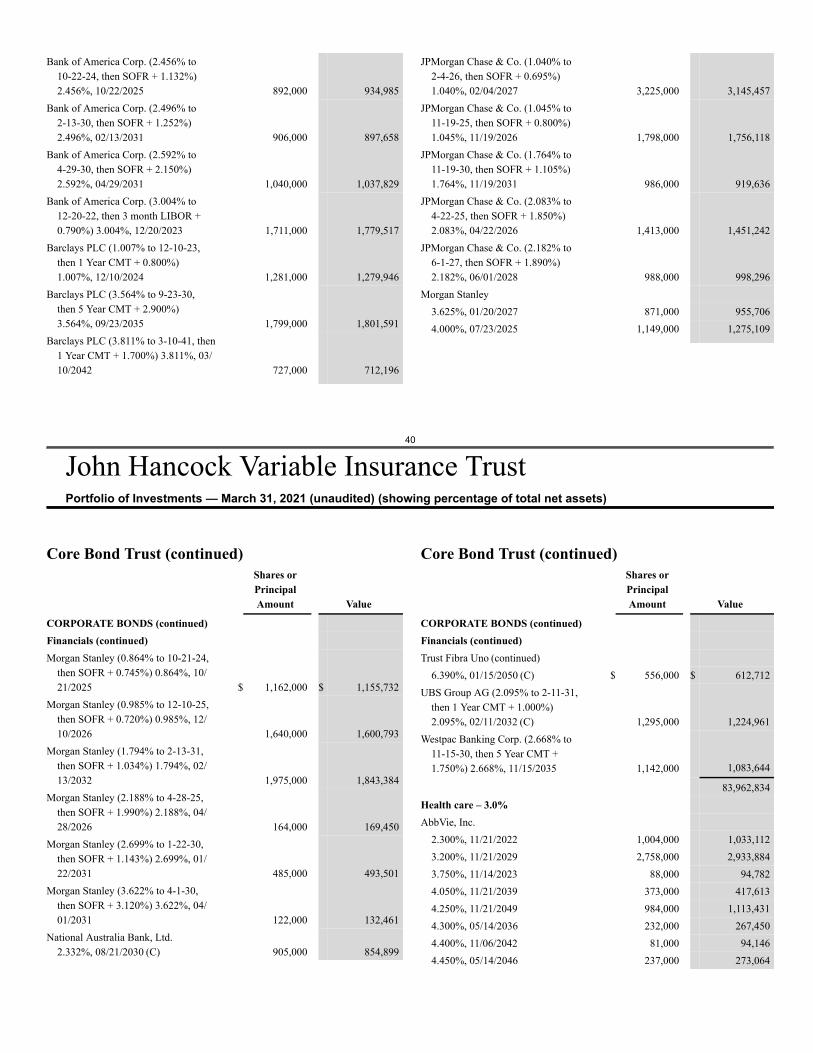
40
John Hancock Variable Insurance TrustPortfolio of Investments — March 31, 2021 (unaudited) (showing percentage of total net assets)
Bank of America Corp. (2.456% to10-22-24, then SOFR + 1.132%)2.456%, 10/22/2025 892,000 934,985
Bank of America Corp. (2.496% to2-13-30, then SOFR + 1.252%)2.496%, 02/13/2031 906,000 897,658
Bank of America Corp. (2.592% to4-29-30, then SOFR + 2.150%)2.592%, 04/29/2031 1,040,000 1,037,829
Bank of America Corp. (3.004% to12-20-22, then 3 month LIBOR +0.790%) 3.004%, 12/20/2023 1,711,000 1,779,517
Barclays PLC (1.007% to 12-10-23,then 1 Year CMT + 0.800%)1.007%, 12/10/2024 1,281,000 1,279,946
Barclays PLC (3.564% to 9-23-30,then 5 Year CMT + 2.900%)3.564%, 09/23/2035 1,799,000 1,801,591
Barclays PLC (3.811% to 3-10-41, then1 Year CMT + 1.700%) 3.811%, 03/10/2042 727,000 712,196
JPMorgan Chase & Co. (1.040% to2-4-26, then SOFR + 0.695%)1.040%, 02/04/2027 3,225,000 3,145,457
JPMorgan Chase & Co. (1.045% to11-19-25, then SOFR + 0.800%)1.045%, 11/19/2026 1,798,000 1,756,118
JPMorgan Chase & Co. (1.764% to11-19-30, then SOFR + 1.105%)1.764%, 11/19/2031 986,000 919,636
JPMorgan Chase & Co. (2.083% to4-22-25, then SOFR + 1.850%)2.083%, 04/22/2026 1,413,000 1,451,242
JPMorgan Chase & Co. (2.182% to6-1-27, then SOFR + 1.890%)2.182%, 06/01/2028 988,000 998,296
Morgan Stanley3.625%, 01/20/2027 871,000 955,7064.000%, 07/23/2025 1,149,000 1,275,109
Core Bond Trust (continued)Shares orPrincipalAmount Value
CORPORATE BONDS (continued)Financials (continued)Morgan Stanley (0.864% to 10-21-24,
then SOFR + 0.745%) 0.864%, 10/21/2025 $ 1,162,000 $ 1,155,732
Morgan Stanley (0.985% to 12-10-25,then SOFR + 0.720%) 0.985%, 12/10/2026 1,640,000 1,600,793
Morgan Stanley (1.794% to 2-13-31,then SOFR + 1.034%) 1.794%, 02/13/2032 1,975,000 1,843,384
Morgan Stanley (2.188% to 4-28-25,then SOFR + 1.990%) 2.188%, 04/28/2026 164,000 169,450
Morgan Stanley (2.699% to 1-22-30,then SOFR + 1.143%) 2.699%, 01/22/2031 485,000 493,501
Morgan Stanley (3.622% to 4-1-30,then SOFR + 3.120%) 3.622%, 04/01/2031 122,000 132,461
National Australia Bank, Ltd.2.332%, 08/21/2030 (C) 905,000 854,899
Core Bond Trust (continued)Shares orPrincipalAmount Value
CORPORATE BONDS (continued)Financials (continued)Trust Fibra Uno (continued)
6.390%, 01/15/2050 (C) $ 556,000 $ 612,712UBS Group AG (2.095% to 2-11-31,
then 1 Year CMT + 1.000%)2.095%, 02/11/2032 (C) 1,295,000 1,224,961
Westpac Banking Corp. (2.668% to11-15-30, then 5 Year CMT +1.750%) 2.668%, 11/15/2035 1,142,000 1,083,644
83,962,834Health care – 3.0%AbbVie, Inc.
2.300%, 11/21/2022 1,004,000 1,033,1123.200%, 11/21/2029 2,758,000 2,933,8843.750%, 11/14/2023 88,000 94,7824.050%, 11/21/2039 373,000 417,6134.250%, 11/21/2049 984,000 1,113,4314.300%, 05/14/2036 232,000 267,4504.400%, 11/06/2042 81,000 94,1464.450%, 05/14/2046 237,000 273,064
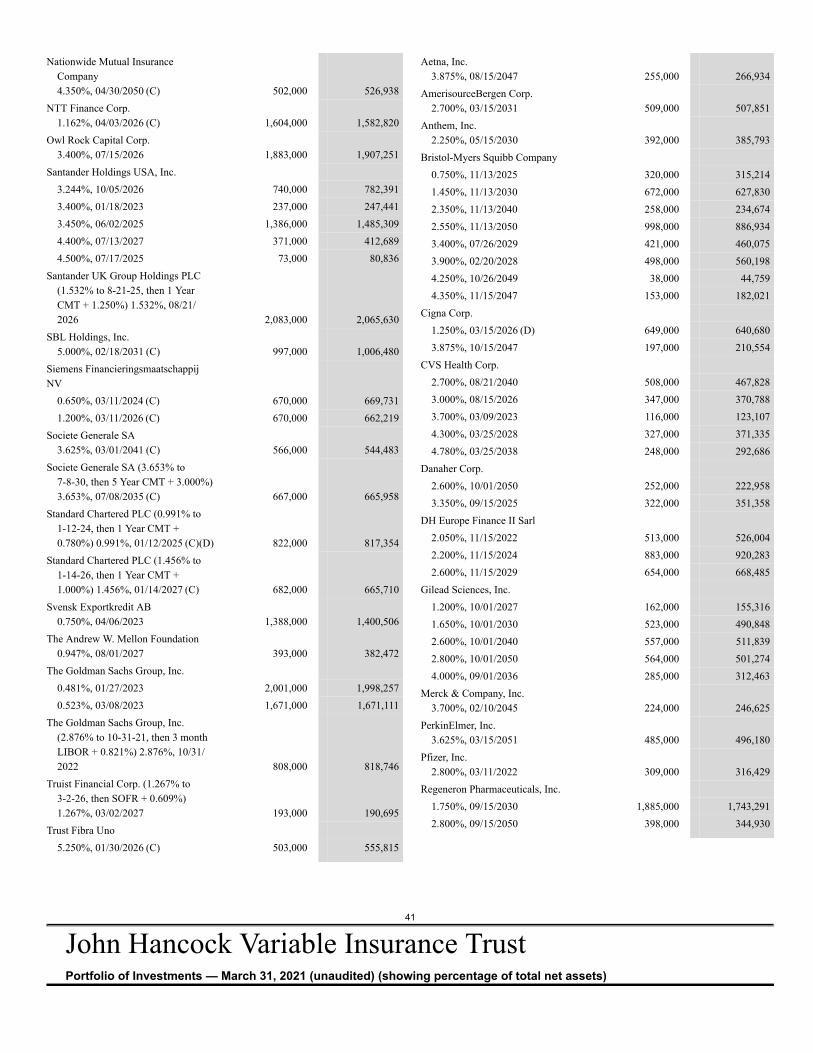
41
John Hancock Variable Insurance TrustPortfolio of Investments — March 31, 2021 (unaudited) (showing percentage of total net assets)
Nationwide Mutual InsuranceCompany4.350%, 04/30/2050 (C) 502,000 526,938
NTT Finance Corp.1.162%, 04/03/2026 (C) 1,604,000 1,582,820
Owl Rock Capital Corp.3.400%, 07/15/2026 1,883,000 1,907,251
Santander Holdings USA, Inc.3.244%, 10/05/2026 740,000 782,3913.400%, 01/18/2023 237,000 247,4413.450%, 06/02/2025 1,386,000 1,485,3094.400%, 07/13/2027 371,000 412,6894.500%, 07/17/2025 73,000 80,836
Santander UK Group Holdings PLC(1.532% to 8-21-25, then 1 YearCMT + 1.250%) 1.532%, 08/21/2026 2,083,000 2,065,630
SBL Holdings, Inc.5.000%, 02/18/2031 (C) 997,000 1,006,480
Siemens FinancieringsmaatschappijNV
0.650%, 03/11/2024 (C) 670,000 669,7311.200%, 03/11/2026 (C) 670,000 662,219
Societe Generale SA3.625%, 03/01/2041 (C) 566,000 544,483
Societe Generale SA (3.653% to7-8-30, then 5 Year CMT + 3.000%)3.653%, 07/08/2035 (C) 667,000 665,958
Standard Chartered PLC (0.991% to1-12-24, then 1 Year CMT +0.780%) 0.991%, 01/12/2025 (C)(D) 822,000 817,354
Standard Chartered PLC (1.456% to1-14-26, then 1 Year CMT +1.000%) 1.456%, 01/14/2027 (C) 682,000 665,710
Svensk Exportkredit AB0.750%, 04/06/2023 1,388,000 1,400,506
The Andrew W. Mellon Foundation0.947%, 08/01/2027 393,000 382,472
The Goldman Sachs Group, Inc.0.481%, 01/27/2023 2,001,000 1,998,2570.523%, 03/08/2023 1,671,000 1,671,111
The Goldman Sachs Group, Inc.(2.876% to 10-31-21, then 3 monthLIBOR + 0.821%) 2.876%, 10/31/2022 808,000 818,746
Truist Financial Corp. (1.267% to3-2-26, then SOFR + 0.609%)1.267%, 03/02/2027 193,000 190,695
Trust Fibra Uno5.250%, 01/30/2026 (C) 503,000 555,815
Aetna, Inc.3.875%, 08/15/2047 255,000 266,934
AmerisourceBergen Corp.2.700%, 03/15/2031 509,000 507,851
Anthem, Inc.2.250%, 05/15/2030 392,000 385,793
Bristol-Myers Squibb Company0.750%, 11/13/2025 320,000 315,2141.450%, 11/13/2030 672,000 627,8302.350%, 11/13/2040 258,000 234,6742.550%, 11/13/2050 998,000 886,9343.400%, 07/26/2029 421,000 460,0753.900%, 02/20/2028 498,000 560,1984.250%, 10/26/2049 38,000 44,7594.350%, 11/15/2047 153,000 182,021
Cigna Corp.1.250%, 03/15/2026 (D) 649,000 640,6803.875%, 10/15/2047 197,000 210,554
CVS Health Corp.2.700%, 08/21/2040 508,000 467,8283.000%, 08/15/2026 347,000 370,7883.700%, 03/09/2023 116,000 123,1074.300%, 03/25/2028 327,000 371,3354.780%, 03/25/2038 248,000 292,686
Danaher Corp.2.600%, 10/01/2050 252,000 222,9583.350%, 09/15/2025 322,000 351,358
DH Europe Finance II Sarl2.050%, 11/15/2022 513,000 526,0042.200%, 11/15/2024 883,000 920,2832.600%, 11/15/2029 654,000 668,485
Gilead Sciences, Inc.1.200%, 10/01/2027 162,000 155,3161.650%, 10/01/2030 523,000 490,8482.600%, 10/01/2040 557,000 511,8392.800%, 10/01/2050 564,000 501,2744.000%, 09/01/2036 285,000 312,463
Merck & Company, Inc.3.700%, 02/10/2045 224,000 246,625
PerkinElmer, Inc.3.625%, 03/15/2051 485,000 496,180
Pfizer, Inc.2.800%, 03/11/2022 309,000 316,429
Regeneron Pharmaceuticals, Inc.1.750%, 09/15/2030 1,885,000 1,743,2912.800%, 09/15/2050 398,000 344,930
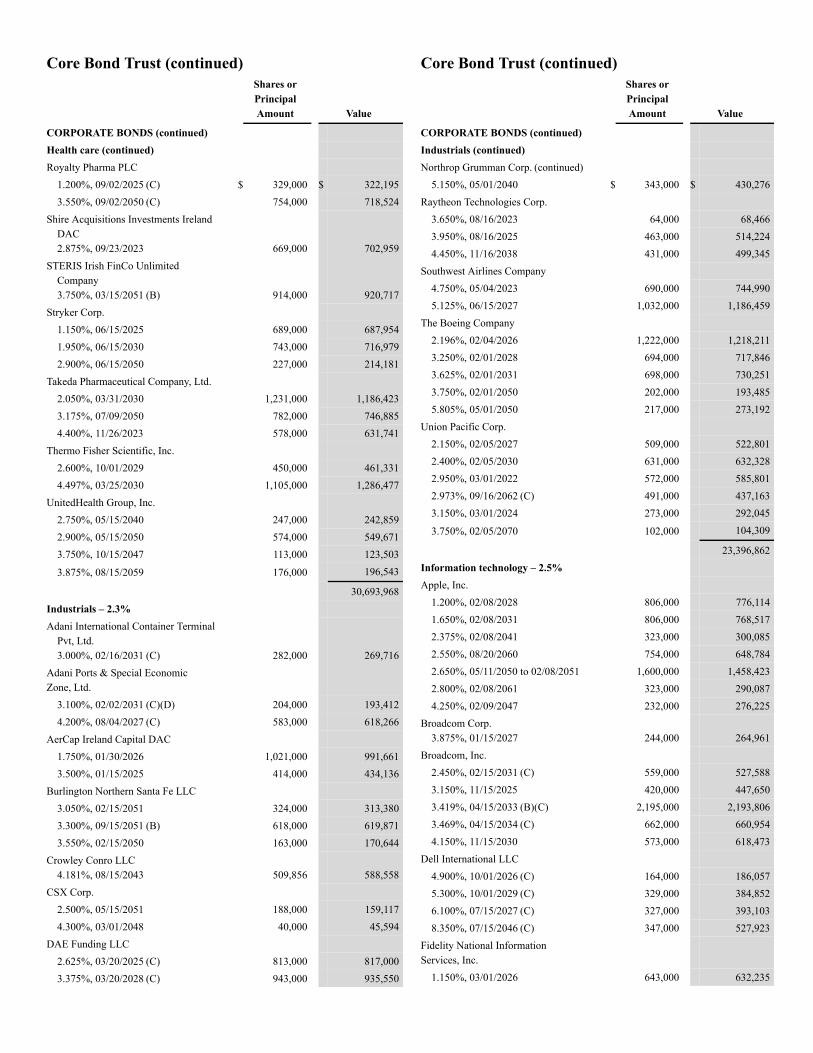
Core Bond Trust (continued)Shares orPrincipalAmount Value
CORPORATE BONDS (continued)Health care (continued)Royalty Pharma PLC
1.200%, 09/02/2025 (C) $ 329,000 $ 322,1953.550%, 09/02/2050 (C) 754,000 718,524
Shire Acquisitions Investments IrelandDAC2.875%, 09/23/2023 669,000 702,959
STERIS Irish FinCo UnlimitedCompany3.750%, 03/15/2051 (B) 914,000 920,717
Stryker Corp.1.150%, 06/15/2025 689,000 687,9541.950%, 06/15/2030 743,000 716,9792.900%, 06/15/2050 227,000 214,181
Takeda Pharmaceutical Company, Ltd.2.050%, 03/31/2030 1,231,000 1,186,4233.175%, 07/09/2050 782,000 746,8854.400%, 11/26/2023 578,000 631,741
Thermo Fisher Scientific, Inc.2.600%, 10/01/2029 450,000 461,3314.497%, 03/25/2030 1,105,000 1,286,477
UnitedHealth Group, Inc.2.750%, 05/15/2040 247,000 242,8592.900%, 05/15/2050 574,000 549,6713.750%, 10/15/2047 113,000 123,503
3.875%, 08/15/2059 176,000 196,543
30,693,968Industrials – 2.3%Adani International Container Terminal
Pvt, Ltd.3.000%, 02/16/2031 (C) 282,000 269,716
Adani Ports & Special EconomicZone, Ltd.
3.100%, 02/02/2031 (C)(D) 204,000 193,4124.200%, 08/04/2027 (C) 583,000 618,266
AerCap Ireland Capital DAC1.750%, 01/30/2026 1,021,000 991,6613.500%, 01/15/2025 414,000 434,136
Burlington Northern Santa Fe LLC3.050%, 02/15/2051 324,000 313,3803.300%, 09/15/2051 (B) 618,000 619,8713.550%, 02/15/2050 163,000 170,644
Crowley Conro LLC4.181%, 08/15/2043 509,856 588,558
CSX Corp.2.500%, 05/15/2051 188,000 159,1174.300%, 03/01/2048 40,000 45,594
DAE Funding LLC2.625%, 03/20/2025 (C) 813,000 817,0003.375%, 03/20/2028 (C) 943,000 935,550
Core Bond Trust (continued)Shares orPrincipalAmount Value
CORPORATE BONDS (continued)Industrials (continued)Northrop Grumman Corp. (continued)
5.150%, 05/01/2040 $ 343,000 $ 430,276Raytheon Technologies Corp.
3.650%, 08/16/2023 64,000 68,4663.950%, 08/16/2025 463,000 514,2244.450%, 11/16/2038 431,000 499,345
Southwest Airlines Company4.750%, 05/04/2023 690,000 744,9905.125%, 06/15/2027 1,032,000 1,186,459
The Boeing Company2.196%, 02/04/2026 1,222,000 1,218,2113.250%, 02/01/2028 694,000 717,8463.625%, 02/01/2031 698,000 730,2513.750%, 02/01/2050 202,000 193,4855.805%, 05/01/2050 217,000 273,192
Union Pacific Corp.2.150%, 02/05/2027 509,000 522,8012.400%, 02/05/2030 631,000 632,3282.950%, 03/01/2022 572,000 585,8012.973%, 09/16/2062 (C) 491,000 437,1633.150%, 03/01/2024 273,000 292,045
3.750%, 02/05/2070 102,000 104,309
23,396,862Information technology – 2.5%Apple, Inc.
1.200%, 02/08/2028 806,000 776,1141.650%, 02/08/2031 806,000 768,5172.375%, 02/08/2041 323,000 300,0852.550%, 08/20/2060 754,000 648,7842.650%, 05/11/2050 to 02/08/2051 1,600,000 1,458,4232.800%, 02/08/2061 323,000 290,0874.250%, 02/09/2047 232,000 276,225
Broadcom Corp.3.875%, 01/15/2027 244,000 264,961
Broadcom, Inc.2.450%, 02/15/2031 (C) 559,000 527,5883.150%, 11/15/2025 420,000 447,6503.419%, 04/15/2033 (B)(C) 2,195,000 2,193,8063.469%, 04/15/2034 (C) 662,000 660,9544.150%, 11/15/2030 573,000 618,473
Dell International LLC4.900%, 10/01/2026 (C) 164,000 186,0575.300%, 10/01/2029 (C) 329,000 384,8526.100%, 07/15/2027 (C) 327,000 393,1038.350%, 07/15/2046 (C) 347,000 527,923
Fidelity National InformationServices, Inc.
1.150%, 03/01/2026 643,000 632,235
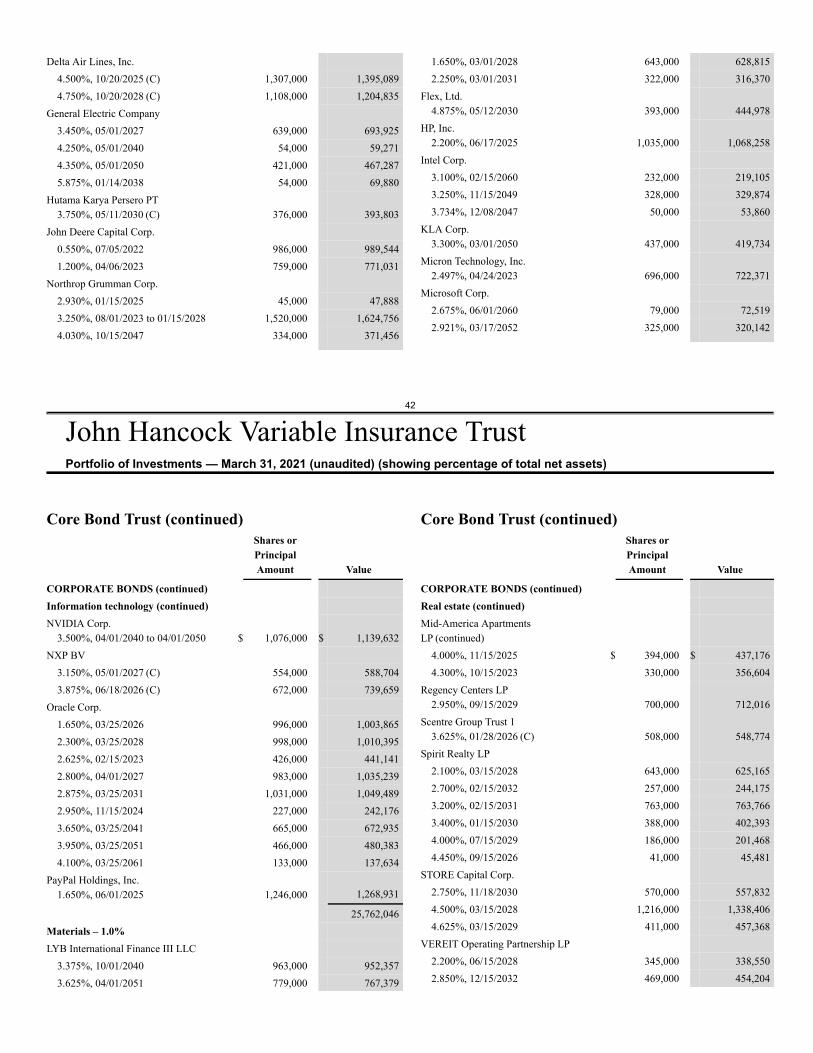
42
John Hancock Variable Insurance TrustPortfolio of Investments — March 31, 2021 (unaudited) (showing percentage of total net assets)
Delta Air Lines, Inc.4.500%, 10/20/2025 (C) 1,307,000 1,395,0894.750%, 10/20/2028 (C) 1,108,000 1,204,835
General Electric Company3.450%, 05/01/2027 639,000 693,9254.250%, 05/01/2040 54,000 59,2714.350%, 05/01/2050 421,000 467,2875.875%, 01/14/2038 54,000 69,880
Hutama Karya Persero PT3.750%, 05/11/2030 (C) 376,000 393,803
John Deere Capital Corp.0.550%, 07/05/2022 986,000 989,5441.200%, 04/06/2023 759,000 771,031
Northrop Grumman Corp.2.930%, 01/15/2025 45,000 47,8883.250%, 08/01/2023 to 01/15/2028 1,520,000 1,624,7564.030%, 10/15/2047 334,000 371,456
1.650%, 03/01/2028 643,000 628,8152.250%, 03/01/2031 322,000 316,370
Flex, Ltd.4.875%, 05/12/2030 393,000 444,978
HP, Inc.2.200%, 06/17/2025 1,035,000 1,068,258
Intel Corp.3.100%, 02/15/2060 232,000 219,1053.250%, 11/15/2049 328,000 329,8743.734%, 12/08/2047 50,000 53,860
KLA Corp.3.300%, 03/01/2050 437,000 419,734
Micron Technology, Inc.2.497%, 04/24/2023 696,000 722,371
Microsoft Corp.2.675%, 06/01/2060 79,000 72,5192.921%, 03/17/2052 325,000 320,142
Core Bond Trust (continued)Shares orPrincipalAmount Value
CORPORATE BONDS (continued)Information technology (continued)NVIDIA Corp.
3.500%, 04/01/2040 to 04/01/2050 $ 1,076,000 $ 1,139,632NXP BV
3.150%, 05/01/2027 (C) 554,000 588,7043.875%, 06/18/2026 (C) 672,000 739,659
Oracle Corp.1.650%, 03/25/2026 996,000 1,003,8652.300%, 03/25/2028 998,000 1,010,3952.625%, 02/15/2023 426,000 441,1412.800%, 04/01/2027 983,000 1,035,2392.875%, 03/25/2031 1,031,000 1,049,4892.950%, 11/15/2024 227,000 242,1763.650%, 03/25/2041 665,000 672,9353.950%, 03/25/2051 466,000 480,3834.100%, 03/25/2061 133,000 137,634
PayPal Holdings, Inc.1.650%, 06/01/2025 1,246,000 1,268,931
25,762,046Materials – 1.0%LYB International Finance III LLC
3.375%, 10/01/2040 963,000 952,3573.625%, 04/01/2051 779,000 767,379
Core Bond Trust (continued)Shares orPrincipalAmount Value
CORPORATE BONDS (continued)Real estate (continued)Mid-America ApartmentsLP (continued)
4.000%, 11/15/2025 $ 394,000 $ 437,1764.300%, 10/15/2023 330,000 356,604
Regency Centers LP2.950%, 09/15/2029 700,000 712,016
Scentre Group Trust 13.625%, 01/28/2026 (C) 508,000 548,774
Spirit Realty LP2.100%, 03/15/2028 643,000 625,1652.700%, 02/15/2032 257,000 244,1753.200%, 02/15/2031 763,000 763,7663.400%, 01/15/2030 388,000 402,3934.000%, 07/15/2029 186,000 201,4684.450%, 09/15/2026 41,000 45,481
STORE Capital Corp.2.750%, 11/18/2030 570,000 557,8324.500%, 03/15/2028 1,216,000 1,338,4064.625%, 03/15/2029 411,000 457,368
VEREIT Operating Partnership LP2.200%, 06/15/2028 345,000 338,5502.850%, 12/15/2032 469,000 454,204
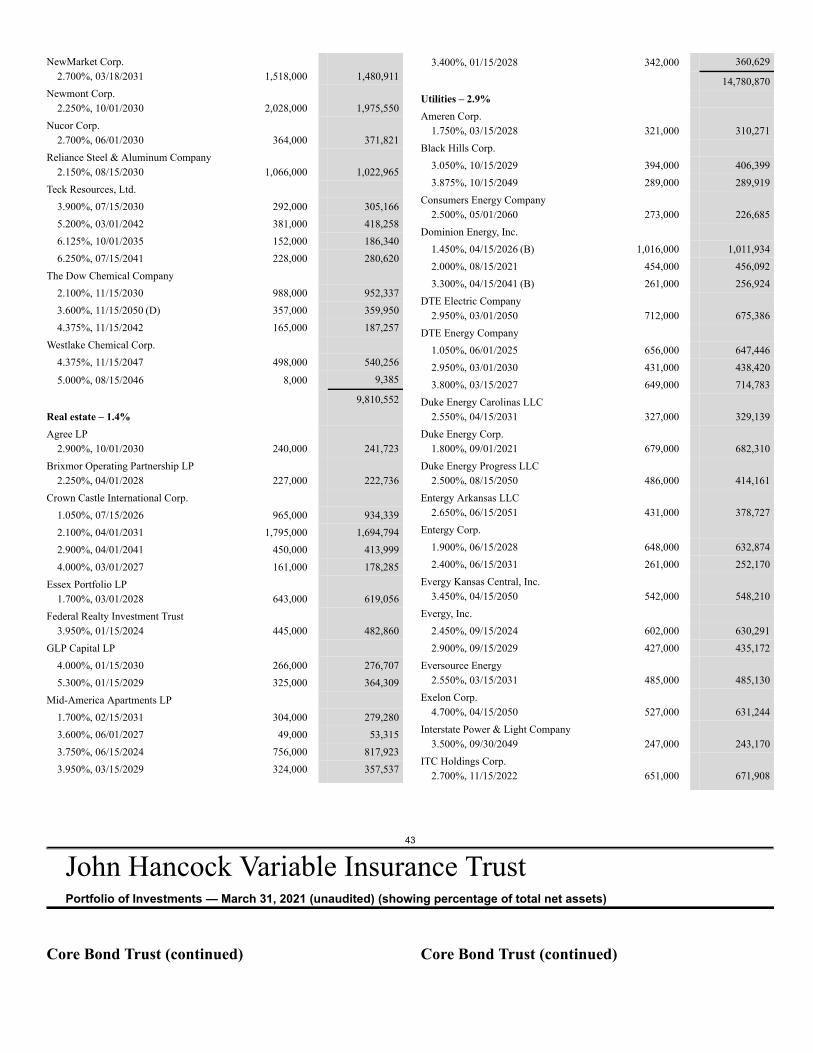
43
John Hancock Variable Insurance TrustPortfolio of Investments — March 31, 2021 (unaudited) (showing percentage of total net assets)
NewMarket Corp.2.700%, 03/18/2031 1,518,000 1,480,911
Newmont Corp.2.250%, 10/01/2030 2,028,000 1,975,550
Nucor Corp.2.700%, 06/01/2030 364,000 371,821
Reliance Steel & Aluminum Company2.150%, 08/15/2030 1,066,000 1,022,965
Teck Resources, Ltd.3.900%, 07/15/2030 292,000 305,1665.200%, 03/01/2042 381,000 418,2586.125%, 10/01/2035 152,000 186,3406.250%, 07/15/2041 228,000 280,620
The Dow Chemical Company2.100%, 11/15/2030 988,000 952,3373.600%, 11/15/2050 (D) 357,000 359,9504.375%, 11/15/2042 165,000 187,257
Westlake Chemical Corp.4.375%, 11/15/2047 498,000 540,256
5.000%, 08/15/2046 8,000 9,385
9,810,552Real estate – 1.4%Agree LP
2.900%, 10/01/2030 240,000 241,723Brixmor Operating Partnership LP
2.250%, 04/01/2028 227,000 222,736Crown Castle International Corp.
1.050%, 07/15/2026 965,000 934,3392.100%, 04/01/2031 1,795,000 1,694,7942.900%, 04/01/2041 450,000 413,9994.000%, 03/01/2027 161,000 178,285
Essex Portfolio LP1.700%, 03/01/2028 643,000 619,056
Federal Realty Investment Trust3.950%, 01/15/2024 445,000 482,860
GLP Capital LP4.000%, 01/15/2030 266,000 276,7075.300%, 01/15/2029 325,000 364,309
Mid-America Apartments LP1.700%, 02/15/2031 304,000 279,2803.600%, 06/01/2027 49,000 53,3153.750%, 06/15/2024 756,000 817,9233.950%, 03/15/2029 324,000 357,537
3.400%, 01/15/2028 342,000 360,629
14,780,870Utilities – 2.9%Ameren Corp.
1.750%, 03/15/2028 321,000 310,271Black Hills Corp.
3.050%, 10/15/2029 394,000 406,3993.875%, 10/15/2049 289,000 289,919
Consumers Energy Company2.500%, 05/01/2060 273,000 226,685
Dominion Energy, Inc.1.450%, 04/15/2026 (B) 1,016,000 1,011,9342.000%, 08/15/2021 454,000 456,0923.300%, 04/15/2041 (B) 261,000 256,924
DTE Electric Company2.950%, 03/01/2050 712,000 675,386
DTE Energy Company1.050%, 06/01/2025 656,000 647,4462.950%, 03/01/2030 431,000 438,4203.800%, 03/15/2027 649,000 714,783
Duke Energy Carolinas LLC2.550%, 04/15/2031 327,000 329,139
Duke Energy Corp.1.800%, 09/01/2021 679,000 682,310
Duke Energy Progress LLC2.500%, 08/15/2050 486,000 414,161
Entergy Arkansas LLC2.650%, 06/15/2051 431,000 378,727
Entergy Corp.1.900%, 06/15/2028 648,000 632,8742.400%, 06/15/2031 261,000 252,170
Evergy Kansas Central, Inc.3.450%, 04/15/2050 542,000 548,210
Evergy, Inc.2.450%, 09/15/2024 602,000 630,2912.900%, 09/15/2029 427,000 435,172
Eversource Energy2.550%, 03/15/2031 485,000 485,130
Exelon Corp.4.700%, 04/15/2050 527,000 631,244
Interstate Power & Light Company3.500%, 09/30/2049 247,000 243,170
ITC Holdings Corp.2.700%, 11/15/2022 651,000 671,908
Core Bond Trust (continued) Core Bond Trust (continued)
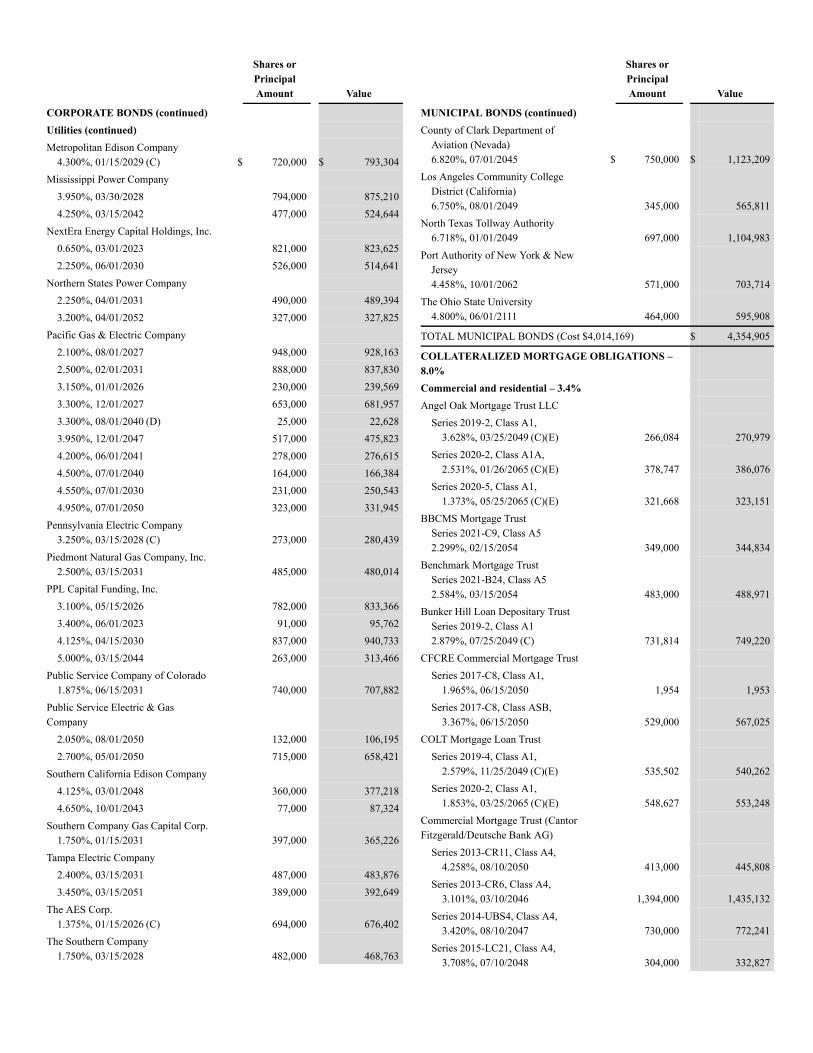
Shares orPrincipalAmount Value
CORPORATE BONDS (continued)Utilities (continued)Metropolitan Edison Company
4.300%, 01/15/2029 (C) $ 720,000 $ 793,304Mississippi Power Company
3.950%, 03/30/2028 794,000 875,2104.250%, 03/15/2042 477,000 524,644
NextEra Energy Capital Holdings, Inc.0.650%, 03/01/2023 821,000 823,6252.250%, 06/01/2030 526,000 514,641
Northern States Power Company2.250%, 04/01/2031 490,000 489,3943.200%, 04/01/2052 327,000 327,825
Pacific Gas & Electric Company2.100%, 08/01/2027 948,000 928,1632.500%, 02/01/2031 888,000 837,8303.150%, 01/01/2026 230,000 239,5693.300%, 12/01/2027 653,000 681,9573.300%, 08/01/2040 (D) 25,000 22,6283.950%, 12/01/2047 517,000 475,8234.200%, 06/01/2041 278,000 276,6154.500%, 07/01/2040 164,000 166,3844.550%, 07/01/2030 231,000 250,5434.950%, 07/01/2050 323,000 331,945
Pennsylvania Electric Company3.250%, 03/15/2028 (C) 273,000 280,439
Piedmont Natural Gas Company, Inc.2.500%, 03/15/2031 485,000 480,014
PPL Capital Funding, Inc.3.100%, 05/15/2026 782,000 833,3663.400%, 06/01/2023 91,000 95,7624.125%, 04/15/2030 837,000 940,7335.000%, 03/15/2044 263,000 313,466
Public Service Company of Colorado1.875%, 06/15/2031 740,000 707,882
Public Service Electric & GasCompany
2.050%, 08/01/2050 132,000 106,1952.700%, 05/01/2050 715,000 658,421
Southern California Edison Company4.125%, 03/01/2048 360,000 377,2184.650%, 10/01/2043 77,000 87,324
Southern Company Gas Capital Corp.1.750%, 01/15/2031 397,000 365,226
Tampa Electric Company2.400%, 03/15/2031 487,000 483,8763.450%, 03/15/2051 389,000 392,649
The AES Corp.1.375%, 01/15/2026 (C) 694,000 676,402
The Southern Company1.750%, 03/15/2028 482,000 468,763
Shares orPrincipalAmount Value
MUNICIPAL BONDS (continued)County of Clark Department of
Aviation (Nevada)6.820%, 07/01/2045 $ 750,000 $ 1,123,209
Los Angeles Community CollegeDistrict (California)6.750%, 08/01/2049 345,000 565,811
North Texas Tollway Authority6.718%, 01/01/2049 697,000 1,104,983
Port Authority of New York & NewJersey4.458%, 10/01/2062 571,000 703,714
The Ohio State University4.800%, 06/01/2111 464,000 595,908
TOTAL MUNICIPAL BONDS (Cost $4,014,169) $ 4,354,905
COLLATERALIZED MORTGAGE OBLIGATIONS –8.0%Commercial and residential – 3.4%Angel Oak Mortgage Trust LLC
Series 2019-2, Class A1,3.628%, 03/25/2049 (C)(E) 266,084 270,979
Series 2020-2, Class A1A,2.531%, 01/26/2065 (C)(E) 378,747 386,076
Series 2020-5, Class A1,1.373%, 05/25/2065 (C)(E) 321,668 323,151
BBCMS Mortgage TrustSeries 2021-C9, Class A52.299%, 02/15/2054 349,000 344,834
Benchmark Mortgage TrustSeries 2021-B24, Class A52.584%, 03/15/2054 483,000 488,971
Bunker Hill Loan Depositary TrustSeries 2019-2, Class A12.879%, 07/25/2049 (C) 731,814 749,220
CFCRE Commercial Mortgage TrustSeries 2017-C8, Class A1,
1.965%, 06/15/2050 1,954 1,953Series 2017-C8, Class ASB,
3.367%, 06/15/2050 529,000 567,025COLT Mortgage Loan Trust
Series 2019-4, Class A1,2.579%, 11/25/2049 (C)(E) 535,502 540,262
Series 2020-2, Class A1,1.853%, 03/25/2065 (C)(E) 548,627 553,248
Commercial Mortgage Trust (CantorFitzgerald/Deutsche Bank AG)
Series 2013-CR11, Class A4,4.258%, 08/10/2050 413,000 445,808
Series 2013-CR6, Class A4,3.101%, 03/10/2046 1,394,000 1,435,132
Series 2014-UBS4, Class A4,3.420%, 08/10/2047 730,000 772,241
Series 2015-LC21, Class A4,3.708%, 07/10/2048 304,000 332,827
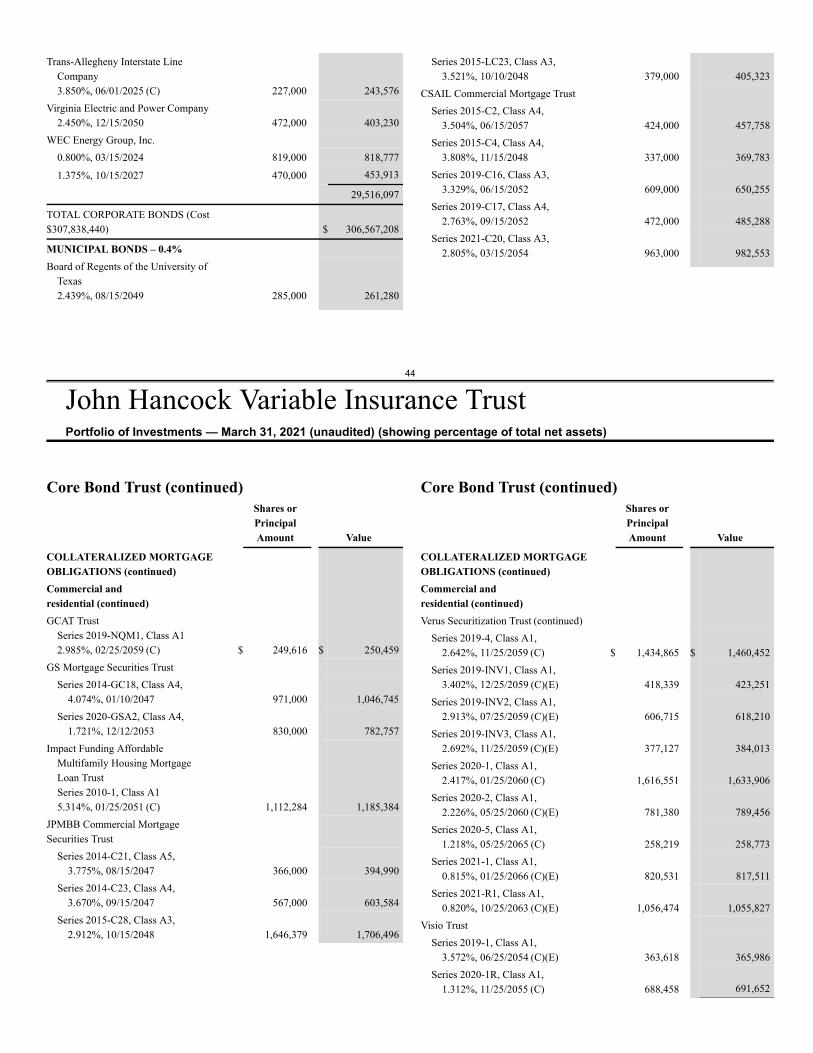
44
John Hancock Variable Insurance TrustPortfolio of Investments — March 31, 2021 (unaudited) (showing percentage of total net assets)
Trans-Allegheny Interstate LineCompany3.850%, 06/01/2025 (C) 227,000 243,576
Virginia Electric and Power Company2.450%, 12/15/2050 472,000 403,230
WEC Energy Group, Inc.0.800%, 03/15/2024 819,000 818,777
1.375%, 10/15/2027 470,000 453,913
29,516,097
TOTAL CORPORATE BONDS (Cost$307,838,440) $ 306,567,208
MUNICIPAL BONDS – 0.4%Board of Regents of the University of
Texas2.439%, 08/15/2049 285,000 261,280
Series 2015-LC23, Class A3,3.521%, 10/10/2048 379,000 405,323
CSAIL Commercial Mortgage TrustSeries 2015-C2, Class A4,
3.504%, 06/15/2057 424,000 457,758Series 2015-C4, Class A4,
3.808%, 11/15/2048 337,000 369,783Series 2019-C16, Class A3,
3.329%, 06/15/2052 609,000 650,255Series 2019-C17, Class A4,
2.763%, 09/15/2052 472,000 485,288Series 2021-C20, Class A3,
2.805%, 03/15/2054 963,000 982,553
Core Bond Trust (continued)Shares orPrincipalAmount Value
COLLATERALIZED MORTGAGEOBLIGATIONS (continued)Commercial andresidential (continued)GCAT Trust
Series 2019-NQM1, Class A12.985%, 02/25/2059 (C) $ 249,616 $ 250,459
GS Mortgage Securities TrustSeries 2014-GC18, Class A4,
4.074%, 01/10/2047 971,000 1,046,745Series 2020-GSA2, Class A4,
1.721%, 12/12/2053 830,000 782,757Impact Funding Affordable
Multifamily Housing MortgageLoan TrustSeries 2010-1, Class A15.314%, 01/25/2051 (C) 1,112,284 1,185,384
JPMBB Commercial MortgageSecurities Trust
Series 2014-C21, Class A5,3.775%, 08/15/2047 366,000 394,990
Series 2014-C23, Class A4,3.670%, 09/15/2047 567,000 603,584
Series 2015-C28, Class A3,2.912%, 10/15/2048 1,646,379 1,706,496
Core Bond Trust (continued)Shares orPrincipalAmount Value
COLLATERALIZED MORTGAGEOBLIGATIONS (continued)Commercial andresidential (continued)Verus Securitization Trust (continued)
Series 2019-4, Class A1,2.642%, 11/25/2059 (C) $ 1,434,865 $ 1,460,452
Series 2019-INV1, Class A1,3.402%, 12/25/2059 (C)(E) 418,339 423,251
Series 2019-INV2, Class A1,2.913%, 07/25/2059 (C)(E) 606,715 618,210
Series 2019-INV3, Class A1,2.692%, 11/25/2059 (C)(E) 377,127 384,013
Series 2020-1, Class A1,2.417%, 01/25/2060 (C) 1,616,551 1,633,906
Series 2020-2, Class A1,2.226%, 05/25/2060 (C)(E) 781,380 789,456
Series 2020-5, Class A1,1.218%, 05/25/2065 (C) 258,219 258,773
Series 2021-1, Class A1,0.815%, 01/25/2066 (C)(E) 820,531 817,511
Series 2021-R1, Class A1,0.820%, 10/25/2063 (C)(E) 1,056,474 1,055,827
Visio TrustSeries 2019-1, Class A1,
3.572%, 06/25/2054 (C)(E) 363,618 365,986Series 2020-1R, Class A1,
1.312%, 11/25/2055 (C) 688,458 691,652
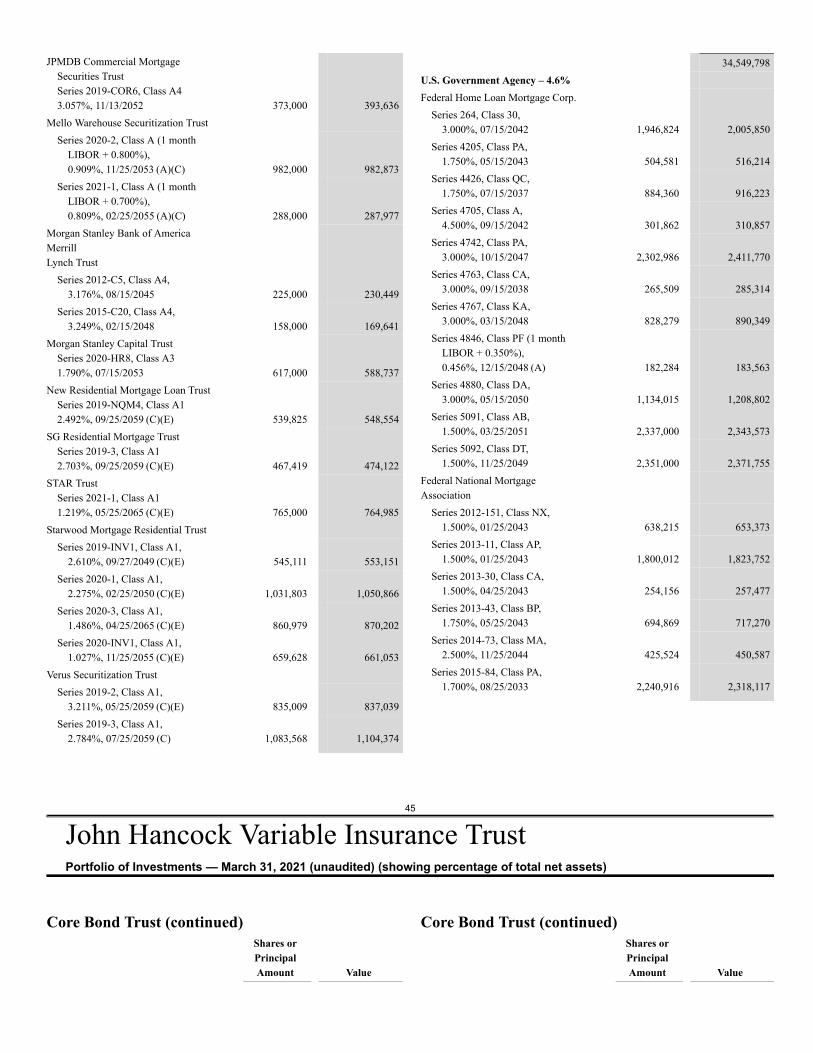
45
John Hancock Variable Insurance TrustPortfolio of Investments — March 31, 2021 (unaudited) (showing percentage of total net assets)
JPMDB Commercial MortgageSecurities TrustSeries 2019-COR6, Class A43.057%, 11/13/2052 373,000 393,636
Mello Warehouse Securitization TrustSeries 2020-2, Class A (1 month
LIBOR + 0.800%),0.909%, 11/25/2053 (A)(C) 982,000 982,873
Series 2021-1, Class A (1 monthLIBOR + 0.700%),0.809%, 02/25/2055 (A)(C) 288,000 287,977
Morgan Stanley Bank of AmericaMerrillLynch Trust
Series 2012-C5, Class A4,3.176%, 08/15/2045 225,000 230,449
Series 2015-C20, Class A4,3.249%, 02/15/2048 158,000 169,641
Morgan Stanley Capital TrustSeries 2020-HR8, Class A31.790%, 07/15/2053 617,000 588,737
New Residential Mortgage Loan TrustSeries 2019-NQM4, Class A12.492%, 09/25/2059 (C)(E) 539,825 548,554
SG Residential Mortgage TrustSeries 2019-3, Class A12.703%, 09/25/2059 (C)(E) 467,419 474,122
STAR TrustSeries 2021-1, Class A11.219%, 05/25/2065 (C)(E) 765,000 764,985
Starwood Mortgage Residential TrustSeries 2019-INV1, Class A1,
2.610%, 09/27/2049 (C)(E) 545,111 553,151Series 2020-1, Class A1,
2.275%, 02/25/2050 (C)(E) 1,031,803 1,050,866Series 2020-3, Class A1,
1.486%, 04/25/2065 (C)(E) 860,979 870,202Series 2020-INV1, Class A1,
1.027%, 11/25/2055 (C)(E) 659,628 661,053Verus Securitization Trust
Series 2019-2, Class A1,3.211%, 05/25/2059 (C)(E) 835,009 837,039
Series 2019-3, Class A1,2.784%, 07/25/2059 (C) 1,083,568 1,104,374
34,549,798U.S. Government Agency – 4.6%Federal Home Loan Mortgage Corp.
Series 264, Class 30,3.000%, 07/15/2042 1,946,824 2,005,850
Series 4205, Class PA,1.750%, 05/15/2043 504,581 516,214
Series 4426, Class QC,1.750%, 07/15/2037 884,360 916,223
Series 4705, Class A,4.500%, 09/15/2042 301,862 310,857
Series 4742, Class PA,3.000%, 10/15/2047 2,302,986 2,411,770
Series 4763, Class CA,3.000%, 09/15/2038 265,509 285,314
Series 4767, Class KA,3.000%, 03/15/2048 828,279 890,349
Series 4846, Class PF (1 monthLIBOR + 0.350%),0.456%, 12/15/2048 (A) 182,284 183,563
Series 4880, Class DA,3.000%, 05/15/2050 1,134,015 1,208,802
Series 5091, Class AB,1.500%, 03/25/2051 2,337,000 2,343,573
Series 5092, Class DT,1.500%, 11/25/2049 2,351,000 2,371,755
Federal National MortgageAssociation
Series 2012-151, Class NX,1.500%, 01/25/2043 638,215 653,373
Series 2013-11, Class AP,1.500%, 01/25/2043 1,800,012 1,823,752
Series 2013-30, Class CA,1.500%, 04/25/2043 254,156 257,477
Series 2013-43, Class BP,1.750%, 05/25/2043 694,869 717,270
Series 2014-73, Class MA,2.500%, 11/25/2044 425,524 450,587
Series 2015-84, Class PA,1.700%, 08/25/2033 2,240,916 2,318,117
Core Bond Trust (continued)Shares orPrincipalAmount Value
Core Bond Trust (continued)Shares orPrincipalAmount Value
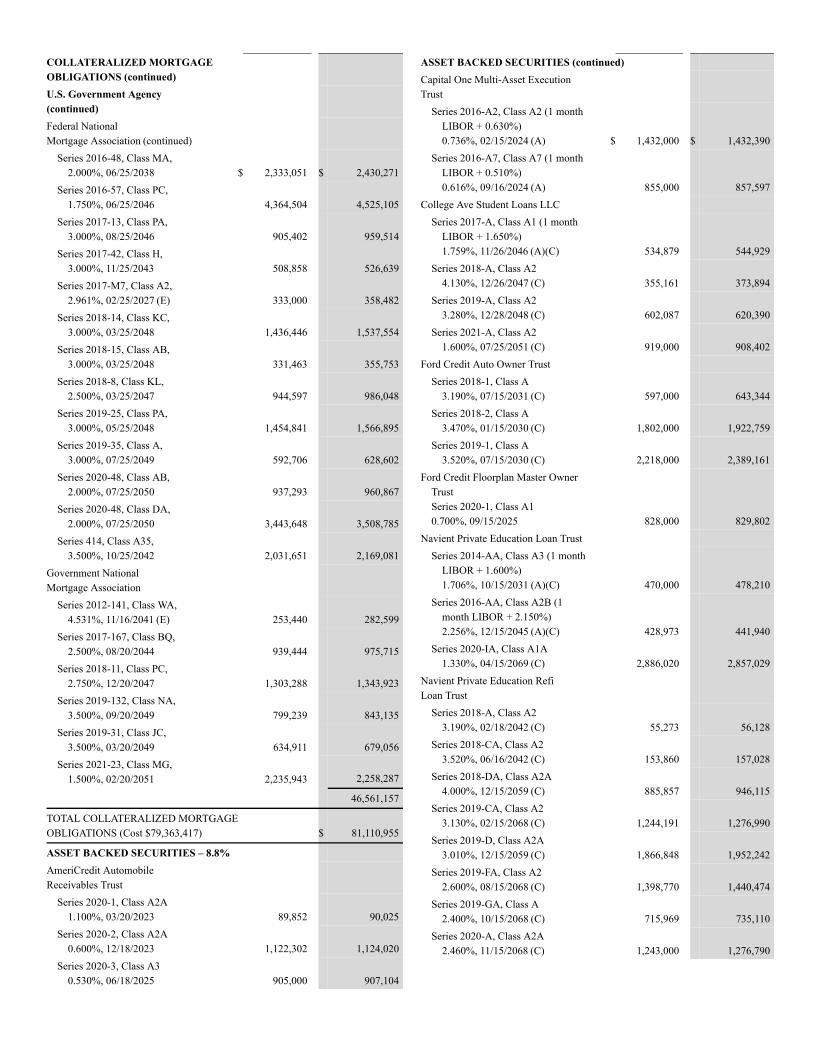
COLLATERALIZED MORTGAGEOBLIGATIONS (continued)U.S. Government Agency(continued)Federal NationalMortgage Association (continued)
Series 2016-48, Class MA,2.000%, 06/25/2038 $ 2,333,051 $ 2,430,271
Series 2016-57, Class PC,1.750%, 06/25/2046 4,364,504 4,525,105
Series 2017-13, Class PA,3.000%, 08/25/2046 905,402 959,514
Series 2017-42, Class H,3.000%, 11/25/2043 508,858 526,639
Series 2017-M7, Class A2,2.961%, 02/25/2027 (E) 333,000 358,482
Series 2018-14, Class KC,3.000%, 03/25/2048 1,436,446 1,537,554
Series 2018-15, Class AB,3.000%, 03/25/2048 331,463 355,753
Series 2018-8, Class KL,2.500%, 03/25/2047 944,597 986,048
Series 2019-25, Class PA,3.000%, 05/25/2048 1,454,841 1,566,895
Series 2019-35, Class A,3.000%, 07/25/2049 592,706 628,602
Series 2020-48, Class AB,2.000%, 07/25/2050 937,293 960,867
Series 2020-48, Class DA,2.000%, 07/25/2050 3,443,648 3,508,785
Series 414, Class A35,3.500%, 10/25/2042 2,031,651 2,169,081
Government NationalMortgage Association
Series 2012-141, Class WA,4.531%, 11/16/2041 (E) 253,440 282,599
Series 2017-167, Class BQ,2.500%, 08/20/2044 939,444 975,715
Series 2018-11, Class PC,2.750%, 12/20/2047 1,303,288 1,343,923
Series 2019-132, Class NA,3.500%, 09/20/2049 799,239 843,135
Series 2019-31, Class JC,3.500%, 03/20/2049 634,911 679,056
Series 2021-23, Class MG,1.500%, 02/20/2051 2,235,943 2,258,287
46,561,157
TOTAL COLLATERALIZED MORTGAGEOBLIGATIONS (Cost $79,363,417) $ 81,110,955
ASSET BACKED SECURITIES – 8.8%AmeriCredit AutomobileReceivables Trust
Series 2020-1, Class A2A1.100%, 03/20/2023 89,852 90,025
Series 2020-2, Class A2A0.600%, 12/18/2023 1,122,302 1,124,020
Series 2020-3, Class A30.530%, 06/18/2025 905,000 907,104
ASSET BACKED SECURITIES (continued)Capital One Multi-Asset ExecutionTrust
Series 2016-A2, Class A2 (1 monthLIBOR + 0.630%)0.736%, 02/15/2024 (A) $ 1,432,000 $ 1,432,390
Series 2016-A7, Class A7 (1 monthLIBOR + 0.510%)0.616%, 09/16/2024 (A) 855,000 857,597
College Ave Student Loans LLCSeries 2017-A, Class A1 (1 month
LIBOR + 1.650%)1.759%, 11/26/2046 (A)(C) 534,879 544,929
Series 2018-A, Class A24.130%, 12/26/2047 (C) 355,161 373,894
Series 2019-A, Class A23.280%, 12/28/2048 (C) 602,087 620,390
Series 2021-A, Class A21.600%, 07/25/2051 (C) 919,000 908,402
Ford Credit Auto Owner TrustSeries 2018-1, Class A
3.190%, 07/15/2031 (C) 597,000 643,344Series 2018-2, Class A
3.470%, 01/15/2030 (C) 1,802,000 1,922,759Series 2019-1, Class A
3.520%, 07/15/2030 (C) 2,218,000 2,389,161Ford Credit Floorplan Master Owner
TrustSeries 2020-1, Class A10.700%, 09/15/2025 828,000 829,802
Navient Private Education Loan TrustSeries 2014-AA, Class A3 (1 month
LIBOR + 1.600%)1.706%, 10/15/2031 (A)(C) 470,000 478,210
Series 2016-AA, Class A2B (1month LIBOR + 2.150%)2.256%, 12/15/2045 (A)(C) 428,973 441,940
Series 2020-IA, Class A1A1.330%, 04/15/2069 (C) 2,886,020 2,857,029
Navient Private Education RefiLoan Trust
Series 2018-A, Class A23.190%, 02/18/2042 (C) 55,273 56,128
Series 2018-CA, Class A23.520%, 06/16/2042 (C) 153,860 157,028
Series 2018-DA, Class A2A4.000%, 12/15/2059 (C) 885,857 946,115
Series 2019-CA, Class A23.130%, 02/15/2068 (C) 1,244,191 1,276,990
Series 2019-D, Class A2A3.010%, 12/15/2059 (C) 1,866,848 1,952,242
Series 2019-FA, Class A22.600%, 08/15/2068 (C) 1,398,770 1,440,474
Series 2019-GA, Class A2.400%, 10/15/2068 (C) 715,969 735,110
Series 2020-A, Class A2A2.460%, 11/15/2068 (C) 1,243,000 1,276,790
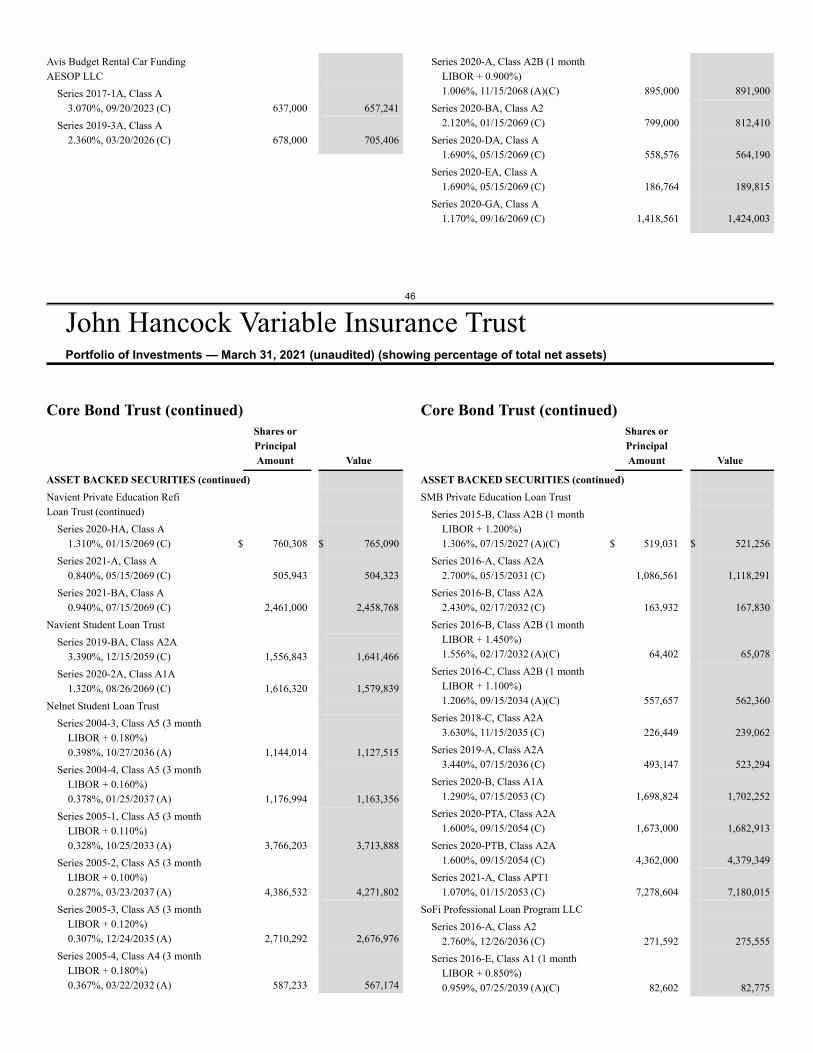
46
John Hancock Variable Insurance TrustPortfolio of Investments — March 31, 2021 (unaudited) (showing percentage of total net assets)
Avis Budget Rental Car FundingAESOP LLC
Series 2017-1A, Class A3.070%, 09/20/2023 (C) 637,000 657,241
Series 2019-3A, Class A2.360%, 03/20/2026 (C) 678,000 705,406
Series 2020-A, Class A2B (1 monthLIBOR + 0.900%)1.006%, 11/15/2068 (A)(C) 895,000 891,900
Series 2020-BA, Class A22.120%, 01/15/2069 (C) 799,000 812,410
Series 2020-DA, Class A1.690%, 05/15/2069 (C) 558,576 564,190
Series 2020-EA, Class A1.690%, 05/15/2069 (C) 186,764 189,815
Series 2020-GA, Class A1.170%, 09/16/2069 (C) 1,418,561 1,424,003
Core Bond Trust (continued)Shares orPrincipalAmount Value
ASSET BACKED SECURITIES (continued)Navient Private Education RefiLoan Trust (continued)
Series 2020-HA, Class A1.310%, 01/15/2069 (C) $ 760,308 $ 765,090
Series 2021-A, Class A0.840%, 05/15/2069 (C) 505,943 504,323
Series 2021-BA, Class A0.940%, 07/15/2069 (C) 2,461,000 2,458,768
Navient Student Loan TrustSeries 2019-BA, Class A2A
3.390%, 12/15/2059 (C) 1,556,843 1,641,466Series 2020-2A, Class A1A
1.320%, 08/26/2069 (C) 1,616,320 1,579,839Nelnet Student Loan Trust
Series 2004-3, Class A5 (3 monthLIBOR + 0.180%)0.398%, 10/27/2036 (A) 1,144,014 1,127,515
Series 2004-4, Class A5 (3 monthLIBOR + 0.160%)0.378%, 01/25/2037 (A) 1,176,994 1,163,356
Series 2005-1, Class A5 (3 monthLIBOR + 0.110%)0.328%, 10/25/2033 (A) 3,766,203 3,713,888
Series 2005-2, Class A5 (3 monthLIBOR + 0.100%)0.287%, 03/23/2037 (A) 4,386,532 4,271,802
Series 2005-3, Class A5 (3 monthLIBOR + 0.120%)0.307%, 12/24/2035 (A) 2,710,292 2,676,976
Series 2005-4, Class A4 (3 monthLIBOR + 0.180%)0.367%, 03/22/2032 (A) 587,233 567,174
Core Bond Trust (continued)Shares orPrincipalAmount Value
ASSET BACKED SECURITIES (continued)SMB Private Education Loan Trust
Series 2015-B, Class A2B (1 monthLIBOR + 1.200%)1.306%, 07/15/2027 (A)(C) $ 519,031 $ 521,256
Series 2016-A, Class A2A2.700%, 05/15/2031 (C) 1,086,561 1,118,291
Series 2016-B, Class A2A2.430%, 02/17/2032 (C) 163,932 167,830
Series 2016-B, Class A2B (1 monthLIBOR + 1.450%)1.556%, 02/17/2032 (A)(C) 64,402 65,078
Series 2016-C, Class A2B (1 monthLIBOR + 1.100%)1.206%, 09/15/2034 (A)(C) 557,657 562,360
Series 2018-C, Class A2A3.630%, 11/15/2035 (C) 226,449 239,062
Series 2019-A, Class A2A3.440%, 07/15/2036 (C) 493,147 523,294
Series 2020-B, Class A1A1.290%, 07/15/2053 (C) 1,698,824 1,702,252
Series 2020-PTA, Class A2A1.600%, 09/15/2054 (C) 1,673,000 1,682,913
Series 2020-PTB, Class A2A1.600%, 09/15/2054 (C) 4,362,000 4,379,349
Series 2021-A, Class APT11.070%, 01/15/2053 (C) 7,278,604 7,180,015
SoFi Professional Loan Program LLCSeries 2016-A, Class A2
2.760%, 12/26/2036 (C) 271,592 275,555Series 2016-E, Class A1 (1 month
LIBOR + 0.850%)0.959%, 07/25/2039 (A)(C) 82,602 82,775
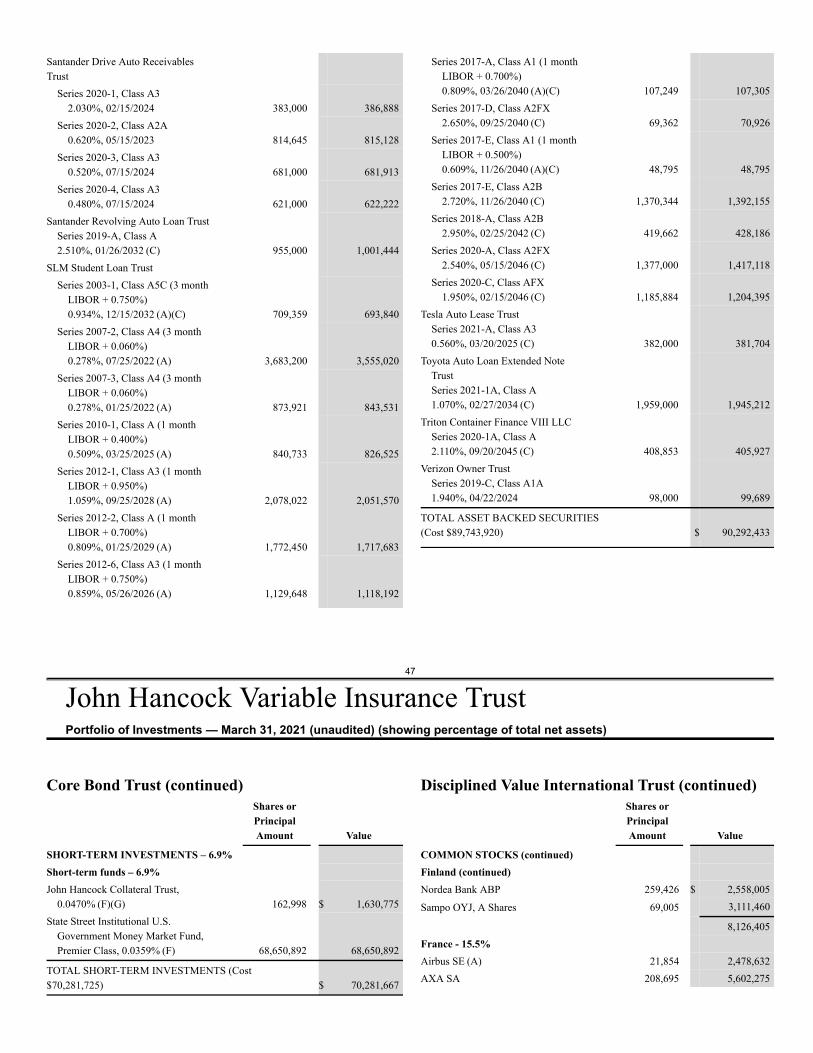
47
John Hancock Variable Insurance TrustPortfolio of Investments — March 31, 2021 (unaudited) (showing percentage of total net assets)
Santander Drive Auto ReceivablesTrust
Series 2020-1, Class A32.030%, 02/15/2024 383,000 386,888
Series 2020-2, Class A2A0.620%, 05/15/2023 814,645 815,128
Series 2020-3, Class A30.520%, 07/15/2024 681,000 681,913
Series 2020-4, Class A30.480%, 07/15/2024 621,000 622,222
Santander Revolving Auto Loan TrustSeries 2019-A, Class A2.510%, 01/26/2032 (C) 955,000 1,001,444
SLM Student Loan TrustSeries 2003-1, Class A5C (3 month
LIBOR + 0.750%)0.934%, 12/15/2032 (A)(C) 709,359 693,840
Series 2007-2, Class A4 (3 monthLIBOR + 0.060%)0.278%, 07/25/2022 (A) 3,683,200 3,555,020
Series 2007-3, Class A4 (3 monthLIBOR + 0.060%)0.278%, 01/25/2022 (A) 873,921 843,531
Series 2010-1, Class A (1 monthLIBOR + 0.400%)0.509%, 03/25/2025 (A) 840,733 826,525
Series 2012-1, Class A3 (1 monthLIBOR + 0.950%)1.059%, 09/25/2028 (A) 2,078,022 2,051,570
Series 2012-2, Class A (1 monthLIBOR + 0.700%)0.809%, 01/25/2029 (A) 1,772,450 1,717,683
Series 2012-6, Class A3 (1 monthLIBOR + 0.750%)0.859%, 05/26/2026 (A) 1,129,648 1,118,192
Series 2017-A, Class A1 (1 monthLIBOR + 0.700%)0.809%, 03/26/2040 (A)(C) 107,249 107,305
Series 2017-D, Class A2FX2.650%, 09/25/2040 (C) 69,362 70,926
Series 2017-E, Class A1 (1 monthLIBOR + 0.500%)0.609%, 11/26/2040 (A)(C) 48,795 48,795
Series 2017-E, Class A2B2.720%, 11/26/2040 (C) 1,370,344 1,392,155
Series 2018-A, Class A2B2.950%, 02/25/2042 (C) 419,662 428,186
Series 2020-A, Class A2FX2.540%, 05/15/2046 (C) 1,377,000 1,417,118
Series 2020-C, Class AFX1.950%, 02/15/2046 (C) 1,185,884 1,204,395
Tesla Auto Lease TrustSeries 2021-A, Class A30.560%, 03/20/2025 (C) 382,000 381,704
Toyota Auto Loan Extended NoteTrustSeries 2021-1A, Class A1.070%, 02/27/2034 (C) 1,959,000 1,945,212
Triton Container Finance VIII LLCSeries 2020-1A, Class A2.110%, 09/20/2045 (C) 408,853 405,927
Verizon Owner TrustSeries 2019-C, Class A1A1.940%, 04/22/2024 98,000 99,689
TOTAL ASSET BACKED SECURITIES(Cost $89,743,920) $ 90,292,433
Core Bond Trust (continued)Shares orPrincipalAmount Value
SHORT-TERM INVESTMENTS – 6.9%Short-term funds – 6.9%John Hancock Collateral Trust,
0.0470% (F)(G) 162,998 $ 1,630,775State Street Institutional U.S.
Government Money Market Fund,Premier Class, 0.0359% (F) 68,650,892 68,650,892
TOTAL SHORT-TERM INVESTMENTS (Cost$70,281,725) $ 70,281,667
Disciplined Value International Trust (continued)Shares orPrincipalAmount Value
COMMON STOCKS (continued)Finland (continued)Nordea Bank ABP 259,426 $ 2,558,005
Sampo OYJ, A Shares 69,005 3,111,460
8,126,405France - 15.5%Airbus SE (A) 21,854 2,478,632AXA SA 208,695 5,602,275
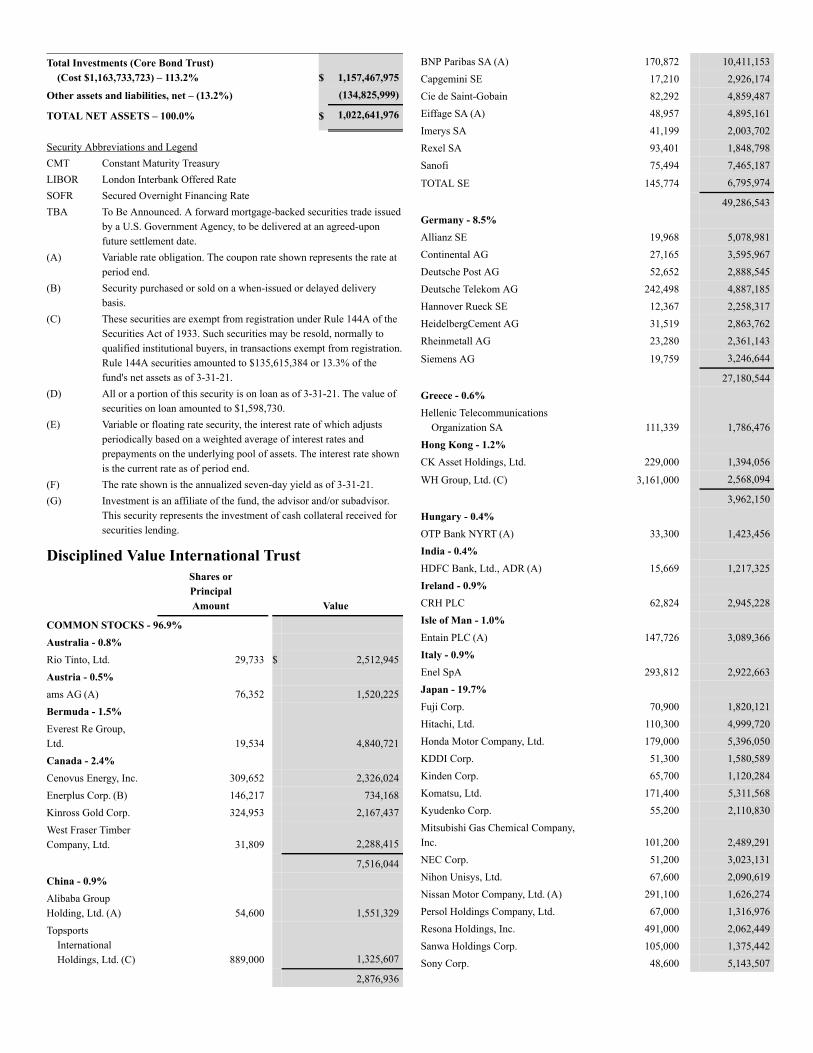
Total Investments (Core Bond Trust)(Cost $1,163,733,723) – 113.2% $ 1,157,467,975
Other assets and liabilities, net – (13.2%) (134,825,999)
TOTAL NET ASSETS – 100.0% $ 1,022,641,976
Security Abbreviations and LegendCMT Constant Maturity TreasuryLIBOR London Interbank Offered RateSOFR Secured Overnight Financing RateTBA To Be Announced. A forward mortgage-backed securities trade issued
by a U.S. Government Agency, to be delivered at an agreed-uponfuture settlement date.
(A) Variable rate obligation. The coupon rate shown represents the rate atperiod end.
(B) Security purchased or sold on a when-issued or delayed deliverybasis.
(C) These securities are exempt from registration under Rule 144A of theSecurities Act of 1933. Such securities may be resold, normally toqualified institutional buyers, in transactions exempt from registration.Rule 144A securities amounted to $135,615,384 or 13.3% of thefund's net assets as of 3-31-21.
(D) All or a portion of this security is on loan as of 3-31-21. The value ofsecurities on loan amounted to $1,598,730.
(E) Variable or floating rate security, the interest rate of which adjustsperiodically based on a weighted average of interest rates andprepayments on the underlying pool of assets. The interest rate shownis the current rate as of period end.
(F) The rate shown is the annualized seven-day yield as of 3-31-21.(G) Investment is an affiliate of the fund, the advisor and/or subadvisor.
This security represents the investment of cash collateral received forsecurities lending.
Disciplined Value International TrustShares orPrincipalAmount Value
COMMON STOCKS - 96.9%Australia - 0.8%Rio Tinto, Ltd. 29,733 $ 2,512,945Austria - 0.5%ams AG (A) 76,352 1,520,225Bermuda - 1.5%Everest Re Group,Ltd. 19,534 4,840,721Canada - 2.4%Cenovus Energy, Inc. 309,652 2,326,024Enerplus Corp. (B) 146,217 734,168Kinross Gold Corp. 324,953 2,167,437West Fraser TimberCompany, Ltd. 31,809 2,288,415
7,516,044China - 0.9%Alibaba GroupHolding, Ltd. (A) 54,600 1,551,329Topsports
InternationalHoldings, Ltd. (C) 889,000 1,325,607
2,876,936
BNP Paribas SA (A) 170,872 10,411,153Capgemini SE 17,210 2,926,174Cie de Saint-Gobain 82,292 4,859,487Eiffage SA (A) 48,957 4,895,161Imerys SA 41,199 2,003,702Rexel SA 93,401 1,848,798Sanofi 75,494 7,465,187
TOTAL SE 145,774 6,795,974
49,286,543Germany - 8.5%Allianz SE 19,968 5,078,981Continental AG 27,165 3,595,967Deutsche Post AG 52,652 2,888,545Deutsche Telekom AG 242,498 4,887,185Hannover Rueck SE 12,367 2,258,317HeidelbergCement AG 31,519 2,863,762Rheinmetall AG 23,280 2,361,143
Siemens AG 19,759 3,246,644
27,180,544Greece - 0.6%Hellenic Telecommunications
Organization SA 111,339 1,786,476Hong Kong - 1.2%CK Asset Holdings, Ltd. 229,000 1,394,056
WH Group, Ltd. (C) 3,161,000 2,568,094
3,962,150Hungary - 0.4%OTP Bank NYRT (A) 33,300 1,423,456India - 0.4%HDFC Bank, Ltd., ADR (A) 15,669 1,217,325Ireland - 0.9%CRH PLC 62,824 2,945,228Isle of Man - 1.0%Entain PLC (A) 147,726 3,089,366Italy - 0.9%Enel SpA 293,812 2,922,663Japan - 19.7%Fuji Corp. 70,900 1,820,121Hitachi, Ltd. 110,300 4,999,720Honda Motor Company, Ltd. 179,000 5,396,050KDDI Corp. 51,300 1,580,589Kinden Corp. 65,700 1,120,284Komatsu, Ltd. 171,400 5,311,568Kyudenko Corp. 55,200 2,110,830Mitsubishi Gas Chemical Company,Inc. 101,200 2,489,291NEC Corp. 51,200 3,023,131Nihon Unisys, Ltd. 67,600 2,090,619Nissan Motor Company, Ltd. (A) 291,100 1,626,274Persol Holdings Company, Ltd. 67,000 1,316,976Resona Holdings, Inc. 491,000 2,062,449Sanwa Holdings Corp. 105,000 1,375,442Sony Corp. 48,600 5,143,507
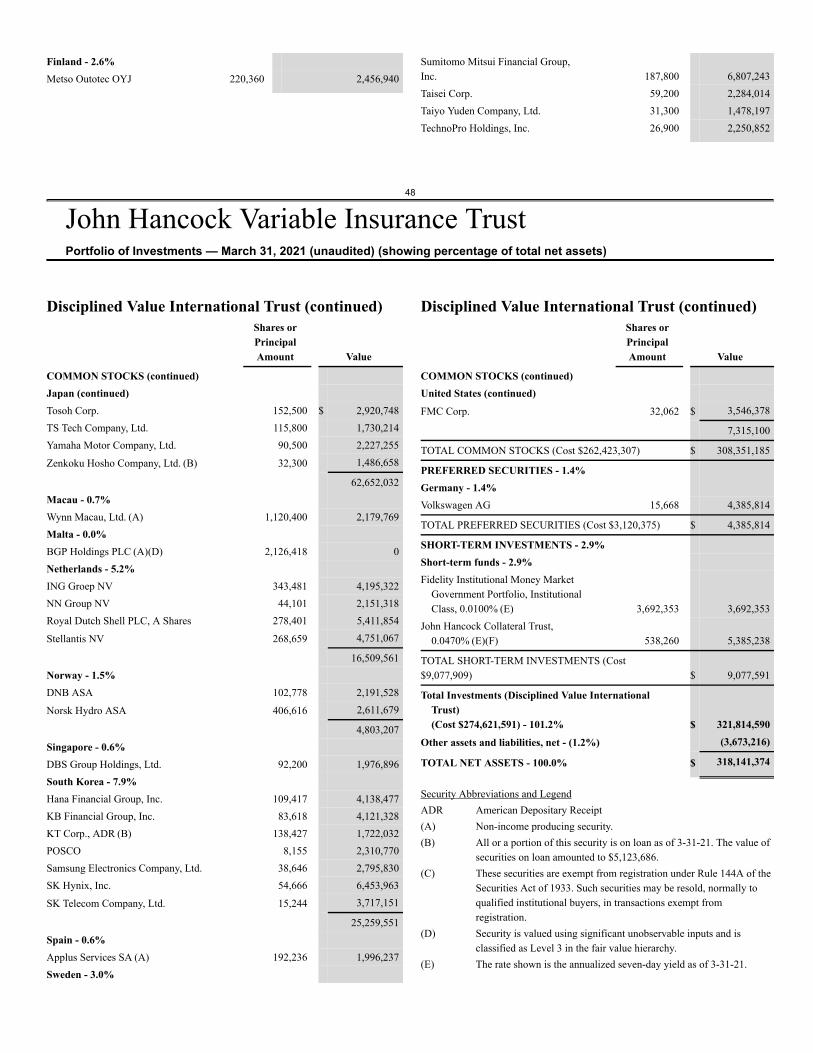
48
John Hancock Variable Insurance TrustPortfolio of Investments — March 31, 2021 (unaudited) (showing percentage of total net assets)
Finland - 2.6%Metso Outotec OYJ 220,360 2,456,940
Sumitomo Mitsui Financial Group,Inc. 187,800 6,807,243Taisei Corp. 59,200 2,284,014Taiyo Yuden Company, Ltd. 31,300 1,478,197TechnoPro Holdings, Inc. 26,900 2,250,852
Disciplined Value International Trust (continued)Shares orPrincipalAmount Value
COMMON STOCKS (continued)Japan (continued)Tosoh Corp. 152,500 $ 2,920,748TS Tech Company, Ltd. 115,800 1,730,214Yamaha Motor Company, Ltd. 90,500 2,227,255
Zenkoku Hosho Company, Ltd. (B) 32,300 1,486,658
62,652,032Macau - 0.7%Wynn Macau, Ltd. (A) 1,120,400 2,179,769Malta - 0.0%BGP Holdings PLC (A)(D) 2,126,418 0Netherlands - 5.2%ING Groep NV 343,481 4,195,322NN Group NV 44,101 2,151,318Royal Dutch Shell PLC, A Shares 278,401 5,411,854
Stellantis NV 268,659 4,751,067
16,509,561Norway - 1.5%DNB ASA 102,778 2,191,528
Norsk Hydro ASA 406,616 2,611,679
4,803,207Singapore - 0.6%DBS Group Holdings, Ltd. 92,200 1,976,896South Korea - 7.9%Hana Financial Group, Inc. 109,417 4,138,477KB Financial Group, Inc. 83,618 4,121,328KT Corp., ADR (B) 138,427 1,722,032POSCO 8,155 2,310,770Samsung Electronics Company, Ltd. 38,646 2,795,830SK Hynix, Inc. 54,666 6,453,963
SK Telecom Company, Ltd. 15,244 3,717,151
25,259,551Spain - 0.6%Applus Services SA (A) 192,236 1,996,237Sweden - 3.0%
Disciplined Value International Trust (continued)Shares orPrincipalAmount Value
COMMON STOCKS (continued)United States (continued)FMC Corp. 32,062 $ 3,546,378
7,315,100
TOTAL COMMON STOCKS (Cost $262,423,307) $ 308,351,185
PREFERRED SECURITIES - 1.4%Germany - 1.4%Volkswagen AG 15,668 4,385,814
TOTAL PREFERRED SECURITIES (Cost $3,120,375) $ 4,385,814
SHORT-TERM INVESTMENTS - 2.9%Short-term funds - 2.9%Fidelity Institutional Money Market
Government Portfolio, InstitutionalClass, 0.0100% (E) 3,692,353 3,692,353
John Hancock Collateral Trust,0.0470% (E)(F) 538,260 5,385,238
TOTAL SHORT-TERM INVESTMENTS (Cost$9,077,909) $ 9,077,591
Total Investments (Disciplined Value InternationalTrust)(Cost $274,621,591) - 101.2% $ 321,814,590
Other assets and liabilities, net - (1.2%) (3,673,216)
TOTAL NET ASSETS - 100.0% $ 318,141,374
Security Abbreviations and LegendADR American Depositary Receipt(A) Non-income producing security.(B) All or a portion of this security is on loan as of 3-31-21. The value of
securities on loan amounted to $5,123,686.(C) These securities are exempt from registration under Rule 144A of the
Securities Act of 1933. Such securities may be resold, normally toqualified institutional buyers, in transactions exempt fromregistration.
(D) Security is valued using significant unobservable inputs and isclassified as Level 3 in the fair value hierarchy.
(E) The rate shown is the annualized seven-day yield as of 3-31-21.
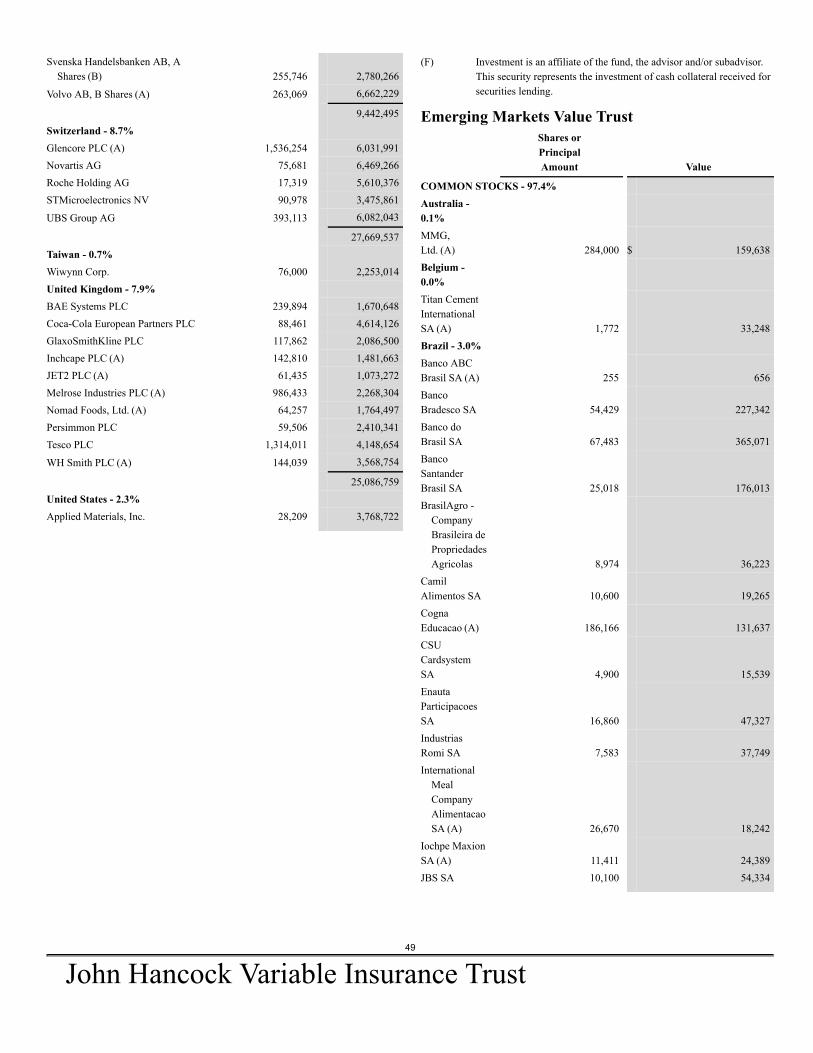
49
John Hancock Variable Insurance Trust
Svenska Handelsbanken AB, AShares (B) 255,746 2,780,266
Volvo AB, B Shares (A) 263,069 6,662,229
9,442,495Switzerland - 8.7%Glencore PLC (A) 1,536,254 6,031,991Novartis AG 75,681 6,469,266Roche Holding AG 17,319 5,610,376STMicroelectronics NV 90,978 3,475,861
UBS Group AG 393,113 6,082,043
27,669,537Taiwan - 0.7%Wiwynn Corp. 76,000 2,253,014United Kingdom - 7.9%BAE Systems PLC 239,894 1,670,648Coca-Cola European Partners PLC 88,461 4,614,126GlaxoSmithKline PLC 117,862 2,086,500Inchcape PLC (A) 142,810 1,481,663JET2 PLC (A) 61,435 1,073,272Melrose Industries PLC (A) 986,433 2,268,304Nomad Foods, Ltd. (A) 64,257 1,764,497Persimmon PLC 59,506 2,410,341Tesco PLC 1,314,011 4,148,654
WH Smith PLC (A) 144,039 3,568,754
25,086,759United States - 2.3%Applied Materials, Inc. 28,209 3,768,722
(F) Investment is an affiliate of the fund, the advisor and/or subadvisor.This security represents the investment of cash collateral received forsecurities lending.
Emerging Markets Value TrustShares orPrincipalAmount Value
COMMON STOCKS - 97.4%Australia -0.1%MMG,Ltd. (A) 284,000 $ 159,638Belgium -0.0%Titan CementInternationalSA (A) 1,772 33,248Brazil - 3.0%Banco ABCBrasil SA (A) 255 656BancoBradesco SA 54,429 227,342Banco doBrasil SA 67,483 365,071BancoSantanderBrasil SA 25,018 176,013BrasilAgro -
CompanyBrasileira dePropriedadesAgricolas 8,974 36,223
CamilAlimentos SA 10,600 19,265CognaEducacao (A) 186,166 131,637CSUCardsystemSA 4,900 15,539EnautaParticipacoesSA 16,860 47,327IndustriasRomi SA 7,583 37,749International
MealCompanyAlimentacaoSA (A) 26,670 18,242
Iochpe MaxionSA (A) 11,411 24,389JBS SA 10,100 54,334
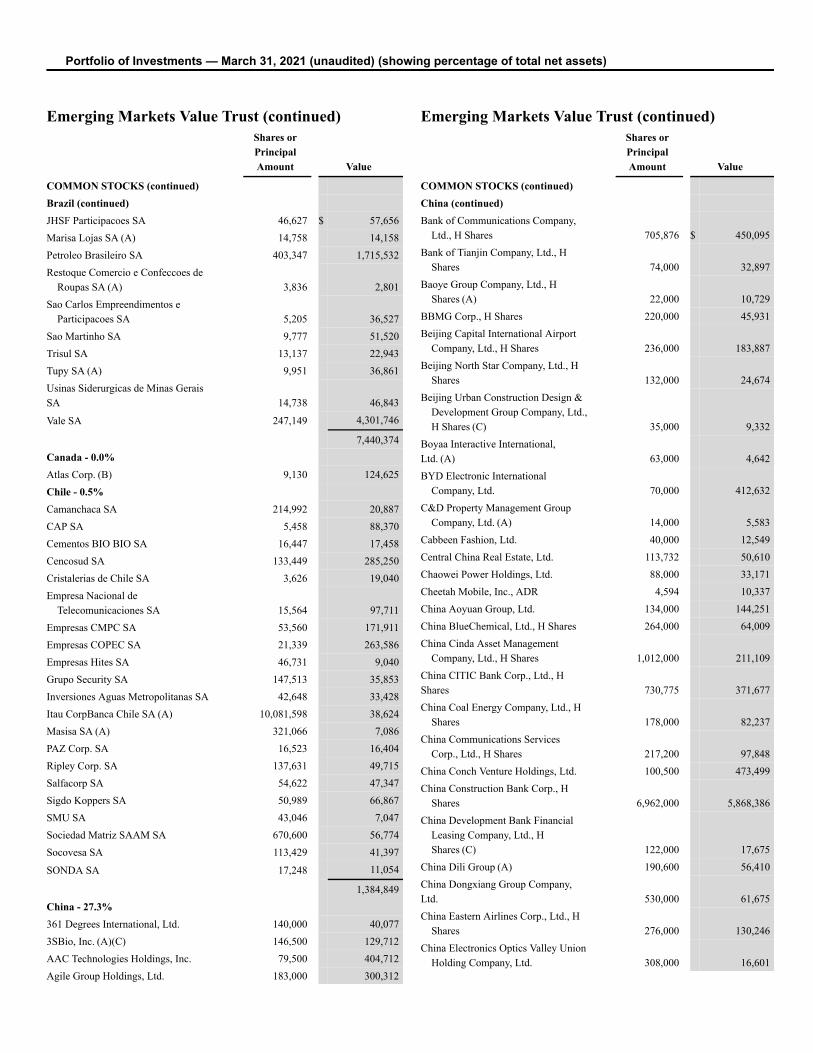
Portfolio of Investments — March 31, 2021 (unaudited) (showing percentage of total net assets)
Emerging Markets Value Trust (continued)Shares orPrincipalAmount Value
COMMON STOCKS (continued)Brazil (continued)JHSF Participacoes SA 46,627 $ 57,656Marisa Lojas SA (A) 14,758 14,158Petroleo Brasileiro SA 403,347 1,715,532Restoque Comercio e Confeccoes de
Roupas SA (A) 3,836 2,801Sao Carlos Empreendimentos e
Participacoes SA 5,205 36,527Sao Martinho SA 9,777 51,520Trisul SA 13,137 22,943Tupy SA (A) 9,951 36,861Usinas Siderurgicas de Minas GeraisSA 14,738 46,843
Vale SA 247,149 4,301,746
7,440,374Canada - 0.0%Atlas Corp. (B) 9,130 124,625Chile - 0.5%Camanchaca SA 214,992 20,887CAP SA 5,458 88,370Cementos BIO BIO SA 16,447 17,458Cencosud SA 133,449 285,250Cristalerias de Chile SA 3,626 19,040Empresa Nacional de
Telecomunicaciones SA 15,564 97,711Empresas CMPC SA 53,560 171,911Empresas COPEC SA 21,339 263,586Empresas Hites SA 46,731 9,040Grupo Security SA 147,513 35,853Inversiones Aguas Metropolitanas SA 42,648 33,428Itau CorpBanca Chile SA (A) 10,081,598 38,624Masisa SA (A) 321,066 7,086PAZ Corp. SA 16,523 16,404Ripley Corp. SA 137,631 49,715Salfacorp SA 54,622 47,347Sigdo Koppers SA 50,989 66,867SMU SA 43,046 7,047Sociedad Matriz SAAM SA 670,600 56,774Socovesa SA 113,429 41,397
SONDA SA 17,248 11,054
1,384,849China - 27.3%361 Degrees International, Ltd. 140,000 40,0773SBio, Inc. (A)(C) 146,500 129,712AAC Technologies Holdings, Inc. 79,500 404,712Agile Group Holdings, Ltd. 183,000 300,312
Emerging Markets Value Trust (continued)Shares orPrincipalAmount Value
COMMON STOCKS (continued)China (continued)Bank of Communications Company,
Ltd., H Shares 705,876 $ 450,095Bank of Tianjin Company, Ltd., H
Shares 74,000 32,897Baoye Group Company, Ltd., H
Shares (A) 22,000 10,729BBMG Corp., H Shares 220,000 45,931Beijing Capital International Airport
Company, Ltd., H Shares 236,000 183,887Beijing North Star Company, Ltd., H
Shares 132,000 24,674Beijing Urban Construction Design &
Development Group Company, Ltd.,H Shares (C) 35,000 9,332
Boyaa Interactive International,Ltd. (A) 63,000 4,642BYD Electronic International
Company, Ltd. 70,000 412,632C&D Property Management Group
Company, Ltd. (A) 14,000 5,583Cabbeen Fashion, Ltd. 40,000 12,549Central China Real Estate, Ltd. 113,732 50,610Chaowei Power Holdings, Ltd. 88,000 33,171Cheetah Mobile, Inc., ADR 4,594 10,337China Aoyuan Group, Ltd. 134,000 144,251China BlueChemical, Ltd., H Shares 264,000 64,009China Cinda Asset Management
Company, Ltd., H Shares 1,012,000 211,109China CITIC Bank Corp., Ltd., HShares 730,775 371,677China Coal Energy Company, Ltd., H
Shares 178,000 82,237China Communications Services
Corp., Ltd., H Shares 217,200 97,848China Conch Venture Holdings, Ltd. 100,500 473,499China Construction Bank Corp., H
Shares 6,962,000 5,868,386China Development Bank Financial
Leasing Company, Ltd., HShares (C) 122,000 17,675
China Dili Group (A) 190,600 56,410China Dongxiang Group Company,Ltd. 530,000 61,675China Eastern Airlines Corp., Ltd., H
Shares 276,000 130,246China Electronics Optics Valley Union
Holding Company, Ltd. 308,000 16,601
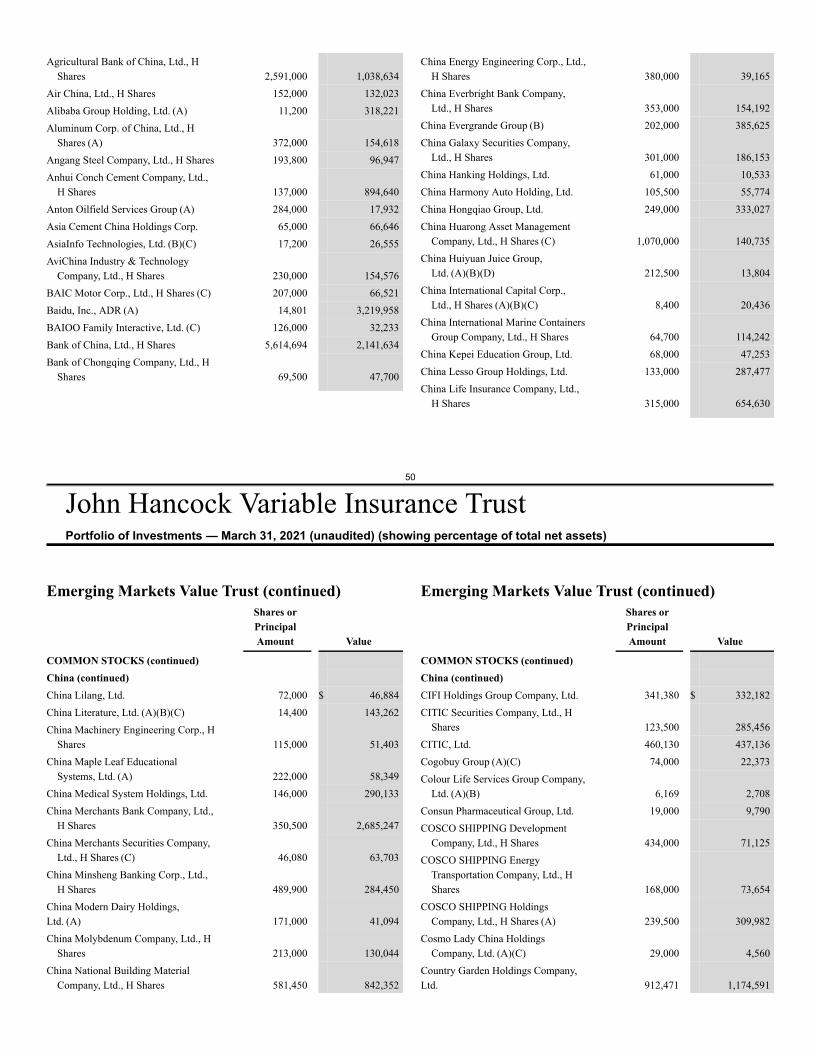
50
John Hancock Variable Insurance TrustPortfolio of Investments — March 31, 2021 (unaudited) (showing percentage of total net assets)
Agricultural Bank of China, Ltd., HShares 2,591,000 1,038,634
Air China, Ltd., H Shares 152,000 132,023Alibaba Group Holding, Ltd. (A) 11,200 318,221Aluminum Corp. of China, Ltd., H
Shares (A) 372,000 154,618Angang Steel Company, Ltd., H Shares 193,800 96,947Anhui Conch Cement Company, Ltd.,
H Shares 137,000 894,640Anton Oilfield Services Group (A) 284,000 17,932Asia Cement China Holdings Corp. 65,000 66,646AsiaInfo Technologies, Ltd. (B)(C) 17,200 26,555AviChina Industry & Technology
Company, Ltd., H Shares 230,000 154,576BAIC Motor Corp., Ltd., H Shares (C) 207,000 66,521Baidu, Inc., ADR (A) 14,801 3,219,958BAIOO Family Interactive, Ltd. (C) 126,000 32,233Bank of China, Ltd., H Shares 5,614,694 2,141,634Bank of Chongqing Company, Ltd., H
Shares 69,500 47,700
China Energy Engineering Corp., Ltd.,H Shares 380,000 39,165
China Everbright Bank Company,Ltd., H Shares 353,000 154,192
China Evergrande Group (B) 202,000 385,625China Galaxy Securities Company,
Ltd., H Shares 301,000 186,153China Hanking Holdings, Ltd. 61,000 10,533China Harmony Auto Holding, Ltd. 105,500 55,774China Hongqiao Group, Ltd. 249,000 333,027China Huarong Asset Management
Company, Ltd., H Shares (C) 1,070,000 140,735China Huiyuan Juice Group,
Ltd. (A)(B)(D) 212,500 13,804China International Capital Corp.,
Ltd., H Shares (A)(B)(C) 8,400 20,436China International Marine Containers
Group Company, Ltd., H Shares 64,700 114,242China Kepei Education Group, Ltd. 68,000 47,253China Lesso Group Holdings, Ltd. 133,000 287,477China Life Insurance Company, Ltd.,
H Shares 315,000 654,630
Emerging Markets Value Trust (continued)Shares orPrincipalAmount Value
COMMON STOCKS (continued)China (continued)China Lilang, Ltd. 72,000 $ 46,884China Literature, Ltd. (A)(B)(C) 14,400 143,262China Machinery Engineering Corp., H
Shares 115,000 51,403China Maple Leaf Educational
Systems, Ltd. (A) 222,000 58,349China Medical System Holdings, Ltd. 146,000 290,133China Merchants Bank Company, Ltd.,
H Shares 350,500 2,685,247China Merchants Securities Company,
Ltd., H Shares (C) 46,080 63,703China Minsheng Banking Corp., Ltd.,
H Shares 489,900 284,450China Modern Dairy Holdings,Ltd. (A) 171,000 41,094China Molybdenum Company, Ltd., H
Shares 213,000 130,044China National Building Material
Company, Ltd., H Shares 581,450 842,352
Emerging Markets Value Trust (continued)Shares orPrincipalAmount Value
COMMON STOCKS (continued)China (continued)CIFI Holdings Group Company, Ltd. 341,380 $ 332,182CITIC Securities Company, Ltd., H
Shares 123,500 285,456CITIC, Ltd. 460,130 437,136Cogobuy Group (A)(C) 74,000 22,373Colour Life Services Group Company,
Ltd. (A)(B) 6,169 2,708Consun Pharmaceutical Group, Ltd. 19,000 9,790COSCO SHIPPING Development
Company, Ltd., H Shares 434,000 71,125COSCO SHIPPING Energy
Transportation Company, Ltd., HShares 168,000 73,654
COSCO SHIPPING HoldingsCompany, Ltd., H Shares (A) 239,500 309,982
Cosmo Lady China HoldingsCompany, Ltd. (A)(C) 29,000 4,560
Country Garden Holdings Company,Ltd. 912,471 1,174,591
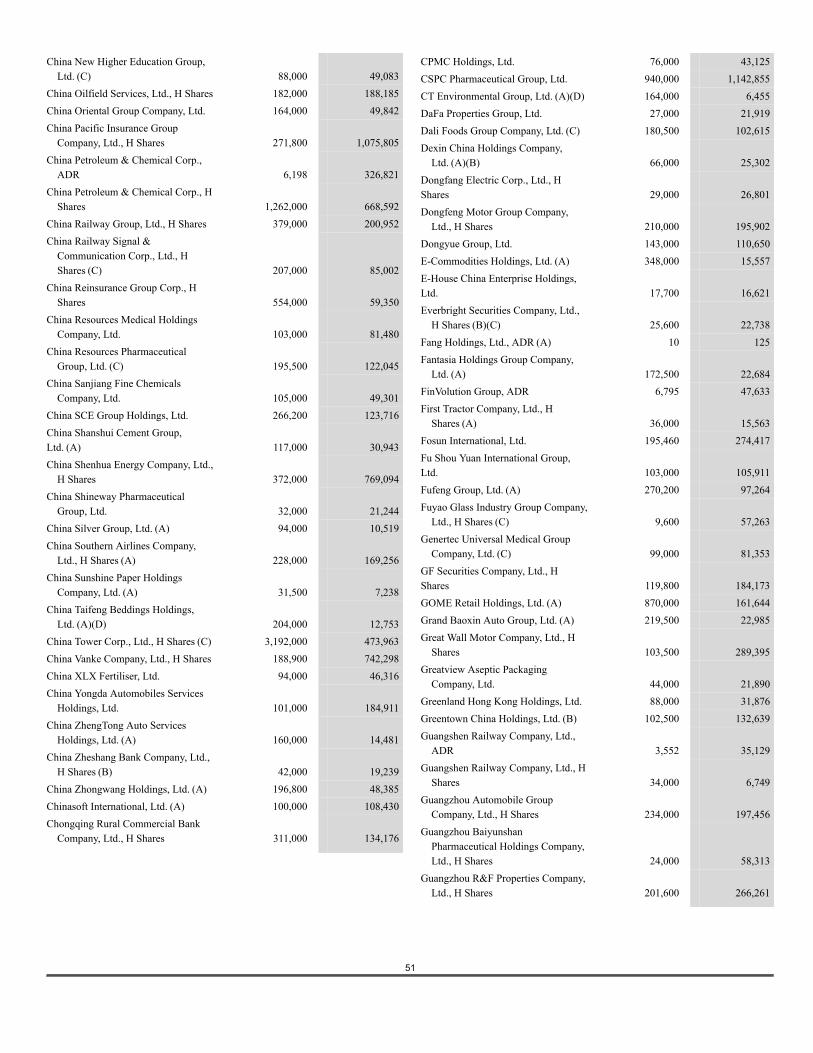
51
China New Higher Education Group,Ltd. (C) 88,000 49,083
China Oilfield Services, Ltd., H Shares 182,000 188,185China Oriental Group Company, Ltd. 164,000 49,842China Pacific Insurance Group
Company, Ltd., H Shares 271,800 1,075,805China Petroleum & Chemical Corp.,
ADR 6,198 326,821China Petroleum & Chemical Corp., H
Shares 1,262,000 668,592China Railway Group, Ltd., H Shares 379,000 200,952China Railway Signal &
Communication Corp., Ltd., HShares (C) 207,000 85,002
China Reinsurance Group Corp., HShares 554,000 59,350
China Resources Medical HoldingsCompany, Ltd. 103,000 81,480
China Resources PharmaceuticalGroup, Ltd. (C) 195,500 122,045
China Sanjiang Fine ChemicalsCompany, Ltd. 105,000 49,301
China SCE Group Holdings, Ltd. 266,200 123,716China Shanshui Cement Group,Ltd. (A) 117,000 30,943China Shenhua Energy Company, Ltd.,
H Shares 372,000 769,094China Shineway Pharmaceutical
Group, Ltd. 32,000 21,244China Silver Group, Ltd. (A) 94,000 10,519China Southern Airlines Company,
Ltd., H Shares (A) 228,000 169,256China Sunshine Paper Holdings
Company, Ltd. (A) 31,500 7,238China Taifeng Beddings Holdings,
Ltd. (A)(D) 204,000 12,753China Tower Corp., Ltd., H Shares (C) 3,192,000 473,963China Vanke Company, Ltd., H Shares 188,900 742,298China XLX Fertiliser, Ltd. 94,000 46,316China Yongda Automobiles Services
Holdings, Ltd. 101,000 184,911China ZhengTong Auto Services
Holdings, Ltd. (A) 160,000 14,481China Zheshang Bank Company, Ltd.,
H Shares (B) 42,000 19,239China Zhongwang Holdings, Ltd. (A) 196,800 48,385Chinasoft International, Ltd. (A) 100,000 108,430Chongqing Rural Commercial Bank
Company, Ltd., H Shares 311,000 134,176
CPMC Holdings, Ltd. 76,000 43,125CSPC Pharmaceutical Group, Ltd. 940,000 1,142,855CT Environmental Group, Ltd. (A)(D) 164,000 6,455DaFa Properties Group, Ltd. 27,000 21,919Dali Foods Group Company, Ltd. (C) 180,500 102,615Dexin China Holdings Company,
Ltd. (A)(B) 66,000 25,302Dongfang Electric Corp., Ltd., HShares 29,000 26,801Dongfeng Motor Group Company,
Ltd., H Shares 210,000 195,902Dongyue Group, Ltd. 143,000 110,650E-Commodities Holdings, Ltd. (A) 348,000 15,557E-House China Enterprise Holdings,Ltd. 17,700 16,621Everbright Securities Company, Ltd.,
H Shares (B)(C) 25,600 22,738Fang Holdings, Ltd., ADR (A) 10 125Fantasia Holdings Group Company,
Ltd. (A) 172,500 22,684FinVolution Group, ADR 6,795 47,633First Tractor Company, Ltd., H
Shares (A) 36,000 15,563Fosun International, Ltd. 195,460 274,417Fu Shou Yuan International Group,Ltd. 103,000 105,911Fufeng Group, Ltd. (A) 270,200 97,264Fuyao Glass Industry Group Company,
Ltd., H Shares (C) 9,600 57,263Genertec Universal Medical Group
Company, Ltd. (C) 99,000 81,353GF Securities Company, Ltd., HShares 119,800 184,173GOME Retail Holdings, Ltd. (A) 870,000 161,644Grand Baoxin Auto Group, Ltd. (A) 219,500 22,985Great Wall Motor Company, Ltd., H
Shares 103,500 289,395Greatview Aseptic Packaging
Company, Ltd. 44,000 21,890Greenland Hong Kong Holdings, Ltd. 88,000 31,876Greentown China Holdings, Ltd. (B) 102,500 132,639Guangshen Railway Company, Ltd.,
ADR 3,552 35,129Guangshen Railway Company, Ltd., H
Shares 34,000 6,749Guangzhou Automobile Group
Company, Ltd., H Shares 234,000 197,456Guangzhou Baiyunshan
Pharmaceutical Holdings Company,Ltd., H Shares 24,000 58,313
Guangzhou R&F Properties Company,Ltd., H Shares 201,600 266,261
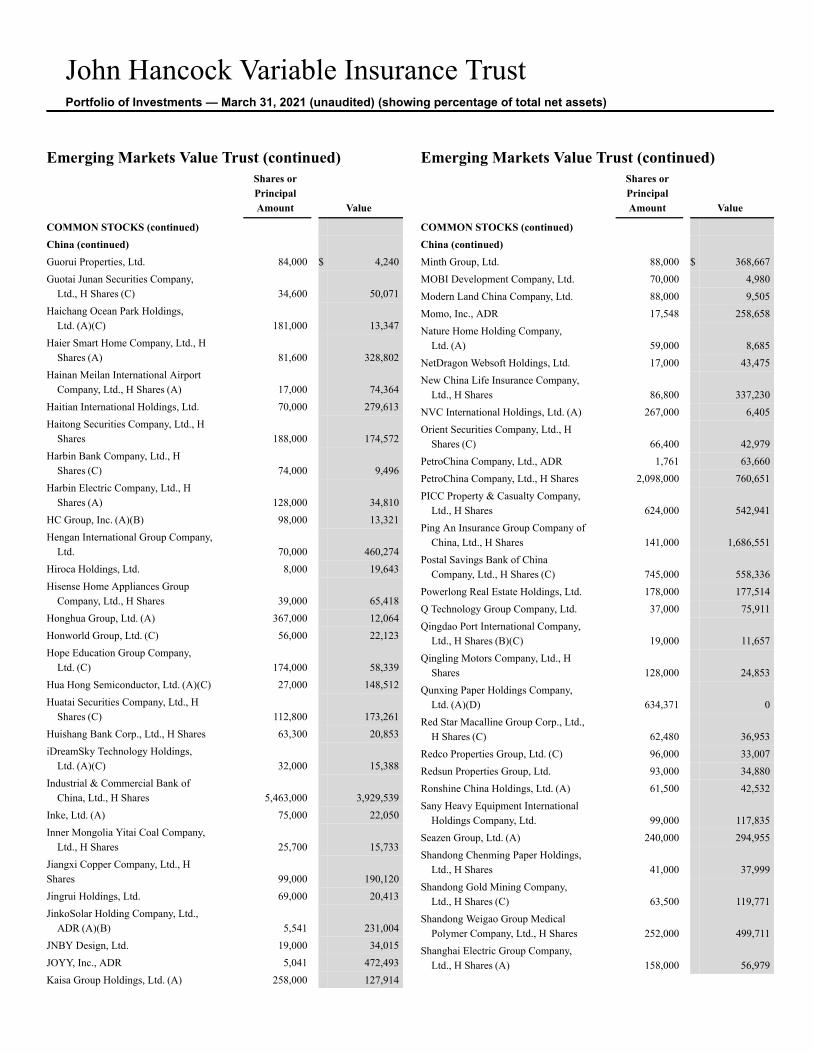
John Hancock Variable Insurance TrustPortfolio of Investments — March 31, 2021 (unaudited) (showing percentage of total net assets)
Emerging Markets Value Trust (continued)Shares orPrincipalAmount Value
COMMON STOCKS (continued)China (continued)Guorui Properties, Ltd. 84,000 $ 4,240Guotai Junan Securities Company,
Ltd., H Shares (C) 34,600 50,071Haichang Ocean Park Holdings,
Ltd. (A)(C) 181,000 13,347Haier Smart Home Company, Ltd., H
Shares (A) 81,600 328,802Hainan Meilan International Airport
Company, Ltd., H Shares (A) 17,000 74,364Haitian International Holdings, Ltd. 70,000 279,613Haitong Securities Company, Ltd., H
Shares 188,000 174,572Harbin Bank Company, Ltd., H
Shares (C) 74,000 9,496Harbin Electric Company, Ltd., H
Shares (A) 128,000 34,810HC Group, Inc. (A)(B) 98,000 13,321Hengan International Group Company,
Ltd. 70,000 460,274Hiroca Holdings, Ltd. 8,000 19,643Hisense Home Appliances Group
Company, Ltd., H Shares 39,000 65,418Honghua Group, Ltd. (A) 367,000 12,064Honworld Group, Ltd. (C) 56,000 22,123Hope Education Group Company,
Ltd. (C) 174,000 58,339Hua Hong Semiconductor, Ltd. (A)(C) 27,000 148,512Huatai Securities Company, Ltd., H
Shares (C) 112,800 173,261Huishang Bank Corp., Ltd., H Shares 63,300 20,853iDreamSky Technology Holdings,
Ltd. (A)(C) 32,000 15,388Industrial & Commercial Bank of
China, Ltd., H Shares 5,463,000 3,929,539Inke, Ltd. (A) 75,000 22,050Inner Mongolia Yitai Coal Company,
Ltd., H Shares 25,700 15,733Jiangxi Copper Company, Ltd., HShares 99,000 190,120Jingrui Holdings, Ltd. 69,000 20,413JinkoSolar Holding Company, Ltd.,
ADR (A)(B) 5,541 231,004JNBY Design, Ltd. 19,000 34,015JOYY, Inc., ADR 5,041 472,493Kaisa Group Holdings, Ltd. (A) 258,000 127,914
Emerging Markets Value Trust (continued)Shares orPrincipalAmount Value
COMMON STOCKS (continued)China (continued)Minth Group, Ltd. 88,000 $ 368,667MOBI Development Company, Ltd. 70,000 4,980Modern Land China Company, Ltd. 88,000 9,505Momo, Inc., ADR 17,548 258,658Nature Home Holding Company,
Ltd. (A) 59,000 8,685NetDragon Websoft Holdings, Ltd. 17,000 43,475New China Life Insurance Company,
Ltd., H Shares 86,800 337,230NVC International Holdings, Ltd. (A) 267,000 6,405Orient Securities Company, Ltd., H
Shares (C) 66,400 42,979PetroChina Company, Ltd., ADR 1,761 63,660PetroChina Company, Ltd., H Shares 2,098,000 760,651PICC Property & Casualty Company,
Ltd., H Shares 624,000 542,941Ping An Insurance Group Company of
China, Ltd., H Shares 141,000 1,686,551Postal Savings Bank of China
Company, Ltd., H Shares (C) 745,000 558,336Powerlong Real Estate Holdings, Ltd. 178,000 177,514Q Technology Group Company, Ltd. 37,000 75,911Qingdao Port International Company,
Ltd., H Shares (B)(C) 19,000 11,657Qingling Motors Company, Ltd., H
Shares 128,000 24,853Qunxing Paper Holdings Company,
Ltd. (A)(D) 634,371 0Red Star Macalline Group Corp., Ltd.,
H Shares (C) 62,480 36,953Redco Properties Group, Ltd. (C) 96,000 33,007Redsun Properties Group, Ltd. 93,000 34,880Ronshine China Holdings, Ltd. (A) 61,500 42,532Sany Heavy Equipment International
Holdings Company, Ltd. 99,000 117,835Seazen Group, Ltd. (A) 240,000 294,955Shandong Chenming Paper Holdings,
Ltd., H Shares 41,000 37,999Shandong Gold Mining Company,
Ltd., H Shares (C) 63,500 119,771Shandong Weigao Group Medical
Polymer Company, Ltd., H Shares 252,000 499,711Shanghai Electric Group Company,
Ltd., H Shares (A) 158,000 56,979
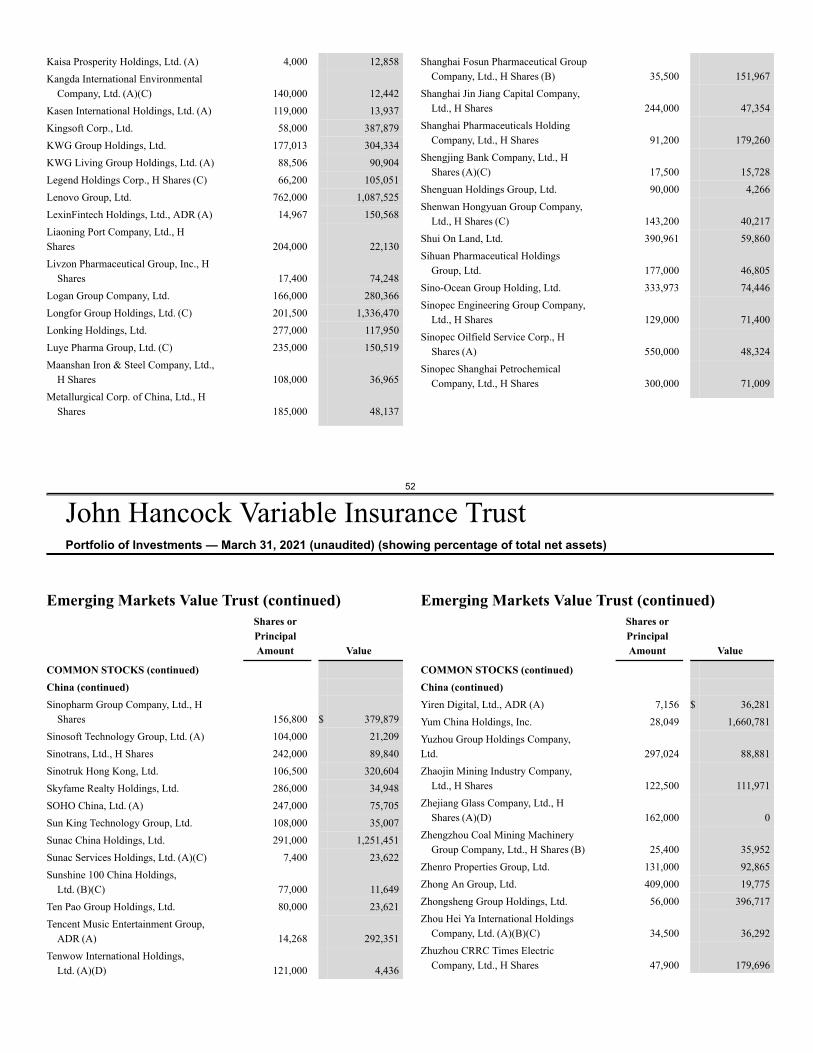
52
John Hancock Variable Insurance TrustPortfolio of Investments — March 31, 2021 (unaudited) (showing percentage of total net assets)
Kaisa Prosperity Holdings, Ltd. (A) 4,000 12,858Kangda International Environmental
Company, Ltd. (A)(C) 140,000 12,442Kasen International Holdings, Ltd. (A) 119,000 13,937Kingsoft Corp., Ltd. 58,000 387,879KWG Group Holdings, Ltd. 177,013 304,334KWG Living Group Holdings, Ltd. (A) 88,506 90,904Legend Holdings Corp., H Shares (C) 66,200 105,051Lenovo Group, Ltd. 762,000 1,087,525LexinFintech Holdings, Ltd., ADR (A) 14,967 150,568Liaoning Port Company, Ltd., HShares 204,000 22,130Livzon Pharmaceutical Group, Inc., H
Shares 17,400 74,248Logan Group Company, Ltd. 166,000 280,366Longfor Group Holdings, Ltd. (C) 201,500 1,336,470Lonking Holdings, Ltd. 277,000 117,950Luye Pharma Group, Ltd. (C) 235,000 150,519Maanshan Iron & Steel Company, Ltd.,
H Shares 108,000 36,965Metallurgical Corp. of China, Ltd., H
Shares 185,000 48,137
Shanghai Fosun Pharmaceutical GroupCompany, Ltd., H Shares (B) 35,500 151,967
Shanghai Jin Jiang Capital Company,Ltd., H Shares 244,000 47,354
Shanghai Pharmaceuticals HoldingCompany, Ltd., H Shares 91,200 179,260
Shengjing Bank Company, Ltd., HShares (A)(C) 17,500 15,728
Shenguan Holdings Group, Ltd. 90,000 4,266Shenwan Hongyuan Group Company,
Ltd., H Shares (C) 143,200 40,217Shui On Land, Ltd. 390,961 59,860Sihuan Pharmaceutical Holdings
Group, Ltd. 177,000 46,805Sino-Ocean Group Holding, Ltd. 333,973 74,446Sinopec Engineering Group Company,
Ltd., H Shares 129,000 71,400Sinopec Oilfield Service Corp., H
Shares (A) 550,000 48,324Sinopec Shanghai Petrochemical
Company, Ltd., H Shares 300,000 71,009
Emerging Markets Value Trust (continued)Shares orPrincipalAmount Value
COMMON STOCKS (continued)China (continued)Sinopharm Group Company, Ltd., H
Shares 156,800 $ 379,879Sinosoft Technology Group, Ltd. (A) 104,000 21,209Sinotrans, Ltd., H Shares 242,000 89,840Sinotruk Hong Kong, Ltd. 106,500 320,604Skyfame Realty Holdings, Ltd. 286,000 34,948SOHO China, Ltd. (A) 247,000 75,705Sun King Technology Group, Ltd. 108,000 35,007Sunac China Holdings, Ltd. 291,000 1,251,451Sunac Services Holdings, Ltd. (A)(C) 7,400 23,622Sunshine 100 China Holdings,
Ltd. (B)(C) 77,000 11,649Ten Pao Group Holdings, Ltd. 80,000 23,621Tencent Music Entertainment Group,
ADR (A) 14,268 292,351Tenwow International Holdings,
Ltd. (A)(D) 121,000 4,436
Emerging Markets Value Trust (continued)Shares orPrincipalAmount Value
COMMON STOCKS (continued)China (continued)Yiren Digital, Ltd., ADR (A) 7,156 $ 36,281Yum China Holdings, Inc. 28,049 1,660,781Yuzhou Group Holdings Company,Ltd. 297,024 88,881Zhaojin Mining Industry Company,
Ltd., H Shares 122,500 111,971Zhejiang Glass Company, Ltd., H
Shares (A)(D) 162,000 0Zhengzhou Coal Mining Machinery
Group Company, Ltd., H Shares (B) 25,400 35,952Zhenro Properties Group, Ltd. 131,000 92,865Zhong An Group, Ltd. 409,000 19,775Zhongsheng Group Holdings, Ltd. 56,000 396,717Zhou Hei Ya International Holdings
Company, Ltd. (A)(B)(C) 34,500 36,292Zhuzhou CRRC Times Electric
Company, Ltd., H Shares 47,900 179,696
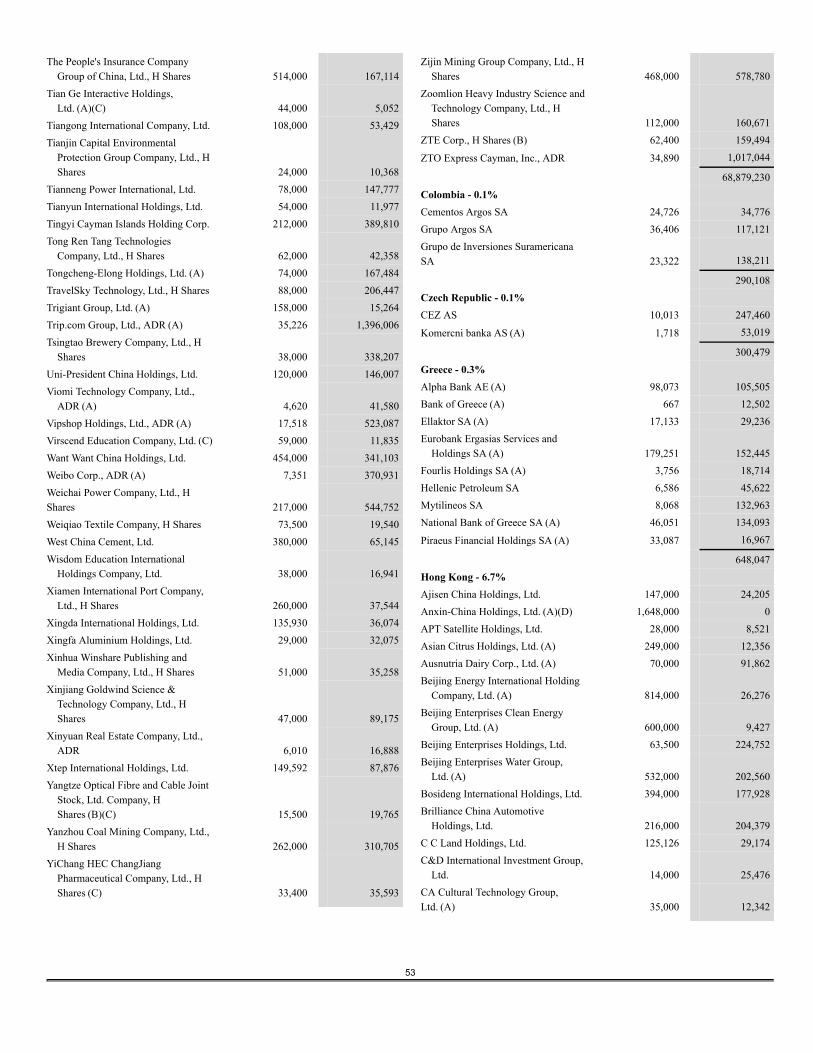
53
The People's Insurance CompanyGroup of China, Ltd., H Shares 514,000 167,114
Tian Ge Interactive Holdings,Ltd. (A)(C) 44,000 5,052
Tiangong International Company, Ltd. 108,000 53,429Tianjin Capital Environmental
Protection Group Company, Ltd., HShares 24,000 10,368
Tianneng Power International, Ltd. 78,000 147,777Tianyun International Holdings, Ltd. 54,000 11,977Tingyi Cayman Islands Holding Corp. 212,000 389,810Tong Ren Tang Technologies
Company, Ltd., H Shares 62,000 42,358Tongcheng-Elong Holdings, Ltd. (A) 74,000 167,484TravelSky Technology, Ltd., H Shares 88,000 206,447Trigiant Group, Ltd. (A) 158,000 15,264Trip.com Group, Ltd., ADR (A) 35,226 1,396,006Tsingtao Brewery Company, Ltd., H
Shares 38,000 338,207Uni-President China Holdings, Ltd. 120,000 146,007Viomi Technology Company, Ltd.,
ADR (A) 4,620 41,580Vipshop Holdings, Ltd., ADR (A) 17,518 523,087Virscend Education Company, Ltd. (C) 59,000 11,835Want Want China Holdings, Ltd. 454,000 341,103Weibo Corp., ADR (A) 7,351 370,931Weichai Power Company, Ltd., HShares 217,000 544,752Weiqiao Textile Company, H Shares 73,500 19,540West China Cement, Ltd. 380,000 65,145Wisdom Education International
Holdings Company, Ltd. 38,000 16,941Xiamen International Port Company,
Ltd., H Shares 260,000 37,544Xingda International Holdings, Ltd. 135,930 36,074Xingfa Aluminium Holdings, Ltd. 29,000 32,075Xinhua Winshare Publishing and
Media Company, Ltd., H Shares 51,000 35,258Xinjiang Goldwind Science &
Technology Company, Ltd., HShares 47,000 89,175
Xinyuan Real Estate Company, Ltd.,ADR 6,010 16,888
Xtep International Holdings, Ltd. 149,592 87,876Yangtze Optical Fibre and Cable Joint
Stock, Ltd. Company, HShares (B)(C) 15,500 19,765
Yanzhou Coal Mining Company, Ltd.,H Shares 262,000 310,705
YiChang HEC ChangJiangPharmaceutical Company, Ltd., HShares (C) 33,400 35,593
Zijin Mining Group Company, Ltd., HShares 468,000 578,780
Zoomlion Heavy Industry Science andTechnology Company, Ltd., HShares 112,000 160,671
ZTE Corp., H Shares (B) 62,400 159,494
ZTO Express Cayman, Inc., ADR 34,890 1,017,044
68,879,230Colombia - 0.1%Cementos Argos SA 24,726 34,776Grupo Argos SA 36,406 117,121Grupo de Inversiones SuramericanaSA 23,322 138,211
290,108Czech Republic - 0.1%CEZ AS 10,013 247,460
Komercni banka AS (A) 1,718 53,019
300,479Greece - 0.3%Alpha Bank AE (A) 98,073 105,505Bank of Greece (A) 667 12,502Ellaktor SA (A) 17,133 29,236Eurobank Ergasias Services and
Holdings SA (A) 179,251 152,445Fourlis Holdings SA (A) 3,756 18,714Hellenic Petroleum SA 6,586 45,622Mytilineos SA 8,068 132,963National Bank of Greece SA (A) 46,051 134,093
Piraeus Financial Holdings SA (A) 33,087 16,967
648,047Hong Kong - 6.7%Ajisen China Holdings, Ltd. 147,000 24,205Anxin-China Holdings, Ltd. (A)(D) 1,648,000 0APT Satellite Holdings, Ltd. 28,000 8,521Asian Citrus Holdings, Ltd. (A) 249,000 12,356Ausnutria Dairy Corp., Ltd. (A) 70,000 91,862Beijing Energy International Holding
Company, Ltd. (A) 814,000 26,276Beijing Enterprises Clean Energy
Group, Ltd. (A) 600,000 9,427Beijing Enterprises Holdings, Ltd. 63,500 224,752Beijing Enterprises Water Group,
Ltd. (A) 532,000 202,560Bosideng International Holdings, Ltd. 394,000 177,928Brilliance China Automotive
Holdings, Ltd. 216,000 204,379C C Land Holdings, Ltd. 125,126 29,174C&D International Investment Group,
Ltd. 14,000 25,476CA Cultural Technology Group,Ltd. (A) 35,000 12,342
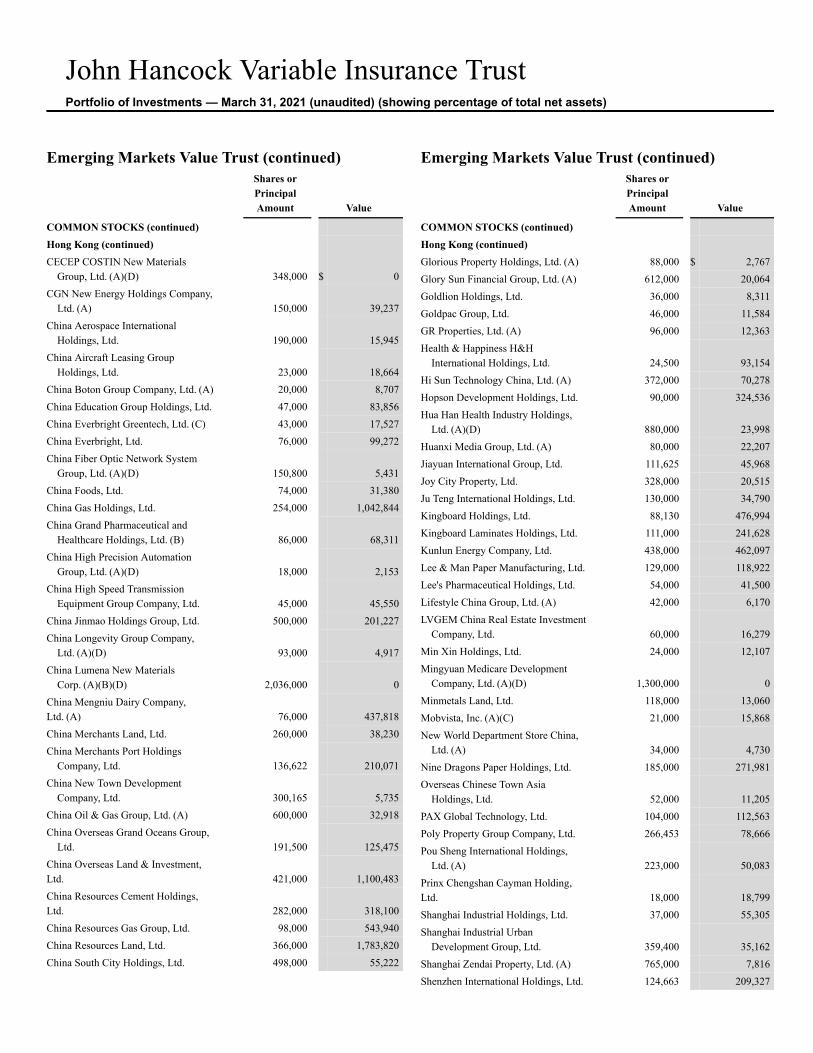
John Hancock Variable Insurance TrustPortfolio of Investments — March 31, 2021 (unaudited) (showing percentage of total net assets)
Emerging Markets Value Trust (continued)Shares orPrincipalAmount Value
COMMON STOCKS (continued)Hong Kong (continued)CECEP COSTIN New Materials
Group, Ltd. (A)(D) 348,000 $ 0CGN New Energy Holdings Company,
Ltd. (A) 150,000 39,237China Aerospace International
Holdings, Ltd. 190,000 15,945China Aircraft Leasing Group
Holdings, Ltd. 23,000 18,664China Boton Group Company, Ltd. (A) 20,000 8,707China Education Group Holdings, Ltd. 47,000 83,856China Everbright Greentech, Ltd. (C) 43,000 17,527China Everbright, Ltd. 76,000 99,272China Fiber Optic Network System
Group, Ltd. (A)(D) 150,800 5,431China Foods, Ltd. 74,000 31,380China Gas Holdings, Ltd. 254,000 1,042,844China Grand Pharmaceutical and
Healthcare Holdings, Ltd. (B) 86,000 68,311China High Precision Automation
Group, Ltd. (A)(D) 18,000 2,153China High Speed Transmission
Equipment Group Company, Ltd. 45,000 45,550China Jinmao Holdings Group, Ltd. 500,000 201,227China Longevity Group Company,
Ltd. (A)(D) 93,000 4,917China Lumena New Materials
Corp. (A)(B)(D) 2,036,000 0China Mengniu Dairy Company,Ltd. (A) 76,000 437,818China Merchants Land, Ltd. 260,000 38,230China Merchants Port Holdings
Company, Ltd. 136,622 210,071China New Town Development
Company, Ltd. 300,165 5,735China Oil & Gas Group, Ltd. (A) 600,000 32,918China Overseas Grand Oceans Group,
Ltd. 191,500 125,475China Overseas Land & Investment,Ltd. 421,000 1,100,483China Resources Cement Holdings,Ltd. 282,000 318,100China Resources Gas Group, Ltd. 98,000 543,940China Resources Land, Ltd. 366,000 1,783,820China South City Holdings, Ltd. 498,000 55,222
Emerging Markets Value Trust (continued)Shares orPrincipalAmount Value
COMMON STOCKS (continued)Hong Kong (continued)Glorious Property Holdings, Ltd. (A) 88,000 $ 2,767Glory Sun Financial Group, Ltd. (A) 612,000 20,064Goldlion Holdings, Ltd. 36,000 8,311Goldpac Group, Ltd. 46,000 11,584GR Properties, Ltd. (A) 96,000 12,363Health & Happiness H&H
International Holdings, Ltd. 24,500 93,154Hi Sun Technology China, Ltd. (A) 372,000 70,278Hopson Development Holdings, Ltd. 90,000 324,536Hua Han Health Industry Holdings,
Ltd. (A)(D) 880,000 23,998Huanxi Media Group, Ltd. (A) 80,000 22,207Jiayuan International Group, Ltd. 111,625 45,968Joy City Property, Ltd. 328,000 20,515Ju Teng International Holdings, Ltd. 130,000 34,790Kingboard Holdings, Ltd. 88,130 476,994Kingboard Laminates Holdings, Ltd. 111,000 241,628Kunlun Energy Company, Ltd. 438,000 462,097Lee & Man Paper Manufacturing, Ltd. 129,000 118,922Lee's Pharmaceutical Holdings, Ltd. 54,000 41,500Lifestyle China Group, Ltd. (A) 42,000 6,170LVGEM China Real Estate Investment
Company, Ltd. 60,000 16,279Min Xin Holdings, Ltd. 24,000 12,107Mingyuan Medicare Development
Company, Ltd. (A)(D) 1,300,000 0Minmetals Land, Ltd. 118,000 13,060Mobvista, Inc. (A)(C) 21,000 15,868New World Department Store China,
Ltd. (A) 34,000 4,730Nine Dragons Paper Holdings, Ltd. 185,000 271,981Overseas Chinese Town Asia
Holdings, Ltd. 52,000 11,205PAX Global Technology, Ltd. 104,000 112,563Poly Property Group Company, Ltd. 266,453 78,666Pou Sheng International Holdings,
Ltd. (A) 223,000 50,083Prinx Chengshan Cayman Holding,Ltd. 18,000 18,799Shanghai Industrial Holdings, Ltd. 37,000 55,305Shanghai Industrial Urban
Development Group, Ltd. 359,400 35,162Shanghai Zendai Property, Ltd. (A) 765,000 7,816Shenzhen International Holdings, Ltd. 124,663 209,327
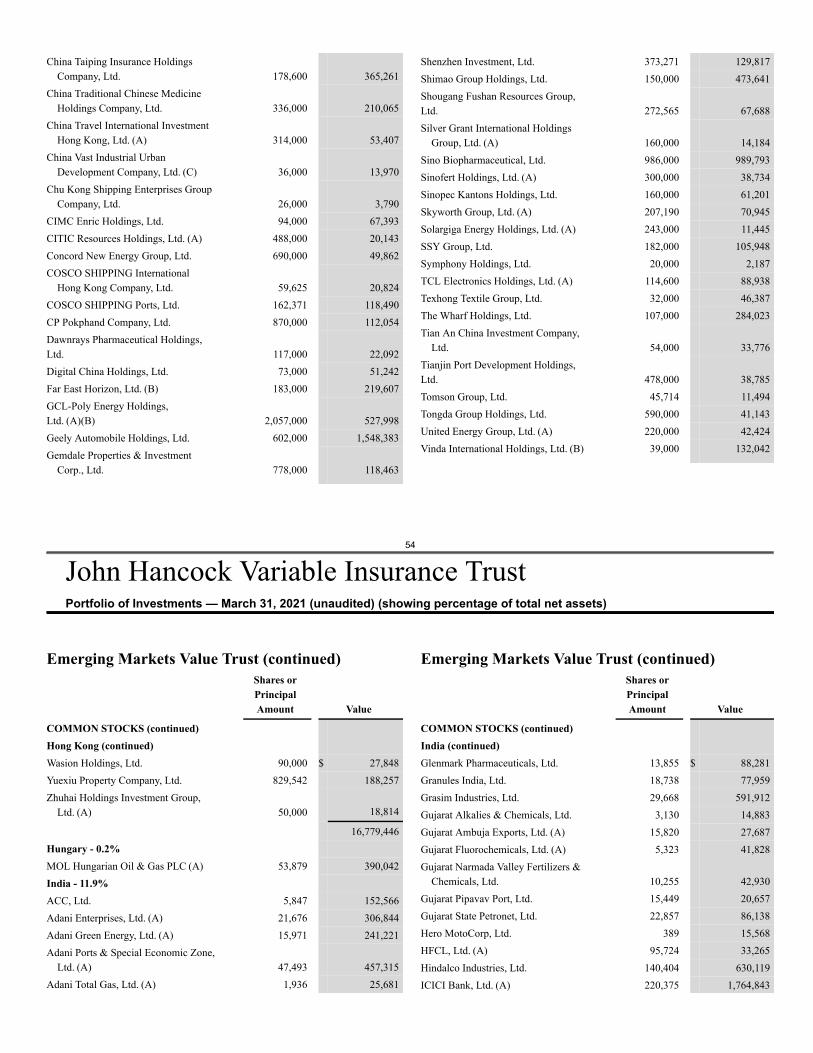
54
John Hancock Variable Insurance TrustPortfolio of Investments — March 31, 2021 (unaudited) (showing percentage of total net assets)
China Taiping Insurance HoldingsCompany, Ltd. 178,600 365,261
China Traditional Chinese MedicineHoldings Company, Ltd. 336,000 210,065
China Travel International InvestmentHong Kong, Ltd. (A) 314,000 53,407
China Vast Industrial UrbanDevelopment Company, Ltd. (C) 36,000 13,970
Chu Kong Shipping Enterprises GroupCompany, Ltd. 26,000 3,790
CIMC Enric Holdings, Ltd. 94,000 67,393CITIC Resources Holdings, Ltd. (A) 488,000 20,143Concord New Energy Group, Ltd. 690,000 49,862COSCO SHIPPING International
Hong Kong Company, Ltd. 59,625 20,824COSCO SHIPPING Ports, Ltd. 162,371 118,490CP Pokphand Company, Ltd. 870,000 112,054Dawnrays Pharmaceutical Holdings,Ltd. 117,000 22,092Digital China Holdings, Ltd. 73,000 51,242Far East Horizon, Ltd. (B) 183,000 219,607GCL-Poly Energy Holdings,Ltd. (A)(B) 2,057,000 527,998Geely Automobile Holdings, Ltd. 602,000 1,548,383Gemdale Properties & Investment
Corp., Ltd. 778,000 118,463
Shenzhen Investment, Ltd. 373,271 129,817Shimao Group Holdings, Ltd. 150,000 473,641Shougang Fushan Resources Group,Ltd. 272,565 67,688Silver Grant International Holdings
Group, Ltd. (A) 160,000 14,184Sino Biopharmaceutical, Ltd. 986,000 989,793Sinofert Holdings, Ltd. (A) 300,000 38,734Sinopec Kantons Holdings, Ltd. 160,000 61,201Skyworth Group, Ltd. (A) 207,190 70,945Solargiga Energy Holdings, Ltd. (A) 243,000 11,445SSY Group, Ltd. 182,000 105,948Symphony Holdings, Ltd. 20,000 2,187TCL Electronics Holdings, Ltd. (A) 114,600 88,938Texhong Textile Group, Ltd. 32,000 46,387The Wharf Holdings, Ltd. 107,000 284,023Tian An China Investment Company,
Ltd. 54,000 33,776Tianjin Port Development Holdings,Ltd. 478,000 38,785Tomson Group, Ltd. 45,714 11,494Tongda Group Holdings, Ltd. 590,000 41,143United Energy Group, Ltd. (A) 220,000 42,424Vinda International Holdings, Ltd. (B) 39,000 132,042
Emerging Markets Value Trust (continued)Shares orPrincipalAmount Value
COMMON STOCKS (continued)Hong Kong (continued)Wasion Holdings, Ltd. 90,000 $ 27,848Yuexiu Property Company, Ltd. 829,542 188,257Zhuhai Holdings Investment Group,
Ltd. (A) 50,000 18,814
16,779,446Hungary - 0.2%MOL Hungarian Oil & Gas PLC (A) 53,879 390,042India - 11.9%ACC, Ltd. 5,847 152,566Adani Enterprises, Ltd. (A) 21,676 306,844Adani Green Energy, Ltd. (A) 15,971 241,221Adani Ports & Special Economic Zone,
Ltd. (A) 47,493 457,315Adani Total Gas, Ltd. (A) 1,936 25,681
Emerging Markets Value Trust (continued)Shares orPrincipalAmount Value
COMMON STOCKS (continued)India (continued)Glenmark Pharmaceuticals, Ltd. 13,855 $ 88,281Granules India, Ltd. 18,738 77,959Grasim Industries, Ltd. 29,668 591,912Gujarat Alkalies & Chemicals, Ltd. 3,130 14,883Gujarat Ambuja Exports, Ltd. (A) 15,820 27,687Gujarat Fluorochemicals, Ltd. (A) 5,323 41,828Gujarat Narmada Valley Fertilizers &
Chemicals, Ltd. 10,255 42,930Gujarat Pipavav Port, Ltd. 15,449 20,657Gujarat State Petronet, Ltd. 22,857 86,138Hero MotoCorp, Ltd. 389 15,568HFCL, Ltd. (A) 95,724 33,265Hindalco Industries, Ltd. 140,404 630,119ICICI Bank, Ltd. (A) 220,375 1,764,843
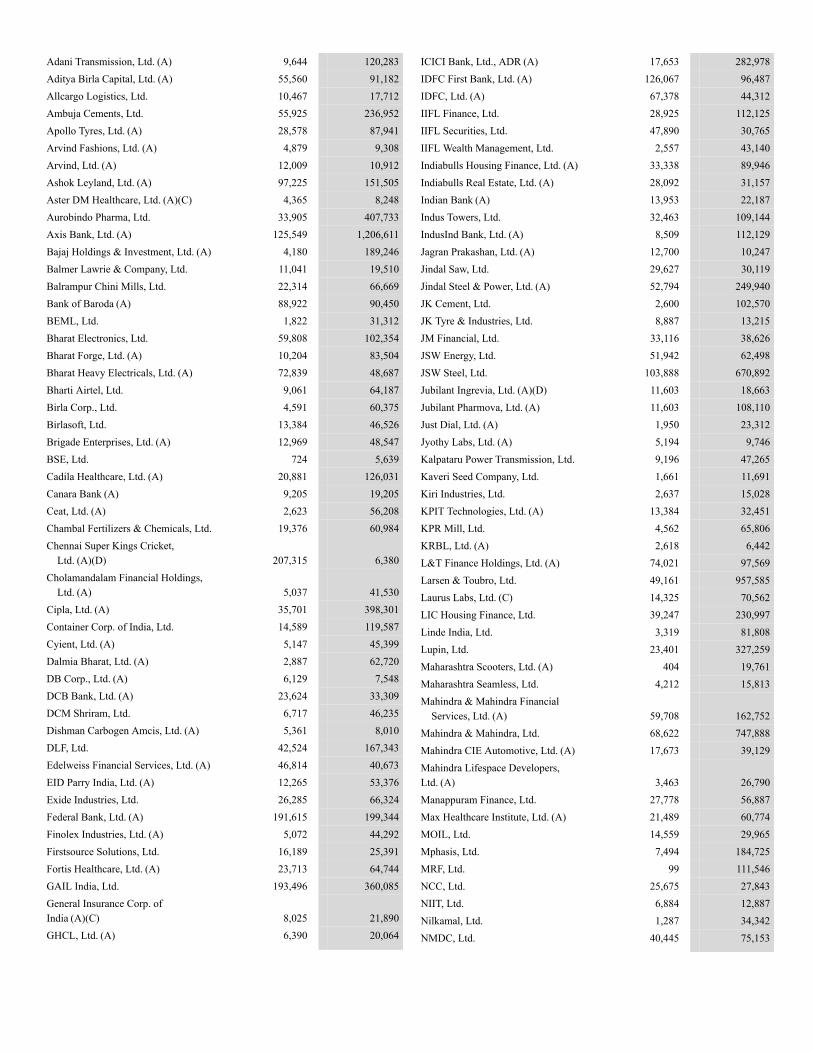
Adani Transmission, Ltd. (A) 9,644 120,283Aditya Birla Capital, Ltd. (A) 55,560 91,182Allcargo Logistics, Ltd. 10,467 17,712Ambuja Cements, Ltd. 55,925 236,952Apollo Tyres, Ltd. (A) 28,578 87,941Arvind Fashions, Ltd. (A) 4,879 9,308Arvind, Ltd. (A) 12,009 10,912Ashok Leyland, Ltd. (A) 97,225 151,505Aster DM Healthcare, Ltd. (A)(C) 4,365 8,248Aurobindo Pharma, Ltd. 33,905 407,733Axis Bank, Ltd. (A) 125,549 1,206,611Bajaj Holdings & Investment, Ltd. (A) 4,180 189,246Balmer Lawrie & Company, Ltd. 11,041 19,510Balrampur Chini Mills, Ltd. 22,314 66,669Bank of Baroda (A) 88,922 90,450BEML, Ltd. 1,822 31,312Bharat Electronics, Ltd. 59,808 102,354Bharat Forge, Ltd. (A) 10,204 83,504Bharat Heavy Electricals, Ltd. (A) 72,839 48,687Bharti Airtel, Ltd. 9,061 64,187Birla Corp., Ltd. 4,591 60,375Birlasoft, Ltd. 13,384 46,526Brigade Enterprises, Ltd. (A) 12,969 48,547BSE, Ltd. 724 5,639Cadila Healthcare, Ltd. (A) 20,881 126,031Canara Bank (A) 9,205 19,205Ceat, Ltd. (A) 2,623 56,208Chambal Fertilizers & Chemicals, Ltd. 19,376 60,984Chennai Super Kings Cricket,
Ltd. (A)(D) 207,315 6,380Cholamandalam Financial Holdings,
Ltd. (A) 5,037 41,530Cipla, Ltd. (A) 35,701 398,301Container Corp. of India, Ltd. 14,589 119,587Cyient, Ltd. (A) 5,147 45,399Dalmia Bharat, Ltd. (A) 2,887 62,720DB Corp., Ltd. (A) 6,129 7,548DCB Bank, Ltd. (A) 23,624 33,309DCM Shriram, Ltd. 6,717 46,235Dishman Carbogen Amcis, Ltd. (A) 5,361 8,010DLF, Ltd. 42,524 167,343Edelweiss Financial Services, Ltd. (A) 46,814 40,673EID Parry India, Ltd. (A) 12,265 53,376Exide Industries, Ltd. 26,285 66,324Federal Bank, Ltd. (A) 191,615 199,344Finolex Industries, Ltd. (A) 5,072 44,292Firstsource Solutions, Ltd. 16,189 25,391Fortis Healthcare, Ltd. (A) 23,713 64,744GAIL India, Ltd. 193,496 360,085General Insurance Corp. ofIndia (A)(C) 8,025 21,890GHCL, Ltd. (A) 6,390 20,064
ICICI Bank, Ltd., ADR (A) 17,653 282,978IDFC First Bank, Ltd. (A) 126,067 96,487IDFC, Ltd. (A) 67,378 44,312IIFL Finance, Ltd. 28,925 112,125IIFL Securities, Ltd. 47,890 30,765IIFL Wealth Management, Ltd. 2,557 43,140Indiabulls Housing Finance, Ltd. (A) 33,338 89,946Indiabulls Real Estate, Ltd. (A) 28,092 31,157Indian Bank (A) 13,953 22,187Indus Towers, Ltd. 32,463 109,144IndusInd Bank, Ltd. (A) 8,509 112,129Jagran Prakashan, Ltd. (A) 12,700 10,247Jindal Saw, Ltd. 29,627 30,119Jindal Steel & Power, Ltd. (A) 52,794 249,940JK Cement, Ltd. 2,600 102,570JK Tyre & Industries, Ltd. 8,887 13,215JM Financial, Ltd. 33,116 38,626JSW Energy, Ltd. 51,942 62,498JSW Steel, Ltd. 103,888 670,892Jubilant Ingrevia, Ltd. (A)(D) 11,603 18,663Jubilant Pharmova, Ltd. (A) 11,603 108,110Just Dial, Ltd. (A) 1,950 23,312Jyothy Labs, Ltd. (A) 5,194 9,746Kalpataru Power Transmission, Ltd. 9,196 47,265Kaveri Seed Company, Ltd. 1,661 11,691Kiri Industries, Ltd. 2,637 15,028KPIT Technologies, Ltd. (A) 13,384 32,451KPR Mill, Ltd. 4,562 65,806KRBL, Ltd. (A) 2,618 6,442L&T Finance Holdings, Ltd. (A) 74,021 97,569Larsen & Toubro, Ltd. 49,161 957,585Laurus Labs, Ltd. (C) 14,325 70,562LIC Housing Finance, Ltd. 39,247 230,997Linde India, Ltd. 3,319 81,808Lupin, Ltd. 23,401 327,259Maharashtra Scooters, Ltd. (A) 404 19,761Maharashtra Seamless, Ltd. 4,212 15,813Mahindra & Mahindra Financial
Services, Ltd. (A) 59,708 162,752Mahindra & Mahindra, Ltd. 68,622 747,888Mahindra CIE Automotive, Ltd. (A) 17,673 39,129Mahindra Lifespace Developers,Ltd. (A) 3,463 26,790Manappuram Finance, Ltd. 27,778 56,887Max Healthcare Institute, Ltd. (A) 21,489 60,774MOIL, Ltd. 14,559 29,965Mphasis, Ltd. 7,494 184,725MRF, Ltd. 99 111,546NCC, Ltd. 25,675 27,843NIIT, Ltd. 6,884 12,887Nilkamal, Ltd. 1,287 34,342NMDC, Ltd. 40,445 75,153
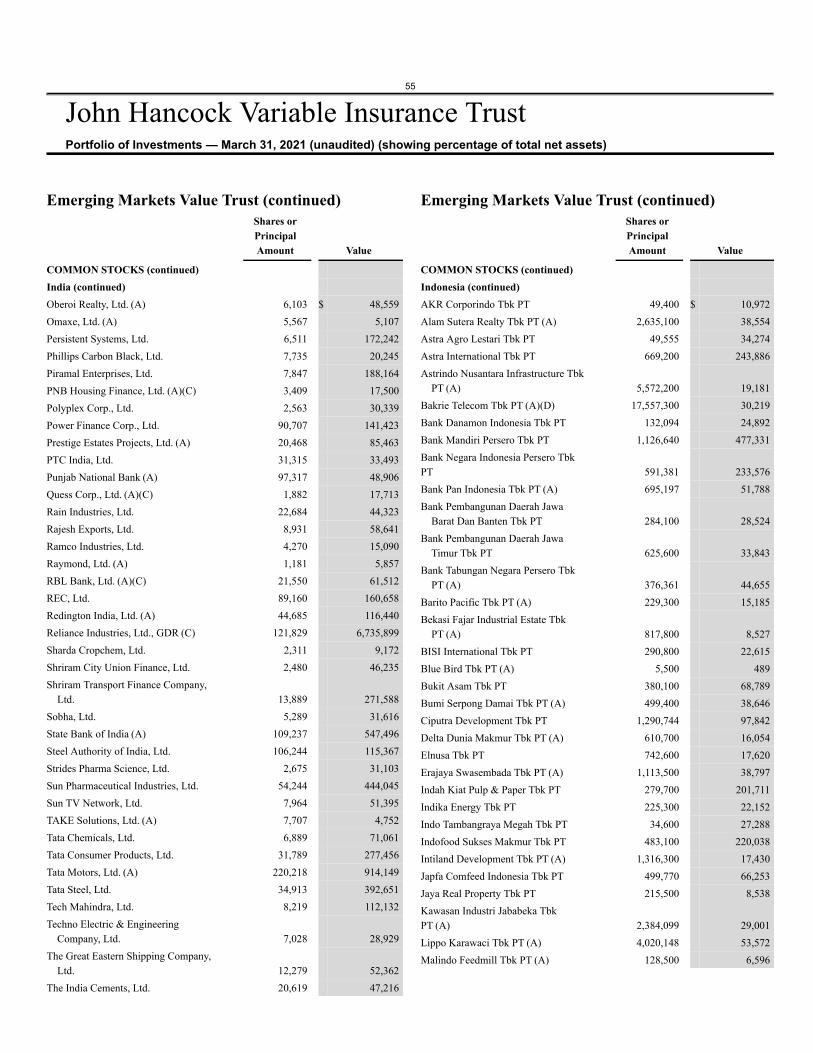
55
John Hancock Variable Insurance TrustPortfolio of Investments — March 31, 2021 (unaudited) (showing percentage of total net assets)
Emerging Markets Value Trust (continued)Shares orPrincipalAmount Value
COMMON STOCKS (continued)India (continued)Oberoi Realty, Ltd. (A) 6,103 $ 48,559Omaxe, Ltd. (A) 5,567 5,107Persistent Systems, Ltd. 6,511 172,242Phillips Carbon Black, Ltd. 7,735 20,245Piramal Enterprises, Ltd. 7,847 188,164PNB Housing Finance, Ltd. (A)(C) 3,409 17,500Polyplex Corp., Ltd. 2,563 30,339Power Finance Corp., Ltd. 90,707 141,423Prestige Estates Projects, Ltd. (A) 20,468 85,463PTC India, Ltd. 31,315 33,493Punjab National Bank (A) 97,317 48,906Quess Corp., Ltd. (A)(C) 1,882 17,713Rain Industries, Ltd. 22,684 44,323Rajesh Exports, Ltd. 8,931 58,641Ramco Industries, Ltd. 4,270 15,090Raymond, Ltd. (A) 1,181 5,857RBL Bank, Ltd. (A)(C) 21,550 61,512REC, Ltd. 89,160 160,658Redington India, Ltd. (A) 44,685 116,440Reliance Industries, Ltd., GDR (C) 121,829 6,735,899Sharda Cropchem, Ltd. 2,311 9,172Shriram City Union Finance, Ltd. 2,480 46,235Shriram Transport Finance Company,
Ltd. 13,889 271,588Sobha, Ltd. 5,289 31,616State Bank of India (A) 109,237 547,496Steel Authority of India, Ltd. 106,244 115,367Strides Pharma Science, Ltd. 2,675 31,103Sun Pharmaceutical Industries, Ltd. 54,244 444,045Sun TV Network, Ltd. 7,964 51,395TAKE Solutions, Ltd. (A) 7,707 4,752Tata Chemicals, Ltd. 6,889 71,061Tata Consumer Products, Ltd. 31,789 277,456Tata Motors, Ltd. (A) 220,218 914,149Tata Steel, Ltd. 34,913 392,651Tech Mahindra, Ltd. 8,219 112,132Techno Electric & Engineering
Company, Ltd. 7,028 28,929The Great Eastern Shipping Company,
Ltd. 12,279 52,362The India Cements, Ltd. 20,619 47,216
Emerging Markets Value Trust (continued)Shares orPrincipalAmount Value
COMMON STOCKS (continued)Indonesia (continued)AKR Corporindo Tbk PT 49,400 $ 10,972Alam Sutera Realty Tbk PT (A) 2,635,100 38,554Astra Agro Lestari Tbk PT 49,555 34,274Astra International Tbk PT 669,200 243,886Astrindo Nusantara Infrastructure Tbk
PT (A) 5,572,200 19,181Bakrie Telecom Tbk PT (A)(D) 17,557,300 30,219Bank Danamon Indonesia Tbk PT 132,094 24,892Bank Mandiri Persero Tbk PT 1,126,640 477,331Bank Negara Indonesia Persero TbkPT 591,381 233,576Bank Pan Indonesia Tbk PT (A) 695,197 51,788Bank Pembangunan Daerah Jawa
Barat Dan Banten Tbk PT 284,100 28,524Bank Pembangunan Daerah Jawa
Timur Tbk PT 625,600 33,843Bank Tabungan Negara Persero Tbk
PT (A) 376,361 44,655Barito Pacific Tbk PT (A) 229,300 15,185Bekasi Fajar Industrial Estate Tbk
PT (A) 817,800 8,527BISI International Tbk PT 290,800 22,615Blue Bird Tbk PT (A) 5,500 489Bukit Asam Tbk PT 380,100 68,789Bumi Serpong Damai Tbk PT (A) 499,400 38,646Ciputra Development Tbk PT 1,290,744 97,842Delta Dunia Makmur Tbk PT (A) 610,700 16,054Elnusa Tbk PT 742,600 17,620Erajaya Swasembada Tbk PT (A) 1,113,500 38,797Indah Kiat Pulp & Paper Tbk PT 279,700 201,711Indika Energy Tbk PT 225,300 22,152Indo Tambangraya Megah Tbk PT 34,600 27,288Indofood Sukses Makmur Tbk PT 483,100 220,038Intiland Development Tbk PT (A) 1,316,300 17,430Japfa Comfeed Indonesia Tbk PT 499,770 66,253Jaya Real Property Tbk PT 215,500 8,538Kawasan Industri Jababeka TbkPT (A) 2,384,099 29,001Lippo Karawaci Tbk PT (A) 4,020,148 53,572Malindo Feedmill Tbk PT (A) 128,500 6,596
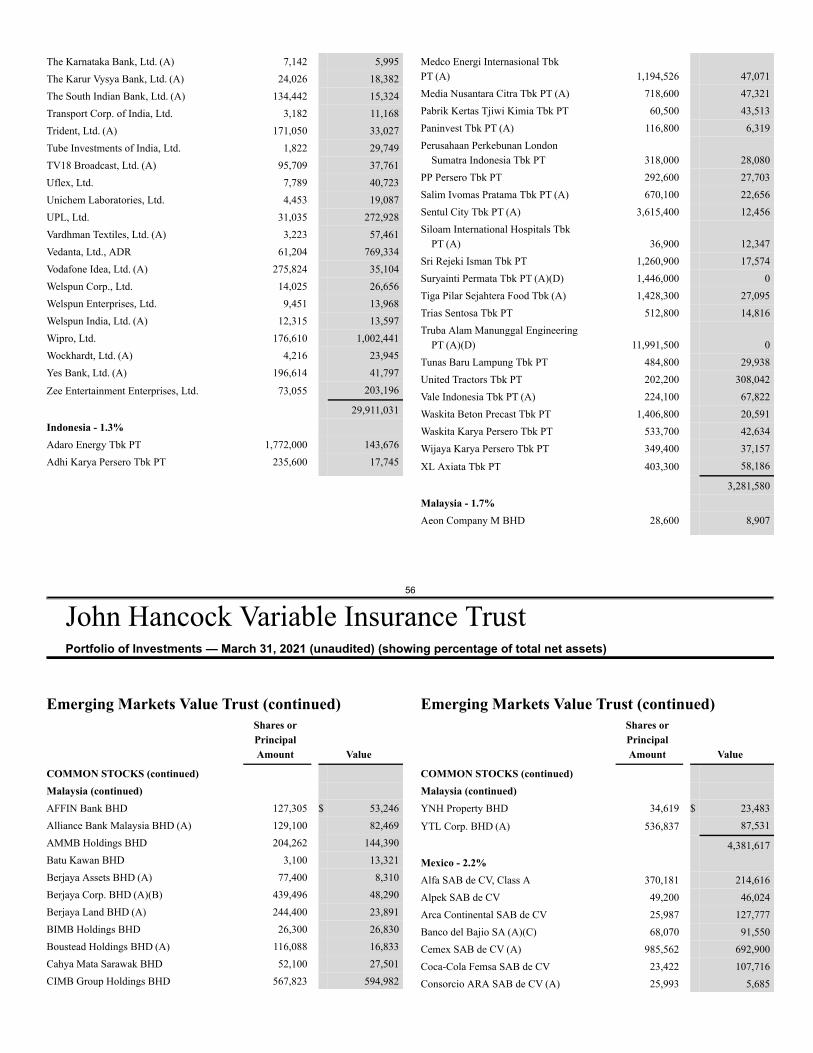
56
John Hancock Variable Insurance TrustPortfolio of Investments — March 31, 2021 (unaudited) (showing percentage of total net assets)
The Karnataka Bank, Ltd. (A) 7,142 5,995The Karur Vysya Bank, Ltd. (A) 24,026 18,382The South Indian Bank, Ltd. (A) 134,442 15,324Transport Corp. of India, Ltd. 3,182 11,168Trident, Ltd. (A) 171,050 33,027Tube Investments of India, Ltd. 1,822 29,749TV18 Broadcast, Ltd. (A) 95,709 37,761Uflex, Ltd. 7,789 40,723Unichem Laboratories, Ltd. 4,453 19,087UPL, Ltd. 31,035 272,928Vardhman Textiles, Ltd. (A) 3,223 57,461Vedanta, Ltd., ADR 61,204 769,334Vodafone Idea, Ltd. (A) 275,824 35,104Welspun Corp., Ltd. 14,025 26,656Welspun Enterprises, Ltd. 9,451 13,968Welspun India, Ltd. (A) 12,315 13,597Wipro, Ltd. 176,610 1,002,441Wockhardt, Ltd. (A) 4,216 23,945Yes Bank, Ltd. (A) 196,614 41,797
Zee Entertainment Enterprises, Ltd. 73,055 203,196
29,911,031Indonesia - 1.3%Adaro Energy Tbk PT 1,772,000 143,676Adhi Karya Persero Tbk PT 235,600 17,745
Medco Energi Internasional TbkPT (A) 1,194,526 47,071Media Nusantara Citra Tbk PT (A) 718,600 47,321Pabrik Kertas Tjiwi Kimia Tbk PT 60,500 43,513Paninvest Tbk PT (A) 116,800 6,319Perusahaan Perkebunan London
Sumatra Indonesia Tbk PT 318,000 28,080PP Persero Tbk PT 292,600 27,703Salim Ivomas Pratama Tbk PT (A) 670,100 22,656Sentul City Tbk PT (A) 3,615,400 12,456Siloam International Hospitals Tbk
PT (A) 36,900 12,347Sri Rejeki Isman Tbk PT 1,260,900 17,574Suryainti Permata Tbk PT (A)(D) 1,446,000 0Tiga Pilar Sejahtera Food Tbk (A) 1,428,300 27,095Trias Sentosa Tbk PT 512,800 14,816Truba Alam Manunggal Engineering
PT (A)(D) 11,991,500 0Tunas Baru Lampung Tbk PT 484,800 29,938United Tractors Tbk PT 202,200 308,042Vale Indonesia Tbk PT (A) 224,100 67,822Waskita Beton Precast Tbk PT 1,406,800 20,591Waskita Karya Persero Tbk PT 533,700 42,634Wijaya Karya Persero Tbk PT 349,400 37,157
XL Axiata Tbk PT 403,300 58,186
3,281,580Malaysia - 1.7%Aeon Company M BHD 28,600 8,907
Emerging Markets Value Trust (continued)Shares orPrincipalAmount Value
COMMON STOCKS (continued)Malaysia (continued)AFFIN Bank BHD 127,305 $ 53,246Alliance Bank Malaysia BHD (A) 129,100 82,469AMMB Holdings BHD 204,262 144,390Batu Kawan BHD 3,100 13,321Berjaya Assets BHD (A) 77,400 8,310Berjaya Corp. BHD (A)(B) 439,496 48,290Berjaya Land BHD (A) 244,400 23,891BIMB Holdings BHD 26,300 26,830Boustead Holdings BHD (A) 116,088 16,833Cahya Mata Sarawak BHD 52,100 27,501CIMB Group Holdings BHD 567,823 594,982
Emerging Markets Value Trust (continued)Shares orPrincipalAmount Value
COMMON STOCKS (continued)Malaysia (continued)YNH Property BHD 34,619 $ 23,483
YTL Corp. BHD (A) 536,837 87,531
4,381,617Mexico - 2.2%Alfa SAB de CV, Class A 370,181 214,616Alpek SAB de CV 49,200 46,024Arca Continental SAB de CV 25,987 127,777Banco del Bajio SA (A)(C) 68,070 91,550Cemex SAB de CV (A) 985,562 692,900Coca-Cola Femsa SAB de CV 23,422 107,716Consorcio ARA SAB de CV (A) 25,993 5,685
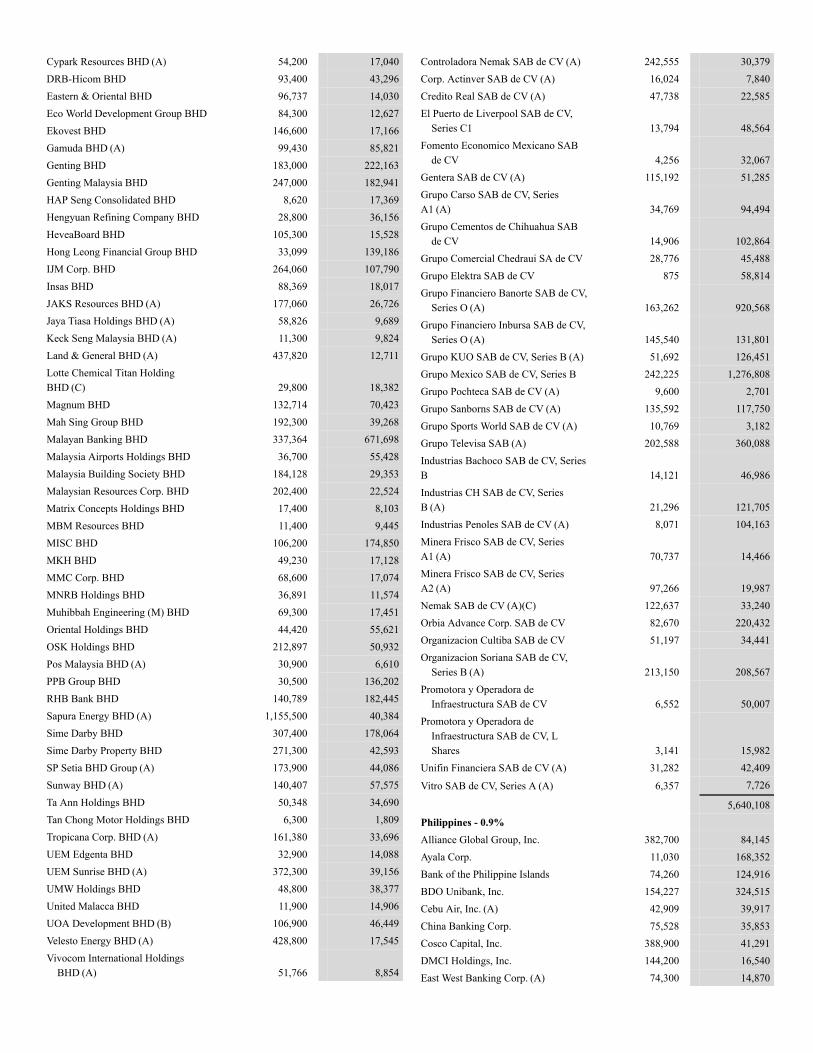
Cypark Resources BHD (A) 54,200 17,040DRB-Hicom BHD 93,400 43,296Eastern & Oriental BHD 96,737 14,030Eco World Development Group BHD 84,300 12,627Ekovest BHD 146,600 17,166Gamuda BHD (A) 99,430 85,821Genting BHD 183,000 222,163Genting Malaysia BHD 247,000 182,941HAP Seng Consolidated BHD 8,620 17,369Hengyuan Refining Company BHD 28,800 36,156HeveaBoard BHD 105,300 15,528Hong Leong Financial Group BHD 33,099 139,186IJM Corp. BHD 264,060 107,790Insas BHD 88,369 18,017JAKS Resources BHD (A) 177,060 26,726Jaya Tiasa Holdings BHD (A) 58,826 9,689Keck Seng Malaysia BHD (A) 11,300 9,824Land & General BHD (A) 437,820 12,711Lotte Chemical Titan HoldingBHD (C) 29,800 18,382Magnum BHD 132,714 70,423Mah Sing Group BHD 192,300 39,268Malayan Banking BHD 337,364 671,698Malaysia Airports Holdings BHD 36,700 55,428Malaysia Building Society BHD 184,128 29,353Malaysian Resources Corp. BHD 202,400 22,524Matrix Concepts Holdings BHD 17,400 8,103MBM Resources BHD 11,400 9,445MISC BHD 106,200 174,850MKH BHD 49,230 17,128MMC Corp. BHD 68,600 17,074MNRB Holdings BHD 36,891 11,574Muhibbah Engineering (M) BHD 69,300 17,451Oriental Holdings BHD 44,420 55,621OSK Holdings BHD 212,897 50,932Pos Malaysia BHD (A) 30,900 6,610PPB Group BHD 30,500 136,202RHB Bank BHD 140,789 182,445Sapura Energy BHD (A) 1,155,500 40,384Sime Darby BHD 307,400 178,064Sime Darby Property BHD 271,300 42,593SP Setia BHD Group (A) 173,900 44,086Sunway BHD (A) 140,407 57,575Ta Ann Holdings BHD 50,348 34,690Tan Chong Motor Holdings BHD 6,300 1,809Tropicana Corp. BHD (A) 161,380 33,696UEM Edgenta BHD 32,900 14,088UEM Sunrise BHD (A) 372,300 39,156UMW Holdings BHD 48,800 38,377United Malacca BHD 11,900 14,906UOA Development BHD (B) 106,900 46,449Velesto Energy BHD (A) 428,800 17,545Vivocom International Holdings
BHD (A) 51,766 8,854
Controladora Nemak SAB de CV (A) 242,555 30,379Corp. Actinver SAB de CV (A) 16,024 7,840Credito Real SAB de CV (A) 47,738 22,585El Puerto de Liverpool SAB de CV,
Series C1 13,794 48,564Fomento Economico Mexicano SAB
de CV 4,256 32,067Gentera SAB de CV (A) 115,192 51,285Grupo Carso SAB de CV, SeriesA1 (A) 34,769 94,494Grupo Cementos de Chihuahua SAB
de CV 14,906 102,864Grupo Comercial Chedraui SA de CV 28,776 45,488Grupo Elektra SAB de CV 875 58,814Grupo Financiero Banorte SAB de CV,
Series O (A) 163,262 920,568Grupo Financiero Inbursa SAB de CV,
Series O (A) 145,540 131,801Grupo KUO SAB de CV, Series B (A) 51,692 126,451Grupo Mexico SAB de CV, Series B 242,225 1,276,808Grupo Pochteca SAB de CV (A) 9,600 2,701Grupo Sanborns SAB de CV (A) 135,592 117,750Grupo Sports World SAB de CV (A) 10,769 3,182Grupo Televisa SAB (A) 202,588 360,088Industrias Bachoco SAB de CV, SeriesB 14,121 46,986Industrias CH SAB de CV, SeriesB (A) 21,296 121,705Industrias Penoles SAB de CV (A) 8,071 104,163Minera Frisco SAB de CV, SeriesA1 (A) 70,737 14,466Minera Frisco SAB de CV, SeriesA2 (A) 97,266 19,987Nemak SAB de CV (A)(C) 122,637 33,240Orbia Advance Corp. SAB de CV 82,670 220,432Organizacion Cultiba SAB de CV 51,197 34,441Organizacion Soriana SAB de CV,
Series B (A) 213,150 208,567Promotora y Operadora de
Infraestructura SAB de CV 6,552 50,007Promotora y Operadora de
Infraestructura SAB de CV, LShares 3,141 15,982
Unifin Financiera SAB de CV (A) 31,282 42,409
Vitro SAB de CV, Series A (A) 6,357 7,726
5,640,108Philippines - 0.9%Alliance Global Group, Inc. 382,700 84,145Ayala Corp. 11,030 168,352Bank of the Philippine Islands 74,260 124,916BDO Unibank, Inc. 154,227 324,515Cebu Air, Inc. (A) 42,909 39,917China Banking Corp. 75,528 35,853Cosco Capital, Inc. 388,900 41,291DMCI Holdings, Inc. 144,200 16,540East West Banking Corp. (A) 74,300 14,870
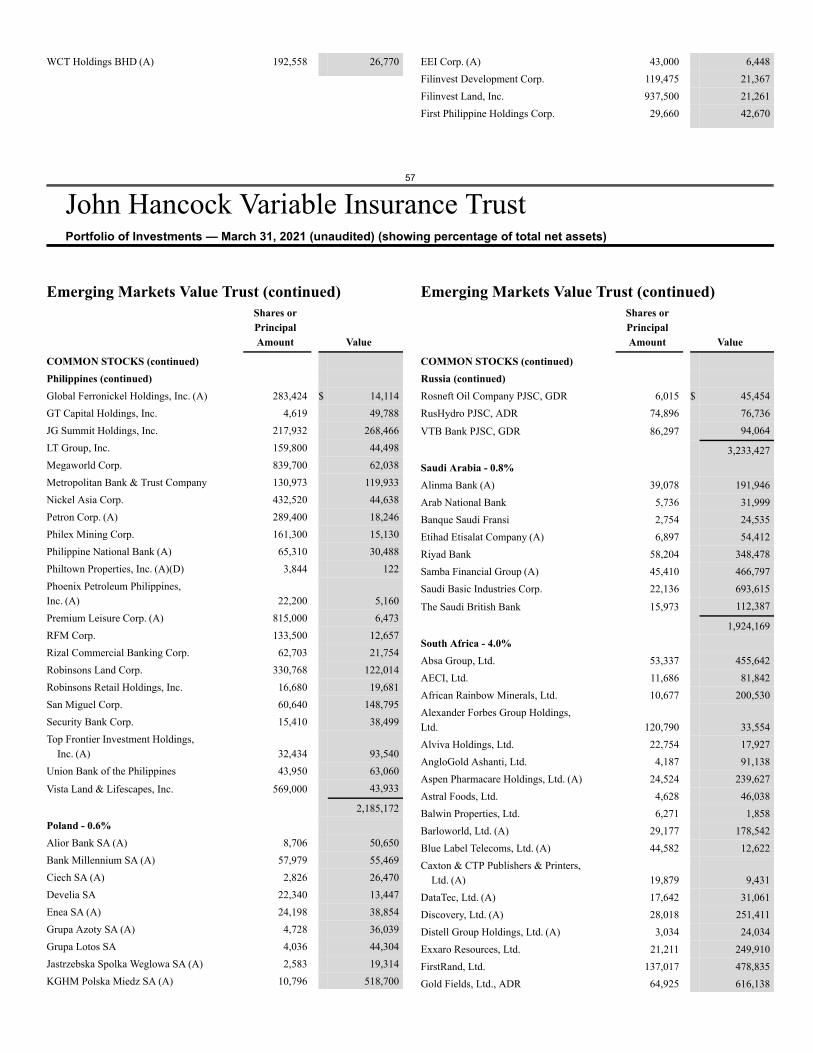
57
John Hancock Variable Insurance TrustPortfolio of Investments — March 31, 2021 (unaudited) (showing percentage of total net assets)
WCT Holdings BHD (A) 192,558 26,770 EEI Corp. (A) 43,000 6,448Filinvest Development Corp. 119,475 21,367Filinvest Land, Inc. 937,500 21,261First Philippine Holdings Corp. 29,660 42,670
Emerging Markets Value Trust (continued)Shares orPrincipalAmount Value
COMMON STOCKS (continued)Philippines (continued)Global Ferronickel Holdings, Inc. (A) 283,424 $ 14,114GT Capital Holdings, Inc. 4,619 49,788JG Summit Holdings, Inc. 217,932 268,466LT Group, Inc. 159,800 44,498Megaworld Corp. 839,700 62,038Metropolitan Bank & Trust Company 130,973 119,933Nickel Asia Corp. 432,520 44,638Petron Corp. (A) 289,400 18,246Philex Mining Corp. 161,300 15,130Philippine National Bank (A) 65,310 30,488Philtown Properties, Inc. (A)(D) 3,844 122Phoenix Petroleum Philippines,Inc. (A) 22,200 5,160Premium Leisure Corp. (A) 815,000 6,473RFM Corp. 133,500 12,657Rizal Commercial Banking Corp. 62,703 21,754Robinsons Land Corp. 330,768 122,014Robinsons Retail Holdings, Inc. 16,680 19,681San Miguel Corp. 60,640 148,795Security Bank Corp. 15,410 38,499Top Frontier Investment Holdings,
Inc. (A) 32,434 93,540Union Bank of the Philippines 43,950 63,060
Vista Land & Lifescapes, Inc. 569,000 43,933
2,185,172Poland - 0.6%Alior Bank SA (A) 8,706 50,650Bank Millennium SA (A) 57,979 55,469Ciech SA (A) 2,826 26,470Develia SA 22,340 13,447Enea SA (A) 24,198 38,854Grupa Azoty SA (A) 4,728 36,039Grupa Lotos SA 4,036 44,304Jastrzebska Spolka Weglowa SA (A) 2,583 19,314KGHM Polska Miedz SA (A) 10,796 518,700
Emerging Markets Value Trust (continued)Shares orPrincipalAmount Value
COMMON STOCKS (continued)Russia (continued)Rosneft Oil Company PJSC, GDR 6,015 $ 45,454RusHydro PJSC, ADR 74,896 76,736
VTB Bank PJSC, GDR 86,297 94,064
3,233,427Saudi Arabia - 0.8%Alinma Bank (A) 39,078 191,946Arab National Bank 5,736 31,999Banque Saudi Fransi 2,754 24,535Etihad Etisalat Company (A) 6,897 54,412Riyad Bank 58,204 348,478Samba Financial Group (A) 45,410 466,797Saudi Basic Industries Corp. 22,136 693,615
The Saudi British Bank 15,973 112,387
1,924,169South Africa - 4.0%Absa Group, Ltd. 53,337 455,642AECI, Ltd. 11,686 81,842African Rainbow Minerals, Ltd. 10,677 200,530Alexander Forbes Group Holdings,Ltd. 120,790 33,554Alviva Holdings, Ltd. 22,754 17,927AngloGold Ashanti, Ltd. 4,187 91,138Aspen Pharmacare Holdings, Ltd. (A) 24,524 239,627Astral Foods, Ltd. 4,628 46,038Balwin Properties, Ltd. 6,271 1,858Barloworld, Ltd. (A) 29,177 178,542Blue Label Telecoms, Ltd. (A) 44,582 12,622Caxton & CTP Publishers & Printers,
Ltd. (A) 19,879 9,431DataTec, Ltd. (A) 17,642 31,061Discovery, Ltd. (A) 28,018 251,411Distell Group Holdings, Ltd. (A) 3,034 24,034Exxaro Resources, Ltd. 21,211 249,910FirstRand, Ltd. 137,017 478,835Gold Fields, Ltd., ADR 64,925 616,138
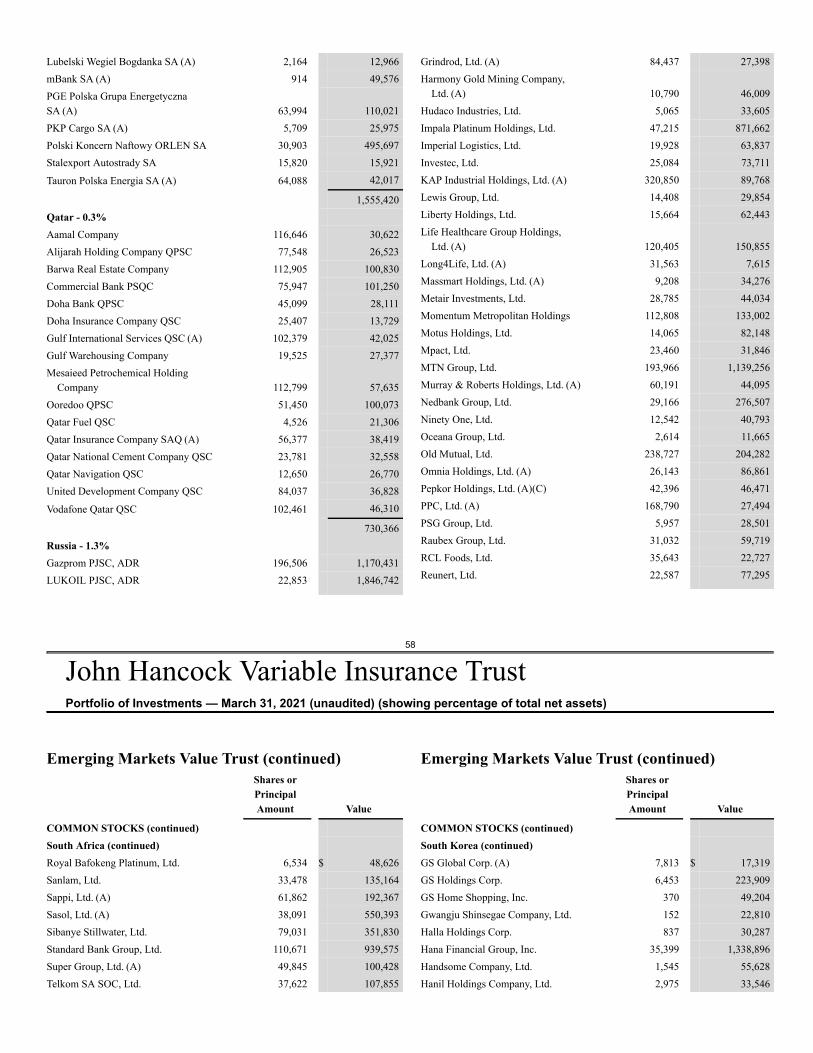
58
John Hancock Variable Insurance TrustPortfolio of Investments — March 31, 2021 (unaudited) (showing percentage of total net assets)
Lubelski Wegiel Bogdanka SA (A) 2,164 12,966mBank SA (A) 914 49,576PGE Polska Grupa EnergetycznaSA (A) 63,994 110,021PKP Cargo SA (A) 5,709 25,975Polski Koncern Naftowy ORLEN SA 30,903 495,697Stalexport Autostrady SA 15,820 15,921
Tauron Polska Energia SA (A) 64,088 42,017
1,555,420Qatar - 0.3%Aamal Company 116,646 30,622Alijarah Holding Company QPSC 77,548 26,523Barwa Real Estate Company 112,905 100,830Commercial Bank PSQC 75,947 101,250Doha Bank QPSC 45,099 28,111Doha Insurance Company QSC 25,407 13,729Gulf International Services QSC (A) 102,379 42,025Gulf Warehousing Company 19,525 27,377Mesaieed Petrochemical Holding
Company 112,799 57,635Ooredoo QPSC 51,450 100,073Qatar Fuel QSC 4,526 21,306Qatar Insurance Company SAQ (A) 56,377 38,419Qatar National Cement Company QSC 23,781 32,558Qatar Navigation QSC 12,650 26,770United Development Company QSC 84,037 36,828
Vodafone Qatar QSC 102,461 46,310
730,366Russia - 1.3%Gazprom PJSC, ADR 196,506 1,170,431LUKOIL PJSC, ADR 22,853 1,846,742
Grindrod, Ltd. (A) 84,437 27,398Harmony Gold Mining Company,
Ltd. (A) 10,790 46,009Hudaco Industries, Ltd. 5,065 33,605Impala Platinum Holdings, Ltd. 47,215 871,662Imperial Logistics, Ltd. 19,928 63,837Investec, Ltd. 25,084 73,711KAP Industrial Holdings, Ltd. (A) 320,850 89,768Lewis Group, Ltd. 14,408 29,854Liberty Holdings, Ltd. 15,664 62,443Life Healthcare Group Holdings,
Ltd. (A) 120,405 150,855Long4Life, Ltd. (A) 31,563 7,615Massmart Holdings, Ltd. (A) 9,208 34,276Metair Investments, Ltd. 28,785 44,034Momentum Metropolitan Holdings 112,808 133,002Motus Holdings, Ltd. 14,065 82,148Mpact, Ltd. 23,460 31,846MTN Group, Ltd. 193,966 1,139,256Murray & Roberts Holdings, Ltd. (A) 60,191 44,095Nedbank Group, Ltd. 29,166 276,507Ninety One, Ltd. 12,542 40,793Oceana Group, Ltd. 2,614 11,665Old Mutual, Ltd. 238,727 204,282Omnia Holdings, Ltd. (A) 26,143 86,861Pepkor Holdings, Ltd. (A)(C) 42,396 46,471PPC, Ltd. (A) 168,790 27,494PSG Group, Ltd. 5,957 28,501Raubex Group, Ltd. 31,032 59,719RCL Foods, Ltd. 35,643 22,727Reunert, Ltd. 22,587 77,295
Emerging Markets Value Trust (continued)Shares orPrincipalAmount Value
COMMON STOCKS (continued)South Africa (continued)Royal Bafokeng Platinum, Ltd. 6,534 $ 48,626Sanlam, Ltd. 33,478 135,164Sappi, Ltd. (A) 61,862 192,367Sasol, Ltd. (A) 38,091 550,393Sibanye Stillwater, Ltd. 79,031 351,830Standard Bank Group, Ltd. 110,671 939,575Super Group, Ltd. (A) 49,845 100,428Telkom SA SOC, Ltd. 37,622 107,855
Emerging Markets Value Trust (continued)Shares orPrincipalAmount Value
COMMON STOCKS (continued)South Korea (continued)GS Global Corp. (A) 7,813 $ 17,319GS Holdings Corp. 6,453 223,909GS Home Shopping, Inc. 370 49,204Gwangju Shinsegae Company, Ltd. 152 22,810Halla Holdings Corp. 837 30,287Hana Financial Group, Inc. 35,399 1,338,896Handsome Company, Ltd. 1,545 55,628Hanil Holdings Company, Ltd. 2,975 33,546
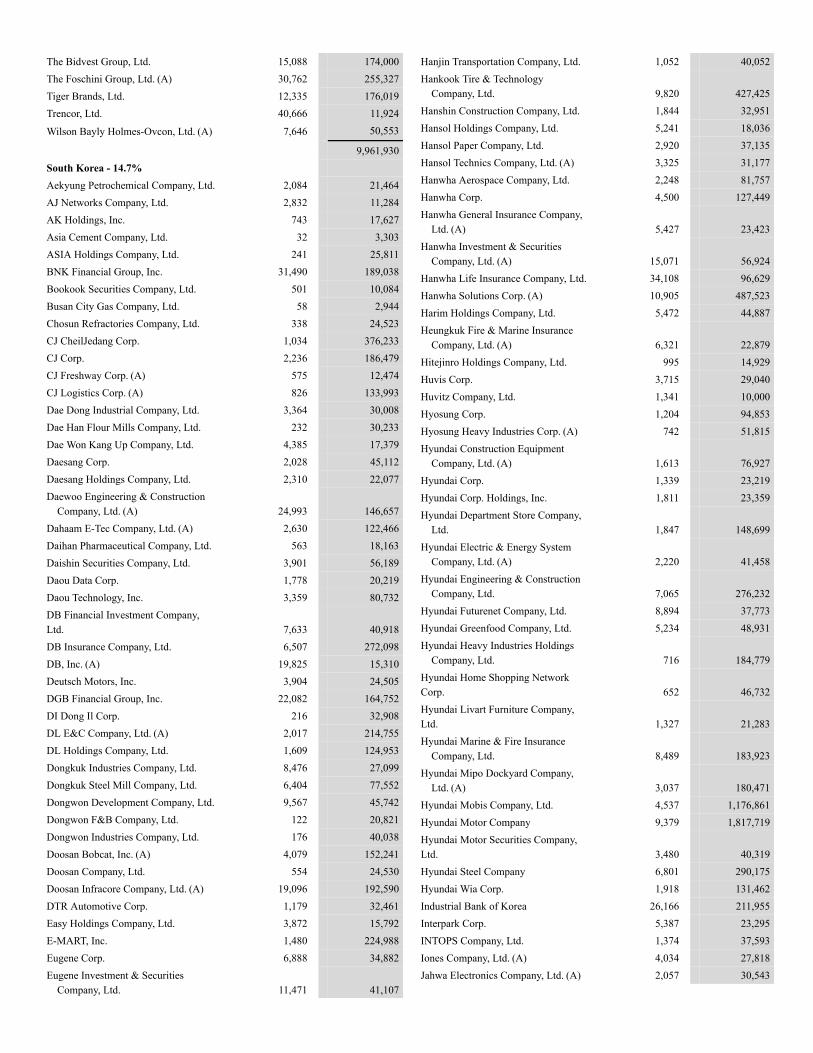
The Bidvest Group, Ltd. 15,088 174,000The Foschini Group, Ltd. (A) 30,762 255,327Tiger Brands, Ltd. 12,335 176,019Trencor, Ltd. 40,666 11,924
Wilson Bayly Holmes-Ovcon, Ltd. (A) 7,646 50,553
9,961,930South Korea - 14.7%Aekyung Petrochemical Company, Ltd. 2,084 21,464AJ Networks Company, Ltd. 2,832 11,284AK Holdings, Inc. 743 17,627Asia Cement Company, Ltd. 32 3,303ASIA Holdings Company, Ltd. 241 25,811BNK Financial Group, Inc. 31,490 189,038Bookook Securities Company, Ltd. 501 10,084Busan City Gas Company, Ltd. 58 2,944Chosun Refractories Company, Ltd. 338 24,523CJ CheilJedang Corp. 1,034 376,233CJ Corp. 2,236 186,479CJ Freshway Corp. (A) 575 12,474CJ Logistics Corp. (A) 826 133,993Dae Dong Industrial Company, Ltd. 3,364 30,008Dae Han Flour Mills Company, Ltd. 232 30,233Dae Won Kang Up Company, Ltd. 4,385 17,379Daesang Corp. 2,028 45,112Daesang Holdings Company, Ltd. 2,310 22,077Daewoo Engineering & Construction
Company, Ltd. (A) 24,993 146,657Dahaam E-Tec Company, Ltd. (A) 2,630 122,466Daihan Pharmaceutical Company, Ltd. 563 18,163Daishin Securities Company, Ltd. 3,901 56,189Daou Data Corp. 1,778 20,219Daou Technology, Inc. 3,359 80,732DB Financial Investment Company,Ltd. 7,633 40,918DB Insurance Company, Ltd. 6,507 272,098DB, Inc. (A) 19,825 15,310Deutsch Motors, Inc. 3,904 24,505DGB Financial Group, Inc. 22,082 164,752DI Dong Il Corp. 216 32,908DL E&C Company, Ltd. (A) 2,017 214,755DL Holdings Company, Ltd. 1,609 124,953Dongkuk Industries Company, Ltd. 8,476 27,099Dongkuk Steel Mill Company, Ltd. 6,404 77,552Dongwon Development Company, Ltd. 9,567 45,742Dongwon F&B Company, Ltd. 122 20,821Dongwon Industries Company, Ltd. 176 40,038Doosan Bobcat, Inc. (A) 4,079 152,241Doosan Company, Ltd. 554 24,530Doosan Infracore Company, Ltd. (A) 19,096 192,590DTR Automotive Corp. 1,179 32,461Easy Holdings Company, Ltd. 3,872 15,792E-MART, Inc. 1,480 224,988Eugene Corp. 6,888 34,882Eugene Investment & Securities
Company, Ltd. 11,471 41,107
Hanjin Transportation Company, Ltd. 1,052 40,052Hankook Tire & Technology
Company, Ltd. 9,820 427,425Hanshin Construction Company, Ltd. 1,844 32,951Hansol Holdings Company, Ltd. 5,241 18,036Hansol Paper Company, Ltd. 2,920 37,135Hansol Technics Company, Ltd. (A) 3,325 31,177Hanwha Aerospace Company, Ltd. 2,248 81,757Hanwha Corp. 4,500 127,449Hanwha General Insurance Company,
Ltd. (A) 5,427 23,423Hanwha Investment & Securities
Company, Ltd. (A) 15,071 56,924Hanwha Life Insurance Company, Ltd. 34,108 96,629Hanwha Solutions Corp. (A) 10,905 487,523Harim Holdings Company, Ltd. 5,472 44,887Heungkuk Fire & Marine Insurance
Company, Ltd. (A) 6,321 22,879Hitejinro Holdings Company, Ltd. 995 14,929Huvis Corp. 3,715 29,040Huvitz Company, Ltd. 1,341 10,000Hyosung Corp. 1,204 94,853Hyosung Heavy Industries Corp. (A) 742 51,815Hyundai Construction Equipment
Company, Ltd. (A) 1,613 76,927Hyundai Corp. 1,339 23,219Hyundai Corp. Holdings, Inc. 1,811 23,359Hyundai Department Store Company,
Ltd. 1,847 148,699Hyundai Electric & Energy System
Company, Ltd. (A) 2,220 41,458Hyundai Engineering & Construction
Company, Ltd. 7,065 276,232Hyundai Futurenet Company, Ltd. 8,894 37,773Hyundai Greenfood Company, Ltd. 5,234 48,931Hyundai Heavy Industries Holdings
Company, Ltd. 716 184,779Hyundai Home Shopping NetworkCorp. 652 46,732Hyundai Livart Furniture Company,Ltd. 1,327 21,283Hyundai Marine & Fire Insurance
Company, Ltd. 8,489 183,923Hyundai Mipo Dockyard Company,
Ltd. (A) 3,037 180,471Hyundai Mobis Company, Ltd. 4,537 1,176,861Hyundai Motor Company 9,379 1,817,719Hyundai Motor Securities Company,Ltd. 3,480 40,319Hyundai Steel Company 6,801 290,175Hyundai Wia Corp. 1,918 131,462Industrial Bank of Korea 26,166 211,955Interpark Corp. 5,387 23,295INTOPS Company, Ltd. 1,374 37,593Iones Company, Ltd. (A) 4,034 27,818Jahwa Electronics Company, Ltd. (A) 2,057 30,543
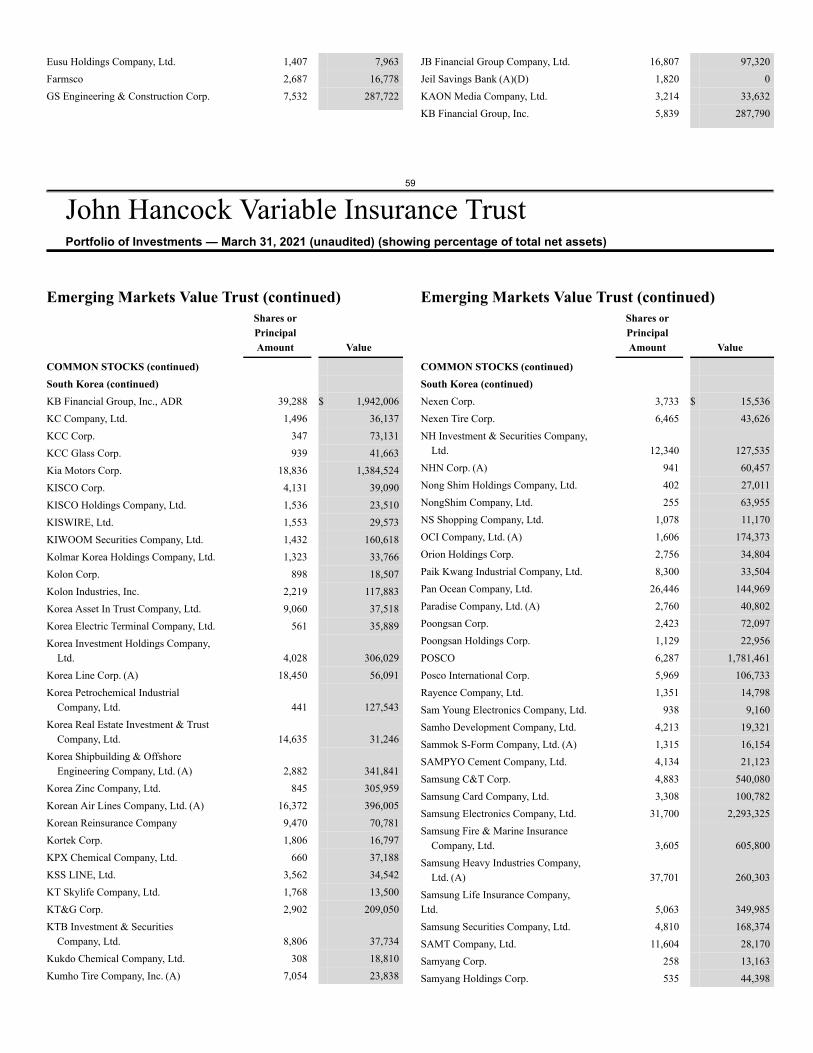
59
John Hancock Variable Insurance TrustPortfolio of Investments — March 31, 2021 (unaudited) (showing percentage of total net assets)
Eusu Holdings Company, Ltd. 1,407 7,963Farmsco 2,687 16,778GS Engineering & Construction Corp. 7,532 287,722
JB Financial Group Company, Ltd. 16,807 97,320Jeil Savings Bank (A)(D) 1,820 0KAON Media Company, Ltd. 3,214 33,632KB Financial Group, Inc. 5,839 287,790
Emerging Markets Value Trust (continued)Shares orPrincipalAmount Value
COMMON STOCKS (continued)South Korea (continued)KB Financial Group, Inc., ADR 39,288 $ 1,942,006KC Company, Ltd. 1,496 36,137KCC Corp. 347 73,131KCC Glass Corp. 939 41,663Kia Motors Corp. 18,836 1,384,524KISCO Corp. 4,131 39,090KISCO Holdings Company, Ltd. 1,536 23,510KISWIRE, Ltd. 1,553 29,573KIWOOM Securities Company, Ltd. 1,432 160,618Kolmar Korea Holdings Company, Ltd. 1,323 33,766Kolon Corp. 898 18,507Kolon Industries, Inc. 2,219 117,883Korea Asset In Trust Company, Ltd. 9,060 37,518Korea Electric Terminal Company, Ltd. 561 35,889Korea Investment Holdings Company,
Ltd. 4,028 306,029Korea Line Corp. (A) 18,450 56,091Korea Petrochemical Industrial
Company, Ltd. 441 127,543Korea Real Estate Investment & Trust
Company, Ltd. 14,635 31,246Korea Shipbuilding & Offshore
Engineering Company, Ltd. (A) 2,882 341,841Korea Zinc Company, Ltd. 845 305,959Korean Air Lines Company, Ltd. (A) 16,372 396,005Korean Reinsurance Company 9,470 70,781Kortek Corp. 1,806 16,797KPX Chemical Company, Ltd. 660 37,188KSS LINE, Ltd. 3,562 34,542KT Skylife Company, Ltd. 1,768 13,500KT&G Corp. 2,902 209,050KTB Investment & Securities
Company, Ltd. 8,806 37,734Kukdo Chemical Company, Ltd. 308 18,810Kumho Tire Company, Inc. (A) 7,054 23,838
Emerging Markets Value Trust (continued)Shares orPrincipalAmount Value
COMMON STOCKS (continued)South Korea (continued)Nexen Corp. 3,733 $ 15,536Nexen Tire Corp. 6,465 43,626NH Investment & Securities Company,
Ltd. 12,340 127,535NHN Corp. (A) 941 60,457Nong Shim Holdings Company, Ltd. 402 27,011NongShim Company, Ltd. 255 63,955NS Shopping Company, Ltd. 1,078 11,170OCI Company, Ltd. (A) 1,606 174,373Orion Holdings Corp. 2,756 34,804Paik Kwang Industrial Company, Ltd. 8,300 33,504Pan Ocean Company, Ltd. 26,446 144,969Paradise Company, Ltd. (A) 2,760 40,802Poongsan Corp. 2,423 72,097Poongsan Holdings Corp. 1,129 22,956POSCO 6,287 1,781,461Posco International Corp. 5,969 106,733Rayence Company, Ltd. 1,351 14,798Sam Young Electronics Company, Ltd. 938 9,160Samho Development Company, Ltd. 4,213 19,321Sammok S-Form Company, Ltd. (A) 1,315 16,154SAMPYO Cement Company, Ltd. 4,134 21,123Samsung C&T Corp. 4,883 540,080Samsung Card Company, Ltd. 3,308 100,782Samsung Electronics Company, Ltd. 31,700 2,293,325Samsung Fire & Marine Insurance
Company, Ltd. 3,605 605,800Samsung Heavy Industries Company,
Ltd. (A) 37,701 260,303Samsung Life Insurance Company,Ltd. 5,063 349,985Samsung Securities Company, Ltd. 4,810 168,374SAMT Company, Ltd. 11,604 28,170Samyang Corp. 258 13,163Samyang Holdings Corp. 535 44,398
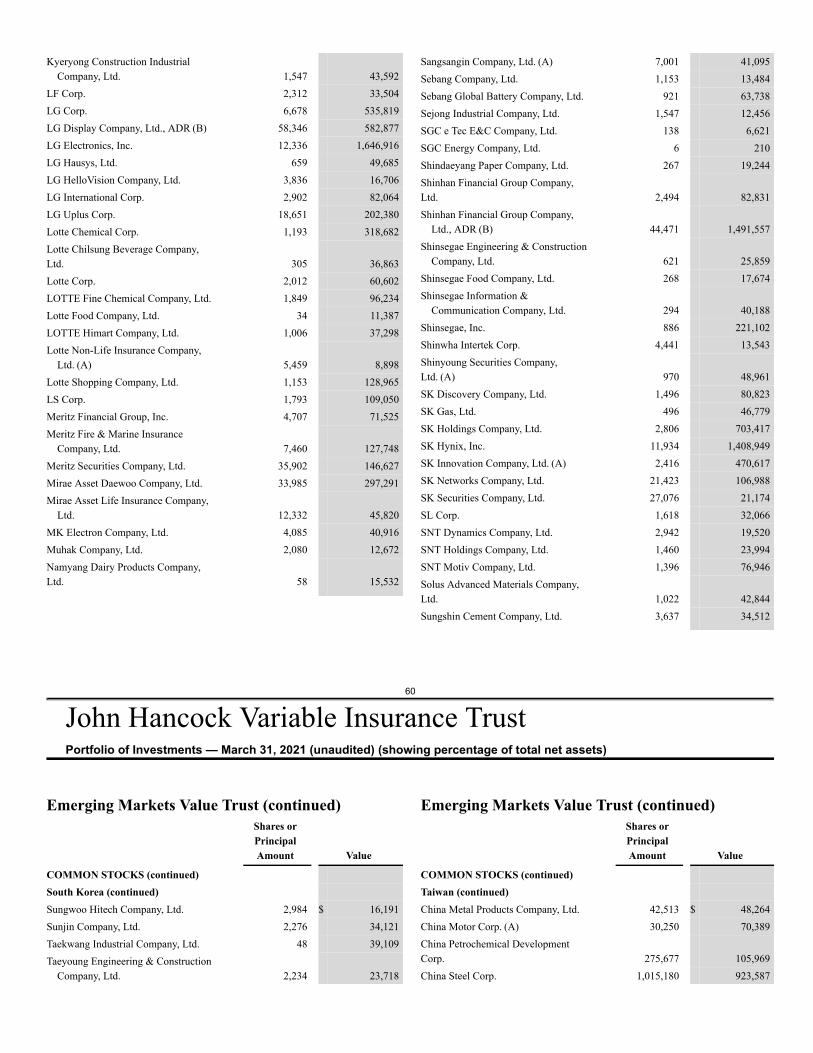
60
John Hancock Variable Insurance TrustPortfolio of Investments — March 31, 2021 (unaudited) (showing percentage of total net assets)
Kyeryong Construction IndustrialCompany, Ltd. 1,547 43,592
LF Corp. 2,312 33,504LG Corp. 6,678 535,819LG Display Company, Ltd., ADR (B) 58,346 582,877LG Electronics, Inc. 12,336 1,646,916LG Hausys, Ltd. 659 49,685LG HelloVision Company, Ltd. 3,836 16,706LG International Corp. 2,902 82,064LG Uplus Corp. 18,651 202,380Lotte Chemical Corp. 1,193 318,682Lotte Chilsung Beverage Company,Ltd. 305 36,863Lotte Corp. 2,012 60,602LOTTE Fine Chemical Company, Ltd. 1,849 96,234Lotte Food Company, Ltd. 34 11,387LOTTE Himart Company, Ltd. 1,006 37,298Lotte Non-Life Insurance Company,
Ltd. (A) 5,459 8,898Lotte Shopping Company, Ltd. 1,153 128,965LS Corp. 1,793 109,050Meritz Financial Group, Inc. 4,707 71,525Meritz Fire & Marine Insurance
Company, Ltd. 7,460 127,748Meritz Securities Company, Ltd. 35,902 146,627Mirae Asset Daewoo Company, Ltd. 33,985 297,291Mirae Asset Life Insurance Company,
Ltd. 12,332 45,820MK Electron Company, Ltd. 4,085 40,916Muhak Company, Ltd. 2,080 12,672Namyang Dairy Products Company,Ltd. 58 15,532
Sangsangin Company, Ltd. (A) 7,001 41,095Sebang Company, Ltd. 1,153 13,484Sebang Global Battery Company, Ltd. 921 63,738Sejong Industrial Company, Ltd. 1,547 12,456SGC e Tec E&C Company, Ltd. 138 6,621SGC Energy Company, Ltd. 6 210Shindaeyang Paper Company, Ltd. 267 19,244Shinhan Financial Group Company,Ltd. 2,494 82,831Shinhan Financial Group Company,
Ltd., ADR (B) 44,471 1,491,557Shinsegae Engineering & Construction
Company, Ltd. 621 25,859Shinsegae Food Company, Ltd. 268 17,674Shinsegae Information &
Communication Company, Ltd. 294 40,188Shinsegae, Inc. 886 221,102Shinwha Intertek Corp. 4,441 13,543Shinyoung Securities Company,Ltd. (A) 970 48,961SK Discovery Company, Ltd. 1,496 80,823SK Gas, Ltd. 496 46,779SK Holdings Company, Ltd. 2,806 703,417SK Hynix, Inc. 11,934 1,408,949SK Innovation Company, Ltd. (A) 2,416 470,617SK Networks Company, Ltd. 21,423 106,988SK Securities Company, Ltd. 27,076 21,174SL Corp. 1,618 32,066SNT Dynamics Company, Ltd. 2,942 19,520SNT Holdings Company, Ltd. 1,460 23,994SNT Motiv Company, Ltd. 1,396 76,946Solus Advanced Materials Company,Ltd. 1,022 42,844Sungshin Cement Company, Ltd. 3,637 34,512
Emerging Markets Value Trust (continued)Shares orPrincipalAmount Value
COMMON STOCKS (continued)South Korea (continued)Sungwoo Hitech Company, Ltd. 2,984 $ 16,191Sunjin Company, Ltd. 2,276 34,121Taekwang Industrial Company, Ltd. 48 39,109Taeyoung Engineering & Construction
Company, Ltd. 2,234 23,718
Emerging Markets Value Trust (continued)Shares orPrincipalAmount Value
COMMON STOCKS (continued)Taiwan (continued)China Metal Products Company, Ltd. 42,513 $ 48,264China Motor Corp. (A) 30,250 70,389China Petrochemical DevelopmentCorp. 275,677 105,969China Steel Corp. 1,015,180 923,587
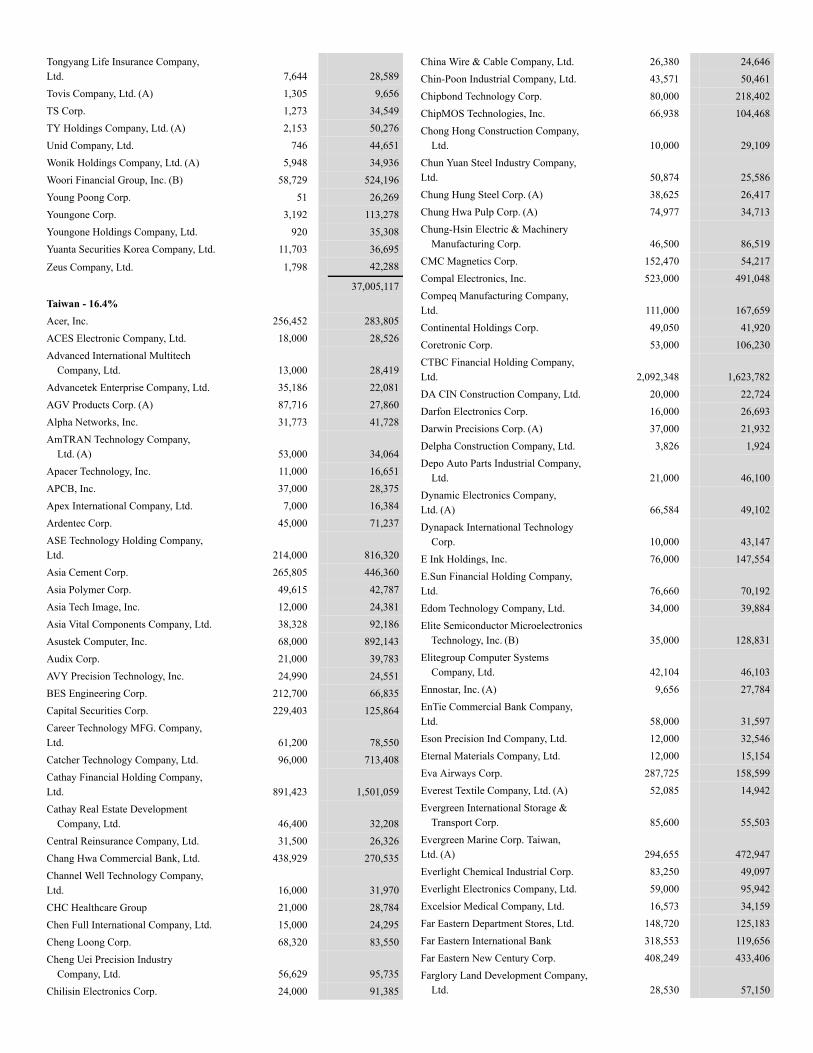
Tongyang Life Insurance Company,Ltd. 7,644 28,589Tovis Company, Ltd. (A) 1,305 9,656TS Corp. 1,273 34,549TY Holdings Company, Ltd. (A) 2,153 50,276Unid Company, Ltd. 746 44,651Wonik Holdings Company, Ltd. (A) 5,948 34,936Woori Financial Group, Inc. (B) 58,729 524,196Young Poong Corp. 51 26,269Youngone Corp. 3,192 113,278Youngone Holdings Company, Ltd. 920 35,308Yuanta Securities Korea Company, Ltd. 11,703 36,695
Zeus Company, Ltd. 1,798 42,288
37,005,117Taiwan - 16.4%Acer, Inc. 256,452 283,805ACES Electronic Company, Ltd. 18,000 28,526Advanced International Multitech
Company, Ltd. 13,000 28,419Advancetek Enterprise Company, Ltd. 35,186 22,081AGV Products Corp. (A) 87,716 27,860Alpha Networks, Inc. 31,773 41,728AmTRAN Technology Company,
Ltd. (A) 53,000 34,064Apacer Technology, Inc. 11,000 16,651APCB, Inc. 37,000 28,375Apex International Company, Ltd. 7,000 16,384Ardentec Corp. 45,000 71,237ASE Technology Holding Company,Ltd. 214,000 816,320Asia Cement Corp. 265,805 446,360Asia Polymer Corp. 49,615 42,787Asia Tech Image, Inc. 12,000 24,381Asia Vital Components Company, Ltd. 38,328 92,186Asustek Computer, Inc. 68,000 892,143Audix Corp. 21,000 39,783AVY Precision Technology, Inc. 24,990 24,551BES Engineering Corp. 212,700 66,835Capital Securities Corp. 229,403 125,864Career Technology MFG. Company,Ltd. 61,200 78,550Catcher Technology Company, Ltd. 96,000 713,408Cathay Financial Holding Company,Ltd. 891,423 1,501,059Cathay Real Estate Development
Company, Ltd. 46,400 32,208Central Reinsurance Company, Ltd. 31,500 26,326Chang Hwa Commercial Bank, Ltd. 438,929 270,535Channel Well Technology Company,Ltd. 16,000 31,970CHC Healthcare Group 21,000 28,784Chen Full International Company, Ltd. 15,000 24,295Cheng Loong Corp. 68,320 83,550Cheng Uei Precision Industry
Company, Ltd. 56,629 95,735Chilisin Electronics Corp. 24,000 91,385
China Wire & Cable Company, Ltd. 26,380 24,646Chin-Poon Industrial Company, Ltd. 43,571 50,461Chipbond Technology Corp. 80,000 218,402ChipMOS Technologies, Inc. 66,938 104,468Chong Hong Construction Company,
Ltd. 10,000 29,109Chun Yuan Steel Industry Company,Ltd. 50,874 25,586Chung Hung Steel Corp. (A) 38,625 26,417Chung Hwa Pulp Corp. (A) 74,977 34,713Chung-Hsin Electric & Machinery
Manufacturing Corp. 46,500 86,519CMC Magnetics Corp. 152,470 54,217Compal Electronics, Inc. 523,000 491,048Compeq Manufacturing Company,Ltd. 111,000 167,659Continental Holdings Corp. 49,050 41,920Coretronic Corp. 53,000 106,230CTBC Financial Holding Company,Ltd. 2,092,348 1,623,782DA CIN Construction Company, Ltd. 20,000 22,724Darfon Electronics Corp. 16,000 26,693Darwin Precisions Corp. (A) 37,000 21,932Delpha Construction Company, Ltd. 3,826 1,924Depo Auto Parts Industrial Company,
Ltd. 21,000 46,100Dynamic Electronics Company,Ltd. (A) 66,584 49,102Dynapack International Technology
Corp. 10,000 43,147E Ink Holdings, Inc. 76,000 147,554E.Sun Financial Holding Company,Ltd. 76,660 70,192Edom Technology Company, Ltd. 34,000 39,884Elite Semiconductor Microelectronics
Technology, Inc. (B) 35,000 128,831Elitegroup Computer Systems
Company, Ltd. 42,104 46,103Ennostar, Inc. (A) 9,656 27,784EnTie Commercial Bank Company,Ltd. 58,000 31,597Eson Precision Ind Company, Ltd. 12,000 32,546Eternal Materials Company, Ltd. 12,000 15,154Eva Airways Corp. 287,725 158,599Everest Textile Company, Ltd. (A) 52,085 14,942Evergreen International Storage &
Transport Corp. 85,600 55,503Evergreen Marine Corp. Taiwan,Ltd. (A) 294,655 472,947Everlight Chemical Industrial Corp. 83,250 49,097Everlight Electronics Company, Ltd. 59,000 95,942Excelsior Medical Company, Ltd. 16,573 34,159Far Eastern Department Stores, Ltd. 148,720 125,183Far Eastern International Bank 318,553 119,656Far Eastern New Century Corp. 408,249 433,406Farglory Land Development Company,
Ltd. 28,530 57,150
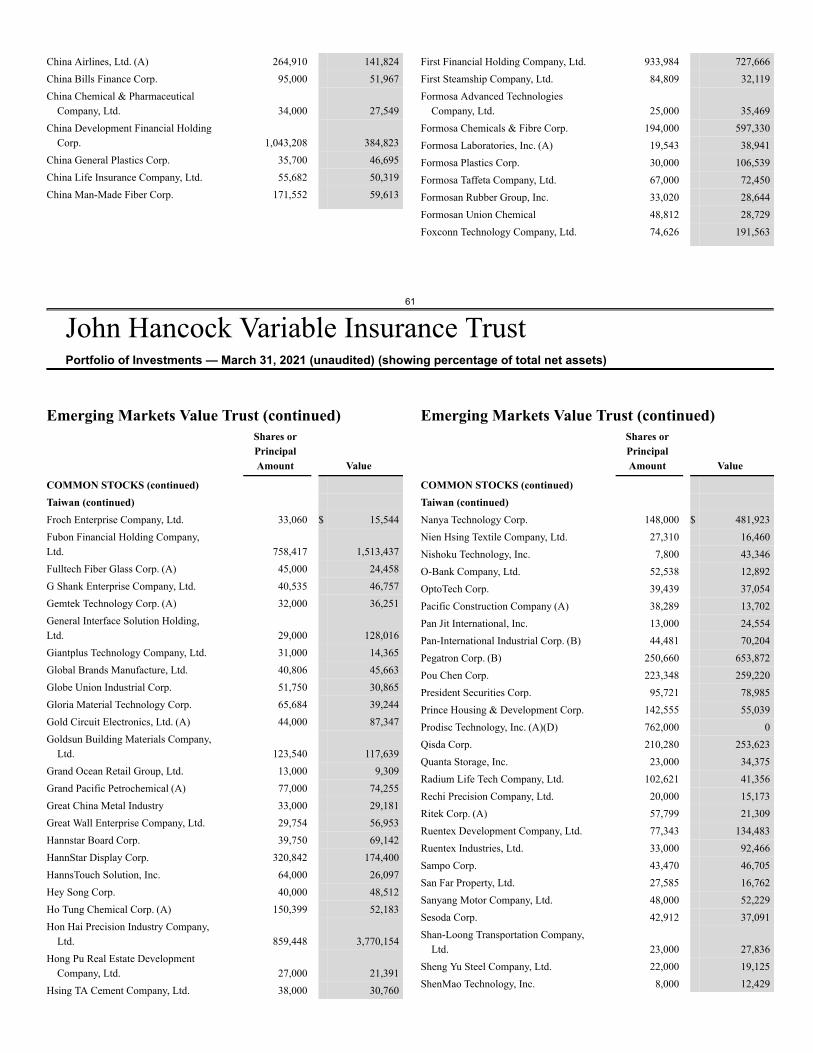
61
John Hancock Variable Insurance TrustPortfolio of Investments — March 31, 2021 (unaudited) (showing percentage of total net assets)
China Airlines, Ltd. (A) 264,910 141,824China Bills Finance Corp. 95,000 51,967China Chemical & Pharmaceutical
Company, Ltd. 34,000 27,549China Development Financial Holding
Corp. 1,043,208 384,823China General Plastics Corp. 35,700 46,695China Life Insurance Company, Ltd. 55,682 50,319China Man-Made Fiber Corp. 171,552 59,613
First Financial Holding Company, Ltd. 933,984 727,666First Steamship Company, Ltd. 84,809 32,119Formosa Advanced Technologies
Company, Ltd. 25,000 35,469Formosa Chemicals & Fibre Corp. 194,000 597,330Formosa Laboratories, Inc. (A) 19,543 38,941Formosa Plastics Corp. 30,000 106,539Formosa Taffeta Company, Ltd. 67,000 72,450Formosan Rubber Group, Inc. 33,020 28,644Formosan Union Chemical 48,812 28,729Foxconn Technology Company, Ltd. 74,626 191,563
Emerging Markets Value Trust (continued)Shares orPrincipalAmount Value
COMMON STOCKS (continued)Taiwan (continued)Froch Enterprise Company, Ltd. 33,060 $ 15,544Fubon Financial Holding Company,Ltd. 758,417 1,513,437Fulltech Fiber Glass Corp. (A) 45,000 24,458G Shank Enterprise Company, Ltd. 40,535 46,757Gemtek Technology Corp. (A) 32,000 36,251General Interface Solution Holding,Ltd. 29,000 128,016Giantplus Technology Company, Ltd. 31,000 14,365Global Brands Manufacture, Ltd. 40,806 45,663Globe Union Industrial Corp. 51,750 30,865Gloria Material Technology Corp. 65,684 39,244Gold Circuit Electronics, Ltd. (A) 44,000 87,347Goldsun Building Materials Company,
Ltd. 123,540 117,639Grand Ocean Retail Group, Ltd. 13,000 9,309Grand Pacific Petrochemical (A) 77,000 74,255Great China Metal Industry 33,000 29,181Great Wall Enterprise Company, Ltd. 29,754 56,953Hannstar Board Corp. 39,750 69,142HannStar Display Corp. 320,842 174,400HannsTouch Solution, Inc. 64,000 26,097Hey Song Corp. 40,000 48,512Ho Tung Chemical Corp. (A) 150,399 52,183Hon Hai Precision Industry Company,
Ltd. 859,448 3,770,154Hong Pu Real Estate Development
Company, Ltd. 27,000 21,391Hsing TA Cement Company, Ltd. 38,000 30,760
Emerging Markets Value Trust (continued)Shares orPrincipalAmount Value
COMMON STOCKS (continued)Taiwan (continued)Nanya Technology Corp. 148,000 $ 481,923Nien Hsing Textile Company, Ltd. 27,310 16,460Nishoku Technology, Inc. 7,800 43,346O-Bank Company, Ltd. 52,538 12,892OptoTech Corp. 39,439 37,054Pacific Construction Company (A) 38,289 13,702Pan Jit International, Inc. 13,000 24,554Pan-International Industrial Corp. (B) 44,481 70,204Pegatron Corp. (B) 250,660 653,872Pou Chen Corp. 223,348 259,220President Securities Corp. 95,721 78,985Prince Housing & Development Corp. 142,555 55,039Prodisc Technology, Inc. (A)(D) 762,000 0Qisda Corp. 210,280 253,623Quanta Storage, Inc. 23,000 34,375Radium Life Tech Company, Ltd. 102,621 41,356Rechi Precision Company, Ltd. 20,000 15,173Ritek Corp. (A) 57,799 21,309Ruentex Development Company, Ltd. 77,343 134,483Ruentex Industries, Ltd. 33,000 92,466Sampo Corp. 43,470 46,705San Far Property, Ltd. 27,585 16,762Sanyang Motor Company, Ltd. 48,000 52,229Sesoda Corp. 42,912 37,091Shan-Loong Transportation Company,
Ltd. 23,000 27,836Sheng Yu Steel Company, Ltd. 22,000 19,125ShenMao Technology, Inc. 8,000 12,429

62
John Hancock Variable Insurance TrustPortfolio of Investments — March 31, 2021 (unaudited) (showing percentage of total net assets)
HUA ENG Wire & Cable Company,Ltd. 42,000 20,536Hua Nan Financial Holdings Company,
Ltd. 594,288 388,885Hung Sheng Construction, Ltd. 42,240 29,153IBF Financial Holdings Company, Ltd. 353,740 209,610Ichia Technologies, Inc. 25,000 16,554Innolux Corp. (A)(B) 657,561 490,740Integrated Service Technology, Inc. 9,000 16,589International CSRC Investment
Holdings Company 102,383 95,092Inventec Corp. 267,000 253,112Jarllytec Company, Ltd. 9,000 27,349Jess-Link Products Company, Ltd. 13,000 19,742Kaimei Electronic Corp. 13,300 55,486Kenda Rubber Industrial Company,Ltd. 39,520 61,250King Yuan Electronics Company, Ltd. 168,796 245,122King's Town Bank Company, Ltd. 113,000 156,167King's Town Construction Company,
Ltd. (A) 7,300 9,207Kinpo Electronics, Inc. 183,269 84,465Kinsus Interconnect Technology Corp. 22,000 86,876Kuo Toong International Company,Ltd. 18,248 25,694L&K Engineering Company, Ltd. 17,000 19,498Lealea Enterprise Company, Ltd. (A) 90,124 37,386Lida Holdings, Ltd. 4,640 5,786Lingsen Precision Industries, Ltd. (A) 73,481 41,508Lite-On Technology Corp. (B) 164,000 363,708Longchen Paper & Packaging
Company, Ltd. 100,177 87,992Macronix International Company, Ltd. 129,000 202,232Mega Financial Holding Company,
Ltd. (B) 745,472 833,944Mercuries & Associates Holding, Ltd. 47,815 35,404Mercuries Life Insurance Company,
Ltd. (A) 53,094 16,523Mitac Holdings Corp. 58,316 59,204MPI Corp. 11,000 48,149Nan Ya Plastics Corp. 79,000 221,983
Shihlin Electric & Engineering Corp. 21,000 36,250Shin Kong Financial Holding
Company, Ltd. (B) 893,997 287,488Shining Building Business Company,
Ltd. (A) 55,118 27,762Shinkong Insurance Company, Ltd. 34,000 47,673Shinkong Synthetic Fibers Corp. 132,239 81,182Sigurd Microelectronics Corp. 47,773 88,063Sincere Navigation Corp. 24,000 18,419Sinher Technology, Inc. 8,000 16,726Sinon Corp. 71,650 58,104SinoPac Financial Holdings Company,
Ltd. 1,133,931 512,248Sirtec International Company, Ltd. 23,800 25,726Siward Crystal Technology Company,
Ltd. 20,000 17,610Sunplus Technology Company, Ltd. 58,000 61,580Sunrex Technology Corp. 11,678 27,167Supreme Electronics Company, Ltd. 12,000 18,031Sweeten Real Estate Development
Company, Ltd. 41,547 37,787Synnex Technology InternationalCorp. 134,000 256,798TA Chen Stainless Pipe 85,894 94,660Ta Ya Electric Wire & Cable 54,893 38,191Taichung Commercial Bank Company,
Ltd. 443,266 178,762Taiflex Scientific Company, Ltd. 24,100 45,133Tainan Spinning Company, Ltd. 164,638 111,084Taishin Financial Holding Company,Ltd. 931,233 437,563Taita Chemical Company, Ltd. 24,086 36,456Taiwan Business Bank 493,028 172,265Taiwan Cement Corp. 711,318 1,168,270Taiwan Chinsan Electronic Industrial
Company, Ltd. (A) 14,420 26,070Taiwan Cooperative Financial Holding
Company, Ltd. 813,725 604,041Taiwan Fertilizer Company, Ltd. 65,000 128,991
Emerging Markets Value Trust (continued)Shares orPrincipalAmount Value
COMMON STOCKS (continued)
Emerging Markets Value Trust (continued)Shares orPrincipalAmount Value
COMMON STOCKS (continued)
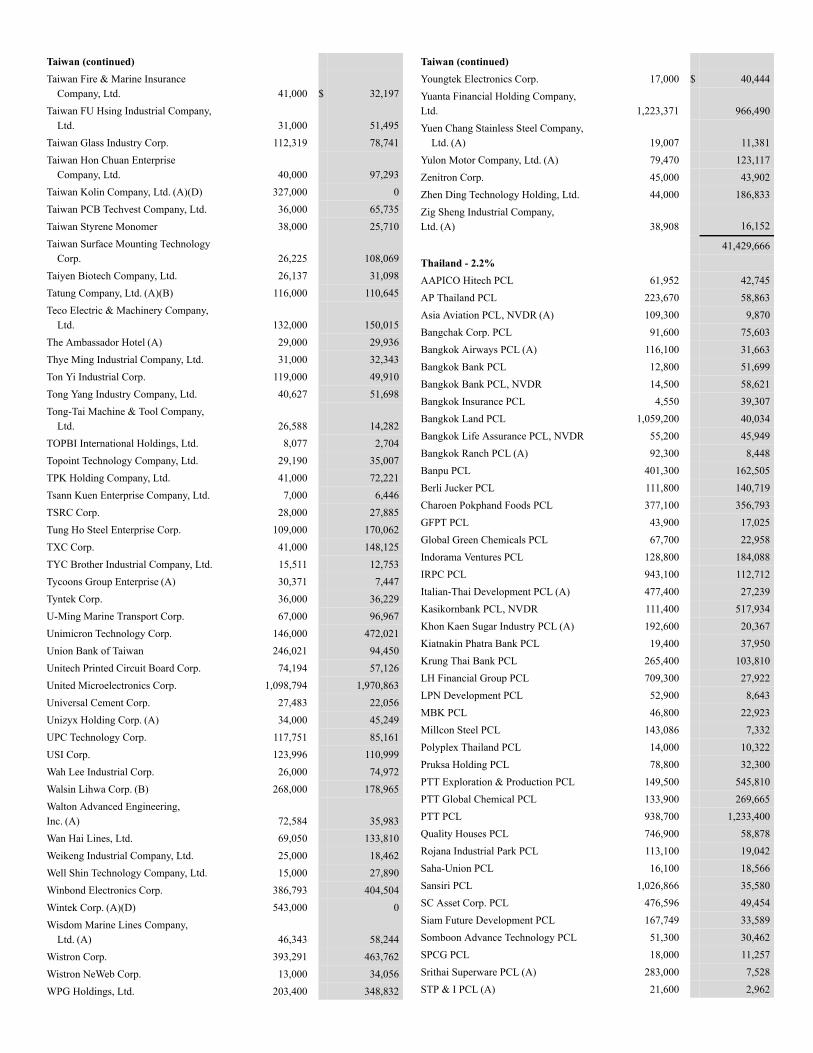
Taiwan (continued)Taiwan Fire & Marine Insurance
Company, Ltd. 41,000 $ 32,197Taiwan FU Hsing Industrial Company,
Ltd. 31,000 51,495Taiwan Glass Industry Corp. 112,319 78,741Taiwan Hon Chuan Enterprise
Company, Ltd. 40,000 97,293Taiwan Kolin Company, Ltd. (A)(D) 327,000 0Taiwan PCB Techvest Company, Ltd. 36,000 65,735Taiwan Styrene Monomer 38,000 25,710Taiwan Surface Mounting Technology
Corp. 26,225 108,069Taiyen Biotech Company, Ltd. 26,137 31,098Tatung Company, Ltd. (A)(B) 116,000 110,645Teco Electric & Machinery Company,
Ltd. 132,000 150,015The Ambassador Hotel (A) 29,000 29,936Thye Ming Industrial Company, Ltd. 31,000 32,343Ton Yi Industrial Corp. 119,000 49,910Tong Yang Industry Company, Ltd. 40,627 51,698Tong-Tai Machine & Tool Company,
Ltd. 26,588 14,282TOPBI International Holdings, Ltd. 8,077 2,704Topoint Technology Company, Ltd. 29,190 35,007TPK Holding Company, Ltd. 41,000 72,221Tsann Kuen Enterprise Company, Ltd. 7,000 6,446TSRC Corp. 28,000 27,885Tung Ho Steel Enterprise Corp. 109,000 170,062TXC Corp. 41,000 148,125TYC Brother Industrial Company, Ltd. 15,511 12,753Tycoons Group Enterprise (A) 30,371 7,447Tyntek Corp. 36,000 36,229U-Ming Marine Transport Corp. 67,000 96,967Unimicron Technology Corp. 146,000 472,021Union Bank of Taiwan 246,021 94,450Unitech Printed Circuit Board Corp. 74,194 57,126United Microelectronics Corp. 1,098,794 1,970,863Universal Cement Corp. 27,483 22,056Unizyx Holding Corp. (A) 34,000 45,249UPC Technology Corp. 117,751 85,161USI Corp. 123,996 110,999Wah Lee Industrial Corp. 26,000 74,972Walsin Lihwa Corp. (B) 268,000 178,965Walton Advanced Engineering,Inc. (A) 72,584 35,983Wan Hai Lines, Ltd. 69,050 133,810Weikeng Industrial Company, Ltd. 25,000 18,462Well Shin Technology Company, Ltd. 15,000 27,890Winbond Electronics Corp. 386,793 404,504Wintek Corp. (A)(D) 543,000 0Wisdom Marine Lines Company,
Ltd. (A) 46,343 58,244Wistron Corp. 393,291 463,762Wistron NeWeb Corp. 13,000 34,056WPG Holdings, Ltd. 203,400 348,832
Taiwan (continued)Youngtek Electronics Corp. 17,000 $ 40,444Yuanta Financial Holding Company,Ltd. 1,223,371 966,490Yuen Chang Stainless Steel Company,
Ltd. (A) 19,007 11,381Yulon Motor Company, Ltd. (A) 79,470 123,117Zenitron Corp. 45,000 43,902Zhen Ding Technology Holding, Ltd. 44,000 186,833Zig Sheng Industrial Company,Ltd. (A) 38,908 16,152
41,429,666Thailand - 2.2%AAPICO Hitech PCL 61,952 42,745AP Thailand PCL 223,670 58,863Asia Aviation PCL, NVDR (A) 109,300 9,870Bangchak Corp. PCL 91,600 75,603Bangkok Airways PCL (A) 116,100 31,663Bangkok Bank PCL 12,800 51,699Bangkok Bank PCL, NVDR 14,500 58,621Bangkok Insurance PCL 4,550 39,307Bangkok Land PCL 1,059,200 40,034Bangkok Life Assurance PCL, NVDR 55,200 45,949Bangkok Ranch PCL (A) 92,300 8,448Banpu PCL 401,300 162,505Berli Jucker PCL 111,800 140,719Charoen Pokphand Foods PCL 377,100 356,793GFPT PCL 43,900 17,025Global Green Chemicals PCL 67,700 22,958Indorama Ventures PCL 128,800 184,088IRPC PCL 943,100 112,712Italian-Thai Development PCL (A) 477,400 27,239Kasikornbank PCL, NVDR 111,400 517,934Khon Kaen Sugar Industry PCL (A) 192,600 20,367Kiatnakin Phatra Bank PCL 19,400 37,950Krung Thai Bank PCL 265,400 103,810LH Financial Group PCL 709,300 27,922LPN Development PCL 52,900 8,643MBK PCL 46,800 22,923Millcon Steel PCL 143,086 7,332Polyplex Thailand PCL 14,000 10,322Pruksa Holding PCL 78,800 32,300PTT Exploration & Production PCL 149,500 545,810PTT Global Chemical PCL 133,900 269,665PTT PCL 938,700 1,233,400Quality Houses PCL 746,900 58,878Rojana Industrial Park PCL 113,100 19,042Saha-Union PCL 16,100 18,566Sansiri PCL 1,026,866 35,580SC Asset Corp. PCL 476,596 49,454Siam Future Development PCL 167,749 33,589Somboon Advance Technology PCL 51,300 30,462SPCG PCL 18,000 11,257Srithai Superware PCL (A) 283,000 7,528STP & I PCL (A) 21,600 2,962
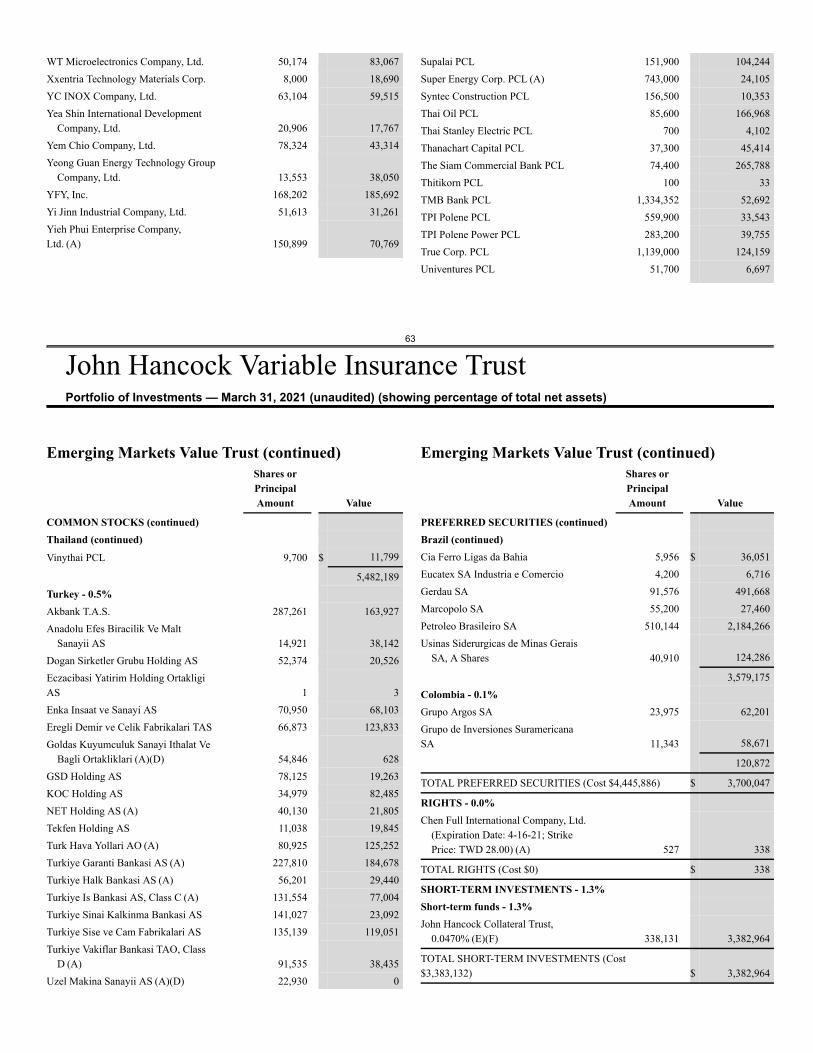
63
John Hancock Variable Insurance TrustPortfolio of Investments — March 31, 2021 (unaudited) (showing percentage of total net assets)
WT Microelectronics Company, Ltd. 50,174 83,067Xxentria Technology Materials Corp. 8,000 18,690YC INOX Company, Ltd. 63,104 59,515Yea Shin International Development
Company, Ltd. 20,906 17,767Yem Chio Company, Ltd. 78,324 43,314Yeong Guan Energy Technology Group
Company, Ltd. 13,553 38,050YFY, Inc. 168,202 185,692Yi Jinn Industrial Company, Ltd. 51,613 31,261Yieh Phui Enterprise Company,Ltd. (A) 150,899 70,769
Supalai PCL 151,900 104,244Super Energy Corp. PCL (A) 743,000 24,105Syntec Construction PCL 156,500 10,353Thai Oil PCL 85,600 166,968Thai Stanley Electric PCL 700 4,102Thanachart Capital PCL 37,300 45,414The Siam Commercial Bank PCL 74,400 265,788Thitikorn PCL 100 33TMB Bank PCL 1,334,352 52,692TPI Polene PCL 559,900 33,543TPI Polene Power PCL 283,200 39,755True Corp. PCL 1,139,000 124,159Univentures PCL 51,700 6,697
Emerging Markets Value Trust (continued)Shares orPrincipalAmount Value
COMMON STOCKS (continued)Thailand (continued)Vinythai PCL 9,700 $ 11,799
5,482,189Turkey - 0.5%Akbank T.A.S. 287,261 163,927Anadolu Efes Biracilik Ve Malt
Sanayii AS 14,921 38,142Dogan Sirketler Grubu Holding AS 52,374 20,526Eczacibasi Yatirim Holding OrtakligiAS 1 3Enka Insaat ve Sanayi AS 70,950 68,103Eregli Demir ve Celik Fabrikalari TAS 66,873 123,833Goldas Kuyumculuk Sanayi Ithalat Ve
Bagli Ortakliklari (A)(D) 54,846 628GSD Holding AS 78,125 19,263KOC Holding AS 34,979 82,485NET Holding AS (A) 40,130 21,805Tekfen Holding AS 11,038 19,845Turk Hava Yollari AO (A) 80,925 125,252Turkiye Garanti Bankasi AS (A) 227,810 184,678Turkiye Halk Bankasi AS (A) 56,201 29,440Turkiye Is Bankasi AS, Class C (A) 131,554 77,004Turkiye Sinai Kalkinma Bankasi AS 141,027 23,092Turkiye Sise ve Cam Fabrikalari AS 135,139 119,051Turkiye Vakiflar Bankasi TAO, Class
D (A) 91,535 38,435Uzel Makina Sanayii AS (A)(D) 22,930 0
Emerging Markets Value Trust (continued)Shares orPrincipalAmount Value
PREFERRED SECURITIES (continued)Brazil (continued)Cia Ferro Ligas da Bahia 5,956 $ 36,051Eucatex SA Industria e Comercio 4,200 6,716Gerdau SA 91,576 491,668Marcopolo SA 55,200 27,460Petroleo Brasileiro SA 510,144 2,184,266Usinas Siderurgicas de Minas Gerais
SA, A Shares 40,910 124,286
3,579,175Colombia - 0.1%Grupo Argos SA 23,975 62,201Grupo de Inversiones SuramericanaSA 11,343 58,671
120,872
TOTAL PREFERRED SECURITIES (Cost $4,445,886) $ 3,700,047
RIGHTS - 0.0%Chen Full International Company, Ltd.
(Expiration Date: 4-16-21; StrikePrice: TWD 28.00) (A) 527 338
TOTAL RIGHTS (Cost $0) $ 338
SHORT-TERM INVESTMENTS - 1.3%Short-term funds - 1.3%John Hancock Collateral Trust,
0.0470% (E)(F) 338,131 3,382,964
TOTAL SHORT-TERM INVESTMENTS (Cost$3,383,132) $ 3,382,964
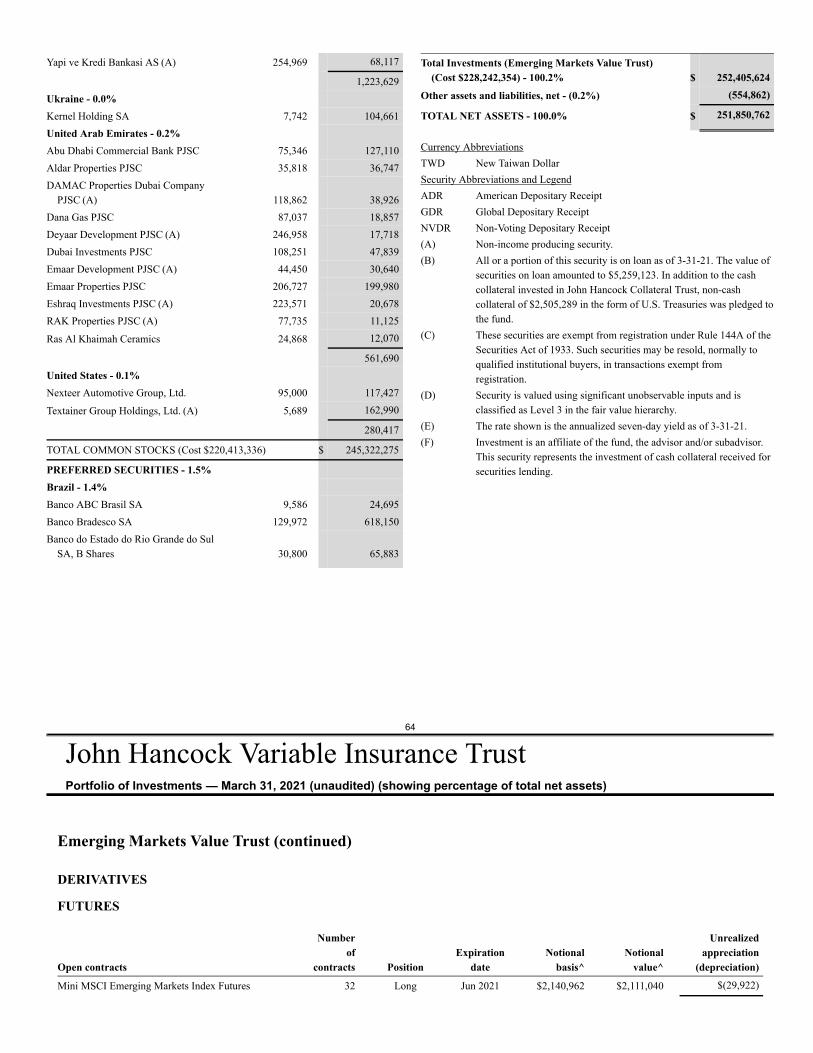
64
John Hancock Variable Insurance TrustPortfolio of Investments — March 31, 2021 (unaudited) (showing percentage of total net assets)
Emerging Markets Value Trust (continued)
DERIVATIVES
FUTURES
Open contracts
Numberof
contracts PositionExpiration
dateNotional
basis^Notional
value^
Unrealizedappreciation
(depreciation)
Mini MSCI Emerging Markets Index Futures 32 Long Jun 2021 $2,140,962 $2,111,040 $(29,922)
Yapi ve Kredi Bankasi AS (A) 254,969 68,117
1,223,629Ukraine - 0.0%Kernel Holding SA 7,742 104,661United Arab Emirates - 0.2%Abu Dhabi Commercial Bank PJSC 75,346 127,110Aldar Properties PJSC 35,818 36,747DAMAC Properties Dubai Company
PJSC (A) 118,862 38,926Dana Gas PJSC 87,037 18,857Deyaar Development PJSC (A) 246,958 17,718Dubai Investments PJSC 108,251 47,839Emaar Development PJSC (A) 44,450 30,640Emaar Properties PJSC 206,727 199,980Eshraq Investments PJSC (A) 223,571 20,678RAK Properties PJSC (A) 77,735 11,125
Ras Al Khaimah Ceramics 24,868 12,070
561,690United States - 0.1%Nexteer Automotive Group, Ltd. 95,000 117,427
Textainer Group Holdings, Ltd. (A) 5,689 162,990
280,417
TOTAL COMMON STOCKS (Cost $220,413,336) $ 245,322,275
PREFERRED SECURITIES - 1.5%Brazil - 1.4%Banco ABC Brasil SA 9,586 24,695Banco Bradesco SA 129,972 618,150Banco do Estado do Rio Grande do Sul
SA, B Shares 30,800 65,883
Total Investments (Emerging Markets Value Trust)(Cost $228,242,354) - 100.2% $ 252,405,624
Other assets and liabilities, net - (0.2%) (554,862)
TOTAL NET ASSETS - 100.0% $ 251,850,762
Currency AbbreviationsTWD New Taiwan DollarSecurity Abbreviations and LegendADR American Depositary ReceiptGDR Global Depositary ReceiptNVDR Non-Voting Depositary Receipt(A) Non-income producing security.(B) All or a portion of this security is on loan as of 3-31-21. The value of
securities on loan amounted to $5,259,123. In addition to the cashcollateral invested in John Hancock Collateral Trust, non-cashcollateral of $2,505,289 in the form of U.S. Treasuries was pledged tothe fund.
(C) These securities are exempt from registration under Rule 144A of theSecurities Act of 1933. Such securities may be resold, normally toqualified institutional buyers, in transactions exempt fromregistration.
(D) Security is valued using significant unobservable inputs and isclassified as Level 3 in the fair value hierarchy.
(E) The rate shown is the annualized seven-day yield as of 3-31-21.(F) Investment is an affiliate of the fund, the advisor and/or subadvisor.
This security represents the investment of cash collateral received forsecurities lending.
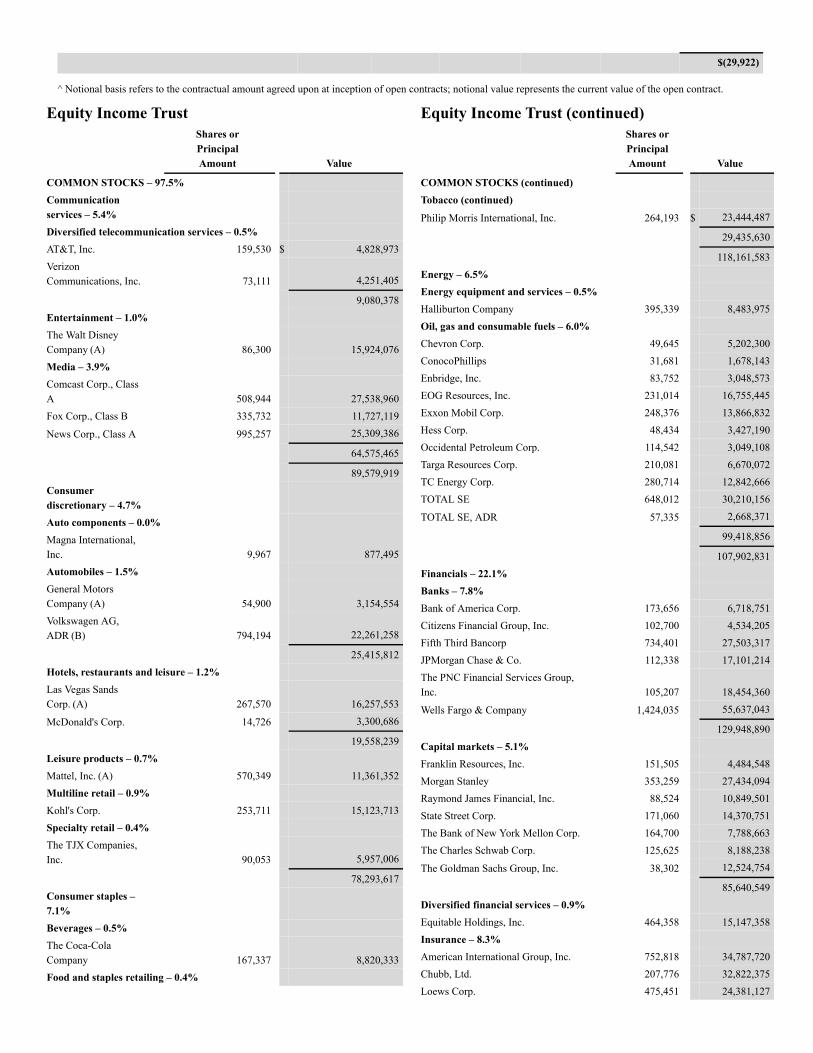
$(29,922)
^ Notional basis refers to the contractual amount agreed upon at inception of open contracts; notional value represents the current value of the open contract.
Equity Income TrustShares orPrincipalAmount Value
COMMON STOCKS – 97.5%Communicationservices – 5.4%Diversified telecommunication services – 0.5%AT&T, Inc. 159,530 $ 4,828,973VerizonCommunications, Inc. 73,111 4,251,405
9,080,378Entertainment – 1.0%The Walt DisneyCompany (A) 86,300 15,924,076Media – 3.9%Comcast Corp., ClassA 508,944 27,538,960Fox Corp., Class B 335,732 11,727,119
News Corp., Class A 995,257 25,309,386
64,575,465
89,579,919Consumerdiscretionary – 4.7%Auto components – 0.0%Magna International,Inc. 9,967 877,495Automobiles – 1.5%General MotorsCompany (A) 54,900 3,154,554Volkswagen AG,ADR (B) 794,194 22,261,258
25,415,812Hotels, restaurants and leisure – 1.2%Las Vegas SandsCorp. (A) 267,570 16,257,553
McDonald's Corp. 14,726 3,300,686
19,558,239Leisure products – 0.7%Mattel, Inc. (A) 570,349 11,361,352Multiline retail – 0.9%Kohl's Corp. 253,711 15,123,713Specialty retail – 0.4%The TJX Companies,Inc. 90,053 5,957,006
78,293,617Consumer staples –7.1%Beverages – 0.5%The Coca-ColaCompany 167,337 8,820,333Food and staples retailing – 0.4%
Equity Income Trust (continued)Shares orPrincipalAmount Value
COMMON STOCKS (continued)Tobacco (continued)Philip Morris International, Inc. 264,193 $ 23,444,487
29,435,630
118,161,583Energy – 6.5%Energy equipment and services – 0.5%Halliburton Company 395,339 8,483,975Oil, gas and consumable fuels – 6.0%Chevron Corp. 49,645 5,202,300ConocoPhillips 31,681 1,678,143Enbridge, Inc. 83,752 3,048,573EOG Resources, Inc. 231,014 16,755,445Exxon Mobil Corp. 248,376 13,866,832Hess Corp. 48,434 3,427,190Occidental Petroleum Corp. 114,542 3,049,108Targa Resources Corp. 210,081 6,670,072TC Energy Corp. 280,714 12,842,666TOTAL SE 648,012 30,210,156
TOTAL SE, ADR 57,335 2,668,371
99,418,856
107,902,831Financials – 22.1%Banks – 7.8%Bank of America Corp. 173,656 6,718,751Citizens Financial Group, Inc. 102,700 4,534,205Fifth Third Bancorp 734,401 27,503,317JPMorgan Chase & Co. 112,338 17,101,214The PNC Financial Services Group,Inc. 105,207 18,454,360
Wells Fargo & Company 1,424,035 55,637,043
129,948,890Capital markets – 5.1%Franklin Resources, Inc. 151,505 4,484,548Morgan Stanley 353,259 27,434,094Raymond James Financial, Inc. 88,524 10,849,501State Street Corp. 171,060 14,370,751The Bank of New York Mellon Corp. 164,700 7,788,663The Charles Schwab Corp. 125,625 8,188,238
The Goldman Sachs Group, Inc. 38,302 12,524,754
85,640,549Diversified financial services – 0.9%Equitable Holdings, Inc. 464,358 15,147,358Insurance – 8.3%American International Group, Inc. 752,818 34,787,720Chubb, Ltd. 207,776 32,822,375Loews Corp. 475,451 24,381,127
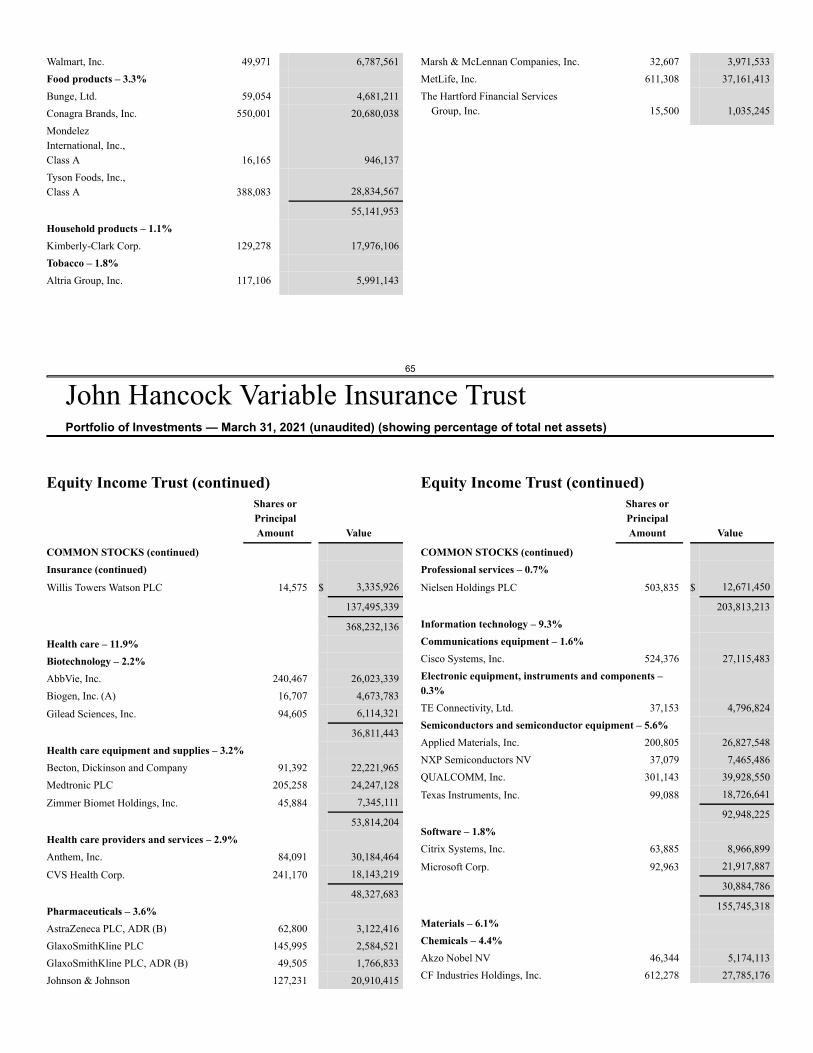
65
John Hancock Variable Insurance TrustPortfolio of Investments — March 31, 2021 (unaudited) (showing percentage of total net assets)
Walmart, Inc. 49,971 6,787,561Food products – 3.3%Bunge, Ltd. 59,054 4,681,211Conagra Brands, Inc. 550,001 20,680,038MondelezInternational, Inc.,Class A 16,165 946,137Tyson Foods, Inc.,Class A 388,083 28,834,567
55,141,953Household products – 1.1%Kimberly-Clark Corp. 129,278 17,976,106Tobacco – 1.8%Altria Group, Inc. 117,106 5,991,143
Marsh & McLennan Companies, Inc. 32,607 3,971,533MetLife, Inc. 611,308 37,161,413The Hartford Financial Services
Group, Inc. 15,500 1,035,245
Equity Income Trust (continued)Shares orPrincipalAmount Value
COMMON STOCKS (continued)Insurance (continued)Willis Towers Watson PLC 14,575 $ 3,335,926
137,495,339
368,232,136Health care – 11.9%Biotechnology – 2.2%AbbVie, Inc. 240,467 26,023,339Biogen, Inc. (A) 16,707 4,673,783
Gilead Sciences, Inc. 94,605 6,114,321
36,811,443Health care equipment and supplies – 3.2%Becton, Dickinson and Company 91,392 22,221,965Medtronic PLC 205,258 24,247,128
Zimmer Biomet Holdings, Inc. 45,884 7,345,111
53,814,204Health care providers and services – 2.9%Anthem, Inc. 84,091 30,184,464
CVS Health Corp. 241,170 18,143,219
48,327,683Pharmaceuticals – 3.6%AstraZeneca PLC, ADR (B) 62,800 3,122,416GlaxoSmithKline PLC 145,995 2,584,521GlaxoSmithKline PLC, ADR (B) 49,505 1,766,833Johnson & Johnson 127,231 20,910,415
Equity Income Trust (continued)Shares orPrincipalAmount Value
COMMON STOCKS (continued)Professional services – 0.7%Nielsen Holdings PLC 503,835 $ 12,671,450
203,813,213Information technology – 9.3%Communications equipment – 1.6%Cisco Systems, Inc. 524,376 27,115,483Electronic equipment, instruments and components –0.3%TE Connectivity, Ltd. 37,153 4,796,824Semiconductors and semiconductor equipment – 5.6%Applied Materials, Inc. 200,805 26,827,548NXP Semiconductors NV 37,079 7,465,486QUALCOMM, Inc. 301,143 39,928,550
Texas Instruments, Inc. 99,088 18,726,641
92,948,225Software – 1.8%Citrix Systems, Inc. 63,885 8,966,899
Microsoft Corp. 92,963 21,917,887
30,884,786
155,745,318Materials – 6.1%Chemicals – 4.4%Akzo Nobel NV 46,344 5,174,113CF Industries Holdings, Inc. 612,278 27,785,176
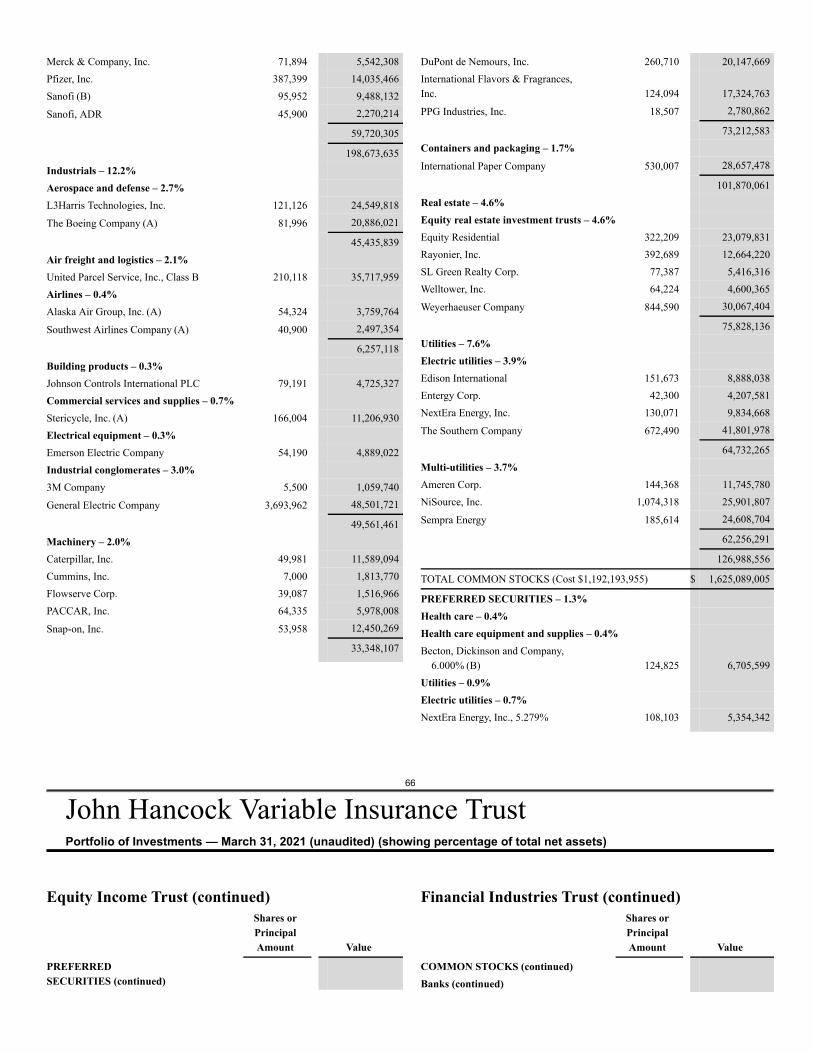
66
John Hancock Variable Insurance TrustPortfolio of Investments — March 31, 2021 (unaudited) (showing percentage of total net assets)
Merck & Company, Inc. 71,894 5,542,308Pfizer, Inc. 387,399 14,035,466Sanofi (B) 95,952 9,488,132
Sanofi, ADR 45,900 2,270,214
59,720,305
198,673,635Industrials – 12.2%Aerospace and defense – 2.7%L3Harris Technologies, Inc. 121,126 24,549,818
The Boeing Company (A) 81,996 20,886,021
45,435,839Air freight and logistics – 2.1%United Parcel Service, Inc., Class B 210,118 35,717,959Airlines – 0.4%Alaska Air Group, Inc. (A) 54,324 3,759,764
Southwest Airlines Company (A) 40,900 2,497,354
6,257,118Building products – 0.3%Johnson Controls International PLC 79,191 4,725,327Commercial services and supplies – 0.7%Stericycle, Inc. (A) 166,004 11,206,930Electrical equipment – 0.3%Emerson Electric Company 54,190 4,889,022Industrial conglomerates – 3.0%3M Company 5,500 1,059,740
General Electric Company 3,693,962 48,501,721
49,561,461Machinery – 2.0%Caterpillar, Inc. 49,981 11,589,094Cummins, Inc. 7,000 1,813,770Flowserve Corp. 39,087 1,516,966PACCAR, Inc. 64,335 5,978,008
Snap-on, Inc. 53,958 12,450,269
33,348,107
DuPont de Nemours, Inc. 260,710 20,147,669International Flavors & Fragrances,Inc. 124,094 17,324,763
PPG Industries, Inc. 18,507 2,780,862
73,212,583Containers and packaging – 1.7%International Paper Company 530,007 28,657,478
101,870,061Real estate – 4.6%Equity real estate investment trusts – 4.6%Equity Residential 322,209 23,079,831Rayonier, Inc. 392,689 12,664,220SL Green Realty Corp. 77,387 5,416,316Welltower, Inc. 64,224 4,600,365
Weyerhaeuser Company 844,590 30,067,404
75,828,136Utilities – 7.6%Electric utilities – 3.9%Edison International 151,673 8,888,038Entergy Corp. 42,300 4,207,581NextEra Energy, Inc. 130,071 9,834,668
The Southern Company 672,490 41,801,978
64,732,265Multi-utilities – 3.7%Ameren Corp. 144,368 11,745,780NiSource, Inc. 1,074,318 25,901,807
Sempra Energy 185,614 24,608,704
62,256,291
126,988,556
TOTAL COMMON STOCKS (Cost $1,192,193,955) $ 1,625,089,005
PREFERRED SECURITIES – 1.3%Health care – 0.4%Health care equipment and supplies – 0.4%Becton, Dickinson and Company,
6.000% (B) 124,825 6,705,599Utilities – 0.9%Electric utilities – 0.7%NextEra Energy, Inc., 5.279% 108,103 5,354,342
Equity Income Trust (continued)Shares orPrincipalAmount Value
PREFERREDSECURITIES (continued)
Financial Industries Trust (continued)Shares orPrincipalAmount Value
COMMON STOCKS (continued)Banks (continued)
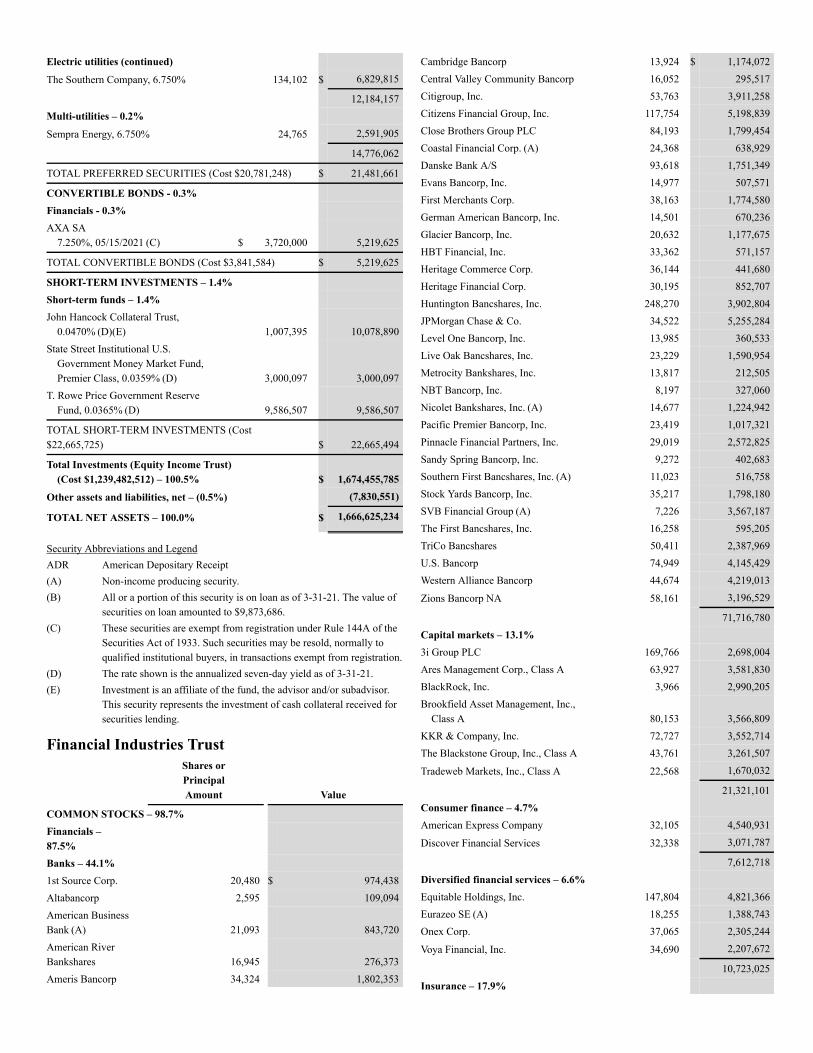
Electric utilities (continued)The Southern Company, 6.750% 134,102 $ 6,829,815
12,184,157Multi-utilities – 0.2%Sempra Energy, 6.750% 24,765 2,591,905
14,776,062
TOTAL PREFERRED SECURITIES (Cost $20,781,248) $ 21,481,661
CONVERTIBLE BONDS - 0.3%Financials - 0.3%AXA SA
7.250%, 05/15/2021 (C) $ 3,720,000 5,219,625
TOTAL CONVERTIBLE BONDS (Cost $3,841,584) $ 5,219,625
SHORT-TERM INVESTMENTS – 1.4%Short-term funds – 1.4%John Hancock Collateral Trust,
0.0470% (D)(E) 1,007,395 10,078,890State Street Institutional U.S.
Government Money Market Fund,Premier Class, 0.0359% (D) 3,000,097 3,000,097
T. Rowe Price Government ReserveFund, 0.0365% (D) 9,586,507 9,586,507
TOTAL SHORT-TERM INVESTMENTS (Cost$22,665,725) $ 22,665,494
Total Investments (Equity Income Trust)(Cost $1,239,482,512) – 100.5% $ 1,674,455,785
Other assets and liabilities, net – (0.5%) (7,830,551)
TOTAL NET ASSETS – 100.0% $ 1,666,625,234
Security Abbreviations and LegendADR American Depositary Receipt(A) Non-income producing security.(B) All or a portion of this security is on loan as of 3-31-21. The value of
securities on loan amounted to $9,873,686.(C) These securities are exempt from registration under Rule 144A of the
Securities Act of 1933. Such securities may be resold, normally toqualified institutional buyers, in transactions exempt from registration.
(D) The rate shown is the annualized seven-day yield as of 3-31-21.(E) Investment is an affiliate of the fund, the advisor and/or subadvisor.
This security represents the investment of cash collateral received forsecurities lending.
Financial Industries TrustShares orPrincipalAmount Value
COMMON STOCKS – 98.7%Financials –87.5%Banks – 44.1%1st Source Corp. 20,480 $ 974,438Altabancorp 2,595 109,094American BusinessBank (A) 21,093 843,720American RiverBankshares 16,945 276,373Ameris Bancorp 34,324 1,802,353
Cambridge Bancorp 13,924 $ 1,174,072Central Valley Community Bancorp 16,052 295,517Citigroup, Inc. 53,763 3,911,258Citizens Financial Group, Inc. 117,754 5,198,839Close Brothers Group PLC 84,193 1,799,454Coastal Financial Corp. (A) 24,368 638,929Danske Bank A/S 93,618 1,751,349Evans Bancorp, Inc. 14,977 507,571First Merchants Corp. 38,163 1,774,580German American Bancorp, Inc. 14,501 670,236Glacier Bancorp, Inc. 20,632 1,177,675HBT Financial, Inc. 33,362 571,157Heritage Commerce Corp. 36,144 441,680Heritage Financial Corp. 30,195 852,707Huntington Bancshares, Inc. 248,270 3,902,804JPMorgan Chase & Co. 34,522 5,255,284Level One Bancorp, Inc. 13,985 360,533Live Oak Bancshares, Inc. 23,229 1,590,954Metrocity Bankshares, Inc. 13,817 212,505NBT Bancorp, Inc. 8,197 327,060Nicolet Bankshares, Inc. (A) 14,677 1,224,942Pacific Premier Bancorp, Inc. 23,419 1,017,321Pinnacle Financial Partners, Inc. 29,019 2,572,825Sandy Spring Bancorp, Inc. 9,272 402,683Southern First Bancshares, Inc. (A) 11,023 516,758Stock Yards Bancorp, Inc. 35,217 1,798,180SVB Financial Group (A) 7,226 3,567,187The First Bancshares, Inc. 16,258 595,205TriCo Bancshares 50,411 2,387,969U.S. Bancorp 74,949 4,145,429Western Alliance Bancorp 44,674 4,219,013
Zions Bancorp NA 58,161 3,196,529
71,716,780Capital markets – 13.1%3i Group PLC 169,766 2,698,004Ares Management Corp., Class A 63,927 3,581,830BlackRock, Inc. 3,966 2,990,205Brookfield Asset Management, Inc.,
Class A 80,153 3,566,809KKR & Company, Inc. 72,727 3,552,714The Blackstone Group, Inc., Class A 43,761 3,261,507
Tradeweb Markets, Inc., Class A 22,568 1,670,032
21,321,101Consumer finance – 4.7%American Express Company 32,105 4,540,931
Discover Financial Services 32,338 3,071,787
7,612,718Diversified financial services – 6.6%Equitable Holdings, Inc. 147,804 4,821,366Eurazeo SE (A) 18,255 1,388,743Onex Corp. 37,065 2,305,244
Voya Financial, Inc. 34,690 2,207,672
10,723,025Insurance – 17.9%
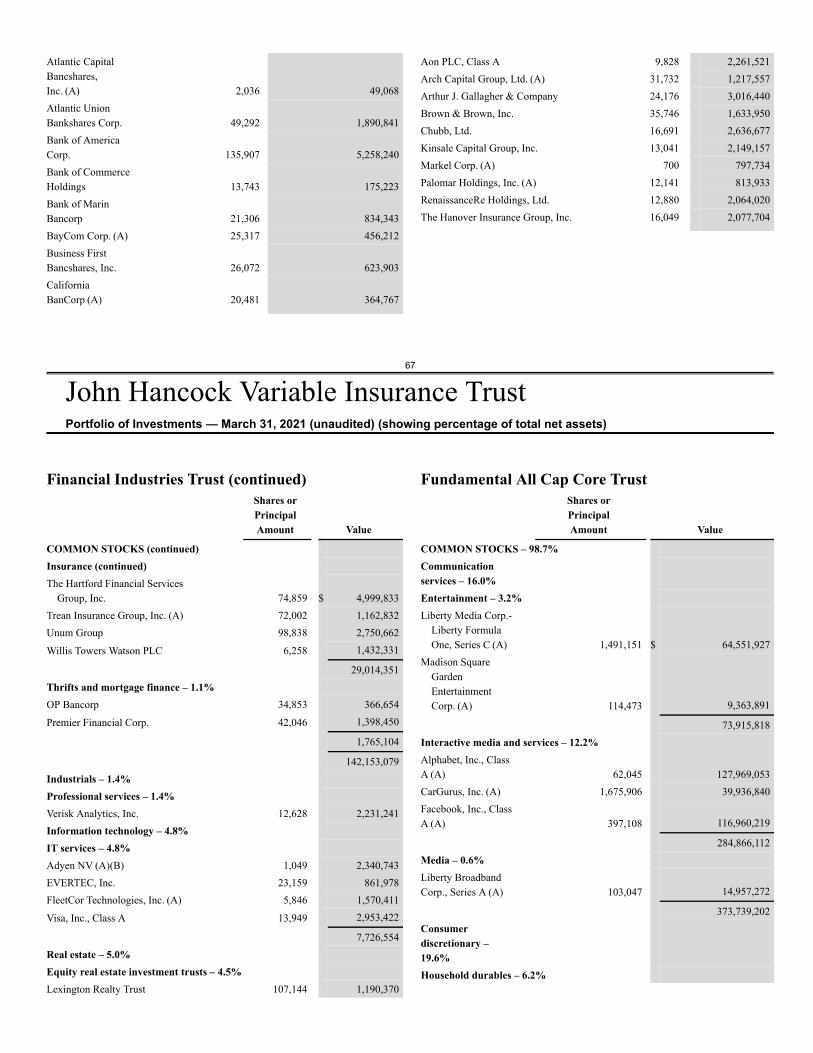
67
John Hancock Variable Insurance TrustPortfolio of Investments — March 31, 2021 (unaudited) (showing percentage of total net assets)
Atlantic CapitalBancshares,Inc. (A) 2,036 49,068Atlantic UnionBankshares Corp. 49,292 1,890,841Bank of AmericaCorp. 135,907 5,258,240Bank of CommerceHoldings 13,743 175,223Bank of MarinBancorp 21,306 834,343BayCom Corp. (A) 25,317 456,212Business FirstBancshares, Inc. 26,072 623,903CaliforniaBanCorp (A) 20,481 364,767
Aon PLC, Class A 9,828 2,261,521Arch Capital Group, Ltd. (A) 31,732 1,217,557Arthur J. Gallagher & Company 24,176 3,016,440Brown & Brown, Inc. 35,746 1,633,950Chubb, Ltd. 16,691 2,636,677Kinsale Capital Group, Inc. 13,041 2,149,157Markel Corp. (A) 700 797,734Palomar Holdings, Inc. (A) 12,141 813,933RenaissanceRe Holdings, Ltd. 12,880 2,064,020The Hanover Insurance Group, Inc. 16,049 2,077,704
Financial Industries Trust (continued)Shares orPrincipalAmount Value
COMMON STOCKS (continued)Insurance (continued)The Hartford Financial Services
Group, Inc. 74,859 $ 4,999,833Trean Insurance Group, Inc. (A) 72,002 1,162,832Unum Group 98,838 2,750,662
Willis Towers Watson PLC 6,258 1,432,331
29,014,351Thrifts and mortgage finance – 1.1%OP Bancorp 34,853 366,654
Premier Financial Corp. 42,046 1,398,450
1,765,104
142,153,079Industrials – 1.4%Professional services – 1.4%Verisk Analytics, Inc. 12,628 2,231,241Information technology – 4.8%IT services – 4.8%Adyen NV (A)(B) 1,049 2,340,743EVERTEC, Inc. 23,159 861,978FleetCor Technologies, Inc. (A) 5,846 1,570,411
Visa, Inc., Class A 13,949 2,953,422
7,726,554Real estate – 5.0%Equity real estate investment trusts – 4.5%Lexington Realty Trust 107,144 1,190,370
Fundamental All Cap Core TrustShares orPrincipalAmount Value
COMMON STOCKS – 98.7%Communicationservices – 16.0%Entertainment – 3.2%Liberty Media Corp.-
Liberty FormulaOne, Series C (A) 1,491,151 $ 64,551,927
Madison SquareGardenEntertainmentCorp. (A) 114,473 9,363,891
73,915,818Interactive media and services – 12.2%Alphabet, Inc., ClassA (A) 62,045 127,969,053CarGurus, Inc. (A) 1,675,906 39,936,840Facebook, Inc., ClassA (A) 397,108 116,960,219
284,866,112Media – 0.6%Liberty BroadbandCorp., Series A (A) 103,047 14,957,272
373,739,202Consumerdiscretionary –19.6%Household durables – 6.2%
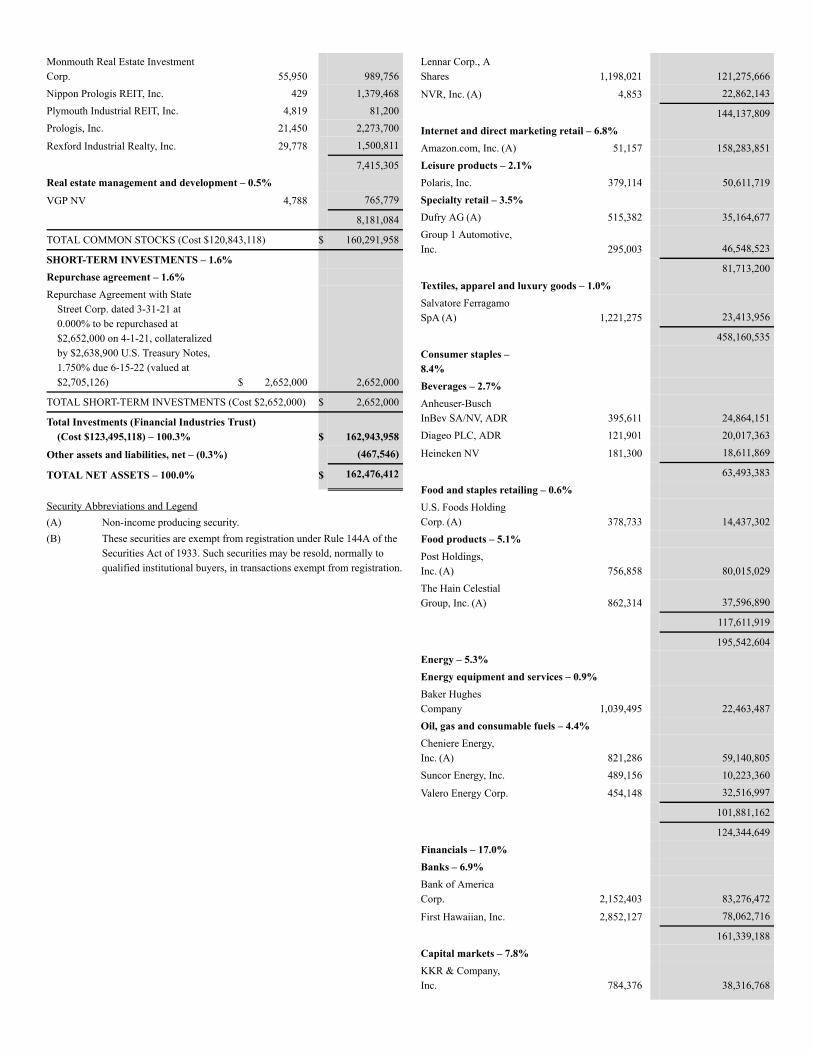
Monmouth Real Estate InvestmentCorp. 55,950 989,756Nippon Prologis REIT, Inc. 429 1,379,468Plymouth Industrial REIT, Inc. 4,819 81,200Prologis, Inc. 21,450 2,273,700
Rexford Industrial Realty, Inc. 29,778 1,500,811
7,415,305Real estate management and development – 0.5%VGP NV 4,788 765,779
8,181,084
TOTAL COMMON STOCKS (Cost $120,843,118) $ 160,291,958
SHORT-TERM INVESTMENTS – 1.6%Repurchase agreement – 1.6%Repurchase Agreement with State
Street Corp. dated 3-31-21 at0.000% to be repurchased at$2,652,000 on 4-1-21, collateralizedby $2,638,900 U.S. Treasury Notes,1.750% due 6-15-22 (valued at$2,705,126) $ 2,652,000 2,652,000
TOTAL SHORT-TERM INVESTMENTS (Cost $2,652,000) $ 2,652,000
Total Investments (Financial Industries Trust)(Cost $123,495,118) – 100.3% $ 162,943,958
Other assets and liabilities, net – (0.3%) (467,546)
TOTAL NET ASSETS – 100.0% $ 162,476,412
Security Abbreviations and Legend(A) Non-income producing security.(B) These securities are exempt from registration under Rule 144A of the
Securities Act of 1933. Such securities may be resold, normally toqualified institutional buyers, in transactions exempt from registration.
Lennar Corp., AShares 1,198,021 121,275,666
NVR, Inc. (A) 4,853 22,862,143
144,137,809Internet and direct marketing retail – 6.8%Amazon.com, Inc. (A) 51,157 158,283,851Leisure products – 2.1%Polaris, Inc. 379,114 50,611,719Specialty retail – 3.5%Dufry AG (A) 515,382 35,164,677Group 1 Automotive,Inc. 295,003 46,548,523
81,713,200Textiles, apparel and luxury goods – 1.0%Salvatore FerragamoSpA (A) 1,221,275 23,413,956
458,160,535Consumer staples –8.4%Beverages – 2.7%Anheuser-BuschInBev SA/NV, ADR 395,611 24,864,151Diageo PLC, ADR 121,901 20,017,363
Heineken NV 181,300 18,611,869
63,493,383Food and staples retailing – 0.6%U.S. Foods HoldingCorp. (A) 378,733 14,437,302Food products – 5.1%Post Holdings,Inc. (A) 756,858 80,015,029The Hain CelestialGroup, Inc. (A) 862,314 37,596,890
117,611,919
195,542,604Energy – 5.3%Energy equipment and services – 0.9%Baker HughesCompany 1,039,495 22,463,487Oil, gas and consumable fuels – 4.4%Cheniere Energy,Inc. (A) 821,286 59,140,805Suncor Energy, Inc. 489,156 10,223,360
Valero Energy Corp. 454,148 32,516,997
101,881,162
124,344,649Financials – 17.0%Banks – 6.9%Bank of AmericaCorp. 2,152,403 83,276,472
First Hawaiian, Inc. 2,852,127 78,062,716
161,339,188Capital markets – 7.8%KKR & Company,Inc. 784,376 38,316,768
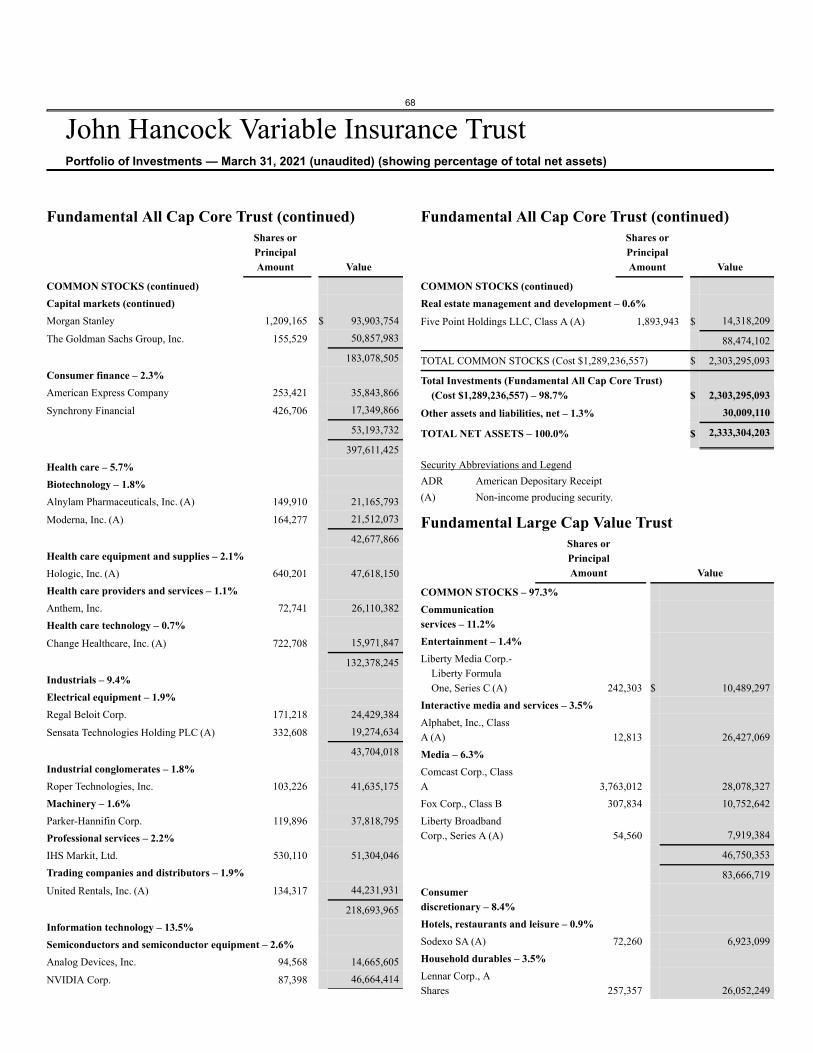
68
John Hancock Variable Insurance TrustPortfolio of Investments — March 31, 2021 (unaudited) (showing percentage of total net assets)
Fundamental All Cap Core Trust (continued)Shares orPrincipalAmount Value
COMMON STOCKS (continued)Capital markets (continued)Morgan Stanley 1,209,165 $ 93,903,754
The Goldman Sachs Group, Inc. 155,529 50,857,983
183,078,505Consumer finance – 2.3%American Express Company 253,421 35,843,866
Synchrony Financial 426,706 17,349,866
53,193,732
397,611,425Health care – 5.7%Biotechnology – 1.8%Alnylam Pharmaceuticals, Inc. (A) 149,910 21,165,793
Moderna, Inc. (A) 164,277 21,512,073
42,677,866Health care equipment and supplies – 2.1%Hologic, Inc. (A) 640,201 47,618,150Health care providers and services – 1.1%Anthem, Inc. 72,741 26,110,382Health care technology – 0.7%Change Healthcare, Inc. (A) 722,708 15,971,847
132,378,245Industrials – 9.4%Electrical equipment – 1.9%Regal Beloit Corp. 171,218 24,429,384
Sensata Technologies Holding PLC (A) 332,608 19,274,634
43,704,018Industrial conglomerates – 1.8%Roper Technologies, Inc. 103,226 41,635,175Machinery – 1.6%Parker-Hannifin Corp. 119,896 37,818,795Professional services – 2.2%IHS Markit, Ltd. 530,110 51,304,046Trading companies and distributors – 1.9%United Rentals, Inc. (A) 134,317 44,231,931
218,693,965Information technology – 13.5%Semiconductors and semiconductor equipment – 2.6%Analog Devices, Inc. 94,568 14,665,605
NVIDIA Corp. 87,398 46,664,414
Fundamental All Cap Core Trust (continued)Shares orPrincipalAmount Value
COMMON STOCKS (continued)Real estate management and development – 0.6%Five Point Holdings LLC, Class A (A) 1,893,943 $ 14,318,209
88,474,102
TOTAL COMMON STOCKS (Cost $1,289,236,557) $ 2,303,295,093
Total Investments (Fundamental All Cap Core Trust)(Cost $1,289,236,557) – 98.7% $ 2,303,295,093
Other assets and liabilities, net – 1.3% 30,009,110
TOTAL NET ASSETS – 100.0% $ 2,333,304,203
Security Abbreviations and LegendADR American Depositary Receipt(A) Non-income producing security.
Fundamental Large Cap Value TrustShares orPrincipalAmount Value
COMMON STOCKS – 97.3%Communicationservices – 11.2%Entertainment – 1.4%Liberty Media Corp.-
Liberty FormulaOne, Series C (A) 242,303 $ 10,489,297
Interactive media and services – 3.5%Alphabet, Inc., ClassA (A) 12,813 26,427,069Media – 6.3%Comcast Corp., ClassA 3,763,012 28,078,327Fox Corp., Class B 307,834 10,752,642Liberty BroadbandCorp., Series A (A) 54,560 7,919,384
46,750,353
83,666,719Consumerdiscretionary – 8.4%Hotels, restaurants and leisure – 0.9%Sodexo SA (A) 72,260 6,923,099Household durables – 3.5%Lennar Corp., AShares 257,357 26,052,249
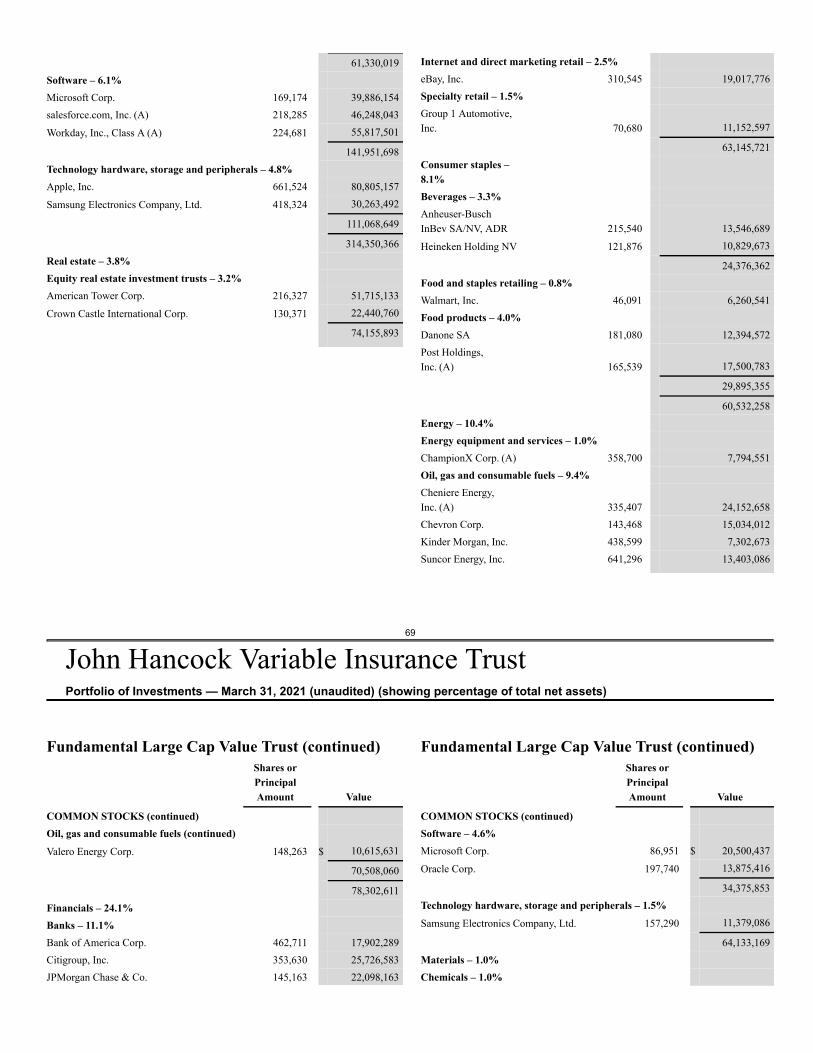
69
John Hancock Variable Insurance TrustPortfolio of Investments — March 31, 2021 (unaudited) (showing percentage of total net assets)
61,330,019Software – 6.1%Microsoft Corp. 169,174 39,886,154salesforce.com, Inc. (A) 218,285 46,248,043
Workday, Inc., Class A (A) 224,681 55,817,501
141,951,698Technology hardware, storage and peripherals – 4.8%Apple, Inc. 661,524 80,805,157
Samsung Electronics Company, Ltd. 418,324 30,263,492
111,068,649
314,350,366Real estate – 3.8%Equity real estate investment trusts – 3.2%American Tower Corp. 216,327 51,715,133
Crown Castle International Corp. 130,371 22,440,760
74,155,893
Internet and direct marketing retail – 2.5%eBay, Inc. 310,545 19,017,776Specialty retail – 1.5%Group 1 Automotive,Inc. 70,680 11,152,597
63,145,721Consumer staples –8.1%Beverages – 3.3%Anheuser-BuschInBev SA/NV, ADR 215,540 13,546,689
Heineken Holding NV 121,876 10,829,673
24,376,362Food and staples retailing – 0.8%Walmart, Inc. 46,091 6,260,541Food products – 4.0%Danone SA 181,080 12,394,572Post Holdings,Inc. (A) 165,539 17,500,783
29,895,355
60,532,258Energy – 10.4%Energy equipment and services – 1.0%ChampionX Corp. (A) 358,700 7,794,551Oil, gas and consumable fuels – 9.4%Cheniere Energy,Inc. (A) 335,407 24,152,658Chevron Corp. 143,468 15,034,012Kinder Morgan, Inc. 438,599 7,302,673Suncor Energy, Inc. 641,296 13,403,086
Fundamental Large Cap Value Trust (continued)Shares orPrincipalAmount Value
COMMON STOCKS (continued)Oil, gas and consumable fuels (continued)Valero Energy Corp. 148,263 $ 10,615,631
70,508,060
78,302,611Financials – 24.1%Banks – 11.1%Bank of America Corp. 462,711 17,902,289Citigroup, Inc. 353,630 25,726,583JPMorgan Chase & Co. 145,163 22,098,163
Fundamental Large Cap Value Trust (continued)Shares orPrincipalAmount Value
COMMON STOCKS (continued)Software – 4.6%Microsoft Corp. 86,951 $ 20,500,437
Oracle Corp. 197,740 13,875,416
34,375,853Technology hardware, storage and peripherals – 1.5%Samsung Electronics Company, Ltd. 157,290 11,379,086
64,133,169Materials – 1.0%Chemicals – 1.0%
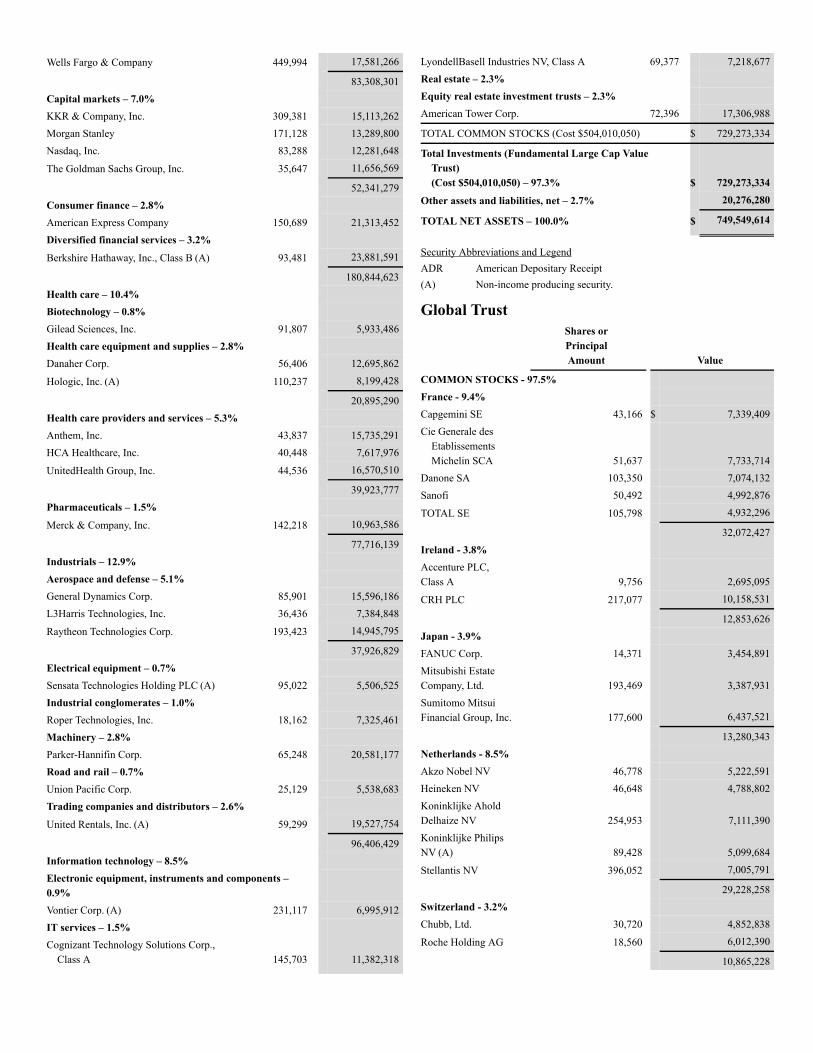
Wells Fargo & Company 449,994 17,581,266
83,308,301Capital markets – 7.0%KKR & Company, Inc. 309,381 15,113,262Morgan Stanley 171,128 13,289,800Nasdaq, Inc. 83,288 12,281,648
The Goldman Sachs Group, Inc. 35,647 11,656,569
52,341,279Consumer finance – 2.8%American Express Company 150,689 21,313,452Diversified financial services – 3.2%Berkshire Hathaway, Inc., Class B (A) 93,481 23,881,591
180,844,623Health care – 10.4%Biotechnology – 0.8%Gilead Sciences, Inc. 91,807 5,933,486Health care equipment and supplies – 2.8%Danaher Corp. 56,406 12,695,862
Hologic, Inc. (A) 110,237 8,199,428
20,895,290Health care providers and services – 5.3%Anthem, Inc. 43,837 15,735,291HCA Healthcare, Inc. 40,448 7,617,976
UnitedHealth Group, Inc. 44,536 16,570,510
39,923,777Pharmaceuticals – 1.5%Merck & Company, Inc. 142,218 10,963,586
77,716,139Industrials – 12.9%Aerospace and defense – 5.1%General Dynamics Corp. 85,901 15,596,186L3Harris Technologies, Inc. 36,436 7,384,848
Raytheon Technologies Corp. 193,423 14,945,795
37,926,829Electrical equipment – 0.7%Sensata Technologies Holding PLC (A) 95,022 5,506,525Industrial conglomerates – 1.0%Roper Technologies, Inc. 18,162 7,325,461Machinery – 2.8%Parker-Hannifin Corp. 65,248 20,581,177Road and rail – 0.7%Union Pacific Corp. 25,129 5,538,683Trading companies and distributors – 2.6%United Rentals, Inc. (A) 59,299 19,527,754
96,406,429Information technology – 8.5%Electronic equipment, instruments and components –0.9%Vontier Corp. (A) 231,117 6,995,912IT services – 1.5%Cognizant Technology Solutions Corp.,
Class A 145,703 11,382,318
LyondellBasell Industries NV, Class A 69,377 7,218,677Real estate – 2.3%Equity real estate investment trusts – 2.3%American Tower Corp. 72,396 17,306,988
TOTAL COMMON STOCKS (Cost $504,010,050) $ 729,273,334
Total Investments (Fundamental Large Cap ValueTrust)(Cost $504,010,050) – 97.3% $ 729,273,334
Other assets and liabilities, net – 2.7% 20,276,280
TOTAL NET ASSETS – 100.0% $ 749,549,614
Security Abbreviations and LegendADR American Depositary Receipt(A) Non-income producing security.
Global TrustShares orPrincipalAmount Value
COMMON STOCKS - 97.5%France - 9.4%Capgemini SE 43,166 $ 7,339,409Cie Generale des
EtablissementsMichelin SCA 51,637 7,733,714
Danone SA 103,350 7,074,132Sanofi 50,492 4,992,876
TOTAL SE 105,798 4,932,296
32,072,427Ireland - 3.8%Accenture PLC,Class A 9,756 2,695,095
CRH PLC 217,077 10,158,531
12,853,626Japan - 3.9%FANUC Corp. 14,371 3,454,891Mitsubishi EstateCompany, Ltd. 193,469 3,387,931Sumitomo MitsuiFinancial Group, Inc. 177,600 6,437,521
13,280,343Netherlands - 8.5%Akzo Nobel NV 46,778 5,222,591Heineken NV 46,648 4,788,802Koninklijke AholdDelhaize NV 254,953 7,111,390Koninklijke PhilipsNV (A) 89,428 5,099,684
Stellantis NV 396,052 7,005,791
29,228,258Switzerland - 3.2%Chubb, Ltd. 30,720 4,852,838
Roche Holding AG 18,560 6,012,390
10,865,228
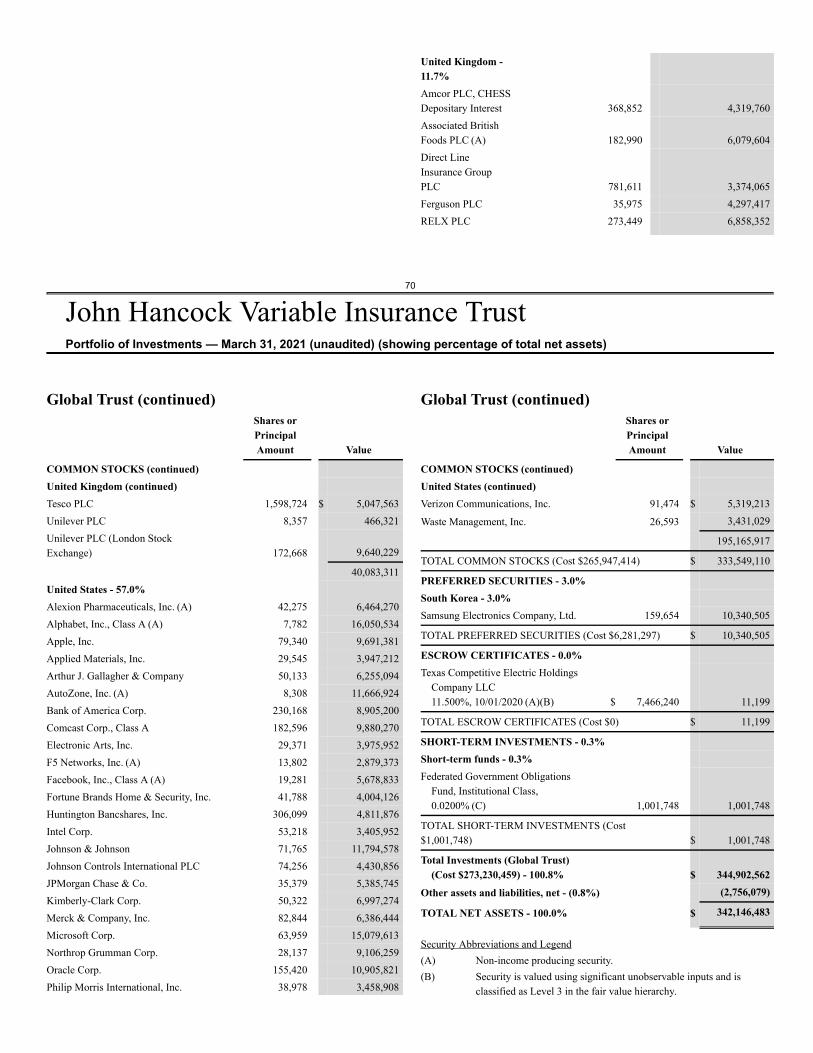
70
John Hancock Variable Insurance TrustPortfolio of Investments — March 31, 2021 (unaudited) (showing percentage of total net assets)
United Kingdom -11.7%Amcor PLC, CHESSDepositary Interest 368,852 4,319,760Associated BritishFoods PLC (A) 182,990 6,079,604Direct LineInsurance GroupPLC 781,611 3,374,065Ferguson PLC 35,975 4,297,417RELX PLC 273,449 6,858,352
Global Trust (continued)Shares orPrincipalAmount Value
COMMON STOCKS (continued)United Kingdom (continued)Tesco PLC 1,598,724 $ 5,047,563Unilever PLC 8,357 466,321Unilever PLC (London StockExchange) 172,668 9,640,229
40,083,311United States - 57.0%Alexion Pharmaceuticals, Inc. (A) 42,275 6,464,270Alphabet, Inc., Class A (A) 7,782 16,050,534Apple, Inc. 79,340 9,691,381Applied Materials, Inc. 29,545 3,947,212Arthur J. Gallagher & Company 50,133 6,255,094AutoZone, Inc. (A) 8,308 11,666,924Bank of America Corp. 230,168 8,905,200Comcast Corp., Class A 182,596 9,880,270Electronic Arts, Inc. 29,371 3,975,952F5 Networks, Inc. (A) 13,802 2,879,373Facebook, Inc., Class A (A) 19,281 5,678,833Fortune Brands Home & Security, Inc. 41,788 4,004,126Huntington Bancshares, Inc. 306,099 4,811,876Intel Corp. 53,218 3,405,952Johnson & Johnson 71,765 11,794,578Johnson Controls International PLC 74,256 4,430,856JPMorgan Chase & Co. 35,379 5,385,745Kimberly-Clark Corp. 50,322 6,997,274Merck & Company, Inc. 82,844 6,386,444Microsoft Corp. 63,959 15,079,613Northrop Grumman Corp. 28,137 9,106,259Oracle Corp. 155,420 10,905,821Philip Morris International, Inc. 38,978 3,458,908
Global Trust (continued)Shares orPrincipalAmount Value
COMMON STOCKS (continued)United States (continued)Verizon Communications, Inc. 91,474 $ 5,319,213
Waste Management, Inc. 26,593 3,431,029
195,165,917
TOTAL COMMON STOCKS (Cost $265,947,414) $ 333,549,110
PREFERRED SECURITIES - 3.0%South Korea - 3.0%Samsung Electronics Company, Ltd. 159,654 10,340,505
TOTAL PREFERRED SECURITIES (Cost $6,281,297) $ 10,340,505
ESCROW CERTIFICATES - 0.0%Texas Competitive Electric Holdings
Company LLC11.500%, 10/01/2020 (A)(B) $ 7,466,240 11,199
TOTAL ESCROW CERTIFICATES (Cost $0) $ 11,199
SHORT-TERM INVESTMENTS - 0.3%Short-term funds - 0.3%Federated Government Obligations
Fund, Institutional Class,0.0200% (C) 1,001,748 1,001,748
TOTAL SHORT-TERM INVESTMENTS (Cost$1,001,748) $ 1,001,748
Total Investments (Global Trust)(Cost $273,230,459) - 100.8% $ 344,902,562
Other assets and liabilities, net - (0.8%) (2,756,079)
TOTAL NET ASSETS - 100.0% $ 342,146,483
Security Abbreviations and Legend(A) Non-income producing security.(B) Security is valued using significant unobservable inputs and is
classified as Level 3 in the fair value hierarchy.
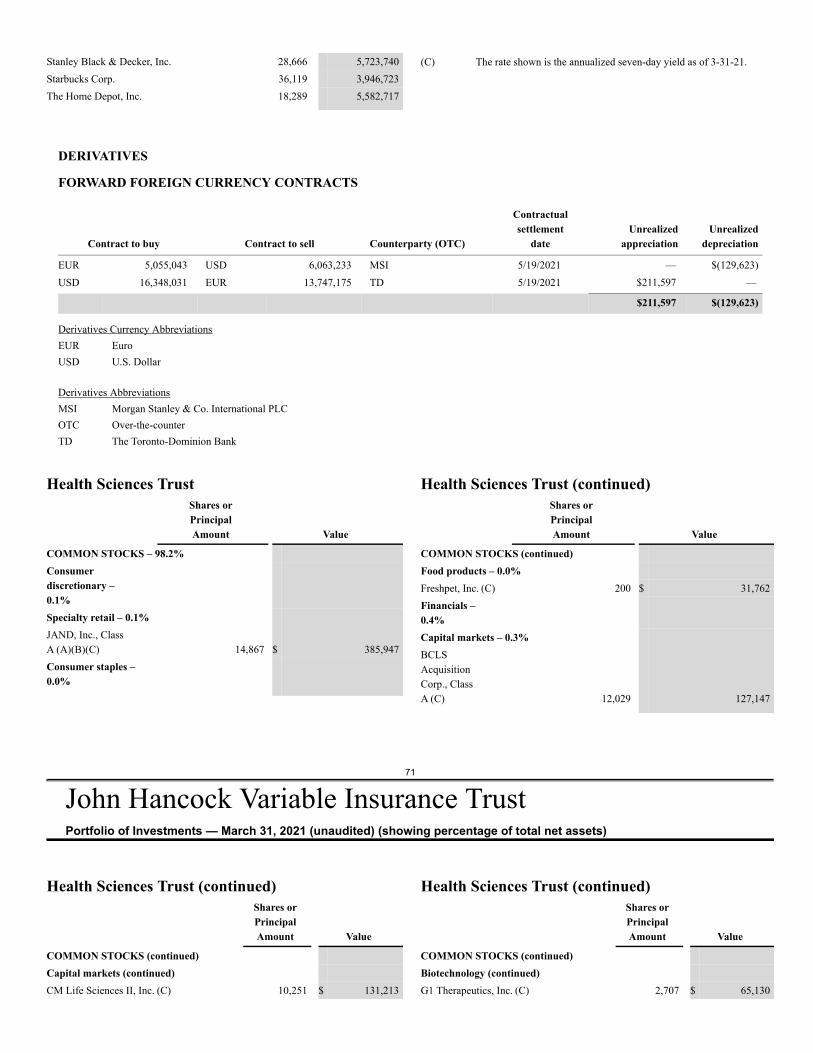
DERIVATIVES
FORWARD FOREIGN CURRENCY CONTRACTS
Contract to buy Contract to sell Counterparty (OTC)
Contractualsettlement
dateUnrealized
appreciationUnrealized
depreciation
EUR 5,055,043 USD 6,063,233 MSI 5/19/2021 — $(129,623)USD 16,348,031 EUR 13,747,175 TD 5/19/2021 $211,597 —
$211,597 $(129,623)
Derivatives Currency AbbreviationsEUR EuroUSD U.S. Dollar
Derivatives AbbreviationsMSI Morgan Stanley & Co. International PLCOTC Over-the-counterTD The Toronto-Dominion Bank
71
John Hancock Variable Insurance TrustPortfolio of Investments — March 31, 2021 (unaudited) (showing percentage of total net assets)
Stanley Black & Decker, Inc. 28,666 5,723,740Starbucks Corp. 36,119 3,946,723The Home Depot, Inc. 18,289 5,582,717
(C) The rate shown is the annualized seven-day yield as of 3-31-21.
Health Sciences TrustShares orPrincipalAmount Value
COMMON STOCKS – 98.2%Consumerdiscretionary –0.1%Specialty retail – 0.1%JAND, Inc., ClassA (A)(B)(C) 14,867 $ 385,947Consumer staples –0.0%
Health Sciences Trust (continued)Shares orPrincipalAmount Value
COMMON STOCKS (continued)Food products – 0.0%Freshpet, Inc. (C) 200 $ 31,762Financials –0.4%Capital markets – 0.3%BCLSAcquisitionCorp., ClassA (C) 12,029 127,147
Health Sciences Trust (continued)Shares orPrincipalAmount Value
COMMON STOCKS (continued)Capital markets (continued)CM Life Sciences II, Inc. (C) 10,251 $ 131,213
Health Sciences Trust (continued)Shares orPrincipalAmount Value
COMMON STOCKS (continued)Biotechnology (continued)G1 Therapeutics, Inc. (C) 2,707 $ 65,130
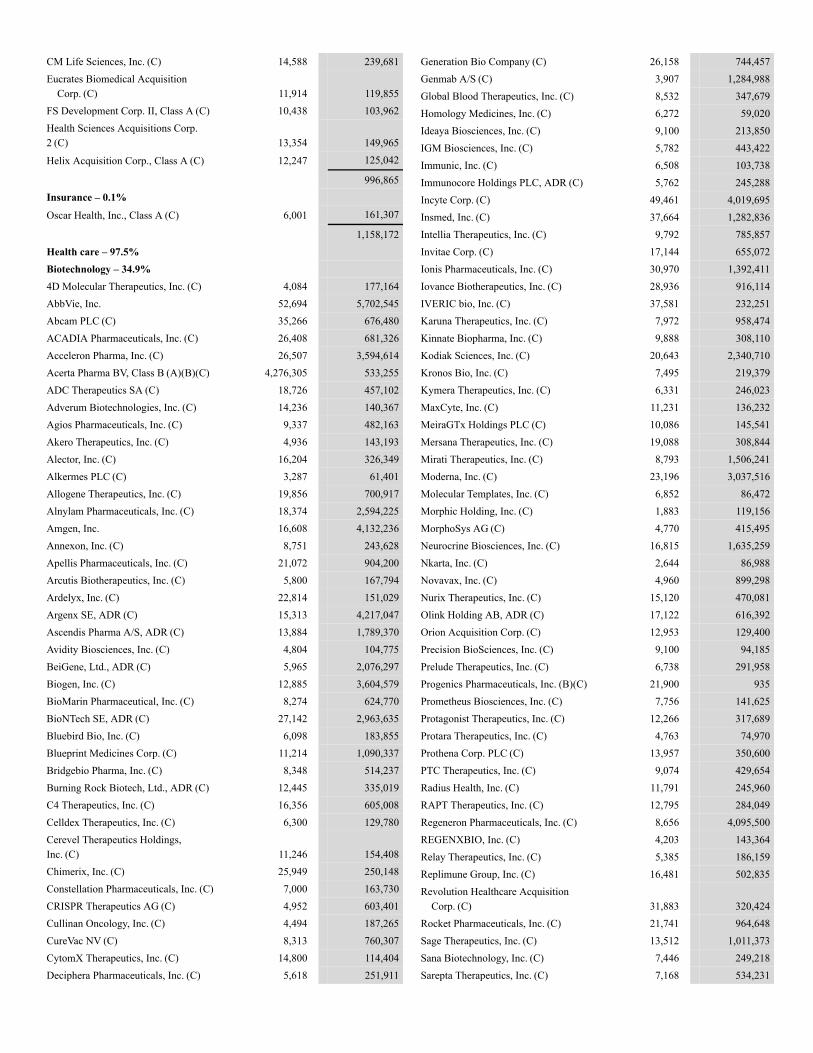
CM Life Sciences, Inc. (C) 14,588 239,681Eucrates Biomedical Acquisition
Corp. (C) 11,914 119,855FS Development Corp. II, Class A (C) 10,438 103,962Health Sciences Acquisitions Corp.2 (C) 13,354 149,965
Helix Acquisition Corp., Class A (C) 12,247 125,042
996,865Insurance – 0.1%Oscar Health, Inc., Class A (C) 6,001 161,307
1,158,172Health care – 97.5%Biotechnology – 34.9%4D Molecular Therapeutics, Inc. (C) 4,084 177,164AbbVie, Inc. 52,694 5,702,545Abcam PLC (C) 35,266 676,480ACADIA Pharmaceuticals, Inc. (C) 26,408 681,326Acceleron Pharma, Inc. (C) 26,507 3,594,614Acerta Pharma BV, Class B (A)(B)(C) 4,276,305 533,255ADC Therapeutics SA (C) 18,726 457,102Adverum Biotechnologies, Inc. (C) 14,236 140,367Agios Pharmaceuticals, Inc. (C) 9,337 482,163Akero Therapeutics, Inc. (C) 4,936 143,193Alector, Inc. (C) 16,204 326,349Alkermes PLC (C) 3,287 61,401Allogene Therapeutics, Inc. (C) 19,856 700,917Alnylam Pharmaceuticals, Inc. (C) 18,374 2,594,225Amgen, Inc. 16,608 4,132,236Annexon, Inc. (C) 8,751 243,628Apellis Pharmaceuticals, Inc. (C) 21,072 904,200Arcutis Biotherapeutics, Inc. (C) 5,800 167,794Ardelyx, Inc. (C) 22,814 151,029Argenx SE, ADR (C) 15,313 4,217,047Ascendis Pharma A/S, ADR (C) 13,884 1,789,370Avidity Biosciences, Inc. (C) 4,804 104,775BeiGene, Ltd., ADR (C) 5,965 2,076,297Biogen, Inc. (C) 12,885 3,604,579BioMarin Pharmaceutical, Inc. (C) 8,274 624,770BioNTech SE, ADR (C) 27,142 2,963,635Bluebird Bio, Inc. (C) 6,098 183,855Blueprint Medicines Corp. (C) 11,214 1,090,337Bridgebio Pharma, Inc. (C) 8,348 514,237Burning Rock Biotech, Ltd., ADR (C) 12,445 335,019C4 Therapeutics, Inc. (C) 16,356 605,008Celldex Therapeutics, Inc. (C) 6,300 129,780Cerevel Therapeutics Holdings,Inc. (C) 11,246 154,408Chimerix, Inc. (C) 25,949 250,148Constellation Pharmaceuticals, Inc. (C) 7,000 163,730CRISPR Therapeutics AG (C) 4,952 603,401Cullinan Oncology, Inc. (C) 4,494 187,265CureVac NV (C) 8,313 760,307CytomX Therapeutics, Inc. (C) 14,800 114,404Deciphera Pharmaceuticals, Inc. (C) 5,618 251,911
Generation Bio Company (C) 26,158 744,457Genmab A/S (C) 3,907 1,284,988Global Blood Therapeutics, Inc. (C) 8,532 347,679Homology Medicines, Inc. (C) 6,272 59,020Ideaya Biosciences, Inc. (C) 9,100 213,850IGM Biosciences, Inc. (C) 5,782 443,422Immunic, Inc. (C) 6,508 103,738Immunocore Holdings PLC, ADR (C) 5,762 245,288Incyte Corp. (C) 49,461 4,019,695Insmed, Inc. (C) 37,664 1,282,836Intellia Therapeutics, Inc. (C) 9,792 785,857Invitae Corp. (C) 17,144 655,072Ionis Pharmaceuticals, Inc. (C) 30,970 1,392,411Iovance Biotherapeutics, Inc. (C) 28,936 916,114IVERIC bio, Inc. (C) 37,581 232,251Karuna Therapeutics, Inc. (C) 7,972 958,474Kinnate Biopharma, Inc. (C) 9,888 308,110Kodiak Sciences, Inc. (C) 20,643 2,340,710Kronos Bio, Inc. (C) 7,495 219,379Kymera Therapeutics, Inc. (C) 6,331 246,023MaxCyte, Inc. (C) 11,231 136,232MeiraGTx Holdings PLC (C) 10,086 145,541Mersana Therapeutics, Inc. (C) 19,088 308,844Mirati Therapeutics, Inc. (C) 8,793 1,506,241Moderna, Inc. (C) 23,196 3,037,516Molecular Templates, Inc. (C) 6,852 86,472Morphic Holding, Inc. (C) 1,883 119,156MorphoSys AG (C) 4,770 415,495Neurocrine Biosciences, Inc. (C) 16,815 1,635,259Nkarta, Inc. (C) 2,644 86,988Novavax, Inc. (C) 4,960 899,298Nurix Therapeutics, Inc. (C) 15,120 470,081Olink Holding AB, ADR (C) 17,122 616,392Orion Acquisition Corp. (C) 12,953 129,400Precision BioSciences, Inc. (C) 9,100 94,185Prelude Therapeutics, Inc. (C) 6,738 291,958Progenics Pharmaceuticals, Inc. (B)(C) 21,900 935Prometheus Biosciences, Inc. (C) 7,756 141,625Protagonist Therapeutics, Inc. (C) 12,266 317,689Protara Therapeutics, Inc. (C) 4,763 74,970Prothena Corp. PLC (C) 13,957 350,600PTC Therapeutics, Inc. (C) 9,074 429,654Radius Health, Inc. (C) 11,791 245,960RAPT Therapeutics, Inc. (C) 12,795 284,049Regeneron Pharmaceuticals, Inc. (C) 8,656 4,095,500REGENXBIO, Inc. (C) 4,203 143,364Relay Therapeutics, Inc. (C) 5,385 186,159Replimune Group, Inc. (C) 16,481 502,835Revolution Healthcare Acquisition
Corp. (C) 31,883 320,424Rocket Pharmaceuticals, Inc. (C) 21,741 964,648Sage Therapeutics, Inc. (C) 13,512 1,011,373Sana Biotechnology, Inc. (C) 7,446 249,218Sarepta Therapeutics, Inc. (C) 7,168 534,231
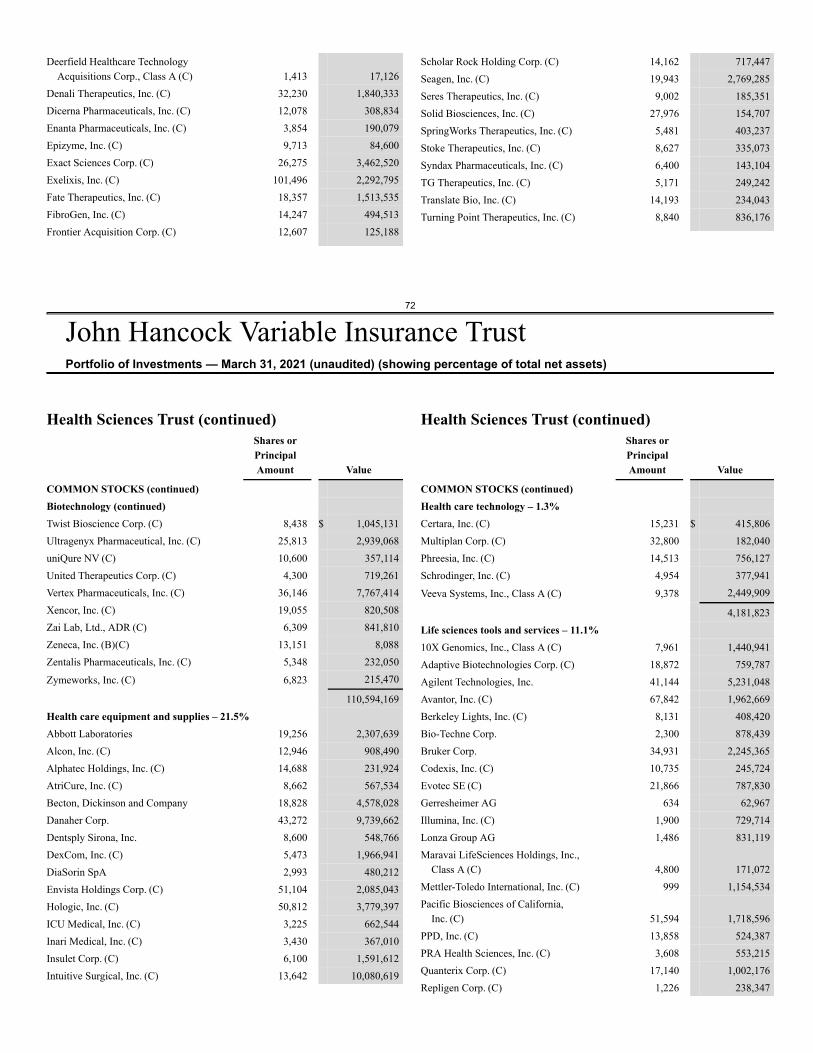
72
John Hancock Variable Insurance TrustPortfolio of Investments — March 31, 2021 (unaudited) (showing percentage of total net assets)
Deerfield Healthcare TechnologyAcquisitions Corp., Class A (C) 1,413 17,126
Denali Therapeutics, Inc. (C) 32,230 1,840,333Dicerna Pharmaceuticals, Inc. (C) 12,078 308,834Enanta Pharmaceuticals, Inc. (C) 3,854 190,079Epizyme, Inc. (C) 9,713 84,600Exact Sciences Corp. (C) 26,275 3,462,520Exelixis, Inc. (C) 101,496 2,292,795Fate Therapeutics, Inc. (C) 18,357 1,513,535FibroGen, Inc. (C) 14,247 494,513Frontier Acquisition Corp. (C) 12,607 125,188
Scholar Rock Holding Corp. (C) 14,162 717,447Seagen, Inc. (C) 19,943 2,769,285Seres Therapeutics, Inc. (C) 9,002 185,351Solid Biosciences, Inc. (C) 27,976 154,707SpringWorks Therapeutics, Inc. (C) 5,481 403,237Stoke Therapeutics, Inc. (C) 8,627 335,073Syndax Pharmaceuticals, Inc. (C) 6,400 143,104TG Therapeutics, Inc. (C) 5,171 249,242Translate Bio, Inc. (C) 14,193 234,043Turning Point Therapeutics, Inc. (C) 8,840 836,176
Health Sciences Trust (continued)Shares orPrincipalAmount Value
COMMON STOCKS (continued)Biotechnology (continued)Twist Bioscience Corp. (C) 8,438 $ 1,045,131Ultragenyx Pharmaceutical, Inc. (C) 25,813 2,939,068uniQure NV (C) 10,600 357,114United Therapeutics Corp. (C) 4,300 719,261Vertex Pharmaceuticals, Inc. (C) 36,146 7,767,414Xencor, Inc. (C) 19,055 820,508Zai Lab, Ltd., ADR (C) 6,309 841,810Zeneca, Inc. (B)(C) 13,151 8,088Zentalis Pharmaceuticals, Inc. (C) 5,348 232,050
Zymeworks, Inc. (C) 6,823 215,470
110,594,169Health care equipment and supplies – 21.5%Abbott Laboratories 19,256 2,307,639Alcon, Inc. (C) 12,946 908,490Alphatec Holdings, Inc. (C) 14,688 231,924AtriCure, Inc. (C) 8,662 567,534Becton, Dickinson and Company 18,828 4,578,028Danaher Corp. 43,272 9,739,662Dentsply Sirona, Inc. 8,600 548,766DexCom, Inc. (C) 5,473 1,966,941DiaSorin SpA 2,993 480,212Envista Holdings Corp. (C) 51,104 2,085,043Hologic, Inc. (C) 50,812 3,779,397ICU Medical, Inc. (C) 3,225 662,544Inari Medical, Inc. (C) 3,430 367,010Insulet Corp. (C) 6,100 1,591,612Intuitive Surgical, Inc. (C) 13,642 10,080,619
Health Sciences Trust (continued)Shares orPrincipalAmount Value
COMMON STOCKS (continued)Health care technology – 1.3%Certara, Inc. (C) 15,231 $ 415,806Multiplan Corp. (C) 32,800 182,040Phreesia, Inc. (C) 14,513 756,127Schrodinger, Inc. (C) 4,954 377,941
Veeva Systems, Inc., Class A (C) 9,378 2,449,909
4,181,823Life sciences tools and services – 11.1%10X Genomics, Inc., Class A (C) 7,961 1,440,941Adaptive Biotechnologies Corp. (C) 18,872 759,787Agilent Technologies, Inc. 41,144 5,231,048Avantor, Inc. (C) 67,842 1,962,669Berkeley Lights, Inc. (C) 8,131 408,420Bio-Techne Corp. 2,300 878,439Bruker Corp. 34,931 2,245,365Codexis, Inc. (C) 10,735 245,724Evotec SE (C) 21,866 787,830Gerresheimer AG 634 62,967Illumina, Inc. (C) 1,900 729,714Lonza Group AG 1,486 831,119Maravai LifeSciences Holdings, Inc.,
Class A (C) 4,800 171,072Mettler-Toledo International, Inc. (C) 999 1,154,534Pacific Biosciences of California,
Inc. (C) 51,594 1,718,596PPD, Inc. (C) 13,858 524,387PRA Health Sciences, Inc. (C) 3,608 553,215Quanterix Corp. (C) 17,140 1,002,176Repligen Corp. (C) 1,226 238,347
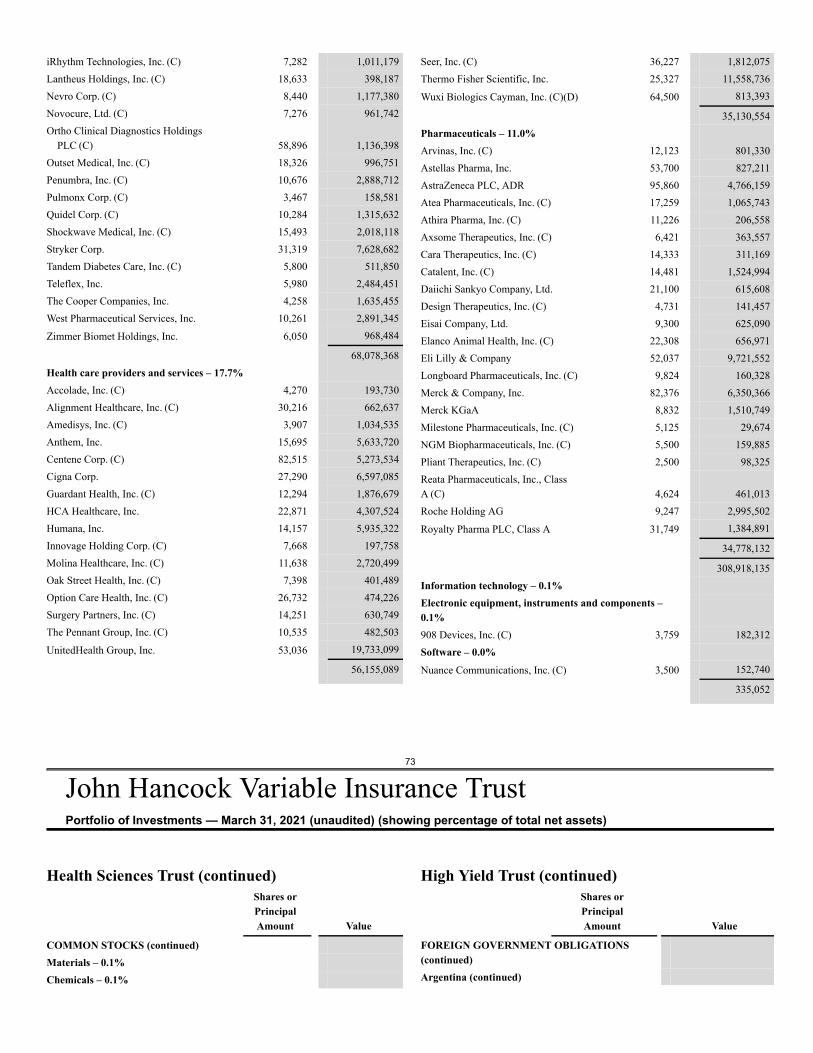
73
John Hancock Variable Insurance TrustPortfolio of Investments — March 31, 2021 (unaudited) (showing percentage of total net assets)
iRhythm Technologies, Inc. (C) 7,282 1,011,179Lantheus Holdings, Inc. (C) 18,633 398,187Nevro Corp. (C) 8,440 1,177,380Novocure, Ltd. (C) 7,276 961,742Ortho Clinical Diagnostics Holdings
PLC (C) 58,896 1,136,398Outset Medical, Inc. (C) 18,326 996,751Penumbra, Inc. (C) 10,676 2,888,712Pulmonx Corp. (C) 3,467 158,581Quidel Corp. (C) 10,284 1,315,632Shockwave Medical, Inc. (C) 15,493 2,018,118Stryker Corp. 31,319 7,628,682Tandem Diabetes Care, Inc. (C) 5,800 511,850Teleflex, Inc. 5,980 2,484,451The Cooper Companies, Inc. 4,258 1,635,455West Pharmaceutical Services, Inc. 10,261 2,891,345
Zimmer Biomet Holdings, Inc. 6,050 968,484
68,078,368Health care providers and services – 17.7%Accolade, Inc. (C) 4,270 193,730Alignment Healthcare, Inc. (C) 30,216 662,637Amedisys, Inc. (C) 3,907 1,034,535Anthem, Inc. 15,695 5,633,720Centene Corp. (C) 82,515 5,273,534Cigna Corp. 27,290 6,597,085Guardant Health, Inc. (C) 12,294 1,876,679HCA Healthcare, Inc. 22,871 4,307,524Humana, Inc. 14,157 5,935,322Innovage Holding Corp. (C) 7,668 197,758Molina Healthcare, Inc. (C) 11,638 2,720,499Oak Street Health, Inc. (C) 7,398 401,489Option Care Health, Inc. (C) 26,732 474,226Surgery Partners, Inc. (C) 14,251 630,749The Pennant Group, Inc. (C) 10,535 482,503
UnitedHealth Group, Inc. 53,036 19,733,099
56,155,089
Seer, Inc. (C) 36,227 1,812,075Thermo Fisher Scientific, Inc. 25,327 11,558,736
Wuxi Biologics Cayman, Inc. (C)(D) 64,500 813,393
35,130,554Pharmaceuticals – 11.0%Arvinas, Inc. (C) 12,123 801,330Astellas Pharma, Inc. 53,700 827,211AstraZeneca PLC, ADR 95,860 4,766,159Atea Pharmaceuticals, Inc. (C) 17,259 1,065,743Athira Pharma, Inc. (C) 11,226 206,558Axsome Therapeutics, Inc. (C) 6,421 363,557Cara Therapeutics, Inc. (C) 14,333 311,169Catalent, Inc. (C) 14,481 1,524,994Daiichi Sankyo Company, Ltd. 21,100 615,608Design Therapeutics, Inc. (C) 4,731 141,457Eisai Company, Ltd. 9,300 625,090Elanco Animal Health, Inc. (C) 22,308 656,971Eli Lilly & Company 52,037 9,721,552Longboard Pharmaceuticals, Inc. (C) 9,824 160,328Merck & Company, Inc. 82,376 6,350,366Merck KGaA 8,832 1,510,749Milestone Pharmaceuticals, Inc. (C) 5,125 29,674NGM Biopharmaceuticals, Inc. (C) 5,500 159,885Pliant Therapeutics, Inc. (C) 2,500 98,325Reata Pharmaceuticals, Inc., ClassA (C) 4,624 461,013Roche Holding AG 9,247 2,995,502
Royalty Pharma PLC, Class A 31,749 1,384,891
34,778,132
308,918,135Information technology – 0.1%Electronic equipment, instruments and components –0.1%908 Devices, Inc. (C) 3,759 182,312Software – 0.0%Nuance Communications, Inc. (C) 3,500 152,740
335,052
Health Sciences Trust (continued)Shares orPrincipalAmount Value
COMMON STOCKS (continued)Materials – 0.1%Chemicals – 0.1%
High Yield Trust (continued)Shares orPrincipalAmount Value
FOREIGN GOVERNMENT OBLIGATIONS(continued)Argentina (continued)
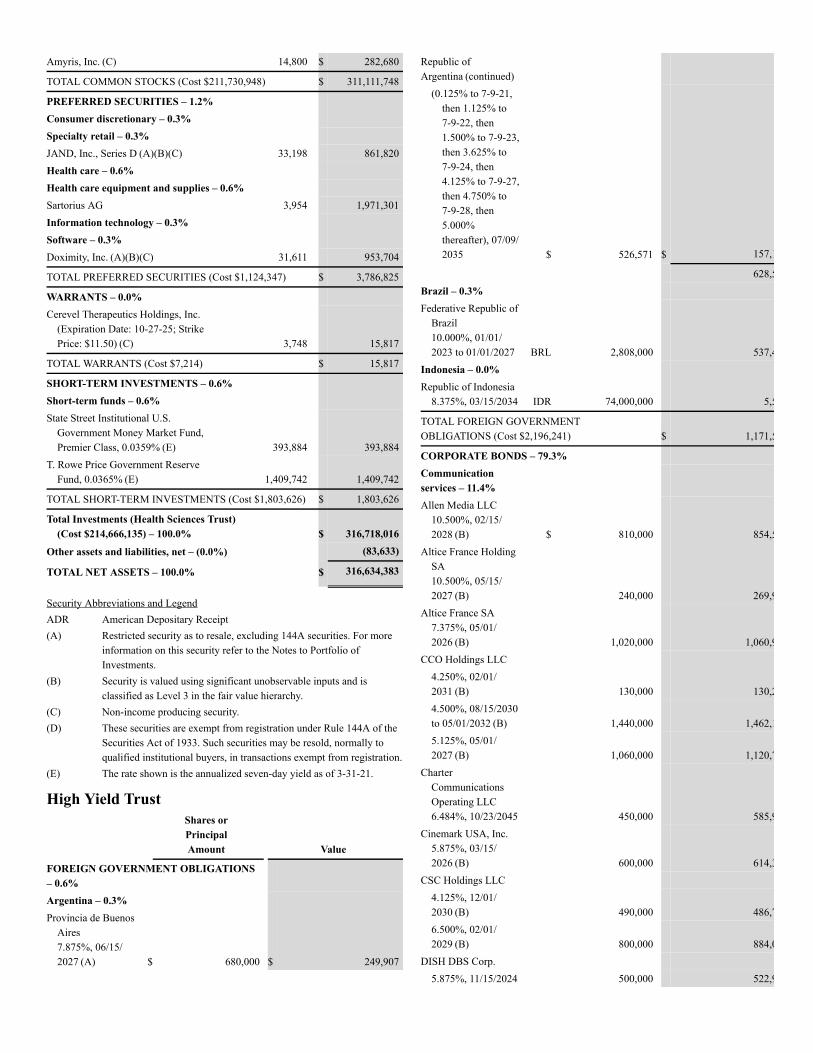
Amyris, Inc. (C) 14,800 $ 282,680
TOTAL COMMON STOCKS (Cost $211,730,948) $ 311,111,748
PREFERRED SECURITIES – 1.2%Consumer discretionary – 0.3%Specialty retail – 0.3%JAND, Inc., Series D (A)(B)(C) 33,198 861,820Health care – 0.6%Health care equipment and supplies – 0.6%Sartorius AG 3,954 1,971,301Information technology – 0.3%Software – 0.3%Doximity, Inc. (A)(B)(C) 31,611 953,704
TOTAL PREFERRED SECURITIES (Cost $1,124,347) $ 3,786,825
WARRANTS – 0.0%Cerevel Therapeutics Holdings, Inc.
(Expiration Date: 10-27-25; StrikePrice: $11.50) (C) 3,748 15,817
TOTAL WARRANTS (Cost $7,214) $ 15,817
SHORT-TERM INVESTMENTS – 0.6%Short-term funds – 0.6%State Street Institutional U.S.
Government Money Market Fund,Premier Class, 0.0359% (E) 393,884 393,884
T. Rowe Price Government ReserveFund, 0.0365% (E) 1,409,742 1,409,742
TOTAL SHORT-TERM INVESTMENTS (Cost $1,803,626) $ 1,803,626
Total Investments (Health Sciences Trust)(Cost $214,666,135) – 100.0% $ 316,718,016
Other assets and liabilities, net – (0.0%) (83,633)
TOTAL NET ASSETS – 100.0% $ 316,634,383
Security Abbreviations and LegendADR American Depositary Receipt(A) Restricted security as to resale, excluding 144A securities. For more
information on this security refer to the Notes to Portfolio ofInvestments.
(B) Security is valued using significant unobservable inputs and isclassified as Level 3 in the fair value hierarchy.
(C) Non-income producing security.(D) These securities are exempt from registration under Rule 144A of the
Securities Act of 1933. Such securities may be resold, normally toqualified institutional buyers, in transactions exempt from registration.
(E) The rate shown is the annualized seven-day yield as of 3-31-21.
High Yield TrustShares orPrincipalAmount Value
FOREIGN GOVERNMENT OBLIGATIONS– 0.6%Argentina – 0.3%Provincia de Buenos
Aires7.875%, 06/15/2027 (A) $ 680,000 $ 249,907
Republic ofArgentina (continued)
(0.125% to 7-9-21,then 1.125% to7-9-22, then1.500% to 7-9-23,then 3.625% to7-9-24, then4.125% to 7-9-27,then 4.750% to7-9-28, then5.000%thereafter), 07/09/2035 $ 526,571 $ 157,187
628,543Brazil – 0.3%Federative Republic of
Brazil10.000%, 01/01/2023 to 01/01/2027 BRL 2,808,000 537,425
Indonesia – 0.0%Republic of Indonesia
8.375%, 03/15/2034 IDR 74,000,000 5,573
TOTAL FOREIGN GOVERNMENTOBLIGATIONS (Cost $2,196,241) $ 1,171,541
CORPORATE BONDS – 79.3%Communicationservices – 11.4%Allen Media LLC
10.500%, 02/15/2028 (B) $ 810,000 854,550
Altice France HoldingSA10.500%, 05/15/2027 (B) 240,000 269,933
Altice France SA7.375%, 05/01/2026 (B) 1,020,000 1,060,902
CCO Holdings LLC4.250%, 02/01/2031 (B) 130,000 130,2894.500%, 08/15/2030to 05/01/2032 (B) 1,440,000 1,462,1545.125%, 05/01/2027 (B) 1,060,000 1,120,754
CharterCommunicationsOperating LLC6.484%, 10/23/2045 450,000 585,905
Cinemark USA, Inc.5.875%, 03/15/2026 (B) 600,000 614,364
CSC Holdings LLC4.125%, 12/01/2030 (B) 490,000 486,7076.500%, 02/01/2029 (B) 800,000 884,000
DISH DBS Corp.5.875%, 11/15/2024 500,000 522,910
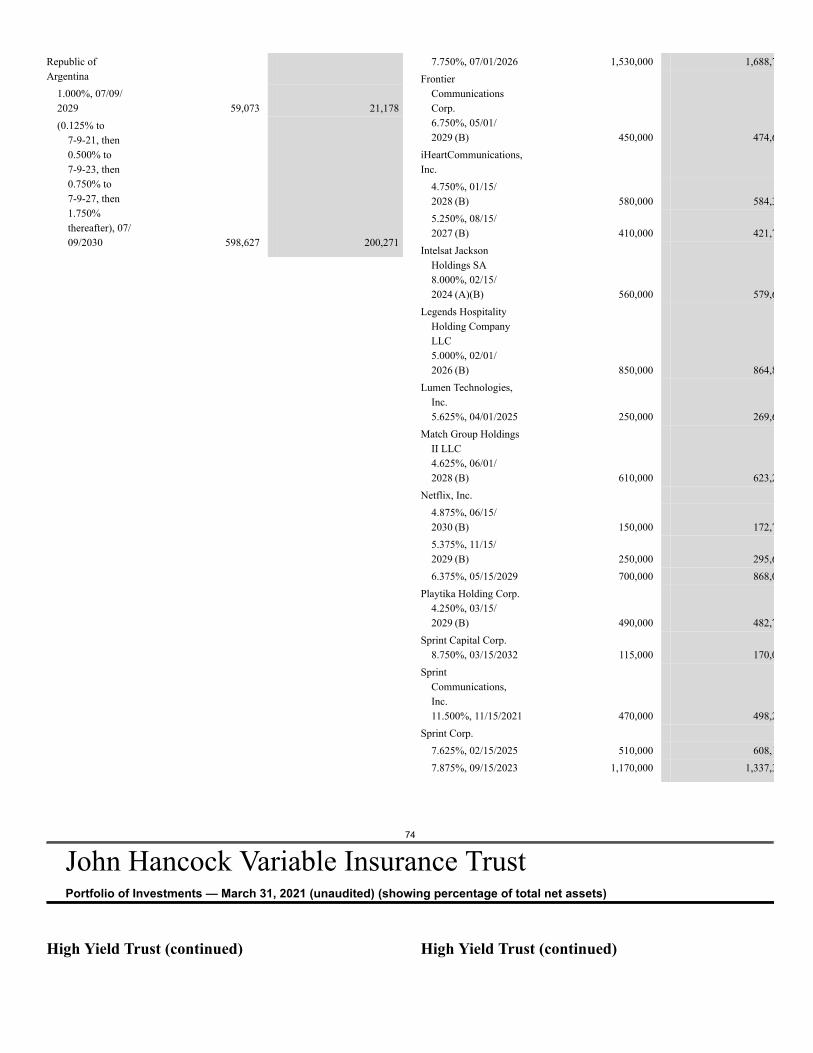
74
John Hancock Variable Insurance TrustPortfolio of Investments — March 31, 2021 (unaudited) (showing percentage of total net assets)
Republic ofArgentina
1.000%, 07/09/2029 59,073 21,178(0.125% to
7-9-21, then0.500% to7-9-23, then0.750% to7-9-27, then1.750%thereafter), 07/09/2030 598,627 200,271
7.750%, 07/01/2026 1,530,000 1,688,715Frontier
CommunicationsCorp.6.750%, 05/01/2029 (B) 450,000 474,615
iHeartCommunications,Inc.
4.750%, 01/15/2028 (B) 580,000 584,3505.250%, 08/15/2027 (B) 410,000 421,730
Intelsat JacksonHoldings SA8.000%, 02/15/2024 (A)(B) 560,000 579,600
Legends HospitalityHolding CompanyLLC5.000%, 02/01/2026 (B) 850,000 864,875
Lumen Technologies,Inc.5.625%, 04/01/2025 250,000 269,688
Match Group HoldingsII LLC4.625%, 06/01/2028 (B) 610,000 623,274
Netflix, Inc.4.875%, 06/15/2030 (B) 150,000 172,7315.375%, 11/15/2029 (B) 250,000 295,6386.375%, 05/15/2029 700,000 868,000
Playtika Holding Corp.4.250%, 03/15/2029 (B) 490,000 482,748
Sprint Capital Corp.8.750%, 03/15/2032 115,000 170,056
SprintCommunications,Inc.11.500%, 11/15/2021 470,000 498,200
Sprint Corp.7.625%, 02/15/2025 510,000 608,1757.875%, 09/15/2023 1,170,000 1,337,310
High Yield Trust (continued) High Yield Trust (continued)
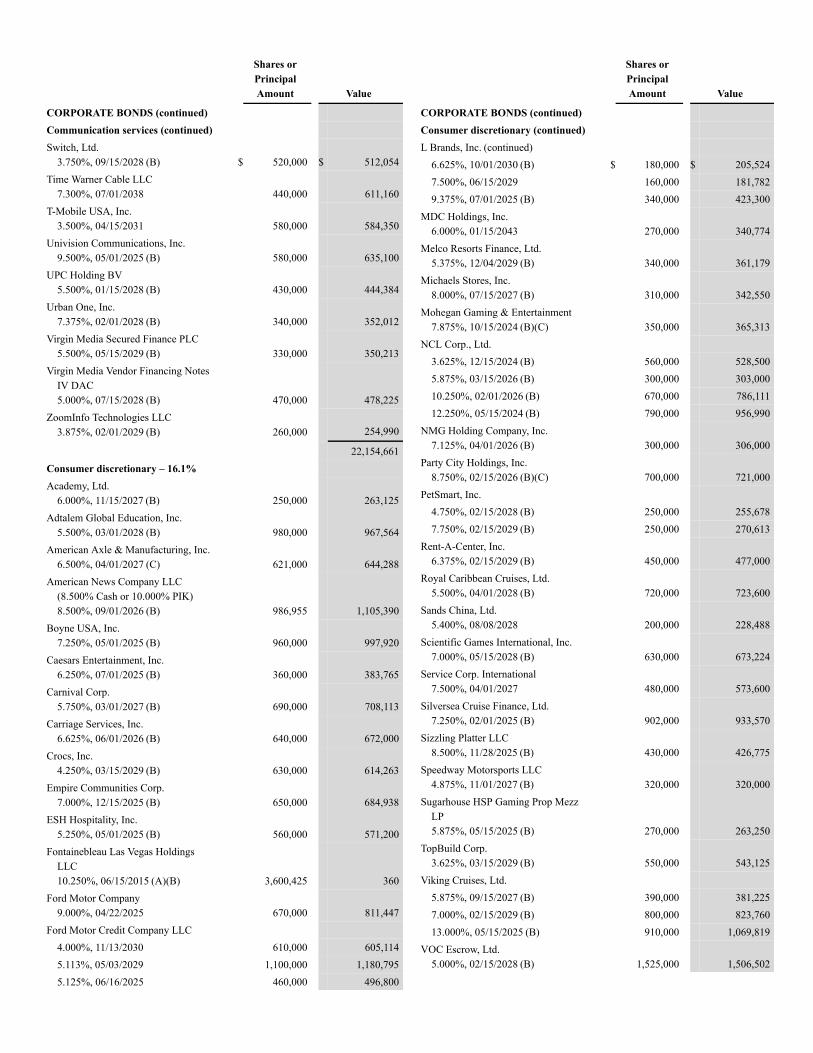
Shares orPrincipalAmount Value
CORPORATE BONDS (continued)Communication services (continued)Switch, Ltd.
3.750%, 09/15/2028 (B) $ 520,000 $ 512,054Time Warner Cable LLC
7.300%, 07/01/2038 440,000 611,160T-Mobile USA, Inc.
3.500%, 04/15/2031 580,000 584,350Univision Communications, Inc.
9.500%, 05/01/2025 (B) 580,000 635,100UPC Holding BV
5.500%, 01/15/2028 (B) 430,000 444,384Urban One, Inc.
7.375%, 02/01/2028 (B) 340,000 352,012Virgin Media Secured Finance PLC
5.500%, 05/15/2029 (B) 330,000 350,213Virgin Media Vendor Financing Notes
IV DAC5.000%, 07/15/2028 (B) 470,000 478,225
ZoomInfo Technologies LLC3.875%, 02/01/2029 (B) 260,000 254,990
22,154,661Consumer discretionary – 16.1%Academy, Ltd.
6.000%, 11/15/2027 (B) 250,000 263,125Adtalem Global Education, Inc.
5.500%, 03/01/2028 (B) 980,000 967,564American Axle & Manufacturing, Inc.
6.500%, 04/01/2027 (C) 621,000 644,288American News Company LLC
(8.500% Cash or 10.000% PIK)8.500%, 09/01/2026 (B) 986,955 1,105,390
Boyne USA, Inc.7.250%, 05/01/2025 (B) 960,000 997,920
Caesars Entertainment, Inc.6.250%, 07/01/2025 (B) 360,000 383,765
Carnival Corp.5.750%, 03/01/2027 (B) 690,000 708,113
Carriage Services, Inc.6.625%, 06/01/2026 (B) 640,000 672,000
Crocs, Inc.4.250%, 03/15/2029 (B) 630,000 614,263
Empire Communities Corp.7.000%, 12/15/2025 (B) 650,000 684,938
ESH Hospitality, Inc.5.250%, 05/01/2025 (B) 560,000 571,200
Fontainebleau Las Vegas HoldingsLLC10.250%, 06/15/2015 (A)(B) 3,600,425 360
Ford Motor Company9.000%, 04/22/2025 670,000 811,447
Ford Motor Credit Company LLC4.000%, 11/13/2030 610,000 605,1145.113%, 05/03/2029 1,100,000 1,180,7955.125%, 06/16/2025 460,000 496,800
Shares orPrincipalAmount Value
CORPORATE BONDS (continued)Consumer discretionary (continued)L Brands, Inc. (continued)
6.625%, 10/01/2030 (B) $ 180,000 $ 205,5247.500%, 06/15/2029 160,000 181,7829.375%, 07/01/2025 (B) 340,000 423,300
MDC Holdings, Inc.6.000%, 01/15/2043 270,000 340,774
Melco Resorts Finance, Ltd.5.375%, 12/04/2029 (B) 340,000 361,179
Michaels Stores, Inc.8.000%, 07/15/2027 (B) 310,000 342,550
Mohegan Gaming & Entertainment7.875%, 10/15/2024 (B)(C) 350,000 365,313
NCL Corp., Ltd.3.625%, 12/15/2024 (B) 560,000 528,5005.875%, 03/15/2026 (B) 300,000 303,00010.250%, 02/01/2026 (B) 670,000 786,11112.250%, 05/15/2024 (B) 790,000 956,990
NMG Holding Company, Inc.7.125%, 04/01/2026 (B) 300,000 306,000
Party City Holdings, Inc.8.750%, 02/15/2026 (B)(C) 700,000 721,000
PetSmart, Inc.4.750%, 02/15/2028 (B) 250,000 255,6787.750%, 02/15/2029 (B) 250,000 270,613
Rent-A-Center, Inc.6.375%, 02/15/2029 (B) 450,000 477,000
Royal Caribbean Cruises, Ltd.5.500%, 04/01/2028 (B) 720,000 723,600
Sands China, Ltd.5.400%, 08/08/2028 200,000 228,488
Scientific Games International, Inc.7.000%, 05/15/2028 (B) 630,000 673,224
Service Corp. International7.500%, 04/01/2027 480,000 573,600
Silversea Cruise Finance, Ltd.7.250%, 02/01/2025 (B) 902,000 933,570
Sizzling Platter LLC8.500%, 11/28/2025 (B) 430,000 426,775
Speedway Motorsports LLC4.875%, 11/01/2027 (B) 320,000 320,000
Sugarhouse HSP Gaming Prop MezzLP5.875%, 05/15/2025 (B) 270,000 263,250
TopBuild Corp.3.625%, 03/15/2029 (B) 550,000 543,125
Viking Cruises, Ltd.5.875%, 09/15/2027 (B) 390,000 381,2257.000%, 02/15/2029 (B) 800,000 823,76013.000%, 05/15/2025 (B) 910,000 1,069,819
VOC Escrow, Ltd.5.000%, 02/15/2028 (B) 1,525,000 1,506,502
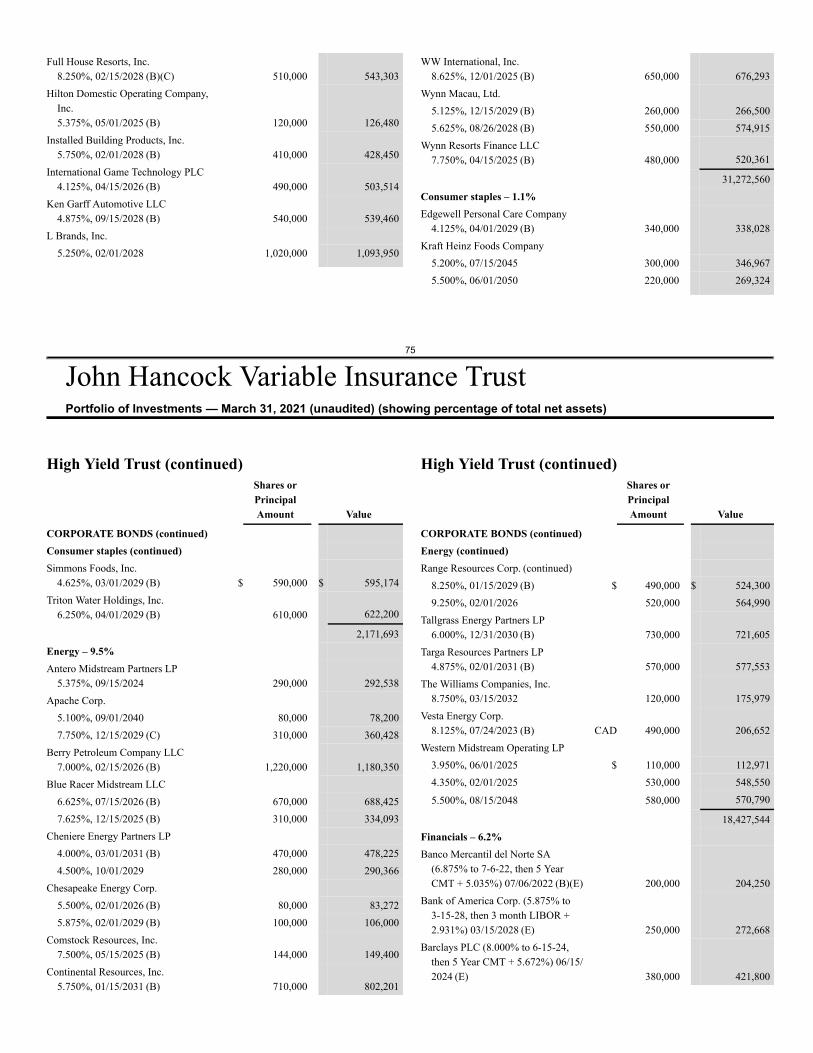
75
John Hancock Variable Insurance TrustPortfolio of Investments — March 31, 2021 (unaudited) (showing percentage of total net assets)
Full House Resorts, Inc.8.250%, 02/15/2028 (B)(C) 510,000 543,303
Hilton Domestic Operating Company,Inc.5.375%, 05/01/2025 (B) 120,000 126,480
Installed Building Products, Inc.5.750%, 02/01/2028 (B) 410,000 428,450
International Game Technology PLC4.125%, 04/15/2026 (B) 490,000 503,514
Ken Garff Automotive LLC4.875%, 09/15/2028 (B) 540,000 539,460
L Brands, Inc.5.250%, 02/01/2028 1,020,000 1,093,950
WW International, Inc.8.625%, 12/01/2025 (B) 650,000 676,293
Wynn Macau, Ltd.5.125%, 12/15/2029 (B) 260,000 266,5005.625%, 08/26/2028 (B) 550,000 574,915
Wynn Resorts Finance LLC7.750%, 04/15/2025 (B) 480,000 520,361
31,272,560Consumer staples – 1.1%Edgewell Personal Care Company
4.125%, 04/01/2029 (B) 340,000 338,028Kraft Heinz Foods Company
5.200%, 07/15/2045 300,000 346,9675.500%, 06/01/2050 220,000 269,324
High Yield Trust (continued)Shares orPrincipalAmount Value
CORPORATE BONDS (continued)Consumer staples (continued)Simmons Foods, Inc.
4.625%, 03/01/2029 (B) $ 590,000 $ 595,174Triton Water Holdings, Inc.
6.250%, 04/01/2029 (B) 610,000 622,200
2,171,693Energy – 9.5%Antero Midstream Partners LP
5.375%, 09/15/2024 290,000 292,538Apache Corp.
5.100%, 09/01/2040 80,000 78,2007.750%, 12/15/2029 (C) 310,000 360,428
Berry Petroleum Company LLC7.000%, 02/15/2026 (B) 1,220,000 1,180,350
Blue Racer Midstream LLC6.625%, 07/15/2026 (B) 670,000 688,4257.625%, 12/15/2025 (B) 310,000 334,093
Cheniere Energy Partners LP4.000%, 03/01/2031 (B) 470,000 478,2254.500%, 10/01/2029 280,000 290,366
Chesapeake Energy Corp.5.500%, 02/01/2026 (B) 80,000 83,2725.875%, 02/01/2029 (B) 100,000 106,000
Comstock Resources, Inc.7.500%, 05/15/2025 (B) 144,000 149,400
Continental Resources, Inc.5.750%, 01/15/2031 (B) 710,000 802,201
High Yield Trust (continued)Shares orPrincipalAmount Value
CORPORATE BONDS (continued)Energy (continued)Range Resources Corp. (continued)
8.250%, 01/15/2029 (B) $ 490,000 $ 524,3009.250%, 02/01/2026 520,000 564,990
Tallgrass Energy Partners LP6.000%, 12/31/2030 (B) 730,000 721,605
Targa Resources Partners LP4.875%, 02/01/2031 (B) 570,000 577,553
The Williams Companies, Inc.8.750%, 03/15/2032 120,000 175,979
Vesta Energy Corp.8.125%, 07/24/2023 (B) CAD 490,000 206,652
Western Midstream Operating LP3.950%, 06/01/2025 $ 110,000 112,9714.350%, 02/01/2025 530,000 548,550
5.500%, 08/15/2048 580,000 570,790
18,427,544Financials – 6.2%Banco Mercantil del Norte SA
(6.875% to 7-6-22, then 5 YearCMT + 5.035%) 07/06/2022 (B)(E) 200,000 204,250
Bank of America Corp. (5.875% to3-15-28, then 3 month LIBOR +2.931%) 03/15/2028 (E) 250,000 272,668
Barclays PLC (8.000% to 6-15-24,then 5 Year CMT + 5.672%) 06/15/2024 (E) 380,000 421,800
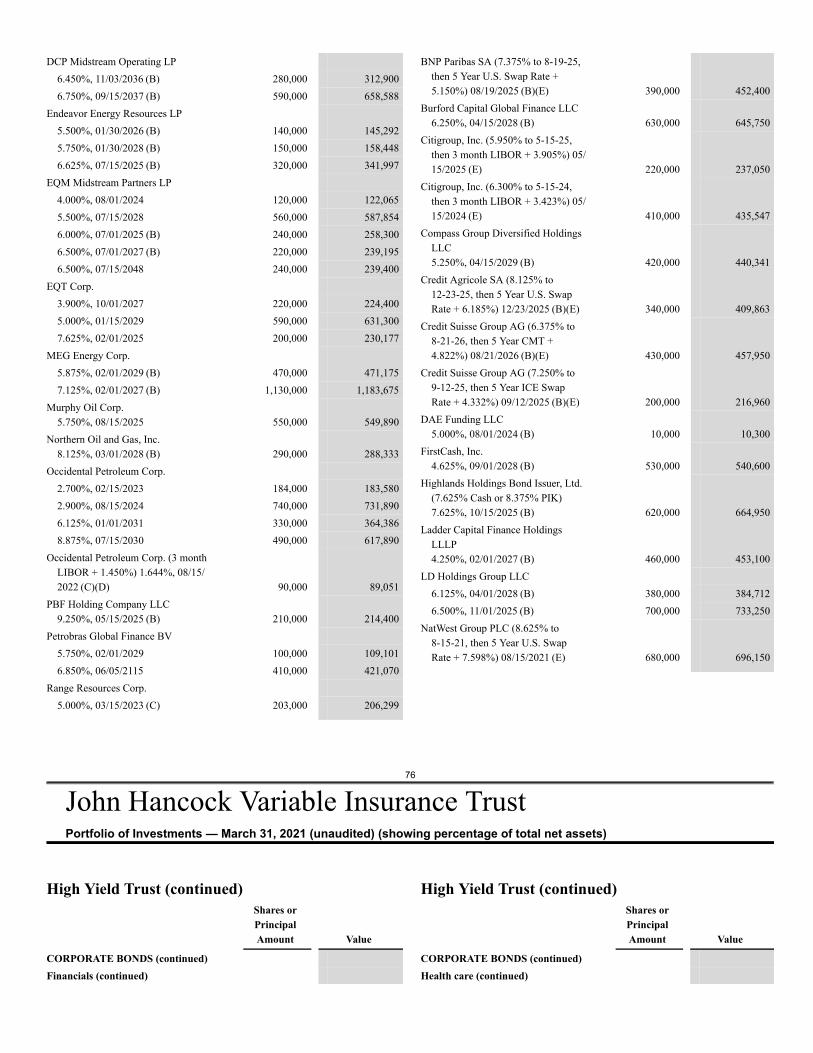
76
John Hancock Variable Insurance TrustPortfolio of Investments — March 31, 2021 (unaudited) (showing percentage of total net assets)
DCP Midstream Operating LP6.450%, 11/03/2036 (B) 280,000 312,9006.750%, 09/15/2037 (B) 590,000 658,588
Endeavor Energy Resources LP5.500%, 01/30/2026 (B) 140,000 145,2925.750%, 01/30/2028 (B) 150,000 158,4486.625%, 07/15/2025 (B) 320,000 341,997
EQM Midstream Partners LP4.000%, 08/01/2024 120,000 122,0655.500%, 07/15/2028 560,000 587,8546.000%, 07/01/2025 (B) 240,000 258,3006.500%, 07/01/2027 (B) 220,000 239,1956.500%, 07/15/2048 240,000 239,400
EQT Corp.3.900%, 10/01/2027 220,000 224,4005.000%, 01/15/2029 590,000 631,3007.625%, 02/01/2025 200,000 230,177
MEG Energy Corp.5.875%, 02/01/2029 (B) 470,000 471,1757.125%, 02/01/2027 (B) 1,130,000 1,183,675
Murphy Oil Corp.5.750%, 08/15/2025 550,000 549,890
Northern Oil and Gas, Inc.8.125%, 03/01/2028 (B) 290,000 288,333
Occidental Petroleum Corp.2.700%, 02/15/2023 184,000 183,5802.900%, 08/15/2024 740,000 731,8906.125%, 01/01/2031 330,000 364,3868.875%, 07/15/2030 490,000 617,890
Occidental Petroleum Corp. (3 monthLIBOR + 1.450%) 1.644%, 08/15/2022 (C)(D) 90,000 89,051
PBF Holding Company LLC9.250%, 05/15/2025 (B) 210,000 214,400
Petrobras Global Finance BV5.750%, 02/01/2029 100,000 109,1016.850%, 06/05/2115 410,000 421,070
Range Resources Corp.5.000%, 03/15/2023 (C) 203,000 206,299
BNP Paribas SA (7.375% to 8-19-25,then 5 Year U.S. Swap Rate +5.150%) 08/19/2025 (B)(E) 390,000 452,400
Burford Capital Global Finance LLC6.250%, 04/15/2028 (B) 630,000 645,750
Citigroup, Inc. (5.950% to 5-15-25,then 3 month LIBOR + 3.905%) 05/15/2025 (E) 220,000 237,050
Citigroup, Inc. (6.300% to 5-15-24,then 3 month LIBOR + 3.423%) 05/15/2024 (E) 410,000 435,547
Compass Group Diversified HoldingsLLC5.250%, 04/15/2029 (B) 420,000 440,341
Credit Agricole SA (8.125% to12-23-25, then 5 Year U.S. SwapRate + 6.185%) 12/23/2025 (B)(E) 340,000 409,863
Credit Suisse Group AG (6.375% to8-21-26, then 5 Year CMT +4.822%) 08/21/2026 (B)(E) 430,000 457,950
Credit Suisse Group AG (7.250% to9-12-25, then 5 Year ICE SwapRate + 4.332%) 09/12/2025 (B)(E) 200,000 216,960
DAE Funding LLC5.000%, 08/01/2024 (B) 10,000 10,300
FirstCash, Inc.4.625%, 09/01/2028 (B) 530,000 540,600
Highlands Holdings Bond Issuer, Ltd.(7.625% Cash or 8.375% PIK)7.625%, 10/15/2025 (B) 620,000 664,950
Ladder Capital Finance HoldingsLLLP4.250%, 02/01/2027 (B) 460,000 453,100
LD Holdings Group LLC6.125%, 04/01/2028 (B) 380,000 384,7126.500%, 11/01/2025 (B) 700,000 733,250
NatWest Group PLC (8.625% to8-15-21, then 5 Year U.S. SwapRate + 7.598%) 08/15/2021 (E) 680,000 696,150
High Yield Trust (continued)Shares orPrincipalAmount Value
CORPORATE BONDS (continued)Financials (continued)
High Yield Trust (continued)Shares orPrincipalAmount Value
CORPORATE BONDS (continued)Health care (continued)
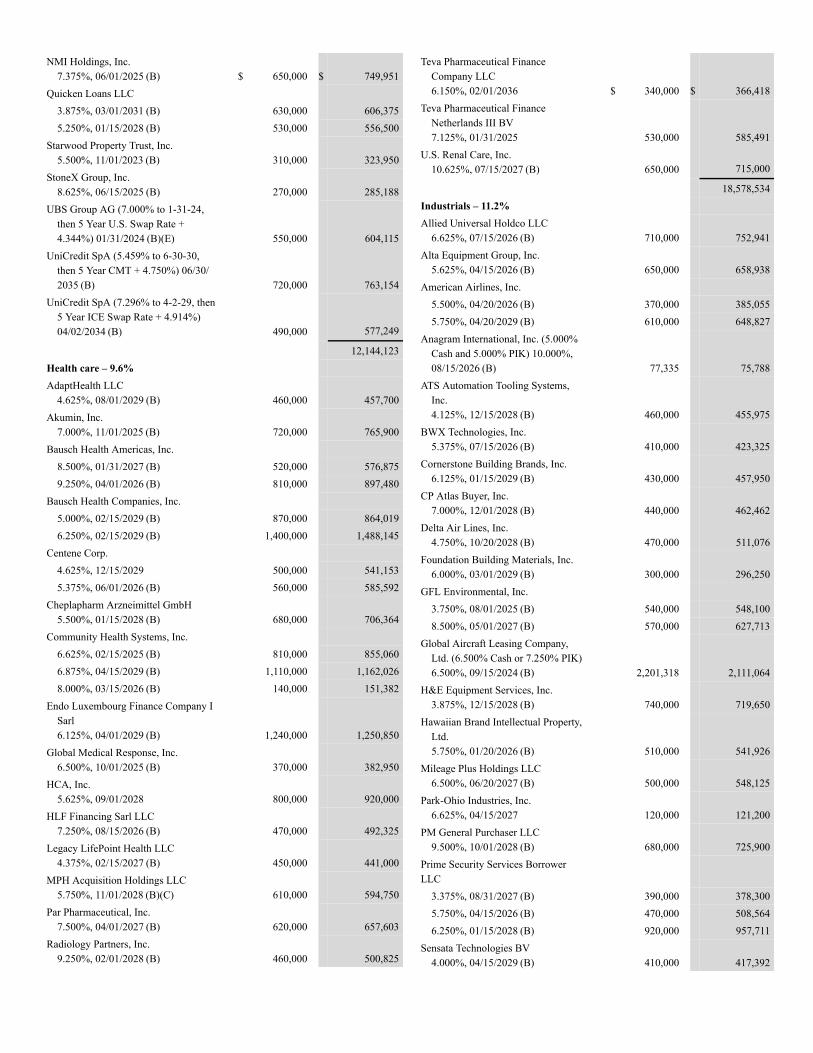
NMI Holdings, Inc.7.375%, 06/01/2025 (B) $ 650,000 $ 749,951
Quicken Loans LLC3.875%, 03/01/2031 (B) 630,000 606,3755.250%, 01/15/2028 (B) 530,000 556,500
Starwood Property Trust, Inc.5.500%, 11/01/2023 (B) 310,000 323,950
StoneX Group, Inc.8.625%, 06/15/2025 (B) 270,000 285,188
UBS Group AG (7.000% to 1-31-24,then 5 Year U.S. Swap Rate +4.344%) 01/31/2024 (B)(E) 550,000 604,115
UniCredit SpA (5.459% to 6-30-30,then 5 Year CMT + 4.750%) 06/30/2035 (B) 720,000 763,154
UniCredit SpA (7.296% to 4-2-29, then5 Year ICE Swap Rate + 4.914%)04/02/2034 (B) 490,000 577,249
12,144,123Health care – 9.6%AdaptHealth LLC
4.625%, 08/01/2029 (B) 460,000 457,700Akumin, Inc.
7.000%, 11/01/2025 (B) 720,000 765,900Bausch Health Americas, Inc.
8.500%, 01/31/2027 (B) 520,000 576,8759.250%, 04/01/2026 (B) 810,000 897,480
Bausch Health Companies, Inc.5.000%, 02/15/2029 (B) 870,000 864,0196.250%, 02/15/2029 (B) 1,400,000 1,488,145
Centene Corp.4.625%, 12/15/2029 500,000 541,1535.375%, 06/01/2026 (B) 560,000 585,592
Cheplapharm Arzneimittel GmbH5.500%, 01/15/2028 (B) 680,000 706,364
Community Health Systems, Inc.6.625%, 02/15/2025 (B) 810,000 855,0606.875%, 04/15/2029 (B) 1,110,000 1,162,0268.000%, 03/15/2026 (B) 140,000 151,382
Endo Luxembourg Finance Company ISarl6.125%, 04/01/2029 (B) 1,240,000 1,250,850
Global Medical Response, Inc.6.500%, 10/01/2025 (B) 370,000 382,950
HCA, Inc.5.625%, 09/01/2028 800,000 920,000
HLF Financing Sarl LLC7.250%, 08/15/2026 (B) 470,000 492,325
Legacy LifePoint Health LLC4.375%, 02/15/2027 (B) 450,000 441,000
MPH Acquisition Holdings LLC5.750%, 11/01/2028 (B)(C) 610,000 594,750
Par Pharmaceutical, Inc.7.500%, 04/01/2027 (B) 620,000 657,603
Radiology Partners, Inc.9.250%, 02/01/2028 (B) 460,000 500,825
Teva Pharmaceutical FinanceCompany LLC6.150%, 02/01/2036 $ 340,000 $ 366,418
Teva Pharmaceutical FinanceNetherlands III BV7.125%, 01/31/2025 530,000 585,491
U.S. Renal Care, Inc.10.625%, 07/15/2027 (B) 650,000 715,000
18,578,534Industrials – 11.2%Allied Universal Holdco LLC
6.625%, 07/15/2026 (B) 710,000 752,941Alta Equipment Group, Inc.
5.625%, 04/15/2026 (B) 650,000 658,938American Airlines, Inc.
5.500%, 04/20/2026 (B) 370,000 385,0555.750%, 04/20/2029 (B) 610,000 648,827
Anagram International, Inc. (5.000%Cash and 5.000% PIK) 10.000%,08/15/2026 (B) 77,335 75,788
ATS Automation Tooling Systems,Inc.4.125%, 12/15/2028 (B) 460,000 455,975
BWX Technologies, Inc.5.375%, 07/15/2026 (B) 410,000 423,325
Cornerstone Building Brands, Inc.6.125%, 01/15/2029 (B) 430,000 457,950
CP Atlas Buyer, Inc.7.000%, 12/01/2028 (B) 440,000 462,462
Delta Air Lines, Inc.4.750%, 10/20/2028 (B) 470,000 511,076
Foundation Building Materials, Inc.6.000%, 03/01/2029 (B) 300,000 296,250
GFL Environmental, Inc.3.750%, 08/01/2025 (B) 540,000 548,1008.500%, 05/01/2027 (B) 570,000 627,713
Global Aircraft Leasing Company,Ltd. (6.500% Cash or 7.250% PIK)6.500%, 09/15/2024 (B) 2,201,318 2,111,064
H&E Equipment Services, Inc.3.875%, 12/15/2028 (B) 740,000 719,650
Hawaiian Brand Intellectual Property,Ltd.5.750%, 01/20/2026 (B) 510,000 541,926
Mileage Plus Holdings LLC6.500%, 06/20/2027 (B) 500,000 548,125
Park-Ohio Industries, Inc.6.625%, 04/15/2027 120,000 121,200
PM General Purchaser LLC9.500%, 10/01/2028 (B) 680,000 725,900
Prime Security Services BorrowerLLC
3.375%, 08/31/2027 (B) 390,000 378,3005.750%, 04/15/2026 (B) 470,000 508,5646.250%, 01/15/2028 (B) 920,000 957,711
Sensata Technologies BV4.000%, 04/15/2029 (B) 410,000 417,392
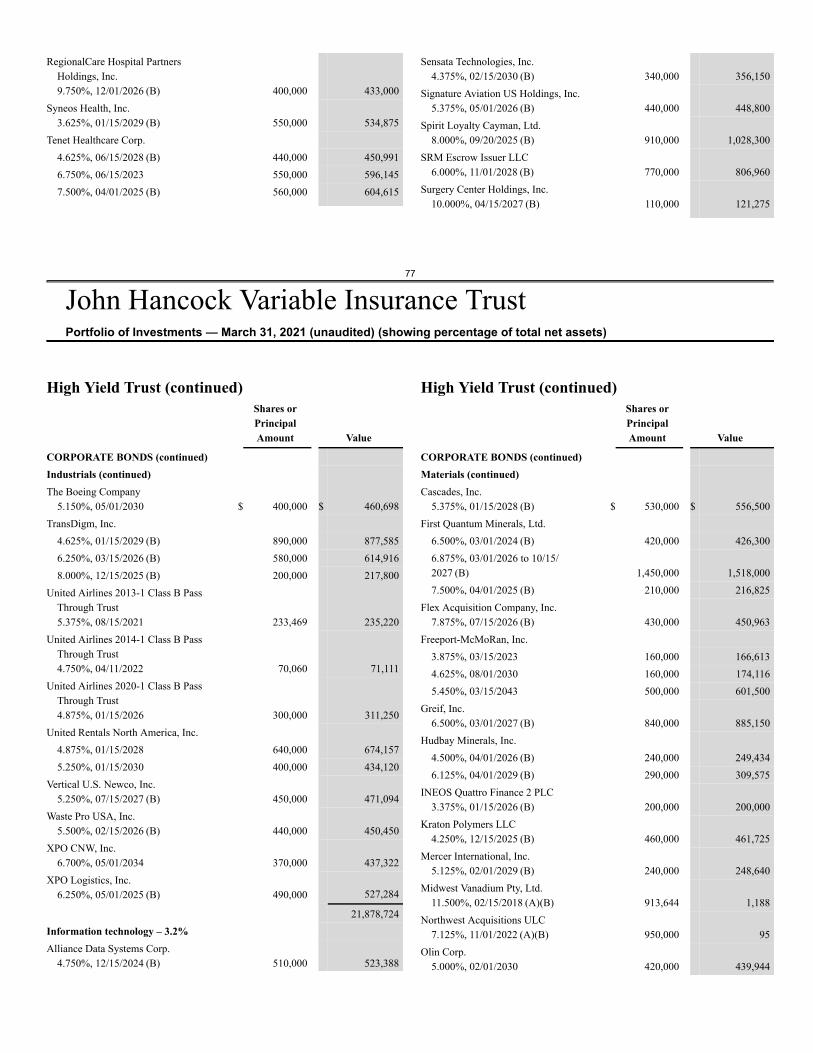
77
John Hancock Variable Insurance TrustPortfolio of Investments — March 31, 2021 (unaudited) (showing percentage of total net assets)
RegionalCare Hospital PartnersHoldings, Inc.9.750%, 12/01/2026 (B) 400,000 433,000
Syneos Health, Inc.3.625%, 01/15/2029 (B) 550,000 534,875
Tenet Healthcare Corp.4.625%, 06/15/2028 (B) 440,000 450,9916.750%, 06/15/2023 550,000 596,1457.500%, 04/01/2025 (B) 560,000 604,615
Sensata Technologies, Inc.4.375%, 02/15/2030 (B) 340,000 356,150
Signature Aviation US Holdings, Inc.5.375%, 05/01/2026 (B) 440,000 448,800
Spirit Loyalty Cayman, Ltd.8.000%, 09/20/2025 (B) 910,000 1,028,300
SRM Escrow Issuer LLC6.000%, 11/01/2028 (B) 770,000 806,960
Surgery Center Holdings, Inc.10.000%, 04/15/2027 (B) 110,000 121,275
High Yield Trust (continued)Shares orPrincipalAmount Value
CORPORATE BONDS (continued)Industrials (continued)The Boeing Company
5.150%, 05/01/2030 $ 400,000 $ 460,698TransDigm, Inc.
4.625%, 01/15/2029 (B) 890,000 877,5856.250%, 03/15/2026 (B) 580,000 614,9168.000%, 12/15/2025 (B) 200,000 217,800
United Airlines 2013-1 Class B PassThrough Trust5.375%, 08/15/2021 233,469 235,220
United Airlines 2014-1 Class B PassThrough Trust4.750%, 04/11/2022 70,060 71,111
United Airlines 2020-1 Class B PassThrough Trust4.875%, 01/15/2026 300,000 311,250
United Rentals North America, Inc.4.875%, 01/15/2028 640,000 674,1575.250%, 01/15/2030 400,000 434,120
Vertical U.S. Newco, Inc.5.250%, 07/15/2027 (B) 450,000 471,094
Waste Pro USA, Inc.5.500%, 02/15/2026 (B) 440,000 450,450
XPO CNW, Inc.6.700%, 05/01/2034 370,000 437,322
XPO Logistics, Inc.6.250%, 05/01/2025 (B) 490,000 527,284
21,878,724Information technology – 3.2%Alliance Data Systems Corp.
4.750%, 12/15/2024 (B) 510,000 523,388
High Yield Trust (continued)Shares orPrincipalAmount Value
CORPORATE BONDS (continued)Materials (continued)Cascades, Inc.
5.375%, 01/15/2028 (B) $ 530,000 $ 556,500First Quantum Minerals, Ltd.
6.500%, 03/01/2024 (B) 420,000 426,3006.875%, 03/01/2026 to 10/15/2027 (B) 1,450,000 1,518,0007.500%, 04/01/2025 (B) 210,000 216,825
Flex Acquisition Company, Inc.7.875%, 07/15/2026 (B) 430,000 450,963
Freeport-McMoRan, Inc.3.875%, 03/15/2023 160,000 166,6134.625%, 08/01/2030 160,000 174,1165.450%, 03/15/2043 500,000 601,500
Greif, Inc.6.500%, 03/01/2027 (B) 840,000 885,150
Hudbay Minerals, Inc.4.500%, 04/01/2026 (B) 240,000 249,4346.125%, 04/01/2029 (B) 290,000 309,575
INEOS Quattro Finance 2 PLC3.375%, 01/15/2026 (B) 200,000 200,000
Kraton Polymers LLC4.250%, 12/15/2025 (B) 460,000 461,725
Mercer International, Inc.5.125%, 02/01/2029 (B) 240,000 248,640
Midwest Vanadium Pty, Ltd.11.500%, 02/15/2018 (A)(B) 913,644 1,188
Northwest Acquisitions ULC7.125%, 11/01/2022 (A)(B) 950,000 95
Olin Corp.5.000%, 02/01/2030 420,000 439,944
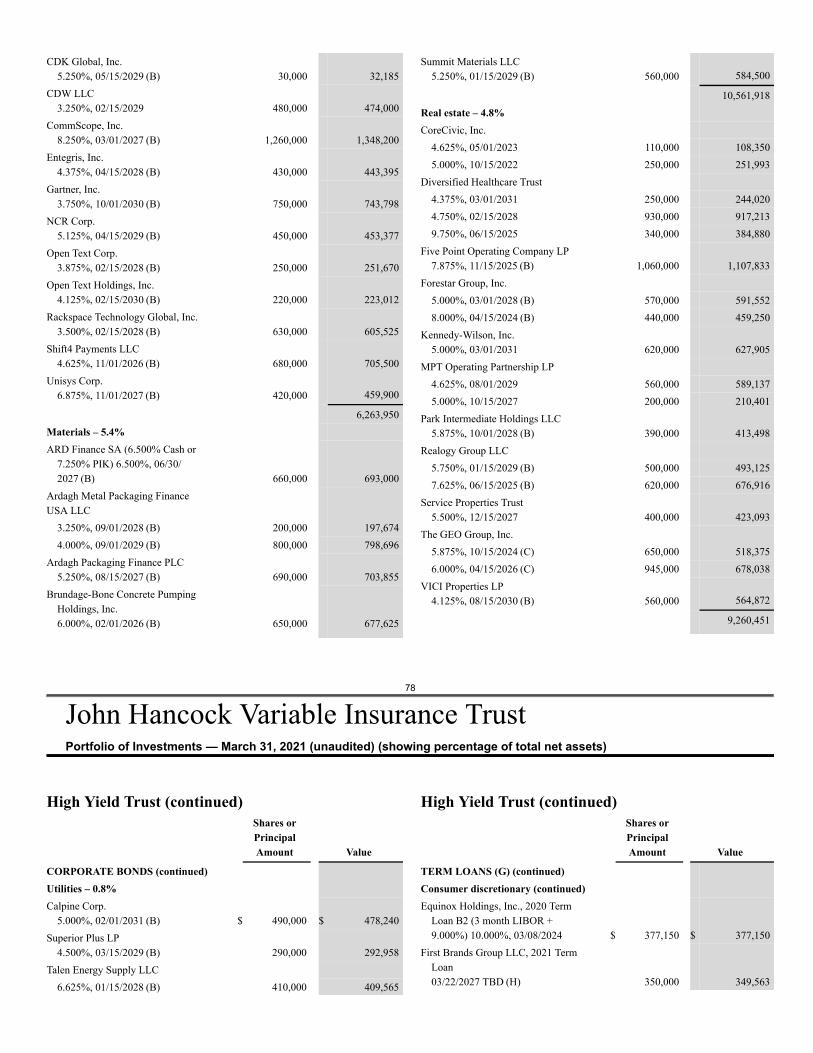
78
John Hancock Variable Insurance TrustPortfolio of Investments — March 31, 2021 (unaudited) (showing percentage of total net assets)
CDK Global, Inc.5.250%, 05/15/2029 (B) 30,000 32,185
CDW LLC3.250%, 02/15/2029 480,000 474,000
CommScope, Inc.8.250%, 03/01/2027 (B) 1,260,000 1,348,200
Entegris, Inc.4.375%, 04/15/2028 (B) 430,000 443,395
Gartner, Inc.3.750%, 10/01/2030 (B) 750,000 743,798
NCR Corp.5.125%, 04/15/2029 (B) 450,000 453,377
Open Text Corp.3.875%, 02/15/2028 (B) 250,000 251,670
Open Text Holdings, Inc.4.125%, 02/15/2030 (B) 220,000 223,012
Rackspace Technology Global, Inc.3.500%, 02/15/2028 (B) 630,000 605,525
Shift4 Payments LLC4.625%, 11/01/2026 (B) 680,000 705,500
Unisys Corp.6.875%, 11/01/2027 (B) 420,000 459,900
6,263,950Materials – 5.4%ARD Finance SA (6.500% Cash or
7.250% PIK) 6.500%, 06/30/2027 (B) 660,000 693,000
Ardagh Metal Packaging FinanceUSA LLC
3.250%, 09/01/2028 (B) 200,000 197,6744.000%, 09/01/2029 (B) 800,000 798,696
Ardagh Packaging Finance PLC5.250%, 08/15/2027 (B) 690,000 703,855
Brundage-Bone Concrete PumpingHoldings, Inc.6.000%, 02/01/2026 (B) 650,000 677,625
Summit Materials LLC5.250%, 01/15/2029 (B) 560,000 584,500
10,561,918Real estate – 4.8%CoreCivic, Inc.
4.625%, 05/01/2023 110,000 108,3505.000%, 10/15/2022 250,000 251,993
Diversified Healthcare Trust4.375%, 03/01/2031 250,000 244,0204.750%, 02/15/2028 930,000 917,2139.750%, 06/15/2025 340,000 384,880
Five Point Operating Company LP7.875%, 11/15/2025 (B) 1,060,000 1,107,833
Forestar Group, Inc.5.000%, 03/01/2028 (B) 570,000 591,5528.000%, 04/15/2024 (B) 440,000 459,250
Kennedy-Wilson, Inc.5.000%, 03/01/2031 620,000 627,905
MPT Operating Partnership LP4.625%, 08/01/2029 560,000 589,1375.000%, 10/15/2027 200,000 210,401
Park Intermediate Holdings LLC5.875%, 10/01/2028 (B) 390,000 413,498
Realogy Group LLC5.750%, 01/15/2029 (B) 500,000 493,1257.625%, 06/15/2025 (B) 620,000 676,916
Service Properties Trust5.500%, 12/15/2027 400,000 423,093
The GEO Group, Inc.5.875%, 10/15/2024 (C) 650,000 518,3756.000%, 04/15/2026 (C) 945,000 678,038
VICI Properties LP4.125%, 08/15/2030 (B) 560,000 564,872
9,260,451
High Yield Trust (continued)Shares orPrincipalAmount Value
CORPORATE BONDS (continued)Utilities – 0.8%Calpine Corp.
5.000%, 02/01/2031 (B) $ 490,000 $ 478,240Superior Plus LP
4.500%, 03/15/2029 (B) 290,000 292,958Talen Energy Supply LLC
6.625%, 01/15/2028 (B) 410,000 409,565
High Yield Trust (continued)Shares orPrincipalAmount Value
TERM LOANS (G) (continued)Consumer discretionary (continued)Equinox Holdings, Inc., 2020 Term
Loan B2 (3 month LIBOR +9.000%) 10.000%, 03/08/2024 $ 377,150 $ 377,150
First Brands Group LLC, 2021 TermLoan03/22/2027 TBD (H) 350,000 349,563
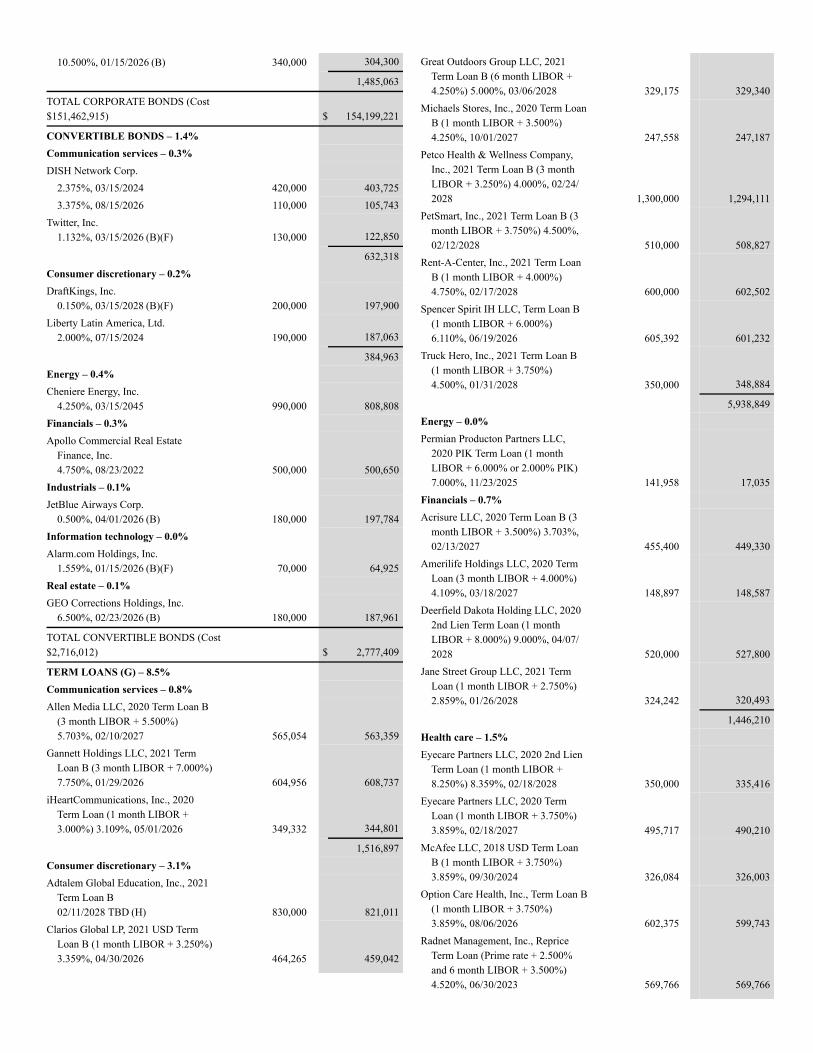
10.500%, 01/15/2026 (B) 340,000 304,300
1,485,063
TOTAL CORPORATE BONDS (Cost$151,462,915) $ 154,199,221
CONVERTIBLE BONDS – 1.4%Communication services – 0.3%DISH Network Corp.
2.375%, 03/15/2024 420,000 403,7253.375%, 08/15/2026 110,000 105,743
Twitter, Inc.1.132%, 03/15/2026 (B)(F) 130,000 122,850
632,318Consumer discretionary – 0.2%DraftKings, Inc.
0.150%, 03/15/2028 (B)(F) 200,000 197,900Liberty Latin America, Ltd.
2.000%, 07/15/2024 190,000 187,063
384,963Energy – 0.4%Cheniere Energy, Inc.
4.250%, 03/15/2045 990,000 808,808Financials – 0.3%Apollo Commercial Real Estate
Finance, Inc.4.750%, 08/23/2022 500,000 500,650
Industrials – 0.1%JetBlue Airways Corp.
0.500%, 04/01/2026 (B) 180,000 197,784Information technology – 0.0%Alarm.com Holdings, Inc.
1.559%, 01/15/2026 (B)(F) 70,000 64,925Real estate – 0.1%GEO Corrections Holdings, Inc.
6.500%, 02/23/2026 (B) 180,000 187,961
TOTAL CONVERTIBLE BONDS (Cost$2,716,012) $ 2,777,409
TERM LOANS (G) – 8.5%Communication services – 0.8%Allen Media LLC, 2020 Term Loan B
(3 month LIBOR + 5.500%)5.703%, 02/10/2027 565,054 563,359
Gannett Holdings LLC, 2021 TermLoan B (3 month LIBOR + 7.000%)7.750%, 01/29/2026 604,956 608,737
iHeartCommunications, Inc., 2020Term Loan (1 month LIBOR +3.000%) 3.109%, 05/01/2026 349,332 344,801
1,516,897Consumer discretionary – 3.1%Adtalem Global Education, Inc., 2021
Term Loan B02/11/2028 TBD (H) 830,000 821,011
Clarios Global LP, 2021 USD TermLoan B (1 month LIBOR + 3.250%)3.359%, 04/30/2026 464,265 459,042
Great Outdoors Group LLC, 2021Term Loan B (6 month LIBOR +4.250%) 5.000%, 03/06/2028 329,175 329,340
Michaels Stores, Inc., 2020 Term LoanB (1 month LIBOR + 3.500%)4.250%, 10/01/2027 247,558 247,187
Petco Health & Wellness Company,Inc., 2021 Term Loan B (3 monthLIBOR + 3.250%) 4.000%, 02/24/2028 1,300,000 1,294,111
PetSmart, Inc., 2021 Term Loan B (3month LIBOR + 3.750%) 4.500%,02/12/2028 510,000 508,827
Rent-A-Center, Inc., 2021 Term LoanB (1 month LIBOR + 4.000%)4.750%, 02/17/2028 600,000 602,502
Spencer Spirit IH LLC, Term Loan B(1 month LIBOR + 6.000%)6.110%, 06/19/2026 605,392 601,232
Truck Hero, Inc., 2021 Term Loan B(1 month LIBOR + 3.750%)4.500%, 01/31/2028 350,000 348,884
5,938,849Energy – 0.0%Permian Producton Partners LLC,
2020 PIK Term Loan (1 monthLIBOR + 6.000% or 2.000% PIK)7.000%, 11/23/2025 141,958 17,035
Financials – 0.7%Acrisure LLC, 2020 Term Loan B (3
month LIBOR + 3.500%) 3.703%,02/13/2027 455,400 449,330
Amerilife Holdings LLC, 2020 TermLoan (3 month LIBOR + 4.000%)4.109%, 03/18/2027 148,897 148,587
Deerfield Dakota Holding LLC, 20202nd Lien Term Loan (1 monthLIBOR + 8.000%) 9.000%, 04/07/2028 520,000 527,800
Jane Street Group LLC, 2021 TermLoan (1 month LIBOR + 2.750%)2.859%, 01/26/2028 324,242 320,493
1,446,210Health care – 1.5%Eyecare Partners LLC, 2020 2nd Lien
Term Loan (1 month LIBOR +8.250%) 8.359%, 02/18/2028 350,000 335,416
Eyecare Partners LLC, 2020 TermLoan (1 month LIBOR + 3.750%)3.859%, 02/18/2027 495,717 490,210
McAfee LLC, 2018 USD Term LoanB (1 month LIBOR + 3.750%)3.859%, 09/30/2024 326,084 326,003
Option Care Health, Inc., Term Loan B(1 month LIBOR + 3.750%)3.859%, 08/06/2026 602,375 599,743
Radnet Management, Inc., RepriceTerm Loan (Prime rate + 2.500%and 6 month LIBOR + 3.500%)4.520%, 06/30/2023 569,766 569,766
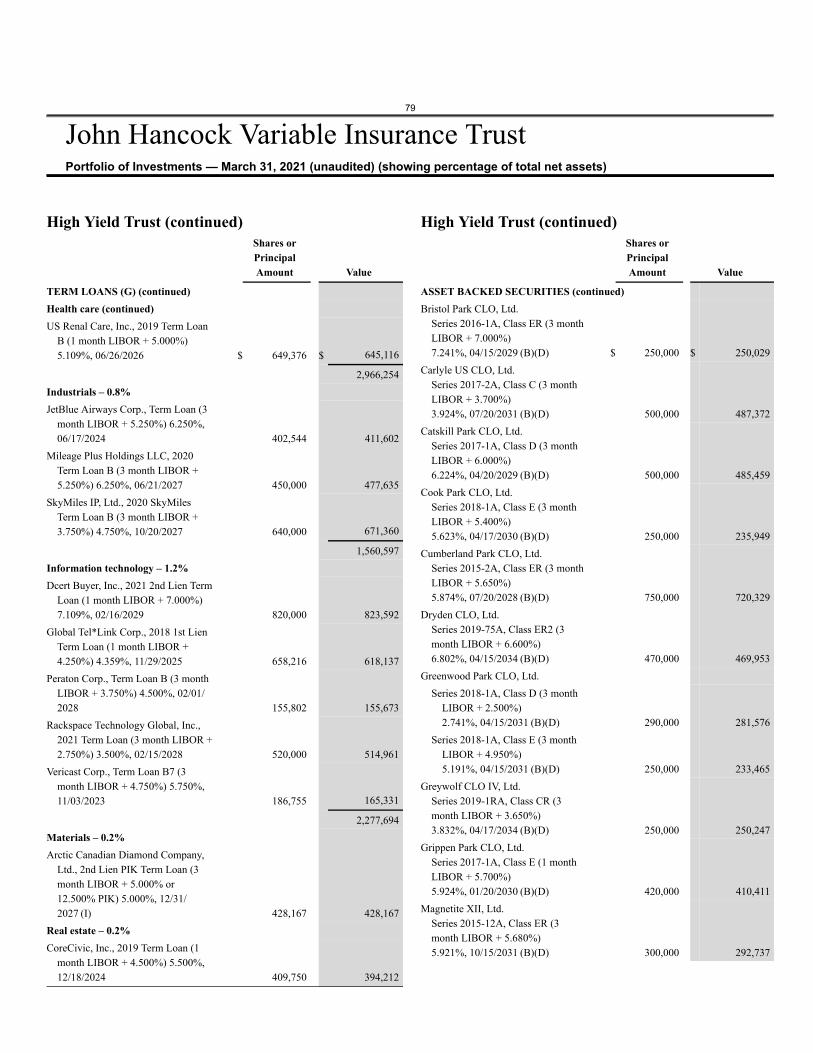
79
John Hancock Variable Insurance TrustPortfolio of Investments — March 31, 2021 (unaudited) (showing percentage of total net assets)
High Yield Trust (continued)Shares orPrincipalAmount Value
TERM LOANS (G) (continued)Health care (continued)US Renal Care, Inc., 2019 Term Loan
B (1 month LIBOR + 5.000%)5.109%, 06/26/2026 $ 649,376 $ 645,116
2,966,254Industrials – 0.8%JetBlue Airways Corp., Term Loan (3
month LIBOR + 5.250%) 6.250%,06/17/2024 402,544 411,602
Mileage Plus Holdings LLC, 2020Term Loan B (3 month LIBOR +5.250%) 6.250%, 06/21/2027 450,000 477,635
SkyMiles IP, Ltd., 2020 SkyMilesTerm Loan B (3 month LIBOR +3.750%) 4.750%, 10/20/2027 640,000 671,360
1,560,597Information technology – 1.2%Dcert Buyer, Inc., 2021 2nd Lien Term
Loan (1 month LIBOR + 7.000%)7.109%, 02/16/2029 820,000 823,592
Global Tel*Link Corp., 2018 1st LienTerm Loan (1 month LIBOR +4.250%) 4.359%, 11/29/2025 658,216 618,137
Peraton Corp., Term Loan B (3 monthLIBOR + 3.750%) 4.500%, 02/01/2028 155,802 155,673
Rackspace Technology Global, Inc.,2021 Term Loan (3 month LIBOR +2.750%) 3.500%, 02/15/2028 520,000 514,961
Vericast Corp., Term Loan B7 (3month LIBOR + 4.750%) 5.750%,11/03/2023 186,755 165,331
2,277,694Materials – 0.2%Arctic Canadian Diamond Company,
Ltd., 2nd Lien PIK Term Loan (3month LIBOR + 5.000% or12.500% PIK) 5.000%, 12/31/2027 (I) 428,167 428,167
Real estate – 0.2%CoreCivic, Inc., 2019 Term Loan (1
month LIBOR + 4.500%) 5.500%,12/18/2024 409,750 394,212
High Yield Trust (continued)Shares orPrincipalAmount Value
ASSET BACKED SECURITIES (continued)Bristol Park CLO, Ltd.
Series 2016-1A, Class ER (3 monthLIBOR + 7.000%)7.241%, 04/15/2029 (B)(D) $ 250,000 $ 250,029
Carlyle US CLO, Ltd.Series 2017-2A, Class C (3 monthLIBOR + 3.700%)3.924%, 07/20/2031 (B)(D) 500,000 487,372
Catskill Park CLO, Ltd.Series 2017-1A, Class D (3 monthLIBOR + 6.000%)6.224%, 04/20/2029 (B)(D) 500,000 485,459
Cook Park CLO, Ltd.Series 2018-1A, Class E (3 monthLIBOR + 5.400%)5.623%, 04/17/2030 (B)(D) 250,000 235,949
Cumberland Park CLO, Ltd.Series 2015-2A, Class ER (3 monthLIBOR + 5.650%)5.874%, 07/20/2028 (B)(D) 750,000 720,329
Dryden CLO, Ltd.Series 2019-75A, Class ER2 (3month LIBOR + 6.600%)6.802%, 04/15/2034 (B)(D) 470,000 469,953
Greenwood Park CLO, Ltd.Series 2018-1A, Class D (3 month
LIBOR + 2.500%)2.741%, 04/15/2031 (B)(D) 290,000 281,576
Series 2018-1A, Class E (3 monthLIBOR + 4.950%)5.191%, 04/15/2031 (B)(D) 250,000 233,465
Greywolf CLO IV, Ltd.Series 2019-1RA, Class CR (3month LIBOR + 3.650%)3.832%, 04/17/2034 (B)(D) 250,000 250,247
Grippen Park CLO, Ltd.Series 2017-1A, Class E (1 monthLIBOR + 5.700%)5.924%, 01/20/2030 (B)(D) 420,000 410,411
Magnetite XII, Ltd.Series 2015-12A, Class ER (3month LIBOR + 5.680%)5.921%, 10/15/2031 (B)(D) 300,000 292,737
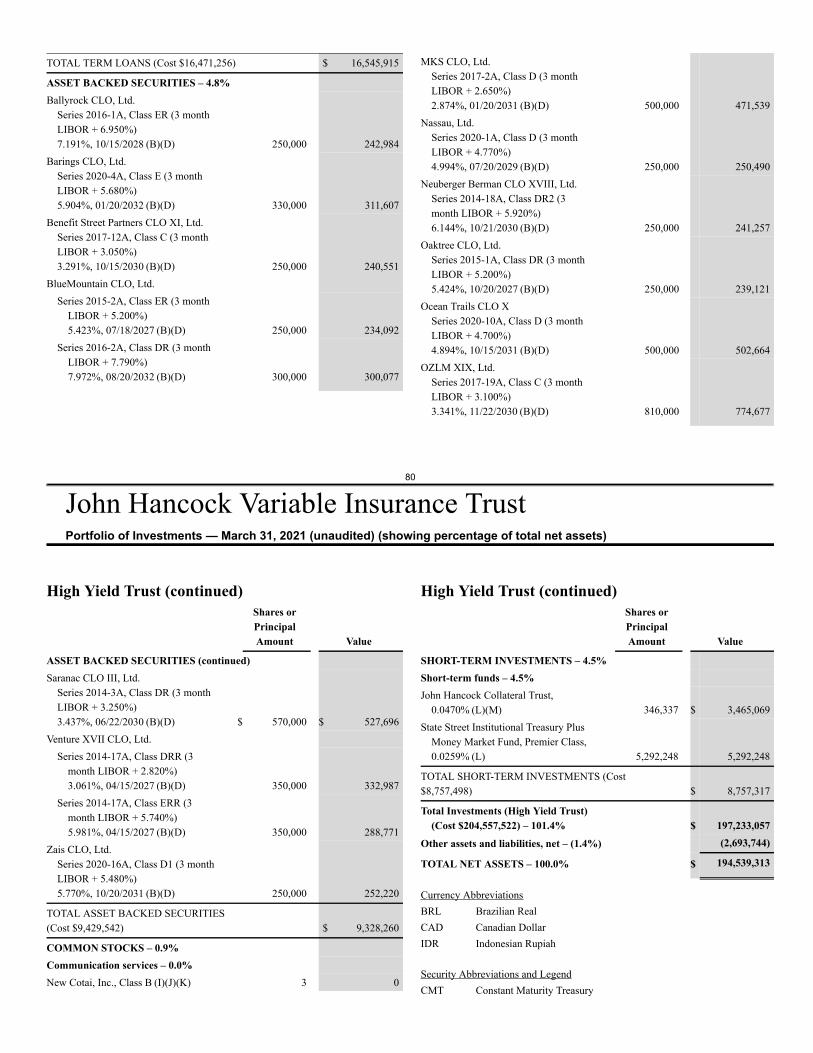
80
John Hancock Variable Insurance TrustPortfolio of Investments — March 31, 2021 (unaudited) (showing percentage of total net assets)
TOTAL TERM LOANS (Cost $16,471,256) $ 16,545,915
ASSET BACKED SECURITIES – 4.8%Ballyrock CLO, Ltd.
Series 2016-1A, Class ER (3 monthLIBOR + 6.950%)7.191%, 10/15/2028 (B)(D) 250,000 242,984
Barings CLO, Ltd.Series 2020-4A, Class E (3 monthLIBOR + 5.680%)5.904%, 01/20/2032 (B)(D) 330,000 311,607
Benefit Street Partners CLO XI, Ltd.Series 2017-12A, Class C (3 monthLIBOR + 3.050%)3.291%, 10/15/2030 (B)(D) 250,000 240,551
BlueMountain CLO, Ltd.Series 2015-2A, Class ER (3 month
LIBOR + 5.200%)5.423%, 07/18/2027 (B)(D) 250,000 234,092
Series 2016-2A, Class DR (3 monthLIBOR + 7.790%)7.972%, 08/20/2032 (B)(D) 300,000 300,077
MKS CLO, Ltd.Series 2017-2A, Class D (3 monthLIBOR + 2.650%)2.874%, 01/20/2031 (B)(D) 500,000 471,539
Nassau, Ltd.Series 2020-1A, Class D (3 monthLIBOR + 4.770%)4.994%, 07/20/2029 (B)(D) 250,000 250,490
Neuberger Berman CLO XVIII, Ltd.Series 2014-18A, Class DR2 (3month LIBOR + 5.920%)6.144%, 10/21/2030 (B)(D) 250,000 241,257
Oaktree CLO, Ltd.Series 2015-1A, Class DR (3 monthLIBOR + 5.200%)5.424%, 10/20/2027 (B)(D) 250,000 239,121
Ocean Trails CLO XSeries 2020-10A, Class D (3 monthLIBOR + 4.700%)4.894%, 10/15/2031 (B)(D) 500,000 502,664
OZLM XIX, Ltd.Series 2017-19A, Class C (3 monthLIBOR + 3.100%)3.341%, 11/22/2030 (B)(D) 810,000 774,677
High Yield Trust (continued)Shares orPrincipalAmount Value
ASSET BACKED SECURITIES (continued)Saranac CLO III, Ltd.
Series 2014-3A, Class DR (3 monthLIBOR + 3.250%)3.437%, 06/22/2030 (B)(D) $ 570,000 $ 527,696
Venture XVII CLO, Ltd.Series 2014-17A, Class DRR (3
month LIBOR + 2.820%)3.061%, 04/15/2027 (B)(D) 350,000 332,987
Series 2014-17A, Class ERR (3month LIBOR + 5.740%)5.981%, 04/15/2027 (B)(D) 350,000 288,771
Zais CLO, Ltd.Series 2020-16A, Class D1 (3 monthLIBOR + 5.480%)5.770%, 10/20/2031 (B)(D) 250,000 252,220
TOTAL ASSET BACKED SECURITIES(Cost $9,429,542) $ 9,328,260
COMMON STOCKS – 0.9%Communication services – 0.0%New Cotai, Inc., Class B (I)(J)(K) 3 0
High Yield Trust (continued)Shares orPrincipalAmount Value
SHORT-TERM INVESTMENTS – 4.5%Short-term funds – 4.5%John Hancock Collateral Trust,
0.0470% (L)(M) 346,337 $ 3,465,069State Street Institutional Treasury Plus
Money Market Fund, Premier Class,0.0259% (L) 5,292,248 5,292,248
TOTAL SHORT-TERM INVESTMENTS (Cost$8,757,498) $ 8,757,317
Total Investments (High Yield Trust)(Cost $204,557,522) – 101.4% $ 197,233,057
Other assets and liabilities, net – (1.4%) (2,693,744)
TOTAL NET ASSETS – 100.0% $ 194,539,313
Currency AbbreviationsBRL Brazilian RealCAD Canadian DollarIDR Indonesian Rupiah
Security Abbreviations and LegendCMT Constant Maturity Treasury
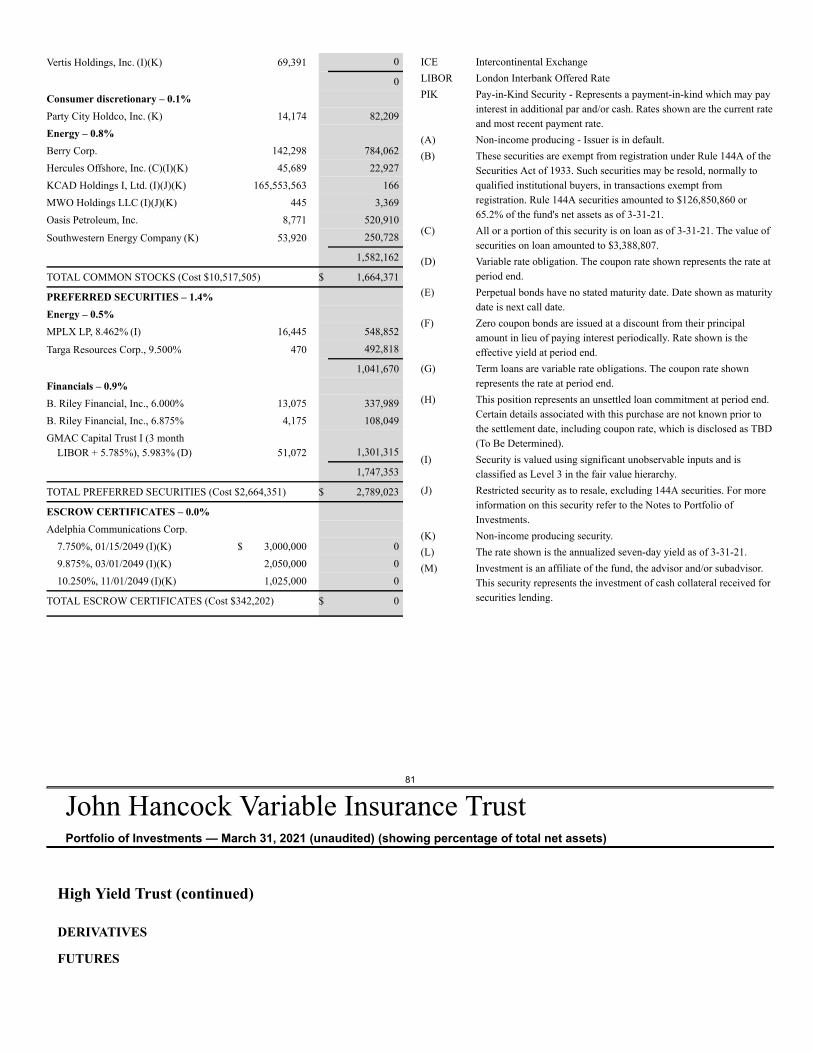
81
John Hancock Variable Insurance TrustPortfolio of Investments — March 31, 2021 (unaudited) (showing percentage of total net assets)
High Yield Trust (continued)
DERIVATIVES
FUTURES
Vertis Holdings, Inc. (I)(K) 69,391 0
0Consumer discretionary – 0.1%Party City Holdco, Inc. (K) 14,174 82,209Energy – 0.8%Berry Corp. 142,298 784,062Hercules Offshore, Inc. (C)(I)(K) 45,689 22,927KCAD Holdings I, Ltd. (I)(J)(K) 165,553,563 166MWO Holdings LLC (I)(J)(K) 445 3,369Oasis Petroleum, Inc. 8,771 520,910
Southwestern Energy Company (K) 53,920 250,728
1,582,162
TOTAL COMMON STOCKS (Cost $10,517,505) $ 1,664,371
PREFERRED SECURITIES – 1.4%Energy – 0.5%MPLX LP, 8.462% (I) 16,445 548,852
Targa Resources Corp., 9.500% 470 492,818
1,041,670Financials – 0.9%B. Riley Financial, Inc., 6.000% 13,075 337,989B. Riley Financial, Inc., 6.875% 4,175 108,049GMAC Capital Trust I (3 month
LIBOR + 5.785%), 5.983% (D) 51,072 1,301,315
1,747,353
TOTAL PREFERRED SECURITIES (Cost $2,664,351) $ 2,789,023
ESCROW CERTIFICATES – 0.0%Adelphia Communications Corp.
7.750%, 01/15/2049 (I)(K) $ 3,000,000 09.875%, 03/01/2049 (I)(K) 2,050,000 010.250%, 11/01/2049 (I)(K) 1,025,000 0
TOTAL ESCROW CERTIFICATES (Cost $342,202) $ 0
ICE Intercontinental ExchangeLIBOR London Interbank Offered RatePIK Pay-in-Kind Security - Represents a payment-in-kind which may pay
interest in additional par and/or cash. Rates shown are the current rateand most recent payment rate.
(A) Non-income producing - Issuer is in default.(B) These securities are exempt from registration under Rule 144A of the
Securities Act of 1933. Such securities may be resold, normally toqualified institutional buyers, in transactions exempt fromregistration. Rule 144A securities amounted to $126,850,860 or65.2% of the fund's net assets as of 3-31-21.
(C) All or a portion of this security is on loan as of 3-31-21. The value ofsecurities on loan amounted to $3,388,807.
(D) Variable rate obligation. The coupon rate shown represents the rate atperiod end.
(E) Perpetual bonds have no stated maturity date. Date shown as maturitydate is next call date.
(F) Zero coupon bonds are issued at a discount from their principalamount in lieu of paying interest periodically. Rate shown is theeffective yield at period end.
(G) Term loans are variable rate obligations. The coupon rate shownrepresents the rate at period end.
(H) This position represents an unsettled loan commitment at period end.Certain details associated with this purchase are not known prior tothe settlement date, including coupon rate, which is disclosed as TBD(To Be Determined).
(I) Security is valued using significant unobservable inputs and isclassified as Level 3 in the fair value hierarchy.
(J) Restricted security as to resale, excluding 144A securities. For moreinformation on this security refer to the Notes to Portfolio ofInvestments.
(K) Non-income producing security.(L) The rate shown is the annualized seven-day yield as of 3-31-21.(M) Investment is an affiliate of the fund, the advisor and/or subadvisor.
This security represents the investment of cash collateral received forsecurities lending.
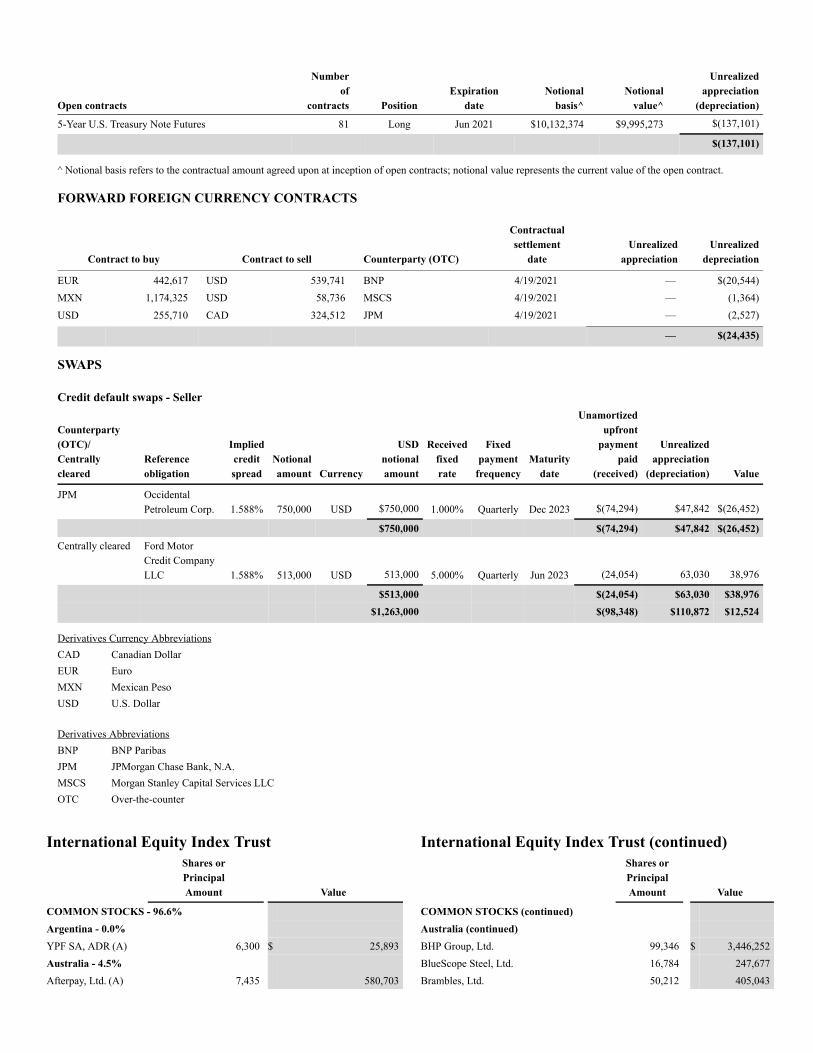
Open contracts
Numberof
contracts PositionExpiration
dateNotional
basis^Notional
value^
Unrealizedappreciation
(depreciation)
5-Year U.S. Treasury Note Futures 81 Long Jun 2021 $10,132,374 $9,995,273 $(137,101)
$(137,101)
^ Notional basis refers to the contractual amount agreed upon at inception of open contracts; notional value represents the current value of the open contract.
FORWARD FOREIGN CURRENCY CONTRACTS
Contract to buy Contract to sell Counterparty (OTC)
Contractualsettlement
dateUnrealized
appreciationUnrealized
depreciation
EUR 442,617 USD 539,741 BNP 4/19/2021 — $(20,544)MXN 1,174,325 USD 58,736 MSCS 4/19/2021 — (1,364)USD 255,710 CAD 324,512 JPM 4/19/2021 — (2,527)
— $(24,435)
SWAPS
Credit default swaps - Seller
Counterparty(OTC)/Centrallycleared
Referenceobligation
Impliedcreditspread
Notionalamount Currency
USDnotionalamount
Receivedfixedrate
Fixedpayment
frequencyMaturity
date
Unamortizedupfront
paymentpaid
(received)
Unrealizedappreciation
(depreciation) Value
JPM OccidentalPetroleum Corp. 1.588% 750,000 USD $750,000 1.000% Quarterly Dec 2023 $(74,294) $47,842 $(26,452)
$750,000 $(74,294) $47,842 $(26,452)Centrally cleared Ford Motor
Credit CompanyLLC 1.588% 513,000 USD 513,000 5.000% Quarterly Jun 2023 (24,054) 63,030 38,976
$513,000 $(24,054) $63,030 $38,976$1,263,000 $(98,348) $110,872 $12,524
Derivatives Currency AbbreviationsCAD Canadian DollarEUR EuroMXN Mexican PesoUSD U.S. Dollar
Derivatives AbbreviationsBNP BNP ParibasJPM JPMorgan Chase Bank, N.A.MSCS Morgan Stanley Capital Services LLCOTC Over-the-counter
International Equity Index TrustShares orPrincipalAmount Value
COMMON STOCKS - 96.6%Argentina - 0.0%YPF SA, ADR (A) 6,300 $ 25,893Australia - 4.5%Afterpay, Ltd. (A) 7,435 580,703
International Equity Index Trust (continued)Shares orPrincipalAmount Value
COMMON STOCKS (continued)Australia (continued)BHP Group, Ltd. 99,346 $ 3,446,252BlueScope Steel, Ltd. 16,784 247,677Brambles, Ltd. 50,212 405,043
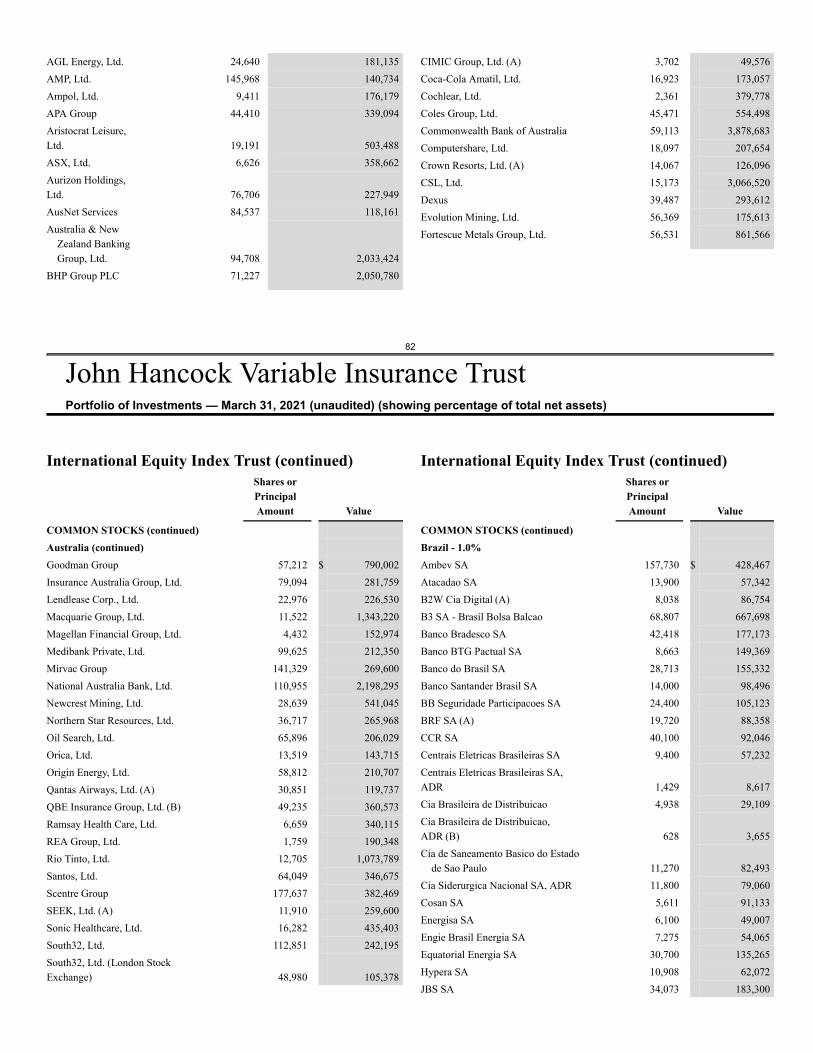
82
John Hancock Variable Insurance TrustPortfolio of Investments — March 31, 2021 (unaudited) (showing percentage of total net assets)
AGL Energy, Ltd. 24,640 181,135AMP, Ltd. 145,968 140,734Ampol, Ltd. 9,411 176,179APA Group 44,410 339,094Aristocrat Leisure,Ltd. 19,191 503,488ASX, Ltd. 6,626 358,662Aurizon Holdings,Ltd. 76,706 227,949AusNet Services 84,537 118,161Australia & New
Zealand BankingGroup, Ltd. 94,708 2,033,424
BHP Group PLC 71,227 2,050,780
CIMIC Group, Ltd. (A) 3,702 49,576Coca-Cola Amatil, Ltd. 16,923 173,057Cochlear, Ltd. 2,361 379,778Coles Group, Ltd. 45,471 554,498Commonwealth Bank of Australia 59,113 3,878,683Computershare, Ltd. 18,097 207,654Crown Resorts, Ltd. (A) 14,067 126,096CSL, Ltd. 15,173 3,066,520Dexus 39,487 293,612Evolution Mining, Ltd. 56,369 175,613Fortescue Metals Group, Ltd. 56,531 861,566
International Equity Index Trust (continued)Shares orPrincipalAmount Value
COMMON STOCKS (continued)Australia (continued)Goodman Group 57,212 $ 790,002Insurance Australia Group, Ltd. 79,094 281,759Lendlease Corp., Ltd. 22,976 226,530Macquarie Group, Ltd. 11,522 1,343,220Magellan Financial Group, Ltd. 4,432 152,974Medibank Private, Ltd. 99,625 212,350Mirvac Group 141,329 269,600National Australia Bank, Ltd. 110,955 2,198,295Newcrest Mining, Ltd. 28,639 541,045Northern Star Resources, Ltd. 36,717 265,968Oil Search, Ltd. 65,896 206,029Orica, Ltd. 13,519 143,715Origin Energy, Ltd. 58,812 210,707Qantas Airways, Ltd. (A) 30,851 119,737QBE Insurance Group, Ltd. (B) 49,235 360,573Ramsay Health Care, Ltd. 6,659 340,115REA Group, Ltd. 1,759 190,348Rio Tinto, Ltd. 12,705 1,073,789Santos, Ltd. 64,049 346,675Scentre Group 177,637 382,469SEEK, Ltd. (A) 11,910 259,600Sonic Healthcare, Ltd. 16,282 435,403South32, Ltd. 112,851 242,195South32, Ltd. (London StockExchange) 48,980 105,378
International Equity Index Trust (continued)Shares orPrincipalAmount Value
COMMON STOCKS (continued)Brazil - 1.0%Ambev SA 157,730 $ 428,467Atacadao SA 13,900 57,342B2W Cia Digital (A) 8,038 86,754B3 SA - Brasil Bolsa Balcao 68,807 667,698Banco Bradesco SA 42,418 177,173Banco BTG Pactual SA 8,663 149,369Banco do Brasil SA 28,713 155,332Banco Santander Brasil SA 14,000 98,496BB Seguridade Participacoes SA 24,400 105,123BRF SA (A) 19,720 88,358CCR SA 40,100 92,046Centrais Eletricas Brasileiras SA 9,400 57,232Centrais Eletricas Brasileiras SA,ADR 1,429 8,617Cia Brasileira de Distribuicao 4,938 29,109Cia Brasileira de Distribuicao,ADR (B) 628 3,655Cia de Saneamento Basico do Estado
de Sao Paulo 11,270 82,493Cia Siderurgica Nacional SA, ADR 11,800 79,060Cosan SA 5,611 91,133Energisa SA 6,100 49,007Engie Brasil Energia SA 7,275 54,065Equatorial Energia SA 30,700 135,265Hypera SA 10,908 62,072JBS SA 34,073 183,300
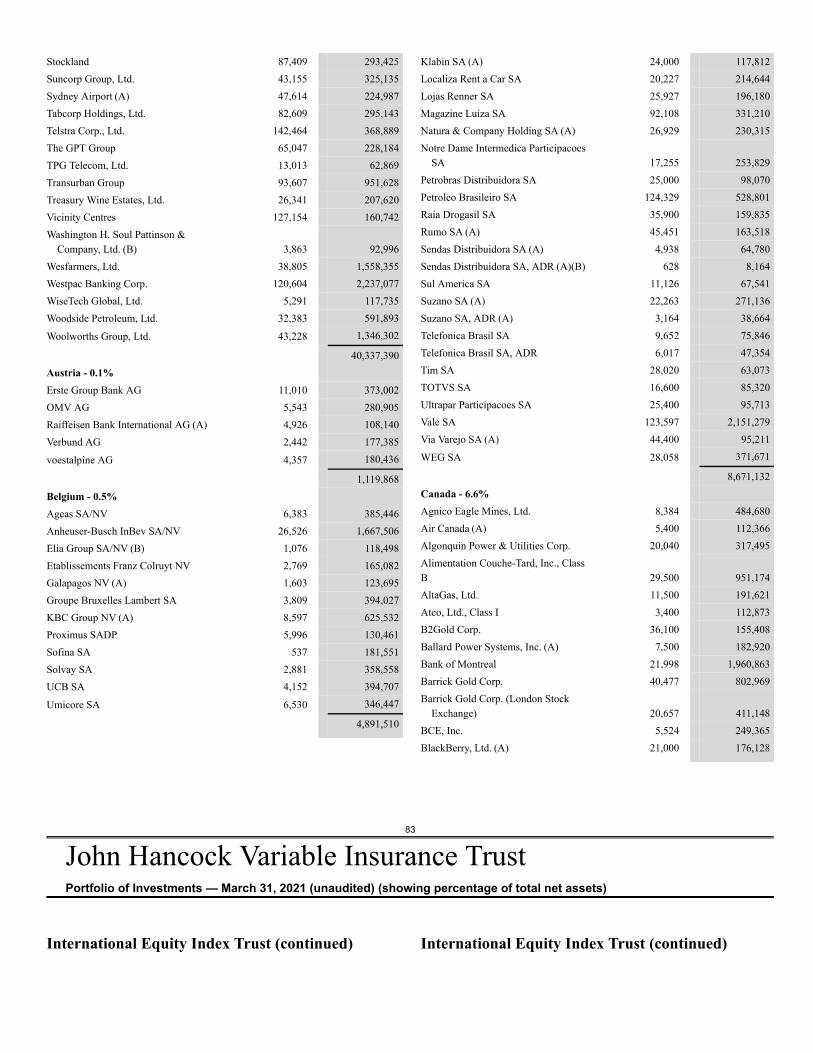
83
John Hancock Variable Insurance TrustPortfolio of Investments — March 31, 2021 (unaudited) (showing percentage of total net assets)
Stockland 87,409 293,425Suncorp Group, Ltd. 43,155 325,135Sydney Airport (A) 47,614 224,987Tabcorp Holdings, Ltd. 82,609 295,143Telstra Corp., Ltd. 142,464 368,889The GPT Group 65,047 228,184TPG Telecom, Ltd. 13,013 62,869Transurban Group 93,607 951,628Treasury Wine Estates, Ltd. 26,341 207,620Vicinity Centres 127,154 160,742Washington H. Soul Pattinson &
Company, Ltd. (B) 3,863 92,996Wesfarmers, Ltd. 38,805 1,558,355Westpac Banking Corp. 120,604 2,237,077WiseTech Global, Ltd. 5,291 117,735Woodside Petroleum, Ltd. 32,383 591,893
Woolworths Group, Ltd. 43,228 1,346,302
40,337,390Austria - 0.1%Erste Group Bank AG 11,010 373,002OMV AG 5,543 280,905Raiffeisen Bank International AG (A) 4,926 108,140Verbund AG 2,442 177,385
voestalpine AG 4,357 180,436
1,119,868Belgium - 0.5%Ageas SA/NV 6,383 385,446Anheuser-Busch InBev SA/NV 26,526 1,667,506Elia Group SA/NV (B) 1,076 118,498Etablissements Franz Colruyt NV 2,769 165,082Galapagos NV (A) 1,603 123,695Groupe Bruxelles Lambert SA 3,809 394,027KBC Group NV (A) 8,597 625,532Proximus SADP 5,996 130,461Sofina SA 537 181,551Solvay SA 2,881 358,558UCB SA 4,152 394,707
Umicore SA 6,530 346,447
4,891,510
Klabin SA (A) 24,000 117,812Localiza Rent a Car SA 20,227 214,644Lojas Renner SA 25,927 196,180Magazine Luiza SA 92,108 331,210Natura & Company Holding SA (A) 26,929 230,315Notre Dame Intermedica Participacoes
SA 17,255 253,829Petrobras Distribuidora SA 25,000 98,070Petroleo Brasileiro SA 124,329 528,801Raia Drogasil SA 35,900 159,835Rumo SA (A) 45,451 163,518Sendas Distribuidora SA (A) 4,938 64,780Sendas Distribuidora SA, ADR (A)(B) 628 8,164Sul America SA 11,126 67,541Suzano SA (A) 22,263 271,136Suzano SA, ADR (A) 3,164 38,664Telefonica Brasil SA 9,652 75,846Telefonica Brasil SA, ADR 6,017 47,354Tim SA 28,020 63,073TOTVS SA 16,600 85,320Ultrapar Participacoes SA 25,400 95,713Vale SA 123,597 2,151,279Via Varejo SA (A) 44,400 95,211
WEG SA 28,058 371,671
8,671,132Canada - 6.6%Agnico Eagle Mines, Ltd. 8,384 484,680Air Canada (A) 5,400 112,366Algonquin Power & Utilities Corp. 20,040 317,495Alimentation Couche-Tard, Inc., ClassB 29,500 951,174AltaGas, Ltd. 11,500 191,621Atco, Ltd., Class I 3,400 112,873B2Gold Corp. 36,100 155,408Ballard Power Systems, Inc. (A) 7,500 182,920Bank of Montreal 21,998 1,960,863Barrick Gold Corp. 40,477 802,969Barrick Gold Corp. (London Stock
Exchange) 20,657 411,148BCE, Inc. 5,524 249,365BlackBerry, Ltd. (A) 21,000 176,128
International Equity Index Trust (continued) International Equity Index Trust (continued)
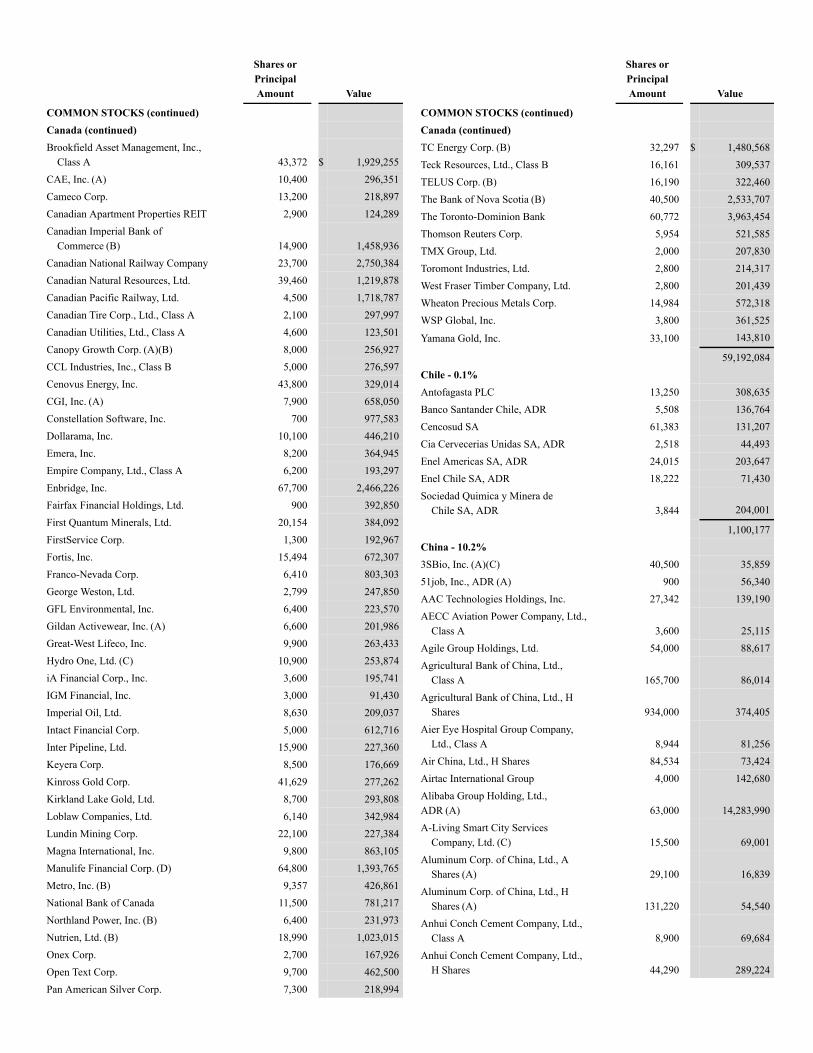
Shares orPrincipalAmount Value
COMMON STOCKS (continued)Canada (continued)Brookfield Asset Management, Inc.,
Class A 43,372 $ 1,929,255CAE, Inc. (A) 10,400 296,351Cameco Corp. 13,200 218,897Canadian Apartment Properties REIT 2,900 124,289Canadian Imperial Bank of
Commerce (B) 14,900 1,458,936Canadian National Railway Company 23,700 2,750,384Canadian Natural Resources, Ltd. 39,460 1,219,878Canadian Pacific Railway, Ltd. 4,500 1,718,787Canadian Tire Corp., Ltd., Class A 2,100 297,997Canadian Utilities, Ltd., Class A 4,600 123,501Canopy Growth Corp. (A)(B) 8,000 256,927CCL Industries, Inc., Class B 5,000 276,597Cenovus Energy, Inc. 43,800 329,014CGI, Inc. (A) 7,900 658,050Constellation Software, Inc. 700 977,583Dollarama, Inc. 10,100 446,210Emera, Inc. 8,200 364,945Empire Company, Ltd., Class A 6,200 193,297Enbridge, Inc. 67,700 2,466,226Fairfax Financial Holdings, Ltd. 900 392,850First Quantum Minerals, Ltd. 20,154 384,092FirstService Corp. 1,300 192,967Fortis, Inc. 15,494 672,307Franco-Nevada Corp. 6,410 803,303George Weston, Ltd. 2,799 247,850GFL Environmental, Inc. 6,400 223,570Gildan Activewear, Inc. (A) 6,600 201,986Great-West Lifeco, Inc. 9,900 263,433Hydro One, Ltd. (C) 10,900 253,874iA Financial Corp., Inc. 3,600 195,741IGM Financial, Inc. 3,000 91,430Imperial Oil, Ltd. 8,630 209,037Intact Financial Corp. 5,000 612,716Inter Pipeline, Ltd. 15,900 227,360Keyera Corp. 8,500 176,669Kinross Gold Corp. 41,629 277,262Kirkland Lake Gold, Ltd. 8,700 293,808Loblaw Companies, Ltd. 6,140 342,984Lundin Mining Corp. 22,100 227,384Magna International, Inc. 9,800 863,105Manulife Financial Corp. (D) 64,800 1,393,765Metro, Inc. (B) 9,357 426,861National Bank of Canada 11,500 781,217Northland Power, Inc. (B) 6,400 231,973Nutrien, Ltd. (B) 18,990 1,023,015Onex Corp. 2,700 167,926Open Text Corp. 9,700 462,500Pan American Silver Corp. 7,300 218,994
Shares orPrincipalAmount Value
COMMON STOCKS (continued)Canada (continued)TC Energy Corp. (B) 32,297 $ 1,480,568Teck Resources, Ltd., Class B 16,161 309,537TELUS Corp. (B) 16,190 322,460The Bank of Nova Scotia (B) 40,500 2,533,707The Toronto-Dominion Bank 60,772 3,963,454Thomson Reuters Corp. 5,954 521,585TMX Group, Ltd. 2,000 207,830Toromont Industries, Ltd. 2,800 214,317West Fraser Timber Company, Ltd. 2,800 201,439Wheaton Precious Metals Corp. 14,984 572,318WSP Global, Inc. 3,800 361,525
Yamana Gold, Inc. 33,100 143,810
59,192,084Chile - 0.1%Antofagasta PLC 13,250 308,635Banco Santander Chile, ADR 5,508 136,764Cencosud SA 61,383 131,207Cia Cervecerias Unidas SA, ADR 2,518 44,493Enel Americas SA, ADR 24,015 203,647Enel Chile SA, ADR 18,222 71,430Sociedad Quimica y Minera de
Chile SA, ADR 3,844 204,001
1,100,177China - 10.2%3SBio, Inc. (A)(C) 40,500 35,85951job, Inc., ADR (A) 900 56,340AAC Technologies Holdings, Inc. 27,342 139,190AECC Aviation Power Company, Ltd.,
Class A 3,600 25,115Agile Group Holdings, Ltd. 54,000 88,617Agricultural Bank of China, Ltd.,
Class A 165,700 86,014Agricultural Bank of China, Ltd., H
Shares 934,000 374,405Aier Eye Hospital Group Company,
Ltd., Class A 8,944 81,256Air China, Ltd., H Shares 84,534 73,424Airtac International Group 4,000 142,680Alibaba Group Holding, Ltd.,ADR (A) 63,000 14,283,990A-Living Smart City Services
Company, Ltd. (C) 15,500 69,001Aluminum Corp. of China, Ltd., A
Shares (A) 29,100 16,839Aluminum Corp. of China, Ltd., H
Shares (A) 131,220 54,540Anhui Conch Cement Company, Ltd.,
Class A 8,900 69,684Anhui Conch Cement Company, Ltd.,
H Shares 44,290 289,224
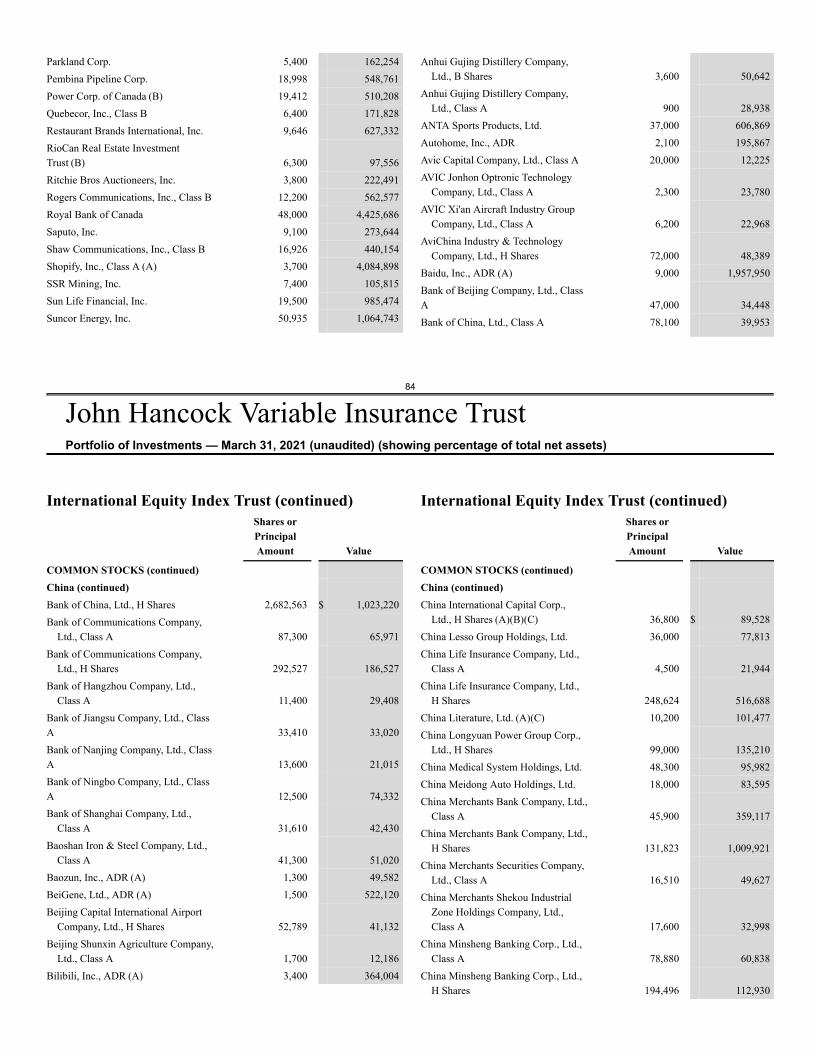
84
John Hancock Variable Insurance TrustPortfolio of Investments — March 31, 2021 (unaudited) (showing percentage of total net assets)
Parkland Corp. 5,400 162,254Pembina Pipeline Corp. 18,998 548,761Power Corp. of Canada (B) 19,412 510,208Quebecor, Inc., Class B 6,400 171,828Restaurant Brands International, Inc. 9,646 627,332RioCan Real Estate InvestmentTrust (B) 6,300 97,556Ritchie Bros Auctioneers, Inc. 3,800 222,491Rogers Communications, Inc., Class B 12,200 562,577Royal Bank of Canada 48,000 4,425,686Saputo, Inc. 9,100 273,644Shaw Communications, Inc., Class B 16,926 440,154Shopify, Inc., Class A (A) 3,700 4,084,898SSR Mining, Inc. 7,400 105,815Sun Life Financial, Inc. 19,500 985,474Suncor Energy, Inc. 50,935 1,064,743
Anhui Gujing Distillery Company,Ltd., B Shares 3,600 50,642
Anhui Gujing Distillery Company,Ltd., Class A 900 28,938
ANTA Sports Products, Ltd. 37,000 606,869Autohome, Inc., ADR 2,100 195,867Avic Capital Company, Ltd., Class A 20,000 12,225AVIC Jonhon Optronic Technology
Company, Ltd., Class A 2,300 23,780AVIC Xi'an Aircraft Industry Group
Company, Ltd., Class A 6,200 22,968AviChina Industry & Technology
Company, Ltd., H Shares 72,000 48,389Baidu, Inc., ADR (A) 9,000 1,957,950Bank of Beijing Company, Ltd., ClassA 47,000 34,448Bank of China, Ltd., Class A 78,100 39,953
International Equity Index Trust (continued)Shares orPrincipalAmount Value
COMMON STOCKS (continued)China (continued)Bank of China, Ltd., H Shares 2,682,563 $ 1,023,220Bank of Communications Company,
Ltd., Class A 87,300 65,971Bank of Communications Company,
Ltd., H Shares 292,527 186,527Bank of Hangzhou Company, Ltd.,
Class A 11,400 29,408Bank of Jiangsu Company, Ltd., ClassA 33,410 33,020Bank of Nanjing Company, Ltd., ClassA 13,600 21,015Bank of Ningbo Company, Ltd., ClassA 12,500 74,332Bank of Shanghai Company, Ltd.,
Class A 31,610 42,430Baoshan Iron & Steel Company, Ltd.,
Class A 41,300 51,020Baozun, Inc., ADR (A) 1,300 49,582BeiGene, Ltd., ADR (A) 1,500 522,120Beijing Capital International Airport
Company, Ltd., H Shares 52,789 41,132Beijing Shunxin Agriculture Company,
Ltd., Class A 1,700 12,186Bilibili, Inc., ADR (A) 3,400 364,004
International Equity Index Trust (continued)Shares orPrincipalAmount Value
COMMON STOCKS (continued)China (continued)China International Capital Corp.,
Ltd., H Shares (A)(B)(C) 36,800 $ 89,528China Lesso Group Holdings, Ltd. 36,000 77,813China Life Insurance Company, Ltd.,
Class A 4,500 21,944China Life Insurance Company, Ltd.,
H Shares 248,624 516,688China Literature, Ltd. (A)(C) 10,200 101,477China Longyuan Power Group Corp.,
Ltd., H Shares 99,000 135,210China Medical System Holdings, Ltd. 48,300 95,982China Meidong Auto Holdings, Ltd. 18,000 83,595China Merchants Bank Company, Ltd.,
Class A 45,900 359,117China Merchants Bank Company, Ltd.,
H Shares 131,823 1,009,921China Merchants Securities Company,
Ltd., Class A 16,510 49,627China Merchants Shekou Industrial
Zone Holdings Company, Ltd.,Class A 17,600 32,998
China Minsheng Banking Corp., Ltd.,Class A 78,880 60,838
China Minsheng Banking Corp., Ltd.,H Shares 194,496 112,930
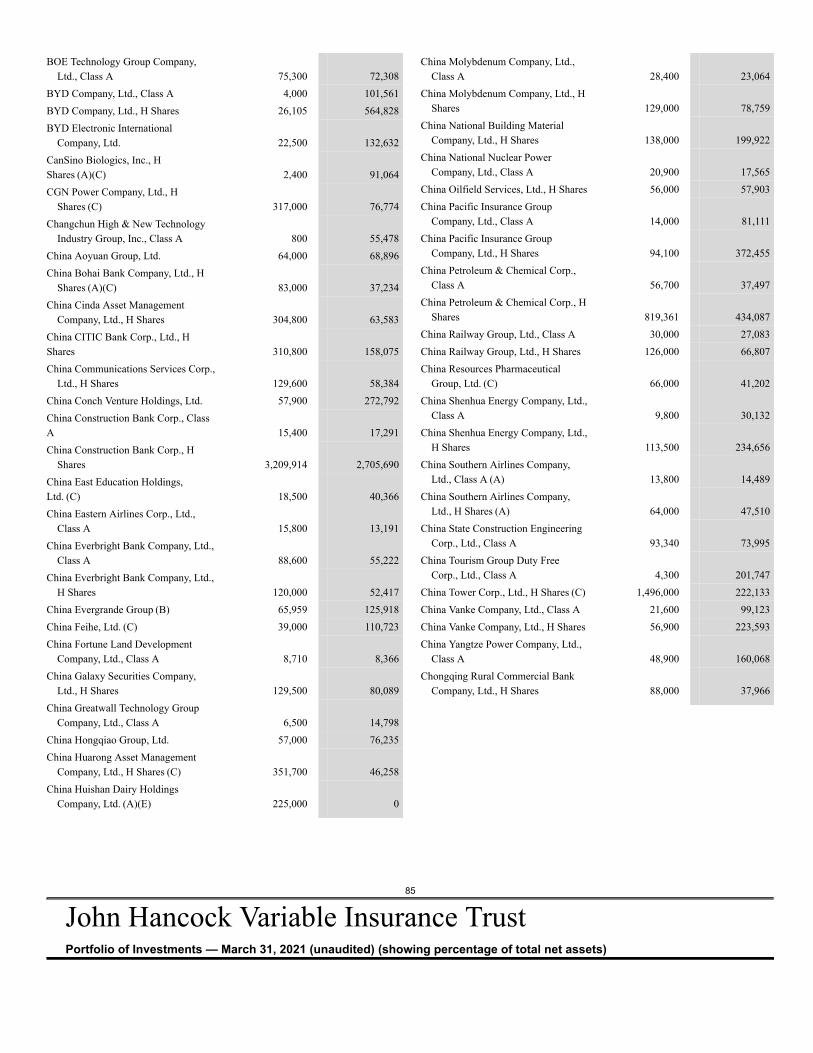
85
John Hancock Variable Insurance TrustPortfolio of Investments — March 31, 2021 (unaudited) (showing percentage of total net assets)
BOE Technology Group Company,Ltd., Class A 75,300 72,308
BYD Company, Ltd., Class A 4,000 101,561BYD Company, Ltd., H Shares 26,105 564,828BYD Electronic International
Company, Ltd. 22,500 132,632CanSino Biologics, Inc., HShares (A)(C) 2,400 91,064CGN Power Company, Ltd., H
Shares (C) 317,000 76,774Changchun High & New Technology
Industry Group, Inc., Class A 800 55,478China Aoyuan Group, Ltd. 64,000 68,896China Bohai Bank Company, Ltd., H
Shares (A)(C) 83,000 37,234China Cinda Asset Management
Company, Ltd., H Shares 304,800 63,583China CITIC Bank Corp., Ltd., HShares 310,800 158,075China Communications Services Corp.,
Ltd., H Shares 129,600 58,384China Conch Venture Holdings, Ltd. 57,900 272,792China Construction Bank Corp., ClassA 15,400 17,291China Construction Bank Corp., H
Shares 3,209,914 2,705,690China East Education Holdings,Ltd. (C) 18,500 40,366China Eastern Airlines Corp., Ltd.,
Class A 15,800 13,191China Everbright Bank Company, Ltd.,
Class A 88,600 55,222China Everbright Bank Company, Ltd.,
H Shares 120,000 52,417China Evergrande Group (B) 65,959 125,918China Feihe, Ltd. (C) 39,000 110,723China Fortune Land Development
Company, Ltd., Class A 8,710 8,366China Galaxy Securities Company,
Ltd., H Shares 129,500 80,089China Greatwall Technology Group
Company, Ltd., Class A 6,500 14,798China Hongqiao Group, Ltd. 57,000 76,235China Huarong Asset Management
Company, Ltd., H Shares (C) 351,700 46,258China Huishan Dairy Holdings
Company, Ltd. (A)(E) 225,000 0
China Molybdenum Company, Ltd.,Class A 28,400 23,064
China Molybdenum Company, Ltd., HShares 129,000 78,759
China National Building MaterialCompany, Ltd., H Shares 138,000 199,922
China National Nuclear PowerCompany, Ltd., Class A 20,900 17,565
China Oilfield Services, Ltd., H Shares 56,000 57,903China Pacific Insurance Group
Company, Ltd., Class A 14,000 81,111China Pacific Insurance Group
Company, Ltd., H Shares 94,100 372,455China Petroleum & Chemical Corp.,
Class A 56,700 37,497China Petroleum & Chemical Corp., H
Shares 819,361 434,087China Railway Group, Ltd., Class A 30,000 27,083China Railway Group, Ltd., H Shares 126,000 66,807China Resources Pharmaceutical
Group, Ltd. (C) 66,000 41,202China Shenhua Energy Company, Ltd.,
Class A 9,800 30,132China Shenhua Energy Company, Ltd.,
H Shares 113,500 234,656China Southern Airlines Company,
Ltd., Class A (A) 13,800 14,489China Southern Airlines Company,
Ltd., H Shares (A) 64,000 47,510China State Construction Engineering
Corp., Ltd., Class A 93,340 73,995China Tourism Group Duty Free
Corp., Ltd., Class A 4,300 201,747China Tower Corp., Ltd., H Shares (C) 1,496,000 222,133China Vanke Company, Ltd., Class A 21,600 99,123China Vanke Company, Ltd., H Shares 56,900 223,593China Yangtze Power Company, Ltd.,
Class A 48,900 160,068Chongqing Rural Commercial Bank
Company, Ltd., H Shares 88,000 37,966
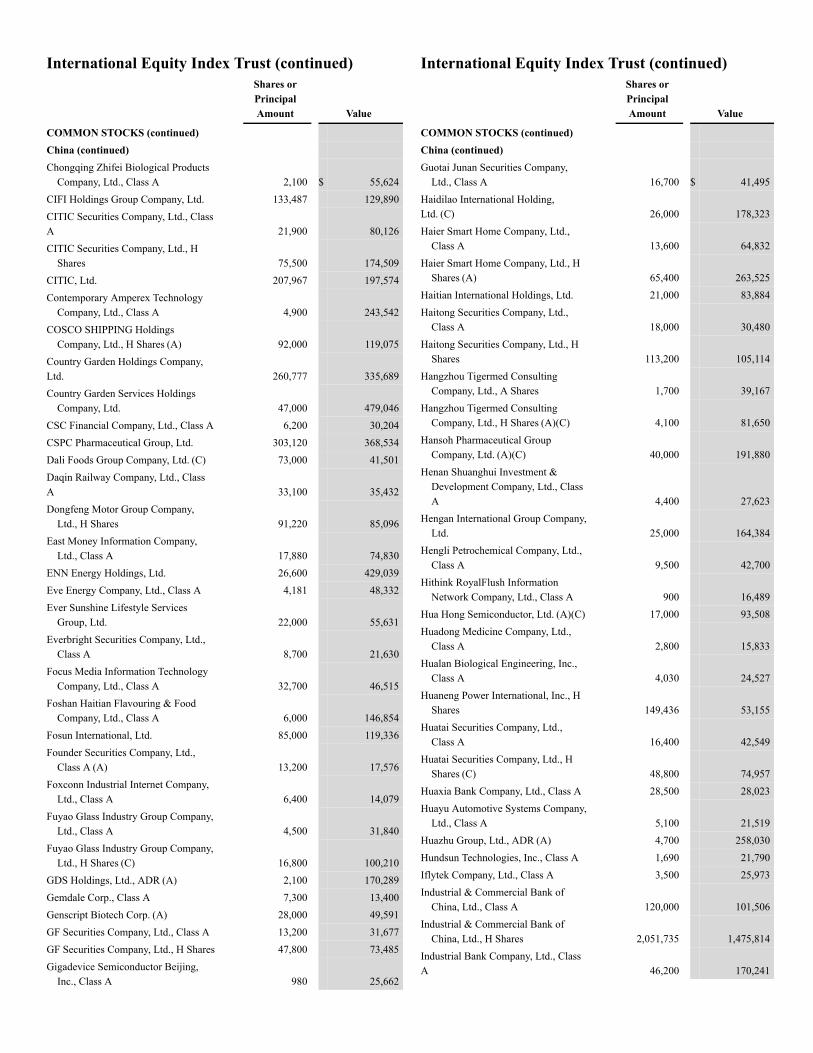
International Equity Index Trust (continued)Shares orPrincipalAmount Value
COMMON STOCKS (continued)China (continued)Chongqing Zhifei Biological Products
Company, Ltd., Class A 2,100 $ 55,624CIFI Holdings Group Company, Ltd. 133,487 129,890CITIC Securities Company, Ltd., ClassA 21,900 80,126CITIC Securities Company, Ltd., H
Shares 75,500 174,509CITIC, Ltd. 207,967 197,574Contemporary Amperex Technology
Company, Ltd., Class A 4,900 243,542COSCO SHIPPING Holdings
Company, Ltd., H Shares (A) 92,000 119,075Country Garden Holdings Company,Ltd. 260,777 335,689Country Garden Services Holdings
Company, Ltd. 47,000 479,046CSC Financial Company, Ltd., Class A 6,200 30,204CSPC Pharmaceutical Group, Ltd. 303,120 368,534Dali Foods Group Company, Ltd. (C) 73,000 41,501Daqin Railway Company, Ltd., ClassA 33,100 35,432Dongfeng Motor Group Company,
Ltd., H Shares 91,220 85,096East Money Information Company,
Ltd., Class A 17,880 74,830ENN Energy Holdings, Ltd. 26,600 429,039Eve Energy Company, Ltd., Class A 4,181 48,332Ever Sunshine Lifestyle Services
Group, Ltd. 22,000 55,631Everbright Securities Company, Ltd.,
Class A 8,700 21,630Focus Media Information Technology
Company, Ltd., Class A 32,700 46,515Foshan Haitian Flavouring & Food
Company, Ltd., Class A 6,000 146,854Fosun International, Ltd. 85,000 119,336Founder Securities Company, Ltd.,
Class A (A) 13,200 17,576Foxconn Industrial Internet Company,
Ltd., Class A 6,400 14,079Fuyao Glass Industry Group Company,
Ltd., Class A 4,500 31,840Fuyao Glass Industry Group Company,
Ltd., H Shares (C) 16,800 100,210GDS Holdings, Ltd., ADR (A) 2,100 170,289Gemdale Corp., Class A 7,300 13,400Genscript Biotech Corp. (A) 28,000 49,591GF Securities Company, Ltd., Class A 13,200 31,677GF Securities Company, Ltd., H Shares 47,800 73,485Gigadevice Semiconductor Beijing,
Inc., Class A 980 25,662
International Equity Index Trust (continued)Shares orPrincipalAmount Value
COMMON STOCKS (continued)China (continued)Guotai Junan Securities Company,
Ltd., Class A 16,700 $ 41,495Haidilao International Holding,Ltd. (C) 26,000 178,323Haier Smart Home Company, Ltd.,
Class A 13,600 64,832Haier Smart Home Company, Ltd., H
Shares (A) 65,400 263,525Haitian International Holdings, Ltd. 21,000 83,884Haitong Securities Company, Ltd.,
Class A 18,000 30,480Haitong Securities Company, Ltd., H
Shares 113,200 105,114Hangzhou Tigermed Consulting
Company, Ltd., A Shares 1,700 39,167Hangzhou Tigermed Consulting
Company, Ltd., H Shares (A)(C) 4,100 81,650Hansoh Pharmaceutical Group
Company, Ltd. (A)(C) 40,000 191,880Henan Shuanghui Investment &
Development Company, Ltd., ClassA 4,400 27,623
Hengan International Group Company,Ltd. 25,000 164,384
Hengli Petrochemical Company, Ltd.,Class A 9,500 42,700
Hithink RoyalFlush InformationNetwork Company, Ltd., Class A 900 16,489
Hua Hong Semiconductor, Ltd. (A)(C) 17,000 93,508Huadong Medicine Company, Ltd.,
Class A 2,800 15,833Hualan Biological Engineering, Inc.,
Class A 4,030 24,527Huaneng Power International, Inc., H
Shares 149,436 53,155Huatai Securities Company, Ltd.,
Class A 16,400 42,549Huatai Securities Company, Ltd., H
Shares (C) 48,800 74,957Huaxia Bank Company, Ltd., Class A 28,500 28,023Huayu Automotive Systems Company,
Ltd., Class A 5,100 21,519Huazhu Group, Ltd., ADR (A) 4,700 258,030Hundsun Technologies, Inc., Class A 1,690 21,790Iflytek Company, Ltd., Class A 3,500 25,973Industrial & Commercial Bank of
China, Ltd., Class A 120,000 101,506Industrial & Commercial Bank of
China, Ltd., H Shares 2,051,735 1,475,814Industrial Bank Company, Ltd., ClassA 46,200 170,241
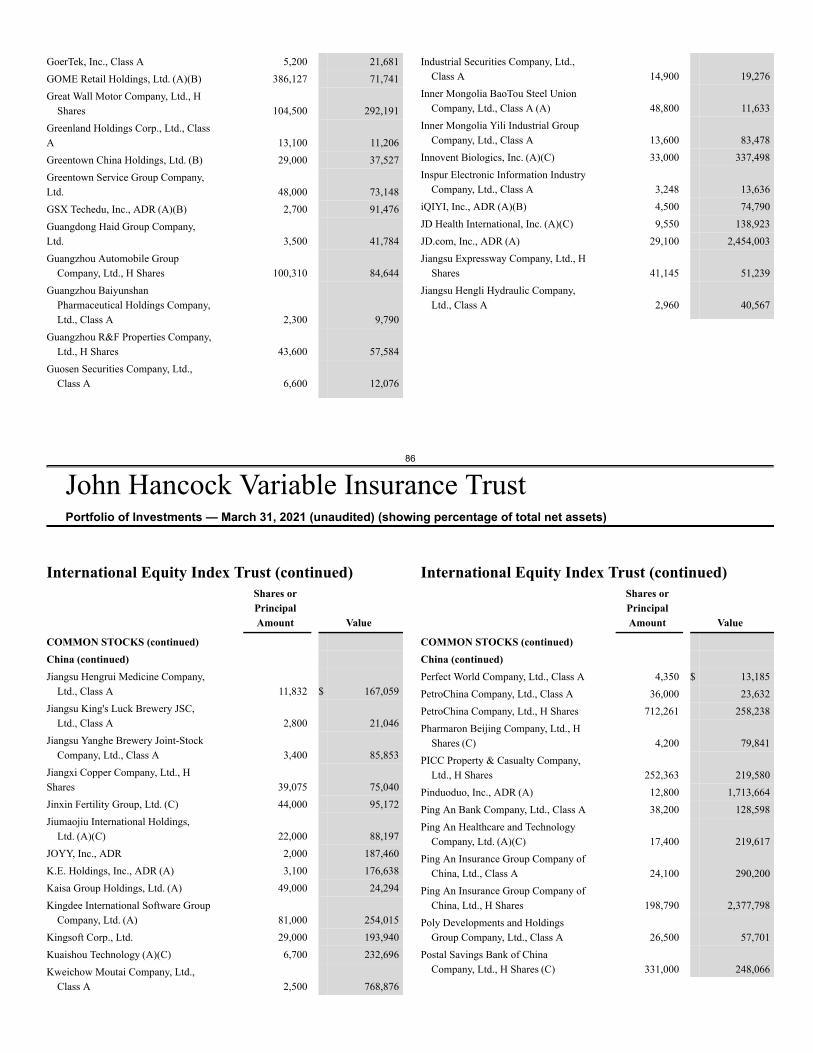
86
John Hancock Variable Insurance TrustPortfolio of Investments — March 31, 2021 (unaudited) (showing percentage of total net assets)
GoerTek, Inc., Class A 5,200 21,681GOME Retail Holdings, Ltd. (A)(B) 386,127 71,741Great Wall Motor Company, Ltd., H
Shares 104,500 292,191Greenland Holdings Corp., Ltd., ClassA 13,100 11,206Greentown China Holdings, Ltd. (B) 29,000 37,527Greentown Service Group Company,Ltd. 48,000 73,148GSX Techedu, Inc., ADR (A)(B) 2,700 91,476Guangdong Haid Group Company,Ltd. 3,500 41,784Guangzhou Automobile Group
Company, Ltd., H Shares 100,310 84,644Guangzhou Baiyunshan
Pharmaceutical Holdings Company,Ltd., Class A 2,300 9,790
Guangzhou R&F Properties Company,Ltd., H Shares 43,600 57,584
Guosen Securities Company, Ltd.,Class A 6,600 12,076
Industrial Securities Company, Ltd.,Class A 14,900 19,276
Inner Mongolia BaoTou Steel UnionCompany, Ltd., Class A (A) 48,800 11,633
Inner Mongolia Yili Industrial GroupCompany, Ltd., Class A 13,600 83,478
Innovent Biologics, Inc. (A)(C) 33,000 337,498Inspur Electronic Information Industry
Company, Ltd., Class A 3,248 13,636iQIYI, Inc., ADR (A)(B) 4,500 74,790JD Health International, Inc. (A)(C) 9,550 138,923JD.com, Inc., ADR (A) 29,100 2,454,003Jiangsu Expressway Company, Ltd., H
Shares 41,145 51,239Jiangsu Hengli Hydraulic Company,
Ltd., Class A 2,960 40,567
International Equity Index Trust (continued)Shares orPrincipalAmount Value
COMMON STOCKS (continued)China (continued)Jiangsu Hengrui Medicine Company,
Ltd., Class A 11,832 $ 167,059Jiangsu King's Luck Brewery JSC,
Ltd., Class A 2,800 21,046Jiangsu Yanghe Brewery Joint-Stock
Company, Ltd., Class A 3,400 85,853Jiangxi Copper Company, Ltd., HShares 39,075 75,040Jinxin Fertility Group, Ltd. (C) 44,000 95,172Jiumaojiu International Holdings,
Ltd. (A)(C) 22,000 88,197JOYY, Inc., ADR 2,000 187,460K.E. Holdings, Inc., ADR (A) 3,100 176,638Kaisa Group Holdings, Ltd. (A) 49,000 24,294Kingdee International Software Group
Company, Ltd. (A) 81,000 254,015Kingsoft Corp., Ltd. 29,000 193,940Kuaishou Technology (A)(C) 6,700 232,696Kweichow Moutai Company, Ltd.,
Class A 2,500 768,876
International Equity Index Trust (continued)Shares orPrincipalAmount Value
COMMON STOCKS (continued)China (continued)Perfect World Company, Ltd., Class A 4,350 $ 13,185PetroChina Company, Ltd., Class A 36,000 23,632PetroChina Company, Ltd., H Shares 712,261 258,238Pharmaron Beijing Company, Ltd., H
Shares (C) 4,200 79,841PICC Property & Casualty Company,
Ltd., H Shares 252,363 219,580Pinduoduo, Inc., ADR (A) 12,800 1,713,664Ping An Bank Company, Ltd., Class A 38,200 128,598Ping An Healthcare and Technology
Company, Ltd. (A)(C) 17,400 219,617Ping An Insurance Group Company of
China, Ltd., Class A 24,100 290,200Ping An Insurance Group Company of
China, Ltd., H Shares 198,790 2,377,798Poly Developments and Holdings
Group Company, Ltd., Class A 26,500 57,701Postal Savings Bank of China
Company, Ltd., H Shares (C) 331,000 248,066
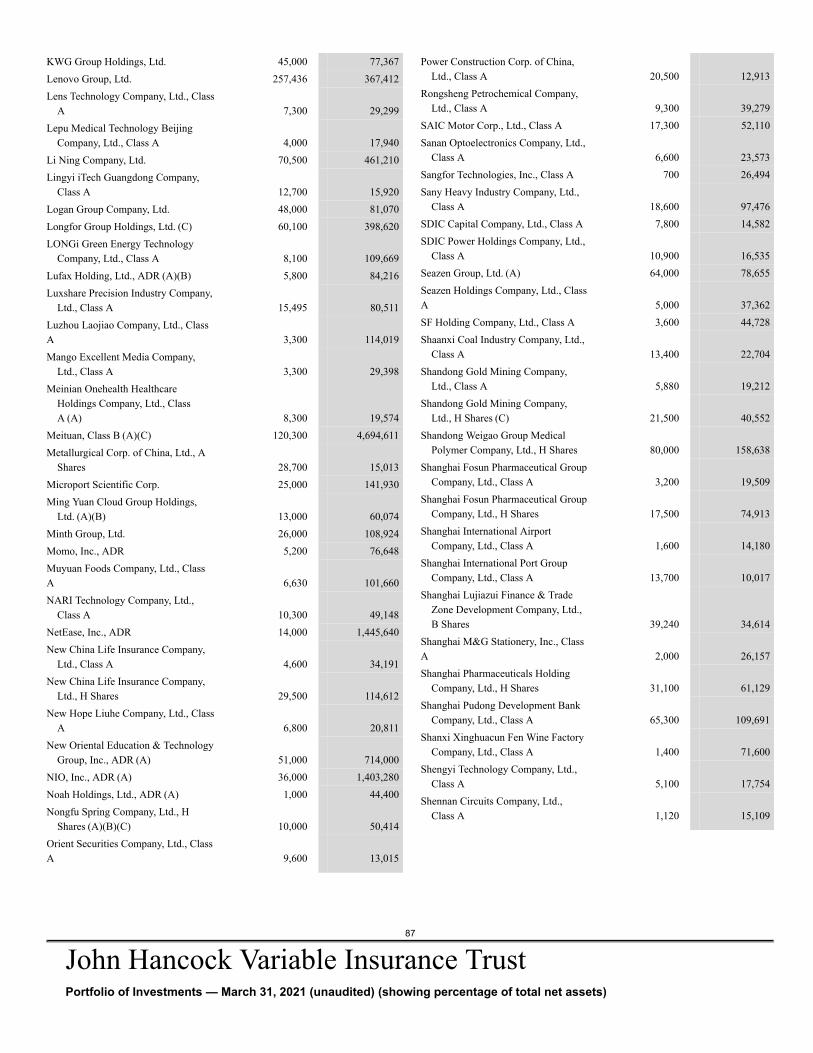
87
John Hancock Variable Insurance TrustPortfolio of Investments — March 31, 2021 (unaudited) (showing percentage of total net assets)
KWG Group Holdings, Ltd. 45,000 77,367Lenovo Group, Ltd. 257,436 367,412Lens Technology Company, Ltd., Class
A 7,300 29,299Lepu Medical Technology Beijing
Company, Ltd., Class A 4,000 17,940Li Ning Company, Ltd. 70,500 461,210Lingyi iTech Guangdong Company,
Class A 12,700 15,920Logan Group Company, Ltd. 48,000 81,070Longfor Group Holdings, Ltd. (C) 60,100 398,620LONGi Green Energy Technology
Company, Ltd., Class A 8,100 109,669Lufax Holding, Ltd., ADR (A)(B) 5,800 84,216Luxshare Precision Industry Company,
Ltd., Class A 15,495 80,511Luzhou Laojiao Company, Ltd., ClassA 3,300 114,019Mango Excellent Media Company,
Ltd., Class A 3,300 29,398Meinian Onehealth Healthcare
Holdings Company, Ltd., ClassA (A) 8,300 19,574
Meituan, Class B (A)(C) 120,300 4,694,611Metallurgical Corp. of China, Ltd., A
Shares 28,700 15,013Microport Scientific Corp. 25,000 141,930Ming Yuan Cloud Group Holdings,
Ltd. (A)(B) 13,000 60,074Minth Group, Ltd. 26,000 108,924Momo, Inc., ADR 5,200 76,648Muyuan Foods Company, Ltd., ClassA 6,630 101,660NARI Technology Company, Ltd.,
Class A 10,300 49,148NetEase, Inc., ADR 14,000 1,445,640New China Life Insurance Company,
Ltd., Class A 4,600 34,191New China Life Insurance Company,
Ltd., H Shares 29,500 114,612New Hope Liuhe Company, Ltd., Class
A 6,800 20,811New Oriental Education & Technology
Group, Inc., ADR (A) 51,000 714,000NIO, Inc., ADR (A) 36,000 1,403,280Noah Holdings, Ltd., ADR (A) 1,000 44,400Nongfu Spring Company, Ltd., H
Shares (A)(B)(C) 10,000 50,414Orient Securities Company, Ltd., ClassA 9,600 13,015
Power Construction Corp. of China,Ltd., Class A 20,500 12,913
Rongsheng Petrochemical Company,Ltd., Class A 9,300 39,279
SAIC Motor Corp., Ltd., Class A 17,300 52,110Sanan Optoelectronics Company, Ltd.,
Class A 6,600 23,573Sangfor Technologies, Inc., Class A 700 26,494Sany Heavy Industry Company, Ltd.,
Class A 18,600 97,476SDIC Capital Company, Ltd., Class A 7,800 14,582SDIC Power Holdings Company, Ltd.,
Class A 10,900 16,535Seazen Group, Ltd. (A) 64,000 78,655Seazen Holdings Company, Ltd., ClassA 5,000 37,362SF Holding Company, Ltd., Class A 3,600 44,728Shaanxi Coal Industry Company, Ltd.,
Class A 13,400 22,704Shandong Gold Mining Company,
Ltd., Class A 5,880 19,212Shandong Gold Mining Company,
Ltd., H Shares (C) 21,500 40,552Shandong Weigao Group Medical
Polymer Company, Ltd., H Shares 80,000 158,638Shanghai Fosun Pharmaceutical Group
Company, Ltd., Class A 3,200 19,509Shanghai Fosun Pharmaceutical Group
Company, Ltd., H Shares 17,500 74,913Shanghai International Airport
Company, Ltd., Class A 1,600 14,180Shanghai International Port Group
Company, Ltd., Class A 13,700 10,017Shanghai Lujiazui Finance & Trade
Zone Development Company, Ltd.,B Shares 39,240 34,614
Shanghai M&G Stationery, Inc., ClassA 2,000 26,157Shanghai Pharmaceuticals Holding
Company, Ltd., H Shares 31,100 61,129Shanghai Pudong Development Bank
Company, Ltd., Class A 65,300 109,691Shanxi Xinghuacun Fen Wine Factory
Company, Ltd., Class A 1,400 71,600Shengyi Technology Company, Ltd.,
Class A 5,100 17,754Shennan Circuits Company, Ltd.,
Class A 1,120 15,109
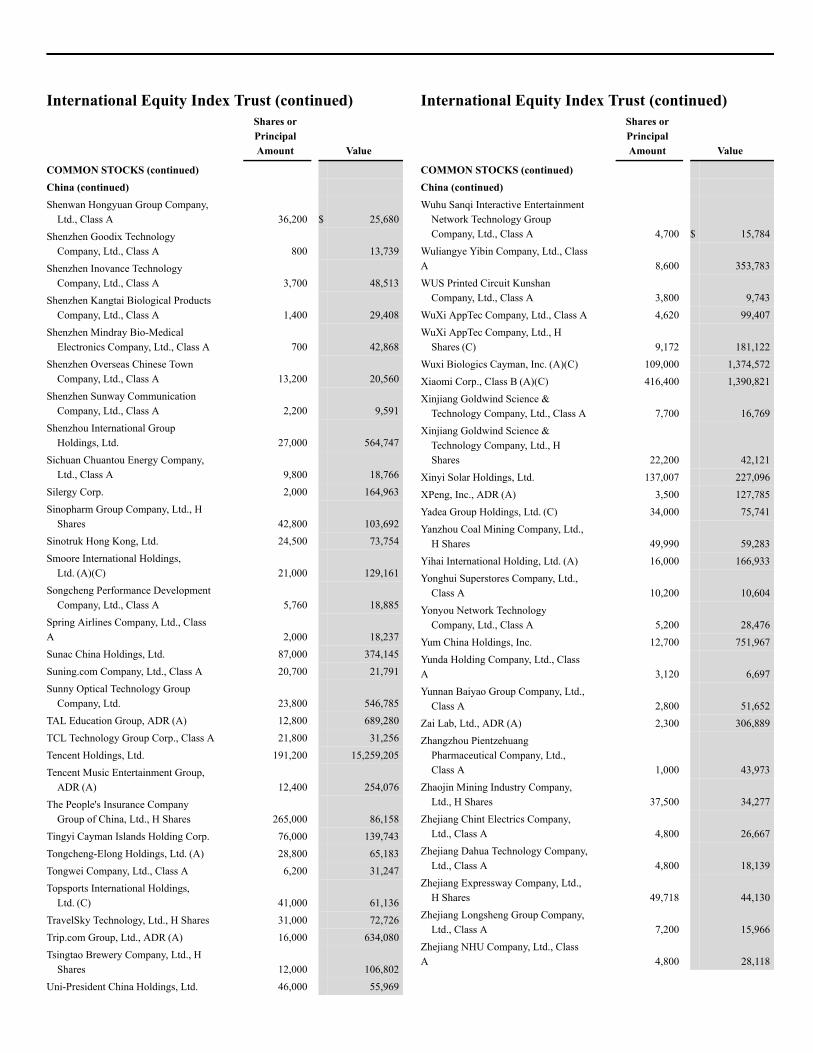
International Equity Index Trust (continued)Shares orPrincipalAmount Value
COMMON STOCKS (continued)China (continued)Shenwan Hongyuan Group Company,
Ltd., Class A 36,200 $ 25,680Shenzhen Goodix Technology
Company, Ltd., Class A 800 13,739Shenzhen Inovance Technology
Company, Ltd., Class A 3,700 48,513Shenzhen Kangtai Biological Products
Company, Ltd., Class A 1,400 29,408Shenzhen Mindray Bio-Medical
Electronics Company, Ltd., Class A 700 42,868Shenzhen Overseas Chinese Town
Company, Ltd., Class A 13,200 20,560Shenzhen Sunway Communication
Company, Ltd., Class A 2,200 9,591Shenzhou International Group
Holdings, Ltd. 27,000 564,747Sichuan Chuantou Energy Company,
Ltd., Class A 9,800 18,766Silergy Corp. 2,000 164,963Sinopharm Group Company, Ltd., H
Shares 42,800 103,692Sinotruk Hong Kong, Ltd. 24,500 73,754Smoore International Holdings,
Ltd. (A)(C) 21,000 129,161Songcheng Performance Development
Company, Ltd., Class A 5,760 18,885Spring Airlines Company, Ltd., ClassA 2,000 18,237Sunac China Holdings, Ltd. 87,000 374,145Suning.com Company, Ltd., Class A 20,700 21,791Sunny Optical Technology Group
Company, Ltd. 23,800 546,785TAL Education Group, ADR (A) 12,800 689,280TCL Technology Group Corp., Class A 21,800 31,256Tencent Holdings, Ltd. 191,200 15,259,205Tencent Music Entertainment Group,
ADR (A) 12,400 254,076The People's Insurance Company
Group of China, Ltd., H Shares 265,000 86,158Tingyi Cayman Islands Holding Corp. 76,000 139,743Tongcheng-Elong Holdings, Ltd. (A) 28,800 65,183Tongwei Company, Ltd., Class A 6,200 31,247Topsports International Holdings,
Ltd. (C) 41,000 61,136TravelSky Technology, Ltd., H Shares 31,000 72,726Trip.com Group, Ltd., ADR (A) 16,000 634,080Tsingtao Brewery Company, Ltd., H
Shares 12,000 106,802Uni-President China Holdings, Ltd. 46,000 55,969
International Equity Index Trust (continued)Shares orPrincipalAmount Value
COMMON STOCKS (continued)China (continued)Wuhu Sanqi Interactive Entertainment
Network Technology GroupCompany, Ltd., Class A 4,700 $ 15,784
Wuliangye Yibin Company, Ltd., ClassA 8,600 353,783WUS Printed Circuit Kunshan
Company, Ltd., Class A 3,800 9,743WuXi AppTec Company, Ltd., Class A 4,620 99,407WuXi AppTec Company, Ltd., H
Shares (C) 9,172 181,122Wuxi Biologics Cayman, Inc. (A)(C) 109,000 1,374,572Xiaomi Corp., Class B (A)(C) 416,400 1,390,821Xinjiang Goldwind Science &
Technology Company, Ltd., Class A 7,700 16,769Xinjiang Goldwind Science &
Technology Company, Ltd., HShares 22,200 42,121
Xinyi Solar Holdings, Ltd. 137,007 227,096XPeng, Inc., ADR (A) 3,500 127,785Yadea Group Holdings, Ltd. (C) 34,000 75,741Yanzhou Coal Mining Company, Ltd.,
H Shares 49,990 59,283Yihai International Holding, Ltd. (A) 16,000 166,933Yonghui Superstores Company, Ltd.,
Class A 10,200 10,604Yonyou Network Technology
Company, Ltd., Class A 5,200 28,476Yum China Holdings, Inc. 12,700 751,967Yunda Holding Company, Ltd., ClassA 3,120 6,697Yunnan Baiyao Group Company, Ltd.,
Class A 2,800 51,652Zai Lab, Ltd., ADR (A) 2,300 306,889Zhangzhou Pientzehuang
Pharmaceutical Company, Ltd.,Class A 1,000 43,973
Zhaojin Mining Industry Company,Ltd., H Shares 37,500 34,277
Zhejiang Chint Electrics Company,Ltd., Class A 4,800 26,667
Zhejiang Dahua Technology Company,Ltd., Class A 4,800 18,139
Zhejiang Expressway Company, Ltd.,H Shares 49,718 44,130
Zhejiang Longsheng Group Company,Ltd., Class A 7,200 15,966
Zhejiang NHU Company, Ltd., ClassA 4,800 28,118
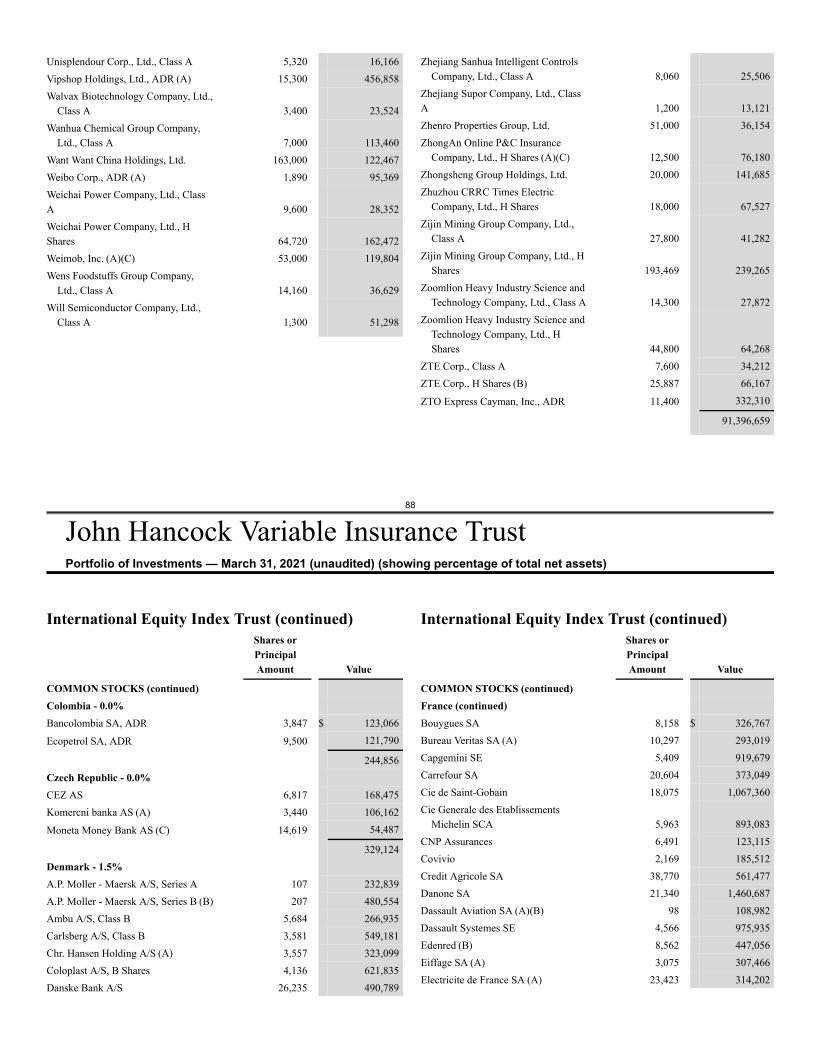
88
John Hancock Variable Insurance TrustPortfolio of Investments — March 31, 2021 (unaudited) (showing percentage of total net assets)
Unisplendour Corp., Ltd., Class A 5,320 16,166Vipshop Holdings, Ltd., ADR (A) 15,300 456,858Walvax Biotechnology Company, Ltd.,
Class A 3,400 23,524Wanhua Chemical Group Company,
Ltd., Class A 7,000 113,460Want Want China Holdings, Ltd. 163,000 122,467Weibo Corp., ADR (A) 1,890 95,369Weichai Power Company, Ltd., ClassA 9,600 28,352Weichai Power Company, Ltd., HShares 64,720 162,472Weimob, Inc. (A)(C) 53,000 119,804Wens Foodstuffs Group Company,
Ltd., Class A 14,160 36,629Will Semiconductor Company, Ltd.,
Class A 1,300 51,298
Zhejiang Sanhua Intelligent ControlsCompany, Ltd., Class A 8,060 25,506
Zhejiang Supor Company, Ltd., ClassA 1,200 13,121Zhenro Properties Group, Ltd. 51,000 36,154ZhongAn Online P&C Insurance
Company, Ltd., H Shares (A)(C) 12,500 76,180Zhongsheng Group Holdings, Ltd. 20,000 141,685Zhuzhou CRRC Times Electric
Company, Ltd., H Shares 18,000 67,527Zijin Mining Group Company, Ltd.,
Class A 27,800 41,282Zijin Mining Group Company, Ltd., H
Shares 193,469 239,265Zoomlion Heavy Industry Science and
Technology Company, Ltd., Class A 14,300 27,872Zoomlion Heavy Industry Science and
Technology Company, Ltd., HShares 44,800 64,268
ZTE Corp., Class A 7,600 34,212ZTE Corp., H Shares (B) 25,887 66,167
ZTO Express Cayman, Inc., ADR 11,400 332,310
91,396,659
International Equity Index Trust (continued)Shares orPrincipalAmount Value
COMMON STOCKS (continued)Colombia - 0.0%Bancolombia SA, ADR 3,847 $ 123,066
Ecopetrol SA, ADR 9,500 121,790
244,856Czech Republic - 0.0%CEZ AS 6,817 168,475Komercni banka AS (A) 3,440 106,162
Moneta Money Bank AS (C) 14,619 54,487
329,124Denmark - 1.5%A.P. Moller - Maersk A/S, Series A 107 232,839A.P. Moller - Maersk A/S, Series B (B) 207 480,554Ambu A/S, Class B 5,684 266,935Carlsberg A/S, Class B 3,581 549,181Chr. Hansen Holding A/S (A) 3,557 323,099Coloplast A/S, B Shares 4,136 621,835Danske Bank A/S 26,235 490,789
International Equity Index Trust (continued)Shares orPrincipalAmount Value
COMMON STOCKS (continued)France (continued)Bouygues SA 8,158 $ 326,767Bureau Veritas SA (A) 10,297 293,019Capgemini SE 5,409 919,679Carrefour SA 20,604 373,049Cie de Saint-Gobain 18,075 1,067,360Cie Generale des Etablissements
Michelin SCA 5,963 893,083CNP Assurances 6,491 123,115Covivio 2,169 185,512Credit Agricole SA 38,770 561,477Danone SA 21,340 1,460,687Dassault Aviation SA (A)(B) 98 108,982Dassault Systemes SE 4,566 975,935Edenred (B) 8,562 447,056Eiffage SA (A) 3,075 307,466Electricite de France SA (A) 23,423 314,202
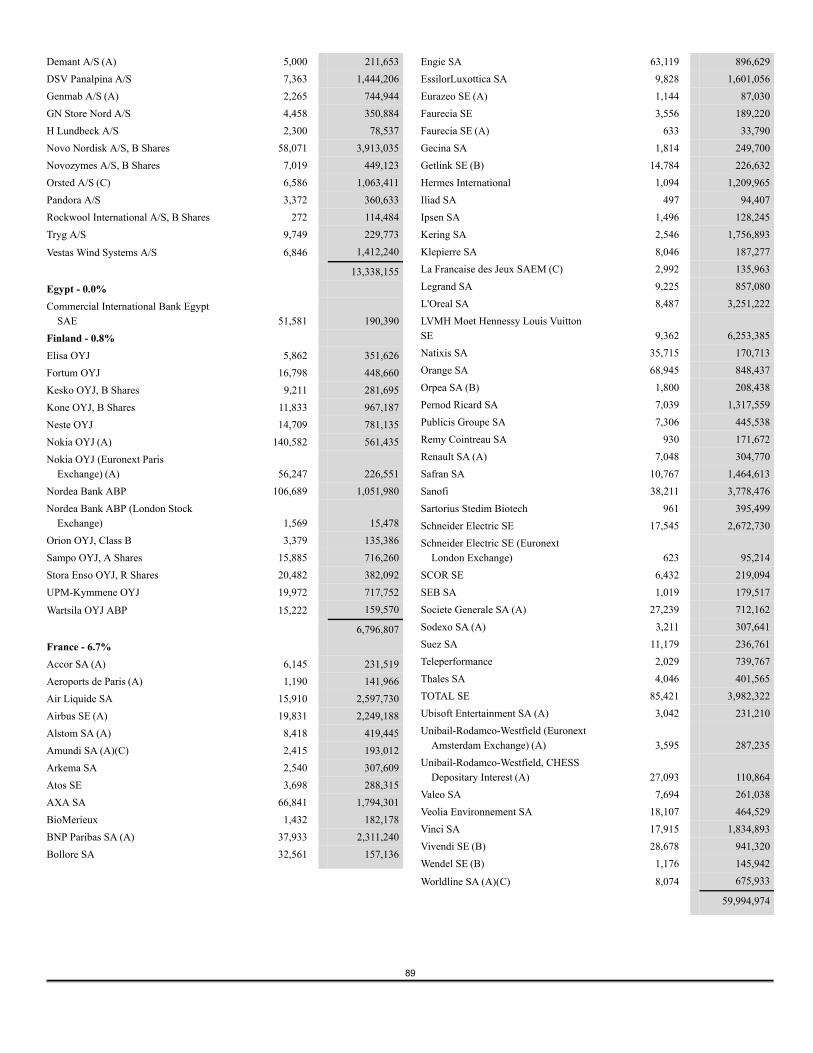
89
Demant A/S (A) 5,000 211,653DSV Panalpina A/S 7,363 1,444,206Genmab A/S (A) 2,265 744,944GN Store Nord A/S 4,458 350,884H Lundbeck A/S 2,300 78,537Novo Nordisk A/S, B Shares 58,071 3,913,035Novozymes A/S, B Shares 7,019 449,123Orsted A/S (C) 6,586 1,063,411Pandora A/S 3,372 360,633Rockwool International A/S, B Shares 272 114,484Tryg A/S 9,749 229,773
Vestas Wind Systems A/S 6,846 1,412,240
13,338,155Egypt - 0.0%Commercial International Bank Egypt
SAE 51,581 190,390Finland - 0.8%Elisa OYJ 5,862 351,626Fortum OYJ 16,798 448,660Kesko OYJ, B Shares 9,211 281,695Kone OYJ, B Shares 11,833 967,187Neste OYJ 14,709 781,135Nokia OYJ (A) 140,582 561,435Nokia OYJ (Euronext Paris
Exchange) (A) 56,247 226,551Nordea Bank ABP 106,689 1,051,980Nordea Bank ABP (London Stock
Exchange) 1,569 15,478Orion OYJ, Class B 3,379 135,386Sampo OYJ, A Shares 15,885 716,260Stora Enso OYJ, R Shares 20,482 382,092UPM-Kymmene OYJ 19,972 717,752
Wartsila OYJ ABP 15,222 159,570
6,796,807France - 6.7%Accor SA (A) 6,145 231,519Aeroports de Paris (A) 1,190 141,966Air Liquide SA 15,910 2,597,730Airbus SE (A) 19,831 2,249,188Alstom SA (A) 8,418 419,445Amundi SA (A)(C) 2,415 193,012Arkema SA 2,540 307,609Atos SE 3,698 288,315AXA SA 66,841 1,794,301BioMerieux 1,432 182,178BNP Paribas SA (A) 37,933 2,311,240Bollore SA 32,561 157,136
Engie SA 63,119 896,629EssilorLuxottica SA 9,828 1,601,056Eurazeo SE (A) 1,144 87,030Faurecia SE 3,556 189,220Faurecia SE (A) 633 33,790Gecina SA 1,814 249,700Getlink SE (B) 14,784 226,632Hermes International 1,094 1,209,965Iliad SA 497 94,407Ipsen SA 1,496 128,245Kering SA 2,546 1,756,893Klepierre SA 8,046 187,277La Francaise des Jeux SAEM (C) 2,992 135,963Legrand SA 9,225 857,080L'Oreal SA 8,487 3,251,222LVMH Moet Hennessy Louis VuittonSE 9,362 6,253,385Natixis SA 35,715 170,713Orange SA 68,945 848,437Orpea SA (B) 1,800 208,438Pernod Ricard SA 7,039 1,317,559Publicis Groupe SA 7,306 445,538Remy Cointreau SA 930 171,672Renault SA (A) 7,048 304,770Safran SA 10,767 1,464,613Sanofi 38,211 3,778,476Sartorius Stedim Biotech 961 395,499Schneider Electric SE 17,545 2,672,730Schneider Electric SE (Euronext
London Exchange) 623 95,214SCOR SE 6,432 219,094SEB SA 1,019 179,517Societe Generale SA (A) 27,239 712,162Sodexo SA (A) 3,211 307,641Suez SA 11,179 236,761Teleperformance 2,029 739,767Thales SA 4,046 401,565TOTAL SE 85,421 3,982,322Ubisoft Entertainment SA (A) 3,042 231,210Unibail-Rodamco-Westfield (Euronext
Amsterdam Exchange) (A) 3,595 287,235Unibail-Rodamco-Westfield, CHESS
Depositary Interest (A) 27,093 110,864Valeo SA 7,694 261,038Veolia Environnement SA 18,107 464,529Vinci SA 17,915 1,834,893Vivendi SE (B) 28,678 941,320Wendel SE (B) 1,176 145,942
Worldline SA (A)(C) 8,074 675,933
59,994,974
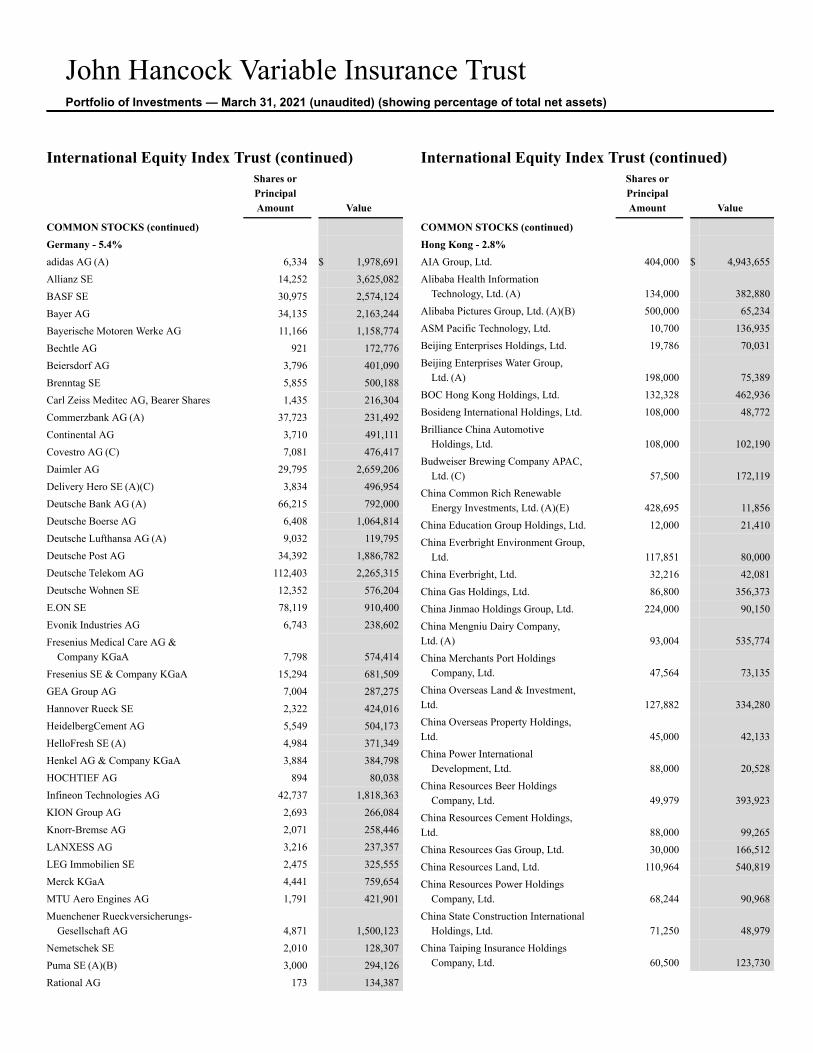
John Hancock Variable Insurance TrustPortfolio of Investments — March 31, 2021 (unaudited) (showing percentage of total net assets)
International Equity Index Trust (continued)Shares orPrincipalAmount Value
COMMON STOCKS (continued)Germany - 5.4%adidas AG (A) 6,334 $ 1,978,691Allianz SE 14,252 3,625,082BASF SE 30,975 2,574,124Bayer AG 34,135 2,163,244Bayerische Motoren Werke AG 11,166 1,158,774Bechtle AG 921 172,776Beiersdorf AG 3,796 401,090Brenntag SE 5,855 500,188Carl Zeiss Meditec AG, Bearer Shares 1,435 216,304Commerzbank AG (A) 37,723 231,492Continental AG 3,710 491,111Covestro AG (C) 7,081 476,417Daimler AG 29,795 2,659,206Delivery Hero SE (A)(C) 3,834 496,954Deutsche Bank AG (A) 66,215 792,000Deutsche Boerse AG 6,408 1,064,814Deutsche Lufthansa AG (A) 9,032 119,795Deutsche Post AG 34,392 1,886,782Deutsche Telekom AG 112,403 2,265,315Deutsche Wohnen SE 12,352 576,204E.ON SE 78,119 910,400Evonik Industries AG 6,743 238,602Fresenius Medical Care AG &
Company KGaA 7,798 574,414Fresenius SE & Company KGaA 15,294 681,509GEA Group AG 7,004 287,275Hannover Rueck SE 2,322 424,016HeidelbergCement AG 5,549 504,173HelloFresh SE (A) 4,984 371,349Henkel AG & Company KGaA 3,884 384,798HOCHTIEF AG 894 80,038Infineon Technologies AG 42,737 1,818,363KION Group AG 2,693 266,084Knorr-Bremse AG 2,071 258,446LANXESS AG 3,216 237,357LEG Immobilien SE 2,475 325,555Merck KGaA 4,441 759,654MTU Aero Engines AG 1,791 421,901Muenchener Rueckversicherungs-
Gesellschaft AG 4,871 1,500,123Nemetschek SE 2,010 128,307Puma SE (A)(B) 3,000 294,126Rational AG 173 134,387
International Equity Index Trust (continued)Shares orPrincipalAmount Value
COMMON STOCKS (continued)Hong Kong - 2.8%AIA Group, Ltd. 404,000 $ 4,943,655Alibaba Health Information
Technology, Ltd. (A) 134,000 382,880Alibaba Pictures Group, Ltd. (A)(B) 500,000 65,234ASM Pacific Technology, Ltd. 10,700 136,935Beijing Enterprises Holdings, Ltd. 19,786 70,031Beijing Enterprises Water Group,
Ltd. (A) 198,000 75,389BOC Hong Kong Holdings, Ltd. 132,328 462,936Bosideng International Holdings, Ltd. 108,000 48,772Brilliance China Automotive
Holdings, Ltd. 108,000 102,190Budweiser Brewing Company APAC,
Ltd. (C) 57,500 172,119China Common Rich Renewable
Energy Investments, Ltd. (A)(E) 428,695 11,856China Education Group Holdings, Ltd. 12,000 21,410China Everbright Environment Group,
Ltd. 117,851 80,000China Everbright, Ltd. 32,216 42,081China Gas Holdings, Ltd. 86,800 356,373China Jinmao Holdings Group, Ltd. 224,000 90,150China Mengniu Dairy Company,Ltd. (A) 93,004 535,774China Merchants Port Holdings
Company, Ltd. 47,564 73,135China Overseas Land & Investment,Ltd. 127,882 334,280China Overseas Property Holdings,Ltd. 45,000 42,133China Power International
Development, Ltd. 88,000 20,528China Resources Beer Holdings
Company, Ltd. 49,979 393,923China Resources Cement Holdings,Ltd. 88,000 99,265China Resources Gas Group, Ltd. 30,000 166,512China Resources Land, Ltd. 110,964 540,819China Resources Power Holdings
Company, Ltd. 68,244 90,968China State Construction International
Holdings, Ltd. 71,250 48,979China Taiping Insurance Holdings
Company, Ltd. 60,500 123,730
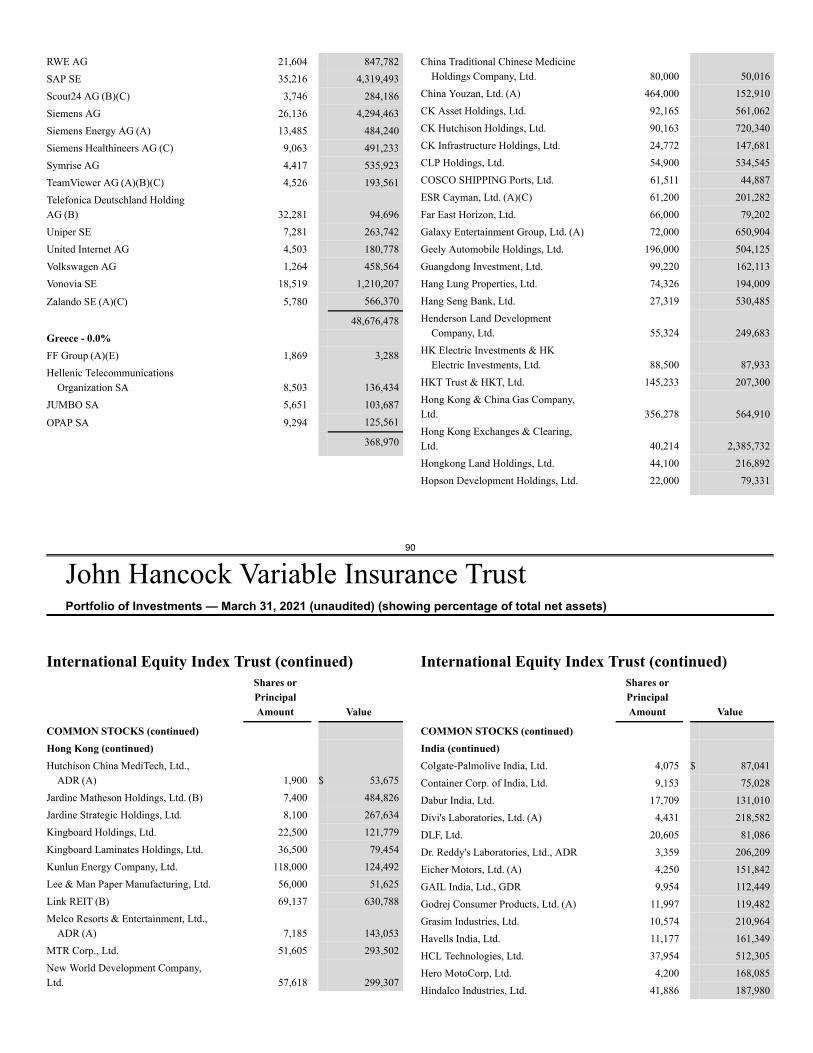
90
John Hancock Variable Insurance TrustPortfolio of Investments — March 31, 2021 (unaudited) (showing percentage of total net assets)
RWE AG 21,604 847,782SAP SE 35,216 4,319,493Scout24 AG (B)(C) 3,746 284,186Siemens AG 26,136 4,294,463Siemens Energy AG (A) 13,485 484,240Siemens Healthineers AG (C) 9,063 491,233Symrise AG 4,417 535,923TeamViewer AG (A)(B)(C) 4,526 193,561Telefonica Deutschland HoldingAG (B) 32,281 94,696Uniper SE 7,281 263,742United Internet AG 4,503 180,778Volkswagen AG 1,264 458,564Vonovia SE 18,519 1,210,207
Zalando SE (A)(C) 5,780 566,370
48,676,478Greece - 0.0%FF Group (A)(E) 1,869 3,288Hellenic Telecommunications
Organization SA 8,503 136,434JUMBO SA 5,651 103,687
OPAP SA 9,294 125,561
368,970
China Traditional Chinese MedicineHoldings Company, Ltd. 80,000 50,016
China Youzan, Ltd. (A) 464,000 152,910CK Asset Holdings, Ltd. 92,165 561,062CK Hutchison Holdings, Ltd. 90,163 720,340CK Infrastructure Holdings, Ltd. 24,772 147,681CLP Holdings, Ltd. 54,900 534,545COSCO SHIPPING Ports, Ltd. 61,511 44,887ESR Cayman, Ltd. (A)(C) 61,200 201,282Far East Horizon, Ltd. 66,000 79,202Galaxy Entertainment Group, Ltd. (A) 72,000 650,904Geely Automobile Holdings, Ltd. 196,000 504,125Guangdong Investment, Ltd. 99,220 162,113Hang Lung Properties, Ltd. 74,326 194,009Hang Seng Bank, Ltd. 27,319 530,485Henderson Land Development
Company, Ltd. 55,324 249,683HK Electric Investments & HK
Electric Investments, Ltd. 88,500 87,933HKT Trust & HKT, Ltd. 145,233 207,300Hong Kong & China Gas Company,Ltd. 356,278 564,910Hong Kong Exchanges & Clearing,Ltd. 40,214 2,385,732Hongkong Land Holdings, Ltd. 44,100 216,892Hopson Development Holdings, Ltd. 22,000 79,331
International Equity Index Trust (continued)Shares orPrincipalAmount Value
COMMON STOCKS (continued)Hong Kong (continued)Hutchison China MediTech, Ltd.,
ADR (A) 1,900 $ 53,675Jardine Matheson Holdings, Ltd. (B) 7,400 484,826Jardine Strategic Holdings, Ltd. 8,100 267,634Kingboard Holdings, Ltd. 22,500 121,779Kingboard Laminates Holdings, Ltd. 36,500 79,454Kunlun Energy Company, Ltd. 118,000 124,492Lee & Man Paper Manufacturing, Ltd. 56,000 51,625Link REIT (B) 69,137 630,788Melco Resorts & Entertainment, Ltd.,
ADR (A) 7,185 143,053MTR Corp., Ltd. 51,605 293,502New World Development Company,Ltd. 57,618 299,307
International Equity Index Trust (continued)Shares orPrincipalAmount Value
COMMON STOCKS (continued)India (continued)Colgate-Palmolive India, Ltd. 4,075 $ 87,041Container Corp. of India, Ltd. 9,153 75,028Dabur India, Ltd. 17,709 131,010Divi's Laboratories, Ltd. (A) 4,431 218,582DLF, Ltd. 20,605 81,086Dr. Reddy's Laboratories, Ltd., ADR 3,359 206,209Eicher Motors, Ltd. (A) 4,250 151,842GAIL India, Ltd., GDR 9,954 112,449Godrej Consumer Products, Ltd. (A) 11,997 119,482Grasim Industries, Ltd. 10,574 210,964Havells India, Ltd. 11,177 161,349HCL Technologies, Ltd. 37,954 512,305Hero MotoCorp, Ltd. 4,200 168,085Hindalco Industries, Ltd. 41,886 187,980
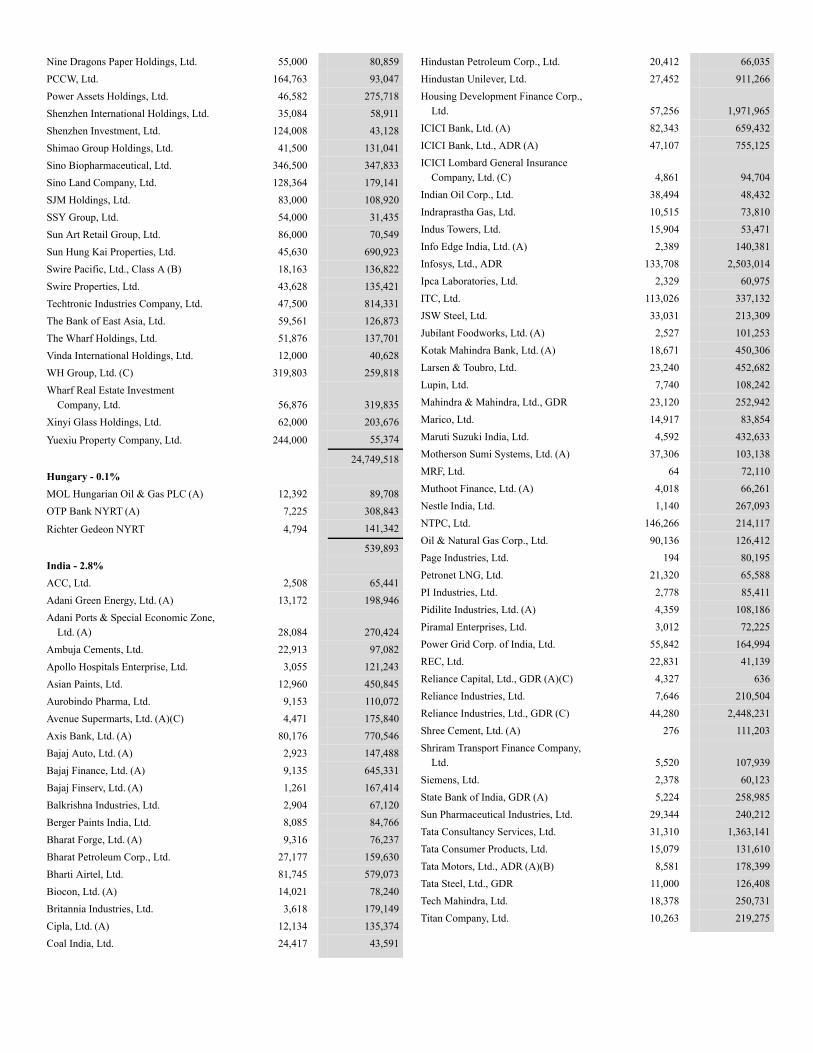
Nine Dragons Paper Holdings, Ltd. 55,000 80,859PCCW, Ltd. 164,763 93,047Power Assets Holdings, Ltd. 46,582 275,718Shenzhen International Holdings, Ltd. 35,084 58,911Shenzhen Investment, Ltd. 124,008 43,128Shimao Group Holdings, Ltd. 41,500 131,041Sino Biopharmaceutical, Ltd. 346,500 347,833Sino Land Company, Ltd. 128,364 179,141SJM Holdings, Ltd. 83,000 108,920SSY Group, Ltd. 54,000 31,435Sun Art Retail Group, Ltd. 86,000 70,549Sun Hung Kai Properties, Ltd. 45,630 690,923Swire Pacific, Ltd., Class A (B) 18,163 136,822Swire Properties, Ltd. 43,628 135,421Techtronic Industries Company, Ltd. 47,500 814,331The Bank of East Asia, Ltd. 59,561 126,873The Wharf Holdings, Ltd. 51,876 137,701Vinda International Holdings, Ltd. 12,000 40,628WH Group, Ltd. (C) 319,803 259,818Wharf Real Estate Investment
Company, Ltd. 56,876 319,835Xinyi Glass Holdings, Ltd. 62,000 203,676
Yuexiu Property Company, Ltd. 244,000 55,374
24,749,518Hungary - 0.1%MOL Hungarian Oil & Gas PLC (A) 12,392 89,708OTP Bank NYRT (A) 7,225 308,843
Richter Gedeon NYRT 4,794 141,342
539,893India - 2.8%ACC, Ltd. 2,508 65,441Adani Green Energy, Ltd. (A) 13,172 198,946Adani Ports & Special Economic Zone,
Ltd. (A) 28,084 270,424Ambuja Cements, Ltd. 22,913 97,082Apollo Hospitals Enterprise, Ltd. 3,055 121,243Asian Paints, Ltd. 12,960 450,845Aurobindo Pharma, Ltd. 9,153 110,072Avenue Supermarts, Ltd. (A)(C) 4,471 175,840Axis Bank, Ltd. (A) 80,176 770,546Bajaj Auto, Ltd. (A) 2,923 147,488Bajaj Finance, Ltd. (A) 9,135 645,331Bajaj Finserv, Ltd. (A) 1,261 167,414Balkrishna Industries, Ltd. 2,904 67,120Berger Paints India, Ltd. 8,085 84,766Bharat Forge, Ltd. (A) 9,316 76,237Bharat Petroleum Corp., Ltd. 27,177 159,630Bharti Airtel, Ltd. 81,745 579,073Biocon, Ltd. (A) 14,021 78,240Britannia Industries, Ltd. 3,618 179,149Cipla, Ltd. (A) 12,134 135,374Coal India, Ltd. 24,417 43,591
Hindustan Petroleum Corp., Ltd. 20,412 66,035Hindustan Unilever, Ltd. 27,452 911,266Housing Development Finance Corp.,
Ltd. 57,256 1,971,965ICICI Bank, Ltd. (A) 82,343 659,432ICICI Bank, Ltd., ADR (A) 47,107 755,125ICICI Lombard General Insurance
Company, Ltd. (C) 4,861 94,704Indian Oil Corp., Ltd. 38,494 48,432Indraprastha Gas, Ltd. 10,515 73,810Indus Towers, Ltd. 15,904 53,471Info Edge India, Ltd. (A) 2,389 140,381Infosys, Ltd., ADR 133,708 2,503,014Ipca Laboratories, Ltd. 2,329 60,975ITC, Ltd. 113,026 337,132JSW Steel, Ltd. 33,031 213,309Jubilant Foodworks, Ltd. (A) 2,527 101,253Kotak Mahindra Bank, Ltd. (A) 18,671 450,306Larsen & Toubro, Ltd. 23,240 452,682Lupin, Ltd. 7,740 108,242Mahindra & Mahindra, Ltd., GDR 23,120 252,942Marico, Ltd. 14,917 83,854Maruti Suzuki India, Ltd. 4,592 432,633Motherson Sumi Systems, Ltd. (A) 37,306 103,138MRF, Ltd. 64 72,110Muthoot Finance, Ltd. (A) 4,018 66,261Nestle India, Ltd. 1,140 267,093NTPC, Ltd. 146,266 214,117Oil & Natural Gas Corp., Ltd. 90,136 126,412Page Industries, Ltd. 194 80,195Petronet LNG, Ltd. 21,320 65,588PI Industries, Ltd. 2,778 85,411Pidilite Industries, Ltd. (A) 4,359 108,186Piramal Enterprises, Ltd. 3,012 72,225Power Grid Corp. of India, Ltd. 55,842 164,994REC, Ltd. 22,831 41,139Reliance Capital, Ltd., GDR (A)(C) 4,327 636Reliance Industries, Ltd. 7,646 210,504Reliance Industries, Ltd., GDR (C) 44,280 2,448,231Shree Cement, Ltd. (A) 276 111,203Shriram Transport Finance Company,
Ltd. 5,520 107,939Siemens, Ltd. 2,378 60,123State Bank of India, GDR (A) 5,224 258,985Sun Pharmaceutical Industries, Ltd. 29,344 240,212Tata Consultancy Services, Ltd. 31,310 1,363,141Tata Consumer Products, Ltd. 15,079 131,610Tata Motors, Ltd., ADR (A)(B) 8,581 178,399Tata Steel, Ltd., GDR 11,000 126,408Tech Mahindra, Ltd. 18,378 250,731Titan Company, Ltd. 10,263 219,275
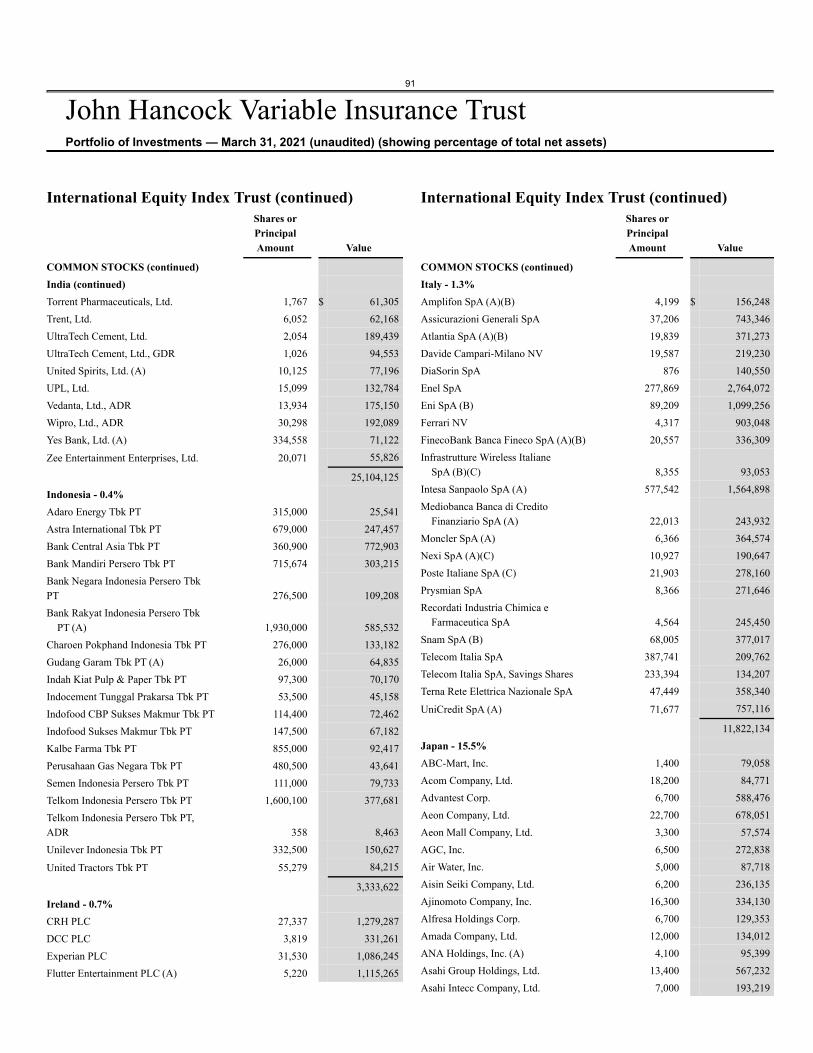
91
John Hancock Variable Insurance TrustPortfolio of Investments — March 31, 2021 (unaudited) (showing percentage of total net assets)
International Equity Index Trust (continued)Shares orPrincipalAmount Value
COMMON STOCKS (continued)India (continued)Torrent Pharmaceuticals, Ltd. 1,767 $ 61,305Trent, Ltd. 6,052 62,168UltraTech Cement, Ltd. 2,054 189,439UltraTech Cement, Ltd., GDR 1,026 94,553United Spirits, Ltd. (A) 10,125 77,196UPL, Ltd. 15,099 132,784Vedanta, Ltd., ADR 13,934 175,150Wipro, Ltd., ADR 30,298 192,089Yes Bank, Ltd. (A) 334,558 71,122
Zee Entertainment Enterprises, Ltd. 20,071 55,826
25,104,125Indonesia - 0.4%Adaro Energy Tbk PT 315,000 25,541Astra International Tbk PT 679,000 247,457Bank Central Asia Tbk PT 360,900 772,903Bank Mandiri Persero Tbk PT 715,674 303,215Bank Negara Indonesia Persero TbkPT 276,500 109,208Bank Rakyat Indonesia Persero Tbk
PT (A) 1,930,000 585,532Charoen Pokphand Indonesia Tbk PT 276,000 133,182Gudang Garam Tbk PT (A) 26,000 64,835Indah Kiat Pulp & Paper Tbk PT 97,300 70,170Indocement Tunggal Prakarsa Tbk PT 53,500 45,158Indofood CBP Sukses Makmur Tbk PT 114,400 72,462Indofood Sukses Makmur Tbk PT 147,500 67,182Kalbe Farma Tbk PT 855,000 92,417Perusahaan Gas Negara Tbk PT 480,500 43,641Semen Indonesia Persero Tbk PT 111,000 79,733Telkom Indonesia Persero Tbk PT 1,600,100 377,681Telkom Indonesia Persero Tbk PT,ADR 358 8,463Unilever Indonesia Tbk PT 332,500 150,627
United Tractors Tbk PT 55,279 84,215
3,333,622Ireland - 0.7%CRH PLC 27,337 1,279,287DCC PLC 3,819 331,261Experian PLC 31,530 1,086,245Flutter Entertainment PLC (A) 5,220 1,115,265
International Equity Index Trust (continued)Shares orPrincipalAmount Value
COMMON STOCKS (continued)Italy - 1.3%Amplifon SpA (A)(B) 4,199 $ 156,248Assicurazioni Generali SpA 37,206 743,346Atlantia SpA (A)(B) 19,839 371,273Davide Campari-Milano NV 19,587 219,230DiaSorin SpA 876 140,550Enel SpA 277,869 2,764,072Eni SpA (B) 89,209 1,099,256Ferrari NV 4,317 903,048FinecoBank Banca Fineco SpA (A)(B) 20,557 336,309Infrastrutture Wireless Italiane
SpA (B)(C) 8,355 93,053Intesa Sanpaolo SpA (A) 577,542 1,564,898Mediobanca Banca di Credito
Finanziario SpA (A) 22,013 243,932Moncler SpA (A) 6,366 364,574Nexi SpA (A)(C) 10,927 190,647Poste Italiane SpA (C) 21,903 278,160Prysmian SpA 8,366 271,646Recordati Industria Chimica e
Farmaceutica SpA 4,564 245,450Snam SpA (B) 68,005 377,017Telecom Italia SpA 387,741 209,762Telecom Italia SpA, Savings Shares 233,394 134,207Terna Rete Elettrica Nazionale SpA 47,449 358,340
UniCredit SpA (A) 71,677 757,116
11,822,134Japan - 15.5%ABC-Mart, Inc. 1,400 79,058Acom Company, Ltd. 18,200 84,771Advantest Corp. 6,700 588,476Aeon Company, Ltd. 22,700 678,051Aeon Mall Company, Ltd. 3,300 57,574AGC, Inc. 6,500 272,838Air Water, Inc. 5,000 87,718Aisin Seiki Company, Ltd. 6,200 236,135Ajinomoto Company, Inc. 16,300 334,130Alfresa Holdings Corp. 6,700 129,353Amada Company, Ltd. 12,000 134,012ANA Holdings, Inc. (A) 4,100 95,399Asahi Group Holdings, Ltd. 13,400 567,232Asahi Intecc Company, Ltd. 7,000 193,219
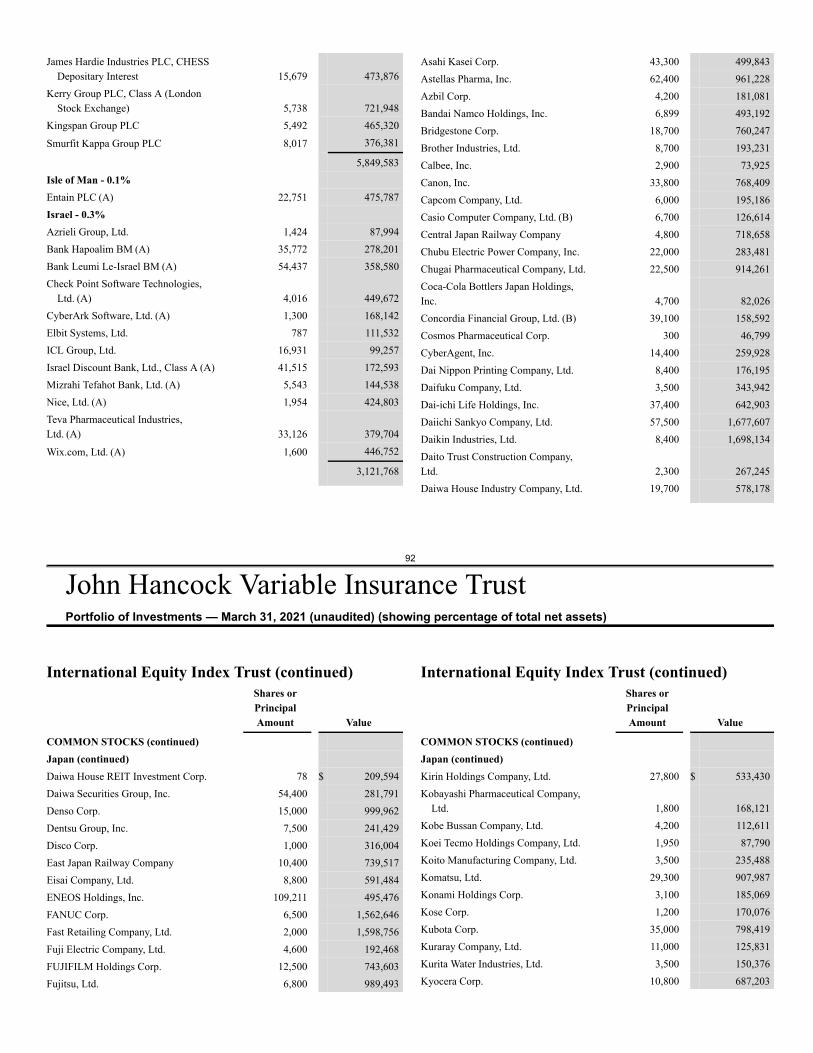
92
John Hancock Variable Insurance TrustPortfolio of Investments — March 31, 2021 (unaudited) (showing percentage of total net assets)
James Hardie Industries PLC, CHESSDepositary Interest 15,679 473,876
Kerry Group PLC, Class A (LondonStock Exchange) 5,738 721,948
Kingspan Group PLC 5,492 465,320
Smurfit Kappa Group PLC 8,017 376,381
5,849,583Isle of Man - 0.1%Entain PLC (A) 22,751 475,787Israel - 0.3%Azrieli Group, Ltd. 1,424 87,994Bank Hapoalim BM (A) 35,772 278,201Bank Leumi Le-Israel BM (A) 54,437 358,580Check Point Software Technologies,
Ltd. (A) 4,016 449,672CyberArk Software, Ltd. (A) 1,300 168,142Elbit Systems, Ltd. 787 111,532ICL Group, Ltd. 16,931 99,257Israel Discount Bank, Ltd., Class A (A) 41,515 172,593Mizrahi Tefahot Bank, Ltd. (A) 5,543 144,538Nice, Ltd. (A) 1,954 424,803Teva Pharmaceutical Industries,Ltd. (A) 33,126 379,704
Wix.com, Ltd. (A) 1,600 446,752
3,121,768
Asahi Kasei Corp. 43,300 499,843Astellas Pharma, Inc. 62,400 961,228Azbil Corp. 4,200 181,081Bandai Namco Holdings, Inc. 6,899 493,192Bridgestone Corp. 18,700 760,247Brother Industries, Ltd. 8,700 193,231Calbee, Inc. 2,900 73,925Canon, Inc. 33,800 768,409Capcom Company, Ltd. 6,000 195,186Casio Computer Company, Ltd. (B) 6,700 126,614Central Japan Railway Company 4,800 718,658Chubu Electric Power Company, Inc. 22,000 283,481Chugai Pharmaceutical Company, Ltd. 22,500 914,261Coca-Cola Bottlers Japan Holdings,Inc. 4,700 82,026Concordia Financial Group, Ltd. (B) 39,100 158,592Cosmos Pharmaceutical Corp. 300 46,799CyberAgent, Inc. 14,400 259,928Dai Nippon Printing Company, Ltd. 8,400 176,195Daifuku Company, Ltd. 3,500 343,942Dai-ichi Life Holdings, Inc. 37,400 642,903Daiichi Sankyo Company, Ltd. 57,500 1,677,607Daikin Industries, Ltd. 8,400 1,698,134Daito Trust Construction Company,Ltd. 2,300 267,245Daiwa House Industry Company, Ltd. 19,700 578,178
International Equity Index Trust (continued)Shares orPrincipalAmount Value
COMMON STOCKS (continued)Japan (continued)Daiwa House REIT Investment Corp. 78 $ 209,594Daiwa Securities Group, Inc. 54,400 281,791Denso Corp. 15,000 999,962Dentsu Group, Inc. 7,500 241,429Disco Corp. 1,000 316,004East Japan Railway Company 10,400 739,517Eisai Company, Ltd. 8,800 591,484ENEOS Holdings, Inc. 109,211 495,476FANUC Corp. 6,500 1,562,646Fast Retailing Company, Ltd. 2,000 1,598,756Fuji Electric Company, Ltd. 4,600 192,468FUJIFILM Holdings Corp. 12,500 743,603Fujitsu, Ltd. 6,800 989,493
International Equity Index Trust (continued)Shares orPrincipalAmount Value
COMMON STOCKS (continued)Japan (continued)Kirin Holdings Company, Ltd. 27,800 $ 533,430Kobayashi Pharmaceutical Company,
Ltd. 1,800 168,121Kobe Bussan Company, Ltd. 4,200 112,611Koei Tecmo Holdings Company, Ltd. 1,950 87,790Koito Manufacturing Company, Ltd. 3,500 235,488Komatsu, Ltd. 29,300 907,987Konami Holdings Corp. 3,100 185,069Kose Corp. 1,200 170,076Kubota Corp. 35,000 798,419Kuraray Company, Ltd. 11,000 125,831Kurita Water Industries, Ltd. 3,500 150,376Kyocera Corp. 10,800 687,203
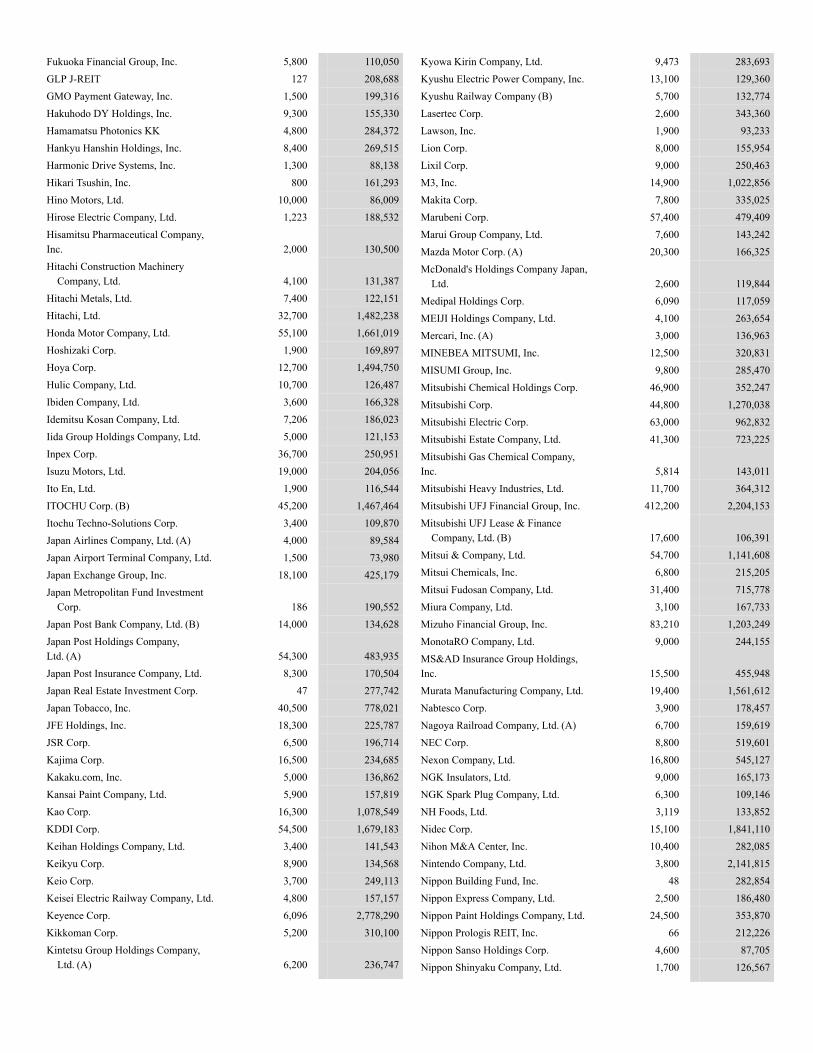
Fukuoka Financial Group, Inc. 5,800 110,050GLP J-REIT 127 208,688GMO Payment Gateway, Inc. 1,500 199,316Hakuhodo DY Holdings, Inc. 9,300 155,330Hamamatsu Photonics KK 4,800 284,372Hankyu Hanshin Holdings, Inc. 8,400 269,515Harmonic Drive Systems, Inc. 1,300 88,138Hikari Tsushin, Inc. 800 161,293Hino Motors, Ltd. 10,000 86,009Hirose Electric Company, Ltd. 1,223 188,532Hisamitsu Pharmaceutical Company,Inc. 2,000 130,500Hitachi Construction Machinery
Company, Ltd. 4,100 131,387Hitachi Metals, Ltd. 7,400 122,151Hitachi, Ltd. 32,700 1,482,238Honda Motor Company, Ltd. 55,100 1,661,019Hoshizaki Corp. 1,900 169,897Hoya Corp. 12,700 1,494,750Hulic Company, Ltd. 10,700 126,487Ibiden Company, Ltd. 3,600 166,328Idemitsu Kosan Company, Ltd. 7,206 186,023Iida Group Holdings Company, Ltd. 5,000 121,153Inpex Corp. 36,700 250,951Isuzu Motors, Ltd. 19,000 204,056Ito En, Ltd. 1,900 116,544ITOCHU Corp. (B) 45,200 1,467,464Itochu Techno-Solutions Corp. 3,400 109,870Japan Airlines Company, Ltd. (A) 4,000 89,584Japan Airport Terminal Company, Ltd. 1,500 73,980Japan Exchange Group, Inc. 18,100 425,179Japan Metropolitan Fund Investment
Corp. 186 190,552Japan Post Bank Company, Ltd. (B) 14,000 134,628Japan Post Holdings Company,Ltd. (A) 54,300 483,935Japan Post Insurance Company, Ltd. 8,300 170,504Japan Real Estate Investment Corp. 47 277,742Japan Tobacco, Inc. 40,500 778,021JFE Holdings, Inc. 18,300 225,787JSR Corp. 6,500 196,714Kajima Corp. 16,500 234,685Kakaku.com, Inc. 5,000 136,862Kansai Paint Company, Ltd. 5,900 157,819Kao Corp. 16,300 1,078,549KDDI Corp. 54,500 1,679,183Keihan Holdings Company, Ltd. 3,400 141,543Keikyu Corp. 8,900 134,568Keio Corp. 3,700 249,113Keisei Electric Railway Company, Ltd. 4,800 157,157Keyence Corp. 6,096 2,778,290Kikkoman Corp. 5,200 310,100Kintetsu Group Holdings Company,
Ltd. (A) 6,200 236,747
Kyowa Kirin Company, Ltd. 9,473 283,693Kyushu Electric Power Company, Inc. 13,100 129,360Kyushu Railway Company (B) 5,700 132,774Lasertec Corp. 2,600 343,360Lawson, Inc. 1,900 93,233Lion Corp. 8,000 155,954Lixil Corp. 9,000 250,463M3, Inc. 14,900 1,022,856Makita Corp. 7,800 335,025Marubeni Corp. 57,400 479,409Marui Group Company, Ltd. 7,600 143,242Mazda Motor Corp. (A) 20,300 166,325McDonald's Holdings Company Japan,
Ltd. 2,600 119,844Medipal Holdings Corp. 6,090 117,059MEIJI Holdings Company, Ltd. 4,100 263,654Mercari, Inc. (A) 3,000 136,963MINEBEA MITSUMI, Inc. 12,500 320,831MISUMI Group, Inc. 9,800 285,470Mitsubishi Chemical Holdings Corp. 46,900 352,247Mitsubishi Corp. 44,800 1,270,038Mitsubishi Electric Corp. 63,000 962,832Mitsubishi Estate Company, Ltd. 41,300 723,225Mitsubishi Gas Chemical Company,Inc. 5,814 143,011Mitsubishi Heavy Industries, Ltd. 11,700 364,312Mitsubishi UFJ Financial Group, Inc. 412,200 2,204,153Mitsubishi UFJ Lease & Finance
Company, Ltd. (B) 17,600 106,391Mitsui & Company, Ltd. 54,700 1,141,608Mitsui Chemicals, Inc. 6,800 215,205Mitsui Fudosan Company, Ltd. 31,400 715,778Miura Company, Ltd. 3,100 167,733Mizuho Financial Group, Inc. 83,210 1,203,249MonotaRO Company, Ltd. 9,000 244,155MS&AD Insurance Group Holdings,Inc. 15,500 455,948Murata Manufacturing Company, Ltd. 19,400 1,561,612Nabtesco Corp. 3,900 178,457Nagoya Railroad Company, Ltd. (A) 6,700 159,619NEC Corp. 8,800 519,601Nexon Company, Ltd. 16,800 545,127NGK Insulators, Ltd. 9,000 165,173NGK Spark Plug Company, Ltd. 6,300 109,146NH Foods, Ltd. 3,119 133,852Nidec Corp. 15,100 1,841,110Nihon M&A Center, Inc. 10,400 282,085Nintendo Company, Ltd. 3,800 2,141,815Nippon Building Fund, Inc. 48 282,854Nippon Express Company, Ltd. 2,500 186,480Nippon Paint Holdings Company, Ltd. 24,500 353,870Nippon Prologis REIT, Inc. 66 212,226Nippon Sanso Holdings Corp. 4,600 87,705Nippon Shinyaku Company, Ltd. 1,700 126,567
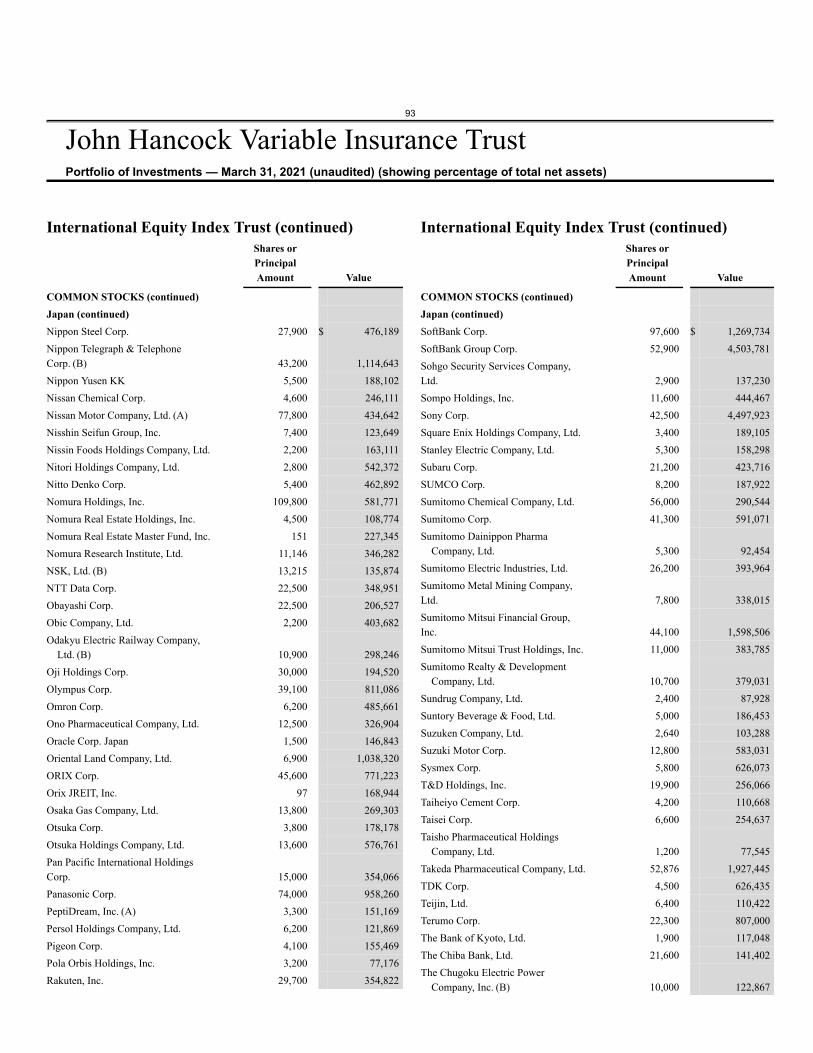
93
John Hancock Variable Insurance TrustPortfolio of Investments — March 31, 2021 (unaudited) (showing percentage of total net assets)
International Equity Index Trust (continued)Shares orPrincipalAmount Value
COMMON STOCKS (continued)Japan (continued)Nippon Steel Corp. 27,900 $ 476,189Nippon Telegraph & TelephoneCorp. (B) 43,200 1,114,643Nippon Yusen KK 5,500 188,102Nissan Chemical Corp. 4,600 246,111Nissan Motor Company, Ltd. (A) 77,800 434,642Nisshin Seifun Group, Inc. 7,400 123,649Nissin Foods Holdings Company, Ltd. 2,200 163,111Nitori Holdings Company, Ltd. 2,800 542,372Nitto Denko Corp. 5,400 462,892Nomura Holdings, Inc. 109,800 581,771Nomura Real Estate Holdings, Inc. 4,500 108,774Nomura Real Estate Master Fund, Inc. 151 227,345Nomura Research Institute, Ltd. 11,146 346,282NSK, Ltd. (B) 13,215 135,874NTT Data Corp. 22,500 348,951Obayashi Corp. 22,500 206,527Obic Company, Ltd. 2,200 403,682Odakyu Electric Railway Company,
Ltd. (B) 10,900 298,246Oji Holdings Corp. 30,000 194,520Olympus Corp. 39,100 811,086Omron Corp. 6,200 485,661Ono Pharmaceutical Company, Ltd. 12,500 326,904Oracle Corp. Japan 1,500 146,843Oriental Land Company, Ltd. 6,900 1,038,320ORIX Corp. 45,600 771,223Orix JREIT, Inc. 97 168,944Osaka Gas Company, Ltd. 13,800 269,303Otsuka Corp. 3,800 178,178Otsuka Holdings Company, Ltd. 13,600 576,761Pan Pacific International HoldingsCorp. 15,000 354,066Panasonic Corp. 74,000 958,260PeptiDream, Inc. (A) 3,300 151,169Persol Holdings Company, Ltd. 6,200 121,869Pigeon Corp. 4,100 155,469Pola Orbis Holdings, Inc. 3,200 77,176Rakuten, Inc. 29,700 354,822
International Equity Index Trust (continued)Shares orPrincipalAmount Value
COMMON STOCKS (continued)Japan (continued)SoftBank Corp. 97,600 $ 1,269,734SoftBank Group Corp. 52,900 4,503,781Sohgo Security Services Company,Ltd. 2,900 137,230Sompo Holdings, Inc. 11,600 444,467Sony Corp. 42,500 4,497,923Square Enix Holdings Company, Ltd. 3,400 189,105Stanley Electric Company, Ltd. 5,300 158,298Subaru Corp. 21,200 423,716SUMCO Corp. 8,200 187,922Sumitomo Chemical Company, Ltd. 56,000 290,544Sumitomo Corp. 41,300 591,071Sumitomo Dainippon Pharma
Company, Ltd. 5,300 92,454Sumitomo Electric Industries, Ltd. 26,200 393,964Sumitomo Metal Mining Company,Ltd. 7,800 338,015Sumitomo Mitsui Financial Group,Inc. 44,100 1,598,506Sumitomo Mitsui Trust Holdings, Inc. 11,000 383,785Sumitomo Realty & Development
Company, Ltd. 10,700 379,031Sundrug Company, Ltd. 2,400 87,928Suntory Beverage & Food, Ltd. 5,000 186,453Suzuken Company, Ltd. 2,640 103,288Suzuki Motor Corp. 12,800 583,031Sysmex Corp. 5,800 626,073T&D Holdings, Inc. 19,900 256,066Taiheiyo Cement Corp. 4,200 110,668Taisei Corp. 6,600 254,637Taisho Pharmaceutical Holdings
Company, Ltd. 1,200 77,545Takeda Pharmaceutical Company, Ltd. 52,876 1,927,445TDK Corp. 4,500 626,435Teijin, Ltd. 6,400 110,422Terumo Corp. 22,300 807,000The Bank of Kyoto, Ltd. 1,900 117,048The Chiba Bank, Ltd. 21,600 141,402The Chugoku Electric Power
Company, Inc. (B) 10,000 122,867
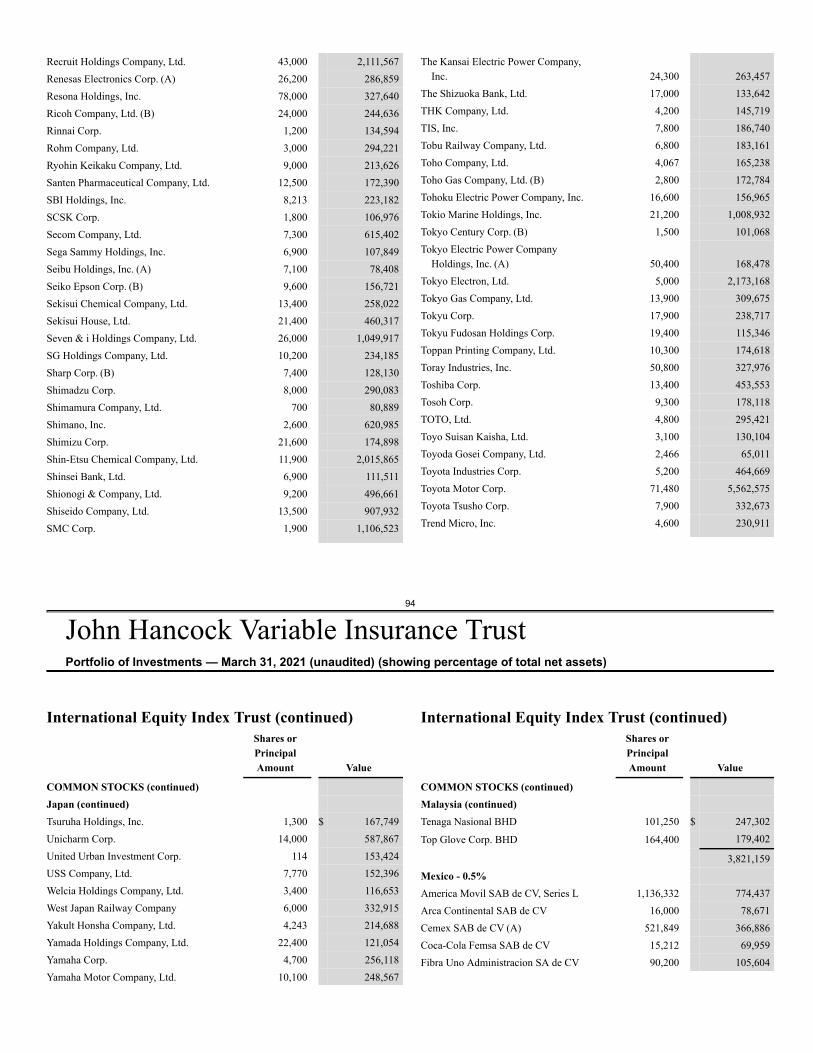
94
John Hancock Variable Insurance TrustPortfolio of Investments — March 31, 2021 (unaudited) (showing percentage of total net assets)
Recruit Holdings Company, Ltd. 43,000 2,111,567Renesas Electronics Corp. (A) 26,200 286,859Resona Holdings, Inc. 78,000 327,640Ricoh Company, Ltd. (B) 24,000 244,636Rinnai Corp. 1,200 134,594Rohm Company, Ltd. 3,000 294,221Ryohin Keikaku Company, Ltd. 9,000 213,626Santen Pharmaceutical Company, Ltd. 12,500 172,390SBI Holdings, Inc. 8,213 223,182SCSK Corp. 1,800 106,976Secom Company, Ltd. 7,300 615,402Sega Sammy Holdings, Inc. 6,900 107,849Seibu Holdings, Inc. (A) 7,100 78,408Seiko Epson Corp. (B) 9,600 156,721Sekisui Chemical Company, Ltd. 13,400 258,022Sekisui House, Ltd. 21,400 460,317Seven & i Holdings Company, Ltd. 26,000 1,049,917SG Holdings Company, Ltd. 10,200 234,185Sharp Corp. (B) 7,400 128,130Shimadzu Corp. 8,000 290,083Shimamura Company, Ltd. 700 80,889Shimano, Inc. 2,600 620,985Shimizu Corp. 21,600 174,898Shin-Etsu Chemical Company, Ltd. 11,900 2,015,865Shinsei Bank, Ltd. 6,900 111,511Shionogi & Company, Ltd. 9,200 496,661Shiseido Company, Ltd. 13,500 907,932SMC Corp. 1,900 1,106,523
The Kansai Electric Power Company,Inc. 24,300 263,457
The Shizuoka Bank, Ltd. 17,000 133,642THK Company, Ltd. 4,200 145,719TIS, Inc. 7,800 186,740Tobu Railway Company, Ltd. 6,800 183,161Toho Company, Ltd. 4,067 165,238Toho Gas Company, Ltd. (B) 2,800 172,784Tohoku Electric Power Company, Inc. 16,600 156,965Tokio Marine Holdings, Inc. 21,200 1,008,932Tokyo Century Corp. (B) 1,500 101,068Tokyo Electric Power Company
Holdings, Inc. (A) 50,400 168,478Tokyo Electron, Ltd. 5,000 2,173,168Tokyo Gas Company, Ltd. 13,900 309,675Tokyu Corp. 17,900 238,717Tokyu Fudosan Holdings Corp. 19,400 115,346Toppan Printing Company, Ltd. 10,300 174,618Toray Industries, Inc. 50,800 327,976Toshiba Corp. 13,400 453,553Tosoh Corp. 9,300 178,118TOTO, Ltd. 4,800 295,421Toyo Suisan Kaisha, Ltd. 3,100 130,104Toyoda Gosei Company, Ltd. 2,466 65,011Toyota Industries Corp. 5,200 464,669Toyota Motor Corp. 71,480 5,562,575Toyota Tsusho Corp. 7,900 332,673Trend Micro, Inc. 4,600 230,911
International Equity Index Trust (continued)Shares orPrincipalAmount Value
COMMON STOCKS (continued)Japan (continued)Tsuruha Holdings, Inc. 1,300 $ 167,749Unicharm Corp. 14,000 587,867United Urban Investment Corp. 114 153,424USS Company, Ltd. 7,770 152,396Welcia Holdings Company, Ltd. 3,400 116,653West Japan Railway Company 6,000 332,915Yakult Honsha Company, Ltd. 4,243 214,688Yamada Holdings Company, Ltd. 22,400 121,054Yamaha Corp. 4,700 256,118Yamaha Motor Company, Ltd. 10,100 248,567
International Equity Index Trust (continued)Shares orPrincipalAmount Value
COMMON STOCKS (continued)Malaysia (continued)Tenaga Nasional BHD 101,250 $ 247,302
Top Glove Corp. BHD 164,400 179,402
3,821,159Mexico - 0.5%America Movil SAB de CV, Series L 1,136,332 774,437Arca Continental SAB de CV 16,000 78,671Cemex SAB de CV (A) 521,849 366,886Coca-Cola Femsa SAB de CV 15,212 69,959Fibra Uno Administracion SA de CV 90,200 105,604
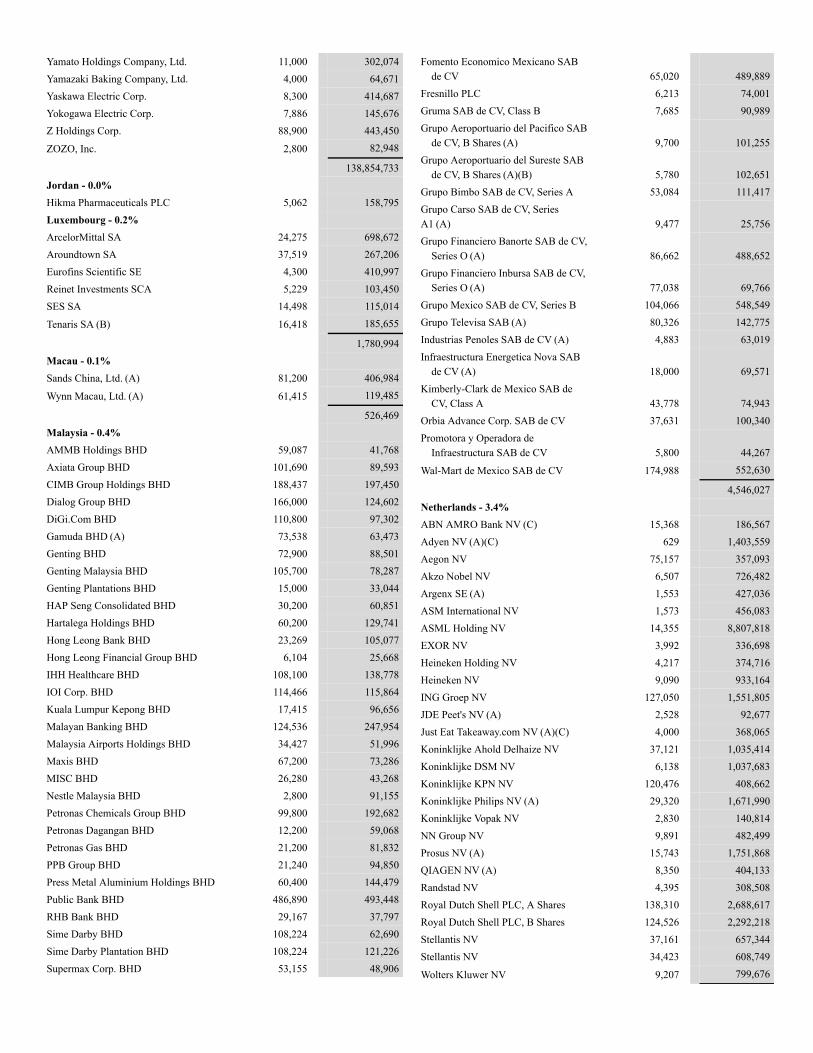
Yamato Holdings Company, Ltd. 11,000 302,074Yamazaki Baking Company, Ltd. 4,000 64,671Yaskawa Electric Corp. 8,300 414,687Yokogawa Electric Corp. 7,886 145,676Z Holdings Corp. 88,900 443,450
ZOZO, Inc. 2,800 82,948
138,854,733Jordan - 0.0%Hikma Pharmaceuticals PLC 5,062 158,795Luxembourg - 0.2%ArcelorMittal SA 24,275 698,672Aroundtown SA 37,519 267,206Eurofins Scientific SE 4,300 410,997Reinet Investments SCA 5,229 103,450SES SA 14,498 115,014
Tenaris SA (B) 16,418 185,655
1,780,994Macau - 0.1%Sands China, Ltd. (A) 81,200 406,984
Wynn Macau, Ltd. (A) 61,415 119,485
526,469Malaysia - 0.4%AMMB Holdings BHD 59,087 41,768Axiata Group BHD 101,690 89,593CIMB Group Holdings BHD 188,437 197,450Dialog Group BHD 166,000 124,602DiGi.Com BHD 110,800 97,302Gamuda BHD (A) 73,538 63,473Genting BHD 72,900 88,501Genting Malaysia BHD 105,700 78,287Genting Plantations BHD 15,000 33,044HAP Seng Consolidated BHD 30,200 60,851Hartalega Holdings BHD 60,200 129,741Hong Leong Bank BHD 23,269 105,077Hong Leong Financial Group BHD 6,104 25,668IHH Healthcare BHD 108,100 138,778IOI Corp. BHD 114,466 115,864Kuala Lumpur Kepong BHD 17,415 96,656Malayan Banking BHD 124,536 247,954Malaysia Airports Holdings BHD 34,427 51,996Maxis BHD 67,200 73,286MISC BHD 26,280 43,268Nestle Malaysia BHD 2,800 91,155Petronas Chemicals Group BHD 99,800 192,682Petronas Dagangan BHD 12,200 59,068Petronas Gas BHD 21,200 81,832PPB Group BHD 21,240 94,850Press Metal Aluminium Holdings BHD 60,400 144,479Public Bank BHD 486,890 493,448RHB Bank BHD 29,167 37,797Sime Darby BHD 108,224 62,690Sime Darby Plantation BHD 108,224 121,226Supermax Corp. BHD 53,155 48,906
Fomento Economico Mexicano SABde CV 65,020 489,889
Fresnillo PLC 6,213 74,001Gruma SAB de CV, Class B 7,685 90,989Grupo Aeroportuario del Pacifico SAB
de CV, B Shares (A) 9,700 101,255Grupo Aeroportuario del Sureste SAB
de CV, B Shares (A)(B) 5,780 102,651Grupo Bimbo SAB de CV, Series A 53,084 111,417Grupo Carso SAB de CV, SeriesA1 (A) 9,477 25,756Grupo Financiero Banorte SAB de CV,
Series O (A) 86,662 488,652Grupo Financiero Inbursa SAB de CV,
Series O (A) 77,038 69,766Grupo Mexico SAB de CV, Series B 104,066 548,549Grupo Televisa SAB (A) 80,326 142,775Industrias Penoles SAB de CV (A) 4,883 63,019Infraestructura Energetica Nova SAB
de CV (A) 18,000 69,571Kimberly-Clark de Mexico SAB de
CV, Class A 43,778 74,943Orbia Advance Corp. SAB de CV 37,631 100,340Promotora y Operadora de
Infraestructura SAB de CV 5,800 44,267
Wal-Mart de Mexico SAB de CV 174,988 552,630
4,546,027Netherlands - 3.4%ABN AMRO Bank NV (C) 15,368 186,567Adyen NV (A)(C) 629 1,403,559Aegon NV 75,157 357,093Akzo Nobel NV 6,507 726,482Argenx SE (A) 1,553 427,036ASM International NV 1,573 456,083ASML Holding NV 14,355 8,807,818EXOR NV 3,992 336,698Heineken Holding NV 4,217 374,716Heineken NV 9,090 933,164ING Groep NV 127,050 1,551,805JDE Peet's NV (A) 2,528 92,677Just Eat Takeaway.com NV (A)(C) 4,000 368,065Koninklijke Ahold Delhaize NV 37,121 1,035,414Koninklijke DSM NV 6,138 1,037,683Koninklijke KPN NV 120,476 408,662Koninklijke Philips NV (A) 29,320 1,671,990Koninklijke Vopak NV 2,830 140,814NN Group NV 9,891 482,499Prosus NV (A) 15,743 1,751,868QIAGEN NV (A) 8,350 404,133Randstad NV 4,395 308,508Royal Dutch Shell PLC, A Shares 138,310 2,688,617Royal Dutch Shell PLC, B Shares 124,526 2,292,218Stellantis NV 37,161 657,344Stellantis NV 34,423 608,749
Wolters Kluwer NV 9,207 799,676
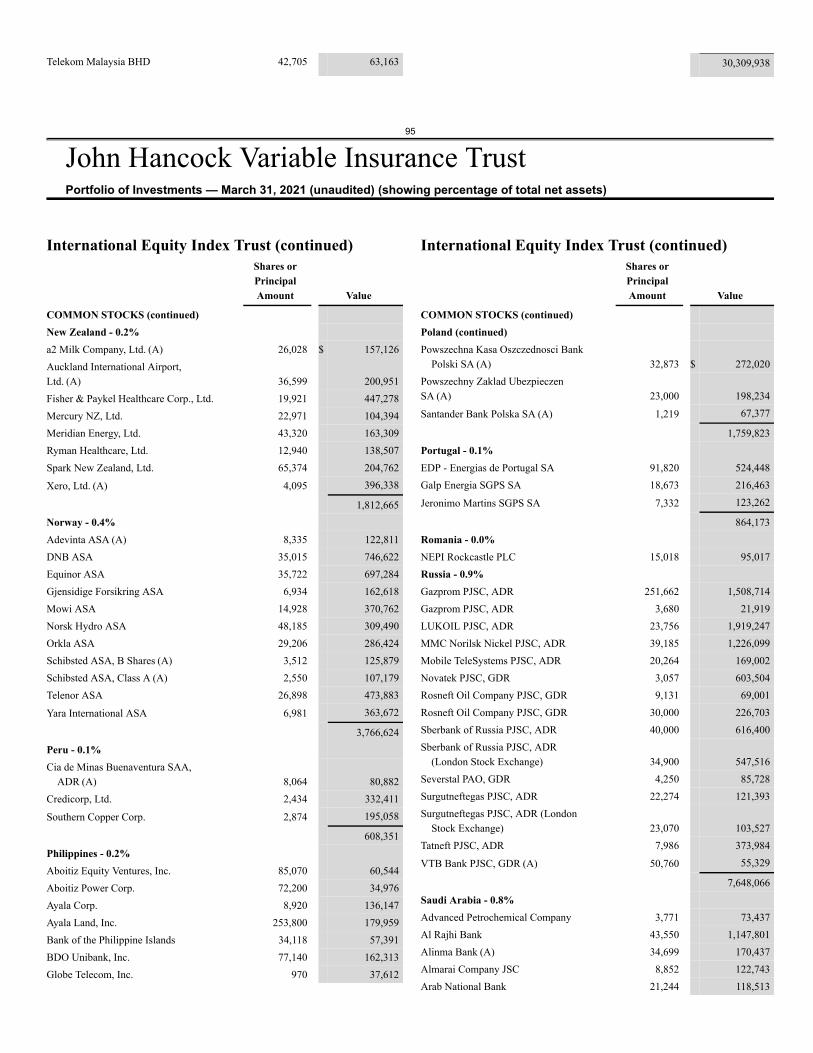
95
John Hancock Variable Insurance TrustPortfolio of Investments — March 31, 2021 (unaudited) (showing percentage of total net assets)
Telekom Malaysia BHD 42,705 63,163 30,309,938
International Equity Index Trust (continued)Shares orPrincipalAmount Value
COMMON STOCKS (continued)New Zealand - 0.2%a2 Milk Company, Ltd. (A) 26,028 $ 157,126Auckland International Airport,Ltd. (A) 36,599 200,951Fisher & Paykel Healthcare Corp., Ltd. 19,921 447,278Mercury NZ, Ltd. 22,971 104,394Meridian Energy, Ltd. 43,320 163,309Ryman Healthcare, Ltd. 12,940 138,507Spark New Zealand, Ltd. 65,374 204,762
Xero, Ltd. (A) 4,095 396,338
1,812,665Norway - 0.4%Adevinta ASA (A) 8,335 122,811DNB ASA 35,015 746,622Equinor ASA 35,722 697,284Gjensidige Forsikring ASA 6,934 162,618Mowi ASA 14,928 370,762Norsk Hydro ASA 48,185 309,490Orkla ASA 29,206 286,424Schibsted ASA, B Shares (A) 3,512 125,879Schibsted ASA, Class A (A) 2,550 107,179Telenor ASA 26,898 473,883
Yara International ASA 6,981 363,672
3,766,624Peru - 0.1%Cia de Minas Buenaventura SAA,
ADR (A) 8,064 80,882Credicorp, Ltd. 2,434 332,411
Southern Copper Corp. 2,874 195,058
608,351Philippines - 0.2%Aboitiz Equity Ventures, Inc. 85,070 60,544Aboitiz Power Corp. 72,200 34,976Ayala Corp. 8,920 136,147Ayala Land, Inc. 253,800 179,959Bank of the Philippine Islands 34,118 57,391BDO Unibank, Inc. 77,140 162,313Globe Telecom, Inc. 970 37,612
International Equity Index Trust (continued)Shares orPrincipalAmount Value
COMMON STOCKS (continued)Poland (continued)Powszechna Kasa Oszczednosci Bank
Polski SA (A) 32,873 $ 272,020Powszechny Zaklad UbezpieczenSA (A) 23,000 198,234
Santander Bank Polska SA (A) 1,219 67,377
1,759,823Portugal - 0.1%EDP - Energias de Portugal SA 91,820 524,448Galp Energia SGPS SA 18,673 216,463
Jeronimo Martins SGPS SA 7,332 123,262
864,173Romania - 0.0%NEPI Rockcastle PLC 15,018 95,017Russia - 0.9%Gazprom PJSC, ADR 251,662 1,508,714Gazprom PJSC, ADR 3,680 21,919LUKOIL PJSC, ADR 23,756 1,919,247MMC Norilsk Nickel PJSC, ADR 39,185 1,226,099Mobile TeleSystems PJSC, ADR 20,264 169,002Novatek PJSC, GDR 3,057 603,504Rosneft Oil Company PJSC, GDR 9,131 69,001Rosneft Oil Company PJSC, GDR 30,000 226,703Sberbank of Russia PJSC, ADR 40,000 616,400Sberbank of Russia PJSC, ADR
(London Stock Exchange) 34,900 547,516Severstal PAO, GDR 4,250 85,728Surgutneftegas PJSC, ADR 22,274 121,393Surgutneftegas PJSC, ADR (London
Stock Exchange) 23,070 103,527Tatneft PJSC, ADR 7,986 373,984
VTB Bank PJSC, GDR (A) 50,760 55,329
7,648,066Saudi Arabia - 0.8%Advanced Petrochemical Company 3,771 73,437Al Rajhi Bank 43,550 1,147,801Alinma Bank (A) 34,699 170,437Almarai Company JSC 8,852 122,743Arab National Bank 21,244 118,513
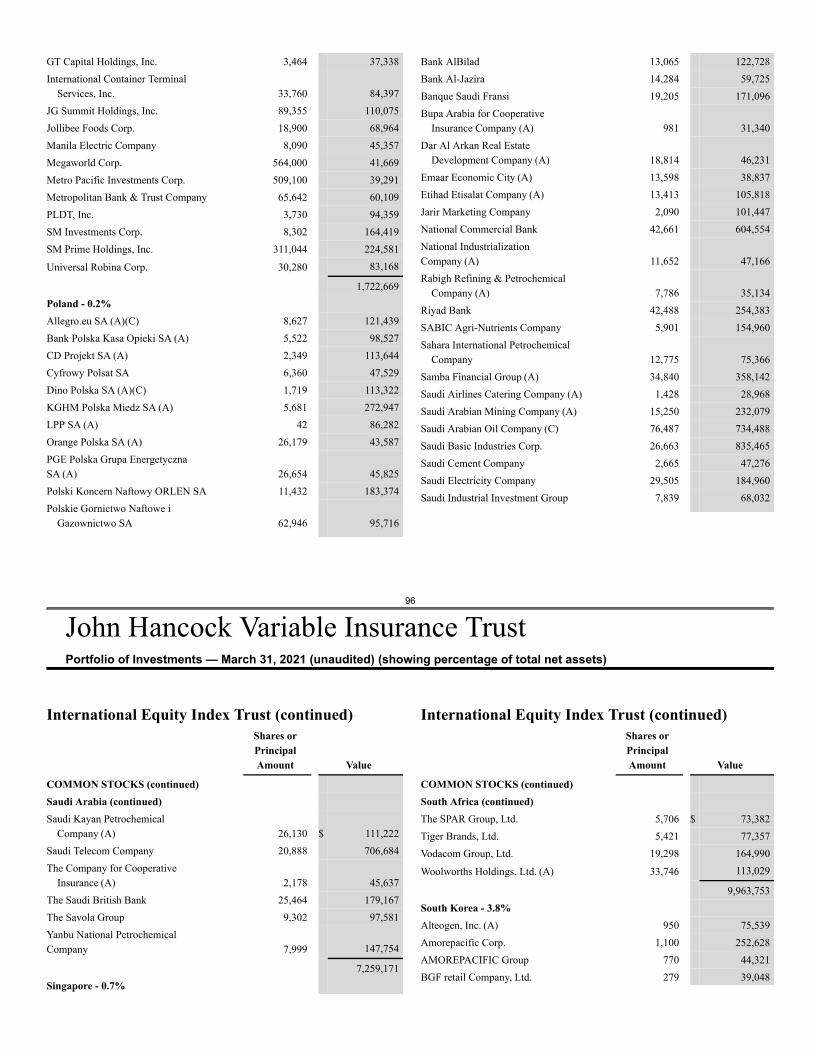
96
John Hancock Variable Insurance TrustPortfolio of Investments — March 31, 2021 (unaudited) (showing percentage of total net assets)
GT Capital Holdings, Inc. 3,464 37,338International Container Terminal
Services, Inc. 33,760 84,397JG Summit Holdings, Inc. 89,355 110,075Jollibee Foods Corp. 18,900 68,964Manila Electric Company 8,090 45,357Megaworld Corp. 564,000 41,669Metro Pacific Investments Corp. 509,100 39,291Metropolitan Bank & Trust Company 65,642 60,109PLDT, Inc. 3,730 94,359SM Investments Corp. 8,302 164,419SM Prime Holdings, Inc. 311,044 224,581
Universal Robina Corp. 30,280 83,168
1,722,669Poland - 0.2%Allegro.eu SA (A)(C) 8,627 121,439Bank Polska Kasa Opieki SA (A) 5,522 98,527CD Projekt SA (A) 2,349 113,644Cyfrowy Polsat SA 6,360 47,529Dino Polska SA (A)(C) 1,719 113,322KGHM Polska Miedz SA (A) 5,681 272,947LPP SA (A) 42 86,282Orange Polska SA (A) 26,179 43,587PGE Polska Grupa EnergetycznaSA (A) 26,654 45,825Polski Koncern Naftowy ORLEN SA 11,432 183,374Polskie Gornictwo Naftowe i
Gazownictwo SA 62,946 95,716
Bank AlBilad 13,065 122,728Bank Al-Jazira 14,284 59,725Banque Saudi Fransi 19,205 171,096Bupa Arabia for Cooperative
Insurance Company (A) 981 31,340Dar Al Arkan Real Estate
Development Company (A) 18,814 46,231Emaar Economic City (A) 13,598 38,837Etihad Etisalat Company (A) 13,413 105,818Jarir Marketing Company 2,090 101,447National Commercial Bank 42,661 604,554National IndustrializationCompany (A) 11,652 47,166Rabigh Refining & Petrochemical
Company (A) 7,786 35,134Riyad Bank 42,488 254,383SABIC Agri-Nutrients Company 5,901 154,960Sahara International Petrochemical
Company 12,775 75,366Samba Financial Group (A) 34,840 358,142Saudi Airlines Catering Company (A) 1,428 28,968Saudi Arabian Mining Company (A) 15,250 232,079Saudi Arabian Oil Company (C) 76,487 734,488Saudi Basic Industries Corp. 26,663 835,465Saudi Cement Company 2,665 47,276Saudi Electricity Company 29,505 184,960Saudi Industrial Investment Group 7,839 68,032
International Equity Index Trust (continued)Shares orPrincipalAmount Value
COMMON STOCKS (continued)Saudi Arabia (continued)Saudi Kayan Petrochemical
Company (A) 26,130 $ 111,222Saudi Telecom Company 20,888 706,684The Company for Cooperative
Insurance (A) 2,178 45,637The Saudi British Bank 25,464 179,167The Savola Group 9,302 97,581Yanbu National PetrochemicalCompany 7,999 147,754
7,259,171Singapore - 0.7%
International Equity Index Trust (continued)Shares orPrincipalAmount Value
COMMON STOCKS (continued)South Africa (continued)The SPAR Group, Ltd. 5,706 $ 73,382Tiger Brands, Ltd. 5,421 77,357Vodacom Group, Ltd. 19,298 164,990
Woolworths Holdings, Ltd. (A) 33,746 113,029
9,963,753South Korea - 3.8%Alteogen, Inc. (A) 950 75,539Amorepacific Corp. 1,100 252,628AMOREPACIFIC Group 770 44,321BGF retail Company, Ltd. 279 39,048
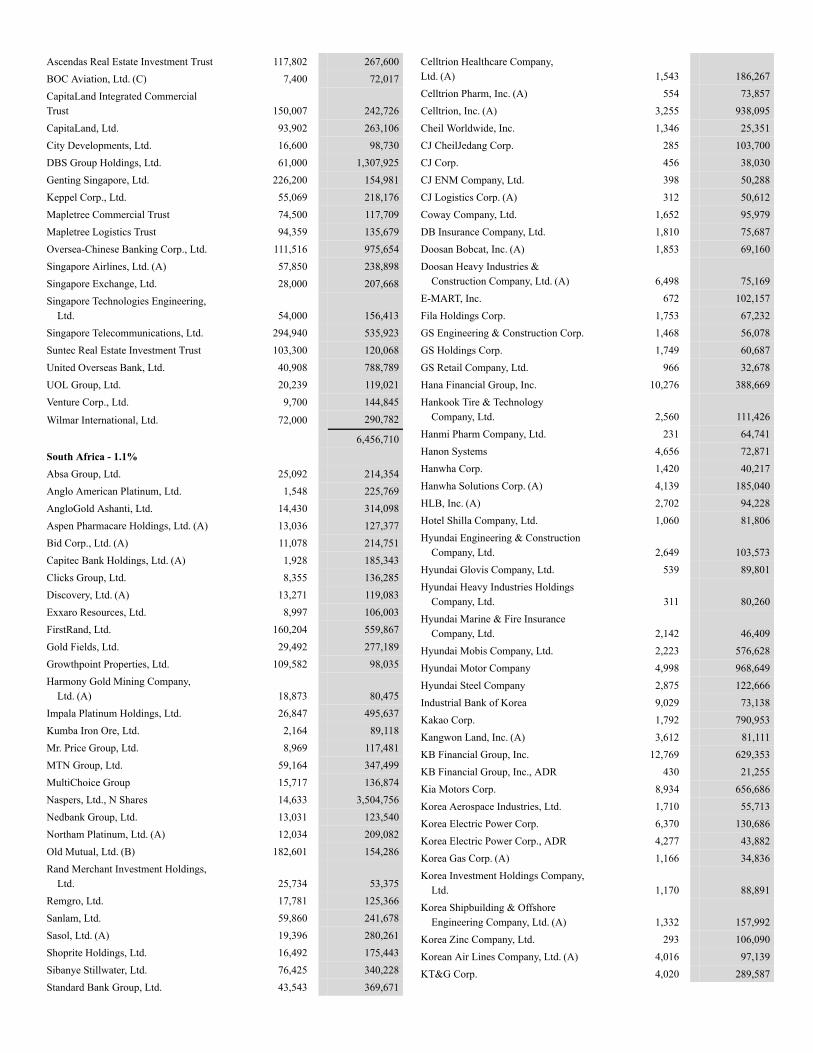
Ascendas Real Estate Investment Trust 117,802 267,600BOC Aviation, Ltd. (C) 7,400 72,017CapitaLand Integrated CommercialTrust 150,007 242,726CapitaLand, Ltd. 93,902 263,106City Developments, Ltd. 16,600 98,730DBS Group Holdings, Ltd. 61,000 1,307,925Genting Singapore, Ltd. 226,200 154,981Keppel Corp., Ltd. 55,069 218,176Mapletree Commercial Trust 74,500 117,709Mapletree Logistics Trust 94,359 135,679Oversea-Chinese Banking Corp., Ltd. 111,516 975,654Singapore Airlines, Ltd. (A) 57,850 238,898Singapore Exchange, Ltd. 28,000 207,668Singapore Technologies Engineering,
Ltd. 54,000 156,413Singapore Telecommunications, Ltd. 294,940 535,923Suntec Real Estate Investment Trust 103,300 120,068United Overseas Bank, Ltd. 40,908 788,789UOL Group, Ltd. 20,239 119,021Venture Corp., Ltd. 9,700 144,845
Wilmar International, Ltd. 72,000 290,782
6,456,710South Africa - 1.1%Absa Group, Ltd. 25,092 214,354Anglo American Platinum, Ltd. 1,548 225,769AngloGold Ashanti, Ltd. 14,430 314,098Aspen Pharmacare Holdings, Ltd. (A) 13,036 127,377Bid Corp., Ltd. (A) 11,078 214,751Capitec Bank Holdings, Ltd. (A) 1,928 185,343Clicks Group, Ltd. 8,355 136,285Discovery, Ltd. (A) 13,271 119,083Exxaro Resources, Ltd. 8,997 106,003FirstRand, Ltd. 160,204 559,867Gold Fields, Ltd. 29,492 277,189Growthpoint Properties, Ltd. 109,582 98,035Harmony Gold Mining Company,
Ltd. (A) 18,873 80,475Impala Platinum Holdings, Ltd. 26,847 495,637Kumba Iron Ore, Ltd. 2,164 89,118Mr. Price Group, Ltd. 8,969 117,481MTN Group, Ltd. 59,164 347,499MultiChoice Group 15,717 136,874Naspers, Ltd., N Shares 14,633 3,504,756Nedbank Group, Ltd. 13,031 123,540Northam Platinum, Ltd. (A) 12,034 209,082Old Mutual, Ltd. (B) 182,601 154,286Rand Merchant Investment Holdings,
Ltd. 25,734 53,375Remgro, Ltd. 17,781 125,366Sanlam, Ltd. 59,860 241,678Sasol, Ltd. (A) 19,396 280,261Shoprite Holdings, Ltd. 16,492 175,443Sibanye Stillwater, Ltd. 76,425 340,228Standard Bank Group, Ltd. 43,543 369,671
Celltrion Healthcare Company,Ltd. (A) 1,543 186,267Celltrion Pharm, Inc. (A) 554 73,857Celltrion, Inc. (A) 3,255 938,095Cheil Worldwide, Inc. 1,346 25,351CJ CheilJedang Corp. 285 103,700CJ Corp. 456 38,030CJ ENM Company, Ltd. 398 50,288CJ Logistics Corp. (A) 312 50,612Coway Company, Ltd. 1,652 95,979DB Insurance Company, Ltd. 1,810 75,687Doosan Bobcat, Inc. (A) 1,853 69,160Doosan Heavy Industries &
Construction Company, Ltd. (A) 6,498 75,169E-MART, Inc. 672 102,157Fila Holdings Corp. 1,753 67,232GS Engineering & Construction Corp. 1,468 56,078GS Holdings Corp. 1,749 60,687GS Retail Company, Ltd. 966 32,678Hana Financial Group, Inc. 10,276 388,669Hankook Tire & Technology
Company, Ltd. 2,560 111,426Hanmi Pharm Company, Ltd. 231 64,741Hanon Systems 4,656 72,871Hanwha Corp. 1,420 40,217Hanwha Solutions Corp. (A) 4,139 185,040HLB, Inc. (A) 2,702 94,228Hotel Shilla Company, Ltd. 1,060 81,806Hyundai Engineering & Construction
Company, Ltd. 2,649 103,573Hyundai Glovis Company, Ltd. 539 89,801Hyundai Heavy Industries Holdings
Company, Ltd. 311 80,260Hyundai Marine & Fire Insurance
Company, Ltd. 2,142 46,409Hyundai Mobis Company, Ltd. 2,223 576,628Hyundai Motor Company 4,998 968,649Hyundai Steel Company 2,875 122,666Industrial Bank of Korea 9,029 73,138Kakao Corp. 1,792 790,953Kangwon Land, Inc. (A) 3,612 81,111KB Financial Group, Inc. 12,769 629,353KB Financial Group, Inc., ADR 430 21,255Kia Motors Corp. 8,934 656,686Korea Aerospace Industries, Ltd. 1,710 55,713Korea Electric Power Corp. 6,370 130,686Korea Electric Power Corp., ADR 4,277 43,882Korea Gas Corp. (A) 1,166 34,836Korea Investment Holdings Company,
Ltd. 1,170 88,891Korea Shipbuilding & Offshore
Engineering Company, Ltd. (A) 1,332 157,992Korea Zinc Company, Ltd. 293 106,090Korean Air Lines Company, Ltd. (A) 4,016 97,139KT&G Corp. 4,020 289,587
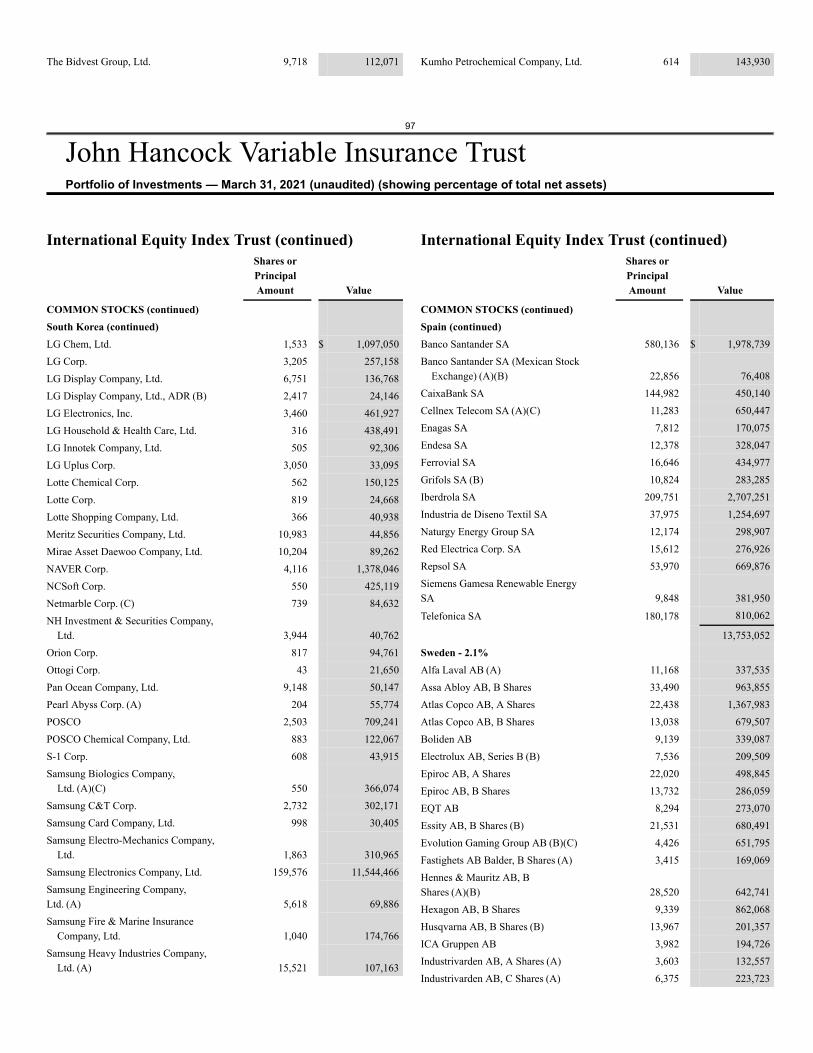
97
John Hancock Variable Insurance TrustPortfolio of Investments — March 31, 2021 (unaudited) (showing percentage of total net assets)
The Bidvest Group, Ltd. 9,718 112,071 Kumho Petrochemical Company, Ltd. 614 143,930
International Equity Index Trust (continued)Shares orPrincipalAmount Value
COMMON STOCKS (continued)South Korea (continued)LG Chem, Ltd. 1,533 $ 1,097,050LG Corp. 3,205 257,158LG Display Company, Ltd. 6,751 136,768LG Display Company, Ltd., ADR (B) 2,417 24,146LG Electronics, Inc. 3,460 461,927LG Household & Health Care, Ltd. 316 438,491LG Innotek Company, Ltd. 505 92,306LG Uplus Corp. 3,050 33,095Lotte Chemical Corp. 562 150,125Lotte Corp. 819 24,668Lotte Shopping Company, Ltd. 366 40,938Meritz Securities Company, Ltd. 10,983 44,856Mirae Asset Daewoo Company, Ltd. 10,204 89,262NAVER Corp. 4,116 1,378,046NCSoft Corp. 550 425,119Netmarble Corp. (C) 739 84,632NH Investment & Securities Company,
Ltd. 3,944 40,762Orion Corp. 817 94,761Ottogi Corp. 43 21,650Pan Ocean Company, Ltd. 9,148 50,147Pearl Abyss Corp. (A) 204 55,774POSCO 2,503 709,241POSCO Chemical Company, Ltd. 883 122,067S-1 Corp. 608 43,915Samsung Biologics Company,
Ltd. (A)(C) 550 366,074Samsung C&T Corp. 2,732 302,171Samsung Card Company, Ltd. 998 30,405Samsung Electro-Mechanics Company,
Ltd. 1,863 310,965Samsung Electronics Company, Ltd. 159,576 11,544,466Samsung Engineering Company,Ltd. (A) 5,618 69,886Samsung Fire & Marine Insurance
Company, Ltd. 1,040 174,766Samsung Heavy Industries Company,
Ltd. (A) 15,521 107,163
International Equity Index Trust (continued)Shares orPrincipalAmount Value
COMMON STOCKS (continued)Spain (continued)Banco Santander SA 580,136 $ 1,978,739Banco Santander SA (Mexican Stock
Exchange) (A)(B) 22,856 76,408CaixaBank SA 144,982 450,140Cellnex Telecom SA (A)(C) 11,283 650,447Enagas SA 7,812 170,075Endesa SA 12,378 328,047Ferrovial SA 16,646 434,977Grifols SA (B) 10,824 283,285Iberdrola SA 209,751 2,707,251Industria de Diseno Textil SA 37,975 1,254,697Naturgy Energy Group SA 12,174 298,907Red Electrica Corp. SA 15,612 276,926Repsol SA 53,970 669,876Siemens Gamesa Renewable EnergySA 9,848 381,950
Telefonica SA 180,178 810,062
13,753,052Sweden - 2.1%Alfa Laval AB (A) 11,168 337,535Assa Abloy AB, B Shares 33,490 963,855Atlas Copco AB, A Shares 22,438 1,367,983Atlas Copco AB, B Shares 13,038 679,507Boliden AB 9,139 339,087Electrolux AB, Series B (B) 7,536 209,509Epiroc AB, A Shares 22,020 498,845Epiroc AB, B Shares 13,732 286,059EQT AB 8,294 273,070Essity AB, B Shares (B) 21,531 680,491Evolution Gaming Group AB (B)(C) 4,426 651,795Fastighets AB Balder, B Shares (A) 3,415 169,069Hennes & Mauritz AB, BShares (A)(B) 28,520 642,741Hexagon AB, B Shares 9,339 862,068Husqvarna AB, B Shares (B) 13,967 201,357ICA Gruppen AB 3,982 194,726Industrivarden AB, A Shares (A) 3,603 132,557Industrivarden AB, C Shares (A) 6,375 223,723
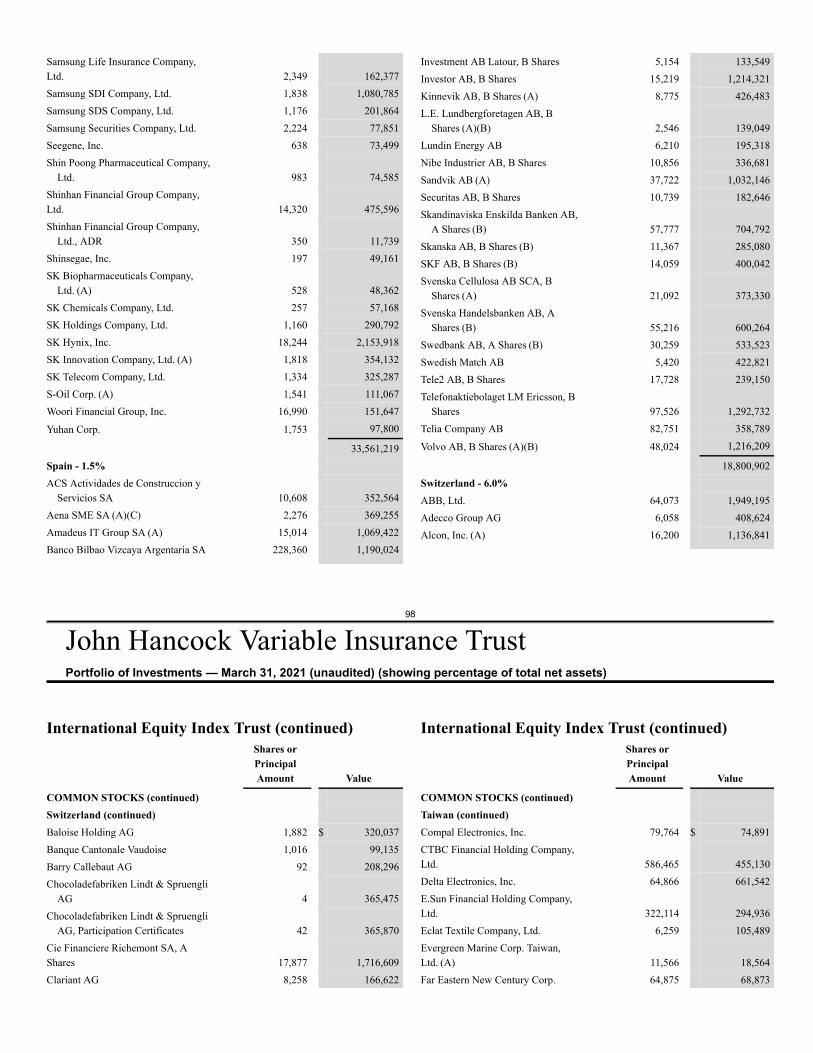
98
John Hancock Variable Insurance TrustPortfolio of Investments — March 31, 2021 (unaudited) (showing percentage of total net assets)
Samsung Life Insurance Company,Ltd. 2,349 162,377Samsung SDI Company, Ltd. 1,838 1,080,785Samsung SDS Company, Ltd. 1,176 201,864Samsung Securities Company, Ltd. 2,224 77,851Seegene, Inc. 638 73,499Shin Poong Pharmaceutical Company,
Ltd. 983 74,585Shinhan Financial Group Company,Ltd. 14,320 475,596Shinhan Financial Group Company,
Ltd., ADR 350 11,739Shinsegae, Inc. 197 49,161SK Biopharmaceuticals Company,
Ltd. (A) 528 48,362SK Chemicals Company, Ltd. 257 57,168SK Holdings Company, Ltd. 1,160 290,792SK Hynix, Inc. 18,244 2,153,918SK Innovation Company, Ltd. (A) 1,818 354,132SK Telecom Company, Ltd. 1,334 325,287S-Oil Corp. (A) 1,541 111,067Woori Financial Group, Inc. 16,990 151,647
Yuhan Corp. 1,753 97,800
33,561,219Spain - 1.5%ACS Actividades de Construccion y
Servicios SA 10,608 352,564Aena SME SA (A)(C) 2,276 369,255Amadeus IT Group SA (A) 15,014 1,069,422Banco Bilbao Vizcaya Argentaria SA 228,360 1,190,024
Investment AB Latour, B Shares 5,154 133,549Investor AB, B Shares 15,219 1,214,321Kinnevik AB, B Shares (A) 8,775 426,483L.E. Lundbergforetagen AB, B
Shares (A)(B) 2,546 139,049Lundin Energy AB 6,210 195,318Nibe Industrier AB, B Shares 10,856 336,681Sandvik AB (A) 37,722 1,032,146Securitas AB, B Shares 10,739 182,646Skandinaviska Enskilda Banken AB,
A Shares (B) 57,777 704,792Skanska AB, B Shares (B) 11,367 285,080SKF AB, B Shares (B) 14,059 400,042Svenska Cellulosa AB SCA, B
Shares (A) 21,092 373,330Svenska Handelsbanken AB, A
Shares (B) 55,216 600,264Swedbank AB, A Shares (B) 30,259 533,523Swedish Match AB 5,420 422,821Tele2 AB, B Shares 17,728 239,150Telefonaktiebolaget LM Ericsson, B
Shares 97,526 1,292,732Telia Company AB 82,751 358,789
Volvo AB, B Shares (A)(B) 48,024 1,216,209
18,800,902Switzerland - 6.0%ABB, Ltd. 64,073 1,949,195Adecco Group AG 6,058 408,624Alcon, Inc. (A) 16,200 1,136,841
International Equity Index Trust (continued)Shares orPrincipalAmount Value
COMMON STOCKS (continued)Switzerland (continued)Baloise Holding AG 1,882 $ 320,037Banque Cantonale Vaudoise 1,016 99,135Barry Callebaut AG 92 208,296Chocoladefabriken Lindt & Spruengli
AG 4 365,475Chocoladefabriken Lindt & Spruengli
AG, Participation Certificates 42 365,870Cie Financiere Richemont SA, AShares 17,877 1,716,609Clariant AG 8,258 166,622
International Equity Index Trust (continued)Shares orPrincipalAmount Value
COMMON STOCKS (continued)Taiwan (continued)Compal Electronics, Inc. 79,764 $ 74,891CTBC Financial Holding Company,Ltd. 586,465 455,130Delta Electronics, Inc. 64,866 661,542E.Sun Financial Holding Company,Ltd. 322,114 294,936Eclat Textile Company, Ltd. 6,259 105,489Evergreen Marine Corp. Taiwan,Ltd. (A) 11,566 18,564Far Eastern New Century Corp. 64,875 68,873
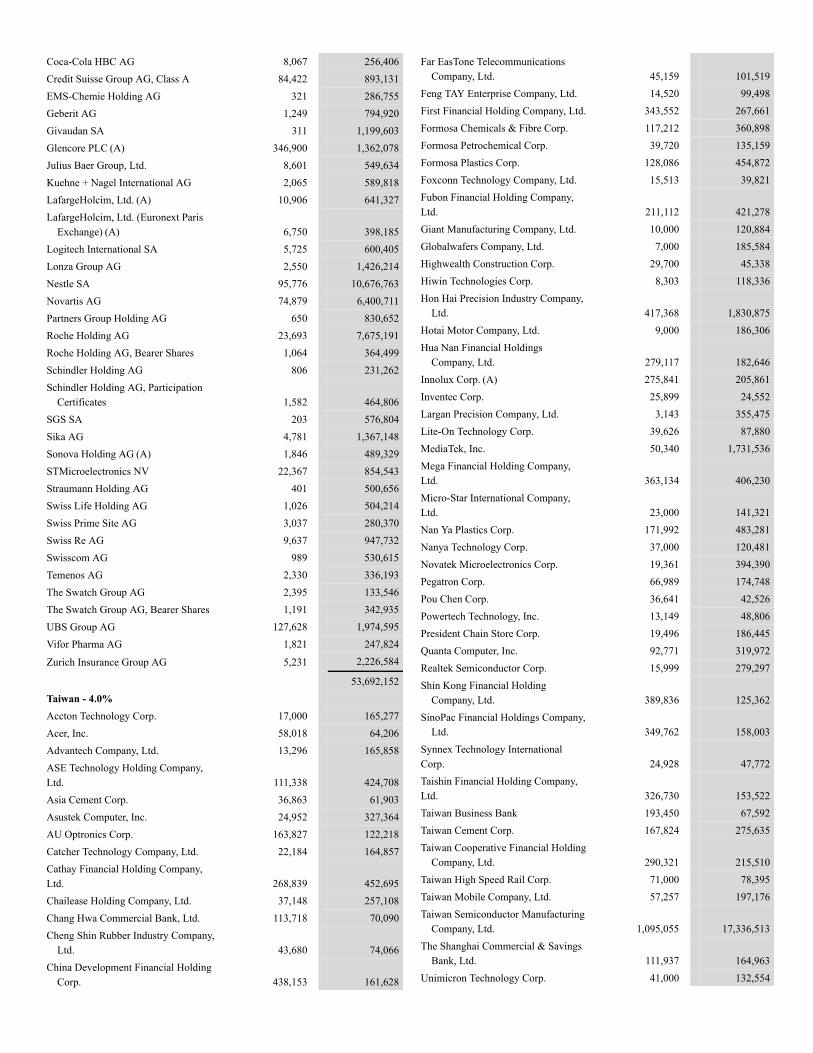
Coca-Cola HBC AG 8,067 256,406Credit Suisse Group AG, Class A 84,422 893,131EMS-Chemie Holding AG 321 286,755Geberit AG 1,249 794,920Givaudan SA 311 1,199,603Glencore PLC (A) 346,900 1,362,078Julius Baer Group, Ltd. 8,601 549,634Kuehne + Nagel International AG 2,065 589,818LafargeHolcim, Ltd. (A) 10,906 641,327LafargeHolcim, Ltd. (Euronext Paris
Exchange) (A) 6,750 398,185Logitech International SA 5,725 600,405Lonza Group AG 2,550 1,426,214Nestle SA 95,776 10,676,763Novartis AG 74,879 6,400,711Partners Group Holding AG 650 830,652Roche Holding AG 23,693 7,675,191Roche Holding AG, Bearer Shares 1,064 364,499Schindler Holding AG 806 231,262Schindler Holding AG, Participation
Certificates 1,582 464,806SGS SA 203 576,804Sika AG 4,781 1,367,148Sonova Holding AG (A) 1,846 489,329STMicroelectronics NV 22,367 854,543Straumann Holding AG 401 500,656Swiss Life Holding AG 1,026 504,214Swiss Prime Site AG 3,037 280,370Swiss Re AG 9,637 947,732Swisscom AG 989 530,615Temenos AG 2,330 336,193The Swatch Group AG 2,395 133,546The Swatch Group AG, Bearer Shares 1,191 342,935UBS Group AG 127,628 1,974,595Vifor Pharma AG 1,821 247,824
Zurich Insurance Group AG 5,231 2,226,584
53,692,152Taiwan - 4.0%Accton Technology Corp. 17,000 165,277Acer, Inc. 58,018 64,206Advantech Company, Ltd. 13,296 165,858ASE Technology Holding Company,Ltd. 111,338 424,708Asia Cement Corp. 36,863 61,903Asustek Computer, Inc. 24,952 327,364AU Optronics Corp. 163,827 122,218Catcher Technology Company, Ltd. 22,184 164,857Cathay Financial Holding Company,Ltd. 268,839 452,695Chailease Holding Company, Ltd. 37,148 257,108Chang Hwa Commercial Bank, Ltd. 113,718 70,090Cheng Shin Rubber Industry Company,
Ltd. 43,680 74,066China Development Financial Holding
Corp. 438,153 161,628
Far EasTone TelecommunicationsCompany, Ltd. 45,159 101,519
Feng TAY Enterprise Company, Ltd. 14,520 99,498First Financial Holding Company, Ltd. 343,552 267,661Formosa Chemicals & Fibre Corp. 117,212 360,898Formosa Petrochemical Corp. 39,720 135,159Formosa Plastics Corp. 128,086 454,872Foxconn Technology Company, Ltd. 15,513 39,821Fubon Financial Holding Company,Ltd. 211,112 421,278Giant Manufacturing Company, Ltd. 10,000 120,884Globalwafers Company, Ltd. 7,000 185,584Highwealth Construction Corp. 29,700 45,338Hiwin Technologies Corp. 8,303 118,336Hon Hai Precision Industry Company,
Ltd. 417,368 1,830,875Hotai Motor Company, Ltd. 9,000 186,306Hua Nan Financial Holdings
Company, Ltd. 279,117 182,646Innolux Corp. (A) 275,841 205,861Inventec Corp. 25,899 24,552Largan Precision Company, Ltd. 3,143 355,475Lite-On Technology Corp. 39,626 87,880MediaTek, Inc. 50,340 1,731,536Mega Financial Holding Company,Ltd. 363,134 406,230Micro-Star International Company,Ltd. 23,000 141,321Nan Ya Plastics Corp. 171,992 483,281Nanya Technology Corp. 37,000 120,481Novatek Microelectronics Corp. 19,361 394,390Pegatron Corp. 66,989 174,748Pou Chen Corp. 36,641 42,526Powertech Technology, Inc. 13,149 48,806President Chain Store Corp. 19,496 186,445Quanta Computer, Inc. 92,771 319,972Realtek Semiconductor Corp. 15,999 279,297Shin Kong Financial Holding
Company, Ltd. 389,836 125,362SinoPac Financial Holdings Company,
Ltd. 349,762 158,003Synnex Technology InternationalCorp. 24,928 47,772Taishin Financial Holding Company,Ltd. 326,730 153,522Taiwan Business Bank 193,450 67,592Taiwan Cement Corp. 167,824 275,635Taiwan Cooperative Financial Holding
Company, Ltd. 290,321 215,510Taiwan High Speed Rail Corp. 71,000 78,395Taiwan Mobile Company, Ltd. 57,257 197,176Taiwan Semiconductor Manufacturing
Company, Ltd. 1,095,055 17,336,513The Shanghai Commercial & Savings
Bank, Ltd. 111,937 164,963Unimicron Technology Corp. 41,000 132,554
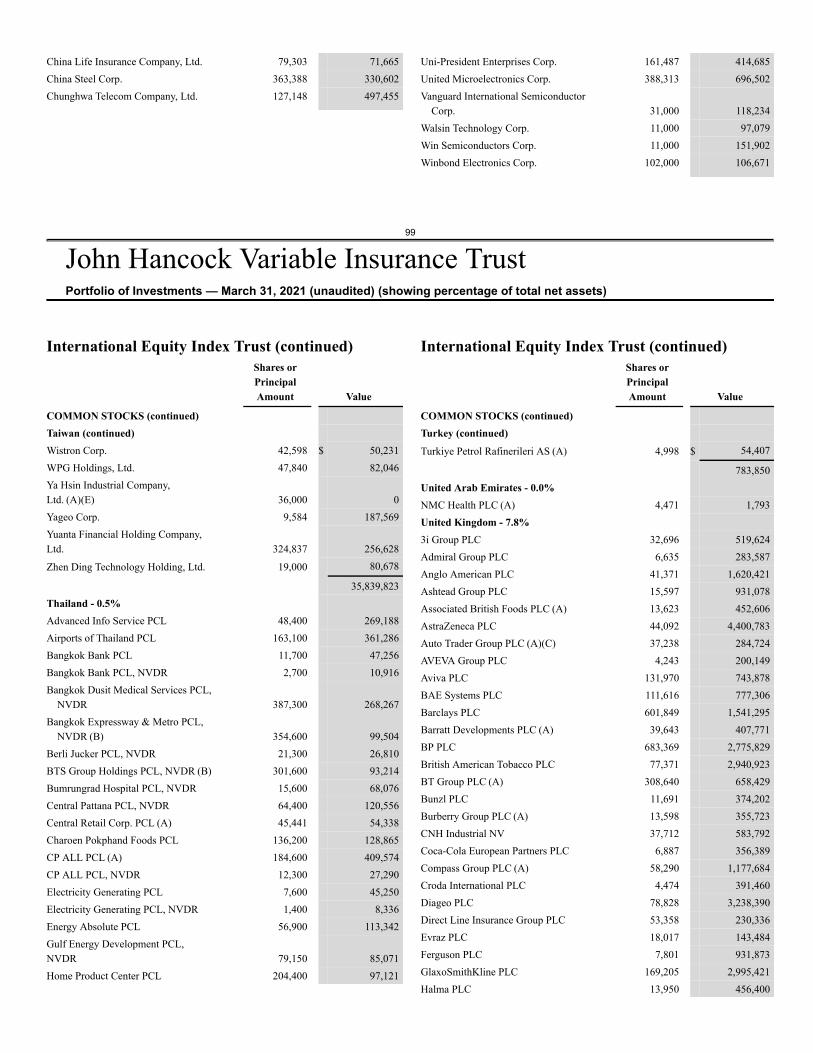
99
John Hancock Variable Insurance TrustPortfolio of Investments — March 31, 2021 (unaudited) (showing percentage of total net assets)
China Life Insurance Company, Ltd. 79,303 71,665China Steel Corp. 363,388 330,602Chunghwa Telecom Company, Ltd. 127,148 497,455
Uni-President Enterprises Corp. 161,487 414,685United Microelectronics Corp. 388,313 696,502Vanguard International Semiconductor
Corp. 31,000 118,234Walsin Technology Corp. 11,000 97,079Win Semiconductors Corp. 11,000 151,902Winbond Electronics Corp. 102,000 106,671
International Equity Index Trust (continued)Shares orPrincipalAmount Value
COMMON STOCKS (continued)Taiwan (continued)Wistron Corp. 42,598 $ 50,231WPG Holdings, Ltd. 47,840 82,046Ya Hsin Industrial Company,Ltd. (A)(E) 36,000 0Yageo Corp. 9,584 187,569Yuanta Financial Holding Company,Ltd. 324,837 256,628
Zhen Ding Technology Holding, Ltd. 19,000 80,678
35,839,823Thailand - 0.5%Advanced Info Service PCL 48,400 269,188Airports of Thailand PCL 163,100 361,286Bangkok Bank PCL 11,700 47,256Bangkok Bank PCL, NVDR 2,700 10,916Bangkok Dusit Medical Services PCL,
NVDR 387,300 268,267Bangkok Expressway & Metro PCL,
NVDR (B) 354,600 99,504Berli Jucker PCL, NVDR 21,300 26,810BTS Group Holdings PCL, NVDR (B) 301,600 93,214Bumrungrad Hospital PCL, NVDR 15,600 68,076Central Pattana PCL, NVDR 64,400 120,556Central Retail Corp. PCL (A) 45,441 54,338Charoen Pokphand Foods PCL 136,200 128,865CP ALL PCL (A) 184,600 409,574CP ALL PCL, NVDR 12,300 27,290Electricity Generating PCL 7,600 45,250Electricity Generating PCL, NVDR 1,400 8,336Energy Absolute PCL 56,900 113,342Gulf Energy Development PCL,NVDR 79,150 85,071Home Product Center PCL 204,400 97,121
International Equity Index Trust (continued)Shares orPrincipalAmount Value
COMMON STOCKS (continued)Turkey (continued)Turkiye Petrol Rafinerileri AS (A) 4,998 $ 54,407
783,850United Arab Emirates - 0.0%NMC Health PLC (A) 4,471 1,793United Kingdom - 7.8%3i Group PLC 32,696 519,624Admiral Group PLC 6,635 283,587Anglo American PLC 41,371 1,620,421Ashtead Group PLC 15,597 931,078Associated British Foods PLC (A) 13,623 452,606AstraZeneca PLC 44,092 4,400,783Auto Trader Group PLC (A)(C) 37,238 284,724AVEVA Group PLC 4,243 200,149Aviva PLC 131,970 743,878BAE Systems PLC 111,616 777,306Barclays PLC 601,849 1,541,295Barratt Developments PLC (A) 39,643 407,771BP PLC 683,369 2,775,829British American Tobacco PLC 77,371 2,940,923BT Group PLC (A) 308,640 658,429Bunzl PLC 11,691 374,202Burberry Group PLC (A) 13,598 355,723CNH Industrial NV 37,712 583,792Coca-Cola European Partners PLC 6,887 356,389Compass Group PLC (A) 58,290 1,177,684Croda International PLC 4,474 391,460Diageo PLC 78,828 3,238,390Direct Line Insurance Group PLC 53,358 230,336Evraz PLC 18,017 143,484Ferguson PLC 7,801 931,873GlaxoSmithKline PLC 169,205 2,995,421Halma PLC 13,950 456,400
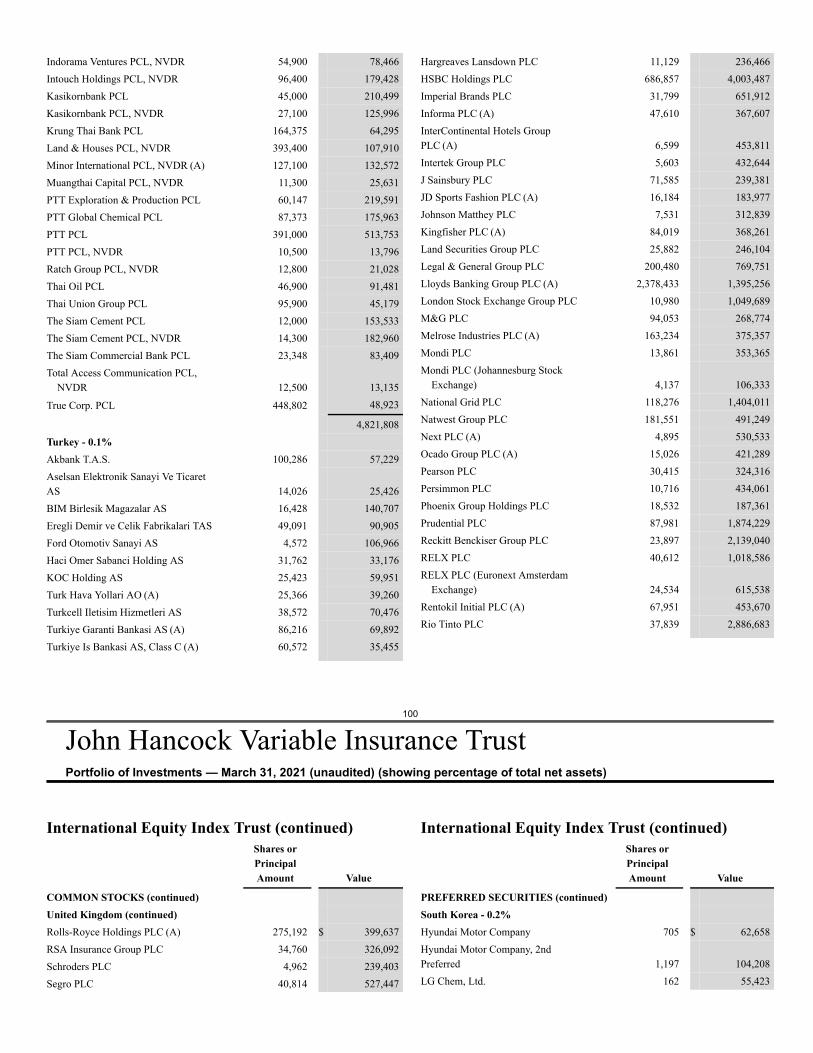
100
John Hancock Variable Insurance TrustPortfolio of Investments — March 31, 2021 (unaudited) (showing percentage of total net assets)
Indorama Ventures PCL, NVDR 54,900 78,466Intouch Holdings PCL, NVDR 96,400 179,428Kasikornbank PCL 45,000 210,499Kasikornbank PCL, NVDR 27,100 125,996Krung Thai Bank PCL 164,375 64,295Land & Houses PCL, NVDR 393,400 107,910Minor International PCL, NVDR (A) 127,100 132,572Muangthai Capital PCL, NVDR 11,300 25,631PTT Exploration & Production PCL 60,147 219,591PTT Global Chemical PCL 87,373 175,963PTT PCL 391,000 513,753PTT PCL, NVDR 10,500 13,796Ratch Group PCL, NVDR 12,800 21,028Thai Oil PCL 46,900 91,481Thai Union Group PCL 95,900 45,179The Siam Cement PCL 12,000 153,533The Siam Cement PCL, NVDR 14,300 182,960The Siam Commercial Bank PCL 23,348 83,409Total Access Communication PCL,
NVDR 12,500 13,135
True Corp. PCL 448,802 48,923
4,821,808Turkey - 0.1%Akbank T.A.S. 100,286 57,229Aselsan Elektronik Sanayi Ve TicaretAS 14,026 25,426BIM Birlesik Magazalar AS 16,428 140,707Eregli Demir ve Celik Fabrikalari TAS 49,091 90,905Ford Otomotiv Sanayi AS 4,572 106,966Haci Omer Sabanci Holding AS 31,762 33,176KOC Holding AS 25,423 59,951Turk Hava Yollari AO (A) 25,366 39,260Turkcell Iletisim Hizmetleri AS 38,572 70,476Turkiye Garanti Bankasi AS (A) 86,216 69,892Turkiye Is Bankasi AS, Class C (A) 60,572 35,455
Hargreaves Lansdown PLC 11,129 236,466HSBC Holdings PLC 686,857 4,003,487Imperial Brands PLC 31,799 651,912Informa PLC (A) 47,610 367,607InterContinental Hotels GroupPLC (A) 6,599 453,811Intertek Group PLC 5,603 432,644J Sainsbury PLC 71,585 239,381JD Sports Fashion PLC (A) 16,184 183,977Johnson Matthey PLC 7,531 312,839Kingfisher PLC (A) 84,019 368,261Land Securities Group PLC 25,882 246,104Legal & General Group PLC 200,480 769,751Lloyds Banking Group PLC (A) 2,378,433 1,395,256London Stock Exchange Group PLC 10,980 1,049,689M&G PLC 94,053 268,774Melrose Industries PLC (A) 163,234 375,357Mondi PLC 13,861 353,365Mondi PLC (Johannesburg Stock
Exchange) 4,137 106,333National Grid PLC 118,276 1,404,011Natwest Group PLC 181,551 491,249Next PLC (A) 4,895 530,533Ocado Group PLC (A) 15,026 421,289Pearson PLC 30,415 324,316Persimmon PLC 10,716 434,061Phoenix Group Holdings PLC 18,532 187,361Prudential PLC 87,981 1,874,229Reckitt Benckiser Group PLC 23,897 2,139,040RELX PLC 40,612 1,018,586RELX PLC (Euronext Amsterdam
Exchange) 24,534 615,538Rentokil Initial PLC (A) 67,951 453,670Rio Tinto PLC 37,839 2,886,683
International Equity Index Trust (continued)Shares orPrincipalAmount Value
COMMON STOCKS (continued)United Kingdom (continued)Rolls-Royce Holdings PLC (A) 275,192 $ 399,637RSA Insurance Group PLC 34,760 326,092Schroders PLC 4,962 239,403Segro PLC 40,814 527,447
International Equity Index Trust (continued)Shares orPrincipalAmount Value
PREFERRED SECURITIES (continued)South Korea - 0.2%Hyundai Motor Company 705 $ 62,658Hyundai Motor Company, 2ndPreferred 1,197 104,208LG Chem, Ltd. 162 55,423
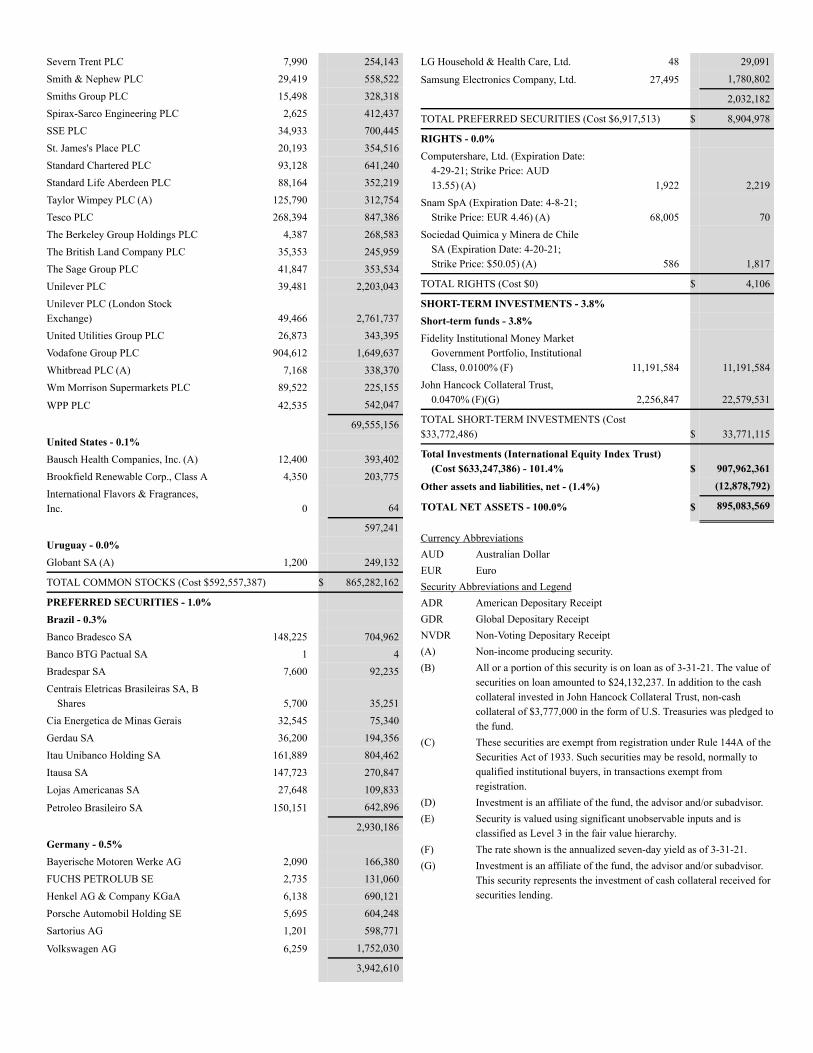
Severn Trent PLC 7,990 254,143Smith & Nephew PLC 29,419 558,522Smiths Group PLC 15,498 328,318Spirax-Sarco Engineering PLC 2,625 412,437SSE PLC 34,933 700,445St. James's Place PLC 20,193 354,516Standard Chartered PLC 93,128 641,240Standard Life Aberdeen PLC 88,164 352,219Taylor Wimpey PLC (A) 125,790 312,754Tesco PLC 268,394 847,386The Berkeley Group Holdings PLC 4,387 268,583The British Land Company PLC 35,353 245,959The Sage Group PLC 41,847 353,534Unilever PLC 39,481 2,203,043Unilever PLC (London StockExchange) 49,466 2,761,737United Utilities Group PLC 26,873 343,395Vodafone Group PLC 904,612 1,649,637Whitbread PLC (A) 7,168 338,370Wm Morrison Supermarkets PLC 89,522 225,155
WPP PLC 42,535 542,047
69,555,156United States - 0.1%Bausch Health Companies, Inc. (A) 12,400 393,402Brookfield Renewable Corp., Class A 4,350 203,775International Flavors & Fragrances,Inc. 0 64
597,241Uruguay - 0.0%Globant SA (A) 1,200 249,132
TOTAL COMMON STOCKS (Cost $592,557,387) $ 865,282,162
PREFERRED SECURITIES - 1.0%Brazil - 0.3%Banco Bradesco SA 148,225 704,962Banco BTG Pactual SA 1 4Bradespar SA 7,600 92,235Centrais Eletricas Brasileiras SA, B
Shares 5,700 35,251Cia Energetica de Minas Gerais 32,545 75,340Gerdau SA 36,200 194,356Itau Unibanco Holding SA 161,889 804,462Itausa SA 147,723 270,847Lojas Americanas SA 27,648 109,833
Petroleo Brasileiro SA 150,151 642,896
2,930,186Germany - 0.5%Bayerische Motoren Werke AG 2,090 166,380FUCHS PETROLUB SE 2,735 131,060Henkel AG & Company KGaA 6,138 690,121Porsche Automobil Holding SE 5,695 604,248Sartorius AG 1,201 598,771
Volkswagen AG 6,259 1,752,030
3,942,610
LG Household & Health Care, Ltd. 48 29,091
Samsung Electronics Company, Ltd. 27,495 1,780,802
2,032,182
TOTAL PREFERRED SECURITIES (Cost $6,917,513) $ 8,904,978
RIGHTS - 0.0%Computershare, Ltd. (Expiration Date:
4-29-21; Strike Price: AUD13.55) (A) 1,922 2,219
Snam SpA (Expiration Date: 4-8-21;Strike Price: EUR 4.46) (A) 68,005 70
Sociedad Quimica y Minera de ChileSA (Expiration Date: 4-20-21;Strike Price: $50.05) (A) 586 1,817
TOTAL RIGHTS (Cost $0) $ 4,106
SHORT-TERM INVESTMENTS - 3.8%Short-term funds - 3.8%Fidelity Institutional Money Market
Government Portfolio, InstitutionalClass, 0.0100% (F) 11,191,584 11,191,584
John Hancock Collateral Trust,0.0470% (F)(G) 2,256,847 22,579,531
TOTAL SHORT-TERM INVESTMENTS (Cost$33,772,486) $ 33,771,115
Total Investments (International Equity Index Trust)(Cost $633,247,386) - 101.4% $ 907,962,361
Other assets and liabilities, net - (1.4%) (12,878,792)
TOTAL NET ASSETS - 100.0% $ 895,083,569
Currency AbbreviationsAUD Australian DollarEUR EuroSecurity Abbreviations and LegendADR American Depositary ReceiptGDR Global Depositary ReceiptNVDR Non-Voting Depositary Receipt(A) Non-income producing security.(B) All or a portion of this security is on loan as of 3-31-21. The value of
securities on loan amounted to $24,132,237. In addition to the cashcollateral invested in John Hancock Collateral Trust, non-cashcollateral of $3,777,000 in the form of U.S. Treasuries was pledged tothe fund.
(C) These securities are exempt from registration under Rule 144A of theSecurities Act of 1933. Such securities may be resold, normally toqualified institutional buyers, in transactions exempt fromregistration.
(D) Investment is an affiliate of the fund, the advisor and/or subadvisor.(E) Security is valued using significant unobservable inputs and is
classified as Level 3 in the fair value hierarchy.(F) The rate shown is the annualized seven-day yield as of 3-31-21.(G) Investment is an affiliate of the fund, the advisor and/or subadvisor.
This security represents the investment of cash collateral received forsecurities lending.
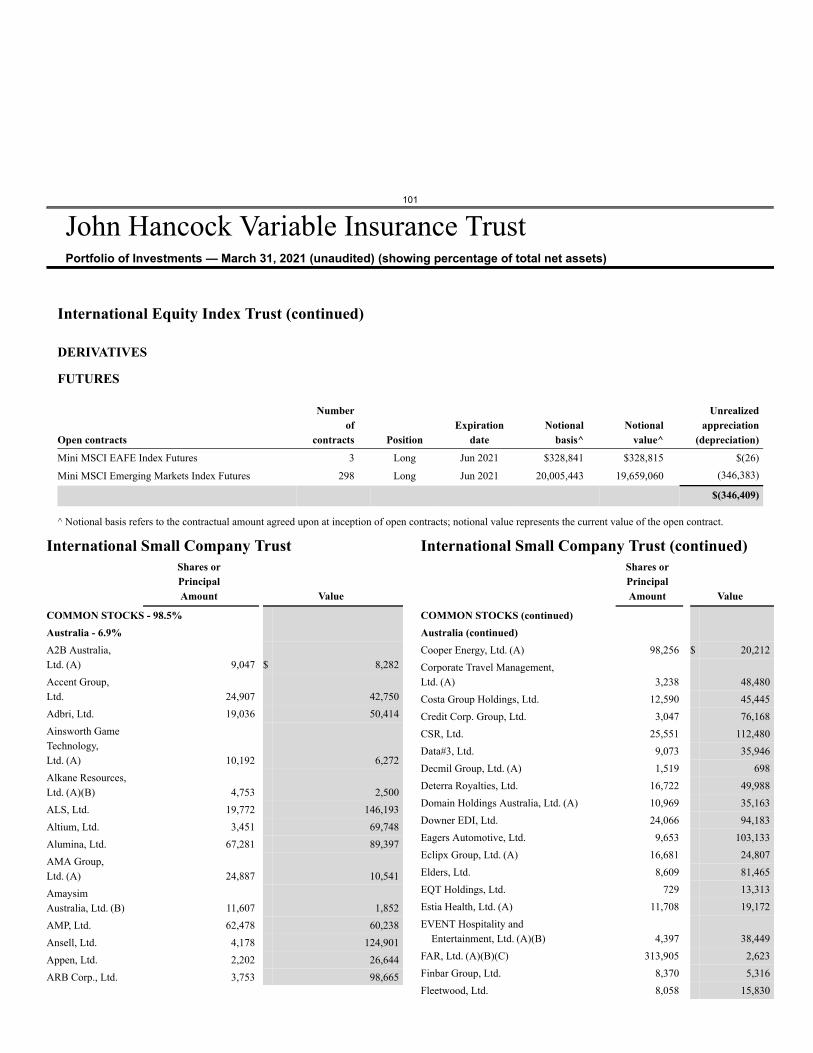
101
John Hancock Variable Insurance TrustPortfolio of Investments — March 31, 2021 (unaudited) (showing percentage of total net assets)
International Equity Index Trust (continued)
DERIVATIVES
FUTURES
Open contracts
Numberof
contracts PositionExpiration
dateNotional
basis^Notional
value^
Unrealizedappreciation
(depreciation)Mini MSCI EAFE Index Futures 3 Long Jun 2021 $328,841 $328,815 $(26)
Mini MSCI Emerging Markets Index Futures 298 Long Jun 2021 20,005,443 19,659,060 (346,383)
$(346,409)
^ Notional basis refers to the contractual amount agreed upon at inception of open contracts; notional value represents the current value of the open contract.
International Small Company TrustShares orPrincipalAmount Value
COMMON STOCKS - 98.5%Australia - 6.9%A2B Australia,Ltd. (A) 9,047 $ 8,282Accent Group,Ltd. 24,907 42,750Adbri, Ltd. 19,036 50,414Ainsworth GameTechnology,Ltd. (A) 10,192 6,272Alkane Resources,Ltd. (A)(B) 4,753 2,500ALS, Ltd. 19,772 146,193Altium, Ltd. 3,451 69,748Alumina, Ltd. 67,281 89,397AMA Group,Ltd. (A) 24,887 10,541AmaysimAustralia, Ltd. (B) 11,607 1,852AMP, Ltd. 62,478 60,238Ansell, Ltd. 4,178 124,901Appen, Ltd. 2,202 26,644ARB Corp., Ltd. 3,753 98,665
International Small Company Trust (continued)Shares orPrincipalAmount Value
COMMON STOCKS (continued)Australia (continued)Cooper Energy, Ltd. (A) 98,256 $ 20,212Corporate Travel Management,Ltd. (A) 3,238 48,480Costa Group Holdings, Ltd. 12,590 45,445Credit Corp. Group, Ltd. 3,047 76,168CSR, Ltd. 25,551 112,480Data#3, Ltd. 9,073 35,946Decmil Group, Ltd. (A) 1,519 698Deterra Royalties, Ltd. 16,722 49,988Domain Holdings Australia, Ltd. (A) 10,969 35,163Downer EDI, Ltd. 24,066 94,183Eagers Automotive, Ltd. 9,653 103,133Eclipx Group, Ltd. (A) 16,681 24,807Elders, Ltd. 8,609 81,465EQT Holdings, Ltd. 729 13,313Estia Health, Ltd. (A) 11,708 19,172EVENT Hospitality and
Entertainment, Ltd. (A)(B) 4,397 38,449FAR, Ltd. (A)(B)(C) 313,905 2,623Finbar Group, Ltd. 8,370 5,316Fleetwood, Ltd. 8,058 15,830
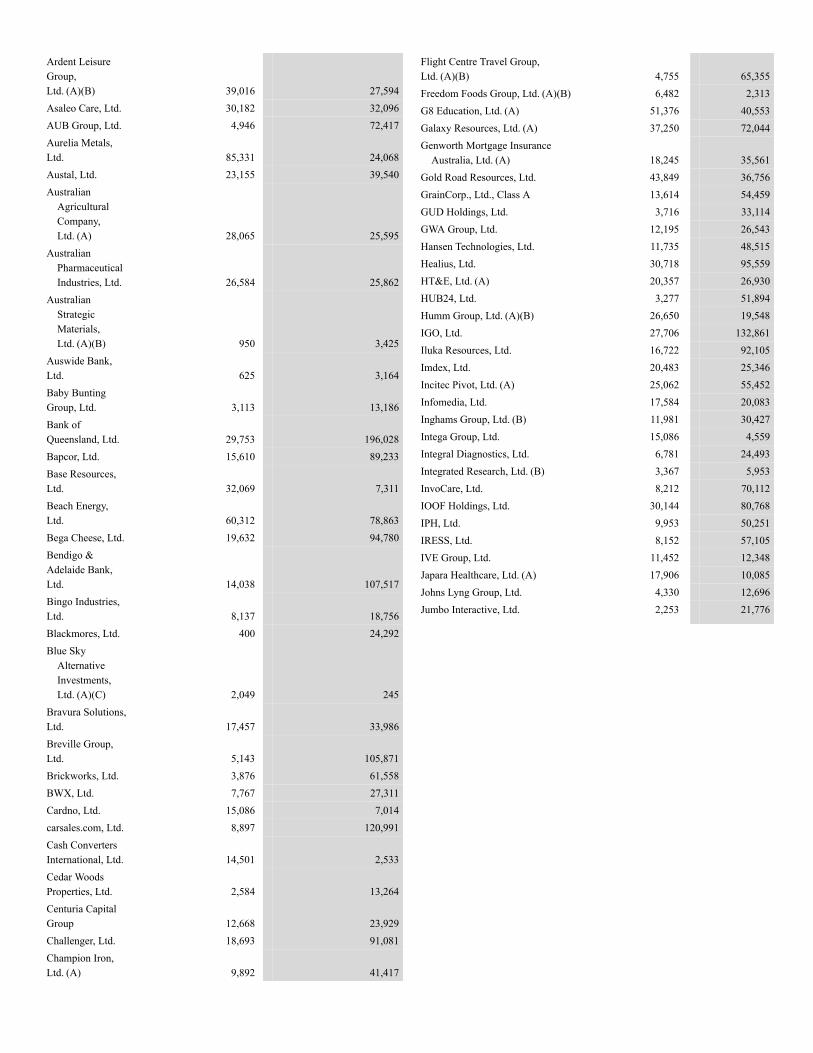
Ardent LeisureGroup,Ltd. (A)(B) 39,016 27,594Asaleo Care, Ltd. 30,182 32,096AUB Group, Ltd. 4,946 72,417Aurelia Metals,Ltd. 85,331 24,068Austal, Ltd. 23,155 39,540Australian
AgriculturalCompany,Ltd. (A) 28,065 25,595
AustralianPharmaceuticalIndustries, Ltd. 26,584 25,862
AustralianStrategicMaterials,Ltd. (A)(B) 950 3,425
Auswide Bank,Ltd. 625 3,164Baby BuntingGroup, Ltd. 3,113 13,186Bank ofQueensland, Ltd. 29,753 196,028Bapcor, Ltd. 15,610 89,233Base Resources,Ltd. 32,069 7,311Beach Energy,Ltd. 60,312 78,863Bega Cheese, Ltd. 19,632 94,780Bendigo &Adelaide Bank,Ltd. 14,038 107,517Bingo Industries,Ltd. 8,137 18,756Blackmores, Ltd. 400 24,292Blue Sky
AlternativeInvestments,Ltd. (A)(C) 2,049 245
Bravura Solutions,Ltd. 17,457 33,986Breville Group,Ltd. 5,143 105,871Brickworks, Ltd. 3,876 61,558BWX, Ltd. 7,767 27,311Cardno, Ltd. 15,086 7,014carsales.com, Ltd. 8,897 120,991Cash ConvertersInternational, Ltd. 14,501 2,533Cedar WoodsProperties, Ltd. 2,584 13,264Centuria CapitalGroup 12,668 23,929Challenger, Ltd. 18,693 91,081Champion Iron,Ltd. (A) 9,892 41,417
Flight Centre Travel Group,Ltd. (A)(B) 4,755 65,355Freedom Foods Group, Ltd. (A)(B) 6,482 2,313G8 Education, Ltd. (A) 51,376 40,553Galaxy Resources, Ltd. (A) 37,250 72,044Genworth Mortgage Insurance
Australia, Ltd. (A) 18,245 35,561Gold Road Resources, Ltd. 43,849 36,756GrainCorp., Ltd., Class A 13,614 54,459GUD Holdings, Ltd. 3,716 33,114GWA Group, Ltd. 12,195 26,543Hansen Technologies, Ltd. 11,735 48,515Healius, Ltd. 30,718 95,559HT&E, Ltd. (A) 20,357 26,930HUB24, Ltd. 3,277 51,894Humm Group, Ltd. (A)(B) 26,650 19,548IGO, Ltd. 27,706 132,861Iluka Resources, Ltd. 16,722 92,105Imdex, Ltd. 20,483 25,346Incitec Pivot, Ltd. (A) 25,062 55,452Infomedia, Ltd. 17,584 20,083Inghams Group, Ltd. (B) 11,981 30,427Intega Group, Ltd. 15,086 4,559Integral Diagnostics, Ltd. 6,781 24,493Integrated Research, Ltd. (B) 3,367 5,953InvoCare, Ltd. 8,212 70,112IOOF Holdings, Ltd. 30,144 80,768IPH, Ltd. 9,953 50,251IRESS, Ltd. 8,152 57,105IVE Group, Ltd. 11,452 12,348Japara Healthcare, Ltd. (A) 17,906 10,085Johns Lyng Group, Ltd. 4,330 12,696Jumbo Interactive, Ltd. 2,253 21,776
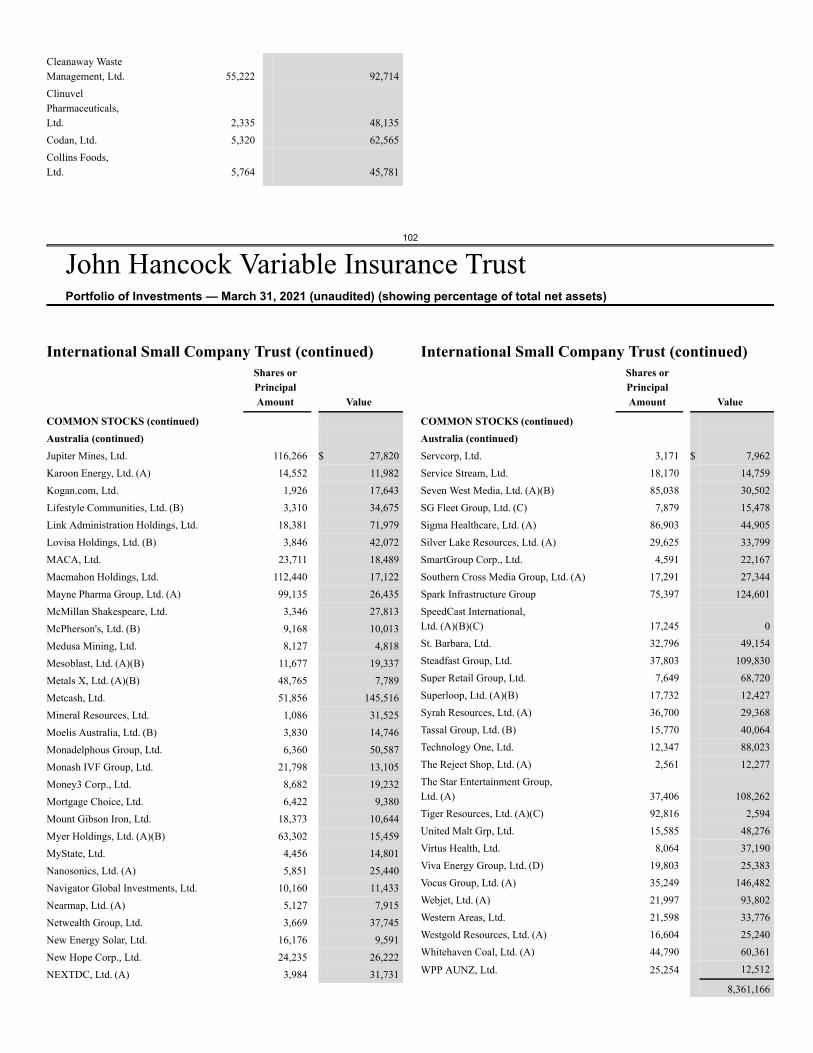
102
John Hancock Variable Insurance TrustPortfolio of Investments — March 31, 2021 (unaudited) (showing percentage of total net assets)
Cleanaway WasteManagement, Ltd. 55,222 92,714ClinuvelPharmaceuticals,Ltd. 2,335 48,135Codan, Ltd. 5,320 62,565Collins Foods,Ltd. 5,764 45,781
International Small Company Trust (continued)Shares orPrincipalAmount Value
COMMON STOCKS (continued)Australia (continued)Jupiter Mines, Ltd. 116,266 $ 27,820Karoon Energy, Ltd. (A) 14,552 11,982Kogan.com, Ltd. 1,926 17,643Lifestyle Communities, Ltd. (B) 3,310 34,675Link Administration Holdings, Ltd. 18,381 71,979Lovisa Holdings, Ltd. (B) 3,846 42,072MACA, Ltd. 23,711 18,489Macmahon Holdings, Ltd. 112,440 17,122Mayne Pharma Group, Ltd. (A) 99,135 26,435McMillan Shakespeare, Ltd. 3,346 27,813McPherson's, Ltd. (B) 9,168 10,013Medusa Mining, Ltd. 8,127 4,818Mesoblast, Ltd. (A)(B) 11,677 19,337Metals X, Ltd. (A)(B) 48,765 7,789Metcash, Ltd. 51,856 145,516Mineral Resources, Ltd. 1,086 31,525Moelis Australia, Ltd. (B) 3,830 14,746Monadelphous Group, Ltd. 6,360 50,587Monash IVF Group, Ltd. 21,798 13,105Money3 Corp., Ltd. 8,682 19,232Mortgage Choice, Ltd. 6,422 9,380Mount Gibson Iron, Ltd. 18,373 10,644Myer Holdings, Ltd. (A)(B) 63,302 15,459MyState, Ltd. 4,456 14,801Nanosonics, Ltd. (A) 5,851 25,440Navigator Global Investments, Ltd. 10,160 11,433Nearmap, Ltd. (A) 5,127 7,915Netwealth Group, Ltd. 3,669 37,745New Energy Solar, Ltd. 16,176 9,591New Hope Corp., Ltd. 24,235 26,222NEXTDC, Ltd. (A) 3,984 31,731
International Small Company Trust (continued)Shares orPrincipalAmount Value
COMMON STOCKS (continued)Australia (continued)Servcorp, Ltd. 3,171 $ 7,962Service Stream, Ltd. 18,170 14,759Seven West Media, Ltd. (A)(B) 85,038 30,502SG Fleet Group, Ltd. (C) 7,879 15,478Sigma Healthcare, Ltd. (A) 86,903 44,905Silver Lake Resources, Ltd. (A) 29,625 33,799SmartGroup Corp., Ltd. 4,591 22,167Southern Cross Media Group, Ltd. (A) 17,291 27,344Spark Infrastructure Group 75,397 124,601SpeedCast International,Ltd. (A)(B)(C) 17,245 0St. Barbara, Ltd. 32,796 49,154Steadfast Group, Ltd. 37,803 109,830Super Retail Group, Ltd. 7,649 68,720Superloop, Ltd. (A)(B) 17,732 12,427Syrah Resources, Ltd. (A) 36,700 29,368Tassal Group, Ltd. (B) 15,770 40,064Technology One, Ltd. 12,347 88,023The Reject Shop, Ltd. (A) 2,561 12,277The Star Entertainment Group,Ltd. (A) 37,406 108,262Tiger Resources, Ltd. (A)(C) 92,816 2,594United Malt Grp, Ltd. 15,585 48,276Virtus Health, Ltd. 8,064 37,190Viva Energy Group, Ltd. (D) 19,803 25,383Vocus Group, Ltd. (A) 35,249 146,482Webjet, Ltd. (A) 21,997 93,802Western Areas, Ltd. 21,598 33,776Westgold Resources, Ltd. (A) 16,604 25,240Whitehaven Coal, Ltd. (A) 44,790 60,361
WPP AUNZ, Ltd. 25,254 12,512
8,361,166
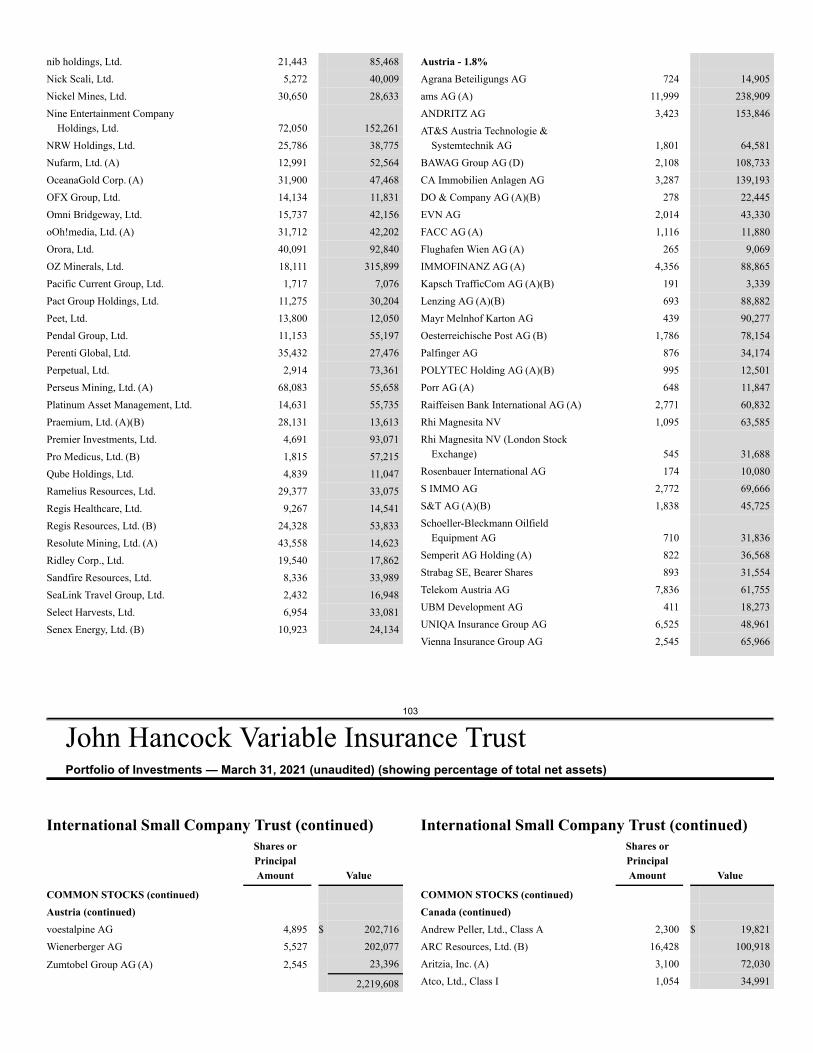
103
John Hancock Variable Insurance TrustPortfolio of Investments — March 31, 2021 (unaudited) (showing percentage of total net assets)
nib holdings, Ltd. 21,443 85,468Nick Scali, Ltd. 5,272 40,009Nickel Mines, Ltd. 30,650 28,633Nine Entertainment Company
Holdings, Ltd. 72,050 152,261NRW Holdings, Ltd. 25,786 38,775Nufarm, Ltd. (A) 12,991 52,564OceanaGold Corp. (A) 31,900 47,468OFX Group, Ltd. 14,134 11,831Omni Bridgeway, Ltd. 15,737 42,156oOh!media, Ltd. (A) 31,712 42,202Orora, Ltd. 40,091 92,840OZ Minerals, Ltd. 18,111 315,899Pacific Current Group, Ltd. 1,717 7,076Pact Group Holdings, Ltd. 11,275 30,204Peet, Ltd. 13,800 12,050Pendal Group, Ltd. 11,153 55,197Perenti Global, Ltd. 35,432 27,476Perpetual, Ltd. 2,914 73,361Perseus Mining, Ltd. (A) 68,083 55,658Platinum Asset Management, Ltd. 14,631 55,735Praemium, Ltd. (A)(B) 28,131 13,613Premier Investments, Ltd. 4,691 93,071Pro Medicus, Ltd. (B) 1,815 57,215Qube Holdings, Ltd. 4,839 11,047Ramelius Resources, Ltd. 29,377 33,075Regis Healthcare, Ltd. 9,267 14,541Regis Resources, Ltd. (B) 24,328 53,833Resolute Mining, Ltd. (A) 43,558 14,623Ridley Corp., Ltd. 19,540 17,862Sandfire Resources, Ltd. 8,336 33,989SeaLink Travel Group, Ltd. 2,432 16,948Select Harvests, Ltd. 6,954 33,081Senex Energy, Ltd. (B) 10,923 24,134
Austria - 1.8%Agrana Beteiligungs AG 724 14,905ams AG (A) 11,999 238,909ANDRITZ AG 3,423 153,846AT&S Austria Technologie &
Systemtechnik AG 1,801 64,581BAWAG Group AG (D) 2,108 108,733CA Immobilien Anlagen AG 3,287 139,193DO & Company AG (A)(B) 278 22,445EVN AG 2,014 43,330FACC AG (A) 1,116 11,880Flughafen Wien AG (A) 265 9,069IMMOFINANZ AG (A) 4,356 88,865Kapsch TrafficCom AG (A)(B) 191 3,339Lenzing AG (A)(B) 693 88,882Mayr Melnhof Karton AG 439 90,277Oesterreichische Post AG (B) 1,786 78,154Palfinger AG 876 34,174POLYTEC Holding AG (A)(B) 995 12,501Porr AG (A) 648 11,847Raiffeisen Bank International AG (A) 2,771 60,832Rhi Magnesita NV 1,095 63,585Rhi Magnesita NV (London Stock
Exchange) 545 31,688Rosenbauer International AG 174 10,080S IMMO AG 2,772 69,666S&T AG (A)(B) 1,838 45,725Schoeller-Bleckmann Oilfield
Equipment AG 710 31,836Semperit AG Holding (A) 822 36,568Strabag SE, Bearer Shares 893 31,554Telekom Austria AG 7,836 61,755UBM Development AG 411 18,273UNIQA Insurance Group AG 6,525 48,961Vienna Insurance Group AG 2,545 65,966
International Small Company Trust (continued)Shares orPrincipalAmount Value
COMMON STOCKS (continued)Austria (continued)voestalpine AG 4,895 $ 202,716Wienerberger AG 5,527 202,077
Zumtobel Group AG (A) 2,545 23,396
2,219,608
International Small Company Trust (continued)Shares orPrincipalAmount Value
COMMON STOCKS (continued)Canada (continued)Andrew Peller, Ltd., Class A 2,300 $ 19,821ARC Resources, Ltd. (B) 16,428 100,918Aritzia, Inc. (A) 3,100 72,030Atco, Ltd., Class I 1,054 34,991
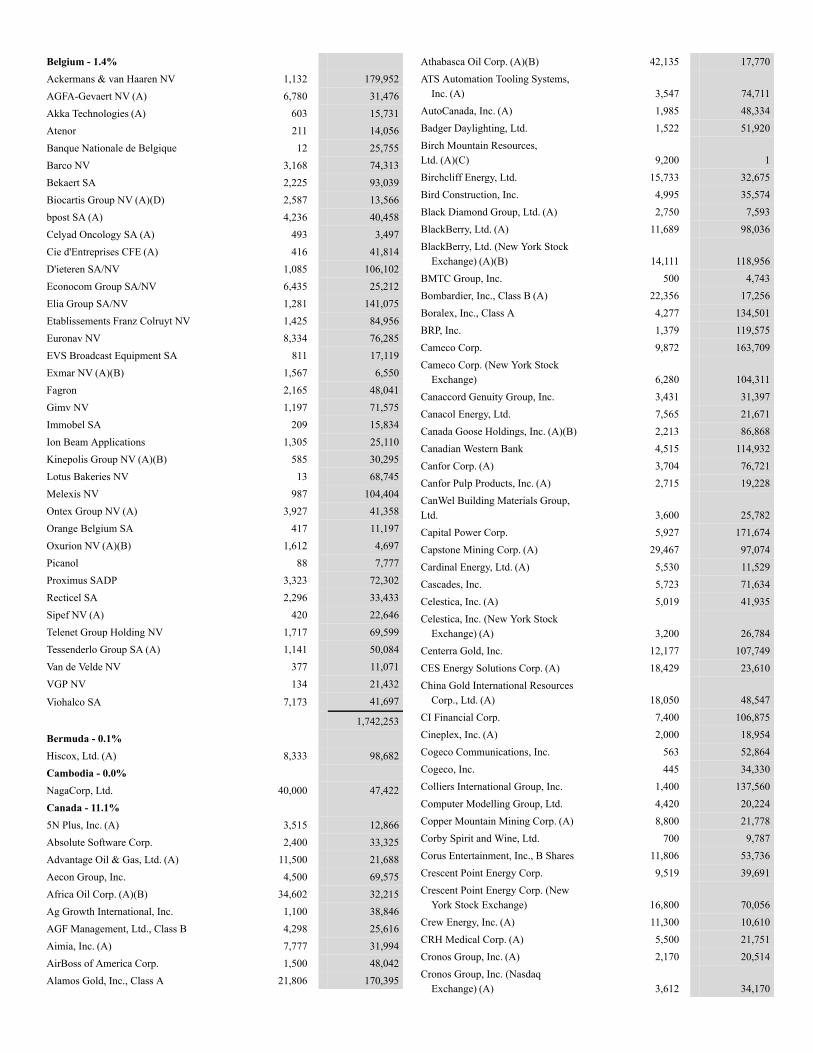
Belgium - 1.4%Ackermans & van Haaren NV 1,132 179,952AGFA-Gevaert NV (A) 6,780 31,476Akka Technologies (A) 603 15,731Atenor 211 14,056Banque Nationale de Belgique 12 25,755Barco NV 3,168 74,313Bekaert SA 2,225 93,039Biocartis Group NV (A)(D) 2,587 13,566bpost SA (A) 4,236 40,458Celyad Oncology SA (A) 493 3,497Cie d'Entreprises CFE (A) 416 41,814D'ieteren SA/NV 1,085 106,102Econocom Group SA/NV 6,435 25,212Elia Group SA/NV 1,281 141,075Etablissements Franz Colruyt NV 1,425 84,956Euronav NV 8,334 76,285EVS Broadcast Equipment SA 811 17,119Exmar NV (A)(B) 1,567 6,550Fagron 2,165 48,041Gimv NV 1,197 71,575Immobel SA 209 15,834Ion Beam Applications 1,305 25,110Kinepolis Group NV (A)(B) 585 30,295Lotus Bakeries NV 13 68,745Melexis NV 987 104,404Ontex Group NV (A) 3,927 41,358Orange Belgium SA 417 11,197Oxurion NV (A)(B) 1,612 4,697Picanol 88 7,777Proximus SADP 3,323 72,302Recticel SA 2,296 33,433Sipef NV (A) 420 22,646Telenet Group Holding NV 1,717 69,599Tessenderlo Group SA (A) 1,141 50,084Van de Velde NV 377 11,071VGP NV 134 21,432
Viohalco SA 7,173 41,697
1,742,253Bermuda - 0.1%Hiscox, Ltd. (A) 8,333 98,682Cambodia - 0.0%NagaCorp, Ltd. 40,000 47,422Canada - 11.1%5N Plus, Inc. (A) 3,515 12,866Absolute Software Corp. 2,400 33,325Advantage Oil & Gas, Ltd. (A) 11,500 21,688Aecon Group, Inc. 4,500 69,575Africa Oil Corp. (A)(B) 34,602 32,215Ag Growth International, Inc. 1,100 38,846AGF Management, Ltd., Class B 4,298 25,616Aimia, Inc. (A) 7,777 31,994AirBoss of America Corp. 1,500 48,042Alamos Gold, Inc., Class A 21,806 170,395
Athabasca Oil Corp. (A)(B) 42,135 17,770ATS Automation Tooling Systems,
Inc. (A) 3,547 74,711AutoCanada, Inc. (A) 1,985 48,334Badger Daylighting, Ltd. 1,522 51,920Birch Mountain Resources,Ltd. (A)(C) 9,200 1Birchcliff Energy, Ltd. 15,733 32,675Bird Construction, Inc. 4,995 35,574Black Diamond Group, Ltd. (A) 2,750 7,593BlackBerry, Ltd. (A) 11,689 98,036BlackBerry, Ltd. (New York Stock
Exchange) (A)(B) 14,111 118,956BMTC Group, Inc. 500 4,743Bombardier, Inc., Class B (A) 22,356 17,256Boralex, Inc., Class A 4,277 134,501BRP, Inc. 1,379 119,575Cameco Corp. 9,872 163,709Cameco Corp. (New York Stock
Exchange) 6,280 104,311Canaccord Genuity Group, Inc. 3,431 31,397Canacol Energy, Ltd. 7,565 21,671Canada Goose Holdings, Inc. (A)(B) 2,213 86,868Canadian Western Bank 4,515 114,932Canfor Corp. (A) 3,704 76,721Canfor Pulp Products, Inc. (A) 2,715 19,228CanWel Building Materials Group,Ltd. 3,600 25,782Capital Power Corp. 5,927 171,674Capstone Mining Corp. (A) 29,467 97,074Cardinal Energy, Ltd. (A) 5,530 11,529Cascades, Inc. 5,723 71,634Celestica, Inc. (A) 5,019 41,935Celestica, Inc. (New York Stock
Exchange) (A) 3,200 26,784Centerra Gold, Inc. 12,177 107,749CES Energy Solutions Corp. (A) 18,429 23,610China Gold International Resources
Corp., Ltd. (A) 18,050 48,547CI Financial Corp. 7,400 106,875Cineplex, Inc. (A) 2,000 18,954Cogeco Communications, Inc. 563 52,864Cogeco, Inc. 445 34,330Colliers International Group, Inc. 1,400 137,560Computer Modelling Group, Ltd. 4,420 20,224Copper Mountain Mining Corp. (A) 8,800 21,778Corby Spirit and Wine, Ltd. 700 9,787Corus Entertainment, Inc., B Shares 11,806 53,736Crescent Point Energy Corp. 9,519 39,691Crescent Point Energy Corp. (New
York Stock Exchange) 16,800 70,056Crew Energy, Inc. (A) 11,300 10,610CRH Medical Corp. (A) 5,500 21,751Cronos Group, Inc. (A) 2,170 20,514Cronos Group, Inc. (Nasdaq
Exchange) (A) 3,612 34,170
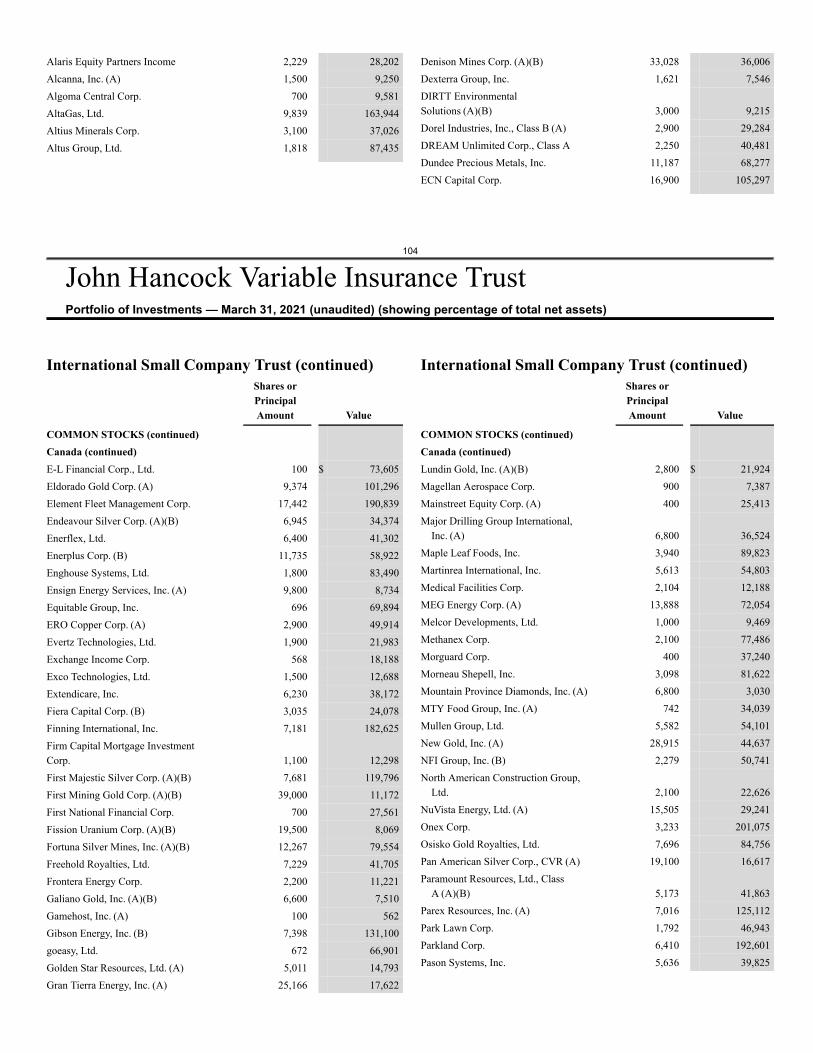
104
John Hancock Variable Insurance TrustPortfolio of Investments — March 31, 2021 (unaudited) (showing percentage of total net assets)
Alaris Equity Partners Income 2,229 28,202Alcanna, Inc. (A) 1,500 9,250Algoma Central Corp. 700 9,581AltaGas, Ltd. 9,839 163,944Altius Minerals Corp. 3,100 37,026Altus Group, Ltd. 1,818 87,435
Denison Mines Corp. (A)(B) 33,028 36,006Dexterra Group, Inc. 1,621 7,546DIRTT EnvironmentalSolutions (A)(B) 3,000 9,215Dorel Industries, Inc., Class B (A) 2,900 29,284DREAM Unlimited Corp., Class A 2,250 40,481Dundee Precious Metals, Inc. 11,187 68,277ECN Capital Corp. 16,900 105,297
International Small Company Trust (continued)Shares orPrincipalAmount Value
COMMON STOCKS (continued)Canada (continued)E-L Financial Corp., Ltd. 100 $ 73,605Eldorado Gold Corp. (A) 9,374 101,296Element Fleet Management Corp. 17,442 190,839Endeavour Silver Corp. (A)(B) 6,945 34,374Enerflex, Ltd. 6,400 41,302Enerplus Corp. (B) 11,735 58,922Enghouse Systems, Ltd. 1,800 83,490Ensign Energy Services, Inc. (A) 9,800 8,734Equitable Group, Inc. 696 69,894ERO Copper Corp. (A) 2,900 49,914Evertz Technologies, Ltd. 1,900 21,983Exchange Income Corp. 568 18,188Exco Technologies, Ltd. 1,500 12,688Extendicare, Inc. 6,230 38,172Fiera Capital Corp. (B) 3,035 24,078Finning International, Inc. 7,181 182,625Firm Capital Mortgage InvestmentCorp. 1,100 12,298First Majestic Silver Corp. (A)(B) 7,681 119,796First Mining Gold Corp. (A)(B) 39,000 11,172First National Financial Corp. 700 27,561Fission Uranium Corp. (A)(B) 19,500 8,069Fortuna Silver Mines, Inc. (A)(B) 12,267 79,554Freehold Royalties, Ltd. 7,229 41,705Frontera Energy Corp. 2,200 11,221Galiano Gold, Inc. (A)(B) 6,600 7,510Gamehost, Inc. (A) 100 562Gibson Energy, Inc. (B) 7,398 131,100goeasy, Ltd. 672 66,901Golden Star Resources, Ltd. (A) 5,011 14,793Gran Tierra Energy, Inc. (A) 25,166 17,622
International Small Company Trust (continued)Shares orPrincipalAmount Value
COMMON STOCKS (continued)Canada (continued)Lundin Gold, Inc. (A)(B) 2,800 $ 21,924Magellan Aerospace Corp. 900 7,387Mainstreet Equity Corp. (A) 400 25,413Major Drilling Group International,
Inc. (A) 6,800 36,524Maple Leaf Foods, Inc. 3,940 89,823Martinrea International, Inc. 5,613 54,803Medical Facilities Corp. 2,104 12,188MEG Energy Corp. (A) 13,888 72,054Melcor Developments, Ltd. 1,000 9,469Methanex Corp. 2,100 77,486Morguard Corp. 400 37,240Morneau Shepell, Inc. 3,098 81,622Mountain Province Diamonds, Inc. (A) 6,800 3,030MTY Food Group, Inc. (A) 742 34,039Mullen Group, Ltd. 5,582 54,101New Gold, Inc. (A) 28,915 44,637NFI Group, Inc. (B) 2,279 50,741North American Construction Group,
Ltd. 2,100 22,626NuVista Energy, Ltd. (A) 15,505 29,241Onex Corp. 3,233 201,075Osisko Gold Royalties, Ltd. 7,696 84,756Pan American Silver Corp., CVR (A) 19,100 16,617Paramount Resources, Ltd., Class
A (A)(B) 5,173 41,863Parex Resources, Inc. (A) 7,016 125,112Park Lawn Corp. 1,792 46,943Parkland Corp. 6,410 192,601Pason Systems, Inc. 5,636 39,825
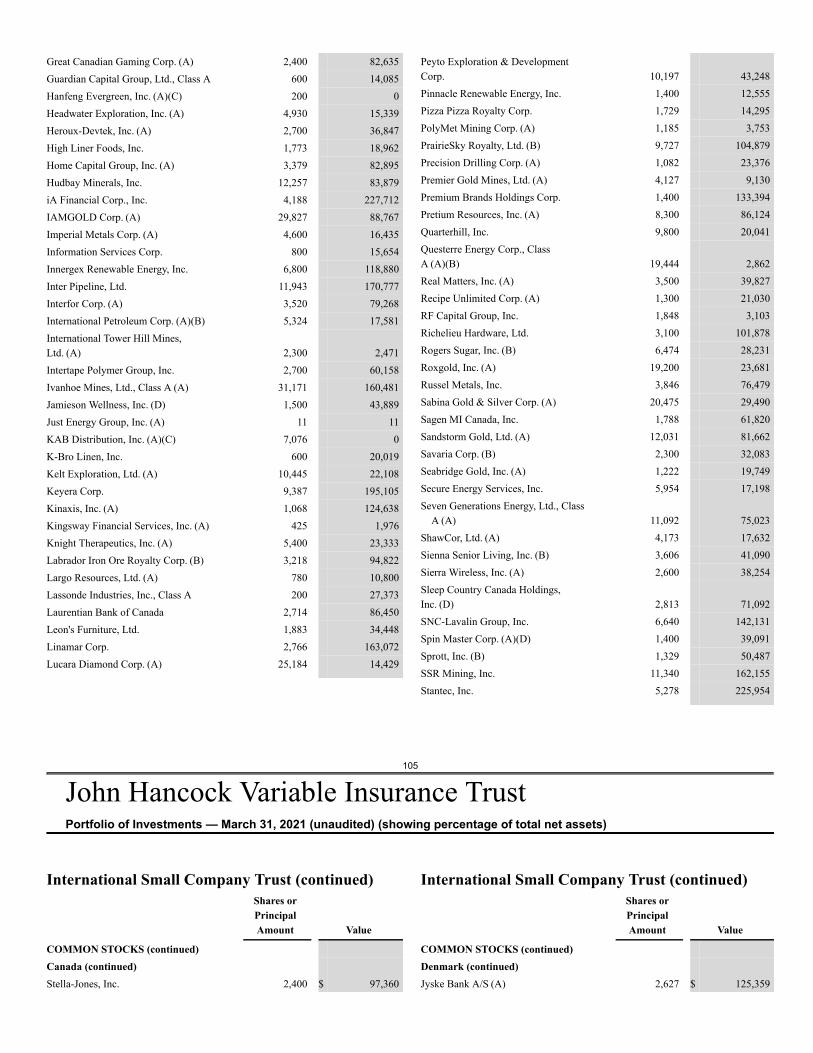
105
John Hancock Variable Insurance TrustPortfolio of Investments — March 31, 2021 (unaudited) (showing percentage of total net assets)
Great Canadian Gaming Corp. (A) 2,400 82,635Guardian Capital Group, Ltd., Class A 600 14,085Hanfeng Evergreen, Inc. (A)(C) 200 0Headwater Exploration, Inc. (A) 4,930 15,339Heroux-Devtek, Inc. (A) 2,700 36,847High Liner Foods, Inc. 1,773 18,962Home Capital Group, Inc. (A) 3,379 82,895Hudbay Minerals, Inc. 12,257 83,879iA Financial Corp., Inc. 4,188 227,712IAMGOLD Corp. (A) 29,827 88,767Imperial Metals Corp. (A) 4,600 16,435Information Services Corp. 800 15,654Innergex Renewable Energy, Inc. 6,800 118,880Inter Pipeline, Ltd. 11,943 170,777Interfor Corp. (A) 3,520 79,268International Petroleum Corp. (A)(B) 5,324 17,581International Tower Hill Mines,Ltd. (A) 2,300 2,471Intertape Polymer Group, Inc. 2,700 60,158Ivanhoe Mines, Ltd., Class A (A) 31,171 160,481Jamieson Wellness, Inc. (D) 1,500 43,889Just Energy Group, Inc. (A) 11 11KAB Distribution, Inc. (A)(C) 7,076 0K-Bro Linen, Inc. 600 20,019Kelt Exploration, Ltd. (A) 10,445 22,108Keyera Corp. 9,387 195,105Kinaxis, Inc. (A) 1,068 124,638Kingsway Financial Services, Inc. (A) 425 1,976Knight Therapeutics, Inc. (A) 5,400 23,333Labrador Iron Ore Royalty Corp. (B) 3,218 94,822Largo Resources, Ltd. (A) 780 10,800Lassonde Industries, Inc., Class A 200 27,373Laurentian Bank of Canada 2,714 86,450Leon's Furniture, Ltd. 1,883 34,448Linamar Corp. 2,766 163,072Lucara Diamond Corp. (A) 25,184 14,429
Peyto Exploration & DevelopmentCorp. 10,197 43,248Pinnacle Renewable Energy, Inc. 1,400 12,555Pizza Pizza Royalty Corp. 1,729 14,295PolyMet Mining Corp. (A) 1,185 3,753PrairieSky Royalty, Ltd. (B) 9,727 104,879Precision Drilling Corp. (A) 1,082 23,376Premier Gold Mines, Ltd. (A) 4,127 9,130Premium Brands Holdings Corp. 1,400 133,394Pretium Resources, Inc. (A) 8,300 86,124Quarterhill, Inc. 9,800 20,041Questerre Energy Corp., ClassA (A)(B) 19,444 2,862Real Matters, Inc. (A) 3,500 39,827Recipe Unlimited Corp. (A) 1,300 21,030RF Capital Group, Inc. 1,848 3,103Richelieu Hardware, Ltd. 3,100 101,878Rogers Sugar, Inc. (B) 6,474 28,231Roxgold, Inc. (A) 19,200 23,681Russel Metals, Inc. 3,846 76,479Sabina Gold & Silver Corp. (A) 20,475 29,490Sagen MI Canada, Inc. 1,788 61,820Sandstorm Gold, Ltd. (A) 12,031 81,662Savaria Corp. (B) 2,300 32,083Seabridge Gold, Inc. (A) 1,222 19,749Secure Energy Services, Inc. 5,954 17,198Seven Generations Energy, Ltd., Class
A (A) 11,092 75,023ShawCor, Ltd. (A) 4,173 17,632Sienna Senior Living, Inc. (B) 3,606 41,090Sierra Wireless, Inc. (A) 2,600 38,254Sleep Country Canada Holdings,Inc. (D) 2,813 71,092SNC-Lavalin Group, Inc. 6,640 142,131Spin Master Corp. (A)(D) 1,400 39,091Sprott, Inc. (B) 1,329 50,487SSR Mining, Inc. 11,340 162,155Stantec, Inc. 5,278 225,954
International Small Company Trust (continued)Shares orPrincipalAmount Value
COMMON STOCKS (continued)Canada (continued)Stella-Jones, Inc. 2,400 $ 97,360
International Small Company Trust (continued)Shares orPrincipalAmount Value
COMMON STOCKS (continued)Denmark (continued)Jyske Bank A/S (A) 2,627 $ 125,359
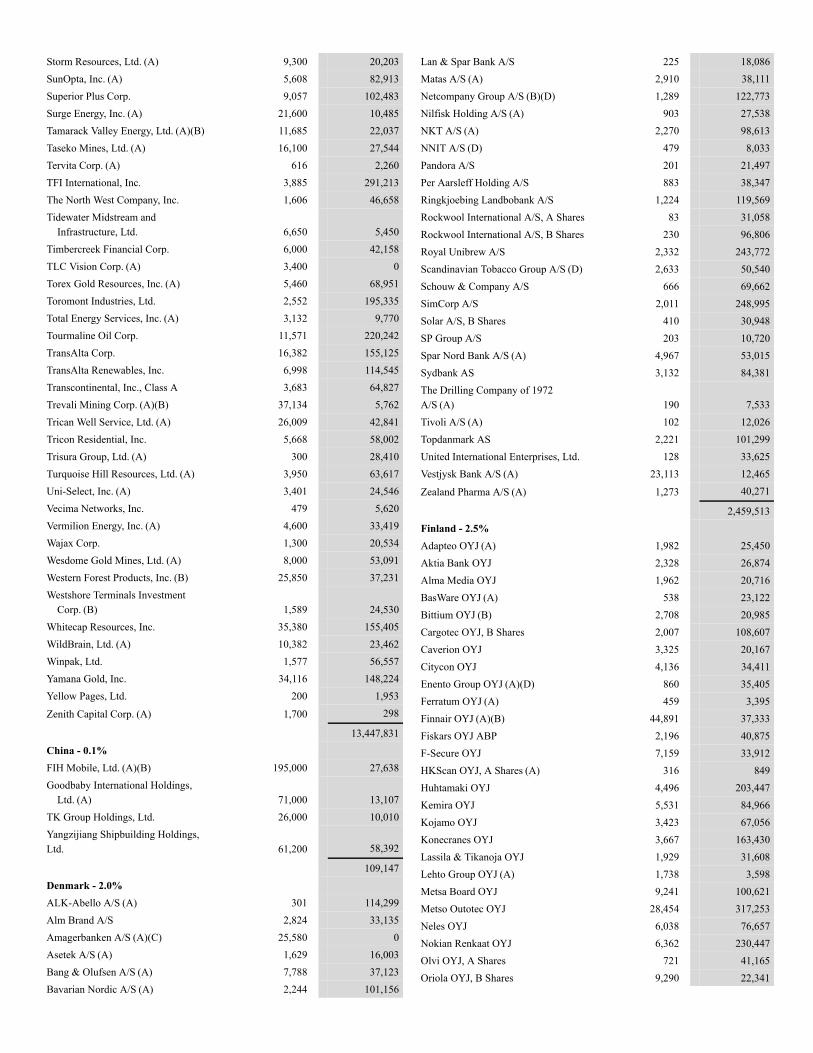
Storm Resources, Ltd. (A) 9,300 20,203SunOpta, Inc. (A) 5,608 82,913Superior Plus Corp. 9,057 102,483Surge Energy, Inc. (A) 21,600 10,485Tamarack Valley Energy, Ltd. (A)(B) 11,685 22,037Taseko Mines, Ltd. (A) 16,100 27,544Tervita Corp. (A) 616 2,260TFI International, Inc. 3,885 291,213The North West Company, Inc. 1,606 46,658Tidewater Midstream and
Infrastructure, Ltd. 6,650 5,450Timbercreek Financial Corp. 6,000 42,158TLC Vision Corp. (A) 3,400 0Torex Gold Resources, Inc. (A) 5,460 68,951Toromont Industries, Ltd. 2,552 195,335Total Energy Services, Inc. (A) 3,132 9,770Tourmaline Oil Corp. 11,571 220,242TransAlta Corp. 16,382 155,125TransAlta Renewables, Inc. 6,998 114,545Transcontinental, Inc., Class A 3,683 64,827Trevali Mining Corp. (A)(B) 37,134 5,762Trican Well Service, Ltd. (A) 26,009 42,841Tricon Residential, Inc. 5,668 58,002Trisura Group, Ltd. (A) 300 28,410Turquoise Hill Resources, Ltd. (A) 3,950 63,617Uni-Select, Inc. (A) 3,401 24,546Vecima Networks, Inc. 479 5,620Vermilion Energy, Inc. (A) 4,600 33,419Wajax Corp. 1,300 20,534Wesdome Gold Mines, Ltd. (A) 8,000 53,091Western Forest Products, Inc. (B) 25,850 37,231Westshore Terminals Investment
Corp. (B) 1,589 24,530Whitecap Resources, Inc. 35,380 155,405WildBrain, Ltd. (A) 10,382 23,462Winpak, Ltd. 1,577 56,557Yamana Gold, Inc. 34,116 148,224Yellow Pages, Ltd. 200 1,953
Zenith Capital Corp. (A) 1,700 298
13,447,831China - 0.1%FIH Mobile, Ltd. (A)(B) 195,000 27,638Goodbaby International Holdings,
Ltd. (A) 71,000 13,107TK Group Holdings, Ltd. 26,000 10,010Yangzijiang Shipbuilding Holdings,Ltd. 61,200 58,392
109,147Denmark - 2.0%ALK-Abello A/S (A) 301 114,299Alm Brand A/S 2,824 33,135Amagerbanken A/S (A)(C) 25,580 0Asetek A/S (A) 1,629 16,003Bang & Olufsen A/S (A) 7,788 37,123Bavarian Nordic A/S (A) 2,244 101,156
Lan & Spar Bank A/S 225 18,086Matas A/S (A) 2,910 38,111Netcompany Group A/S (B)(D) 1,289 122,773Nilfisk Holding A/S (A) 903 27,538NKT A/S (A) 2,270 98,613NNIT A/S (D) 479 8,033Pandora A/S 201 21,497Per Aarsleff Holding A/S 883 38,347Ringkjoebing Landbobank A/S 1,224 119,569Rockwool International A/S, A Shares 83 31,058Rockwool International A/S, B Shares 230 96,806Royal Unibrew A/S 2,332 243,772Scandinavian Tobacco Group A/S (D) 2,633 50,540Schouw & Company A/S 666 69,662SimCorp A/S 2,011 248,995Solar A/S, B Shares 410 30,948SP Group A/S 203 10,720Spar Nord Bank A/S (A) 4,967 53,015Sydbank AS 3,132 84,381The Drilling Company of 1972A/S (A) 190 7,533Tivoli A/S (A) 102 12,026Topdanmark AS 2,221 101,299United International Enterprises, Ltd. 128 33,625Vestjysk Bank A/S (A) 23,113 12,465
Zealand Pharma A/S (A) 1,273 40,271
2,459,513Finland - 2.5%Adapteo OYJ (A) 1,982 25,450Aktia Bank OYJ 2,328 26,874Alma Media OYJ 1,962 20,716BasWare OYJ (A) 538 23,122Bittium OYJ (B) 2,708 20,985Cargotec OYJ, B Shares 2,007 108,607Caverion OYJ 3,325 20,167Citycon OYJ 4,136 34,411Enento Group OYJ (A)(D) 860 35,405Ferratum OYJ (A) 459 3,395Finnair OYJ (A)(B) 44,891 37,333Fiskars OYJ ABP 2,196 40,875F-Secure OYJ 7,159 33,912HKScan OYJ, A Shares (A) 316 849Huhtamaki OYJ 4,496 203,447Kemira OYJ 5,531 84,966Kojamo OYJ 3,423 67,056Konecranes OYJ 3,667 163,430Lassila & Tikanoja OYJ 1,929 31,608Lehto Group OYJ (A) 1,738 3,598Metsa Board OYJ 9,241 100,621Metso Outotec OYJ 28,454 317,253Neles OYJ 6,038 76,657Nokian Renkaat OYJ 6,362 230,447Olvi OYJ, A Shares 721 41,165Oriola OYJ, B Shares 9,290 22,341
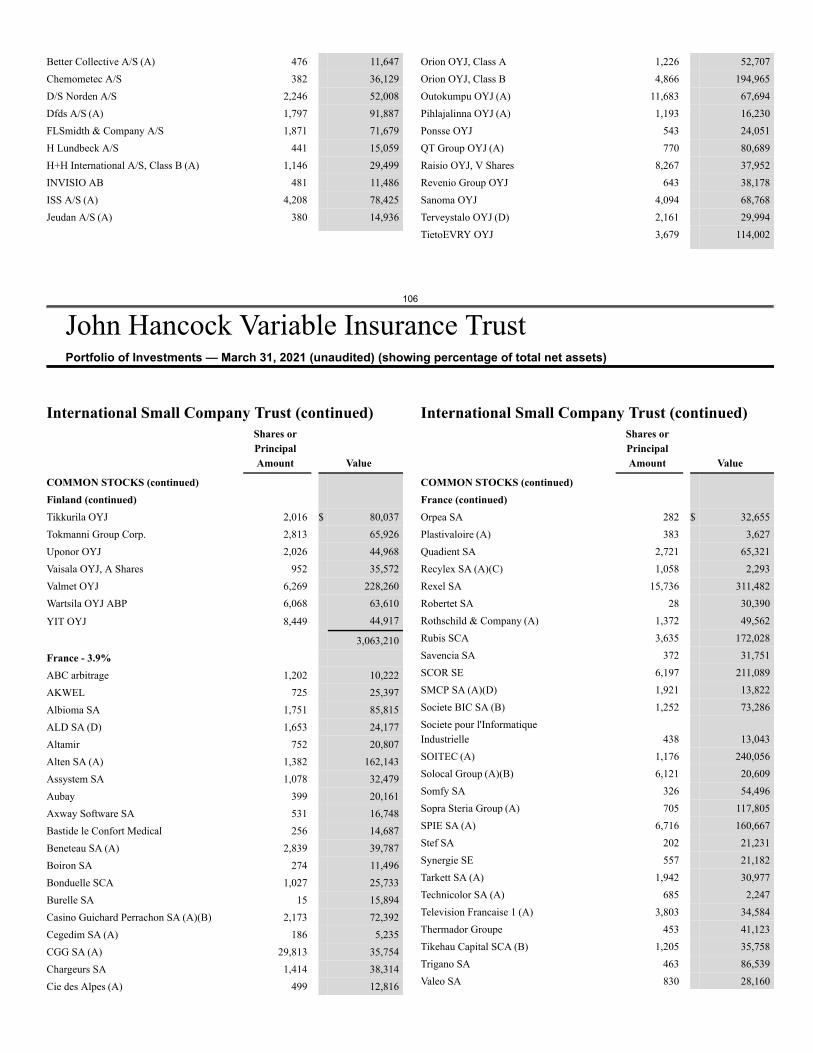
106
John Hancock Variable Insurance TrustPortfolio of Investments — March 31, 2021 (unaudited) (showing percentage of total net assets)
Better Collective A/S (A) 476 11,647Chemometec A/S 382 36,129D/S Norden A/S 2,246 52,008Dfds A/S (A) 1,797 91,887FLSmidth & Company A/S 1,871 71,679H Lundbeck A/S 441 15,059H+H International A/S, Class B (A) 1,146 29,499INVISIO AB 481 11,486ISS A/S (A) 4,208 78,425Jeudan A/S (A) 380 14,936
Orion OYJ, Class A 1,226 52,707Orion OYJ, Class B 4,866 194,965Outokumpu OYJ (A) 11,683 67,694Pihlajalinna OYJ (A) 1,193 16,230Ponsse OYJ 543 24,051QT Group OYJ (A) 770 80,689Raisio OYJ, V Shares 8,267 37,952Revenio Group OYJ 643 38,178Sanoma OYJ 4,094 68,768Terveystalo OYJ (D) 2,161 29,994TietoEVRY OYJ 3,679 114,002
International Small Company Trust (continued)Shares orPrincipalAmount Value
COMMON STOCKS (continued)Finland (continued)Tikkurila OYJ 2,016 $ 80,037Tokmanni Group Corp. 2,813 65,926Uponor OYJ 2,026 44,968Vaisala OYJ, A Shares 952 35,572Valmet OYJ 6,269 228,260Wartsila OYJ ABP 6,068 63,610
YIT OYJ 8,449 44,917
3,063,210France - 3.9%ABC arbitrage 1,202 10,222AKWEL 725 25,397Albioma SA 1,751 85,815ALD SA (D) 1,653 24,177Altamir 752 20,807Alten SA (A) 1,382 162,143Assystem SA 1,078 32,479Aubay 399 20,161Axway Software SA 531 16,748Bastide le Confort Medical 256 14,687Beneteau SA (A) 2,839 39,787Boiron SA 274 11,496Bonduelle SCA 1,027 25,733Burelle SA 15 15,894Casino Guichard Perrachon SA (A)(B) 2,173 72,392Cegedim SA (A) 186 5,235CGG SA (A) 29,813 35,754Chargeurs SA 1,414 38,314Cie des Alpes (A) 499 12,816
International Small Company Trust (continued)Shares orPrincipalAmount Value
COMMON STOCKS (continued)France (continued)Orpea SA 282 $ 32,655Plastivaloire (A) 383 3,627Quadient SA 2,721 65,321Recylex SA (A)(C) 1,058 2,293Rexel SA 15,736 311,482Robertet SA 28 30,390Rothschild & Company (A) 1,372 49,562Rubis SCA 3,635 172,028Savencia SA 372 31,751SCOR SE 6,197 211,089SMCP SA (A)(D) 1,921 13,822Societe BIC SA (B) 1,252 73,286Societe pour l'InformatiqueIndustrielle 438 13,043SOITEC (A) 1,176 240,056Solocal Group (A)(B) 6,121 20,609Somfy SA 326 54,496Sopra Steria Group (A) 705 117,805SPIE SA (A) 6,716 160,667Stef SA 202 21,231Synergie SE 557 21,182Tarkett SA (A) 1,942 30,977Technicolor SA (A) 685 2,247Television Francaise 1 (A) 3,803 34,584Thermador Groupe 453 41,123Tikehau Capital SCA (B) 1,205 35,758Trigano SA 463 86,539Valeo SA 830 28,160
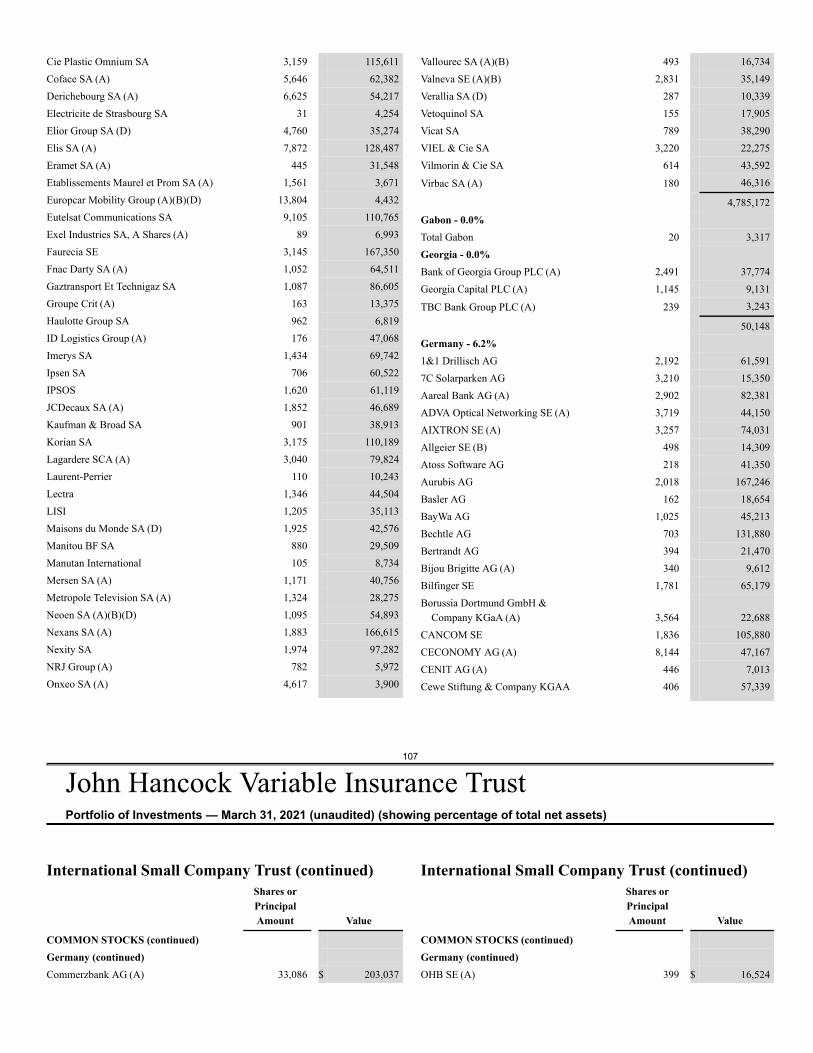
107
John Hancock Variable Insurance TrustPortfolio of Investments — March 31, 2021 (unaudited) (showing percentage of total net assets)
Cie Plastic Omnium SA 3,159 115,611Coface SA (A) 5,646 62,382Derichebourg SA (A) 6,625 54,217Electricite de Strasbourg SA 31 4,254Elior Group SA (D) 4,760 35,274Elis SA (A) 7,872 128,487Eramet SA (A) 445 31,548Etablissements Maurel et Prom SA (A) 1,561 3,671Europcar Mobility Group (A)(B)(D) 13,804 4,432Eutelsat Communications SA 9,105 110,765Exel Industries SA, A Shares (A) 89 6,993Faurecia SE 3,145 167,350Fnac Darty SA (A) 1,052 64,511Gaztransport Et Technigaz SA 1,087 86,605Groupe Crit (A) 163 13,375Haulotte Group SA 962 6,819ID Logistics Group (A) 176 47,068Imerys SA 1,434 69,742Ipsen SA 706 60,522IPSOS 1,620 61,119JCDecaux SA (A) 1,852 46,689Kaufman & Broad SA 901 38,913Korian SA 3,175 110,189Lagardere SCA (A) 3,040 79,824Laurent-Perrier 110 10,243Lectra 1,346 44,504LISI 1,205 35,113Maisons du Monde SA (D) 1,925 42,576Manitou BF SA 880 29,509Manutan International 105 8,734Mersen SA (A) 1,171 40,756Metropole Television SA (A) 1,324 28,275Neoen SA (A)(B)(D) 1,095 54,893Nexans SA (A) 1,883 166,615Nexity SA 1,974 97,282NRJ Group (A) 782 5,972Onxeo SA (A) 4,617 3,900
Vallourec SA (A)(B) 493 16,734Valneva SE (A)(B) 2,831 35,149Verallia SA (D) 287 10,339Vetoquinol SA 155 17,905Vicat SA 789 38,290VIEL & Cie SA 3,220 22,275Vilmorin & Cie SA 614 43,592
Virbac SA (A) 180 46,316
4,785,172Gabon - 0.0%Total Gabon 20 3,317Georgia - 0.0%Bank of Georgia Group PLC (A) 2,491 37,774Georgia Capital PLC (A) 1,145 9,131
TBC Bank Group PLC (A) 239 3,243
50,148Germany - 6.2%1&1 Drillisch AG 2,192 61,5917C Solarparken AG 3,210 15,350Aareal Bank AG (A) 2,902 82,381ADVA Optical Networking SE (A) 3,719 44,150AIXTRON SE (A) 3,257 74,031Allgeier SE (B) 498 14,309Atoss Software AG 218 41,350Aurubis AG 2,018 167,246Basler AG 162 18,654BayWa AG 1,025 45,213Bechtle AG 703 131,880Bertrandt AG 394 21,470Bijou Brigitte AG (A) 340 9,612Bilfinger SE 1,781 65,179Borussia Dortmund GmbH &
Company KGaA (A) 3,564 22,688CANCOM SE 1,836 105,880CECONOMY AG (A) 8,144 47,167CENIT AG (A) 446 7,013Cewe Stiftung & Company KGAA 406 57,339
International Small Company Trust (continued)Shares orPrincipalAmount Value
COMMON STOCKS (continued)Germany (continued)Commerzbank AG (A) 33,086 $ 203,037
International Small Company Trust (continued)Shares orPrincipalAmount Value
COMMON STOCKS (continued)Germany (continued)OHB SE (A) 399 $ 16,524
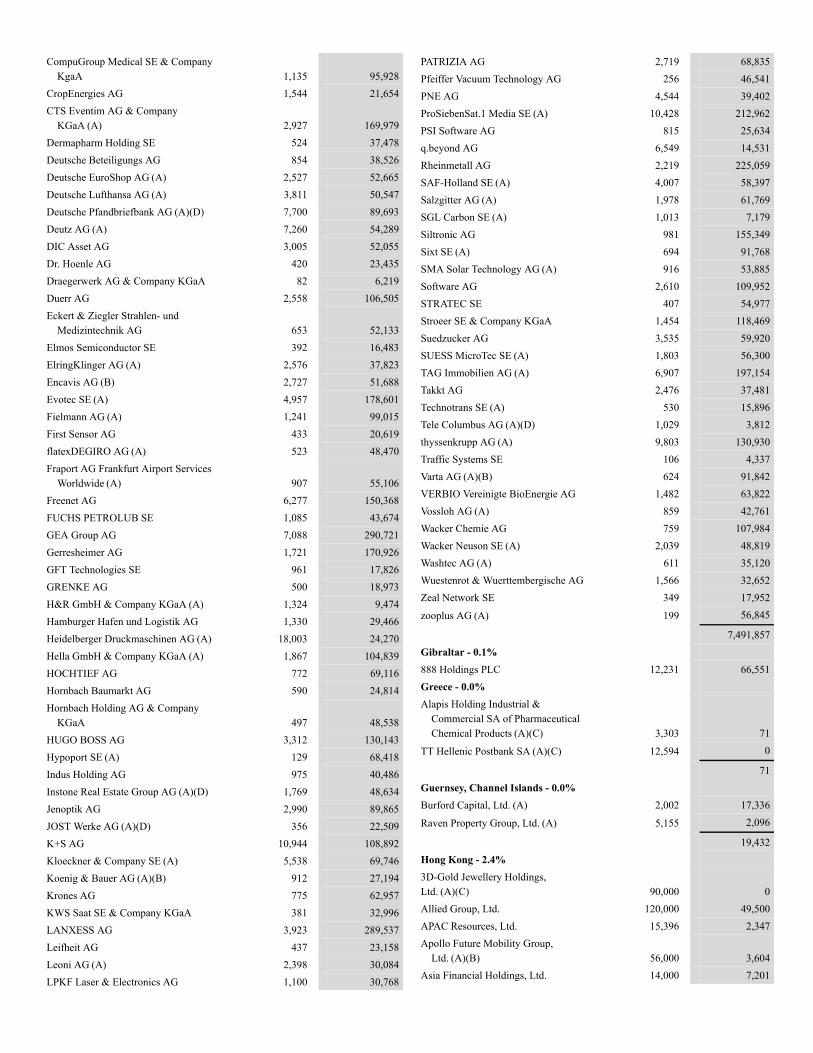
CompuGroup Medical SE & CompanyKgaA 1,135 95,928
CropEnergies AG 1,544 21,654CTS Eventim AG & Company
KGaA (A) 2,927 169,979Dermapharm Holding SE 524 37,478Deutsche Beteiligungs AG 854 38,526Deutsche EuroShop AG (A) 2,527 52,665Deutsche Lufthansa AG (A) 3,811 50,547Deutsche Pfandbriefbank AG (A)(D) 7,700 89,693Deutz AG (A) 7,260 54,289DIC Asset AG 3,005 52,055Dr. Hoenle AG 420 23,435Draegerwerk AG & Company KGaA 82 6,219Duerr AG 2,558 106,505Eckert & Ziegler Strahlen- und
Medizintechnik AG 653 52,133Elmos Semiconductor SE 392 16,483ElringKlinger AG (A) 2,576 37,823Encavis AG (B) 2,727 51,688Evotec SE (A) 4,957 178,601Fielmann AG (A) 1,241 99,015First Sensor AG 433 20,619flatexDEGIRO AG (A) 523 48,470Fraport AG Frankfurt Airport Services
Worldwide (A) 907 55,106Freenet AG 6,277 150,368FUCHS PETROLUB SE 1,085 43,674GEA Group AG 7,088 290,721Gerresheimer AG 1,721 170,926GFT Technologies SE 961 17,826GRENKE AG 500 18,973H&R GmbH & Company KGaA (A) 1,324 9,474Hamburger Hafen und Logistik AG 1,330 29,466Heidelberger Druckmaschinen AG (A) 18,003 24,270Hella GmbH & Company KGaA (A) 1,867 104,839HOCHTIEF AG 772 69,116Hornbach Baumarkt AG 590 24,814Hornbach Holding AG & Company
KGaA 497 48,538HUGO BOSS AG 3,312 130,143Hypoport SE (A) 129 68,418Indus Holding AG 975 40,486Instone Real Estate Group AG (A)(D) 1,769 48,634Jenoptik AG 2,990 89,865JOST Werke AG (A)(D) 356 22,509K+S AG 10,944 108,892Kloeckner & Company SE (A) 5,538 69,746Koenig & Bauer AG (A)(B) 912 27,194Krones AG 775 62,957KWS Saat SE & Company KGaA 381 32,996LANXESS AG 3,923 289,537Leifheit AG 437 23,158Leoni AG (A) 2,398 30,084LPKF Laser & Electronics AG 1,100 30,768
PATRIZIA AG 2,719 68,835Pfeiffer Vacuum Technology AG 256 46,541PNE AG 4,544 39,402ProSiebenSat.1 Media SE (A) 10,428 212,962PSI Software AG 815 25,634q.beyond AG 6,549 14,531Rheinmetall AG 2,219 225,059SAF-Holland SE (A) 4,007 58,397Salzgitter AG (A) 1,978 61,769SGL Carbon SE (A) 1,013 7,179Siltronic AG 981 155,349Sixt SE (A) 694 91,768SMA Solar Technology AG (A) 916 53,885Software AG 2,610 109,952STRATEC SE 407 54,977Stroeer SE & Company KGaA 1,454 118,469Suedzucker AG 3,535 59,920SUESS MicroTec SE (A) 1,803 56,300TAG Immobilien AG (A) 6,907 197,154Takkt AG 2,476 37,481Technotrans SE (A) 530 15,896Tele Columbus AG (A)(D) 1,029 3,812thyssenkrupp AG (A) 9,803 130,930Traffic Systems SE 106 4,337Varta AG (A)(B) 624 91,842VERBIO Vereinigte BioEnergie AG 1,482 63,822Vossloh AG (A) 859 42,761Wacker Chemie AG 759 107,984Wacker Neuson SE (A) 2,039 48,819Washtec AG (A) 611 35,120Wuestenrot & Wuerttembergische AG 1,566 32,652Zeal Network SE 349 17,952
zooplus AG (A) 199 56,845
7,491,857Gibraltar - 0.1%888 Holdings PLC 12,231 66,551Greece - 0.0%Alapis Holding Industrial &
Commercial SA of PharmaceuticalChemical Products (A)(C) 3,303 71
TT Hellenic Postbank SA (A)(C) 12,594 0
71Guernsey, Channel Islands - 0.0%Burford Capital, Ltd. (A) 2,002 17,336
Raven Property Group, Ltd. (A) 5,155 2,096
19,432Hong Kong - 2.4%3D-Gold Jewellery Holdings,Ltd. (A)(C) 90,000 0Allied Group, Ltd. 120,000 49,500APAC Resources, Ltd. 15,396 2,347Apollo Future Mobility Group,
Ltd. (A)(B) 56,000 3,604Asia Financial Holdings, Ltd. 14,000 7,201
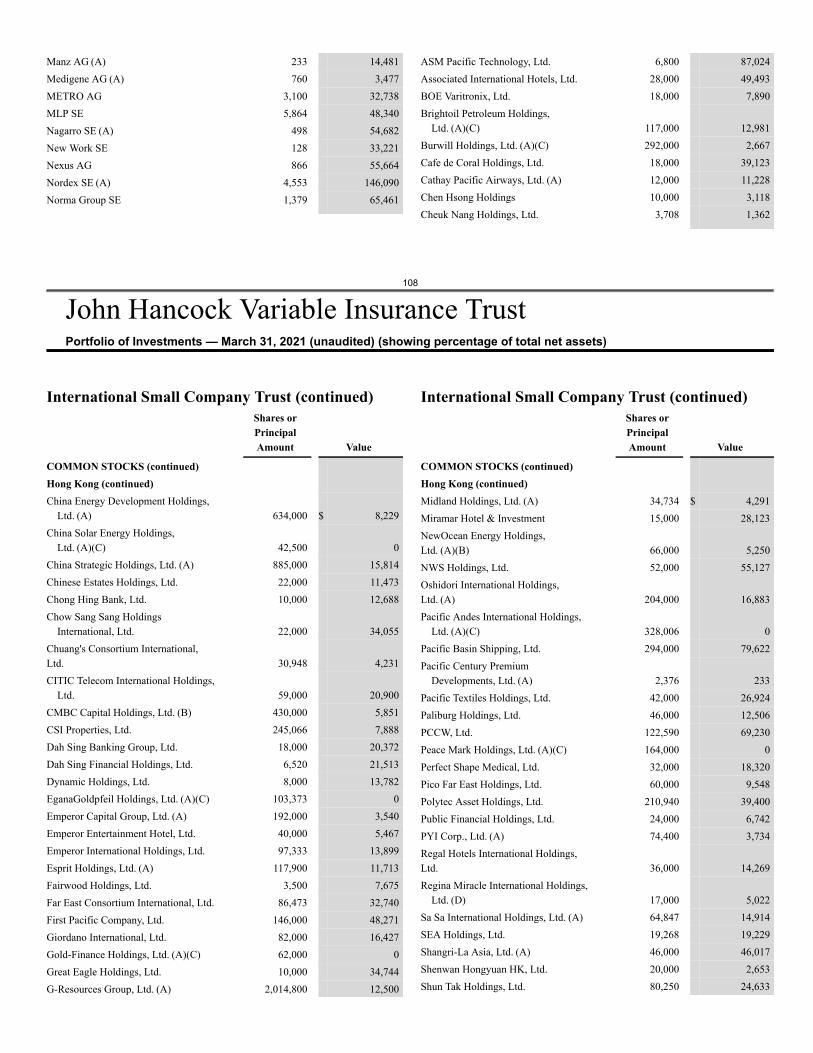
108
John Hancock Variable Insurance TrustPortfolio of Investments — March 31, 2021 (unaudited) (showing percentage of total net assets)
Manz AG (A) 233 14,481Medigene AG (A) 760 3,477METRO AG 3,100 32,738MLP SE 5,864 48,340Nagarro SE (A) 498 54,682New Work SE 128 33,221Nexus AG 866 55,664Nordex SE (A) 4,553 146,090Norma Group SE 1,379 65,461
ASM Pacific Technology, Ltd. 6,800 87,024Associated International Hotels, Ltd. 28,000 49,493BOE Varitronix, Ltd. 18,000 7,890Brightoil Petroleum Holdings,
Ltd. (A)(C) 117,000 12,981Burwill Holdings, Ltd. (A)(C) 292,000 2,667Cafe de Coral Holdings, Ltd. 18,000 39,123Cathay Pacific Airways, Ltd. (A) 12,000 11,228Chen Hsong Holdings 10,000 3,118Cheuk Nang Holdings, Ltd. 3,708 1,362
International Small Company Trust (continued)Shares orPrincipalAmount Value
COMMON STOCKS (continued)Hong Kong (continued)China Energy Development Holdings,
Ltd. (A) 634,000 $ 8,229China Solar Energy Holdings,
Ltd. (A)(C) 42,500 0China Strategic Holdings, Ltd. (A) 885,000 15,814Chinese Estates Holdings, Ltd. 22,000 11,473Chong Hing Bank, Ltd. 10,000 12,688Chow Sang Sang Holdings
International, Ltd. 22,000 34,055Chuang's Consortium International,Ltd. 30,948 4,231CITIC Telecom International Holdings,
Ltd. 59,000 20,900CMBC Capital Holdings, Ltd. (B) 430,000 5,851CSI Properties, Ltd. 245,066 7,888Dah Sing Banking Group, Ltd. 18,000 20,372Dah Sing Financial Holdings, Ltd. 6,520 21,513Dynamic Holdings, Ltd. 8,000 13,782EganaGoldpfeil Holdings, Ltd. (A)(C) 103,373 0Emperor Capital Group, Ltd. (A) 192,000 3,540Emperor Entertainment Hotel, Ltd. 40,000 5,467Emperor International Holdings, Ltd. 97,333 13,899Esprit Holdings, Ltd. (A) 117,900 11,713Fairwood Holdings, Ltd. 3,500 7,675Far East Consortium International, Ltd. 86,473 32,740First Pacific Company, Ltd. 146,000 48,271Giordano International, Ltd. 82,000 16,427Gold-Finance Holdings, Ltd. (A)(C) 62,000 0Great Eagle Holdings, Ltd. 10,000 34,744G-Resources Group, Ltd. (A) 2,014,800 12,500
International Small Company Trust (continued)Shares orPrincipalAmount Value
COMMON STOCKS (continued)Hong Kong (continued)Midland Holdings, Ltd. (A) 34,734 $ 4,291Miramar Hotel & Investment 15,000 28,123NewOcean Energy Holdings,Ltd. (A)(B) 66,000 5,250NWS Holdings, Ltd. 52,000 55,127Oshidori International Holdings,Ltd. (A) 204,000 16,883Pacific Andes International Holdings,
Ltd. (A)(C) 328,006 0Pacific Basin Shipping, Ltd. 294,000 79,622Pacific Century Premium
Developments, Ltd. (A) 2,376 233Pacific Textiles Holdings, Ltd. 42,000 26,924Paliburg Holdings, Ltd. 46,000 12,506PCCW, Ltd. 122,590 69,230Peace Mark Holdings, Ltd. (A)(C) 164,000 0Perfect Shape Medical, Ltd. 32,000 18,320Pico Far East Holdings, Ltd. 60,000 9,548Polytec Asset Holdings, Ltd. 210,940 39,400Public Financial Holdings, Ltd. 24,000 6,742PYI Corp., Ltd. (A) 74,400 3,734Regal Hotels International Holdings,Ltd. 36,000 14,269Regina Miracle International Holdings,
Ltd. (D) 17,000 5,022Sa Sa International Holdings, Ltd. (A) 64,847 14,914SEA Holdings, Ltd. 19,268 19,229Shangri-La Asia, Ltd. (A) 46,000 46,017Shenwan Hongyuan HK, Ltd. 20,000 2,653Shun Tak Holdings, Ltd. 80,250 24,633
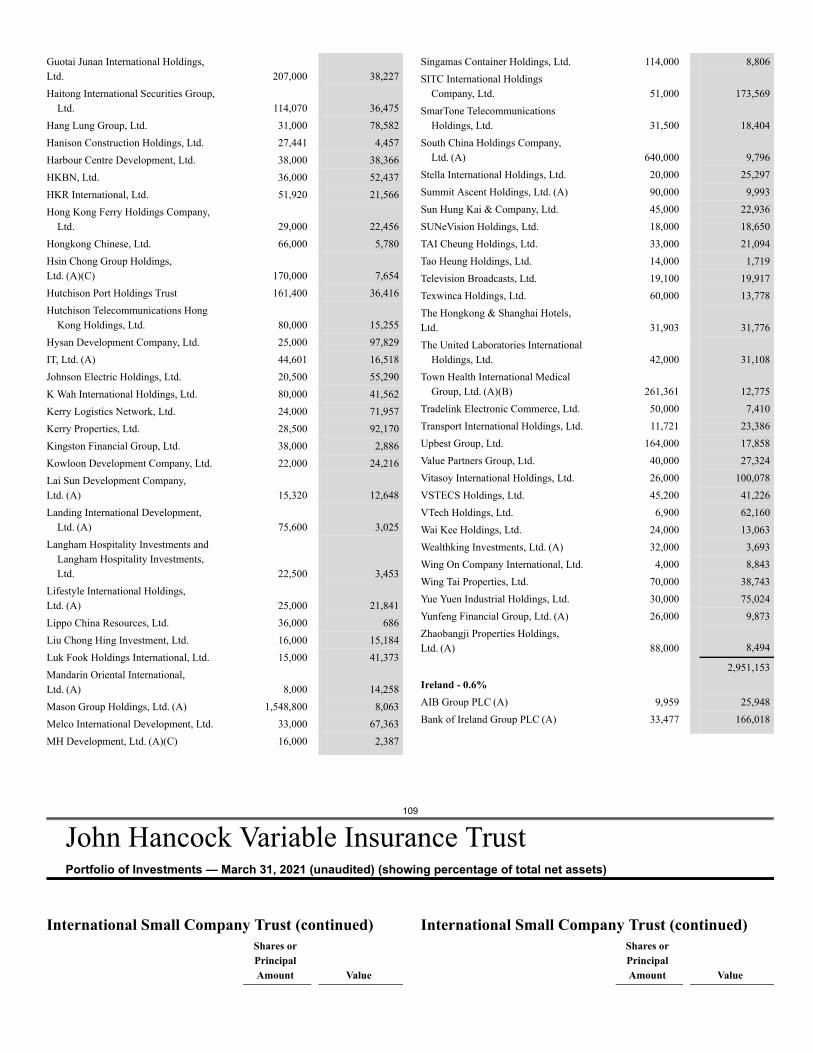
109
John Hancock Variable Insurance TrustPortfolio of Investments — March 31, 2021 (unaudited) (showing percentage of total net assets)
Guotai Junan International Holdings,Ltd. 207,000 38,227Haitong International Securities Group,
Ltd. 114,070 36,475Hang Lung Group, Ltd. 31,000 78,582Hanison Construction Holdings, Ltd. 27,441 4,457Harbour Centre Development, Ltd. 38,000 38,366HKBN, Ltd. 36,000 52,437HKR International, Ltd. 51,920 21,566Hong Kong Ferry Holdings Company,
Ltd. 29,000 22,456Hongkong Chinese, Ltd. 66,000 5,780Hsin Chong Group Holdings,Ltd. (A)(C) 170,000 7,654Hutchison Port Holdings Trust 161,400 36,416Hutchison Telecommunications Hong
Kong Holdings, Ltd. 80,000 15,255Hysan Development Company, Ltd. 25,000 97,829IT, Ltd. (A) 44,601 16,518Johnson Electric Holdings, Ltd. 20,500 55,290K Wah International Holdings, Ltd. 80,000 41,562Kerry Logistics Network, Ltd. 24,000 71,957Kerry Properties, Ltd. 28,500 92,170Kingston Financial Group, Ltd. 38,000 2,886Kowloon Development Company, Ltd. 22,000 24,216Lai Sun Development Company,Ltd. (A) 15,320 12,648Landing International Development,
Ltd. (A) 75,600 3,025Langham Hospitality Investments and
Langham Hospitality Investments,Ltd. 22,500 3,453
Lifestyle International Holdings,Ltd. (A) 25,000 21,841Lippo China Resources, Ltd. 36,000 686Liu Chong Hing Investment, Ltd. 16,000 15,184Luk Fook Holdings International, Ltd. 15,000 41,373Mandarin Oriental International,Ltd. (A) 8,000 14,258Mason Group Holdings, Ltd. (A) 1,548,800 8,063Melco International Development, Ltd. 33,000 67,363MH Development, Ltd. (A)(C) 16,000 2,387
Singamas Container Holdings, Ltd. 114,000 8,806SITC International Holdings
Company, Ltd. 51,000 173,569SmarTone Telecommunications
Holdings, Ltd. 31,500 18,404South China Holdings Company,
Ltd. (A) 640,000 9,796Stella International Holdings, Ltd. 20,000 25,297Summit Ascent Holdings, Ltd. (A) 90,000 9,993Sun Hung Kai & Company, Ltd. 45,000 22,936SUNeVision Holdings, Ltd. 18,000 18,650TAI Cheung Holdings, Ltd. 33,000 21,094Tao Heung Holdings, Ltd. 14,000 1,719Television Broadcasts, Ltd. 19,100 19,917Texwinca Holdings, Ltd. 60,000 13,778The Hongkong & Shanghai Hotels,Ltd. 31,903 31,776The United Laboratories International
Holdings, Ltd. 42,000 31,108Town Health International Medical
Group, Ltd. (A)(B) 261,361 12,775Tradelink Electronic Commerce, Ltd. 50,000 7,410Transport International Holdings, Ltd. 11,721 23,386Upbest Group, Ltd. 164,000 17,858Value Partners Group, Ltd. 40,000 27,324Vitasoy International Holdings, Ltd. 26,000 100,078VSTECS Holdings, Ltd. 45,200 41,226VTech Holdings, Ltd. 6,900 62,160Wai Kee Holdings, Ltd. 24,000 13,063Wealthking Investments, Ltd. (A) 32,000 3,693Wing On Company International, Ltd. 4,000 8,843Wing Tai Properties, Ltd. 70,000 38,743Yue Yuen Industrial Holdings, Ltd. 30,000 75,024Yunfeng Financial Group, Ltd. (A) 26,000 9,873Zhaobangji Properties Holdings,Ltd. (A) 88,000 8,494
2,951,153Ireland - 0.6%AIB Group PLC (A) 9,959 25,948Bank of Ireland Group PLC (A) 33,477 166,018
International Small Company Trust (continued)Shares orPrincipalAmount Value
International Small Company Trust (continued)Shares orPrincipalAmount Value
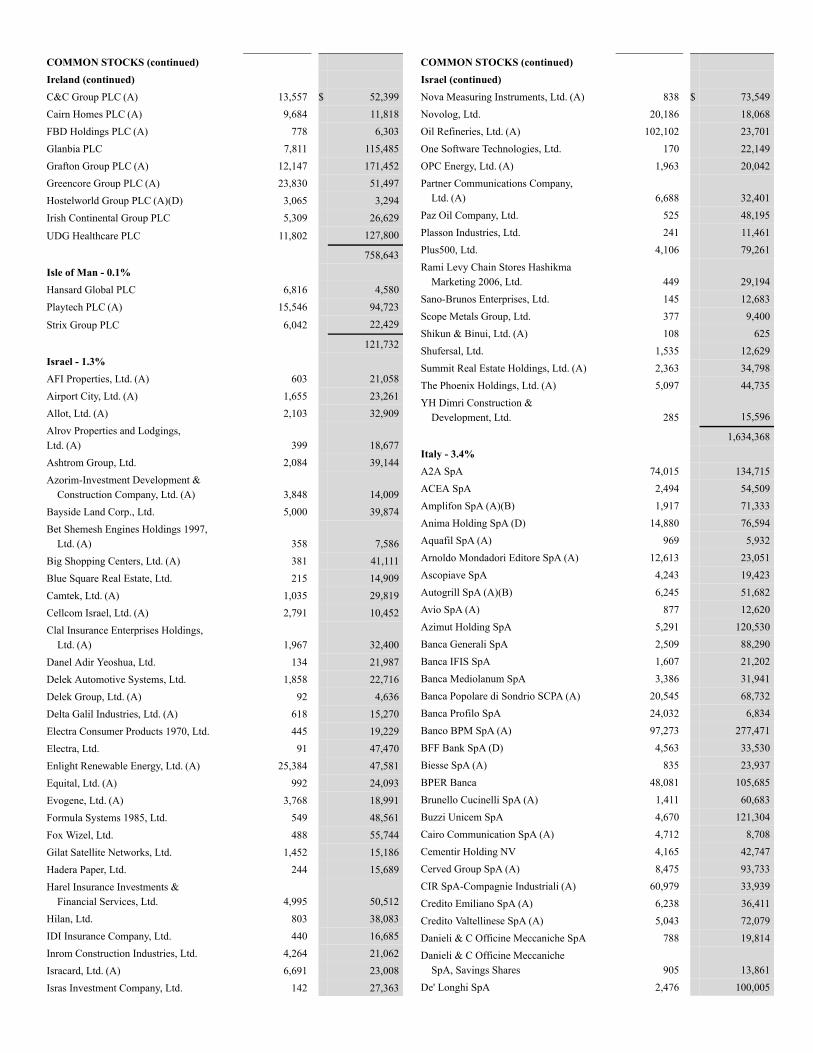
COMMON STOCKS (continued)Ireland (continued)C&C Group PLC (A) 13,557 $ 52,399Cairn Homes PLC (A) 9,684 11,818FBD Holdings PLC (A) 778 6,303Glanbia PLC 7,811 115,485Grafton Group PLC (A) 12,147 171,452Greencore Group PLC (A) 23,830 51,497Hostelworld Group PLC (A)(D) 3,065 3,294Irish Continental Group PLC 5,309 26,629
UDG Healthcare PLC 11,802 127,800
758,643Isle of Man - 0.1%Hansard Global PLC 6,816 4,580Playtech PLC (A) 15,546 94,723
Strix Group PLC 6,042 22,429
121,732Israel - 1.3%AFI Properties, Ltd. (A) 603 21,058Airport City, Ltd. (A) 1,655 23,261Allot, Ltd. (A) 2,103 32,909Alrov Properties and Lodgings,Ltd. (A) 399 18,677Ashtrom Group, Ltd. 2,084 39,144Azorim-Investment Development &
Construction Company, Ltd. (A) 3,848 14,009Bayside Land Corp., Ltd. 5,000 39,874Bet Shemesh Engines Holdings 1997,
Ltd. (A) 358 7,586Big Shopping Centers, Ltd. (A) 381 41,111Blue Square Real Estate, Ltd. 215 14,909Camtek, Ltd. (A) 1,035 29,819Cellcom Israel, Ltd. (A) 2,791 10,452Clal Insurance Enterprises Holdings,
Ltd. (A) 1,967 32,400Danel Adir Yeoshua, Ltd. 134 21,987Delek Automotive Systems, Ltd. 1,858 22,716Delek Group, Ltd. (A) 92 4,636Delta Galil Industries, Ltd. (A) 618 15,270Electra Consumer Products 1970, Ltd. 445 19,229Electra, Ltd. 91 47,470Enlight Renewable Energy, Ltd. (A) 25,384 47,581Equital, Ltd. (A) 992 24,093Evogene, Ltd. (A) 3,768 18,991Formula Systems 1985, Ltd. 549 48,561Fox Wizel, Ltd. 488 55,744Gilat Satellite Networks, Ltd. 1,452 15,186Hadera Paper, Ltd. 244 15,689Harel Insurance Investments &
Financial Services, Ltd. 4,995 50,512Hilan, Ltd. 803 38,083IDI Insurance Company, Ltd. 440 16,685Inrom Construction Industries, Ltd. 4,264 21,062Isracard, Ltd. (A) 6,691 23,008Isras Investment Company, Ltd. 142 27,363
COMMON STOCKS (continued)Israel (continued)Nova Measuring Instruments, Ltd. (A) 838 $ 73,549Novolog, Ltd. 20,186 18,068Oil Refineries, Ltd. (A) 102,102 23,701One Software Technologies, Ltd. 170 22,149OPC Energy, Ltd. (A) 1,963 20,042Partner Communications Company,
Ltd. (A) 6,688 32,401Paz Oil Company, Ltd. 525 48,195Plasson Industries, Ltd. 241 11,461Plus500, Ltd. 4,106 79,261Rami Levy Chain Stores Hashikma
Marketing 2006, Ltd. 449 29,194Sano-Brunos Enterprises, Ltd. 145 12,683Scope Metals Group, Ltd. 377 9,400Shikun & Binui, Ltd. (A) 108 625Shufersal, Ltd. 1,535 12,629Summit Real Estate Holdings, Ltd. (A) 2,363 34,798The Phoenix Holdings, Ltd. (A) 5,097 44,735YH Dimri Construction &
Development, Ltd. 285 15,596
1,634,368Italy - 3.4%A2A SpA 74,015 134,715ACEA SpA 2,494 54,509Amplifon SpA (A)(B) 1,917 71,333Anima Holding SpA (D) 14,880 76,594Aquafil SpA (A) 969 5,932Arnoldo Mondadori Editore SpA (A) 12,613 23,051Ascopiave SpA 4,243 19,423Autogrill SpA (A)(B) 6,245 51,682Avio SpA (A) 877 12,620Azimut Holding SpA 5,291 120,530Banca Generali SpA 2,509 88,290Banca IFIS SpA 1,607 21,202Banca Mediolanum SpA 3,386 31,941Banca Popolare di Sondrio SCPA (A) 20,545 68,732Banca Profilo SpA 24,032 6,834Banco BPM SpA (A) 97,273 277,471BFF Bank SpA (D) 4,563 33,530Biesse SpA (A) 835 23,937BPER Banca 48,081 105,685Brunello Cucinelli SpA (A) 1,411 60,683Buzzi Unicem SpA 4,670 121,304Cairo Communication SpA (A) 4,712 8,708Cementir Holding NV 4,165 42,747Cerved Group SpA (A) 8,475 93,733CIR SpA-Compagnie Industriali (A) 60,979 33,939Credito Emiliano SpA (A) 6,238 36,411Credito Valtellinese SpA (A) 5,043 72,079Danieli & C Officine Meccaniche SpA 788 19,814Danieli & C Officine Meccaniche
SpA, Savings Shares 905 13,861De' Longhi SpA 2,476 100,005
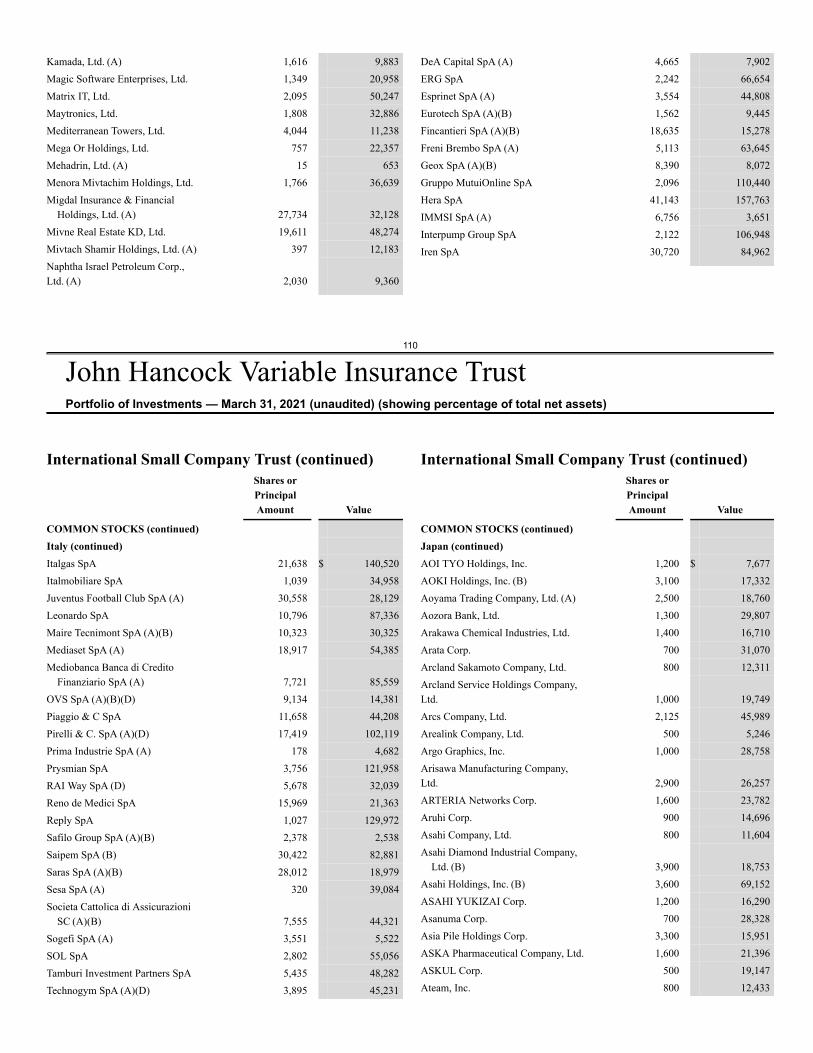
110
John Hancock Variable Insurance TrustPortfolio of Investments — March 31, 2021 (unaudited) (showing percentage of total net assets)
Kamada, Ltd. (A) 1,616 9,883Magic Software Enterprises, Ltd. 1,349 20,958Matrix IT, Ltd. 2,095 50,247Maytronics, Ltd. 1,808 32,886Mediterranean Towers, Ltd. 4,044 11,238Mega Or Holdings, Ltd. 757 22,357Mehadrin, Ltd. (A) 15 653Menora Mivtachim Holdings, Ltd. 1,766 36,639Migdal Insurance & Financial
Holdings, Ltd. (A) 27,734 32,128Mivne Real Estate KD, Ltd. 19,611 48,274Mivtach Shamir Holdings, Ltd. (A) 397 12,183Naphtha Israel Petroleum Corp.,Ltd. (A) 2,030 9,360
DeA Capital SpA (A) 4,665 7,902ERG SpA 2,242 66,654Esprinet SpA (A) 3,554 44,808Eurotech SpA (A)(B) 1,562 9,445Fincantieri SpA (A)(B) 18,635 15,278Freni Brembo SpA (A) 5,113 63,645Geox SpA (A)(B) 8,390 8,072Gruppo MutuiOnline SpA 2,096 110,440Hera SpA 41,143 157,763IMMSI SpA (A) 6,756 3,651Interpump Group SpA 2,122 106,948Iren SpA 30,720 84,962
International Small Company Trust (continued)Shares orPrincipalAmount Value
COMMON STOCKS (continued)Italy (continued)Italgas SpA 21,638 $ 140,520Italmobiliare SpA 1,039 34,958Juventus Football Club SpA (A) 30,558 28,129Leonardo SpA 10,796 87,336Maire Tecnimont SpA (A)(B) 10,323 30,325Mediaset SpA (A) 18,917 54,385Mediobanca Banca di Credito
Finanziario SpA (A) 7,721 85,559OVS SpA (A)(B)(D) 9,134 14,381Piaggio & C SpA 11,658 44,208Pirelli & C. SpA (A)(D) 17,419 102,119Prima Industrie SpA (A) 178 4,682Prysmian SpA 3,756 121,958RAI Way SpA (D) 5,678 32,039Reno de Medici SpA 15,969 21,363Reply SpA 1,027 129,972Safilo Group SpA (A)(B) 2,378 2,538Saipem SpA (B) 30,422 82,881Saras SpA (A)(B) 28,012 18,979Sesa SpA (A) 320 39,084Societa Cattolica di Assicurazioni
SC (A)(B) 7,555 44,321Sogefi SpA (A) 3,551 5,522SOL SpA 2,802 55,056Tamburi Investment Partners SpA 5,435 48,282Technogym SpA (A)(D) 3,895 45,231
International Small Company Trust (continued)Shares orPrincipalAmount Value
COMMON STOCKS (continued)Japan (continued)AOI TYO Holdings, Inc. 1,200 $ 7,677AOKI Holdings, Inc. (B) 3,100 17,332Aoyama Trading Company, Ltd. (A) 2,500 18,760Aozora Bank, Ltd. 1,300 29,807Arakawa Chemical Industries, Ltd. 1,400 16,710Arata Corp. 700 31,070Arcland Sakamoto Company, Ltd. 800 12,311Arcland Service Holdings Company,Ltd. 1,000 19,749Arcs Company, Ltd. 2,125 45,989Arealink Company, Ltd. 500 5,246Argo Graphics, Inc. 1,000 28,758Arisawa Manufacturing Company,Ltd. 2,900 26,257ARTERIA Networks Corp. 1,600 23,782Aruhi Corp. 900 14,696Asahi Company, Ltd. 800 11,604Asahi Diamond Industrial Company,
Ltd. (B) 3,900 18,753Asahi Holdings, Inc. (B) 3,600 69,152ASAHI YUKIZAI Corp. 1,200 16,290Asanuma Corp. 700 28,328Asia Pile Holdings Corp. 3,300 15,951ASKA Pharmaceutical Company, Ltd. 1,600 21,396ASKUL Corp. 500 19,147Ateam, Inc. 800 12,433
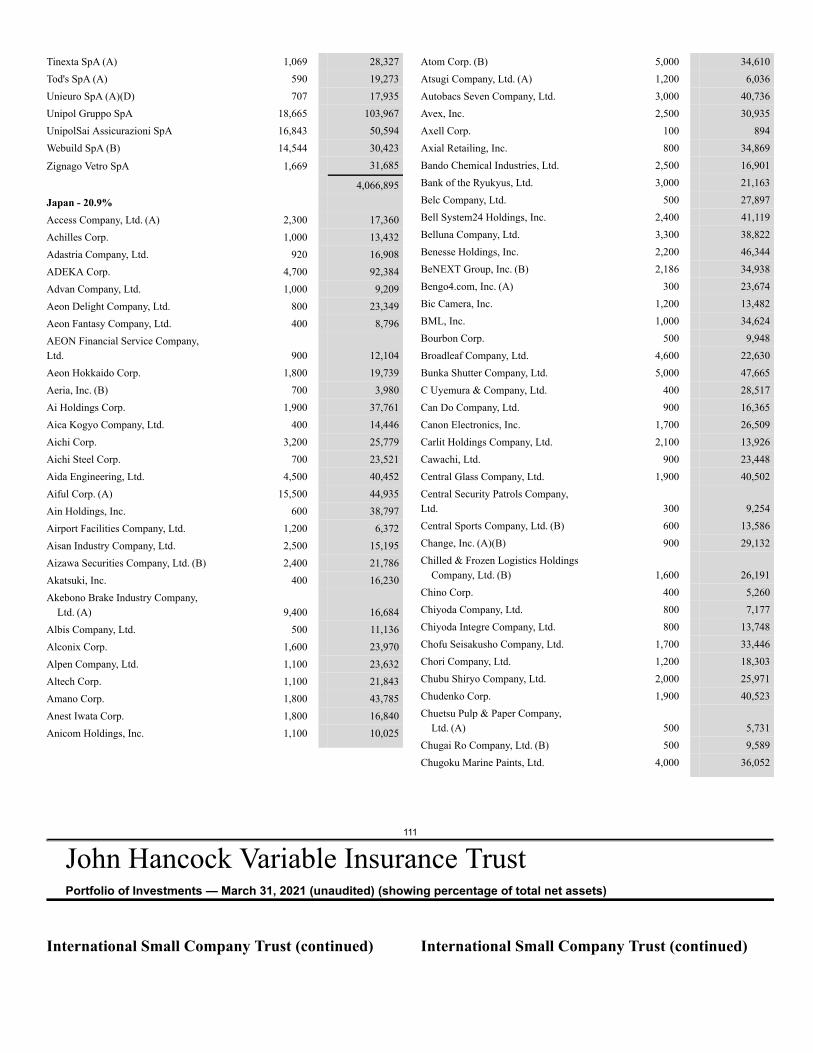
111
John Hancock Variable Insurance TrustPortfolio of Investments — March 31, 2021 (unaudited) (showing percentage of total net assets)
Tinexta SpA (A) 1,069 28,327Tod's SpA (A) 590 19,273Unieuro SpA (A)(D) 707 17,935Unipol Gruppo SpA 18,665 103,967UnipolSai Assicurazioni SpA 16,843 50,594Webuild SpA (B) 14,544 30,423
Zignago Vetro SpA 1,669 31,685
4,066,895Japan - 20.9%Access Company, Ltd. (A) 2,300 17,360Achilles Corp. 1,000 13,432Adastria Company, Ltd. 920 16,908ADEKA Corp. 4,700 92,384Advan Company, Ltd. 1,000 9,209Aeon Delight Company, Ltd. 800 23,349Aeon Fantasy Company, Ltd. 400 8,796AEON Financial Service Company,Ltd. 900 12,104Aeon Hokkaido Corp. 1,800 19,739Aeria, Inc. (B) 700 3,980Ai Holdings Corp. 1,900 37,761Aica Kogyo Company, Ltd. 400 14,446Aichi Corp. 3,200 25,779Aichi Steel Corp. 700 23,521Aida Engineering, Ltd. 4,500 40,452Aiful Corp. (A) 15,500 44,935Ain Holdings, Inc. 600 38,797Airport Facilities Company, Ltd. 1,200 6,372Aisan Industry Company, Ltd. 2,500 15,195Aizawa Securities Company, Ltd. (B) 2,400 21,786Akatsuki, Inc. 400 16,230Akebono Brake Industry Company,
Ltd. (A) 9,400 16,684Albis Company, Ltd. 500 11,136Alconix Corp. 1,600 23,970Alpen Company, Ltd. 1,100 23,632Altech Corp. 1,100 21,843Amano Corp. 1,800 43,785Anest Iwata Corp. 1,800 16,840Anicom Holdings, Inc. 1,100 10,025
Atom Corp. (B) 5,000 34,610Atsugi Company, Ltd. (A) 1,200 6,036Autobacs Seven Company, Ltd. 3,000 40,736Avex, Inc. 2,500 30,935Axell Corp. 100 894Axial Retailing, Inc. 800 34,869Bando Chemical Industries, Ltd. 2,500 16,901Bank of the Ryukyus, Ltd. 3,000 21,163Belc Company, Ltd. 500 27,897Bell System24 Holdings, Inc. 2,400 41,119Belluna Company, Ltd. 3,300 38,822Benesse Holdings, Inc. 2,200 46,344BeNEXT Group, Inc. (B) 2,186 34,938Bengo4.com, Inc. (A) 300 23,674Bic Camera, Inc. 1,200 13,482BML, Inc. 1,000 34,624Bourbon Corp. 500 9,948Broadleaf Company, Ltd. 4,600 22,630Bunka Shutter Company, Ltd. 5,000 47,665C Uyemura & Company, Ltd. 400 28,517Can Do Company, Ltd. 900 16,365Canon Electronics, Inc. 1,700 26,509Carlit Holdings Company, Ltd. 2,100 13,926Cawachi, Ltd. 900 23,448Central Glass Company, Ltd. 1,900 40,502Central Security Patrols Company,Ltd. 300 9,254Central Sports Company, Ltd. (B) 600 13,586Change, Inc. (A)(B) 900 29,132Chilled & Frozen Logistics Holdings
Company, Ltd. (B) 1,600 26,191Chino Corp. 400 5,260Chiyoda Company, Ltd. 800 7,177Chiyoda Integre Company, Ltd. 800 13,748Chofu Seisakusho Company, Ltd. 1,700 33,446Chori Company, Ltd. 1,200 18,303Chubu Shiryo Company, Ltd. 2,000 25,971Chudenko Corp. 1,900 40,523Chuetsu Pulp & Paper Company,
Ltd. (A) 500 5,731Chugai Ro Company, Ltd. (B) 500 9,589Chugoku Marine Paints, Ltd. 4,000 36,052
International Small Company Trust (continued) International Small Company Trust (continued)
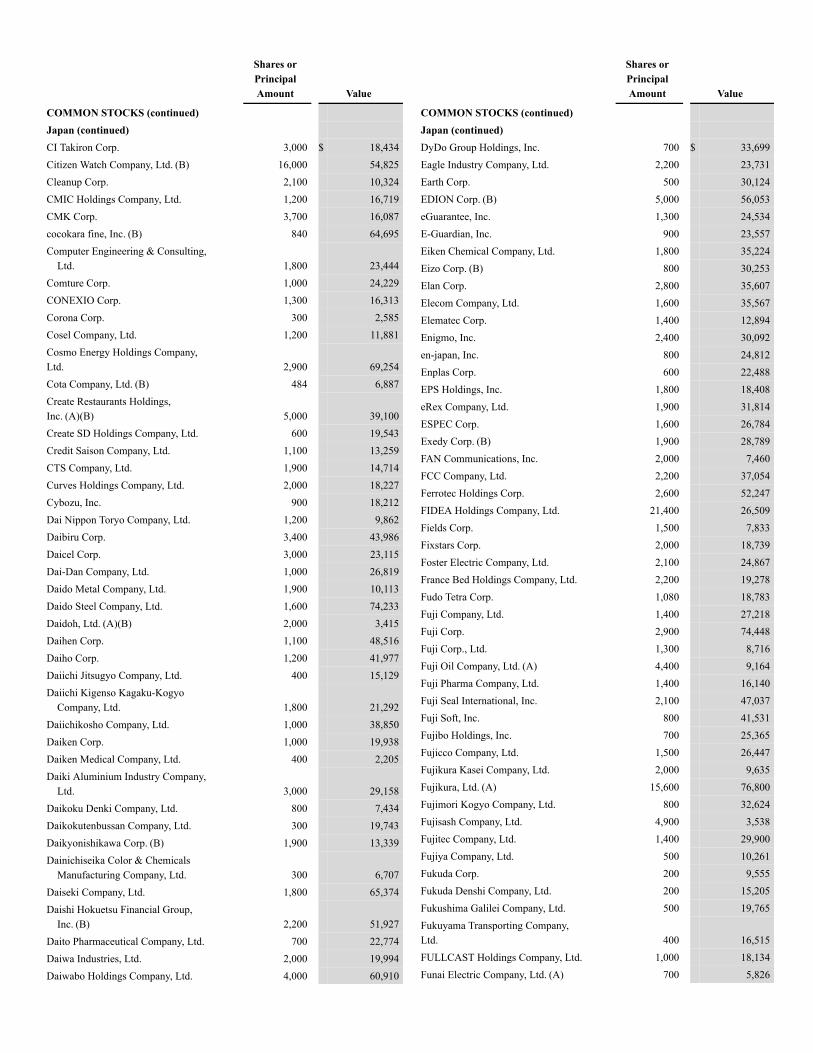
Shares orPrincipalAmount Value
COMMON STOCKS (continued)Japan (continued)CI Takiron Corp. 3,000 $ 18,434Citizen Watch Company, Ltd. (B) 16,000 54,825Cleanup Corp. 2,100 10,324CMIC Holdings Company, Ltd. 1,200 16,719CMK Corp. 3,700 16,087cocokara fine, Inc. (B) 840 64,695Computer Engineering & Consulting,
Ltd. 1,800 23,444Comture Corp. 1,000 24,229CONEXIO Corp. 1,300 16,313Corona Corp. 300 2,585Cosel Company, Ltd. 1,200 11,881Cosmo Energy Holdings Company,Ltd. 2,900 69,254Cota Company, Ltd. (B) 484 6,887Create Restaurants Holdings,Inc. (A)(B) 5,000 39,100Create SD Holdings Company, Ltd. 600 19,543Credit Saison Company, Ltd. 1,100 13,259CTS Company, Ltd. 1,900 14,714Curves Holdings Company, Ltd. 2,000 18,227Cybozu, Inc. 900 18,212Dai Nippon Toryo Company, Ltd. 1,200 9,862Daibiru Corp. 3,400 43,986Daicel Corp. 3,000 23,115Dai-Dan Company, Ltd. 1,000 26,819Daido Metal Company, Ltd. 1,900 10,113Daido Steel Company, Ltd. 1,600 74,233Daidoh, Ltd. (A)(B) 2,000 3,415Daihen Corp. 1,100 48,516Daiho Corp. 1,200 41,977Daiichi Jitsugyo Company, Ltd. 400 15,129Daiichi Kigenso Kagaku-Kogyo
Company, Ltd. 1,800 21,292Daiichikosho Company, Ltd. 1,000 38,850Daiken Corp. 1,000 19,938Daiken Medical Company, Ltd. 400 2,205Daiki Aluminium Industry Company,
Ltd. 3,000 29,158Daikoku Denki Company, Ltd. 800 7,434Daikokutenbussan Company, Ltd. 300 19,743Daikyonishikawa Corp. (B) 1,900 13,339Dainichiseika Color & Chemicals
Manufacturing Company, Ltd. 300 6,707Daiseki Company, Ltd. 1,800 65,374Daishi Hokuetsu Financial Group,
Inc. (B) 2,200 51,927Daito Pharmaceutical Company, Ltd. 700 22,774Daiwa Industries, Ltd. 2,000 19,994Daiwabo Holdings Company, Ltd. 4,000 60,910
Shares orPrincipalAmount Value
COMMON STOCKS (continued)Japan (continued)DyDo Group Holdings, Inc. 700 $ 33,699Eagle Industry Company, Ltd. 2,200 23,731Earth Corp. 500 30,124EDION Corp. (B) 5,000 56,053eGuarantee, Inc. 1,300 24,534E-Guardian, Inc. 900 23,557Eiken Chemical Company, Ltd. 1,800 35,224Eizo Corp. (B) 800 30,253Elan Corp. 2,800 35,607Elecom Company, Ltd. 1,600 35,567Elematec Corp. 1,400 12,894Enigmo, Inc. 2,400 30,092en-japan, Inc. 800 24,812Enplas Corp. 600 22,488EPS Holdings, Inc. 1,800 18,408eRex Company, Ltd. 1,900 31,814ESPEC Corp. 1,600 26,784Exedy Corp. (B) 1,900 28,789FAN Communications, Inc. 2,000 7,460FCC Company, Ltd. 2,200 37,054Ferrotec Holdings Corp. 2,600 52,247FIDEA Holdings Company, Ltd. 21,400 26,509Fields Corp. 1,500 7,833Fixstars Corp. 2,000 18,739Foster Electric Company, Ltd. 2,100 24,867France Bed Holdings Company, Ltd. 2,200 19,278Fudo Tetra Corp. 1,080 18,783Fuji Company, Ltd. 1,400 27,218Fuji Corp. 2,900 74,448Fuji Corp., Ltd. 1,300 8,716Fuji Oil Company, Ltd. (A) 4,400 9,164Fuji Pharma Company, Ltd. 1,400 16,140Fuji Seal International, Inc. 2,100 47,037Fuji Soft, Inc. 800 41,531Fujibo Holdings, Inc. 700 25,365Fujicco Company, Ltd. 1,500 26,447Fujikura Kasei Company, Ltd. 2,000 9,635Fujikura, Ltd. (A) 15,600 76,800Fujimori Kogyo Company, Ltd. 800 32,624Fujisash Company, Ltd. 4,900 3,538Fujitec Company, Ltd. 1,400 29,900Fujiya Company, Ltd. 500 10,261Fukuda Corp. 200 9,555Fukuda Denshi Company, Ltd. 200 15,205Fukushima Galilei Company, Ltd. 500 19,765Fukuyama Transporting Company,Ltd. 400 16,515FULLCAST Holdings Company, Ltd. 1,000 18,134Funai Electric Company, Ltd. (A) 700 5,826
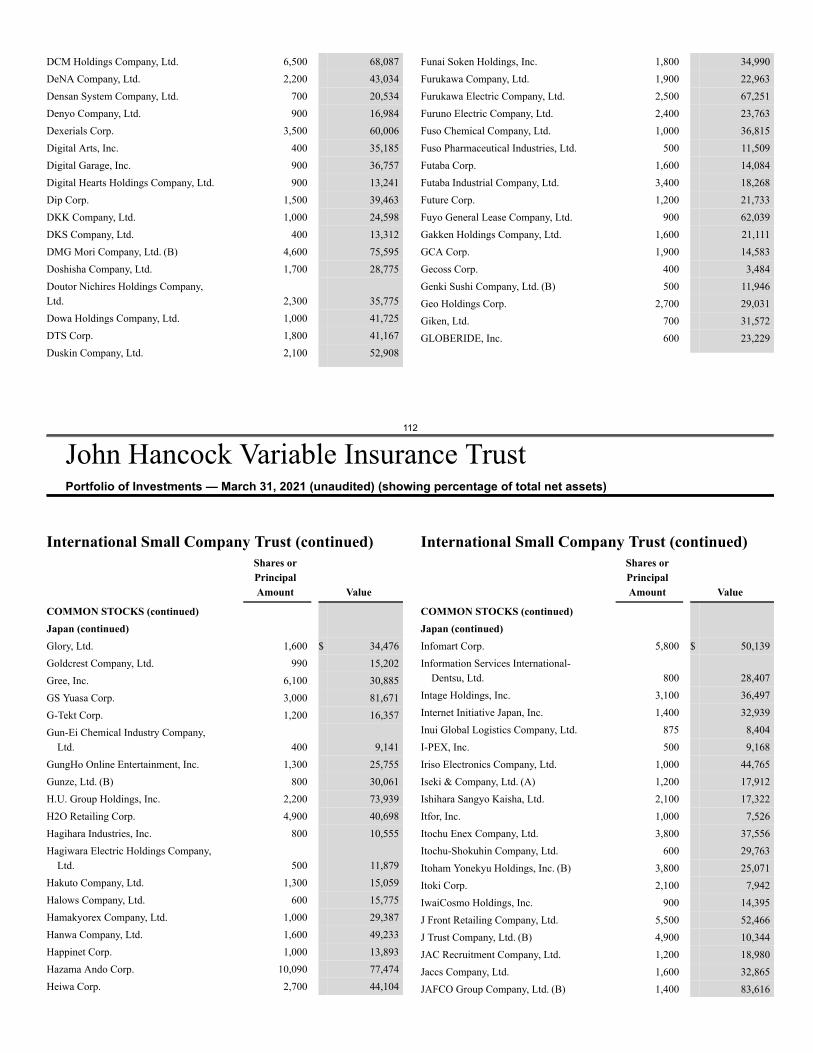
112
John Hancock Variable Insurance TrustPortfolio of Investments — March 31, 2021 (unaudited) (showing percentage of total net assets)
DCM Holdings Company, Ltd. 6,500 68,087DeNA Company, Ltd. 2,200 43,034Densan System Company, Ltd. 700 20,534Denyo Company, Ltd. 900 16,984Dexerials Corp. 3,500 60,006Digital Arts, Inc. 400 35,185Digital Garage, Inc. 900 36,757Digital Hearts Holdings Company, Ltd. 900 13,241Dip Corp. 1,500 39,463DKK Company, Ltd. 1,000 24,598DKS Company, Ltd. 400 13,312DMG Mori Company, Ltd. (B) 4,600 75,595Doshisha Company, Ltd. 1,700 28,775Doutor Nichires Holdings Company,Ltd. 2,300 35,775Dowa Holdings Company, Ltd. 1,000 41,725DTS Corp. 1,800 41,167Duskin Company, Ltd. 2,100 52,908
Funai Soken Holdings, Inc. 1,800 34,990Furukawa Company, Ltd. 1,900 22,963Furukawa Electric Company, Ltd. 2,500 67,251Furuno Electric Company, Ltd. 2,400 23,763Fuso Chemical Company, Ltd. 1,000 36,815Fuso Pharmaceutical Industries, Ltd. 500 11,509Futaba Corp. 1,600 14,084Futaba Industrial Company, Ltd. 3,400 18,268Future Corp. 1,200 21,733Fuyo General Lease Company, Ltd. 900 62,039Gakken Holdings Company, Ltd. 1,600 21,111GCA Corp. 1,900 14,583Gecoss Corp. 400 3,484Genki Sushi Company, Ltd. (B) 500 11,946Geo Holdings Corp. 2,700 29,031Giken, Ltd. 700 31,572GLOBERIDE, Inc. 600 23,229
International Small Company Trust (continued)Shares orPrincipalAmount Value
COMMON STOCKS (continued)Japan (continued)Glory, Ltd. 1,600 $ 34,476Goldcrest Company, Ltd. 990 15,202Gree, Inc. 6,100 30,885GS Yuasa Corp. 3,000 81,671G-Tekt Corp. 1,200 16,357Gun-Ei Chemical Industry Company,
Ltd. 400 9,141GungHo Online Entertainment, Inc. 1,300 25,755Gunze, Ltd. (B) 800 30,061H.U. Group Holdings, Inc. 2,200 73,939H2O Retailing Corp. 4,900 40,698Hagihara Industries, Inc. 800 10,555Hagiwara Electric Holdings Company,
Ltd. 500 11,879Hakuto Company, Ltd. 1,300 15,059Halows Company, Ltd. 600 15,775Hamakyorex Company, Ltd. 1,000 29,387Hanwa Company, Ltd. 1,600 49,233Happinet Corp. 1,000 13,893Hazama Ando Corp. 10,090 77,474Heiwa Corp. 2,700 44,104
International Small Company Trust (continued)Shares orPrincipalAmount Value
COMMON STOCKS (continued)Japan (continued)Infomart Corp. 5,800 $ 50,139Information Services International-
Dentsu, Ltd. 800 28,407Intage Holdings, Inc. 3,100 36,497Internet Initiative Japan, Inc. 1,400 32,939Inui Global Logistics Company, Ltd. 875 8,404I-PEX, Inc. 500 9,168Iriso Electronics Company, Ltd. 1,000 44,765Iseki & Company, Ltd. (A) 1,200 17,912Ishihara Sangyo Kaisha, Ltd. 2,100 17,322Itfor, Inc. 1,000 7,526Itochu Enex Company, Ltd. 3,800 37,556Itochu-Shokuhin Company, Ltd. 600 29,763Itoham Yonekyu Holdings, Inc. (B) 3,800 25,071Itoki Corp. 2,100 7,942IwaiCosmo Holdings, Inc. 900 14,395J Front Retailing Company, Ltd. 5,500 52,466J Trust Company, Ltd. (B) 4,900 10,344JAC Recruitment Company, Ltd. 1,200 18,980Jaccs Company, Ltd. 1,600 32,865JAFCO Group Company, Ltd. (B) 1,400 83,616
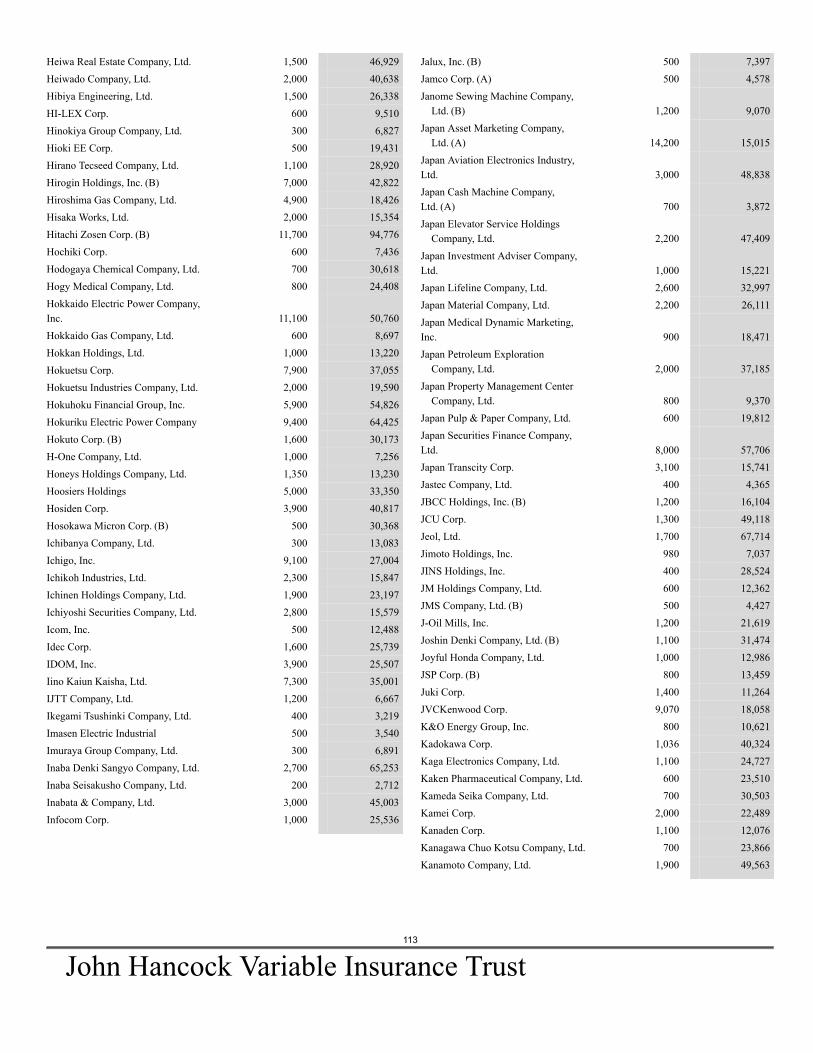
113
John Hancock Variable Insurance Trust
Heiwa Real Estate Company, Ltd. 1,500 46,929Heiwado Company, Ltd. 2,000 40,638Hibiya Engineering, Ltd. 1,500 26,338HI-LEX Corp. 600 9,510Hinokiya Group Company, Ltd. 300 6,827Hioki EE Corp. 500 19,431Hirano Tecseed Company, Ltd. 1,100 28,920Hirogin Holdings, Inc. (B) 7,000 42,822Hiroshima Gas Company, Ltd. 4,900 18,426Hisaka Works, Ltd. 2,000 15,354Hitachi Zosen Corp. (B) 11,700 94,776Hochiki Corp. 600 7,436Hodogaya Chemical Company, Ltd. 700 30,618Hogy Medical Company, Ltd. 800 24,408Hokkaido Electric Power Company,Inc. 11,100 50,760Hokkaido Gas Company, Ltd. 600 8,697Hokkan Holdings, Ltd. 1,000 13,220Hokuetsu Corp. 7,900 37,055Hokuetsu Industries Company, Ltd. 2,000 19,590Hokuhoku Financial Group, Inc. 5,900 54,826Hokuriku Electric Power Company 9,400 64,425Hokuto Corp. (B) 1,600 30,173H-One Company, Ltd. 1,000 7,256Honeys Holdings Company, Ltd. 1,350 13,230Hoosiers Holdings 5,000 33,350Hosiden Corp. 3,900 40,817Hosokawa Micron Corp. (B) 500 30,368Ichibanya Company, Ltd. 300 13,083Ichigo, Inc. 9,100 27,004Ichikoh Industries, Ltd. 2,300 15,847Ichinen Holdings Company, Ltd. 1,900 23,197Ichiyoshi Securities Company, Ltd. 2,800 15,579Icom, Inc. 500 12,488Idec Corp. 1,600 25,739IDOM, Inc. 3,900 25,507Iino Kaiun Kaisha, Ltd. 7,300 35,001IJTT Company, Ltd. 1,200 6,667Ikegami Tsushinki Company, Ltd. 400 3,219Imasen Electric Industrial 500 3,540Imuraya Group Company, Ltd. 300 6,891Inaba Denki Sangyo Company, Ltd. 2,700 65,253Inaba Seisakusho Company, Ltd. 200 2,712Inabata & Company, Ltd. 3,000 45,003Infocom Corp. 1,000 25,536
Jalux, Inc. (B) 500 7,397Jamco Corp. (A) 500 4,578Janome Sewing Machine Company,
Ltd. (B) 1,200 9,070Japan Asset Marketing Company,
Ltd. (A) 14,200 15,015Japan Aviation Electronics Industry,Ltd. 3,000 48,838Japan Cash Machine Company,Ltd. (A) 700 3,872Japan Elevator Service Holdings
Company, Ltd. 2,200 47,409Japan Investment Adviser Company,Ltd. 1,000 15,221Japan Lifeline Company, Ltd. 2,600 32,997Japan Material Company, Ltd. 2,200 26,111Japan Medical Dynamic Marketing,Inc. 900 18,471Japan Petroleum Exploration
Company, Ltd. 2,000 37,185Japan Property Management Center
Company, Ltd. 800 9,370Japan Pulp & Paper Company, Ltd. 600 19,812Japan Securities Finance Company,Ltd. 8,000 57,706Japan Transcity Corp. 3,100 15,741Jastec Company, Ltd. 400 4,365JBCC Holdings, Inc. (B) 1,200 16,104JCU Corp. 1,300 49,118Jeol, Ltd. 1,700 67,714Jimoto Holdings, Inc. 980 7,037JINS Holdings, Inc. 400 28,524JM Holdings Company, Ltd. 600 12,362JMS Company, Ltd. (B) 500 4,427J-Oil Mills, Inc. 1,200 21,619Joshin Denki Company, Ltd. (B) 1,100 31,474Joyful Honda Company, Ltd. 1,000 12,986JSP Corp. (B) 800 13,459Juki Corp. 1,400 11,264JVCKenwood Corp. 9,070 18,058K&O Energy Group, Inc. 800 10,621Kadokawa Corp. 1,036 40,324Kaga Electronics Company, Ltd. 1,100 24,727Kaken Pharmaceutical Company, Ltd. 600 23,510Kameda Seika Company, Ltd. 700 30,503Kamei Corp. 2,000 22,489Kanaden Corp. 1,100 12,076Kanagawa Chuo Kotsu Company, Ltd. 700 23,866Kanamoto Company, Ltd. 1,900 49,563
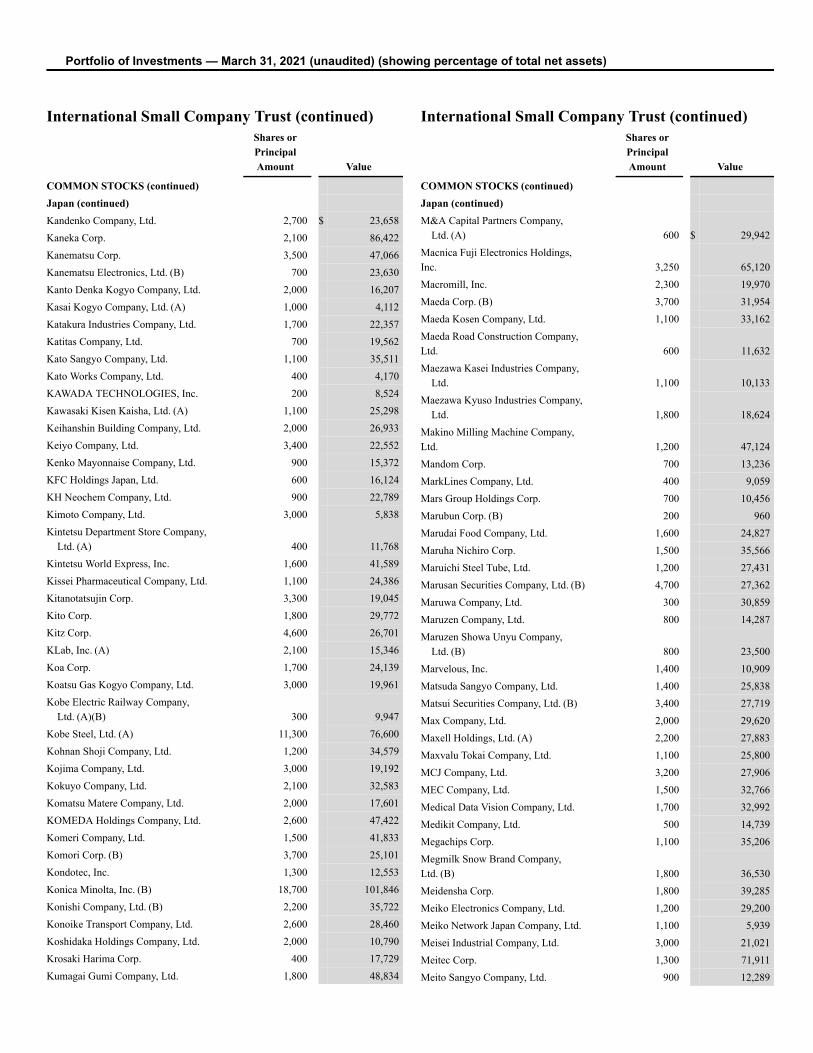
Portfolio of Investments — March 31, 2021 (unaudited) (showing percentage of total net assets)
International Small Company Trust (continued)Shares orPrincipalAmount Value
COMMON STOCKS (continued)Japan (continued)Kandenko Company, Ltd. 2,700 $ 23,658Kaneka Corp. 2,100 86,422Kanematsu Corp. 3,500 47,066Kanematsu Electronics, Ltd. (B) 700 23,630Kanto Denka Kogyo Company, Ltd. 2,000 16,207Kasai Kogyo Company, Ltd. (A) 1,000 4,112Katakura Industries Company, Ltd. 1,700 22,357Katitas Company, Ltd. 700 19,562Kato Sangyo Company, Ltd. 1,100 35,511Kato Works Company, Ltd. 400 4,170KAWADA TECHNOLOGIES, Inc. 200 8,524Kawasaki Kisen Kaisha, Ltd. (A) 1,100 25,298Keihanshin Building Company, Ltd. 2,000 26,933Keiyo Company, Ltd. 3,400 22,552Kenko Mayonnaise Company, Ltd. 900 15,372KFC Holdings Japan, Ltd. 600 16,124KH Neochem Company, Ltd. 900 22,789Kimoto Company, Ltd. 3,000 5,838Kintetsu Department Store Company,
Ltd. (A) 400 11,768Kintetsu World Express, Inc. 1,600 41,589Kissei Pharmaceutical Company, Ltd. 1,100 24,386Kitanotatsujin Corp. 3,300 19,045Kito Corp. 1,800 29,772Kitz Corp. 4,600 26,701KLab, Inc. (A) 2,100 15,346Koa Corp. 1,700 24,139Koatsu Gas Kogyo Company, Ltd. 3,000 19,961Kobe Electric Railway Company,
Ltd. (A)(B) 300 9,947Kobe Steel, Ltd. (A) 11,300 76,600Kohnan Shoji Company, Ltd. 1,200 34,579Kojima Company, Ltd. 3,000 19,192Kokuyo Company, Ltd. 2,100 32,583Komatsu Matere Company, Ltd. 2,000 17,601KOMEDA Holdings Company, Ltd. 2,600 47,422Komeri Company, Ltd. 1,500 41,833Komori Corp. (B) 3,700 25,101Kondotec, Inc. 1,300 12,553Konica Minolta, Inc. (B) 18,700 101,846Konishi Company, Ltd. (B) 2,200 35,722Konoike Transport Company, Ltd. 2,600 28,460Koshidaka Holdings Company, Ltd. 2,000 10,790Krosaki Harima Corp. 400 17,729Kumagai Gumi Company, Ltd. 1,800 48,834
International Small Company Trust (continued)Shares orPrincipalAmount Value
COMMON STOCKS (continued)Japan (continued)M&A Capital Partners Company,
Ltd. (A) 600 $ 29,942Macnica Fuji Electronics Holdings,Inc. 3,250 65,120Macromill, Inc. 2,300 19,970Maeda Corp. (B) 3,700 31,954Maeda Kosen Company, Ltd. 1,100 33,162Maeda Road Construction Company,Ltd. 600 11,632Maezawa Kasei Industries Company,
Ltd. 1,100 10,133Maezawa Kyuso Industries Company,
Ltd. 1,800 18,624Makino Milling Machine Company,Ltd. 1,200 47,124Mandom Corp. 700 13,236MarkLines Company, Ltd. 400 9,059Mars Group Holdings Corp. 700 10,456Marubun Corp. (B) 200 960Marudai Food Company, Ltd. 1,600 24,827Maruha Nichiro Corp. 1,500 35,566Maruichi Steel Tube, Ltd. 1,200 27,431Marusan Securities Company, Ltd. (B) 4,700 27,362Maruwa Company, Ltd. 300 30,859Maruzen Company, Ltd. 800 14,287Maruzen Showa Unyu Company,
Ltd. (B) 800 23,500Marvelous, Inc. 1,400 10,909Matsuda Sangyo Company, Ltd. 1,400 25,838Matsui Securities Company, Ltd. (B) 3,400 27,719Max Company, Ltd. 2,000 29,620Maxell Holdings, Ltd. (A) 2,200 27,883Maxvalu Tokai Company, Ltd. 1,100 25,800MCJ Company, Ltd. 3,200 27,906MEC Company, Ltd. 1,500 32,766Medical Data Vision Company, Ltd. 1,700 32,992Medikit Company, Ltd. 500 14,739Megachips Corp. 1,100 35,206Megmilk Snow Brand Company,Ltd. (B) 1,800 36,530Meidensha Corp. 1,800 39,285Meiko Electronics Company, Ltd. 1,200 29,200Meiko Network Japan Company, Ltd. 1,100 5,939Meisei Industrial Company, Ltd. 3,000 21,021Meitec Corp. 1,300 71,911Meito Sangyo Company, Ltd. 900 12,289
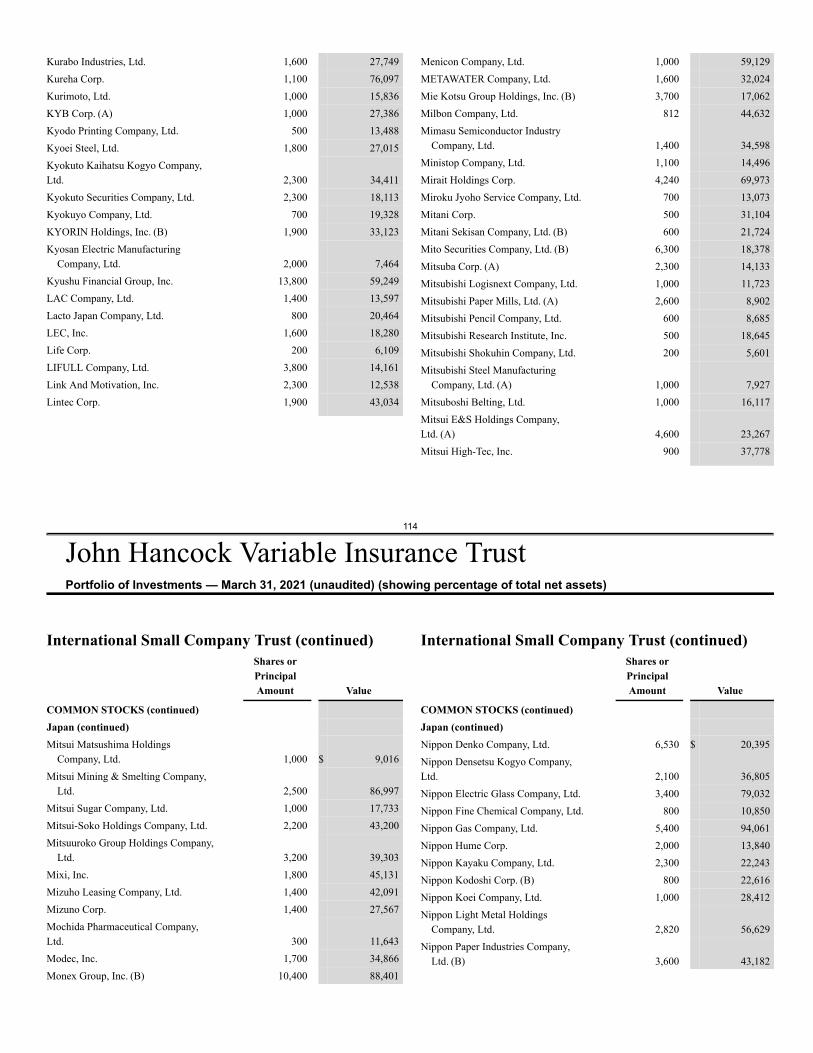
114
John Hancock Variable Insurance TrustPortfolio of Investments — March 31, 2021 (unaudited) (showing percentage of total net assets)
Kurabo Industries, Ltd. 1,600 27,749Kureha Corp. 1,100 76,097Kurimoto, Ltd. 1,000 15,836KYB Corp. (A) 1,000 27,386Kyodo Printing Company, Ltd. 500 13,488Kyoei Steel, Ltd. 1,800 27,015Kyokuto Kaihatsu Kogyo Company,Ltd. 2,300 34,411Kyokuto Securities Company, Ltd. 2,300 18,113Kyokuyo Company, Ltd. 700 19,328KYORIN Holdings, Inc. (B) 1,900 33,123Kyosan Electric Manufacturing
Company, Ltd. 2,000 7,464Kyushu Financial Group, Inc. 13,800 59,249LAC Company, Ltd. 1,400 13,597Lacto Japan Company, Ltd. 800 20,464LEC, Inc. 1,600 18,280Life Corp. 200 6,109LIFULL Company, Ltd. 3,800 14,161Link And Motivation, Inc. 2,300 12,538Lintec Corp. 1,900 43,034
Menicon Company, Ltd. 1,000 59,129METAWATER Company, Ltd. 1,600 32,024Mie Kotsu Group Holdings, Inc. (B) 3,700 17,062Milbon Company, Ltd. 812 44,632Mimasu Semiconductor Industry
Company, Ltd. 1,400 34,598Ministop Company, Ltd. 1,100 14,496Mirait Holdings Corp. 4,240 69,973Miroku Jyoho Service Company, Ltd. 700 13,073Mitani Corp. 500 31,104Mitani Sekisan Company, Ltd. (B) 600 21,724Mito Securities Company, Ltd. (B) 6,300 18,378Mitsuba Corp. (A) 2,300 14,133Mitsubishi Logisnext Company, Ltd. 1,000 11,723Mitsubishi Paper Mills, Ltd. (A) 2,600 8,902Mitsubishi Pencil Company, Ltd. 600 8,685Mitsubishi Research Institute, Inc. 500 18,645Mitsubishi Shokuhin Company, Ltd. 200 5,601Mitsubishi Steel Manufacturing
Company, Ltd. (A) 1,000 7,927Mitsuboshi Belting, Ltd. 1,000 16,117Mitsui E&S Holdings Company,Ltd. (A) 4,600 23,267Mitsui High-Tec, Inc. 900 37,778
International Small Company Trust (continued)Shares orPrincipalAmount Value
COMMON STOCKS (continued)Japan (continued)Mitsui Matsushima Holdings
Company, Ltd. 1,000 $ 9,016Mitsui Mining & Smelting Company,
Ltd. 2,500 86,997Mitsui Sugar Company, Ltd. 1,000 17,733Mitsui-Soko Holdings Company, Ltd. 2,200 43,200Mitsuuroko Group Holdings Company,
Ltd. 3,200 39,303Mixi, Inc. 1,800 45,131Mizuho Leasing Company, Ltd. 1,400 42,091Mizuno Corp. 1,400 27,567Mochida Pharmaceutical Company,Ltd. 300 11,643Modec, Inc. 1,700 34,866Monex Group, Inc. (B) 10,400 88,401
International Small Company Trust (continued)Shares orPrincipalAmount Value
COMMON STOCKS (continued)Japan (continued)Nippon Denko Company, Ltd. 6,530 $ 20,395Nippon Densetsu Kogyo Company,Ltd. 2,100 36,805Nippon Electric Glass Company, Ltd. 3,400 79,032Nippon Fine Chemical Company, Ltd. 800 10,850Nippon Gas Company, Ltd. 5,400 94,061Nippon Hume Corp. 2,000 13,840Nippon Kayaku Company, Ltd. 2,300 22,243Nippon Kodoshi Corp. (B) 800 22,616Nippon Koei Company, Ltd. 1,000 28,412Nippon Light Metal Holdings
Company, Ltd. 2,820 56,629Nippon Paper Industries Company,
Ltd. (B) 3,600 43,182
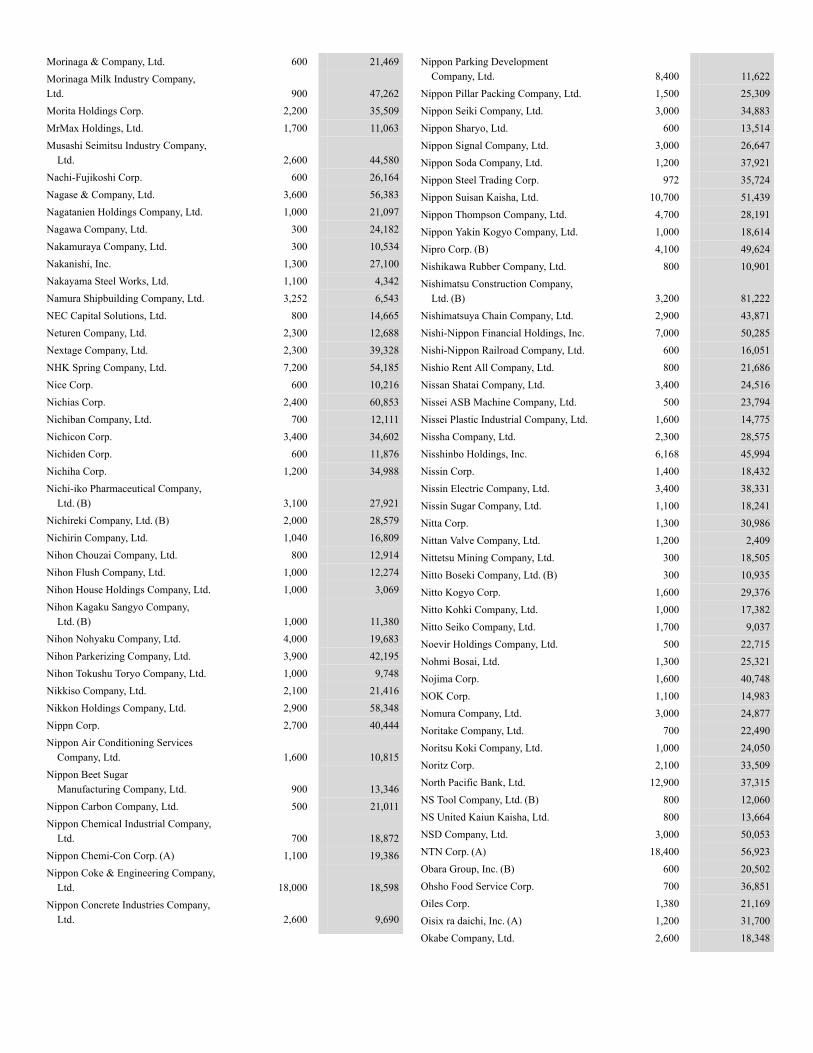
Morinaga & Company, Ltd. 600 21,469Morinaga Milk Industry Company,Ltd. 900 47,262Morita Holdings Corp. 2,200 35,509MrMax Holdings, Ltd. 1,700 11,063Musashi Seimitsu Industry Company,
Ltd. 2,600 44,580Nachi-Fujikoshi Corp. 600 26,164Nagase & Company, Ltd. 3,600 56,383Nagatanien Holdings Company, Ltd. 1,000 21,097Nagawa Company, Ltd. 300 24,182Nakamuraya Company, Ltd. 300 10,534Nakanishi, Inc. 1,300 27,100Nakayama Steel Works, Ltd. 1,100 4,342Namura Shipbuilding Company, Ltd. 3,252 6,543NEC Capital Solutions, Ltd. 800 14,665Neturen Company, Ltd. 2,300 12,688Nextage Company, Ltd. 2,300 39,328NHK Spring Company, Ltd. 7,200 54,185Nice Corp. 600 10,216Nichias Corp. 2,400 60,853Nichiban Company, Ltd. 700 12,111Nichicon Corp. 3,400 34,602Nichiden Corp. 600 11,876Nichiha Corp. 1,200 34,988Nichi-iko Pharmaceutical Company,
Ltd. (B) 3,100 27,921Nichireki Company, Ltd. (B) 2,000 28,579Nichirin Company, Ltd. 1,040 16,809Nihon Chouzai Company, Ltd. 800 12,914Nihon Flush Company, Ltd. 1,000 12,274Nihon House Holdings Company, Ltd. 1,000 3,069Nihon Kagaku Sangyo Company,
Ltd. (B) 1,000 11,380Nihon Nohyaku Company, Ltd. 4,000 19,683Nihon Parkerizing Company, Ltd. 3,900 42,195Nihon Tokushu Toryo Company, Ltd. 1,000 9,748Nikkiso Company, Ltd. 2,100 21,416Nikkon Holdings Company, Ltd. 2,900 58,348Nippn Corp. 2,700 40,444Nippon Air Conditioning Services
Company, Ltd. 1,600 10,815Nippon Beet Sugar
Manufacturing Company, Ltd. 900 13,346Nippon Carbon Company, Ltd. 500 21,011Nippon Chemical Industrial Company,
Ltd. 700 18,872Nippon Chemi-Con Corp. (A) 1,100 19,386Nippon Coke & Engineering Company,
Ltd. 18,000 18,598Nippon Concrete Industries Company,
Ltd. 2,600 9,690
Nippon Parking DevelopmentCompany, Ltd. 8,400 11,622
Nippon Pillar Packing Company, Ltd. 1,500 25,309Nippon Seiki Company, Ltd. 3,000 34,883Nippon Sharyo, Ltd. 600 13,514Nippon Signal Company, Ltd. 3,000 26,647Nippon Soda Company, Ltd. 1,200 37,921Nippon Steel Trading Corp. 972 35,724Nippon Suisan Kaisha, Ltd. 10,700 51,439Nippon Thompson Company, Ltd. 4,700 28,191Nippon Yakin Kogyo Company, Ltd. 1,000 18,614Nipro Corp. (B) 4,100 49,624Nishikawa Rubber Company, Ltd. 800 10,901Nishimatsu Construction Company,
Ltd. (B) 3,200 81,222Nishimatsuya Chain Company, Ltd. 2,900 43,871Nishi-Nippon Financial Holdings, Inc. 7,000 50,285Nishi-Nippon Railroad Company, Ltd. 600 16,051Nishio Rent All Company, Ltd. 800 21,686Nissan Shatai Company, Ltd. 3,400 24,516Nissei ASB Machine Company, Ltd. 500 23,794Nissei Plastic Industrial Company, Ltd. 1,600 14,775Nissha Company, Ltd. 2,300 28,575Nisshinbo Holdings, Inc. 6,168 45,994Nissin Corp. 1,400 18,432Nissin Electric Company, Ltd. 3,400 38,331Nissin Sugar Company, Ltd. 1,100 18,241Nitta Corp. 1,300 30,986Nittan Valve Company, Ltd. 1,200 2,409Nittetsu Mining Company, Ltd. 300 18,505Nitto Boseki Company, Ltd. (B) 300 10,935Nitto Kogyo Corp. 1,600 29,376Nitto Kohki Company, Ltd. 1,000 17,382Nitto Seiko Company, Ltd. 1,700 9,037Noevir Holdings Company, Ltd. 500 22,715Nohmi Bosai, Ltd. 1,300 25,321Nojima Corp. 1,600 40,748NOK Corp. 1,100 14,983Nomura Company, Ltd. 3,000 24,877Noritake Company, Ltd. 700 22,490Noritsu Koki Company, Ltd. 1,000 24,050Noritz Corp. 2,100 33,509North Pacific Bank, Ltd. 12,900 37,315NS Tool Company, Ltd. (B) 800 12,060NS United Kaiun Kaisha, Ltd. 800 13,664NSD Company, Ltd. 3,000 50,053NTN Corp. (A) 18,400 56,923Obara Group, Inc. (B) 600 20,502Ohsho Food Service Corp. 700 36,851Oiles Corp. 1,380 21,169Oisix ra daichi, Inc. (A) 1,200 31,700Okabe Company, Ltd. 2,600 18,348
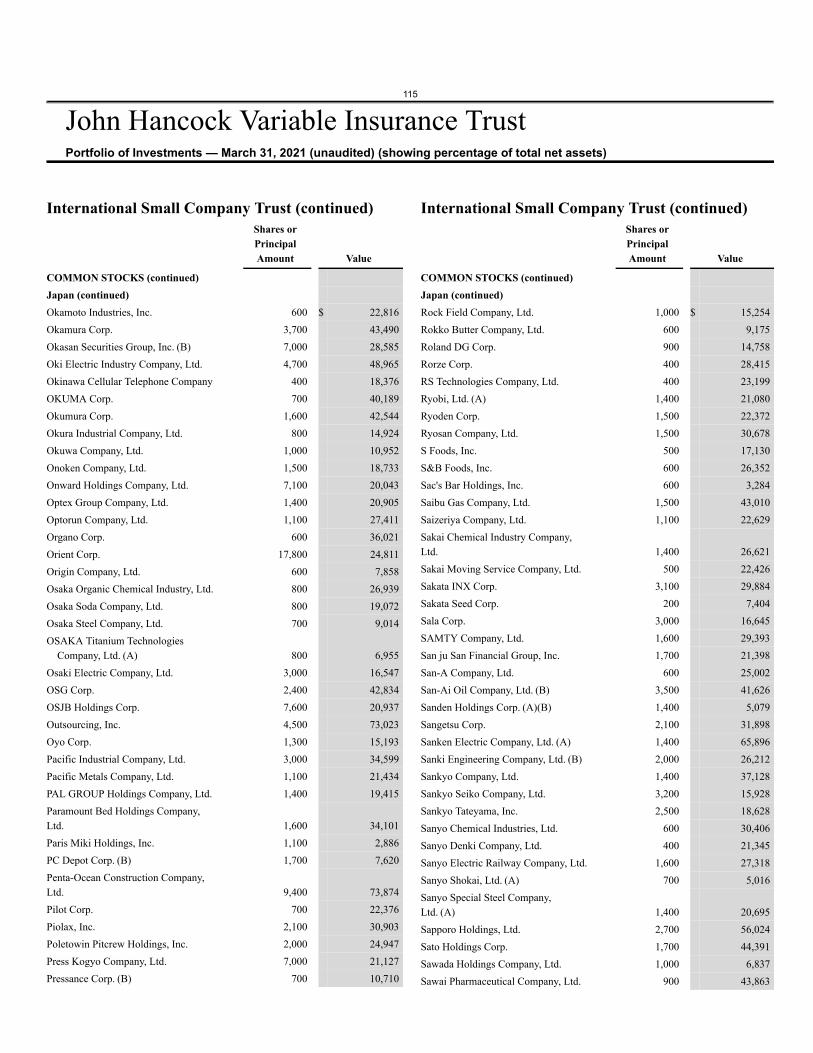
115
John Hancock Variable Insurance TrustPortfolio of Investments — March 31, 2021 (unaudited) (showing percentage of total net assets)
International Small Company Trust (continued)Shares orPrincipalAmount Value
COMMON STOCKS (continued)Japan (continued)Okamoto Industries, Inc. 600 $ 22,816Okamura Corp. 3,700 43,490Okasan Securities Group, Inc. (B) 7,000 28,585Oki Electric Industry Company, Ltd. 4,700 48,965Okinawa Cellular Telephone Company 400 18,376OKUMA Corp. 700 40,189Okumura Corp. 1,600 42,544Okura Industrial Company, Ltd. 800 14,924Okuwa Company, Ltd. 1,000 10,952Onoken Company, Ltd. 1,500 18,733Onward Holdings Company, Ltd. 7,100 20,043Optex Group Company, Ltd. 1,400 20,905Optorun Company, Ltd. 1,100 27,411Organo Corp. 600 36,021Orient Corp. 17,800 24,811Origin Company, Ltd. 600 7,858Osaka Organic Chemical Industry, Ltd. 800 26,939Osaka Soda Company, Ltd. 800 19,072Osaka Steel Company, Ltd. 700 9,014OSAKA Titanium Technologies
Company, Ltd. (A) 800 6,955Osaki Electric Company, Ltd. 3,000 16,547OSG Corp. 2,400 42,834OSJB Holdings Corp. 7,600 20,937Outsourcing, Inc. 4,500 73,023Oyo Corp. 1,300 15,193Pacific Industrial Company, Ltd. 3,000 34,599Pacific Metals Company, Ltd. 1,100 21,434PAL GROUP Holdings Company, Ltd. 1,400 19,415Paramount Bed Holdings Company,Ltd. 1,600 34,101Paris Miki Holdings, Inc. 1,100 2,886PC Depot Corp. (B) 1,700 7,620Penta-Ocean Construction Company,Ltd. 9,400 73,874Pilot Corp. 700 22,376Piolax, Inc. 2,100 30,903Poletowin Pitcrew Holdings, Inc. 2,000 24,947Press Kogyo Company, Ltd. 7,000 21,127Pressance Corp. (B) 700 10,710
International Small Company Trust (continued)Shares orPrincipalAmount Value
COMMON STOCKS (continued)Japan (continued)Rock Field Company, Ltd. 1,000 $ 15,254Rokko Butter Company, Ltd. 600 9,175Roland DG Corp. 900 14,758Rorze Corp. 400 28,415RS Technologies Company, Ltd. 400 23,199Ryobi, Ltd. (A) 1,400 21,080Ryoden Corp. 1,500 22,372Ryosan Company, Ltd. 1,500 30,678S Foods, Inc. 500 17,130S&B Foods, Inc. 600 26,352Sac's Bar Holdings, Inc. 600 3,284Saibu Gas Company, Ltd. 1,500 43,010Saizeriya Company, Ltd. 1,100 22,629Sakai Chemical Industry Company,Ltd. 1,400 26,621Sakai Moving Service Company, Ltd. 500 22,426Sakata INX Corp. 3,100 29,884Sakata Seed Corp. 200 7,404Sala Corp. 3,000 16,645SAMTY Company, Ltd. 1,600 29,393San ju San Financial Group, Inc. 1,700 21,398San-A Company, Ltd. 600 25,002San-Ai Oil Company, Ltd. (B) 3,500 41,626Sanden Holdings Corp. (A)(B) 1,400 5,079Sangetsu Corp. 2,100 31,898Sanken Electric Company, Ltd. (A) 1,400 65,896Sanki Engineering Company, Ltd. (B) 2,000 26,212Sankyo Company, Ltd. 1,400 37,128Sankyo Seiko Company, Ltd. 3,200 15,928Sankyo Tateyama, Inc. 2,500 18,628Sanyo Chemical Industries, Ltd. 600 30,406Sanyo Denki Company, Ltd. 400 21,345Sanyo Electric Railway Company, Ltd. 1,600 27,318Sanyo Shokai, Ltd. (A) 700 5,016Sanyo Special Steel Company,Ltd. (A) 1,400 20,695Sapporo Holdings, Ltd. 2,700 56,024Sato Holdings Corp. 1,700 44,391Sawada Holdings Company, Ltd. 1,000 6,837Sawai Pharmaceutical Company, Ltd. 900 43,863
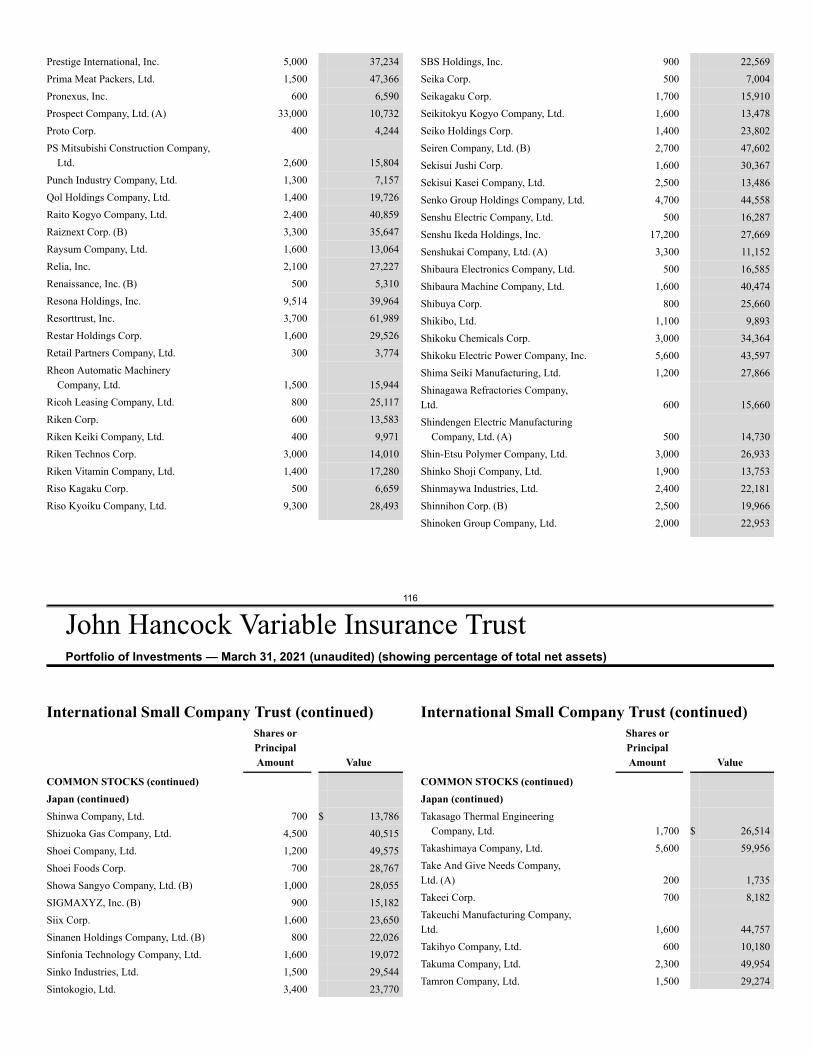
116
John Hancock Variable Insurance TrustPortfolio of Investments — March 31, 2021 (unaudited) (showing percentage of total net assets)
Prestige International, Inc. 5,000 37,234Prima Meat Packers, Ltd. 1,500 47,366Pronexus, Inc. 600 6,590Prospect Company, Ltd. (A) 33,000 10,732Proto Corp. 400 4,244PS Mitsubishi Construction Company,
Ltd. 2,600 15,804Punch Industry Company, Ltd. 1,300 7,157Qol Holdings Company, Ltd. 1,400 19,726Raito Kogyo Company, Ltd. 2,400 40,859Raiznext Corp. (B) 3,300 35,647Raysum Company, Ltd. 1,600 13,064Relia, Inc. 2,100 27,227Renaissance, Inc. (B) 500 5,310Resona Holdings, Inc. 9,514 39,964Resorttrust, Inc. 3,700 61,989Restar Holdings Corp. 1,600 29,526Retail Partners Company, Ltd. 300 3,774Rheon Automatic Machinery
Company, Ltd. 1,500 15,944Ricoh Leasing Company, Ltd. 800 25,117Riken Corp. 600 13,583Riken Keiki Company, Ltd. 400 9,971Riken Technos Corp. 3,000 14,010Riken Vitamin Company, Ltd. 1,400 17,280Riso Kagaku Corp. 500 6,659Riso Kyoiku Company, Ltd. 9,300 28,493
SBS Holdings, Inc. 900 22,569Seika Corp. 500 7,004Seikagaku Corp. 1,700 15,910Seikitokyu Kogyo Company, Ltd. 1,600 13,478Seiko Holdings Corp. 1,400 23,802Seiren Company, Ltd. (B) 2,700 47,602Sekisui Jushi Corp. 1,600 30,367Sekisui Kasei Company, Ltd. 2,500 13,486Senko Group Holdings Company, Ltd. 4,700 44,558Senshu Electric Company, Ltd. 500 16,287Senshu Ikeda Holdings, Inc. 17,200 27,669Senshukai Company, Ltd. (A) 3,300 11,152Shibaura Electronics Company, Ltd. 500 16,585Shibaura Machine Company, Ltd. 1,600 40,474Shibuya Corp. 800 25,660Shikibo, Ltd. 1,100 9,893Shikoku Chemicals Corp. 3,000 34,364Shikoku Electric Power Company, Inc. 5,600 43,597Shima Seiki Manufacturing, Ltd. 1,200 27,866Shinagawa Refractories Company,Ltd. 600 15,660Shindengen Electric Manufacturing
Company, Ltd. (A) 500 14,730Shin-Etsu Polymer Company, Ltd. 3,000 26,933Shinko Shoji Company, Ltd. 1,900 13,753Shinmaywa Industries, Ltd. 2,400 22,181Shinnihon Corp. (B) 2,500 19,966Shinoken Group Company, Ltd. 2,000 22,953
International Small Company Trust (continued)Shares orPrincipalAmount Value
COMMON STOCKS (continued)Japan (continued)Shinwa Company, Ltd. 700 $ 13,786Shizuoka Gas Company, Ltd. 4,500 40,515Shoei Company, Ltd. 1,200 49,575Shoei Foods Corp. 700 28,767Showa Sangyo Company, Ltd. (B) 1,000 28,055SIGMAXYZ, Inc. (B) 900 15,182Siix Corp. 1,600 23,650Sinanen Holdings Company, Ltd. (B) 800 22,026Sinfonia Technology Company, Ltd. 1,600 19,072Sinko Industries, Ltd. 1,500 29,544Sintokogio, Ltd. 3,400 23,770
International Small Company Trust (continued)Shares orPrincipalAmount Value
COMMON STOCKS (continued)Japan (continued)Takasago Thermal Engineering
Company, Ltd. 1,700 $ 26,514Takashimaya Company, Ltd. 5,600 59,956Take And Give Needs Company,Ltd. (A) 200 1,735Takeei Corp. 700 8,182Takeuchi Manufacturing Company,Ltd. 1,600 44,757Takihyo Company, Ltd. 600 10,180Takuma Company, Ltd. 2,300 49,954Tamron Company, Ltd. 1,500 29,274
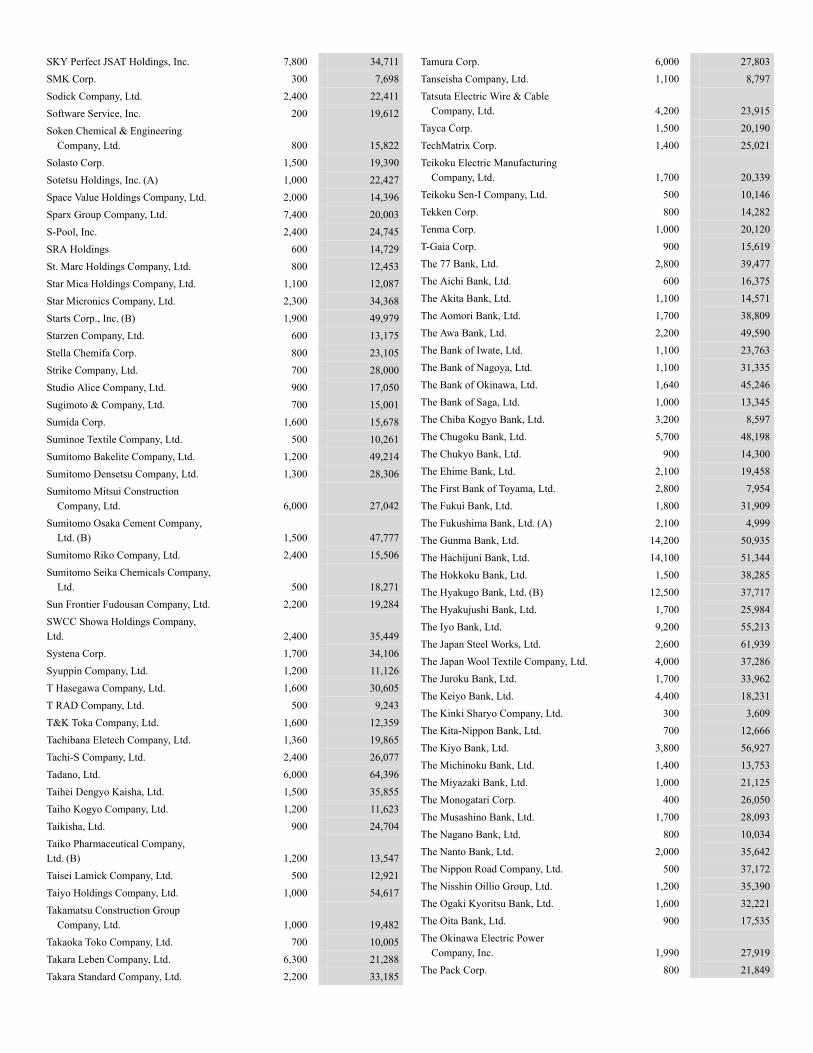
SKY Perfect JSAT Holdings, Inc. 7,800 34,711SMK Corp. 300 7,698Sodick Company, Ltd. 2,400 22,411Software Service, Inc. 200 19,612Soken Chemical & Engineering
Company, Ltd. 800 15,822Solasto Corp. 1,500 19,390Sotetsu Holdings, Inc. (A) 1,000 22,427Space Value Holdings Company, Ltd. 2,000 14,396Sparx Group Company, Ltd. 7,400 20,003S-Pool, Inc. 2,400 24,745SRA Holdings 600 14,729St. Marc Holdings Company, Ltd. 800 12,453Star Mica Holdings Company, Ltd. 1,100 12,087Star Micronics Company, Ltd. 2,300 34,368Starts Corp., Inc. (B) 1,900 49,979Starzen Company, Ltd. 600 13,175Stella Chemifa Corp. 800 23,105Strike Company, Ltd. 700 28,000Studio Alice Company, Ltd. 900 17,050Sugimoto & Company, Ltd. 700 15,001Sumida Corp. 1,600 15,678Suminoe Textile Company, Ltd. 500 10,261Sumitomo Bakelite Company, Ltd. 1,200 49,214Sumitomo Densetsu Company, Ltd. 1,300 28,306Sumitomo Mitsui Construction
Company, Ltd. 6,000 27,042Sumitomo Osaka Cement Company,
Ltd. (B) 1,500 47,777Sumitomo Riko Company, Ltd. 2,400 15,506Sumitomo Seika Chemicals Company,
Ltd. 500 18,271Sun Frontier Fudousan Company, Ltd. 2,200 19,284SWCC Showa Holdings Company,Ltd. 2,400 35,449Systena Corp. 1,700 34,106Syuppin Company, Ltd. 1,200 11,126T Hasegawa Company, Ltd. 1,600 30,605T RAD Company, Ltd. 500 9,243T&K Toka Company, Ltd. 1,600 12,359Tachibana Eletech Company, Ltd. 1,360 19,865Tachi-S Company, Ltd. 2,400 26,077Tadano, Ltd. 6,000 64,396Taihei Dengyo Kaisha, Ltd. 1,500 35,855Taiho Kogyo Company, Ltd. 1,200 11,623Taikisha, Ltd. 900 24,704Taiko Pharmaceutical Company,Ltd. (B) 1,200 13,547Taisei Lamick Company, Ltd. 500 12,921Taiyo Holdings Company, Ltd. 1,000 54,617Takamatsu Construction Group
Company, Ltd. 1,000 19,482Takaoka Toko Company, Ltd. 700 10,005Takara Leben Company, Ltd. 6,300 21,288Takara Standard Company, Ltd. 2,200 33,185
Tamura Corp. 6,000 27,803Tanseisha Company, Ltd. 1,100 8,797Tatsuta Electric Wire & Cable
Company, Ltd. 4,200 23,915Tayca Corp. 1,500 20,190TechMatrix Corp. 1,400 25,021Teikoku Electric Manufacturing
Company, Ltd. 1,700 20,339Teikoku Sen-I Company, Ltd. 500 10,146Tekken Corp. 800 14,282Tenma Corp. 1,000 20,120T-Gaia Corp. 900 15,619The 77 Bank, Ltd. 2,800 39,477The Aichi Bank, Ltd. 600 16,375The Akita Bank, Ltd. 1,100 14,571The Aomori Bank, Ltd. 1,700 38,809The Awa Bank, Ltd. 2,200 49,590The Bank of Iwate, Ltd. 1,100 23,763The Bank of Nagoya, Ltd. 1,100 31,335The Bank of Okinawa, Ltd. 1,640 45,246The Bank of Saga, Ltd. 1,000 13,345The Chiba Kogyo Bank, Ltd. 3,200 8,597The Chugoku Bank, Ltd. 5,700 48,198The Chukyo Bank, Ltd. 900 14,300The Ehime Bank, Ltd. 2,100 19,458The First Bank of Toyama, Ltd. 2,800 7,954The Fukui Bank, Ltd. 1,800 31,909The Fukushima Bank, Ltd. (A) 2,100 4,999The Gunma Bank, Ltd. 14,200 50,935The Hachijuni Bank, Ltd. 14,100 51,344The Hokkoku Bank, Ltd. 1,500 38,285The Hyakugo Bank, Ltd. (B) 12,500 37,717The Hyakujushi Bank, Ltd. 1,700 25,984The Iyo Bank, Ltd. 9,200 55,213The Japan Steel Works, Ltd. 2,600 61,939The Japan Wool Textile Company, Ltd. 4,000 37,286The Juroku Bank, Ltd. 1,700 33,962The Keiyo Bank, Ltd. 4,400 18,231The Kinki Sharyo Company, Ltd. 300 3,609The Kita-Nippon Bank, Ltd. 700 12,666The Kiyo Bank, Ltd. 3,800 56,927The Michinoku Bank, Ltd. 1,400 13,753The Miyazaki Bank, Ltd. 1,000 21,125The Monogatari Corp. 400 26,050The Musashino Bank, Ltd. 1,700 28,093The Nagano Bank, Ltd. 800 10,034The Nanto Bank, Ltd. 2,000 35,642The Nippon Road Company, Ltd. 500 37,172The Nisshin Oillio Group, Ltd. 1,200 35,390The Ogaki Kyoritsu Bank, Ltd. 1,600 32,221The Oita Bank, Ltd. 900 17,535The Okinawa Electric Power
Company, Inc. 1,990 27,919The Pack Corp. 800 21,849
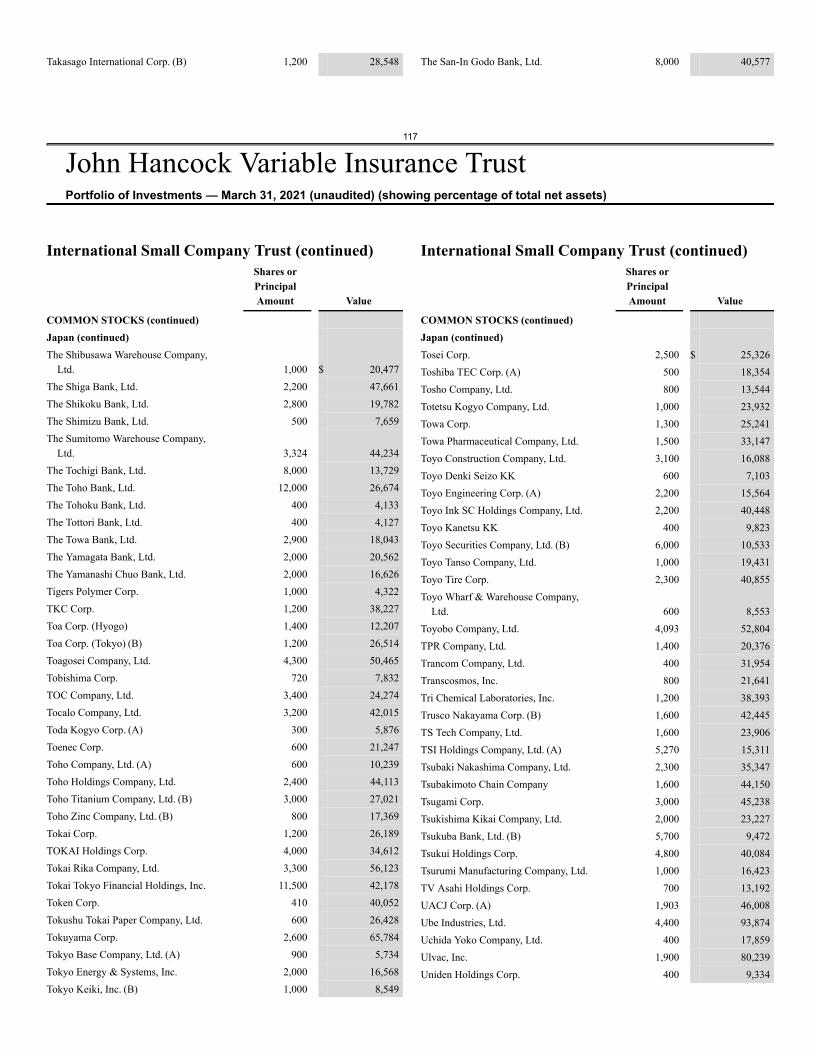
117
John Hancock Variable Insurance TrustPortfolio of Investments — March 31, 2021 (unaudited) (showing percentage of total net assets)
Takasago International Corp. (B) 1,200 28,548 The San-In Godo Bank, Ltd. 8,000 40,577
International Small Company Trust (continued)Shares orPrincipalAmount Value
COMMON STOCKS (continued)Japan (continued)The Shibusawa Warehouse Company,
Ltd. 1,000 $ 20,477The Shiga Bank, Ltd. 2,200 47,661The Shikoku Bank, Ltd. 2,800 19,782The Shimizu Bank, Ltd. 500 7,659The Sumitomo Warehouse Company,
Ltd. 3,324 44,234The Tochigi Bank, Ltd. 8,000 13,729The Toho Bank, Ltd. 12,000 26,674The Tohoku Bank, Ltd. 400 4,133The Tottori Bank, Ltd. 400 4,127The Towa Bank, Ltd. 2,900 18,043The Yamagata Bank, Ltd. 2,000 20,562The Yamanashi Chuo Bank, Ltd. 2,000 16,626Tigers Polymer Corp. 1,000 4,322TKC Corp. 1,200 38,227Toa Corp. (Hyogo) 1,400 12,207Toa Corp. (Tokyo) (B) 1,200 26,514Toagosei Company, Ltd. 4,300 50,465Tobishima Corp. 720 7,832TOC Company, Ltd. 3,400 24,274Tocalo Company, Ltd. 3,200 42,015Toda Kogyo Corp. (A) 300 5,876Toenec Corp. 600 21,247Toho Company, Ltd. (A) 600 10,239Toho Holdings Company, Ltd. 2,400 44,113Toho Titanium Company, Ltd. (B) 3,000 27,021Toho Zinc Company, Ltd. (B) 800 17,369Tokai Corp. 1,200 26,189TOKAI Holdings Corp. 4,000 34,612Tokai Rika Company, Ltd. 3,300 56,123Tokai Tokyo Financial Holdings, Inc. 11,500 42,178Token Corp. 410 40,052Tokushu Tokai Paper Company, Ltd. 600 26,428Tokuyama Corp. 2,600 65,784Tokyo Base Company, Ltd. (A) 900 5,734Tokyo Energy & Systems, Inc. 2,000 16,568Tokyo Keiki, Inc. (B) 1,000 8,549
International Small Company Trust (continued)Shares orPrincipalAmount Value
COMMON STOCKS (continued)Japan (continued)Tosei Corp. 2,500 $ 25,326Toshiba TEC Corp. (A) 500 18,354Tosho Company, Ltd. 800 13,544Totetsu Kogyo Company, Ltd. 1,000 23,932Towa Corp. 1,300 25,241Towa Pharmaceutical Company, Ltd. 1,500 33,147Toyo Construction Company, Ltd. 3,100 16,088Toyo Denki Seizo KK 600 7,103Toyo Engineering Corp. (A) 2,200 15,564Toyo Ink SC Holdings Company, Ltd. 2,200 40,448Toyo Kanetsu KK 400 9,823Toyo Securities Company, Ltd. (B) 6,000 10,533Toyo Tanso Company, Ltd. 1,000 19,431Toyo Tire Corp. 2,300 40,855Toyo Wharf & Warehouse Company,
Ltd. 600 8,553Toyobo Company, Ltd. 4,093 52,804TPR Company, Ltd. 1,400 20,376Trancom Company, Ltd. 400 31,954Transcosmos, Inc. 800 21,641Tri Chemical Laboratories, Inc. 1,200 38,393Trusco Nakayama Corp. (B) 1,600 42,445TS Tech Company, Ltd. 1,600 23,906TSI Holdings Company, Ltd. (A) 5,270 15,311Tsubaki Nakashima Company, Ltd. 2,300 35,347Tsubakimoto Chain Company 1,600 44,150Tsugami Corp. 3,000 45,238Tsukishima Kikai Company, Ltd. 2,000 23,227Tsukuba Bank, Ltd. (B) 5,700 9,472Tsukui Holdings Corp. 4,800 40,084Tsurumi Manufacturing Company, Ltd. 1,000 16,423TV Asahi Holdings Corp. 700 13,192UACJ Corp. (A) 1,903 46,008Ube Industries, Ltd. 4,400 93,874Uchida Yoko Company, Ltd. 400 17,859Ulvac, Inc. 1,900 80,239Uniden Holdings Corp. 400 9,334
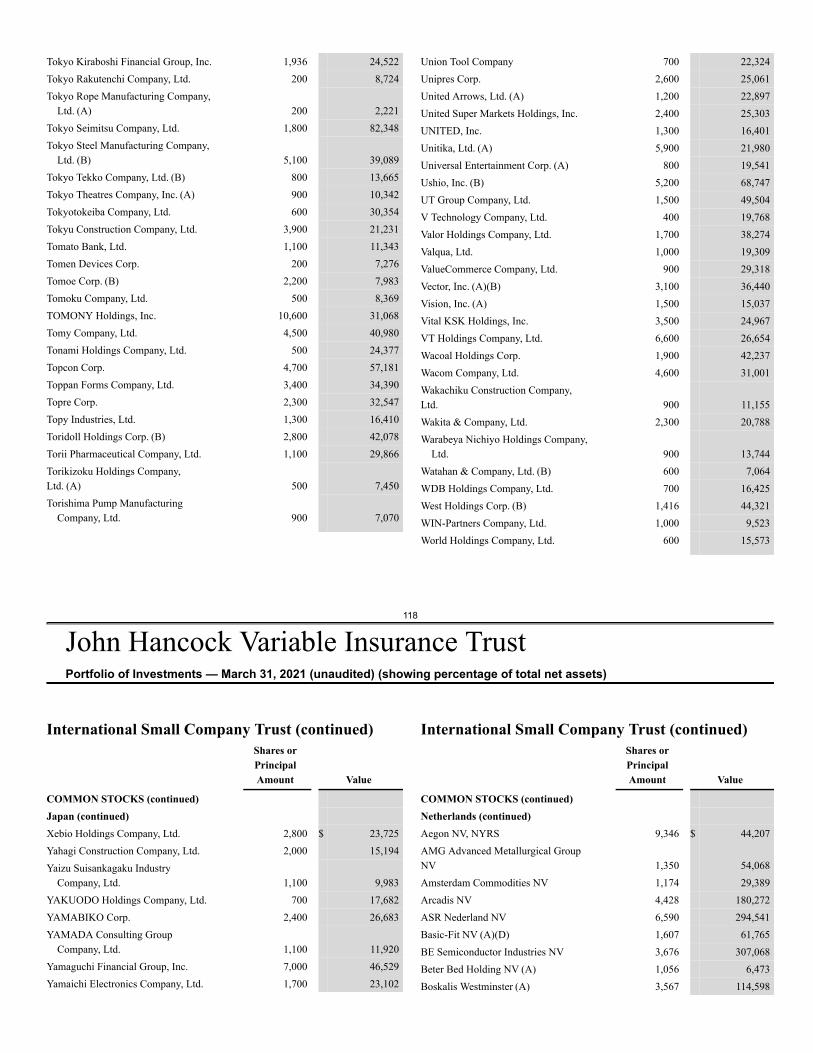
118
John Hancock Variable Insurance TrustPortfolio of Investments — March 31, 2021 (unaudited) (showing percentage of total net assets)
Tokyo Kiraboshi Financial Group, Inc. 1,936 24,522Tokyo Rakutenchi Company, Ltd. 200 8,724Tokyo Rope Manufacturing Company,
Ltd. (A) 200 2,221Tokyo Seimitsu Company, Ltd. 1,800 82,348Tokyo Steel Manufacturing Company,
Ltd. (B) 5,100 39,089Tokyo Tekko Company, Ltd. (B) 800 13,665Tokyo Theatres Company, Inc. (A) 900 10,342Tokyotokeiba Company, Ltd. 600 30,354Tokyu Construction Company, Ltd. 3,900 21,231Tomato Bank, Ltd. 1,100 11,343Tomen Devices Corp. 200 7,276Tomoe Corp. (B) 2,200 7,983Tomoku Company, Ltd. 500 8,369TOMONY Holdings, Inc. 10,600 31,068Tomy Company, Ltd. 4,500 40,980Tonami Holdings Company, Ltd. 500 24,377Topcon Corp. 4,700 57,181Toppan Forms Company, Ltd. 3,400 34,390Topre Corp. 2,300 32,547Topy Industries, Ltd. 1,300 16,410Toridoll Holdings Corp. (B) 2,800 42,078Torii Pharmaceutical Company, Ltd. 1,100 29,866Torikizoku Holdings Company,Ltd. (A) 500 7,450Torishima Pump Manufacturing
Company, Ltd. 900 7,070
Union Tool Company 700 22,324Unipres Corp. 2,600 25,061United Arrows, Ltd. (A) 1,200 22,897United Super Markets Holdings, Inc. 2,400 25,303UNITED, Inc. 1,300 16,401Unitika, Ltd. (A) 5,900 21,980Universal Entertainment Corp. (A) 800 19,541Ushio, Inc. (B) 5,200 68,747UT Group Company, Ltd. 1,500 49,504V Technology Company, Ltd. 400 19,768Valor Holdings Company, Ltd. 1,700 38,274Valqua, Ltd. 1,000 19,309ValueCommerce Company, Ltd. 900 29,318Vector, Inc. (A)(B) 3,100 36,440Vision, Inc. (A) 1,500 15,037Vital KSK Holdings, Inc. 3,500 24,967VT Holdings Company, Ltd. 6,600 26,654Wacoal Holdings Corp. 1,900 42,237Wacom Company, Ltd. 4,600 31,001Wakachiku Construction Company,Ltd. 900 11,155Wakita & Company, Ltd. 2,300 20,788Warabeya Nichiyo Holdings Company,
Ltd. 900 13,744Watahan & Company, Ltd. (B) 600 7,064WDB Holdings Company, Ltd. 700 16,425West Holdings Corp. (B) 1,416 44,321WIN-Partners Company, Ltd. 1,000 9,523World Holdings Company, Ltd. 600 15,573
International Small Company Trust (continued)Shares orPrincipalAmount Value
COMMON STOCKS (continued)Japan (continued)Xebio Holdings Company, Ltd. 2,800 $ 23,725Yahagi Construction Company, Ltd. 2,000 15,194Yaizu Suisankagaku Industry
Company, Ltd. 1,100 9,983YAKUODO Holdings Company, Ltd. 700 17,682YAMABIKO Corp. 2,400 26,683YAMADA Consulting Group
Company, Ltd. 1,100 11,920Yamaguchi Financial Group, Inc. 7,000 46,529Yamaichi Electronics Company, Ltd. 1,700 23,102
International Small Company Trust (continued)Shares orPrincipalAmount Value
COMMON STOCKS (continued)Netherlands (continued)Aegon NV, NYRS 9,346 $ 44,207AMG Advanced Metallurgical GroupNV 1,350 54,068Amsterdam Commodities NV 1,174 29,389Arcadis NV 4,428 180,272ASR Nederland NV 6,590 294,541Basic-Fit NV (A)(D) 1,607 61,765BE Semiconductor Industries NV 3,676 307,068Beter Bed Holding NV (A) 1,056 6,473Boskalis Westminster (A) 3,567 114,598
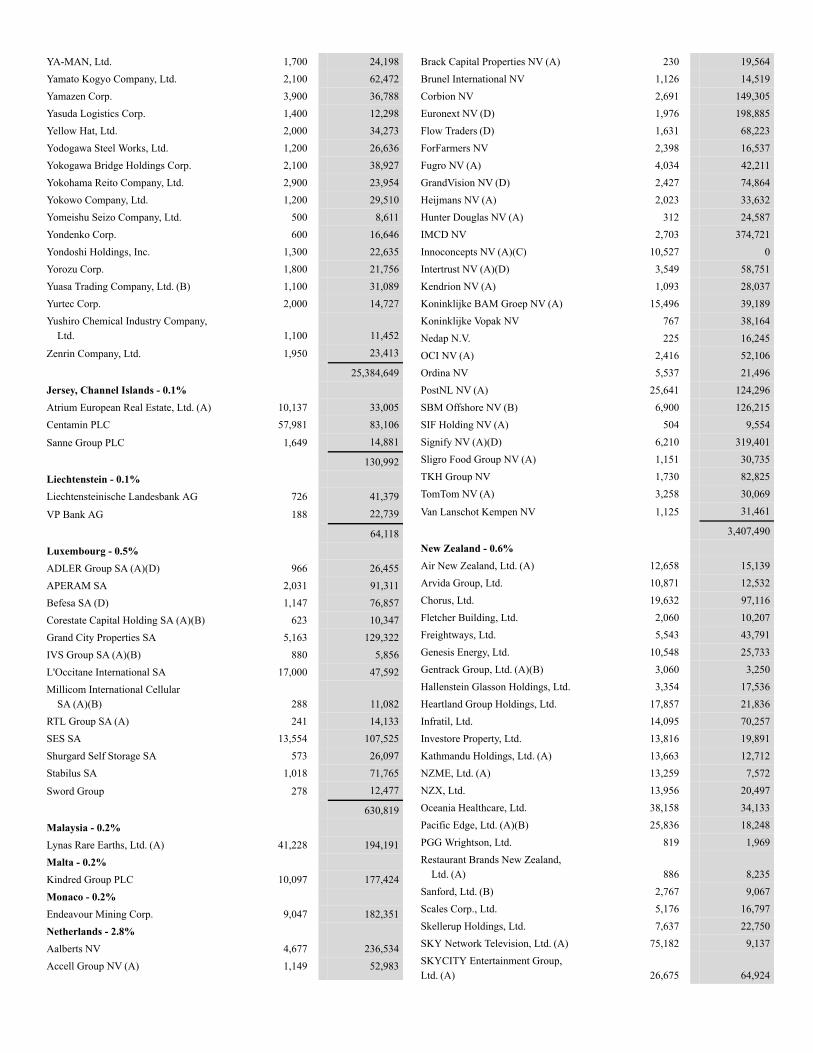
YA-MAN, Ltd. 1,700 24,198Yamato Kogyo Company, Ltd. 2,100 62,472Yamazen Corp. 3,900 36,788Yasuda Logistics Corp. 1,400 12,298Yellow Hat, Ltd. 2,000 34,273Yodogawa Steel Works, Ltd. 1,200 26,636Yokogawa Bridge Holdings Corp. 2,100 38,927Yokohama Reito Company, Ltd. 2,900 23,954Yokowo Company, Ltd. 1,200 29,510Yomeishu Seizo Company, Ltd. 500 8,611Yondenko Corp. 600 16,646Yondoshi Holdings, Inc. 1,300 22,635Yorozu Corp. 1,800 21,756Yuasa Trading Company, Ltd. (B) 1,100 31,089Yurtec Corp. 2,000 14,727Yushiro Chemical Industry Company,
Ltd. 1,100 11,452
Zenrin Company, Ltd. 1,950 23,413
25,384,649Jersey, Channel Islands - 0.1%Atrium European Real Estate, Ltd. (A) 10,137 33,005Centamin PLC 57,981 83,106
Sanne Group PLC 1,649 14,881
130,992Liechtenstein - 0.1%Liechtensteinische Landesbank AG 726 41,379
VP Bank AG 188 22,739
64,118Luxembourg - 0.5%ADLER Group SA (A)(D) 966 26,455APERAM SA 2,031 91,311Befesa SA (D) 1,147 76,857Corestate Capital Holding SA (A)(B) 623 10,347Grand City Properties SA 5,163 129,322IVS Group SA (A)(B) 880 5,856L'Occitane International SA 17,000 47,592Millicom International Cellular
SA (A)(B) 288 11,082RTL Group SA (A) 241 14,133SES SA 13,554 107,525Shurgard Self Storage SA 573 26,097Stabilus SA 1,018 71,765
Sword Group 278 12,477
630,819Malaysia - 0.2%Lynas Rare Earths, Ltd. (A) 41,228 194,191Malta - 0.2%Kindred Group PLC 10,097 177,424Monaco - 0.2%Endeavour Mining Corp. 9,047 182,351Netherlands - 2.8%Aalberts NV 4,677 236,534Accell Group NV (A) 1,149 52,983
Brack Capital Properties NV (A) 230 19,564Brunel International NV 1,126 14,519Corbion NV 2,691 149,305Euronext NV (D) 1,976 198,885Flow Traders (D) 1,631 68,223ForFarmers NV 2,398 16,537Fugro NV (A) 4,034 42,211GrandVision NV (D) 2,427 74,864Heijmans NV (A) 2,023 33,632Hunter Douglas NV (A) 312 24,587IMCD NV 2,703 374,721Innoconcepts NV (A)(C) 10,527 0Intertrust NV (A)(D) 3,549 58,751Kendrion NV (A) 1,093 28,037Koninklijke BAM Groep NV (A) 15,496 39,189Koninklijke Vopak NV 767 38,164Nedap N.V. 225 16,245OCI NV (A) 2,416 52,106Ordina NV 5,537 21,496PostNL NV (A) 25,641 124,296SBM Offshore NV (B) 6,900 126,215SIF Holding NV (A) 504 9,554Signify NV (A)(D) 6,210 319,401Sligro Food Group NV (A) 1,151 30,735TKH Group NV 1,730 82,825TomTom NV (A) 3,258 30,069
Van Lanschot Kempen NV 1,125 31,461
3,407,490New Zealand - 0.6%Air New Zealand, Ltd. (A) 12,658 15,139Arvida Group, Ltd. 10,871 12,532Chorus, Ltd. 19,632 97,116Fletcher Building, Ltd. 2,060 10,207Freightways, Ltd. 5,543 43,791Genesis Energy, Ltd. 10,548 25,733Gentrack Group, Ltd. (A)(B) 3,060 3,250Hallenstein Glasson Holdings, Ltd. 3,354 17,536Heartland Group Holdings, Ltd. 17,857 21,836Infratil, Ltd. 14,095 70,257Investore Property, Ltd. 13,816 19,891Kathmandu Holdings, Ltd. (A) 13,663 12,712NZME, Ltd. (A) 13,259 7,572NZX, Ltd. 13,956 20,497Oceania Healthcare, Ltd. 38,158 34,133Pacific Edge, Ltd. (A)(B) 25,836 18,248PGG Wrightson, Ltd. 819 1,969Restaurant Brands New Zealand,
Ltd. (A) 886 8,235Sanford, Ltd. (B) 2,767 9,067Scales Corp., Ltd. 5,176 16,797Skellerup Holdings, Ltd. 7,637 22,750SKY Network Television, Ltd. (A) 75,182 9,137SKYCITY Entertainment Group,Ltd. (A) 26,675 64,924
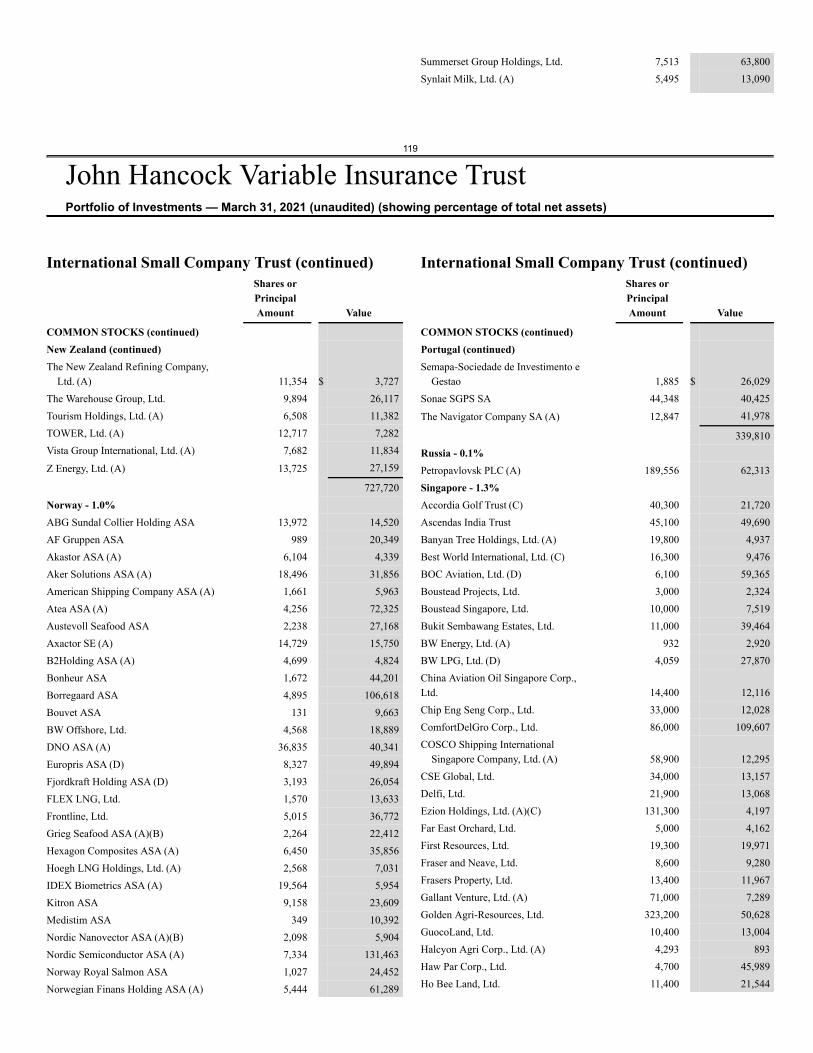
119
John Hancock Variable Insurance TrustPortfolio of Investments — March 31, 2021 (unaudited) (showing percentage of total net assets)
Summerset Group Holdings, Ltd. 7,513 63,800Synlait Milk, Ltd. (A) 5,495 13,090
International Small Company Trust (continued)Shares orPrincipalAmount Value
COMMON STOCKS (continued)New Zealand (continued)The New Zealand Refining Company,
Ltd. (A) 11,354 $ 3,727The Warehouse Group, Ltd. 9,894 26,117Tourism Holdings, Ltd. (A) 6,508 11,382TOWER, Ltd. (A) 12,717 7,282Vista Group International, Ltd. (A) 7,682 11,834
Z Energy, Ltd. (A) 13,725 27,159
727,720Norway - 1.0%ABG Sundal Collier Holding ASA 13,972 14,520AF Gruppen ASA 989 20,349Akastor ASA (A) 6,104 4,339Aker Solutions ASA (A) 18,496 31,856American Shipping Company ASA (A) 1,661 5,963Atea ASA (A) 4,256 72,325Austevoll Seafood ASA 2,238 27,168Axactor SE (A) 14,729 15,750B2Holding ASA (A) 4,699 4,824Bonheur ASA 1,672 44,201Borregaard ASA 4,895 106,618Bouvet ASA 131 9,663BW Offshore, Ltd. 4,568 18,889DNO ASA (A) 36,835 40,341Europris ASA (D) 8,327 49,894Fjordkraft Holding ASA (D) 3,193 26,054FLEX LNG, Ltd. 1,570 13,633Frontline, Ltd. 5,015 36,772Grieg Seafood ASA (A)(B) 2,264 22,412Hexagon Composites ASA (A) 6,450 35,856Hoegh LNG Holdings, Ltd. (A) 2,568 7,031IDEX Biometrics ASA (A) 19,564 5,954Kitron ASA 9,158 23,609Medistim ASA 349 10,392Nordic Nanovector ASA (A)(B) 2,098 5,904Nordic Semiconductor ASA (A) 7,334 131,463Norway Royal Salmon ASA 1,027 24,452Norwegian Finans Holding ASA (A) 5,444 61,289
International Small Company Trust (continued)Shares orPrincipalAmount Value
COMMON STOCKS (continued)Portugal (continued)Semapa-Sociedade de Investimento e
Gestao 1,885 $ 26,029Sonae SGPS SA 44,348 40,425
The Navigator Company SA (A) 12,847 41,978
339,810Russia - 0.1%Petropavlovsk PLC (A) 189,556 62,313Singapore - 1.3%Accordia Golf Trust (C) 40,300 21,720Ascendas India Trust 45,100 49,690Banyan Tree Holdings, Ltd. (A) 19,800 4,937Best World International, Ltd. (C) 16,300 9,476BOC Aviation, Ltd. (D) 6,100 59,365Boustead Projects, Ltd. 3,000 2,324Boustead Singapore, Ltd. 10,000 7,519Bukit Sembawang Estates, Ltd. 11,000 39,464BW Energy, Ltd. (A) 932 2,920BW LPG, Ltd. (D) 4,059 27,870China Aviation Oil Singapore Corp.,Ltd. 14,400 12,116Chip Eng Seng Corp., Ltd. 33,000 12,028ComfortDelGro Corp., Ltd. 86,000 109,607COSCO Shipping International
Singapore Company, Ltd. (A) 58,900 12,295CSE Global, Ltd. 34,000 13,157Delfi, Ltd. 21,900 13,068Ezion Holdings, Ltd. (A)(C) 131,300 4,197Far East Orchard, Ltd. 5,000 4,162First Resources, Ltd. 19,300 19,971Fraser and Neave, Ltd. 8,600 9,280Frasers Property, Ltd. 13,400 11,967Gallant Venture, Ltd. (A) 71,000 7,289Golden Agri-Resources, Ltd. 323,200 50,628GuocoLand, Ltd. 10,400 13,004Halcyon Agri Corp., Ltd. (A) 4,293 893Haw Par Corp., Ltd. 4,700 45,989Ho Bee Land, Ltd. 11,400 21,544
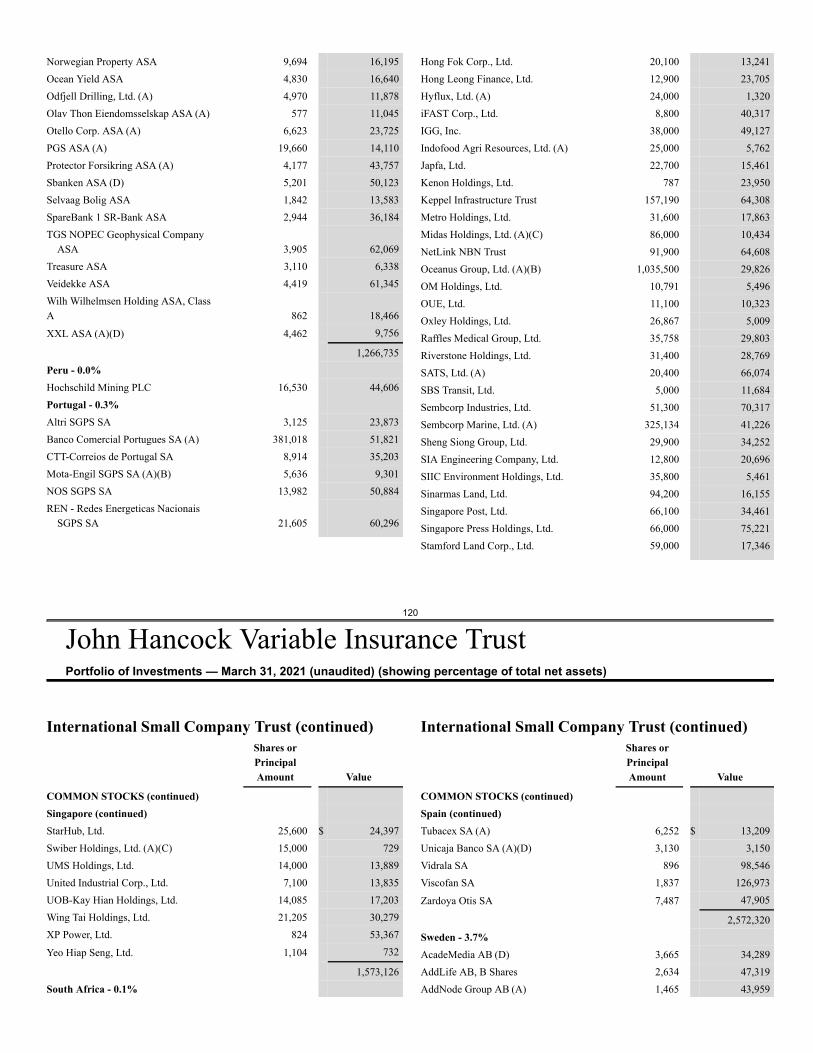
120
John Hancock Variable Insurance TrustPortfolio of Investments — March 31, 2021 (unaudited) (showing percentage of total net assets)
Norwegian Property ASA 9,694 16,195Ocean Yield ASA 4,830 16,640Odfjell Drilling, Ltd. (A) 4,970 11,878Olav Thon Eiendomsselskap ASA (A) 577 11,045Otello Corp. ASA (A) 6,623 23,725PGS ASA (A) 19,660 14,110Protector Forsikring ASA (A) 4,177 43,757Sbanken ASA (D) 5,201 50,123Selvaag Bolig ASA 1,842 13,583SpareBank 1 SR-Bank ASA 2,944 36,184TGS NOPEC Geophysical Company
ASA 3,905 62,069Treasure ASA 3,110 6,338Veidekke ASA 4,419 61,345Wilh Wilhelmsen Holding ASA, ClassA 862 18,466
XXL ASA (A)(D) 4,462 9,756
1,266,735Peru - 0.0%Hochschild Mining PLC 16,530 44,606Portugal - 0.3%Altri SGPS SA 3,125 23,873Banco Comercial Portugues SA (A) 381,018 51,821CTT-Correios de Portugal SA 8,914 35,203Mota-Engil SGPS SA (A)(B) 5,636 9,301NOS SGPS SA 13,982 50,884REN - Redes Energeticas Nacionais
SGPS SA 21,605 60,296
Hong Fok Corp., Ltd. 20,100 13,241Hong Leong Finance, Ltd. 12,900 23,705Hyflux, Ltd. (A) 24,000 1,320iFAST Corp., Ltd. 8,800 40,317IGG, Inc. 38,000 49,127Indofood Agri Resources, Ltd. (A) 25,000 5,762Japfa, Ltd. 22,700 15,461Kenon Holdings, Ltd. 787 23,950Keppel Infrastructure Trust 157,190 64,308Metro Holdings, Ltd. 31,600 17,863Midas Holdings, Ltd. (A)(C) 86,000 10,434NetLink NBN Trust 91,900 64,608Oceanus Group, Ltd. (A)(B) 1,035,500 29,826OM Holdings, Ltd. 10,791 5,496OUE, Ltd. 11,100 10,323Oxley Holdings, Ltd. 26,867 5,009Raffles Medical Group, Ltd. 35,758 29,803Riverstone Holdings, Ltd. 31,400 28,769SATS, Ltd. (A) 20,400 66,074SBS Transit, Ltd. 5,000 11,684Sembcorp Industries, Ltd. 51,300 70,317Sembcorp Marine, Ltd. (A) 325,134 41,226Sheng Siong Group, Ltd. 29,900 34,252SIA Engineering Company, Ltd. 12,800 20,696SIIC Environment Holdings, Ltd. 35,800 5,461Sinarmas Land, Ltd. 94,200 16,155Singapore Post, Ltd. 66,100 34,461Singapore Press Holdings, Ltd. 66,000 75,221Stamford Land Corp., Ltd. 59,000 17,346
International Small Company Trust (continued)Shares orPrincipalAmount Value
COMMON STOCKS (continued)Singapore (continued)StarHub, Ltd. 25,600 $ 24,397Swiber Holdings, Ltd. (A)(C) 15,000 729UMS Holdings, Ltd. 14,000 13,889United Industrial Corp., Ltd. 7,100 13,835UOB-Kay Hian Holdings, Ltd. 14,085 17,203Wing Tai Holdings, Ltd. 21,205 30,279XP Power, Ltd. 824 53,367
Yeo Hiap Seng, Ltd. 1,104 732
1,573,126South Africa - 0.1%
International Small Company Trust (continued)Shares orPrincipalAmount Value
COMMON STOCKS (continued)Spain (continued)Tubacex SA (A) 6,252 $ 13,209Unicaja Banco SA (A)(D) 3,130 3,150Vidrala SA 896 98,546Viscofan SA 1,837 126,973
Zardoya Otis SA 7,487 47,905
2,572,320Sweden - 3.7%AcadeMedia AB (D) 3,665 34,289AddLife AB, B Shares 2,634 47,319AddNode Group AB (A) 1,465 43,959
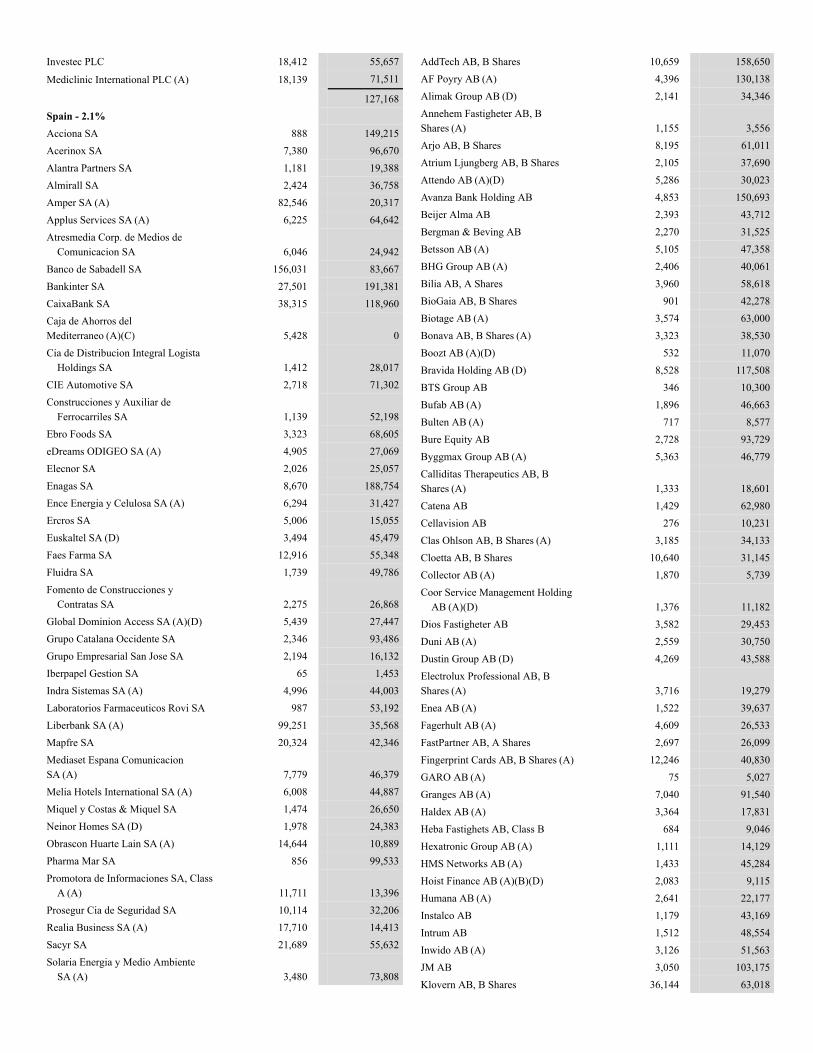
Investec PLC 18,412 55,657
Mediclinic International PLC (A) 18,139 71,511
127,168Spain - 2.1%Acciona SA 888 149,215Acerinox SA 7,380 96,670Alantra Partners SA 1,181 19,388Almirall SA 2,424 36,758Amper SA (A) 82,546 20,317Applus Services SA (A) 6,225 64,642Atresmedia Corp. de Medios de
Comunicacion SA 6,046 24,942Banco de Sabadell SA 156,031 83,667Bankinter SA 27,501 191,381CaixaBank SA 38,315 118,960Caja de Ahorros delMediterraneo (A)(C) 5,428 0Cia de Distribucion Integral Logista
Holdings SA 1,412 28,017CIE Automotive SA 2,718 71,302Construcciones y Auxiliar de
Ferrocarriles SA 1,139 52,198Ebro Foods SA 3,323 68,605eDreams ODIGEO SA (A) 4,905 27,069Elecnor SA 2,026 25,057Enagas SA 8,670 188,754Ence Energia y Celulosa SA (A) 6,294 31,427Ercros SA 5,006 15,055Euskaltel SA (D) 3,494 45,479Faes Farma SA 12,916 55,348Fluidra SA 1,739 49,786Fomento de Construcciones y
Contratas SA 2,275 26,868Global Dominion Access SA (A)(D) 5,439 27,447Grupo Catalana Occidente SA 2,346 93,486Grupo Empresarial San Jose SA 2,194 16,132Iberpapel Gestion SA 65 1,453Indra Sistemas SA (A) 4,996 44,003Laboratorios Farmaceuticos Rovi SA 987 53,192Liberbank SA (A) 99,251 35,568Mapfre SA 20,324 42,346Mediaset Espana ComunicacionSA (A) 7,779 46,379Melia Hotels International SA (A) 6,008 44,887Miquel y Costas & Miquel SA 1,474 26,650Neinor Homes SA (D) 1,978 24,383Obrascon Huarte Lain SA (A) 14,644 10,889Pharma Mar SA 856 99,533Promotora de Informaciones SA, Class
A (A) 11,711 13,396Prosegur Cia de Seguridad SA 10,114 32,206Realia Business SA (A) 17,710 14,413Sacyr SA 21,689 55,632Solaria Energia y Medio Ambiente
SA (A) 3,480 73,808
AddTech AB, B Shares 10,659 158,650AF Poyry AB (A) 4,396 130,138Alimak Group AB (D) 2,141 34,346Annehem Fastigheter AB, BShares (A) 1,155 3,556Arjo AB, B Shares 8,195 61,011Atrium Ljungberg AB, B Shares 2,105 37,690Attendo AB (A)(D) 5,286 30,023Avanza Bank Holding AB 4,853 150,693Beijer Alma AB 2,393 43,712Bergman & Beving AB 2,270 31,525Betsson AB (A) 5,105 47,358BHG Group AB (A) 2,406 40,061Bilia AB, A Shares 3,960 58,618BioGaia AB, B Shares 901 42,278Biotage AB (A) 3,574 63,000Bonava AB, B Shares (A) 3,323 38,530Boozt AB (A)(D) 532 11,070Bravida Holding AB (D) 8,528 117,508BTS Group AB 346 10,300Bufab AB (A) 1,896 46,663Bulten AB (A) 717 8,577Bure Equity AB 2,728 93,729Byggmax Group AB (A) 5,363 46,779Calliditas Therapeutics AB, BShares (A) 1,333 18,601Catena AB 1,429 62,980Cellavision AB 276 10,231Clas Ohlson AB, B Shares (A) 3,185 34,133Cloetta AB, B Shares 10,640 31,145Collector AB (A) 1,870 5,739Coor Service Management Holding
AB (A)(D) 1,376 11,182Dios Fastigheter AB 3,582 29,453Duni AB (A) 2,559 30,750Dustin Group AB (D) 4,269 43,588Electrolux Professional AB, BShares (A) 3,716 19,279Enea AB (A) 1,522 39,637Fagerhult AB (A) 4,609 26,533FastPartner AB, A Shares 2,697 26,099Fingerprint Cards AB, B Shares (A) 12,246 40,830GARO AB (A) 75 5,027Granges AB (A) 7,040 91,540Haldex AB (A) 3,364 17,831Heba Fastighets AB, Class B 684 9,046Hexatronic Group AB (A) 1,111 14,129HMS Networks AB (A) 1,433 45,284Hoist Finance AB (A)(B)(D) 2,083 9,115Humana AB (A) 2,641 22,177Instalco AB 1,179 43,169Intrum AB 1,512 48,554Inwido AB (A) 3,126 51,563JM AB 3,050 103,175Klovern AB, B Shares 36,144 63,018
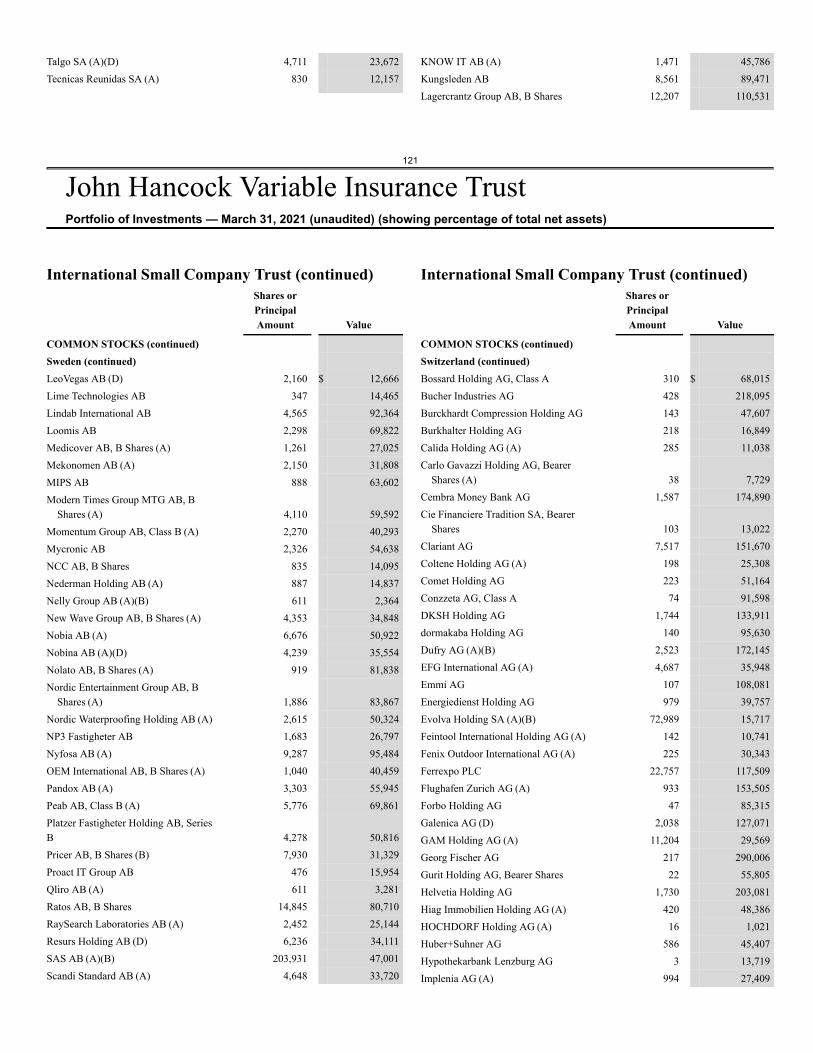
121
John Hancock Variable Insurance TrustPortfolio of Investments — March 31, 2021 (unaudited) (showing percentage of total net assets)
Talgo SA (A)(D) 4,711 23,672Tecnicas Reunidas SA (A) 830 12,157
KNOW IT AB (A) 1,471 45,786Kungsleden AB 8,561 89,471Lagercrantz Group AB, B Shares 12,207 110,531
International Small Company Trust (continued)Shares orPrincipalAmount Value
COMMON STOCKS (continued)Sweden (continued)LeoVegas AB (D) 2,160 $ 12,666Lime Technologies AB 347 14,465Lindab International AB 4,565 92,364Loomis AB 2,298 69,822Medicover AB, B Shares (A) 1,261 27,025Mekonomen AB (A) 2,150 31,808MIPS AB 888 63,602Modern Times Group MTG AB, B
Shares (A) 4,110 59,592Momentum Group AB, Class B (A) 2,270 40,293Mycronic AB 2,326 54,638NCC AB, B Shares 835 14,095Nederman Holding AB (A) 887 14,837Nelly Group AB (A)(B) 611 2,364New Wave Group AB, B Shares (A) 4,353 34,848Nobia AB (A) 6,676 50,922Nobina AB (A)(D) 4,239 35,554Nolato AB, B Shares (A) 919 81,838Nordic Entertainment Group AB, B
Shares (A) 1,886 83,867Nordic Waterproofing Holding AB (A) 2,615 50,324NP3 Fastigheter AB 1,683 26,797Nyfosa AB (A) 9,287 95,484OEM International AB, B Shares (A) 1,040 40,459Pandox AB (A) 3,303 55,945Peab AB, Class B (A) 5,776 69,861Platzer Fastigheter Holding AB, SeriesB 4,278 50,816Pricer AB, B Shares (B) 7,930 31,329Proact IT Group AB 476 15,954Qliro AB (A) 611 3,281Ratos AB, B Shares 14,845 80,710RaySearch Laboratories AB (A) 2,452 25,144Resurs Holding AB (D) 6,236 34,111SAS AB (A)(B) 203,931 47,001Scandi Standard AB (A) 4,648 33,720
International Small Company Trust (continued)Shares orPrincipalAmount Value
COMMON STOCKS (continued)Switzerland (continued)Bossard Holding AG, Class A 310 $ 68,015Bucher Industries AG 428 218,095Burckhardt Compression Holding AG 143 47,607Burkhalter Holding AG 218 16,849Calida Holding AG (A) 285 11,038Carlo Gavazzi Holding AG, Bearer
Shares (A) 38 7,729Cembra Money Bank AG 1,587 174,890Cie Financiere Tradition SA, Bearer
Shares 103 13,022Clariant AG 7,517 151,670Coltene Holding AG (A) 198 25,308Comet Holding AG 223 51,164Conzzeta AG, Class A 74 91,598DKSH Holding AG 1,744 133,911dormakaba Holding AG 140 95,630Dufry AG (A)(B) 2,523 172,145EFG International AG (A) 4,687 35,948Emmi AG 107 108,081Energiedienst Holding AG 979 39,757Evolva Holding SA (A)(B) 72,989 15,717Feintool International Holding AG (A) 142 10,741Fenix Outdoor International AG (A) 225 30,343Ferrexpo PLC 22,757 117,509Flughafen Zurich AG (A) 933 153,505Forbo Holding AG 47 85,315Galenica AG (D) 2,038 127,071GAM Holding AG (A) 11,204 29,569Georg Fischer AG 217 290,006Gurit Holding AG, Bearer Shares 22 55,805Helvetia Holding AG 1,730 203,081Hiag Immobilien Holding AG (A) 420 48,386HOCHDORF Holding AG (A) 16 1,021Huber+Suhner AG 586 45,407Hypothekarbank Lenzburg AG 3 13,719Implenia AG (A) 994 27,409
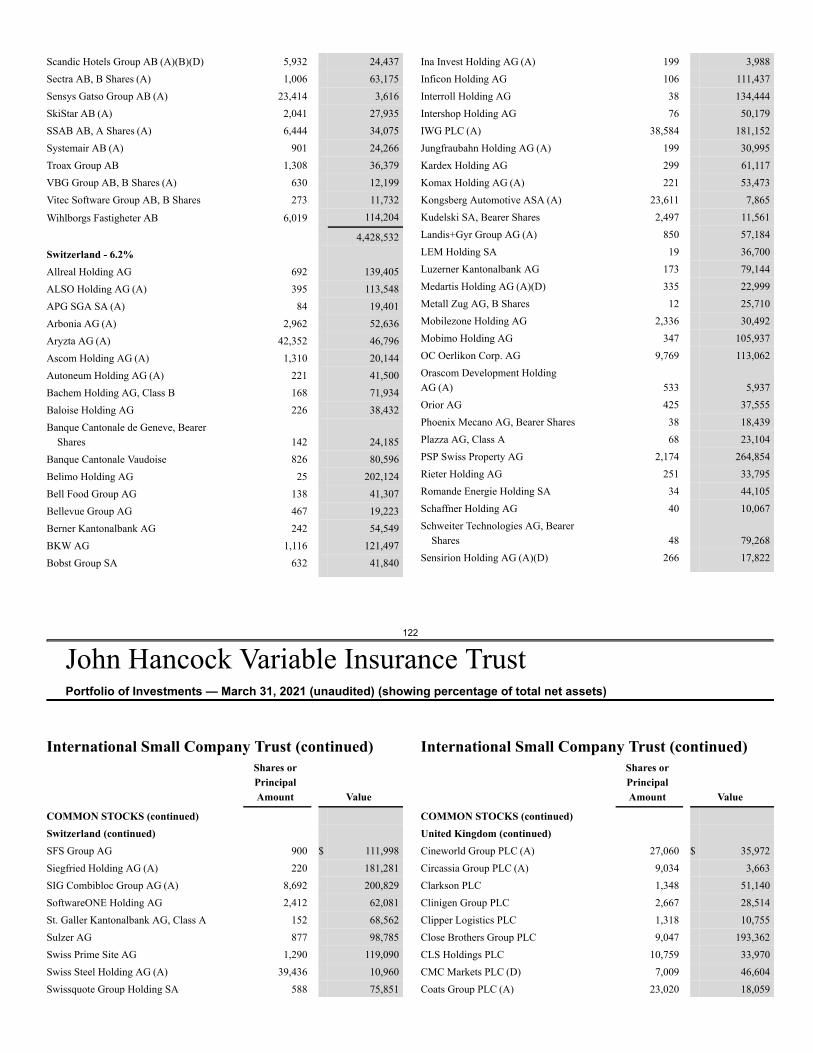
122
John Hancock Variable Insurance TrustPortfolio of Investments — March 31, 2021 (unaudited) (showing percentage of total net assets)
Scandic Hotels Group AB (A)(B)(D) 5,932 24,437Sectra AB, B Shares (A) 1,006 63,175Sensys Gatso Group AB (A) 23,414 3,616SkiStar AB (A) 2,041 27,935SSAB AB, A Shares (A) 6,444 34,075Systemair AB (A) 901 24,266Troax Group AB 1,308 36,379VBG Group AB, B Shares (A) 630 12,199Vitec Software Group AB, B Shares 273 11,732
Wihlborgs Fastigheter AB 6,019 114,204
4,428,532Switzerland - 6.2%Allreal Holding AG 692 139,405ALSO Holding AG (A) 395 113,548APG SGA SA (A) 84 19,401Arbonia AG (A) 2,962 52,636Aryzta AG (A) 42,352 46,796Ascom Holding AG (A) 1,310 20,144Autoneum Holding AG (A) 221 41,500Bachem Holding AG, Class B 168 71,934Baloise Holding AG 226 38,432Banque Cantonale de Geneve, Bearer
Shares 142 24,185Banque Cantonale Vaudoise 826 80,596Belimo Holding AG 25 202,124Bell Food Group AG 138 41,307Bellevue Group AG 467 19,223Berner Kantonalbank AG 242 54,549BKW AG 1,116 121,497Bobst Group SA 632 41,840
Ina Invest Holding AG (A) 199 3,988Inficon Holding AG 106 111,437Interroll Holding AG 38 134,444Intershop Holding AG 76 50,179IWG PLC (A) 38,584 181,152Jungfraubahn Holding AG (A) 199 30,995Kardex Holding AG 299 61,117Komax Holding AG (A) 221 53,473Kongsberg Automotive ASA (A) 23,611 7,865Kudelski SA, Bearer Shares 2,497 11,561Landis+Gyr Group AG (A) 850 57,184LEM Holding SA 19 36,700Luzerner Kantonalbank AG 173 79,144Medartis Holding AG (A)(D) 335 22,999Metall Zug AG, B Shares 12 25,710Mobilezone Holding AG 2,336 30,492Mobimo Holding AG 347 105,937OC Oerlikon Corp. AG 9,769 113,062Orascom Development HoldingAG (A) 533 5,937Orior AG 425 37,555Phoenix Mecano AG, Bearer Shares 38 18,439Plazza AG, Class A 68 23,104PSP Swiss Property AG 2,174 264,854Rieter Holding AG 251 33,795Romande Energie Holding SA 34 44,105Schaffner Holding AG 40 10,067Schweiter Technologies AG, Bearer
Shares 48 79,268Sensirion Holding AG (A)(D) 266 17,822
International Small Company Trust (continued)Shares orPrincipalAmount Value
COMMON STOCKS (continued)Switzerland (continued)SFS Group AG 900 $ 111,998Siegfried Holding AG (A) 220 181,281SIG Combibloc Group AG (A) 8,692 200,829SoftwareONE Holding AG 2,412 62,081St. Galler Kantonalbank AG, Class A 152 68,562Sulzer AG 877 98,785Swiss Prime Site AG 1,290 119,090Swiss Steel Holding AG (A) 39,436 10,960Swissquote Group Holding SA 588 75,851
International Small Company Trust (continued)Shares orPrincipalAmount Value
COMMON STOCKS (continued)United Kingdom (continued)Cineworld Group PLC (A) 27,060 $ 35,972Circassia Group PLC (A) 9,034 3,663Clarkson PLC 1,348 51,140Clinigen Group PLC 2,667 28,514Clipper Logistics PLC 1,318 10,755Close Brothers Group PLC 9,047 193,362CLS Holdings PLC 10,759 33,970CMC Markets PLC (D) 7,009 46,604Coats Group PLC (A) 23,020 18,059
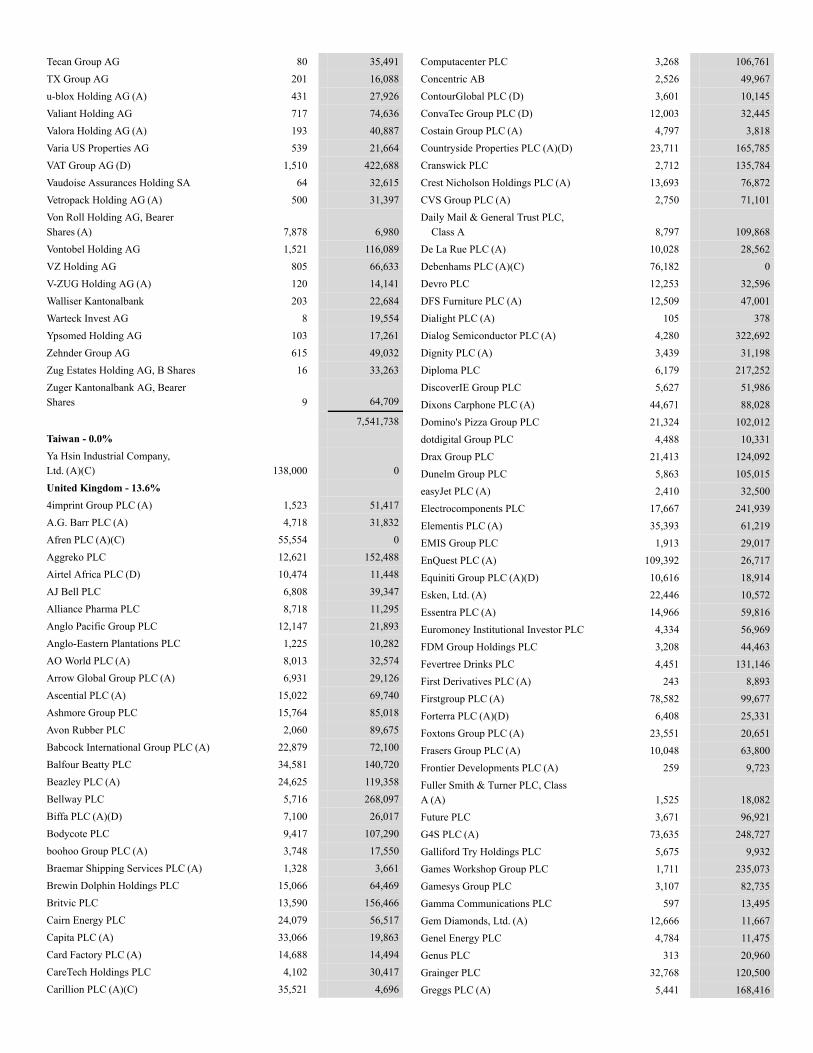
Tecan Group AG 80 35,491TX Group AG 201 16,088u-blox Holding AG (A) 431 27,926Valiant Holding AG 717 74,636Valora Holding AG (A) 193 40,887Varia US Properties AG 539 21,664VAT Group AG (D) 1,510 422,688Vaudoise Assurances Holding SA 64 32,615Vetropack Holding AG (A) 500 31,397Von Roll Holding AG, BearerShares (A) 7,878 6,980Vontobel Holding AG 1,521 116,089VZ Holding AG 805 66,633V-ZUG Holding AG (A) 120 14,141Walliser Kantonalbank 203 22,684Warteck Invest AG 8 19,554Ypsomed Holding AG 103 17,261Zehnder Group AG 615 49,032Zug Estates Holding AG, B Shares 16 33,263Zuger Kantonalbank AG, BearerShares 9 64,709
7,541,738Taiwan - 0.0%Ya Hsin Industrial Company,Ltd. (A)(C) 138,000 0United Kingdom - 13.6%4imprint Group PLC (A) 1,523 51,417A.G. Barr PLC (A) 4,718 31,832Afren PLC (A)(C) 55,554 0Aggreko PLC 12,621 152,488Airtel Africa PLC (D) 10,474 11,448AJ Bell PLC 6,808 39,347Alliance Pharma PLC 8,718 11,295Anglo Pacific Group PLC 12,147 21,893Anglo-Eastern Plantations PLC 1,225 10,282AO World PLC (A) 8,013 32,574Arrow Global Group PLC (A) 6,931 29,126Ascential PLC (A) 15,022 69,740Ashmore Group PLC 15,764 85,018Avon Rubber PLC 2,060 89,675Babcock International Group PLC (A) 22,879 72,100Balfour Beatty PLC 34,581 140,720Beazley PLC (A) 24,625 119,358Bellway PLC 5,716 268,097Biffa PLC (A)(D) 7,100 26,017Bodycote PLC 9,417 107,290boohoo Group PLC (A) 3,748 17,550Braemar Shipping Services PLC (A) 1,328 3,661Brewin Dolphin Holdings PLC 15,066 64,469Britvic PLC 13,590 156,466Cairn Energy PLC 24,079 56,517Capita PLC (A) 33,066 19,863Card Factory PLC (A) 14,688 14,494CareTech Holdings PLC 4,102 30,417Carillion PLC (A)(C) 35,521 4,696
Computacenter PLC 3,268 106,761Concentric AB 2,526 49,967ContourGlobal PLC (D) 3,601 10,145ConvaTec Group PLC (D) 12,003 32,445Costain Group PLC (A) 4,797 3,818Countryside Properties PLC (A)(D) 23,711 165,785Cranswick PLC 2,712 135,784Crest Nicholson Holdings PLC (A) 13,693 76,872CVS Group PLC (A) 2,750 71,101Daily Mail & General Trust PLC,
Class A 8,797 109,868De La Rue PLC (A) 10,028 28,562Debenhams PLC (A)(C) 76,182 0Devro PLC 12,253 32,596DFS Furniture PLC (A) 12,509 47,001Dialight PLC (A) 105 378Dialog Semiconductor PLC (A) 4,280 322,692Dignity PLC (A) 3,439 31,198Diploma PLC 6,179 217,252DiscoverIE Group PLC 5,627 51,986Dixons Carphone PLC (A) 44,671 88,028Domino's Pizza Group PLC 21,324 102,012dotdigital Group PLC 4,488 10,331Drax Group PLC 21,413 124,092Dunelm Group PLC 5,863 105,015easyJet PLC (A) 2,410 32,500Electrocomponents PLC 17,667 241,939Elementis PLC (A) 35,393 61,219EMIS Group PLC 1,913 29,017EnQuest PLC (A) 109,392 26,717Equiniti Group PLC (A)(D) 10,616 18,914Esken, Ltd. (A) 22,446 10,572Essentra PLC (A) 14,966 59,816Euromoney Institutional Investor PLC 4,334 56,969FDM Group Holdings PLC 3,208 44,463Fevertree Drinks PLC 4,451 131,146First Derivatives PLC (A) 243 8,893Firstgroup PLC (A) 78,582 99,677Forterra PLC (A)(D) 6,408 25,331Foxtons Group PLC (A) 23,551 20,651Frasers Group PLC (A) 10,048 63,800Frontier Developments PLC (A) 259 9,723Fuller Smith & Turner PLC, ClassA (A) 1,525 18,082Future PLC 3,671 96,921G4S PLC (A) 73,635 248,727Galliford Try Holdings PLC 5,675 9,932Games Workshop Group PLC 1,711 235,073Gamesys Group PLC 3,107 82,735Gamma Communications PLC 597 13,495Gem Diamonds, Ltd. (A) 12,666 11,667Genel Energy PLC 4,784 11,475Genus PLC 313 20,960Grainger PLC 32,768 120,500Greggs PLC (A) 5,441 168,416
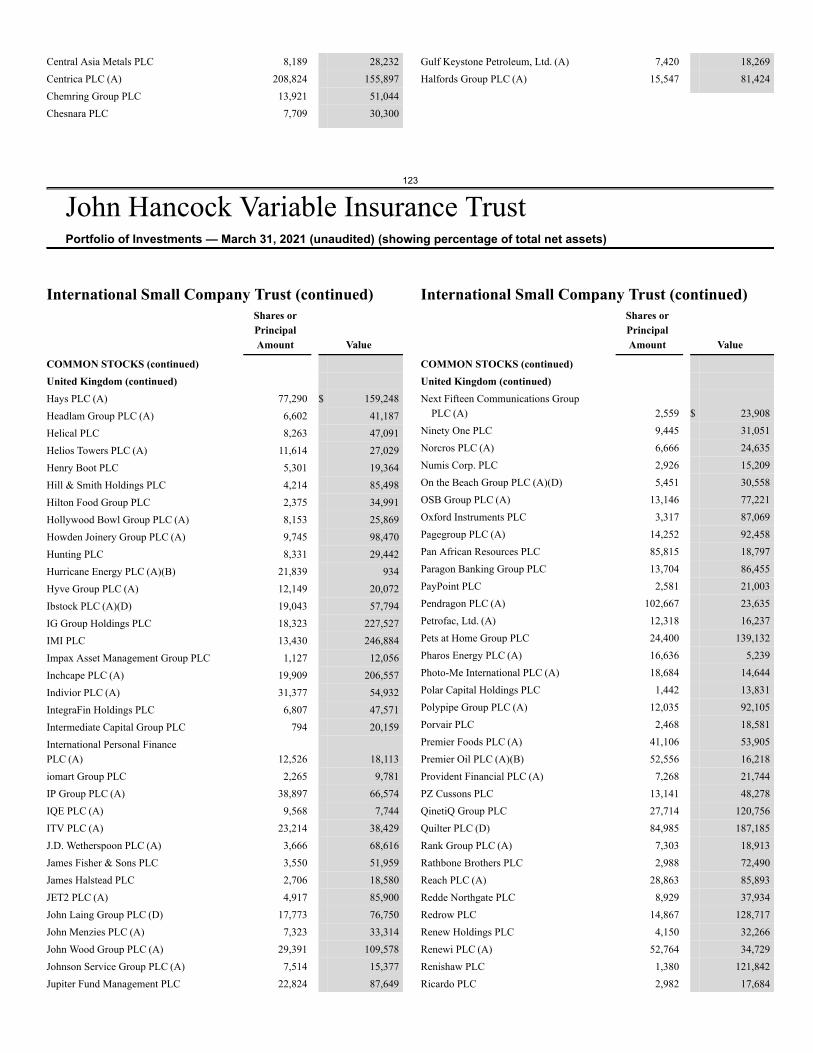
123
John Hancock Variable Insurance TrustPortfolio of Investments — March 31, 2021 (unaudited) (showing percentage of total net assets)
Central Asia Metals PLC 8,189 28,232Centrica PLC (A) 208,824 155,897Chemring Group PLC 13,921 51,044Chesnara PLC 7,709 30,300
Gulf Keystone Petroleum, Ltd. (A) 7,420 18,269Halfords Group PLC (A) 15,547 81,424
International Small Company Trust (continued)Shares orPrincipalAmount Value
COMMON STOCKS (continued)United Kingdom (continued)Hays PLC (A) 77,290 $ 159,248Headlam Group PLC (A) 6,602 41,187Helical PLC 8,263 47,091Helios Towers PLC (A) 11,614 27,029Henry Boot PLC 5,301 19,364Hill & Smith Holdings PLC 4,214 85,498Hilton Food Group PLC 2,375 34,991Hollywood Bowl Group PLC (A) 8,153 25,869Howden Joinery Group PLC (A) 9,745 98,470Hunting PLC 8,331 29,442Hurricane Energy PLC (A)(B) 21,839 934Hyve Group PLC (A) 12,149 20,072Ibstock PLC (A)(D) 19,043 57,794IG Group Holdings PLC 18,323 227,527IMI PLC 13,430 246,884Impax Asset Management Group PLC 1,127 12,056Inchcape PLC (A) 19,909 206,557Indivior PLC (A) 31,377 54,932IntegraFin Holdings PLC 6,807 47,571Intermediate Capital Group PLC 794 20,159International Personal FinancePLC (A) 12,526 18,113iomart Group PLC 2,265 9,781IP Group PLC (A) 38,897 66,574IQE PLC (A) 9,568 7,744ITV PLC (A) 23,214 38,429J.D. Wetherspoon PLC (A) 3,666 68,616James Fisher & Sons PLC 3,550 51,959James Halstead PLC 2,706 18,580JET2 PLC (A) 4,917 85,900John Laing Group PLC (D) 17,773 76,750John Menzies PLC (A) 7,323 33,314John Wood Group PLC (A) 29,391 109,578Johnson Service Group PLC (A) 7,514 15,377Jupiter Fund Management PLC 22,824 87,649
International Small Company Trust (continued)Shares orPrincipalAmount Value
COMMON STOCKS (continued)United Kingdom (continued)Next Fifteen Communications Group
PLC (A) 2,559 $ 23,908Ninety One PLC 9,445 31,051Norcros PLC (A) 6,666 24,635Numis Corp. PLC 2,926 15,209On the Beach Group PLC (A)(D) 5,451 30,558OSB Group PLC (A) 13,146 77,221Oxford Instruments PLC 3,317 87,069Pagegroup PLC (A) 14,252 92,458Pan African Resources PLC 85,815 18,797Paragon Banking Group PLC 13,704 86,455PayPoint PLC 2,581 21,003Pendragon PLC (A) 102,667 23,635Petrofac, Ltd. (A) 12,318 16,237Pets at Home Group PLC 24,400 139,132Pharos Energy PLC (A) 16,636 5,239Photo-Me International PLC (A) 18,684 14,644Polar Capital Holdings PLC 1,442 13,831Polypipe Group PLC (A) 12,035 92,105Porvair PLC 2,468 18,581Premier Foods PLC (A) 41,106 53,905Premier Oil PLC (A)(B) 52,556 16,218Provident Financial PLC (A) 7,268 21,744PZ Cussons PLC 13,141 48,278QinetiQ Group PLC 27,714 120,756Quilter PLC (D) 84,985 187,185Rank Group PLC (A) 7,303 18,913Rathbone Brothers PLC 2,988 72,490Reach PLC (A) 28,863 85,893Redde Northgate PLC 8,929 37,934Redrow PLC 14,867 128,717Renew Holdings PLC 4,150 32,266Renewi PLC (A) 52,764 34,729Renishaw PLC 1,380 121,842Ricardo PLC 2,982 17,684
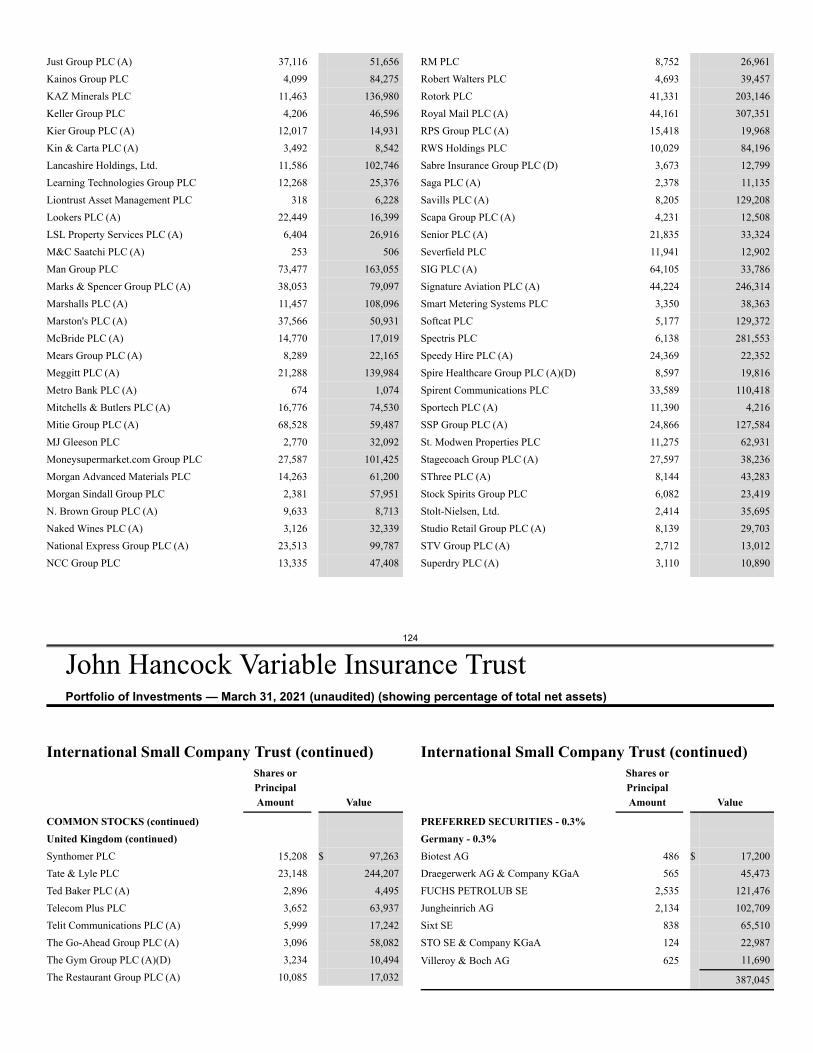
124
John Hancock Variable Insurance TrustPortfolio of Investments — March 31, 2021 (unaudited) (showing percentage of total net assets)
Just Group PLC (A) 37,116 51,656Kainos Group PLC 4,099 84,275KAZ Minerals PLC 11,463 136,980Keller Group PLC 4,206 46,596Kier Group PLC (A) 12,017 14,931Kin & Carta PLC (A) 3,492 8,542Lancashire Holdings, Ltd. 11,586 102,746Learning Technologies Group PLC 12,268 25,376Liontrust Asset Management PLC 318 6,228Lookers PLC (A) 22,449 16,399LSL Property Services PLC (A) 6,404 26,916M&C Saatchi PLC (A) 253 506Man Group PLC 73,477 163,055Marks & Spencer Group PLC (A) 38,053 79,097Marshalls PLC (A) 11,457 108,096Marston's PLC (A) 37,566 50,931McBride PLC (A) 14,770 17,019Mears Group PLC (A) 8,289 22,165Meggitt PLC (A) 21,288 139,984Metro Bank PLC (A) 674 1,074Mitchells & Butlers PLC (A) 16,776 74,530Mitie Group PLC (A) 68,528 59,487MJ Gleeson PLC 2,770 32,092Moneysupermarket.com Group PLC 27,587 101,425Morgan Advanced Materials PLC 14,263 61,200Morgan Sindall Group PLC 2,381 57,951N. Brown Group PLC (A) 9,633 8,713Naked Wines PLC (A) 3,126 32,339National Express Group PLC (A) 23,513 99,787NCC Group PLC 13,335 47,408
RM PLC 8,752 26,961Robert Walters PLC 4,693 39,457Rotork PLC 41,331 203,146Royal Mail PLC (A) 44,161 307,351RPS Group PLC (A) 15,418 19,968RWS Holdings PLC 10,029 84,196Sabre Insurance Group PLC (D) 3,673 12,799Saga PLC (A) 2,378 11,135Savills PLC (A) 8,205 129,208Scapa Group PLC (A) 4,231 12,508Senior PLC (A) 21,835 33,324Severfield PLC 11,941 12,902SIG PLC (A) 64,105 33,786Signature Aviation PLC (A) 44,224 246,314Smart Metering Systems PLC 3,350 38,363Softcat PLC 5,177 129,372Spectris PLC 6,138 281,553Speedy Hire PLC (A) 24,369 22,352Spire Healthcare Group PLC (A)(D) 8,597 19,816Spirent Communications PLC 33,589 110,418Sportech PLC (A) 11,390 4,216SSP Group PLC (A) 24,866 127,584St. Modwen Properties PLC 11,275 62,931Stagecoach Group PLC (A) 27,597 38,236SThree PLC (A) 8,144 43,283Stock Spirits Group PLC 6,082 23,419Stolt-Nielsen, Ltd. 2,414 35,695Studio Retail Group PLC (A) 8,139 29,703STV Group PLC (A) 2,712 13,012Superdry PLC (A) 3,110 10,890
International Small Company Trust (continued)Shares orPrincipalAmount Value
COMMON STOCKS (continued)United Kingdom (continued)Synthomer PLC 15,208 $ 97,263Tate & Lyle PLC 23,148 244,207Ted Baker PLC (A) 2,896 4,495Telecom Plus PLC 3,652 63,937Telit Communications PLC (A) 5,999 17,242The Go-Ahead Group PLC (A) 3,096 58,082The Gym Group PLC (A)(D) 3,234 10,494The Restaurant Group PLC (A) 10,085 17,032
International Small Company Trust (continued)Shares orPrincipalAmount Value
PREFERRED SECURITIES - 0.3%Germany - 0.3%Biotest AG 486 $ 17,200Draegerwerk AG & Company KGaA 565 45,473FUCHS PETROLUB SE 2,535 121,476Jungheinrich AG 2,134 102,709Sixt SE 838 65,510STO SE & Company KGaA 124 22,987
Villeroy & Boch AG 625 11,690
387,045
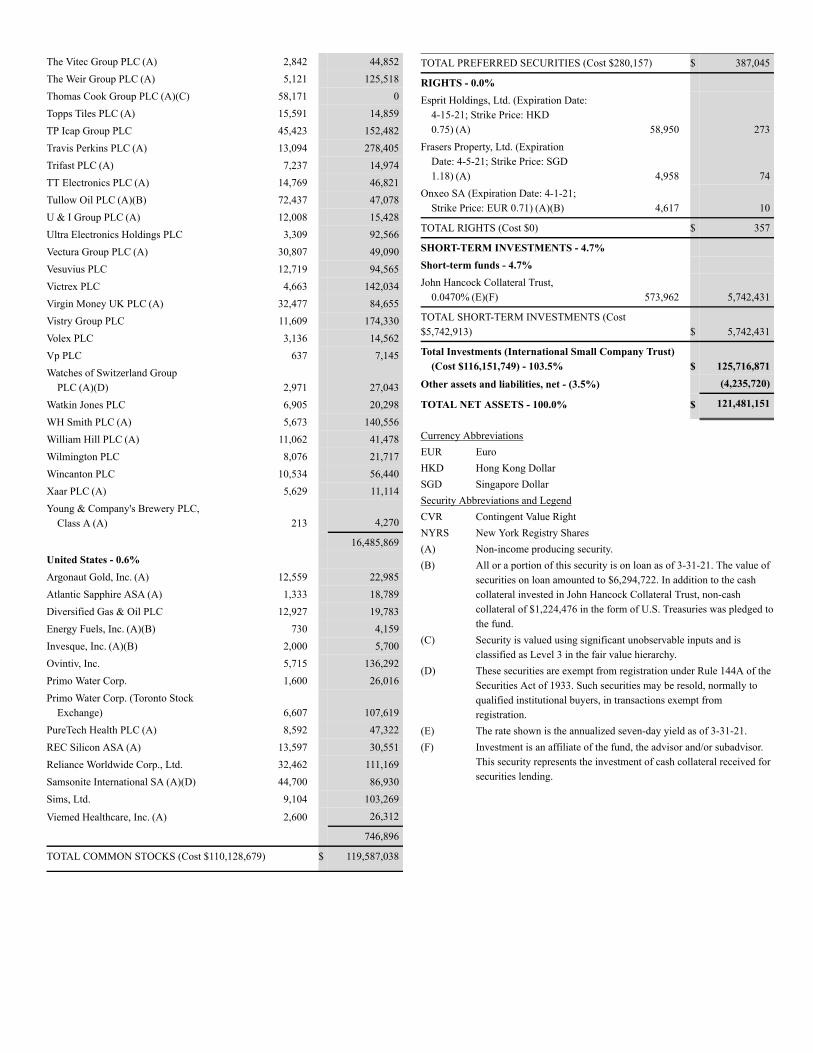
The Vitec Group PLC (A) 2,842 44,852The Weir Group PLC (A) 5,121 125,518Thomas Cook Group PLC (A)(C) 58,171 0Topps Tiles PLC (A) 15,591 14,859TP Icap Group PLC 45,423 152,482Travis Perkins PLC (A) 13,094 278,405Trifast PLC (A) 7,237 14,974TT Electronics PLC (A) 14,769 46,821Tullow Oil PLC (A)(B) 72,437 47,078U & I Group PLC (A) 12,008 15,428Ultra Electronics Holdings PLC 3,309 92,566Vectura Group PLC (A) 30,807 49,090Vesuvius PLC 12,719 94,565Victrex PLC 4,663 142,034Virgin Money UK PLC (A) 32,477 84,655Vistry Group PLC 11,609 174,330Volex PLC 3,136 14,562Vp PLC 637 7,145Watches of Switzerland Group
PLC (A)(D) 2,971 27,043Watkin Jones PLC 6,905 20,298WH Smith PLC (A) 5,673 140,556William Hill PLC (A) 11,062 41,478Wilmington PLC 8,076 21,717Wincanton PLC 10,534 56,440Xaar PLC (A) 5,629 11,114Young & Company's Brewery PLC,
Class A (A) 213 4,270
16,485,869United States - 0.6%Argonaut Gold, Inc. (A) 12,559 22,985Atlantic Sapphire ASA (A) 1,333 18,789Diversified Gas & Oil PLC 12,927 19,783Energy Fuels, Inc. (A)(B) 730 4,159Invesque, Inc. (A)(B) 2,000 5,700Ovintiv, Inc. 5,715 136,292Primo Water Corp. 1,600 26,016Primo Water Corp. (Toronto Stock
Exchange) 6,607 107,619PureTech Health PLC (A) 8,592 47,322REC Silicon ASA (A) 13,597 30,551Reliance Worldwide Corp., Ltd. 32,462 111,169Samsonite International SA (A)(D) 44,700 86,930Sims, Ltd. 9,104 103,269
Viemed Healthcare, Inc. (A) 2,600 26,312
746,896
TOTAL COMMON STOCKS (Cost $110,128,679) $ 119,587,038
TOTAL PREFERRED SECURITIES (Cost $280,157) $ 387,045
RIGHTS - 0.0%Esprit Holdings, Ltd. (Expiration Date:
4-15-21; Strike Price: HKD0.75) (A) 58,950 273
Frasers Property, Ltd. (ExpirationDate: 4-5-21; Strike Price: SGD1.18) (A) 4,958 74
Onxeo SA (Expiration Date: 4-1-21;Strike Price: EUR 0.71) (A)(B) 4,617 10
TOTAL RIGHTS (Cost $0) $ 357
SHORT-TERM INVESTMENTS - 4.7%Short-term funds - 4.7%John Hancock Collateral Trust,
0.0470% (E)(F) 573,962 5,742,431
TOTAL SHORT-TERM INVESTMENTS (Cost$5,742,913) $ 5,742,431
Total Investments (International Small Company Trust)(Cost $116,151,749) - 103.5% $ 125,716,871
Other assets and liabilities, net - (3.5%) (4,235,720)
TOTAL NET ASSETS - 100.0% $ 121,481,151
Currency AbbreviationsEUR EuroHKD Hong Kong DollarSGD Singapore DollarSecurity Abbreviations and LegendCVR Contingent Value RightNYRS New York Registry Shares(A) Non-income producing security.(B) All or a portion of this security is on loan as of 3-31-21. The value of
securities on loan amounted to $6,294,722. In addition to the cashcollateral invested in John Hancock Collateral Trust, non-cashcollateral of $1,224,476 in the form of U.S. Treasuries was pledged tothe fund.
(C) Security is valued using significant unobservable inputs and isclassified as Level 3 in the fair value hierarchy.
(D) These securities are exempt from registration under Rule 144A of theSecurities Act of 1933. Such securities may be resold, normally toqualified institutional buyers, in transactions exempt fromregistration.
(E) The rate shown is the annualized seven-day yield as of 3-31-21.(F) Investment is an affiliate of the fund, the advisor and/or subadvisor.
This security represents the investment of cash collateral received forsecurities lending.
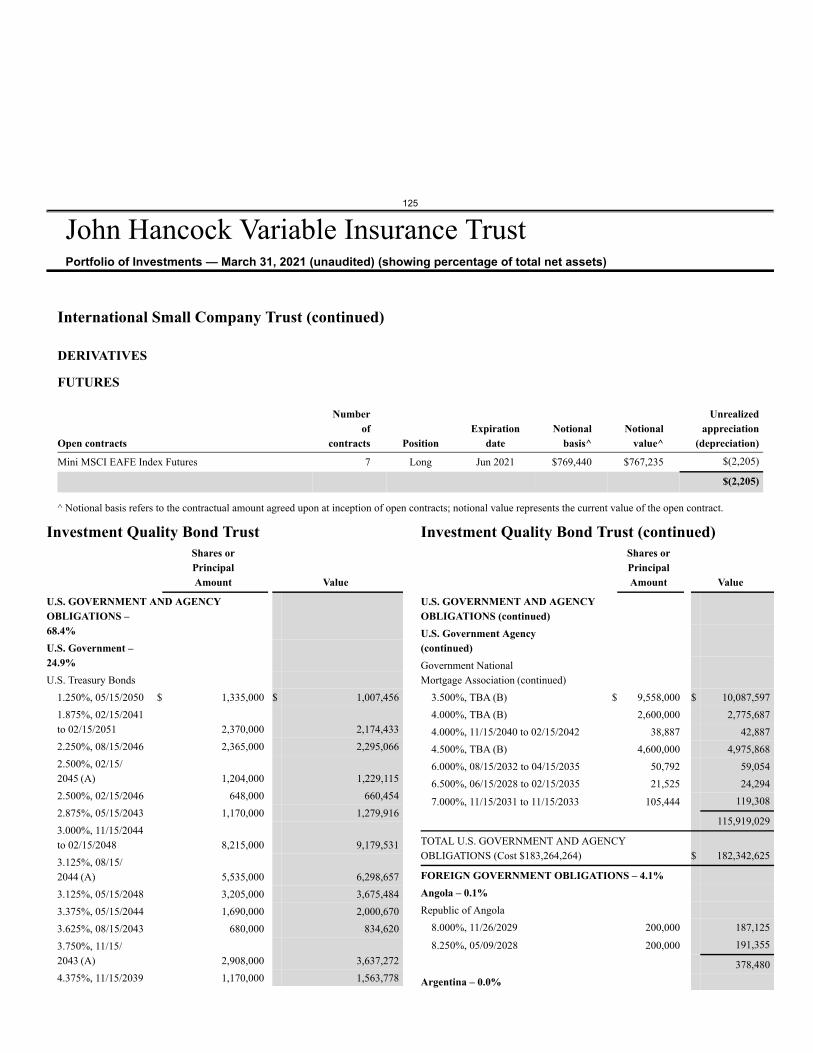
125
John Hancock Variable Insurance TrustPortfolio of Investments — March 31, 2021 (unaudited) (showing percentage of total net assets)
International Small Company Trust (continued)
DERIVATIVES
FUTURES
Open contracts
Numberof
contracts PositionExpiration
dateNotional
basis^Notional
value^
Unrealizedappreciation
(depreciation)
Mini MSCI EAFE Index Futures 7 Long Jun 2021 $769,440 $767,235 $(2,205)
$(2,205)
^ Notional basis refers to the contractual amount agreed upon at inception of open contracts; notional value represents the current value of the open contract.
Investment Quality Bond TrustShares orPrincipalAmount Value
U.S. GOVERNMENT AND AGENCYOBLIGATIONS –68.4%U.S. Government –24.9%U.S. Treasury Bonds
1.250%, 05/15/2050 $ 1,335,000 $ 1,007,4561.875%, 02/15/2041to 02/15/2051 2,370,000 2,174,4332.250%, 08/15/2046 2,365,000 2,295,0662.500%, 02/15/2045 (A) 1,204,000 1,229,1152.500%, 02/15/2046 648,000 660,4542.875%, 05/15/2043 1,170,000 1,279,9163.000%, 11/15/2044to 02/15/2048 8,215,000 9,179,5313.125%, 08/15/2044 (A) 5,535,000 6,298,6573.125%, 05/15/2048 3,205,000 3,675,4843.375%, 05/15/2044 1,690,000 2,000,6703.625%, 08/15/2043 680,000 834,6203.750%, 11/15/2043 (A) 2,908,000 3,637,2724.375%, 11/15/2039 1,170,000 1,563,778
Investment Quality Bond Trust (continued)Shares orPrincipalAmount Value
U.S. GOVERNMENT AND AGENCYOBLIGATIONS (continued)U.S. Government Agency(continued)Government NationalMortgage Association (continued)
3.500%, TBA (B) $ 9,558,000 $ 10,087,5974.000%, TBA (B) 2,600,000 2,775,6874.000%, 11/15/2040 to 02/15/2042 38,887 42,8874.500%, TBA (B) 4,600,000 4,975,8686.000%, 08/15/2032 to 04/15/2035 50,792 59,0546.500%, 06/15/2028 to 02/15/2035 21,525 24,294
7.000%, 11/15/2031 to 11/15/2033 105,444 119,308
115,919,029
TOTAL U.S. GOVERNMENT AND AGENCYOBLIGATIONS (Cost $183,264,264) $ 182,342,625
FOREIGN GOVERNMENT OBLIGATIONS – 4.1%Angola – 0.1%Republic of Angola
8.000%, 11/26/2029 200,000 187,125
8.250%, 05/09/2028 200,000 191,355
378,480Argentina – 0.0%
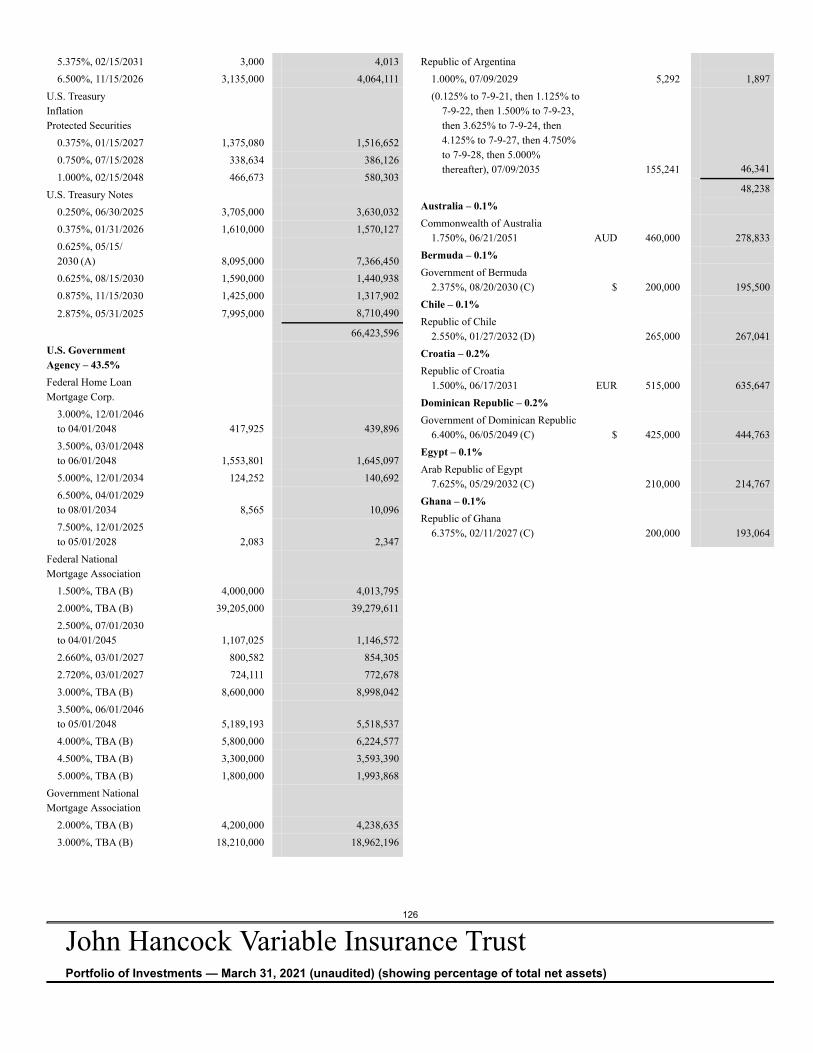
126
John Hancock Variable Insurance TrustPortfolio of Investments — March 31, 2021 (unaudited) (showing percentage of total net assets)
5.375%, 02/15/2031 3,000 4,0136.500%, 11/15/2026 3,135,000 4,064,111
U.S. TreasuryInflationProtected Securities
0.375%, 01/15/2027 1,375,080 1,516,6520.750%, 07/15/2028 338,634 386,1261.000%, 02/15/2048 466,673 580,303
U.S. Treasury Notes0.250%, 06/30/2025 3,705,000 3,630,0320.375%, 01/31/2026 1,610,000 1,570,1270.625%, 05/15/2030 (A) 8,095,000 7,366,4500.625%, 08/15/2030 1,590,000 1,440,9380.875%, 11/15/2030 1,425,000 1,317,902
2.875%, 05/31/2025 7,995,000 8,710,490
66,423,596U.S. GovernmentAgency – 43.5%Federal Home LoanMortgage Corp.
3.000%, 12/01/2046to 04/01/2048 417,925 439,8963.500%, 03/01/2048to 06/01/2048 1,553,801 1,645,0975.000%, 12/01/2034 124,252 140,6926.500%, 04/01/2029to 08/01/2034 8,565 10,0967.500%, 12/01/2025to 05/01/2028 2,083 2,347
Federal NationalMortgage Association
1.500%, TBA (B) 4,000,000 4,013,7952.000%, TBA (B) 39,205,000 39,279,6112.500%, 07/01/2030to 04/01/2045 1,107,025 1,146,5722.660%, 03/01/2027 800,582 854,3052.720%, 03/01/2027 724,111 772,6783.000%, TBA (B) 8,600,000 8,998,0423.500%, 06/01/2046to 05/01/2048 5,189,193 5,518,5374.000%, TBA (B) 5,800,000 6,224,5774.500%, TBA (B) 3,300,000 3,593,3905.000%, TBA (B) 1,800,000 1,993,868
Government NationalMortgage Association
2.000%, TBA (B) 4,200,000 4,238,6353.000%, TBA (B) 18,210,000 18,962,196
Republic of Argentina1.000%, 07/09/2029 5,292 1,897(0.125% to 7-9-21, then 1.125% to
7-9-22, then 1.500% to 7-9-23,then 3.625% to 7-9-24, then4.125% to 7-9-27, then 4.750%to 7-9-28, then 5.000%thereafter), 07/09/2035 155,241 46,341
48,238Australia – 0.1%Commonwealth of Australia
1.750%, 06/21/2051 AUD 460,000 278,833Bermuda – 0.1%Government of Bermuda
2.375%, 08/20/2030 (C) $ 200,000 195,500Chile – 0.1%Republic of Chile
2.550%, 01/27/2032 (D) 265,000 267,041Croatia – 0.2%Republic of Croatia
1.500%, 06/17/2031 EUR 515,000 635,647Dominican Republic – 0.2%Government of Dominican Republic
6.400%, 06/05/2049 (C) $ 425,000 444,763Egypt – 0.1%Arab Republic of Egypt
7.625%, 05/29/2032 (C) 210,000 214,767Ghana – 0.1%Republic of Ghana
6.375%, 02/11/2027 (C) 200,000 193,064
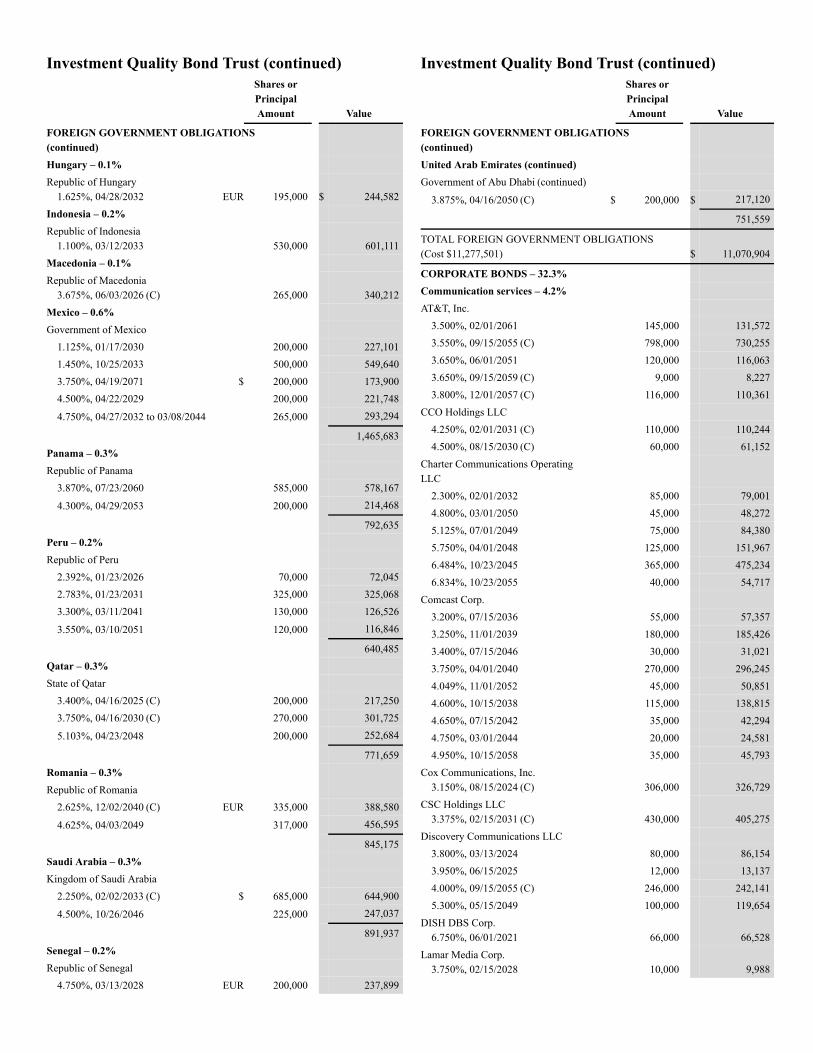
Investment Quality Bond Trust (continued)Shares orPrincipalAmount Value
FOREIGN GOVERNMENT OBLIGATIONS(continued)Hungary – 0.1%Republic of Hungary
1.625%, 04/28/2032 EUR 195,000 $ 244,582Indonesia – 0.2%Republic of Indonesia
1.100%, 03/12/2033 530,000 601,111Macedonia – 0.1%Republic of Macedonia
3.675%, 06/03/2026 (C) 265,000 340,212Mexico – 0.6%Government of Mexico
1.125%, 01/17/2030 200,000 227,1011.450%, 10/25/2033 500,000 549,6403.750%, 04/19/2071 $ 200,000 173,9004.500%, 04/22/2029 200,000 221,748
4.750%, 04/27/2032 to 03/08/2044 265,000 293,294
1,465,683Panama – 0.3%Republic of Panama
3.870%, 07/23/2060 585,000 578,167
4.300%, 04/29/2053 200,000 214,468
792,635Peru – 0.2%Republic of Peru
2.392%, 01/23/2026 70,000 72,0452.783%, 01/23/2031 325,000 325,0683.300%, 03/11/2041 130,000 126,526
3.550%, 03/10/2051 120,000 116,846
640,485Qatar – 0.3%State of Qatar
3.400%, 04/16/2025 (C) 200,000 217,2503.750%, 04/16/2030 (C) 270,000 301,725
5.103%, 04/23/2048 200,000 252,684
771,659Romania – 0.3%Republic of Romania
2.625%, 12/02/2040 (C) EUR 335,000 388,580
4.625%, 04/03/2049 317,000 456,595
845,175Saudi Arabia – 0.3%Kingdom of Saudi Arabia
2.250%, 02/02/2033 (C) $ 685,000 644,900
4.500%, 10/26/2046 225,000 247,037
891,937Senegal – 0.2%Republic of Senegal
4.750%, 03/13/2028 EUR 200,000 237,899
Investment Quality Bond Trust (continued)Shares orPrincipalAmount Value
FOREIGN GOVERNMENT OBLIGATIONS(continued)United Arab Emirates (continued)Government of Abu Dhabi (continued)
3.875%, 04/16/2050 (C) $ 200,000 $ 217,120
751,559
TOTAL FOREIGN GOVERNMENT OBLIGATIONS(Cost $11,277,501) $ 11,070,904
CORPORATE BONDS – 32.3%Communication services – 4.2%AT&T, Inc.
3.500%, 02/01/2061 145,000 131,5723.550%, 09/15/2055 (C) 798,000 730,2553.650%, 06/01/2051 120,000 116,0633.650%, 09/15/2059 (C) 9,000 8,2273.800%, 12/01/2057 (C) 116,000 110,361
CCO Holdings LLC4.250%, 02/01/2031 (C) 110,000 110,2444.500%, 08/15/2030 (C) 60,000 61,152
Charter Communications OperatingLLC
2.300%, 02/01/2032 85,000 79,0014.800%, 03/01/2050 45,000 48,2725.125%, 07/01/2049 75,000 84,3805.750%, 04/01/2048 125,000 151,9676.484%, 10/23/2045 365,000 475,2346.834%, 10/23/2055 40,000 54,717
Comcast Corp.3.200%, 07/15/2036 55,000 57,3573.250%, 11/01/2039 180,000 185,4263.400%, 07/15/2046 30,000 31,0213.750%, 04/01/2040 270,000 296,2454.049%, 11/01/2052 45,000 50,8514.600%, 10/15/2038 115,000 138,8154.650%, 07/15/2042 35,000 42,2944.750%, 03/01/2044 20,000 24,5814.950%, 10/15/2058 35,000 45,793
Cox Communications, Inc.3.150%, 08/15/2024 (C) 306,000 326,729
CSC Holdings LLC3.375%, 02/15/2031 (C) 430,000 405,275
Discovery Communications LLC3.800%, 03/13/2024 80,000 86,1543.950%, 06/15/2025 12,000 13,1374.000%, 09/15/2055 (C) 246,000 242,1415.300%, 05/15/2049 100,000 119,654
DISH DBS Corp.6.750%, 06/01/2021 66,000 66,528
Lamar Media Corp.3.750%, 02/15/2028 10,000 9,988
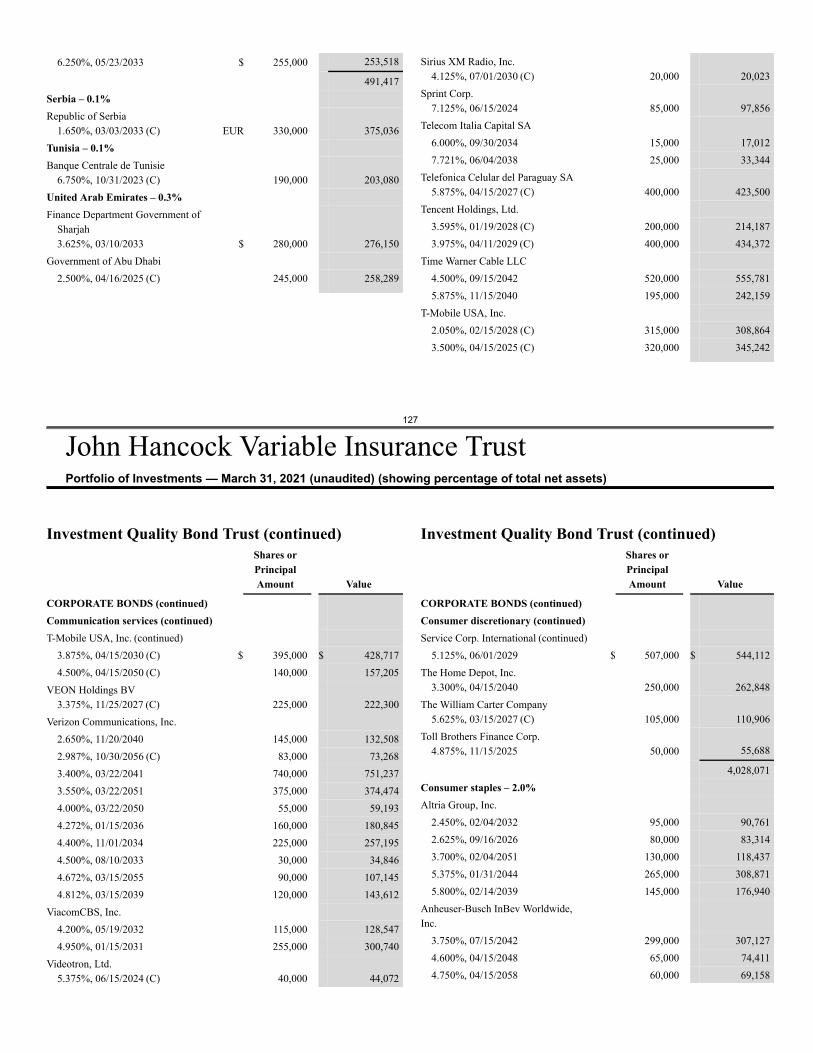
127
John Hancock Variable Insurance TrustPortfolio of Investments — March 31, 2021 (unaudited) (showing percentage of total net assets)
6.250%, 05/23/2033 $ 255,000 253,518
491,417Serbia – 0.1%Republic of Serbia
1.650%, 03/03/2033 (C) EUR 330,000 375,036Tunisia – 0.1%Banque Centrale de Tunisie
6.750%, 10/31/2023 (C) 190,000 203,080United Arab Emirates – 0.3%Finance Department Government of
Sharjah3.625%, 03/10/2033 $ 280,000 276,150
Government of Abu Dhabi2.500%, 04/16/2025 (C) 245,000 258,289
Sirius XM Radio, Inc.4.125%, 07/01/2030 (C) 20,000 20,023
Sprint Corp.7.125%, 06/15/2024 85,000 97,856
Telecom Italia Capital SA6.000%, 09/30/2034 15,000 17,0127.721%, 06/04/2038 25,000 33,344
Telefonica Celular del Paraguay SA5.875%, 04/15/2027 (C) 400,000 423,500
Tencent Holdings, Ltd.3.595%, 01/19/2028 (C) 200,000 214,1873.975%, 04/11/2029 (C) 400,000 434,372
Time Warner Cable LLC4.500%, 09/15/2042 520,000 555,7815.875%, 11/15/2040 195,000 242,159
T-Mobile USA, Inc.2.050%, 02/15/2028 (C) 315,000 308,8643.500%, 04/15/2025 (C) 320,000 345,242
Investment Quality Bond Trust (continued)Shares orPrincipalAmount Value
CORPORATE BONDS (continued)Communication services (continued)T-Mobile USA, Inc. (continued)
3.875%, 04/15/2030 (C) $ 395,000 $ 428,7174.500%, 04/15/2050 (C) 140,000 157,205
VEON Holdings BV3.375%, 11/25/2027 (C) 225,000 222,300
Verizon Communications, Inc.2.650%, 11/20/2040 145,000 132,5082.987%, 10/30/2056 (C) 83,000 73,2683.400%, 03/22/2041 740,000 751,2373.550%, 03/22/2051 375,000 374,4744.000%, 03/22/2050 55,000 59,1934.272%, 01/15/2036 160,000 180,8454.400%, 11/01/2034 225,000 257,1954.500%, 08/10/2033 30,000 34,8464.672%, 03/15/2055 90,000 107,1454.812%, 03/15/2039 120,000 143,612
ViacomCBS, Inc.4.200%, 05/19/2032 115,000 128,5474.950%, 01/15/2031 255,000 300,740
Videotron, Ltd.5.375%, 06/15/2024 (C) 40,000 44,072
Investment Quality Bond Trust (continued)Shares orPrincipalAmount Value
CORPORATE BONDS (continued)Consumer discretionary (continued)Service Corp. International (continued)
5.125%, 06/01/2029 $ 507,000 $ 544,112The Home Depot, Inc.
3.300%, 04/15/2040 250,000 262,848The William Carter Company
5.625%, 03/15/2027 (C) 105,000 110,906Toll Brothers Finance Corp.
4.875%, 11/15/2025 50,000 55,688
4,028,071Consumer staples – 2.0%Altria Group, Inc.
2.450%, 02/04/2032 95,000 90,7612.625%, 09/16/2026 80,000 83,3143.700%, 02/04/2051 130,000 118,4375.375%, 01/31/2044 265,000 308,8715.800%, 02/14/2039 145,000 176,940
Anheuser-Busch InBev Worldwide,Inc.
3.750%, 07/15/2042 299,000 307,1274.600%, 04/15/2048 65,000 74,4114.750%, 04/15/2058 60,000 69,158
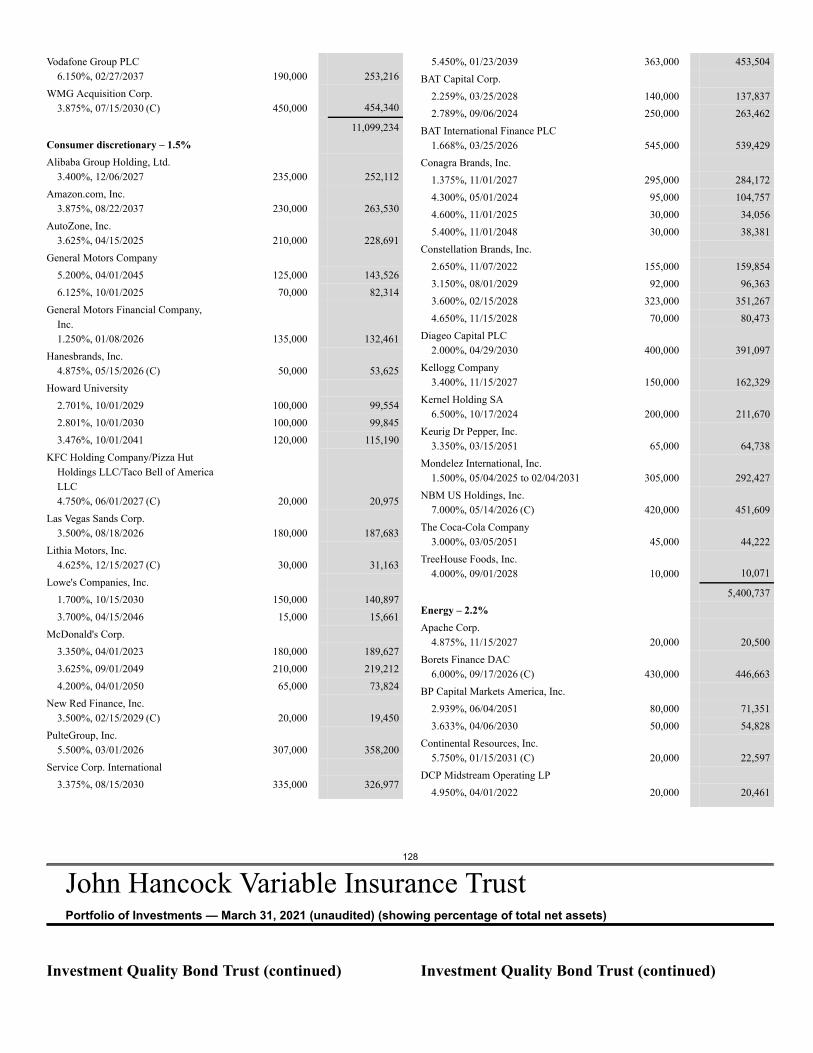
128
John Hancock Variable Insurance TrustPortfolio of Investments — March 31, 2021 (unaudited) (showing percentage of total net assets)
Vodafone Group PLC6.150%, 02/27/2037 190,000 253,216
WMG Acquisition Corp.3.875%, 07/15/2030 (C) 450,000 454,340
11,099,234Consumer discretionary – 1.5%Alibaba Group Holding, Ltd.
3.400%, 12/06/2027 235,000 252,112Amazon.com, Inc.
3.875%, 08/22/2037 230,000 263,530AutoZone, Inc.
3.625%, 04/15/2025 210,000 228,691General Motors Company
5.200%, 04/01/2045 125,000 143,5266.125%, 10/01/2025 70,000 82,314
General Motors Financial Company,Inc.1.250%, 01/08/2026 135,000 132,461
Hanesbrands, Inc.4.875%, 05/15/2026 (C) 50,000 53,625
Howard University2.701%, 10/01/2029 100,000 99,5542.801%, 10/01/2030 100,000 99,8453.476%, 10/01/2041 120,000 115,190
KFC Holding Company/Pizza HutHoldings LLC/Taco Bell of AmericaLLC4.750%, 06/01/2027 (C) 20,000 20,975
Las Vegas Sands Corp.3.500%, 08/18/2026 180,000 187,683
Lithia Motors, Inc.4.625%, 12/15/2027 (C) 30,000 31,163
Lowe's Companies, Inc.1.700%, 10/15/2030 150,000 140,8973.700%, 04/15/2046 15,000 15,661
McDonald's Corp.3.350%, 04/01/2023 180,000 189,6273.625%, 09/01/2049 210,000 219,2124.200%, 04/01/2050 65,000 73,824
New Red Finance, Inc.3.500%, 02/15/2029 (C) 20,000 19,450
PulteGroup, Inc.5.500%, 03/01/2026 307,000 358,200
Service Corp. International3.375%, 08/15/2030 335,000 326,977
5.450%, 01/23/2039 363,000 453,504BAT Capital Corp.
2.259%, 03/25/2028 140,000 137,8372.789%, 09/06/2024 250,000 263,462
BAT International Finance PLC1.668%, 03/25/2026 545,000 539,429
Conagra Brands, Inc.1.375%, 11/01/2027 295,000 284,1724.300%, 05/01/2024 95,000 104,7574.600%, 11/01/2025 30,000 34,0565.400%, 11/01/2048 30,000 38,381
Constellation Brands, Inc.2.650%, 11/07/2022 155,000 159,8543.150%, 08/01/2029 92,000 96,3633.600%, 02/15/2028 323,000 351,2674.650%, 11/15/2028 70,000 80,473
Diageo Capital PLC2.000%, 04/29/2030 400,000 391,097
Kellogg Company3.400%, 11/15/2027 150,000 162,329
Kernel Holding SA6.500%, 10/17/2024 200,000 211,670
Keurig Dr Pepper, Inc.3.350%, 03/15/2051 65,000 64,738
Mondelez International, Inc.1.500%, 05/04/2025 to 02/04/2031 305,000 292,427
NBM US Holdings, Inc.7.000%, 05/14/2026 (C) 420,000 451,609
The Coca-Cola Company3.000%, 03/05/2051 45,000 44,222
TreeHouse Foods, Inc.4.000%, 09/01/2028 10,000 10,071
5,400,737Energy – 2.2%Apache Corp.
4.875%, 11/15/2027 20,000 20,500Borets Finance DAC
6.000%, 09/17/2026 (C) 430,000 446,663BP Capital Markets America, Inc.
2.939%, 06/04/2051 80,000 71,3513.633%, 04/06/2030 50,000 54,828
Continental Resources, Inc.5.750%, 01/15/2031 (C) 20,000 22,597
DCP Midstream Operating LP4.950%, 04/01/2022 20,000 20,461
Investment Quality Bond Trust (continued) Investment Quality Bond Trust (continued)
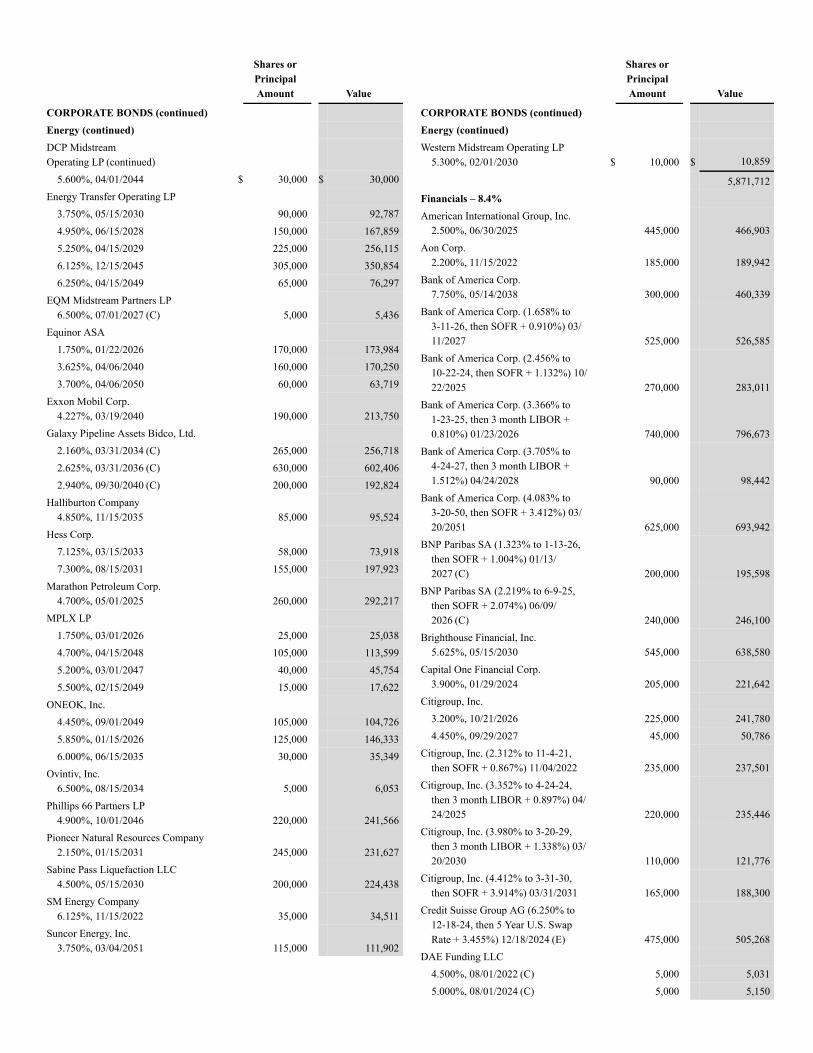
Shares orPrincipalAmount Value
CORPORATE BONDS (continued)Energy (continued)DCP MidstreamOperating LP (continued)
5.600%, 04/01/2044 $ 30,000 $ 30,000Energy Transfer Operating LP
3.750%, 05/15/2030 90,000 92,7874.950%, 06/15/2028 150,000 167,8595.250%, 04/15/2029 225,000 256,1156.125%, 12/15/2045 305,000 350,8546.250%, 04/15/2049 65,000 76,297
EQM Midstream Partners LP6.500%, 07/01/2027 (C) 5,000 5,436
Equinor ASA1.750%, 01/22/2026 170,000 173,9843.625%, 04/06/2040 160,000 170,2503.700%, 04/06/2050 60,000 63,719
Exxon Mobil Corp.4.227%, 03/19/2040 190,000 213,750
Galaxy Pipeline Assets Bidco, Ltd.2.160%, 03/31/2034 (C) 265,000 256,7182.625%, 03/31/2036 (C) 630,000 602,4062.940%, 09/30/2040 (C) 200,000 192,824
Halliburton Company4.850%, 11/15/2035 85,000 95,524
Hess Corp.7.125%, 03/15/2033 58,000 73,9187.300%, 08/15/2031 155,000 197,923
Marathon Petroleum Corp.4.700%, 05/01/2025 260,000 292,217
MPLX LP1.750%, 03/01/2026 25,000 25,0384.700%, 04/15/2048 105,000 113,5995.200%, 03/01/2047 40,000 45,7545.500%, 02/15/2049 15,000 17,622
ONEOK, Inc.4.450%, 09/01/2049 105,000 104,7265.850%, 01/15/2026 125,000 146,3336.000%, 06/15/2035 30,000 35,349
Ovintiv, Inc.6.500%, 08/15/2034 5,000 6,053
Phillips 66 Partners LP4.900%, 10/01/2046 220,000 241,566
Pioneer Natural Resources Company2.150%, 01/15/2031 245,000 231,627
Sabine Pass Liquefaction LLC4.500%, 05/15/2030 200,000 224,438
SM Energy Company6.125%, 11/15/2022 35,000 34,511
Suncor Energy, Inc.3.750%, 03/04/2051 115,000 111,902
Shares orPrincipalAmount Value
CORPORATE BONDS (continued)Energy (continued)Western Midstream Operating LP
5.300%, 02/01/2030 $ 10,000 $ 10,859
5,871,712Financials – 8.4%American International Group, Inc.
2.500%, 06/30/2025 445,000 466,903Aon Corp.
2.200%, 11/15/2022 185,000 189,942Bank of America Corp.
7.750%, 05/14/2038 300,000 460,339Bank of America Corp. (1.658% to
3-11-26, then SOFR + 0.910%) 03/11/2027 525,000 526,585
Bank of America Corp. (2.456% to10-22-24, then SOFR + 1.132%) 10/22/2025 270,000 283,011
Bank of America Corp. (3.366% to1-23-25, then 3 month LIBOR +0.810%) 01/23/2026 740,000 796,673
Bank of America Corp. (3.705% to4-24-27, then 3 month LIBOR +1.512%) 04/24/2028 90,000 98,442
Bank of America Corp. (4.083% to3-20-50, then SOFR + 3.412%) 03/20/2051 625,000 693,942
BNP Paribas SA (1.323% to 1-13-26,then SOFR + 1.004%) 01/13/2027 (C) 200,000 195,598
BNP Paribas SA (2.219% to 6-9-25,then SOFR + 2.074%) 06/09/2026 (C) 240,000 246,100
Brighthouse Financial, Inc.5.625%, 05/15/2030 545,000 638,580
Capital One Financial Corp.3.900%, 01/29/2024 205,000 221,642
Citigroup, Inc.3.200%, 10/21/2026 225,000 241,7804.450%, 09/29/2027 45,000 50,786
Citigroup, Inc. (2.312% to 11-4-21,then SOFR + 0.867%) 11/04/2022 235,000 237,501
Citigroup, Inc. (3.352% to 4-24-24,then 3 month LIBOR + 0.897%) 04/24/2025 220,000 235,446
Citigroup, Inc. (3.980% to 3-20-29,then 3 month LIBOR + 1.338%) 03/20/2030 110,000 121,776
Citigroup, Inc. (4.412% to 3-31-30,then SOFR + 3.914%) 03/31/2031 165,000 188,300
Credit Suisse Group AG (6.250% to12-18-24, then 5 Year U.S. SwapRate + 3.455%) 12/18/2024 (E) 475,000 505,268
DAE Funding LLC4.500%, 08/01/2022 (C) 5,000 5,0315.000%, 08/01/2024 (C) 5,000 5,150
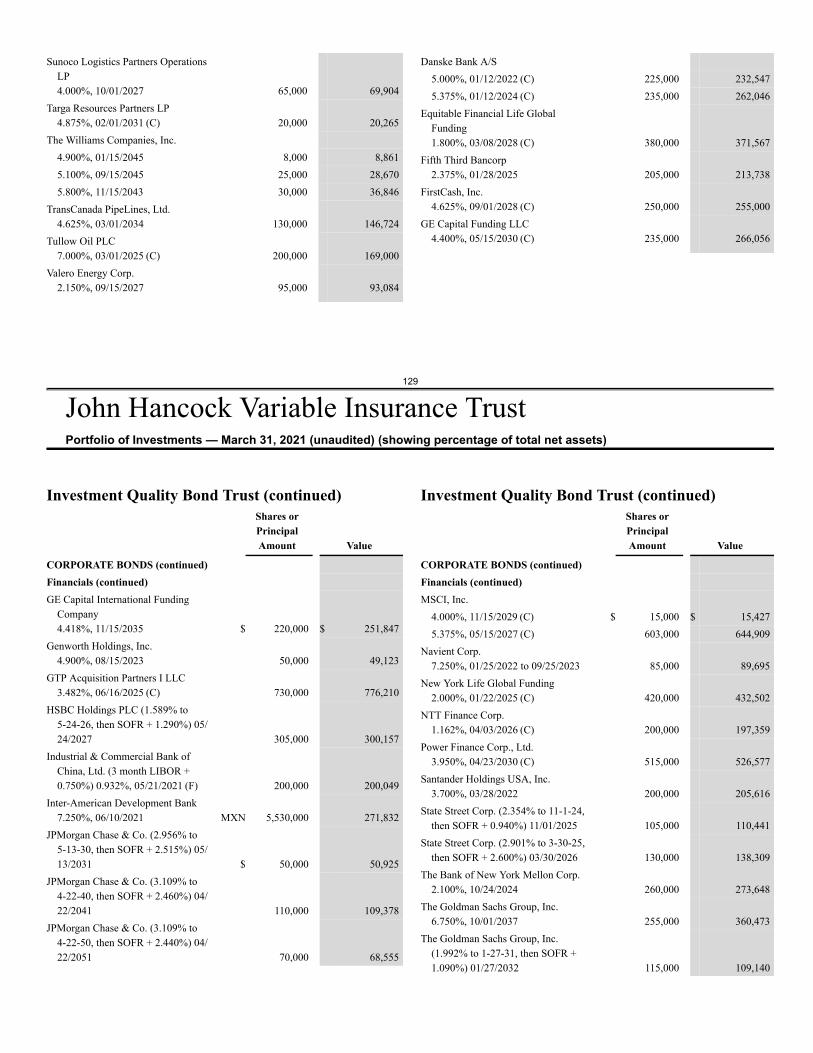
129
John Hancock Variable Insurance TrustPortfolio of Investments — March 31, 2021 (unaudited) (showing percentage of total net assets)
Sunoco Logistics Partners OperationsLP4.000%, 10/01/2027 65,000 69,904
Targa Resources Partners LP4.875%, 02/01/2031 (C) 20,000 20,265
The Williams Companies, Inc.4.900%, 01/15/2045 8,000 8,8615.100%, 09/15/2045 25,000 28,6705.800%, 11/15/2043 30,000 36,846
TransCanada PipeLines, Ltd.4.625%, 03/01/2034 130,000 146,724
Tullow Oil PLC7.000%, 03/01/2025 (C) 200,000 169,000
Valero Energy Corp.2.150%, 09/15/2027 95,000 93,084
Danske Bank A/S5.000%, 01/12/2022 (C) 225,000 232,5475.375%, 01/12/2024 (C) 235,000 262,046
Equitable Financial Life GlobalFunding1.800%, 03/08/2028 (C) 380,000 371,567
Fifth Third Bancorp2.375%, 01/28/2025 205,000 213,738
FirstCash, Inc.4.625%, 09/01/2028 (C) 250,000 255,000
GE Capital Funding LLC4.400%, 05/15/2030 (C) 235,000 266,056
Investment Quality Bond Trust (continued)Shares orPrincipalAmount Value
CORPORATE BONDS (continued)Financials (continued)GE Capital International Funding
Company4.418%, 11/15/2035 $ 220,000 $ 251,847
Genworth Holdings, Inc.4.900%, 08/15/2023 50,000 49,123
GTP Acquisition Partners I LLC3.482%, 06/16/2025 (C) 730,000 776,210
HSBC Holdings PLC (1.589% to5-24-26, then SOFR + 1.290%) 05/24/2027 305,000 300,157
Industrial & Commercial Bank ofChina, Ltd. (3 month LIBOR +0.750%) 0.932%, 05/21/2021 (F) 200,000 200,049
Inter-American Development Bank7.250%, 06/10/2021 MXN 5,530,000 271,832
JPMorgan Chase & Co. (2.956% to5-13-30, then SOFR + 2.515%) 05/13/2031 $ 50,000 50,925
JPMorgan Chase & Co. (3.109% to4-22-40, then SOFR + 2.460%) 04/22/2041 110,000 109,378
JPMorgan Chase & Co. (3.109% to4-22-50, then SOFR + 2.440%) 04/22/2051 70,000 68,555
Investment Quality Bond Trust (continued)Shares orPrincipalAmount Value
CORPORATE BONDS (continued)Financials (continued)MSCI, Inc.
4.000%, 11/15/2029 (C) $ 15,000 $ 15,4275.375%, 05/15/2027 (C) 603,000 644,909
Navient Corp.7.250%, 01/25/2022 to 09/25/2023 85,000 89,695
New York Life Global Funding2.000%, 01/22/2025 (C) 420,000 432,502
NTT Finance Corp.1.162%, 04/03/2026 (C) 200,000 197,359
Power Finance Corp., Ltd.3.950%, 04/23/2030 (C) 515,000 526,577
Santander Holdings USA, Inc.3.700%, 03/28/2022 200,000 205,616
State Street Corp. (2.354% to 11-1-24,then SOFR + 0.940%) 11/01/2025 105,000 110,441
State Street Corp. (2.901% to 3-30-25,then SOFR + 2.600%) 03/30/2026 130,000 138,309
The Bank of New York Mellon Corp.2.100%, 10/24/2024 260,000 273,648
The Goldman Sachs Group, Inc.6.750%, 10/01/2037 255,000 360,473
The Goldman Sachs Group, Inc.(1.992% to 1-27-31, then SOFR +1.090%) 01/27/2032 115,000 109,140
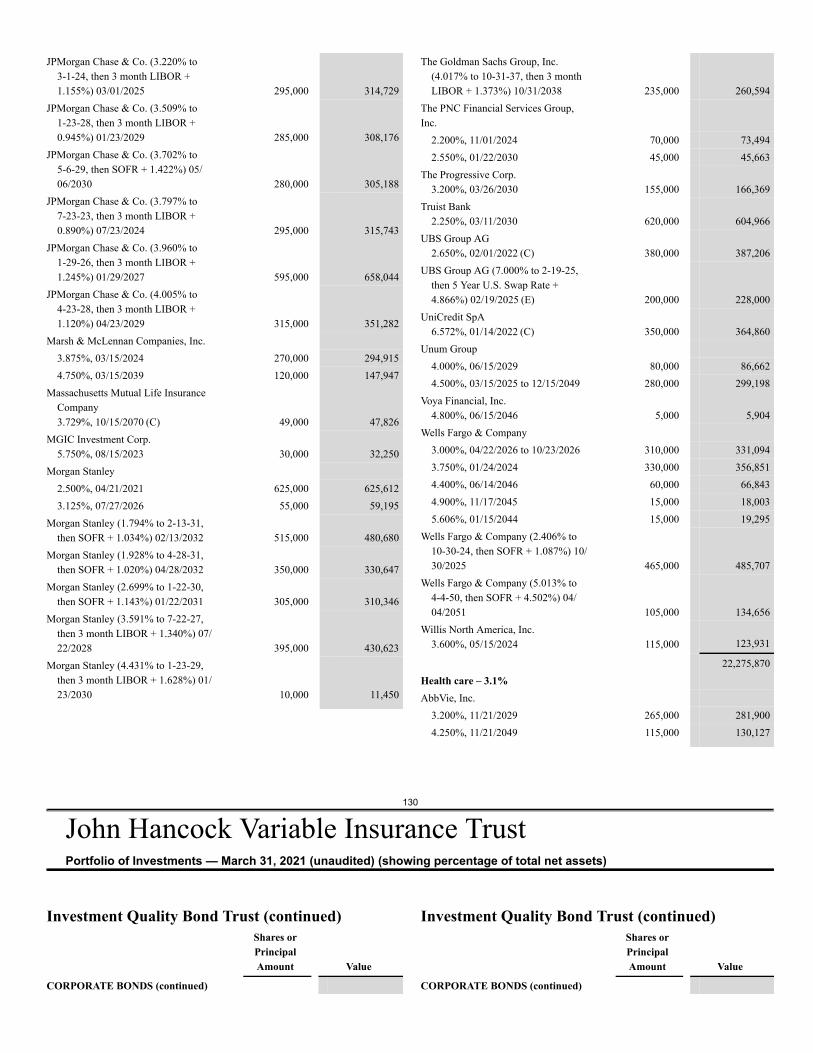
130
John Hancock Variable Insurance TrustPortfolio of Investments — March 31, 2021 (unaudited) (showing percentage of total net assets)
JPMorgan Chase & Co. (3.220% to3-1-24, then 3 month LIBOR +1.155%) 03/01/2025 295,000 314,729
JPMorgan Chase & Co. (3.509% to1-23-28, then 3 month LIBOR +0.945%) 01/23/2029 285,000 308,176
JPMorgan Chase & Co. (3.702% to5-6-29, then SOFR + 1.422%) 05/06/2030 280,000 305,188
JPMorgan Chase & Co. (3.797% to7-23-23, then 3 month LIBOR +0.890%) 07/23/2024 295,000 315,743
JPMorgan Chase & Co. (3.960% to1-29-26, then 3 month LIBOR +1.245%) 01/29/2027 595,000 658,044
JPMorgan Chase & Co. (4.005% to4-23-28, then 3 month LIBOR +1.120%) 04/23/2029 315,000 351,282
Marsh & McLennan Companies, Inc.3.875%, 03/15/2024 270,000 294,9154.750%, 03/15/2039 120,000 147,947
Massachusetts Mutual Life InsuranceCompany3.729%, 10/15/2070 (C) 49,000 47,826
MGIC Investment Corp.5.750%, 08/15/2023 30,000 32,250
Morgan Stanley2.500%, 04/21/2021 625,000 625,6123.125%, 07/27/2026 55,000 59,195
Morgan Stanley (1.794% to 2-13-31,then SOFR + 1.034%) 02/13/2032 515,000 480,680
Morgan Stanley (1.928% to 4-28-31,then SOFR + 1.020%) 04/28/2032 350,000 330,647
Morgan Stanley (2.699% to 1-22-30,then SOFR + 1.143%) 01/22/2031 305,000 310,346
Morgan Stanley (3.591% to 7-22-27,then 3 month LIBOR + 1.340%) 07/22/2028 395,000 430,623
Morgan Stanley (4.431% to 1-23-29,then 3 month LIBOR + 1.628%) 01/23/2030 10,000 11,450
The Goldman Sachs Group, Inc.(4.017% to 10-31-37, then 3 monthLIBOR + 1.373%) 10/31/2038 235,000 260,594
The PNC Financial Services Group,Inc.
2.200%, 11/01/2024 70,000 73,4942.550%, 01/22/2030 45,000 45,663
The Progressive Corp.3.200%, 03/26/2030 155,000 166,369
Truist Bank2.250%, 03/11/2030 620,000 604,966
UBS Group AG2.650%, 02/01/2022 (C) 380,000 387,206
UBS Group AG (7.000% to 2-19-25,then 5 Year U.S. Swap Rate +4.866%) 02/19/2025 (E) 200,000 228,000
UniCredit SpA6.572%, 01/14/2022 (C) 350,000 364,860
Unum Group4.000%, 06/15/2029 80,000 86,6624.500%, 03/15/2025 to 12/15/2049 280,000 299,198
Voya Financial, Inc.4.800%, 06/15/2046 5,000 5,904
Wells Fargo & Company3.000%, 04/22/2026 to 10/23/2026 310,000 331,0943.750%, 01/24/2024 330,000 356,8514.400%, 06/14/2046 60,000 66,8434.900%, 11/17/2045 15,000 18,0035.606%, 01/15/2044 15,000 19,295
Wells Fargo & Company (2.406% to10-30-24, then SOFR + 1.087%) 10/30/2025 465,000 485,707
Wells Fargo & Company (5.013% to4-4-50, then SOFR + 4.502%) 04/04/2051 105,000 134,656
Willis North America, Inc.3.600%, 05/15/2024 115,000 123,931
22,275,870Health care – 3.1%AbbVie, Inc.
3.200%, 11/21/2029 265,000 281,9004.250%, 11/21/2049 115,000 130,127
Investment Quality Bond Trust (continued)Shares orPrincipalAmount Value
CORPORATE BONDS (continued)
Investment Quality Bond Trust (continued)Shares orPrincipalAmount Value
CORPORATE BONDS (continued)
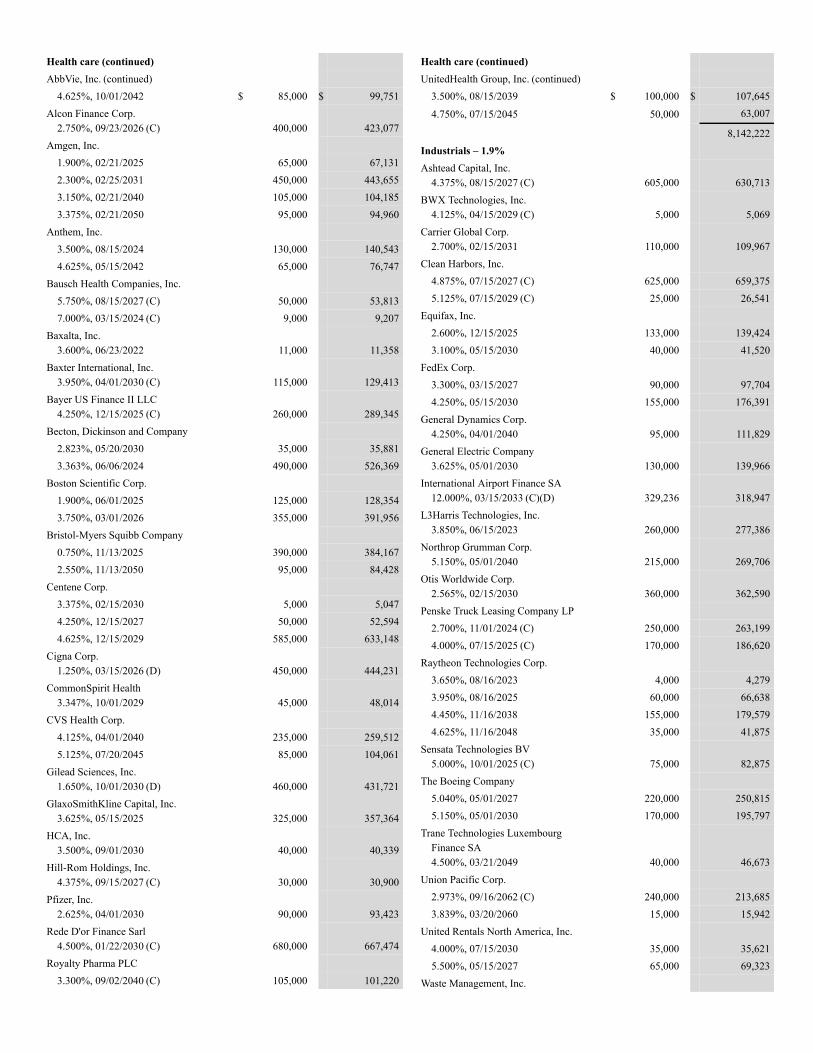
Health care (continued)AbbVie, Inc. (continued)
4.625%, 10/01/2042 $ 85,000 $ 99,751Alcon Finance Corp.
2.750%, 09/23/2026 (C) 400,000 423,077Amgen, Inc.
1.900%, 02/21/2025 65,000 67,1312.300%, 02/25/2031 450,000 443,6553.150%, 02/21/2040 105,000 104,1853.375%, 02/21/2050 95,000 94,960
Anthem, Inc.3.500%, 08/15/2024 130,000 140,5434.625%, 05/15/2042 65,000 76,747
Bausch Health Companies, Inc.5.750%, 08/15/2027 (C) 50,000 53,8137.000%, 03/15/2024 (C) 9,000 9,207
Baxalta, Inc.3.600%, 06/23/2022 11,000 11,358
Baxter International, Inc.3.950%, 04/01/2030 (C) 115,000 129,413
Bayer US Finance II LLC4.250%, 12/15/2025 (C) 260,000 289,345
Becton, Dickinson and Company2.823%, 05/20/2030 35,000 35,8813.363%, 06/06/2024 490,000 526,369
Boston Scientific Corp.1.900%, 06/01/2025 125,000 128,3543.750%, 03/01/2026 355,000 391,956
Bristol-Myers Squibb Company0.750%, 11/13/2025 390,000 384,1672.550%, 11/13/2050 95,000 84,428
Centene Corp.3.375%, 02/15/2030 5,000 5,0474.250%, 12/15/2027 50,000 52,5944.625%, 12/15/2029 585,000 633,148
Cigna Corp.1.250%, 03/15/2026 (D) 450,000 444,231
CommonSpirit Health3.347%, 10/01/2029 45,000 48,014
CVS Health Corp.4.125%, 04/01/2040 235,000 259,5125.125%, 07/20/2045 85,000 104,061
Gilead Sciences, Inc.1.650%, 10/01/2030 (D) 460,000 431,721
GlaxoSmithKline Capital, Inc.3.625%, 05/15/2025 325,000 357,364
HCA, Inc.3.500%, 09/01/2030 40,000 40,339
Hill-Rom Holdings, Inc.4.375%, 09/15/2027 (C) 30,000 30,900
Pfizer, Inc.2.625%, 04/01/2030 90,000 93,423
Rede D'or Finance Sarl4.500%, 01/22/2030 (C) 680,000 667,474
Royalty Pharma PLC3.300%, 09/02/2040 (C) 105,000 101,220
Health care (continued)UnitedHealth Group, Inc. (continued)
3.500%, 08/15/2039 $ 100,000 $ 107,645
4.750%, 07/15/2045 50,000 63,007
8,142,222Industrials – 1.9%Ashtead Capital, Inc.
4.375%, 08/15/2027 (C) 605,000 630,713BWX Technologies, Inc.
4.125%, 04/15/2029 (C) 5,000 5,069Carrier Global Corp.
2.700%, 02/15/2031 110,000 109,967Clean Harbors, Inc.
4.875%, 07/15/2027 (C) 625,000 659,3755.125%, 07/15/2029 (C) 25,000 26,541
Equifax, Inc.2.600%, 12/15/2025 133,000 139,4243.100%, 05/15/2030 40,000 41,520
FedEx Corp.3.300%, 03/15/2027 90,000 97,7044.250%, 05/15/2030 155,000 176,391
General Dynamics Corp.4.250%, 04/01/2040 95,000 111,829
General Electric Company3.625%, 05/01/2030 130,000 139,966
International Airport Finance SA12.000%, 03/15/2033 (C)(D) 329,236 318,947
L3Harris Technologies, Inc.3.850%, 06/15/2023 260,000 277,386
Northrop Grumman Corp.5.150%, 05/01/2040 215,000 269,706
Otis Worldwide Corp.2.565%, 02/15/2030 360,000 362,590
Penske Truck Leasing Company LP2.700%, 11/01/2024 (C) 250,000 263,1994.000%, 07/15/2025 (C) 170,000 186,620
Raytheon Technologies Corp.3.650%, 08/16/2023 4,000 4,2793.950%, 08/16/2025 60,000 66,6384.450%, 11/16/2038 155,000 179,5794.625%, 11/16/2048 35,000 41,875
Sensata Technologies BV5.000%, 10/01/2025 (C) 75,000 82,875
The Boeing Company5.040%, 05/01/2027 220,000 250,8155.150%, 05/01/2030 170,000 195,797
Trane Technologies LuxembourgFinance SA4.500%, 03/21/2049 40,000 46,673
Union Pacific Corp.2.973%, 09/16/2062 (C) 240,000 213,6853.839%, 03/20/2060 15,000 15,942
United Rentals North America, Inc.4.000%, 07/15/2030 35,000 35,6215.500%, 05/15/2027 65,000 69,323
Waste Management, Inc.
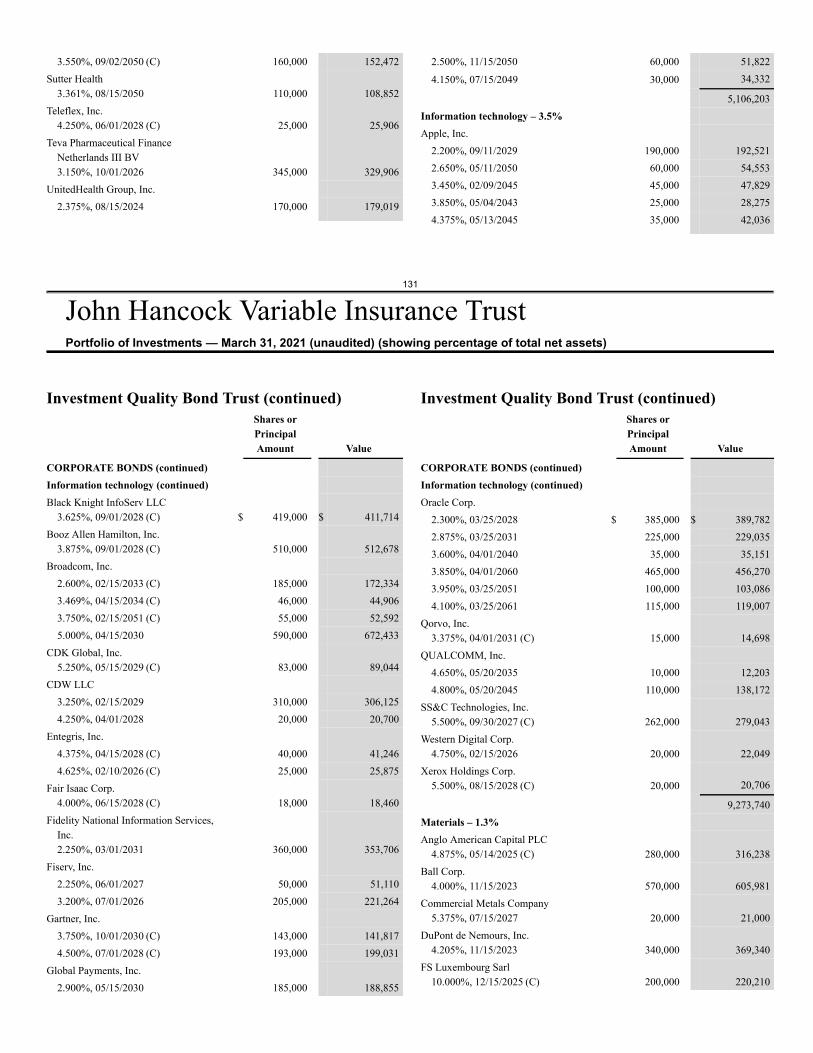
131
John Hancock Variable Insurance TrustPortfolio of Investments — March 31, 2021 (unaudited) (showing percentage of total net assets)
3.550%, 09/02/2050 (C) 160,000 152,472Sutter Health
3.361%, 08/15/2050 110,000 108,852Teleflex, Inc.
4.250%, 06/01/2028 (C) 25,000 25,906Teva Pharmaceutical Finance
Netherlands III BV3.150%, 10/01/2026 345,000 329,906
UnitedHealth Group, Inc.2.375%, 08/15/2024 170,000 179,019
2.500%, 11/15/2050 60,000 51,822
4.150%, 07/15/2049 30,000 34,332
5,106,203Information technology – 3.5%Apple, Inc.
2.200%, 09/11/2029 190,000 192,5212.650%, 05/11/2050 60,000 54,5533.450%, 02/09/2045 45,000 47,8293.850%, 05/04/2043 25,000 28,2754.375%, 05/13/2045 35,000 42,036
Investment Quality Bond Trust (continued)Shares orPrincipalAmount Value
CORPORATE BONDS (continued)Information technology (continued)Black Knight InfoServ LLC
3.625%, 09/01/2028 (C) $ 419,000 $ 411,714Booz Allen Hamilton, Inc.
3.875%, 09/01/2028 (C) 510,000 512,678Broadcom, Inc.
2.600%, 02/15/2033 (C) 185,000 172,3343.469%, 04/15/2034 (C) 46,000 44,9063.750%, 02/15/2051 (C) 55,000 52,5925.000%, 04/15/2030 590,000 672,433
CDK Global, Inc.5.250%, 05/15/2029 (C) 83,000 89,044
CDW LLC3.250%, 02/15/2029 310,000 306,1254.250%, 04/01/2028 20,000 20,700
Entegris, Inc.4.375%, 04/15/2028 (C) 40,000 41,2464.625%, 02/10/2026 (C) 25,000 25,875
Fair Isaac Corp.4.000%, 06/15/2028 (C) 18,000 18,460
Fidelity National Information Services,Inc.2.250%, 03/01/2031 360,000 353,706
Fiserv, Inc.2.250%, 06/01/2027 50,000 51,1103.200%, 07/01/2026 205,000 221,264
Gartner, Inc.3.750%, 10/01/2030 (C) 143,000 141,8174.500%, 07/01/2028 (C) 193,000 199,031
Global Payments, Inc.2.900%, 05/15/2030 185,000 188,855
Investment Quality Bond Trust (continued)Shares orPrincipalAmount Value
CORPORATE BONDS (continued)Information technology (continued)Oracle Corp.
2.300%, 03/25/2028 $ 385,000 $ 389,7822.875%, 03/25/2031 225,000 229,0353.600%, 04/01/2040 35,000 35,1513.850%, 04/01/2060 465,000 456,2703.950%, 03/25/2051 100,000 103,0864.100%, 03/25/2061 115,000 119,007
Qorvo, Inc.3.375%, 04/01/2031 (C) 15,000 14,698
QUALCOMM, Inc.4.650%, 05/20/2035 10,000 12,2034.800%, 05/20/2045 110,000 138,172
SS&C Technologies, Inc.5.500%, 09/30/2027 (C) 262,000 279,043
Western Digital Corp.4.750%, 02/15/2026 20,000 22,049
Xerox Holdings Corp.5.500%, 08/15/2028 (C) 20,000 20,706
9,273,740Materials – 1.3%Anglo American Capital PLC
4.875%, 05/14/2025 (C) 280,000 316,238Ball Corp.
4.000%, 11/15/2023 570,000 605,981Commercial Metals Company
5.375%, 07/15/2027 20,000 21,000DuPont de Nemours, Inc.
4.205%, 11/15/2023 340,000 369,340FS Luxembourg Sarl
10.000%, 12/15/2025 (C) 200,000 220,210
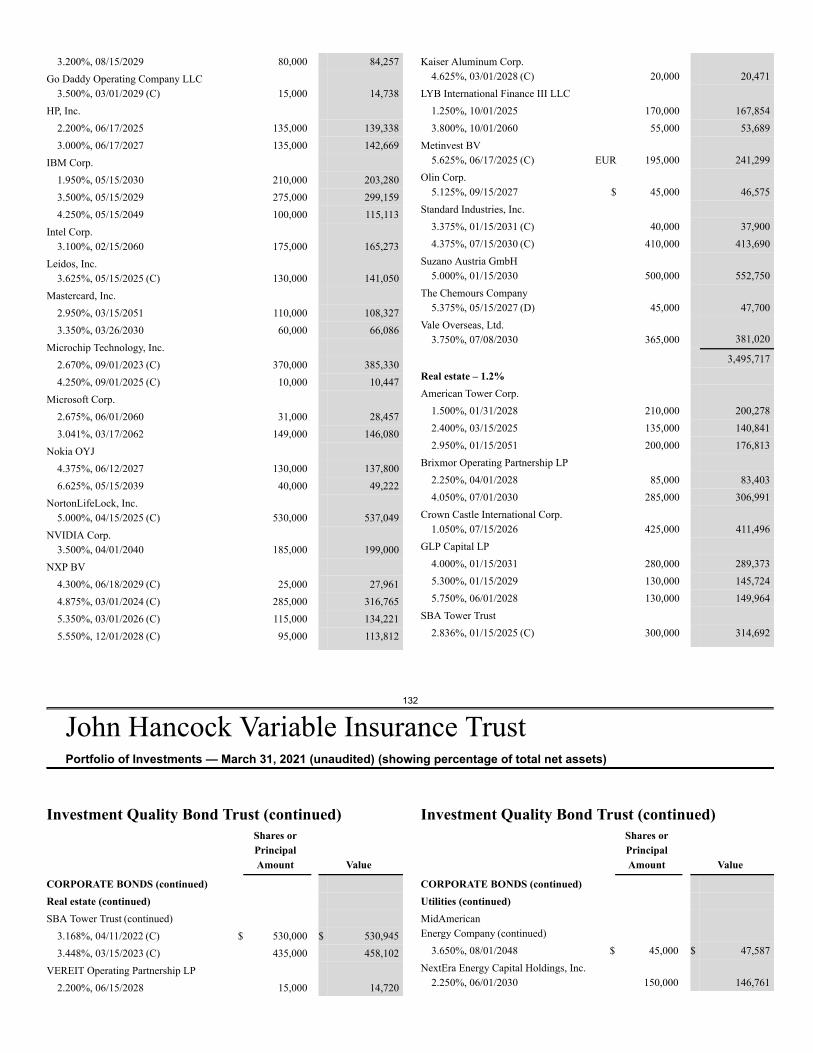
132
John Hancock Variable Insurance TrustPortfolio of Investments — March 31, 2021 (unaudited) (showing percentage of total net assets)
3.200%, 08/15/2029 80,000 84,257Go Daddy Operating Company LLC
3.500%, 03/01/2029 (C) 15,000 14,738HP, Inc.
2.200%, 06/17/2025 135,000 139,3383.000%, 06/17/2027 135,000 142,669
IBM Corp.1.950%, 05/15/2030 210,000 203,2803.500%, 05/15/2029 275,000 299,1594.250%, 05/15/2049 100,000 115,113
Intel Corp.3.100%, 02/15/2060 175,000 165,273
Leidos, Inc.3.625%, 05/15/2025 (C) 130,000 141,050
Mastercard, Inc.2.950%, 03/15/2051 110,000 108,3273.350%, 03/26/2030 60,000 66,086
Microchip Technology, Inc.2.670%, 09/01/2023 (C) 370,000 385,3304.250%, 09/01/2025 (C) 10,000 10,447
Microsoft Corp.2.675%, 06/01/2060 31,000 28,4573.041%, 03/17/2062 149,000 146,080
Nokia OYJ4.375%, 06/12/2027 130,000 137,8006.625%, 05/15/2039 40,000 49,222
NortonLifeLock, Inc.5.000%, 04/15/2025 (C) 530,000 537,049
NVIDIA Corp.3.500%, 04/01/2040 185,000 199,000
NXP BV4.300%, 06/18/2029 (C) 25,000 27,9614.875%, 03/01/2024 (C) 285,000 316,7655.350%, 03/01/2026 (C) 115,000 134,2215.550%, 12/01/2028 (C) 95,000 113,812
Kaiser Aluminum Corp.4.625%, 03/01/2028 (C) 20,000 20,471
LYB International Finance III LLC1.250%, 10/01/2025 170,000 167,8543.800%, 10/01/2060 55,000 53,689
Metinvest BV5.625%, 06/17/2025 (C) EUR 195,000 241,299
Olin Corp.5.125%, 09/15/2027 $ 45,000 46,575
Standard Industries, Inc.3.375%, 01/15/2031 (C) 40,000 37,9004.375%, 07/15/2030 (C) 410,000 413,690
Suzano Austria GmbH5.000%, 01/15/2030 500,000 552,750
The Chemours Company5.375%, 05/15/2027 (D) 45,000 47,700
Vale Overseas, Ltd.3.750%, 07/08/2030 365,000 381,020
3,495,717Real estate – 1.2%American Tower Corp.
1.500%, 01/31/2028 210,000 200,2782.400%, 03/15/2025 135,000 140,8412.950%, 01/15/2051 200,000 176,813
Brixmor Operating Partnership LP2.250%, 04/01/2028 85,000 83,4034.050%, 07/01/2030 285,000 306,991
Crown Castle International Corp.1.050%, 07/15/2026 425,000 411,496
GLP Capital LP4.000%, 01/15/2031 280,000 289,3735.300%, 01/15/2029 130,000 145,7245.750%, 06/01/2028 130,000 149,964
SBA Tower Trust2.836%, 01/15/2025 (C) 300,000 314,692
Investment Quality Bond Trust (continued)Shares orPrincipalAmount Value
CORPORATE BONDS (continued)Real estate (continued)SBA Tower Trust (continued)
3.168%, 04/11/2022 (C) $ 530,000 $ 530,9453.448%, 03/15/2023 (C) 435,000 458,102
VEREIT Operating Partnership LP2.200%, 06/15/2028 15,000 14,720
Investment Quality Bond Trust (continued)Shares orPrincipalAmount Value
CORPORATE BONDS (continued)Utilities (continued)MidAmericanEnergy Company (continued)
3.650%, 08/01/2048 $ 45,000 $ 47,587NextEra Energy Capital Holdings, Inc.
2.250%, 06/01/2030 150,000 146,761
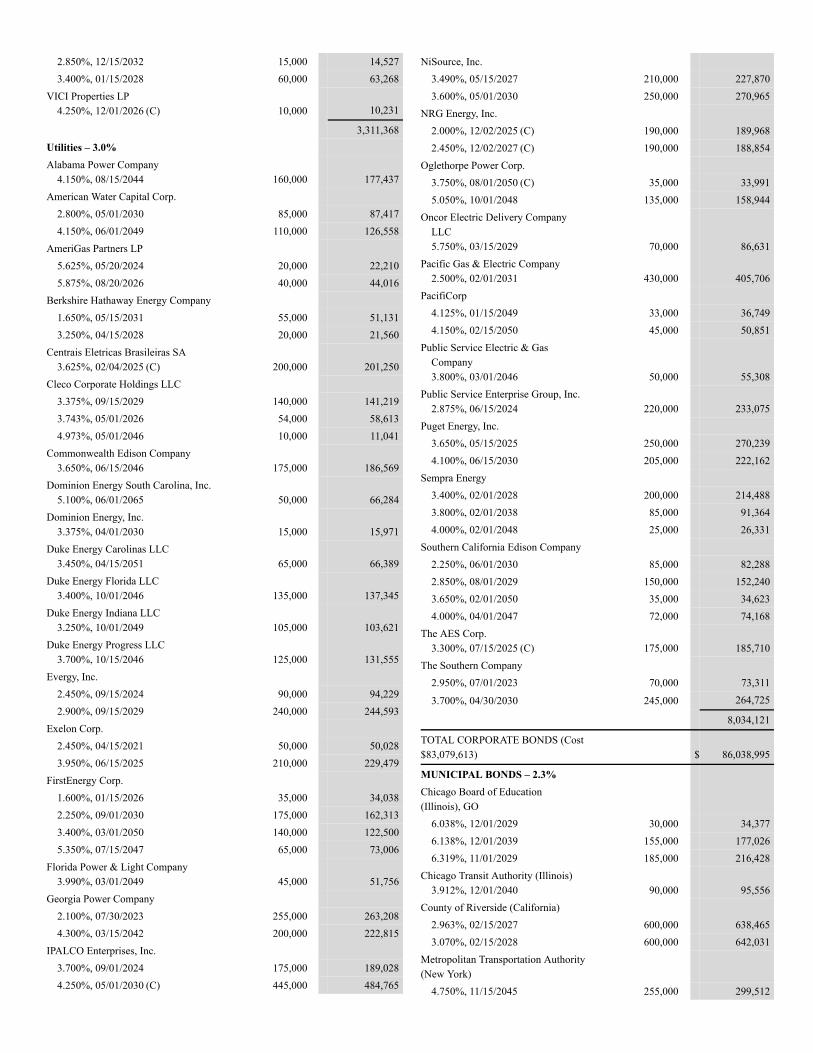
2.850%, 12/15/2032 15,000 14,5273.400%, 01/15/2028 60,000 63,268
VICI Properties LP4.250%, 12/01/2026 (C) 10,000 10,231
3,311,368Utilities – 3.0%Alabama Power Company
4.150%, 08/15/2044 160,000 177,437American Water Capital Corp.
2.800%, 05/01/2030 85,000 87,4174.150%, 06/01/2049 110,000 126,558
AmeriGas Partners LP5.625%, 05/20/2024 20,000 22,2105.875%, 08/20/2026 40,000 44,016
Berkshire Hathaway Energy Company1.650%, 05/15/2031 55,000 51,1313.250%, 04/15/2028 20,000 21,560
Centrais Eletricas Brasileiras SA3.625%, 02/04/2025 (C) 200,000 201,250
Cleco Corporate Holdings LLC3.375%, 09/15/2029 140,000 141,2193.743%, 05/01/2026 54,000 58,6134.973%, 05/01/2046 10,000 11,041
Commonwealth Edison Company3.650%, 06/15/2046 175,000 186,569
Dominion Energy South Carolina, Inc.5.100%, 06/01/2065 50,000 66,284
Dominion Energy, Inc.3.375%, 04/01/2030 15,000 15,971
Duke Energy Carolinas LLC3.450%, 04/15/2051 65,000 66,389
Duke Energy Florida LLC3.400%, 10/01/2046 135,000 137,345
Duke Energy Indiana LLC3.250%, 10/01/2049 105,000 103,621
Duke Energy Progress LLC3.700%, 10/15/2046 125,000 131,555
Evergy, Inc.2.450%, 09/15/2024 90,000 94,2292.900%, 09/15/2029 240,000 244,593
Exelon Corp.2.450%, 04/15/2021 50,000 50,0283.950%, 06/15/2025 210,000 229,479
FirstEnergy Corp.1.600%, 01/15/2026 35,000 34,0382.250%, 09/01/2030 175,000 162,3133.400%, 03/01/2050 140,000 122,5005.350%, 07/15/2047 65,000 73,006
Florida Power & Light Company3.990%, 03/01/2049 45,000 51,756
Georgia Power Company2.100%, 07/30/2023 255,000 263,2084.300%, 03/15/2042 200,000 222,815
IPALCO Enterprises, Inc.3.700%, 09/01/2024 175,000 189,0284.250%, 05/01/2030 (C) 445,000 484,765
NiSource, Inc.3.490%, 05/15/2027 210,000 227,8703.600%, 05/01/2030 250,000 270,965
NRG Energy, Inc.2.000%, 12/02/2025 (C) 190,000 189,9682.450%, 12/02/2027 (C) 190,000 188,854
Oglethorpe Power Corp.3.750%, 08/01/2050 (C) 35,000 33,9915.050%, 10/01/2048 135,000 158,944
Oncor Electric Delivery CompanyLLC5.750%, 03/15/2029 70,000 86,631
Pacific Gas & Electric Company2.500%, 02/01/2031 430,000 405,706
PacifiCorp4.125%, 01/15/2049 33,000 36,7494.150%, 02/15/2050 45,000 50,851
Public Service Electric & GasCompany3.800%, 03/01/2046 50,000 55,308
Public Service Enterprise Group, Inc.2.875%, 06/15/2024 220,000 233,075
Puget Energy, Inc.3.650%, 05/15/2025 250,000 270,2394.100%, 06/15/2030 205,000 222,162
Sempra Energy3.400%, 02/01/2028 200,000 214,4883.800%, 02/01/2038 85,000 91,3644.000%, 02/01/2048 25,000 26,331
Southern California Edison Company2.250%, 06/01/2030 85,000 82,2882.850%, 08/01/2029 150,000 152,2403.650%, 02/01/2050 35,000 34,6234.000%, 04/01/2047 72,000 74,168
The AES Corp.3.300%, 07/15/2025 (C) 175,000 185,710
The Southern Company2.950%, 07/01/2023 70,000 73,311
3.700%, 04/30/2030 245,000 264,725
8,034,121
TOTAL CORPORATE BONDS (Cost$83,079,613) $ 86,038,995
MUNICIPAL BONDS – 2.3%Chicago Board of Education(Illinois), GO
6.038%, 12/01/2029 30,000 34,3776.138%, 12/01/2039 155,000 177,0266.319%, 11/01/2029 185,000 216,428
Chicago Transit Authority (Illinois)3.912%, 12/01/2040 90,000 95,556
County of Riverside (California)2.963%, 02/15/2027 600,000 638,4653.070%, 02/15/2028 600,000 642,031
Metropolitan Transportation Authority(New York)
4.750%, 11/15/2045 255,000 299,512
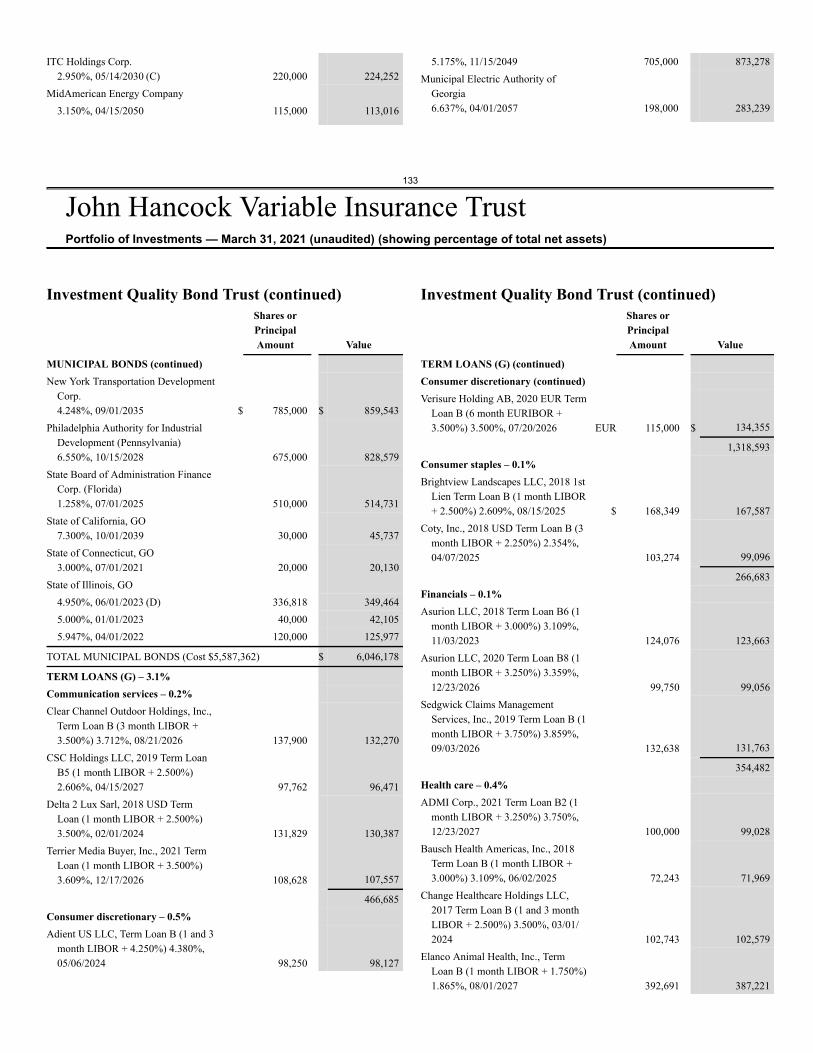
133
John Hancock Variable Insurance TrustPortfolio of Investments — March 31, 2021 (unaudited) (showing percentage of total net assets)
ITC Holdings Corp.2.950%, 05/14/2030 (C) 220,000 224,252
MidAmerican Energy Company3.150%, 04/15/2050 115,000 113,016
5.175%, 11/15/2049 705,000 873,278Municipal Electric Authority of
Georgia6.637%, 04/01/2057 198,000 283,239
Investment Quality Bond Trust (continued)Shares orPrincipalAmount Value
MUNICIPAL BONDS (continued)New York Transportation Development
Corp.4.248%, 09/01/2035 $ 785,000 $ 859,543
Philadelphia Authority for IndustrialDevelopment (Pennsylvania)6.550%, 10/15/2028 675,000 828,579
State Board of Administration FinanceCorp. (Florida)1.258%, 07/01/2025 510,000 514,731
State of California, GO7.300%, 10/01/2039 30,000 45,737
State of Connecticut, GO3.000%, 07/01/2021 20,000 20,130
State of Illinois, GO4.950%, 06/01/2023 (D) 336,818 349,4645.000%, 01/01/2023 40,000 42,1055.947%, 04/01/2022 120,000 125,977
TOTAL MUNICIPAL BONDS (Cost $5,587,362) $ 6,046,178
TERM LOANS (G) – 3.1%Communication services – 0.2%Clear Channel Outdoor Holdings, Inc.,
Term Loan B (3 month LIBOR +3.500%) 3.712%, 08/21/2026 137,900 132,270
CSC Holdings LLC, 2019 Term LoanB5 (1 month LIBOR + 2.500%)2.606%, 04/15/2027 97,762 96,471
Delta 2 Lux Sarl, 2018 USD TermLoan (1 month LIBOR + 2.500%)3.500%, 02/01/2024 131,829 130,387
Terrier Media Buyer, Inc., 2021 TermLoan (1 month LIBOR + 3.500%)3.609%, 12/17/2026 108,628 107,557
466,685Consumer discretionary – 0.5%Adient US LLC, Term Loan B (1 and 3
month LIBOR + 4.250%) 4.380%,05/06/2024 98,250 98,127
Investment Quality Bond Trust (continued)Shares orPrincipalAmount Value
TERM LOANS (G) (continued)Consumer discretionary (continued)Verisure Holding AB, 2020 EUR Term
Loan B (6 month EURIBOR +3.500%) 3.500%, 07/20/2026 EUR 115,000 $ 134,355
1,318,593Consumer staples – 0.1%Brightview Landscapes LLC, 2018 1st
Lien Term Loan B (1 month LIBOR+ 2.500%) 2.609%, 08/15/2025 $ 168,349 167,587
Coty, Inc., 2018 USD Term Loan B (3month LIBOR + 2.250%) 2.354%,04/07/2025 103,274 99,096
266,683Financials – 0.1%Asurion LLC, 2018 Term Loan B6 (1
month LIBOR + 3.000%) 3.109%,11/03/2023 124,076 123,663
Asurion LLC, 2020 Term Loan B8 (1month LIBOR + 3.250%) 3.359%,12/23/2026 99,750 99,056
Sedgwick Claims ManagementServices, Inc., 2019 Term Loan B (1month LIBOR + 3.750%) 3.859%,09/03/2026 132,638 131,763
354,482Health care – 0.4%ADMI Corp., 2021 Term Loan B2 (1
month LIBOR + 3.250%) 3.750%,12/23/2027 100,000 99,028
Bausch Health Americas, Inc., 2018Term Loan B (1 month LIBOR +3.000%) 3.109%, 06/02/2025 72,243 71,969
Change Healthcare Holdings LLC,2017 Term Loan B (1 and 3 monthLIBOR + 2.500%) 3.500%, 03/01/2024 102,743 102,579
Elanco Animal Health, Inc., TermLoan B (1 month LIBOR + 1.750%)1.865%, 08/01/2027 392,691 387,221
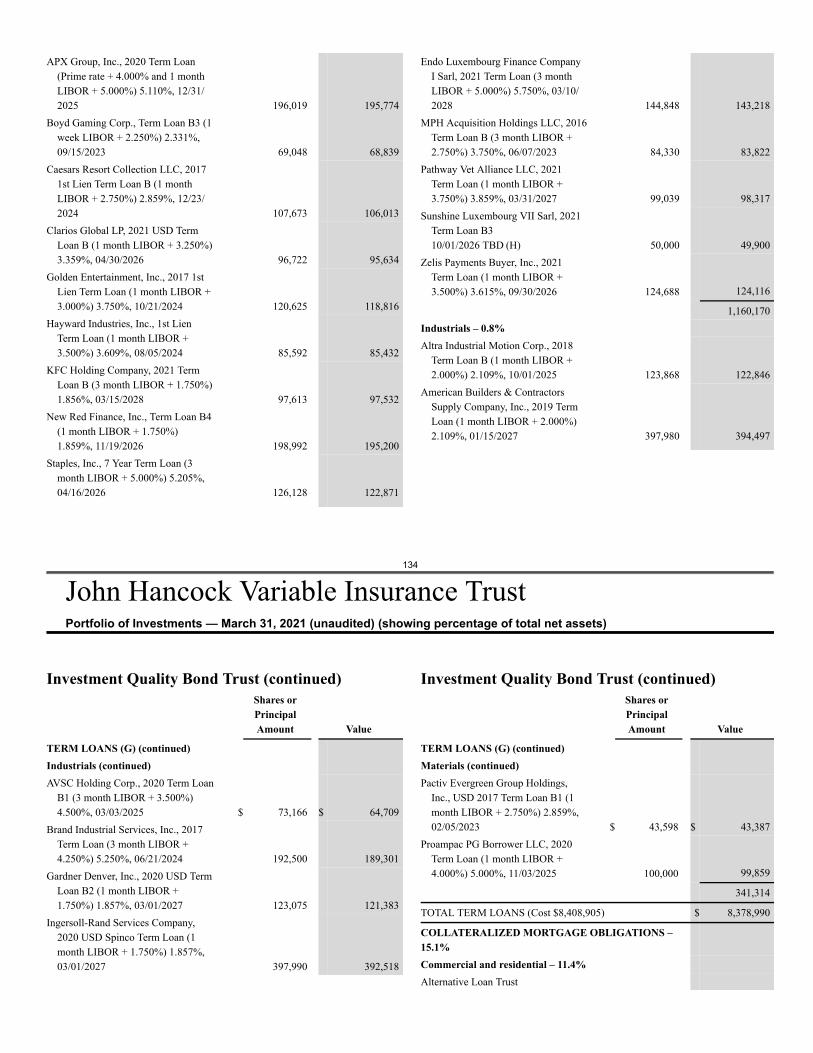
134
John Hancock Variable Insurance TrustPortfolio of Investments — March 31, 2021 (unaudited) (showing percentage of total net assets)
APX Group, Inc., 2020 Term Loan(Prime rate + 4.000% and 1 monthLIBOR + 5.000%) 5.110%, 12/31/2025 196,019 195,774
Boyd Gaming Corp., Term Loan B3 (1week LIBOR + 2.250%) 2.331%,09/15/2023 69,048 68,839
Caesars Resort Collection LLC, 20171st Lien Term Loan B (1 monthLIBOR + 2.750%) 2.859%, 12/23/2024 107,673 106,013
Clarios Global LP, 2021 USD TermLoan B (1 month LIBOR + 3.250%)3.359%, 04/30/2026 96,722 95,634
Golden Entertainment, Inc., 2017 1stLien Term Loan (1 month LIBOR +3.000%) 3.750%, 10/21/2024 120,625 118,816
Hayward Industries, Inc., 1st LienTerm Loan (1 month LIBOR +3.500%) 3.609%, 08/05/2024 85,592 85,432
KFC Holding Company, 2021 TermLoan B (3 month LIBOR + 1.750%)1.856%, 03/15/2028 97,613 97,532
New Red Finance, Inc., Term Loan B4(1 month LIBOR + 1.750%)1.859%, 11/19/2026 198,992 195,200
Staples, Inc., 7 Year Term Loan (3month LIBOR + 5.000%) 5.205%,04/16/2026 126,128 122,871
Endo Luxembourg Finance CompanyI Sarl, 2021 Term Loan (3 monthLIBOR + 5.000%) 5.750%, 03/10/2028 144,848 143,218
MPH Acquisition Holdings LLC, 2016Term Loan B (3 month LIBOR +2.750%) 3.750%, 06/07/2023 84,330 83,822
Pathway Vet Alliance LLC, 2021Term Loan (1 month LIBOR +3.750%) 3.859%, 03/31/2027 99,039 98,317
Sunshine Luxembourg VII Sarl, 2021Term Loan B310/01/2026 TBD (H) 50,000 49,900
Zelis Payments Buyer, Inc., 2021Term Loan (1 month LIBOR +3.500%) 3.615%, 09/30/2026 124,688 124,116
1,160,170Industrials – 0.8%Altra Industrial Motion Corp., 2018
Term Loan B (1 month LIBOR +2.000%) 2.109%, 10/01/2025 123,868 122,846
American Builders & ContractorsSupply Company, Inc., 2019 TermLoan (1 month LIBOR + 2.000%)2.109%, 01/15/2027 397,980 394,497
Investment Quality Bond Trust (continued)Shares orPrincipalAmount Value
TERM LOANS (G) (continued)Industrials (continued)AVSC Holding Corp., 2020 Term Loan
B1 (3 month LIBOR + 3.500%)4.500%, 03/03/2025 $ 73,166 $ 64,709
Brand Industrial Services, Inc., 2017Term Loan (3 month LIBOR +4.250%) 5.250%, 06/21/2024 192,500 189,301
Gardner Denver, Inc., 2020 USD TermLoan B2 (1 month LIBOR +1.750%) 1.857%, 03/01/2027 123,075 121,383
Ingersoll-Rand Services Company,2020 USD Spinco Term Loan (1month LIBOR + 1.750%) 1.857%,03/01/2027 397,990 392,518
Investment Quality Bond Trust (continued)Shares orPrincipalAmount Value
TERM LOANS (G) (continued)Materials (continued)Pactiv Evergreen Group Holdings,
Inc., USD 2017 Term Loan B1 (1month LIBOR + 2.750%) 2.859%,02/05/2023 $ 43,598 $ 43,387
Proampac PG Borrower LLC, 2020Term Loan (1 month LIBOR +4.000%) 5.000%, 11/03/2025 100,000 99,859
341,314
TOTAL TERM LOANS (Cost $8,408,905) $ 8,378,990
COLLATERALIZED MORTGAGE OBLIGATIONS –15.1%Commercial and residential – 11.4%Alternative Loan Trust
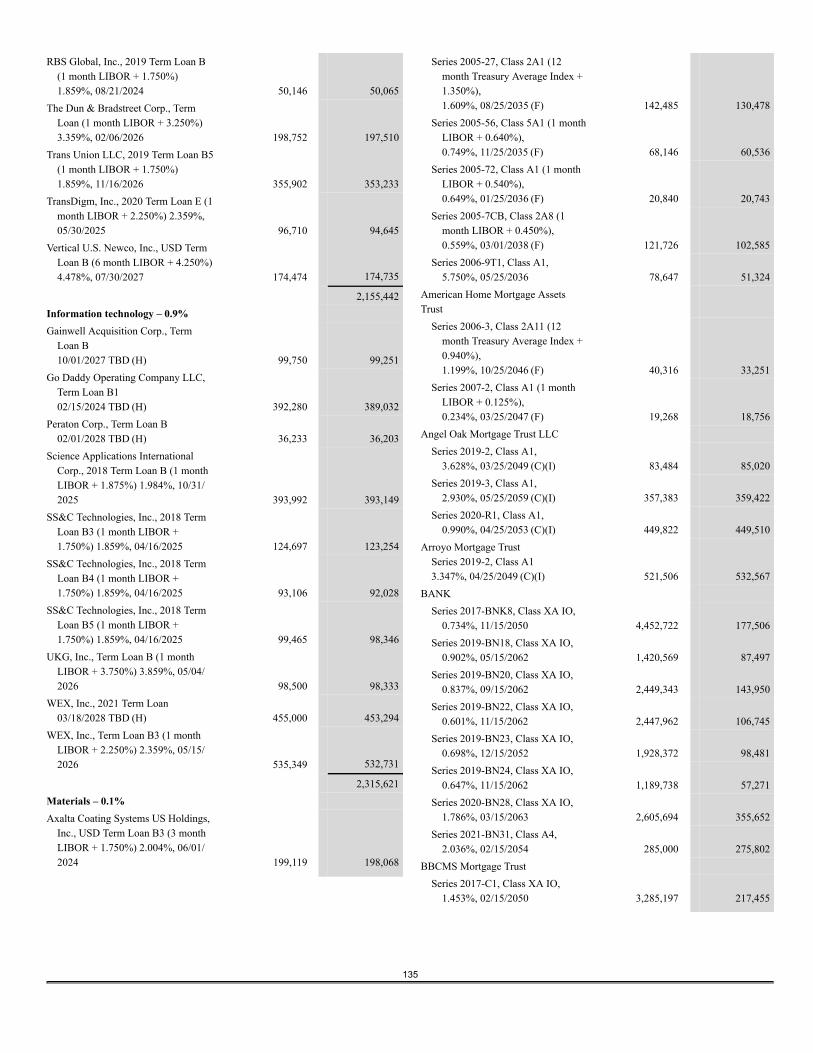
135
RBS Global, Inc., 2019 Term Loan B(1 month LIBOR + 1.750%)1.859%, 08/21/2024 50,146 50,065
The Dun & Bradstreet Corp., TermLoan (1 month LIBOR + 3.250%)3.359%, 02/06/2026 198,752 197,510
Trans Union LLC, 2019 Term Loan B5(1 month LIBOR + 1.750%)1.859%, 11/16/2026 355,902 353,233
TransDigm, Inc., 2020 Term Loan E (1month LIBOR + 2.250%) 2.359%,05/30/2025 96,710 94,645
Vertical U.S. Newco, Inc., USD TermLoan B (6 month LIBOR + 4.250%)4.478%, 07/30/2027 174,474 174,735
2,155,442Information technology – 0.9%Gainwell Acquisition Corp., Term
Loan B10/01/2027 TBD (H) 99,750 99,251
Go Daddy Operating Company LLC,Term Loan B102/15/2024 TBD (H) 392,280 389,032
Peraton Corp., Term Loan B02/01/2028 TBD (H) 36,233 36,203
Science Applications InternationalCorp., 2018 Term Loan B (1 monthLIBOR + 1.875%) 1.984%, 10/31/2025 393,992 393,149
SS&C Technologies, Inc., 2018 TermLoan B3 (1 month LIBOR +1.750%) 1.859%, 04/16/2025 124,697 123,254
SS&C Technologies, Inc., 2018 TermLoan B4 (1 month LIBOR +1.750%) 1.859%, 04/16/2025 93,106 92,028
SS&C Technologies, Inc., 2018 TermLoan B5 (1 month LIBOR +1.750%) 1.859%, 04/16/2025 99,465 98,346
UKG, Inc., Term Loan B (1 monthLIBOR + 3.750%) 3.859%, 05/04/2026 98,500 98,333
WEX, Inc., 2021 Term Loan03/18/2028 TBD (H) 455,000 453,294
WEX, Inc., Term Loan B3 (1 monthLIBOR + 2.250%) 2.359%, 05/15/2026 535,349 532,731
2,315,621Materials – 0.1%Axalta Coating Systems US Holdings,
Inc., USD Term Loan B3 (3 monthLIBOR + 1.750%) 2.004%, 06/01/2024 199,119 198,068
Series 2005-27, Class 2A1 (12month Treasury Average Index +1.350%),1.609%, 08/25/2035 (F) 142,485 130,478
Series 2005-56, Class 5A1 (1 monthLIBOR + 0.640%),0.749%, 11/25/2035 (F) 68,146 60,536
Series 2005-72, Class A1 (1 monthLIBOR + 0.540%),0.649%, 01/25/2036 (F) 20,840 20,743
Series 2005-7CB, Class 2A8 (1month LIBOR + 0.450%),0.559%, 03/01/2038 (F) 121,726 102,585
Series 2006-9T1, Class A1,5.750%, 05/25/2036 78,647 51,324
American Home Mortgage AssetsTrust
Series 2006-3, Class 2A11 (12month Treasury Average Index +0.940%),1.199%, 10/25/2046 (F) 40,316 33,251
Series 2007-2, Class A1 (1 monthLIBOR + 0.125%),0.234%, 03/25/2047 (F) 19,268 18,756
Angel Oak Mortgage Trust LLCSeries 2019-2, Class A1,
3.628%, 03/25/2049 (C)(I) 83,484 85,020Series 2019-3, Class A1,
2.930%, 05/25/2059 (C)(I) 357,383 359,422Series 2020-R1, Class A1,
0.990%, 04/25/2053 (C)(I) 449,822 449,510Arroyo Mortgage Trust
Series 2019-2, Class A13.347%, 04/25/2049 (C)(I) 521,506 532,567
BANKSeries 2017-BNK8, Class XA IO,
0.734%, 11/15/2050 4,452,722 177,506Series 2019-BN18, Class XA IO,
0.902%, 05/15/2062 1,420,569 87,497Series 2019-BN20, Class XA IO,
0.837%, 09/15/2062 2,449,343 143,950Series 2019-BN22, Class XA IO,
0.601%, 11/15/2062 2,447,962 106,745Series 2019-BN23, Class XA IO,
0.698%, 12/15/2052 1,928,372 98,481Series 2019-BN24, Class XA IO,
0.647%, 11/15/2062 1,189,738 57,271Series 2020-BN28, Class XA IO,
1.786%, 03/15/2063 2,605,694 355,652Series 2021-BN31, Class A4,
2.036%, 02/15/2054 285,000 275,802BBCMS Mortgage Trust
Series 2017-C1, Class XA IO,1.453%, 02/15/2050 3,285,197 217,455
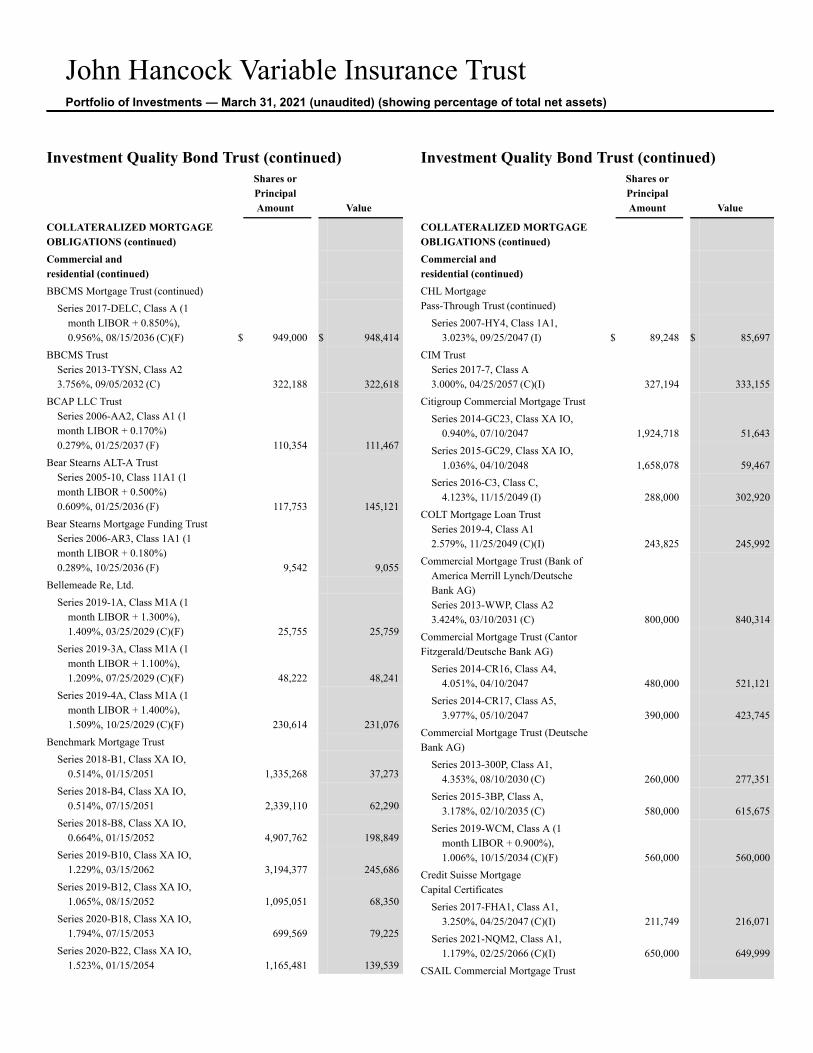
John Hancock Variable Insurance TrustPortfolio of Investments — March 31, 2021 (unaudited) (showing percentage of total net assets)
Investment Quality Bond Trust (continued)Shares orPrincipalAmount Value
COLLATERALIZED MORTGAGEOBLIGATIONS (continued)Commercial andresidential (continued)BBCMS Mortgage Trust (continued)
Series 2017-DELC, Class A (1month LIBOR + 0.850%),0.956%, 08/15/2036 (C)(F) $ 949,000 $ 948,414
BBCMS TrustSeries 2013-TYSN, Class A23.756%, 09/05/2032 (C) 322,188 322,618
BCAP LLC TrustSeries 2006-AA2, Class A1 (1month LIBOR + 0.170%)0.279%, 01/25/2037 (F) 110,354 111,467
Bear Stearns ALT-A TrustSeries 2005-10, Class 11A1 (1month LIBOR + 0.500%)0.609%, 01/25/2036 (F) 117,753 145,121
Bear Stearns Mortgage Funding TrustSeries 2006-AR3, Class 1A1 (1month LIBOR + 0.180%)0.289%, 10/25/2036 (F) 9,542 9,055
Bellemeade Re, Ltd.Series 2019-1A, Class M1A (1
month LIBOR + 1.300%),1.409%, 03/25/2029 (C)(F) 25,755 25,759
Series 2019-3A, Class M1A (1month LIBOR + 1.100%),1.209%, 07/25/2029 (C)(F) 48,222 48,241
Series 2019-4A, Class M1A (1month LIBOR + 1.400%),1.509%, 10/25/2029 (C)(F) 230,614 231,076
Benchmark Mortgage TrustSeries 2018-B1, Class XA IO,
0.514%, 01/15/2051 1,335,268 37,273Series 2018-B4, Class XA IO,
0.514%, 07/15/2051 2,339,110 62,290Series 2018-B8, Class XA IO,
0.664%, 01/15/2052 4,907,762 198,849Series 2019-B10, Class XA IO,
1.229%, 03/15/2062 3,194,377 245,686Series 2019-B12, Class XA IO,
1.065%, 08/15/2052 1,095,051 68,350Series 2020-B18, Class XA IO,
1.794%, 07/15/2053 699,569 79,225Series 2020-B22, Class XA IO,
1.523%, 01/15/2054 1,165,481 139,539
Investment Quality Bond Trust (continued)Shares orPrincipalAmount Value
COLLATERALIZED MORTGAGEOBLIGATIONS (continued)Commercial andresidential (continued)CHL MortgagePass-Through Trust (continued)
Series 2007-HY4, Class 1A1,3.023%, 09/25/2047 (I) $ 89,248 $ 85,697
CIM TrustSeries 2017-7, Class A3.000%, 04/25/2057 (C)(I) 327,194 333,155
Citigroup Commercial Mortgage TrustSeries 2014-GC23, Class XA IO,
0.940%, 07/10/2047 1,924,718 51,643Series 2015-GC29, Class XA IO,
1.036%, 04/10/2048 1,658,078 59,467Series 2016-C3, Class C,
4.123%, 11/15/2049 (I) 288,000 302,920COLT Mortgage Loan Trust
Series 2019-4, Class A12.579%, 11/25/2049 (C)(I) 243,825 245,992
Commercial Mortgage Trust (Bank ofAmerica Merrill Lynch/DeutscheBank AG)Series 2013-WWP, Class A23.424%, 03/10/2031 (C) 800,000 840,314
Commercial Mortgage Trust (CantorFitzgerald/Deutsche Bank AG)
Series 2014-CR16, Class A4,4.051%, 04/10/2047 480,000 521,121
Series 2014-CR17, Class A5,3.977%, 05/10/2047 390,000 423,745
Commercial Mortgage Trust (DeutscheBank AG)
Series 2013-300P, Class A1,4.353%, 08/10/2030 (C) 260,000 277,351
Series 2015-3BP, Class A,3.178%, 02/10/2035 (C) 580,000 615,675
Series 2019-WCM, Class A (1month LIBOR + 0.900%),1.006%, 10/15/2034 (C)(F) 560,000 560,000
Credit Suisse MortgageCapital Certificates
Series 2017-FHA1, Class A1,3.250%, 04/25/2047 (C)(I) 211,749 216,071
Series 2021-NQM2, Class A1,1.179%, 02/25/2066 (C)(I) 650,000 649,999
CSAIL Commercial Mortgage Trust
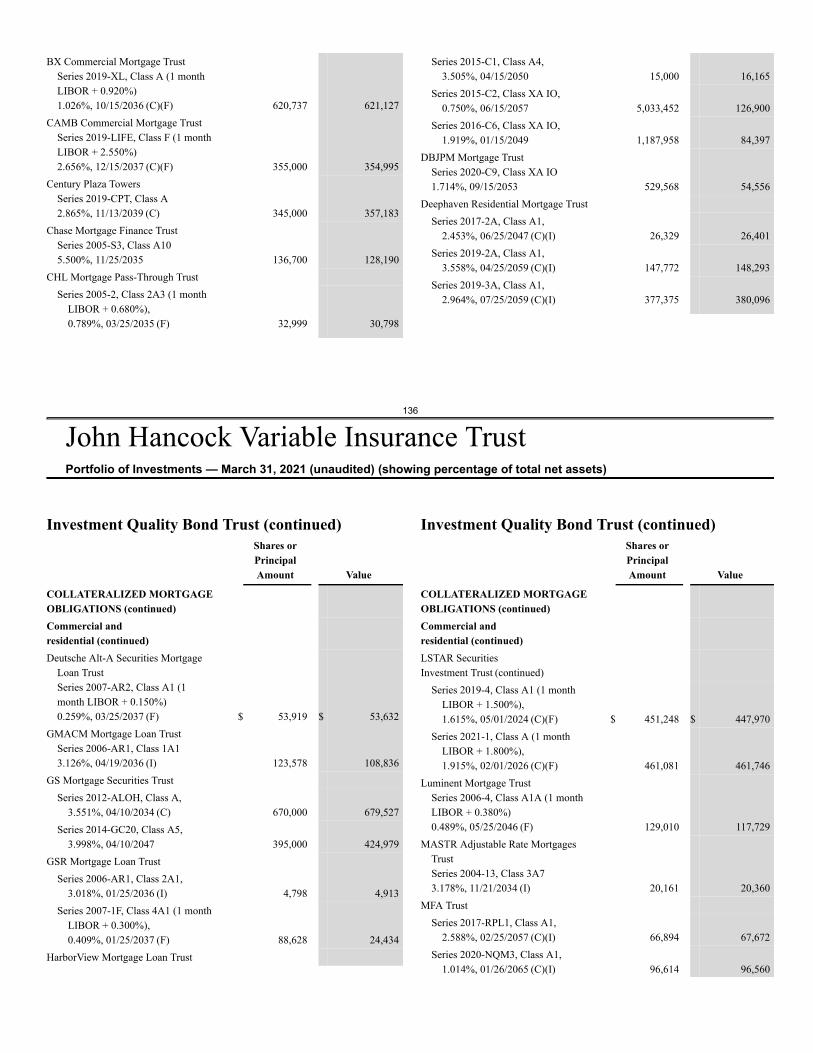
136
John Hancock Variable Insurance TrustPortfolio of Investments — March 31, 2021 (unaudited) (showing percentage of total net assets)
BX Commercial Mortgage TrustSeries 2019-XL, Class A (1 monthLIBOR + 0.920%)1.026%, 10/15/2036 (C)(F) 620,737 621,127
CAMB Commercial Mortgage TrustSeries 2019-LIFE, Class F (1 monthLIBOR + 2.550%)2.656%, 12/15/2037 (C)(F) 355,000 354,995
Century Plaza TowersSeries 2019-CPT, Class A2.865%, 11/13/2039 (C) 345,000 357,183
Chase Mortgage Finance TrustSeries 2005-S3, Class A105.500%, 11/25/2035 136,700 128,190
CHL Mortgage Pass-Through TrustSeries 2005-2, Class 2A3 (1 month
LIBOR + 0.680%),0.789%, 03/25/2035 (F) 32,999 30,798
Series 2015-C1, Class A4,3.505%, 04/15/2050 15,000 16,165
Series 2015-C2, Class XA IO,0.750%, 06/15/2057 5,033,452 126,900
Series 2016-C6, Class XA IO,1.919%, 01/15/2049 1,187,958 84,397
DBJPM Mortgage TrustSeries 2020-C9, Class XA IO1.714%, 09/15/2053 529,568 54,556
Deephaven Residential Mortgage TrustSeries 2017-2A, Class A1,
2.453%, 06/25/2047 (C)(I) 26,329 26,401Series 2019-2A, Class A1,
3.558%, 04/25/2059 (C)(I) 147,772 148,293Series 2019-3A, Class A1,
2.964%, 07/25/2059 (C)(I) 377,375 380,096
Investment Quality Bond Trust (continued)Shares orPrincipalAmount Value
COLLATERALIZED MORTGAGEOBLIGATIONS (continued)Commercial andresidential (continued)Deutsche Alt-A Securities Mortgage
Loan TrustSeries 2007-AR2, Class A1 (1month LIBOR + 0.150%)0.259%, 03/25/2037 (F) $ 53,919 $ 53,632
GMACM Mortgage Loan TrustSeries 2006-AR1, Class 1A13.126%, 04/19/2036 (I) 123,578 108,836
GS Mortgage Securities TrustSeries 2012-ALOH, Class A,
3.551%, 04/10/2034 (C) 670,000 679,527Series 2014-GC20, Class A5,
3.998%, 04/10/2047 395,000 424,979GSR Mortgage Loan Trust
Series 2006-AR1, Class 2A1,3.018%, 01/25/2036 (I) 4,798 4,913
Series 2007-1F, Class 4A1 (1 monthLIBOR + 0.300%),0.409%, 01/25/2037 (F) 88,628 24,434
HarborView Mortgage Loan Trust
Investment Quality Bond Trust (continued)Shares orPrincipalAmount Value
COLLATERALIZED MORTGAGEOBLIGATIONS (continued)Commercial andresidential (continued)LSTAR SecuritiesInvestment Trust (continued)
Series 2019-4, Class A1 (1 monthLIBOR + 1.500%),1.615%, 05/01/2024 (C)(F) $ 451,248 $ 447,970
Series 2021-1, Class A (1 monthLIBOR + 1.800%),1.915%, 02/01/2026 (C)(F) 461,081 461,746
Luminent Mortgage TrustSeries 2006-4, Class A1A (1 monthLIBOR + 0.380%)0.489%, 05/25/2046 (F) 129,010 117,729
MASTR Adjustable Rate MortgagesTrustSeries 2004-13, Class 3A73.178%, 11/21/2034 (I) 20,161 20,360
MFA TrustSeries 2017-RPL1, Class A1,
2.588%, 02/25/2057 (C)(I) 66,894 67,672Series 2020-NQM3, Class A1,
1.014%, 01/26/2065 (C)(I) 96,614 96,560
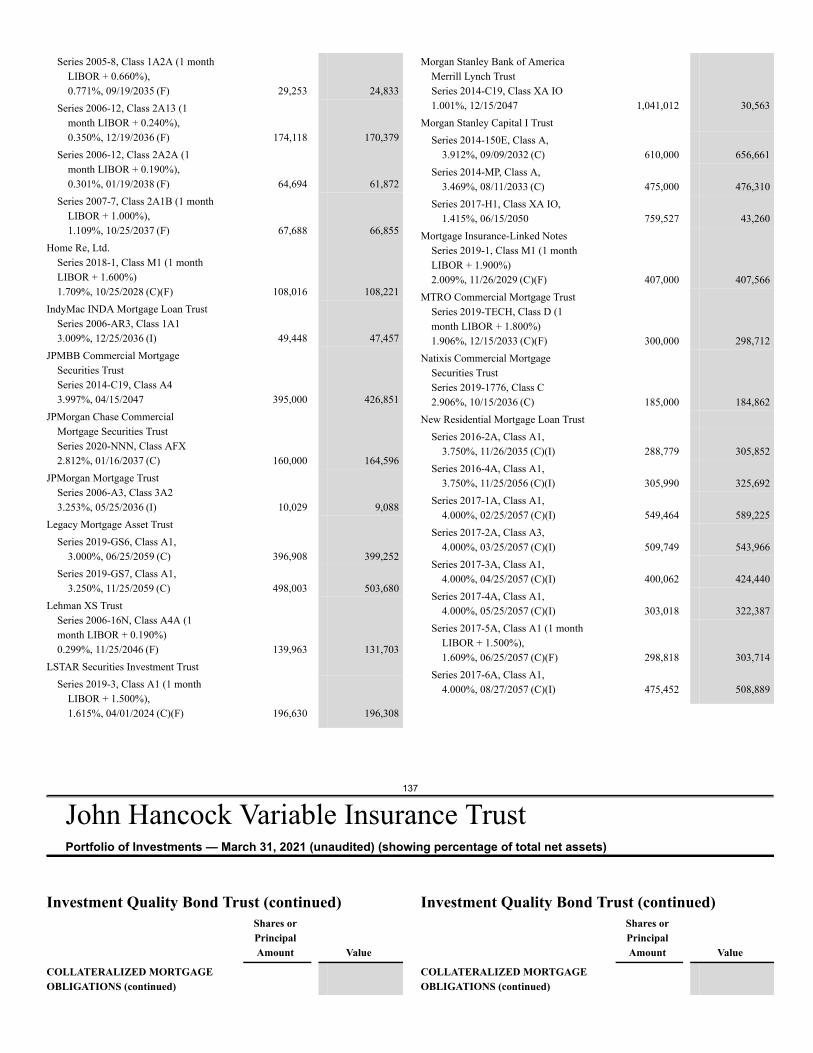
137
John Hancock Variable Insurance TrustPortfolio of Investments — March 31, 2021 (unaudited) (showing percentage of total net assets)
Series 2005-8, Class 1A2A (1 monthLIBOR + 0.660%),0.771%, 09/19/2035 (F) 29,253 24,833
Series 2006-12, Class 2A13 (1month LIBOR + 0.240%),0.350%, 12/19/2036 (F) 174,118 170,379
Series 2006-12, Class 2A2A (1month LIBOR + 0.190%),0.301%, 01/19/2038 (F) 64,694 61,872
Series 2007-7, Class 2A1B (1 monthLIBOR + 1.000%),1.109%, 10/25/2037 (F) 67,688 66,855
Home Re, Ltd.Series 2018-1, Class M1 (1 monthLIBOR + 1.600%)1.709%, 10/25/2028 (C)(F) 108,016 108,221
IndyMac INDA Mortgage Loan TrustSeries 2006-AR3, Class 1A13.009%, 12/25/2036 (I) 49,448 47,457
JPMBB Commercial MortgageSecurities TrustSeries 2014-C19, Class A43.997%, 04/15/2047 395,000 426,851
JPMorgan Chase CommercialMortgage Securities TrustSeries 2020-NNN, Class AFX2.812%, 01/16/2037 (C) 160,000 164,596
JPMorgan Mortgage TrustSeries 2006-A3, Class 3A23.253%, 05/25/2036 (I) 10,029 9,088
Legacy Mortgage Asset TrustSeries 2019-GS6, Class A1,
3.000%, 06/25/2059 (C) 396,908 399,252Series 2019-GS7, Class A1,
3.250%, 11/25/2059 (C) 498,003 503,680Lehman XS Trust
Series 2006-16N, Class A4A (1month LIBOR + 0.190%)0.299%, 11/25/2046 (F) 139,963 131,703
LSTAR Securities Investment TrustSeries 2019-3, Class A1 (1 month
LIBOR + 1.500%),1.615%, 04/01/2024 (C)(F) 196,630 196,308
Morgan Stanley Bank of AmericaMerrill Lynch TrustSeries 2014-C19, Class XA IO1.001%, 12/15/2047 1,041,012 30,563
Morgan Stanley Capital I TrustSeries 2014-150E, Class A,
3.912%, 09/09/2032 (C) 610,000 656,661Series 2014-MP, Class A,
3.469%, 08/11/2033 (C) 475,000 476,310Series 2017-H1, Class XA IO,
1.415%, 06/15/2050 759,527 43,260Mortgage Insurance-Linked Notes
Series 2019-1, Class M1 (1 monthLIBOR + 1.900%)2.009%, 11/26/2029 (C)(F) 407,000 407,566
MTRO Commercial Mortgage TrustSeries 2019-TECH, Class D (1month LIBOR + 1.800%)1.906%, 12/15/2033 (C)(F) 300,000 298,712
Natixis Commercial MortgageSecurities TrustSeries 2019-1776, Class C2.906%, 10/15/2036 (C) 185,000 184,862
New Residential Mortgage Loan TrustSeries 2016-2A, Class A1,
3.750%, 11/26/2035 (C)(I) 288,779 305,852Series 2016-4A, Class A1,
3.750%, 11/25/2056 (C)(I) 305,990 325,692Series 2017-1A, Class A1,
4.000%, 02/25/2057 (C)(I) 549,464 589,225Series 2017-2A, Class A3,
4.000%, 03/25/2057 (C)(I) 509,749 543,966Series 2017-3A, Class A1,
4.000%, 04/25/2057 (C)(I) 400,062 424,440Series 2017-4A, Class A1,
4.000%, 05/25/2057 (C)(I) 303,018 322,387Series 2017-5A, Class A1 (1 month
LIBOR + 1.500%),1.609%, 06/25/2057 (C)(F) 298,818 303,714
Series 2017-6A, Class A1,4.000%, 08/27/2057 (C)(I) 475,452 508,889
Investment Quality Bond Trust (continued)Shares orPrincipalAmount Value
COLLATERALIZED MORTGAGEOBLIGATIONS (continued)
Investment Quality Bond Trust (continued)Shares orPrincipalAmount Value
COLLATERALIZED MORTGAGEOBLIGATIONS (continued)
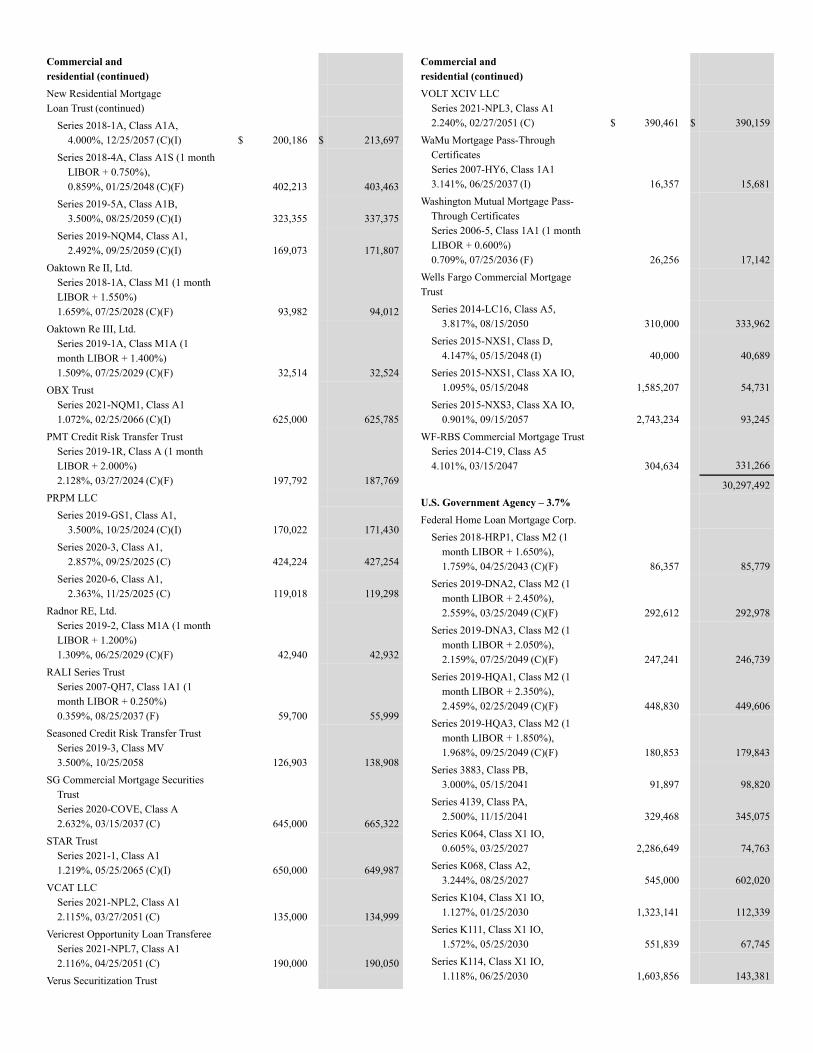
Commercial andresidential (continued)New Residential MortgageLoan Trust (continued)
Series 2018-1A, Class A1A,4.000%, 12/25/2057 (C)(I) $ 200,186 $ 213,697
Series 2018-4A, Class A1S (1 monthLIBOR + 0.750%),0.859%, 01/25/2048 (C)(F) 402,213 403,463
Series 2019-5A, Class A1B,3.500%, 08/25/2059 (C)(I) 323,355 337,375
Series 2019-NQM4, Class A1,2.492%, 09/25/2059 (C)(I) 169,073 171,807
Oaktown Re II, Ltd.Series 2018-1A, Class M1 (1 monthLIBOR + 1.550%)1.659%, 07/25/2028 (C)(F) 93,982 94,012
Oaktown Re III, Ltd.Series 2019-1A, Class M1A (1month LIBOR + 1.400%)1.509%, 07/25/2029 (C)(F) 32,514 32,524
OBX TrustSeries 2021-NQM1, Class A11.072%, 02/25/2066 (C)(I) 625,000 625,785
PMT Credit Risk Transfer TrustSeries 2019-1R, Class A (1 monthLIBOR + 2.000%)2.128%, 03/27/2024 (C)(F) 197,792 187,769
PRPM LLCSeries 2019-GS1, Class A1,
3.500%, 10/25/2024 (C)(I) 170,022 171,430Series 2020-3, Class A1,
2.857%, 09/25/2025 (C) 424,224 427,254Series 2020-6, Class A1,
2.363%, 11/25/2025 (C) 119,018 119,298Radnor RE, Ltd.
Series 2019-2, Class M1A (1 monthLIBOR + 1.200%)1.309%, 06/25/2029 (C)(F) 42,940 42,932
RALI Series TrustSeries 2007-QH7, Class 1A1 (1month LIBOR + 0.250%)0.359%, 08/25/2037 (F) 59,700 55,999
Seasoned Credit Risk Transfer TrustSeries 2019-3, Class MV3.500%, 10/25/2058 126,903 138,908
SG Commercial Mortgage SecuritiesTrustSeries 2020-COVE, Class A2.632%, 03/15/2037 (C) 645,000 665,322
STAR TrustSeries 2021-1, Class A11.219%, 05/25/2065 (C)(I) 650,000 649,987
VCAT LLCSeries 2021-NPL2, Class A12.115%, 03/27/2051 (C) 135,000 134,999
Vericrest Opportunity Loan TransfereeSeries 2021-NPL7, Class A12.116%, 04/25/2051 (C) 190,000 190,050
Verus Securitization Trust
Commercial andresidential (continued)VOLT XCIV LLC
Series 2021-NPL3, Class A12.240%, 02/27/2051 (C) $ 390,461 $ 390,159
WaMu Mortgage Pass-ThroughCertificatesSeries 2007-HY6, Class 1A13.141%, 06/25/2037 (I) 16,357 15,681
Washington Mutual Mortgage Pass-Through CertificatesSeries 2006-5, Class 1A1 (1 monthLIBOR + 0.600%)0.709%, 07/25/2036 (F) 26,256 17,142
Wells Fargo Commercial MortgageTrust
Series 2014-LC16, Class A5,3.817%, 08/15/2050 310,000 333,962
Series 2015-NXS1, Class D,4.147%, 05/15/2048 (I) 40,000 40,689
Series 2015-NXS1, Class XA IO,1.095%, 05/15/2048 1,585,207 54,731
Series 2015-NXS3, Class XA IO,0.901%, 09/15/2057 2,743,234 93,245
WF-RBS Commercial Mortgage TrustSeries 2014-C19, Class A54.101%, 03/15/2047 304,634 331,266
30,297,492U.S. Government Agency – 3.7%Federal Home Loan Mortgage Corp.
Series 2018-HRP1, Class M2 (1month LIBOR + 1.650%),1.759%, 04/25/2043 (C)(F) 86,357 85,779
Series 2019-DNA2, Class M2 (1month LIBOR + 2.450%),2.559%, 03/25/2049 (C)(F) 292,612 292,978
Series 2019-DNA3, Class M2 (1month LIBOR + 2.050%),2.159%, 07/25/2049 (C)(F) 247,241 246,739
Series 2019-HQA1, Class M2 (1month LIBOR + 2.350%),2.459%, 02/25/2049 (C)(F) 448,830 449,606
Series 2019-HQA3, Class M2 (1month LIBOR + 1.850%),1.968%, 09/25/2049 (C)(F) 180,853 179,843
Series 3883, Class PB,3.000%, 05/15/2041 91,897 98,820
Series 4139, Class PA,2.500%, 11/15/2041 329,468 345,075
Series K064, Class X1 IO,0.605%, 03/25/2027 2,286,649 74,763
Series K068, Class A2,3.244%, 08/25/2027 545,000 602,020
Series K104, Class X1 IO,1.127%, 01/25/2030 1,323,141 112,339
Series K111, Class X1 IO,1.572%, 05/25/2030 551,839 67,745
Series K114, Class X1 IO,1.118%, 06/25/2030 1,603,856 143,381
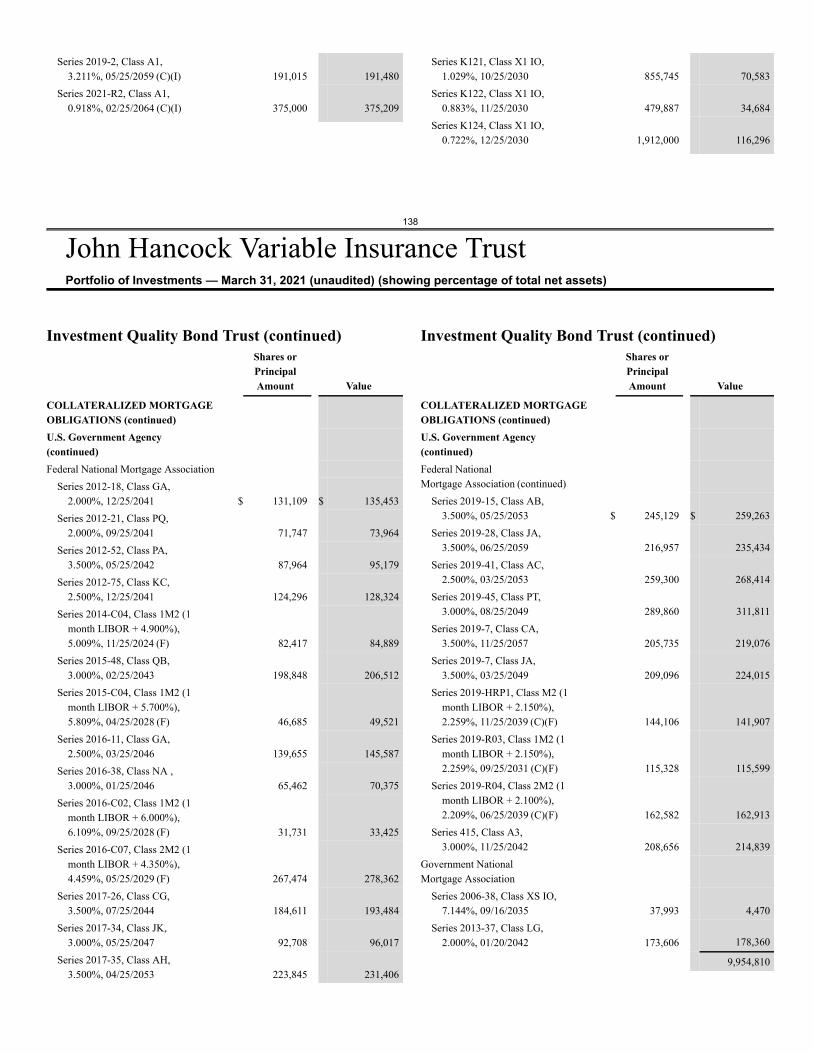
138
John Hancock Variable Insurance TrustPortfolio of Investments — March 31, 2021 (unaudited) (showing percentage of total net assets)
Series 2019-2, Class A1,3.211%, 05/25/2059 (C)(I) 191,015 191,480
Series 2021-R2, Class A1,0.918%, 02/25/2064 (C)(I) 375,000 375,209
Series K121, Class X1 IO,1.029%, 10/25/2030 855,745 70,583
Series K122, Class X1 IO,0.883%, 11/25/2030 479,887 34,684
Series K124, Class X1 IO,0.722%, 12/25/2030 1,912,000 116,296
Investment Quality Bond Trust (continued)Shares orPrincipalAmount Value
COLLATERALIZED MORTGAGEOBLIGATIONS (continued)U.S. Government Agency(continued)Federal National Mortgage Association
Series 2012-18, Class GA,2.000%, 12/25/2041 $ 131,109 $ 135,453
Series 2012-21, Class PQ,2.000%, 09/25/2041 71,747 73,964
Series 2012-52, Class PA,3.500%, 05/25/2042 87,964 95,179
Series 2012-75, Class KC,2.500%, 12/25/2041 124,296 128,324
Series 2014-C04, Class 1M2 (1month LIBOR + 4.900%),5.009%, 11/25/2024 (F) 82,417 84,889
Series 2015-48, Class QB,3.000%, 02/25/2043 198,848 206,512
Series 2015-C04, Class 1M2 (1month LIBOR + 5.700%),5.809%, 04/25/2028 (F) 46,685 49,521
Series 2016-11, Class GA,2.500%, 03/25/2046 139,655 145,587
Series 2016-38, Class NA ,3.000%, 01/25/2046 65,462 70,375
Series 2016-C02, Class 1M2 (1month LIBOR + 6.000%),6.109%, 09/25/2028 (F) 31,731 33,425
Series 2016-C07, Class 2M2 (1month LIBOR + 4.350%),4.459%, 05/25/2029 (F) 267,474 278,362
Series 2017-26, Class CG,3.500%, 07/25/2044 184,611 193,484
Series 2017-34, Class JK,3.000%, 05/25/2047 92,708 96,017
Series 2017-35, Class AH,3.500%, 04/25/2053 223,845 231,406
Investment Quality Bond Trust (continued)Shares orPrincipalAmount Value
COLLATERALIZED MORTGAGEOBLIGATIONS (continued)U.S. Government Agency(continued)Federal NationalMortgage Association (continued)
Series 2019-15, Class AB,3.500%, 05/25/2053 $ 245,129 $ 259,263
Series 2019-28, Class JA,3.500%, 06/25/2059 216,957 235,434
Series 2019-41, Class AC,2.500%, 03/25/2053 259,300 268,414
Series 2019-45, Class PT,3.000%, 08/25/2049 289,860 311,811
Series 2019-7, Class CA,3.500%, 11/25/2057 205,735 219,076
Series 2019-7, Class JA,3.500%, 03/25/2049 209,096 224,015
Series 2019-HRP1, Class M2 (1month LIBOR + 2.150%),2.259%, 11/25/2039 (C)(F) 144,106 141,907
Series 2019-R03, Class 1M2 (1month LIBOR + 2.150%),2.259%, 09/25/2031 (C)(F) 115,328 115,599
Series 2019-R04, Class 2M2 (1month LIBOR + 2.100%),2.209%, 06/25/2039 (C)(F) 162,582 162,913
Series 415, Class A3,3.000%, 11/25/2042 208,656 214,839
Government NationalMortgage Association
Series 2006-38, Class XS IO,7.144%, 09/16/2035 37,993 4,470
Series 2013-37, Class LG,2.000%, 01/20/2042 173,606 178,360
9,954,810
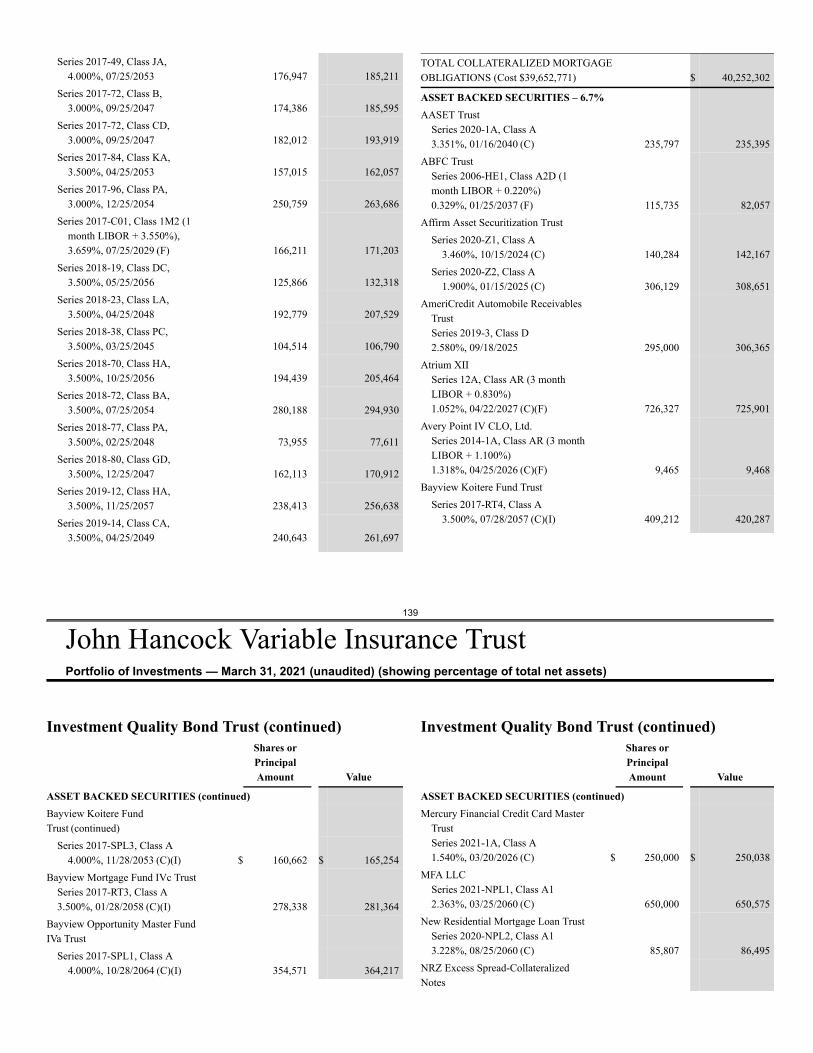
139
John Hancock Variable Insurance TrustPortfolio of Investments — March 31, 2021 (unaudited) (showing percentage of total net assets)
Series 2017-49, Class JA,4.000%, 07/25/2053 176,947 185,211
Series 2017-72, Class B,3.000%, 09/25/2047 174,386 185,595
Series 2017-72, Class CD,3.000%, 09/25/2047 182,012 193,919
Series 2017-84, Class KA,3.500%, 04/25/2053 157,015 162,057
Series 2017-96, Class PA,3.000%, 12/25/2054 250,759 263,686
Series 2017-C01, Class 1M2 (1month LIBOR + 3.550%),3.659%, 07/25/2029 (F) 166,211 171,203
Series 2018-19, Class DC,3.500%, 05/25/2056 125,866 132,318
Series 2018-23, Class LA,3.500%, 04/25/2048 192,779 207,529
Series 2018-38, Class PC,3.500%, 03/25/2045 104,514 106,790
Series 2018-70, Class HA,3.500%, 10/25/2056 194,439 205,464
Series 2018-72, Class BA,3.500%, 07/25/2054 280,188 294,930
Series 2018-77, Class PA,3.500%, 02/25/2048 73,955 77,611
Series 2018-80, Class GD,3.500%, 12/25/2047 162,113 170,912
Series 2019-12, Class HA,3.500%, 11/25/2057 238,413 256,638
Series 2019-14, Class CA,3.500%, 04/25/2049 240,643 261,697
TOTAL COLLATERALIZED MORTGAGEOBLIGATIONS (Cost $39,652,771) $ 40,252,302
ASSET BACKED SECURITIES – 6.7%AASET Trust
Series 2020-1A, Class A3.351%, 01/16/2040 (C) 235,797 235,395
ABFC TrustSeries 2006-HE1, Class A2D (1month LIBOR + 0.220%)0.329%, 01/25/2037 (F) 115,735 82,057
Affirm Asset Securitization TrustSeries 2020-Z1, Class A
3.460%, 10/15/2024 (C) 140,284 142,167Series 2020-Z2, Class A
1.900%, 01/15/2025 (C) 306,129 308,651AmeriCredit Automobile Receivables
TrustSeries 2019-3, Class D2.580%, 09/18/2025 295,000 306,365
Atrium XIISeries 12A, Class AR (3 monthLIBOR + 0.830%)1.052%, 04/22/2027 (C)(F) 726,327 725,901
Avery Point IV CLO, Ltd.Series 2014-1A, Class AR (3 monthLIBOR + 1.100%)1.318%, 04/25/2026 (C)(F) 9,465 9,468
Bayview Koitere Fund TrustSeries 2017-RT4, Class A
3.500%, 07/28/2057 (C)(I) 409,212 420,287
Investment Quality Bond Trust (continued)Shares orPrincipalAmount Value
ASSET BACKED SECURITIES (continued)Bayview Koitere FundTrust (continued)
Series 2017-SPL3, Class A4.000%, 11/28/2053 (C)(I) $ 160,662 $ 165,254
Bayview Mortgage Fund IVc TrustSeries 2017-RT3, Class A3.500%, 01/28/2058 (C)(I) 278,338 281,364
Bayview Opportunity Master FundIVa Trust
Series 2017-SPL1, Class A4.000%, 10/28/2064 (C)(I) 354,571 364,217
Investment Quality Bond Trust (continued)Shares orPrincipalAmount Value
ASSET BACKED SECURITIES (continued)Mercury Financial Credit Card Master
TrustSeries 2021-1A, Class A1.540%, 03/20/2026 (C) $ 250,000 $ 250,038
MFA LLCSeries 2021-NPL1, Class A12.363%, 03/25/2060 (C) 650,000 650,575
New Residential Mortgage Loan TrustSeries 2020-NPL2, Class A13.228%, 08/25/2060 (C) 85,807 86,495
NRZ Excess Spread-CollateralizedNotes
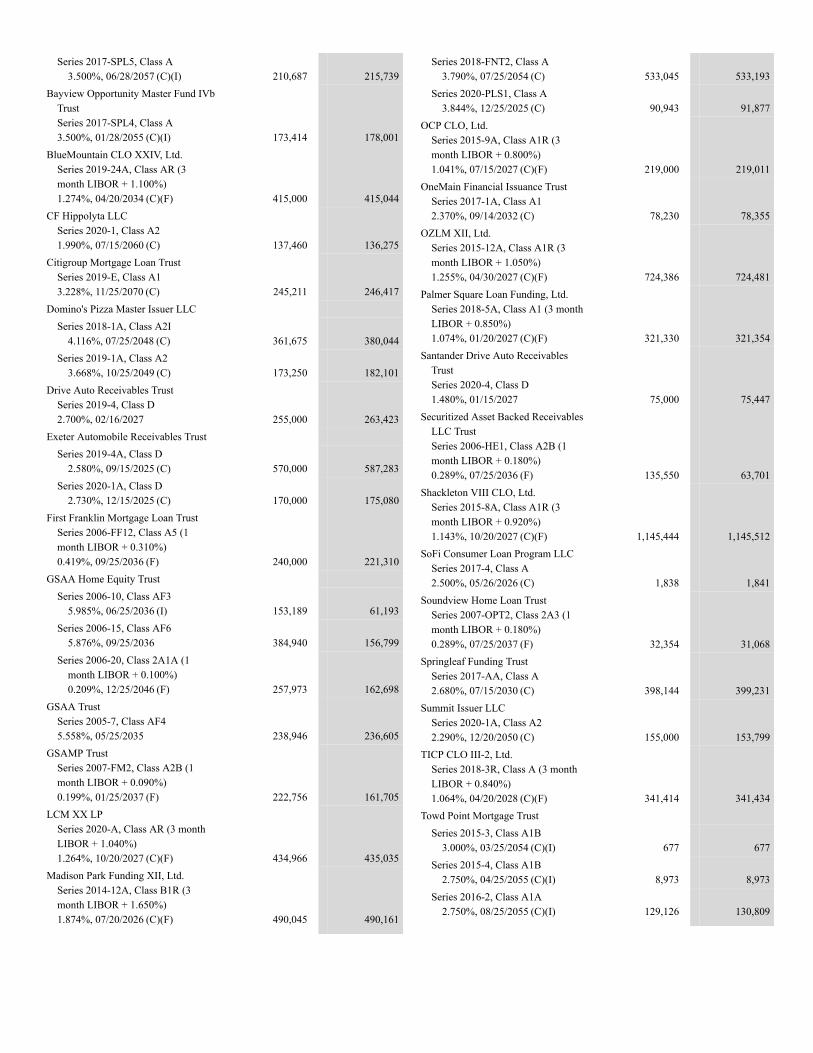
Series 2017-SPL5, Class A3.500%, 06/28/2057 (C)(I) 210,687 215,739
Bayview Opportunity Master Fund IVbTrustSeries 2017-SPL4, Class A3.500%, 01/28/2055 (C)(I) 173,414 178,001
BlueMountain CLO XXIV, Ltd.Series 2019-24A, Class AR (3month LIBOR + 1.100%)1.274%, 04/20/2034 (C)(F) 415,000 415,044
CF Hippolyta LLCSeries 2020-1, Class A21.990%, 07/15/2060 (C) 137,460 136,275
Citigroup Mortgage Loan TrustSeries 2019-E, Class A13.228%, 11/25/2070 (C) 245,211 246,417
Domino's Pizza Master Issuer LLCSeries 2018-1A, Class A2I
4.116%, 07/25/2048 (C) 361,675 380,044Series 2019-1A, Class A2
3.668%, 10/25/2049 (C) 173,250 182,101Drive Auto Receivables Trust
Series 2019-4, Class D2.700%, 02/16/2027 255,000 263,423
Exeter Automobile Receivables TrustSeries 2019-4A, Class D
2.580%, 09/15/2025 (C) 570,000 587,283Series 2020-1A, Class D
2.730%, 12/15/2025 (C) 170,000 175,080First Franklin Mortgage Loan Trust
Series 2006-FF12, Class A5 (1month LIBOR + 0.310%)0.419%, 09/25/2036 (F) 240,000 221,310
GSAA Home Equity TrustSeries 2006-10, Class AF3
5.985%, 06/25/2036 (I) 153,189 61,193Series 2006-15, Class AF6
5.876%, 09/25/2036 384,940 156,799Series 2006-20, Class 2A1A (1
month LIBOR + 0.100%)0.209%, 12/25/2046 (F) 257,973 162,698
GSAA TrustSeries 2005-7, Class AF45.558%, 05/25/2035 238,946 236,605
GSAMP TrustSeries 2007-FM2, Class A2B (1month LIBOR + 0.090%)0.199%, 01/25/2037 (F) 222,756 161,705
LCM XX LPSeries 2020-A, Class AR (3 monthLIBOR + 1.040%)1.264%, 10/20/2027 (C)(F) 434,966 435,035
Madison Park Funding XII, Ltd.Series 2014-12A, Class B1R (3month LIBOR + 1.650%)1.874%, 07/20/2026 (C)(F) 490,045 490,161
Series 2018-FNT2, Class A3.790%, 07/25/2054 (C) 533,045 533,193
Series 2020-PLS1, Class A3.844%, 12/25/2025 (C) 90,943 91,877
OCP CLO, Ltd.Series 2015-9A, Class A1R (3month LIBOR + 0.800%)1.041%, 07/15/2027 (C)(F) 219,000 219,011
OneMain Financial Issuance TrustSeries 2017-1A, Class A12.370%, 09/14/2032 (C) 78,230 78,355
OZLM XII, Ltd.Series 2015-12A, Class A1R (3month LIBOR + 1.050%)1.255%, 04/30/2027 (C)(F) 724,386 724,481
Palmer Square Loan Funding, Ltd.Series 2018-5A, Class A1 (3 monthLIBOR + 0.850%)1.074%, 01/20/2027 (C)(F) 321,330 321,354
Santander Drive Auto ReceivablesTrustSeries 2020-4, Class D1.480%, 01/15/2027 75,000 75,447
Securitized Asset Backed ReceivablesLLC TrustSeries 2006-HE1, Class A2B (1month LIBOR + 0.180%)0.289%, 07/25/2036 (F) 135,550 63,701
Shackleton VIII CLO, Ltd.Series 2015-8A, Class A1R (3month LIBOR + 0.920%)1.143%, 10/20/2027 (C)(F) 1,145,444 1,145,512
SoFi Consumer Loan Program LLCSeries 2017-4, Class A2.500%, 05/26/2026 (C) 1,838 1,841
Soundview Home Loan TrustSeries 2007-OPT2, Class 2A3 (1month LIBOR + 0.180%)0.289%, 07/25/2037 (F) 32,354 31,068
Springleaf Funding TrustSeries 2017-AA, Class A2.680%, 07/15/2030 (C) 398,144 399,231
Summit Issuer LLCSeries 2020-1A, Class A22.290%, 12/20/2050 (C) 155,000 153,799
TICP CLO III-2, Ltd.Series 2018-3R, Class A (3 monthLIBOR + 0.840%)1.064%, 04/20/2028 (C)(F) 341,414 341,434
Towd Point Mortgage TrustSeries 2015-3, Class A1B
3.000%, 03/25/2054 (C)(I) 677 677Series 2015-4, Class A1B
2.750%, 04/25/2055 (C)(I) 8,973 8,973Series 2016-2, Class A1A
2.750%, 08/25/2055 (C)(I) 129,126 130,809
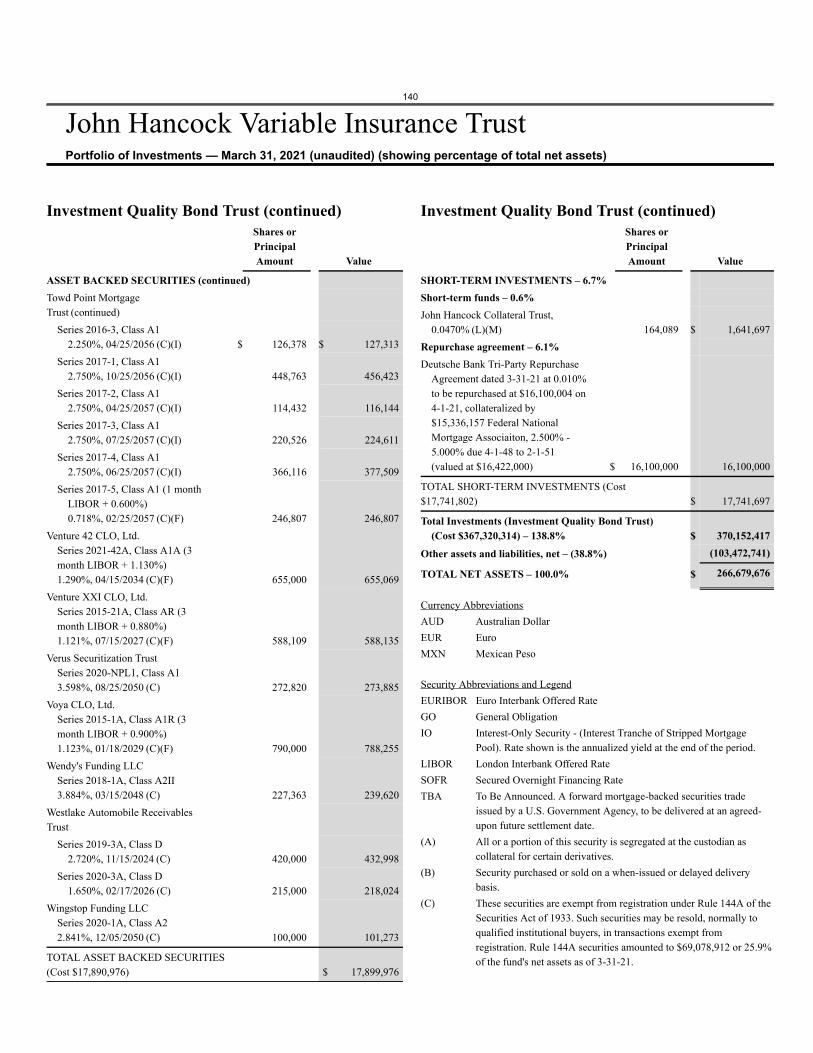
140
John Hancock Variable Insurance TrustPortfolio of Investments — March 31, 2021 (unaudited) (showing percentage of total net assets)
Investment Quality Bond Trust (continued)Shares orPrincipalAmount Value
ASSET BACKED SECURITIES (continued)Towd Point MortgageTrust (continued)
Series 2016-3, Class A12.250%, 04/25/2056 (C)(I) $ 126,378 $ 127,313
Series 2017-1, Class A12.750%, 10/25/2056 (C)(I) 448,763 456,423
Series 2017-2, Class A12.750%, 04/25/2057 (C)(I) 114,432 116,144
Series 2017-3, Class A12.750%, 07/25/2057 (C)(I) 220,526 224,611
Series 2017-4, Class A12.750%, 06/25/2057 (C)(I) 366,116 377,509
Series 2017-5, Class A1 (1 monthLIBOR + 0.600%)0.718%, 02/25/2057 (C)(F) 246,807 246,807
Venture 42 CLO, Ltd.Series 2021-42A, Class A1A (3month LIBOR + 1.130%)1.290%, 04/15/2034 (C)(F) 655,000 655,069
Venture XXI CLO, Ltd.Series 2015-21A, Class AR (3month LIBOR + 0.880%)1.121%, 07/15/2027 (C)(F) 588,109 588,135
Verus Securitization TrustSeries 2020-NPL1, Class A13.598%, 08/25/2050 (C) 272,820 273,885
Voya CLO, Ltd.Series 2015-1A, Class A1R (3month LIBOR + 0.900%)1.123%, 01/18/2029 (C)(F) 790,000 788,255
Wendy's Funding LLCSeries 2018-1A, Class A2II3.884%, 03/15/2048 (C) 227,363 239,620
Westlake Automobile ReceivablesTrust
Series 2019-3A, Class D2.720%, 11/15/2024 (C) 420,000 432,998
Series 2020-3A, Class D1.650%, 02/17/2026 (C) 215,000 218,024
Wingstop Funding LLCSeries 2020-1A, Class A22.841%, 12/05/2050 (C) 100,000 101,273
TOTAL ASSET BACKED SECURITIES(Cost $17,890,976) $ 17,899,976
Investment Quality Bond Trust (continued)Shares orPrincipalAmount Value
SHORT-TERM INVESTMENTS – 6.7%Short-term funds – 0.6%John Hancock Collateral Trust,
0.0470% (L)(M) 164,089 $ 1,641,697Repurchase agreement – 6.1%Deutsche Bank Tri-Party Repurchase
Agreement dated 3-31-21 at 0.010%to be repurchased at $16,100,004 on4-1-21, collateralized by$15,336,157 Federal NationalMortgage Associaiton, 2.500% -5.000% due 4-1-48 to 2-1-51(valued at $16,422,000) $ 16,100,000 16,100,000
TOTAL SHORT-TERM INVESTMENTS (Cost$17,741,802) $ 17,741,697
Total Investments (Investment Quality Bond Trust)(Cost $367,320,314) – 138.8% $ 370,152,417
Other assets and liabilities, net – (38.8%) (103,472,741)
TOTAL NET ASSETS – 100.0% $ 266,679,676
Currency AbbreviationsAUD Australian DollarEUR EuroMXN Mexican Peso
Security Abbreviations and LegendEURIBOR Euro Interbank Offered RateGO General ObligationIO Interest-Only Security - (Interest Tranche of Stripped Mortgage
Pool). Rate shown is the annualized yield at the end of the period.LIBOR London Interbank Offered RateSOFR Secured Overnight Financing RateTBA To Be Announced. A forward mortgage-backed securities trade
issued by a U.S. Government Agency, to be delivered at an agreed-upon future settlement date.
(A) All or a portion of this security is segregated at the custodian ascollateral for certain derivatives.
(B) Security purchased or sold on a when-issued or delayed deliverybasis.
(C) These securities are exempt from registration under Rule 144A of theSecurities Act of 1933. Such securities may be resold, normally toqualified institutional buyers, in transactions exempt fromregistration. Rule 144A securities amounted to $69,078,912 or 25.9%of the fund's net assets as of 3-31-21.
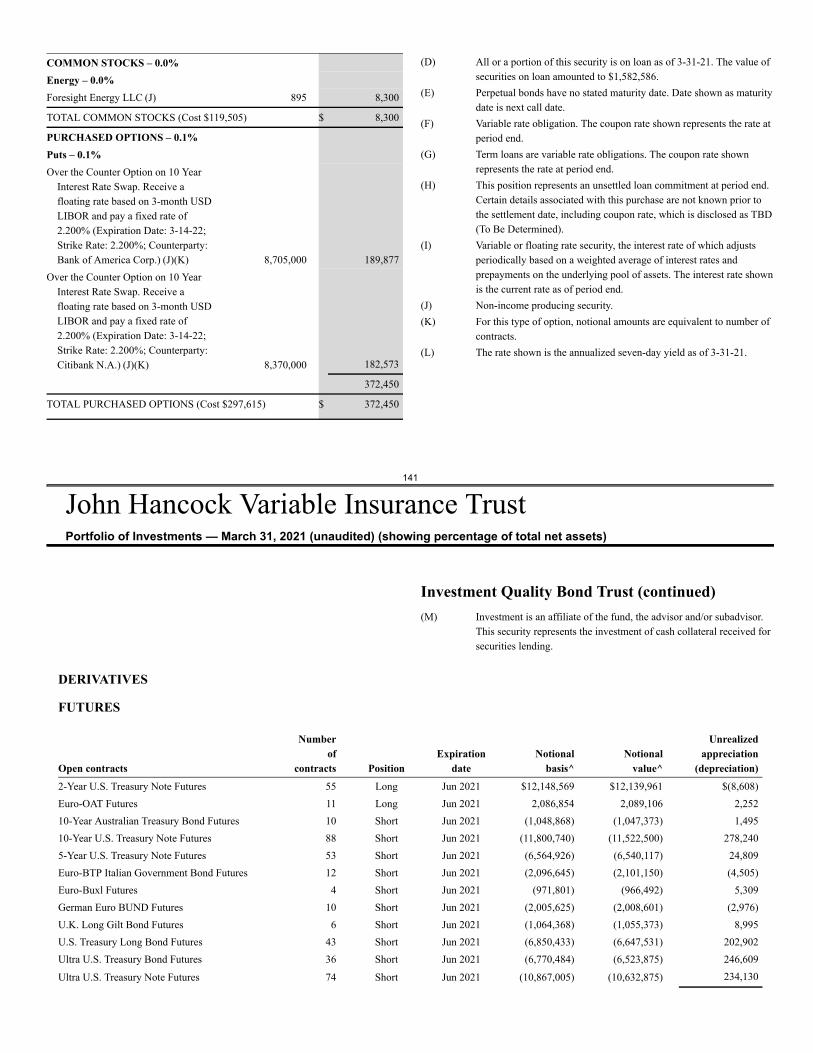
141
John Hancock Variable Insurance TrustPortfolio of Investments — March 31, 2021 (unaudited) (showing percentage of total net assets)
DERIVATIVES
FUTURES
Open contracts
Numberof
contracts PositionExpiration
dateNotional
basis^Notional
value^
Unrealizedappreciation
(depreciation)2-Year U.S. Treasury Note Futures 55 Long Jun 2021 $12,148,569 $12,139,961 $(8,608)Euro-OAT Futures 11 Long Jun 2021 2,086,854 2,089,106 2,25210-Year Australian Treasury Bond Futures 10 Short Jun 2021 (1,048,868) (1,047,373) 1,49510-Year U.S. Treasury Note Futures 88 Short Jun 2021 (11,800,740) (11,522,500) 278,2405-Year U.S. Treasury Note Futures 53 Short Jun 2021 (6,564,926) (6,540,117) 24,809Euro-BTP Italian Government Bond Futures 12 Short Jun 2021 (2,096,645) (2,101,150) (4,505)Euro-Buxl Futures 4 Short Jun 2021 (971,801) (966,492) 5,309German Euro BUND Futures 10 Short Jun 2021 (2,005,625) (2,008,601) (2,976)U.K. Long Gilt Bond Futures 6 Short Jun 2021 (1,064,368) (1,055,373) 8,995U.S. Treasury Long Bond Futures 43 Short Jun 2021 (6,850,433) (6,647,531) 202,902Ultra U.S. Treasury Bond Futures 36 Short Jun 2021 (6,770,484) (6,523,875) 246,609
Ultra U.S. Treasury Note Futures 74 Short Jun 2021 (10,867,005) (10,632,875) 234,130
COMMON STOCKS – 0.0%Energy – 0.0%Foresight Energy LLC (J) 895 8,300
TOTAL COMMON STOCKS (Cost $119,505) $ 8,300
PURCHASED OPTIONS – 0.1%Puts – 0.1%Over the Counter Option on 10 Year
Interest Rate Swap. Receive afloating rate based on 3-month USDLIBOR and pay a fixed rate of2.200% (Expiration Date: 3-14-22;Strike Rate: 2.200%; Counterparty:Bank of America Corp.) (J)(K) 8,705,000 189,877
Over the Counter Option on 10 YearInterest Rate Swap. Receive afloating rate based on 3-month USDLIBOR and pay a fixed rate of2.200% (Expiration Date: 3-14-22;Strike Rate: 2.200%; Counterparty:Citibank N.A.) (J)(K) 8,370,000 182,573
372,450
TOTAL PURCHASED OPTIONS (Cost $297,615) $ 372,450
(D) All or a portion of this security is on loan as of 3-31-21. The value ofsecurities on loan amounted to $1,582,586.
(E) Perpetual bonds have no stated maturity date. Date shown as maturitydate is next call date.
(F) Variable rate obligation. The coupon rate shown represents the rate atperiod end.
(G) Term loans are variable rate obligations. The coupon rate shownrepresents the rate at period end.
(H) This position represents an unsettled loan commitment at period end.Certain details associated with this purchase are not known prior tothe settlement date, including coupon rate, which is disclosed as TBD(To Be Determined).
(I) Variable or floating rate security, the interest rate of which adjustsperiodically based on a weighted average of interest rates andprepayments on the underlying pool of assets. The interest rate shownis the current rate as of period end.
(J) Non-income producing security.(K) For this type of option, notional amounts are equivalent to number of
contracts.(L) The rate shown is the annualized seven-day yield as of 3-31-21.
Investment Quality Bond Trust (continued)(M) Investment is an affiliate of the fund, the advisor and/or subadvisor.
This security represents the investment of cash collateral received forsecurities lending.
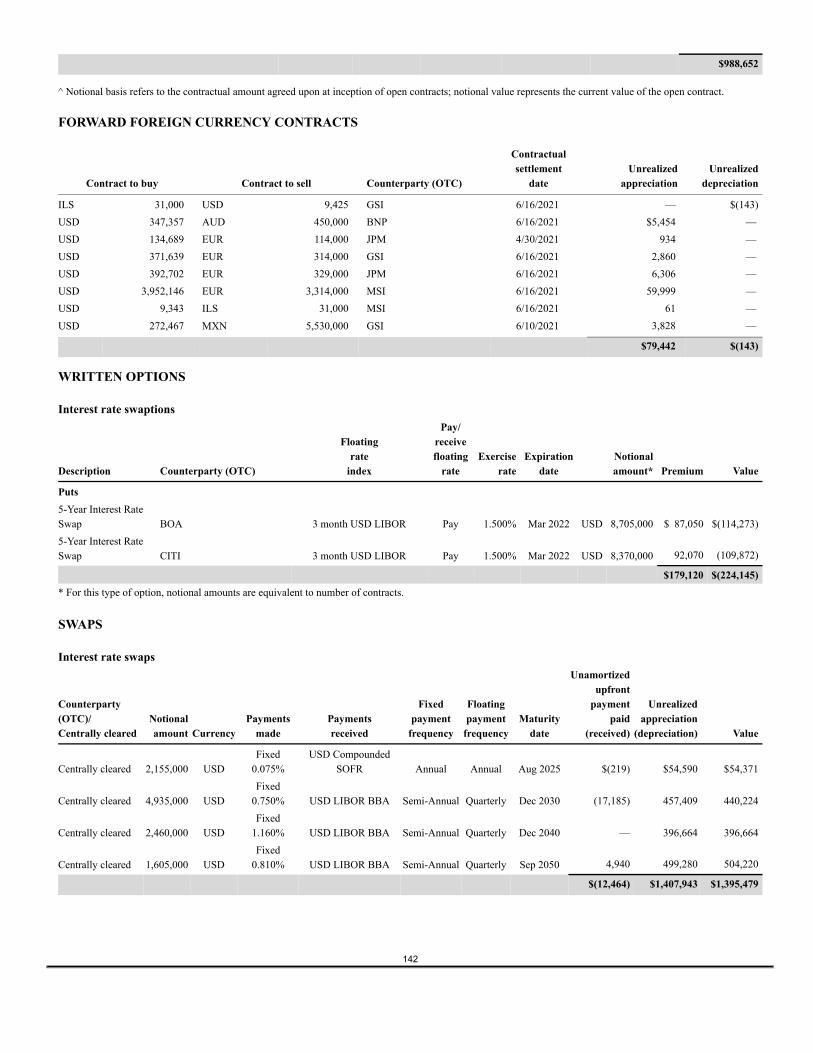
$988,652
^ Notional basis refers to the contractual amount agreed upon at inception of open contracts; notional value represents the current value of the open contract.
FORWARD FOREIGN CURRENCY CONTRACTS
Contract to buy Contract to sell Counterparty (OTC)
Contractualsettlement
dateUnrealized
appreciationUnrealized
depreciation
ILS 31,000 USD 9,425 GSI 6/16/2021 — $(143)USD 347,357 AUD 450,000 BNP 6/16/2021 $5,454 —USD 134,689 EUR 114,000 JPM 4/30/2021 934 —USD 371,639 EUR 314,000 GSI 6/16/2021 2,860 —USD 392,702 EUR 329,000 JPM 6/16/2021 6,306 —USD 3,952,146 EUR 3,314,000 MSI 6/16/2021 59,999 —USD 9,343 ILS 31,000 MSI 6/16/2021 61 —USD 272,467 MXN 5,530,000 GSI 6/10/2021 3,828 —
$79,442 $(143)
WRITTEN OPTIONS
Interest rate swaptions
Description Counterparty (OTC)
Floatingrate
index
Pay/receivefloating
rateExercise
rateExpiration
dateNotionalamount* Premium Value
Puts5-Year Interest RateSwap BOA 3 month USD LIBOR Pay 1.500% Mar 2022 USD 8,705,000 $ 87,050 $(114,273)5-Year Interest RateSwap CITI 3 month USD LIBOR Pay 1.500% Mar 2022 USD 8,370,000 92,070 (109,872)
$179,120 $(224,145)* For this type of option, notional amounts are equivalent to number of contracts.
SWAPS
Interest rate swaps
Counterparty(OTC)/Centrally cleared
Notionalamount Currency
Paymentsmade
Paymentsreceived
Fixedpayment
frequency
Floatingpayment
frequencyMaturity
date
Unamortizedupfront
paymentpaid
(received)
Unrealizedappreciation
(depreciation) Value
Centrally cleared 2,155,000 USDFixed
0.075%USD Compounded
SOFR Annual Annual Aug 2025 $(219) $54,590 $54,371
Centrally cleared 4,935,000 USDFixed
0.750% USD LIBOR BBA Semi-Annual Quarterly Dec 2030 (17,185) 457,409 440,224
Centrally cleared 2,460,000 USDFixed
1.160% USD LIBOR BBA Semi-Annual Quarterly Dec 2040 — 396,664 396,664
Centrally cleared 1,605,000 USDFixed
0.810% USD LIBOR BBA Semi-Annual Quarterly Sep 2050 4,940 499,280 504,220
$(12,464) $1,407,943 $1,395,479
142
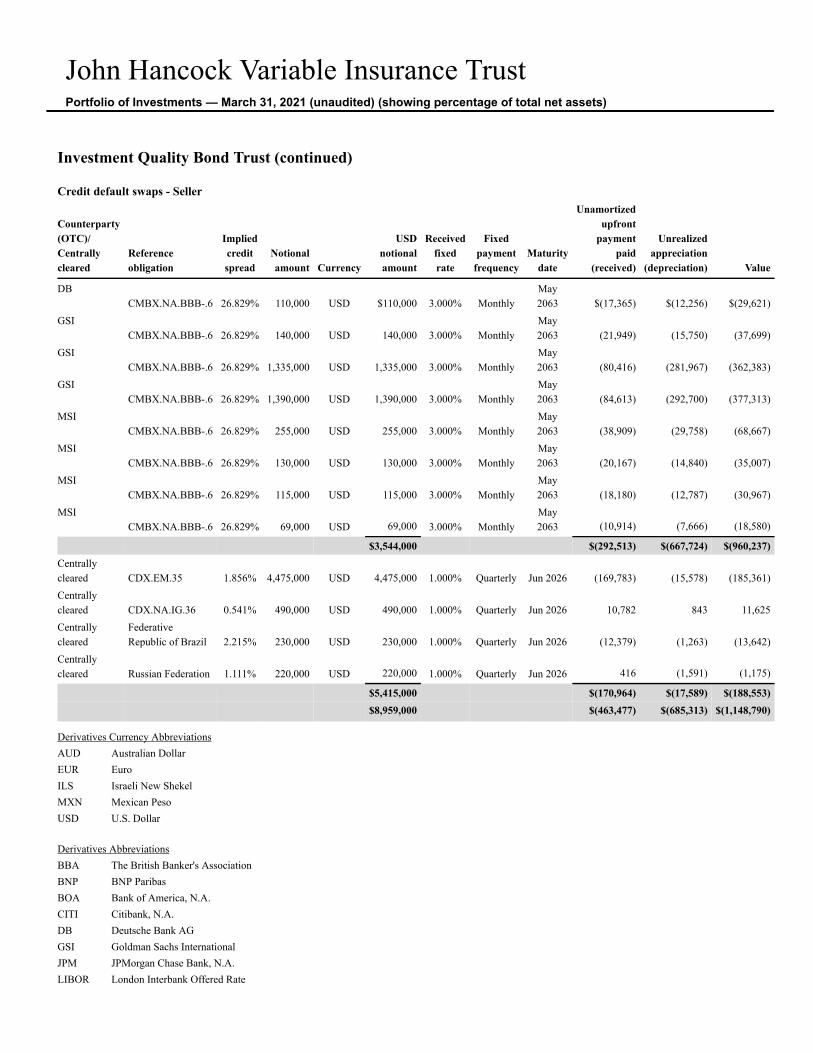
John Hancock Variable Insurance TrustPortfolio of Investments — March 31, 2021 (unaudited) (showing percentage of total net assets)
Investment Quality Bond Trust (continued)
Credit default swaps - Seller
Counterparty(OTC)/Centrallycleared
Referenceobligation
Impliedcreditspread
Notionalamount Currency
USDnotionalamount
Receivedfixedrate
Fixedpayment
frequencyMaturity
date
Unamortizedupfront
paymentpaid
(received)
Unrealizedappreciation
(depreciation) Value
DBCMBX.NA.BBB-.6 26.829% 110,000 USD $110,000 3.000% Monthly
May2063 $(17,365) $(12,256) $(29,621)
GSICMBX.NA.BBB-.6 26.829% 140,000 USD 140,000 3.000% Monthly
May2063 (21,949) (15,750) (37,699)
GSICMBX.NA.BBB-.6 26.829% 1,335,000 USD 1,335,000 3.000% Monthly
May2063 (80,416) (281,967) (362,383)
GSICMBX.NA.BBB-.6 26.829% 1,390,000 USD 1,390,000 3.000% Monthly
May2063 (84,613) (292,700) (377,313)
MSICMBX.NA.BBB-.6 26.829% 255,000 USD 255,000 3.000% Monthly
May2063 (38,909) (29,758) (68,667)
MSICMBX.NA.BBB-.6 26.829% 130,000 USD 130,000 3.000% Monthly
May2063 (20,167) (14,840) (35,007)
MSICMBX.NA.BBB-.6 26.829% 115,000 USD 115,000 3.000% Monthly
May2063 (18,180) (12,787) (30,967)
MSICMBX.NA.BBB-.6 26.829% 69,000 USD 69,000 3.000% Monthly
May2063 (10,914) (7,666) (18,580)
$3,544,000 $(292,513) $(667,724) $(960,237)Centrallycleared CDX.EM.35 1.856% 4,475,000 USD 4,475,000 1.000% Quarterly Jun 2026 (169,783) (15,578) (185,361)Centrallycleared CDX.NA.IG.36 0.541% 490,000 USD 490,000 1.000% Quarterly Jun 2026 10,782 843 11,625Centrallycleared
FederativeRepublic of Brazil 2.215% 230,000 USD 230,000 1.000% Quarterly Jun 2026 (12,379) (1,263) (13,642)
Centrallycleared Russian Federation 1.111% 220,000 USD 220,000 1.000% Quarterly Jun 2026 416 (1,591) (1,175)
$5,415,000 $(170,964) $(17,589) $(188,553)$8,959,000 $(463,477) $(685,313) $(1,148,790)
Derivatives Currency AbbreviationsAUD Australian DollarEUR EuroILS Israeli New ShekelMXN Mexican PesoUSD U.S. Dollar
Derivatives AbbreviationsBBA The British Banker's AssociationBNP BNP ParibasBOA Bank of America, N.A.CITI Citibank, N.A.DB Deutsche Bank AGGSI Goldman Sachs InternationalJPM JPMorgan Chase Bank, N.A.LIBOR London Interbank Offered Rate
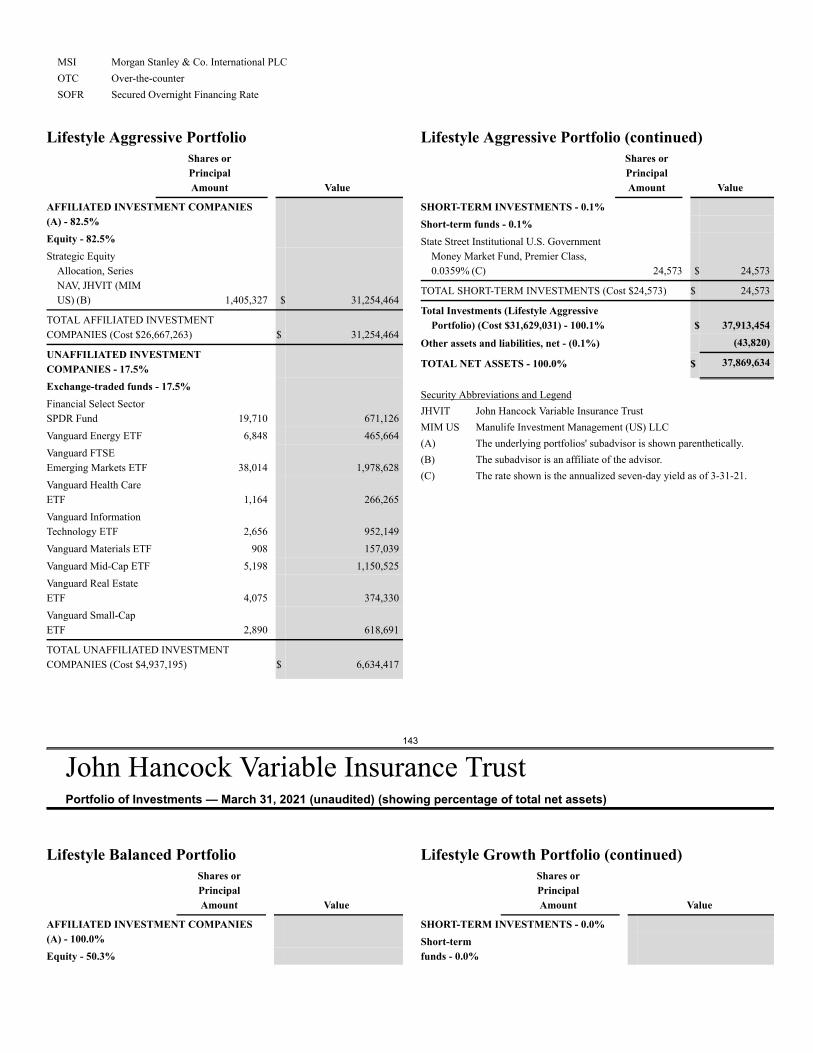
MSI Morgan Stanley & Co. International PLCOTC Over-the-counterSOFR Secured Overnight Financing Rate
143
John Hancock Variable Insurance TrustPortfolio of Investments — March 31, 2021 (unaudited) (showing percentage of total net assets)
Lifestyle Aggressive PortfolioShares orPrincipalAmount Value
AFFILIATED INVESTMENT COMPANIES(A) - 82.5%Equity - 82.5%Strategic Equity
Allocation, SeriesNAV, JHVIT (MIMUS) (B) 1,405,327 $ 31,254,464
TOTAL AFFILIATED INVESTMENTCOMPANIES (Cost $26,667,263) $ 31,254,464
UNAFFILIATED INVESTMENTCOMPANIES - 17.5%Exchange-traded funds - 17.5%Financial Select SectorSPDR Fund 19,710 671,126Vanguard Energy ETF 6,848 465,664Vanguard FTSEEmerging Markets ETF 38,014 1,978,628Vanguard Health CareETF 1,164 266,265Vanguard InformationTechnology ETF 2,656 952,149Vanguard Materials ETF 908 157,039Vanguard Mid-Cap ETF 5,198 1,150,525Vanguard Real EstateETF 4,075 374,330Vanguard Small-CapETF 2,890 618,691
TOTAL UNAFFILIATED INVESTMENTCOMPANIES (Cost $4,937,195) $ 6,634,417
Lifestyle Aggressive Portfolio (continued)Shares orPrincipalAmount Value
SHORT-TERM INVESTMENTS - 0.1%Short-term funds - 0.1%State Street Institutional U.S. Government
Money Market Fund, Premier Class,0.0359% (C) 24,573 $ 24,573
TOTAL SHORT-TERM INVESTMENTS (Cost $24,573) $ 24,573
Total Investments (Lifestyle AggressivePortfolio) (Cost $31,629,031) - 100.1% $ 37,913,454
Other assets and liabilities, net - (0.1%) (43,820)
TOTAL NET ASSETS - 100.0% $ 37,869,634
Security Abbreviations and LegendJHVIT John Hancock Variable Insurance TrustMIM US Manulife Investment Management (US) LLC(A) The underlying portfolios' subadvisor is shown parenthetically.(B) The subadvisor is an affiliate of the advisor.(C) The rate shown is the annualized seven-day yield as of 3-31-21.
Lifestyle Balanced PortfolioShares orPrincipalAmount Value
AFFILIATED INVESTMENT COMPANIES(A) - 100.0%Equity - 50.3%
Lifestyle Growth Portfolio (continued)Shares orPrincipalAmount Value
SHORT-TERM INVESTMENTS - 0.0%Short-termfunds - 0.0%
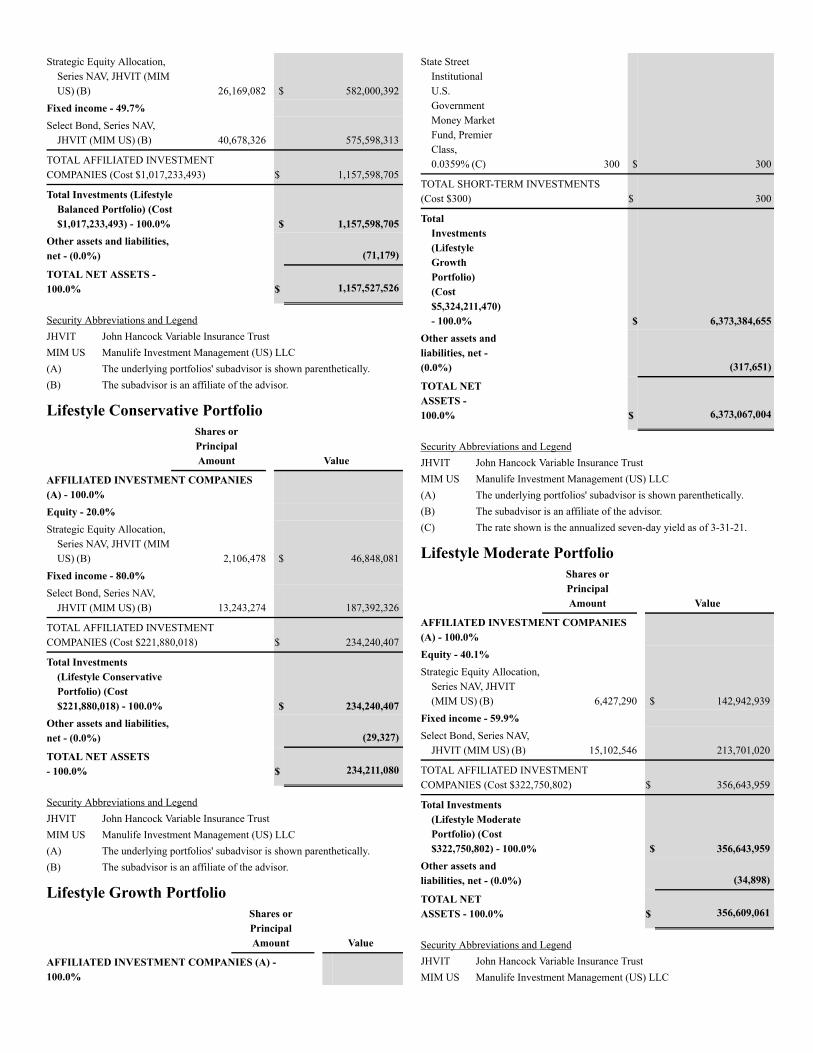
Strategic Equity Allocation,Series NAV, JHVIT (MIMUS) (B) 26,169,082 $ 582,000,392
Fixed income - 49.7%Select Bond, Series NAV,
JHVIT (MIM US) (B) 40,678,326 575,598,313
TOTAL AFFILIATED INVESTMENTCOMPANIES (Cost $1,017,233,493) $ 1,157,598,705
Total Investments (LifestyleBalanced Portfolio) (Cost$1,017,233,493) - 100.0% $ 1,157,598,705
Other assets and liabilities,net - (0.0%) (71,179)
TOTAL NET ASSETS -100.0% $ 1,157,527,526
Security Abbreviations and LegendJHVIT John Hancock Variable Insurance TrustMIM US Manulife Investment Management (US) LLC(A) The underlying portfolios' subadvisor is shown parenthetically.(B) The subadvisor is an affiliate of the advisor.
Lifestyle Conservative PortfolioShares orPrincipalAmount Value
AFFILIATED INVESTMENT COMPANIES(A) - 100.0%Equity - 20.0%Strategic Equity Allocation,
Series NAV, JHVIT (MIMUS) (B) 2,106,478 $ 46,848,081
Fixed income - 80.0%Select Bond, Series NAV,
JHVIT (MIM US) (B) 13,243,274 187,392,326
TOTAL AFFILIATED INVESTMENTCOMPANIES (Cost $221,880,018) $ 234,240,407
Total Investments(Lifestyle ConservativePortfolio) (Cost$221,880,018) - 100.0% $ 234,240,407
Other assets and liabilities,net - (0.0%) (29,327)
TOTAL NET ASSETS- 100.0% $ 234,211,080
Security Abbreviations and LegendJHVIT John Hancock Variable Insurance TrustMIM US Manulife Investment Management (US) LLC(A) The underlying portfolios' subadvisor is shown parenthetically.(B) The subadvisor is an affiliate of the advisor.
Lifestyle Growth PortfolioShares orPrincipalAmount Value
AFFILIATED INVESTMENT COMPANIES (A) -100.0%
State StreetInstitutionalU.S.GovernmentMoney MarketFund, PremierClass,0.0359% (C) 300 $ 300
TOTAL SHORT-TERM INVESTMENTS(Cost $300) $ 300
TotalInvestments(LifestyleGrowthPortfolio)(Cost$5,324,211,470)- 100.0% $ 6,373,384,655
Other assets andliabilities, net -(0.0%) (317,651)
TOTAL NETASSETS -100.0% $ 6,373,067,004
Security Abbreviations and LegendJHVIT John Hancock Variable Insurance TrustMIM US Manulife Investment Management (US) LLC(A) The underlying portfolios' subadvisor is shown parenthetically.(B) The subadvisor is an affiliate of the advisor.(C) The rate shown is the annualized seven-day yield as of 3-31-21.
Lifestyle Moderate PortfolioShares orPrincipalAmount Value
AFFILIATED INVESTMENT COMPANIES(A) - 100.0%Equity - 40.1%Strategic Equity Allocation,
Series NAV, JHVIT(MIM US) (B) 6,427,290 $ 142,942,939
Fixed income - 59.9%Select Bond, Series NAV,
JHVIT (MIM US) (B) 15,102,546 213,701,020
TOTAL AFFILIATED INVESTMENTCOMPANIES (Cost $322,750,802) $ 356,643,959
Total Investments(Lifestyle ModeratePortfolio) (Cost$322,750,802) - 100.0% $ 356,643,959
Other assets andliabilities, net - (0.0%) (34,898)
TOTAL NETASSETS - 100.0% $ 356,609,061
Security Abbreviations and LegendJHVIT John Hancock Variable Insurance TrustMIM US Manulife Investment Management (US) LLC
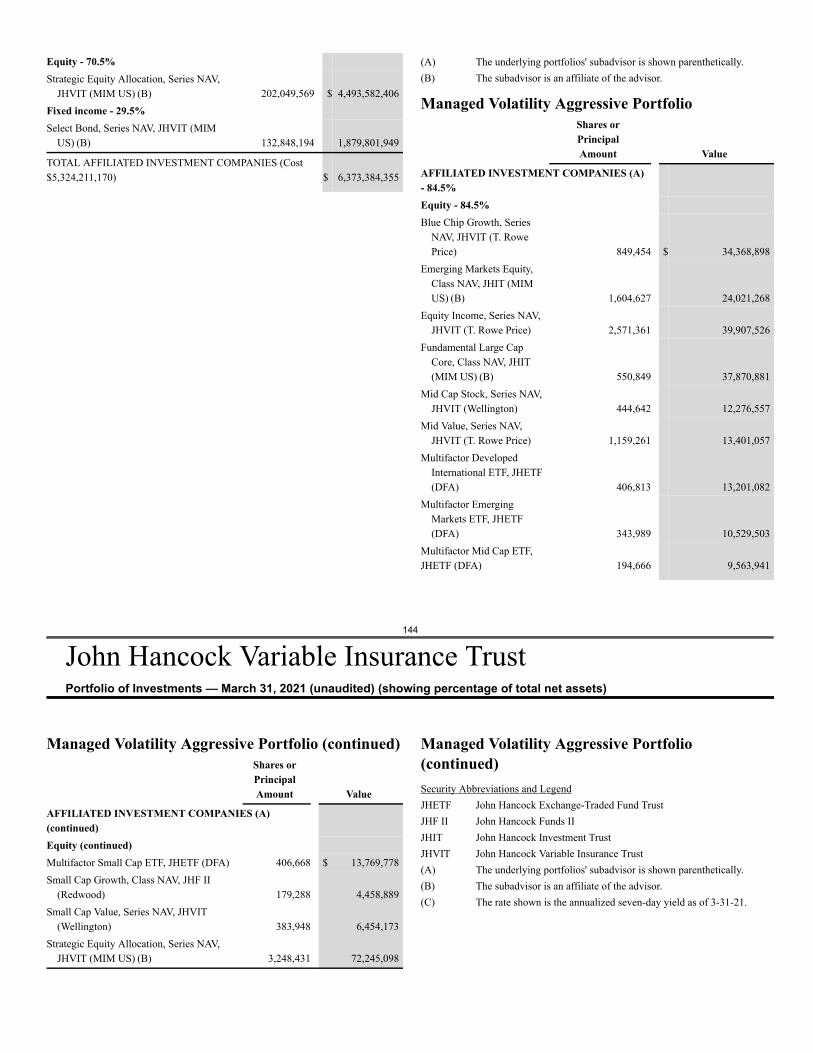
144
John Hancock Variable Insurance TrustPortfolio of Investments — March 31, 2021 (unaudited) (showing percentage of total net assets)
Equity - 70.5%Strategic Equity Allocation, Series NAV,
JHVIT (MIM US) (B) 202,049,569 $ 4,493,582,406Fixed income - 29.5%Select Bond, Series NAV, JHVIT (MIM
US) (B) 132,848,194 1,879,801,949
TOTAL AFFILIATED INVESTMENT COMPANIES (Cost$5,324,211,170) $ 6,373,384,355
(A) The underlying portfolios' subadvisor is shown parenthetically.(B) The subadvisor is an affiliate of the advisor.
Managed Volatility Aggressive PortfolioShares orPrincipalAmount Value
AFFILIATED INVESTMENT COMPANIES (A)- 84.5%Equity - 84.5%Blue Chip Growth, Series
NAV, JHVIT (T. RowePrice) 849,454 $ 34,368,898
Emerging Markets Equity,Class NAV, JHIT (MIMUS) (B) 1,604,627 24,021,268
Equity Income, Series NAV,JHVIT (T. Rowe Price) 2,571,361 39,907,526
Fundamental Large CapCore, Class NAV, JHIT(MIM US) (B) 550,849 37,870,881
Mid Cap Stock, Series NAV,JHVIT (Wellington) 444,642 12,276,557
Mid Value, Series NAV,JHVIT (T. Rowe Price) 1,159,261 13,401,057
Multifactor DevelopedInternational ETF, JHETF(DFA) 406,813 13,201,082
Multifactor EmergingMarkets ETF, JHETF(DFA) 343,989 10,529,503
Multifactor Mid Cap ETF,JHETF (DFA) 194,666 9,563,941
Managed Volatility Aggressive Portfolio (continued)Shares orPrincipalAmount Value
AFFILIATED INVESTMENT COMPANIES (A)(continued)Equity (continued)Multifactor Small Cap ETF, JHETF (DFA) 406,668 $ 13,769,778Small Cap Growth, Class NAV, JHF II
(Redwood) 179,288 4,458,889Small Cap Value, Series NAV, JHVIT
(Wellington) 383,948 6,454,173Strategic Equity Allocation, Series NAV,
JHVIT (MIM US) (B) 3,248,431 72,245,098
Managed Volatility Aggressive Portfolio(continued)Security Abbreviations and LegendJHETF John Hancock Exchange-Traded Fund TrustJHF II John Hancock Funds IIJHIT John Hancock Investment TrustJHVIT John Hancock Variable Insurance Trust(A) The underlying portfolios' subadvisor is shown parenthetically.(B) The subadvisor is an affiliate of the advisor.(C) The rate shown is the annualized seven-day yield as of 3-31-21.
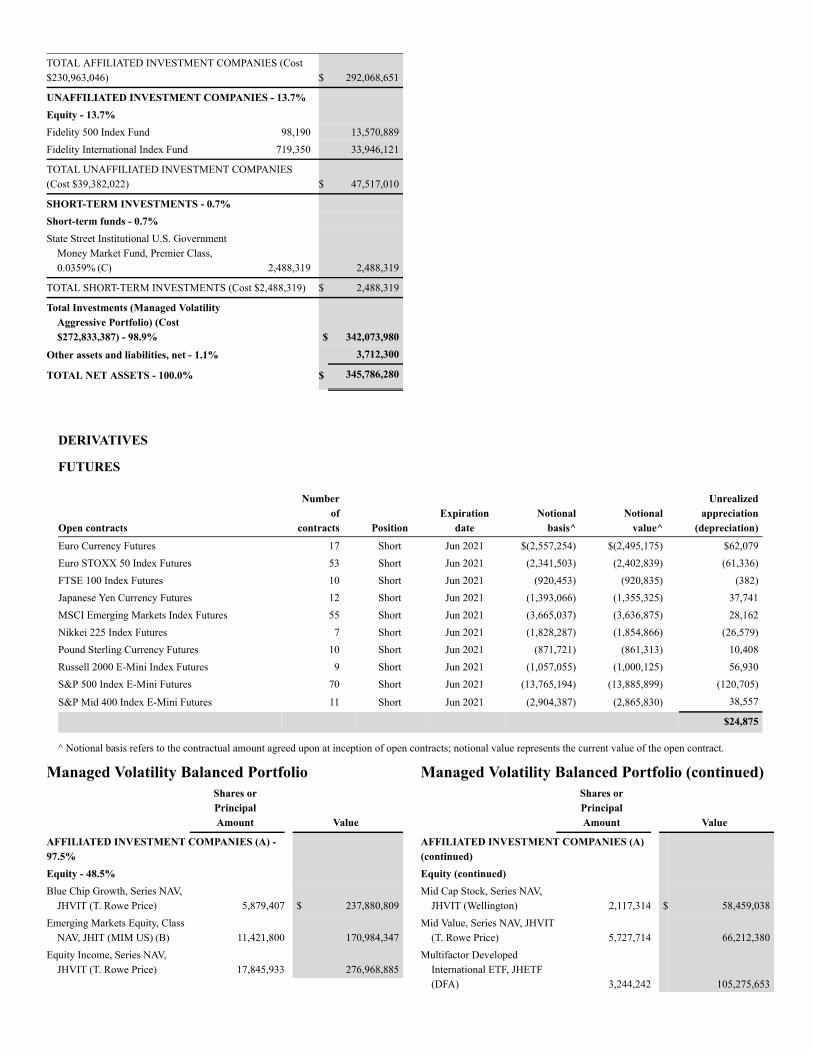
DERIVATIVES
FUTURES
Open contracts
Numberof
contracts PositionExpiration
dateNotional
basis^Notional
value^
Unrealizedappreciation
(depreciation)Euro Currency Futures 17 Short Jun 2021 $(2,557,254) $(2,495,175) $62,079Euro STOXX 50 Index Futures 53 Short Jun 2021 (2,341,503) (2,402,839) (61,336)FTSE 100 Index Futures 10 Short Jun 2021 (920,453) (920,835) (382)Japanese Yen Currency Futures 12 Short Jun 2021 (1,393,066) (1,355,325) 37,741MSCI Emerging Markets Index Futures 55 Short Jun 2021 (3,665,037) (3,636,875) 28,162Nikkei 225 Index Futures 7 Short Jun 2021 (1,828,287) (1,854,866) (26,579)Pound Sterling Currency Futures 10 Short Jun 2021 (871,721) (861,313) 10,408Russell 2000 E-Mini Index Futures 9 Short Jun 2021 (1,057,055) (1,000,125) 56,930S&P 500 Index E-Mini Futures 70 Short Jun 2021 (13,765,194) (13,885,899) (120,705)
S&P Mid 400 Index E-Mini Futures 11 Short Jun 2021 (2,904,387) (2,865,830) 38,557
$24,875
^ Notional basis refers to the contractual amount agreed upon at inception of open contracts; notional value represents the current value of the open contract.
TOTAL AFFILIATED INVESTMENT COMPANIES (Cost$230,963,046) $ 292,068,651
UNAFFILIATED INVESTMENT COMPANIES - 13.7%Equity - 13.7%Fidelity 500 Index Fund 98,190 13,570,889Fidelity International Index Fund 719,350 33,946,121
TOTAL UNAFFILIATED INVESTMENT COMPANIES(Cost $39,382,022) $ 47,517,010
SHORT-TERM INVESTMENTS - 0.7%Short-term funds - 0.7%State Street Institutional U.S. Government
Money Market Fund, Premier Class,0.0359% (C) 2,488,319 2,488,319
TOTAL SHORT-TERM INVESTMENTS (Cost $2,488,319) $ 2,488,319
Total Investments (Managed VolatilityAggressive Portfolio) (Cost$272,833,387) - 98.9% $ 342,073,980
Other assets and liabilities, net - 1.1% 3,712,300
TOTAL NET ASSETS - 100.0% $ 345,786,280
Managed Volatility Balanced PortfolioShares orPrincipalAmount Value
AFFILIATED INVESTMENT COMPANIES (A) -97.5%Equity - 48.5%Blue Chip Growth, Series NAV,
JHVIT (T. Rowe Price) 5,879,407 $ 237,880,809Emerging Markets Equity, Class
NAV, JHIT (MIM US) (B) 11,421,800 170,984,347Equity Income, Series NAV,
JHVIT (T. Rowe Price) 17,845,933 276,968,885
Managed Volatility Balanced Portfolio (continued)Shares orPrincipalAmount Value
AFFILIATED INVESTMENT COMPANIES (A)(continued)Equity (continued)Mid Cap Stock, Series NAV,
JHVIT (Wellington) 2,117,314 $ 58,459,038Mid Value, Series NAV, JHVIT
(T. Rowe Price) 5,727,714 66,212,380Multifactor Developed
International ETF, JHETF(DFA) 3,244,242 105,275,653
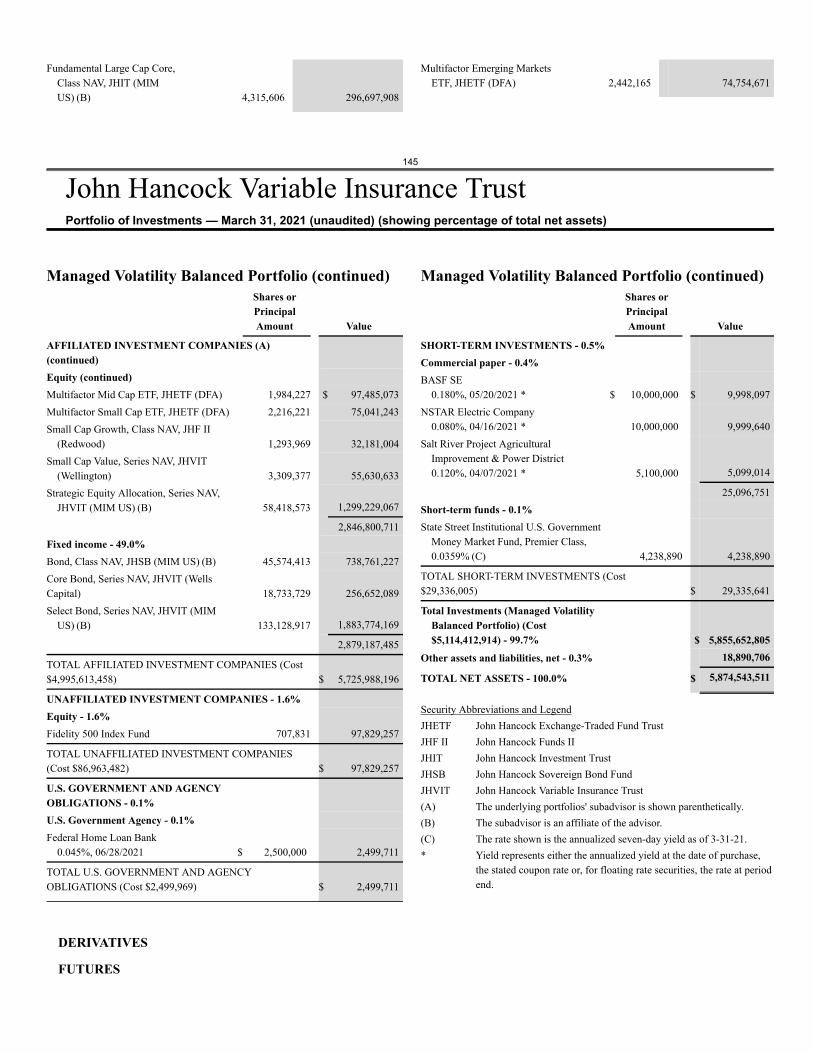
145
John Hancock Variable Insurance TrustPortfolio of Investments — March 31, 2021 (unaudited) (showing percentage of total net assets)
DERIVATIVES
FUTURES
Fundamental Large Cap Core,Class NAV, JHIT (MIMUS) (B) 4,315,606 296,697,908
Multifactor Emerging MarketsETF, JHETF (DFA) 2,442,165 74,754,671
Managed Volatility Balanced Portfolio (continued)Shares orPrincipalAmount Value
AFFILIATED INVESTMENT COMPANIES (A)(continued)Equity (continued)Multifactor Mid Cap ETF, JHETF (DFA) 1,984,227 $ 97,485,073Multifactor Small Cap ETF, JHETF (DFA) 2,216,221 75,041,243Small Cap Growth, Class NAV, JHF II
(Redwood) 1,293,969 32,181,004Small Cap Value, Series NAV, JHVIT
(Wellington) 3,309,377 55,630,633Strategic Equity Allocation, Series NAV,
JHVIT (MIM US) (B) 58,418,573 1,299,229,067
2,846,800,711Fixed income - 49.0%Bond, Class NAV, JHSB (MIM US) (B) 45,574,413 738,761,227Core Bond, Series NAV, JHVIT (WellsCapital) 18,733,729 256,652,089Select Bond, Series NAV, JHVIT (MIM
US) (B) 133,128,917 1,883,774,169
2,879,187,485
TOTAL AFFILIATED INVESTMENT COMPANIES (Cost$4,995,613,458) $ 5,725,988,196
UNAFFILIATED INVESTMENT COMPANIES - 1.6%Equity - 1.6%Fidelity 500 Index Fund 707,831 97,829,257
TOTAL UNAFFILIATED INVESTMENT COMPANIES(Cost $86,963,482) $ 97,829,257
U.S. GOVERNMENT AND AGENCYOBLIGATIONS - 0.1%U.S. Government Agency - 0.1%Federal Home Loan Bank
0.045%, 06/28/2021 $ 2,500,000 2,499,711
TOTAL U.S. GOVERNMENT AND AGENCYOBLIGATIONS (Cost $2,499,969) $ 2,499,711
Managed Volatility Balanced Portfolio (continued)Shares orPrincipalAmount Value
SHORT-TERM INVESTMENTS - 0.5%Commercial paper - 0.4%BASF SE
0.180%, 05/20/2021 * $ 10,000,000 $ 9,998,097NSTAR Electric Company
0.080%, 04/16/2021 * 10,000,000 9,999,640Salt River Project Agricultural
Improvement & Power District0.120%, 04/07/2021 * 5,100,000 5,099,014
25,096,751Short-term funds - 0.1%State Street Institutional U.S. Government
Money Market Fund, Premier Class,0.0359% (C) 4,238,890 4,238,890
TOTAL SHORT-TERM INVESTMENTS (Cost$29,336,005) $ 29,335,641
Total Investments (Managed VolatilityBalanced Portfolio) (Cost$5,114,412,914) - 99.7% $ 5,855,652,805
Other assets and liabilities, net - 0.3% 18,890,706
TOTAL NET ASSETS - 100.0% $ 5,874,543,511
Security Abbreviations and LegendJHETF John Hancock Exchange-Traded Fund TrustJHF II John Hancock Funds IIJHIT John Hancock Investment TrustJHSB John Hancock Sovereign Bond FundJHVIT John Hancock Variable Insurance Trust(A) The underlying portfolios' subadvisor is shown parenthetically.(B) The subadvisor is an affiliate of the advisor.(C) The rate shown is the annualized seven-day yield as of 3-31-21.* Yield represents either the annualized yield at the date of purchase,
the stated coupon rate or, for floating rate securities, the rate at periodend.
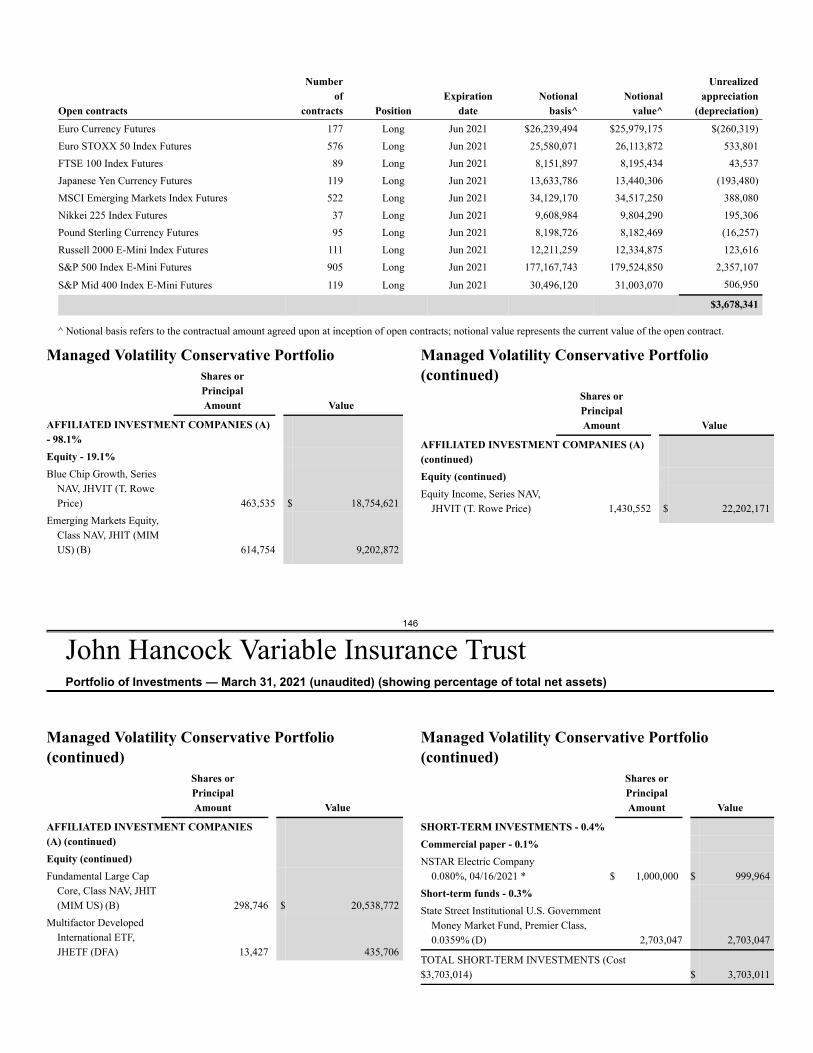
Open contracts
Numberof
contracts PositionExpiration
dateNotional
basis^Notional
value^
Unrealizedappreciation
(depreciation)Euro Currency Futures 177 Long Jun 2021 $26,239,494 $25,979,175 $(260,319)Euro STOXX 50 Index Futures 576 Long Jun 2021 25,580,071 26,113,872 533,801FTSE 100 Index Futures 89 Long Jun 2021 8,151,897 8,195,434 43,537Japanese Yen Currency Futures 119 Long Jun 2021 13,633,786 13,440,306 (193,480)MSCI Emerging Markets Index Futures 522 Long Jun 2021 34,129,170 34,517,250 388,080Nikkei 225 Index Futures 37 Long Jun 2021 9,608,984 9,804,290 195,306Pound Sterling Currency Futures 95 Long Jun 2021 8,198,726 8,182,469 (16,257)Russell 2000 E-Mini Index Futures 111 Long Jun 2021 12,211,259 12,334,875 123,616S&P 500 Index E-Mini Futures 905 Long Jun 2021 177,167,743 179,524,850 2,357,107
S&P Mid 400 Index E-Mini Futures 119 Long Jun 2021 30,496,120 31,003,070 506,950
$3,678,341
^ Notional basis refers to the contractual amount agreed upon at inception of open contracts; notional value represents the current value of the open contract.
146
John Hancock Variable Insurance TrustPortfolio of Investments — March 31, 2021 (unaudited) (showing percentage of total net assets)
Managed Volatility Conservative PortfolioShares orPrincipalAmount Value
AFFILIATED INVESTMENT COMPANIES (A)- 98.1%Equity - 19.1%Blue Chip Growth, Series
NAV, JHVIT (T. RowePrice) 463,535 $ 18,754,621
Emerging Markets Equity,Class NAV, JHIT (MIMUS) (B) 614,754 9,202,872
Managed Volatility Conservative Portfolio(continued)
Shares orPrincipalAmount Value
AFFILIATED INVESTMENT COMPANIES (A)(continued)Equity (continued)Equity Income, Series NAV,
JHVIT (T. Rowe Price) 1,430,552 $ 22,202,171
Managed Volatility Conservative Portfolio(continued)
Shares orPrincipalAmount Value
AFFILIATED INVESTMENT COMPANIES(A) (continued)Equity (continued)Fundamental Large Cap
Core, Class NAV, JHIT(MIM US) (B) 298,746 $ 20,538,772
Multifactor DevelopedInternational ETF,JHETF (DFA) 13,427 435,706
Managed Volatility Conservative Portfolio(continued)
Shares orPrincipalAmount Value
SHORT-TERM INVESTMENTS - 0.4%Commercial paper - 0.1%NSTAR Electric Company
0.080%, 04/16/2021 * $ 1,000,000 $ 999,964Short-term funds - 0.3%State Street Institutional U.S. Government
Money Market Fund, Premier Class,0.0359% (D) 2,703,047 2,703,047
TOTAL SHORT-TERM INVESTMENTS (Cost$3,703,014) $ 3,703,011
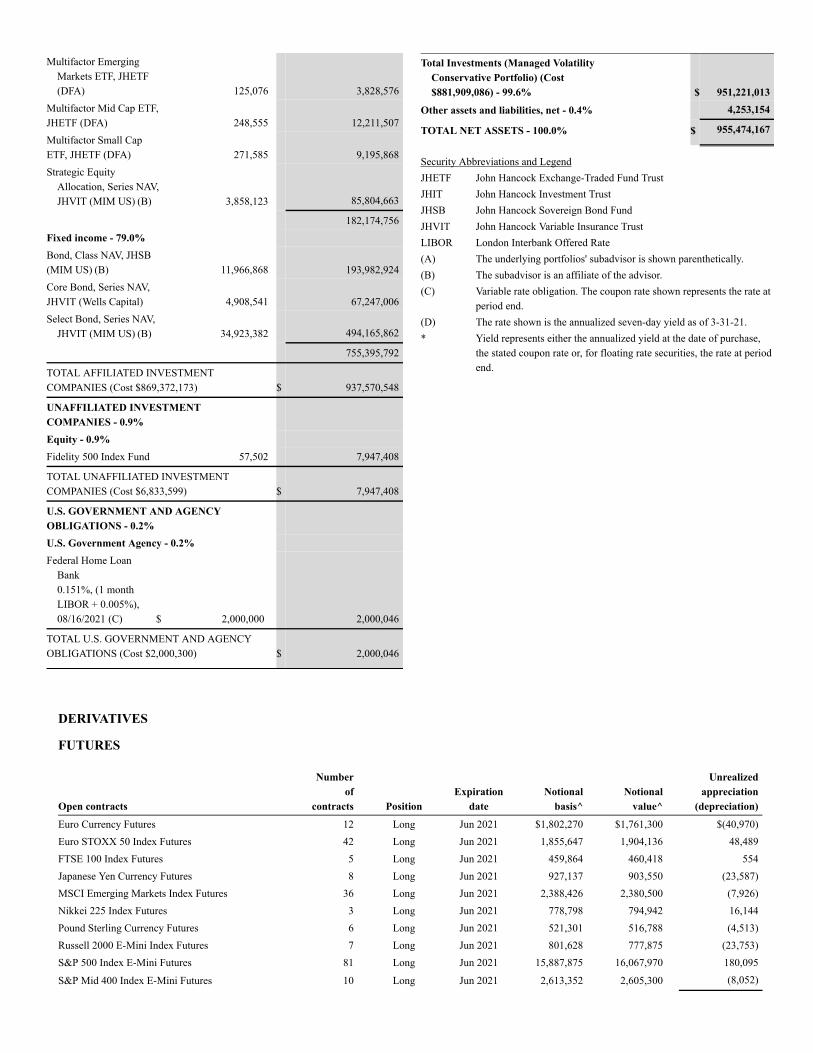
DERIVATIVES
FUTURES
Open contracts
Numberof
contracts PositionExpiration
dateNotional
basis^Notional
value^
Unrealizedappreciation
(depreciation)Euro Currency Futures 12 Long Jun 2021 $1,802,270 $1,761,300 $(40,970)Euro STOXX 50 Index Futures 42 Long Jun 2021 1,855,647 1,904,136 48,489FTSE 100 Index Futures 5 Long Jun 2021 459,864 460,418 554Japanese Yen Currency Futures 8 Long Jun 2021 927,137 903,550 (23,587)MSCI Emerging Markets Index Futures 36 Long Jun 2021 2,388,426 2,380,500 (7,926)Nikkei 225 Index Futures 3 Long Jun 2021 778,798 794,942 16,144Pound Sterling Currency Futures 6 Long Jun 2021 521,301 516,788 (4,513)Russell 2000 E-Mini Index Futures 7 Long Jun 2021 801,628 777,875 (23,753)S&P 500 Index E-Mini Futures 81 Long Jun 2021 15,887,875 16,067,970 180,095
S&P Mid 400 Index E-Mini Futures 10 Long Jun 2021 2,613,352 2,605,300 (8,052)
Multifactor EmergingMarkets ETF, JHETF(DFA) 125,076 3,828,576
Multifactor Mid Cap ETF,JHETF (DFA) 248,555 12,211,507Multifactor Small CapETF, JHETF (DFA) 271,585 9,195,868Strategic Equity
Allocation, Series NAV,JHVIT (MIM US) (B) 3,858,123 85,804,663
182,174,756Fixed income - 79.0%Bond, Class NAV, JHSB(MIM US) (B) 11,966,868 193,982,924Core Bond, Series NAV,JHVIT (Wells Capital) 4,908,541 67,247,006Select Bond, Series NAV,
JHVIT (MIM US) (B) 34,923,382 494,165,862
755,395,792
TOTAL AFFILIATED INVESTMENTCOMPANIES (Cost $869,372,173) $ 937,570,548
UNAFFILIATED INVESTMENTCOMPANIES - 0.9%Equity - 0.9%Fidelity 500 Index Fund 57,502 7,947,408
TOTAL UNAFFILIATED INVESTMENTCOMPANIES (Cost $6,833,599) $ 7,947,408
U.S. GOVERNMENT AND AGENCYOBLIGATIONS - 0.2%U.S. Government Agency - 0.2%Federal Home Loan
Bank0.151%, (1 monthLIBOR + 0.005%),08/16/2021 (C) $ 2,000,000 2,000,046
TOTAL U.S. GOVERNMENT AND AGENCYOBLIGATIONS (Cost $2,000,300) $ 2,000,046
Total Investments (Managed VolatilityConservative Portfolio) (Cost$881,909,086) - 99.6% $ 951,221,013
Other assets and liabilities, net - 0.4% 4,253,154
TOTAL NET ASSETS - 100.0% $ 955,474,167
Security Abbreviations and LegendJHETF John Hancock Exchange-Traded Fund TrustJHIT John Hancock Investment TrustJHSB John Hancock Sovereign Bond FundJHVIT John Hancock Variable Insurance TrustLIBOR London Interbank Offered Rate(A) The underlying portfolios' subadvisor is shown parenthetically.(B) The subadvisor is an affiliate of the advisor.(C) Variable rate obligation. The coupon rate shown represents the rate at
period end.(D) The rate shown is the annualized seven-day yield as of 3-31-21.* Yield represents either the annualized yield at the date of purchase,
the stated coupon rate or, for floating rate securities, the rate at periodend.
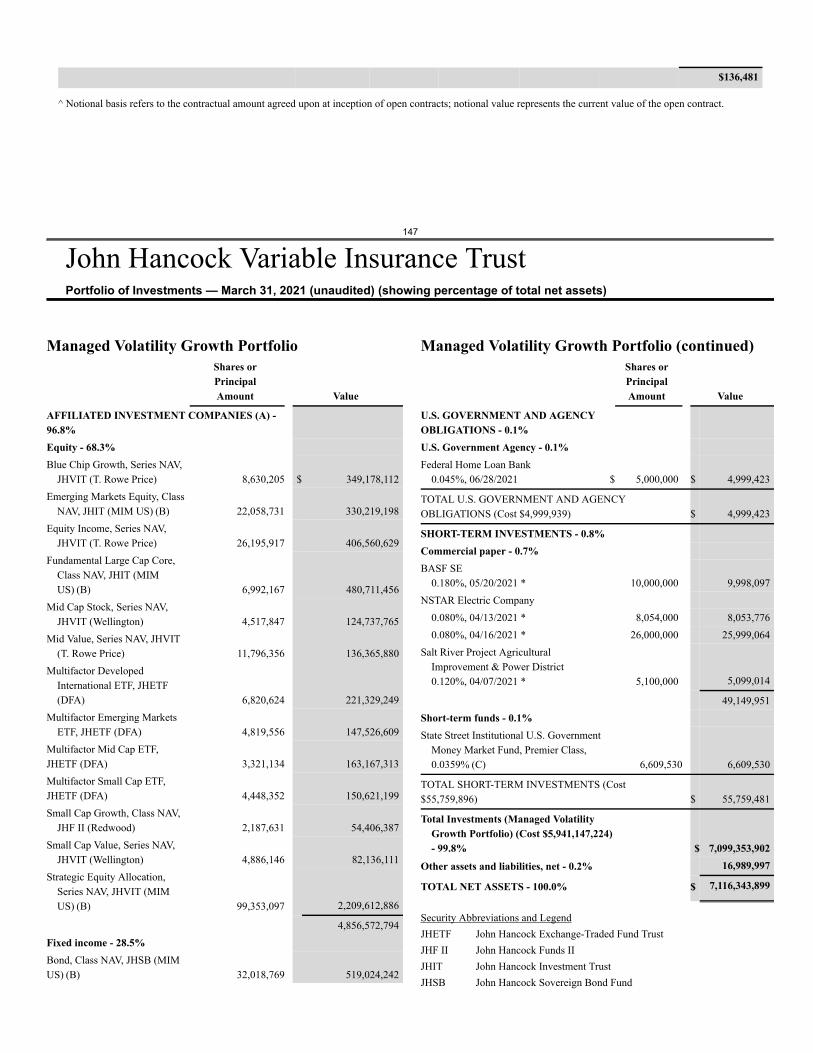
$136,481
^ Notional basis refers to the contractual amount agreed upon at inception of open contracts; notional value represents the current value of the open contract.
147
John Hancock Variable Insurance TrustPortfolio of Investments — March 31, 2021 (unaudited) (showing percentage of total net assets)
Managed Volatility Growth PortfolioShares orPrincipalAmount Value
AFFILIATED INVESTMENT COMPANIES (A) -96.8%Equity - 68.3%Blue Chip Growth, Series NAV,
JHVIT (T. Rowe Price) 8,630,205 $ 349,178,112Emerging Markets Equity, Class
NAV, JHIT (MIM US) (B) 22,058,731 330,219,198Equity Income, Series NAV,
JHVIT (T. Rowe Price) 26,195,917 406,560,629Fundamental Large Cap Core,
Class NAV, JHIT (MIMUS) (B) 6,992,167 480,711,456
Mid Cap Stock, Series NAV,JHVIT (Wellington) 4,517,847 124,737,765
Mid Value, Series NAV, JHVIT(T. Rowe Price) 11,796,356 136,365,880
Multifactor DevelopedInternational ETF, JHETF(DFA) 6,820,624 221,329,249
Multifactor Emerging MarketsETF, JHETF (DFA) 4,819,556 147,526,609
Multifactor Mid Cap ETF,JHETF (DFA) 3,321,134 163,167,313Multifactor Small Cap ETF,JHETF (DFA) 4,448,352 150,621,199Small Cap Growth, Class NAV,
JHF II (Redwood) 2,187,631 54,406,387Small Cap Value, Series NAV,
JHVIT (Wellington) 4,886,146 82,136,111Strategic Equity Allocation,
Series NAV, JHVIT (MIMUS) (B) 99,353,097 2,209,612,886
4,856,572,794Fixed income - 28.5%Bond, Class NAV, JHSB (MIMUS) (B) 32,018,769 519,024,242
Managed Volatility Growth Portfolio (continued)Shares orPrincipalAmount Value
U.S. GOVERNMENT AND AGENCYOBLIGATIONS - 0.1%U.S. Government Agency - 0.1%Federal Home Loan Bank
0.045%, 06/28/2021 $ 5,000,000 $ 4,999,423
TOTAL U.S. GOVERNMENT AND AGENCYOBLIGATIONS (Cost $4,999,939) $ 4,999,423
SHORT-TERM INVESTMENTS - 0.8%Commercial paper - 0.7%BASF SE
0.180%, 05/20/2021 * 10,000,000 9,998,097NSTAR Electric Company
0.080%, 04/13/2021 * 8,054,000 8,053,7760.080%, 04/16/2021 * 26,000,000 25,999,064
Salt River Project AgriculturalImprovement & Power District0.120%, 04/07/2021 * 5,100,000 5,099,014
49,149,951Short-term funds - 0.1%State Street Institutional U.S. Government
Money Market Fund, Premier Class,0.0359% (C) 6,609,530 6,609,530
TOTAL SHORT-TERM INVESTMENTS (Cost$55,759,896) $ 55,759,481
Total Investments (Managed VolatilityGrowth Portfolio) (Cost $5,941,147,224)- 99.8% $ 7,099,353,902
Other assets and liabilities, net - 0.2% 16,989,997
TOTAL NET ASSETS - 100.0% $ 7,116,343,899
Security Abbreviations and LegendJHETF John Hancock Exchange-Traded Fund TrustJHF II John Hancock Funds IIJHIT John Hancock Investment TrustJHSB John Hancock Sovereign Bond Fund
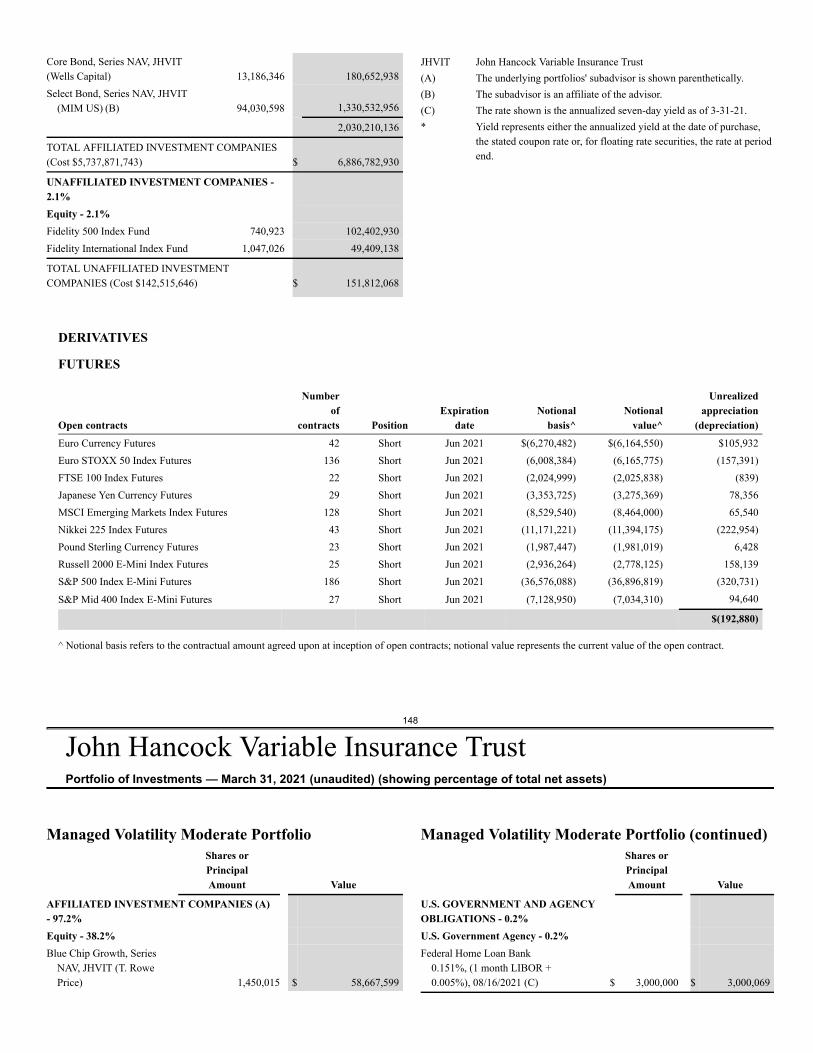
DERIVATIVES
FUTURES
Open contracts
Numberof
contracts PositionExpiration
dateNotional
basis^Notional
value^
Unrealizedappreciation
(depreciation)Euro Currency Futures 42 Short Jun 2021 $(6,270,482) $(6,164,550) $105,932Euro STOXX 50 Index Futures 136 Short Jun 2021 (6,008,384) (6,165,775) (157,391)FTSE 100 Index Futures 22 Short Jun 2021 (2,024,999) (2,025,838) (839)Japanese Yen Currency Futures 29 Short Jun 2021 (3,353,725) (3,275,369) 78,356MSCI Emerging Markets Index Futures 128 Short Jun 2021 (8,529,540) (8,464,000) 65,540Nikkei 225 Index Futures 43 Short Jun 2021 (11,171,221) (11,394,175) (222,954)Pound Sterling Currency Futures 23 Short Jun 2021 (1,987,447) (1,981,019) 6,428Russell 2000 E-Mini Index Futures 25 Short Jun 2021 (2,936,264) (2,778,125) 158,139S&P 500 Index E-Mini Futures 186 Short Jun 2021 (36,576,088) (36,896,819) (320,731)
S&P Mid 400 Index E-Mini Futures 27 Short Jun 2021 (7,128,950) (7,034,310) 94,640
$(192,880)
^ Notional basis refers to the contractual amount agreed upon at inception of open contracts; notional value represents the current value of the open contract.
148
John Hancock Variable Insurance TrustPortfolio of Investments — March 31, 2021 (unaudited) (showing percentage of total net assets)
Core Bond, Series NAV, JHVIT(Wells Capital) 13,186,346 180,652,938Select Bond, Series NAV, JHVIT
(MIM US) (B) 94,030,598 1,330,532,956
2,030,210,136
TOTAL AFFILIATED INVESTMENT COMPANIES(Cost $5,737,871,743) $ 6,886,782,930
UNAFFILIATED INVESTMENT COMPANIES -2.1%Equity - 2.1%Fidelity 500 Index Fund 740,923 102,402,930Fidelity International Index Fund 1,047,026 49,409,138
TOTAL UNAFFILIATED INVESTMENTCOMPANIES (Cost $142,515,646) $ 151,812,068
JHVIT John Hancock Variable Insurance Trust(A) The underlying portfolios' subadvisor is shown parenthetically.(B) The subadvisor is an affiliate of the advisor.(C) The rate shown is the annualized seven-day yield as of 3-31-21.* Yield represents either the annualized yield at the date of purchase,
the stated coupon rate or, for floating rate securities, the rate at periodend.
Managed Volatility Moderate PortfolioShares orPrincipalAmount Value
AFFILIATED INVESTMENT COMPANIES (A)- 97.2%Equity - 38.2%Blue Chip Growth, Series
NAV, JHVIT (T. RowePrice) 1,450,015 $ 58,667,599
Managed Volatility Moderate Portfolio (continued)Shares orPrincipalAmount Value
U.S. GOVERNMENT AND AGENCYOBLIGATIONS - 0.2%U.S. Government Agency - 0.2%Federal Home Loan Bank
0.151%, (1 month LIBOR +0.005%), 08/16/2021 (C) $ 3,000,000 $ 3,000,069
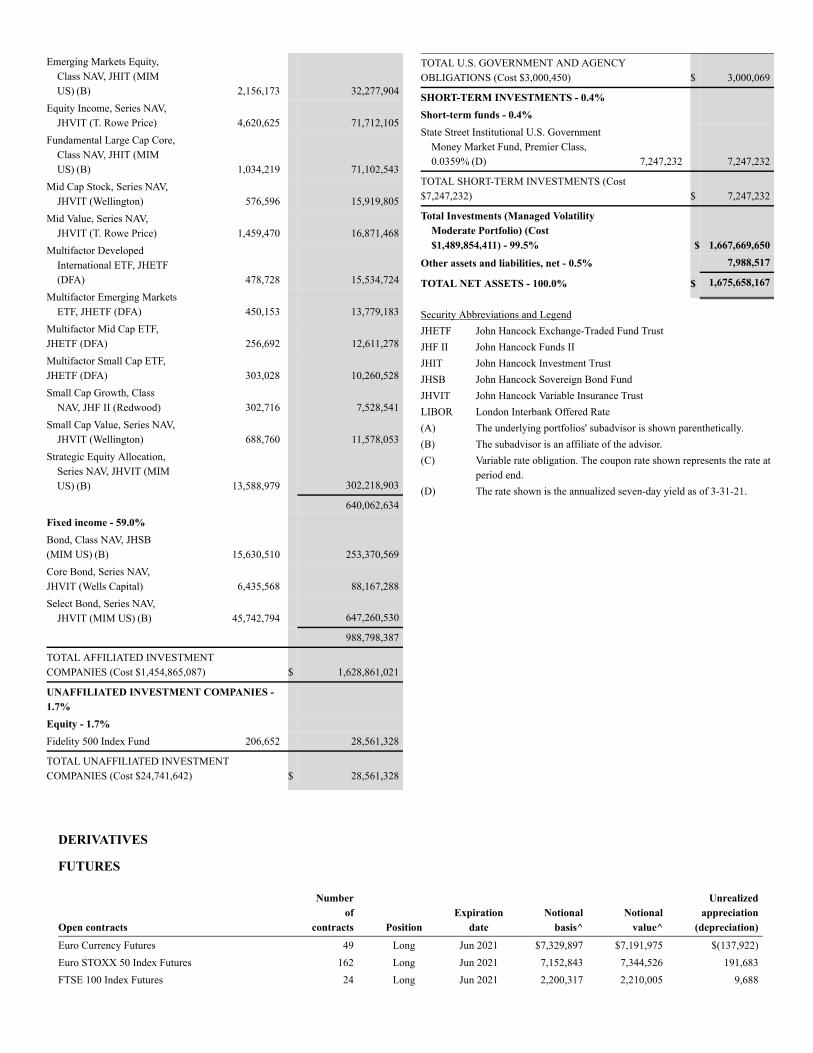
DERIVATIVES
FUTURES
Open contracts
Numberof
contracts PositionExpiration
dateNotional
basis^Notional
value^
Unrealizedappreciation
(depreciation)Euro Currency Futures 49 Long Jun 2021 $7,329,897 $7,191,975 $(137,922)Euro STOXX 50 Index Futures 162 Long Jun 2021 7,152,843 7,344,526 191,683FTSE 100 Index Futures 24 Long Jun 2021 2,200,317 2,210,005 9,688
Emerging Markets Equity,Class NAV, JHIT (MIMUS) (B) 2,156,173 32,277,904
Equity Income, Series NAV,JHVIT (T. Rowe Price) 4,620,625 71,712,105
Fundamental Large Cap Core,Class NAV, JHIT (MIMUS) (B) 1,034,219 71,102,543
Mid Cap Stock, Series NAV,JHVIT (Wellington) 576,596 15,919,805
Mid Value, Series NAV,JHVIT (T. Rowe Price) 1,459,470 16,871,468
Multifactor DevelopedInternational ETF, JHETF(DFA) 478,728 15,534,724
Multifactor Emerging MarketsETF, JHETF (DFA) 450,153 13,779,183
Multifactor Mid Cap ETF,JHETF (DFA) 256,692 12,611,278Multifactor Small Cap ETF,JHETF (DFA) 303,028 10,260,528Small Cap Growth, Class
NAV, JHF II (Redwood) 302,716 7,528,541Small Cap Value, Series NAV,
JHVIT (Wellington) 688,760 11,578,053Strategic Equity Allocation,
Series NAV, JHVIT (MIMUS) (B) 13,588,979 302,218,903
640,062,634Fixed income - 59.0%Bond, Class NAV, JHSB(MIM US) (B) 15,630,510 253,370,569Core Bond, Series NAV,JHVIT (Wells Capital) 6,435,568 88,167,288Select Bond, Series NAV,
JHVIT (MIM US) (B) 45,742,794 647,260,530
988,798,387
TOTAL AFFILIATED INVESTMENTCOMPANIES (Cost $1,454,865,087) $ 1,628,861,021
UNAFFILIATED INVESTMENT COMPANIES -1.7%Equity - 1.7%Fidelity 500 Index Fund 206,652 28,561,328
TOTAL UNAFFILIATED INVESTMENTCOMPANIES (Cost $24,741,642) $ 28,561,328
TOTAL U.S. GOVERNMENT AND AGENCYOBLIGATIONS (Cost $3,000,450) $ 3,000,069
SHORT-TERM INVESTMENTS - 0.4%Short-term funds - 0.4%State Street Institutional U.S. Government
Money Market Fund, Premier Class,0.0359% (D) 7,247,232 7,247,232
TOTAL SHORT-TERM INVESTMENTS (Cost$7,247,232) $ 7,247,232
Total Investments (Managed VolatilityModerate Portfolio) (Cost$1,489,854,411) - 99.5% $ 1,667,669,650
Other assets and liabilities, net - 0.5% 7,988,517
TOTAL NET ASSETS - 100.0% $ 1,675,658,167
Security Abbreviations and LegendJHETF John Hancock Exchange-Traded Fund TrustJHF II John Hancock Funds IIJHIT John Hancock Investment TrustJHSB John Hancock Sovereign Bond FundJHVIT John Hancock Variable Insurance TrustLIBOR London Interbank Offered Rate(A) The underlying portfolios' subadvisor is shown parenthetically.(B) The subadvisor is an affiliate of the advisor.(C) Variable rate obligation. The coupon rate shown represents the rate at
period end.(D) The rate shown is the annualized seven-day yield as of 3-31-21.
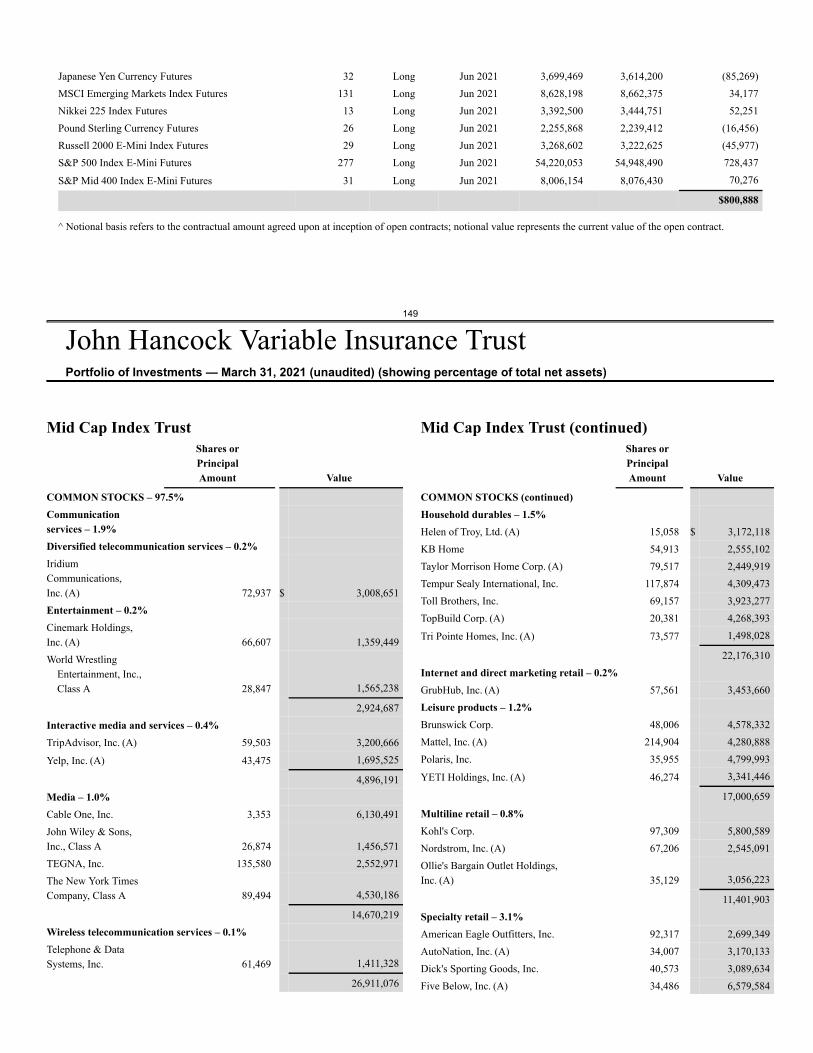
Japanese Yen Currency Futures 32 Long Jun 2021 3,699,469 3,614,200 (85,269)MSCI Emerging Markets Index Futures 131 Long Jun 2021 8,628,198 8,662,375 34,177Nikkei 225 Index Futures 13 Long Jun 2021 3,392,500 3,444,751 52,251Pound Sterling Currency Futures 26 Long Jun 2021 2,255,868 2,239,412 (16,456)Russell 2000 E-Mini Index Futures 29 Long Jun 2021 3,268,602 3,222,625 (45,977)S&P 500 Index E-Mini Futures 277 Long Jun 2021 54,220,053 54,948,490 728,437
S&P Mid 400 Index E-Mini Futures 31 Long Jun 2021 8,006,154 8,076,430 70,276
$800,888
^ Notional basis refers to the contractual amount agreed upon at inception of open contracts; notional value represents the current value of the open contract.
149
John Hancock Variable Insurance TrustPortfolio of Investments — March 31, 2021 (unaudited) (showing percentage of total net assets)
Mid Cap Index TrustShares orPrincipalAmount Value
COMMON STOCKS – 97.5%Communicationservices – 1.9%Diversified telecommunication services – 0.2%IridiumCommunications,Inc. (A) 72,937 $ 3,008,651Entertainment – 0.2%Cinemark Holdings,Inc. (A) 66,607 1,359,449World Wrestling
Entertainment, Inc.,Class A 28,847 1,565,238
2,924,687Interactive media and services – 0.4%TripAdvisor, Inc. (A) 59,503 3,200,666
Yelp, Inc. (A) 43,475 1,695,525
4,896,191Media – 1.0%Cable One, Inc. 3,353 6,130,491John Wiley & Sons,Inc., Class A 26,874 1,456,571TEGNA, Inc. 135,580 2,552,971The New York TimesCompany, Class A 89,494 4,530,186
14,670,219Wireless telecommunication services – 0.1%Telephone & DataSystems, Inc. 61,469 1,411,328
26,911,076
Mid Cap Index Trust (continued)Shares orPrincipalAmount Value
COMMON STOCKS (continued)Household durables – 1.5%Helen of Troy, Ltd. (A) 15,058 $ 3,172,118KB Home 54,913 2,555,102Taylor Morrison Home Corp. (A) 79,517 2,449,919Tempur Sealy International, Inc. 117,874 4,309,473Toll Brothers, Inc. 69,157 3,923,277TopBuild Corp. (A) 20,381 4,268,393
Tri Pointe Homes, Inc. (A) 73,577 1,498,028
22,176,310Internet and direct marketing retail – 0.2%GrubHub, Inc. (A) 57,561 3,453,660Leisure products – 1.2%Brunswick Corp. 48,006 4,578,332Mattel, Inc. (A) 214,904 4,280,888Polaris, Inc. 35,955 4,799,993
YETI Holdings, Inc. (A) 46,274 3,341,446
17,000,659Multiline retail – 0.8%Kohl's Corp. 97,309 5,800,589Nordstrom, Inc. (A) 67,206 2,545,091Ollie's Bargain Outlet Holdings,Inc. (A) 35,129 3,056,223
11,401,903Specialty retail – 3.1%American Eagle Outfitters, Inc. 92,317 2,699,349AutoNation, Inc. (A) 34,007 3,170,133Dick's Sporting Goods, Inc. 40,573 3,089,634Five Below, Inc. (A) 34,486 6,579,584
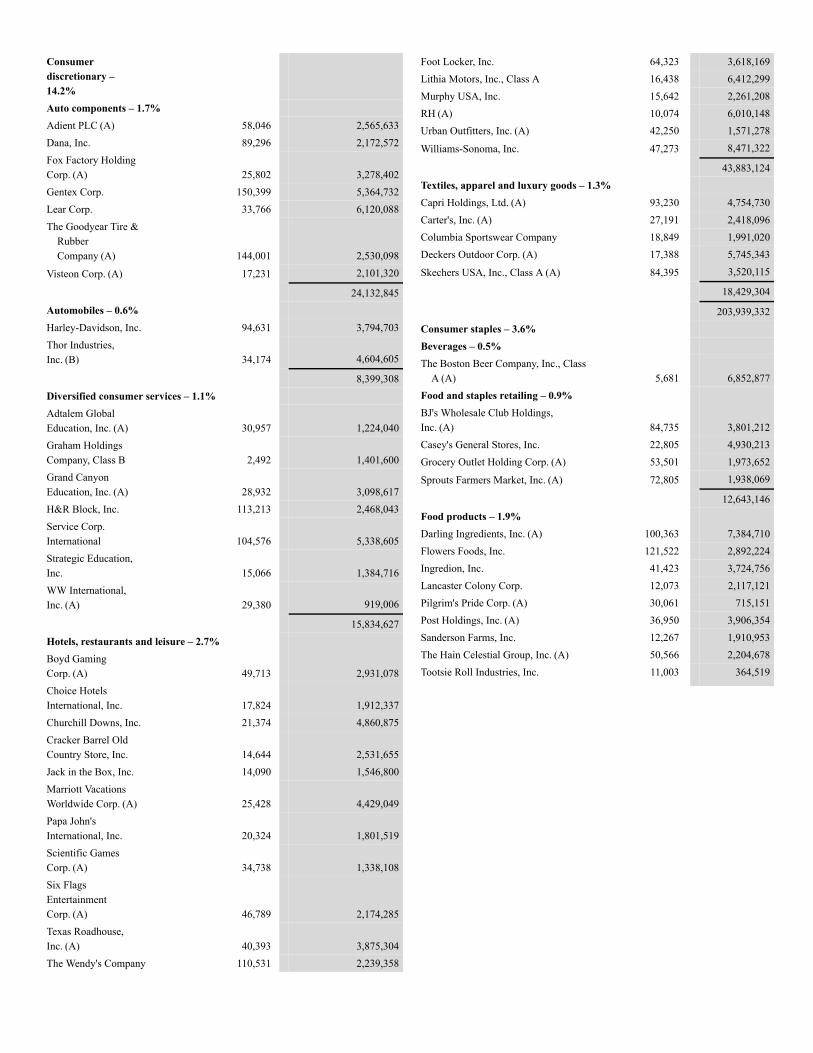
Consumerdiscretionary –14.2%Auto components – 1.7%Adient PLC (A) 58,046 2,565,633Dana, Inc. 89,296 2,172,572Fox Factory HoldingCorp. (A) 25,802 3,278,402Gentex Corp. 150,399 5,364,732Lear Corp. 33,766 6,120,088The Goodyear Tire &
RubberCompany (A) 144,001 2,530,098
Visteon Corp. (A) 17,231 2,101,320
24,132,845Automobiles – 0.6%Harley-Davidson, Inc. 94,631 3,794,703Thor Industries,Inc. (B) 34,174 4,604,605
8,399,308Diversified consumer services – 1.1%Adtalem GlobalEducation, Inc. (A) 30,957 1,224,040Graham HoldingsCompany, Class B 2,492 1,401,600Grand CanyonEducation, Inc. (A) 28,932 3,098,617H&R Block, Inc. 113,213 2,468,043Service Corp.International 104,576 5,338,605Strategic Education,Inc. 15,066 1,384,716WW International,Inc. (A) 29,380 919,006
15,834,627Hotels, restaurants and leisure – 2.7%Boyd GamingCorp. (A) 49,713 2,931,078Choice HotelsInternational, Inc. 17,824 1,912,337Churchill Downs, Inc. 21,374 4,860,875Cracker Barrel OldCountry Store, Inc. 14,644 2,531,655Jack in the Box, Inc. 14,090 1,546,800Marriott VacationsWorldwide Corp. (A) 25,428 4,429,049Papa John'sInternational, Inc. 20,324 1,801,519Scientific GamesCorp. (A) 34,738 1,338,108Six FlagsEntertainmentCorp. (A) 46,789 2,174,285Texas Roadhouse,Inc. (A) 40,393 3,875,304The Wendy's Company 110,531 2,239,358
Foot Locker, Inc. 64,323 3,618,169Lithia Motors, Inc., Class A 16,438 6,412,299Murphy USA, Inc. 15,642 2,261,208RH (A) 10,074 6,010,148Urban Outfitters, Inc. (A) 42,250 1,571,278
Williams-Sonoma, Inc. 47,273 8,471,322
43,883,124Textiles, apparel and luxury goods – 1.3%Capri Holdings, Ltd. (A) 93,230 4,754,730Carter's, Inc. (A) 27,191 2,418,096Columbia Sportswear Company 18,849 1,991,020Deckers Outdoor Corp. (A) 17,388 5,745,343
Skechers USA, Inc., Class A (A) 84,395 3,520,115
18,429,304
203,939,332Consumer staples – 3.6%Beverages – 0.5%The Boston Beer Company, Inc., Class
A (A) 5,681 6,852,877Food and staples retailing – 0.9%BJ's Wholesale Club Holdings,Inc. (A) 84,735 3,801,212Casey's General Stores, Inc. 22,805 4,930,213Grocery Outlet Holding Corp. (A) 53,501 1,973,652
Sprouts Farmers Market, Inc. (A) 72,805 1,938,069
12,643,146Food products – 1.9%Darling Ingredients, Inc. (A) 100,363 7,384,710Flowers Foods, Inc. 121,522 2,892,224Ingredion, Inc. 41,423 3,724,756Lancaster Colony Corp. 12,073 2,117,121Pilgrim's Pride Corp. (A) 30,061 715,151Post Holdings, Inc. (A) 36,950 3,906,354Sanderson Farms, Inc. 12,267 1,910,953The Hain Celestial Group, Inc. (A) 50,566 2,204,678Tootsie Roll Industries, Inc. 11,003 364,519
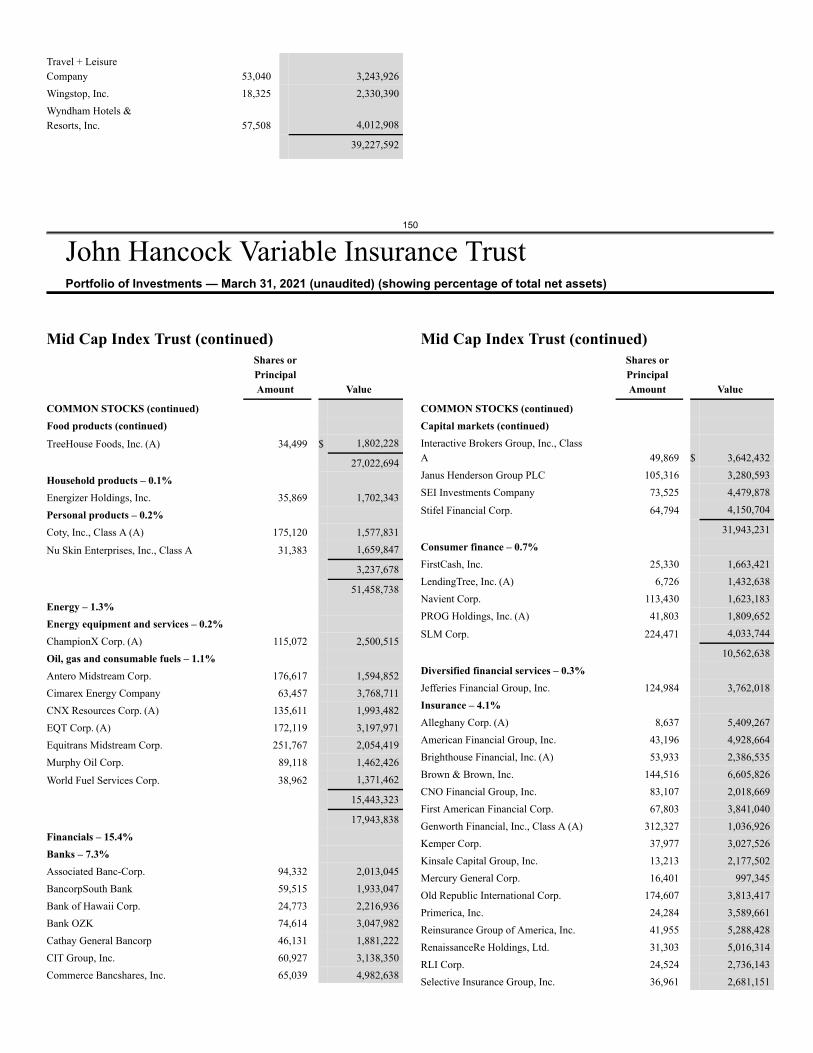
150
John Hancock Variable Insurance TrustPortfolio of Investments — March 31, 2021 (unaudited) (showing percentage of total net assets)
Travel + LeisureCompany 53,040 3,243,926Wingstop, Inc. 18,325 2,330,390Wyndham Hotels &Resorts, Inc. 57,508 4,012,908
39,227,592
Mid Cap Index Trust (continued)Shares orPrincipalAmount Value
COMMON STOCKS (continued)Food products (continued)TreeHouse Foods, Inc. (A) 34,499 $ 1,802,228
27,022,694Household products – 0.1%Energizer Holdings, Inc. 35,869 1,702,343Personal products – 0.2%Coty, Inc., Class A (A) 175,120 1,577,831
Nu Skin Enterprises, Inc., Class A 31,383 1,659,847
3,237,678
51,458,738Energy – 1.3%Energy equipment and services – 0.2%ChampionX Corp. (A) 115,072 2,500,515Oil, gas and consumable fuels – 1.1%Antero Midstream Corp. 176,617 1,594,852Cimarex Energy Company 63,457 3,768,711CNX Resources Corp. (A) 135,611 1,993,482EQT Corp. (A) 172,119 3,197,971Equitrans Midstream Corp. 251,767 2,054,419Murphy Oil Corp. 89,118 1,462,426
World Fuel Services Corp. 38,962 1,371,462
15,443,323
17,943,838Financials – 15.4%Banks – 7.3%Associated Banc-Corp. 94,332 2,013,045BancorpSouth Bank 59,515 1,933,047Bank of Hawaii Corp. 24,773 2,216,936Bank OZK 74,614 3,047,982Cathay General Bancorp 46,131 1,881,222CIT Group, Inc. 60,927 3,138,350Commerce Bancshares, Inc. 65,039 4,982,638
Mid Cap Index Trust (continued)Shares orPrincipalAmount Value
COMMON STOCKS (continued)Capital markets (continued)Interactive Brokers Group, Inc., ClassA 49,869 $ 3,642,432Janus Henderson Group PLC 105,316 3,280,593SEI Investments Company 73,525 4,479,878
Stifel Financial Corp. 64,794 4,150,704
31,943,231Consumer finance – 0.7%FirstCash, Inc. 25,330 1,663,421LendingTree, Inc. (A) 6,726 1,432,638Navient Corp. 113,430 1,623,183PROG Holdings, Inc. (A) 41,803 1,809,652
SLM Corp. 224,471 4,033,744
10,562,638Diversified financial services – 0.3%Jefferies Financial Group, Inc. 124,984 3,762,018Insurance – 4.1%Alleghany Corp. (A) 8,637 5,409,267American Financial Group, Inc. 43,196 4,928,664Brighthouse Financial, Inc. (A) 53,933 2,386,535Brown & Brown, Inc. 144,516 6,605,826CNO Financial Group, Inc. 83,107 2,018,669First American Financial Corp. 67,803 3,841,040Genworth Financial, Inc., Class A (A) 312,327 1,036,926Kemper Corp. 37,977 3,027,526Kinsale Capital Group, Inc. 13,213 2,177,502Mercury General Corp. 16,401 997,345Old Republic International Corp. 174,607 3,813,417Primerica, Inc. 24,284 3,589,661Reinsurance Group of America, Inc. 41,955 5,288,428RenaissanceRe Holdings, Ltd. 31,303 5,016,314RLI Corp. 24,524 2,736,143Selective Insurance Group, Inc. 36,961 2,681,151
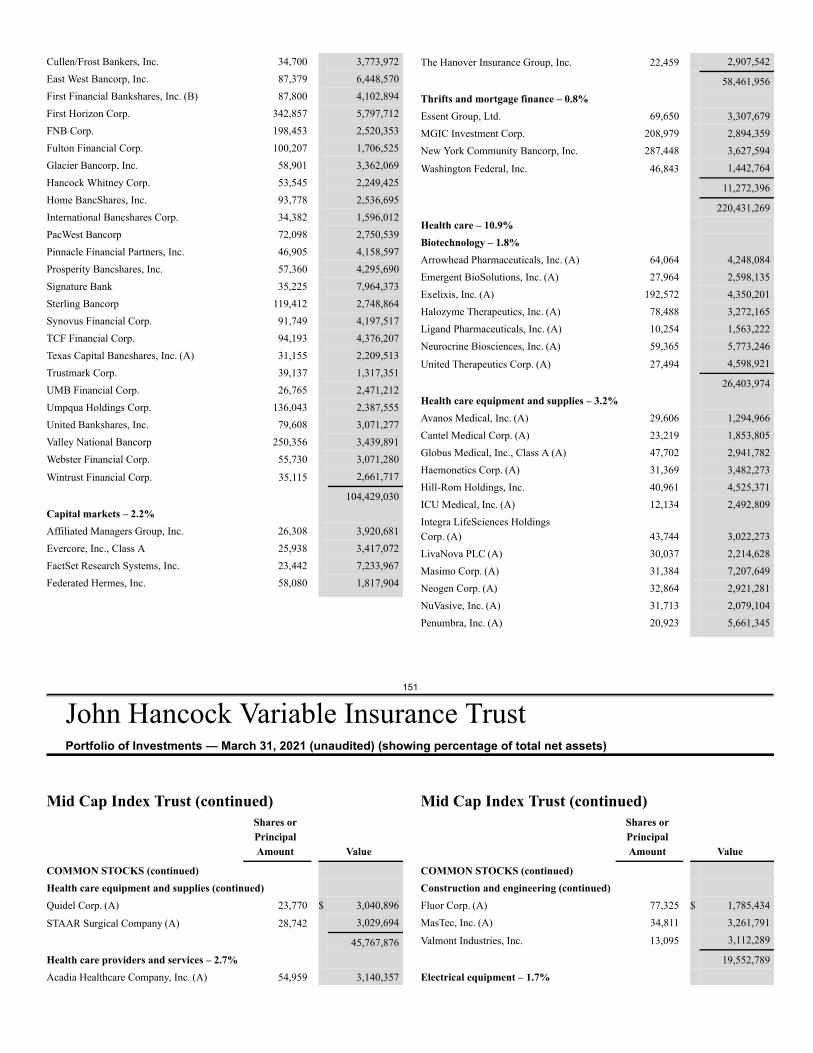
151
John Hancock Variable Insurance TrustPortfolio of Investments — March 31, 2021 (unaudited) (showing percentage of total net assets)
Cullen/Frost Bankers, Inc. 34,700 3,773,972East West Bancorp, Inc. 87,379 6,448,570First Financial Bankshares, Inc. (B) 87,800 4,102,894First Horizon Corp. 342,857 5,797,712FNB Corp. 198,453 2,520,353Fulton Financial Corp. 100,207 1,706,525Glacier Bancorp, Inc. 58,901 3,362,069Hancock Whitney Corp. 53,545 2,249,425Home BancShares, Inc. 93,778 2,536,695International Bancshares Corp. 34,382 1,596,012PacWest Bancorp 72,098 2,750,539Pinnacle Financial Partners, Inc. 46,905 4,158,597Prosperity Bancshares, Inc. 57,360 4,295,690Signature Bank 35,225 7,964,373Sterling Bancorp 119,412 2,748,864Synovus Financial Corp. 91,749 4,197,517TCF Financial Corp. 94,193 4,376,207Texas Capital Bancshares, Inc. (A) 31,155 2,209,513Trustmark Corp. 39,137 1,317,351UMB Financial Corp. 26,765 2,471,212Umpqua Holdings Corp. 136,043 2,387,555United Bankshares, Inc. 79,608 3,071,277Valley National Bancorp 250,356 3,439,891Webster Financial Corp. 55,730 3,071,280
Wintrust Financial Corp. 35,115 2,661,717
104,429,030Capital markets – 2.2%Affiliated Managers Group, Inc. 26,308 3,920,681Evercore, Inc., Class A 25,938 3,417,072FactSet Research Systems, Inc. 23,442 7,233,967Federated Hermes, Inc. 58,080 1,817,904
The Hanover Insurance Group, Inc. 22,459 2,907,542
58,461,956Thrifts and mortgage finance – 0.8%Essent Group, Ltd. 69,650 3,307,679MGIC Investment Corp. 208,979 2,894,359New York Community Bancorp, Inc. 287,448 3,627,594
Washington Federal, Inc. 46,843 1,442,764
11,272,396
220,431,269Health care – 10.9%Biotechnology – 1.8%Arrowhead Pharmaceuticals, Inc. (A) 64,064 4,248,084Emergent BioSolutions, Inc. (A) 27,964 2,598,135Exelixis, Inc. (A) 192,572 4,350,201Halozyme Therapeutics, Inc. (A) 78,488 3,272,165Ligand Pharmaceuticals, Inc. (A) 10,254 1,563,222Neurocrine Biosciences, Inc. (A) 59,365 5,773,246
United Therapeutics Corp. (A) 27,494 4,598,921
26,403,974Health care equipment and supplies – 3.2%Avanos Medical, Inc. (A) 29,606 1,294,966Cantel Medical Corp. (A) 23,219 1,853,805Globus Medical, Inc., Class A (A) 47,702 2,941,782Haemonetics Corp. (A) 31,369 3,482,273Hill-Rom Holdings, Inc. 40,961 4,525,371ICU Medical, Inc. (A) 12,134 2,492,809Integra LifeSciences HoldingsCorp. (A) 43,744 3,022,273LivaNova PLC (A) 30,037 2,214,628Masimo Corp. (A) 31,384 7,207,649Neogen Corp. (A) 32,864 2,921,281NuVasive, Inc. (A) 31,713 2,079,104Penumbra, Inc. (A) 20,923 5,661,345
Mid Cap Index Trust (continued)Shares orPrincipalAmount Value
COMMON STOCKS (continued)Health care equipment and supplies (continued)Quidel Corp. (A) 23,770 $ 3,040,896
STAAR Surgical Company (A) 28,742 3,029,694
45,767,876Health care providers and services – 2.7%Acadia Healthcare Company, Inc. (A) 54,959 3,140,357
Mid Cap Index Trust (continued)Shares orPrincipalAmount Value
COMMON STOCKS (continued)Construction and engineering (continued)Fluor Corp. (A) 77,325 $ 1,785,434MasTec, Inc. (A) 34,811 3,261,791
Valmont Industries, Inc. 13,095 3,112,289
19,552,789Electrical equipment – 1.7%
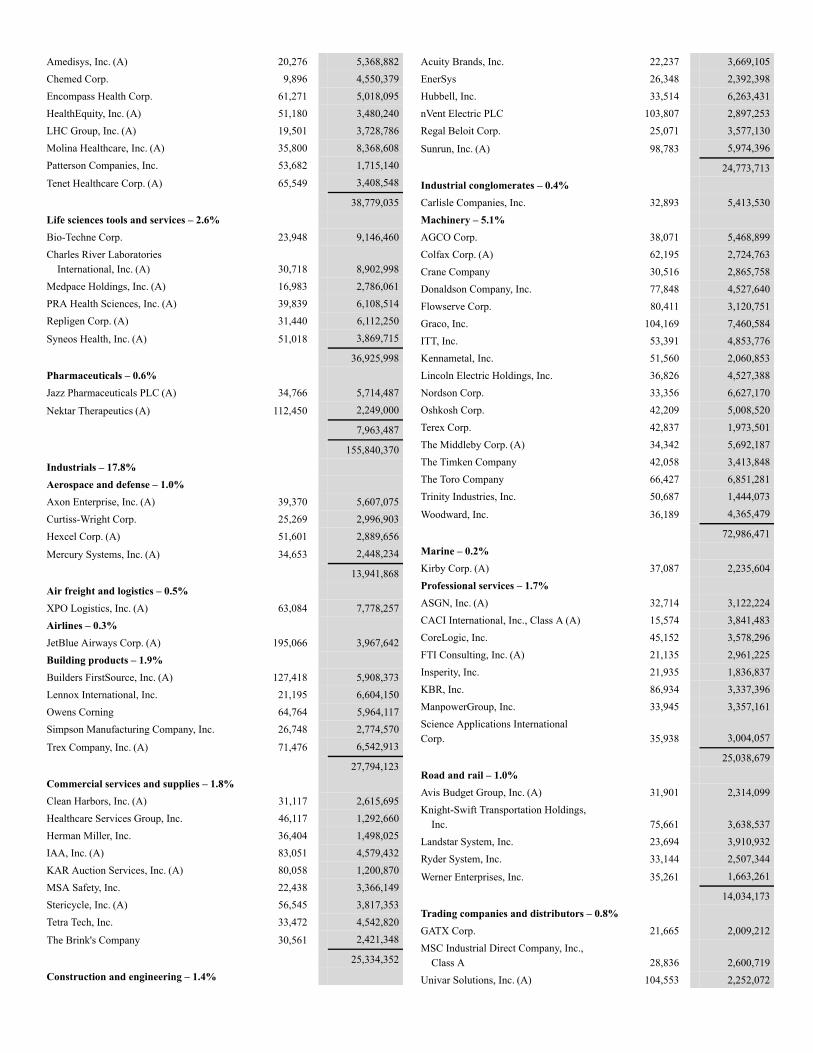
Amedisys, Inc. (A) 20,276 5,368,882Chemed Corp. 9,896 4,550,379Encompass Health Corp. 61,271 5,018,095HealthEquity, Inc. (A) 51,180 3,480,240LHC Group, Inc. (A) 19,501 3,728,786Molina Healthcare, Inc. (A) 35,800 8,368,608Patterson Companies, Inc. 53,682 1,715,140
Tenet Healthcare Corp. (A) 65,549 3,408,548
38,779,035Life sciences tools and services – 2.6%Bio-Techne Corp. 23,948 9,146,460Charles River Laboratories
International, Inc. (A) 30,718 8,902,998Medpace Holdings, Inc. (A) 16,983 2,786,061PRA Health Sciences, Inc. (A) 39,839 6,108,514Repligen Corp. (A) 31,440 6,112,250
Syneos Health, Inc. (A) 51,018 3,869,715
36,925,998Pharmaceuticals – 0.6%Jazz Pharmaceuticals PLC (A) 34,766 5,714,487
Nektar Therapeutics (A) 112,450 2,249,000
7,963,487
155,840,370Industrials – 17.8%Aerospace and defense – 1.0%Axon Enterprise, Inc. (A) 39,370 5,607,075Curtiss-Wright Corp. 25,269 2,996,903Hexcel Corp. (A) 51,601 2,889,656
Mercury Systems, Inc. (A) 34,653 2,448,234
13,941,868Air freight and logistics – 0.5%XPO Logistics, Inc. (A) 63,084 7,778,257Airlines – 0.3%JetBlue Airways Corp. (A) 195,066 3,967,642Building products – 1.9%Builders FirstSource, Inc. (A) 127,418 5,908,373Lennox International, Inc. 21,195 6,604,150Owens Corning 64,764 5,964,117Simpson Manufacturing Company, Inc. 26,748 2,774,570
Trex Company, Inc. (A) 71,476 6,542,913
27,794,123Commercial services and supplies – 1.8%Clean Harbors, Inc. (A) 31,117 2,615,695Healthcare Services Group, Inc. 46,117 1,292,660Herman Miller, Inc. 36,404 1,498,025IAA, Inc. (A) 83,051 4,579,432KAR Auction Services, Inc. (A) 80,058 1,200,870MSA Safety, Inc. 22,438 3,366,149Stericycle, Inc. (A) 56,545 3,817,353Tetra Tech, Inc. 33,472 4,542,820
The Brink's Company 30,561 2,421,348
25,334,352Construction and engineering – 1.4%
Acuity Brands, Inc. 22,237 3,669,105EnerSys 26,348 2,392,398Hubbell, Inc. 33,514 6,263,431nVent Electric PLC 103,807 2,897,253Regal Beloit Corp. 25,071 3,577,130
Sunrun, Inc. (A) 98,783 5,974,396
24,773,713Industrial conglomerates – 0.4%Carlisle Companies, Inc. 32,893 5,413,530Machinery – 5.1%AGCO Corp. 38,071 5,468,899Colfax Corp. (A) 62,195 2,724,763Crane Company 30,516 2,865,758Donaldson Company, Inc. 77,848 4,527,640Flowserve Corp. 80,411 3,120,751Graco, Inc. 104,169 7,460,584ITT, Inc. 53,391 4,853,776Kennametal, Inc. 51,560 2,060,853Lincoln Electric Holdings, Inc. 36,826 4,527,388Nordson Corp. 33,356 6,627,170Oshkosh Corp. 42,209 5,008,520Terex Corp. 42,837 1,973,501The Middleby Corp. (A) 34,342 5,692,187The Timken Company 42,058 3,413,848The Toro Company 66,427 6,851,281Trinity Industries, Inc. 50,687 1,444,073
Woodward, Inc. 36,189 4,365,479
72,986,471Marine – 0.2%Kirby Corp. (A) 37,087 2,235,604Professional services – 1.7%ASGN, Inc. (A) 32,714 3,122,224CACI International, Inc., Class A (A) 15,574 3,841,483CoreLogic, Inc. 45,152 3,578,296FTI Consulting, Inc. (A) 21,135 2,961,225Insperity, Inc. 21,935 1,836,837KBR, Inc. 86,934 3,337,396ManpowerGroup, Inc. 33,945 3,357,161Science Applications InternationalCorp. 35,938 3,004,057
25,038,679Road and rail – 1.0%Avis Budget Group, Inc. (A) 31,901 2,314,099Knight-Swift Transportation Holdings,
Inc. 75,661 3,638,537Landstar System, Inc. 23,694 3,910,932Ryder System, Inc. 33,144 2,507,344
Werner Enterprises, Inc. 35,261 1,663,261
14,034,173Trading companies and distributors – 0.8%GATX Corp. 21,665 2,009,212MSC Industrial Direct Company, Inc.,
Class A 28,836 2,600,719Univar Solutions, Inc. (A) 104,553 2,252,072
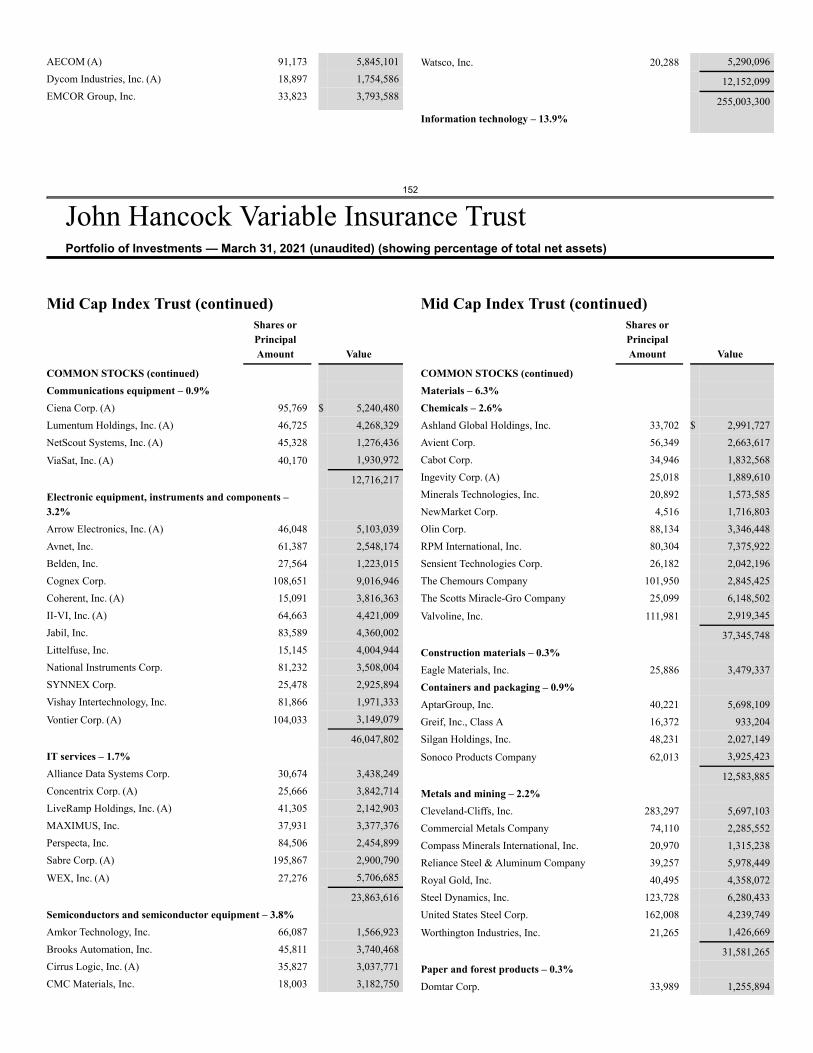
152
John Hancock Variable Insurance TrustPortfolio of Investments — March 31, 2021 (unaudited) (showing percentage of total net assets)
AECOM (A) 91,173 5,845,101Dycom Industries, Inc. (A) 18,897 1,754,586EMCOR Group, Inc. 33,823 3,793,588
Watsco, Inc. 20,288 5,290,096
12,152,099
255,003,300Information technology – 13.9%
Mid Cap Index Trust (continued)Shares orPrincipalAmount Value
COMMON STOCKS (continued)Communications equipment – 0.9%Ciena Corp. (A) 95,769 $ 5,240,480Lumentum Holdings, Inc. (A) 46,725 4,268,329NetScout Systems, Inc. (A) 45,328 1,276,436
ViaSat, Inc. (A) 40,170 1,930,972
12,716,217Electronic equipment, instruments and components –3.2%Arrow Electronics, Inc. (A) 46,048 5,103,039Avnet, Inc. 61,387 2,548,174Belden, Inc. 27,564 1,223,015Cognex Corp. 108,651 9,016,946Coherent, Inc. (A) 15,091 3,816,363II-VI, Inc. (A) 64,663 4,421,009Jabil, Inc. 83,589 4,360,002Littelfuse, Inc. 15,145 4,004,944National Instruments Corp. 81,232 3,508,004SYNNEX Corp. 25,478 2,925,894Vishay Intertechnology, Inc. 81,866 1,971,333
Vontier Corp. (A) 104,033 3,149,079
46,047,802IT services – 1.7%Alliance Data Systems Corp. 30,674 3,438,249Concentrix Corp. (A) 25,666 3,842,714LiveRamp Holdings, Inc. (A) 41,305 2,142,903MAXIMUS, Inc. 37,931 3,377,376Perspecta, Inc. 84,506 2,454,899Sabre Corp. (A) 195,867 2,900,790
WEX, Inc. (A) 27,276 5,706,685
23,863,616Semiconductors and semiconductor equipment – 3.8%Amkor Technology, Inc. 66,087 1,566,923Brooks Automation, Inc. 45,811 3,740,468Cirrus Logic, Inc. (A) 35,827 3,037,771CMC Materials, Inc. 18,003 3,182,750
Mid Cap Index Trust (continued)Shares orPrincipalAmount Value
COMMON STOCKS (continued)Materials – 6.3%Chemicals – 2.6%Ashland Global Holdings, Inc. 33,702 $ 2,991,727Avient Corp. 56,349 2,663,617Cabot Corp. 34,946 1,832,568Ingevity Corp. (A) 25,018 1,889,610Minerals Technologies, Inc. 20,892 1,573,585NewMarket Corp. 4,516 1,716,803Olin Corp. 88,134 3,346,448RPM International, Inc. 80,304 7,375,922Sensient Technologies Corp. 26,182 2,042,196The Chemours Company 101,950 2,845,425The Scotts Miracle-Gro Company 25,099 6,148,502
Valvoline, Inc. 111,981 2,919,345
37,345,748Construction materials – 0.3%Eagle Materials, Inc. 25,886 3,479,337Containers and packaging – 0.9%AptarGroup, Inc. 40,221 5,698,109Greif, Inc., Class A 16,372 933,204Silgan Holdings, Inc. 48,231 2,027,149
Sonoco Products Company 62,013 3,925,423
12,583,885Metals and mining – 2.2%Cleveland-Cliffs, Inc. 283,297 5,697,103Commercial Metals Company 74,110 2,285,552Compass Minerals International, Inc. 20,970 1,315,238Reliance Steel & Aluminum Company 39,257 5,978,449Royal Gold, Inc. 40,495 4,358,072Steel Dynamics, Inc. 123,728 6,280,433United States Steel Corp. 162,008 4,239,749
Worthington Industries, Inc. 21,265 1,426,669
31,581,265Paper and forest products – 0.3%Domtar Corp. 33,989 1,255,894
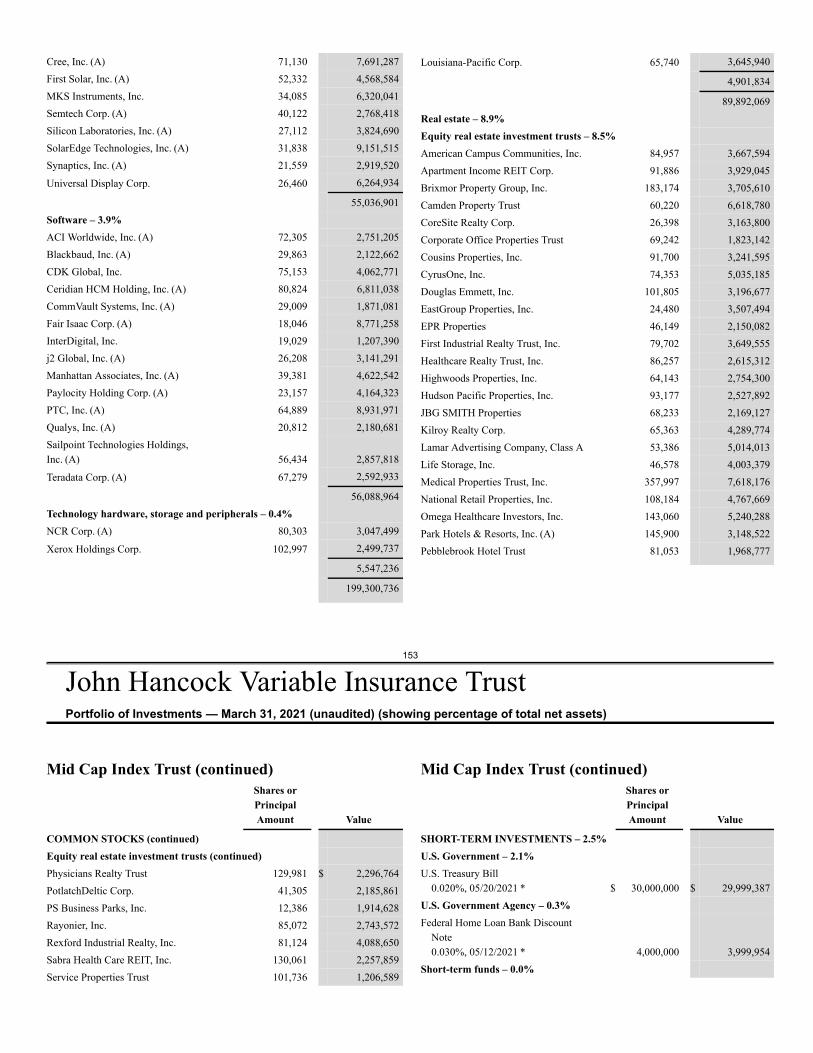
153
John Hancock Variable Insurance TrustPortfolio of Investments — March 31, 2021 (unaudited) (showing percentage of total net assets)
Cree, Inc. (A) 71,130 7,691,287First Solar, Inc. (A) 52,332 4,568,584MKS Instruments, Inc. 34,085 6,320,041Semtech Corp. (A) 40,122 2,768,418Silicon Laboratories, Inc. (A) 27,112 3,824,690SolarEdge Technologies, Inc. (A) 31,838 9,151,515Synaptics, Inc. (A) 21,559 2,919,520
Universal Display Corp. 26,460 6,264,934
55,036,901Software – 3.9%ACI Worldwide, Inc. (A) 72,305 2,751,205Blackbaud, Inc. (A) 29,863 2,122,662CDK Global, Inc. 75,153 4,062,771Ceridian HCM Holding, Inc. (A) 80,824 6,811,038CommVault Systems, Inc. (A) 29,009 1,871,081Fair Isaac Corp. (A) 18,046 8,771,258InterDigital, Inc. 19,029 1,207,390j2 Global, Inc. (A) 26,208 3,141,291Manhattan Associates, Inc. (A) 39,381 4,622,542Paylocity Holding Corp. (A) 23,157 4,164,323PTC, Inc. (A) 64,889 8,931,971Qualys, Inc. (A) 20,812 2,180,681Sailpoint Technologies Holdings,Inc. (A) 56,434 2,857,818
Teradata Corp. (A) 67,279 2,592,933
56,088,964Technology hardware, storage and peripherals – 0.4%NCR Corp. (A) 80,303 3,047,499
Xerox Holdings Corp. 102,997 2,499,737
5,547,236
199,300,736
Louisiana-Pacific Corp. 65,740 3,645,940
4,901,834
89,892,069Real estate – 8.9%Equity real estate investment trusts – 8.5%American Campus Communities, Inc. 84,957 3,667,594Apartment Income REIT Corp. 91,886 3,929,045Brixmor Property Group, Inc. 183,174 3,705,610Camden Property Trust 60,220 6,618,780CoreSite Realty Corp. 26,398 3,163,800Corporate Office Properties Trust 69,242 1,823,142Cousins Properties, Inc. 91,700 3,241,595CyrusOne, Inc. 74,353 5,035,185Douglas Emmett, Inc. 101,805 3,196,677EastGroup Properties, Inc. 24,480 3,507,494EPR Properties 46,149 2,150,082First Industrial Realty Trust, Inc. 79,702 3,649,555Healthcare Realty Trust, Inc. 86,257 2,615,312Highwoods Properties, Inc. 64,143 2,754,300Hudson Pacific Properties, Inc. 93,177 2,527,892JBG SMITH Properties 68,233 2,169,127Kilroy Realty Corp. 65,363 4,289,774Lamar Advertising Company, Class A 53,386 5,014,013Life Storage, Inc. 46,578 4,003,379Medical Properties Trust, Inc. 357,997 7,618,176National Retail Properties, Inc. 108,184 4,767,669Omega Healthcare Investors, Inc. 143,060 5,240,288Park Hotels & Resorts, Inc. (A) 145,900 3,148,522Pebblebrook Hotel Trust 81,053 1,968,777
Mid Cap Index Trust (continued)Shares orPrincipalAmount Value
COMMON STOCKS (continued)Equity real estate investment trusts (continued)Physicians Realty Trust 129,981 $ 2,296,764PotlatchDeltic Corp. 41,305 2,185,861PS Business Parks, Inc. 12,386 1,914,628Rayonier, Inc. 85,072 2,743,572Rexford Industrial Realty, Inc. 81,124 4,088,650Sabra Health Care REIT, Inc. 130,061 2,257,859Service Properties Trust 101,736 1,206,589
Mid Cap Index Trust (continued)Shares orPrincipalAmount Value
SHORT-TERM INVESTMENTS – 2.5%U.S. Government – 2.1%U.S. Treasury Bill
0.020%, 05/20/2021 * $ 30,000,000 $ 29,999,387U.S. Government Agency – 0.3%Federal Home Loan Bank Discount
Note0.030%, 05/12/2021 * 4,000,000 3,999,954
Short-term funds – 0.0%
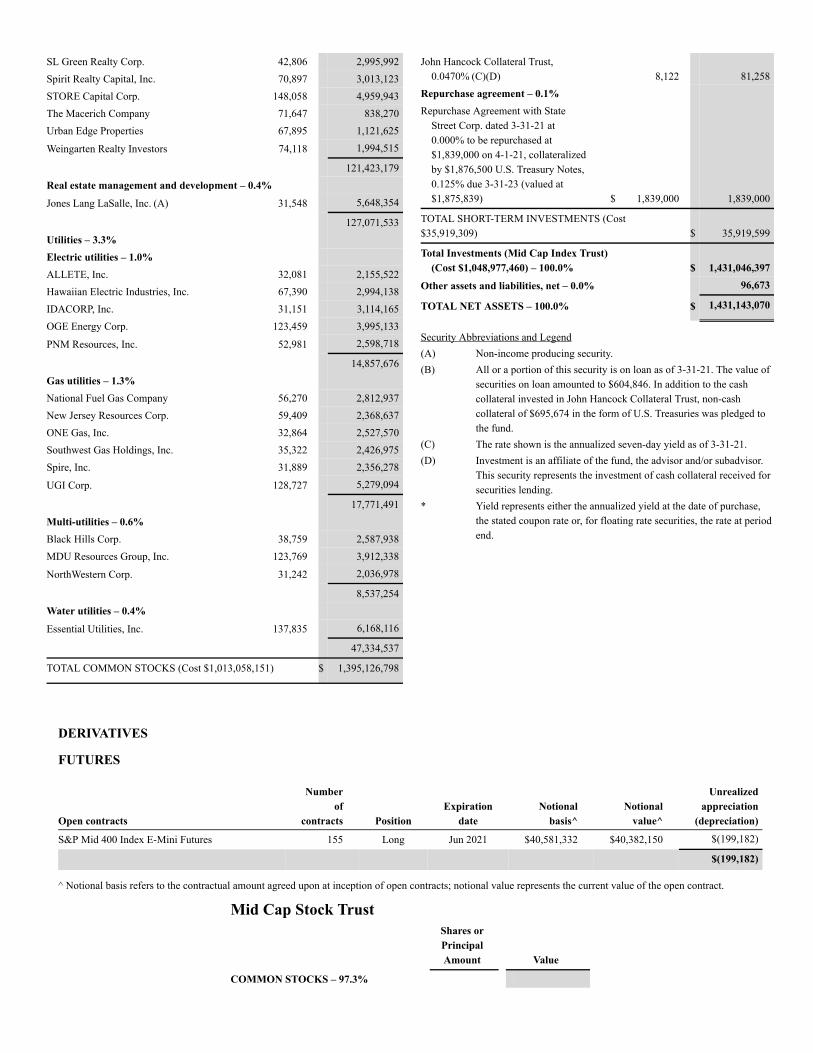
DERIVATIVES
FUTURES
Open contracts
Numberof
contracts PositionExpiration
dateNotional
basis^Notional
value^
Unrealizedappreciation
(depreciation)
S&P Mid 400 Index E-Mini Futures 155 Long Jun 2021 $40,581,332 $40,382,150 $(199,182)
$(199,182)
^ Notional basis refers to the contractual amount agreed upon at inception of open contracts; notional value represents the current value of the open contract.
Mid Cap Stock TrustShares orPrincipalAmount Value
COMMON STOCKS – 97.3%
SL Green Realty Corp. 42,806 2,995,992Spirit Realty Capital, Inc. 70,897 3,013,123STORE Capital Corp. 148,058 4,959,943The Macerich Company 71,647 838,270Urban Edge Properties 67,895 1,121,625
Weingarten Realty Investors 74,118 1,994,515
121,423,179Real estate management and development – 0.4%Jones Lang LaSalle, Inc. (A) 31,548 5,648,354
127,071,533Utilities – 3.3%Electric utilities – 1.0%ALLETE, Inc. 32,081 2,155,522Hawaiian Electric Industries, Inc. 67,390 2,994,138IDACORP, Inc. 31,151 3,114,165OGE Energy Corp. 123,459 3,995,133
PNM Resources, Inc. 52,981 2,598,718
14,857,676Gas utilities – 1.3%National Fuel Gas Company 56,270 2,812,937New Jersey Resources Corp. 59,409 2,368,637ONE Gas, Inc. 32,864 2,527,570Southwest Gas Holdings, Inc. 35,322 2,426,975Spire, Inc. 31,889 2,356,278
UGI Corp. 128,727 5,279,094
17,771,491Multi-utilities – 0.6%Black Hills Corp. 38,759 2,587,938MDU Resources Group, Inc. 123,769 3,912,338
NorthWestern Corp. 31,242 2,036,978
8,537,254Water utilities – 0.4%Essential Utilities, Inc. 137,835 6,168,116
47,334,537
TOTAL COMMON STOCKS (Cost $1,013,058,151) $ 1,395,126,798
John Hancock Collateral Trust,0.0470% (C)(D) 8,122 81,258
Repurchase agreement – 0.1%Repurchase Agreement with State
Street Corp. dated 3-31-21 at0.000% to be repurchased at$1,839,000 on 4-1-21, collateralizedby $1,876,500 U.S. Treasury Notes,0.125% due 3-31-23 (valued at$1,875,839) $ 1,839,000 1,839,000
TOTAL SHORT-TERM INVESTMENTS (Cost$35,919,309) $ 35,919,599
Total Investments (Mid Cap Index Trust)(Cost $1,048,977,460) – 100.0% $ 1,431,046,397
Other assets and liabilities, net – 0.0% 96,673
TOTAL NET ASSETS – 100.0% $ 1,431,143,070
Security Abbreviations and Legend(A) Non-income producing security.(B) All or a portion of this security is on loan as of 3-31-21. The value of
securities on loan amounted to $604,846. In addition to the cashcollateral invested in John Hancock Collateral Trust, non-cashcollateral of $695,674 in the form of U.S. Treasuries was pledged tothe fund.
(C) The rate shown is the annualized seven-day yield as of 3-31-21.(D) Investment is an affiliate of the fund, the advisor and/or subadvisor.
This security represents the investment of cash collateral received forsecurities lending.
* Yield represents either the annualized yield at the date of purchase,the stated coupon rate or, for floating rate securities, the rate at periodend.
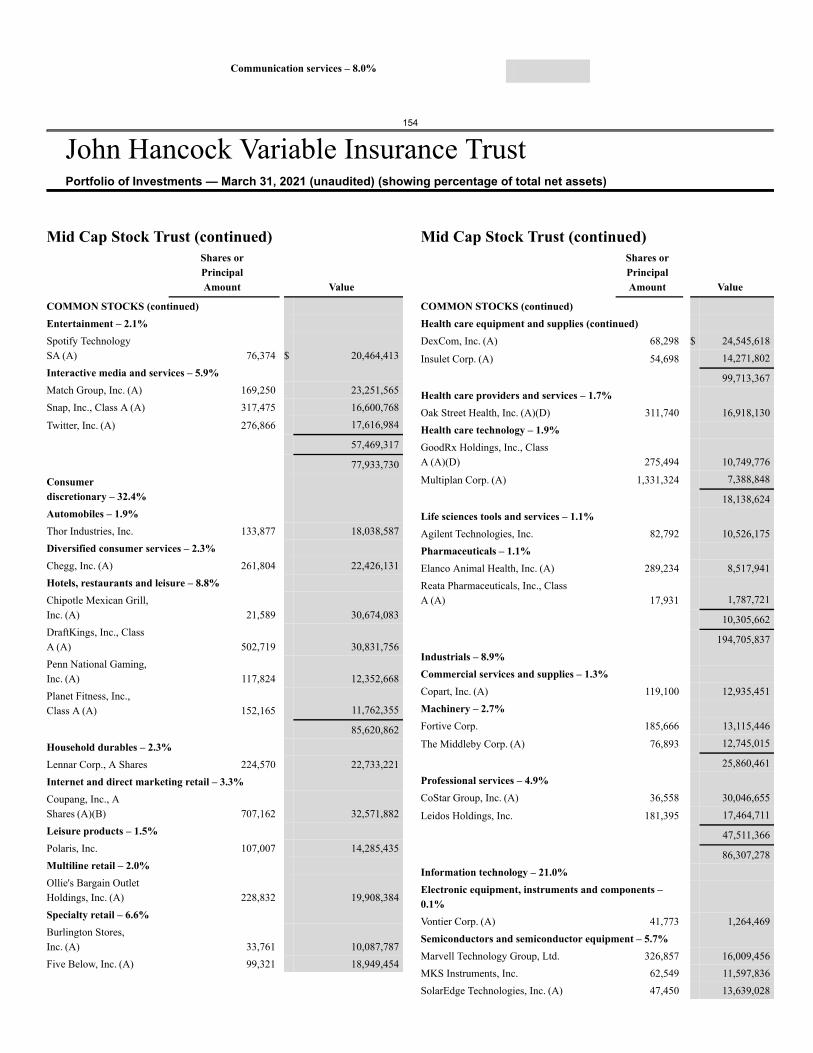
Communication services – 8.0%
154
John Hancock Variable Insurance TrustPortfolio of Investments — March 31, 2021 (unaudited) (showing percentage of total net assets)
Mid Cap Stock Trust (continued)Shares orPrincipalAmount Value
COMMON STOCKS (continued)Entertainment – 2.1%Spotify TechnologySA (A) 76,374 $ 20,464,413Interactive media and services – 5.9%Match Group, Inc. (A) 169,250 23,251,565Snap, Inc., Class A (A) 317,475 16,600,768
Twitter, Inc. (A) 276,866 17,616,984
57,469,317
77,933,730Consumerdiscretionary – 32.4%Automobiles – 1.9%Thor Industries, Inc. 133,877 18,038,587Diversified consumer services – 2.3%Chegg, Inc. (A) 261,804 22,426,131Hotels, restaurants and leisure – 8.8%Chipotle Mexican Grill,Inc. (A) 21,589 30,674,083DraftKings, Inc., ClassA (A) 502,719 30,831,756Penn National Gaming,Inc. (A) 117,824 12,352,668Planet Fitness, Inc.,Class A (A) 152,165 11,762,355
85,620,862Household durables – 2.3%Lennar Corp., A Shares 224,570 22,733,221Internet and direct marketing retail – 3.3%Coupang, Inc., AShares (A)(B) 707,162 32,571,882Leisure products – 1.5%Polaris, Inc. 107,007 14,285,435Multiline retail – 2.0%Ollie's Bargain OutletHoldings, Inc. (A) 228,832 19,908,384Specialty retail – 6.6%Burlington Stores,Inc. (A) 33,761 10,087,787Five Below, Inc. (A) 99,321 18,949,454
Mid Cap Stock Trust (continued)Shares orPrincipalAmount Value
COMMON STOCKS (continued)Health care equipment and supplies (continued)DexCom, Inc. (A) 68,298 $ 24,545,618
Insulet Corp. (A) 54,698 14,271,802
99,713,367Health care providers and services – 1.7%Oak Street Health, Inc. (A)(D) 311,740 16,918,130Health care technology – 1.9%GoodRx Holdings, Inc., ClassA (A)(D) 275,494 10,749,776
Multiplan Corp. (A) 1,331,324 7,388,848
18,138,624Life sciences tools and services – 1.1%Agilent Technologies, Inc. 82,792 10,526,175Pharmaceuticals – 1.1%Elanco Animal Health, Inc. (A) 289,234 8,517,941Reata Pharmaceuticals, Inc., ClassA (A) 17,931 1,787,721
10,305,662
194,705,837Industrials – 8.9%Commercial services and supplies – 1.3%Copart, Inc. (A) 119,100 12,935,451Machinery – 2.7%Fortive Corp. 185,666 13,115,446
The Middleby Corp. (A) 76,893 12,745,015
25,860,461Professional services – 4.9%CoStar Group, Inc. (A) 36,558 30,046,655
Leidos Holdings, Inc. 181,395 17,464,711
47,511,366
86,307,278Information technology – 21.0%Electronic equipment, instruments and components –0.1%Vontier Corp. (A) 41,773 1,264,469Semiconductors and semiconductor equipment – 5.7%Marvell Technology Group, Ltd. 326,857 16,009,456MKS Instruments, Inc. 62,549 11,597,836SolarEdge Technologies, Inc. (A) 47,450 13,639,028
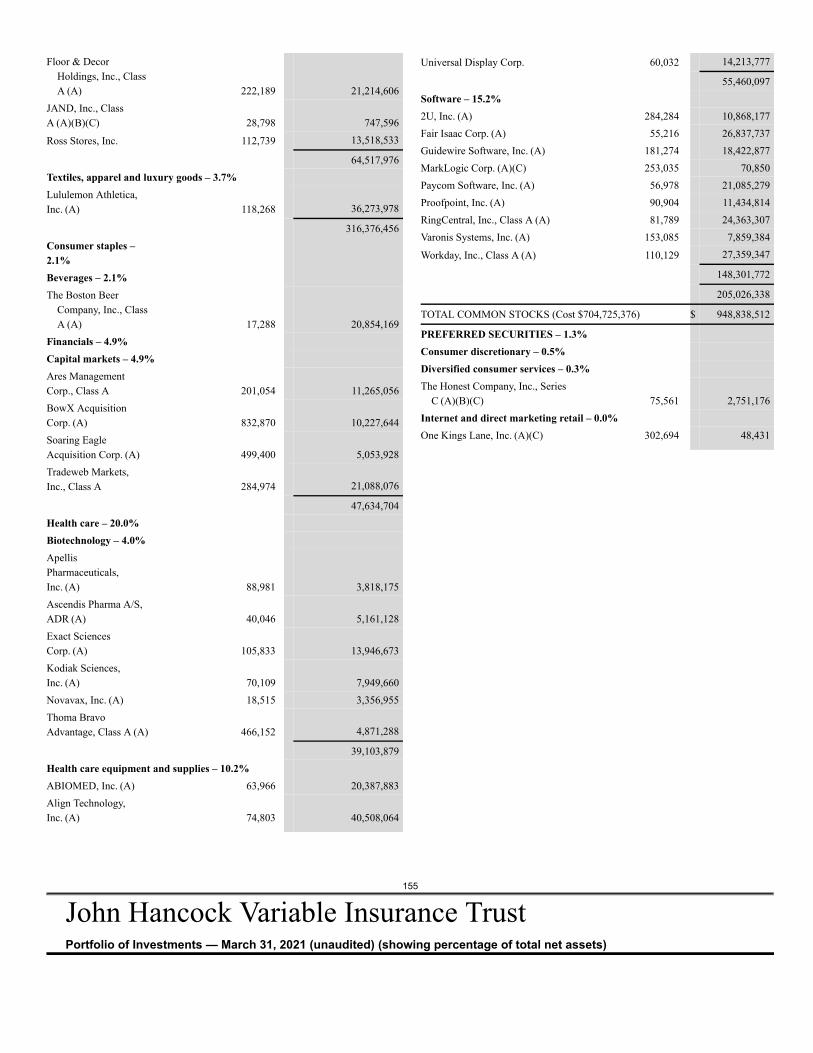
155
John Hancock Variable Insurance TrustPortfolio of Investments — March 31, 2021 (unaudited) (showing percentage of total net assets)
Floor & DecorHoldings, Inc., ClassA (A) 222,189 21,214,606
JAND, Inc., ClassA (A)(B)(C) 28,798 747,596
Ross Stores, Inc. 112,739 13,518,533
64,517,976Textiles, apparel and luxury goods – 3.7%Lululemon Athletica,Inc. (A) 118,268 36,273,978
316,376,456Consumer staples –2.1%Beverages – 2.1%The Boston Beer
Company, Inc., ClassA (A) 17,288 20,854,169
Financials – 4.9%Capital markets – 4.9%Ares ManagementCorp., Class A 201,054 11,265,056BowX AcquisitionCorp. (A) 832,870 10,227,644Soaring EagleAcquisition Corp. (A) 499,400 5,053,928Tradeweb Markets,Inc., Class A 284,974 21,088,076
47,634,704Health care – 20.0%Biotechnology – 4.0%ApellisPharmaceuticals,Inc. (A) 88,981 3,818,175Ascendis Pharma A/S,ADR (A) 40,046 5,161,128Exact SciencesCorp. (A) 105,833 13,946,673Kodiak Sciences,Inc. (A) 70,109 7,949,660Novavax, Inc. (A) 18,515 3,356,955Thoma BravoAdvantage, Class A (A) 466,152 4,871,288
39,103,879Health care equipment and supplies – 10.2%ABIOMED, Inc. (A) 63,966 20,387,883Align Technology,Inc. (A) 74,803 40,508,064
Universal Display Corp. 60,032 14,213,777
55,460,097Software – 15.2%2U, Inc. (A) 284,284 10,868,177Fair Isaac Corp. (A) 55,216 26,837,737Guidewire Software, Inc. (A) 181,274 18,422,877MarkLogic Corp. (A)(C) 253,035 70,850Paycom Software, Inc. (A) 56,978 21,085,279Proofpoint, Inc. (A) 90,904 11,434,814RingCentral, Inc., Class A (A) 81,789 24,363,307Varonis Systems, Inc. (A) 153,085 7,859,384
Workday, Inc., Class A (A) 110,129 27,359,347
148,301,772
205,026,338
TOTAL COMMON STOCKS (Cost $704,725,376) $ 948,838,512
PREFERRED SECURITIES – 1.3%Consumer discretionary – 0.5%Diversified consumer services – 0.3%The Honest Company, Inc., Series
C (A)(B)(C) 75,561 2,751,176Internet and direct marketing retail – 0.0%One Kings Lane, Inc. (A)(C) 302,694 48,431
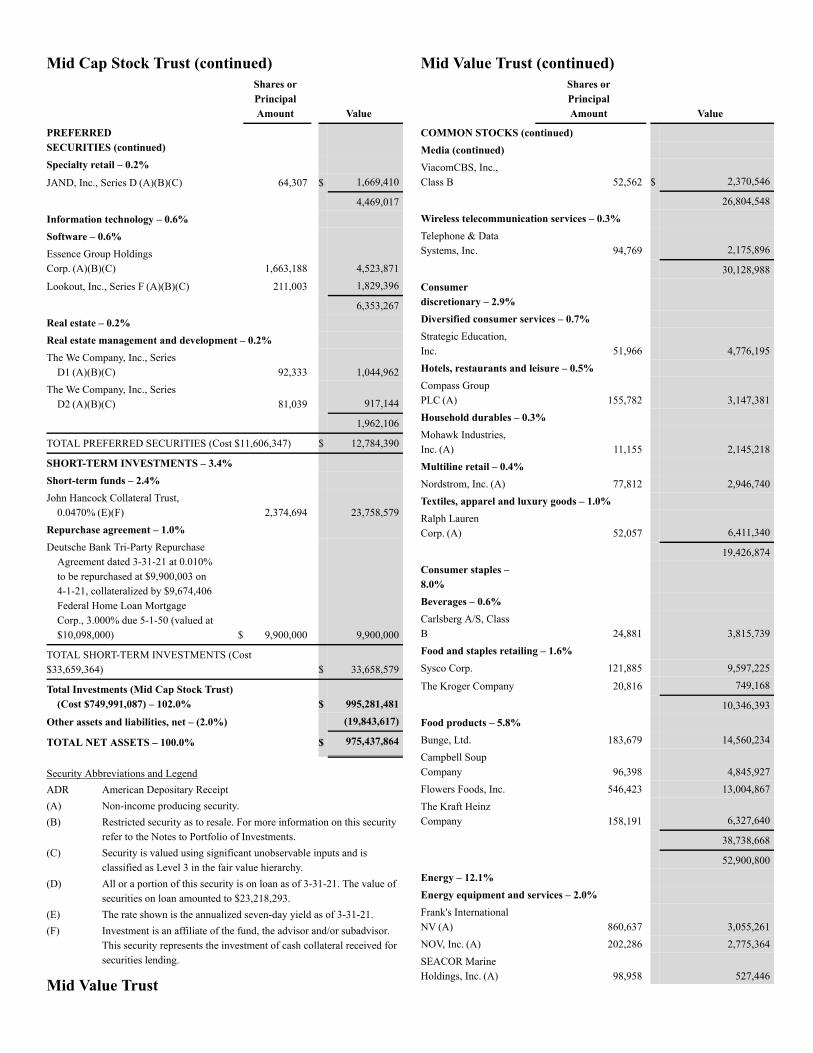
Mid Cap Stock Trust (continued)Shares orPrincipalAmount Value
PREFERREDSECURITIES (continued)Specialty retail – 0.2%JAND, Inc., Series D (A)(B)(C) 64,307 $ 1,669,410
4,469,017Information technology – 0.6%Software – 0.6%Essence Group HoldingsCorp. (A)(B)(C) 1,663,188 4,523,871
Lookout, Inc., Series F (A)(B)(C) 211,003 1,829,396
6,353,267Real estate – 0.2%Real estate management and development – 0.2%The We Company, Inc., Series
D1 (A)(B)(C) 92,333 1,044,962The We Company, Inc., Series
D2 (A)(B)(C) 81,039 917,144
1,962,106
TOTAL PREFERRED SECURITIES (Cost $11,606,347) $ 12,784,390
SHORT-TERM INVESTMENTS – 3.4%Short-term funds – 2.4%John Hancock Collateral Trust,
0.0470% (E)(F) 2,374,694 23,758,579Repurchase agreement – 1.0%Deutsche Bank Tri-Party Repurchase
Agreement dated 3-31-21 at 0.010%to be repurchased at $9,900,003 on4-1-21, collateralized by $9,674,406Federal Home Loan MortgageCorp., 3.000% due 5-1-50 (valued at$10,098,000) $ 9,900,000 9,900,000
TOTAL SHORT-TERM INVESTMENTS (Cost$33,659,364) $ 33,658,579
Total Investments (Mid Cap Stock Trust)(Cost $749,991,087) – 102.0% $ 995,281,481
Other assets and liabilities, net – (2.0%) (19,843,617)
TOTAL NET ASSETS – 100.0% $ 975,437,864
Security Abbreviations and LegendADR American Depositary Receipt(A) Non-income producing security.(B) Restricted security as to resale. For more information on this security
refer to the Notes to Portfolio of Investments.(C) Security is valued using significant unobservable inputs and is
classified as Level 3 in the fair value hierarchy.(D) All or a portion of this security is on loan as of 3-31-21. The value of
securities on loan amounted to $23,218,293.(E) The rate shown is the annualized seven-day yield as of 3-31-21.(F) Investment is an affiliate of the fund, the advisor and/or subadvisor.
This security represents the investment of cash collateral received forsecurities lending.
Mid Value Trust
Mid Value Trust (continued)Shares orPrincipalAmount Value
COMMON STOCKS (continued)Media (continued)ViacomCBS, Inc.,Class B 52,562 $ 2,370,546
26,804,548Wireless telecommunication services – 0.3%Telephone & DataSystems, Inc. 94,769 2,175,896
30,128,988Consumerdiscretionary – 2.9%Diversified consumer services – 0.7%Strategic Education,Inc. 51,966 4,776,195Hotels, restaurants and leisure – 0.5%Compass GroupPLC (A) 155,782 3,147,381Household durables – 0.3%Mohawk Industries,Inc. (A) 11,155 2,145,218Multiline retail – 0.4%Nordstrom, Inc. (A) 77,812 2,946,740Textiles, apparel and luxury goods – 1.0%Ralph LaurenCorp. (A) 52,057 6,411,340
19,426,874Consumer staples –8.0%Beverages – 0.6%Carlsberg A/S, ClassB 24,881 3,815,739Food and staples retailing – 1.6%Sysco Corp. 121,885 9,597,225
The Kroger Company 20,816 749,168
10,346,393Food products – 5.8%Bunge, Ltd. 183,679 14,560,234Campbell SoupCompany 96,398 4,845,927Flowers Foods, Inc. 546,423 13,004,867The Kraft HeinzCompany 158,191 6,327,640
38,738,668
52,900,800Energy – 12.1%Energy equipment and services – 2.0%Frank's InternationalNV (A) 860,637 3,055,261NOV, Inc. (A) 202,286 2,775,364SEACOR MarineHoldings, Inc. (A) 98,958 527,446
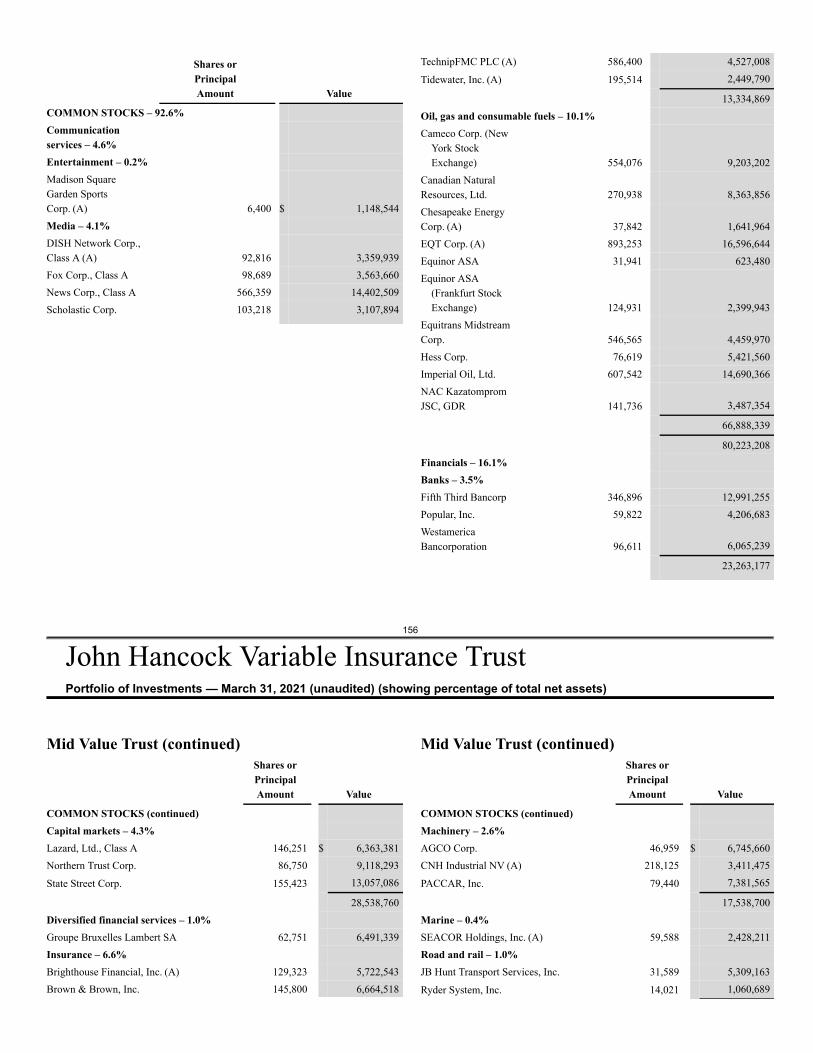
156
John Hancock Variable Insurance TrustPortfolio of Investments — March 31, 2021 (unaudited) (showing percentage of total net assets)
Shares orPrincipalAmount Value
COMMON STOCKS – 92.6%Communicationservices – 4.6%Entertainment – 0.2%Madison SquareGarden SportsCorp. (A) 6,400 $ 1,148,544Media – 4.1%DISH Network Corp.,Class A (A) 92,816 3,359,939Fox Corp., Class A 98,689 3,563,660News Corp., Class A 566,359 14,402,509Scholastic Corp. 103,218 3,107,894
TechnipFMC PLC (A) 586,400 4,527,008
Tidewater, Inc. (A) 195,514 2,449,790
13,334,869Oil, gas and consumable fuels – 10.1%Cameco Corp. (New
York StockExchange) 554,076 9,203,202
Canadian NaturalResources, Ltd. 270,938 8,363,856Chesapeake EnergyCorp. (A) 37,842 1,641,964EQT Corp. (A) 893,253 16,596,644Equinor ASA 31,941 623,480Equinor ASA
(Frankfurt StockExchange) 124,931 2,399,943
Equitrans MidstreamCorp. 546,565 4,459,970Hess Corp. 76,619 5,421,560Imperial Oil, Ltd. 607,542 14,690,366NAC KazatompromJSC, GDR 141,736 3,487,354
66,888,339
80,223,208Financials – 16.1%Banks – 3.5%Fifth Third Bancorp 346,896 12,991,255Popular, Inc. 59,822 4,206,683WestamericaBancorporation 96,611 6,065,239
23,263,177
Mid Value Trust (continued)Shares orPrincipalAmount Value
COMMON STOCKS (continued)Capital markets – 4.3%Lazard, Ltd., Class A 146,251 $ 6,363,381Northern Trust Corp. 86,750 9,118,293
State Street Corp. 155,423 13,057,086
28,538,760Diversified financial services – 1.0%Groupe Bruxelles Lambert SA 62,751 6,491,339Insurance – 6.6%Brighthouse Financial, Inc. (A) 129,323 5,722,543Brown & Brown, Inc. 145,800 6,664,518
Mid Value Trust (continued)Shares orPrincipalAmount Value
COMMON STOCKS (continued)Machinery – 2.6%AGCO Corp. 46,959 $ 6,745,660CNH Industrial NV (A) 218,125 3,411,475
PACCAR, Inc. 79,440 7,381,565
17,538,700Marine – 0.4%SEACOR Holdings, Inc. (A) 59,588 2,428,211Road and rail – 1.0%JB Hunt Transport Services, Inc. 31,589 5,309,163
Ryder System, Inc. 14,021 1,060,689
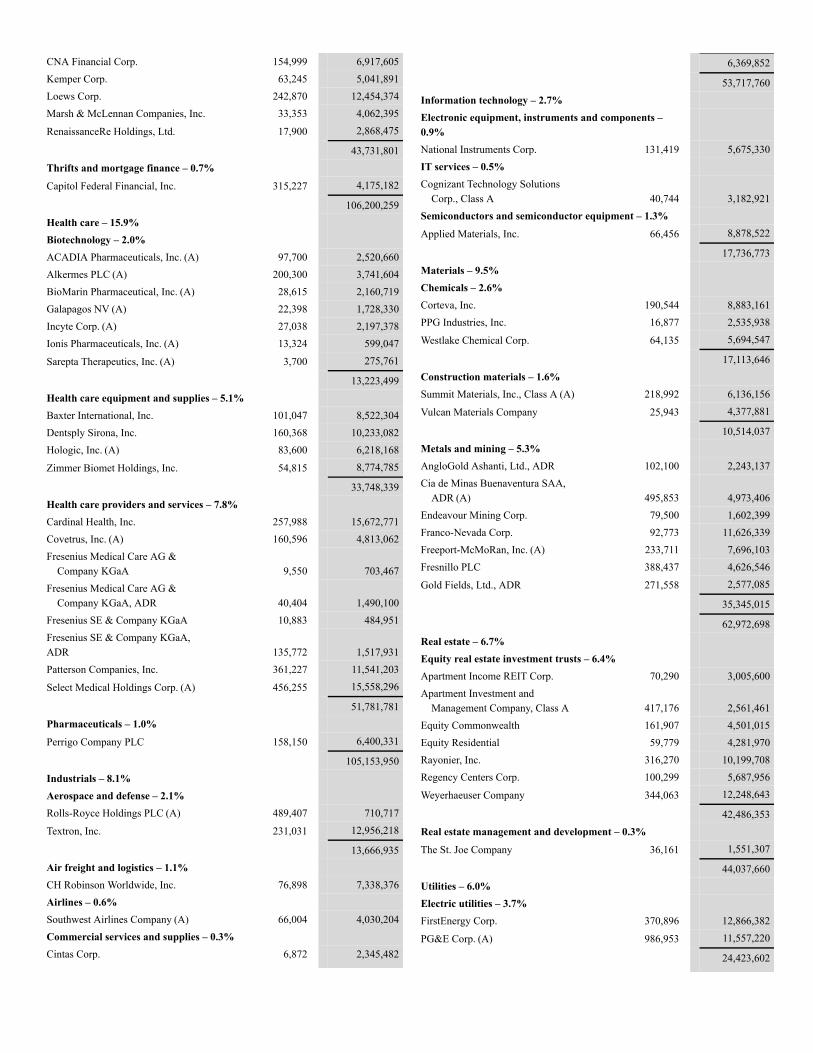
CNA Financial Corp. 154,999 6,917,605Kemper Corp. 63,245 5,041,891Loews Corp. 242,870 12,454,374Marsh & McLennan Companies, Inc. 33,353 4,062,395
RenaissanceRe Holdings, Ltd. 17,900 2,868,475
43,731,801Thrifts and mortgage finance – 0.7%Capitol Federal Financial, Inc. 315,227 4,175,182
106,200,259Health care – 15.9%Biotechnology – 2.0%ACADIA Pharmaceuticals, Inc. (A) 97,700 2,520,660Alkermes PLC (A) 200,300 3,741,604BioMarin Pharmaceutical, Inc. (A) 28,615 2,160,719Galapagos NV (A) 22,398 1,728,330Incyte Corp. (A) 27,038 2,197,378Ionis Pharmaceuticals, Inc. (A) 13,324 599,047
Sarepta Therapeutics, Inc. (A) 3,700 275,761
13,223,499Health care equipment and supplies – 5.1%Baxter International, Inc. 101,047 8,522,304Dentsply Sirona, Inc. 160,368 10,233,082Hologic, Inc. (A) 83,600 6,218,168
Zimmer Biomet Holdings, Inc. 54,815 8,774,785
33,748,339Health care providers and services – 7.8%Cardinal Health, Inc. 257,988 15,672,771Covetrus, Inc. (A) 160,596 4,813,062Fresenius Medical Care AG &
Company KGaA 9,550 703,467Fresenius Medical Care AG &
Company KGaA, ADR 40,404 1,490,100Fresenius SE & Company KGaA 10,883 484,951Fresenius SE & Company KGaA,ADR 135,772 1,517,931Patterson Companies, Inc. 361,227 11,541,203
Select Medical Holdings Corp. (A) 456,255 15,558,296
51,781,781Pharmaceuticals – 1.0%Perrigo Company PLC 158,150 6,400,331
105,153,950Industrials – 8.1%Aerospace and defense – 2.1%Rolls-Royce Holdings PLC (A) 489,407 710,717
Textron, Inc. 231,031 12,956,218
13,666,935Air freight and logistics – 1.1%CH Robinson Worldwide, Inc. 76,898 7,338,376Airlines – 0.6%Southwest Airlines Company (A) 66,004 4,030,204Commercial services and supplies – 0.3%Cintas Corp. 6,872 2,345,482
6,369,852
53,717,760Information technology – 2.7%Electronic equipment, instruments and components –0.9%National Instruments Corp. 131,419 5,675,330IT services – 0.5%Cognizant Technology Solutions
Corp., Class A 40,744 3,182,921Semiconductors and semiconductor equipment – 1.3%Applied Materials, Inc. 66,456 8,878,522
17,736,773Materials – 9.5%Chemicals – 2.6%Corteva, Inc. 190,544 8,883,161PPG Industries, Inc. 16,877 2,535,938
Westlake Chemical Corp. 64,135 5,694,547
17,113,646Construction materials – 1.6%Summit Materials, Inc., Class A (A) 218,992 6,136,156
Vulcan Materials Company 25,943 4,377,881
10,514,037Metals and mining – 5.3%AngloGold Ashanti, Ltd., ADR 102,100 2,243,137Cia de Minas Buenaventura SAA,
ADR (A) 495,853 4,973,406Endeavour Mining Corp. 79,500 1,602,399Franco-Nevada Corp. 92,773 11,626,339Freeport-McMoRan, Inc. (A) 233,711 7,696,103Fresnillo PLC 388,437 4,626,546
Gold Fields, Ltd., ADR 271,558 2,577,085
35,345,015
62,972,698Real estate – 6.7%Equity real estate investment trusts – 6.4%Apartment Income REIT Corp. 70,290 3,005,600Apartment Investment and
Management Company, Class A 417,176 2,561,461Equity Commonwealth 161,907 4,501,015Equity Residential 59,779 4,281,970Rayonier, Inc. 316,270 10,199,708Regency Centers Corp. 100,299 5,687,956
Weyerhaeuser Company 344,063 12,248,643
42,486,353Real estate management and development – 0.3%The St. Joe Company 36,161 1,551,307
44,037,660Utilities – 6.0%Electric utilities – 3.7%FirstEnergy Corp. 370,896 12,866,382
PG&E Corp. (A) 986,953 11,557,220
24,423,602
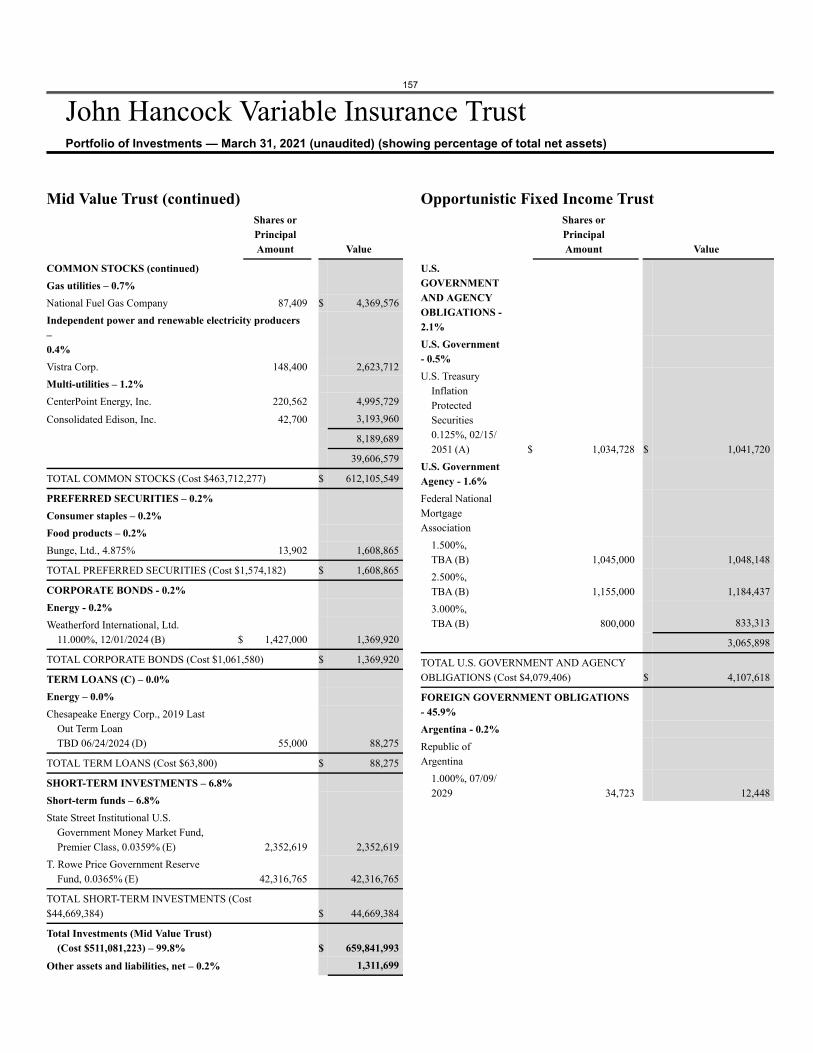
157
John Hancock Variable Insurance TrustPortfolio of Investments — March 31, 2021 (unaudited) (showing percentage of total net assets)
Mid Value Trust (continued)Shares orPrincipalAmount Value
COMMON STOCKS (continued)Gas utilities – 0.7%National Fuel Gas Company 87,409 $ 4,369,576Independent power and renewable electricity producers–0.4%Vistra Corp. 148,400 2,623,712Multi-utilities – 1.2%CenterPoint Energy, Inc. 220,562 4,995,729
Consolidated Edison, Inc. 42,700 3,193,960
8,189,689
39,606,579
TOTAL COMMON STOCKS (Cost $463,712,277) $ 612,105,549
PREFERRED SECURITIES – 0.2%Consumer staples – 0.2%Food products – 0.2%Bunge, Ltd., 4.875% 13,902 1,608,865
TOTAL PREFERRED SECURITIES (Cost $1,574,182) $ 1,608,865
CORPORATE BONDS - 0.2%Energy - 0.2%Weatherford International, Ltd.
11.000%, 12/01/2024 (B) $ 1,427,000 1,369,920
TOTAL CORPORATE BONDS (Cost $1,061,580) $ 1,369,920
TERM LOANS (C) – 0.0%Energy – 0.0%Chesapeake Energy Corp., 2019 Last
Out Term LoanTBD 06/24/2024 (D) 55,000 88,275
TOTAL TERM LOANS (Cost $63,800) $ 88,275
SHORT-TERM INVESTMENTS – 6.8%Short-term funds – 6.8%State Street Institutional U.S.
Government Money Market Fund,Premier Class, 0.0359% (E) 2,352,619 2,352,619
T. Rowe Price Government ReserveFund, 0.0365% (E) 42,316,765 42,316,765
TOTAL SHORT-TERM INVESTMENTS (Cost$44,669,384) $ 44,669,384
Total Investments (Mid Value Trust)(Cost $511,081,223) – 99.8% $ 659,841,993
Other assets and liabilities, net – 0.2% 1,311,699
Opportunistic Fixed Income TrustShares orPrincipalAmount Value
U.S.GOVERNMENTAND AGENCYOBLIGATIONS -2.1%U.S. Government- 0.5%U.S. Treasury
InflationProtectedSecurities0.125%, 02/15/2051 (A) $ 1,034,728 $ 1,041,720
U.S. GovernmentAgency - 1.6%Federal NationalMortgageAssociation
1.500%,TBA (B) 1,045,000 1,048,1482.500%,TBA (B) 1,155,000 1,184,4373.000%,TBA (B) 800,000 833,313
3,065,898
TOTAL U.S. GOVERNMENT AND AGENCYOBLIGATIONS (Cost $4,079,406) $ 4,107,618
FOREIGN GOVERNMENT OBLIGATIONS- 45.9%Argentina - 0.2%Republic ofArgentina
1.000%, 07/09/2029 34,723 12,448
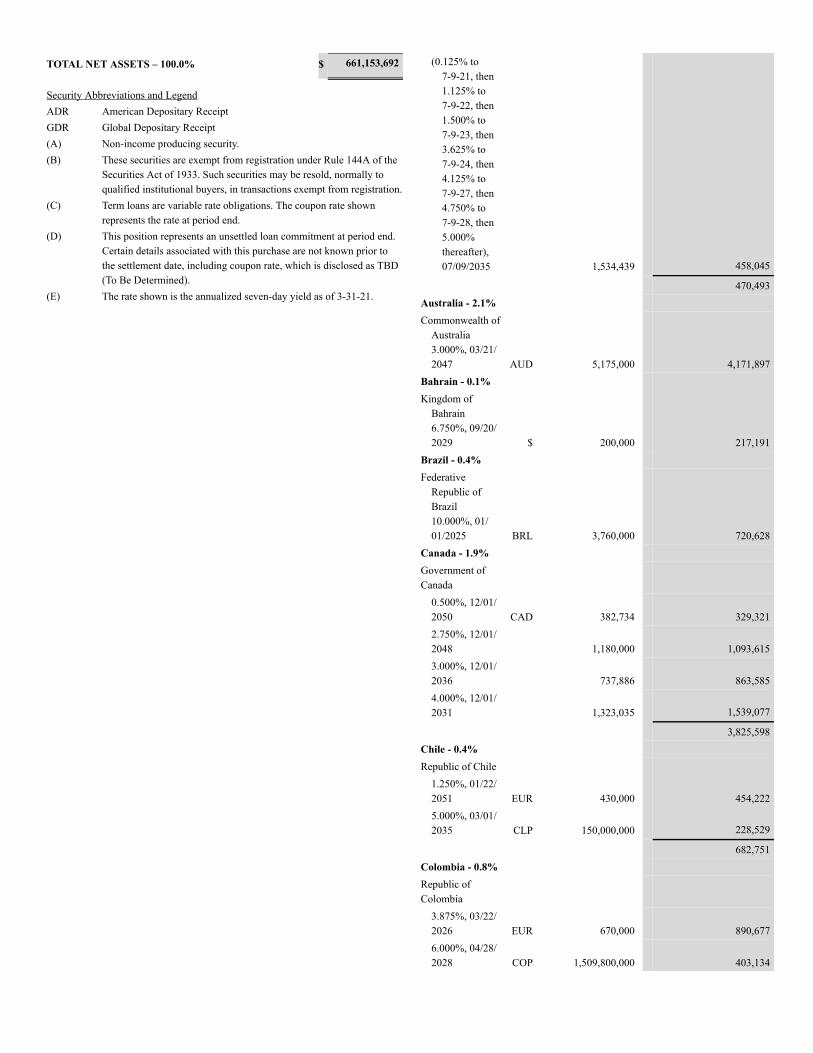
TOTAL NET ASSETS – 100.0% $ 661,153,692
Security Abbreviations and LegendADR American Depositary ReceiptGDR Global Depositary Receipt(A) Non-income producing security.(B) These securities are exempt from registration under Rule 144A of the
Securities Act of 1933. Such securities may be resold, normally toqualified institutional buyers, in transactions exempt from registration.
(C) Term loans are variable rate obligations. The coupon rate shownrepresents the rate at period end.
(D) This position represents an unsettled loan commitment at period end.Certain details associated with this purchase are not known prior tothe settlement date, including coupon rate, which is disclosed as TBD(To Be Determined).
(E) The rate shown is the annualized seven-day yield as of 3-31-21.
(0.125% to7-9-21, then1.125% to7-9-22, then1.500% to7-9-23, then3.625% to7-9-24, then4.125% to7-9-27, then4.750% to7-9-28, then5.000%thereafter),07/09/2035 1,534,439 458,045
470,493Australia - 2.1%Commonwealth of
Australia3.000%, 03/21/2047 AUD 5,175,000 4,171,897
Bahrain - 0.1%Kingdom of
Bahrain6.750%, 09/20/2029 $ 200,000 217,191
Brazil - 0.4%Federative
Republic ofBrazil10.000%, 01/01/2025 BRL 3,760,000 720,628
Canada - 1.9%Government ofCanada
0.500%, 12/01/2050 CAD 382,734 329,3212.750%, 12/01/2048 1,180,000 1,093,6153.000%, 12/01/2036 737,886 863,5854.000%, 12/01/2031 1,323,035 1,539,077
3,825,598Chile - 0.4%Republic of Chile
1.250%, 01/22/2051 EUR 430,000 454,2225.000%, 03/01/2035 CLP 150,000,000 228,529
682,751Colombia - 0.8%Republic ofColombia
3.875%, 03/22/2026 EUR 670,000 890,6776.000%, 04/28/2028 COP 1,509,800,000 403,134
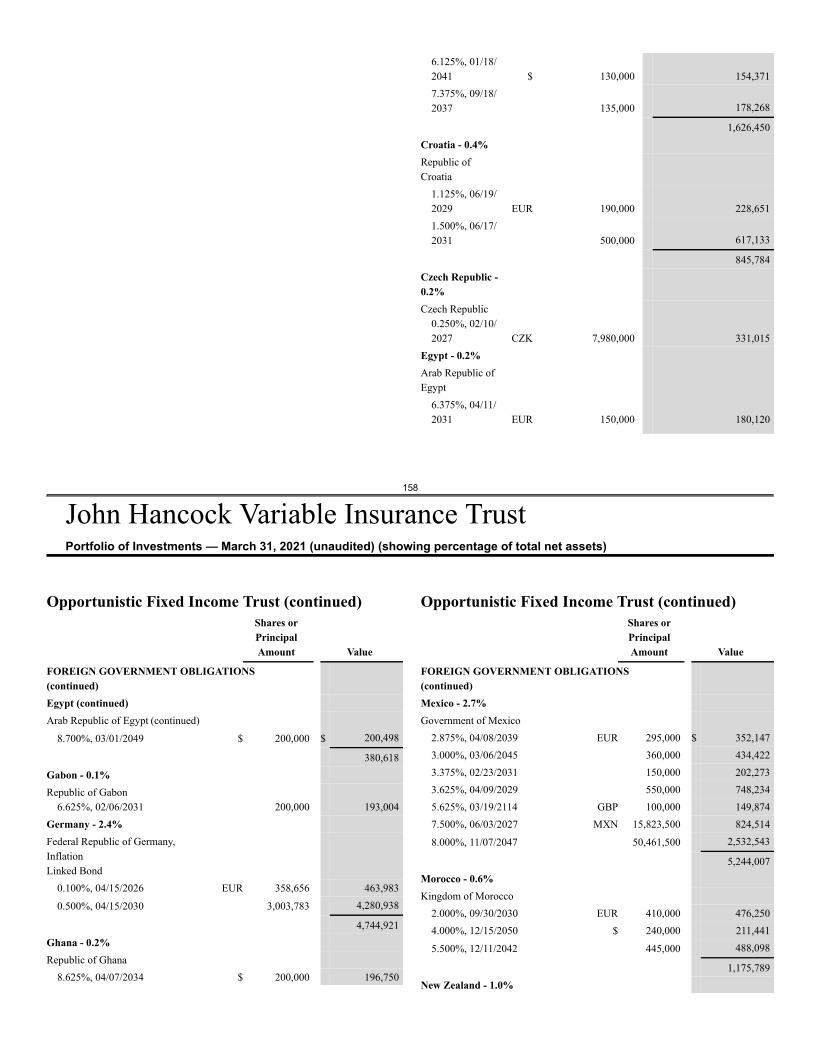
158
John Hancock Variable Insurance TrustPortfolio of Investments — March 31, 2021 (unaudited) (showing percentage of total net assets)
6.125%, 01/18/2041 $ 130,000 154,3717.375%, 09/18/2037 135,000 178,268
1,626,450Croatia - 0.4%Republic ofCroatia
1.125%, 06/19/2029 EUR 190,000 228,6511.500%, 06/17/2031 500,000 617,133
845,784Czech Republic -0.2%Czech Republic
0.250%, 02/10/2027 CZK 7,980,000 331,015
Egypt - 0.2%Arab Republic ofEgypt
6.375%, 04/11/2031 EUR 150,000 180,120
Opportunistic Fixed Income Trust (continued)Shares orPrincipalAmount Value
FOREIGN GOVERNMENT OBLIGATIONS(continued)Egypt (continued)Arab Republic of Egypt (continued)
8.700%, 03/01/2049 $ 200,000 $ 200,498
380,618Gabon - 0.1%Republic of Gabon
6.625%, 02/06/2031 200,000 193,004Germany - 2.4%Federal Republic of Germany,InflationLinked Bond
0.100%, 04/15/2026 EUR 358,656 463,983
0.500%, 04/15/2030 3,003,783 4,280,938
4,744,921Ghana - 0.2%Republic of Ghana
8.625%, 04/07/2034 $ 200,000 196,750
Opportunistic Fixed Income Trust (continued)Shares orPrincipalAmount Value
FOREIGN GOVERNMENT OBLIGATIONS(continued)Mexico - 2.7%Government of Mexico
2.875%, 04/08/2039 EUR 295,000 $ 352,1473.000%, 03/06/2045 360,000 434,4223.375%, 02/23/2031 150,000 202,2733.625%, 04/09/2029 550,000 748,2345.625%, 03/19/2114 GBP 100,000 149,8747.500%, 06/03/2027 MXN 15,823,500 824,514
8.000%, 11/07/2047 50,461,500 2,532,543
5,244,007Morocco - 0.6%Kingdom of Morocco
2.000%, 09/30/2030 EUR 410,000 476,2504.000%, 12/15/2050 $ 240,000 211,441
5.500%, 12/11/2042 445,000 488,098
1,175,789New Zealand - 1.0%
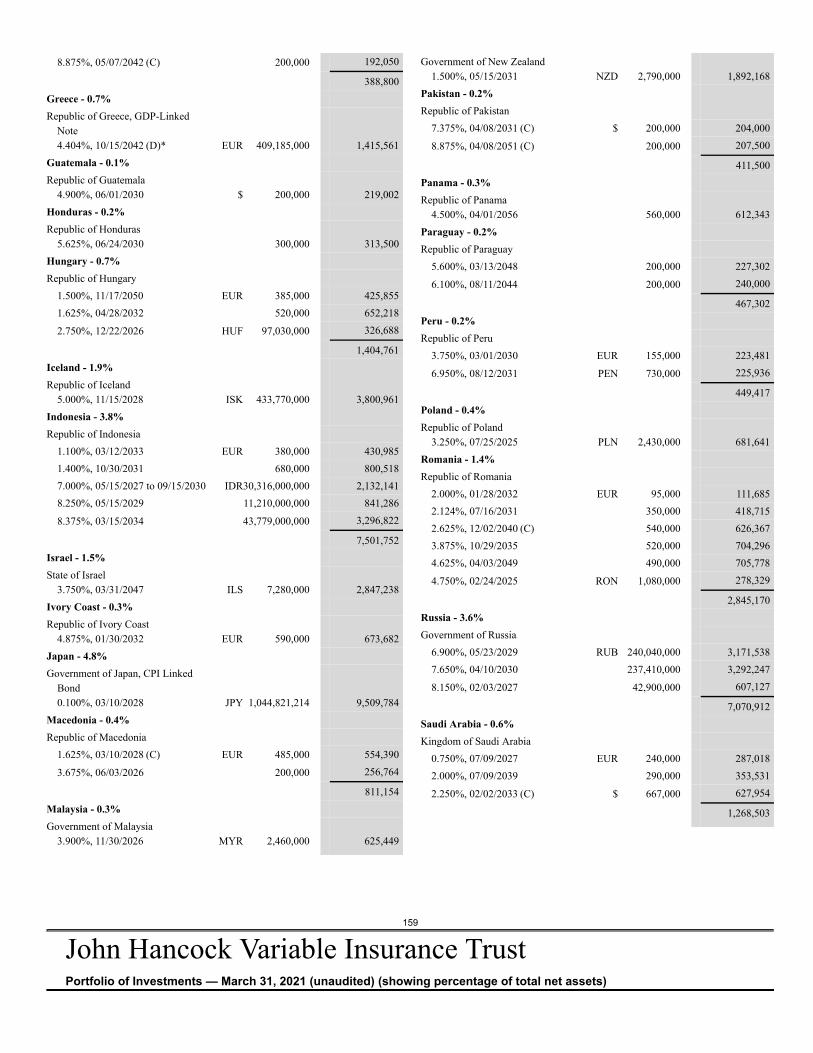
159
John Hancock Variable Insurance TrustPortfolio of Investments — March 31, 2021 (unaudited) (showing percentage of total net assets)
8.875%, 05/07/2042 (C) 200,000 192,050
388,800Greece - 0.7%Republic of Greece, GDP-Linked
Note4.404%, 10/15/2042 (D)* EUR 409,185,000 1,415,561
Guatemala - 0.1%Republic of Guatemala
4.900%, 06/01/2030 $ 200,000 219,002Honduras - 0.2%Republic of Honduras
5.625%, 06/24/2030 300,000 313,500Hungary - 0.7%Republic of Hungary
1.500%, 11/17/2050 EUR 385,000 425,8551.625%, 04/28/2032 520,000 652,218
2.750%, 12/22/2026 HUF 97,030,000 326,688
1,404,761Iceland - 1.9%Republic of Iceland
5.000%, 11/15/2028 ISK 433,770,000 3,800,961Indonesia - 3.8%Republic of Indonesia
1.100%, 03/12/2033 EUR 380,000 430,9851.400%, 10/30/2031 680,000 800,5187.000%, 05/15/2027 to 09/15/2030 IDR30,316,000,000 2,132,1418.250%, 05/15/2029 11,210,000,000 841,286
8.375%, 03/15/2034 43,779,000,000 3,296,822
7,501,752Israel - 1.5%State of Israel
3.750%, 03/31/2047 ILS 7,280,000 2,847,238Ivory Coast - 0.3%Republic of Ivory Coast
4.875%, 01/30/2032 EUR 590,000 673,682Japan - 4.8%Government of Japan, CPI Linked
Bond0.100%, 03/10/2028 JPY 1,044,821,214 9,509,784
Macedonia - 0.4%Republic of Macedonia
1.625%, 03/10/2028 (C) EUR 485,000 554,390
3.675%, 06/03/2026 200,000 256,764
811,154Malaysia - 0.3%Government of Malaysia
3.900%, 11/30/2026 MYR 2,460,000 625,449
Government of New Zealand1.500%, 05/15/2031 NZD 2,790,000 1,892,168
Pakistan - 0.2%Republic of Pakistan
7.375%, 04/08/2031 (C) $ 200,000 204,000
8.875%, 04/08/2051 (C) 200,000 207,500
411,500Panama - 0.3%Republic of Panama
4.500%, 04/01/2056 560,000 612,343Paraguay - 0.2%Republic of Paraguay
5.600%, 03/13/2048 200,000 227,302
6.100%, 08/11/2044 200,000 240,000
467,302Peru - 0.2%Republic of Peru
3.750%, 03/01/2030 EUR 155,000 223,481
6.950%, 08/12/2031 PEN 730,000 225,936
449,417Poland - 0.4%Republic of Poland
3.250%, 07/25/2025 PLN 2,430,000 681,641Romania - 1.4%Republic of Romania
2.000%, 01/28/2032 EUR 95,000 111,6852.124%, 07/16/2031 350,000 418,7152.625%, 12/02/2040 (C) 540,000 626,3673.875%, 10/29/2035 520,000 704,2964.625%, 04/03/2049 490,000 705,778
4.750%, 02/24/2025 RON 1,080,000 278,329
2,845,170Russia - 3.6%Government of Russia
6.900%, 05/23/2029 RUB 240,040,000 3,171,5387.650%, 04/10/2030 237,410,000 3,292,247
8.150%, 02/03/2027 42,900,000 607,127
7,070,912Saudi Arabia - 0.6%Kingdom of Saudi Arabia
0.750%, 07/09/2027 EUR 240,000 287,0182.000%, 07/09/2039 290,000 353,531
2.250%, 02/02/2033 (C) $ 667,000 627,954
1,268,503
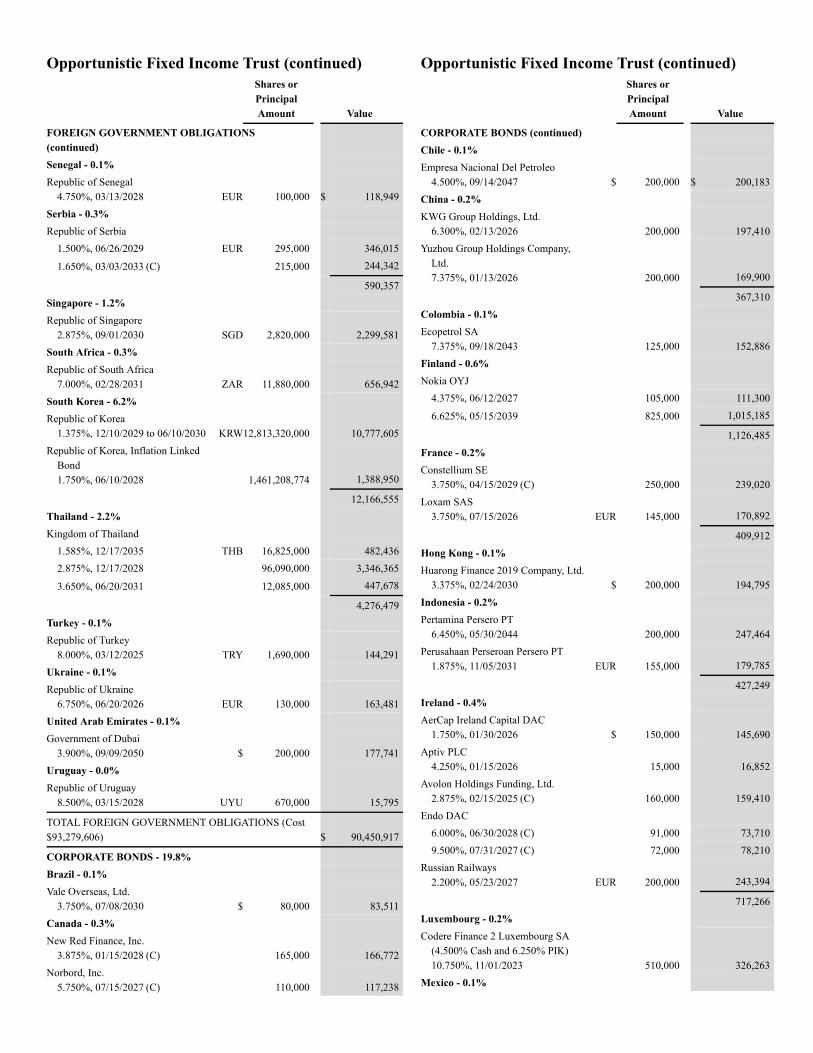
Opportunistic Fixed Income Trust (continued)Shares orPrincipalAmount Value
FOREIGN GOVERNMENT OBLIGATIONS(continued)Senegal - 0.1%Republic of Senegal
4.750%, 03/13/2028 EUR 100,000 $ 118,949Serbia - 0.3%Republic of Serbia
1.500%, 06/26/2029 EUR 295,000 346,015
1.650%, 03/03/2033 (C) 215,000 244,342
590,357Singapore - 1.2%Republic of Singapore
2.875%, 09/01/2030 SGD 2,820,000 2,299,581South Africa - 0.3%Republic of South Africa
7.000%, 02/28/2031 ZAR 11,880,000 656,942South Korea - 6.2%Republic of Korea
1.375%, 12/10/2029 to 06/10/2030 KRW12,813,320,000 10,777,605Republic of Korea, Inflation Linked
Bond1.750%, 06/10/2028 1,461,208,774 1,388,950
12,166,555Thailand - 2.2%Kingdom of Thailand
1.585%, 12/17/2035 THB 16,825,000 482,4362.875%, 12/17/2028 96,090,000 3,346,365
3.650%, 06/20/2031 12,085,000 447,678
4,276,479Turkey - 0.1%Republic of Turkey
8.000%, 03/12/2025 TRY 1,690,000 144,291Ukraine - 0.1%Republic of Ukraine
6.750%, 06/20/2026 EUR 130,000 163,481United Arab Emirates - 0.1%Government of Dubai
3.900%, 09/09/2050 $ 200,000 177,741Uruguay - 0.0%Republic of Uruguay
8.500%, 03/15/2028 UYU 670,000 15,795
TOTAL FOREIGN GOVERNMENT OBLIGATIONS (Cost$93,279,606) $ 90,450,917
CORPORATE BONDS - 19.8%Brazil - 0.1%Vale Overseas, Ltd.
3.750%, 07/08/2030 $ 80,000 83,511Canada - 0.3%New Red Finance, Inc.
3.875%, 01/15/2028 (C) 165,000 166,772Norbord, Inc.
5.750%, 07/15/2027 (C) 110,000 117,238
Opportunistic Fixed Income Trust (continued)Shares orPrincipalAmount Value
CORPORATE BONDS (continued)Chile - 0.1%Empresa Nacional Del Petroleo
4.500%, 09/14/2047 $ 200,000 $ 200,183China - 0.2%KWG Group Holdings, Ltd.
6.300%, 02/13/2026 200,000 197,410Yuzhou Group Holdings Company,
Ltd.7.375%, 01/13/2026 200,000 169,900
367,310Colombia - 0.1%Ecopetrol SA
7.375%, 09/18/2043 125,000 152,886Finland - 0.6%Nokia OYJ
4.375%, 06/12/2027 105,000 111,300
6.625%, 05/15/2039 825,000 1,015,185
1,126,485France - 0.2%Constellium SE
3.750%, 04/15/2029 (C) 250,000 239,020Loxam SAS
3.750%, 07/15/2026 EUR 145,000 170,892
409,912Hong Kong - 0.1%Huarong Finance 2019 Company, Ltd.
3.375%, 02/24/2030 $ 200,000 194,795Indonesia - 0.2%Pertamina Persero PT
6.450%, 05/30/2044 200,000 247,464Perusahaan Perseroan Persero PT
1.875%, 11/05/2031 EUR 155,000 179,785
427,249Ireland - 0.4%AerCap Ireland Capital DAC
1.750%, 01/30/2026 $ 150,000 145,690Aptiv PLC
4.250%, 01/15/2026 15,000 16,852Avolon Holdings Funding, Ltd.
2.875%, 02/15/2025 (C) 160,000 159,410Endo DAC
6.000%, 06/30/2028 (C) 91,000 73,7109.500%, 07/31/2027 (C) 72,000 78,210
Russian Railways2.200%, 05/23/2027 EUR 200,000 243,394
717,266Luxembourg - 0.2%Codere Finance 2 Luxembourg SA
(4.500% Cash and 6.250% PIK)10.750%, 11/01/2023 510,000 326,263
Mexico - 0.1%
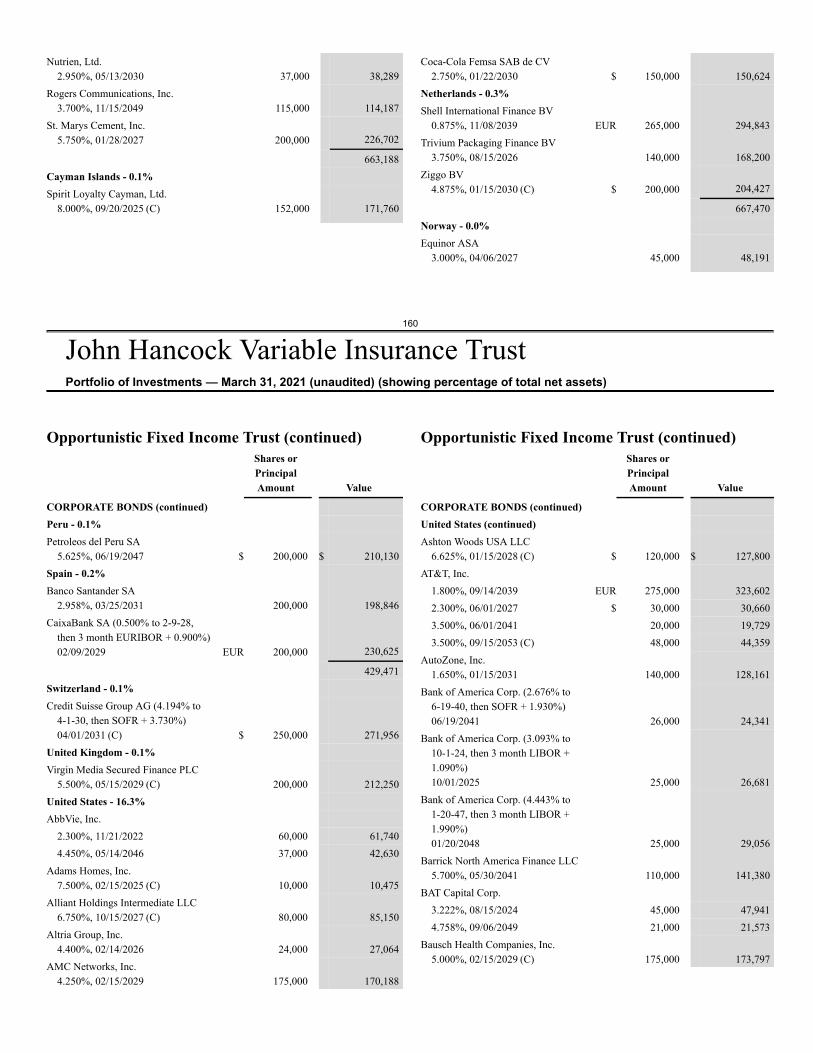
160
John Hancock Variable Insurance TrustPortfolio of Investments — March 31, 2021 (unaudited) (showing percentage of total net assets)
Nutrien, Ltd.2.950%, 05/13/2030 37,000 38,289
Rogers Communications, Inc.3.700%, 11/15/2049 115,000 114,187
St. Marys Cement, Inc.5.750%, 01/28/2027 200,000 226,702
663,188Cayman Islands - 0.1%Spirit Loyalty Cayman, Ltd.
8.000%, 09/20/2025 (C) 152,000 171,760
Coca-Cola Femsa SAB de CV2.750%, 01/22/2030 $ 150,000 150,624
Netherlands - 0.3%Shell International Finance BV
0.875%, 11/08/2039 EUR 265,000 294,843Trivium Packaging Finance BV
3.750%, 08/15/2026 140,000 168,200Ziggo BV
4.875%, 01/15/2030 (C) $ 200,000 204,427
667,470Norway - 0.0%Equinor ASA
3.000%, 04/06/2027 45,000 48,191
Opportunistic Fixed Income Trust (continued)Shares orPrincipalAmount Value
CORPORATE BONDS (continued)Peru - 0.1%Petroleos del Peru SA
5.625%, 06/19/2047 $ 200,000 $ 210,130Spain - 0.2%Banco Santander SA
2.958%, 03/25/2031 200,000 198,846CaixaBank SA (0.500% to 2-9-28,
then 3 month EURIBOR + 0.900%)02/09/2029 EUR 200,000 230,625
429,471Switzerland - 0.1%Credit Suisse Group AG (4.194% to
4-1-30, then SOFR + 3.730%)04/01/2031 (C) $ 250,000 271,956
United Kingdom - 0.1%Virgin Media Secured Finance PLC
5.500%, 05/15/2029 (C) 200,000 212,250United States - 16.3%AbbVie, Inc.
2.300%, 11/21/2022 60,000 61,7404.450%, 05/14/2046 37,000 42,630
Adams Homes, Inc.7.500%, 02/15/2025 (C) 10,000 10,475
Alliant Holdings Intermediate LLC6.750%, 10/15/2027 (C) 80,000 85,150
Altria Group, Inc.4.400%, 02/14/2026 24,000 27,064
AMC Networks, Inc.4.250%, 02/15/2029 175,000 170,188
Opportunistic Fixed Income Trust (continued)Shares orPrincipalAmount Value
CORPORATE BONDS (continued)United States (continued)Ashton Woods USA LLC
6.625%, 01/15/2028 (C) $ 120,000 $ 127,800AT&T, Inc.
1.800%, 09/14/2039 EUR 275,000 323,6022.300%, 06/01/2027 $ 30,000 30,6603.500%, 06/01/2041 20,000 19,7293.500%, 09/15/2053 (C) 48,000 44,359
AutoZone, Inc.1.650%, 01/15/2031 140,000 128,161
Bank of America Corp. (2.676% to6-19-40, then SOFR + 1.930%)06/19/2041 26,000 24,341
Bank of America Corp. (3.093% to10-1-24, then 3 month LIBOR +1.090%)10/01/2025 25,000 26,681
Bank of America Corp. (4.443% to1-20-47, then 3 month LIBOR +1.990%)01/20/2048 25,000 29,056
Barrick North America Finance LLC5.700%, 05/30/2041 110,000 141,380
BAT Capital Corp.3.222%, 08/15/2024 45,000 47,9414.758%, 09/06/2049 21,000 21,573
Bausch Health Companies, Inc.5.000%, 02/15/2029 (C) 175,000 173,797
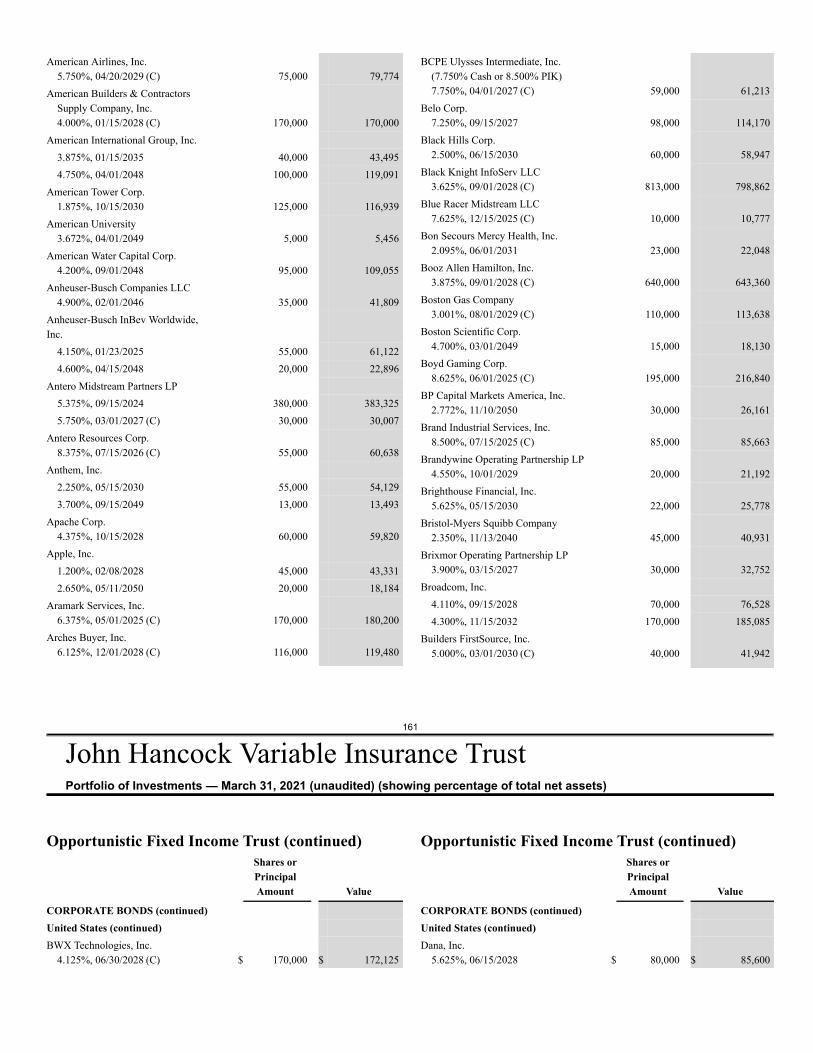
161
John Hancock Variable Insurance TrustPortfolio of Investments — March 31, 2021 (unaudited) (showing percentage of total net assets)
American Airlines, Inc.5.750%, 04/20/2029 (C) 75,000 79,774
American Builders & ContractorsSupply Company, Inc.4.000%, 01/15/2028 (C) 170,000 170,000
American International Group, Inc.3.875%, 01/15/2035 40,000 43,4954.750%, 04/01/2048 100,000 119,091
American Tower Corp.1.875%, 10/15/2030 125,000 116,939
American University3.672%, 04/01/2049 5,000 5,456
American Water Capital Corp.4.200%, 09/01/2048 95,000 109,055
Anheuser-Busch Companies LLC4.900%, 02/01/2046 35,000 41,809
Anheuser-Busch InBev Worldwide,Inc.
4.150%, 01/23/2025 55,000 61,1224.600%, 04/15/2048 20,000 22,896
Antero Midstream Partners LP5.375%, 09/15/2024 380,000 383,3255.750%, 03/01/2027 (C) 30,000 30,007
Antero Resources Corp.8.375%, 07/15/2026 (C) 55,000 60,638
Anthem, Inc.2.250%, 05/15/2030 55,000 54,1293.700%, 09/15/2049 13,000 13,493
Apache Corp.4.375%, 10/15/2028 60,000 59,820
Apple, Inc.1.200%, 02/08/2028 45,000 43,3312.650%, 05/11/2050 20,000 18,184
Aramark Services, Inc.6.375%, 05/01/2025 (C) 170,000 180,200
Arches Buyer, Inc.6.125%, 12/01/2028 (C) 116,000 119,480
BCPE Ulysses Intermediate, Inc.(7.750% Cash or 8.500% PIK)7.750%, 04/01/2027 (C) 59,000 61,213
Belo Corp.7.250%, 09/15/2027 98,000 114,170
Black Hills Corp.2.500%, 06/15/2030 60,000 58,947
Black Knight InfoServ LLC3.625%, 09/01/2028 (C) 813,000 798,862
Blue Racer Midstream LLC7.625%, 12/15/2025 (C) 10,000 10,777
Bon Secours Mercy Health, Inc.2.095%, 06/01/2031 23,000 22,048
Booz Allen Hamilton, Inc.3.875%, 09/01/2028 (C) 640,000 643,360
Boston Gas Company3.001%, 08/01/2029 (C) 110,000 113,638
Boston Scientific Corp.4.700%, 03/01/2049 15,000 18,130
Boyd Gaming Corp.8.625%, 06/01/2025 (C) 195,000 216,840
BP Capital Markets America, Inc.2.772%, 11/10/2050 30,000 26,161
Brand Industrial Services, Inc.8.500%, 07/15/2025 (C) 85,000 85,663
Brandywine Operating Partnership LP4.550%, 10/01/2029 20,000 21,192
Brighthouse Financial, Inc.5.625%, 05/15/2030 22,000 25,778
Bristol-Myers Squibb Company2.350%, 11/13/2040 45,000 40,931
Brixmor Operating Partnership LP3.900%, 03/15/2027 30,000 32,752
Broadcom, Inc.4.110%, 09/15/2028 70,000 76,5284.300%, 11/15/2032 170,000 185,085
Builders FirstSource, Inc.5.000%, 03/01/2030 (C) 40,000 41,942
Opportunistic Fixed Income Trust (continued)Shares orPrincipalAmount Value
CORPORATE BONDS (continued)United States (continued)BWX Technologies, Inc.
4.125%, 06/30/2028 (C) $ 170,000 $ 172,125
Opportunistic Fixed Income Trust (continued)Shares orPrincipalAmount Value
CORPORATE BONDS (continued)United States (continued)Dana, Inc.
5.625%, 06/15/2028 $ 80,000 $ 85,600
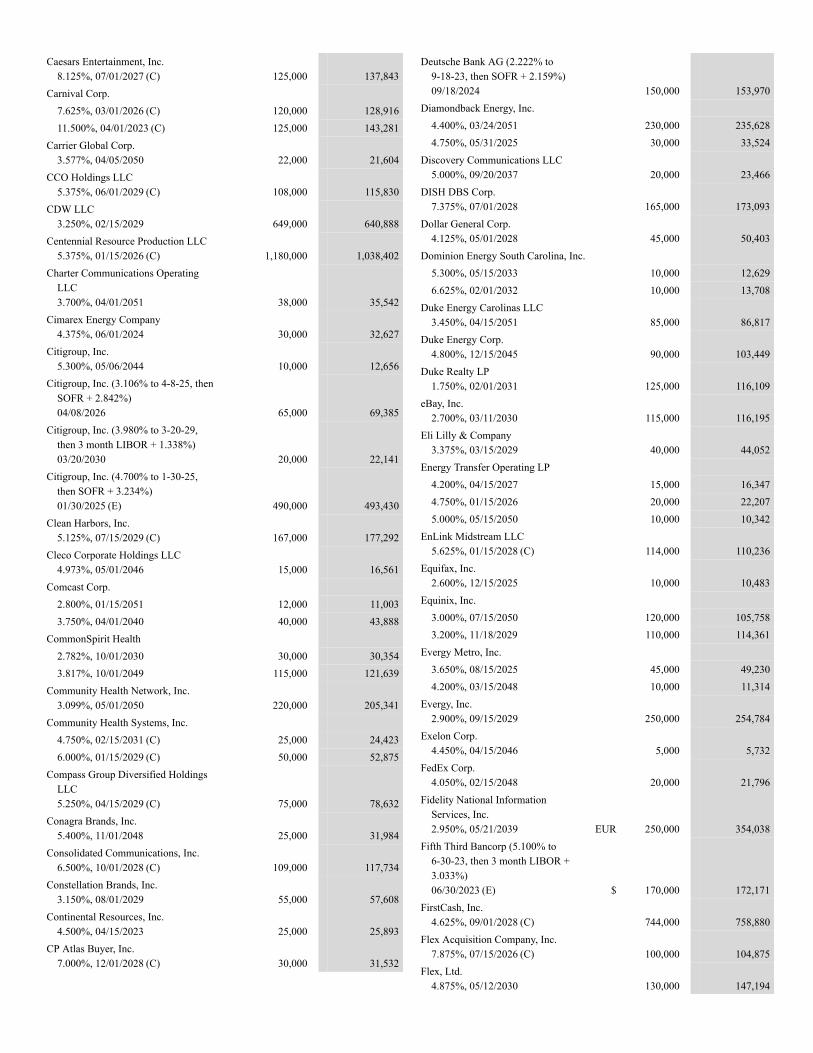
Caesars Entertainment, Inc.8.125%, 07/01/2027 (C) 125,000 137,843
Carnival Corp.7.625%, 03/01/2026 (C) 120,000 128,91611.500%, 04/01/2023 (C) 125,000 143,281
Carrier Global Corp.3.577%, 04/05/2050 22,000 21,604
CCO Holdings LLC5.375%, 06/01/2029 (C) 108,000 115,830
CDW LLC3.250%, 02/15/2029 649,000 640,888
Centennial Resource Production LLC5.375%, 01/15/2026 (C) 1,180,000 1,038,402
Charter Communications OperatingLLC3.700%, 04/01/2051 38,000 35,542
Cimarex Energy Company4.375%, 06/01/2024 30,000 32,627
Citigroup, Inc.5.300%, 05/06/2044 10,000 12,656
Citigroup, Inc. (3.106% to 4-8-25, thenSOFR + 2.842%)04/08/2026 65,000 69,385
Citigroup, Inc. (3.980% to 3-20-29,then 3 month LIBOR + 1.338%)03/20/2030 20,000 22,141
Citigroup, Inc. (4.700% to 1-30-25,then SOFR + 3.234%)01/30/2025 (E) 490,000 493,430
Clean Harbors, Inc.5.125%, 07/15/2029 (C) 167,000 177,292
Cleco Corporate Holdings LLC4.973%, 05/01/2046 15,000 16,561
Comcast Corp.2.800%, 01/15/2051 12,000 11,0033.750%, 04/01/2040 40,000 43,888
CommonSpirit Health2.782%, 10/01/2030 30,000 30,3543.817%, 10/01/2049 115,000 121,639
Community Health Network, Inc.3.099%, 05/01/2050 220,000 205,341
Community Health Systems, Inc.4.750%, 02/15/2031 (C) 25,000 24,4236.000%, 01/15/2029 (C) 50,000 52,875
Compass Group Diversified HoldingsLLC5.250%, 04/15/2029 (C) 75,000 78,632
Conagra Brands, Inc.5.400%, 11/01/2048 25,000 31,984
Consolidated Communications, Inc.6.500%, 10/01/2028 (C) 109,000 117,734
Constellation Brands, Inc.3.150%, 08/01/2029 55,000 57,608
Continental Resources, Inc.4.500%, 04/15/2023 25,000 25,893
CP Atlas Buyer, Inc.7.000%, 12/01/2028 (C) 30,000 31,532
Deutsche Bank AG (2.222% to9-18-23, then SOFR + 2.159%)09/18/2024 150,000 153,970
Diamondback Energy, Inc.4.400%, 03/24/2051 230,000 235,6284.750%, 05/31/2025 30,000 33,524
Discovery Communications LLC5.000%, 09/20/2037 20,000 23,466
DISH DBS Corp.7.375%, 07/01/2028 165,000 173,093
Dollar General Corp.4.125%, 05/01/2028 45,000 50,403
Dominion Energy South Carolina, Inc.5.300%, 05/15/2033 10,000 12,6296.625%, 02/01/2032 10,000 13,708
Duke Energy Carolinas LLC3.450%, 04/15/2051 85,000 86,817
Duke Energy Corp.4.800%, 12/15/2045 90,000 103,449
Duke Realty LP1.750%, 02/01/2031 125,000 116,109
eBay, Inc.2.700%, 03/11/2030 115,000 116,195
Eli Lilly & Company3.375%, 03/15/2029 40,000 44,052
Energy Transfer Operating LP4.200%, 04/15/2027 15,000 16,3474.750%, 01/15/2026 20,000 22,2075.000%, 05/15/2050 10,000 10,342
EnLink Midstream LLC5.625%, 01/15/2028 (C) 114,000 110,236
Equifax, Inc.2.600%, 12/15/2025 10,000 10,483
Equinix, Inc.3.000%, 07/15/2050 120,000 105,7583.200%, 11/18/2029 110,000 114,361
Evergy Metro, Inc.3.650%, 08/15/2025 45,000 49,2304.200%, 03/15/2048 10,000 11,314
Evergy, Inc.2.900%, 09/15/2029 250,000 254,784
Exelon Corp.4.450%, 04/15/2046 5,000 5,732
FedEx Corp.4.050%, 02/15/2048 20,000 21,796
Fidelity National InformationServices, Inc.2.950%, 05/21/2039 EUR 250,000 354,038
Fifth Third Bancorp (5.100% to6-30-23, then 3 month LIBOR +3.033%)06/30/2023 (E) $ 170,000 172,171
FirstCash, Inc.4.625%, 09/01/2028 (C) 744,000 758,880
Flex Acquisition Company, Inc.7.875%, 07/15/2026 (C) 100,000 104,875
Flex, Ltd.4.875%, 05/12/2030 130,000 147,194
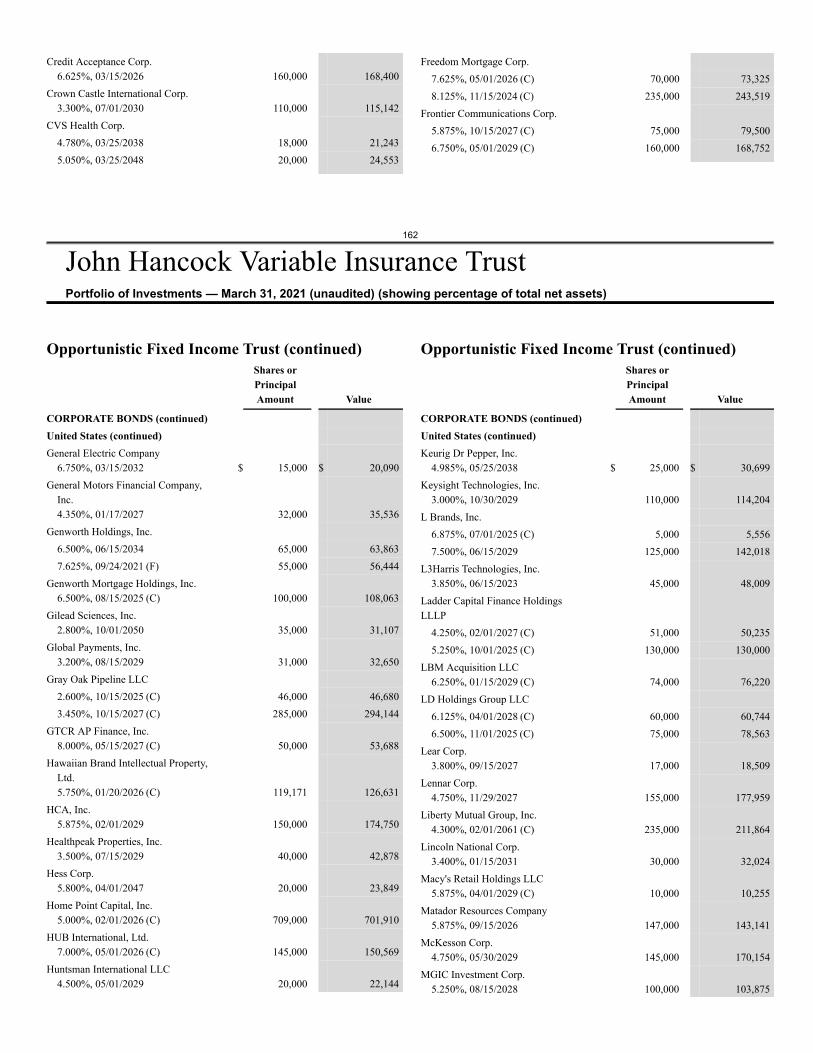
162
John Hancock Variable Insurance TrustPortfolio of Investments — March 31, 2021 (unaudited) (showing percentage of total net assets)
Credit Acceptance Corp.6.625%, 03/15/2026 160,000 168,400
Crown Castle International Corp.3.300%, 07/01/2030 110,000 115,142
CVS Health Corp.4.780%, 03/25/2038 18,000 21,2435.050%, 03/25/2048 20,000 24,553
Freedom Mortgage Corp.7.625%, 05/01/2026 (C) 70,000 73,3258.125%, 11/15/2024 (C) 235,000 243,519
Frontier Communications Corp.5.875%, 10/15/2027 (C) 75,000 79,5006.750%, 05/01/2029 (C) 160,000 168,752
Opportunistic Fixed Income Trust (continued)Shares orPrincipalAmount Value
CORPORATE BONDS (continued)United States (continued)General Electric Company
6.750%, 03/15/2032 $ 15,000 $ 20,090General Motors Financial Company,
Inc.4.350%, 01/17/2027 32,000 35,536
Genworth Holdings, Inc.6.500%, 06/15/2034 65,000 63,8637.625%, 09/24/2021 (F) 55,000 56,444
Genworth Mortgage Holdings, Inc.6.500%, 08/15/2025 (C) 100,000 108,063
Gilead Sciences, Inc.2.800%, 10/01/2050 35,000 31,107
Global Payments, Inc.3.200%, 08/15/2029 31,000 32,650
Gray Oak Pipeline LLC2.600%, 10/15/2025 (C) 46,000 46,6803.450%, 10/15/2027 (C) 285,000 294,144
GTCR AP Finance, Inc.8.000%, 05/15/2027 (C) 50,000 53,688
Hawaiian Brand Intellectual Property,Ltd.5.750%, 01/20/2026 (C) 119,171 126,631
HCA, Inc.5.875%, 02/01/2029 150,000 174,750
Healthpeak Properties, Inc.3.500%, 07/15/2029 40,000 42,878
Hess Corp.5.800%, 04/01/2047 20,000 23,849
Home Point Capital, Inc.5.000%, 02/01/2026 (C) 709,000 701,910
HUB International, Ltd.7.000%, 05/01/2026 (C) 145,000 150,569
Huntsman International LLC4.500%, 05/01/2029 20,000 22,144
Opportunistic Fixed Income Trust (continued)Shares orPrincipalAmount Value
CORPORATE BONDS (continued)United States (continued)Keurig Dr Pepper, Inc.
4.985%, 05/25/2038 $ 25,000 $ 30,699Keysight Technologies, Inc.
3.000%, 10/30/2029 110,000 114,204L Brands, Inc.
6.875%, 07/01/2025 (C) 5,000 5,5567.500%, 06/15/2029 125,000 142,018
L3Harris Technologies, Inc.3.850%, 06/15/2023 45,000 48,009
Ladder Capital Finance HoldingsLLLP
4.250%, 02/01/2027 (C) 51,000 50,2355.250%, 10/01/2025 (C) 130,000 130,000
LBM Acquisition LLC6.250%, 01/15/2029 (C) 74,000 76,220
LD Holdings Group LLC6.125%, 04/01/2028 (C) 60,000 60,7446.500%, 11/01/2025 (C) 75,000 78,563
Lear Corp.3.800%, 09/15/2027 17,000 18,509
Lennar Corp.4.750%, 11/29/2027 155,000 177,959
Liberty Mutual Group, Inc.4.300%, 02/01/2061 (C) 235,000 211,864
Lincoln National Corp.3.400%, 01/15/2031 30,000 32,024
Macy's Retail Holdings LLC5.875%, 04/01/2029 (C) 10,000 10,255
Matador Resources Company5.875%, 09/15/2026 147,000 143,141
McKesson Corp.4.750%, 05/30/2029 145,000 170,154
MGIC Investment Corp.5.250%, 08/15/2028 100,000 103,875
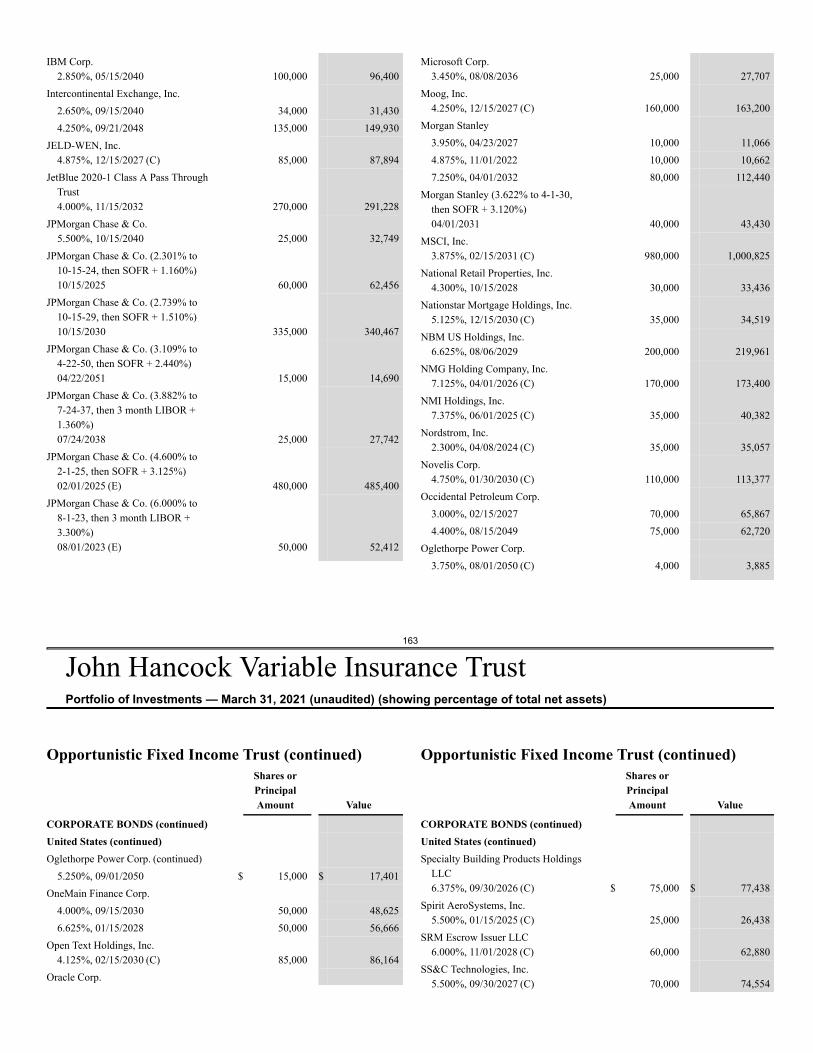
163
John Hancock Variable Insurance TrustPortfolio of Investments — March 31, 2021 (unaudited) (showing percentage of total net assets)
IBM Corp.2.850%, 05/15/2040 100,000 96,400
Intercontinental Exchange, Inc.2.650%, 09/15/2040 34,000 31,4304.250%, 09/21/2048 135,000 149,930
JELD-WEN, Inc.4.875%, 12/15/2027 (C) 85,000 87,894
JetBlue 2020-1 Class A Pass ThroughTrust4.000%, 11/15/2032 270,000 291,228
JPMorgan Chase & Co.5.500%, 10/15/2040 25,000 32,749
JPMorgan Chase & Co. (2.301% to10-15-24, then SOFR + 1.160%)10/15/2025 60,000 62,456
JPMorgan Chase & Co. (2.739% to10-15-29, then SOFR + 1.510%)10/15/2030 335,000 340,467
JPMorgan Chase & Co. (3.109% to4-22-50, then SOFR + 2.440%)04/22/2051 15,000 14,690
JPMorgan Chase & Co. (3.882% to7-24-37, then 3 month LIBOR +1.360%)07/24/2038 25,000 27,742
JPMorgan Chase & Co. (4.600% to2-1-25, then SOFR + 3.125%)02/01/2025 (E) 480,000 485,400
JPMorgan Chase & Co. (6.000% to8-1-23, then 3 month LIBOR +3.300%)08/01/2023 (E) 50,000 52,412
Microsoft Corp.3.450%, 08/08/2036 25,000 27,707
Moog, Inc.4.250%, 12/15/2027 (C) 160,000 163,200
Morgan Stanley3.950%, 04/23/2027 10,000 11,0664.875%, 11/01/2022 10,000 10,6627.250%, 04/01/2032 80,000 112,440
Morgan Stanley (3.622% to 4-1-30,then SOFR + 3.120%)04/01/2031 40,000 43,430
MSCI, Inc.3.875%, 02/15/2031 (C) 980,000 1,000,825
National Retail Properties, Inc.4.300%, 10/15/2028 30,000 33,436
Nationstar Mortgage Holdings, Inc.5.125%, 12/15/2030 (C) 35,000 34,519
NBM US Holdings, Inc.6.625%, 08/06/2029 200,000 219,961
NMG Holding Company, Inc.7.125%, 04/01/2026 (C) 170,000 173,400
NMI Holdings, Inc.7.375%, 06/01/2025 (C) 35,000 40,382
Nordstrom, Inc.2.300%, 04/08/2024 (C) 35,000 35,057
Novelis Corp.4.750%, 01/30/2030 (C) 110,000 113,377
Occidental Petroleum Corp.3.000%, 02/15/2027 70,000 65,8674.400%, 08/15/2049 75,000 62,720
Oglethorpe Power Corp.3.750%, 08/01/2050 (C) 4,000 3,885
Opportunistic Fixed Income Trust (continued)Shares orPrincipalAmount Value
CORPORATE BONDS (continued)United States (continued)Oglethorpe Power Corp. (continued)
5.250%, 09/01/2050 $ 15,000 $ 17,401OneMain Finance Corp.
4.000%, 09/15/2030 50,000 48,6256.625%, 01/15/2028 50,000 56,666
Open Text Holdings, Inc.4.125%, 02/15/2030 (C) 85,000 86,164
Oracle Corp.
Opportunistic Fixed Income Trust (continued)Shares orPrincipalAmount Value
CORPORATE BONDS (continued)United States (continued)Specialty Building Products Holdings
LLC6.375%, 09/30/2026 (C) $ 75,000 $ 77,438
Spirit AeroSystems, Inc.5.500%, 01/15/2025 (C) 25,000 26,438
SRM Escrow Issuer LLC6.000%, 11/01/2028 (C) 60,000 62,880
SS&C Technologies, Inc.5.500%, 09/30/2027 (C) 70,000 74,554
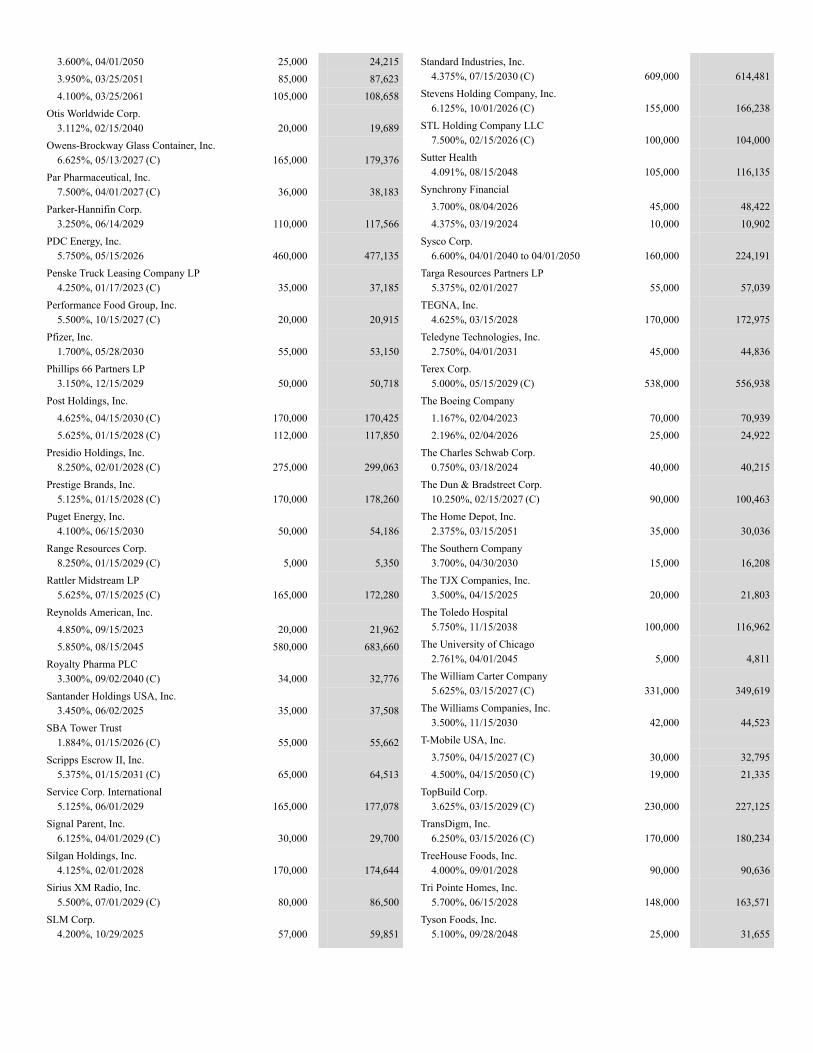
3.600%, 04/01/2050 25,000 24,2153.950%, 03/25/2051 85,000 87,6234.100%, 03/25/2061 105,000 108,658
Otis Worldwide Corp.3.112%, 02/15/2040 20,000 19,689
Owens-Brockway Glass Container, Inc.6.625%, 05/13/2027 (C) 165,000 179,376
Par Pharmaceutical, Inc.7.500%, 04/01/2027 (C) 36,000 38,183
Parker-Hannifin Corp.3.250%, 06/14/2029 110,000 117,566
PDC Energy, Inc.5.750%, 05/15/2026 460,000 477,135
Penske Truck Leasing Company LP4.250%, 01/17/2023 (C) 35,000 37,185
Performance Food Group, Inc.5.500%, 10/15/2027 (C) 20,000 20,915
Pfizer, Inc.1.700%, 05/28/2030 55,000 53,150
Phillips 66 Partners LP3.150%, 12/15/2029 50,000 50,718
Post Holdings, Inc.4.625%, 04/15/2030 (C) 170,000 170,4255.625%, 01/15/2028 (C) 112,000 117,850
Presidio Holdings, Inc.8.250%, 02/01/2028 (C) 275,000 299,063
Prestige Brands, Inc.5.125%, 01/15/2028 (C) 170,000 178,260
Puget Energy, Inc.4.100%, 06/15/2030 50,000 54,186
Range Resources Corp.8.250%, 01/15/2029 (C) 5,000 5,350
Rattler Midstream LP5.625%, 07/15/2025 (C) 165,000 172,280
Reynolds American, Inc.4.850%, 09/15/2023 20,000 21,9625.850%, 08/15/2045 580,000 683,660
Royalty Pharma PLC3.300%, 09/02/2040 (C) 34,000 32,776
Santander Holdings USA, Inc.3.450%, 06/02/2025 35,000 37,508
SBA Tower Trust1.884%, 01/15/2026 (C) 55,000 55,662
Scripps Escrow II, Inc.5.375%, 01/15/2031 (C) 65,000 64,513
Service Corp. International5.125%, 06/01/2029 165,000 177,078
Signal Parent, Inc.6.125%, 04/01/2029 (C) 30,000 29,700
Silgan Holdings, Inc.4.125%, 02/01/2028 170,000 174,644
Sirius XM Radio, Inc.5.500%, 07/01/2029 (C) 80,000 86,500
SLM Corp.4.200%, 10/29/2025 57,000 59,851
Standard Industries, Inc.4.375%, 07/15/2030 (C) 609,000 614,481
Stevens Holding Company, Inc.6.125%, 10/01/2026 (C) 155,000 166,238
STL Holding Company LLC7.500%, 02/15/2026 (C) 100,000 104,000
Sutter Health4.091%, 08/15/2048 105,000 116,135
Synchrony Financial3.700%, 08/04/2026 45,000 48,4224.375%, 03/19/2024 10,000 10,902
Sysco Corp.6.600%, 04/01/2040 to 04/01/2050 160,000 224,191
Targa Resources Partners LP5.375%, 02/01/2027 55,000 57,039
TEGNA, Inc.4.625%, 03/15/2028 170,000 172,975
Teledyne Technologies, Inc.2.750%, 04/01/2031 45,000 44,836
Terex Corp.5.000%, 05/15/2029 (C) 538,000 556,938
The Boeing Company1.167%, 02/04/2023 70,000 70,9392.196%, 02/04/2026 25,000 24,922
The Charles Schwab Corp.0.750%, 03/18/2024 40,000 40,215
The Dun & Bradstreet Corp.10.250%, 02/15/2027 (C) 90,000 100,463
The Home Depot, Inc.2.375%, 03/15/2051 35,000 30,036
The Southern Company3.700%, 04/30/2030 15,000 16,208
The TJX Companies, Inc.3.500%, 04/15/2025 20,000 21,803
The Toledo Hospital5.750%, 11/15/2038 100,000 116,962
The University of Chicago2.761%, 04/01/2045 5,000 4,811
The William Carter Company5.625%, 03/15/2027 (C) 331,000 349,619
The Williams Companies, Inc.3.500%, 11/15/2030 42,000 44,523
T-Mobile USA, Inc.3.750%, 04/15/2027 (C) 30,000 32,7954.500%, 04/15/2050 (C) 19,000 21,335
TopBuild Corp.3.625%, 03/15/2029 (C) 230,000 227,125
TransDigm, Inc.6.250%, 03/15/2026 (C) 170,000 180,234
TreeHouse Foods, Inc.4.000%, 09/01/2028 90,000 90,636
Tri Pointe Homes, Inc.5.700%, 06/15/2028 148,000 163,571
Tyson Foods, Inc.5.100%, 09/28/2048 25,000 31,655
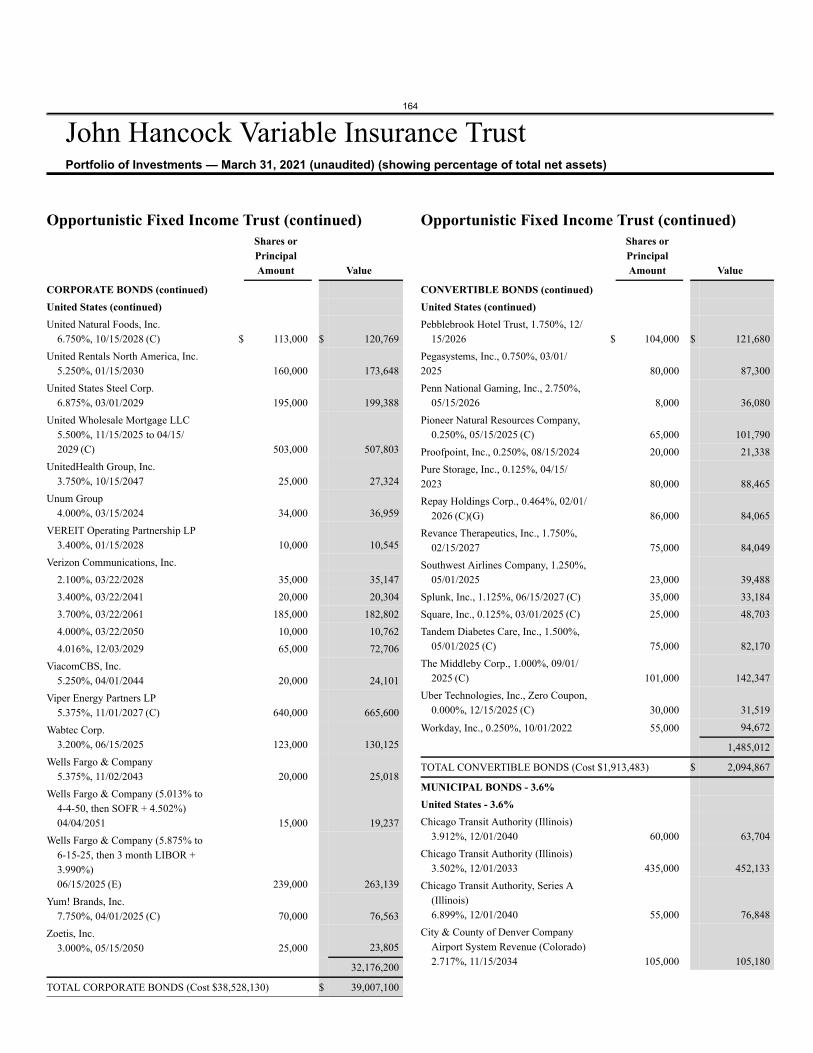
164
John Hancock Variable Insurance TrustPortfolio of Investments — March 31, 2021 (unaudited) (showing percentage of total net assets)
Opportunistic Fixed Income Trust (continued)Shares orPrincipalAmount Value
CORPORATE BONDS (continued)United States (continued)United Natural Foods, Inc.
6.750%, 10/15/2028 (C) $ 113,000 $ 120,769United Rentals North America, Inc.
5.250%, 01/15/2030 160,000 173,648United States Steel Corp.
6.875%, 03/01/2029 195,000 199,388United Wholesale Mortgage LLC
5.500%, 11/15/2025 to 04/15/2029 (C) 503,000 507,803
UnitedHealth Group, Inc.3.750%, 10/15/2047 25,000 27,324
Unum Group4.000%, 03/15/2024 34,000 36,959
VEREIT Operating Partnership LP3.400%, 01/15/2028 10,000 10,545
Verizon Communications, Inc.2.100%, 03/22/2028 35,000 35,1473.400%, 03/22/2041 20,000 20,3043.700%, 03/22/2061 185,000 182,8024.000%, 03/22/2050 10,000 10,7624.016%, 12/03/2029 65,000 72,706
ViacomCBS, Inc.5.250%, 04/01/2044 20,000 24,101
Viper Energy Partners LP5.375%, 11/01/2027 (C) 640,000 665,600
Wabtec Corp.3.200%, 06/15/2025 123,000 130,125
Wells Fargo & Company5.375%, 11/02/2043 20,000 25,018
Wells Fargo & Company (5.013% to4-4-50, then SOFR + 4.502%)04/04/2051 15,000 19,237
Wells Fargo & Company (5.875% to6-15-25, then 3 month LIBOR +3.990%)06/15/2025 (E) 239,000 263,139
Yum! Brands, Inc.7.750%, 04/01/2025 (C) 70,000 76,563
Zoetis, Inc.3.000%, 05/15/2050 25,000 23,805
32,176,200
TOTAL CORPORATE BONDS (Cost $38,528,130) $ 39,007,100
Opportunistic Fixed Income Trust (continued)Shares orPrincipalAmount Value
CONVERTIBLE BONDS (continued)United States (continued)Pebblebrook Hotel Trust, 1.750%, 12/
15/2026 $ 104,000 $ 121,680Pegasystems, Inc., 0.750%, 03/01/2025 80,000 87,300Penn National Gaming, Inc., 2.750%,
05/15/2026 8,000 36,080Pioneer Natural Resources Company,
0.250%, 05/15/2025 (C) 65,000 101,790Proofpoint, Inc., 0.250%, 08/15/2024 20,000 21,338Pure Storage, Inc., 0.125%, 04/15/2023 80,000 88,465Repay Holdings Corp., 0.464%, 02/01/
2026 (C)(G) 86,000 84,065Revance Therapeutics, Inc., 1.750%,
02/15/2027 75,000 84,049Southwest Airlines Company, 1.250%,
05/01/2025 23,000 39,488Splunk, Inc., 1.125%, 06/15/2027 (C) 35,000 33,184Square, Inc., 0.125%, 03/01/2025 (C) 25,000 48,703Tandem Diabetes Care, Inc., 1.500%,
05/01/2025 (C) 75,000 82,170The Middleby Corp., 1.000%, 09/01/
2025 (C) 101,000 142,347Uber Technologies, Inc., Zero Coupon,
0.000%, 12/15/2025 (C) 30,000 31,519
Workday, Inc., 0.250%, 10/01/2022 55,000 94,672
1,485,012
TOTAL CONVERTIBLE BONDS (Cost $1,913,483) $ 2,094,867
MUNICIPAL BONDS - 3.6%United States - 3.6%Chicago Transit Authority (Illinois)
3.912%, 12/01/2040 60,000 63,704Chicago Transit Authority (Illinois)
3.502%, 12/01/2033 435,000 452,133Chicago Transit Authority, Series A
(Illinois)6.899%, 12/01/2040 55,000 76,848
City & County of Denver CompanyAirport System Revenue (Colorado)2.717%, 11/15/2034 105,000 105,180
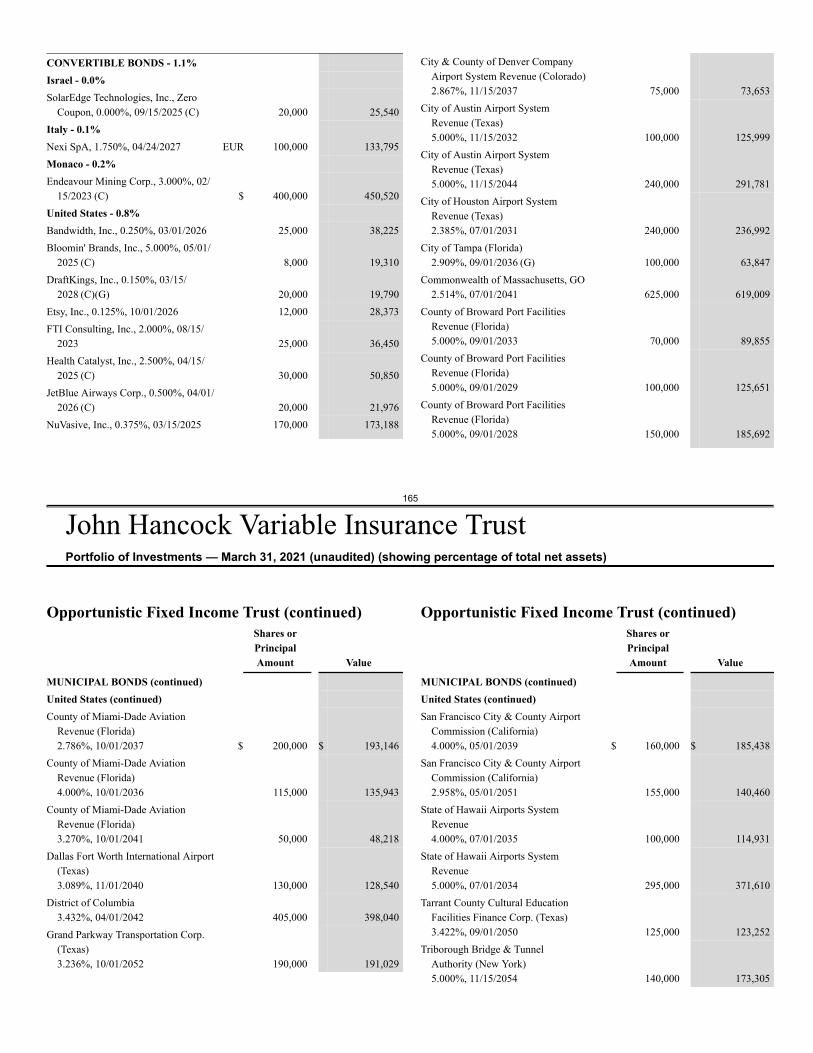
165
John Hancock Variable Insurance TrustPortfolio of Investments — March 31, 2021 (unaudited) (showing percentage of total net assets)
CONVERTIBLE BONDS - 1.1%Israel - 0.0%SolarEdge Technologies, Inc., Zero
Coupon, 0.000%, 09/15/2025 (C) 20,000 25,540Italy - 0.1%Nexi SpA, 1.750%, 04/24/2027 EUR 100,000 133,795Monaco - 0.2%Endeavour Mining Corp., 3.000%, 02/
15/2023 (C) $ 400,000 450,520United States - 0.8%Bandwidth, Inc., 0.250%, 03/01/2026 25,000 38,225Bloomin' Brands, Inc., 5.000%, 05/01/
2025 (C) 8,000 19,310DraftKings, Inc., 0.150%, 03/15/
2028 (C)(G) 20,000 19,790Etsy, Inc., 0.125%, 10/01/2026 12,000 28,373FTI Consulting, Inc., 2.000%, 08/15/
2023 25,000 36,450Health Catalyst, Inc., 2.500%, 04/15/
2025 (C) 30,000 50,850JetBlue Airways Corp., 0.500%, 04/01/
2026 (C) 20,000 21,976NuVasive, Inc., 0.375%, 03/15/2025 170,000 173,188
City & County of Denver CompanyAirport System Revenue (Colorado)2.867%, 11/15/2037 75,000 73,653
City of Austin Airport SystemRevenue (Texas)5.000%, 11/15/2032 100,000 125,999
City of Austin Airport SystemRevenue (Texas)5.000%, 11/15/2044 240,000 291,781
City of Houston Airport SystemRevenue (Texas)2.385%, 07/01/2031 240,000 236,992
City of Tampa (Florida)2.909%, 09/01/2036 (G) 100,000 63,847
Commonwealth of Massachusetts, GO2.514%, 07/01/2041 625,000 619,009
County of Broward Port FacilitiesRevenue (Florida)5.000%, 09/01/2033 70,000 89,855
County of Broward Port FacilitiesRevenue (Florida)5.000%, 09/01/2029 100,000 125,651
County of Broward Port FacilitiesRevenue (Florida)5.000%, 09/01/2028 150,000 185,692
Opportunistic Fixed Income Trust (continued)Shares orPrincipalAmount Value
MUNICIPAL BONDS (continued)United States (continued)County of Miami-Dade Aviation
Revenue (Florida)2.786%, 10/01/2037 $ 200,000 $ 193,146
County of Miami-Dade AviationRevenue (Florida)4.000%, 10/01/2036 115,000 135,943
County of Miami-Dade AviationRevenue (Florida)3.270%, 10/01/2041 50,000 48,218
Dallas Fort Worth International Airport(Texas)3.089%, 11/01/2040 130,000 128,540
District of Columbia3.432%, 04/01/2042 405,000 398,040
Grand Parkway Transportation Corp.(Texas)3.236%, 10/01/2052 190,000 191,029
Opportunistic Fixed Income Trust (continued)Shares orPrincipalAmount Value
MUNICIPAL BONDS (continued)United States (continued)San Francisco City & County Airport
Commission (California)4.000%, 05/01/2039 $ 160,000 $ 185,438
San Francisco City & County AirportCommission (California)2.958%, 05/01/2051 155,000 140,460
State of Hawaii Airports SystemRevenue4.000%, 07/01/2035 100,000 114,931
State of Hawaii Airports SystemRevenue5.000%, 07/01/2034 295,000 371,610
Tarrant County Cultural EducationFacilities Finance Corp. (Texas)3.422%, 09/01/2050 125,000 123,252
Triborough Bridge & TunnelAuthority (New York)5.000%, 11/15/2054 140,000 173,305
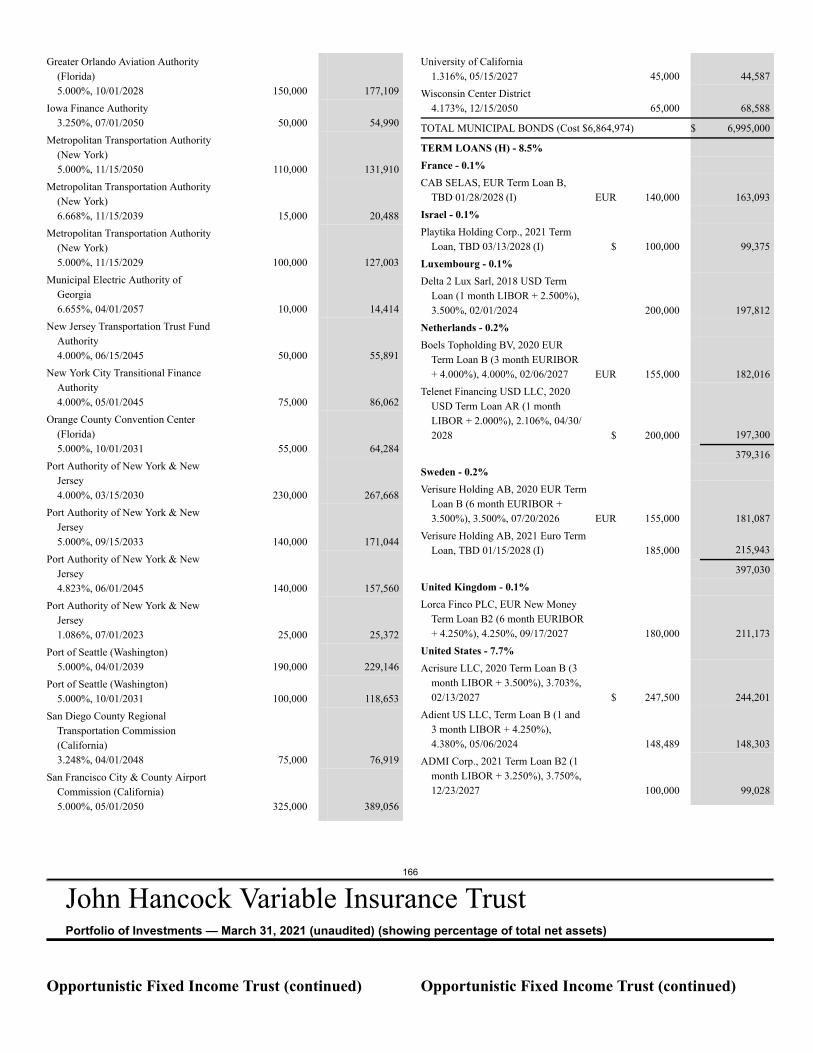
166
John Hancock Variable Insurance TrustPortfolio of Investments — March 31, 2021 (unaudited) (showing percentage of total net assets)
Greater Orlando Aviation Authority(Florida)5.000%, 10/01/2028 150,000 177,109
Iowa Finance Authority3.250%, 07/01/2050 50,000 54,990
Metropolitan Transportation Authority(New York)5.000%, 11/15/2050 110,000 131,910
Metropolitan Transportation Authority(New York)6.668%, 11/15/2039 15,000 20,488
Metropolitan Transportation Authority(New York)5.000%, 11/15/2029 100,000 127,003
Municipal Electric Authority ofGeorgia6.655%, 04/01/2057 10,000 14,414
New Jersey Transportation Trust FundAuthority4.000%, 06/15/2045 50,000 55,891
New York City Transitional FinanceAuthority4.000%, 05/01/2045 75,000 86,062
Orange County Convention Center(Florida)5.000%, 10/01/2031 55,000 64,284
Port Authority of New York & NewJersey4.000%, 03/15/2030 230,000 267,668
Port Authority of New York & NewJersey5.000%, 09/15/2033 140,000 171,044
Port Authority of New York & NewJersey4.823%, 06/01/2045 140,000 157,560
Port Authority of New York & NewJersey1.086%, 07/01/2023 25,000 25,372
Port of Seattle (Washington)5.000%, 04/01/2039 190,000 229,146
Port of Seattle (Washington)5.000%, 10/01/2031 100,000 118,653
San Diego County RegionalTransportation Commission(California)3.248%, 04/01/2048 75,000 76,919
San Francisco City & County AirportCommission (California)5.000%, 05/01/2050 325,000 389,056
University of California1.316%, 05/15/2027 45,000 44,587
Wisconsin Center District4.173%, 12/15/2050 65,000 68,588
TOTAL MUNICIPAL BONDS (Cost $6,864,974) $ 6,995,000
TERM LOANS (H) - 8.5%France - 0.1%CAB SELAS, EUR Term Loan B,
TBD 01/28/2028 (I) EUR 140,000 163,093Israel - 0.1%Playtika Holding Corp., 2021 Term
Loan, TBD 03/13/2028 (I) $ 100,000 99,375Luxembourg - 0.1%Delta 2 Lux Sarl, 2018 USD Term
Loan (1 month LIBOR + 2.500%),3.500%, 02/01/2024 200,000 197,812
Netherlands - 0.2%Boels Topholding BV, 2020 EUR
Term Loan B (3 month EURIBOR+ 4.000%), 4.000%, 02/06/2027 EUR 155,000 182,016
Telenet Financing USD LLC, 2020USD Term Loan AR (1 monthLIBOR + 2.000%), 2.106%, 04/30/2028 $ 200,000 197,300
379,316Sweden - 0.2%Verisure Holding AB, 2020 EUR Term
Loan B (6 month EURIBOR +3.500%), 3.500%, 07/20/2026 EUR 155,000 181,087
Verisure Holding AB, 2021 Euro TermLoan, TBD 01/15/2028 (I) 185,000 215,943
397,030United Kingdom - 0.1%Lorca Finco PLC, EUR New Money
Term Loan B2 (6 month EURIBOR+ 4.250%), 4.250%, 09/17/2027 180,000 211,173
United States - 7.7%Acrisure LLC, 2020 Term Loan B (3
month LIBOR + 3.500%), 3.703%,02/13/2027 $ 247,500 244,201
Adient US LLC, Term Loan B (1 and3 month LIBOR + 4.250%),4.380%, 05/06/2024 148,489 148,303
ADMI Corp., 2021 Term Loan B2 (1month LIBOR + 3.250%), 3.750%,12/23/2027 100,000 99,028
Opportunistic Fixed Income Trust (continued) Opportunistic Fixed Income Trust (continued)
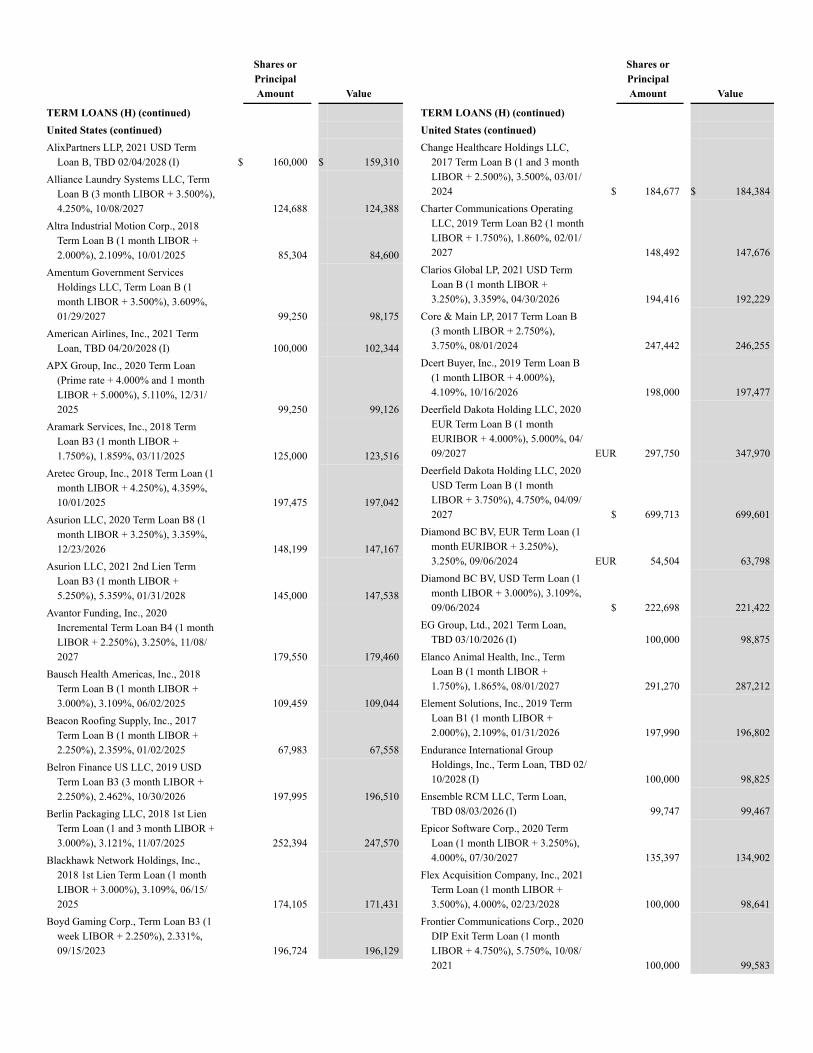
Shares orPrincipalAmount Value
TERM LOANS (H) (continued)United States (continued)AlixPartners LLP, 2021 USD Term
Loan B, TBD 02/04/2028 (I) $ 160,000 $ 159,310Alliance Laundry Systems LLC, Term
Loan B (3 month LIBOR + 3.500%),4.250%, 10/08/2027 124,688 124,388
Altra Industrial Motion Corp., 2018Term Loan B (1 month LIBOR +2.000%), 2.109%, 10/01/2025 85,304 84,600
Amentum Government ServicesHoldings LLC, Term Loan B (1month LIBOR + 3.500%), 3.609%,01/29/2027 99,250 98,175
American Airlines, Inc., 2021 TermLoan, TBD 04/20/2028 (I) 100,000 102,344
APX Group, Inc., 2020 Term Loan(Prime rate + 4.000% and 1 monthLIBOR + 5.000%), 5.110%, 12/31/2025 99,250 99,126
Aramark Services, Inc., 2018 TermLoan B3 (1 month LIBOR +1.750%), 1.859%, 03/11/2025 125,000 123,516
Aretec Group, Inc., 2018 Term Loan (1month LIBOR + 4.250%), 4.359%,10/01/2025 197,475 197,042
Asurion LLC, 2020 Term Loan B8 (1month LIBOR + 3.250%), 3.359%,12/23/2026 148,199 147,167
Asurion LLC, 2021 2nd Lien TermLoan B3 (1 month LIBOR +5.250%), 5.359%, 01/31/2028 145,000 147,538
Avantor Funding, Inc., 2020Incremental Term Loan B4 (1 monthLIBOR + 2.250%), 3.250%, 11/08/2027 179,550 179,460
Bausch Health Americas, Inc., 2018Term Loan B (1 month LIBOR +3.000%), 3.109%, 06/02/2025 109,459 109,044
Beacon Roofing Supply, Inc., 2017Term Loan B (1 month LIBOR +2.250%), 2.359%, 01/02/2025 67,983 67,558
Belron Finance US LLC, 2019 USDTerm Loan B3 (3 month LIBOR +2.250%), 2.462%, 10/30/2026 197,995 196,510
Berlin Packaging LLC, 2018 1st LienTerm Loan (1 and 3 month LIBOR +3.000%), 3.121%, 11/07/2025 252,394 247,570
Blackhawk Network Holdings, Inc.,2018 1st Lien Term Loan (1 monthLIBOR + 3.000%), 3.109%, 06/15/2025 174,105 171,431
Boyd Gaming Corp., Term Loan B3 (1week LIBOR + 2.250%), 2.331%,09/15/2023 196,724 196,129
Shares orPrincipalAmount Value
TERM LOANS (H) (continued)United States (continued)Change Healthcare Holdings LLC,
2017 Term Loan B (1 and 3 monthLIBOR + 2.500%), 3.500%, 03/01/2024 $ 184,677 $ 184,384
Charter Communications OperatingLLC, 2019 Term Loan B2 (1 monthLIBOR + 1.750%), 1.860%, 02/01/2027 148,492 147,676
Clarios Global LP, 2021 USD TermLoan B (1 month LIBOR +3.250%), 3.359%, 04/30/2026 194,416 192,229
Core & Main LP, 2017 Term Loan B(3 month LIBOR + 2.750%),3.750%, 08/01/2024 247,442 246,255
Dcert Buyer, Inc., 2019 Term Loan B(1 month LIBOR + 4.000%),4.109%, 10/16/2026 198,000 197,477
Deerfield Dakota Holding LLC, 2020EUR Term Loan B (1 monthEURIBOR + 4.000%), 5.000%, 04/09/2027 EUR 297,750 347,970
Deerfield Dakota Holding LLC, 2020USD Term Loan B (1 monthLIBOR + 3.750%), 4.750%, 04/09/2027 $ 699,713 699,601
Diamond BC BV, EUR Term Loan (1month EURIBOR + 3.250%),3.250%, 09/06/2024 EUR 54,504 63,798
Diamond BC BV, USD Term Loan (1month LIBOR + 3.000%), 3.109%,09/06/2024 $ 222,698 221,422
EG Group, Ltd., 2021 Term Loan,TBD 03/10/2026 (I) 100,000 98,875
Elanco Animal Health, Inc., TermLoan B (1 month LIBOR +1.750%), 1.865%, 08/01/2027 291,270 287,212
Element Solutions, Inc., 2019 TermLoan B1 (1 month LIBOR +2.000%), 2.109%, 01/31/2026 197,990 196,802
Endurance International GroupHoldings, Inc., Term Loan, TBD 02/10/2028 (I) 100,000 98,825
Ensemble RCM LLC, Term Loan,TBD 08/03/2026 (I) 99,747 99,467
Epicor Software Corp., 2020 TermLoan (1 month LIBOR + 3.250%),4.000%, 07/30/2027 135,397 134,902
Flex Acquisition Company, Inc., 2021Term Loan (1 month LIBOR +3.500%), 4.000%, 02/23/2028 100,000 98,641
Frontier Communications Corp., 2020DIP Exit Term Loan (1 monthLIBOR + 4.750%), 5.750%, 10/08/2021 100,000 99,583
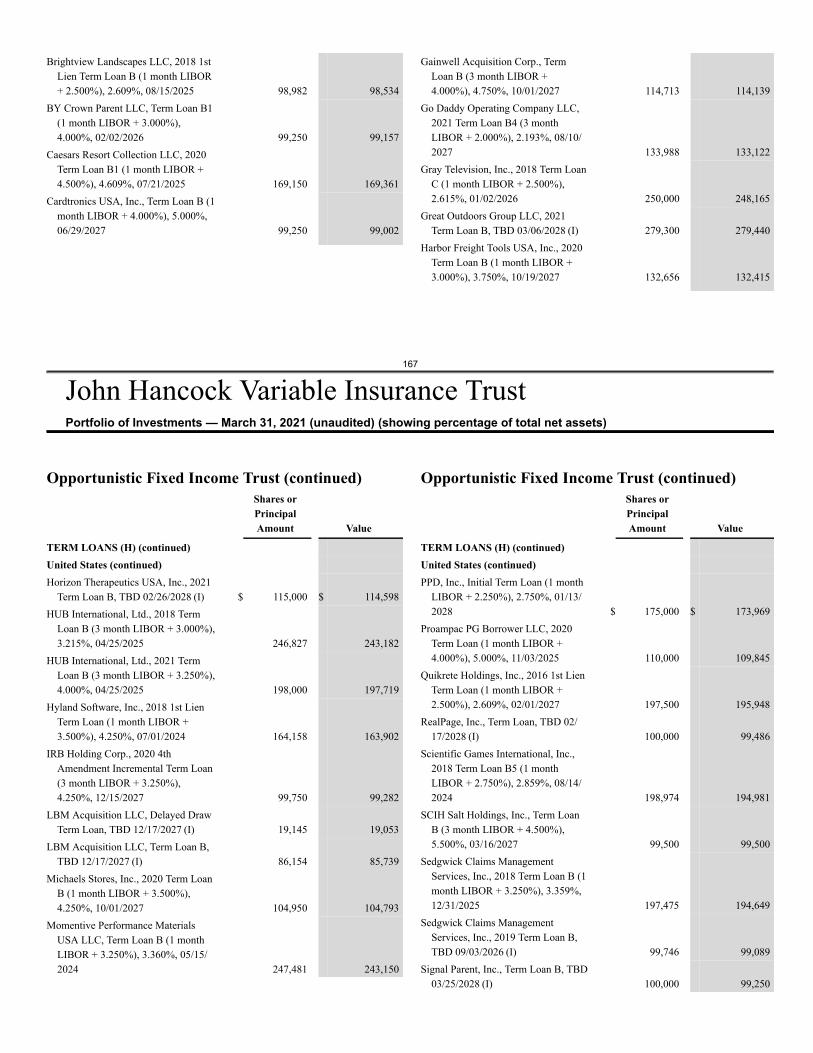
167
John Hancock Variable Insurance TrustPortfolio of Investments — March 31, 2021 (unaudited) (showing percentage of total net assets)
Brightview Landscapes LLC, 2018 1stLien Term Loan B (1 month LIBOR+ 2.500%), 2.609%, 08/15/2025 98,982 98,534
BY Crown Parent LLC, Term Loan B1(1 month LIBOR + 3.000%),4.000%, 02/02/2026 99,250 99,157
Caesars Resort Collection LLC, 2020Term Loan B1 (1 month LIBOR +4.500%), 4.609%, 07/21/2025 169,150 169,361
Cardtronics USA, Inc., Term Loan B (1month LIBOR + 4.000%), 5.000%,06/29/2027 99,250 99,002
Gainwell Acquisition Corp., TermLoan B (3 month LIBOR +4.000%), 4.750%, 10/01/2027 114,713 114,139
Go Daddy Operating Company LLC,2021 Term Loan B4 (3 monthLIBOR + 2.000%), 2.193%, 08/10/2027 133,988 133,122
Gray Television, Inc., 2018 Term LoanC (1 month LIBOR + 2.500%),2.615%, 01/02/2026 250,000 248,165
Great Outdoors Group LLC, 2021Term Loan B, TBD 03/06/2028 (I) 279,300 279,440
Harbor Freight Tools USA, Inc., 2020Term Loan B (1 month LIBOR +3.000%), 3.750%, 10/19/2027 132,656 132,415
Opportunistic Fixed Income Trust (continued)Shares orPrincipalAmount Value
TERM LOANS (H) (continued)United States (continued)Horizon Therapeutics USA, Inc., 2021
Term Loan B, TBD 02/26/2028 (I) $ 115,000 $ 114,598HUB International, Ltd., 2018 Term
Loan B (3 month LIBOR + 3.000%),3.215%, 04/25/2025 246,827 243,182
HUB International, Ltd., 2021 TermLoan B (3 month LIBOR + 3.250%),4.000%, 04/25/2025 198,000 197,719
Hyland Software, Inc., 2018 1st LienTerm Loan (1 month LIBOR +3.500%), 4.250%, 07/01/2024 164,158 163,902
IRB Holding Corp., 2020 4thAmendment Incremental Term Loan(3 month LIBOR + 3.250%),4.250%, 12/15/2027 99,750 99,282
LBM Acquisition LLC, Delayed DrawTerm Loan, TBD 12/17/2027 (I) 19,145 19,053
LBM Acquisition LLC, Term Loan B,TBD 12/17/2027 (I) 86,154 85,739
Michaels Stores, Inc., 2020 Term LoanB (1 month LIBOR + 3.500%),4.250%, 10/01/2027 104,950 104,793
Momentive Performance MaterialsUSA LLC, Term Loan B (1 monthLIBOR + 3.250%), 3.360%, 05/15/2024 247,481 243,150
Opportunistic Fixed Income Trust (continued)Shares orPrincipalAmount Value
TERM LOANS (H) (continued)United States (continued)PPD, Inc., Initial Term Loan (1 month
LIBOR + 2.250%), 2.750%, 01/13/2028 $ 175,000 $ 173,969
Proampac PG Borrower LLC, 2020Term Loan (1 month LIBOR +4.000%), 5.000%, 11/03/2025 110,000 109,845
Quikrete Holdings, Inc., 2016 1st LienTerm Loan (1 month LIBOR +2.500%), 2.609%, 02/01/2027 197,500 195,948
RealPage, Inc., Term Loan, TBD 02/17/2028 (I) 100,000 99,486
Scientific Games International, Inc.,2018 Term Loan B5 (1 monthLIBOR + 2.750%), 2.859%, 08/14/2024 198,974 194,981
SCIH Salt Holdings, Inc., Term LoanB (3 month LIBOR + 4.500%),5.500%, 03/16/2027 99,500 99,500
Sedgwick Claims ManagementServices, Inc., 2018 Term Loan B (1month LIBOR + 3.250%), 3.359%,12/31/2025 197,475 194,649
Sedgwick Claims ManagementServices, Inc., 2019 Term Loan B,TBD 09/03/2026 (I) 99,746 99,089
Signal Parent, Inc., Term Loan B, TBD03/25/2028 (I) 100,000 99,250
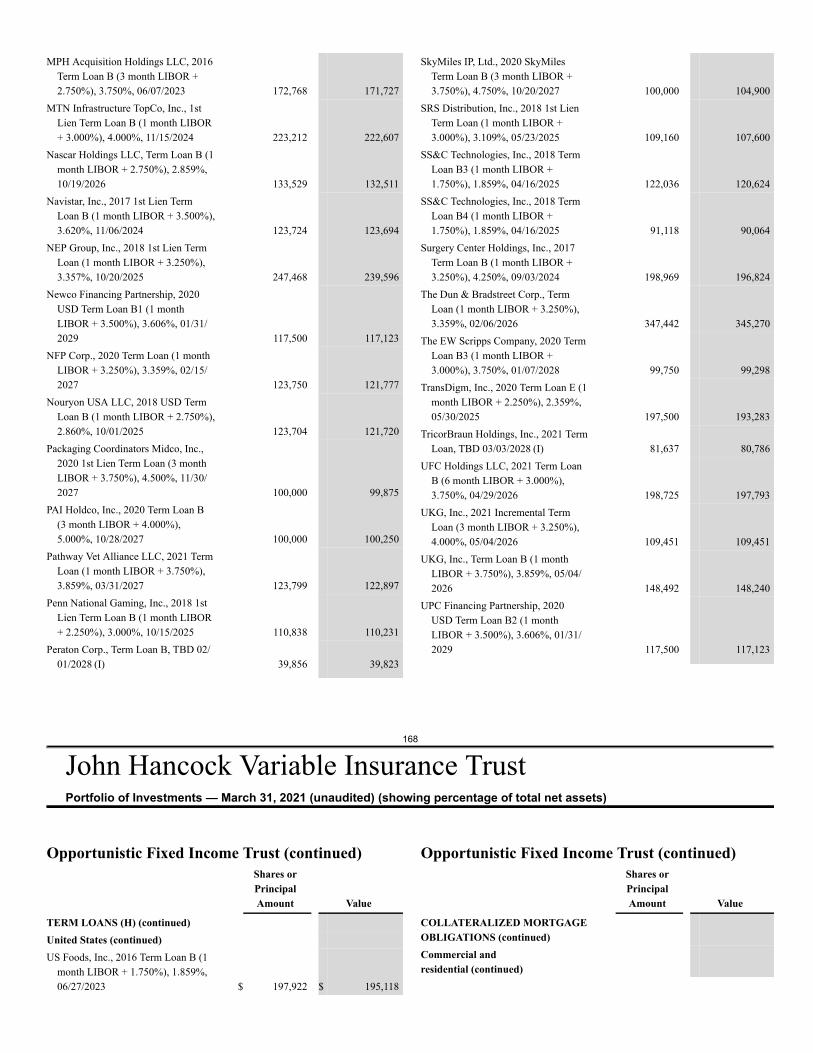
168
John Hancock Variable Insurance TrustPortfolio of Investments — March 31, 2021 (unaudited) (showing percentage of total net assets)
MPH Acquisition Holdings LLC, 2016Term Loan B (3 month LIBOR +2.750%), 3.750%, 06/07/2023 172,768 171,727
MTN Infrastructure TopCo, Inc., 1stLien Term Loan B (1 month LIBOR+ 3.000%), 4.000%, 11/15/2024 223,212 222,607
Nascar Holdings LLC, Term Loan B (1month LIBOR + 2.750%), 2.859%,10/19/2026 133,529 132,511
Navistar, Inc., 2017 1st Lien TermLoan B (1 month LIBOR + 3.500%),3.620%, 11/06/2024 123,724 123,694
NEP Group, Inc., 2018 1st Lien TermLoan (1 month LIBOR + 3.250%),3.357%, 10/20/2025 247,468 239,596
Newco Financing Partnership, 2020USD Term Loan B1 (1 monthLIBOR + 3.500%), 3.606%, 01/31/2029 117,500 117,123
NFP Corp., 2020 Term Loan (1 monthLIBOR + 3.250%), 3.359%, 02/15/2027 123,750 121,777
Nouryon USA LLC, 2018 USD TermLoan B (1 month LIBOR + 2.750%),2.860%, 10/01/2025 123,704 121,720
Packaging Coordinators Midco, Inc.,2020 1st Lien Term Loan (3 monthLIBOR + 3.750%), 4.500%, 11/30/2027 100,000 99,875
PAI Holdco, Inc., 2020 Term Loan B(3 month LIBOR + 4.000%),5.000%, 10/28/2027 100,000 100,250
Pathway Vet Alliance LLC, 2021 TermLoan (1 month LIBOR + 3.750%),3.859%, 03/31/2027 123,799 122,897
Penn National Gaming, Inc., 2018 1stLien Term Loan B (1 month LIBOR+ 2.250%), 3.000%, 10/15/2025 110,838 110,231
Peraton Corp., Term Loan B, TBD 02/01/2028 (I) 39,856 39,823
SkyMiles IP, Ltd., 2020 SkyMilesTerm Loan B (3 month LIBOR +3.750%), 4.750%, 10/20/2027 100,000 104,900
SRS Distribution, Inc., 2018 1st LienTerm Loan (1 month LIBOR +3.000%), 3.109%, 05/23/2025 109,160 107,600
SS&C Technologies, Inc., 2018 TermLoan B3 (1 month LIBOR +1.750%), 1.859%, 04/16/2025 122,036 120,624
SS&C Technologies, Inc., 2018 TermLoan B4 (1 month LIBOR +1.750%), 1.859%, 04/16/2025 91,118 90,064
Surgery Center Holdings, Inc., 2017Term Loan B (1 month LIBOR +3.250%), 4.250%, 09/03/2024 198,969 196,824
The Dun & Bradstreet Corp., TermLoan (1 month LIBOR + 3.250%),3.359%, 02/06/2026 347,442 345,270
The EW Scripps Company, 2020 TermLoan B3 (1 month LIBOR +3.000%), 3.750%, 01/07/2028 99,750 99,298
TransDigm, Inc., 2020 Term Loan E (1month LIBOR + 2.250%), 2.359%,05/30/2025 197,500 193,283
TricorBraun Holdings, Inc., 2021 TermLoan, TBD 03/03/2028 (I) 81,637 80,786
UFC Holdings LLC, 2021 Term LoanB (6 month LIBOR + 3.000%),3.750%, 04/29/2026 198,725 197,793
UKG, Inc., 2021 Incremental TermLoan (3 month LIBOR + 3.250%),4.000%, 05/04/2026 109,451 109,451
UKG, Inc., Term Loan B (1 monthLIBOR + 3.750%), 3.859%, 05/04/2026 148,492 148,240
UPC Financing Partnership, 2020USD Term Loan B2 (1 monthLIBOR + 3.500%), 3.606%, 01/31/2029 117,500 117,123
Opportunistic Fixed Income Trust (continued)Shares orPrincipalAmount Value
TERM LOANS (H) (continued)United States (continued)US Foods, Inc., 2016 Term Loan B (1
month LIBOR + 1.750%), 1.859%,06/27/2023 $ 197,922 $ 195,118
Opportunistic Fixed Income Trust (continued)Shares orPrincipalAmount Value
COLLATERALIZED MORTGAGEOBLIGATIONS (continued)Commercial andresidential (continued)
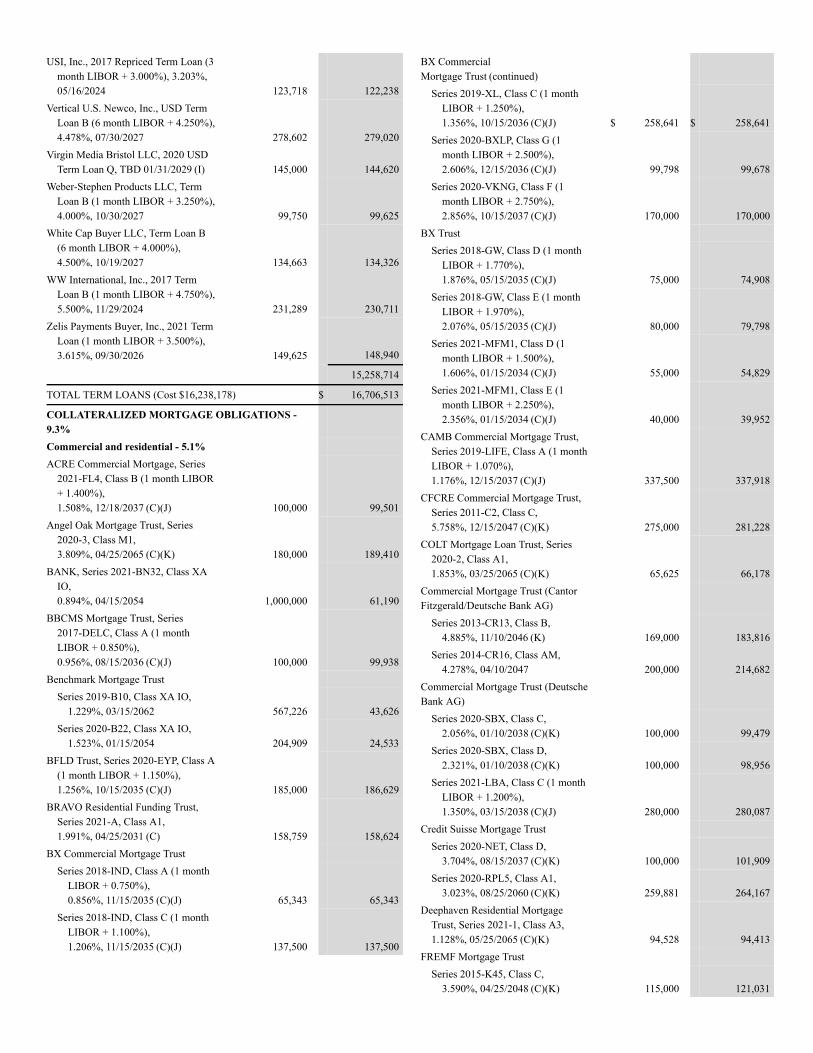
USI, Inc., 2017 Repriced Term Loan (3month LIBOR + 3.000%), 3.203%,05/16/2024 123,718 122,238
Vertical U.S. Newco, Inc., USD TermLoan B (6 month LIBOR + 4.250%),4.478%, 07/30/2027 278,602 279,020
Virgin Media Bristol LLC, 2020 USDTerm Loan Q, TBD 01/31/2029 (I) 145,000 144,620
Weber-Stephen Products LLC, TermLoan B (1 month LIBOR + 3.250%),4.000%, 10/30/2027 99,750 99,625
White Cap Buyer LLC, Term Loan B(6 month LIBOR + 4.000%),4.500%, 10/19/2027 134,663 134,326
WW International, Inc., 2017 TermLoan B (1 month LIBOR + 4.750%),5.500%, 11/29/2024 231,289 230,711
Zelis Payments Buyer, Inc., 2021 TermLoan (1 month LIBOR + 3.500%),3.615%, 09/30/2026 149,625 148,940
15,258,714
TOTAL TERM LOANS (Cost $16,238,178) $ 16,706,513
COLLATERALIZED MORTGAGE OBLIGATIONS -9.3%Commercial and residential - 5.1%ACRE Commercial Mortgage, Series
2021-FL4, Class B (1 month LIBOR+ 1.400%),1.508%, 12/18/2037 (C)(J) 100,000 99,501
Angel Oak Mortgage Trust, Series2020-3, Class M1,3.809%, 04/25/2065 (C)(K) 180,000 189,410
BANK, Series 2021-BN32, Class XAIO,0.894%, 04/15/2054 1,000,000 61,190
BBCMS Mortgage Trust, Series2017-DELC, Class A (1 monthLIBOR + 0.850%),0.956%, 08/15/2036 (C)(J) 100,000 99,938
Benchmark Mortgage TrustSeries 2019-B10, Class XA IO,
1.229%, 03/15/2062 567,226 43,626Series 2020-B22, Class XA IO,
1.523%, 01/15/2054 204,909 24,533BFLD Trust, Series 2020-EYP, Class A
(1 month LIBOR + 1.150%),1.256%, 10/15/2035 (C)(J) 185,000 186,629
BRAVO Residential Funding Trust,Series 2021-A, Class A1,1.991%, 04/25/2031 (C) 158,759 158,624
BX Commercial Mortgage TrustSeries 2018-IND, Class A (1 month
LIBOR + 0.750%),0.856%, 11/15/2035 (C)(J) 65,343 65,343
Series 2018-IND, Class C (1 monthLIBOR + 1.100%),1.206%, 11/15/2035 (C)(J) 137,500 137,500
BX CommercialMortgage Trust (continued)
Series 2019-XL, Class C (1 monthLIBOR + 1.250%),1.356%, 10/15/2036 (C)(J) $ 258,641 $ 258,641
Series 2020-BXLP, Class G (1month LIBOR + 2.500%),2.606%, 12/15/2036 (C)(J) 99,798 99,678
Series 2020-VKNG, Class F (1month LIBOR + 2.750%),2.856%, 10/15/2037 (C)(J) 170,000 170,000
BX TrustSeries 2018-GW, Class D (1 month
LIBOR + 1.770%),1.876%, 05/15/2035 (C)(J) 75,000 74,908
Series 2018-GW, Class E (1 monthLIBOR + 1.970%),2.076%, 05/15/2035 (C)(J) 80,000 79,798
Series 2021-MFM1, Class D (1month LIBOR + 1.500%),1.606%, 01/15/2034 (C)(J) 55,000 54,829
Series 2021-MFM1, Class E (1month LIBOR + 2.250%),2.356%, 01/15/2034 (C)(J) 40,000 39,952
CAMB Commercial Mortgage Trust,Series 2019-LIFE, Class A (1 monthLIBOR + 1.070%),1.176%, 12/15/2037 (C)(J) 337,500 337,918
CFCRE Commercial Mortgage Trust,Series 2011-C2, Class C,5.758%, 12/15/2047 (C)(K) 275,000 281,228
COLT Mortgage Loan Trust, Series2020-2, Class A1,1.853%, 03/25/2065 (C)(K) 65,625 66,178
Commercial Mortgage Trust (CantorFitzgerald/Deutsche Bank AG)
Series 2013-CR13, Class B,4.885%, 11/10/2046 (K) 169,000 183,816
Series 2014-CR16, Class AM,4.278%, 04/10/2047 200,000 214,682
Commercial Mortgage Trust (DeutscheBank AG)
Series 2020-SBX, Class C,2.056%, 01/10/2038 (C)(K) 100,000 99,479
Series 2020-SBX, Class D,2.321%, 01/10/2038 (C)(K) 100,000 98,956
Series 2021-LBA, Class C (1 monthLIBOR + 1.200%),1.350%, 03/15/2038 (C)(J) 280,000 280,087
Credit Suisse Mortgage TrustSeries 2020-NET, Class D,
3.704%, 08/15/2037 (C)(K) 100,000 101,909Series 2020-RPL5, Class A1,
3.023%, 08/25/2060 (C)(K) 259,881 264,167Deephaven Residential Mortgage
Trust, Series 2021-1, Class A3,1.128%, 05/25/2065 (C)(K) 94,528 94,413
FREMF Mortgage TrustSeries 2015-K45, Class C,
3.590%, 04/25/2048 (C)(K) 115,000 121,031
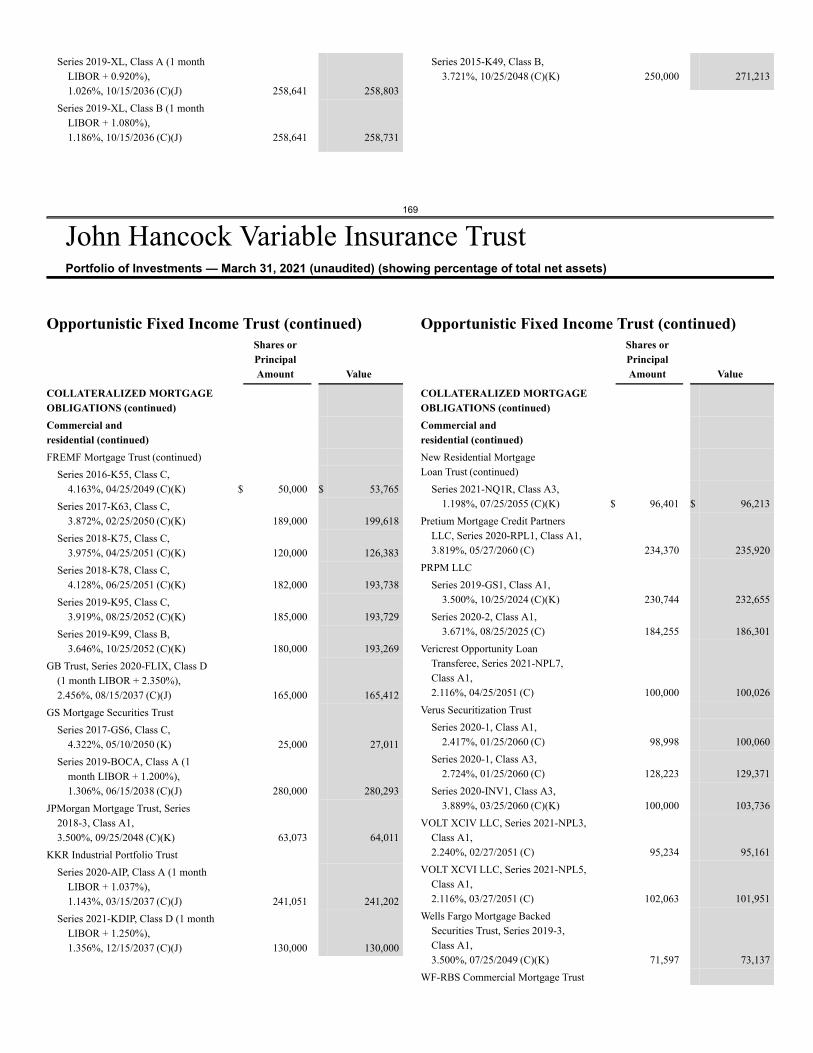
169
John Hancock Variable Insurance TrustPortfolio of Investments — March 31, 2021 (unaudited) (showing percentage of total net assets)
Series 2019-XL, Class A (1 monthLIBOR + 0.920%),1.026%, 10/15/2036 (C)(J) 258,641 258,803
Series 2019-XL, Class B (1 monthLIBOR + 1.080%),1.186%, 10/15/2036 (C)(J) 258,641 258,731
Series 2015-K49, Class B,3.721%, 10/25/2048 (C)(K) 250,000 271,213
Opportunistic Fixed Income Trust (continued)Shares orPrincipalAmount Value
COLLATERALIZED MORTGAGEOBLIGATIONS (continued)Commercial andresidential (continued)FREMF Mortgage Trust (continued)
Series 2016-K55, Class C,4.163%, 04/25/2049 (C)(K) $ 50,000 $ 53,765
Series 2017-K63, Class C,3.872%, 02/25/2050 (C)(K) 189,000 199,618
Series 2018-K75, Class C,3.975%, 04/25/2051 (C)(K) 120,000 126,383
Series 2018-K78, Class C,4.128%, 06/25/2051 (C)(K) 182,000 193,738
Series 2019-K95, Class C,3.919%, 08/25/2052 (C)(K) 185,000 193,729
Series 2019-K99, Class B,3.646%, 10/25/2052 (C)(K) 180,000 193,269
GB Trust, Series 2020-FLIX, Class D(1 month LIBOR + 2.350%),2.456%, 08/15/2037 (C)(J) 165,000 165,412
GS Mortgage Securities TrustSeries 2017-GS6, Class C,
4.322%, 05/10/2050 (K) 25,000 27,011Series 2019-BOCA, Class A (1
month LIBOR + 1.200%),1.306%, 06/15/2038 (C)(J) 280,000 280,293
JPMorgan Mortgage Trust, Series2018-3, Class A1,3.500%, 09/25/2048 (C)(K) 63,073 64,011
KKR Industrial Portfolio TrustSeries 2020-AIP, Class A (1 month
LIBOR + 1.037%),1.143%, 03/15/2037 (C)(J) 241,051 241,202
Series 2021-KDIP, Class D (1 monthLIBOR + 1.250%),1.356%, 12/15/2037 (C)(J) 130,000 130,000
Opportunistic Fixed Income Trust (continued)Shares orPrincipalAmount Value
COLLATERALIZED MORTGAGEOBLIGATIONS (continued)Commercial andresidential (continued)New Residential MortgageLoan Trust (continued)
Series 2021-NQ1R, Class A3,1.198%, 07/25/2055 (C)(K) $ 96,401 $ 96,213
Pretium Mortgage Credit PartnersLLC, Series 2020-RPL1, Class A1,3.819%, 05/27/2060 (C) 234,370 235,920
PRPM LLCSeries 2019-GS1, Class A1,
3.500%, 10/25/2024 (C)(K) 230,744 232,655Series 2020-2, Class A1,
3.671%, 08/25/2025 (C) 184,255 186,301Vericrest Opportunity Loan
Transferee, Series 2021-NPL7,Class A1,2.116%, 04/25/2051 (C) 100,000 100,026
Verus Securitization TrustSeries 2020-1, Class A1,
2.417%, 01/25/2060 (C) 98,998 100,060Series 2020-1, Class A3,
2.724%, 01/25/2060 (C) 128,223 129,371Series 2020-INV1, Class A3,
3.889%, 03/25/2060 (C)(K) 100,000 103,736VOLT XCIV LLC, Series 2021-NPL3,
Class A1,2.240%, 02/27/2051 (C) 95,234 95,161
VOLT XCVI LLC, Series 2021-NPL5,Class A1,2.116%, 03/27/2051 (C) 102,063 101,951
Wells Fargo Mortgage BackedSecurities Trust, Series 2019-3,Class A1,3.500%, 07/25/2049 (C)(K) 71,597 73,137
WF-RBS Commercial Mortgage Trust
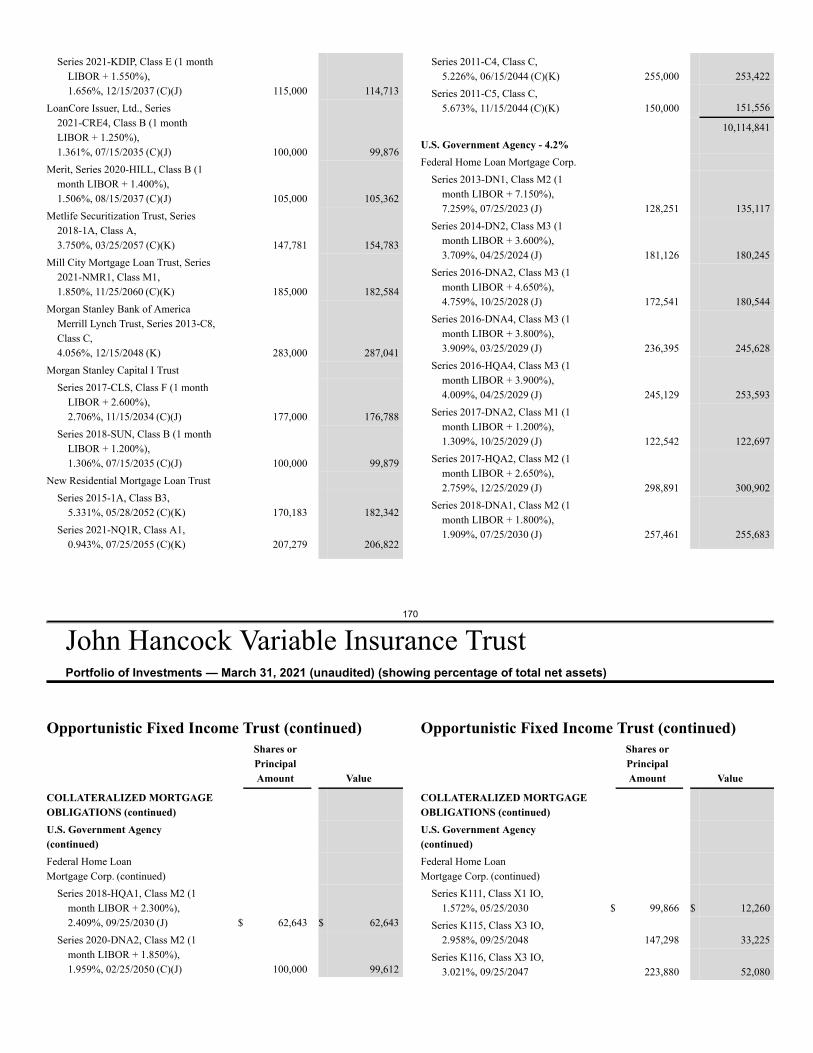
170
John Hancock Variable Insurance TrustPortfolio of Investments — March 31, 2021 (unaudited) (showing percentage of total net assets)
Series 2021-KDIP, Class E (1 monthLIBOR + 1.550%),1.656%, 12/15/2037 (C)(J) 115,000 114,713
LoanCore Issuer, Ltd., Series2021-CRE4, Class B (1 monthLIBOR + 1.250%),1.361%, 07/15/2035 (C)(J) 100,000 99,876
Merit, Series 2020-HILL, Class B (1month LIBOR + 1.400%),1.506%, 08/15/2037 (C)(J) 105,000 105,362
Metlife Securitization Trust, Series2018-1A, Class A,3.750%, 03/25/2057 (C)(K) 147,781 154,783
Mill City Mortgage Loan Trust, Series2021-NMR1, Class M1,1.850%, 11/25/2060 (C)(K) 185,000 182,584
Morgan Stanley Bank of AmericaMerrill Lynch Trust, Series 2013-C8,Class C,4.056%, 12/15/2048 (K) 283,000 287,041
Morgan Stanley Capital I TrustSeries 2017-CLS, Class F (1 month
LIBOR + 2.600%),2.706%, 11/15/2034 (C)(J) 177,000 176,788
Series 2018-SUN, Class B (1 monthLIBOR + 1.200%),1.306%, 07/15/2035 (C)(J) 100,000 99,879
New Residential Mortgage Loan TrustSeries 2015-1A, Class B3,
5.331%, 05/28/2052 (C)(K) 170,183 182,342Series 2021-NQ1R, Class A1,
0.943%, 07/25/2055 (C)(K) 207,279 206,822
Series 2011-C4, Class C,5.226%, 06/15/2044 (C)(K) 255,000 253,422
Series 2011-C5, Class C,5.673%, 11/15/2044 (C)(K) 150,000 151,556
10,114,841U.S. Government Agency - 4.2%Federal Home Loan Mortgage Corp.
Series 2013-DN1, Class M2 (1month LIBOR + 7.150%),7.259%, 07/25/2023 (J) 128,251 135,117
Series 2014-DN2, Class M3 (1month LIBOR + 3.600%),3.709%, 04/25/2024 (J) 181,126 180,245
Series 2016-DNA2, Class M3 (1month LIBOR + 4.650%),4.759%, 10/25/2028 (J) 172,541 180,544
Series 2016-DNA4, Class M3 (1month LIBOR + 3.800%),3.909%, 03/25/2029 (J) 236,395 245,628
Series 2016-HQA4, Class M3 (1month LIBOR + 3.900%),4.009%, 04/25/2029 (J) 245,129 253,593
Series 2017-DNA2, Class M1 (1month LIBOR + 1.200%),1.309%, 10/25/2029 (J) 122,542 122,697
Series 2017-HQA2, Class M2 (1month LIBOR + 2.650%),2.759%, 12/25/2029 (J) 298,891 300,902
Series 2018-DNA1, Class M2 (1month LIBOR + 1.800%),1.909%, 07/25/2030 (J) 257,461 255,683
Opportunistic Fixed Income Trust (continued)Shares orPrincipalAmount Value
COLLATERALIZED MORTGAGEOBLIGATIONS (continued)U.S. Government Agency(continued)Federal Home LoanMortgage Corp. (continued)
Series 2018-HQA1, Class M2 (1month LIBOR + 2.300%),2.409%, 09/25/2030 (J) $ 62,643 $ 62,643
Series 2020-DNA2, Class M2 (1month LIBOR + 1.850%),1.959%, 02/25/2050 (C)(J) 100,000 99,612
Opportunistic Fixed Income Trust (continued)Shares orPrincipalAmount Value
COLLATERALIZED MORTGAGEOBLIGATIONS (continued)U.S. Government Agency(continued)Federal Home LoanMortgage Corp. (continued)
Series K111, Class X1 IO,1.572%, 05/25/2030 $ 99,866 $ 12,260
Series K115, Class X3 IO,2.958%, 09/25/2048 147,298 33,225
Series K116, Class X3 IO,3.021%, 09/25/2047 223,880 52,080
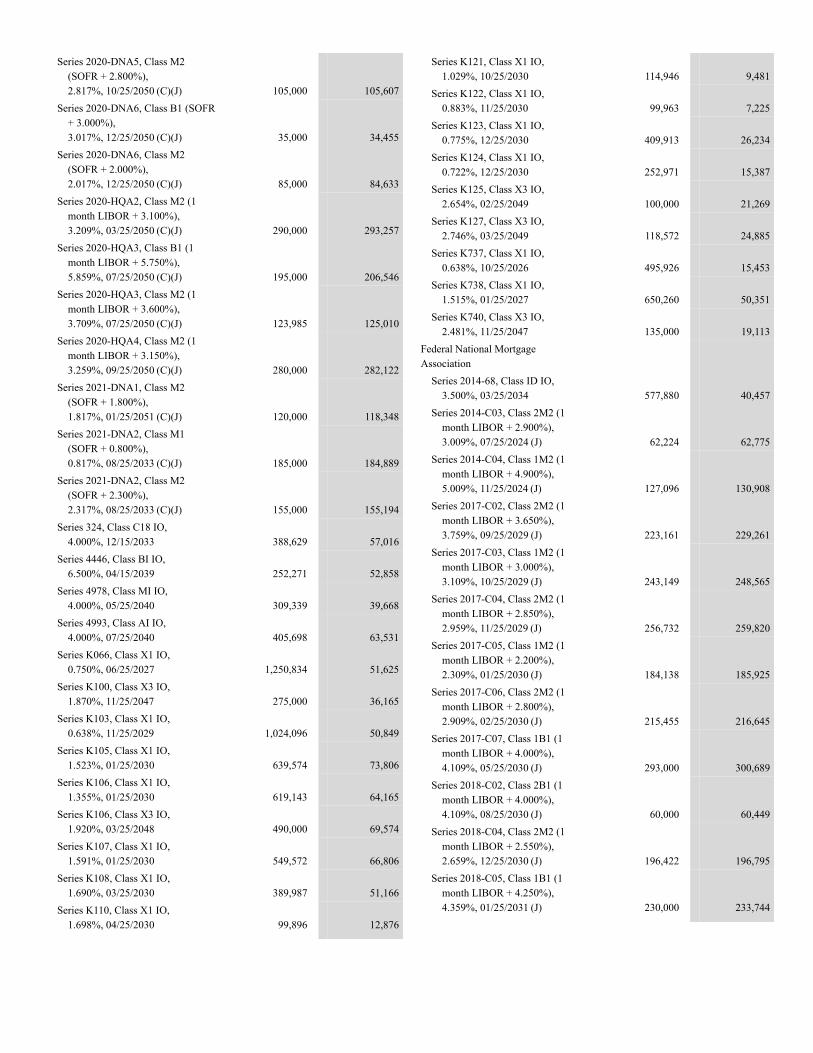
Series 2020-DNA5, Class M2(SOFR + 2.800%),2.817%, 10/25/2050 (C)(J) 105,000 105,607
Series 2020-DNA6, Class B1 (SOFR+ 3.000%),3.017%, 12/25/2050 (C)(J) 35,000 34,455
Series 2020-DNA6, Class M2(SOFR + 2.000%),2.017%, 12/25/2050 (C)(J) 85,000 84,633
Series 2020-HQA2, Class M2 (1month LIBOR + 3.100%),3.209%, 03/25/2050 (C)(J) 290,000 293,257
Series 2020-HQA3, Class B1 (1month LIBOR + 5.750%),5.859%, 07/25/2050 (C)(J) 195,000 206,546
Series 2020-HQA3, Class M2 (1month LIBOR + 3.600%),3.709%, 07/25/2050 (C)(J) 123,985 125,010
Series 2020-HQA4, Class M2 (1month LIBOR + 3.150%),3.259%, 09/25/2050 (C)(J) 280,000 282,122
Series 2021-DNA1, Class M2(SOFR + 1.800%),1.817%, 01/25/2051 (C)(J) 120,000 118,348
Series 2021-DNA2, Class M1(SOFR + 0.800%),0.817%, 08/25/2033 (C)(J) 185,000 184,889
Series 2021-DNA2, Class M2(SOFR + 2.300%),2.317%, 08/25/2033 (C)(J) 155,000 155,194
Series 324, Class C18 IO,4.000%, 12/15/2033 388,629 57,016
Series 4446, Class BI IO,6.500%, 04/15/2039 252,271 52,858
Series 4978, Class MI IO,4.000%, 05/25/2040 309,339 39,668
Series 4993, Class AI IO,4.000%, 07/25/2040 405,698 63,531
Series K066, Class X1 IO,0.750%, 06/25/2027 1,250,834 51,625
Series K100, Class X3 IO,1.870%, 11/25/2047 275,000 36,165
Series K103, Class X1 IO,0.638%, 11/25/2029 1,024,096 50,849
Series K105, Class X1 IO,1.523%, 01/25/2030 639,574 73,806
Series K106, Class X1 IO,1.355%, 01/25/2030 619,143 64,165
Series K106, Class X3 IO,1.920%, 03/25/2048 490,000 69,574
Series K107, Class X1 IO,1.591%, 01/25/2030 549,572 66,806
Series K108, Class X1 IO,1.690%, 03/25/2030 389,987 51,166
Series K110, Class X1 IO,1.698%, 04/25/2030 99,896 12,876
Series K121, Class X1 IO,1.029%, 10/25/2030 114,946 9,481
Series K122, Class X1 IO,0.883%, 11/25/2030 99,963 7,225
Series K123, Class X1 IO,0.775%, 12/25/2030 409,913 26,234
Series K124, Class X1 IO,0.722%, 12/25/2030 252,971 15,387
Series K125, Class X3 IO,2.654%, 02/25/2049 100,000 21,269
Series K127, Class X3 IO,2.746%, 03/25/2049 118,572 24,885
Series K737, Class X1 IO,0.638%, 10/25/2026 495,926 15,453
Series K738, Class X1 IO,1.515%, 01/25/2027 650,260 50,351
Series K740, Class X3 IO,2.481%, 11/25/2047 135,000 19,113
Federal National MortgageAssociation
Series 2014-68, Class ID IO,3.500%, 03/25/2034 577,880 40,457
Series 2014-C03, Class 2M2 (1month LIBOR + 2.900%),3.009%, 07/25/2024 (J) 62,224 62,775
Series 2014-C04, Class 1M2 (1month LIBOR + 4.900%),5.009%, 11/25/2024 (J) 127,096 130,908
Series 2017-C02, Class 2M2 (1month LIBOR + 3.650%),3.759%, 09/25/2029 (J) 223,161 229,261
Series 2017-C03, Class 1M2 (1month LIBOR + 3.000%),3.109%, 10/25/2029 (J) 243,149 248,565
Series 2017-C04, Class 2M2 (1month LIBOR + 2.850%),2.959%, 11/25/2029 (J) 256,732 259,820
Series 2017-C05, Class 1M2 (1month LIBOR + 2.200%),2.309%, 01/25/2030 (J) 184,138 185,925
Series 2017-C06, Class 2M2 (1month LIBOR + 2.800%),2.909%, 02/25/2030 (J) 215,455 216,645
Series 2017-C07, Class 1B1 (1month LIBOR + 4.000%),4.109%, 05/25/2030 (J) 293,000 300,689
Series 2018-C02, Class 2B1 (1month LIBOR + 4.000%),4.109%, 08/25/2030 (J) 60,000 60,449
Series 2018-C04, Class 2M2 (1month LIBOR + 2.550%),2.659%, 12/25/2030 (J) 196,422 196,795
Series 2018-C05, Class 1B1 (1month LIBOR + 4.250%),4.359%, 01/25/2031 (J) 230,000 233,744
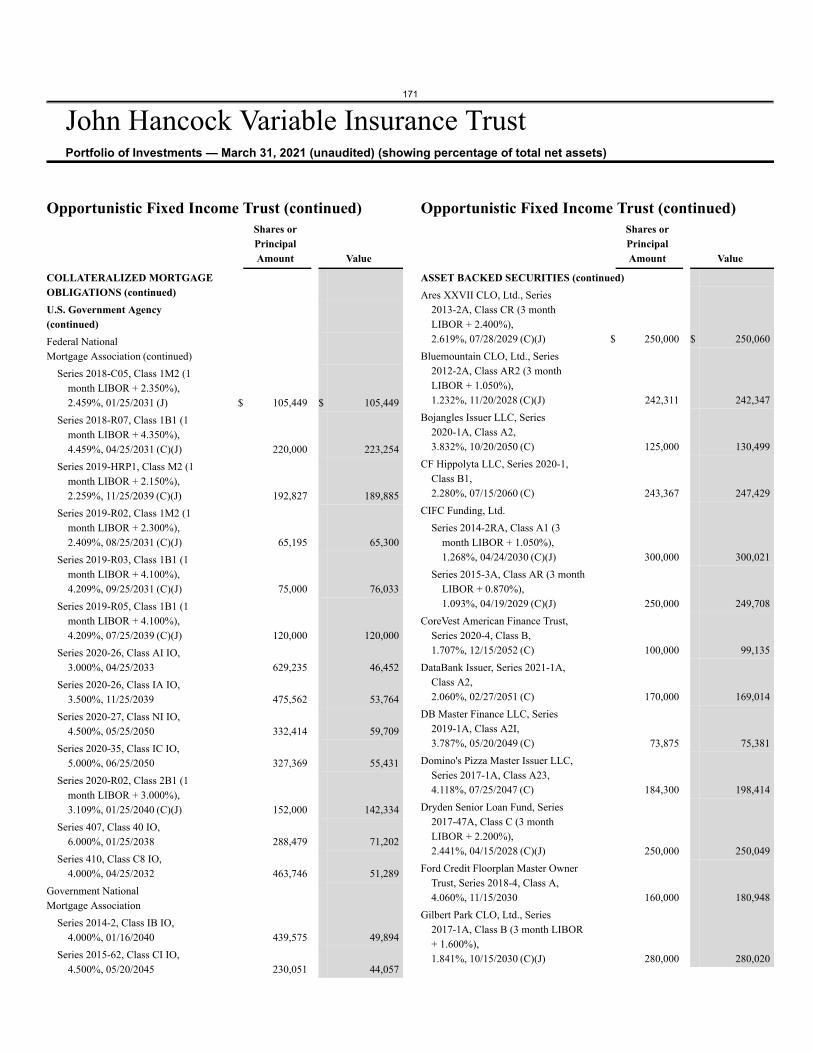
171
John Hancock Variable Insurance TrustPortfolio of Investments — March 31, 2021 (unaudited) (showing percentage of total net assets)
Opportunistic Fixed Income Trust (continued)Shares orPrincipalAmount Value
COLLATERALIZED MORTGAGEOBLIGATIONS (continued)U.S. Government Agency(continued)Federal NationalMortgage Association (continued)
Series 2018-C05, Class 1M2 (1month LIBOR + 2.350%),2.459%, 01/25/2031 (J) $ 105,449 $ 105,449
Series 2018-R07, Class 1B1 (1month LIBOR + 4.350%),4.459%, 04/25/2031 (C)(J) 220,000 223,254
Series 2019-HRP1, Class M2 (1month LIBOR + 2.150%),2.259%, 11/25/2039 (C)(J) 192,827 189,885
Series 2019-R02, Class 1M2 (1month LIBOR + 2.300%),2.409%, 08/25/2031 (C)(J) 65,195 65,300
Series 2019-R03, Class 1B1 (1month LIBOR + 4.100%),4.209%, 09/25/2031 (C)(J) 75,000 76,033
Series 2019-R05, Class 1B1 (1month LIBOR + 4.100%),4.209%, 07/25/2039 (C)(J) 120,000 120,000
Series 2020-26, Class AI IO,3.000%, 04/25/2033 629,235 46,452
Series 2020-26, Class IA IO,3.500%, 11/25/2039 475,562 53,764
Series 2020-27, Class NI IO,4.500%, 05/25/2050 332,414 59,709
Series 2020-35, Class IC IO,5.000%, 06/25/2050 327,369 55,431
Series 2020-R02, Class 2B1 (1month LIBOR + 3.000%),3.109%, 01/25/2040 (C)(J) 152,000 142,334
Series 407, Class 40 IO,6.000%, 01/25/2038 288,479 71,202
Series 410, Class C8 IO,4.000%, 04/25/2032 463,746 51,289
Government NationalMortgage Association
Series 2014-2, Class IB IO,4.000%, 01/16/2040 439,575 49,894
Series 2015-62, Class CI IO,4.500%, 05/20/2045 230,051 44,057
Opportunistic Fixed Income Trust (continued)Shares orPrincipalAmount Value
ASSET BACKED SECURITIES (continued)Ares XXVII CLO, Ltd., Series
2013-2A, Class CR (3 monthLIBOR + 2.400%),2.619%, 07/28/2029 (C)(J) $ 250,000 $ 250,060
Bluemountain CLO, Ltd., Series2012-2A, Class AR2 (3 monthLIBOR + 1.050%),1.232%, 11/20/2028 (C)(J) 242,311 242,347
Bojangles Issuer LLC, Series2020-1A, Class A2,3.832%, 10/20/2050 (C) 125,000 130,499
CF Hippolyta LLC, Series 2020-1,Class B1,2.280%, 07/15/2060 (C) 243,367 247,429
CIFC Funding, Ltd.Series 2014-2RA, Class A1 (3
month LIBOR + 1.050%),1.268%, 04/24/2030 (C)(J) 300,000 300,021
Series 2015-3A, Class AR (3 monthLIBOR + 0.870%),1.093%, 04/19/2029 (C)(J) 250,000 249,708
CoreVest American Finance Trust,Series 2020-4, Class B,1.707%, 12/15/2052 (C) 100,000 99,135
DataBank Issuer, Series 2021-1A,Class A2,2.060%, 02/27/2051 (C) 170,000 169,014
DB Master Finance LLC, Series2019-1A, Class A2I,3.787%, 05/20/2049 (C) 73,875 75,381
Domino's Pizza Master Issuer LLC,Series 2017-1A, Class A23,4.118%, 07/25/2047 (C) 184,300 198,414
Dryden Senior Loan Fund, Series2017-47A, Class C (3 monthLIBOR + 2.200%),2.441%, 04/15/2028 (C)(J) 250,000 250,049
Ford Credit Floorplan Master OwnerTrust, Series 2018-4, Class A,4.060%, 11/15/2030 160,000 180,948
Gilbert Park CLO, Ltd., Series2017-1A, Class B (3 month LIBOR+ 1.600%),1.841%, 10/15/2030 (C)(J) 280,000 280,020
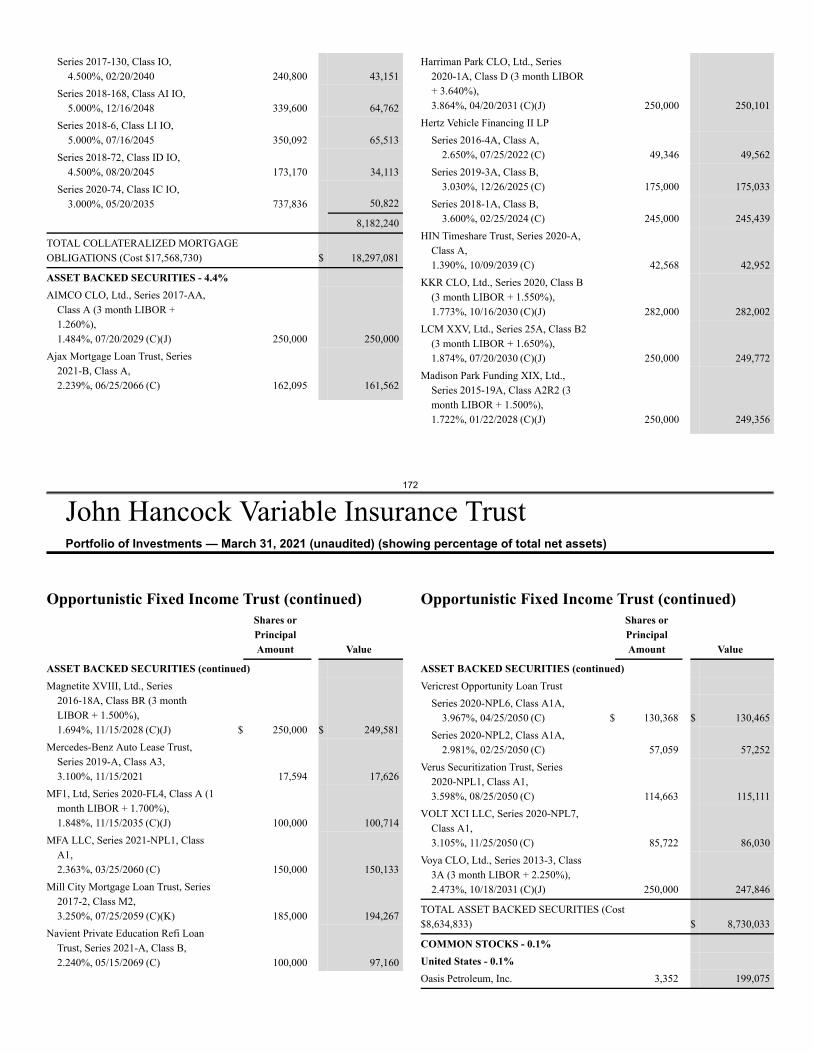
172
John Hancock Variable Insurance TrustPortfolio of Investments — March 31, 2021 (unaudited) (showing percentage of total net assets)
Series 2017-130, Class IO,4.500%, 02/20/2040 240,800 43,151
Series 2018-168, Class AI IO,5.000%, 12/16/2048 339,600 64,762
Series 2018-6, Class LI IO,5.000%, 07/16/2045 350,092 65,513
Series 2018-72, Class ID IO,4.500%, 08/20/2045 173,170 34,113
Series 2020-74, Class IC IO,3.000%, 05/20/2035 737,836 50,822
8,182,240
TOTAL COLLATERALIZED MORTGAGEOBLIGATIONS (Cost $17,568,730) $ 18,297,081
ASSET BACKED SECURITIES - 4.4%AIMCO CLO, Ltd., Series 2017-AA,
Class A (3 month LIBOR +1.260%),1.484%, 07/20/2029 (C)(J) 250,000 250,000
Ajax Mortgage Loan Trust, Series2021-B, Class A,2.239%, 06/25/2066 (C) 162,095 161,562
Harriman Park CLO, Ltd., Series2020-1A, Class D (3 month LIBOR+ 3.640%),3.864%, 04/20/2031 (C)(J) 250,000 250,101
Hertz Vehicle Financing II LPSeries 2016-4A, Class A,
2.650%, 07/25/2022 (C) 49,346 49,562Series 2019-3A, Class B,
3.030%, 12/26/2025 (C) 175,000 175,033Series 2018-1A, Class B,
3.600%, 02/25/2024 (C) 245,000 245,439HIN Timeshare Trust, Series 2020-A,
Class A,1.390%, 10/09/2039 (C) 42,568 42,952
KKR CLO, Ltd., Series 2020, Class B(3 month LIBOR + 1.550%),1.773%, 10/16/2030 (C)(J) 282,000 282,002
LCM XXV, Ltd., Series 25A, Class B2(3 month LIBOR + 1.650%),1.874%, 07/20/2030 (C)(J) 250,000 249,772
Madison Park Funding XIX, Ltd.,Series 2015-19A, Class A2R2 (3month LIBOR + 1.500%),1.722%, 01/22/2028 (C)(J) 250,000 249,356
Opportunistic Fixed Income Trust (continued)Shares orPrincipalAmount Value
ASSET BACKED SECURITIES (continued)Magnetite XVIII, Ltd., Series
2016-18A, Class BR (3 monthLIBOR + 1.500%),1.694%, 11/15/2028 (C)(J) $ 250,000 $ 249,581
Mercedes-Benz Auto Lease Trust,Series 2019-A, Class A3,3.100%, 11/15/2021 17,594 17,626
MF1, Ltd, Series 2020-FL4, Class A (1month LIBOR + 1.700%),1.848%, 11/15/2035 (C)(J) 100,000 100,714
MFA LLC, Series 2021-NPL1, ClassA1,2.363%, 03/25/2060 (C) 150,000 150,133
Mill City Mortgage Loan Trust, Series2017-2, Class M2,3.250%, 07/25/2059 (C)(K) 185,000 194,267
Navient Private Education Refi LoanTrust, Series 2021-A, Class B,2.240%, 05/15/2069 (C) 100,000 97,160
Opportunistic Fixed Income Trust (continued)Shares orPrincipalAmount Value
ASSET BACKED SECURITIES (continued)Vericrest Opportunity Loan Trust
Series 2020-NPL6, Class A1A,3.967%, 04/25/2050 (C) $ 130,368 $ 130,465
Series 2020-NPL2, Class A1A,2.981%, 02/25/2050 (C) 57,059 57,252
Verus Securitization Trust, Series2020-NPL1, Class A1,3.598%, 08/25/2050 (C) 114,663 115,111
VOLT XCI LLC, Series 2020-NPL7,Class A1,3.105%, 11/25/2050 (C) 85,722 86,030
Voya CLO, Ltd., Series 2013-3, Class3A (3 month LIBOR + 2.250%),2.473%, 10/18/2031 (C)(J) 250,000 247,846
TOTAL ASSET BACKED SECURITIES (Cost$8,634,833) $ 8,730,033
COMMON STOCKS - 0.1%United States - 0.1%Oasis Petroleum, Inc. 3,352 199,075
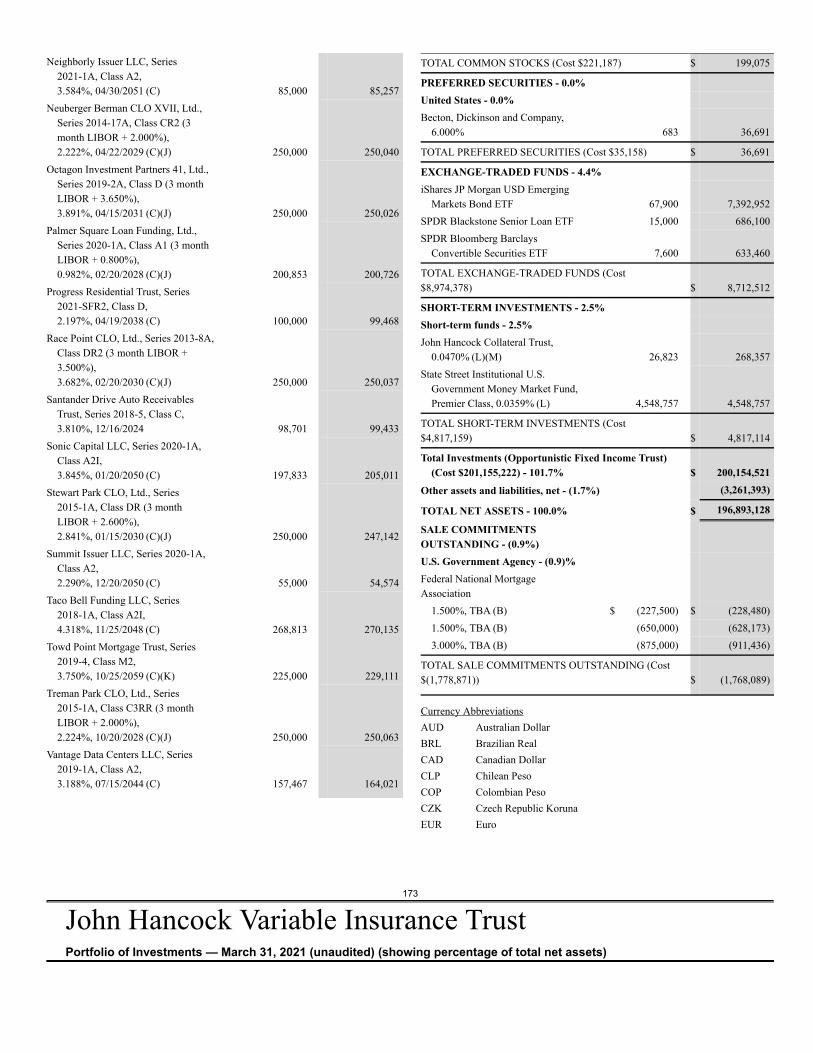
173
John Hancock Variable Insurance TrustPortfolio of Investments — March 31, 2021 (unaudited) (showing percentage of total net assets)
Neighborly Issuer LLC, Series2021-1A, Class A2,3.584%, 04/30/2051 (C) 85,000 85,257
Neuberger Berman CLO XVII, Ltd.,Series 2014-17A, Class CR2 (3month LIBOR + 2.000%),2.222%, 04/22/2029 (C)(J) 250,000 250,040
Octagon Investment Partners 41, Ltd.,Series 2019-2A, Class D (3 monthLIBOR + 3.650%),3.891%, 04/15/2031 (C)(J) 250,000 250,026
Palmer Square Loan Funding, Ltd.,Series 2020-1A, Class A1 (3 monthLIBOR + 0.800%),0.982%, 02/20/2028 (C)(J) 200,853 200,726
Progress Residential Trust, Series2021-SFR2, Class D,2.197%, 04/19/2038 (C) 100,000 99,468
Race Point CLO, Ltd., Series 2013-8A,Class DR2 (3 month LIBOR +3.500%),3.682%, 02/20/2030 (C)(J) 250,000 250,037
Santander Drive Auto ReceivablesTrust, Series 2018-5, Class C,3.810%, 12/16/2024 98,701 99,433
Sonic Capital LLC, Series 2020-1A,Class A2I,3.845%, 01/20/2050 (C) 197,833 205,011
Stewart Park CLO, Ltd., Series2015-1A, Class DR (3 monthLIBOR + 2.600%),2.841%, 01/15/2030 (C)(J) 250,000 247,142
Summit Issuer LLC, Series 2020-1A,Class A2,2.290%, 12/20/2050 (C) 55,000 54,574
Taco Bell Funding LLC, Series2018-1A, Class A2I,4.318%, 11/25/2048 (C) 268,813 270,135
Towd Point Mortgage Trust, Series2019-4, Class M2,3.750%, 10/25/2059 (C)(K) 225,000 229,111
Treman Park CLO, Ltd., Series2015-1A, Class C3RR (3 monthLIBOR + 2.000%),2.224%, 10/20/2028 (C)(J) 250,000 250,063
Vantage Data Centers LLC, Series2019-1A, Class A2,3.188%, 07/15/2044 (C) 157,467 164,021
TOTAL COMMON STOCKS (Cost $221,187) $ 199,075
PREFERRED SECURITIES - 0.0%United States - 0.0%Becton, Dickinson and Company,
6.000% 683 36,691
TOTAL PREFERRED SECURITIES (Cost $35,158) $ 36,691
EXCHANGE-TRADED FUNDS - 4.4%iShares JP Morgan USD Emerging
Markets Bond ETF 67,900 7,392,952SPDR Blackstone Senior Loan ETF 15,000 686,100SPDR Bloomberg Barclays
Convertible Securities ETF 7,600 633,460
TOTAL EXCHANGE-TRADED FUNDS (Cost$8,974,378) $ 8,712,512
SHORT-TERM INVESTMENTS - 2.5%Short-term funds - 2.5%John Hancock Collateral Trust,
0.0470% (L)(M) 26,823 268,357State Street Institutional U.S.
Government Money Market Fund,Premier Class, 0.0359% (L) 4,548,757 4,548,757
TOTAL SHORT-TERM INVESTMENTS (Cost$4,817,159) $ 4,817,114
Total Investments (Opportunistic Fixed Income Trust)(Cost $201,155,222) - 101.7% $ 200,154,521
Other assets and liabilities, net - (1.7%) (3,261,393)
TOTAL NET ASSETS - 100.0% $ 196,893,128
SALE COMMITMENTSOUTSTANDING - (0.9%)U.S. Government Agency - (0.9)%Federal National MortgageAssociation
1.500%, TBA (B) $ (227,500) $ (228,480)1.500%, TBA (B) (650,000) (628,173)3.000%, TBA (B) (875,000) (911,436)
TOTAL SALE COMMITMENTS OUTSTANDING (Cost$(1,778,871)) $ (1,768,089)
Currency AbbreviationsAUD Australian DollarBRL Brazilian RealCAD Canadian DollarCLP Chilean PesoCOP Colombian PesoCZK Czech Republic KorunaEUR Euro
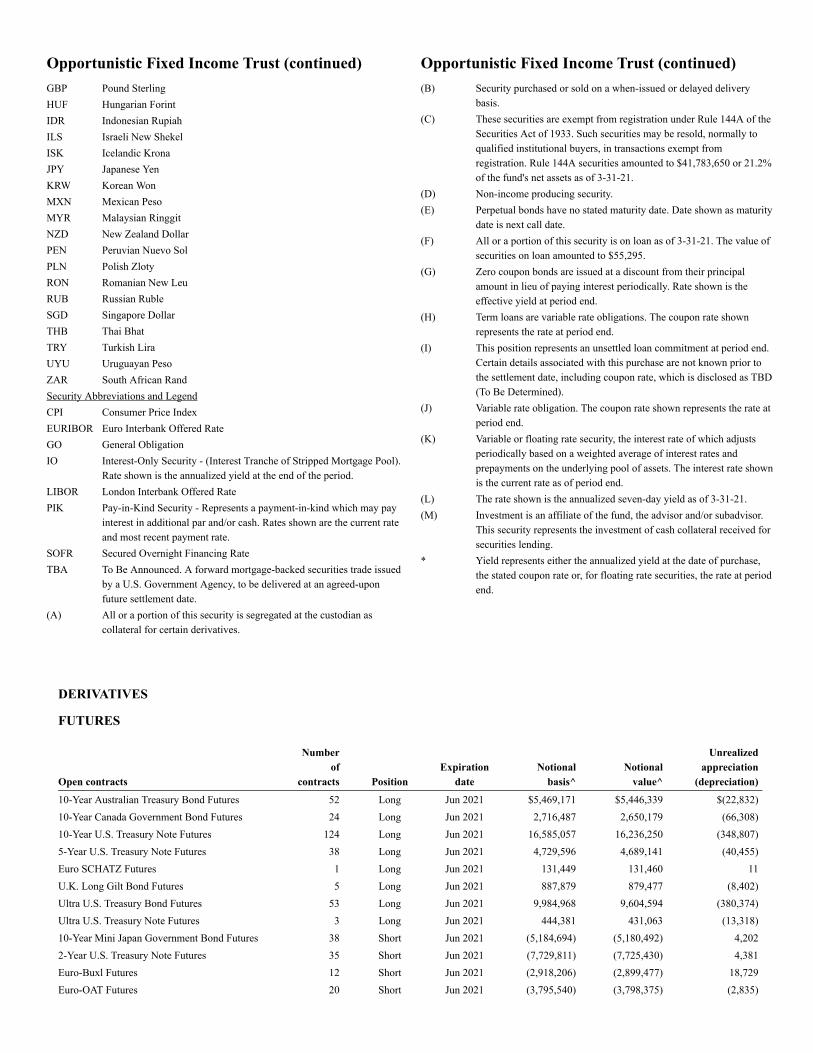
DERIVATIVES
FUTURES
Open contracts
Numberof
contracts PositionExpiration
dateNotional
basis^Notional
value^
Unrealizedappreciation
(depreciation)10-Year Australian Treasury Bond Futures 52 Long Jun 2021 $5,469,171 $5,446,339 $(22,832)10-Year Canada Government Bond Futures 24 Long Jun 2021 2,716,487 2,650,179 (66,308)10-Year U.S. Treasury Note Futures 124 Long Jun 2021 16,585,057 16,236,250 (348,807)5-Year U.S. Treasury Note Futures 38 Long Jun 2021 4,729,596 4,689,141 (40,455)Euro SCHATZ Futures 1 Long Jun 2021 131,449 131,460 11U.K. Long Gilt Bond Futures 5 Long Jun 2021 887,879 879,477 (8,402)Ultra U.S. Treasury Bond Futures 53 Long Jun 2021 9,984,968 9,604,594 (380,374)Ultra U.S. Treasury Note Futures 3 Long Jun 2021 444,381 431,063 (13,318)10-Year Mini Japan Government Bond Futures 38 Short Jun 2021 (5,184,694) (5,180,492) 4,2022-Year U.S. Treasury Note Futures 35 Short Jun 2021 (7,729,811) (7,725,430) 4,381Euro-Buxl Futures 12 Short Jun 2021 (2,918,206) (2,899,477) 18,729Euro-OAT Futures 20 Short Jun 2021 (3,795,540) (3,798,375) (2,835)
Opportunistic Fixed Income Trust (continued)GBP Pound SterlingHUF Hungarian ForintIDR Indonesian RupiahILS Israeli New ShekelISK Icelandic KronaJPY Japanese YenKRW Korean WonMXN Mexican PesoMYR Malaysian RinggitNZD New Zealand DollarPEN Peruvian Nuevo SolPLN Polish ZlotyRON Romanian New LeuRUB Russian RubleSGD Singapore DollarTHB Thai BhatTRY Turkish LiraUYU Uruguayan PesoZAR South African RandSecurity Abbreviations and LegendCPI Consumer Price IndexEURIBOR Euro Interbank Offered RateGO General ObligationIO Interest-Only Security - (Interest Tranche of Stripped Mortgage Pool).
Rate shown is the annualized yield at the end of the period.LIBOR London Interbank Offered RatePIK Pay-in-Kind Security - Represents a payment-in-kind which may pay
interest in additional par and/or cash. Rates shown are the current rateand most recent payment rate.
SOFR Secured Overnight Financing RateTBA To Be Announced. A forward mortgage-backed securities trade issued
by a U.S. Government Agency, to be delivered at an agreed-uponfuture settlement date.
(A) All or a portion of this security is segregated at the custodian ascollateral for certain derivatives.
Opportunistic Fixed Income Trust (continued)(B) Security purchased or sold on a when-issued or delayed delivery
basis.(C) These securities are exempt from registration under Rule 144A of the
Securities Act of 1933. Such securities may be resold, normally toqualified institutional buyers, in transactions exempt fromregistration. Rule 144A securities amounted to $41,783,650 or 21.2%of the fund's net assets as of 3-31-21.
(D) Non-income producing security.(E) Perpetual bonds have no stated maturity date. Date shown as maturity
date is next call date.(F) All or a portion of this security is on loan as of 3-31-21. The value of
securities on loan amounted to $55,295.(G) Zero coupon bonds are issued at a discount from their principal
amount in lieu of paying interest periodically. Rate shown is theeffective yield at period end.
(H) Term loans are variable rate obligations. The coupon rate shownrepresents the rate at period end.
(I) This position represents an unsettled loan commitment at period end.Certain details associated with this purchase are not known prior tothe settlement date, including coupon rate, which is disclosed as TBD(To Be Determined).
(J) Variable rate obligation. The coupon rate shown represents the rate atperiod end.
(K) Variable or floating rate security, the interest rate of which adjustsperiodically based on a weighted average of interest rates andprepayments on the underlying pool of assets. The interest rate shownis the current rate as of period end.
(L) The rate shown is the annualized seven-day yield as of 3-31-21.(M) Investment is an affiliate of the fund, the advisor and/or subadvisor.
This security represents the investment of cash collateral received forsecurities lending.
* Yield represents either the annualized yield at the date of purchase,the stated coupon rate or, for floating rate securities, the rate at periodend.
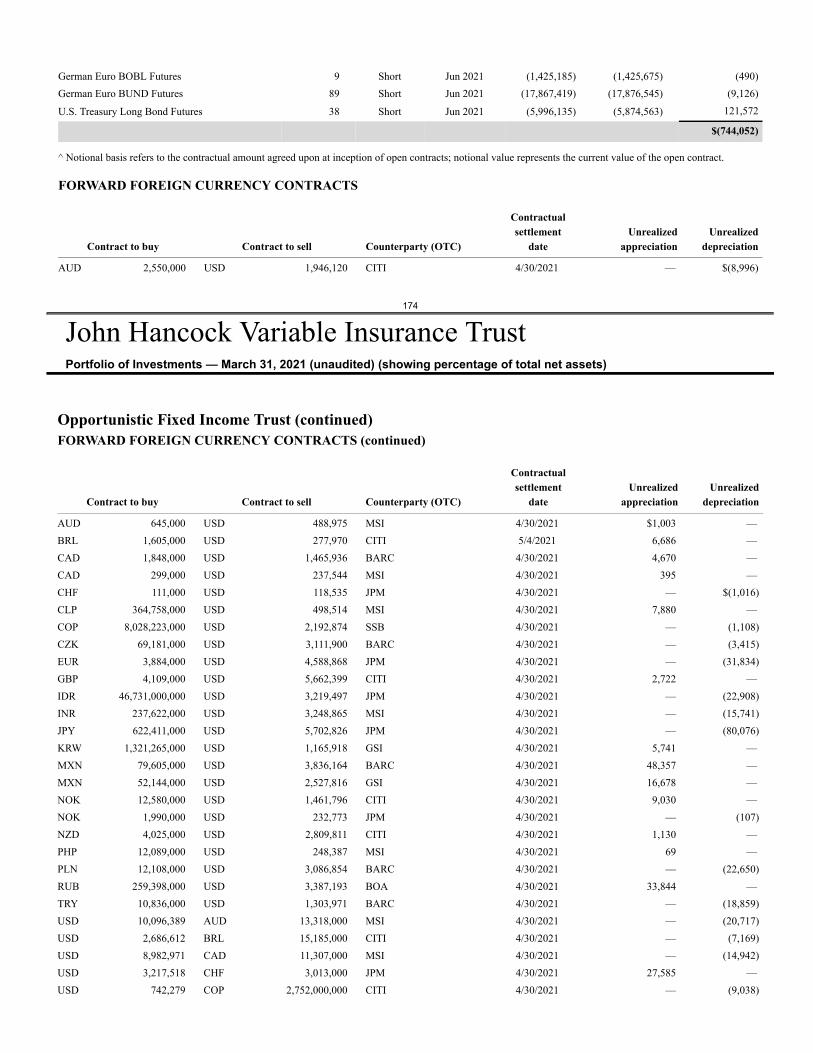
German Euro BOBL Futures 9 Short Jun 2021 (1,425,185) (1,425,675) (490)German Euro BUND Futures 89 Short Jun 2021 (17,867,419) (17,876,545) (9,126)
U.S. Treasury Long Bond Futures 38 Short Jun 2021 (5,996,135) (5,874,563) 121,572
$(744,052)
^ Notional basis refers to the contractual amount agreed upon at inception of open contracts; notional value represents the current value of the open contract.
FORWARD FOREIGN CURRENCY CONTRACTS
Contract to buy Contract to sell Counterparty (OTC)
Contractualsettlement
dateUnrealized
appreciationUnrealized
depreciation
AUD 2,550,000 USD 1,946,120 CITI 4/30/2021 — $(8,996)
174
John Hancock Variable Insurance TrustPortfolio of Investments — March 31, 2021 (unaudited) (showing percentage of total net assets)
Opportunistic Fixed Income Trust (continued)FORWARD FOREIGN CURRENCY CONTRACTS (continued)
Contract to buy Contract to sell Counterparty (OTC)
Contractualsettlement
dateUnrealized
appreciationUnrealized
depreciation
AUD 645,000 USD 488,975 MSI 4/30/2021 $1,003 —BRL 1,605,000 USD 277,970 CITI 5/4/2021 6,686 —CAD 1,848,000 USD 1,465,936 BARC 4/30/2021 4,670 —CAD 299,000 USD 237,544 MSI 4/30/2021 395 —CHF 111,000 USD 118,535 JPM 4/30/2021 — $(1,016)CLP 364,758,000 USD 498,514 MSI 4/30/2021 7,880 —COP 8,028,223,000 USD 2,192,874 SSB 4/30/2021 — (1,108)CZK 69,181,000 USD 3,111,900 BARC 4/30/2021 — (3,415)EUR 3,884,000 USD 4,588,868 JPM 4/30/2021 — (31,834)GBP 4,109,000 USD 5,662,399 CITI 4/30/2021 2,722 —IDR 46,731,000,000 USD 3,219,497 JPM 4/30/2021 — (22,908)INR 237,622,000 USD 3,248,865 MSI 4/30/2021 — (15,741)JPY 622,411,000 USD 5,702,826 JPM 4/30/2021 — (80,076)KRW 1,321,265,000 USD 1,165,918 GSI 4/30/2021 5,741 —MXN 79,605,000 USD 3,836,164 BARC 4/30/2021 48,357 —MXN 52,144,000 USD 2,527,816 GSI 4/30/2021 16,678 —NOK 12,580,000 USD 1,461,796 CITI 4/30/2021 9,030 —NOK 1,990,000 USD 232,773 JPM 4/30/2021 — (107)NZD 4,025,000 USD 2,809,811 CITI 4/30/2021 1,130 —PHP 12,089,000 USD 248,387 MSI 4/30/2021 69 —PLN 12,108,000 USD 3,086,854 BARC 4/30/2021 — (22,650)RUB 259,398,000 USD 3,387,193 BOA 4/30/2021 33,844 —TRY 10,836,000 USD 1,303,971 BARC 4/30/2021 — (18,859)USD 10,096,389 AUD 13,318,000 MSI 4/30/2021 — (20,717)USD 2,686,612 BRL 15,185,000 CITI 4/30/2021 — (7,169)USD 8,982,971 CAD 11,307,000 MSI 4/30/2021 — (14,942)USD 3,217,518 CHF 3,013,000 JPM 4/30/2021 27,585 —USD 742,279 COP 2,752,000,000 CITI 4/30/2021 — (9,038)
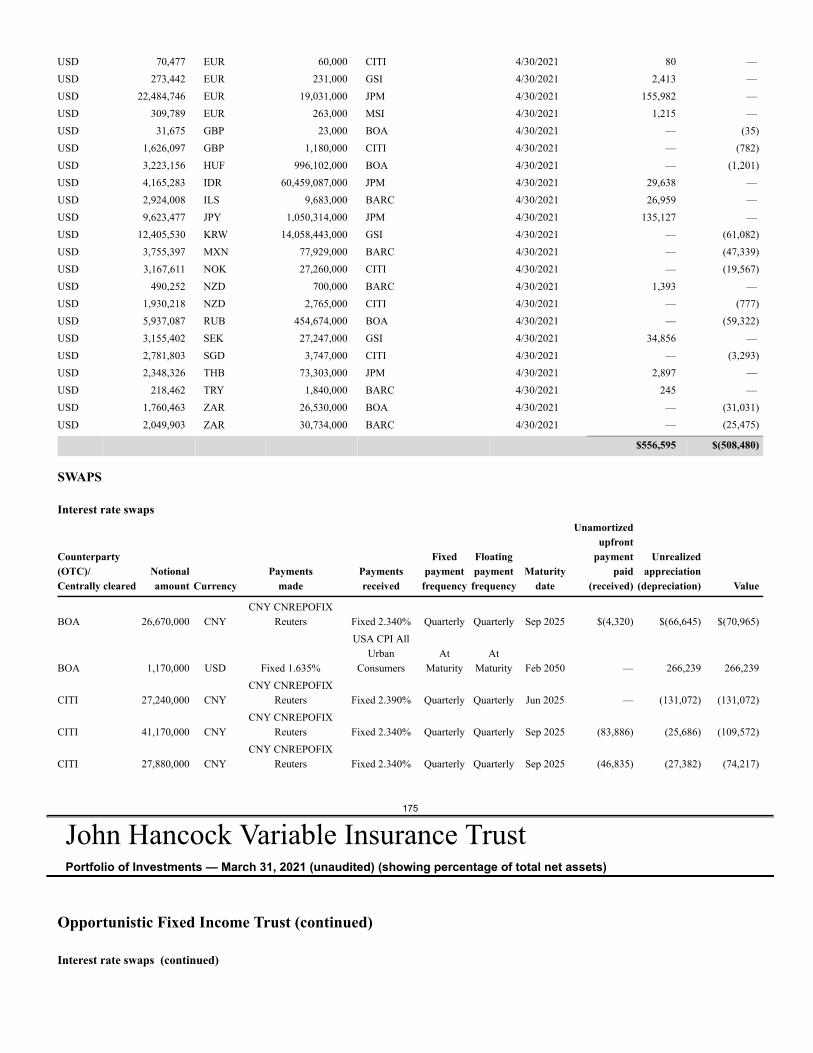
USD 70,477 EUR 60,000 CITI 4/30/2021 80 —USD 273,442 EUR 231,000 GSI 4/30/2021 2,413 —USD 22,484,746 EUR 19,031,000 JPM 4/30/2021 155,982 —USD 309,789 EUR 263,000 MSI 4/30/2021 1,215 —USD 31,675 GBP 23,000 BOA 4/30/2021 — (35)USD 1,626,097 GBP 1,180,000 CITI 4/30/2021 — (782)USD 3,223,156 HUF 996,102,000 BOA 4/30/2021 — (1,201)USD 4,165,283 IDR 60,459,087,000 JPM 4/30/2021 29,638 —USD 2,924,008 ILS 9,683,000 BARC 4/30/2021 26,959 —USD 9,623,477 JPY 1,050,314,000 JPM 4/30/2021 135,127 —USD 12,405,530 KRW 14,058,443,000 GSI 4/30/2021 — (61,082)USD 3,755,397 MXN 77,929,000 BARC 4/30/2021 — (47,339)USD 3,167,611 NOK 27,260,000 CITI 4/30/2021 — (19,567)USD 490,252 NZD 700,000 BARC 4/30/2021 1,393 —USD 1,930,218 NZD 2,765,000 CITI 4/30/2021 — (777)USD 5,937,087 RUB 454,674,000 BOA 4/30/2021 — (59,322)USD 3,155,402 SEK 27,247,000 GSI 4/30/2021 34,856 —USD 2,781,803 SGD 3,747,000 CITI 4/30/2021 — (3,293)USD 2,348,326 THB 73,303,000 JPM 4/30/2021 2,897 —USD 218,462 TRY 1,840,000 BARC 4/30/2021 245 —USD 1,760,463 ZAR 26,530,000 BOA 4/30/2021 — (31,031)USD 2,049,903 ZAR 30,734,000 BARC 4/30/2021 — (25,475)
$556,595 $(508,480)
SWAPS
Interest rate swaps
Counterparty(OTC)/Centrally cleared
Notionalamount Currency
Paymentsmade
Paymentsreceived
Fixedpayment
frequency
Floatingpayment
frequencyMaturity
date
Unamortizedupfront
paymentpaid
(received)
Unrealizedappreciation
(depreciation) Value
BOA 26,670,000 CNYCNY CNREPOFIX
Reuters Fixed 2.340% Quarterly Quarterly Sep 2025 $(4,320) $(66,645) $(70,965)
BOA 1,170,000 USD Fixed 1.635%
USA CPI AllUrban
ConsumersAt
MaturityAt
Maturity Feb 2050 — 266,239 266,239
CITI 27,240,000 CNYCNY CNREPOFIX
Reuters Fixed 2.390% Quarterly Quarterly Jun 2025 — (131,072) (131,072)
CITI 41,170,000 CNYCNY CNREPOFIX
Reuters Fixed 2.340% Quarterly Quarterly Sep 2025 (83,886) (25,686) (109,572)
CITI 27,880,000 CNYCNY CNREPOFIX
Reuters Fixed 2.340% Quarterly Quarterly Sep 2025 (46,835) (27,382) (74,217)
175
John Hancock Variable Insurance TrustPortfolio of Investments — March 31, 2021 (unaudited) (showing percentage of total net assets)
Opportunistic Fixed Income Trust (continued)
Interest rate swaps (continued)
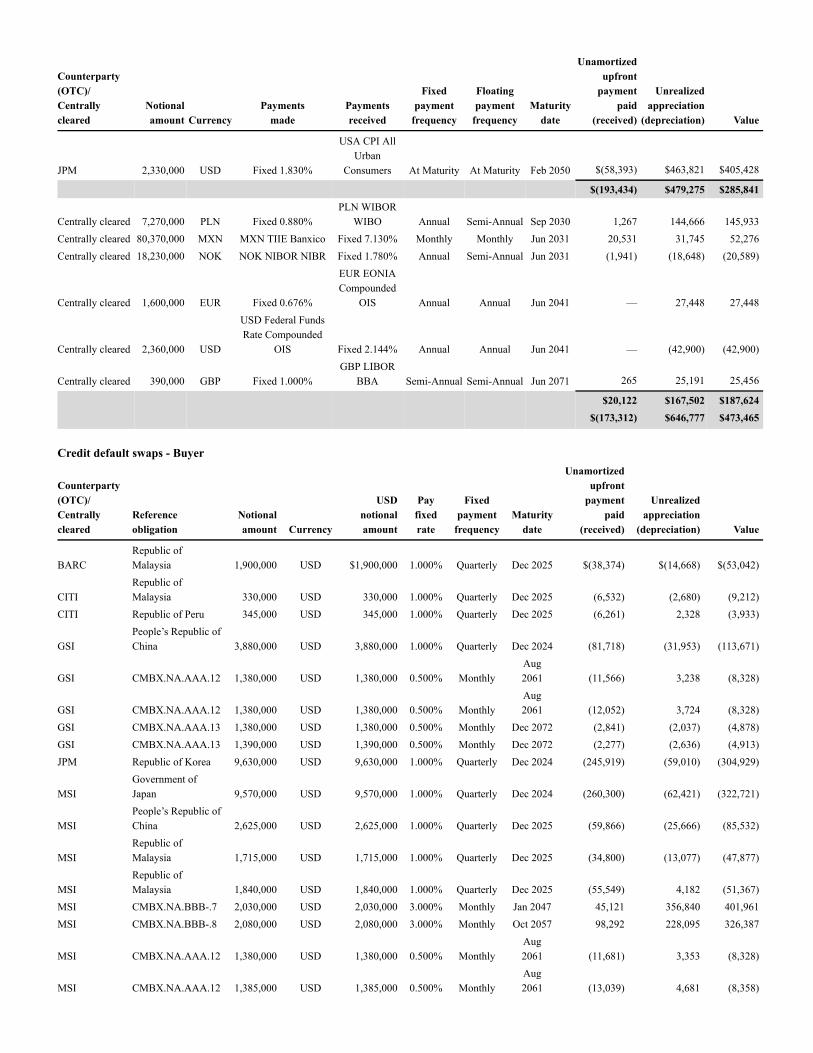
Counterparty(OTC)/Centrallycleared
Notionalamount Currency
Paymentsmade
Paymentsreceived
Fixedpayment
frequency
Floatingpayment
frequencyMaturity
date
Unamortizedupfront
paymentpaid
(received)
Unrealizedappreciation
(depreciation) Value
JPM 2,330,000 USD Fixed 1.830%
USA CPI AllUrban
Consumers At Maturity At Maturity Feb 2050 $(58,393) $463,821 $405,428
$(193,434) $479,275 $285,841
Centrally cleared 7,270,000 PLN Fixed 0.880%PLN WIBOR
WIBO Annual Semi-Annual Sep 2030 1,267 144,666 145,933Centrally cleared 80,370,000 MXN MXN TIIE Banxico Fixed 7.130% Monthly Monthly Jun 2031 20,531 31,745 52,276Centrally cleared 18,230,000 NOK NOK NIBOR NIBR Fixed 1.780% Annual Semi-Annual Jun 2031 (1,941) (18,648) (20,589)
Centrally cleared 1,600,000 EUR Fixed 0.676%
EUR EONIACompounded
OIS Annual Annual Jun 2041 — 27,448 27,448
Centrally cleared 2,360,000 USD
USD Federal FundsRate Compounded
OIS Fixed 2.144% Annual Annual Jun 2041 — (42,900) (42,900)
Centrally cleared 390,000 GBP Fixed 1.000%GBP LIBOR
BBA Semi-Annual Semi-Annual Jun 2071 265 25,191 25,456
$20,122 $167,502 $187,624$(173,312) $646,777 $473,465
Credit default swaps - Buyer
Counterparty(OTC)/Centrallycleared
Referenceobligation
Notionalamount Currency
USDnotionalamount
Payfixedrate
Fixedpayment
frequencyMaturity
date
Unamortizedupfront
paymentpaid
(received)
Unrealizedappreciation
(depreciation) Value
BARCRepublic ofMalaysia 1,900,000 USD $1,900,000 1.000% Quarterly Dec 2025 $(38,374) $(14,668) $(53,042)
CITIRepublic ofMalaysia 330,000 USD 330,000 1.000% Quarterly Dec 2025 (6,532) (2,680) (9,212)
CITI Republic of Peru 345,000 USD 345,000 1.000% Quarterly Dec 2025 (6,261) 2,328 (3,933)
GSIPeople’s Republic ofChina 3,880,000 USD 3,880,000 1.000% Quarterly Dec 2024 (81,718) (31,953) (113,671)
GSI CMBX.NA.AAA.12 1,380,000 USD 1,380,000 0.500% MonthlyAug2061 (11,566) 3,238 (8,328)
GSI CMBX.NA.AAA.12 1,380,000 USD 1,380,000 0.500% MonthlyAug2061 (12,052) 3,724 (8,328)
GSI CMBX.NA.AAA.13 1,380,000 USD 1,380,000 0.500% Monthly Dec 2072 (2,841) (2,037) (4,878)GSI CMBX.NA.AAA.13 1,390,000 USD 1,390,000 0.500% Monthly Dec 2072 (2,277) (2,636) (4,913)JPM Republic of Korea 9,630,000 USD 9,630,000 1.000% Quarterly Dec 2024 (245,919) (59,010) (304,929)
MSIGovernment ofJapan 9,570,000 USD 9,570,000 1.000% Quarterly Dec 2024 (260,300) (62,421) (322,721)
MSIPeople’s Republic ofChina 2,625,000 USD 2,625,000 1.000% Quarterly Dec 2025 (59,866) (25,666) (85,532)
MSIRepublic ofMalaysia 1,715,000 USD 1,715,000 1.000% Quarterly Dec 2025 (34,800) (13,077) (47,877)
MSIRepublic ofMalaysia 1,840,000 USD 1,840,000 1.000% Quarterly Dec 2025 (55,549) 4,182 (51,367)
MSI CMBX.NA.BBB-.7 2,030,000 USD 2,030,000 3.000% Monthly Jan 2047 45,121 356,840 401,961MSI CMBX.NA.BBB-.8 2,080,000 USD 2,080,000 3.000% Monthly Oct 2057 98,292 228,095 326,387
MSI CMBX.NA.AAA.12 1,380,000 USD 1,380,000 0.500% MonthlyAug2061 (11,681) 3,353 (8,328)
MSI CMBX.NA.AAA.12 1,385,000 USD 1,385,000 0.500% MonthlyAug2061 (13,039) 4,681 (8,358)
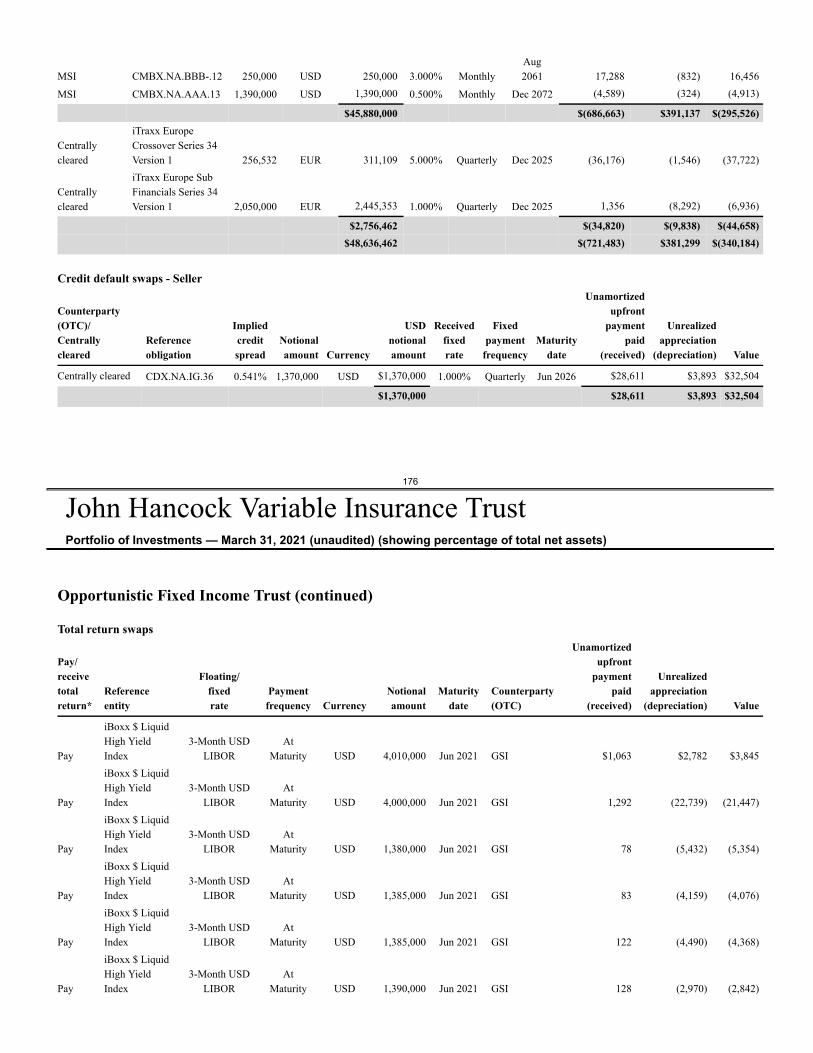
MSI CMBX.NA.BBB-.12 250,000 USD 250,000 3.000% MonthlyAug2061 17,288 (832) 16,456
MSI CMBX.NA.AAA.13 1,390,000 USD 1,390,000 0.500% Monthly Dec 2072 (4,589) (324) (4,913)
$45,880,000 $(686,663) $391,137 $(295,526)
Centrallycleared
iTraxx EuropeCrossover Series 34Version 1 256,532 EUR 311,109 5.000% Quarterly Dec 2025 (36,176) (1,546) (37,722)
Centrallycleared
iTraxx Europe SubFinancials Series 34Version 1 2,050,000 EUR 2,445,353 1.000% Quarterly Dec 2025 1,356 (8,292) (6,936)
$2,756,462 $(34,820) $(9,838) $(44,658)$48,636,462 $(721,483) $381,299 $(340,184)
Credit default swaps - Seller
Counterparty(OTC)/Centrallycleared
Referenceobligation
Impliedcreditspread
Notionalamount Currency
USDnotionalamount
Receivedfixedrate
Fixedpayment
frequencyMaturity
date
Unamortizedupfront
paymentpaid
(received)
Unrealizedappreciation
(depreciation) Value
Centrally cleared CDX.NA.IG.36 0.541% 1,370,000 USD $1,370,000 1.000% Quarterly Jun 2026 $28,611 $3,893 $32,504
$1,370,000 $28,611 $3,893 $32,504
176
John Hancock Variable Insurance TrustPortfolio of Investments — March 31, 2021 (unaudited) (showing percentage of total net assets)
Opportunistic Fixed Income Trust (continued)
Total return swaps
Pay/receivetotalreturn*
Referenceentity
Floating/fixedrate
Paymentfrequency Currency
Notionalamount
Maturitydate
Counterparty(OTC)
Unamortizedupfront
paymentpaid
(received)
Unrealizedappreciation
(depreciation) Value
Pay
iBoxx $ LiquidHigh YieldIndex
3-Month USDLIBOR
AtMaturity USD 4,010,000 Jun 2021 GSI $1,063 $2,782 $3,845
Pay
iBoxx $ LiquidHigh YieldIndex
3-Month USDLIBOR
AtMaturity USD 4,000,000 Jun 2021 GSI 1,292 (22,739) (21,447)
Pay
iBoxx $ LiquidHigh YieldIndex
3-Month USDLIBOR
AtMaturity USD 1,380,000 Jun 2021 GSI 78 (5,432) (5,354)
Pay
iBoxx $ LiquidHigh YieldIndex
3-Month USDLIBOR
AtMaturity USD 1,385,000 Jun 2021 GSI 83 (4,159) (4,076)
Pay
iBoxx $ LiquidHigh YieldIndex
3-Month USDLIBOR
AtMaturity USD 1,385,000 Jun 2021 GSI 122 (4,490) (4,368)
Pay
iBoxx $ LiquidHigh YieldIndex
3-Month USDLIBOR
AtMaturity USD 1,390,000 Jun 2021 GSI 128 (2,970) (2,842)
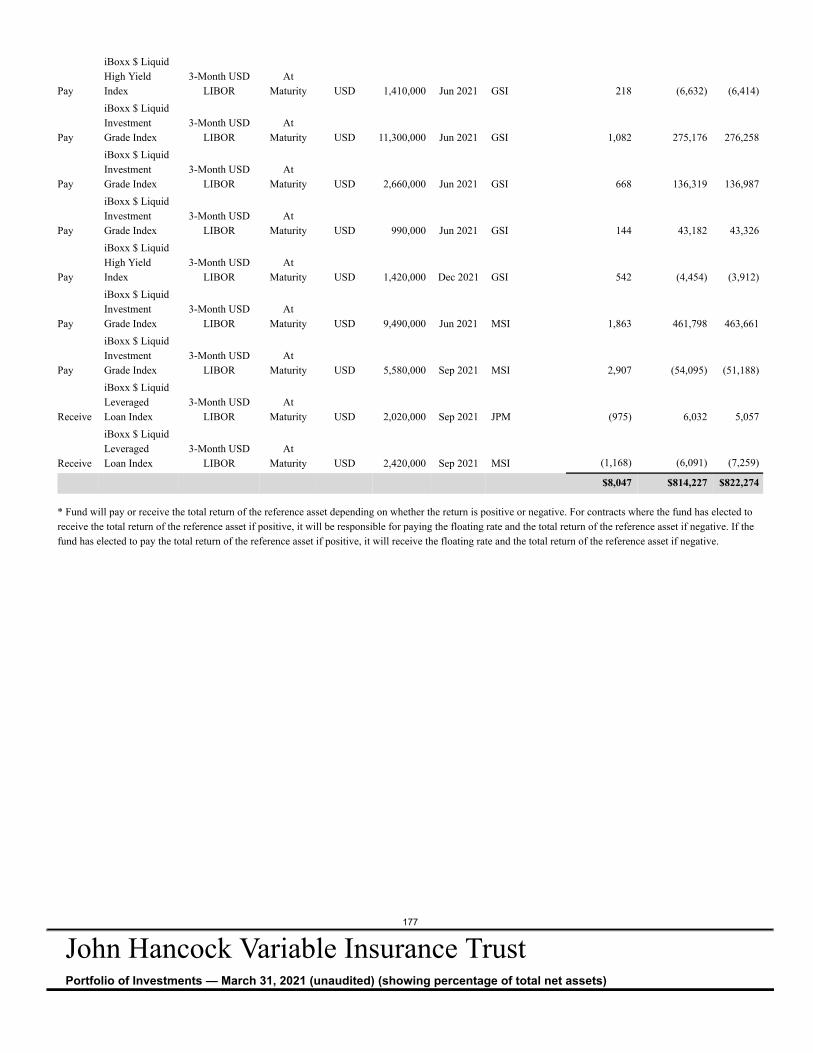
Pay
iBoxx $ LiquidHigh YieldIndex
3-Month USDLIBOR
AtMaturity USD 1,410,000 Jun 2021 GSI 218 (6,632) (6,414)
Pay
iBoxx $ LiquidInvestmentGrade Index
3-Month USDLIBOR
AtMaturity USD 11,300,000 Jun 2021 GSI 1,082 275,176 276,258
Pay
iBoxx $ LiquidInvestmentGrade Index
3-Month USDLIBOR
AtMaturity USD 2,660,000 Jun 2021 GSI 668 136,319 136,987
Pay
iBoxx $ LiquidInvestmentGrade Index
3-Month USDLIBOR
AtMaturity USD 990,000 Jun 2021 GSI 144 43,182 43,326
Pay
iBoxx $ LiquidHigh YieldIndex
3-Month USDLIBOR
AtMaturity USD 1,420,000 Dec 2021 GSI 542 (4,454) (3,912)
Pay
iBoxx $ LiquidInvestmentGrade Index
3-Month USDLIBOR
AtMaturity USD 9,490,000 Jun 2021 MSI 1,863 461,798 463,661
Pay
iBoxx $ LiquidInvestmentGrade Index
3-Month USDLIBOR
AtMaturity USD 5,580,000 Sep 2021 MSI 2,907 (54,095) (51,188)
Receive
iBoxx $ LiquidLeveragedLoan Index
3-Month USDLIBOR
AtMaturity USD 2,020,000 Sep 2021 JPM (975) 6,032 5,057
Receive
iBoxx $ LiquidLeveragedLoan Index
3-Month USDLIBOR
AtMaturity USD 2,420,000 Sep 2021 MSI (1,168) (6,091) (7,259)
$8,047 $814,227 $822,274
* Fund will pay or receive the total return of the reference asset depending on whether the return is positive or negative. For contracts where the fund has elected toreceive the total return of the reference asset if positive, it will be responsible for paying the floating rate and the total return of the reference asset if negative. If thefund has elected to pay the total return of the reference asset if positive, it will receive the floating rate and the total return of the reference asset if negative.
177
John Hancock Variable Insurance TrustPortfolio of Investments — March 31, 2021 (unaudited) (showing percentage of total net assets)
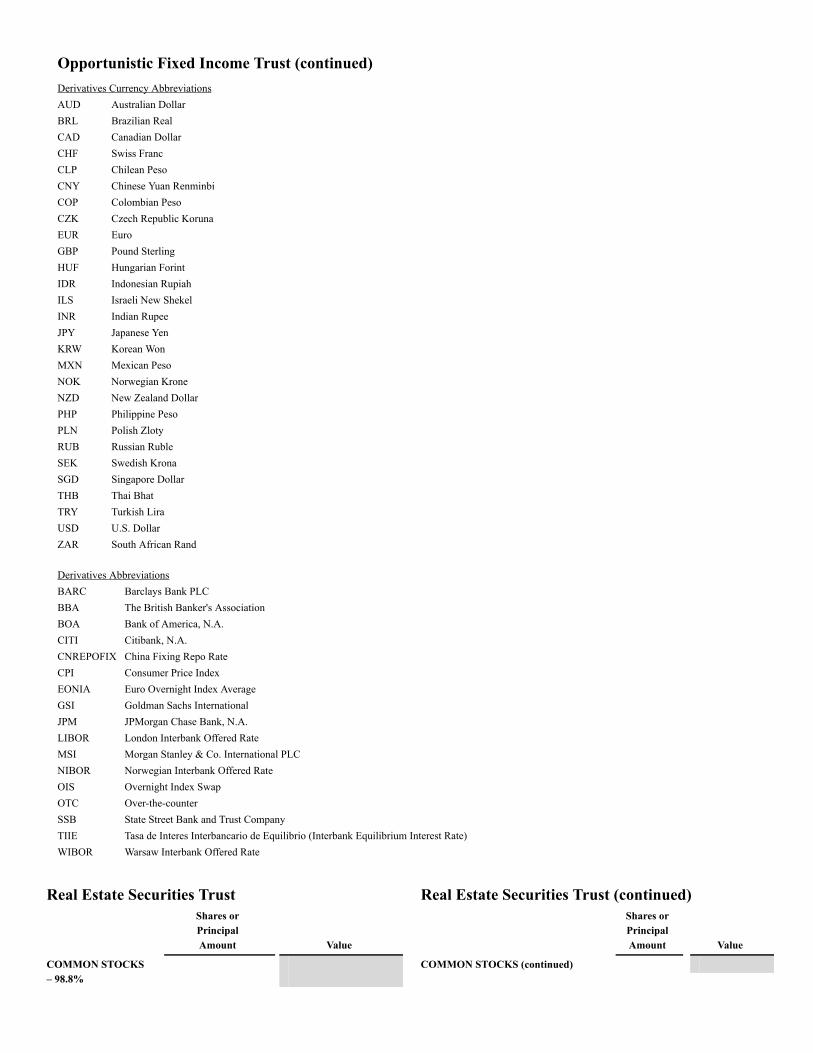
Opportunistic Fixed Income Trust (continued)Derivatives Currency AbbreviationsAUD Australian DollarBRL Brazilian RealCAD Canadian DollarCHF Swiss FrancCLP Chilean PesoCNY Chinese Yuan RenminbiCOP Colombian PesoCZK Czech Republic KorunaEUR EuroGBP Pound SterlingHUF Hungarian ForintIDR Indonesian RupiahILS Israeli New ShekelINR Indian RupeeJPY Japanese YenKRW Korean WonMXN Mexican PesoNOK Norwegian KroneNZD New Zealand DollarPHP Philippine PesoPLN Polish ZlotyRUB Russian RubleSEK Swedish KronaSGD Singapore DollarTHB Thai BhatTRY Turkish LiraUSD U.S. DollarZAR South African Rand
Derivatives AbbreviationsBARC Barclays Bank PLCBBA The British Banker's AssociationBOA Bank of America, N.A.CITI Citibank, N.A.CNREPOFIX China Fixing Repo RateCPI Consumer Price IndexEONIA Euro Overnight Index AverageGSI Goldman Sachs InternationalJPM JPMorgan Chase Bank, N.A.LIBOR London Interbank Offered RateMSI Morgan Stanley & Co. International PLCNIBOR Norwegian Interbank Offered RateOIS Overnight Index SwapOTC Over-the-counterSSB State Street Bank and Trust CompanyTIIE Tasa de Interes Interbancario de Equilibrio (Interbank Equilibrium Interest Rate)WIBOR Warsaw Interbank Offered Rate
Real Estate Securities TrustShares orPrincipalAmount Value
COMMON STOCKS– 98.8%
Real Estate Securities Trust (continued)Shares orPrincipalAmount Value
COMMON STOCKS (continued)
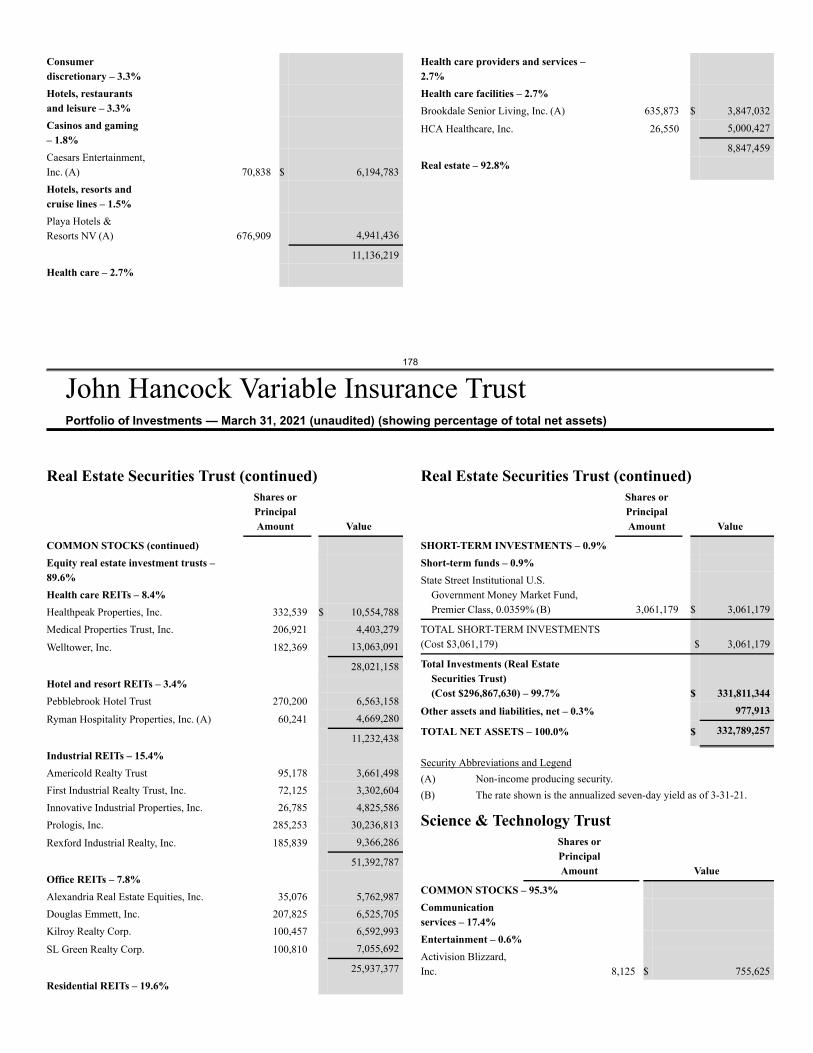
178
John Hancock Variable Insurance TrustPortfolio of Investments — March 31, 2021 (unaudited) (showing percentage of total net assets)
Consumerdiscretionary – 3.3%Hotels, restaurantsand leisure – 3.3%Casinos and gaming– 1.8%Caesars Entertainment,Inc. (A) 70,838 $ 6,194,783Hotels, resorts andcruise lines – 1.5%Playa Hotels &Resorts NV (A) 676,909 4,941,436
11,136,219Health care – 2.7%
Health care providers and services –2.7%Health care facilities – 2.7%Brookdale Senior Living, Inc. (A) 635,873 $ 3,847,032
HCA Healthcare, Inc. 26,550 5,000,427
8,847,459Real estate – 92.8%
Real Estate Securities Trust (continued)Shares orPrincipalAmount Value
COMMON STOCKS (continued)Equity real estate investment trusts –89.6%Health care REITs – 8.4%Healthpeak Properties, Inc. 332,539 $ 10,554,788Medical Properties Trust, Inc. 206,921 4,403,279
Welltower, Inc. 182,369 13,063,091
28,021,158Hotel and resort REITs – 3.4%Pebblebrook Hotel Trust 270,200 6,563,158
Ryman Hospitality Properties, Inc. (A) 60,241 4,669,280
11,232,438Industrial REITs – 15.4%Americold Realty Trust 95,178 3,661,498First Industrial Realty Trust, Inc. 72,125 3,302,604Innovative Industrial Properties, Inc. 26,785 4,825,586Prologis, Inc. 285,253 30,236,813
Rexford Industrial Realty, Inc. 185,839 9,366,286
51,392,787Office REITs – 7.8%Alexandria Real Estate Equities, Inc. 35,076 5,762,987Douglas Emmett, Inc. 207,825 6,525,705Kilroy Realty Corp. 100,457 6,592,993
SL Green Realty Corp. 100,810 7,055,692
25,937,377Residential REITs – 19.6%
Real Estate Securities Trust (continued)Shares orPrincipalAmount Value
SHORT-TERM INVESTMENTS – 0.9%Short-term funds – 0.9%State Street Institutional U.S.
Government Money Market Fund,Premier Class, 0.0359% (B) 3,061,179 $ 3,061,179
TOTAL SHORT-TERM INVESTMENTS(Cost $3,061,179) $ 3,061,179
Total Investments (Real EstateSecurities Trust)(Cost $296,867,630) – 99.7% $ 331,811,344
Other assets and liabilities, net – 0.3% 977,913
TOTAL NET ASSETS – 100.0% $ 332,789,257
Security Abbreviations and Legend(A) Non-income producing security.(B) The rate shown is the annualized seven-day yield as of 3-31-21.
Science & Technology TrustShares orPrincipalAmount Value
COMMON STOCKS – 95.3%Communicationservices – 17.4%Entertainment – 0.6%Activision Blizzard,Inc. 8,125 $ 755,625
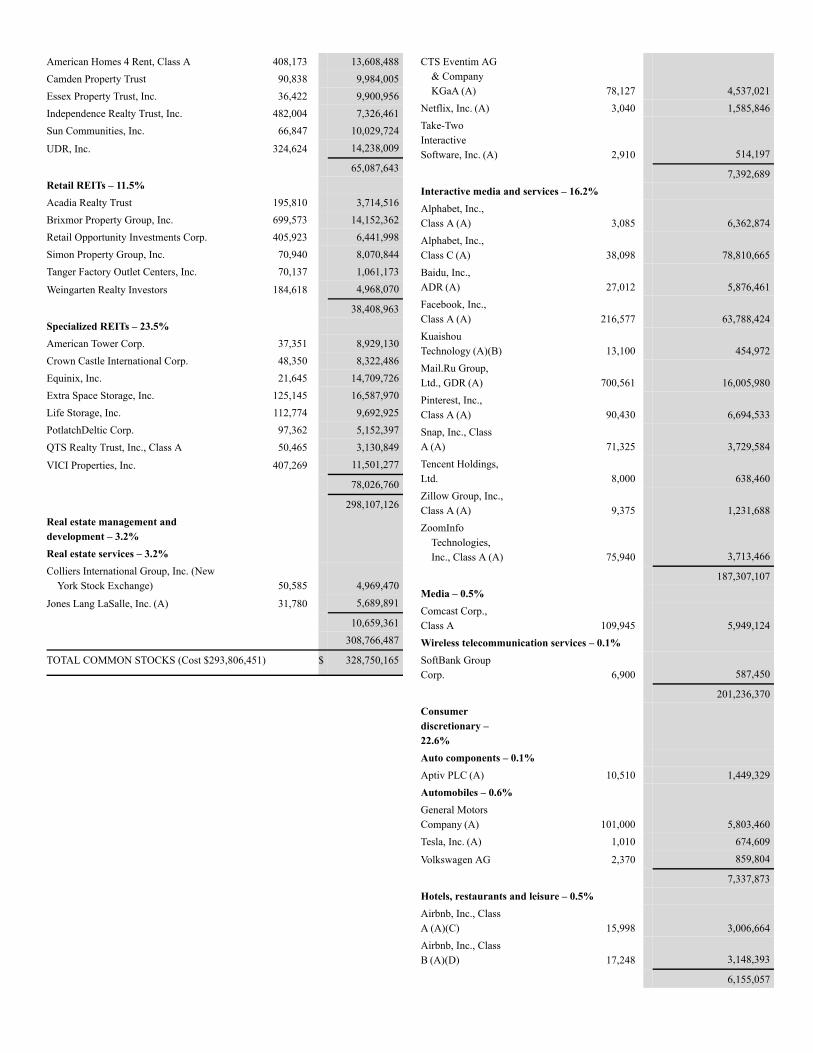
American Homes 4 Rent, Class A 408,173 13,608,488Camden Property Trust 90,838 9,984,005Essex Property Trust, Inc. 36,422 9,900,956Independence Realty Trust, Inc. 482,004 7,326,461Sun Communities, Inc. 66,847 10,029,724
UDR, Inc. 324,624 14,238,009
65,087,643Retail REITs – 11.5%Acadia Realty Trust 195,810 3,714,516Brixmor Property Group, Inc. 699,573 14,152,362Retail Opportunity Investments Corp. 405,923 6,441,998Simon Property Group, Inc. 70,940 8,070,844Tanger Factory Outlet Centers, Inc. 70,137 1,061,173
Weingarten Realty Investors 184,618 4,968,070
38,408,963Specialized REITs – 23.5%American Tower Corp. 37,351 8,929,130Crown Castle International Corp. 48,350 8,322,486Equinix, Inc. 21,645 14,709,726Extra Space Storage, Inc. 125,145 16,587,970Life Storage, Inc. 112,774 9,692,925PotlatchDeltic Corp. 97,362 5,152,397QTS Realty Trust, Inc., Class A 50,465 3,130,849
VICI Properties, Inc. 407,269 11,501,277
78,026,760
298,107,126Real estate management anddevelopment – 3.2%Real estate services – 3.2%Colliers International Group, Inc. (New
York Stock Exchange) 50,585 4,969,470
Jones Lang LaSalle, Inc. (A) 31,780 5,689,891
10,659,361308,766,487
TOTAL COMMON STOCKS (Cost $293,806,451) $ 328,750,165
CTS Eventim AG& CompanyKGaA (A) 78,127 4,537,021
Netflix, Inc. (A) 3,040 1,585,846Take-TwoInteractiveSoftware, Inc. (A) 2,910 514,197
7,392,689Interactive media and services – 16.2%Alphabet, Inc.,Class A (A) 3,085 6,362,874Alphabet, Inc.,Class C (A) 38,098 78,810,665Baidu, Inc.,ADR (A) 27,012 5,876,461Facebook, Inc.,Class A (A) 216,577 63,788,424KuaishouTechnology (A)(B) 13,100 454,972Mail.Ru Group,Ltd., GDR (A) 700,561 16,005,980Pinterest, Inc.,Class A (A) 90,430 6,694,533Snap, Inc., ClassA (A) 71,325 3,729,584Tencent Holdings,Ltd. 8,000 638,460Zillow Group, Inc.,Class A (A) 9,375 1,231,688ZoomInfo
Technologies,Inc., Class A (A) 75,940 3,713,466
187,307,107Media – 0.5%Comcast Corp.,Class A 109,945 5,949,124Wireless telecommunication services – 0.1%SoftBank GroupCorp. 6,900 587,450
201,236,370Consumerdiscretionary –22.6%Auto components – 0.1%Aptiv PLC (A) 10,510 1,449,329Automobiles – 0.6%General MotorsCompany (A) 101,000 5,803,460Tesla, Inc. (A) 1,010 674,609
Volkswagen AG 2,370 859,804
7,337,873Hotels, restaurants and leisure – 0.5%Airbnb, Inc., ClassA (A)(C) 15,998 3,006,664Airbnb, Inc., ClassB (A)(D) 17,248 3,148,393
6,155,057
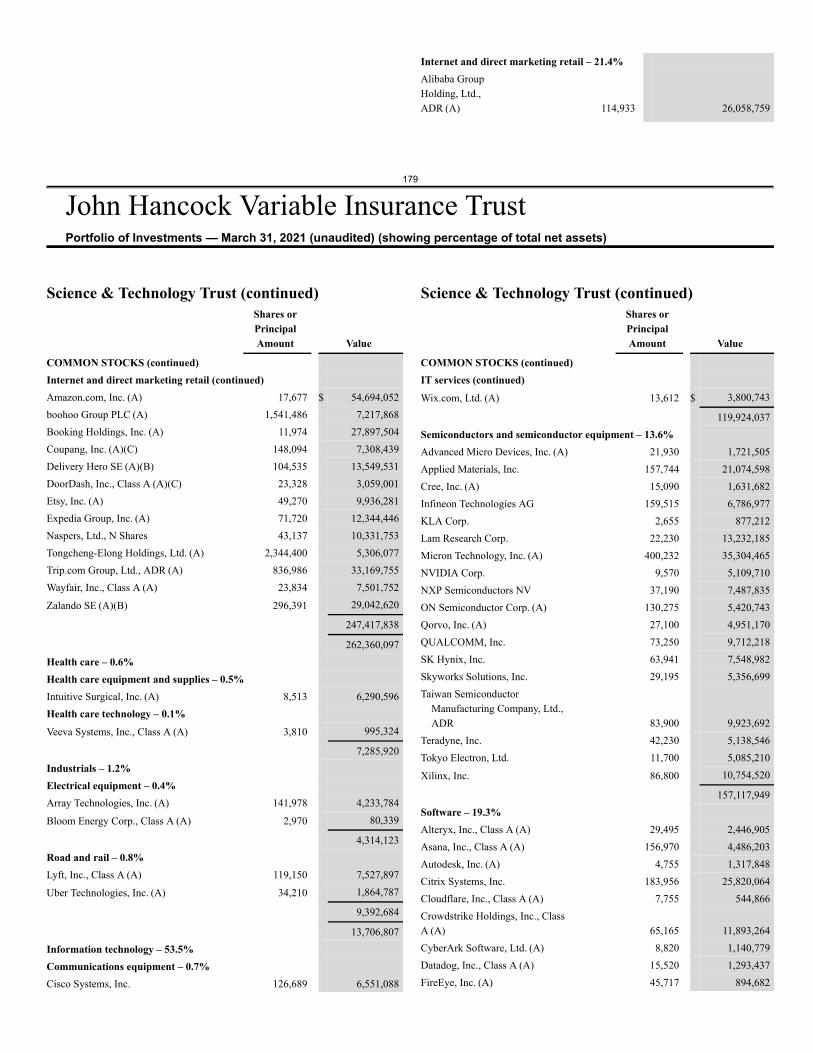
179
John Hancock Variable Insurance TrustPortfolio of Investments — March 31, 2021 (unaudited) (showing percentage of total net assets)
Internet and direct marketing retail – 21.4%Alibaba GroupHolding, Ltd.,ADR (A) 114,933 26,058,759
Science & Technology Trust (continued)Shares orPrincipalAmount Value
COMMON STOCKS (continued)Internet and direct marketing retail (continued)Amazon.com, Inc. (A) 17,677 $ 54,694,052boohoo Group PLC (A) 1,541,486 7,217,868Booking Holdings, Inc. (A) 11,974 27,897,504Coupang, Inc. (A)(C) 148,094 7,308,439Delivery Hero SE (A)(B) 104,535 13,549,531DoorDash, Inc., Class A (A)(C) 23,328 3,059,001Etsy, Inc. (A) 49,270 9,936,281Expedia Group, Inc. (A) 71,720 12,344,446Naspers, Ltd., N Shares 43,137 10,331,753Tongcheng-Elong Holdings, Ltd. (A) 2,344,400 5,306,077Trip.com Group, Ltd., ADR (A) 836,986 33,169,755Wayfair, Inc., Class A (A) 23,834 7,501,752
Zalando SE (A)(B) 296,391 29,042,620
247,417,838
262,360,097Health care – 0.6%Health care equipment and supplies – 0.5%Intuitive Surgical, Inc. (A) 8,513 6,290,596Health care technology – 0.1%Veeva Systems, Inc., Class A (A) 3,810 995,324
7,285,920Industrials – 1.2%Electrical equipment – 0.4%Array Technologies, Inc. (A) 141,978 4,233,784
Bloom Energy Corp., Class A (A) 2,970 80,339
4,314,123Road and rail – 0.8%Lyft, Inc., Class A (A) 119,150 7,527,897
Uber Technologies, Inc. (A) 34,210 1,864,787
9,392,684
13,706,807Information technology – 53.5%Communications equipment – 0.7%Cisco Systems, Inc. 126,689 6,551,088
Science & Technology Trust (continued)Shares orPrincipalAmount Value
COMMON STOCKS (continued)IT services (continued)Wix.com, Ltd. (A) 13,612 $ 3,800,743
119,924,037Semiconductors and semiconductor equipment – 13.6%Advanced Micro Devices, Inc. (A) 21,930 1,721,505Applied Materials, Inc. 157,744 21,074,598Cree, Inc. (A) 15,090 1,631,682Infineon Technologies AG 159,515 6,786,977KLA Corp. 2,655 877,212Lam Research Corp. 22,230 13,232,185Micron Technology, Inc. (A) 400,232 35,304,465NVIDIA Corp. 9,570 5,109,710NXP Semiconductors NV 37,190 7,487,835ON Semiconductor Corp. (A) 130,275 5,420,743Qorvo, Inc. (A) 27,100 4,951,170QUALCOMM, Inc. 73,250 9,712,218SK Hynix, Inc. 63,941 7,548,982Skyworks Solutions, Inc. 29,195 5,356,699Taiwan Semiconductor
Manufacturing Company, Ltd.,ADR 83,900 9,923,692
Teradyne, Inc. 42,230 5,138,546Tokyo Electron, Ltd. 11,700 5,085,210
Xilinx, Inc. 86,800 10,754,520
157,117,949Software – 19.3%Alteryx, Inc., Class A (A) 29,495 2,446,905Asana, Inc., Class A (A) 156,970 4,486,203Autodesk, Inc. (A) 4,755 1,317,848Citrix Systems, Inc. 183,956 25,820,064Cloudflare, Inc., Class A (A) 7,755 544,866Crowdstrike Holdings, Inc., ClassA (A) 65,165 11,893,264CyberArk Software, Ltd. (A) 8,820 1,140,779Datadog, Inc., Class A (A) 15,520 1,293,437FireEye, Inc. (A) 45,717 894,682
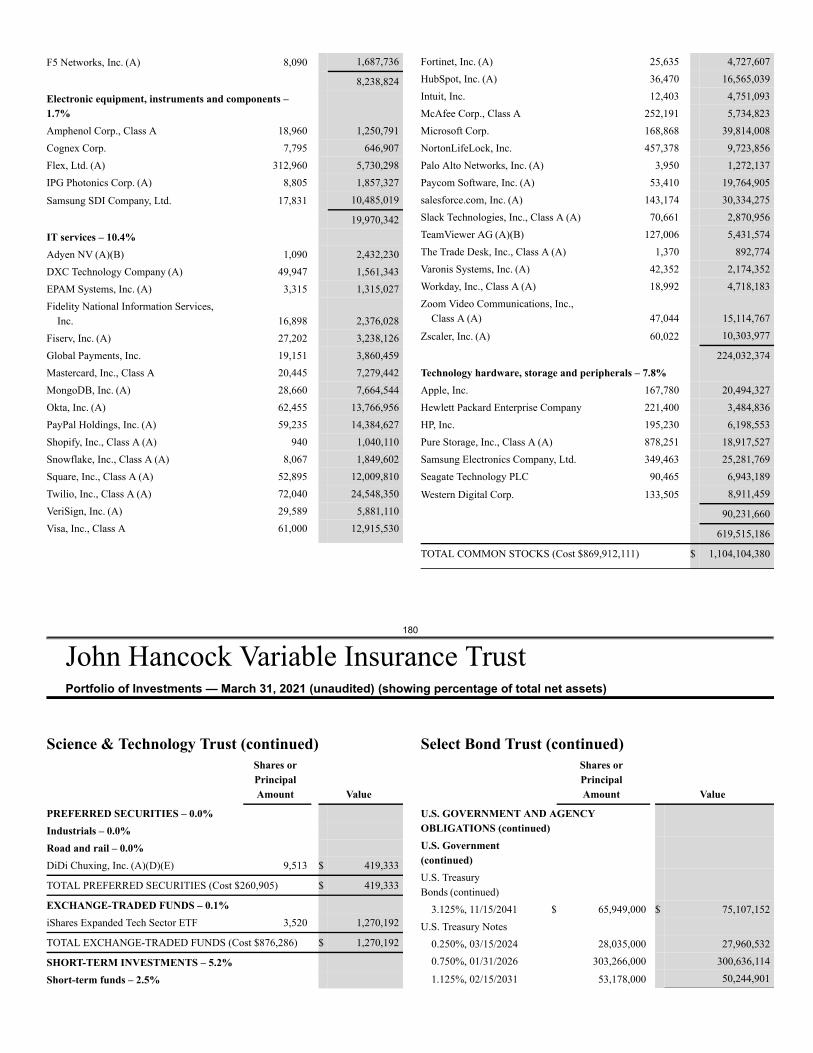
180
John Hancock Variable Insurance TrustPortfolio of Investments — March 31, 2021 (unaudited) (showing percentage of total net assets)
F5 Networks, Inc. (A) 8,090 1,687,736
8,238,824Electronic equipment, instruments and components –1.7%Amphenol Corp., Class A 18,960 1,250,791Cognex Corp. 7,795 646,907Flex, Ltd. (A) 312,960 5,730,298IPG Photonics Corp. (A) 8,805 1,857,327
Samsung SDI Company, Ltd. 17,831 10,485,019
19,970,342IT services – 10.4%Adyen NV (A)(B) 1,090 2,432,230DXC Technology Company (A) 49,947 1,561,343EPAM Systems, Inc. (A) 3,315 1,315,027Fidelity National Information Services,
Inc. 16,898 2,376,028Fiserv, Inc. (A) 27,202 3,238,126Global Payments, Inc. 19,151 3,860,459Mastercard, Inc., Class A 20,445 7,279,442MongoDB, Inc. (A) 28,660 7,664,544Okta, Inc. (A) 62,455 13,766,956PayPal Holdings, Inc. (A) 59,235 14,384,627Shopify, Inc., Class A (A) 940 1,040,110Snowflake, Inc., Class A (A) 8,067 1,849,602Square, Inc., Class A (A) 52,895 12,009,810Twilio, Inc., Class A (A) 72,040 24,548,350VeriSign, Inc. (A) 29,589 5,881,110Visa, Inc., Class A 61,000 12,915,530
Fortinet, Inc. (A) 25,635 4,727,607HubSpot, Inc. (A) 36,470 16,565,039Intuit, Inc. 12,403 4,751,093McAfee Corp., Class A 252,191 5,734,823Microsoft Corp. 168,868 39,814,008NortonLifeLock, Inc. 457,378 9,723,856Palo Alto Networks, Inc. (A) 3,950 1,272,137Paycom Software, Inc. (A) 53,410 19,764,905salesforce.com, Inc. (A) 143,174 30,334,275Slack Technologies, Inc., Class A (A) 70,661 2,870,956TeamViewer AG (A)(B) 127,006 5,431,574The Trade Desk, Inc., Class A (A) 1,370 892,774Varonis Systems, Inc. (A) 42,352 2,174,352Workday, Inc., Class A (A) 18,992 4,718,183Zoom Video Communications, Inc.,
Class A (A) 47,044 15,114,767
Zscaler, Inc. (A) 60,022 10,303,977
224,032,374Technology hardware, storage and peripherals – 7.8%Apple, Inc. 167,780 20,494,327Hewlett Packard Enterprise Company 221,400 3,484,836HP, Inc. 195,230 6,198,553Pure Storage, Inc., Class A (A) 878,251 18,917,527Samsung Electronics Company, Ltd. 349,463 25,281,769Seagate Technology PLC 90,465 6,943,189
Western Digital Corp. 133,505 8,911,459
90,231,660
619,515,186
TOTAL COMMON STOCKS (Cost $869,912,111) $ 1,104,104,380
Science & Technology Trust (continued)Shares orPrincipalAmount Value
PREFERRED SECURITIES – 0.0%Industrials – 0.0%Road and rail – 0.0%DiDi Chuxing, Inc. (A)(D)(E) 9,513 $ 419,333
TOTAL PREFERRED SECURITIES (Cost $260,905) $ 419,333
EXCHANGE-TRADED FUNDS – 0.1%iShares Expanded Tech Sector ETF 3,520 1,270,192
TOTAL EXCHANGE-TRADED FUNDS (Cost $876,286) $ 1,270,192
SHORT-TERM INVESTMENTS – 5.2%Short-term funds – 2.5%
Select Bond Trust (continued)Shares orPrincipalAmount Value
U.S. GOVERNMENT AND AGENCYOBLIGATIONS (continued)U.S. Government(continued)U.S. TreasuryBonds (continued)
3.125%, 11/15/2041 $ 65,949,000 $ 75,107,152U.S. Treasury Notes
0.250%, 03/15/2024 28,035,000 27,960,5320.750%, 01/31/2026 303,266,000 300,636,114
1.125%, 02/15/2031 53,178,000 50,244,901
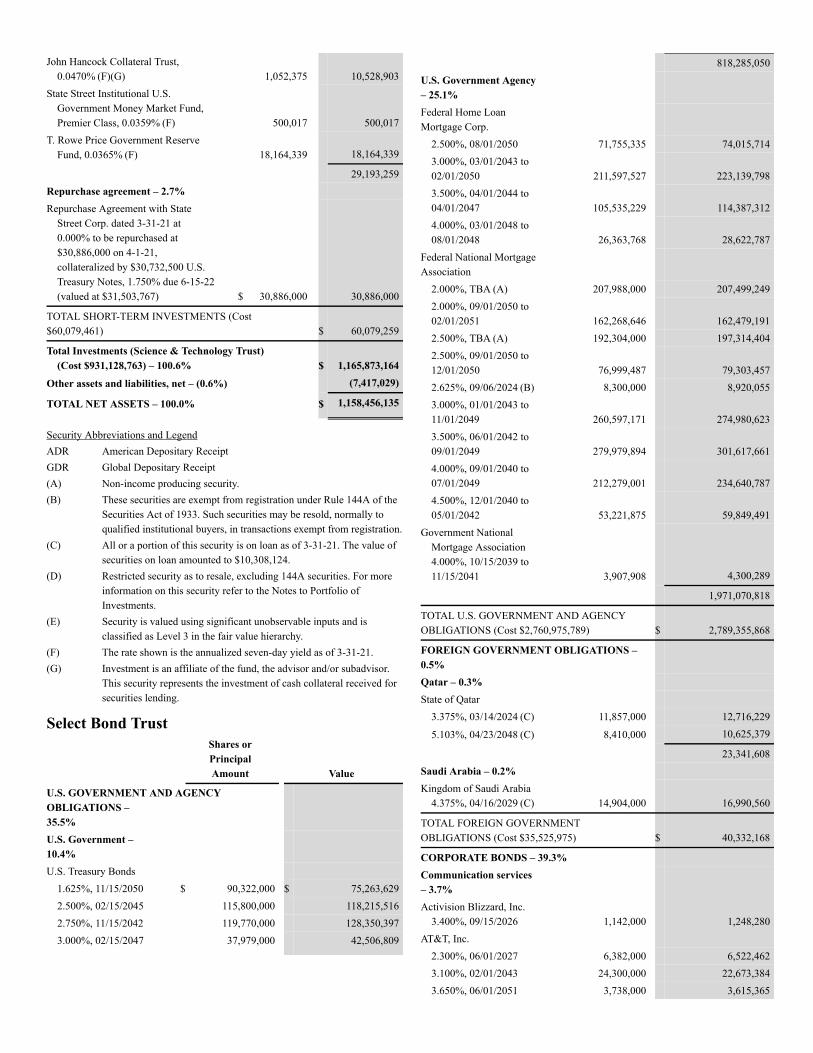
John Hancock Collateral Trust,0.0470% (F)(G) 1,052,375 10,528,903
State Street Institutional U.S.Government Money Market Fund,Premier Class, 0.0359% (F) 500,017 500,017
T. Rowe Price Government ReserveFund, 0.0365% (F) 18,164,339 18,164,339
29,193,259Repurchase agreement – 2.7%Repurchase Agreement with State
Street Corp. dated 3-31-21 at0.000% to be repurchased at$30,886,000 on 4-1-21,collateralized by $30,732,500 U.S.Treasury Notes, 1.750% due 6-15-22(valued at $31,503,767) $ 30,886,000 30,886,000
TOTAL SHORT-TERM INVESTMENTS (Cost$60,079,461) $ 60,079,259
Total Investments (Science & Technology Trust)(Cost $931,128,763) – 100.6% $ 1,165,873,164
Other assets and liabilities, net – (0.6%) (7,417,029)
TOTAL NET ASSETS – 100.0% $ 1,158,456,135
Security Abbreviations and LegendADR American Depositary ReceiptGDR Global Depositary Receipt(A) Non-income producing security.(B) These securities are exempt from registration under Rule 144A of the
Securities Act of 1933. Such securities may be resold, normally toqualified institutional buyers, in transactions exempt from registration.
(C) All or a portion of this security is on loan as of 3-31-21. The value ofsecurities on loan amounted to $10,308,124.
(D) Restricted security as to resale, excluding 144A securities. For moreinformation on this security refer to the Notes to Portfolio ofInvestments.
(E) Security is valued using significant unobservable inputs and isclassified as Level 3 in the fair value hierarchy.
(F) The rate shown is the annualized seven-day yield as of 3-31-21.(G) Investment is an affiliate of the fund, the advisor and/or subadvisor.
This security represents the investment of cash collateral received forsecurities lending.
Select Bond TrustShares orPrincipalAmount Value
U.S. GOVERNMENT AND AGENCYOBLIGATIONS –35.5%U.S. Government –10.4%U.S. Treasury Bonds
1.625%, 11/15/2050 $ 90,322,000 $ 75,263,6292.500%, 02/15/2045 115,800,000 118,215,5162.750%, 11/15/2042 119,770,000 128,350,3973.000%, 02/15/2047 37,979,000 42,506,809
818,285,050U.S. Government Agency– 25.1%Federal Home LoanMortgage Corp.
2.500%, 08/01/2050 71,755,335 74,015,7143.000%, 03/01/2043 to02/01/2050 211,597,527 223,139,7983.500%, 04/01/2044 to04/01/2047 105,535,229 114,387,3124.000%, 03/01/2048 to08/01/2048 26,363,768 28,622,787
Federal National MortgageAssociation
2.000%, TBA (A) 207,988,000 207,499,2492.000%, 09/01/2050 to02/01/2051 162,268,646 162,479,1912.500%, TBA (A) 192,304,000 197,314,4042.500%, 09/01/2050 to12/01/2050 76,999,487 79,303,4572.625%, 09/06/2024 (B) 8,300,000 8,920,0553.000%, 01/01/2043 to11/01/2049 260,597,171 274,980,6233.500%, 06/01/2042 to09/01/2049 279,979,894 301,617,6614.000%, 09/01/2040 to07/01/2049 212,279,001 234,640,7874.500%, 12/01/2040 to05/01/2042 53,221,875 59,849,491
Government NationalMortgage Association4.000%, 10/15/2039 to11/15/2041 3,907,908 4,300,289
1,971,070,818
TOTAL U.S. GOVERNMENT AND AGENCYOBLIGATIONS (Cost $2,760,975,789) $ 2,789,355,868
FOREIGN GOVERNMENT OBLIGATIONS –0.5%Qatar – 0.3%State of Qatar
3.375%, 03/14/2024 (C) 11,857,000 12,716,229
5.103%, 04/23/2048 (C) 8,410,000 10,625,379
23,341,608Saudi Arabia – 0.2%Kingdom of Saudi Arabia
4.375%, 04/16/2029 (C) 14,904,000 16,990,560
TOTAL FOREIGN GOVERNMENTOBLIGATIONS (Cost $35,525,975) $ 40,332,168
CORPORATE BONDS – 39.3%Communication services– 3.7%Activision Blizzard, Inc.
3.400%, 09/15/2026 1,142,000 1,248,280AT&T, Inc.
2.300%, 06/01/2027 6,382,000 6,522,4623.100%, 02/01/2043 24,300,000 22,673,3843.650%, 06/01/2051 3,738,000 3,615,365
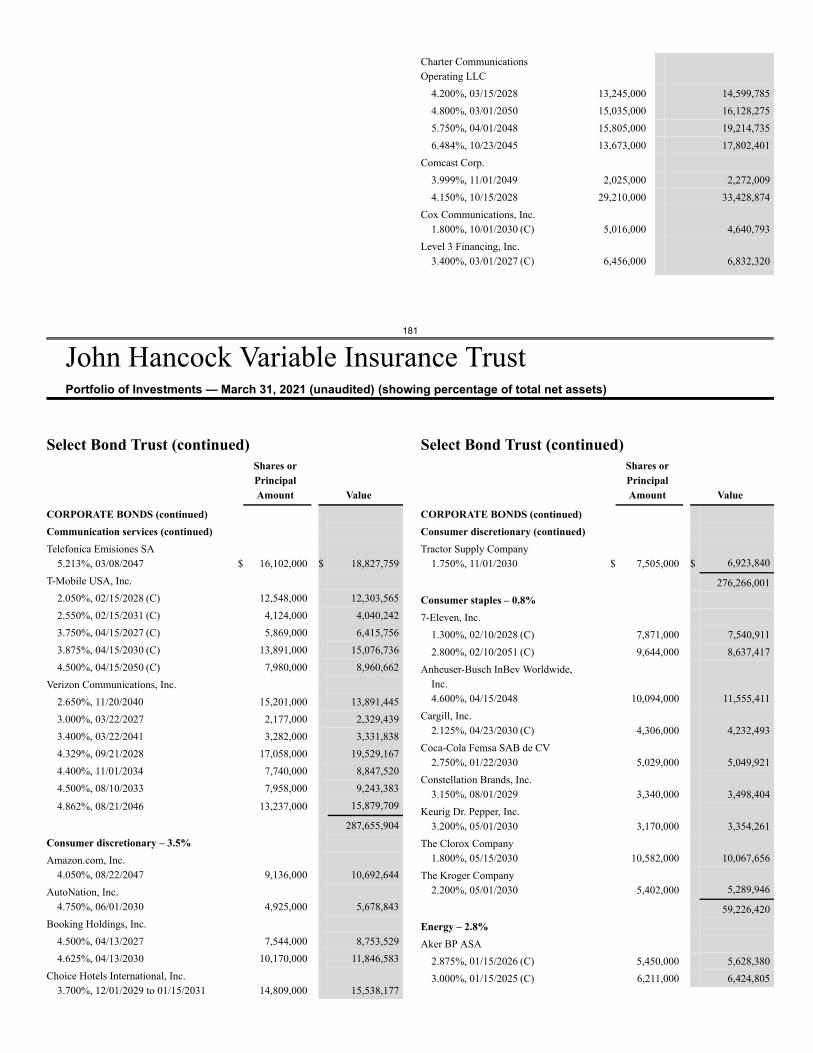
181
John Hancock Variable Insurance TrustPortfolio of Investments — March 31, 2021 (unaudited) (showing percentage of total net assets)
Charter CommunicationsOperating LLC
4.200%, 03/15/2028 13,245,000 14,599,7854.800%, 03/01/2050 15,035,000 16,128,2755.750%, 04/01/2048 15,805,000 19,214,7356.484%, 10/23/2045 13,673,000 17,802,401
Comcast Corp.3.999%, 11/01/2049 2,025,000 2,272,0094.150%, 10/15/2028 29,210,000 33,428,874
Cox Communications, Inc.1.800%, 10/01/2030 (C) 5,016,000 4,640,793
Level 3 Financing, Inc.3.400%, 03/01/2027 (C) 6,456,000 6,832,320
Select Bond Trust (continued)Shares orPrincipalAmount Value
CORPORATE BONDS (continued)Communication services (continued)Telefonica Emisiones SA
5.213%, 03/08/2047 $ 16,102,000 $ 18,827,759T-Mobile USA, Inc.
2.050%, 02/15/2028 (C) 12,548,000 12,303,5652.550%, 02/15/2031 (C) 4,124,000 4,040,2423.750%, 04/15/2027 (C) 5,869,000 6,415,7563.875%, 04/15/2030 (C) 13,891,000 15,076,7364.500%, 04/15/2050 (C) 7,980,000 8,960,662
Verizon Communications, Inc.2.650%, 11/20/2040 15,201,000 13,891,4453.000%, 03/22/2027 2,177,000 2,329,4393.400%, 03/22/2041 3,282,000 3,331,8384.329%, 09/21/2028 17,058,000 19,529,1674.400%, 11/01/2034 7,740,000 8,847,5204.500%, 08/10/2033 7,958,000 9,243,383
4.862%, 08/21/2046 13,237,000 15,879,709
287,655,904Consumer discretionary – 3.5%Amazon.com, Inc.
4.050%, 08/22/2047 9,136,000 10,692,644AutoNation, Inc.
4.750%, 06/01/2030 4,925,000 5,678,843Booking Holdings, Inc.
4.500%, 04/13/2027 7,544,000 8,753,5294.625%, 04/13/2030 10,170,000 11,846,583
Choice Hotels International, Inc.3.700%, 12/01/2029 to 01/15/2031 14,809,000 15,538,177
Select Bond Trust (continued)Shares orPrincipalAmount Value
CORPORATE BONDS (continued)Consumer discretionary (continued)Tractor Supply Company
1.750%, 11/01/2030 $ 7,505,000 $ 6,923,840
276,266,001Consumer staples – 0.8%7-Eleven, Inc.
1.300%, 02/10/2028 (C) 7,871,000 7,540,9112.800%, 02/10/2051 (C) 9,644,000 8,637,417
Anheuser-Busch InBev Worldwide,Inc.4.600%, 04/15/2048 10,094,000 11,555,411
Cargill, Inc.2.125%, 04/23/2030 (C) 4,306,000 4,232,493
Coca-Cola Femsa SAB de CV2.750%, 01/22/2030 5,029,000 5,049,921
Constellation Brands, Inc.3.150%, 08/01/2029 3,340,000 3,498,404
Keurig Dr. Pepper, Inc.3.200%, 05/01/2030 3,170,000 3,354,261
The Clorox Company1.800%, 05/15/2030 10,582,000 10,067,656
The Kroger Company2.200%, 05/01/2030 5,402,000 5,289,946
59,226,420Energy – 2.8%Aker BP ASA
2.875%, 01/15/2026 (C) 5,450,000 5,628,3803.000%, 01/15/2025 (C) 6,211,000 6,424,805
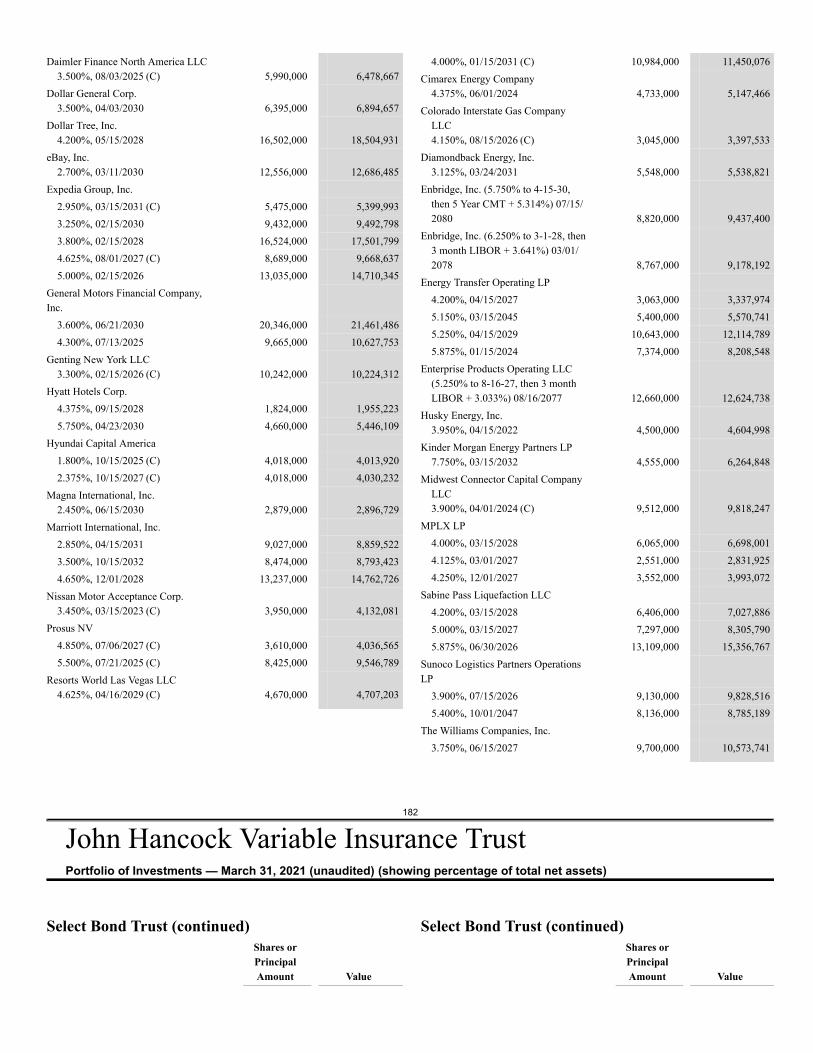
182
John Hancock Variable Insurance TrustPortfolio of Investments — March 31, 2021 (unaudited) (showing percentage of total net assets)
Daimler Finance North America LLC3.500%, 08/03/2025 (C) 5,990,000 6,478,667
Dollar General Corp.3.500%, 04/03/2030 6,395,000 6,894,657
Dollar Tree, Inc.4.200%, 05/15/2028 16,502,000 18,504,931
eBay, Inc.2.700%, 03/11/2030 12,556,000 12,686,485
Expedia Group, Inc.2.950%, 03/15/2031 (C) 5,475,000 5,399,9933.250%, 02/15/2030 9,432,000 9,492,7983.800%, 02/15/2028 16,524,000 17,501,7994.625%, 08/01/2027 (C) 8,689,000 9,668,6375.000%, 02/15/2026 13,035,000 14,710,345
General Motors Financial Company,Inc.
3.600%, 06/21/2030 20,346,000 21,461,4864.300%, 07/13/2025 9,665,000 10,627,753
Genting New York LLC3.300%, 02/15/2026 (C) 10,242,000 10,224,312
Hyatt Hotels Corp.4.375%, 09/15/2028 1,824,000 1,955,2235.750%, 04/23/2030 4,660,000 5,446,109
Hyundai Capital America1.800%, 10/15/2025 (C) 4,018,000 4,013,9202.375%, 10/15/2027 (C) 4,018,000 4,030,232
Magna International, Inc.2.450%, 06/15/2030 2,879,000 2,896,729
Marriott International, Inc.2.850%, 04/15/2031 9,027,000 8,859,5223.500%, 10/15/2032 8,474,000 8,793,4234.650%, 12/01/2028 13,237,000 14,762,726
Nissan Motor Acceptance Corp.3.450%, 03/15/2023 (C) 3,950,000 4,132,081
Prosus NV4.850%, 07/06/2027 (C) 3,610,000 4,036,5655.500%, 07/21/2025 (C) 8,425,000 9,546,789
Resorts World Las Vegas LLC4.625%, 04/16/2029 (C) 4,670,000 4,707,203
4.000%, 01/15/2031 (C) 10,984,000 11,450,076Cimarex Energy Company
4.375%, 06/01/2024 4,733,000 5,147,466Colorado Interstate Gas Company
LLC4.150%, 08/15/2026 (C) 3,045,000 3,397,533
Diamondback Energy, Inc.3.125%, 03/24/2031 5,548,000 5,538,821
Enbridge, Inc. (5.750% to 4-15-30,then 5 Year CMT + 5.314%) 07/15/2080 8,820,000 9,437,400
Enbridge, Inc. (6.250% to 3-1-28, then3 month LIBOR + 3.641%) 03/01/2078 8,767,000 9,178,192
Energy Transfer Operating LP4.200%, 04/15/2027 3,063,000 3,337,9745.150%, 03/15/2045 5,400,000 5,570,7415.250%, 04/15/2029 10,643,000 12,114,7895.875%, 01/15/2024 7,374,000 8,208,548
Enterprise Products Operating LLC(5.250% to 8-16-27, then 3 monthLIBOR + 3.033%) 08/16/2077 12,660,000 12,624,738
Husky Energy, Inc.3.950%, 04/15/2022 4,500,000 4,604,998
Kinder Morgan Energy Partners LP7.750%, 03/15/2032 4,555,000 6,264,848
Midwest Connector Capital CompanyLLC3.900%, 04/01/2024 (C) 9,512,000 9,818,247
MPLX LP4.000%, 03/15/2028 6,065,000 6,698,0014.125%, 03/01/2027 2,551,000 2,831,9254.250%, 12/01/2027 3,552,000 3,993,072
Sabine Pass Liquefaction LLC4.200%, 03/15/2028 6,406,000 7,027,8865.000%, 03/15/2027 7,297,000 8,305,7905.875%, 06/30/2026 13,109,000 15,356,767
Sunoco Logistics Partners OperationsLP
3.900%, 07/15/2026 9,130,000 9,828,5165.400%, 10/01/2047 8,136,000 8,785,189
The Williams Companies, Inc.3.750%, 06/15/2027 9,700,000 10,573,741
Select Bond Trust (continued)Shares orPrincipalAmount Value
Select Bond Trust (continued)Shares orPrincipalAmount Value
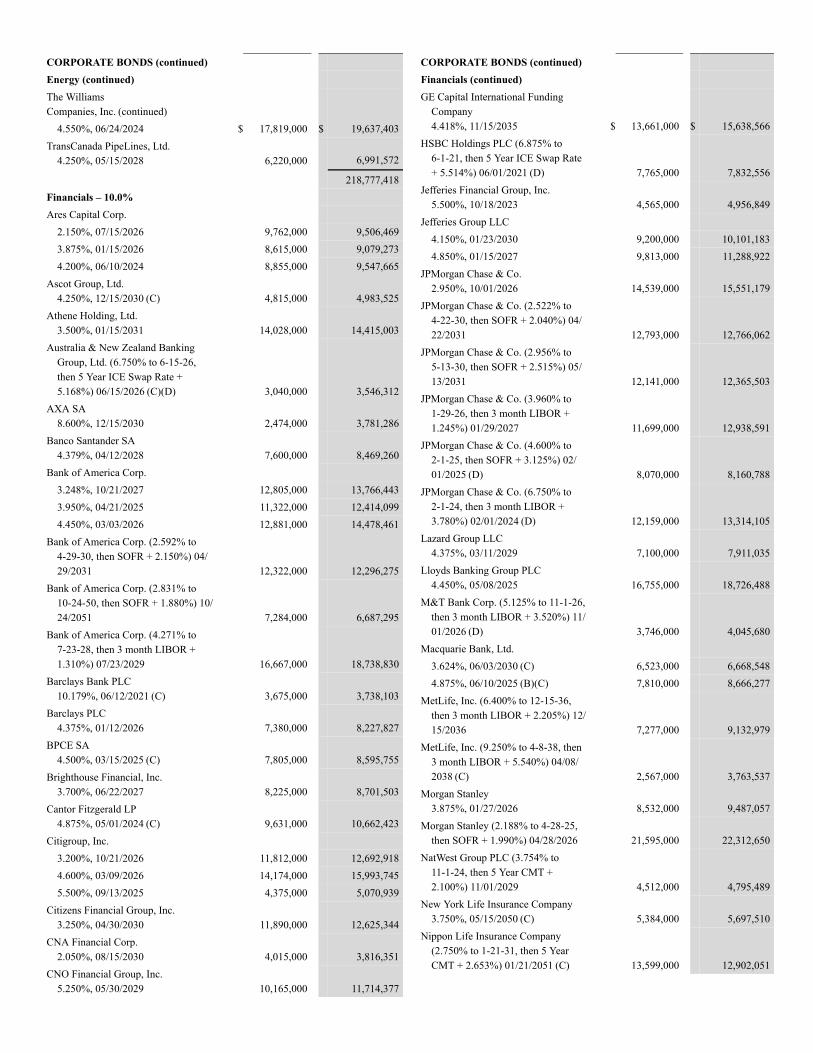
CORPORATE BONDS (continued)Energy (continued)The WilliamsCompanies, Inc. (continued)
4.550%, 06/24/2024 $ 17,819,000 $ 19,637,403TransCanada PipeLines, Ltd.
4.250%, 05/15/2028 6,220,000 6,991,572
218,777,418Financials – 10.0%Ares Capital Corp.
2.150%, 07/15/2026 9,762,000 9,506,4693.875%, 01/15/2026 8,615,000 9,079,2734.200%, 06/10/2024 8,855,000 9,547,665
Ascot Group, Ltd.4.250%, 12/15/2030 (C) 4,815,000 4,983,525
Athene Holding, Ltd.3.500%, 01/15/2031 14,028,000 14,415,003
Australia & New Zealand BankingGroup, Ltd. (6.750% to 6-15-26,then 5 Year ICE Swap Rate +5.168%) 06/15/2026 (C)(D) 3,040,000 3,546,312
AXA SA8.600%, 12/15/2030 2,474,000 3,781,286
Banco Santander SA4.379%, 04/12/2028 7,600,000 8,469,260
Bank of America Corp.3.248%, 10/21/2027 12,805,000 13,766,4433.950%, 04/21/2025 11,322,000 12,414,0994.450%, 03/03/2026 12,881,000 14,478,461
Bank of America Corp. (2.592% to4-29-30, then SOFR + 2.150%) 04/29/2031 12,322,000 12,296,275
Bank of America Corp. (2.831% to10-24-50, then SOFR + 1.880%) 10/24/2051 7,284,000 6,687,295
Bank of America Corp. (4.271% to7-23-28, then 3 month LIBOR +1.310%) 07/23/2029 16,667,000 18,738,830
Barclays Bank PLC10.179%, 06/12/2021 (C) 3,675,000 3,738,103
Barclays PLC4.375%, 01/12/2026 7,380,000 8,227,827
BPCE SA4.500%, 03/15/2025 (C) 7,805,000 8,595,755
Brighthouse Financial, Inc.3.700%, 06/22/2027 8,225,000 8,701,503
Cantor Fitzgerald LP4.875%, 05/01/2024 (C) 9,631,000 10,662,423
Citigroup, Inc.3.200%, 10/21/2026 11,812,000 12,692,9184.600%, 03/09/2026 14,174,000 15,993,7455.500%, 09/13/2025 4,375,000 5,070,939
Citizens Financial Group, Inc.3.250%, 04/30/2030 11,890,000 12,625,344
CNA Financial Corp.2.050%, 08/15/2030 4,015,000 3,816,351
CNO Financial Group, Inc.5.250%, 05/30/2029 10,165,000 11,714,377
CORPORATE BONDS (continued)Financials (continued)GE Capital International Funding
Company4.418%, 11/15/2035 $ 13,661,000 $ 15,638,566
HSBC Holdings PLC (6.875% to6-1-21, then 5 Year ICE Swap Rate+ 5.514%) 06/01/2021 (D) 7,765,000 7,832,556
Jefferies Financial Group, Inc.5.500%, 10/18/2023 4,565,000 4,956,849
Jefferies Group LLC4.150%, 01/23/2030 9,200,000 10,101,1834.850%, 01/15/2027 9,813,000 11,288,922
JPMorgan Chase & Co.2.950%, 10/01/2026 14,539,000 15,551,179
JPMorgan Chase & Co. (2.522% to4-22-30, then SOFR + 2.040%) 04/22/2031 12,793,000 12,766,062
JPMorgan Chase & Co. (2.956% to5-13-30, then SOFR + 2.515%) 05/13/2031 12,141,000 12,365,503
JPMorgan Chase & Co. (3.960% to1-29-26, then 3 month LIBOR +1.245%) 01/29/2027 11,699,000 12,938,591
JPMorgan Chase & Co. (4.600% to2-1-25, then SOFR + 3.125%) 02/01/2025 (D) 8,070,000 8,160,788
JPMorgan Chase & Co. (6.750% to2-1-24, then 3 month LIBOR +3.780%) 02/01/2024 (D) 12,159,000 13,314,105
Lazard Group LLC4.375%, 03/11/2029 7,100,000 7,911,035
Lloyds Banking Group PLC4.450%, 05/08/2025 16,755,000 18,726,488
M&T Bank Corp. (5.125% to 11-1-26,then 3 month LIBOR + 3.520%) 11/01/2026 (D) 3,746,000 4,045,680
Macquarie Bank, Ltd.3.624%, 06/03/2030 (C) 6,523,000 6,668,5484.875%, 06/10/2025 (B)(C) 7,810,000 8,666,277
MetLife, Inc. (6.400% to 12-15-36,then 3 month LIBOR + 2.205%) 12/15/2036 7,277,000 9,132,979
MetLife, Inc. (9.250% to 4-8-38, then3 month LIBOR + 5.540%) 04/08/2038 (C) 2,567,000 3,763,537
Morgan Stanley3.875%, 01/27/2026 8,532,000 9,487,057
Morgan Stanley (2.188% to 4-28-25,then SOFR + 1.990%) 04/28/2026 21,595,000 22,312,650
NatWest Group PLC (3.754% to11-1-24, then 5 Year CMT +2.100%) 11/01/2029 4,512,000 4,795,489
New York Life Insurance Company3.750%, 05/15/2050 (C) 5,384,000 5,697,510
Nippon Life Insurance Company(2.750% to 1-21-31, then 5 YearCMT + 2.653%) 01/21/2051 (C) 13,599,000 12,902,051
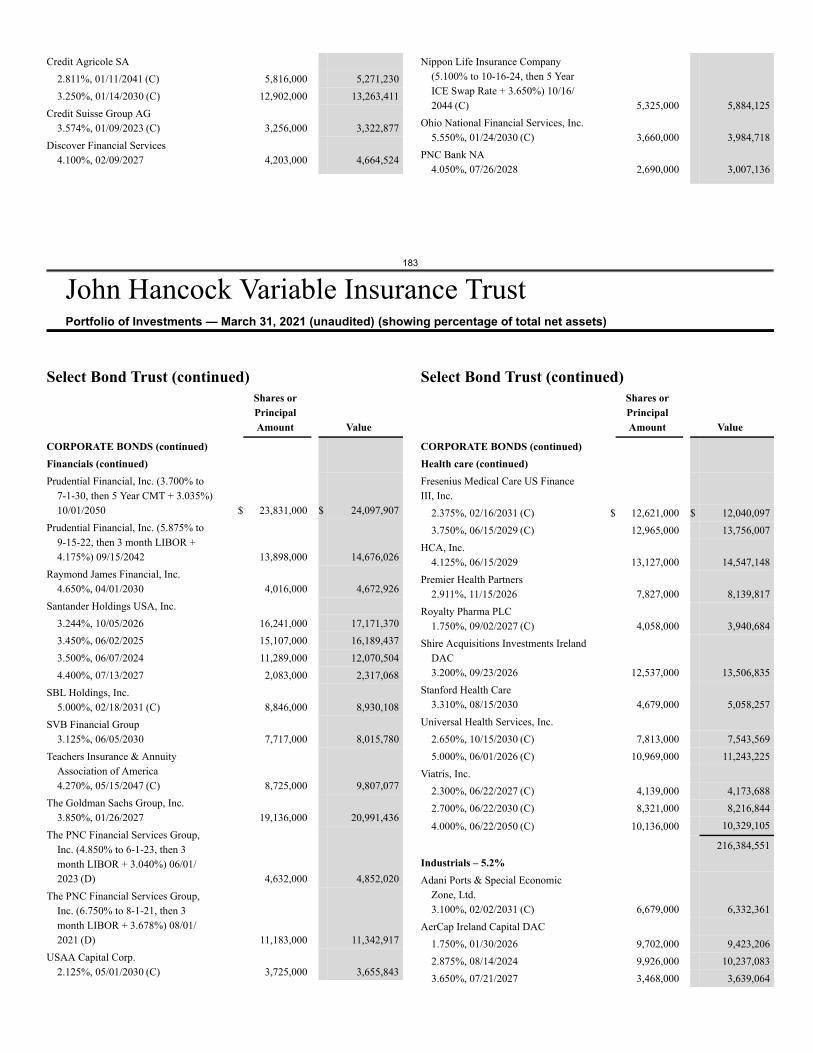
183
John Hancock Variable Insurance TrustPortfolio of Investments — March 31, 2021 (unaudited) (showing percentage of total net assets)
Credit Agricole SA2.811%, 01/11/2041 (C) 5,816,000 5,271,2303.250%, 01/14/2030 (C) 12,902,000 13,263,411
Credit Suisse Group AG3.574%, 01/09/2023 (C) 3,256,000 3,322,877
Discover Financial Services4.100%, 02/09/2027 4,203,000 4,664,524
Nippon Life Insurance Company(5.100% to 10-16-24, then 5 YearICE Swap Rate + 3.650%) 10/16/2044 (C) 5,325,000 5,884,125
Ohio National Financial Services, Inc.5.550%, 01/24/2030 (C) 3,660,000 3,984,718
PNC Bank NA4.050%, 07/26/2028 2,690,000 3,007,136
Select Bond Trust (continued)Shares orPrincipalAmount Value
CORPORATE BONDS (continued)Financials (continued)Prudential Financial, Inc. (3.700% to
7-1-30, then 5 Year CMT + 3.035%)10/01/2050 $ 23,831,000 $ 24,097,907
Prudential Financial, Inc. (5.875% to9-15-22, then 3 month LIBOR +4.175%) 09/15/2042 13,898,000 14,676,026
Raymond James Financial, Inc.4.650%, 04/01/2030 4,016,000 4,672,926
Santander Holdings USA, Inc.3.244%, 10/05/2026 16,241,000 17,171,3703.450%, 06/02/2025 15,107,000 16,189,4373.500%, 06/07/2024 11,289,000 12,070,5044.400%, 07/13/2027 2,083,000 2,317,068
SBL Holdings, Inc.5.000%, 02/18/2031 (C) 8,846,000 8,930,108
SVB Financial Group3.125%, 06/05/2030 7,717,000 8,015,780
Teachers Insurance & AnnuityAssociation of America4.270%, 05/15/2047 (C) 8,725,000 9,807,077
The Goldman Sachs Group, Inc.3.850%, 01/26/2027 19,136,000 20,991,436
The PNC Financial Services Group,Inc. (4.850% to 6-1-23, then 3month LIBOR + 3.040%) 06/01/2023 (D) 4,632,000 4,852,020
The PNC Financial Services Group,Inc. (6.750% to 8-1-21, then 3month LIBOR + 3.678%) 08/01/2021 (D) 11,183,000 11,342,917
USAA Capital Corp.2.125%, 05/01/2030 (C) 3,725,000 3,655,843
Select Bond Trust (continued)Shares orPrincipalAmount Value
CORPORATE BONDS (continued)Health care (continued)Fresenius Medical Care US FinanceIII, Inc.
2.375%, 02/16/2031 (C) $ 12,621,000 $ 12,040,0973.750%, 06/15/2029 (C) 12,965,000 13,756,007
HCA, Inc.4.125%, 06/15/2029 13,127,000 14,547,148
Premier Health Partners2.911%, 11/15/2026 7,827,000 8,139,817
Royalty Pharma PLC1.750%, 09/02/2027 (C) 4,058,000 3,940,684
Shire Acquisitions Investments IrelandDAC3.200%, 09/23/2026 12,537,000 13,506,835
Stanford Health Care3.310%, 08/15/2030 4,679,000 5,058,257
Universal Health Services, Inc.2.650%, 10/15/2030 (C) 7,813,000 7,543,5695.000%, 06/01/2026 (C) 10,969,000 11,243,225
Viatris, Inc.2.300%, 06/22/2027 (C) 4,139,000 4,173,6882.700%, 06/22/2030 (C) 8,321,000 8,216,844
4.000%, 06/22/2050 (C) 10,136,000 10,329,105
216,384,551Industrials – 5.2%Adani Ports & Special Economic
Zone, Ltd.3.100%, 02/02/2031 (C) 6,679,000 6,332,361
AerCap Ireland Capital DAC1.750%, 01/30/2026 9,702,000 9,423,2062.875%, 08/14/2024 9,926,000 10,237,0833.650%, 07/21/2027 3,468,000 3,639,064
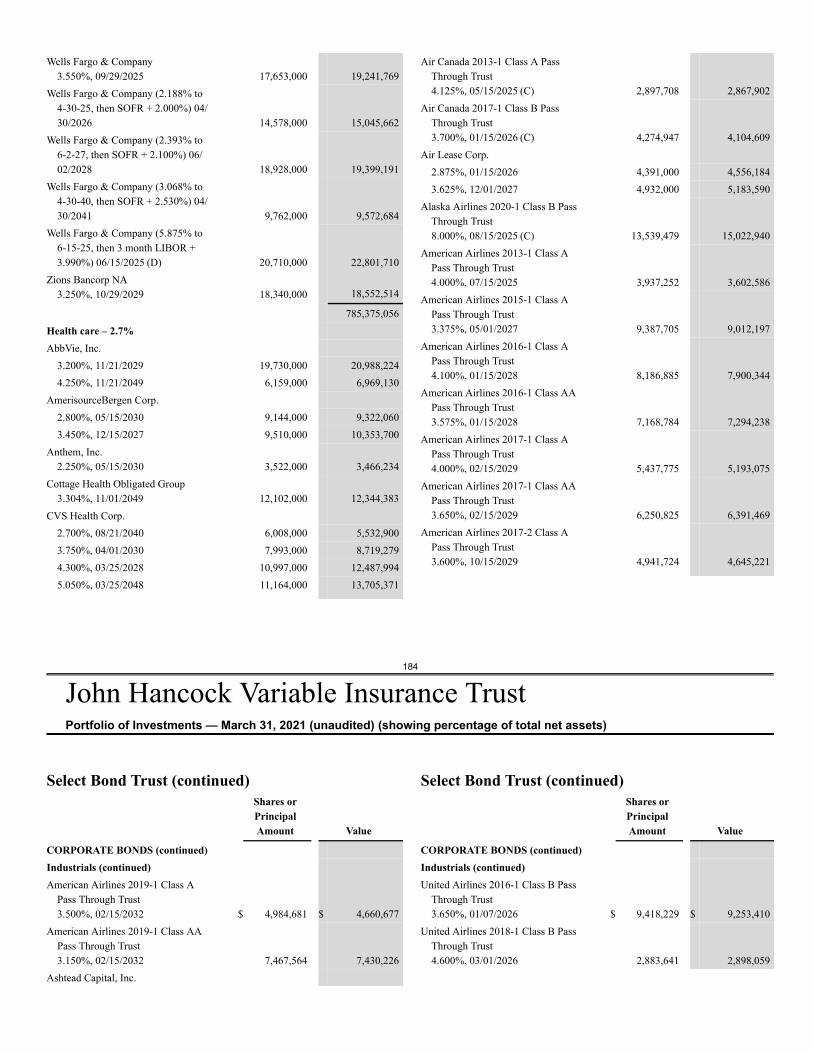
184
John Hancock Variable Insurance TrustPortfolio of Investments — March 31, 2021 (unaudited) (showing percentage of total net assets)
Wells Fargo & Company3.550%, 09/29/2025 17,653,000 19,241,769
Wells Fargo & Company (2.188% to4-30-25, then SOFR + 2.000%) 04/30/2026 14,578,000 15,045,662
Wells Fargo & Company (2.393% to6-2-27, then SOFR + 2.100%) 06/02/2028 18,928,000 19,399,191
Wells Fargo & Company (3.068% to4-30-40, then SOFR + 2.530%) 04/30/2041 9,762,000 9,572,684
Wells Fargo & Company (5.875% to6-15-25, then 3 month LIBOR +3.990%) 06/15/2025 (D) 20,710,000 22,801,710
Zions Bancorp NA3.250%, 10/29/2029 18,340,000 18,552,514
785,375,056Health care – 2.7%AbbVie, Inc.
3.200%, 11/21/2029 19,730,000 20,988,2244.250%, 11/21/2049 6,159,000 6,969,130
AmerisourceBergen Corp.2.800%, 05/15/2030 9,144,000 9,322,0603.450%, 12/15/2027 9,510,000 10,353,700
Anthem, Inc.2.250%, 05/15/2030 3,522,000 3,466,234
Cottage Health Obligated Group3.304%, 11/01/2049 12,102,000 12,344,383
CVS Health Corp.2.700%, 08/21/2040 6,008,000 5,532,9003.750%, 04/01/2030 7,993,000 8,719,2794.300%, 03/25/2028 10,997,000 12,487,9945.050%, 03/25/2048 11,164,000 13,705,371
Air Canada 2013-1 Class A PassThrough Trust4.125%, 05/15/2025 (C) 2,897,708 2,867,902
Air Canada 2017-1 Class B PassThrough Trust3.700%, 01/15/2026 (C) 4,274,947 4,104,609
Air Lease Corp.2.875%, 01/15/2026 4,391,000 4,556,1843.625%, 12/01/2027 4,932,000 5,183,590
Alaska Airlines 2020-1 Class B PassThrough Trust8.000%, 08/15/2025 (C) 13,539,479 15,022,940
American Airlines 2013-1 Class APass Through Trust4.000%, 07/15/2025 3,937,252 3,602,586
American Airlines 2015-1 Class APass Through Trust3.375%, 05/01/2027 9,387,705 9,012,197
American Airlines 2016-1 Class APass Through Trust4.100%, 01/15/2028 8,186,885 7,900,344
American Airlines 2016-1 Class AAPass Through Trust3.575%, 01/15/2028 7,168,784 7,294,238
American Airlines 2017-1 Class APass Through Trust4.000%, 02/15/2029 5,437,775 5,193,075
American Airlines 2017-1 Class AAPass Through Trust3.650%, 02/15/2029 6,250,825 6,391,469
American Airlines 2017-2 Class APass Through Trust3.600%, 10/15/2029 4,941,724 4,645,221
Select Bond Trust (continued)Shares orPrincipalAmount Value
CORPORATE BONDS (continued)Industrials (continued)American Airlines 2019-1 Class A
Pass Through Trust3.500%, 02/15/2032 $ 4,984,681 $ 4,660,677
American Airlines 2019-1 Class AAPass Through Trust3.150%, 02/15/2032 7,467,564 7,430,226
Ashtead Capital, Inc.
Select Bond Trust (continued)Shares orPrincipalAmount Value
CORPORATE BONDS (continued)Industrials (continued)United Airlines 2016-1 Class B Pass
Through Trust3.650%, 01/07/2026 $ 9,418,229 $ 9,253,410
United Airlines 2018-1 Class B PassThrough Trust4.600%, 03/01/2026 2,883,641 2,898,059
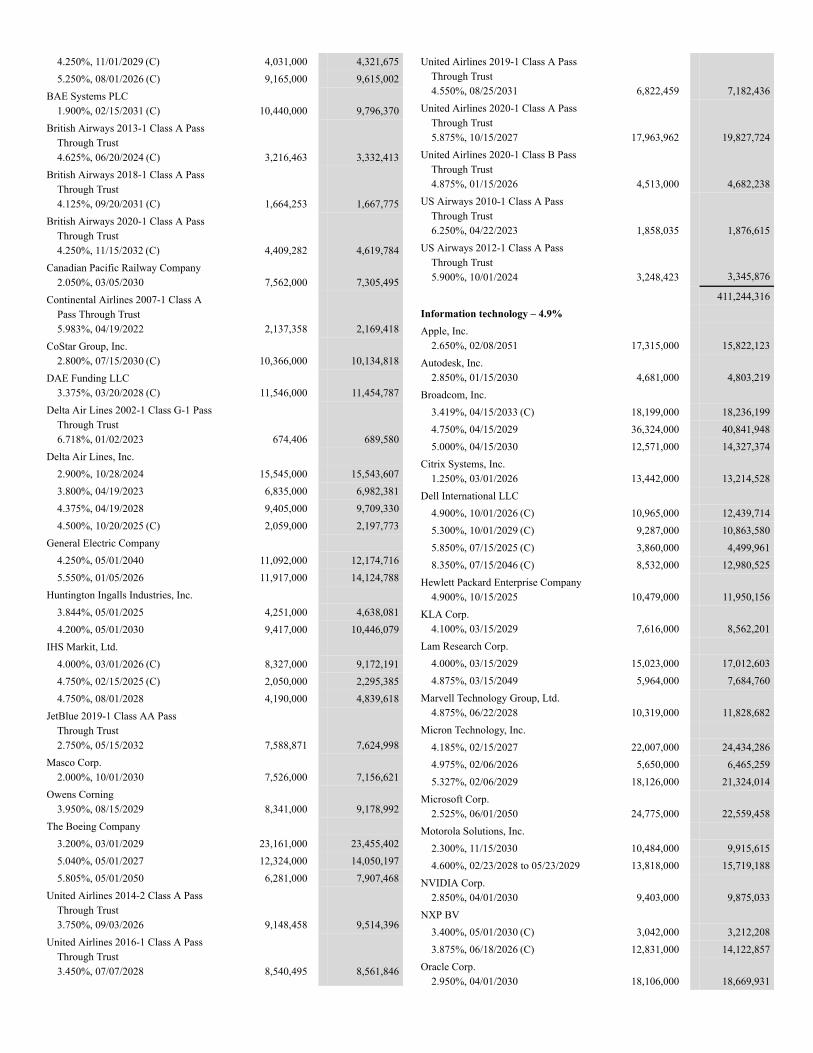
4.250%, 11/01/2029 (C) 4,031,000 4,321,6755.250%, 08/01/2026 (C) 9,165,000 9,615,002
BAE Systems PLC1.900%, 02/15/2031 (C) 10,440,000 9,796,370
British Airways 2013-1 Class A PassThrough Trust4.625%, 06/20/2024 (C) 3,216,463 3,332,413
British Airways 2018-1 Class A PassThrough Trust4.125%, 09/20/2031 (C) 1,664,253 1,667,775
British Airways 2020-1 Class A PassThrough Trust4.250%, 11/15/2032 (C) 4,409,282 4,619,784
Canadian Pacific Railway Company2.050%, 03/05/2030 7,562,000 7,305,495
Continental Airlines 2007-1 Class APass Through Trust5.983%, 04/19/2022 2,137,358 2,169,418
CoStar Group, Inc.2.800%, 07/15/2030 (C) 10,366,000 10,134,818
DAE Funding LLC3.375%, 03/20/2028 (C) 11,546,000 11,454,787
Delta Air Lines 2002-1 Class G-1 PassThrough Trust6.718%, 01/02/2023 674,406 689,580
Delta Air Lines, Inc.2.900%, 10/28/2024 15,545,000 15,543,6073.800%, 04/19/2023 6,835,000 6,982,3814.375%, 04/19/2028 9,405,000 9,709,3304.500%, 10/20/2025 (C) 2,059,000 2,197,773
General Electric Company4.250%, 05/01/2040 11,092,000 12,174,7165.550%, 01/05/2026 11,917,000 14,124,788
Huntington Ingalls Industries, Inc.3.844%, 05/01/2025 4,251,000 4,638,0814.200%, 05/01/2030 9,417,000 10,446,079
IHS Markit, Ltd.4.000%, 03/01/2026 (C) 8,327,000 9,172,1914.750%, 02/15/2025 (C) 2,050,000 2,295,3854.750%, 08/01/2028 4,190,000 4,839,618
JetBlue 2019-1 Class AA PassThrough Trust2.750%, 05/15/2032 7,588,871 7,624,998
Masco Corp.2.000%, 10/01/2030 7,526,000 7,156,621
Owens Corning3.950%, 08/15/2029 8,341,000 9,178,992
The Boeing Company3.200%, 03/01/2029 23,161,000 23,455,4025.040%, 05/01/2027 12,324,000 14,050,1975.805%, 05/01/2050 6,281,000 7,907,468
United Airlines 2014-2 Class A PassThrough Trust3.750%, 09/03/2026 9,148,458 9,514,396
United Airlines 2016-1 Class A PassThrough Trust3.450%, 07/07/2028 8,540,495 8,561,846
United Airlines 2019-1 Class A PassThrough Trust4.550%, 08/25/2031 6,822,459 7,182,436
United Airlines 2020-1 Class A PassThrough Trust5.875%, 10/15/2027 17,963,962 19,827,724
United Airlines 2020-1 Class B PassThrough Trust4.875%, 01/15/2026 4,513,000 4,682,238
US Airways 2010-1 Class A PassThrough Trust6.250%, 04/22/2023 1,858,035 1,876,615
US Airways 2012-1 Class A PassThrough Trust5.900%, 10/01/2024 3,248,423 3,345,876
411,244,316Information technology – 4.9%Apple, Inc.
2.650%, 02/08/2051 17,315,000 15,822,123Autodesk, Inc.
2.850%, 01/15/2030 4,681,000 4,803,219Broadcom, Inc.
3.419%, 04/15/2033 (C) 18,199,000 18,236,1994.750%, 04/15/2029 36,324,000 40,841,9485.000%, 04/15/2030 12,571,000 14,327,374
Citrix Systems, Inc.1.250%, 03/01/2026 13,442,000 13,214,528
Dell International LLC4.900%, 10/01/2026 (C) 10,965,000 12,439,7145.300%, 10/01/2029 (C) 9,287,000 10,863,5805.850%, 07/15/2025 (C) 3,860,000 4,499,9618.350%, 07/15/2046 (C) 8,532,000 12,980,525
Hewlett Packard Enterprise Company4.900%, 10/15/2025 10,479,000 11,950,156
KLA Corp.4.100%, 03/15/2029 7,616,000 8,562,201
Lam Research Corp.4.000%, 03/15/2029 15,023,000 17,012,6034.875%, 03/15/2049 5,964,000 7,684,760
Marvell Technology Group, Ltd.4.875%, 06/22/2028 10,319,000 11,828,682
Micron Technology, Inc.4.185%, 02/15/2027 22,007,000 24,434,2864.975%, 02/06/2026 5,650,000 6,465,2595.327%, 02/06/2029 18,126,000 21,324,014
Microsoft Corp.2.525%, 06/01/2050 24,775,000 22,559,458
Motorola Solutions, Inc.2.300%, 11/15/2030 10,484,000 9,915,6154.600%, 02/23/2028 to 05/23/2029 13,818,000 15,719,188
NVIDIA Corp.2.850%, 04/01/2030 9,403,000 9,875,033
NXP BV3.400%, 05/01/2030 (C) 3,042,000 3,212,2083.875%, 06/18/2026 (C) 12,831,000 14,122,857
Oracle Corp.2.950%, 04/01/2030 18,106,000 18,669,931
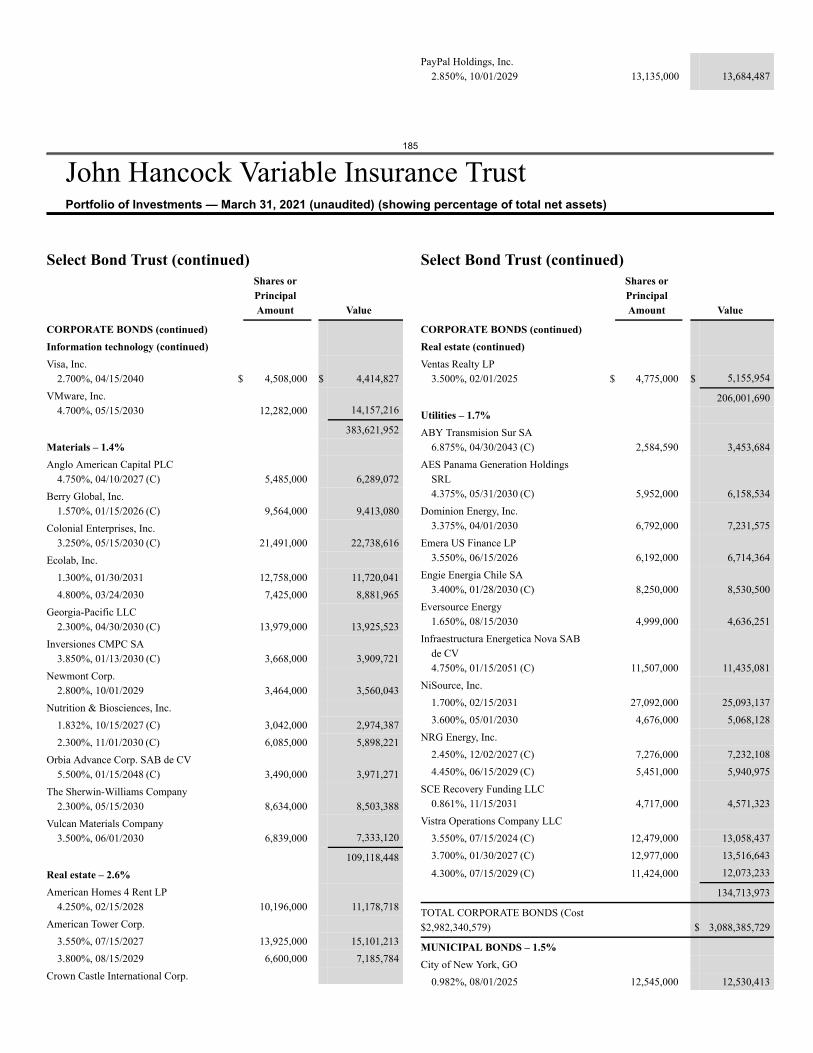
185
John Hancock Variable Insurance TrustPortfolio of Investments — March 31, 2021 (unaudited) (showing percentage of total net assets)
PayPal Holdings, Inc.2.850%, 10/01/2029 13,135,000 13,684,487
Select Bond Trust (continued)Shares orPrincipalAmount Value
CORPORATE BONDS (continued)Information technology (continued)Visa, Inc.
2.700%, 04/15/2040 $ 4,508,000 $ 4,414,827VMware, Inc.
4.700%, 05/15/2030 12,282,000 14,157,216
383,621,952Materials – 1.4%Anglo American Capital PLC
4.750%, 04/10/2027 (C) 5,485,000 6,289,072Berry Global, Inc.
1.570%, 01/15/2026 (C) 9,564,000 9,413,080Colonial Enterprises, Inc.
3.250%, 05/15/2030 (C) 21,491,000 22,738,616Ecolab, Inc.
1.300%, 01/30/2031 12,758,000 11,720,0414.800%, 03/24/2030 7,425,000 8,881,965
Georgia-Pacific LLC2.300%, 04/30/2030 (C) 13,979,000 13,925,523
Inversiones CMPC SA3.850%, 01/13/2030 (C) 3,668,000 3,909,721
Newmont Corp.2.800%, 10/01/2029 3,464,000 3,560,043
Nutrition & Biosciences, Inc.1.832%, 10/15/2027 (C) 3,042,000 2,974,3872.300%, 11/01/2030 (C) 6,085,000 5,898,221
Orbia Advance Corp. SAB de CV5.500%, 01/15/2048 (C) 3,490,000 3,971,271
The Sherwin-Williams Company2.300%, 05/15/2030 8,634,000 8,503,388
Vulcan Materials Company3.500%, 06/01/2030 6,839,000 7,333,120
109,118,448Real estate – 2.6%American Homes 4 Rent LP
4.250%, 02/15/2028 10,196,000 11,178,718American Tower Corp.
3.550%, 07/15/2027 13,925,000 15,101,2133.800%, 08/15/2029 6,600,000 7,185,784
Crown Castle International Corp.
Select Bond Trust (continued)Shares orPrincipalAmount Value
CORPORATE BONDS (continued)Real estate (continued)Ventas Realty LP
3.500%, 02/01/2025 $ 4,775,000 $ 5,155,954
206,001,690Utilities – 1.7%ABY Transmision Sur SA
6.875%, 04/30/2043 (C) 2,584,590 3,453,684AES Panama Generation Holdings
SRL4.375%, 05/31/2030 (C) 5,952,000 6,158,534
Dominion Energy, Inc.3.375%, 04/01/2030 6,792,000 7,231,575
Emera US Finance LP3.550%, 06/15/2026 6,192,000 6,714,364
Engie Energia Chile SA3.400%, 01/28/2030 (C) 8,250,000 8,530,500
Eversource Energy1.650%, 08/15/2030 4,999,000 4,636,251
Infraestructura Energetica Nova SABde CV4.750%, 01/15/2051 (C) 11,507,000 11,435,081
NiSource, Inc.1.700%, 02/15/2031 27,092,000 25,093,1373.600%, 05/01/2030 4,676,000 5,068,128
NRG Energy, Inc.2.450%, 12/02/2027 (C) 7,276,000 7,232,1084.450%, 06/15/2029 (C) 5,451,000 5,940,975
SCE Recovery Funding LLC0.861%, 11/15/2031 4,717,000 4,571,323
Vistra Operations Company LLC3.550%, 07/15/2024 (C) 12,479,000 13,058,4373.700%, 01/30/2027 (C) 12,977,000 13,516,643
4.300%, 07/15/2029 (C) 11,424,000 12,073,233
134,713,973
TOTAL CORPORATE BONDS (Cost$2,982,340,579) $ 3,088,385,729
MUNICIPAL BONDS – 1.5%City of New York, GO
0.982%, 08/01/2025 12,545,000 12,530,413
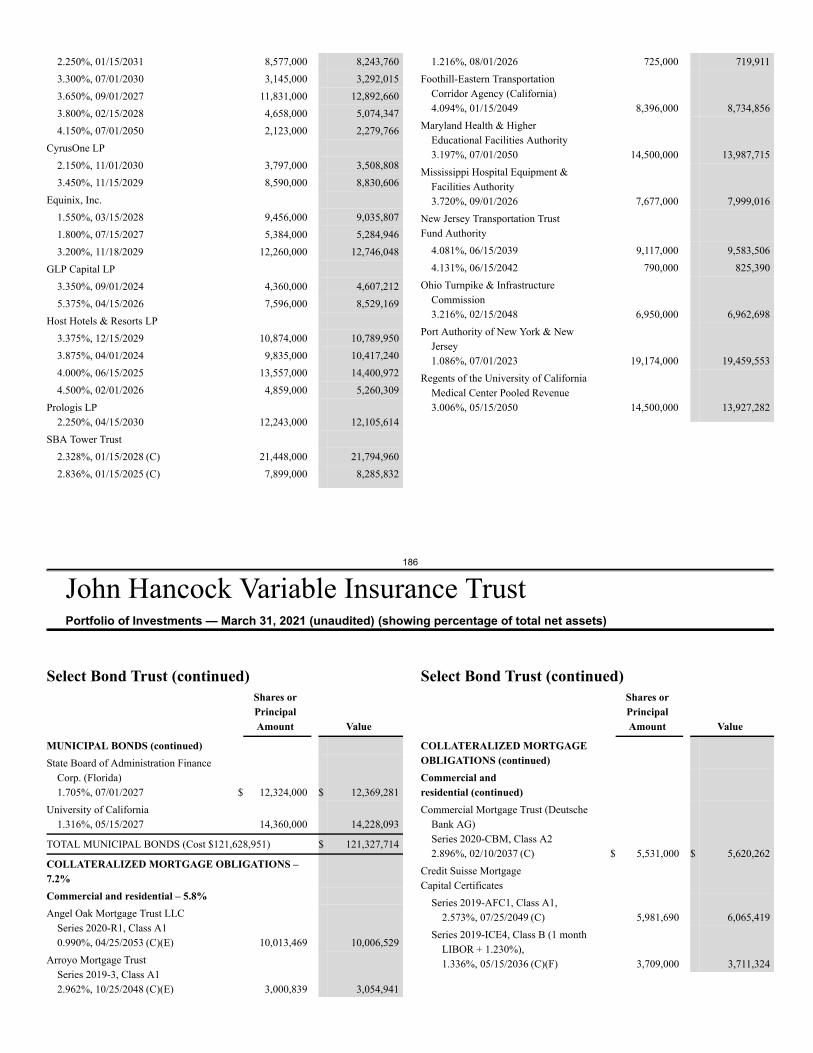
186
John Hancock Variable Insurance TrustPortfolio of Investments — March 31, 2021 (unaudited) (showing percentage of total net assets)
2.250%, 01/15/2031 8,577,000 8,243,7603.300%, 07/01/2030 3,145,000 3,292,0153.650%, 09/01/2027 11,831,000 12,892,6603.800%, 02/15/2028 4,658,000 5,074,3474.150%, 07/01/2050 2,123,000 2,279,766
CyrusOne LP2.150%, 11/01/2030 3,797,000 3,508,8083.450%, 11/15/2029 8,590,000 8,830,606
Equinix, Inc.1.550%, 03/15/2028 9,456,000 9,035,8071.800%, 07/15/2027 5,384,000 5,284,9463.200%, 11/18/2029 12,260,000 12,746,048
GLP Capital LP3.350%, 09/01/2024 4,360,000 4,607,2125.375%, 04/15/2026 7,596,000 8,529,169
Host Hotels & Resorts LP3.375%, 12/15/2029 10,874,000 10,789,9503.875%, 04/01/2024 9,835,000 10,417,2404.000%, 06/15/2025 13,557,000 14,400,9724.500%, 02/01/2026 4,859,000 5,260,309
Prologis LP2.250%, 04/15/2030 12,243,000 12,105,614
SBA Tower Trust2.328%, 01/15/2028 (C) 21,448,000 21,794,9602.836%, 01/15/2025 (C) 7,899,000 8,285,832
1.216%, 08/01/2026 725,000 719,911Foothill-Eastern Transportation
Corridor Agency (California)4.094%, 01/15/2049 8,396,000 8,734,856
Maryland Health & HigherEducational Facilities Authority3.197%, 07/01/2050 14,500,000 13,987,715
Mississippi Hospital Equipment &Facilities Authority3.720%, 09/01/2026 7,677,000 7,999,016
New Jersey Transportation TrustFund Authority
4.081%, 06/15/2039 9,117,000 9,583,5064.131%, 06/15/2042 790,000 825,390
Ohio Turnpike & InfrastructureCommission3.216%, 02/15/2048 6,950,000 6,962,698
Port Authority of New York & NewJersey1.086%, 07/01/2023 19,174,000 19,459,553
Regents of the University of CaliforniaMedical Center Pooled Revenue3.006%, 05/15/2050 14,500,000 13,927,282
Select Bond Trust (continued)Shares orPrincipalAmount Value
MUNICIPAL BONDS (continued)State Board of Administration Finance
Corp. (Florida)1.705%, 07/01/2027 $ 12,324,000 $ 12,369,281
University of California1.316%, 05/15/2027 14,360,000 14,228,093
TOTAL MUNICIPAL BONDS (Cost $121,628,951) $ 121,327,714
COLLATERALIZED MORTGAGE OBLIGATIONS –7.2%Commercial and residential – 5.8%Angel Oak Mortgage Trust LLC
Series 2020-R1, Class A10.990%, 04/25/2053 (C)(E) 10,013,469 10,006,529
Arroyo Mortgage TrustSeries 2019-3, Class A12.962%, 10/25/2048 (C)(E) 3,000,839 3,054,941
Select Bond Trust (continued)Shares orPrincipalAmount Value
COLLATERALIZED MORTGAGEOBLIGATIONS (continued)Commercial andresidential (continued)Commercial Mortgage Trust (Deutsche
Bank AG)Series 2020-CBM, Class A22.896%, 02/10/2037 (C) $ 5,531,000 $ 5,620,262
Credit Suisse MortgageCapital Certificates
Series 2019-AFC1, Class A1,2.573%, 07/25/2049 (C) 5,981,690 6,065,419
Series 2019-ICE4, Class B (1 monthLIBOR + 1.230%),1.336%, 05/15/2036 (C)(F) 3,709,000 3,711,324
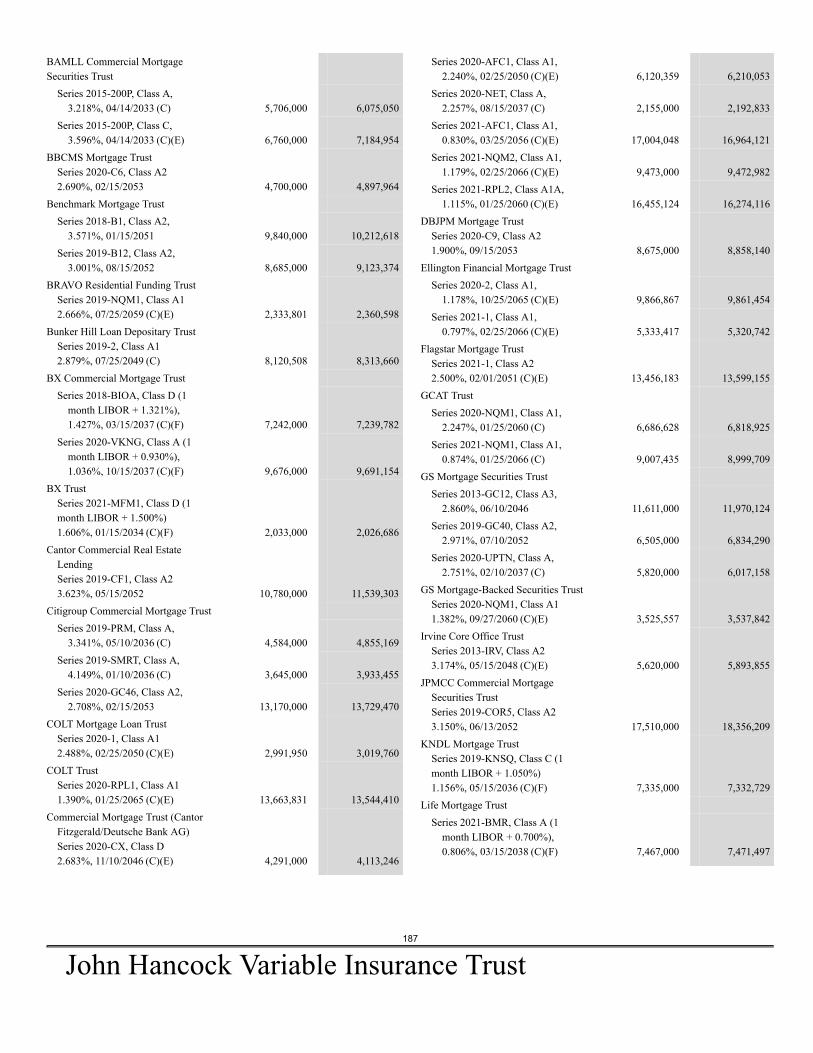
187
John Hancock Variable Insurance Trust
BAMLL Commercial MortgageSecurities Trust
Series 2015-200P, Class A,3.218%, 04/14/2033 (C) 5,706,000 6,075,050
Series 2015-200P, Class C,3.596%, 04/14/2033 (C)(E) 6,760,000 7,184,954
BBCMS Mortgage TrustSeries 2020-C6, Class A22.690%, 02/15/2053 4,700,000 4,897,964
Benchmark Mortgage TrustSeries 2018-B1, Class A2,
3.571%, 01/15/2051 9,840,000 10,212,618Series 2019-B12, Class A2,
3.001%, 08/15/2052 8,685,000 9,123,374BRAVO Residential Funding Trust
Series 2019-NQM1, Class A12.666%, 07/25/2059 (C)(E) 2,333,801 2,360,598
Bunker Hill Loan Depositary TrustSeries 2019-2, Class A12.879%, 07/25/2049 (C) 8,120,508 8,313,660
BX Commercial Mortgage TrustSeries 2018-BIOA, Class D (1
month LIBOR + 1.321%),1.427%, 03/15/2037 (C)(F) 7,242,000 7,239,782
Series 2020-VKNG, Class A (1month LIBOR + 0.930%),1.036%, 10/15/2037 (C)(F) 9,676,000 9,691,154
BX TrustSeries 2021-MFM1, Class D (1month LIBOR + 1.500%)1.606%, 01/15/2034 (C)(F) 2,033,000 2,026,686
Cantor Commercial Real EstateLendingSeries 2019-CF1, Class A23.623%, 05/15/2052 10,780,000 11,539,303
Citigroup Commercial Mortgage TrustSeries 2019-PRM, Class A,
3.341%, 05/10/2036 (C) 4,584,000 4,855,169Series 2019-SMRT, Class A,
4.149%, 01/10/2036 (C) 3,645,000 3,933,455Series 2020-GC46, Class A2,
2.708%, 02/15/2053 13,170,000 13,729,470COLT Mortgage Loan Trust
Series 2020-1, Class A12.488%, 02/25/2050 (C)(E) 2,991,950 3,019,760
COLT TrustSeries 2020-RPL1, Class A11.390%, 01/25/2065 (C)(E) 13,663,831 13,544,410
Commercial Mortgage Trust (CantorFitzgerald/Deutsche Bank AG)Series 2020-CX, Class D2.683%, 11/10/2046 (C)(E) 4,291,000 4,113,246
Series 2020-AFC1, Class A1,2.240%, 02/25/2050 (C)(E) 6,120,359 6,210,053
Series 2020-NET, Class A,2.257%, 08/15/2037 (C) 2,155,000 2,192,833
Series 2021-AFC1, Class A1,0.830%, 03/25/2056 (C)(E) 17,004,048 16,964,121
Series 2021-NQM2, Class A1,1.179%, 02/25/2066 (C)(E) 9,473,000 9,472,982
Series 2021-RPL2, Class A1A,1.115%, 01/25/2060 (C)(E) 16,455,124 16,274,116
DBJPM Mortgage TrustSeries 2020-C9, Class A21.900%, 09/15/2053 8,675,000 8,858,140
Ellington Financial Mortgage TrustSeries 2020-2, Class A1,
1.178%, 10/25/2065 (C)(E) 9,866,867 9,861,454Series 2021-1, Class A1,
0.797%, 02/25/2066 (C)(E) 5,333,417 5,320,742Flagstar Mortgage Trust
Series 2021-1, Class A22.500%, 02/01/2051 (C)(E) 13,456,183 13,599,155
GCAT TrustSeries 2020-NQM1, Class A1,
2.247%, 01/25/2060 (C) 6,686,628 6,818,925Series 2021-NQM1, Class A1,
0.874%, 01/25/2066 (C) 9,007,435 8,999,709GS Mortgage Securities Trust
Series 2013-GC12, Class A3,2.860%, 06/10/2046 11,611,000 11,970,124
Series 2019-GC40, Class A2,2.971%, 07/10/2052 6,505,000 6,834,290
Series 2020-UPTN, Class A,2.751%, 02/10/2037 (C) 5,820,000 6,017,158
GS Mortgage-Backed Securities TrustSeries 2020-NQM1, Class A11.382%, 09/27/2060 (C)(E) 3,525,557 3,537,842
Irvine Core Office TrustSeries 2013-IRV, Class A23.174%, 05/15/2048 (C)(E) 5,620,000 5,893,855
JPMCC Commercial MortgageSecurities TrustSeries 2019-COR5, Class A23.150%, 06/13/2052 17,510,000 18,356,209
KNDL Mortgage TrustSeries 2019-KNSQ, Class C (1month LIBOR + 1.050%)1.156%, 05/15/2036 (C)(F) 7,335,000 7,332,729
Life Mortgage TrustSeries 2021-BMR, Class A (1
month LIBOR + 0.700%),0.806%, 03/15/2038 (C)(F) 7,467,000 7,471,497
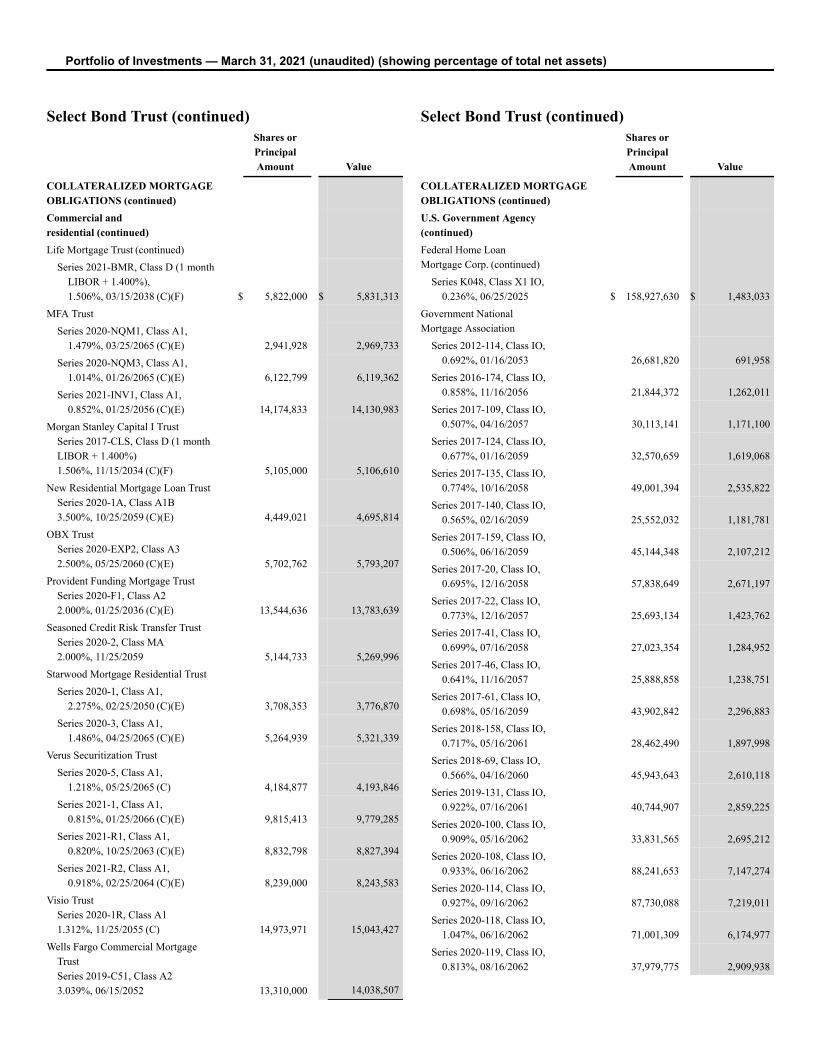
Portfolio of Investments — March 31, 2021 (unaudited) (showing percentage of total net assets)
Select Bond Trust (continued)Shares orPrincipalAmount Value
COLLATERALIZED MORTGAGEOBLIGATIONS (continued)Commercial andresidential (continued)Life Mortgage Trust (continued)
Series 2021-BMR, Class D (1 monthLIBOR + 1.400%),1.506%, 03/15/2038 (C)(F) $ 5,822,000 $ 5,831,313
MFA TrustSeries 2020-NQM1, Class A1,
1.479%, 03/25/2065 (C)(E) 2,941,928 2,969,733Series 2020-NQM3, Class A1,
1.014%, 01/26/2065 (C)(E) 6,122,799 6,119,362Series 2021-INV1, Class A1,
0.852%, 01/25/2056 (C)(E) 14,174,833 14,130,983Morgan Stanley Capital I Trust
Series 2017-CLS, Class D (1 monthLIBOR + 1.400%)1.506%, 11/15/2034 (C)(F) 5,105,000 5,106,610
New Residential Mortgage Loan TrustSeries 2020-1A, Class A1B3.500%, 10/25/2059 (C)(E) 4,449,021 4,695,814
OBX TrustSeries 2020-EXP2, Class A32.500%, 05/25/2060 (C)(E) 5,702,762 5,793,207
Provident Funding Mortgage TrustSeries 2020-F1, Class A22.000%, 01/25/2036 (C)(E) 13,544,636 13,783,639
Seasoned Credit Risk Transfer TrustSeries 2020-2, Class MA2.000%, 11/25/2059 5,144,733 5,269,996
Starwood Mortgage Residential TrustSeries 2020-1, Class A1,
2.275%, 02/25/2050 (C)(E) 3,708,353 3,776,870Series 2020-3, Class A1,
1.486%, 04/25/2065 (C)(E) 5,264,939 5,321,339Verus Securitization Trust
Series 2020-5, Class A1,1.218%, 05/25/2065 (C) 4,184,877 4,193,846
Series 2021-1, Class A1,0.815%, 01/25/2066 (C)(E) 9,815,413 9,779,285
Series 2021-R1, Class A1,0.820%, 10/25/2063 (C)(E) 8,832,798 8,827,394
Series 2021-R2, Class A1,0.918%, 02/25/2064 (C)(E) 8,239,000 8,243,583
Visio TrustSeries 2020-1R, Class A11.312%, 11/25/2055 (C) 14,973,971 15,043,427
Wells Fargo Commercial MortgageTrustSeries 2019-C51, Class A23.039%, 06/15/2052 13,310,000 14,038,507
Select Bond Trust (continued)Shares orPrincipalAmount Value
COLLATERALIZED MORTGAGEOBLIGATIONS (continued)U.S. Government Agency(continued)Federal Home LoanMortgage Corp. (continued)
Series K048, Class X1 IO,0.236%, 06/25/2025 $ 158,927,630 $ 1,483,033
Government NationalMortgage Association
Series 2012-114, Class IO,0.692%, 01/16/2053 26,681,820 691,958
Series 2016-174, Class IO,0.858%, 11/16/2056 21,844,372 1,262,011
Series 2017-109, Class IO,0.507%, 04/16/2057 30,113,141 1,171,100
Series 2017-124, Class IO,0.677%, 01/16/2059 32,570,659 1,619,068
Series 2017-135, Class IO,0.774%, 10/16/2058 49,001,394 2,535,822
Series 2017-140, Class IO,0.565%, 02/16/2059 25,552,032 1,181,781
Series 2017-159, Class IO,0.506%, 06/16/2059 45,144,348 2,107,212
Series 2017-20, Class IO,0.695%, 12/16/2058 57,838,649 2,671,197
Series 2017-22, Class IO,0.773%, 12/16/2057 25,693,134 1,423,762
Series 2017-41, Class IO,0.699%, 07/16/2058 27,023,354 1,284,952
Series 2017-46, Class IO,0.641%, 11/16/2057 25,888,858 1,238,751
Series 2017-61, Class IO,0.698%, 05/16/2059 43,902,842 2,296,883
Series 2018-158, Class IO,0.717%, 05/16/2061 28,462,490 1,897,998
Series 2018-69, Class IO,0.566%, 04/16/2060 45,943,643 2,610,118
Series 2019-131, Class IO,0.922%, 07/16/2061 40,744,907 2,859,225
Series 2020-100, Class IO,0.909%, 05/16/2062 33,831,565 2,695,212
Series 2020-108, Class IO,0.933%, 06/16/2062 88,241,653 7,147,274
Series 2020-114, Class IO,0.927%, 09/16/2062 87,730,088 7,219,011
Series 2020-118, Class IO,1.047%, 06/16/2062 71,001,309 6,174,977
Series 2020-119, Class IO,0.813%, 08/16/2062 37,979,775 2,909,938
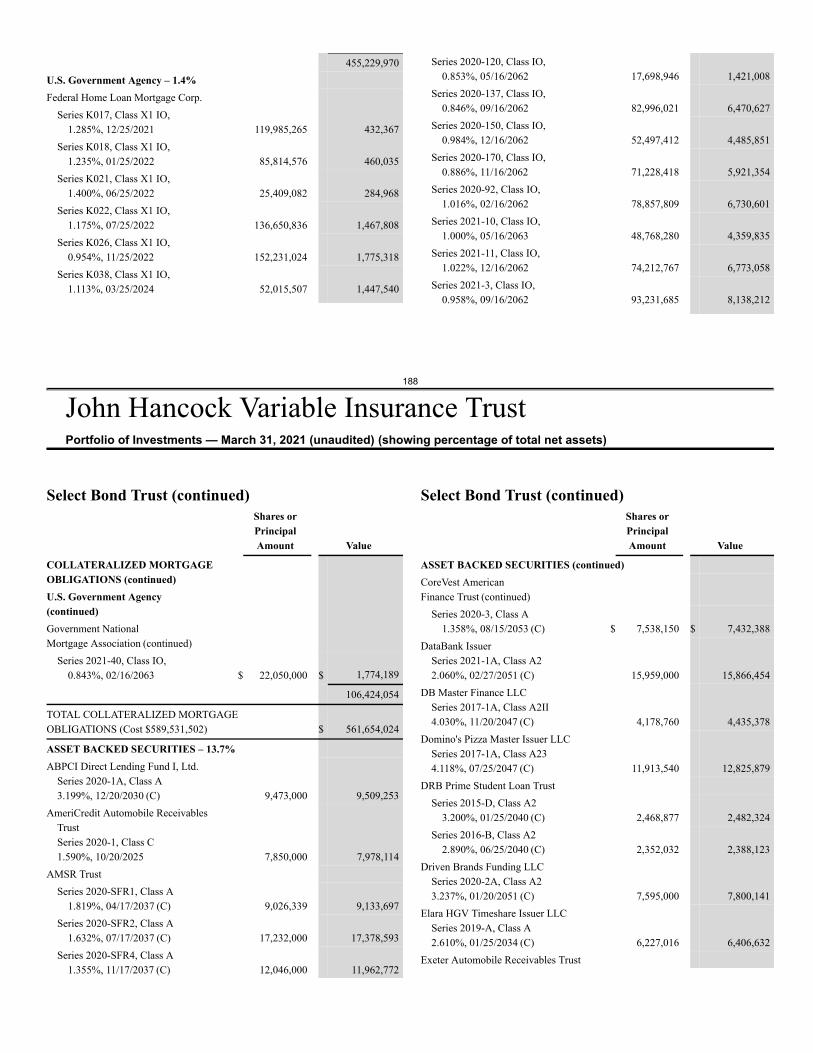
188
John Hancock Variable Insurance TrustPortfolio of Investments — March 31, 2021 (unaudited) (showing percentage of total net assets)
455,229,970U.S. Government Agency – 1.4%Federal Home Loan Mortgage Corp.
Series K017, Class X1 IO,1.285%, 12/25/2021 119,985,265 432,367
Series K018, Class X1 IO,1.235%, 01/25/2022 85,814,576 460,035
Series K021, Class X1 IO,1.400%, 06/25/2022 25,409,082 284,968
Series K022, Class X1 IO,1.175%, 07/25/2022 136,650,836 1,467,808
Series K026, Class X1 IO,0.954%, 11/25/2022 152,231,024 1,775,318
Series K038, Class X1 IO,1.113%, 03/25/2024 52,015,507 1,447,540
Series 2020-120, Class IO,0.853%, 05/16/2062 17,698,946 1,421,008
Series 2020-137, Class IO,0.846%, 09/16/2062 82,996,021 6,470,627
Series 2020-150, Class IO,0.984%, 12/16/2062 52,497,412 4,485,851
Series 2020-170, Class IO,0.886%, 11/16/2062 71,228,418 5,921,354
Series 2020-92, Class IO,1.016%, 02/16/2062 78,857,809 6,730,601
Series 2021-10, Class IO,1.000%, 05/16/2063 48,768,280 4,359,835
Series 2021-11, Class IO,1.022%, 12/16/2062 74,212,767 6,773,058
Series 2021-3, Class IO,0.958%, 09/16/2062 93,231,685 8,138,212
Select Bond Trust (continued)Shares orPrincipalAmount Value
COLLATERALIZED MORTGAGEOBLIGATIONS (continued)U.S. Government Agency(continued)Government NationalMortgage Association (continued)
Series 2021-40, Class IO,0.843%, 02/16/2063 $ 22,050,000 $ 1,774,189
106,424,054
TOTAL COLLATERALIZED MORTGAGEOBLIGATIONS (Cost $589,531,502) $ 561,654,024
ASSET BACKED SECURITIES – 13.7%ABPCI Direct Lending Fund I, Ltd.
Series 2020-1A, Class A3.199%, 12/20/2030 (C) 9,473,000 9,509,253
AmeriCredit Automobile ReceivablesTrustSeries 2020-1, Class C1.590%, 10/20/2025 7,850,000 7,978,114
AMSR TrustSeries 2020-SFR1, Class A
1.819%, 04/17/2037 (C) 9,026,339 9,133,697Series 2020-SFR2, Class A
1.632%, 07/17/2037 (C) 17,232,000 17,378,593Series 2020-SFR4, Class A
1.355%, 11/17/2037 (C) 12,046,000 11,962,772
Select Bond Trust (continued)Shares orPrincipalAmount Value
ASSET BACKED SECURITIES (continued)CoreVest AmericanFinance Trust (continued)
Series 2020-3, Class A1.358%, 08/15/2053 (C) $ 7,538,150 $ 7,432,388
DataBank IssuerSeries 2021-1A, Class A22.060%, 02/27/2051 (C) 15,959,000 15,866,454
DB Master Finance LLCSeries 2017-1A, Class A2II4.030%, 11/20/2047 (C) 4,178,760 4,435,378
Domino's Pizza Master Issuer LLCSeries 2017-1A, Class A234.118%, 07/25/2047 (C) 11,913,540 12,825,879
DRB Prime Student Loan TrustSeries 2015-D, Class A2
3.200%, 01/25/2040 (C) 2,468,877 2,482,324Series 2016-B, Class A2
2.890%, 06/25/2040 (C) 2,352,032 2,388,123Driven Brands Funding LLC
Series 2020-2A, Class A23.237%, 01/20/2051 (C) 7,595,000 7,800,141
Elara HGV Timeshare Issuer LLCSeries 2019-A, Class A2.610%, 01/25/2034 (C) 6,227,016 6,406,632
Exeter Automobile Receivables Trust
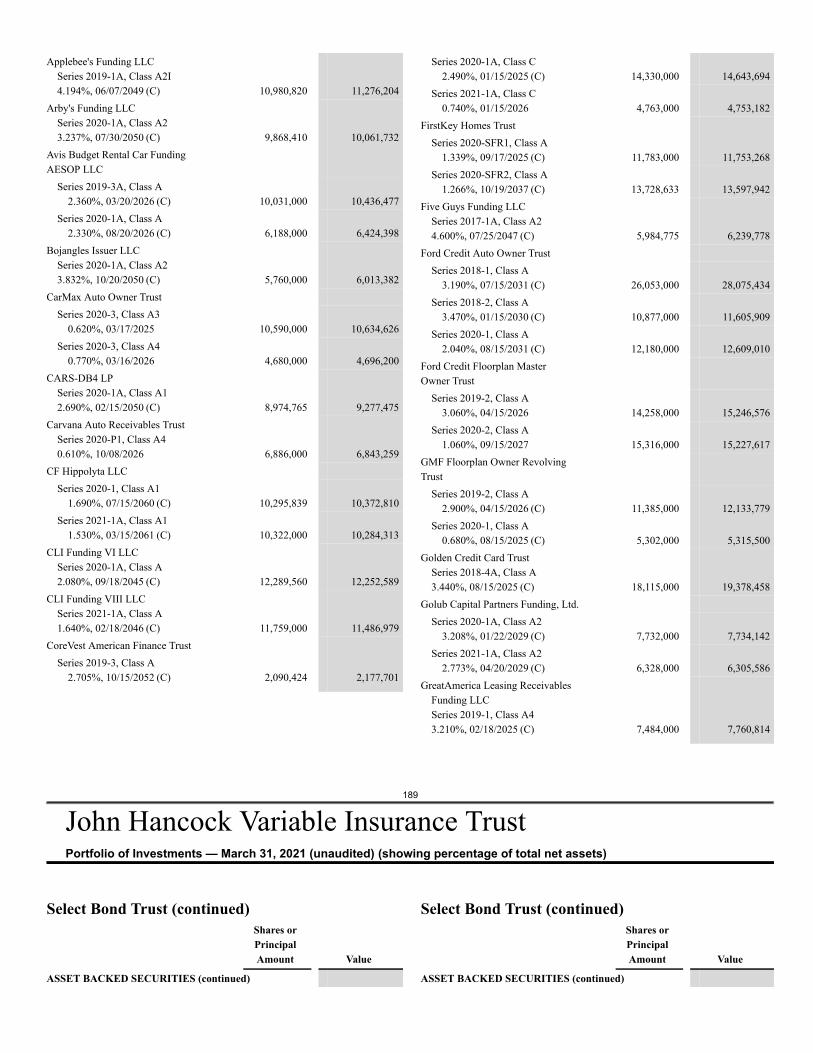
189
John Hancock Variable Insurance TrustPortfolio of Investments — March 31, 2021 (unaudited) (showing percentage of total net assets)
Applebee's Funding LLCSeries 2019-1A, Class A2I4.194%, 06/07/2049 (C) 10,980,820 11,276,204
Arby's Funding LLCSeries 2020-1A, Class A23.237%, 07/30/2050 (C) 9,868,410 10,061,732
Avis Budget Rental Car FundingAESOP LLC
Series 2019-3A, Class A2.360%, 03/20/2026 (C) 10,031,000 10,436,477
Series 2020-1A, Class A2.330%, 08/20/2026 (C) 6,188,000 6,424,398
Bojangles Issuer LLCSeries 2020-1A, Class A23.832%, 10/20/2050 (C) 5,760,000 6,013,382
CarMax Auto Owner TrustSeries 2020-3, Class A3
0.620%, 03/17/2025 10,590,000 10,634,626Series 2020-3, Class A4
0.770%, 03/16/2026 4,680,000 4,696,200CARS-DB4 LP
Series 2020-1A, Class A12.690%, 02/15/2050 (C) 8,974,765 9,277,475
Carvana Auto Receivables TrustSeries 2020-P1, Class A40.610%, 10/08/2026 6,886,000 6,843,259
CF Hippolyta LLCSeries 2020-1, Class A1
1.690%, 07/15/2060 (C) 10,295,839 10,372,810Series 2021-1A, Class A1
1.530%, 03/15/2061 (C) 10,322,000 10,284,313CLI Funding VI LLC
Series 2020-1A, Class A2.080%, 09/18/2045 (C) 12,289,560 12,252,589
CLI Funding VIII LLCSeries 2021-1A, Class A1.640%, 02/18/2046 (C) 11,759,000 11,486,979
CoreVest American Finance TrustSeries 2019-3, Class A
2.705%, 10/15/2052 (C) 2,090,424 2,177,701
Series 2020-1A, Class C2.490%, 01/15/2025 (C) 14,330,000 14,643,694
Series 2021-1A, Class C0.740%, 01/15/2026 4,763,000 4,753,182
FirstKey Homes TrustSeries 2020-SFR1, Class A
1.339%, 09/17/2025 (C) 11,783,000 11,753,268Series 2020-SFR2, Class A
1.266%, 10/19/2037 (C) 13,728,633 13,597,942Five Guys Funding LLC
Series 2017-1A, Class A24.600%, 07/25/2047 (C) 5,984,775 6,239,778
Ford Credit Auto Owner TrustSeries 2018-1, Class A
3.190%, 07/15/2031 (C) 26,053,000 28,075,434Series 2018-2, Class A
3.470%, 01/15/2030 (C) 10,877,000 11,605,909Series 2020-1, Class A
2.040%, 08/15/2031 (C) 12,180,000 12,609,010Ford Credit Floorplan MasterOwner Trust
Series 2019-2, Class A3.060%, 04/15/2026 14,258,000 15,246,576
Series 2020-2, Class A1.060%, 09/15/2027 15,316,000 15,227,617
GMF Floorplan Owner RevolvingTrust
Series 2019-2, Class A2.900%, 04/15/2026 (C) 11,385,000 12,133,779
Series 2020-1, Class A0.680%, 08/15/2025 (C) 5,302,000 5,315,500
Golden Credit Card TrustSeries 2018-4A, Class A3.440%, 08/15/2025 (C) 18,115,000 19,378,458
Golub Capital Partners Funding, Ltd.Series 2020-1A, Class A2
3.208%, 01/22/2029 (C) 7,732,000 7,734,142Series 2021-1A, Class A2
2.773%, 04/20/2029 (C) 6,328,000 6,305,586GreatAmerica Leasing Receivables
Funding LLCSeries 2019-1, Class A43.210%, 02/18/2025 (C) 7,484,000 7,760,814
Select Bond Trust (continued)Shares orPrincipalAmount Value
ASSET BACKED SECURITIES (continued)
Select Bond Trust (continued)Shares orPrincipalAmount Value
ASSET BACKED SECURITIES (continued)
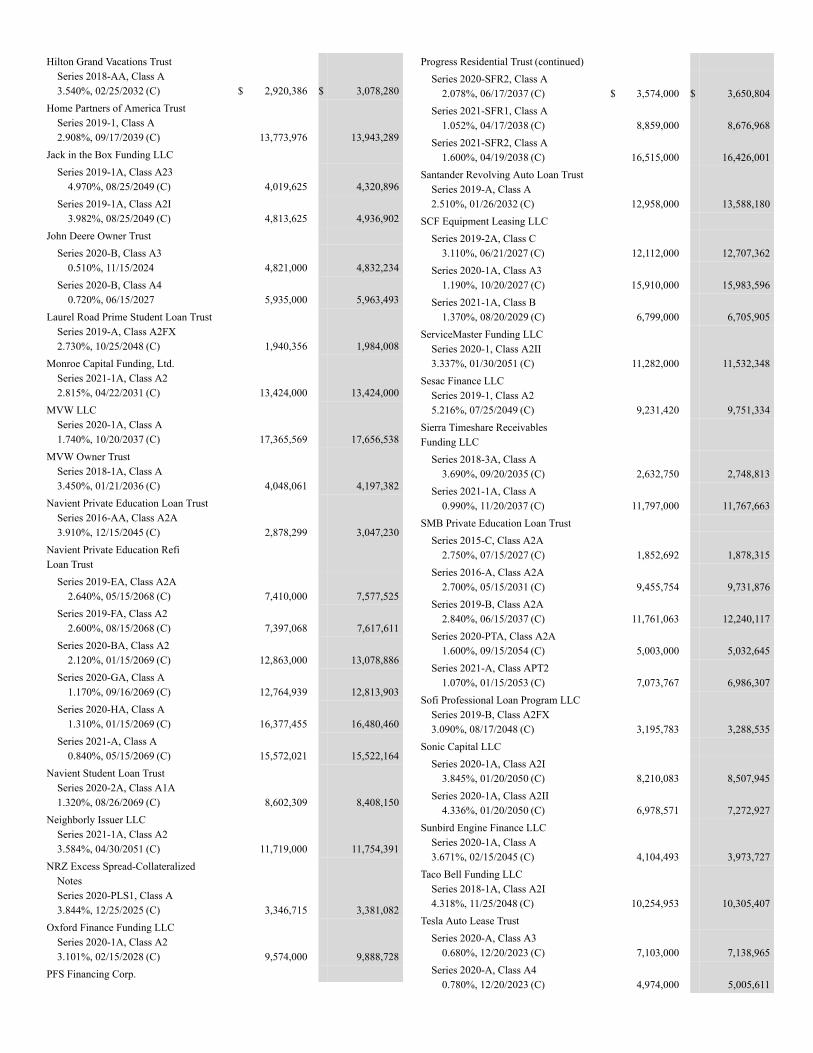
Hilton Grand Vacations TrustSeries 2018-AA, Class A3.540%, 02/25/2032 (C) $ 2,920,386 $ 3,078,280
Home Partners of America TrustSeries 2019-1, Class A2.908%, 09/17/2039 (C) 13,773,976 13,943,289
Jack in the Box Funding LLCSeries 2019-1A, Class A23
4.970%, 08/25/2049 (C) 4,019,625 4,320,896Series 2019-1A, Class A2I
3.982%, 08/25/2049 (C) 4,813,625 4,936,902John Deere Owner Trust
Series 2020-B, Class A30.510%, 11/15/2024 4,821,000 4,832,234
Series 2020-B, Class A40.720%, 06/15/2027 5,935,000 5,963,493
Laurel Road Prime Student Loan TrustSeries 2019-A, Class A2FX2.730%, 10/25/2048 (C) 1,940,356 1,984,008
Monroe Capital Funding, Ltd.Series 2021-1A, Class A22.815%, 04/22/2031 (C) 13,424,000 13,424,000
MVW LLCSeries 2020-1A, Class A1.740%, 10/20/2037 (C) 17,365,569 17,656,538
MVW Owner TrustSeries 2018-1A, Class A3.450%, 01/21/2036 (C) 4,048,061 4,197,382
Navient Private Education Loan TrustSeries 2016-AA, Class A2A3.910%, 12/15/2045 (C) 2,878,299 3,047,230
Navient Private Education RefiLoan Trust
Series 2019-EA, Class A2A2.640%, 05/15/2068 (C) 7,410,000 7,577,525
Series 2019-FA, Class A22.600%, 08/15/2068 (C) 7,397,068 7,617,611
Series 2020-BA, Class A22.120%, 01/15/2069 (C) 12,863,000 13,078,886
Series 2020-GA, Class A1.170%, 09/16/2069 (C) 12,764,939 12,813,903
Series 2020-HA, Class A1.310%, 01/15/2069 (C) 16,377,455 16,480,460
Series 2021-A, Class A0.840%, 05/15/2069 (C) 15,572,021 15,522,164
Navient Student Loan TrustSeries 2020-2A, Class A1A1.320%, 08/26/2069 (C) 8,602,309 8,408,150
Neighborly Issuer LLCSeries 2021-1A, Class A23.584%, 04/30/2051 (C) 11,719,000 11,754,391
NRZ Excess Spread-CollateralizedNotesSeries 2020-PLS1, Class A3.844%, 12/25/2025 (C) 3,346,715 3,381,082
Oxford Finance Funding LLCSeries 2020-1A, Class A23.101%, 02/15/2028 (C) 9,574,000 9,888,728
PFS Financing Corp.
Progress Residential Trust (continued)Series 2020-SFR2, Class A
2.078%, 06/17/2037 (C) $ 3,574,000 $ 3,650,804Series 2021-SFR1, Class A
1.052%, 04/17/2038 (C) 8,859,000 8,676,968Series 2021-SFR2, Class A
1.600%, 04/19/2038 (C) 16,515,000 16,426,001Santander Revolving Auto Loan Trust
Series 2019-A, Class A2.510%, 01/26/2032 (C) 12,958,000 13,588,180
SCF Equipment Leasing LLCSeries 2019-2A, Class C
3.110%, 06/21/2027 (C) 12,112,000 12,707,362Series 2020-1A, Class A3
1.190%, 10/20/2027 (C) 15,910,000 15,983,596Series 2021-1A, Class B
1.370%, 08/20/2029 (C) 6,799,000 6,705,905ServiceMaster Funding LLC
Series 2020-1, Class A2II3.337%, 01/30/2051 (C) 11,282,000 11,532,348
Sesac Finance LLCSeries 2019-1, Class A25.216%, 07/25/2049 (C) 9,231,420 9,751,334
Sierra Timeshare ReceivablesFunding LLC
Series 2018-3A, Class A3.690%, 09/20/2035 (C) 2,632,750 2,748,813
Series 2021-1A, Class A0.990%, 11/20/2037 (C) 11,797,000 11,767,663
SMB Private Education Loan TrustSeries 2015-C, Class A2A
2.750%, 07/15/2027 (C) 1,852,692 1,878,315Series 2016-A, Class A2A
2.700%, 05/15/2031 (C) 9,455,754 9,731,876Series 2019-B, Class A2A
2.840%, 06/15/2037 (C) 11,761,063 12,240,117Series 2020-PTA, Class A2A
1.600%, 09/15/2054 (C) 5,003,000 5,032,645Series 2021-A, Class APT2
1.070%, 01/15/2053 (C) 7,073,767 6,986,307Sofi Professional Loan Program LLC
Series 2019-B, Class A2FX3.090%, 08/17/2048 (C) 3,195,783 3,288,535
Sonic Capital LLCSeries 2020-1A, Class A2I
3.845%, 01/20/2050 (C) 8,210,083 8,507,945Series 2020-1A, Class A2II
4.336%, 01/20/2050 (C) 6,978,571 7,272,927Sunbird Engine Finance LLC
Series 2020-1A, Class A3.671%, 02/15/2045 (C) 4,104,493 3,973,727
Taco Bell Funding LLCSeries 2018-1A, Class A2I4.318%, 11/25/2048 (C) 10,254,953 10,305,407
Tesla Auto Lease TrustSeries 2020-A, Class A3
0.680%, 12/20/2023 (C) 7,103,000 7,138,965Series 2020-A, Class A4
0.780%, 12/20/2023 (C) 4,974,000 5,005,611
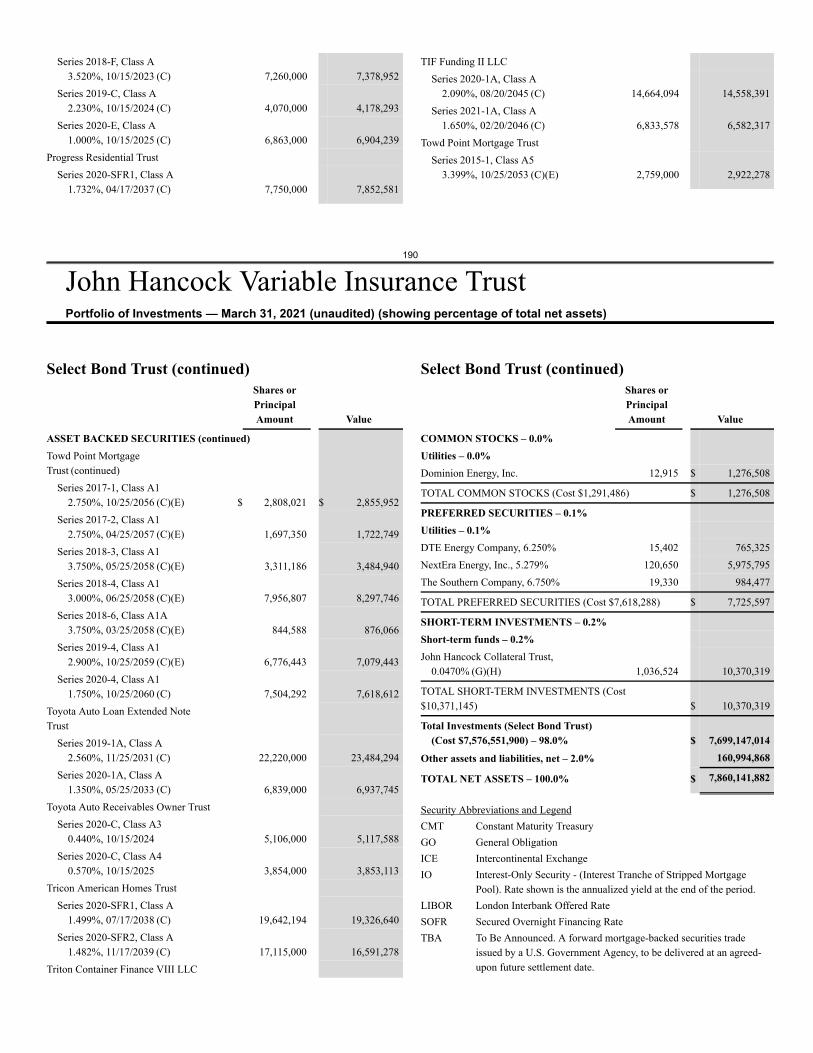
190
John Hancock Variable Insurance TrustPortfolio of Investments — March 31, 2021 (unaudited) (showing percentage of total net assets)
Series 2018-F, Class A3.520%, 10/15/2023 (C) 7,260,000 7,378,952
Series 2019-C, Class A2.230%, 10/15/2024 (C) 4,070,000 4,178,293
Series 2020-E, Class A1.000%, 10/15/2025 (C) 6,863,000 6,904,239
Progress Residential TrustSeries 2020-SFR1, Class A
1.732%, 04/17/2037 (C) 7,750,000 7,852,581
TIF Funding II LLCSeries 2020-1A, Class A
2.090%, 08/20/2045 (C) 14,664,094 14,558,391Series 2021-1A, Class A
1.650%, 02/20/2046 (C) 6,833,578 6,582,317Towd Point Mortgage Trust
Series 2015-1, Class A53.399%, 10/25/2053 (C)(E) 2,759,000 2,922,278
Select Bond Trust (continued)Shares orPrincipalAmount Value
ASSET BACKED SECURITIES (continued)Towd Point MortgageTrust (continued)
Series 2017-1, Class A12.750%, 10/25/2056 (C)(E) $ 2,808,021 $ 2,855,952
Series 2017-2, Class A12.750%, 04/25/2057 (C)(E) 1,697,350 1,722,749
Series 2018-3, Class A13.750%, 05/25/2058 (C)(E) 3,311,186 3,484,940
Series 2018-4, Class A13.000%, 06/25/2058 (C)(E) 7,956,807 8,297,746
Series 2018-6, Class A1A3.750%, 03/25/2058 (C)(E) 844,588 876,066
Series 2019-4, Class A12.900%, 10/25/2059 (C)(E) 6,776,443 7,079,443
Series 2020-4, Class A11.750%, 10/25/2060 (C) 7,504,292 7,618,612
Toyota Auto Loan Extended NoteTrust
Series 2019-1A, Class A2.560%, 11/25/2031 (C) 22,220,000 23,484,294
Series 2020-1A, Class A1.350%, 05/25/2033 (C) 6,839,000 6,937,745
Toyota Auto Receivables Owner TrustSeries 2020-C, Class A3
0.440%, 10/15/2024 5,106,000 5,117,588Series 2020-C, Class A4
0.570%, 10/15/2025 3,854,000 3,853,113Tricon American Homes Trust
Series 2020-SFR1, Class A1.499%, 07/17/2038 (C) 19,642,194 19,326,640
Series 2020-SFR2, Class A1.482%, 11/17/2039 (C) 17,115,000 16,591,278
Triton Container Finance VIII LLC
Select Bond Trust (continued)Shares orPrincipalAmount Value
COMMON STOCKS – 0.0%Utilities – 0.0%Dominion Energy, Inc. 12,915 $ 1,276,508
TOTAL COMMON STOCKS (Cost $1,291,486) $ 1,276,508
PREFERRED SECURITIES – 0.1%Utilities – 0.1%DTE Energy Company, 6.250% 15,402 765,325NextEra Energy, Inc., 5.279% 120,650 5,975,795The Southern Company, 6.750% 19,330 984,477
TOTAL PREFERRED SECURITIES (Cost $7,618,288) $ 7,725,597
SHORT-TERM INVESTMENTS – 0.2%Short-term funds – 0.2%John Hancock Collateral Trust,
0.0470% (G)(H) 1,036,524 10,370,319
TOTAL SHORT-TERM INVESTMENTS (Cost$10,371,145) $ 10,370,319
Total Investments (Select Bond Trust)(Cost $7,576,551,900) – 98.0% $ 7,699,147,014
Other assets and liabilities, net – 2.0% 160,994,868
TOTAL NET ASSETS – 100.0% $ 7,860,141,882
Security Abbreviations and LegendCMT Constant Maturity TreasuryGO General ObligationICE Intercontinental ExchangeIO Interest-Only Security - (Interest Tranche of Stripped Mortgage
Pool). Rate shown is the annualized yield at the end of the period.LIBOR London Interbank Offered RateSOFR Secured Overnight Financing RateTBA To Be Announced. A forward mortgage-backed securities trade
issued by a U.S. Government Agency, to be delivered at an agreed-upon future settlement date.
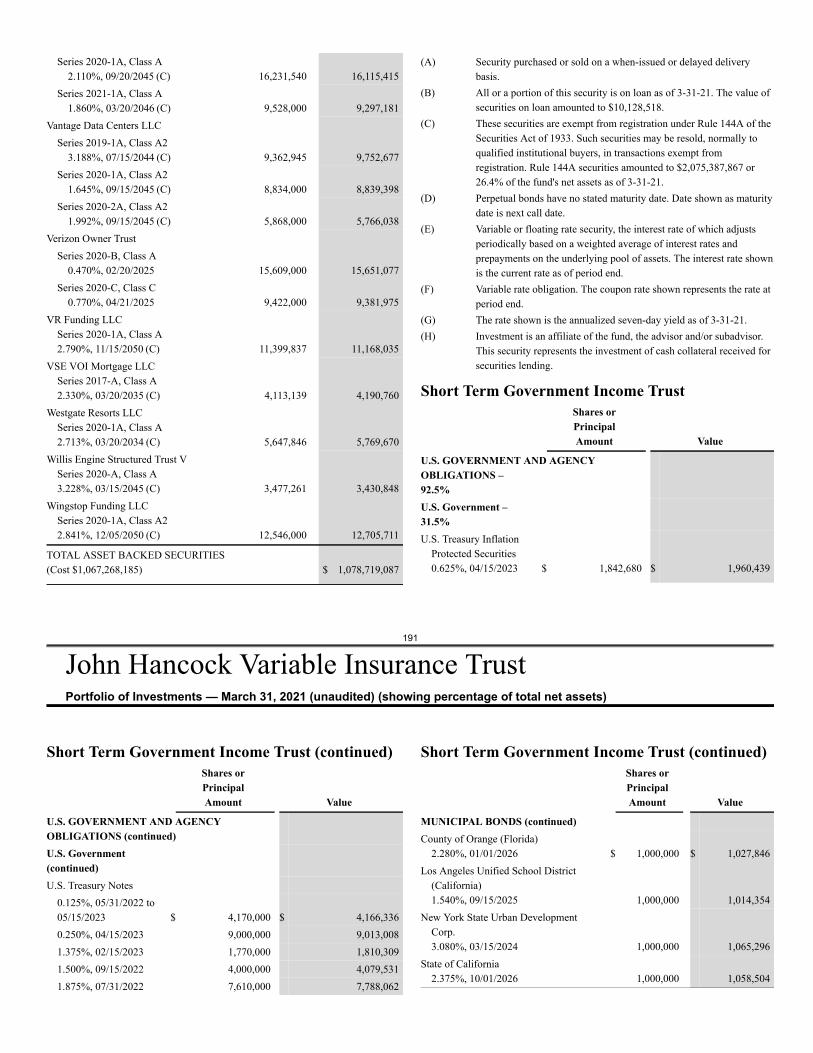
191
John Hancock Variable Insurance TrustPortfolio of Investments — March 31, 2021 (unaudited) (showing percentage of total net assets)
Series 2020-1A, Class A2.110%, 09/20/2045 (C) 16,231,540 16,115,415
Series 2021-1A, Class A1.860%, 03/20/2046 (C) 9,528,000 9,297,181
Vantage Data Centers LLCSeries 2019-1A, Class A2
3.188%, 07/15/2044 (C) 9,362,945 9,752,677Series 2020-1A, Class A2
1.645%, 09/15/2045 (C) 8,834,000 8,839,398Series 2020-2A, Class A2
1.992%, 09/15/2045 (C) 5,868,000 5,766,038Verizon Owner Trust
Series 2020-B, Class A0.470%, 02/20/2025 15,609,000 15,651,077
Series 2020-C, Class C0.770%, 04/21/2025 9,422,000 9,381,975
VR Funding LLCSeries 2020-1A, Class A2.790%, 11/15/2050 (C) 11,399,837 11,168,035
VSE VOI Mortgage LLCSeries 2017-A, Class A2.330%, 03/20/2035 (C) 4,113,139 4,190,760
Westgate Resorts LLCSeries 2020-1A, Class A2.713%, 03/20/2034 (C) 5,647,846 5,769,670
Willis Engine Structured Trust VSeries 2020-A, Class A3.228%, 03/15/2045 (C) 3,477,261 3,430,848
Wingstop Funding LLCSeries 2020-1A, Class A22.841%, 12/05/2050 (C) 12,546,000 12,705,711
TOTAL ASSET BACKED SECURITIES(Cost $1,067,268,185) $ 1,078,719,087
(A) Security purchased or sold on a when-issued or delayed deliverybasis.
(B) All or a portion of this security is on loan as of 3-31-21. The value ofsecurities on loan amounted to $10,128,518.
(C) These securities are exempt from registration under Rule 144A of theSecurities Act of 1933. Such securities may be resold, normally toqualified institutional buyers, in transactions exempt fromregistration. Rule 144A securities amounted to $2,075,387,867 or26.4% of the fund's net assets as of 3-31-21.
(D) Perpetual bonds have no stated maturity date. Date shown as maturitydate is next call date.
(E) Variable or floating rate security, the interest rate of which adjustsperiodically based on a weighted average of interest rates andprepayments on the underlying pool of assets. The interest rate shownis the current rate as of period end.
(F) Variable rate obligation. The coupon rate shown represents the rate atperiod end.
(G) The rate shown is the annualized seven-day yield as of 3-31-21.(H) Investment is an affiliate of the fund, the advisor and/or subadvisor.
This security represents the investment of cash collateral received forsecurities lending.
Short Term Government Income TrustShares orPrincipalAmount Value
U.S. GOVERNMENT AND AGENCYOBLIGATIONS –92.5%U.S. Government –31.5%U.S. Treasury Inflation
Protected Securities0.625%, 04/15/2023 $ 1,842,680 $ 1,960,439
Short Term Government Income Trust (continued)Shares orPrincipalAmount Value
U.S. GOVERNMENT AND AGENCYOBLIGATIONS (continued)U.S. Government(continued)U.S. Treasury Notes
0.125%, 05/31/2022 to05/15/2023 $ 4,170,000 $ 4,166,3360.250%, 04/15/2023 9,000,000 9,013,0081.375%, 02/15/2023 1,770,000 1,810,3091.500%, 09/15/2022 4,000,000 4,079,5311.875%, 07/31/2022 7,610,000 7,788,062
Short Term Government Income Trust (continued)Shares orPrincipalAmount Value
MUNICIPAL BONDS (continued)County of Orange (Florida)
2.280%, 01/01/2026 $ 1,000,000 $ 1,027,846Los Angeles Unified School District
(California)1.540%, 09/15/2025 1,000,000 1,014,354
New York State Urban DevelopmentCorp.3.080%, 03/15/2024 1,000,000 1,065,296
State of California2.375%, 10/01/2026 1,000,000 1,058,504
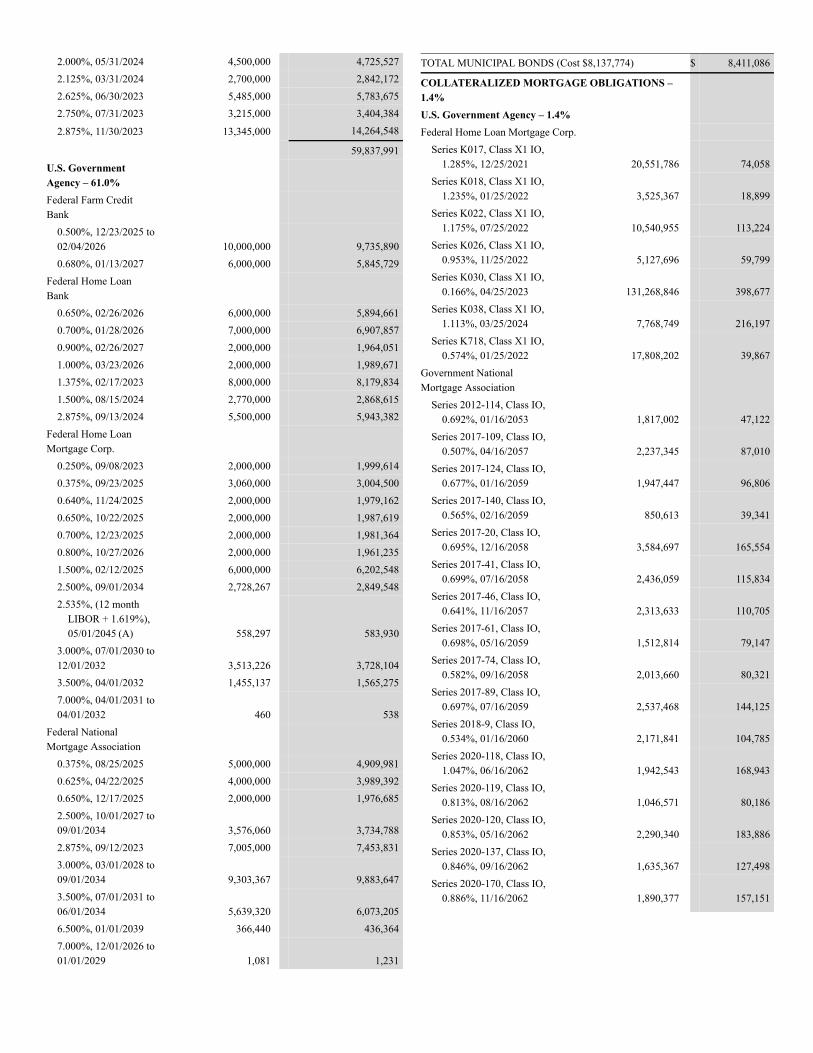
2.000%, 05/31/2024 4,500,000 4,725,5272.125%, 03/31/2024 2,700,000 2,842,1722.625%, 06/30/2023 5,485,000 5,783,6752.750%, 07/31/2023 3,215,000 3,404,384
2.875%, 11/30/2023 13,345,000 14,264,548
59,837,991U.S. GovernmentAgency – 61.0%Federal Farm CreditBank
0.500%, 12/23/2025 to02/04/2026 10,000,000 9,735,8900.680%, 01/13/2027 6,000,000 5,845,729
Federal Home LoanBank
0.650%, 02/26/2026 6,000,000 5,894,6610.700%, 01/28/2026 7,000,000 6,907,8570.900%, 02/26/2027 2,000,000 1,964,0511.000%, 03/23/2026 2,000,000 1,989,6711.375%, 02/17/2023 8,000,000 8,179,8341.500%, 08/15/2024 2,770,000 2,868,6152.875%, 09/13/2024 5,500,000 5,943,382
Federal Home LoanMortgage Corp.
0.250%, 09/08/2023 2,000,000 1,999,6140.375%, 09/23/2025 3,060,000 3,004,5000.640%, 11/24/2025 2,000,000 1,979,1620.650%, 10/22/2025 2,000,000 1,987,6190.700%, 12/23/2025 2,000,000 1,981,3640.800%, 10/27/2026 2,000,000 1,961,2351.500%, 02/12/2025 6,000,000 6,202,5482.500%, 09/01/2034 2,728,267 2,849,5482.535%, (12 month
LIBOR + 1.619%),05/01/2045 (A) 558,297 583,930
3.000%, 07/01/2030 to12/01/2032 3,513,226 3,728,1043.500%, 04/01/2032 1,455,137 1,565,2757.000%, 04/01/2031 to04/01/2032 460 538
Federal NationalMortgage Association
0.375%, 08/25/2025 5,000,000 4,909,9810.625%, 04/22/2025 4,000,000 3,989,3920.650%, 12/17/2025 2,000,000 1,976,6852.500%, 10/01/2027 to09/01/2034 3,576,060 3,734,7882.875%, 09/12/2023 7,005,000 7,453,8313.000%, 03/01/2028 to09/01/2034 9,303,367 9,883,6473.500%, 07/01/2031 to06/01/2034 5,639,320 6,073,2056.500%, 01/01/2039 366,440 436,3647.000%, 12/01/2026 to01/01/2029 1,081 1,231
TOTAL MUNICIPAL BONDS (Cost $8,137,774) $ 8,411,086
COLLATERALIZED MORTGAGE OBLIGATIONS –1.4%U.S. Government Agency – 1.4%Federal Home Loan Mortgage Corp.
Series K017, Class X1 IO,1.285%, 12/25/2021 20,551,786 74,058
Series K018, Class X1 IO,1.235%, 01/25/2022 3,525,367 18,899
Series K022, Class X1 IO,1.175%, 07/25/2022 10,540,955 113,224
Series K026, Class X1 IO,0.953%, 11/25/2022 5,127,696 59,799
Series K030, Class X1 IO,0.166%, 04/25/2023 131,268,846 398,677
Series K038, Class X1 IO,1.113%, 03/25/2024 7,768,749 216,197
Series K718, Class X1 IO,0.574%, 01/25/2022 17,808,202 39,867
Government NationalMortgage Association
Series 2012-114, Class IO,0.692%, 01/16/2053 1,817,002 47,122
Series 2017-109, Class IO,0.507%, 04/16/2057 2,237,345 87,010
Series 2017-124, Class IO,0.677%, 01/16/2059 1,947,447 96,806
Series 2017-140, Class IO,0.565%, 02/16/2059 850,613 39,341
Series 2017-20, Class IO,0.695%, 12/16/2058 3,584,697 165,554
Series 2017-41, Class IO,0.699%, 07/16/2058 2,436,059 115,834
Series 2017-46, Class IO,0.641%, 11/16/2057 2,313,633 110,705
Series 2017-61, Class IO,0.698%, 05/16/2059 1,512,814 79,147
Series 2017-74, Class IO,0.582%, 09/16/2058 2,013,660 80,321
Series 2017-89, Class IO,0.697%, 07/16/2059 2,537,468 144,125
Series 2018-9, Class IO,0.534%, 01/16/2060 2,171,841 104,785
Series 2020-118, Class IO,1.047%, 06/16/2062 1,942,543 168,943
Series 2020-119, Class IO,0.813%, 08/16/2062 1,046,571 80,186
Series 2020-120, Class IO,0.853%, 05/16/2062 2,290,340 183,886
Series 2020-137, Class IO,0.846%, 09/16/2062 1,635,367 127,498
Series 2020-170, Class IO,0.886%, 11/16/2062 1,890,377 157,151
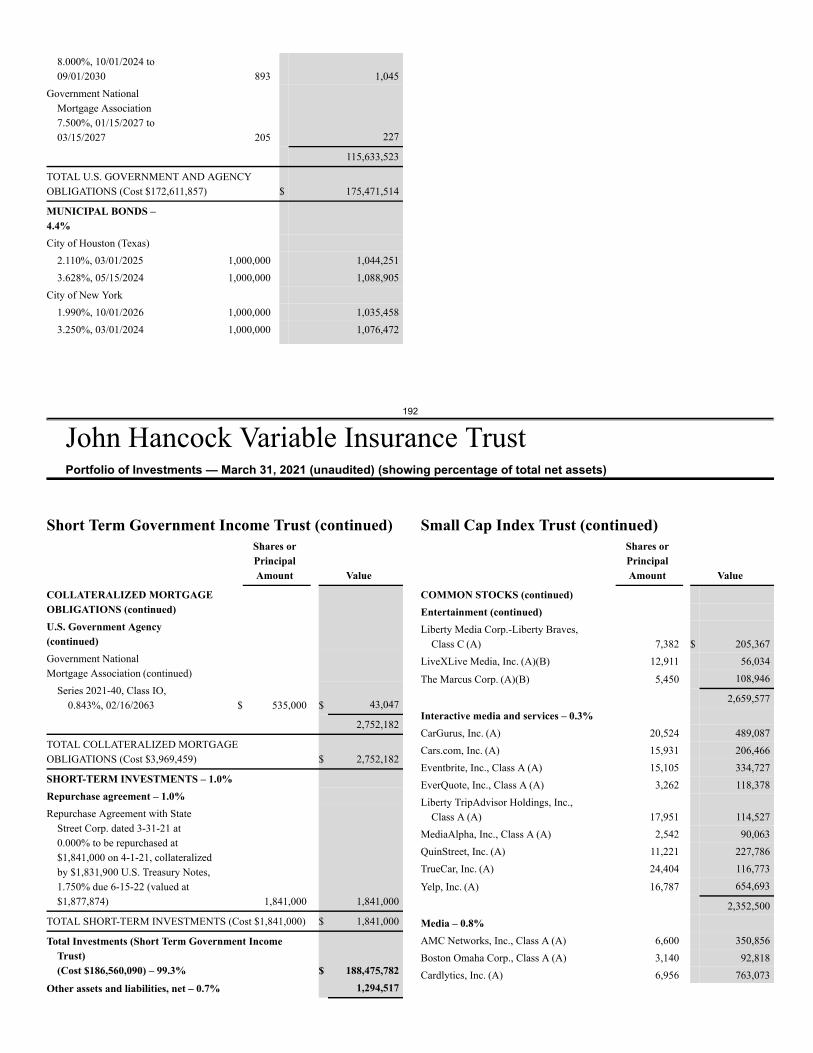
192
John Hancock Variable Insurance TrustPortfolio of Investments — March 31, 2021 (unaudited) (showing percentage of total net assets)
8.000%, 10/01/2024 to09/01/2030 893 1,045
Government NationalMortgage Association7.500%, 01/15/2027 to03/15/2027 205 227
115,633,523
TOTAL U.S. GOVERNMENT AND AGENCYOBLIGATIONS (Cost $172,611,857) $ 175,471,514
MUNICIPAL BONDS –4.4%City of Houston (Texas)
2.110%, 03/01/2025 1,000,000 1,044,2513.628%, 05/15/2024 1,000,000 1,088,905
City of New York1.990%, 10/01/2026 1,000,000 1,035,4583.250%, 03/01/2024 1,000,000 1,076,472
Short Term Government Income Trust (continued)Shares orPrincipalAmount Value
COLLATERALIZED MORTGAGEOBLIGATIONS (continued)U.S. Government Agency(continued)Government NationalMortgage Association (continued)
Series 2021-40, Class IO,0.843%, 02/16/2063 $ 535,000 $ 43,047
2,752,182
TOTAL COLLATERALIZED MORTGAGEOBLIGATIONS (Cost $3,969,459) $ 2,752,182
SHORT-TERM INVESTMENTS – 1.0%Repurchase agreement – 1.0%Repurchase Agreement with State
Street Corp. dated 3-31-21 at0.000% to be repurchased at$1,841,000 on 4-1-21, collateralizedby $1,831,900 U.S. Treasury Notes,1.750% due 6-15-22 (valued at$1,877,874) 1,841,000 1,841,000
TOTAL SHORT-TERM INVESTMENTS (Cost $1,841,000) $ 1,841,000
Total Investments (Short Term Government IncomeTrust)(Cost $186,560,090) – 99.3% $ 188,475,782
Other assets and liabilities, net – 0.7% 1,294,517
Small Cap Index Trust (continued)Shares orPrincipalAmount Value
COMMON STOCKS (continued)Entertainment (continued)Liberty Media Corp.-Liberty Braves,
Class C (A) 7,382 $ 205,367LiveXLive Media, Inc. (A)(B) 12,911 56,034
The Marcus Corp. (A)(B) 5,450 108,946
2,659,577Interactive media and services – 0.3%CarGurus, Inc. (A) 20,524 489,087Cars.com, Inc. (A) 15,931 206,466Eventbrite, Inc., Class A (A) 15,105 334,727EverQuote, Inc., Class A (A) 3,262 118,378Liberty TripAdvisor Holdings, Inc.,
Class A (A) 17,951 114,527MediaAlpha, Inc., Class A (A) 2,542 90,063QuinStreet, Inc. (A) 11,221 227,786TrueCar, Inc. (A) 24,404 116,773
Yelp, Inc. (A) 16,787 654,693
2,352,500Media – 0.8%AMC Networks, Inc., Class A (A) 6,600 350,856Boston Omaha Corp., Class A (A) 3,140 92,818Cardlytics, Inc. (A) 6,956 763,073
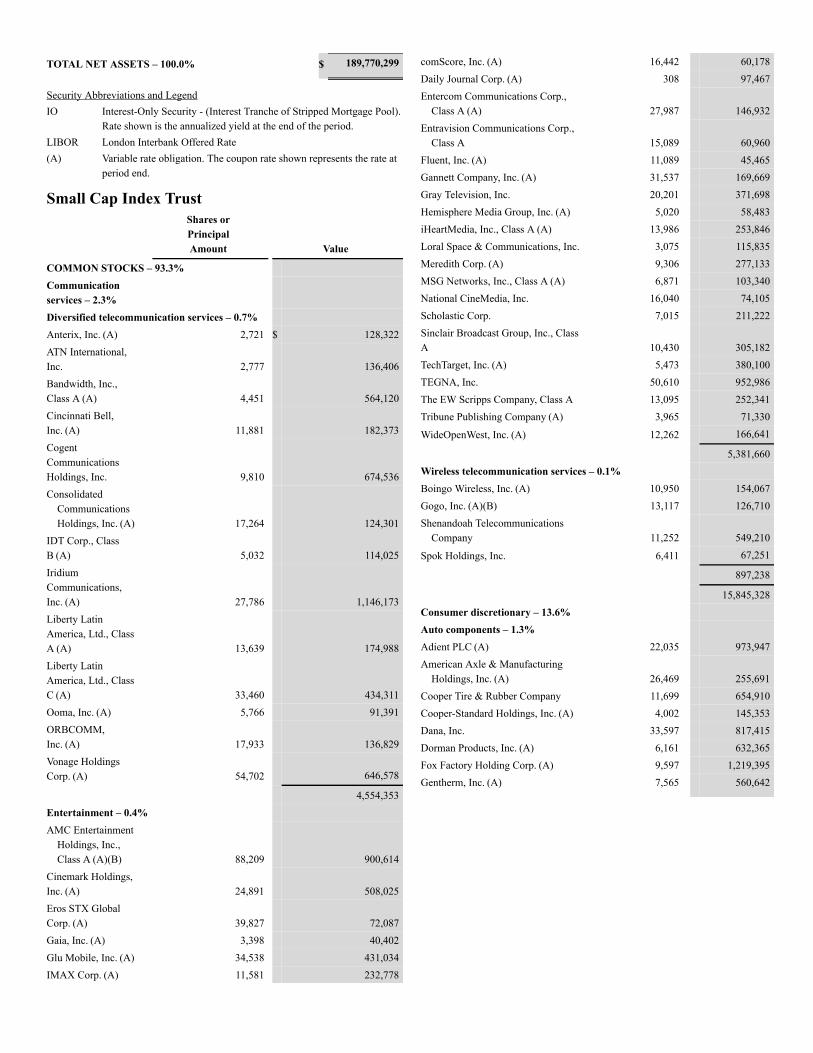
TOTAL NET ASSETS – 100.0% $ 189,770,299
Security Abbreviations and LegendIO Interest-Only Security - (Interest Tranche of Stripped Mortgage Pool).
Rate shown is the annualized yield at the end of the period.LIBOR London Interbank Offered Rate(A) Variable rate obligation. The coupon rate shown represents the rate at
period end.
Small Cap Index TrustShares orPrincipalAmount Value
COMMON STOCKS – 93.3%Communicationservices – 2.3%Diversified telecommunication services – 0.7%Anterix, Inc. (A) 2,721 $ 128,322ATN International,Inc. 2,777 136,406Bandwidth, Inc.,Class A (A) 4,451 564,120Cincinnati Bell,Inc. (A) 11,881 182,373CogentCommunicationsHoldings, Inc. 9,810 674,536Consolidated
CommunicationsHoldings, Inc. (A) 17,264 124,301
IDT Corp., ClassB (A) 5,032 114,025IridiumCommunications,Inc. (A) 27,786 1,146,173Liberty LatinAmerica, Ltd., ClassA (A) 13,639 174,988Liberty LatinAmerica, Ltd., ClassC (A) 33,460 434,311Ooma, Inc. (A) 5,766 91,391ORBCOMM,Inc. (A) 17,933 136,829Vonage HoldingsCorp. (A) 54,702 646,578
4,554,353Entertainment – 0.4%AMC Entertainment
Holdings, Inc.,Class A (A)(B) 88,209 900,614
Cinemark Holdings,Inc. (A) 24,891 508,025Eros STX GlobalCorp. (A) 39,827 72,087Gaia, Inc. (A) 3,398 40,402Glu Mobile, Inc. (A) 34,538 431,034IMAX Corp. (A) 11,581 232,778
comScore, Inc. (A) 16,442 60,178Daily Journal Corp. (A) 308 97,467Entercom Communications Corp.,
Class A (A) 27,987 146,932Entravision Communications Corp.,
Class A 15,089 60,960Fluent, Inc. (A) 11,089 45,465Gannett Company, Inc. (A) 31,537 169,669Gray Television, Inc. 20,201 371,698Hemisphere Media Group, Inc. (A) 5,020 58,483iHeartMedia, Inc., Class A (A) 13,986 253,846Loral Space & Communications, Inc. 3,075 115,835Meredith Corp. (A) 9,306 277,133MSG Networks, Inc., Class A (A) 6,871 103,340National CineMedia, Inc. 16,040 74,105Scholastic Corp. 7,015 211,222Sinclair Broadcast Group, Inc., ClassA 10,430 305,182TechTarget, Inc. (A) 5,473 380,100TEGNA, Inc. 50,610 952,986The EW Scripps Company, Class A 13,095 252,341Tribune Publishing Company (A) 3,965 71,330
WideOpenWest, Inc. (A) 12,262 166,641
5,381,660Wireless telecommunication services – 0.1%Boingo Wireless, Inc. (A) 10,950 154,067Gogo, Inc. (A)(B) 13,117 126,710Shenandoah Telecommunications
Company 11,252 549,210
Spok Holdings, Inc. 6,411 67,251
897,238
15,845,328Consumer discretionary – 13.6%Auto components – 1.3%Adient PLC (A) 22,035 973,947American Axle & Manufacturing
Holdings, Inc. (A) 26,469 255,691Cooper Tire & Rubber Company 11,699 654,910Cooper-Standard Holdings, Inc. (A) 4,002 145,353Dana, Inc. 33,597 817,415Dorman Products, Inc. (A) 6,161 632,365Fox Factory Holding Corp. (A) 9,597 1,219,395Gentherm, Inc. (A) 7,565 560,642
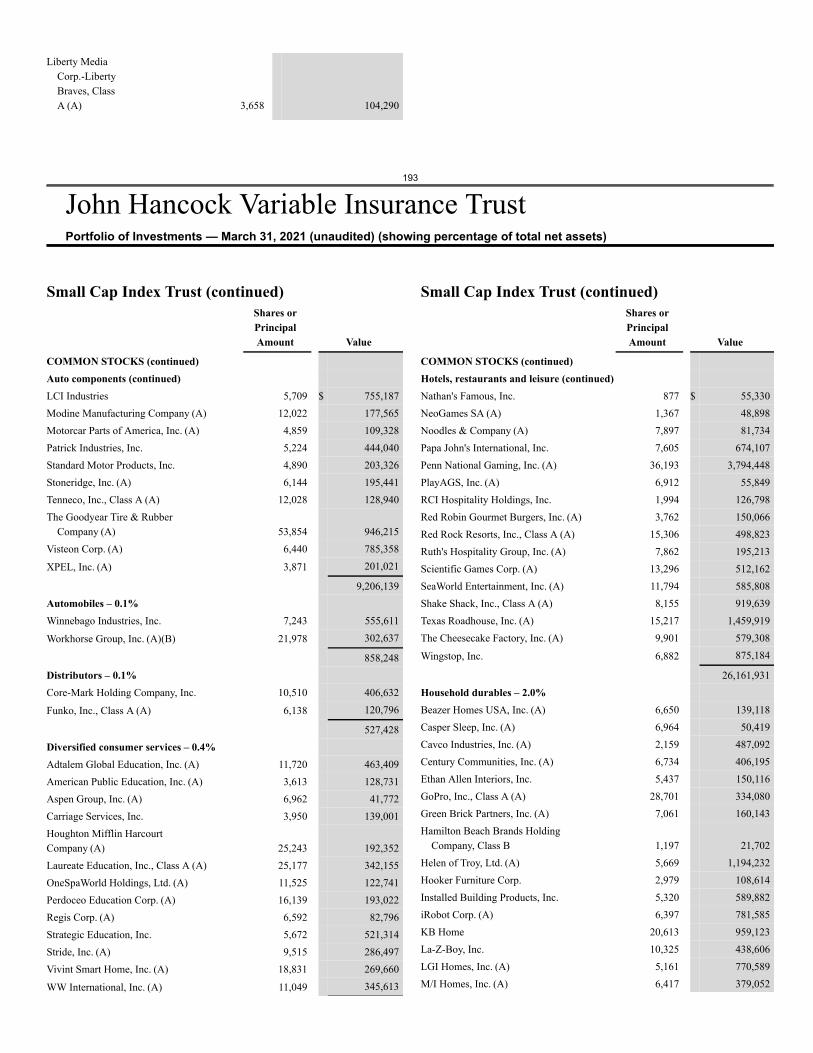
193
John Hancock Variable Insurance TrustPortfolio of Investments — March 31, 2021 (unaudited) (showing percentage of total net assets)
Liberty MediaCorp.-LibertyBraves, ClassA (A) 3,658 104,290
Small Cap Index Trust (continued)Shares orPrincipalAmount Value
COMMON STOCKS (continued)Auto components (continued)LCI Industries 5,709 $ 755,187Modine Manufacturing Company (A) 12,022 177,565Motorcar Parts of America, Inc. (A) 4,859 109,328Patrick Industries, Inc. 5,224 444,040Standard Motor Products, Inc. 4,890 203,326Stoneridge, Inc. (A) 6,144 195,441Tenneco, Inc., Class A (A) 12,028 128,940The Goodyear Tire & Rubber
Company (A) 53,854 946,215Visteon Corp. (A) 6,440 785,358
XPEL, Inc. (A) 3,871 201,021
9,206,139Automobiles – 0.1%Winnebago Industries, Inc. 7,243 555,611
Workhorse Group, Inc. (A)(B) 21,978 302,637
858,248Distributors – 0.1%Core-Mark Holding Company, Inc. 10,510 406,632
Funko, Inc., Class A (A) 6,138 120,796
527,428Diversified consumer services – 0.4%Adtalem Global Education, Inc. (A) 11,720 463,409American Public Education, Inc. (A) 3,613 128,731Aspen Group, Inc. (A) 6,962 41,772Carriage Services, Inc. 3,950 139,001Houghton Mifflin HarcourtCompany (A) 25,243 192,352Laureate Education, Inc., Class A (A) 25,177 342,155OneSpaWorld Holdings, Ltd. (A) 11,525 122,741Perdoceo Education Corp. (A) 16,139 193,022Regis Corp. (A) 6,592 82,796Strategic Education, Inc. 5,672 521,314Stride, Inc. (A) 9,515 286,497Vivint Smart Home, Inc. (A) 18,831 269,660
WW International, Inc. (A) 11,049 345,613
Small Cap Index Trust (continued)Shares orPrincipalAmount Value
COMMON STOCKS (continued)Hotels, restaurants and leisure (continued)Nathan's Famous, Inc. 877 $ 55,330NeoGames SA (A) 1,367 48,898Noodles & Company (A) 7,897 81,734Papa John's International, Inc. 7,605 674,107Penn National Gaming, Inc. (A) 36,193 3,794,448PlayAGS, Inc. (A) 6,912 55,849RCI Hospitality Holdings, Inc. 1,994 126,798Red Robin Gourmet Burgers, Inc. (A) 3,762 150,066Red Rock Resorts, Inc., Class A (A) 15,306 498,823Ruth's Hospitality Group, Inc. (A) 7,862 195,213Scientific Games Corp. (A) 13,296 512,162SeaWorld Entertainment, Inc. (A) 11,794 585,808Shake Shack, Inc., Class A (A) 8,155 919,639Texas Roadhouse, Inc. (A) 15,217 1,459,919The Cheesecake Factory, Inc. (A) 9,901 579,308
Wingstop, Inc. 6,882 875,184
26,161,931Household durables – 2.0%Beazer Homes USA, Inc. (A) 6,650 139,118Casper Sleep, Inc. (A) 6,964 50,419Cavco Industries, Inc. (A) 2,159 487,092Century Communities, Inc. (A) 6,734 406,195Ethan Allen Interiors, Inc. 5,437 150,116GoPro, Inc., Class A (A) 28,701 334,080Green Brick Partners, Inc. (A) 7,061 160,143Hamilton Beach Brands Holding
Company, Class B 1,197 21,702Helen of Troy, Ltd. (A) 5,669 1,194,232Hooker Furniture Corp. 2,979 108,614Installed Building Products, Inc. 5,320 589,882iRobot Corp. (A) 6,397 781,585KB Home 20,613 959,123La-Z-Boy, Inc. 10,325 438,606LGI Homes, Inc. (A) 5,161 770,589M/I Homes, Inc. (A) 6,417 379,052
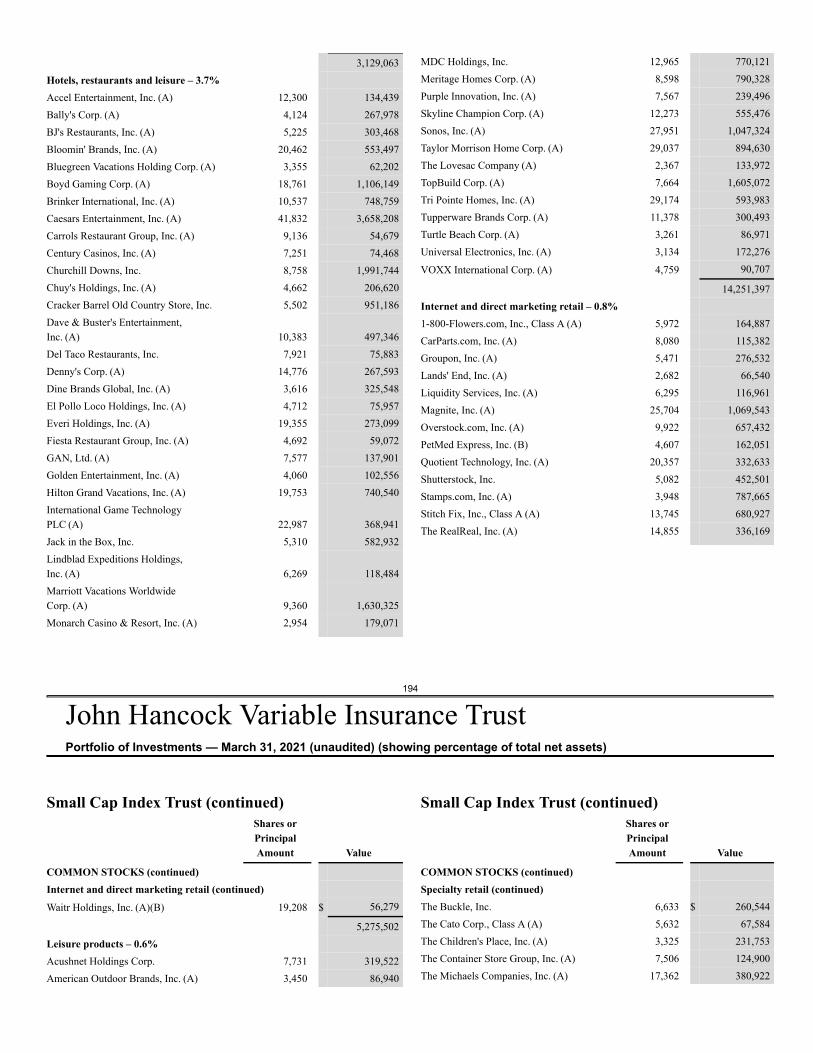
194
John Hancock Variable Insurance TrustPortfolio of Investments — March 31, 2021 (unaudited) (showing percentage of total net assets)
3,129,063Hotels, restaurants and leisure – 3.7%Accel Entertainment, Inc. (A) 12,300 134,439Bally's Corp. (A) 4,124 267,978BJ's Restaurants, Inc. (A) 5,225 303,468Bloomin' Brands, Inc. (A) 20,462 553,497Bluegreen Vacations Holding Corp. (A) 3,355 62,202Boyd Gaming Corp. (A) 18,761 1,106,149Brinker International, Inc. (A) 10,537 748,759Caesars Entertainment, Inc. (A) 41,832 3,658,208Carrols Restaurant Group, Inc. (A) 9,136 54,679Century Casinos, Inc. (A) 7,251 74,468Churchill Downs, Inc. 8,758 1,991,744Chuy's Holdings, Inc. (A) 4,662 206,620Cracker Barrel Old Country Store, Inc. 5,502 951,186Dave & Buster's Entertainment,Inc. (A) 10,383 497,346Del Taco Restaurants, Inc. 7,921 75,883Denny's Corp. (A) 14,776 267,593Dine Brands Global, Inc. (A) 3,616 325,548El Pollo Loco Holdings, Inc. (A) 4,712 75,957Everi Holdings, Inc. (A) 19,355 273,099Fiesta Restaurant Group, Inc. (A) 4,692 59,072GAN, Ltd. (A) 7,577 137,901Golden Entertainment, Inc. (A) 4,060 102,556Hilton Grand Vacations, Inc. (A) 19,753 740,540International Game TechnologyPLC (A) 22,987 368,941Jack in the Box, Inc. 5,310 582,932Lindblad Expeditions Holdings,Inc. (A) 6,269 118,484Marriott Vacations WorldwideCorp. (A) 9,360 1,630,325Monarch Casino & Resort, Inc. (A) 2,954 179,071
MDC Holdings, Inc. 12,965 770,121Meritage Homes Corp. (A) 8,598 790,328Purple Innovation, Inc. (A) 7,567 239,496Skyline Champion Corp. (A) 12,273 555,476Sonos, Inc. (A) 27,951 1,047,324Taylor Morrison Home Corp. (A) 29,037 894,630The Lovesac Company (A) 2,367 133,972TopBuild Corp. (A) 7,664 1,605,072Tri Pointe Homes, Inc. (A) 29,174 593,983Tupperware Brands Corp. (A) 11,378 300,493Turtle Beach Corp. (A) 3,261 86,971Universal Electronics, Inc. (A) 3,134 172,276
VOXX International Corp. (A) 4,759 90,707
14,251,397Internet and direct marketing retail – 0.8%1-800-Flowers.com, Inc., Class A (A) 5,972 164,887CarParts.com, Inc. (A) 8,080 115,382Groupon, Inc. (A) 5,471 276,532Lands' End, Inc. (A) 2,682 66,540Liquidity Services, Inc. (A) 6,295 116,961Magnite, Inc. (A) 25,704 1,069,543Overstock.com, Inc. (A) 9,922 657,432PetMed Express, Inc. (B) 4,607 162,051Quotient Technology, Inc. (A) 20,357 332,633Shutterstock, Inc. 5,082 452,501Stamps.com, Inc. (A) 3,948 787,665Stitch Fix, Inc., Class A (A) 13,745 680,927The RealReal, Inc. (A) 14,855 336,169
Small Cap Index Trust (continued)Shares orPrincipalAmount Value
COMMON STOCKS (continued)Internet and direct marketing retail (continued)Waitr Holdings, Inc. (A)(B) 19,208 $ 56,279
5,275,502Leisure products – 0.6%Acushnet Holdings Corp. 7,731 319,522American Outdoor Brands, Inc. (A) 3,450 86,940
Small Cap Index Trust (continued)Shares orPrincipalAmount Value
COMMON STOCKS (continued)Specialty retail (continued)The Buckle, Inc. 6,633 $ 260,544The Cato Corp., Class A (A) 5,632 67,584The Children's Place, Inc. (A) 3,325 231,753The Container Store Group, Inc. (A) 7,506 124,900The Michaels Companies, Inc. (A) 17,362 380,922
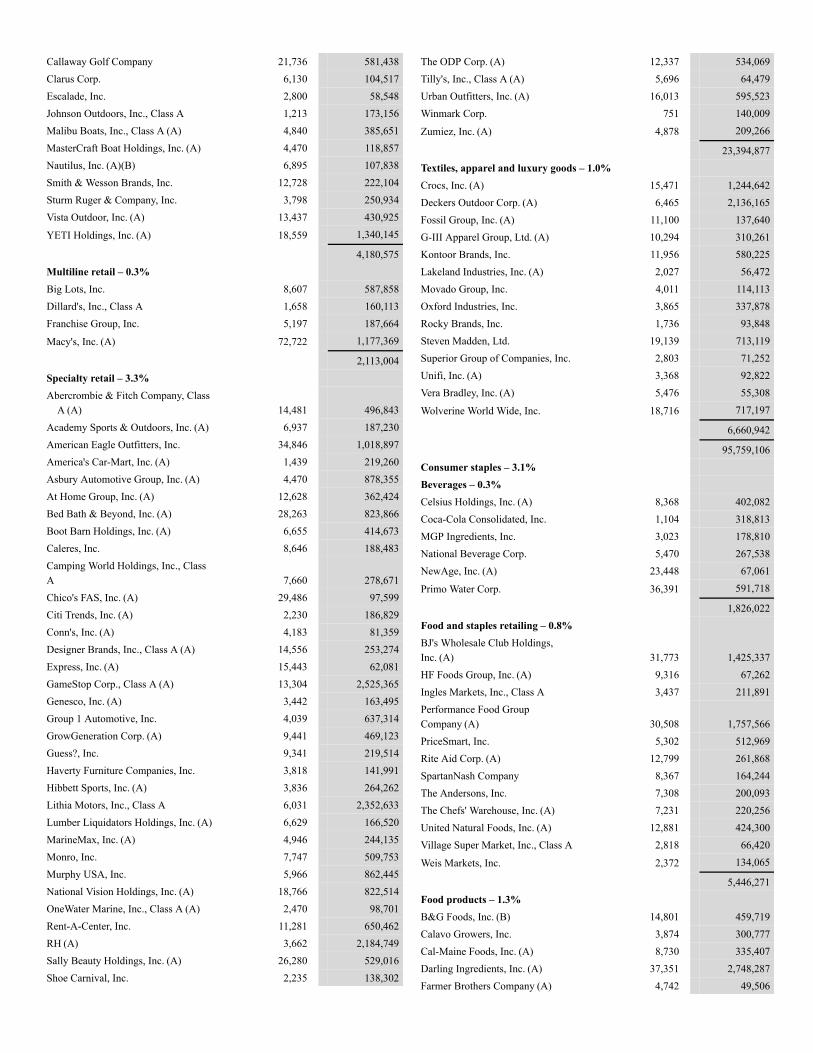
Callaway Golf Company 21,736 581,438Clarus Corp. 6,130 104,517Escalade, Inc. 2,800 58,548Johnson Outdoors, Inc., Class A 1,213 173,156Malibu Boats, Inc., Class A (A) 4,840 385,651MasterCraft Boat Holdings, Inc. (A) 4,470 118,857Nautilus, Inc. (A)(B) 6,895 107,838Smith & Wesson Brands, Inc. 12,728 222,104Sturm Ruger & Company, Inc. 3,798 250,934Vista Outdoor, Inc. (A) 13,437 430,925
YETI Holdings, Inc. (A) 18,559 1,340,145
4,180,575Multiline retail – 0.3%Big Lots, Inc. 8,607 587,858Dillard's, Inc., Class A 1,658 160,113Franchise Group, Inc. 5,197 187,664
Macy's, Inc. (A) 72,722 1,177,369
2,113,004Specialty retail – 3.3%Abercrombie & Fitch Company, Class
A (A) 14,481 496,843Academy Sports & Outdoors, Inc. (A) 6,937 187,230American Eagle Outfitters, Inc. 34,846 1,018,897America's Car-Mart, Inc. (A) 1,439 219,260Asbury Automotive Group, Inc. (A) 4,470 878,355At Home Group, Inc. (A) 12,628 362,424Bed Bath & Beyond, Inc. (A) 28,263 823,866Boot Barn Holdings, Inc. (A) 6,655 414,673Caleres, Inc. 8,646 188,483Camping World Holdings, Inc., ClassA 7,660 278,671Chico's FAS, Inc. (A) 29,486 97,599Citi Trends, Inc. (A) 2,230 186,829Conn's, Inc. (A) 4,183 81,359Designer Brands, Inc., Class A (A) 14,556 253,274Express, Inc. (A) 15,443 62,081GameStop Corp., Class A (A) 13,304 2,525,365Genesco, Inc. (A) 3,442 163,495Group 1 Automotive, Inc. 4,039 637,314GrowGeneration Corp. (A) 9,441 469,123Guess?, Inc. 9,341 219,514Haverty Furniture Companies, Inc. 3,818 141,991Hibbett Sports, Inc. (A) 3,836 264,262Lithia Motors, Inc., Class A 6,031 2,352,633Lumber Liquidators Holdings, Inc. (A) 6,629 166,520MarineMax, Inc. (A) 4,946 244,135Monro, Inc. 7,747 509,753Murphy USA, Inc. 5,966 862,445National Vision Holdings, Inc. (A) 18,766 822,514OneWater Marine, Inc., Class A (A) 2,470 98,701Rent-A-Center, Inc. 11,281 650,462RH (A) 3,662 2,184,749Sally Beauty Holdings, Inc. (A) 26,280 529,016Shoe Carnival, Inc. 2,235 138,302
The ODP Corp. (A) 12,337 534,069Tilly's, Inc., Class A (A) 5,696 64,479Urban Outfitters, Inc. (A) 16,013 595,523Winmark Corp. 751 140,009
Zumiez, Inc. (A) 4,878 209,266
23,394,877Textiles, apparel and luxury goods – 1.0%Crocs, Inc. (A) 15,471 1,244,642Deckers Outdoor Corp. (A) 6,465 2,136,165Fossil Group, Inc. (A) 11,100 137,640G-III Apparel Group, Ltd. (A) 10,294 310,261Kontoor Brands, Inc. 11,956 580,225Lakeland Industries, Inc. (A) 2,027 56,472Movado Group, Inc. 4,011 114,113Oxford Industries, Inc. 3,865 337,878Rocky Brands, Inc. 1,736 93,848Steven Madden, Ltd. 19,139 713,119Superior Group of Companies, Inc. 2,803 71,252Unifi, Inc. (A) 3,368 92,822Vera Bradley, Inc. (A) 5,476 55,308
Wolverine World Wide, Inc. 18,716 717,197
6,660,942
95,759,106Consumer staples – 3.1%Beverages – 0.3%Celsius Holdings, Inc. (A) 8,368 402,082Coca-Cola Consolidated, Inc. 1,104 318,813MGP Ingredients, Inc. 3,023 178,810National Beverage Corp. 5,470 267,538NewAge, Inc. (A) 23,448 67,061
Primo Water Corp. 36,391 591,718
1,826,022Food and staples retailing – 0.8%BJ's Wholesale Club Holdings,Inc. (A) 31,773 1,425,337HF Foods Group, Inc. (A) 9,316 67,262Ingles Markets, Inc., Class A 3,437 211,891Performance Food GroupCompany (A) 30,508 1,757,566PriceSmart, Inc. 5,302 512,969Rite Aid Corp. (A) 12,799 261,868SpartanNash Company 8,367 164,244The Andersons, Inc. 7,308 200,093The Chefs' Warehouse, Inc. (A) 7,231 220,256United Natural Foods, Inc. (A) 12,881 424,300Village Super Market, Inc., Class A 2,818 66,420
Weis Markets, Inc. 2,372 134,065
5,446,271Food products – 1.3%B&G Foods, Inc. (B) 14,801 459,719Calavo Growers, Inc. 3,874 300,777Cal-Maine Foods, Inc. (A) 8,730 335,407Darling Ingredients, Inc. (A) 37,351 2,748,287Farmer Brothers Company (A) 4,742 49,506
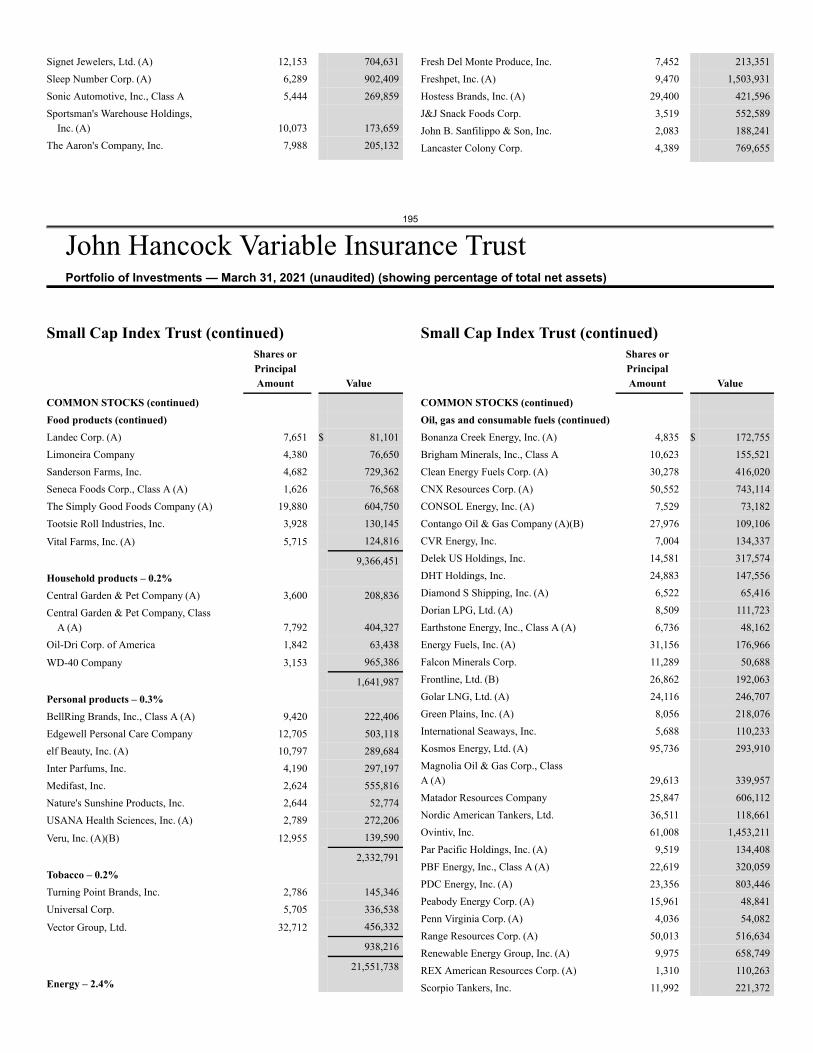
195
John Hancock Variable Insurance TrustPortfolio of Investments — March 31, 2021 (unaudited) (showing percentage of total net assets)
Signet Jewelers, Ltd. (A) 12,153 704,631Sleep Number Corp. (A) 6,289 902,409Sonic Automotive, Inc., Class A 5,444 269,859Sportsman's Warehouse Holdings,
Inc. (A) 10,073 173,659The Aaron's Company, Inc. 7,988 205,132
Fresh Del Monte Produce, Inc. 7,452 213,351Freshpet, Inc. (A) 9,470 1,503,931Hostess Brands, Inc. (A) 29,400 421,596J&J Snack Foods Corp. 3,519 552,589John B. Sanfilippo & Son, Inc. 2,083 188,241Lancaster Colony Corp. 4,389 769,655
Small Cap Index Trust (continued)Shares orPrincipalAmount Value
COMMON STOCKS (continued)Food products (continued)Landec Corp. (A) 7,651 $ 81,101Limoneira Company 4,380 76,650Sanderson Farms, Inc. 4,682 729,362Seneca Foods Corp., Class A (A) 1,626 76,568The Simply Good Foods Company (A) 19,880 604,750Tootsie Roll Industries, Inc. 3,928 130,145
Vital Farms, Inc. (A) 5,715 124,816
9,366,451Household products – 0.2%Central Garden & Pet Company (A) 3,600 208,836Central Garden & Pet Company, Class
A (A) 7,792 404,327Oil-Dri Corp. of America 1,842 63,438
WD-40 Company 3,153 965,386
1,641,987Personal products – 0.3%BellRing Brands, Inc., Class A (A) 9,420 222,406Edgewell Personal Care Company 12,705 503,118elf Beauty, Inc. (A) 10,797 289,684Inter Parfums, Inc. 4,190 297,197Medifast, Inc. 2,624 555,816Nature's Sunshine Products, Inc. 2,644 52,774USANA Health Sciences, Inc. (A) 2,789 272,206
Veru, Inc. (A)(B) 12,955 139,590
2,332,791Tobacco – 0.2%Turning Point Brands, Inc. 2,786 145,346Universal Corp. 5,705 336,538
Vector Group, Ltd. 32,712 456,332
938,216
21,551,738Energy – 2.4%
Small Cap Index Trust (continued)Shares orPrincipalAmount Value
COMMON STOCKS (continued)Oil, gas and consumable fuels (continued)Bonanza Creek Energy, Inc. (A) 4,835 $ 172,755Brigham Minerals, Inc., Class A 10,623 155,521Clean Energy Fuels Corp. (A) 30,278 416,020CNX Resources Corp. (A) 50,552 743,114CONSOL Energy, Inc. (A) 7,529 73,182Contango Oil & Gas Company (A)(B) 27,976 109,106CVR Energy, Inc. 7,004 134,337Delek US Holdings, Inc. 14,581 317,574DHT Holdings, Inc. 24,883 147,556Diamond S Shipping, Inc. (A) 6,522 65,416Dorian LPG, Ltd. (A) 8,509 111,723Earthstone Energy, Inc., Class A (A) 6,736 48,162Energy Fuels, Inc. (A) 31,156 176,966Falcon Minerals Corp. 11,289 50,688Frontline, Ltd. (B) 26,862 192,063Golar LNG, Ltd. (A) 24,116 246,707Green Plains, Inc. (A) 8,056 218,076International Seaways, Inc. 5,688 110,233Kosmos Energy, Ltd. (A) 95,736 293,910Magnolia Oil & Gas Corp., ClassA (A) 29,613 339,957Matador Resources Company 25,847 606,112Nordic American Tankers, Ltd. 36,511 118,661Ovintiv, Inc. 61,008 1,453,211Par Pacific Holdings, Inc. (A) 9,519 134,408PBF Energy, Inc., Class A (A) 22,619 320,059PDC Energy, Inc. (A) 23,356 803,446Peabody Energy Corp. (A) 15,961 48,841Penn Virginia Corp. (A) 4,036 54,082Range Resources Corp. (A) 50,013 516,634Renewable Energy Group, Inc. (A) 9,975 658,749REX American Resources Corp. (A) 1,310 110,263Scorpio Tankers, Inc. 11,992 221,372
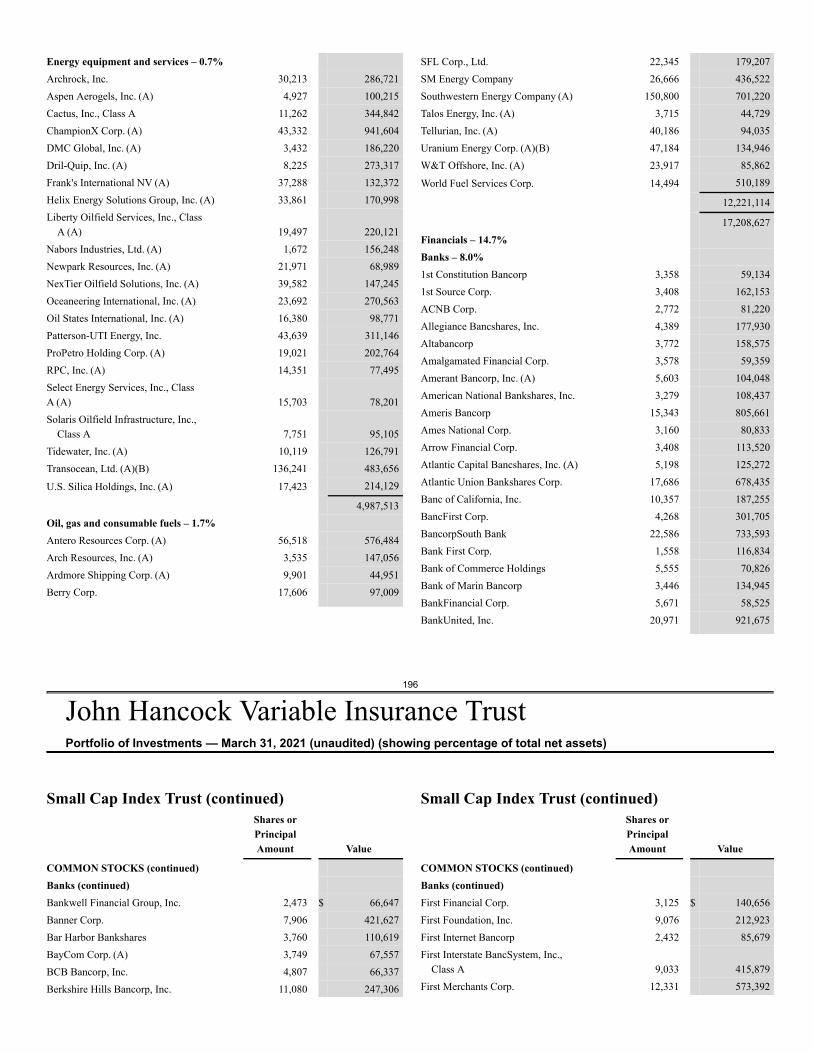
196
John Hancock Variable Insurance TrustPortfolio of Investments — March 31, 2021 (unaudited) (showing percentage of total net assets)
Energy equipment and services – 0.7%Archrock, Inc. 30,213 286,721Aspen Aerogels, Inc. (A) 4,927 100,215Cactus, Inc., Class A 11,262 344,842ChampionX Corp. (A) 43,332 941,604DMC Global, Inc. (A) 3,432 186,220Dril-Quip, Inc. (A) 8,225 273,317Frank's International NV (A) 37,288 132,372Helix Energy Solutions Group, Inc. (A) 33,861 170,998Liberty Oilfield Services, Inc., Class
A (A) 19,497 220,121Nabors Industries, Ltd. (A) 1,672 156,248Newpark Resources, Inc. (A) 21,971 68,989NexTier Oilfield Solutions, Inc. (A) 39,582 147,245Oceaneering International, Inc. (A) 23,692 270,563Oil States International, Inc. (A) 16,380 98,771Patterson-UTI Energy, Inc. 43,639 311,146ProPetro Holding Corp. (A) 19,021 202,764RPC, Inc. (A) 14,351 77,495Select Energy Services, Inc., ClassA (A) 15,703 78,201Solaris Oilfield Infrastructure, Inc.,
Class A 7,751 95,105Tidewater, Inc. (A) 10,119 126,791Transocean, Ltd. (A)(B) 136,241 483,656
U.S. Silica Holdings, Inc. (A) 17,423 214,129
4,987,513Oil, gas and consumable fuels – 1.7%Antero Resources Corp. (A) 56,518 576,484Arch Resources, Inc. (A) 3,535 147,056Ardmore Shipping Corp. (A) 9,901 44,951Berry Corp. 17,606 97,009
SFL Corp., Ltd. 22,345 179,207SM Energy Company 26,666 436,522Southwestern Energy Company (A) 150,800 701,220Talos Energy, Inc. (A) 3,715 44,729Tellurian, Inc. (A) 40,186 94,035Uranium Energy Corp. (A)(B) 47,184 134,946W&T Offshore, Inc. (A) 23,917 85,862
World Fuel Services Corp. 14,494 510,189
12,221,114
17,208,627Financials – 14.7%Banks – 8.0%1st Constitution Bancorp 3,358 59,1341st Source Corp. 3,408 162,153ACNB Corp. 2,772 81,220Allegiance Bancshares, Inc. 4,389 177,930Altabancorp 3,772 158,575Amalgamated Financial Corp. 3,578 59,359Amerant Bancorp, Inc. (A) 5,603 104,048American National Bankshares, Inc. 3,279 108,437Ameris Bancorp 15,343 805,661Ames National Corp. 3,160 80,833Arrow Financial Corp. 3,408 113,520Atlantic Capital Bancshares, Inc. (A) 5,198 125,272Atlantic Union Bankshares Corp. 17,686 678,435Banc of California, Inc. 10,357 187,255BancFirst Corp. 4,268 301,705BancorpSouth Bank 22,586 733,593Bank First Corp. 1,558 116,834Bank of Commerce Holdings 5,555 70,826Bank of Marin Bancorp 3,446 134,945BankFinancial Corp. 5,671 58,525BankUnited, Inc. 20,971 921,675
Small Cap Index Trust (continued)Shares orPrincipalAmount Value
COMMON STOCKS (continued)Banks (continued)Bankwell Financial Group, Inc. 2,473 $ 66,647Banner Corp. 7,906 421,627Bar Harbor Bankshares 3,760 110,619BayCom Corp. (A) 3,749 67,557BCB Bancorp, Inc. 4,807 66,337Berkshire Hills Bancorp, Inc. 11,080 247,306
Small Cap Index Trust (continued)Shares orPrincipalAmount Value
COMMON STOCKS (continued)Banks (continued)First Financial Corp. 3,125 $ 140,656First Foundation, Inc. 9,076 212,923First Internet Bancorp 2,432 85,679First Interstate BancSystem, Inc.,
Class A 9,033 415,879First Merchants Corp. 12,331 573,392
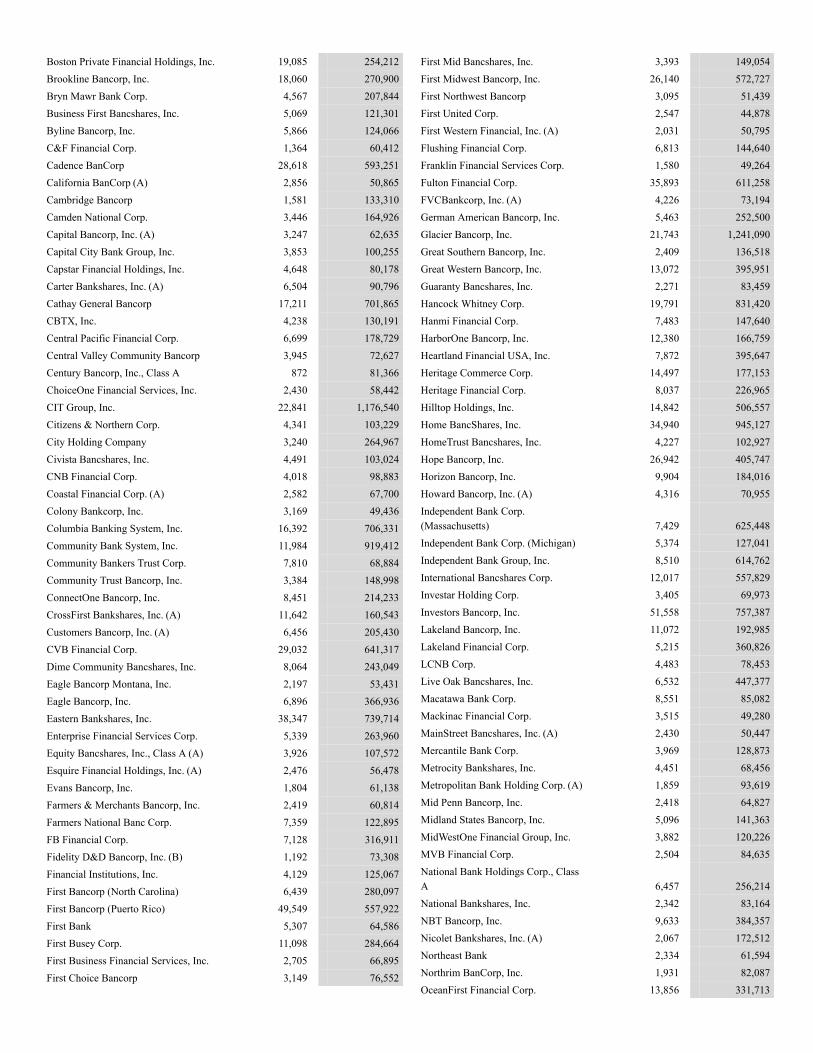
Boston Private Financial Holdings, Inc. 19,085 254,212Brookline Bancorp, Inc. 18,060 270,900Bryn Mawr Bank Corp. 4,567 207,844Business First Bancshares, Inc. 5,069 121,301Byline Bancorp, Inc. 5,866 124,066C&F Financial Corp. 1,364 60,412Cadence BanCorp 28,618 593,251California BanCorp (A) 2,856 50,865Cambridge Bancorp 1,581 133,310Camden National Corp. 3,446 164,926Capital Bancorp, Inc. (A) 3,247 62,635Capital City Bank Group, Inc. 3,853 100,255Capstar Financial Holdings, Inc. 4,648 80,178Carter Bankshares, Inc. (A) 6,504 90,796Cathay General Bancorp 17,211 701,865CBTX, Inc. 4,238 130,191Central Pacific Financial Corp. 6,699 178,729Central Valley Community Bancorp 3,945 72,627Century Bancorp, Inc., Class A 872 81,366ChoiceOne Financial Services, Inc. 2,430 58,442CIT Group, Inc. 22,841 1,176,540Citizens & Northern Corp. 4,341 103,229City Holding Company 3,240 264,967Civista Bancshares, Inc. 4,491 103,024CNB Financial Corp. 4,018 98,883Coastal Financial Corp. (A) 2,582 67,700Colony Bankcorp, Inc. 3,169 49,436Columbia Banking System, Inc. 16,392 706,331Community Bank System, Inc. 11,984 919,412Community Bankers Trust Corp. 7,810 68,884Community Trust Bancorp, Inc. 3,384 148,998ConnectOne Bancorp, Inc. 8,451 214,233CrossFirst Bankshares, Inc. (A) 11,642 160,543Customers Bancorp, Inc. (A) 6,456 205,430CVB Financial Corp. 29,032 641,317Dime Community Bancshares, Inc. 8,064 243,049Eagle Bancorp Montana, Inc. 2,197 53,431Eagle Bancorp, Inc. 6,896 366,936Eastern Bankshares, Inc. 38,347 739,714Enterprise Financial Services Corp. 5,339 263,960Equity Bancshares, Inc., Class A (A) 3,926 107,572Esquire Financial Holdings, Inc. (A) 2,476 56,478Evans Bancorp, Inc. 1,804 61,138Farmers & Merchants Bancorp, Inc. 2,419 60,814Farmers National Banc Corp. 7,359 122,895FB Financial Corp. 7,128 316,911Fidelity D&D Bancorp, Inc. (B) 1,192 73,308Financial Institutions, Inc. 4,129 125,067First Bancorp (North Carolina) 6,439 280,097First Bancorp (Puerto Rico) 49,549 557,922First Bank 5,307 64,586First Busey Corp. 11,098 284,664First Business Financial Services, Inc. 2,705 66,895First Choice Bancorp 3,149 76,552
First Mid Bancshares, Inc. 3,393 149,054First Midwest Bancorp, Inc. 26,140 572,727First Northwest Bancorp 3,095 51,439First United Corp. 2,547 44,878First Western Financial, Inc. (A) 2,031 50,795Flushing Financial Corp. 6,813 144,640Franklin Financial Services Corp. 1,580 49,264Fulton Financial Corp. 35,893 611,258FVCBankcorp, Inc. (A) 4,226 73,194German American Bancorp, Inc. 5,463 252,500Glacier Bancorp, Inc. 21,743 1,241,090Great Southern Bancorp, Inc. 2,409 136,518Great Western Bancorp, Inc. 13,072 395,951Guaranty Bancshares, Inc. 2,271 83,459Hancock Whitney Corp. 19,791 831,420Hanmi Financial Corp. 7,483 147,640HarborOne Bancorp, Inc. 12,380 166,759Heartland Financial USA, Inc. 7,872 395,647Heritage Commerce Corp. 14,497 177,153Heritage Financial Corp. 8,037 226,965Hilltop Holdings, Inc. 14,842 506,557Home BancShares, Inc. 34,940 945,127HomeTrust Bancshares, Inc. 4,227 102,927Hope Bancorp, Inc. 26,942 405,747Horizon Bancorp, Inc. 9,904 184,016Howard Bancorp, Inc. (A) 4,316 70,955Independent Bank Corp.(Massachusetts) 7,429 625,448Independent Bank Corp. (Michigan) 5,374 127,041Independent Bank Group, Inc. 8,510 614,762International Bancshares Corp. 12,017 557,829Investar Holding Corp. 3,405 69,973Investors Bancorp, Inc. 51,558 757,387Lakeland Bancorp, Inc. 11,072 192,985Lakeland Financial Corp. 5,215 360,826LCNB Corp. 4,483 78,453Live Oak Bancshares, Inc. 6,532 447,377Macatawa Bank Corp. 8,551 85,082Mackinac Financial Corp. 3,515 49,280MainStreet Bancshares, Inc. (A) 2,430 50,447Mercantile Bank Corp. 3,969 128,873Metrocity Bankshares, Inc. 4,451 68,456Metropolitan Bank Holding Corp. (A) 1,859 93,619Mid Penn Bancorp, Inc. 2,418 64,827Midland States Bancorp, Inc. 5,096 141,363MidWestOne Financial Group, Inc. 3,882 120,226MVB Financial Corp. 2,504 84,635National Bank Holdings Corp., ClassA 6,457 256,214National Bankshares, Inc. 2,342 83,164NBT Bancorp, Inc. 9,633 384,357Nicolet Bankshares, Inc. (A) 2,067 172,512Northeast Bank 2,334 61,594Northrim BanCorp, Inc. 1,931 82,087OceanFirst Financial Corp. 13,856 331,713
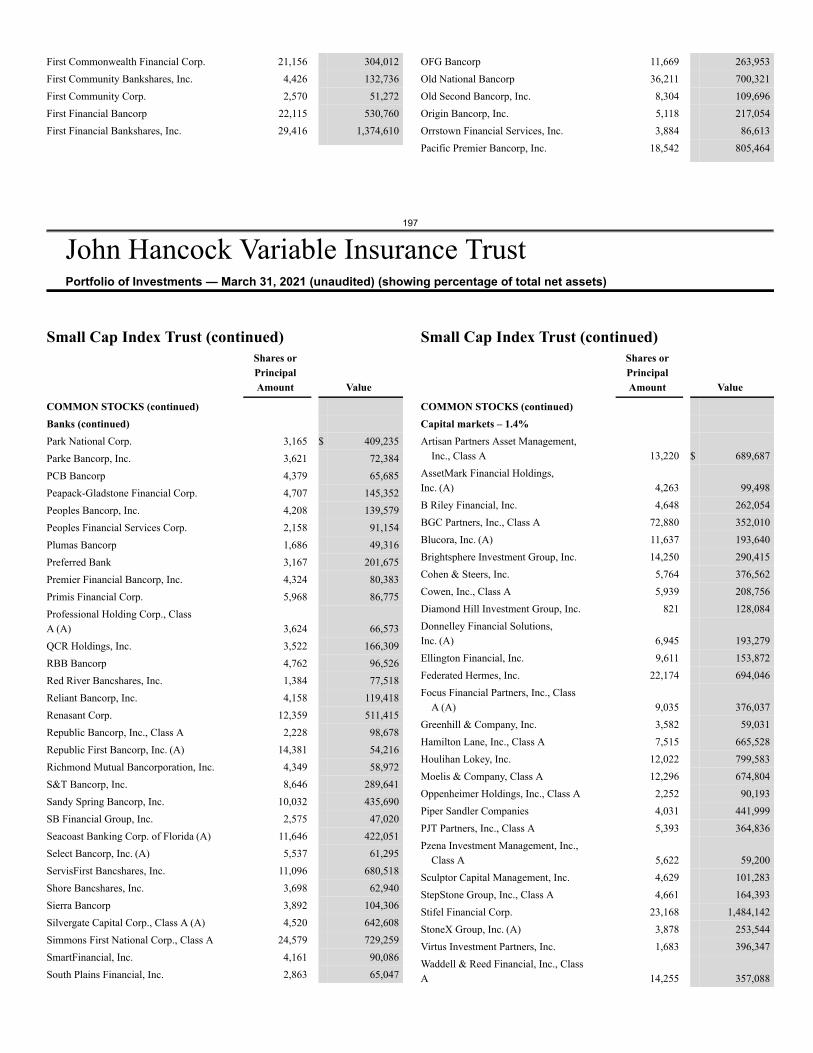
197
John Hancock Variable Insurance TrustPortfolio of Investments — March 31, 2021 (unaudited) (showing percentage of total net assets)
First Commonwealth Financial Corp. 21,156 304,012First Community Bankshares, Inc. 4,426 132,736First Community Corp. 2,570 51,272First Financial Bancorp 22,115 530,760First Financial Bankshares, Inc. 29,416 1,374,610
OFG Bancorp 11,669 263,953Old National Bancorp 36,211 700,321Old Second Bancorp, Inc. 8,304 109,696Origin Bancorp, Inc. 5,118 217,054Orrstown Financial Services, Inc. 3,884 86,613Pacific Premier Bancorp, Inc. 18,542 805,464
Small Cap Index Trust (continued)Shares orPrincipalAmount Value
COMMON STOCKS (continued)Banks (continued)Park National Corp. 3,165 $ 409,235Parke Bancorp, Inc. 3,621 72,384PCB Bancorp 4,379 65,685Peapack-Gladstone Financial Corp. 4,707 145,352Peoples Bancorp, Inc. 4,208 139,579Peoples Financial Services Corp. 2,158 91,154Plumas Bancorp 1,686 49,316Preferred Bank 3,167 201,675Premier Financial Bancorp, Inc. 4,324 80,383Primis Financial Corp. 5,968 86,775Professional Holding Corp., ClassA (A) 3,624 66,573QCR Holdings, Inc. 3,522 166,309RBB Bancorp 4,762 96,526Red River Bancshares, Inc. 1,384 77,518Reliant Bancorp, Inc. 4,158 119,418Renasant Corp. 12,359 511,415Republic Bancorp, Inc., Class A 2,228 98,678Republic First Bancorp, Inc. (A) 14,381 54,216Richmond Mutual Bancorporation, Inc. 4,349 58,972S&T Bancorp, Inc. 8,646 289,641Sandy Spring Bancorp, Inc. 10,032 435,690SB Financial Group, Inc. 2,575 47,020Seacoast Banking Corp. of Florida (A) 11,646 422,051Select Bancorp, Inc. (A) 5,537 61,295ServisFirst Bancshares, Inc. 11,096 680,518Shore Bancshares, Inc. 3,698 62,940Sierra Bancorp 3,892 104,306Silvergate Capital Corp., Class A (A) 4,520 642,608Simmons First National Corp., Class A 24,579 729,259SmartFinancial, Inc. 4,161 90,086South Plains Financial, Inc. 2,863 65,047
Small Cap Index Trust (continued)Shares orPrincipalAmount Value
COMMON STOCKS (continued)Capital markets – 1.4%Artisan Partners Asset Management,
Inc., Class A 13,220 $ 689,687AssetMark Financial Holdings,Inc. (A) 4,263 99,498B Riley Financial, Inc. 4,648 262,054BGC Partners, Inc., Class A 72,880 352,010Blucora, Inc. (A) 11,637 193,640Brightsphere Investment Group, Inc. 14,250 290,415Cohen & Steers, Inc. 5,764 376,562Cowen, Inc., Class A 5,939 208,756Diamond Hill Investment Group, Inc. 821 128,084Donnelley Financial Solutions,Inc. (A) 6,945 193,279Ellington Financial, Inc. 9,611 153,872Federated Hermes, Inc. 22,174 694,046Focus Financial Partners, Inc., Class
A (A) 9,035 376,037Greenhill & Company, Inc. 3,582 59,031Hamilton Lane, Inc., Class A 7,515 665,528Houlihan Lokey, Inc. 12,022 799,583Moelis & Company, Class A 12,296 674,804Oppenheimer Holdings, Inc., Class A 2,252 90,193Piper Sandler Companies 4,031 441,999PJT Partners, Inc., Class A 5,393 364,836Pzena Investment Management, Inc.,
Class A 5,622 59,200Sculptor Capital Management, Inc. 4,629 101,283StepStone Group, Inc., Class A 4,661 164,393Stifel Financial Corp. 23,168 1,484,142StoneX Group, Inc. (A) 3,878 253,544Virtus Investment Partners, Inc. 1,683 396,347Waddell & Reed Financial, Inc., ClassA 14,255 357,088
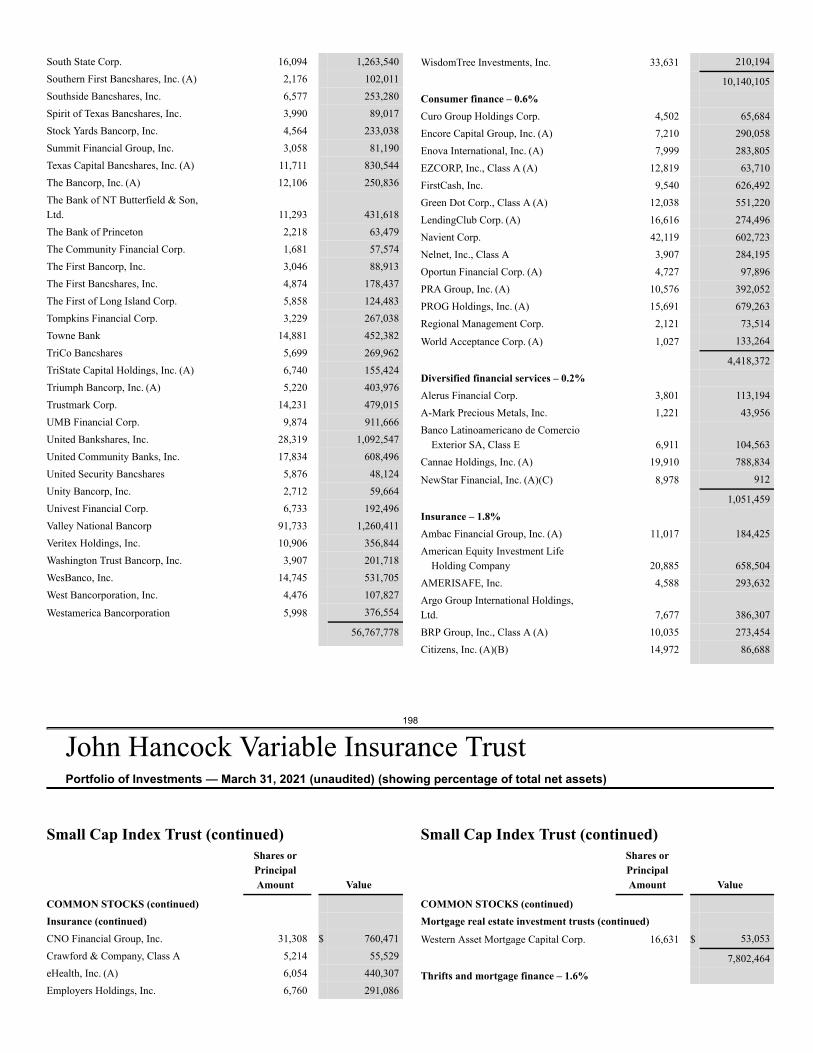
198
John Hancock Variable Insurance TrustPortfolio of Investments — March 31, 2021 (unaudited) (showing percentage of total net assets)
South State Corp. 16,094 1,263,540Southern First Bancshares, Inc. (A) 2,176 102,011Southside Bancshares, Inc. 6,577 253,280Spirit of Texas Bancshares, Inc. 3,990 89,017Stock Yards Bancorp, Inc. 4,564 233,038Summit Financial Group, Inc. 3,058 81,190Texas Capital Bancshares, Inc. (A) 11,711 830,544The Bancorp, Inc. (A) 12,106 250,836The Bank of NT Butterfield & Son,Ltd. 11,293 431,618The Bank of Princeton 2,218 63,479The Community Financial Corp. 1,681 57,574The First Bancorp, Inc. 3,046 88,913The First Bancshares, Inc. 4,874 178,437The First of Long Island Corp. 5,858 124,483Tompkins Financial Corp. 3,229 267,038Towne Bank 14,881 452,382TriCo Bancshares 5,699 269,962TriState Capital Holdings, Inc. (A) 6,740 155,424Triumph Bancorp, Inc. (A) 5,220 403,976Trustmark Corp. 14,231 479,015UMB Financial Corp. 9,874 911,666United Bankshares, Inc. 28,319 1,092,547United Community Banks, Inc. 17,834 608,496United Security Bancshares 5,876 48,124Unity Bancorp, Inc. 2,712 59,664Univest Financial Corp. 6,733 192,496Valley National Bancorp 91,733 1,260,411Veritex Holdings, Inc. 10,906 356,844Washington Trust Bancorp, Inc. 3,907 201,718WesBanco, Inc. 14,745 531,705West Bancorporation, Inc. 4,476 107,827
Westamerica Bancorporation 5,998 376,554
56,767,778
WisdomTree Investments, Inc. 33,631 210,194
10,140,105Consumer finance – 0.6%Curo Group Holdings Corp. 4,502 65,684Encore Capital Group, Inc. (A) 7,210 290,058Enova International, Inc. (A) 7,999 283,805EZCORP, Inc., Class A (A) 12,819 63,710FirstCash, Inc. 9,540 626,492Green Dot Corp., Class A (A) 12,038 551,220LendingClub Corp. (A) 16,616 274,496Navient Corp. 42,119 602,723Nelnet, Inc., Class A 3,907 284,195Oportun Financial Corp. (A) 4,727 97,896PRA Group, Inc. (A) 10,576 392,052PROG Holdings, Inc. (A) 15,691 679,263Regional Management Corp. 2,121 73,514
World Acceptance Corp. (A) 1,027 133,264
4,418,372Diversified financial services – 0.2%Alerus Financial Corp. 3,801 113,194A-Mark Precious Metals, Inc. 1,221 43,956Banco Latinoamericano de Comercio
Exterior SA, Class E 6,911 104,563Cannae Holdings, Inc. (A) 19,910 788,834
NewStar Financial, Inc. (A)(C) 8,978 912
1,051,459Insurance – 1.8%Ambac Financial Group, Inc. (A) 11,017 184,425American Equity Investment Life
Holding Company 20,885 658,504AMERISAFE, Inc. 4,588 293,632Argo Group International Holdings,Ltd. 7,677 386,307BRP Group, Inc., Class A (A) 10,035 273,454Citizens, Inc. (A)(B) 14,972 86,688
Small Cap Index Trust (continued)Shares orPrincipalAmount Value
COMMON STOCKS (continued)Insurance (continued)CNO Financial Group, Inc. 31,308 $ 760,471Crawford & Company, Class A 5,214 55,529eHealth, Inc. (A) 6,054 440,307Employers Holdings, Inc. 6,760 291,086
Small Cap Index Trust (continued)Shares orPrincipalAmount Value
COMMON STOCKS (continued)Mortgage real estate investment trusts (continued)Western Asset Mortgage Capital Corp. 16,631 $ 53,053
7,802,464Thrifts and mortgage finance – 1.6%
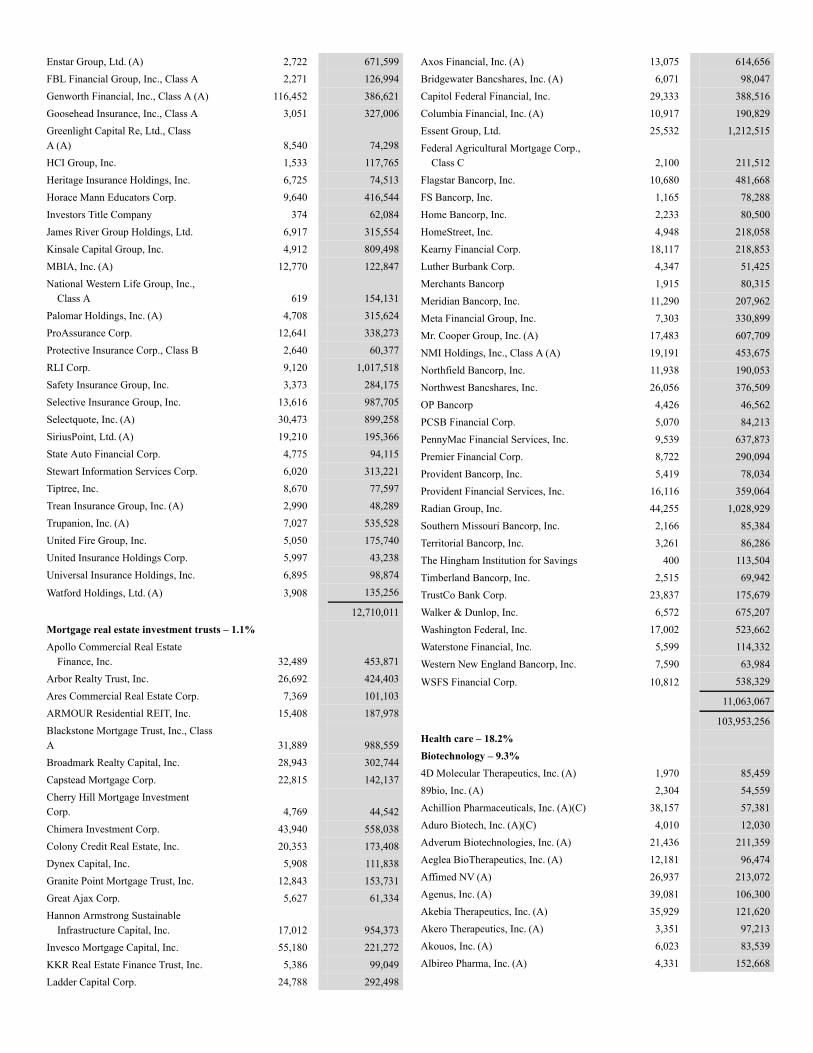
Enstar Group, Ltd. (A) 2,722 671,599FBL Financial Group, Inc., Class A 2,271 126,994Genworth Financial, Inc., Class A (A) 116,452 386,621Goosehead Insurance, Inc., Class A 3,051 327,006Greenlight Capital Re, Ltd., ClassA (A) 8,540 74,298HCI Group, Inc. 1,533 117,765Heritage Insurance Holdings, Inc. 6,725 74,513Horace Mann Educators Corp. 9,640 416,544Investors Title Company 374 62,084James River Group Holdings, Ltd. 6,917 315,554Kinsale Capital Group, Inc. 4,912 809,498MBIA, Inc. (A) 12,770 122,847National Western Life Group, Inc.,
Class A 619 154,131Palomar Holdings, Inc. (A) 4,708 315,624ProAssurance Corp. 12,641 338,273Protective Insurance Corp., Class B 2,640 60,377RLI Corp. 9,120 1,017,518Safety Insurance Group, Inc. 3,373 284,175Selective Insurance Group, Inc. 13,616 987,705Selectquote, Inc. (A) 30,473 899,258SiriusPoint, Ltd. (A) 19,210 195,366State Auto Financial Corp. 4,775 94,115Stewart Information Services Corp. 6,020 313,221Tiptree, Inc. 8,670 77,597Trean Insurance Group, Inc. (A) 2,990 48,289Trupanion, Inc. (A) 7,027 535,528United Fire Group, Inc. 5,050 175,740United Insurance Holdings Corp. 5,997 43,238Universal Insurance Holdings, Inc. 6,895 98,874
Watford Holdings, Ltd. (A) 3,908 135,256
12,710,011Mortgage real estate investment trusts – 1.1%Apollo Commercial Real Estate
Finance, Inc. 32,489 453,871Arbor Realty Trust, Inc. 26,692 424,403Ares Commercial Real Estate Corp. 7,369 101,103ARMOUR Residential REIT, Inc. 15,408 187,978Blackstone Mortgage Trust, Inc., ClassA 31,889 988,559Broadmark Realty Capital, Inc. 28,943 302,744Capstead Mortgage Corp. 22,815 142,137Cherry Hill Mortgage InvestmentCorp. 4,769 44,542Chimera Investment Corp. 43,940 558,038Colony Credit Real Estate, Inc. 20,353 173,408Dynex Capital, Inc. 5,908 111,838Granite Point Mortgage Trust, Inc. 12,843 153,731Great Ajax Corp. 5,627 61,334Hannon Armstrong Sustainable
Infrastructure Capital, Inc. 17,012 954,373Invesco Mortgage Capital, Inc. 55,180 221,272KKR Real Estate Finance Trust, Inc. 5,386 99,049Ladder Capital Corp. 24,788 292,498
Axos Financial, Inc. (A) 13,075 614,656Bridgewater Bancshares, Inc. (A) 6,071 98,047Capitol Federal Financial, Inc. 29,333 388,516Columbia Financial, Inc. (A) 10,917 190,829Essent Group, Ltd. 25,532 1,212,515Federal Agricultural Mortgage Corp.,
Class C 2,100 211,512Flagstar Bancorp, Inc. 10,680 481,668FS Bancorp, Inc. 1,165 78,288Home Bancorp, Inc. 2,233 80,500HomeStreet, Inc. 4,948 218,058Kearny Financial Corp. 18,117 218,853Luther Burbank Corp. 4,347 51,425Merchants Bancorp 1,915 80,315Meridian Bancorp, Inc. 11,290 207,962Meta Financial Group, Inc. 7,303 330,899Mr. Cooper Group, Inc. (A) 17,483 607,709NMI Holdings, Inc., Class A (A) 19,191 453,675Northfield Bancorp, Inc. 11,938 190,053Northwest Bancshares, Inc. 26,056 376,509OP Bancorp 4,426 46,562PCSB Financial Corp. 5,070 84,213PennyMac Financial Services, Inc. 9,539 637,873Premier Financial Corp. 8,722 290,094Provident Bancorp, Inc. 5,419 78,034Provident Financial Services, Inc. 16,116 359,064Radian Group, Inc. 44,255 1,028,929Southern Missouri Bancorp, Inc. 2,166 85,384Territorial Bancorp, Inc. 3,261 86,286The Hingham Institution for Savings 400 113,504Timberland Bancorp, Inc. 2,515 69,942TrustCo Bank Corp. 23,837 175,679Walker & Dunlop, Inc. 6,572 675,207Washington Federal, Inc. 17,002 523,662Waterstone Financial, Inc. 5,599 114,332Western New England Bancorp, Inc. 7,590 63,984
WSFS Financial Corp. 10,812 538,329
11,063,067
103,953,256Health care – 18.2%Biotechnology – 9.3%4D Molecular Therapeutics, Inc. (A) 1,970 85,45989bio, Inc. (A) 2,304 54,559Achillion Pharmaceuticals, Inc. (A)(C) 38,157 57,381Aduro Biotech, Inc. (A)(C) 4,010 12,030Adverum Biotechnologies, Inc. (A) 21,436 211,359Aeglea BioTherapeutics, Inc. (A) 12,181 96,474Affimed NV (A) 26,937 213,072Agenus, Inc. (A) 39,081 106,300Akebia Therapeutics, Inc. (A) 35,929 121,620Akero Therapeutics, Inc. (A) 3,351 97,213Akouos, Inc. (A) 6,023 83,539Albireo Pharma, Inc. (A) 4,331 152,668
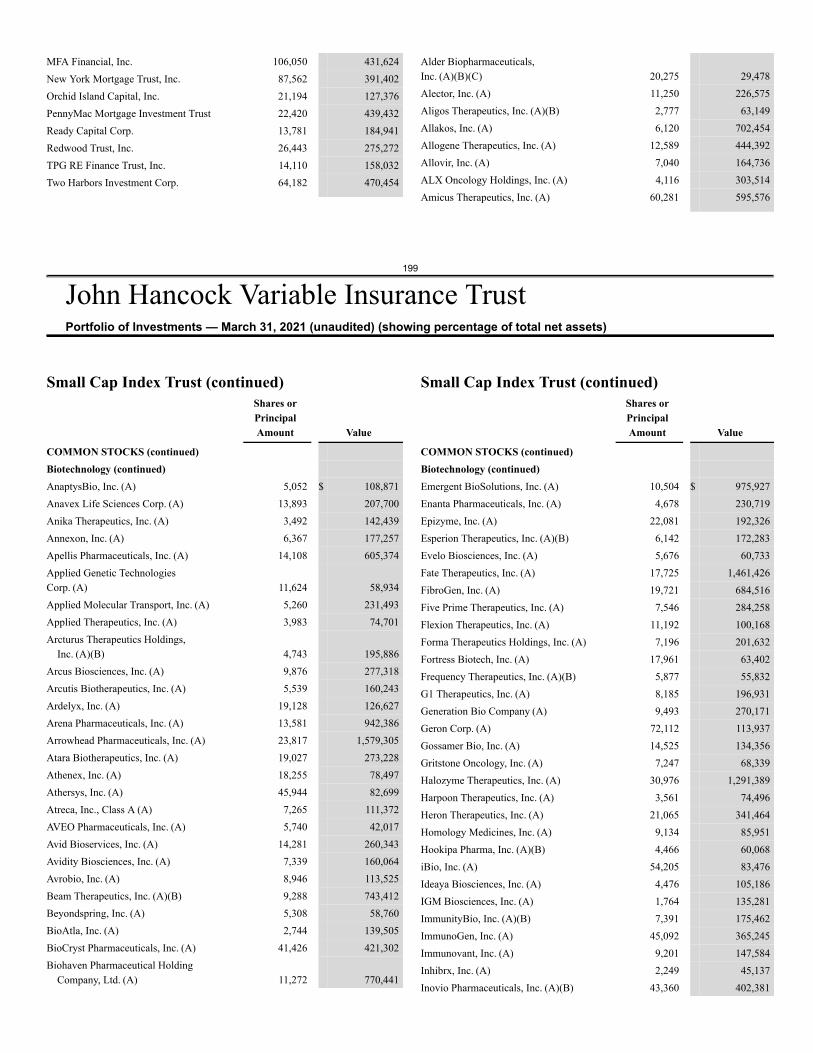
199
John Hancock Variable Insurance TrustPortfolio of Investments — March 31, 2021 (unaudited) (showing percentage of total net assets)
MFA Financial, Inc. 106,050 431,624New York Mortgage Trust, Inc. 87,562 391,402Orchid Island Capital, Inc. 21,194 127,376PennyMac Mortgage Investment Trust 22,420 439,432Ready Capital Corp. 13,781 184,941Redwood Trust, Inc. 26,443 275,272TPG RE Finance Trust, Inc. 14,110 158,032Two Harbors Investment Corp. 64,182 470,454
Alder Biopharmaceuticals,Inc. (A)(B)(C) 20,275 29,478Alector, Inc. (A) 11,250 226,575Aligos Therapeutics, Inc. (A)(B) 2,777 63,149Allakos, Inc. (A) 6,120 702,454Allogene Therapeutics, Inc. (A) 12,589 444,392Allovir, Inc. (A) 7,040 164,736ALX Oncology Holdings, Inc. (A) 4,116 303,514Amicus Therapeutics, Inc. (A) 60,281 595,576
Small Cap Index Trust (continued)Shares orPrincipalAmount Value
COMMON STOCKS (continued)Biotechnology (continued)AnaptysBio, Inc. (A) 5,052 $ 108,871Anavex Life Sciences Corp. (A) 13,893 207,700Anika Therapeutics, Inc. (A) 3,492 142,439Annexon, Inc. (A) 6,367 177,257Apellis Pharmaceuticals, Inc. (A) 14,108 605,374Applied Genetic TechnologiesCorp. (A) 11,624 58,934Applied Molecular Transport, Inc. (A) 5,260 231,493Applied Therapeutics, Inc. (A) 3,983 74,701Arcturus Therapeutics Holdings,
Inc. (A)(B) 4,743 195,886Arcus Biosciences, Inc. (A) 9,876 277,318Arcutis Biotherapeutics, Inc. (A) 5,539 160,243Ardelyx, Inc. (A) 19,128 126,627Arena Pharmaceuticals, Inc. (A) 13,581 942,386Arrowhead Pharmaceuticals, Inc. (A) 23,817 1,579,305Atara Biotherapeutics, Inc. (A) 19,027 273,228Athenex, Inc. (A) 18,255 78,497Athersys, Inc. (A) 45,944 82,699Atreca, Inc., Class A (A) 7,265 111,372AVEO Pharmaceuticals, Inc. (A) 5,740 42,017Avid Bioservices, Inc. (A) 14,281 260,343Avidity Biosciences, Inc. (A) 7,339 160,064Avrobio, Inc. (A) 8,946 113,525Beam Therapeutics, Inc. (A)(B) 9,288 743,412Beyondspring, Inc. (A) 5,308 58,760BioAtla, Inc. (A) 2,744 139,505BioCryst Pharmaceuticals, Inc. (A) 41,426 421,302Biohaven Pharmaceutical Holding
Company, Ltd. (A) 11,272 770,441
Small Cap Index Trust (continued)Shares orPrincipalAmount Value
COMMON STOCKS (continued)Biotechnology (continued)Emergent BioSolutions, Inc. (A) 10,504 $ 975,927Enanta Pharmaceuticals, Inc. (A) 4,678 230,719Epizyme, Inc. (A) 22,081 192,326Esperion Therapeutics, Inc. (A)(B) 6,142 172,283Evelo Biosciences, Inc. (A) 5,676 60,733Fate Therapeutics, Inc. (A) 17,725 1,461,426FibroGen, Inc. (A) 19,721 684,516Five Prime Therapeutics, Inc. (A) 7,546 284,258Flexion Therapeutics, Inc. (A) 11,192 100,168Forma Therapeutics Holdings, Inc. (A) 7,196 201,632Fortress Biotech, Inc. (A) 17,961 63,402Frequency Therapeutics, Inc. (A)(B) 5,877 55,832G1 Therapeutics, Inc. (A) 8,185 196,931Generation Bio Company (A) 9,493 270,171Geron Corp. (A) 72,112 113,937Gossamer Bio, Inc. (A) 14,525 134,356Gritstone Oncology, Inc. (A) 7,247 68,339Halozyme Therapeutics, Inc. (A) 30,976 1,291,389Harpoon Therapeutics, Inc. (A) 3,561 74,496Heron Therapeutics, Inc. (A) 21,065 341,464Homology Medicines, Inc. (A) 9,134 85,951Hookipa Pharma, Inc. (A)(B) 4,466 60,068iBio, Inc. (A) 54,205 83,476Ideaya Biosciences, Inc. (A) 4,476 105,186IGM Biosciences, Inc. (A) 1,764 135,281ImmunityBio, Inc. (A)(B) 7,391 175,462ImmunoGen, Inc. (A) 45,092 365,245Immunovant, Inc. (A) 9,201 147,584Inhibrx, Inc. (A) 2,249 45,137Inovio Pharmaceuticals, Inc. (A)(B) 43,360 402,381
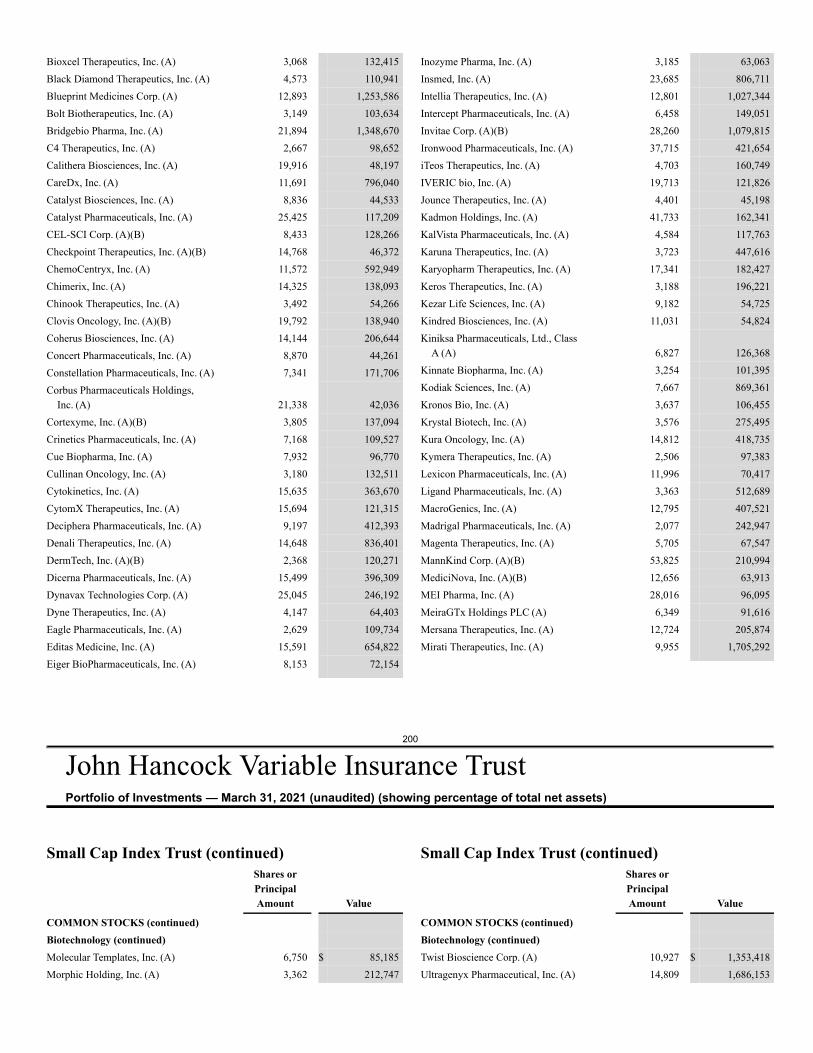
200
John Hancock Variable Insurance TrustPortfolio of Investments — March 31, 2021 (unaudited) (showing percentage of total net assets)
Bioxcel Therapeutics, Inc. (A) 3,068 132,415Black Diamond Therapeutics, Inc. (A) 4,573 110,941Blueprint Medicines Corp. (A) 12,893 1,253,586Bolt Biotherapeutics, Inc. (A) 3,149 103,634Bridgebio Pharma, Inc. (A) 21,894 1,348,670C4 Therapeutics, Inc. (A) 2,667 98,652Calithera Biosciences, Inc. (A) 19,916 48,197CareDx, Inc. (A) 11,691 796,040Catalyst Biosciences, Inc. (A) 8,836 44,533Catalyst Pharmaceuticals, Inc. (A) 25,425 117,209CEL-SCI Corp. (A)(B) 8,433 128,266Checkpoint Therapeutics, Inc. (A)(B) 14,768 46,372ChemoCentryx, Inc. (A) 11,572 592,949Chimerix, Inc. (A) 14,325 138,093Chinook Therapeutics, Inc. (A) 3,492 54,266Clovis Oncology, Inc. (A)(B) 19,792 138,940Coherus Biosciences, Inc. (A) 14,144 206,644Concert Pharmaceuticals, Inc. (A) 8,870 44,261Constellation Pharmaceuticals, Inc. (A) 7,341 171,706Corbus Pharmaceuticals Holdings,
Inc. (A) 21,338 42,036Cortexyme, Inc. (A)(B) 3,805 137,094Crinetics Pharmaceuticals, Inc. (A) 7,168 109,527Cue Biopharma, Inc. (A) 7,932 96,770Cullinan Oncology, Inc. (A) 3,180 132,511Cytokinetics, Inc. (A) 15,635 363,670CytomX Therapeutics, Inc. (A) 15,694 121,315Deciphera Pharmaceuticals, Inc. (A) 9,197 412,393Denali Therapeutics, Inc. (A) 14,648 836,401DermTech, Inc. (A)(B) 2,368 120,271Dicerna Pharmaceuticals, Inc. (A) 15,499 396,309Dynavax Technologies Corp. (A) 25,045 246,192Dyne Therapeutics, Inc. (A) 4,147 64,403Eagle Pharmaceuticals, Inc. (A) 2,629 109,734Editas Medicine, Inc. (A) 15,591 654,822Eiger BioPharmaceuticals, Inc. (A) 8,153 72,154
Inozyme Pharma, Inc. (A) 3,185 63,063Insmed, Inc. (A) 23,685 806,711Intellia Therapeutics, Inc. (A) 12,801 1,027,344Intercept Pharmaceuticals, Inc. (A) 6,458 149,051Invitae Corp. (A)(B) 28,260 1,079,815Ironwood Pharmaceuticals, Inc. (A) 37,715 421,654iTeos Therapeutics, Inc. (A) 4,703 160,749IVERIC bio, Inc. (A) 19,713 121,826Jounce Therapeutics, Inc. (A) 4,401 45,198Kadmon Holdings, Inc. (A) 41,733 162,341KalVista Pharmaceuticals, Inc. (A) 4,584 117,763Karuna Therapeutics, Inc. (A) 3,723 447,616Karyopharm Therapeutics, Inc. (A) 17,341 182,427Keros Therapeutics, Inc. (A) 3,188 196,221Kezar Life Sciences, Inc. (A) 9,182 54,725Kindred Biosciences, Inc. (A) 11,031 54,824Kiniksa Pharmaceuticals, Ltd., Class
A (A) 6,827 126,368Kinnate Biopharma, Inc. (A) 3,254 101,395Kodiak Sciences, Inc. (A) 7,667 869,361Kronos Bio, Inc. (A) 3,637 106,455Krystal Biotech, Inc. (A) 3,576 275,495Kura Oncology, Inc. (A) 14,812 418,735Kymera Therapeutics, Inc. (A) 2,506 97,383Lexicon Pharmaceuticals, Inc. (A) 11,996 70,417Ligand Pharmaceuticals, Inc. (A) 3,363 512,689MacroGenics, Inc. (A) 12,795 407,521Madrigal Pharmaceuticals, Inc. (A) 2,077 242,947Magenta Therapeutics, Inc. (A) 5,705 67,547MannKind Corp. (A)(B) 53,825 210,994MediciNova, Inc. (A)(B) 12,656 63,913MEI Pharma, Inc. (A) 28,016 96,095MeiraGTx Holdings PLC (A) 6,349 91,616Mersana Therapeutics, Inc. (A) 12,724 205,874Mirati Therapeutics, Inc. (A) 9,955 1,705,292
Small Cap Index Trust (continued)Shares orPrincipalAmount Value
COMMON STOCKS (continued)Biotechnology (continued)Molecular Templates, Inc. (A) 6,750 $ 85,185Morphic Holding, Inc. (A) 3,362 212,747
Small Cap Index Trust (continued)Shares orPrincipalAmount Value
COMMON STOCKS (continued)Biotechnology (continued)Twist Bioscience Corp. (A) 10,927 $ 1,353,418Ultragenyx Pharmaceutical, Inc. (A) 14,809 1,686,153
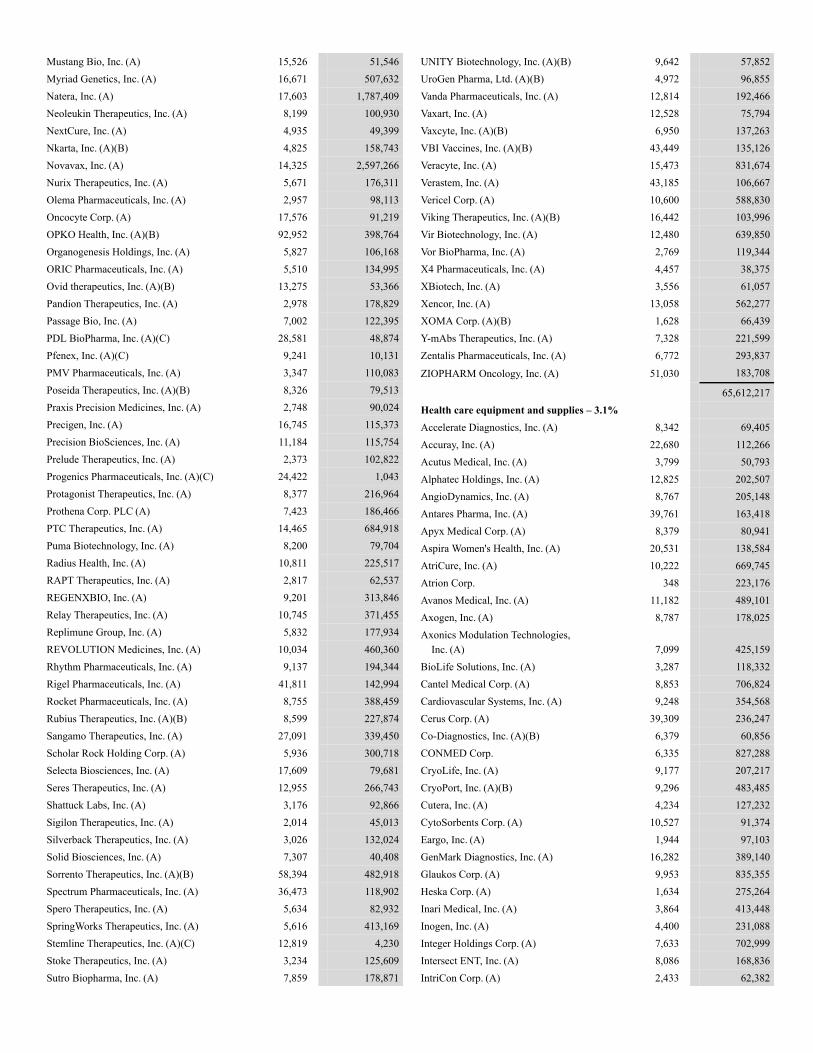
Mustang Bio, Inc. (A) 15,526 51,546Myriad Genetics, Inc. (A) 16,671 507,632Natera, Inc. (A) 17,603 1,787,409Neoleukin Therapeutics, Inc. (A) 8,199 100,930NextCure, Inc. (A) 4,935 49,399Nkarta, Inc. (A)(B) 4,825 158,743Novavax, Inc. (A) 14,325 2,597,266Nurix Therapeutics, Inc. (A) 5,671 176,311Olema Pharmaceuticals, Inc. (A) 2,957 98,113Oncocyte Corp. (A) 17,576 91,219OPKO Health, Inc. (A)(B) 92,952 398,764Organogenesis Holdings, Inc. (A) 5,827 106,168ORIC Pharmaceuticals, Inc. (A) 5,510 134,995Ovid therapeutics, Inc. (A)(B) 13,275 53,366Pandion Therapeutics, Inc. (A) 2,978 178,829Passage Bio, Inc. (A) 7,002 122,395PDL BioPharma, Inc. (A)(C) 28,581 48,874Pfenex, Inc. (A)(C) 9,241 10,131PMV Pharmaceuticals, Inc. (A) 3,347 110,083Poseida Therapeutics, Inc. (A)(B) 8,326 79,513Praxis Precision Medicines, Inc. (A) 2,748 90,024Precigen, Inc. (A) 16,745 115,373Precision BioSciences, Inc. (A) 11,184 115,754Prelude Therapeutics, Inc. (A) 2,373 102,822Progenics Pharmaceuticals, Inc. (A)(C) 24,422 1,043Protagonist Therapeutics, Inc. (A) 8,377 216,964Prothena Corp. PLC (A) 7,423 186,466PTC Therapeutics, Inc. (A) 14,465 684,918Puma Biotechnology, Inc. (A) 8,200 79,704Radius Health, Inc. (A) 10,811 225,517RAPT Therapeutics, Inc. (A) 2,817 62,537REGENXBIO, Inc. (A) 9,201 313,846Relay Therapeutics, Inc. (A) 10,745 371,455Replimune Group, Inc. (A) 5,832 177,934REVOLUTION Medicines, Inc. (A) 10,034 460,360Rhythm Pharmaceuticals, Inc. (A) 9,137 194,344Rigel Pharmaceuticals, Inc. (A) 41,811 142,994Rocket Pharmaceuticals, Inc. (A) 8,755 388,459Rubius Therapeutics, Inc. (A)(B) 8,599 227,874Sangamo Therapeutics, Inc. (A) 27,091 339,450Scholar Rock Holding Corp. (A) 5,936 300,718Selecta Biosciences, Inc. (A) 17,609 79,681Seres Therapeutics, Inc. (A) 12,955 266,743Shattuck Labs, Inc. (A) 3,176 92,866Sigilon Therapeutics, Inc. (A) 2,014 45,013Silverback Therapeutics, Inc. (A) 3,026 132,024Solid Biosciences, Inc. (A) 7,307 40,408Sorrento Therapeutics, Inc. (A)(B) 58,394 482,918Spectrum Pharmaceuticals, Inc. (A) 36,473 118,902Spero Therapeutics, Inc. (A) 5,634 82,932SpringWorks Therapeutics, Inc. (A) 5,616 413,169Stemline Therapeutics, Inc. (A)(C) 12,819 4,230Stoke Therapeutics, Inc. (A) 3,234 125,609Sutro Biopharma, Inc. (A) 7,859 178,871
UNITY Biotechnology, Inc. (A)(B) 9,642 57,852UroGen Pharma, Ltd. (A)(B) 4,972 96,855Vanda Pharmaceuticals, Inc. (A) 12,814 192,466Vaxart, Inc. (A) 12,528 75,794Vaxcyte, Inc. (A)(B) 6,950 137,263VBI Vaccines, Inc. (A)(B) 43,449 135,126Veracyte, Inc. (A) 15,473 831,674Verastem, Inc. (A) 43,185 106,667Vericel Corp. (A) 10,600 588,830Viking Therapeutics, Inc. (A)(B) 16,442 103,996Vir Biotechnology, Inc. (A) 12,480 639,850Vor BioPharma, Inc. (A) 2,769 119,344X4 Pharmaceuticals, Inc. (A) 4,457 38,375XBiotech, Inc. (A) 3,556 61,057Xencor, Inc. (A) 13,058 562,277XOMA Corp. (A)(B) 1,628 66,439Y-mAbs Therapeutics, Inc. (A) 7,328 221,599Zentalis Pharmaceuticals, Inc. (A) 6,772 293,837
ZIOPHARM Oncology, Inc. (A) 51,030 183,708
65,612,217Health care equipment and supplies – 3.1%Accelerate Diagnostics, Inc. (A) 8,342 69,405Accuray, Inc. (A) 22,680 112,266Acutus Medical, Inc. (A) 3,799 50,793Alphatec Holdings, Inc. (A) 12,825 202,507AngioDynamics, Inc. (A) 8,767 205,148Antares Pharma, Inc. (A) 39,761 163,418Apyx Medical Corp. (A) 8,379 80,941Aspira Women's Health, Inc. (A) 20,531 138,584AtriCure, Inc. (A) 10,222 669,745Atrion Corp. 348 223,176Avanos Medical, Inc. (A) 11,182 489,101Axogen, Inc. (A) 8,787 178,025Axonics Modulation Technologies,
Inc. (A) 7,099 425,159BioLife Solutions, Inc. (A) 3,287 118,332Cantel Medical Corp. (A) 8,853 706,824Cardiovascular Systems, Inc. (A) 9,248 354,568Cerus Corp. (A) 39,309 236,247Co-Diagnostics, Inc. (A)(B) 6,379 60,856CONMED Corp. 6,335 827,288CryoLife, Inc. (A) 9,177 207,217CryoPort, Inc. (A)(B) 9,296 483,485Cutera, Inc. (A) 4,234 127,232CytoSorbents Corp. (A) 10,527 91,374Eargo, Inc. (A) 1,944 97,103GenMark Diagnostics, Inc. (A) 16,282 389,140Glaukos Corp. (A) 9,953 835,355Heska Corp. (A) 1,634 275,264Inari Medical, Inc. (A) 3,864 413,448Inogen, Inc. (A) 4,400 231,088Integer Holdings Corp. (A) 7,633 702,999Intersect ENT, Inc. (A) 8,086 168,836IntriCon Corp. (A) 2,433 62,382
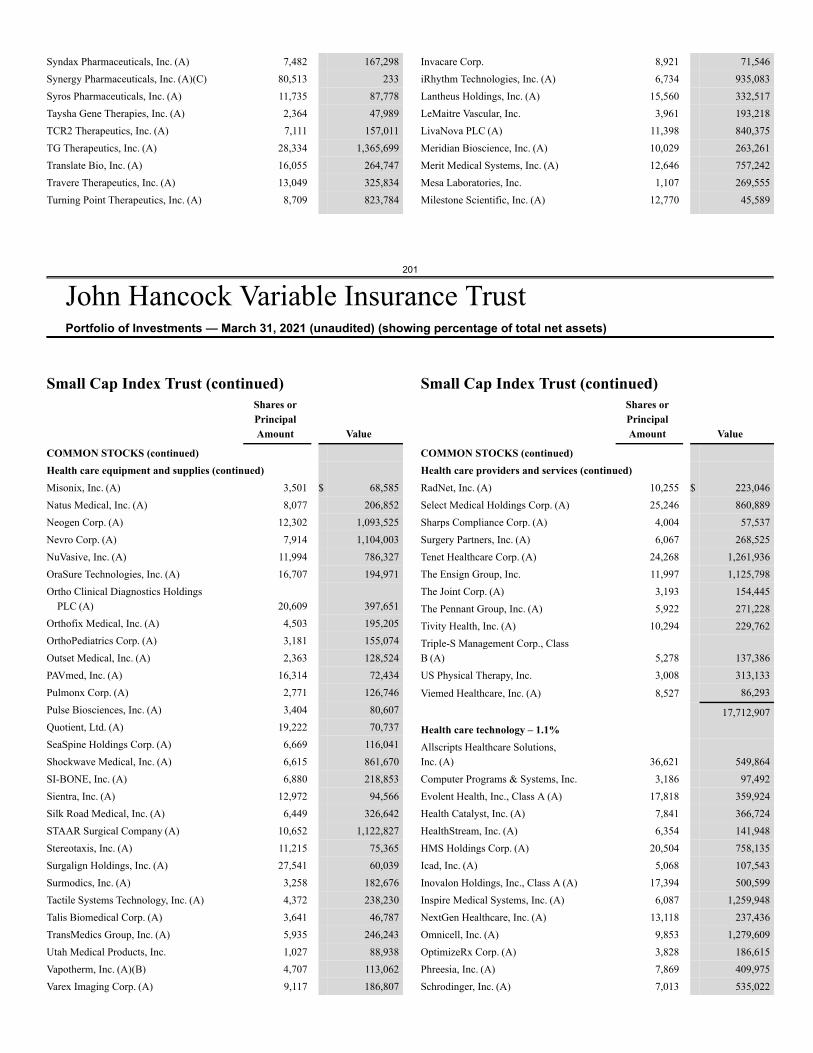
201
John Hancock Variable Insurance TrustPortfolio of Investments — March 31, 2021 (unaudited) (showing percentage of total net assets)
Syndax Pharmaceuticals, Inc. (A) 7,482 167,298Synergy Pharmaceuticals, Inc. (A)(C) 80,513 233Syros Pharmaceuticals, Inc. (A) 11,735 87,778Taysha Gene Therapies, Inc. (A) 2,364 47,989TCR2 Therapeutics, Inc. (A) 7,111 157,011TG Therapeutics, Inc. (A) 28,334 1,365,699Translate Bio, Inc. (A) 16,055 264,747Travere Therapeutics, Inc. (A) 13,049 325,834Turning Point Therapeutics, Inc. (A) 8,709 823,784
Invacare Corp. 8,921 71,546iRhythm Technologies, Inc. (A) 6,734 935,083Lantheus Holdings, Inc. (A) 15,560 332,517LeMaitre Vascular, Inc. 3,961 193,218LivaNova PLC (A) 11,398 840,375Meridian Bioscience, Inc. (A) 10,029 263,261Merit Medical Systems, Inc. (A) 12,646 757,242Mesa Laboratories, Inc. 1,107 269,555Milestone Scientific, Inc. (A) 12,770 45,589
Small Cap Index Trust (continued)Shares orPrincipalAmount Value
COMMON STOCKS (continued)Health care equipment and supplies (continued)Misonix, Inc. (A) 3,501 $ 68,585Natus Medical, Inc. (A) 8,077 206,852Neogen Corp. (A) 12,302 1,093,525Nevro Corp. (A) 7,914 1,104,003NuVasive, Inc. (A) 11,994 786,327OraSure Technologies, Inc. (A) 16,707 194,971Ortho Clinical Diagnostics Holdings
PLC (A) 20,609 397,651Orthofix Medical, Inc. (A) 4,503 195,205OrthoPediatrics Corp. (A) 3,181 155,074Outset Medical, Inc. (A) 2,363 128,524PAVmed, Inc. (A) 16,314 72,434Pulmonx Corp. (A) 2,771 126,746Pulse Biosciences, Inc. (A) 3,404 80,607Quotient, Ltd. (A) 19,222 70,737SeaSpine Holdings Corp. (A) 6,669 116,041Shockwave Medical, Inc. (A) 6,615 861,670SI-BONE, Inc. (A) 6,880 218,853Sientra, Inc. (A) 12,972 94,566Silk Road Medical, Inc. (A) 6,449 326,642STAAR Surgical Company (A) 10,652 1,122,827Stereotaxis, Inc. (A) 11,215 75,365Surgalign Holdings, Inc. (A) 27,541 60,039Surmodics, Inc. (A) 3,258 182,676Tactile Systems Technology, Inc. (A) 4,372 238,230Talis Biomedical Corp. (A) 3,641 46,787TransMedics Group, Inc. (A) 5,935 246,243Utah Medical Products, Inc. 1,027 88,938Vapotherm, Inc. (A)(B) 4,707 113,062Varex Imaging Corp. (A) 9,117 186,807
Small Cap Index Trust (continued)Shares orPrincipalAmount Value
COMMON STOCKS (continued)Health care providers and services (continued)RadNet, Inc. (A) 10,255 $ 223,046Select Medical Holdings Corp. (A) 25,246 860,889Sharps Compliance Corp. (A) 4,004 57,537Surgery Partners, Inc. (A) 6,067 268,525Tenet Healthcare Corp. (A) 24,268 1,261,936The Ensign Group, Inc. 11,997 1,125,798The Joint Corp. (A) 3,193 154,445The Pennant Group, Inc. (A) 5,922 271,228Tivity Health, Inc. (A) 10,294 229,762Triple-S Management Corp., ClassB (A) 5,278 137,386US Physical Therapy, Inc. 3,008 313,133
Viemed Healthcare, Inc. (A) 8,527 86,293
17,712,907Health care technology – 1.1%Allscripts Healthcare Solutions,Inc. (A) 36,621 549,864Computer Programs & Systems, Inc. 3,186 97,492Evolent Health, Inc., Class A (A) 17,818 359,924Health Catalyst, Inc. (A) 7,841 366,724HealthStream, Inc. (A) 6,354 141,948HMS Holdings Corp. (A) 20,504 758,135Icad, Inc. (A) 5,068 107,543Inovalon Holdings, Inc., Class A (A) 17,394 500,599Inspire Medical Systems, Inc. (A) 6,087 1,259,948NextGen Healthcare, Inc. (A) 13,118 237,436Omnicell, Inc. (A) 9,853 1,279,609OptimizeRx Corp. (A) 3,828 186,615Phreesia, Inc. (A) 7,869 409,975Schrodinger, Inc. (A) 7,013 535,022
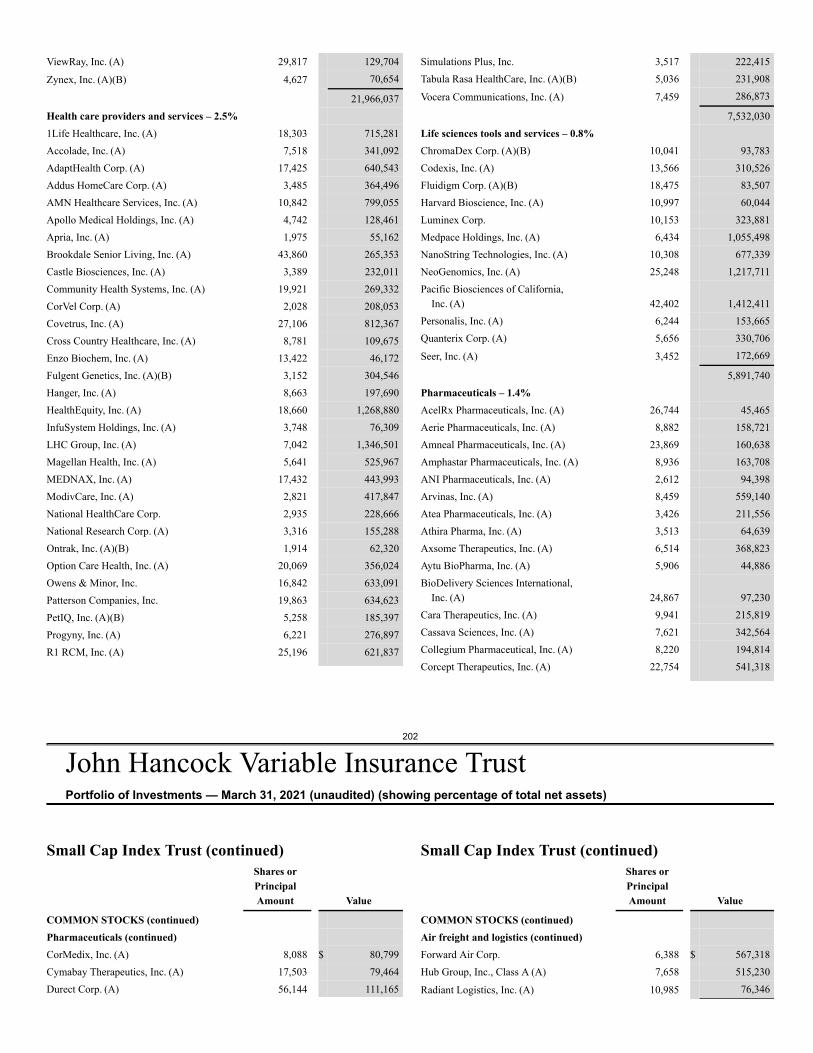
202
John Hancock Variable Insurance TrustPortfolio of Investments — March 31, 2021 (unaudited) (showing percentage of total net assets)
ViewRay, Inc. (A) 29,817 129,704
Zynex, Inc. (A)(B) 4,627 70,654
21,966,037Health care providers and services – 2.5%1Life Healthcare, Inc. (A) 18,303 715,281Accolade, Inc. (A) 7,518 341,092AdaptHealth Corp. (A) 17,425 640,543Addus HomeCare Corp. (A) 3,485 364,496AMN Healthcare Services, Inc. (A) 10,842 799,055Apollo Medical Holdings, Inc. (A) 4,742 128,461Apria, Inc. (A) 1,975 55,162Brookdale Senior Living, Inc. (A) 43,860 265,353Castle Biosciences, Inc. (A) 3,389 232,011Community Health Systems, Inc. (A) 19,921 269,332CorVel Corp. (A) 2,028 208,053Covetrus, Inc. (A) 27,106 812,367Cross Country Healthcare, Inc. (A) 8,781 109,675Enzo Biochem, Inc. (A) 13,422 46,172Fulgent Genetics, Inc. (A)(B) 3,152 304,546Hanger, Inc. (A) 8,663 197,690HealthEquity, Inc. (A) 18,660 1,268,880InfuSystem Holdings, Inc. (A) 3,748 76,309LHC Group, Inc. (A) 7,042 1,346,501Magellan Health, Inc. (A) 5,641 525,967MEDNAX, Inc. (A) 17,432 443,993ModivCare, Inc. (A) 2,821 417,847National HealthCare Corp. 2,935 228,666National Research Corp. (A) 3,316 155,288Ontrak, Inc. (A)(B) 1,914 62,320Option Care Health, Inc. (A) 20,069 356,024Owens & Minor, Inc. 16,842 633,091Patterson Companies, Inc. 19,863 634,623PetIQ, Inc. (A)(B) 5,258 185,397Progyny, Inc. (A) 6,221 276,897R1 RCM, Inc. (A) 25,196 621,837
Simulations Plus, Inc. 3,517 222,415Tabula Rasa HealthCare, Inc. (A)(B) 5,036 231,908
Vocera Communications, Inc. (A) 7,459 286,873
7,532,030Life sciences tools and services – 0.8%ChromaDex Corp. (A)(B) 10,041 93,783Codexis, Inc. (A) 13,566 310,526Fluidigm Corp. (A)(B) 18,475 83,507Harvard Bioscience, Inc. (A) 10,997 60,044Luminex Corp. 10,153 323,881Medpace Holdings, Inc. (A) 6,434 1,055,498NanoString Technologies, Inc. (A) 10,308 677,339NeoGenomics, Inc. (A) 25,248 1,217,711Pacific Biosciences of California,
Inc. (A) 42,402 1,412,411Personalis, Inc. (A) 6,244 153,665Quanterix Corp. (A) 5,656 330,706
Seer, Inc. (A) 3,452 172,669
5,891,740Pharmaceuticals – 1.4%AcelRx Pharmaceuticals, Inc. (A) 26,744 45,465Aerie Pharmaceuticals, Inc. (A) 8,882 158,721Amneal Pharmaceuticals, Inc. (A) 23,869 160,638Amphastar Pharmaceuticals, Inc. (A) 8,936 163,708ANI Pharmaceuticals, Inc. (A) 2,612 94,398Arvinas, Inc. (A) 8,459 559,140Atea Pharmaceuticals, Inc. (A) 3,426 211,556Athira Pharma, Inc. (A) 3,513 64,639Axsome Therapeutics, Inc. (A) 6,514 368,823Aytu BioPharma, Inc. (A) 5,906 44,886BioDelivery Sciences International,
Inc. (A) 24,867 97,230Cara Therapeutics, Inc. (A) 9,941 215,819Cassava Sciences, Inc. (A) 7,621 342,564Collegium Pharmaceutical, Inc. (A) 8,220 194,814Corcept Therapeutics, Inc. (A) 22,754 541,318
Small Cap Index Trust (continued)Shares orPrincipalAmount Value
COMMON STOCKS (continued)Pharmaceuticals (continued)CorMedix, Inc. (A) 8,088 $ 80,799Cymabay Therapeutics, Inc. (A) 17,503 79,464Durect Corp. (A) 56,144 111,165
Small Cap Index Trust (continued)Shares orPrincipalAmount Value
COMMON STOCKS (continued)Air freight and logistics (continued)Forward Air Corp. 6,388 $ 567,318Hub Group, Inc., Class A (A) 7,658 515,230
Radiant Logistics, Inc. (A) 10,985 76,346
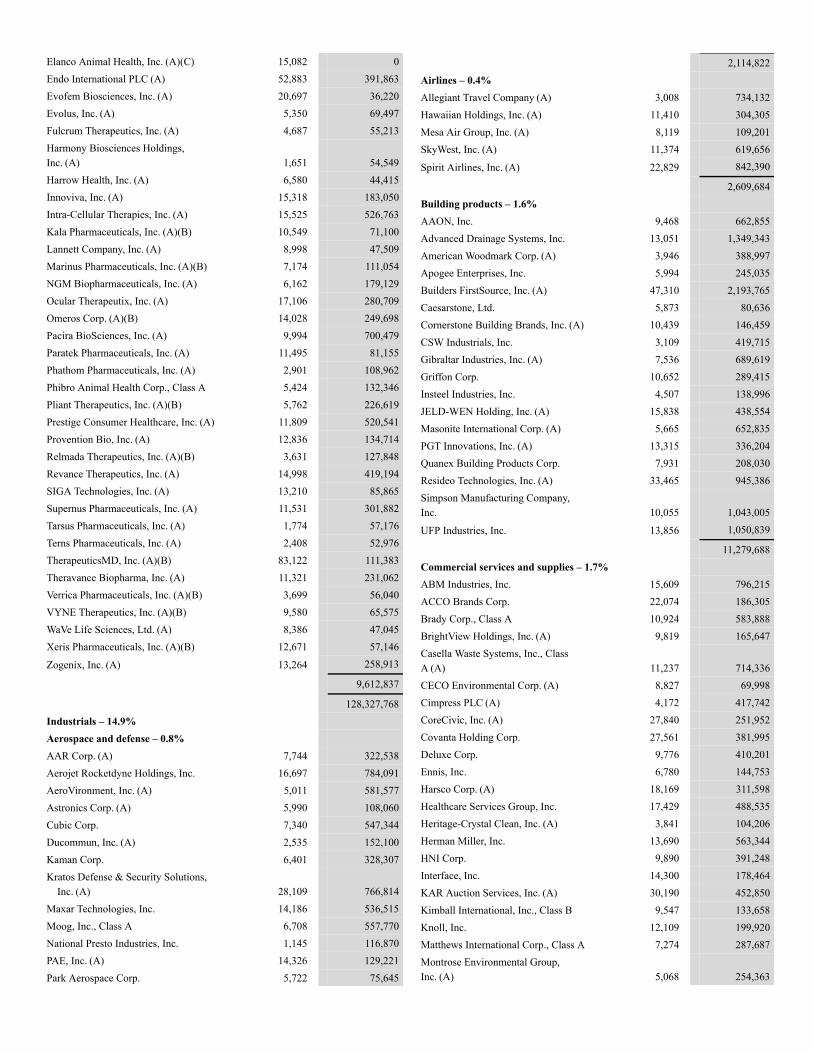
Elanco Animal Health, Inc. (A)(C) 15,082 0Endo International PLC (A) 52,883 391,863Evofem Biosciences, Inc. (A) 20,697 36,220Evolus, Inc. (A) 5,350 69,497Fulcrum Therapeutics, Inc. (A) 4,687 55,213Harmony Biosciences Holdings,Inc. (A) 1,651 54,549Harrow Health, Inc. (A) 6,580 44,415Innoviva, Inc. (A) 15,318 183,050Intra-Cellular Therapies, Inc. (A) 15,525 526,763Kala Pharmaceuticals, Inc. (A)(B) 10,549 71,100Lannett Company, Inc. (A) 8,998 47,509Marinus Pharmaceuticals, Inc. (A)(B) 7,174 111,054NGM Biopharmaceuticals, Inc. (A) 6,162 179,129Ocular Therapeutix, Inc. (A) 17,106 280,709Omeros Corp. (A)(B) 14,028 249,698Pacira BioSciences, Inc. (A) 9,994 700,479Paratek Pharmaceuticals, Inc. (A) 11,495 81,155Phathom Pharmaceuticals, Inc. (A) 2,901 108,962Phibro Animal Health Corp., Class A 5,424 132,346Pliant Therapeutics, Inc. (A)(B) 5,762 226,619Prestige Consumer Healthcare, Inc. (A) 11,809 520,541Provention Bio, Inc. (A) 12,836 134,714Relmada Therapeutics, Inc. (A)(B) 3,631 127,848Revance Therapeutics, Inc. (A) 14,998 419,194SIGA Technologies, Inc. (A) 13,210 85,865Supernus Pharmaceuticals, Inc. (A) 11,531 301,882Tarsus Pharmaceuticals, Inc. (A) 1,774 57,176Terns Pharmaceuticals, Inc. (A) 2,408 52,976TherapeuticsMD, Inc. (A)(B) 83,122 111,383Theravance Biopharma, Inc. (A) 11,321 231,062Verrica Pharmaceuticals, Inc. (A)(B) 3,699 56,040VYNE Therapeutics, Inc. (A)(B) 9,580 65,575WaVe Life Sciences, Ltd. (A) 8,386 47,045Xeris Pharmaceuticals, Inc. (A)(B) 12,671 57,146
Zogenix, Inc. (A) 13,264 258,913
9,612,837
128,327,768Industrials – 14.9%Aerospace and defense – 0.8%AAR Corp. (A) 7,744 322,538Aerojet Rocketdyne Holdings, Inc. 16,697 784,091AeroVironment, Inc. (A) 5,011 581,577Astronics Corp. (A) 5,990 108,060Cubic Corp. 7,340 547,344Ducommun, Inc. (A) 2,535 152,100Kaman Corp. 6,401 328,307Kratos Defense & Security Solutions,
Inc. (A) 28,109 766,814Maxar Technologies, Inc. 14,186 536,515Moog, Inc., Class A 6,708 557,770National Presto Industries, Inc. 1,145 116,870PAE, Inc. (A) 14,326 129,221Park Aerospace Corp. 5,722 75,645
2,114,822Airlines – 0.4%Allegiant Travel Company (A) 3,008 734,132Hawaiian Holdings, Inc. (A) 11,410 304,305Mesa Air Group, Inc. (A) 8,119 109,201SkyWest, Inc. (A) 11,374 619,656
Spirit Airlines, Inc. (A) 22,829 842,390
2,609,684Building products – 1.6%AAON, Inc. 9,468 662,855Advanced Drainage Systems, Inc. 13,051 1,349,343American Woodmark Corp. (A) 3,946 388,997Apogee Enterprises, Inc. 5,994 245,035Builders FirstSource, Inc. (A) 47,310 2,193,765Caesarstone, Ltd. 5,873 80,636Cornerstone Building Brands, Inc. (A) 10,439 146,459CSW Industrials, Inc. 3,109 419,715Gibraltar Industries, Inc. (A) 7,536 689,619Griffon Corp. 10,652 289,415Insteel Industries, Inc. 4,507 138,996JELD-WEN Holding, Inc. (A) 15,838 438,554Masonite International Corp. (A) 5,665 652,835PGT Innovations, Inc. (A) 13,315 336,204Quanex Building Products Corp. 7,931 208,030Resideo Technologies, Inc. (A) 33,465 945,386Simpson Manufacturing Company,Inc. 10,055 1,043,005
UFP Industries, Inc. 13,856 1,050,839
11,279,688Commercial services and supplies – 1.7%ABM Industries, Inc. 15,609 796,215ACCO Brands Corp. 22,074 186,305Brady Corp., Class A 10,924 583,888BrightView Holdings, Inc. (A) 9,819 165,647Casella Waste Systems, Inc., ClassA (A) 11,237 714,336CECO Environmental Corp. (A) 8,827 69,998Cimpress PLC (A) 4,172 417,742CoreCivic, Inc. (A) 27,840 251,952Covanta Holding Corp. 27,561 381,995Deluxe Corp. 9,776 410,201Ennis, Inc. 6,780 144,753Harsco Corp. (A) 18,169 311,598Healthcare Services Group, Inc. 17,429 488,535Heritage-Crystal Clean, Inc. (A) 3,841 104,206Herman Miller, Inc. 13,690 563,344HNI Corp. 9,890 391,248Interface, Inc. 14,300 178,464KAR Auction Services, Inc. (A) 30,190 452,850Kimball International, Inc., Class B 9,547 133,658Knoll, Inc. 12,109 199,920Matthews International Corp., Class A 7,274 287,687Montrose Environmental Group,Inc. (A) 5,068 254,363
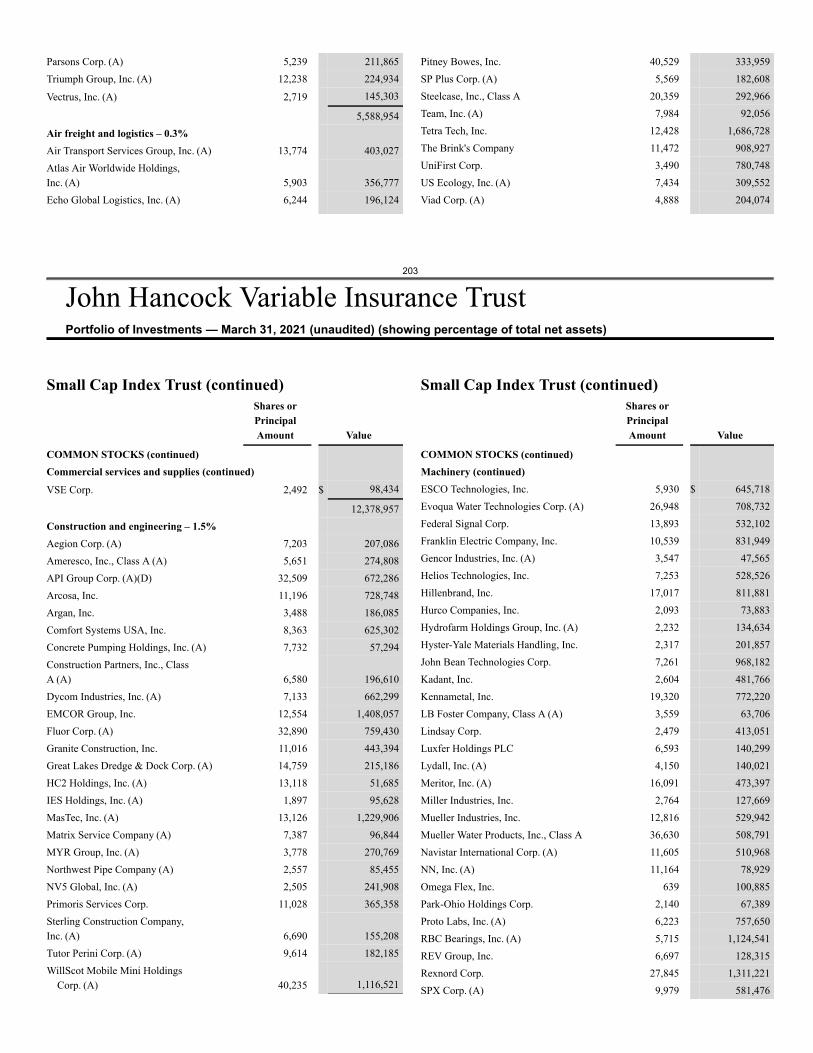
203
John Hancock Variable Insurance TrustPortfolio of Investments — March 31, 2021 (unaudited) (showing percentage of total net assets)
Parsons Corp. (A) 5,239 211,865Triumph Group, Inc. (A) 12,238 224,934
Vectrus, Inc. (A) 2,719 145,303
5,588,954Air freight and logistics – 0.3%Air Transport Services Group, Inc. (A) 13,774 403,027Atlas Air Worldwide Holdings,Inc. (A) 5,903 356,777Echo Global Logistics, Inc. (A) 6,244 196,124
Pitney Bowes, Inc. 40,529 333,959SP Plus Corp. (A) 5,569 182,608Steelcase, Inc., Class A 20,359 292,966Team, Inc. (A) 7,984 92,056Tetra Tech, Inc. 12,428 1,686,728The Brink's Company 11,472 908,927UniFirst Corp. 3,490 780,748US Ecology, Inc. (A) 7,434 309,552Viad Corp. (A) 4,888 204,074
Small Cap Index Trust (continued)Shares orPrincipalAmount Value
COMMON STOCKS (continued)Commercial services and supplies (continued)VSE Corp. 2,492 $ 98,434
12,378,957Construction and engineering – 1.5%Aegion Corp. (A) 7,203 207,086Ameresco, Inc., Class A (A) 5,651 274,808API Group Corp. (A)(D) 32,509 672,286Arcosa, Inc. 11,196 728,748Argan, Inc. 3,488 186,085Comfort Systems USA, Inc. 8,363 625,302Concrete Pumping Holdings, Inc. (A) 7,732 57,294Construction Partners, Inc., ClassA (A) 6,580 196,610Dycom Industries, Inc. (A) 7,133 662,299EMCOR Group, Inc. 12,554 1,408,057Fluor Corp. (A) 32,890 759,430Granite Construction, Inc. 11,016 443,394Great Lakes Dredge & Dock Corp. (A) 14,759 215,186HC2 Holdings, Inc. (A) 13,118 51,685IES Holdings, Inc. (A) 1,897 95,628MasTec, Inc. (A) 13,126 1,229,906Matrix Service Company (A) 7,387 96,844MYR Group, Inc. (A) 3,778 270,769Northwest Pipe Company (A) 2,557 85,455NV5 Global, Inc. (A) 2,505 241,908Primoris Services Corp. 11,028 365,358Sterling Construction Company,Inc. (A) 6,690 155,208Tutor Perini Corp. (A) 9,614 182,185WillScot Mobile Mini Holdings
Corp. (A) 40,235 1,116,521
Small Cap Index Trust (continued)Shares orPrincipalAmount Value
COMMON STOCKS (continued)Machinery (continued)ESCO Technologies, Inc. 5,930 $ 645,718Evoqua Water Technologies Corp. (A) 26,948 708,732Federal Signal Corp. 13,893 532,102Franklin Electric Company, Inc. 10,539 831,949Gencor Industries, Inc. (A) 3,547 47,565Helios Technologies, Inc. 7,253 528,526Hillenbrand, Inc. 17,017 811,881Hurco Companies, Inc. 2,093 73,883Hydrofarm Holdings Group, Inc. (A) 2,232 134,634Hyster-Yale Materials Handling, Inc. 2,317 201,857John Bean Technologies Corp. 7,261 968,182Kadant, Inc. 2,604 481,766Kennametal, Inc. 19,320 772,220LB Foster Company, Class A (A) 3,559 63,706Lindsay Corp. 2,479 413,051Luxfer Holdings PLC 6,593 140,299Lydall, Inc. (A) 4,150 140,021Meritor, Inc. (A) 16,091 473,397Miller Industries, Inc. 2,764 127,669Mueller Industries, Inc. 12,816 529,942Mueller Water Products, Inc., Class A 36,630 508,791Navistar International Corp. (A) 11,605 510,968NN, Inc. (A) 11,164 78,929Omega Flex, Inc. 639 100,885Park-Ohio Holdings Corp. 2,140 67,389Proto Labs, Inc. (A) 6,223 757,650RBC Bearings, Inc. (A) 5,715 1,124,541REV Group, Inc. 6,697 128,315Rexnord Corp. 27,845 1,311,221SPX Corp. (A) 9,979 581,476
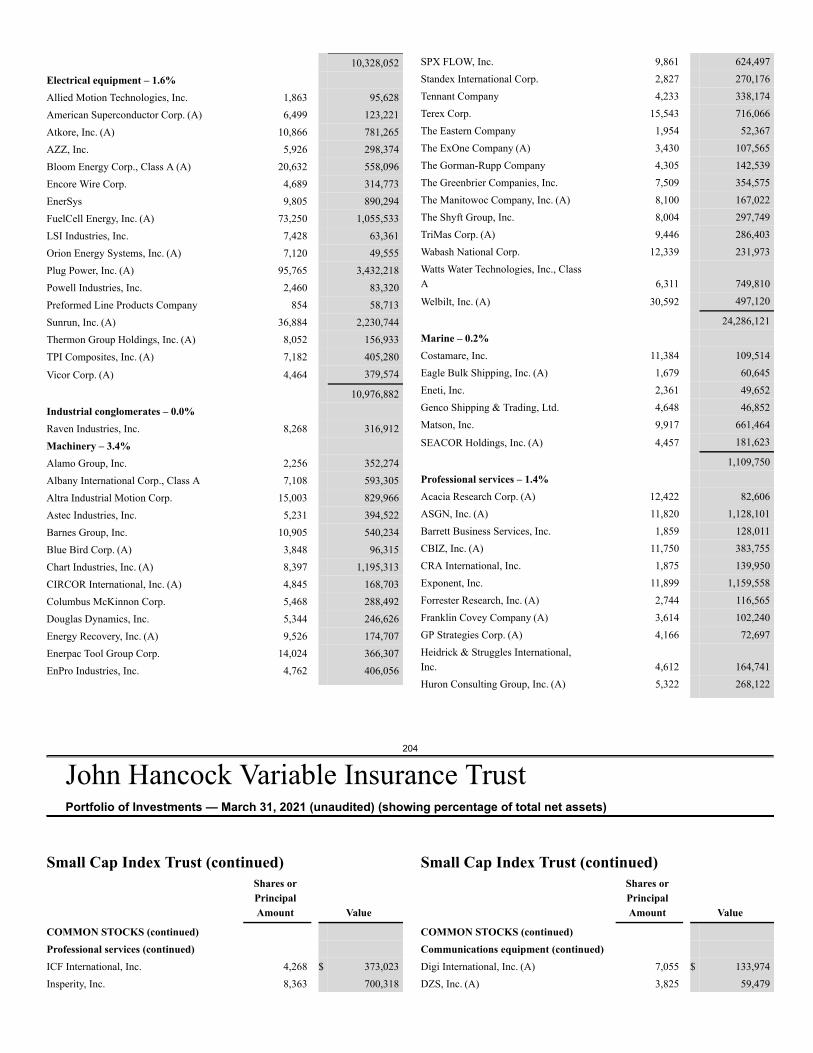
204
John Hancock Variable Insurance TrustPortfolio of Investments — March 31, 2021 (unaudited) (showing percentage of total net assets)
10,328,052Electrical equipment – 1.6%Allied Motion Technologies, Inc. 1,863 95,628American Superconductor Corp. (A) 6,499 123,221Atkore, Inc. (A) 10,866 781,265AZZ, Inc. 5,926 298,374Bloom Energy Corp., Class A (A) 20,632 558,096Encore Wire Corp. 4,689 314,773EnerSys 9,805 890,294FuelCell Energy, Inc. (A) 73,250 1,055,533LSI Industries, Inc. 7,428 63,361Orion Energy Systems, Inc. (A) 7,120 49,555Plug Power, Inc. (A) 95,765 3,432,218Powell Industries, Inc. 2,460 83,320Preformed Line Products Company 854 58,713Sunrun, Inc. (A) 36,884 2,230,744Thermon Group Holdings, Inc. (A) 8,052 156,933TPI Composites, Inc. (A) 7,182 405,280
Vicor Corp. (A) 4,464 379,574
10,976,882Industrial conglomerates – 0.0%Raven Industries, Inc. 8,268 316,912Machinery – 3.4%Alamo Group, Inc. 2,256 352,274Albany International Corp., Class A 7,108 593,305Altra Industrial Motion Corp. 15,003 829,966Astec Industries, Inc. 5,231 394,522Barnes Group, Inc. 10,905 540,234Blue Bird Corp. (A) 3,848 96,315Chart Industries, Inc. (A) 8,397 1,195,313CIRCOR International, Inc. (A) 4,845 168,703Columbus McKinnon Corp. 5,468 288,492Douglas Dynamics, Inc. 5,344 246,626Energy Recovery, Inc. (A) 9,526 174,707Enerpac Tool Group Corp. 14,024 366,307EnPro Industries, Inc. 4,762 406,056
SPX FLOW, Inc. 9,861 624,497Standex International Corp. 2,827 270,176Tennant Company 4,233 338,174Terex Corp. 15,543 716,066The Eastern Company 1,954 52,367The ExOne Company (A) 3,430 107,565The Gorman-Rupp Company 4,305 142,539The Greenbrier Companies, Inc. 7,509 354,575The Manitowoc Company, Inc. (A) 8,100 167,022The Shyft Group, Inc. 8,004 297,749TriMas Corp. (A) 9,446 286,403Wabash National Corp. 12,339 231,973Watts Water Technologies, Inc., ClassA 6,311 749,810
Welbilt, Inc. (A) 30,592 497,120
24,286,121Marine – 0.2%Costamare, Inc. 11,384 109,514Eagle Bulk Shipping, Inc. (A) 1,679 60,645Eneti, Inc. 2,361 49,652Genco Shipping & Trading, Ltd. 4,648 46,852Matson, Inc. 9,917 661,464
SEACOR Holdings, Inc. (A) 4,457 181,623
1,109,750Professional services – 1.4%Acacia Research Corp. (A) 12,422 82,606ASGN, Inc. (A) 11,820 1,128,101Barrett Business Services, Inc. 1,859 128,011CBIZ, Inc. (A) 11,750 383,755CRA International, Inc. 1,875 139,950Exponent, Inc. 11,899 1,159,558Forrester Research, Inc. (A) 2,744 116,565Franklin Covey Company (A) 3,614 102,240GP Strategies Corp. (A) 4,166 72,697Heidrick & Struggles International,Inc. 4,612 164,741Huron Consulting Group, Inc. (A) 5,322 268,122
Small Cap Index Trust (continued)Shares orPrincipalAmount Value
COMMON STOCKS (continued)Professional services (continued)ICF International, Inc. 4,268 $ 373,023Insperity, Inc. 8,363 700,318
Small Cap Index Trust (continued)Shares orPrincipalAmount Value
COMMON STOCKS (continued)Communications equipment (continued)Digi International, Inc. (A) 7,055 $ 133,974DZS, Inc. (A) 3,825 59,479
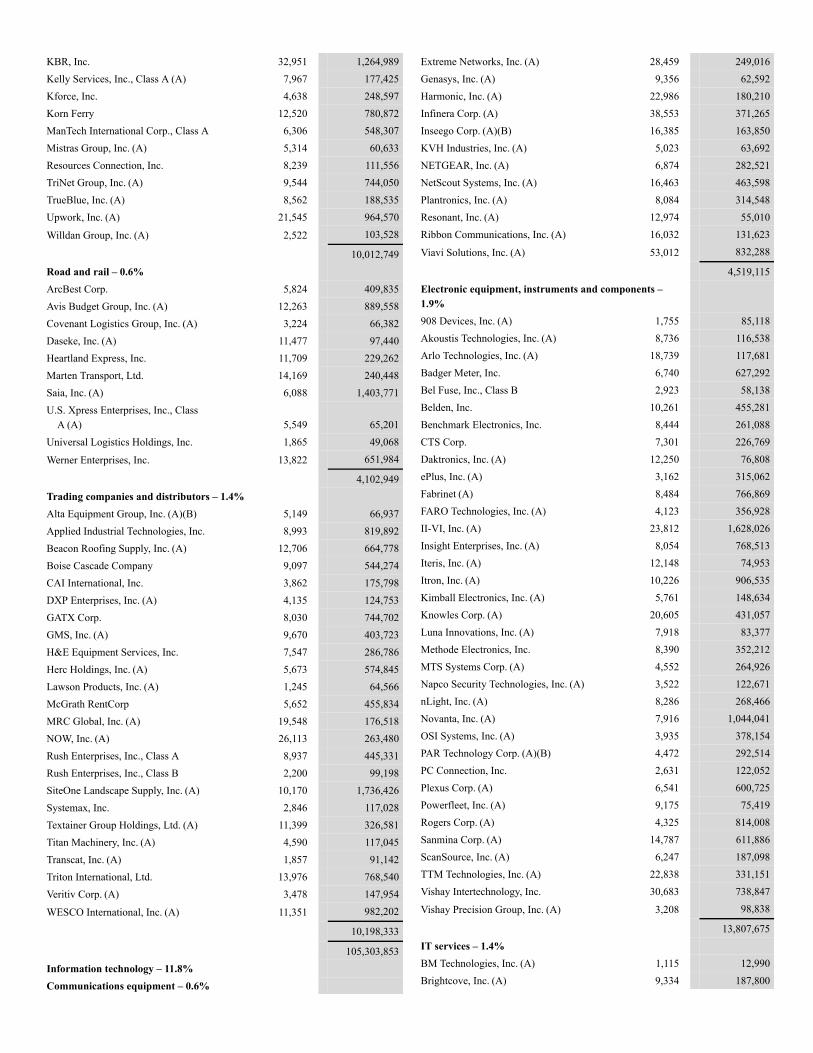
KBR, Inc. 32,951 1,264,989Kelly Services, Inc., Class A (A) 7,967 177,425Kforce, Inc. 4,638 248,597Korn Ferry 12,520 780,872ManTech International Corp., Class A 6,306 548,307Mistras Group, Inc. (A) 5,314 60,633Resources Connection, Inc. 8,239 111,556TriNet Group, Inc. (A) 9,544 744,050TrueBlue, Inc. (A) 8,562 188,535Upwork, Inc. (A) 21,545 964,570
Willdan Group, Inc. (A) 2,522 103,528
10,012,749Road and rail – 0.6%ArcBest Corp. 5,824 409,835Avis Budget Group, Inc. (A) 12,263 889,558Covenant Logistics Group, Inc. (A) 3,224 66,382Daseke, Inc. (A) 11,477 97,440Heartland Express, Inc. 11,709 229,262Marten Transport, Ltd. 14,169 240,448Saia, Inc. (A) 6,088 1,403,771U.S. Xpress Enterprises, Inc., Class
A (A) 5,549 65,201Universal Logistics Holdings, Inc. 1,865 49,068
Werner Enterprises, Inc. 13,822 651,984
4,102,949Trading companies and distributors – 1.4%Alta Equipment Group, Inc. (A)(B) 5,149 66,937Applied Industrial Technologies, Inc. 8,993 819,892Beacon Roofing Supply, Inc. (A) 12,706 664,778Boise Cascade Company 9,097 544,274CAI International, Inc. 3,862 175,798DXP Enterprises, Inc. (A) 4,135 124,753GATX Corp. 8,030 744,702GMS, Inc. (A) 9,670 403,723H&E Equipment Services, Inc. 7,547 286,786Herc Holdings, Inc. (A) 5,673 574,845Lawson Products, Inc. (A) 1,245 64,566McGrath RentCorp 5,652 455,834MRC Global, Inc. (A) 19,548 176,518NOW, Inc. (A) 26,113 263,480Rush Enterprises, Inc., Class A 8,937 445,331Rush Enterprises, Inc., Class B 2,200 99,198SiteOne Landscape Supply, Inc. (A) 10,170 1,736,426Systemax, Inc. 2,846 117,028Textainer Group Holdings, Ltd. (A) 11,399 326,581Titan Machinery, Inc. (A) 4,590 117,045Transcat, Inc. (A) 1,857 91,142Triton International, Ltd. 13,976 768,540Veritiv Corp. (A) 3,478 147,954
WESCO International, Inc. (A) 11,351 982,202
10,198,333
105,303,853Information technology – 11.8%Communications equipment – 0.6%
Extreme Networks, Inc. (A) 28,459 249,016Genasys, Inc. (A) 9,356 62,592Harmonic, Inc. (A) 22,986 180,210Infinera Corp. (A) 38,553 371,265Inseego Corp. (A)(B) 16,385 163,850KVH Industries, Inc. (A) 5,023 63,692NETGEAR, Inc. (A) 6,874 282,521NetScout Systems, Inc. (A) 16,463 463,598Plantronics, Inc. (A) 8,084 314,548Resonant, Inc. (A) 12,974 55,010Ribbon Communications, Inc. (A) 16,032 131,623
Viavi Solutions, Inc. (A) 53,012 832,288
4,519,115Electronic equipment, instruments and components –1.9%908 Devices, Inc. (A) 1,755 85,118Akoustis Technologies, Inc. (A) 8,736 116,538Arlo Technologies, Inc. (A) 18,739 117,681Badger Meter, Inc. 6,740 627,292Bel Fuse, Inc., Class B 2,923 58,138Belden, Inc. 10,261 455,281Benchmark Electronics, Inc. 8,444 261,088CTS Corp. 7,301 226,769Daktronics, Inc. (A) 12,250 76,808ePlus, Inc. (A) 3,162 315,062Fabrinet (A) 8,484 766,869FARO Technologies, Inc. (A) 4,123 356,928II-VI, Inc. (A) 23,812 1,628,026Insight Enterprises, Inc. (A) 8,054 768,513Iteris, Inc. (A) 12,148 74,953Itron, Inc. (A) 10,226 906,535Kimball Electronics, Inc. (A) 5,761 148,634Knowles Corp. (A) 20,605 431,057Luna Innovations, Inc. (A) 7,918 83,377Methode Electronics, Inc. 8,390 352,212MTS Systems Corp. (A) 4,552 264,926Napco Security Technologies, Inc. (A) 3,522 122,671nLight, Inc. (A) 8,286 268,466Novanta, Inc. (A) 7,916 1,044,041OSI Systems, Inc. (A) 3,935 378,154PAR Technology Corp. (A)(B) 4,472 292,514PC Connection, Inc. 2,631 122,052Plexus Corp. (A) 6,541 600,725Powerfleet, Inc. (A) 9,175 75,419Rogers Corp. (A) 4,325 814,008Sanmina Corp. (A) 14,787 611,886ScanSource, Inc. (A) 6,247 187,098TTM Technologies, Inc. (A) 22,838 331,151Vishay Intertechnology, Inc. 30,683 738,847
Vishay Precision Group, Inc. (A) 3,208 98,838
13,807,675IT services – 1.4%BM Technologies, Inc. (A) 1,115 12,990Brightcove, Inc. (A) 9,334 187,800
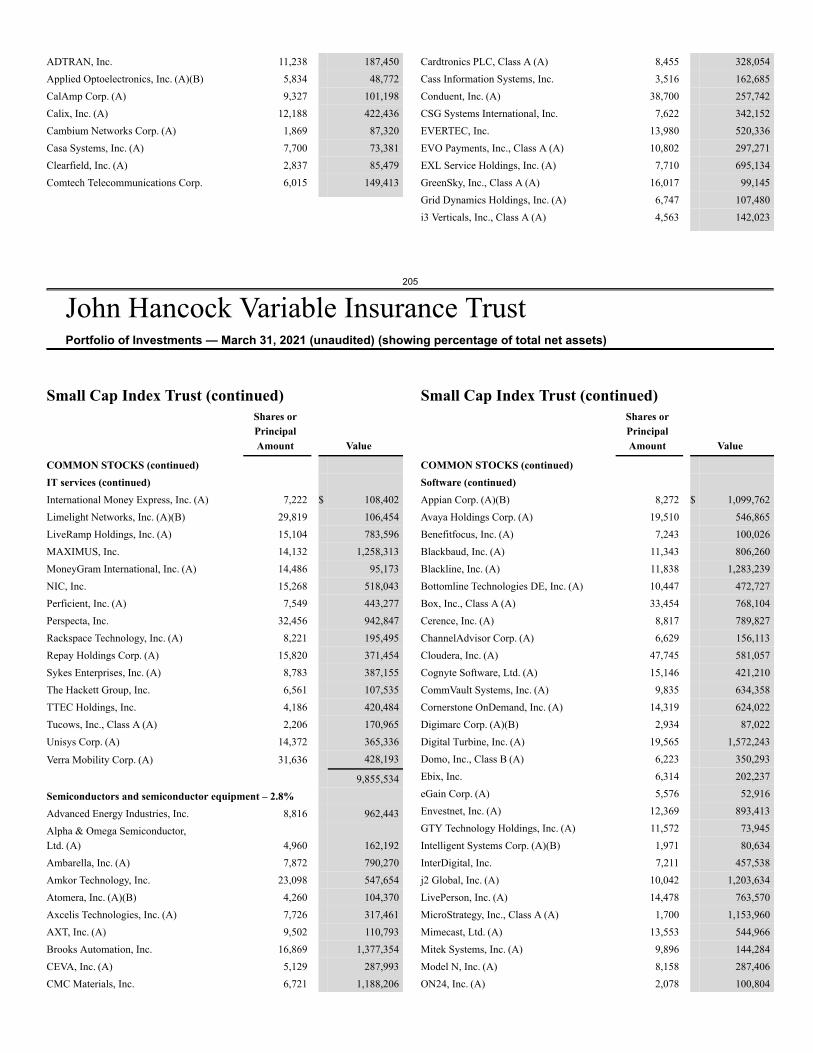
205
John Hancock Variable Insurance TrustPortfolio of Investments — March 31, 2021 (unaudited) (showing percentage of total net assets)
ADTRAN, Inc. 11,238 187,450Applied Optoelectronics, Inc. (A)(B) 5,834 48,772CalAmp Corp. (A) 9,327 101,198Calix, Inc. (A) 12,188 422,436Cambium Networks Corp. (A) 1,869 87,320Casa Systems, Inc. (A) 7,700 73,381Clearfield, Inc. (A) 2,837 85,479Comtech Telecommunications Corp. 6,015 149,413
Cardtronics PLC, Class A (A) 8,455 328,054Cass Information Systems, Inc. 3,516 162,685Conduent, Inc. (A) 38,700 257,742CSG Systems International, Inc. 7,622 342,152EVERTEC, Inc. 13,980 520,336EVO Payments, Inc., Class A (A) 10,802 297,271EXL Service Holdings, Inc. (A) 7,710 695,134GreenSky, Inc., Class A (A) 16,017 99,145Grid Dynamics Holdings, Inc. (A) 6,747 107,480i3 Verticals, Inc., Class A (A) 4,563 142,023
Small Cap Index Trust (continued)Shares orPrincipalAmount Value
COMMON STOCKS (continued)IT services (continued)International Money Express, Inc. (A) 7,222 $ 108,402Limelight Networks, Inc. (A)(B) 29,819 106,454LiveRamp Holdings, Inc. (A) 15,104 783,596MAXIMUS, Inc. 14,132 1,258,313MoneyGram International, Inc. (A) 14,486 95,173NIC, Inc. 15,268 518,043Perficient, Inc. (A) 7,549 443,277Perspecta, Inc. 32,456 942,847Rackspace Technology, Inc. (A) 8,221 195,495Repay Holdings Corp. (A) 15,820 371,454Sykes Enterprises, Inc. (A) 8,783 387,155The Hackett Group, Inc. 6,561 107,535TTEC Holdings, Inc. 4,186 420,484Tucows, Inc., Class A (A) 2,206 170,965Unisys Corp. (A) 14,372 365,336
Verra Mobility Corp. (A) 31,636 428,193
9,855,534Semiconductors and semiconductor equipment – 2.8%Advanced Energy Industries, Inc. 8,816 962,443Alpha & Omega Semiconductor,Ltd. (A) 4,960 162,192Ambarella, Inc. (A) 7,872 790,270Amkor Technology, Inc. 23,098 547,654Atomera, Inc. (A)(B) 4,260 104,370Axcelis Technologies, Inc. (A) 7,726 317,461AXT, Inc. (A) 9,502 110,793Brooks Automation, Inc. 16,869 1,377,354CEVA, Inc. (A) 5,129 287,993CMC Materials, Inc. 6,721 1,188,206
Small Cap Index Trust (continued)Shares orPrincipalAmount Value
COMMON STOCKS (continued)Software (continued)Appian Corp. (A)(B) 8,272 $ 1,099,762Avaya Holdings Corp. (A) 19,510 546,865Benefitfocus, Inc. (A) 7,243 100,026Blackbaud, Inc. (A) 11,343 806,260Blackline, Inc. (A) 11,838 1,283,239Bottomline Technologies DE, Inc. (A) 10,447 472,727Box, Inc., Class A (A) 33,454 768,104Cerence, Inc. (A) 8,817 789,827ChannelAdvisor Corp. (A) 6,629 156,113Cloudera, Inc. (A) 47,745 581,057Cognyte Software, Ltd. (A) 15,146 421,210CommVault Systems, Inc. (A) 9,835 634,358Cornerstone OnDemand, Inc. (A) 14,319 624,022Digimarc Corp. (A)(B) 2,934 87,022Digital Turbine, Inc. (A) 19,565 1,572,243Domo, Inc., Class B (A) 6,223 350,293Ebix, Inc. 6,314 202,237eGain Corp. (A) 5,576 52,916Envestnet, Inc. (A) 12,369 893,413GTY Technology Holdings, Inc. (A) 11,572 73,945Intelligent Systems Corp. (A)(B) 1,971 80,634InterDigital, Inc. 7,211 457,538j2 Global, Inc. (A) 10,042 1,203,634LivePerson, Inc. (A) 14,478 763,570MicroStrategy, Inc., Class A (A) 1,700 1,153,960Mimecast, Ltd. (A) 13,553 544,966Mitek Systems, Inc. (A) 9,896 144,284Model N, Inc. (A) 8,158 287,406ON24, Inc. (A) 2,078 100,804
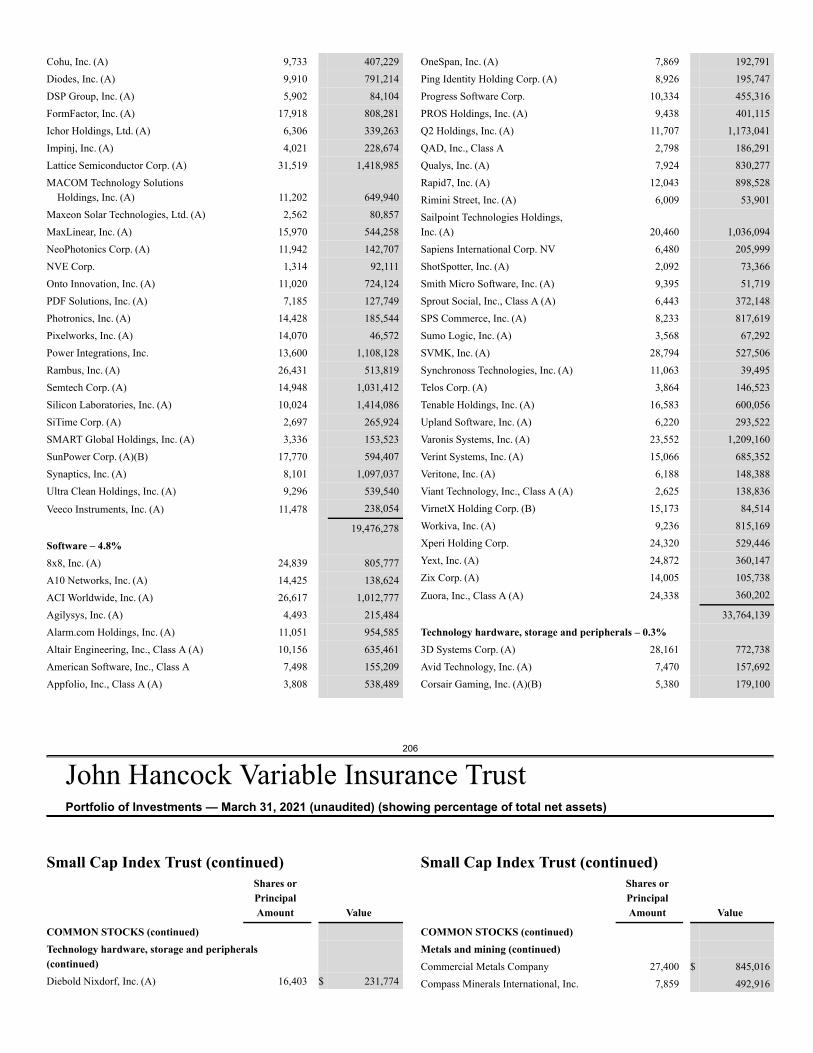
206
John Hancock Variable Insurance TrustPortfolio of Investments — March 31, 2021 (unaudited) (showing percentage of total net assets)
Cohu, Inc. (A) 9,733 407,229Diodes, Inc. (A) 9,910 791,214DSP Group, Inc. (A) 5,902 84,104FormFactor, Inc. (A) 17,918 808,281Ichor Holdings, Ltd. (A) 6,306 339,263Impinj, Inc. (A) 4,021 228,674Lattice Semiconductor Corp. (A) 31,519 1,418,985MACOM Technology Solutions
Holdings, Inc. (A) 11,202 649,940Maxeon Solar Technologies, Ltd. (A) 2,562 80,857MaxLinear, Inc. (A) 15,970 544,258NeoPhotonics Corp. (A) 11,942 142,707NVE Corp. 1,314 92,111Onto Innovation, Inc. (A) 11,020 724,124PDF Solutions, Inc. (A) 7,185 127,749Photronics, Inc. (A) 14,428 185,544Pixelworks, Inc. (A) 14,070 46,572Power Integrations, Inc. 13,600 1,108,128Rambus, Inc. (A) 26,431 513,819Semtech Corp. (A) 14,948 1,031,412Silicon Laboratories, Inc. (A) 10,024 1,414,086SiTime Corp. (A) 2,697 265,924SMART Global Holdings, Inc. (A) 3,336 153,523SunPower Corp. (A)(B) 17,770 594,407Synaptics, Inc. (A) 8,101 1,097,037Ultra Clean Holdings, Inc. (A) 9,296 539,540
Veeco Instruments, Inc. (A) 11,478 238,054
19,476,278Software – 4.8%8x8, Inc. (A) 24,839 805,777A10 Networks, Inc. (A) 14,425 138,624ACI Worldwide, Inc. (A) 26,617 1,012,777Agilysys, Inc. (A) 4,493 215,484Alarm.com Holdings, Inc. (A) 11,051 954,585Altair Engineering, Inc., Class A (A) 10,156 635,461American Software, Inc., Class A 7,498 155,209Appfolio, Inc., Class A (A) 3,808 538,489
OneSpan, Inc. (A) 7,869 192,791Ping Identity Holding Corp. (A) 8,926 195,747Progress Software Corp. 10,334 455,316PROS Holdings, Inc. (A) 9,438 401,115Q2 Holdings, Inc. (A) 11,707 1,173,041QAD, Inc., Class A 2,798 186,291Qualys, Inc. (A) 7,924 830,277Rapid7, Inc. (A) 12,043 898,528Rimini Street, Inc. (A) 6,009 53,901Sailpoint Technologies Holdings,Inc. (A) 20,460 1,036,094Sapiens International Corp. NV 6,480 205,999ShotSpotter, Inc. (A) 2,092 73,366Smith Micro Software, Inc. (A) 9,395 51,719Sprout Social, Inc., Class A (A) 6,443 372,148SPS Commerce, Inc. (A) 8,233 817,619Sumo Logic, Inc. (A) 3,568 67,292SVMK, Inc. (A) 28,794 527,506Synchronoss Technologies, Inc. (A) 11,063 39,495Telos Corp. (A) 3,864 146,523Tenable Holdings, Inc. (A) 16,583 600,056Upland Software, Inc. (A) 6,220 293,522Varonis Systems, Inc. (A) 23,552 1,209,160Verint Systems, Inc. (A) 15,066 685,352Veritone, Inc. (A) 6,188 148,388Viant Technology, Inc., Class A (A) 2,625 138,836VirnetX Holding Corp. (B) 15,173 84,514Workiva, Inc. (A) 9,236 815,169Xperi Holding Corp. 24,320 529,446Yext, Inc. (A) 24,872 360,147Zix Corp. (A) 14,005 105,738
Zuora, Inc., Class A (A) 24,338 360,202
33,764,139Technology hardware, storage and peripherals – 0.3%3D Systems Corp. (A) 28,161 772,738Avid Technology, Inc. (A) 7,470 157,692Corsair Gaming, Inc. (A)(B) 5,380 179,100
Small Cap Index Trust (continued)Shares orPrincipalAmount Value
COMMON STOCKS (continued)Technology hardware, storage and peripherals(continued)Diebold Nixdorf, Inc. (A) 16,403 $ 231,774
Small Cap Index Trust (continued)Shares orPrincipalAmount Value
COMMON STOCKS (continued)Metals and mining (continued)Commercial Metals Company 27,400 $ 845,016Compass Minerals International, Inc. 7,859 492,916
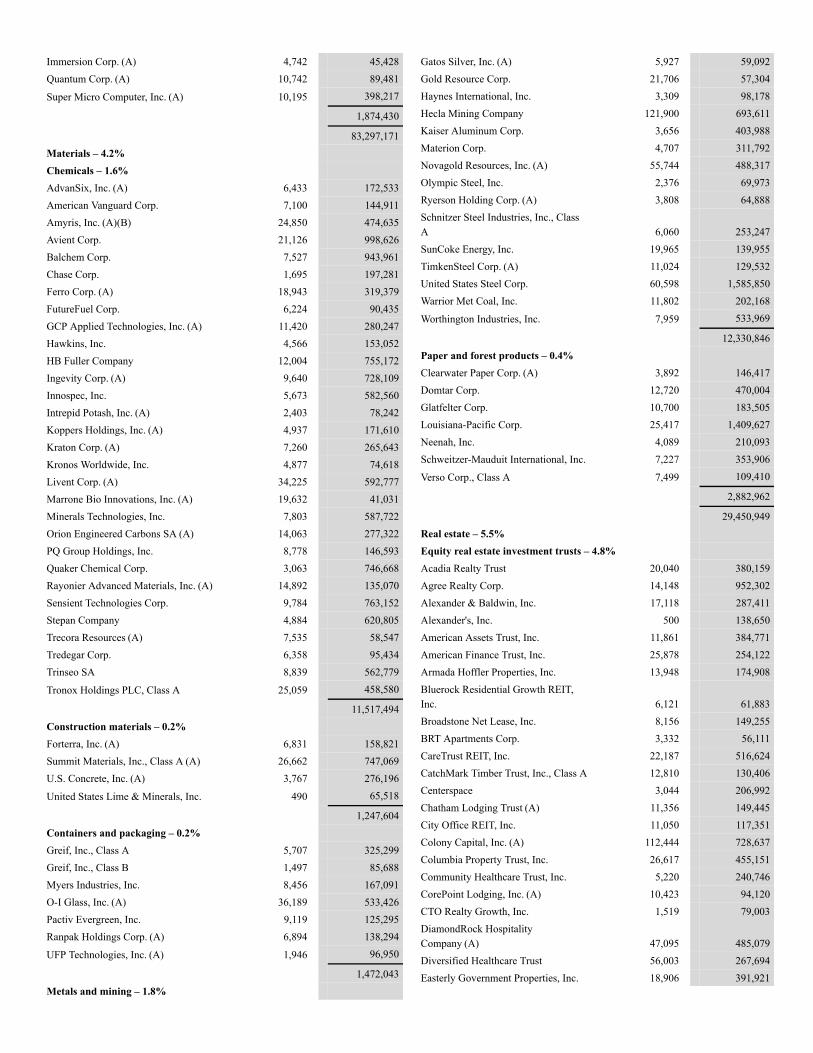
Immersion Corp. (A) 4,742 45,428Quantum Corp. (A) 10,742 89,481
Super Micro Computer, Inc. (A) 10,195 398,217
1,874,430
83,297,171Materials – 4.2%Chemicals – 1.6%AdvanSix, Inc. (A) 6,433 172,533American Vanguard Corp. 7,100 144,911Amyris, Inc. (A)(B) 24,850 474,635Avient Corp. 21,126 998,626Balchem Corp. 7,527 943,961Chase Corp. 1,695 197,281Ferro Corp. (A) 18,943 319,379FutureFuel Corp. 6,224 90,435GCP Applied Technologies, Inc. (A) 11,420 280,247Hawkins, Inc. 4,566 153,052HB Fuller Company 12,004 755,172Ingevity Corp. (A) 9,640 728,109Innospec, Inc. 5,673 582,560Intrepid Potash, Inc. (A) 2,403 78,242Koppers Holdings, Inc. (A) 4,937 171,610Kraton Corp. (A) 7,260 265,643Kronos Worldwide, Inc. 4,877 74,618Livent Corp. (A) 34,225 592,777Marrone Bio Innovations, Inc. (A) 19,632 41,031Minerals Technologies, Inc. 7,803 587,722Orion Engineered Carbons SA (A) 14,063 277,322PQ Group Holdings, Inc. 8,778 146,593Quaker Chemical Corp. 3,063 746,668Rayonier Advanced Materials, Inc. (A) 14,892 135,070Sensient Technologies Corp. 9,784 763,152Stepan Company 4,884 620,805Trecora Resources (A) 7,535 58,547Tredegar Corp. 6,358 95,434Trinseo SA 8,839 562,779
Tronox Holdings PLC, Class A 25,059 458,580
11,517,494Construction materials – 0.2%Forterra, Inc. (A) 6,831 158,821Summit Materials, Inc., Class A (A) 26,662 747,069U.S. Concrete, Inc. (A) 3,767 276,196
United States Lime & Minerals, Inc. 490 65,518
1,247,604Containers and packaging – 0.2%Greif, Inc., Class A 5,707 325,299Greif, Inc., Class B 1,497 85,688Myers Industries, Inc. 8,456 167,091O-I Glass, Inc. (A) 36,189 533,426Pactiv Evergreen, Inc. 9,119 125,295Ranpak Holdings Corp. (A) 6,894 138,294
UFP Technologies, Inc. (A) 1,946 96,950
1,472,043Metals and mining – 1.8%
Gatos Silver, Inc. (A) 5,927 59,092Gold Resource Corp. 21,706 57,304Haynes International, Inc. 3,309 98,178Hecla Mining Company 121,900 693,611Kaiser Aluminum Corp. 3,656 403,988Materion Corp. 4,707 311,792Novagold Resources, Inc. (A) 55,744 488,317Olympic Steel, Inc. 2,376 69,973Ryerson Holding Corp. (A) 3,808 64,888Schnitzer Steel Industries, Inc., ClassA 6,060 253,247SunCoke Energy, Inc. 19,965 139,955TimkenSteel Corp. (A) 11,024 129,532United States Steel Corp. 60,598 1,585,850Warrior Met Coal, Inc. 11,802 202,168
Worthington Industries, Inc. 7,959 533,969
12,330,846Paper and forest products – 0.4%Clearwater Paper Corp. (A) 3,892 146,417Domtar Corp. 12,720 470,004Glatfelter Corp. 10,700 183,505Louisiana-Pacific Corp. 25,417 1,409,627Neenah, Inc. 4,089 210,093Schweitzer-Mauduit International, Inc. 7,227 353,906
Verso Corp., Class A 7,499 109,410
2,882,962
29,450,949Real estate – 5.5%Equity real estate investment trusts – 4.8%Acadia Realty Trust 20,040 380,159Agree Realty Corp. 14,148 952,302Alexander & Baldwin, Inc. 17,118 287,411Alexander's, Inc. 500 138,650American Assets Trust, Inc. 11,861 384,771American Finance Trust, Inc. 25,878 254,122Armada Hoffler Properties, Inc. 13,948 174,908Bluerock Residential Growth REIT,Inc. 6,121 61,883Broadstone Net Lease, Inc. 8,156 149,255BRT Apartments Corp. 3,332 56,111CareTrust REIT, Inc. 22,187 516,624CatchMark Timber Trust, Inc., Class A 12,810 130,406Centerspace 3,044 206,992Chatham Lodging Trust (A) 11,356 149,445City Office REIT, Inc. 11,050 117,351Colony Capital, Inc. (A) 112,444 728,637Columbia Property Trust, Inc. 26,617 455,151Community Healthcare Trust, Inc. 5,220 240,746CorePoint Lodging, Inc. (A) 10,423 94,120CTO Realty Growth, Inc. 1,519 79,003DiamondRock HospitalityCompany (A) 47,095 485,079Diversified Healthcare Trust 56,003 267,694Easterly Government Properties, Inc. 18,906 391,921
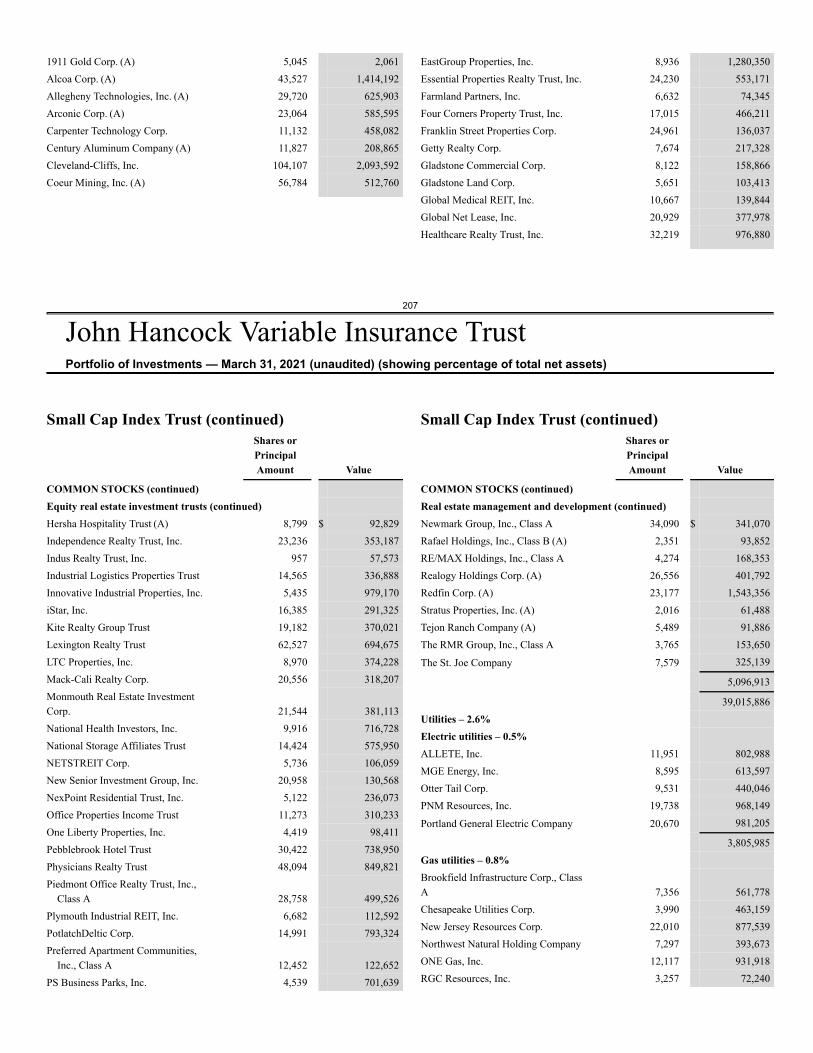
207
John Hancock Variable Insurance TrustPortfolio of Investments — March 31, 2021 (unaudited) (showing percentage of total net assets)
1911 Gold Corp. (A) 5,045 2,061Alcoa Corp. (A) 43,527 1,414,192Allegheny Technologies, Inc. (A) 29,720 625,903Arconic Corp. (A) 23,064 585,595Carpenter Technology Corp. 11,132 458,082Century Aluminum Company (A) 11,827 208,865Cleveland-Cliffs, Inc. 104,107 2,093,592Coeur Mining, Inc. (A) 56,784 512,760
EastGroup Properties, Inc. 8,936 1,280,350Essential Properties Realty Trust, Inc. 24,230 553,171Farmland Partners, Inc. 6,632 74,345Four Corners Property Trust, Inc. 17,015 466,211Franklin Street Properties Corp. 24,961 136,037Getty Realty Corp. 7,674 217,328Gladstone Commercial Corp. 8,122 158,866Gladstone Land Corp. 5,651 103,413Global Medical REIT, Inc. 10,667 139,844Global Net Lease, Inc. 20,929 377,978Healthcare Realty Trust, Inc. 32,219 976,880
Small Cap Index Trust (continued)Shares orPrincipalAmount Value
COMMON STOCKS (continued)Equity real estate investment trusts (continued)Hersha Hospitality Trust (A) 8,799 $ 92,829Independence Realty Trust, Inc. 23,236 353,187Indus Realty Trust, Inc. 957 57,573Industrial Logistics Properties Trust 14,565 336,888Innovative Industrial Properties, Inc. 5,435 979,170iStar, Inc. 16,385 291,325Kite Realty Group Trust 19,182 370,021Lexington Realty Trust 62,527 694,675LTC Properties, Inc. 8,970 374,228Mack-Cali Realty Corp. 20,556 318,207Monmouth Real Estate InvestmentCorp. 21,544 381,113National Health Investors, Inc. 9,916 716,728National Storage Affiliates Trust 14,424 575,950NETSTREIT Corp. 5,736 106,059New Senior Investment Group, Inc. 20,958 130,568NexPoint Residential Trust, Inc. 5,122 236,073Office Properties Income Trust 11,273 310,233One Liberty Properties, Inc. 4,419 98,411Pebblebrook Hotel Trust 30,422 738,950Physicians Realty Trust 48,094 849,821Piedmont Office Realty Trust, Inc.,
Class A 28,758 499,526Plymouth Industrial REIT, Inc. 6,682 112,592PotlatchDeltic Corp. 14,991 793,324Preferred Apartment Communities,
Inc., Class A 12,452 122,652PS Business Parks, Inc. 4,539 701,639
Small Cap Index Trust (continued)Shares orPrincipalAmount Value
COMMON STOCKS (continued)Real estate management and development (continued)Newmark Group, Inc., Class A 34,090 $ 341,070Rafael Holdings, Inc., Class B (A) 2,351 93,852RE/MAX Holdings, Inc., Class A 4,274 168,353Realogy Holdings Corp. (A) 26,556 401,792Redfin Corp. (A) 23,177 1,543,356Stratus Properties, Inc. (A) 2,016 61,488Tejon Ranch Company (A) 5,489 91,886The RMR Group, Inc., Class A 3,765 153,650
The St. Joe Company 7,579 325,139
5,096,913
39,015,886Utilities – 2.6%Electric utilities – 0.5%ALLETE, Inc. 11,951 802,988MGE Energy, Inc. 8,595 613,597Otter Tail Corp. 9,531 440,046PNM Resources, Inc. 19,738 968,149
Portland General Electric Company 20,670 981,205
3,805,985Gas utilities – 0.8%Brookfield Infrastructure Corp., ClassA 7,356 561,778Chesapeake Utilities Corp. 3,990 463,159New Jersey Resources Corp. 22,010 877,539Northwest Natural Holding Company 7,297 393,673ONE Gas, Inc. 12,117 931,918RGC Resources, Inc. 3,257 72,240
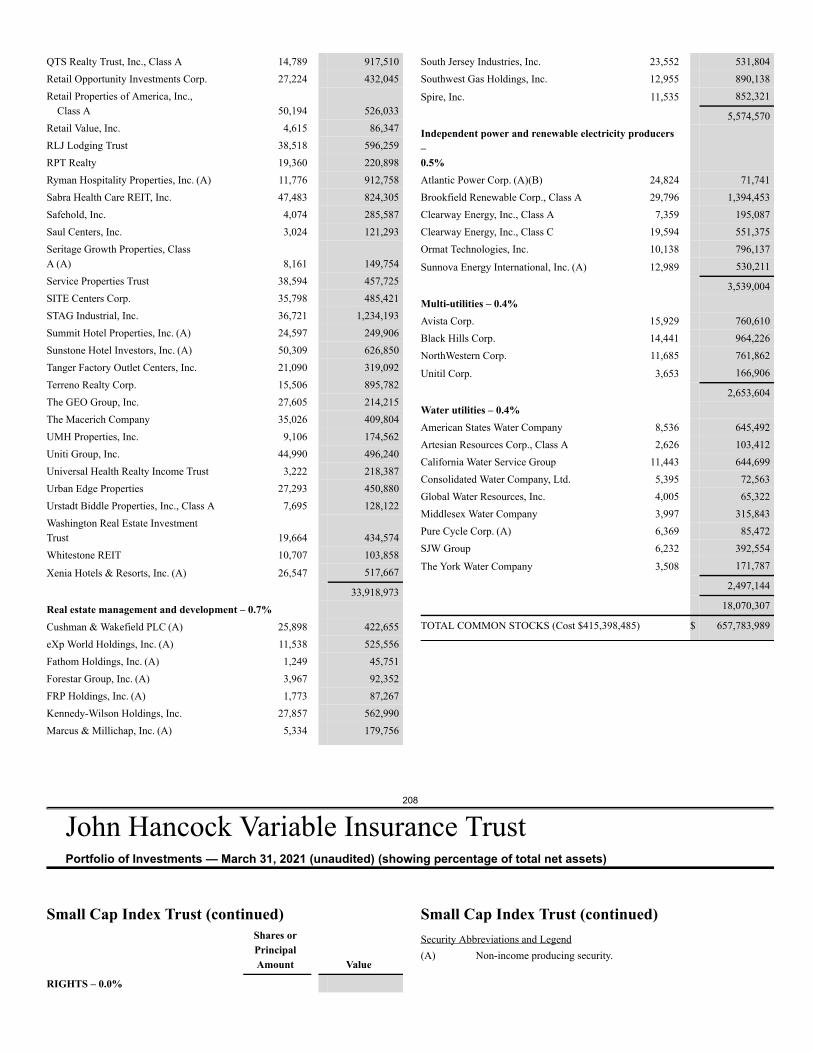
208
John Hancock Variable Insurance TrustPortfolio of Investments — March 31, 2021 (unaudited) (showing percentage of total net assets)
QTS Realty Trust, Inc., Class A 14,789 917,510Retail Opportunity Investments Corp. 27,224 432,045Retail Properties of America, Inc.,
Class A 50,194 526,033Retail Value, Inc. 4,615 86,347RLJ Lodging Trust 38,518 596,259RPT Realty 19,360 220,898Ryman Hospitality Properties, Inc. (A) 11,776 912,758Sabra Health Care REIT, Inc. 47,483 824,305Safehold, Inc. 4,074 285,587Saul Centers, Inc. 3,024 121,293Seritage Growth Properties, ClassA (A) 8,161 149,754Service Properties Trust 38,594 457,725SITE Centers Corp. 35,798 485,421STAG Industrial, Inc. 36,721 1,234,193Summit Hotel Properties, Inc. (A) 24,597 249,906Sunstone Hotel Investors, Inc. (A) 50,309 626,850Tanger Factory Outlet Centers, Inc. 21,090 319,092Terreno Realty Corp. 15,506 895,782The GEO Group, Inc. 27,605 214,215The Macerich Company 35,026 409,804UMH Properties, Inc. 9,106 174,562Uniti Group, Inc. 44,990 496,240Universal Health Realty Income Trust 3,222 218,387Urban Edge Properties 27,293 450,880Urstadt Biddle Properties, Inc., Class A 7,695 128,122Washington Real Estate InvestmentTrust 19,664 434,574Whitestone REIT 10,707 103,858
Xenia Hotels & Resorts, Inc. (A) 26,547 517,667
33,918,973Real estate management and development – 0.7%Cushman & Wakefield PLC (A) 25,898 422,655eXp World Holdings, Inc. (A) 11,538 525,556Fathom Holdings, Inc. (A) 1,249 45,751Forestar Group, Inc. (A) 3,967 92,352FRP Holdings, Inc. (A) 1,773 87,267Kennedy-Wilson Holdings, Inc. 27,857 562,990Marcus & Millichap, Inc. (A) 5,334 179,756
South Jersey Industries, Inc. 23,552 531,804Southwest Gas Holdings, Inc. 12,955 890,138
Spire, Inc. 11,535 852,321
5,574,570Independent power and renewable electricity producers–0.5%Atlantic Power Corp. (A)(B) 24,824 71,741Brookfield Renewable Corp., Class A 29,796 1,394,453Clearway Energy, Inc., Class A 7,359 195,087Clearway Energy, Inc., Class C 19,594 551,375Ormat Technologies, Inc. 10,138 796,137
Sunnova Energy International, Inc. (A) 12,989 530,211
3,539,004Multi-utilities – 0.4%Avista Corp. 15,929 760,610Black Hills Corp. 14,441 964,226NorthWestern Corp. 11,685 761,862
Unitil Corp. 3,653 166,906
2,653,604Water utilities – 0.4%American States Water Company 8,536 645,492Artesian Resources Corp., Class A 2,626 103,412California Water Service Group 11,443 644,699Consolidated Water Company, Ltd. 5,395 72,563Global Water Resources, Inc. 4,005 65,322Middlesex Water Company 3,997 315,843Pure Cycle Corp. (A) 6,369 85,472SJW Group 6,232 392,554
The York Water Company 3,508 171,787
2,497,144
18,070,307
TOTAL COMMON STOCKS (Cost $415,398,485) $ 657,783,989
Small Cap Index Trust (continued)Shares orPrincipalAmount Value
RIGHTS – 0.0%
Small Cap Index Trust (continued)Security Abbreviations and Legend(A) Non-income producing security.
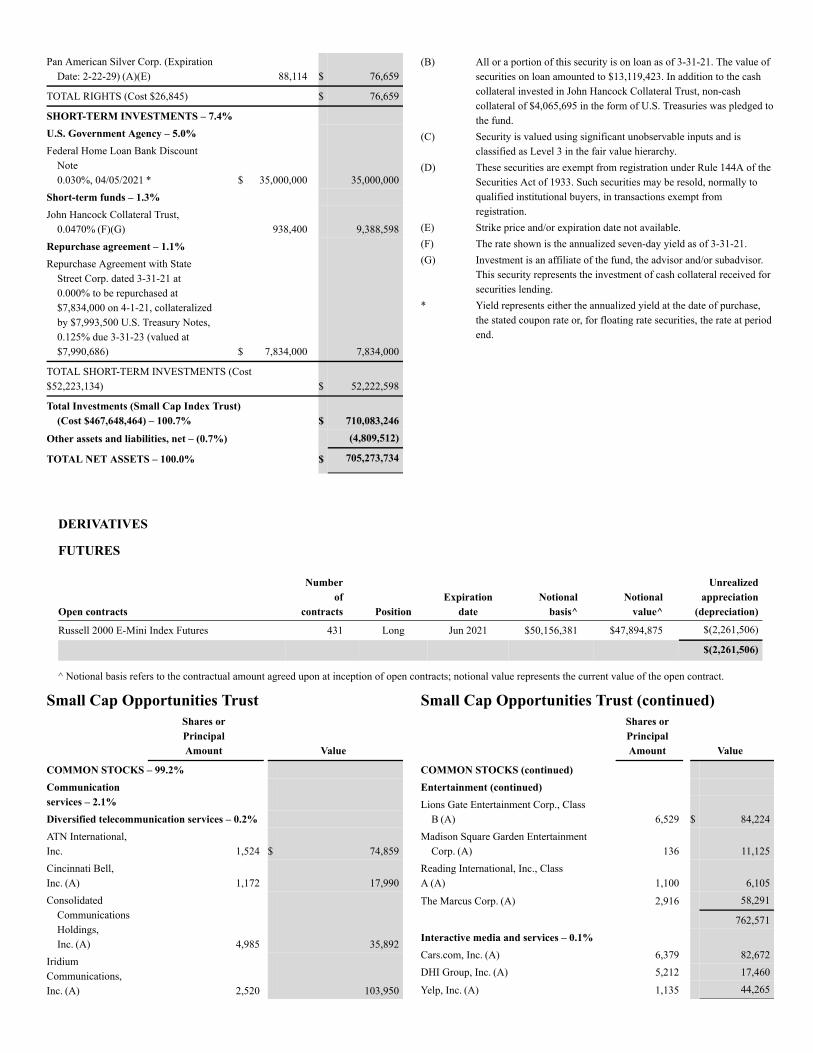
DERIVATIVES
FUTURES
Open contracts
Numberof
contracts PositionExpiration
dateNotional
basis^Notional
value^
Unrealizedappreciation
(depreciation)
Russell 2000 E-Mini Index Futures 431 Long Jun 2021 $50,156,381 $47,894,875 $(2,261,506)
$(2,261,506)
^ Notional basis refers to the contractual amount agreed upon at inception of open contracts; notional value represents the current value of the open contract.
Pan American Silver Corp. (ExpirationDate: 2-22-29) (A)(E) 88,114 $ 76,659
TOTAL RIGHTS (Cost $26,845) $ 76,659
SHORT-TERM INVESTMENTS – 7.4%U.S. Government Agency – 5.0%Federal Home Loan Bank Discount
Note0.030%, 04/05/2021 * $ 35,000,000 35,000,000
Short-term funds – 1.3%John Hancock Collateral Trust,
0.0470% (F)(G) 938,400 9,388,598Repurchase agreement – 1.1%Repurchase Agreement with State
Street Corp. dated 3-31-21 at0.000% to be repurchased at$7,834,000 on 4-1-21, collateralizedby $7,993,500 U.S. Treasury Notes,0.125% due 3-31-23 (valued at$7,990,686) $ 7,834,000 7,834,000
TOTAL SHORT-TERM INVESTMENTS (Cost$52,223,134) $ 52,222,598
Total Investments (Small Cap Index Trust)(Cost $467,648,464) – 100.7% $ 710,083,246
Other assets and liabilities, net – (0.7%) (4,809,512)
TOTAL NET ASSETS – 100.0% $ 705,273,734
(B) All or a portion of this security is on loan as of 3-31-21. The value ofsecurities on loan amounted to $13,119,423. In addition to the cashcollateral invested in John Hancock Collateral Trust, non-cashcollateral of $4,065,695 in the form of U.S. Treasuries was pledged tothe fund.
(C) Security is valued using significant unobservable inputs and isclassified as Level 3 in the fair value hierarchy.
(D) These securities are exempt from registration under Rule 144A of theSecurities Act of 1933. Such securities may be resold, normally toqualified institutional buyers, in transactions exempt fromregistration.
(E) Strike price and/or expiration date not available.(F) The rate shown is the annualized seven-day yield as of 3-31-21.(G) Investment is an affiliate of the fund, the advisor and/or subadvisor.
This security represents the investment of cash collateral received forsecurities lending.
* Yield represents either the annualized yield at the date of purchase,the stated coupon rate or, for floating rate securities, the rate at periodend.
Small Cap Opportunities TrustShares orPrincipalAmount Value
COMMON STOCKS – 99.2%Communicationservices – 2.1%Diversified telecommunication services – 0.2%ATN International,Inc. 1,524 $ 74,859Cincinnati Bell,Inc. (A) 1,172 17,990Consolidated
CommunicationsHoldings,Inc. (A) 4,985 35,892
IridiumCommunications,Inc. (A) 2,520 103,950
Small Cap Opportunities Trust (continued)Shares orPrincipalAmount Value
COMMON STOCKS (continued)Entertainment (continued)Lions Gate Entertainment Corp., Class
B (A) 6,529 $ 84,224Madison Square Garden Entertainment
Corp. (A) 136 11,125Reading International, Inc., ClassA (A) 1,100 6,105
The Marcus Corp. (A) 2,916 58,291
762,571Interactive media and services – 0.1%Cars.com, Inc. (A) 6,379 82,672DHI Group, Inc. (A) 5,212 17,460
Yelp, Inc. (A) 1,135 44,265
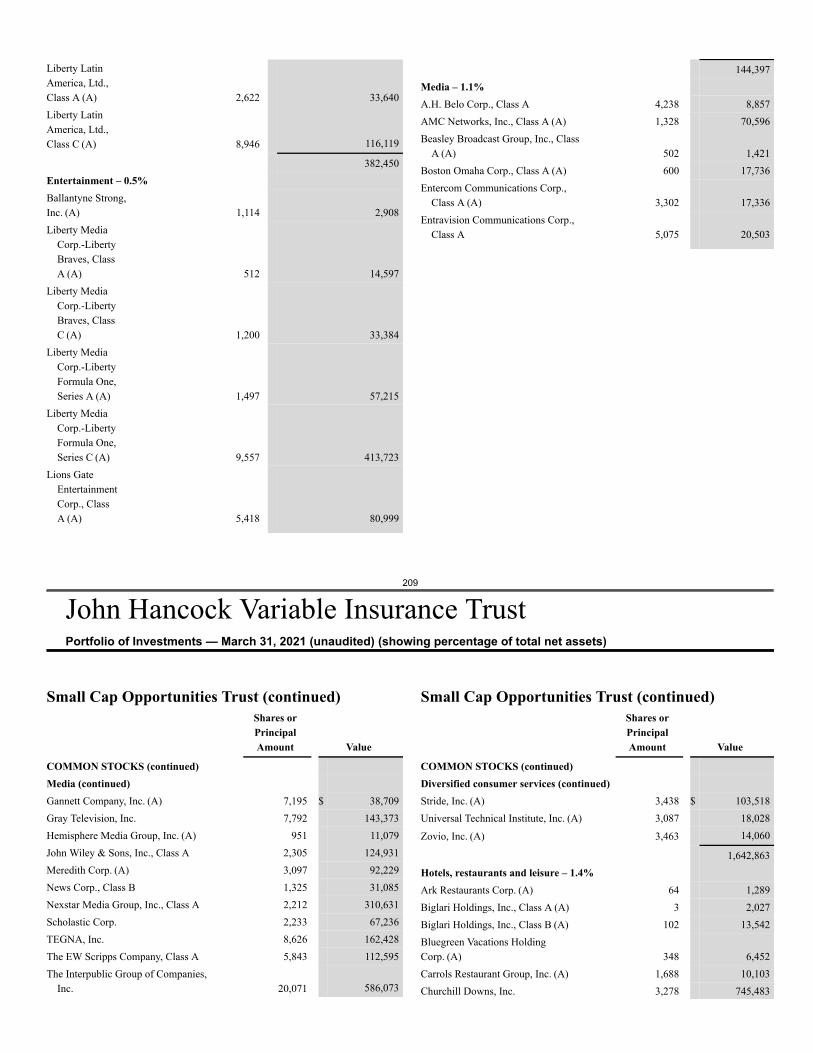
209
John Hancock Variable Insurance TrustPortfolio of Investments — March 31, 2021 (unaudited) (showing percentage of total net assets)
Liberty LatinAmerica, Ltd.,Class A (A) 2,622 33,640Liberty LatinAmerica, Ltd.,Class C (A) 8,946 116,119
382,450Entertainment – 0.5%Ballantyne Strong,Inc. (A) 1,114 2,908Liberty Media
Corp.-LibertyBraves, ClassA (A) 512 14,597
Liberty MediaCorp.-LibertyBraves, ClassC (A) 1,200 33,384
Liberty MediaCorp.-LibertyFormula One,Series A (A) 1,497 57,215
Liberty MediaCorp.-LibertyFormula One,Series C (A) 9,557 413,723
Lions GateEntertainmentCorp., ClassA (A) 5,418 80,999
144,397Media – 1.1%A.H. Belo Corp., Class A 4,238 8,857AMC Networks, Inc., Class A (A) 1,328 70,596Beasley Broadcast Group, Inc., Class
A (A) 502 1,421Boston Omaha Corp., Class A (A) 600 17,736Entercom Communications Corp.,
Class A (A) 3,302 17,336Entravision Communications Corp.,
Class A 5,075 20,503
Small Cap Opportunities Trust (continued)Shares orPrincipalAmount Value
COMMON STOCKS (continued)Media (continued)Gannett Company, Inc. (A) 7,195 $ 38,709Gray Television, Inc. 7,792 143,373Hemisphere Media Group, Inc. (A) 951 11,079John Wiley & Sons, Inc., Class A 2,305 124,931Meredith Corp. (A) 3,097 92,229News Corp., Class B 1,325 31,085Nexstar Media Group, Inc., Class A 2,212 310,631Scholastic Corp. 2,233 67,236TEGNA, Inc. 8,626 162,428The EW Scripps Company, Class A 5,843 112,595The Interpublic Group of Companies,
Inc. 20,071 586,073
Small Cap Opportunities Trust (continued)Shares orPrincipalAmount Value
COMMON STOCKS (continued)Diversified consumer services (continued)Stride, Inc. (A) 3,438 $ 103,518Universal Technical Institute, Inc. (A) 3,087 18,028
Zovio, Inc. (A) 3,463 14,060
1,642,863Hotels, restaurants and leisure – 1.4%Ark Restaurants Corp. (A) 64 1,289Biglari Holdings, Inc., Class A (A) 3 2,027Biglari Holdings, Inc., Class B (A) 102 13,542Bluegreen Vacations HoldingCorp. (A) 348 6,452Carrols Restaurant Group, Inc. (A) 1,688 10,103Churchill Downs, Inc. 3,278 745,483
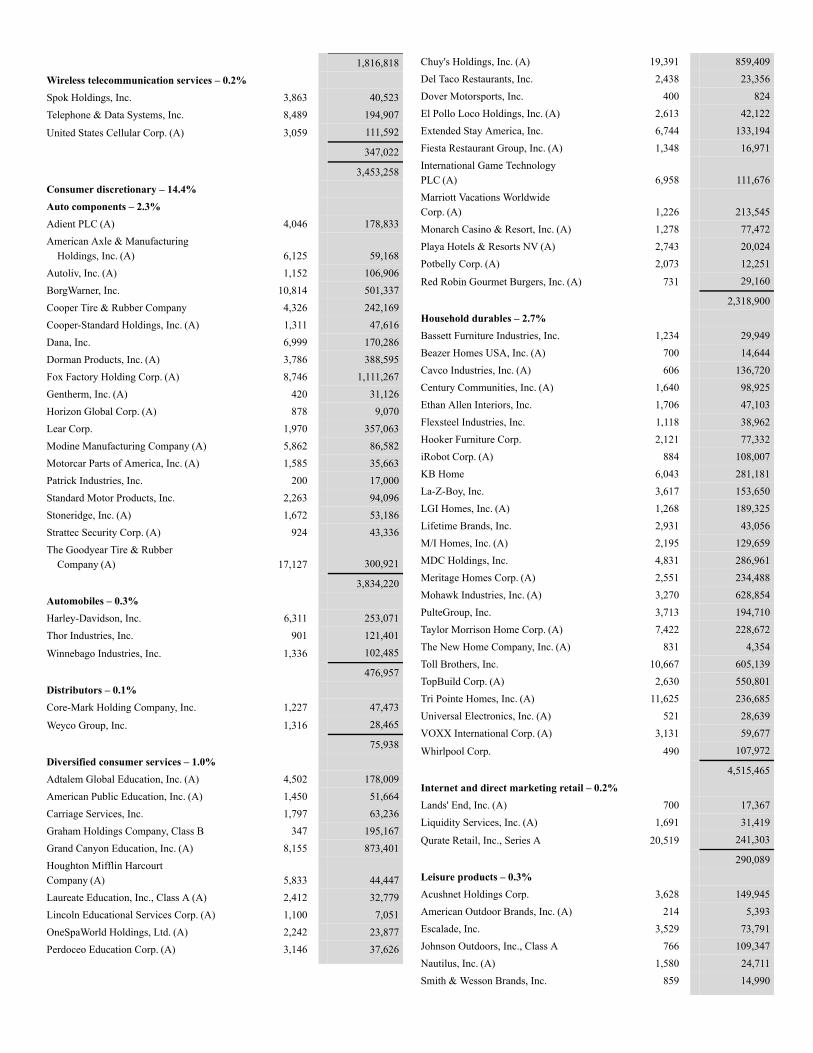
1,816,818Wireless telecommunication services – 0.2%Spok Holdings, Inc. 3,863 40,523Telephone & Data Systems, Inc. 8,489 194,907
United States Cellular Corp. (A) 3,059 111,592
347,022
3,453,258Consumer discretionary – 14.4%Auto components – 2.3%Adient PLC (A) 4,046 178,833American Axle & Manufacturing
Holdings, Inc. (A) 6,125 59,168Autoliv, Inc. (A) 1,152 106,906BorgWarner, Inc. 10,814 501,337Cooper Tire & Rubber Company 4,326 242,169Cooper-Standard Holdings, Inc. (A) 1,311 47,616Dana, Inc. 6,999 170,286Dorman Products, Inc. (A) 3,786 388,595Fox Factory Holding Corp. (A) 8,746 1,111,267Gentherm, Inc. (A) 420 31,126Horizon Global Corp. (A) 878 9,070Lear Corp. 1,970 357,063Modine Manufacturing Company (A) 5,862 86,582Motorcar Parts of America, Inc. (A) 1,585 35,663Patrick Industries, Inc. 200 17,000Standard Motor Products, Inc. 2,263 94,096Stoneridge, Inc. (A) 1,672 53,186Strattec Security Corp. (A) 924 43,336The Goodyear Tire & Rubber
Company (A) 17,127 300,921
3,834,220Automobiles – 0.3%Harley-Davidson, Inc. 6,311 253,071Thor Industries, Inc. 901 121,401
Winnebago Industries, Inc. 1,336 102,485
476,957Distributors – 0.1%Core-Mark Holding Company, Inc. 1,227 47,473
Weyco Group, Inc. 1,316 28,465
75,938Diversified consumer services – 1.0%Adtalem Global Education, Inc. (A) 4,502 178,009American Public Education, Inc. (A) 1,450 51,664Carriage Services, Inc. 1,797 63,236Graham Holdings Company, Class B 347 195,167Grand Canyon Education, Inc. (A) 8,155 873,401Houghton Mifflin HarcourtCompany (A) 5,833 44,447Laureate Education, Inc., Class A (A) 2,412 32,779Lincoln Educational Services Corp. (A) 1,100 7,051OneSpaWorld Holdings, Ltd. (A) 2,242 23,877Perdoceo Education Corp. (A) 3,146 37,626
Chuy's Holdings, Inc. (A) 19,391 859,409Del Taco Restaurants, Inc. 2,438 23,356Dover Motorsports, Inc. 400 824El Pollo Loco Holdings, Inc. (A) 2,613 42,122Extended Stay America, Inc. 6,744 133,194Fiesta Restaurant Group, Inc. (A) 1,348 16,971International Game TechnologyPLC (A) 6,958 111,676Marriott Vacations WorldwideCorp. (A) 1,226 213,545Monarch Casino & Resort, Inc. (A) 1,278 77,472Playa Hotels & Resorts NV (A) 2,743 20,024Potbelly Corp. (A) 2,073 12,251
Red Robin Gourmet Burgers, Inc. (A) 731 29,160
2,318,900Household durables – 2.7%Bassett Furniture Industries, Inc. 1,234 29,949Beazer Homes USA, Inc. (A) 700 14,644Cavco Industries, Inc. (A) 606 136,720Century Communities, Inc. (A) 1,640 98,925Ethan Allen Interiors, Inc. 1,706 47,103Flexsteel Industries, Inc. 1,118 38,962Hooker Furniture Corp. 2,121 77,332iRobot Corp. (A) 884 108,007KB Home 6,043 281,181La-Z-Boy, Inc. 3,617 153,650LGI Homes, Inc. (A) 1,268 189,325Lifetime Brands, Inc. 2,931 43,056M/I Homes, Inc. (A) 2,195 129,659MDC Holdings, Inc. 4,831 286,961Meritage Homes Corp. (A) 2,551 234,488Mohawk Industries, Inc. (A) 3,270 628,854PulteGroup, Inc. 3,713 194,710Taylor Morrison Home Corp. (A) 7,422 228,672The New Home Company, Inc. (A) 831 4,354Toll Brothers, Inc. 10,667 605,139TopBuild Corp. (A) 2,630 550,801Tri Pointe Homes, Inc. (A) 11,625 236,685Universal Electronics, Inc. (A) 521 28,639VOXX International Corp. (A) 3,131 59,677
Whirlpool Corp. 490 107,972
4,515,465Internet and direct marketing retail – 0.2%Lands' End, Inc. (A) 700 17,367Liquidity Services, Inc. (A) 1,691 31,419
Qurate Retail, Inc., Series A 20,519 241,303
290,089Leisure products – 0.3%Acushnet Holdings Corp. 3,628 149,945American Outdoor Brands, Inc. (A) 214 5,393Escalade, Inc. 3,529 73,791Johnson Outdoors, Inc., Class A 766 109,347Nautilus, Inc. (A) 1,580 24,711Smith & Wesson Brands, Inc. 859 14,990
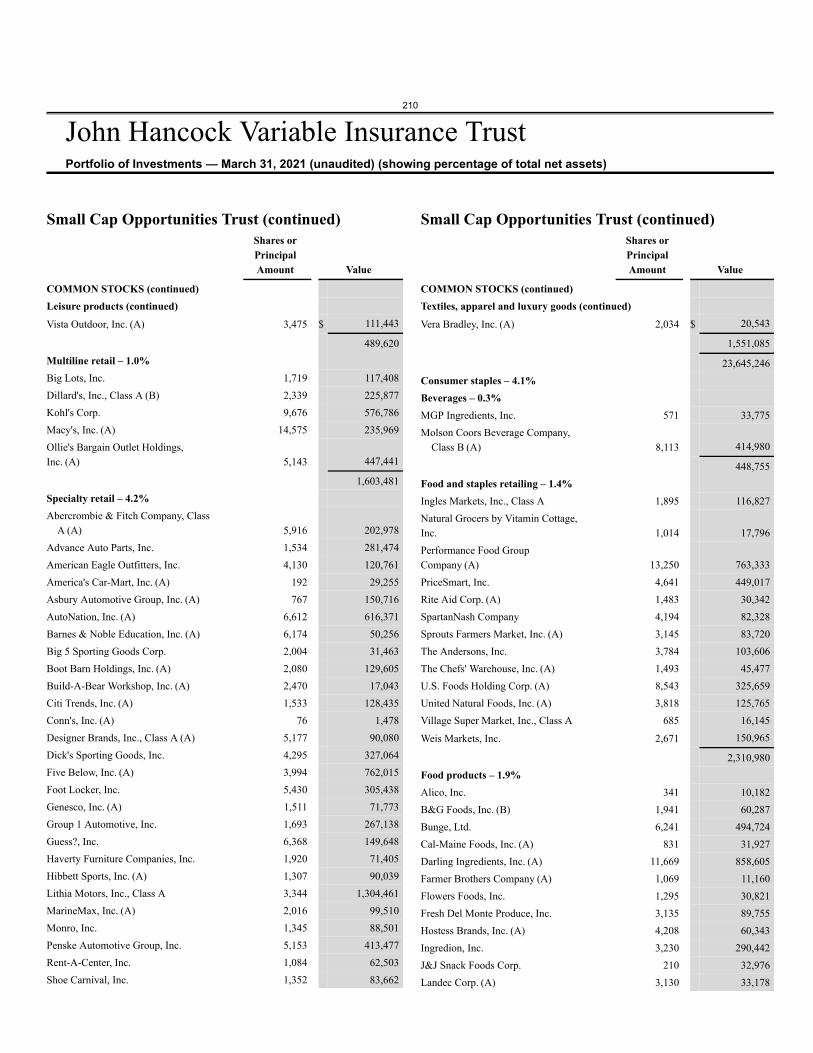
210
John Hancock Variable Insurance TrustPortfolio of Investments — March 31, 2021 (unaudited) (showing percentage of total net assets)
Small Cap Opportunities Trust (continued)Shares orPrincipalAmount Value
COMMON STOCKS (continued)Leisure products (continued)Vista Outdoor, Inc. (A) 3,475 $ 111,443
489,620Multiline retail – 1.0%Big Lots, Inc. 1,719 117,408Dillard's, Inc., Class A (B) 2,339 225,877Kohl's Corp. 9,676 576,786Macy's, Inc. (A) 14,575 235,969Ollie's Bargain Outlet Holdings,Inc. (A) 5,143 447,441
1,603,481Specialty retail – 4.2%Abercrombie & Fitch Company, Class
A (A) 5,916 202,978Advance Auto Parts, Inc. 1,534 281,474American Eagle Outfitters, Inc. 4,130 120,761America's Car-Mart, Inc. (A) 192 29,255Asbury Automotive Group, Inc. (A) 767 150,716AutoNation, Inc. (A) 6,612 616,371Barnes & Noble Education, Inc. (A) 6,174 50,256Big 5 Sporting Goods Corp. 2,004 31,463Boot Barn Holdings, Inc. (A) 2,080 129,605Build-A-Bear Workshop, Inc. (A) 2,470 17,043Citi Trends, Inc. (A) 1,533 128,435Conn's, Inc. (A) 76 1,478Designer Brands, Inc., Class A (A) 5,177 90,080Dick's Sporting Goods, Inc. 4,295 327,064Five Below, Inc. (A) 3,994 762,015Foot Locker, Inc. 5,430 305,438Genesco, Inc. (A) 1,511 71,773Group 1 Automotive, Inc. 1,693 267,138Guess?, Inc. 6,368 149,648Haverty Furniture Companies, Inc. 1,920 71,405Hibbett Sports, Inc. (A) 1,307 90,039Lithia Motors, Inc., Class A 3,344 1,304,461MarineMax, Inc. (A) 2,016 99,510Monro, Inc. 1,345 88,501Penske Automotive Group, Inc. 5,153 413,477Rent-A-Center, Inc. 1,084 62,503Shoe Carnival, Inc. 1,352 83,662
Small Cap Opportunities Trust (continued)Shares orPrincipalAmount Value
COMMON STOCKS (continued)Textiles, apparel and luxury goods (continued)Vera Bradley, Inc. (A) 2,034 $ 20,543
1,551,085
23,645,246Consumer staples – 4.1%Beverages – 0.3%MGP Ingredients, Inc. 571 33,775Molson Coors Beverage Company,
Class B (A) 8,113 414,980
448,755Food and staples retailing – 1.4%Ingles Markets, Inc., Class A 1,895 116,827Natural Grocers by Vitamin Cottage,Inc. 1,014 17,796Performance Food GroupCompany (A) 13,250 763,333PriceSmart, Inc. 4,641 449,017Rite Aid Corp. (A) 1,483 30,342SpartanNash Company 4,194 82,328Sprouts Farmers Market, Inc. (A) 3,145 83,720The Andersons, Inc. 3,784 103,606The Chefs' Warehouse, Inc. (A) 1,493 45,477U.S. Foods Holding Corp. (A) 8,543 325,659United Natural Foods, Inc. (A) 3,818 125,765Village Super Market, Inc., Class A 685 16,145
Weis Markets, Inc. 2,671 150,965
2,310,980Food products – 1.9%Alico, Inc. 341 10,182B&G Foods, Inc. (B) 1,941 60,287Bunge, Ltd. 6,241 494,724Cal-Maine Foods, Inc. (A) 831 31,927Darling Ingredients, Inc. (A) 11,669 858,605Farmer Brothers Company (A) 1,069 11,160Flowers Foods, Inc. 1,295 30,821Fresh Del Monte Produce, Inc. 3,135 89,755Hostess Brands, Inc. (A) 4,208 60,343Ingredion, Inc. 3,230 290,442J&J Snack Foods Corp. 210 32,976Landec Corp. (A) 3,130 33,178
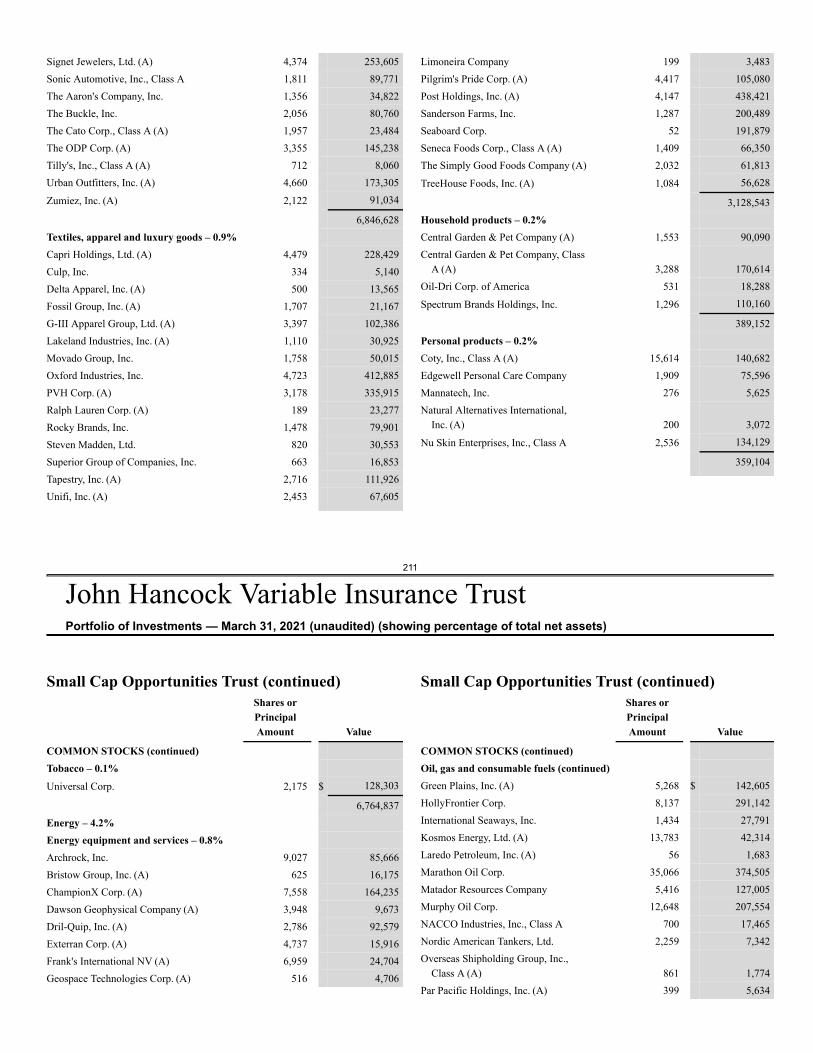
211
John Hancock Variable Insurance TrustPortfolio of Investments — March 31, 2021 (unaudited) (showing percentage of total net assets)
Signet Jewelers, Ltd. (A) 4,374 253,605Sonic Automotive, Inc., Class A 1,811 89,771The Aaron's Company, Inc. 1,356 34,822The Buckle, Inc. 2,056 80,760The Cato Corp., Class A (A) 1,957 23,484The ODP Corp. (A) 3,355 145,238Tilly's, Inc., Class A (A) 712 8,060Urban Outfitters, Inc. (A) 4,660 173,305
Zumiez, Inc. (A) 2,122 91,034
6,846,628Textiles, apparel and luxury goods – 0.9%Capri Holdings, Ltd. (A) 4,479 228,429Culp, Inc. 334 5,140Delta Apparel, Inc. (A) 500 13,565Fossil Group, Inc. (A) 1,707 21,167G-III Apparel Group, Ltd. (A) 3,397 102,386Lakeland Industries, Inc. (A) 1,110 30,925Movado Group, Inc. 1,758 50,015Oxford Industries, Inc. 4,723 412,885PVH Corp. (A) 3,178 335,915Ralph Lauren Corp. (A) 189 23,277Rocky Brands, Inc. 1,478 79,901Steven Madden, Ltd. 820 30,553Superior Group of Companies, Inc. 663 16,853Tapestry, Inc. (A) 2,716 111,926Unifi, Inc. (A) 2,453 67,605
Limoneira Company 199 3,483Pilgrim's Pride Corp. (A) 4,417 105,080Post Holdings, Inc. (A) 4,147 438,421Sanderson Farms, Inc. 1,287 200,489Seaboard Corp. 52 191,879Seneca Foods Corp., Class A (A) 1,409 66,350The Simply Good Foods Company (A) 2,032 61,813
TreeHouse Foods, Inc. (A) 1,084 56,628
3,128,543Household products – 0.2%Central Garden & Pet Company (A) 1,553 90,090Central Garden & Pet Company, Class
A (A) 3,288 170,614Oil-Dri Corp. of America 531 18,288
Spectrum Brands Holdings, Inc. 1,296 110,160
389,152Personal products – 0.2%Coty, Inc., Class A (A) 15,614 140,682Edgewell Personal Care Company 1,909 75,596Mannatech, Inc. 276 5,625Natural Alternatives International,
Inc. (A) 200 3,072
Nu Skin Enterprises, Inc., Class A 2,536 134,129
359,104
Small Cap Opportunities Trust (continued)Shares orPrincipalAmount Value
COMMON STOCKS (continued)Tobacco – 0.1%Universal Corp. 2,175 $ 128,303
6,764,837Energy – 4.2%Energy equipment and services – 0.8%Archrock, Inc. 9,027 85,666Bristow Group, Inc. (A) 625 16,175ChampionX Corp. (A) 7,558 164,235Dawson Geophysical Company (A) 3,948 9,673Dril-Quip, Inc. (A) 2,786 92,579Exterran Corp. (A) 4,737 15,916Frank's International NV (A) 6,959 24,704Geospace Technologies Corp. (A) 516 4,706
Small Cap Opportunities Trust (continued)Shares orPrincipalAmount Value
COMMON STOCKS (continued)Oil, gas and consumable fuels (continued)Green Plains, Inc. (A) 5,268 $ 142,605HollyFrontier Corp. 8,137 291,142International Seaways, Inc. 1,434 27,791Kosmos Energy, Ltd. (A) 13,783 42,314Laredo Petroleum, Inc. (A) 56 1,683Marathon Oil Corp. 35,066 374,505Matador Resources Company 5,416 127,005Murphy Oil Corp. 12,648 207,554NACCO Industries, Inc., Class A 700 17,465Nordic American Tankers, Ltd. 2,259 7,342Overseas Shipholding Group, Inc.,
Class A (A) 861 1,774Par Pacific Holdings, Inc. (A) 399 5,634
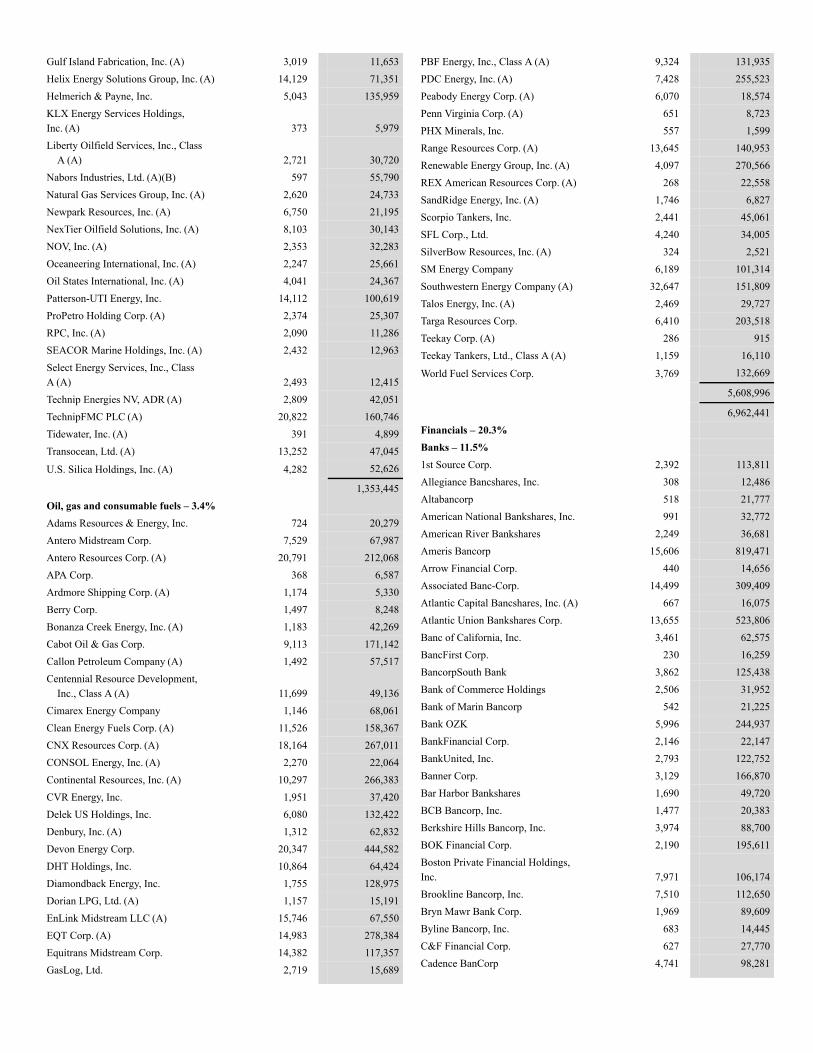
Gulf Island Fabrication, Inc. (A) 3,019 11,653Helix Energy Solutions Group, Inc. (A) 14,129 71,351Helmerich & Payne, Inc. 5,043 135,959KLX Energy Services Holdings,Inc. (A) 373 5,979Liberty Oilfield Services, Inc., Class
A (A) 2,721 30,720Nabors Industries, Ltd. (A)(B) 597 55,790Natural Gas Services Group, Inc. (A) 2,620 24,733Newpark Resources, Inc. (A) 6,750 21,195NexTier Oilfield Solutions, Inc. (A) 8,103 30,143NOV, Inc. (A) 2,353 32,283Oceaneering International, Inc. (A) 2,247 25,661Oil States International, Inc. (A) 4,041 24,367Patterson-UTI Energy, Inc. 14,112 100,619ProPetro Holding Corp. (A) 2,374 25,307RPC, Inc. (A) 2,090 11,286SEACOR Marine Holdings, Inc. (A) 2,432 12,963Select Energy Services, Inc., ClassA (A) 2,493 12,415Technip Energies NV, ADR (A) 2,809 42,051TechnipFMC PLC (A) 20,822 160,746Tidewater, Inc. (A) 391 4,899Transocean, Ltd. (A) 13,252 47,045
U.S. Silica Holdings, Inc. (A) 4,282 52,626
1,353,445Oil, gas and consumable fuels – 3.4%Adams Resources & Energy, Inc. 724 20,279Antero Midstream Corp. 7,529 67,987Antero Resources Corp. (A) 20,791 212,068APA Corp. 368 6,587Ardmore Shipping Corp. (A) 1,174 5,330Berry Corp. 1,497 8,248Bonanza Creek Energy, Inc. (A) 1,183 42,269Cabot Oil & Gas Corp. 9,113 171,142Callon Petroleum Company (A) 1,492 57,517Centennial Resource Development,
Inc., Class A (A) 11,699 49,136Cimarex Energy Company 1,146 68,061Clean Energy Fuels Corp. (A) 11,526 158,367CNX Resources Corp. (A) 18,164 267,011CONSOL Energy, Inc. (A) 2,270 22,064Continental Resources, Inc. (A) 10,297 266,383CVR Energy, Inc. 1,951 37,420Delek US Holdings, Inc. 6,080 132,422Denbury, Inc. (A) 1,312 62,832Devon Energy Corp. 20,347 444,582DHT Holdings, Inc. 10,864 64,424Diamondback Energy, Inc. 1,755 128,975Dorian LPG, Ltd. (A) 1,157 15,191EnLink Midstream LLC (A) 15,746 67,550EQT Corp. (A) 14,983 278,384Equitrans Midstream Corp. 14,382 117,357GasLog, Ltd. 2,719 15,689
PBF Energy, Inc., Class A (A) 9,324 131,935PDC Energy, Inc. (A) 7,428 255,523Peabody Energy Corp. (A) 6,070 18,574Penn Virginia Corp. (A) 651 8,723PHX Minerals, Inc. 557 1,599Range Resources Corp. (A) 13,645 140,953Renewable Energy Group, Inc. (A) 4,097 270,566REX American Resources Corp. (A) 268 22,558SandRidge Energy, Inc. (A) 1,746 6,827Scorpio Tankers, Inc. 2,441 45,061SFL Corp., Ltd. 4,240 34,005SilverBow Resources, Inc. (A) 324 2,521SM Energy Company 6,189 101,314Southwestern Energy Company (A) 32,647 151,809Talos Energy, Inc. (A) 2,469 29,727Targa Resources Corp. 6,410 203,518Teekay Corp. (A) 286 915Teekay Tankers, Ltd., Class A (A) 1,159 16,110
World Fuel Services Corp. 3,769 132,669
5,608,996
6,962,441Financials – 20.3%Banks – 11.5%1st Source Corp. 2,392 113,811Allegiance Bancshares, Inc. 308 12,486Altabancorp 518 21,777American National Bankshares, Inc. 991 32,772American River Bankshares 2,249 36,681Ameris Bancorp 15,606 819,471Arrow Financial Corp. 440 14,656Associated Banc-Corp. 14,499 309,409Atlantic Capital Bancshares, Inc. (A) 667 16,075Atlantic Union Bankshares Corp. 13,655 523,806Banc of California, Inc. 3,461 62,575BancFirst Corp. 230 16,259BancorpSouth Bank 3,862 125,438Bank of Commerce Holdings 2,506 31,952Bank of Marin Bancorp 542 21,225Bank OZK 5,996 244,937BankFinancial Corp. 2,146 22,147BankUnited, Inc. 2,793 122,752Banner Corp. 3,129 166,870Bar Harbor Bankshares 1,690 49,720BCB Bancorp, Inc. 1,477 20,383Berkshire Hills Bancorp, Inc. 3,974 88,700BOK Financial Corp. 2,190 195,611Boston Private Financial Holdings,Inc. 7,971 106,174Brookline Bancorp, Inc. 7,510 112,650Bryn Mawr Bank Corp. 1,969 89,609Byline Bancorp, Inc. 683 14,445C&F Financial Corp. 627 27,770Cadence BanCorp 4,741 98,281
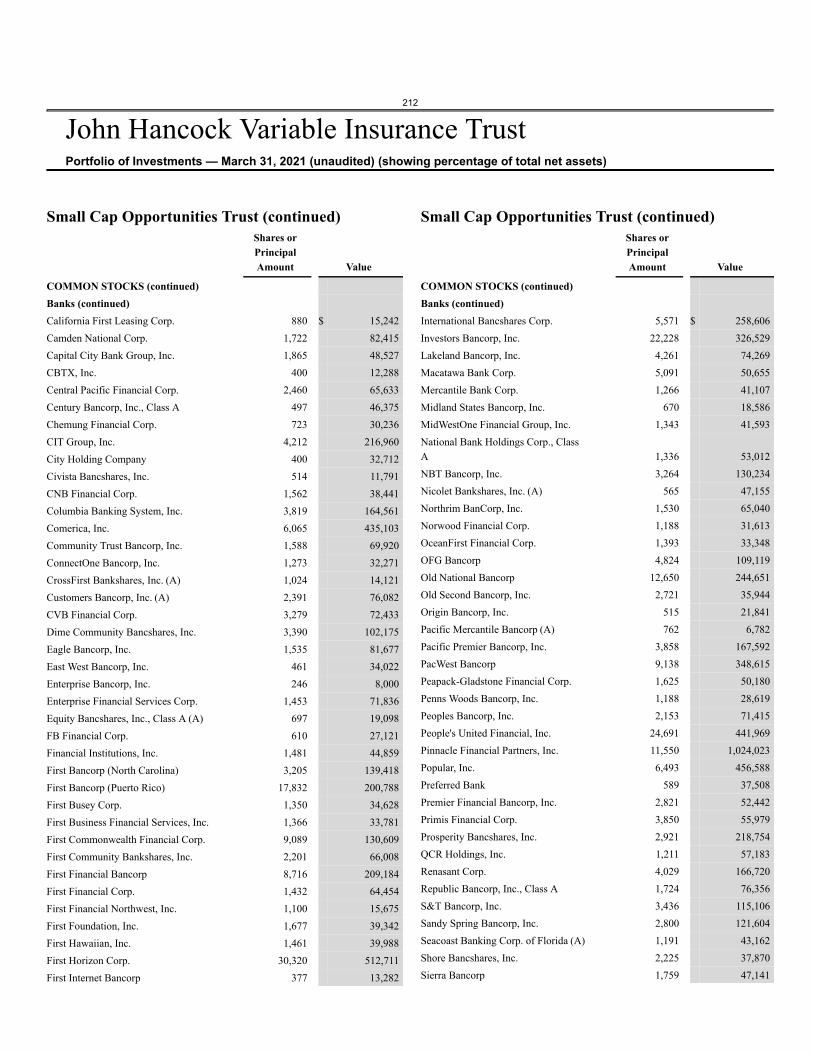
212
John Hancock Variable Insurance TrustPortfolio of Investments — March 31, 2021 (unaudited) (showing percentage of total net assets)
Small Cap Opportunities Trust (continued)Shares orPrincipalAmount Value
COMMON STOCKS (continued)Banks (continued)California First Leasing Corp. 880 $ 15,242Camden National Corp. 1,722 82,415Capital City Bank Group, Inc. 1,865 48,527CBTX, Inc. 400 12,288Central Pacific Financial Corp. 2,460 65,633Century Bancorp, Inc., Class A 497 46,375Chemung Financial Corp. 723 30,236CIT Group, Inc. 4,212 216,960City Holding Company 400 32,712Civista Bancshares, Inc. 514 11,791CNB Financial Corp. 1,562 38,441Columbia Banking System, Inc. 3,819 164,561Comerica, Inc. 6,065 435,103Community Trust Bancorp, Inc. 1,588 69,920ConnectOne Bancorp, Inc. 1,273 32,271CrossFirst Bankshares, Inc. (A) 1,024 14,121Customers Bancorp, Inc. (A) 2,391 76,082CVB Financial Corp. 3,279 72,433Dime Community Bancshares, Inc. 3,390 102,175Eagle Bancorp, Inc. 1,535 81,677East West Bancorp, Inc. 461 34,022Enterprise Bancorp, Inc. 246 8,000Enterprise Financial Services Corp. 1,453 71,836Equity Bancshares, Inc., Class A (A) 697 19,098FB Financial Corp. 610 27,121Financial Institutions, Inc. 1,481 44,859First Bancorp (North Carolina) 3,205 139,418First Bancorp (Puerto Rico) 17,832 200,788First Busey Corp. 1,350 34,628First Business Financial Services, Inc. 1,366 33,781First Commonwealth Financial Corp. 9,089 130,609First Community Bankshares, Inc. 2,201 66,008First Financial Bancorp 8,716 209,184First Financial Corp. 1,432 64,454First Financial Northwest, Inc. 1,100 15,675First Foundation, Inc. 1,677 39,342First Hawaiian, Inc. 1,461 39,988First Horizon Corp. 30,320 512,711First Internet Bancorp 377 13,282
Small Cap Opportunities Trust (continued)Shares orPrincipalAmount Value
COMMON STOCKS (continued)Banks (continued)International Bancshares Corp. 5,571 $ 258,606Investors Bancorp, Inc. 22,228 326,529Lakeland Bancorp, Inc. 4,261 74,269Macatawa Bank Corp. 5,091 50,655Mercantile Bank Corp. 1,266 41,107Midland States Bancorp, Inc. 670 18,586MidWestOne Financial Group, Inc. 1,343 41,593National Bank Holdings Corp., ClassA 1,336 53,012NBT Bancorp, Inc. 3,264 130,234Nicolet Bankshares, Inc. (A) 565 47,155Northrim BanCorp, Inc. 1,530 65,040Norwood Financial Corp. 1,188 31,613OceanFirst Financial Corp. 1,393 33,348OFG Bancorp 4,824 109,119Old National Bancorp 12,650 244,651Old Second Bancorp, Inc. 2,721 35,944Origin Bancorp, Inc. 515 21,841Pacific Mercantile Bancorp (A) 762 6,782Pacific Premier Bancorp, Inc. 3,858 167,592PacWest Bancorp 9,138 348,615Peapack-Gladstone Financial Corp. 1,625 50,180Penns Woods Bancorp, Inc. 1,188 28,619Peoples Bancorp, Inc. 2,153 71,415People's United Financial, Inc. 24,691 441,969Pinnacle Financial Partners, Inc. 11,550 1,024,023Popular, Inc. 6,493 456,588Preferred Bank 589 37,508Premier Financial Bancorp, Inc. 2,821 52,442Primis Financial Corp. 3,850 55,979Prosperity Bancshares, Inc. 2,921 218,754QCR Holdings, Inc. 1,211 57,183Renasant Corp. 4,029 166,720Republic Bancorp, Inc., Class A 1,724 76,356S&T Bancorp, Inc. 3,436 115,106Sandy Spring Bancorp, Inc. 2,800 121,604Seacoast Banking Corp. of Florida (A) 1,191 43,162Shore Bancshares, Inc. 2,225 37,870Sierra Bancorp 1,759 47,141
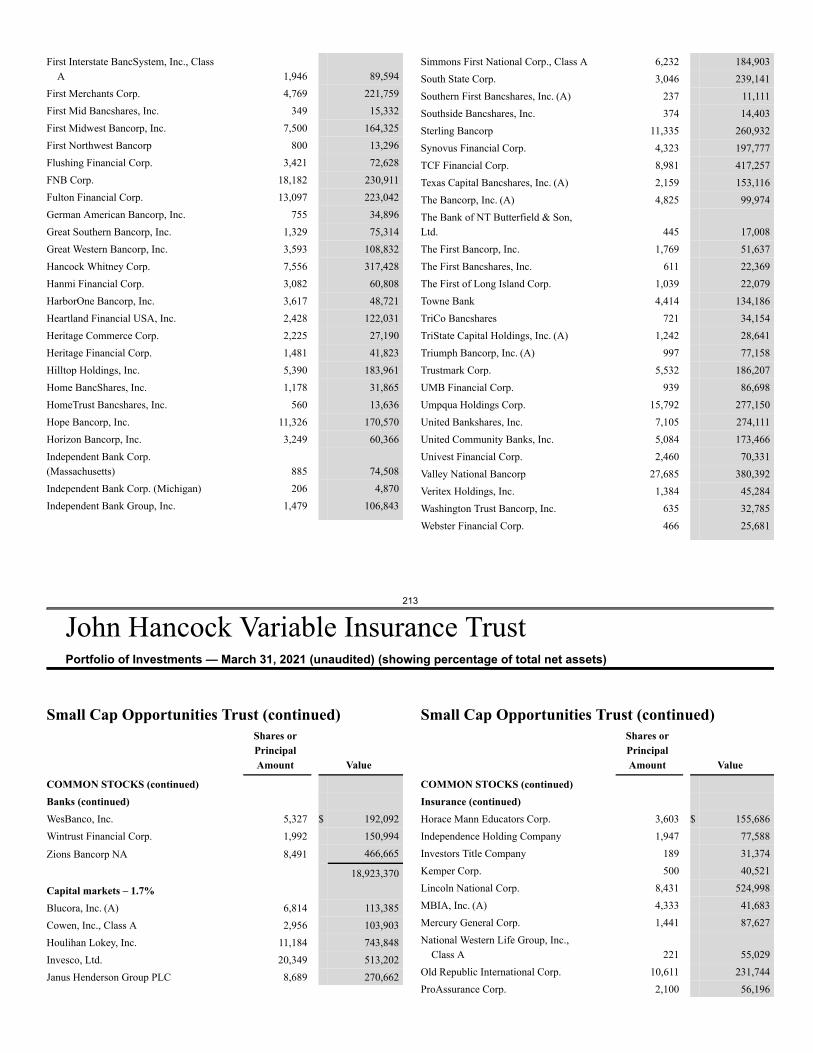
213
John Hancock Variable Insurance TrustPortfolio of Investments — March 31, 2021 (unaudited) (showing percentage of total net assets)
First Interstate BancSystem, Inc., ClassA 1,946 89,594
First Merchants Corp. 4,769 221,759First Mid Bancshares, Inc. 349 15,332First Midwest Bancorp, Inc. 7,500 164,325First Northwest Bancorp 800 13,296Flushing Financial Corp. 3,421 72,628FNB Corp. 18,182 230,911Fulton Financial Corp. 13,097 223,042German American Bancorp, Inc. 755 34,896Great Southern Bancorp, Inc. 1,329 75,314Great Western Bancorp, Inc. 3,593 108,832Hancock Whitney Corp. 7,556 317,428Hanmi Financial Corp. 3,082 60,808HarborOne Bancorp, Inc. 3,617 48,721Heartland Financial USA, Inc. 2,428 122,031Heritage Commerce Corp. 2,225 27,190Heritage Financial Corp. 1,481 41,823Hilltop Holdings, Inc. 5,390 183,961Home BancShares, Inc. 1,178 31,865HomeTrust Bancshares, Inc. 560 13,636Hope Bancorp, Inc. 11,326 170,570Horizon Bancorp, Inc. 3,249 60,366Independent Bank Corp.(Massachusetts) 885 74,508Independent Bank Corp. (Michigan) 206 4,870Independent Bank Group, Inc. 1,479 106,843
Simmons First National Corp., Class A 6,232 184,903South State Corp. 3,046 239,141Southern First Bancshares, Inc. (A) 237 11,111Southside Bancshares, Inc. 374 14,403Sterling Bancorp 11,335 260,932Synovus Financial Corp. 4,323 197,777TCF Financial Corp. 8,981 417,257Texas Capital Bancshares, Inc. (A) 2,159 153,116The Bancorp, Inc. (A) 4,825 99,974The Bank of NT Butterfield & Son,Ltd. 445 17,008The First Bancorp, Inc. 1,769 51,637The First Bancshares, Inc. 611 22,369The First of Long Island Corp. 1,039 22,079Towne Bank 4,414 134,186TriCo Bancshares 721 34,154TriState Capital Holdings, Inc. (A) 1,242 28,641Triumph Bancorp, Inc. (A) 997 77,158Trustmark Corp. 5,532 186,207UMB Financial Corp. 939 86,698Umpqua Holdings Corp. 15,792 277,150United Bankshares, Inc. 7,105 274,111United Community Banks, Inc. 5,084 173,466Univest Financial Corp. 2,460 70,331Valley National Bancorp 27,685 380,392Veritex Holdings, Inc. 1,384 45,284Washington Trust Bancorp, Inc. 635 32,785Webster Financial Corp. 466 25,681
Small Cap Opportunities Trust (continued)Shares orPrincipalAmount Value
COMMON STOCKS (continued)Banks (continued)WesBanco, Inc. 5,327 $ 192,092Wintrust Financial Corp. 1,992 150,994
Zions Bancorp NA 8,491 466,665
18,923,370Capital markets – 1.7%Blucora, Inc. (A) 6,814 113,385Cowen, Inc., Class A 2,956 103,903Houlihan Lokey, Inc. 11,184 743,848Invesco, Ltd. 20,349 513,202Janus Henderson Group PLC 8,689 270,662
Small Cap Opportunities Trust (continued)Shares orPrincipalAmount Value
COMMON STOCKS (continued)Insurance (continued)Horace Mann Educators Corp. 3,603 $ 155,686Independence Holding Company 1,947 77,588Investors Title Company 189 31,374Kemper Corp. 500 40,521Lincoln National Corp. 8,431 524,998MBIA, Inc. (A) 4,333 41,683Mercury General Corp. 1,441 87,627National Western Life Group, Inc.,
Class A 221 55,029Old Republic International Corp. 10,611 231,744ProAssurance Corp. 2,100 56,196
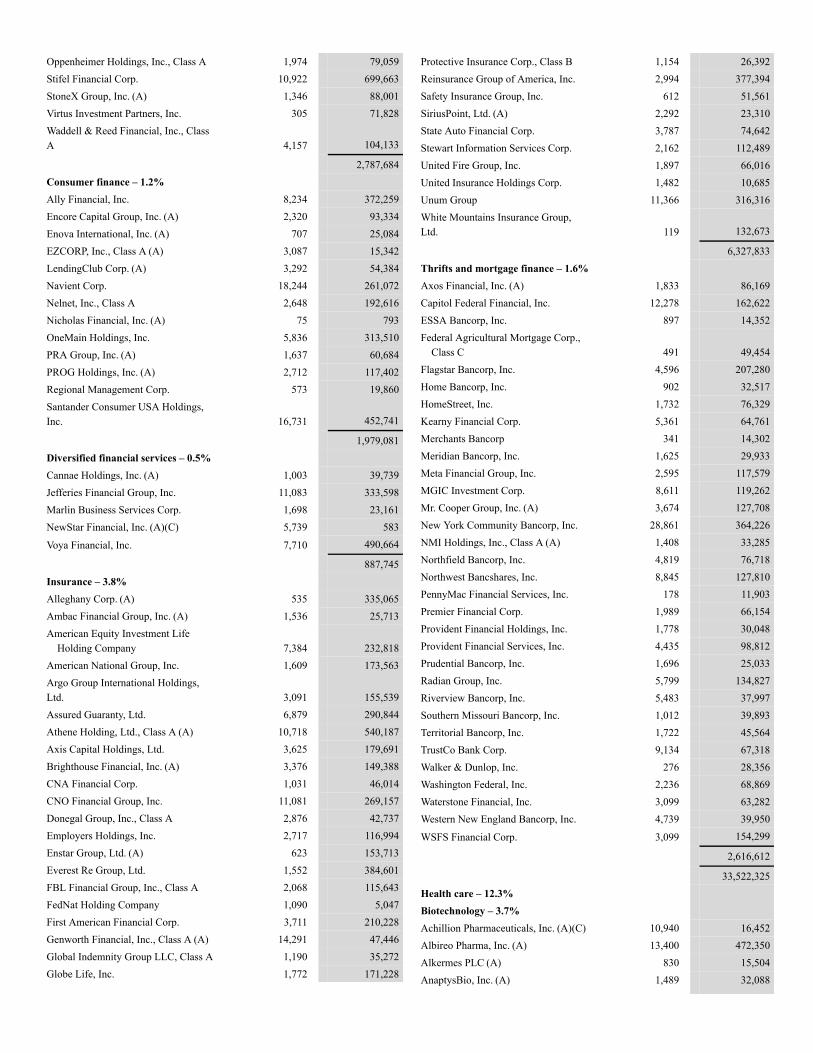
Oppenheimer Holdings, Inc., Class A 1,974 79,059Stifel Financial Corp. 10,922 699,663StoneX Group, Inc. (A) 1,346 88,001Virtus Investment Partners, Inc. 305 71,828Waddell & Reed Financial, Inc., ClassA 4,157 104,133
2,787,684Consumer finance – 1.2%Ally Financial, Inc. 8,234 372,259Encore Capital Group, Inc. (A) 2,320 93,334Enova International, Inc. (A) 707 25,084EZCORP, Inc., Class A (A) 3,087 15,342LendingClub Corp. (A) 3,292 54,384Navient Corp. 18,244 261,072Nelnet, Inc., Class A 2,648 192,616Nicholas Financial, Inc. (A) 75 793OneMain Holdings, Inc. 5,836 313,510PRA Group, Inc. (A) 1,637 60,684PROG Holdings, Inc. (A) 2,712 117,402Regional Management Corp. 573 19,860Santander Consumer USA Holdings,Inc. 16,731 452,741
1,979,081Diversified financial services – 0.5%Cannae Holdings, Inc. (A) 1,003 39,739Jefferies Financial Group, Inc. 11,083 333,598Marlin Business Services Corp. 1,698 23,161NewStar Financial, Inc. (A)(C) 5,739 583
Voya Financial, Inc. 7,710 490,664
887,745Insurance – 3.8%Alleghany Corp. (A) 535 335,065Ambac Financial Group, Inc. (A) 1,536 25,713American Equity Investment Life
Holding Company 7,384 232,818American National Group, Inc. 1,609 173,563Argo Group International Holdings,Ltd. 3,091 155,539Assured Guaranty, Ltd. 6,879 290,844Athene Holding, Ltd., Class A (A) 10,718 540,187Axis Capital Holdings, Ltd. 3,625 179,691Brighthouse Financial, Inc. (A) 3,376 149,388CNA Financial Corp. 1,031 46,014CNO Financial Group, Inc. 11,081 269,157Donegal Group, Inc., Class A 2,876 42,737Employers Holdings, Inc. 2,717 116,994Enstar Group, Ltd. (A) 623 153,713Everest Re Group, Ltd. 1,552 384,601FBL Financial Group, Inc., Class A 2,068 115,643FedNat Holding Company 1,090 5,047First American Financial Corp. 3,711 210,228Genworth Financial, Inc., Class A (A) 14,291 47,446Global Indemnity Group LLC, Class A 1,190 35,272Globe Life, Inc. 1,772 171,228
Protective Insurance Corp., Class B 1,154 26,392Reinsurance Group of America, Inc. 2,994 377,394Safety Insurance Group, Inc. 612 51,561SiriusPoint, Ltd. (A) 2,292 23,310State Auto Financial Corp. 3,787 74,642Stewart Information Services Corp. 2,162 112,489United Fire Group, Inc. 1,897 66,016United Insurance Holdings Corp. 1,482 10,685Unum Group 11,366 316,316White Mountains Insurance Group,Ltd. 119 132,673
6,327,833Thrifts and mortgage finance – 1.6%Axos Financial, Inc. (A) 1,833 86,169Capitol Federal Financial, Inc. 12,278 162,622ESSA Bancorp, Inc. 897 14,352Federal Agricultural Mortgage Corp.,
Class C 491 49,454Flagstar Bancorp, Inc. 4,596 207,280Home Bancorp, Inc. 902 32,517HomeStreet, Inc. 1,732 76,329Kearny Financial Corp. 5,361 64,761Merchants Bancorp 341 14,302Meridian Bancorp, Inc. 1,625 29,933Meta Financial Group, Inc. 2,595 117,579MGIC Investment Corp. 8,611 119,262Mr. Cooper Group, Inc. (A) 3,674 127,708New York Community Bancorp, Inc. 28,861 364,226NMI Holdings, Inc., Class A (A) 1,408 33,285Northfield Bancorp, Inc. 4,819 76,718Northwest Bancshares, Inc. 8,845 127,810PennyMac Financial Services, Inc. 178 11,903Premier Financial Corp. 1,989 66,154Provident Financial Holdings, Inc. 1,778 30,048Provident Financial Services, Inc. 4,435 98,812Prudential Bancorp, Inc. 1,696 25,033Radian Group, Inc. 5,799 134,827Riverview Bancorp, Inc. 5,483 37,997Southern Missouri Bancorp, Inc. 1,012 39,893Territorial Bancorp, Inc. 1,722 45,564TrustCo Bank Corp. 9,134 67,318Walker & Dunlop, Inc. 276 28,356Washington Federal, Inc. 2,236 68,869Waterstone Financial, Inc. 3,099 63,282Western New England Bancorp, Inc. 4,739 39,950
WSFS Financial Corp. 3,099 154,299
2,616,612
33,522,325Health care – 12.3%Biotechnology – 3.7%Achillion Pharmaceuticals, Inc. (A)(C) 10,940 16,452Albireo Pharma, Inc. (A) 13,400 472,350Alkermes PLC (A) 830 15,504AnaptysBio, Inc. (A) 1,489 32,088
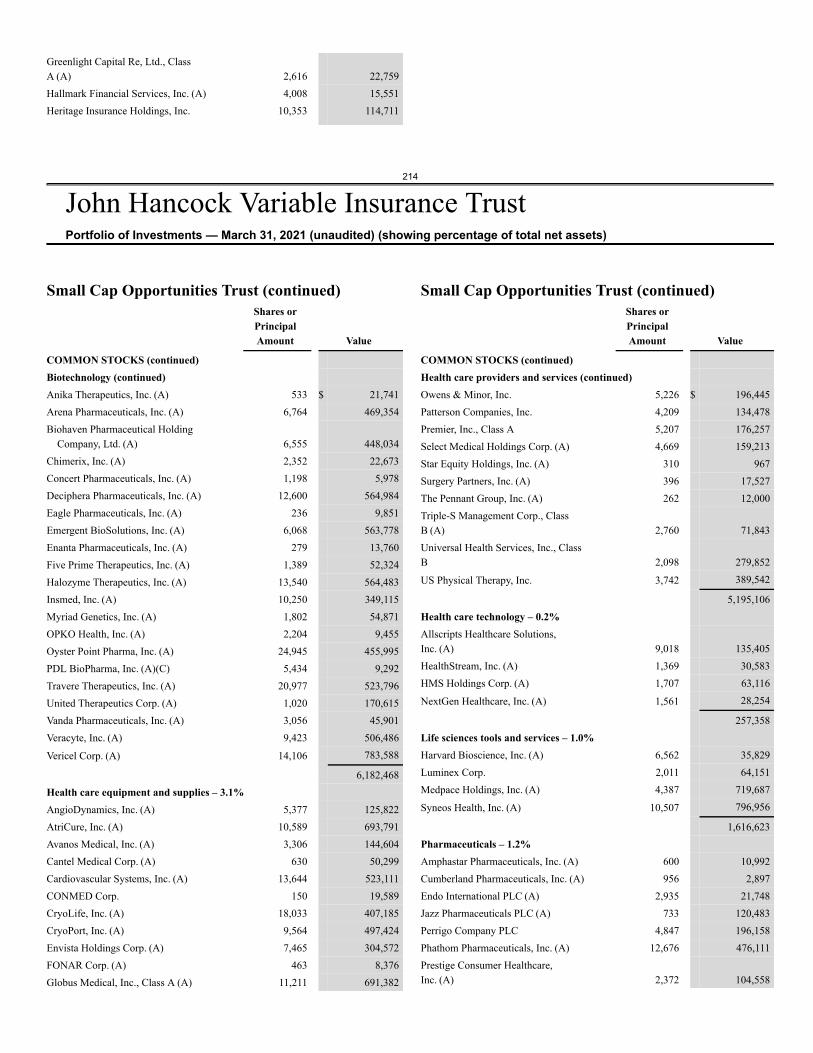
214
John Hancock Variable Insurance TrustPortfolio of Investments — March 31, 2021 (unaudited) (showing percentage of total net assets)
Greenlight Capital Re, Ltd., ClassA (A) 2,616 22,759Hallmark Financial Services, Inc. (A) 4,008 15,551Heritage Insurance Holdings, Inc. 10,353 114,711
Small Cap Opportunities Trust (continued)Shares orPrincipalAmount Value
COMMON STOCKS (continued)Biotechnology (continued)Anika Therapeutics, Inc. (A) 533 $ 21,741Arena Pharmaceuticals, Inc. (A) 6,764 469,354Biohaven Pharmaceutical Holding
Company, Ltd. (A) 6,555 448,034Chimerix, Inc. (A) 2,352 22,673Concert Pharmaceuticals, Inc. (A) 1,198 5,978Deciphera Pharmaceuticals, Inc. (A) 12,600 564,984Eagle Pharmaceuticals, Inc. (A) 236 9,851Emergent BioSolutions, Inc. (A) 6,068 563,778Enanta Pharmaceuticals, Inc. (A) 279 13,760Five Prime Therapeutics, Inc. (A) 1,389 52,324Halozyme Therapeutics, Inc. (A) 13,540 564,483Insmed, Inc. (A) 10,250 349,115Myriad Genetics, Inc. (A) 1,802 54,871OPKO Health, Inc. (A) 2,204 9,455Oyster Point Pharma, Inc. (A) 24,945 455,995PDL BioPharma, Inc. (A)(C) 5,434 9,292Travere Therapeutics, Inc. (A) 20,977 523,796United Therapeutics Corp. (A) 1,020 170,615Vanda Pharmaceuticals, Inc. (A) 3,056 45,901Veracyte, Inc. (A) 9,423 506,486
Vericel Corp. (A) 14,106 783,588
6,182,468Health care equipment and supplies – 3.1%AngioDynamics, Inc. (A) 5,377 125,822AtriCure, Inc. (A) 10,589 693,791Avanos Medical, Inc. (A) 3,306 144,604Cantel Medical Corp. (A) 630 50,299Cardiovascular Systems, Inc. (A) 13,644 523,111CONMED Corp. 150 19,589CryoLife, Inc. (A) 18,033 407,185CryoPort, Inc. (A) 9,564 497,424Envista Holdings Corp. (A) 7,465 304,572FONAR Corp. (A) 463 8,376Globus Medical, Inc., Class A (A) 11,211 691,382
Small Cap Opportunities Trust (continued)Shares orPrincipalAmount Value
COMMON STOCKS (continued)Health care providers and services (continued)Owens & Minor, Inc. 5,226 $ 196,445Patterson Companies, Inc. 4,209 134,478Premier, Inc., Class A 5,207 176,257Select Medical Holdings Corp. (A) 4,669 159,213Star Equity Holdings, Inc. (A) 310 967Surgery Partners, Inc. (A) 396 17,527The Pennant Group, Inc. (A) 262 12,000Triple-S Management Corp., ClassB (A) 2,760 71,843Universal Health Services, Inc., ClassB 2,098 279,852
US Physical Therapy, Inc. 3,742 389,542
5,195,106Health care technology – 0.2%Allscripts Healthcare Solutions,Inc. (A) 9,018 135,405HealthStream, Inc. (A) 1,369 30,583HMS Holdings Corp. (A) 1,707 63,116
NextGen Healthcare, Inc. (A) 1,561 28,254
257,358Life sciences tools and services – 1.0%Harvard Bioscience, Inc. (A) 6,562 35,829Luminex Corp. 2,011 64,151Medpace Holdings, Inc. (A) 4,387 719,687
Syneos Health, Inc. (A) 10,507 796,956
1,616,623Pharmaceuticals – 1.2%Amphastar Pharmaceuticals, Inc. (A) 600 10,992Cumberland Pharmaceuticals, Inc. (A) 956 2,897Endo International PLC (A) 2,935 21,748Jazz Pharmaceuticals PLC (A) 733 120,483Perrigo Company PLC 4,847 196,158Phathom Pharmaceuticals, Inc. (A) 12,676 476,111Prestige Consumer Healthcare,Inc. (A) 2,372 104,558
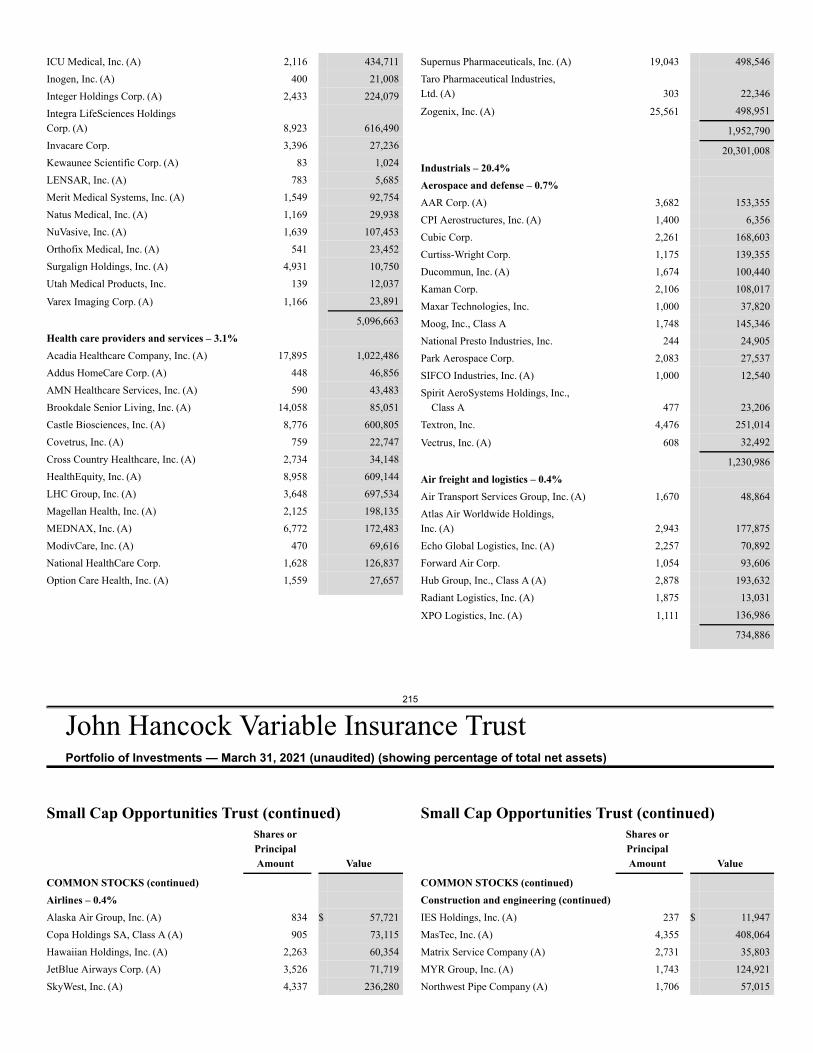
215
John Hancock Variable Insurance TrustPortfolio of Investments — March 31, 2021 (unaudited) (showing percentage of total net assets)
ICU Medical, Inc. (A) 2,116 434,711Inogen, Inc. (A) 400 21,008Integer Holdings Corp. (A) 2,433 224,079Integra LifeSciences HoldingsCorp. (A) 8,923 616,490Invacare Corp. 3,396 27,236Kewaunee Scientific Corp. (A) 83 1,024LENSAR, Inc. (A) 783 5,685Merit Medical Systems, Inc. (A) 1,549 92,754Natus Medical, Inc. (A) 1,169 29,938NuVasive, Inc. (A) 1,639 107,453Orthofix Medical, Inc. (A) 541 23,452Surgalign Holdings, Inc. (A) 4,931 10,750Utah Medical Products, Inc. 139 12,037
Varex Imaging Corp. (A) 1,166 23,891
5,096,663Health care providers and services – 3.1%Acadia Healthcare Company, Inc. (A) 17,895 1,022,486Addus HomeCare Corp. (A) 448 46,856AMN Healthcare Services, Inc. (A) 590 43,483Brookdale Senior Living, Inc. (A) 14,058 85,051Castle Biosciences, Inc. (A) 8,776 600,805Covetrus, Inc. (A) 759 22,747Cross Country Healthcare, Inc. (A) 2,734 34,148HealthEquity, Inc. (A) 8,958 609,144LHC Group, Inc. (A) 3,648 697,534Magellan Health, Inc. (A) 2,125 198,135MEDNAX, Inc. (A) 6,772 172,483ModivCare, Inc. (A) 470 69,616National HealthCare Corp. 1,628 126,837Option Care Health, Inc. (A) 1,559 27,657
Supernus Pharmaceuticals, Inc. (A) 19,043 498,546Taro Pharmaceutical Industries,Ltd. (A) 303 22,346
Zogenix, Inc. (A) 25,561 498,951
1,952,790
20,301,008Industrials – 20.4%Aerospace and defense – 0.7%AAR Corp. (A) 3,682 153,355CPI Aerostructures, Inc. (A) 1,400 6,356Cubic Corp. 2,261 168,603Curtiss-Wright Corp. 1,175 139,355Ducommun, Inc. (A) 1,674 100,440Kaman Corp. 2,106 108,017Maxar Technologies, Inc. 1,000 37,820Moog, Inc., Class A 1,748 145,346National Presto Industries, Inc. 244 24,905Park Aerospace Corp. 2,083 27,537SIFCO Industries, Inc. (A) 1,000 12,540Spirit AeroSystems Holdings, Inc.,
Class A 477 23,206Textron, Inc. 4,476 251,014
Vectrus, Inc. (A) 608 32,492
1,230,986Air freight and logistics – 0.4%Air Transport Services Group, Inc. (A) 1,670 48,864Atlas Air Worldwide Holdings,Inc. (A) 2,943 177,875Echo Global Logistics, Inc. (A) 2,257 70,892Forward Air Corp. 1,054 93,606Hub Group, Inc., Class A (A) 2,878 193,632Radiant Logistics, Inc. (A) 1,875 13,031
XPO Logistics, Inc. (A) 1,111 136,986
734,886
Small Cap Opportunities Trust (continued)Shares orPrincipalAmount Value
COMMON STOCKS (continued)Airlines – 0.4%Alaska Air Group, Inc. (A) 834 $ 57,721Copa Holdings SA, Class A (A) 905 73,115Hawaiian Holdings, Inc. (A) 2,263 60,354JetBlue Airways Corp. (A) 3,526 71,719SkyWest, Inc. (A) 4,337 236,280
Small Cap Opportunities Trust (continued)Shares orPrincipalAmount Value
COMMON STOCKS (continued)Construction and engineering (continued)IES Holdings, Inc. (A) 237 $ 11,947MasTec, Inc. (A) 4,355 408,064Matrix Service Company (A) 2,731 35,803MYR Group, Inc. (A) 1,743 124,921Northwest Pipe Company (A) 1,706 57,015
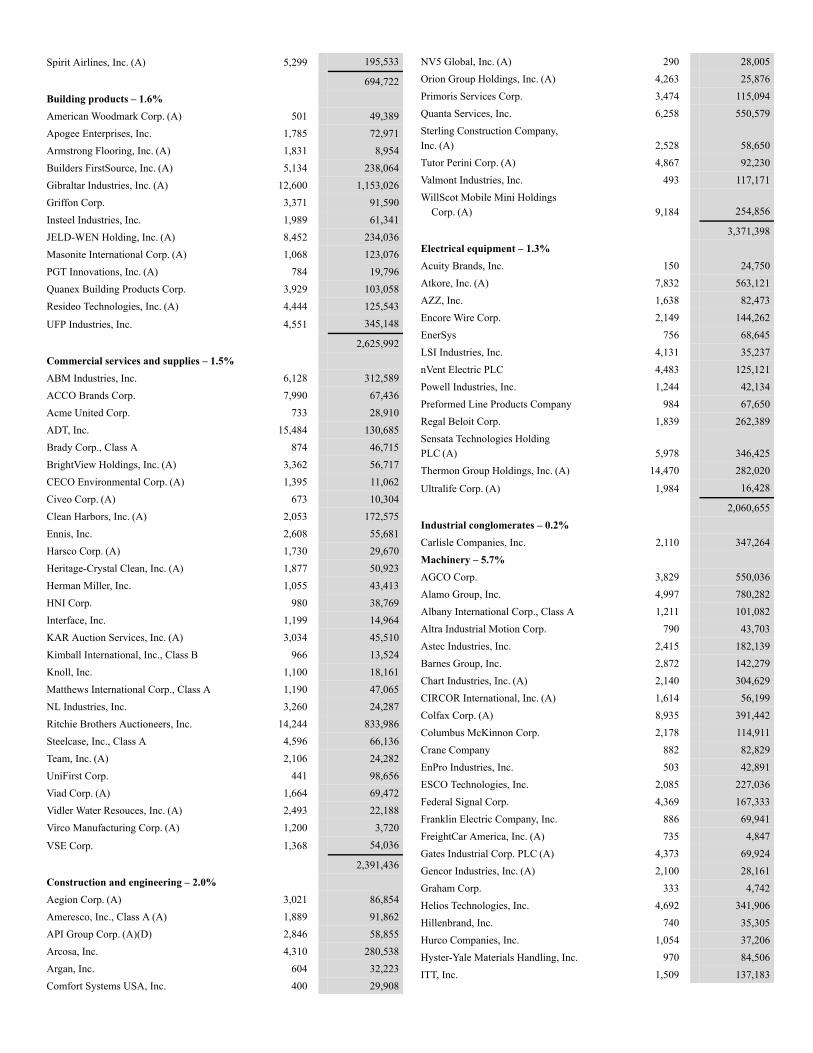
Spirit Airlines, Inc. (A) 5,299 195,533
694,722Building products – 1.6%American Woodmark Corp. (A) 501 49,389Apogee Enterprises, Inc. 1,785 72,971Armstrong Flooring, Inc. (A) 1,831 8,954Builders FirstSource, Inc. (A) 5,134 238,064Gibraltar Industries, Inc. (A) 12,600 1,153,026Griffon Corp. 3,371 91,590Insteel Industries, Inc. 1,989 61,341JELD-WEN Holding, Inc. (A) 8,452 234,036Masonite International Corp. (A) 1,068 123,076PGT Innovations, Inc. (A) 784 19,796Quanex Building Products Corp. 3,929 103,058Resideo Technologies, Inc. (A) 4,444 125,543
UFP Industries, Inc. 4,551 345,148
2,625,992Commercial services and supplies – 1.5%ABM Industries, Inc. 6,128 312,589ACCO Brands Corp. 7,990 67,436Acme United Corp. 733 28,910ADT, Inc. 15,484 130,685Brady Corp., Class A 874 46,715BrightView Holdings, Inc. (A) 3,362 56,717CECO Environmental Corp. (A) 1,395 11,062Civeo Corp. (A) 673 10,304Clean Harbors, Inc. (A) 2,053 172,575Ennis, Inc. 2,608 55,681Harsco Corp. (A) 1,730 29,670Heritage-Crystal Clean, Inc. (A) 1,877 50,923Herman Miller, Inc. 1,055 43,413HNI Corp. 980 38,769Interface, Inc. 1,199 14,964KAR Auction Services, Inc. (A) 3,034 45,510Kimball International, Inc., Class B 966 13,524Knoll, Inc. 1,100 18,161Matthews International Corp., Class A 1,190 47,065NL Industries, Inc. 3,260 24,287Ritchie Brothers Auctioneers, Inc. 14,244 833,986Steelcase, Inc., Class A 4,596 66,136Team, Inc. (A) 2,106 24,282UniFirst Corp. 441 98,656Viad Corp. (A) 1,664 69,472Vidler Water Resouces, Inc. (A) 2,493 22,188Virco Manufacturing Corp. (A) 1,200 3,720
VSE Corp. 1,368 54,036
2,391,436Construction and engineering – 2.0%Aegion Corp. (A) 3,021 86,854Ameresco, Inc., Class A (A) 1,889 91,862API Group Corp. (A)(D) 2,846 58,855Arcosa, Inc. 4,310 280,538Argan, Inc. 604 32,223Comfort Systems USA, Inc. 400 29,908
NV5 Global, Inc. (A) 290 28,005Orion Group Holdings, Inc. (A) 4,263 25,876Primoris Services Corp. 3,474 115,094Quanta Services, Inc. 6,258 550,579Sterling Construction Company,Inc. (A) 2,528 58,650Tutor Perini Corp. (A) 4,867 92,230Valmont Industries, Inc. 493 117,171WillScot Mobile Mini Holdings
Corp. (A) 9,184 254,856
3,371,398Electrical equipment – 1.3%Acuity Brands, Inc. 150 24,750Atkore, Inc. (A) 7,832 563,121AZZ, Inc. 1,638 82,473Encore Wire Corp. 2,149 144,262EnerSys 756 68,645LSI Industries, Inc. 4,131 35,237nVent Electric PLC 4,483 125,121Powell Industries, Inc. 1,244 42,134Preformed Line Products Company 984 67,650Regal Beloit Corp. 1,839 262,389Sensata Technologies HoldingPLC (A) 5,978 346,425Thermon Group Holdings, Inc. (A) 14,470 282,020
Ultralife Corp. (A) 1,984 16,428
2,060,655Industrial conglomerates – 0.2%Carlisle Companies, Inc. 2,110 347,264Machinery – 5.7%AGCO Corp. 3,829 550,036Alamo Group, Inc. 4,997 780,282Albany International Corp., Class A 1,211 101,082Altra Industrial Motion Corp. 790 43,703Astec Industries, Inc. 2,415 182,139Barnes Group, Inc. 2,872 142,279Chart Industries, Inc. (A) 2,140 304,629CIRCOR International, Inc. (A) 1,614 56,199Colfax Corp. (A) 8,935 391,442Columbus McKinnon Corp. 2,178 114,911Crane Company 882 82,829EnPro Industries, Inc. 503 42,891ESCO Technologies, Inc. 2,085 227,036Federal Signal Corp. 4,369 167,333Franklin Electric Company, Inc. 886 69,941FreightCar America, Inc. (A) 735 4,847Gates Industrial Corp. PLC (A) 4,373 69,924Gencor Industries, Inc. (A) 2,100 28,161Graham Corp. 333 4,742Helios Technologies, Inc. 4,692 341,906Hillenbrand, Inc. 740 35,305Hurco Companies, Inc. 1,054 37,206Hyster-Yale Materials Handling, Inc. 970 84,506ITT, Inc. 1,509 137,183
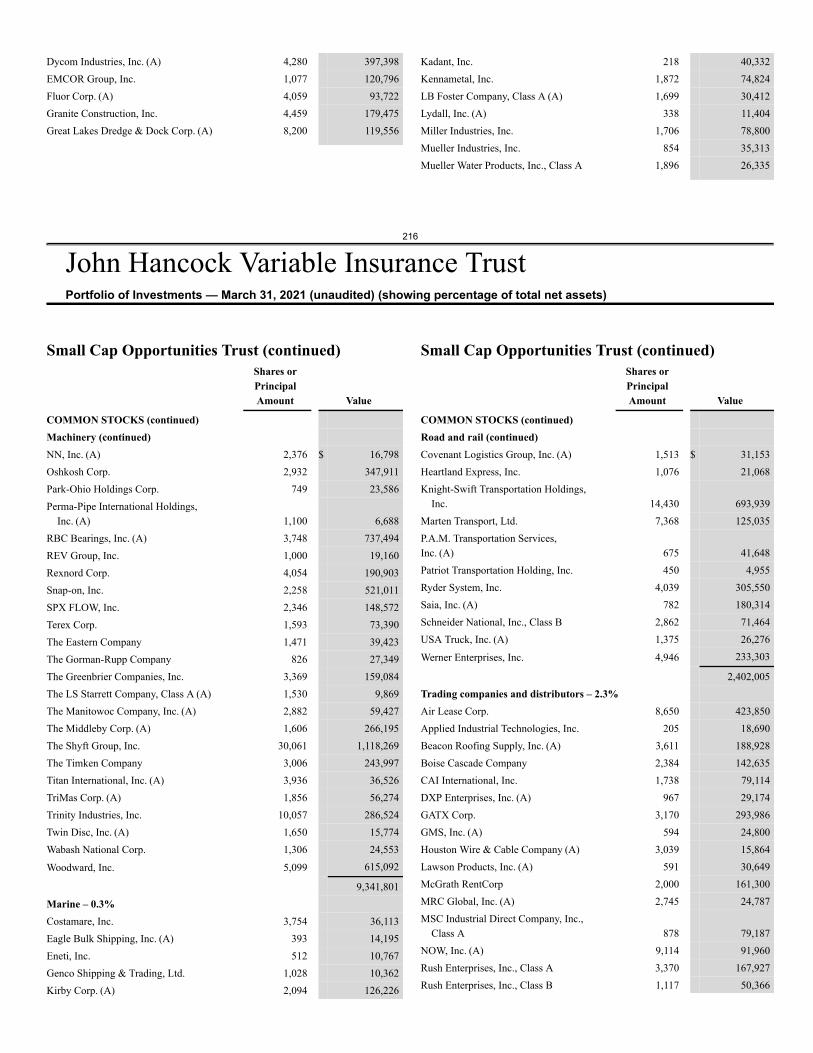
216
John Hancock Variable Insurance TrustPortfolio of Investments — March 31, 2021 (unaudited) (showing percentage of total net assets)
Dycom Industries, Inc. (A) 4,280 397,398EMCOR Group, Inc. 1,077 120,796Fluor Corp. (A) 4,059 93,722Granite Construction, Inc. 4,459 179,475Great Lakes Dredge & Dock Corp. (A) 8,200 119,556
Kadant, Inc. 218 40,332Kennametal, Inc. 1,872 74,824LB Foster Company, Class A (A) 1,699 30,412Lydall, Inc. (A) 338 11,404Miller Industries, Inc. 1,706 78,800Mueller Industries, Inc. 854 35,313Mueller Water Products, Inc., Class A 1,896 26,335
Small Cap Opportunities Trust (continued)Shares orPrincipalAmount Value
COMMON STOCKS (continued)Machinery (continued)NN, Inc. (A) 2,376 $ 16,798Oshkosh Corp. 2,932 347,911Park-Ohio Holdings Corp. 749 23,586Perma-Pipe International Holdings,
Inc. (A) 1,100 6,688RBC Bearings, Inc. (A) 3,748 737,494REV Group, Inc. 1,000 19,160Rexnord Corp. 4,054 190,903Snap-on, Inc. 2,258 521,011SPX FLOW, Inc. 2,346 148,572Terex Corp. 1,593 73,390The Eastern Company 1,471 39,423The Gorman-Rupp Company 826 27,349The Greenbrier Companies, Inc. 3,369 159,084The LS Starrett Company, Class A (A) 1,530 9,869The Manitowoc Company, Inc. (A) 2,882 59,427The Middleby Corp. (A) 1,606 266,195The Shyft Group, Inc. 30,061 1,118,269The Timken Company 3,006 243,997Titan International, Inc. (A) 3,936 36,526TriMas Corp. (A) 1,856 56,274Trinity Industries, Inc. 10,057 286,524Twin Disc, Inc. (A) 1,650 15,774Wabash National Corp. 1,306 24,553
Woodward, Inc. 5,099 615,092
9,341,801Marine – 0.3%Costamare, Inc. 3,754 36,113Eagle Bulk Shipping, Inc. (A) 393 14,195Eneti, Inc. 512 10,767Genco Shipping & Trading, Ltd. 1,028 10,362Kirby Corp. (A) 2,094 126,226
Small Cap Opportunities Trust (continued)Shares orPrincipalAmount Value
COMMON STOCKS (continued)Road and rail (continued)Covenant Logistics Group, Inc. (A) 1,513 $ 31,153Heartland Express, Inc. 1,076 21,068Knight-Swift Transportation Holdings,
Inc. 14,430 693,939Marten Transport, Ltd. 7,368 125,035P.A.M. Transportation Services,Inc. (A) 675 41,648Patriot Transportation Holding, Inc. 450 4,955Ryder System, Inc. 4,039 305,550Saia, Inc. (A) 782 180,314Schneider National, Inc., Class B 2,862 71,464USA Truck, Inc. (A) 1,375 26,276
Werner Enterprises, Inc. 4,946 233,303
2,402,005Trading companies and distributors – 2.3%Air Lease Corp. 8,650 423,850Applied Industrial Technologies, Inc. 205 18,690Beacon Roofing Supply, Inc. (A) 3,611 188,928Boise Cascade Company 2,384 142,635CAI International, Inc. 1,738 79,114DXP Enterprises, Inc. (A) 967 29,174GATX Corp. 3,170 293,986GMS, Inc. (A) 594 24,800Houston Wire & Cable Company (A) 3,039 15,864Lawson Products, Inc. (A) 591 30,649McGrath RentCorp 2,000 161,300MRC Global, Inc. (A) 2,745 24,787MSC Industrial Direct Company, Inc.,
Class A 878 79,187NOW, Inc. (A) 9,114 91,960Rush Enterprises, Inc., Class A 3,370 167,927Rush Enterprises, Inc., Class B 1,117 50,366
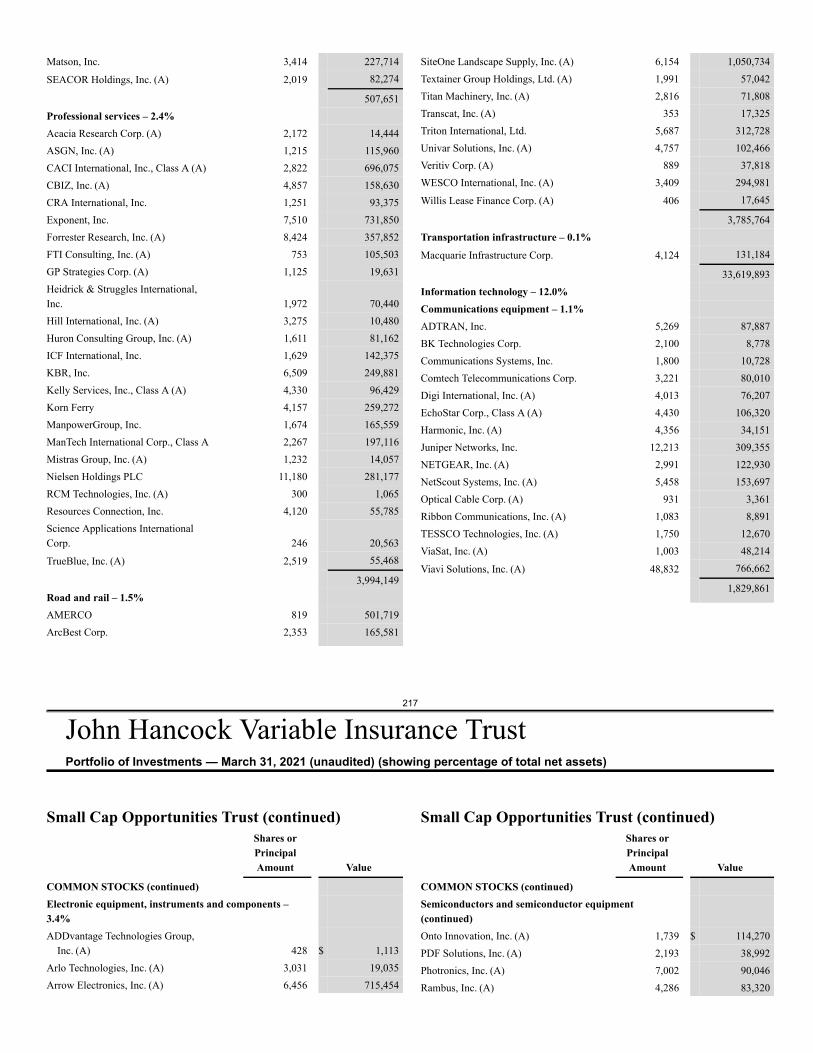
217
John Hancock Variable Insurance TrustPortfolio of Investments — March 31, 2021 (unaudited) (showing percentage of total net assets)
Matson, Inc. 3,414 227,714
SEACOR Holdings, Inc. (A) 2,019 82,274
507,651Professional services – 2.4%Acacia Research Corp. (A) 2,172 14,444ASGN, Inc. (A) 1,215 115,960CACI International, Inc., Class A (A) 2,822 696,075CBIZ, Inc. (A) 4,857 158,630CRA International, Inc. 1,251 93,375Exponent, Inc. 7,510 731,850Forrester Research, Inc. (A) 8,424 357,852FTI Consulting, Inc. (A) 753 105,503GP Strategies Corp. (A) 1,125 19,631Heidrick & Struggles International,Inc. 1,972 70,440Hill International, Inc. (A) 3,275 10,480Huron Consulting Group, Inc. (A) 1,611 81,162ICF International, Inc. 1,629 142,375KBR, Inc. 6,509 249,881Kelly Services, Inc., Class A (A) 4,330 96,429Korn Ferry 4,157 259,272ManpowerGroup, Inc. 1,674 165,559ManTech International Corp., Class A 2,267 197,116Mistras Group, Inc. (A) 1,232 14,057Nielsen Holdings PLC 11,180 281,177RCM Technologies, Inc. (A) 300 1,065Resources Connection, Inc. 4,120 55,785Science Applications InternationalCorp. 246 20,563
TrueBlue, Inc. (A) 2,519 55,468
3,994,149Road and rail – 1.5%AMERCO 819 501,719ArcBest Corp. 2,353 165,581
SiteOne Landscape Supply, Inc. (A) 6,154 1,050,734Textainer Group Holdings, Ltd. (A) 1,991 57,042Titan Machinery, Inc. (A) 2,816 71,808Transcat, Inc. (A) 353 17,325Triton International, Ltd. 5,687 312,728Univar Solutions, Inc. (A) 4,757 102,466Veritiv Corp. (A) 889 37,818WESCO International, Inc. (A) 3,409 294,981
Willis Lease Finance Corp. (A) 406 17,645
3,785,764Transportation infrastructure – 0.1%Macquarie Infrastructure Corp. 4,124 131,184
33,619,893Information technology – 12.0%Communications equipment – 1.1%ADTRAN, Inc. 5,269 87,887BK Technologies Corp. 2,100 8,778Communications Systems, Inc. 1,800 10,728Comtech Telecommunications Corp. 3,221 80,010Digi International, Inc. (A) 4,013 76,207EchoStar Corp., Class A (A) 4,430 106,320Harmonic, Inc. (A) 4,356 34,151Juniper Networks, Inc. 12,213 309,355NETGEAR, Inc. (A) 2,991 122,930NetScout Systems, Inc. (A) 5,458 153,697Optical Cable Corp. (A) 931 3,361Ribbon Communications, Inc. (A) 1,083 8,891TESSCO Technologies, Inc. (A) 1,750 12,670ViaSat, Inc. (A) 1,003 48,214
Viavi Solutions, Inc. (A) 48,832 766,662
1,829,861
Small Cap Opportunities Trust (continued)Shares orPrincipalAmount Value
COMMON STOCKS (continued)Electronic equipment, instruments and components –3.4%ADDvantage Technologies Group,
Inc. (A) 428 $ 1,113Arlo Technologies, Inc. (A) 3,031 19,035Arrow Electronics, Inc. (A) 6,456 715,454
Small Cap Opportunities Trust (continued)Shares orPrincipalAmount Value
COMMON STOCKS (continued)Semiconductors and semiconductor equipment(continued)Onto Innovation, Inc. (A) 1,739 $ 114,270PDF Solutions, Inc. (A) 2,193 38,992Photronics, Inc. (A) 7,002 90,046Rambus, Inc. (A) 4,286 83,320
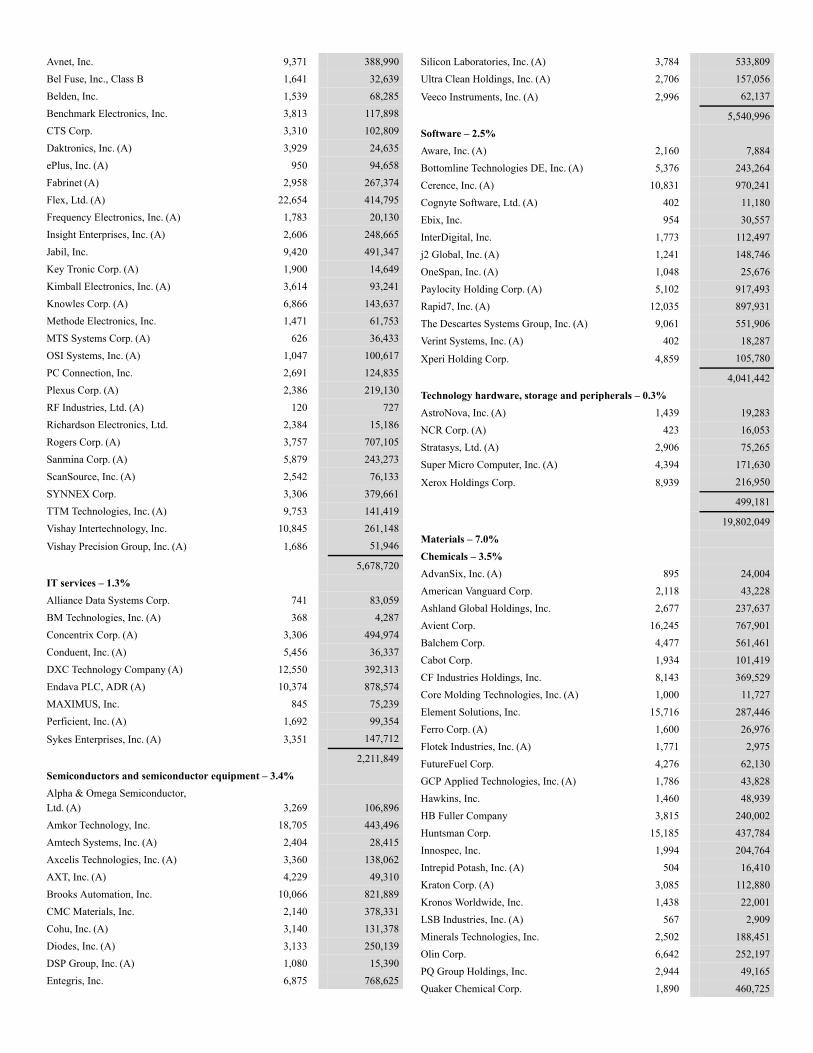
Avnet, Inc. 9,371 388,990Bel Fuse, Inc., Class B 1,641 32,639Belden, Inc. 1,539 68,285Benchmark Electronics, Inc. 3,813 117,898CTS Corp. 3,310 102,809Daktronics, Inc. (A) 3,929 24,635ePlus, Inc. (A) 950 94,658Fabrinet (A) 2,958 267,374Flex, Ltd. (A) 22,654 414,795Frequency Electronics, Inc. (A) 1,783 20,130Insight Enterprises, Inc. (A) 2,606 248,665Jabil, Inc. 9,420 491,347Key Tronic Corp. (A) 1,900 14,649Kimball Electronics, Inc. (A) 3,614 93,241Knowles Corp. (A) 6,866 143,637Methode Electronics, Inc. 1,471 61,753MTS Systems Corp. (A) 626 36,433OSI Systems, Inc. (A) 1,047 100,617PC Connection, Inc. 2,691 124,835Plexus Corp. (A) 2,386 219,130RF Industries, Ltd. (A) 120 727Richardson Electronics, Ltd. 2,384 15,186Rogers Corp. (A) 3,757 707,105Sanmina Corp. (A) 5,879 243,273ScanSource, Inc. (A) 2,542 76,133SYNNEX Corp. 3,306 379,661TTM Technologies, Inc. (A) 9,753 141,419Vishay Intertechnology, Inc. 10,845 261,148
Vishay Precision Group, Inc. (A) 1,686 51,946
5,678,720IT services – 1.3%Alliance Data Systems Corp. 741 83,059BM Technologies, Inc. (A) 368 4,287Concentrix Corp. (A) 3,306 494,974Conduent, Inc. (A) 5,456 36,337DXC Technology Company (A) 12,550 392,313Endava PLC, ADR (A) 10,374 878,574MAXIMUS, Inc. 845 75,239Perficient, Inc. (A) 1,692 99,354
Sykes Enterprises, Inc. (A) 3,351 147,712
2,211,849Semiconductors and semiconductor equipment – 3.4%Alpha & Omega Semiconductor,Ltd. (A) 3,269 106,896Amkor Technology, Inc. 18,705 443,496Amtech Systems, Inc. (A) 2,404 28,415Axcelis Technologies, Inc. (A) 3,360 138,062AXT, Inc. (A) 4,229 49,310Brooks Automation, Inc. 10,066 821,889CMC Materials, Inc. 2,140 378,331Cohu, Inc. (A) 3,140 131,378Diodes, Inc. (A) 3,133 250,139DSP Group, Inc. (A) 1,080 15,390Entegris, Inc. 6,875 768,625
Silicon Laboratories, Inc. (A) 3,784 533,809Ultra Clean Holdings, Inc. (A) 2,706 157,056
Veeco Instruments, Inc. (A) 2,996 62,137
5,540,996Software – 2.5%Aware, Inc. (A) 2,160 7,884Bottomline Technologies DE, Inc. (A) 5,376 243,264Cerence, Inc. (A) 10,831 970,241Cognyte Software, Ltd. (A) 402 11,180Ebix, Inc. 954 30,557InterDigital, Inc. 1,773 112,497j2 Global, Inc. (A) 1,241 148,746OneSpan, Inc. (A) 1,048 25,676Paylocity Holding Corp. (A) 5,102 917,493Rapid7, Inc. (A) 12,035 897,931The Descartes Systems Group, Inc. (A) 9,061 551,906Verint Systems, Inc. (A) 402 18,287
Xperi Holding Corp. 4,859 105,780
4,041,442Technology hardware, storage and peripherals – 0.3%AstroNova, Inc. (A) 1,439 19,283NCR Corp. (A) 423 16,053Stratasys, Ltd. (A) 2,906 75,265Super Micro Computer, Inc. (A) 4,394 171,630
Xerox Holdings Corp. 8,939 216,950
499,181
19,802,049Materials – 7.0%Chemicals – 3.5%AdvanSix, Inc. (A) 895 24,004American Vanguard Corp. 2,118 43,228Ashland Global Holdings, Inc. 2,677 237,637Avient Corp. 16,245 767,901Balchem Corp. 4,477 561,461Cabot Corp. 1,934 101,419CF Industries Holdings, Inc. 8,143 369,529Core Molding Technologies, Inc. (A) 1,000 11,727Element Solutions, Inc. 15,716 287,446Ferro Corp. (A) 1,600 26,976Flotek Industries, Inc. (A) 1,771 2,975FutureFuel Corp. 4,276 62,130GCP Applied Technologies, Inc. (A) 1,786 43,828Hawkins, Inc. 1,460 48,939HB Fuller Company 3,815 240,002Huntsman Corp. 15,185 437,784Innospec, Inc. 1,994 204,764Intrepid Potash, Inc. (A) 504 16,410Kraton Corp. (A) 3,085 112,880Kronos Worldwide, Inc. 1,438 22,001LSB Industries, Inc. (A) 567 2,909Minerals Technologies, Inc. 2,502 188,451Olin Corp. 6,642 252,197PQ Group Holdings, Inc. 2,944 49,165Quaker Chemical Corp. 1,890 460,725
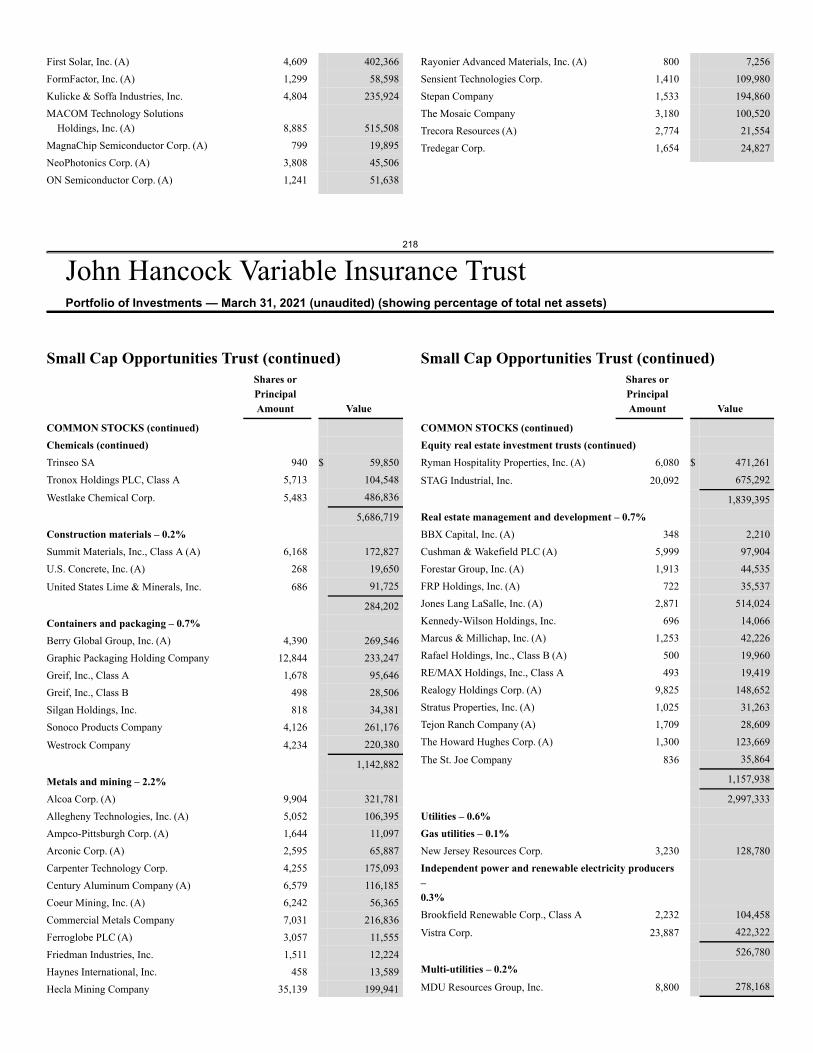
218
John Hancock Variable Insurance TrustPortfolio of Investments — March 31, 2021 (unaudited) (showing percentage of total net assets)
First Solar, Inc. (A) 4,609 402,366FormFactor, Inc. (A) 1,299 58,598Kulicke & Soffa Industries, Inc. 4,804 235,924MACOM Technology Solutions
Holdings, Inc. (A) 8,885 515,508MagnaChip Semiconductor Corp. (A) 799 19,895NeoPhotonics Corp. (A) 3,808 45,506ON Semiconductor Corp. (A) 1,241 51,638
Rayonier Advanced Materials, Inc. (A) 800 7,256Sensient Technologies Corp. 1,410 109,980Stepan Company 1,533 194,860The Mosaic Company 3,180 100,520Trecora Resources (A) 2,774 21,554Tredegar Corp. 1,654 24,827
Small Cap Opportunities Trust (continued)Shares orPrincipalAmount Value
COMMON STOCKS (continued)Chemicals (continued)Trinseo SA 940 $ 59,850Tronox Holdings PLC, Class A 5,713 104,548
Westlake Chemical Corp. 5,483 486,836
5,686,719Construction materials – 0.2%Summit Materials, Inc., Class A (A) 6,168 172,827U.S. Concrete, Inc. (A) 268 19,650
United States Lime & Minerals, Inc. 686 91,725
284,202Containers and packaging – 0.7%Berry Global Group, Inc. (A) 4,390 269,546Graphic Packaging Holding Company 12,844 233,247Greif, Inc., Class A 1,678 95,646Greif, Inc., Class B 498 28,506Silgan Holdings, Inc. 818 34,381Sonoco Products Company 4,126 261,176
Westrock Company 4,234 220,380
1,142,882Metals and mining – 2.2%Alcoa Corp. (A) 9,904 321,781Allegheny Technologies, Inc. (A) 5,052 106,395Ampco-Pittsburgh Corp. (A) 1,644 11,097Arconic Corp. (A) 2,595 65,887Carpenter Technology Corp. 4,255 175,093Century Aluminum Company (A) 6,579 116,185Coeur Mining, Inc. (A) 6,242 56,365Commercial Metals Company 7,031 216,836Ferroglobe PLC (A) 3,057 11,555Friedman Industries, Inc. 1,511 12,224Haynes International, Inc. 458 13,589Hecla Mining Company 35,139 199,941
Small Cap Opportunities Trust (continued)Shares orPrincipalAmount Value
COMMON STOCKS (continued)Equity real estate investment trusts (continued)Ryman Hospitality Properties, Inc. (A) 6,080 $ 471,261
STAG Industrial, Inc. 20,092 675,292
1,839,395Real estate management and development – 0.7%BBX Capital, Inc. (A) 348 2,210Cushman & Wakefield PLC (A) 5,999 97,904Forestar Group, Inc. (A) 1,913 44,535FRP Holdings, Inc. (A) 722 35,537Jones Lang LaSalle, Inc. (A) 2,871 514,024Kennedy-Wilson Holdings, Inc. 696 14,066Marcus & Millichap, Inc. (A) 1,253 42,226Rafael Holdings, Inc., Class B (A) 500 19,960RE/MAX Holdings, Inc., Class A 493 19,419Realogy Holdings Corp. (A) 9,825 148,652Stratus Properties, Inc. (A) 1,025 31,263Tejon Ranch Company (A) 1,709 28,609The Howard Hughes Corp. (A) 1,300 123,669
The St. Joe Company 836 35,864
1,157,938
2,997,333Utilities – 0.6%Gas utilities – 0.1%New Jersey Resources Corp. 3,230 128,780Independent power and renewable electricity producers–0.3%Brookfield Renewable Corp., Class A 2,232 104,458
Vistra Corp. 23,887 422,322
526,780Multi-utilities – 0.2%MDU Resources Group, Inc. 8,800 278,168
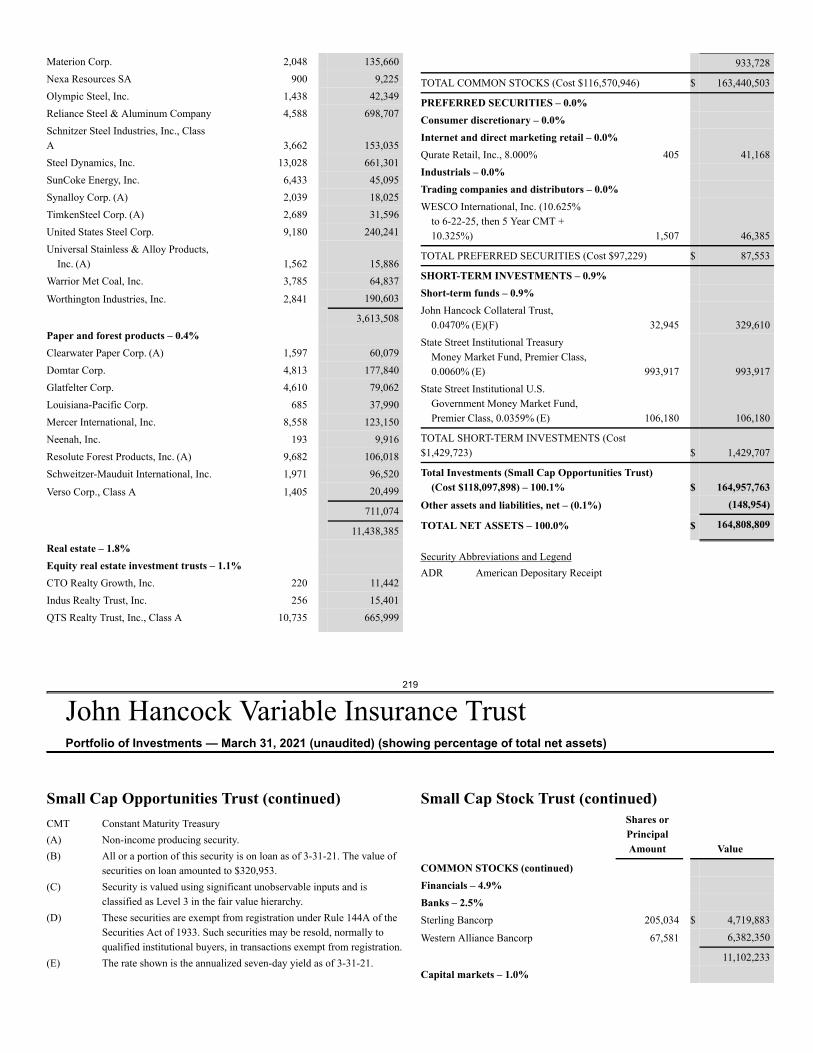
219
John Hancock Variable Insurance TrustPortfolio of Investments — March 31, 2021 (unaudited) (showing percentage of total net assets)
Materion Corp. 2,048 135,660Nexa Resources SA 900 9,225Olympic Steel, Inc. 1,438 42,349Reliance Steel & Aluminum Company 4,588 698,707Schnitzer Steel Industries, Inc., ClassA 3,662 153,035Steel Dynamics, Inc. 13,028 661,301SunCoke Energy, Inc. 6,433 45,095Synalloy Corp. (A) 2,039 18,025TimkenSteel Corp. (A) 2,689 31,596United States Steel Corp. 9,180 240,241Universal Stainless & Alloy Products,
Inc. (A) 1,562 15,886Warrior Met Coal, Inc. 3,785 64,837
Worthington Industries, Inc. 2,841 190,603
3,613,508Paper and forest products – 0.4%Clearwater Paper Corp. (A) 1,597 60,079Domtar Corp. 4,813 177,840Glatfelter Corp. 4,610 79,062Louisiana-Pacific Corp. 685 37,990Mercer International, Inc. 8,558 123,150Neenah, Inc. 193 9,916Resolute Forest Products, Inc. (A) 9,682 106,018Schweitzer-Mauduit International, Inc. 1,971 96,520
Verso Corp., Class A 1,405 20,499
711,074
11,438,385Real estate – 1.8%Equity real estate investment trusts – 1.1%CTO Realty Growth, Inc. 220 11,442Indus Realty Trust, Inc. 256 15,401QTS Realty Trust, Inc., Class A 10,735 665,999
933,728
TOTAL COMMON STOCKS (Cost $116,570,946) $ 163,440,503
PREFERRED SECURITIES – 0.0%Consumer discretionary – 0.0%Internet and direct marketing retail – 0.0%Qurate Retail, Inc., 8.000% 405 41,168Industrials – 0.0%Trading companies and distributors – 0.0%WESCO International, Inc. (10.625%
to 6-22-25, then 5 Year CMT +10.325%) 1,507 46,385
TOTAL PREFERRED SECURITIES (Cost $97,229) $ 87,553
SHORT-TERM INVESTMENTS – 0.9%Short-term funds – 0.9%John Hancock Collateral Trust,
0.0470% (E)(F) 32,945 329,610State Street Institutional Treasury
Money Market Fund, Premier Class,0.0060% (E) 993,917 993,917
State Street Institutional U.S.Government Money Market Fund,Premier Class, 0.0359% (E) 106,180 106,180
TOTAL SHORT-TERM INVESTMENTS (Cost$1,429,723) $ 1,429,707
Total Investments (Small Cap Opportunities Trust)(Cost $118,097,898) – 100.1% $ 164,957,763
Other assets and liabilities, net – (0.1%) (148,954)
TOTAL NET ASSETS – 100.0% $ 164,808,809
Security Abbreviations and LegendADR American Depositary Receipt
Small Cap Opportunities Trust (continued)CMT Constant Maturity Treasury(A) Non-income producing security.(B) All or a portion of this security is on loan as of 3-31-21. The value of
securities on loan amounted to $320,953.(C) Security is valued using significant unobservable inputs and is
classified as Level 3 in the fair value hierarchy.(D) These securities are exempt from registration under Rule 144A of the
Securities Act of 1933. Such securities may be resold, normally toqualified institutional buyers, in transactions exempt from registration.
(E) The rate shown is the annualized seven-day yield as of 3-31-21.
Small Cap Stock Trust (continued)Shares orPrincipalAmount Value
COMMON STOCKS (continued)Financials – 4.9%Banks – 2.5%Sterling Bancorp 205,034 $ 4,719,883
Western Alliance Bancorp 67,581 6,382,350
11,102,233Capital markets – 1.0%
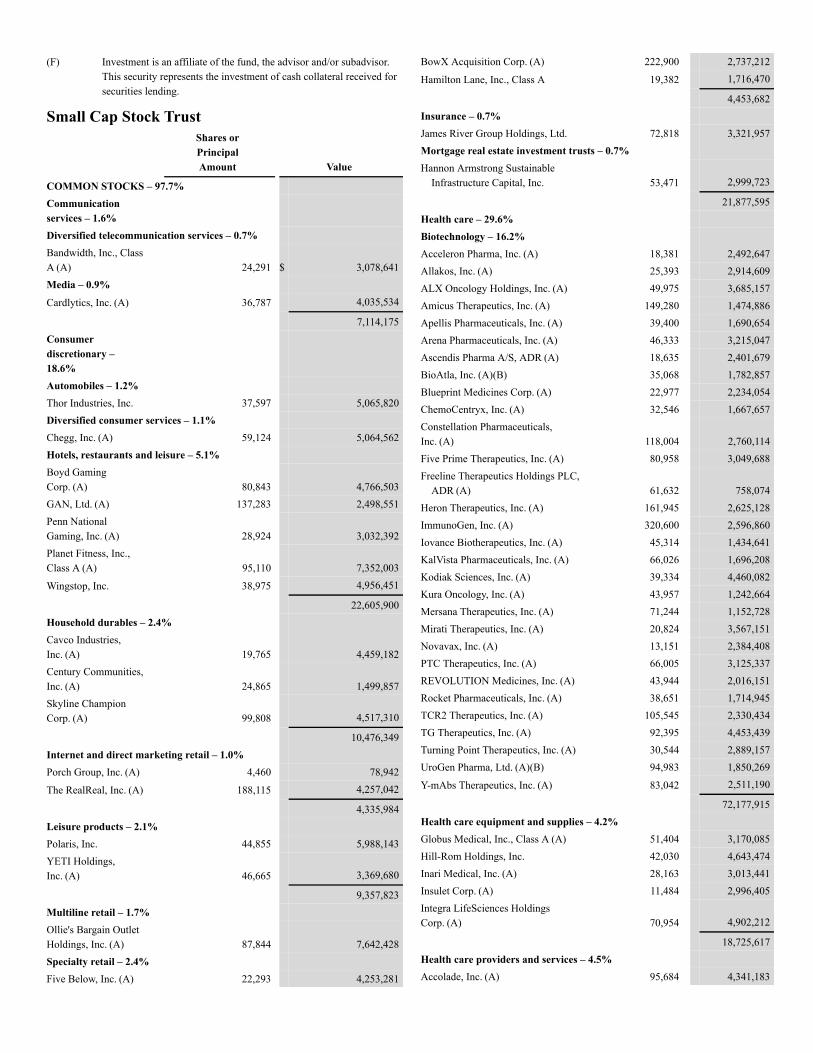
(F) Investment is an affiliate of the fund, the advisor and/or subadvisor.This security represents the investment of cash collateral received forsecurities lending.
Small Cap Stock TrustShares orPrincipalAmount Value
COMMON STOCKS – 97.7%Communicationservices – 1.6%Diversified telecommunication services – 0.7%Bandwidth, Inc., ClassA (A) 24,291 $ 3,078,641Media – 0.9%Cardlytics, Inc. (A) 36,787 4,035,534
7,114,175Consumerdiscretionary –18.6%Automobiles – 1.2%Thor Industries, Inc. 37,597 5,065,820Diversified consumer services – 1.1%Chegg, Inc. (A) 59,124 5,064,562Hotels, restaurants and leisure – 5.1%Boyd GamingCorp. (A) 80,843 4,766,503GAN, Ltd. (A) 137,283 2,498,551Penn NationalGaming, Inc. (A) 28,924 3,032,392Planet Fitness, Inc.,Class A (A) 95,110 7,352,003
Wingstop, Inc. 38,975 4,956,451
22,605,900Household durables – 2.4%Cavco Industries,Inc. (A) 19,765 4,459,182Century Communities,Inc. (A) 24,865 1,499,857Skyline ChampionCorp. (A) 99,808 4,517,310
10,476,349Internet and direct marketing retail – 1.0%Porch Group, Inc. (A) 4,460 78,942
The RealReal, Inc. (A) 188,115 4,257,042
4,335,984Leisure products – 2.1%Polaris, Inc. 44,855 5,988,143YETI Holdings,Inc. (A) 46,665 3,369,680
9,357,823Multiline retail – 1.7%Ollie's Bargain OutletHoldings, Inc. (A) 87,844 7,642,428Specialty retail – 2.4%Five Below, Inc. (A) 22,293 4,253,281
BowX Acquisition Corp. (A) 222,900 2,737,212
Hamilton Lane, Inc., Class A 19,382 1,716,470
4,453,682Insurance – 0.7%James River Group Holdings, Ltd. 72,818 3,321,957Mortgage real estate investment trusts – 0.7%Hannon Armstrong Sustainable
Infrastructure Capital, Inc. 53,471 2,999,723
21,877,595Health care – 29.6%Biotechnology – 16.2%Acceleron Pharma, Inc. (A) 18,381 2,492,647Allakos, Inc. (A) 25,393 2,914,609ALX Oncology Holdings, Inc. (A) 49,975 3,685,157Amicus Therapeutics, Inc. (A) 149,280 1,474,886Apellis Pharmaceuticals, Inc. (A) 39,400 1,690,654Arena Pharmaceuticals, Inc. (A) 46,333 3,215,047Ascendis Pharma A/S, ADR (A) 18,635 2,401,679BioAtla, Inc. (A)(B) 35,068 1,782,857Blueprint Medicines Corp. (A) 22,977 2,234,054ChemoCentryx, Inc. (A) 32,546 1,667,657Constellation Pharmaceuticals,Inc. (A) 118,004 2,760,114Five Prime Therapeutics, Inc. (A) 80,958 3,049,688Freeline Therapeutics Holdings PLC,
ADR (A) 61,632 758,074Heron Therapeutics, Inc. (A) 161,945 2,625,128ImmunoGen, Inc. (A) 320,600 2,596,860Iovance Biotherapeutics, Inc. (A) 45,314 1,434,641KalVista Pharmaceuticals, Inc. (A) 66,026 1,696,208Kodiak Sciences, Inc. (A) 39,334 4,460,082Kura Oncology, Inc. (A) 43,957 1,242,664Mersana Therapeutics, Inc. (A) 71,244 1,152,728Mirati Therapeutics, Inc. (A) 20,824 3,567,151Novavax, Inc. (A) 13,151 2,384,408PTC Therapeutics, Inc. (A) 66,005 3,125,337REVOLUTION Medicines, Inc. (A) 43,944 2,016,151Rocket Pharmaceuticals, Inc. (A) 38,651 1,714,945TCR2 Therapeutics, Inc. (A) 105,545 2,330,434TG Therapeutics, Inc. (A) 92,395 4,453,439Turning Point Therapeutics, Inc. (A) 30,544 2,889,157UroGen Pharma, Ltd. (A)(B) 94,983 1,850,269
Y-mAbs Therapeutics, Inc. (A) 83,042 2,511,190
72,177,915Health care equipment and supplies – 4.2%Globus Medical, Inc., Class A (A) 51,404 3,170,085Hill-Rom Holdings, Inc. 42,030 4,643,474Inari Medical, Inc. (A) 28,163 3,013,441Insulet Corp. (A) 11,484 2,996,405Integra LifeSciences HoldingsCorp. (A) 70,954 4,902,212
18,725,617Health care providers and services – 4.5%Accolade, Inc. (A) 95,684 4,341,183
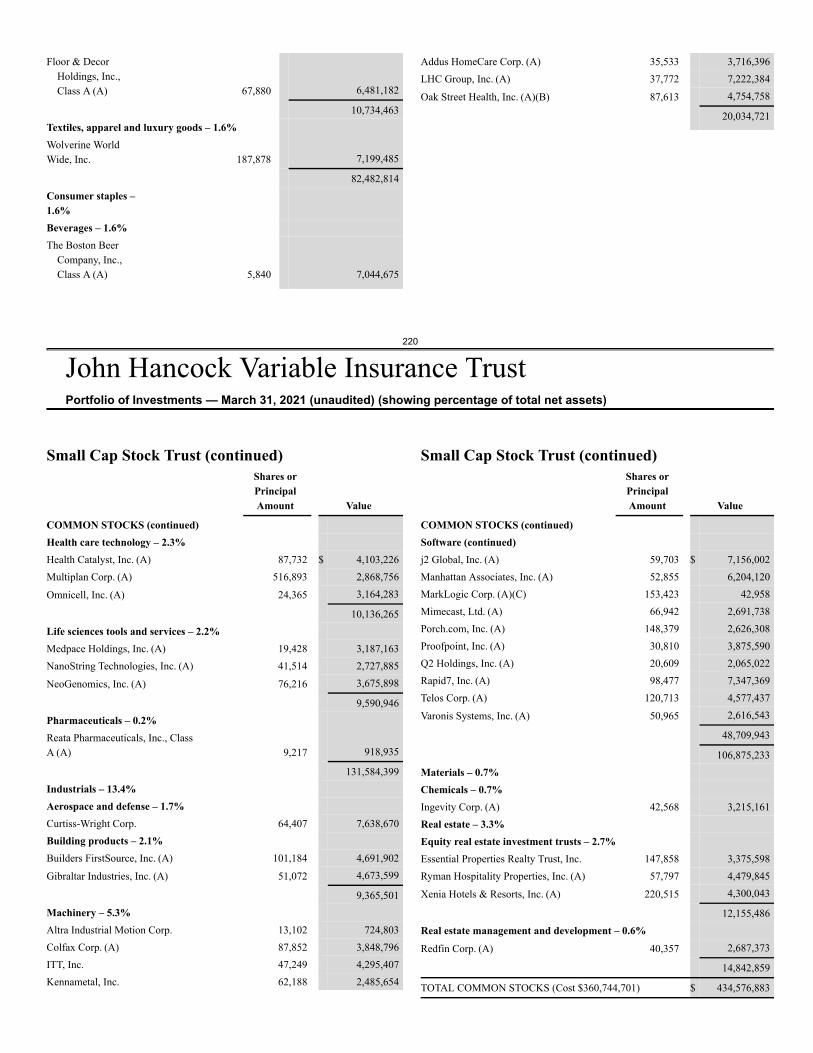
220
John Hancock Variable Insurance TrustPortfolio of Investments — March 31, 2021 (unaudited) (showing percentage of total net assets)
Floor & DecorHoldings, Inc.,Class A (A) 67,880 6,481,182
10,734,463Textiles, apparel and luxury goods – 1.6%Wolverine WorldWide, Inc. 187,878 7,199,485
82,482,814Consumer staples –1.6%Beverages – 1.6%The Boston Beer
Company, Inc.,Class A (A) 5,840 7,044,675
Addus HomeCare Corp. (A) 35,533 3,716,396LHC Group, Inc. (A) 37,772 7,222,384
Oak Street Health, Inc. (A)(B) 87,613 4,754,758
20,034,721
Small Cap Stock Trust (continued)Shares orPrincipalAmount Value
COMMON STOCKS (continued)Health care technology – 2.3%Health Catalyst, Inc. (A) 87,732 $ 4,103,226Multiplan Corp. (A) 516,893 2,868,756
Omnicell, Inc. (A) 24,365 3,164,283
10,136,265Life sciences tools and services – 2.2%Medpace Holdings, Inc. (A) 19,428 3,187,163NanoString Technologies, Inc. (A) 41,514 2,727,885
NeoGenomics, Inc. (A) 76,216 3,675,898
9,590,946Pharmaceuticals – 0.2%Reata Pharmaceuticals, Inc., ClassA (A) 9,217 918,935
131,584,399Industrials – 13.4%Aerospace and defense – 1.7%Curtiss-Wright Corp. 64,407 7,638,670Building products – 2.1%Builders FirstSource, Inc. (A) 101,184 4,691,902
Gibraltar Industries, Inc. (A) 51,072 4,673,599
9,365,501Machinery – 5.3%Altra Industrial Motion Corp. 13,102 724,803Colfax Corp. (A) 87,852 3,848,796ITT, Inc. 47,249 4,295,407Kennametal, Inc. 62,188 2,485,654
Small Cap Stock Trust (continued)Shares orPrincipalAmount Value
COMMON STOCKS (continued)Software (continued)j2 Global, Inc. (A) 59,703 $ 7,156,002Manhattan Associates, Inc. (A) 52,855 6,204,120MarkLogic Corp. (A)(C) 153,423 42,958Mimecast, Ltd. (A) 66,942 2,691,738Porch.com, Inc. (A) 148,379 2,626,308Proofpoint, Inc. (A) 30,810 3,875,590Q2 Holdings, Inc. (A) 20,609 2,065,022Rapid7, Inc. (A) 98,477 7,347,369Telos Corp. (A) 120,713 4,577,437
Varonis Systems, Inc. (A) 50,965 2,616,543
48,709,943
106,875,233Materials – 0.7%Chemicals – 0.7%Ingevity Corp. (A) 42,568 3,215,161Real estate – 3.3%Equity real estate investment trusts – 2.7%Essential Properties Realty Trust, Inc. 147,858 3,375,598Ryman Hospitality Properties, Inc. (A) 57,797 4,479,845
Xenia Hotels & Resorts, Inc. (A) 220,515 4,300,043
12,155,486Real estate management and development – 0.6%Redfin Corp. (A) 40,357 2,687,373
14,842,859
TOTAL COMMON STOCKS (Cost $360,744,701) $ 434,576,883
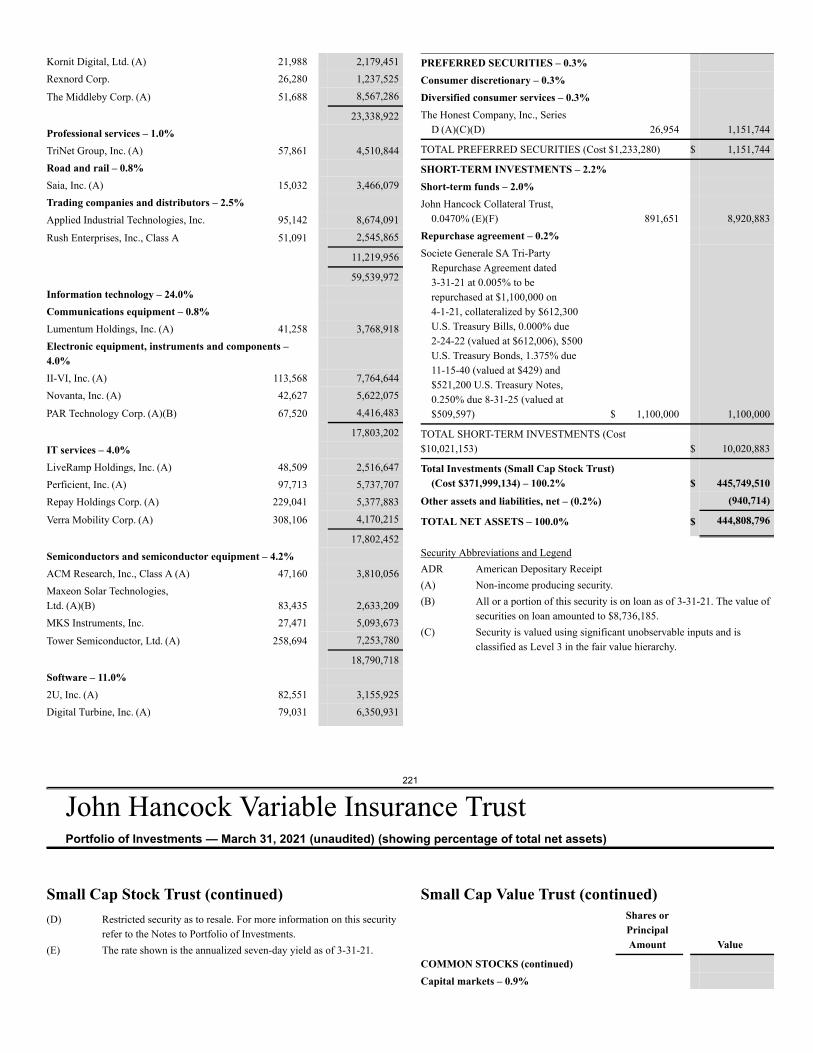
221
John Hancock Variable Insurance TrustPortfolio of Investments — March 31, 2021 (unaudited) (showing percentage of total net assets)
Kornit Digital, Ltd. (A) 21,988 2,179,451Rexnord Corp. 26,280 1,237,525
The Middleby Corp. (A) 51,688 8,567,286
23,338,922Professional services – 1.0%TriNet Group, Inc. (A) 57,861 4,510,844Road and rail – 0.8%Saia, Inc. (A) 15,032 3,466,079Trading companies and distributors – 2.5%Applied Industrial Technologies, Inc. 95,142 8,674,091
Rush Enterprises, Inc., Class A 51,091 2,545,865
11,219,956
59,539,972Information technology – 24.0%Communications equipment – 0.8%Lumentum Holdings, Inc. (A) 41,258 3,768,918Electronic equipment, instruments and components –4.0%II-VI, Inc. (A) 113,568 7,764,644Novanta, Inc. (A) 42,627 5,622,075
PAR Technology Corp. (A)(B) 67,520 4,416,483
17,803,202IT services – 4.0%LiveRamp Holdings, Inc. (A) 48,509 2,516,647Perficient, Inc. (A) 97,713 5,737,707Repay Holdings Corp. (A) 229,041 5,377,883
Verra Mobility Corp. (A) 308,106 4,170,215
17,802,452Semiconductors and semiconductor equipment – 4.2%ACM Research, Inc., Class A (A) 47,160 3,810,056Maxeon Solar Technologies,Ltd. (A)(B) 83,435 2,633,209MKS Instruments, Inc. 27,471 5,093,673
Tower Semiconductor, Ltd. (A) 258,694 7,253,780
18,790,718Software – 11.0%2U, Inc. (A) 82,551 3,155,925Digital Turbine, Inc. (A) 79,031 6,350,931
PREFERRED SECURITIES – 0.3%Consumer discretionary – 0.3%Diversified consumer services – 0.3%The Honest Company, Inc., Series
D (A)(C)(D) 26,954 1,151,744
TOTAL PREFERRED SECURITIES (Cost $1,233,280) $ 1,151,744
SHORT-TERM INVESTMENTS – 2.2%Short-term funds – 2.0%John Hancock Collateral Trust,
0.0470% (E)(F) 891,651 8,920,883Repurchase agreement – 0.2%Societe Generale SA Tri-Party
Repurchase Agreement dated3-31-21 at 0.005% to berepurchased at $1,100,000 on4-1-21, collateralized by $612,300U.S. Treasury Bills, 0.000% due2-24-22 (valued at $612,006), $500U.S. Treasury Bonds, 1.375% due11-15-40 (valued at $429) and$521,200 U.S. Treasury Notes,0.250% due 8-31-25 (valued at$509,597) $ 1,100,000 1,100,000
TOTAL SHORT-TERM INVESTMENTS (Cost$10,021,153) $ 10,020,883
Total Investments (Small Cap Stock Trust)(Cost $371,999,134) – 100.2% $ 445,749,510
Other assets and liabilities, net – (0.2%) (940,714)
TOTAL NET ASSETS – 100.0% $ 444,808,796
Security Abbreviations and LegendADR American Depositary Receipt(A) Non-income producing security.(B) All or a portion of this security is on loan as of 3-31-21. The value of
securities on loan amounted to $8,736,185.(C) Security is valued using significant unobservable inputs and is
classified as Level 3 in the fair value hierarchy.
Small Cap Stock Trust (continued)(D) Restricted security as to resale. For more information on this security
refer to the Notes to Portfolio of Investments.(E) The rate shown is the annualized seven-day yield as of 3-31-21.
Small Cap Value Trust (continued)Shares orPrincipalAmount Value
COMMON STOCKS (continued)Capital markets – 0.9%
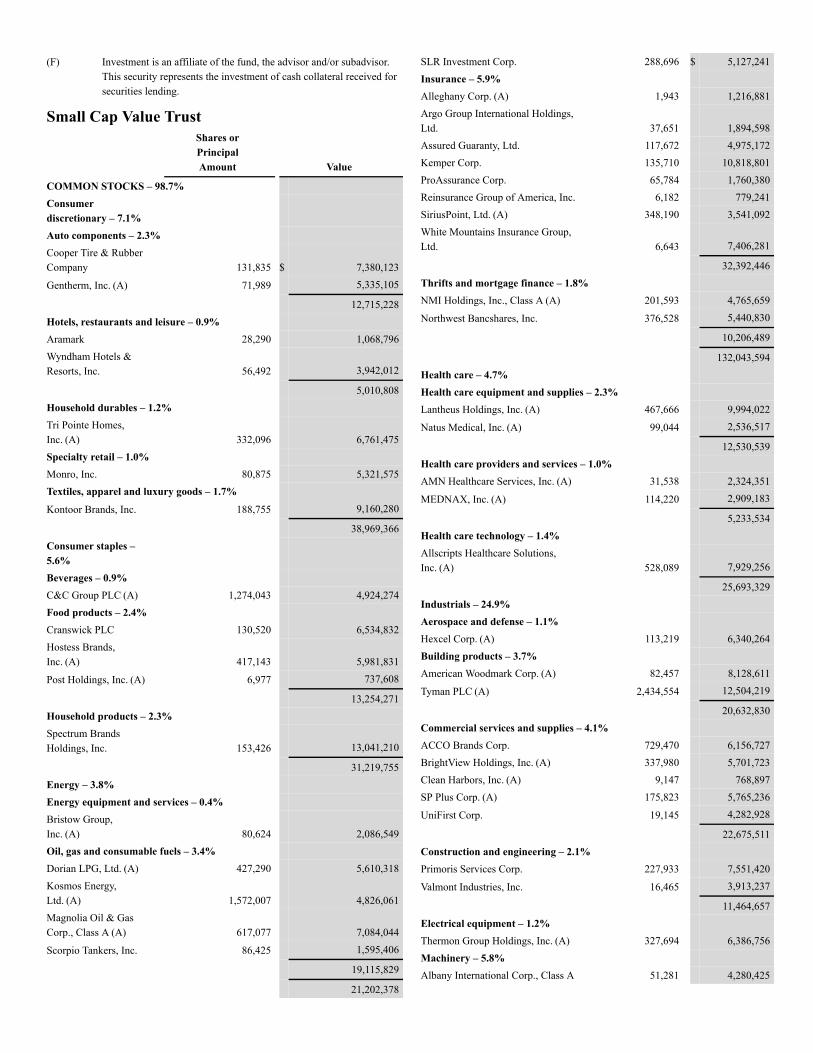
(F) Investment is an affiliate of the fund, the advisor and/or subadvisor.This security represents the investment of cash collateral received forsecurities lending.
Small Cap Value TrustShares orPrincipalAmount Value
COMMON STOCKS – 98.7%Consumerdiscretionary – 7.1%Auto components – 2.3%Cooper Tire & RubberCompany 131,835 $ 7,380,123
Gentherm, Inc. (A) 71,989 5,335,105
12,715,228Hotels, restaurants and leisure – 0.9%Aramark 28,290 1,068,796Wyndham Hotels &Resorts, Inc. 56,492 3,942,012
5,010,808Household durables – 1.2%Tri Pointe Homes,Inc. (A) 332,096 6,761,475Specialty retail – 1.0%Monro, Inc. 80,875 5,321,575Textiles, apparel and luxury goods – 1.7%Kontoor Brands, Inc. 188,755 9,160,280
38,969,366Consumer staples –5.6%Beverages – 0.9%C&C Group PLC (A) 1,274,043 4,924,274Food products – 2.4%Cranswick PLC 130,520 6,534,832Hostess Brands,Inc. (A) 417,143 5,981,831
Post Holdings, Inc. (A) 6,977 737,608
13,254,271Household products – 2.3%Spectrum BrandsHoldings, Inc. 153,426 13,041,210
31,219,755Energy – 3.8%Energy equipment and services – 0.4%Bristow Group,Inc. (A) 80,624 2,086,549Oil, gas and consumable fuels – 3.4%Dorian LPG, Ltd. (A) 427,290 5,610,318Kosmos Energy,Ltd. (A) 1,572,007 4,826,061Magnolia Oil & GasCorp., Class A (A) 617,077 7,084,044
Scorpio Tankers, Inc. 86,425 1,595,406
19,115,829
21,202,378
SLR Investment Corp. 288,696 $ 5,127,241Insurance – 5.9%Alleghany Corp. (A) 1,943 1,216,881Argo Group International Holdings,Ltd. 37,651 1,894,598Assured Guaranty, Ltd. 117,672 4,975,172Kemper Corp. 135,710 10,818,801ProAssurance Corp. 65,784 1,760,380Reinsurance Group of America, Inc. 6,182 779,241SiriusPoint, Ltd. (A) 348,190 3,541,092White Mountains Insurance Group,Ltd. 6,643 7,406,281
32,392,446Thrifts and mortgage finance – 1.8%NMI Holdings, Inc., Class A (A) 201,593 4,765,659
Northwest Bancshares, Inc. 376,528 5,440,830
10,206,489
132,043,594Health care – 4.7%Health care equipment and supplies – 2.3%Lantheus Holdings, Inc. (A) 467,666 9,994,022
Natus Medical, Inc. (A) 99,044 2,536,517
12,530,539Health care providers and services – 1.0%AMN Healthcare Services, Inc. (A) 31,538 2,324,351
MEDNAX, Inc. (A) 114,220 2,909,183
5,233,534Health care technology – 1.4%Allscripts Healthcare Solutions,Inc. (A) 528,089 7,929,256
25,693,329Industrials – 24.9%Aerospace and defense – 1.1%Hexcel Corp. (A) 113,219 6,340,264Building products – 3.7%American Woodmark Corp. (A) 82,457 8,128,611
Tyman PLC (A) 2,434,554 12,504,219
20,632,830Commercial services and supplies – 4.1%ACCO Brands Corp. 729,470 6,156,727BrightView Holdings, Inc. (A) 337,980 5,701,723Clean Harbors, Inc. (A) 9,147 768,897SP Plus Corp. (A) 175,823 5,765,236
UniFirst Corp. 19,145 4,282,928
22,675,511Construction and engineering – 2.1%Primoris Services Corp. 227,933 7,551,420
Valmont Industries, Inc. 16,465 3,913,237
11,464,657Electrical equipment – 1.2%Thermon Group Holdings, Inc. (A) 327,694 6,386,756Machinery – 5.8%Albany International Corp., Class A 51,281 4,280,425
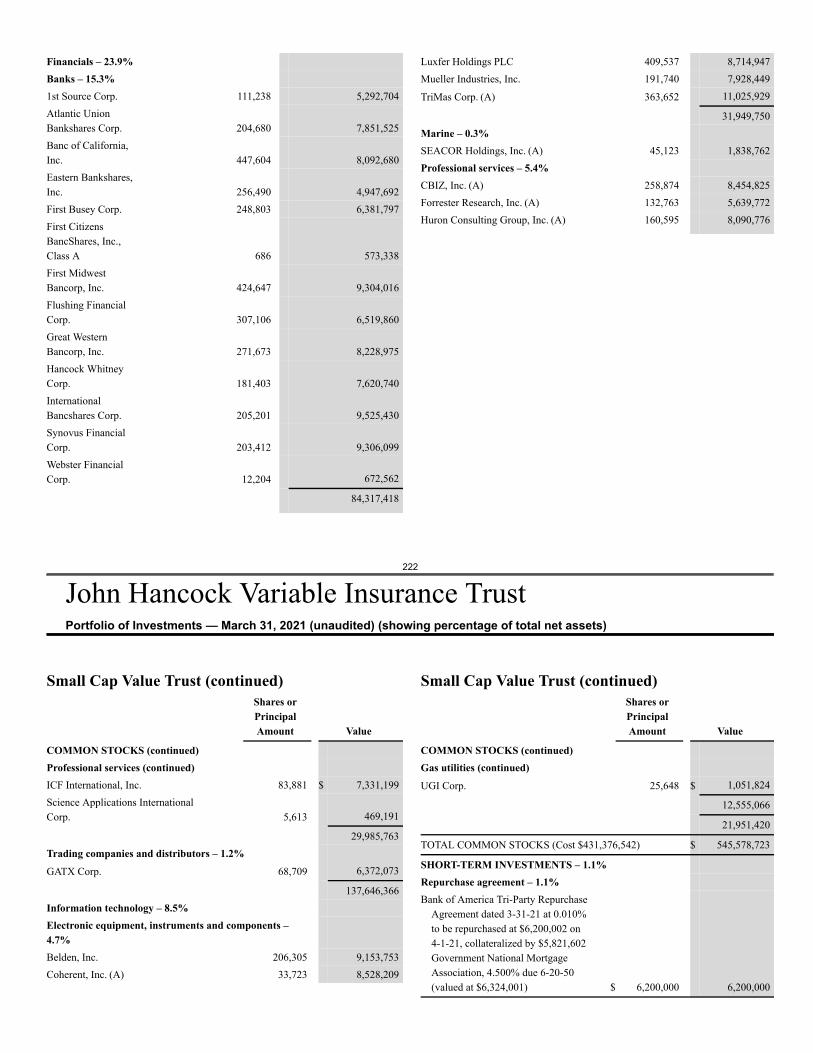
222
John Hancock Variable Insurance TrustPortfolio of Investments — March 31, 2021 (unaudited) (showing percentage of total net assets)
Financials – 23.9%Banks – 15.3%1st Source Corp. 111,238 5,292,704Atlantic UnionBankshares Corp. 204,680 7,851,525Banc of California,Inc. 447,604 8,092,680Eastern Bankshares,Inc. 256,490 4,947,692First Busey Corp. 248,803 6,381,797First CitizensBancShares, Inc.,Class A 686 573,338First MidwestBancorp, Inc. 424,647 9,304,016Flushing FinancialCorp. 307,106 6,519,860Great WesternBancorp, Inc. 271,673 8,228,975Hancock WhitneyCorp. 181,403 7,620,740InternationalBancshares Corp. 205,201 9,525,430Synovus FinancialCorp. 203,412 9,306,099Webster FinancialCorp. 12,204 672,562
84,317,418
Luxfer Holdings PLC 409,537 8,714,947Mueller Industries, Inc. 191,740 7,928,449
TriMas Corp. (A) 363,652 11,025,929
31,949,750Marine – 0.3%SEACOR Holdings, Inc. (A) 45,123 1,838,762Professional services – 5.4%CBIZ, Inc. (A) 258,874 8,454,825Forrester Research, Inc. (A) 132,763 5,639,772Huron Consulting Group, Inc. (A) 160,595 8,090,776
Small Cap Value Trust (continued)Shares orPrincipalAmount Value
COMMON STOCKS (continued)Professional services (continued)ICF International, Inc. 83,881 $ 7,331,199Science Applications InternationalCorp. 5,613 469,191
29,985,763Trading companies and distributors – 1.2%GATX Corp. 68,709 6,372,073
137,646,366Information technology – 8.5%Electronic equipment, instruments and components –4.7%Belden, Inc. 206,305 9,153,753Coherent, Inc. (A) 33,723 8,528,209
Small Cap Value Trust (continued)Shares orPrincipalAmount Value
COMMON STOCKS (continued)Gas utilities (continued)UGI Corp. 25,648 $ 1,051,824
12,555,066
21,951,420
TOTAL COMMON STOCKS (Cost $431,376,542) $ 545,578,723
SHORT-TERM INVESTMENTS – 1.1%Repurchase agreement – 1.1%Bank of America Tri-Party Repurchase
Agreement dated 3-31-21 at 0.010%to be repurchased at $6,200,002 on4-1-21, collateralized by $5,821,602Government National MortgageAssociation, 4.500% due 6-20-50(valued at $6,324,001) $ 6,200,000 6,200,000
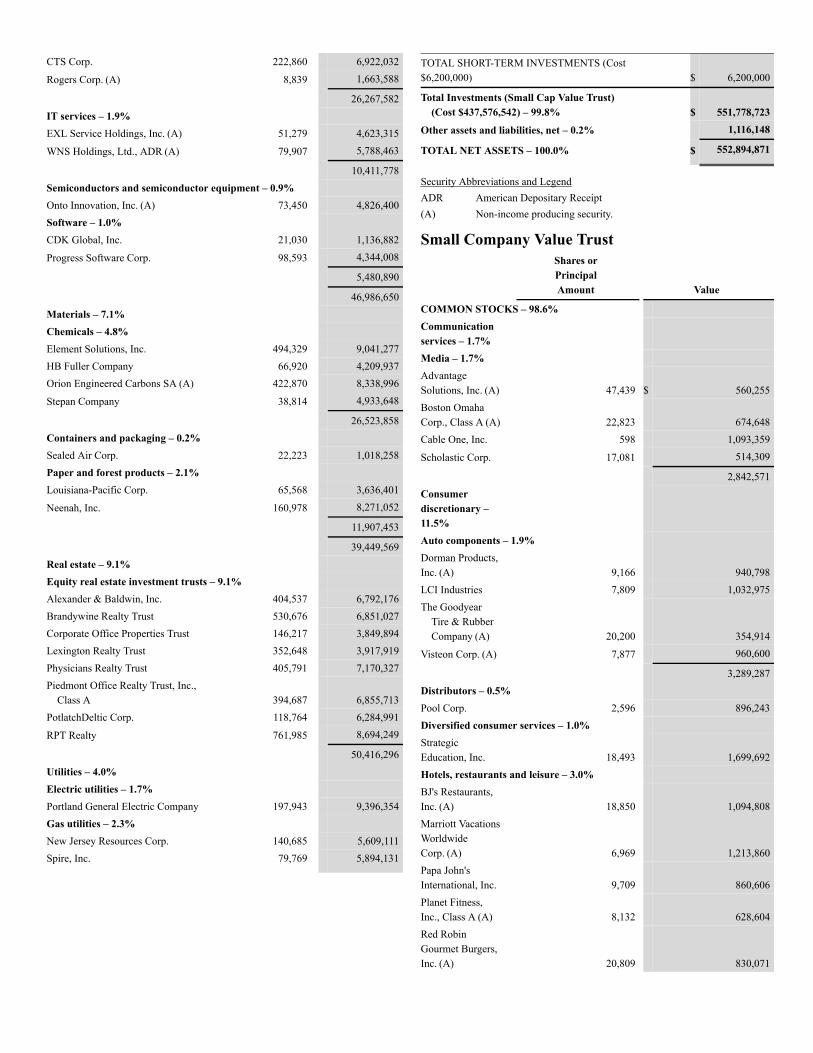
CTS Corp. 222,860 6,922,032
Rogers Corp. (A) 8,839 1,663,588
26,267,582IT services – 1.9%EXL Service Holdings, Inc. (A) 51,279 4,623,315
WNS Holdings, Ltd., ADR (A) 79,907 5,788,463
10,411,778Semiconductors and semiconductor equipment – 0.9%Onto Innovation, Inc. (A) 73,450 4,826,400Software – 1.0%CDK Global, Inc. 21,030 1,136,882
Progress Software Corp. 98,593 4,344,008
5,480,890
46,986,650Materials – 7.1%Chemicals – 4.8%Element Solutions, Inc. 494,329 9,041,277HB Fuller Company 66,920 4,209,937Orion Engineered Carbons SA (A) 422,870 8,338,996
Stepan Company 38,814 4,933,648
26,523,858Containers and packaging – 0.2%Sealed Air Corp. 22,223 1,018,258Paper and forest products – 2.1%Louisiana-Pacific Corp. 65,568 3,636,401
Neenah, Inc. 160,978 8,271,052
11,907,453
39,449,569Real estate – 9.1%Equity real estate investment trusts – 9.1%Alexander & Baldwin, Inc. 404,537 6,792,176Brandywine Realty Trust 530,676 6,851,027Corporate Office Properties Trust 146,217 3,849,894Lexington Realty Trust 352,648 3,917,919Physicians Realty Trust 405,791 7,170,327Piedmont Office Realty Trust, Inc.,
Class A 394,687 6,855,713PotlatchDeltic Corp. 118,764 6,284,991
RPT Realty 761,985 8,694,249
50,416,296Utilities – 4.0%Electric utilities – 1.7%Portland General Electric Company 197,943 9,396,354Gas utilities – 2.3%New Jersey Resources Corp. 140,685 5,609,111Spire, Inc. 79,769 5,894,131
TOTAL SHORT-TERM INVESTMENTS (Cost$6,200,000) $ 6,200,000
Total Investments (Small Cap Value Trust)(Cost $437,576,542) – 99.8% $ 551,778,723
Other assets and liabilities, net – 0.2% 1,116,148
TOTAL NET ASSETS – 100.0% $ 552,894,871
Security Abbreviations and LegendADR American Depositary Receipt(A) Non-income producing security.
Small Company Value TrustShares orPrincipalAmount Value
COMMON STOCKS – 98.6%Communicationservices – 1.7%Media – 1.7%AdvantageSolutions, Inc. (A) 47,439 $ 560,255Boston OmahaCorp., Class A (A) 22,823 674,648Cable One, Inc. 598 1,093,359
Scholastic Corp. 17,081 514,309
2,842,571Consumerdiscretionary –11.5%Auto components – 1.9%Dorman Products,Inc. (A) 9,166 940,798LCI Industries 7,809 1,032,975The Goodyear
Tire & RubberCompany (A) 20,200 354,914
Visteon Corp. (A) 7,877 960,600
3,289,287Distributors – 0.5%Pool Corp. 2,596 896,243Diversified consumer services – 1.0%StrategicEducation, Inc. 18,493 1,699,692Hotels, restaurants and leisure – 3.0%BJ's Restaurants,Inc. (A) 18,850 1,094,808Marriott VacationsWorldwideCorp. (A) 6,969 1,213,860Papa John'sInternational, Inc. 9,709 860,606Planet Fitness,Inc., Class A (A) 8,132 628,604Red RobinGourmet Burgers,Inc. (A) 20,809 830,071
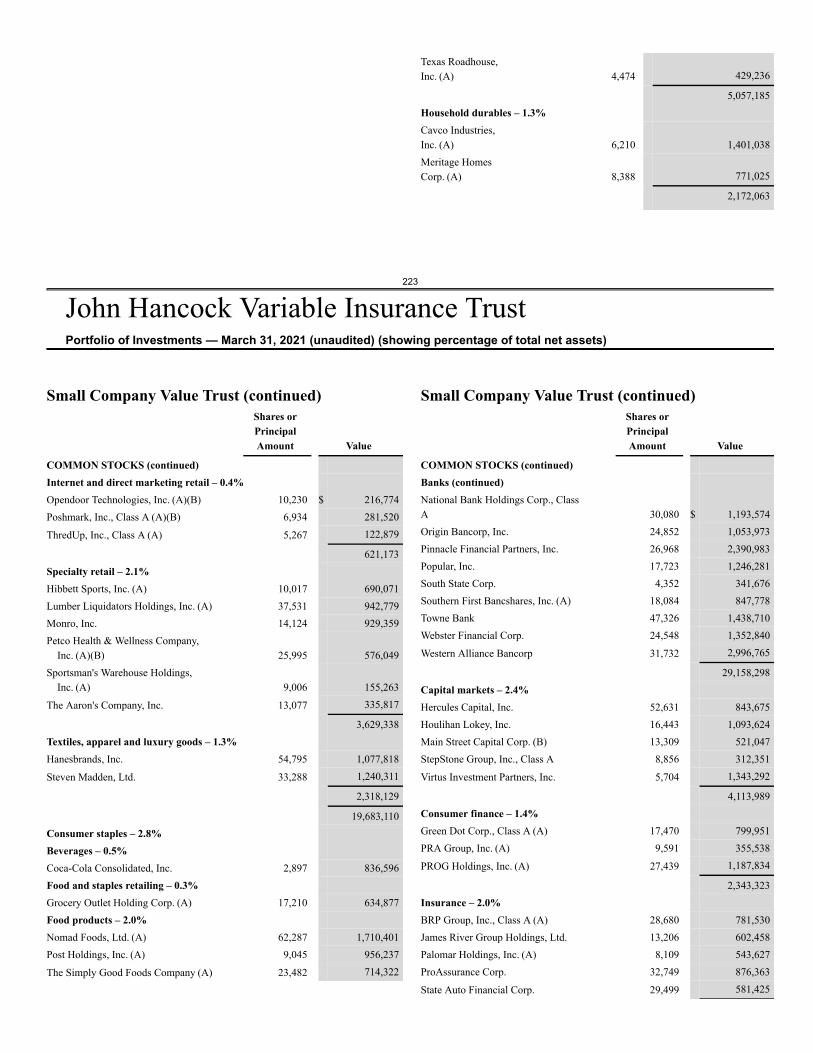
223
John Hancock Variable Insurance TrustPortfolio of Investments — March 31, 2021 (unaudited) (showing percentage of total net assets)
Texas Roadhouse,Inc. (A) 4,474 429,236
5,057,185Household durables – 1.3%Cavco Industries,Inc. (A) 6,210 1,401,038Meritage HomesCorp. (A) 8,388 771,025
2,172,063
Small Company Value Trust (continued)Shares orPrincipalAmount Value
COMMON STOCKS (continued)Internet and direct marketing retail – 0.4%Opendoor Technologies, Inc. (A)(B) 10,230 $ 216,774Poshmark, Inc., Class A (A)(B) 6,934 281,520
ThredUp, Inc., Class A (A) 5,267 122,879
621,173Specialty retail – 2.1%Hibbett Sports, Inc. (A) 10,017 690,071Lumber Liquidators Holdings, Inc. (A) 37,531 942,779Monro, Inc. 14,124 929,359Petco Health & Wellness Company,
Inc. (A)(B) 25,995 576,049Sportsman's Warehouse Holdings,
Inc. (A) 9,006 155,263
The Aaron's Company, Inc. 13,077 335,817
3,629,338Textiles, apparel and luxury goods – 1.3%Hanesbrands, Inc. 54,795 1,077,818
Steven Madden, Ltd. 33,288 1,240,311
2,318,129
19,683,110Consumer staples – 2.8%Beverages – 0.5%Coca-Cola Consolidated, Inc. 2,897 836,596Food and staples retailing – 0.3%Grocery Outlet Holding Corp. (A) 17,210 634,877Food products – 2.0%Nomad Foods, Ltd. (A) 62,287 1,710,401Post Holdings, Inc. (A) 9,045 956,237
The Simply Good Foods Company (A) 23,482 714,322
Small Company Value Trust (continued)Shares orPrincipalAmount Value
COMMON STOCKS (continued)Banks (continued)National Bank Holdings Corp., ClassA 30,080 $ 1,193,574Origin Bancorp, Inc. 24,852 1,053,973Pinnacle Financial Partners, Inc. 26,968 2,390,983Popular, Inc. 17,723 1,246,281South State Corp. 4,352 341,676Southern First Bancshares, Inc. (A) 18,084 847,778Towne Bank 47,326 1,438,710Webster Financial Corp. 24,548 1,352,840
Western Alliance Bancorp 31,732 2,996,765
29,158,298Capital markets – 2.4%Hercules Capital, Inc. 52,631 843,675Houlihan Lokey, Inc. 16,443 1,093,624Main Street Capital Corp. (B) 13,309 521,047StepStone Group, Inc., Class A 8,856 312,351
Virtus Investment Partners, Inc. 5,704 1,343,292
4,113,989Consumer finance – 1.4%Green Dot Corp., Class A (A) 17,470 799,951PRA Group, Inc. (A) 9,591 355,538
PROG Holdings, Inc. (A) 27,439 1,187,834
2,343,323Insurance – 2.0%BRP Group, Inc., Class A (A) 28,680 781,530James River Group Holdings, Ltd. 13,206 602,458Palomar Holdings, Inc. (A) 8,109 543,627ProAssurance Corp. 32,749 876,363
State Auto Financial Corp. 29,499 581,425
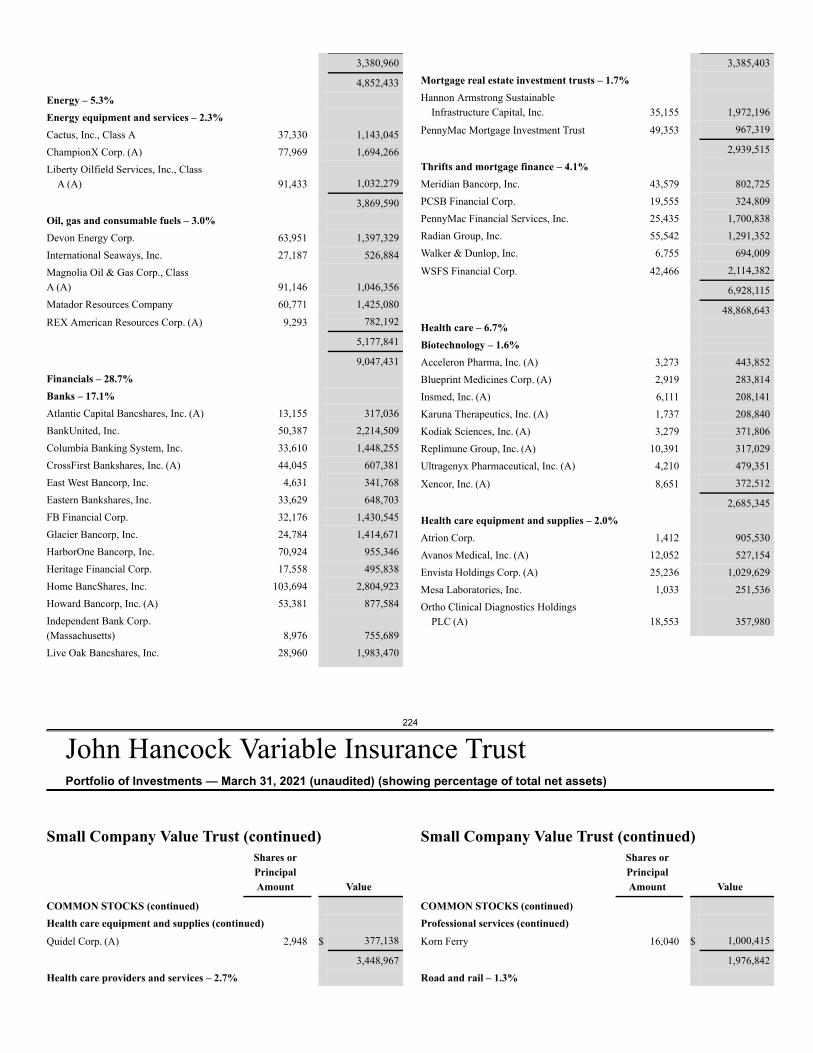
224
John Hancock Variable Insurance TrustPortfolio of Investments — March 31, 2021 (unaudited) (showing percentage of total net assets)
3,380,960
4,852,433Energy – 5.3%Energy equipment and services – 2.3%Cactus, Inc., Class A 37,330 1,143,045ChampionX Corp. (A) 77,969 1,694,266Liberty Oilfield Services, Inc., Class
A (A) 91,433 1,032,279
3,869,590Oil, gas and consumable fuels – 3.0%Devon Energy Corp. 63,951 1,397,329International Seaways, Inc. 27,187 526,884Magnolia Oil & Gas Corp., ClassA (A) 91,146 1,046,356Matador Resources Company 60,771 1,425,080
REX American Resources Corp. (A) 9,293 782,192
5,177,841
9,047,431Financials – 28.7%Banks – 17.1%Atlantic Capital Bancshares, Inc. (A) 13,155 317,036BankUnited, Inc. 50,387 2,214,509Columbia Banking System, Inc. 33,610 1,448,255CrossFirst Bankshares, Inc. (A) 44,045 607,381East West Bancorp, Inc. 4,631 341,768Eastern Bankshares, Inc. 33,629 648,703FB Financial Corp. 32,176 1,430,545Glacier Bancorp, Inc. 24,784 1,414,671HarborOne Bancorp, Inc. 70,924 955,346Heritage Financial Corp. 17,558 495,838Home BancShares, Inc. 103,694 2,804,923Howard Bancorp, Inc. (A) 53,381 877,584Independent Bank Corp.(Massachusetts) 8,976 755,689Live Oak Bancshares, Inc. 28,960 1,983,470
3,385,403Mortgage real estate investment trusts – 1.7%Hannon Armstrong Sustainable
Infrastructure Capital, Inc. 35,155 1,972,196
PennyMac Mortgage Investment Trust 49,353 967,319
2,939,515Thrifts and mortgage finance – 4.1%Meridian Bancorp, Inc. 43,579 802,725PCSB Financial Corp. 19,555 324,809PennyMac Financial Services, Inc. 25,435 1,700,838Radian Group, Inc. 55,542 1,291,352Walker & Dunlop, Inc. 6,755 694,009
WSFS Financial Corp. 42,466 2,114,382
6,928,115
48,868,643Health care – 6.7%Biotechnology – 1.6%Acceleron Pharma, Inc. (A) 3,273 443,852Blueprint Medicines Corp. (A) 2,919 283,814Insmed, Inc. (A) 6,111 208,141Karuna Therapeutics, Inc. (A) 1,737 208,840Kodiak Sciences, Inc. (A) 3,279 371,806Replimune Group, Inc. (A) 10,391 317,029Ultragenyx Pharmaceutical, Inc. (A) 4,210 479,351
Xencor, Inc. (A) 8,651 372,512
2,685,345Health care equipment and supplies – 2.0%Atrion Corp. 1,412 905,530Avanos Medical, Inc. (A) 12,052 527,154Envista Holdings Corp. (A) 25,236 1,029,629Mesa Laboratories, Inc. 1,033 251,536Ortho Clinical Diagnostics Holdings
PLC (A) 18,553 357,980
Small Company Value Trust (continued)Shares orPrincipalAmount Value
COMMON STOCKS (continued)Health care equipment and supplies (continued)Quidel Corp. (A) 2,948 $ 377,138
3,448,967Health care providers and services – 2.7%
Small Company Value Trust (continued)Shares orPrincipalAmount Value
COMMON STOCKS (continued)Professional services (continued)Korn Ferry 16,040 $ 1,000,415
1,976,842Road and rail – 1.3%
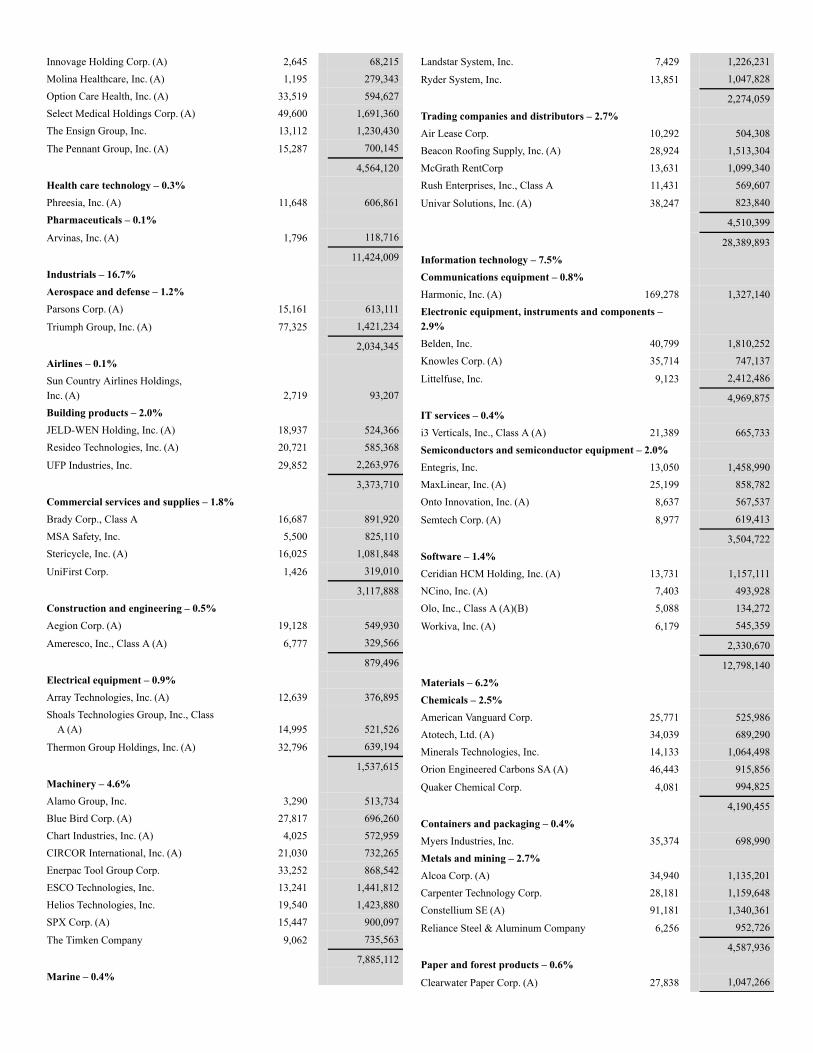
Innovage Holding Corp. (A) 2,645 68,215Molina Healthcare, Inc. (A) 1,195 279,343Option Care Health, Inc. (A) 33,519 594,627Select Medical Holdings Corp. (A) 49,600 1,691,360The Ensign Group, Inc. 13,112 1,230,430
The Pennant Group, Inc. (A) 15,287 700,145
4,564,120Health care technology – 0.3%Phreesia, Inc. (A) 11,648 606,861Pharmaceuticals – 0.1%Arvinas, Inc. (A) 1,796 118,716
11,424,009Industrials – 16.7%Aerospace and defense – 1.2%Parsons Corp. (A) 15,161 613,111
Triumph Group, Inc. (A) 77,325 1,421,234
2,034,345Airlines – 0.1%Sun Country Airlines Holdings,Inc. (A) 2,719 93,207Building products – 2.0%JELD-WEN Holding, Inc. (A) 18,937 524,366Resideo Technologies, Inc. (A) 20,721 585,368
UFP Industries, Inc. 29,852 2,263,976
3,373,710Commercial services and supplies – 1.8%Brady Corp., Class A 16,687 891,920MSA Safety, Inc. 5,500 825,110Stericycle, Inc. (A) 16,025 1,081,848
UniFirst Corp. 1,426 319,010
3,117,888Construction and engineering – 0.5%Aegion Corp. (A) 19,128 549,930
Ameresco, Inc., Class A (A) 6,777 329,566
879,496Electrical equipment – 0.9%Array Technologies, Inc. (A) 12,639 376,895Shoals Technologies Group, Inc., Class
A (A) 14,995 521,526
Thermon Group Holdings, Inc. (A) 32,796 639,194
1,537,615Machinery – 4.6%Alamo Group, Inc. 3,290 513,734Blue Bird Corp. (A) 27,817 696,260Chart Industries, Inc. (A) 4,025 572,959CIRCOR International, Inc. (A) 21,030 732,265Enerpac Tool Group Corp. 33,252 868,542ESCO Technologies, Inc. 13,241 1,441,812Helios Technologies, Inc. 19,540 1,423,880SPX Corp. (A) 15,447 900,097
The Timken Company 9,062 735,563
7,885,112Marine – 0.4%
Landstar System, Inc. 7,429 1,226,231
Ryder System, Inc. 13,851 1,047,828
2,274,059Trading companies and distributors – 2.7%Air Lease Corp. 10,292 504,308Beacon Roofing Supply, Inc. (A) 28,924 1,513,304McGrath RentCorp 13,631 1,099,340Rush Enterprises, Inc., Class A 11,431 569,607
Univar Solutions, Inc. (A) 38,247 823,840
4,510,399
28,389,893Information technology – 7.5%Communications equipment – 0.8%Harmonic, Inc. (A) 169,278 1,327,140Electronic equipment, instruments and components –2.9%Belden, Inc. 40,799 1,810,252Knowles Corp. (A) 35,714 747,137
Littelfuse, Inc. 9,123 2,412,486
4,969,875IT services – 0.4%i3 Verticals, Inc., Class A (A) 21,389 665,733Semiconductors and semiconductor equipment – 2.0%Entegris, Inc. 13,050 1,458,990MaxLinear, Inc. (A) 25,199 858,782Onto Innovation, Inc. (A) 8,637 567,537
Semtech Corp. (A) 8,977 619,413
3,504,722Software – 1.4%Ceridian HCM Holding, Inc. (A) 13,731 1,157,111NCino, Inc. (A) 7,403 493,928Olo, Inc., Class A (A)(B) 5,088 134,272
Workiva, Inc. (A) 6,179 545,359
2,330,670
12,798,140Materials – 6.2%Chemicals – 2.5%American Vanguard Corp. 25,771 525,986Atotech, Ltd. (A) 34,039 689,290Minerals Technologies, Inc. 14,133 1,064,498Orion Engineered Carbons SA (A) 46,443 915,856
Quaker Chemical Corp. 4,081 994,825
4,190,455Containers and packaging – 0.4%Myers Industries, Inc. 35,374 698,990Metals and mining – 2.7%Alcoa Corp. (A) 34,940 1,135,201Carpenter Technology Corp. 28,181 1,159,648Constellium SE (A) 91,181 1,340,361
Reliance Steel & Aluminum Company 6,256 952,726
4,587,936Paper and forest products – 0.6%Clearwater Paper Corp. (A) 27,838 1,047,266
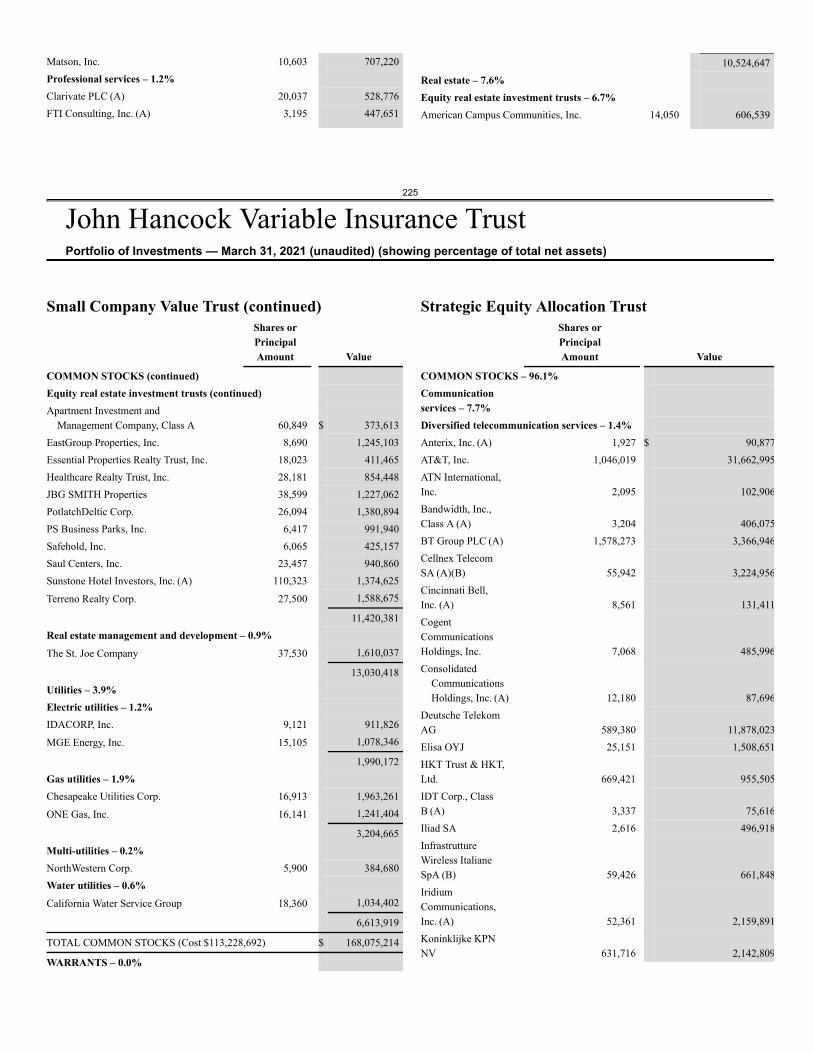
225
John Hancock Variable Insurance TrustPortfolio of Investments — March 31, 2021 (unaudited) (showing percentage of total net assets)
Matson, Inc. 10,603 707,220Professional services – 1.2%Clarivate PLC (A) 20,037 528,776FTI Consulting, Inc. (A) 3,195 447,651
10,524,647Real estate – 7.6%Equity real estate investment trusts – 6.7%American Campus Communities, Inc. 14,050 606,539
Small Company Value Trust (continued)Shares orPrincipalAmount Value
COMMON STOCKS (continued)Equity real estate investment trusts (continued)Apartment Investment and
Management Company, Class A 60,849 $ 373,613EastGroup Properties, Inc. 8,690 1,245,103Essential Properties Realty Trust, Inc. 18,023 411,465Healthcare Realty Trust, Inc. 28,181 854,448JBG SMITH Properties 38,599 1,227,062PotlatchDeltic Corp. 26,094 1,380,894PS Business Parks, Inc. 6,417 991,940Safehold, Inc. 6,065 425,157Saul Centers, Inc. 23,457 940,860Sunstone Hotel Investors, Inc. (A) 110,323 1,374,625
Terreno Realty Corp. 27,500 1,588,675
11,420,381Real estate management and development – 0.9%The St. Joe Company 37,530 1,610,037
13,030,418Utilities – 3.9%Electric utilities – 1.2%IDACORP, Inc. 9,121 911,826
MGE Energy, Inc. 15,105 1,078,346
1,990,172Gas utilities – 1.9%Chesapeake Utilities Corp. 16,913 1,963,261
ONE Gas, Inc. 16,141 1,241,404
3,204,665Multi-utilities – 0.2%NorthWestern Corp. 5,900 384,680Water utilities – 0.6%California Water Service Group 18,360 1,034,402
6,613,919
TOTAL COMMON STOCKS (Cost $113,228,692) $ 168,075,214
WARRANTS – 0.0%
Strategic Equity Allocation TrustShares orPrincipalAmount Value
COMMON STOCKS – 96.1%Communicationservices – 7.7%Diversified telecommunication services – 1.4%Anterix, Inc. (A) 1,927 $ 90,877AT&T, Inc. 1,046,019 31,662,995ATN International,Inc. 2,095 102,906Bandwidth, Inc.,Class A (A) 3,204 406,075BT Group PLC (A) 1,578,273 3,366,946Cellnex TelecomSA (A)(B) 55,942 3,224,956Cincinnati Bell,Inc. (A) 8,561 131,411CogentCommunicationsHoldings, Inc. 7,068 485,996Consolidated
CommunicationsHoldings, Inc. (A) 12,180 87,696
Deutsche TelekomAG 589,380 11,878,023Elisa OYJ 25,151 1,508,651HKT Trust & HKT,Ltd. 669,421 955,505IDT Corp., ClassB (A) 3,337 75,616Iliad SA 2,616 496,918InfrastruttureWireless ItalianeSpA (B) 59,426 661,848IridiumCommunications,Inc. (A) 52,361 2,159,891Koninklijke KPNNV 631,716 2,142,809
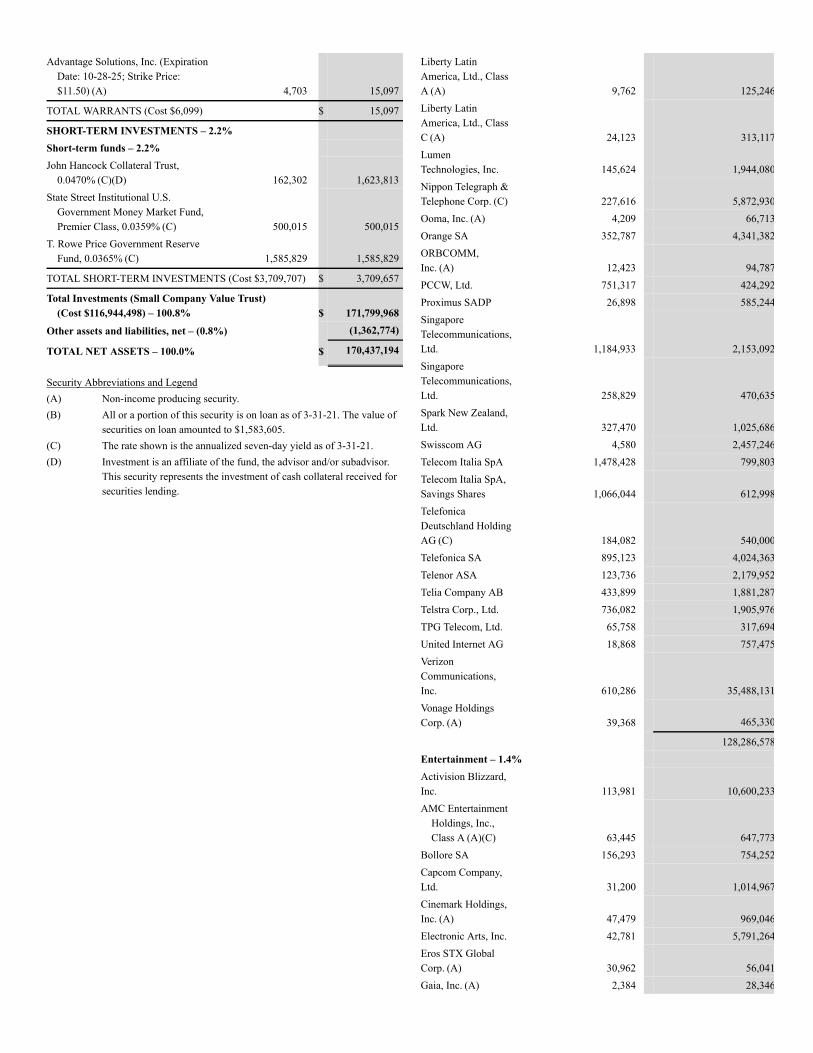
Advantage Solutions, Inc. (ExpirationDate: 10-28-25; Strike Price:$11.50) (A) 4,703 15,097
TOTAL WARRANTS (Cost $6,099) $ 15,097
SHORT-TERM INVESTMENTS – 2.2%Short-term funds – 2.2%John Hancock Collateral Trust,
0.0470% (C)(D) 162,302 1,623,813State Street Institutional U.S.
Government Money Market Fund,Premier Class, 0.0359% (C) 500,015 500,015
T. Rowe Price Government ReserveFund, 0.0365% (C) 1,585,829 1,585,829
TOTAL SHORT-TERM INVESTMENTS (Cost $3,709,707) $ 3,709,657
Total Investments (Small Company Value Trust)(Cost $116,944,498) – 100.8% $ 171,799,968
Other assets and liabilities, net – (0.8%) (1,362,774)
TOTAL NET ASSETS – 100.0% $ 170,437,194
Security Abbreviations and Legend(A) Non-income producing security.(B) All or a portion of this security is on loan as of 3-31-21. The value of
securities on loan amounted to $1,583,605.(C) The rate shown is the annualized seven-day yield as of 3-31-21.(D) Investment is an affiliate of the fund, the advisor and/or subadvisor.
This security represents the investment of cash collateral received forsecurities lending.
Liberty LatinAmerica, Ltd., ClassA (A) 9,762 125,246Liberty LatinAmerica, Ltd., ClassC (A) 24,123 313,117LumenTechnologies, Inc. 145,624 1,944,080Nippon Telegraph &Telephone Corp. (C) 227,616 5,872,930Ooma, Inc. (A) 4,209 66,713Orange SA 352,787 4,341,382ORBCOMM,Inc. (A) 12,423 94,787PCCW, Ltd. 751,317 424,292Proximus SADP 26,898 585,244SingaporeTelecommunications,Ltd. 1,184,933 2,153,092SingaporeTelecommunications,Ltd. 258,829 470,635Spark New Zealand,Ltd. 327,470 1,025,686Swisscom AG 4,580 2,457,246Telecom Italia SpA 1,478,428 799,803Telecom Italia SpA,Savings Shares 1,066,044 612,998TelefonicaDeutschland HoldingAG (C) 184,082 540,000Telefonica SA 895,123 4,024,363Telenor ASA 123,736 2,179,952Telia Company AB 433,899 1,881,287Telstra Corp., Ltd. 736,082 1,905,976TPG Telecom, Ltd. 65,758 317,694United Internet AG 18,868 757,475VerizonCommunications,Inc. 610,286 35,488,131Vonage HoldingsCorp. (A) 39,368 465,330
128,286,578Entertainment – 1.4%Activision Blizzard,Inc. 113,981 10,600,233AMC Entertainment
Holdings, Inc.,Class A (A)(C) 63,445 647,773
Bollore SA 156,293 754,252Capcom Company,Ltd. 31,200 1,014,967Cinemark Holdings,Inc. (A) 47,479 969,046Electronic Arts, Inc. 42,781 5,791,264Eros STX GlobalCorp. (A) 30,962 56,041Gaia, Inc. (A) 2,384 28,346
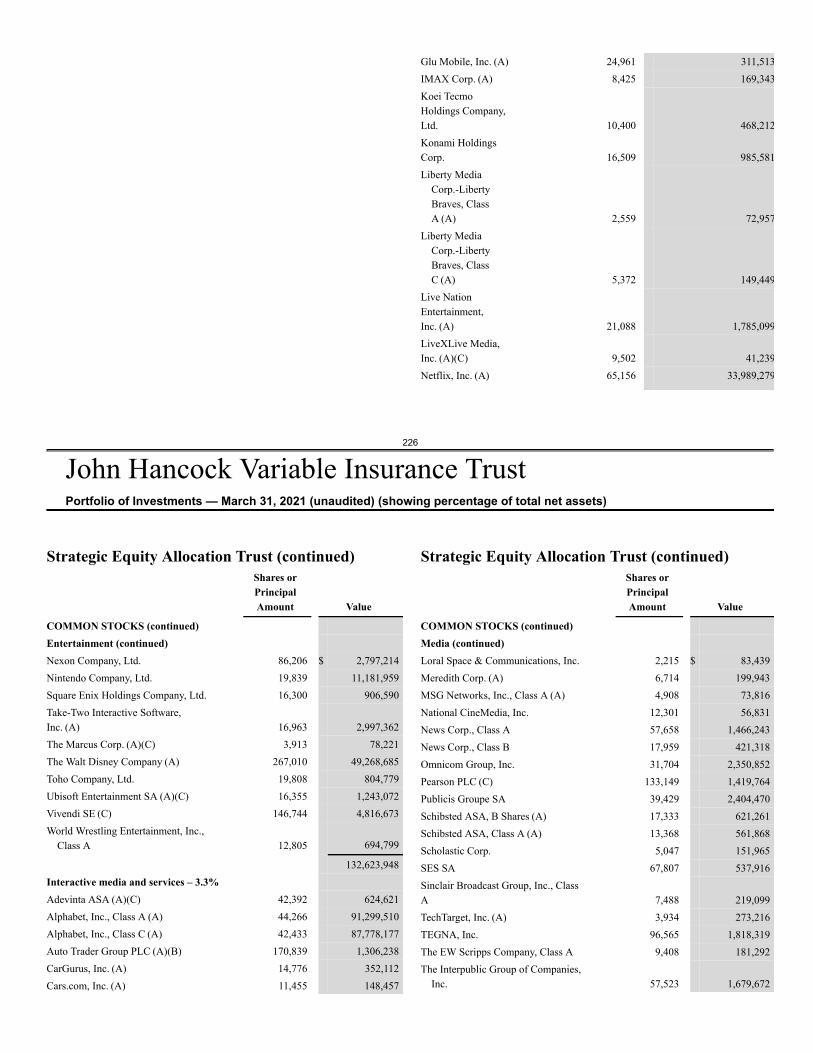
226
John Hancock Variable Insurance TrustPortfolio of Investments — March 31, 2021 (unaudited) (showing percentage of total net assets)
Glu Mobile, Inc. (A) 24,961 311,513IMAX Corp. (A) 8,425 169,343Koei TecmoHoldings Company,Ltd. 10,400 468,212Konami HoldingsCorp. 16,509 985,581Liberty Media
Corp.-LibertyBraves, ClassA (A) 2,559 72,957
Liberty MediaCorp.-LibertyBraves, ClassC (A) 5,372 149,449
Live NationEntertainment,Inc. (A) 21,088 1,785,099LiveXLive Media,Inc. (A)(C) 9,502 41,239Netflix, Inc. (A) 65,156 33,989,279
Strategic Equity Allocation Trust (continued)Shares orPrincipalAmount Value
COMMON STOCKS (continued)Entertainment (continued)Nexon Company, Ltd. 86,206 $ 2,797,214Nintendo Company, Ltd. 19,839 11,181,959Square Enix Holdings Company, Ltd. 16,300 906,590Take-Two Interactive Software,Inc. (A) 16,963 2,997,362The Marcus Corp. (A)(C) 3,913 78,221The Walt Disney Company (A) 267,010 49,268,685Toho Company, Ltd. 19,808 804,779Ubisoft Entertainment SA (A)(C) 16,355 1,243,072Vivendi SE (C) 146,744 4,816,673World Wrestling Entertainment, Inc.,
Class A 12,805 694,799
132,623,948Interactive media and services – 3.3%Adevinta ASA (A)(C) 42,392 624,621Alphabet, Inc., Class A (A) 44,266 91,299,510Alphabet, Inc., Class C (A) 42,433 87,778,177Auto Trader Group PLC (A)(B) 170,839 1,306,238CarGurus, Inc. (A) 14,776 352,112Cars.com, Inc. (A) 11,455 148,457
Strategic Equity Allocation Trust (continued)Shares orPrincipalAmount Value
COMMON STOCKS (continued)Media (continued)Loral Space & Communications, Inc. 2,215 $ 83,439Meredith Corp. (A) 6,714 199,943MSG Networks, Inc., Class A (A) 4,908 73,816National CineMedia, Inc. 12,301 56,831News Corp., Class A 57,658 1,466,243News Corp., Class B 17,959 421,318Omnicom Group, Inc. 31,704 2,350,852Pearson PLC (C) 133,149 1,419,764Publicis Groupe SA 39,429 2,404,470Schibsted ASA, B Shares (A) 17,333 621,261Schibsted ASA, Class A (A) 13,368 561,868Scholastic Corp. 5,047 151,965SES SA 67,807 537,916Sinclair Broadcast Group, Inc., ClassA 7,488 219,099TechTarget, Inc. (A) 3,934 273,216TEGNA, Inc. 96,565 1,818,319The EW Scripps Company, Class A 9,408 181,292The Interpublic Group of Companies,
Inc. 57,523 1,679,672
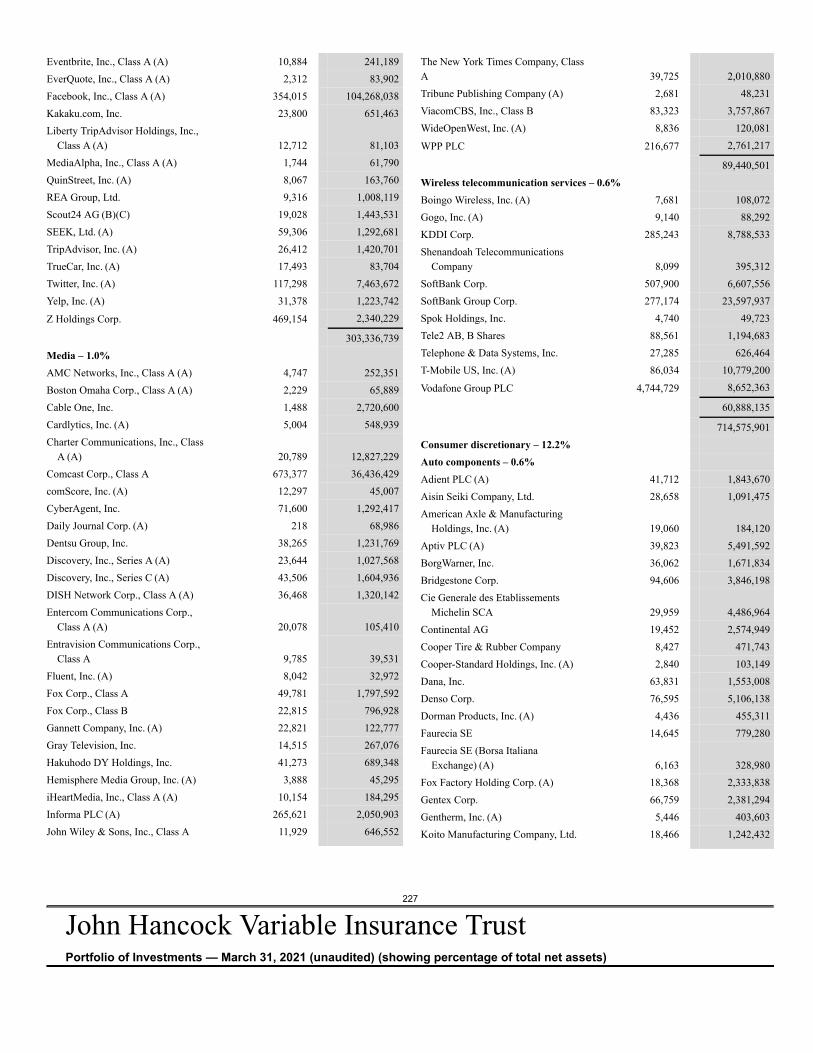
227
John Hancock Variable Insurance TrustPortfolio of Investments — March 31, 2021 (unaudited) (showing percentage of total net assets)
Eventbrite, Inc., Class A (A) 10,884 241,189EverQuote, Inc., Class A (A) 2,312 83,902Facebook, Inc., Class A (A) 354,015 104,268,038Kakaku.com, Inc. 23,800 651,463Liberty TripAdvisor Holdings, Inc.,
Class A (A) 12,712 81,103MediaAlpha, Inc., Class A (A) 1,744 61,790QuinStreet, Inc. (A) 8,067 163,760REA Group, Ltd. 9,316 1,008,119Scout24 AG (B)(C) 19,028 1,443,531SEEK, Ltd. (A) 59,306 1,292,681TripAdvisor, Inc. (A) 26,412 1,420,701TrueCar, Inc. (A) 17,493 83,704Twitter, Inc. (A) 117,298 7,463,672Yelp, Inc. (A) 31,378 1,223,742
Z Holdings Corp. 469,154 2,340,229
303,336,739Media – 1.0%AMC Networks, Inc., Class A (A) 4,747 252,351Boston Omaha Corp., Class A (A) 2,229 65,889Cable One, Inc. 1,488 2,720,600Cardlytics, Inc. (A) 5,004 548,939Charter Communications, Inc., Class
A (A) 20,789 12,827,229Comcast Corp., Class A 673,377 36,436,429comScore, Inc. (A) 12,297 45,007CyberAgent, Inc. 71,600 1,292,417Daily Journal Corp. (A) 218 68,986Dentsu Group, Inc. 38,265 1,231,769Discovery, Inc., Series A (A) 23,644 1,027,568Discovery, Inc., Series C (A) 43,506 1,604,936DISH Network Corp., Class A (A) 36,468 1,320,142Entercom Communications Corp.,
Class A (A) 20,078 105,410Entravision Communications Corp.,
Class A 9,785 39,531Fluent, Inc. (A) 8,042 32,972Fox Corp., Class A 49,781 1,797,592Fox Corp., Class B 22,815 796,928Gannett Company, Inc. (A) 22,821 122,777Gray Television, Inc. 14,515 267,076Hakuhodo DY Holdings, Inc. 41,273 689,348Hemisphere Media Group, Inc. (A) 3,888 45,295iHeartMedia, Inc., Class A (A) 10,154 184,295Informa PLC (A) 265,621 2,050,903John Wiley & Sons, Inc., Class A 11,929 646,552
The New York Times Company, ClassA 39,725 2,010,880Tribune Publishing Company (A) 2,681 48,231ViacomCBS, Inc., Class B 83,323 3,757,867WideOpenWest, Inc. (A) 8,836 120,081
WPP PLC 216,677 2,761,217
89,440,501Wireless telecommunication services – 0.6%Boingo Wireless, Inc. (A) 7,681 108,072Gogo, Inc. (A) 9,140 88,292KDDI Corp. 285,243 8,788,533Shenandoah Telecommunications
Company 8,099 395,312SoftBank Corp. 507,900 6,607,556SoftBank Group Corp. 277,174 23,597,937Spok Holdings, Inc. 4,740 49,723Tele2 AB, B Shares 88,561 1,194,683Telephone & Data Systems, Inc. 27,285 626,464T-Mobile US, Inc. (A) 86,034 10,779,200
Vodafone Group PLC 4,744,729 8,652,363
60,888,135
714,575,901Consumer discretionary – 12.2%Auto components – 0.6%Adient PLC (A) 41,712 1,843,670Aisin Seiki Company, Ltd. 28,658 1,091,475American Axle & Manufacturing
Holdings, Inc. (A) 19,060 184,120Aptiv PLC (A) 39,823 5,491,592BorgWarner, Inc. 36,062 1,671,834Bridgestone Corp. 94,606 3,846,198Cie Generale des Etablissements
Michelin SCA 29,959 4,486,964Continental AG 19,452 2,574,949Cooper Tire & Rubber Company 8,427 471,743Cooper-Standard Holdings, Inc. (A) 2,840 103,149Dana, Inc. 63,831 1,553,008Denso Corp. 76,595 5,106,138Dorman Products, Inc. (A) 4,436 455,311Faurecia SE 14,645 779,280Faurecia SE (Borsa Italiana
Exchange) (A) 6,163 328,980Fox Factory Holding Corp. (A) 18,368 2,333,838Gentex Corp. 66,759 2,381,294Gentherm, Inc. (A) 5,446 403,603Koito Manufacturing Company, Ltd. 18,466 1,242,432
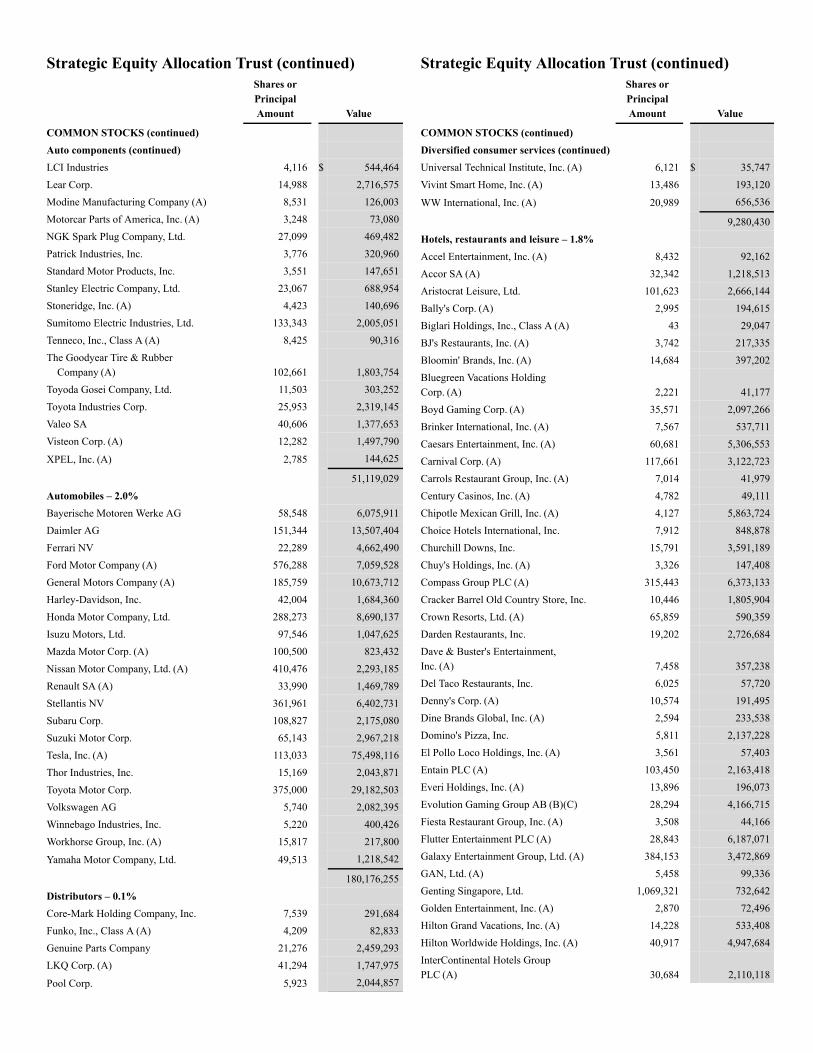
Strategic Equity Allocation Trust (continued)Shares orPrincipalAmount Value
COMMON STOCKS (continued)Auto components (continued)LCI Industries 4,116 $ 544,464Lear Corp. 14,988 2,716,575Modine Manufacturing Company (A) 8,531 126,003Motorcar Parts of America, Inc. (A) 3,248 73,080NGK Spark Plug Company, Ltd. 27,099 469,482Patrick Industries, Inc. 3,776 320,960Standard Motor Products, Inc. 3,551 147,651Stanley Electric Company, Ltd. 23,067 688,954Stoneridge, Inc. (A) 4,423 140,696Sumitomo Electric Industries, Ltd. 133,343 2,005,051Tenneco, Inc., Class A (A) 8,425 90,316The Goodyear Tire & Rubber
Company (A) 102,661 1,803,754Toyoda Gosei Company, Ltd. 11,503 303,252Toyota Industries Corp. 25,953 2,319,145Valeo SA 40,606 1,377,653Visteon Corp. (A) 12,282 1,497,790
XPEL, Inc. (A) 2,785 144,625
51,119,029Automobiles – 2.0%Bayerische Motoren Werke AG 58,548 6,075,911Daimler AG 151,344 13,507,404Ferrari NV 22,289 4,662,490Ford Motor Company (A) 576,288 7,059,528General Motors Company (A) 185,759 10,673,712Harley-Davidson, Inc. 42,004 1,684,360Honda Motor Company, Ltd. 288,273 8,690,137Isuzu Motors, Ltd. 97,546 1,047,625Mazda Motor Corp. (A) 100,500 823,432Nissan Motor Company, Ltd. (A) 410,476 2,293,185Renault SA (A) 33,990 1,469,789Stellantis NV 361,961 6,402,731Subaru Corp. 108,827 2,175,080Suzuki Motor Corp. 65,143 2,967,218Tesla, Inc. (A) 113,033 75,498,116Thor Industries, Inc. 15,169 2,043,871Toyota Motor Corp. 375,000 29,182,503Volkswagen AG 5,740 2,082,395Winnebago Industries, Inc. 5,220 400,426Workhorse Group, Inc. (A) 15,817 217,800
Yamaha Motor Company, Ltd. 49,513 1,218,542
180,176,255Distributors – 0.1%Core-Mark Holding Company, Inc. 7,539 291,684Funko, Inc., Class A (A) 4,209 82,833Genuine Parts Company 21,276 2,459,293LKQ Corp. (A) 41,294 1,747,975
Pool Corp. 5,923 2,044,857
Strategic Equity Allocation Trust (continued)Shares orPrincipalAmount Value
COMMON STOCKS (continued)Diversified consumer services (continued)Universal Technical Institute, Inc. (A) 6,121 $ 35,747Vivint Smart Home, Inc. (A) 13,486 193,120
WW International, Inc. (A) 20,989 656,536
9,280,430Hotels, restaurants and leisure – 1.8%Accel Entertainment, Inc. (A) 8,432 92,162Accor SA (A) 32,342 1,218,513Aristocrat Leisure, Ltd. 101,623 2,666,144Bally's Corp. (A) 2,995 194,615Biglari Holdings, Inc., Class A (A) 43 29,047BJ's Restaurants, Inc. (A) 3,742 217,335Bloomin' Brands, Inc. (A) 14,684 397,202Bluegreen Vacations HoldingCorp. (A) 2,221 41,177Boyd Gaming Corp. (A) 35,571 2,097,266Brinker International, Inc. (A) 7,567 537,711Caesars Entertainment, Inc. (A) 60,681 5,306,553Carnival Corp. (A) 117,661 3,122,723Carrols Restaurant Group, Inc. (A) 7,014 41,979Century Casinos, Inc. (A) 4,782 49,111Chipotle Mexican Grill, Inc. (A) 4,127 5,863,724Choice Hotels International, Inc. 7,912 848,878Churchill Downs, Inc. 15,791 3,591,189Chuy's Holdings, Inc. (A) 3,326 147,408Compass Group PLC (A) 315,443 6,373,133Cracker Barrel Old Country Store, Inc. 10,446 1,805,904Crown Resorts, Ltd. (A) 65,859 590,359Darden Restaurants, Inc. 19,202 2,726,684Dave & Buster's Entertainment,Inc. (A) 7,458 357,238Del Taco Restaurants, Inc. 6,025 57,720Denny's Corp. (A) 10,574 191,495Dine Brands Global, Inc. (A) 2,594 233,538Domino's Pizza, Inc. 5,811 2,137,228El Pollo Loco Holdings, Inc. (A) 3,561 57,403Entain PLC (A) 103,450 2,163,418Everi Holdings, Inc. (A) 13,896 196,073Evolution Gaming Group AB (B)(C) 28,294 4,166,715Fiesta Restaurant Group, Inc. (A) 3,508 44,166Flutter Entertainment PLC (A) 28,843 6,187,071Galaxy Entertainment Group, Ltd. (A) 384,153 3,472,869GAN, Ltd. (A) 5,458 99,336Genting Singapore, Ltd. 1,069,321 732,642Golden Entertainment, Inc. (A) 2,870 72,496Hilton Grand Vacations, Inc. (A) 14,228 533,408Hilton Worldwide Holdings, Inc. (A) 40,917 4,947,684InterContinental Hotels GroupPLC (A) 30,684 2,110,118
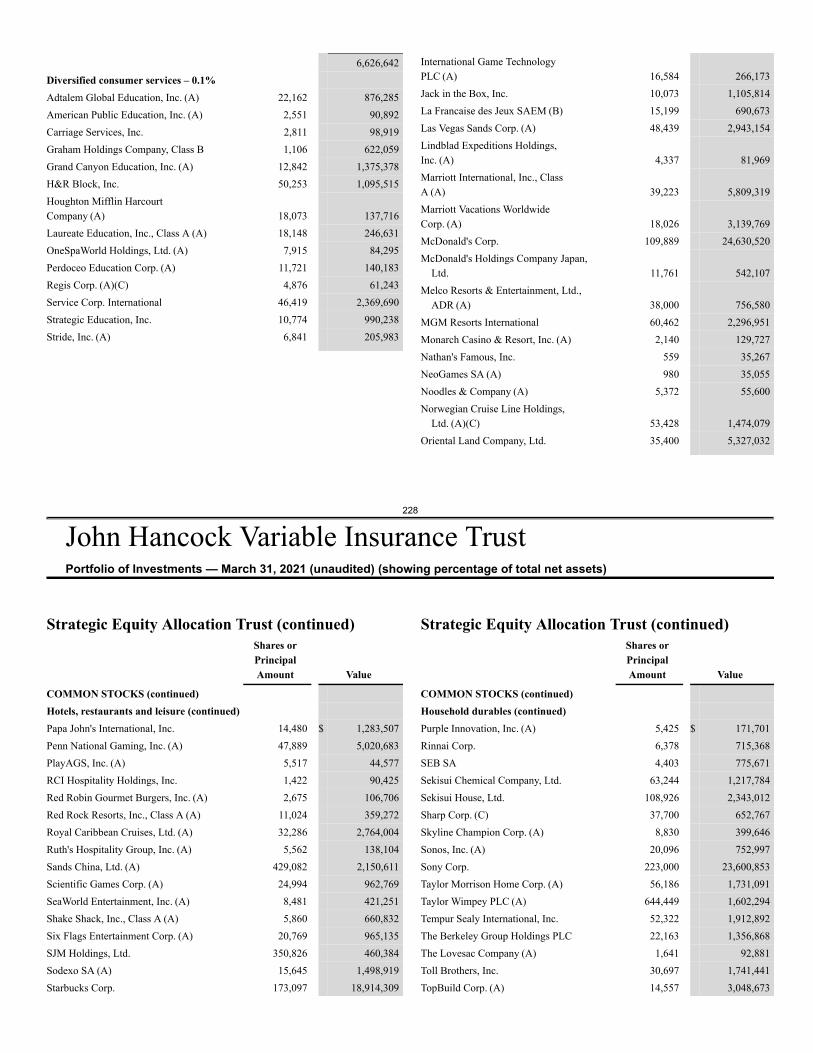
228
John Hancock Variable Insurance TrustPortfolio of Investments — March 31, 2021 (unaudited) (showing percentage of total net assets)
6,626,642Diversified consumer services – 0.1%Adtalem Global Education, Inc. (A) 22,162 876,285American Public Education, Inc. (A) 2,551 90,892Carriage Services, Inc. 2,811 98,919Graham Holdings Company, Class B 1,106 622,059Grand Canyon Education, Inc. (A) 12,842 1,375,378H&R Block, Inc. 50,253 1,095,515Houghton Mifflin HarcourtCompany (A) 18,073 137,716Laureate Education, Inc., Class A (A) 18,148 246,631OneSpaWorld Holdings, Ltd. (A) 7,915 84,295Perdoceo Education Corp. (A) 11,721 140,183Regis Corp. (A)(C) 4,876 61,243Service Corp. International 46,419 2,369,690Strategic Education, Inc. 10,774 990,238Stride, Inc. (A) 6,841 205,983
International Game TechnologyPLC (A) 16,584 266,173Jack in the Box, Inc. 10,073 1,105,814La Francaise des Jeux SAEM (B) 15,199 690,673Las Vegas Sands Corp. (A) 48,439 2,943,154Lindblad Expeditions Holdings,Inc. (A) 4,337 81,969Marriott International, Inc., ClassA (A) 39,223 5,809,319Marriott Vacations WorldwideCorp. (A) 18,026 3,139,769McDonald's Corp. 109,889 24,630,520McDonald's Holdings Company Japan,
Ltd. 11,761 542,107Melco Resorts & Entertainment, Ltd.,
ADR (A) 38,000 756,580MGM Resorts International 60,462 2,296,951Monarch Casino & Resort, Inc. (A) 2,140 129,727Nathan's Famous, Inc. 559 35,267NeoGames SA (A) 980 35,055Noodles & Company (A) 5,372 55,600Norwegian Cruise Line Holdings,
Ltd. (A)(C) 53,428 1,474,079Oriental Land Company, Ltd. 35,400 5,327,032
Strategic Equity Allocation Trust (continued)Shares orPrincipalAmount Value
COMMON STOCKS (continued)Hotels, restaurants and leisure (continued)Papa John's International, Inc. 14,480 $ 1,283,507Penn National Gaming, Inc. (A) 47,889 5,020,683PlayAGS, Inc. (A) 5,517 44,577RCI Hospitality Holdings, Inc. 1,422 90,425Red Robin Gourmet Burgers, Inc. (A) 2,675 106,706Red Rock Resorts, Inc., Class A (A) 11,024 359,272Royal Caribbean Cruises, Ltd. (A) 32,286 2,764,004Ruth's Hospitality Group, Inc. (A) 5,562 138,104Sands China, Ltd. (A) 429,082 2,150,611Scientific Games Corp. (A) 24,994 962,769SeaWorld Entertainment, Inc. (A) 8,481 421,251Shake Shack, Inc., Class A (A) 5,860 660,832Six Flags Entertainment Corp. (A) 20,769 965,135SJM Holdings, Ltd. 350,826 460,384Sodexo SA (A) 15,645 1,498,919Starbucks Corp. 173,097 18,914,309
Strategic Equity Allocation Trust (continued)Shares orPrincipalAmount Value
COMMON STOCKS (continued)Household durables (continued)Purple Innovation, Inc. (A) 5,425 $ 171,701Rinnai Corp. 6,378 715,368SEB SA 4,403 775,671Sekisui Chemical Company, Ltd. 63,244 1,217,784Sekisui House, Ltd. 108,926 2,343,012Sharp Corp. (C) 37,700 652,767Skyline Champion Corp. (A) 8,830 399,646Sonos, Inc. (A) 20,096 752,997Sony Corp. 223,000 23,600,853Taylor Morrison Home Corp. (A) 56,186 1,731,091Taylor Wimpey PLC (A) 644,449 1,602,294Tempur Sealy International, Inc. 52,322 1,912,892The Berkeley Group Holdings PLC 22,163 1,356,868The Lovesac Company (A) 1,641 92,881Toll Brothers, Inc. 30,697 1,741,441TopBuild Corp. (A) 14,557 3,048,673
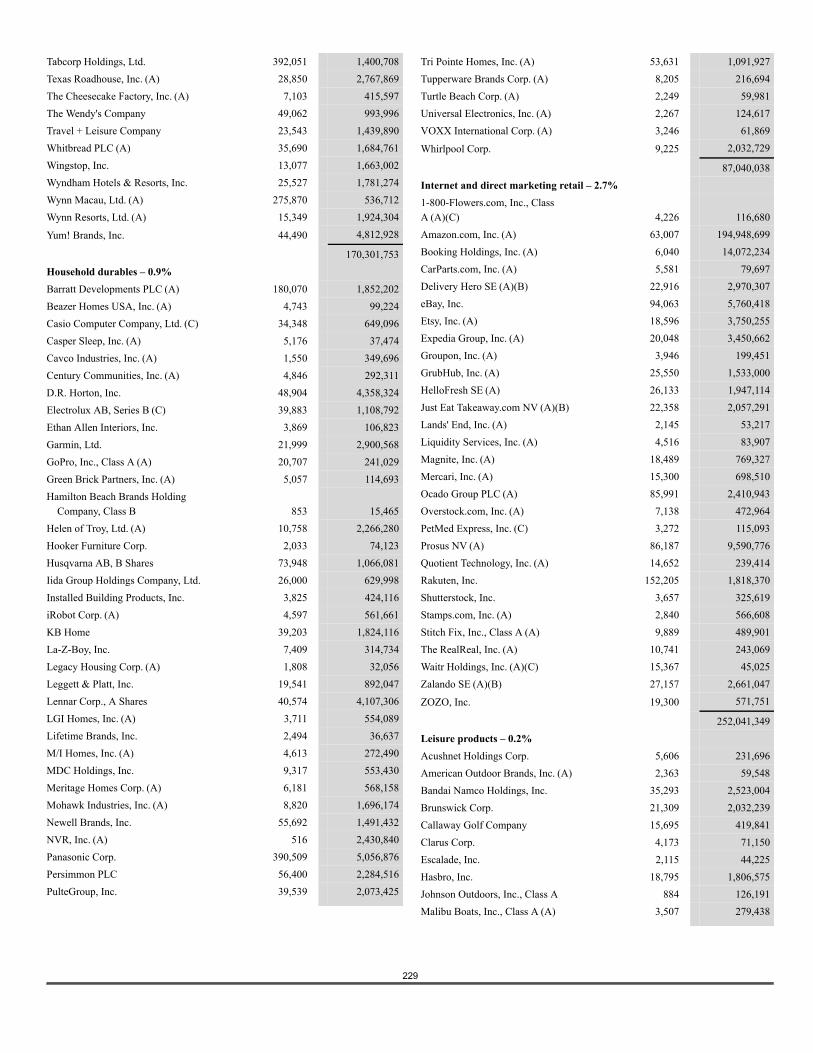
229
Tabcorp Holdings, Ltd. 392,051 1,400,708Texas Roadhouse, Inc. (A) 28,850 2,767,869The Cheesecake Factory, Inc. (A) 7,103 415,597The Wendy's Company 49,062 993,996Travel + Leisure Company 23,543 1,439,890Whitbread PLC (A) 35,690 1,684,761Wingstop, Inc. 13,077 1,663,002Wyndham Hotels & Resorts, Inc. 25,527 1,781,274Wynn Macau, Ltd. (A) 275,870 536,712Wynn Resorts, Ltd. (A) 15,349 1,924,304
Yum! Brands, Inc. 44,490 4,812,928
170,301,753Household durables – 0.9%Barratt Developments PLC (A) 180,070 1,852,202Beazer Homes USA, Inc. (A) 4,743 99,224Casio Computer Company, Ltd. (C) 34,348 649,096Casper Sleep, Inc. (A) 5,176 37,474Cavco Industries, Inc. (A) 1,550 349,696Century Communities, Inc. (A) 4,846 292,311D.R. Horton, Inc. 48,904 4,358,324Electrolux AB, Series B (C) 39,883 1,108,792Ethan Allen Interiors, Inc. 3,869 106,823Garmin, Ltd. 21,999 2,900,568GoPro, Inc., Class A (A) 20,707 241,029Green Brick Partners, Inc. (A) 5,057 114,693Hamilton Beach Brands Holding
Company, Class B 853 15,465Helen of Troy, Ltd. (A) 10,758 2,266,280Hooker Furniture Corp. 2,033 74,123Husqvarna AB, B Shares 73,948 1,066,081Iida Group Holdings Company, Ltd. 26,000 629,998Installed Building Products, Inc. 3,825 424,116iRobot Corp. (A) 4,597 561,661KB Home 39,203 1,824,116La-Z-Boy, Inc. 7,409 314,734Legacy Housing Corp. (A) 1,808 32,056Leggett & Platt, Inc. 19,541 892,047Lennar Corp., A Shares 40,574 4,107,306LGI Homes, Inc. (A) 3,711 554,089Lifetime Brands, Inc. 2,494 36,637M/I Homes, Inc. (A) 4,613 272,490MDC Holdings, Inc. 9,317 553,430Meritage Homes Corp. (A) 6,181 568,158Mohawk Industries, Inc. (A) 8,820 1,696,174Newell Brands, Inc. 55,692 1,491,432NVR, Inc. (A) 516 2,430,840Panasonic Corp. 390,509 5,056,876Persimmon PLC 56,400 2,284,516PulteGroup, Inc. 39,539 2,073,425
Tri Pointe Homes, Inc. (A) 53,631 1,091,927Tupperware Brands Corp. (A) 8,205 216,694Turtle Beach Corp. (A) 2,249 59,981Universal Electronics, Inc. (A) 2,267 124,617VOXX International Corp. (A) 3,246 61,869
Whirlpool Corp. 9,225 2,032,729
87,040,038Internet and direct marketing retail – 2.7%1-800-Flowers.com, Inc., ClassA (A)(C) 4,226 116,680Amazon.com, Inc. (A) 63,007 194,948,699Booking Holdings, Inc. (A) 6,040 14,072,234CarParts.com, Inc. (A) 5,581 79,697Delivery Hero SE (A)(B) 22,916 2,970,307eBay, Inc. 94,063 5,760,418Etsy, Inc. (A) 18,596 3,750,255Expedia Group, Inc. (A) 20,048 3,450,662Groupon, Inc. (A) 3,946 199,451GrubHub, Inc. (A) 25,550 1,533,000HelloFresh SE (A) 26,133 1,947,114Just Eat Takeaway.com NV (A)(B) 22,358 2,057,291Lands' End, Inc. (A) 2,145 53,217Liquidity Services, Inc. (A) 4,516 83,907Magnite, Inc. (A) 18,489 769,327Mercari, Inc. (A) 15,300 698,510Ocado Group PLC (A) 85,991 2,410,943Overstock.com, Inc. (A) 7,138 472,964PetMed Express, Inc. (C) 3,272 115,093Prosus NV (A) 86,187 9,590,776Quotient Technology, Inc. (A) 14,652 239,414Rakuten, Inc. 152,205 1,818,370Shutterstock, Inc. 3,657 325,619Stamps.com, Inc. (A) 2,840 566,608Stitch Fix, Inc., Class A (A) 9,889 489,901The RealReal, Inc. (A) 10,741 243,069Waitr Holdings, Inc. (A)(C) 15,367 45,025Zalando SE (A)(B) 27,157 2,661,047
ZOZO, Inc. 19,300 571,751
252,041,349Leisure products – 0.2%Acushnet Holdings Corp. 5,606 231,696American Outdoor Brands, Inc. (A) 2,363 59,548Bandai Namco Holdings, Inc. 35,293 2,523,004Brunswick Corp. 21,309 2,032,239Callaway Golf Company 15,695 419,841Clarus Corp. 4,173 71,150Escalade, Inc. 2,115 44,225Hasbro, Inc. 18,795 1,806,575Johnson Outdoors, Inc., Class A 884 126,191Malibu Boats, Inc., Class A (A) 3,507 279,438
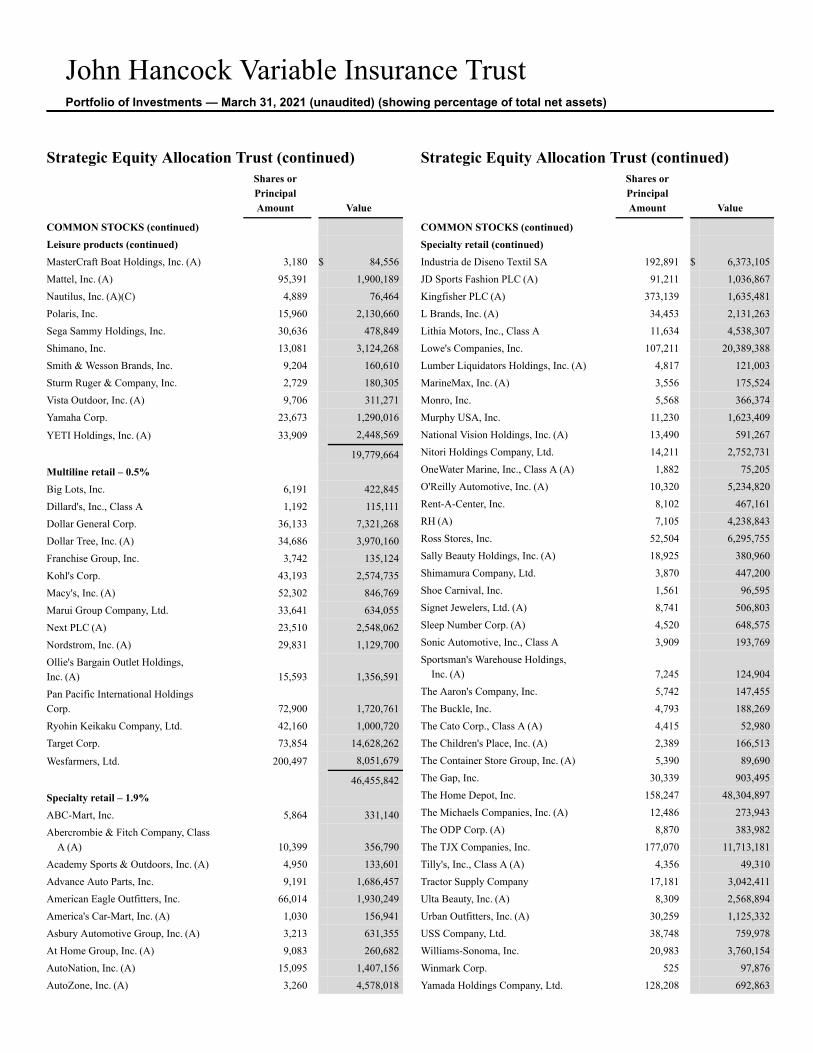
John Hancock Variable Insurance TrustPortfolio of Investments — March 31, 2021 (unaudited) (showing percentage of total net assets)
Strategic Equity Allocation Trust (continued)Shares orPrincipalAmount Value
COMMON STOCKS (continued)Leisure products (continued)MasterCraft Boat Holdings, Inc. (A) 3,180 $ 84,556Mattel, Inc. (A) 95,391 1,900,189Nautilus, Inc. (A)(C) 4,889 76,464Polaris, Inc. 15,960 2,130,660Sega Sammy Holdings, Inc. 30,636 478,849Shimano, Inc. 13,081 3,124,268Smith & Wesson Brands, Inc. 9,204 160,610Sturm Ruger & Company, Inc. 2,729 180,305Vista Outdoor, Inc. (A) 9,706 311,271Yamaha Corp. 23,673 1,290,016
YETI Holdings, Inc. (A) 33,909 2,448,569
19,779,664Multiline retail – 0.5%Big Lots, Inc. 6,191 422,845Dillard's, Inc., Class A 1,192 115,111Dollar General Corp. 36,133 7,321,268Dollar Tree, Inc. (A) 34,686 3,970,160Franchise Group, Inc. 3,742 135,124Kohl's Corp. 43,193 2,574,735Macy's, Inc. (A) 52,302 846,769Marui Group Company, Ltd. 33,641 634,055Next PLC (A) 23,510 2,548,062Nordstrom, Inc. (A) 29,831 1,129,700Ollie's Bargain Outlet Holdings,Inc. (A) 15,593 1,356,591Pan Pacific International HoldingsCorp. 72,900 1,720,761Ryohin Keikaku Company, Ltd. 42,160 1,000,720Target Corp. 73,854 14,628,262
Wesfarmers, Ltd. 200,497 8,051,679
46,455,842Specialty retail – 1.9%ABC-Mart, Inc. 5,864 331,140Abercrombie & Fitch Company, Class
A (A) 10,399 356,790Academy Sports & Outdoors, Inc. (A) 4,950 133,601Advance Auto Parts, Inc. 9,191 1,686,457American Eagle Outfitters, Inc. 66,014 1,930,249America's Car-Mart, Inc. (A) 1,030 156,941Asbury Automotive Group, Inc. (A) 3,213 631,355At Home Group, Inc. (A) 9,083 260,682AutoNation, Inc. (A) 15,095 1,407,156AutoZone, Inc. (A) 3,260 4,578,018
Strategic Equity Allocation Trust (continued)Shares orPrincipalAmount Value
COMMON STOCKS (continued)Specialty retail (continued)Industria de Diseno Textil SA 192,891 $ 6,373,105JD Sports Fashion PLC (A) 91,211 1,036,867Kingfisher PLC (A) 373,139 1,635,481L Brands, Inc. (A) 34,453 2,131,263Lithia Motors, Inc., Class A 11,634 4,538,307Lowe's Companies, Inc. 107,211 20,389,388Lumber Liquidators Holdings, Inc. (A) 4,817 121,003MarineMax, Inc. (A) 3,556 175,524Monro, Inc. 5,568 366,374Murphy USA, Inc. 11,230 1,623,409National Vision Holdings, Inc. (A) 13,490 591,267Nitori Holdings Company, Ltd. 14,211 2,752,731OneWater Marine, Inc., Class A (A) 1,882 75,205O'Reilly Automotive, Inc. (A) 10,320 5,234,820Rent-A-Center, Inc. 8,102 467,161RH (A) 7,105 4,238,843Ross Stores, Inc. 52,504 6,295,755Sally Beauty Holdings, Inc. (A) 18,925 380,960Shimamura Company, Ltd. 3,870 447,200Shoe Carnival, Inc. 1,561 96,595Signet Jewelers, Ltd. (A) 8,741 506,803Sleep Number Corp. (A) 4,520 648,575Sonic Automotive, Inc., Class A 3,909 193,769Sportsman's Warehouse Holdings,
Inc. (A) 7,245 124,904The Aaron's Company, Inc. 5,742 147,455The Buckle, Inc. 4,793 188,269The Cato Corp., Class A (A) 4,415 52,980The Children's Place, Inc. (A) 2,389 166,513The Container Store Group, Inc. (A) 5,390 89,690The Gap, Inc. 30,339 903,495The Home Depot, Inc. 158,247 48,304,897The Michaels Companies, Inc. (A) 12,486 273,943The ODP Corp. (A) 8,870 383,982The TJX Companies, Inc. 177,070 11,713,181Tilly's, Inc., Class A (A) 4,356 49,310Tractor Supply Company 17,181 3,042,411Ulta Beauty, Inc. (A) 8,309 2,568,894Urban Outfitters, Inc. (A) 30,259 1,125,332USS Company, Ltd. 38,748 759,978Williams-Sonoma, Inc. 20,983 3,760,154Winmark Corp. 525 97,876Yamada Holdings Company, Ltd. 128,208 692,863
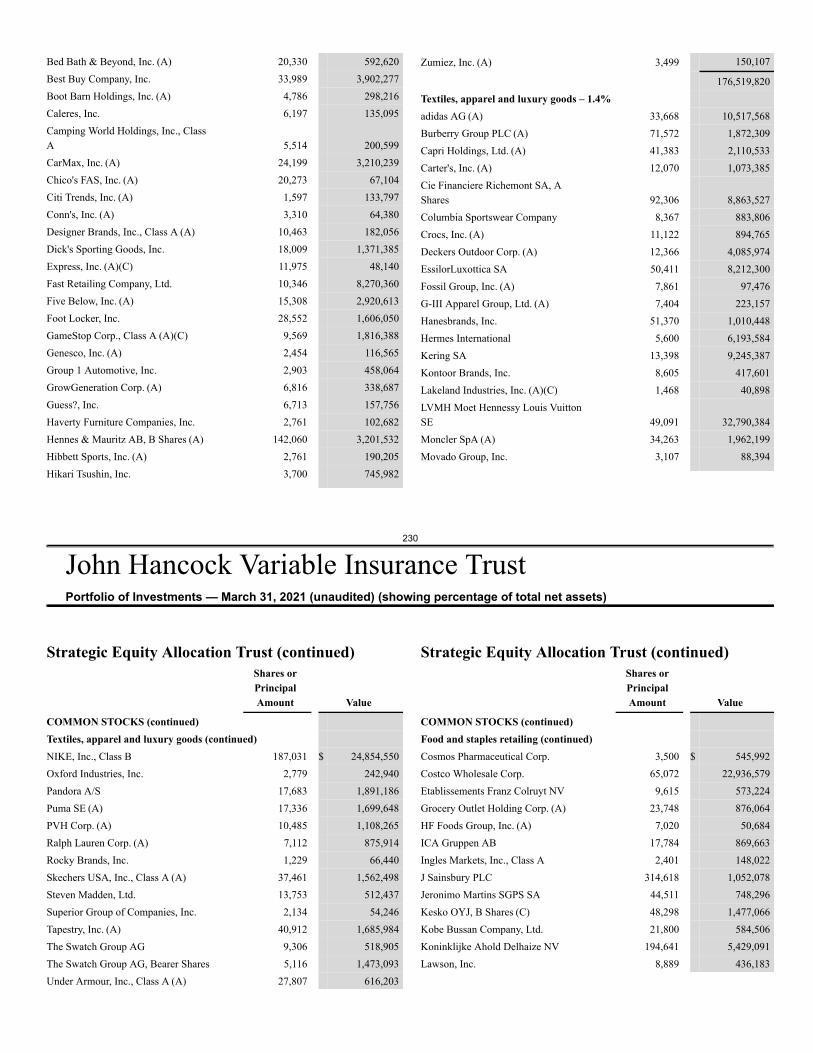
230
John Hancock Variable Insurance TrustPortfolio of Investments — March 31, 2021 (unaudited) (showing percentage of total net assets)
Bed Bath & Beyond, Inc. (A) 20,330 592,620Best Buy Company, Inc. 33,989 3,902,277Boot Barn Holdings, Inc. (A) 4,786 298,216Caleres, Inc. 6,197 135,095Camping World Holdings, Inc., ClassA 5,514 200,599CarMax, Inc. (A) 24,199 3,210,239Chico's FAS, Inc. (A) 20,273 67,104Citi Trends, Inc. (A) 1,597 133,797Conn's, Inc. (A) 3,310 64,380Designer Brands, Inc., Class A (A) 10,463 182,056Dick's Sporting Goods, Inc. 18,009 1,371,385Express, Inc. (A)(C) 11,975 48,140Fast Retailing Company, Ltd. 10,346 8,270,360Five Below, Inc. (A) 15,308 2,920,613Foot Locker, Inc. 28,552 1,606,050GameStop Corp., Class A (A)(C) 9,569 1,816,388Genesco, Inc. (A) 2,454 116,565Group 1 Automotive, Inc. 2,903 458,064GrowGeneration Corp. (A) 6,816 338,687Guess?, Inc. 6,713 157,756Haverty Furniture Companies, Inc. 2,761 102,682Hennes & Mauritz AB, B Shares (A) 142,060 3,201,532Hibbett Sports, Inc. (A) 2,761 190,205Hikari Tsushin, Inc. 3,700 745,982
Zumiez, Inc. (A) 3,499 150,107
176,519,820Textiles, apparel and luxury goods – 1.4%adidas AG (A) 33,668 10,517,568Burberry Group PLC (A) 71,572 1,872,309Capri Holdings, Ltd. (A) 41,383 2,110,533Carter's, Inc. (A) 12,070 1,073,385Cie Financiere Richemont SA, AShares 92,306 8,863,527Columbia Sportswear Company 8,367 883,806Crocs, Inc. (A) 11,122 894,765Deckers Outdoor Corp. (A) 12,366 4,085,974EssilorLuxottica SA 50,411 8,212,300Fossil Group, Inc. (A) 7,861 97,476G-III Apparel Group, Ltd. (A) 7,404 223,157Hanesbrands, Inc. 51,370 1,010,448Hermes International 5,600 6,193,584Kering SA 13,398 9,245,387Kontoor Brands, Inc. 8,605 417,601Lakeland Industries, Inc. (A)(C) 1,468 40,898LVMH Moet Hennessy Louis VuittonSE 49,091 32,790,384Moncler SpA (A) 34,263 1,962,199Movado Group, Inc. 3,107 88,394
Strategic Equity Allocation Trust (continued)Shares orPrincipalAmount Value
COMMON STOCKS (continued)Textiles, apparel and luxury goods (continued)NIKE, Inc., Class B 187,031 $ 24,854,550Oxford Industries, Inc. 2,779 242,940Pandora A/S 17,683 1,891,186Puma SE (A) 17,336 1,699,648PVH Corp. (A) 10,485 1,108,265Ralph Lauren Corp. (A) 7,112 875,914Rocky Brands, Inc. 1,229 66,440Skechers USA, Inc., Class A (A) 37,461 1,562,498Steven Madden, Ltd. 13,753 512,437Superior Group of Companies, Inc. 2,134 54,246Tapestry, Inc. (A) 40,912 1,685,984The Swatch Group AG 9,306 518,905The Swatch Group AG, Bearer Shares 5,116 1,473,093Under Armour, Inc., Class A (A) 27,807 616,203
Strategic Equity Allocation Trust (continued)Shares orPrincipalAmount Value
COMMON STOCKS (continued)Food and staples retailing (continued)Cosmos Pharmaceutical Corp. 3,500 $ 545,992Costco Wholesale Corp. 65,072 22,936,579Etablissements Franz Colruyt NV 9,615 573,224Grocery Outlet Holding Corp. (A) 23,748 876,064HF Foods Group, Inc. (A) 7,020 50,684ICA Gruppen AB 17,784 869,663Ingles Markets, Inc., Class A 2,401 148,022J Sainsbury PLC 314,618 1,052,078Jeronimo Martins SGPS SA 44,511 748,296Kesko OYJ, B Shares (C) 48,298 1,477,066Kobe Bussan Company, Ltd. 21,800 584,506Koninklijke Ahold Delhaize NV 194,641 5,429,091Lawson, Inc. 8,889 436,183
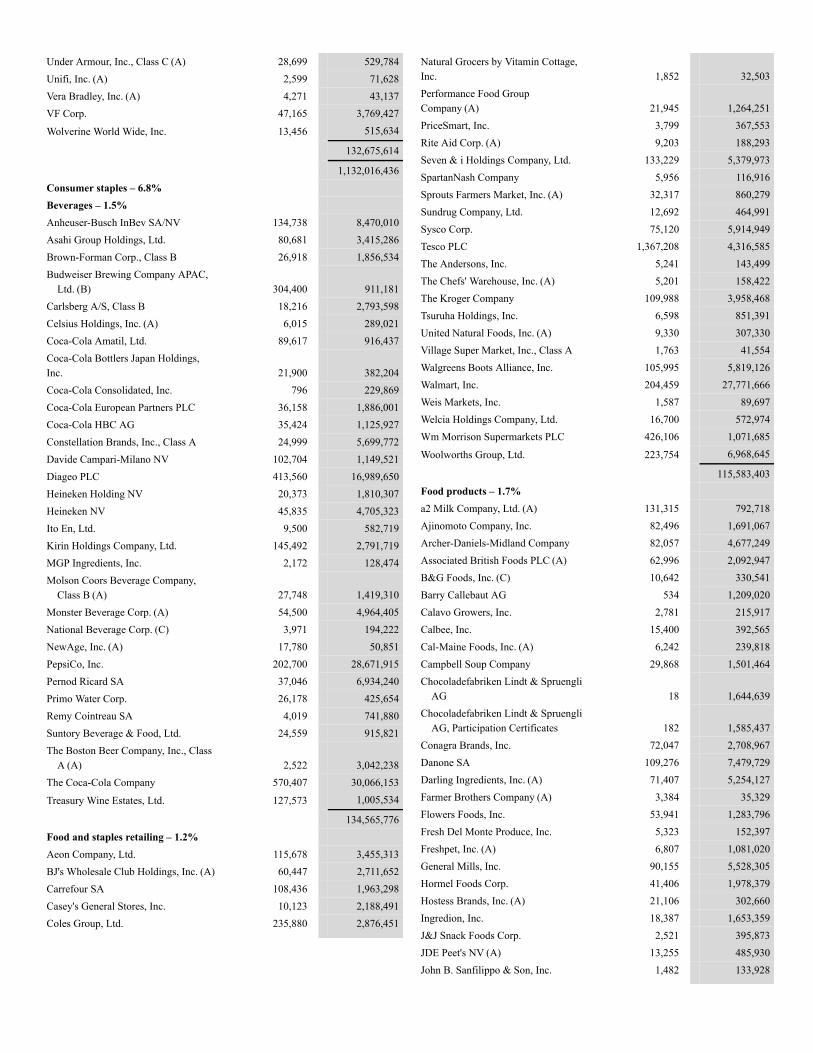
Under Armour, Inc., Class C (A) 28,699 529,784Unifi, Inc. (A) 2,599 71,628Vera Bradley, Inc. (A) 4,271 43,137VF Corp. 47,165 3,769,427
Wolverine World Wide, Inc. 13,456 515,634
132,675,614
1,132,016,436Consumer staples – 6.8%Beverages – 1.5%Anheuser-Busch InBev SA/NV 134,738 8,470,010Asahi Group Holdings, Ltd. 80,681 3,415,286Brown-Forman Corp., Class B 26,918 1,856,534Budweiser Brewing Company APAC,
Ltd. (B) 304,400 911,181Carlsberg A/S, Class B 18,216 2,793,598Celsius Holdings, Inc. (A) 6,015 289,021Coca-Cola Amatil, Ltd. 89,617 916,437Coca-Cola Bottlers Japan Holdings,Inc. 21,900 382,204Coca-Cola Consolidated, Inc. 796 229,869Coca-Cola European Partners PLC 36,158 1,886,001Coca-Cola HBC AG 35,424 1,125,927Constellation Brands, Inc., Class A 24,999 5,699,772Davide Campari-Milano NV 102,704 1,149,521Diageo PLC 413,560 16,989,650Heineken Holding NV 20,373 1,810,307Heineken NV 45,835 4,705,323Ito En, Ltd. 9,500 582,719Kirin Holdings Company, Ltd. 145,492 2,791,719MGP Ingredients, Inc. 2,172 128,474Molson Coors Beverage Company,
Class B (A) 27,748 1,419,310Monster Beverage Corp. (A) 54,500 4,964,405National Beverage Corp. (C) 3,971 194,222NewAge, Inc. (A) 17,780 50,851PepsiCo, Inc. 202,700 28,671,915Pernod Ricard SA 37,046 6,934,240Primo Water Corp. 26,178 425,654Remy Cointreau SA 4,019 741,880Suntory Beverage & Food, Ltd. 24,559 915,821The Boston Beer Company, Inc., Class
A (A) 2,522 3,042,238The Coca-Cola Company 570,407 30,066,153
Treasury Wine Estates, Ltd. 127,573 1,005,534
134,565,776Food and staples retailing – 1.2%Aeon Company, Ltd. 115,678 3,455,313BJ's Wholesale Club Holdings, Inc. (A) 60,447 2,711,652Carrefour SA 108,436 1,963,298Casey's General Stores, Inc. 10,123 2,188,491Coles Group, Ltd. 235,880 2,876,451
Natural Grocers by Vitamin Cottage,Inc. 1,852 32,503Performance Food GroupCompany (A) 21,945 1,264,251PriceSmart, Inc. 3,799 367,553Rite Aid Corp. (A) 9,203 188,293Seven & i Holdings Company, Ltd. 133,229 5,379,973SpartanNash Company 5,956 116,916Sprouts Farmers Market, Inc. (A) 32,317 860,279Sundrug Company, Ltd. 12,692 464,991Sysco Corp. 75,120 5,914,949Tesco PLC 1,367,208 4,316,585The Andersons, Inc. 5,241 143,499The Chefs' Warehouse, Inc. (A) 5,201 158,422The Kroger Company 109,988 3,958,468Tsuruha Holdings, Inc. 6,598 851,391United Natural Foods, Inc. (A) 9,330 307,330Village Super Market, Inc., Class A 1,763 41,554Walgreens Boots Alliance, Inc. 105,995 5,819,126Walmart, Inc. 204,459 27,771,666Weis Markets, Inc. 1,587 89,697Welcia Holdings Company, Ltd. 16,700 572,974Wm Morrison Supermarkets PLC 426,106 1,071,685
Woolworths Group, Ltd. 223,754 6,968,645
115,583,403Food products – 1.7%a2 Milk Company, Ltd. (A) 131,315 792,718Ajinomoto Company, Inc. 82,496 1,691,067Archer-Daniels-Midland Company 82,057 4,677,249Associated British Foods PLC (A) 62,996 2,092,947B&G Foods, Inc. (C) 10,642 330,541Barry Callebaut AG 534 1,209,020Calavo Growers, Inc. 2,781 215,917Calbee, Inc. 15,400 392,565Cal-Maine Foods, Inc. (A) 6,242 239,818Campbell Soup Company 29,868 1,501,464Chocoladefabriken Lindt & Spruengli
AG 18 1,644,639Chocoladefabriken Lindt & Spruengli
AG, Participation Certificates 182 1,585,437Conagra Brands, Inc. 72,047 2,708,967Danone SA 109,276 7,479,729Darling Ingredients, Inc. (A) 71,407 5,254,127Farmer Brothers Company (A) 3,384 35,329Flowers Foods, Inc. 53,941 1,283,796Fresh Del Monte Produce, Inc. 5,323 152,397Freshpet, Inc. (A) 6,807 1,081,020General Mills, Inc. 90,155 5,528,305Hormel Foods Corp. 41,406 1,978,379Hostess Brands, Inc. (A) 21,106 302,660Ingredion, Inc. 18,387 1,653,359J&J Snack Foods Corp. 2,521 395,873JDE Peet's NV (A) 13,255 485,930John B. Sanfilippo & Son, Inc. 1,482 133,928
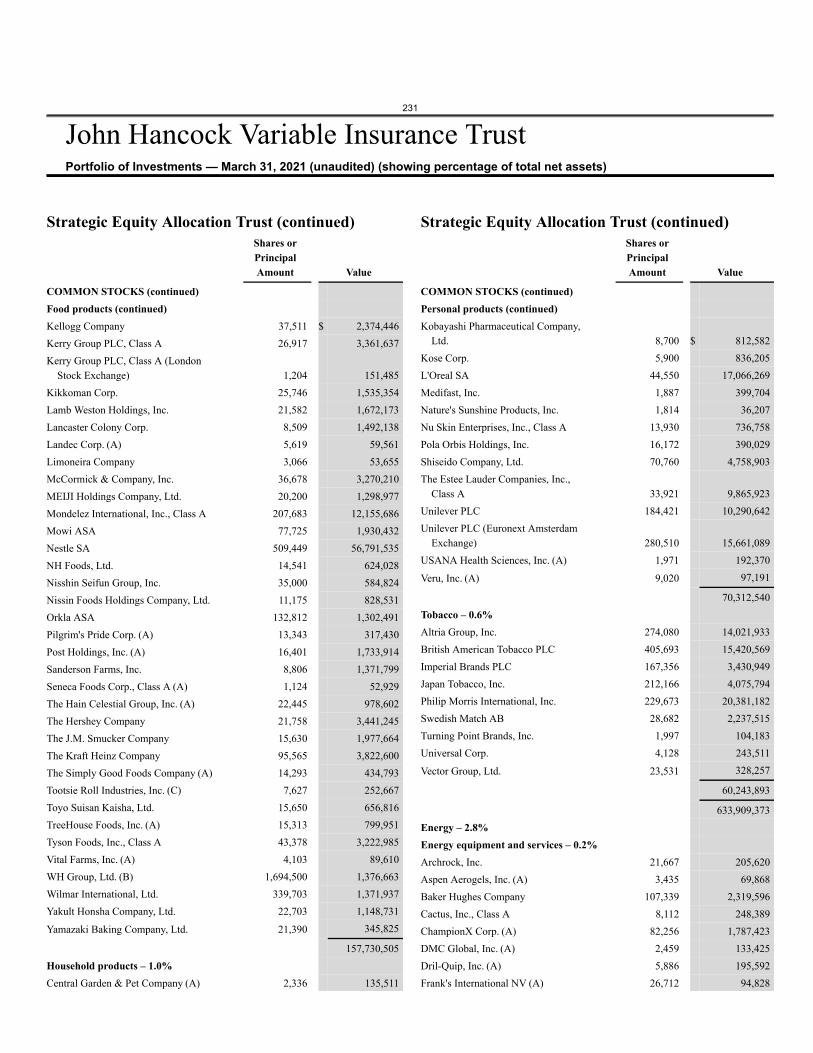
231
John Hancock Variable Insurance TrustPortfolio of Investments — March 31, 2021 (unaudited) (showing percentage of total net assets)
Strategic Equity Allocation Trust (continued)Shares orPrincipalAmount Value
COMMON STOCKS (continued)Food products (continued)Kellogg Company 37,511 $ 2,374,446Kerry Group PLC, Class A 26,917 3,361,637Kerry Group PLC, Class A (London
Stock Exchange) 1,204 151,485Kikkoman Corp. 25,746 1,535,354Lamb Weston Holdings, Inc. 21,582 1,672,173Lancaster Colony Corp. 8,509 1,492,138Landec Corp. (A) 5,619 59,561Limoneira Company 3,066 53,655McCormick & Company, Inc. 36,678 3,270,210MEIJI Holdings Company, Ltd. 20,200 1,298,977Mondelez International, Inc., Class A 207,683 12,155,686Mowi ASA 77,725 1,930,432Nestle SA 509,449 56,791,535NH Foods, Ltd. 14,541 624,028Nisshin Seifun Group, Inc. 35,000 584,824Nissin Foods Holdings Company, Ltd. 11,175 828,531Orkla ASA 132,812 1,302,491Pilgrim's Pride Corp. (A) 13,343 317,430Post Holdings, Inc. (A) 16,401 1,733,914Sanderson Farms, Inc. 8,806 1,371,799Seneca Foods Corp., Class A (A) 1,124 52,929The Hain Celestial Group, Inc. (A) 22,445 978,602The Hershey Company 21,758 3,441,245The J.M. Smucker Company 15,630 1,977,664The Kraft Heinz Company 95,565 3,822,600The Simply Good Foods Company (A) 14,293 434,793Tootsie Roll Industries, Inc. (C) 7,627 252,667Toyo Suisan Kaisha, Ltd. 15,650 656,816TreeHouse Foods, Inc. (A) 15,313 799,951Tyson Foods, Inc., Class A 43,378 3,222,985Vital Farms, Inc. (A) 4,103 89,610WH Group, Ltd. (B) 1,694,500 1,376,663Wilmar International, Ltd. 339,703 1,371,937Yakult Honsha Company, Ltd. 22,703 1,148,731
Yamazaki Baking Company, Ltd. 21,390 345,825
157,730,505Household products – 1.0%Central Garden & Pet Company (A) 2,336 135,511
Strategic Equity Allocation Trust (continued)Shares orPrincipalAmount Value
COMMON STOCKS (continued)Personal products (continued)Kobayashi Pharmaceutical Company,
Ltd. 8,700 $ 812,582Kose Corp. 5,900 836,205L'Oreal SA 44,550 17,066,269Medifast, Inc. 1,887 399,704Nature's Sunshine Products, Inc. 1,814 36,207Nu Skin Enterprises, Inc., Class A 13,930 736,758Pola Orbis Holdings, Inc. 16,172 390,029Shiseido Company, Ltd. 70,760 4,758,903The Estee Lauder Companies, Inc.,
Class A 33,921 9,865,923Unilever PLC 184,421 10,290,642Unilever PLC (Euronext Amsterdam
Exchange) 280,510 15,661,089USANA Health Sciences, Inc. (A) 1,971 192,370
Veru, Inc. (A) 9,020 97,191
70,312,540Tobacco – 0.6%Altria Group, Inc. 274,080 14,021,933British American Tobacco PLC 405,693 15,420,569Imperial Brands PLC 167,356 3,430,949Japan Tobacco, Inc. 212,166 4,075,794Philip Morris International, Inc. 229,673 20,381,182Swedish Match AB 28,682 2,237,515Turning Point Brands, Inc. 1,997 104,183Universal Corp. 4,128 243,511
Vector Group, Ltd. 23,531 328,257
60,243,893
633,909,373Energy – 2.8%Energy equipment and services – 0.2%Archrock, Inc. 21,667 205,620Aspen Aerogels, Inc. (A) 3,435 69,868Baker Hughes Company 107,339 2,319,596Cactus, Inc., Class A 8,112 248,389ChampionX Corp. (A) 82,256 1,787,423DMC Global, Inc. (A) 2,459 133,425Dril-Quip, Inc. (A) 5,886 195,592Frank's International NV (A) 26,712 94,828
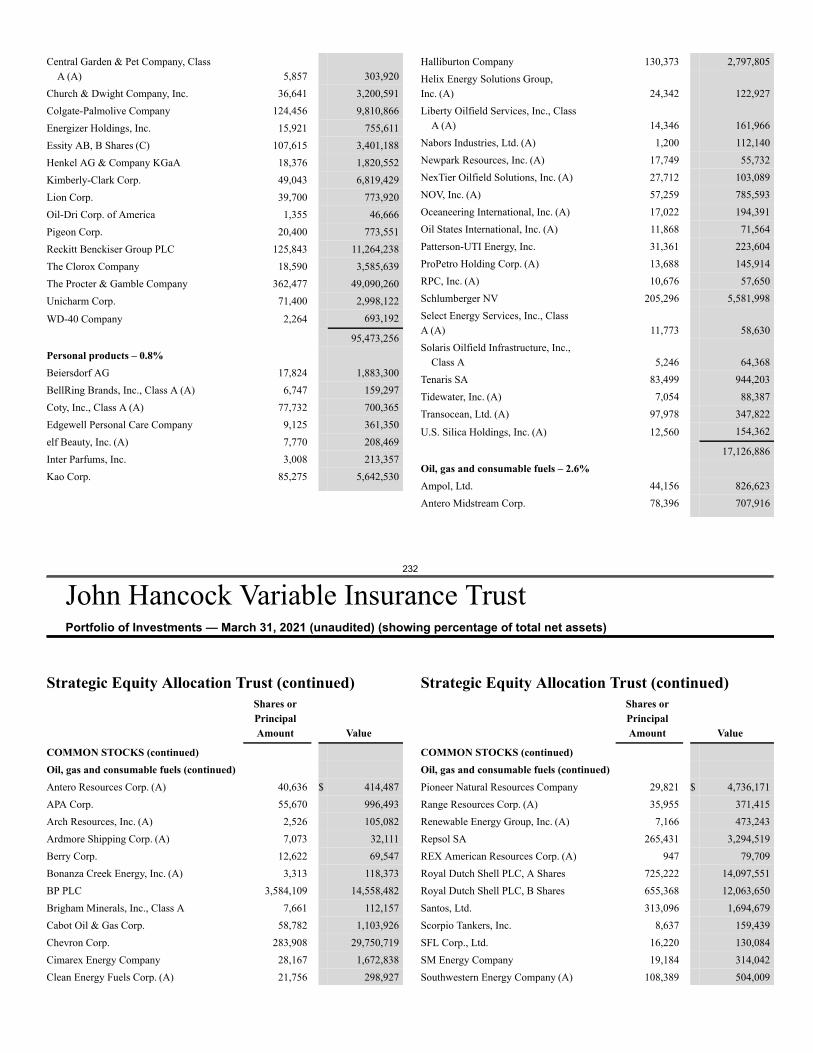
232
John Hancock Variable Insurance TrustPortfolio of Investments — March 31, 2021 (unaudited) (showing percentage of total net assets)
Central Garden & Pet Company, ClassA (A) 5,857 303,920
Church & Dwight Company, Inc. 36,641 3,200,591Colgate-Palmolive Company 124,456 9,810,866Energizer Holdings, Inc. 15,921 755,611Essity AB, B Shares (C) 107,615 3,401,188Henkel AG & Company KGaA 18,376 1,820,552Kimberly-Clark Corp. 49,043 6,819,429Lion Corp. 39,700 773,920Oil-Dri Corp. of America 1,355 46,666Pigeon Corp. 20,400 773,551Reckitt Benckiser Group PLC 125,843 11,264,238The Clorox Company 18,590 3,585,639The Procter & Gamble Company 362,477 49,090,260Unicharm Corp. 71,400 2,998,122
WD-40 Company 2,264 693,192
95,473,256Personal products – 0.8%Beiersdorf AG 17,824 1,883,300BellRing Brands, Inc., Class A (A) 6,747 159,297Coty, Inc., Class A (A) 77,732 700,365Edgewell Personal Care Company 9,125 361,350elf Beauty, Inc. (A) 7,770 208,469Inter Parfums, Inc. 3,008 213,357Kao Corp. 85,275 5,642,530
Halliburton Company 130,373 2,797,805Helix Energy Solutions Group,Inc. (A) 24,342 122,927Liberty Oilfield Services, Inc., Class
A (A) 14,346 161,966Nabors Industries, Ltd. (A) 1,200 112,140Newpark Resources, Inc. (A) 17,749 55,732NexTier Oilfield Solutions, Inc. (A) 27,712 103,089NOV, Inc. (A) 57,259 785,593Oceaneering International, Inc. (A) 17,022 194,391Oil States International, Inc. (A) 11,868 71,564Patterson-UTI Energy, Inc. 31,361 223,604ProPetro Holding Corp. (A) 13,688 145,914RPC, Inc. (A) 10,676 57,650Schlumberger NV 205,296 5,581,998Select Energy Services, Inc., ClassA (A) 11,773 58,630Solaris Oilfield Infrastructure, Inc.,
Class A 5,246 64,368Tenaris SA 83,499 944,203Tidewater, Inc. (A) 7,054 88,387Transocean, Ltd. (A) 97,978 347,822
U.S. Silica Holdings, Inc. (A) 12,560 154,362
17,126,886Oil, gas and consumable fuels – 2.6%Ampol, Ltd. 44,156 826,623Antero Midstream Corp. 78,396 707,916
Strategic Equity Allocation Trust (continued)Shares orPrincipalAmount Value
COMMON STOCKS (continued)Oil, gas and consumable fuels (continued)Antero Resources Corp. (A) 40,636 $ 414,487APA Corp. 55,670 996,493Arch Resources, Inc. (A) 2,526 105,082Ardmore Shipping Corp. (A) 7,073 32,111Berry Corp. 12,622 69,547Bonanza Creek Energy, Inc. (A) 3,313 118,373BP PLC 3,584,109 14,558,482Brigham Minerals, Inc., Class A 7,661 112,157Cabot Oil & Gas Corp. 58,782 1,103,926Chevron Corp. 283,908 29,750,719Cimarex Energy Company 28,167 1,672,838Clean Energy Fuels Corp. (A) 21,756 298,927
Strategic Equity Allocation Trust (continued)Shares orPrincipalAmount Value
COMMON STOCKS (continued)Oil, gas and consumable fuels (continued)Pioneer Natural Resources Company 29,821 $ 4,736,171Range Resources Corp. (A) 35,955 371,415Renewable Energy Group, Inc. (A) 7,166 473,243Repsol SA 265,431 3,294,519REX American Resources Corp. (A) 947 79,709Royal Dutch Shell PLC, A Shares 725,222 14,097,551Royal Dutch Shell PLC, B Shares 655,368 12,063,650Santos, Ltd. 313,096 1,694,679Scorpio Tankers, Inc. 8,637 159,439SFL Corp., Ltd. 16,220 130,084SM Energy Company 19,184 314,042Southwestern Energy Company (A) 108,389 504,009
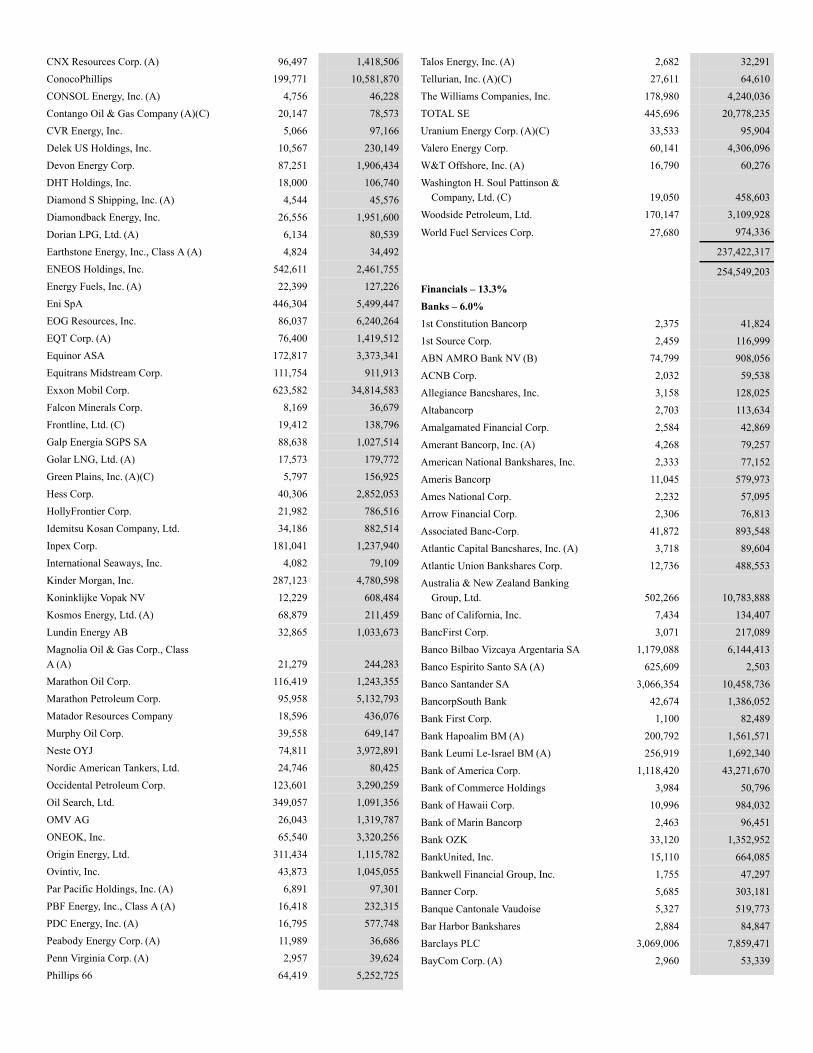
CNX Resources Corp. (A) 96,497 1,418,506ConocoPhillips 199,771 10,581,870CONSOL Energy, Inc. (A) 4,756 46,228Contango Oil & Gas Company (A)(C) 20,147 78,573CVR Energy, Inc. 5,066 97,166Delek US Holdings, Inc. 10,567 230,149Devon Energy Corp. 87,251 1,906,434DHT Holdings, Inc. 18,000 106,740Diamond S Shipping, Inc. (A) 4,544 45,576Diamondback Energy, Inc. 26,556 1,951,600Dorian LPG, Ltd. (A) 6,134 80,539Earthstone Energy, Inc., Class A (A) 4,824 34,492ENEOS Holdings, Inc. 542,611 2,461,755Energy Fuels, Inc. (A) 22,399 127,226Eni SpA 446,304 5,499,447EOG Resources, Inc. 86,037 6,240,264EQT Corp. (A) 76,400 1,419,512Equinor ASA 172,817 3,373,341Equitrans Midstream Corp. 111,754 911,913Exxon Mobil Corp. 623,582 34,814,583Falcon Minerals Corp. 8,169 36,679Frontline, Ltd. (C) 19,412 138,796Galp Energia SGPS SA 88,638 1,027,514Golar LNG, Ltd. (A) 17,573 179,772Green Plains, Inc. (A)(C) 5,797 156,925Hess Corp. 40,306 2,852,053HollyFrontier Corp. 21,982 786,516Idemitsu Kosan Company, Ltd. 34,186 882,514Inpex Corp. 181,041 1,237,940International Seaways, Inc. 4,082 79,109Kinder Morgan, Inc. 287,123 4,780,598Koninklijke Vopak NV 12,229 608,484Kosmos Energy, Ltd. (A) 68,879 211,459Lundin Energy AB 32,865 1,033,673Magnolia Oil & Gas Corp., ClassA (A) 21,279 244,283Marathon Oil Corp. 116,419 1,243,355Marathon Petroleum Corp. 95,958 5,132,793Matador Resources Company 18,596 436,076Murphy Oil Corp. 39,558 649,147Neste OYJ 74,811 3,972,891Nordic American Tankers, Ltd. 24,746 80,425Occidental Petroleum Corp. 123,601 3,290,259Oil Search, Ltd. 349,057 1,091,356OMV AG 26,043 1,319,787ONEOK, Inc. 65,540 3,320,256Origin Energy, Ltd. 311,434 1,115,782Ovintiv, Inc. 43,873 1,045,055Par Pacific Holdings, Inc. (A) 6,891 97,301PBF Energy, Inc., Class A (A) 16,418 232,315PDC Energy, Inc. (A) 16,795 577,748Peabody Energy Corp. (A) 11,989 36,686Penn Virginia Corp. (A) 2,957 39,624Phillips 66 64,419 5,252,725
Talos Energy, Inc. (A) 2,682 32,291Tellurian, Inc. (A)(C) 27,611 64,610The Williams Companies, Inc. 178,980 4,240,036TOTAL SE 445,696 20,778,235Uranium Energy Corp. (A)(C) 33,533 95,904Valero Energy Corp. 60,141 4,306,096W&T Offshore, Inc. (A) 16,790 60,276Washington H. Soul Pattinson &
Company, Ltd. (C) 19,050 458,603Woodside Petroleum, Ltd. 170,147 3,109,928
World Fuel Services Corp. 27,680 974,336
237,422,317
254,549,203Financials – 13.3%Banks – 6.0%1st Constitution Bancorp 2,375 41,8241st Source Corp. 2,459 116,999ABN AMRO Bank NV (B) 74,799 908,056ACNB Corp. 2,032 59,538Allegiance Bancshares, Inc. 3,158 128,025Altabancorp 2,703 113,634Amalgamated Financial Corp. 2,584 42,869Amerant Bancorp, Inc. (A) 4,268 79,257American National Bankshares, Inc. 2,333 77,152Ameris Bancorp 11,045 579,973Ames National Corp. 2,232 57,095Arrow Financial Corp. 2,306 76,813Associated Banc-Corp. 41,872 893,548Atlantic Capital Bancshares, Inc. (A) 3,718 89,604Atlantic Union Bankshares Corp. 12,736 488,553Australia & New Zealand Banking
Group, Ltd. 502,266 10,783,888Banc of California, Inc. 7,434 134,407BancFirst Corp. 3,071 217,089Banco Bilbao Vizcaya Argentaria SA 1,179,088 6,144,413Banco Espirito Santo SA (A) 625,609 2,503Banco Santander SA 3,066,354 10,458,736BancorpSouth Bank 42,674 1,386,052Bank First Corp. 1,100 82,489Bank Hapoalim BM (A) 200,792 1,561,571Bank Leumi Le-Israel BM (A) 256,919 1,692,340Bank of America Corp. 1,118,420 43,271,670Bank of Commerce Holdings 3,984 50,796Bank of Hawaii Corp. 10,996 984,032Bank of Marin Bancorp 2,463 96,451Bank OZK 33,120 1,352,952BankUnited, Inc. 15,110 664,085Bankwell Financial Group, Inc. 1,755 47,297Banner Corp. 5,685 303,181Banque Cantonale Vaudoise 5,327 519,773Bar Harbor Bankshares 2,884 84,847Barclays PLC 3,069,006 7,859,471BayCom Corp. (A) 2,960 53,339
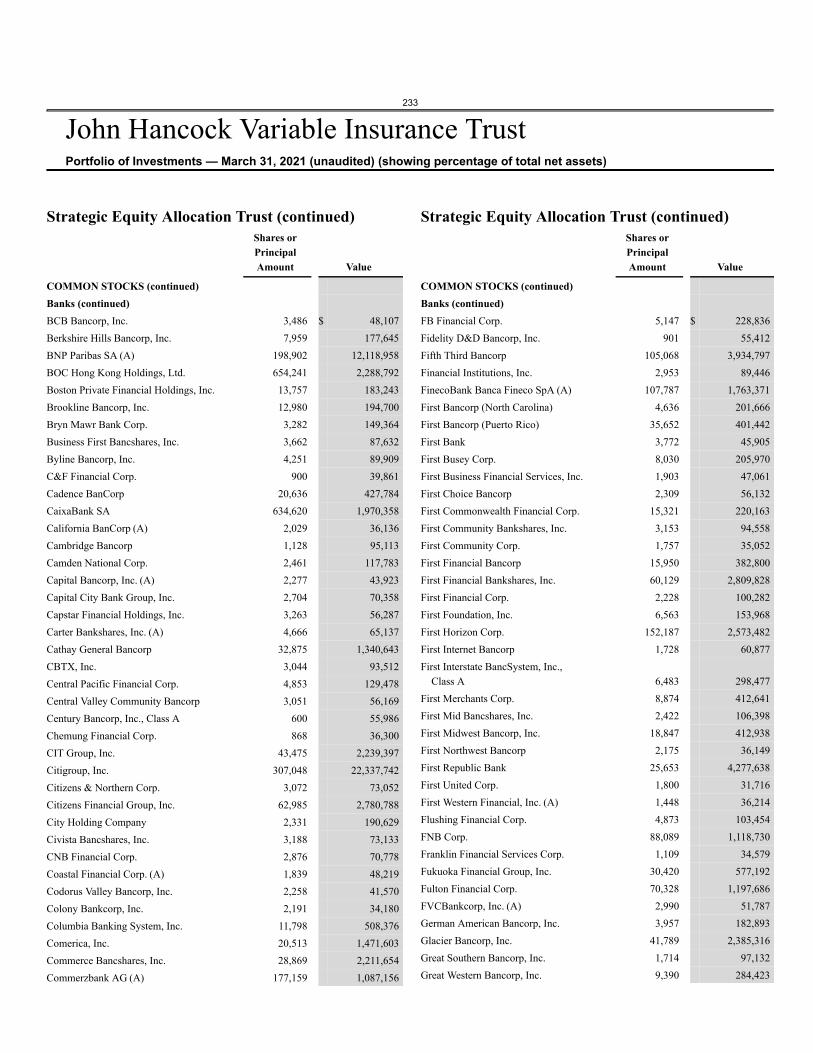
233
John Hancock Variable Insurance TrustPortfolio of Investments — March 31, 2021 (unaudited) (showing percentage of total net assets)
Strategic Equity Allocation Trust (continued)Shares orPrincipalAmount Value
COMMON STOCKS (continued)Banks (continued)BCB Bancorp, Inc. 3,486 $ 48,107Berkshire Hills Bancorp, Inc. 7,959 177,645BNP Paribas SA (A) 198,902 12,118,958BOC Hong Kong Holdings, Ltd. 654,241 2,288,792Boston Private Financial Holdings, Inc. 13,757 183,243Brookline Bancorp, Inc. 12,980 194,700Bryn Mawr Bank Corp. 3,282 149,364Business First Bancshares, Inc. 3,662 87,632Byline Bancorp, Inc. 4,251 89,909C&F Financial Corp. 900 39,861Cadence BanCorp 20,636 427,784CaixaBank SA 634,620 1,970,358California BanCorp (A) 2,029 36,136Cambridge Bancorp 1,128 95,113Camden National Corp. 2,461 117,783Capital Bancorp, Inc. (A) 2,277 43,923Capital City Bank Group, Inc. 2,704 70,358Capstar Financial Holdings, Inc. 3,263 56,287Carter Bankshares, Inc. (A) 4,666 65,137Cathay General Bancorp 32,875 1,340,643CBTX, Inc. 3,044 93,512Central Pacific Financial Corp. 4,853 129,478Central Valley Community Bancorp 3,051 56,169Century Bancorp, Inc., Class A 600 55,986Chemung Financial Corp. 868 36,300CIT Group, Inc. 43,475 2,239,397Citigroup, Inc. 307,048 22,337,742Citizens & Northern Corp. 3,072 73,052Citizens Financial Group, Inc. 62,985 2,780,788City Holding Company 2,331 190,629Civista Bancshares, Inc. 3,188 73,133CNB Financial Corp. 2,876 70,778Coastal Financial Corp. (A) 1,839 48,219Codorus Valley Bancorp, Inc. 2,258 41,570Colony Bankcorp, Inc. 2,191 34,180Columbia Banking System, Inc. 11,798 508,376Comerica, Inc. 20,513 1,471,603Commerce Bancshares, Inc. 28,869 2,211,654Commerzbank AG (A) 177,159 1,087,156
Strategic Equity Allocation Trust (continued)Shares orPrincipalAmount Value
COMMON STOCKS (continued)Banks (continued)FB Financial Corp. 5,147 $ 228,836Fidelity D&D Bancorp, Inc. 901 55,412Fifth Third Bancorp 105,068 3,934,797Financial Institutions, Inc. 2,953 89,446FinecoBank Banca Fineco SpA (A) 107,787 1,763,371First Bancorp (North Carolina) 4,636 201,666First Bancorp (Puerto Rico) 35,652 401,442First Bank 3,772 45,905First Busey Corp. 8,030 205,970First Business Financial Services, Inc. 1,903 47,061First Choice Bancorp 2,309 56,132First Commonwealth Financial Corp. 15,321 220,163First Community Bankshares, Inc. 3,153 94,558First Community Corp. 1,757 35,052First Financial Bancorp 15,950 382,800First Financial Bankshares, Inc. 60,129 2,809,828First Financial Corp. 2,228 100,282First Foundation, Inc. 6,563 153,968First Horizon Corp. 152,187 2,573,482First Internet Bancorp 1,728 60,877First Interstate BancSystem, Inc.,
Class A 6,483 298,477First Merchants Corp. 8,874 412,641First Mid Bancshares, Inc. 2,422 106,398First Midwest Bancorp, Inc. 18,847 412,938First Northwest Bancorp 2,175 36,149First Republic Bank 25,653 4,277,638First United Corp. 1,800 31,716First Western Financial, Inc. (A) 1,448 36,214Flushing Financial Corp. 4,873 103,454FNB Corp. 88,089 1,118,730Franklin Financial Services Corp. 1,109 34,579Fukuoka Financial Group, Inc. 30,420 577,192Fulton Financial Corp. 70,328 1,197,686FVCBankcorp, Inc. (A) 2,990 51,787German American Bancorp, Inc. 3,957 182,893Glacier Bancorp, Inc. 41,789 2,385,316Great Southern Bancorp, Inc. 1,714 97,132Great Western Bancorp, Inc. 9,390 284,423
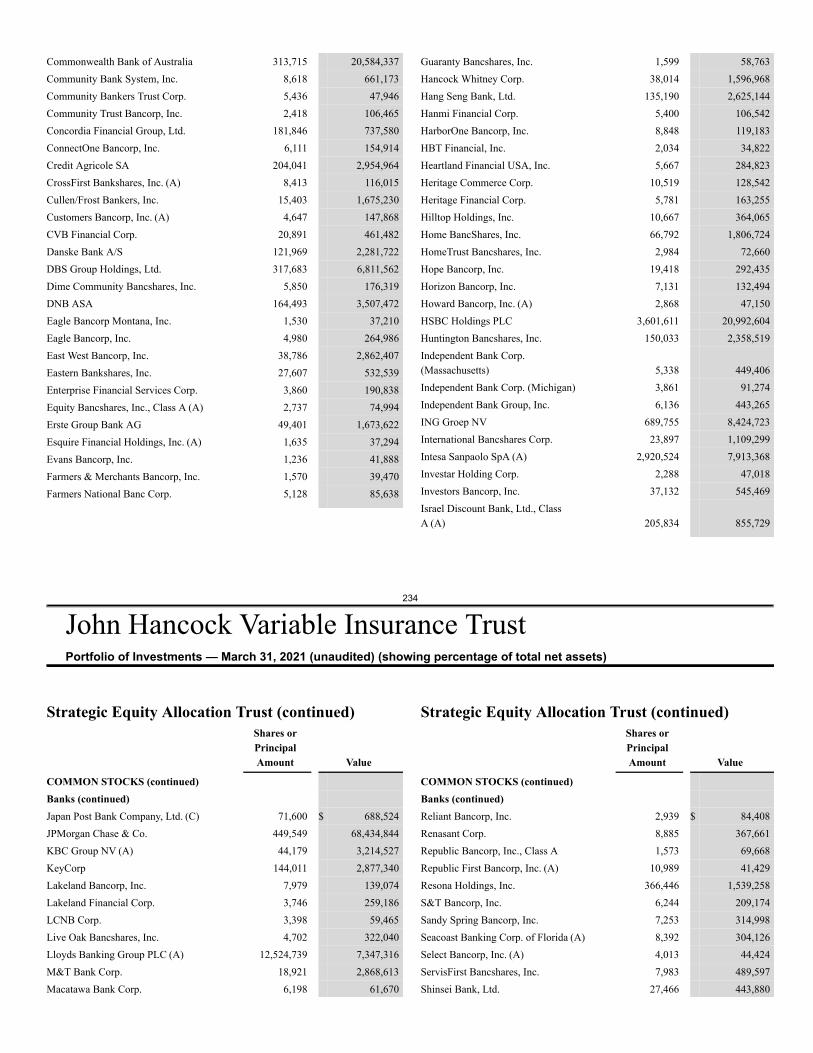
234
John Hancock Variable Insurance TrustPortfolio of Investments — March 31, 2021 (unaudited) (showing percentage of total net assets)
Commonwealth Bank of Australia 313,715 20,584,337Community Bank System, Inc. 8,618 661,173Community Bankers Trust Corp. 5,436 47,946Community Trust Bancorp, Inc. 2,418 106,465Concordia Financial Group, Ltd. 181,846 737,580ConnectOne Bancorp, Inc. 6,111 154,914Credit Agricole SA 204,041 2,954,964CrossFirst Bankshares, Inc. (A) 8,413 116,015Cullen/Frost Bankers, Inc. 15,403 1,675,230Customers Bancorp, Inc. (A) 4,647 147,868CVB Financial Corp. 20,891 461,482Danske Bank A/S 121,969 2,281,722DBS Group Holdings, Ltd. 317,683 6,811,562Dime Community Bancshares, Inc. 5,850 176,319DNB ASA 164,493 3,507,472Eagle Bancorp Montana, Inc. 1,530 37,210Eagle Bancorp, Inc. 4,980 264,986East West Bancorp, Inc. 38,786 2,862,407Eastern Bankshares, Inc. 27,607 532,539Enterprise Financial Services Corp. 3,860 190,838Equity Bancshares, Inc., Class A (A) 2,737 74,994Erste Group Bank AG 49,401 1,673,622Esquire Financial Holdings, Inc. (A) 1,635 37,294Evans Bancorp, Inc. 1,236 41,888Farmers & Merchants Bancorp, Inc. 1,570 39,470Farmers National Banc Corp. 5,128 85,638
Guaranty Bancshares, Inc. 1,599 58,763Hancock Whitney Corp. 38,014 1,596,968Hang Seng Bank, Ltd. 135,190 2,625,144Hanmi Financial Corp. 5,400 106,542HarborOne Bancorp, Inc. 8,848 119,183HBT Financial, Inc. 2,034 34,822Heartland Financial USA, Inc. 5,667 284,823Heritage Commerce Corp. 10,519 128,542Heritage Financial Corp. 5,781 163,255Hilltop Holdings, Inc. 10,667 364,065Home BancShares, Inc. 66,792 1,806,724HomeTrust Bancshares, Inc. 2,984 72,660Hope Bancorp, Inc. 19,418 292,435Horizon Bancorp, Inc. 7,131 132,494Howard Bancorp, Inc. (A) 2,868 47,150HSBC Holdings PLC 3,601,611 20,992,604Huntington Bancshares, Inc. 150,033 2,358,519Independent Bank Corp.(Massachusetts) 5,338 449,406Independent Bank Corp. (Michigan) 3,861 91,274Independent Bank Group, Inc. 6,136 443,265ING Groep NV 689,755 8,424,723International Bancshares Corp. 23,897 1,109,299Intesa Sanpaolo SpA (A) 2,920,524 7,913,368Investar Holding Corp. 2,288 47,018Investors Bancorp, Inc. 37,132 545,469Israel Discount Bank, Ltd., ClassA (A) 205,834 855,729
Strategic Equity Allocation Trust (continued)Shares orPrincipalAmount Value
COMMON STOCKS (continued)Banks (continued)Japan Post Bank Company, Ltd. (C) 71,600 $ 688,524JPMorgan Chase & Co. 449,549 68,434,844KBC Group NV (A) 44,179 3,214,527KeyCorp 144,011 2,877,340Lakeland Bancorp, Inc. 7,979 139,074Lakeland Financial Corp. 3,746 259,186LCNB Corp. 3,398 59,465Live Oak Bancshares, Inc. 4,702 322,040Lloyds Banking Group PLC (A) 12,524,739 7,347,316M&T Bank Corp. 18,921 2,868,613Macatawa Bank Corp. 6,198 61,670
Strategic Equity Allocation Trust (continued)Shares orPrincipalAmount Value
COMMON STOCKS (continued)Banks (continued)Reliant Bancorp, Inc. 2,939 $ 84,408Renasant Corp. 8,885 367,661Republic Bancorp, Inc., Class A 1,573 69,668Republic First Bancorp, Inc. (A) 10,989 41,429Resona Holdings, Inc. 366,446 1,539,258S&T Bancorp, Inc. 6,244 209,174Sandy Spring Bancorp, Inc. 7,253 314,998Seacoast Banking Corp. of Florida (A) 8,392 304,126Select Bancorp, Inc. (A) 4,013 44,424ServisFirst Bancshares, Inc. 7,983 489,597Shinsei Bank, Ltd. 27,466 443,880
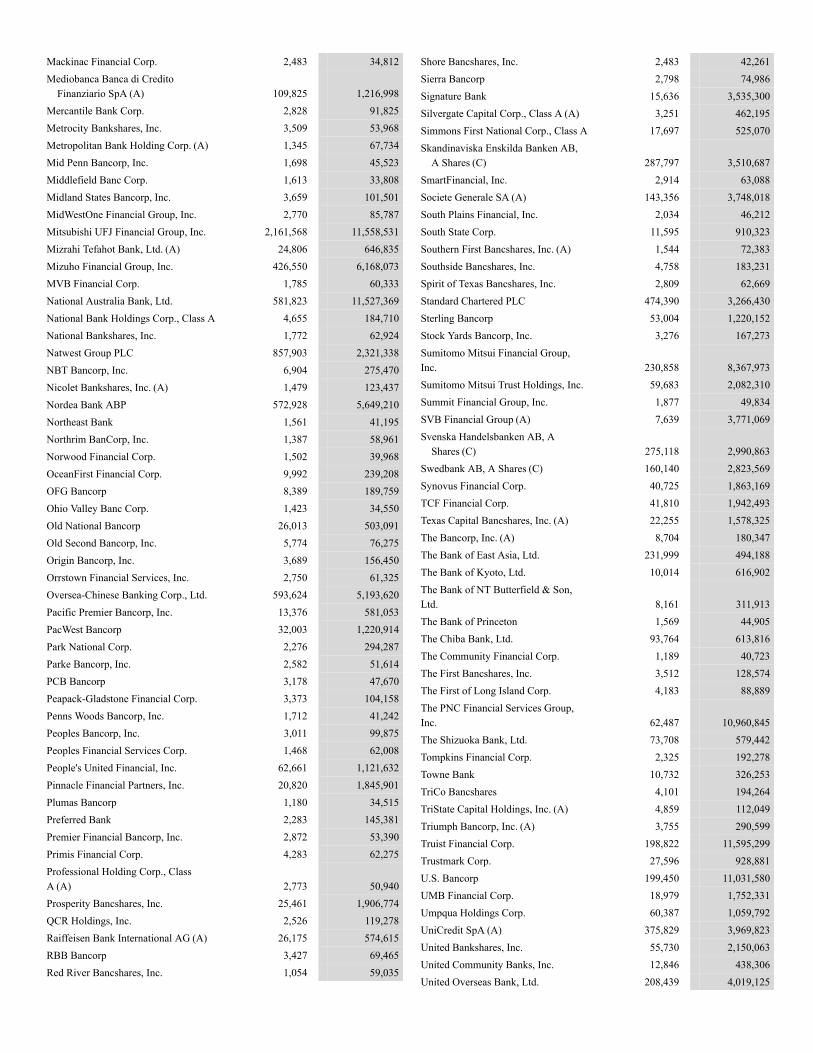
Mackinac Financial Corp. 2,483 34,812Mediobanca Banca di Credito
Finanziario SpA (A) 109,825 1,216,998Mercantile Bank Corp. 2,828 91,825Metrocity Bankshares, Inc. 3,509 53,968Metropolitan Bank Holding Corp. (A) 1,345 67,734Mid Penn Bancorp, Inc. 1,698 45,523Middlefield Banc Corp. 1,613 33,808Midland States Bancorp, Inc. 3,659 101,501MidWestOne Financial Group, Inc. 2,770 85,787Mitsubishi UFJ Financial Group, Inc. 2,161,568 11,558,531Mizrahi Tefahot Bank, Ltd. (A) 24,806 646,835Mizuho Financial Group, Inc. 426,550 6,168,073MVB Financial Corp. 1,785 60,333National Australia Bank, Ltd. 581,823 11,527,369National Bank Holdings Corp., Class A 4,655 184,710National Bankshares, Inc. 1,772 62,924Natwest Group PLC 857,903 2,321,338NBT Bancorp, Inc. 6,904 275,470Nicolet Bankshares, Inc. (A) 1,479 123,437Nordea Bank ABP 572,928 5,649,210Northeast Bank 1,561 41,195Northrim BanCorp, Inc. 1,387 58,961Norwood Financial Corp. 1,502 39,968OceanFirst Financial Corp. 9,992 239,208OFG Bancorp 8,389 189,759Ohio Valley Banc Corp. 1,423 34,550Old National Bancorp 26,013 503,091Old Second Bancorp, Inc. 5,774 76,275Origin Bancorp, Inc. 3,689 156,450Orrstown Financial Services, Inc. 2,750 61,325Oversea-Chinese Banking Corp., Ltd. 593,624 5,193,620Pacific Premier Bancorp, Inc. 13,376 581,053PacWest Bancorp 32,003 1,220,914Park National Corp. 2,276 294,287Parke Bancorp, Inc. 2,582 51,614PCB Bancorp 3,178 47,670Peapack-Gladstone Financial Corp. 3,373 104,158Penns Woods Bancorp, Inc. 1,712 41,242Peoples Bancorp, Inc. 3,011 99,875Peoples Financial Services Corp. 1,468 62,008People's United Financial, Inc. 62,661 1,121,632Pinnacle Financial Partners, Inc. 20,820 1,845,901Plumas Bancorp 1,180 34,515Preferred Bank 2,283 145,381Premier Financial Bancorp, Inc. 2,872 53,390Primis Financial Corp. 4,283 62,275Professional Holding Corp., ClassA (A) 2,773 50,940Prosperity Bancshares, Inc. 25,461 1,906,774QCR Holdings, Inc. 2,526 119,278Raiffeisen Bank International AG (A) 26,175 574,615RBB Bancorp 3,427 69,465Red River Bancshares, Inc. 1,054 59,035
Shore Bancshares, Inc. 2,483 42,261Sierra Bancorp 2,798 74,986Signature Bank 15,636 3,535,300Silvergate Capital Corp., Class A (A) 3,251 462,195Simmons First National Corp., Class A 17,697 525,070Skandinaviska Enskilda Banken AB,
A Shares (C) 287,797 3,510,687SmartFinancial, Inc. 2,914 63,088Societe Generale SA (A) 143,356 3,748,018South Plains Financial, Inc. 2,034 46,212South State Corp. 11,595 910,323Southern First Bancshares, Inc. (A) 1,544 72,383Southside Bancshares, Inc. 4,758 183,231Spirit of Texas Bancshares, Inc. 2,809 62,669Standard Chartered PLC 474,390 3,266,430Sterling Bancorp 53,004 1,220,152Stock Yards Bancorp, Inc. 3,276 167,273Sumitomo Mitsui Financial Group,Inc. 230,858 8,367,973Sumitomo Mitsui Trust Holdings, Inc. 59,683 2,082,310Summit Financial Group, Inc. 1,877 49,834SVB Financial Group (A) 7,639 3,771,069Svenska Handelsbanken AB, A
Shares (C) 275,118 2,990,863Swedbank AB, A Shares (C) 160,140 2,823,569Synovus Financial Corp. 40,725 1,863,169TCF Financial Corp. 41,810 1,942,493Texas Capital Bancshares, Inc. (A) 22,255 1,578,325The Bancorp, Inc. (A) 8,704 180,347The Bank of East Asia, Ltd. 231,999 494,188The Bank of Kyoto, Ltd. 10,014 616,902The Bank of NT Butterfield & Son,Ltd. 8,161 311,913The Bank of Princeton 1,569 44,905The Chiba Bank, Ltd. 93,764 613,816The Community Financial Corp. 1,189 40,723The First Bancshares, Inc. 3,512 128,574The First of Long Island Corp. 4,183 88,889The PNC Financial Services Group,Inc. 62,487 10,960,845The Shizuoka Bank, Ltd. 73,708 579,442Tompkins Financial Corp. 2,325 192,278Towne Bank 10,732 326,253TriCo Bancshares 4,101 194,264TriState Capital Holdings, Inc. (A) 4,859 112,049Triumph Bancorp, Inc. (A) 3,755 290,599Truist Financial Corp. 198,822 11,595,299Trustmark Corp. 27,596 928,881U.S. Bancorp 199,450 11,031,580UMB Financial Corp. 18,979 1,752,331Umpqua Holdings Corp. 60,387 1,059,792UniCredit SpA (A) 375,829 3,969,823United Bankshares, Inc. 55,730 2,150,063United Community Banks, Inc. 12,846 438,306United Overseas Bank, Ltd. 208,439 4,019,125
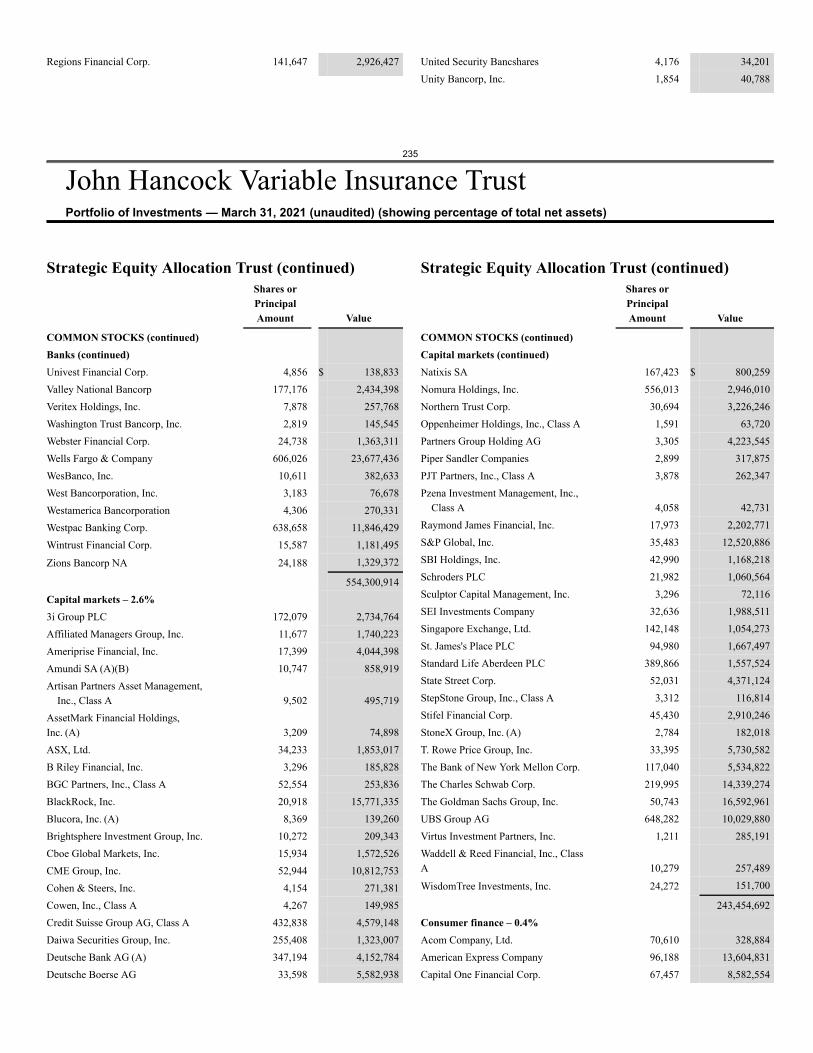
235
John Hancock Variable Insurance TrustPortfolio of Investments — March 31, 2021 (unaudited) (showing percentage of total net assets)
Regions Financial Corp. 141,647 2,926,427 United Security Bancshares 4,176 34,201Unity Bancorp, Inc. 1,854 40,788
Strategic Equity Allocation Trust (continued)Shares orPrincipalAmount Value
COMMON STOCKS (continued)Banks (continued)Univest Financial Corp. 4,856 $ 138,833Valley National Bancorp 177,176 2,434,398Veritex Holdings, Inc. 7,878 257,768Washington Trust Bancorp, Inc. 2,819 145,545Webster Financial Corp. 24,738 1,363,311Wells Fargo & Company 606,026 23,677,436WesBanco, Inc. 10,611 382,633West Bancorporation, Inc. 3,183 76,678Westamerica Bancorporation 4,306 270,331Westpac Banking Corp. 638,658 11,846,429Wintrust Financial Corp. 15,587 1,181,495
Zions Bancorp NA 24,188 1,329,372
554,300,914Capital markets – 2.6%3i Group PLC 172,079 2,734,764Affiliated Managers Group, Inc. 11,677 1,740,223Ameriprise Financial, Inc. 17,399 4,044,398Amundi SA (A)(B) 10,747 858,919Artisan Partners Asset Management,
Inc., Class A 9,502 495,719AssetMark Financial Holdings,Inc. (A) 3,209 74,898ASX, Ltd. 34,233 1,853,017B Riley Financial, Inc. 3,296 185,828BGC Partners, Inc., Class A 52,554 253,836BlackRock, Inc. 20,918 15,771,335Blucora, Inc. (A) 8,369 139,260Brightsphere Investment Group, Inc. 10,272 209,343Cboe Global Markets, Inc. 15,934 1,572,526CME Group, Inc. 52,944 10,812,753Cohen & Steers, Inc. 4,154 271,381Cowen, Inc., Class A 4,267 149,985Credit Suisse Group AG, Class A 432,838 4,579,148Daiwa Securities Group, Inc. 255,408 1,323,007Deutsche Bank AG (A) 347,194 4,152,784Deutsche Boerse AG 33,598 5,582,938
Strategic Equity Allocation Trust (continued)Shares orPrincipalAmount Value
COMMON STOCKS (continued)Capital markets (continued)Natixis SA 167,423 $ 800,259Nomura Holdings, Inc. 556,013 2,946,010Northern Trust Corp. 30,694 3,226,246Oppenheimer Holdings, Inc., Class A 1,591 63,720Partners Group Holding AG 3,305 4,223,545Piper Sandler Companies 2,899 317,875PJT Partners, Inc., Class A 3,878 262,347Pzena Investment Management, Inc.,
Class A 4,058 42,731Raymond James Financial, Inc. 17,973 2,202,771S&P Global, Inc. 35,483 12,520,886SBI Holdings, Inc. 42,990 1,168,218Schroders PLC 21,982 1,060,564Sculptor Capital Management, Inc. 3,296 72,116SEI Investments Company 32,636 1,988,511Singapore Exchange, Ltd. 142,148 1,054,273St. James's Place PLC 94,980 1,667,497Standard Life Aberdeen PLC 389,866 1,557,524State Street Corp. 52,031 4,371,124StepStone Group, Inc., Class A 3,312 116,814Stifel Financial Corp. 45,430 2,910,246StoneX Group, Inc. (A) 2,784 182,018T. Rowe Price Group, Inc. 33,395 5,730,582The Bank of New York Mellon Corp. 117,040 5,534,822The Charles Schwab Corp. 219,995 14,339,274The Goldman Sachs Group, Inc. 50,743 16,592,961UBS Group AG 648,282 10,029,880Virtus Investment Partners, Inc. 1,211 285,191Waddell & Reed Financial, Inc., ClassA 10,279 257,489
WisdomTree Investments, Inc. 24,272 151,700
243,454,692Consumer finance – 0.4%Acom Company, Ltd. 70,610 328,884American Express Company 96,188 13,604,831Capital One Financial Corp. 67,457 8,582,554
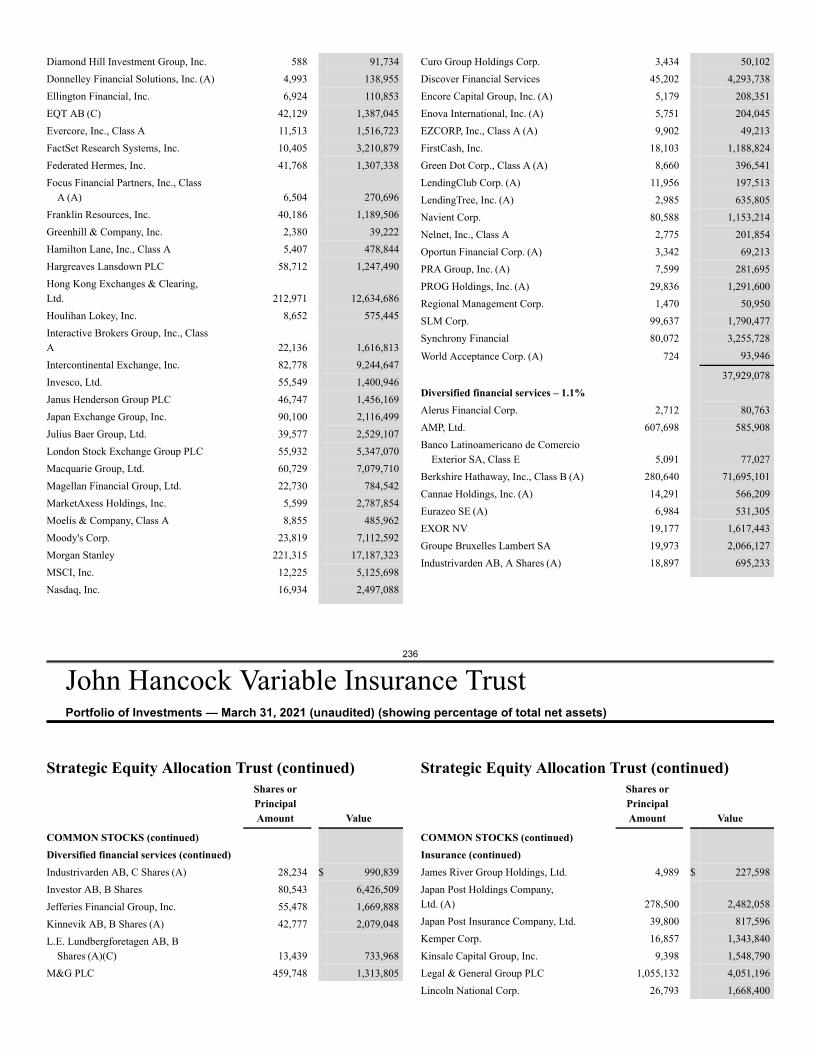
236
John Hancock Variable Insurance TrustPortfolio of Investments — March 31, 2021 (unaudited) (showing percentage of total net assets)
Diamond Hill Investment Group, Inc. 588 91,734Donnelley Financial Solutions, Inc. (A) 4,993 138,955Ellington Financial, Inc. 6,924 110,853EQT AB (C) 42,129 1,387,045Evercore, Inc., Class A 11,513 1,516,723FactSet Research Systems, Inc. 10,405 3,210,879Federated Hermes, Inc. 41,768 1,307,338Focus Financial Partners, Inc., Class
A (A) 6,504 270,696Franklin Resources, Inc. 40,186 1,189,506Greenhill & Company, Inc. 2,380 39,222Hamilton Lane, Inc., Class A 5,407 478,844Hargreaves Lansdown PLC 58,712 1,247,490Hong Kong Exchanges & Clearing,Ltd. 212,971 12,634,686Houlihan Lokey, Inc. 8,652 575,445Interactive Brokers Group, Inc., ClassA 22,136 1,616,813Intercontinental Exchange, Inc. 82,778 9,244,647Invesco, Ltd. 55,549 1,400,946Janus Henderson Group PLC 46,747 1,456,169Japan Exchange Group, Inc. 90,100 2,116,499Julius Baer Group, Ltd. 39,577 2,529,107London Stock Exchange Group PLC 55,932 5,347,070Macquarie Group, Ltd. 60,729 7,079,710Magellan Financial Group, Ltd. 22,730 784,542MarketAxess Holdings, Inc. 5,599 2,787,854Moelis & Company, Class A 8,855 485,962Moody's Corp. 23,819 7,112,592Morgan Stanley 221,315 17,187,323MSCI, Inc. 12,225 5,125,698Nasdaq, Inc. 16,934 2,497,088
Curo Group Holdings Corp. 3,434 50,102Discover Financial Services 45,202 4,293,738Encore Capital Group, Inc. (A) 5,179 208,351Enova International, Inc. (A) 5,751 204,045EZCORP, Inc., Class A (A) 9,902 49,213FirstCash, Inc. 18,103 1,188,824Green Dot Corp., Class A (A) 8,660 396,541LendingClub Corp. (A) 11,956 197,513LendingTree, Inc. (A) 2,985 635,805Navient Corp. 80,588 1,153,214Nelnet, Inc., Class A 2,775 201,854Oportun Financial Corp. (A) 3,342 69,213PRA Group, Inc. (A) 7,599 281,695PROG Holdings, Inc. (A) 29,836 1,291,600Regional Management Corp. 1,470 50,950SLM Corp. 99,637 1,790,477Synchrony Financial 80,072 3,255,728
World Acceptance Corp. (A) 724 93,946
37,929,078Diversified financial services – 1.1%Alerus Financial Corp. 2,712 80,763AMP, Ltd. 607,698 585,908Banco Latinoamericano de Comercio
Exterior SA, Class E 5,091 77,027Berkshire Hathaway, Inc., Class B (A) 280,640 71,695,101Cannae Holdings, Inc. (A) 14,291 566,209Eurazeo SE (A) 6,984 531,305EXOR NV 19,177 1,617,443Groupe Bruxelles Lambert SA 19,973 2,066,127Industrivarden AB, A Shares (A) 18,897 695,233
Strategic Equity Allocation Trust (continued)Shares orPrincipalAmount Value
COMMON STOCKS (continued)Diversified financial services (continued)Industrivarden AB, C Shares (A) 28,234 $ 990,839Investor AB, B Shares 80,543 6,426,509Jefferies Financial Group, Inc. 55,478 1,669,888Kinnevik AB, B Shares (A) 42,777 2,079,048L.E. Lundbergforetagen AB, B
Shares (A)(C) 13,439 733,968M&G PLC 459,748 1,313,805
Strategic Equity Allocation Trust (continued)Shares orPrincipalAmount Value
COMMON STOCKS (continued)Insurance (continued)James River Group Holdings, Ltd. 4,989 $ 227,598Japan Post Holdings Company,Ltd. (A) 278,500 2,482,058Japan Post Insurance Company, Ltd. 39,800 817,596Kemper Corp. 16,857 1,343,840Kinsale Capital Group, Inc. 9,398 1,548,790Legal & General Group PLC 1,055,132 4,051,196Lincoln National Corp. 26,793 1,668,400
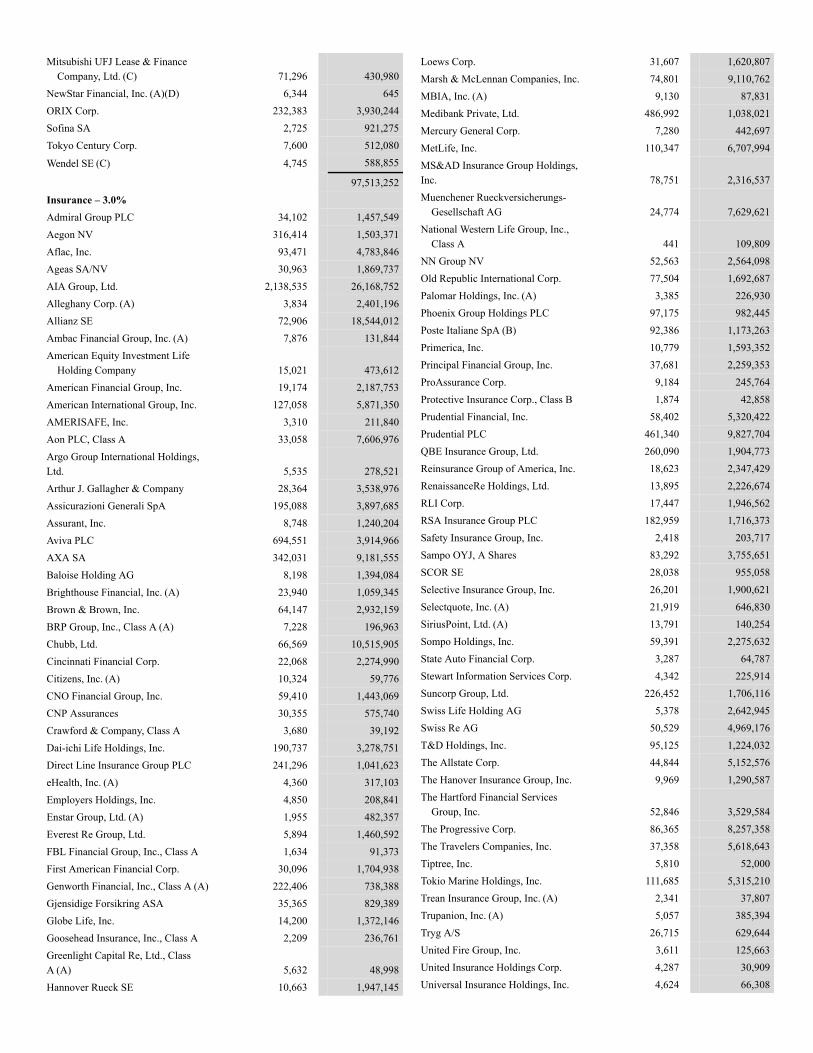
Mitsubishi UFJ Lease & FinanceCompany, Ltd. (C) 71,296 430,980
NewStar Financial, Inc. (A)(D) 6,344 645ORIX Corp. 232,383 3,930,244Sofina SA 2,725 921,275Tokyo Century Corp. 7,600 512,080
Wendel SE (C) 4,745 588,855
97,513,252Insurance – 3.0%Admiral Group PLC 34,102 1,457,549Aegon NV 316,414 1,503,371Aflac, Inc. 93,471 4,783,846Ageas SA/NV 30,963 1,869,737AIA Group, Ltd. 2,138,535 26,168,752Alleghany Corp. (A) 3,834 2,401,196Allianz SE 72,906 18,544,012Ambac Financial Group, Inc. (A) 7,876 131,844American Equity Investment Life
Holding Company 15,021 473,612American Financial Group, Inc. 19,174 2,187,753American International Group, Inc. 127,058 5,871,350AMERISAFE, Inc. 3,310 211,840Aon PLC, Class A 33,058 7,606,976Argo Group International Holdings,Ltd. 5,535 278,521Arthur J. Gallagher & Company 28,364 3,538,976Assicurazioni Generali SpA 195,088 3,897,685Assurant, Inc. 8,748 1,240,204Aviva PLC 694,551 3,914,966AXA SA 342,031 9,181,555Baloise Holding AG 8,198 1,394,084Brighthouse Financial, Inc. (A) 23,940 1,059,345Brown & Brown, Inc. 64,147 2,932,159BRP Group, Inc., Class A (A) 7,228 196,963Chubb, Ltd. 66,569 10,515,905Cincinnati Financial Corp. 22,068 2,274,990Citizens, Inc. (A) 10,324 59,776CNO Financial Group, Inc. 59,410 1,443,069CNP Assurances 30,355 575,740Crawford & Company, Class A 3,680 39,192Dai-ichi Life Holdings, Inc. 190,737 3,278,751Direct Line Insurance Group PLC 241,296 1,041,623eHealth, Inc. (A) 4,360 317,103Employers Holdings, Inc. 4,850 208,841Enstar Group, Ltd. (A) 1,955 482,357Everest Re Group, Ltd. 5,894 1,460,592FBL Financial Group, Inc., Class A 1,634 91,373First American Financial Corp. 30,096 1,704,938Genworth Financial, Inc., Class A (A) 222,406 738,388Gjensidige Forsikring ASA 35,365 829,389Globe Life, Inc. 14,200 1,372,146Goosehead Insurance, Inc., Class A 2,209 236,761Greenlight Capital Re, Ltd., ClassA (A) 5,632 48,998Hannover Rueck SE 10,663 1,947,145
Loews Corp. 31,607 1,620,807Marsh & McLennan Companies, Inc. 74,801 9,110,762MBIA, Inc. (A) 9,130 87,831Medibank Private, Ltd. 486,992 1,038,021Mercury General Corp. 7,280 442,697MetLife, Inc. 110,347 6,707,994MS&AD Insurance Group Holdings,Inc. 78,751 2,316,537Muenchener Rueckversicherungs-
Gesellschaft AG 24,774 7,629,621National Western Life Group, Inc.,
Class A 441 109,809NN Group NV 52,563 2,564,098Old Republic International Corp. 77,504 1,692,687Palomar Holdings, Inc. (A) 3,385 226,930Phoenix Group Holdings PLC 97,175 982,445Poste Italiane SpA (B) 92,386 1,173,263Primerica, Inc. 10,779 1,593,352Principal Financial Group, Inc. 37,681 2,259,353ProAssurance Corp. 9,184 245,764Protective Insurance Corp., Class B 1,874 42,858Prudential Financial, Inc. 58,402 5,320,422Prudential PLC 461,340 9,827,704QBE Insurance Group, Ltd. 260,090 1,904,773Reinsurance Group of America, Inc. 18,623 2,347,429RenaissanceRe Holdings, Ltd. 13,895 2,226,674RLI Corp. 17,447 1,946,562RSA Insurance Group PLC 182,959 1,716,373Safety Insurance Group, Inc. 2,418 203,717Sampo OYJ, A Shares 83,292 3,755,651SCOR SE 28,038 955,058Selective Insurance Group, Inc. 26,201 1,900,621Selectquote, Inc. (A) 21,919 646,830SiriusPoint, Ltd. (A) 13,791 140,254Sompo Holdings, Inc. 59,391 2,275,632State Auto Financial Corp. 3,287 64,787Stewart Information Services Corp. 4,342 225,914Suncorp Group, Ltd. 226,452 1,706,116Swiss Life Holding AG 5,378 2,642,945Swiss Re AG 50,529 4,969,176T&D Holdings, Inc. 95,125 1,224,032The Allstate Corp. 44,844 5,152,576The Hanover Insurance Group, Inc. 9,969 1,290,587The Hartford Financial Services
Group, Inc. 52,846 3,529,584The Progressive Corp. 86,365 8,257,358The Travelers Companies, Inc. 37,358 5,618,643Tiptree, Inc. 5,810 52,000Tokio Marine Holdings, Inc. 111,685 5,315,210Trean Insurance Group, Inc. (A) 2,341 37,807Trupanion, Inc. (A) 5,057 385,394Tryg A/S 26,715 629,644United Fire Group, Inc. 3,611 125,663United Insurance Holdings Corp. 4,287 30,909Universal Insurance Holdings, Inc. 4,624 66,308
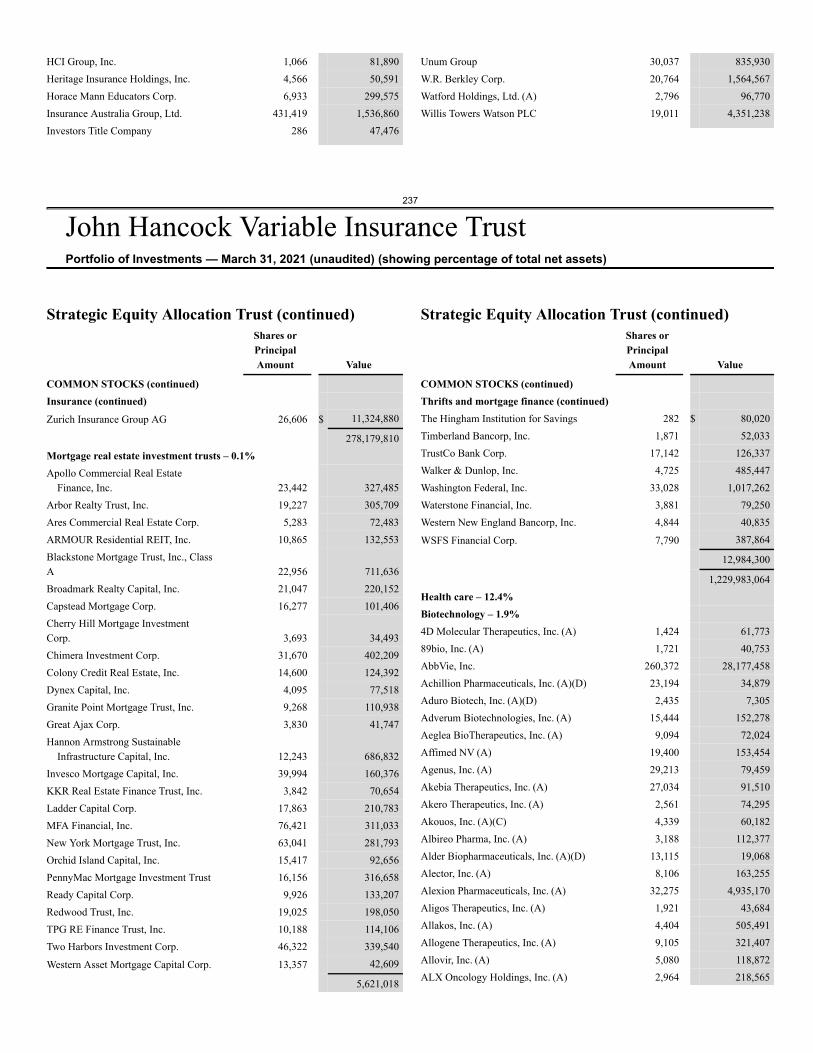
237
John Hancock Variable Insurance TrustPortfolio of Investments — March 31, 2021 (unaudited) (showing percentage of total net assets)
HCI Group, Inc. 1,066 81,890Heritage Insurance Holdings, Inc. 4,566 50,591Horace Mann Educators Corp. 6,933 299,575Insurance Australia Group, Ltd. 431,419 1,536,860Investors Title Company 286 47,476
Unum Group 30,037 835,930W.R. Berkley Corp. 20,764 1,564,567Watford Holdings, Ltd. (A) 2,796 96,770Willis Towers Watson PLC 19,011 4,351,238
Strategic Equity Allocation Trust (continued)Shares orPrincipalAmount Value
COMMON STOCKS (continued)Insurance (continued)Zurich Insurance Group AG 26,606 $ 11,324,880
278,179,810Mortgage real estate investment trusts – 0.1%Apollo Commercial Real Estate
Finance, Inc. 23,442 327,485Arbor Realty Trust, Inc. 19,227 305,709Ares Commercial Real Estate Corp. 5,283 72,483ARMOUR Residential REIT, Inc. 10,865 132,553Blackstone Mortgage Trust, Inc., ClassA 22,956 711,636Broadmark Realty Capital, Inc. 21,047 220,152Capstead Mortgage Corp. 16,277 101,406Cherry Hill Mortgage InvestmentCorp. 3,693 34,493Chimera Investment Corp. 31,670 402,209Colony Credit Real Estate, Inc. 14,600 124,392Dynex Capital, Inc. 4,095 77,518Granite Point Mortgage Trust, Inc. 9,268 110,938Great Ajax Corp. 3,830 41,747Hannon Armstrong Sustainable
Infrastructure Capital, Inc. 12,243 686,832Invesco Mortgage Capital, Inc. 39,994 160,376KKR Real Estate Finance Trust, Inc. 3,842 70,654Ladder Capital Corp. 17,863 210,783MFA Financial, Inc. 76,421 311,033New York Mortgage Trust, Inc. 63,041 281,793Orchid Island Capital, Inc. 15,417 92,656PennyMac Mortgage Investment Trust 16,156 316,658Ready Capital Corp. 9,926 133,207Redwood Trust, Inc. 19,025 198,050TPG RE Finance Trust, Inc. 10,188 114,106Two Harbors Investment Corp. 46,322 339,540
Western Asset Mortgage Capital Corp. 13,357 42,609
5,621,018
Strategic Equity Allocation Trust (continued)Shares orPrincipalAmount Value
COMMON STOCKS (continued)Thrifts and mortgage finance (continued)The Hingham Institution for Savings 282 $ 80,020Timberland Bancorp, Inc. 1,871 52,033TrustCo Bank Corp. 17,142 126,337Walker & Dunlop, Inc. 4,725 485,447Washington Federal, Inc. 33,028 1,017,262Waterstone Financial, Inc. 3,881 79,250Western New England Bancorp, Inc. 4,844 40,835
WSFS Financial Corp. 7,790 387,864
12,984,300
1,229,983,064Health care – 12.4%Biotechnology – 1.9%4D Molecular Therapeutics, Inc. (A) 1,424 61,77389bio, Inc. (A) 1,721 40,753AbbVie, Inc. 260,372 28,177,458Achillion Pharmaceuticals, Inc. (A)(D) 23,194 34,879Aduro Biotech, Inc. (A)(D) 2,435 7,305Adverum Biotechnologies, Inc. (A) 15,444 152,278Aeglea BioTherapeutics, Inc. (A) 9,094 72,024Affimed NV (A) 19,400 153,454Agenus, Inc. (A) 29,213 79,459Akebia Therapeutics, Inc. (A) 27,034 91,510Akero Therapeutics, Inc. (A) 2,561 74,295Akouos, Inc. (A)(C) 4,339 60,182Albireo Pharma, Inc. (A) 3,188 112,377Alder Biopharmaceuticals, Inc. (A)(D) 13,115 19,068Alector, Inc. (A) 8,106 163,255Alexion Pharmaceuticals, Inc. (A) 32,275 4,935,170Aligos Therapeutics, Inc. (A) 1,921 43,684Allakos, Inc. (A) 4,404 505,491Allogene Therapeutics, Inc. (A) 9,105 321,407Allovir, Inc. (A) 5,080 118,872ALX Oncology Holdings, Inc. (A) 2,964 218,565
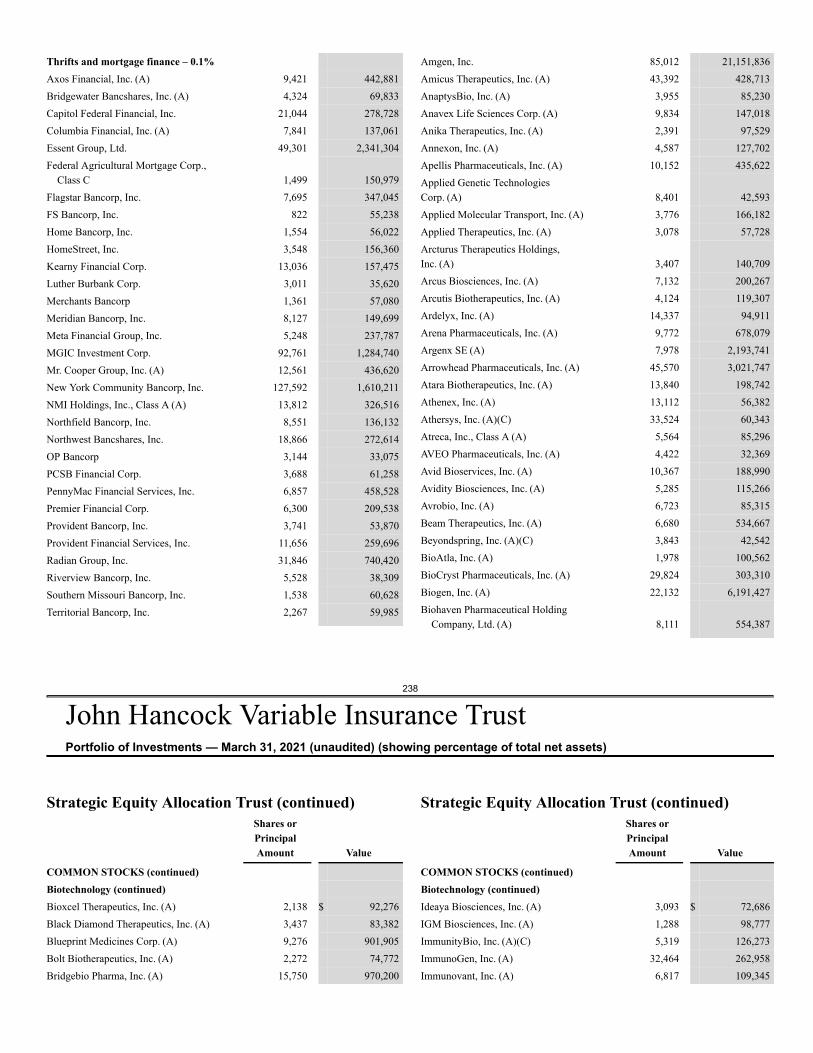
238
John Hancock Variable Insurance TrustPortfolio of Investments — March 31, 2021 (unaudited) (showing percentage of total net assets)
Thrifts and mortgage finance – 0.1%Axos Financial, Inc. (A) 9,421 442,881Bridgewater Bancshares, Inc. (A) 4,324 69,833Capitol Federal Financial, Inc. 21,044 278,728Columbia Financial, Inc. (A) 7,841 137,061Essent Group, Ltd. 49,301 2,341,304Federal Agricultural Mortgage Corp.,
Class C 1,499 150,979Flagstar Bancorp, Inc. 7,695 347,045FS Bancorp, Inc. 822 55,238Home Bancorp, Inc. 1,554 56,022HomeStreet, Inc. 3,548 156,360Kearny Financial Corp. 13,036 157,475Luther Burbank Corp. 3,011 35,620Merchants Bancorp 1,361 57,080Meridian Bancorp, Inc. 8,127 149,699Meta Financial Group, Inc. 5,248 237,787MGIC Investment Corp. 92,761 1,284,740Mr. Cooper Group, Inc. (A) 12,561 436,620New York Community Bancorp, Inc. 127,592 1,610,211NMI Holdings, Inc., Class A (A) 13,812 326,516Northfield Bancorp, Inc. 8,551 136,132Northwest Bancshares, Inc. 18,866 272,614OP Bancorp 3,144 33,075PCSB Financial Corp. 3,688 61,258PennyMac Financial Services, Inc. 6,857 458,528Premier Financial Corp. 6,300 209,538Provident Bancorp, Inc. 3,741 53,870Provident Financial Services, Inc. 11,656 259,696Radian Group, Inc. 31,846 740,420Riverview Bancorp, Inc. 5,528 38,309Southern Missouri Bancorp, Inc. 1,538 60,628Territorial Bancorp, Inc. 2,267 59,985
Amgen, Inc. 85,012 21,151,836Amicus Therapeutics, Inc. (A) 43,392 428,713AnaptysBio, Inc. (A) 3,955 85,230Anavex Life Sciences Corp. (A) 9,834 147,018Anika Therapeutics, Inc. (A) 2,391 97,529Annexon, Inc. (A) 4,587 127,702Apellis Pharmaceuticals, Inc. (A) 10,152 435,622Applied Genetic TechnologiesCorp. (A) 8,401 42,593Applied Molecular Transport, Inc. (A) 3,776 166,182Applied Therapeutics, Inc. (A) 3,078 57,728Arcturus Therapeutics Holdings,Inc. (A) 3,407 140,709Arcus Biosciences, Inc. (A) 7,132 200,267Arcutis Biotherapeutics, Inc. (A) 4,124 119,307Ardelyx, Inc. (A) 14,337 94,911Arena Pharmaceuticals, Inc. (A) 9,772 678,079Argenx SE (A) 7,978 2,193,741Arrowhead Pharmaceuticals, Inc. (A) 45,570 3,021,747Atara Biotherapeutics, Inc. (A) 13,840 198,742Athenex, Inc. (A) 13,112 56,382Athersys, Inc. (A)(C) 33,524 60,343Atreca, Inc., Class A (A) 5,564 85,296AVEO Pharmaceuticals, Inc. (A) 4,422 32,369Avid Bioservices, Inc. (A) 10,367 188,990Avidity Biosciences, Inc. (A) 5,285 115,266Avrobio, Inc. (A) 6,723 85,315Beam Therapeutics, Inc. (A) 6,680 534,667Beyondspring, Inc. (A)(C) 3,843 42,542BioAtla, Inc. (A) 1,978 100,562BioCryst Pharmaceuticals, Inc. (A) 29,824 303,310Biogen, Inc. (A) 22,132 6,191,427Biohaven Pharmaceutical Holding
Company, Ltd. (A) 8,111 554,387
Strategic Equity Allocation Trust (continued)Shares orPrincipalAmount Value
COMMON STOCKS (continued)Biotechnology (continued)Bioxcel Therapeutics, Inc. (A) 2,138 $ 92,276Black Diamond Therapeutics, Inc. (A) 3,437 83,382Blueprint Medicines Corp. (A) 9,276 901,905Bolt Biotherapeutics, Inc. (A) 2,272 74,772Bridgebio Pharma, Inc. (A) 15,750 970,200
Strategic Equity Allocation Trust (continued)Shares orPrincipalAmount Value
COMMON STOCKS (continued)Biotechnology (continued)Ideaya Biosciences, Inc. (A) 3,093 $ 72,686IGM Biosciences, Inc. (A) 1,288 98,777ImmunityBio, Inc. (A)(C) 5,319 126,273ImmunoGen, Inc. (A) 32,464 262,958Immunovant, Inc. (A) 6,817 109,345
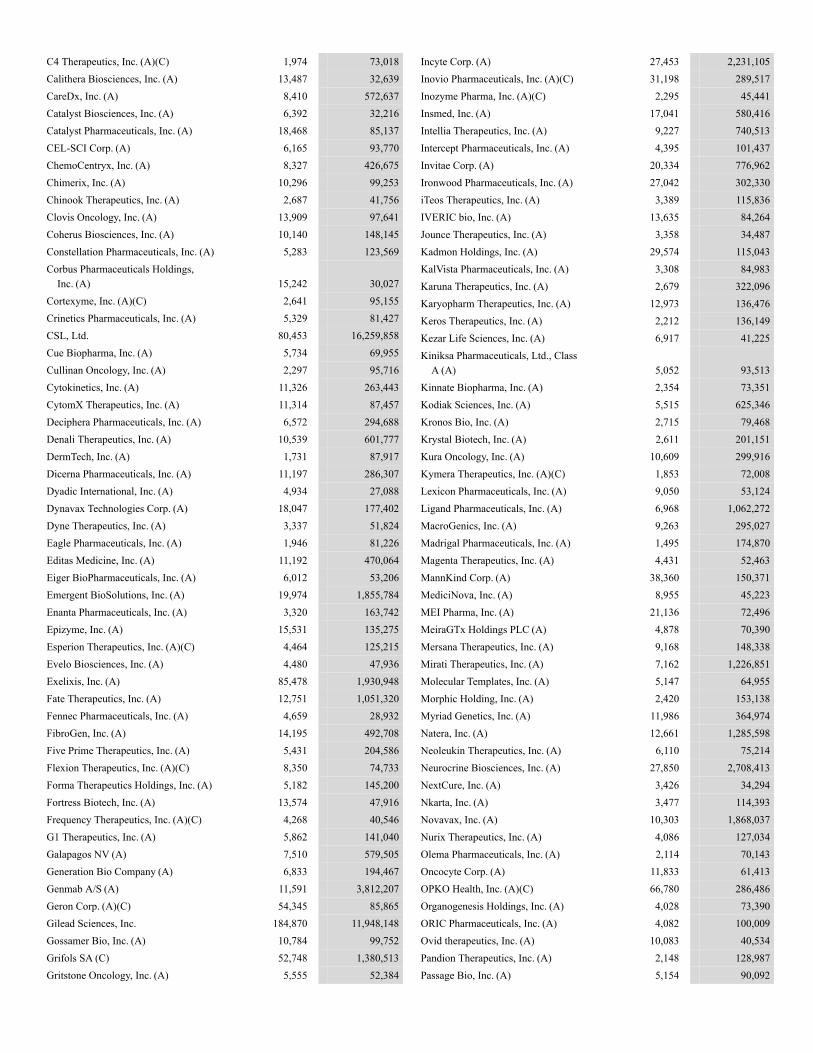
C4 Therapeutics, Inc. (A)(C) 1,974 73,018Calithera Biosciences, Inc. (A) 13,487 32,639CareDx, Inc. (A) 8,410 572,637Catalyst Biosciences, Inc. (A) 6,392 32,216Catalyst Pharmaceuticals, Inc. (A) 18,468 85,137CEL-SCI Corp. (A) 6,165 93,770ChemoCentryx, Inc. (A) 8,327 426,675Chimerix, Inc. (A) 10,296 99,253Chinook Therapeutics, Inc. (A) 2,687 41,756Clovis Oncology, Inc. (A) 13,909 97,641Coherus Biosciences, Inc. (A) 10,140 148,145Constellation Pharmaceuticals, Inc. (A) 5,283 123,569Corbus Pharmaceuticals Holdings,
Inc. (A) 15,242 30,027Cortexyme, Inc. (A)(C) 2,641 95,155Crinetics Pharmaceuticals, Inc. (A) 5,329 81,427CSL, Ltd. 80,453 16,259,858Cue Biopharma, Inc. (A) 5,734 69,955Cullinan Oncology, Inc. (A) 2,297 95,716Cytokinetics, Inc. (A) 11,326 263,443CytomX Therapeutics, Inc. (A) 11,314 87,457Deciphera Pharmaceuticals, Inc. (A) 6,572 294,688Denali Therapeutics, Inc. (A) 10,539 601,777DermTech, Inc. (A) 1,731 87,917Dicerna Pharmaceuticals, Inc. (A) 11,197 286,307Dyadic International, Inc. (A) 4,934 27,088Dynavax Technologies Corp. (A) 18,047 177,402Dyne Therapeutics, Inc. (A) 3,337 51,824Eagle Pharmaceuticals, Inc. (A) 1,946 81,226Editas Medicine, Inc. (A) 11,192 470,064Eiger BioPharmaceuticals, Inc. (A) 6,012 53,206Emergent BioSolutions, Inc. (A) 19,974 1,855,784Enanta Pharmaceuticals, Inc. (A) 3,320 163,742Epizyme, Inc. (A) 15,531 135,275Esperion Therapeutics, Inc. (A)(C) 4,464 125,215Evelo Biosciences, Inc. (A) 4,480 47,936Exelixis, Inc. (A) 85,478 1,930,948Fate Therapeutics, Inc. (A) 12,751 1,051,320Fennec Pharmaceuticals, Inc. (A) 4,659 28,932FibroGen, Inc. (A) 14,195 492,708Five Prime Therapeutics, Inc. (A) 5,431 204,586Flexion Therapeutics, Inc. (A)(C) 8,350 74,733Forma Therapeutics Holdings, Inc. (A) 5,182 145,200Fortress Biotech, Inc. (A) 13,574 47,916Frequency Therapeutics, Inc. (A)(C) 4,268 40,546G1 Therapeutics, Inc. (A) 5,862 141,040Galapagos NV (A) 7,510 579,505Generation Bio Company (A) 6,833 194,467Genmab A/S (A) 11,591 3,812,207Geron Corp. (A)(C) 54,345 85,865Gilead Sciences, Inc. 184,870 11,948,148Gossamer Bio, Inc. (A) 10,784 99,752Grifols SA (C) 52,748 1,380,513Gritstone Oncology, Inc. (A) 5,555 52,384
Incyte Corp. (A) 27,453 2,231,105Inovio Pharmaceuticals, Inc. (A)(C) 31,198 289,517Inozyme Pharma, Inc. (A)(C) 2,295 45,441Insmed, Inc. (A) 17,041 580,416Intellia Therapeutics, Inc. (A) 9,227 740,513Intercept Pharmaceuticals, Inc. (A) 4,395 101,437Invitae Corp. (A) 20,334 776,962Ironwood Pharmaceuticals, Inc. (A) 27,042 302,330iTeos Therapeutics, Inc. (A) 3,389 115,836IVERIC bio, Inc. (A) 13,635 84,264Jounce Therapeutics, Inc. (A) 3,358 34,487Kadmon Holdings, Inc. (A) 29,574 115,043KalVista Pharmaceuticals, Inc. (A) 3,308 84,983Karuna Therapeutics, Inc. (A) 2,679 322,096Karyopharm Therapeutics, Inc. (A) 12,973 136,476Keros Therapeutics, Inc. (A) 2,212 136,149Kezar Life Sciences, Inc. (A) 6,917 41,225Kiniksa Pharmaceuticals, Ltd., Class
A (A) 5,052 93,513Kinnate Biopharma, Inc. (A) 2,354 73,351Kodiak Sciences, Inc. (A) 5,515 625,346Kronos Bio, Inc. (A) 2,715 79,468Krystal Biotech, Inc. (A) 2,611 201,151Kura Oncology, Inc. (A) 10,609 299,916Kymera Therapeutics, Inc. (A)(C) 1,853 72,008Lexicon Pharmaceuticals, Inc. (A) 9,050 53,124Ligand Pharmaceuticals, Inc. (A) 6,968 1,062,272MacroGenics, Inc. (A) 9,263 295,027Madrigal Pharmaceuticals, Inc. (A) 1,495 174,870Magenta Therapeutics, Inc. (A) 4,431 52,463MannKind Corp. (A) 38,360 150,371MediciNova, Inc. (A) 8,955 45,223MEI Pharma, Inc. (A) 21,136 72,496MeiraGTx Holdings PLC (A) 4,878 70,390Mersana Therapeutics, Inc. (A) 9,168 148,338Mirati Therapeutics, Inc. (A) 7,162 1,226,851Molecular Templates, Inc. (A) 5,147 64,955Morphic Holding, Inc. (A) 2,420 153,138Myriad Genetics, Inc. (A) 11,986 364,974Natera, Inc. (A) 12,661 1,285,598Neoleukin Therapeutics, Inc. (A) 6,110 75,214Neurocrine Biosciences, Inc. (A) 27,850 2,708,413NextCure, Inc. (A) 3,426 34,294Nkarta, Inc. (A) 3,477 114,393Novavax, Inc. (A) 10,303 1,868,037Nurix Therapeutics, Inc. (A) 4,086 127,034Olema Pharmaceuticals, Inc. (A) 2,114 70,143Oncocyte Corp. (A) 11,833 61,413OPKO Health, Inc. (A)(C) 66,780 286,486Organogenesis Holdings, Inc. (A) 4,028 73,390ORIC Pharmaceuticals, Inc. (A) 4,082 100,009Ovid therapeutics, Inc. (A) 10,083 40,534Pandion Therapeutics, Inc. (A) 2,148 128,987Passage Bio, Inc. (A) 5,154 90,092
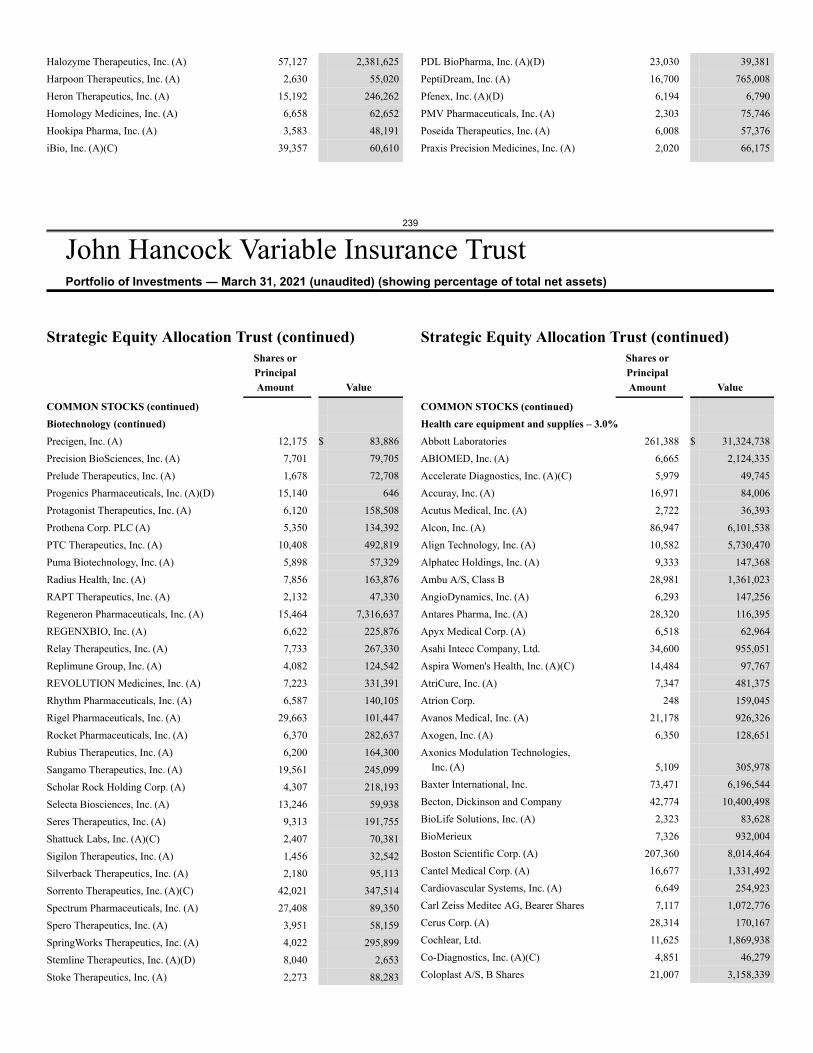
239
John Hancock Variable Insurance TrustPortfolio of Investments — March 31, 2021 (unaudited) (showing percentage of total net assets)
Halozyme Therapeutics, Inc. (A) 57,127 2,381,625Harpoon Therapeutics, Inc. (A) 2,630 55,020Heron Therapeutics, Inc. (A) 15,192 246,262Homology Medicines, Inc. (A) 6,658 62,652Hookipa Pharma, Inc. (A) 3,583 48,191iBio, Inc. (A)(C) 39,357 60,610
PDL BioPharma, Inc. (A)(D) 23,030 39,381PeptiDream, Inc. (A) 16,700 765,008Pfenex, Inc. (A)(D) 6,194 6,790PMV Pharmaceuticals, Inc. (A) 2,303 75,746Poseida Therapeutics, Inc. (A) 6,008 57,376Praxis Precision Medicines, Inc. (A) 2,020 66,175
Strategic Equity Allocation Trust (continued)Shares orPrincipalAmount Value
COMMON STOCKS (continued)Biotechnology (continued)Precigen, Inc. (A) 12,175 $ 83,886Precision BioSciences, Inc. (A) 7,701 79,705Prelude Therapeutics, Inc. (A) 1,678 72,708Progenics Pharmaceuticals, Inc. (A)(D) 15,140 646Protagonist Therapeutics, Inc. (A) 6,120 158,508Prothena Corp. PLC (A) 5,350 134,392PTC Therapeutics, Inc. (A) 10,408 492,819Puma Biotechnology, Inc. (A) 5,898 57,329Radius Health, Inc. (A) 7,856 163,876RAPT Therapeutics, Inc. (A) 2,132 47,330Regeneron Pharmaceuticals, Inc. (A) 15,464 7,316,637REGENXBIO, Inc. (A) 6,622 225,876Relay Therapeutics, Inc. (A) 7,733 267,330Replimune Group, Inc. (A) 4,082 124,542REVOLUTION Medicines, Inc. (A) 7,223 331,391Rhythm Pharmaceuticals, Inc. (A) 6,587 140,105Rigel Pharmaceuticals, Inc. (A) 29,663 101,447Rocket Pharmaceuticals, Inc. (A) 6,370 282,637Rubius Therapeutics, Inc. (A) 6,200 164,300Sangamo Therapeutics, Inc. (A) 19,561 245,099Scholar Rock Holding Corp. (A) 4,307 218,193Selecta Biosciences, Inc. (A) 13,246 59,938Seres Therapeutics, Inc. (A) 9,313 191,755Shattuck Labs, Inc. (A)(C) 2,407 70,381Sigilon Therapeutics, Inc. (A) 1,456 32,542Silverback Therapeutics, Inc. (A) 2,180 95,113Sorrento Therapeutics, Inc. (A)(C) 42,021 347,514Spectrum Pharmaceuticals, Inc. (A) 27,408 89,350Spero Therapeutics, Inc. (A) 3,951 58,159SpringWorks Therapeutics, Inc. (A) 4,022 295,899Stemline Therapeutics, Inc. (A)(D) 8,040 2,653Stoke Therapeutics, Inc. (A) 2,273 88,283
Strategic Equity Allocation Trust (continued)Shares orPrincipalAmount Value
COMMON STOCKS (continued)Health care equipment and supplies – 3.0%Abbott Laboratories 261,388 $ 31,324,738ABIOMED, Inc. (A) 6,665 2,124,335Accelerate Diagnostics, Inc. (A)(C) 5,979 49,745Accuray, Inc. (A) 16,971 84,006Acutus Medical, Inc. (A) 2,722 36,393Alcon, Inc. (A) 86,947 6,101,538Align Technology, Inc. (A) 10,582 5,730,470Alphatec Holdings, Inc. (A) 9,333 147,368Ambu A/S, Class B 28,981 1,361,023AngioDynamics, Inc. (A) 6,293 147,256Antares Pharma, Inc. (A) 28,320 116,395Apyx Medical Corp. (A) 6,518 62,964Asahi Intecc Company, Ltd. 34,600 955,051Aspira Women's Health, Inc. (A)(C) 14,484 97,767AtriCure, Inc. (A) 7,347 481,375Atrion Corp. 248 159,045Avanos Medical, Inc. (A) 21,178 926,326Axogen, Inc. (A) 6,350 128,651Axonics Modulation Technologies,
Inc. (A) 5,109 305,978Baxter International, Inc. 73,471 6,196,544Becton, Dickinson and Company 42,774 10,400,498BioLife Solutions, Inc. (A) 2,323 83,628BioMerieux 7,326 932,004Boston Scientific Corp. (A) 207,360 8,014,464Cantel Medical Corp. (A) 16,677 1,331,492Cardiovascular Systems, Inc. (A) 6,649 254,923Carl Zeiss Meditec AG, Bearer Shares 7,117 1,072,776Cerus Corp. (A) 28,314 170,167Cochlear, Ltd. 11,625 1,869,938Co-Diagnostics, Inc. (A)(C) 4,851 46,279Coloplast A/S, B Shares 21,007 3,158,339
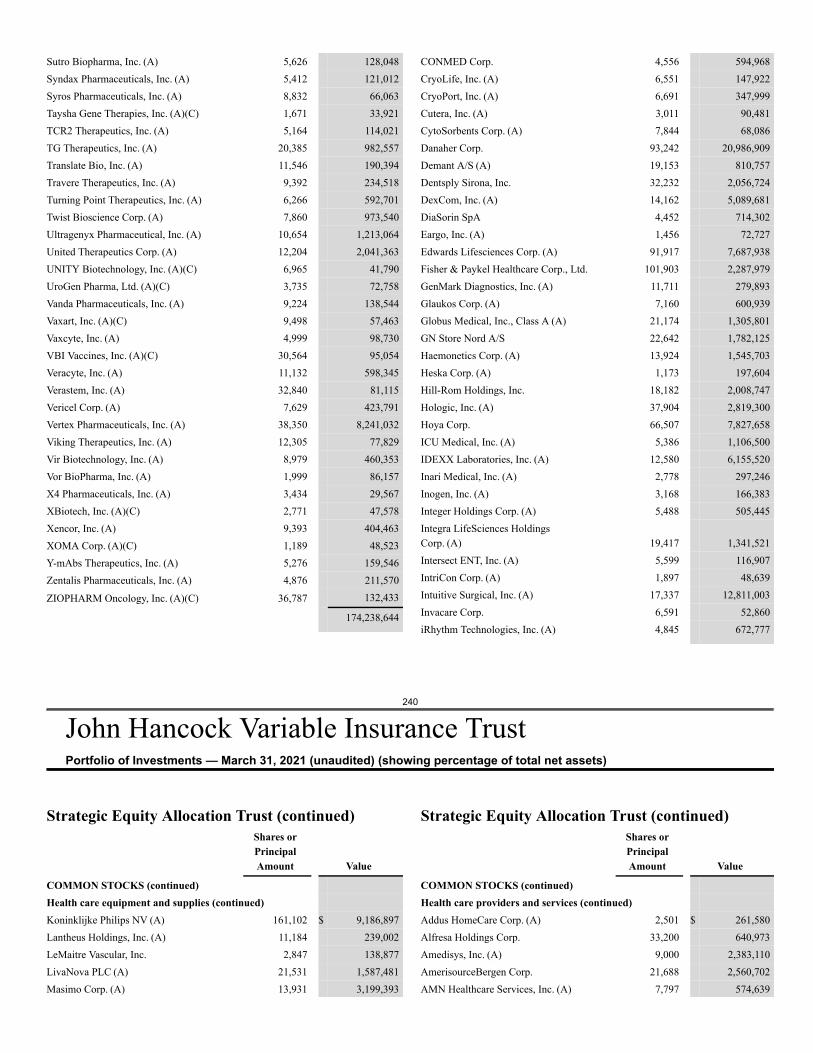
240
John Hancock Variable Insurance TrustPortfolio of Investments — March 31, 2021 (unaudited) (showing percentage of total net assets)
Sutro Biopharma, Inc. (A) 5,626 128,048Syndax Pharmaceuticals, Inc. (A) 5,412 121,012Syros Pharmaceuticals, Inc. (A) 8,832 66,063Taysha Gene Therapies, Inc. (A)(C) 1,671 33,921TCR2 Therapeutics, Inc. (A) 5,164 114,021TG Therapeutics, Inc. (A) 20,385 982,557Translate Bio, Inc. (A) 11,546 190,394Travere Therapeutics, Inc. (A) 9,392 234,518Turning Point Therapeutics, Inc. (A) 6,266 592,701Twist Bioscience Corp. (A) 7,860 973,540Ultragenyx Pharmaceutical, Inc. (A) 10,654 1,213,064United Therapeutics Corp. (A) 12,204 2,041,363UNITY Biotechnology, Inc. (A)(C) 6,965 41,790UroGen Pharma, Ltd. (A)(C) 3,735 72,758Vanda Pharmaceuticals, Inc. (A) 9,224 138,544Vaxart, Inc. (A)(C) 9,498 57,463Vaxcyte, Inc. (A) 4,999 98,730VBI Vaccines, Inc. (A)(C) 30,564 95,054Veracyte, Inc. (A) 11,132 598,345Verastem, Inc. (A) 32,840 81,115Vericel Corp. (A) 7,629 423,791Vertex Pharmaceuticals, Inc. (A) 38,350 8,241,032Viking Therapeutics, Inc. (A) 12,305 77,829Vir Biotechnology, Inc. (A) 8,979 460,353Vor BioPharma, Inc. (A) 1,999 86,157X4 Pharmaceuticals, Inc. (A) 3,434 29,567XBiotech, Inc. (A)(C) 2,771 47,578Xencor, Inc. (A) 9,393 404,463XOMA Corp. (A)(C) 1,189 48,523Y-mAbs Therapeutics, Inc. (A) 5,276 159,546Zentalis Pharmaceuticals, Inc. (A) 4,876 211,570
ZIOPHARM Oncology, Inc. (A)(C) 36,787 132,433
174,238,644
CONMED Corp. 4,556 594,968CryoLife, Inc. (A) 6,551 147,922CryoPort, Inc. (A) 6,691 347,999Cutera, Inc. (A) 3,011 90,481CytoSorbents Corp. (A) 7,844 68,086Danaher Corp. 93,242 20,986,909Demant A/S (A) 19,153 810,757Dentsply Sirona, Inc. 32,232 2,056,724DexCom, Inc. (A) 14,162 5,089,681DiaSorin SpA 4,452 714,302Eargo, Inc. (A) 1,456 72,727Edwards Lifesciences Corp. (A) 91,917 7,687,938Fisher & Paykel Healthcare Corp., Ltd. 101,903 2,287,979GenMark Diagnostics, Inc. (A) 11,711 279,893Glaukos Corp. (A) 7,160 600,939Globus Medical, Inc., Class A (A) 21,174 1,305,801GN Store Nord A/S 22,642 1,782,125Haemonetics Corp. (A) 13,924 1,545,703Heska Corp. (A) 1,173 197,604Hill-Rom Holdings, Inc. 18,182 2,008,747Hologic, Inc. (A) 37,904 2,819,300Hoya Corp. 66,507 7,827,658ICU Medical, Inc. (A) 5,386 1,106,500IDEXX Laboratories, Inc. (A) 12,580 6,155,520Inari Medical, Inc. (A) 2,778 297,246Inogen, Inc. (A) 3,168 166,383Integer Holdings Corp. (A) 5,488 505,445Integra LifeSciences HoldingsCorp. (A) 19,417 1,341,521Intersect ENT, Inc. (A) 5,599 116,907IntriCon Corp. (A) 1,897 48,639Intuitive Surgical, Inc. (A) 17,337 12,811,003Invacare Corp. 6,591 52,860iRhythm Technologies, Inc. (A) 4,845 672,777
Strategic Equity Allocation Trust (continued)Shares orPrincipalAmount Value
COMMON STOCKS (continued)Health care equipment and supplies (continued)Koninklijke Philips NV (A) 161,102 $ 9,186,897Lantheus Holdings, Inc. (A) 11,184 239,002LeMaitre Vascular, Inc. 2,847 138,877LivaNova PLC (A) 21,531 1,587,481Masimo Corp. (A) 13,931 3,199,393
Strategic Equity Allocation Trust (continued)Shares orPrincipalAmount Value
COMMON STOCKS (continued)Health care providers and services (continued)Addus HomeCare Corp. (A) 2,501 $ 261,580Alfresa Holdings Corp. 33,200 640,973Amedisys, Inc. (A) 9,000 2,383,110AmerisourceBergen Corp. 21,688 2,560,702AMN Healthcare Services, Inc. (A) 7,797 574,639
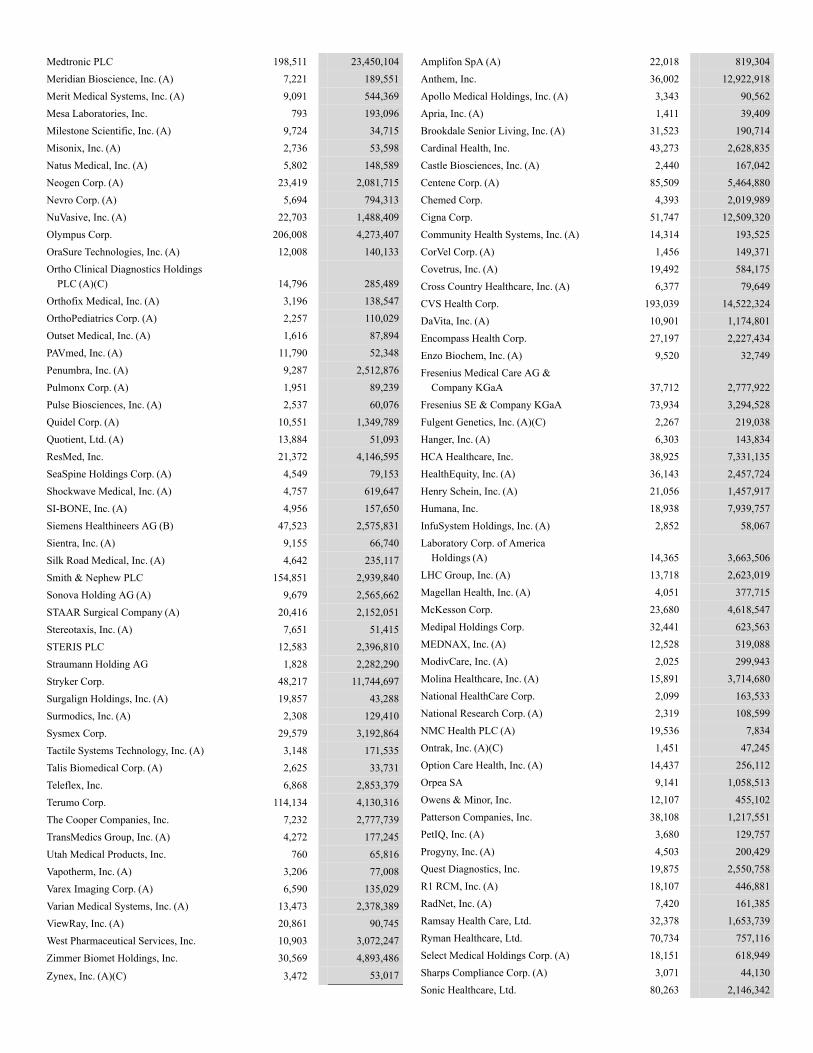
Medtronic PLC 198,511 23,450,104Meridian Bioscience, Inc. (A) 7,221 189,551Merit Medical Systems, Inc. (A) 9,091 544,369Mesa Laboratories, Inc. 793 193,096Milestone Scientific, Inc. (A) 9,724 34,715Misonix, Inc. (A) 2,736 53,598Natus Medical, Inc. (A) 5,802 148,589Neogen Corp. (A) 23,419 2,081,715Nevro Corp. (A) 5,694 794,313NuVasive, Inc. (A) 22,703 1,488,409Olympus Corp. 206,008 4,273,407OraSure Technologies, Inc. (A) 12,008 140,133Ortho Clinical Diagnostics Holdings
PLC (A)(C) 14,796 285,489Orthofix Medical, Inc. (A) 3,196 138,547OrthoPediatrics Corp. (A) 2,257 110,029Outset Medical, Inc. (A) 1,616 87,894PAVmed, Inc. (A) 11,790 52,348Penumbra, Inc. (A) 9,287 2,512,876Pulmonx Corp. (A) 1,951 89,239Pulse Biosciences, Inc. (A) 2,537 60,076Quidel Corp. (A) 10,551 1,349,789Quotient, Ltd. (A) 13,884 51,093ResMed, Inc. 21,372 4,146,595SeaSpine Holdings Corp. (A) 4,549 79,153Shockwave Medical, Inc. (A) 4,757 619,647SI-BONE, Inc. (A) 4,956 157,650Siemens Healthineers AG (B) 47,523 2,575,831Sientra, Inc. (A) 9,155 66,740Silk Road Medical, Inc. (A) 4,642 235,117Smith & Nephew PLC 154,851 2,939,840Sonova Holding AG (A) 9,679 2,565,662STAAR Surgical Company (A) 20,416 2,152,051Stereotaxis, Inc. (A) 7,651 51,415STERIS PLC 12,583 2,396,810Straumann Holding AG 1,828 2,282,290Stryker Corp. 48,217 11,744,697Surgalign Holdings, Inc. (A) 19,857 43,288Surmodics, Inc. (A) 2,308 129,410Sysmex Corp. 29,579 3,192,864Tactile Systems Technology, Inc. (A) 3,148 171,535Talis Biomedical Corp. (A) 2,625 33,731Teleflex, Inc. 6,868 2,853,379Terumo Corp. 114,134 4,130,316The Cooper Companies, Inc. 7,232 2,777,739TransMedics Group, Inc. (A) 4,272 177,245Utah Medical Products, Inc. 760 65,816Vapotherm, Inc. (A) 3,206 77,008Varex Imaging Corp. (A) 6,590 135,029Varian Medical Systems, Inc. (A) 13,473 2,378,389ViewRay, Inc. (A) 20,861 90,745West Pharmaceutical Services, Inc. 10,903 3,072,247Zimmer Biomet Holdings, Inc. 30,569 4,893,486
Zynex, Inc. (A)(C) 3,472 53,017
Amplifon SpA (A) 22,018 819,304Anthem, Inc. 36,002 12,922,918Apollo Medical Holdings, Inc. (A) 3,343 90,562Apria, Inc. (A) 1,411 39,409Brookdale Senior Living, Inc. (A) 31,523 190,714Cardinal Health, Inc. 43,273 2,628,835Castle Biosciences, Inc. (A) 2,440 167,042Centene Corp. (A) 85,509 5,464,880Chemed Corp. 4,393 2,019,989Cigna Corp. 51,747 12,509,320Community Health Systems, Inc. (A) 14,314 193,525CorVel Corp. (A) 1,456 149,371Covetrus, Inc. (A) 19,492 584,175Cross Country Healthcare, Inc. (A) 6,377 79,649CVS Health Corp. 193,039 14,522,324DaVita, Inc. (A) 10,901 1,174,801Encompass Health Corp. 27,197 2,227,434Enzo Biochem, Inc. (A) 9,520 32,749Fresenius Medical Care AG &
Company KGaA 37,712 2,777,922Fresenius SE & Company KGaA 73,934 3,294,528Fulgent Genetics, Inc. (A)(C) 2,267 219,038Hanger, Inc. (A) 6,303 143,834HCA Healthcare, Inc. 38,925 7,331,135HealthEquity, Inc. (A) 36,143 2,457,724Henry Schein, Inc. (A) 21,056 1,457,917Humana, Inc. 18,938 7,939,757InfuSystem Holdings, Inc. (A) 2,852 58,067Laboratory Corp. of America
Holdings (A) 14,365 3,663,506LHC Group, Inc. (A) 13,718 2,623,019Magellan Health, Inc. (A) 4,051 377,715McKesson Corp. 23,680 4,618,547Medipal Holdings Corp. 32,441 623,563MEDNAX, Inc. (A) 12,528 319,088ModivCare, Inc. (A) 2,025 299,943Molina Healthcare, Inc. (A) 15,891 3,714,680National HealthCare Corp. 2,099 163,533National Research Corp. (A) 2,319 108,599NMC Health PLC (A) 19,536 7,834Ontrak, Inc. (A)(C) 1,451 47,245Option Care Health, Inc. (A) 14,437 256,112Orpea SA 9,141 1,058,513Owens & Minor, Inc. 12,107 455,102Patterson Companies, Inc. 38,108 1,217,551PetIQ, Inc. (A) 3,680 129,757Progyny, Inc. (A) 4,503 200,429Quest Diagnostics, Inc. 19,875 2,550,758R1 RCM, Inc. (A) 18,107 446,881RadNet, Inc. (A) 7,420 161,385Ramsay Health Care, Ltd. 32,378 1,653,739Ryman Healthcare, Ltd. 70,734 757,116Select Medical Holdings Corp. (A) 18,151 618,949Sharps Compliance Corp. (A) 3,071 44,130Sonic Healthcare, Ltd. 80,263 2,146,342
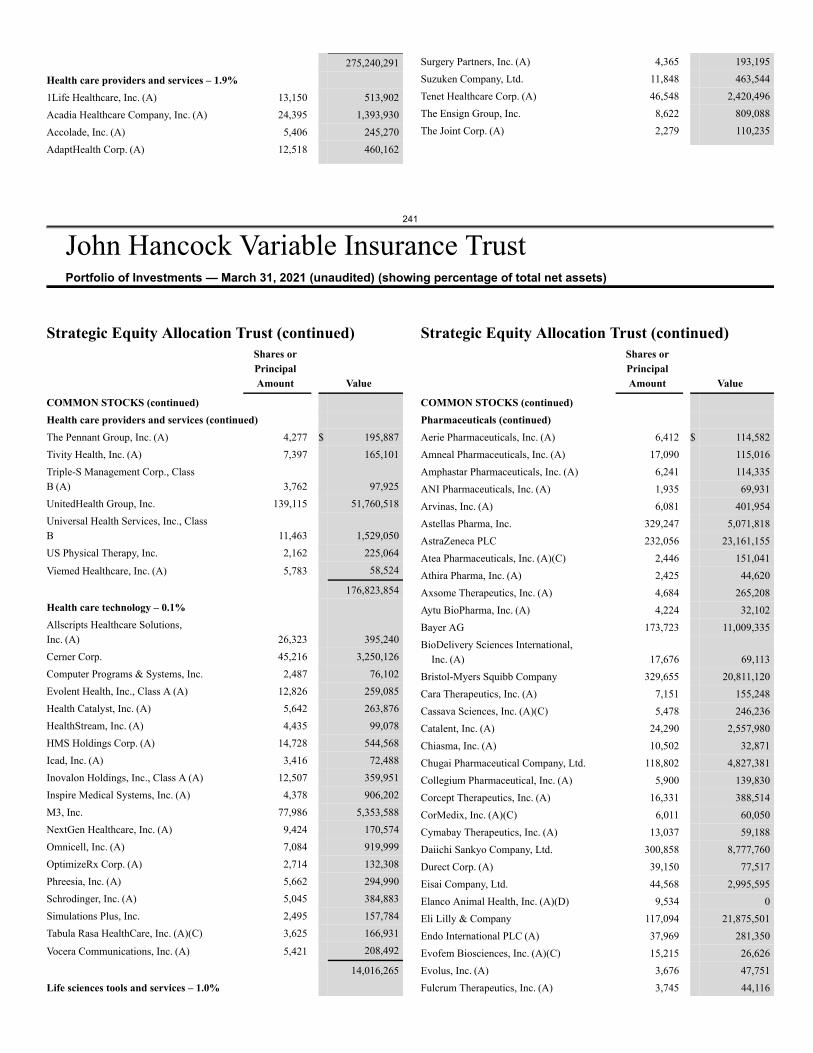
241
John Hancock Variable Insurance TrustPortfolio of Investments — March 31, 2021 (unaudited) (showing percentage of total net assets)
275,240,291Health care providers and services – 1.9%1Life Healthcare, Inc. (A) 13,150 513,902Acadia Healthcare Company, Inc. (A) 24,395 1,393,930Accolade, Inc. (A) 5,406 245,270AdaptHealth Corp. (A) 12,518 460,162
Surgery Partners, Inc. (A) 4,365 193,195Suzuken Company, Ltd. 11,848 463,544Tenet Healthcare Corp. (A) 46,548 2,420,496The Ensign Group, Inc. 8,622 809,088The Joint Corp. (A) 2,279 110,235
Strategic Equity Allocation Trust (continued)Shares orPrincipalAmount Value
COMMON STOCKS (continued)Health care providers and services (continued)The Pennant Group, Inc. (A) 4,277 $ 195,887Tivity Health, Inc. (A) 7,397 165,101Triple-S Management Corp., ClassB (A) 3,762 97,925UnitedHealth Group, Inc. 139,115 51,760,518Universal Health Services, Inc., ClassB 11,463 1,529,050US Physical Therapy, Inc. 2,162 225,064
Viemed Healthcare, Inc. (A) 5,783 58,524
176,823,854Health care technology – 0.1%Allscripts Healthcare Solutions,Inc. (A) 26,323 395,240Cerner Corp. 45,216 3,250,126Computer Programs & Systems, Inc. 2,487 76,102Evolent Health, Inc., Class A (A) 12,826 259,085Health Catalyst, Inc. (A) 5,642 263,876HealthStream, Inc. (A) 4,435 99,078HMS Holdings Corp. (A) 14,728 544,568Icad, Inc. (A) 3,416 72,488Inovalon Holdings, Inc., Class A (A) 12,507 359,951Inspire Medical Systems, Inc. (A) 4,378 906,202M3, Inc. 77,986 5,353,588NextGen Healthcare, Inc. (A) 9,424 170,574Omnicell, Inc. (A) 7,084 919,999OptimizeRx Corp. (A) 2,714 132,308Phreesia, Inc. (A) 5,662 294,990Schrodinger, Inc. (A) 5,045 384,883Simulations Plus, Inc. 2,495 157,784Tabula Rasa HealthCare, Inc. (A)(C) 3,625 166,931
Vocera Communications, Inc. (A) 5,421 208,492
14,016,265Life sciences tools and services – 1.0%
Strategic Equity Allocation Trust (continued)Shares orPrincipalAmount Value
COMMON STOCKS (continued)Pharmaceuticals (continued)Aerie Pharmaceuticals, Inc. (A) 6,412 $ 114,582Amneal Pharmaceuticals, Inc. (A) 17,090 115,016Amphastar Pharmaceuticals, Inc. (A) 6,241 114,335ANI Pharmaceuticals, Inc. (A) 1,935 69,931Arvinas, Inc. (A) 6,081 401,954Astellas Pharma, Inc. 329,247 5,071,818AstraZeneca PLC 232,056 23,161,155Atea Pharmaceuticals, Inc. (A)(C) 2,446 151,041Athira Pharma, Inc. (A) 2,425 44,620Axsome Therapeutics, Inc. (A) 4,684 265,208Aytu BioPharma, Inc. (A) 4,224 32,102Bayer AG 173,723 11,009,335BioDelivery Sciences International,
Inc. (A) 17,676 69,113Bristol-Myers Squibb Company 329,655 20,811,120Cara Therapeutics, Inc. (A) 7,151 155,248Cassava Sciences, Inc. (A)(C) 5,478 246,236Catalent, Inc. (A) 24,290 2,557,980Chiasma, Inc. (A) 10,502 32,871Chugai Pharmaceutical Company, Ltd. 118,802 4,827,381Collegium Pharmaceutical, Inc. (A) 5,900 139,830Corcept Therapeutics, Inc. (A) 16,331 388,514CorMedix, Inc. (A)(C) 6,011 60,050Cymabay Therapeutics, Inc. (A) 13,037 59,188Daiichi Sankyo Company, Ltd. 300,858 8,777,760Durect Corp. (A) 39,150 77,517Eisai Company, Ltd. 44,568 2,995,595Elanco Animal Health, Inc. (A)(D) 9,534 0Eli Lilly & Company 117,094 21,875,501Endo International PLC (A) 37,969 281,350Evofem Biosciences, Inc. (A)(C) 15,215 26,626Evolus, Inc. (A) 3,676 47,751Fulcrum Therapeutics, Inc. (A) 3,745 44,116
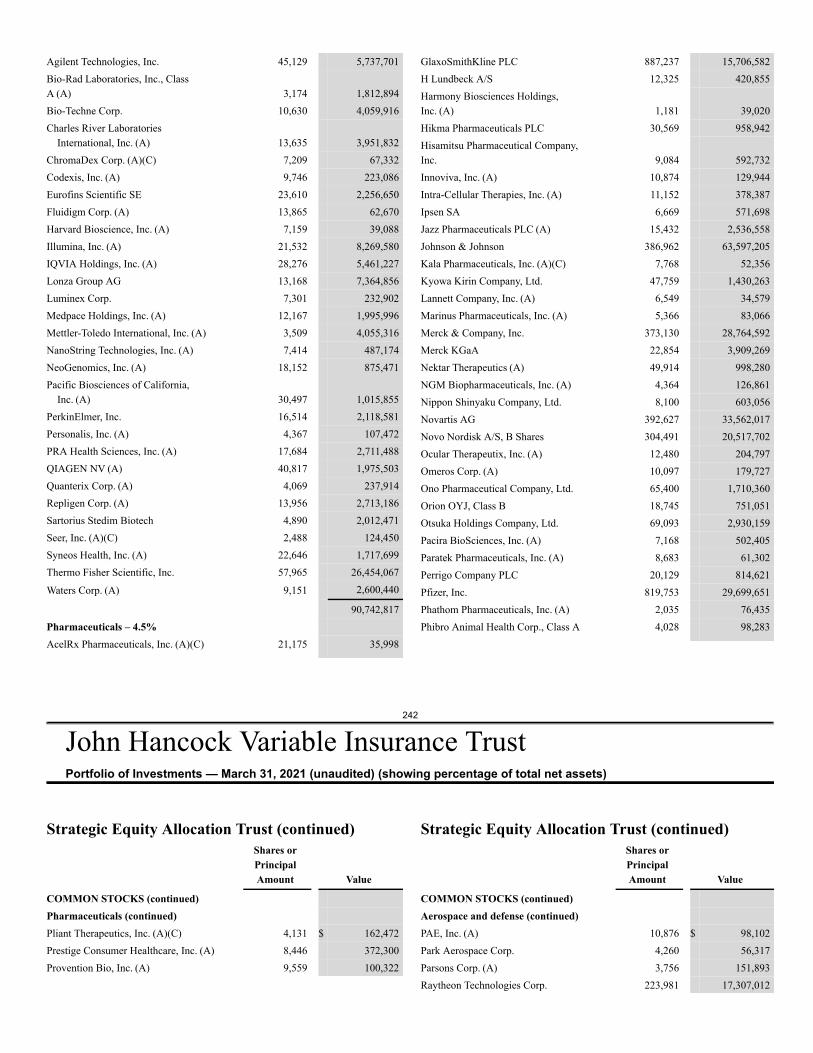
242
John Hancock Variable Insurance TrustPortfolio of Investments — March 31, 2021 (unaudited) (showing percentage of total net assets)
Agilent Technologies, Inc. 45,129 5,737,701Bio-Rad Laboratories, Inc., ClassA (A) 3,174 1,812,894Bio-Techne Corp. 10,630 4,059,916Charles River Laboratories
International, Inc. (A) 13,635 3,951,832ChromaDex Corp. (A)(C) 7,209 67,332Codexis, Inc. (A) 9,746 223,086Eurofins Scientific SE 23,610 2,256,650Fluidigm Corp. (A) 13,865 62,670Harvard Bioscience, Inc. (A) 7,159 39,088Illumina, Inc. (A) 21,532 8,269,580IQVIA Holdings, Inc. (A) 28,276 5,461,227Lonza Group AG 13,168 7,364,856Luminex Corp. 7,301 232,902Medpace Holdings, Inc. (A) 12,167 1,995,996Mettler-Toledo International, Inc. (A) 3,509 4,055,316NanoString Technologies, Inc. (A) 7,414 487,174NeoGenomics, Inc. (A) 18,152 875,471Pacific Biosciences of California,
Inc. (A) 30,497 1,015,855PerkinElmer, Inc. 16,514 2,118,581Personalis, Inc. (A) 4,367 107,472PRA Health Sciences, Inc. (A) 17,684 2,711,488QIAGEN NV (A) 40,817 1,975,503Quanterix Corp. (A) 4,069 237,914Repligen Corp. (A) 13,956 2,713,186Sartorius Stedim Biotech 4,890 2,012,471Seer, Inc. (A)(C) 2,488 124,450Syneos Health, Inc. (A) 22,646 1,717,699Thermo Fisher Scientific, Inc. 57,965 26,454,067
Waters Corp. (A) 9,151 2,600,440
90,742,817Pharmaceuticals – 4.5%AcelRx Pharmaceuticals, Inc. (A)(C) 21,175 35,998
GlaxoSmithKline PLC 887,237 15,706,582H Lundbeck A/S 12,325 420,855Harmony Biosciences Holdings,Inc. (A) 1,181 39,020Hikma Pharmaceuticals PLC 30,569 958,942Hisamitsu Pharmaceutical Company,Inc. 9,084 592,732Innoviva, Inc. (A) 10,874 129,944Intra-Cellular Therapies, Inc. (A) 11,152 378,387Ipsen SA 6,669 571,698Jazz Pharmaceuticals PLC (A) 15,432 2,536,558Johnson & Johnson 386,962 63,597,205Kala Pharmaceuticals, Inc. (A)(C) 7,768 52,356Kyowa Kirin Company, Ltd. 47,759 1,430,263Lannett Company, Inc. (A) 6,549 34,579Marinus Pharmaceuticals, Inc. (A) 5,366 83,066Merck & Company, Inc. 373,130 28,764,592Merck KGaA 22,854 3,909,269Nektar Therapeutics (A) 49,914 998,280NGM Biopharmaceuticals, Inc. (A) 4,364 126,861Nippon Shinyaku Company, Ltd. 8,100 603,056Novartis AG 392,627 33,562,017Novo Nordisk A/S, B Shares 304,491 20,517,702Ocular Therapeutix, Inc. (A) 12,480 204,797Omeros Corp. (A) 10,097 179,727Ono Pharmaceutical Company, Ltd. 65,400 1,710,360Orion OYJ, Class B 18,745 751,051Otsuka Holdings Company, Ltd. 69,093 2,930,159Pacira BioSciences, Inc. (A) 7,168 502,405Paratek Pharmaceuticals, Inc. (A) 8,683 61,302Perrigo Company PLC 20,129 814,621Pfizer, Inc. 819,753 29,699,651Phathom Pharmaceuticals, Inc. (A) 2,035 76,435Phibro Animal Health Corp., Class A 4,028 98,283
Strategic Equity Allocation Trust (continued)Shares orPrincipalAmount Value
COMMON STOCKS (continued)Pharmaceuticals (continued)Pliant Therapeutics, Inc. (A)(C) 4,131 $ 162,472Prestige Consumer Healthcare, Inc. (A) 8,446 372,300Provention Bio, Inc. (A) 9,559 100,322
Strategic Equity Allocation Trust (continued)Shares orPrincipalAmount Value
COMMON STOCKS (continued)Aerospace and defense (continued)PAE, Inc. (A) 10,876 $ 98,102Park Aerospace Corp. 4,260 56,317Parsons Corp. (A) 3,756 151,893Raytheon Technologies Corp. 223,981 17,307,012
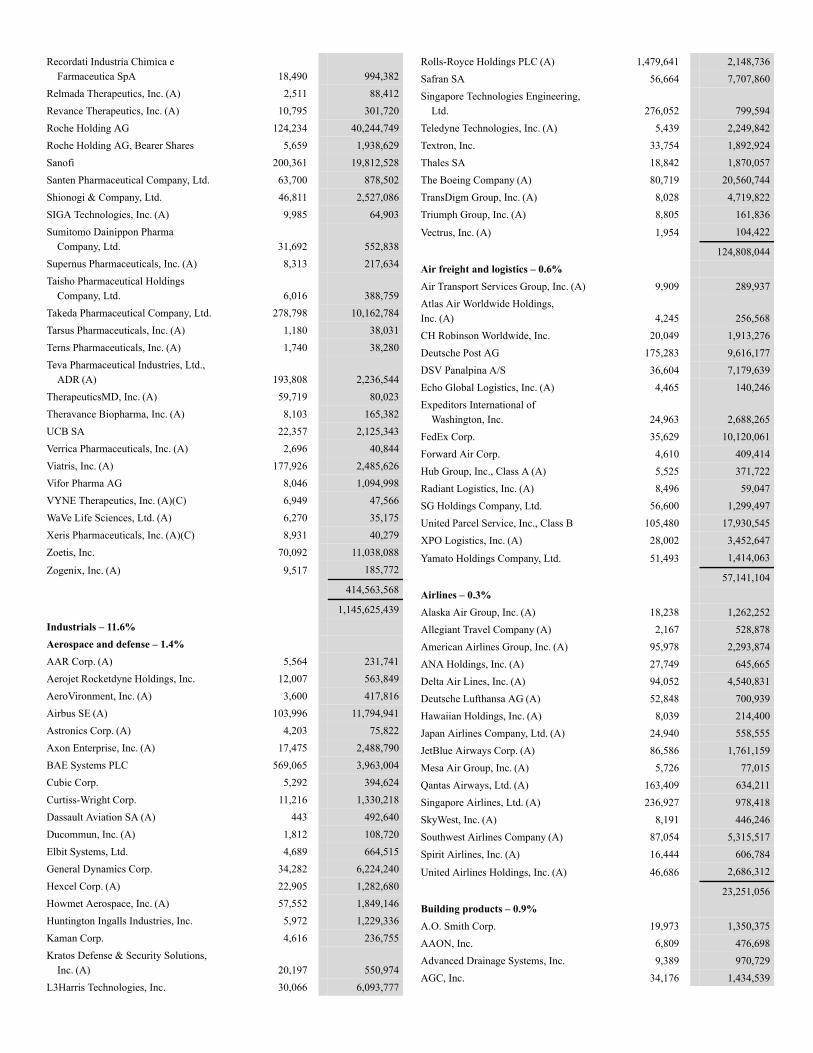
Recordati Industria Chimica eFarmaceutica SpA 18,490 994,382
Relmada Therapeutics, Inc. (A) 2,511 88,412Revance Therapeutics, Inc. (A) 10,795 301,720Roche Holding AG 124,234 40,244,749Roche Holding AG, Bearer Shares 5,659 1,938,629Sanofi 200,361 19,812,528Santen Pharmaceutical Company, Ltd. 63,700 878,502Shionogi & Company, Ltd. 46,811 2,527,086SIGA Technologies, Inc. (A) 9,985 64,903Sumitomo Dainippon Pharma
Company, Ltd. 31,692 552,838Supernus Pharmaceuticals, Inc. (A) 8,313 217,634Taisho Pharmaceutical Holdings
Company, Ltd. 6,016 388,759Takeda Pharmaceutical Company, Ltd. 278,798 10,162,784Tarsus Pharmaceuticals, Inc. (A) 1,180 38,031Terns Pharmaceuticals, Inc. (A) 1,740 38,280Teva Pharmaceutical Industries, Ltd.,
ADR (A) 193,808 2,236,544TherapeuticsMD, Inc. (A) 59,719 80,023Theravance Biopharma, Inc. (A) 8,103 165,382UCB SA 22,357 2,125,343Verrica Pharmaceuticals, Inc. (A) 2,696 40,844Viatris, Inc. (A) 177,926 2,485,626Vifor Pharma AG 8,046 1,094,998VYNE Therapeutics, Inc. (A)(C) 6,949 47,566WaVe Life Sciences, Ltd. (A) 6,270 35,175Xeris Pharmaceuticals, Inc. (A)(C) 8,931 40,279Zoetis, Inc. 70,092 11,038,088
Zogenix, Inc. (A) 9,517 185,772
414,563,568
1,145,625,439Industrials – 11.6%Aerospace and defense – 1.4%AAR Corp. (A) 5,564 231,741Aerojet Rocketdyne Holdings, Inc. 12,007 563,849AeroVironment, Inc. (A) 3,600 417,816Airbus SE (A) 103,996 11,794,941Astronics Corp. (A) 4,203 75,822Axon Enterprise, Inc. (A) 17,475 2,488,790BAE Systems PLC 569,065 3,963,004Cubic Corp. 5,292 394,624Curtiss-Wright Corp. 11,216 1,330,218Dassault Aviation SA (A) 443 492,640Ducommun, Inc. (A) 1,812 108,720Elbit Systems, Ltd. 4,689 664,515General Dynamics Corp. 34,282 6,224,240Hexcel Corp. (A) 22,905 1,282,680Howmet Aerospace, Inc. (A) 57,552 1,849,146Huntington Ingalls Industries, Inc. 5,972 1,229,336Kaman Corp. 4,616 236,755Kratos Defense & Security Solutions,
Inc. (A) 20,197 550,974L3Harris Technologies, Inc. 30,066 6,093,777
Rolls-Royce Holdings PLC (A) 1,479,641 2,148,736Safran SA 56,664 7,707,860Singapore Technologies Engineering,
Ltd. 276,052 799,594Teledyne Technologies, Inc. (A) 5,439 2,249,842Textron, Inc. 33,754 1,892,924Thales SA 18,842 1,870,057The Boeing Company (A) 80,719 20,560,744TransDigm Group, Inc. (A) 8,028 4,719,822Triumph Group, Inc. (A) 8,805 161,836
Vectrus, Inc. (A) 1,954 104,422
124,808,044Air freight and logistics – 0.6%Air Transport Services Group, Inc. (A) 9,909 289,937Atlas Air Worldwide Holdings,Inc. (A) 4,245 256,568CH Robinson Worldwide, Inc. 20,049 1,913,276Deutsche Post AG 175,283 9,616,177DSV Panalpina A/S 36,604 7,179,639Echo Global Logistics, Inc. (A) 4,465 140,246Expeditors International of
Washington, Inc. 24,963 2,688,265FedEx Corp. 35,629 10,120,061Forward Air Corp. 4,610 409,414Hub Group, Inc., Class A (A) 5,525 371,722Radiant Logistics, Inc. (A) 8,496 59,047SG Holdings Company, Ltd. 56,600 1,299,497United Parcel Service, Inc., Class B 105,480 17,930,545XPO Logistics, Inc. (A) 28,002 3,452,647
Yamato Holdings Company, Ltd. 51,493 1,414,063
57,141,104Airlines – 0.3%Alaska Air Group, Inc. (A) 18,238 1,262,252Allegiant Travel Company (A) 2,167 528,878American Airlines Group, Inc. (A) 95,978 2,293,874ANA Holdings, Inc. (A) 27,749 645,665Delta Air Lines, Inc. (A) 94,052 4,540,831Deutsche Lufthansa AG (A) 52,848 700,939Hawaiian Holdings, Inc. (A) 8,039 214,400Japan Airlines Company, Ltd. (A) 24,940 558,555JetBlue Airways Corp. (A) 86,586 1,761,159Mesa Air Group, Inc. (A) 5,726 77,015Qantas Airways, Ltd. (A) 163,409 634,211Singapore Airlines, Ltd. (A) 236,927 978,418SkyWest, Inc. (A) 8,191 446,246Southwest Airlines Company (A) 87,054 5,315,517Spirit Airlines, Inc. (A) 16,444 606,784
United Airlines Holdings, Inc. (A) 46,686 2,686,312
23,251,056Building products – 0.9%A.O. Smith Corp. 19,973 1,350,375AAON, Inc. 6,809 476,698Advanced Drainage Systems, Inc. 9,389 970,729AGC, Inc. 34,176 1,434,539
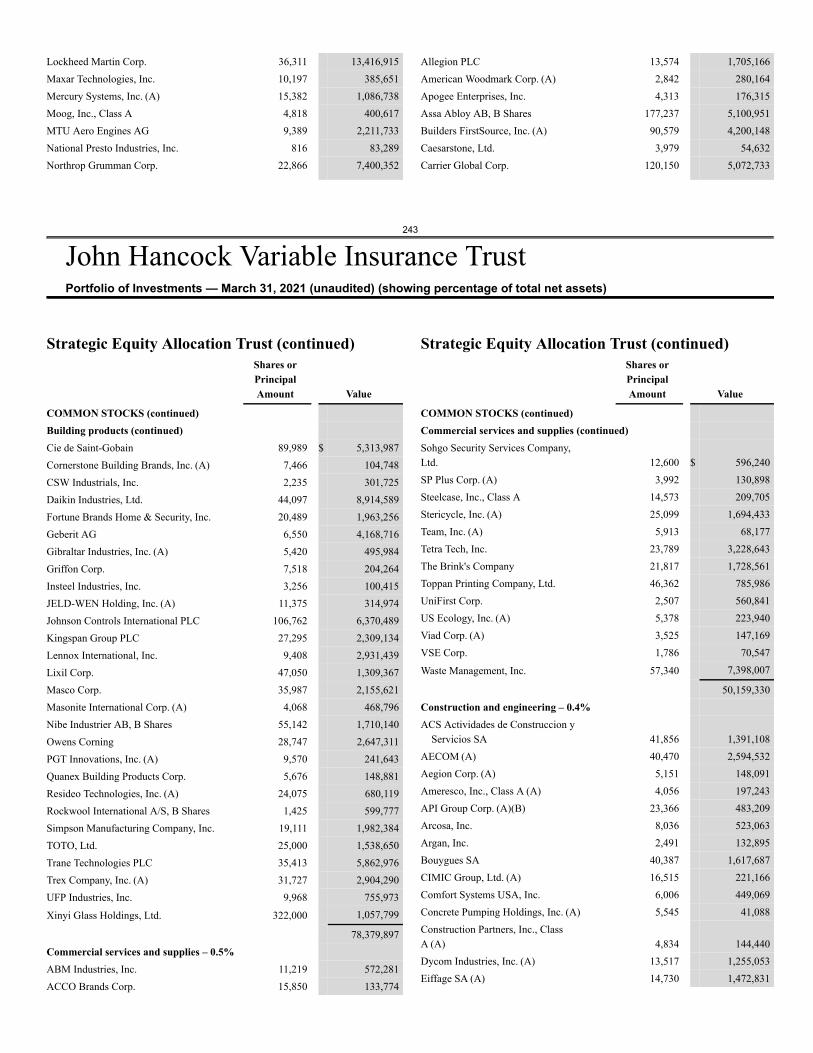
243
John Hancock Variable Insurance TrustPortfolio of Investments — March 31, 2021 (unaudited) (showing percentage of total net assets)
Lockheed Martin Corp. 36,311 13,416,915Maxar Technologies, Inc. 10,197 385,651Mercury Systems, Inc. (A) 15,382 1,086,738Moog, Inc., Class A 4,818 400,617MTU Aero Engines AG 9,389 2,211,733National Presto Industries, Inc. 816 83,289Northrop Grumman Corp. 22,866 7,400,352
Allegion PLC 13,574 1,705,166American Woodmark Corp. (A) 2,842 280,164Apogee Enterprises, Inc. 4,313 176,315Assa Abloy AB, B Shares 177,237 5,100,951Builders FirstSource, Inc. (A) 90,579 4,200,148Caesarstone, Ltd. 3,979 54,632Carrier Global Corp. 120,150 5,072,733
Strategic Equity Allocation Trust (continued)Shares orPrincipalAmount Value
COMMON STOCKS (continued)Building products (continued)Cie de Saint-Gobain 89,989 $ 5,313,987Cornerstone Building Brands, Inc. (A) 7,466 104,748CSW Industrials, Inc. 2,235 301,725Daikin Industries, Ltd. 44,097 8,914,589Fortune Brands Home & Security, Inc. 20,489 1,963,256Geberit AG 6,550 4,168,716Gibraltar Industries, Inc. (A) 5,420 495,984Griffon Corp. 7,518 204,264Insteel Industries, Inc. 3,256 100,415JELD-WEN Holding, Inc. (A) 11,375 314,974Johnson Controls International PLC 106,762 6,370,489Kingspan Group PLC 27,295 2,309,134Lennox International, Inc. 9,408 2,931,439Lixil Corp. 47,050 1,309,367Masco Corp. 35,987 2,155,621Masonite International Corp. (A) 4,068 468,796Nibe Industrier AB, B Shares 55,142 1,710,140Owens Corning 28,747 2,647,311PGT Innovations, Inc. (A) 9,570 241,643Quanex Building Products Corp. 5,676 148,881Resideo Technologies, Inc. (A) 24,075 680,119Rockwool International A/S, B Shares 1,425 599,777Simpson Manufacturing Company, Inc. 19,111 1,982,384TOTO, Ltd. 25,000 1,538,650Trane Technologies PLC 35,413 5,862,976Trex Company, Inc. (A) 31,727 2,904,290UFP Industries, Inc. 9,968 755,973
Xinyi Glass Holdings, Ltd. 322,000 1,057,799
78,379,897Commercial services and supplies – 0.5%ABM Industries, Inc. 11,219 572,281ACCO Brands Corp. 15,850 133,774
Strategic Equity Allocation Trust (continued)Shares orPrincipalAmount Value
COMMON STOCKS (continued)Commercial services and supplies (continued)Sohgo Security Services Company,Ltd. 12,600 $ 596,240SP Plus Corp. (A) 3,992 130,898Steelcase, Inc., Class A 14,573 209,705Stericycle, Inc. (A) 25,099 1,694,433Team, Inc. (A) 5,913 68,177Tetra Tech, Inc. 23,789 3,228,643The Brink's Company 21,817 1,728,561Toppan Printing Company, Ltd. 46,362 785,986UniFirst Corp. 2,507 560,841US Ecology, Inc. (A) 5,378 223,940Viad Corp. (A) 3,525 147,169VSE Corp. 1,786 70,547
Waste Management, Inc. 57,340 7,398,007
50,159,330Construction and engineering – 0.4%ACS Actividades de Construccion y
Servicios SA 41,856 1,391,108AECOM (A) 40,470 2,594,532Aegion Corp. (A) 5,151 148,091Ameresco, Inc., Class A (A) 4,056 197,243API Group Corp. (A)(B) 23,366 483,209Arcosa, Inc. 8,036 523,063Argan, Inc. 2,491 132,895Bouygues SA 40,387 1,617,687CIMIC Group, Ltd. (A) 16,515 221,166Comfort Systems USA, Inc. 6,006 449,069Concrete Pumping Holdings, Inc. (A) 5,545 41,088Construction Partners, Inc., ClassA (A) 4,834 144,440Dycom Industries, Inc. (A) 13,517 1,255,053Eiffage SA (A) 14,730 1,472,831
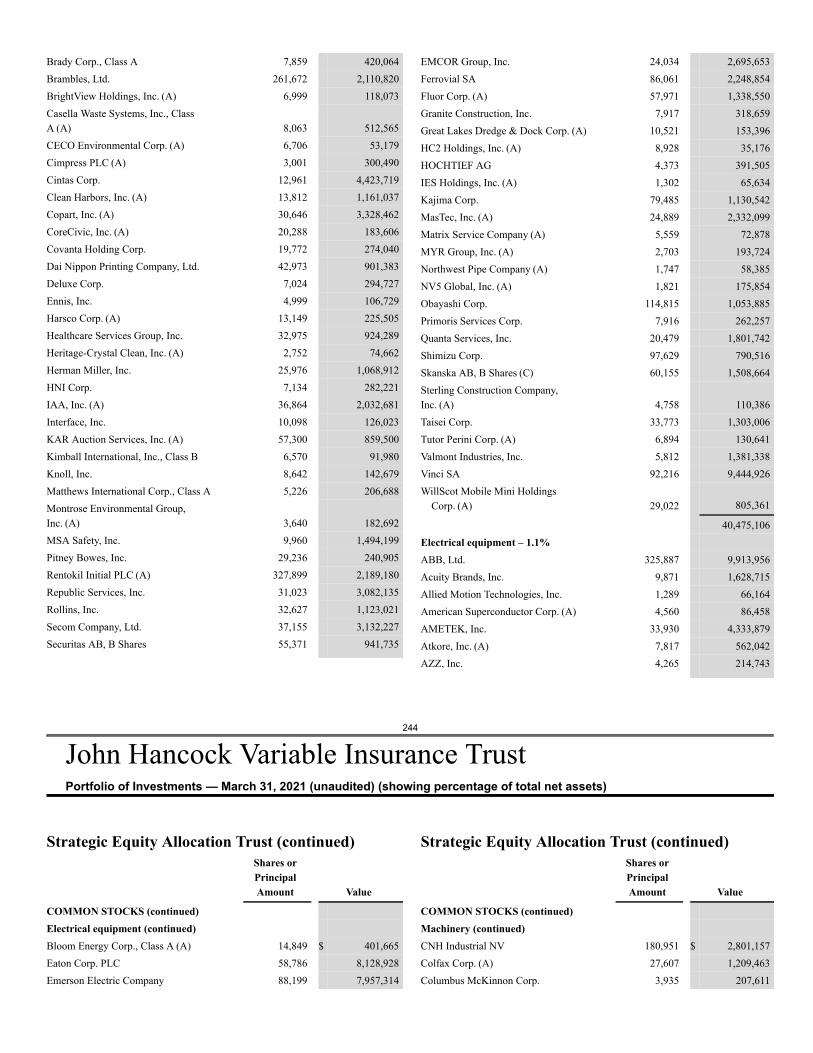
244
John Hancock Variable Insurance TrustPortfolio of Investments — March 31, 2021 (unaudited) (showing percentage of total net assets)
Brady Corp., Class A 7,859 420,064Brambles, Ltd. 261,672 2,110,820BrightView Holdings, Inc. (A) 6,999 118,073Casella Waste Systems, Inc., ClassA (A) 8,063 512,565CECO Environmental Corp. (A) 6,706 53,179Cimpress PLC (A) 3,001 300,490Cintas Corp. 12,961 4,423,719Clean Harbors, Inc. (A) 13,812 1,161,037Copart, Inc. (A) 30,646 3,328,462CoreCivic, Inc. (A) 20,288 183,606Covanta Holding Corp. 19,772 274,040Dai Nippon Printing Company, Ltd. 42,973 901,383Deluxe Corp. 7,024 294,727Ennis, Inc. 4,999 106,729Harsco Corp. (A) 13,149 225,505Healthcare Services Group, Inc. 32,975 924,289Heritage-Crystal Clean, Inc. (A) 2,752 74,662Herman Miller, Inc. 25,976 1,068,912HNI Corp. 7,134 282,221IAA, Inc. (A) 36,864 2,032,681Interface, Inc. 10,098 126,023KAR Auction Services, Inc. (A) 57,300 859,500Kimball International, Inc., Class B 6,570 91,980Knoll, Inc. 8,642 142,679Matthews International Corp., Class A 5,226 206,688Montrose Environmental Group,Inc. (A) 3,640 182,692MSA Safety, Inc. 9,960 1,494,199Pitney Bowes, Inc. 29,236 240,905Rentokil Initial PLC (A) 327,899 2,189,180Republic Services, Inc. 31,023 3,082,135Rollins, Inc. 32,627 1,123,021Secom Company, Ltd. 37,155 3,132,227Securitas AB, B Shares 55,371 941,735
EMCOR Group, Inc. 24,034 2,695,653Ferrovial SA 86,061 2,248,854Fluor Corp. (A) 57,971 1,338,550Granite Construction, Inc. 7,917 318,659Great Lakes Dredge & Dock Corp. (A) 10,521 153,396HC2 Holdings, Inc. (A) 8,928 35,176HOCHTIEF AG 4,373 391,505IES Holdings, Inc. (A) 1,302 65,634Kajima Corp. 79,485 1,130,542MasTec, Inc. (A) 24,889 2,332,099Matrix Service Company (A) 5,559 72,878MYR Group, Inc. (A) 2,703 193,724Northwest Pipe Company (A) 1,747 58,385NV5 Global, Inc. (A) 1,821 175,854Obayashi Corp. 114,815 1,053,885Primoris Services Corp. 7,916 262,257Quanta Services, Inc. 20,479 1,801,742Shimizu Corp. 97,629 790,516Skanska AB, B Shares (C) 60,155 1,508,664Sterling Construction Company,Inc. (A) 4,758 110,386Taisei Corp. 33,773 1,303,006Tutor Perini Corp. (A) 6,894 130,641Valmont Industries, Inc. 5,812 1,381,338Vinci SA 92,216 9,444,926WillScot Mobile Mini Holdings
Corp. (A) 29,022 805,361
40,475,106Electrical equipment – 1.1%ABB, Ltd. 325,887 9,913,956Acuity Brands, Inc. 9,871 1,628,715Allied Motion Technologies, Inc. 1,289 66,164American Superconductor Corp. (A) 4,560 86,458AMETEK, Inc. 33,930 4,333,879Atkore, Inc. (A) 7,817 562,042AZZ, Inc. 4,265 214,743
Strategic Equity Allocation Trust (continued)Shares orPrincipalAmount Value
COMMON STOCKS (continued)Electrical equipment (continued)Bloom Energy Corp., Class A (A) 14,849 $ 401,665Eaton Corp. PLC 58,786 8,128,928Emerson Electric Company 88,199 7,957,314
Strategic Equity Allocation Trust (continued)Shares orPrincipalAmount Value
COMMON STOCKS (continued)Machinery (continued)CNH Industrial NV 180,951 $ 2,801,157Colfax Corp. (A) 27,607 1,209,463Columbus McKinnon Corp. 3,935 207,611
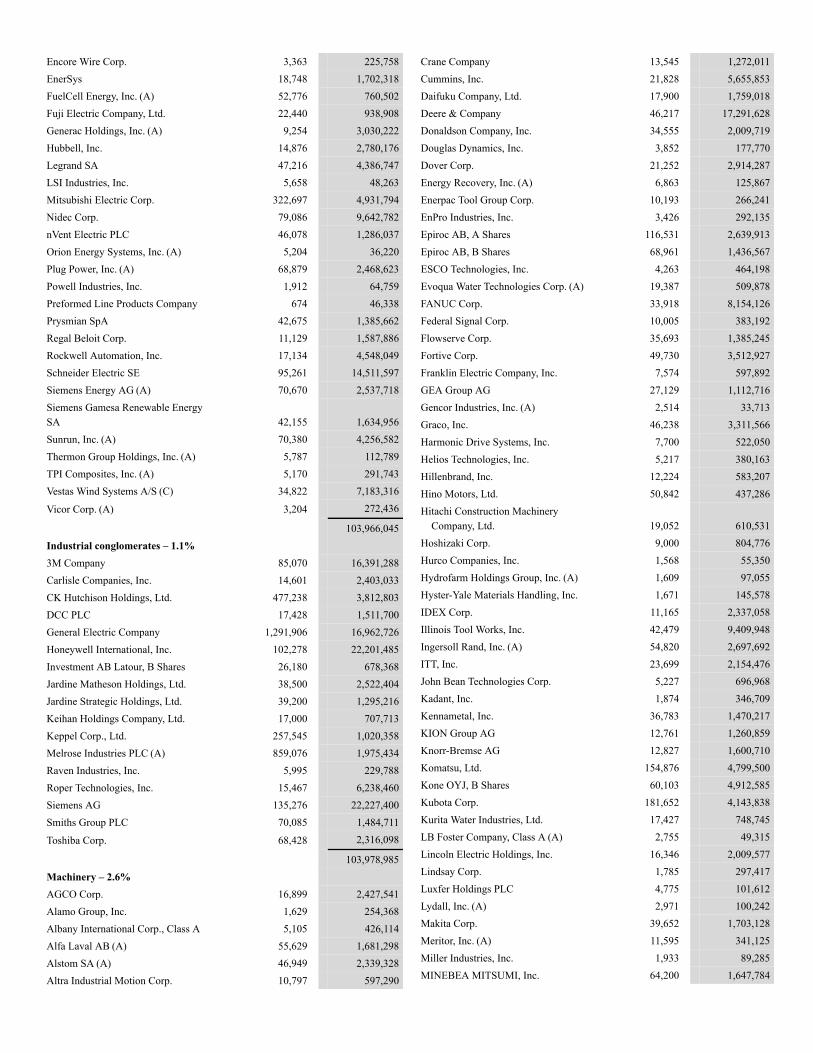
Encore Wire Corp. 3,363 225,758EnerSys 18,748 1,702,318FuelCell Energy, Inc. (A) 52,776 760,502Fuji Electric Company, Ltd. 22,440 938,908Generac Holdings, Inc. (A) 9,254 3,030,222Hubbell, Inc. 14,876 2,780,176Legrand SA 47,216 4,386,747LSI Industries, Inc. 5,658 48,263Mitsubishi Electric Corp. 322,697 4,931,794Nidec Corp. 79,086 9,642,782nVent Electric PLC 46,078 1,286,037Orion Energy Systems, Inc. (A) 5,204 36,220Plug Power, Inc. (A) 68,879 2,468,623Powell Industries, Inc. 1,912 64,759Preformed Line Products Company 674 46,338Prysmian SpA 42,675 1,385,662Regal Beloit Corp. 11,129 1,587,886Rockwell Automation, Inc. 17,134 4,548,049Schneider Electric SE 95,261 14,511,597Siemens Energy AG (A) 70,670 2,537,718Siemens Gamesa Renewable EnergySA 42,155 1,634,956Sunrun, Inc. (A) 70,380 4,256,582Thermon Group Holdings, Inc. (A) 5,787 112,789TPI Composites, Inc. (A) 5,170 291,743Vestas Wind Systems A/S (C) 34,822 7,183,316
Vicor Corp. (A) 3,204 272,436
103,966,045Industrial conglomerates – 1.1%3M Company 85,070 16,391,288Carlisle Companies, Inc. 14,601 2,403,033CK Hutchison Holdings, Ltd. 477,238 3,812,803DCC PLC 17,428 1,511,700General Electric Company 1,291,906 16,962,726Honeywell International, Inc. 102,278 22,201,485Investment AB Latour, B Shares 26,180 678,368Jardine Matheson Holdings, Ltd. 38,500 2,522,404Jardine Strategic Holdings, Ltd. 39,200 1,295,216Keihan Holdings Company, Ltd. 17,000 707,713Keppel Corp., Ltd. 257,545 1,020,358Melrose Industries PLC (A) 859,076 1,975,434Raven Industries, Inc. 5,995 229,788Roper Technologies, Inc. 15,467 6,238,460Siemens AG 135,276 22,227,400Smiths Group PLC 70,085 1,484,711
Toshiba Corp. 68,428 2,316,098
103,978,985Machinery – 2.6%AGCO Corp. 16,899 2,427,541Alamo Group, Inc. 1,629 254,368Albany International Corp., Class A 5,105 426,114Alfa Laval AB (A) 55,629 1,681,298Alstom SA (A) 46,949 2,339,328Altra Industrial Motion Corp. 10,797 597,290
Crane Company 13,545 1,272,011Cummins, Inc. 21,828 5,655,853Daifuku Company, Ltd. 17,900 1,759,018Deere & Company 46,217 17,291,628Donaldson Company, Inc. 34,555 2,009,719Douglas Dynamics, Inc. 3,852 177,770Dover Corp. 21,252 2,914,287Energy Recovery, Inc. (A) 6,863 125,867Enerpac Tool Group Corp. 10,193 266,241EnPro Industries, Inc. 3,426 292,135Epiroc AB, A Shares 116,531 2,639,913Epiroc AB, B Shares 68,961 1,436,567ESCO Technologies, Inc. 4,263 464,198Evoqua Water Technologies Corp. (A) 19,387 509,878FANUC Corp. 33,918 8,154,126Federal Signal Corp. 10,005 383,192Flowserve Corp. 35,693 1,385,245Fortive Corp. 49,730 3,512,927Franklin Electric Company, Inc. 7,574 597,892GEA Group AG 27,129 1,112,716Gencor Industries, Inc. (A) 2,514 33,713Graco, Inc. 46,238 3,311,566Harmonic Drive Systems, Inc. 7,700 522,050Helios Technologies, Inc. 5,217 380,163Hillenbrand, Inc. 12,224 583,207Hino Motors, Ltd. 50,842 437,286Hitachi Construction Machinery
Company, Ltd. 19,052 610,531Hoshizaki Corp. 9,000 804,776Hurco Companies, Inc. 1,568 55,350Hydrofarm Holdings Group, Inc. (A) 1,609 97,055Hyster-Yale Materials Handling, Inc. 1,671 145,578IDEX Corp. 11,165 2,337,058Illinois Tool Works, Inc. 42,479 9,409,948Ingersoll Rand, Inc. (A) 54,820 2,697,692ITT, Inc. 23,699 2,154,476John Bean Technologies Corp. 5,227 696,968Kadant, Inc. 1,874 346,709Kennametal, Inc. 36,783 1,470,217KION Group AG 12,761 1,260,859Knorr-Bremse AG 12,827 1,600,710Komatsu, Ltd. 154,876 4,799,500Kone OYJ, B Shares 60,103 4,912,585Kubota Corp. 181,652 4,143,838Kurita Water Industries, Ltd. 17,427 748,745LB Foster Company, Class A (A) 2,755 49,315Lincoln Electric Holdings, Inc. 16,346 2,009,577Lindsay Corp. 1,785 297,417Luxfer Holdings PLC 4,775 101,612Lydall, Inc. (A) 2,971 100,242Makita Corp. 39,652 1,703,128Meritor, Inc. (A) 11,595 341,125Miller Industries, Inc. 1,933 89,285MINEBEA MITSUMI, Inc. 64,200 1,647,784
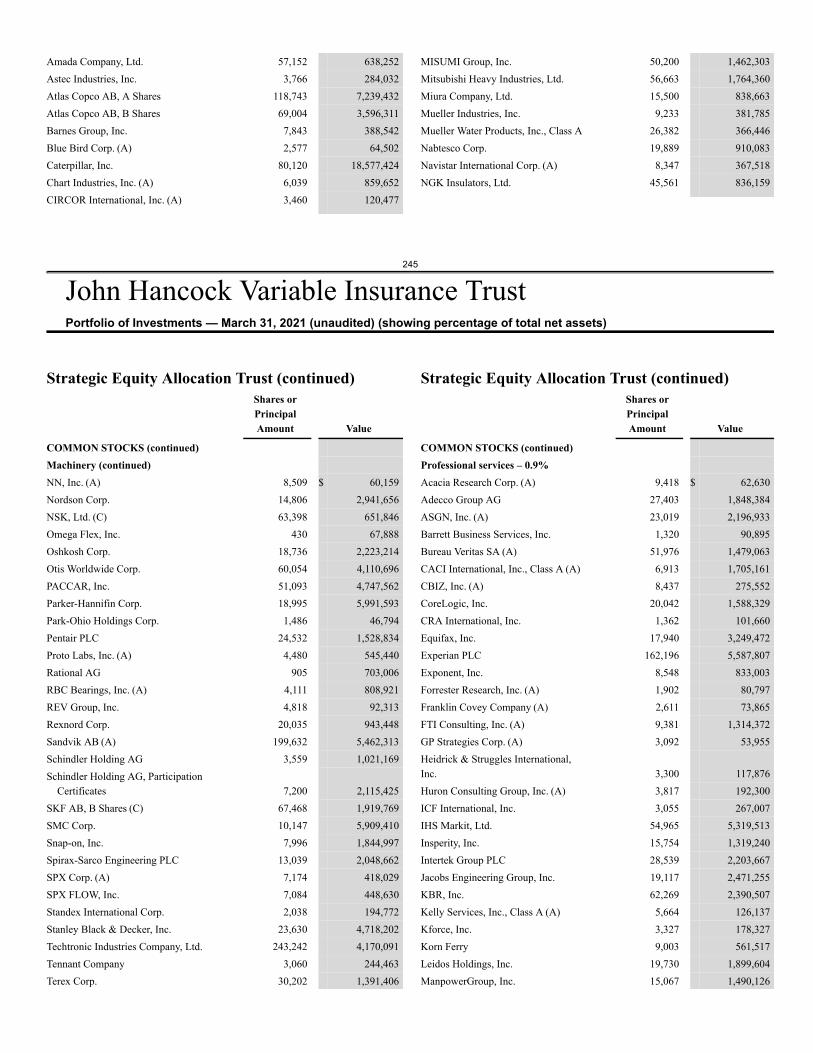
245
John Hancock Variable Insurance TrustPortfolio of Investments — March 31, 2021 (unaudited) (showing percentage of total net assets)
Amada Company, Ltd. 57,152 638,252Astec Industries, Inc. 3,766 284,032Atlas Copco AB, A Shares 118,743 7,239,432Atlas Copco AB, B Shares 69,004 3,596,311Barnes Group, Inc. 7,843 388,542Blue Bird Corp. (A) 2,577 64,502Caterpillar, Inc. 80,120 18,577,424Chart Industries, Inc. (A) 6,039 859,652CIRCOR International, Inc. (A) 3,460 120,477
MISUMI Group, Inc. 50,200 1,462,303Mitsubishi Heavy Industries, Ltd. 56,663 1,764,360Miura Company, Ltd. 15,500 838,663Mueller Industries, Inc. 9,233 381,785Mueller Water Products, Inc., Class A 26,382 366,446Nabtesco Corp. 19,889 910,083Navistar International Corp. (A) 8,347 367,518NGK Insulators, Ltd. 45,561 836,159
Strategic Equity Allocation Trust (continued)Shares orPrincipalAmount Value
COMMON STOCKS (continued)Machinery (continued)NN, Inc. (A) 8,509 $ 60,159Nordson Corp. 14,806 2,941,656NSK, Ltd. (C) 63,398 651,846Omega Flex, Inc. 430 67,888Oshkosh Corp. 18,736 2,223,214Otis Worldwide Corp. 60,054 4,110,696PACCAR, Inc. 51,093 4,747,562Parker-Hannifin Corp. 18,995 5,991,593Park-Ohio Holdings Corp. 1,486 46,794Pentair PLC 24,532 1,528,834Proto Labs, Inc. (A) 4,480 545,440Rational AG 905 703,006RBC Bearings, Inc. (A) 4,111 808,921REV Group, Inc. 4,818 92,313Rexnord Corp. 20,035 943,448Sandvik AB (A) 199,632 5,462,313Schindler Holding AG 3,559 1,021,169Schindler Holding AG, Participation
Certificates 7,200 2,115,425SKF AB, B Shares (C) 67,468 1,919,769SMC Corp. 10,147 5,909,410Snap-on, Inc. 7,996 1,844,997Spirax-Sarco Engineering PLC 13,039 2,048,662SPX Corp. (A) 7,174 418,029SPX FLOW, Inc. 7,084 448,630Standex International Corp. 2,038 194,772Stanley Black & Decker, Inc. 23,630 4,718,202Techtronic Industries Company, Ltd. 243,242 4,170,091Tennant Company 3,060 244,463Terex Corp. 30,202 1,391,406
Strategic Equity Allocation Trust (continued)Shares orPrincipalAmount Value
COMMON STOCKS (continued)Professional services – 0.9%Acacia Research Corp. (A) 9,418 $ 62,630Adecco Group AG 27,403 1,848,384ASGN, Inc. (A) 23,019 2,196,933Barrett Business Services, Inc. 1,320 90,895Bureau Veritas SA (A) 51,976 1,479,063CACI International, Inc., Class A (A) 6,913 1,705,161CBIZ, Inc. (A) 8,437 275,552CoreLogic, Inc. 20,042 1,588,329CRA International, Inc. 1,362 101,660Equifax, Inc. 17,940 3,249,472Experian PLC 162,196 5,587,807Exponent, Inc. 8,548 833,003Forrester Research, Inc. (A) 1,902 80,797Franklin Covey Company (A) 2,611 73,865FTI Consulting, Inc. (A) 9,381 1,314,372GP Strategies Corp. (A) 3,092 53,955Heidrick & Struggles International,Inc. 3,300 117,876Huron Consulting Group, Inc. (A) 3,817 192,300ICF International, Inc. 3,055 267,007IHS Markit, Ltd. 54,965 5,319,513Insperity, Inc. 15,754 1,319,240Intertek Group PLC 28,539 2,203,667Jacobs Engineering Group, Inc. 19,117 2,471,255KBR, Inc. 62,269 2,390,507Kelly Services, Inc., Class A (A) 5,664 126,137Kforce, Inc. 3,327 178,327Korn Ferry 9,003 561,517Leidos Holdings, Inc. 19,730 1,899,604ManpowerGroup, Inc. 15,067 1,490,126
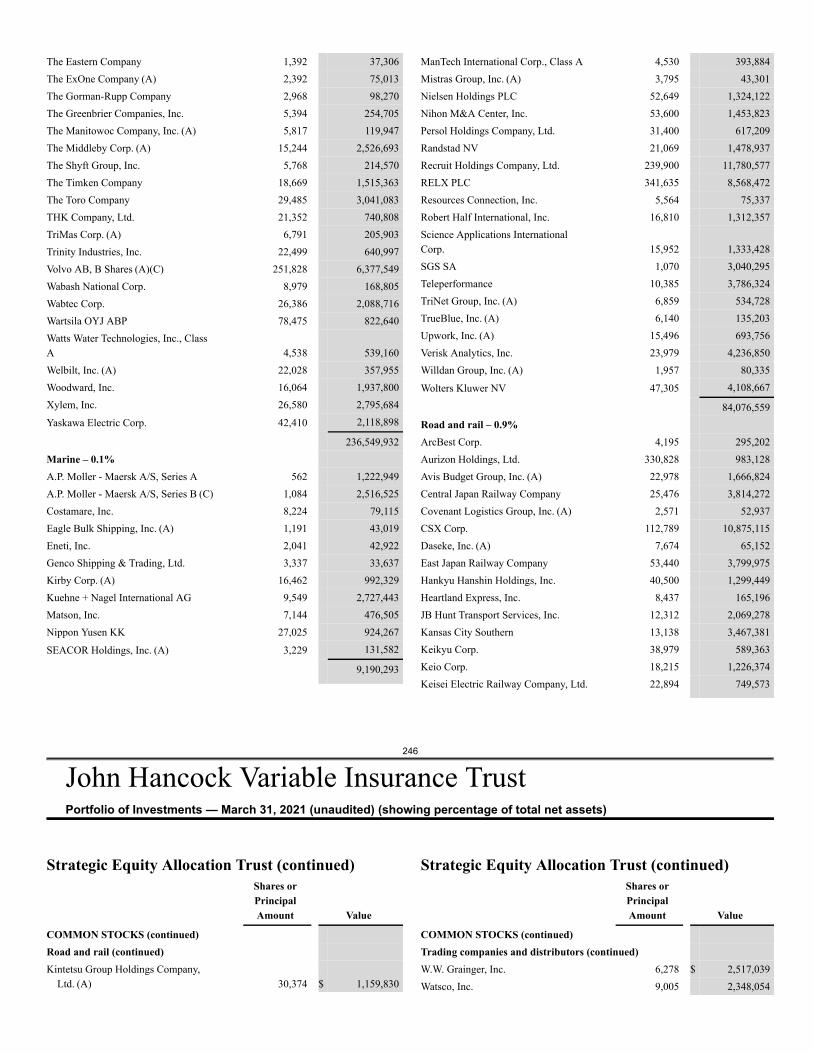
246
John Hancock Variable Insurance TrustPortfolio of Investments — March 31, 2021 (unaudited) (showing percentage of total net assets)
The Eastern Company 1,392 37,306The ExOne Company (A) 2,392 75,013The Gorman-Rupp Company 2,968 98,270The Greenbrier Companies, Inc. 5,394 254,705The Manitowoc Company, Inc. (A) 5,817 119,947The Middleby Corp. (A) 15,244 2,526,693The Shyft Group, Inc. 5,768 214,570The Timken Company 18,669 1,515,363The Toro Company 29,485 3,041,083THK Company, Ltd. 21,352 740,808TriMas Corp. (A) 6,791 205,903Trinity Industries, Inc. 22,499 640,997Volvo AB, B Shares (A)(C) 251,828 6,377,549Wabash National Corp. 8,979 168,805Wabtec Corp. 26,386 2,088,716Wartsila OYJ ABP 78,475 822,640Watts Water Technologies, Inc., ClassA 4,538 539,160Welbilt, Inc. (A) 22,028 357,955Woodward, Inc. 16,064 1,937,800Xylem, Inc. 26,580 2,795,684
Yaskawa Electric Corp. 42,410 2,118,898
236,549,932Marine – 0.1%A.P. Moller - Maersk A/S, Series A 562 1,222,949A.P. Moller - Maersk A/S, Series B (C) 1,084 2,516,525Costamare, Inc. 8,224 79,115Eagle Bulk Shipping, Inc. (A) 1,191 43,019Eneti, Inc. 2,041 42,922Genco Shipping & Trading, Ltd. 3,337 33,637Kirby Corp. (A) 16,462 992,329Kuehne + Nagel International AG 9,549 2,727,443Matson, Inc. 7,144 476,505Nippon Yusen KK 27,025 924,267
SEACOR Holdings, Inc. (A) 3,229 131,582
9,190,293
ManTech International Corp., Class A 4,530 393,884Mistras Group, Inc. (A) 3,795 43,301Nielsen Holdings PLC 52,649 1,324,122Nihon M&A Center, Inc. 53,600 1,453,823Persol Holdings Company, Ltd. 31,400 617,209Randstad NV 21,069 1,478,937Recruit Holdings Company, Ltd. 239,900 11,780,577RELX PLC 341,635 8,568,472Resources Connection, Inc. 5,564 75,337Robert Half International, Inc. 16,810 1,312,357Science Applications InternationalCorp. 15,952 1,333,428SGS SA 1,070 3,040,295Teleperformance 10,385 3,786,324TriNet Group, Inc. (A) 6,859 534,728TrueBlue, Inc. (A) 6,140 135,203Upwork, Inc. (A) 15,496 693,756Verisk Analytics, Inc. 23,979 4,236,850Willdan Group, Inc. (A) 1,957 80,335
Wolters Kluwer NV 47,305 4,108,667
84,076,559Road and rail – 0.9%ArcBest Corp. 4,195 295,202Aurizon Holdings, Ltd. 330,828 983,128Avis Budget Group, Inc. (A) 22,978 1,666,824Central Japan Railway Company 25,476 3,814,272Covenant Logistics Group, Inc. (A) 2,571 52,937CSX Corp. 112,789 10,875,115Daseke, Inc. (A) 7,674 65,152East Japan Railway Company 53,440 3,799,975Hankyu Hanshin Holdings, Inc. 40,500 1,299,449Heartland Express, Inc. 8,437 165,196JB Hunt Transport Services, Inc. 12,312 2,069,278Kansas City Southern 13,138 3,467,381Keikyu Corp. 38,979 589,363Keio Corp. 18,215 1,226,374Keisei Electric Railway Company, Ltd. 22,894 749,573
Strategic Equity Allocation Trust (continued)Shares orPrincipalAmount Value
COMMON STOCKS (continued)Road and rail (continued)Kintetsu Group Holdings Company,
Ltd. (A) 30,374 $ 1,159,830
Strategic Equity Allocation Trust (continued)Shares orPrincipalAmount Value
COMMON STOCKS (continued)Trading companies and distributors (continued)W.W. Grainger, Inc. 6,278 $ 2,517,039Watsco, Inc. 9,005 2,348,054
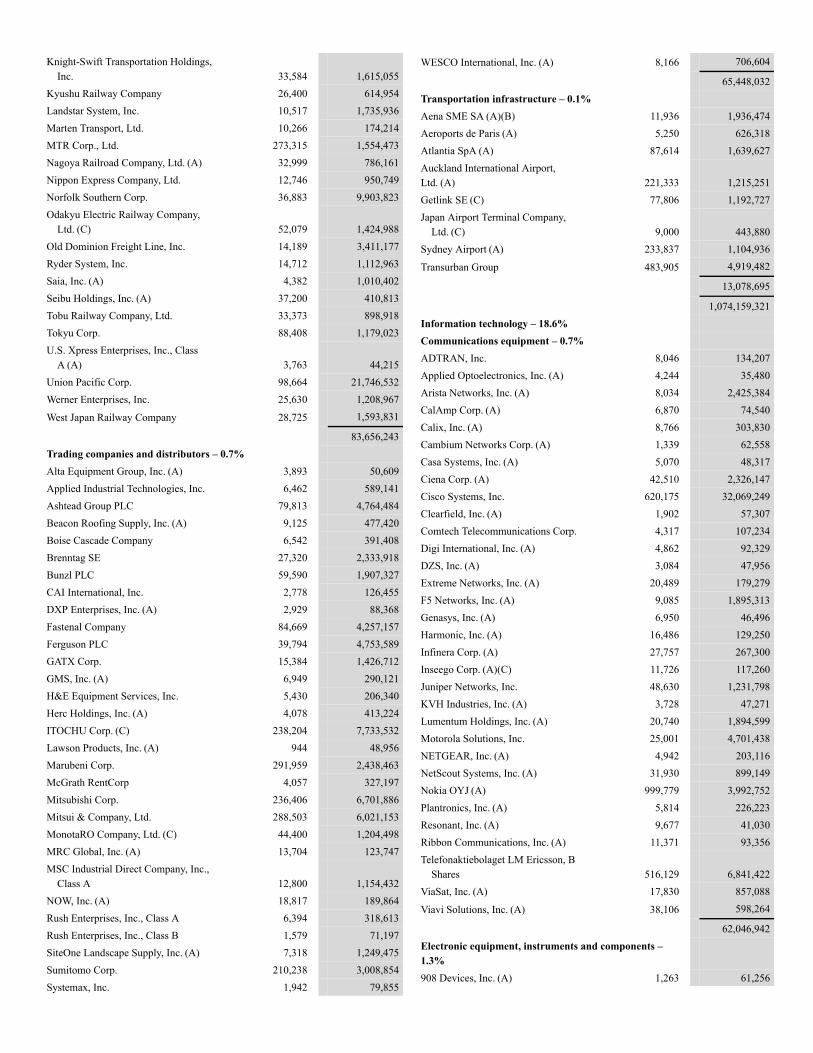
Knight-Swift Transportation Holdings,Inc. 33,584 1,615,055
Kyushu Railway Company 26,400 614,954Landstar System, Inc. 10,517 1,735,936Marten Transport, Ltd. 10,266 174,214MTR Corp., Ltd. 273,315 1,554,473Nagoya Railroad Company, Ltd. (A) 32,999 786,161Nippon Express Company, Ltd. 12,746 950,749Norfolk Southern Corp. 36,883 9,903,823Odakyu Electric Railway Company,
Ltd. (C) 52,079 1,424,988Old Dominion Freight Line, Inc. 14,189 3,411,177Ryder System, Inc. 14,712 1,112,963Saia, Inc. (A) 4,382 1,010,402Seibu Holdings, Inc. (A) 37,200 410,813Tobu Railway Company, Ltd. 33,373 898,918Tokyu Corp. 88,408 1,179,023U.S. Xpress Enterprises, Inc., Class
A (A) 3,763 44,215Union Pacific Corp. 98,664 21,746,532Werner Enterprises, Inc. 25,630 1,208,967
West Japan Railway Company 28,725 1,593,831
83,656,243Trading companies and distributors – 0.7%Alta Equipment Group, Inc. (A) 3,893 50,609Applied Industrial Technologies, Inc. 6,462 589,141Ashtead Group PLC 79,813 4,764,484Beacon Roofing Supply, Inc. (A) 9,125 477,420Boise Cascade Company 6,542 391,408Brenntag SE 27,320 2,333,918Bunzl PLC 59,590 1,907,327CAI International, Inc. 2,778 126,455DXP Enterprises, Inc. (A) 2,929 88,368Fastenal Company 84,669 4,257,157Ferguson PLC 39,794 4,753,589GATX Corp. 15,384 1,426,712GMS, Inc. (A) 6,949 290,121H&E Equipment Services, Inc. 5,430 206,340Herc Holdings, Inc. (A) 4,078 413,224ITOCHU Corp. (C) 238,204 7,733,532Lawson Products, Inc. (A) 944 48,956Marubeni Corp. 291,959 2,438,463McGrath RentCorp 4,057 327,197Mitsubishi Corp. 236,406 6,701,886Mitsui & Company, Ltd. 288,503 6,021,153MonotaRO Company, Ltd. (C) 44,400 1,204,498MRC Global, Inc. (A) 13,704 123,747MSC Industrial Direct Company, Inc.,
Class A 12,800 1,154,432NOW, Inc. (A) 18,817 189,864Rush Enterprises, Inc., Class A 6,394 318,613Rush Enterprises, Inc., Class B 1,579 71,197SiteOne Landscape Supply, Inc. (A) 7,318 1,249,475Sumitomo Corp. 210,238 3,008,854Systemax, Inc. 1,942 79,855
WESCO International, Inc. (A) 8,166 706,604
65,448,032Transportation infrastructure – 0.1%Aena SME SA (A)(B) 11,936 1,936,474Aeroports de Paris (A) 5,250 626,318Atlantia SpA (A) 87,614 1,639,627Auckland International Airport,Ltd. (A) 221,333 1,215,251Getlink SE (C) 77,806 1,192,727Japan Airport Terminal Company,
Ltd. (C) 9,000 443,880Sydney Airport (A) 233,837 1,104,936
Transurban Group 483,905 4,919,482
13,078,695
1,074,159,321Information technology – 18.6%Communications equipment – 0.7%ADTRAN, Inc. 8,046 134,207Applied Optoelectronics, Inc. (A) 4,244 35,480Arista Networks, Inc. (A) 8,034 2,425,384CalAmp Corp. (A) 6,870 74,540Calix, Inc. (A) 8,766 303,830Cambium Networks Corp. (A) 1,339 62,558Casa Systems, Inc. (A) 5,070 48,317Ciena Corp. (A) 42,510 2,326,147Cisco Systems, Inc. 620,175 32,069,249Clearfield, Inc. (A) 1,902 57,307Comtech Telecommunications Corp. 4,317 107,234Digi International, Inc. (A) 4,862 92,329DZS, Inc. (A) 3,084 47,956Extreme Networks, Inc. (A) 20,489 179,279F5 Networks, Inc. (A) 9,085 1,895,313Genasys, Inc. (A) 6,950 46,496Harmonic, Inc. (A) 16,486 129,250Infinera Corp. (A) 27,757 267,300Inseego Corp. (A)(C) 11,726 117,260Juniper Networks, Inc. 48,630 1,231,798KVH Industries, Inc. (A) 3,728 47,271Lumentum Holdings, Inc. (A) 20,740 1,894,599Motorola Solutions, Inc. 25,001 4,701,438NETGEAR, Inc. (A) 4,942 203,116NetScout Systems, Inc. (A) 31,930 899,149Nokia OYJ (A) 999,779 3,992,752Plantronics, Inc. (A) 5,814 226,223Resonant, Inc. (A) 9,677 41,030Ribbon Communications, Inc. (A) 11,371 93,356Telefonaktiebolaget LM Ericsson, B
Shares 516,129 6,841,422ViaSat, Inc. (A) 17,830 857,088
Viavi Solutions, Inc. (A) 38,106 598,264
62,046,942Electronic equipment, instruments and components –1.3%908 Devices, Inc. (A) 1,263 61,256
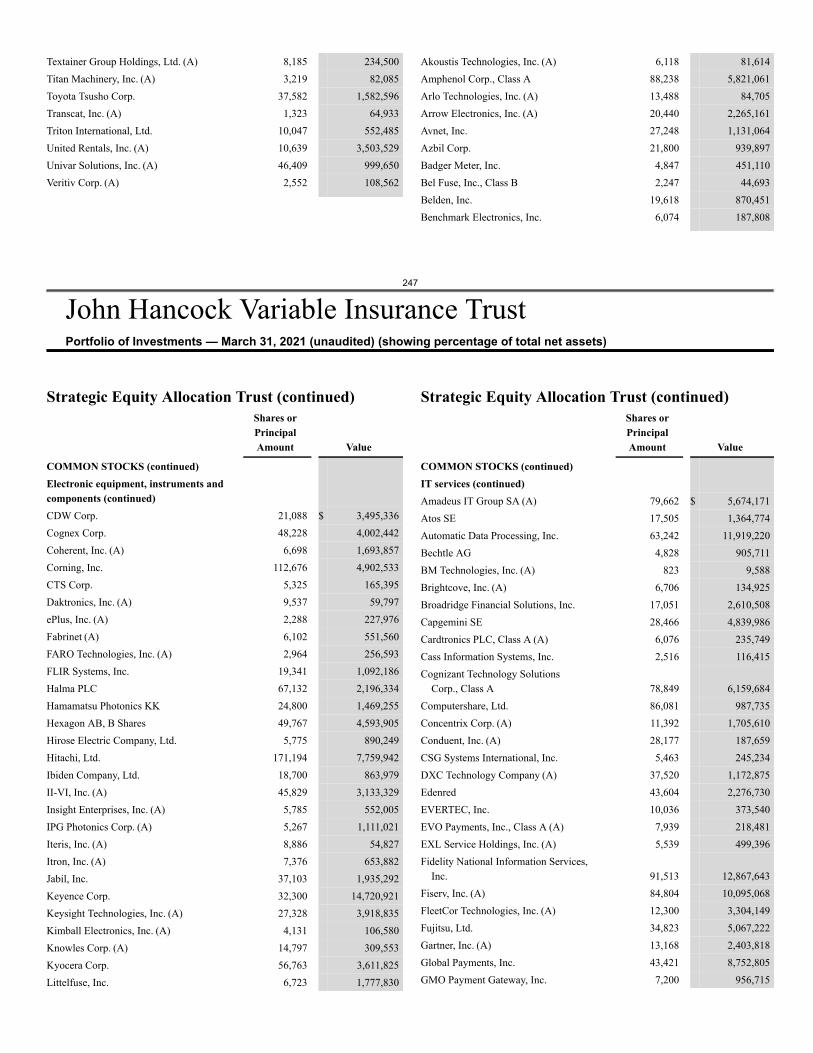
247
John Hancock Variable Insurance TrustPortfolio of Investments — March 31, 2021 (unaudited) (showing percentage of total net assets)
Textainer Group Holdings, Ltd. (A) 8,185 234,500Titan Machinery, Inc. (A) 3,219 82,085Toyota Tsusho Corp. 37,582 1,582,596Transcat, Inc. (A) 1,323 64,933Triton International, Ltd. 10,047 552,485United Rentals, Inc. (A) 10,639 3,503,529Univar Solutions, Inc. (A) 46,409 999,650Veritiv Corp. (A) 2,552 108,562
Akoustis Technologies, Inc. (A) 6,118 81,614Amphenol Corp., Class A 88,238 5,821,061Arlo Technologies, Inc. (A) 13,488 84,705Arrow Electronics, Inc. (A) 20,440 2,265,161Avnet, Inc. 27,248 1,131,064Azbil Corp. 21,800 939,897Badger Meter, Inc. 4,847 451,110Bel Fuse, Inc., Class B 2,247 44,693Belden, Inc. 19,618 870,451Benchmark Electronics, Inc. 6,074 187,808
Strategic Equity Allocation Trust (continued)Shares orPrincipalAmount Value
COMMON STOCKS (continued)Electronic equipment, instruments andcomponents (continued)CDW Corp. 21,088 $ 3,495,336Cognex Corp. 48,228 4,002,442Coherent, Inc. (A) 6,698 1,693,857Corning, Inc. 112,676 4,902,533CTS Corp. 5,325 165,395Daktronics, Inc. (A) 9,537 59,797ePlus, Inc. (A) 2,288 227,976Fabrinet (A) 6,102 551,560FARO Technologies, Inc. (A) 2,964 256,593FLIR Systems, Inc. 19,341 1,092,186Halma PLC 67,132 2,196,334Hamamatsu Photonics KK 24,800 1,469,255Hexagon AB, B Shares 49,767 4,593,905Hirose Electric Company, Ltd. 5,775 890,249Hitachi, Ltd. 171,194 7,759,942Ibiden Company, Ltd. 18,700 863,979II-VI, Inc. (A) 45,829 3,133,329Insight Enterprises, Inc. (A) 5,785 552,005IPG Photonics Corp. (A) 5,267 1,111,021Iteris, Inc. (A) 8,886 54,827Itron, Inc. (A) 7,376 653,882Jabil, Inc. 37,103 1,935,292Keyence Corp. 32,300 14,720,921Keysight Technologies, Inc. (A) 27,328 3,918,835Kimball Electronics, Inc. (A) 4,131 106,580Knowles Corp. (A) 14,797 309,553Kyocera Corp. 56,763 3,611,825Littelfuse, Inc. 6,723 1,777,830
Strategic Equity Allocation Trust (continued)Shares orPrincipalAmount Value
COMMON STOCKS (continued)IT services (continued)Amadeus IT Group SA (A) 79,662 $ 5,674,171Atos SE 17,505 1,364,774Automatic Data Processing, Inc. 63,242 11,919,220Bechtle AG 4,828 905,711BM Technologies, Inc. (A) 823 9,588Brightcove, Inc. (A) 6,706 134,925Broadridge Financial Solutions, Inc. 17,051 2,610,508Capgemini SE 28,466 4,839,986Cardtronics PLC, Class A (A) 6,076 235,749Cass Information Systems, Inc. 2,516 116,415Cognizant Technology Solutions
Corp., Class A 78,849 6,159,684Computershare, Ltd. 86,081 987,735Concentrix Corp. (A) 11,392 1,705,610Conduent, Inc. (A) 28,177 187,659CSG Systems International, Inc. 5,463 245,234DXC Technology Company (A) 37,520 1,172,875Edenred 43,604 2,276,730EVERTEC, Inc. 10,036 373,540EVO Payments, Inc., Class A (A) 7,939 218,481EXL Service Holdings, Inc. (A) 5,539 499,396Fidelity National Information Services,
Inc. 91,513 12,867,643Fiserv, Inc. (A) 84,804 10,095,068FleetCor Technologies, Inc. (A) 12,300 3,304,149Fujitsu, Ltd. 34,823 5,067,222Gartner, Inc. (A) 13,168 2,403,818Global Payments, Inc. 43,421 8,752,805GMO Payment Gateway, Inc. 7,200 956,715
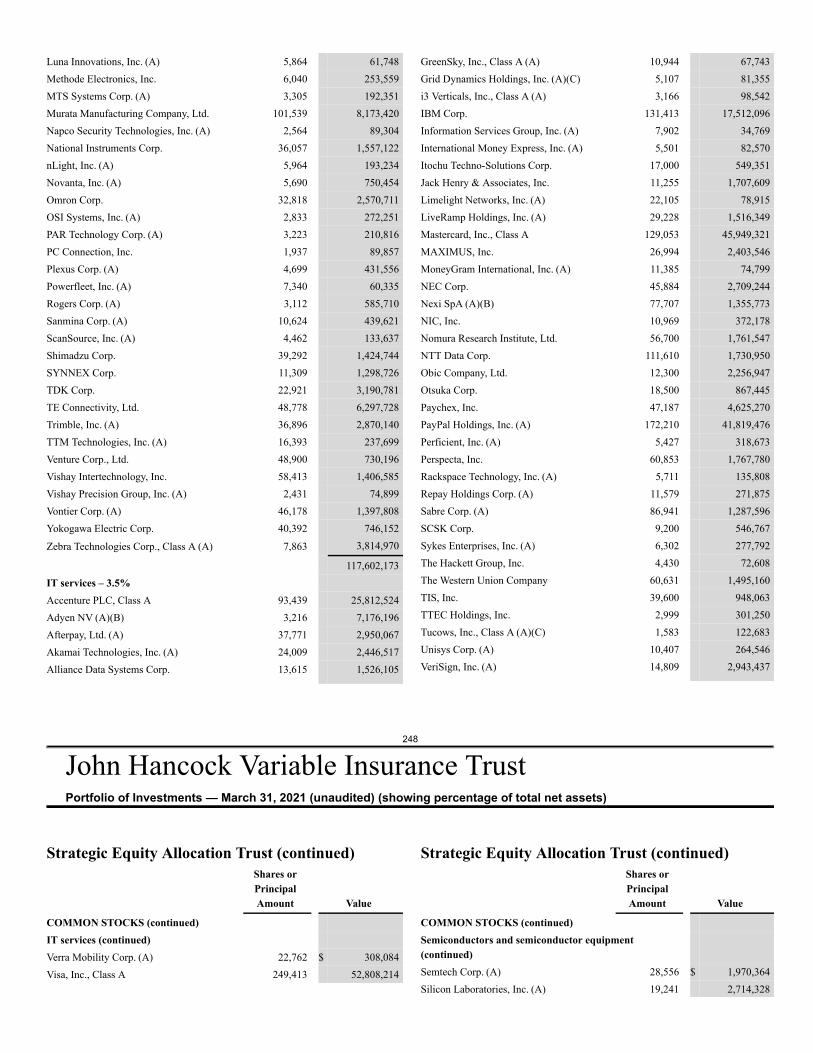
248
John Hancock Variable Insurance TrustPortfolio of Investments — March 31, 2021 (unaudited) (showing percentage of total net assets)
Luna Innovations, Inc. (A) 5,864 61,748Methode Electronics, Inc. 6,040 253,559MTS Systems Corp. (A) 3,305 192,351Murata Manufacturing Company, Ltd. 101,539 8,173,420Napco Security Technologies, Inc. (A) 2,564 89,304National Instruments Corp. 36,057 1,557,122nLight, Inc. (A) 5,964 193,234Novanta, Inc. (A) 5,690 750,454Omron Corp. 32,818 2,570,711OSI Systems, Inc. (A) 2,833 272,251PAR Technology Corp. (A) 3,223 210,816PC Connection, Inc. 1,937 89,857Plexus Corp. (A) 4,699 431,556Powerfleet, Inc. (A) 7,340 60,335Rogers Corp. (A) 3,112 585,710Sanmina Corp. (A) 10,624 439,621ScanSource, Inc. (A) 4,462 133,637Shimadzu Corp. 39,292 1,424,744SYNNEX Corp. 11,309 1,298,726TDK Corp. 22,921 3,190,781TE Connectivity, Ltd. 48,778 6,297,728Trimble, Inc. (A) 36,896 2,870,140TTM Technologies, Inc. (A) 16,393 237,699Venture Corp., Ltd. 48,900 730,196Vishay Intertechnology, Inc. 58,413 1,406,585Vishay Precision Group, Inc. (A) 2,431 74,899Vontier Corp. (A) 46,178 1,397,808Yokogawa Electric Corp. 40,392 746,152
Zebra Technologies Corp., Class A (A) 7,863 3,814,970
117,602,173IT services – 3.5%Accenture PLC, Class A 93,439 25,812,524Adyen NV (A)(B) 3,216 7,176,196Afterpay, Ltd. (A) 37,771 2,950,067Akamai Technologies, Inc. (A) 24,009 2,446,517Alliance Data Systems Corp. 13,615 1,526,105
GreenSky, Inc., Class A (A) 10,944 67,743Grid Dynamics Holdings, Inc. (A)(C) 5,107 81,355i3 Verticals, Inc., Class A (A) 3,166 98,542IBM Corp. 131,413 17,512,096Information Services Group, Inc. (A) 7,902 34,769International Money Express, Inc. (A) 5,501 82,570Itochu Techno-Solutions Corp. 17,000 549,351Jack Henry & Associates, Inc. 11,255 1,707,609Limelight Networks, Inc. (A) 22,105 78,915LiveRamp Holdings, Inc. (A) 29,228 1,516,349Mastercard, Inc., Class A 129,053 45,949,321MAXIMUS, Inc. 26,994 2,403,546MoneyGram International, Inc. (A) 11,385 74,799NEC Corp. 45,884 2,709,244Nexi SpA (A)(B) 77,707 1,355,773NIC, Inc. 10,969 372,178Nomura Research Institute, Ltd. 56,700 1,761,547NTT Data Corp. 111,610 1,730,950Obic Company, Ltd. 12,300 2,256,947Otsuka Corp. 18,500 867,445Paychex, Inc. 47,187 4,625,270PayPal Holdings, Inc. (A) 172,210 41,819,476Perficient, Inc. (A) 5,427 318,673Perspecta, Inc. 60,853 1,767,780Rackspace Technology, Inc. (A) 5,711 135,808Repay Holdings Corp. (A) 11,579 271,875Sabre Corp. (A) 86,941 1,287,596SCSK Corp. 9,200 546,767Sykes Enterprises, Inc. (A) 6,302 277,792The Hackett Group, Inc. 4,430 72,608The Western Union Company 60,631 1,495,160TIS, Inc. 39,600 948,063TTEC Holdings, Inc. 2,999 301,250Tucows, Inc., Class A (A)(C) 1,583 122,683Unisys Corp. (A) 10,407 264,546VeriSign, Inc. (A) 14,809 2,943,437
Strategic Equity Allocation Trust (continued)Shares orPrincipalAmount Value
COMMON STOCKS (continued)IT services (continued)Verra Mobility Corp. (A) 22,762 $ 308,084Visa, Inc., Class A 249,413 52,808,214
Strategic Equity Allocation Trust (continued)Shares orPrincipalAmount Value
COMMON STOCKS (continued)Semiconductors and semiconductor equipment(continued)Semtech Corp. (A) 28,556 $ 1,970,364Silicon Laboratories, Inc. (A) 19,241 2,714,328
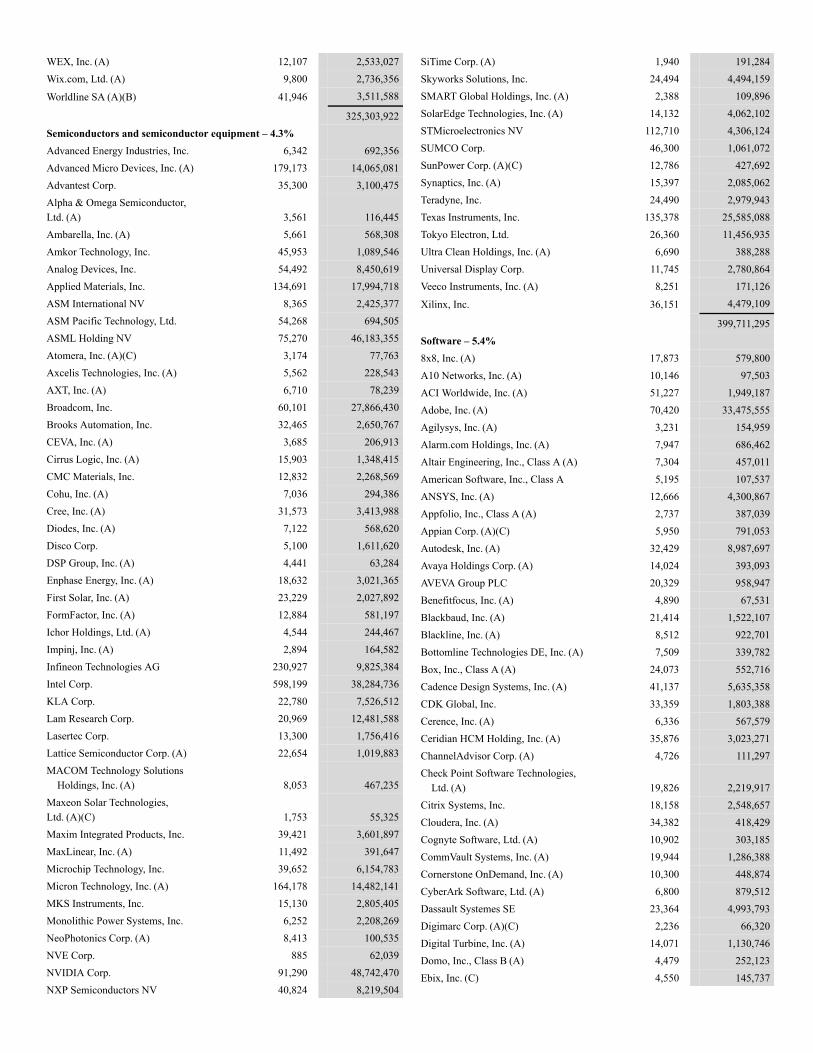
WEX, Inc. (A) 12,107 2,533,027Wix.com, Ltd. (A) 9,800 2,736,356
Worldline SA (A)(B) 41,946 3,511,588
325,303,922Semiconductors and semiconductor equipment – 4.3%Advanced Energy Industries, Inc. 6,342 692,356Advanced Micro Devices, Inc. (A) 179,173 14,065,081Advantest Corp. 35,300 3,100,475Alpha & Omega Semiconductor,Ltd. (A) 3,561 116,445Ambarella, Inc. (A) 5,661 568,308Amkor Technology, Inc. 45,953 1,089,546Analog Devices, Inc. 54,492 8,450,619Applied Materials, Inc. 134,691 17,994,718ASM International NV 8,365 2,425,377ASM Pacific Technology, Ltd. 54,268 694,505ASML Holding NV 75,270 46,183,355Atomera, Inc. (A)(C) 3,174 77,763Axcelis Technologies, Inc. (A) 5,562 228,543AXT, Inc. (A) 6,710 78,239Broadcom, Inc. 60,101 27,866,430Brooks Automation, Inc. 32,465 2,650,767CEVA, Inc. (A) 3,685 206,913Cirrus Logic, Inc. (A) 15,903 1,348,415CMC Materials, Inc. 12,832 2,268,569Cohu, Inc. (A) 7,036 294,386Cree, Inc. (A) 31,573 3,413,988Diodes, Inc. (A) 7,122 568,620Disco Corp. 5,100 1,611,620DSP Group, Inc. (A) 4,441 63,284Enphase Energy, Inc. (A) 18,632 3,021,365First Solar, Inc. (A) 23,229 2,027,892FormFactor, Inc. (A) 12,884 581,197Ichor Holdings, Ltd. (A) 4,544 244,467Impinj, Inc. (A) 2,894 164,582Infineon Technologies AG 230,927 9,825,384Intel Corp. 598,199 38,284,736KLA Corp. 22,780 7,526,512Lam Research Corp. 20,969 12,481,588Lasertec Corp. 13,300 1,756,416Lattice Semiconductor Corp. (A) 22,654 1,019,883MACOM Technology Solutions
Holdings, Inc. (A) 8,053 467,235Maxeon Solar Technologies,Ltd. (A)(C) 1,753 55,325Maxim Integrated Products, Inc. 39,421 3,601,897MaxLinear, Inc. (A) 11,492 391,647Microchip Technology, Inc. 39,652 6,154,783Micron Technology, Inc. (A) 164,178 14,482,141MKS Instruments, Inc. 15,130 2,805,405Monolithic Power Systems, Inc. 6,252 2,208,269NeoPhotonics Corp. (A) 8,413 100,535NVE Corp. 885 62,039NVIDIA Corp. 91,290 48,742,470NXP Semiconductors NV 40,824 8,219,504
SiTime Corp. (A) 1,940 191,284Skyworks Solutions, Inc. 24,494 4,494,159SMART Global Holdings, Inc. (A) 2,388 109,896SolarEdge Technologies, Inc. (A) 14,132 4,062,102STMicroelectronics NV 112,710 4,306,124SUMCO Corp. 46,300 1,061,072SunPower Corp. (A)(C) 12,786 427,692Synaptics, Inc. (A) 15,397 2,085,062Teradyne, Inc. 24,490 2,979,943Texas Instruments, Inc. 135,378 25,585,088Tokyo Electron, Ltd. 26,360 11,456,935Ultra Clean Holdings, Inc. (A) 6,690 388,288Universal Display Corp. 11,745 2,780,864Veeco Instruments, Inc. (A) 8,251 171,126
Xilinx, Inc. 36,151 4,479,109
399,711,295Software – 5.4%8x8, Inc. (A) 17,873 579,800A10 Networks, Inc. (A) 10,146 97,503ACI Worldwide, Inc. (A) 51,227 1,949,187Adobe, Inc. (A) 70,420 33,475,555Agilysys, Inc. (A) 3,231 154,959Alarm.com Holdings, Inc. (A) 7,947 686,462Altair Engineering, Inc., Class A (A) 7,304 457,011American Software, Inc., Class A 5,195 107,537ANSYS, Inc. (A) 12,666 4,300,867Appfolio, Inc., Class A (A) 2,737 387,039Appian Corp. (A)(C) 5,950 791,053Autodesk, Inc. (A) 32,429 8,987,697Avaya Holdings Corp. (A) 14,024 393,093AVEVA Group PLC 20,329 958,947Benefitfocus, Inc. (A) 4,890 67,531Blackbaud, Inc. (A) 21,414 1,522,107Blackline, Inc. (A) 8,512 922,701Bottomline Technologies DE, Inc. (A) 7,509 339,782Box, Inc., Class A (A) 24,073 552,716Cadence Design Systems, Inc. (A) 41,137 5,635,358CDK Global, Inc. 33,359 1,803,388Cerence, Inc. (A) 6,336 567,579Ceridian HCM Holding, Inc. (A) 35,876 3,023,271ChannelAdvisor Corp. (A) 4,726 111,297Check Point Software Technologies,
Ltd. (A) 19,826 2,219,917Citrix Systems, Inc. 18,158 2,548,657Cloudera, Inc. (A) 34,382 418,429Cognyte Software, Ltd. (A) 10,902 303,185CommVault Systems, Inc. (A) 19,944 1,286,388Cornerstone OnDemand, Inc. (A) 10,300 448,874CyberArk Software, Ltd. (A) 6,800 879,512Dassault Systemes SE 23,364 4,993,793Digimarc Corp. (A)(C) 2,236 66,320Digital Turbine, Inc. (A) 14,071 1,130,746Domo, Inc., Class B (A) 4,479 252,123Ebix, Inc. (C) 4,550 145,737
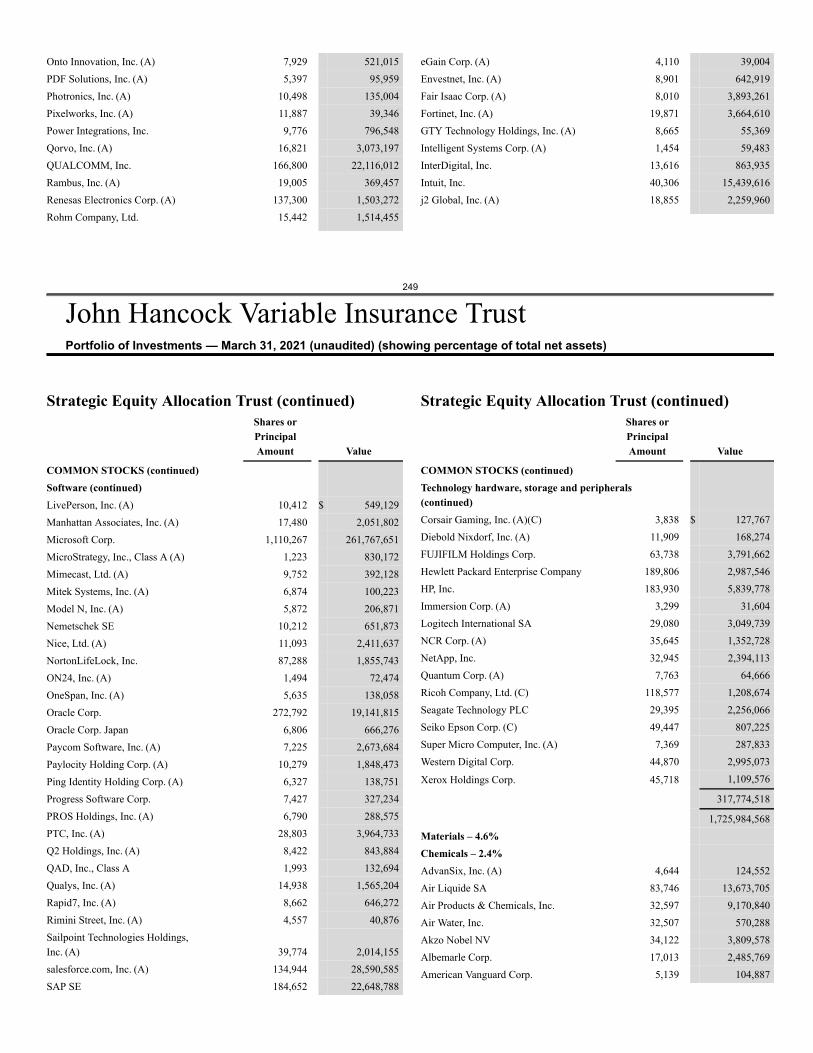
249
John Hancock Variable Insurance TrustPortfolio of Investments — March 31, 2021 (unaudited) (showing percentage of total net assets)
Onto Innovation, Inc. (A) 7,929 521,015PDF Solutions, Inc. (A) 5,397 95,959Photronics, Inc. (A) 10,498 135,004Pixelworks, Inc. (A) 11,887 39,346Power Integrations, Inc. 9,776 796,548Qorvo, Inc. (A) 16,821 3,073,197QUALCOMM, Inc. 166,800 22,116,012Rambus, Inc. (A) 19,005 369,457Renesas Electronics Corp. (A) 137,300 1,503,272Rohm Company, Ltd. 15,442 1,514,455
eGain Corp. (A) 4,110 39,004Envestnet, Inc. (A) 8,901 642,919Fair Isaac Corp. (A) 8,010 3,893,261Fortinet, Inc. (A) 19,871 3,664,610GTY Technology Holdings, Inc. (A) 8,665 55,369Intelligent Systems Corp. (A) 1,454 59,483InterDigital, Inc. 13,616 863,935Intuit, Inc. 40,306 15,439,616j2 Global, Inc. (A) 18,855 2,259,960
Strategic Equity Allocation Trust (continued)Shares orPrincipalAmount Value
COMMON STOCKS (continued)Software (continued)LivePerson, Inc. (A) 10,412 $ 549,129Manhattan Associates, Inc. (A) 17,480 2,051,802Microsoft Corp. 1,110,267 261,767,651MicroStrategy, Inc., Class A (A) 1,223 830,172Mimecast, Ltd. (A) 9,752 392,128Mitek Systems, Inc. (A) 6,874 100,223Model N, Inc. (A) 5,872 206,871Nemetschek SE 10,212 651,873Nice, Ltd. (A) 11,093 2,411,637NortonLifeLock, Inc. 87,288 1,855,743ON24, Inc. (A) 1,494 72,474OneSpan, Inc. (A) 5,635 138,058Oracle Corp. 272,792 19,141,815Oracle Corp. Japan 6,806 666,276Paycom Software, Inc. (A) 7,225 2,673,684Paylocity Holding Corp. (A) 10,279 1,848,473Ping Identity Holding Corp. (A) 6,327 138,751Progress Software Corp. 7,427 327,234PROS Holdings, Inc. (A) 6,790 288,575PTC, Inc. (A) 28,803 3,964,733Q2 Holdings, Inc. (A) 8,422 843,884QAD, Inc., Class A 1,993 132,694Qualys, Inc. (A) 14,938 1,565,204Rapid7, Inc. (A) 8,662 646,272Rimini Street, Inc. (A) 4,557 40,876Sailpoint Technologies Holdings,Inc. (A) 39,774 2,014,155salesforce.com, Inc. (A) 134,944 28,590,585SAP SE 184,652 22,648,788
Strategic Equity Allocation Trust (continued)Shares orPrincipalAmount Value
COMMON STOCKS (continued)Technology hardware, storage and peripherals(continued)Corsair Gaming, Inc. (A)(C) 3,838 $ 127,767Diebold Nixdorf, Inc. (A) 11,909 168,274FUJIFILM Holdings Corp. 63,738 3,791,662Hewlett Packard Enterprise Company 189,806 2,987,546HP, Inc. 183,930 5,839,778Immersion Corp. (A) 3,299 31,604Logitech International SA 29,080 3,049,739NCR Corp. (A) 35,645 1,352,728NetApp, Inc. 32,945 2,394,113Quantum Corp. (A) 7,763 64,666Ricoh Company, Ltd. (C) 118,577 1,208,674Seagate Technology PLC 29,395 2,256,066Seiko Epson Corp. (C) 49,447 807,225Super Micro Computer, Inc. (A) 7,369 287,833Western Digital Corp. 44,870 2,995,073
Xerox Holdings Corp. 45,718 1,109,576
317,774,518
1,725,984,568Materials – 4.6%Chemicals – 2.4%AdvanSix, Inc. (A) 4,644 124,552Air Liquide SA 83,746 13,673,705Air Products & Chemicals, Inc. 32,597 9,170,840Air Water, Inc. 32,507 570,288Akzo Nobel NV 34,122 3,809,578Albemarle Corp. 17,013 2,485,769American Vanguard Corp. 5,139 104,887
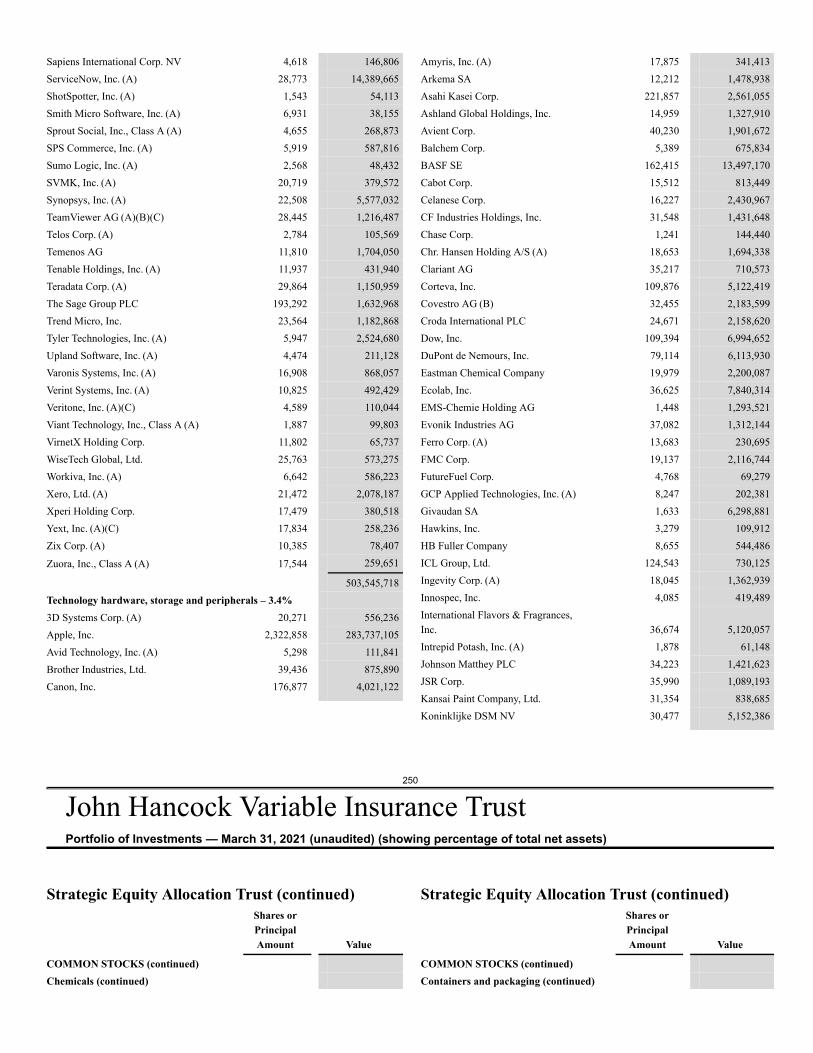
250
John Hancock Variable Insurance TrustPortfolio of Investments — March 31, 2021 (unaudited) (showing percentage of total net assets)
Sapiens International Corp. NV 4,618 146,806ServiceNow, Inc. (A) 28,773 14,389,665ShotSpotter, Inc. (A) 1,543 54,113Smith Micro Software, Inc. (A) 6,931 38,155Sprout Social, Inc., Class A (A) 4,655 268,873SPS Commerce, Inc. (A) 5,919 587,816Sumo Logic, Inc. (A) 2,568 48,432SVMK, Inc. (A) 20,719 379,572Synopsys, Inc. (A) 22,508 5,577,032TeamViewer AG (A)(B)(C) 28,445 1,216,487Telos Corp. (A) 2,784 105,569Temenos AG 11,810 1,704,050Tenable Holdings, Inc. (A) 11,937 431,940Teradata Corp. (A) 29,864 1,150,959The Sage Group PLC 193,292 1,632,968Trend Micro, Inc. 23,564 1,182,868Tyler Technologies, Inc. (A) 5,947 2,524,680Upland Software, Inc. (A) 4,474 211,128Varonis Systems, Inc. (A) 16,908 868,057Verint Systems, Inc. (A) 10,825 492,429Veritone, Inc. (A)(C) 4,589 110,044Viant Technology, Inc., Class A (A) 1,887 99,803VirnetX Holding Corp. 11,802 65,737WiseTech Global, Ltd. 25,763 573,275Workiva, Inc. (A) 6,642 586,223Xero, Ltd. (A) 21,472 2,078,187Xperi Holding Corp. 17,479 380,518Yext, Inc. (A)(C) 17,834 258,236Zix Corp. (A) 10,385 78,407
Zuora, Inc., Class A (A) 17,544 259,651
503,545,718Technology hardware, storage and peripherals – 3.4%3D Systems Corp. (A) 20,271 556,236Apple, Inc. 2,322,858 283,737,105Avid Technology, Inc. (A) 5,298 111,841Brother Industries, Ltd. 39,436 875,890Canon, Inc. 176,877 4,021,122
Amyris, Inc. (A) 17,875 341,413Arkema SA 12,212 1,478,938Asahi Kasei Corp. 221,857 2,561,055Ashland Global Holdings, Inc. 14,959 1,327,910Avient Corp. 40,230 1,901,672Balchem Corp. 5,389 675,834BASF SE 162,415 13,497,170Cabot Corp. 15,512 813,449Celanese Corp. 16,227 2,430,967CF Industries Holdings, Inc. 31,548 1,431,648Chase Corp. 1,241 144,440Chr. Hansen Holding A/S (A) 18,653 1,694,338Clariant AG 35,217 710,573Corteva, Inc. 109,876 5,122,419Covestro AG (B) 32,455 2,183,599Croda International PLC 24,671 2,158,620Dow, Inc. 109,394 6,994,652DuPont de Nemours, Inc. 79,114 6,113,930Eastman Chemical Company 19,979 2,200,087Ecolab, Inc. 36,625 7,840,314EMS-Chemie Holding AG 1,448 1,293,521Evonik Industries AG 37,082 1,312,144Ferro Corp. (A) 13,683 230,695FMC Corp. 19,137 2,116,744FutureFuel Corp. 4,768 69,279GCP Applied Technologies, Inc. (A) 8,247 202,381Givaudan SA 1,633 6,298,881Hawkins, Inc. 3,279 109,912HB Fuller Company 8,655 544,486ICL Group, Ltd. 124,543 730,125Ingevity Corp. (A) 18,045 1,362,939Innospec, Inc. 4,085 419,489International Flavors & Fragrances,Inc. 36,674 5,120,057Intrepid Potash, Inc. (A) 1,878 61,148Johnson Matthey PLC 34,223 1,421,623JSR Corp. 35,990 1,089,193Kansai Paint Company, Ltd. 31,354 838,685Koninklijke DSM NV 30,477 5,152,386
Strategic Equity Allocation Trust (continued)Shares orPrincipalAmount Value
COMMON STOCKS (continued)Chemicals (continued)
Strategic Equity Allocation Trust (continued)Shares orPrincipalAmount Value
COMMON STOCKS (continued)Containers and packaging (continued)
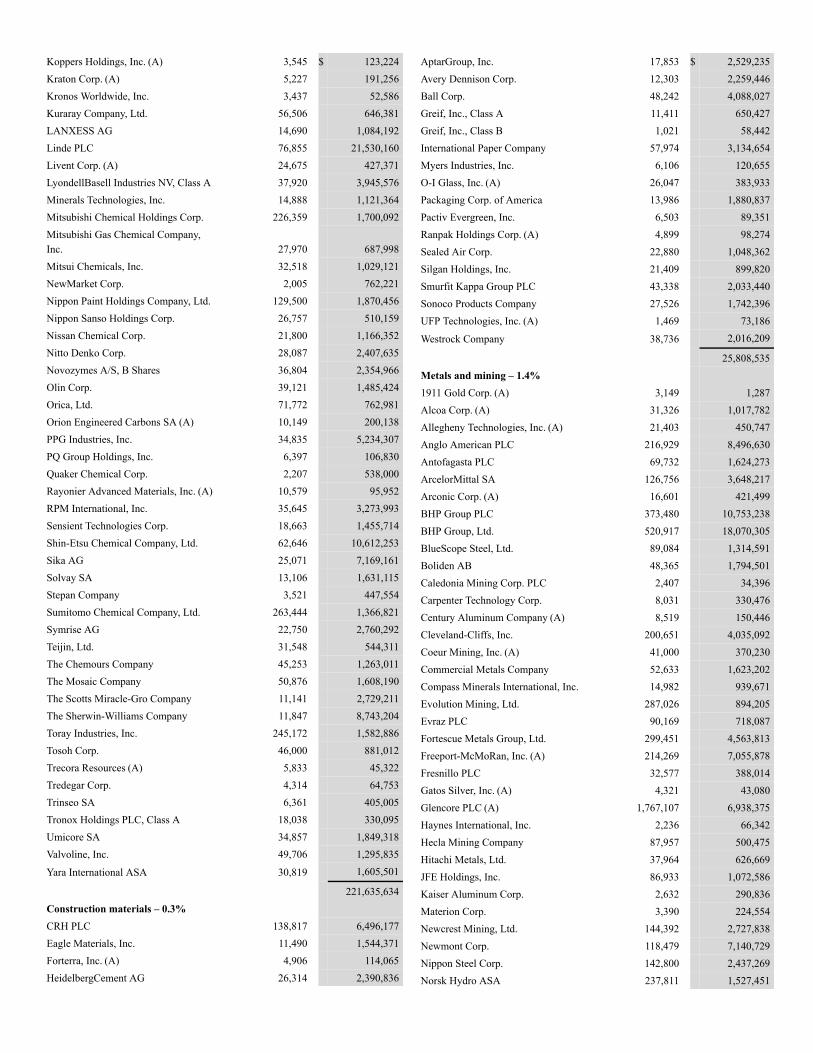
Koppers Holdings, Inc. (A) 3,545 $ 123,224Kraton Corp. (A) 5,227 191,256Kronos Worldwide, Inc. 3,437 52,586Kuraray Company, Ltd. 56,506 646,381LANXESS AG 14,690 1,084,192Linde PLC 76,855 21,530,160Livent Corp. (A) 24,675 427,371LyondellBasell Industries NV, Class A 37,920 3,945,576Minerals Technologies, Inc. 14,888 1,121,364Mitsubishi Chemical Holdings Corp. 226,359 1,700,092Mitsubishi Gas Chemical Company,Inc. 27,970 687,998Mitsui Chemicals, Inc. 32,518 1,029,121NewMarket Corp. 2,005 762,221Nippon Paint Holdings Company, Ltd. 129,500 1,870,456Nippon Sanso Holdings Corp. 26,757 510,159Nissan Chemical Corp. 21,800 1,166,352Nitto Denko Corp. 28,087 2,407,635Novozymes A/S, B Shares 36,804 2,354,966Olin Corp. 39,121 1,485,424Orica, Ltd. 71,772 762,981Orion Engineered Carbons SA (A) 10,149 200,138PPG Industries, Inc. 34,835 5,234,307PQ Group Holdings, Inc. 6,397 106,830Quaker Chemical Corp. 2,207 538,000Rayonier Advanced Materials, Inc. (A) 10,579 95,952RPM International, Inc. 35,645 3,273,993Sensient Technologies Corp. 18,663 1,455,714Shin-Etsu Chemical Company, Ltd. 62,646 10,612,253Sika AG 25,071 7,169,161Solvay SA 13,106 1,631,115Stepan Company 3,521 447,554Sumitomo Chemical Company, Ltd. 263,444 1,366,821Symrise AG 22,750 2,760,292Teijin, Ltd. 31,548 544,311The Chemours Company 45,253 1,263,011The Mosaic Company 50,876 1,608,190The Scotts Miracle-Gro Company 11,141 2,729,211The Sherwin-Williams Company 11,847 8,743,204Toray Industries, Inc. 245,172 1,582,886Tosoh Corp. 46,000 881,012Trecora Resources (A) 5,833 45,322Tredegar Corp. 4,314 64,753Trinseo SA 6,361 405,005Tronox Holdings PLC, Class A 18,038 330,095Umicore SA 34,857 1,849,318Valvoline, Inc. 49,706 1,295,835
Yara International ASA 30,819 1,605,501
221,635,634Construction materials – 0.3%CRH PLC 138,817 6,496,177Eagle Materials, Inc. 11,490 1,544,371Forterra, Inc. (A) 4,906 114,065HeidelbergCement AG 26,314 2,390,836
AptarGroup, Inc. 17,853 $ 2,529,235Avery Dennison Corp. 12,303 2,259,446Ball Corp. 48,242 4,088,027Greif, Inc., Class A 11,411 650,427Greif, Inc., Class B 1,021 58,442International Paper Company 57,974 3,134,654Myers Industries, Inc. 6,106 120,655O-I Glass, Inc. (A) 26,047 383,933Packaging Corp. of America 13,986 1,880,837Pactiv Evergreen, Inc. 6,503 89,351Ranpak Holdings Corp. (A) 4,899 98,274Sealed Air Corp. 22,880 1,048,362Silgan Holdings, Inc. 21,409 899,820Smurfit Kappa Group PLC 43,338 2,033,440Sonoco Products Company 27,526 1,742,396UFP Technologies, Inc. (A) 1,469 73,186
Westrock Company 38,736 2,016,209
25,808,535Metals and mining – 1.4%1911 Gold Corp. (A) 3,149 1,287Alcoa Corp. (A) 31,326 1,017,782Allegheny Technologies, Inc. (A) 21,403 450,747Anglo American PLC 216,929 8,496,630Antofagasta PLC 69,732 1,624,273ArcelorMittal SA 126,756 3,648,217Arconic Corp. (A) 16,601 421,499BHP Group PLC 373,480 10,753,238BHP Group, Ltd. 520,917 18,070,305BlueScope Steel, Ltd. 89,084 1,314,591Boliden AB 48,365 1,794,501Caledonia Mining Corp. PLC 2,407 34,396Carpenter Technology Corp. 8,031 330,476Century Aluminum Company (A) 8,519 150,446Cleveland-Cliffs, Inc. 200,651 4,035,092Coeur Mining, Inc. (A) 41,000 370,230Commercial Metals Company 52,633 1,623,202Compass Minerals International, Inc. 14,982 939,671Evolution Mining, Ltd. 287,026 894,205Evraz PLC 90,169 718,087Fortescue Metals Group, Ltd. 299,451 4,563,813Freeport-McMoRan, Inc. (A) 214,269 7,055,878Fresnillo PLC 32,577 388,014Gatos Silver, Inc. (A) 4,321 43,080Glencore PLC (A) 1,767,107 6,938,375Haynes International, Inc. 2,236 66,342Hecla Mining Company 87,957 500,475Hitachi Metals, Ltd. 37,964 626,669JFE Holdings, Inc. 86,933 1,072,586Kaiser Aluminum Corp. 2,632 290,836Materion Corp. 3,390 224,554Newcrest Mining, Ltd. 144,392 2,727,838Newmont Corp. 118,479 7,140,729Nippon Steel Corp. 142,800 2,437,269Norsk Hydro ASA 237,811 1,527,451
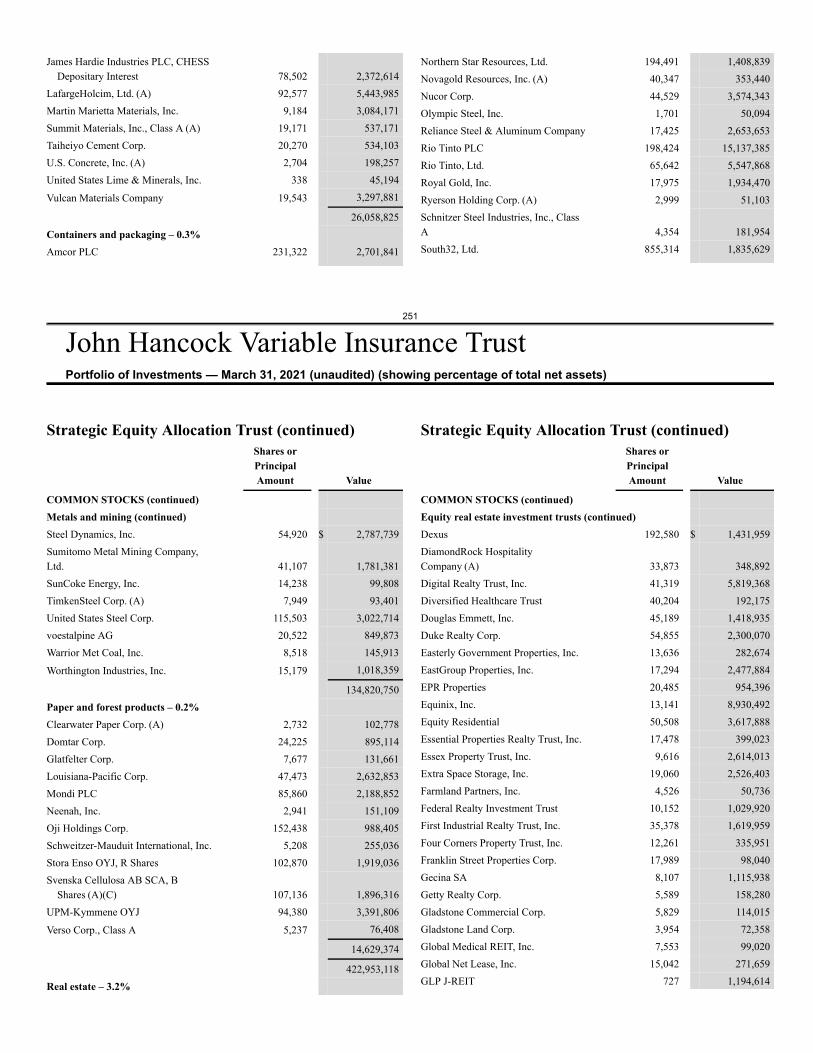
251
John Hancock Variable Insurance TrustPortfolio of Investments — March 31, 2021 (unaudited) (showing percentage of total net assets)
James Hardie Industries PLC, CHESSDepositary Interest 78,502 2,372,614
LafargeHolcim, Ltd. (A) 92,577 5,443,985Martin Marietta Materials, Inc. 9,184 3,084,171Summit Materials, Inc., Class A (A) 19,171 537,171Taiheiyo Cement Corp. 20,270 534,103U.S. Concrete, Inc. (A) 2,704 198,257United States Lime & Minerals, Inc. 338 45,194
Vulcan Materials Company 19,543 3,297,881
26,058,825Containers and packaging – 0.3%Amcor PLC 231,322 2,701,841
Northern Star Resources, Ltd. 194,491 1,408,839Novagold Resources, Inc. (A) 40,347 353,440Nucor Corp. 44,529 3,574,343Olympic Steel, Inc. 1,701 50,094Reliance Steel & Aluminum Company 17,425 2,653,653Rio Tinto PLC 198,424 15,137,385Rio Tinto, Ltd. 65,642 5,547,868Royal Gold, Inc. 17,975 1,934,470Ryerson Holding Corp. (A) 2,999 51,103Schnitzer Steel Industries, Inc., ClassA 4,354 181,954South32, Ltd. 855,314 1,835,629
Strategic Equity Allocation Trust (continued)Shares orPrincipalAmount Value
COMMON STOCKS (continued)Metals and mining (continued)Steel Dynamics, Inc. 54,920 $ 2,787,739Sumitomo Metal Mining Company,Ltd. 41,107 1,781,381SunCoke Energy, Inc. 14,238 99,808TimkenSteel Corp. (A) 7,949 93,401United States Steel Corp. 115,503 3,022,714voestalpine AG 20,522 849,873Warrior Met Coal, Inc. 8,518 145,913
Worthington Industries, Inc. 15,179 1,018,359
134,820,750Paper and forest products – 0.2%Clearwater Paper Corp. (A) 2,732 102,778Domtar Corp. 24,225 895,114Glatfelter Corp. 7,677 131,661Louisiana-Pacific Corp. 47,473 2,632,853Mondi PLC 85,860 2,188,852Neenah, Inc. 2,941 151,109Oji Holdings Corp. 152,438 988,405Schweitzer-Mauduit International, Inc. 5,208 255,036Stora Enso OYJ, R Shares 102,870 1,919,036Svenska Cellulosa AB SCA, B
Shares (A)(C) 107,136 1,896,316UPM-Kymmene OYJ 94,380 3,391,806
Verso Corp., Class A 5,237 76,408
14,629,374
422,953,118Real estate – 3.2%
Strategic Equity Allocation Trust (continued)Shares orPrincipalAmount Value
COMMON STOCKS (continued)Equity real estate investment trusts (continued)Dexus 192,580 $ 1,431,959DiamondRock HospitalityCompany (A) 33,873 348,892Digital Realty Trust, Inc. 41,319 5,819,368Diversified Healthcare Trust 40,204 192,175Douglas Emmett, Inc. 45,189 1,418,935Duke Realty Corp. 54,855 2,300,070Easterly Government Properties, Inc. 13,636 282,674EastGroup Properties, Inc. 17,294 2,477,884EPR Properties 20,485 954,396Equinix, Inc. 13,141 8,930,492Equity Residential 50,508 3,617,888Essential Properties Realty Trust, Inc. 17,478 399,023Essex Property Trust, Inc. 9,616 2,614,013Extra Space Storage, Inc. 19,060 2,526,403Farmland Partners, Inc. 4,526 50,736Federal Realty Investment Trust 10,152 1,029,920First Industrial Realty Trust, Inc. 35,378 1,619,959Four Corners Property Trust, Inc. 12,261 335,951Franklin Street Properties Corp. 17,989 98,040Gecina SA 8,107 1,115,938Getty Realty Corp. 5,589 158,280Gladstone Commercial Corp. 5,829 114,015Gladstone Land Corp. 3,954 72,358Global Medical REIT, Inc. 7,553 99,020Global Net Lease, Inc. 15,042 271,659GLP J-REIT 727 1,194,614
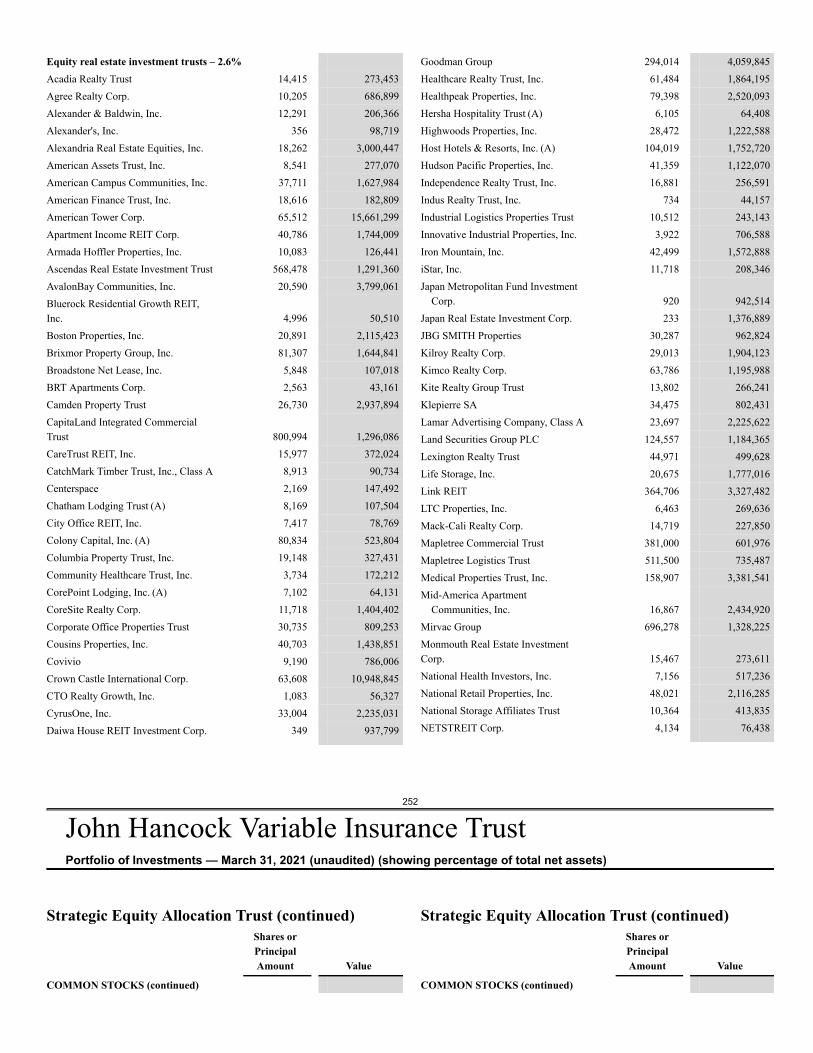
252
John Hancock Variable Insurance TrustPortfolio of Investments — March 31, 2021 (unaudited) (showing percentage of total net assets)
Equity real estate investment trusts – 2.6%Acadia Realty Trust 14,415 273,453Agree Realty Corp. 10,205 686,899Alexander & Baldwin, Inc. 12,291 206,366Alexander's, Inc. 356 98,719Alexandria Real Estate Equities, Inc. 18,262 3,000,447American Assets Trust, Inc. 8,541 277,070American Campus Communities, Inc. 37,711 1,627,984American Finance Trust, Inc. 18,616 182,809American Tower Corp. 65,512 15,661,299Apartment Income REIT Corp. 40,786 1,744,009Armada Hoffler Properties, Inc. 10,083 126,441Ascendas Real Estate Investment Trust 568,478 1,291,360AvalonBay Communities, Inc. 20,590 3,799,061Bluerock Residential Growth REIT,Inc. 4,996 50,510Boston Properties, Inc. 20,891 2,115,423Brixmor Property Group, Inc. 81,307 1,644,841Broadstone Net Lease, Inc. 5,848 107,018BRT Apartments Corp. 2,563 43,161Camden Property Trust 26,730 2,937,894CapitaLand Integrated CommercialTrust 800,994 1,296,086CareTrust REIT, Inc. 15,977 372,024CatchMark Timber Trust, Inc., Class A 8,913 90,734Centerspace 2,169 147,492Chatham Lodging Trust (A) 8,169 107,504City Office REIT, Inc. 7,417 78,769Colony Capital, Inc. (A) 80,834 523,804Columbia Property Trust, Inc. 19,148 327,431Community Healthcare Trust, Inc. 3,734 172,212CorePoint Lodging, Inc. (A) 7,102 64,131CoreSite Realty Corp. 11,718 1,404,402Corporate Office Properties Trust 30,735 809,253Cousins Properties, Inc. 40,703 1,438,851Covivio 9,190 786,006Crown Castle International Corp. 63,608 10,948,845CTO Realty Growth, Inc. 1,083 56,327CyrusOne, Inc. 33,004 2,235,031Daiwa House REIT Investment Corp. 349 937,799
Goodman Group 294,014 4,059,845Healthcare Realty Trust, Inc. 61,484 1,864,195Healthpeak Properties, Inc. 79,398 2,520,093Hersha Hospitality Trust (A) 6,105 64,408Highwoods Properties, Inc. 28,472 1,222,588Host Hotels & Resorts, Inc. (A) 104,019 1,752,720Hudson Pacific Properties, Inc. 41,359 1,122,070Independence Realty Trust, Inc. 16,881 256,591Indus Realty Trust, Inc. 734 44,157Industrial Logistics Properties Trust 10,512 243,143Innovative Industrial Properties, Inc. 3,922 706,588Iron Mountain, Inc. 42,499 1,572,888iStar, Inc. 11,718 208,346Japan Metropolitan Fund Investment
Corp. 920 942,514Japan Real Estate Investment Corp. 233 1,376,889JBG SMITH Properties 30,287 962,824Kilroy Realty Corp. 29,013 1,904,123Kimco Realty Corp. 63,786 1,195,988Kite Realty Group Trust 13,802 266,241Klepierre SA 34,475 802,431Lamar Advertising Company, Class A 23,697 2,225,622Land Securities Group PLC 124,557 1,184,365Lexington Realty Trust 44,971 499,628Life Storage, Inc. 20,675 1,777,016Link REIT 364,706 3,327,482LTC Properties, Inc. 6,463 269,636Mack-Cali Realty Corp. 14,719 227,850Mapletree Commercial Trust 381,000 601,976Mapletree Logistics Trust 511,500 735,487Medical Properties Trust, Inc. 158,907 3,381,541Mid-America Apartment
Communities, Inc. 16,867 2,434,920Mirvac Group 696,278 1,328,225Monmouth Real Estate InvestmentCorp. 15,467 273,611National Health Investors, Inc. 7,156 517,236National Retail Properties, Inc. 48,021 2,116,285National Storage Affiliates Trust 10,364 413,835NETSTREIT Corp. 4,134 76,438
Strategic Equity Allocation Trust (continued)Shares orPrincipalAmount Value
COMMON STOCKS (continued)
Strategic Equity Allocation Trust (continued)Shares orPrincipalAmount Value
COMMON STOCKS (continued)
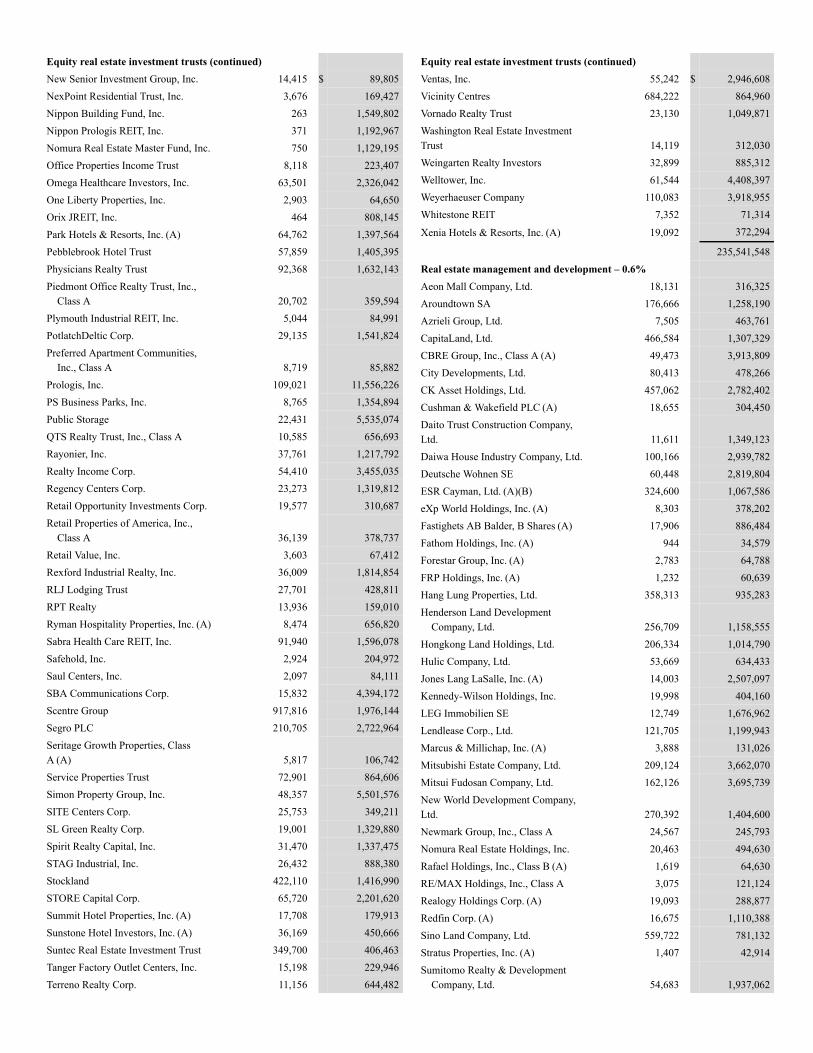
Equity real estate investment trusts (continued)New Senior Investment Group, Inc. 14,415 $ 89,805NexPoint Residential Trust, Inc. 3,676 169,427Nippon Building Fund, Inc. 263 1,549,802Nippon Prologis REIT, Inc. 371 1,192,967Nomura Real Estate Master Fund, Inc. 750 1,129,195Office Properties Income Trust 8,118 223,407Omega Healthcare Investors, Inc. 63,501 2,326,042One Liberty Properties, Inc. 2,903 64,650Orix JREIT, Inc. 464 808,145Park Hotels & Resorts, Inc. (A) 64,762 1,397,564Pebblebrook Hotel Trust 57,859 1,405,395Physicians Realty Trust 92,368 1,632,143Piedmont Office Realty Trust, Inc.,
Class A 20,702 359,594Plymouth Industrial REIT, Inc. 5,044 84,991PotlatchDeltic Corp. 29,135 1,541,824Preferred Apartment Communities,
Inc., Class A 8,719 85,882Prologis, Inc. 109,021 11,556,226PS Business Parks, Inc. 8,765 1,354,894Public Storage 22,431 5,535,074QTS Realty Trust, Inc., Class A 10,585 656,693Rayonier, Inc. 37,761 1,217,792Realty Income Corp. 54,410 3,455,035Regency Centers Corp. 23,273 1,319,812Retail Opportunity Investments Corp. 19,577 310,687Retail Properties of America, Inc.,
Class A 36,139 378,737Retail Value, Inc. 3,603 67,412Rexford Industrial Realty, Inc. 36,009 1,814,854RLJ Lodging Trust 27,701 428,811RPT Realty 13,936 159,010Ryman Hospitality Properties, Inc. (A) 8,474 656,820Sabra Health Care REIT, Inc. 91,940 1,596,078Safehold, Inc. 2,924 204,972Saul Centers, Inc. 2,097 84,111SBA Communications Corp. 15,832 4,394,172Scentre Group 917,816 1,976,144Segro PLC 210,705 2,722,964Seritage Growth Properties, ClassA (A) 5,817 106,742Service Properties Trust 72,901 864,606Simon Property Group, Inc. 48,357 5,501,576SITE Centers Corp. 25,753 349,211SL Green Realty Corp. 19,001 1,329,880Spirit Realty Capital, Inc. 31,470 1,337,475STAG Industrial, Inc. 26,432 888,380Stockland 422,110 1,416,990STORE Capital Corp. 65,720 2,201,620Summit Hotel Properties, Inc. (A) 17,708 179,913Sunstone Hotel Investors, Inc. (A) 36,169 450,666Suntec Real Estate Investment Trust 349,700 406,463Tanger Factory Outlet Centers, Inc. 15,198 229,946Terreno Realty Corp. 11,156 644,482
Equity real estate investment trusts (continued)Ventas, Inc. 55,242 $ 2,946,608Vicinity Centres 684,222 864,960Vornado Realty Trust 23,130 1,049,871Washington Real Estate InvestmentTrust 14,119 312,030Weingarten Realty Investors 32,899 885,312Welltower, Inc. 61,544 4,408,397Weyerhaeuser Company 110,083 3,918,955Whitestone REIT 7,352 71,314
Xenia Hotels & Resorts, Inc. (A) 19,092 372,294
235,541,548Real estate management and development – 0.6%Aeon Mall Company, Ltd. 18,131 316,325Aroundtown SA 176,666 1,258,190Azrieli Group, Ltd. 7,505 463,761CapitaLand, Ltd. 466,584 1,307,329CBRE Group, Inc., Class A (A) 49,473 3,913,809City Developments, Ltd. 80,413 478,266CK Asset Holdings, Ltd. 457,062 2,782,402Cushman & Wakefield PLC (A) 18,655 304,450Daito Trust Construction Company,Ltd. 11,611 1,349,123Daiwa House Industry Company, Ltd. 100,166 2,939,782Deutsche Wohnen SE 60,448 2,819,804ESR Cayman, Ltd. (A)(B) 324,600 1,067,586eXp World Holdings, Inc. (A) 8,303 378,202Fastighets AB Balder, B Shares (A) 17,906 886,484Fathom Holdings, Inc. (A) 944 34,579Forestar Group, Inc. (A) 2,783 64,788FRP Holdings, Inc. (A) 1,232 60,639Hang Lung Properties, Ltd. 358,313 935,283Henderson Land Development
Company, Ltd. 256,709 1,158,555Hongkong Land Holdings, Ltd. 206,334 1,014,790Hulic Company, Ltd. 53,669 634,433Jones Lang LaSalle, Inc. (A) 14,003 2,507,097Kennedy-Wilson Holdings, Inc. 19,998 404,160LEG Immobilien SE 12,749 1,676,962Lendlease Corp., Ltd. 121,705 1,199,943Marcus & Millichap, Inc. (A) 3,888 131,026Mitsubishi Estate Company, Ltd. 209,124 3,662,070Mitsui Fudosan Company, Ltd. 162,126 3,695,739New World Development Company,Ltd. 270,392 1,404,600Newmark Group, Inc., Class A 24,567 245,793Nomura Real Estate Holdings, Inc. 20,463 494,630Rafael Holdings, Inc., Class B (A) 1,619 64,630RE/MAX Holdings, Inc., Class A 3,075 121,124Realogy Holdings Corp. (A) 19,093 288,877Redfin Corp. (A) 16,675 1,110,388Sino Land Company, Ltd. 559,722 781,132Stratus Properties, Inc. (A) 1,407 42,914Sumitomo Realty & Development
Company, Ltd. 54,683 1,937,062
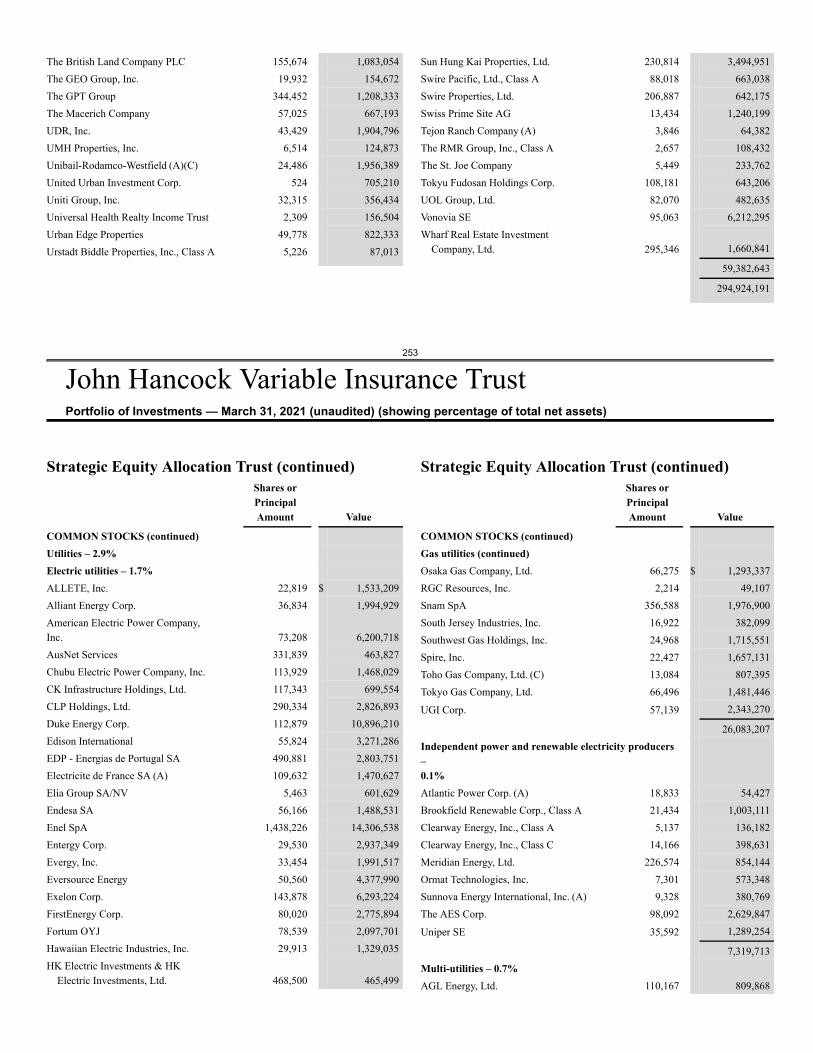
253
John Hancock Variable Insurance TrustPortfolio of Investments — March 31, 2021 (unaudited) (showing percentage of total net assets)
The British Land Company PLC 155,674 1,083,054The GEO Group, Inc. 19,932 154,672The GPT Group 344,452 1,208,333The Macerich Company 57,025 667,193UDR, Inc. 43,429 1,904,796UMH Properties, Inc. 6,514 124,873Unibail-Rodamco-Westfield (A)(C) 24,486 1,956,389United Urban Investment Corp. 524 705,210Uniti Group, Inc. 32,315 356,434Universal Health Realty Income Trust 2,309 156,504Urban Edge Properties 49,778 822,333Urstadt Biddle Properties, Inc., Class A 5,226 87,013
Sun Hung Kai Properties, Ltd. 230,814 3,494,951Swire Pacific, Ltd., Class A 88,018 663,038Swire Properties, Ltd. 206,887 642,175Swiss Prime Site AG 13,434 1,240,199Tejon Ranch Company (A) 3,846 64,382The RMR Group, Inc., Class A 2,657 108,432The St. Joe Company 5,449 233,762Tokyu Fudosan Holdings Corp. 108,181 643,206UOL Group, Ltd. 82,070 482,635Vonovia SE 95,063 6,212,295Wharf Real Estate Investment
Company, Ltd. 295,346 1,660,841
59,382,643
294,924,191
Strategic Equity Allocation Trust (continued)Shares orPrincipalAmount Value
COMMON STOCKS (continued)Utilities – 2.9%Electric utilities – 1.7%ALLETE, Inc. 22,819 $ 1,533,209Alliant Energy Corp. 36,834 1,994,929American Electric Power Company,Inc. 73,208 6,200,718AusNet Services 331,839 463,827Chubu Electric Power Company, Inc. 113,929 1,468,029CK Infrastructure Holdings, Ltd. 117,343 699,554CLP Holdings, Ltd. 290,334 2,826,893Duke Energy Corp. 112,879 10,896,210Edison International 55,824 3,271,286EDP - Energias de Portugal SA 490,881 2,803,751Electricite de France SA (A) 109,632 1,470,627Elia Group SA/NV 5,463 601,629Endesa SA 56,166 1,488,531Enel SpA 1,438,226 14,306,538Entergy Corp. 29,530 2,937,349Evergy, Inc. 33,454 1,991,517Eversource Energy 50,560 4,377,990Exelon Corp. 143,878 6,293,224FirstEnergy Corp. 80,020 2,775,894Fortum OYJ 78,539 2,097,701Hawaiian Electric Industries, Inc. 29,913 1,329,035HK Electric Investments & HK
Electric Investments, Ltd. 468,500 465,499
Strategic Equity Allocation Trust (continued)Shares orPrincipalAmount Value
COMMON STOCKS (continued)Gas utilities (continued)Osaka Gas Company, Ltd. 66,275 $ 1,293,337RGC Resources, Inc. 2,214 49,107Snam SpA 356,588 1,976,900South Jersey Industries, Inc. 16,922 382,099Southwest Gas Holdings, Inc. 24,968 1,715,551Spire, Inc. 22,427 1,657,131Toho Gas Company, Ltd. (C) 13,084 807,395Tokyo Gas Company, Ltd. 66,496 1,481,446
UGI Corp. 57,139 2,343,270
26,083,207Independent power and renewable electricity producers–0.1%Atlantic Power Corp. (A) 18,833 54,427Brookfield Renewable Corp., Class A 21,434 1,003,111Clearway Energy, Inc., Class A 5,137 136,182Clearway Energy, Inc., Class C 14,166 398,631Meridian Energy, Ltd. 226,574 854,144Ormat Technologies, Inc. 7,301 573,348Sunnova Energy International, Inc. (A) 9,328 380,769The AES Corp. 98,092 2,629,847
Uniper SE 35,592 1,289,254
7,319,713Multi-utilities – 0.7%AGL Energy, Ltd. 110,167 809,868
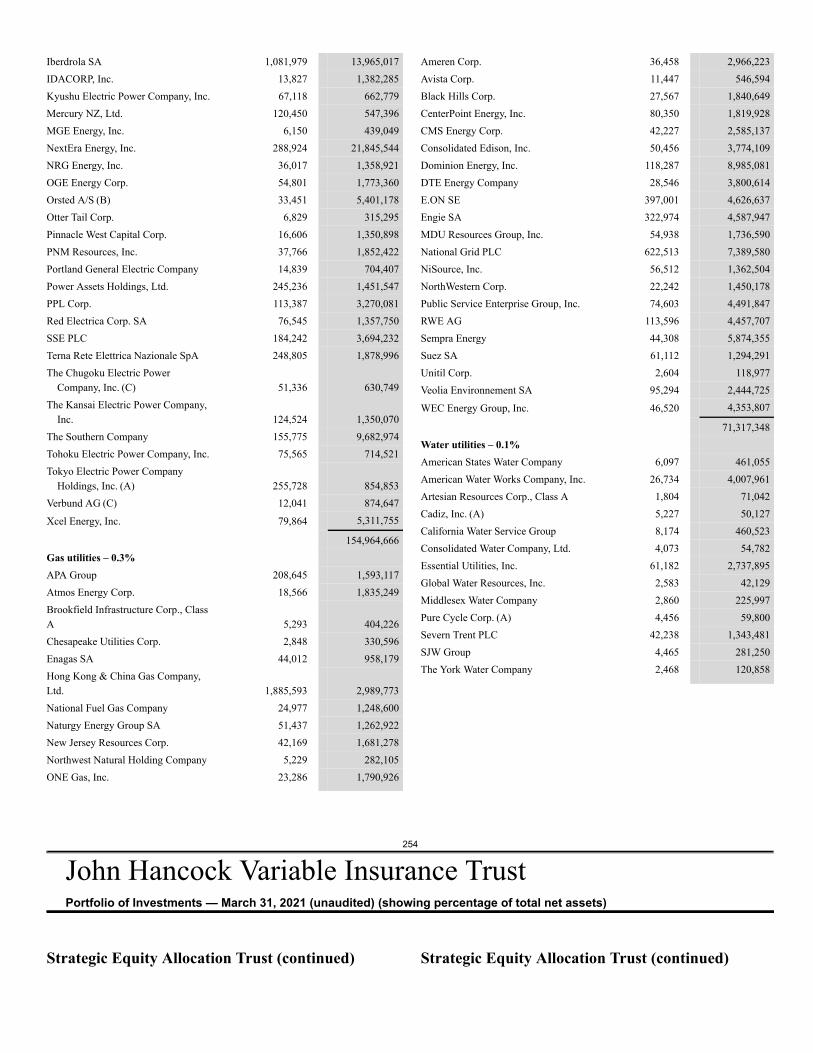
254
John Hancock Variable Insurance TrustPortfolio of Investments — March 31, 2021 (unaudited) (showing percentage of total net assets)
Iberdrola SA 1,081,979 13,965,017IDACORP, Inc. 13,827 1,382,285Kyushu Electric Power Company, Inc. 67,118 662,779Mercury NZ, Ltd. 120,450 547,396MGE Energy, Inc. 6,150 439,049NextEra Energy, Inc. 288,924 21,845,544NRG Energy, Inc. 36,017 1,358,921OGE Energy Corp. 54,801 1,773,360Orsted A/S (B) 33,451 5,401,178Otter Tail Corp. 6,829 315,295Pinnacle West Capital Corp. 16,606 1,350,898PNM Resources, Inc. 37,766 1,852,422Portland General Electric Company 14,839 704,407Power Assets Holdings, Ltd. 245,236 1,451,547PPL Corp. 113,387 3,270,081Red Electrica Corp. SA 76,545 1,357,750SSE PLC 184,242 3,694,232Terna Rete Elettrica Nazionale SpA 248,805 1,878,996The Chugoku Electric Power
Company, Inc. (C) 51,336 630,749The Kansai Electric Power Company,
Inc. 124,524 1,350,070The Southern Company 155,775 9,682,974Tohoku Electric Power Company, Inc. 75,565 714,521Tokyo Electric Power Company
Holdings, Inc. (A) 255,728 854,853Verbund AG (C) 12,041 874,647
Xcel Energy, Inc. 79,864 5,311,755
154,964,666Gas utilities – 0.3%APA Group 208,645 1,593,117Atmos Energy Corp. 18,566 1,835,249Brookfield Infrastructure Corp., ClassA 5,293 404,226Chesapeake Utilities Corp. 2,848 330,596Enagas SA 44,012 958,179Hong Kong & China Gas Company,Ltd. 1,885,593 2,989,773National Fuel Gas Company 24,977 1,248,600Naturgy Energy Group SA 51,437 1,262,922New Jersey Resources Corp. 42,169 1,681,278Northwest Natural Holding Company 5,229 282,105ONE Gas, Inc. 23,286 1,790,926
Ameren Corp. 36,458 2,966,223Avista Corp. 11,447 546,594Black Hills Corp. 27,567 1,840,649CenterPoint Energy, Inc. 80,350 1,819,928CMS Energy Corp. 42,227 2,585,137Consolidated Edison, Inc. 50,456 3,774,109Dominion Energy, Inc. 118,287 8,985,081DTE Energy Company 28,546 3,800,614E.ON SE 397,001 4,626,637Engie SA 322,974 4,587,947MDU Resources Group, Inc. 54,938 1,736,590National Grid PLC 622,513 7,389,580NiSource, Inc. 56,512 1,362,504NorthWestern Corp. 22,242 1,450,178Public Service Enterprise Group, Inc. 74,603 4,491,847RWE AG 113,596 4,457,707Sempra Energy 44,308 5,874,355Suez SA 61,112 1,294,291Unitil Corp. 2,604 118,977Veolia Environnement SA 95,294 2,444,725
WEC Energy Group, Inc. 46,520 4,353,807
71,317,348Water utilities – 0.1%American States Water Company 6,097 461,055American Water Works Company, Inc. 26,734 4,007,961Artesian Resources Corp., Class A 1,804 71,042Cadiz, Inc. (A) 5,227 50,127California Water Service Group 8,174 460,523Consolidated Water Company, Ltd. 4,073 54,782Essential Utilities, Inc. 61,182 2,737,895Global Water Resources, Inc. 2,583 42,129Middlesex Water Company 2,860 225,997Pure Cycle Corp. (A) 4,456 59,800Severn Trent PLC 42,238 1,343,481SJW Group 4,465 281,250The York Water Company 2,468 120,858
Strategic Equity Allocation Trust (continued) Strategic Equity Allocation Trust (continued)
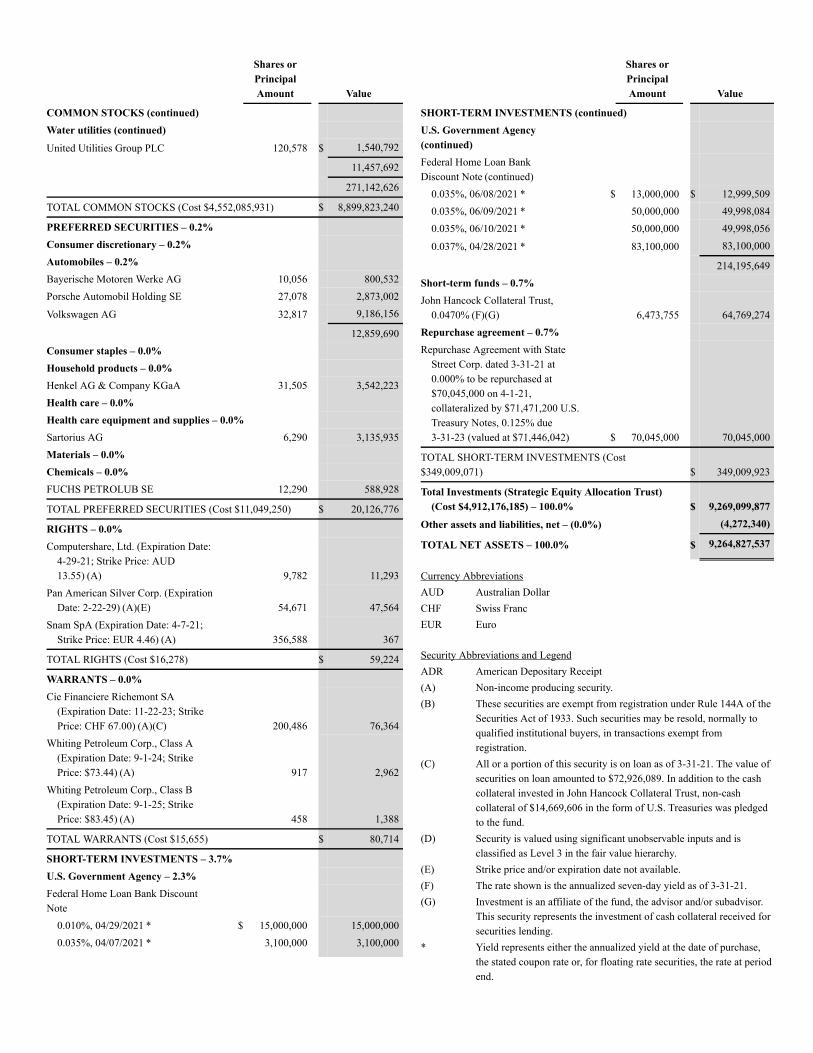
Shares orPrincipalAmount Value
COMMON STOCKS (continued)Water utilities (continued)United Utilities Group PLC 120,578 $ 1,540,792
11,457,692
271,142,626
TOTAL COMMON STOCKS (Cost $4,552,085,931) $ 8,899,823,240
PREFERRED SECURITIES – 0.2%Consumer discretionary – 0.2%Automobiles – 0.2%Bayerische Motoren Werke AG 10,056 800,532Porsche Automobil Holding SE 27,078 2,873,002
Volkswagen AG 32,817 9,186,156
12,859,690Consumer staples – 0.0%Household products – 0.0%Henkel AG & Company KGaA 31,505 3,542,223Health care – 0.0%Health care equipment and supplies – 0.0%Sartorius AG 6,290 3,135,935Materials – 0.0%Chemicals – 0.0%FUCHS PETROLUB SE 12,290 588,928
TOTAL PREFERRED SECURITIES (Cost $11,049,250) $ 20,126,776
RIGHTS – 0.0%Computershare, Ltd. (Expiration Date:
4-29-21; Strike Price: AUD13.55) (A) 9,782 11,293
Pan American Silver Corp. (ExpirationDate: 2-22-29) (A)(E) 54,671 47,564
Snam SpA (Expiration Date: 4-7-21;Strike Price: EUR 4.46) (A) 356,588 367
TOTAL RIGHTS (Cost $16,278) $ 59,224
WARRANTS – 0.0%Cie Financiere Richemont SA
(Expiration Date: 11-22-23; StrikePrice: CHF 67.00) (A)(C) 200,486 76,364
Whiting Petroleum Corp., Class A(Expiration Date: 9-1-24; StrikePrice: $73.44) (A) 917 2,962
Whiting Petroleum Corp., Class B(Expiration Date: 9-1-25; StrikePrice: $83.45) (A) 458 1,388
TOTAL WARRANTS (Cost $15,655) $ 80,714
SHORT-TERM INVESTMENTS – 3.7%U.S. Government Agency – 2.3%Federal Home Loan Bank DiscountNote
0.010%, 04/29/2021 * $ 15,000,000 15,000,0000.035%, 04/07/2021 * 3,100,000 3,100,000
Shares orPrincipalAmount Value
SHORT-TERM INVESTMENTS (continued)U.S. Government Agency(continued)Federal Home Loan BankDiscount Note (continued)
0.035%, 06/08/2021 * $ 13,000,000 $ 12,999,5090.035%, 06/09/2021 * 50,000,000 49,998,0840.035%, 06/10/2021 * 50,000,000 49,998,056
0.037%, 04/28/2021 * 83,100,000 83,100,000
214,195,649Short-term funds – 0.7%John Hancock Collateral Trust,
0.0470% (F)(G) 6,473,755 64,769,274Repurchase agreement – 0.7%Repurchase Agreement with State
Street Corp. dated 3-31-21 at0.000% to be repurchased at$70,045,000 on 4-1-21,collateralized by $71,471,200 U.S.Treasury Notes, 0.125% due3-31-23 (valued at $71,446,042) $ 70,045,000 70,045,000
TOTAL SHORT-TERM INVESTMENTS (Cost$349,009,071) $ 349,009,923
Total Investments (Strategic Equity Allocation Trust)(Cost $4,912,176,185) – 100.0% $ 9,269,099,877
Other assets and liabilities, net – (0.0%) (4,272,340)
TOTAL NET ASSETS – 100.0% $ 9,264,827,537
Currency AbbreviationsAUD Australian DollarCHF Swiss FrancEUR Euro
Security Abbreviations and LegendADR American Depositary Receipt(A) Non-income producing security.(B) These securities are exempt from registration under Rule 144A of the
Securities Act of 1933. Such securities may be resold, normally toqualified institutional buyers, in transactions exempt fromregistration.
(C) All or a portion of this security is on loan as of 3-31-21. The value ofsecurities on loan amounted to $72,926,089. In addition to the cashcollateral invested in John Hancock Collateral Trust, non-cashcollateral of $14,669,606 in the form of U.S. Treasuries was pledgedto the fund.
(D) Security is valued using significant unobservable inputs and isclassified as Level 3 in the fair value hierarchy.
(E) Strike price and/or expiration date not available.(F) The rate shown is the annualized seven-day yield as of 3-31-21.(G) Investment is an affiliate of the fund, the advisor and/or subadvisor.
This security represents the investment of cash collateral received forsecurities lending.
* Yield represents either the annualized yield at the date of purchase,the stated coupon rate or, for floating rate securities, the rate at periodend.
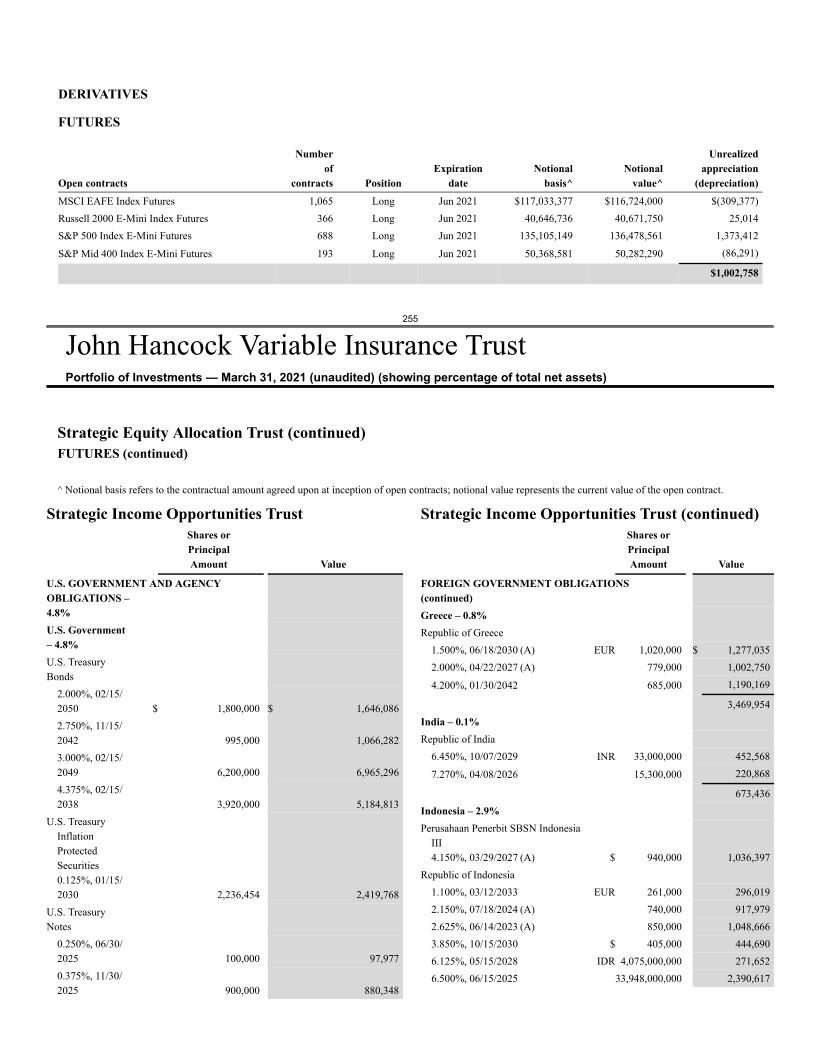
DERIVATIVES
FUTURES
Open contracts
Numberof
contracts PositionExpiration
dateNotional
basis^Notional
value^
Unrealizedappreciation
(depreciation)MSCI EAFE Index Futures 1,065 Long Jun 2021 $117,033,377 $116,724,000 $(309,377)Russell 2000 E-Mini Index Futures 366 Long Jun 2021 40,646,736 40,671,750 25,014S&P 500 Index E-Mini Futures 688 Long Jun 2021 135,105,149 136,478,561 1,373,412
S&P Mid 400 Index E-Mini Futures 193 Long Jun 2021 50,368,581 50,282,290 (86,291)
$1,002,758
255
John Hancock Variable Insurance TrustPortfolio of Investments — March 31, 2021 (unaudited) (showing percentage of total net assets)
Strategic Equity Allocation Trust (continued)FUTURES (continued)
^ Notional basis refers to the contractual amount agreed upon at inception of open contracts; notional value represents the current value of the open contract.
Strategic Income Opportunities TrustShares orPrincipalAmount Value
U.S. GOVERNMENT AND AGENCYOBLIGATIONS –4.8%U.S. Government– 4.8%U.S. TreasuryBonds
2.000%, 02/15/2050 $ 1,800,000 $ 1,646,0862.750%, 11/15/2042 995,000 1,066,2823.000%, 02/15/2049 6,200,000 6,965,2964.375%, 02/15/2038 3,920,000 5,184,813
U.S. TreasuryInflationProtectedSecurities0.125%, 01/15/2030 2,236,454 2,419,768
U.S. TreasuryNotes
0.250%, 06/30/2025 100,000 97,9770.375%, 11/30/2025 900,000 880,348
Strategic Income Opportunities Trust (continued)Shares orPrincipalAmount Value
FOREIGN GOVERNMENT OBLIGATIONS(continued)Greece – 0.8%Republic of Greece
1.500%, 06/18/2030 (A) EUR 1,020,000 $ 1,277,0352.000%, 04/22/2027 (A) 779,000 1,002,750
4.200%, 01/30/2042 685,000 1,190,169
3,469,954India – 0.1%Republic of India
6.450%, 10/07/2029 INR 33,000,000 452,568
7.270%, 04/08/2026 15,300,000 220,868
673,436Indonesia – 2.9%Perusahaan Penerbit SBSN Indonesia
III4.150%, 03/29/2027 (A) $ 940,000 1,036,397
Republic of Indonesia1.100%, 03/12/2033 EUR 261,000 296,0192.150%, 07/18/2024 (A) 740,000 917,9792.625%, 06/14/2023 (A) 850,000 1,048,6663.850%, 10/15/2030 $ 405,000 444,6906.125%, 05/15/2028 IDR 4,075,000,000 271,6526.500%, 06/15/2025 33,948,000,000 2,390,617
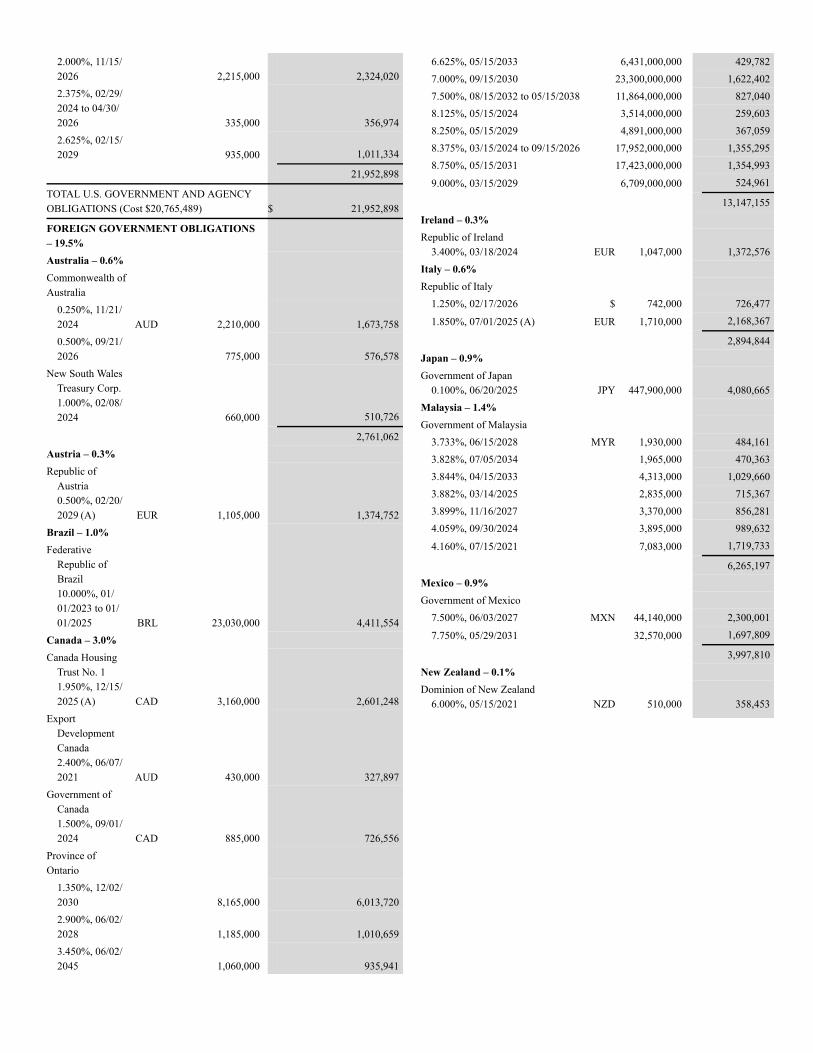
2.000%, 11/15/2026 2,215,000 2,324,0202.375%, 02/29/2024 to 04/30/2026 335,000 356,9742.625%, 02/15/2029 935,000 1,011,334
21,952,898
TOTAL U.S. GOVERNMENT AND AGENCYOBLIGATIONS (Cost $20,765,489) $ 21,952,898
FOREIGN GOVERNMENT OBLIGATIONS– 19.5%Australia – 0.6%Commonwealth ofAustralia
0.250%, 11/21/2024 AUD 2,210,000 1,673,7580.500%, 09/21/2026 775,000 576,578
New South WalesTreasury Corp.1.000%, 02/08/2024 660,000 510,726
2,761,062Austria – 0.3%Republic of
Austria0.500%, 02/20/2029 (A) EUR 1,105,000 1,374,752
Brazil – 1.0%Federative
Republic ofBrazil10.000%, 01/01/2023 to 01/01/2025 BRL 23,030,000 4,411,554
Canada – 3.0%Canada Housing
Trust No. 11.950%, 12/15/2025 (A) CAD 3,160,000 2,601,248
ExportDevelopmentCanada2.400%, 06/07/2021 AUD 430,000 327,897
Government ofCanada1.500%, 09/01/2024 CAD 885,000 726,556
Province ofOntario
1.350%, 12/02/2030 8,165,000 6,013,7202.900%, 06/02/2028 1,185,000 1,010,6593.450%, 06/02/2045 1,060,000 935,941
6.625%, 05/15/2033 6,431,000,000 429,7827.000%, 09/15/2030 23,300,000,000 1,622,4027.500%, 08/15/2032 to 05/15/2038 11,864,000,000 827,0408.125%, 05/15/2024 3,514,000,000 259,6038.250%, 05/15/2029 4,891,000,000 367,0598.375%, 03/15/2024 to 09/15/2026 17,952,000,000 1,355,2958.750%, 05/15/2031 17,423,000,000 1,354,993
9.000%, 03/15/2029 6,709,000,000 524,961
13,147,155Ireland – 0.3%Republic of Ireland
3.400%, 03/18/2024 EUR 1,047,000 1,372,576Italy – 0.6%Republic of Italy
1.250%, 02/17/2026 $ 742,000 726,477
1.850%, 07/01/2025 (A) EUR 1,710,000 2,168,367
2,894,844Japan – 0.9%Government of Japan
0.100%, 06/20/2025 JPY 447,900,000 4,080,665Malaysia – 1.4%Government of Malaysia
3.733%, 06/15/2028 MYR 1,930,000 484,1613.828%, 07/05/2034 1,965,000 470,3633.844%, 04/15/2033 4,313,000 1,029,6603.882%, 03/14/2025 2,835,000 715,3673.899%, 11/16/2027 3,370,000 856,2814.059%, 09/30/2024 3,895,000 989,632
4.160%, 07/15/2021 7,083,000 1,719,733
6,265,197Mexico – 0.9%Government of Mexico
7.500%, 06/03/2027 MXN 44,140,000 2,300,001
7.750%, 05/29/2031 32,570,000 1,697,809
3,997,810New Zealand – 0.1%Dominion of New Zealand
6.000%, 05/15/2021 NZD 510,000 358,453
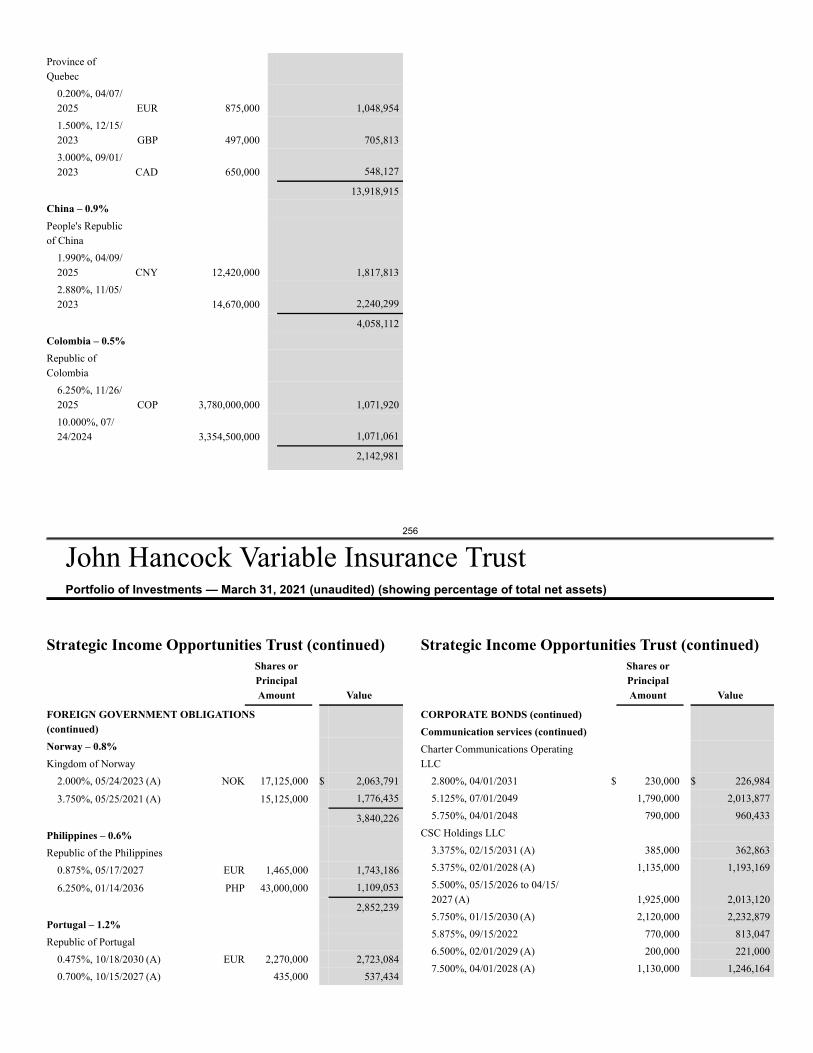
256
John Hancock Variable Insurance TrustPortfolio of Investments — March 31, 2021 (unaudited) (showing percentage of total net assets)
Province ofQuebec
0.200%, 04/07/2025 EUR 875,000 1,048,9541.500%, 12/15/2023 GBP 497,000 705,8133.000%, 09/01/2023 CAD 650,000 548,127
13,918,915China – 0.9%People's Republicof China
1.990%, 04/09/2025 CNY 12,420,000 1,817,8132.880%, 11/05/2023 14,670,000 2,240,299
4,058,112Colombia – 0.5%Republic ofColombia
6.250%, 11/26/2025 COP 3,780,000,000 1,071,92010.000%, 07/24/2024 3,354,500,000 1,071,061
2,142,981
Strategic Income Opportunities Trust (continued)Shares orPrincipalAmount Value
FOREIGN GOVERNMENT OBLIGATIONS(continued)Norway – 0.8%Kingdom of Norway
2.000%, 05/24/2023 (A) NOK 17,125,000 $ 2,063,791
3.750%, 05/25/2021 (A) 15,125,000 1,776,435
3,840,226Philippines – 0.6%Republic of the Philippines
0.875%, 05/17/2027 EUR 1,465,000 1,743,186
6.250%, 01/14/2036 PHP 43,000,000 1,109,053
2,852,239Portugal – 1.2%Republic of Portugal
0.475%, 10/18/2030 (A) EUR 2,270,000 2,723,0840.700%, 10/15/2027 (A) 435,000 537,434
Strategic Income Opportunities Trust (continued)Shares orPrincipalAmount Value
CORPORATE BONDS (continued)Communication services (continued)Charter Communications OperatingLLC
2.800%, 04/01/2031 $ 230,000 $ 226,9845.125%, 07/01/2049 1,790,000 2,013,8775.750%, 04/01/2048 790,000 960,433
CSC Holdings LLC3.375%, 02/15/2031 (A) 385,000 362,8635.375%, 02/01/2028 (A) 1,135,000 1,193,1695.500%, 05/15/2026 to 04/15/2027 (A) 1,925,000 2,013,1205.750%, 01/15/2030 (A) 2,120,000 2,232,8795.875%, 09/15/2022 770,000 813,0476.500%, 02/01/2029 (A) 200,000 221,0007.500%, 04/01/2028 (A) 1,130,000 1,246,164
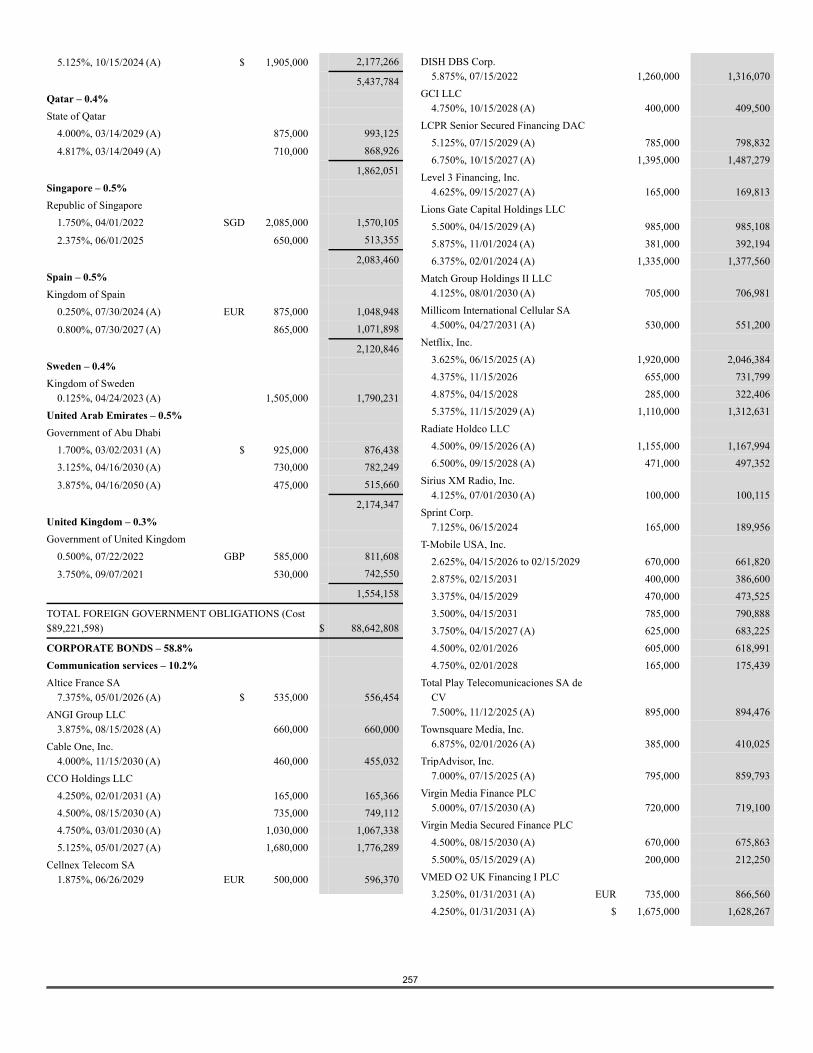
257
5.125%, 10/15/2024 (A) $ 1,905,000 2,177,266
5,437,784Qatar – 0.4%State of Qatar
4.000%, 03/14/2029 (A) 875,000 993,125
4.817%, 03/14/2049 (A) 710,000 868,926
1,862,051Singapore – 0.5%Republic of Singapore
1.750%, 04/01/2022 SGD 2,085,000 1,570,105
2.375%, 06/01/2025 650,000 513,355
2,083,460Spain – 0.5%Kingdom of Spain
0.250%, 07/30/2024 (A) EUR 875,000 1,048,948
0.800%, 07/30/2027 (A) 865,000 1,071,898
2,120,846Sweden – 0.4%Kingdom of Sweden
0.125%, 04/24/2023 (A) 1,505,000 1,790,231United Arab Emirates – 0.5%Government of Abu Dhabi
1.700%, 03/02/2031 (A) $ 925,000 876,4383.125%, 04/16/2030 (A) 730,000 782,249
3.875%, 04/16/2050 (A) 475,000 515,660
2,174,347United Kingdom – 0.3%Government of United Kingdom
0.500%, 07/22/2022 GBP 585,000 811,608
3.750%, 09/07/2021 530,000 742,550
1,554,158
TOTAL FOREIGN GOVERNMENT OBLIGATIONS (Cost$89,221,598) $ 88,642,808
CORPORATE BONDS – 58.8%Communication services – 10.2%Altice France SA
7.375%, 05/01/2026 (A) $ 535,000 556,454ANGI Group LLC
3.875%, 08/15/2028 (A) 660,000 660,000Cable One, Inc.
4.000%, 11/15/2030 (A) 460,000 455,032CCO Holdings LLC
4.250%, 02/01/2031 (A) 165,000 165,3664.500%, 08/15/2030 (A) 735,000 749,1124.750%, 03/01/2030 (A) 1,030,000 1,067,3385.125%, 05/01/2027 (A) 1,680,000 1,776,289
Cellnex Telecom SA1.875%, 06/26/2029 EUR 500,000 596,370
DISH DBS Corp.5.875%, 07/15/2022 1,260,000 1,316,070
GCI LLC4.750%, 10/15/2028 (A) 400,000 409,500
LCPR Senior Secured Financing DAC5.125%, 07/15/2029 (A) 785,000 798,8326.750%, 10/15/2027 (A) 1,395,000 1,487,279
Level 3 Financing, Inc.4.625%, 09/15/2027 (A) 165,000 169,813
Lions Gate Capital Holdings LLC5.500%, 04/15/2029 (A) 985,000 985,1085.875%, 11/01/2024 (A) 381,000 392,1946.375%, 02/01/2024 (A) 1,335,000 1,377,560
Match Group Holdings II LLC4.125%, 08/01/2030 (A) 705,000 706,981
Millicom International Cellular SA4.500%, 04/27/2031 (A) 530,000 551,200
Netflix, Inc.3.625%, 06/15/2025 (A) 1,920,000 2,046,3844.375%, 11/15/2026 655,000 731,7994.875%, 04/15/2028 285,000 322,4065.375%, 11/15/2029 (A) 1,110,000 1,312,631
Radiate Holdco LLC4.500%, 09/15/2026 (A) 1,155,000 1,167,9946.500%, 09/15/2028 (A) 471,000 497,352
Sirius XM Radio, Inc.4.125%, 07/01/2030 (A) 100,000 100,115
Sprint Corp.7.125%, 06/15/2024 165,000 189,956
T-Mobile USA, Inc.2.625%, 04/15/2026 to 02/15/2029 670,000 661,8202.875%, 02/15/2031 400,000 386,6003.375%, 04/15/2029 470,000 473,5253.500%, 04/15/2031 785,000 790,8883.750%, 04/15/2027 (A) 625,000 683,2254.500%, 02/01/2026 605,000 618,9914.750%, 02/01/2028 165,000 175,439
Total Play Telecomunicaciones SA deCV7.500%, 11/12/2025 (A) 895,000 894,476
Townsquare Media, Inc.6.875%, 02/01/2026 (A) 385,000 410,025
TripAdvisor, Inc.7.000%, 07/15/2025 (A) 795,000 859,793
Virgin Media Finance PLC5.000%, 07/15/2030 (A) 720,000 719,100
Virgin Media Secured Finance PLC4.500%, 08/15/2030 (A) 670,000 675,8635.500%, 05/15/2029 (A) 200,000 212,250
VMED O2 UK Financing I PLC3.250%, 01/31/2031 (A) EUR 735,000 866,5604.250%, 01/31/2031 (A) $ 1,675,000 1,628,267
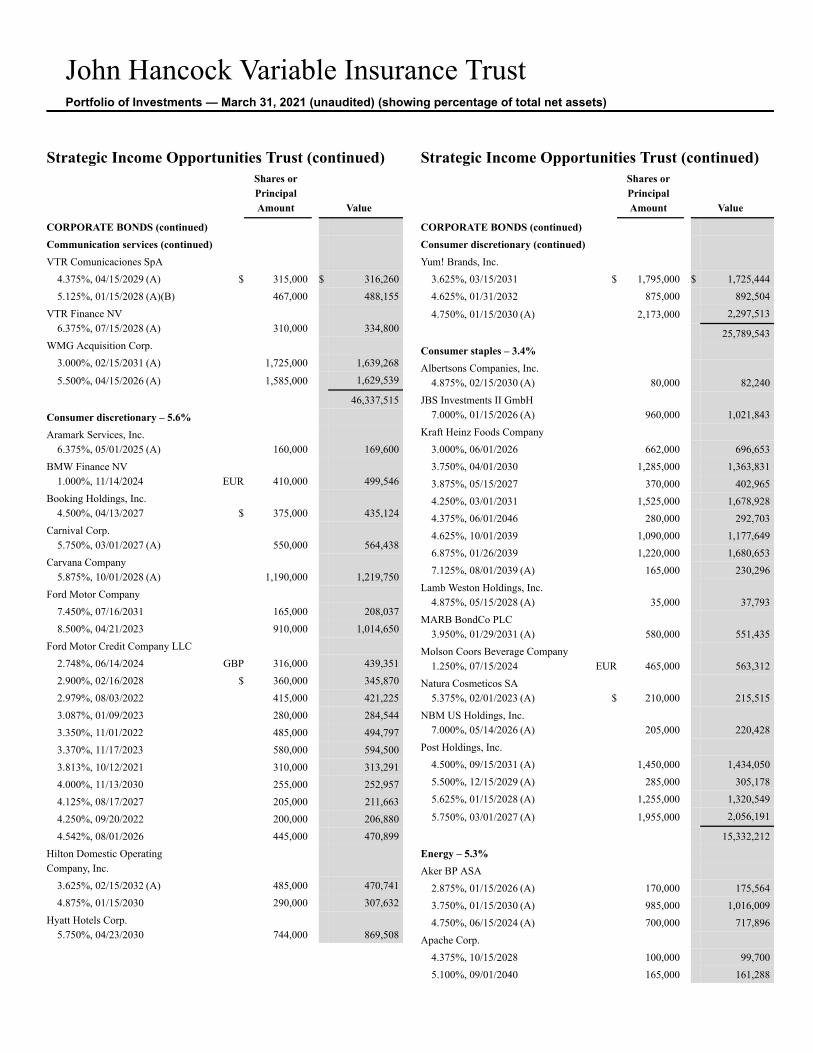
John Hancock Variable Insurance TrustPortfolio of Investments — March 31, 2021 (unaudited) (showing percentage of total net assets)
Strategic Income Opportunities Trust (continued)Shares orPrincipalAmount Value
CORPORATE BONDS (continued)Communication services (continued)VTR Comunicaciones SpA
4.375%, 04/15/2029 (A) $ 315,000 $ 316,2605.125%, 01/15/2028 (A)(B) 467,000 488,155
VTR Finance NV6.375%, 07/15/2028 (A) 310,000 334,800
WMG Acquisition Corp.3.000%, 02/15/2031 (A) 1,725,000 1,639,268
5.500%, 04/15/2026 (A) 1,585,000 1,629,539
46,337,515Consumer discretionary – 5.6%Aramark Services, Inc.
6.375%, 05/01/2025 (A) 160,000 169,600BMW Finance NV
1.000%, 11/14/2024 EUR 410,000 499,546Booking Holdings, Inc.
4.500%, 04/13/2027 $ 375,000 435,124Carnival Corp.
5.750%, 03/01/2027 (A) 550,000 564,438Carvana Company
5.875%, 10/01/2028 (A) 1,190,000 1,219,750Ford Motor Company
7.450%, 07/16/2031 165,000 208,0378.500%, 04/21/2023 910,000 1,014,650
Ford Motor Credit Company LLC2.748%, 06/14/2024 GBP 316,000 439,3512.900%, 02/16/2028 $ 360,000 345,8702.979%, 08/03/2022 415,000 421,2253.087%, 01/09/2023 280,000 284,5443.350%, 11/01/2022 485,000 494,7973.370%, 11/17/2023 580,000 594,5003.813%, 10/12/2021 310,000 313,2914.000%, 11/13/2030 255,000 252,9574.125%, 08/17/2027 205,000 211,6634.250%, 09/20/2022 200,000 206,8804.542%, 08/01/2026 445,000 470,899
Hilton Domestic OperatingCompany, Inc.
3.625%, 02/15/2032 (A) 485,000 470,7414.875%, 01/15/2030 290,000 307,632
Hyatt Hotels Corp.5.750%, 04/23/2030 744,000 869,508
Strategic Income Opportunities Trust (continued)Shares orPrincipalAmount Value
CORPORATE BONDS (continued)Consumer discretionary (continued)Yum! Brands, Inc.
3.625%, 03/15/2031 $ 1,795,000 $ 1,725,4444.625%, 01/31/2032 875,000 892,504
4.750%, 01/15/2030 (A) 2,173,000 2,297,513
25,789,543Consumer staples – 3.4%Albertsons Companies, Inc.
4.875%, 02/15/2030 (A) 80,000 82,240JBS Investments II GmbH
7.000%, 01/15/2026 (A) 960,000 1,021,843Kraft Heinz Foods Company
3.000%, 06/01/2026 662,000 696,6533.750%, 04/01/2030 1,285,000 1,363,8313.875%, 05/15/2027 370,000 402,9654.250%, 03/01/2031 1,525,000 1,678,9284.375%, 06/01/2046 280,000 292,7034.625%, 10/01/2039 1,090,000 1,177,6496.875%, 01/26/2039 1,220,000 1,680,6537.125%, 08/01/2039 (A) 165,000 230,296
Lamb Weston Holdings, Inc.4.875%, 05/15/2028 (A) 35,000 37,793
MARB BondCo PLC3.950%, 01/29/2031 (A) 580,000 551,435
Molson Coors Beverage Company1.250%, 07/15/2024 EUR 465,000 563,312
Natura Cosmeticos SA5.375%, 02/01/2023 (A) $ 210,000 215,515
NBM US Holdings, Inc.7.000%, 05/14/2026 (A) 205,000 220,428
Post Holdings, Inc.4.500%, 09/15/2031 (A) 1,450,000 1,434,0505.500%, 12/15/2029 (A) 285,000 305,1785.625%, 01/15/2028 (A) 1,255,000 1,320,549
5.750%, 03/01/2027 (A) 1,955,000 2,056,191
15,332,212Energy – 5.3%Aker BP ASA
2.875%, 01/15/2026 (A) 170,000 175,5643.750%, 01/15/2030 (A) 985,000 1,016,0094.750%, 06/15/2024 (A) 700,000 717,896
Apache Corp.4.375%, 10/15/2028 100,000 99,7005.100%, 09/01/2040 165,000 161,288
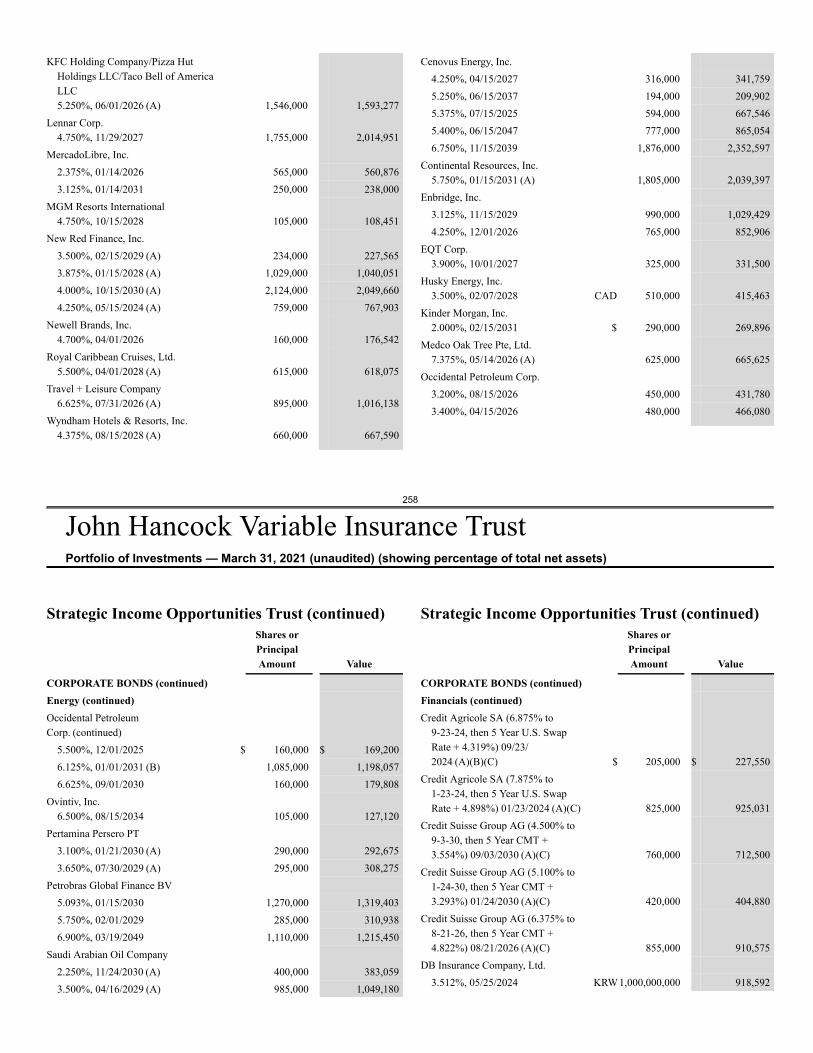
258
John Hancock Variable Insurance TrustPortfolio of Investments — March 31, 2021 (unaudited) (showing percentage of total net assets)
KFC Holding Company/Pizza HutHoldings LLC/Taco Bell of AmericaLLC5.250%, 06/01/2026 (A) 1,546,000 1,593,277
Lennar Corp.4.750%, 11/29/2027 1,755,000 2,014,951
MercadoLibre, Inc.2.375%, 01/14/2026 565,000 560,8763.125%, 01/14/2031 250,000 238,000
MGM Resorts International4.750%, 10/15/2028 105,000 108,451
New Red Finance, Inc.3.500%, 02/15/2029 (A) 234,000 227,5653.875%, 01/15/2028 (A) 1,029,000 1,040,0514.000%, 10/15/2030 (A) 2,124,000 2,049,6604.250%, 05/15/2024 (A) 759,000 767,903
Newell Brands, Inc.4.700%, 04/01/2026 160,000 176,542
Royal Caribbean Cruises, Ltd.5.500%, 04/01/2028 (A) 615,000 618,075
Travel + Leisure Company6.625%, 07/31/2026 (A) 895,000 1,016,138
Wyndham Hotels & Resorts, Inc.4.375%, 08/15/2028 (A) 660,000 667,590
Cenovus Energy, Inc.4.250%, 04/15/2027 316,000 341,7595.250%, 06/15/2037 194,000 209,9025.375%, 07/15/2025 594,000 667,5465.400%, 06/15/2047 777,000 865,0546.750%, 11/15/2039 1,876,000 2,352,597
Continental Resources, Inc.5.750%, 01/15/2031 (A) 1,805,000 2,039,397
Enbridge, Inc.3.125%, 11/15/2029 990,000 1,029,4294.250%, 12/01/2026 765,000 852,906
EQT Corp.3.900%, 10/01/2027 325,000 331,500
Husky Energy, Inc.3.500%, 02/07/2028 CAD 510,000 415,463
Kinder Morgan, Inc.2.000%, 02/15/2031 $ 290,000 269,896
Medco Oak Tree Pte, Ltd.7.375%, 05/14/2026 (A) 625,000 665,625
Occidental Petroleum Corp.3.200%, 08/15/2026 450,000 431,7803.400%, 04/15/2026 480,000 466,080
Strategic Income Opportunities Trust (continued)Shares orPrincipalAmount Value
CORPORATE BONDS (continued)Energy (continued)Occidental PetroleumCorp. (continued)
5.500%, 12/01/2025 $ 160,000 $ 169,2006.125%, 01/01/2031 (B) 1,085,000 1,198,0576.625%, 09/01/2030 160,000 179,808
Ovintiv, Inc.6.500%, 08/15/2034 105,000 127,120
Pertamina Persero PT3.100%, 01/21/2030 (A) 290,000 292,6753.650%, 07/30/2029 (A) 295,000 308,275
Petrobras Global Finance BV5.093%, 01/15/2030 1,270,000 1,319,4035.750%, 02/01/2029 285,000 310,9386.900%, 03/19/2049 1,110,000 1,215,450
Saudi Arabian Oil Company2.250%, 11/24/2030 (A) 400,000 383,0593.500%, 04/16/2029 (A) 985,000 1,049,180
Strategic Income Opportunities Trust (continued)Shares orPrincipalAmount Value
CORPORATE BONDS (continued)Financials (continued)Credit Agricole SA (6.875% to
9-23-24, then 5 Year U.S. SwapRate + 4.319%) 09/23/2024 (A)(B)(C) $ 205,000 $ 227,550
Credit Agricole SA (7.875% to1-23-24, then 5 Year U.S. SwapRate + 4.898%) 01/23/2024 (A)(C) 825,000 925,031
Credit Suisse Group AG (4.500% to9-3-30, then 5 Year CMT +3.554%) 09/03/2030 (A)(C) 760,000 712,500
Credit Suisse Group AG (5.100% to1-24-30, then 5 Year CMT +3.293%) 01/24/2030 (A)(C) 420,000 404,880
Credit Suisse Group AG (6.375% to8-21-26, then 5 Year CMT +4.822%) 08/21/2026 (A)(C) 855,000 910,575
DB Insurance Company, Ltd.3.512%, 05/25/2024 KRW 1,000,000,000 918,592
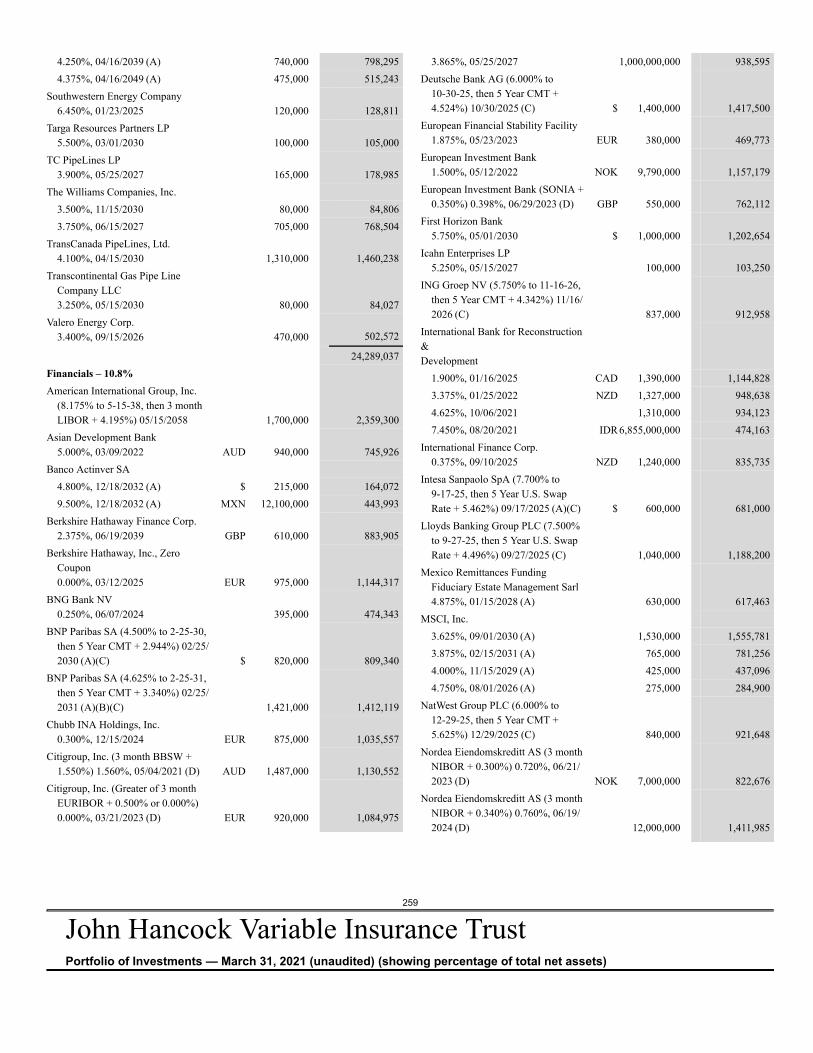
259
John Hancock Variable Insurance TrustPortfolio of Investments — March 31, 2021 (unaudited) (showing percentage of total net assets)
4.250%, 04/16/2039 (A) 740,000 798,2954.375%, 04/16/2049 (A) 475,000 515,243
Southwestern Energy Company6.450%, 01/23/2025 120,000 128,811
Targa Resources Partners LP5.500%, 03/01/2030 100,000 105,000
TC PipeLines LP3.900%, 05/25/2027 165,000 178,985
The Williams Companies, Inc.3.500%, 11/15/2030 80,000 84,8063.750%, 06/15/2027 705,000 768,504
TransCanada PipeLines, Ltd.4.100%, 04/15/2030 1,310,000 1,460,238
Transcontinental Gas Pipe LineCompany LLC3.250%, 05/15/2030 80,000 84,027
Valero Energy Corp.3.400%, 09/15/2026 470,000 502,572
24,289,037Financials – 10.8%American International Group, Inc.
(8.175% to 5-15-38, then 3 monthLIBOR + 4.195%) 05/15/2058 1,700,000 2,359,300
Asian Development Bank5.000%, 03/09/2022 AUD 940,000 745,926
Banco Actinver SA4.800%, 12/18/2032 (A) $ 215,000 164,0729.500%, 12/18/2032 (A) MXN 12,100,000 443,993
Berkshire Hathaway Finance Corp.2.375%, 06/19/2039 GBP 610,000 883,905
Berkshire Hathaway, Inc., ZeroCoupon0.000%, 03/12/2025 EUR 975,000 1,144,317
BNG Bank NV0.250%, 06/07/2024 395,000 474,343
BNP Paribas SA (4.500% to 2-25-30,then 5 Year CMT + 2.944%) 02/25/2030 (A)(C) $ 820,000 809,340
BNP Paribas SA (4.625% to 2-25-31,then 5 Year CMT + 3.340%) 02/25/2031 (A)(B)(C) 1,421,000 1,412,119
Chubb INA Holdings, Inc.0.300%, 12/15/2024 EUR 875,000 1,035,557
Citigroup, Inc. (3 month BBSW +1.550%) 1.560%, 05/04/2021 (D) AUD 1,487,000 1,130,552
Citigroup, Inc. (Greater of 3 monthEURIBOR + 0.500% or 0.000%)0.000%, 03/21/2023 (D) EUR 920,000 1,084,975
3.865%, 05/25/2027 1,000,000,000 938,595Deutsche Bank AG (6.000% to
10-30-25, then 5 Year CMT +4.524%) 10/30/2025 (C) $ 1,400,000 1,417,500
European Financial Stability Facility1.875%, 05/23/2023 EUR 380,000 469,773
European Investment Bank1.500%, 05/12/2022 NOK 9,790,000 1,157,179
European Investment Bank (SONIA +0.350%) 0.398%, 06/29/2023 (D) GBP 550,000 762,112
First Horizon Bank5.750%, 05/01/2030 $ 1,000,000 1,202,654
Icahn Enterprises LP5.250%, 05/15/2027 100,000 103,250
ING Groep NV (5.750% to 11-16-26,then 5 Year CMT + 4.342%) 11/16/2026 (C) 837,000 912,958
International Bank for Reconstruction&Development
1.900%, 01/16/2025 CAD 1,390,000 1,144,8283.375%, 01/25/2022 NZD 1,327,000 948,6384.625%, 10/06/2021 1,310,000 934,1237.450%, 08/20/2021 IDR 6,855,000,000 474,163
International Finance Corp.0.375%, 09/10/2025 NZD 1,240,000 835,735
Intesa Sanpaolo SpA (7.700% to9-17-25, then 5 Year U.S. SwapRate + 5.462%) 09/17/2025 (A)(C) $ 600,000 681,000
Lloyds Banking Group PLC (7.500%to 9-27-25, then 5 Year U.S. SwapRate + 4.496%) 09/27/2025 (C) 1,040,000 1,188,200
Mexico Remittances FundingFiduciary Estate Management Sarl4.875%, 01/15/2028 (A) 630,000 617,463
MSCI, Inc.3.625%, 09/01/2030 (A) 1,530,000 1,555,7813.875%, 02/15/2031 (A) 765,000 781,2564.000%, 11/15/2029 (A) 425,000 437,0964.750%, 08/01/2026 (A) 275,000 284,900
NatWest Group PLC (6.000% to12-29-25, then 5 Year CMT +5.625%) 12/29/2025 (C) 840,000 921,648
Nordea Eiendomskreditt AS (3 monthNIBOR + 0.300%) 0.720%, 06/21/2023 (D) NOK 7,000,000 822,676
Nordea Eiendomskreditt AS (3 monthNIBOR + 0.340%) 0.760%, 06/19/2024 (D) 12,000,000 1,411,985
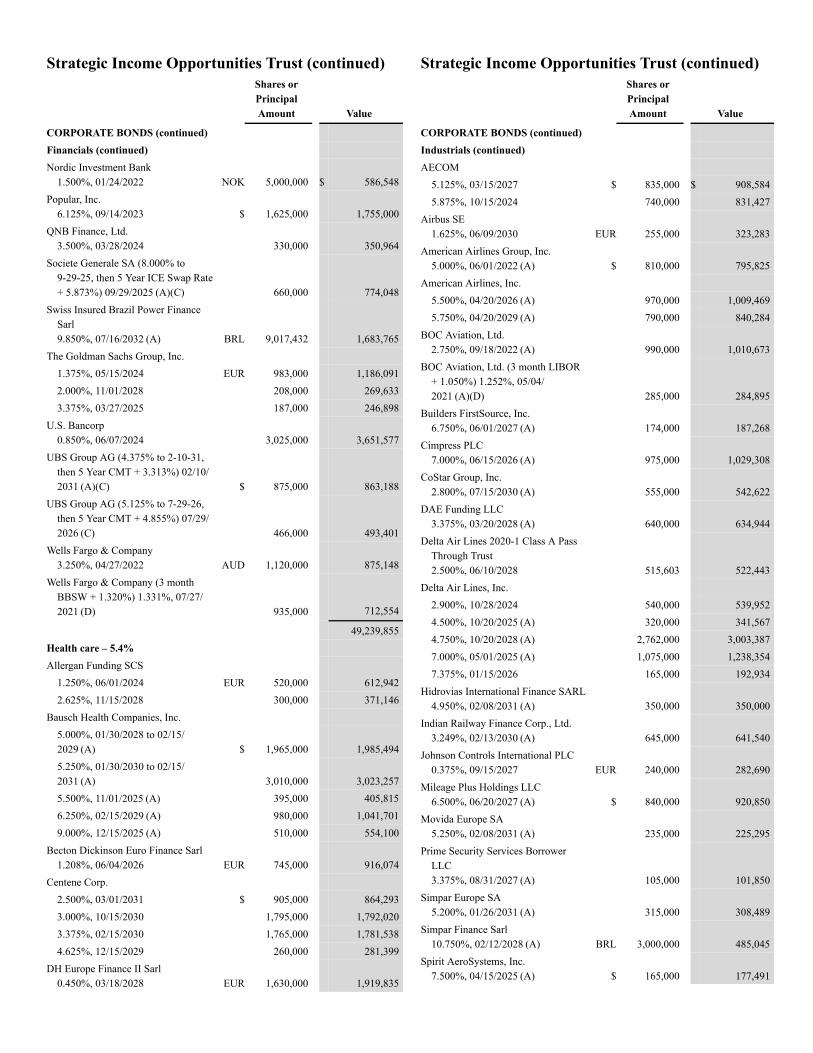
Strategic Income Opportunities Trust (continued)Shares orPrincipalAmount Value
CORPORATE BONDS (continued)Financials (continued)Nordic Investment Bank
1.500%, 01/24/2022 NOK 5,000,000 $ 586,548Popular, Inc.
6.125%, 09/14/2023 $ 1,625,000 1,755,000QNB Finance, Ltd.
3.500%, 03/28/2024 330,000 350,964Societe Generale SA (8.000% to
9-29-25, then 5 Year ICE Swap Rate+ 5.873%) 09/29/2025 (A)(C) 660,000 774,048
Swiss Insured Brazil Power FinanceSarl9.850%, 07/16/2032 (A) BRL 9,017,432 1,683,765
The Goldman Sachs Group, Inc.1.375%, 05/15/2024 EUR 983,000 1,186,0912.000%, 11/01/2028 208,000 269,6333.375%, 03/27/2025 187,000 246,898
U.S. Bancorp0.850%, 06/07/2024 3,025,000 3,651,577
UBS Group AG (4.375% to 2-10-31,then 5 Year CMT + 3.313%) 02/10/2031 (A)(C) $ 875,000 863,188
UBS Group AG (5.125% to 7-29-26,then 5 Year CMT + 4.855%) 07/29/2026 (C) 466,000 493,401
Wells Fargo & Company3.250%, 04/27/2022 AUD 1,120,000 875,148
Wells Fargo & Company (3 monthBBSW + 1.320%) 1.331%, 07/27/2021 (D) 935,000 712,554
49,239,855Health care – 5.4%Allergan Funding SCS
1.250%, 06/01/2024 EUR 520,000 612,9422.625%, 11/15/2028 300,000 371,146
Bausch Health Companies, Inc.5.000%, 01/30/2028 to 02/15/2029 (A) $ 1,965,000 1,985,4945.250%, 01/30/2030 to 02/15/2031 (A) 3,010,000 3,023,2575.500%, 11/01/2025 (A) 395,000 405,8156.250%, 02/15/2029 (A) 980,000 1,041,7019.000%, 12/15/2025 (A) 510,000 554,100
Becton Dickinson Euro Finance Sarl1.208%, 06/04/2026 EUR 745,000 916,074
Centene Corp.2.500%, 03/01/2031 $ 905,000 864,2933.000%, 10/15/2030 1,795,000 1,792,0203.375%, 02/15/2030 1,765,000 1,781,5384.625%, 12/15/2029 260,000 281,399
DH Europe Finance II Sarl0.450%, 03/18/2028 EUR 1,630,000 1,919,835
Strategic Income Opportunities Trust (continued)Shares orPrincipalAmount Value
CORPORATE BONDS (continued)Industrials (continued)AECOM
5.125%, 03/15/2027 $ 835,000 $ 908,5845.875%, 10/15/2024 740,000 831,427
Airbus SE1.625%, 06/09/2030 EUR 255,000 323,283
American Airlines Group, Inc.5.000%, 06/01/2022 (A) $ 810,000 795,825
American Airlines, Inc.5.500%, 04/20/2026 (A) 970,000 1,009,4695.750%, 04/20/2029 (A) 790,000 840,284
BOC Aviation, Ltd.2.750%, 09/18/2022 (A) 990,000 1,010,673
BOC Aviation, Ltd. (3 month LIBOR+ 1.050%) 1.252%, 05/04/2021 (A)(D) 285,000 284,895
Builders FirstSource, Inc.6.750%, 06/01/2027 (A) 174,000 187,268
Cimpress PLC7.000%, 06/15/2026 (A) 975,000 1,029,308
CoStar Group, Inc.2.800%, 07/15/2030 (A) 555,000 542,622
DAE Funding LLC3.375%, 03/20/2028 (A) 640,000 634,944
Delta Air Lines 2020-1 Class A PassThrough Trust2.500%, 06/10/2028 515,603 522,443
Delta Air Lines, Inc.2.900%, 10/28/2024 540,000 539,9524.500%, 10/20/2025 (A) 320,000 341,5674.750%, 10/20/2028 (A) 2,762,000 3,003,3877.000%, 05/01/2025 (A) 1,075,000 1,238,3547.375%, 01/15/2026 165,000 192,934
Hidrovias International Finance SARL4.950%, 02/08/2031 (A) 350,000 350,000
Indian Railway Finance Corp., Ltd.3.249%, 02/13/2030 (A) 645,000 641,540
Johnson Controls International PLC0.375%, 09/15/2027 EUR 240,000 282,690
Mileage Plus Holdings LLC6.500%, 06/20/2027 (A) $ 840,000 920,850
Movida Europe SA5.250%, 02/08/2031 (A) 235,000 225,295
Prime Security Services BorrowerLLC3.375%, 08/31/2027 (A) 105,000 101,850
Simpar Europe SA5.200%, 01/26/2031 (A) 315,000 308,489
Simpar Finance Sarl10.750%, 02/12/2028 (A) BRL 3,000,000 485,045
Spirit AeroSystems, Inc.7.500%, 04/15/2025 (A) $ 165,000 177,491
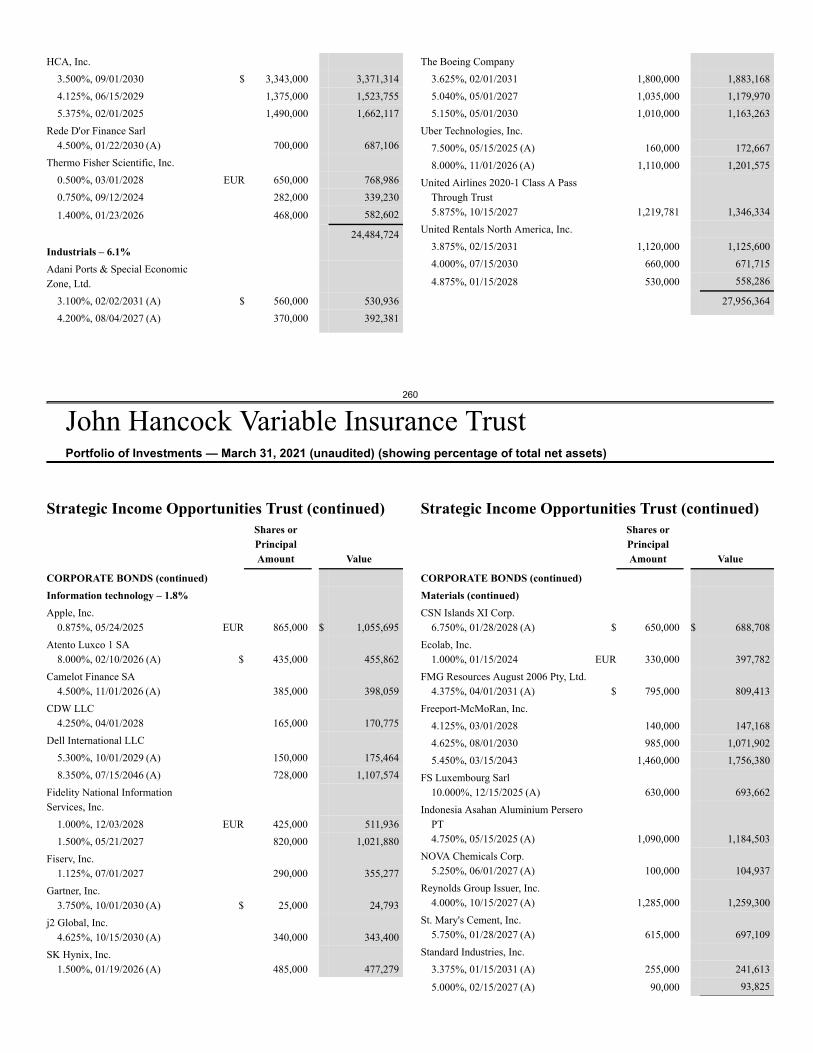
260
John Hancock Variable Insurance TrustPortfolio of Investments — March 31, 2021 (unaudited) (showing percentage of total net assets)
HCA, Inc.3.500%, 09/01/2030 $ 3,343,000 3,371,3144.125%, 06/15/2029 1,375,000 1,523,7555.375%, 02/01/2025 1,490,000 1,662,117
Rede D'or Finance Sarl4.500%, 01/22/2030 (A) 700,000 687,106
Thermo Fisher Scientific, Inc.0.500%, 03/01/2028 EUR 650,000 768,9860.750%, 09/12/2024 282,000 339,230
1.400%, 01/23/2026 468,000 582,602
24,484,724Industrials – 6.1%Adani Ports & Special EconomicZone, Ltd.
3.100%, 02/02/2031 (A) $ 560,000 530,9364.200%, 08/04/2027 (A) 370,000 392,381
The Boeing Company3.625%, 02/01/2031 1,800,000 1,883,1685.040%, 05/01/2027 1,035,000 1,179,9705.150%, 05/01/2030 1,010,000 1,163,263
Uber Technologies, Inc.7.500%, 05/15/2025 (A) 160,000 172,6678.000%, 11/01/2026 (A) 1,110,000 1,201,575
United Airlines 2020-1 Class A PassThrough Trust5.875%, 10/15/2027 1,219,781 1,346,334
United Rentals North America, Inc.3.875%, 02/15/2031 1,120,000 1,125,6004.000%, 07/15/2030 660,000 671,715
4.875%, 01/15/2028 530,000 558,286
27,956,364
Strategic Income Opportunities Trust (continued)Shares orPrincipalAmount Value
CORPORATE BONDS (continued)Information technology – 1.8%Apple, Inc.
0.875%, 05/24/2025 EUR 865,000 $ 1,055,695Atento Luxco 1 SA
8.000%, 02/10/2026 (A) $ 435,000 455,862Camelot Finance SA
4.500%, 11/01/2026 (A) 385,000 398,059CDW LLC
4.250%, 04/01/2028 165,000 170,775Dell International LLC
5.300%, 10/01/2029 (A) 150,000 175,4648.350%, 07/15/2046 (A) 728,000 1,107,574
Fidelity National InformationServices, Inc.
1.000%, 12/03/2028 EUR 425,000 511,9361.500%, 05/21/2027 820,000 1,021,880
Fiserv, Inc.1.125%, 07/01/2027 290,000 355,277
Gartner, Inc.3.750%, 10/01/2030 (A) $ 25,000 24,793
j2 Global, Inc.4.625%, 10/15/2030 (A) 340,000 343,400
SK Hynix, Inc.1.500%, 01/19/2026 (A) 485,000 477,279
Strategic Income Opportunities Trust (continued)Shares orPrincipalAmount Value
CORPORATE BONDS (continued)Materials (continued)CSN Islands XI Corp.
6.750%, 01/28/2028 (A) $ 650,000 $ 688,708Ecolab, Inc.
1.000%, 01/15/2024 EUR 330,000 397,782FMG Resources August 2006 Pty, Ltd.
4.375%, 04/01/2031 (A) $ 795,000 809,413Freeport-McMoRan, Inc.
4.125%, 03/01/2028 140,000 147,1684.625%, 08/01/2030 985,000 1,071,9025.450%, 03/15/2043 1,460,000 1,756,380
FS Luxembourg Sarl10.000%, 12/15/2025 (A) 630,000 693,662
Indonesia Asahan Aluminium PerseroPT4.750%, 05/15/2025 (A) 1,090,000 1,184,503
NOVA Chemicals Corp.5.250%, 06/01/2027 (A) 100,000 104,937
Reynolds Group Issuer, Inc.4.000%, 10/15/2027 (A) 1,285,000 1,259,300
St. Mary's Cement, Inc.5.750%, 01/28/2027 (A) 615,000 697,109
Standard Industries, Inc.3.375%, 01/15/2031 (A) 255,000 241,613
5.000%, 02/15/2027 (A) 90,000 93,825
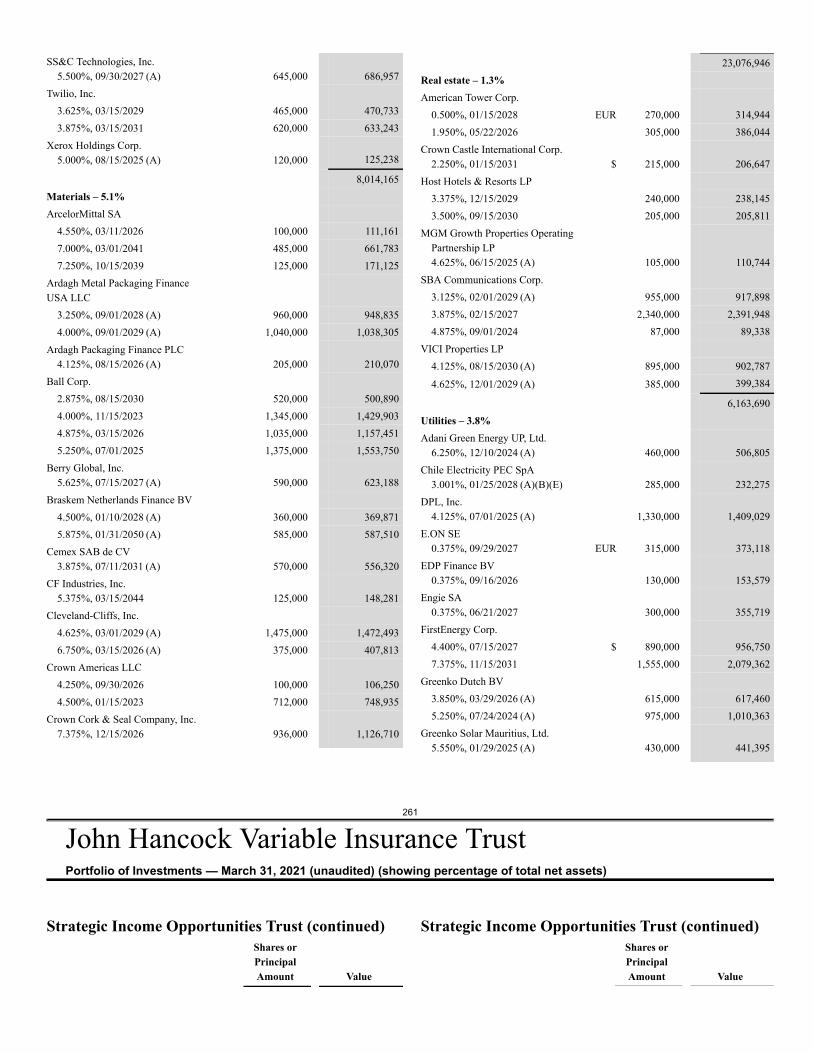
261
John Hancock Variable Insurance TrustPortfolio of Investments — March 31, 2021 (unaudited) (showing percentage of total net assets)
SS&C Technologies, Inc.5.500%, 09/30/2027 (A) 645,000 686,957
Twilio, Inc.3.625%, 03/15/2029 465,000 470,7333.875%, 03/15/2031 620,000 633,243
Xerox Holdings Corp.5.000%, 08/15/2025 (A) 120,000 125,238
8,014,165Materials – 5.1%ArcelorMittal SA
4.550%, 03/11/2026 100,000 111,1617.000%, 03/01/2041 485,000 661,7837.250%, 10/15/2039 125,000 171,125
Ardagh Metal Packaging FinanceUSA LLC
3.250%, 09/01/2028 (A) 960,000 948,8354.000%, 09/01/2029 (A) 1,040,000 1,038,305
Ardagh Packaging Finance PLC4.125%, 08/15/2026 (A) 205,000 210,070
Ball Corp.2.875%, 08/15/2030 520,000 500,8904.000%, 11/15/2023 1,345,000 1,429,9034.875%, 03/15/2026 1,035,000 1,157,4515.250%, 07/01/2025 1,375,000 1,553,750
Berry Global, Inc.5.625%, 07/15/2027 (A) 590,000 623,188
Braskem Netherlands Finance BV4.500%, 01/10/2028 (A) 360,000 369,8715.875%, 01/31/2050 (A) 585,000 587,510
Cemex SAB de CV3.875%, 07/11/2031 (A) 570,000 556,320
CF Industries, Inc.5.375%, 03/15/2044 125,000 148,281
Cleveland-Cliffs, Inc.4.625%, 03/01/2029 (A) 1,475,000 1,472,4936.750%, 03/15/2026 (A) 375,000 407,813
Crown Americas LLC4.250%, 09/30/2026 100,000 106,2504.500%, 01/15/2023 712,000 748,935
Crown Cork & Seal Company, Inc.7.375%, 12/15/2026 936,000 1,126,710
23,076,946Real estate – 1.3%American Tower Corp.
0.500%, 01/15/2028 EUR 270,000 314,9441.950%, 05/22/2026 305,000 386,044
Crown Castle International Corp.2.250%, 01/15/2031 $ 215,000 206,647
Host Hotels & Resorts LP3.375%, 12/15/2029 240,000 238,1453.500%, 09/15/2030 205,000 205,811
MGM Growth Properties OperatingPartnership LP4.625%, 06/15/2025 (A) 105,000 110,744
SBA Communications Corp.3.125%, 02/01/2029 (A) 955,000 917,8983.875%, 02/15/2027 2,340,000 2,391,9484.875%, 09/01/2024 87,000 89,338
VICI Properties LP4.125%, 08/15/2030 (A) 895,000 902,787
4.625%, 12/01/2029 (A) 385,000 399,384
6,163,690Utilities – 3.8%Adani Green Energy UP, Ltd.
6.250%, 12/10/2024 (A) 460,000 506,805Chile Electricity PEC SpA
3.001%, 01/25/2028 (A)(B)(E) 285,000 232,275DPL, Inc.
4.125%, 07/01/2025 (A) 1,330,000 1,409,029E.ON SE
0.375%, 09/29/2027 EUR 315,000 373,118EDP Finance BV
0.375%, 09/16/2026 130,000 153,579Engie SA
0.375%, 06/21/2027 300,000 355,719FirstEnergy Corp.
4.400%, 07/15/2027 $ 890,000 956,7507.375%, 11/15/2031 1,555,000 2,079,362
Greenko Dutch BV3.850%, 03/29/2026 (A) 615,000 617,4605.250%, 07/24/2024 (A) 975,000 1,010,363
Greenko Solar Mauritius, Ltd.5.550%, 01/29/2025 (A) 430,000 441,395
Strategic Income Opportunities Trust (continued)Shares orPrincipalAmount Value
Strategic Income Opportunities Trust (continued)Shares orPrincipalAmount Value
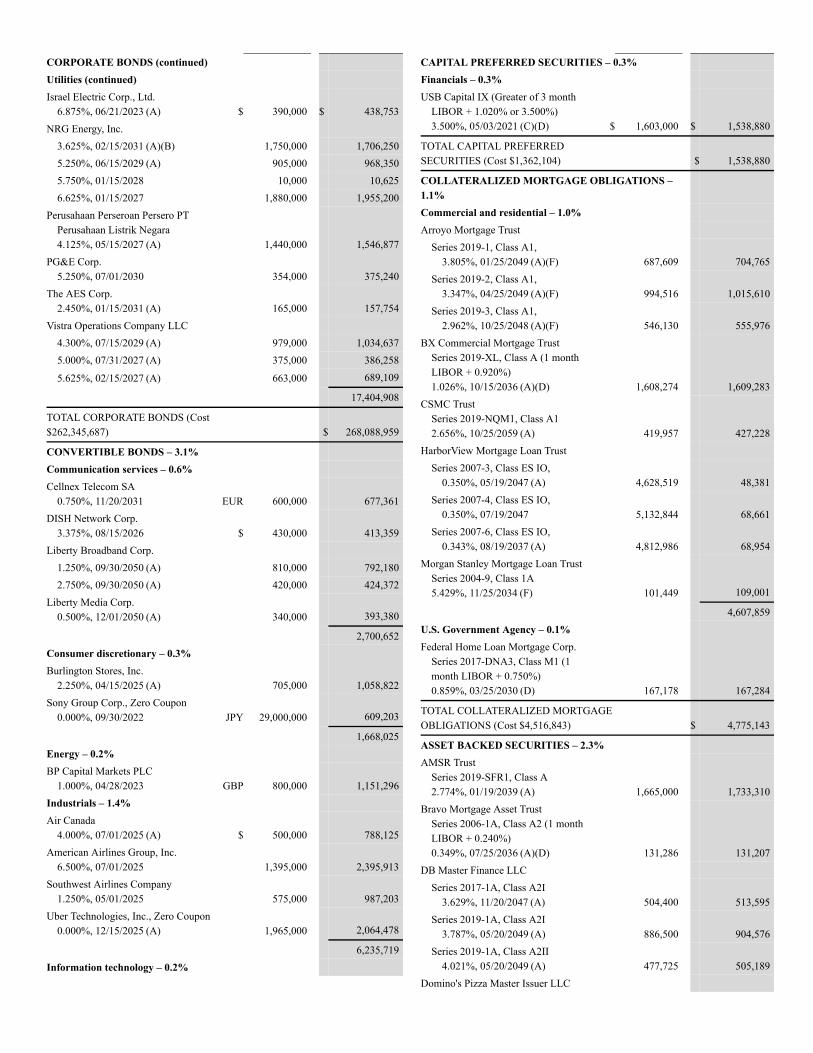
CORPORATE BONDS (continued)Utilities (continued)Israel Electric Corp., Ltd.
6.875%, 06/21/2023 (A) $ 390,000 $ 438,753NRG Energy, Inc.
3.625%, 02/15/2031 (A)(B) 1,750,000 1,706,2505.250%, 06/15/2029 (A) 905,000 968,3505.750%, 01/15/2028 10,000 10,6256.625%, 01/15/2027 1,880,000 1,955,200
Perusahaan Perseroan Persero PTPerusahaan Listrik Negara4.125%, 05/15/2027 (A) 1,440,000 1,546,877
PG&E Corp.5.250%, 07/01/2030 354,000 375,240
The AES Corp.2.450%, 01/15/2031 (A) 165,000 157,754
Vistra Operations Company LLC4.300%, 07/15/2029 (A) 979,000 1,034,6375.000%, 07/31/2027 (A) 375,000 386,258
5.625%, 02/15/2027 (A) 663,000 689,109
17,404,908
TOTAL CORPORATE BONDS (Cost$262,345,687) $ 268,088,959
CONVERTIBLE BONDS – 3.1%Communication services – 0.6%Cellnex Telecom SA
0.750%, 11/20/2031 EUR 600,000 677,361DISH Network Corp.
3.375%, 08/15/2026 $ 430,000 413,359Liberty Broadband Corp.
1.250%, 09/30/2050 (A) 810,000 792,1802.750%, 09/30/2050 (A) 420,000 424,372
Liberty Media Corp.0.500%, 12/01/2050 (A) 340,000 393,380
2,700,652Consumer discretionary – 0.3%Burlington Stores, Inc.
2.250%, 04/15/2025 (A) 705,000 1,058,822Sony Group Corp., Zero Coupon
0.000%, 09/30/2022 JPY 29,000,000 609,203
1,668,025Energy – 0.2%BP Capital Markets PLC
1.000%, 04/28/2023 GBP 800,000 1,151,296Industrials – 1.4%Air Canada
4.000%, 07/01/2025 (A) $ 500,000 788,125American Airlines Group, Inc.
6.500%, 07/01/2025 1,395,000 2,395,913Southwest Airlines Company
1.250%, 05/01/2025 575,000 987,203Uber Technologies, Inc., Zero Coupon
0.000%, 12/15/2025 (A) 1,965,000 2,064,478
6,235,719Information technology – 0.2%
CAPITAL PREFERRED SECURITIES – 0.3%Financials – 0.3%USB Capital IX (Greater of 3 month
LIBOR + 1.020% or 3.500%)3.500%, 05/03/2021 (C)(D) $ 1,603,000 $ 1,538,880
TOTAL CAPITAL PREFERREDSECURITIES (Cost $1,362,104) $ 1,538,880
COLLATERALIZED MORTGAGE OBLIGATIONS –1.1%Commercial and residential – 1.0%Arroyo Mortgage Trust
Series 2019-1, Class A1,3.805%, 01/25/2049 (A)(F) 687,609 704,765
Series 2019-2, Class A1,3.347%, 04/25/2049 (A)(F) 994,516 1,015,610
Series 2019-3, Class A1,2.962%, 10/25/2048 (A)(F) 546,130 555,976
BX Commercial Mortgage TrustSeries 2019-XL, Class A (1 monthLIBOR + 0.920%)1.026%, 10/15/2036 (A)(D) 1,608,274 1,609,283
CSMC TrustSeries 2019-NQM1, Class A12.656%, 10/25/2059 (A) 419,957 427,228
HarborView Mortgage Loan TrustSeries 2007-3, Class ES IO,
0.350%, 05/19/2047 (A) 4,628,519 48,381Series 2007-4, Class ES IO,
0.350%, 07/19/2047 5,132,844 68,661Series 2007-6, Class ES IO,
0.343%, 08/19/2037 (A) 4,812,986 68,954Morgan Stanley Mortgage Loan Trust
Series 2004-9, Class 1A5.429%, 11/25/2034 (F) 101,449 109,001
4,607,859U.S. Government Agency – 0.1%Federal Home Loan Mortgage Corp.
Series 2017-DNA3, Class M1 (1month LIBOR + 0.750%)0.859%, 03/25/2030 (D) 167,178 167,284
TOTAL COLLATERALIZED MORTGAGEOBLIGATIONS (Cost $4,516,843) $ 4,775,143
ASSET BACKED SECURITIES – 2.3%AMSR Trust
Series 2019-SFR1, Class A2.774%, 01/19/2039 (A) 1,665,000 1,733,310
Bravo Mortgage Asset TrustSeries 2006-1A, Class A2 (1 monthLIBOR + 0.240%)0.349%, 07/25/2036 (A)(D) 131,286 131,207
DB Master Finance LLCSeries 2017-1A, Class A2I
3.629%, 11/20/2047 (A) 504,400 513,595Series 2019-1A, Class A2I
3.787%, 05/20/2049 (A) 886,500 904,576Series 2019-1A, Class A2II
4.021%, 05/20/2049 (A) 477,725 505,189Domino's Pizza Master Issuer LLC
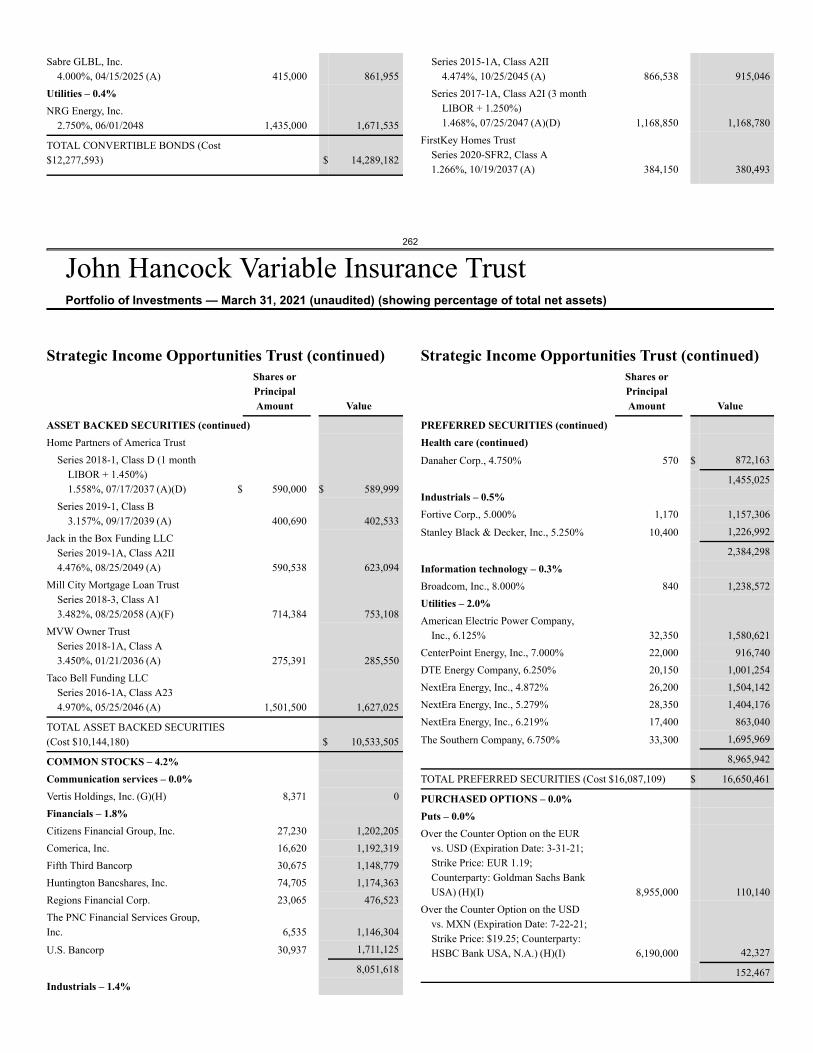
262
John Hancock Variable Insurance TrustPortfolio of Investments — March 31, 2021 (unaudited) (showing percentage of total net assets)
Sabre GLBL, Inc.4.000%, 04/15/2025 (A) 415,000 861,955
Utilities – 0.4%NRG Energy, Inc.
2.750%, 06/01/2048 1,435,000 1,671,535
TOTAL CONVERTIBLE BONDS (Cost$12,277,593) $ 14,289,182
Series 2015-1A, Class A2II4.474%, 10/25/2045 (A) 866,538 915,046
Series 2017-1A, Class A2I (3 monthLIBOR + 1.250%)1.468%, 07/25/2047 (A)(D) 1,168,850 1,168,780
FirstKey Homes TrustSeries 2020-SFR2, Class A1.266%, 10/19/2037 (A) 384,150 380,493
Strategic Income Opportunities Trust (continued)Shares orPrincipalAmount Value
ASSET BACKED SECURITIES (continued)Home Partners of America Trust
Series 2018-1, Class D (1 monthLIBOR + 1.450%)1.558%, 07/17/2037 (A)(D) $ 590,000 $ 589,999
Series 2019-1, Class B3.157%, 09/17/2039 (A) 400,690 402,533
Jack in the Box Funding LLCSeries 2019-1A, Class A2II4.476%, 08/25/2049 (A) 590,538 623,094
Mill City Mortgage Loan TrustSeries 2018-3, Class A13.482%, 08/25/2058 (A)(F) 714,384 753,108
MVW Owner TrustSeries 2018-1A, Class A3.450%, 01/21/2036 (A) 275,391 285,550
Taco Bell Funding LLCSeries 2016-1A, Class A234.970%, 05/25/2046 (A) 1,501,500 1,627,025
TOTAL ASSET BACKED SECURITIES(Cost $10,144,180) $ 10,533,505
COMMON STOCKS – 4.2%Communication services – 0.0%Vertis Holdings, Inc. (G)(H) 8,371 0Financials – 1.8%Citizens Financial Group, Inc. 27,230 1,202,205Comerica, Inc. 16,620 1,192,319Fifth Third Bancorp 30,675 1,148,779Huntington Bancshares, Inc. 74,705 1,174,363Regions Financial Corp. 23,065 476,523The PNC Financial Services Group,Inc. 6,535 1,146,304
U.S. Bancorp 30,937 1,711,125
8,051,618Industrials – 1.4%
Strategic Income Opportunities Trust (continued)Shares orPrincipalAmount Value
PREFERRED SECURITIES (continued)Health care (continued)Danaher Corp., 4.750% 570 $ 872,163
1,455,025Industrials – 0.5%Fortive Corp., 5.000% 1,170 1,157,306
Stanley Black & Decker, Inc., 5.250% 10,400 1,226,992
2,384,298Information technology – 0.3%Broadcom, Inc., 8.000% 840 1,238,572Utilities – 2.0%American Electric Power Company,
Inc., 6.125% 32,350 1,580,621CenterPoint Energy, Inc., 7.000% 22,000 916,740DTE Energy Company, 6.250% 20,150 1,001,254NextEra Energy, Inc., 4.872% 26,200 1,504,142NextEra Energy, Inc., 5.279% 28,350 1,404,176NextEra Energy, Inc., 6.219% 17,400 863,040
The Southern Company, 6.750% 33,300 1,695,969
8,965,942
TOTAL PREFERRED SECURITIES (Cost $16,087,109) $ 16,650,461
PURCHASED OPTIONS – 0.0%Puts – 0.0%Over the Counter Option on the EUR
vs. USD (Expiration Date: 3-31-21;Strike Price: EUR 1.19;Counterparty: Goldman Sachs BankUSA) (H)(I) 8,955,000 110,140
Over the Counter Option on the USDvs. MXN (Expiration Date: 7-22-21;Strike Price: $19.25; Counterparty:HSBC Bank USA, N.A.) (H)(I) 6,190,000 42,327
152,467
263
John Hancock Variable Insurance TrustPortfolio of Investments — March 31, 2021 (unaudited) (showing percentage of total net assets)
Delta Air Lines, Inc. (H) 60,240 2,908,387HC2 Holdings, Inc. (H) 88,710 349,517
The Boeing Company (H) 12,542 3,194,698
6,452,602Real estate – 0.6%Americold Realty Trust 13,451 517,460
RioCan Real Estate Investment Trust 149,241 2,310,997
2,828,457Utilities – 0.4%Dominion Energy, Inc. 18,000 1,779,120
TOTAL COMMON STOCKS (Cost $18,132,137) $ 19,111,797
PREFERRED SECURITIES – 3.6%Communication services – 0.1%2020 Cash Mandatory Exchangeable
Trust, 5.250% (A) 475 534,209Financials – 0.4%U.S. Bancorp (Greater of 3 month
LIBOR + 1.020% or 3.500%),3.500% (D) 804 743,716
Valley National Bancorp (5.500% to9-30-22, then 3 month LIBOR +3.578%) 22,825 588,885
Wells Fargo & Company (5.850% to9-15-23, then 3 month LIBOR +3.090%) 27,605 739,814
2,072,415Health care – 0.3%Becton, Dickinson and Company,
6.000% 10,850 582,862
TOTAL PURCHASED OPTIONS (Cost $116,699) $ 152,467
SHORT-TERM INVESTMENTS – 2.6%Short-term funds – 1.2%John Hancock Collateral Trust,
0.0470% (J)(K) 533,886 5,341,473Repurchase agreement – 1.4%Repurchase Agreement with State
Street Corp. dated 3-31-21 at0.000% to be repurchased at$6,533,000 on 4-1-21, collateralizedby $6,500,600 U.S. Treasury Notes,1.750% due 6-15-22 (valued at$6,663,740) $ 6,533,000 6,533,000
TOTAL SHORT-TERM INVESTMENTS (Cost$11,874,682) $ 11,874,473
Total Investments (Strategic Income OpportunitiesTrust)(Cost $446,844,121) – 100.3% $ 457,610,573
Other assets and liabilities, net – (0.3%) (1,572,664)
TOTAL NET ASSETS – 100.0% $ 456,037,909
Currency AbbreviationsAUD Australian DollarBRL Brazilian RealCAD Canadian DollarCNY Chinese Yuan RenminbiCOP Colombian PesoEUR EuroGBP Pound SterlingIDR Indonesian RupiahINR Indian Rupee
Strategic Income Opportunities Trust (continued)JPY Japanese YenKRW Korean WonMXN Mexican PesoMYR Malaysian RinggitNOK Norwegian KroneNZD New Zealand DollarPHP Philippine PesoSGD Singapore Dollar
Security Abbreviations and LegendBBSW Bank Bill Swap RateCMT Constant Maturity TreasuryEURIBOR Euro Interbank Offered RateICE Intercontinental Exchange
Strategic Income Opportunities Trust (continued)(B) All or a portion of this security is on loan as of 3-31-21. The value of
securities on loan amounted to $5,197,961.(C) Perpetual bonds have no stated maturity date. Date shown as maturity
date is next call date.(D) Variable rate obligation. The coupon rate shown represents the rate at
period end.(E) Zero coupon bonds are issued at a discount from their principal
amount in lieu of paying interest periodically. Rate shown is theeffective yield at period end.
(F) Variable or floating rate security, the interest rate of which adjustsperiodically based on a weighted average of interest rates andprepayments on the underlying pool of assets. The interest rate shownis the current rate as of period end.
(G) Security is valued using significant unobservable inputs and isclassified as Level 3 in the fair value hierarchy.
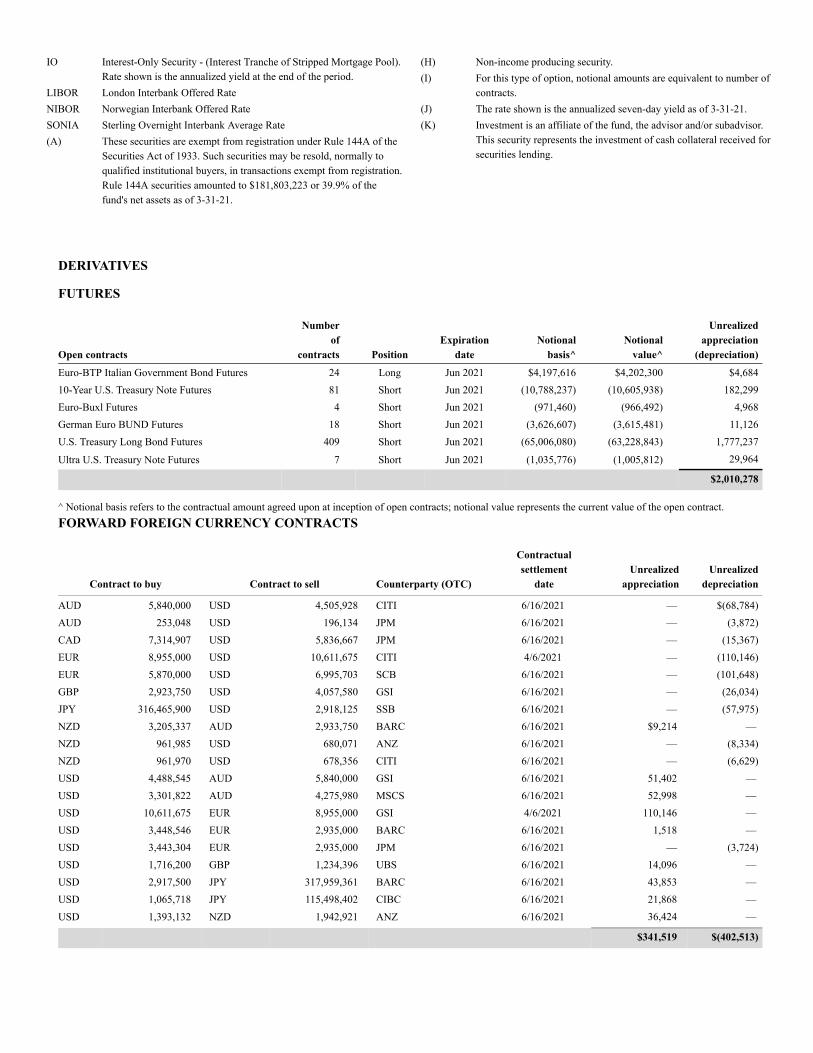
DERIVATIVES
FUTURES
Open contracts
Numberof
contracts PositionExpiration
dateNotional
basis^Notional
value^
Unrealizedappreciation
(depreciation)Euro-BTP Italian Government Bond Futures 24 Long Jun 2021 $4,197,616 $4,202,300 $4,68410-Year U.S. Treasury Note Futures 81 Short Jun 2021 (10,788,237) (10,605,938) 182,299Euro-Buxl Futures 4 Short Jun 2021 (971,460) (966,492) 4,968German Euro BUND Futures 18 Short Jun 2021 (3,626,607) (3,615,481) 11,126U.S. Treasury Long Bond Futures 409 Short Jun 2021 (65,006,080) (63,228,843) 1,777,237
Ultra U.S. Treasury Note Futures 7 Short Jun 2021 (1,035,776) (1,005,812) 29,964
$2,010,278
^ Notional basis refers to the contractual amount agreed upon at inception of open contracts; notional value represents the current value of the open contract.FORWARD FOREIGN CURRENCY CONTRACTS
Contract to buy Contract to sell Counterparty (OTC)
Contractualsettlement
dateUnrealized
appreciationUnrealized
depreciation
AUD 5,840,000 USD 4,505,928 CITI 6/16/2021 — $(68,784)AUD 253,048 USD 196,134 JPM 6/16/2021 — (3,872)CAD 7,314,907 USD 5,836,667 JPM 6/16/2021 — (15,367)EUR 8,955,000 USD 10,611,675 CITI 4/6/2021 — (110,146)EUR 5,870,000 USD 6,995,703 SCB 6/16/2021 — (101,648)GBP 2,923,750 USD 4,057,580 GSI 6/16/2021 — (26,034)JPY 316,465,900 USD 2,918,125 SSB 6/16/2021 — (57,975)NZD 3,205,337 AUD 2,933,750 BARC 6/16/2021 $9,214 —NZD 961,985 USD 680,071 ANZ 6/16/2021 — (8,334)NZD 961,970 USD 678,356 CITI 6/16/2021 — (6,629)USD 4,488,545 AUD 5,840,000 GSI 6/16/2021 51,402 —USD 3,301,822 AUD 4,275,980 MSCS 6/16/2021 52,998 —USD 10,611,675 EUR 8,955,000 GSI 4/6/2021 110,146 —USD 3,448,546 EUR 2,935,000 BARC 6/16/2021 1,518 —USD 3,443,304 EUR 2,935,000 JPM 6/16/2021 — (3,724)USD 1,716,200 GBP 1,234,396 UBS 6/16/2021 14,096 —USD 2,917,500 JPY 317,959,361 BARC 6/16/2021 43,853 —USD 1,065,718 JPY 115,498,402 CIBC 6/16/2021 21,868 —USD 1,393,132 NZD 1,942,921 ANZ 6/16/2021 36,424 —
$341,519 $(402,513)
IO Interest-Only Security - (Interest Tranche of Stripped Mortgage Pool).Rate shown is the annualized yield at the end of the period.
LIBOR London Interbank Offered RateNIBOR Norwegian Interbank Offered RateSONIA Sterling Overnight Interbank Average Rate(A) These securities are exempt from registration under Rule 144A of the
Securities Act of 1933. Such securities may be resold, normally toqualified institutional buyers, in transactions exempt from registration.Rule 144A securities amounted to $181,803,223 or 39.9% of thefund's net assets as of 3-31-21.
(H) Non-income producing security.(I) For this type of option, notional amounts are equivalent to number of
contracts.(J) The rate shown is the annualized seven-day yield as of 3-31-21.(K) Investment is an affiliate of the fund, the advisor and/or subadvisor.
This security represents the investment of cash collateral received forsecurities lending.
264
John Hancock Variable Insurance TrustPortfolio of Investments — March 31, 2021 (unaudited) (showing percentage of total net assets)
Strategic Income Opportunities Trust (continued)
WRITTEN OPTIONS
Foreign currency options
DescriptionCounterparty(OTC) Currency
Exerciseprice
Expirationdate
Notionalamount* Premium Value
CallsEuro vs. U.S. Dollar CITI EUR 1.20 Mar 2021 9,705,000 $140,722 $ (11)
$140,722 $ (11)PutsEuro vs. U.S. Dollar CITI EUR 1.19 Mar 2021 8,955,000 72,536 (110,140)
$ 72,536 $(110,140)$213,258 $(110,151)
* For this type of option, notional amounts are equivalent to number of contracts.
Derivatives Currency AbbreviationsAUD Australian DollarCAD Canadian DollarEUR EuroGBP Pound SterlingJPY Japanese YenNZD New Zealand DollarUSD U.S. Dollar
Derivatives AbbreviationsANZ Australia and New Zealand Banking Group LimitedBARC Barclays Bank PLCCIBC Canadian Imperial Bank of CommerceCITI Citibank, N.A.GSI Goldman Sachs InternationalJPM JPMorgan Chase Bank, N.A.MSCS Morgan Stanley Capital Services LLCOTC Over-the-counterSCB Standard Chartered BankSSB State Street Bank and Trust CompanyUBS UBS AG
Total Bond Market TrustShares orPrincipalAmount Value
U.S. GOVERNMENT AND AGENCYOBLIGATIONS –66.0%U.S. Government –36.8%
Total Bond Market Trust (continued)Shares orPrincipalAmount Value
U.S. GOVERNMENT AND AGENCYOBLIGATIONS (continued)U.S. Government (continued)U.S. Treasury Notes (continued)
265
John Hancock Variable Insurance TrustPortfolio of Investments — March 31, 2021 (unaudited) (showing percentage of total net assets)
U.S. Treasury Bonds1.250%, 05/15/2050 $ 8,000,000 $ 6,037,1882.000%, 02/15/2050 3,000,000 2,743,4772.250%, 08/15/2049 2,000,000 1,933,9842.750%, 08/15/2047 3,000,000 3,206,4842.875%, 05/15/2049 1,500,000 1,647,1883.000%, 02/15/2047 to02/15/2049 28,635,000 32,078,4584.250%, 05/15/2039 to11/15/2040 4,610,000 6,063,5114.375%, 05/15/2041 1,830,000 2,464,9244.625%, 02/15/2040 5,000,000 6,895,5084.750%, 02/15/2041 2,000,000 2,815,7818.125%, 08/15/2021 1,400,000 1,442,438
U.S. Treasury Notes0.125%, 10/31/2022 to02/28/2023 16,000,000 15,996,5630.250%, 11/15/2023 to10/31/2025 32,000,000 31,581,2490.375%, 07/31/2027 4,000,000 3,778,5940.500%, 10/31/2027 12,000,000 11,365,7810.625%, 03/31/2027 to05/15/2030 16,000,000 14,901,0160.750%, 01/31/2026 4,000,000 3,968,5941.250%, 08/31/2024 5,000,000 5,129,8831.375%, 08/31/2026 5,000,000 5,086,5231.500%, 01/31/2027 5,000,000 5,098,8281.625%, 08/15/2029 8,000,000 8,028,4381.750%, 07/31/2021 to12/31/2024 13,000,000 13,307,930
2.000%, 11/15/2021 to 02/15/2022 $ 29,400,000 $ 29,778,6522.125%, 05/31/2026 3,000,000 3,174,0232.250%, 11/15/2027 20,595,000 21,800,9342.375%, 05/15/2029 5,000,000 5,313,2812.625%, 02/28/2023 3,000,000 3,140,7422.750%, 04/30/2023 3,500,000 3,685,9382.875%, 11/30/2023 to 05/15/2028 9,300,000 10,147,2193.000%, 10/31/2025 2,000,000 2,196,641
3.125%, 05/15/2021 13,100,000 13,148,626
277,958,396U.S. Government Agency – 29.2%Federal Home Loan Bank
5.500%, 07/15/2036 1,690,000 2,438,371Federal Home Loan Mortgage Corp.
2.000%, 07/01/2035 1,166,606 1,198,2782.375%, 01/13/2022 1,500,000 1,527,0912.475%, (12 month LIBOR +
2.100%), 02/01/2037 (A) 58,201 61,2682.500%, 04/01/2031 to 08/01/2050 5,883,866 6,058,7792.532%, (12 month LIBOR +
1.863%), 08/01/2037 (A) 420,270 440,3152.750%, 06/19/2023 2,000,000 2,112,261
Total Bond Market Trust (continued)Shares orPrincipalAmount Value
U.S. GOVERNMENT AND AGENCYOBLIGATIONS (continued)U.S. Government Agency(continued)Federal Home LoanMortgage Corp. (continued)
3.000%, 07/01/2032 to 08/01/2046 $ 5,543,133 $ 5,887,3133.500%, 12/01/2025 to 06/01/2048 4,813,895 5,153,8064.000%, 02/01/2024 to 09/01/2047 2,212,087 2,400,7244.500%, 05/01/2024 to 11/01/2048 3,573,943 3,924,6325.000%, 06/01/2023 to 09/01/2039 257,660 293,2905.500%, 02/01/2023 to 01/01/2039 422,649 488,153
Total Bond Market Trust (continued)Shares orPrincipalAmount Value
U.S. GOVERNMENT AND AGENCYOBLIGATIONS (continued)U.S. Government Agency(continued)Government NationalMortgage Association (continued)
6.500%, 05/15/2028 to 12/15/2038 $ 151,192 $ 177,6837.000%, 08/15/2029 to 05/15/2032 26,159 30,1297.500%, 09/15/2030 to 01/15/2031 6,250 7,327
8.000%, 04/15/2031 6,754 8,010
220,788,936
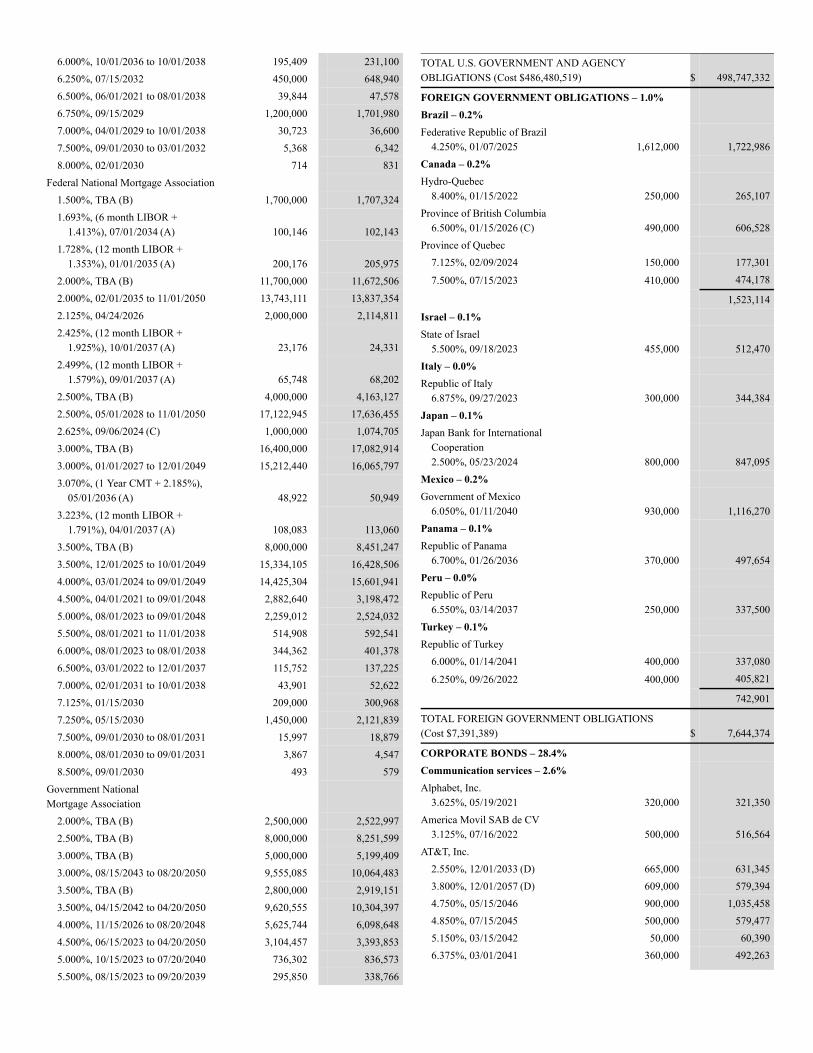
6.000%, 10/01/2036 to 10/01/2038 195,409 231,1006.250%, 07/15/2032 450,000 648,9406.500%, 06/01/2021 to 08/01/2038 39,844 47,5786.750%, 09/15/2029 1,200,000 1,701,9807.000%, 04/01/2029 to 10/01/2038 30,723 36,6007.500%, 09/01/2030 to 03/01/2032 5,368 6,3428.000%, 02/01/2030 714 831
Federal National Mortgage Association1.500%, TBA (B) 1,700,000 1,707,3241.693%, (6 month LIBOR +
1.413%), 07/01/2034 (A) 100,146 102,1431.728%, (12 month LIBOR +
1.353%), 01/01/2035 (A) 200,176 205,9752.000%, TBA (B) 11,700,000 11,672,5062.000%, 02/01/2035 to 11/01/2050 13,743,111 13,837,3542.125%, 04/24/2026 2,000,000 2,114,8112.425%, (12 month LIBOR +
1.925%), 10/01/2037 (A) 23,176 24,3312.499%, (12 month LIBOR +
1.579%), 09/01/2037 (A) 65,748 68,2022.500%, TBA (B) 4,000,000 4,163,1272.500%, 05/01/2028 to 11/01/2050 17,122,945 17,636,4552.625%, 09/06/2024 (C) 1,000,000 1,074,7053.000%, TBA (B) 16,400,000 17,082,9143.000%, 01/01/2027 to 12/01/2049 15,212,440 16,065,7973.070%, (1 Year CMT + 2.185%),
05/01/2036 (A) 48,922 50,9493.223%, (12 month LIBOR +
1.791%), 04/01/2037 (A) 108,083 113,0603.500%, TBA (B) 8,000,000 8,451,2473.500%, 12/01/2025 to 10/01/2049 15,334,105 16,428,5064.000%, 03/01/2024 to 09/01/2049 14,425,304 15,601,9414.500%, 04/01/2021 to 09/01/2048 2,882,640 3,198,4725.000%, 08/01/2023 to 09/01/2048 2,259,012 2,524,0325.500%, 08/01/2021 to 11/01/2038 514,908 592,5416.000%, 08/01/2023 to 08/01/2038 344,362 401,3786.500%, 03/01/2022 to 12/01/2037 115,752 137,2257.000%, 02/01/2031 to 10/01/2038 43,901 52,6227.125%, 01/15/2030 209,000 300,9687.250%, 05/15/2030 1,450,000 2,121,8397.500%, 09/01/2030 to 08/01/2031 15,997 18,8798.000%, 08/01/2030 to 09/01/2031 3,867 4,5478.500%, 09/01/2030 493 579
Government NationalMortgage Association
2.000%, TBA (B) 2,500,000 2,522,9972.500%, TBA (B) 8,000,000 8,251,5993.000%, TBA (B) 5,000,000 5,199,4093.000%, 08/15/2043 to 08/20/2050 9,555,085 10,064,4833.500%, TBA (B) 2,800,000 2,919,1513.500%, 04/15/2042 to 04/20/2050 9,620,555 10,304,3974.000%, 11/15/2026 to 08/20/2048 5,625,744 6,098,6484.500%, 06/15/2023 to 04/20/2050 3,104,457 3,393,8535.000%, 10/15/2023 to 07/20/2040 736,302 836,5735.500%, 08/15/2023 to 09/20/2039 295,850 338,766
TOTAL U.S. GOVERNMENT AND AGENCYOBLIGATIONS (Cost $486,480,519) $ 498,747,332
FOREIGN GOVERNMENT OBLIGATIONS – 1.0%Brazil – 0.2%Federative Republic of Brazil
4.250%, 01/07/2025 1,612,000 1,722,986Canada – 0.2%Hydro-Quebec
8.400%, 01/15/2022 250,000 265,107Province of British Columbia
6.500%, 01/15/2026 (C) 490,000 606,528Province of Quebec
7.125%, 02/09/2024 150,000 177,301
7.500%, 07/15/2023 410,000 474,178
1,523,114Israel – 0.1%State of Israel
5.500%, 09/18/2023 455,000 512,470Italy – 0.0%Republic of Italy
6.875%, 09/27/2023 300,000 344,384Japan – 0.1%Japan Bank for International
Cooperation2.500%, 05/23/2024 800,000 847,095
Mexico – 0.2%Government of Mexico
6.050%, 01/11/2040 930,000 1,116,270Panama – 0.1%Republic of Panama
6.700%, 01/26/2036 370,000 497,654Peru – 0.0%Republic of Peru
6.550%, 03/14/2037 250,000 337,500Turkey – 0.1%Republic of Turkey
6.000%, 01/14/2041 400,000 337,080
6.250%, 09/26/2022 400,000 405,821
742,901
TOTAL FOREIGN GOVERNMENT OBLIGATIONS(Cost $7,391,389) $ 7,644,374
CORPORATE BONDS – 28.4%Communication services – 2.6%Alphabet, Inc.
3.625%, 05/19/2021 320,000 321,350America Movil SAB de CV
3.125%, 07/16/2022 500,000 516,564AT&T, Inc.
2.550%, 12/01/2033 (D) 665,000 631,3453.800%, 12/01/2057 (D) 609,000 579,3944.750%, 05/15/2046 900,000 1,035,4584.850%, 07/15/2045 500,000 579,4775.150%, 03/15/2042 50,000 60,3906.375%, 03/01/2041 360,000 492,263
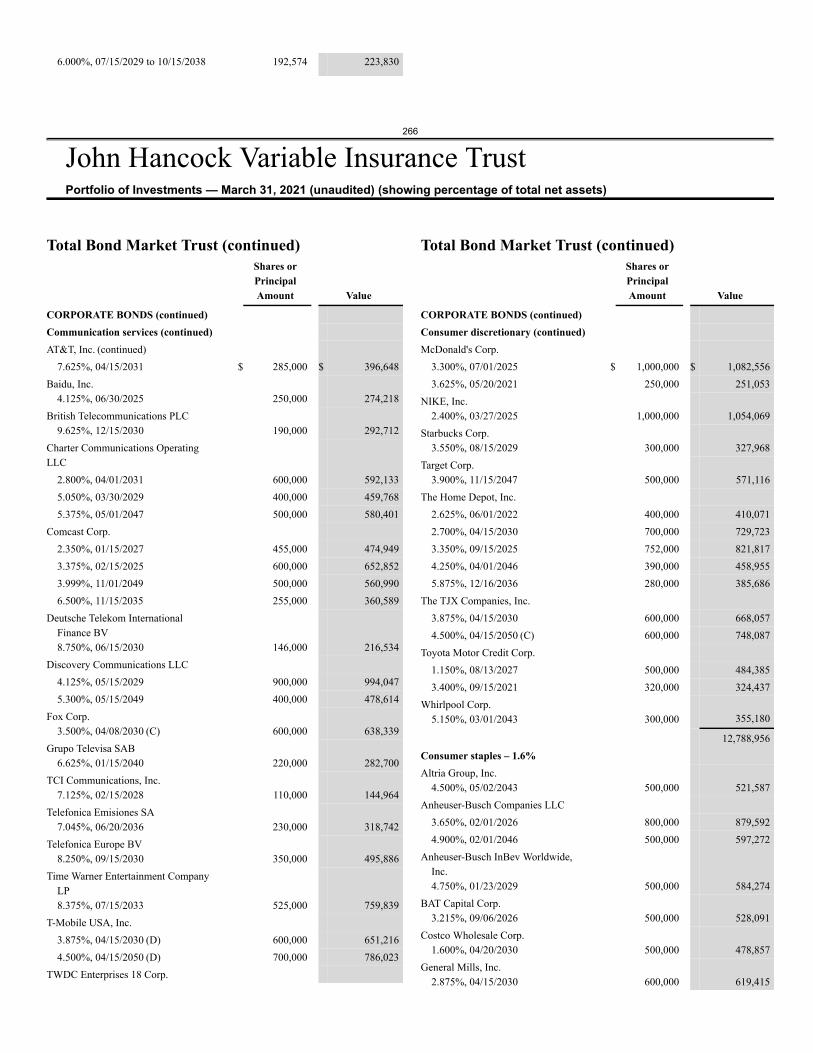
266
John Hancock Variable Insurance TrustPortfolio of Investments — March 31, 2021 (unaudited) (showing percentage of total net assets)
6.000%, 07/15/2029 to 10/15/2038 192,574 223,830
Total Bond Market Trust (continued)Shares orPrincipalAmount Value
CORPORATE BONDS (continued)Communication services (continued)AT&T, Inc. (continued)
7.625%, 04/15/2031 $ 285,000 $ 396,648Baidu, Inc.
4.125%, 06/30/2025 250,000 274,218British Telecommunications PLC
9.625%, 12/15/2030 190,000 292,712Charter Communications OperatingLLC
2.800%, 04/01/2031 600,000 592,1335.050%, 03/30/2029 400,000 459,7685.375%, 05/01/2047 500,000 580,401
Comcast Corp.2.350%, 01/15/2027 455,000 474,9493.375%, 02/15/2025 600,000 652,8523.999%, 11/01/2049 500,000 560,9906.500%, 11/15/2035 255,000 360,589
Deutsche Telekom InternationalFinance BV8.750%, 06/15/2030 146,000 216,534
Discovery Communications LLC4.125%, 05/15/2029 900,000 994,0475.300%, 05/15/2049 400,000 478,614
Fox Corp.3.500%, 04/08/2030 (C) 600,000 638,339
Grupo Televisa SAB6.625%, 01/15/2040 220,000 282,700
TCI Communications, Inc.7.125%, 02/15/2028 110,000 144,964
Telefonica Emisiones SA7.045%, 06/20/2036 230,000 318,742
Telefonica Europe BV8.250%, 09/15/2030 350,000 495,886
Time Warner Entertainment CompanyLP8.375%, 07/15/2033 525,000 759,839
T-Mobile USA, Inc.3.875%, 04/15/2030 (D) 600,000 651,2164.500%, 04/15/2050 (D) 700,000 786,023
TWDC Enterprises 18 Corp.
Total Bond Market Trust (continued)Shares orPrincipalAmount Value
CORPORATE BONDS (continued)Consumer discretionary (continued)McDonald's Corp.
3.300%, 07/01/2025 $ 1,000,000 $ 1,082,5563.625%, 05/20/2021 250,000 251,053
NIKE, Inc.2.400%, 03/27/2025 1,000,000 1,054,069
Starbucks Corp.3.550%, 08/15/2029 300,000 327,968
Target Corp.3.900%, 11/15/2047 500,000 571,116
The Home Depot, Inc.2.625%, 06/01/2022 400,000 410,0712.700%, 04/15/2030 700,000 729,7233.350%, 09/15/2025 752,000 821,8174.250%, 04/01/2046 390,000 458,9555.875%, 12/16/2036 280,000 385,686
The TJX Companies, Inc.3.875%, 04/15/2030 600,000 668,0574.500%, 04/15/2050 (C) 600,000 748,087
Toyota Motor Credit Corp.1.150%, 08/13/2027 500,000 484,3853.400%, 09/15/2021 320,000 324,437
Whirlpool Corp.5.150%, 03/01/2043 300,000 355,180
12,788,956Consumer staples – 1.6%Altria Group, Inc.
4.500%, 05/02/2043 500,000 521,587Anheuser-Busch Companies LLC
3.650%, 02/01/2026 800,000 879,5924.900%, 02/01/2046 500,000 597,272
Anheuser-Busch InBev Worldwide,Inc.4.750%, 01/23/2029 500,000 584,274
BAT Capital Corp.3.215%, 09/06/2026 500,000 528,091
Costco Wholesale Corp.1.600%, 04/20/2030 500,000 478,857
General Mills, Inc.2.875%, 04/15/2030 600,000 619,415
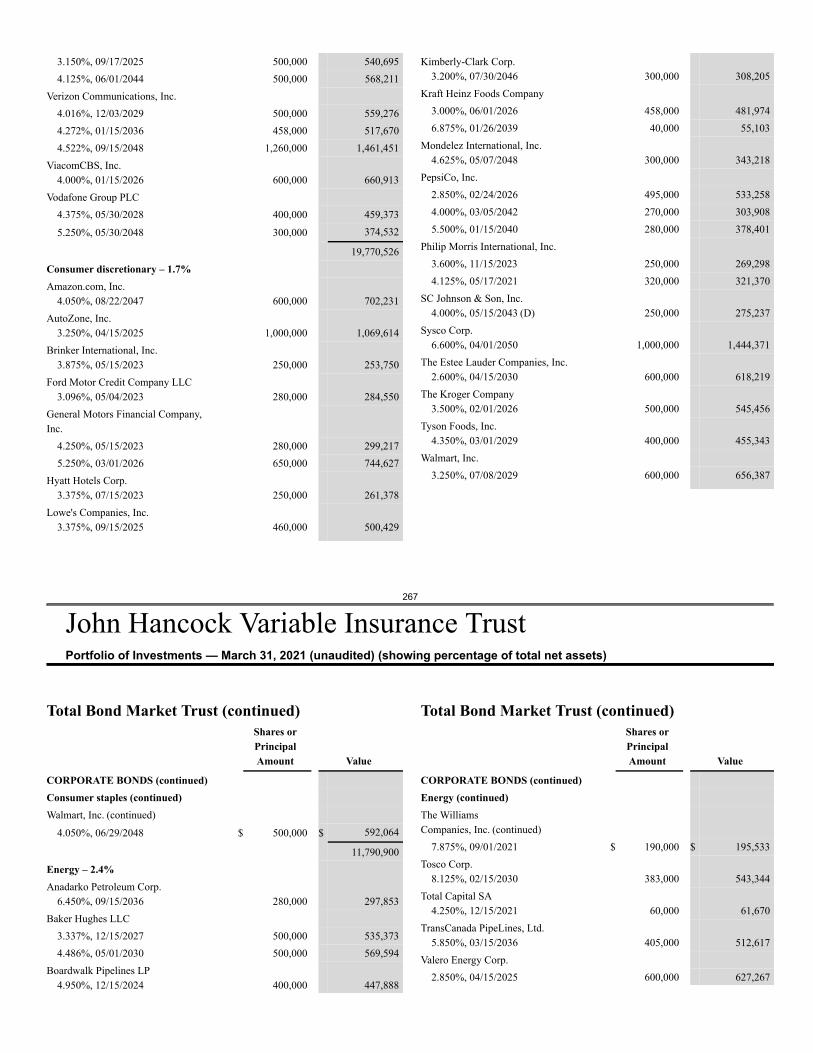
267
John Hancock Variable Insurance TrustPortfolio of Investments — March 31, 2021 (unaudited) (showing percentage of total net assets)
3.150%, 09/17/2025 500,000 540,6954.125%, 06/01/2044 500,000 568,211
Verizon Communications, Inc.4.016%, 12/03/2029 500,000 559,2764.272%, 01/15/2036 458,000 517,6704.522%, 09/15/2048 1,260,000 1,461,451
ViacomCBS, Inc.4.000%, 01/15/2026 600,000 660,913
Vodafone Group PLC4.375%, 05/30/2028 400,000 459,373
5.250%, 05/30/2048 300,000 374,532
19,770,526Consumer discretionary – 1.7%Amazon.com, Inc.
4.050%, 08/22/2047 600,000 702,231AutoZone, Inc.
3.250%, 04/15/2025 1,000,000 1,069,614Brinker International, Inc.
3.875%, 05/15/2023 250,000 253,750Ford Motor Credit Company LLC
3.096%, 05/04/2023 280,000 284,550General Motors Financial Company,Inc.
4.250%, 05/15/2023 280,000 299,2175.250%, 03/01/2026 650,000 744,627
Hyatt Hotels Corp.3.375%, 07/15/2023 250,000 261,378
Lowe's Companies, Inc.3.375%, 09/15/2025 460,000 500,429
Kimberly-Clark Corp.3.200%, 07/30/2046 300,000 308,205
Kraft Heinz Foods Company3.000%, 06/01/2026 458,000 481,9746.875%, 01/26/2039 40,000 55,103
Mondelez International, Inc.4.625%, 05/07/2048 300,000 343,218
PepsiCo, Inc.2.850%, 02/24/2026 495,000 533,2584.000%, 03/05/2042 270,000 303,9085.500%, 01/15/2040 280,000 378,401
Philip Morris International, Inc.3.600%, 11/15/2023 250,000 269,2984.125%, 05/17/2021 320,000 321,370
SC Johnson & Son, Inc.4.000%, 05/15/2043 (D) 250,000 275,237
Sysco Corp.6.600%, 04/01/2050 1,000,000 1,444,371
The Estee Lauder Companies, Inc.2.600%, 04/15/2030 600,000 618,219
The Kroger Company3.500%, 02/01/2026 500,000 545,456
Tyson Foods, Inc.4.350%, 03/01/2029 400,000 455,343
Walmart, Inc.3.250%, 07/08/2029 600,000 656,387
Total Bond Market Trust (continued)Shares orPrincipalAmount Value
CORPORATE BONDS (continued)Consumer staples (continued)Walmart, Inc. (continued)
4.050%, 06/29/2048 $ 500,000 $ 592,064
11,790,900Energy – 2.4%Anadarko Petroleum Corp.
6.450%, 09/15/2036 280,000 297,853Baker Hughes LLC
3.337%, 12/15/2027 500,000 535,3734.486%, 05/01/2030 500,000 569,594
Boardwalk Pipelines LP4.950%, 12/15/2024 400,000 447,888
Total Bond Market Trust (continued)Shares orPrincipalAmount Value
CORPORATE BONDS (continued)Energy (continued)The WilliamsCompanies, Inc. (continued)
7.875%, 09/01/2021 $ 190,000 $ 195,533Tosco Corp.
8.125%, 02/15/2030 383,000 543,344Total Capital SA
4.250%, 12/15/2021 60,000 61,670TransCanada PipeLines, Ltd.
5.850%, 03/15/2036 405,000 512,617Valero Energy Corp.
2.850%, 04/15/2025 600,000 627,267
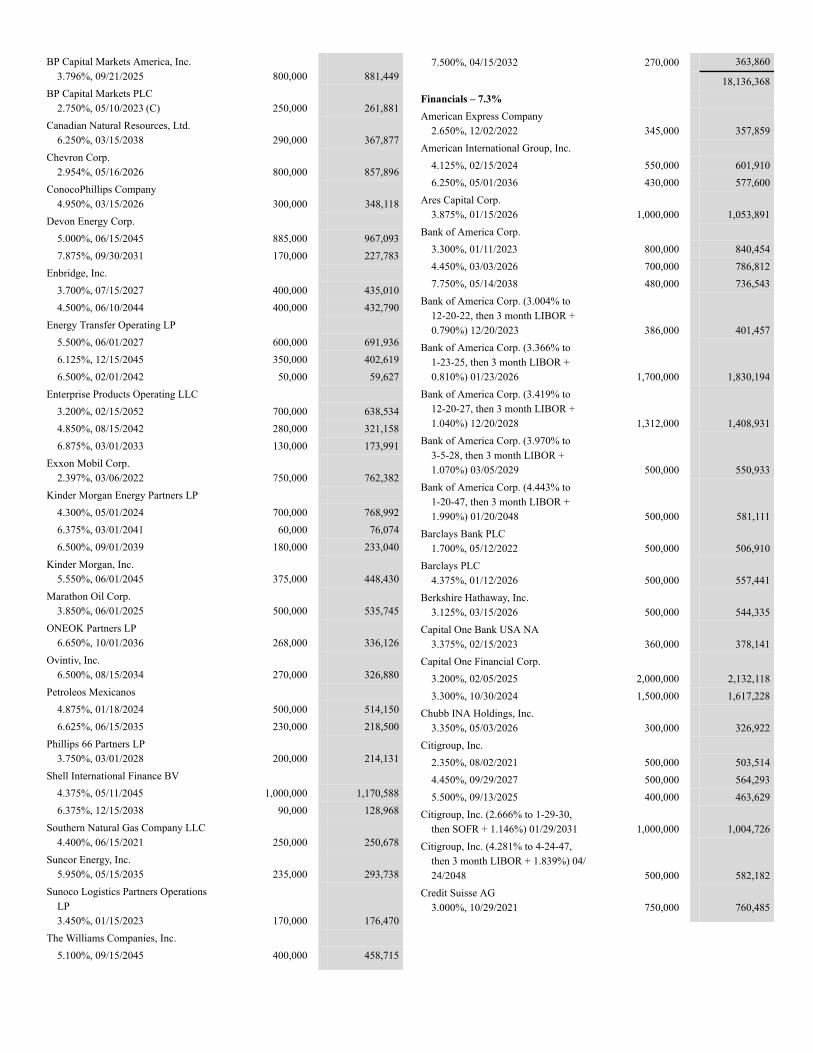
BP Capital Markets America, Inc.3.796%, 09/21/2025 800,000 881,449
BP Capital Markets PLC2.750%, 05/10/2023 (C) 250,000 261,881
Canadian Natural Resources, Ltd.6.250%, 03/15/2038 290,000 367,877
Chevron Corp.2.954%, 05/16/2026 800,000 857,896
ConocoPhillips Company4.950%, 03/15/2026 300,000 348,118
Devon Energy Corp.5.000%, 06/15/2045 885,000 967,0937.875%, 09/30/2031 170,000 227,783
Enbridge, Inc.3.700%, 07/15/2027 400,000 435,0104.500%, 06/10/2044 400,000 432,790
Energy Transfer Operating LP5.500%, 06/01/2027 600,000 691,9366.125%, 12/15/2045 350,000 402,6196.500%, 02/01/2042 50,000 59,627
Enterprise Products Operating LLC3.200%, 02/15/2052 700,000 638,5344.850%, 08/15/2042 280,000 321,1586.875%, 03/01/2033 130,000 173,991
Exxon Mobil Corp.2.397%, 03/06/2022 750,000 762,382
Kinder Morgan Energy Partners LP4.300%, 05/01/2024 700,000 768,9926.375%, 03/01/2041 60,000 76,0746.500%, 09/01/2039 180,000 233,040
Kinder Morgan, Inc.5.550%, 06/01/2045 375,000 448,430
Marathon Oil Corp.3.850%, 06/01/2025 500,000 535,745
ONEOK Partners LP6.650%, 10/01/2036 268,000 336,126
Ovintiv, Inc.6.500%, 08/15/2034 270,000 326,880
Petroleos Mexicanos4.875%, 01/18/2024 500,000 514,1506.625%, 06/15/2035 230,000 218,500
Phillips 66 Partners LP3.750%, 03/01/2028 200,000 214,131
Shell International Finance BV4.375%, 05/11/2045 1,000,000 1,170,5886.375%, 12/15/2038 90,000 128,968
Southern Natural Gas Company LLC4.400%, 06/15/2021 250,000 250,678
Suncor Energy, Inc.5.950%, 05/15/2035 235,000 293,738
Sunoco Logistics Partners OperationsLP3.450%, 01/15/2023 170,000 176,470
The Williams Companies, Inc.5.100%, 09/15/2045 400,000 458,715
7.500%, 04/15/2032 270,000 363,860
18,136,368Financials – 7.3%American Express Company
2.650%, 12/02/2022 345,000 357,859American International Group, Inc.
4.125%, 02/15/2024 550,000 601,9106.250%, 05/01/2036 430,000 577,600
Ares Capital Corp.3.875%, 01/15/2026 1,000,000 1,053,891
Bank of America Corp.3.300%, 01/11/2023 800,000 840,4544.450%, 03/03/2026 700,000 786,8127.750%, 05/14/2038 480,000 736,543
Bank of America Corp. (3.004% to12-20-22, then 3 month LIBOR +0.790%) 12/20/2023 386,000 401,457
Bank of America Corp. (3.366% to1-23-25, then 3 month LIBOR +0.810%) 01/23/2026 1,700,000 1,830,194
Bank of America Corp. (3.419% to12-20-27, then 3 month LIBOR +1.040%) 12/20/2028 1,312,000 1,408,931
Bank of America Corp. (3.970% to3-5-28, then 3 month LIBOR +1.070%) 03/05/2029 500,000 550,933
Bank of America Corp. (4.443% to1-20-47, then 3 month LIBOR +1.990%) 01/20/2048 500,000 581,111
Barclays Bank PLC1.700%, 05/12/2022 500,000 506,910
Barclays PLC4.375%, 01/12/2026 500,000 557,441
Berkshire Hathaway, Inc.3.125%, 03/15/2026 500,000 544,335
Capital One Bank USA NA3.375%, 02/15/2023 360,000 378,141
Capital One Financial Corp.3.200%, 02/05/2025 2,000,000 2,132,1183.300%, 10/30/2024 1,500,000 1,617,228
Chubb INA Holdings, Inc.3.350%, 05/03/2026 300,000 326,922
Citigroup, Inc.2.350%, 08/02/2021 500,000 503,5144.450%, 09/29/2027 500,000 564,2935.500%, 09/13/2025 400,000 463,629
Citigroup, Inc. (2.666% to 1-29-30,then SOFR + 1.146%) 01/29/2031 1,000,000 1,004,726
Citigroup, Inc. (4.281% to 4-24-47,then 3 month LIBOR + 1.839%) 04/24/2048 500,000 582,182
Credit Suisse AG3.000%, 10/29/2021 750,000 760,485
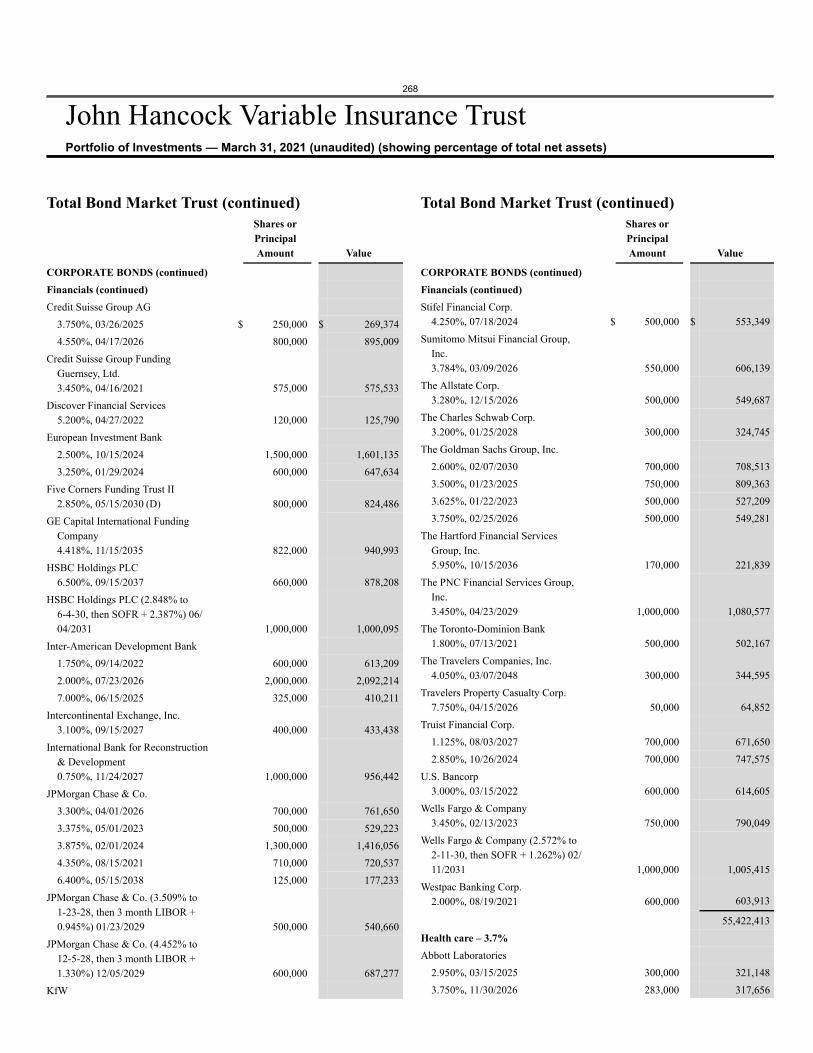
268
John Hancock Variable Insurance TrustPortfolio of Investments — March 31, 2021 (unaudited) (showing percentage of total net assets)
Total Bond Market Trust (continued)Shares orPrincipalAmount Value
CORPORATE BONDS (continued)Financials (continued)Credit Suisse Group AG
3.750%, 03/26/2025 $ 250,000 $ 269,3744.550%, 04/17/2026 800,000 895,009
Credit Suisse Group FundingGuernsey, Ltd.3.450%, 04/16/2021 575,000 575,533
Discover Financial Services5.200%, 04/27/2022 120,000 125,790
European Investment Bank2.500%, 10/15/2024 1,500,000 1,601,1353.250%, 01/29/2024 600,000 647,634
Five Corners Funding Trust II2.850%, 05/15/2030 (D) 800,000 824,486
GE Capital International FundingCompany4.418%, 11/15/2035 822,000 940,993
HSBC Holdings PLC6.500%, 09/15/2037 660,000 878,208
HSBC Holdings PLC (2.848% to6-4-30, then SOFR + 2.387%) 06/04/2031 1,000,000 1,000,095
Inter-American Development Bank1.750%, 09/14/2022 600,000 613,2092.000%, 07/23/2026 2,000,000 2,092,2147.000%, 06/15/2025 325,000 410,211
Intercontinental Exchange, Inc.3.100%, 09/15/2027 400,000 433,438
International Bank for Reconstruction& Development0.750%, 11/24/2027 1,000,000 956,442
JPMorgan Chase & Co.3.300%, 04/01/2026 700,000 761,6503.375%, 05/01/2023 500,000 529,2233.875%, 02/01/2024 1,300,000 1,416,0564.350%, 08/15/2021 710,000 720,5376.400%, 05/15/2038 125,000 177,233
JPMorgan Chase & Co. (3.509% to1-23-28, then 3 month LIBOR +0.945%) 01/23/2029 500,000 540,660
JPMorgan Chase & Co. (4.452% to12-5-28, then 3 month LIBOR +1.330%) 12/05/2029 600,000 687,277
KfW
Total Bond Market Trust (continued)Shares orPrincipalAmount Value
CORPORATE BONDS (continued)Financials (continued)Stifel Financial Corp.
4.250%, 07/18/2024 $ 500,000 $ 553,349Sumitomo Mitsui Financial Group,
Inc.3.784%, 03/09/2026 550,000 606,139
The Allstate Corp.3.280%, 12/15/2026 500,000 549,687
The Charles Schwab Corp.3.200%, 01/25/2028 300,000 324,745
The Goldman Sachs Group, Inc.2.600%, 02/07/2030 700,000 708,5133.500%, 01/23/2025 750,000 809,3633.625%, 01/22/2023 500,000 527,2093.750%, 02/25/2026 500,000 549,281
The Hartford Financial ServicesGroup, Inc.5.950%, 10/15/2036 170,000 221,839
The PNC Financial Services Group,Inc.3.450%, 04/23/2029 1,000,000 1,080,577
The Toronto-Dominion Bank1.800%, 07/13/2021 500,000 502,167
The Travelers Companies, Inc.4.050%, 03/07/2048 300,000 344,595
Travelers Property Casualty Corp.7.750%, 04/15/2026 50,000 64,852
Truist Financial Corp.1.125%, 08/03/2027 700,000 671,6502.850%, 10/26/2024 700,000 747,575
U.S. Bancorp3.000%, 03/15/2022 600,000 614,605
Wells Fargo & Company3.450%, 02/13/2023 750,000 790,049
Wells Fargo & Company (2.572% to2-11-30, then SOFR + 1.262%) 02/11/2031 1,000,000 1,005,415
Westpac Banking Corp.2.000%, 08/19/2021 600,000 603,913
55,422,413Health care – 3.7%Abbott Laboratories
2.950%, 03/15/2025 300,000 321,1483.750%, 11/30/2026 283,000 317,656
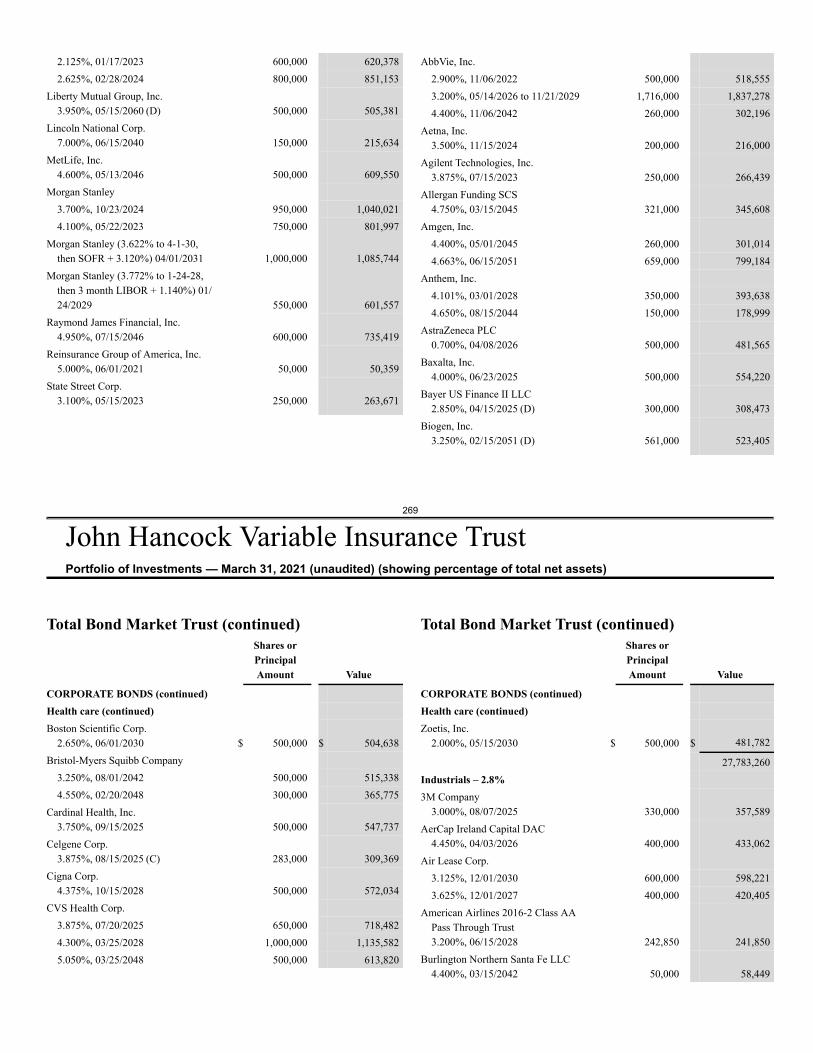
269
John Hancock Variable Insurance TrustPortfolio of Investments — March 31, 2021 (unaudited) (showing percentage of total net assets)
2.125%, 01/17/2023 600,000 620,3782.625%, 02/28/2024 800,000 851,153
Liberty Mutual Group, Inc.3.950%, 05/15/2060 (D) 500,000 505,381
Lincoln National Corp.7.000%, 06/15/2040 150,000 215,634
MetLife, Inc.4.600%, 05/13/2046 500,000 609,550
Morgan Stanley3.700%, 10/23/2024 950,000 1,040,0214.100%, 05/22/2023 750,000 801,997
Morgan Stanley (3.622% to 4-1-30,then SOFR + 3.120%) 04/01/2031 1,000,000 1,085,744
Morgan Stanley (3.772% to 1-24-28,then 3 month LIBOR + 1.140%) 01/24/2029 550,000 601,557
Raymond James Financial, Inc.4.950%, 07/15/2046 600,000 735,419
Reinsurance Group of America, Inc.5.000%, 06/01/2021 50,000 50,359
State Street Corp.3.100%, 05/15/2023 250,000 263,671
AbbVie, Inc.2.900%, 11/06/2022 500,000 518,5553.200%, 05/14/2026 to 11/21/2029 1,716,000 1,837,2784.400%, 11/06/2042 260,000 302,196
Aetna, Inc.3.500%, 11/15/2024 200,000 216,000
Agilent Technologies, Inc.3.875%, 07/15/2023 250,000 266,439
Allergan Funding SCS4.750%, 03/15/2045 321,000 345,608
Amgen, Inc.4.400%, 05/01/2045 260,000 301,0144.663%, 06/15/2051 659,000 799,184
Anthem, Inc.4.101%, 03/01/2028 350,000 393,6384.650%, 08/15/2044 150,000 178,999
AstraZeneca PLC0.700%, 04/08/2026 500,000 481,565
Baxalta, Inc.4.000%, 06/23/2025 500,000 554,220
Bayer US Finance II LLC2.850%, 04/15/2025 (D) 300,000 308,473
Biogen, Inc.3.250%, 02/15/2051 (D) 561,000 523,405
Total Bond Market Trust (continued)Shares orPrincipalAmount Value
CORPORATE BONDS (continued)Health care (continued)Boston Scientific Corp.
2.650%, 06/01/2030 $ 500,000 $ 504,638Bristol-Myers Squibb Company
3.250%, 08/01/2042 500,000 515,3384.550%, 02/20/2048 300,000 365,775
Cardinal Health, Inc.3.750%, 09/15/2025 500,000 547,737
Celgene Corp.3.875%, 08/15/2025 (C) 283,000 309,369
Cigna Corp.4.375%, 10/15/2028 500,000 572,034
CVS Health Corp.3.875%, 07/20/2025 650,000 718,4824.300%, 03/25/2028 1,000,000 1,135,5825.050%, 03/25/2048 500,000 613,820
Total Bond Market Trust (continued)Shares orPrincipalAmount Value
CORPORATE BONDS (continued)Health care (continued)Zoetis, Inc.
2.000%, 05/15/2030 $ 500,000 $ 481,782
27,783,260Industrials – 2.8%3M Company
3.000%, 08/07/2025 330,000 357,589AerCap Ireland Capital DAC
4.450%, 04/03/2026 400,000 433,062Air Lease Corp.
3.125%, 12/01/2030 600,000 598,2213.625%, 12/01/2027 400,000 420,405
American Airlines 2016-2 Class AAPass Through Trust3.200%, 06/15/2028 242,850 241,850
Burlington Northern Santa Fe LLC4.400%, 03/15/2042 50,000 58,449
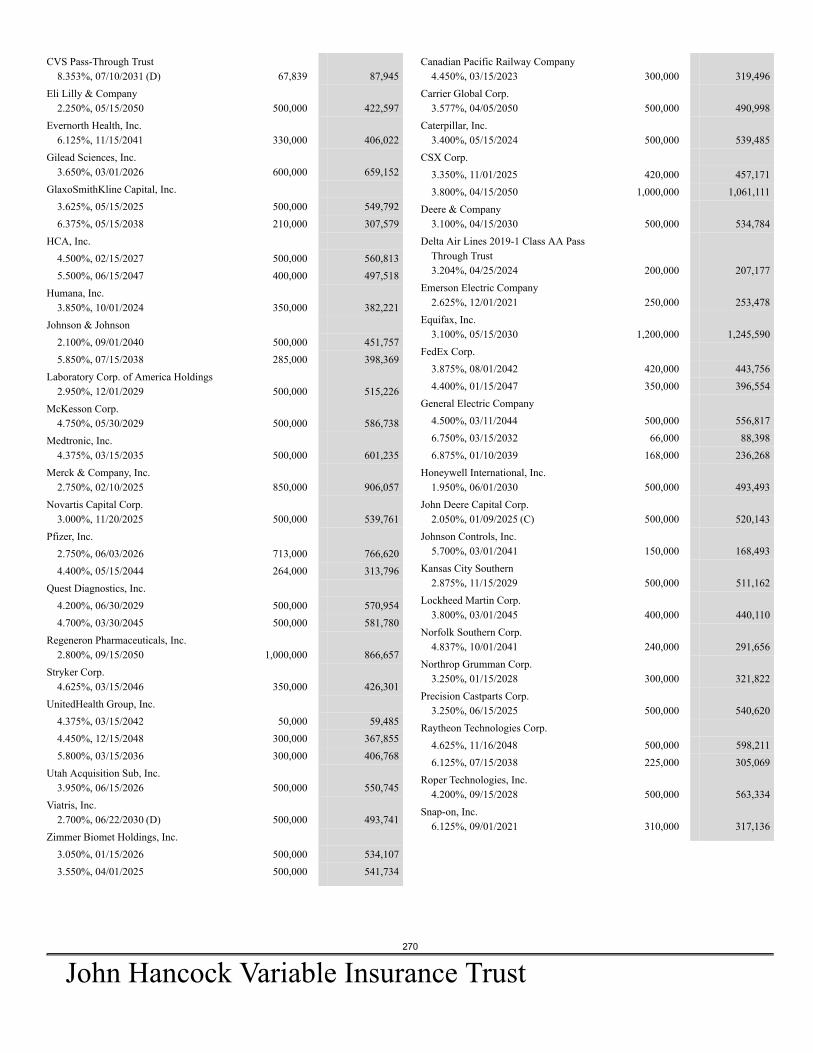
270
John Hancock Variable Insurance Trust
CVS Pass-Through Trust8.353%, 07/10/2031 (D) 67,839 87,945
Eli Lilly & Company2.250%, 05/15/2050 500,000 422,597
Evernorth Health, Inc.6.125%, 11/15/2041 330,000 406,022
Gilead Sciences, Inc.3.650%, 03/01/2026 600,000 659,152
GlaxoSmithKline Capital, Inc.3.625%, 05/15/2025 500,000 549,7926.375%, 05/15/2038 210,000 307,579
HCA, Inc.4.500%, 02/15/2027 500,000 560,8135.500%, 06/15/2047 400,000 497,518
Humana, Inc.3.850%, 10/01/2024 350,000 382,221
Johnson & Johnson2.100%, 09/01/2040 500,000 451,7575.850%, 07/15/2038 285,000 398,369
Laboratory Corp. of America Holdings2.950%, 12/01/2029 500,000 515,226
McKesson Corp.4.750%, 05/30/2029 500,000 586,738
Medtronic, Inc.4.375%, 03/15/2035 500,000 601,235
Merck & Company, Inc.2.750%, 02/10/2025 850,000 906,057
Novartis Capital Corp.3.000%, 11/20/2025 500,000 539,761
Pfizer, Inc.2.750%, 06/03/2026 713,000 766,6204.400%, 05/15/2044 264,000 313,796
Quest Diagnostics, Inc.4.200%, 06/30/2029 500,000 570,9544.700%, 03/30/2045 500,000 581,780
Regeneron Pharmaceuticals, Inc.2.800%, 09/15/2050 1,000,000 866,657
Stryker Corp.4.625%, 03/15/2046 350,000 426,301
UnitedHealth Group, Inc.4.375%, 03/15/2042 50,000 59,4854.450%, 12/15/2048 300,000 367,8555.800%, 03/15/2036 300,000 406,768
Utah Acquisition Sub, Inc.3.950%, 06/15/2026 500,000 550,745
Viatris, Inc.2.700%, 06/22/2030 (D) 500,000 493,741
Zimmer Biomet Holdings, Inc.3.050%, 01/15/2026 500,000 534,1073.550%, 04/01/2025 500,000 541,734
Canadian Pacific Railway Company4.450%, 03/15/2023 300,000 319,496
Carrier Global Corp.3.577%, 04/05/2050 500,000 490,998
Caterpillar, Inc.3.400%, 05/15/2024 500,000 539,485
CSX Corp.3.350%, 11/01/2025 420,000 457,1713.800%, 04/15/2050 1,000,000 1,061,111
Deere & Company3.100%, 04/15/2030 500,000 534,784
Delta Air Lines 2019-1 Class AA PassThrough Trust3.204%, 04/25/2024 200,000 207,177
Emerson Electric Company2.625%, 12/01/2021 250,000 253,478
Equifax, Inc.3.100%, 05/15/2030 1,200,000 1,245,590
FedEx Corp.3.875%, 08/01/2042 420,000 443,7564.400%, 01/15/2047 350,000 396,554
General Electric Company4.500%, 03/11/2044 500,000 556,8176.750%, 03/15/2032 66,000 88,3986.875%, 01/10/2039 168,000 236,268
Honeywell International, Inc.1.950%, 06/01/2030 500,000 493,493
John Deere Capital Corp.2.050%, 01/09/2025 (C) 500,000 520,143
Johnson Controls, Inc.5.700%, 03/01/2041 150,000 168,493
Kansas City Southern2.875%, 11/15/2029 500,000 511,162
Lockheed Martin Corp.3.800%, 03/01/2045 400,000 440,110
Norfolk Southern Corp.4.837%, 10/01/2041 240,000 291,656
Northrop Grumman Corp.3.250%, 01/15/2028 300,000 321,822
Precision Castparts Corp.3.250%, 06/15/2025 500,000 540,620
Raytheon Technologies Corp.4.625%, 11/16/2048 500,000 598,2116.125%, 07/15/2038 225,000 305,069
Roper Technologies, Inc.4.200%, 09/15/2028 500,000 563,334
Snap-on, Inc.6.125%, 09/01/2021 310,000 317,136
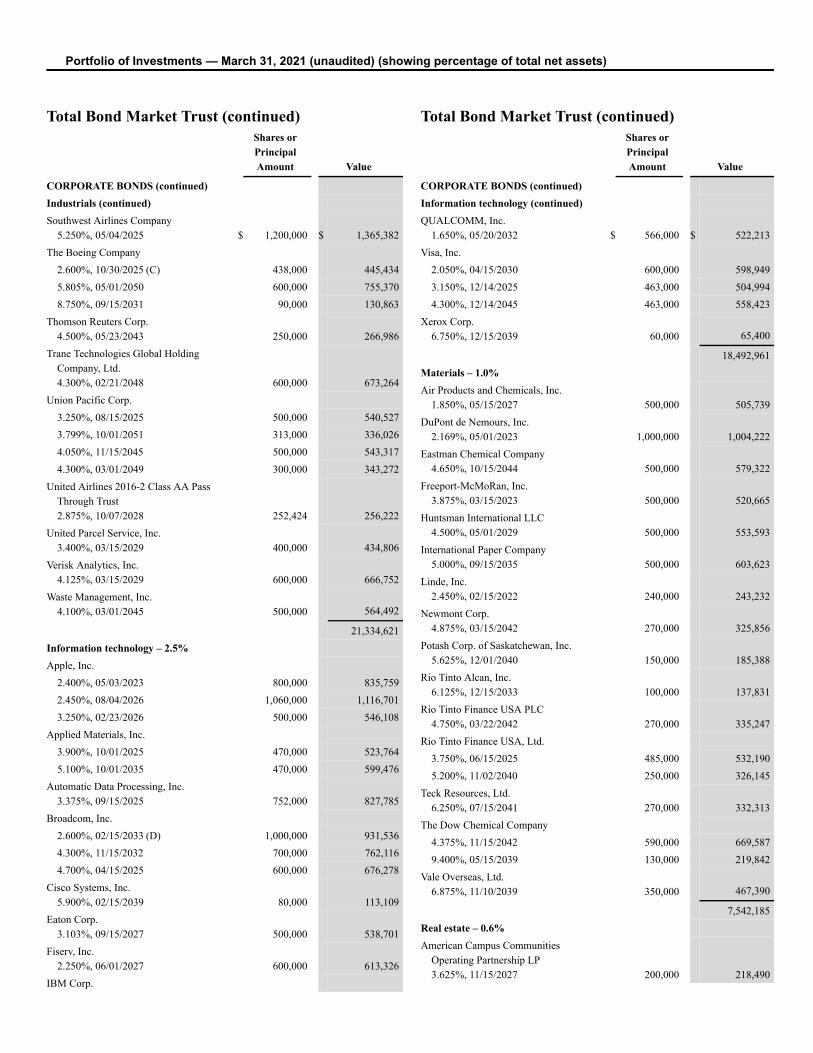
Portfolio of Investments — March 31, 2021 (unaudited) (showing percentage of total net assets)
Total Bond Market Trust (continued)Shares orPrincipalAmount Value
CORPORATE BONDS (continued)Industrials (continued)Southwest Airlines Company
5.250%, 05/04/2025 $ 1,200,000 $ 1,365,382The Boeing Company
2.600%, 10/30/2025 (C) 438,000 445,4345.805%, 05/01/2050 600,000 755,3708.750%, 09/15/2031 90,000 130,863
Thomson Reuters Corp.4.500%, 05/23/2043 250,000 266,986
Trane Technologies Global HoldingCompany, Ltd.4.300%, 02/21/2048 600,000 673,264
Union Pacific Corp.3.250%, 08/15/2025 500,000 540,5273.799%, 10/01/2051 313,000 336,0264.050%, 11/15/2045 500,000 543,3174.300%, 03/01/2049 300,000 343,272
United Airlines 2016-2 Class AA PassThrough Trust2.875%, 10/07/2028 252,424 256,222
United Parcel Service, Inc.3.400%, 03/15/2029 400,000 434,806
Verisk Analytics, Inc.4.125%, 03/15/2029 600,000 666,752
Waste Management, Inc.4.100%, 03/01/2045 500,000 564,492
21,334,621Information technology – 2.5%Apple, Inc.
2.400%, 05/03/2023 800,000 835,7592.450%, 08/04/2026 1,060,000 1,116,7013.250%, 02/23/2026 500,000 546,108
Applied Materials, Inc.3.900%, 10/01/2025 470,000 523,7645.100%, 10/01/2035 470,000 599,476
Automatic Data Processing, Inc.3.375%, 09/15/2025 752,000 827,785
Broadcom, Inc.2.600%, 02/15/2033 (D) 1,000,000 931,5364.300%, 11/15/2032 700,000 762,1164.700%, 04/15/2025 600,000 676,278
Cisco Systems, Inc.5.900%, 02/15/2039 80,000 113,109
Eaton Corp.3.103%, 09/15/2027 500,000 538,701
Fiserv, Inc.2.250%, 06/01/2027 600,000 613,326
IBM Corp.
Total Bond Market Trust (continued)Shares orPrincipalAmount Value
CORPORATE BONDS (continued)Information technology (continued)QUALCOMM, Inc.
1.650%, 05/20/2032 $ 566,000 $ 522,213Visa, Inc.
2.050%, 04/15/2030 600,000 598,9493.150%, 12/14/2025 463,000 504,9944.300%, 12/14/2045 463,000 558,423
Xerox Corp.6.750%, 12/15/2039 60,000 65,400
18,492,961Materials – 1.0%Air Products and Chemicals, Inc.
1.850%, 05/15/2027 500,000 505,739DuPont de Nemours, Inc.
2.169%, 05/01/2023 1,000,000 1,004,222Eastman Chemical Company
4.650%, 10/15/2044 500,000 579,322Freeport-McMoRan, Inc.
3.875%, 03/15/2023 500,000 520,665Huntsman International LLC
4.500%, 05/01/2029 500,000 553,593International Paper Company
5.000%, 09/15/2035 500,000 603,623Linde, Inc.
2.450%, 02/15/2022 240,000 243,232Newmont Corp.
4.875%, 03/15/2042 270,000 325,856Potash Corp. of Saskatchewan, Inc.
5.625%, 12/01/2040 150,000 185,388Rio Tinto Alcan, Inc.
6.125%, 12/15/2033 100,000 137,831Rio Tinto Finance USA PLC
4.750%, 03/22/2042 270,000 335,247Rio Tinto Finance USA, Ltd.
3.750%, 06/15/2025 485,000 532,1905.200%, 11/02/2040 250,000 326,145
Teck Resources, Ltd.6.250%, 07/15/2041 270,000 332,313
The Dow Chemical Company4.375%, 11/15/2042 590,000 669,5879.400%, 05/15/2039 130,000 219,842
Vale Overseas, Ltd.6.875%, 11/10/2039 350,000 467,390
7,542,185Real estate – 0.6%American Campus Communities
Operating Partnership LP3.625%, 11/15/2027 200,000 218,490
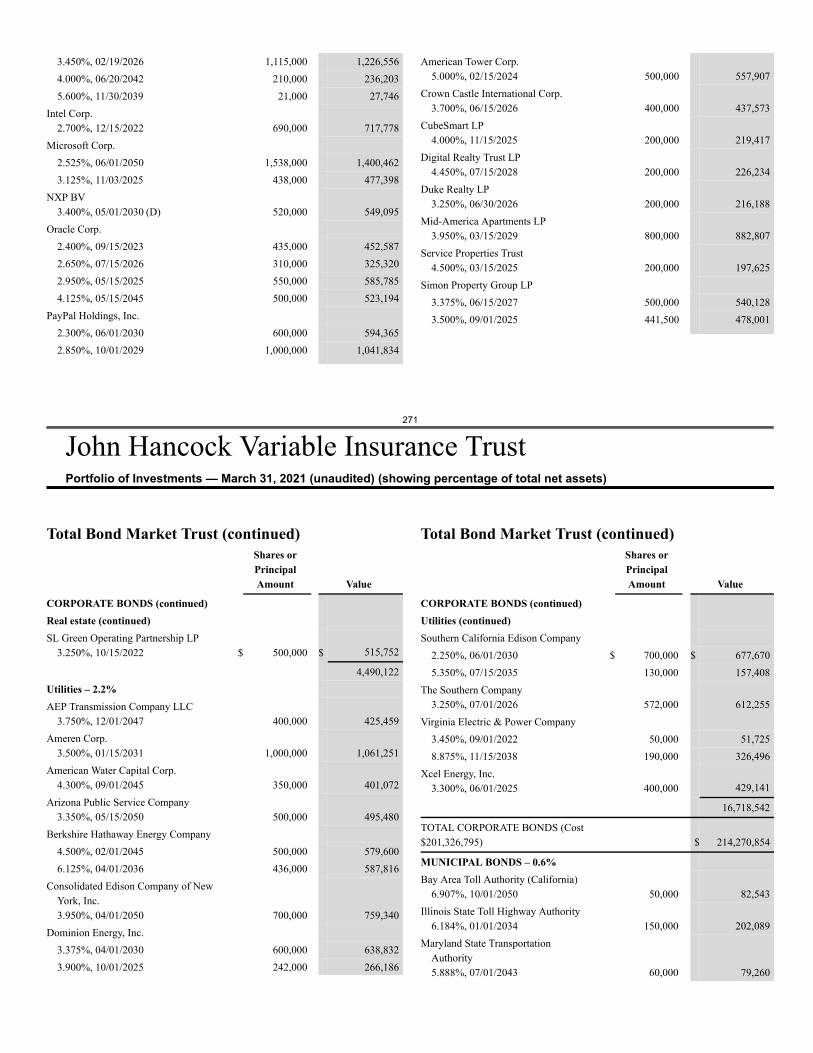
271
John Hancock Variable Insurance TrustPortfolio of Investments — March 31, 2021 (unaudited) (showing percentage of total net assets)
3.450%, 02/19/2026 1,115,000 1,226,5564.000%, 06/20/2042 210,000 236,2035.600%, 11/30/2039 21,000 27,746
Intel Corp.2.700%, 12/15/2022 690,000 717,778
Microsoft Corp.2.525%, 06/01/2050 1,538,000 1,400,4623.125%, 11/03/2025 438,000 477,398
NXP BV3.400%, 05/01/2030 (D) 520,000 549,095
Oracle Corp.2.400%, 09/15/2023 435,000 452,5872.650%, 07/15/2026 310,000 325,3202.950%, 05/15/2025 550,000 585,7854.125%, 05/15/2045 500,000 523,194
PayPal Holdings, Inc.2.300%, 06/01/2030 600,000 594,3652.850%, 10/01/2029 1,000,000 1,041,834
American Tower Corp.5.000%, 02/15/2024 500,000 557,907
Crown Castle International Corp.3.700%, 06/15/2026 400,000 437,573
CubeSmart LP4.000%, 11/15/2025 200,000 219,417
Digital Realty Trust LP4.450%, 07/15/2028 200,000 226,234
Duke Realty LP3.250%, 06/30/2026 200,000 216,188
Mid-America Apartments LP3.950%, 03/15/2029 800,000 882,807
Service Properties Trust4.500%, 03/15/2025 200,000 197,625
Simon Property Group LP3.375%, 06/15/2027 500,000 540,1283.500%, 09/01/2025 441,500 478,001
Total Bond Market Trust (continued)Shares orPrincipalAmount Value
CORPORATE BONDS (continued)Real estate (continued)SL Green Operating Partnership LP
3.250%, 10/15/2022 $ 500,000 $ 515,752
4,490,122Utilities – 2.2%AEP Transmission Company LLC
3.750%, 12/01/2047 400,000 425,459Ameren Corp.
3.500%, 01/15/2031 1,000,000 1,061,251American Water Capital Corp.
4.300%, 09/01/2045 350,000 401,072Arizona Public Service Company
3.350%, 05/15/2050 500,000 495,480Berkshire Hathaway Energy Company
4.500%, 02/01/2045 500,000 579,6006.125%, 04/01/2036 436,000 587,816
Consolidated Edison Company of NewYork, Inc.3.950%, 04/01/2050 700,000 759,340
Dominion Energy, Inc.3.375%, 04/01/2030 600,000 638,8323.900%, 10/01/2025 242,000 266,186
Total Bond Market Trust (continued)Shares orPrincipalAmount Value
CORPORATE BONDS (continued)Utilities (continued)Southern California Edison Company
2.250%, 06/01/2030 $ 700,000 $ 677,6705.350%, 07/15/2035 130,000 157,408
The Southern Company3.250%, 07/01/2026 572,000 612,255
Virginia Electric & Power Company3.450%, 09/01/2022 50,000 51,7258.875%, 11/15/2038 190,000 326,496
Xcel Energy, Inc.3.300%, 06/01/2025 400,000 429,141
16,718,542
TOTAL CORPORATE BONDS (Cost$201,326,795) $ 214,270,854
MUNICIPAL BONDS – 0.6%Bay Area Toll Authority (California)
6.907%, 10/01/2050 50,000 82,543Illinois State Toll Highway Authority
6.184%, 01/01/2034 150,000 202,089Maryland State Transportation
Authority5.888%, 07/01/2043 60,000 79,260
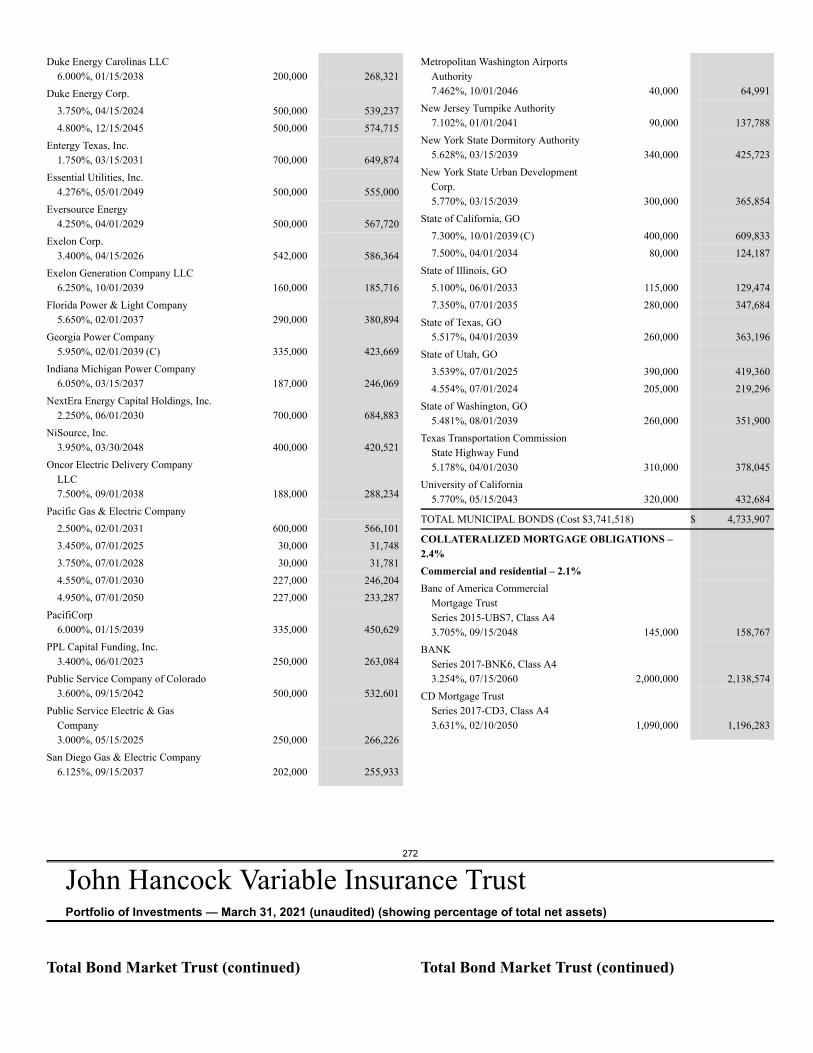
272
John Hancock Variable Insurance TrustPortfolio of Investments — March 31, 2021 (unaudited) (showing percentage of total net assets)
Duke Energy Carolinas LLC6.000%, 01/15/2038 200,000 268,321
Duke Energy Corp.3.750%, 04/15/2024 500,000 539,2374.800%, 12/15/2045 500,000 574,715
Entergy Texas, Inc.1.750%, 03/15/2031 700,000 649,874
Essential Utilities, Inc.4.276%, 05/01/2049 500,000 555,000
Eversource Energy4.250%, 04/01/2029 500,000 567,720
Exelon Corp.3.400%, 04/15/2026 542,000 586,364
Exelon Generation Company LLC6.250%, 10/01/2039 160,000 185,716
Florida Power & Light Company5.650%, 02/01/2037 290,000 380,894
Georgia Power Company5.950%, 02/01/2039 (C) 335,000 423,669
Indiana Michigan Power Company6.050%, 03/15/2037 187,000 246,069
NextEra Energy Capital Holdings, Inc.2.250%, 06/01/2030 700,000 684,883
NiSource, Inc.3.950%, 03/30/2048 400,000 420,521
Oncor Electric Delivery CompanyLLC7.500%, 09/01/2038 188,000 288,234
Pacific Gas & Electric Company2.500%, 02/01/2031 600,000 566,1013.450%, 07/01/2025 30,000 31,7483.750%, 07/01/2028 30,000 31,7814.550%, 07/01/2030 227,000 246,2044.950%, 07/01/2050 227,000 233,287
PacifiCorp6.000%, 01/15/2039 335,000 450,629
PPL Capital Funding, Inc.3.400%, 06/01/2023 250,000 263,084
Public Service Company of Colorado3.600%, 09/15/2042 500,000 532,601
Public Service Electric & GasCompany3.000%, 05/15/2025 250,000 266,226
San Diego Gas & Electric Company6.125%, 09/15/2037 202,000 255,933
Metropolitan Washington AirportsAuthority7.462%, 10/01/2046 40,000 64,991
New Jersey Turnpike Authority7.102%, 01/01/2041 90,000 137,788
New York State Dormitory Authority5.628%, 03/15/2039 340,000 425,723
New York State Urban DevelopmentCorp.5.770%, 03/15/2039 300,000 365,854
State of California, GO7.300%, 10/01/2039 (C) 400,000 609,8337.500%, 04/01/2034 80,000 124,187
State of Illinois, GO5.100%, 06/01/2033 115,000 129,4747.350%, 07/01/2035 280,000 347,684
State of Texas, GO5.517%, 04/01/2039 260,000 363,196
State of Utah, GO3.539%, 07/01/2025 390,000 419,3604.554%, 07/01/2024 205,000 219,296
State of Washington, GO5.481%, 08/01/2039 260,000 351,900
Texas Transportation CommissionState Highway Fund5.178%, 04/01/2030 310,000 378,045
University of California5.770%, 05/15/2043 320,000 432,684
TOTAL MUNICIPAL BONDS (Cost $3,741,518) $ 4,733,907
COLLATERALIZED MORTGAGE OBLIGATIONS –2.4%Commercial and residential – 2.1%Banc of America Commercial
Mortgage TrustSeries 2015-UBS7, Class A43.705%, 09/15/2048 145,000 158,767
BANKSeries 2017-BNK6, Class A43.254%, 07/15/2060 2,000,000 2,138,574
CD Mortgage TrustSeries 2017-CD3, Class A43.631%, 02/10/2050 1,090,000 1,196,283
Total Bond Market Trust (continued) Total Bond Market Trust (continued)
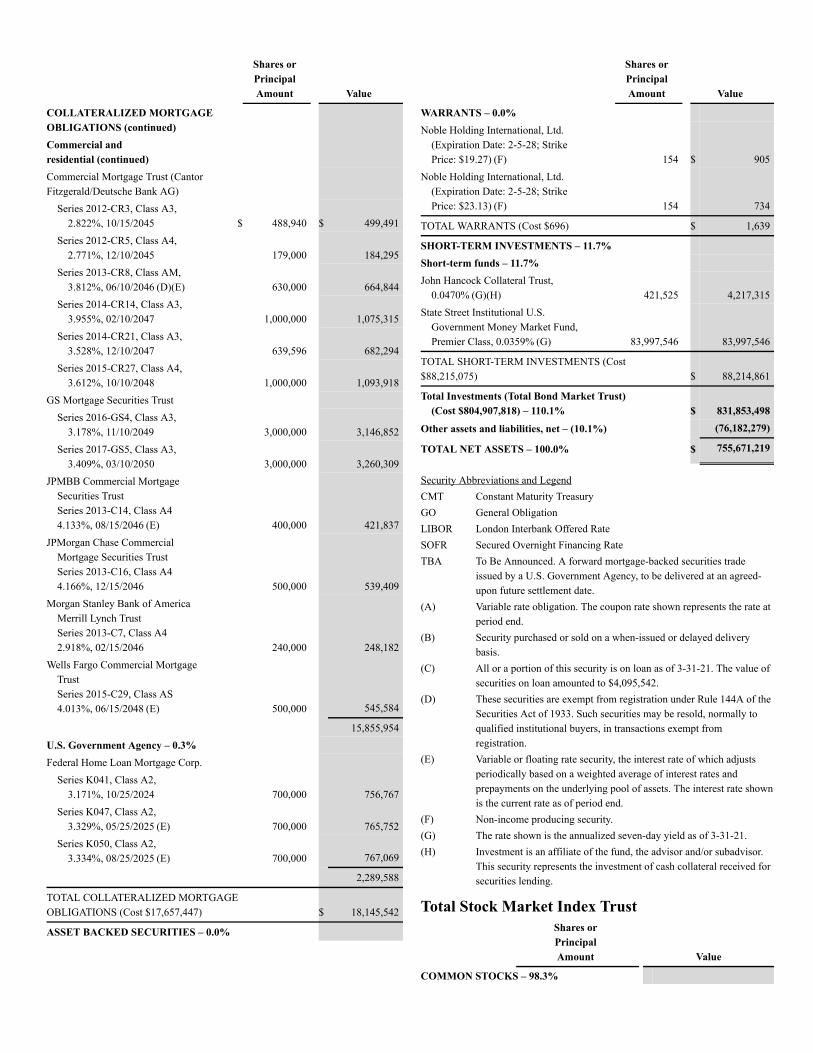
Shares orPrincipalAmount Value
COLLATERALIZED MORTGAGEOBLIGATIONS (continued)Commercial andresidential (continued)Commercial Mortgage Trust (CantorFitzgerald/Deutsche Bank AG)
Series 2012-CR3, Class A3,2.822%, 10/15/2045 $ 488,940 $ 499,491
Series 2012-CR5, Class A4,2.771%, 12/10/2045 179,000 184,295
Series 2013-CR8, Class AM,3.812%, 06/10/2046 (D)(E) 630,000 664,844
Series 2014-CR14, Class A3,3.955%, 02/10/2047 1,000,000 1,075,315
Series 2014-CR21, Class A3,3.528%, 12/10/2047 639,596 682,294
Series 2015-CR27, Class A4,3.612%, 10/10/2048 1,000,000 1,093,918
GS Mortgage Securities TrustSeries 2016-GS4, Class A3,
3.178%, 11/10/2049 3,000,000 3,146,852Series 2017-GS5, Class A3,
3.409%, 03/10/2050 3,000,000 3,260,309JPMBB Commercial Mortgage
Securities TrustSeries 2013-C14, Class A44.133%, 08/15/2046 (E) 400,000 421,837
JPMorgan Chase CommercialMortgage Securities TrustSeries 2013-C16, Class A44.166%, 12/15/2046 500,000 539,409
Morgan Stanley Bank of AmericaMerrill Lynch TrustSeries 2013-C7, Class A42.918%, 02/15/2046 240,000 248,182
Wells Fargo Commercial MortgageTrustSeries 2015-C29, Class AS4.013%, 06/15/2048 (E) 500,000 545,584
15,855,954U.S. Government Agency – 0.3%Federal Home Loan Mortgage Corp.
Series K041, Class A2,3.171%, 10/25/2024 700,000 756,767
Series K047, Class A2,3.329%, 05/25/2025 (E) 700,000 765,752
Series K050, Class A2,3.334%, 08/25/2025 (E) 700,000 767,069
2,289,588
TOTAL COLLATERALIZED MORTGAGEOBLIGATIONS (Cost $17,657,447) $ 18,145,542
ASSET BACKED SECURITIES – 0.0%
Shares orPrincipalAmount Value
WARRANTS – 0.0%Noble Holding International, Ltd.
(Expiration Date: 2-5-28; StrikePrice: $19.27) (F) 154 $ 905
Noble Holding International, Ltd.(Expiration Date: 2-5-28; StrikePrice: $23.13) (F) 154 734
TOTAL WARRANTS (Cost $696) $ 1,639
SHORT-TERM INVESTMENTS – 11.7%Short-term funds – 11.7%John Hancock Collateral Trust,
0.0470% (G)(H) 421,525 4,217,315State Street Institutional U.S.
Government Money Market Fund,Premier Class, 0.0359% (G) 83,997,546 83,997,546
TOTAL SHORT-TERM INVESTMENTS (Cost$88,215,075) $ 88,214,861
Total Investments (Total Bond Market Trust)(Cost $804,907,818) – 110.1% $ 831,853,498
Other assets and liabilities, net – (10.1%) (76,182,279)
TOTAL NET ASSETS – 100.0% $ 755,671,219
Security Abbreviations and LegendCMT Constant Maturity TreasuryGO General ObligationLIBOR London Interbank Offered RateSOFR Secured Overnight Financing RateTBA To Be Announced. A forward mortgage-backed securities trade
issued by a U.S. Government Agency, to be delivered at an agreed-upon future settlement date.
(A) Variable rate obligation. The coupon rate shown represents the rate atperiod end.
(B) Security purchased or sold on a when-issued or delayed deliverybasis.
(C) All or a portion of this security is on loan as of 3-31-21. The value ofsecurities on loan amounted to $4,095,542.
(D) These securities are exempt from registration under Rule 144A of theSecurities Act of 1933. Such securities may be resold, normally toqualified institutional buyers, in transactions exempt fromregistration.
(E) Variable or floating rate security, the interest rate of which adjustsperiodically based on a weighted average of interest rates andprepayments on the underlying pool of assets. The interest rate shownis the current rate as of period end.
(F) Non-income producing security.(G) The rate shown is the annualized seven-day yield as of 3-31-21.(H) Investment is an affiliate of the fund, the advisor and/or subadvisor.
This security represents the investment of cash collateral received forsecurities lending.
Total Stock Market Index TrustShares orPrincipalAmount Value
COMMON STOCKS – 98.3%
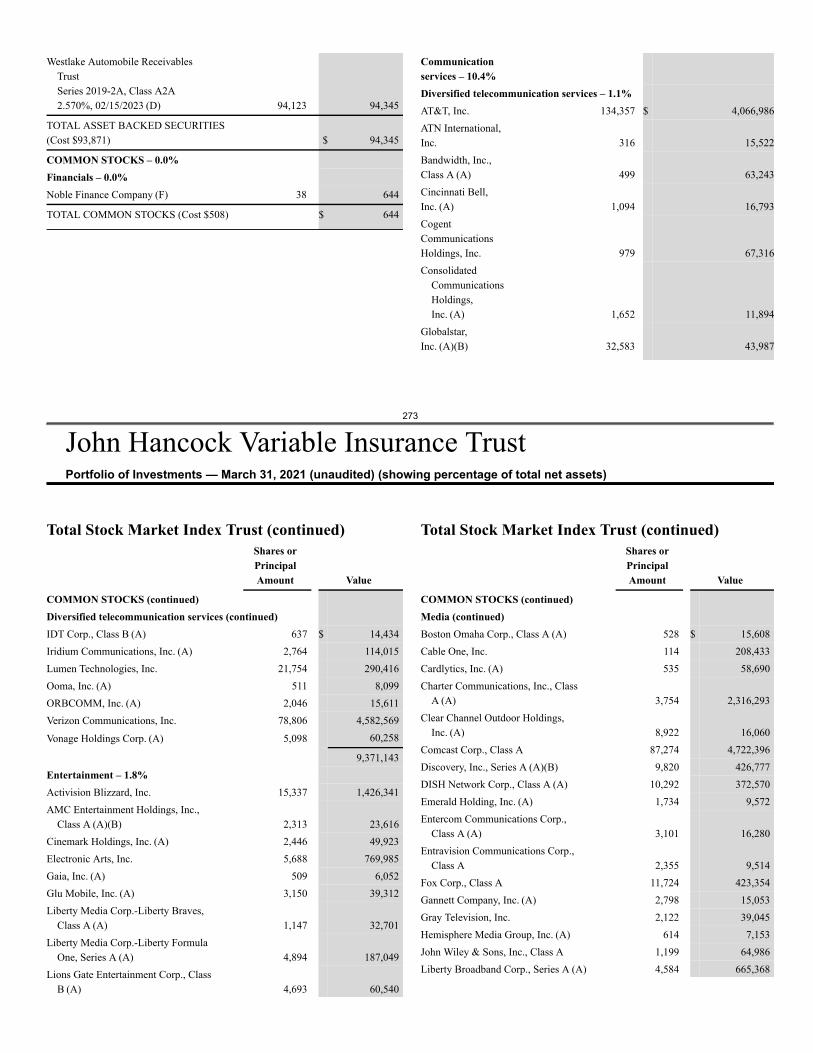
273
John Hancock Variable Insurance TrustPortfolio of Investments — March 31, 2021 (unaudited) (showing percentage of total net assets)
Westlake Automobile ReceivablesTrustSeries 2019-2A, Class A2A2.570%, 02/15/2023 (D) 94,123 94,345
TOTAL ASSET BACKED SECURITIES(Cost $93,871) $ 94,345
COMMON STOCKS – 0.0%Financials – 0.0%Noble Finance Company (F) 38 644
TOTAL COMMON STOCKS (Cost $508) $ 644
Communicationservices – 10.4%Diversified telecommunication services – 1.1%AT&T, Inc. 134,357 $ 4,066,986ATN International,Inc. 316 15,522Bandwidth, Inc.,Class A (A) 499 63,243Cincinnati Bell,Inc. (A) 1,094 16,793CogentCommunicationsHoldings, Inc. 979 67,316Consolidated
CommunicationsHoldings,Inc. (A) 1,652 11,894
Globalstar,Inc. (A)(B) 32,583 43,987
Total Stock Market Index Trust (continued)Shares orPrincipalAmount Value
COMMON STOCKS (continued)Diversified telecommunication services (continued)IDT Corp., Class B (A) 637 $ 14,434Iridium Communications, Inc. (A) 2,764 114,015Lumen Technologies, Inc. 21,754 290,416Ooma, Inc. (A) 511 8,099ORBCOMM, Inc. (A) 2,046 15,611Verizon Communications, Inc. 78,806 4,582,569
Vonage Holdings Corp. (A) 5,098 60,258
9,371,143Entertainment – 1.8%Activision Blizzard, Inc. 15,337 1,426,341AMC Entertainment Holdings, Inc.,
Class A (A)(B) 2,313 23,616Cinemark Holdings, Inc. (A) 2,446 49,923Electronic Arts, Inc. 5,688 769,985Gaia, Inc. (A) 509 6,052Glu Mobile, Inc. (A) 3,150 39,312Liberty Media Corp.-Liberty Braves,
Class A (A) 1,147 32,701Liberty Media Corp.-Liberty Formula
One, Series A (A) 4,894 187,049Lions Gate Entertainment Corp., Class
B (A) 4,693 60,540
Total Stock Market Index Trust (continued)Shares orPrincipalAmount Value
COMMON STOCKS (continued)Media (continued)Boston Omaha Corp., Class A (A) 528 $ 15,608Cable One, Inc. 114 208,433Cardlytics, Inc. (A) 535 58,690Charter Communications, Inc., Class
A (A) 3,754 2,316,293Clear Channel Outdoor Holdings,
Inc. (A) 8,922 16,060Comcast Corp., Class A 87,274 4,722,396Discovery, Inc., Series A (A)(B) 9,820 426,777DISH Network Corp., Class A (A) 10,292 372,570Emerald Holding, Inc. (A) 1,734 9,572Entercom Communications Corp.,
Class A (A) 3,101 16,280Entravision Communications Corp.,
Class A 2,355 9,514Fox Corp., Class A 11,724 423,354Gannett Company, Inc. (A) 2,798 15,053Gray Television, Inc. 2,122 39,045Hemisphere Media Group, Inc. (A) 614 7,153John Wiley & Sons, Inc., Class A 1,199 64,986Liberty Broadband Corp., Series A (A) 4,584 665,368
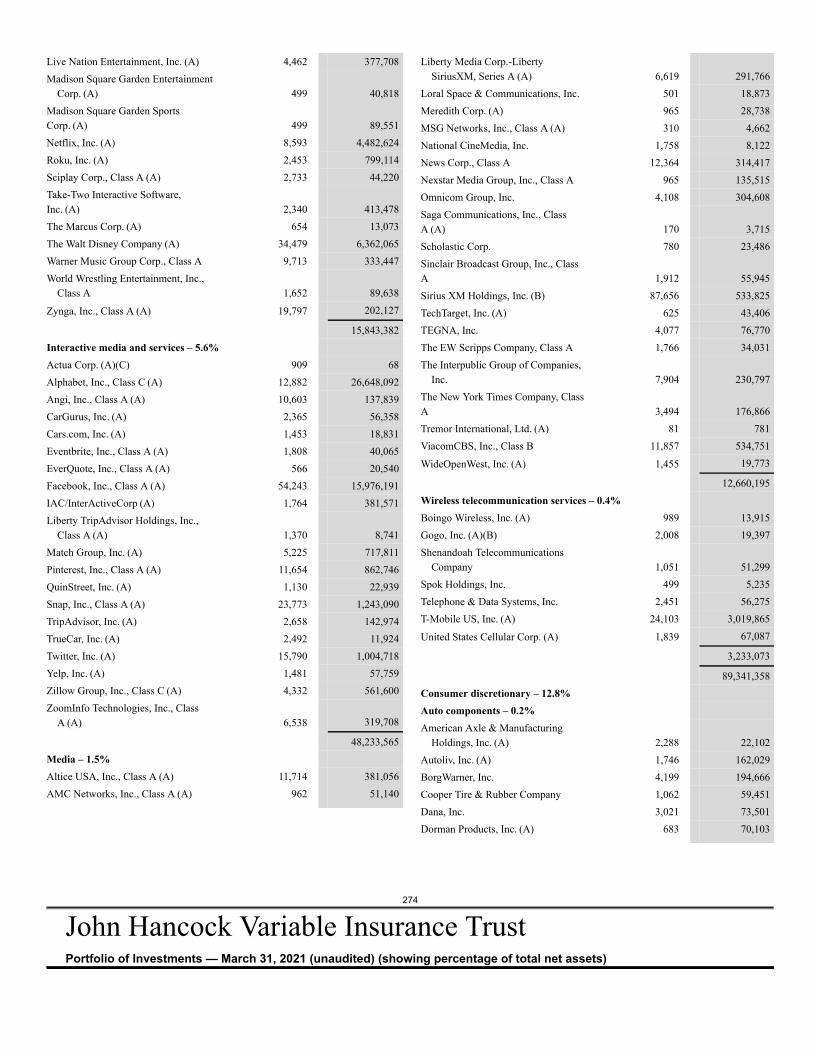
274
John Hancock Variable Insurance TrustPortfolio of Investments — March 31, 2021 (unaudited) (showing percentage of total net assets)
Live Nation Entertainment, Inc. (A) 4,462 377,708Madison Square Garden Entertainment
Corp. (A) 499 40,818Madison Square Garden SportsCorp. (A) 499 89,551Netflix, Inc. (A) 8,593 4,482,624Roku, Inc. (A) 2,453 799,114Sciplay Corp., Class A (A) 2,733 44,220Take-Two Interactive Software,Inc. (A) 2,340 413,478The Marcus Corp. (A) 654 13,073The Walt Disney Company (A) 34,479 6,362,065Warner Music Group Corp., Class A 9,713 333,447World Wrestling Entertainment, Inc.,
Class A 1,652 89,638
Zynga, Inc., Class A (A) 19,797 202,127
15,843,382Interactive media and services – 5.6%Actua Corp. (A)(C) 909 68Alphabet, Inc., Class C (A) 12,882 26,648,092Angi, Inc., Class A (A) 10,603 137,839CarGurus, Inc. (A) 2,365 56,358Cars.com, Inc. (A) 1,453 18,831Eventbrite, Inc., Class A (A) 1,808 40,065EverQuote, Inc., Class A (A) 566 20,540Facebook, Inc., Class A (A) 54,243 15,976,191IAC/InterActiveCorp (A) 1,764 381,571Liberty TripAdvisor Holdings, Inc.,
Class A (A) 1,370 8,741Match Group, Inc. (A) 5,225 717,811Pinterest, Inc., Class A (A) 11,654 862,746QuinStreet, Inc. (A) 1,130 22,939Snap, Inc., Class A (A) 23,773 1,243,090TripAdvisor, Inc. (A) 2,658 142,974TrueCar, Inc. (A) 2,492 11,924Twitter, Inc. (A) 15,790 1,004,718Yelp, Inc. (A) 1,481 57,759Zillow Group, Inc., Class C (A) 4,332 561,600ZoomInfo Technologies, Inc., Class
A (A) 6,538 319,708
48,233,565Media – 1.5%Altice USA, Inc., Class A (A) 11,714 381,056AMC Networks, Inc., Class A (A) 962 51,140
Liberty Media Corp.-LibertySiriusXM, Series A (A) 6,619 291,766
Loral Space & Communications, Inc. 501 18,873Meredith Corp. (A) 965 28,738MSG Networks, Inc., Class A (A) 310 4,662National CineMedia, Inc. 1,758 8,122News Corp., Class A 12,364 314,417Nexstar Media Group, Inc., Class A 965 135,515Omnicom Group, Inc. 4,108 304,608Saga Communications, Inc., ClassA (A) 170 3,715Scholastic Corp. 780 23,486Sinclair Broadcast Group, Inc., ClassA 1,912 55,945Sirius XM Holdings, Inc. (B) 87,656 533,825TechTarget, Inc. (A) 625 43,406TEGNA, Inc. 4,077 76,770The EW Scripps Company, Class A 1,766 34,031The Interpublic Group of Companies,
Inc. 7,904 230,797The New York Times Company, ClassA 3,494 176,866Tremor International, Ltd. (A) 81 781ViacomCBS, Inc., Class B 11,857 534,751
WideOpenWest, Inc. (A) 1,455 19,773
12,660,195Wireless telecommunication services – 0.4%Boingo Wireless, Inc. (A) 989 13,915Gogo, Inc. (A)(B) 2,008 19,397Shenandoah Telecommunications
Company 1,051 51,299Spok Holdings, Inc. 499 5,235Telephone & Data Systems, Inc. 2,451 56,275T-Mobile US, Inc. (A) 24,103 3,019,865
United States Cellular Corp. (A) 1,839 67,087
3,233,073
89,341,358Consumer discretionary – 12.8%Auto components – 0.2%American Axle & Manufacturing
Holdings, Inc. (A) 2,288 22,102Autoliv, Inc. (A) 1,746 162,029BorgWarner, Inc. 4,199 194,666Cooper Tire & Rubber Company 1,062 59,451Dana, Inc. 3,021 73,501Dorman Products, Inc. (A) 683 70,103
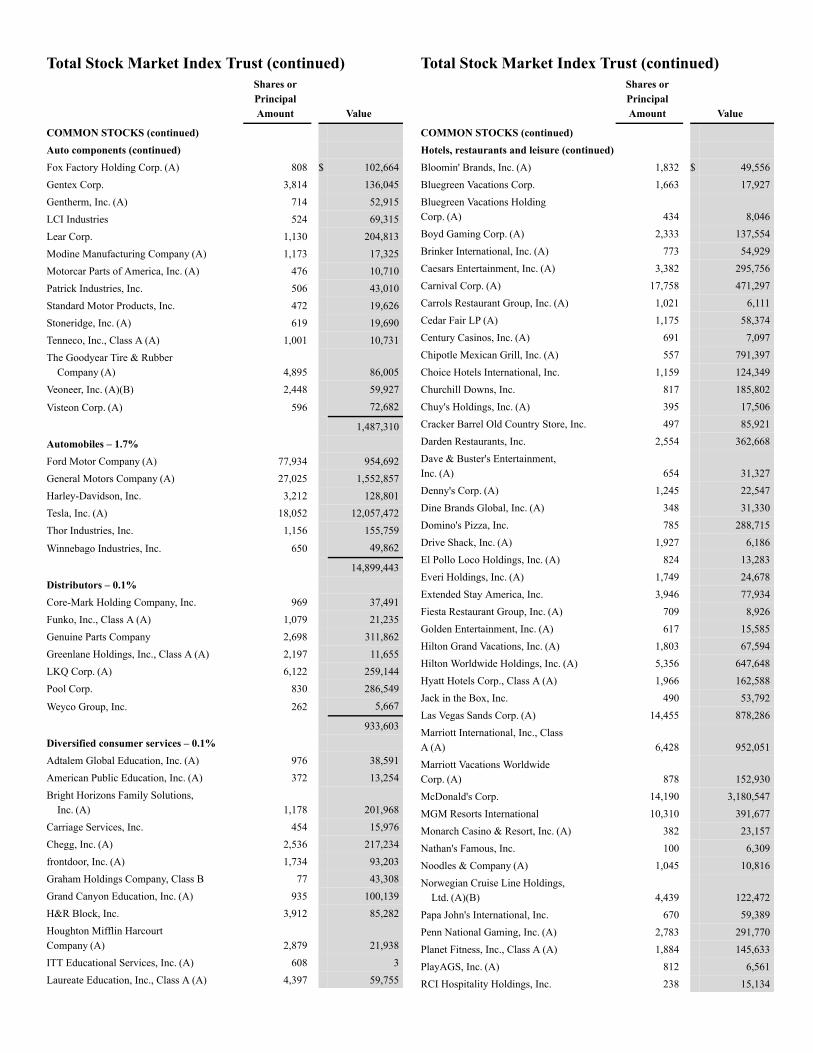
Total Stock Market Index Trust (continued)Shares orPrincipalAmount Value
COMMON STOCKS (continued)Auto components (continued)Fox Factory Holding Corp. (A) 808 $ 102,664Gentex Corp. 3,814 136,045Gentherm, Inc. (A) 714 52,915LCI Industries 524 69,315Lear Corp. 1,130 204,813Modine Manufacturing Company (A) 1,173 17,325Motorcar Parts of America, Inc. (A) 476 10,710Patrick Industries, Inc. 506 43,010Standard Motor Products, Inc. 472 19,626Stoneridge, Inc. (A) 619 19,690Tenneco, Inc., Class A (A) 1,001 10,731The Goodyear Tire & Rubber
Company (A) 4,895 86,005Veoneer, Inc. (A)(B) 2,448 59,927
Visteon Corp. (A) 596 72,682
1,487,310Automobiles – 1.7%Ford Motor Company (A) 77,934 954,692General Motors Company (A) 27,025 1,552,857Harley-Davidson, Inc. 3,212 128,801Tesla, Inc. (A) 18,052 12,057,472Thor Industries, Inc. 1,156 155,759
Winnebago Industries, Inc. 650 49,862
14,899,443Distributors – 0.1%Core-Mark Holding Company, Inc. 969 37,491Funko, Inc., Class A (A) 1,079 21,235Genuine Parts Company 2,698 311,862Greenlane Holdings, Inc., Class A (A) 2,197 11,655LKQ Corp. (A) 6,122 259,144Pool Corp. 830 286,549
Weyco Group, Inc. 262 5,667
933,603Diversified consumer services – 0.1%Adtalem Global Education, Inc. (A) 976 38,591American Public Education, Inc. (A) 372 13,254Bright Horizons Family Solutions,
Inc. (A) 1,178 201,968Carriage Services, Inc. 454 15,976Chegg, Inc. (A) 2,536 217,234frontdoor, Inc. (A) 1,734 93,203Graham Holdings Company, Class B 77 43,308Grand Canyon Education, Inc. (A) 935 100,139H&R Block, Inc. 3,912 85,282Houghton Mifflin HarcourtCompany (A) 2,879 21,938ITT Educational Services, Inc. (A) 608 3Laureate Education, Inc., Class A (A) 4,397 59,755
Total Stock Market Index Trust (continued)Shares orPrincipalAmount Value
COMMON STOCKS (continued)Hotels, restaurants and leisure (continued)Bloomin' Brands, Inc. (A) 1,832 $ 49,556Bluegreen Vacations Corp. 1,663 17,927Bluegreen Vacations HoldingCorp. (A) 434 8,046Boyd Gaming Corp. (A) 2,333 137,554Brinker International, Inc. (A) 773 54,929Caesars Entertainment, Inc. (A) 3,382 295,756Carnival Corp. (A) 17,758 471,297Carrols Restaurant Group, Inc. (A) 1,021 6,111Cedar Fair LP (A) 1,175 58,374Century Casinos, Inc. (A) 691 7,097Chipotle Mexican Grill, Inc. (A) 557 791,397Choice Hotels International, Inc. 1,159 124,349Churchill Downs, Inc. 817 185,802Chuy's Holdings, Inc. (A) 395 17,506Cracker Barrel Old Country Store, Inc. 497 85,921Darden Restaurants, Inc. 2,554 362,668Dave & Buster's Entertainment,Inc. (A) 654 31,327Denny's Corp. (A) 1,245 22,547Dine Brands Global, Inc. (A) 348 31,330Domino's Pizza, Inc. 785 288,715Drive Shack, Inc. (A) 1,927 6,186El Pollo Loco Holdings, Inc. (A) 824 13,283Everi Holdings, Inc. (A) 1,749 24,678Extended Stay America, Inc. 3,946 77,934Fiesta Restaurant Group, Inc. (A) 709 8,926Golden Entertainment, Inc. (A) 617 15,585Hilton Grand Vacations, Inc. (A) 1,803 67,594Hilton Worldwide Holdings, Inc. (A) 5,356 647,648Hyatt Hotels Corp., Class A (A) 1,966 162,588Jack in the Box, Inc. 490 53,792Las Vegas Sands Corp. (A) 14,455 878,286Marriott International, Inc., ClassA (A) 6,428 952,051Marriott Vacations WorldwideCorp. (A) 878 152,930McDonald's Corp. 14,190 3,180,547MGM Resorts International 10,310 391,677Monarch Casino & Resort, Inc. (A) 382 23,157Nathan's Famous, Inc. 100 6,309Noodles & Company (A) 1,045 10,816Norwegian Cruise Line Holdings,
Ltd. (A)(B) 4,439 122,472Papa John's International, Inc. 670 59,389Penn National Gaming, Inc. (A) 2,783 291,770Planet Fitness, Inc., Class A (A) 1,884 145,633PlayAGS, Inc. (A) 812 6,561RCI Hospitality Holdings, Inc. 238 15,134
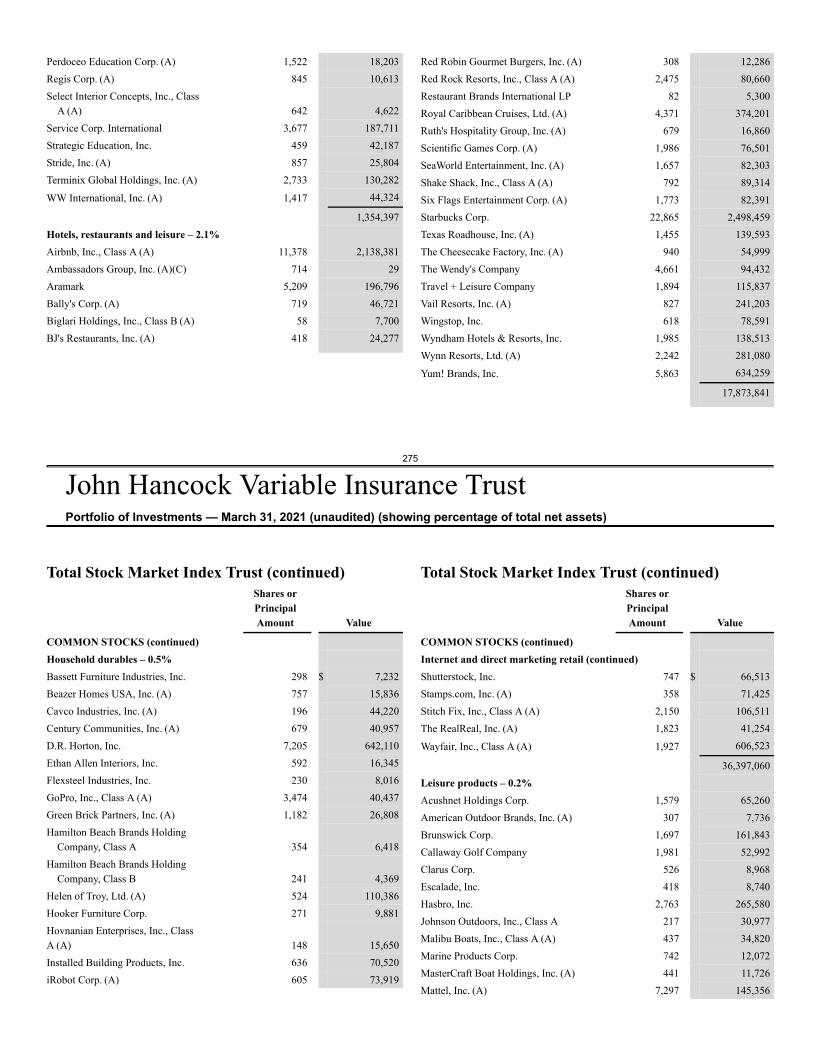
275
John Hancock Variable Insurance TrustPortfolio of Investments — March 31, 2021 (unaudited) (showing percentage of total net assets)
Perdoceo Education Corp. (A) 1,522 18,203Regis Corp. (A) 845 10,613Select Interior Concepts, Inc., Class
A (A) 642 4,622Service Corp. International 3,677 187,711Strategic Education, Inc. 459 42,187Stride, Inc. (A) 857 25,804Terminix Global Holdings, Inc. (A) 2,733 130,282
WW International, Inc. (A) 1,417 44,324
1,354,397Hotels, restaurants and leisure – 2.1%Airbnb, Inc., Class A (A) 11,378 2,138,381Ambassadors Group, Inc. (A)(C) 714 29Aramark 5,209 196,796Bally's Corp. (A) 719 46,721Biglari Holdings, Inc., Class B (A) 58 7,700BJ's Restaurants, Inc. (A) 418 24,277
Red Robin Gourmet Burgers, Inc. (A) 308 12,286Red Rock Resorts, Inc., Class A (A) 2,475 80,660Restaurant Brands International LP 82 5,300Royal Caribbean Cruises, Ltd. (A) 4,371 374,201Ruth's Hospitality Group, Inc. (A) 679 16,860Scientific Games Corp. (A) 1,986 76,501SeaWorld Entertainment, Inc. (A) 1,657 82,303Shake Shack, Inc., Class A (A) 792 89,314Six Flags Entertainment Corp. (A) 1,773 82,391Starbucks Corp. 22,865 2,498,459Texas Roadhouse, Inc. (A) 1,455 139,593The Cheesecake Factory, Inc. (A) 940 54,999The Wendy's Company 4,661 94,432Travel + Leisure Company 1,894 115,837Vail Resorts, Inc. (A) 827 241,203Wingstop, Inc. 618 78,591Wyndham Hotels & Resorts, Inc. 1,985 138,513Wynn Resorts, Ltd. (A) 2,242 281,080
Yum! Brands, Inc. 5,863 634,259
17,873,841
Total Stock Market Index Trust (continued)Shares orPrincipalAmount Value
COMMON STOCKS (continued)Household durables – 0.5%Bassett Furniture Industries, Inc. 298 $ 7,232Beazer Homes USA, Inc. (A) 757 15,836Cavco Industries, Inc. (A) 196 44,220Century Communities, Inc. (A) 679 40,957D.R. Horton, Inc. 7,205 642,110Ethan Allen Interiors, Inc. 592 16,345Flexsteel Industries, Inc. 230 8,016GoPro, Inc., Class A (A) 3,474 40,437Green Brick Partners, Inc. (A) 1,182 26,808Hamilton Beach Brands Holding
Company, Class A 354 6,418Hamilton Beach Brands Holding
Company, Class B 241 4,369Helen of Troy, Ltd. (A) 524 110,386Hooker Furniture Corp. 271 9,881Hovnanian Enterprises, Inc., ClassA (A) 148 15,650Installed Building Products, Inc. 636 70,520iRobot Corp. (A) 605 73,919
Total Stock Market Index Trust (continued)Shares orPrincipalAmount Value
COMMON STOCKS (continued)Internet and direct marketing retail (continued)Shutterstock, Inc. 747 $ 66,513Stamps.com, Inc. (A) 358 71,425Stitch Fix, Inc., Class A (A) 2,150 106,511The RealReal, Inc. (A) 1,823 41,254
Wayfair, Inc., Class A (A) 1,927 606,523
36,397,060Leisure products – 0.2%Acushnet Holdings Corp. 1,579 65,260American Outdoor Brands, Inc. (A) 307 7,736Brunswick Corp. 1,697 161,843Callaway Golf Company 1,981 52,992Clarus Corp. 526 8,968Escalade, Inc. 418 8,740Hasbro, Inc. 2,763 265,580Johnson Outdoors, Inc., Class A 217 30,977Malibu Boats, Inc., Class A (A) 437 34,820Marine Products Corp. 742 12,072MasterCraft Boat Holdings, Inc. (A) 441 11,726Mattel, Inc. (A) 7,297 145,356
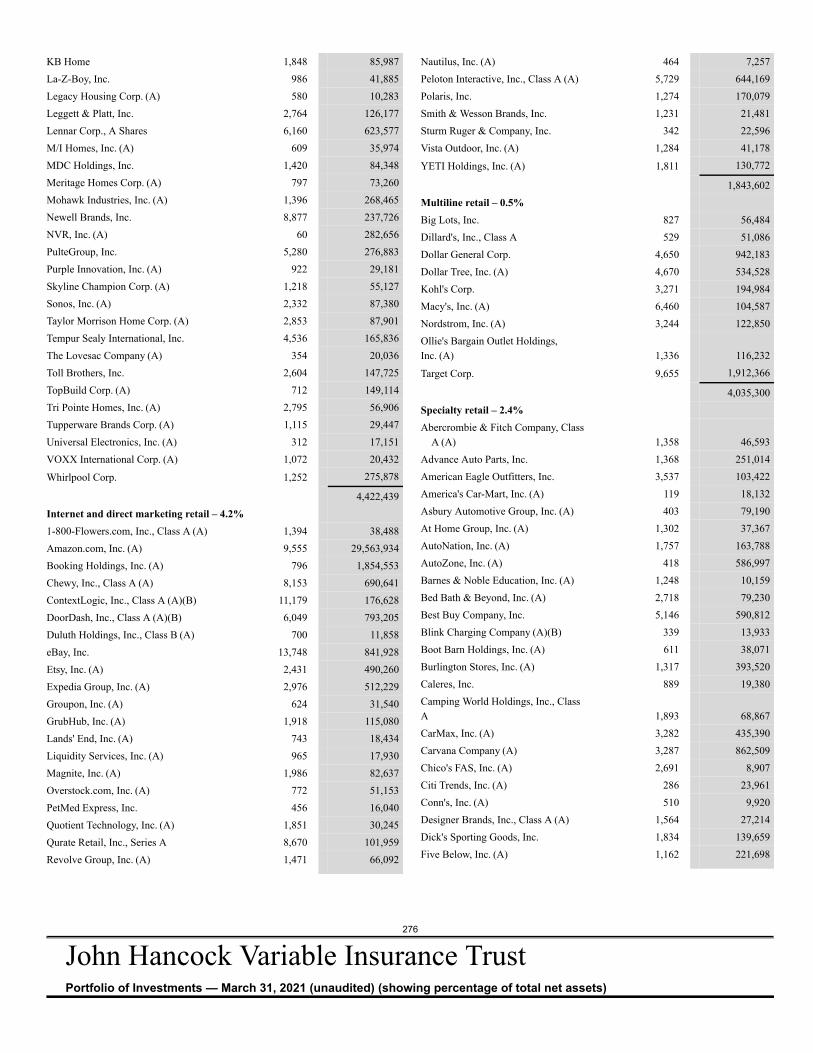
276
John Hancock Variable Insurance TrustPortfolio of Investments — March 31, 2021 (unaudited) (showing percentage of total net assets)
KB Home 1,848 85,987La-Z-Boy, Inc. 986 41,885Legacy Housing Corp. (A) 580 10,283Leggett & Platt, Inc. 2,764 126,177Lennar Corp., A Shares 6,160 623,577M/I Homes, Inc. (A) 609 35,974MDC Holdings, Inc. 1,420 84,348Meritage Homes Corp. (A) 797 73,260Mohawk Industries, Inc. (A) 1,396 268,465Newell Brands, Inc. 8,877 237,726NVR, Inc. (A) 60 282,656PulteGroup, Inc. 5,280 276,883Purple Innovation, Inc. (A) 922 29,181Skyline Champion Corp. (A) 1,218 55,127Sonos, Inc. (A) 2,332 87,380Taylor Morrison Home Corp. (A) 2,853 87,901Tempur Sealy International, Inc. 4,536 165,836The Lovesac Company (A) 354 20,036Toll Brothers, Inc. 2,604 147,725TopBuild Corp. (A) 712 149,114Tri Pointe Homes, Inc. (A) 2,795 56,906Tupperware Brands Corp. (A) 1,115 29,447Universal Electronics, Inc. (A) 312 17,151VOXX International Corp. (A) 1,072 20,432
Whirlpool Corp. 1,252 275,878
4,422,439Internet and direct marketing retail – 4.2%1-800-Flowers.com, Inc., Class A (A) 1,394 38,488Amazon.com, Inc. (A) 9,555 29,563,934Booking Holdings, Inc. (A) 796 1,854,553Chewy, Inc., Class A (A) 8,153 690,641ContextLogic, Inc., Class A (A)(B) 11,179 176,628DoorDash, Inc., Class A (A)(B) 6,049 793,205Duluth Holdings, Inc., Class B (A) 700 11,858eBay, Inc. 13,748 841,928Etsy, Inc. (A) 2,431 490,260Expedia Group, Inc. (A) 2,976 512,229Groupon, Inc. (A) 624 31,540GrubHub, Inc. (A) 1,918 115,080Lands' End, Inc. (A) 743 18,434Liquidity Services, Inc. (A) 965 17,930Magnite, Inc. (A) 1,986 82,637Overstock.com, Inc. (A) 772 51,153PetMed Express, Inc. 456 16,040Quotient Technology, Inc. (A) 1,851 30,245Qurate Retail, Inc., Series A 8,670 101,959Revolve Group, Inc. (A) 1,471 66,092
Nautilus, Inc. (A) 464 7,257Peloton Interactive, Inc., Class A (A) 5,729 644,169Polaris, Inc. 1,274 170,079Smith & Wesson Brands, Inc. 1,231 21,481Sturm Ruger & Company, Inc. 342 22,596Vista Outdoor, Inc. (A) 1,284 41,178
YETI Holdings, Inc. (A) 1,811 130,772
1,843,602Multiline retail – 0.5%Big Lots, Inc. 827 56,484Dillard's, Inc., Class A 529 51,086Dollar General Corp. 4,650 942,183Dollar Tree, Inc. (A) 4,670 534,528Kohl's Corp. 3,271 194,984Macy's, Inc. (A) 6,460 104,587Nordstrom, Inc. (A) 3,244 122,850Ollie's Bargain Outlet Holdings,Inc. (A) 1,336 116,232
Target Corp. 9,655 1,912,366
4,035,300Specialty retail – 2.4%Abercrombie & Fitch Company, Class
A (A) 1,358 46,593Advance Auto Parts, Inc. 1,368 251,014American Eagle Outfitters, Inc. 3,537 103,422America's Car-Mart, Inc. (A) 119 18,132Asbury Automotive Group, Inc. (A) 403 79,190At Home Group, Inc. (A) 1,302 37,367AutoNation, Inc. (A) 1,757 163,788AutoZone, Inc. (A) 418 586,997Barnes & Noble Education, Inc. (A) 1,248 10,159Bed Bath & Beyond, Inc. (A) 2,718 79,230Best Buy Company, Inc. 5,146 590,812Blink Charging Company (A)(B) 339 13,933Boot Barn Holdings, Inc. (A) 611 38,071Burlington Stores, Inc. (A) 1,317 393,520Caleres, Inc. 889 19,380Camping World Holdings, Inc., ClassA 1,893 68,867CarMax, Inc. (A) 3,282 435,390Carvana Company (A) 3,287 862,509Chico's FAS, Inc. (A) 2,691 8,907Citi Trends, Inc. (A) 286 23,961Conn's, Inc. (A) 510 9,920Designer Brands, Inc., Class A (A) 1,564 27,214Dick's Sporting Goods, Inc. 1,834 139,659Five Below, Inc. (A) 1,162 221,698
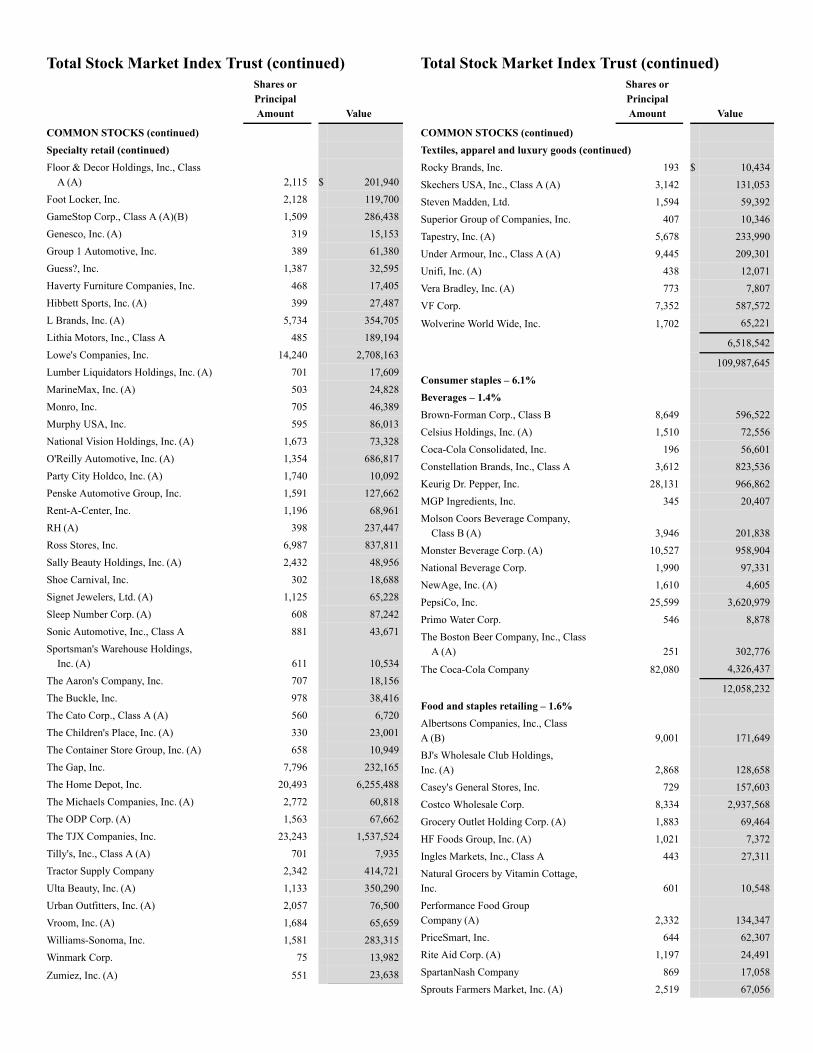
Total Stock Market Index Trust (continued)Shares orPrincipalAmount Value
COMMON STOCKS (continued)Specialty retail (continued)Floor & Decor Holdings, Inc., Class
A (A) 2,115 $ 201,940Foot Locker, Inc. 2,128 119,700GameStop Corp., Class A (A)(B) 1,509 286,438Genesco, Inc. (A) 319 15,153Group 1 Automotive, Inc. 389 61,380Guess?, Inc. 1,387 32,595Haverty Furniture Companies, Inc. 468 17,405Hibbett Sports, Inc. (A) 399 27,487L Brands, Inc. (A) 5,734 354,705Lithia Motors, Inc., Class A 485 189,194Lowe's Companies, Inc. 14,240 2,708,163Lumber Liquidators Holdings, Inc. (A) 701 17,609MarineMax, Inc. (A) 503 24,828Monro, Inc. 705 46,389Murphy USA, Inc. 595 86,013National Vision Holdings, Inc. (A) 1,673 73,328O'Reilly Automotive, Inc. (A) 1,354 686,817Party City Holdco, Inc. (A) 1,740 10,092Penske Automotive Group, Inc. 1,591 127,662Rent-A-Center, Inc. 1,196 68,961RH (A) 398 237,447Ross Stores, Inc. 6,987 837,811Sally Beauty Holdings, Inc. (A) 2,432 48,956Shoe Carnival, Inc. 302 18,688Signet Jewelers, Ltd. (A) 1,125 65,228Sleep Number Corp. (A) 608 87,242Sonic Automotive, Inc., Class A 881 43,671Sportsman's Warehouse Holdings,
Inc. (A) 611 10,534The Aaron's Company, Inc. 707 18,156The Buckle, Inc. 978 38,416The Cato Corp., Class A (A) 560 6,720The Children's Place, Inc. (A) 330 23,001The Container Store Group, Inc. (A) 658 10,949The Gap, Inc. 7,796 232,165The Home Depot, Inc. 20,493 6,255,488The Michaels Companies, Inc. (A) 2,772 60,818The ODP Corp. (A) 1,563 67,662The TJX Companies, Inc. 23,243 1,537,524Tilly's, Inc., Class A (A) 701 7,935Tractor Supply Company 2,342 414,721Ulta Beauty, Inc. (A) 1,133 350,290Urban Outfitters, Inc. (A) 2,057 76,500Vroom, Inc. (A) 1,684 65,659Williams-Sonoma, Inc. 1,581 283,315Winmark Corp. 75 13,982
Zumiez, Inc. (A) 551 23,638
Total Stock Market Index Trust (continued)Shares orPrincipalAmount Value
COMMON STOCKS (continued)Textiles, apparel and luxury goods (continued)Rocky Brands, Inc. 193 $ 10,434Skechers USA, Inc., Class A (A) 3,142 131,053Steven Madden, Ltd. 1,594 59,392Superior Group of Companies, Inc. 407 10,346Tapestry, Inc. (A) 5,678 233,990Under Armour, Inc., Class A (A) 9,445 209,301Unifi, Inc. (A) 438 12,071Vera Bradley, Inc. (A) 773 7,807VF Corp. 7,352 587,572
Wolverine World Wide, Inc. 1,702 65,221
6,518,542
109,987,645Consumer staples – 6.1%Beverages – 1.4%Brown-Forman Corp., Class B 8,649 596,522Celsius Holdings, Inc. (A) 1,510 72,556Coca-Cola Consolidated, Inc. 196 56,601Constellation Brands, Inc., Class A 3,612 823,536Keurig Dr. Pepper, Inc. 28,131 966,862MGP Ingredients, Inc. 345 20,407Molson Coors Beverage Company,
Class B (A) 3,946 201,838Monster Beverage Corp. (A) 10,527 958,904National Beverage Corp. 1,990 97,331NewAge, Inc. (A) 1,610 4,605PepsiCo, Inc. 25,599 3,620,979Primo Water Corp. 546 8,878The Boston Beer Company, Inc., Class
A (A) 251 302,776
The Coca-Cola Company 82,080 4,326,437
12,058,232Food and staples retailing – 1.6%Albertsons Companies, Inc., ClassA (B) 9,001 171,649BJ's Wholesale Club Holdings,Inc. (A) 2,868 128,658Casey's General Stores, Inc. 729 157,603Costco Wholesale Corp. 8,334 2,937,568Grocery Outlet Holding Corp. (A) 1,883 69,464HF Foods Group, Inc. (A) 1,021 7,372Ingles Markets, Inc., Class A 443 27,311Natural Grocers by Vitamin Cottage,Inc. 601 10,548Performance Food GroupCompany (A) 2,332 134,347PriceSmart, Inc. 644 62,307Rite Aid Corp. (A) 1,197 24,491SpartanNash Company 869 17,058Sprouts Farmers Market, Inc. (A) 2,519 67,056
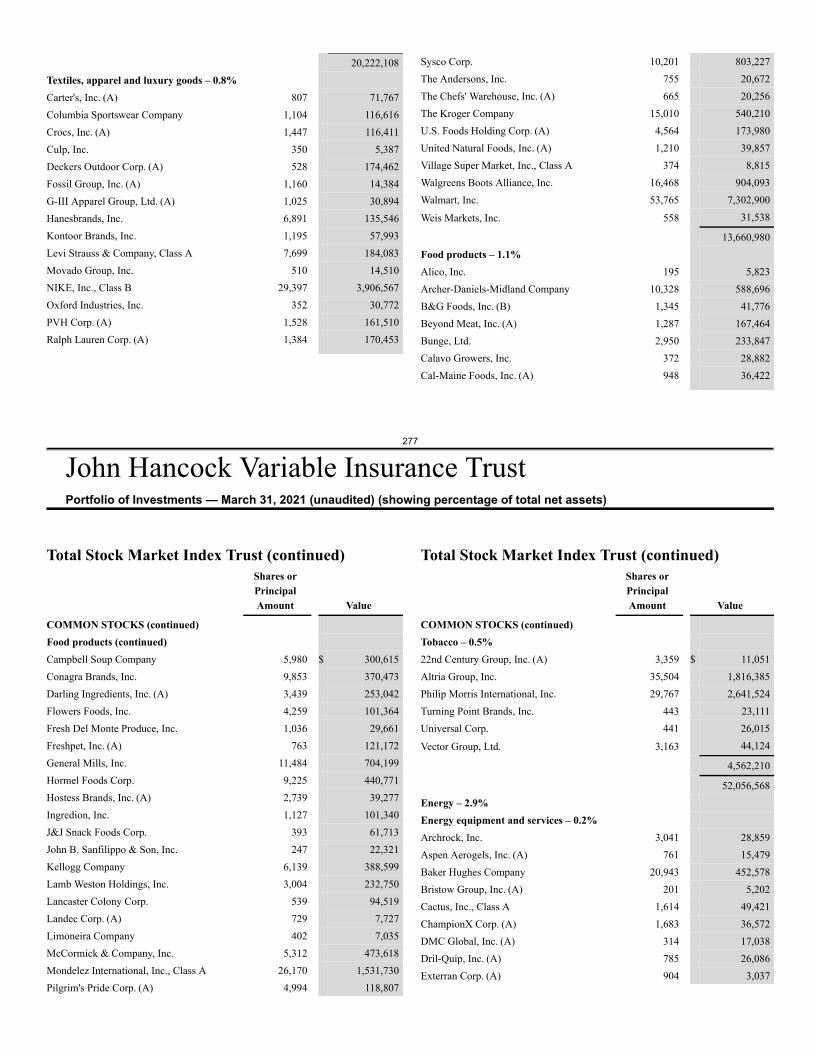
277
John Hancock Variable Insurance TrustPortfolio of Investments — March 31, 2021 (unaudited) (showing percentage of total net assets)
20,222,108Textiles, apparel and luxury goods – 0.8%Carter's, Inc. (A) 807 71,767Columbia Sportswear Company 1,104 116,616Crocs, Inc. (A) 1,447 116,411Culp, Inc. 350 5,387Deckers Outdoor Corp. (A) 528 174,462Fossil Group, Inc. (A) 1,160 14,384G-III Apparel Group, Ltd. (A) 1,025 30,894Hanesbrands, Inc. 6,891 135,546Kontoor Brands, Inc. 1,195 57,993Levi Strauss & Company, Class A 7,699 184,083Movado Group, Inc. 510 14,510NIKE, Inc., Class B 29,397 3,906,567Oxford Industries, Inc. 352 30,772PVH Corp. (A) 1,528 161,510Ralph Lauren Corp. (A) 1,384 170,453
Sysco Corp. 10,201 803,227The Andersons, Inc. 755 20,672The Chefs' Warehouse, Inc. (A) 665 20,256The Kroger Company 15,010 540,210U.S. Foods Holding Corp. (A) 4,564 173,980United Natural Foods, Inc. (A) 1,210 39,857Village Super Market, Inc., Class A 374 8,815Walgreens Boots Alliance, Inc. 16,468 904,093Walmart, Inc. 53,765 7,302,900
Weis Markets, Inc. 558 31,538
13,660,980Food products – 1.1%Alico, Inc. 195 5,823Archer-Daniels-Midland Company 10,328 588,696B&G Foods, Inc. (B) 1,345 41,776Beyond Meat, Inc. (A) 1,287 167,464Bunge, Ltd. 2,950 233,847Calavo Growers, Inc. 372 28,882Cal-Maine Foods, Inc. (A) 948 36,422
Total Stock Market Index Trust (continued)Shares orPrincipalAmount Value
COMMON STOCKS (continued)Food products (continued)Campbell Soup Company 5,980 $ 300,615Conagra Brands, Inc. 9,853 370,473Darling Ingredients, Inc. (A) 3,439 253,042Flowers Foods, Inc. 4,259 101,364Fresh Del Monte Produce, Inc. 1,036 29,661Freshpet, Inc. (A) 763 121,172General Mills, Inc. 11,484 704,199Hormel Foods Corp. 9,225 440,771Hostess Brands, Inc. (A) 2,739 39,277Ingredion, Inc. 1,127 101,340J&J Snack Foods Corp. 393 61,713John B. Sanfilippo & Son, Inc. 247 22,321Kellogg Company 6,139 388,599Lamb Weston Holdings, Inc. 3,004 232,750Lancaster Colony Corp. 539 94,519Landec Corp. (A) 729 7,727Limoneira Company 402 7,035McCormick & Company, Inc. 5,312 473,618Mondelez International, Inc., Class A 26,170 1,531,730Pilgrim's Pride Corp. (A) 4,994 118,807
Total Stock Market Index Trust (continued)Shares orPrincipalAmount Value
COMMON STOCKS (continued)Tobacco – 0.5%22nd Century Group, Inc. (A) 3,359 $ 11,051Altria Group, Inc. 35,504 1,816,385Philip Morris International, Inc. 29,767 2,641,524Turning Point Brands, Inc. 443 23,111Universal Corp. 441 26,015
Vector Group, Ltd. 3,163 44,124
4,562,210
52,056,568Energy – 2.9%Energy equipment and services – 0.2%Archrock, Inc. 3,041 28,859Aspen Aerogels, Inc. (A) 761 15,479Baker Hughes Company 20,943 452,578Bristow Group, Inc. (A) 201 5,202Cactus, Inc., Class A 1,614 49,421ChampionX Corp. (A) 1,683 36,572DMC Global, Inc. (A) 314 17,038Dril-Quip, Inc. (A) 785 26,086Exterran Corp. (A) 904 3,037
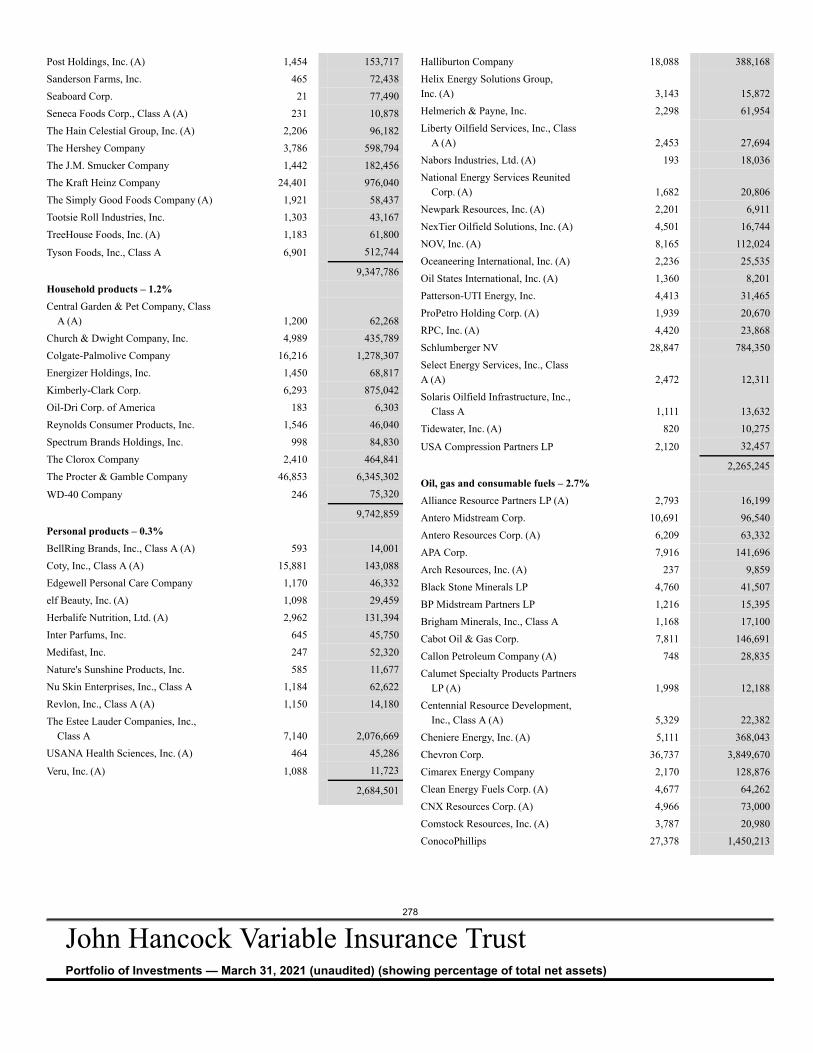
278
John Hancock Variable Insurance TrustPortfolio of Investments — March 31, 2021 (unaudited) (showing percentage of total net assets)
Post Holdings, Inc. (A) 1,454 153,717Sanderson Farms, Inc. 465 72,438Seaboard Corp. 21 77,490Seneca Foods Corp., Class A (A) 231 10,878The Hain Celestial Group, Inc. (A) 2,206 96,182The Hershey Company 3,786 598,794The J.M. Smucker Company 1,442 182,456The Kraft Heinz Company 24,401 976,040The Simply Good Foods Company (A) 1,921 58,437Tootsie Roll Industries, Inc. 1,303 43,167TreeHouse Foods, Inc. (A) 1,183 61,800
Tyson Foods, Inc., Class A 6,901 512,744
9,347,786Household products – 1.2%Central Garden & Pet Company, Class
A (A) 1,200 62,268Church & Dwight Company, Inc. 4,989 435,789Colgate-Palmolive Company 16,216 1,278,307Energizer Holdings, Inc. 1,450 68,817Kimberly-Clark Corp. 6,293 875,042Oil-Dri Corp. of America 183 6,303Reynolds Consumer Products, Inc. 1,546 46,040Spectrum Brands Holdings, Inc. 998 84,830The Clorox Company 2,410 464,841The Procter & Gamble Company 46,853 6,345,302
WD-40 Company 246 75,320
9,742,859Personal products – 0.3%BellRing Brands, Inc., Class A (A) 593 14,001Coty, Inc., Class A (A) 15,881 143,088Edgewell Personal Care Company 1,170 46,332elf Beauty, Inc. (A) 1,098 29,459Herbalife Nutrition, Ltd. (A) 2,962 131,394Inter Parfums, Inc. 645 45,750Medifast, Inc. 247 52,320Nature's Sunshine Products, Inc. 585 11,677Nu Skin Enterprises, Inc., Class A 1,184 62,622Revlon, Inc., Class A (A) 1,150 14,180The Estee Lauder Companies, Inc.,
Class A 7,140 2,076,669USANA Health Sciences, Inc. (A) 464 45,286
Veru, Inc. (A) 1,088 11,723
2,684,501
Halliburton Company 18,088 388,168Helix Energy Solutions Group,Inc. (A) 3,143 15,872Helmerich & Payne, Inc. 2,298 61,954Liberty Oilfield Services, Inc., Class
A (A) 2,453 27,694Nabors Industries, Ltd. (A) 193 18,036National Energy Services Reunited
Corp. (A) 1,682 20,806Newpark Resources, Inc. (A) 2,201 6,911NexTier Oilfield Solutions, Inc. (A) 4,501 16,744NOV, Inc. (A) 8,165 112,024Oceaneering International, Inc. (A) 2,236 25,535Oil States International, Inc. (A) 1,360 8,201Patterson-UTI Energy, Inc. 4,413 31,465ProPetro Holding Corp. (A) 1,939 20,670RPC, Inc. (A) 4,420 23,868Schlumberger NV 28,847 784,350Select Energy Services, Inc., ClassA (A) 2,472 12,311Solaris Oilfield Infrastructure, Inc.,
Class A 1,111 13,632Tidewater, Inc. (A) 820 10,275
USA Compression Partners LP 2,120 32,457
2,265,245Oil, gas and consumable fuels – 2.7%Alliance Resource Partners LP (A) 2,793 16,199Antero Midstream Corp. 10,691 96,540Antero Resources Corp. (A) 6,209 63,332APA Corp. 7,916 141,696Arch Resources, Inc. (A) 237 9,859Black Stone Minerals LP 4,760 41,507BP Midstream Partners LP 1,216 15,395Brigham Minerals, Inc., Class A 1,168 17,100Cabot Oil & Gas Corp. 7,811 146,691Callon Petroleum Company (A) 748 28,835Calumet Specialty Products Partners
LP (A) 1,998 12,188Centennial Resource Development,
Inc., Class A (A) 5,329 22,382Cheniere Energy, Inc. (A) 5,111 368,043Chevron Corp. 36,737 3,849,670Cimarex Energy Company 2,170 128,876Clean Energy Fuels Corp. (A) 4,677 64,262CNX Resources Corp. (A) 4,966 73,000Comstock Resources, Inc. (A) 3,787 20,980ConocoPhillips 27,378 1,450,213
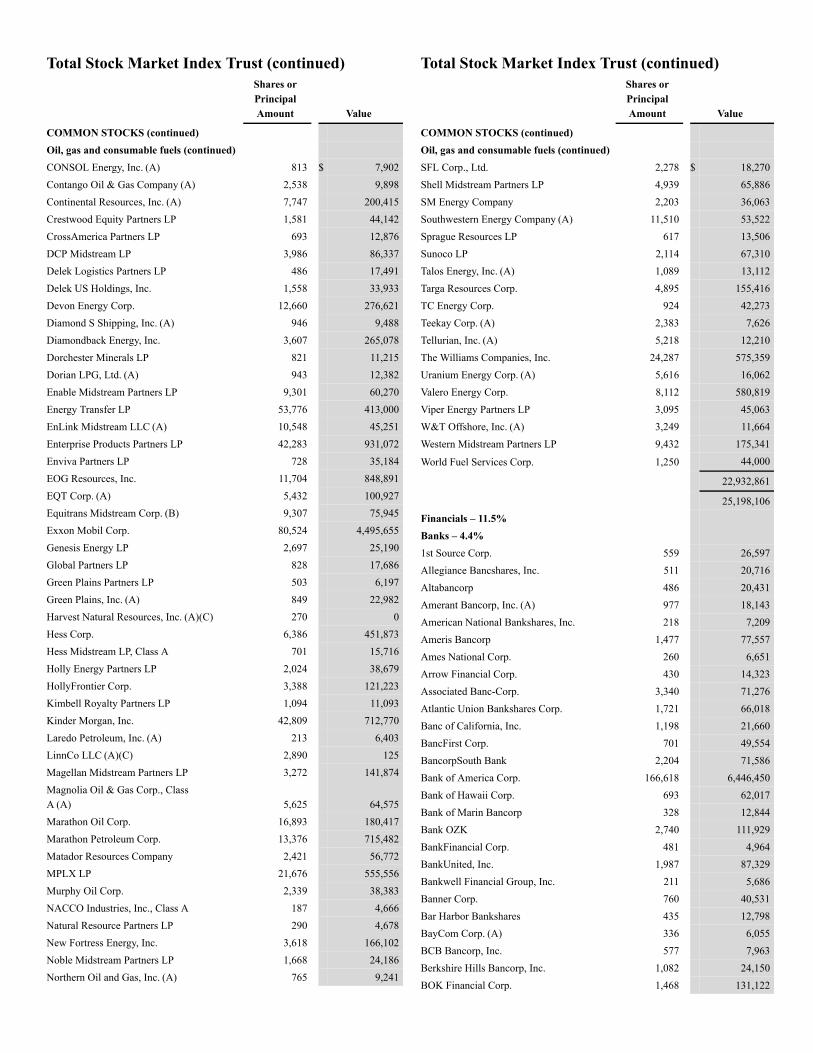
Total Stock Market Index Trust (continued)Shares orPrincipalAmount Value
COMMON STOCKS (continued)Oil, gas and consumable fuels (continued)CONSOL Energy, Inc. (A) 813 $ 7,902Contango Oil & Gas Company (A) 2,538 9,898Continental Resources, Inc. (A) 7,747 200,415Crestwood Equity Partners LP 1,581 44,142CrossAmerica Partners LP 693 12,876DCP Midstream LP 3,986 86,337Delek Logistics Partners LP 486 17,491Delek US Holdings, Inc. 1,558 33,933Devon Energy Corp. 12,660 276,621Diamond S Shipping, Inc. (A) 946 9,488Diamondback Energy, Inc. 3,607 265,078Dorchester Minerals LP 821 11,215Dorian LPG, Ltd. (A) 943 12,382Enable Midstream Partners LP 9,301 60,270Energy Transfer LP 53,776 413,000EnLink Midstream LLC (A) 10,548 45,251Enterprise Products Partners LP 42,283 931,072Enviva Partners LP 728 35,184EOG Resources, Inc. 11,704 848,891EQT Corp. (A) 5,432 100,927Equitrans Midstream Corp. (B) 9,307 75,945Exxon Mobil Corp. 80,524 4,495,655Genesis Energy LP 2,697 25,190Global Partners LP 828 17,686Green Plains Partners LP 503 6,197Green Plains, Inc. (A) 849 22,982Harvest Natural Resources, Inc. (A)(C) 270 0Hess Corp. 6,386 451,873Hess Midstream LP, Class A 701 15,716Holly Energy Partners LP 2,024 38,679HollyFrontier Corp. 3,388 121,223Kimbell Royalty Partners LP 1,094 11,093Kinder Morgan, Inc. 42,809 712,770Laredo Petroleum, Inc. (A) 213 6,403LinnCo LLC (A)(C) 2,890 125Magellan Midstream Partners LP 3,272 141,874Magnolia Oil & Gas Corp., ClassA (A) 5,625 64,575Marathon Oil Corp. 16,893 180,417Marathon Petroleum Corp. 13,376 715,482Matador Resources Company 2,421 56,772MPLX LP 21,676 555,556Murphy Oil Corp. 2,339 38,383NACCO Industries, Inc., Class A 187 4,666Natural Resource Partners LP 290 4,678New Fortress Energy, Inc. 3,618 166,102Noble Midstream Partners LP 1,668 24,186Northern Oil and Gas, Inc. (A) 765 9,241
Total Stock Market Index Trust (continued)Shares orPrincipalAmount Value
COMMON STOCKS (continued)Oil, gas and consumable fuels (continued)SFL Corp., Ltd. 2,278 $ 18,270Shell Midstream Partners LP 4,939 65,886SM Energy Company 2,203 36,063Southwestern Energy Company (A) 11,510 53,522Sprague Resources LP 617 13,506Sunoco LP 2,114 67,310Talos Energy, Inc. (A) 1,089 13,112Targa Resources Corp. 4,895 155,416TC Energy Corp. 924 42,273Teekay Corp. (A) 2,383 7,626Tellurian, Inc. (A) 5,218 12,210The Williams Companies, Inc. 24,287 575,359Uranium Energy Corp. (A) 5,616 16,062Valero Energy Corp. 8,112 580,819Viper Energy Partners LP 3,095 45,063W&T Offshore, Inc. (A) 3,249 11,664Western Midstream Partners LP 9,432 175,341
World Fuel Services Corp. 1,250 44,000
22,932,861
25,198,106Financials – 11.5%Banks – 4.4%1st Source Corp. 559 26,597Allegiance Bancshares, Inc. 511 20,716Altabancorp 486 20,431Amerant Bancorp, Inc. (A) 977 18,143American National Bankshares, Inc. 218 7,209Ameris Bancorp 1,477 77,557Ames National Corp. 260 6,651Arrow Financial Corp. 430 14,323Associated Banc-Corp. 3,340 71,276Atlantic Union Bankshares Corp. 1,721 66,018Banc of California, Inc. 1,198 21,660BancFirst Corp. 701 49,554BancorpSouth Bank 2,204 71,586Bank of America Corp. 166,618 6,446,450Bank of Hawaii Corp. 693 62,017Bank of Marin Bancorp 328 12,844Bank OZK 2,740 111,929BankFinancial Corp. 481 4,964BankUnited, Inc. 1,987 87,329Bankwell Financial Group, Inc. 211 5,686Banner Corp. 760 40,531Bar Harbor Bankshares 435 12,798BayCom Corp. (A) 336 6,055BCB Bancorp, Inc. 577 7,963Berkshire Hills Bancorp, Inc. 1,082 24,150BOK Financial Corp. 1,468 131,122
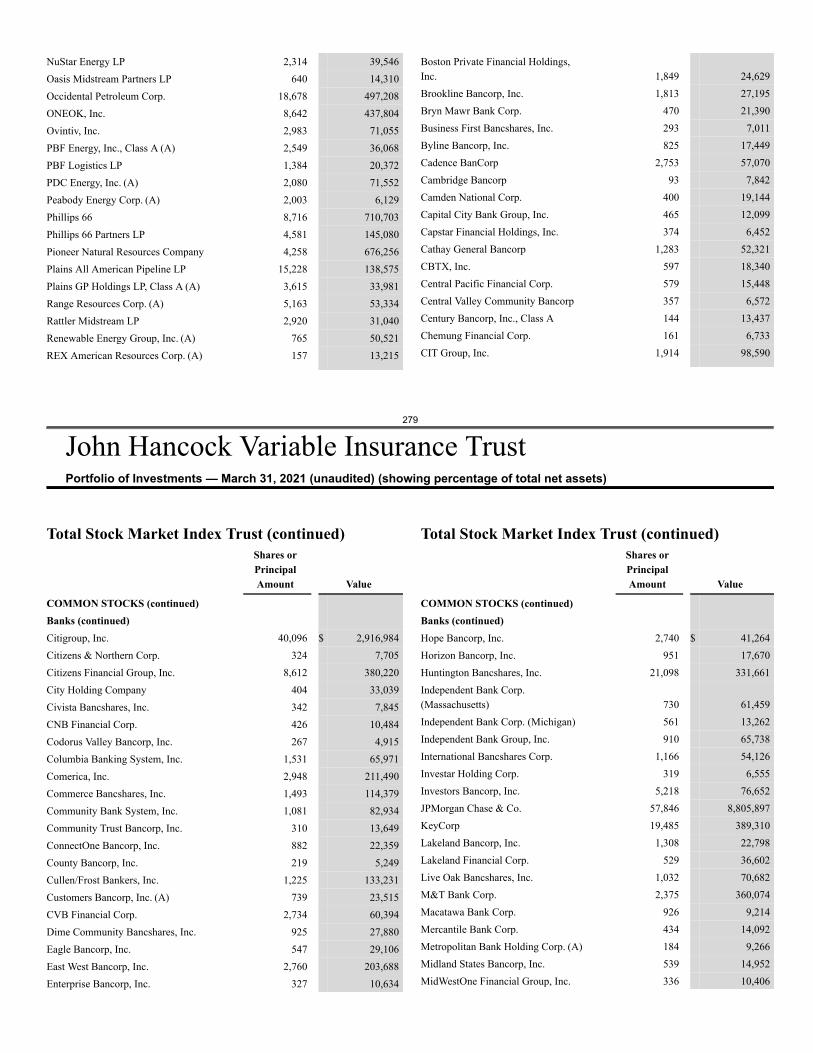
279
John Hancock Variable Insurance TrustPortfolio of Investments — March 31, 2021 (unaudited) (showing percentage of total net assets)
NuStar Energy LP 2,314 39,546Oasis Midstream Partners LP 640 14,310Occidental Petroleum Corp. 18,678 497,208ONEOK, Inc. 8,642 437,804Ovintiv, Inc. 2,983 71,055PBF Energy, Inc., Class A (A) 2,549 36,068PBF Logistics LP 1,384 20,372PDC Energy, Inc. (A) 2,080 71,552Peabody Energy Corp. (A) 2,003 6,129Phillips 66 8,716 710,703Phillips 66 Partners LP 4,581 145,080Pioneer Natural Resources Company 4,258 676,256Plains All American Pipeline LP 15,228 138,575Plains GP Holdings LP, Class A (A) 3,615 33,981Range Resources Corp. (A) 5,163 53,334Rattler Midstream LP 2,920 31,040Renewable Energy Group, Inc. (A) 765 50,521REX American Resources Corp. (A) 157 13,215
Boston Private Financial Holdings,Inc. 1,849 24,629Brookline Bancorp, Inc. 1,813 27,195Bryn Mawr Bank Corp. 470 21,390Business First Bancshares, Inc. 293 7,011Byline Bancorp, Inc. 825 17,449Cadence BanCorp 2,753 57,070Cambridge Bancorp 93 7,842Camden National Corp. 400 19,144Capital City Bank Group, Inc. 465 12,099Capstar Financial Holdings, Inc. 374 6,452Cathay General Bancorp 1,283 52,321CBTX, Inc. 597 18,340Central Pacific Financial Corp. 579 15,448Central Valley Community Bancorp 357 6,572Century Bancorp, Inc., Class A 144 13,437Chemung Financial Corp. 161 6,733CIT Group, Inc. 1,914 98,590
Total Stock Market Index Trust (continued)Shares orPrincipalAmount Value
COMMON STOCKS (continued)Banks (continued)Citigroup, Inc. 40,096 $ 2,916,984Citizens & Northern Corp. 324 7,705Citizens Financial Group, Inc. 8,612 380,220City Holding Company 404 33,039Civista Bancshares, Inc. 342 7,845CNB Financial Corp. 426 10,484Codorus Valley Bancorp, Inc. 267 4,915Columbia Banking System, Inc. 1,531 65,971Comerica, Inc. 2,948 211,490Commerce Bancshares, Inc. 1,493 114,379Community Bank System, Inc. 1,081 82,934Community Trust Bancorp, Inc. 310 13,649ConnectOne Bancorp, Inc. 882 22,359County Bancorp, Inc. 219 5,249Cullen/Frost Bankers, Inc. 1,225 133,231Customers Bancorp, Inc. (A) 739 23,515CVB Financial Corp. 2,734 60,394Dime Community Bancshares, Inc. 925 27,880Eagle Bancorp, Inc. 547 29,106East West Bancorp, Inc. 2,760 203,688Enterprise Bancorp, Inc. 327 10,634
Total Stock Market Index Trust (continued)Shares orPrincipalAmount Value
COMMON STOCKS (continued)Banks (continued)Hope Bancorp, Inc. 2,740 $ 41,264Horizon Bancorp, Inc. 951 17,670Huntington Bancshares, Inc. 21,098 331,661Independent Bank Corp.(Massachusetts) 730 61,459Independent Bank Corp. (Michigan) 561 13,262Independent Bank Group, Inc. 910 65,738International Bancshares Corp. 1,166 54,126Investar Holding Corp. 319 6,555Investors Bancorp, Inc. 5,218 76,652JPMorgan Chase & Co. 57,846 8,805,897KeyCorp 19,485 389,310Lakeland Bancorp, Inc. 1,308 22,798Lakeland Financial Corp. 529 36,602Live Oak Bancshares, Inc. 1,032 70,682M&T Bank Corp. 2,375 360,074Macatawa Bank Corp. 926 9,214Mercantile Bank Corp. 434 14,092Metropolitan Bank Holding Corp. (A) 184 9,266Midland States Bancorp, Inc. 539 14,952MidWestOne Financial Group, Inc. 336 10,406
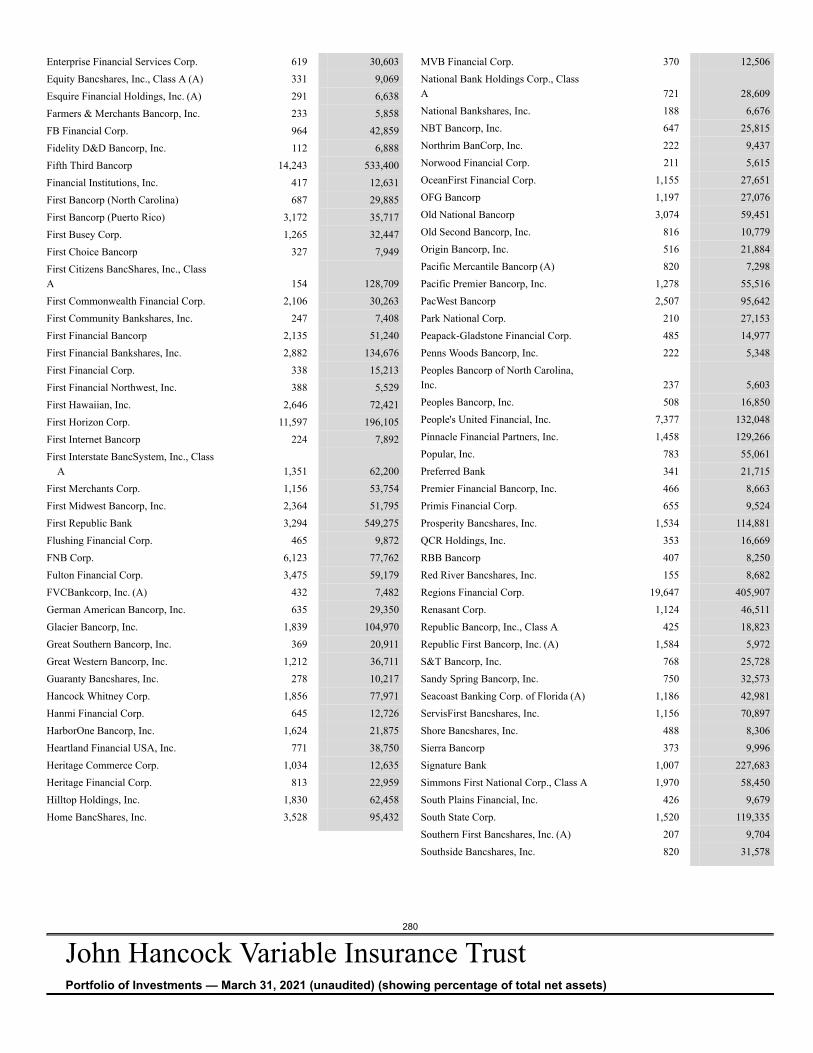
280
John Hancock Variable Insurance TrustPortfolio of Investments — March 31, 2021 (unaudited) (showing percentage of total net assets)
Enterprise Financial Services Corp. 619 30,603Equity Bancshares, Inc., Class A (A) 331 9,069Esquire Financial Holdings, Inc. (A) 291 6,638Farmers & Merchants Bancorp, Inc. 233 5,858FB Financial Corp. 964 42,859Fidelity D&D Bancorp, Inc. 112 6,888Fifth Third Bancorp 14,243 533,400Financial Institutions, Inc. 417 12,631First Bancorp (North Carolina) 687 29,885First Bancorp (Puerto Rico) 3,172 35,717First Busey Corp. 1,265 32,447First Choice Bancorp 327 7,949First Citizens BancShares, Inc., ClassA 154 128,709First Commonwealth Financial Corp. 2,106 30,263First Community Bankshares, Inc. 247 7,408First Financial Bancorp 2,135 51,240First Financial Bankshares, Inc. 2,882 134,676First Financial Corp. 338 15,213First Financial Northwest, Inc. 388 5,529First Hawaiian, Inc. 2,646 72,421First Horizon Corp. 11,597 196,105First Internet Bancorp 224 7,892First Interstate BancSystem, Inc., Class
A 1,351 62,200First Merchants Corp. 1,156 53,754First Midwest Bancorp, Inc. 2,364 51,795First Republic Bank 3,294 549,275Flushing Financial Corp. 465 9,872FNB Corp. 6,123 77,762Fulton Financial Corp. 3,475 59,179FVCBankcorp, Inc. (A) 432 7,482German American Bancorp, Inc. 635 29,350Glacier Bancorp, Inc. 1,839 104,970Great Southern Bancorp, Inc. 369 20,911Great Western Bancorp, Inc. 1,212 36,711Guaranty Bancshares, Inc. 278 10,217Hancock Whitney Corp. 1,856 77,971Hanmi Financial Corp. 645 12,726HarborOne Bancorp, Inc. 1,624 21,875Heartland Financial USA, Inc. 771 38,750Heritage Commerce Corp. 1,034 12,635Heritage Financial Corp. 813 22,959Hilltop Holdings, Inc. 1,830 62,458Home BancShares, Inc. 3,528 95,432
MVB Financial Corp. 370 12,506National Bank Holdings Corp., ClassA 721 28,609National Bankshares, Inc. 188 6,676NBT Bancorp, Inc. 647 25,815Northrim BanCorp, Inc. 222 9,437Norwood Financial Corp. 211 5,615OceanFirst Financial Corp. 1,155 27,651OFG Bancorp 1,197 27,076Old National Bancorp 3,074 59,451Old Second Bancorp, Inc. 816 10,779Origin Bancorp, Inc. 516 21,884Pacific Mercantile Bancorp (A) 820 7,298Pacific Premier Bancorp, Inc. 1,278 55,516PacWest Bancorp 2,507 95,642Park National Corp. 210 27,153Peapack-Gladstone Financial Corp. 485 14,977Penns Woods Bancorp, Inc. 222 5,348Peoples Bancorp of North Carolina,Inc. 237 5,603Peoples Bancorp, Inc. 508 16,850People's United Financial, Inc. 7,377 132,048Pinnacle Financial Partners, Inc. 1,458 129,266Popular, Inc. 783 55,061Preferred Bank 341 21,715Premier Financial Bancorp, Inc. 466 8,663Primis Financial Corp. 655 9,524Prosperity Bancshares, Inc. 1,534 114,881QCR Holdings, Inc. 353 16,669RBB Bancorp 407 8,250Red River Bancshares, Inc. 155 8,682Regions Financial Corp. 19,647 405,907Renasant Corp. 1,124 46,511Republic Bancorp, Inc., Class A 425 18,823Republic First Bancorp, Inc. (A) 1,584 5,972S&T Bancorp, Inc. 768 25,728Sandy Spring Bancorp, Inc. 750 32,573Seacoast Banking Corp. of Florida (A) 1,186 42,981ServisFirst Bancshares, Inc. 1,156 70,897Shore Bancshares, Inc. 488 8,306Sierra Bancorp 373 9,996Signature Bank 1,007 227,683Simmons First National Corp., Class A 1,970 58,450South Plains Financial, Inc. 426 9,679South State Corp. 1,520 119,335Southern First Bancshares, Inc. (A) 207 9,704Southside Bancshares, Inc. 820 31,578
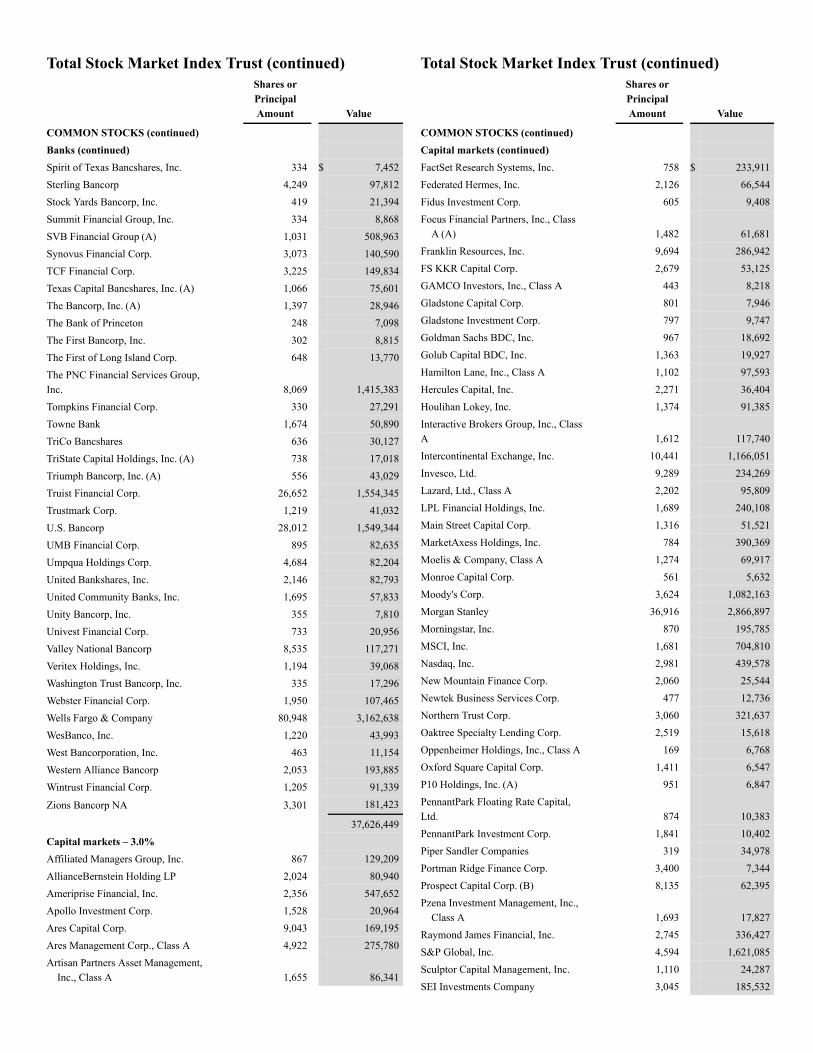
Total Stock Market Index Trust (continued)Shares orPrincipalAmount Value
COMMON STOCKS (continued)Banks (continued)Spirit of Texas Bancshares, Inc. 334 $ 7,452Sterling Bancorp 4,249 97,812Stock Yards Bancorp, Inc. 419 21,394Summit Financial Group, Inc. 334 8,868SVB Financial Group (A) 1,031 508,963Synovus Financial Corp. 3,073 140,590TCF Financial Corp. 3,225 149,834Texas Capital Bancshares, Inc. (A) 1,066 75,601The Bancorp, Inc. (A) 1,397 28,946The Bank of Princeton 248 7,098The First Bancorp, Inc. 302 8,815The First of Long Island Corp. 648 13,770The PNC Financial Services Group,Inc. 8,069 1,415,383Tompkins Financial Corp. 330 27,291Towne Bank 1,674 50,890TriCo Bancshares 636 30,127TriState Capital Holdings, Inc. (A) 738 17,018Triumph Bancorp, Inc. (A) 556 43,029Truist Financial Corp. 26,652 1,554,345Trustmark Corp. 1,219 41,032U.S. Bancorp 28,012 1,549,344UMB Financial Corp. 895 82,635Umpqua Holdings Corp. 4,684 82,204United Bankshares, Inc. 2,146 82,793United Community Banks, Inc. 1,695 57,833Unity Bancorp, Inc. 355 7,810Univest Financial Corp. 733 20,956Valley National Bancorp 8,535 117,271Veritex Holdings, Inc. 1,194 39,068Washington Trust Bancorp, Inc. 335 17,296Webster Financial Corp. 1,950 107,465Wells Fargo & Company 80,948 3,162,638WesBanco, Inc. 1,220 43,993West Bancorporation, Inc. 463 11,154Western Alliance Bancorp 2,053 193,885Wintrust Financial Corp. 1,205 91,339
Zions Bancorp NA 3,301 181,423
37,626,449Capital markets – 3.0%Affiliated Managers Group, Inc. 867 129,209AllianceBernstein Holding LP 2,024 80,940Ameriprise Financial, Inc. 2,356 547,652Apollo Investment Corp. 1,528 20,964Ares Capital Corp. 9,043 169,195Ares Management Corp., Class A 4,922 275,780Artisan Partners Asset Management,
Inc., Class A 1,655 86,341
Total Stock Market Index Trust (continued)Shares orPrincipalAmount Value
COMMON STOCKS (continued)Capital markets (continued)FactSet Research Systems, Inc. 758 $ 233,911Federated Hermes, Inc. 2,126 66,544Fidus Investment Corp. 605 9,408Focus Financial Partners, Inc., Class
A (A) 1,482 61,681Franklin Resources, Inc. 9,694 286,942FS KKR Capital Corp. 2,679 53,125GAMCO Investors, Inc., Class A 443 8,218Gladstone Capital Corp. 801 7,946Gladstone Investment Corp. 797 9,747Goldman Sachs BDC, Inc. 967 18,692Golub Capital BDC, Inc. 1,363 19,927Hamilton Lane, Inc., Class A 1,102 97,593Hercules Capital, Inc. 2,271 36,404Houlihan Lokey, Inc. 1,374 91,385Interactive Brokers Group, Inc., ClassA 1,612 117,740Intercontinental Exchange, Inc. 10,441 1,166,051Invesco, Ltd. 9,289 234,269Lazard, Ltd., Class A 2,202 95,809LPL Financial Holdings, Inc. 1,689 240,108Main Street Capital Corp. 1,316 51,521MarketAxess Holdings, Inc. 784 390,369Moelis & Company, Class A 1,274 69,917Monroe Capital Corp. 561 5,632Moody's Corp. 3,624 1,082,163Morgan Stanley 36,916 2,866,897Morningstar, Inc. 870 195,785MSCI, Inc. 1,681 704,810Nasdaq, Inc. 2,981 439,578New Mountain Finance Corp. 2,060 25,544Newtek Business Services Corp. 477 12,736Northern Trust Corp. 3,060 321,637Oaktree Specialty Lending Corp. 2,519 15,618Oppenheimer Holdings, Inc., Class A 169 6,768Oxford Square Capital Corp. 1,411 6,547P10 Holdings, Inc. (A) 951 6,847PennantPark Floating Rate Capital,Ltd. 874 10,383PennantPark Investment Corp. 1,841 10,402Piper Sandler Companies 319 34,978Portman Ridge Finance Corp. 3,400 7,344Prospect Capital Corp. (B) 8,135 62,395Pzena Investment Management, Inc.,
Class A 1,693 17,827Raymond James Financial, Inc. 2,745 336,427S&P Global, Inc. 4,594 1,621,085Sculptor Capital Management, Inc. 1,110 24,287SEI Investments Company 3,045 185,532
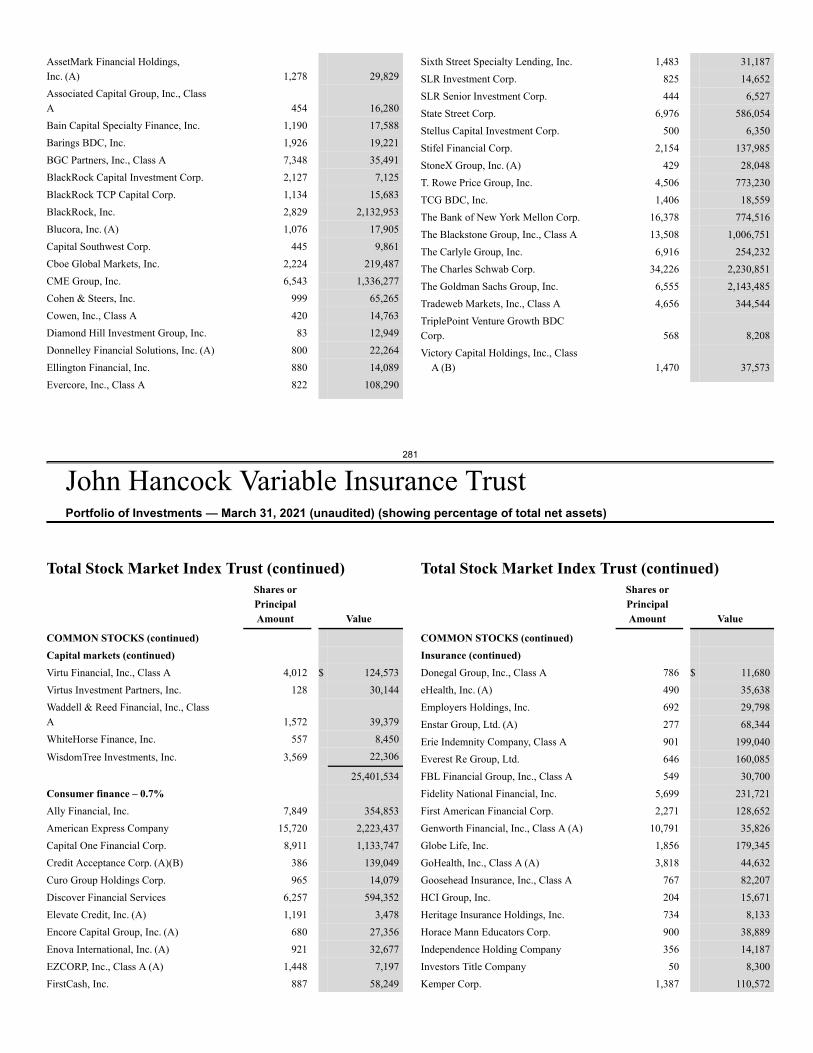
281
John Hancock Variable Insurance TrustPortfolio of Investments — March 31, 2021 (unaudited) (showing percentage of total net assets)
AssetMark Financial Holdings,Inc. (A) 1,278 29,829Associated Capital Group, Inc., ClassA 454 16,280Bain Capital Specialty Finance, Inc. 1,190 17,588Barings BDC, Inc. 1,926 19,221BGC Partners, Inc., Class A 7,348 35,491BlackRock Capital Investment Corp. 2,127 7,125BlackRock TCP Capital Corp. 1,134 15,683BlackRock, Inc. 2,829 2,132,953Blucora, Inc. (A) 1,076 17,905Capital Southwest Corp. 445 9,861Cboe Global Markets, Inc. 2,224 219,487CME Group, Inc. 6,543 1,336,277Cohen & Steers, Inc. 999 65,265Cowen, Inc., Class A 420 14,763Diamond Hill Investment Group, Inc. 83 12,949Donnelley Financial Solutions, Inc. (A) 800 22,264Ellington Financial, Inc. 880 14,089Evercore, Inc., Class A 822 108,290
Sixth Street Specialty Lending, Inc. 1,483 31,187SLR Investment Corp. 825 14,652SLR Senior Investment Corp. 444 6,527State Street Corp. 6,976 586,054Stellus Capital Investment Corp. 500 6,350Stifel Financial Corp. 2,154 137,985StoneX Group, Inc. (A) 429 28,048T. Rowe Price Group, Inc. 4,506 773,230TCG BDC, Inc. 1,406 18,559The Bank of New York Mellon Corp. 16,378 774,516The Blackstone Group, Inc., Class A 13,508 1,006,751The Carlyle Group, Inc. 6,916 254,232The Charles Schwab Corp. 34,226 2,230,851The Goldman Sachs Group, Inc. 6,555 2,143,485Tradeweb Markets, Inc., Class A 4,656 344,544TriplePoint Venture Growth BDCCorp. 568 8,208Victory Capital Holdings, Inc., Class
A (B) 1,470 37,573
Total Stock Market Index Trust (continued)Shares orPrincipalAmount Value
COMMON STOCKS (continued)Capital markets (continued)Virtu Financial, Inc., Class A 4,012 $ 124,573Virtus Investment Partners, Inc. 128 30,144Waddell & Reed Financial, Inc., ClassA 1,572 39,379WhiteHorse Finance, Inc. 557 8,450
WisdomTree Investments, Inc. 3,569 22,306
25,401,534Consumer finance – 0.7%Ally Financial, Inc. 7,849 354,853American Express Company 15,720 2,223,437Capital One Financial Corp. 8,911 1,133,747Credit Acceptance Corp. (A)(B) 386 139,049Curo Group Holdings Corp. 965 14,079Discover Financial Services 6,257 594,352Elevate Credit, Inc. (A) 1,191 3,478Encore Capital Group, Inc. (A) 680 27,356Enova International, Inc. (A) 921 32,677EZCORP, Inc., Class A (A) 1,448 7,197FirstCash, Inc. 887 58,249
Total Stock Market Index Trust (continued)Shares orPrincipalAmount Value
COMMON STOCKS (continued)Insurance (continued)Donegal Group, Inc., Class A 786 $ 11,680eHealth, Inc. (A) 490 35,638Employers Holdings, Inc. 692 29,798Enstar Group, Ltd. (A) 277 68,344Erie Indemnity Company, Class A 901 199,040Everest Re Group, Ltd. 646 160,085FBL Financial Group, Inc., Class A 549 30,700Fidelity National Financial, Inc. 5,699 231,721First American Financial Corp. 2,271 128,652Genworth Financial, Inc., Class A (A) 10,791 35,826Globe Life, Inc. 1,856 179,345GoHealth, Inc., Class A (A) 3,818 44,632Goosehead Insurance, Inc., Class A 767 82,207HCI Group, Inc. 204 15,671Heritage Insurance Holdings, Inc. 734 8,133Horace Mann Educators Corp. 900 38,889Independence Holding Company 356 14,187Investors Title Company 50 8,300Kemper Corp. 1,387 110,572
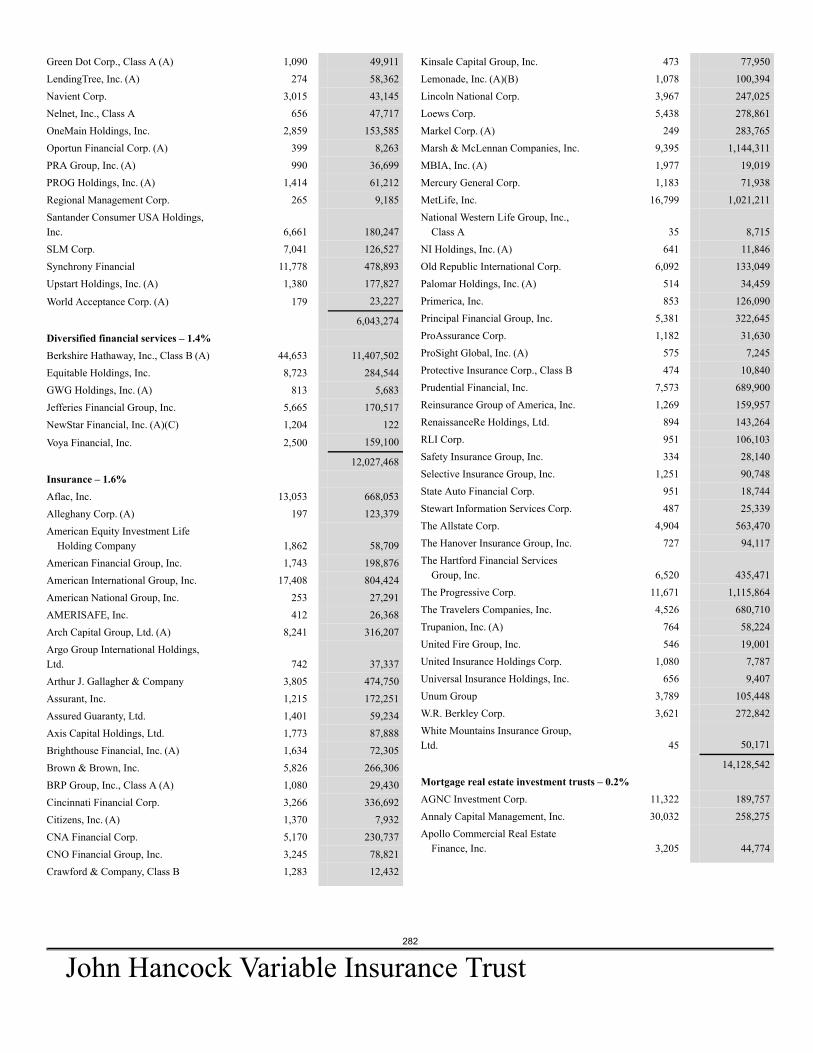
282
John Hancock Variable Insurance Trust
Green Dot Corp., Class A (A) 1,090 49,911LendingTree, Inc. (A) 274 58,362Navient Corp. 3,015 43,145Nelnet, Inc., Class A 656 47,717OneMain Holdings, Inc. 2,859 153,585Oportun Financial Corp. (A) 399 8,263PRA Group, Inc. (A) 990 36,699PROG Holdings, Inc. (A) 1,414 61,212Regional Management Corp. 265 9,185Santander Consumer USA Holdings,Inc. 6,661 180,247SLM Corp. 7,041 126,527Synchrony Financial 11,778 478,893Upstart Holdings, Inc. (A) 1,380 177,827
World Acceptance Corp. (A) 179 23,227
6,043,274Diversified financial services – 1.4%Berkshire Hathaway, Inc., Class B (A) 44,653 11,407,502Equitable Holdings, Inc. 8,723 284,544GWG Holdings, Inc. (A) 813 5,683Jefferies Financial Group, Inc. 5,665 170,517NewStar Financial, Inc. (A)(C) 1,204 122
Voya Financial, Inc. 2,500 159,100
12,027,468Insurance – 1.6%Aflac, Inc. 13,053 668,053Alleghany Corp. (A) 197 123,379American Equity Investment Life
Holding Company 1,862 58,709American Financial Group, Inc. 1,743 198,876American International Group, Inc. 17,408 804,424American National Group, Inc. 253 27,291AMERISAFE, Inc. 412 26,368Arch Capital Group, Ltd. (A) 8,241 316,207Argo Group International Holdings,Ltd. 742 37,337Arthur J. Gallagher & Company 3,805 474,750Assurant, Inc. 1,215 172,251Assured Guaranty, Ltd. 1,401 59,234Axis Capital Holdings, Ltd. 1,773 87,888Brighthouse Financial, Inc. (A) 1,634 72,305Brown & Brown, Inc. 5,826 266,306BRP Group, Inc., Class A (A) 1,080 29,430Cincinnati Financial Corp. 3,266 336,692Citizens, Inc. (A) 1,370 7,932CNA Financial Corp. 5,170 230,737CNO Financial Group, Inc. 3,245 78,821Crawford & Company, Class B 1,283 12,432
Kinsale Capital Group, Inc. 473 77,950Lemonade, Inc. (A)(B) 1,078 100,394Lincoln National Corp. 3,967 247,025Loews Corp. 5,438 278,861Markel Corp. (A) 249 283,765Marsh & McLennan Companies, Inc. 9,395 1,144,311MBIA, Inc. (A) 1,977 19,019Mercury General Corp. 1,183 71,938MetLife, Inc. 16,799 1,021,211National Western Life Group, Inc.,
Class A 35 8,715NI Holdings, Inc. (A) 641 11,846Old Republic International Corp. 6,092 133,049Palomar Holdings, Inc. (A) 514 34,459Primerica, Inc. 853 126,090Principal Financial Group, Inc. 5,381 322,645ProAssurance Corp. 1,182 31,630ProSight Global, Inc. (A) 575 7,245Protective Insurance Corp., Class B 474 10,840Prudential Financial, Inc. 7,573 689,900Reinsurance Group of America, Inc. 1,269 159,957RenaissanceRe Holdings, Ltd. 894 143,264RLI Corp. 951 106,103Safety Insurance Group, Inc. 334 28,140Selective Insurance Group, Inc. 1,251 90,748State Auto Financial Corp. 951 18,744Stewart Information Services Corp. 487 25,339The Allstate Corp. 4,904 563,470The Hanover Insurance Group, Inc. 727 94,117The Hartford Financial Services
Group, Inc. 6,520 435,471The Progressive Corp. 11,671 1,115,864The Travelers Companies, Inc. 4,526 680,710Trupanion, Inc. (A) 764 58,224United Fire Group, Inc. 546 19,001United Insurance Holdings Corp. 1,080 7,787Universal Insurance Holdings, Inc. 656 9,407Unum Group 3,789 105,448W.R. Berkley Corp. 3,621 272,842White Mountains Insurance Group,Ltd. 45 50,171
14,128,542Mortgage real estate investment trusts – 0.2%AGNC Investment Corp. 11,322 189,757Annaly Capital Management, Inc. 30,032 258,275Apollo Commercial Real Estate
Finance, Inc. 3,205 44,774
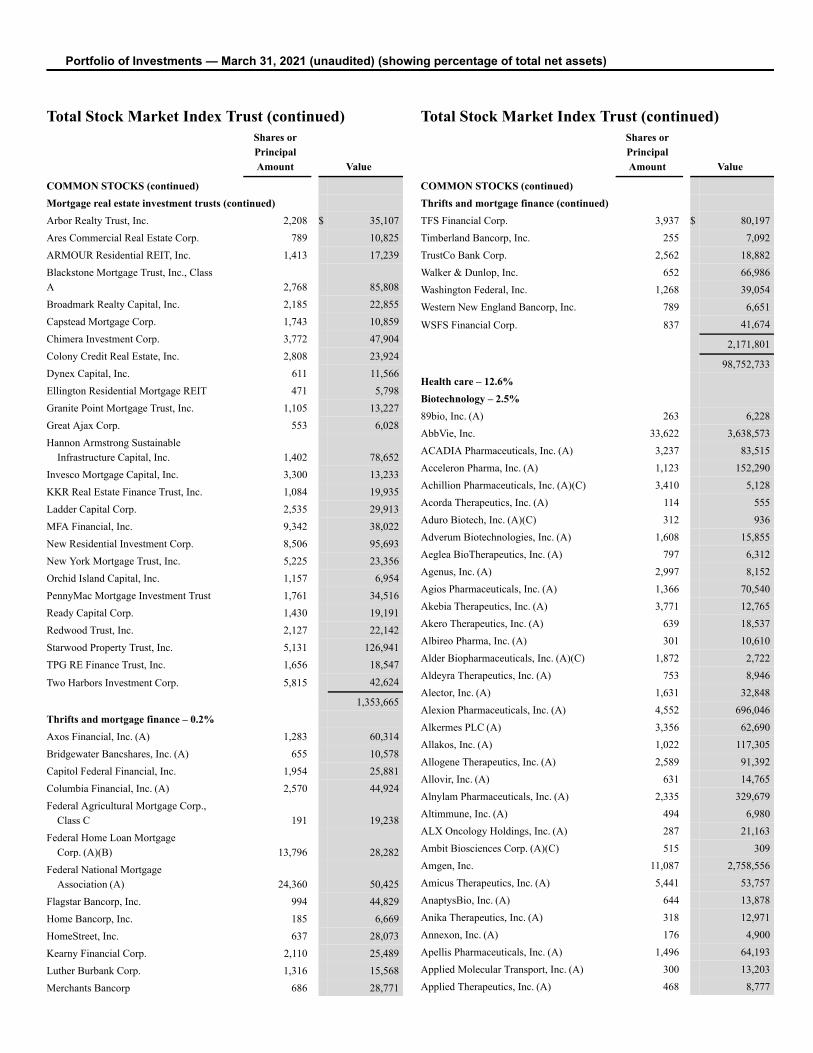
Portfolio of Investments — March 31, 2021 (unaudited) (showing percentage of total net assets)
Total Stock Market Index Trust (continued)Shares orPrincipalAmount Value
COMMON STOCKS (continued)Mortgage real estate investment trusts (continued)Arbor Realty Trust, Inc. 2,208 $ 35,107Ares Commercial Real Estate Corp. 789 10,825ARMOUR Residential REIT, Inc. 1,413 17,239Blackstone Mortgage Trust, Inc., ClassA 2,768 85,808Broadmark Realty Capital, Inc. 2,185 22,855Capstead Mortgage Corp. 1,743 10,859Chimera Investment Corp. 3,772 47,904Colony Credit Real Estate, Inc. 2,808 23,924Dynex Capital, Inc. 611 11,566Ellington Residential Mortgage REIT 471 5,798Granite Point Mortgage Trust, Inc. 1,105 13,227Great Ajax Corp. 553 6,028Hannon Armstrong Sustainable
Infrastructure Capital, Inc. 1,402 78,652Invesco Mortgage Capital, Inc. 3,300 13,233KKR Real Estate Finance Trust, Inc. 1,084 19,935Ladder Capital Corp. 2,535 29,913MFA Financial, Inc. 9,342 38,022New Residential Investment Corp. 8,506 95,693New York Mortgage Trust, Inc. 5,225 23,356Orchid Island Capital, Inc. 1,157 6,954PennyMac Mortgage Investment Trust 1,761 34,516Ready Capital Corp. 1,430 19,191Redwood Trust, Inc. 2,127 22,142Starwood Property Trust, Inc. 5,131 126,941TPG RE Finance Trust, Inc. 1,656 18,547
Two Harbors Investment Corp. 5,815 42,624
1,353,665Thrifts and mortgage finance – 0.2%Axos Financial, Inc. (A) 1,283 60,314Bridgewater Bancshares, Inc. (A) 655 10,578Capitol Federal Financial, Inc. 1,954 25,881Columbia Financial, Inc. (A) 2,570 44,924Federal Agricultural Mortgage Corp.,
Class C 191 19,238Federal Home Loan Mortgage
Corp. (A)(B) 13,796 28,282Federal National Mortgage
Association (A) 24,360 50,425Flagstar Bancorp, Inc. 994 44,829Home Bancorp, Inc. 185 6,669HomeStreet, Inc. 637 28,073Kearny Financial Corp. 2,110 25,489Luther Burbank Corp. 1,316 15,568Merchants Bancorp 686 28,771
Total Stock Market Index Trust (continued)Shares orPrincipalAmount Value
COMMON STOCKS (continued)Thrifts and mortgage finance (continued)TFS Financial Corp. 3,937 $ 80,197Timberland Bancorp, Inc. 255 7,092TrustCo Bank Corp. 2,562 18,882Walker & Dunlop, Inc. 652 66,986Washington Federal, Inc. 1,268 39,054Western New England Bancorp, Inc. 789 6,651
WSFS Financial Corp. 837 41,674
2,171,801
98,752,733Health care – 12.6%Biotechnology – 2.5%89bio, Inc. (A) 263 6,228AbbVie, Inc. 33,622 3,638,573ACADIA Pharmaceuticals, Inc. (A) 3,237 83,515Acceleron Pharma, Inc. (A) 1,123 152,290Achillion Pharmaceuticals, Inc. (A)(C) 3,410 5,128Acorda Therapeutics, Inc. (A) 114 555Aduro Biotech, Inc. (A)(C) 312 936Adverum Biotechnologies, Inc. (A) 1,608 15,855Aeglea BioTherapeutics, Inc. (A) 797 6,312Agenus, Inc. (A) 2,997 8,152Agios Pharmaceuticals, Inc. (A) 1,366 70,540Akebia Therapeutics, Inc. (A) 3,771 12,765Akero Therapeutics, Inc. (A) 639 18,537Albireo Pharma, Inc. (A) 301 10,610Alder Biopharmaceuticals, Inc. (A)(C) 1,872 2,722Aldeyra Therapeutics, Inc. (A) 753 8,946Alector, Inc. (A) 1,631 32,848Alexion Pharmaceuticals, Inc. (A) 4,552 696,046Alkermes PLC (A) 3,356 62,690Allakos, Inc. (A) 1,022 117,305Allogene Therapeutics, Inc. (A) 2,589 91,392Allovir, Inc. (A) 631 14,765Alnylam Pharmaceuticals, Inc. (A) 2,335 329,679Altimmune, Inc. (A) 494 6,980ALX Oncology Holdings, Inc. (A) 287 21,163Ambit Biosciences Corp. (A)(C) 515 309Amgen, Inc. 11,087 2,758,556Amicus Therapeutics, Inc. (A) 5,441 53,757AnaptysBio, Inc. (A) 644 13,878Anika Therapeutics, Inc. (A) 318 12,971Annexon, Inc. (A) 176 4,900Apellis Pharmaceuticals, Inc. (A) 1,496 64,193Applied Molecular Transport, Inc. (A) 300 13,203Applied Therapeutics, Inc. (A) 468 8,777
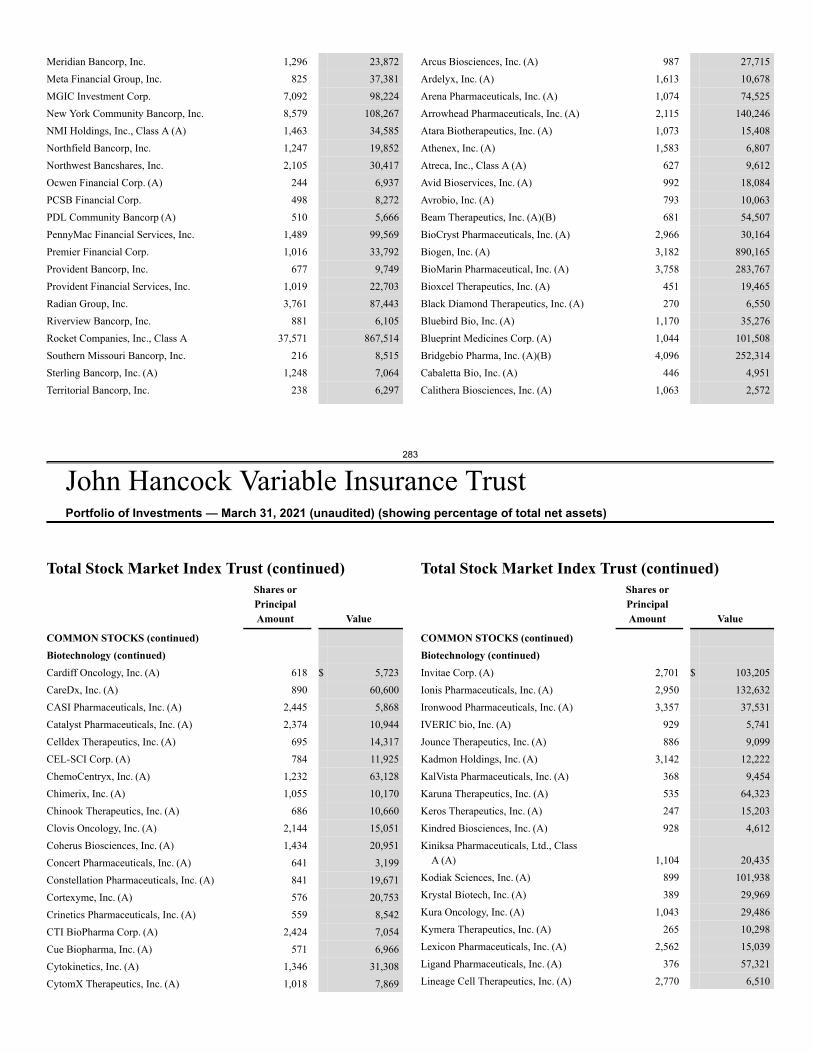
283
John Hancock Variable Insurance TrustPortfolio of Investments — March 31, 2021 (unaudited) (showing percentage of total net assets)
Meridian Bancorp, Inc. 1,296 23,872Meta Financial Group, Inc. 825 37,381MGIC Investment Corp. 7,092 98,224New York Community Bancorp, Inc. 8,579 108,267NMI Holdings, Inc., Class A (A) 1,463 34,585Northfield Bancorp, Inc. 1,247 19,852Northwest Bancshares, Inc. 2,105 30,417Ocwen Financial Corp. (A) 244 6,937PCSB Financial Corp. 498 8,272PDL Community Bancorp (A) 510 5,666PennyMac Financial Services, Inc. 1,489 99,569Premier Financial Corp. 1,016 33,792Provident Bancorp, Inc. 677 9,749Provident Financial Services, Inc. 1,019 22,703Radian Group, Inc. 3,761 87,443Riverview Bancorp, Inc. 881 6,105Rocket Companies, Inc., Class A 37,571 867,514Southern Missouri Bancorp, Inc. 216 8,515Sterling Bancorp, Inc. (A) 1,248 7,064Territorial Bancorp, Inc. 238 6,297
Arcus Biosciences, Inc. (A) 987 27,715Ardelyx, Inc. (A) 1,613 10,678Arena Pharmaceuticals, Inc. (A) 1,074 74,525Arrowhead Pharmaceuticals, Inc. (A) 2,115 140,246Atara Biotherapeutics, Inc. (A) 1,073 15,408Athenex, Inc. (A) 1,583 6,807Atreca, Inc., Class A (A) 627 9,612Avid Bioservices, Inc. (A) 992 18,084Avrobio, Inc. (A) 793 10,063Beam Therapeutics, Inc. (A)(B) 681 54,507BioCryst Pharmaceuticals, Inc. (A) 2,966 30,164Biogen, Inc. (A) 3,182 890,165BioMarin Pharmaceutical, Inc. (A) 3,758 283,767Bioxcel Therapeutics, Inc. (A) 451 19,465Black Diamond Therapeutics, Inc. (A) 270 6,550Bluebird Bio, Inc. (A) 1,170 35,276Blueprint Medicines Corp. (A) 1,044 101,508Bridgebio Pharma, Inc. (A)(B) 4,096 252,314Cabaletta Bio, Inc. (A) 446 4,951Calithera Biosciences, Inc. (A) 1,063 2,572
Total Stock Market Index Trust (continued)Shares orPrincipalAmount Value
COMMON STOCKS (continued)Biotechnology (continued)Cardiff Oncology, Inc. (A) 618 $ 5,723CareDx, Inc. (A) 890 60,600CASI Pharmaceuticals, Inc. (A) 2,445 5,868Catalyst Pharmaceuticals, Inc. (A) 2,374 10,944Celldex Therapeutics, Inc. (A) 695 14,317CEL-SCI Corp. (A) 784 11,925ChemoCentryx, Inc. (A) 1,232 63,128Chimerix, Inc. (A) 1,055 10,170Chinook Therapeutics, Inc. (A) 686 10,660Clovis Oncology, Inc. (A) 2,144 15,051Coherus Biosciences, Inc. (A) 1,434 20,951Concert Pharmaceuticals, Inc. (A) 641 3,199Constellation Pharmaceuticals, Inc. (A) 841 19,671Cortexyme, Inc. (A) 576 20,753Crinetics Pharmaceuticals, Inc. (A) 559 8,542CTI BioPharma Corp. (A) 2,424 7,054Cue Biopharma, Inc. (A) 571 6,966Cytokinetics, Inc. (A) 1,346 31,308CytomX Therapeutics, Inc. (A) 1,018 7,869
Total Stock Market Index Trust (continued)Shares orPrincipalAmount Value
COMMON STOCKS (continued)Biotechnology (continued)Invitae Corp. (A) 2,701 $ 103,205Ionis Pharmaceuticals, Inc. (A) 2,950 132,632Ironwood Pharmaceuticals, Inc. (A) 3,357 37,531IVERIC bio, Inc. (A) 929 5,741Jounce Therapeutics, Inc. (A) 886 9,099Kadmon Holdings, Inc. (A) 3,142 12,222KalVista Pharmaceuticals, Inc. (A) 368 9,454Karuna Therapeutics, Inc. (A) 535 64,323Keros Therapeutics, Inc. (A) 247 15,203Kindred Biosciences, Inc. (A) 928 4,612Kiniksa Pharmaceuticals, Ltd., Class
A (A) 1,104 20,435Kodiak Sciences, Inc. (A) 899 101,938Krystal Biotech, Inc. (A) 389 29,969Kura Oncology, Inc. (A) 1,043 29,486Kymera Therapeutics, Inc. (A) 265 10,298Lexicon Pharmaceuticals, Inc. (A) 2,562 15,039Ligand Pharmaceuticals, Inc. (A) 376 57,321Lineage Cell Therapeutics, Inc. (A) 2,770 6,510
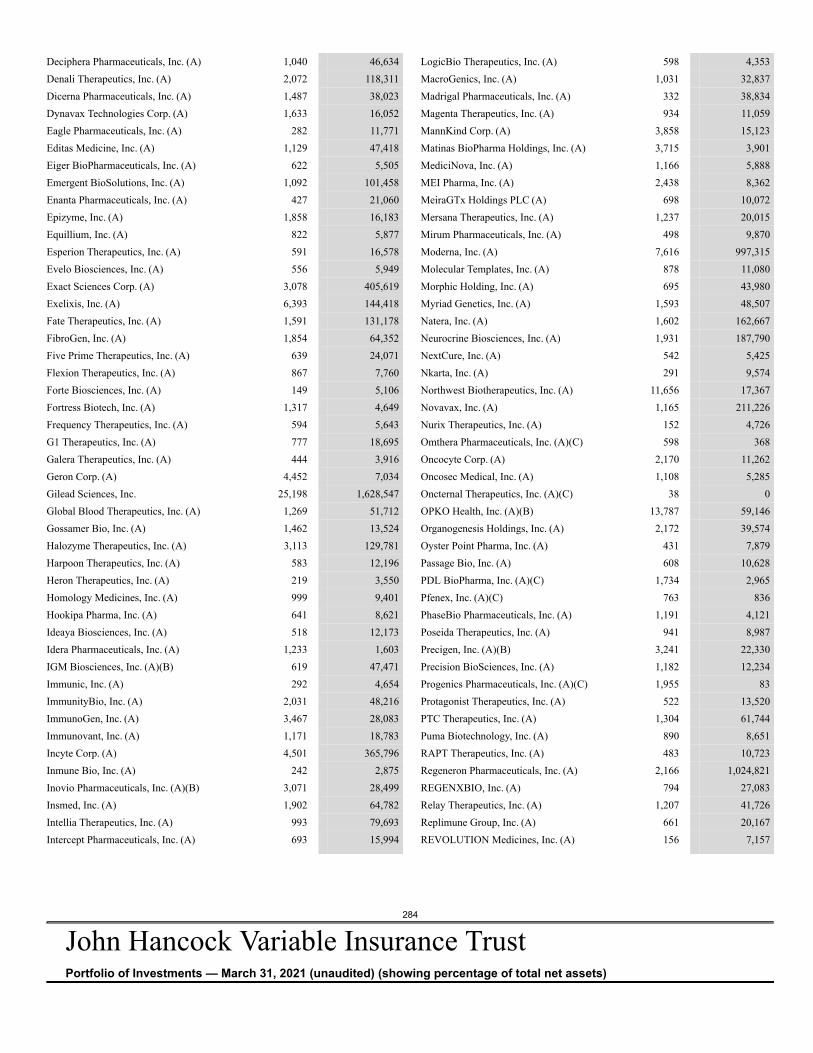
284
John Hancock Variable Insurance TrustPortfolio of Investments — March 31, 2021 (unaudited) (showing percentage of total net assets)
Deciphera Pharmaceuticals, Inc. (A) 1,040 46,634Denali Therapeutics, Inc. (A) 2,072 118,311Dicerna Pharmaceuticals, Inc. (A) 1,487 38,023Dynavax Technologies Corp. (A) 1,633 16,052Eagle Pharmaceuticals, Inc. (A) 282 11,771Editas Medicine, Inc. (A) 1,129 47,418Eiger BioPharmaceuticals, Inc. (A) 622 5,505Emergent BioSolutions, Inc. (A) 1,092 101,458Enanta Pharmaceuticals, Inc. (A) 427 21,060Epizyme, Inc. (A) 1,858 16,183Equillium, Inc. (A) 822 5,877Esperion Therapeutics, Inc. (A) 591 16,578Evelo Biosciences, Inc. (A) 556 5,949Exact Sciences Corp. (A) 3,078 405,619Exelixis, Inc. (A) 6,393 144,418Fate Therapeutics, Inc. (A) 1,591 131,178FibroGen, Inc. (A) 1,854 64,352Five Prime Therapeutics, Inc. (A) 639 24,071Flexion Therapeutics, Inc. (A) 867 7,760Forte Biosciences, Inc. (A) 149 5,106Fortress Biotech, Inc. (A) 1,317 4,649Frequency Therapeutics, Inc. (A) 594 5,643G1 Therapeutics, Inc. (A) 777 18,695Galera Therapeutics, Inc. (A) 444 3,916Geron Corp. (A) 4,452 7,034Gilead Sciences, Inc. 25,198 1,628,547Global Blood Therapeutics, Inc. (A) 1,269 51,712Gossamer Bio, Inc. (A) 1,462 13,524Halozyme Therapeutics, Inc. (A) 3,113 129,781Harpoon Therapeutics, Inc. (A) 583 12,196Heron Therapeutics, Inc. (A) 219 3,550Homology Medicines, Inc. (A) 999 9,401Hookipa Pharma, Inc. (A) 641 8,621Ideaya Biosciences, Inc. (A) 518 12,173Idera Pharmaceuticals, Inc. (A) 1,233 1,603IGM Biosciences, Inc. (A)(B) 619 47,471Immunic, Inc. (A) 292 4,654ImmunityBio, Inc. (A) 2,031 48,216ImmunoGen, Inc. (A) 3,467 28,083Immunovant, Inc. (A) 1,171 18,783Incyte Corp. (A) 4,501 365,796Inmune Bio, Inc. (A) 242 2,875Inovio Pharmaceuticals, Inc. (A)(B) 3,071 28,499Insmed, Inc. (A) 1,902 64,782Intellia Therapeutics, Inc. (A) 993 79,693Intercept Pharmaceuticals, Inc. (A) 693 15,994
LogicBio Therapeutics, Inc. (A) 598 4,353MacroGenics, Inc. (A) 1,031 32,837Madrigal Pharmaceuticals, Inc. (A) 332 38,834Magenta Therapeutics, Inc. (A) 934 11,059MannKind Corp. (A) 3,858 15,123Matinas BioPharma Holdings, Inc. (A) 3,715 3,901MediciNova, Inc. (A) 1,166 5,888MEI Pharma, Inc. (A) 2,438 8,362MeiraGTx Holdings PLC (A) 698 10,072Mersana Therapeutics, Inc. (A) 1,237 20,015Mirum Pharmaceuticals, Inc. (A) 498 9,870Moderna, Inc. (A) 7,616 997,315Molecular Templates, Inc. (A) 878 11,080Morphic Holding, Inc. (A) 695 43,980Myriad Genetics, Inc. (A) 1,593 48,507Natera, Inc. (A) 1,602 162,667Neurocrine Biosciences, Inc. (A) 1,931 187,790NextCure, Inc. (A) 542 5,425Nkarta, Inc. (A) 291 9,574Northwest Biotherapeutics, Inc. (A) 11,656 17,367Novavax, Inc. (A) 1,165 211,226Nurix Therapeutics, Inc. (A) 152 4,726Omthera Pharmaceuticals, Inc. (A)(C) 598 368Oncocyte Corp. (A) 2,170 11,262Oncosec Medical, Inc. (A) 1,108 5,285Oncternal Therapeutics, Inc. (A)(C) 38 0OPKO Health, Inc. (A)(B) 13,787 59,146Organogenesis Holdings, Inc. (A) 2,172 39,574Oyster Point Pharma, Inc. (A) 431 7,879Passage Bio, Inc. (A) 608 10,628PDL BioPharma, Inc. (A)(C) 1,734 2,965Pfenex, Inc. (A)(C) 763 836PhaseBio Pharmaceuticals, Inc. (A) 1,191 4,121Poseida Therapeutics, Inc. (A) 941 8,987Precigen, Inc. (A)(B) 3,241 22,330Precision BioSciences, Inc. (A) 1,182 12,234Progenics Pharmaceuticals, Inc. (A)(C) 1,955 83Protagonist Therapeutics, Inc. (A) 522 13,520PTC Therapeutics, Inc. (A) 1,304 61,744Puma Biotechnology, Inc. (A) 890 8,651RAPT Therapeutics, Inc. (A) 483 10,723Regeneron Pharmaceuticals, Inc. (A) 2,166 1,024,821REGENXBIO, Inc. (A) 794 27,083Relay Therapeutics, Inc. (A) 1,207 41,726Replimune Group, Inc. (A) 661 20,167REVOLUTION Medicines, Inc. (A) 156 7,157
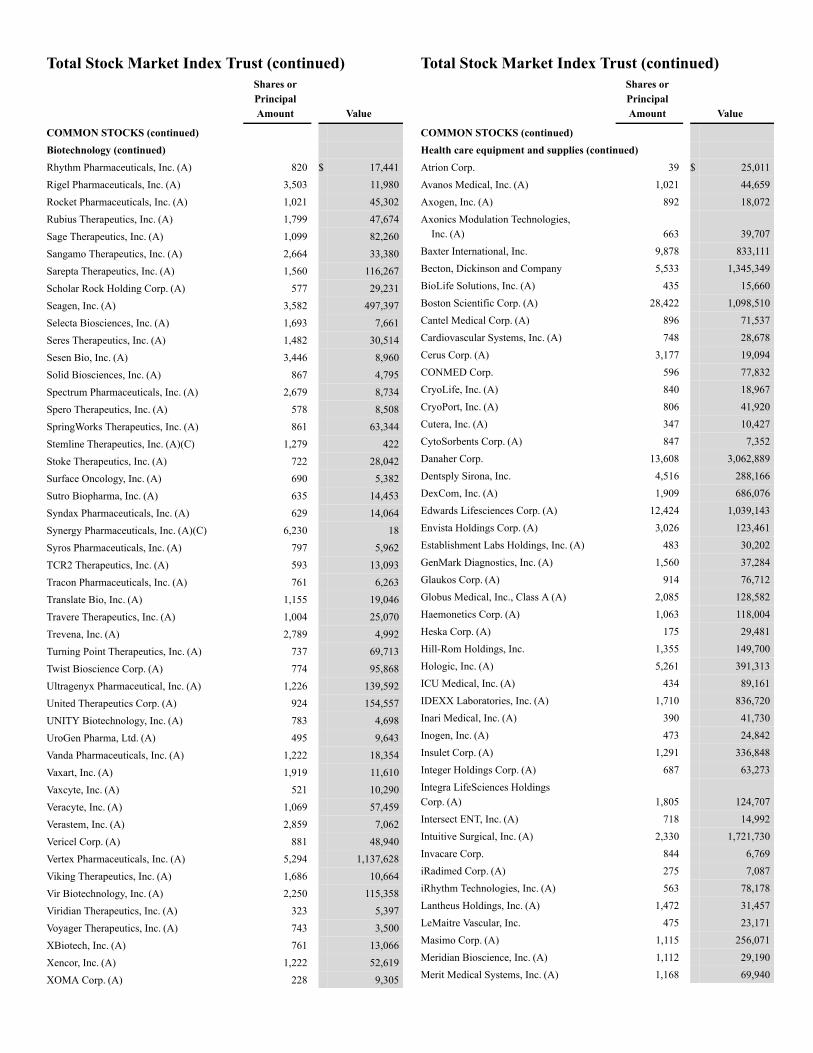
Total Stock Market Index Trust (continued)Shares orPrincipalAmount Value
COMMON STOCKS (continued)Biotechnology (continued)Rhythm Pharmaceuticals, Inc. (A) 820 $ 17,441Rigel Pharmaceuticals, Inc. (A) 3,503 11,980Rocket Pharmaceuticals, Inc. (A) 1,021 45,302Rubius Therapeutics, Inc. (A) 1,799 47,674Sage Therapeutics, Inc. (A) 1,099 82,260Sangamo Therapeutics, Inc. (A) 2,664 33,380Sarepta Therapeutics, Inc. (A) 1,560 116,267Scholar Rock Holding Corp. (A) 577 29,231Seagen, Inc. (A) 3,582 497,397Selecta Biosciences, Inc. (A) 1,693 7,661Seres Therapeutics, Inc. (A) 1,482 30,514Sesen Bio, Inc. (A) 3,446 8,960Solid Biosciences, Inc. (A) 867 4,795Spectrum Pharmaceuticals, Inc. (A) 2,679 8,734Spero Therapeutics, Inc. (A) 578 8,508SpringWorks Therapeutics, Inc. (A) 861 63,344Stemline Therapeutics, Inc. (A)(C) 1,279 422Stoke Therapeutics, Inc. (A) 722 28,042Surface Oncology, Inc. (A) 690 5,382Sutro Biopharma, Inc. (A) 635 14,453Syndax Pharmaceuticals, Inc. (A) 629 14,064Synergy Pharmaceuticals, Inc. (A)(C) 6,230 18Syros Pharmaceuticals, Inc. (A) 797 5,962TCR2 Therapeutics, Inc. (A) 593 13,093Tracon Pharmaceuticals, Inc. (A) 761 6,263Translate Bio, Inc. (A) 1,155 19,046Travere Therapeutics, Inc. (A) 1,004 25,070Trevena, Inc. (A) 2,789 4,992Turning Point Therapeutics, Inc. (A) 737 69,713Twist Bioscience Corp. (A) 774 95,868Ultragenyx Pharmaceutical, Inc. (A) 1,226 139,592United Therapeutics Corp. (A) 924 154,557UNITY Biotechnology, Inc. (A) 783 4,698UroGen Pharma, Ltd. (A) 495 9,643Vanda Pharmaceuticals, Inc. (A) 1,222 18,354Vaxart, Inc. (A) 1,919 11,610Vaxcyte, Inc. (A) 521 10,290Veracyte, Inc. (A) 1,069 57,459Verastem, Inc. (A) 2,859 7,062Vericel Corp. (A) 881 48,940Vertex Pharmaceuticals, Inc. (A) 5,294 1,137,628Viking Therapeutics, Inc. (A) 1,686 10,664Vir Biotechnology, Inc. (A) 2,250 115,358Viridian Therapeutics, Inc. (A) 323 5,397Voyager Therapeutics, Inc. (A) 743 3,500XBiotech, Inc. (A) 761 13,066Xencor, Inc. (A) 1,222 52,619XOMA Corp. (A) 228 9,305
Total Stock Market Index Trust (continued)Shares orPrincipalAmount Value
COMMON STOCKS (continued)Health care equipment and supplies (continued)Atrion Corp. 39 $ 25,011Avanos Medical, Inc. (A) 1,021 44,659Axogen, Inc. (A) 892 18,072Axonics Modulation Technologies,
Inc. (A) 663 39,707Baxter International, Inc. 9,878 833,111Becton, Dickinson and Company 5,533 1,345,349BioLife Solutions, Inc. (A) 435 15,660Boston Scientific Corp. (A) 28,422 1,098,510Cantel Medical Corp. (A) 896 71,537Cardiovascular Systems, Inc. (A) 748 28,678Cerus Corp. (A) 3,177 19,094CONMED Corp. 596 77,832CryoLife, Inc. (A) 840 18,967CryoPort, Inc. (A) 806 41,920Cutera, Inc. (A) 347 10,427CytoSorbents Corp. (A) 847 7,352Danaher Corp. 13,608 3,062,889Dentsply Sirona, Inc. 4,516 288,166DexCom, Inc. (A) 1,909 686,076Edwards Lifesciences Corp. (A) 12,424 1,039,143Envista Holdings Corp. (A) 3,026 123,461Establishment Labs Holdings, Inc. (A) 483 30,202GenMark Diagnostics, Inc. (A) 1,560 37,284Glaukos Corp. (A) 914 76,712Globus Medical, Inc., Class A (A) 2,085 128,582Haemonetics Corp. (A) 1,063 118,004Heska Corp. (A) 175 29,481Hill-Rom Holdings, Inc. 1,355 149,700Hologic, Inc. (A) 5,261 391,313ICU Medical, Inc. (A) 434 89,161IDEXX Laboratories, Inc. (A) 1,710 836,720Inari Medical, Inc. (A) 390 41,730Inogen, Inc. (A) 473 24,842Insulet Corp. (A) 1,291 336,848Integer Holdings Corp. (A) 687 63,273Integra LifeSciences HoldingsCorp. (A) 1,805 124,707Intersect ENT, Inc. (A) 718 14,992Intuitive Surgical, Inc. (A) 2,330 1,721,730Invacare Corp. 844 6,769iRadimed Corp. (A) 275 7,087iRhythm Technologies, Inc. (A) 563 78,178Lantheus Holdings, Inc. (A) 1,472 31,457LeMaitre Vascular, Inc. 475 23,171Masimo Corp. (A) 1,115 256,071Meridian Bioscience, Inc. (A) 1,112 29,190Merit Medical Systems, Inc. (A) 1,168 69,940
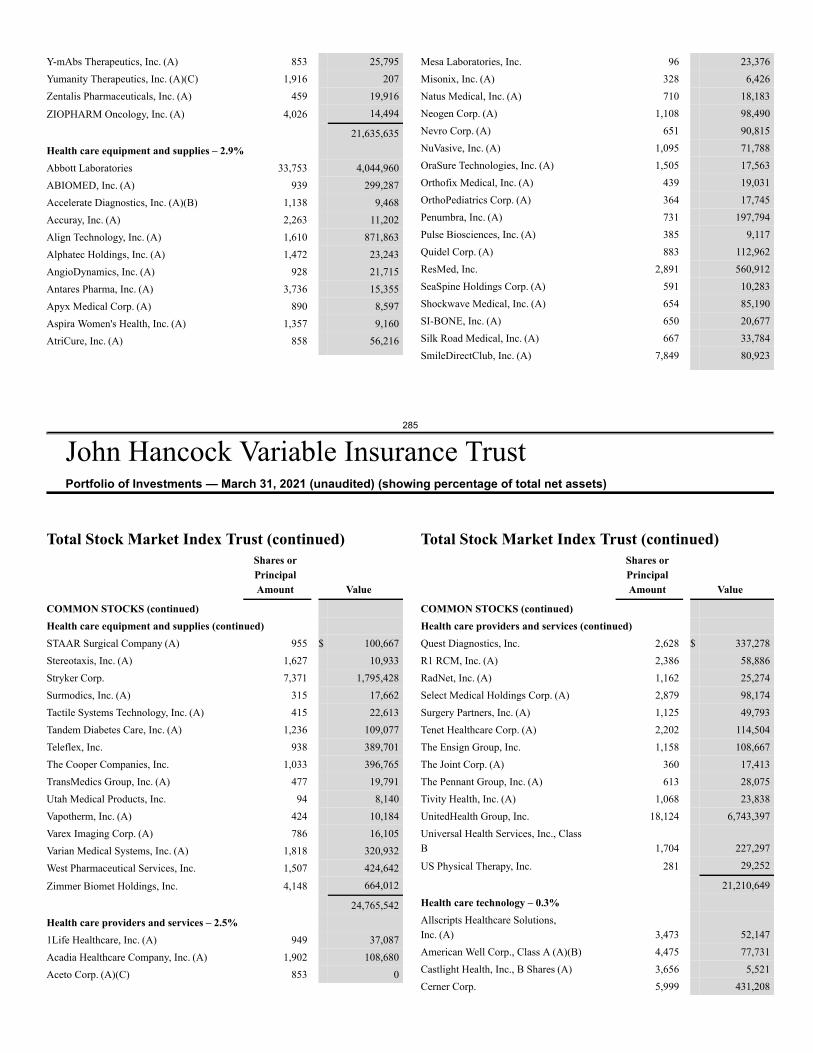
285
John Hancock Variable Insurance TrustPortfolio of Investments — March 31, 2021 (unaudited) (showing percentage of total net assets)
Y-mAbs Therapeutics, Inc. (A) 853 25,795Yumanity Therapeutics, Inc. (A)(C) 1,916 207Zentalis Pharmaceuticals, Inc. (A) 459 19,916
ZIOPHARM Oncology, Inc. (A) 4,026 14,494
21,635,635Health care equipment and supplies – 2.9%Abbott Laboratories 33,753 4,044,960ABIOMED, Inc. (A) 939 299,287Accelerate Diagnostics, Inc. (A)(B) 1,138 9,468Accuray, Inc. (A) 2,263 11,202Align Technology, Inc. (A) 1,610 871,863Alphatec Holdings, Inc. (A) 1,472 23,243AngioDynamics, Inc. (A) 928 21,715Antares Pharma, Inc. (A) 3,736 15,355Apyx Medical Corp. (A) 890 8,597Aspira Women's Health, Inc. (A) 1,357 9,160AtriCure, Inc. (A) 858 56,216
Mesa Laboratories, Inc. 96 23,376Misonix, Inc. (A) 328 6,426Natus Medical, Inc. (A) 710 18,183Neogen Corp. (A) 1,108 98,490Nevro Corp. (A) 651 90,815NuVasive, Inc. (A) 1,095 71,788OraSure Technologies, Inc. (A) 1,505 17,563Orthofix Medical, Inc. (A) 439 19,031OrthoPediatrics Corp. (A) 364 17,745Penumbra, Inc. (A) 731 197,794Pulse Biosciences, Inc. (A) 385 9,117Quidel Corp. (A) 883 112,962ResMed, Inc. 2,891 560,912SeaSpine Holdings Corp. (A) 591 10,283Shockwave Medical, Inc. (A) 654 85,190SI-BONE, Inc. (A) 650 20,677Silk Road Medical, Inc. (A) 667 33,784SmileDirectClub, Inc. (A) 7,849 80,923
Total Stock Market Index Trust (continued)Shares orPrincipalAmount Value
COMMON STOCKS (continued)Health care equipment and supplies (continued)STAAR Surgical Company (A) 955 $ 100,667Stereotaxis, Inc. (A) 1,627 10,933Stryker Corp. 7,371 1,795,428Surmodics, Inc. (A) 315 17,662Tactile Systems Technology, Inc. (A) 415 22,613Tandem Diabetes Care, Inc. (A) 1,236 109,077Teleflex, Inc. 938 389,701The Cooper Companies, Inc. 1,033 396,765TransMedics Group, Inc. (A) 477 19,791Utah Medical Products, Inc. 94 8,140Vapotherm, Inc. (A) 424 10,184Varex Imaging Corp. (A) 786 16,105Varian Medical Systems, Inc. (A) 1,818 320,932West Pharmaceutical Services, Inc. 1,507 424,642
Zimmer Biomet Holdings, Inc. 4,148 664,012
24,765,542Health care providers and services – 2.5%1Life Healthcare, Inc. (A) 949 37,087Acadia Healthcare Company, Inc. (A) 1,902 108,680Aceto Corp. (A)(C) 853 0
Total Stock Market Index Trust (continued)Shares orPrincipalAmount Value
COMMON STOCKS (continued)Health care providers and services (continued)Quest Diagnostics, Inc. 2,628 $ 337,278R1 RCM, Inc. (A) 2,386 58,886RadNet, Inc. (A) 1,162 25,274Select Medical Holdings Corp. (A) 2,879 98,174Surgery Partners, Inc. (A) 1,125 49,793Tenet Healthcare Corp. (A) 2,202 114,504The Ensign Group, Inc. 1,158 108,667The Joint Corp. (A) 360 17,413The Pennant Group, Inc. (A) 613 28,075Tivity Health, Inc. (A) 1,068 23,838UnitedHealth Group, Inc. 18,124 6,743,397Universal Health Services, Inc., ClassB 1,704 227,297
US Physical Therapy, Inc. 281 29,252
21,210,649Health care technology – 0.3%Allscripts Healthcare Solutions,Inc. (A) 3,473 52,147American Well Corp., Class A (A)(B) 4,475 77,731Castlight Health, Inc., B Shares (A) 3,656 5,521Cerner Corp. 5,999 431,208
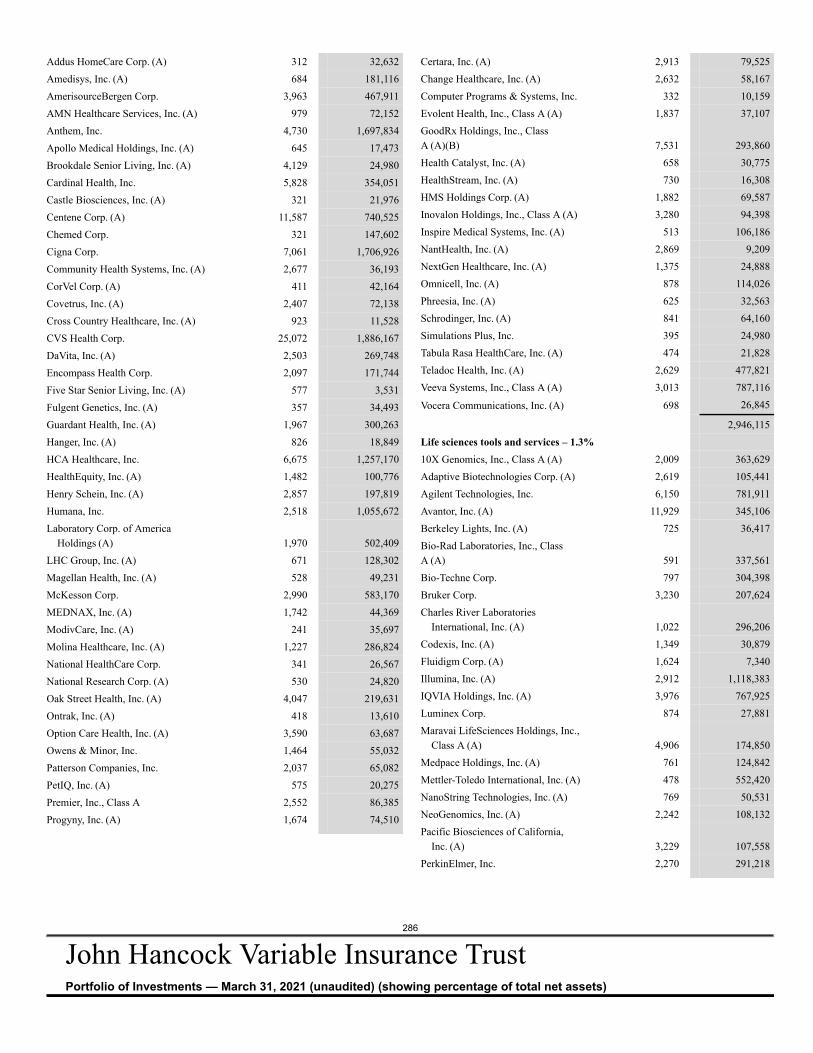
286
John Hancock Variable Insurance TrustPortfolio of Investments — March 31, 2021 (unaudited) (showing percentage of total net assets)
Addus HomeCare Corp. (A) 312 32,632Amedisys, Inc. (A) 684 181,116AmerisourceBergen Corp. 3,963 467,911AMN Healthcare Services, Inc. (A) 979 72,152Anthem, Inc. 4,730 1,697,834Apollo Medical Holdings, Inc. (A) 645 17,473Brookdale Senior Living, Inc. (A) 4,129 24,980Cardinal Health, Inc. 5,828 354,051Castle Biosciences, Inc. (A) 321 21,976Centene Corp. (A) 11,587 740,525Chemed Corp. 321 147,602Cigna Corp. 7,061 1,706,926Community Health Systems, Inc. (A) 2,677 36,193CorVel Corp. (A) 411 42,164Covetrus, Inc. (A) 2,407 72,138Cross Country Healthcare, Inc. (A) 923 11,528CVS Health Corp. 25,072 1,886,167DaVita, Inc. (A) 2,503 269,748Encompass Health Corp. 2,097 171,744Five Star Senior Living, Inc. (A) 577 3,531Fulgent Genetics, Inc. (A) 357 34,493Guardant Health, Inc. (A) 1,967 300,263Hanger, Inc. (A) 826 18,849HCA Healthcare, Inc. 6,675 1,257,170HealthEquity, Inc. (A) 1,482 100,776Henry Schein, Inc. (A) 2,857 197,819Humana, Inc. 2,518 1,055,672Laboratory Corp. of America
Holdings (A) 1,970 502,409LHC Group, Inc. (A) 671 128,302Magellan Health, Inc. (A) 528 49,231McKesson Corp. 2,990 583,170MEDNAX, Inc. (A) 1,742 44,369ModivCare, Inc. (A) 241 35,697Molina Healthcare, Inc. (A) 1,227 286,824National HealthCare Corp. 341 26,567National Research Corp. (A) 530 24,820Oak Street Health, Inc. (A) 4,047 219,631Ontrak, Inc. (A) 418 13,610Option Care Health, Inc. (A) 3,590 63,687Owens & Minor, Inc. 1,464 55,032Patterson Companies, Inc. 2,037 65,082PetIQ, Inc. (A) 575 20,275Premier, Inc., Class A 2,552 86,385Progyny, Inc. (A) 1,674 74,510
Certara, Inc. (A) 2,913 79,525Change Healthcare, Inc. (A) 2,632 58,167Computer Programs & Systems, Inc. 332 10,159Evolent Health, Inc., Class A (A) 1,837 37,107GoodRx Holdings, Inc., ClassA (A)(B) 7,531 293,860Health Catalyst, Inc. (A) 658 30,775HealthStream, Inc. (A) 730 16,308HMS Holdings Corp. (A) 1,882 69,587Inovalon Holdings, Inc., Class A (A) 3,280 94,398Inspire Medical Systems, Inc. (A) 513 106,186NantHealth, Inc. (A) 2,869 9,209NextGen Healthcare, Inc. (A) 1,375 24,888Omnicell, Inc. (A) 878 114,026Phreesia, Inc. (A) 625 32,563Schrodinger, Inc. (A) 841 64,160Simulations Plus, Inc. 395 24,980Tabula Rasa HealthCare, Inc. (A) 474 21,828Teladoc Health, Inc. (A) 2,629 477,821Veeva Systems, Inc., Class A (A) 3,013 787,116
Vocera Communications, Inc. (A) 698 26,845
2,946,115Life sciences tools and services – 1.3%10X Genomics, Inc., Class A (A) 2,009 363,629Adaptive Biotechnologies Corp. (A) 2,619 105,441Agilent Technologies, Inc. 6,150 781,911Avantor, Inc. (A) 11,929 345,106Berkeley Lights, Inc. (A) 725 36,417Bio-Rad Laboratories, Inc., ClassA (A) 591 337,561Bio-Techne Corp. 797 304,398Bruker Corp. 3,230 207,624Charles River Laboratories
International, Inc. (A) 1,022 296,206Codexis, Inc. (A) 1,349 30,879Fluidigm Corp. (A) 1,624 7,340Illumina, Inc. (A) 2,912 1,118,383IQVIA Holdings, Inc. (A) 3,976 767,925Luminex Corp. 874 27,881Maravai LifeSciences Holdings, Inc.,
Class A (A) 4,906 174,850Medpace Holdings, Inc. (A) 761 124,842Mettler-Toledo International, Inc. (A) 478 552,420NanoString Technologies, Inc. (A) 769 50,531NeoGenomics, Inc. (A) 2,242 108,132Pacific Biosciences of California,
Inc. (A) 3,229 107,558PerkinElmer, Inc. 2,270 291,218
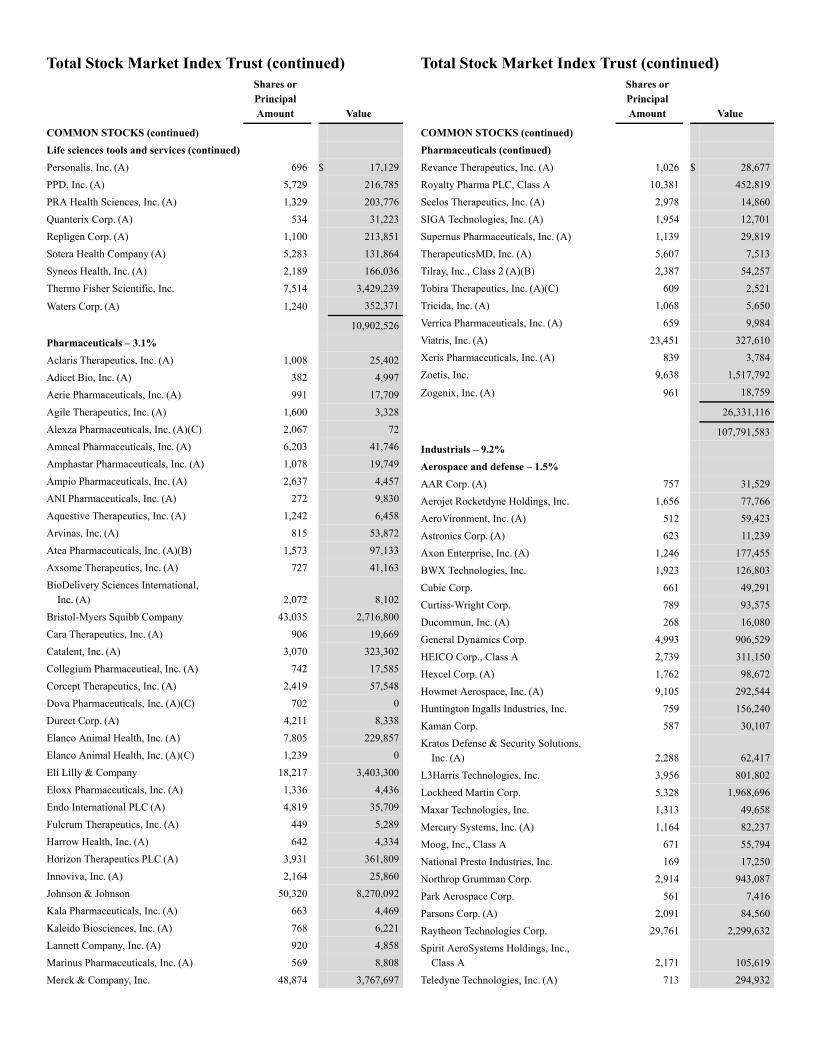
Total Stock Market Index Trust (continued)Shares orPrincipalAmount Value
COMMON STOCKS (continued)Life sciences tools and services (continued)Personalis, Inc. (A) 696 $ 17,129PPD, Inc. (A) 5,729 216,785PRA Health Sciences, Inc. (A) 1,329 203,776Quanterix Corp. (A) 534 31,223Repligen Corp. (A) 1,100 213,851Sotera Health Company (A) 5,283 131,864Syneos Health, Inc. (A) 2,189 166,036Thermo Fisher Scientific, Inc. 7,514 3,429,239
Waters Corp. (A) 1,240 352,371
10,902,526Pharmaceuticals – 3.1%Aclaris Therapeutics, Inc. (A) 1,008 25,402Adicet Bio, Inc. (A) 382 4,997Aerie Pharmaceuticals, Inc. (A) 991 17,709Agile Therapeutics, Inc. (A) 1,600 3,328Alexza Pharmaceuticals, Inc. (A)(C) 2,067 72Amneal Pharmaceuticals, Inc. (A) 6,203 41,746Amphastar Pharmaceuticals, Inc. (A) 1,078 19,749Ampio Pharmaceuticals, Inc. (A) 2,637 4,457ANI Pharmaceuticals, Inc. (A) 272 9,830Aquestive Therapeutics, Inc. (A) 1,242 6,458Arvinas, Inc. (A) 815 53,872Atea Pharmaceuticals, Inc. (A)(B) 1,573 97,133Axsome Therapeutics, Inc. (A) 727 41,163BioDelivery Sciences International,
Inc. (A) 2,072 8,102Bristol-Myers Squibb Company 43,035 2,716,800Cara Therapeutics, Inc. (A) 906 19,669Catalent, Inc. (A) 3,070 323,302Collegium Pharmaceutical, Inc. (A) 742 17,585Corcept Therapeutics, Inc. (A) 2,419 57,548Dova Pharmaceuticals, Inc. (A)(C) 702 0Durect Corp. (A) 4,211 8,338Elanco Animal Health, Inc. (A) 7,805 229,857Elanco Animal Health, Inc. (A)(C) 1,239 0Eli Lilly & Company 18,217 3,403,300Eloxx Pharmaceuticals, Inc. (A) 1,336 4,436Endo International PLC (A) 4,819 35,709Fulcrum Therapeutics, Inc. (A) 449 5,289Harrow Health, Inc. (A) 642 4,334Horizon Therapeutics PLC (A) 3,931 361,809Innoviva, Inc. (A) 2,164 25,860Johnson & Johnson 50,320 8,270,092Kala Pharmaceuticals, Inc. (A) 663 4,469Kaleido Biosciences, Inc. (A) 768 6,221Lannett Company, Inc. (A) 920 4,858Marinus Pharmaceuticals, Inc. (A) 569 8,808Merck & Company, Inc. 48,874 3,767,697
Total Stock Market Index Trust (continued)Shares orPrincipalAmount Value
COMMON STOCKS (continued)Pharmaceuticals (continued)Revance Therapeutics, Inc. (A) 1,026 $ 28,677Royalty Pharma PLC, Class A 10,381 452,819Seelos Therapeutics, Inc. (A) 2,978 14,860SIGA Technologies, Inc. (A) 1,954 12,701Supernus Pharmaceuticals, Inc. (A) 1,139 29,819TherapeuticsMD, Inc. (A) 5,607 7,513Tilray, Inc., Class 2 (A)(B) 2,387 54,257Tobira Therapeutics, Inc. (A)(C) 609 2,521Tricida, Inc. (A) 1,068 5,650Verrica Pharmaceuticals, Inc. (A) 659 9,984Viatris, Inc. (A) 23,451 327,610Xeris Pharmaceuticals, Inc. (A) 839 3,784Zoetis, Inc. 9,638 1,517,792
Zogenix, Inc. (A) 961 18,759
26,331,116
107,791,583Industrials – 9.2%Aerospace and defense – 1.5%AAR Corp. (A) 757 31,529Aerojet Rocketdyne Holdings, Inc. 1,656 77,766AeroVironment, Inc. (A) 512 59,423Astronics Corp. (A) 623 11,239Axon Enterprise, Inc. (A) 1,246 177,455BWX Technologies, Inc. 1,923 126,803Cubic Corp. 661 49,291Curtiss-Wright Corp. 789 93,575Ducommun, Inc. (A) 268 16,080General Dynamics Corp. 4,993 906,529HEICO Corp., Class A 2,739 311,150Hexcel Corp. (A) 1,762 98,672Howmet Aerospace, Inc. (A) 9,105 292,544Huntington Ingalls Industries, Inc. 759 156,240Kaman Corp. 587 30,107Kratos Defense & Security Solutions,
Inc. (A) 2,288 62,417L3Harris Technologies, Inc. 3,956 801,802Lockheed Martin Corp. 5,328 1,968,696Maxar Technologies, Inc. 1,313 49,658Mercury Systems, Inc. (A) 1,164 82,237Moog, Inc., Class A 671 55,794National Presto Industries, Inc. 169 17,250Northrop Grumman Corp. 2,914 943,087Park Aerospace Corp. 561 7,416Parsons Corp. (A) 2,091 84,560Raytheon Technologies Corp. 29,761 2,299,632Spirit AeroSystems Holdings, Inc.,
Class A 2,171 105,619Teledyne Technologies, Inc. (A) 713 294,932
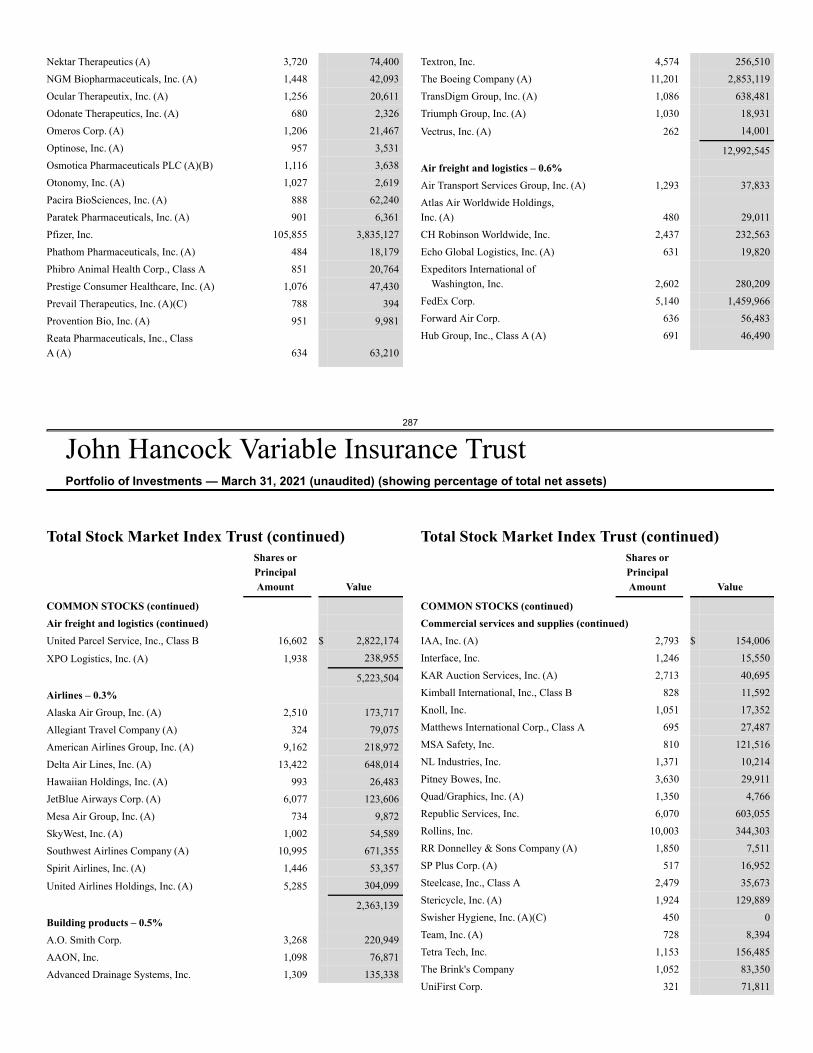
287
John Hancock Variable Insurance TrustPortfolio of Investments — March 31, 2021 (unaudited) (showing percentage of total net assets)
Nektar Therapeutics (A) 3,720 74,400NGM Biopharmaceuticals, Inc. (A) 1,448 42,093Ocular Therapeutix, Inc. (A) 1,256 20,611Odonate Therapeutics, Inc. (A) 680 2,326Omeros Corp. (A) 1,206 21,467Optinose, Inc. (A) 957 3,531Osmotica Pharmaceuticals PLC (A)(B) 1,116 3,638Otonomy, Inc. (A) 1,027 2,619Pacira BioSciences, Inc. (A) 888 62,240Paratek Pharmaceuticals, Inc. (A) 901 6,361Pfizer, Inc. 105,855 3,835,127Phathom Pharmaceuticals, Inc. (A) 484 18,179Phibro Animal Health Corp., Class A 851 20,764Prestige Consumer Healthcare, Inc. (A) 1,076 47,430Prevail Therapeutics, Inc. (A)(C) 788 394Provention Bio, Inc. (A) 951 9,981Reata Pharmaceuticals, Inc., ClassA (A) 634 63,210
Textron, Inc. 4,574 256,510The Boeing Company (A) 11,201 2,853,119TransDigm Group, Inc. (A) 1,086 638,481Triumph Group, Inc. (A) 1,030 18,931
Vectrus, Inc. (A) 262 14,001
12,992,545Air freight and logistics – 0.6%Air Transport Services Group, Inc. (A) 1,293 37,833Atlas Air Worldwide Holdings,Inc. (A) 480 29,011CH Robinson Worldwide, Inc. 2,437 232,563Echo Global Logistics, Inc. (A) 631 19,820Expeditors International of
Washington, Inc. 2,602 280,209FedEx Corp. 5,140 1,459,966Forward Air Corp. 636 56,483Hub Group, Inc., Class A (A) 691 46,490
Total Stock Market Index Trust (continued)Shares orPrincipalAmount Value
COMMON STOCKS (continued)Air freight and logistics (continued)United Parcel Service, Inc., Class B 16,602 $ 2,822,174
XPO Logistics, Inc. (A) 1,938 238,955
5,223,504Airlines – 0.3%Alaska Air Group, Inc. (A) 2,510 173,717Allegiant Travel Company (A) 324 79,075American Airlines Group, Inc. (A) 9,162 218,972Delta Air Lines, Inc. (A) 13,422 648,014Hawaiian Holdings, Inc. (A) 993 26,483JetBlue Airways Corp. (A) 6,077 123,606Mesa Air Group, Inc. (A) 734 9,872SkyWest, Inc. (A) 1,002 54,589Southwest Airlines Company (A) 10,995 671,355Spirit Airlines, Inc. (A) 1,446 53,357
United Airlines Holdings, Inc. (A) 5,285 304,099
2,363,139Building products – 0.5%A.O. Smith Corp. 3,268 220,949AAON, Inc. 1,098 76,871Advanced Drainage Systems, Inc. 1,309 135,338
Total Stock Market Index Trust (continued)Shares orPrincipalAmount Value
COMMON STOCKS (continued)Commercial services and supplies (continued)IAA, Inc. (A) 2,793 $ 154,006Interface, Inc. 1,246 15,550KAR Auction Services, Inc. (A) 2,713 40,695Kimball International, Inc., Class B 828 11,592Knoll, Inc. 1,051 17,352Matthews International Corp., Class A 695 27,487MSA Safety, Inc. 810 121,516NL Industries, Inc. 1,371 10,214Pitney Bowes, Inc. 3,630 29,911Quad/Graphics, Inc. (A) 1,350 4,766Republic Services, Inc. 6,070 603,055Rollins, Inc. 10,003 344,303RR Donnelley & Sons Company (A) 1,850 7,511SP Plus Corp. (A) 517 16,952Steelcase, Inc., Class A 2,479 35,673Stericycle, Inc. (A) 1,924 129,889Swisher Hygiene, Inc. (A)(C) 450 0Team, Inc. (A) 728 8,394Tetra Tech, Inc. 1,153 156,485The Brink's Company 1,052 83,350UniFirst Corp. 321 71,811
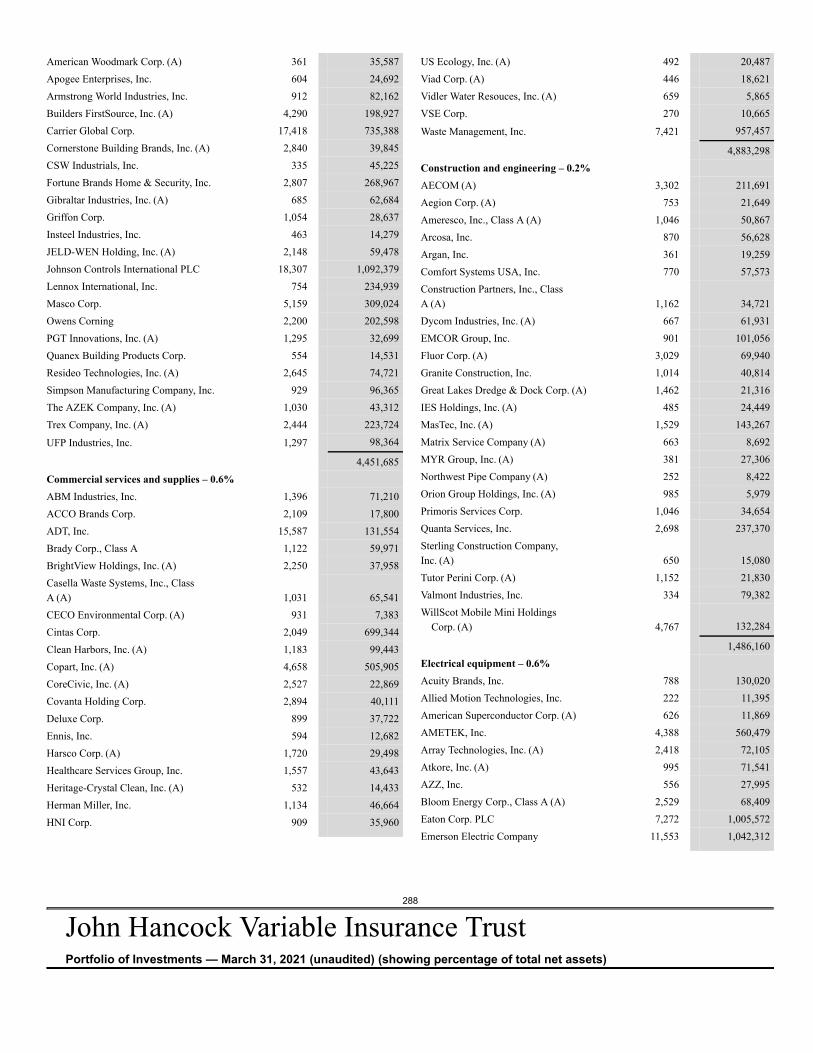
288
John Hancock Variable Insurance TrustPortfolio of Investments — March 31, 2021 (unaudited) (showing percentage of total net assets)
American Woodmark Corp. (A) 361 35,587Apogee Enterprises, Inc. 604 24,692Armstrong World Industries, Inc. 912 82,162Builders FirstSource, Inc. (A) 4,290 198,927Carrier Global Corp. 17,418 735,388Cornerstone Building Brands, Inc. (A) 2,840 39,845CSW Industrials, Inc. 335 45,225Fortune Brands Home & Security, Inc. 2,807 268,967Gibraltar Industries, Inc. (A) 685 62,684Griffon Corp. 1,054 28,637Insteel Industries, Inc. 463 14,279JELD-WEN Holding, Inc. (A) 2,148 59,478Johnson Controls International PLC 18,307 1,092,379Lennox International, Inc. 754 234,939Masco Corp. 5,159 309,024Owens Corning 2,200 202,598PGT Innovations, Inc. (A) 1,295 32,699Quanex Building Products Corp. 554 14,531Resideo Technologies, Inc. (A) 2,645 74,721Simpson Manufacturing Company, Inc. 929 96,365The AZEK Company, Inc. (A) 1,030 43,312Trex Company, Inc. (A) 2,444 223,724
UFP Industries, Inc. 1,297 98,364
4,451,685Commercial services and supplies – 0.6%ABM Industries, Inc. 1,396 71,210ACCO Brands Corp. 2,109 17,800ADT, Inc. 15,587 131,554Brady Corp., Class A 1,122 59,971BrightView Holdings, Inc. (A) 2,250 37,958Casella Waste Systems, Inc., ClassA (A) 1,031 65,541CECO Environmental Corp. (A) 931 7,383Cintas Corp. 2,049 699,344Clean Harbors, Inc. (A) 1,183 99,443Copart, Inc. (A) 4,658 505,905CoreCivic, Inc. (A) 2,527 22,869Covanta Holding Corp. 2,894 40,111Deluxe Corp. 899 37,722Ennis, Inc. 594 12,682Harsco Corp. (A) 1,720 29,498Healthcare Services Group, Inc. 1,557 43,643Heritage-Crystal Clean, Inc. (A) 532 14,433Herman Miller, Inc. 1,134 46,664HNI Corp. 909 35,960
US Ecology, Inc. (A) 492 20,487Viad Corp. (A) 446 18,621Vidler Water Resouces, Inc. (A) 659 5,865VSE Corp. 270 10,665
Waste Management, Inc. 7,421 957,457
4,883,298Construction and engineering – 0.2%AECOM (A) 3,302 211,691Aegion Corp. (A) 753 21,649Ameresco, Inc., Class A (A) 1,046 50,867Arcosa, Inc. 870 56,628Argan, Inc. 361 19,259Comfort Systems USA, Inc. 770 57,573Construction Partners, Inc., ClassA (A) 1,162 34,721Dycom Industries, Inc. (A) 667 61,931EMCOR Group, Inc. 901 101,056Fluor Corp. (A) 3,029 69,940Granite Construction, Inc. 1,014 40,814Great Lakes Dredge & Dock Corp. (A) 1,462 21,316IES Holdings, Inc. (A) 485 24,449MasTec, Inc. (A) 1,529 143,267Matrix Service Company (A) 663 8,692MYR Group, Inc. (A) 381 27,306Northwest Pipe Company (A) 252 8,422Orion Group Holdings, Inc. (A) 985 5,979Primoris Services Corp. 1,046 34,654Quanta Services, Inc. 2,698 237,370Sterling Construction Company,Inc. (A) 650 15,080Tutor Perini Corp. (A) 1,152 21,830Valmont Industries, Inc. 334 79,382WillScot Mobile Mini Holdings
Corp. (A) 4,767 132,284
1,486,160Electrical equipment – 0.6%Acuity Brands, Inc. 788 130,020Allied Motion Technologies, Inc. 222 11,395American Superconductor Corp. (A) 626 11,869AMETEK, Inc. 4,388 560,479Array Technologies, Inc. (A) 2,418 72,105Atkore, Inc. (A) 995 71,541AZZ, Inc. 556 27,995Bloom Energy Corp., Class A (A) 2,529 68,409Eaton Corp. PLC 7,272 1,005,572Emerson Electric Company 11,553 1,042,312
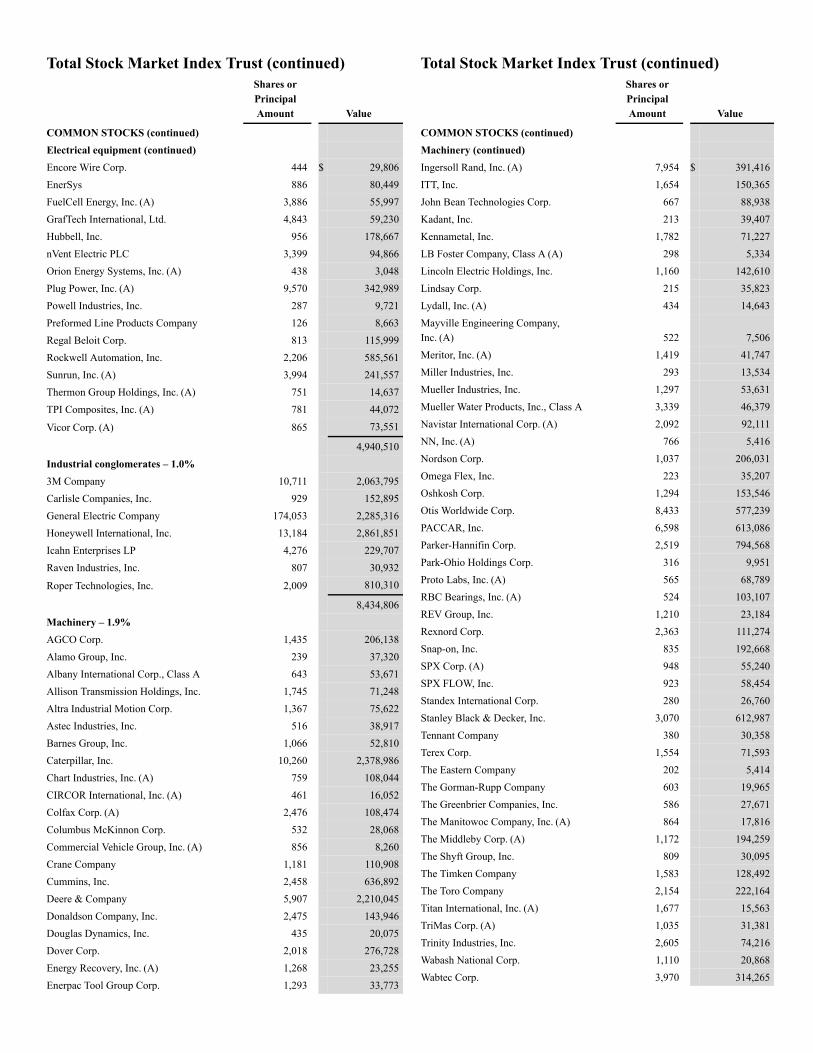
Total Stock Market Index Trust (continued)Shares orPrincipalAmount Value
COMMON STOCKS (continued)Electrical equipment (continued)Encore Wire Corp. 444 $ 29,806EnerSys 886 80,449FuelCell Energy, Inc. (A) 3,886 55,997GrafTech International, Ltd. 4,843 59,230Hubbell, Inc. 956 178,667nVent Electric PLC 3,399 94,866Orion Energy Systems, Inc. (A) 438 3,048Plug Power, Inc. (A) 9,570 342,989Powell Industries, Inc. 287 9,721Preformed Line Products Company 126 8,663Regal Beloit Corp. 813 115,999Rockwell Automation, Inc. 2,206 585,561Sunrun, Inc. (A) 3,994 241,557Thermon Group Holdings, Inc. (A) 751 14,637TPI Composites, Inc. (A) 781 44,072
Vicor Corp. (A) 865 73,551
4,940,510Industrial conglomerates – 1.0%3M Company 10,711 2,063,795Carlisle Companies, Inc. 929 152,895General Electric Company 174,053 2,285,316Honeywell International, Inc. 13,184 2,861,851Icahn Enterprises LP 4,276 229,707Raven Industries, Inc. 807 30,932
Roper Technologies, Inc. 2,009 810,310
8,434,806Machinery – 1.9%AGCO Corp. 1,435 206,138Alamo Group, Inc. 239 37,320Albany International Corp., Class A 643 53,671Allison Transmission Holdings, Inc. 1,745 71,248Altra Industrial Motion Corp. 1,367 75,622Astec Industries, Inc. 516 38,917Barnes Group, Inc. 1,066 52,810Caterpillar, Inc. 10,260 2,378,986Chart Industries, Inc. (A) 759 108,044CIRCOR International, Inc. (A) 461 16,052Colfax Corp. (A) 2,476 108,474Columbus McKinnon Corp. 532 28,068Commercial Vehicle Group, Inc. (A) 856 8,260Crane Company 1,181 110,908Cummins, Inc. 2,458 636,892Deere & Company 5,907 2,210,045Donaldson Company, Inc. 2,475 143,946Douglas Dynamics, Inc. 435 20,075Dover Corp. 2,018 276,728Energy Recovery, Inc. (A) 1,268 23,255Enerpac Tool Group Corp. 1,293 33,773
Total Stock Market Index Trust (continued)Shares orPrincipalAmount Value
COMMON STOCKS (continued)Machinery (continued)Ingersoll Rand, Inc. (A) 7,954 $ 391,416ITT, Inc. 1,654 150,365John Bean Technologies Corp. 667 88,938Kadant, Inc. 213 39,407Kennametal, Inc. 1,782 71,227LB Foster Company, Class A (A) 298 5,334Lincoln Electric Holdings, Inc. 1,160 142,610Lindsay Corp. 215 35,823Lydall, Inc. (A) 434 14,643Mayville Engineering Company,Inc. (A) 522 7,506Meritor, Inc. (A) 1,419 41,747Miller Industries, Inc. 293 13,534Mueller Industries, Inc. 1,297 53,631Mueller Water Products, Inc., Class A 3,339 46,379Navistar International Corp. (A) 2,092 92,111NN, Inc. (A) 766 5,416Nordson Corp. 1,037 206,031Omega Flex, Inc. 223 35,207Oshkosh Corp. 1,294 153,546Otis Worldwide Corp. 8,433 577,239PACCAR, Inc. 6,598 613,086Parker-Hannifin Corp. 2,519 794,568Park-Ohio Holdings Corp. 316 9,951Proto Labs, Inc. (A) 565 68,789RBC Bearings, Inc. (A) 524 103,107REV Group, Inc. 1,210 23,184Rexnord Corp. 2,363 111,274Snap-on, Inc. 835 192,668SPX Corp. (A) 948 55,240SPX FLOW, Inc. 923 58,454Standex International Corp. 280 26,760Stanley Black & Decker, Inc. 3,070 612,987Tennant Company 380 30,358Terex Corp. 1,554 71,593The Eastern Company 202 5,414The Gorman-Rupp Company 603 19,965The Greenbrier Companies, Inc. 586 27,671The Manitowoc Company, Inc. (A) 864 17,816The Middleby Corp. (A) 1,172 194,259The Shyft Group, Inc. 809 30,095The Timken Company 1,583 128,492The Toro Company 2,154 222,164Titan International, Inc. (A) 1,677 15,563TriMas Corp. (A) 1,035 31,381Trinity Industries, Inc. 2,605 74,216Wabash National Corp. 1,110 20,868Wabtec Corp. 3,970 314,265
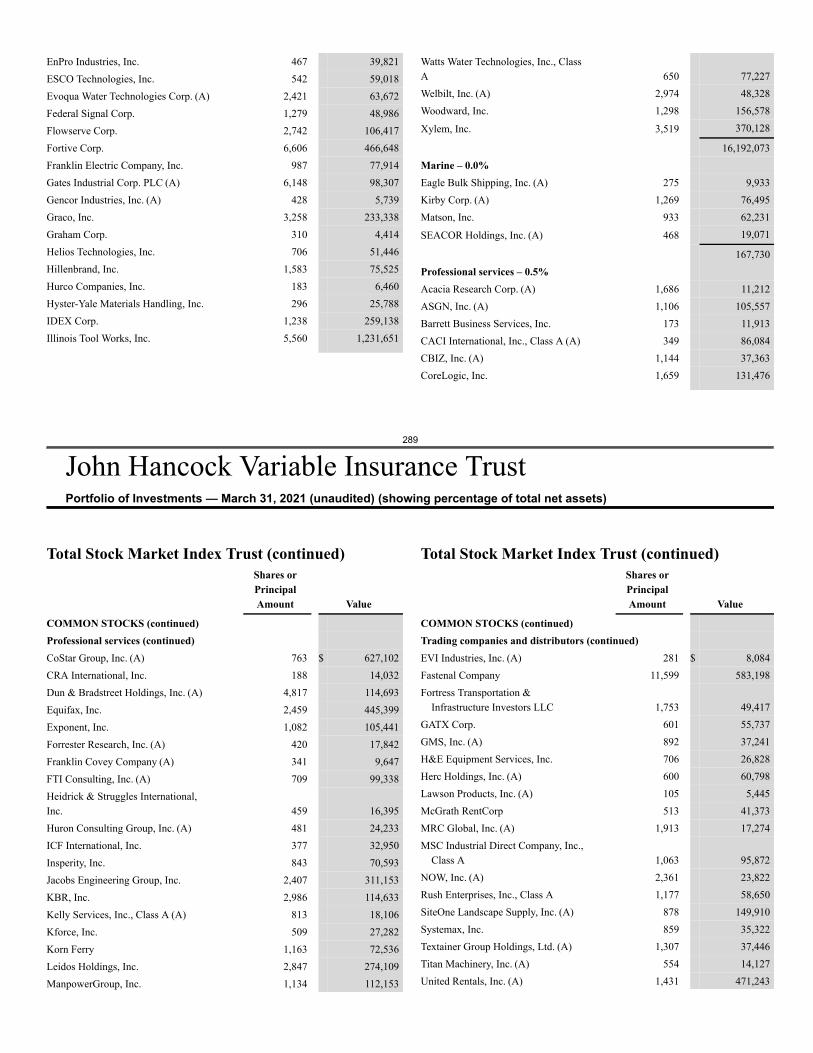
289
John Hancock Variable Insurance TrustPortfolio of Investments — March 31, 2021 (unaudited) (showing percentage of total net assets)
EnPro Industries, Inc. 467 39,821ESCO Technologies, Inc. 542 59,018Evoqua Water Technologies Corp. (A) 2,421 63,672Federal Signal Corp. 1,279 48,986Flowserve Corp. 2,742 106,417Fortive Corp. 6,606 466,648Franklin Electric Company, Inc. 987 77,914Gates Industrial Corp. PLC (A) 6,148 98,307Gencor Industries, Inc. (A) 428 5,739Graco, Inc. 3,258 233,338Graham Corp. 310 4,414Helios Technologies, Inc. 706 51,446Hillenbrand, Inc. 1,583 75,525Hurco Companies, Inc. 183 6,460Hyster-Yale Materials Handling, Inc. 296 25,788IDEX Corp. 1,238 259,138Illinois Tool Works, Inc. 5,560 1,231,651
Watts Water Technologies, Inc., ClassA 650 77,227Welbilt, Inc. (A) 2,974 48,328Woodward, Inc. 1,298 156,578
Xylem, Inc. 3,519 370,128
16,192,073Marine – 0.0%Eagle Bulk Shipping, Inc. (A) 275 9,933Kirby Corp. (A) 1,269 76,495Matson, Inc. 933 62,231
SEACOR Holdings, Inc. (A) 468 19,071
167,730Professional services – 0.5%Acacia Research Corp. (A) 1,686 11,212ASGN, Inc. (A) 1,106 105,557Barrett Business Services, Inc. 173 11,913CACI International, Inc., Class A (A) 349 86,084CBIZ, Inc. (A) 1,144 37,363CoreLogic, Inc. 1,659 131,476
Total Stock Market Index Trust (continued)Shares orPrincipalAmount Value
COMMON STOCKS (continued)Professional services (continued)CoStar Group, Inc. (A) 763 $ 627,102CRA International, Inc. 188 14,032Dun & Bradstreet Holdings, Inc. (A) 4,817 114,693Equifax, Inc. 2,459 445,399Exponent, Inc. 1,082 105,441Forrester Research, Inc. (A) 420 17,842Franklin Covey Company (A) 341 9,647FTI Consulting, Inc. (A) 709 99,338Heidrick & Struggles International,Inc. 459 16,395Huron Consulting Group, Inc. (A) 481 24,233ICF International, Inc. 377 32,950Insperity, Inc. 843 70,593Jacobs Engineering Group, Inc. 2,407 311,153KBR, Inc. 2,986 114,633Kelly Services, Inc., Class A (A) 813 18,106Kforce, Inc. 509 27,282Korn Ferry 1,163 72,536Leidos Holdings, Inc. 2,847 274,109ManpowerGroup, Inc. 1,134 112,153
Total Stock Market Index Trust (continued)Shares orPrincipalAmount Value
COMMON STOCKS (continued)Trading companies and distributors (continued)EVI Industries, Inc. (A) 281 $ 8,084Fastenal Company 11,599 583,198Fortress Transportation &
Infrastructure Investors LLC 1,753 49,417GATX Corp. 601 55,737GMS, Inc. (A) 892 37,241H&E Equipment Services, Inc. 706 26,828Herc Holdings, Inc. (A) 600 60,798Lawson Products, Inc. (A) 105 5,445McGrath RentCorp 513 41,373MRC Global, Inc. (A) 1,913 17,274MSC Industrial Direct Company, Inc.,
Class A 1,063 95,872NOW, Inc. (A) 2,361 23,822Rush Enterprises, Inc., Class A 1,177 58,650SiteOne Landscape Supply, Inc. (A) 878 149,910Systemax, Inc. 859 35,322Textainer Group Holdings, Ltd. (A) 1,307 37,446Titan Machinery, Inc. (A) 554 14,127United Rentals, Inc. (A) 1,431 471,243
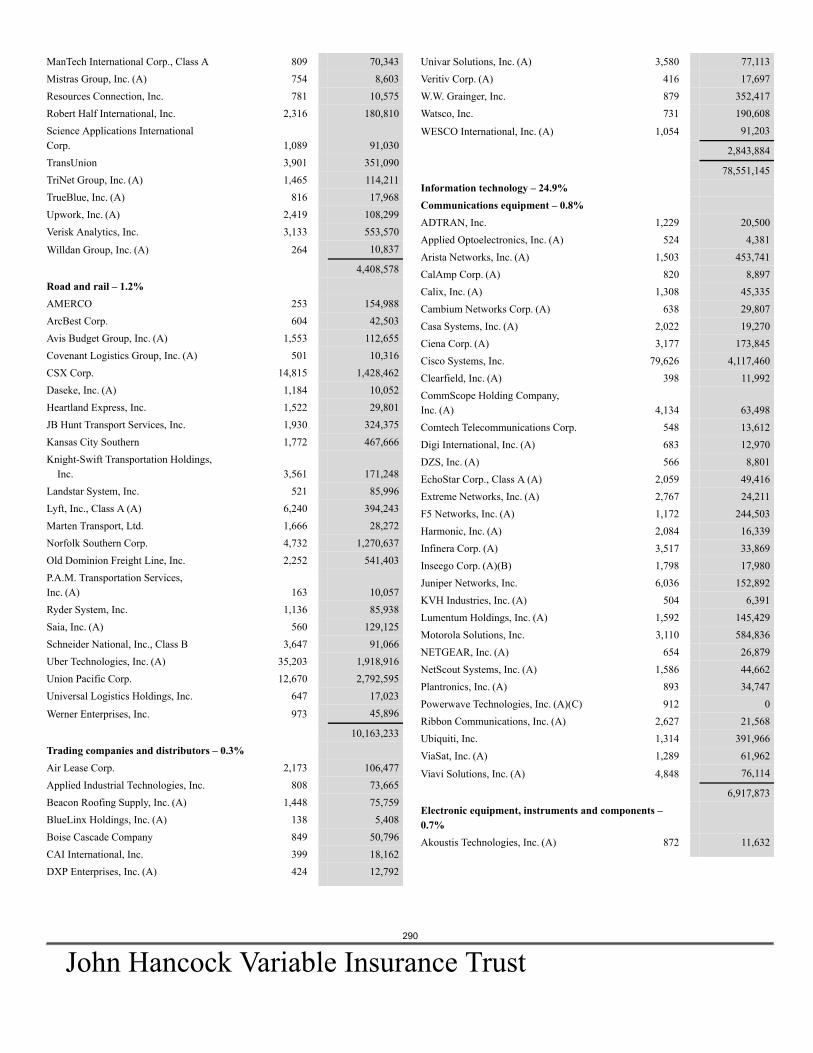
290
John Hancock Variable Insurance Trust
ManTech International Corp., Class A 809 70,343Mistras Group, Inc. (A) 754 8,603Resources Connection, Inc. 781 10,575Robert Half International, Inc. 2,316 180,810Science Applications InternationalCorp. 1,089 91,030TransUnion 3,901 351,090TriNet Group, Inc. (A) 1,465 114,211TrueBlue, Inc. (A) 816 17,968Upwork, Inc. (A) 2,419 108,299Verisk Analytics, Inc. 3,133 553,570
Willdan Group, Inc. (A) 264 10,837
4,408,578Road and rail – 1.2%AMERCO 253 154,988ArcBest Corp. 604 42,503Avis Budget Group, Inc. (A) 1,553 112,655Covenant Logistics Group, Inc. (A) 501 10,316CSX Corp. 14,815 1,428,462Daseke, Inc. (A) 1,184 10,052Heartland Express, Inc. 1,522 29,801JB Hunt Transport Services, Inc. 1,930 324,375Kansas City Southern 1,772 467,666Knight-Swift Transportation Holdings,
Inc. 3,561 171,248Landstar System, Inc. 521 85,996Lyft, Inc., Class A (A) 6,240 394,243Marten Transport, Ltd. 1,666 28,272Norfolk Southern Corp. 4,732 1,270,637Old Dominion Freight Line, Inc. 2,252 541,403P.A.M. Transportation Services,Inc. (A) 163 10,057Ryder System, Inc. 1,136 85,938Saia, Inc. (A) 560 129,125Schneider National, Inc., Class B 3,647 91,066Uber Technologies, Inc. (A) 35,203 1,918,916Union Pacific Corp. 12,670 2,792,595Universal Logistics Holdings, Inc. 647 17,023
Werner Enterprises, Inc. 973 45,896
10,163,233Trading companies and distributors – 0.3%Air Lease Corp. 2,173 106,477Applied Industrial Technologies, Inc. 808 73,665Beacon Roofing Supply, Inc. (A) 1,448 75,759BlueLinx Holdings, Inc. (A) 138 5,408Boise Cascade Company 849 50,796CAI International, Inc. 399 18,162DXP Enterprises, Inc. (A) 424 12,792
Univar Solutions, Inc. (A) 3,580 77,113Veritiv Corp. (A) 416 17,697W.W. Grainger, Inc. 879 352,417Watsco, Inc. 731 190,608
WESCO International, Inc. (A) 1,054 91,203
2,843,884
78,551,145Information technology – 24.9%Communications equipment – 0.8%ADTRAN, Inc. 1,229 20,500Applied Optoelectronics, Inc. (A) 524 4,381Arista Networks, Inc. (A) 1,503 453,741CalAmp Corp. (A) 820 8,897Calix, Inc. (A) 1,308 45,335Cambium Networks Corp. (A) 638 29,807Casa Systems, Inc. (A) 2,022 19,270Ciena Corp. (A) 3,177 173,845Cisco Systems, Inc. 79,626 4,117,460Clearfield, Inc. (A) 398 11,992CommScope Holding Company,Inc. (A) 4,134 63,498Comtech Telecommunications Corp. 548 13,612Digi International, Inc. (A) 683 12,970DZS, Inc. (A) 566 8,801EchoStar Corp., Class A (A) 2,059 49,416Extreme Networks, Inc. (A) 2,767 24,211F5 Networks, Inc. (A) 1,172 244,503Harmonic, Inc. (A) 2,084 16,339Infinera Corp. (A) 3,517 33,869Inseego Corp. (A)(B) 1,798 17,980Juniper Networks, Inc. 6,036 152,892KVH Industries, Inc. (A) 504 6,391Lumentum Holdings, Inc. (A) 1,592 145,429Motorola Solutions, Inc. 3,110 584,836NETGEAR, Inc. (A) 654 26,879NetScout Systems, Inc. (A) 1,586 44,662Plantronics, Inc. (A) 893 34,747Powerwave Technologies, Inc. (A)(C) 912 0Ribbon Communications, Inc. (A) 2,627 21,568Ubiquiti, Inc. 1,314 391,966ViaSat, Inc. (A) 1,289 61,962
Viavi Solutions, Inc. (A) 4,848 76,114
6,917,873Electronic equipment, instruments and components –0.7%Akoustis Technologies, Inc. (A) 872 11,632
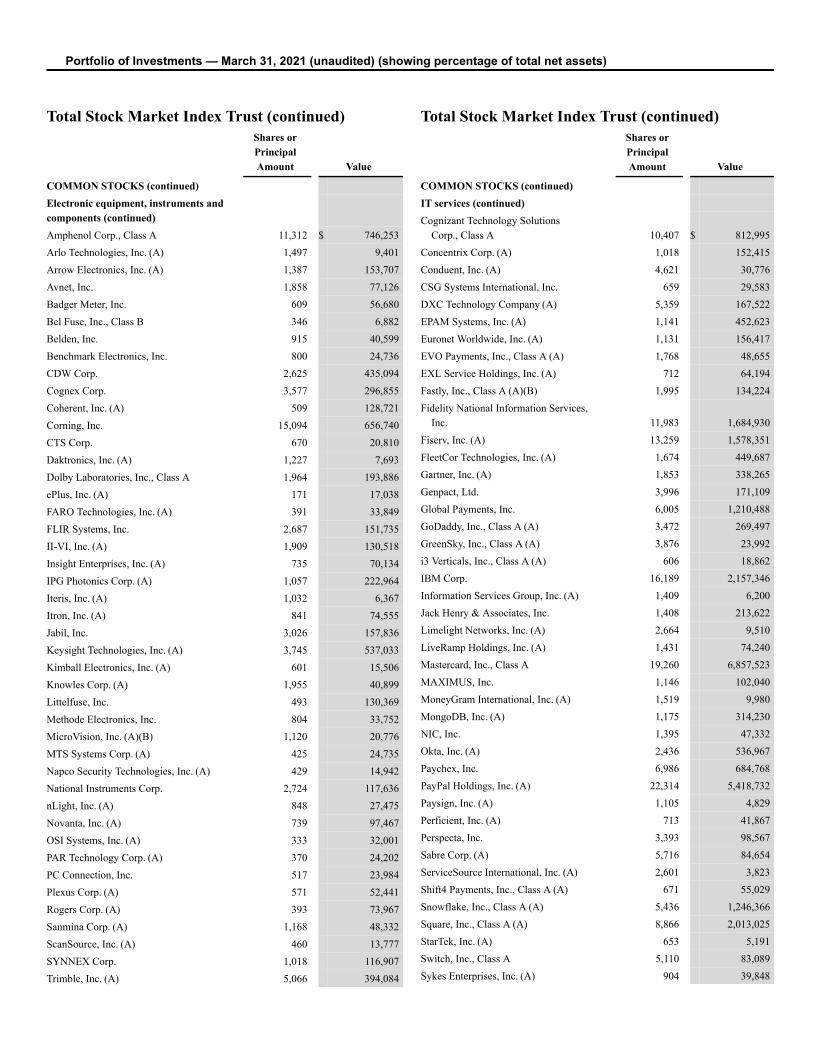
Portfolio of Investments — March 31, 2021 (unaudited) (showing percentage of total net assets)
Total Stock Market Index Trust (continued)Shares orPrincipalAmount Value
COMMON STOCKS (continued)Electronic equipment, instruments andcomponents (continued)Amphenol Corp., Class A 11,312 $ 746,253Arlo Technologies, Inc. (A) 1,497 9,401Arrow Electronics, Inc. (A) 1,387 153,707Avnet, Inc. 1,858 77,126Badger Meter, Inc. 609 56,680Bel Fuse, Inc., Class B 346 6,882Belden, Inc. 915 40,599Benchmark Electronics, Inc. 800 24,736CDW Corp. 2,625 435,094Cognex Corp. 3,577 296,855Coherent, Inc. (A) 509 128,721Corning, Inc. 15,094 656,740CTS Corp. 670 20,810Daktronics, Inc. (A) 1,227 7,693Dolby Laboratories, Inc., Class A 1,964 193,886ePlus, Inc. (A) 171 17,038FARO Technologies, Inc. (A) 391 33,849FLIR Systems, Inc. 2,687 151,735II-VI, Inc. (A) 1,909 130,518Insight Enterprises, Inc. (A) 735 70,134IPG Photonics Corp. (A) 1,057 222,964Iteris, Inc. (A) 1,032 6,367Itron, Inc. (A) 841 74,555Jabil, Inc. 3,026 157,836Keysight Technologies, Inc. (A) 3,745 537,033Kimball Electronics, Inc. (A) 601 15,506Knowles Corp. (A) 1,955 40,899Littelfuse, Inc. 493 130,369Methode Electronics, Inc. 804 33,752MicroVision, Inc. (A)(B) 1,120 20,776MTS Systems Corp. (A) 425 24,735Napco Security Technologies, Inc. (A) 429 14,942National Instruments Corp. 2,724 117,636nLight, Inc. (A) 848 27,475Novanta, Inc. (A) 739 97,467OSI Systems, Inc. (A) 333 32,001PAR Technology Corp. (A) 370 24,202PC Connection, Inc. 517 23,984Plexus Corp. (A) 571 52,441Rogers Corp. (A) 393 73,967Sanmina Corp. (A) 1,168 48,332ScanSource, Inc. (A) 460 13,777SYNNEX Corp. 1,018 116,907Trimble, Inc. (A) 5,066 394,084
Total Stock Market Index Trust (continued)Shares orPrincipalAmount Value
COMMON STOCKS (continued)IT services (continued)Cognizant Technology Solutions
Corp., Class A 10,407 $ 812,995Concentrix Corp. (A) 1,018 152,415Conduent, Inc. (A) 4,621 30,776CSG Systems International, Inc. 659 29,583DXC Technology Company (A) 5,359 167,522EPAM Systems, Inc. (A) 1,141 452,623Euronet Worldwide, Inc. (A) 1,131 156,417EVO Payments, Inc., Class A (A) 1,768 48,655EXL Service Holdings, Inc. (A) 712 64,194Fastly, Inc., Class A (A)(B) 1,995 134,224Fidelity National Information Services,
Inc. 11,983 1,684,930Fiserv, Inc. (A) 13,259 1,578,351FleetCor Technologies, Inc. (A) 1,674 449,687Gartner, Inc. (A) 1,853 338,265Genpact, Ltd. 3,996 171,109Global Payments, Inc. 6,005 1,210,488GoDaddy, Inc., Class A (A) 3,472 269,497GreenSky, Inc., Class A (A) 3,876 23,992i3 Verticals, Inc., Class A (A) 606 18,862IBM Corp. 16,189 2,157,346Information Services Group, Inc. (A) 1,409 6,200Jack Henry & Associates, Inc. 1,408 213,622Limelight Networks, Inc. (A) 2,664 9,510LiveRamp Holdings, Inc. (A) 1,431 74,240Mastercard, Inc., Class A 19,260 6,857,523MAXIMUS, Inc. 1,146 102,040MoneyGram International, Inc. (A) 1,519 9,980MongoDB, Inc. (A) 1,175 314,230NIC, Inc. 1,395 47,332Okta, Inc. (A) 2,436 536,967Paychex, Inc. 6,986 684,768PayPal Holdings, Inc. (A) 22,314 5,418,732Paysign, Inc. (A) 1,105 4,829Perficient, Inc. (A) 713 41,867Perspecta, Inc. 3,393 98,567Sabre Corp. (A) 5,716 84,654ServiceSource International, Inc. (A) 2,601 3,823Shift4 Payments, Inc., Class A (A) 671 55,029Snowflake, Inc., Class A (A) 5,436 1,246,366Square, Inc., Class A (A) 8,866 2,013,025StarTek, Inc. (A) 653 5,191Switch, Inc., Class A 5,110 83,089Sykes Enterprises, Inc. (A) 904 39,848
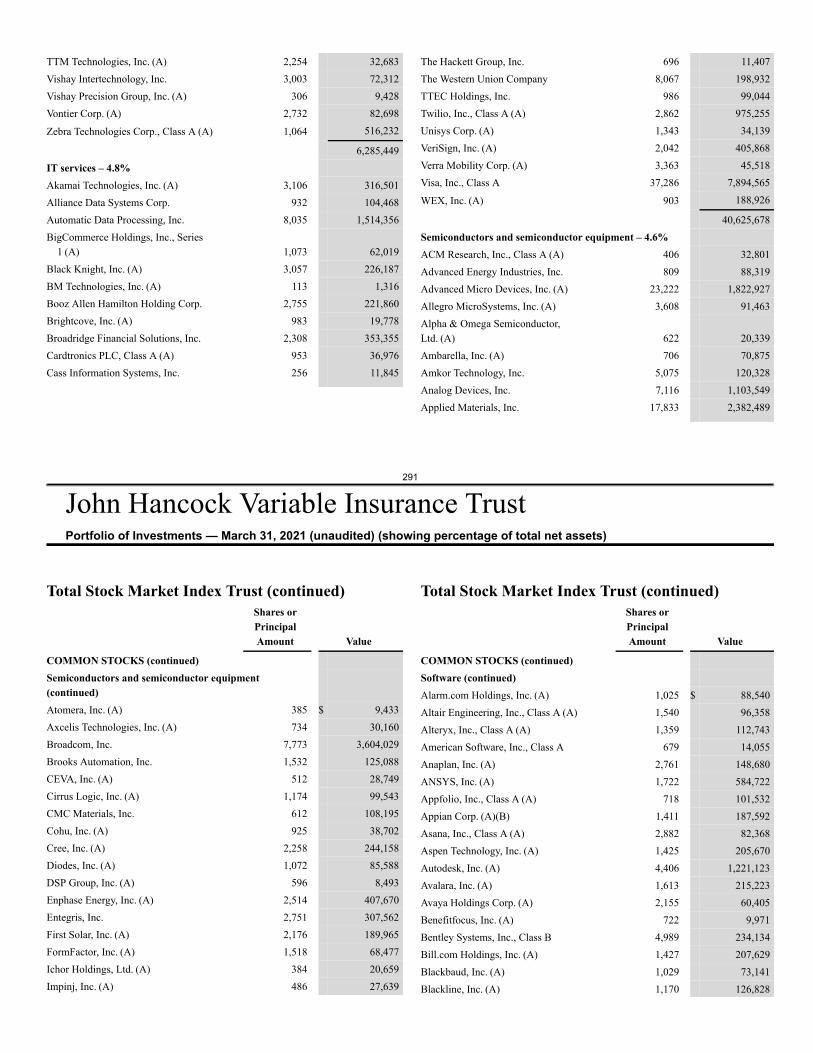
291
John Hancock Variable Insurance TrustPortfolio of Investments — March 31, 2021 (unaudited) (showing percentage of total net assets)
TTM Technologies, Inc. (A) 2,254 32,683Vishay Intertechnology, Inc. 3,003 72,312Vishay Precision Group, Inc. (A) 306 9,428Vontier Corp. (A) 2,732 82,698
Zebra Technologies Corp., Class A (A) 1,064 516,232
6,285,449IT services – 4.8%Akamai Technologies, Inc. (A) 3,106 316,501Alliance Data Systems Corp. 932 104,468Automatic Data Processing, Inc. 8,035 1,514,356BigCommerce Holdings, Inc., Series
1 (A) 1,073 62,019Black Knight, Inc. (A) 3,057 226,187BM Technologies, Inc. (A) 113 1,316Booz Allen Hamilton Holding Corp. 2,755 221,860Brightcove, Inc. (A) 983 19,778Broadridge Financial Solutions, Inc. 2,308 353,355Cardtronics PLC, Class A (A) 953 36,976Cass Information Systems, Inc. 256 11,845
The Hackett Group, Inc. 696 11,407The Western Union Company 8,067 198,932TTEC Holdings, Inc. 986 99,044Twilio, Inc., Class A (A) 2,862 975,255Unisys Corp. (A) 1,343 34,139VeriSign, Inc. (A) 2,042 405,868Verra Mobility Corp. (A) 3,363 45,518Visa, Inc., Class A 37,286 7,894,565
WEX, Inc. (A) 903 188,926
40,625,678Semiconductors and semiconductor equipment – 4.6%ACM Research, Inc., Class A (A) 406 32,801Advanced Energy Industries, Inc. 809 88,319Advanced Micro Devices, Inc. (A) 23,222 1,822,927Allegro MicroSystems, Inc. (A) 3,608 91,463Alpha & Omega Semiconductor,Ltd. (A) 622 20,339Ambarella, Inc. (A) 706 70,875Amkor Technology, Inc. 5,075 120,328Analog Devices, Inc. 7,116 1,103,549Applied Materials, Inc. 17,833 2,382,489
Total Stock Market Index Trust (continued)Shares orPrincipalAmount Value
COMMON STOCKS (continued)Semiconductors and semiconductor equipment(continued)Atomera, Inc. (A) 385 $ 9,433Axcelis Technologies, Inc. (A) 734 30,160Broadcom, Inc. 7,773 3,604,029Brooks Automation, Inc. 1,532 125,088CEVA, Inc. (A) 512 28,749Cirrus Logic, Inc. (A) 1,174 99,543CMC Materials, Inc. 612 108,195Cohu, Inc. (A) 925 38,702Cree, Inc. (A) 2,258 244,158Diodes, Inc. (A) 1,072 85,588DSP Group, Inc. (A) 596 8,493Enphase Energy, Inc. (A) 2,514 407,670Entegris, Inc. 2,751 307,562First Solar, Inc. (A) 2,176 189,965FormFactor, Inc. (A) 1,518 68,477Ichor Holdings, Ltd. (A) 384 20,659Impinj, Inc. (A) 486 27,639
Total Stock Market Index Trust (continued)Shares orPrincipalAmount Value
COMMON STOCKS (continued)Software (continued)Alarm.com Holdings, Inc. (A) 1,025 $ 88,540Altair Engineering, Inc., Class A (A) 1,540 96,358Alteryx, Inc., Class A (A) 1,359 112,743American Software, Inc., Class A 679 14,055Anaplan, Inc. (A) 2,761 148,680ANSYS, Inc. (A) 1,722 584,722Appfolio, Inc., Class A (A) 718 101,532Appian Corp. (A)(B) 1,411 187,592Asana, Inc., Class A (A) 2,882 82,368Aspen Technology, Inc. (A) 1,425 205,670Autodesk, Inc. (A) 4,406 1,221,123Avalara, Inc. (A) 1,613 215,223Avaya Holdings Corp. (A) 2,155 60,405Benefitfocus, Inc. (A) 722 9,971Bentley Systems, Inc., Class B 4,989 234,134Bill.com Holdings, Inc. (A) 1,427 207,629Blackbaud, Inc. (A) 1,029 73,141Blackline, Inc. (A) 1,170 126,828
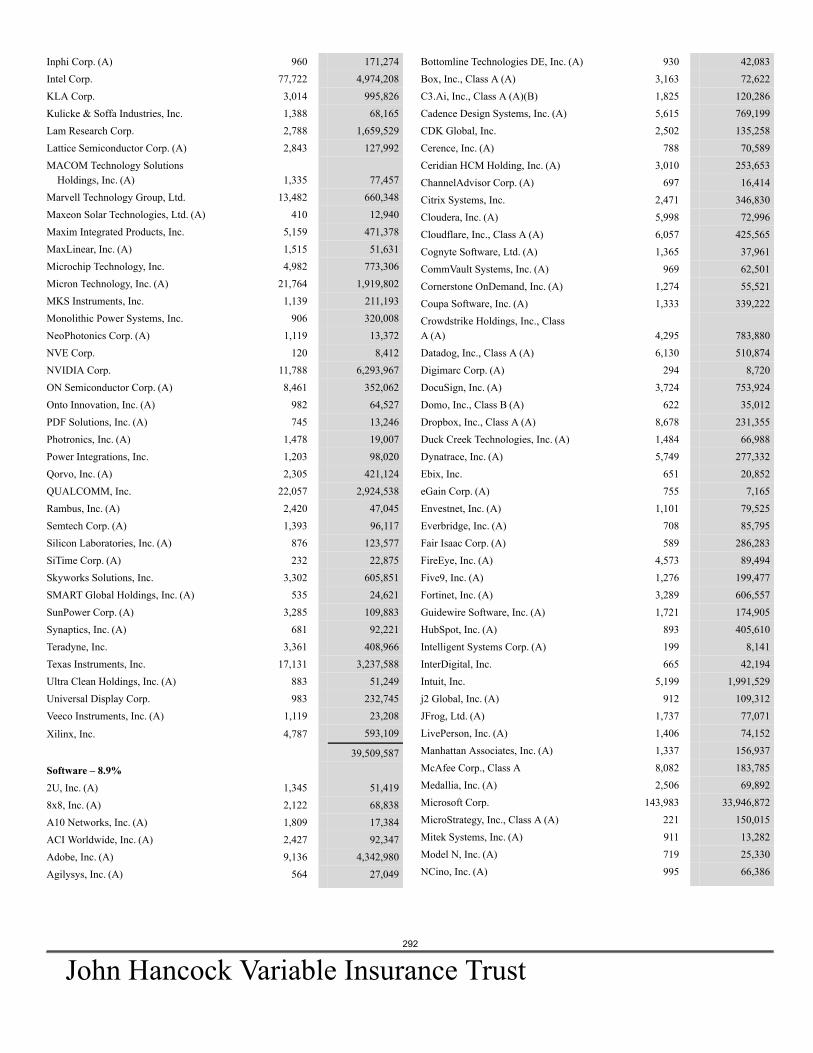
292
John Hancock Variable Insurance Trust
Inphi Corp. (A) 960 171,274Intel Corp. 77,722 4,974,208KLA Corp. 3,014 995,826Kulicke & Soffa Industries, Inc. 1,388 68,165Lam Research Corp. 2,788 1,659,529Lattice Semiconductor Corp. (A) 2,843 127,992MACOM Technology Solutions
Holdings, Inc. (A) 1,335 77,457Marvell Technology Group, Ltd. 13,482 660,348Maxeon Solar Technologies, Ltd. (A) 410 12,940Maxim Integrated Products, Inc. 5,159 471,378MaxLinear, Inc. (A) 1,515 51,631Microchip Technology, Inc. 4,982 773,306Micron Technology, Inc. (A) 21,764 1,919,802MKS Instruments, Inc. 1,139 211,193Monolithic Power Systems, Inc. 906 320,008NeoPhotonics Corp. (A) 1,119 13,372NVE Corp. 120 8,412NVIDIA Corp. 11,788 6,293,967ON Semiconductor Corp. (A) 8,461 352,062Onto Innovation, Inc. (A) 982 64,527PDF Solutions, Inc. (A) 745 13,246Photronics, Inc. (A) 1,478 19,007Power Integrations, Inc. 1,203 98,020Qorvo, Inc. (A) 2,305 421,124QUALCOMM, Inc. 22,057 2,924,538Rambus, Inc. (A) 2,420 47,045Semtech Corp. (A) 1,393 96,117Silicon Laboratories, Inc. (A) 876 123,577SiTime Corp. (A) 232 22,875Skyworks Solutions, Inc. 3,302 605,851SMART Global Holdings, Inc. (A) 535 24,621SunPower Corp. (A) 3,285 109,883Synaptics, Inc. (A) 681 92,221Teradyne, Inc. 3,361 408,966Texas Instruments, Inc. 17,131 3,237,588Ultra Clean Holdings, Inc. (A) 883 51,249Universal Display Corp. 983 232,745Veeco Instruments, Inc. (A) 1,119 23,208
Xilinx, Inc. 4,787 593,109
39,509,587Software – 8.9%2U, Inc. (A) 1,345 51,4198x8, Inc. (A) 2,122 68,838A10 Networks, Inc. (A) 1,809 17,384ACI Worldwide, Inc. (A) 2,427 92,347Adobe, Inc. (A) 9,136 4,342,980Agilysys, Inc. (A) 564 27,049
Bottomline Technologies DE, Inc. (A) 930 42,083Box, Inc., Class A (A) 3,163 72,622C3.Ai, Inc., Class A (A)(B) 1,825 120,286Cadence Design Systems, Inc. (A) 5,615 769,199CDK Global, Inc. 2,502 135,258Cerence, Inc. (A) 788 70,589Ceridian HCM Holding, Inc. (A) 3,010 253,653ChannelAdvisor Corp. (A) 697 16,414Citrix Systems, Inc. 2,471 346,830Cloudera, Inc. (A) 5,998 72,996Cloudflare, Inc., Class A (A) 6,057 425,565Cognyte Software, Ltd. (A) 1,365 37,961CommVault Systems, Inc. (A) 969 62,501Cornerstone OnDemand, Inc. (A) 1,274 55,521Coupa Software, Inc. (A) 1,333 339,222Crowdstrike Holdings, Inc., ClassA (A) 4,295 783,880Datadog, Inc., Class A (A) 6,130 510,874Digimarc Corp. (A) 294 8,720DocuSign, Inc. (A) 3,724 753,924Domo, Inc., Class B (A) 622 35,012Dropbox, Inc., Class A (A) 8,678 231,355Duck Creek Technologies, Inc. (A) 1,484 66,988Dynatrace, Inc. (A) 5,749 277,332Ebix, Inc. 651 20,852eGain Corp. (A) 755 7,165Envestnet, Inc. (A) 1,101 79,525Everbridge, Inc. (A) 708 85,795Fair Isaac Corp. (A) 589 286,283FireEye, Inc. (A) 4,573 89,494Five9, Inc. (A) 1,276 199,477Fortinet, Inc. (A) 3,289 606,557Guidewire Software, Inc. (A) 1,721 174,905HubSpot, Inc. (A) 893 405,610Intelligent Systems Corp. (A) 199 8,141InterDigital, Inc. 665 42,194Intuit, Inc. 5,199 1,991,529j2 Global, Inc. (A) 912 109,312JFrog, Ltd. (A) 1,737 77,071LivePerson, Inc. (A) 1,406 74,152Manhattan Associates, Inc. (A) 1,337 156,937McAfee Corp., Class A 8,082 183,785Medallia, Inc. (A) 2,506 69,892Microsoft Corp. 143,983 33,946,872MicroStrategy, Inc., Class A (A) 221 150,015Mitek Systems, Inc. (A) 911 13,282Model N, Inc. (A) 719 25,330NCino, Inc. (A) 995 66,386
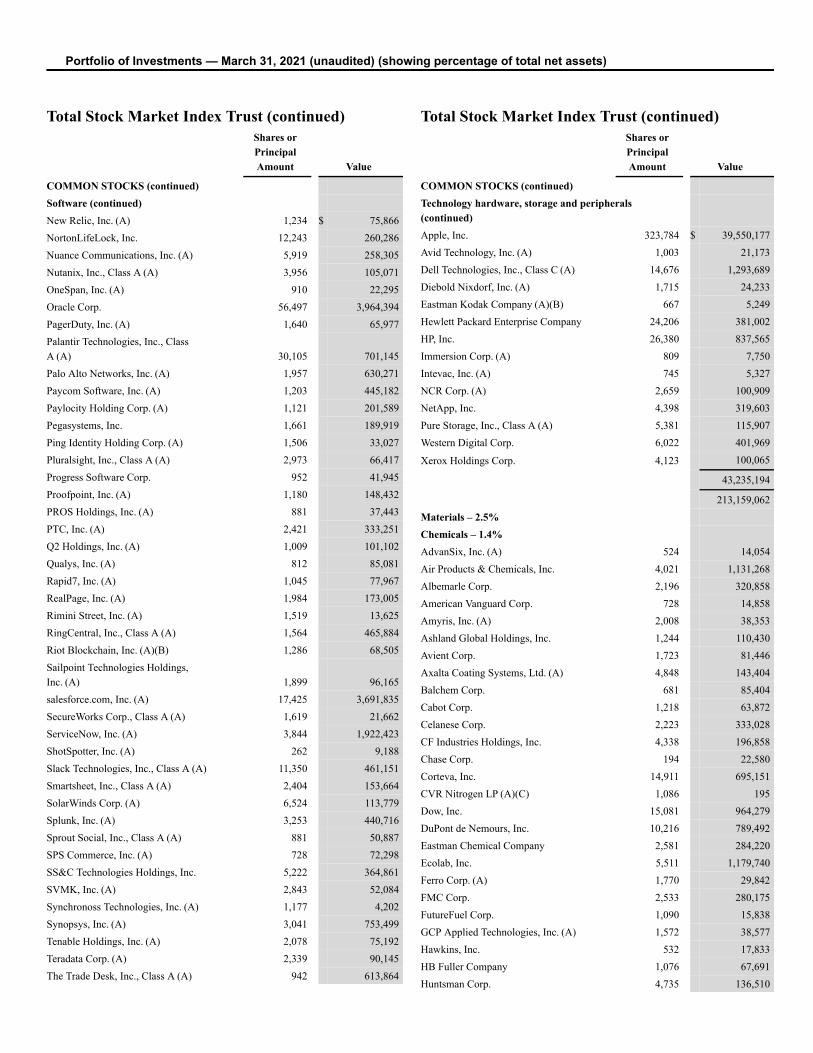
Portfolio of Investments — March 31, 2021 (unaudited) (showing percentage of total net assets)
Total Stock Market Index Trust (continued)Shares orPrincipalAmount Value
COMMON STOCKS (continued)Software (continued)New Relic, Inc. (A) 1,234 $ 75,866NortonLifeLock, Inc. 12,243 260,286Nuance Communications, Inc. (A) 5,919 258,305Nutanix, Inc., Class A (A) 3,956 105,071OneSpan, Inc. (A) 910 22,295Oracle Corp. 56,497 3,964,394PagerDuty, Inc. (A) 1,640 65,977Palantir Technologies, Inc., ClassA (A) 30,105 701,145Palo Alto Networks, Inc. (A) 1,957 630,271Paycom Software, Inc. (A) 1,203 445,182Paylocity Holding Corp. (A) 1,121 201,589Pegasystems, Inc. 1,661 189,919Ping Identity Holding Corp. (A) 1,506 33,027Pluralsight, Inc., Class A (A) 2,973 66,417Progress Software Corp. 952 41,945Proofpoint, Inc. (A) 1,180 148,432PROS Holdings, Inc. (A) 881 37,443PTC, Inc. (A) 2,421 333,251Q2 Holdings, Inc. (A) 1,009 101,102Qualys, Inc. (A) 812 85,081Rapid7, Inc. (A) 1,045 77,967RealPage, Inc. (A) 1,984 173,005Rimini Street, Inc. (A) 1,519 13,625RingCentral, Inc., Class A (A) 1,564 465,884Riot Blockchain, Inc. (A)(B) 1,286 68,505Sailpoint Technologies Holdings,Inc. (A) 1,899 96,165salesforce.com, Inc. (A) 17,425 3,691,835SecureWorks Corp., Class A (A) 1,619 21,662ServiceNow, Inc. (A) 3,844 1,922,423ShotSpotter, Inc. (A) 262 9,188Slack Technologies, Inc., Class A (A) 11,350 461,151Smartsheet, Inc., Class A (A) 2,404 153,664SolarWinds Corp. (A) 6,524 113,779Splunk, Inc. (A) 3,253 440,716Sprout Social, Inc., Class A (A) 881 50,887SPS Commerce, Inc. (A) 728 72,298SS&C Technologies Holdings, Inc. 5,222 364,861SVMK, Inc. (A) 2,843 52,084Synchronoss Technologies, Inc. (A) 1,177 4,202Synopsys, Inc. (A) 3,041 753,499Tenable Holdings, Inc. (A) 2,078 75,192Teradata Corp. (A) 2,339 90,145The Trade Desk, Inc., Class A (A) 942 613,864
Total Stock Market Index Trust (continued)Shares orPrincipalAmount Value
COMMON STOCKS (continued)Technology hardware, storage and peripherals(continued)Apple, Inc. 323,784 $ 39,550,177Avid Technology, Inc. (A) 1,003 21,173Dell Technologies, Inc., Class C (A) 14,676 1,293,689Diebold Nixdorf, Inc. (A) 1,715 24,233Eastman Kodak Company (A)(B) 667 5,249Hewlett Packard Enterprise Company 24,206 381,002HP, Inc. 26,380 837,565Immersion Corp. (A) 809 7,750Intevac, Inc. (A) 745 5,327NCR Corp. (A) 2,659 100,909NetApp, Inc. 4,398 319,603Pure Storage, Inc., Class A (A) 5,381 115,907Western Digital Corp. 6,022 401,969
Xerox Holdings Corp. 4,123 100,065
43,235,194
213,159,062Materials – 2.5%Chemicals – 1.4%AdvanSix, Inc. (A) 524 14,054Air Products & Chemicals, Inc. 4,021 1,131,268Albemarle Corp. 2,196 320,858American Vanguard Corp. 728 14,858Amyris, Inc. (A) 2,008 38,353Ashland Global Holdings, Inc. 1,244 110,430Avient Corp. 1,723 81,446Axalta Coating Systems, Ltd. (A) 4,848 143,404Balchem Corp. 681 85,404Cabot Corp. 1,218 63,872Celanese Corp. 2,223 333,028CF Industries Holdings, Inc. 4,338 196,858Chase Corp. 194 22,580Corteva, Inc. 14,911 695,151CVR Nitrogen LP (A)(C) 1,086 195Dow, Inc. 15,081 964,279DuPont de Nemours, Inc. 10,216 789,492Eastman Chemical Company 2,581 284,220Ecolab, Inc. 5,511 1,179,740Ferro Corp. (A) 1,770 29,842FMC Corp. 2,533 280,175FutureFuel Corp. 1,090 15,838GCP Applied Technologies, Inc. (A) 1,572 38,577Hawkins, Inc. 532 17,833HB Fuller Company 1,076 67,691Huntsman Corp. 4,735 136,510
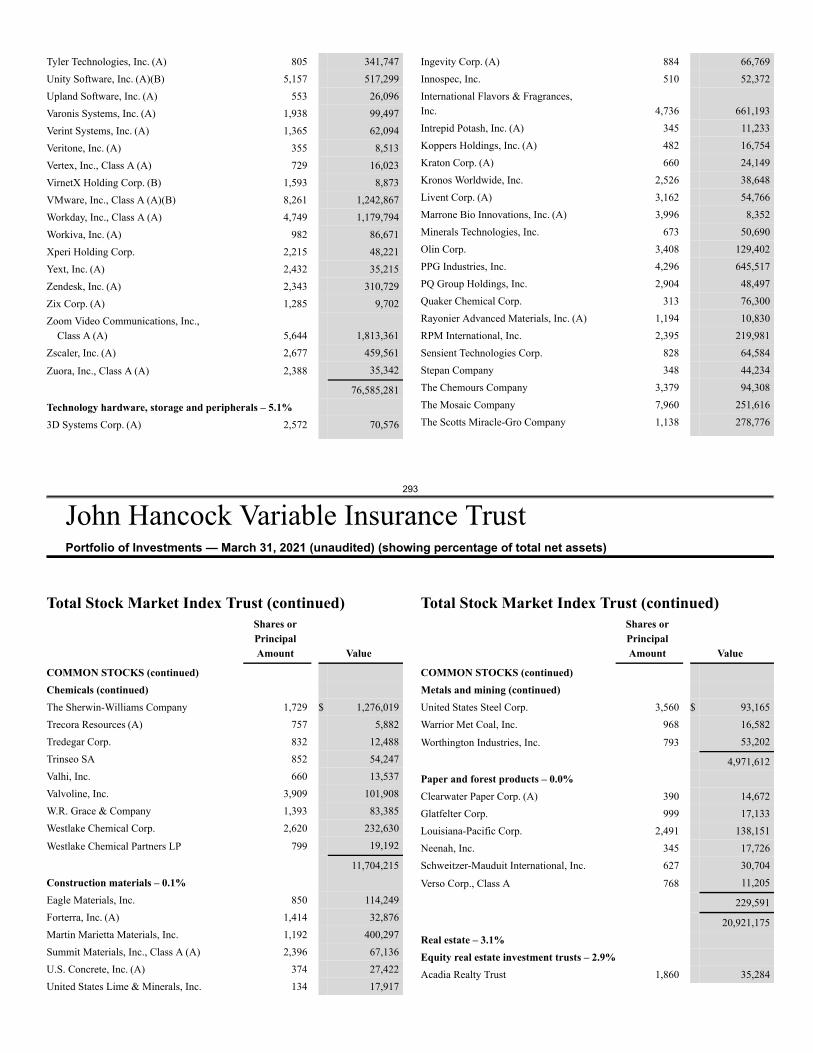
293
John Hancock Variable Insurance TrustPortfolio of Investments — March 31, 2021 (unaudited) (showing percentage of total net assets)
Tyler Technologies, Inc. (A) 805 341,747Unity Software, Inc. (A)(B) 5,157 517,299Upland Software, Inc. (A) 553 26,096Varonis Systems, Inc. (A) 1,938 99,497Verint Systems, Inc. (A) 1,365 62,094Veritone, Inc. (A) 355 8,513Vertex, Inc., Class A (A) 729 16,023VirnetX Holding Corp. (B) 1,593 8,873VMware, Inc., Class A (A)(B) 8,261 1,242,867Workday, Inc., Class A (A) 4,749 1,179,794Workiva, Inc. (A) 982 86,671Xperi Holding Corp. 2,215 48,221Yext, Inc. (A) 2,432 35,215Zendesk, Inc. (A) 2,343 310,729Zix Corp. (A) 1,285 9,702Zoom Video Communications, Inc.,
Class A (A) 5,644 1,813,361Zscaler, Inc. (A) 2,677 459,561
Zuora, Inc., Class A (A) 2,388 35,342
76,585,281Technology hardware, storage and peripherals – 5.1%3D Systems Corp. (A) 2,572 70,576
Ingevity Corp. (A) 884 66,769Innospec, Inc. 510 52,372International Flavors & Fragrances,Inc. 4,736 661,193Intrepid Potash, Inc. (A) 345 11,233Koppers Holdings, Inc. (A) 482 16,754Kraton Corp. (A) 660 24,149Kronos Worldwide, Inc. 2,526 38,648Livent Corp. (A) 3,162 54,766Marrone Bio Innovations, Inc. (A) 3,996 8,352Minerals Technologies, Inc. 673 50,690Olin Corp. 3,408 129,402PPG Industries, Inc. 4,296 645,517PQ Group Holdings, Inc. 2,904 48,497Quaker Chemical Corp. 313 76,300Rayonier Advanced Materials, Inc. (A) 1,194 10,830RPM International, Inc. 2,395 219,981Sensient Technologies Corp. 828 64,584Stepan Company 348 44,234The Chemours Company 3,379 94,308The Mosaic Company 7,960 251,616The Scotts Miracle-Gro Company 1,138 278,776
Total Stock Market Index Trust (continued)Shares orPrincipalAmount Value
COMMON STOCKS (continued)Chemicals (continued)The Sherwin-Williams Company 1,729 $ 1,276,019Trecora Resources (A) 757 5,882Tredegar Corp. 832 12,488Trinseo SA 852 54,247Valhi, Inc. 660 13,537Valvoline, Inc. 3,909 101,908W.R. Grace & Company 1,393 83,385Westlake Chemical Corp. 2,620 232,630
Westlake Chemical Partners LP 799 19,192
11,704,215Construction materials – 0.1%Eagle Materials, Inc. 850 114,249Forterra, Inc. (A) 1,414 32,876Martin Marietta Materials, Inc. 1,192 400,297Summit Materials, Inc., Class A (A) 2,396 67,136U.S. Concrete, Inc. (A) 374 27,422United States Lime & Minerals, Inc. 134 17,917
Total Stock Market Index Trust (continued)Shares orPrincipalAmount Value
COMMON STOCKS (continued)Metals and mining (continued)United States Steel Corp. 3,560 $ 93,165Warrior Met Coal, Inc. 968 16,582
Worthington Industries, Inc. 793 53,202
4,971,612Paper and forest products – 0.0%Clearwater Paper Corp. (A) 390 14,672Glatfelter Corp. 999 17,133Louisiana-Pacific Corp. 2,491 138,151Neenah, Inc. 345 17,726Schweitzer-Mauduit International, Inc. 627 30,704
Verso Corp., Class A 768 11,205
229,591
20,921,175Real estate – 3.1%Equity real estate investment trusts – 2.9%Acadia Realty Trust 1,860 35,284
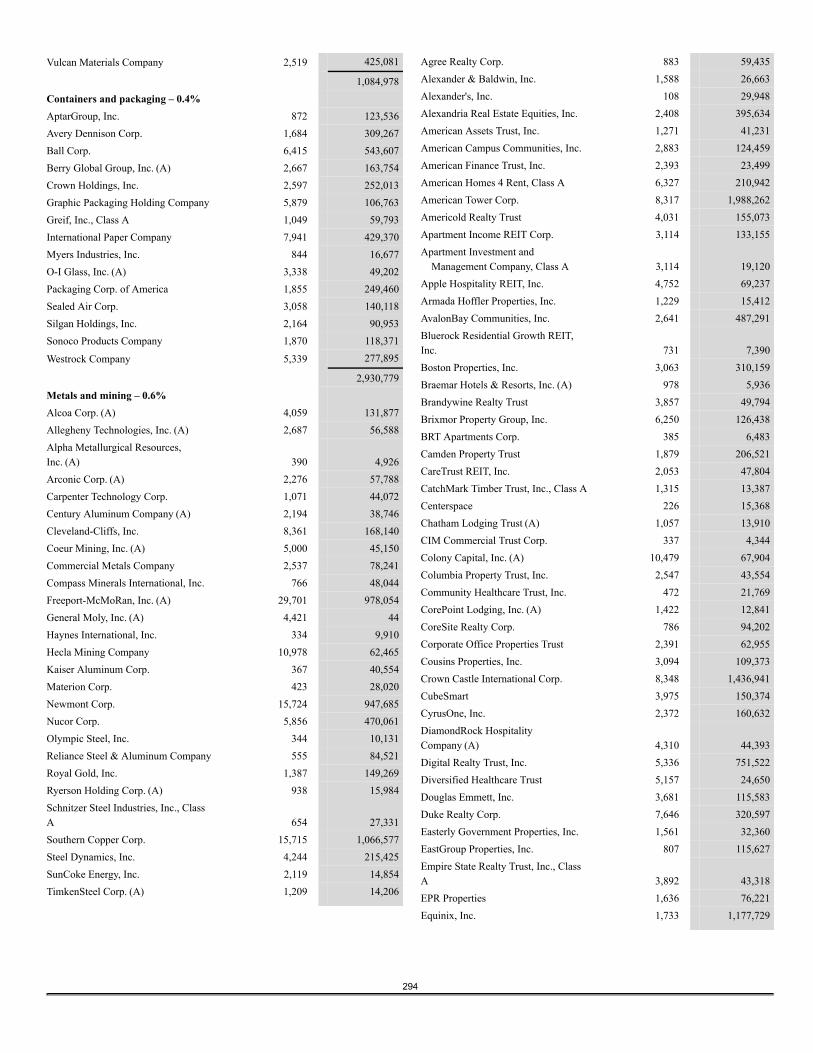
294
Vulcan Materials Company 2,519 425,081
1,084,978Containers and packaging – 0.4%AptarGroup, Inc. 872 123,536Avery Dennison Corp. 1,684 309,267Ball Corp. 6,415 543,607Berry Global Group, Inc. (A) 2,667 163,754Crown Holdings, Inc. 2,597 252,013Graphic Packaging Holding Company 5,879 106,763Greif, Inc., Class A 1,049 59,793International Paper Company 7,941 429,370Myers Industries, Inc. 844 16,677O-I Glass, Inc. (A) 3,338 49,202Packaging Corp. of America 1,855 249,460Sealed Air Corp. 3,058 140,118Silgan Holdings, Inc. 2,164 90,953Sonoco Products Company 1,870 118,371
Westrock Company 5,339 277,895
2,930,779Metals and mining – 0.6%Alcoa Corp. (A) 4,059 131,877Allegheny Technologies, Inc. (A) 2,687 56,588Alpha Metallurgical Resources,Inc. (A) 390 4,926Arconic Corp. (A) 2,276 57,788Carpenter Technology Corp. 1,071 44,072Century Aluminum Company (A) 2,194 38,746Cleveland-Cliffs, Inc. 8,361 168,140Coeur Mining, Inc. (A) 5,000 45,150Commercial Metals Company 2,537 78,241Compass Minerals International, Inc. 766 48,044Freeport-McMoRan, Inc. (A) 29,701 978,054General Moly, Inc. (A) 4,421 44Haynes International, Inc. 334 9,910Hecla Mining Company 10,978 62,465Kaiser Aluminum Corp. 367 40,554Materion Corp. 423 28,020Newmont Corp. 15,724 947,685Nucor Corp. 5,856 470,061Olympic Steel, Inc. 344 10,131Reliance Steel & Aluminum Company 555 84,521Royal Gold, Inc. 1,387 149,269Ryerson Holding Corp. (A) 938 15,984Schnitzer Steel Industries, Inc., ClassA 654 27,331Southern Copper Corp. 15,715 1,066,577Steel Dynamics, Inc. 4,244 215,425SunCoke Energy, Inc. 2,119 14,854TimkenSteel Corp. (A) 1,209 14,206
Agree Realty Corp. 883 59,435Alexander & Baldwin, Inc. 1,588 26,663Alexander's, Inc. 108 29,948Alexandria Real Estate Equities, Inc. 2,408 395,634American Assets Trust, Inc. 1,271 41,231American Campus Communities, Inc. 2,883 124,459American Finance Trust, Inc. 2,393 23,499American Homes 4 Rent, Class A 6,327 210,942American Tower Corp. 8,317 1,988,262Americold Realty Trust 4,031 155,073Apartment Income REIT Corp. 3,114 133,155Apartment Investment and
Management Company, Class A 3,114 19,120Apple Hospitality REIT, Inc. 4,752 69,237Armada Hoffler Properties, Inc. 1,229 15,412AvalonBay Communities, Inc. 2,641 487,291Bluerock Residential Growth REIT,Inc. 731 7,390Boston Properties, Inc. 3,063 310,159Braemar Hotels & Resorts, Inc. (A) 978 5,936Brandywine Realty Trust 3,857 49,794Brixmor Property Group, Inc. 6,250 126,438BRT Apartments Corp. 385 6,483Camden Property Trust 1,879 206,521CareTrust REIT, Inc. 2,053 47,804CatchMark Timber Trust, Inc., Class A 1,315 13,387Centerspace 226 15,368Chatham Lodging Trust (A) 1,057 13,910CIM Commercial Trust Corp. 337 4,344Colony Capital, Inc. (A) 10,479 67,904Columbia Property Trust, Inc. 2,547 43,554Community Healthcare Trust, Inc. 472 21,769CorePoint Lodging, Inc. (A) 1,422 12,841CoreSite Realty Corp. 786 94,202Corporate Office Properties Trust 2,391 62,955Cousins Properties, Inc. 3,094 109,373Crown Castle International Corp. 8,348 1,436,941CubeSmart 3,975 150,374CyrusOne, Inc. 2,372 160,632DiamondRock HospitalityCompany (A) 4,310 44,393Digital Realty Trust, Inc. 5,336 751,522Diversified Healthcare Trust 5,157 24,650Douglas Emmett, Inc. 3,681 115,583Duke Realty Corp. 7,646 320,597Easterly Government Properties, Inc. 1,561 32,360EastGroup Properties, Inc. 807 115,627Empire State Realty Trust, Inc., ClassA 3,892 43,318EPR Properties 1,636 76,221Equinix, Inc. 1,733 1,177,729
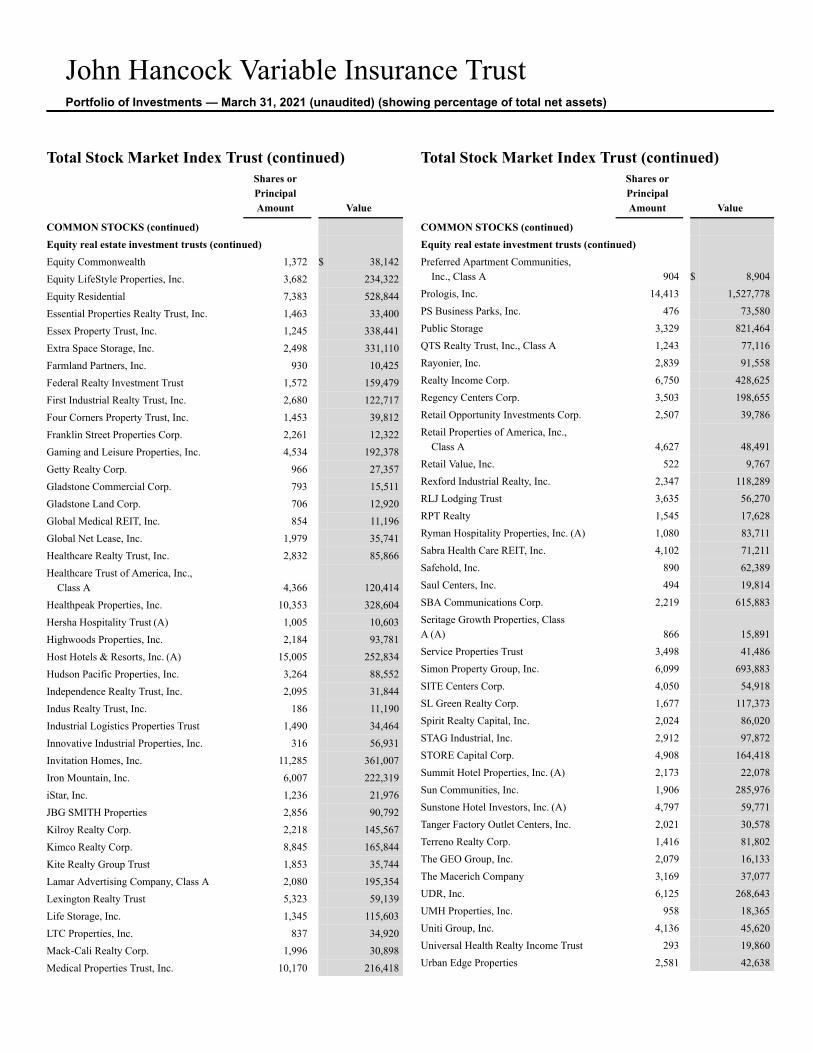
John Hancock Variable Insurance TrustPortfolio of Investments — March 31, 2021 (unaudited) (showing percentage of total net assets)
Total Stock Market Index Trust (continued)Shares orPrincipalAmount Value
COMMON STOCKS (continued)Equity real estate investment trusts (continued)Equity Commonwealth 1,372 $ 38,142Equity LifeStyle Properties, Inc. 3,682 234,322Equity Residential 7,383 528,844Essential Properties Realty Trust, Inc. 1,463 33,400Essex Property Trust, Inc. 1,245 338,441Extra Space Storage, Inc. 2,498 331,110Farmland Partners, Inc. 930 10,425Federal Realty Investment Trust 1,572 159,479First Industrial Realty Trust, Inc. 2,680 122,717Four Corners Property Trust, Inc. 1,453 39,812Franklin Street Properties Corp. 2,261 12,322Gaming and Leisure Properties, Inc. 4,534 192,378Getty Realty Corp. 966 27,357Gladstone Commercial Corp. 793 15,511Gladstone Land Corp. 706 12,920Global Medical REIT, Inc. 854 11,196Global Net Lease, Inc. 1,979 35,741Healthcare Realty Trust, Inc. 2,832 85,866Healthcare Trust of America, Inc.,
Class A 4,366 120,414Healthpeak Properties, Inc. 10,353 328,604Hersha Hospitality Trust (A) 1,005 10,603Highwoods Properties, Inc. 2,184 93,781Host Hotels & Resorts, Inc. (A) 15,005 252,834Hudson Pacific Properties, Inc. 3,264 88,552Independence Realty Trust, Inc. 2,095 31,844Indus Realty Trust, Inc. 186 11,190Industrial Logistics Properties Trust 1,490 34,464Innovative Industrial Properties, Inc. 316 56,931Invitation Homes, Inc. 11,285 361,007Iron Mountain, Inc. 6,007 222,319iStar, Inc. 1,236 21,976JBG SMITH Properties 2,856 90,792Kilroy Realty Corp. 2,218 145,567Kimco Realty Corp. 8,845 165,844Kite Realty Group Trust 1,853 35,744Lamar Advertising Company, Class A 2,080 195,354Lexington Realty Trust 5,323 59,139Life Storage, Inc. 1,345 115,603LTC Properties, Inc. 837 34,920Mack-Cali Realty Corp. 1,996 30,898Medical Properties Trust, Inc. 10,170 216,418
Total Stock Market Index Trust (continued)Shares orPrincipalAmount Value
COMMON STOCKS (continued)Equity real estate investment trusts (continued)Preferred Apartment Communities,
Inc., Class A 904 $ 8,904Prologis, Inc. 14,413 1,527,778PS Business Parks, Inc. 476 73,580Public Storage 3,329 821,464QTS Realty Trust, Inc., Class A 1,243 77,116Rayonier, Inc. 2,839 91,558Realty Income Corp. 6,750 428,625Regency Centers Corp. 3,503 198,655Retail Opportunity Investments Corp. 2,507 39,786Retail Properties of America, Inc.,
Class A 4,627 48,491Retail Value, Inc. 522 9,767Rexford Industrial Realty, Inc. 2,347 118,289RLJ Lodging Trust 3,635 56,270RPT Realty 1,545 17,628Ryman Hospitality Properties, Inc. (A) 1,080 83,711Sabra Health Care REIT, Inc. 4,102 71,211Safehold, Inc. 890 62,389Saul Centers, Inc. 494 19,814SBA Communications Corp. 2,219 615,883Seritage Growth Properties, ClassA (A) 866 15,891Service Properties Trust 3,498 41,486Simon Property Group, Inc. 6,099 693,883SITE Centers Corp. 4,050 54,918SL Green Realty Corp. 1,677 117,373Spirit Realty Capital, Inc. 2,024 86,020STAG Industrial, Inc. 2,912 97,872STORE Capital Corp. 4,908 164,418Summit Hotel Properties, Inc. (A) 2,173 22,078Sun Communities, Inc. 1,906 285,976Sunstone Hotel Investors, Inc. (A) 4,797 59,771Tanger Factory Outlet Centers, Inc. 2,021 30,578Terreno Realty Corp. 1,416 81,802The GEO Group, Inc. 2,079 16,133The Macerich Company 3,169 37,077UDR, Inc. 6,125 268,643UMH Properties, Inc. 958 18,365Uniti Group, Inc. 4,136 45,620Universal Health Realty Income Trust 293 19,860Urban Edge Properties 2,581 42,638
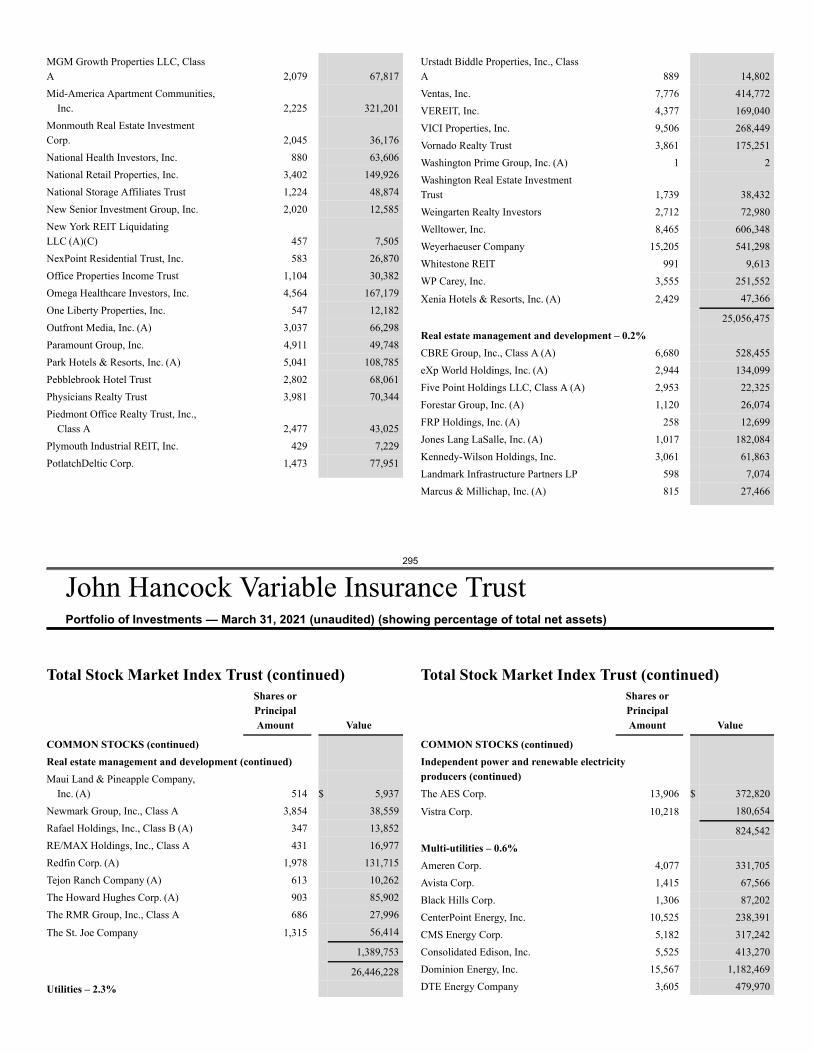
295
John Hancock Variable Insurance TrustPortfolio of Investments — March 31, 2021 (unaudited) (showing percentage of total net assets)
MGM Growth Properties LLC, ClassA 2,079 67,817Mid-America Apartment Communities,
Inc. 2,225 321,201Monmouth Real Estate InvestmentCorp. 2,045 36,176National Health Investors, Inc. 880 63,606National Retail Properties, Inc. 3,402 149,926National Storage Affiliates Trust 1,224 48,874New Senior Investment Group, Inc. 2,020 12,585New York REIT LiquidatingLLC (A)(C) 457 7,505NexPoint Residential Trust, Inc. 583 26,870Office Properties Income Trust 1,104 30,382Omega Healthcare Investors, Inc. 4,564 167,179One Liberty Properties, Inc. 547 12,182Outfront Media, Inc. (A) 3,037 66,298Paramount Group, Inc. 4,911 49,748Park Hotels & Resorts, Inc. (A) 5,041 108,785Pebblebrook Hotel Trust 2,802 68,061Physicians Realty Trust 3,981 70,344Piedmont Office Realty Trust, Inc.,
Class A 2,477 43,025Plymouth Industrial REIT, Inc. 429 7,229PotlatchDeltic Corp. 1,473 77,951
Urstadt Biddle Properties, Inc., ClassA 889 14,802Ventas, Inc. 7,776 414,772VEREIT, Inc. 4,377 169,040VICI Properties, Inc. 9,506 268,449Vornado Realty Trust 3,861 175,251Washington Prime Group, Inc. (A) 1 2Washington Real Estate InvestmentTrust 1,739 38,432Weingarten Realty Investors 2,712 72,980Welltower, Inc. 8,465 606,348Weyerhaeuser Company 15,205 541,298Whitestone REIT 991 9,613WP Carey, Inc. 3,555 251,552
Xenia Hotels & Resorts, Inc. (A) 2,429 47,366
25,056,475Real estate management and development – 0.2%CBRE Group, Inc., Class A (A) 6,680 528,455eXp World Holdings, Inc. (A) 2,944 134,099Five Point Holdings LLC, Class A (A) 2,953 22,325Forestar Group, Inc. (A) 1,120 26,074FRP Holdings, Inc. (A) 258 12,699Jones Lang LaSalle, Inc. (A) 1,017 182,084Kennedy-Wilson Holdings, Inc. 3,061 61,863Landmark Infrastructure Partners LP 598 7,074Marcus & Millichap, Inc. (A) 815 27,466
Total Stock Market Index Trust (continued)Shares orPrincipalAmount Value
COMMON STOCKS (continued)Real estate management and development (continued)Maui Land & Pineapple Company,
Inc. (A) 514 $ 5,937Newmark Group, Inc., Class A 3,854 38,559Rafael Holdings, Inc., Class B (A) 347 13,852RE/MAX Holdings, Inc., Class A 431 16,977Redfin Corp. (A) 1,978 131,715Tejon Ranch Company (A) 613 10,262The Howard Hughes Corp. (A) 903 85,902The RMR Group, Inc., Class A 686 27,996
The St. Joe Company 1,315 56,414
1,389,753
26,446,228Utilities – 2.3%
Total Stock Market Index Trust (continued)Shares orPrincipalAmount Value
COMMON STOCKS (continued)Independent power and renewable electricityproducers (continued)The AES Corp. 13,906 $ 372,820
Vistra Corp. 10,218 180,654
824,542Multi-utilities – 0.6%Ameren Corp. 4,077 331,705Avista Corp. 1,415 67,566Black Hills Corp. 1,306 87,202CenterPoint Energy, Inc. 10,525 238,391CMS Energy Corp. 5,182 317,242Consolidated Edison, Inc. 5,525 413,270Dominion Energy, Inc. 15,567 1,182,469DTE Energy Company 3,605 479,970
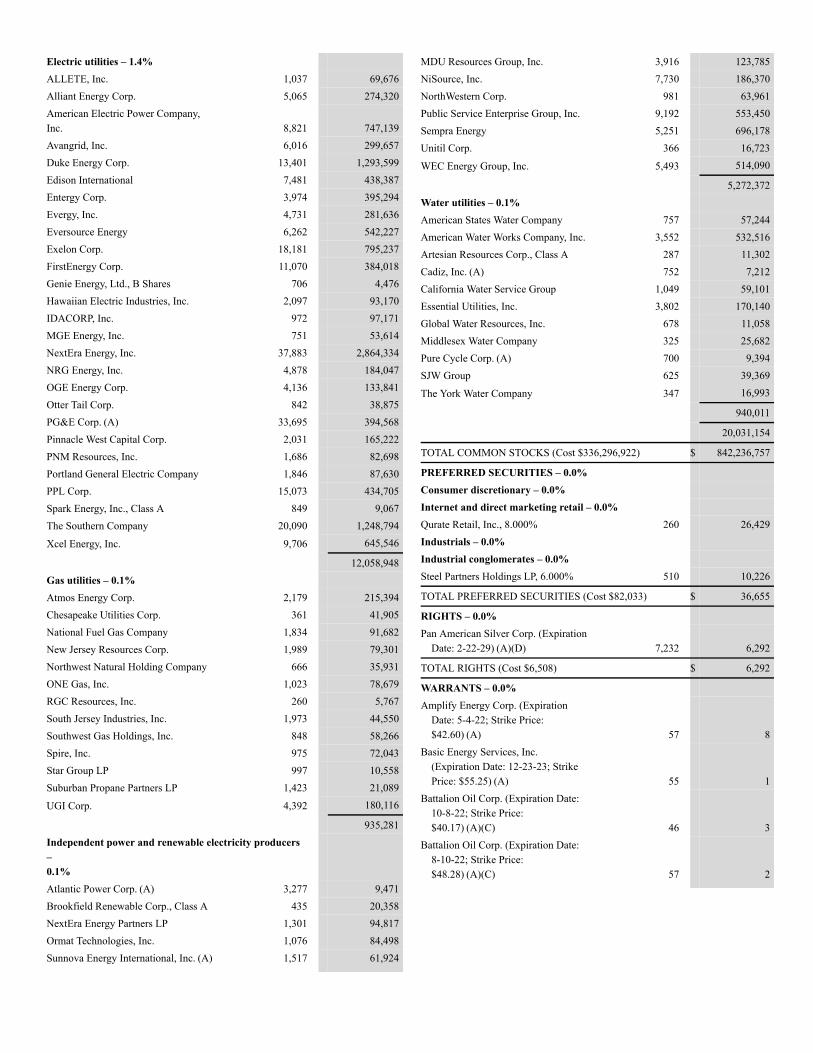
Electric utilities – 1.4%ALLETE, Inc. 1,037 69,676Alliant Energy Corp. 5,065 274,320American Electric Power Company,Inc. 8,821 747,139Avangrid, Inc. 6,016 299,657Duke Energy Corp. 13,401 1,293,599Edison International 7,481 438,387Entergy Corp. 3,974 395,294Evergy, Inc. 4,731 281,636Eversource Energy 6,262 542,227Exelon Corp. 18,181 795,237FirstEnergy Corp. 11,070 384,018Genie Energy, Ltd., B Shares 706 4,476Hawaiian Electric Industries, Inc. 2,097 93,170IDACORP, Inc. 972 97,171MGE Energy, Inc. 751 53,614NextEra Energy, Inc. 37,883 2,864,334NRG Energy, Inc. 4,878 184,047OGE Energy Corp. 4,136 133,841Otter Tail Corp. 842 38,875PG&E Corp. (A) 33,695 394,568Pinnacle West Capital Corp. 2,031 165,222PNM Resources, Inc. 1,686 82,698Portland General Electric Company 1,846 87,630PPL Corp. 15,073 434,705Spark Energy, Inc., Class A 849 9,067The Southern Company 20,090 1,248,794
Xcel Energy, Inc. 9,706 645,546
12,058,948Gas utilities – 0.1%Atmos Energy Corp. 2,179 215,394Chesapeake Utilities Corp. 361 41,905National Fuel Gas Company 1,834 91,682New Jersey Resources Corp. 1,989 79,301Northwest Natural Holding Company 666 35,931ONE Gas, Inc. 1,023 78,679RGC Resources, Inc. 260 5,767South Jersey Industries, Inc. 1,973 44,550Southwest Gas Holdings, Inc. 848 58,266Spire, Inc. 975 72,043Star Group LP 997 10,558Suburban Propane Partners LP 1,423 21,089
UGI Corp. 4,392 180,116
935,281Independent power and renewable electricity producers–0.1%Atlantic Power Corp. (A) 3,277 9,471Brookfield Renewable Corp., Class A 435 20,358NextEra Energy Partners LP 1,301 94,817Ormat Technologies, Inc. 1,076 84,498Sunnova Energy International, Inc. (A) 1,517 61,924
MDU Resources Group, Inc. 3,916 123,785NiSource, Inc. 7,730 186,370NorthWestern Corp. 981 63,961Public Service Enterprise Group, Inc. 9,192 553,450Sempra Energy 5,251 696,178Unitil Corp. 366 16,723
WEC Energy Group, Inc. 5,493 514,090
5,272,372Water utilities – 0.1%American States Water Company 757 57,244American Water Works Company, Inc. 3,552 532,516Artesian Resources Corp., Class A 287 11,302Cadiz, Inc. (A) 752 7,212California Water Service Group 1,049 59,101Essential Utilities, Inc. 3,802 170,140Global Water Resources, Inc. 678 11,058Middlesex Water Company 325 25,682Pure Cycle Corp. (A) 700 9,394SJW Group 625 39,369
The York Water Company 347 16,993
940,011
20,031,154
TOTAL COMMON STOCKS (Cost $336,296,922) $ 842,236,757
PREFERRED SECURITIES – 0.0%Consumer discretionary – 0.0%Internet and direct marketing retail – 0.0%Qurate Retail, Inc., 8.000% 260 26,429Industrials – 0.0%Industrial conglomerates – 0.0%Steel Partners Holdings LP, 6.000% 510 10,226
TOTAL PREFERRED SECURITIES (Cost $82,033) $ 36,655
RIGHTS – 0.0%Pan American Silver Corp. (Expiration
Date: 2-22-29) (A)(D) 7,232 6,292
TOTAL RIGHTS (Cost $6,508) $ 6,292
WARRANTS – 0.0%Amplify Energy Corp. (Expiration
Date: 5-4-22; Strike Price:$42.60) (A) 57 8
Basic Energy Services, Inc.(Expiration Date: 12-23-23; StrikePrice: $55.25) (A) 55 1
Battalion Oil Corp. (Expiration Date:10-8-22; Strike Price:$40.17) (A)(C) 46 3
Battalion Oil Corp. (Expiration Date:8-10-22; Strike Price:$48.28) (A)(C) 57 2
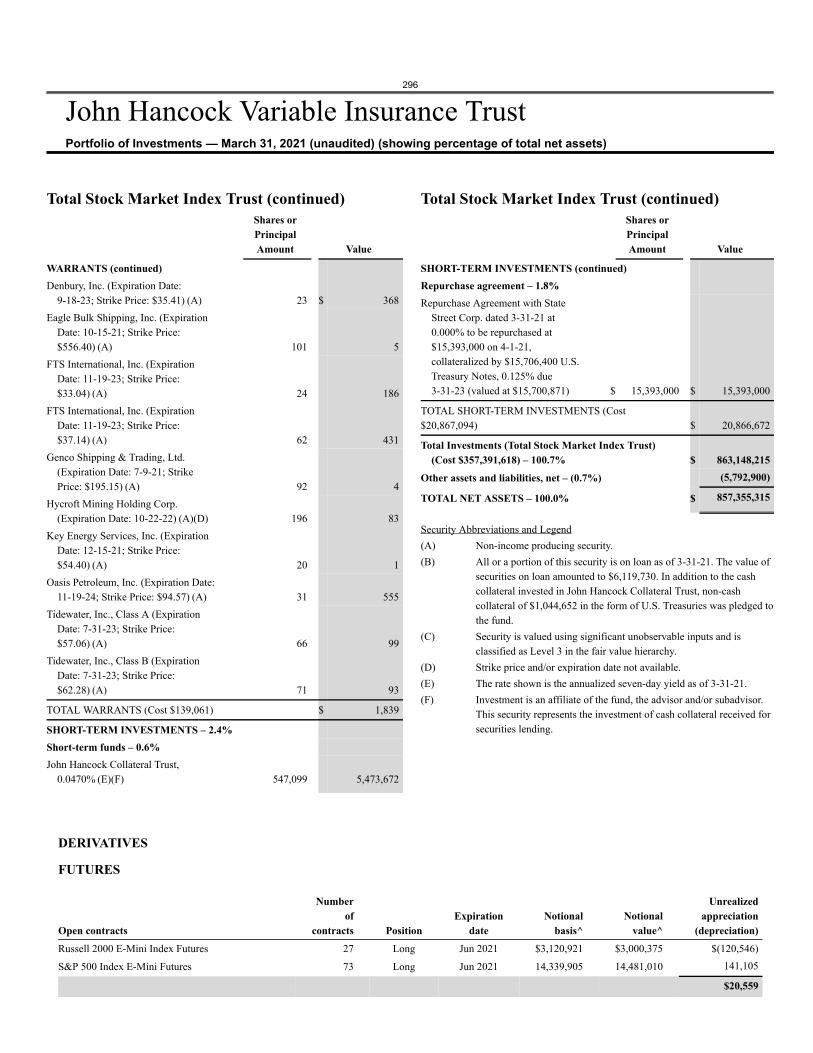
296
John Hancock Variable Insurance TrustPortfolio of Investments — March 31, 2021 (unaudited) (showing percentage of total net assets)
DERIVATIVES
FUTURES
Open contracts
Numberof
contracts PositionExpiration
dateNotional
basis^Notional
value^
Unrealizedappreciation
(depreciation)Russell 2000 E-Mini Index Futures 27 Long Jun 2021 $3,120,921 $3,000,375 $(120,546)
S&P 500 Index E-Mini Futures 73 Long Jun 2021 14,339,905 14,481,010 141,105
$20,559
Total Stock Market Index Trust (continued)Shares orPrincipalAmount Value
WARRANTS (continued)Denbury, Inc. (Expiration Date:
9-18-23; Strike Price: $35.41) (A) 23 $ 368Eagle Bulk Shipping, Inc. (Expiration
Date: 10-15-21; Strike Price:$556.40) (A) 101 5
FTS International, Inc. (ExpirationDate: 11-19-23; Strike Price:$33.04) (A) 24 186
FTS International, Inc. (ExpirationDate: 11-19-23; Strike Price:$37.14) (A) 62 431
Genco Shipping & Trading, Ltd.(Expiration Date: 7-9-21; StrikePrice: $195.15) (A) 92 4
Hycroft Mining Holding Corp.(Expiration Date: 10-22-22) (A)(D) 196 83
Key Energy Services, Inc. (ExpirationDate: 12-15-21; Strike Price:$54.40) (A) 20 1
Oasis Petroleum, Inc. (Expiration Date:11-19-24; Strike Price: $94.57) (A) 31 555
Tidewater, Inc., Class A (ExpirationDate: 7-31-23; Strike Price:$57.06) (A) 66 99
Tidewater, Inc., Class B (ExpirationDate: 7-31-23; Strike Price:$62.28) (A) 71 93
TOTAL WARRANTS (Cost $139,061) $ 1,839
SHORT-TERM INVESTMENTS – 2.4%Short-term funds – 0.6%John Hancock Collateral Trust,
0.0470% (E)(F) 547,099 5,473,672
Total Stock Market Index Trust (continued)Shares orPrincipalAmount Value
SHORT-TERM INVESTMENTS (continued)Repurchase agreement – 1.8%Repurchase Agreement with State
Street Corp. dated 3-31-21 at0.000% to be repurchased at$15,393,000 on 4-1-21,collateralized by $15,706,400 U.S.Treasury Notes, 0.125% due3-31-23 (valued at $15,700,871) $ 15,393,000 $ 15,393,000
TOTAL SHORT-TERM INVESTMENTS (Cost$20,867,094) $ 20,866,672
Total Investments (Total Stock Market Index Trust)(Cost $357,391,618) – 100.7% $ 863,148,215
Other assets and liabilities, net – (0.7%) (5,792,900)
TOTAL NET ASSETS – 100.0% $ 857,355,315
Security Abbreviations and Legend(A) Non-income producing security.(B) All or a portion of this security is on loan as of 3-31-21. The value of
securities on loan amounted to $6,119,730. In addition to the cashcollateral invested in John Hancock Collateral Trust, non-cashcollateral of $1,044,652 in the form of U.S. Treasuries was pledged tothe fund.
(C) Security is valued using significant unobservable inputs and isclassified as Level 3 in the fair value hierarchy.
(D) Strike price and/or expiration date not available.(E) The rate shown is the annualized seven-day yield as of 3-31-21.(F) Investment is an affiliate of the fund, the advisor and/or subadvisor.
This security represents the investment of cash collateral received forsecurities lending.
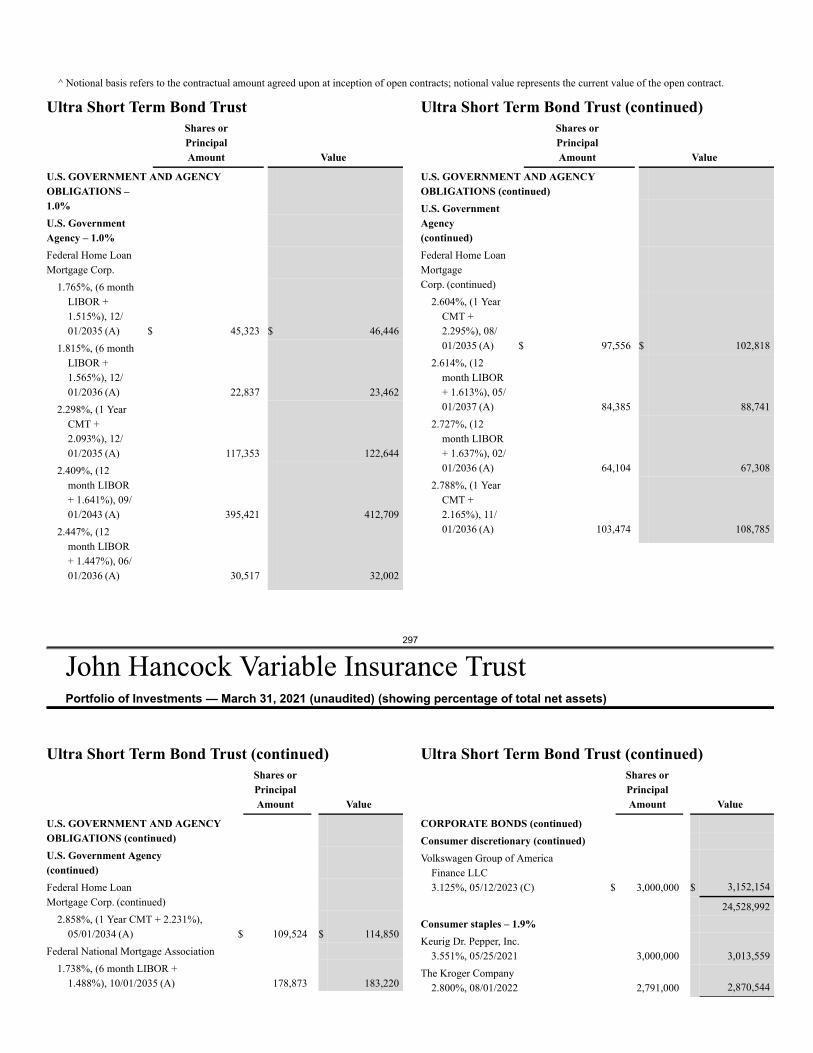
^ Notional basis refers to the contractual amount agreed upon at inception of open contracts; notional value represents the current value of the open contract.
297
John Hancock Variable Insurance TrustPortfolio of Investments — March 31, 2021 (unaudited) (showing percentage of total net assets)
Ultra Short Term Bond TrustShares orPrincipalAmount Value
U.S. GOVERNMENT AND AGENCYOBLIGATIONS –1.0%U.S. GovernmentAgency – 1.0%Federal Home LoanMortgage Corp.
1.765%, (6 monthLIBOR +1.515%), 12/01/2035 (A) $ 45,323 $ 46,446
1.815%, (6 monthLIBOR +1.565%), 12/01/2036 (A) 22,837 23,462
2.298%, (1 YearCMT +2.093%), 12/01/2035 (A) 117,353 122,644
2.409%, (12month LIBOR+ 1.641%), 09/01/2043 (A) 395,421 412,709
2.447%, (12month LIBOR+ 1.447%), 06/01/2036 (A) 30,517 32,002
Ultra Short Term Bond Trust (continued)Shares orPrincipalAmount Value
U.S. GOVERNMENT AND AGENCYOBLIGATIONS (continued)U.S. GovernmentAgency(continued)Federal Home LoanMortgageCorp. (continued)
2.604%, (1 YearCMT +2.295%), 08/01/2035 (A) $ 97,556 $ 102,818
2.614%, (12month LIBOR+ 1.613%), 05/01/2037 (A) 84,385 88,741
2.727%, (12month LIBOR+ 1.637%), 02/01/2036 (A) 64,104 67,308
2.788%, (1 YearCMT +2.165%), 11/01/2036 (A) 103,474 108,785
Ultra Short Term Bond Trust (continued)Shares orPrincipalAmount Value
U.S. GOVERNMENT AND AGENCYOBLIGATIONS (continued)U.S. Government Agency(continued)Federal Home LoanMortgage Corp. (continued)
2.858%, (1 Year CMT + 2.231%),05/01/2034 (A) $ 109,524 $ 114,850
Federal National Mortgage Association1.738%, (6 month LIBOR +
1.488%), 10/01/2035 (A) 178,873 183,220
Ultra Short Term Bond Trust (continued)Shares orPrincipalAmount Value
CORPORATE BONDS (continued)Consumer discretionary (continued)Volkswagen Group of America
Finance LLC3.125%, 05/12/2023 (C) $ 3,000,000 $ 3,152,154
24,528,992Consumer staples – 1.9%Keurig Dr. Pepper, Inc.
3.551%, 05/25/2021 3,000,000 3,013,559The Kroger Company
2.800%, 08/01/2022 2,791,000 2,870,544
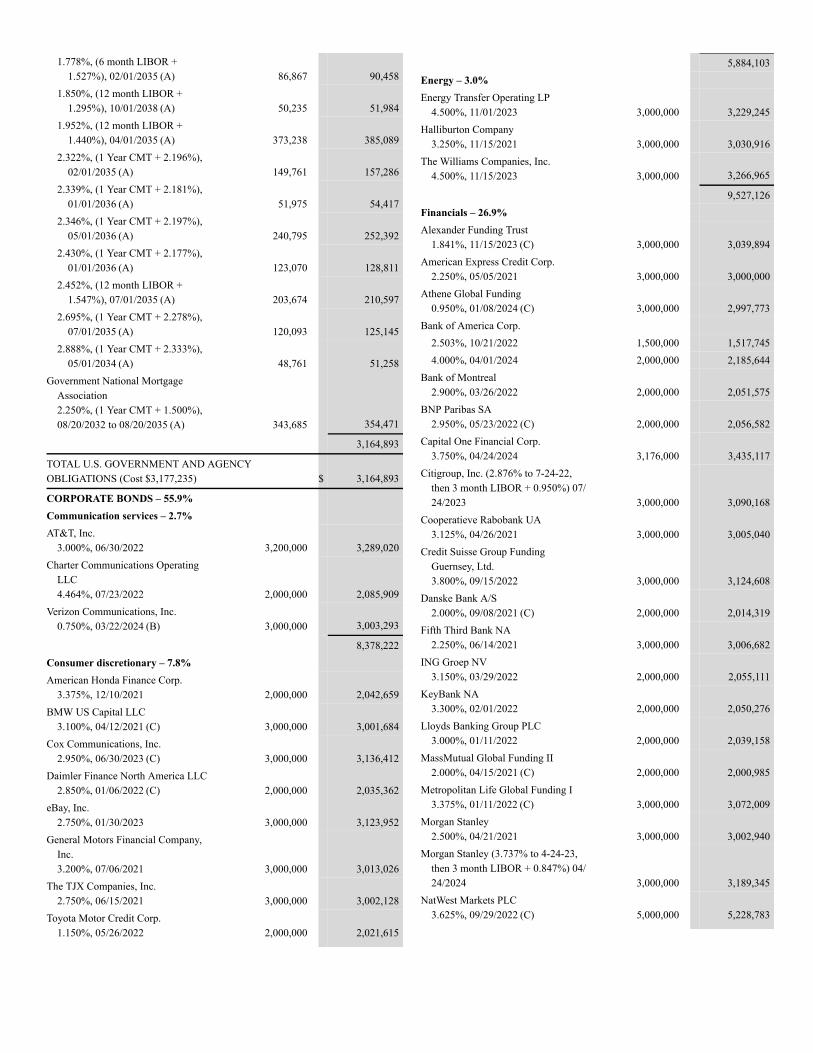
1.778%, (6 month LIBOR +1.527%), 02/01/2035 (A) 86,867 90,458
1.850%, (12 month LIBOR +1.295%), 10/01/2038 (A) 50,235 51,984
1.952%, (12 month LIBOR +1.440%), 04/01/2035 (A) 373,238 385,089
2.322%, (1 Year CMT + 2.196%),02/01/2035 (A) 149,761 157,286
2.339%, (1 Year CMT + 2.181%),01/01/2036 (A) 51,975 54,417
2.346%, (1 Year CMT + 2.197%),05/01/2036 (A) 240,795 252,392
2.430%, (1 Year CMT + 2.177%),01/01/2036 (A) 123,070 128,811
2.452%, (12 month LIBOR +1.547%), 07/01/2035 (A) 203,674 210,597
2.695%, (1 Year CMT + 2.278%),07/01/2035 (A) 120,093 125,145
2.888%, (1 Year CMT + 2.333%),05/01/2034 (A) 48,761 51,258
Government National MortgageAssociation2.250%, (1 Year CMT + 1.500%),08/20/2032 to 08/20/2035 (A) 343,685 354,471
3,164,893
TOTAL U.S. GOVERNMENT AND AGENCYOBLIGATIONS (Cost $3,177,235) $ 3,164,893
CORPORATE BONDS – 55.9%Communication services – 2.7%AT&T, Inc.
3.000%, 06/30/2022 3,200,000 3,289,020Charter Communications Operating
LLC4.464%, 07/23/2022 2,000,000 2,085,909
Verizon Communications, Inc.0.750%, 03/22/2024 (B) 3,000,000 3,003,293
8,378,222Consumer discretionary – 7.8%American Honda Finance Corp.
3.375%, 12/10/2021 2,000,000 2,042,659BMW US Capital LLC
3.100%, 04/12/2021 (C) 3,000,000 3,001,684Cox Communications, Inc.
2.950%, 06/30/2023 (C) 3,000,000 3,136,412Daimler Finance North America LLC
2.850%, 01/06/2022 (C) 2,000,000 2,035,362eBay, Inc.
2.750%, 01/30/2023 3,000,000 3,123,952General Motors Financial Company,
Inc.3.200%, 07/06/2021 3,000,000 3,013,026
The TJX Companies, Inc.2.750%, 06/15/2021 3,000,000 3,002,128
Toyota Motor Credit Corp.1.150%, 05/26/2022 2,000,000 2,021,615
5,884,103Energy – 3.0%Energy Transfer Operating LP
4.500%, 11/01/2023 3,000,000 3,229,245Halliburton Company
3.250%, 11/15/2021 3,000,000 3,030,916The Williams Companies, Inc.
4.500%, 11/15/2023 3,000,000 3,266,965
9,527,126Financials – 26.9%Alexander Funding Trust
1.841%, 11/15/2023 (C) 3,000,000 3,039,894American Express Credit Corp.
2.250%, 05/05/2021 3,000,000 3,000,000Athene Global Funding
0.950%, 01/08/2024 (C) 3,000,000 2,997,773Bank of America Corp.
2.503%, 10/21/2022 1,500,000 1,517,7454.000%, 04/01/2024 2,000,000 2,185,644
Bank of Montreal2.900%, 03/26/2022 2,000,000 2,051,575
BNP Paribas SA2.950%, 05/23/2022 (C) 2,000,000 2,056,582
Capital One Financial Corp.3.750%, 04/24/2024 3,176,000 3,435,117
Citigroup, Inc. (2.876% to 7-24-22,then 3 month LIBOR + 0.950%) 07/24/2023 3,000,000 3,090,168
Cooperatieve Rabobank UA3.125%, 04/26/2021 3,000,000 3,005,040
Credit Suisse Group FundingGuernsey, Ltd.3.800%, 09/15/2022 3,000,000 3,124,608
Danske Bank A/S2.000%, 09/08/2021 (C) 2,000,000 2,014,319
Fifth Third Bank NA2.250%, 06/14/2021 3,000,000 3,006,682
ING Groep NV3.150%, 03/29/2022 2,000,000 2,055,111
KeyBank NA3.300%, 02/01/2022 2,000,000 2,050,276
Lloyds Banking Group PLC3.000%, 01/11/2022 2,000,000 2,039,158
MassMutual Global Funding II2.000%, 04/15/2021 (C) 2,000,000 2,000,985
Metropolitan Life Global Funding I3.375%, 01/11/2022 (C) 3,000,000 3,072,009
Morgan Stanley2.500%, 04/21/2021 3,000,000 3,002,940
Morgan Stanley (3.737% to 4-24-23,then 3 month LIBOR + 0.847%) 04/24/2024 3,000,000 3,189,345
NatWest Markets PLC3.625%, 09/29/2022 (C) 5,000,000 5,228,783
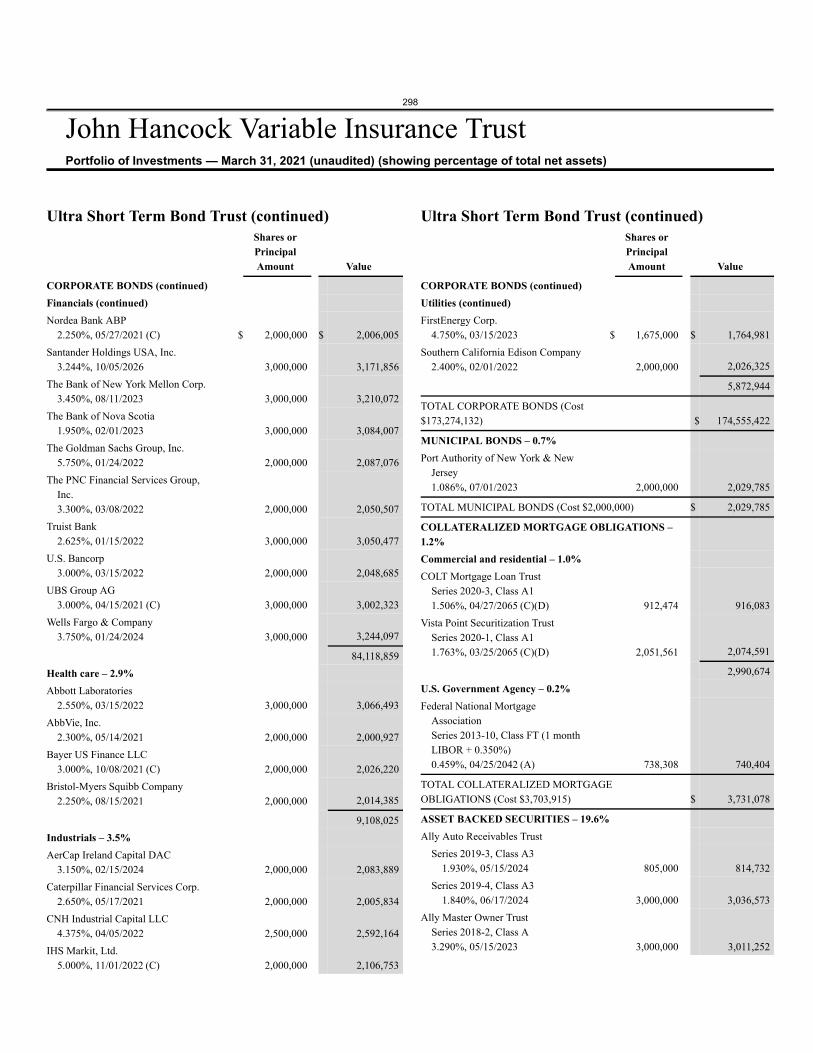
298
John Hancock Variable Insurance TrustPortfolio of Investments — March 31, 2021 (unaudited) (showing percentage of total net assets)
Ultra Short Term Bond Trust (continued)Shares orPrincipalAmount Value
CORPORATE BONDS (continued)Financials (continued)Nordea Bank ABP
2.250%, 05/27/2021 (C) $ 2,000,000 $ 2,006,005Santander Holdings USA, Inc.
3.244%, 10/05/2026 3,000,000 3,171,856The Bank of New York Mellon Corp.
3.450%, 08/11/2023 3,000,000 3,210,072The Bank of Nova Scotia
1.950%, 02/01/2023 3,000,000 3,084,007The Goldman Sachs Group, Inc.
5.750%, 01/24/2022 2,000,000 2,087,076The PNC Financial Services Group,
Inc.3.300%, 03/08/2022 2,000,000 2,050,507
Truist Bank2.625%, 01/15/2022 3,000,000 3,050,477
U.S. Bancorp3.000%, 03/15/2022 2,000,000 2,048,685
UBS Group AG3.000%, 04/15/2021 (C) 3,000,000 3,002,323
Wells Fargo & Company3.750%, 01/24/2024 3,000,000 3,244,097
84,118,859Health care – 2.9%Abbott Laboratories
2.550%, 03/15/2022 3,000,000 3,066,493AbbVie, Inc.
2.300%, 05/14/2021 2,000,000 2,000,927Bayer US Finance LLC
3.000%, 10/08/2021 (C) 2,000,000 2,026,220Bristol-Myers Squibb Company
2.250%, 08/15/2021 2,000,000 2,014,385
9,108,025Industrials – 3.5%AerCap Ireland Capital DAC
3.150%, 02/15/2024 2,000,000 2,083,889Caterpillar Financial Services Corp.
2.650%, 05/17/2021 2,000,000 2,005,834CNH Industrial Capital LLC
4.375%, 04/05/2022 2,500,000 2,592,164IHS Markit, Ltd.
5.000%, 11/01/2022 (C) 2,000,000 2,106,753
Ultra Short Term Bond Trust (continued)Shares orPrincipalAmount Value
CORPORATE BONDS (continued)Utilities (continued)FirstEnergy Corp.
4.750%, 03/15/2023 $ 1,675,000 $ 1,764,981Southern California Edison Company
2.400%, 02/01/2022 2,000,000 2,026,325
5,872,944
TOTAL CORPORATE BONDS (Cost$173,274,132) $ 174,555,422
MUNICIPAL BONDS – 0.7%Port Authority of New York & New
Jersey1.086%, 07/01/2023 2,000,000 2,029,785
TOTAL MUNICIPAL BONDS (Cost $2,000,000) $ 2,029,785
COLLATERALIZED MORTGAGE OBLIGATIONS –1.2%Commercial and residential – 1.0%COLT Mortgage Loan Trust
Series 2020-3, Class A11.506%, 04/27/2065 (C)(D) 912,474 916,083
Vista Point Securitization TrustSeries 2020-1, Class A11.763%, 03/25/2065 (C)(D) 2,051,561 2,074,591
2,990,674U.S. Government Agency – 0.2%Federal National Mortgage
AssociationSeries 2013-10, Class FT (1 monthLIBOR + 0.350%)0.459%, 04/25/2042 (A) 738,308 740,404
TOTAL COLLATERALIZED MORTGAGEOBLIGATIONS (Cost $3,703,915) $ 3,731,078
ASSET BACKED SECURITIES – 19.6%Ally Auto Receivables Trust
Series 2019-3, Class A31.930%, 05/15/2024 805,000 814,732
Series 2019-4, Class A31.840%, 06/17/2024 3,000,000 3,036,573
Ally Master Owner TrustSeries 2018-2, Class A3.290%, 05/15/2023 3,000,000 3,011,252
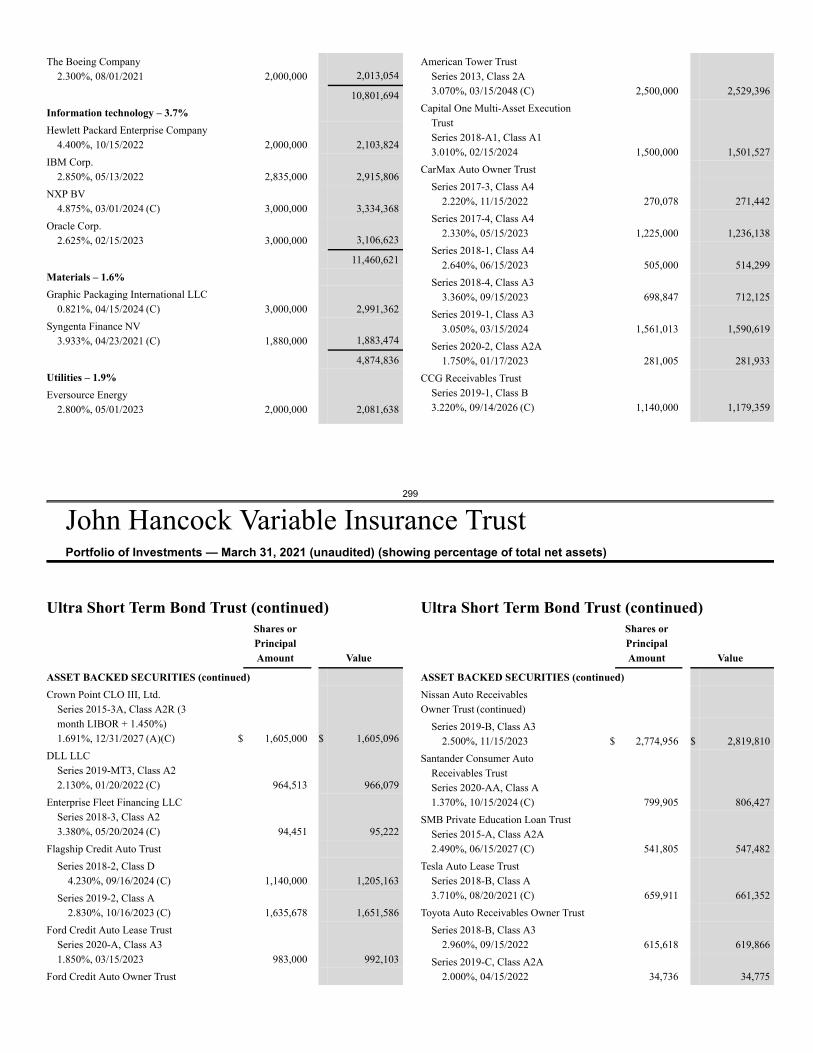
299
John Hancock Variable Insurance TrustPortfolio of Investments — March 31, 2021 (unaudited) (showing percentage of total net assets)
The Boeing Company2.300%, 08/01/2021 2,000,000 2,013,054
10,801,694Information technology – 3.7%Hewlett Packard Enterprise Company
4.400%, 10/15/2022 2,000,000 2,103,824IBM Corp.
2.850%, 05/13/2022 2,835,000 2,915,806NXP BV
4.875%, 03/01/2024 (C) 3,000,000 3,334,368Oracle Corp.
2.625%, 02/15/2023 3,000,000 3,106,623
11,460,621Materials – 1.6%Graphic Packaging International LLC
0.821%, 04/15/2024 (C) 3,000,000 2,991,362Syngenta Finance NV
3.933%, 04/23/2021 (C) 1,880,000 1,883,474
4,874,836Utilities – 1.9%Eversource Energy
2.800%, 05/01/2023 2,000,000 2,081,638
American Tower TrustSeries 2013, Class 2A3.070%, 03/15/2048 (C) 2,500,000 2,529,396
Capital One Multi-Asset ExecutionTrustSeries 2018-A1, Class A13.010%, 02/15/2024 1,500,000 1,501,527
CarMax Auto Owner TrustSeries 2017-3, Class A4
2.220%, 11/15/2022 270,078 271,442Series 2017-4, Class A4
2.330%, 05/15/2023 1,225,000 1,236,138Series 2018-1, Class A4
2.640%, 06/15/2023 505,000 514,299Series 2018-4, Class A3
3.360%, 09/15/2023 698,847 712,125Series 2019-1, Class A3
3.050%, 03/15/2024 1,561,013 1,590,619Series 2020-2, Class A2A
1.750%, 01/17/2023 281,005 281,933CCG Receivables Trust
Series 2019-1, Class B3.220%, 09/14/2026 (C) 1,140,000 1,179,359
Ultra Short Term Bond Trust (continued)Shares orPrincipalAmount Value
ASSET BACKED SECURITIES (continued)Crown Point CLO III, Ltd.
Series 2015-3A, Class A2R (3month LIBOR + 1.450%)1.691%, 12/31/2027 (A)(C) $ 1,605,000 $ 1,605,096
DLL LLCSeries 2019-MT3, Class A22.130%, 01/20/2022 (C) 964,513 966,079
Enterprise Fleet Financing LLCSeries 2018-3, Class A23.380%, 05/20/2024 (C) 94,451 95,222
Flagship Credit Auto TrustSeries 2018-2, Class D
4.230%, 09/16/2024 (C) 1,140,000 1,205,163Series 2019-2, Class A
2.830%, 10/16/2023 (C) 1,635,678 1,651,586Ford Credit Auto Lease Trust
Series 2020-A, Class A31.850%, 03/15/2023 983,000 992,103
Ford Credit Auto Owner Trust
Ultra Short Term Bond Trust (continued)Shares orPrincipalAmount Value
ASSET BACKED SECURITIES (continued)Nissan Auto ReceivablesOwner Trust (continued)
Series 2019-B, Class A32.500%, 11/15/2023 $ 2,774,956 $ 2,819,810
Santander Consumer AutoReceivables TrustSeries 2020-AA, Class A1.370%, 10/15/2024 (C) 799,905 806,427
SMB Private Education Loan TrustSeries 2015-A, Class A2A2.490%, 06/15/2027 (C) 541,805 547,482
Tesla Auto Lease TrustSeries 2018-B, Class A3.710%, 08/20/2021 (C) 659,911 661,352
Toyota Auto Receivables Owner TrustSeries 2018-B, Class A3
2.960%, 09/15/2022 615,618 619,866Series 2019-C, Class A2A
2.000%, 04/15/2022 34,736 34,775
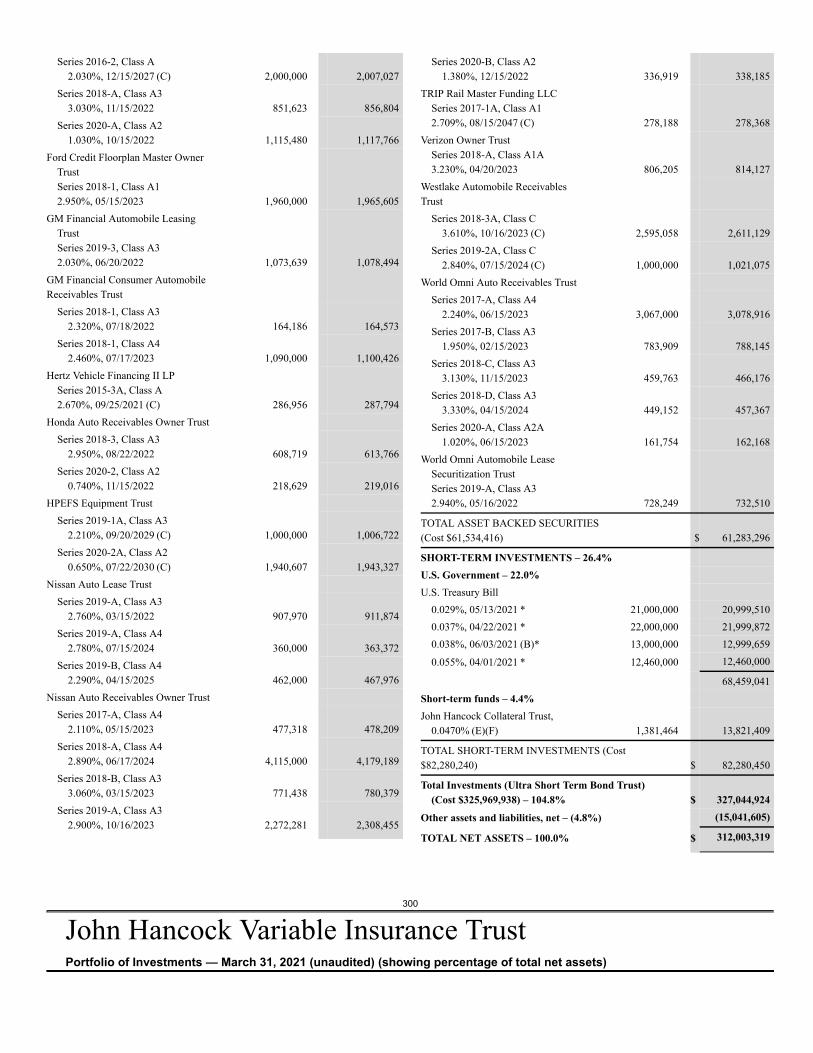
300
John Hancock Variable Insurance TrustPortfolio of Investments — March 31, 2021 (unaudited) (showing percentage of total net assets)
Series 2016-2, Class A2.030%, 12/15/2027 (C) 2,000,000 2,007,027
Series 2018-A, Class A33.030%, 11/15/2022 851,623 856,804
Series 2020-A, Class A21.030%, 10/15/2022 1,115,480 1,117,766
Ford Credit Floorplan Master OwnerTrustSeries 2018-1, Class A12.950%, 05/15/2023 1,960,000 1,965,605
GM Financial Automobile LeasingTrustSeries 2019-3, Class A32.030%, 06/20/2022 1,073,639 1,078,494
GM Financial Consumer AutomobileReceivables Trust
Series 2018-1, Class A32.320%, 07/18/2022 164,186 164,573
Series 2018-1, Class A42.460%, 07/17/2023 1,090,000 1,100,426
Hertz Vehicle Financing II LPSeries 2015-3A, Class A2.670%, 09/25/2021 (C) 286,956 287,794
Honda Auto Receivables Owner TrustSeries 2018-3, Class A3
2.950%, 08/22/2022 608,719 613,766Series 2020-2, Class A2
0.740%, 11/15/2022 218,629 219,016HPEFS Equipment Trust
Series 2019-1A, Class A32.210%, 09/20/2029 (C) 1,000,000 1,006,722
Series 2020-2A, Class A20.650%, 07/22/2030 (C) 1,940,607 1,943,327
Nissan Auto Lease TrustSeries 2019-A, Class A3
2.760%, 03/15/2022 907,970 911,874Series 2019-A, Class A4
2.780%, 07/15/2024 360,000 363,372Series 2019-B, Class A4
2.290%, 04/15/2025 462,000 467,976Nissan Auto Receivables Owner Trust
Series 2017-A, Class A42.110%, 05/15/2023 477,318 478,209
Series 2018-A, Class A42.890%, 06/17/2024 4,115,000 4,179,189
Series 2018-B, Class A33.060%, 03/15/2023 771,438 780,379
Series 2019-A, Class A32.900%, 10/16/2023 2,272,281 2,308,455
Series 2020-B, Class A21.380%, 12/15/2022 336,919 338,185
TRIP Rail Master Funding LLCSeries 2017-1A, Class A12.709%, 08/15/2047 (C) 278,188 278,368
Verizon Owner TrustSeries 2018-A, Class A1A3.230%, 04/20/2023 806,205 814,127
Westlake Automobile ReceivablesTrust
Series 2018-3A, Class C3.610%, 10/16/2023 (C) 2,595,058 2,611,129
Series 2019-2A, Class C2.840%, 07/15/2024 (C) 1,000,000 1,021,075
World Omni Auto Receivables TrustSeries 2017-A, Class A4
2.240%, 06/15/2023 3,067,000 3,078,916Series 2017-B, Class A3
1.950%, 02/15/2023 783,909 788,145Series 2018-C, Class A3
3.130%, 11/15/2023 459,763 466,176Series 2018-D, Class A3
3.330%, 04/15/2024 449,152 457,367Series 2020-A, Class A2A
1.020%, 06/15/2023 161,754 162,168World Omni Automobile Lease
Securitization TrustSeries 2019-A, Class A32.940%, 05/16/2022 728,249 732,510
TOTAL ASSET BACKED SECURITIES(Cost $61,534,416) $ 61,283,296
SHORT-TERM INVESTMENTS – 26.4%U.S. Government – 22.0%U.S. Treasury Bill
0.029%, 05/13/2021 * 21,000,000 20,999,5100.037%, 04/22/2021 * 22,000,000 21,999,8720.038%, 06/03/2021 (B)* 13,000,000 12,999,659
0.055%, 04/01/2021 * 12,460,000 12,460,000
68,459,041Short-term funds – 4.4%John Hancock Collateral Trust,
0.0470% (E)(F) 1,381,464 13,821,409
TOTAL SHORT-TERM INVESTMENTS (Cost$82,280,240) $ 82,280,450
Total Investments (Ultra Short Term Bond Trust)(Cost $325,969,938) – 104.8% $ 327,044,924
Other assets and liabilities, net – (4.8%) (15,041,605)
TOTAL NET ASSETS – 100.0% $ 312,003,319
Ultra Short Term Bond Trust (continued)Security Abbreviations and LegendCMT Constant Maturity TreasuryLIBOR London Interbank Offered Rate(A) Variable rate obligation. The coupon rate shown represents the rate at
period end.(B) All or a portion of this security is on loan as of 3-31-21. The value of
securities on loan amounted to $13,544,252.(C) These securities are exempt from registration under Rule 144A of the
Securities Act of 1933. Such securities may be resold, normally toqualified institutional buyers, in transactions exempt from registration.Rule 144A securities amounted to $72,479,740 or 23.2% of the fund'snet assets as of 3-31-21.
(D) Variable or floating rate security, the interest rate of which adjustsperiodically based on a weighted average of interest rates andprepayments on the underlying pool of assets. The interest rate shownis the current rate as of period end.
(E) The rate shown is the annualized seven-day yield as of 3-31-21.(F) Investment is an affiliate of the fund, the advisor and/or subadvisor.
This security represents the investment of cash collateral received forsecurities lending.
* Yield represents either the annualized yield at the date of purchase, thestated coupon rate or, for floating rate securities, the rate at period end.
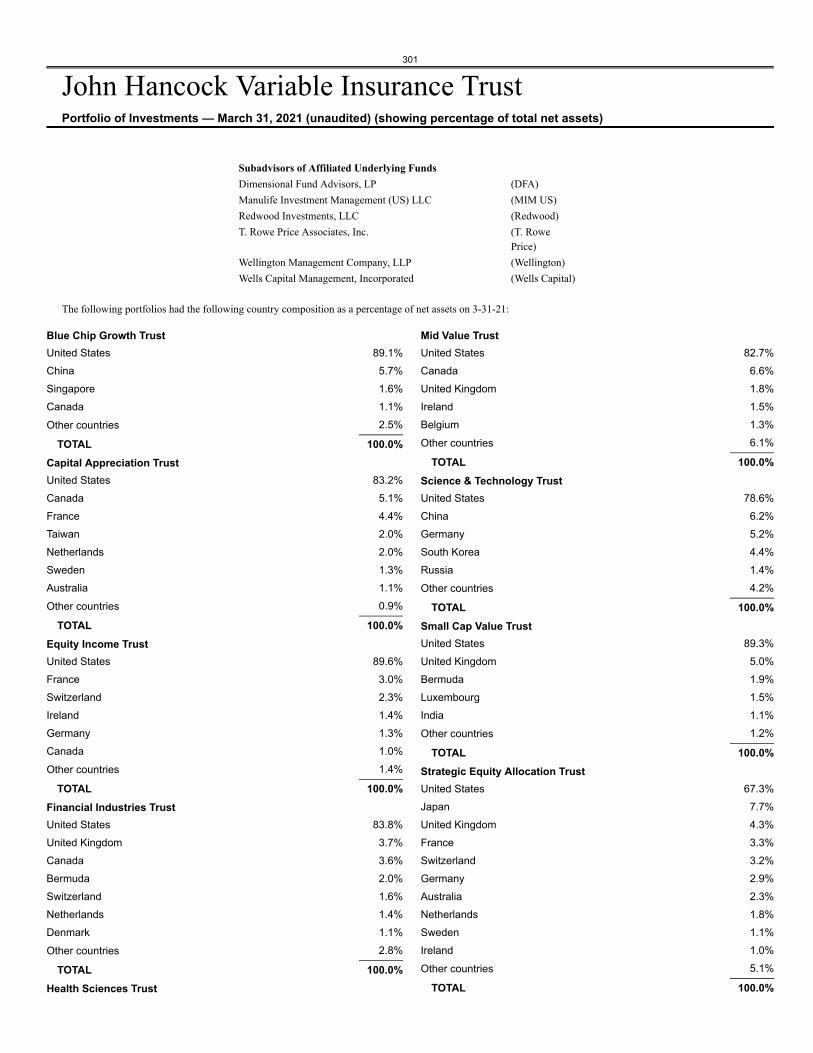
301
John Hancock Variable Insurance TrustPortfolio of Investments — March 31, 2021 (unaudited) (showing percentage of total net assets)
Subadvisors of Affiliated Underlying FundsDimensional Fund Advisors, LP (DFA)Manulife Investment Management (US) LLC (MIM US)Redwood Investments, LLC (Redwood)T. Rowe Price Associates, Inc. (T. Rowe
Price)Wellington Management Company, LLP (Wellington)Wells Capital Management, Incorporated (Wells Capital)
The following portfolios had the following country composition as a percentage of net assets on 3-31-21:
Blue Chip Growth TrustUnited States 89.1%China 5.7%Singapore 1.6%Canada 1.1%
Other countries 2.5%
TOTAL 100.0%Capital Appreciation TrustUnited States 83.2%Canada 5.1%France 4.4%Taiwan 2.0%Netherlands 2.0%Sweden 1.3%Australia 1.1%
Other countries 0.9%
TOTAL 100.0%Equity Income TrustUnited States 89.6%France 3.0%Switzerland 2.3%Ireland 1.4%Germany 1.3%Canada 1.0%
Other countries 1.4%
TOTAL 100.0%Financial Industries TrustUnited States 83.8%United Kingdom 3.7%Canada 3.6%Bermuda 2.0%Switzerland 1.6%Netherlands 1.4%Denmark 1.1%
Other countries 2.8%
TOTAL 100.0%Health Sciences Trust
Mid Value TrustUnited States 82.7%Canada 6.6%United Kingdom 1.8%Ireland 1.5%Belgium 1.3%
Other countries 6.1%
TOTAL 100.0%Science & Technology TrustUnited States 78.6%China 6.2%Germany 5.2%South Korea 4.4%Russia 1.4%
Other countries 4.2%
TOTAL 100.0%Small Cap Value TrustUnited States 89.3%United Kingdom 5.0%Bermuda 1.9%Luxembourg 1.5%India 1.1%
Other countries 1.2%
TOTAL 100.0%Strategic Equity Allocation TrustUnited States 67.3%Japan 7.7%United Kingdom 4.3%France 3.3%Switzerland 3.2%Germany 2.9%Australia 2.3%Netherlands 1.8%Sweden 1.1%Ireland 1.0%
Other countries 5.1%
TOTAL 100.0%
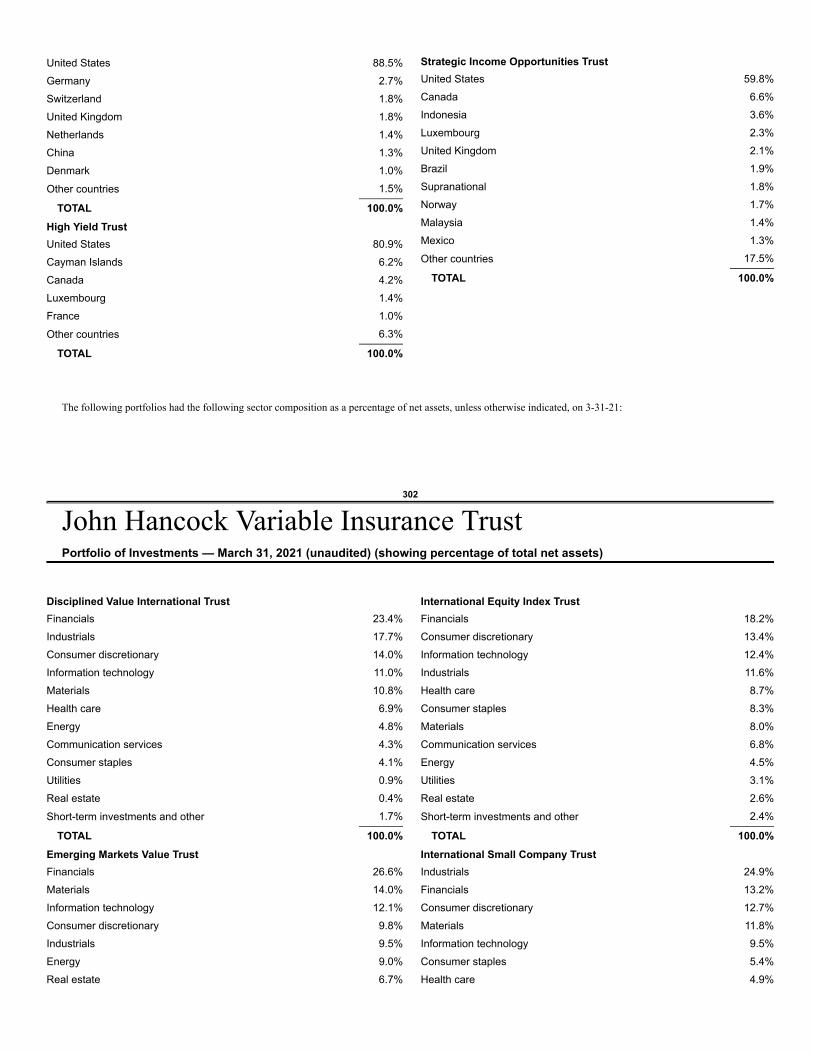
The following portfolios had the following sector composition as a percentage of net assets, unless otherwise indicated, on 3-31-21:
302
John Hancock Variable Insurance TrustPortfolio of Investments — March 31, 2021 (unaudited) (showing percentage of total net assets)
United States 88.5%Germany 2.7%Switzerland 1.8%United Kingdom 1.8%Netherlands 1.4%China 1.3%Denmark 1.0%
Other countries 1.5%
TOTAL 100.0%High Yield TrustUnited States 80.9%Cayman Islands 6.2%Canada 4.2%Luxembourg 1.4%France 1.0%
Other countries 6.3%
TOTAL 100.0%
Strategic Income Opportunities TrustUnited States 59.8%Canada 6.6%Indonesia 3.6%Luxembourg 2.3%United Kingdom 2.1%Brazil 1.9%Supranational 1.8%Norway 1.7%Malaysia 1.4%Mexico 1.3%
Other countries 17.5%
TOTAL 100.0%
Disciplined Value International TrustFinancials 23.4%Industrials 17.7%Consumer discretionary 14.0%Information technology 11.0%Materials 10.8%Health care 6.9%Energy 4.8%Communication services 4.3%Consumer staples 4.1%Utilities 0.9%Real estate 0.4%
Short-term investments and other 1.7%
TOTAL 100.0%Emerging Markets Value TrustFinancials 26.6%Materials 14.0%Information technology 12.1%Consumer discretionary 9.8%Industrials 9.5%Energy 9.0%Real estate 6.7%
International Equity Index TrustFinancials 18.2%Consumer discretionary 13.4%Information technology 12.4%Industrials 11.6%Health care 8.7%Consumer staples 8.3%Materials 8.0%Communication services 6.8%Energy 4.5%Utilities 3.1%Real estate 2.6%
Short-term investments and other 2.4%
TOTAL 100.0%International Small Company TrustIndustrials 24.9%Financials 13.2%Consumer discretionary 12.7%Materials 11.8%Information technology 9.5%Consumer staples 5.4%Health care 4.9%
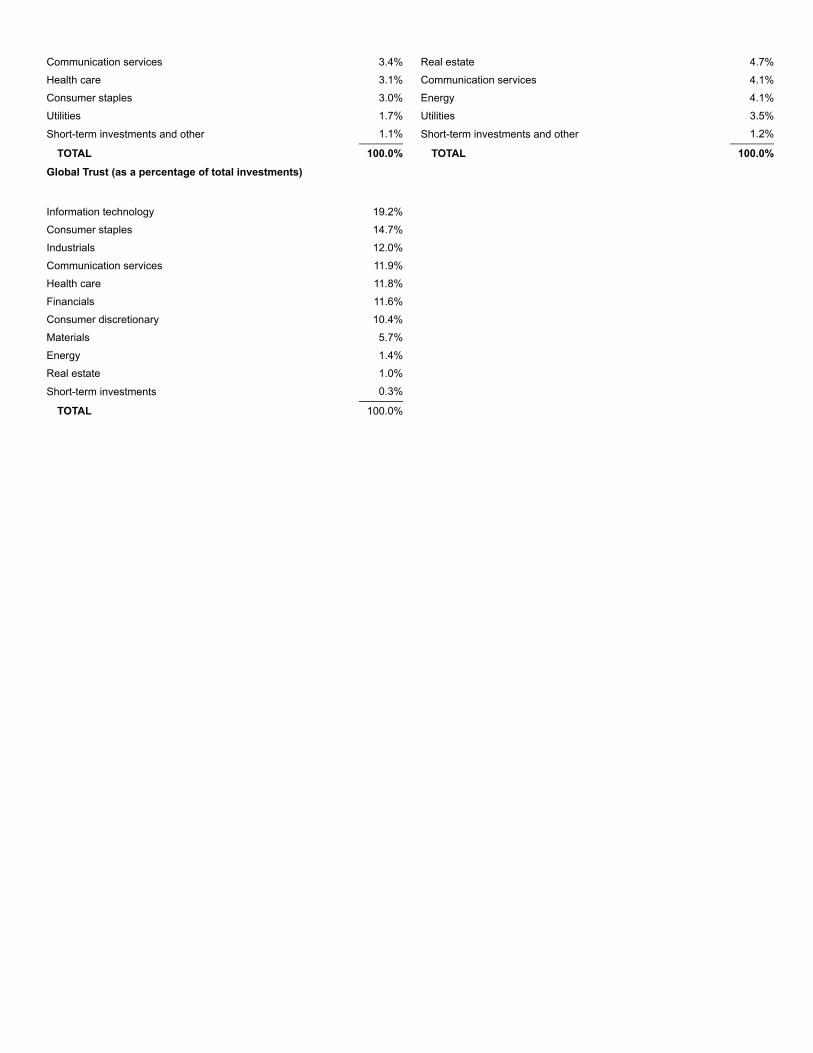
Communication services 3.4%Health care 3.1%Consumer staples 3.0%Utilities 1.7%
Short-term investments and other 1.1%
TOTAL 100.0%Global Trust (as a percentage of total investments)
Information technology 19.2%Consumer staples 14.7%Industrials 12.0%Communication services 11.9%Health care 11.8%Financials 11.6%Consumer discretionary 10.4%Materials 5.7%Energy 1.4%Real estate 1.0%
Short-term investments 0.3%
TOTAL 100.0%
Real estate 4.7%Communication services 4.1%Energy 4.1%Utilities 3.5%
Short-term investments and other 1.2%
TOTAL 100.0%

303
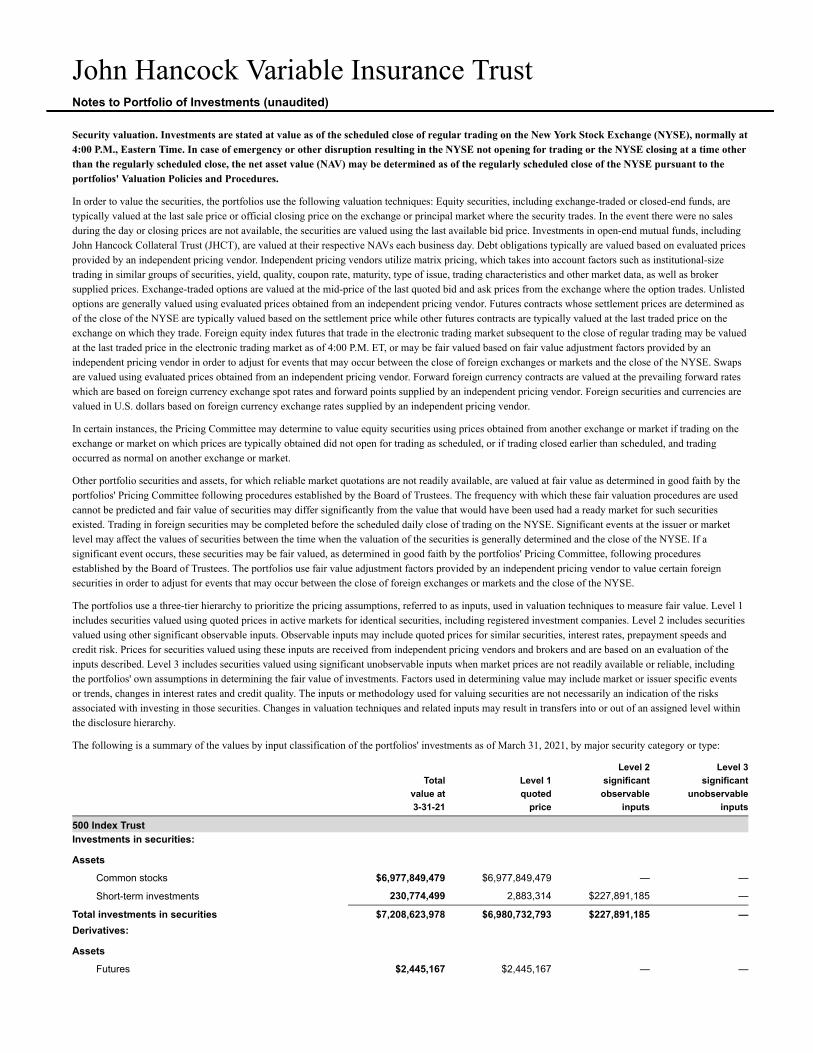
John Hancock Variable Insurance TrustNotes to Portfolio of Investments (unaudited)
Security valuation. Investments are stated at value as of the scheduled close of regular trading on the New York Stock Exchange (NYSE), normally at4:00 P.M., Eastern Time. In case of emergency or other disruption resulting in the NYSE not opening for trading or the NYSE closing at a time otherthan the regularly scheduled close, the net asset value (NAV) may be determined as of the regularly scheduled close of the NYSE pursuant to theportfolios' Valuation Policies and Procedures.
In order to value the securities, the portfolios use the following valuation techniques: Equity securities, including exchange-traded or closed-end funds, aretypically valued at the last sale price or official closing price on the exchange or principal market where the security trades. In the event there were no salesduring the day or closing prices are not available, the securities are valued using the last available bid price. Investments in open-end mutual funds, includingJohn Hancock Collateral Trust (JHCT), are valued at their respective NAVs each business day. Debt obligations typically are valued based on evaluated pricesprovided by an independent pricing vendor. Independent pricing vendors utilize matrix pricing, which takes into account factors such as institutional-sizetrading in similar groups of securities, yield, quality, coupon rate, maturity, type of issue, trading characteristics and other market data, as well as brokersupplied prices. Exchange-traded options are valued at the mid-price of the last quoted bid and ask prices from the exchange where the option trades. Unlistedoptions are generally valued using evaluated prices obtained from an independent pricing vendor. Futures contracts whose settlement prices are determined asof the close of the NYSE are typically valued based on the settlement price while other futures contracts are typically valued at the last traded price on theexchange on which they trade. Foreign equity index futures that trade in the electronic trading market subsequent to the close of regular trading may be valuedat the last traded price in the electronic trading market as of 4:00 P.M. ET, or may be fair valued based on fair value adjustment factors provided by anindependent pricing vendor in order to adjust for events that may occur between the close of foreign exchanges or markets and the close of the NYSE. Swapsare valued using evaluated prices obtained from an independent pricing vendor. Forward foreign currency contracts are valued at the prevailing forward rateswhich are based on foreign currency exchange spot rates and forward points supplied by an independent pricing vendor. Foreign securities and currencies arevalued in U.S. dollars based on foreign currency exchange rates supplied by an independent pricing vendor.
In certain instances, the Pricing Committee may determine to value equity securities using prices obtained from another exchange or market if trading on theexchange or market on which prices are typically obtained did not open for trading as scheduled, or if trading closed earlier than scheduled, and tradingoccurred as normal on another exchange or market.
Other portfolio securities and assets, for which reliable market quotations are not readily available, are valued at fair value as determined in good faith by theportfolios' Pricing Committee following procedures established by the Board of Trustees. The frequency with which these fair valuation procedures are usedcannot be predicted and fair value of securities may differ significantly from the value that would have been used had a ready market for such securitiesexisted. Trading in foreign securities may be completed before the scheduled daily close of trading on the NYSE. Significant events at the issuer or marketlevel may affect the values of securities between the time when the valuation of the securities is generally determined and the close of the NYSE. If asignificant event occurs, these securities may be fair valued, as determined in good faith by the portfolios' Pricing Committee, following proceduresestablished by the Board of Trustees. The portfolios use fair value adjustment factors provided by an independent pricing vendor to value certain foreignsecurities in order to adjust for events that may occur between the close of foreign exchanges or markets and the close of the NYSE.
The portfolios use a three-tier hierarchy to prioritize the pricing assumptions, referred to as inputs, used in valuation techniques to measure fair value. Level 1includes securities valued using quoted prices in active markets for identical securities, including registered investment companies. Level 2 includes securitiesvalued using other significant observable inputs. Observable inputs may include quoted prices for similar securities, interest rates, prepayment speeds andcredit risk. Prices for securities valued using these inputs are received from independent pricing vendors and brokers and are based on an evaluation of theinputs described. Level 3 includes securities valued using significant unobservable inputs when market prices are not readily available or reliable, includingthe portfolios' own assumptions in determining the fair value of investments. Factors used in determining value may include market or issuer specific eventsor trends, changes in interest rates and credit quality. The inputs or methodology used for valuing securities are not necessarily an indication of the risksassociated with investing in those securities. Changes in valuation techniques and related inputs may result in transfers into or out of an assigned level withinthe disclosure hierarchy.
The following is a summary of the values by input classification of the portfolios' investments as of March 31, 2021, by major security category or type:
Totalvalue at3-31-21
Level 1quoted
price
Level 2significant
observableinputs
Level 3significant
unobservableinputs
500 Index TrustInvestments in securities:
Assets
Common stocks $6,977,849,479 $6,977,849,479 — —
Short-term investments 230,774,499 2,883,314 $227,891,185 —
Total investments in securities $7,208,623,978 $6,980,732,793 $227,891,185 —Derivatives:
Assets
Futures $2,445,167 $2,445,167 — —
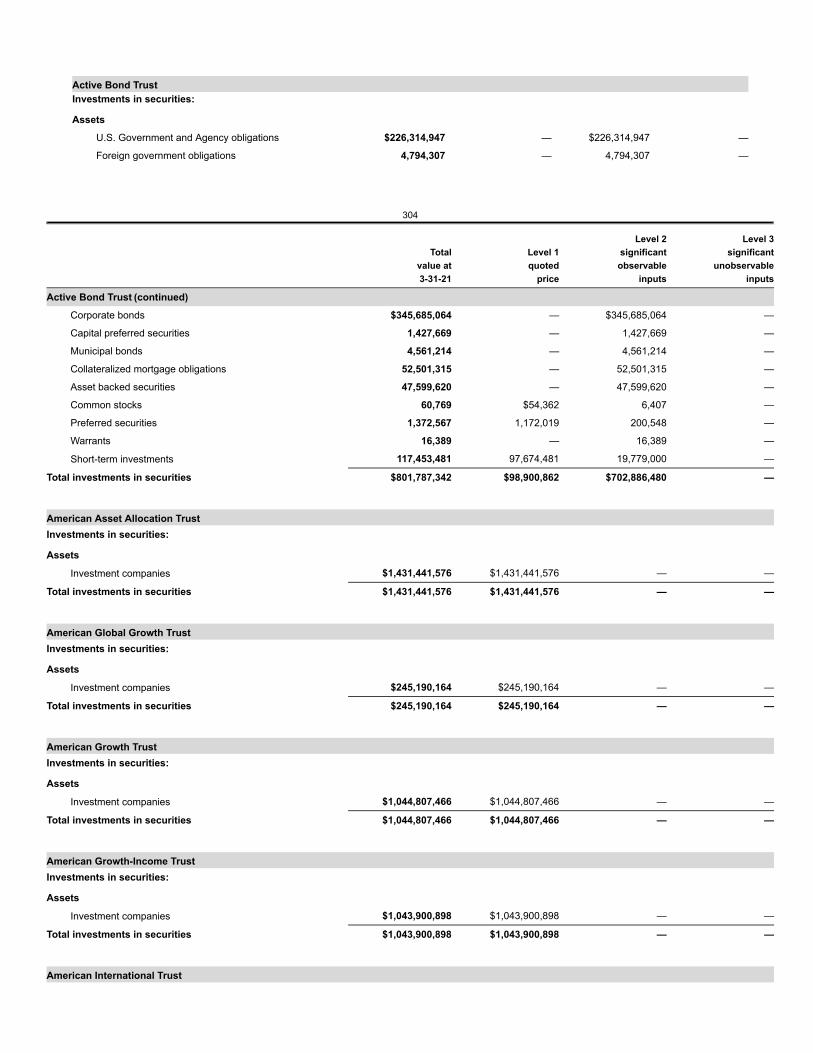
Active Bond TrustInvestments in securities:
Assets
U.S. Government and Agency obligations $226,314,947 — $226,314,947 —
Foreign government obligations 4,794,307 — 4,794,307 —
304
Totalvalue at3-31-21
Level 1quoted
price
Level 2significant
observableinputs
Level 3significant
unobservableinputs
Active Bond Trust (continued)
Corporate bonds $345,685,064 — $345,685,064 —
Capital preferred securities 1,427,669 — 1,427,669 —
Municipal bonds 4,561,214 — 4,561,214 —
Collateralized mortgage obligations 52,501,315 — 52,501,315 —
Asset backed securities 47,599,620 — 47,599,620 —
Common stocks 60,769 $54,362 6,407 —
Preferred securities 1,372,567 1,172,019 200,548 —
Warrants 16,389 — 16,389 —
Short-term investments 117,453,481 97,674,481 19,779,000 —
Total investments in securities $801,787,342 $98,900,862 $702,886,480 —
American Asset Allocation TrustInvestments in securities:
Assets
Investment companies $1,431,441,576 $1,431,441,576 — —
Total investments in securities $1,431,441,576 $1,431,441,576 — —
American Global Growth TrustInvestments in securities:
Assets
Investment companies $245,190,164 $245,190,164 — —
Total investments in securities $245,190,164 $245,190,164 — —
American Growth TrustInvestments in securities:
Assets
Investment companies $1,044,807,466 $1,044,807,466 — —
Total investments in securities $1,044,807,466 $1,044,807,466 — —
American Growth-Income TrustInvestments in securities:
Assets
Investment companies $1,043,900,898 $1,043,900,898 — —
Total investments in securities $1,043,900,898 $1,043,900,898 — —
American International Trust
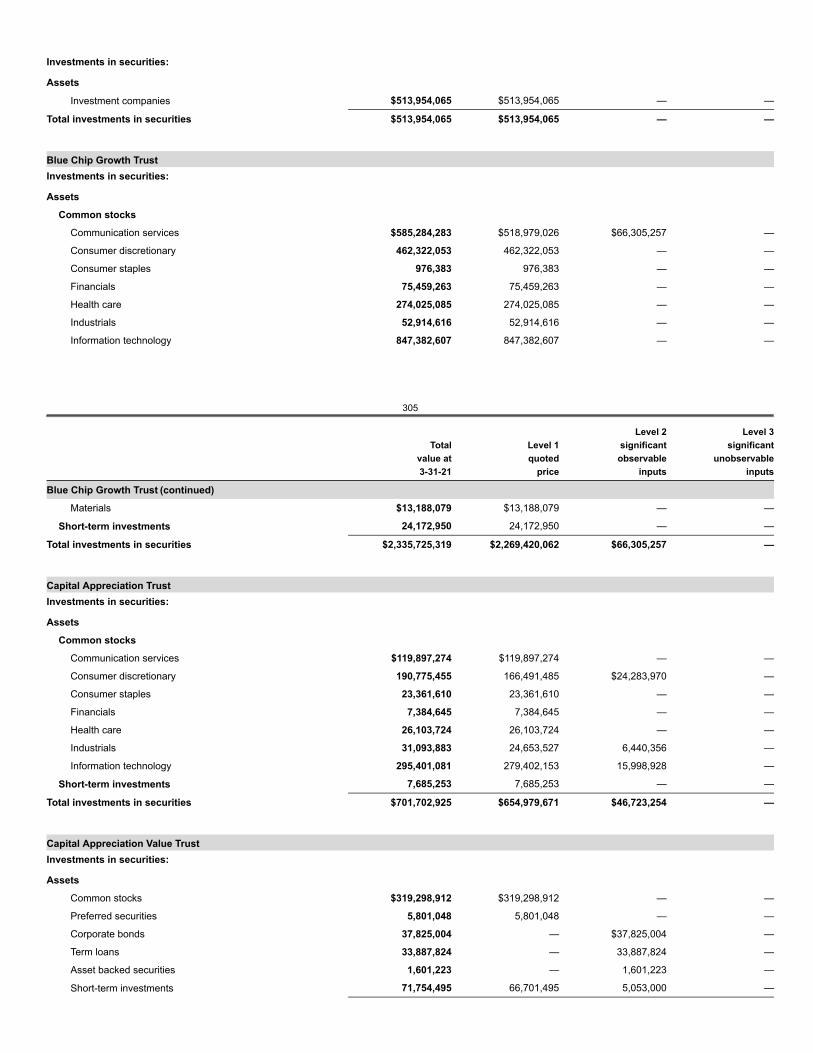
Investments in securities:
Assets
Investment companies $513,954,065 $513,954,065 — —
Total investments in securities $513,954,065 $513,954,065 — —
Blue Chip Growth TrustInvestments in securities:
Assets
Common stocks
Communication services $585,284,283 $518,979,026 $66,305,257 —
Consumer discretionary 462,322,053 462,322,053 — —
Consumer staples 976,383 976,383 — —
Financials 75,459,263 75,459,263 — —
Health care 274,025,085 274,025,085 — —
Industrials 52,914,616 52,914,616 — —
Information technology 847,382,607 847,382,607 — —
305
Totalvalue at3-31-21
Level 1quoted
price
Level 2significant
observableinputs
Level 3significant
unobservableinputs
Blue Chip Growth Trust (continued)
Materials $13,188,079 $13,188,079 — —
Short-term investments 24,172,950 24,172,950 — —
Total investments in securities $2,335,725,319 $2,269,420,062 $66,305,257 —
Capital Appreciation TrustInvestments in securities:
Assets
Common stocks
Communication services $119,897,274 $119,897,274 — —
Consumer discretionary 190,775,455 166,491,485 $24,283,970 —
Consumer staples 23,361,610 23,361,610 — —
Financials 7,384,645 7,384,645 — —
Health care 26,103,724 26,103,724 — —
Industrials 31,093,883 24,653,527 6,440,356 —
Information technology 295,401,081 279,402,153 15,998,928 —
Short-term investments 7,685,253 7,685,253 — —
Total investments in securities $701,702,925 $654,979,671 $46,723,254 —
Capital Appreciation Value TrustInvestments in securities:
Assets
Common stocks $319,298,912 $319,298,912 — —
Preferred securities 5,801,048 5,801,048 — —
Corporate bonds 37,825,004 — $37,825,004 —
Term loans 33,887,824 — 33,887,824 —
Asset backed securities 1,601,223 — 1,601,223 —
Short-term investments 71,754,495 66,701,495 5,053,000 —
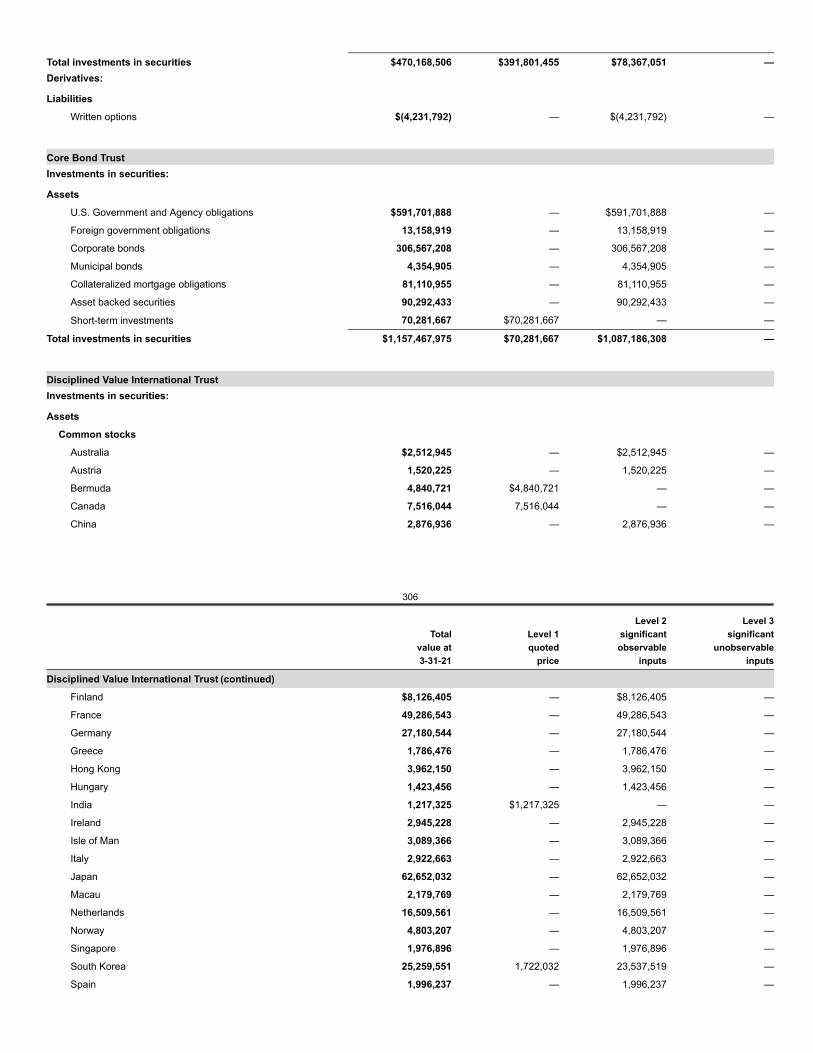
Total investments in securities $470,168,506 $391,801,455 $78,367,051 —Derivatives:
Liabilities
Written options $(4,231,792) — $(4,231,792) —
Core Bond TrustInvestments in securities:
Assets
U.S. Government and Agency obligations $591,701,888 — $591,701,888 —
Foreign government obligations 13,158,919 — 13,158,919 —
Corporate bonds 306,567,208 — 306,567,208 —
Municipal bonds 4,354,905 — 4,354,905 —
Collateralized mortgage obligations 81,110,955 — 81,110,955 —
Asset backed securities 90,292,433 — 90,292,433 —
Short-term investments 70,281,667 $70,281,667 — —
Total investments in securities $1,157,467,975 $70,281,667 $1,087,186,308 —
Disciplined Value International TrustInvestments in securities:
Assets
Common stocks
Australia $2,512,945 — $2,512,945 —
Austria 1,520,225 — 1,520,225 —
Bermuda 4,840,721 $4,840,721 — —
Canada 7,516,044 7,516,044 — —
China 2,876,936 — 2,876,936 —
306
Totalvalue at3-31-21
Level 1quoted
price
Level 2significant
observableinputs
Level 3significant
unobservableinputs
Disciplined Value International Trust (continued)
Finland $8,126,405 — $8,126,405 —
France 49,286,543 — 49,286,543 —
Germany 27,180,544 — 27,180,544 —
Greece 1,786,476 — 1,786,476 —
Hong Kong 3,962,150 — 3,962,150 —
Hungary 1,423,456 — 1,423,456 —
India 1,217,325 $1,217,325 — —
Ireland 2,945,228 — 2,945,228 —
Isle of Man 3,089,366 — 3,089,366 —
Italy 2,922,663 — 2,922,663 —
Japan 62,652,032 — 62,652,032 —
Macau 2,179,769 — 2,179,769 —
Netherlands 16,509,561 — 16,509,561 —
Norway 4,803,207 — 4,803,207 —
Singapore 1,976,896 — 1,976,896 —
South Korea 25,259,551 1,722,032 23,537,519 —
Spain 1,996,237 — 1,996,237 —
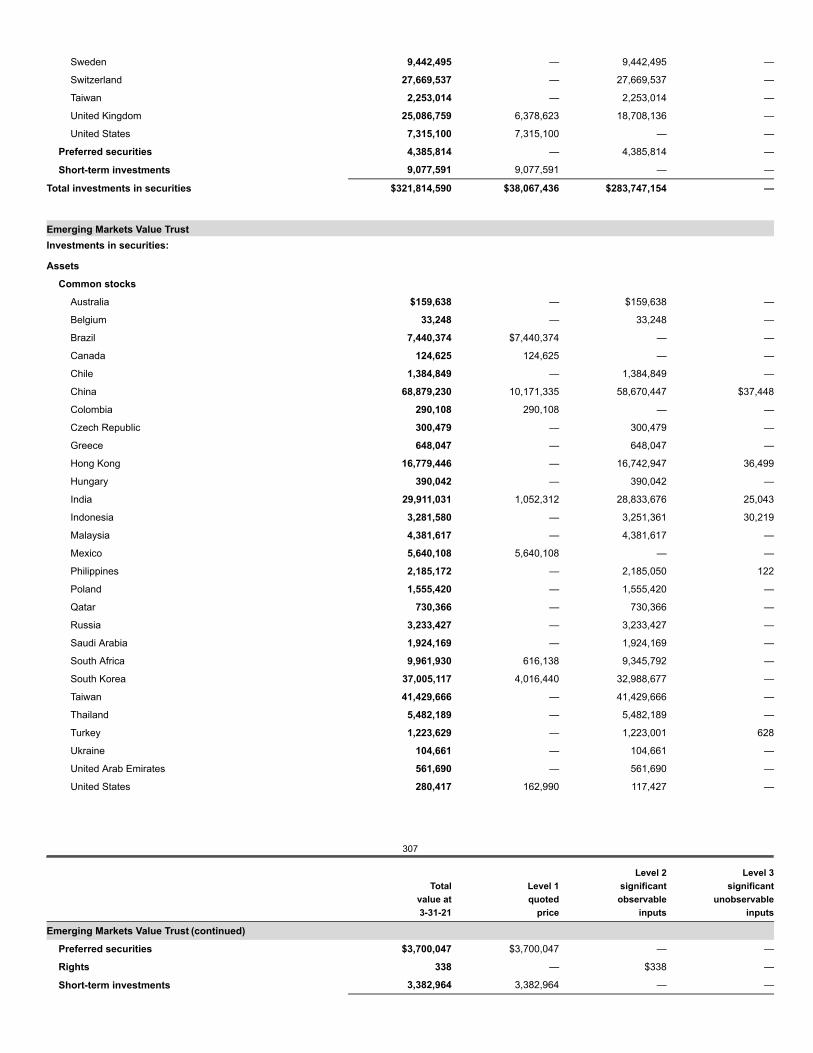
Sweden 9,442,495 — 9,442,495 —
Switzerland 27,669,537 — 27,669,537 —
Taiwan 2,253,014 — 2,253,014 —
United Kingdom 25,086,759 6,378,623 18,708,136 —
United States 7,315,100 7,315,100 — —
Preferred securities 4,385,814 — 4,385,814 —
Short-term investments 9,077,591 9,077,591 — —
Total investments in securities $321,814,590 $38,067,436 $283,747,154 —
Emerging Markets Value TrustInvestments in securities:
Assets
Common stocks
Australia $159,638 — $159,638 —
Belgium 33,248 — 33,248 —
Brazil 7,440,374 $7,440,374 — —
Canada 124,625 124,625 — —
Chile 1,384,849 — 1,384,849 —
China 68,879,230 10,171,335 58,670,447 $37,448
Colombia 290,108 290,108 — —
Czech Republic 300,479 — 300,479 —
Greece 648,047 — 648,047 —
Hong Kong 16,779,446 — 16,742,947 36,499
Hungary 390,042 — 390,042 —
India 29,911,031 1,052,312 28,833,676 25,043
Indonesia 3,281,580 — 3,251,361 30,219
Malaysia 4,381,617 — 4,381,617 —
Mexico 5,640,108 5,640,108 — —
Philippines 2,185,172 — 2,185,050 122
Poland 1,555,420 — 1,555,420 —
Qatar 730,366 — 730,366 —
Russia 3,233,427 — 3,233,427 —
Saudi Arabia 1,924,169 — 1,924,169 —
South Africa 9,961,930 616,138 9,345,792 —
South Korea 37,005,117 4,016,440 32,988,677 —
Taiwan 41,429,666 — 41,429,666 —
Thailand 5,482,189 — 5,482,189 —
Turkey 1,223,629 — 1,223,001 628
Ukraine 104,661 — 104,661 —
United Arab Emirates 561,690 — 561,690 —
United States 280,417 162,990 117,427 —
307
Totalvalue at3-31-21
Level 1quoted
price
Level 2significant
observableinputs
Level 3significant
unobservableinputs
Emerging Markets Value Trust (continued)
Preferred securities $3,700,047 $3,700,047 — —
Rights 338 — $338 —
Short-term investments 3,382,964 3,382,964 — —
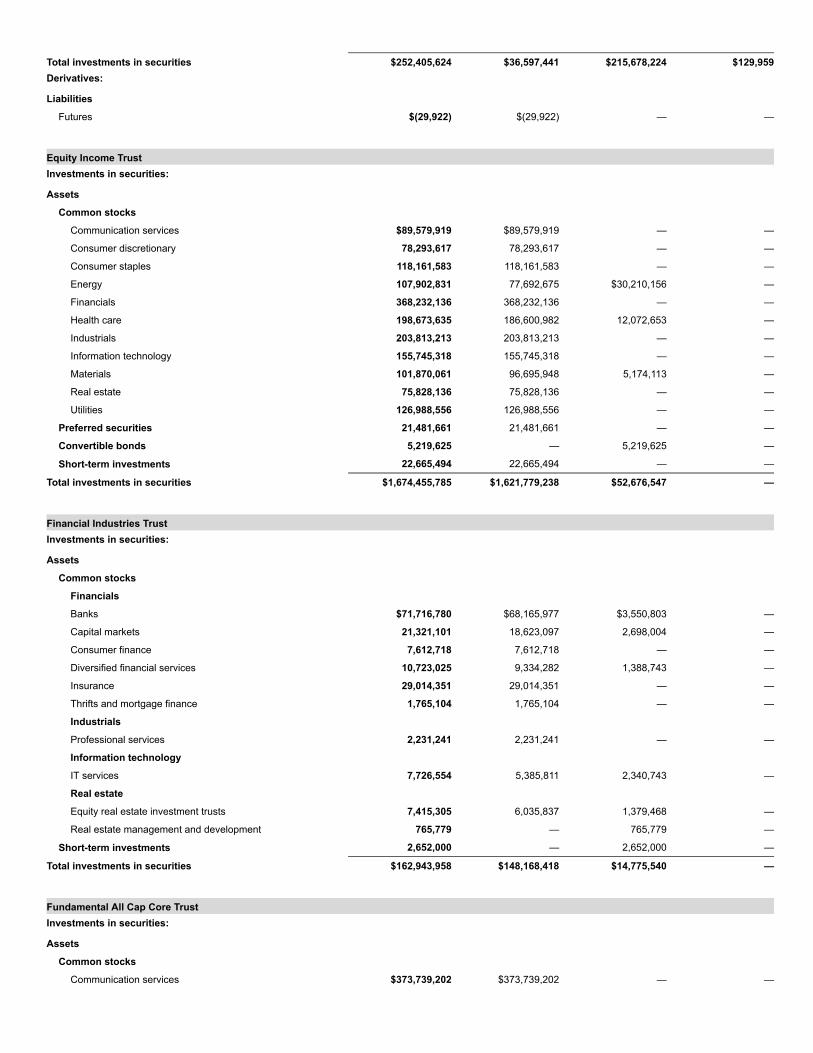
Total investments in securities $252,405,624 $36,597,441 $215,678,224 $129,959Derivatives:
Liabilities
Futures $(29,922) $(29,922) — —
Equity Income TrustInvestments in securities:
Assets
Common stocks
Communication services $89,579,919 $89,579,919 — —
Consumer discretionary 78,293,617 78,293,617 — —
Consumer staples 118,161,583 118,161,583 — —
Energy 107,902,831 77,692,675 $30,210,156 —
Financials 368,232,136 368,232,136 — —
Health care 198,673,635 186,600,982 12,072,653 —
Industrials 203,813,213 203,813,213 — —
Information technology 155,745,318 155,745,318 — —
Materials 101,870,061 96,695,948 5,174,113 —
Real estate 75,828,136 75,828,136 — —
Utilities 126,988,556 126,988,556 — —
Preferred securities 21,481,661 21,481,661 — —
Convertible bonds 5,219,625 — 5,219,625 —
Short-term investments 22,665,494 22,665,494 — —
Total investments in securities $1,674,455,785 $1,621,779,238 $52,676,547 —
Financial Industries TrustInvestments in securities:
Assets
Common stocks
Financials
Banks $71,716,780 $68,165,977 $3,550,803 —
Capital markets 21,321,101 18,623,097 2,698,004 —
Consumer finance 7,612,718 7,612,718 — —
Diversified financial services 10,723,025 9,334,282 1,388,743 —
Insurance 29,014,351 29,014,351 — —
Thrifts and mortgage finance 1,765,104 1,765,104 — —
Industrials
Professional services 2,231,241 2,231,241 — —
Information technology
IT services 7,726,554 5,385,811 2,340,743 —
Real estate
Equity real estate investment trusts 7,415,305 6,035,837 1,379,468 —
Real estate management and development 765,779 — 765,779 —
Short-term investments 2,652,000 — 2,652,000 —
Total investments in securities $162,943,958 $148,168,418 $14,775,540 —
Fundamental All Cap Core TrustInvestments in securities:
Assets
Common stocks
Communication services $373,739,202 $373,739,202 — —
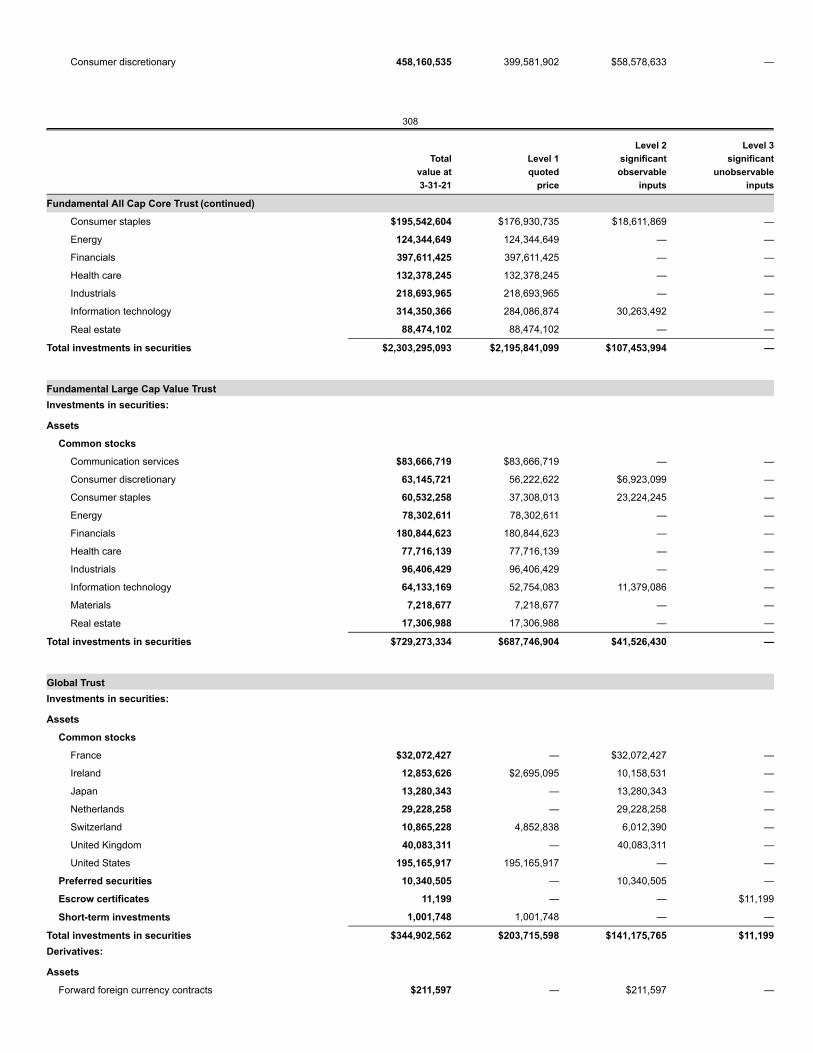
Consumer discretionary 458,160,535 399,581,902 $58,578,633 —
308
Totalvalue at3-31-21
Level 1quoted
price
Level 2significant
observableinputs
Level 3significant
unobservableinputs
Fundamental All Cap Core Trust (continued)
Consumer staples $195,542,604 $176,930,735 $18,611,869 —
Energy 124,344,649 124,344,649 — —
Financials 397,611,425 397,611,425 — —
Health care 132,378,245 132,378,245 — —
Industrials 218,693,965 218,693,965 — —
Information technology 314,350,366 284,086,874 30,263,492 —
Real estate 88,474,102 88,474,102 — —
Total investments in securities $2,303,295,093 $2,195,841,099 $107,453,994 —
Fundamental Large Cap Value TrustInvestments in securities:
Assets
Common stocks
Communication services $83,666,719 $83,666,719 — —
Consumer discretionary 63,145,721 56,222,622 $6,923,099 —
Consumer staples 60,532,258 37,308,013 23,224,245 —
Energy 78,302,611 78,302,611 — —
Financials 180,844,623 180,844,623 — —
Health care 77,716,139 77,716,139 — —
Industrials 96,406,429 96,406,429 — —
Information technology 64,133,169 52,754,083 11,379,086 —
Materials 7,218,677 7,218,677 — —
Real estate 17,306,988 17,306,988 — —
Total investments in securities $729,273,334 $687,746,904 $41,526,430 —
Global TrustInvestments in securities:
Assets
Common stocks
France $32,072,427 — $32,072,427 —
Ireland 12,853,626 $2,695,095 10,158,531 —
Japan 13,280,343 — 13,280,343 —
Netherlands 29,228,258 — 29,228,258 —
Switzerland 10,865,228 4,852,838 6,012,390 —
United Kingdom 40,083,311 — 40,083,311 —
United States 195,165,917 195,165,917 — —
Preferred securities 10,340,505 — 10,340,505 —
Escrow certificates 11,199 — — $11,199
Short-term investments 1,001,748 1,001,748 — —
Total investments in securities $344,902,562 $203,715,598 $141,175,765 $11,199Derivatives:
Assets
Forward foreign currency contracts $211,597 — $211,597 —
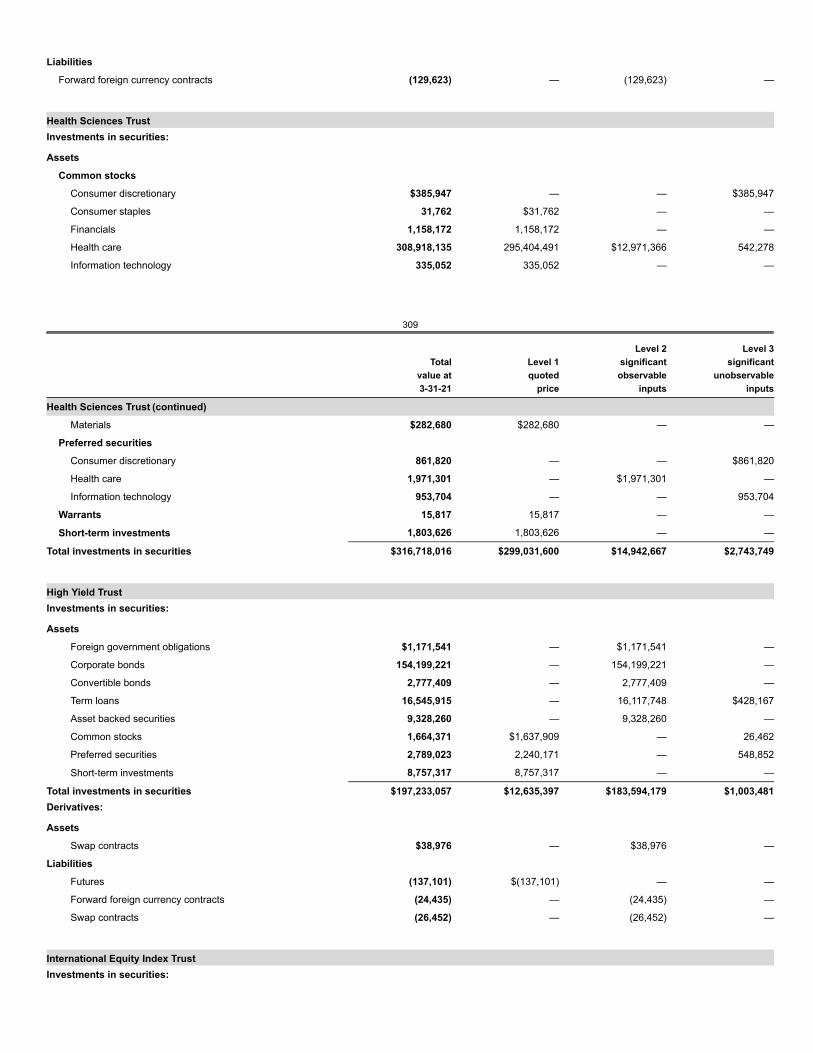
Liabilities
Forward foreign currency contracts (129,623) — (129,623) —
Health Sciences TrustInvestments in securities:
Assets
Common stocks
Consumer discretionary $385,947 — — $385,947
Consumer staples 31,762 $31,762 — —
Financials 1,158,172 1,158,172 — —
Health care 308,918,135 295,404,491 $12,971,366 542,278
Information technology 335,052 335,052 — —
309
Totalvalue at3-31-21
Level 1quoted
price
Level 2significant
observableinputs
Level 3significant
unobservableinputs
Health Sciences Trust (continued)
Materials $282,680 $282,680 — —
Preferred securities
Consumer discretionary 861,820 — — $861,820
Health care 1,971,301 — $1,971,301 —
Information technology 953,704 — — 953,704
Warrants 15,817 15,817 — —
Short-term investments 1,803,626 1,803,626 — —
Total investments in securities $316,718,016 $299,031,600 $14,942,667 $2,743,749
High Yield TrustInvestments in securities:
Assets
Foreign government obligations $1,171,541 — $1,171,541 —
Corporate bonds 154,199,221 — 154,199,221 —
Convertible bonds 2,777,409 — 2,777,409 —
Term loans 16,545,915 — 16,117,748 $428,167
Asset backed securities 9,328,260 — 9,328,260 —
Common stocks 1,664,371 $1,637,909 — 26,462
Preferred securities 2,789,023 2,240,171 — 548,852
Short-term investments 8,757,317 8,757,317 — —
Total investments in securities $197,233,057 $12,635,397 $183,594,179 $1,003,481Derivatives:
Assets
Swap contracts $38,976 — $38,976 —
Liabilities
Futures (137,101) $(137,101) — —
Forward foreign currency contracts (24,435) — (24,435) —
Swap contracts (26,452) — (26,452) —
International Equity Index TrustInvestments in securities:
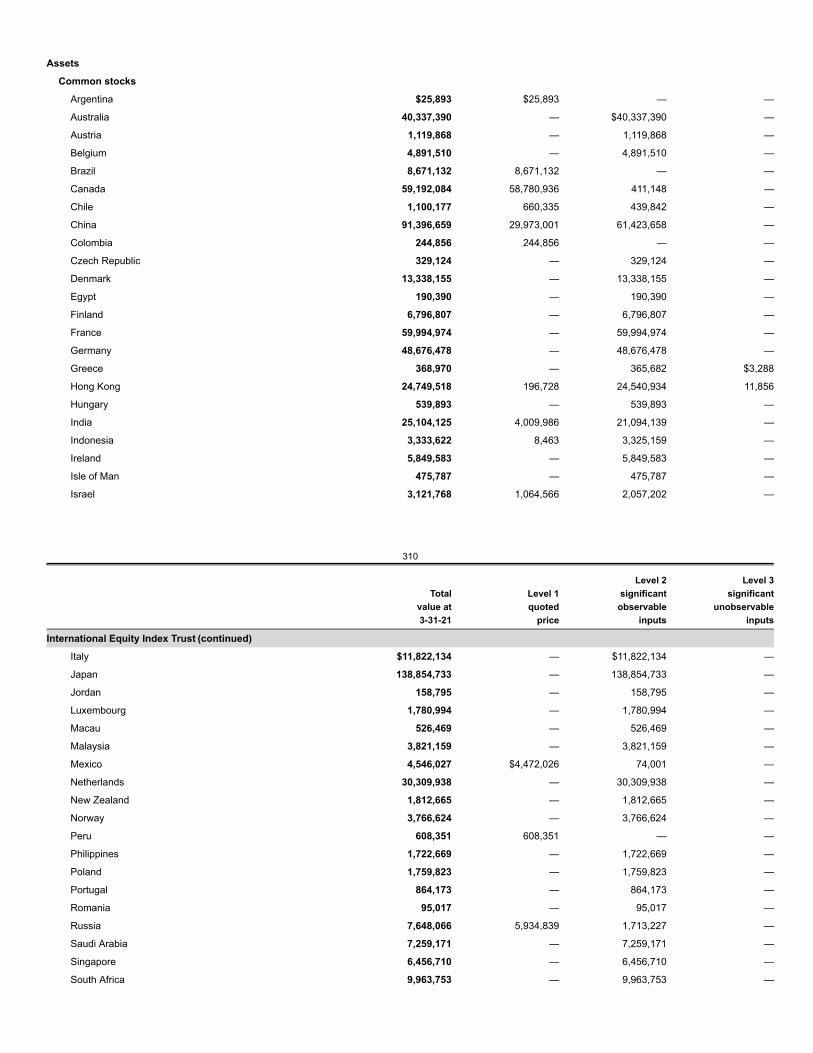
Assets
Common stocks
Argentina $25,893 $25,893 — —
Australia 40,337,390 — $40,337,390 —
Austria 1,119,868 — 1,119,868 —
Belgium 4,891,510 — 4,891,510 —
Brazil 8,671,132 8,671,132 — —
Canada 59,192,084 58,780,936 411,148 —
Chile 1,100,177 660,335 439,842 —
China 91,396,659 29,973,001 61,423,658 —
Colombia 244,856 244,856 — —
Czech Republic 329,124 — 329,124 —
Denmark 13,338,155 — 13,338,155 —
Egypt 190,390 — 190,390 —
Finland 6,796,807 — 6,796,807 —
France 59,994,974 — 59,994,974 —
Germany 48,676,478 — 48,676,478 —
Greece 368,970 — 365,682 $3,288
Hong Kong 24,749,518 196,728 24,540,934 11,856
Hungary 539,893 — 539,893 —
India 25,104,125 4,009,986 21,094,139 —
Indonesia 3,333,622 8,463 3,325,159 —
Ireland 5,849,583 — 5,849,583 —
Isle of Man 475,787 — 475,787 —
Israel 3,121,768 1,064,566 2,057,202 —
310
Totalvalue at3-31-21
Level 1quoted
price
Level 2significant
observableinputs
Level 3significant
unobservableinputs
International Equity Index Trust (continued)
Italy $11,822,134 — $11,822,134 —
Japan 138,854,733 — 138,854,733 —
Jordan 158,795 — 158,795 —
Luxembourg 1,780,994 — 1,780,994 —
Macau 526,469 — 526,469 —
Malaysia 3,821,159 — 3,821,159 —
Mexico 4,546,027 $4,472,026 74,001 —
Netherlands 30,309,938 — 30,309,938 —
New Zealand 1,812,665 — 1,812,665 —
Norway 3,766,624 — 3,766,624 —
Peru 608,351 608,351 — —
Philippines 1,722,669 — 1,722,669 —
Poland 1,759,823 — 1,759,823 —
Portugal 864,173 — 864,173 —
Romania 95,017 — 95,017 —
Russia 7,648,066 5,934,839 1,713,227 —
Saudi Arabia 7,259,171 — 7,259,171 —
Singapore 6,456,710 — 6,456,710 —
South Africa 9,963,753 — 9,963,753 —
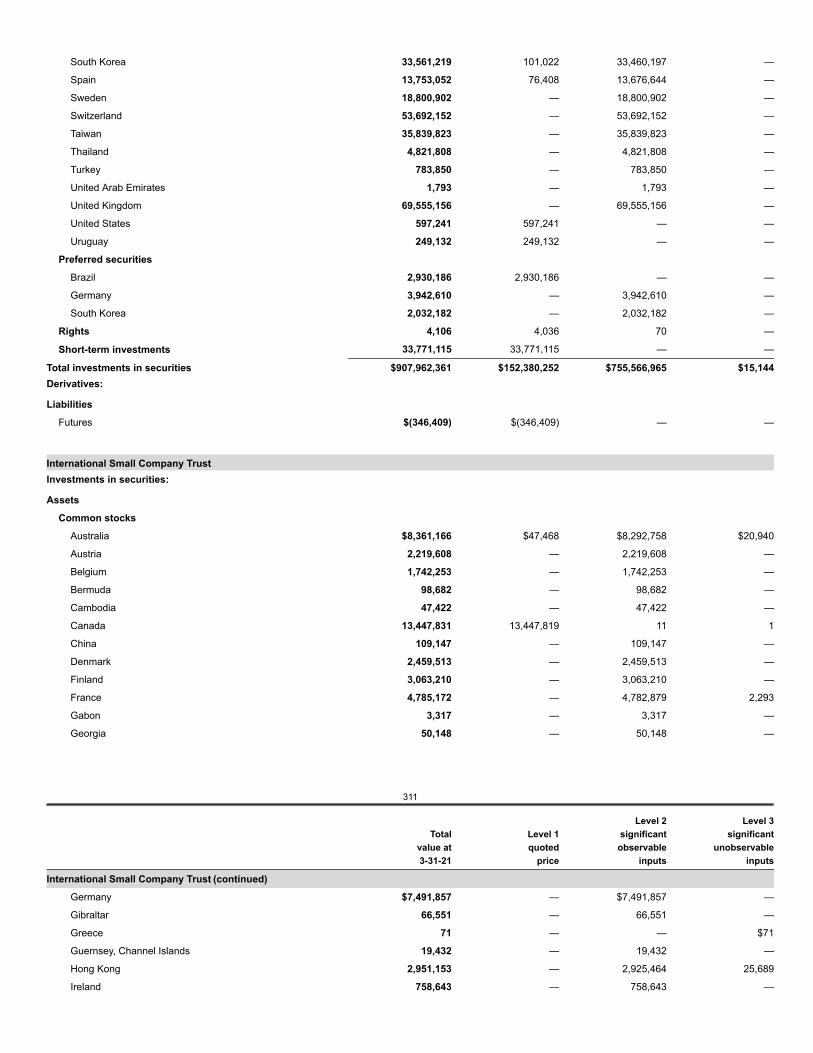
South Korea 33,561,219 101,022 33,460,197 —
Spain 13,753,052 76,408 13,676,644 —
Sweden 18,800,902 — 18,800,902 —
Switzerland 53,692,152 — 53,692,152 —
Taiwan 35,839,823 — 35,839,823 —
Thailand 4,821,808 — 4,821,808 —
Turkey 783,850 — 783,850 —
United Arab Emirates 1,793 — 1,793 —
United Kingdom 69,555,156 — 69,555,156 —
United States 597,241 597,241 — —
Uruguay 249,132 249,132 — —
Preferred securities
Brazil 2,930,186 2,930,186 — —
Germany 3,942,610 — 3,942,610 —
South Korea 2,032,182 — 2,032,182 —
Rights 4,106 4,036 70 —
Short-term investments 33,771,115 33,771,115 — —
Total investments in securities $907,962,361 $152,380,252 $755,566,965 $15,144Derivatives:
Liabilities
Futures $(346,409) $(346,409) — —
International Small Company TrustInvestments in securities:
Assets
Common stocks
Australia $8,361,166 $47,468 $8,292,758 $20,940
Austria 2,219,608 — 2,219,608 —
Belgium 1,742,253 — 1,742,253 —
Bermuda 98,682 — 98,682 —
Cambodia 47,422 — 47,422 —
Canada 13,447,831 13,447,819 11 1
China 109,147 — 109,147 —
Denmark 2,459,513 — 2,459,513 —
Finland 3,063,210 — 3,063,210 —
France 4,785,172 — 4,782,879 2,293
Gabon 3,317 — 3,317 —
Georgia 50,148 — 50,148 —
311
Totalvalue at3-31-21
Level 1quoted
price
Level 2significant
observableinputs
Level 3significant
unobservableinputs
International Small Company Trust (continued)
Germany $7,491,857 — $7,491,857 —
Gibraltar 66,551 — 66,551 —
Greece 71 — — $71
Guernsey, Channel Islands 19,432 — 19,432 —
Hong Kong 2,951,153 — 2,925,464 25,689
Ireland 758,643 — 758,643 —
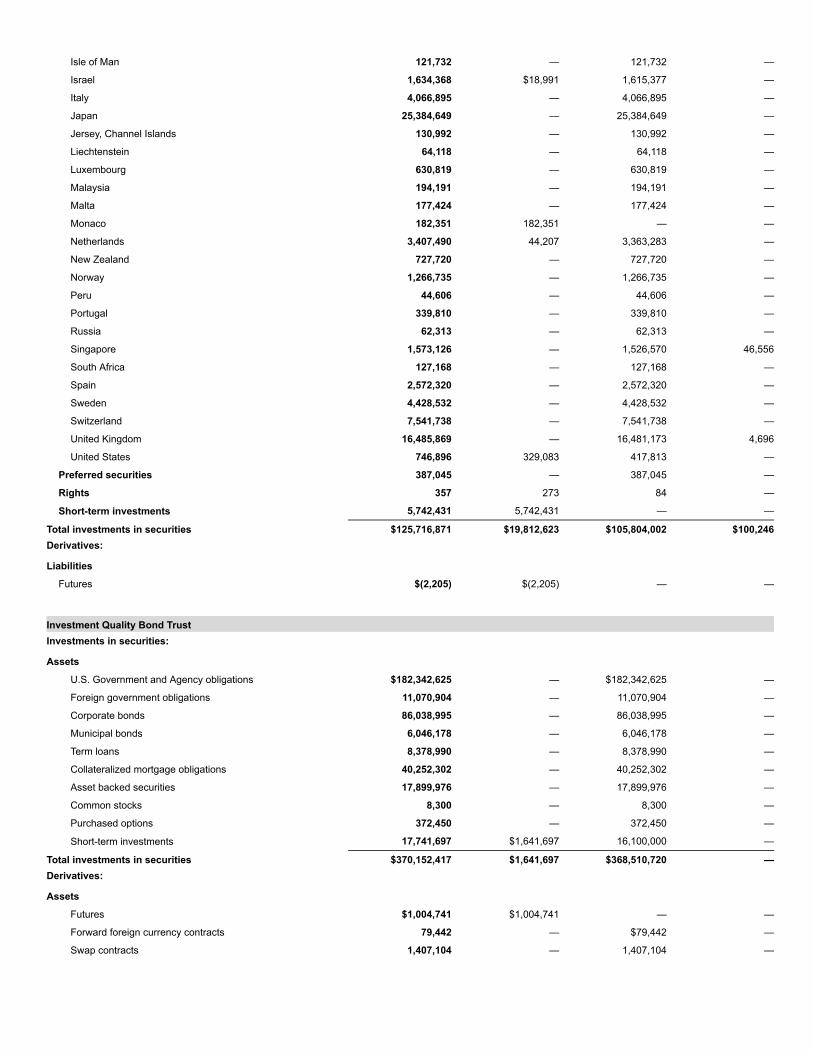
Isle of Man 121,732 — 121,732 —
Israel 1,634,368 $18,991 1,615,377 —
Italy 4,066,895 — 4,066,895 —
Japan 25,384,649 — 25,384,649 —
Jersey, Channel Islands 130,992 — 130,992 —
Liechtenstein 64,118 — 64,118 —
Luxembourg 630,819 — 630,819 —
Malaysia 194,191 — 194,191 —
Malta 177,424 — 177,424 —
Monaco 182,351 182,351 — —
Netherlands 3,407,490 44,207 3,363,283 —
New Zealand 727,720 — 727,720 —
Norway 1,266,735 — 1,266,735 —
Peru 44,606 — 44,606 —
Portugal 339,810 — 339,810 —
Russia 62,313 — 62,313 —
Singapore 1,573,126 — 1,526,570 46,556
South Africa 127,168 — 127,168 —
Spain 2,572,320 — 2,572,320 —
Sweden 4,428,532 — 4,428,532 —
Switzerland 7,541,738 — 7,541,738 —
United Kingdom 16,485,869 — 16,481,173 4,696
United States 746,896 329,083 417,813 —
Preferred securities 387,045 — 387,045 —
Rights 357 273 84 —
Short-term investments 5,742,431 5,742,431 — —
Total investments in securities $125,716,871 $19,812,623 $105,804,002 $100,246Derivatives:
Liabilities
Futures $(2,205) $(2,205) — —
Investment Quality Bond TrustInvestments in securities:
Assets
U.S. Government and Agency obligations $182,342,625 — $182,342,625 —
Foreign government obligations 11,070,904 — 11,070,904 —
Corporate bonds 86,038,995 — 86,038,995 —
Municipal bonds 6,046,178 — 6,046,178 —
Term loans 8,378,990 — 8,378,990 —
Collateralized mortgage obligations 40,252,302 — 40,252,302 —
Asset backed securities 17,899,976 — 17,899,976 —
Common stocks 8,300 — 8,300 —
Purchased options 372,450 — 372,450 —
Short-term investments 17,741,697 $1,641,697 16,100,000 —
Total investments in securities $370,152,417 $1,641,697 $368,510,720 —Derivatives:
Assets
Futures $1,004,741 $1,004,741 — —
Forward foreign currency contracts 79,442 — $79,442 —
Swap contracts 1,407,104 — 1,407,104 —
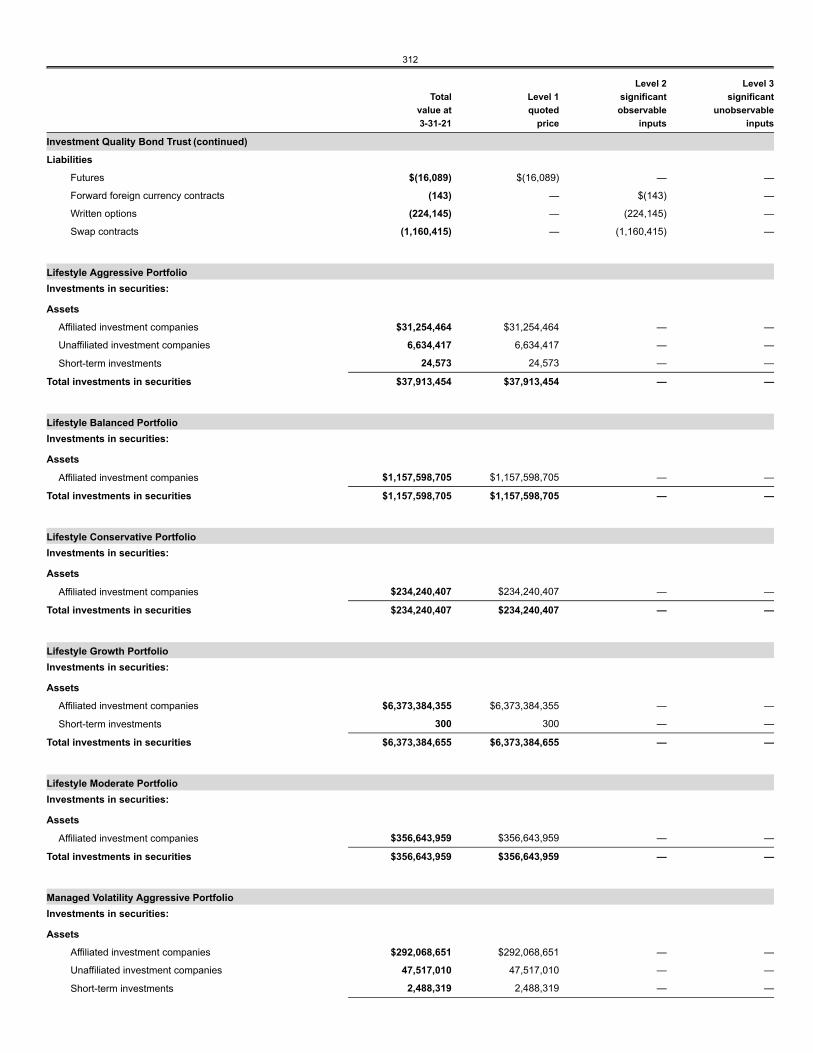
312
Totalvalue at3-31-21
Level 1quoted
price
Level 2significant
observableinputs
Level 3significant
unobservableinputs
Investment Quality Bond Trust (continued)
Liabilities
Futures $(16,089) $(16,089) — —
Forward foreign currency contracts (143) — $(143) —
Written options (224,145) — (224,145) —
Swap contracts (1,160,415) — (1,160,415) —
Lifestyle Aggressive PortfolioInvestments in securities:
Assets
Affiliated investment companies $31,254,464 $31,254,464 — —
Unaffiliated investment companies 6,634,417 6,634,417 — —
Short-term investments 24,573 24,573 — —
Total investments in securities $37,913,454 $37,913,454 — —
Lifestyle Balanced PortfolioInvestments in securities:
Assets
Affiliated investment companies $1,157,598,705 $1,157,598,705 — —
Total investments in securities $1,157,598,705 $1,157,598,705 — —
Lifestyle Conservative PortfolioInvestments in securities:
Assets
Affiliated investment companies $234,240,407 $234,240,407 — —
Total investments in securities $234,240,407 $234,240,407 — —
Lifestyle Growth PortfolioInvestments in securities:
Assets
Affiliated investment companies $6,373,384,355 $6,373,384,355 — —
Short-term investments 300 300 — —
Total investments in securities $6,373,384,655 $6,373,384,655 — —
Lifestyle Moderate PortfolioInvestments in securities:
Assets
Affiliated investment companies $356,643,959 $356,643,959 — —
Total investments in securities $356,643,959 $356,643,959 — —
Managed Volatility Aggressive PortfolioInvestments in securities:
Assets
Affiliated investment companies $292,068,651 $292,068,651 — —
Unaffiliated investment companies 47,517,010 47,517,010 — —
Short-term investments 2,488,319 2,488,319 — —
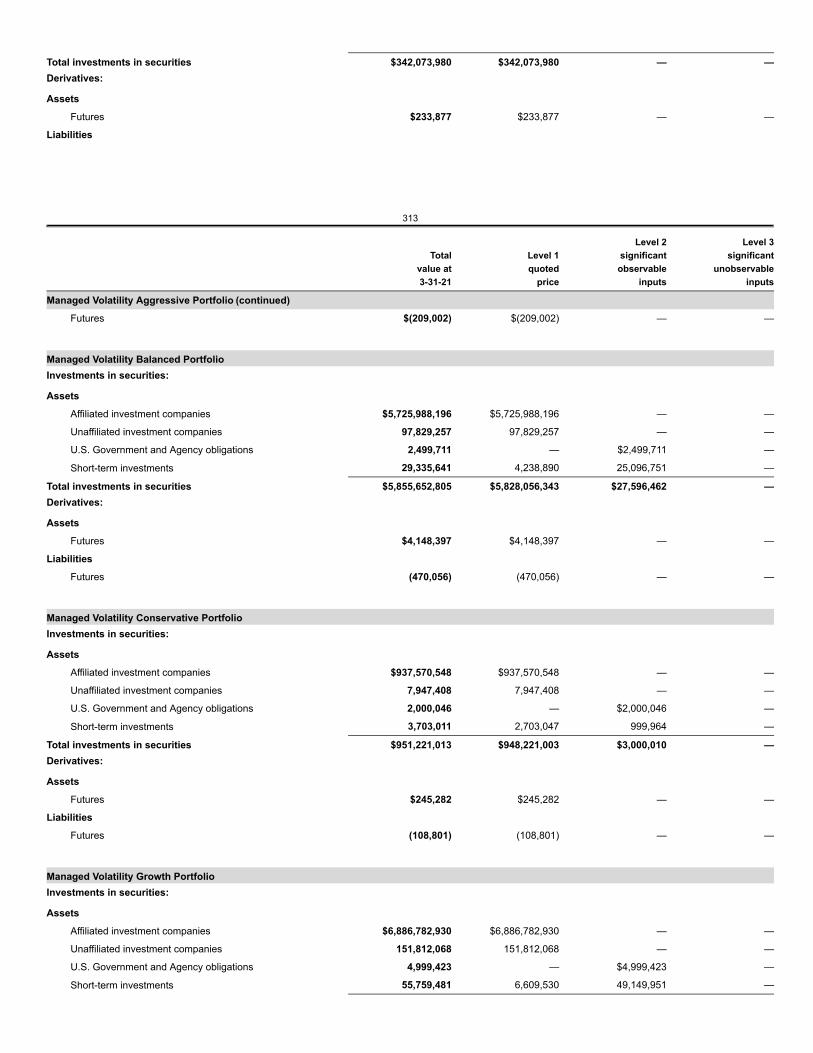
Total investments in securities $342,073,980 $342,073,980 — —Derivatives:
Assets
Futures $233,877 $233,877 — —
Liabilities
313
Totalvalue at3-31-21
Level 1quoted
price
Level 2significant
observableinputs
Level 3significant
unobservableinputs
Managed Volatility Aggressive Portfolio (continued)
Futures $(209,002) $(209,002) — —
Managed Volatility Balanced PortfolioInvestments in securities:
Assets
Affiliated investment companies $5,725,988,196 $5,725,988,196 — —
Unaffiliated investment companies 97,829,257 97,829,257 — —
U.S. Government and Agency obligations 2,499,711 — $2,499,711 —
Short-term investments 29,335,641 4,238,890 25,096,751 —
Total investments in securities $5,855,652,805 $5,828,056,343 $27,596,462 —Derivatives:
Assets
Futures $4,148,397 $4,148,397 — —
Liabilities
Futures (470,056) (470,056) — —
Managed Volatility Conservative PortfolioInvestments in securities:
Assets
Affiliated investment companies $937,570,548 $937,570,548 — —
Unaffiliated investment companies 7,947,408 7,947,408 — —
U.S. Government and Agency obligations 2,000,046 — $2,000,046 —
Short-term investments 3,703,011 2,703,047 999,964 —
Total investments in securities $951,221,013 $948,221,003 $3,000,010 —Derivatives:
Assets
Futures $245,282 $245,282 — —
Liabilities
Futures (108,801) (108,801) — —
Managed Volatility Growth PortfolioInvestments in securities:
Assets
Affiliated investment companies $6,886,782,930 $6,886,782,930 — —
Unaffiliated investment companies 151,812,068 151,812,068 — —
U.S. Government and Agency obligations 4,999,423 — $4,999,423 —
Short-term investments 55,759,481 6,609,530 49,149,951 —
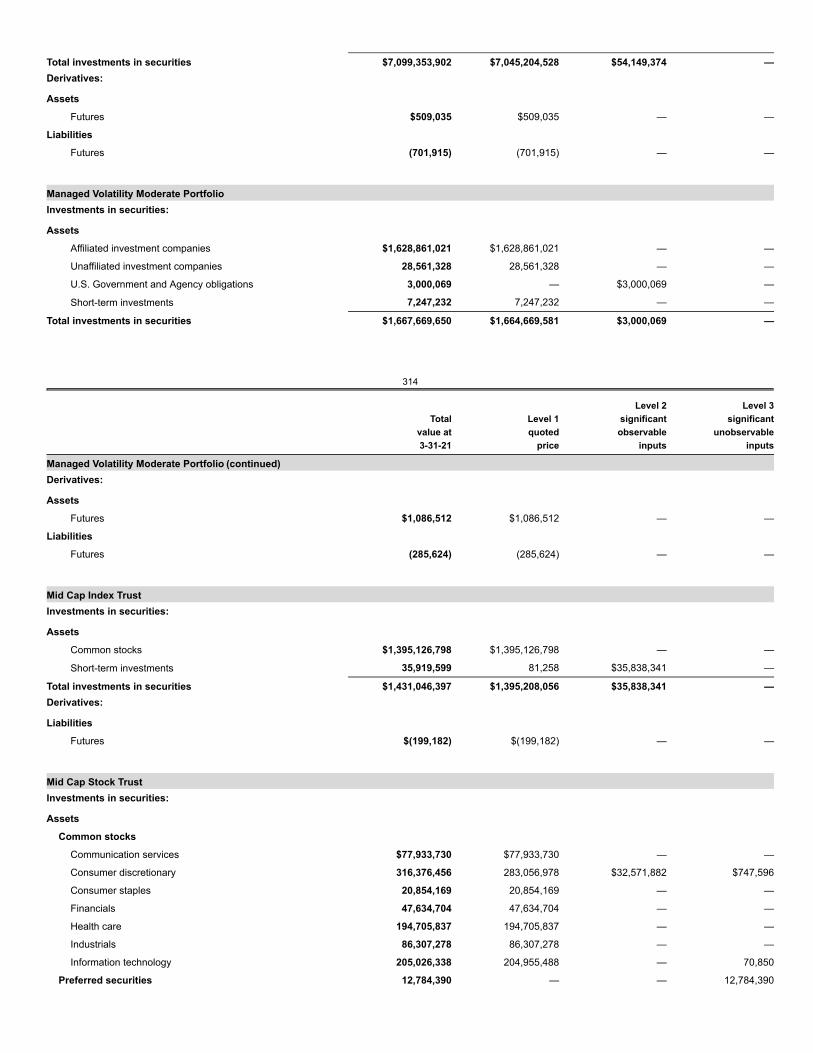
Total investments in securities $7,099,353,902 $7,045,204,528 $54,149,374 —Derivatives:
Assets
Futures $509,035 $509,035 — —
Liabilities
Futures (701,915) (701,915) — —
Managed Volatility Moderate PortfolioInvestments in securities:
Assets
Affiliated investment companies $1,628,861,021 $1,628,861,021 — —
Unaffiliated investment companies 28,561,328 28,561,328 — —
U.S. Government and Agency obligations 3,000,069 — $3,000,069 —
Short-term investments 7,247,232 7,247,232 — —
Total investments in securities $1,667,669,650 $1,664,669,581 $3,000,069 —
314
Totalvalue at3-31-21
Level 1quoted
price
Level 2significant
observableinputs
Level 3significant
unobservableinputs
Managed Volatility Moderate Portfolio (continued)Derivatives:
Assets
Futures $1,086,512 $1,086,512 — —
Liabilities
Futures (285,624) (285,624) — —
Mid Cap Index TrustInvestments in securities:
Assets
Common stocks $1,395,126,798 $1,395,126,798 — —
Short-term investments 35,919,599 81,258 $35,838,341 —
Total investments in securities $1,431,046,397 $1,395,208,056 $35,838,341 —Derivatives:
Liabilities
Futures $(199,182) $(199,182) — —
Mid Cap Stock TrustInvestments in securities:
Assets
Common stocks
Communication services $77,933,730 $77,933,730 — —
Consumer discretionary 316,376,456 283,056,978 $32,571,882 $747,596
Consumer staples 20,854,169 20,854,169 — —
Financials 47,634,704 47,634,704 — —
Health care 194,705,837 194,705,837 — —
Industrials 86,307,278 86,307,278 — —
Information technology 205,026,338 204,955,488 — 70,850
Preferred securities 12,784,390 — — 12,784,390
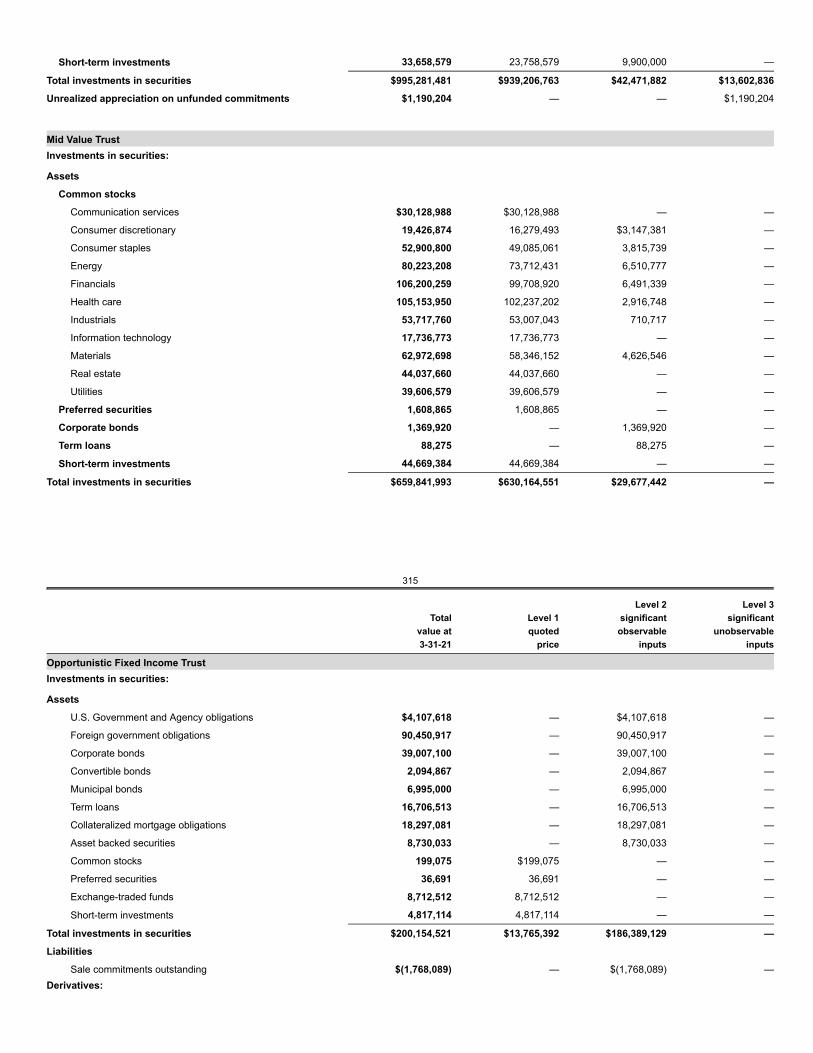
Short-term investments 33,658,579 23,758,579 9,900,000 —
Total investments in securities $995,281,481 $939,206,763 $42,471,882 $13,602,836
Unrealized appreciation on unfunded commitments $1,190,204 — — $1,190,204
Mid Value TrustInvestments in securities:
Assets
Common stocks
Communication services $30,128,988 $30,128,988 — —
Consumer discretionary 19,426,874 16,279,493 $3,147,381 —
Consumer staples 52,900,800 49,085,061 3,815,739 —
Energy 80,223,208 73,712,431 6,510,777 —
Financials 106,200,259 99,708,920 6,491,339 —
Health care 105,153,950 102,237,202 2,916,748 —
Industrials 53,717,760 53,007,043 710,717 —
Information technology 17,736,773 17,736,773 — —
Materials 62,972,698 58,346,152 4,626,546 —
Real estate 44,037,660 44,037,660 — —
Utilities 39,606,579 39,606,579 — —
Preferred securities 1,608,865 1,608,865 — —
Corporate bonds 1,369,920 — 1,369,920 —
Term loans 88,275 — 88,275 —
Short-term investments 44,669,384 44,669,384 — —
Total investments in securities $659,841,993 $630,164,551 $29,677,442 —
315
Totalvalue at3-31-21
Level 1quoted
price
Level 2significant
observableinputs
Level 3significant
unobservableinputs
Opportunistic Fixed Income TrustInvestments in securities:
Assets
U.S. Government and Agency obligations $4,107,618 — $4,107,618 —
Foreign government obligations 90,450,917 — 90,450,917 —
Corporate bonds 39,007,100 — 39,007,100 —
Convertible bonds 2,094,867 — 2,094,867 —
Municipal bonds 6,995,000 — 6,995,000 —
Term loans 16,706,513 — 16,706,513 —
Collateralized mortgage obligations 18,297,081 — 18,297,081 —
Asset backed securities 8,730,033 — 8,730,033 —
Common stocks 199,075 $199,075 — —
Preferred securities 36,691 36,691 — —
Exchange-traded funds 8,712,512 8,712,512 — —
Short-term investments 4,817,114 4,817,114 — —
Total investments in securities $200,154,521 $13,765,392 $186,389,129 —
Liabilities
Sale commitments outstanding $(1,768,089) — $(1,768,089) —Derivatives:
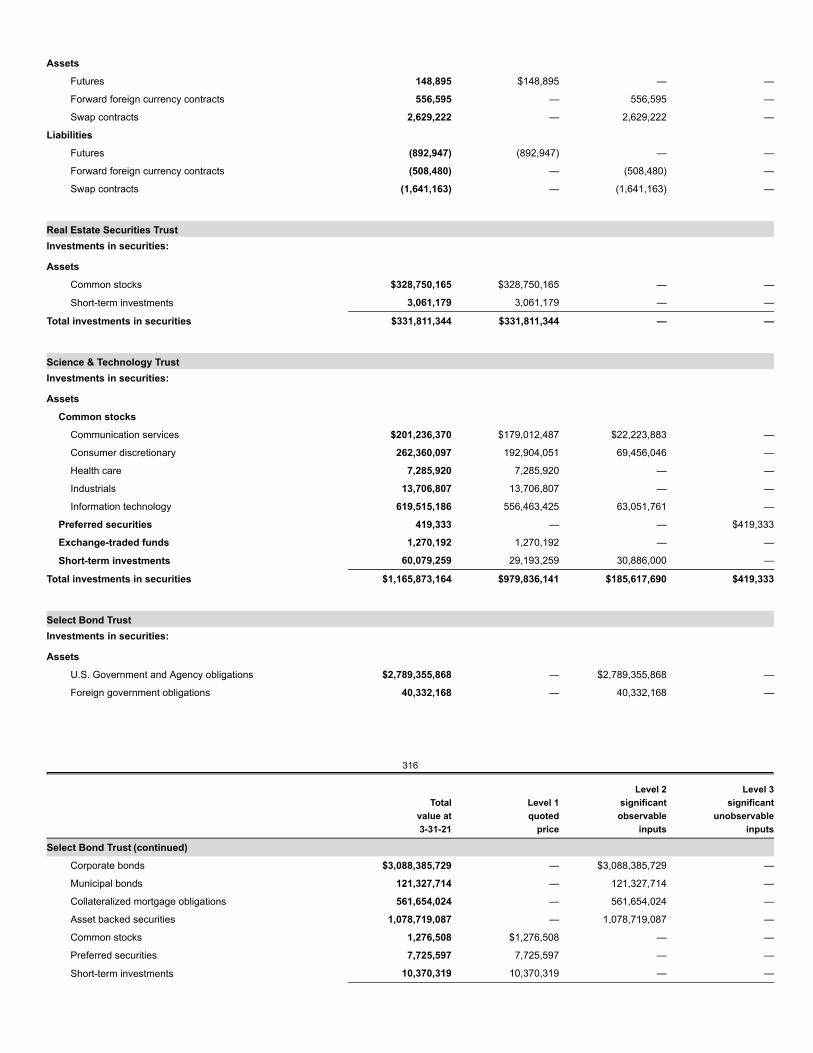
Assets
Futures 148,895 $148,895 — —
Forward foreign currency contracts 556,595 — 556,595 —
Swap contracts 2,629,222 — 2,629,222 —
Liabilities
Futures (892,947) (892,947) — —
Forward foreign currency contracts (508,480) — (508,480) —
Swap contracts (1,641,163) — (1,641,163) —
Real Estate Securities TrustInvestments in securities:
Assets
Common stocks $328,750,165 $328,750,165 — —
Short-term investments 3,061,179 3,061,179 — —
Total investments in securities $331,811,344 $331,811,344 — —
Science & Technology TrustInvestments in securities:
Assets
Common stocks
Communication services $201,236,370 $179,012,487 $22,223,883 —
Consumer discretionary 262,360,097 192,904,051 69,456,046 —
Health care 7,285,920 7,285,920 — —
Industrials 13,706,807 13,706,807 — —
Information technology 619,515,186 556,463,425 63,051,761 —
Preferred securities 419,333 — — $419,333
Exchange-traded funds 1,270,192 1,270,192 — —
Short-term investments 60,079,259 29,193,259 30,886,000 —
Total investments in securities $1,165,873,164 $979,836,141 $185,617,690 $419,333
Select Bond TrustInvestments in securities:
Assets
U.S. Government and Agency obligations $2,789,355,868 — $2,789,355,868 —
Foreign government obligations 40,332,168 — 40,332,168 —
316
Totalvalue at3-31-21
Level 1quoted
price
Level 2significant
observableinputs
Level 3significant
unobservableinputs
Select Bond Trust (continued)
Corporate bonds $3,088,385,729 — $3,088,385,729 —
Municipal bonds 121,327,714 — 121,327,714 —
Collateralized mortgage obligations 561,654,024 — 561,654,024 —
Asset backed securities 1,078,719,087 — 1,078,719,087 —
Common stocks 1,276,508 $1,276,508 — —
Preferred securities 7,725,597 7,725,597 — —
Short-term investments 10,370,319 10,370,319 — —
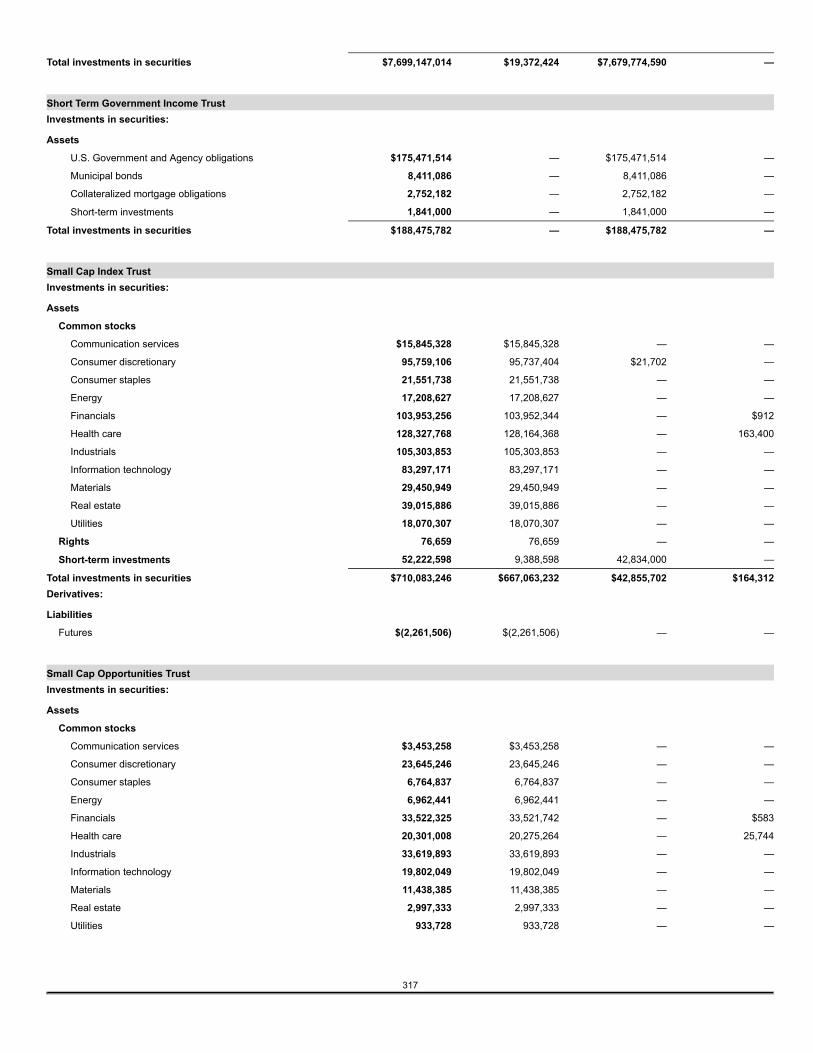
Total investments in securities $7,699,147,014 $19,372,424 $7,679,774,590 —
Short Term Government Income TrustInvestments in securities:
Assets
U.S. Government and Agency obligations $175,471,514 — $175,471,514 —
Municipal bonds 8,411,086 — 8,411,086 —
Collateralized mortgage obligations 2,752,182 — 2,752,182 —
Short-term investments 1,841,000 — 1,841,000 —
Total investments in securities $188,475,782 — $188,475,782 —
Small Cap Index TrustInvestments in securities:
Assets
Common stocks
Communication services $15,845,328 $15,845,328 — —
Consumer discretionary 95,759,106 95,737,404 $21,702 —
Consumer staples 21,551,738 21,551,738 — —
Energy 17,208,627 17,208,627 — —
Financials 103,953,256 103,952,344 — $912
Health care 128,327,768 128,164,368 — 163,400
Industrials 105,303,853 105,303,853 — —
Information technology 83,297,171 83,297,171 — —
Materials 29,450,949 29,450,949 — —
Real estate 39,015,886 39,015,886 — —
Utilities 18,070,307 18,070,307 — —
Rights 76,659 76,659 — —
Short-term investments 52,222,598 9,388,598 42,834,000 —
Total investments in securities $710,083,246 $667,063,232 $42,855,702 $164,312Derivatives:
Liabilities
Futures $(2,261,506) $(2,261,506) — —
Small Cap Opportunities TrustInvestments in securities:
Assets
Common stocks
Communication services $3,453,258 $3,453,258 — —
Consumer discretionary 23,645,246 23,645,246 — —
Consumer staples 6,764,837 6,764,837 — —
Energy 6,962,441 6,962,441 — —
Financials 33,522,325 33,521,742 — $583
Health care 20,301,008 20,275,264 — 25,744
Industrials 33,619,893 33,619,893 — —
Information technology 19,802,049 19,802,049 — —
Materials 11,438,385 11,438,385 — —
Real estate 2,997,333 2,997,333 — —
Utilities 933,728 933,728 — —
317
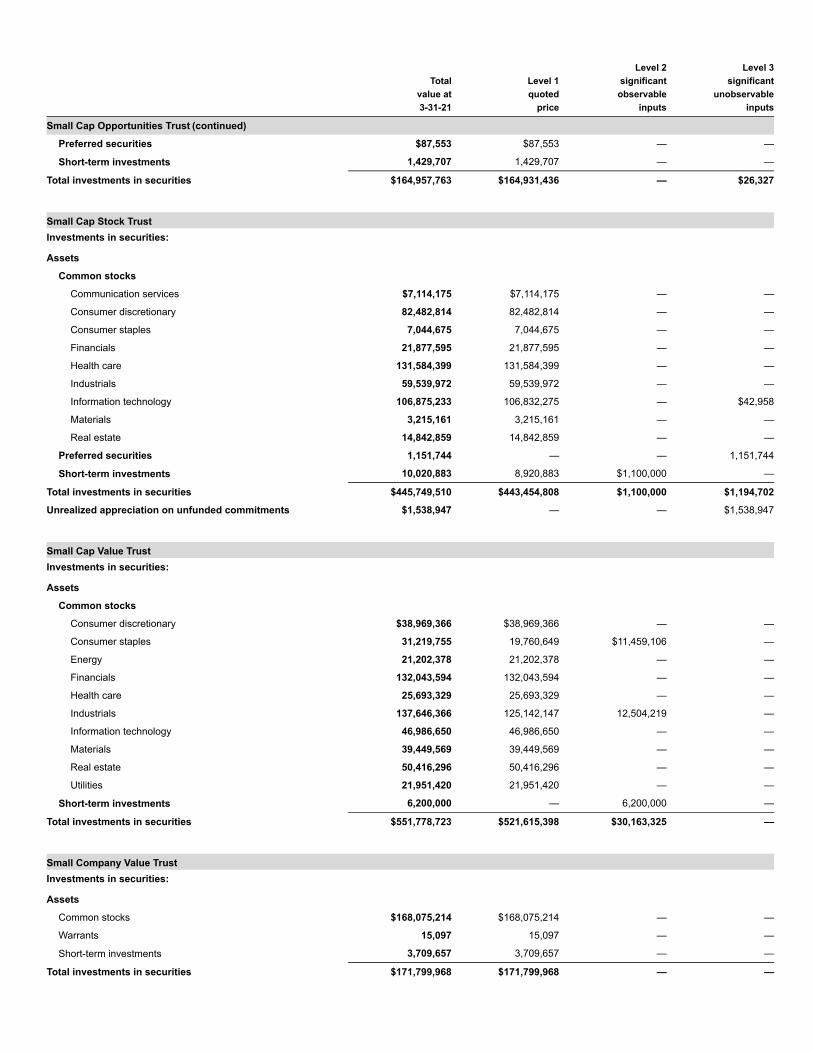
Totalvalue at3-31-21
Level 1quoted
price
Level 2significant
observableinputs
Level 3significant
unobservableinputs
Small Cap Opportunities Trust (continued)
Preferred securities $87,553 $87,553 — —
Short-term investments 1,429,707 1,429,707 — —
Total investments in securities $164,957,763 $164,931,436 — $26,327
Small Cap Stock TrustInvestments in securities:
Assets
Common stocks
Communication services $7,114,175 $7,114,175 — —
Consumer discretionary 82,482,814 82,482,814 — —
Consumer staples 7,044,675 7,044,675 — —
Financials 21,877,595 21,877,595 — —
Health care 131,584,399 131,584,399 — —
Industrials 59,539,972 59,539,972 — —
Information technology 106,875,233 106,832,275 — $42,958
Materials 3,215,161 3,215,161 — —
Real estate 14,842,859 14,842,859 — —
Preferred securities 1,151,744 — — 1,151,744
Short-term investments 10,020,883 8,920,883 $1,100,000 —
Total investments in securities $445,749,510 $443,454,808 $1,100,000 $1,194,702
Unrealized appreciation on unfunded commitments $1,538,947 — — $1,538,947
Small Cap Value TrustInvestments in securities:
Assets
Common stocks
Consumer discretionary $38,969,366 $38,969,366 — —
Consumer staples 31,219,755 19,760,649 $11,459,106 —
Energy 21,202,378 21,202,378 — —
Financials 132,043,594 132,043,594 — —
Health care 25,693,329 25,693,329 — —
Industrials 137,646,366 125,142,147 12,504,219 —
Information technology 46,986,650 46,986,650 — —
Materials 39,449,569 39,449,569 — —
Real estate 50,416,296 50,416,296 — —
Utilities 21,951,420 21,951,420 — —
Short-term investments 6,200,000 — 6,200,000 —
Total investments in securities $551,778,723 $521,615,398 $30,163,325 —
Small Company Value TrustInvestments in securities:
Assets
Common stocks $168,075,214 $168,075,214 — —
Warrants 15,097 15,097 — —
Short-term investments 3,709,657 3,709,657 — —
Total investments in securities $171,799,968 $171,799,968 — —
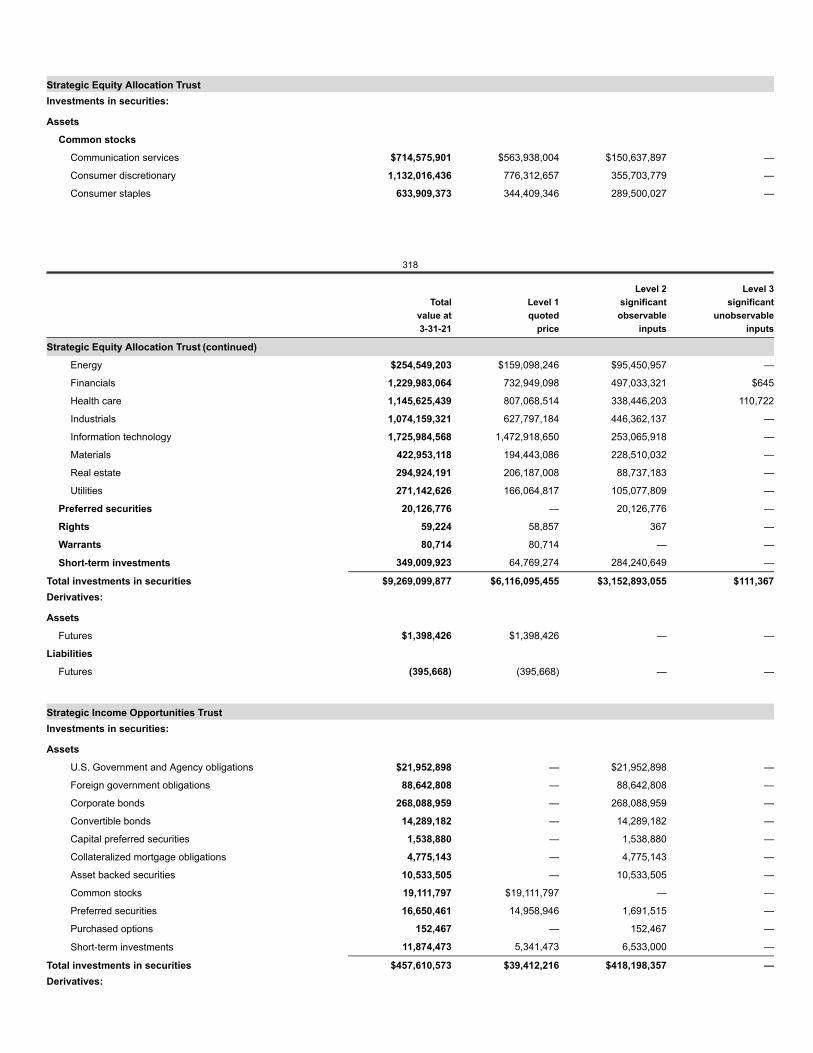
Strategic Equity Allocation TrustInvestments in securities:
Assets
Common stocks
Communication services $714,575,901 $563,938,004 $150,637,897 —
Consumer discretionary 1,132,016,436 776,312,657 355,703,779 —
Consumer staples 633,909,373 344,409,346 289,500,027 —
318
Totalvalue at3-31-21
Level 1quoted
price
Level 2significant
observableinputs
Level 3significant
unobservableinputs
Strategic Equity Allocation Trust (continued)
Energy $254,549,203 $159,098,246 $95,450,957 —
Financials 1,229,983,064 732,949,098 497,033,321 $645
Health care 1,145,625,439 807,068,514 338,446,203 110,722
Industrials 1,074,159,321 627,797,184 446,362,137 —
Information technology 1,725,984,568 1,472,918,650 253,065,918 —
Materials 422,953,118 194,443,086 228,510,032 —
Real estate 294,924,191 206,187,008 88,737,183 —
Utilities 271,142,626 166,064,817 105,077,809 —
Preferred securities 20,126,776 — 20,126,776 —
Rights 59,224 58,857 367 —
Warrants 80,714 80,714 — —
Short-term investments 349,009,923 64,769,274 284,240,649 —
Total investments in securities $9,269,099,877 $6,116,095,455 $3,152,893,055 $111,367Derivatives:
Assets
Futures $1,398,426 $1,398,426 — —
Liabilities
Futures (395,668) (395,668) — —
Strategic Income Opportunities TrustInvestments in securities:
Assets
U.S. Government and Agency obligations $21,952,898 — $21,952,898 —
Foreign government obligations 88,642,808 — 88,642,808 —
Corporate bonds 268,088,959 — 268,088,959 —
Convertible bonds 14,289,182 — 14,289,182 —
Capital preferred securities 1,538,880 — 1,538,880 —
Collateralized mortgage obligations 4,775,143 — 4,775,143 —
Asset backed securities 10,533,505 — 10,533,505 —
Common stocks 19,111,797 $19,111,797 — —
Preferred securities 16,650,461 14,958,946 1,691,515 —
Purchased options 152,467 — 152,467 —
Short-term investments 11,874,473 5,341,473 6,533,000 —
Total investments in securities $457,610,573 $39,412,216 $418,198,357 —Derivatives:
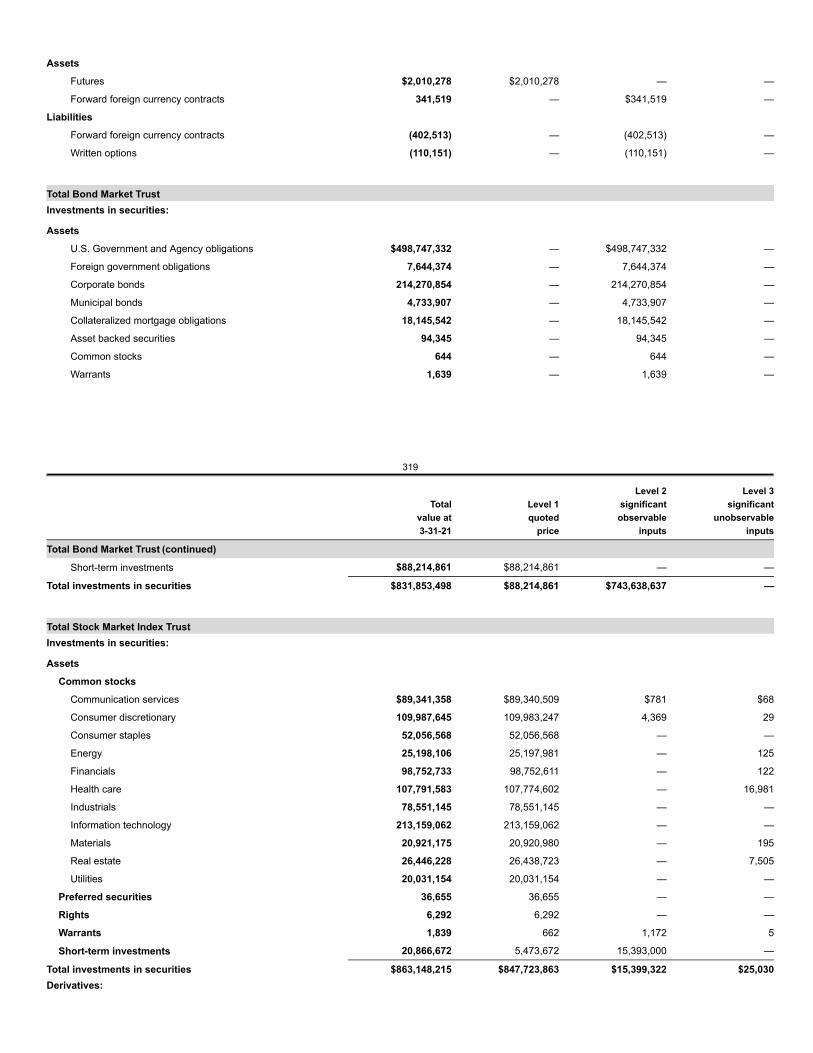
Assets
Futures $2,010,278 $2,010,278 — —
Forward foreign currency contracts 341,519 — $341,519 —
Liabilities
Forward foreign currency contracts (402,513) — (402,513) —
Written options (110,151) — (110,151) —
Total Bond Market TrustInvestments in securities:
Assets
U.S. Government and Agency obligations $498,747,332 — $498,747,332 —
Foreign government obligations 7,644,374 — 7,644,374 —
Corporate bonds 214,270,854 — 214,270,854 —
Municipal bonds 4,733,907 — 4,733,907 —
Collateralized mortgage obligations 18,145,542 — 18,145,542 —
Asset backed securities 94,345 — 94,345 —
Common stocks 644 — 644 —
Warrants 1,639 — 1,639 —
319
Totalvalue at3-31-21
Level 1quoted
price
Level 2significant
observableinputs
Level 3significant
unobservableinputs
Total Bond Market Trust (continued)
Short-term investments $88,214,861 $88,214,861 — —
Total investments in securities $831,853,498 $88,214,861 $743,638,637 —
Total Stock Market Index TrustInvestments in securities:
Assets
Common stocks
Communication services $89,341,358 $89,340,509 $781 $68
Consumer discretionary 109,987,645 109,983,247 4,369 29
Consumer staples 52,056,568 52,056,568 — —
Energy 25,198,106 25,197,981 — 125
Financials 98,752,733 98,752,611 — 122
Health care 107,791,583 107,774,602 — 16,981
Industrials 78,551,145 78,551,145 — —
Information technology 213,159,062 213,159,062 — —
Materials 20,921,175 20,920,980 — 195
Real estate 26,446,228 26,438,723 — 7,505
Utilities 20,031,154 20,031,154 — —
Preferred securities 36,655 36,655 — —
Rights 6,292 6,292 — —
Warrants 1,839 662 1,172 5
Short-term investments 20,866,672 5,473,672 15,393,000 —
Total investments in securities $863,148,215 $847,723,863 $15,399,322 $25,030Derivatives:
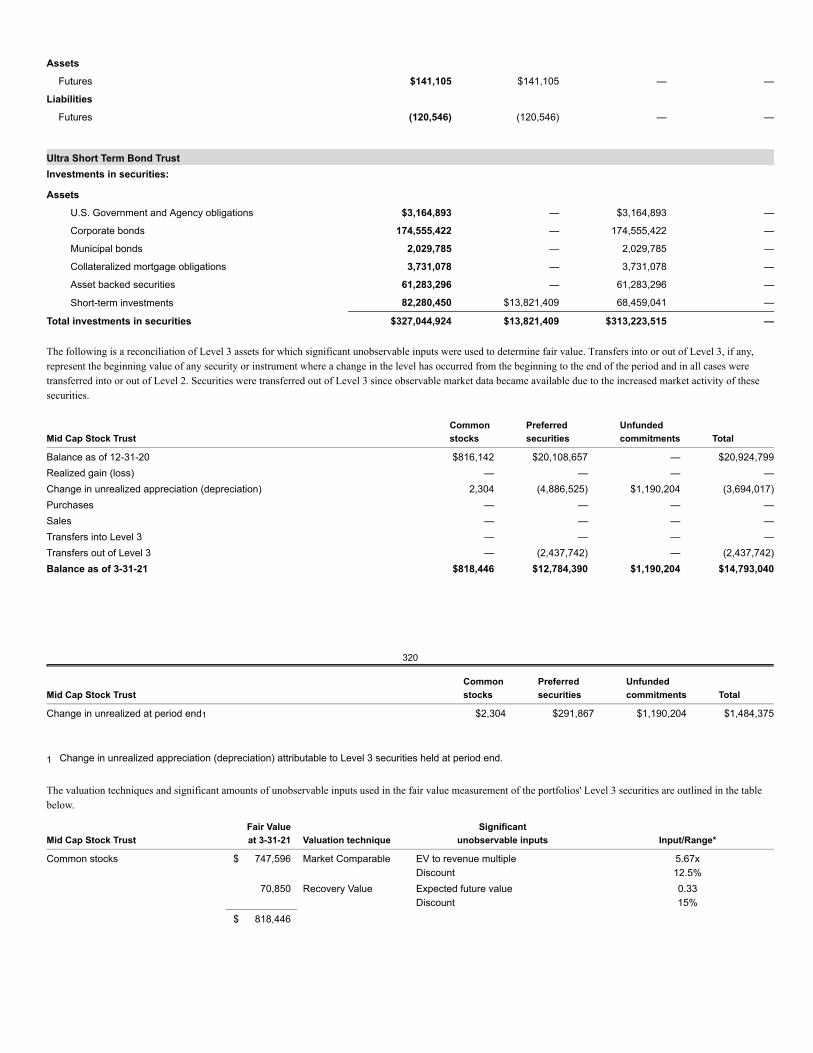
Assets
Futures $141,105 $141,105 — —
Liabilities
Futures (120,546) (120,546) — —
Ultra Short Term Bond TrustInvestments in securities:
Assets
U.S. Government and Agency obligations $3,164,893 — $3,164,893 —
Corporate bonds 174,555,422 — 174,555,422 —
Municipal bonds 2,029,785 — 2,029,785 —
Collateralized mortgage obligations 3,731,078 — 3,731,078 —
Asset backed securities 61,283,296 — 61,283,296 —
Short-term investments 82,280,450 $13,821,409 68,459,041 —
Total investments in securities $327,044,924 $13,821,409 $313,223,515 —
The following is a reconciliation of Level 3 assets for which significant unobservable inputs were used to determine fair value. Transfers into or out of Level 3, if any,represent the beginning value of any security or instrument where a change in the level has occurred from the beginning to the end of the period and in all cases weretransferred into or out of Level 2. Securities were transferred out of Level 3 since observable market data became available due to the increased market activity of thesesecurities.
Mid Cap Stock TrustCommonstocks
Preferredsecurities
Unfundedcommitments Total
Balance as of 12-31-20 $816,142 $20,108,657 — $20,924,799Realized gain (loss) — — — —Change in unrealized appreciation (depreciation) 2,304 (4,886,525) $1,190,204 (3,694,017)Purchases — — — —Sales — — — —Transfers into Level 3 — — — —Transfers out of Level 3 — (2,437,742) — (2,437,742)Balance as of 3-31-21 $818,446 $12,784,390 $1,190,204 $14,793,040
320
Mid Cap Stock TrustCommonstocks
Preferredsecurities
Unfundedcommitments Total
Change in unrealized at period end1 $2,304 $291,867 $1,190,204 $1,484,375
1 Change in unrealized appreciation (depreciation) attributable to Level 3 securities held at period end.
The valuation techniques and significant amounts of unobservable inputs used in the fair value measurement of the portfolios' Level 3 securities are outlined in the tablebelow.
Mid Cap Stock TrustFair Valueat 3-31-21 Valuation technique
Significantunobservable inputs Input/Range*
Common stocks $ 747,596 Market Comparable EV to revenue multipleDiscount
5.67x12.5%
70,850 Recovery Value Expected future valueDiscount
0.3315%
$ 818,446
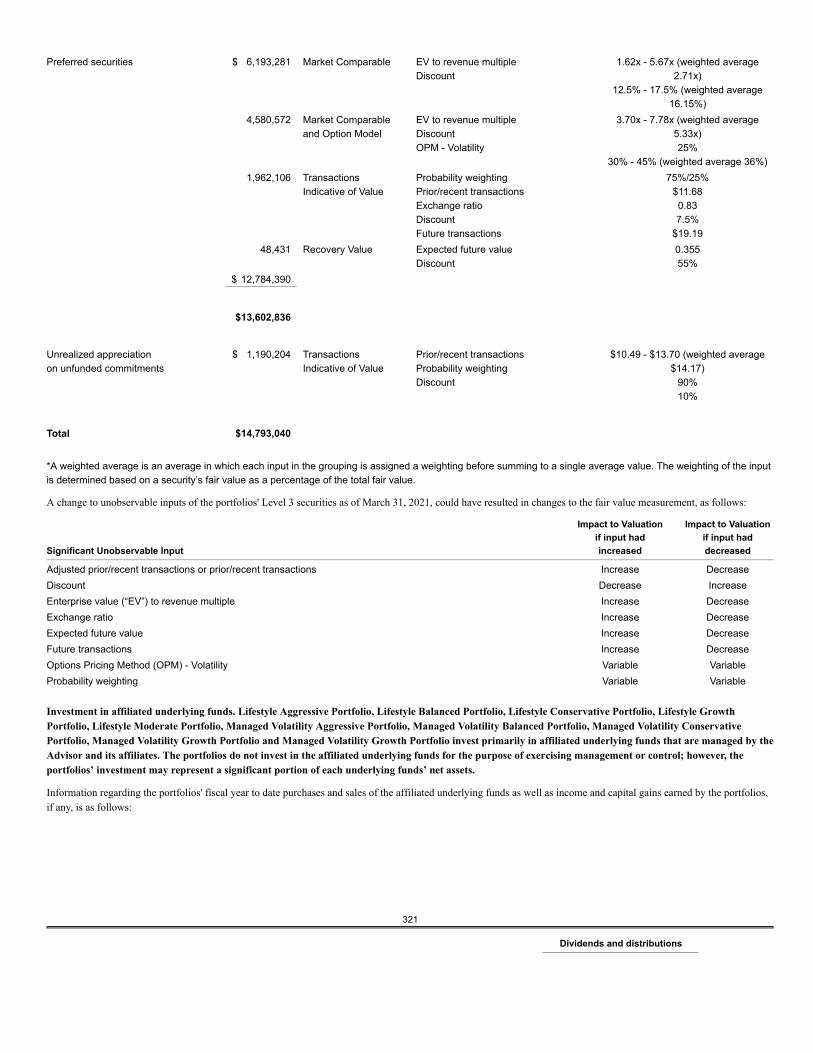
Preferred securities $ 6,193,281 Market Comparable EV to revenue multipleDiscount
1.62x - 5.67x (weighted average2.71x)
12.5% - 17.5% (weighted average16.15%)
4,580,572 Market Comparableand Option Model
EV to revenue multipleDiscountOPM - Volatility
3.70x - 7.78x (weighted average5.33x)25%
30% - 45% (weighted average 36%)1,962,106 Transactions
Indicative of ValueProbability weightingPrior/recent transactionsExchange ratioDiscountFuture transactions
75%/25%$11.680.837.5%
$19.1948,431 Recovery Value Expected future value
Discount0.35555%
$ 12,784,390
$13,602,836
Unrealized appreciationon unfunded commitments
$ 1,190,204 TransactionsIndicative of Value
Prior/recent transactionsProbability weightingDiscount
$10.49 - $13.70 (weighted average$14.17)
90%10%
Total $14,793,040
*A weighted average is an average in which each input in the grouping is assigned a weighting before summing to a single average value. The weighting of the inputis determined based on a security’s fair value as a percentage of the total fair value.
A change to unobservable inputs of the portfolios' Level 3 securities as of March 31, 2021, could have resulted in changes to the fair value measurement, as follows:
Significant Unobservable Input
Impact to Valuationif input hadincreased
Impact to Valuationif input haddecreased
Adjusted prior/recent transactions or prior/recent transactions Increase DecreaseDiscount Decrease IncreaseEnterprise value (“EV”) to revenue multiple Increase DecreaseExchange ratio Increase DecreaseExpected future value Increase DecreaseFuture transactions Increase DecreaseOptions Pricing Method (OPM) - Volatility Variable VariableProbability weighting Variable Variable
Investment in affiliated underlying funds. Lifestyle Aggressive Portfolio, Lifestyle Balanced Portfolio, Lifestyle Conservative Portfolio, Lifestyle GrowthPortfolio, Lifestyle Moderate Portfolio, Managed Volatility Aggressive Portfolio, Managed Volatility Balanced Portfolio, Managed Volatility ConservativePortfolio, Managed Volatility Growth Portfolio and Managed Volatility Growth Portfolio invest primarily in affiliated underlying funds that are managed by theAdvisor and its affiliates. The portfolios do not invest in the affiliated underlying funds for the purpose of exercising management or control; however, theportfolios’ investment may represent a significant portion of each underlying funds’ net assets.
Information regarding the portfolios' fiscal year to date purchases and sales of the affiliated underlying funds as well as income and capital gains earned by the portfolios,if any, is as follows:
321
Dividends and distributions
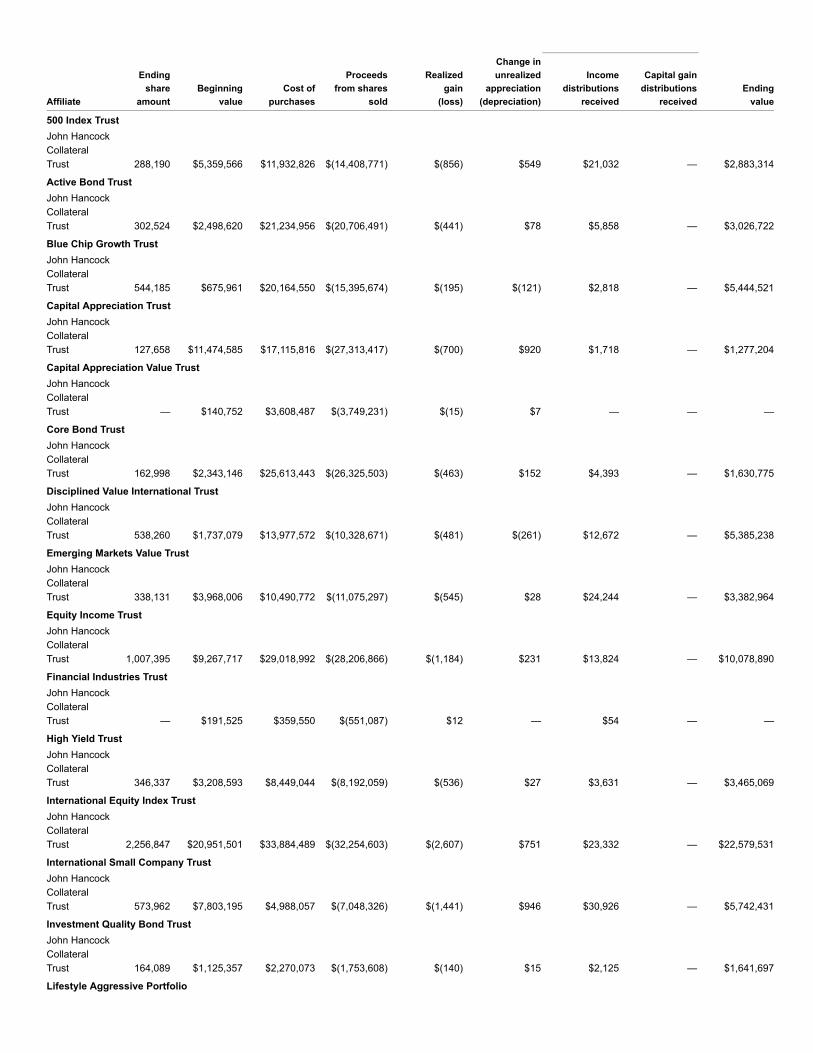
Affiliate
Endingshare
amountBeginning
valueCost of
purchases
Proceedsfrom shares
sold
Realizedgain
(loss)
Change inunrealized
appreciation(depreciation)
Incomedistributions
received
Capital gaindistributions
receivedEnding
value
500 Index TrustJohn HancockCollateralTrust 288,190 $5,359,566 $11,932,826 $(14,408,771) $(856) $549 $21,032 — $2,883,314
Active Bond TrustJohn HancockCollateralTrust 302,524 $2,498,620 $21,234,956 $(20,706,491) $(441) $78 $5,858 — $3,026,722
Blue Chip Growth TrustJohn HancockCollateralTrust 544,185 $675,961 $20,164,550 $(15,395,674) $(195) $(121) $2,818 — $5,444,521
Capital Appreciation TrustJohn HancockCollateralTrust 127,658 $11,474,585 $17,115,816 $(27,313,417) $(700) $920 $1,718 — $1,277,204
Capital Appreciation Value TrustJohn HancockCollateralTrust — $140,752 $3,608,487 $(3,749,231) $(15) $7 — — —
Core Bond TrustJohn HancockCollateralTrust 162,998 $2,343,146 $25,613,443 $(26,325,503) $(463) $152 $4,393 — $1,630,775
Disciplined Value International TrustJohn HancockCollateralTrust 538,260 $1,737,079 $13,977,572 $(10,328,671) $(481) $(261) $12,672 — $5,385,238
Emerging Markets Value TrustJohn HancockCollateralTrust 338,131 $3,968,006 $10,490,772 $(11,075,297) $(545) $28 $24,244 — $3,382,964
Equity Income TrustJohn HancockCollateralTrust 1,007,395 $9,267,717 $29,018,992 $(28,206,866) $(1,184) $231 $13,824 — $10,078,890
Financial Industries TrustJohn HancockCollateralTrust — $191,525 $359,550 $(551,087) $12 — $54 — —
High Yield TrustJohn HancockCollateralTrust 346,337 $3,208,593 $8,449,044 $(8,192,059) $(536) $27 $3,631 — $3,465,069
International Equity Index TrustJohn HancockCollateralTrust 2,256,847 $20,951,501 $33,884,489 $(32,254,603) $(2,607) $751 $23,332 — $22,579,531
International Small Company TrustJohn HancockCollateralTrust 573,962 $7,803,195 $4,988,057 $(7,048,326) $(1,441) $946 $30,926 — $5,742,431
Investment Quality Bond TrustJohn HancockCollateralTrust 164,089 $1,125,357 $2,270,073 $(1,753,608) $(140) $15 $2,125 — $1,641,697
Lifestyle Aggressive Portfolio
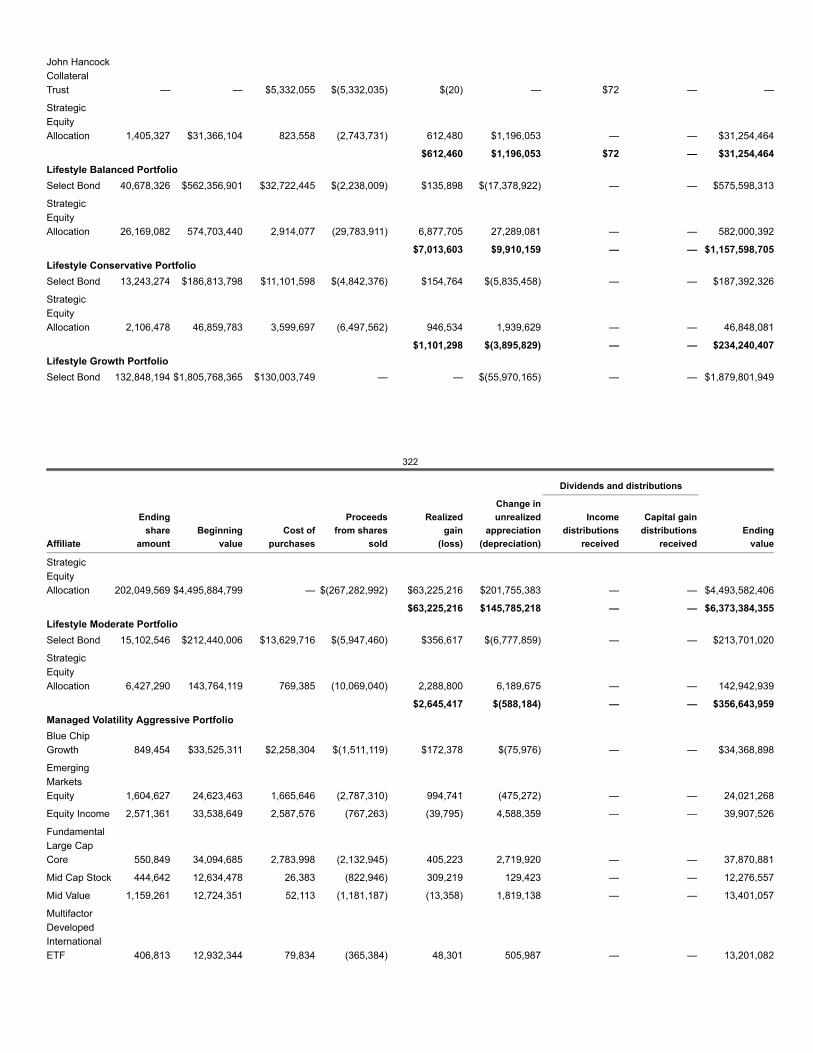
John HancockCollateralTrust — — $5,332,055 $(5,332,035) $(20) — $72 — —
StrategicEquityAllocation 1,405,327 $31,366,104 823,558 (2,743,731) 612,480 $1,196,053 — — $31,254,464
$612,460 $1,196,053 $72 — $31,254,464Lifestyle Balanced PortfolioSelect Bond 40,678,326 $562,356,901 $32,722,445 $(2,238,009) $135,898 $(17,378,922) — — $575,598,313
StrategicEquityAllocation 26,169,082 574,703,440 2,914,077 (29,783,911) 6,877,705 27,289,081 — — 582,000,392
$7,013,603 $9,910,159 — — $1,157,598,705Lifestyle Conservative PortfolioSelect Bond 13,243,274 $186,813,798 $11,101,598 $(4,842,376) $154,764 $(5,835,458) — — $187,392,326
StrategicEquityAllocation 2,106,478 46,859,783 3,599,697 (6,497,562) 946,534 1,939,629 — — 46,848,081
$1,101,298 $(3,895,829) — — $234,240,407Lifestyle Growth PortfolioSelect Bond 132,848,194 $1,805,768,365 $130,003,749 — — $(55,970,165) — — $1,879,801,949
322
Dividends and distributions
Affiliate
Endingshare
amountBeginning
valueCost of
purchases
Proceedsfrom shares
sold
Realizedgain
(loss)
Change inunrealized
appreciation(depreciation)
Incomedistributions
received
Capital gaindistributions
receivedEnding
value
StrategicEquityAllocation 202,049,569 $4,495,884,799 — $(267,282,992) $63,225,216 $201,755,383 — — $4,493,582,406
$63,225,216 $145,785,218 — — $6,373,384,355Lifestyle Moderate PortfolioSelect Bond 15,102,546 $212,440,006 $13,629,716 $(5,947,460) $356,617 $(6,777,859) — — $213,701,020
StrategicEquityAllocation 6,427,290 143,764,119 769,385 (10,069,040) 2,288,800 6,189,675 — — 142,942,939
$2,645,417 $(588,184) — — $356,643,959Managed Volatility Aggressive PortfolioBlue ChipGrowth 849,454 $33,525,311 $2,258,304 $(1,511,119) $172,378 $(75,976) — — $34,368,898
EmergingMarketsEquity 1,604,627 24,623,463 1,665,646 (2,787,310) 994,741 (475,272) — — 24,021,268
Equity Income 2,571,361 33,538,649 2,587,576 (767,263) (39,795) 4,588,359 — — 39,907,526
FundamentalLarge CapCore 550,849 34,094,685 2,783,998 (2,132,945) 405,223 2,719,920 — — 37,870,881
Mid Cap Stock 444,642 12,634,478 26,383 (822,946) 309,219 129,423 — — 12,276,557
Mid Value 1,159,261 12,724,351 52,113 (1,181,187) (13,358) 1,819,138 — — 13,401,057
MultifactorDevelopedInternationalETF 406,813 12,932,344 79,834 (365,384) 48,301 505,987 — — 13,201,082
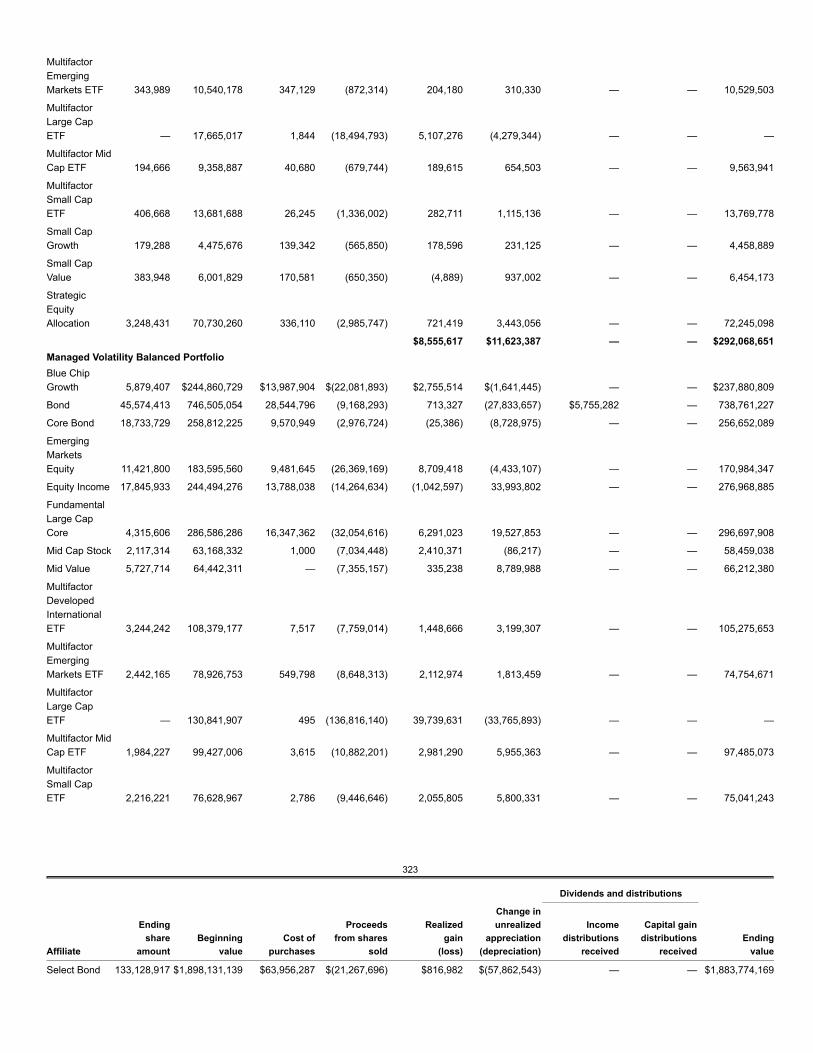
MultifactorEmergingMarkets ETF 343,989 10,540,178 347,129 (872,314) 204,180 310,330 — — 10,529,503
MultifactorLarge CapETF — 17,665,017 1,844 (18,494,793) 5,107,276 (4,279,344) — — —
Multifactor MidCap ETF 194,666 9,358,887 40,680 (679,744) 189,615 654,503 — — 9,563,941
MultifactorSmall CapETF 406,668 13,681,688 26,245 (1,336,002) 282,711 1,115,136 — — 13,769,778
Small CapGrowth 179,288 4,475,676 139,342 (565,850) 178,596 231,125 — — 4,458,889
Small CapValue 383,948 6,001,829 170,581 (650,350) (4,889) 937,002 — — 6,454,173
StrategicEquityAllocation 3,248,431 70,730,260 336,110 (2,985,747) 721,419 3,443,056 — — 72,245,098
$8,555,617 $11,623,387 — — $292,068,651Managed Volatility Balanced PortfolioBlue ChipGrowth 5,879,407 $244,860,729 $13,987,904 $(22,081,893) $2,755,514 $(1,641,445) — — $237,880,809
Bond 45,574,413 746,505,054 28,544,796 (9,168,293) 713,327 (27,833,657) $5,755,282 — 738,761,227
Core Bond 18,733,729 258,812,225 9,570,949 (2,976,724) (25,386) (8,728,975) — — 256,652,089
EmergingMarketsEquity 11,421,800 183,595,560 9,481,645 (26,369,169) 8,709,418 (4,433,107) — — 170,984,347
Equity Income 17,845,933 244,494,276 13,788,038 (14,264,634) (1,042,597) 33,993,802 — — 276,968,885
FundamentalLarge CapCore 4,315,606 286,586,286 16,347,362 (32,054,616) 6,291,023 19,527,853 — — 296,697,908
Mid Cap Stock 2,117,314 63,168,332 1,000 (7,034,448) 2,410,371 (86,217) — — 58,459,038
Mid Value 5,727,714 64,442,311 — (7,355,157) 335,238 8,789,988 — — 66,212,380
MultifactorDevelopedInternationalETF 3,244,242 108,379,177 7,517 (7,759,014) 1,448,666 3,199,307 — — 105,275,653
MultifactorEmergingMarkets ETF 2,442,165 78,926,753 549,798 (8,648,313) 2,112,974 1,813,459 — — 74,754,671
MultifactorLarge CapETF — 130,841,907 495 (136,816,140) 39,739,631 (33,765,893) — — —
Multifactor MidCap ETF 1,984,227 99,427,006 3,615 (10,882,201) 2,981,290 5,955,363 — — 97,485,073
MultifactorSmall CapETF 2,216,221 76,628,967 2,786 (9,446,646) 2,055,805 5,800,331 — — 75,041,243
323
Dividends and distributions
Affiliate
Endingshare
amountBeginning
valueCost of
purchases
Proceedsfrom shares
sold
Realizedgain
(loss)
Change inunrealized
appreciation(depreciation)
Incomedistributions
received
Capital gaindistributions
receivedEnding
value
Select Bond 133,128,917 $1,898,131,139 $63,956,287 $(21,267,696) $816,982 $(57,862,543) — — $1,883,774,169
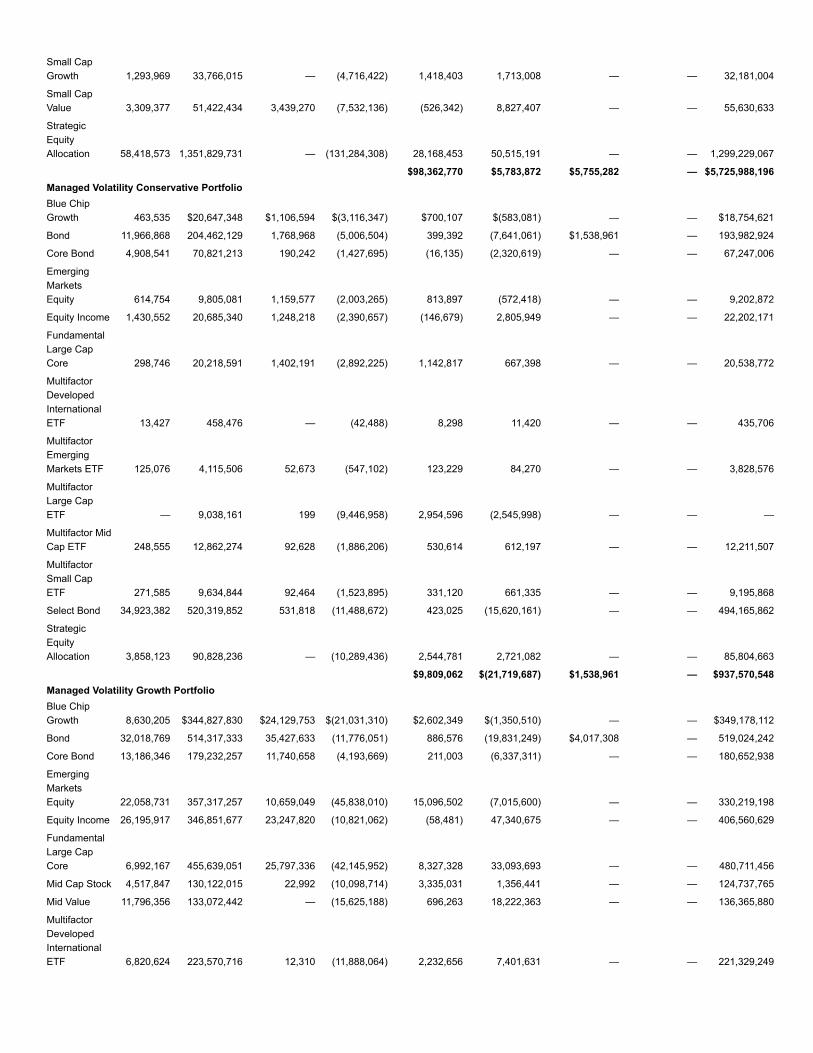
Small CapGrowth 1,293,969 33,766,015 — (4,716,422) 1,418,403 1,713,008 — — 32,181,004
Small CapValue 3,309,377 51,422,434 3,439,270 (7,532,136) (526,342) 8,827,407 — — 55,630,633
StrategicEquityAllocation 58,418,573 1,351,829,731 — (131,284,308) 28,168,453 50,515,191 — — 1,299,229,067
$98,362,770 $5,783,872 $5,755,282 — $5,725,988,196Managed Volatility Conservative PortfolioBlue ChipGrowth 463,535 $20,647,348 $1,106,594 $(3,116,347) $700,107 $(583,081) — — $18,754,621
Bond 11,966,868 204,462,129 1,768,968 (5,006,504) 399,392 (7,641,061) $1,538,961 — 193,982,924
Core Bond 4,908,541 70,821,213 190,242 (1,427,695) (16,135) (2,320,619) — — 67,247,006
EmergingMarketsEquity 614,754 9,805,081 1,159,577 (2,003,265) 813,897 (572,418) — — 9,202,872
Equity Income 1,430,552 20,685,340 1,248,218 (2,390,657) (146,679) 2,805,949 — — 22,202,171
FundamentalLarge CapCore 298,746 20,218,591 1,402,191 (2,892,225) 1,142,817 667,398 — — 20,538,772
MultifactorDevelopedInternationalETF 13,427 458,476 — (42,488) 8,298 11,420 — — 435,706
MultifactorEmergingMarkets ETF 125,076 4,115,506 52,673 (547,102) 123,229 84,270 — — 3,828,576
MultifactorLarge CapETF — 9,038,161 199 (9,446,958) 2,954,596 (2,545,998) — — —
Multifactor MidCap ETF 248,555 12,862,274 92,628 (1,886,206) 530,614 612,197 — — 12,211,507
MultifactorSmall CapETF 271,585 9,634,844 92,464 (1,523,895) 331,120 661,335 — — 9,195,868
Select Bond 34,923,382 520,319,852 531,818 (11,488,672) 423,025 (15,620,161) — — 494,165,862
StrategicEquityAllocation 3,858,123 90,828,236 — (10,289,436) 2,544,781 2,721,082 — — 85,804,663
$9,809,062 $(21,719,687) $1,538,961 — $937,570,548Managed Volatility Growth PortfolioBlue ChipGrowth 8,630,205 $344,827,830 $24,129,753 $(21,031,310) $2,602,349 $(1,350,510) — — $349,178,112
Bond 32,018,769 514,317,333 35,427,633 (11,776,051) 886,576 (19,831,249) $4,017,308 — 519,024,242
Core Bond 13,186,346 179,232,257 11,740,658 (4,193,669) 211,003 (6,337,311) — — 180,652,938
EmergingMarketsEquity 22,058,731 357,317,257 10,659,049 (45,838,010) 15,096,502 (7,015,600) — — 330,219,198
Equity Income 26,195,917 346,851,677 23,247,820 (10,821,062) (58,481) 47,340,675 — — 406,560,629
FundamentalLarge CapCore 6,992,167 455,639,051 25,797,336 (42,145,952) 8,327,328 33,093,693 — — 480,711,456
Mid Cap Stock 4,517,847 130,122,015 22,992 (10,098,714) 3,335,031 1,356,441 — — 124,737,765
Mid Value 11,796,356 133,072,442 — (15,625,188) 696,263 18,222,363 — — 136,365,880
MultifactorDevelopedInternationalETF 6,820,624 223,570,716 12,310 (11,888,064) 2,232,656 7,401,631 — — 221,329,249
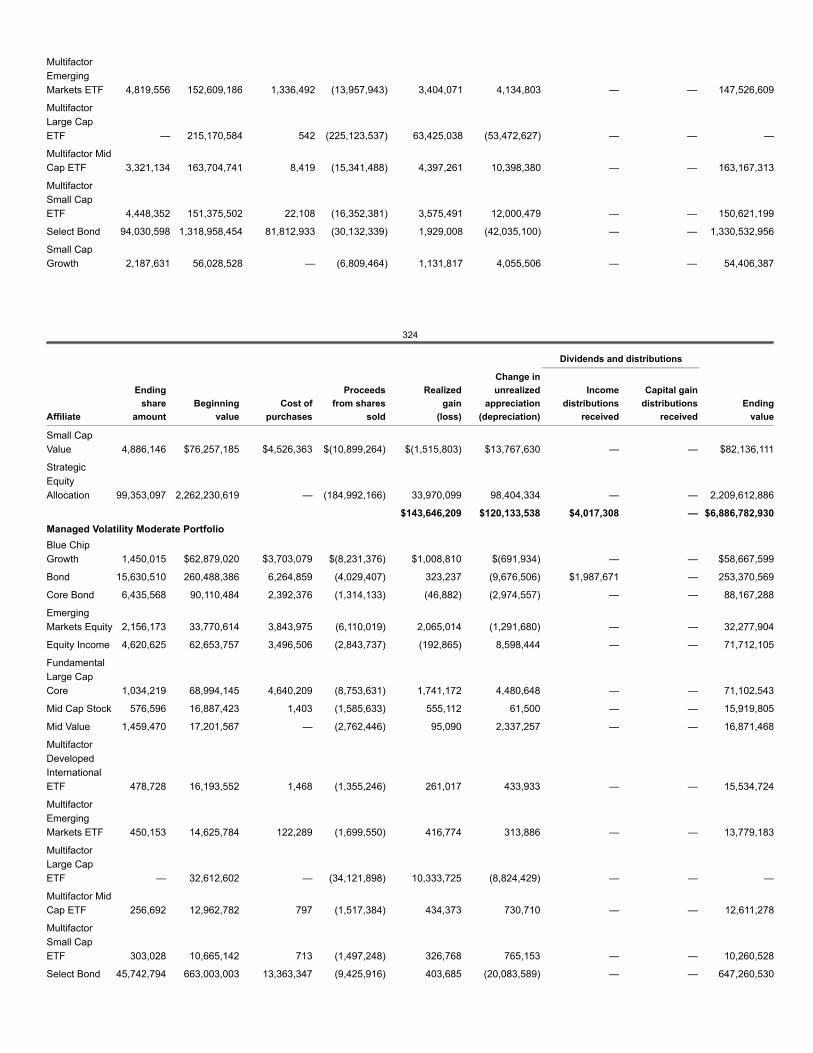
MultifactorEmergingMarkets ETF 4,819,556 152,609,186 1,336,492 (13,957,943) 3,404,071 4,134,803 — — 147,526,609
MultifactorLarge CapETF — 215,170,584 542 (225,123,537) 63,425,038 (53,472,627) — — —
Multifactor MidCap ETF 3,321,134 163,704,741 8,419 (15,341,488) 4,397,261 10,398,380 — — 163,167,313
MultifactorSmall CapETF 4,448,352 151,375,502 22,108 (16,352,381) 3,575,491 12,000,479 — — 150,621,199
Select Bond 94,030,598 1,318,958,454 81,812,933 (30,132,339) 1,929,008 (42,035,100) — — 1,330,532,956
Small CapGrowth 2,187,631 56,028,528 — (6,809,464) 1,131,817 4,055,506 — — 54,406,387
324
Dividends and distributions
Affiliate
Endingshare
amountBeginning
valueCost of
purchases
Proceedsfrom shares
sold
Realizedgain
(loss)
Change inunrealized
appreciation(depreciation)
Incomedistributions
received
Capital gaindistributions
receivedEnding
value
Small CapValue 4,886,146 $76,257,185 $4,526,363 $(10,899,264) $(1,515,803) $13,767,630 — — $82,136,111
StrategicEquityAllocation 99,353,097 2,262,230,619 — (184,992,166) 33,970,099 98,404,334 — — 2,209,612,886
$143,646,209 $120,133,538 $4,017,308 — $6,886,782,930Managed Volatility Moderate PortfolioBlue ChipGrowth 1,450,015 $62,879,020 $3,703,079 $(8,231,376) $1,008,810 $(691,934) — — $58,667,599
Bond 15,630,510 260,488,386 6,264,859 (4,029,407) 323,237 (9,676,506) $1,987,671 — 253,370,569
Core Bond 6,435,568 90,110,484 2,392,376 (1,314,133) (46,882) (2,974,557) — — 88,167,288
EmergingMarkets Equity 2,156,173 33,770,614 3,843,975 (6,110,019) 2,065,014 (1,291,680) — — 32,277,904
Equity Income 4,620,625 62,653,757 3,496,506 (2,843,737) (192,865) 8,598,444 — — 71,712,105
FundamentalLarge CapCore 1,034,219 68,994,145 4,640,209 (8,753,631) 1,741,172 4,480,648 — — 71,102,543
Mid Cap Stock 576,596 16,887,423 1,403 (1,585,633) 555,112 61,500 — — 15,919,805
Mid Value 1,459,470 17,201,567 — (2,762,446) 95,090 2,337,257 — — 16,871,468
MultifactorDevelopedInternationalETF 478,728 16,193,552 1,468 (1,355,246) 261,017 433,933 — — 15,534,724
MultifactorEmergingMarkets ETF 450,153 14,625,784 122,289 (1,699,550) 416,774 313,886 — — 13,779,183
MultifactorLarge CapETF — 32,612,602 — (34,121,898) 10,333,725 (8,824,429) — — —
Multifactor MidCap ETF 256,692 12,962,782 797 (1,517,384) 434,373 730,710 — — 12,611,278
MultifactorSmall CapETF 303,028 10,665,142 713 (1,497,248) 326,768 765,153 — — 10,260,528
Select Bond 45,742,794 663,003,003 13,363,347 (9,425,916) 403,685 (20,083,589) — — 647,260,530
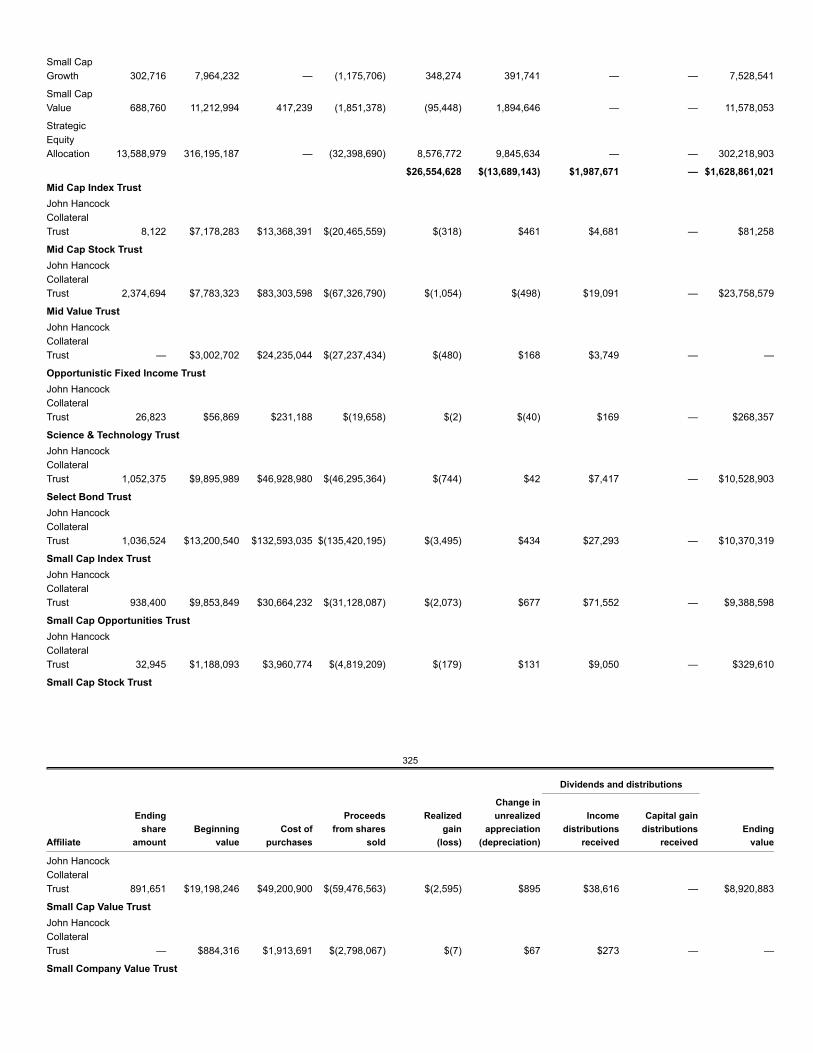
Small CapGrowth 302,716 7,964,232 — (1,175,706) 348,274 391,741 — — 7,528,541
Small CapValue 688,760 11,212,994 417,239 (1,851,378) (95,448) 1,894,646 — — 11,578,053
StrategicEquityAllocation 13,588,979 316,195,187 — (32,398,690) 8,576,772 9,845,634 — — 302,218,903
$26,554,628 $(13,689,143) $1,987,671 — $1,628,861,021Mid Cap Index TrustJohn HancockCollateralTrust 8,122 $7,178,283 $13,368,391 $(20,465,559) $(318) $461 $4,681 — $81,258
Mid Cap Stock TrustJohn HancockCollateralTrust 2,374,694 $7,783,323 $83,303,598 $(67,326,790) $(1,054) $(498) $19,091 — $23,758,579
Mid Value TrustJohn HancockCollateralTrust — $3,002,702 $24,235,044 $(27,237,434) $(480) $168 $3,749 — —
Opportunistic Fixed Income TrustJohn HancockCollateralTrust 26,823 $56,869 $231,188 $(19,658) $(2) $(40) $169 — $268,357
Science & Technology TrustJohn HancockCollateralTrust 1,052,375 $9,895,989 $46,928,980 $(46,295,364) $(744) $42 $7,417 — $10,528,903
Select Bond TrustJohn HancockCollateralTrust 1,036,524 $13,200,540 $132,593,035 $(135,420,195) $(3,495) $434 $27,293 — $10,370,319
Small Cap Index TrustJohn HancockCollateralTrust 938,400 $9,853,849 $30,664,232 $(31,128,087) $(2,073) $677 $71,552 — $9,388,598
Small Cap Opportunities TrustJohn HancockCollateralTrust 32,945 $1,188,093 $3,960,774 $(4,819,209) $(179) $131 $9,050 — $329,610
Small Cap Stock Trust
325
Dividends and distributions
Affiliate
Endingshare
amountBeginning
valueCost of
purchases
Proceedsfrom shares
sold
Realizedgain
(loss)
Change inunrealized
appreciation(depreciation)
Incomedistributions
received
Capital gaindistributions
receivedEnding
value
John HancockCollateralTrust 891,651 $19,198,246 $49,200,900 $(59,476,563) $(2,595) $895 $38,616 — $8,920,883
Small Cap Value TrustJohn HancockCollateralTrust — $884,316 $1,913,691 $(2,798,067) $(7) $67 $273 — —
Small Company Value Trust
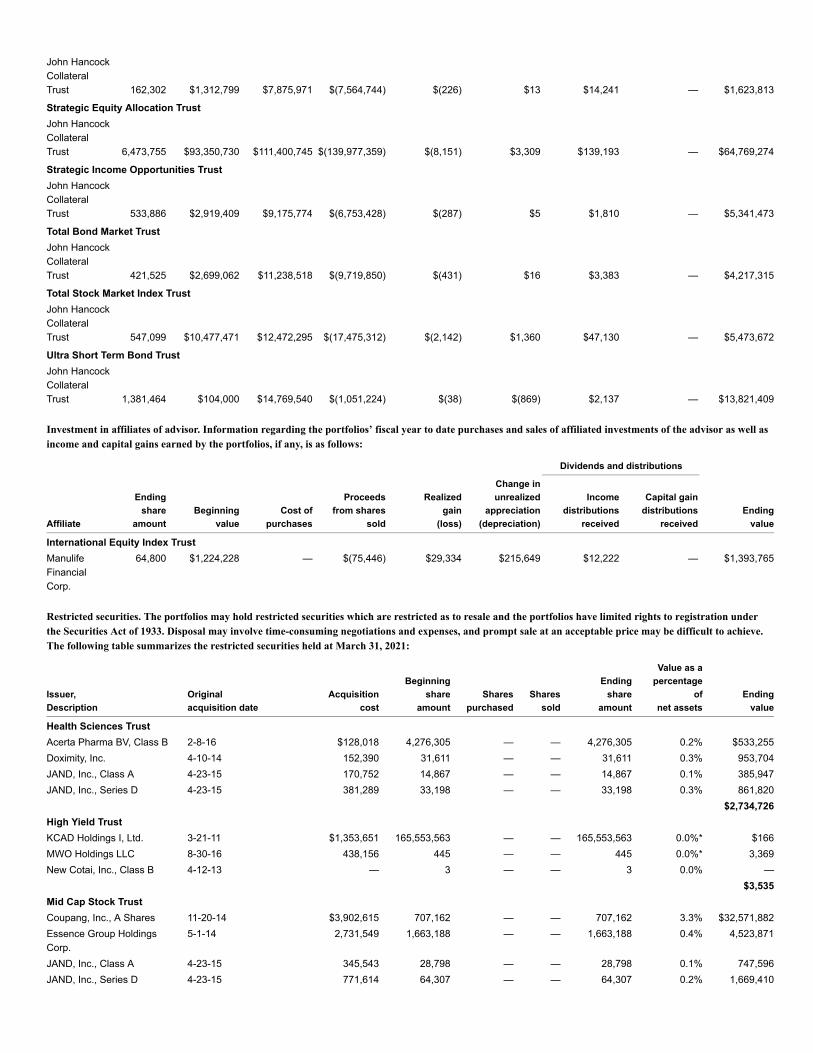
John HancockCollateralTrust 162,302 $1,312,799 $7,875,971 $(7,564,744) $(226) $13 $14,241 — $1,623,813
Strategic Equity Allocation TrustJohn HancockCollateralTrust 6,473,755 $93,350,730 $111,400,745 $(139,977,359) $(8,151) $3,309 $139,193 — $64,769,274
Strategic Income Opportunities TrustJohn HancockCollateralTrust 533,886 $2,919,409 $9,175,774 $(6,753,428) $(287) $5 $1,810 — $5,341,473
Total Bond Market TrustJohn HancockCollateralTrust 421,525 $2,699,062 $11,238,518 $(9,719,850) $(431) $16 $3,383 — $4,217,315
Total Stock Market Index TrustJohn HancockCollateralTrust 547,099 $10,477,471 $12,472,295 $(17,475,312) $(2,142) $1,360 $47,130 — $5,473,672
Ultra Short Term Bond TrustJohn HancockCollateralTrust 1,381,464 $104,000 $14,769,540 $(1,051,224) $(38) $(869) $2,137 — $13,821,409
Investment in affiliates of advisor. Information regarding the portfolios’ fiscal year to date purchases and sales of affiliated investments of the advisor as well asincome and capital gains earned by the portfolios, if any, is as follows:
Dividends and distributions
Affiliate
Endingshare
amountBeginning
valueCost of
purchases
Proceedsfrom shares
sold
Realizedgain
(loss)
Change inunrealized
appreciation(depreciation)
Incomedistributions
received
Capital gaindistributions
receivedEnding
value
International Equity Index TrustManulifeFinancialCorp.
64,800 $1,224,228 — $(75,446) $29,334 $215,649 $12,222 — $1,393,765
Restricted securities. The portfolios may hold restricted securities which are restricted as to resale and the portfolios have limited rights to registration underthe Securities Act of 1933. Disposal may involve time-consuming negotiations and expenses, and prompt sale at an acceptable price may be difficult to achieve.The following table summarizes the restricted securities held at March 31, 2021:
Issuer,Description
Originalacquisition date
Acquisitioncost
Beginningshare
amountShares
purchasedShares
sold
Endingshare
amount
Value as apercentage
ofnet assets
Endingvalue
Health Sciences TrustAcerta Pharma BV, Class B 2-8-16 $128,018 4,276,305 — — 4,276,305 0.2% $533,255Doximity, Inc. 4-10-14 152,390 31,611 — — 31,611 0.3% 953,704JAND, Inc., Class A 4-23-15 170,752 14,867 — — 14,867 0.1% 385,947JAND, Inc., Series D 4-23-15 381,289 33,198 — — 33,198 0.3% 861,820
$2,734,726High Yield TrustKCAD Holdings I, Ltd. 3-21-11 $1,353,651 165,553,563 — — 165,553,563 0.0%* $166MWO Holdings LLC 8-30-16 438,156 445 — — 445 0.0%* 3,369New Cotai, Inc., Class B 4-12-13 — 3 — — 3 0.0% —
$3,535Mid Cap Stock TrustCoupang, Inc., A Shares 11-20-14 $3,902,615 707,162 — — 707,162 3.3% $32,571,882Essence Group HoldingsCorp.
5-1-14 2,731,549 1,663,188 — — 1,663,188 0.4% 4,523,871
JAND, Inc., Class A 4-23-15 345,543 28,798 — — 28,798 0.1% 747,596JAND, Inc., Series D 4-23-15 771,614 64,307 — — 64,307 0.2% 1,669,410
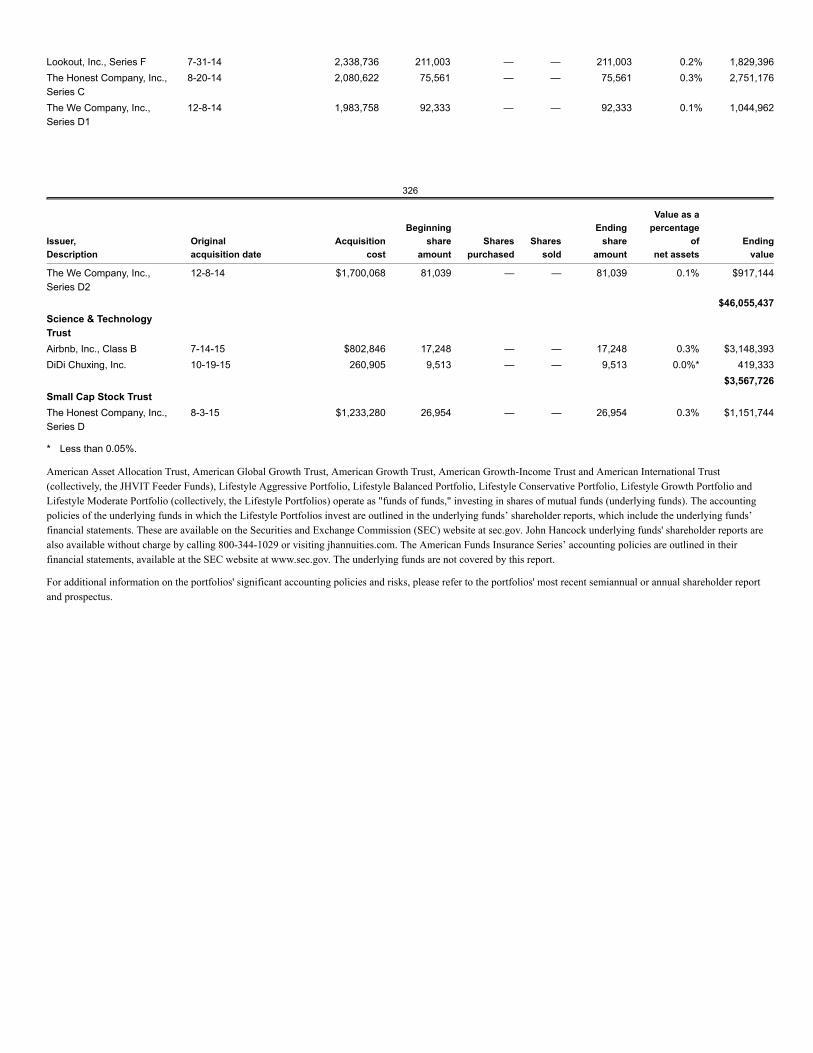
Lookout, Inc., Series F 7-31-14 2,338,736 211,003 — — 211,003 0.2% 1,829,396The Honest Company, Inc.,Series C
8-20-14 2,080,622 75,561 — — 75,561 0.3% 2,751,176
The We Company, Inc.,Series D1
12-8-14 1,983,758 92,333 — — 92,333 0.1% 1,044,962
326
Issuer,Description
Originalacquisition date
Acquisitioncost
Beginningshare
amountShares
purchasedShares
sold
Endingshare
amount
Value as apercentage
ofnet assets
Endingvalue
The We Company, Inc.,Series D2
12-8-14 $1,700,068 81,039 — — 81,039 0.1% $917,144
$46,055,437Science & TechnologyTrustAirbnb, Inc., Class B 7-14-15 $802,846 17,248 — — 17,248 0.3% $3,148,393DiDi Chuxing, Inc. 10-19-15 260,905 9,513 — — 9,513 0.0%* 419,333
$3,567,726Small Cap Stock TrustThe Honest Company, Inc.,Series D
8-3-15 $1,233,280 26,954 — — 26,954 0.3% $1,151,744
* Less than 0.05%.
American Asset Allocation Trust, American Global Growth Trust, American Growth Trust, American Growth-Income Trust and American International Trust(collectively, the JHVIT Feeder Funds), Lifestyle Aggressive Portfolio, Lifestyle Balanced Portfolio, Lifestyle Conservative Portfolio, Lifestyle Growth Portfolio andLifestyle Moderate Portfolio (collectively, the Lifestyle Portfolios) operate as "funds of funds," investing in shares of mutual funds (underlying funds). The accountingpolicies of the underlying funds in which the Lifestyle Portfolios invest are outlined in the underlying funds’ shareholder reports, which include the underlying funds’financial statements. These are available on the Securities and Exchange Commission (SEC) website at sec.gov. John Hancock underlying funds' shareholder reports arealso available without charge by calling 800-344-1029 or visiting jhannuities.com. The American Funds Insurance Series’ accounting policies are outlined in theirfinancial statements, available at the SEC website at www.sec.gov. The underlying funds are not covered by this report.
For additional information on the portfolios' significant accounting policies and risks, please refer to the portfolios' most recent semiannual or annual shareholder reportand prospectus.

327
Related Documents