John Deere Financial Portfolio and Funding Deere & Company February 2014

Welcome message from author
This document is posted to help you gain knowledge. Please leave a comment to let me know what you think about it! Share it to your friends and learn new things together.
Transcript

John Deere Financial Portfolio and Funding
Deere & Company
February 2014
| 2
Safe Harbor Statement & Disclosures
This presentation includes forward-looking information subject to important risks and uncertainties. Refer to Deere’s reports filed on Forms 8-K (current), 10-Q (quarterly), and 10-K (annual) for factors that could cause actual results to differ materially from information in this presentation. Those factors are incorporated herein by reference.
The following information was current as of the date on the front page. The Use-of-Cash Priorities may not be exhaustive. New and different needs and priorities arise from time to time. We cannot predict such new or different priorities or the impacts on our business. Accordingly, we do not assume responsibility for the accuracy or completeness of these statements. Nor do we have or assume any duty to update any of the statements after the date of this presentation. All of the information is qualified in its entirety by the information in any relevant prospectus and related supplemental information.
This presentation is not an offer to sell or a solicitation of offers to buy any of Deere’s securities.
Deere & Company | February 2014

|
Deere Use-of-Cash Priorities
Manage the balance sheet, including liquidity, to support a rating that provides access to low-cost and readily available short- and long-term funding mechanisms
Reflects the strategic nature of our financial services operation
Committed to “A” Rating
Cash from Operations
Fund Operating and Growth Needs
Common Stock Dividend
Share Repurchase
Fund value-creating investments in our businesses
Consistently and moderately raise dividend targeting a 25%-35% payout ratio of mid-cycle earnings
Consider share repurchase as a means to deploy excess cash to shareholders, once above requirements are met and repurchase is viewed as value-enhancing
3 Deere & Company | February 2014

| Deere & Company | February 2014
Portfolio Composition by Market
John Deere Financial Services $36.8 Billion Owned Portfolio at 31 October 2013
Portfolio Composition by Geography
Portfolio Composition by Product
Information above includes all Deere lending activities worldwide. John Deere Capital Corporation is the largest lending operation of Deere & Company.
Ag & Turf 88%
C&F 12%
U.S. 74%
Canada 11%
Europe 6%
Latin America 6%
Australia 3%
4
Installment Financing
57%
Wholesale / Floorplan
23%
Leasing 13%
Revolving Credit 7%

| Deere & Company | February 2014
John Deere Capital Corporation Profitability and Growth
5
383
291 311
282
149
319
364
2006 2007 2008 2009 2010 2011 2012 2013
Net Income ($ Millions)
0.22% 0.29% 0.33%
0.70%
0.48%
0.12% 0.05% 0.03%
2006 2007 2008 2009 2010 2011 2012 2013
Write-offs/Average Owned Portfolio
18.6 19.0 19.1 19.3
21.1 23.3
26.6
30.7
2006 2007 2008 2009 2010 2011 2012 2013
Administered Portfolio Growth ($ Billions)
469

| Deere & Company | February 2014
John Deere Capital Corporation Retail Notes 60+ Days Past Due vs. Write-offs
Agriculture & Turf1
• Continued extremely low write-offs
• Average write-offs less than 5 bps over last 10 years
Construction & Forestry
• Extremely low write-offs in 2013
• Steady decline in write-offs since 2009
(1) 1982 – 1985 includes Construction; 1986 - 1994 includes Lawn & Grounds Care; beginning in 2009 includes both Ag and Turf equipment; As % of Owned Losses After Dealer Reserve Charges
Source: 1982 – 1994 internal reporting, 1995 - 2011 JDCC 10-K filings, 2012-2013 internal reporting
6
-0.05%
0.45%
0.95%
1.45%
1.95%
2.45%
2.95%
3.45%
3.95%
'83 '86 '89 '92 '95 '98 '01 '04 '07 '10 13
Net Write-offs (Ag) Installments 60+DPD (Ag)
-0.05%
0.45%
0.95%
1.45%
1.95%
2.45%
2.95%
3.45%
3.95%
'95 '98 '01 '04 '07 '10 13
Net Write-offs (C&F) Installments 60+DPD (C&F)
| 7
Ag & Turf Dealer Reserve • Total dealer reserve levels are 0.92% of the portfolio as of 31 January 2014
– Dealers have financial interest in performance – 1% withheld on each note, pooled reserve – Reserve level caps ranging from 0.5% to 3.0% of outstanding portfolio
• Based on credit performance, avoiding reserve charges
Collection • Experts in the equipment markets served
• Strong analytics to support approach
• Internally serviced / regional assignments
• Close working relationship with dealers
Remarketing • Product expertise
• Best distribution channel
– Dealer network • Dedicated remarketing team
• Proven inspection process
• Strong collateral support
Lending, Collection and Remarketing Practices Contribute to Low Losses
Deere & Company | February 2014
| 8
John Deere Financial Funding Strategy
Maintain diverse, sustainable funding sources:
• Term Debt, Asset Backed Securitization, and Commercial Paper
• Commercial Paper issuances backstopped by a $6 billion credit line
Sustain appropriate liquidity profile:
• Develop redundancy and flexibility in funding options
• Balance funding cost and refunding risk
Deere & Company | February 2014

|
Committed Bank Group Supports Credit Facility
• Average length of continuous relationship = ~30 Years
• $6.00 billion credit facility supporting commercial paper
– $2.50 billion tranche expiring in 2019
– $2.50 billion tranche expiring in 2018
– $1.00 billion 364-day tranche expiring in 2015
– Have not drawn on facility
– $3.2 billion incremental capacity as of 31 January 2014
Credit Facility Size & Commercial Paper Outstanding
$ M
illions
$0
$1,000
$2,000
$3,000
$4,000
$5,000
$6,000
$7,000
1999 2000 2001 2002 2003 2004 2005 2006 2007 2008 2009 2010 2011 2012 2013
Total Facility CP Outstanding as of October 31
Deere & Company | February 2014 9

|
Multiple Sources of Liquidity
Successful Access to Traditional Markets
• Commercial Paper
• Term Asset Backed Securitization
• Unsecured Term Debt
– USD
– EUR
– CAD
– ARS
Incremental Sources of Liquidity
• Asset Backed Commercial Paper Conduit
• Retail Notes
10 10 Deere & Company | February 2014

|
John Deere Financial External Funding Mix
Deere & Company | February 2014
68% 69% 67% 72% 70%
74% 78%
84% 80% 83% 84%
75%
20% 18% 22% 17% 17% 12%
8%
15%
11% 12% 13%
14%
12% 13% 11% 11% 13% 14% 14%
1% 9%
4% 4% 11%
0%
20%
40%
60%
80%
100%
Oct FY02 Oct FY03 Oct FY04 Oct FY05 Oct FY06 Oct FY07 Oct FY08 Oct FY09 Oct FY10 Oct FY11 Oct FY12 Oct FY13
Pe
rce
nt
of
Tota
l Ext
ern
al F
un
din
g
Long Term Debt ABS CP
$12.5 $14.8 $18.1 $19.7 $20.2 $21.0 $20.9 $22.9 Total Debt ($B) $14.0 $17.0 $26.6 $28.5

| 12
John Deere Capital Corp.
United States (Deere Support Agreement)
Deere & Company
United States
John Deere Financial Ltd.
Australia (Debt guaranteed by JDCC)
Support Agreement - Deere agrees to:
• Maintain JDCC’s fixed charge coverage > 1.05 to 1
• Own > 51% voting shares of JDCC’s capital stock
• Maintain JDCC net worth > $50 million
Key Funding Entities
John Deere Cash Mgmt.
Luxembourg (Debt guaranteed by Deere)
John Deere Canada ULC (Debt guaranteed by Deere)
John Deere Bank S.A.
Luxembourg (Debt guaranteed by JDCC)
John Deere Financial Inc.
Canada (Debt guaranteed by JDCC)
12
John Deere Canada
Funding Inc. (Debt guaranteed by JDCC)
Deere & Company | February 2014
John Deere Credit Compañía
Financiera S.A. Argentina
(No guarantee)
| 13
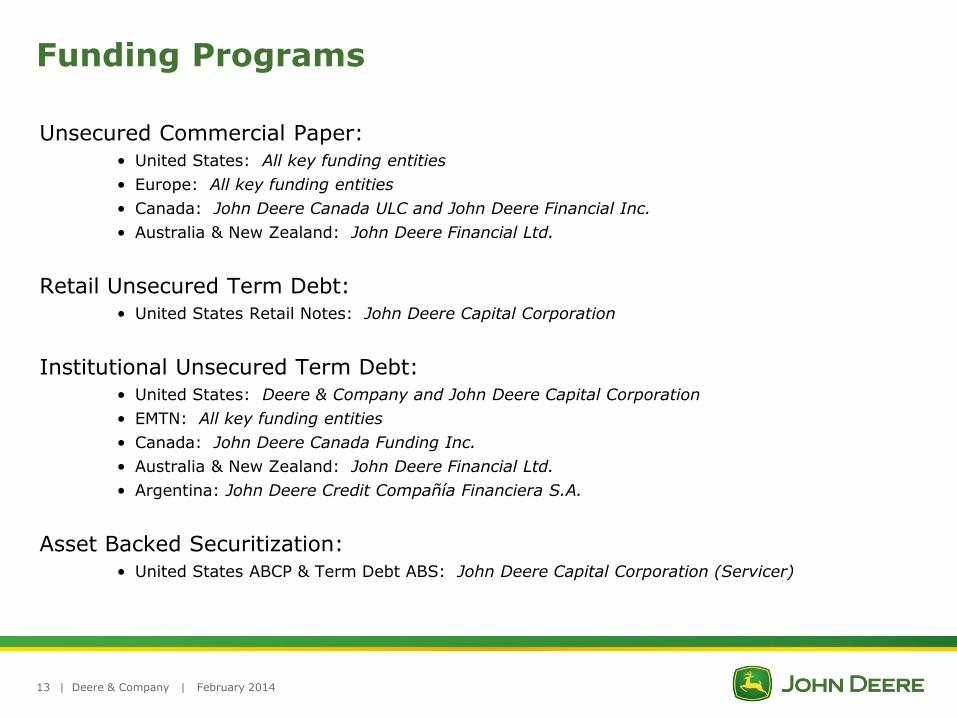
Funding Programs
Unsecured Commercial Paper: • United States: All key funding entities
• Europe: All key funding entities
• Canada: John Deere Canada ULC and John Deere Financial Inc.
• Australia & New Zealand: John Deere Financial Ltd.
Retail Unsecured Term Debt: • United States Retail Notes: John Deere Capital Corporation
Institutional Unsecured Term Debt: • United States: Deere & Company and John Deere Capital Corporation
• EMTN: All key funding entities
• Canada: John Deere Canada Funding Inc.
• Australia & New Zealand: John Deere Financial Ltd.
• Argentina: John Deere Credit Compañía Financiera S.A.
Asset Backed Securitization: • United States ABCP & Term Debt ABS: John Deere Capital Corporation (Servicer)
Deere & Company | February 2014

|
John Deere Financial Maturity Profile
Deere & Company | February 2014
-
300
600
900
1,200
1,500
1,800
2,100
2,400
2,700
3,000
3,300
3,600
3,900
4,200
4,500
4,800
FY 2015 FY 2016 FY 2017 FY 2018 FY 2019 FY 2020 FY 2021 FY 2022 FY 2023 FY 2024
$ M
illio
ns
John Deere Financial Services Unsecured Term Debt Maturities
USD CAD EUR ARS
As of 01/31/2014

Related Documents