Center for Energy and Environmental Policy University of Delaware http://ceep.udel.edu JOHN BYRNE June 22, 2011 NEW ENERGY FOR A NEW CLIMATE

Welcome message from author
This document is posted to help you gain knowledge. Please leave a comment to let me know what you think about it! Share it to your friends and learn new things together.
Transcript

8/6/2019 John Byrne - A New Energy Strategy for a New Climate
http://slidepdf.com/reader/full/john-byrne-a-new-energy-strategy-for-a-new-climate 1/30
Center for Energy and Environmental Policy
University of Delawarehttp://ceep.udel.edu
JOHN BYRNE
June 22, 2011
NEW ENERGY FOR A NEW CLIMATE

8/6/2019 John Byrne - A New Energy Strategy for a New Climate
http://slidepdf.com/reader/full/john-byrne-a-new-energy-strategy-for-a-new-climate 2/30
New York
Times Square 1890
Times Square
1902
Times Square1921

8/6/2019 John Byrne - A New Energy Strategy for a New Climate
http://slidepdf.com/reader/full/john-byrne-a-new-energy-strategy-for-a-new-climate 3/30
Seoul
Chongno-r 1890 Chongno-ro1910

8/6/2019 John Byrne - A New Energy Strategy for a New Climate
http://slidepdf.com/reader/full/john-byrne-a-new-energy-strategy-for-a-new-climate 4/30
Avenida Rizal 1930s Avenida Rizal 1960s

8/6/2019 John Byrne - A New Energy Strategy for a New Climate
http://slidepdf.com/reader/full/john-byrne-a-new-energy-strategy-for-a-new-climate 5/30
8/6/2019 John Byrne - A New Energy Strategy for a New Climate
http://slidepdf.com/reader/full/john-byrne-a-new-energy-strategy-for-a-new-climate 6/30
8/6/2019 John Byrne - A New Energy Strategy for a New Climate
http://slidepdf.com/reader/full/john-byrne-a-new-energy-strategy-for-a-new-climate 7/30

8/6/2019 John Byrne - A New Energy Strategy for a New Climate
http://slidepdf.com/reader/full/john-byrne-a-new-energy-strategy-for-a-new-climate 8/30
Energy Expenditures as % of US GDP
4.0%
5.0%
6.0%
7.0%
8.0%
9.0%
10.0%
1 9 9 5
1 9 9 6
1 9 9 7
1 9 9 8
1 9 9 9
2 0 0 0
2 0 0 1
2 0 0 2
2 0 0 3
2 0 0 4
2 0 0 5
2 0 0 6
2 0 0 7
2 0 0 8
P
e r c e n t
9.8% of GDP in 2008
Highest in 25 yrs
Source: Data used to prepare EIA Annual Energy Outlook, March 2009
Center for Energy and Environmental Policy

8/6/2019 John Byrne - A New Energy Strategy for a New Climate
http://slidepdf.com/reader/full/john-byrne-a-new-energy-strategy-for-a-new-climate 9/30
The scenario on the left (A1B) assumes a business as usual approach to carbon dioxide emissions, with growth in thepopulation, the economy and in fossil fuel use, leading to an approximate rise of 4 C by 2100.The scenario on the right (E1) represents what may happen if swift action is taken to constrain emissions. It assumesthat they will start to fall from 2015 onwards and that the global average temperature will rise by about 2°C by 2100.
Sources: IPCC (scenarios); UK Meteorological Office (maps)
The two projections begin to diverge dramatically after the middle of the century. By 2055 they are already more thana degree apart.
A 4 C rise threatens permafrost across the Northern Hemisphere, the Greenland ice sheet is under pressure, the Amazonfaces twin threats of fire and drought, and sea levels could be up by 80cm (4 C scenario) putting coastal populations atgreater risk of flooding.

8/6/2019 John Byrne - A New Energy Strategy for a New Climate
http://slidepdf.com/reader/full/john-byrne-a-new-energy-strategy-for-a-new-climate 10/30
Center for Energy and Environmental Policy
University of Delawarehttp://ceep.udel.edu
The Challenge of Climate Justice
M e t r i c T o n
s o f C O 2 P e r C a p i t a
WesternEurope
South Korea
Eastern Europe
18
0
3.3
R u s s i a
United
States
J a p a
n
Sub-Saharan AfricaIndia Latin America& Caribbean
Sustainable Limit Sustainable Limit ——3.3 Tons 3.3 Tons
500 million
Population
China
CEEP research (Byrne et al, 1998, Energy Policy v. 26, n.4: 335-343) established the benchmark for an equitableand sustainable climate future: 3.3 tons per person per
year. The United States is the leading emissions debtor,exceeding the sustainable & equitable emissions limit bymore than 500%.

8/6/2019 John Byrne - A New Energy Strategy for a New Climate
http://slidepdf.com/reader/full/john-byrne-a-new-energy-strategy-for-a-new-climate 11/30
-25
-15
-5
5
15
25
Needed Emission Reductions
Other*
Renewable Energy
Sustainable Land Use & Transport Planning
Electric Efficiency & Conservation Improvements
Non-Electric Efficiency & Conservation Improvements
New Emissions Above 1990
* Other includes 1.1 Gt CO2-e reduced through several options including:carbon capture & storage; waste & wastewater management; new nuclearpower plant designs.
Source: IPCC 2007. Fourth Assessment Report, WG III Report, Mitigation
of Climate Change.Supporting Sources: Olivier et al 2005 & 2006; WBCSD 2004.
2.5 (10%)
G T C O 2 - e
7.2 (30%)
4.2
7.8 12.0
(51%)
1990 1995 2000 2005 2010 2015 2020 2025 2030
23.7
IPCC Assessment of Principal Mitigation Options
2.0 ( 9%)
8/6/2019 John Byrne - A New Energy Strategy for a New Climate
http://slidepdf.com/reader/full/john-byrne-a-new-energy-strategy-for-a-new-climate 12/30
Center for Energy and Environmental Policy
University of Delawarehttp://ceep.udel.edu
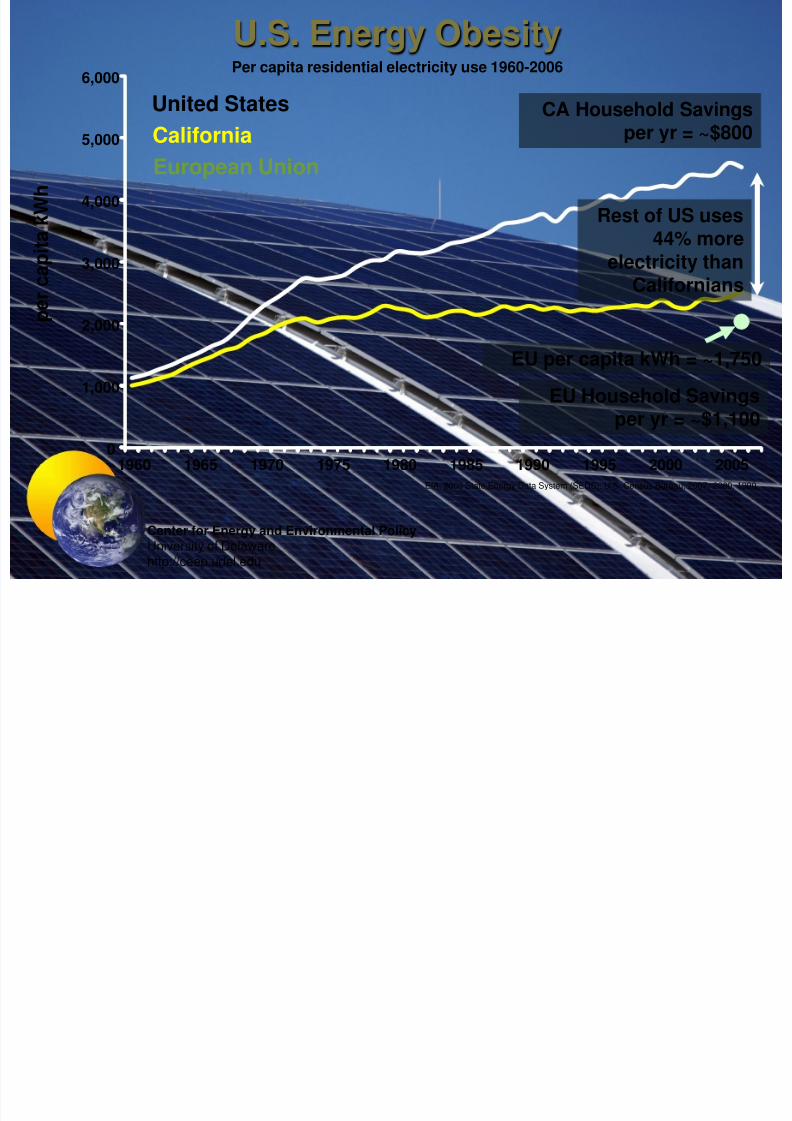
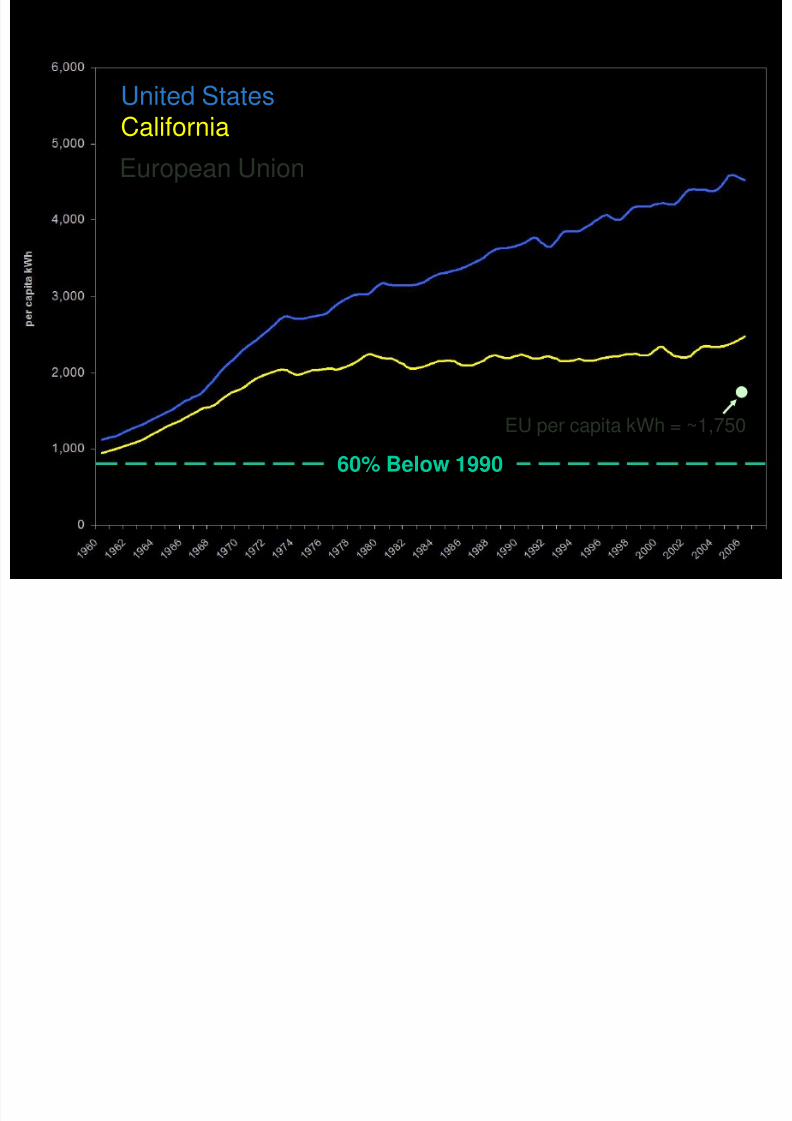
U.S. Energy Obesity
0
1,000
2,000
3,000
4,000
5,000
6,000
1960 1965 1970 1975 1980 1985 1990 1995 2000 2005
p e r c a
p i t a k W h
California
United States
European Union
Per capita residential electricity use 1960-2006
EIA, 2009 State Energy Data System (SEDS); U.S. Census Bureau, 2007, 2000, 1990
Rest of US uses44% more
electricity thanCalifornians
CA Household Savings
per yr = ~$800
EU per capita kWh = ~1,750
EU Household Savingsper yr = ~$1,100
8/6/2019 John Byrne - A New Energy Strategy for a New Climate
http://slidepdf.com/reader/full/john-byrne-a-new-energy-strategy-for-a-new-climate 13/30

8/6/2019 John Byrne - A New Energy Strategy for a New Climate
http://slidepdf.com/reader/full/john-byrne-a-new-energy-strategy-for-a-new-climate 14/30

8/6/2019 John Byrne - A New Energy Strategy for a New Climate
http://slidepdf.com/reader/full/john-byrne-a-new-energy-strategy-for-a-new-climate 15/30
Changing Built Environment Obesity
Center for Energy and Environmental Policy
8/6/2019 John Byrne - A New Energy Strategy for a New Climate
http://slidepdf.com/reader/full/john-byrne-a-new-energy-strategy-for-a-new-climate 16/30
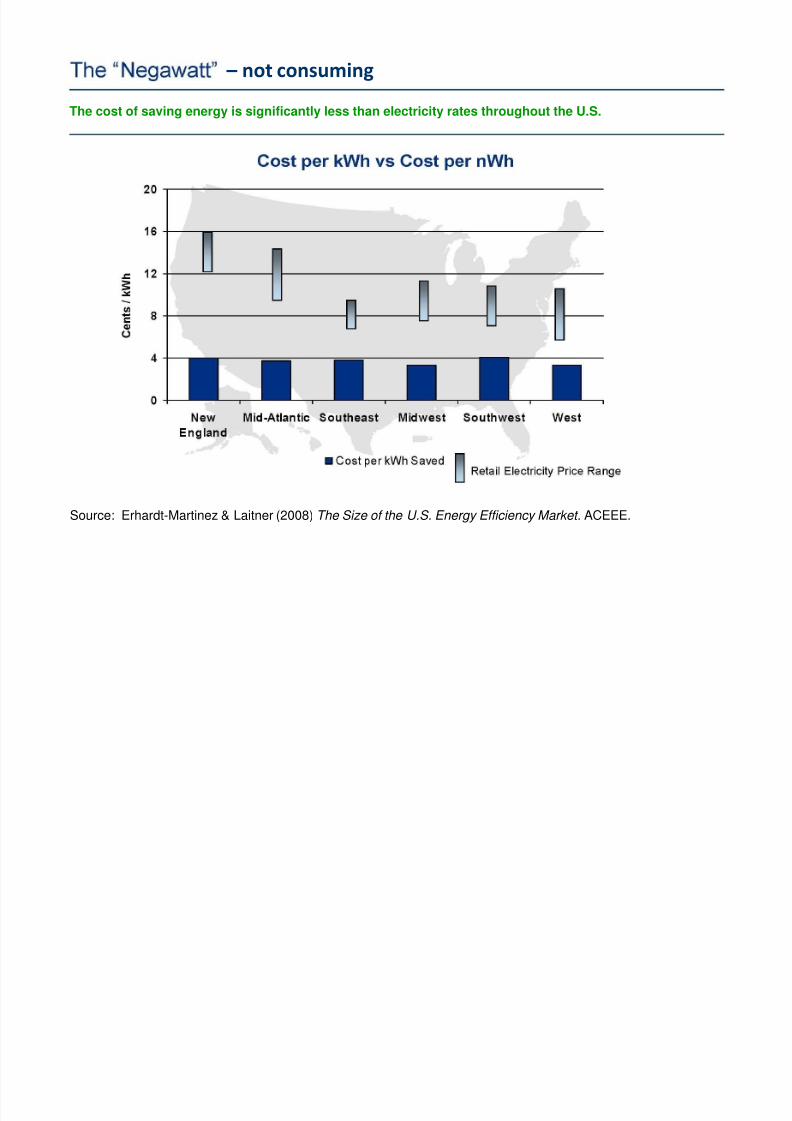
The cost of saving energy is significantly less than electricity rates throughout the U.S.
– not consuming
Source: Erhardt-Martinez & Laitner (2008) The Size of the U.S. Energy Efficiency Market . ACEEE.

8/6/2019 John Byrne - A New Energy Strategy for a New Climate
http://slidepdf.com/reader/full/john-byrne-a-new-energy-strategy-for-a-new-climate 17/30

8/6/2019 John Byrne - A New Energy Strategy for a New Climate
http://slidepdf.com/reader/full/john-byrne-a-new-energy-strategy-for-a-new-climate 18/30
US Household Savingsfrom Multi-modalism
per yr = ~$3,000
Todd Litman, Victoria Transport Policy Institute. 2010. Evaluating Public
Transit Benefits and Costs
E ti t f th T h i l P t ti l f
8/6/2019 John Byrne - A New Energy Strategy for a New Climate
http://slidepdf.com/reader/full/john-byrne-a-new-energy-strategy-for-a-new-climate 19/30
Center for Energy and Environmental Policy
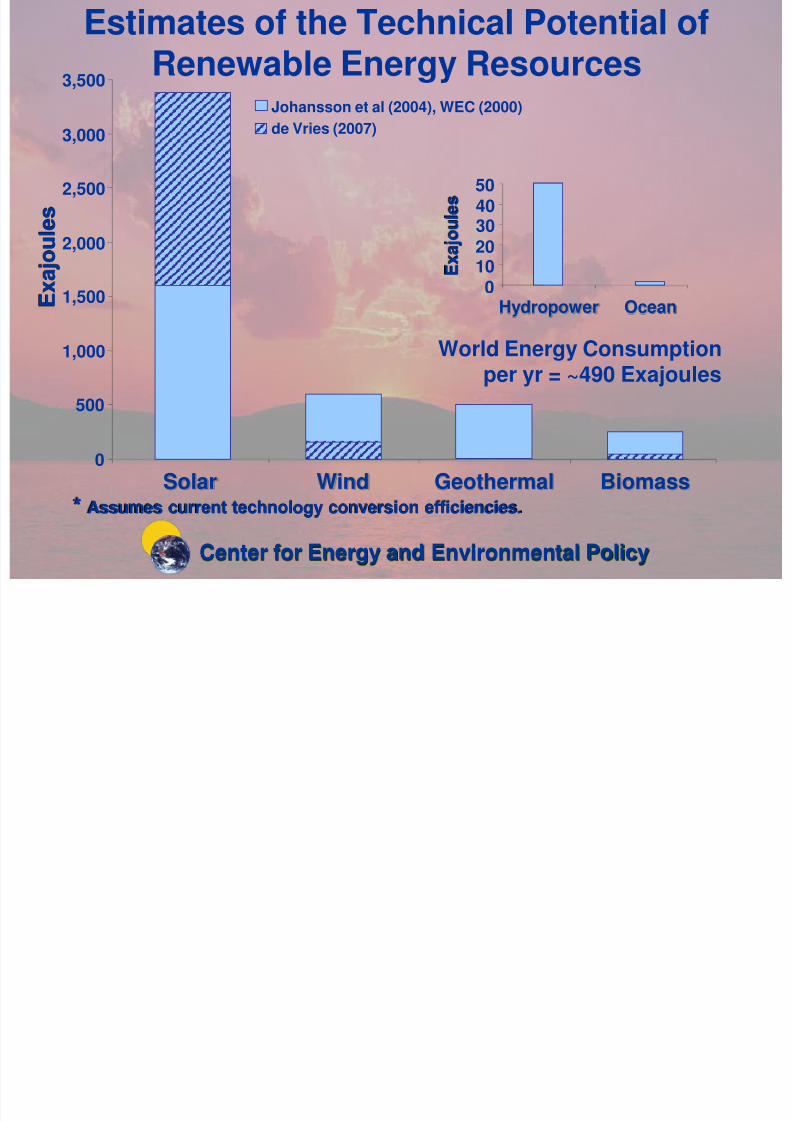
Estimates of the Technical Potential ofRenewable Energy Resources
0
500
1,000
1,500
2,000
2,500
3,000
3,500
Solar Wind Geothermal Biomass
Johansson et al (2004), WEC (2000)
de Vries (2007)
E x a j o u l e s
010
20304050
Hydropower Ocean
E
x a j o u l e s
* Assumes current technology conversion efficiencies.
World Energy Consumptionper yr = ~490 Exajoules

8/6/2019 John Byrne - A New Energy Strategy for a New Climate
http://slidepdf.com/reader/full/john-byrne-a-new-energy-strategy-for-a-new-climate 20/30
Renewables – Approaching Parity
Data Source: Lazard 2008-09; CEEP (2010)
0
5
1015
20
25
30
35
40
L e v e l i z e d C o s t p e r k W h ( U S c e
n t s )
Utility Scale
(competes inWholesale Market)
Average U.S. RetailElectricity Price
LCOE with US Incentives LCOE w/o Incentives
Distributed Energy
(competes inRetail Market)
8/6/2019 John Byrne - A New Energy Strategy for a New Climate
http://slidepdf.com/reader/full/john-byrne-a-new-energy-strategy-for-a-new-climate 21/30
PV P t ti l i S l

8/6/2019 John Byrne - A New Energy Strategy for a New Climate
http://slidepdf.com/reader/full/john-byrne-a-new-energy-strategy-for-a-new-climate 22/30
PV Potential in Seoul
Total AvailableRooftop Real Estate: 130.8 million m2
Assumptions: 40% of flat rooftop area used to collect solarenergy; PV module efficiency = 20%; Inverter efficiency: 95%
Sources: Columbia University, 2006; SEIA website.
2005 CityElectricity Use: 40.5 TWh
2005 CityPeak Demand: 18.8 GW
Solar PotentialElectricity Supply: 10.0 TWh (36%)
Solar PotentialPeak Shaving: 6.7 GW (51%)
900 MW1,354 GWh(14%)
Commercial
134 MW201 GWh (2%)
Public
885 MW1,330 GWh
(13%)
Educational
67 MW101 GWh (1%)
Industrial
197 MW296 GWh (2%)
Other
Residential
4,494 MW6,759 GWh
(68%)
Population = 12 million

8/6/2019 John Byrne - A New Energy Strategy for a New Climate
http://slidepdf.com/reader/full/john-byrne-a-new-energy-strategy-for-a-new-climate 23/30

8/6/2019 John Byrne - A New Energy Strategy for a New Climate
http://slidepdf.com/reader/full/john-byrne-a-new-energy-strategy-for-a-new-climate 24/30
8/6/2019 John Byrne - A New Energy Strategy for a New Climate
http://slidepdf.com/reader/full/john-byrne-a-new-energy-strategy-for-a-new-climate 25/30
Center for Energy and Environmental Policy
University of Delawarehttp://ceep.udel.edu
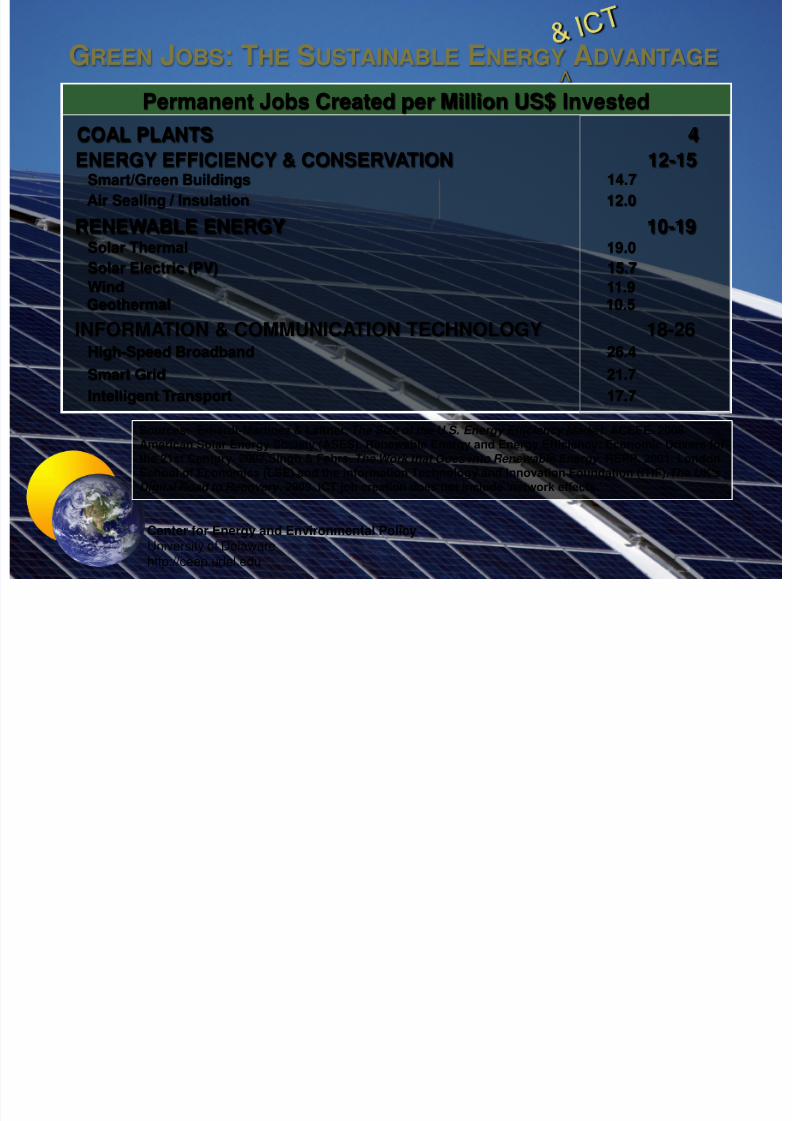
GREEN JOBS: THE SUSTAINABLE ENERGY ADVANTAGE
Permanent Jobs Created per Million US$ Invested
ENERGY EFFICIENCY & CONSERVATION 12-15
Solar Electric (PV) 15.7
COAL PLANTS 4
RENEWABLE ENERGY 10-19
Smart/Green Buildings 14.7
Air Sealing / Insulation 12.0
Solar Thermal 19.0
Wind 11.9Geothermal 10.5
INFORMATION & COMMUNICATION TECHNOLOGY 18-26High-Speed Broadband 26.4
Smart Grid 21.7
Intelligent Transport 17.7
^
Sources: Erhardt-Martinez & Laitner, The Size of the U.S. Energy Efficiency Market . ACEEE. 2008.American Solar Energy Society (ASES). Renewable Energy and Energy Efficiency: Economic Drivers forthe 21st Century. 2007.Singh & Fehrs, The Work that Goes into Renewable Energy . REPP. 2001. LondonSchool of Economics (LSE) and the information Technology and Innovation Foundation (ITIF). The UK’s
Digital Road to Recovery . 2009. ICT job creation does not include ‘network effects.’
Shifting the Energy Paradigm:

8/6/2019 John Byrne - A New Energy Strategy for a New Climate
http://slidepdf.com/reader/full/john-byrne-a-new-energy-strategy-for-a-new-climate 26/30
Center for Energy and Environmental Policy
University of Delawarehttp://ceep.udel.edu
Developed at CEEP, the
Sustainable Energy Utility(SEU) is an innovativepublic-private partnershipfocused exclusively ondelivering renewable energyand conservation services
Implemented in:-Delaware-Philadelphia-Washington, DCUnder consideration in:-Seoul, South Korea
-Cities in China
Shifting the Energy Paradigm:The Sustainable Energy Utility Model

8/6/2019 John Byrne - A New Energy Strategy for a New Climate
http://slidepdf.com/reader/full/john-byrne-a-new-energy-strategy-for-a-new-climate 27/30
Shenzhen, PRC 1980

8/6/2019 John Byrne - A New Energy Strategy for a New Climate
http://slidepdf.com/reader/full/john-byrne-a-new-energy-strategy-for-a-new-climate 28/30
Leading PV Manufacturers
2006 2008
JAPAN 52%
CHINA 11%
CHINA 60%
JAPAN 25%
World Solar Cell Production =~1,700 MW
World Solar Cell Production =~4,100 MW
Sources: Prometheus Institute, 2009, PV News (April); Japan PV Energy Association,2010; IEA PVPS, 2010.
8/6/2019 John Byrne - A New Energy Strategy for a New Climate
http://slidepdf.com/reader/full/john-byrne-a-new-energy-strategy-for-a-new-climate 29/30
United States
California
Per capita residential electricity use 1960-2006
EIA, 2009 State Energy Data System (SEDS); U.S. Census Bureau, 2007, 2000, 1990
ENERGY OBESITY
EU per capita kWh = ~1,750
European Union
60% Below 1990

8/6/2019 John Byrne - A New Energy Strategy for a New Climate
http://slidepdf.com/reader/full/john-byrne-a-new-energy-strategy-for-a-new-climate 30/30
Related Documents