Uncorrected Proof Commonalities for Numerical and Continuous Quantity Skills at Temporo-parietal Junction Marinella Cappelletti 1 , Rebecca Chamberlain 1 , Elliot D. Freeman 2 , Ryota Kanai 1 , Brian Butterworth 1 , Cathy J. Price 1 , and Geraint Rees 1 Abstract ■ How do our abilities to process number and other continu- ous quantities such as time and space relate to each other? Recent evidence suggests that these abilities share common magnitude processing and neural resources, although other findings also highlight the role of dimension-specific processes. To further characterize the relation between number, time, and space, we first examined them in a population with a devel- opmental numerical dysfunction (developmental dyscalculia) and then assessed the extent to which these abilities correlated both behaviorally and anatomically in numerically normal partic- ipants. We found that (1) participants with dyscalculia showed preserved continuous quantity processing and (2) in numeri- cally normal adults, numerical and continuous quantity abilities were at least partially dissociated both behaviorally and anato- mically. Specifically, gray matter volume correlated with both measures of numerical and continuous quantity processing in the right TPJ; in contrast, individual differences in number pro- ficiency were associated with gray matter volume in number- specific cortical regions in the right parietal lobe. Together, our new converging evidence of selective numerical impair- ment and of number-specific brain areas at least partially dis- tinct from common magnitude areas suggests that the human brain is equipped with different ways of quantifying the outside world. ■ INTRODUCTION Philosophers, neurologists, educators, and psychologists have long pondered the relation between number and con- tinuous quantities, such as space and time (see Dehaene & Brannon, 2011): Are these dimensions built on one com- mon system for quantification, or do they stand indepen- dently from each other? The first hypothesis derives from the popular idea that number, time, and space all depend on shared magnitude processing (Bueti & Walsh, 2009; Cantlon, Platt, & Brannon, 2009; Walsh, 2003). However, evidence for this common processing is mixed. For example, supporting data come from the similarity of performance in number, time, or space processing (e.g., Brannon, Suanda, & Libertus, 2007; Zorzi, Priftis, & Umiltà, 2002), but the opposite possibility—that number, time, and space may each be fully independent—was supported by TMS and lesion studies showing dissociations among these dimensions (e.g., Aiello et al., 2012; Dormal, Seron, & Pesenti, 2006; Doricchi, Guariglia, Gasparini, & Tomaiuolo, 2005). A third, intermediate, possibility is that number, time, and space are only partly independent (e.g., Walsh, 2003). This is suggested by interactions between dimensions: For instance, large numbers can be perceived as longer than veridical in physical size or duration (e.g., Dormal et al., 2006), even when number or time are selec- tively impaired by brain lesions (Cappelletti, Freeman, & Cipolotti, 2009, 2011). Although previous studies investigated the relationship between number, time, and space by examining perfor- mance either averaged across groups or in single cases, here we focused on individual differences in task perfor- mance and in brain anatomy. Individual differences were assessed within both the normal and abnormal spectrum of numerical skills, the latter consisting of participants whose numerical abilities are developmentally impaired, that is, dyscalculia (Butterworth, 2003). Our reasoning for including participants with dyscalculia was that they offer a unique perspective on the relation between number, time, and space and in particular, because number skills are by diagnosis impaired in dyscalculia, on possible associations or dissociations between number, time, and space. The above three hypotheses on the link between num- ber, time, and space predict different patterns of results. The proposal of a common magnitude system predicts that numerical proficiency will be associated with perfor- mance in continuous quantity discrimination in numeri- cally normal and participants with dyscalculia and also a possible correlation of number, time, and space measures with the volume of common brain regions. In contrast, the second hypothesis of fully independent magnitude dimen- sions predicts dissociation between behavioral measures and independent correlations of each measure with the volume of distinct brain regions. Dyscalculicsʼ performance 1 University College London, 2 City University London © Massachusetts Institute of Technology Journal of Cognitive Neuroscience X:Y, pp. 1–14 doi:10.1162/jocn_a_00546

Welcome message from author
This document is posted to help you gain knowledge. Please leave a comment to let me know what you think about it! Share it to your friends and learn new things together.
Transcript
UncorrectedProof
Commonalities for Numerical and Continuous QuantitySkills at Temporo-parietal Junction
Marinella Cappelletti1, Rebecca Chamberlain1, Elliot D. Freeman2,Ryota Kanai1, Brian Butterworth1, Cathy J. Price1, and Geraint Rees1
Abstract
■ How do our abilities to process number and other continu-ous quantities such as time and space relate to each other?Recent evidence suggests that these abilities share commonmagnitude processing and neural resources, although otherfindings also highlight the role of dimension-specific processes.To further characterize the relation between number, time,and space, we first examined them in a population with a devel-opmental numerical dysfunction (developmental dyscalculia)and then assessed the extent to which these abilities correlatedboth behaviorally and anatomically in numerically normal partic-ipants. We found that (1) participants with dyscalculia showedpreserved continuous quantity processing and (2) in numeri-
cally normal adults, numerical and continuous quantity abilitieswere at least partially dissociated both behaviorally and anato-mically. Specifically, gray matter volume correlated with bothmeasures of numerical and continuous quantity processing inthe right TPJ; in contrast, individual differences in number pro-ficiency were associated with gray matter volume in number-specific cortical regions in the right parietal lobe. Together,our new converging evidence of selective numerical impair-ment and of number-specific brain areas at least partially dis-tinct from common magnitude areas suggests that the humanbrain is equipped with different ways of quantifying the outsideworld. ■
INTRODUCTION
Philosophers, neurologists, educators, and psychologistshave long pondered the relation between number and con-tinuous quantities, such as space and time (see Dehaene& Brannon, 2011): Are these dimensions built on one com-mon system for quantification, or do they stand indepen-dently from each other? The first hypothesis derives fromthe popular idea that number, time, and space all dependon shared magnitude processing (Bueti & Walsh, 2009;Cantlon, Platt, & Brannon, 2009; Walsh, 2003). However,evidence for this common processing is mixed. Forexample, supporting data come from the similarity ofperformance in number, time, or space processing (e.g.,Brannon, Suanda, & Libertus, 2007; Zorzi, Priftis, & Umiltà,2002), but the opposite possibility—that number, time, andspace may each be fully independent—was supportedby TMS and lesion studies showing dissociations amongthese dimensions (e.g., Aiello et al., 2012; Dormal,Seron, & Pesenti, 2006; Doricchi, Guariglia, Gasparini, &Tomaiuolo, 2005). A third, intermediate, possibility is thatnumber, time, and space are only partly independent (e.g.,Walsh, 2003). This is suggested by interactions betweendimensions: For instance, large numbers can be perceivedas longer than veridical in physical size or duration (e.g.,Dormal et al., 2006), even when number or time are selec-
tively impaired by brain lesions (Cappelletti, Freeman, &Cipolotti, 2009, 2011).
Although previous studies investigated the relationshipbetween number, time, and space by examining perfor-mance either averaged across groups or in single cases,here we focused on individual differences in task perfor-mance and in brain anatomy. Individual differences wereassessed within both the normal and abnormal spectrumof numerical skills, the latter consisting of participantswhose numerical abilities are developmentally impaired,that is, dyscalculia (Butterworth, 2003). Our reasoning forincluding participants with dyscalculia was that they offer aunique perspective on the relation between number, time,and space and in particular, because number skills are bydiagnosis impaired in dyscalculia, on possible associationsor dissociations between number, time, and space.
The above three hypotheses on the link between num-ber, time, and space predict different patterns of results.The proposal of a common magnitude system predictsthat numerical proficiency will be associated with perfor-mance in continuous quantity discrimination in numeri-cally normal and participants with dyscalculia and also apossible correlation of number, time, and space measureswith the volume of common brain regions. In contrast, thesecond hypothesis of fully independent magnitude dimen-sions predicts dissociation between behavioral measuresand independent correlations of each measure with thevolume of distinct brain regions. Dyscalculicsʼ performance1University College London, 2City University London
© Massachusetts Institute of Technology Journal of Cognitive Neuroscience X:Y, pp. 1–14doi:10.1162/jocn_a_00546
UncorrectedProof
may provide converging evidence of independent ratherthan shared processes among dimensions if number pro-cessing dissociate from maintained continuous quantityprocessing. The third hypothesis of partial independenceof number and continuous quantity processing predicts apartial correlation between behavioral measures, whichmay be associated with both common and distinct brainregions.
We first tested whether continuous quantity process-ing was maintained in participants with dyscalculia; havingfound a dissociation between impaired numerical abilitiesand preserved continuous quantity skills in dyscalculia,we then measured correlations between individual differ-ences in number, time, and space performance in anothernondyscalculic sample for whom numeracy skills variedwithin the normal range. In the same sample, we usedvoxel-based morphometry (VBM; Ashburner & Friston,2000), optimized for neurologically normal brains, to testwhether our measures each correlated with anatomicaldifferences in common and/or distinct brain areas.
METHODS
For all participants, we administered a series of carefullyselected numerical and arithmetical tasks, as well as psy-chophysical tasks measuring continuous quantity dis-crimination in space and time. Our choice of tasks andstimuli was motivated by the aim of measuring numerical/arithmetical and continuous quantity skills as indepen-dently as possible. This independence was essential toobtain an unbiased measure of how these cognitive abil-ities correlate with each other. We reasoned that if ex-perimental paradigms that are different but more suitedto test each individual magnitude dimension result insimilar behavioral and anatomical responses in processingnumber, time, and space, then such similarities are morelikely to be accounted for by a common magnitude systemor other processes shared between number and continuousquantity. We used symbolic numbers (1–9), typically em-ployed to test numerical proficiency (Butterworth, 2010)independently from nonsymbolic continua (horizontallines changing in length or duration), such that numberswere never manipulated along continuous dimensionsand nonsymbolic continua were never presented withsymbolic numbers.
Participants
Ninety-three right-handed, neurologically normal adultswith normal or corrected-to-normal vision gave writteninformed consent to take part in the study. The main sam-ple consisted of 16 participants (mean age = 34.7 years,range = 22–38 years, 15 women, 1 man) who had beendiagnosed with dyscalculia (see below) and 37 participantswho were age- and gender-matched to the previous group(Control Group 1: mean age = 23 years, range = 19–35,
23 women) but with numerical abilities within the normalrange. All participants performed the numerical and con-tinuous quantity tasks, and we obtained brain scans from37 nondyscalculic participants only. Two additional groupsof numerically normal participants performed two sup-plementary control tasks (Supplementary Task 1 in Con-trol Group 2: n = 18, mean age = 26.1 years, range =20–35 years, 8 women; Supplementary Task 2 in ControlGroup 3: n = 22, mean age = 24.6 years, range = 20–34 years, 13 women). The study was approved by the localresearch ethics committee.
Participants with Dyscalculia
Dyscalculia was diagnosed before participants were invitedto take part in the study. The diagnosis was based on (1)the Dyscalculia Screener (Butterworth, 2003); (2) a stan-dardized arithmetical task, that is, the Graded DifficultyArithmetic Task ( Jackson & Warrington, 1986); (3) thearithmetic subtest of WAIS-R (Wechsler, 1986); and(4) a task consisting of discriminating the numerosity ofclouds of dots, which allows the calculation of the Weberfraction, an index of accuracy sensitive to dyscalculia(Mazzocco, Feingenson, & Halberda, 2011; Piazza et al.,2010; Halberda, Mazzocco, & Feigenson, 2008). Generalintelligence was also assessed (Wechsler, 1986).In the Dyscalculia Screener, all 16 participants with
dyscalculia obtained a score below the cutoff point ineither the capacity or the achievement scale, thereby ful-filling the criteria for dyscalculia. They were also impairedin the other numerical or arithmetical tasks consistentwith their diagnosis. IQ was average or high average, sug-gesting preserved intellectual functioning (see Table 1).
Experimental Tasks
There were two sets of experimental tasks, one testingcontinuous quantity discrimination and the other testingnumerical competence. Stimulus presentation and datacollection were controlled using the Cogent Graphicstoolbox (www.vislab.ucl.ac.uk/Cogent/) and MATLAB 7.3software on a Sony S2VP laptop computer with videomode of 640 × 480 pixels, screen dimensions of 20.8°horizontal by 15.83° vertical and 60 Hz refresh rate.Participants placed their head on a chin rest positioned50 cm from the screen.
Continuous Quantity Tasks
Two tasks were used, which have been extensivelyemployed in neurologically normal and brain-lesionedparticipants (Cappelletti, Freeman, & Butterworth,2011; Cappelletti, Freeman, & Cipolotti, 2011; Cappellettiet al., 2009). The two tasks required comparing visualstimuli along the dimension of length or the orthogonaldimension of time.
2 Journal of Cognitive Neuroscience Volume X, Number Y
UncorrectedProof
Stimuli. These consisted of two horizontal white lines(thickness = 0.17°) centered on the vertical meridianon a black background and presented sequentially ina two-interval discrimination paradigm, one line 5.07°above the horizontal meridian and the other 5.07° belowin random order.
Design. The first line stimulus (the Reference) was fixed(length of 10.29° and duration of 600 msec), whereasthe second line (the Test) could vary according to themethod of constant stimuli either in length or duration,depending on the dimension to be judged (the irrelevantdimension always matched the Reference). For each di-mension, the ratio between the smaller and the largerstimulus could vary unpredictably over five levels: 1.06,1.13, 1.2, 1.26, and 1.33 for time and 1.025, 1.05, 1.075,1.10, and 1.25 for length, selected from previous studies(Cappelletti, Freeman, & Cipolotti, 2011; Cappellettiet al., 2009). Test stimulus values were randomly sampledwithout replacement from a set of five equally spacedvalues for each dimension (steps of 0.257° for length and40 msec for time) with equal frequency. There were fiveblocks of 40 observations for each level of the test stim-ulus (total 200 observations for each task). The time andspace discrimination tasks were run independently from
each other in counterbalanced order across participantsto avoid order effects.
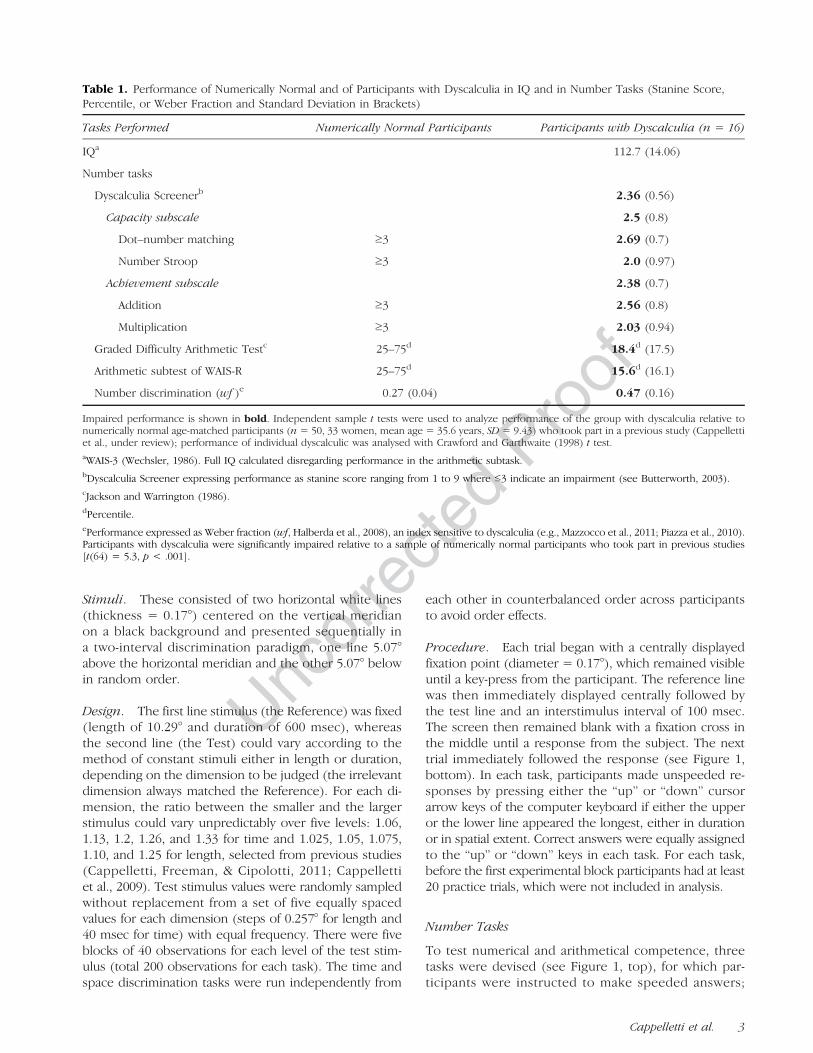
Procedure. Each trial began with a centrally displayedfixation point (diameter = 0.17°), which remained visibleuntil a key-press from the participant. The reference linewas then immediately displayed centrally followed bythe test line and an interstimulus interval of 100 msec.The screen then remained blank with a fixation cross inthe middle until a response from the subject. The nexttrial immediately followed the response (see Figure 1,bottom). In each task, participants made unspeeded re-sponses by pressing either the “up” or “down” cursorarrow keys of the computer keyboard if either the upperor the lower line appeared the longest, either in durationor in spatial extent. Correct answers were equally assignedto the “up” or “down” keys in each task. For each task,before the first experimental block participants had at least20 practice trials, which were not included in analysis.
Number Tasks
To test numerical and arithmetical competence, threetasks were devised (see Figure 1, top), for which par-ticipants were instructed to make speeded answers;
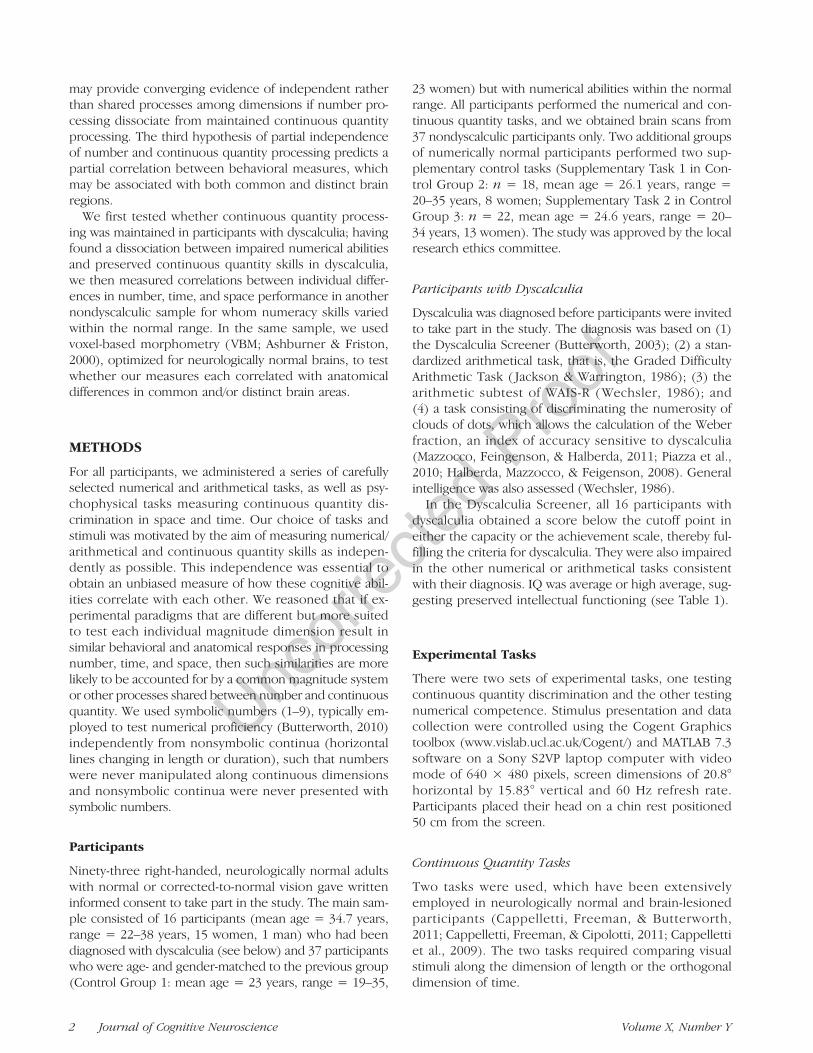
Table 1. Performance of Numerically Normal and of Participants with Dyscalculia in IQ and in Number Tasks (Stanine Score,Percentile, or Weber Fraction and Standard Deviation in Brackets)
Tasks Performed Numerically Normal Participants Participants with Dyscalculia (n = 16)
IQa 112.7 (14.06)
Number tasks
Dyscalculia Screenerb 2.36 (0.56)
Capacity subscale 2.5 (0.8)
Dot–number matching ≥3 2.69 (0.7)
Number Stroop ≥3 2.0 (0.97)
Achievement subscale 2.38 (0.7)
Addition ≥3 2.56 (0.8)
Multiplication ≥3 2.03 (0.94)
Graded Difficulty Arithmetic Testc 25–75d 18.4d (17.5)
Arithmetic subtest of WAIS-R 25–75d 15.6d (16.1)
Number discrimination (wf )e 0.27 (0.04) 0.47 (0.16)
Impaired performance is shown in bold. Independent sample t tests were used to analyze performance of the group with dyscalculia relative tonumerically normal age-matched participants (n = 50, 33 women, mean age = 35.6 years, SD = 9.43) who took part in a previous study (Cappellettiet al., under review); performance of individual dyscalculic was analysed with Crawford and Garthwaite (1998) t test.aWAIS-3 (Wechsler, 1986). Full IQ calculated disregarding performance in the arithmetic subtask.bDyscalculia Screener expressing performance as stanine score ranging from 1 to 9 where ≤3 indicate an impairment (see Butterworth, 2003).cJackson and Warrington (1986).dPercentile.ePerformance expressed as Weber fraction (wf, Halberda et al., 2008), an index sensitive to dyscalculia (e.g., Mazzocco et al., 2011; Piazza et al., 2010).Participants with dyscalculia were significantly impaired relative to a sample of numerically normal participants who took part in previous studies[t(64) = 5.3, p < .001].
Cappelletti et al. 3
UncorrectedProof
accuracy and RTs were collected. These tasks were similarbut not identical to those used to diagnose dyscalculia:For instance, the Screener uses a “Number Stroop” taskwhere numbers change in value as well as physical size(e.g., 1 vs. 3) because this task is sensitive to dyscalculia(e.g., Rubinsten & Henik, 2005); moreover, the Screeneris based on addition and multiplication problems only. Incontrast, our experimental tasks used a “number com-parison” task where the numbers changed only in valuebut not physical size; our tasks also included subtractionproblems besides addition and multiplication becausesubtractions are thought to rely on quantity-based ratherthan verbal memory processes (Dehaene, Piazza, Pinel,& Cohen, 2003).
Arithmetical verification. This task required partici-pants to indicate as fast as possible using predefined re-sponse keys whether an arithmetic problem displayedthe correct or incorrect answer. Twenty single-digit pro-blems for each type of operation (addition, subtraction,and multiplication) were presented in separate blocks.
STIMULI AND DESIGN. Single-digit and two-digit Arabic num-bers were presented as operands or as possible resultsof the arithmetical operations. For instance, participantswere presented with problems such as “9 + 6 = 13,”“7 − 2 = 3,” or “6 × 3 = 16.” When results were incor-rect, these were either 1 or 2 units apart from the correctresult for addition and subtraction problems (e.g., “9 +6 = 13” or “7 − 2 = 3”) or 2 units apart for multiplicationproblems (e.g., “6 × 3 = 16”).
PROCEDURE. Following a 500-msec central fixation cross,each operation was presented for up to 7 sec duringwhich participants could answer.
Number comparison. This asked participants to indi-cate as fast as possible the larger of two Arabic numbers.
STIMULI AND DESIGN. Thirty-six pairs of single-digit Arabicnumbers (1–9) were individually presented. Using a de-sign similar to previous studies (e.g., Cappelletti, Didino,Stoianov, & Zorzi, under review), the following numericaldistances were used: 1 (e.g., 7 vs. 6 or 4 vs. 5; eight trials),2 (e.g., 3 vs. 1 or 7 vs. 9; eight trials), 3 (e.g., 5 vs. 8 or4 vs. 1; eight trials), 4 (e.g., 6 vs. 2 or 3 vs. 7; eight trials),5 (e.g., 9 vs. 4 or 1 vs. 6; four trials). Within each numericaldistance, there was an equal number of trials wherethe smaller digit displayed on the left or on the right offixation.
PROCEDURE. Stimulus pairs were centered along thehorizontal line of the computer screen and each displayedfor 500 msec to the left or the right of the fixation cross.Stimuli were then replaced by a black screen for a maxi-mum of 4 sec during which participants made an answer.After this, the following trial started immediately. Partici-pants were required to make speeded answer by pressingone of two predefined keys.
Dot–number matching. This required participants toindicate as fast as possible with a finger press whetheror not an Arabic number presented in one hemifieldmatched the number of dots presented in the otherhemifield.
STIMULI AND DESIGN. Thirty-six pairs of stimuli rangingfrom 1 to 9 were used. When the stimuli did not match,they could differ by 1, 2, 3 or 4 units, for instance, 6 dotspresented with the Arabic number 5, or 7 dots withnumber 8, or 5 dots with number 2.
PROCEDURE. Each pair of stimuli was presented for500 msec with hemifield assignment of the dot andnumber stimuli counterbalanced between trials.
Control Tasks
Two control tasks were designed to match either thebehavioral measures (accuracy and speeded RTs) or theexperimental paradigm (line stimuli presented aboveand below fixation) of the number and continuous quan-tity tasks, respectively. However, these control tasks didnot measure number, time, or space processing and assuch allowed us to distinguish effects reflecting numberand continuous quantity processing from other effectsreflecting generic aspects of performance such as compar-ing stimuli or stimulus and response selection processes.
Figure 1. Experimental tasks. Schematic depiction of the number/arithmetic and the continuous quantity discrimination tasks. In thenumber tasks, participants had to decide (from left) the larger amongtwo numbers, (2) whether a number and a set of dots indicated thesame quantity, and (3) whether the result of arithmetical operationswas correct. In the continuous quantity tasks, participants indicatedwhether the upper or the lower line was longer in either duration orlength, in different blocks.
4 Journal of Cognitive Neuroscience Volume X, Number Y
UncorrectedProof
Location discrimination. This control task consistedof 40 trials each displaying a dot for 200 msec in randomlocations on the left or right of a computer monitor andfollowing an ISI randomly selected between 500 msecand 2 sec. Similar to the number tasks, participants wereinstructed to make speeded responses identifying thelocation of each stimulus (left or right of fixation) bypressing one of two predefined keys. Accuracy and RTswere recorded similarly to the number tasks.
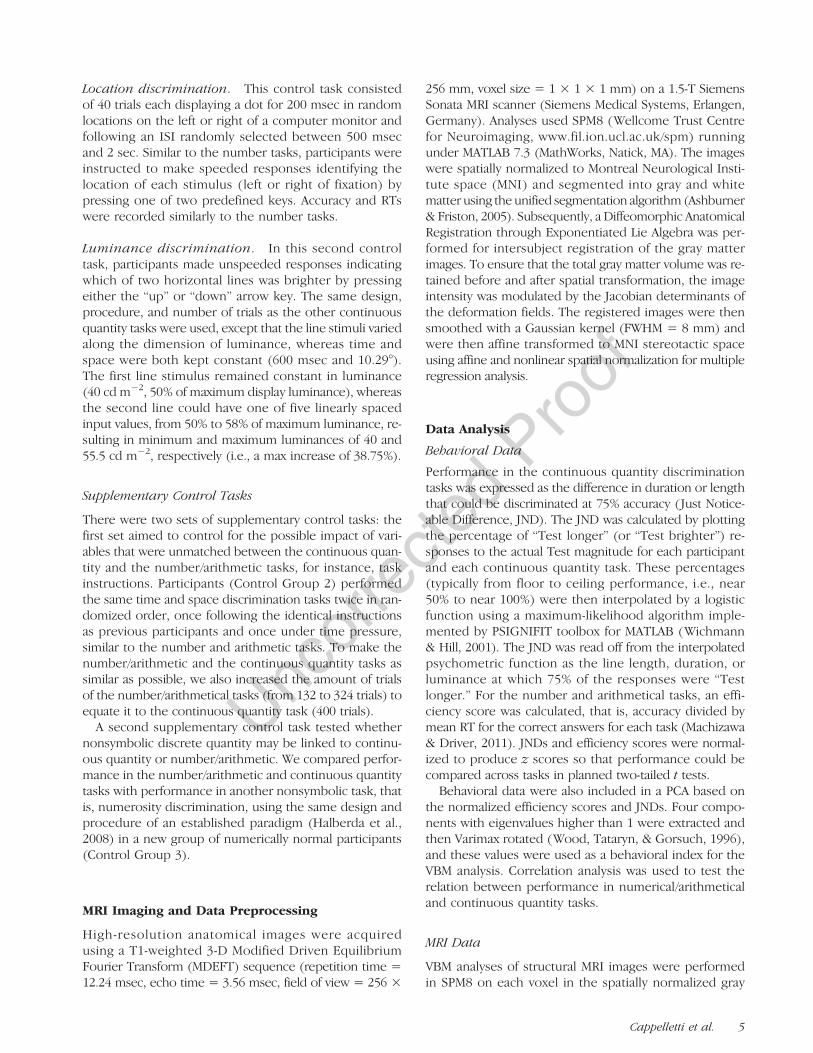
Luminance discrimination. In this second controltask, participants made unspeeded responses indicatingwhich of two horizontal lines was brighter by pressingeither the “up” or “down” arrow key. The same design,procedure, and number of trials as the other continuousquantity tasks were used, except that the line stimuli variedalong the dimension of luminance, whereas time andspace were both kept constant (600 msec and 10.29°).The first line stimulus remained constant in luminance(40 cd m−2, 50% of maximum display luminance), whereasthe second line could have one of five linearly spacedinput values, from 50% to 58% of maximum luminance, re-sulting in minimum and maximum luminances of 40 and55.5 cd m−2, respectively (i.e., a max increase of 38.75%).
Supplementary Control Tasks
There were two sets of supplementary control tasks: thefirst set aimed to control for the possible impact of vari-ables that were unmatched between the continuous quan-tity and the number/arithmetic tasks, for instance, taskinstructions. Participants (Control Group 2) performedthe same time and space discrimination tasks twice in ran-domized order, once following the identical instructionsas previous participants and once under time pressure,similar to the number and arithmetic tasks. To make thenumber/arithmetic and the continuous quantity tasks assimilar as possible, we also increased the amount of trialsof the number/arithmetical tasks (from 132 to 324 trials) toequate it to the continuous quantity task (400 trials).A second supplementary control task tested whether
nonsymbolic discrete quantity may be linked to continu-ous quantity or number/arithmetic. We compared perfor-mance in the number/arithmetic and continuous quantitytasks with performance in another nonsymbolic task, thatis, numerosity discrimination, using the same design andprocedure of an established paradigm (Halberda et al.,2008) in a new group of numerically normal participants(Control Group 3).
MRI Imaging and Data Preprocessing
High-resolution anatomical images were acquiredusing a T1-weighted 3-D Modified Driven EquilibriumFourier Transform (MDEFT) sequence (repetition time =12.24 msec, echo time = 3.56 msec, field of view = 256 ×
256 mm, voxel size = 1 × 1 × 1 mm) on a 1.5-T SiemensSonata MRI scanner (Siemens Medical Systems, Erlangen,Germany). Analyses used SPM8 (Wellcome Trust Centrefor Neuroimaging, www.fil.ion.ucl.ac.uk/spm) runningunder MATLAB 7.3 (MathWorks, Natick, MA). The imageswere spatially normalized to Montreal Neurological Insti-tute space (MNI) and segmented into gray and whitematter using the unified segmentation algorithm (Ashburner& Friston, 2005). Subsequently, a Diffeomorphic AnatomicalRegistration through Exponentiated Lie Algebra was per-formed for intersubject registration of the gray matterimages. To ensure that the total gray matter volume was re-tained before and after spatial transformation, the imageintensity was modulated by the Jacobian determinants ofthe deformation fields. The registered images were thensmoothed with a Gaussian kernel (FWHM = 8 mm) andwere then affine transformed to MNI stereotactic spaceusing affine and nonlinear spatial normalization for multipleregression analysis.
Data Analysis
Behavioral Data
Performance in the continuous quantity discriminationtasks was expressed as the difference in duration or lengththat could be discriminated at 75% accuracy (Just Notice-able Difference, JND). The JND was calculated by plottingthe percentage of “Test longer” (or “Test brighter”) re-sponses to the actual Test magnitude for each participantand each continuous quantity task. These percentages(typically from floor to ceiling performance, i.e., near50% to near 100%) were then interpolated by a logisticfunction using a maximum-likelihood algorithm imple-mented by PSIGNIFIT toolbox for MATLAB (Wichmann& Hill, 2001). The JND was read off from the interpolatedpsychometric function as the line length, duration, orluminance at which 75% of the responses were “Testlonger.” For the number and arithmetical tasks, an effi-ciency score was calculated, that is, accuracy divided bymean RT for the correct answers for each task (Machizawa& Driver, 2011). JNDs and efficiency scores were normal-ized to produce z scores so that performance could becompared across tasks in planned two-tailed t tests.
Behavioral data were also included in a PCA based onthe normalized efficiency scores and JNDs. Four compo-nents with eigenvalues higher than 1 were extracted andthen Varimax rotated (Wood, Tataryn, & Gorsuch, 1996),and these values were used as a behavioral index for theVBM analysis. Correlation analysis was used to test therelation between performance in numerical/arithmeticaland continuous quantity tasks.
MRI Data
VBM analyses of structural MRI images were performedin SPM8 on each voxel in the spatially normalized gray
Cappelletti et al. 5
UncorrectedProof
matter images (see above) using behavioral measures asthe independent variable and the gray matter volume ineach voxel as the dependent variable. Global signalintensity differences were removed using proportionalscaling. For these analyses, we report regions that showedsignificant effects at a threshold p < .05, corrected formultiple comparisons (using family-wise error correction)across the whole brain. We used cluster level statistics witha nonstationary correction, which is essential to adjustcluster sizes according to local “roughness” (Hayasaka,Phan, Liberzon, Worsley, & Nichols, 2004). Three analyseswere performed: two were based on examination of thewhole-brain volume and one on predefined ROIs inaccordance with our prior hypotheses (see below).
Analysis 1: Gray matter volumes associated with perfor-mance on both number and continuous quantity tasks.This analysis introduced the two PCA rotated values cor-responding to numerical/arithmetical and continuous quan-tity performance as behavioral regressors in the VBManalysis, controlling for age, gender, and intracranialvolume, following an approach used successfully in pre-vious VBM studies (e.g., Garrido et al., 2009). Statisticalcontrasts identified brain areas where there was a correla-tion between gray matter increase and (1) the main effectof each PC factor, (2) any common effect between thefirst and second principle component (PC1 and PC2),and (3) any effect that was higher for one factor over theother, that is, an interaction.
Analysis 2: Gray matter volumes associated with perfor-mance on number/arithmetic and continuous quantitytasks relative to control tasks. This analysis includedthe normalized raw values corresponding to performancein the number/arithmetic, the continuous quantity, and thetwo control tasks (individual tasks for number/arithmeticand for continuous quantity averaged together). It testedwhether any gray matter change in areas previously iden-tified (Analysis 1) remained significant after controlling forany effect related to the control tasks.
Analysis 3: Predefined ROIs. This analysis was restrictedto brain regions identified by a previous functional im-aging study we conducted (Cappelletti, Lee, Freeman, &Price, 2010) and by meta-analyses of functional resultsbased on behavioral tasks similar to those used here(Wiener, Turkeltaub, & Coslett, 2010; Cohen Kadosh,Lammertyn, & Izard, 2008; Dehaene et al., 2003). Specifi-cally, it included the bilateral intraparietal sulcus (IPS),superior parietal lobe, and left angular gyrus for numbersand the left SMA, right inferior parietal lobe and supra-marginal gyrus, and the left frontal gyrus for continuousquantity. For these areas, we used small spheres of 8-mmradius placed in the anatomical ROIs and reported effectsat a threshold of p < .05 after correction.
RESULTS
Comparison of Behavioral Performancein Participants with Dyscalculia and inNumerically Normal Participants
In participants with dyscalculia, we found individualvariability in performing number and arithmetic tasks, con-sistent with previous studies looking at dyscalculic perfor-mance (Cappelletti & Price, under review; Rubinsten &Henik, 2009). For instance, accuracy across number tasksranged from 50% (chance) to 68% correct, and the meanRT varied from about 760 msec to over 4 sec. We alsofound a large and not previously reported variability inperforming the continuous quantity tasks such that, forexample, accuracy for discriminating the smallest incre-ment ranged from 50% (chance) to 90% correct for lengthdiscrimination from 50% to 73% correct for time.Moreover, in adults with dyscalculia, performance in the
number/arithmetic tasks correlated significantly with ameasure of nonsymbolic numerosity discrimination [i.e.,indicating the set with the larger number of items basedon an established paradigm, see Halberda et al., 2008,r = 0.56, F(1, 15) = 6.6, p = .02] and consistent with pre-vious reports (e.g., Mazzocco et al., 2011; Piazza et al.,2010). Performance in time and space discrimination tasksalso correlated significantly [r = 0.79, F(1, 15) = 21.3, p <.001]. Critically, continuous quantity and number perfor-mance did not correlate significantly [time vs. mean num-ber tasks: r = 0.25, F(1, 15) = 0.8, p = .36, ns; space vs.mean number tasks: r = 0.29, F(1, 15) = 1.2, p = .29, ns],similar to numerically normal participants (see below).To examine the extent to which performance in par-
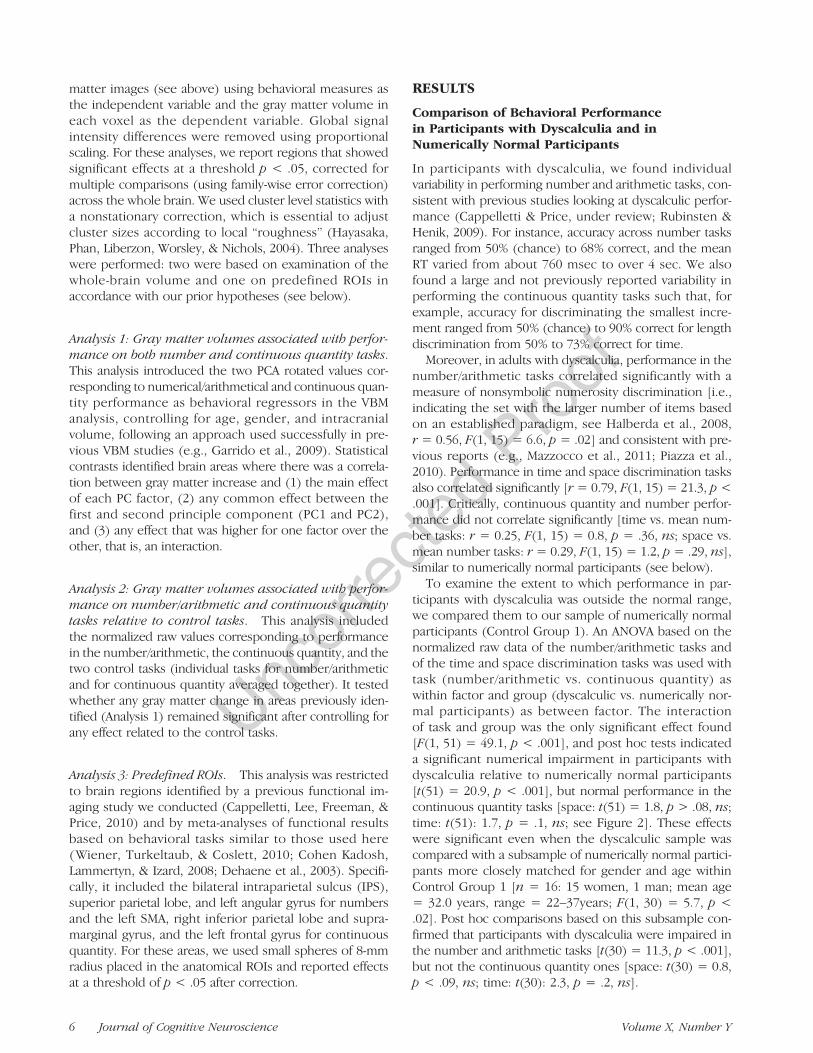
ticipants with dyscalculia was outside the normal range,we compared them to our sample of numerically normalparticipants (Control Group 1). An ANOVA based on thenormalized raw data of the number/arithmetic tasks andof the time and space discrimination tasks was used withtask (number/arithmetic vs. continuous quantity) aswithin factor and group (dyscalculic vs. numerically nor-mal participants) as between factor. The interactionof task and group was the only significant effect found[F(1, 51) = 49.1, p < .001], and post hoc tests indicateda significant numerical impairment in participants withdyscalculia relative to numerically normal participants[t(51) = 20.9, p < .001], but normal performance in thecontinuous quantity tasks [space: t(51) = 1.8, p > .08, ns;time: t(51): 1.7, p = .1, ns; see Figure 2]. These effectswere significant even when the dyscalculic sample wascompared with a subsample of numerically normal partici-pants more closely matched for gender and age withinControl Group 1 [n = 16: 15 women, 1 man; mean age= 32.0 years, range = 22–37years; F(1, 30) = 5.7, p <.02]. Post hoc comparisons based on this subsample con-firmed that participants with dyscalculia were impaired inthe number and arithmetic tasks [t(30) = 11.3, p < .001],but not the continuous quantity ones [space: t(30) = 0.8,p < .09, ns; time: t(30): 2.3, p = .2, ns].
6 Journal of Cognitive Neuroscience Volume X, Number Y
UncorrectedProof
The dissociation between number/arithmetic and con-tinuous quantity performance in participants with dys-calculia as well as the lack of correlation between thesetasks suggests that atypical number development leavesspared other types of quantity processing like time andspace (see also Cappelletti, Freeman, & Butterworth,2011; Rubinsten et al., 2005).
Behavioral Performance in NumericallyNormal Participants
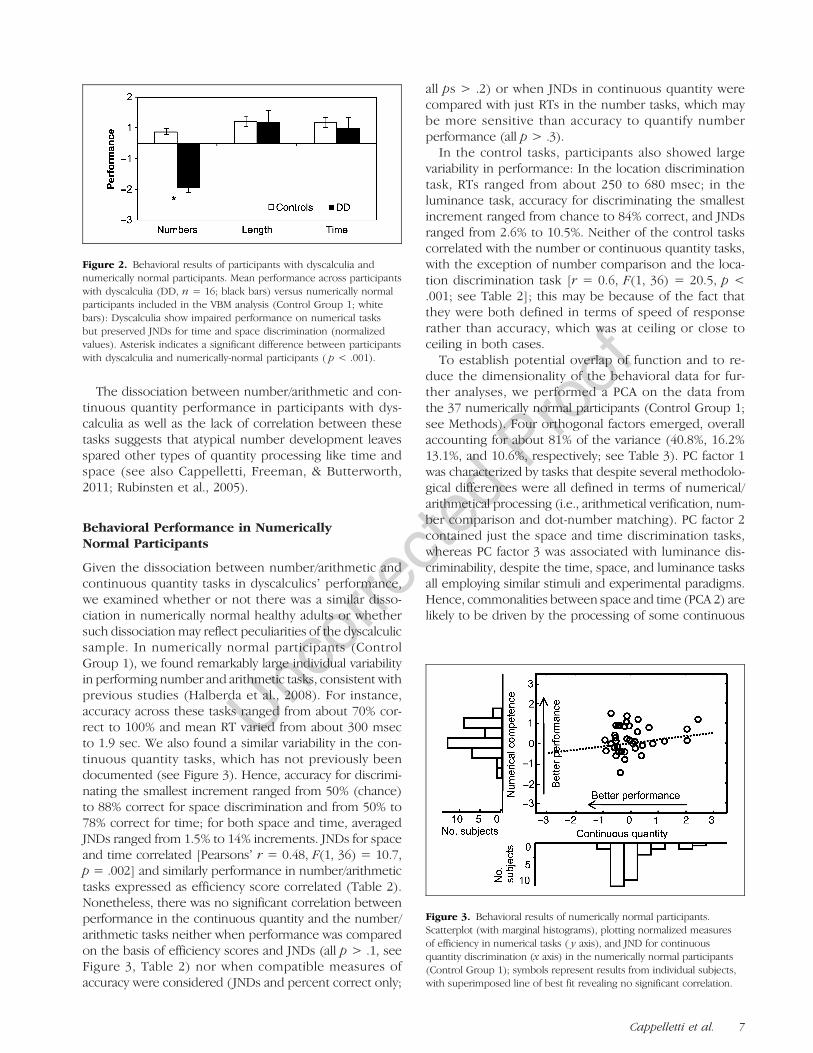
Given the dissociation between number/arithmetic andcontinuous quantity tasks in dyscalculicsʼ performance,we examined whether or not there was a similar disso-ciation in numerically normal healthy adults or whethersuch dissociation may reflect peculiarities of the dyscalculicsample. In numerically normal participants (ControlGroup 1), we found remarkably large individual variabilityin performing number and arithmetic tasks, consistent withprevious studies (Halberda et al., 2008). For instance,accuracy across these tasks ranged from about 70% cor-rect to 100% and mean RT varied from about 300 msecto 1.9 sec. We also found a similar variability in the con-tinuous quantity tasks, which has not previously beendocumented (see Figure 3). Hence, accuracy for discrimi-nating the smallest increment ranged from 50% (chance)to 88% correct for space discrimination and from 50% to78% correct for time; for both space and time, averagedJNDs ranged from 1.5% to 14% increments. JNDs for spaceand time correlated [Pearsonsʼ r = 0.48, F(1, 36) = 10.7,p = .002] and similarly performance in number/arithmetictasks expressed as efficiency score correlated (Table 2).Nonetheless, there was no significant correlation betweenperformance in the continuous quantity and the number/arithmetic tasks neither when performance was comparedon the basis of efficiency scores and JNDs (all p > .1, seeFigure 3, Table 2) nor when compatible measures ofaccuracy were considered (JNDs and percent correct only;
all ps > .2) or when JNDs in continuous quantity werecompared with just RTs in the number tasks, which maybe more sensitive than accuracy to quantify numberperformance (all p > .3).
In the control tasks, participants also showed largevariability in performance: In the location discriminationtask, RTs ranged from about 250 to 680 msec; in theluminance task, accuracy for discriminating the smallestincrement ranged from chance to 84% correct, and JNDsranged from 2.6% to 10.5%. Neither of the control taskscorrelated with the number or continuous quantity tasks,with the exception of number comparison and the loca-tion discrimination task [r = 0.6, F(1, 36) = 20.5, p <.001; see Table 2]; this may be because of the fact thatthey were both defined in terms of speed of responserather than accuracy, which was at ceiling or close toceiling in both cases.
To establish potential overlap of function and to re-duce the dimensionality of the behavioral data for fur-ther analyses, we performed a PCA on the data fromthe 37 numerically normal participants (Control Group 1;see Methods). Four orthogonal factors emerged, overallaccounting for about 81% of the variance (40.8%, 16.2%13.1%, and 10.6%, respectively; see Table 3). PC factor 1was characterized by tasks that despite several methodolo-gical differences were all defined in terms of numerical/arithmetical processing (i.e., arithmetical verification, num-ber comparison and dot-number matching). PC factor 2contained just the space and time discrimination tasks,whereas PC factor 3 was associated with luminance dis-criminability, despite the time, space, and luminance tasksall employing similar stimuli and experimental paradigms.Hence, commonalities between space and time (PCA 2) arelikely to be driven by the processing of some continuous
Figure 3. Behavioral results of numerically normal participants.Scatterplot (with marginal histograms), plotting normalized measuresof efficiency in numerical tasks ( y axis), and JND for continuousquantity discrimination (x axis) in the numerically normal participants(Control Group 1); symbols represent results from individual subjects,with superimposed line of best fit revealing no significant correlation.
Figure 2. Behavioral results of participants with dyscalculia andnumerically normal participants. Mean performance across participantswith dyscalculia (DD, n = 16; black bars) versus numerically normalparticipants included in the VBM analysis (Control Group 1; whitebars): Dyscalculia show impaired performance on numerical tasksbut preserved JNDs for time and space discrimination (normalizedvalues). Asterisk indicates a significant difference between participantswith dyscalculia and numerically-normal participants ( p < .001).
Cappelletti et al. 7
UncorrectedProof
quantity rather than similarities in the paradigm used. PCfactor 4 was associated with the location discriminationtask. In summary, the PCA (1) confirmed our initial hypoth-esis that our tasks probe distinct versus common resourcesand (2) allowed us to reduce the number of behavioral di-mensions used in the VBM analyses, as done in previousstudies (see Garrido et al., 2009).
Our behavioral data showed a dissociation betweennumber/arithmetic and continuous quantity tasks in par-ticipants with dyscalculia and no evidence for a correla-tion between these tasks in numerically normalparticipants. This was also the case when we controlledfor variables that were unmatched between the con-tinuous quantity and the number/arithmetic tasks, for in-stance, task instructions (Supplementary Control Task 1).Using similar task instructions, we found that perfor-mance in the time and space discrimination indexed byJNDs correlated irrespective of whether the tasks wereperformed under time pressure [r(16) = .53, p < .04]or with no time pressure [r(16) = .72, p < .003], consis-tent with our previous results. However, performance intime and space discrimination did not correlate withnumber and arithmetic proficiency whether this wasmeasured in terms of accuracy ( p> .09) or RTs ( p> .8).
Moreover, proficiency in the numerosity task (mea-sured in the second supplementary control task) corre-lated with accuracy in arithmetic verification [r = 0.45,F(1, 21) = 5.2, p = .03] and dot–number matching tasks[r = 0.43, F(1, 21) = 4.7, p = .04], but not number com-parison [r = 0.3, F(1, 21) = 2.8, p < .1, ns]. Critically,performance in the numerosity discrimination task didnot correlate with performance in either the time [r =0.33, F(1, 21) = 2.4, p = .1, ns] or the space discrimina-tion tasks [r = 0.26, F(1, 21) = 0.13, p = .7, ns].
VBM of Regional Gray Matter Volume
A dissociation and no correlation between number/arithmetic and continuous quantity tasks might indicatetheir independence or alternatively the presence ofadditional uncontrolled variables. To test such possibleindependence, we used VBM with the prediction thatindependence in processing might result in different brainregions being associated with number/arithmetic and con-tinuous quantity. In contrast, commonality in number/arithmetic and continuous quantity processing might bereflected in commonality in the brain regions associatedwith these processes.
Table 2. Correlations across Tasks and between Behavior and Gray Matter Volume
Task
Brain Area
1 2 3 4 5 6 7 8 9 10
Numbera
1 D-N matching – .37* .54** ns ns ns ns .6** .65** ns
2 Number comparison – .31* ns ns .57** ns .29* .37* .36*
3 Arithmetics – ns ns ns ns .5** .59** .46*
Continuous Quantityb
4 Length – .48** ns ns ns ns .42*
5 Time – ns ns ns ns .48**
Control Tasks
6 Location detectiona – ns ns ns ns
7 Luminanceb – ns ns ns
8 IPS – .48** ns
9 Cuneus – ns
10 TPJ –
Significant correlations (indicated by asterisks) between performance in number/arithmetic, continuous quantity, control tasks (expressed as effi-ciency scores or JNDs), and gray matter volume in the IPS, cuneus, and TPJ regions.
D-N matching = dot–number matching; ns = not significant.aEfficiency score = accuracy/mean RT of correct answers only.bJNDs.
*p < .05.
**p < .001.
8 Journal of Cognitive Neuroscience Volume X, Number Y
UncorrectedProof
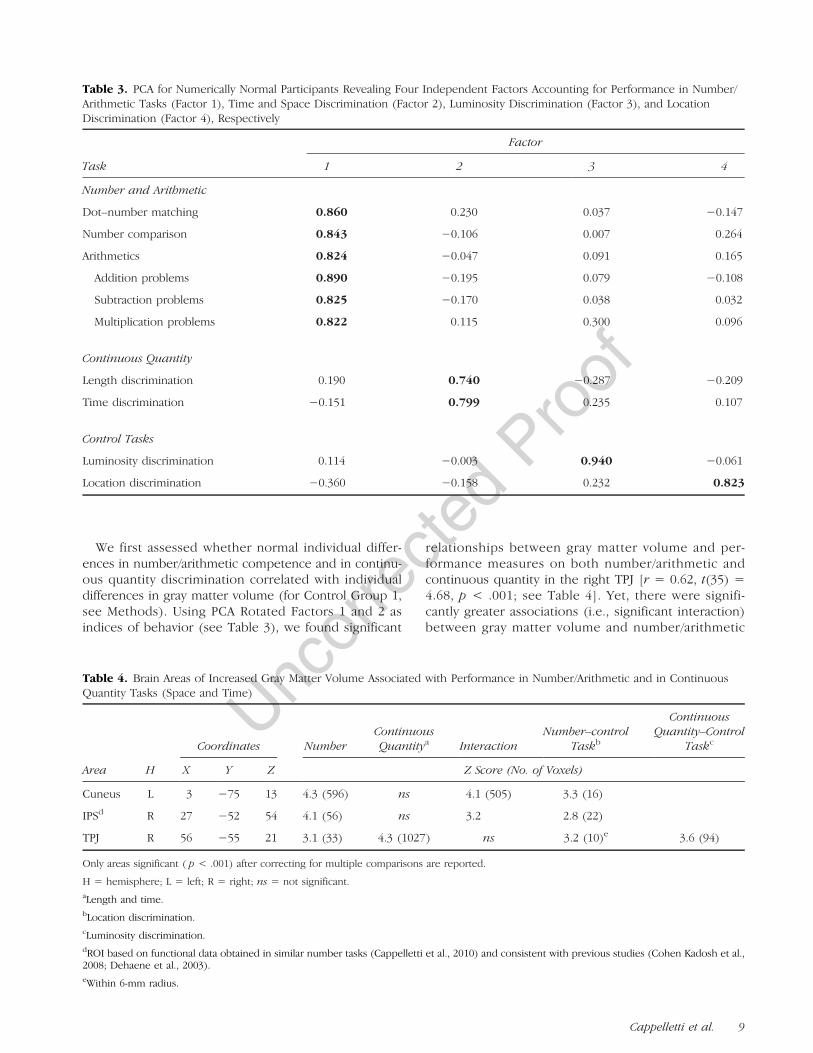
We first assessed whether normal individual differ-ences in number/arithmetic competence and in continu-ous quantity discrimination correlated with individualdifferences in gray matter volume (for Control Group 1,see Methods). Using PCA Rotated Factors 1 and 2 asindices of behavior (see Table 3), we found significant
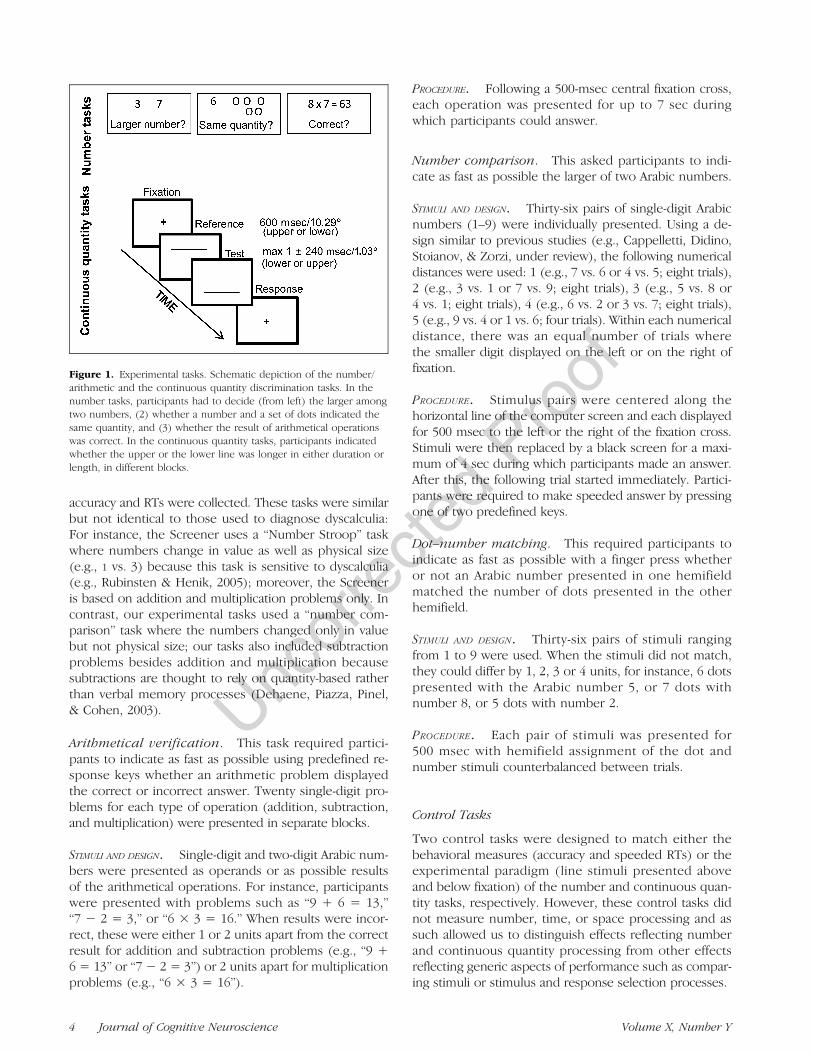
relationships between gray matter volume and per-formance measures on both number/arithmetic andcontinuous quantity in the right TPJ [r = 0.62, t(35) =4.68, p < .001; see Table 4]. Yet, there were signifi-cantly greater associations (i.e., significant interaction)between gray matter volume and number/arithmetic
Table 4. Brain Areas of Increased Gray Matter Volume Associated with Performance in Number/Arithmetic and in ContinuousQuantity Tasks (Space and Time)
Area H
Coordinates NumberContinuousQuantitya Interaction
Number–controlTaskb
ContinuousQuantity–Control
Taskc
X Y Z Z Score (No. of Voxels)
Cuneus L 3 −75 13 4.3 (596) ns 4.1 (505) 3.3 (16)
IPSd R 27 −52 54 4.1 (56) ns 3.2 2.8 (22)
TPJ R 56 −55 21 3.1 (33) 4.3 (1027) ns 3.2 (10)e 3.6 (94)
Only areas significant ( p < .001) after correcting for multiple comparisons are reported.
H = hemisphere; L = left; R = right; ns = not significant.aLength and time.bLocation discrimination.cLuminosity discrimination.dROI based on functional data obtained in similar number tasks (Cappelletti et al., 2010) and consistent with previous studies (Cohen Kadosh et al.,2008; Dehaene et al., 2003).eWithin 6-mm radius.
Table 3. PCA for Numerically Normal Participants Revealing Four Independent Factors Accounting for Performance in Number/Arithmetic Tasks (Factor 1), Time and Space Discrimination (Factor 2), Luminosity Discrimination (Factor 3), and LocationDiscrimination (Factor 4), Respectively
Task
Factor
1 2 3 4
Number and Arithmetic
Dot–number matching 0.860 0.230 0.037 −0.147
Number comparison 0.843 −0.106 0.007 0.264
Arithmetics 0.824 −0.047 0.091 0.165
Addition problems 0.890 −0.195 0.079 −0.108
Subtraction problems 0.825 −0.170 0.038 0.032
Multiplication problems 0.822 0.115 0.300 0.096
Continuous Quantity
Length discrimination 0.190 0.740 −0.287 −0.209
Time discrimination −0.151 0.799 0.235 0.107
Control Tasks
Luminosity discrimination 0.114 −0.003 0.940 −0.061
Location discrimination −0.360 −0.158 0.232 0.823
Cappelletti et al. 9
UncorrectedProof
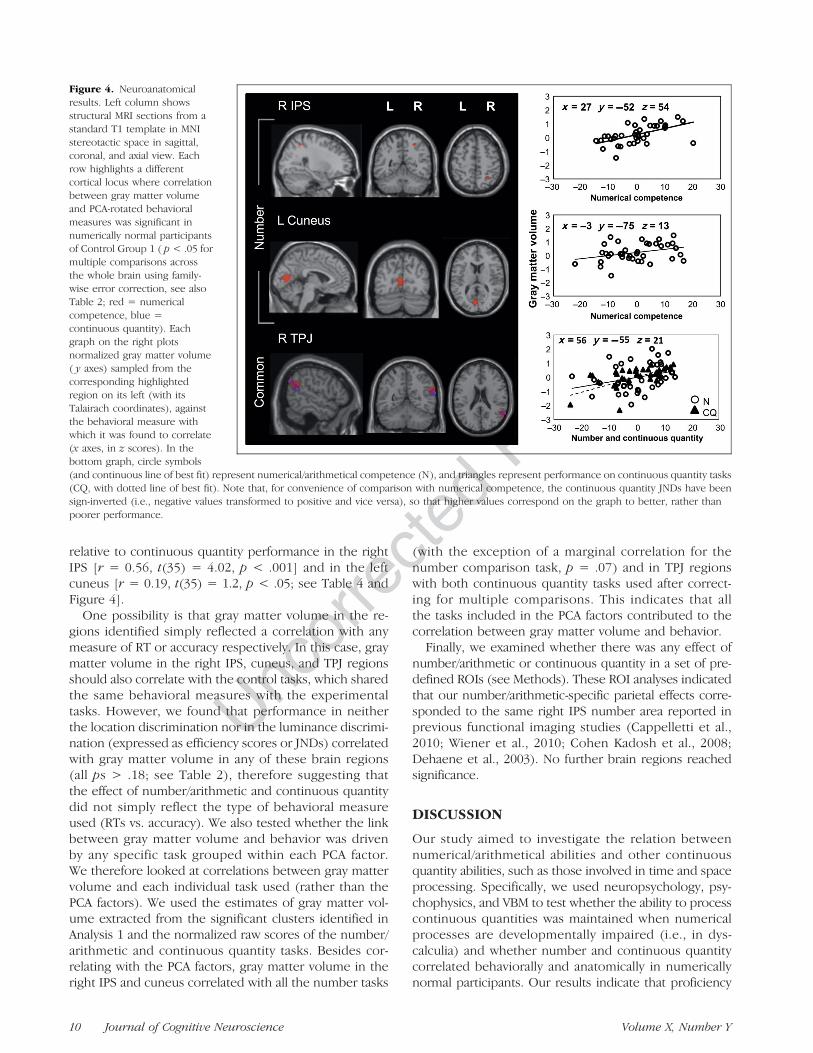
relative to continuous quantity performance in the rightIPS [r = 0.56, t(35) = 4.02, p < .001] and in the leftcuneus [r = 0.19, t(35) = 1.2, p < .05; see Table 4 andFigure 4].
One possibility is that gray matter volume in the re-gions identified simply reflected a correlation with anymeasure of RT or accuracy respectively. In this case, graymatter volume in the right IPS, cuneus, and TPJ regionsshould also correlate with the control tasks, which sharedthe same behavioral measures with the experimentaltasks. However, we found that performance in neitherthe location discrimination nor in the luminance discrimi-nation (expressed as efficiency scores or JNDs) correlatedwith gray matter volume in any of these brain regions(all ps > .18; see Table 2), therefore suggesting thatthe effect of number/arithmetic and continuous quantitydid not simply reflect the type of behavioral measureused (RTs vs. accuracy). We also tested whether the linkbetween gray matter volume and behavior was drivenby any specific task grouped within each PCA factor.We therefore looked at correlations between gray mattervolume and each individual task used (rather than thePCA factors). We used the estimates of gray matter vol-ume extracted from the significant clusters identified inAnalysis 1 and the normalized raw scores of the number/arithmetic and continuous quantity tasks. Besides cor-relating with the PCA factors, gray matter volume in theright IPS and cuneus correlated with all the number tasks
(with the exception of a marginal correlation for thenumber comparison task, p = .07) and in TPJ regionswith both continuous quantity tasks used after correct-ing for multiple comparisons. This indicates that allthe tasks included in the PCA factors contributed to thecorrelation between gray matter volume and behavior.Finally, we examined whether there was any effect of
number/arithmetic or continuous quantity in a set of pre-defined ROIs (see Methods). These ROI analyses indicatedthat our number/arithmetic-specific parietal effects corre-sponded to the same right IPS number area reported inprevious functional imaging studies (Cappelletti et al.,2010; Wiener et al., 2010; Cohen Kadosh et al., 2008;Dehaene et al., 2003). No further brain regions reachedsignificance.
DISCUSSION
Our study aimed to investigate the relation betweennumerical/arithmetical abilities and other continuousquantity abilities, such as those involved in time and spaceprocessing. Specifically, we used neuropsychology, psy-chophysics, and VBM to test whether the ability to processcontinuous quantities was maintained when numericalprocesses are developmentally impaired (i.e., in dys-calculia) and whether number and continuous quantitycorrelated behaviorally and anatomically in numericallynormal participants. Our results indicate that proficiency
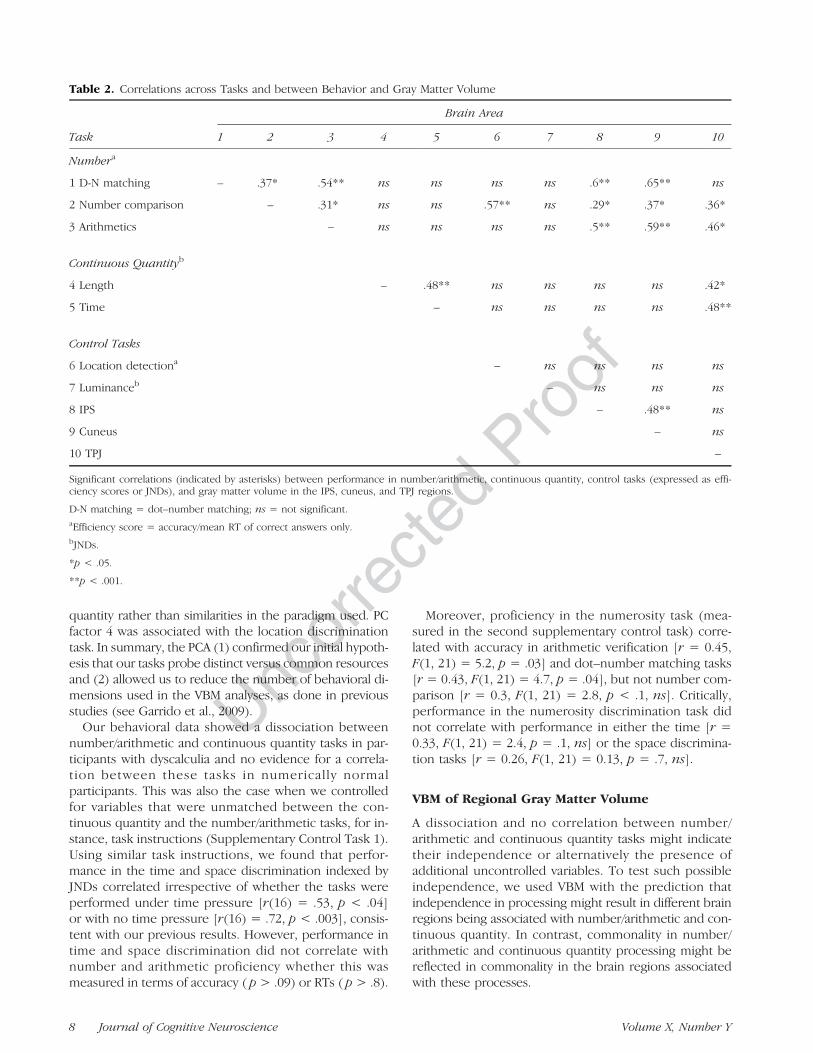
Figure 4. Neuroanatomicalresults. Left column showsstructural MRI sections from astandard T1 template in MNIstereotactic space in sagittal,coronal, and axial view. Eachrow highlights a differentcortical locus where correlationbetween gray matter volumeand PCA-rotated behavioralmeasures was significant innumerically normal participantsof Control Group 1 ( p < .05 formultiple comparisons acrossthe whole brain using family-wise error correction, see alsoTable 2; red = numericalcompetence, blue =continuous quantity). Eachgraph on the right plotsnormalized gray matter volume( y axes) sampled from thecorresponding highlightedregion on its left (with itsTalairach coordinates), againstthe behavioral measure withwhich it was found to correlate(x axes, in z scores). In thebottom graph, circle symbols(and continuous line of best fit) represent numerical/arithmetical competence (N), and triangles represent performance on continuous quantity tasks(CQ, with dotted line of best fit). Note that, for convenience of comparison with numerical competence, the continuous quantity JNDs have beensign-inverted (i.e., negative values transformed to positive and vice versa), so that higher values correspond on the graph to better, rather thanpoorer performance.
10 Journal of Cognitive Neuroscience Volume X, Number Y
UncorrectedProof
in numerical and continuous quantity tasks dissociated indyscalculia (i.e., impaired number but spared time andspace processing). Moreover, performance in these tasksdid not correlate in numerically normal participants,although individual differences in performing numericaland continuous quantity tasks both correlated with in-creased gray matter volume in the right TPJ. By usingseveral control measures, we also established that theseresults did not just depend on generic aspects of ourbehavioral measures but appeared specific for numericaland continuous quantity tasks. In addition, gray matterin right IPS and left cuneus was more closely related tonumerical/arithmetical than continuous quantity tasks.
Numerical Proficiency Dissociates from Timeand Space
Our two main findings of behavioral independence de-spite anatomical association of numerical and continuousquantity skills provide a deeper understanding of the rela-tion between these skills. The independence of numberand continuous quantity was supported by their disso-ciation in dyscalculia, the lack of behavioral correlation innumerically normal participants, and the number-specificanatomical correlations in right IPS and cuneus. This in-dependence may reflect some intrinsic differences in pro-cessing number and continuous quantity. For instance,unlike continuous quantity, number has discrete referentsand is based on enumeration and arithmetical principlesrather than approximation as in time and space processing(Henik, Leibovich, Naparstek, Diesendruck, & Rubinsten,2011; Castelli, Glaser, & Butterworth, 2006). Critically, thedissociation between numerical and continuous quantityskills in dyscalculia suggests that contrary to numericalskills, continuous quantity processing develops adequatelyand is adequately maintained in dyscalculia (see alsoCappelletti, Freeman, & Butterworth, 2011). However, itis currently unknown whether in dyscalculia number pro-cessing is independent and dysfunctional from birth orwhether numerical and continuous quantity skills correctlydevelop together with number skills deteriorating later.Besides the IPS, increased gray matter volume associ-
ated with RTs but not accuracy in number tasks wasshown in the cuneus, a brain area frequently reported inrelation to working memory (Slotinick & Schacter, 2006),suggesting that this area may be sensitive to task difficultyin the context of number processing.A recent study indicated a link between performing
continuous quantity tasks (spatial extent), numerosity dis-crimination, and arithmetical abilities. Specifically, spaceand numerosity processing were shown to be linked andfoundational to arithmetical proficiency (Lourenco, Bonny,Fernandez, & Rao, 2012). This is different to what wefound, although a closer look at these recent data showsonly an apparent discrepancy with ours: This is becausethe contribution of space processing to arithmetical abil-ities was actually only indirect, with a much stronger role
in performing geometry rather than arithmetical tasks(Lourenco et al., 2012).
One or Multiple Quantity Systems?
Our second finding is of an association between number/arithmetical and continuous quantity, which were bothrelated to an increase in gray matter volume in TPJ.The anatomical association between these tasks couldreflect magnitude processes (Cantlon et al., 2009; Walsh,2003) or alternatively the cognitive resources needed tojudge magnitude, which could include decision, stimulus,response selection, or attentional processes (Cappellettiet al., 2010; Cohen Kadosh et al., 2008). The contributionof attentional processes may be suggested by the in-volvement of the right TPJ region, a brain area part of astimulus-driven attention system that detects relevant stim-uli or changes in their status (Kincade, Abrams, Astafiev,Shulman, & Corbetta, 2005; Corbetta & Shulman, 2002)also on dimensions such as duration, location, and numer-osity (Coull, Cheng, & Meck, 2011; Vetter, Butterworth, &Bahrami, 2011; Ansari, Lyons, van Eimeren, & Xu, 2007).Our data indicate that such processes can also be asso-ciated with symbolic numbers, in line with lesion datashowing that right TPJ lesions affect attention-relatedprocesses. These processes, albeit not always in the con-text of TPJ lesions, are known to interfere with number(Vuilleumier, Ortigue, & Brugger, 2004) or with continuousquantity processing (Danckert et al., 2007).
Attentional processes associated with right TPJ maysubserve different functions on which different tasks mayrely. For instance, separate processes may be needed tomaintain attention up to the end of the stimulus presen-tation (in the time task) to respond to a change in thestimuli (in both the time and space tasks) or to extractthe meaning of symbols or retrieve the correct result ofthe arithmetical operations (in the arithmetic tasks). Thishypothesis of multiple types of attention converging inthe right TPJ may explain the apparent similarity of perfor-mance in number and continuous quantity tasks previouslyreported (Vetter et al., 2011; Brannon et al., 2007; Zorziet al., 2002) and may be the reason why performance onnumber and continuous quantities tasks did not correlatein our study. Alternatively, the right TPJ might support thesame function in all number and continuous quantitytasks, for instance, comparison processes may be a pointof convergence between these tasks (Cantlon et al.,2009). More specifically, the number and the continuousquantity tasks imply the preparation and maintenance ofa target-stimulus template to be compared with the actualtarget, that is, a matching or mismatching process, which islinked to the left and right TPJ area (DiQuattro & Geng,2011; Doricchi, Macci, Silvetti, & Macaluso, 2010; Kincadeet al., 2005). This comparison or matching process maybe different in the luminance task, possibly because infor-mation about luminance could be obtained directly fromevery local part of the stimulus line (Gilchrist & Radonjić,
Cappelletti et al. 11
UncorrectedProof
2009). Therefore, participants did not need to build upand keep active the whole line stimulus template toperform the luminance comparison, as they would do fortime and space. This may explain why discriminating lumi-nance, arguably another quantity dimension, did not cor-relate with gray matter volume in the right TPJ, whichwas linked to number, time, and space. Likewise, in theother control task used, location discrimination, therewas no reference–template matching or mismatching astimulus target, a process linked to the TPJ area (Doricchiet al., 2010; Kincade et al., 2005). Thus, although lumi-nance discrimination and location detection tasks aimedrespectively to control for response and stimulus selectionprocesses in common with the time and space discrimina-tion tasks and to match the behavioral measure used withthe number tasks, they differed substantially in otherunderlying cognitive processes. This may explain the lackof anatomical overlap with the number, time, and spacetasks.
It may be surprising that common resources were notdetected in the IPS, a region previously hypothesized tohost a shared magnitude representation (Walsh, 2003)and that functional imaging studies often report as in-volved in number processing (e.g., Cappelletti et al., 2010;Dehaene et al., 2003). This may be because functionaland structural imaging studies measure different things,and currently the relationship between function andstructure is only poorly understood (however, see Song,Schwarzkopf, & Rees, 2013, for a study on the relationbetween brain function and structure in primary visualcortex). Functional imaging looks at neural responses aver-aged across individuals (i.e., activations common acrossmany participants), and it measures current involvementin a task, with more activation for more involvement (lesswith practice and efficiency). In contrast, in structuralimaging measures are derived from differences across in-dividuals, and they reflect many different factors includinga lifetime of responses and efficiency (more with practiceand efficiency). As many different activations can engagethe same process (e.g., spatial attention), there may beno correlation with performance of a single task (e.g.,numerical processing), but a correlation might arise witha measure that encompasses process rather than task.
In conclusion, we report novel evidence that charac-terizes the relation between number and continuous quan-tity processing. First, in a population with a developmentalnumerical dysfunction, that is, dyscalculia, continuousquantity processing was well maintained; second, innumerically normal people, numerical/arithmetical andcontinuous quantity skills were at least partially dissoci-ated, both behaviorally and anatomically. Despite no cor-relation between behavioral measures, both number/arithmetic and continuous quantity correlated with struc-tural changes in right TPJ, whereas the right IPS and thecuneus were distinguished by their correlation with thenumber/arithmetic tasks only. Together, our new evidenceof a number-specific impairment and of number-specific
brain areas distinct from common magnitude areas sug-gests that the human brain is equipped with differentways of quantifying the outside world.
UNCITED REFERENCES
Crawford, Howell, & Garthwaite, 1998Dormal, Dormal, Joassin, & Pesenti, 2011Fias, Lammertyn, Reynvoet, Dupont, & Orban, 2003Kanai & Rees, 2011Ogata, Horaguchi, Watanabe, & Yamamoto, 2011Pinel, Piazza, LeBihan, & Dehaene, 2004Shulman, Astafiev, McAvoy, dʼAvossa, & Corbetta, 2007
Acknowledgments
This work was supported by the Wellcome Trust (G. R.); a RoyalSociety Dorothy Hodgkin Fellowship, Royal Society, and BritishAcademy Research Grants (M. C.); and the Japan Society forthe Promotion of Science and Japan Science and TechnologyAgency (R. K.). We would like to thank two anonymous reviewersfor their helpful comments.
Reprint requests should be sent to Marinella Cappelletti, UniversityCollege London Institute of Cognitive Neuroscience, 17 QueenSquare, London, WC1N 3AR, UK, or via e-mail: [email protected].
REFERENCES
Aiello, M., Jacquin-Courtois, S., Merola, S., Ottaviani, T.,Tomaiuolo, F., Bueti, D., et al. (2012). No inherent leftand right side in human “mental number line”: Evidencefrom right brain damage. Brain, 135, 2492–2505.
Ansari, D., Lyons, I. M., van Eimeren, L., & Xu, F. (2007).Linking visual attention and number processing in the brain:The role of the temporo-parietal junction in small and largesymbolic and nonsymbolic number comparison. Journalof Cognitive Neuroscience, 19, 1845–1853.
Ashburner, J., & Friston, K. J. (2000). Voxel-basedmorphometry. The methods. Neuroimage, 11, 805–821.
Ashburner, J., & Friston, K. J. (2005). Unified segmentation.Neuroimage, 26, 839–851.
Brannon, E. M., Suanda, S., & Libertus, K. (2007). Temporaldiscrimination increases in precision over development andparallels the development of numerosity discrimination.Developmental Science, 10, 770–777.
Bueti, D., & Walsh, V. (2009). The parietal cortex andthe representation of time, space, number and othermagnitudes. Phil Trans of Royal Society, Series B,Biological Science, 364, 1831–1840.
Butterworth, B. (2003). Dyscalculia screener. London:Nelson Publishing Company Ltd.
Butterworth, B. (2010). Foundational numerical capacitiesand the origins of dyscalculia. Trends in CognitiveSciences, 14, 534–541.
Cantlon, J. F., Platt, M. L., & Brannon, E. M. (2009). Beyondthe number domain. Trends in Cognitive Science, 13,83–91.
Cappelletti, M., Didino, D., Stoianov, I., & Zorzi, M. (underreview). Number skills are maintained in healthy aging.
Cappelletti, M., Freeman, E., & Butterworth, B. (2011). Timeperception in dyscalculia. Frontiers in Cognitive Science,2, 364.
12 Journal of Cognitive Neuroscience Volume X, Number Y
UncorrectedProof
Cappelletti, M., Freeman, E. D., & Cipolotti, L. (2009).Dissociations and interactions between time, numerosityand space processing. Neuropsychologia, 47, 2732–2748.
Cappelletti, M., Freeman, E. D., & Cipolotti, L. (2011).Numbers and time doubly dissociate. Neuropsychologia,49, 3078–3092.
Cappelletti, M., Lee, H. L., Freeman, E. D., & Price, C. J. (2010).Dissociating number selectivity and response-times in theparietal lobes. Journal of Cognitive Neuroscience, 22,331–346.
Cappelletti, M., & Price, C. J. (under review). Residualnumber skills in adults with dyscalculia.
Castelli, F., Glaser, D. E., & Butterworth, B. (2006). Discreteand analogue quantity processing in the parietal lobe:A functional MRI study. Proceedings of the NationalAcademy of Sciences, U.S.A., 103, 4693–4698.
Cohen Kadosh, R., Lammertyn, J., & Izard, V. (2008).Are numbers special? An overview of chronometric,neuroimaging, developmental and comparative studiesof magnitude representation. Progress in Neurobiology,84, 132–147.
Corbetta, M., & Shulman, G. L. (2002). Control of goal-directedand stimulus-driven attention in the brain. Nature ReviewNeuroscience, 3, 215–229.
Coull, J. T., Cheng, R., & Meck, W. H. (2011). Neuroanatomicaland neurochemical substrates of timing.Neuropsychopharmacology, 36, 3–25.
Crawford, J. R., Howell, D. C., & Garthwaite, P. H. (1998).Payne and Jones revisited: Estimating the abnormality oftest score differences using a modified paired samplest test. Journal of Clinical and ExperimentalNeuropsychology, 20, 898–905.
Danckert, J., Ferber, S., Pun, C., Broderick, C., Striemer, C.,Rock, S., et al. (2007). Neglected time: Impaired temporalperception of multisecond intervals in unilateral neglect.Journal of Cognitive Neuroscience, 19, 1706–1720.
Dehaene, S., & Brannon, E. M. (2011). Space, time and numberin the brain: Searching for evolutionary foundations ofmathematical thought. London: Elsevier.
Dehaene, S., Piazza, M., Pinel, P., & Cohen, L. (2003).Three parietal circuits for number processing.Cognitive Neuropsychology, 20, 487–506.
DiQuattro, N. E., & Geng, J. J. (2011). Contextual knowledgeconfigures attentional control networks. Journal ofNeuroscience, 31, 18026–18035.
Doricchi, F., Guariglia, P., Gasparini, M., & Tomaiuolo, F.(2005). Dissociation between physical and mental numberline bisection in right hemisphere brain damage. NatureNeuroscience, 12, 1663–1665.
Doricchi, F., Macci, E., Silvetti, M., & Macaluso, E. (2010).Neural correlates of the spatial and expectancy componentsof endogenous and stimulus-driven orienting of attentionin the Posner task. Cerebral Cortex, 20, 1574–1585.
Dormal, V., Dormal, G., Joassin, F., & Pesenti, M. (2011).A common right fronto-parietal network for numerosityand duration processing: An fMRI study. Human BrainMapping. doi: 10.1002/hbm.21300.
Dormal, V., Seron, X., & Pesenti, M. (2006). Numerosity-durationinterference: A Stroop experiment. Acta Psychologica(Amsterdam), 121, 109–124.
Fias, W., Lammertyn, J., Reynvoet, B., Dupont, P., & Orban,G. A. (2003). Parietal representation of symbolicand nonsymbolic magnitude. Journal of CognitiveNeuroscience, 15, 47–56.
Garrido, L., Furl, N., Draganski, B., Weiskopf, N., Stevens, J.,Tan, G. C., et al. (2009). VBM reveals reduced gray mattervolume in the temporal cortex of developmentalprosopagnosics. Brain, 132, 3443–3455.
Gilchrist, A. L., & Radonjić, A. (2009). Anchoring of lightnessvalues by relative luminance and relative area. Journal ofVision, 9, 1–10.
Halberda, J., Mazzocco, M. M. M., & Feigenson, L. (2008).Individual differences in nonverbal number acuity predictmaths achievement. Nature, 455, 665–668.
Hayasaka, S., Phan, K. L., Liberzon, I., Worsley, K. J., & Nichols,T. E. (2004). Non-stationary cluster-size inference withrandom field and permutation methods. Neuroimage, 22,676–687.
Henik, A., Leibovich, T., Naparstek, S., Diesendruck, L., &Rubinsten, O. (2011). Quantities, amounts, and thenumerical core system. Frontiers in Human Neuroscience,5, 186.
Jackson, M., & Warrington, E. K. (1986). Arithmetic skills inpatients with unilateral cerebral lesions. Cortex, 22, 611–620.
Kanai, R., & Rees, G. (2011). The structural basis of inter-individual differences in human behaviour and cognition.Nature Reviews Neuroscience, 12, 231–242.
Kincade, J. M., Abrams, R. A., Astafiev, S. V., Shulman, G. L., &Corbetta, M. (2005). An event-related functional magneticresonance imaging study of voluntary and stimulus-drivenorienting of attention. Journal of Neuroscience, 25,4593–4604.
Lourenco, S., Bonny, J., Fernandez, E., & Rao, S. (2012).Nonsymbolic number and cumulative area representationscontribute shared and unique variance to symbolic mathcompetence. PNAS/10.1073/pnas.1207212109.
Machizawa, M., & Driver, J. (2011). Principal componentanalysis of behavioural individual differences suggests thatparticular aspects of visual working memory may relate tospecific aspects of attention. Neuropsychologia, 49,1518, 1526.
Mazzocco, M., Feingenson, L., & Halberda, J. (2011). Impairedacuity of the approximate number system underliesmathematical learning disability (dyscalculia). ChildDevelopment, 82, 1224–1237.
Ogata, Y., Horaguchi, T., Watanabe, N., & Yamamoto, M.(2011). Comparison of the choice effect and the distanceeffect in a number-comparison task by fMRI. PLoS One, 6,21716.
Piazza, M., Facoetti, A., Trussardi, A. N., Berteletti, I., Conte, S.,Lucangeli, D., et al. (2010). Developmental trajectory ofnumber acuity reveals a severe impairment in developmentaldyscalculia. Cognition, 116, 33–41.
Pinel, P., Piazza, M., LeBihan, D., & Dehaene, S. (2004).Distributed and overlapping cerebral representations ofnumber size and luminance during comparative judgements.Neuron, 41, 983–993.
Rubinsten, O., & Henik, A. (2005). Automatic activation ofinternal magnitudes: A study of developmental dyscalculia.Neuropsychology, 19, 641–648.
Rubinsten, O., & Henik, A. (2009). Developmental dyscalculia:Heterogeneity may not mean different mechanisms. Trendsin Cognitive Science, 13, 92–99.
Shulman, G. L., Astafiev, S. V., McAvoy, M. P., dʼAvossa, G., &Corbetta, M. (2007). Right TPJ deactivation during visualsearch: Functional significance and support for a filterhypothesis. Cerebral Cortex, 17, 2625–2633.
Slotinick, S., & Schacter, D. (2006). The nature of memoryrelated activity in early visual areas. Neuropsychologia, 44,2874–2886.
Song, C., Schwarzkopf, D. S., & Rees, G. (2013). Variability invisual cortex size reflects tradeoff between local orientationsensitivity and global orientation modulation. NatureCommunications, 4, 2201.
Vetter, P., Butterworth, B., & Bahrami, B. (2011). A candidatefor the attentional bottleneck: Set-size specific modulation of
Cappelletti et al. 13

UncorrectedProof
right TPJ during attentive enumeration. Journal of CognitiveNeuroscience, 23, 728–736.
Vuilleumier, P., Ortigue, S., & Brugger, P. (2004). The numberspace and neglect. Cortex, 40, 399–410.
Walsh, V. (2003). A theory of magnitude: Common corticalmetrics of time, space and quantity. Trends in CognitiveSciences, 7, 483–488.
Wechsler, D. (1986). Wechsler Adult Intelligence Scale-Revised.The Psychological Corporation.
Wichmann, F. A., & Hill, N. J. (2001). The psychometric
function: I. Fitting, sampling and goodness-of-fit. Perceptionand Psychophysics, 63, 1293–1313.
Wiener, M., Turkeltaub, P., & Coslett, H. B. (2010). Theimage of time: A voxel-wise meta-analysis. Neuroimage,49, 1728–1740.
Wood, D. J., Tataryn, R., & Gorsuch, L. (1996). Effects of underand overextraction on principal axis factor analysis withvarimax rotation. Psychological Methods, 14, 354–365.
Zorzi, M., Priftis, C., & Umiltà, C. (2002). Neglect disrupts themental number line. Nature, 417, 138.
14 Journal of Cognitive Neuroscience Volume X, Number Y
Related Documents


