1 Job satisfaction among young workers in Eastern and Southern Africa: a comparative analysis 1 Andy McKay (University of Sussex) Andy Newell (University of Sussex and IZA) Cinzia Rienzo (National Institute of Economic and Social Research) Abstract Sub-Saharan Africa is the only region in the world where the youth population continues to grow. It is also a region where ensuring that young people find rewarding employment is a major policy concern. But little is known about the extent to which young workers in the region are satisfied with their employment. This paper aims to help to fill this gap by presenting a comparative analysis of job satisfaction of youth aged 15- 29 in four countries from Eastern and Southern Africa: Madagascar, Malawi, Uganda and Zambia. In each case we focus on young workers using data from the School-to-work Transition Survey (SWTS), and estimate ordered probit models of the degree of satisfaction in the respondent’s main job. While the majority of workers are satisfied with their work, many are not. We find two important and large negative partial correlations with job satisfaction in all four countries: the first is that respondents from poor households are less satisfied with their work and the second is that being over-educated or under-educated for the current job breeds dissatisfaction. We also find in three of the countries that working for someone else as a wage employee has a substantial negative associated with job satisfaction. This extent of dissatisfaction with much wage work is very important to recognise from a policy perspective. And while it may not come as a surprise that being poor, mis-mismatched, and having little choice about work breed dissatisfaction, it is important to have the empirical evidence. I. Introduction 1 Corresponding author: Cinzia Rienzo, National Institute of Economic and Social Research. 2 Dean Trench Street, Smith Square, London SW1 3HE. UK. e-mail: [email protected]. Phone 0044 020 7654 1910. Andy McKay, Sussex University email: [email protected] Andy Newell, Sussex University and IZA email: [email protected];. Acknowledgments: We are grateful to Marco Principi for help and explanations with the data. Our thanks to Valentina Barcucci, Werner Eichhorst, Sara Elder and participants of the "Labour market transitions of young women and men: Innovative research from 30 school-to-work transition survey datasets, Work4Youth Global Research Symposium" (Genève) for comments and suggestions.

Welcome message from author
This document is posted to help you gain knowledge. Please leave a comment to let me know what you think about it! Share it to your friends and learn new things together.
Transcript
1
Job satisfaction among young workers in Eastern and Southern Africa: a comparative
analysis1
Andy McKay (University of Sussex)
Andy Newell (University of Sussex and IZA)
Cinzia Rienzo (National Institute of Economic and Social Research)
Abstract
Sub-Saharan Africa is the only region in the world where the youth population continues to grow. It is also a
region where ensuring that young people find rewarding employment is a major policy concern. But little is
known about the extent to which young workers in the region are satisfied with their employment. This
paper aims to help to fill this gap by presenting a comparative analysis of job satisfaction of youth aged 15-
29 in four countries from Eastern and Southern Africa: Madagascar, Malawi, Uganda and Zambia. In each
case we focus on young workers using data from the School-to-work Transition Survey (SWTS), and
estimate ordered probit models of the degree of satisfaction in the respondent’s main job. While the
majority of workers are satisfied with their work, many are not. We find two important and large negative
partial correlations with job satisfaction in all four countries: the first is that respondents from poor
households are less satisfied with their work and the second is that being over-educated or under-educated
for the current job breeds dissatisfaction. We also find in three of the countries that working for someone
else as a wage employee has a substantial negative associated with job satisfaction. This extent of
dissatisfaction with much wage work is very important to recognise from a policy perspective. And while it
may not come as a surprise that being poor, mis-mismatched, and having little choice about work breed
dissatisfaction, it is important to have the empirical evidence.
I. Introduction
1 Corresponding author: Cinzia Rienzo, National Institute of Economic and Social Research. 2 Dean Trench Street,
Smith Square, London SW1 3HE. UK. e-mail: [email protected]. Phone 0044 020 7654 1910. Andy McKay, Sussex University email: [email protected] Andy Newell, Sussex University and IZA email: [email protected];. Acknowledgments: We are grateful to Marco Principi for help and explanations with the data. Our thanks to Valentina Barcucci, Werner Eichhorst, Sara Elder and participants of the "Labour market transitions of young women and men: Innovative research from 30 school-to-work transition survey datasets, Work4Youth Global Research Symposium" (Genève) for comments and suggestions.
2
In 2014 UN DESA reported a global youth population, defined as those aged between 15 and 24
years, of 1.2 billion, and projected that this would have grown to 1.3 billion by 2030. A growing, and
increasingly educated, youth population offers considerable potential; but the major challenge the world
faces in realising this potential is to find adequate employment opportunities for them. The lack of good
employment opportunities for the youth population is widely recognised, including in the Sustainable
Development Goals, where the eighth goal, focused on “good jobs and economic growth”, includes early
targets specifically relating to youth employment. Addressing the employment needs of a growing and
increasingly active youth population is also recognised as a major political imperative by most national
governments, and by many regional and international organisations, including the African Development
Bank, the International Labour Organisation (ILO) and the World Bank, see, for instance, Filmer et. al.
(2014).
These issues are particularly pressing in sub-Saharan Africa. 226 million 15 to 24 year olds lived in
this region in 2015, and this is the only world region where the youth population is growing and projected to
continue to grow for much of this century. Limited progress on employment creation in sub-Saharan Africa
in recent years is almost certainly a key issue why the substantially better growth performance in many
countries over the past 15 to 20 years has not always translated into commensurate poverty reduction
(World Bank, 2014; Arndt at al, 2016 ; Mattes et al, 2016).
The youth employment issue in Sub-Saharan Africa is not so much open unemployment – anyway
very difficult to meaningfully measure in this context – simply because most people cannot afford not to
work. But the nature of the work may be an issue. Few sub-Saharan African countries have yet managed
to achieve significant structural transformation. Yet it is growth outside of the primary sector, and perhaps
especially in manufacturing, which is likely to be able to generate more better-paid wage jobs. In much of
sub-Saharan Africa formal sector jobs have failed to grow; to add to which young people typically have
more difficulty getting access to these jobs. The large majority of young people in sub-Saharan Africa,
male and female, work in self-employment activities, many of which may have quite low returns, or in
household based work. And among those in wage work, many are employed in the informal sector, with
the uncertainties and low wages that this frequently implies. Young people may need to undertake this
work in the absence of any alternatives and because they cannot afford not to work.
But almost nothing is known in Sub-Saharan Africa about the extent to which young people are
satisfied with the work they do, as well as about which types of people are more satisfied or types of work
provide more satisfaction. We discuss in the next section how the issue has been more studied in
developed countries, but there is very limited evidence on job satisfaction in developing countries in
general, and particularly in Sub-Saharan Africa. Existing contributions are limited and scope and coverage:
Mulinge and Mueller (1998) study the issue among agricultural personnel in Kenya, while Hinks (2009)
studies South African data and Razafindrakoto and Roubaud (2013) focus in eight Sub-Saharan Africa
capital cities. More recently, two studies focus on Ghana: Abugre, (2014) and Falco, Maloney, Rijkers, and
Sarrias (2015).
This paper aims to start to fill some of the gaps by presenting a comparative analysis of job
satisfaction of youth aged 15-29 in four countries from Eastern and Southern Africa: Madagascar, Malawi,
3
Uganda and Zambia. This analysis is enabled by data from the School-to-work Transition Survey (SWTS),
a comparable survey conducted across many developing countries by the ILO in partnership with the
Mastercard Foundation.
The respondents of these surveys broadly reflect the picture of youth employment already
described. The proportion of respondents working in self-employment activities or as unpaid family workers
is high: 86% in Madagascar, 79% in Malawi, 73% in Uganda and 64% in Zambia. The very large majority
of these are informal. And among the rest, who are mostly wage workers, 61% work in the informal sector
in Madagascar, 75% in Malawi, 78% in Uganda, and 82% in Zambia. The dominant activity is agriculture,
generally followed by elementary occupations and sales and services. Very few young people are
employed as professional, managerial, technical or clerical workers in the formal sector.
In this paper, following the existing literature, we estimate ordered probit models of the level of
satisfaction in the main job. One first key result from this analysis is that being self-employed or an unpaid
family worker is positively associated with higher job satisfaction in both Malawi, Uganda and Zambia,
though not in Madagascar; and these effects are quite substantial. Those coming from poor households are
generally substantially less satisfied with their work. In each of these cases these factors may be
associated with the type of work the respondents are able to obtain. Another important factor identified by
this analysis is the quality of the match between a worker’s education/skills and the skills required by the
job is an important component of job satisfaction. Being over educated for the job has a strong, significant
and negative impact on job satisfaction in all countries, although the results vary by magnitude and
significance. Sensitivity results performed using the workers' self-assessment as an alternative definition of
mismatch, statistically significantly confirms the importance of skill mismatch in determining job satisfaction.
2. Literature Review
The issues of youth employment have been addressed by many researchers over a long period of
time, and we do not intend to review this comprehensively here. However, two important recent review
articles by Pieters (2013) and World Bank (2014) offer useful entry points for this paper. Both
recognise the important role played by the private sector, and the need for sustained, employment-
intensive economic growth. That said, the World Bank study recognises the critical role of self-
employment and own account work for young people. It identifies low productivity, in agriculture, non-
farm enterprises and wage firms as being a major constraint to youth employment opportunities, and
discusses policies intended to respond to obstacles faced by households and firms in raising their
productivity. Pieters highlights the important fact that the relatively low rates of inactivity and
unemployment in the labour market of low income countries does not imply good labour market
outcomes. Rather these statistics hide high levels of vulnerable employment (defined by her as self-
employment and unpaid family work), informality and working poverty, so that the issue is quality much
more than quantity of jobs.
4
So while most young people may be employed in some activity, it is important also to consider how
satisfied they are with the work they currently do. As already noted, this issue has not been widely studied
in the developing world. In developed countries researchers and public policymakers have recognised that
increasing individuals' subjective well-being is an important policy objective (see, for example Layard, 2011
and O' Donnell et al, 2014), with many studies having been conducted of subjective well-being.2 Job
satisfaction is frequently identified to be an important dimension of this, and has been the subject of several
studies in its own right. Many studies examine the role that education can exert on job satisfaction, with
Clark and Oswald (1996) pointing out the importance of expectations: more educated workers have higher
expectations for the pecuniary and non-pecuniary returns from their jobs, and so that they are more easily
disappointed and dissatisfied. Allen and Van Der Velden (2001) using data of graduate workers at the end
of the 1990s for Netherlands, show that skill mismatches exert a strong influence on job satisfaction, while
skill underutilisation has a strong negative effect on satisfaction. It has also been documented that job
satisfaction can raise workplace performance (Oswald et al, 2014), resulting in productivity improvements
and, ultimately, to economic growth (Bryson, Forth and Stokes, 2015).
But studies of job satisfaction in developing countries are scarce and often based on non-
representative samples. The existing limited evidence includes, for example, the study of Mulinge and
Mueller (1998), who analyse the determinants of job satisfaction in Kenya in 1991 and 1992 by focusing on
technically trained agricultural personnel. They find that a perceived higher participation in organizational
intrinsic reward, workplace conditions3 and social rewards derived from interacting with others increase job
satisfaction. Focusing on South Africa, Hinks (2009) analyses the determinants of job satisfaction by
studying the impact of earnings, racial group and the presence of an employment equity plan on job
satisfaction. Using Mesebetsi labour data for 1999 for workers aged 18 to 65 he finds that affirmative
action in the workplace enhances black workers’ job satisfaction but significantly diminishes job satisfaction
of coloured workers.
Razafindrakoto and Roubaud (2013) analyse job satisfaction in eight Sub-Saharan Africa capitals
and find significant links between objective job characteristics such as possibility of promotion, training,
autonomy, work relations as well as remuneration and working hours and the satisfaction individuals
express with their jobs. More recently, Abugre (2014) analyses job satisfaction for public administration
workers in Ghana and highlights a very low level of job satisfaction, though with significant variations by
educational levels. The most recent contribution of Falco, Maloney, Rijkers and Sarrias (2015) exploits the
Ghana Urban Household Panel Survey (GUHPS) to study job satisfaction across sectors in Ghana. The
authors adopt a mixed (stochastic parameter) ordered probit estimators to characterize the distribution of
subjective wellbeing across employment sectors. Their findings show that being self-employed with
employees is by far the most desirable type of employment. By contrast, workers appear indifferent
2 See for instance Layard et al, 2014; Gardner and Oswald, 2007; Clark and Georgellis, 2013; Clark, 2014;
Powdthavee, 2012; Frijters et al, 2014; Dorsett et al, 2015. 3 Organizational intrinsic reward refers to participating in decision making, autonomy, upward communication, task
significance, distributive justice and career growth. While workplace conditions refers to pay, fringe benefits, promotional opportunity and job security.
5
between formal salaried employment, self-employment without employees, and civil service/public sector
employment.
Aside from these studies, the issue of job satisfaction in Sub-Saharan countries has received little
attention, in part due to a lack of data.
3. Data
The School to Work Transition Survey (SWTS) is a programme of surveys of young people aged
15-29 conducted in 36 countries4, 8 of which are in Sub-Saharan Africa, between 2012 and 2015 by the
International Labour Organisation (ILO) in partnership with the Mastercard Foundation. These surveys
aimed to collect in-depth information regarding the labour force situation of youth, and seek to study the
ease of entry into the labour market of young men and women as they exit school (Elder, 2009). Young
people aged 15-29 were interviewed. As well as personal, family and household information, the survey
collects data on formal education/training, activity history and aspirations, as well as collecting information
on non-working youth and those not in the labour force.
The survey is generally carried out at national level, using a multistage cluster sampling technique.
Two rounds of the survey have now been conducted in most countries. We choose here to focus on four of
the five countries from Eastern and Southern Africa, Madagascar, Malawi, Uganda and Zambia. The
sample sizes in each case were 3,300 (2013) and 5,000 (2015) in Madagascar; 3,102 (2012) and 3,097
(2014) in Malawi; 3,811 (2013) and 3,049 (2015) in Uganda; 3,206 (2012) and 3,225 (2014) in Zambia The
current analysis is conducted at the country level, pooling the two waves available.
The sample used here is based on employed men and women who report not being currently
enrolled and are either employees, self-employed, or unpaid family workers. The final samples amount to
4,905 for Madagascar, 2,882 for Malawi, 3,453 for Uganda, and 2,262 for Zambia.
In the current paper the main outcome measure is job satisfaction. Respondents were asked "to
what extent are you satisfied with your main job?", and chose one of four responses: 1. ‘very satisfied’, 2.
‘somewhat satisfied’, 3.‘somewhat unsatisfied’, 4. ‘very unsatisfied’. The question on job satisfaction is
asked to those currently working and refers to the main job. For analytic purposes we transformed this
variable by reversing its order to range from 0 (very unsatisfied) to 3 (very satisfied).
In terms of explanatory variables, the surveys collect extensive information on individual
background, including age, gender, relationship to the head of household (which may capture some
aspects of social norms, such as family/carer responsibilities5 that might be associated with differences in
job satisfaction), the highest level of education completed and whether people have ever worked while
going to school at the same time (the latter a common issue in developing countries, (Parent, 2006, Kruger
et. al., 2010). To account for family/household background, we use a self-reported variable on the living
standard of the household to which the individual belongs, using this response to distinguish poor and non-
4The surveys are part of the Work4Youth project conducted in partnership between the ILO Youth Employment
Programme and The MasterCard Foundation to support the SWTS in 36 target countries. Data from the first round of surveys were made available throughout 2013. 5 Details of variables are provided in Appendix A1.
6
poor households. We define poor the household that has been identified by its member as being fairly poor
or poor; while we define as non-poor the household that has been identified by its member as being well-
off, fairly well-off or around average.
In addition, the SWTS collects extensive information on current employment. Job variables are
potentially important determinants of job satisfaction, as they capture working conditions. The survey
records information on the employment status (employee; employer; own account worker; working as
unpaid family worker; member of a producers' cooperative). We define as self-employed anyone who
reports being an employer, own account worker, or member of a producers' cooperative. Given sample
size, we classify the information on sector of employment into four categories: agriculture, forestry and
fishing; mining and manufacturing, wholesale and retail trade, and other sectors6. The sector of
employment may reflect the quality of working conditions, where in some countries many workers may be
employed under poor health, safety and environmental conditions (ILO, 2015). For the current job, the
surveys record information on the actual number of hours worked per week7.
For the selected sample of employees only, we also consider a series of variables that capture
characteristics of the workplace, features which could be correlated with job satisfaction. We use the survey
responses to estimate the weekly average wage/salary in Malagasy Ariary, Malawian Kwacha, Ugandan
Schillings, and Zambian Kwacha, in Madagascar, Malawi, Uganda and Zambia respectively, but for
comparability convert it into US Dollar values8. We use an indicator for whether the worker is employed on
the basis of a contract, another for whether this is a written contract and a third for whether it is for an
unlimited time period, and also compute two dummy variables for having pay related benefits and having
any other benefit. For the self-employed we look at whether the individual has chosen to be self-employed
or had no other option based on the reason why is self-employed9. This captures whether being self-
employed is mainly a choice or an enforced situation (Fields, 2014) because the individual could not find a
wage or salary job, or because they were required by the family to do this work.
Since the quality of the match between a worker’s education/skills and the skills required by the job
is an important component of job satisfaction (Allen and Van Der Velden, 2001), we derive an indicator to
capture the mismatch between a worker’s skills, measured by education, and the skills required by the job
based on current occupation. The existing literature has various measures of this (Chiswick and Miller,
2009): a realized matches (RM) technique (reflecting the outcome of the labor market matching process,
based on the actual educational attainments of workers in each occupation compared to the mean or modal
6 Rest of industry includes: Electricity, Gas, steam; Water supply, sewerage, waste management; Construction; Transportation and
storage; Accommodation and food service activities; Information and communication; Financial service and real estate activities; Professional, scientific and technical; Administrative and support service activities; Public administration and defence; Education; Human health and social work activities; Arts, entertainment and recreation and other services. 7 Less than 0.01% of the sample report working more than 105 hours per week. To reduce the effect of outliers on the average
weekly hours, weekly hours worked has been top-coded to 105. 8The conversion rate has been based on the exchange rate of the 3rd January available on Yahoo converter
https://finance.yahoo.com/currency-converter/#from=GBP;to=USD;amt=1 $1 corresponds to 3,224.45 Malagasy Ariary; 669.67 Malawian kwacha,3,372.00 Uganda Shilling, and 9,444.57 Zambian Kwacha. 9 Those identified as being self-employed by choice are those reporting being self employed for greater independence, more
flexible hours and higher income. Those who report being self employed for non choice are those who could not find a wage or salary job or required by family. These two categories together represents about 25% in Madagascar, 46% in Malawi,53% in Uganda, and 52% in Zambia.
7
attainments within each occupation (see Verdugo and Verdugo, 1989; Cohn and Khan, 1995 respectively);
a Worker Self-Assessment (WSA) based on self-rating (see, for example, Allen and Van der Velden, 2001);
and a Job Analyst (JA) technique based on “objective” evaluations of experts (see, for example, guidelines
of the International Standard Classification of Occupation 2008 (ISCO-08).
We construct what we consider an “objective” measure of mismatch looking at the difference in the
educational attainment of a worker and the usual or required level of education of those working in the
same occupation. We define the "usual" level of education required in the current task/job following
guidelines of the International Standard Classification of Occupation 2008 (ISCO-08) provided by the ILO,
based on 9 1-digit-major groups of occupations10, though making some adjustments11 We considered
secondary education or above to be the usual level of education required for the highest skilled
occupations, such as managers; professionals; technicians and associate professionals; no schooling or
less than primary as sufficient for the lowest skill occupations (elementary occupations); and primary and
lower secondary level of education to the middle skilled occupations. But we also use a second subjective
measure of educational mismatch based on workers' self-reported answer to a question about whether they
believed their education/training was relevant for their current job.12 For both objective and subjective
mismatch measures we derive three categories: matched, overqualified and under qualified.
The next section presents an initial descriptive analysis of the results.
4. Descriptive analysis of data
We start by presenting the descriptive statistics13 of the main outcome variable: job satisfaction.
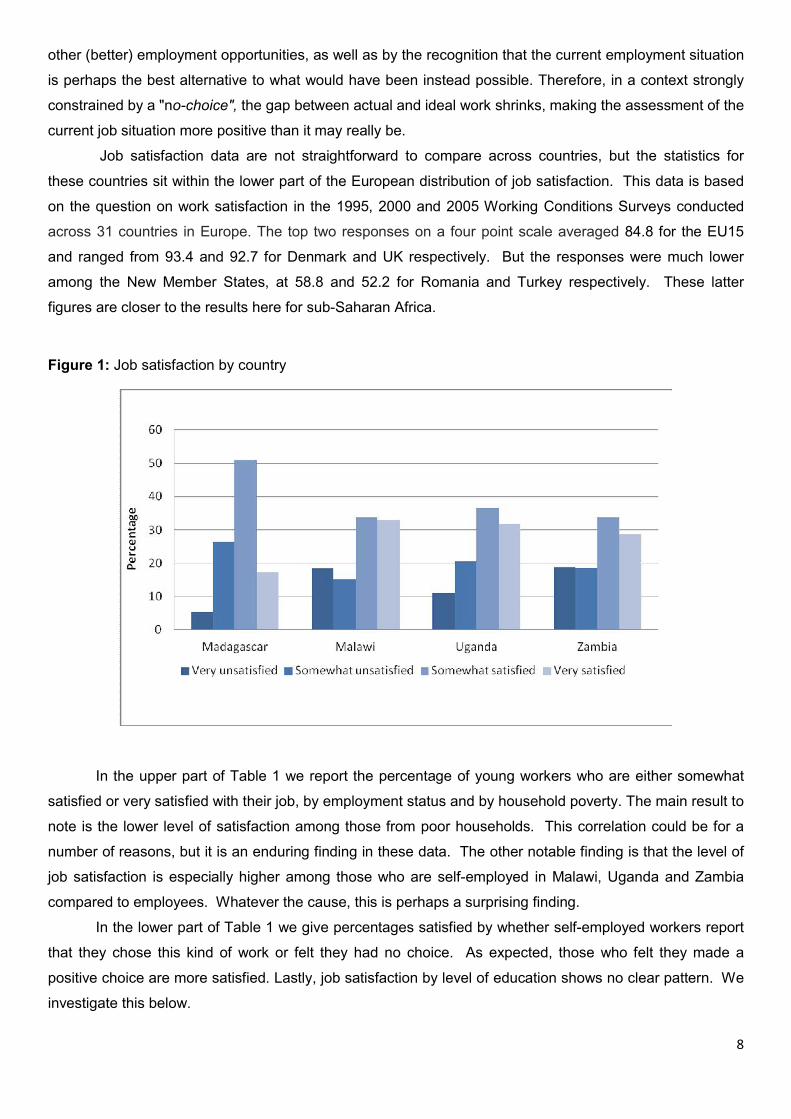
Figure 1 plots the distribution of job satisfaction for the four countries analysed. The figure documents that
over sixty percent of young workers are either somewhat satisfied or very satisfied with their current jobs.
For Malawi, Uganda and Zambia the satisfied workers and roughly equally split between being ‘somewhat’
or ‘very’ satisfied, while the balance is more toward ‘somewhat’ for Madagascar.
The message of young people being on average satisfied with their current job may be striking but
not totally surprising. Existing studies for developed countries (see Clark et. al. 1996, for a detailed
discussion) show that overall job satisfaction is indeed U-shaped in relation to age, with the youngest being
on average highly satisfied with their job. In addition, the high level of job satisfaction for youth in the four
countries analysed could be, in fact, explained by different factors. Firstly, as suggested by Clark et. al.
(1996) it can be interpreted in terms of young people entering the labour market and feeling positively about
their new situation and their transition into adulthood. Young people are likely to have different expectations
and perceptions that might change (diminish) with increasing age. Secondly, in the context of Sub-Saharan
Africa, job satisfaction of young people is also likely to be shaped by the awareness of the limited or lack of
10
The occupations were mangers; professionals; technicians and associate professionals; clerical support workers; services and sales workers; skilled agricultural, forestry and fishery workers; craft and related trades workers; plant and machine operators and assemblers; elementary occupations) 11
See appendix A2 for details on the ILO classification and a comparison of the classification adopted. 12
Specifically, we construct the subjective measure of educational mismatch based on the following question: "Do you feel your education/training qualifications are relevant in performing your present job?". Individuals can select one of the following answers: 1) Yes, they are relevant. 2) No, I feel overqualified. 3) No, I experience gaps in my knowledge and skills need additional training. 4) The question is not relevant as I am still studying. 13
All descriptive statistics are obtained using weights available.
8
other (better) employment opportunities, as well as by the recognition that the current employment situation
is perhaps the best alternative to what would have been instead possible. Therefore, in a context strongly
constrained by a "no-choice", the gap between actual and ideal work shrinks, making the assessment of the
current job situation more positive than it may really be.
Job satisfaction data are not straightforward to compare across countries, but the statistics for
these countries sit within the lower part of the European distribution of job satisfaction. This data is based
on the question on work satisfaction in the 1995, 2000 and 2005 Working Conditions Surveys conducted
across 31 countries in Europe. The top two responses on a four point scale averaged 84.8 for the EU15
and ranged from 93.4 and 92.7 for Denmark and UK respectively. But the responses were much lower
among the New Member States, at 58.8 and 52.2 for Romania and Turkey respectively. These latter
figures are closer to the results here for sub-Saharan Africa.
Figure 1: Job satisfaction by country
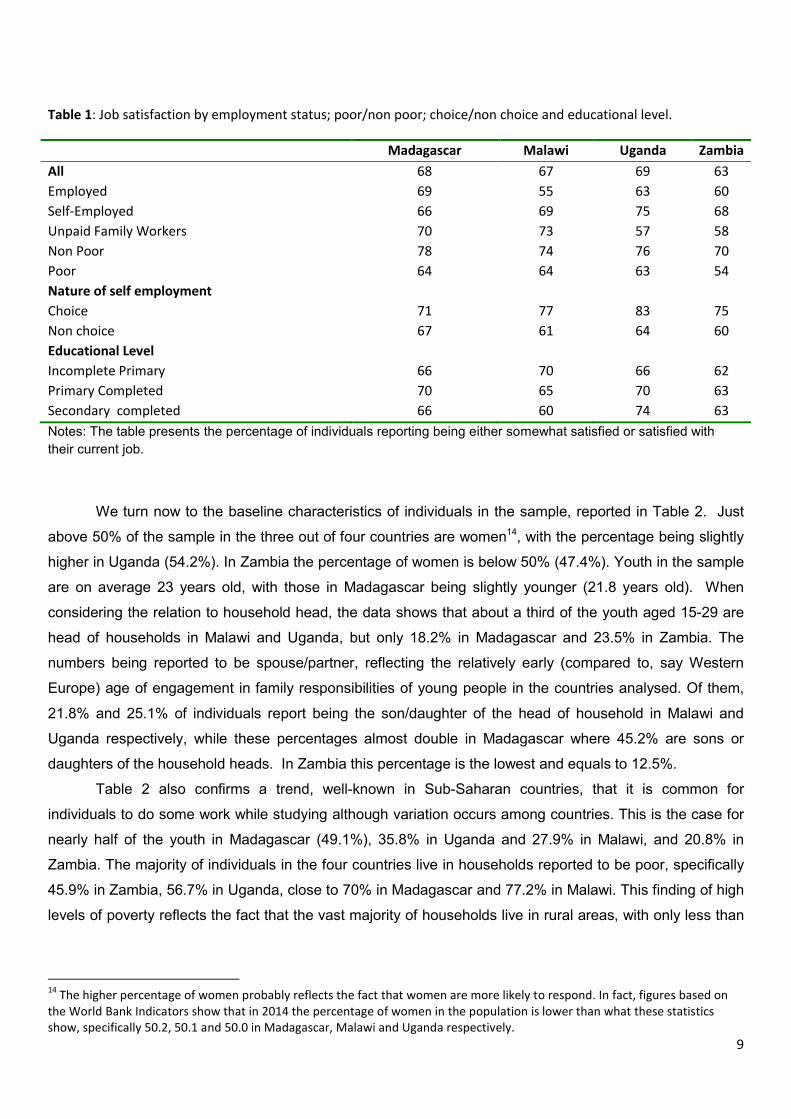
In the upper part of Table 1 we report the percentage of young workers who are either somewhat
satisfied or very satisfied with their job, by employment status and by household poverty. The main result to
note is the lower level of satisfaction among those from poor households. This correlation could be for a
number of reasons, but it is an enduring finding in these data. The other notable finding is that the level of
job satisfaction is especially higher among those who are self-employed in Malawi, Uganda and Zambia
compared to employees. Whatever the cause, this is perhaps a surprising finding.
In the lower part of Table 1 we give percentages satisfied by whether self-employed workers report
that they chose this kind of work or felt they had no choice. As expected, those who felt they made a
positive choice are more satisfied. Lastly, job satisfaction by level of education shows no clear pattern. We
investigate this below.
9
Table 1: Job satisfaction by employment status; poor/non poor; choice/non choice and educational level.
Madagascar Malawi Uganda Zambia
All 68 67 69 63
Employed 69 55 63 60
Self-Employed 66 69 75 68
Unpaid Family Workers 70 73 57 58
Non Poor 78 74 76 70
Poor 64 64 63 54
Nature of self employment
Choice 71 77 83 75
Non choice 67 61 64 60
Educational Level
Incomplete Primary 66 70 66 62
Primary Completed 70 65 70 63
Secondary completed 66 60 74 63
Notes: The table presents the percentage of individuals reporting being either somewhat satisfied or satisfied with
their current job.
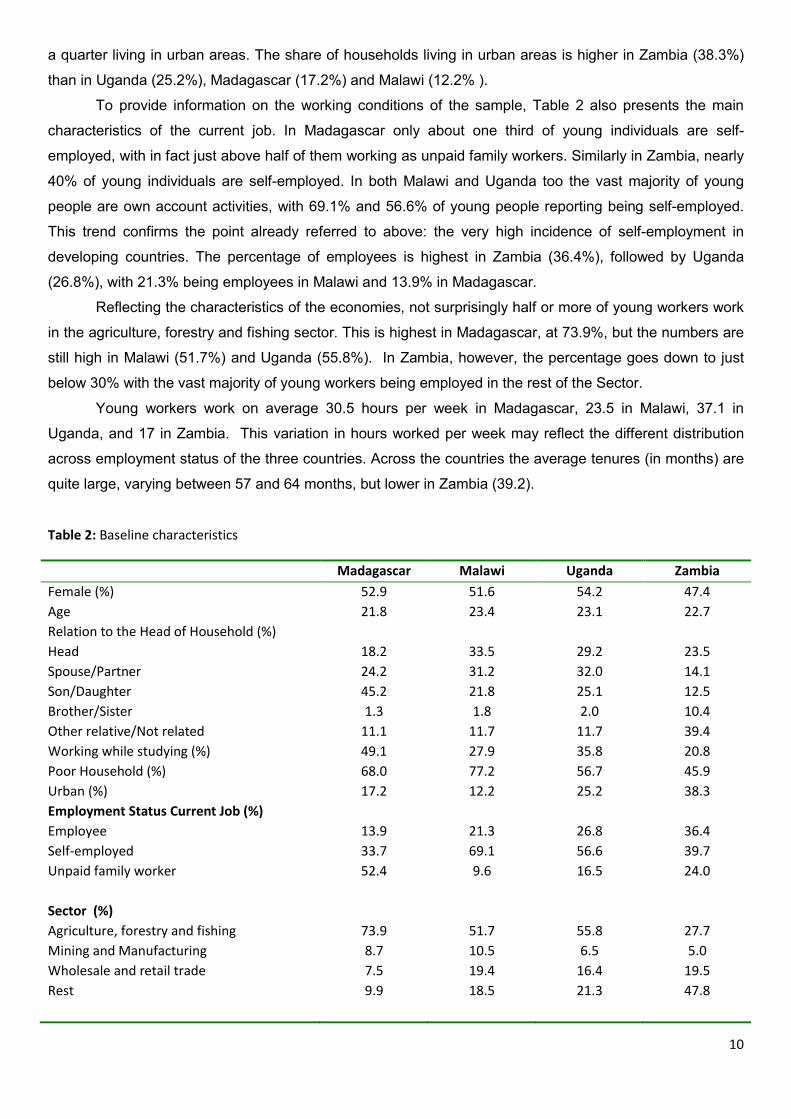
We turn now to the baseline characteristics of individuals in the sample, reported in Table 2. Just
above 50% of the sample in the three out of four countries are women14, with the percentage being slightly
higher in Uganda (54.2%). In Zambia the percentage of women is below 50% (47.4%). Youth in the sample
are on average 23 years old, with those in Madagascar being slightly younger (21.8 years old). When
considering the relation to household head, the data shows that about a third of the youth aged 15-29 are
head of households in Malawi and Uganda, but only 18.2% in Madagascar and 23.5% in Zambia. The
numbers being reported to be spouse/partner, reflecting the relatively early (compared to, say Western
Europe) age of engagement in family responsibilities of young people in the countries analysed. Of them,
21.8% and 25.1% of individuals report being the son/daughter of the head of household in Malawi and
Uganda respectively, while these percentages almost double in Madagascar where 45.2% are sons or
daughters of the household heads. In Zambia this percentage is the lowest and equals to 12.5%.
Table 2 also confirms a trend, well-known in Sub-Saharan countries, that it is common for
individuals to do some work while studying although variation occurs among countries. This is the case for
nearly half of the youth in Madagascar (49.1%), 35.8% in Uganda and 27.9% in Malawi, and 20.8% in
Zambia. The majority of individuals in the four countries live in households reported to be poor, specifically
45.9% in Zambia, 56.7% in Uganda, close to 70% in Madagascar and 77.2% in Malawi. This finding of high
levels of poverty reflects the fact that the vast majority of households live in rural areas, with only less than
14
The higher percentage of women probably reflects the fact that women are more likely to respond. In fact, figures based on the World Bank Indicators show that in 2014 the percentage of women in the population is lower than what these statistics show, specifically 50.2, 50.1 and 50.0 in Madagascar, Malawi and Uganda respectively.
10
a quarter living in urban areas. The share of households living in urban areas is higher in Zambia (38.3%)
than in Uganda (25.2%), Madagascar (17.2%) and Malawi (12.2% ).
To provide information on the working conditions of the sample, Table 2 also presents the main
characteristics of the current job. In Madagascar only about one third of young individuals are self-
employed, with in fact just above half of them working as unpaid family workers. Similarly in Zambia, nearly
40% of young individuals are self-employed. In both Malawi and Uganda too the vast majority of young
people are own account activities, with 69.1% and 56.6% of young people reporting being self-employed.
This trend confirms the point already referred to above: the very high incidence of self-employment in
developing countries. The percentage of employees is highest in Zambia (36.4%), followed by Uganda
(26.8%), with 21.3% being employees in Malawi and 13.9% in Madagascar.
Reflecting the characteristics of the economies, not surprisingly half or more of young workers work
in the agriculture, forestry and fishing sector. This is highest in Madagascar, at 73.9%, but the numbers are
still high in Malawi (51.7%) and Uganda (55.8%). In Zambia, however, the percentage goes down to just
below 30% with the vast majority of young workers being employed in the rest of the Sector.
Young workers work on average 30.5 hours per week in Madagascar, 23.5 in Malawi, 37.1 in
Uganda, and 17 in Zambia. This variation in hours worked per week may reflect the different distribution
across employment status of the three countries. Across the countries the average tenures (in months) are
quite large, varying between 57 and 64 months, but lower in Zambia (39.2).
Table 2: Baseline characteristics
Madagascar Malawi Uganda Zambia
Female (%) 52.9 51.6 54.2 47.4
Age 21.8 23.4 23.1 22.7
Relation to the Head of Household (%)
Head 18.2 33.5 29.2 23.5
Spouse/Partner 24.2 31.2 32.0 14.1
Son/Daughter 45.2 21.8 25.1 12.5
Brother/Sister 1.3 1.8 2.0 10.4
Other relative/Not related 11.1 11.7 11.7 39.4
Working while studying (%) 49.1 27.9 35.8 20.8
Poor Household (%) 68.0 77.2 56.7 45.9
Urban (%) 17.2 12.2 25.2 38.3
Employment Status Current Job (%)
Employee 13.9 21.3 26.8 36.4
Self-employed 33.7 69.1 56.6 39.7
Unpaid family worker 52.4 9.6 16.5 24.0
Sector (%)
Agriculture, forestry and fishing 73.9 51.7 55.8 27.7
Mining and Manufacturing 8.7 10.5 6.5 5.0
Wholesale and retail trade 7.5 19.4 16.4 19.5
Rest 9.9 18.5 21.3 47.8
11
Actual weekly Hours 30.5 23.5 37.1 17.2
Tenure in months 64 57 61 39.2
Total N 5,905 2,882 3,453 2,262
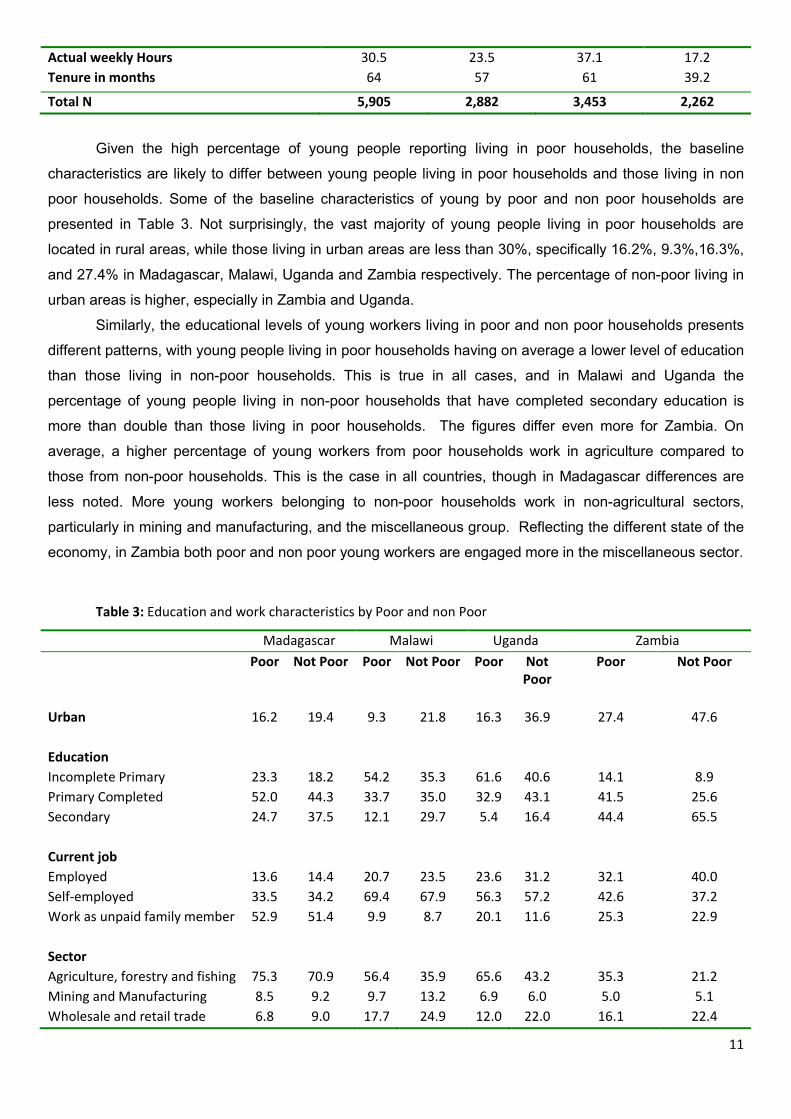
Given the high percentage of young people reporting living in poor households, the baseline
characteristics are likely to differ between young people living in poor households and those living in non
poor households. Some of the baseline characteristics of young by poor and non poor households are
presented in Table 3. Not surprisingly, the vast majority of young people living in poor households are
located in rural areas, while those living in urban areas are less than 30%, specifically 16.2%, 9.3%,16.3%,
and 27.4% in Madagascar, Malawi, Uganda and Zambia respectively. The percentage of non-poor living in
urban areas is higher, especially in Zambia and Uganda.
Similarly, the educational levels of young workers living in poor and non poor households presents
different patterns, with young people living in poor households having on average a lower level of education
than those living in non-poor households. This is true in all cases, and in Malawi and Uganda the
percentage of young people living in non-poor households that have completed secondary education is
more than double than those living in poor households. The figures differ even more for Zambia. On
average, a higher percentage of young workers from poor households work in agriculture compared to
those from non-poor households. This is the case in all countries, though in Madagascar differences are
less noted. More young workers belonging to non-poor households work in non-agricultural sectors,
particularly in mining and manufacturing, and the miscellaneous group. Reflecting the different state of the
economy, in Zambia both poor and non poor young workers are engaged more in the miscellaneous sector.
Table 3: Education and work characteristics by Poor and non Poor
Madagascar Malawi Uganda Zambia
Poor Not Poor Poor Not Poor Poor Not Poor
Poor Not Poor
Urban 16.2 19.4 9.3 21.8 16.3 36.9 27.4 47.6
Education
Incomplete Primary 23.3 18.2 54.2 35.3 61.6 40.6 14.1 8.9
Primary Completed 52.0 44.3 33.7 35.0 32.9 43.1 41.5 25.6
Secondary 24.7 37.5 12.1 29.7 5.4 16.4 44.4 65.5
Current job
Employed 13.6 14.4 20.7 23.5 23.6 31.2 32.1 40.0
Self-employed 33.5 34.2 69.4 67.9 56.3 57.2 42.6 37.2
Work as unpaid family member 52.9 51.4 9.9 8.7 20.1 11.6 25.3 22.9
Sector
Agriculture, forestry and fishing 75.3 70.9 56.4 35.9 65.6 43.2 35.3 21.2
Mining and Manufacturing 8.5 9.2 9.7 13.2 6.9 6.0 5.0 5.1
Wholesale and retail trade 6.8 9.0 17.7 24.9 12.0 22.0 16.1 22.4
12
Rest 9.5 10.8 16.2 26.0 15.5 28.8 43.6 51.4
The higher concentration of young workers from poor backgrounds in rural areas, along with their
lower level of education, and the higher concentration in sectors traditionally characterised by harsher
working conditions, and lower paid such as the agricultural sector, probably reflect that the challenging
social and economic context that young people from poor backgrounds face, have implications for the job
choices they make. In fact, poverty forces young workers to make inferior job choices, having to take up
unattractive jobs compared to their counterparts from non-poor backgrounds, due not only to the lack of
opportunities but also to contextual constraints.
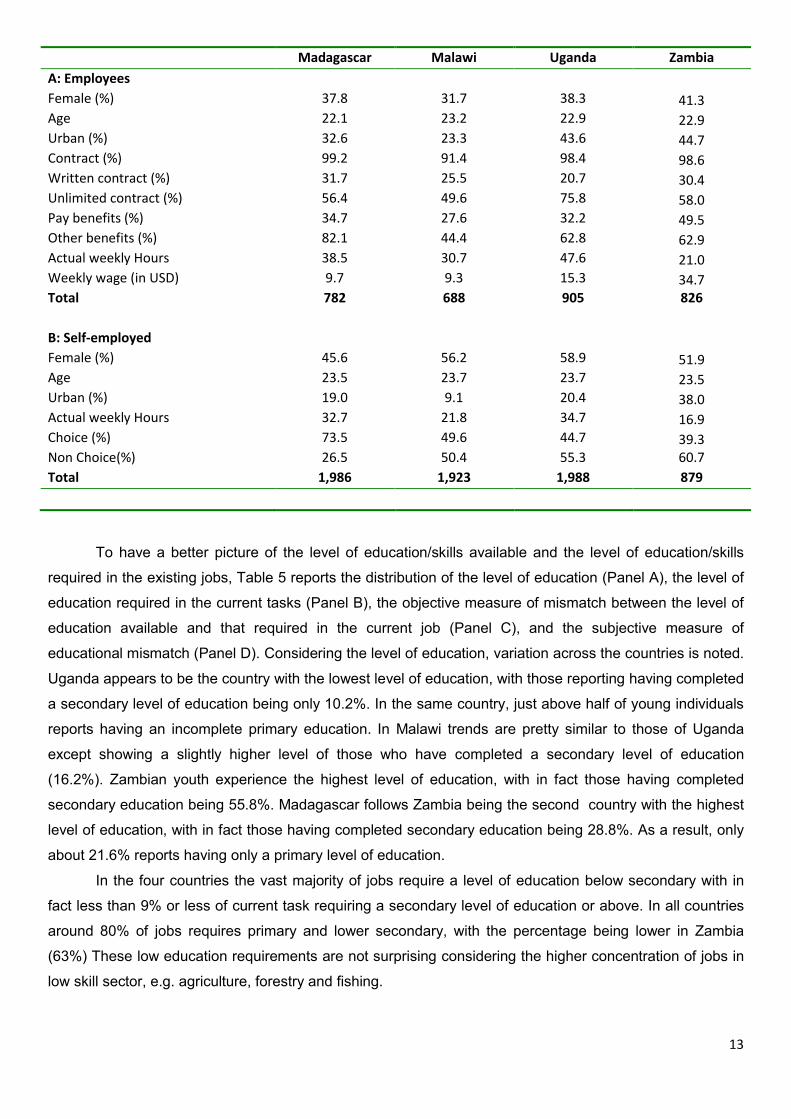
Table 4 analyses the working characteristics of those employed as employees (Panel A) and sefl-
employed (Panel B). On average, the vast majority of youth working as employees are male and aged
around 22 and 23 years old. Almost all employees have a contract, however only about a third (or fewer)
has a written contract. Madagascar is the country with the higher percentage of young workers with a
written contract (31.7%), while only about 20.7% in Uganda have a written contract. The low percentage of
those reporting to have a written contract is likely to mirror the highly informal conditions of the work, since
the informal sector still represents the dominant share of all sectors. Even more variation occurs looking at
contract that have unlimited time. The vast majority of contracts in Uganda (75.8%) are of unlimited time;
while in Madagascar, Malawi and Zambia around half to just below 60% of them are of unlimited time.
In most of the cases employees enjoy some sort of benefits at workplace. On average, the
incidence of pay benefits in the four countries is around a third or even more in Zambia (49.5%) while that
of employees taking advantage of other benefits, rather than the monetary ones, is much higher for all
countries and is particularly high in Madagascar,(82.1%), and lower in Malawi (44.4%). As already
observed in Table 2, variation occurs in hours worked per week across the countries also for those who are
employees, although on average employees work longer hours than those who are either self-employed or
unpaid family workers. Uganda reports the highest average number of hours worked per week (47.6) while
Zambia reports the lowest average (21.0). Weekly wage varies across the countries, reflecting the
economy and level of poverty.
Considering the average characteristics of those working as self-employed (Panel B), unlike the
employees a higher percentage of young female workers are self-employed being nearly half in
Madagascar, and above half in Malawi, Uganda and Zambia. Workers are also slightly older and a smaller
proportion of them are located in urban area, probably reflecting the informal aspect and more agricultural
oriented activities located in rural areas. Moreover, the vast majority of young self-employed workers in
Madagascar reporting doing this activity by their own choice, while in Malawi, Uganda and Zambia below
half of them report that being a choice activity, with the vast majority instead reporting being self-employed
due to lack of wage/salary opportunities or due to family choice.
Table 4: Characteristics and working conditions for employees and self-employed
13
Madagascar Malawi Uganda Zambia
A: Employees
Female (%) 37.8 31.7 38.3 41.3 Age 22.1 23.2 22.9 22.9 Urban (%) 32.6 23.3 43.6 44.7 Contract (%) 99.2 91.4 98.4 98.6 Written contract (%) 31.7 25.5 20.7 30.4 Unlimited contract (%) 56.4 49.6 75.8 58.0 Pay benefits (%) 34.7 27.6 32.2 49.5 Other benefits (%) 82.1 44.4 62.8 62.9 Actual weekly Hours 38.5 30.7 47.6 21.0 Weekly wage (in USD) 9.7 9.3 15.3 34.7 Total 782 688 905 826
B: Self-employed
Female (%) 45.6 56.2 58.9 51.9 Age 23.5 23.7 23.7 23.5 Urban (%) 19.0 9.1 20.4 38.0 Actual weekly Hours 32.7 21.8 34.7 16.9 Choice (%) 73.5 49.6 44.7 39.3 Non Choice(%) 26.5 50.4 55.3 60.7
Total 1,986 1,923 1,988 879
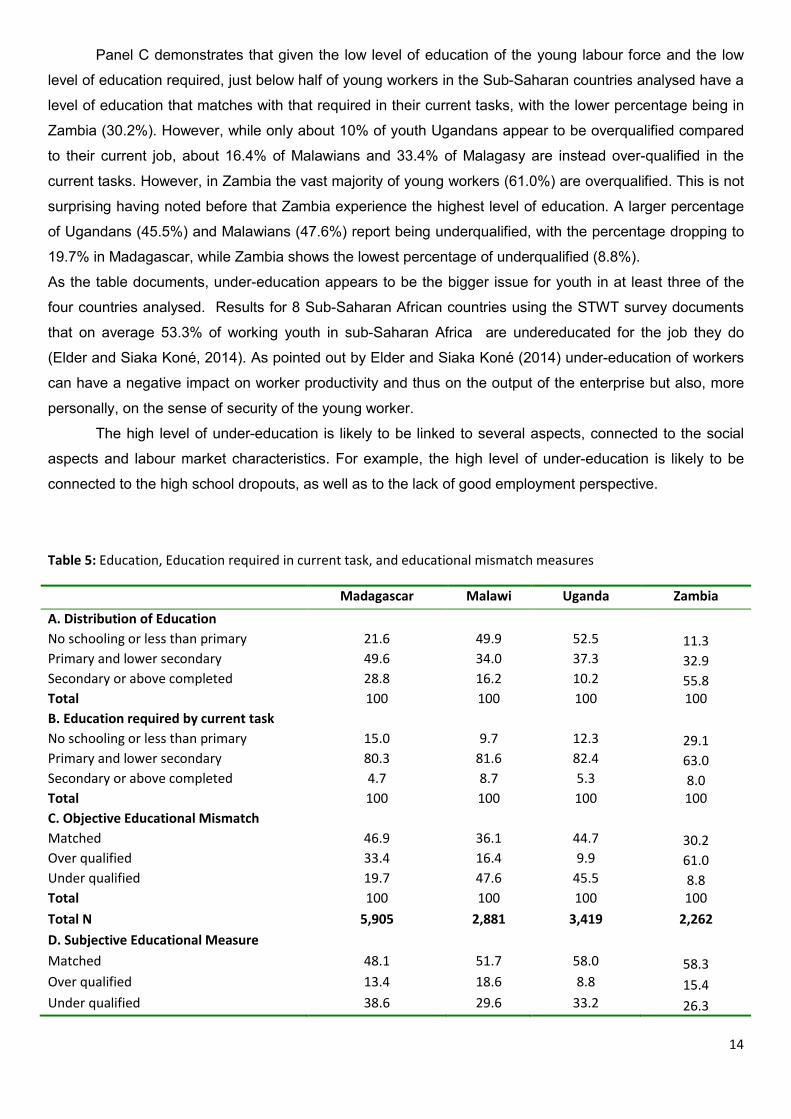
To have a better picture of the level of education/skills available and the level of education/skills
required in the existing jobs, Table 5 reports the distribution of the level of education (Panel A), the level of
education required in the current tasks (Panel B), the objective measure of mismatch between the level of
education available and that required in the current job (Panel C), and the subjective measure of
educational mismatch (Panel D). Considering the level of education, variation across the countries is noted.
Uganda appears to be the country with the lowest level of education, with those reporting having completed
a secondary level of education being only 10.2%. In the same country, just above half of young individuals
reports having an incomplete primary education. In Malawi trends are pretty similar to those of Uganda
except showing a slightly higher level of those who have completed a secondary level of education
(16.2%). Zambian youth experience the highest level of education, with in fact those having completed
secondary education being 55.8%. Madagascar follows Zambia being the second country with the highest
level of education, with in fact those having completed secondary education being 28.8%. As a result, only
about 21.6% reports having only a primary level of education.
In the four countries the vast majority of jobs require a level of education below secondary with in
fact less than 9% or less of current task requiring a secondary level of education or above. In all countries
around 80% of jobs requires primary and lower secondary, with the percentage being lower in Zambia
(63%) These low education requirements are not surprising considering the higher concentration of jobs in
low skill sector, e.g. agriculture, forestry and fishing.
14
Panel C demonstrates that given the low level of education of the young labour force and the low
level of education required, just below half of young workers in the Sub-Saharan countries analysed have a
level of education that matches with that required in their current tasks, with the lower percentage being in
Zambia (30.2%). However, while only about 10% of youth Ugandans appear to be overqualified compared
to their current job, about 16.4% of Malawians and 33.4% of Malagasy are instead over-qualified in the
current tasks. However, in Zambia the vast majority of young workers (61.0%) are overqualified. This is not
surprising having noted before that Zambia experience the highest level of education. A larger percentage
of Ugandans (45.5%) and Malawians (47.6%) report being underqualified, with the percentage dropping to
19.7% in Madagascar, while Zambia shows the lowest percentage of underqualified (8.8%).
As the table documents, under-education appears to be the bigger issue for youth in at least three of the
four countries analysed. Results for 8 Sub-Saharan African countries using the STWT survey documents
that on average 53.3% of working youth in sub-Saharan Africa are undereducated for the job they do
(Elder and Siaka Koné, 2014). As pointed out by Elder and Siaka Koné (2014) under-education of workers
can have a negative impact on worker productivity and thus on the output of the enterprise but also, more
personally, on the sense of security of the young worker.
The high level of under-education is likely to be linked to several aspects, connected to the social
aspects and labour market characteristics. For example, the high level of under-education is likely to be
connected to the high school dropouts, as well as to the lack of good employment perspective.
Table 5: Education, Education required in current task, and educational mismatch measures
Madagascar Malawi Uganda Zambia
A. Distribution of Education
No schooling or less than primary 21.6 49.9 52.5 11.3 Primary and lower secondary 49.6 34.0 37.3 32.9 Secondary or above completed 28.8 16.2 10.2 55.8 Total 100 100 100 100
B. Education required by current task
No schooling or less than primary 15.0 9.7 12.3 29.1 Primary and lower secondary 80.3 81.6 82.4 63.0 Secondary or above completed 4.7 8.7 5.3 8.0 Total 100 100 100 100
C. Objective Educational Mismatch
Matched 46.9 36.1 44.7 30.2 Over qualified 33.4 16.4 9.9 61.0 Under qualified 19.7 47.6 45.5 8.8 Total 100 100 100 100
Total N 5,905 2,881 3,419 2,262
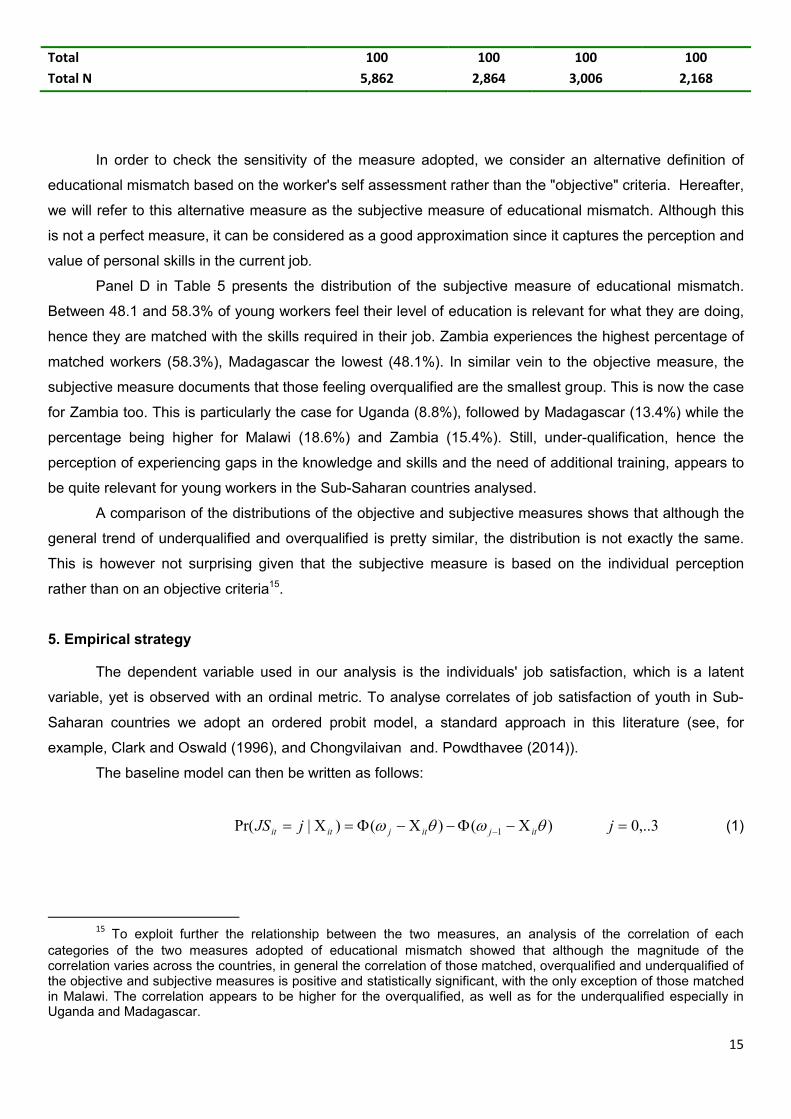
D. Subjective Educational Measure
Matched 48.1 51.7 58.0 58.3 Over qualified 13.4 18.6 8.8 15.4 Under qualified 38.6 29.6 33.2 26.3
15
Total 100 100 100 100
Total N 5,862 2,864 3,006 2,168
In order to check the sensitivity of the measure adopted, we consider an alternative definition of
educational mismatch based on the worker's self assessment rather than the "objective" criteria. Hereafter,
we will refer to this alternative measure as the subjective measure of educational mismatch. Although this
is not a perfect measure, it can be considered as a good approximation since it captures the perception and
value of personal skills in the current job.
Panel D in Table 5 presents the distribution of the subjective measure of educational mismatch.
Between 48.1 and 58.3% of young workers feel their level of education is relevant for what they are doing,
hence they are matched with the skills required in their job. Zambia experiences the highest percentage of
matched workers (58.3%), Madagascar the lowest (48.1%). In similar vein to the objective measure, the
subjective measure documents that those feeling overqualified are the smallest group. This is now the case
for Zambia too. This is particularly the case for Uganda (8.8%), followed by Madagascar (13.4%) while the
percentage being higher for Malawi (18.6%) and Zambia (15.4%). Still, under-qualification, hence the
perception of experiencing gaps in the knowledge and skills and the need of additional training, appears to
be quite relevant for young workers in the Sub-Saharan countries analysed.
A comparison of the distributions of the objective and subjective measures shows that although the
general trend of underqualified and overqualified is pretty similar, the distribution is not exactly the same.
This is however not surprising given that the subjective measure is based on the individual perception
rather than on an objective criteria15.
5. Empirical strategy
The dependent variable used in our analysis is the individuals' job satisfaction, which is a latent
variable, yet is observed with an ordinal metric. To analyse correlates of job satisfaction of youth in Sub-
Saharan countries we adopt an ordered probit model, a standard approach in this literature (see, for
example, Clark and Oswald (1996), and Chongvilaivan and. Powdthavee (2014)).
The baseline model can then be written as follows:
)()()|Pr( 1 itjitjitit jJS 3,..0j (1)
15 To exploit further the relationship between the two measures, an analysis of the correlation of each
categories of the two measures adopted of educational mismatch showed that although the magnitude of the correlation varies across the countries, in general the correlation of those matched, overqualified and underqualified of the objective and subjective measures is positive and statistically significant, with the only exception of those matched in Malawi. The correlation appears to be higher for the overqualified, as well as for the underqualified especially in Uganda and Madagascar.
16
Where i = 1,…n. The dependent variable 3,.0iJS is the self-reported response to an overall job
satisfaction question; is a vector of explanatory variables; )( represents the cumulative density
function; ωi represents the threshold values and θ is a vector of parameter estimates.
We model job satisfaction as a function of individual, household and geographical characteristics.
Specifically, the variables are: age group (15-19, 20-24, 25-30); age squared; gender; relationship to the
head of household (head; spouse/partner; son/daughter; brother/sister; other relatives/not related); a
dummy for secondary education completed; a dummy for living in urban area; tenure in work (in months);
tenure squared; employment status (employee; self-employed; working as unpaid family member); actual
weekly hours worked; a dummy for working while studying; an interaction term between working while
studying and female; an objective measure of educational mismatch (matched, over educated, under
educated); a dummy for poor household; and interaction term between poor household and living in urban
area; the sector of employment (agriculture, forestry and fishing; mining and manufacturing; wholesale; rest
of the industry); year control and regional control. In addition, estimates restricted to employees also
include as described above, a dummy for written contract; a dummy for unlimited contract; a dummy for pay
benefits and other benefits and log weekly wage. Estimates restricted to self-employed also include a
dummy capturing whether the individual is self-employed by choice or non-choice. Additional estimates
include a subjective measure of educational mismatch.
The cross-sectional nature of the data does not allow to us control for unobserved heterogeneity,
and we recognise that the assumed direction of causality is questionable for many of the explanatory
variables. Reflecting this, we interpret the results with due caution.
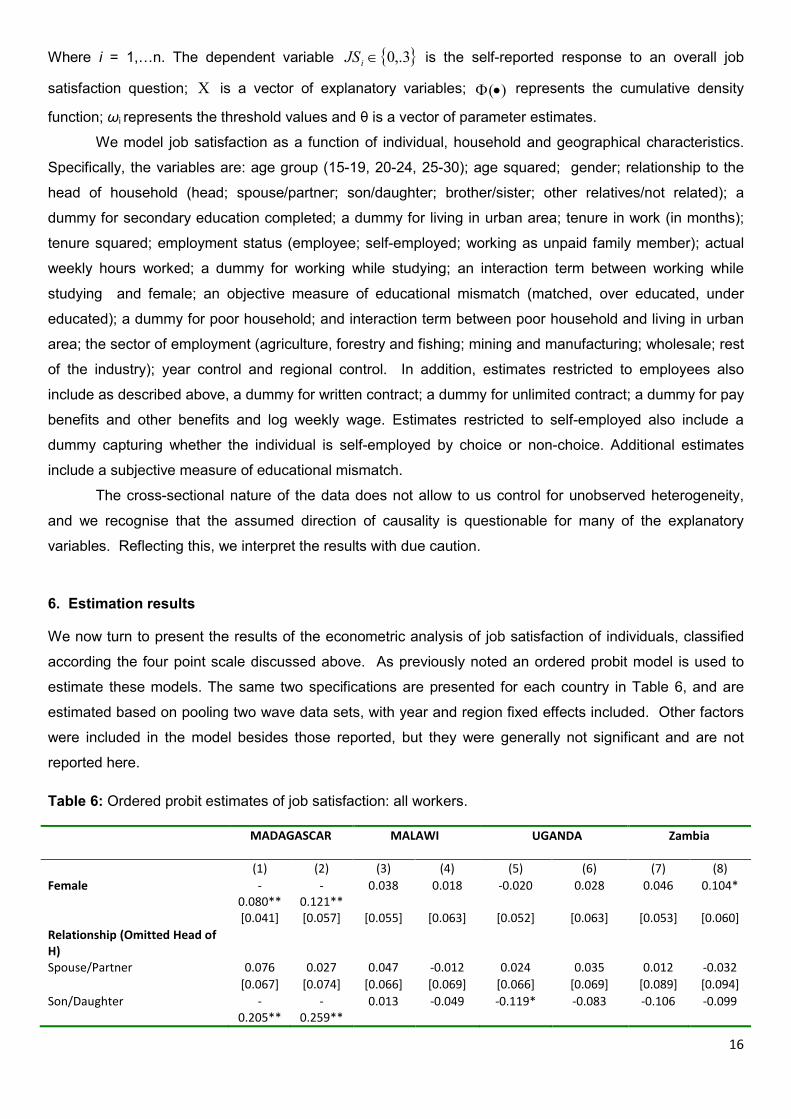
6. Estimation results
We now turn to present the results of the econometric analysis of job satisfaction of individuals, classified
according the four point scale discussed above. As previously noted an ordered probit model is used to
estimate these models. The same two specifications are presented for each country in Table 6, and are
estimated based on pooling two wave data sets, with year and region fixed effects included. Other factors
were included in the model besides those reported, but they were generally not significant and are not
reported here.
Table 6: Ordered probit estimates of job satisfaction: all workers.
MADAGASCAR MALAWI UGANDA Zambia
(1) (2) (3) (4) (5) (6) (7) (8)
Female -0.080**
-0.121**
0.038 0.018 -0.020 0.028 0.046 0.104*
[0.041] [0.057] [0.055] [0.063] [0.052] [0.063] [0.053] [0.060]
Relationship (Omitted Head of H)
Spouse/Partner 0.076 0.027 0.047 -0.012 0.024 0.035 0.012 -0.032
[0.067] [0.074] [0.066] [0.069] [0.066] [0.069] [0.089] [0.094]
Son/Daughter -0.205**
-0.259**
0.013 -0.049 -0.119* -0.083 -0.106 -0.099
17
* *
[0.059] [0.066] [0.069] [0.072] [0.062] [0.065] [0.086] [0.089]
Bother/Sister -0.439**
-0.645**
*
-0.168 -0.203 -0.144 -0.219 -0.069 -0.130
[0.173] [0.190] [0.142] [0.142] [0.157] [0.166] [0.093] [0.098]
Other relative/not related -0.060 -0.040 -0.138* -0.164** -0.130* -0.097 -0.147**
-0.171**
[0.073] [0.081] [0.079] [0.081] [0.077] [0.079] [0.067] [0.072]
Urban -0.082**
-0.090 -0.036 -0.011 -0.105** -0.136** -0.010 0.046
[0.042] [0.070] [0.058] [0.099] [0.050] [0.066] [0.053] [0.077]
Current job (Omitted employed)
Self-employed -0.029 0.026 0.272***
0.286*** 0.449*** 0.389*** 0.225***
0.242***
[0.060] [0.065] [0.059] [0.060] [0.057] [0.059] [0.056] [0.059]
Unpaid Family Member 0.016 0.054 0.349***
0.332*** 0.200*** 0.165** 0.089 0.134*
[0.062] [0.068] [0.088] [0.091] [0.075] [0.080] [0.070] [0.074]
Actual Weekly Hours 0.004***
0.004***
0.002** 0.001 0.005*** 0.005*** -0.003**
*
-0.002*
[0.001] [0.001] [0.001] [0.001] [0.001] [0.001] [0.001] [0.001]
Working while studying -0.107* -0.002 0.214*** 0.255***
[0.056] [0.069] [0.060] [0.077]
Objective Measure: Educational Mismatch (Matched omitted)
Over-qualified -0.143**
-0.138* -0.286*** -0.176**
* [0.056] [0.081] [0.082] [0.067]
Under-qualified -0.013 0.157*** 0.019 -0.053
[0.102] [0.051] [0.045] [0.214]
Poor Households -0.279**
*
-0.282***
-0.256*** -0.443**
* [0.045] [0.064] [0.051] [0.065]
Sector (Omitted Agriculture, forestry and fishing)
Mining and Manufacturing -0.027 -0.021 -0.137* -0.153** 0.365*** 0.315*** -0.010 0.034
[0.061] [0.066] [0.070] [0.074] [0.088] [0.094] [0.126] [0.131]
Wholesale and retail trade -0.083 -0.108 -0.063 -0.067 0.256*** 0.258*** -0.212**
*
-0.215**
* [0.063] [0.069] [0.058] [0.061] [0.064] [0.066] [0.075] [0.079]
Rest of industry -0.090 -0.105 -0.026 -0.064 0.286*** 0.227*** -0.142**
-0.115*
[0.067] [0.071] [0.065] [0.071] [0.066] [0.069] [0.064] [0.069]
Year Yes Yes Yes Yes Yes Yes Yes Yes
Region control Yes Yes Yes Yes Yes Yes Yes Yes
Observations 4,102 3,551 2,616 2,482 3,199 2,992 2,082 1,936
Note: Estimation by ordered probit. The dependent variable is Job satisfaction which is an ordered variable with the following
categories: 0. Very unsatisfied, 1. Somewhat unsatisfied, 2. Somewhat satisfied, 3. Very satisfied. Additional control not reported
are: age group 15-19, 20-24, 25-30; age squared; tenure, tenure squared; secondary completed; interaction term working while
studying and female; Interaction term Poor Household-Urban, year and region controls. Robust standard error in [.]. Significance
*** p<0.01, ** p<0.05, * p<0.1.
18
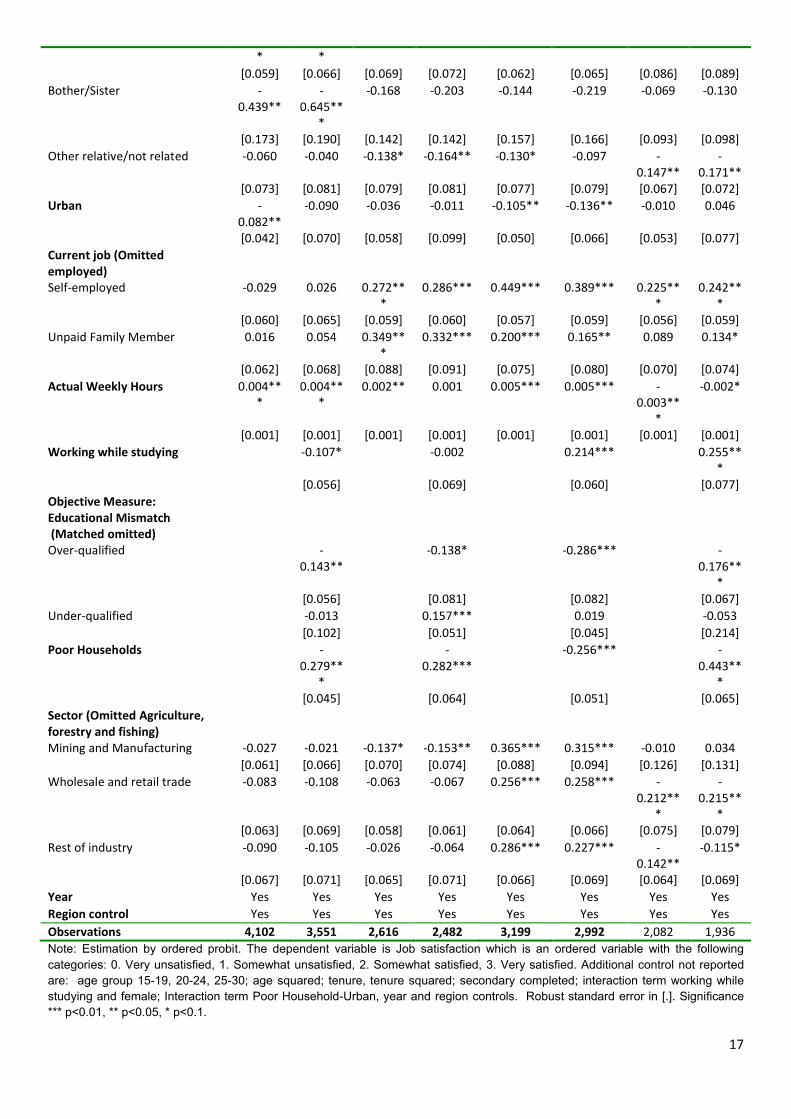
Considering first the initial specification in each case, being self-employed or an unpaid family
worker are positively associated with higher job satisfaction in Malawi, Uganda and Zambia, though not in
Madagascar; and these effects are quite substantial. Other things being equal, working for someone else
as a wage employee is negatively associated with job satisfaction in Malawi, Uganda and Zambia. Working
in agriculture, as opposed to any other sector, is substantially negatively associated with job satisfaction in
Uganda, but not in Malawi, Madagascar and Zambia. This may reflect the more agricultural nature of the
Madagascar and especially Malawi economies. In Madagascar there are no significant sectoral effects in
the base model; while in Malawi working in mining and manufacturing has a negative association with job
satisfaction relative to working in agriculture. In Zambia working in both mining and manufacturing, as well
as the rest of the sector has a negative association with job satisfaction relative to working in agriculture.
Interestingly hours of work are positively associated with job satisfaction in all data sets, except in
Zambia. This suggests that underemployment may be associated with lower job satisfaction; however the
magnitude of this effect is quite small.
Job satisfaction is lower in urban areas in all four countries, though this is not significant in Malawi
and Zambia. Females have lower levels of job satisfaction in Madagascar and Zambia, though there are no
significant effects in the other countries. Where significant, each of these effects are quite large.
Household heads generally enjoy higher levels of job satisfaction, in comparison with sons or daughters in
the cases of Uganda and Madagascar, and completed to more distant relatives in Malawi and Zambia.
The second model in each case adds variables such as the objective measure of educational
mismatch, as well as including variables for self-reported poverty status. The inclusion of these variables
does not affect the sign or significance of most of the effects already discussed above.
Being over-qualified for the job has a strong, significant and negative impact on job satisfaction in
the four countries analysed although the magnitude varies, with the effect for Uganda being larger. These
effects suggest that despite the variation across countries, the poor quality of the jobs are likely to generate
increased frustration especially for workers who find it difficult to find jobs that match their current level of
education. Moreover, being from a poor household though is strong negatively associated with job
satisfaction in all countries. The negative association between job satisfaction and poor household can be
explained by the fact that poor households captures different contextual aspects, related not only to job
opportunities and/or working conditions, but also to family constraints.
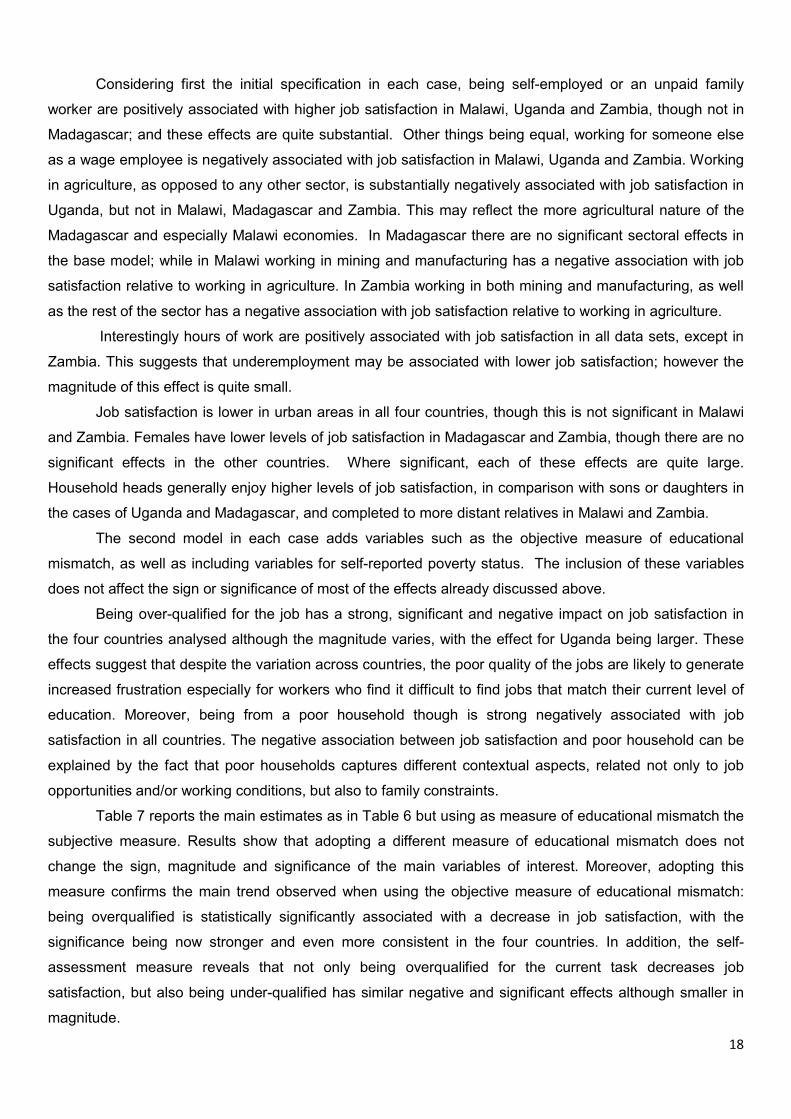
Table 7 reports the main estimates as in Table 6 but using as measure of educational mismatch the
subjective measure. Results show that adopting a different measure of educational mismatch does not
change the sign, magnitude and significance of the main variables of interest. Moreover, adopting this
measure confirms the main trend observed when using the objective measure of educational mismatch:
being overqualified is statistically significantly associated with a decrease in job satisfaction, with the
significance being now stronger and even more consistent in the four countries. In addition, the self-
assessment measure reveals that not only being overqualified for the current task decreases job
satisfaction, but also being under-qualified has similar negative and significant effects although smaller in
magnitude.
19
Table 7: Ordered probit estimates of job satisfaction: all workers, using subjective measure of educational
mismatch.
Madagascar Malawi Uganda Zambia
Female -0.114** 0.013 0.088 0.095
[0.057] [0.063] [0.067] [0.062] Relationship (Omitted Head of H)
Spouse/Partner 0.04 0.005 0.006 -0.030
[0.075] [0.069] [0.074] [0.097] Son/Daughter -0.246*** -0.037 -0.065 -0.130
[0.067] [0.072] [0.068] [0.091] Bother/Sister -0.567*** -0.13 -0.186 -0.126
[0.192] [0.148] [0.179] [0.098] Other relative/not related -0.051 -0.113 -0.111 -0.148**
[0.081] [0.081] [0.084] [0.073] Urban -0.107 -0.073 -0.143** 0.054
[0.071] [0.097] [0.069] [0.079] Current job (Omitted employed)
Self-employed 0.056 0.315*** 0.319*** 0.235***
[0.065] [0.060] [0.061] [0.060] Unpaid Family Member 0.078 0.322*** 0.084 0.139*
[0.068] [0.089] [0.084] [0.077] Actual Weekly Hours 0.003** 0.001 0.004*** -0.003**
[0.001] [0.001] [0.001] [0.001] Working while studying -0.087 0.007 0.157** 0.274***
[0.056] [0.069] [0.064] [0.079] Subjective Measure:
Educational Mismatch (Matched omitted)
Over Qualified -0.626*** -0.573*** -0.557*** -0.385***
[0.057] [0.060] [0.078] [0.079] Under Qualified -0.243*** -0.305*** -0.456*** -0.212***
[0.044] [0.052] [0.048] [0.063] Poor Households -0.301*** -0.263*** -0.269*** -0.436***
[0.046] [0.064] [0.054] [0.067] Year Yes Yes Yes Yes
Region control Yes Yes Yes Yes
Sector control Yes Yes Yes Yes
Observations 3,539 2,477 2,622 1,860
Note: Estimation by ordered probit. The dependent variable is Job satisfaction which is an ordered variable with the following
categories: 0. Very unsatisfied, 1. Somewhat unsatisfied, 2. Somewhat satisfied, 3. Very satisfied. Additional control not reported
are: age group 15-19, 20-24, 25-30; age squared; secondary education; tenure, tenure squared; interaction term working while
studying and female; Interaction term Poor Household-Urban, year and region controls. Robust standard error in [.]. Significance
*** p<0.01, ** p<0.05, * p<0.1.
Given the importance of the self-employment/wage employment distinction, Table 8 reports
separate estimates for the self-employed and wage employees. The poor household effect occurs
20
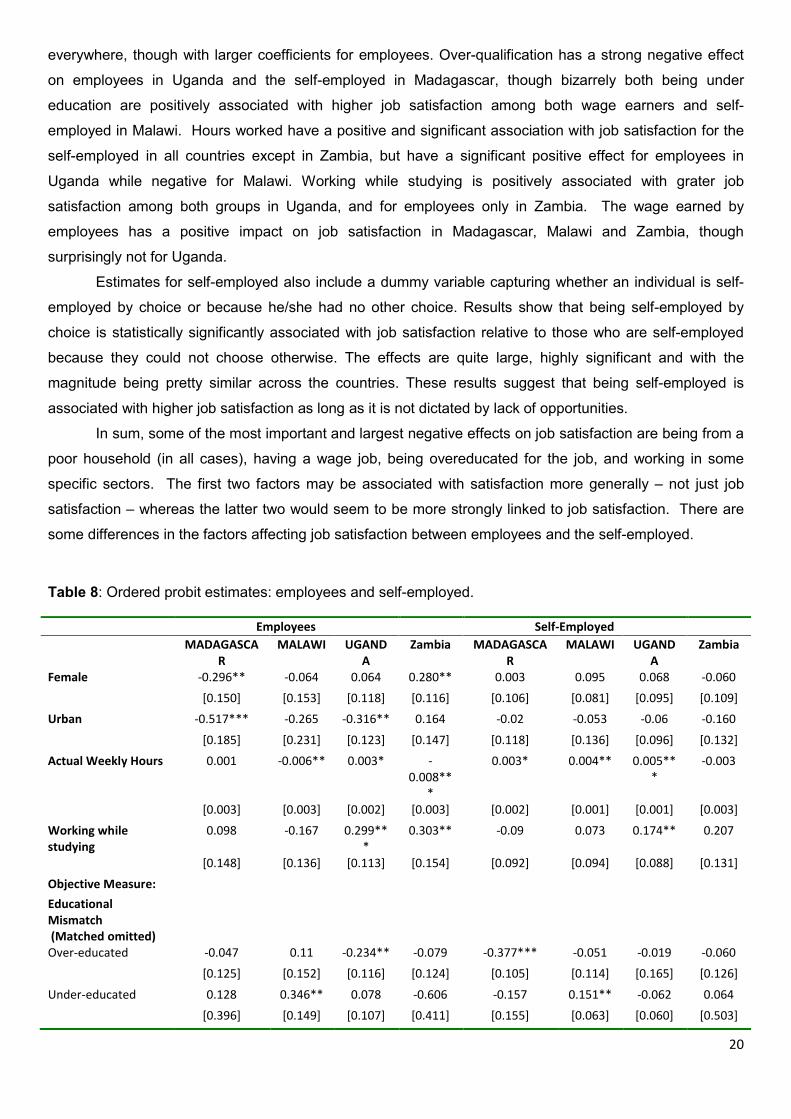
everywhere, though with larger coefficients for employees. Over-qualification has a strong negative effect
on employees in Uganda and the self-employed in Madagascar, though bizarrely both being under
education are positively associated with higher job satisfaction among both wage earners and self-
employed in Malawi. Hours worked have a positive and significant association with job satisfaction for the
self-employed in all countries except in Zambia, but have a significant positive effect for employees in
Uganda while negative for Malawi. Working while studying is positively associated with grater job
satisfaction among both groups in Uganda, and for employees only in Zambia. The wage earned by
employees has a positive impact on job satisfaction in Madagascar, Malawi and Zambia, though
surprisingly not for Uganda.
Estimates for self-employed also include a dummy variable capturing whether an individual is self-
employed by choice or because he/she had no other choice. Results show that being self-employed by
choice is statistically significantly associated with job satisfaction relative to those who are self-employed
because they could not choose otherwise. The effects are quite large, highly significant and with the
magnitude being pretty similar across the countries. These results suggest that being self-employed is
associated with higher job satisfaction as long as it is not dictated by lack of opportunities.
In sum, some of the most important and largest negative effects on job satisfaction are being from a
poor household (in all cases), having a wage job, being overeducated for the job, and working in some
specific sectors. The first two factors may be associated with satisfaction more generally – not just job
satisfaction – whereas the latter two would seem to be more strongly linked to job satisfaction. There are
some differences in the factors affecting job satisfaction between employees and the self-employed.
Table 8: Ordered probit estimates: employees and self-employed.
Employees Self-Employed
MADAGASCAR
MALAWI UGANDA
Zambia MADAGASCAR
MALAWI UGANDA
Zambia
Female -0.296** -0.064 0.064 0.280** 0.003 0.095 0.068 -0.060
[0.150] [0.153] [0.118] [0.116] [0.106] [0.081] [0.095] [0.109]
Urban -0.517*** -0.265 -0.316** 0.164 -0.02 -0.053 -0.06 -0.160
[0.185] [0.231] [0.123] [0.147] [0.118] [0.136] [0.096] [0.132]
Actual Weekly Hours 0.001 -0.006** 0.003* -0.008**
*
0.003* 0.004** 0.005***
-0.003
[0.003] [0.003] [0.002] [0.003] [0.002] [0.001] [0.001] [0.003]
Working while studying
0.098 -0.167 0.299***
0.303** -0.09 0.073 0.174** 0.207
[0.148] [0.136] [0.113] [0.154] [0.092] [0.094] [0.088] [0.131]
Objective Measure:
Educational Mismatch (Matched omitted)
Over-educated -0.047 0.11 -0.234** -0.079 -0.377*** -0.051 -0.019 -0.060
[0.125] [0.152] [0.116] [0.124] [0.105] [0.114] [0.165] [0.126]
Under-educated 0.128 0.346** 0.078 -0.606 -0.157 0.151** -0.062 0.064
[0.396] [0.149] [0.107] [0.411] [0.155] [0.063] [0.060] [0.503]
21
Poor Households -0.518*** -0.682**
*
-0.317** -0.515**
*
-0.385*** -0.139* -0.150** -0.405**
*
[0.176] [0.230] [0.125] [0.144] [0.079] [0.075] [0.066] [0.108]
Written Contract -0.139 0.394***
0.055 0.094
[0.148] [0.147] [0.136] [0.132]
Unlimited Contract 0.407*** -0.089 0.095 -0.037
[0.129] [0.124] [0.111] [0.111]
Log Wage 0.127* 0.109* 0.043 0.078*
[0.076] [0.062] [0.057] [0.043]
Monetary Benefits 0.290** 0.178 0.155 0.346***
[0.137] [0.138] [0.106] [0.117]
Self Employed by choice
0.438*** 0.458***
0.459***
0.359***
[0.073] [0.057] [0.061] [0.089]
Year Yes Yes Yes Yes Yes Yes Yes Yes
Region control Yes Yes Yes Yes Yes Yes Yes Yes
Sector control Yes Yes Yes Yes Yes Yes Yes Yes
Observations 450 469 699 521 1,208 1,635 1,735 694
Note: Estimation by ordered probit. The dependent variable is Job satisfaction which is an ordered variable with the following
categories: 0. Very unsatisfied, 1. Somewhat unsatisfied, 2. Somewhat satisfied, 3. Very satisfied. Additional control not reported
are: age group 15-19, 20-24, 25-30; age squared; relationship with the head of household; secondary education; tenure, tenure
squared; interaction term working while studying and female; Interaction term Poor Household-Urban, year and region controls.
Estimates for employees also include other benefits. Robust standard error in [.]. Significance *** p<0.01, ** p<0.05, * p<0.1.
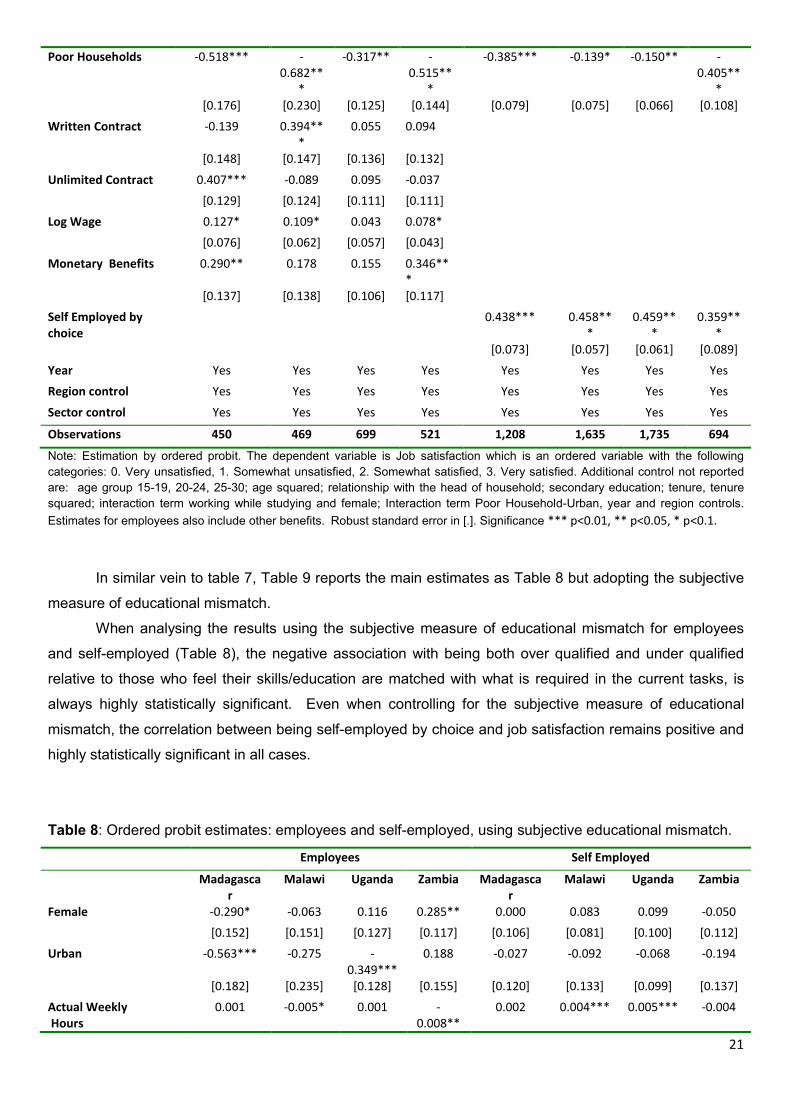
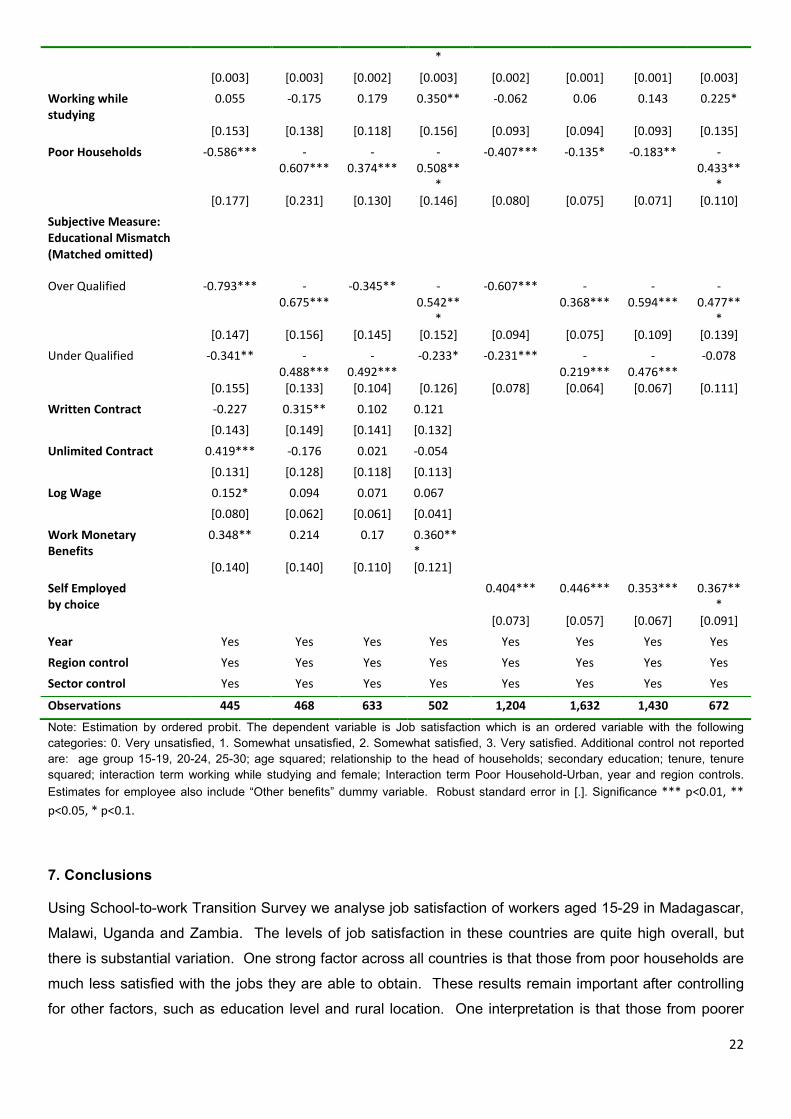
In similar vein to table 7, Table 9 reports the main estimates as Table 8 but adopting the subjective
measure of educational mismatch.
When analysing the results using the subjective measure of educational mismatch for employees
and self-employed (Table 8), the negative association with being both over qualified and under qualified
relative to those who feel their skills/education are matched with what is required in the current tasks, is
always highly statistically significant. Even when controlling for the subjective measure of educational
mismatch, the correlation between being self-employed by choice and job satisfaction remains positive and
highly statistically significant in all cases.
Table 8: Ordered probit estimates: employees and self-employed, using subjective educational mismatch.
Employees Self Employed
Madagascar
Malawi Uganda Zambia Madagascar
Malawi Uganda Zambia
Female -0.290* -0.063 0.116 0.285** 0.000 0.083 0.099 -0.050
[0.152] [0.151] [0.127] [0.117] [0.106] [0.081] [0.100] [0.112]
Urban -0.563*** -0.275 -0.349***
0.188 -0.027 -0.092 -0.068 -0.194
[0.182] [0.235] [0.128] [0.155] [0.120] [0.133] [0.099] [0.137]
Actual Weekly Hours
0.001 -0.005* 0.001 -0.008**
0.002 0.004*** 0.005*** -0.004
22
*
[0.003] [0.003] [0.002] [0.003] [0.002] [0.001] [0.001] [0.003]
Working while studying
0.055 -0.175 0.179 0.350** -0.062 0.06 0.143 0.225*
[0.153] [0.138] [0.118] [0.156] [0.093] [0.094] [0.093] [0.135]
Poor Households -0.586*** -0.607***
-0.374***
-0.508**
*
-0.407*** -0.135* -0.183** -0.433**
*
[0.177] [0.231] [0.130] [0.146] [0.080] [0.075] [0.071] [0.110]
Subjective Measure: Educational Mismatch (Matched omitted)
Over Qualified -0.793*** -0.675***
-0.345** -0.542**
*
-0.607*** -0.368***
-0.594***
-0.477**
* [0.147] [0.156] [0.145] [0.152] [0.094] [0.075] [0.109] [0.139]
Under Qualified -0.341** -0.488***
-0.492***
-0.233* -0.231*** -0.219***
-0.476***
-0.078
[0.155] [0.133] [0.104] [0.126] [0.078] [0.064] [0.067] [0.111]
Written Contract -0.227 0.315** 0.102 0.121
[0.143] [0.149] [0.141] [0.132]
Unlimited Contract 0.419*** -0.176 0.021 -0.054
[0.131] [0.128] [0.118] [0.113]
Log Wage 0.152* 0.094 0.071 0.067
[0.080] [0.062] [0.061] [0.041]
Work Monetary Benefits
0.348** 0.214 0.17 0.360***
[0.140] [0.140] [0.110] [0.121]
Self Employed by choice
0.404*** 0.446*** 0.353*** 0.367***
[0.073] [0.057] [0.067] [0.091]
Year Yes Yes Yes Yes Yes Yes Yes Yes
Region control Yes Yes Yes Yes Yes Yes Yes Yes
Sector control Yes Yes Yes Yes Yes Yes Yes Yes
Observations 445 468 633 502 1,204 1,632 1,430 672
Note: Estimation by ordered probit. The dependent variable is Job satisfaction which is an ordered variable with the following
categories: 0. Very unsatisfied, 1. Somewhat unsatisfied, 2. Somewhat satisfied, 3. Very satisfied. Additional control not reported
are: age group 15-19, 20-24, 25-30; age squared; relationship to the head of households; secondary education; tenure, tenure
squared; interaction term working while studying and female; Interaction term Poor Household-Urban, year and region controls.
Estimates for employee also include “Other benefits” dummy variable. Robust standard error in [.]. Significance *** p<0.01, **
p<0.05, * p<0.1.
7. Conclusions
Using School-to-work Transition Survey we analyse job satisfaction of workers aged 15-29 in Madagascar,
Malawi, Uganda and Zambia. The levels of job satisfaction in these countries are quite high overall, but
there is substantial variation. One strong factor across all countries is that those from poor households are
much less satisfied with the jobs they are able to obtain. These results remain important after controlling
for other factors, such as education level and rural location. One interpretation is that those from poorer
23
households are less able to obtain better quality employment. However, it may not be the nature of the job
so much as the pressure that a poor household puts on workers to earn well. One result that seems to
support this is that self-employed workers working longer hours are more likely to report being satisfied.
A second important result is the substantially lower level of job satisfaction across all countries
among those who are subjectively under- or over-qualified in their current job.
Finally in three countries, Malawi, Uganda, and Zambia working as a wage employee is associated
with substantially lower levels of job satisfaction compared to working in self-employment or unpaid family
work. This may reflect the poor quality of the available wage jobs. But it may also reflect that in some
cases self-employment or unpaid family work is a preferred option for the individual, whether for reasons of
childcare, or a preference for greater independence or perhaps just because of the poor quality of the
available wage jobs. Those who are self-employed by choice have a higher level of job satisfaction than
those who are self-employed because they did not have other choice.
The takeaway picture these results suggest is that employment is highly valued among young
workers, especially when they can exercise choice. But a very important result here is that it is not the
case that wage work leads to greater satisfaction. This potentially questions the common definitions used
of vulnerable unemployment, as for example Pieters (2013) above among many others. But many of the
results here may not be too surprising: most would think it likely that those who exercised choice over their
work or who come from less poor backgrounds are more satisfied. But it is important nonetheless that we
are aware of the breeding grounds for dissatisfaction.
References
Abugre, J., B. (2014) "Job Satisfaction of public sector employees in Sub-Saharan Africa: testing the
Minnesota Satisfaction Questionnaire in Ghana. International Journal of public administration, 37 (10): 655-
665 August.
Allen, J. and R. van der Velden (2001) "Educational mismatches versus skill mismatches: effects on wages, job satisfaction, and on-the-job search." Oxford Economic Papers, V.3, 434-452.
Arndt, C., A. McKay and F. Tarp (2016, eds), Growth and Poverty in Sub-Saharan Africa, Oxford University
Press.
Bryson, A., Forth, J, and L. Stokes (2015) "Does worker wellbeing affect workplace performance? NIESR Disucssion Paper N. 447.
24
Chiswick, B. R. and Miller, P. W., (2009) Educational Mismatch: Are High-Skilled Immigrants Really Working at High-Skilled Jobs and the Price They Pay If They Aren't?. IZA Discussion Paper No. 4280.
Chongvilaivan, A. and N. Powdthavee (2014) “Do different work characteristics have different distributional
Impacts on the job Satisfaction? A study of slope heterogeneity in workers’ well-being.” British Journal of
Industrial Relations, Relations, Volume 52, Issue 3, Pages 426-444.
Clark, A. (2014) “Son of my father? The life-cycle analysis of well-being: introduction.” The Economic Journal, 124, November, F684-F687. Clark, A. and Y. Georgellis. (2013) “Back to Baseline in Britain: Adaptation in the BHPS”, Economica, Vol.80, pp. 496-512. Clark, A. E. and A. J. Oswald. (1996) “Satisfaction and comparison income.” Journal of Public Economics 61: 359–381. Clark, A.E. , A. J. Oswald and P. Warr (1996) "Is job satisfaction U-shaped in age?" Journal of Occupational and Organizational Psychology, 60, pp. 57-81. Cohn, E. and Khan, S., P., (1995). “The Wage Effects of Overschooling Revisited”, Labour Economics, Vol. 2, pp.67-76. Dorsett, R., Rienzo, C. and M. Weale (2015) "Intergenerational and Inter-Ethnic Well-Being: An Analysis for the UK". NIESR Discussion Paper N. 451. Elder, S. (2009), ILO school-to-work transition survey: a methodological guide. International Labour Office, Geneve: ILO. Elder, S. and Siaka Koné, K. (2014) "Labour market transitions of young women and men in sub-Saharan Africa", Work4Youth Publication Series No. 9, International Labour Office, Youth Employment Programme, Employment Policy Department.. – Geneva: ILO. Falco, P., Maloney, W. F., Rijkers B. and M. Sarrias (2015) "Heterogeneity in subjective wellbeing: An
application to occupational allocation in Africa" Journal of Economic behaviour &Organization. Volume 111,
March, Pages 137-153.
Fields, G. (2014) "Self-employment and poverty in developing countries." IZA World of Labour, 60. Filmer, D.and L. Fox with K. Brooks, A. Goyal, T. Mengistae, P.Premand, D. Ringold, S. Sharma, and S.
Zorya (2014) Youth Employment in Sub-Saharan Africa, Afric Development Forum, A copublication of the
Agence Française de Développement and the World Bank, International Bank for Reconstruction and
Development, Washington.
https://openknowledge.worldbank.org/bitstream/handle/10986/16608/9781464801075.pdf?sequence=1
Frijters, P., Johnston, D., and M. Shields. (2014) “Does childhood predict adult life satisfaction? Evidence from British cohort surveys.” The Economic Journal. 124. November. F688-F719.
Forth European Working Conditions Survey (2005), European Foundation for the Improvement of Living
and Working Conditions.
Gardner J., and A. J. Oswald (2007) “Money and mental wellbeing: A longitudinal study of mediumsized lottery wins.” Journal of Health Economics, 26(1), 49-60.
25
Hinks, T. (2010) Job satisfaction and employment equity in South Africa. Journal of African Economies, 19 (2). pp. 237-255. International Labour Organisation (2012) International Standard Classification of Occupation:ISCO-08/International Labour Office, Geneve Volume 1. International Labour Organisation (2015) "Decent and Productive work in agriculture. Decent work in the
rural economy Policy guidance notes". Geneva.
Kruger, A.I., M.Berthelon and R.R. Soares (2010), Allocation of children's time along gender lines: Work, school, and domestic work in Brazil, in R.K.Q. Akee, E.V. Edmonds, K.Tatsiramos (ed.) Child Labor and the Transition between School and Work (Research in Labor Economics, Volume 31), Emerald Group Publishing Limited, pp.161-192.
La Porta, R. and A. Shleifer (2014) “Informality and development”. Journal of Economic Perspectives—
Volume 28, Number 3 —Pages 109–126.
Layard, R. (2011) Happiness: Lessons from a New Science, 2nd edition, Penguin Books.
Layard, R., Clark, A., Cornaglia, F. Powdthavee, N., and J. Vernoit (2014) “What predicts a successful life? A life-course model of well-being.” The Economic Journal. 124. November. F720-F738.
Mattes, R., B. Dulani, and E. Gyimah-Boadi (2016), “Africa’s growth dividend? Lived poverty drops across
much of the continent”, Afrobarometer Policy Paper No. 29 | January 2016
Mulinge, M. and C. Mueller. (1998). "Employees job satisfaction in developing countries: the case of
Kenya". World Development. Vol. 26, No. 12, pp. 2181-2199.
O' Donnell G. Deaton A., Durand M., Halpern R. and Layard R. (2014) Well-being and policy, London: Legatum Institute.
Oswald, A. Proto E., and Sgroi D. (2014) "Happiness and Productivity" Forthcoming in the Journal of Labour Economics. Parent, D. (2006), Youth Labor Market in Burkina Faso: Recent Trends, World Bank Social Protection
Discussion Paper No 0607. Pieters J. (2013) Youth employment in developing countries. IZA Research Report No. 58. Powdthavee, N. (2012) “Resilience to Economic Shocks and the Long Reach of Childhood Bullying”. CEP DP 1173. Razafindrakoto, M. and Roubaud, F. (2013) "Job Satisfaction in eight African cities" in Urban Labor Markets is Sub-Saharan Africa, Editors: P. De Vreyer and F. Roubaud. Verdugo, R. R. and Verdugo, N. T., (1989), “The Impact of Surplus Schooling on Earnings: Some Additional Findings”, The Journal of Human Resources, Vol. 26, No. 4, pp.629-643.
26
Appendix A1: Variables description
Secondary Education:
The indicator for Secondary Education completed is constructed based on the question: "What is your
highest level of completed formal education/training?". The categories for this question varies by country
and year. To ensure consistency over country and year, for Uganda we identify an individual as having
completed secondary education or above if he/she reports as highest completed level of education being
Incomplete or Complete A level; tertiary education, bachelors degree, or postgraduate studies. In 2015
those categories for Uganda change slightly so we identify an individual as having completed secondary
education or above if he/she reports as highest completed level of education being O level; A level;
Professional Certificate; Diploma; First Degree; Post graduate certificate; post graduate diploma or masters
degree and above. For Malawi we identify an individual as having completed secondary education or
above if he/she reports as highest completed level of education being secondary; university; other tertiary;
or vocational school. For Madagascar we identify an individual as having completed secondary education
or above if he/she reports as highest completed level of education being secondary; secondary studies;
post-secondary; university; post-university.
Poor/Non poor Households:
This dummy variable is constructed based on a self-reported assessment of households’ status with the
individuals being asked "How would you describe your household overall financial situation?". We consider
as poor the household that has been defined by its member as being fairly poor or poor; while we define as
non-poor the household that has been defined by its member as being well-off, fairly well-off or around
average.
Region:
Using detailed information on districts (111 in Uganda; 28 in Malawi; 114 in Madagascar) we derive a
regional indicator. Specifically, the region categories for Uganda are: Central, Eastern, Northern, and
Western. For Malawi are Central, Eastern, and Northern; for Madagascar they reflect the 6 provinces such
as Antananarivo, Antsiranana, Fianarantsoa, Mahajanga, Toamasina, and Toliara, and fro Zambia they
reflect the 10 provinces such as Central, Copperbelt, Eastern, Luapula, Lusaka, Muchinga, North Western,
Northern, Southern and Western.
Pay and other benefits:
Pay and other benefits are defined on a series of questions asking whether the employee benefits from a
service at workplace.
An employee is identified as receiving a pay benefit if he/she reports one or more of the following at work
place: Annual paid leave (holiday time); Paid sick leave; Severance/end of service payment; Overtime pay;
Bonus/reward for good performance;
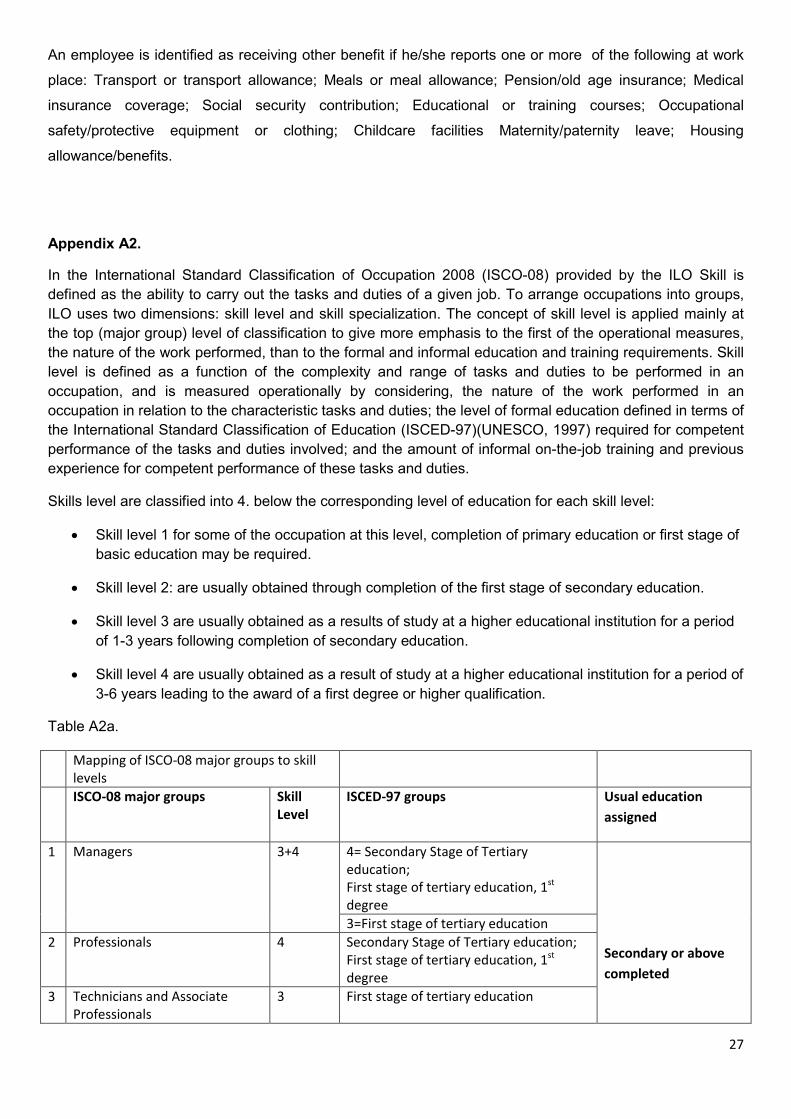
27
An employee is identified as receiving other benefit if he/she reports one or more of the following at work
place: Transport or transport allowance; Meals or meal allowance; Pension/old age insurance; Medical
insurance coverage; Social security contribution; Educational or training courses; Occupational
safety/protective equipment or clothing; Childcare facilities Maternity/paternity leave; Housing
allowance/benefits.
Appendix A2.
In the International Standard Classification of Occupation 2008 (ISCO-08) provided by the ILO Skill is
defined as the ability to carry out the tasks and duties of a given job. To arrange occupations into groups,
ILO uses two dimensions: skill level and skill specialization. The concept of skill level is applied mainly at
the top (major group) level of classification to give more emphasis to the first of the operational measures,
the nature of the work performed, than to the formal and informal education and training requirements. Skill
level is defined as a function of the complexity and range of tasks and duties to be performed in an
occupation, and is measured operationally by considering, the nature of the work performed in an
occupation in relation to the characteristic tasks and duties; the level of formal education defined in terms of
the International Standard Classification of Education (ISCED-97)(UNESCO, 1997) required for competent
performance of the tasks and duties involved; and the amount of informal on-the-job training and previous
experience for competent performance of these tasks and duties.
Skills level are classified into 4. below the corresponding level of education for each skill level:
Skill level 1 for some of the occupation at this level, completion of primary education or first stage of
basic education may be required.
Skill level 2: are usually obtained through completion of the first stage of secondary education.
Skill level 3 are usually obtained as a results of study at a higher educational institution for a period
of 1-3 years following completion of secondary education.
Skill level 4 are usually obtained as a result of study at a higher educational institution for a period of
3-6 years leading to the award of a first degree or higher qualification.
Table A2a.
Mapping of ISCO-08 major groups to skill levels
ISCO-08 major groups Skill Level
ISCED-97 groups Usual education
assigned
1 Managers 3+4 4= Secondary Stage of Tertiary education; First stage of tertiary education, 1st degree
Secondary or above
completed
3=First stage of tertiary education
2 Professionals 4 Secondary Stage of Tertiary education; First stage of tertiary education, 1st degree
3 Technicians and Associate Professionals
3 First stage of tertiary education
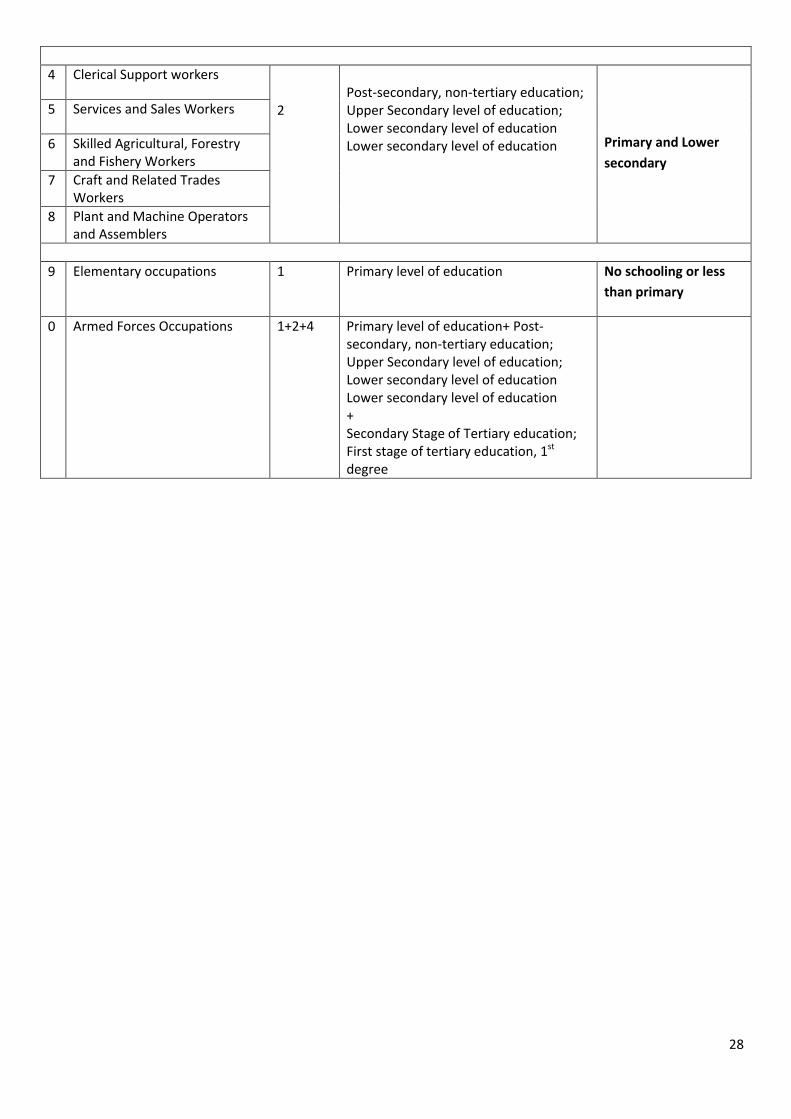
28
4 Clerical Support workers 2
Post-secondary, non-tertiary education; Upper Secondary level of education; Lower secondary level of education Lower secondary level of education
Primary and Lower
secondary
5 Services and Sales Workers
6 Skilled Agricultural, Forestry and Fishery Workers
7 Craft and Related Trades Workers
8 Plant and Machine Operators and Assemblers
9 Elementary occupations 1 Primary level of education No schooling or less
than primary
0 Armed Forces Occupations 1+2+4 Primary level of education+ Post-secondary, non-tertiary education; Upper Secondary level of education; Lower secondary level of education Lower secondary level of education + Secondary Stage of Tertiary education; First stage of tertiary education, 1st degree
Related Documents