This article was downloaded by: [The Librarian] On: 04 June 2015, At: 03:23 Publisher: Routledge Informa Ltd Registered in England and Wales Registered Number: 1072954 Registered office: Mortimer House, 37-41 Mortimer Street, London W1T 3JH, UK Click for updates Eurasian Geography and Economics Publication details, including instructions for authors and subscription information: http://www.tandfonline.com/loi/rege20 Job acquisition, retention, and outcomes for ethnic minorities in urban China Reza Hasmath a & Benjamin Ho b a School of Interdisciplinary Area Studies, University of Oxford, Dickson Poon Building, Canterbury Road, Oxford OX2 6LU UK b Department of Economics, Vassar College, 124 Raymond Avenue, Poughkeepsie, NY 12604, USA Published online: 03 Jun 2015. To cite this article: Reza Hasmath & Benjamin Ho (2015): Job acquisition, retention, and outcomes for ethnic minorities in urban China, Eurasian Geography and Economics, DOI: 10.1080/15387216.2015.1049637 To link to this article: http://dx.doi.org/10.1080/15387216.2015.1049637 PLEASE SCROLL DOWN FOR ARTICLE Taylor & Francis makes every effort to ensure the accuracy of all the information (the “Content”) contained in the publications on our platform. However, Taylor & Francis, our agents, and our licensors make no representations or warranties whatsoever as to the accuracy, completeness, or suitability for any purpose of the Content. Any opinions and views expressed in this publication are the opinions and views of the authors, and are not the views of or endorsed by Taylor & Francis. The accuracy of the Content should not be relied upon and should be independently verified with primary sources of information. Taylor and Francis shall not be liable for any losses, actions, claims, proceedings, demands, costs, expenses, damages, and other liabilities whatsoever or howsoever caused arising directly or indirectly in connection with, in relation to or arising out of the use of the Content. This article may be used for research, teaching, and private study purposes. Any substantial or systematic reproduction, redistribution, reselling, loan, sub-licensing, systematic supply, or distribution in any form to anyone is expressly forbidden. Terms &

Welcome message from author
This document is posted to help you gain knowledge. Please leave a comment to let me know what you think about it! Share it to your friends and learn new things together.
Transcript
This article was downloaded by: [The Librarian]On: 04 June 2015, At: 03:23Publisher: RoutledgeInforma Ltd Registered in England and Wales Registered Number: 1072954 Registeredoffice: Mortimer House, 37-41 Mortimer Street, London W1T 3JH, UK
Click for updates
Eurasian Geography and EconomicsPublication details, including instructions for authors andsubscription information:http://www.tandfonline.com/loi/rege20
Job acquisition, retention, andoutcomes for ethnic minorities in urbanChinaReza Hasmatha & Benjamin Hob
a School of Interdisciplinary Area Studies, University of Oxford,Dickson Poon Building, Canterbury Road, Oxford OX2 6LU UKb Department of Economics, Vassar College, 124 Raymond Avenue,Poughkeepsie, NY 12604, USAPublished online: 03 Jun 2015.
To cite this article: Reza Hasmath & Benjamin Ho (2015): Job acquisition, retention, andoutcomes for ethnic minorities in urban China, Eurasian Geography and Economics, DOI:10.1080/15387216.2015.1049637
To link to this article: http://dx.doi.org/10.1080/15387216.2015.1049637
PLEASE SCROLL DOWN FOR ARTICLE
Taylor & Francis makes every effort to ensure the accuracy of all the information (the“Content”) contained in the publications on our platform. However, Taylor & Francis,our agents, and our licensors make no representations or warranties whatsoever as tothe accuracy, completeness, or suitability for any purpose of the Content. Any opinionsand views expressed in this publication are the opinions and views of the authors,and are not the views of or endorsed by Taylor & Francis. The accuracy of the Contentshould not be relied upon and should be independently verified with primary sourcesof information. Taylor and Francis shall not be liable for any losses, actions, claims,proceedings, demands, costs, expenses, damages, and other liabilities whatsoever orhowsoever caused arising directly or indirectly in connection with, in relation to or arisingout of the use of the Content.
This article may be used for research, teaching, and private study purposes. Anysubstantial or systematic reproduction, redistribution, reselling, loan, sub-licensing,systematic supply, or distribution in any form to anyone is expressly forbidden. Terms &

Conditions of access and use can be found at http://www.tandfonline.com/page/terms-and-conditions
Dow
nloa
ded
by [
The
Lib
rari
an]
at 0
3:23
04
June
201
5
Job acquisition, retention, and outcomes for ethnic minorities inurban China
Reza Hasmatha* and Benjamin Hob
aSchool of Interdisciplinary Area Studies, University of Oxford, Dickson Poon Building,Canterbury Road, Oxford OX2 6LU UK; bDepartment of Economics, Vassar College, 124Raymond Avenue, Poughkeepsie, NY 12604, USA
(Received 9 December 2014; accepted 6 May 2015)
This article estimates wage differentials between ethnic minorities and the Hanmajority in China. While Han-minority wage differentials estimated with regressionanalysis demonstrate little evidence for ethnic minority disadvantages, evidence look-ing at the process of ethnic minority job acquisition and retention suggests thatminorities perceive they are at a disadvantage in the job search process. The articleassesses potential factors for perceived disadvantages in China’s labor market such asdiscrimination, social network capital, and working culture.
Keywords: China; ethnic minorities; labor market; discrimination; social networks;working culture
Introduction
A decade after market reforms commenced in 1978, the Communist Party of China(CPC) abandoned its job assignment system. In effect, the CPC shifted from a systemof jobs guaranteed for life (tie fan wan) in government departments, state-owned enter-prises (SOEs), and collective-owned enterprises (COEs) to a system where individualswere urged to create jobs for themselves and to seek employment in the emerging pri-vate sector. These changes further initiated new patterns of employment behavior inurban China: the growth of part-time, temporary, and seasonal employment; theincreased prominence of joint venture foreign firms; and the adoption of new non-standard employment practices. In short, whereas previously the state played a dominantand active role in providing secure jobs for the individual, the onus started to shift tothe individual to find employment within parameters that fitted market conditions ofwages and experiences whilst negotiating new occupational categories.
In general, the available literature suggests mixed labor market experiences for eth-nic minorities, with most suggesting this cohort are not faring well since the terminationof the job assignment system. For example, using census data in 1982 and 1990,Hannum and Xie (1998) focus on the effects of market reforms on the differences inoccupational attainment between Hans and various ethnic minorities in the XinjiangUyghur Autonomous Region. Their study finds a gap in occupational attainmentbetween Hans and minorities, widening further between the two base years. They alsosuggest that the wage differential between Hans and minorities could be explained by
*Corresponding author. Email: [email protected]
© 2015 Taylor & Francis
Eurasian Geography and Economics, 2015http://dx.doi.org/10.1080/15387216.2015.1049637
Dow
nloa
ded
by [
The
Lib
rari
an]
at 0
3:23
04
June
201
5
education. Gustafsson and Shi (2003) examine survey information from 19 provinces in1988 and 1995 to discern aggregate differences in rural incomes between Hans andethnic minorities. They find there is an income gap of 19.2 percent between Hans andethnic minorities in 1988, which increased dramatically to 35.9 percent in 1995. Using1988 Chinese Household Income Project (CHIP) data, Johnson and Chow (1997)discover that in all specifications across urban and rural areas, there is a significant,negative coefficient on the minority variable. In rural areas, minorities receive wagesthat are approximately 19 percent less than the Han population, while in urban areas thecorresponding figure is approximately 4.5 percent. Likewise, using CHIP data, Li(2003) looks at wage differentials in 1995 and finds that ethnic minorities make ninepercent less than the majority Han group. Follow-up work by Yang (2005) andAppleton, Song, and Xia (2005), however, yield inconclusive evidence. Yang, studyingchanges in returns to education using CHIP data from 1988 to 1995, finds that acrossalmost all specifications coefficients on the minority variable are generally insignificant.Appleton, Song, and Xia examining the 1988, 1995, 1999 and 2002 CHIP data-set, findthat in every year except 1995, the coefficients on the minority variable are insignifi-cant. In addition, they propose that urban workers from ethnic minority groupsexperience faster increases in wages than their Han counterparts from 1990 to 2002.
This study seeks to augment the existing literature in three ways. First, given thatthe labor market in China has undergone a substantial transformation due to massiverural to urban migration over the past decade, this study provides an up-to-date pictureof urban labor market conditions for ethnic minorities. Secondly, while most studies onthis topic focus on the poorer Western or minority autonomous regions, this articlehighlights the ethnic minority experience in the relatively developed urban areas of theEastern coastal provinces. Lastly, a mixed-qualitative/quantitative methods approach isadopted, which seldom is the case for studies of this nature on ethnic minorities inChina. Our approach is to examine the current job acquisition process for ethnic minori-ties in the job search and hiring process and thereafter analyze wage differentials todiscern similarities and differences in the experiences reported.
To preview the findings, the qualitative data suggest that ethnic minorities face a dif-ferent job matching process than Hans due to a combination of discrimination, lack ofsocial network capital, and differences in working culture. However, analysis of theChina Health and Nutrition Surveys (CHNS) data finds that the difference in wage out-comes between the Han majority and ethnic minorities can be explained by differencesin education and job type. Once these factors are controlled for the wage differentialdisappears. However, the quantitative data cannot explain why minorities are sorted intojobs that provide lower compensation than Hans.
What are the major potential barriers ethnic minorities report in job acquisition?
In order to understand the potential barriers ethnic minorities face in job acquisition, aqualitative sampling was conducted in 2007, with follow-up interviews with the sameinterviewees in 2010 and 2013. The qualitative sample includes 59 semi-structured inter-views with ethnic minorities in Beijing, Shanghai, and Shenzhen. The interviewscollected data on their experiences in the urban labor market, notably about their jobsearch strategies and workplace interactions. A typical interview lasted approximately40–50 min. Ethnic minority groups represented in the sample include Hui, Uyghurs,Mongolians, Tibetans, Manchus, Koreans, Zhuang, and Miao. Responses were analyzedusing emergent theme coding, whereby each response was coded into as many themes
2 R. Hasmath and B. Ho
Dow
nloa
ded
by [
The
Lib
rari
an]
at 0
3:23
04
June
201
5
as the statements warranted. Emerging themes from semi-structured interviews werereinforced by in-depth field observations of hiring practices of 12 enterprises of varioussizes in the above three cities, who have employed and/or currently employ ethnicminorities. Coded interview narratives and field observation yielded three major themes:discrimination, lack of social network capital, and an inability to fit within the workingculture.
Discrimination
Discrimination on the basis of ascriptive factors such as one’s appearance – denotingethnic minority status – is generally regarded as a source of economic inefficiency andsocial injustice. Therefore, ascriptive discrimination challenges both the precepts of neo-classical economics (Becker 1957; Arrow 1998) and the normative principles of equalityof opportunity espoused in theory by China’s legal and public policy frameworks. Forinstance, China’s employment law – which came into effect in 2007, along with the1995 version denounces workers’ discrimination on the basis of ethnic identity withclaims that, “laborers enjoy equal right of employment and selection of jobs” and“laborers shall not be discriminated against because of their ethnicity or religiousbeliefs.” It is also worthwhile to note that both versions of the employment law seek tofulfill China’s commitments to the International Labor Organization’s Discrimination(Employment and Occupation) Convention 1958, ratified in 1995.
Suffice to say, the neoclassical economic model’s view that the market is driven byimpersonal exchange is incomplete since it underplays the social and psychological ele-ments that are involved (see Arrow 1972, 1998). When it comes to the employment oflabor, direct personal relations both between employee and employer as well as amongemployees are involved, which has the potential to add a discriminatory element. In thisregard, to fully examine discrimination in the labor market in China, it is useful toconsider its statistical and exclusionary dimensions.
The theory of statistical discrimination assumes that employers have imperfectinformation. In practice, statistical discrimination may occur at each stage of the hiringand promotion process, as an employer may fail to fully assess the relevant occupationalabilities of a member of an ethnic group and makes generalized assumptions about thevalue of their human capital (Hasmath 2012). Consider the following example of anemployer perceiving ethnic minority status as a proxy for lower quality of human capi-tal. The hiring manager of A Company, a technology and consumer goods corporationwith revenues of over US $13 billion expressed less enthusiasm for hiring Uyghurs dueto the manager’s perception of the group member’s low productivity. Paraphrasing thediscussion:
[E]thnicity should not be an issue when it comes to hiring … [however] for some ethnicgroups, especially from Xinjiang [referring to Uyghurs], there might be a problem fittinginto our company … we had a Uyghur who worked in the company and they got rid ofhim because he was a poor worker … why hire another Uyghur?
In this situation, A Company’s hiring manager concluded that particular members of anethnic group may have either higher or lower productivity than other workers with asimilar qualification. Ethnicity is therefore transformed into a proxy signaling potentialfuture productivity by members of the same ethnic group, with hiring patterns adjustedaccordingly.1
Eurasian Geography and Economics 3
Dow
nloa
ded
by [
The
Lib
rari
an]
at 0
3:23
04
June
201
5
Another avenue for statistical discrimination arises when an employer undervaluesan ethnic minority’s formal qualifications. While educational attainment may signal toan employer one’s potential abilities and promise (see Spence 1974), this signaling maybe disjointed with the presence of China’s preferential treatment in education for ethnicminorities. Since the beginning of the modern liberalization process in 1978, the CPChas sought to actively increase educational opportunities and expand access for ethnicminority students, providing special assistance at all levels of education. One such mea-sure is to provide preferential treatment in university admissions. This usually equatesto lowering minimum requirements for the National University Entrance Examination(scored out of 900), which is a mandatory exam for all students to enter university.A highly selective university such as Beijing University or Tsinghua University maylower its threshold from its normal requirement of a score of 850 (99.98 percent), whileother universities may lower the threshold from their normal requirements of 600 (85.31percent). Some universities may set ratios between ethnic minorities and Han applicantsfor their incoming class. For instance, the Central University for Nationalities in Beijingallocates spots to ensure every ethnic minority group is represented each year, to theextent that on several occasions minimum university entrance scores are lowered addi-tionally to ensure that the least represented ethnic groups are admitted (see Hasmath2011).
This kind of preferential treatment may signal to employers that ethnic minorities maybe less productive or of lesser talent (Coate and Loury 1993). In the enterprises observed,it was agreed that ethnic minority candidates may not be the most qualified given the pres-ence of preferential treatment in education.2 This was more acute and explicit in enter-prises with a predominance of professional workers – a pattern that echoes the findings inTable 5 – which shows that workers with higher educational levels are the ones who aremost likely to get paid a bonus, and that it is precisely in jobs with bonuses where we finda disadvantage for ethnic minority workers. For example, at E Company, a computer ITenterprise in Shanghai, ethnic minority employees were recruited after demonstrating pro-ven experience at previous employment and were in the same position and salary structureat the point of employment of recent non-minority graduate recruits. According to Wang,a personnel executive at E Company, potential minority employees were screened toensure that they were highly skilled and demonstrably productive. While Wang wasunable to cite specific policies that produced preferential treatments for minorities ineducation, he believed it was riskier to hire a minority candidate vs. a non-minority candi-date directly upon graduation given the prevalence of what he perceived as widespreadpreferential treatments. This was a common theme among the companies observed: therewas an awareness of preferential treatments for ethnic minorities, though little was knownabout the rationale and scope of preferential minority policies. In fact, Coate and Loury(1993) make the point that the increased statistical discrimination created by preferentialtreatments could do more harm than the benefit of greater access to education, paradoxi-cally making minorities worse off.
Demonstrating exclusionary discrimination can be a more difficult proposition thanstatistical discrimination given its predominantly anecdotal nature. Exclusionary discrim-ination occurs when a member of an ethnic minority group is impeded at a potential orcurrent position due not to their capacity, but an external barrier that artificially inhibitstheir growth (Abella 1984). In interviews, minority respondents articulated frustrationwith the hiring process regarding queries into their “home” province, although theywere born and raised native (often multi-generational) locals. It appears that employersoften raise these questions as though it is part of the assessment calculus to determine
4 R. Hasmath and B. Ho
Dow
nloa
ded
by [
The
Lib
rari
an]
at 0
3:23
04
June
201
5
their productive value and suitability for a particular job. For instance, in conversationwith Ms. D, an ethnic minority who graduated with an advance degree in economicsfrom one of the China’s most recognized universities, she discusses her experiences dur-ing the job search. Upon graduation, Ms. D applied to 20 positions in both governmentand private enterprises – of which she received three interviews and one offer, whichshe accepted. While her skills and human capital in terms of education did not appearto be the subject of any employer queries during the interview process – she was in thetop 99.98 percent on the National University Examination and had highly competitivemarks – her background became the subject of interest. Notwithstanding the fact thatshe was a second-generation local (and legal) resident, potential employers wonderedabout her ethnicity and her “home” town. Her ethnicity and family background wasreaffirmed through the dangan, a life and career dossier, which contains autobiographicinformation, work appraisals, and schooling results. While Ms. D did experience a goodoutcome in the employment market, it is important to note that her ethnic and familybackground was of interest to potential employees. The behavior exhibited by employershad a strong potential for impeding her chances of being hired on the basis of capacityand enters the realm of a case of potential exclusionary discrimination.
Though it is unusual to see job postings reading “minorities need not apply” – asGilley (2001) and CECC (2008) report – the prevalence of ethnic discrimination may bea matter of linguistics. Lacking a “standard” Mandarin pronunciation can be a marker ofdifference that potentially increases the odds for exclusionary discrimination in China(see Hasmath 2008, 2014b). Evidence to this effect was offered by various accounts ofinterviewees’ life experiences and anecdotal evidence from their extended families orethnic minority friends. For example, one Mongolian interviewee recalled a situationwhere she received an interview for a service-oriented job. A few minutes into the inter-view, the potential employer bluntly remarked that her non-local accent immediatelyruled her out for the position. Other accounts – though less dramatic – corroborated asignificant theme: recruiters feared that their potential customers could not completelyunderstand their non-local (minority) accent. While ethnic minorities as an aggregatemay have higher human capital in terms of education (see Table 1),3 some may lack thedistinguishable local linguistic markers. Chiswick and Miller (2002) point out that insituations where communication skills are important, a lack of fluency will effectivelyreduce one’s potential productivity in the workplace. This has the consequence ofrestricting many ethnic minorities in China to a cycle of underemployment (seeHasmath 2014a) or to work with co-ethnic minorities (in often lower paying and “lowstatus” positions) with whom they share a linguistic commonality.
Lack of social network capital
With the abandonment of the job assignment system, a different set of rules and prac-tices emerged for securing employment. Commonplace strategies amongst intervieweeswas the use of open market job search methods such as direct application, media tools(e.g. newspapers advertisements, online job search engines), employment centers, andusing one’s guanxi, or social network capital. In fact, the latter can be one of the mostsuccessful strategies for obtaining a job. Jean, an ethnic Mongolian, described how sheobtained her position as an accountant in a prominent SOE:
Through a friend (who at the time was working for the SOE), I heard they were lookingfor a new accountant. I asked my friend to send the job information (as the job was not
Eurasian Geography and Economics 5
Dow
nloa
ded
by [
The
Lib
rari
an]
at 0
3:23
04
June
201
5
advertised). It looked perfect for me. I sent my friend my CV, and she advocated on mybehalf for the position. A few weeks later, I spoke to the manager in person, and I wasoffered the job. I have been at this job for two years now.
Jean’s position was not advertised on the open market. A combination of luck (the rightplace at the right time) and social connections provided an entry point into her positionat the SOE. In fact, according to a study by Bian (2002), approximately two-thirds ofhis mainly Han interviewees found their current jobs by using their social network con-nections, comprising of family, friends, and acquaintances. While Jean’s narrative is oneof success, less than 10 percent of the ethnic minorities interviewed for this study foundjobs through guanxi, potentially suggesting major differences in minority and non-minority experiences. This lack of guanxi could explain the discrepancy in joballocations between Han and ethnic minorities.
Although the significance of guanxi in the reform era is under heavy debate (seeNee 1996; Hanser 2002), word-of-mouth exchanges about job openings and/or provid-ing the initial introduction to a potential employer are still effective methods in the jobsearch process. The labor market in China is still full of “institutional holes.” The for-mal mechanisms are insufficient to connect potential employers with job searchers. Forinstance, employers, particularly private firms, do not necessarily hire in large numbersthrough open market-oriented methods, since these channels are controlled by CPC offi-cials who lack incentives to take active roles in collecting and diffusing employmentinformation. Moreover, employers and job seekers are biased against these channels,believing that only undesirable jobs would be advertised. In this environment, guanxibecomes the primary mechanism to match seekers to jobs, bringing with it the possibil-ity that the most suitably qualified may not be the best connected. More alarmingly,when the job search process fails, attitudes towards the job search and an overalleconomic marginalization of the ethnic minorities may disadvantage the performance ofthe future generations (see Portes 1998).
Inability to fit within the working culture
The predominance of informal contacts in hiring strategies maintains homogeneity atthe organizational level and strengthens the power of non-minorities to steer and shapethe working culture. Working culture, which includes patterns of informal social behav-ior such as communication, decision-making, and interpersonal relationships – is oftendictated by the dominating group’s values, assumptions, and norms (see Martin 1992).In all enterprises under observation, a monoculture reflecting the standpoint of thenumerical majority Han members was the reality. For example, in D Company – a smalltechnology enterprise in Shanghai with 79 employees and the largest percentage of non-minorities (21.5 percent) observed throughout the study – the minority workers affirmedthey were not alienated from the firm’s working culture even though they normallyspoke the local dialect of Shanghainese to each other instead of Mandarin used by theHan majority. These workers are representative of those interviewees in our sample whoperceived that they did “fit in” to the working culture of their place of employment.These minority workers who felt they did “fit in” represent approximately 50 percent ofour sample and reported greater opportunities for advancement within their currentcompany.
The interview narratives suggest that a supportive relationship with one’s supervisorplays an important role in encouraging ethnic minorities to perceive a sense of
6 R. Hasmath and B. Ho
Dow
nloa
ded
by [
The
Lib
rari
an]
at 0
3:23
04
June
201
5
belonging with the working culture. Support can take the form of performance feedback,career guidance, and the provision of assignments that promote the ethnic minorityworker’s development (see Hasmath 2012). Sunny, an ethnic Uyghur working in one ofChina’s major banks, articulated her experiences with her supervisor this way:
I think my boss is confused by my ethnicity. I have lived here for most of my life, but yethe seems to think that I am somehow different. It is not something that I think about everyday, but I do have a feeling that he does see me differently. He does not treat me the wayhe treats the others [employees]. He talks to the others [employees] a lot. Me, he is verydirect with his instructions. I don’t feel I have a lot of support from my boss.
Identifying differential treatment in a working culture is a contentious proposition,since minority and non-minority groups often perceive the same working environmentdifferently (see Kossek and Zonia 1993). Both groups may live in different perceptualspheres within the organization and thus, often have conflicting perceptions about theworking environment and their ability to participate in the working culture. With thiscaveat in mind, for Sunny, the lack of support by her supervisor has caused her to con-sider moving to another position, even though this may mean accepting a lower wage.
While more case studies are needed to further assess these differences in China,acknowledging that the working culture of an organization can play a role in perpetuat-ing ethnic minority disadvantages in the nation is a first step towards rectifying thesituation. The next step is to create a positive working culture that is inclusive for bothminorities and non-minorities. Of course, those who do experience differential treatmentin the working culture and who seek to bring about change must do so within a struc-ture of inequality that may respond with denial and resistance. This has the possibilityof further compounding the ethnic minority disadvantages in the labor market.
Do ethnic minorities experience a wage penalty in the urban labor market?
While ethnic minorities interviewed perceived they were at a disadvantage compared totheir Han counterparts in the process for obtaining employment, whether this translatesto a wage penalty in the urban labor market is a subject of interest.
The quantitative part of our analysis uses the CHNS data-set from 1989, 1991,1993, 1997, 2000, 2004, and 2006. The CHNS uses a multistage, random cluster pro-cess to draw sample across nine provinces. For our purpose, the CHNS data-set hasadvantages over the frequently used Chinese Household Income Project data-set for thefollowing two reasons. First, the CHIP only covers households with official registration(hukou), while the CHNS data include households irrespective of their hukou status.Given that many minorities could be rural–urban migrant workers and these migrantworkers rarely receive urban hukou, they would be excluded or under-represented fromCHIP’s sampling scheme. Moreover, CHNS data are a more accurate reflection ofnational demographics – ethnic minorities comprise approximately 8 percent of theCHNS sample in urban areas and 15 percent in rural areas, whereas in the CHIP datathe composition of minorities ranges from 4–5 percent. Notwithstanding, CHNS doeshave some drawbacks. Given the sample size of minorities in the CHNS, we cannot dis-tinguish possible differential treatment across the 55 recognized ethnic minority groupsin China. Therefore, the regression analysis effectively estimates the average ethnicminority experience, potentially overlooking heterogeneity across minority groups.
In the CHNS sample utilized, attention is first restricted to individuals who are olderthan 15 years of age. For the analysis of wage differential, the sample is further
Eurasian Geography and Economics 7
Dow
nloa
ded
by [
The
Lib
rari
an]
at 0
3:23
04
June
201
5
restricted to non-farmers who have earned a positive wage4 and who are not self-employed.5 In total, the sample for wage differential includes 16,877 observations.Table 1 presents the summary statistics of our sample. According to the summary statis-tics described in Table 1, between the years 1991 and 2000 there is an 8–17 percentdeficit in monthly compensation between ethnic Han and ethnic minority workers.6 Thedifference in compensation is consistent with the discrimination reported by past studies.However, the difference in income could be explained by differences in education, hoursworked, or urban vs. rural residence, so a statistically controlled investigation isnecessary. By examining the sample across many years, a more comprehensive statisti-cal picture can be provided.
Mincer’s (1974) wage equation is first used in our wage differential analysis: ln(yit)= α + βMi + γSit + λXit + δt + μit where yit is the hourly wage of individual i at year t, Mi
is an indicator variable indicating whether individual i is an ethnic minority, Sit mea-sures years of formal schooling individual i have received at year t, Xit is a vector ofcovariates such as experience, the quadratic term of experience, and province dummies.δt is a vector of year dummies and μit is an error term.7 An ordinary least squares(OLS) estimation of the Mincer wage equation provides an estimate of ethnic minoritydisadvantages in the labor market in terms of the percent difference in income, a minor-ity worker receives relative to a Han worker, holding other factors fixed such as educa-tion and experience.8 In our analysis, we are particularly interested in the change of βt,the vector of coefficients on ethnic minority status overtime. Therefore, our regressionspecification can be rewritten by including the full interaction term between yeardummies and ethnic minority status as below9:
lnðyitÞ ¼ aþX
t¼1991;:::;2006
btðMi � dtÞ þ b0Mi
þX
t¼1991;:::;2006
ctðSit � dtÞ þ c0S þ ktXit þ dt þ lit(1)
In this specification, the net effect of being ethnic minority in year t would becharacterized by (β0 + βt).
In addition to the basic estimate of the wage differential for ethnic minority workers,the study also examines how ethnic minority disadvantages differ by the sector of theeconomy. We also estimate the coefficient of the interaction term between minority sta-tus and education to see whether minority members face different returns to education.10
We follow this specification in order to obtain comparable estimates to prior literatureon ethnic minorities in China.11
Regression results
In Table 2, columns 1 and 2 present the main results of Equation (1)12 – the coefficienton ethnic minorities wage differential over the year controlling for education, experi-ence, experience squared, gender, and type of work unit.13 After controlling for thesefactors,14 the data show little systematic bias between Hans and ethnic minorities inurban areas. In fact, we find that the hourly wage of ethnic minorities in urban areaswas 12.8 percent higher than their Han counterparts in 1989. By 1991, this wage dif-ferential had dissipated – the wage difference between Han and ethnic minorities wasmostly negative, but not significantly different in the remaining years of our sample.Similarly, we find no evidence of wage differentials in rural areas. Smaller bonuses andfewer hours worked (due to underemployment, different working norms and/or access
8 R. Hasmath and B. Ho
Dow
nloa
ded
by [
The
Lib
rari
an]
at 0
3:23
04
June
201
5
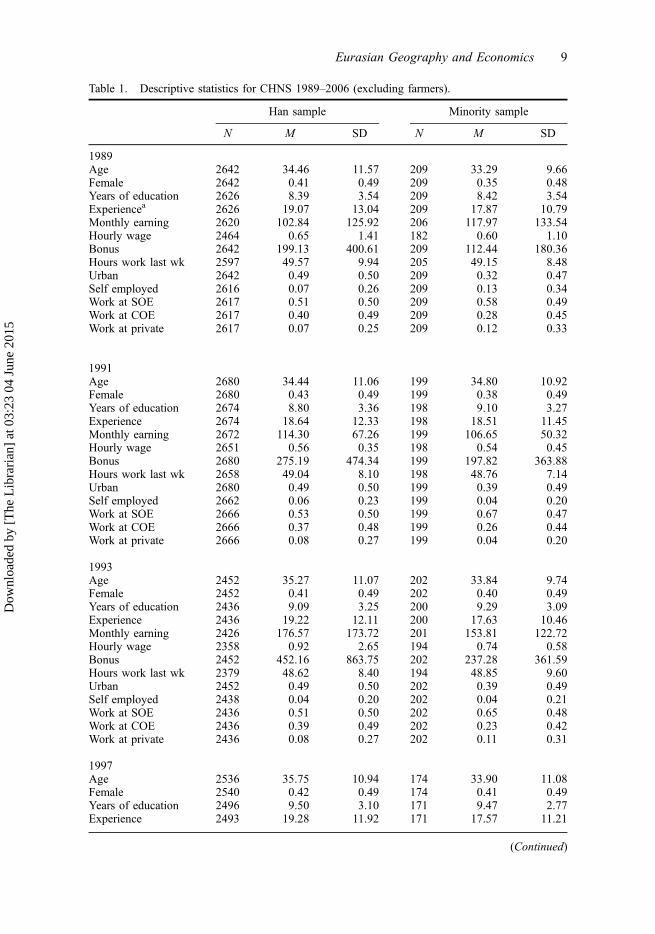
Table 1. Descriptive statistics for CHNS 1989–2006 (excluding farmers).
Han sample Minority sample
N M SD N M SD
1989Age 2642 34.46 11.57 209 33.29 9.66Female 2642 0.41 0.49 209 0.35 0.48Years of education 2626 8.39 3.54 209 8.42 3.54Experiencea 2626 19.07 13.04 209 17.87 10.79Monthly earning 2620 102.84 125.92 206 117.97 133.54Hourly wage 2464 0.65 1.41 182 0.60 1.10Bonus 2642 199.13 400.61 209 112.44 180.36Hours work last wk 2597 49.57 9.94 205 49.15 8.48Urban 2642 0.49 0.50 209 0.32 0.47Self employed 2616 0.07 0.26 209 0.13 0.34Work at SOE 2617 0.51 0.50 209 0.58 0.49Work at COE 2617 0.40 0.49 209 0.28 0.45Work at private 2617 0.07 0.25 209 0.12 0.33
1991Age 2680 34.44 11.06 199 34.80 10.92Female 2680 0.43 0.49 199 0.38 0.49Years of education 2674 8.80 3.36 198 9.10 3.27Experience 2674 18.64 12.33 198 18.51 11.45Monthly earning 2672 114.30 67.26 199 106.65 50.32Hourly wage 2651 0.56 0.35 198 0.54 0.45Bonus 2680 275.19 474.34 199 197.82 363.88Hours work last wk 2658 49.04 8.10 198 48.76 7.14Urban 2680 0.49 0.50 199 0.39 0.49Self employed 2662 0.06 0.23 199 0.04 0.20Work at SOE 2666 0.53 0.50 199 0.67 0.47Work at COE 2666 0.37 0.48 199 0.26 0.44Work at private 2666 0.08 0.27 199 0.04 0.20
1993Age 2452 35.27 11.07 202 33.84 9.74Female 2452 0.41 0.49 202 0.40 0.49Years of education 2436 9.09 3.25 200 9.29 3.09Experience 2436 19.22 12.11 200 17.63 10.46Monthly earning 2426 176.57 173.72 201 153.81 122.72Hourly wage 2358 0.92 2.65 194 0.74 0.58Bonus 2452 452.16 863.75 202 237.28 361.59Hours work last wk 2379 48.62 8.40 194 48.85 9.60Urban 2452 0.49 0.50 202 0.39 0.49Self employed 2438 0.04 0.20 202 0.04 0.21Work at SOE 2436 0.51 0.50 202 0.65 0.48Work at COE 2436 0.39 0.49 202 0.23 0.42Work at private 2436 0.08 0.27 202 0.11 0.31
1997Age 2536 35.75 10.94 174 33.90 11.08Female 2540 0.42 0.49 174 0.41 0.49Years of education 2496 9.50 3.10 171 9.47 2.77Experience 2493 19.28 11.92 171 17.57 11.21
(Continued)
Eurasian Geography and Economics 9
Dow
nloa
ded
by [
The
Lib
rari
an]
at 0
3:23
04
June
201
5
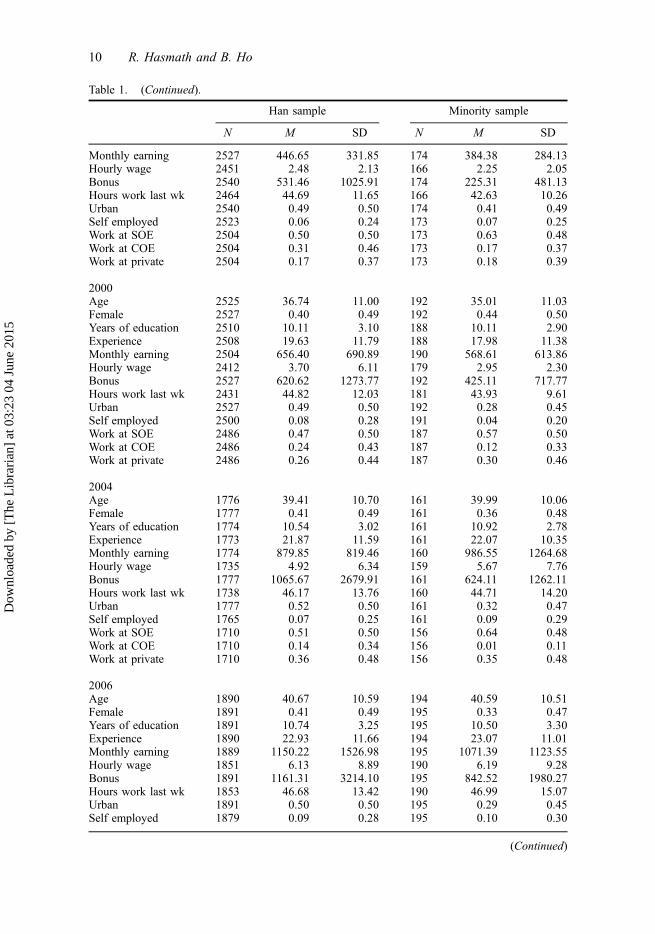
Table 1. (Continued).
Han sample Minority sample
N M SD N M SD
Monthly earning 2527 446.65 331.85 174 384.38 284.13Hourly wage 2451 2.48 2.13 166 2.25 2.05Bonus 2540 531.46 1025.91 174 225.31 481.13Hours work last wk 2464 44.69 11.65 166 42.63 10.26Urban 2540 0.49 0.50 174 0.41 0.49Self employed 2523 0.06 0.24 173 0.07 0.25Work at SOE 2504 0.50 0.50 173 0.63 0.48Work at COE 2504 0.31 0.46 173 0.17 0.37Work at private 2504 0.17 0.37 173 0.18 0.39
2000Age 2525 36.74 11.00 192 35.01 11.03Female 2527 0.40 0.49 192 0.44 0.50Years of education 2510 10.11 3.10 188 10.11 2.90Experience 2508 19.63 11.79 188 17.98 11.38Monthly earning 2504 656.40 690.89 190 568.61 613.86Hourly wage 2412 3.70 6.11 179 2.95 2.30Bonus 2527 620.62 1273.77 192 425.11 717.77Hours work last wk 2431 44.82 12.03 181 43.93 9.61Urban 2527 0.49 0.50 192 0.28 0.45Self employed 2500 0.08 0.28 191 0.04 0.20Work at SOE 2486 0.47 0.50 187 0.57 0.50Work at COE 2486 0.24 0.43 187 0.12 0.33Work at private 2486 0.26 0.44 187 0.30 0.46
2004Age 1776 39.41 10.70 161 39.99 10.06Female 1777 0.41 0.49 161 0.36 0.48Years of education 1774 10.54 3.02 161 10.92 2.78Experience 1773 21.87 11.59 161 22.07 10.35Monthly earning 1774 879.85 819.46 160 986.55 1264.68Hourly wage 1735 4.92 6.34 159 5.67 7.76Bonus 1777 1065.67 2679.91 161 624.11 1262.11Hours work last wk 1738 46.17 13.76 160 44.71 14.20Urban 1777 0.52 0.50 161 0.32 0.47Self employed 1765 0.07 0.25 161 0.09 0.29Work at SOE 1710 0.51 0.50 156 0.64 0.48Work at COE 1710 0.14 0.34 156 0.01 0.11Work at private 1710 0.36 0.48 156 0.35 0.48
2006Age 1890 40.67 10.59 194 40.59 10.51Female 1891 0.41 0.49 195 0.33 0.47Years of education 1891 10.74 3.25 195 10.50 3.30Experience 1890 22.93 11.66 194 23.07 11.01Monthly earning 1889 1150.22 1526.98 195 1071.39 1123.55Hourly wage 1851 6.13 8.89 190 6.19 9.28Bonus 1891 1161.31 3214.10 195 842.52 1980.27Hours work last wk 1853 46.68 13.42 190 46.99 15.07Urban 1891 0.50 0.50 195 0.29 0.45Self employed 1879 0.09 0.28 195 0.10 0.30
(Continued)
10 R. Hasmath and B. Ho
Dow
nloa
ded
by [
The
Lib
rari
an]
at 0
3:23
04
June
201
5
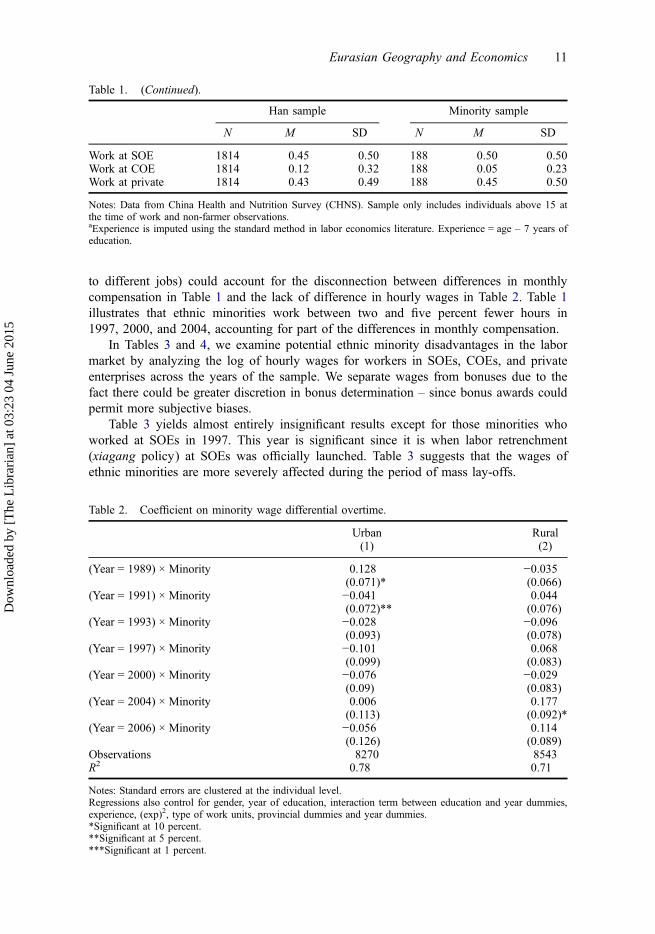
to different jobs) could account for the disconnection between differences in monthlycompensation in Table 1 and the lack of difference in hourly wages in Table 2. Table 1illustrates that ethnic minorities work between two and five percent fewer hours in1997, 2000, and 2004, accounting for part of the differences in monthly compensation.
In Tables 3 and 4, we examine potential ethnic minority disadvantages in the labormarket by analyzing the log of hourly wages for workers in SOEs, COEs, and privateenterprises across the years of the sample. We separate wages from bonuses due to thefact there could be greater discretion in bonus determination – since bonus awards couldpermit more subjective biases.
Table 3 yields almost entirely insignificant results except for those minorities whoworked at SOEs in 1997. This year is significant since it is when labor retrenchment(xiagang policy) at SOEs was officially launched. Table 3 suggests that the wages ofethnic minorities are more severely affected during the period of mass lay-offs.
Table 1. (Continued).
Han sample Minority sample
N M SD N M SD
Work at SOE 1814 0.45 0.50 188 0.50 0.50Work at COE 1814 0.12 0.32 188 0.05 0.23Work at private 1814 0.43 0.49 188 0.45 0.50
Notes: Data from China Health and Nutrition Survey (CHNS). Sample only includes individuals above 15 atthe time of work and non-farmer observations.aExperience is imputed using the standard method in labor economics literature. Experience = age – 7 years ofeducation.
Table 2. Coefficient on minority wage differential overtime.
Urban Rural(1) (2)
(Year = 1989) × Minority 0.128 −0.035(0.071)* (0.066)
(Year = 1991) × Minority −0.041 0.044(0.072)** (0.076)
(Year = 1993) × Minority −0.028 −0.096(0.093) (0.078)
(Year = 1997) × Minority −0.101 0.068(0.099) (0.083)
(Year = 2000) × Minority −0.076 −0.029(0.09) (0.083)
(Year = 2004) × Minority 0.006 0.177(0.113) (0.092)*
(Year = 2006) × Minority −0.056 0.114(0.126) (0.089)
Observations 8270 8543R2 0.78 0.71
Notes: Standard errors are clustered at the individual level.Regressions also control for gender, year of education, interaction term between education and year dummies,experience, (exp)2, type of work units, provincial dummies and year dummies.*Significant at 10 percent.**Significant at 5 percent.***Significant at 1 percent.
Eurasian Geography and Economics 11
Dow
nloa
ded
by [
The
Lib
rari
an]
at 0
3:23
04
June
201
5

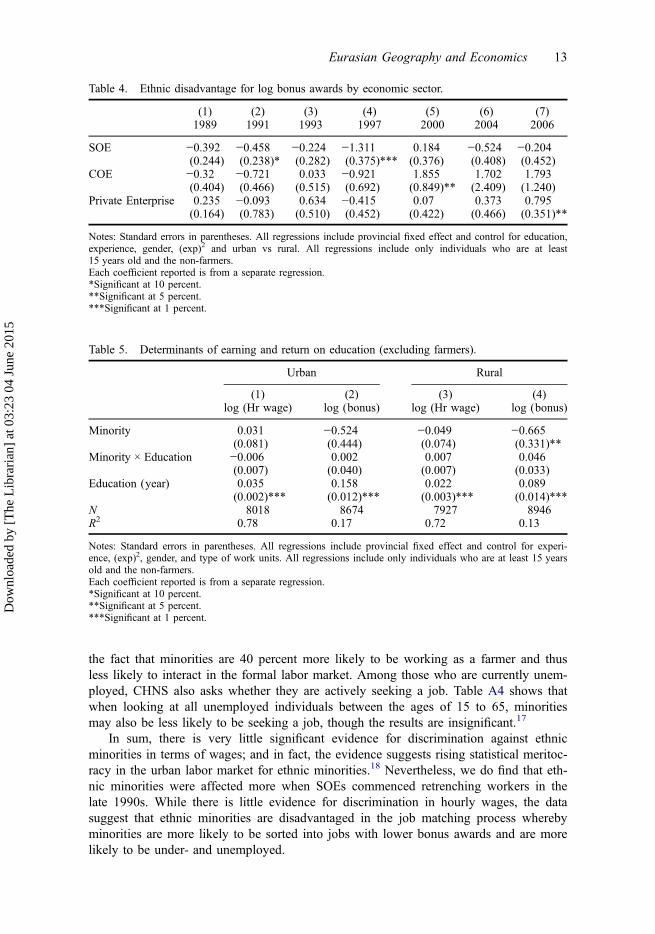
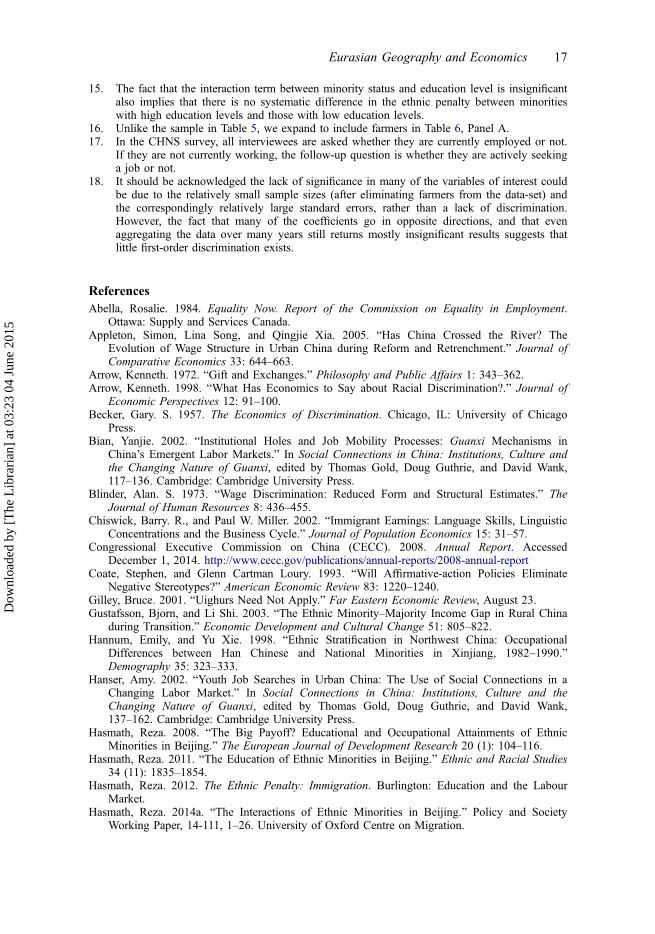
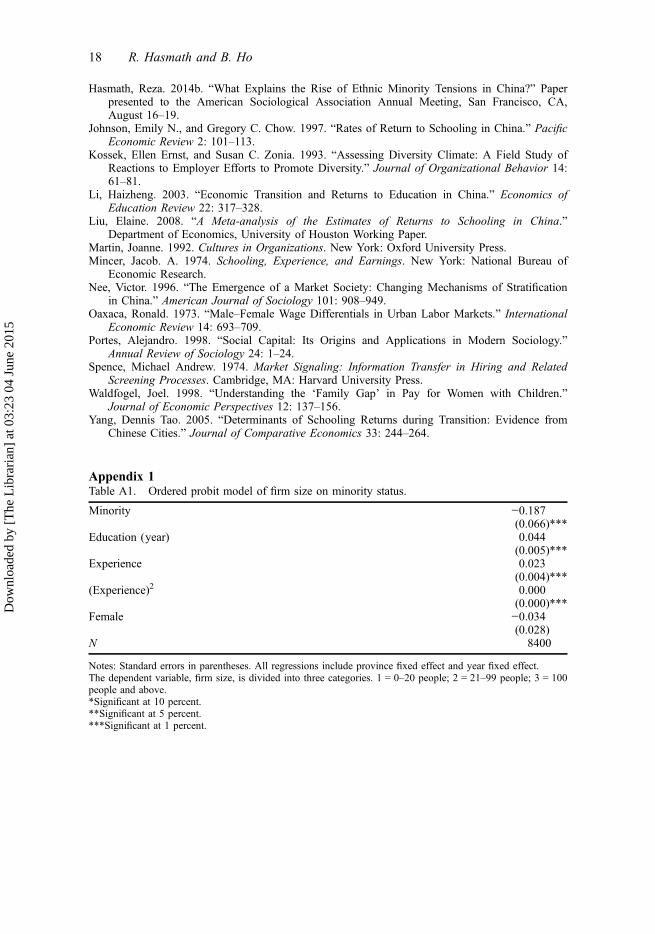
The results presented in Table 4 show that despite the parity in terms of hourlywages, ethnic minorities as a group are disadvantaged in terms of the bonuses theyreceive. Echoing the results in Table 3, we find that minorities who worked in SOEs in1997 received lower bonuses compared to their Han counterparts. Though we should becareful to point out that the disadvantages observed in bonus awards are largely limitedto workers in SOEs, and that the deficit is statistically significant only for two of theyears in the sample. The penalty in bonuses could be due to the greater discretion inbonus determination, since bonus awards could permit more subjective biases. However,given that there is little discretion in the setting of bonuses at SOEs within a givenworkgroup, the penalty is more likely due to the fact that ethnic minorities are sortedinto jobs where bonuses are lower or less common. Consistent with this interpretation,in regression results reported in Tables A1 and A2, minorities who reside in the urbanenvironment are less likely to work for SOEs and more likely to work for smaller firms.
Evidence that it is the type of job that matters can also be seen from Table 5, wherethe interaction term between minority status and education can be interpreted as theimpact of minority status on the rate of return from schooling. Consistent with our otherestimates, there is no evidence that ethnic minorities are rewarded any differently fortheir education in terms of how much they receive for hourly wages or for bonuses. Anadditional year of education yields 3 percent higher hourly wages and 12 percent higherbonuses for the Han majority, while minorities receive the same benefits for each addi-tional year of education.15 However, consistent with Table 4, once factors such aseducation and experience are held fixed, Table 5 illustrates that minorities as a cohortearn significantly smaller bonuses than their Han counterparts. Furthermore, sinceTable 5 shows that jobs associated with higher education levels are the ones that yieldhigher bonuses, one can infer that it is within these relatively higher skilled jobs wherethe disadvantaged sorting into lower bonus jobs occurs.
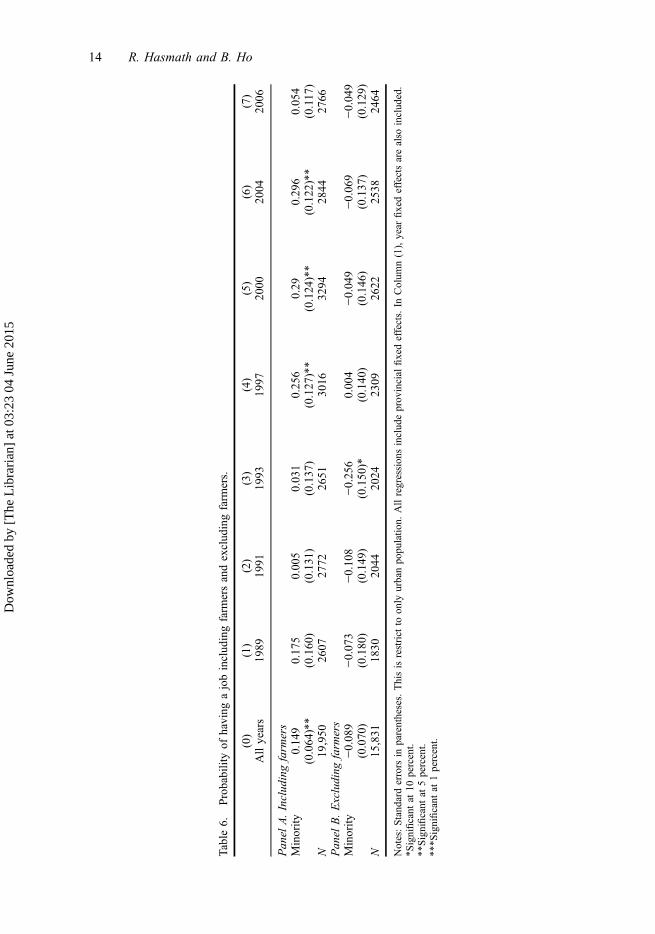
Further evidence about the job sorting of minorities can be seen from Table 6 PanelA and Panel B. In Panel A, when we expand our sample to include farmers and all indi-viduals who are older than 15 years of age regardless of their employment status,16
minorities are more likely to be employed. But once we exclude farmers in Panel B,regressions show that minorities may be less likely to have a job in recent years (resultsare consistently negative but insignificant). Table A3 shows that this difference is due to
Table 3. Ethnic penalty of log hourly wage by economic sector.
(1) (2) (3) (4) (5) (6) (7)1989 1991 1993 1997 2000 2004 2006
SOE −0.035 −0.013 −0.07 −0.109 −0.047 0.068 −0.032(0.065) (0.028) (0.046) (0.054)** (0.061) (0.062) (0.069)
COE 0.179 0.008 0.032 0.215 −0.131 −0.336 0.056(0.109) (0.077) (0.089) (0.126)* (0.136) (0.437) (0.180)
Private Enterprise 0.17 0.078 −0.119 0.057 −0.133 0.107 0.037(0.148) (0.265) (0.212) (0.132) (0.097) (0.107) (0.084)
Notes: Standard errors in parentheses. All regressions include provincial fixed effect and control for education,experience, gender, (exp)2 and urban vs. rural. All regressions include only individuals who are at least15 years old and the non-farmers.Each coefficient reported is from a separate regression.*Significant at 10 percent.**Significant at 5 percent.***Significant at 1 percent.
12 R. Hasmath and B. Ho
Dow
nloa
ded
by [
The
Lib
rari
an]
at 0
3:23
04
June
201
5
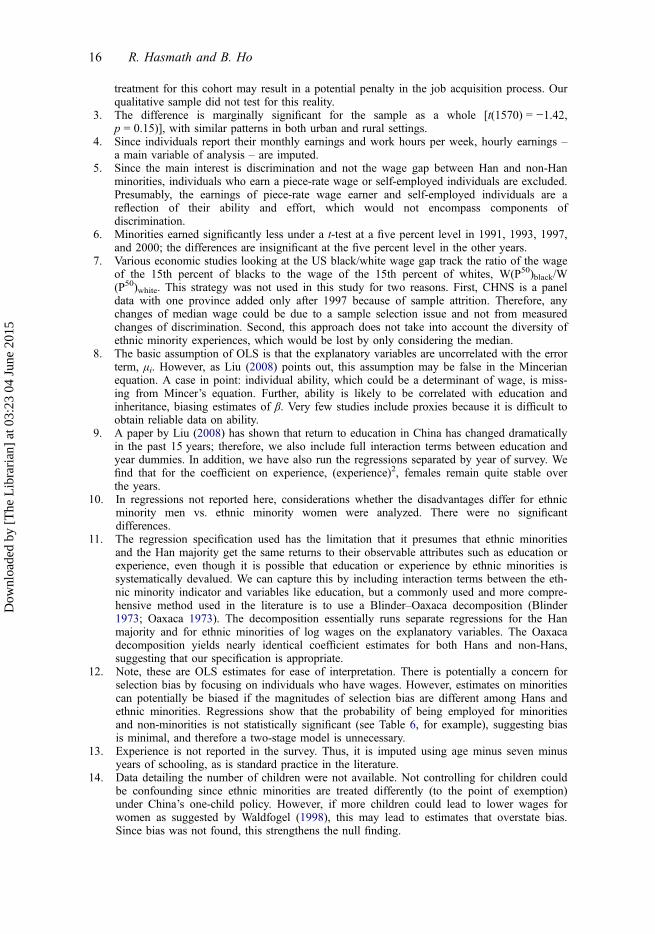
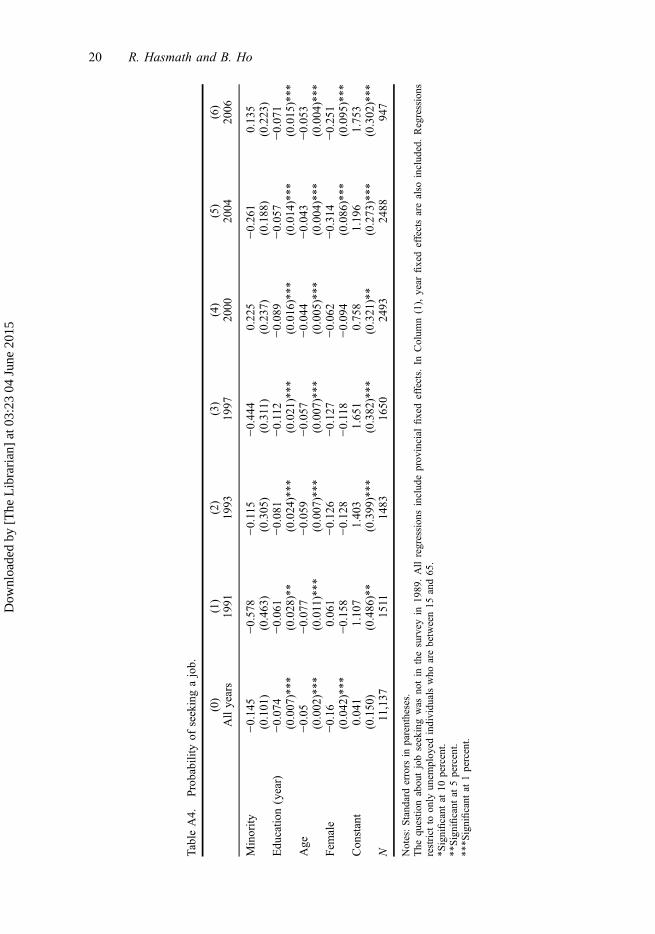
the fact that minorities are 40 percent more likely to be working as a farmer and thusless likely to interact in the formal labor market. Among those who are currently unem-ployed, CHNS also asks whether they are actively seeking a job. Table A4 shows thatwhen looking at all unemployed individuals between the ages of 15 to 65, minoritiesmay also be less likely to be seeking a job, though the results are insignificant.17
In sum, there is very little significant evidence for discrimination against ethnicminorities in terms of wages; and in fact, the evidence suggests rising statistical meritoc-racy in the urban labor market for ethnic minorities.18 Nevertheless, we do find that eth-nic minorities were affected more when SOEs commenced retrenching workers in thelate 1990s. While there is little evidence for discrimination in hourly wages, the datasuggest that ethnic minorities are disadvantaged in the job matching process wherebyminorities are more likely to be sorted into jobs with lower bonus awards and are morelikely to be under- and unemployed.
Table 4. Ethnic disadvantage for log bonus awards by economic sector.
(1) (2) (3) (4) (5) (6) (7)1989 1991 1993 1997 2000 2004 2006
SOE −0.392 −0.458 −0.224 −1.311 0.184 −0.524 −0.204(0.244) (0.238)* (0.282) (0.375)*** (0.376) (0.408) (0.452)
COE −0.32 −0.721 0.033 −0.921 1.855 1.702 1.793(0.404) (0.466) (0.515) (0.692) (0.849)** (2.409) (1.240)
Private Enterprise 0.235 −0.093 0.634 −0.415 0.07 0.373 0.795(0.164) (0.783) (0.510) (0.452) (0.422) (0.466) (0.351)**
Notes: Standard errors in parentheses. All regressions include provincial fixed effect and control for education,experience, gender, (exp)2 and urban vs rural. All regressions include only individuals who are at least15 years old and the non-farmers.Each coefficient reported is from a separate regression.*Significant at 10 percent.**Significant at 5 percent.***Significant at 1 percent.
Table 5. Determinants of earning and return on education (excluding farmers).
Urban Rural
(1) (2) (3) (4)log (Hr wage) log (bonus) log (Hr wage) log (bonus)
Minority 0.031 −0.524 −0.049 −0.665(0.081) (0.444) (0.074) (0.331)**
Minority × Education −0.006 0.002 0.007 0.046(0.007) (0.040) (0.007) (0.033)
Education (year) 0.035 0.158 0.022 0.089(0.002)*** (0.012)*** (0.003)*** (0.014)***
N 8018 8674 7927 8946R2 0.78 0.17 0.72 0.13
Notes: Standard errors in parentheses. All regressions include provincial fixed effect and control for experi-ence, (exp)2, gender, and type of work units. All regressions include only individuals who are at least 15 yearsold and the non-farmers.Each coefficient reported is from a separate regression.*Significant at 10 percent.**Significant at 5 percent.***Significant at 1 percent.
Eurasian Geography and Economics 13
Dow
nloa
ded
by [
The
Lib
rari
an]
at 0
3:23
04
June
201
5
Table
6.Probabilityof
having
ajobincludingfarm
ersandexcludingfarm
ers.
(0)
(1)
(2)
(3)
(4)
(5)
(6)
(7)
Allyears
1989
1991
1993
1997
2000
2004
2006
Pan
elA.Includ
ingfarm
ers
Minority
0.14
90.17
50.00
50.03
10.25
60.29
0.29
60.05
4(0.064
)**
(0.160
)(0.131
)(0.137
)(0.127
)**
(0.124
)**
(0.122
)**
(0.117
)N
19,950
2607
2772
2651
3016
3294
2844
2766
Pan
elB.Excluding
farm
ers
Minority
−0.08
9−0.07
3−0.10
8−0.25
60.00
4−0.04
9−0.06
9−0.04
9(0.070
)(0.180
)(0.149
)(0.150
)*(0.140
)(0.146
)(0.137
)(0.129
)N
15,831
1830
2044
2024
2309
2622
2538
2464
Notes:Standarderrors
inparentheses.Thisisrestrict
toonly
urbanpopulatio
n.Allregressionsincludeprovincial
fixedeffects.In
Colum
n(1),year
fixedeffectsarealso
included.
*Significant
at10
percent.
**Significant
at5percent.
***S
ignificant
at1percent.
14 R. Hasmath and B. Ho
Dow
nloa
ded
by [
The
Lib
rari
an]
at 0
3:23
04
June
201
5
Conclusion
What is striking to observe in this study is the initial gulf in the results between the pro-cess of ethnic minority job acquisition and wage outcomes. Summary statistics suggestthat there may be discrimination, an 8–17 percent difference in monthly compensation,between Hans and minorities. However, a controlled investigation – factoring education,experience, and gender – yields results that suggest that there is little systematic wagebias between both groups.
Notwithstanding these outcomes, documented perceived ethnic minority disadvan-tages were found throughout the job acquisition and retention process. At the onset, eth-nic minorities’ formal qualifications have a tendency to be undervalued given theprevalence of preferential treatment for this cohort in education. This seemingly signalsto employers that minorities may be less qualified – a situation further compounded bya crowded labor market where an employer has numerous “safer” Han labor options.This is consistent with the finding from the statistical analysis that it is within the jobsearch and matching process where a minority disadvantage can be statistically detected.
Furthermore, ethnic minority disadvantages were found in the social domain due totheir demonstrable deficit of social network capital requisite in the hiring and promotionprocess. Less than 10 percent of minorities interviewed for this study found a workplacement utilizing their social network connections. This is contrast to the estimatedtwo-thirds of Hans in other studies who found work placements via social network con-nections. The disjoint between non-Han and Han experiences is likewise experienced inthe working culture of organizations observed. Only half of the interviewees perceivedthat they did “fit in” with the working culture at their current placement, with manyreporting that they are still perceived as “outsiders.” The fact that the inability to “fit in”impedes advancement is troublesome given that the majority of this cohort perceive theyhave low odds of workplace advancement.
In this unpropitious background, if minorities continue to perceive widespread disad-vantages in the job search and workplace environment, it may lead to long-term labormarket withdrawal. The concern is that despite their preferential treatment in highereducation, the returns on public investment on ethnic minority education will not berealized. Insofar as preferential treatment leads to greater discrimination, the preferentialtreatment could paradoxically make things worse.
AcknowledgementsThe authors are grateful to Elaine M. Liu and Amita Chudgar for their insightful comments.Working data files and additional statistical results generated for this study are available uponrequest.
Disclosure statementNo potential conflict of interest was reported by the authors.
Notes1. One can postulate that the frequency of this practice may increase during periods of surplus
labor, where the employer has the luxury of selecting from a wider pool of candidates.2. We thank the anonymous reviewer for pointing out that preferential treatment in tertiary
admissions is often extended to “home residents.” As such, it is plausible that preferential
Eurasian Geography and Economics 15
Dow
nloa
ded
by [
The
Lib
rari
an]
at 0
3:23
04
June
201
5
treatment for this cohort may result in a potential penalty in the job acquisition process. Ourqualitative sample did not test for this reality.
3. The difference is marginally significant for the sample as a whole [t(1570) = −1.42,p = 0.15)], with similar patterns in both urban and rural settings.
4. Since individuals report their monthly earnings and work hours per week, hourly earnings –a main variable of analysis – are imputed.
5. Since the main interest is discrimination and not the wage gap between Han and non-Hanminorities, individuals who earn a piece-rate wage or self-employed individuals are excluded.Presumably, the earnings of piece-rate wage earner and self-employed individuals are areflection of their ability and effort, which would not encompass components ofdiscrimination.
6. Minorities earned significantly less under a t-test at a five percent level in 1991, 1993, 1997,and 2000; the differences are insignificant at the five percent level in the other years.
7. Various economic studies looking at the US black/white wage gap track the ratio of the wageof the 15th percent of blacks to the wage of the 15th percent of whites, W(P50)black/W(P50)white. This strategy was not used in this study for two reasons. First, CHNS is a paneldata with one province added only after 1997 because of sample attrition. Therefore, anychanges of median wage could be due to a sample selection issue and not from measuredchanges of discrimination. Second, this approach does not take into account the diversity ofethnic minority experiences, which would be lost by only considering the median.
8. The basic assumption of OLS is that the explanatory variables are uncorrelated with the errorterm, μi. However, as Liu (2008) points out, this assumption may be false in the Mincerianequation. A case in point: individual ability, which could be a determinant of wage, is miss-ing from Mincer’s equation. Further, ability is likely to be correlated with education andinheritance, biasing estimates of β. Very few studies include proxies because it is difficult toobtain reliable data on ability.
9. A paper by Liu (2008) has shown that return to education in China has changed dramaticallyin the past 15 years; therefore, we also include full interaction terms between education andyear dummies. In addition, we have also run the regressions separated by year of survey. Wefind that for the coefficient on experience, (experience)2, females remain quite stable overthe years.
10. In regressions not reported here, considerations whether the disadvantages differ for ethnicminority men vs. ethnic minority women were analyzed. There were no significantdifferences.
11. The regression specification used has the limitation that it presumes that ethnic minoritiesand the Han majority get the same returns to their observable attributes such as education orexperience, even though it is possible that education or experience by ethnic minorities issystematically devalued. We can capture this by including interaction terms between the eth-nic minority indicator and variables like education, but a commonly used and more compre-hensive method used in the literature is to use a Blinder–Oaxaca decomposition (Blinder1973; Oaxaca 1973). The decomposition essentially runs separate regressions for the Hanmajority and for ethnic minorities of log wages on the explanatory variables. The Oaxacadecomposition yields nearly identical coefficient estimates for both Hans and non-Hans,suggesting that our specification is appropriate.
12. Note, these are OLS estimates for ease of interpretation. There is potentially a concern forselection bias by focusing on individuals who have wages. However, estimates on minoritiescan potentially be biased if the magnitudes of selection bias are different among Hans andethnic minorities. Regressions show that the probability of being employed for minoritiesand non-minorities is not statistically significant (see Table 6, for example), suggesting biasis minimal, and therefore a two-stage model is unnecessary.
13. Experience is not reported in the survey. Thus, it is imputed using age minus seven minusyears of schooling, as is standard practice in the literature.
14. Data detailing the number of children were not available. Not controlling for children couldbe confounding since ethnic minorities are treated differently (to the point of exemption)under China’s one-child policy. However, if more children could lead to lower wages forwomen as suggested by Waldfogel (1998), this may lead to estimates that overstate bias.Since bias was not found, this strengthens the null finding.
16 R. Hasmath and B. Ho
Dow
nloa
ded
by [
The
Lib
rari
an]
at 0
3:23
04
June
201
5
15. The fact that the interaction term between minority status and education level is insignificantalso implies that there is no systematic difference in the ethnic penalty between minoritieswith high education levels and those with low education levels.
16. Unlike the sample in Table 5, we expand to include farmers in Table 6, Panel A.17. In the CHNS survey, all interviewees are asked whether they are currently employed or not.
If they are not currently working, the follow-up question is whether they are actively seekinga job or not.
18. It should be acknowledged the lack of significance in many of the variables of interest couldbe due to the relatively small sample sizes (after eliminating farmers from the data-set) andthe correspondingly relatively large standard errors, rather than a lack of discrimination.However, the fact that many of the coefficients go in opposite directions, and that evenaggregating the data over many years still returns mostly insignificant results suggests thatlittle first-order discrimination exists.
ReferencesAbella, Rosalie. 1984. Equality Now. Report of the Commission on Equality in Employment.
Ottawa: Supply and Services Canada.Appleton, Simon, Lina Song, and Qingjie Xia. 2005. “Has China Crossed the River? The
Evolution of Wage Structure in Urban China during Reform and Retrenchment.” Journal ofComparative Economics 33: 644–663.
Arrow, Kenneth. 1972. “Gift and Exchanges.” Philosophy and Public Affairs 1: 343–362.Arrow, Kenneth. 1998. “What Has Economics to Say about Racial Discrimination?.” Journal of
Economic Perspectives 12: 91–100.Becker, Gary. S. 1957. The Economics of Discrimination. Chicago, IL: University of Chicago
Press.Bian, Yanjie. 2002. “Institutional Holes and Job Mobility Processes: Guanxi Mechanisms in
China’s Emergent Labor Markets.” In Social Connections in China: Institutions, Culture andthe Changing Nature of Guanxi, edited by Thomas Gold, Doug Guthrie, and David Wank,117–136. Cambridge: Cambridge University Press.
Blinder, Alan. S. 1973. “Wage Discrimination: Reduced Form and Structural Estimates.” TheJournal of Human Resources 8: 436–455.
Chiswick, Barry. R., and Paul W. Miller. 2002. “Immigrant Earnings: Language Skills, LinguisticConcentrations and the Business Cycle.” Journal of Population Economics 15: 31–57.
Congressional Executive Commission on China (CECC). 2008. Annual Report. AccessedDecember 1, 2014. http://www.cecc.gov/publications/annual-reports/2008-annual-report
Coate, Stephen, and Glenn Cartman Loury. 1993. “Will Affirmative-action Policies EliminateNegative Stereotypes?” American Economic Review 83: 1220–1240.
Gilley, Bruce. 2001. “Uighurs Need Not Apply.” Far Eastern Economic Review, August 23.Gustafsson, Bjorn, and Li Shi. 2003. “The Ethnic Minority–Majority Income Gap in Rural China
during Transition.” Economic Development and Cultural Change 51: 805–822.Hannum, Emily, and Yu Xie. 1998. “Ethnic Stratification in Northwest China: Occupational
Differences between Han Chinese and National Minorities in Xinjiang, 1982–1990.”Demography 35: 323–333.
Hanser, Amy. 2002. “Youth Job Searches in Urban China: The Use of Social Connections in aChanging Labor Market.” In Social Connections in China: Institutions, Culture and theChanging Nature of Guanxi, edited by Thomas Gold, Doug Guthrie, and David Wank,137–162. Cambridge: Cambridge University Press.
Hasmath, Reza. 2008. “The Big Payoff? Educational and Occupational Attainments of EthnicMinorities in Beijing.” The European Journal of Development Research 20 (1): 104–116.
Hasmath, Reza. 2011. “The Education of Ethnic Minorities in Beijing.” Ethnic and Racial Studies34 (11): 1835–1854.
Hasmath, Reza. 2012. The Ethnic Penalty: Immigration. Burlington: Education and the LabourMarket.
Hasmath, Reza. 2014a. “The Interactions of Ethnic Minorities in Beijing.” Policy and SocietyWorking Paper, 14-111, 1–26. University of Oxford Centre on Migration.
Eurasian Geography and Economics 17
Dow
nloa
ded
by [
The
Lib
rari
an]
at 0
3:23
04
June
201
5
Hasmath, Reza. 2014b. “What Explains the Rise of Ethnic Minority Tensions in China?” Paperpresented to the American Sociological Association Annual Meeting, San Francisco, CA,August 16–19.
Johnson, Emily N., and Gregory C. Chow. 1997. “Rates of Return to Schooling in China.” PacificEconomic Review 2: 101–113.
Kossek, Ellen Ernst, and Susan C. Zonia. 1993. “Assessing Diversity Climate: A Field Study ofReactions to Employer Efforts to Promote Diversity.” Journal of Organizational Behavior 14:61–81.
Li, Haizheng. 2003. “Economic Transition and Returns to Education in China.” Economics ofEducation Review 22: 317–328.
Liu, Elaine. 2008. “A Meta-analysis of the Estimates of Returns to Schooling in China.”Department of Economics, University of Houston Working Paper.
Martin, Joanne. 1992. Cultures in Organizations. New York: Oxford University Press.Mincer, Jacob. A. 1974. Schooling, Experience, and Earnings. New York: National Bureau of
Economic Research.Nee, Victor. 1996. “The Emergence of a Market Society: Changing Mechanisms of Stratification
in China.” American Journal of Sociology 101: 908–949.Oaxaca, Ronald. 1973. “Male–Female Wage Differentials in Urban Labor Markets.” International
Economic Review 14: 693–709.Portes, Alejandro. 1998. “Social Capital: Its Origins and Applications in Modern Sociology.”
Annual Review of Sociology 24: 1–24.Spence, Michael Andrew. 1974. Market Signaling: Information Transfer in Hiring and Related
Screening Processes. Cambridge, MA: Harvard University Press.Waldfogel, Joel. 1998. “Understanding the ‘Family Gap’ in Pay for Women with Children.”
Journal of Economic Perspectives 12: 137–156.Yang, Dennis Tao. 2005. “Determinants of Schooling Returns during Transition: Evidence from
Chinese Cities.” Journal of Comparative Economics 33: 244–264.
Appendix 1Table A1. Ordered probit model of firm size on minority status.
Minority −0.187(0.066)***
Education (year) 0.044(0.005)***
Experience 0.023(0.004)***
(Experience)2 0.000(0.000)***
Female −0.034(0.028)
N 8400
Notes: Standard errors in parentheses. All regressions include province fixed effect and year fixed effect.The dependent variable, firm size, is divided into three categories. 1 = 0–20 people; 2 = 21–99 people; 3 = 100people and above.*Significant at 10 percent.**Significant at 5 percent.***Significant at 1 percent.
18 R. Hasmath and B. Ho
Dow
nloa
ded
by [
The
Lib
rari
an]
at 0
3:23
04
June
201
5
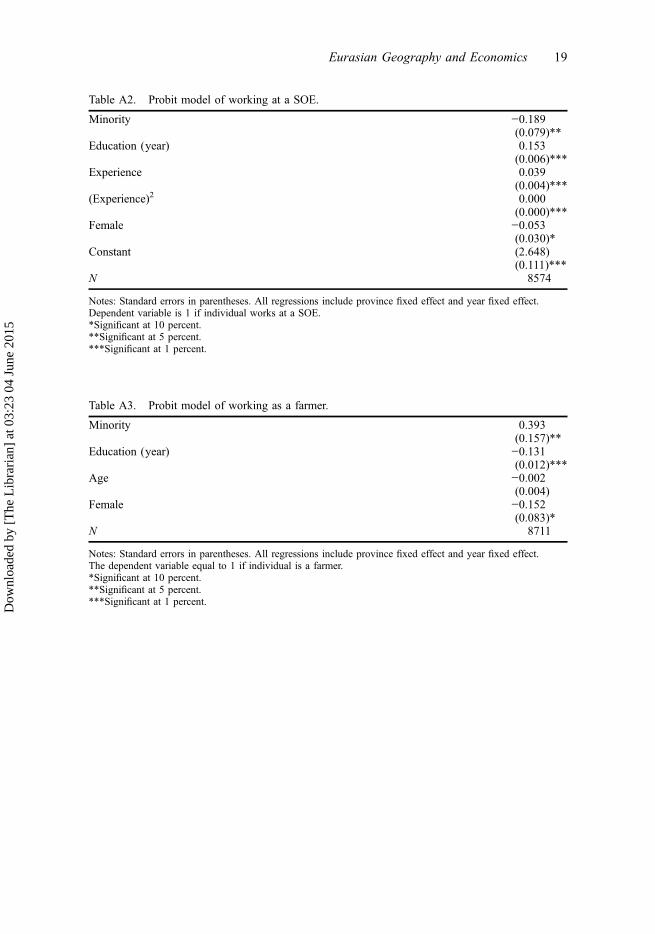
Table A2. Probit model of working at a SOE.
Minority −0.189(0.079)**
Education (year) 0.153(0.006)***
Experience 0.039(0.004)***
(Experience)2 0.000(0.000)***
Female −0.053(0.030)*
Constant (2.648)(0.111)***
N 8574
Notes: Standard errors in parentheses. All regressions include province fixed effect and year fixed effect.Dependent variable is 1 if individual works at a SOE.*Significant at 10 percent.**Significant at 5 percent.***Significant at 1 percent.
Table A3. Probit model of working as a farmer.
Minority 0.393(0.157)**
Education (year) −0.131(0.012)***
Age −0.002(0.004)
Female −0.152(0.083)*
N 8711
Notes: Standard errors in parentheses. All regressions include province fixed effect and year fixed effect.The dependent variable equal to 1 if individual is a farmer.*Significant at 10 percent.**Significant at 5 percent.***Significant at 1 percent.
Eurasian Geography and Economics 19
Dow
nloa
ded
by [
The
Lib
rari
an]
at 0
3:23
04
June
201
5
Table
A4.
Probabilityof
seekingajob.
(0)
(1)
(2)
(3)
(4)
(5)
(6)
Allyears
1991
1993
1997
2000
2004
2006
Minority
−0.14
5−0.57
8−0.115
−0.44
40.22
5−0.26
10.13
5(0.101
)(0.463
)(0.305
)(0.311)
(0.237
)(0.188
)(0.223
)Edu
catio
n(year)
−0.07
4−0.06
1−0.08
1−0.112
−0.08
9−0.05
7−0.07
1(0.007
)***
(0.028
)**
(0.024
)***
(0.021
)***
(0.016
)***
(0.014
)***
(0.015
)***
Age
−0.05
−0.07
7−0.05
9−0.05
7−0.04
4−0.04
3−0.05
3(0.002
)***
(0.011)***
(0.007
)***
(0.007
)***
(0.005
)***
(0.004
)***
(0.004
)***
Fem
ale
−0.16
0.06
1−0.12
6−0.12
7−0.06
2−0.31
4−0.25
1(0.042
)***
−0.15
8−0.12
8−0.118
−0.09
4(0.086
)***
(0.095
)***
Con
stant
0.04
11.10
71.40
31.65
10.75
81.19
61.75
3(0.150
)(0.486
)**
(0.399
)***
(0.382
)***
(0.321
)**
(0.273
)***
(0.302
)***
N11,137
1511
1483
1650
2493
2488
947
Notes:Standarderrors
inparentheses.
The
questio
naboutjobseekingwas
notin
thesurvey
in19
89.Allregression
sinclud
eprovincial
fixedeffects.
InColum
n(1),year
fixedeffectsarealso
included.Regressions
restrict
toon
lyun
employed
individu
alswho
arebetween15
and65
.*S
ignificant
at10
percent.
**Significant
at5percent.
***S
ignificant
at1percent.
20 R. Hasmath and B. Ho
Dow
nloa
ded
by [
The
Lib
rari
an]
at 0
3:23
04
June
201
5
Related Documents


