JK Cements Ltd. 1 Lorem ipsum dolor sit amet, consectetuer adipiscing elit, sed diam nonummy nibh euismod tincidunt ut laoreet dolore magna aliquam erat volutpat. Ut wisi enim ad minim veniam, quis nostrud exerci tation ullamcorper suscipit lobortis nisl ut aliquip ex ea commodo consequat. Duis autem vel eum iriure dolor in hendrerit in vulputate velit esse molestie consequat, vel illum dolore eu feugiat nulla ▪ Lorem ipsum dolor sit amet, consectetuer adipiscing elit, sed diam nonummy nibh euismod tincidunt ut laoreet dolore magna aliquam erat volutpat. Ut wisi enim ad minim veniam, ▪ quis nostrud exerci tation ullamcorper suscipit lobortis nisl ut aliquip ex ea commodo consequat. Duis autem vel eum iriure dolor in hendrerit in vulputate velit esse molestie consequat, ▪ vel illum dolore eu feugiat nulla facilisis at vero eros et accumsan et iusto odio dignissim qui blandit praesent luptatum zzril delenit augue duis dolore te feugait nulla facilisi. et iusto odio dignissim qui blandit praesent luptatum zzril delenit augue duis dolore te feugait nulla facilisLorem ipsum dolor sit amet, Initiating Coverage JK Cements Ltd. 20-November-2020

Welcome message from author
This document is posted to help you gain knowledge. Please leave a comment to let me know what you think about it! Share it to your friends and learn new things together.
Transcript

JK Cements Ltd.
1
Lorem ipsum dolor sit amet, consectetuer adipiscing elit, sed diam nonummy nibh euismod tincidunt ut laoreet dolore magna aliquam erat volutpat. Ut wisi enim ad minim veniam, quis nostrud exerci tation ullamcorper suscipit lobortis nisl ut aliquip ex ea commodo consequat. Duis autem vel eum iriure dolor in hendrerit in vulputate velit esse molestie consequat, vel illum dolore eu feugiat nulla
▪ Lorem ipsum dolor sit amet, consectetuer adipiscing elit, sed diam nonummy
nibh euismod tincidunt ut laoreet dolore magna aliquam erat volutpat. Ut wisi enim ad minim veniam,
▪ quis nostrud exerci tation ullamcorper suscipit lobortis nisl ut aliquip ex ea commodo consequat. Duis autem vel eum iriure dolor in hendrerit in vulputate velit esse molestie consequat,
▪ vel illum dolore eu feugiat nulla facilisis at vero eros et accumsan et iusto odio dignissim qui blandit praesent luptatum zzril delenit augue duis dolore te feugait nulla facilisi. et iusto odio dignissim qui blandit praesent luptatum zzril delenit augue duis dolore te feugait nulla facilisLorem ipsum dolor sit amet,
Initiating Coverage
JK Cements Ltd. 20-November-2020

JK Cements Ltd.
2
Industry LTP Base case Fair Value Bull case Fair Value Recommendation Time Horizon
Cement Rs. 1884.65 Rs.2063 Rs.2146 Buy at LTP and add on dips to Rs.1727-1735 band 2 quarters
Our Take:
JK Cement (JKCE) is a part of the JK Group. It has a multi-region presence which helps the company to take benefits of demand from different regions. The company commands ~40% of market share in white cement industry with an installed capacity of 2.42MTPA. JKCE has 17.1MTPA of total installed cement capacity.
We expect that Covid-19 led slowdown in the economy to result in subdued revenue growth of JKCE for FY21 but benign raw material price and aggressive control on variable costs are likely to drive EBIDTA growth. The industry has a high dependence on real estate and infra sector which is expected to be impacted due to expected slowdown in the economy. Going forward, we expect, a gradual recovery in cement demand and volumes are likely to pick-up from H2FY21 onwards. In the case of JKCE, incremental volumes from the commencement of additional capacities will result in a lower decline in volumes compared to the industry. Also, on the demand side, key growth drivers are likely to be pick up in rural housing, Pradhan Mantri Awas Yojana (rural), Pradhan Mantri Gram Sadak Yojana and spending on key infrastructure projects.
Valuations & Recommendation:
We expect, that the company will get benefit from a strong position in grey as well as white cement market. Also, captive power plants (~125.7 MW of captive power plants and upcoming ~25 MW of capacity) and stable working capital augur well for JK Cement. JKCE continues to be a strong growth story in the cement space. It has commissioned the on-going 4.2MTPA of expansion projects across north, central and west India Post this, it further plans to accelerate its work on 3.5 MTPA greenfield capacity in Central India (Panna-MP) which will take its overall capacity to 18MTPA. With the commissioning of this capacity, JK Cement is well-placed to tap demand recovery post COVID-19. High RoE along with strong FCF generation and reduction in Net Debt over FY21-22 provides comfort..
JKCE provides strong growth visibility in regions with favorable market dynamics and remains a play on high margin-high growth white cement segment. It also benefits out of high exposure to North where prices remain steady, offers volume growth visibility owing to ramp-up from new capacities, and sticky cash flows from white cement/wall putty segment. JKCE could deliver high double-digit volume growth over next two years largely led by ramp-up from new brownfield units at Nimbahera/Mangrol and grinding units in Gujarat and UP.
HDFC Scrip Code JKCLTDEQNR
BSE Code 532644
NSE Code JKCEMENT
Bloomberg JKCE:IN
CMP Nov 19, 2020 1884.65
Equity Capital (cr) 77
Face Value (Rs) 10
Eq- Share O/S(cr) 7.73
Market Cap (Rscr) 14568
Book Value (Rs) 392
Avg.52 Wk Volume 213862
52 Week High 2001.40
52 Week Low 800.00
Share holding Pattern % (Sept, 2020)
Promoters 58.07
Institutions 37.24
Non Institutions 4.69
Total 100.0
Fundamental Research Analyst Jimit Zaveri [email protected]

JK Cements Ltd.
3
We expect, 10% CAGR in top-line and 21% EPS CAGR over FY20-22E. The company is trading at FY22E EV/T of $134/T. We feel the base case fair value of the stock is Rs.2063(11.4xFY22E EV/EBITDA, FY22E EV/T of $145) and the bull case fair value is Rs.2146 (11.8xFY22E EV/EBIDTA, FY22E EV/T of $150) over the next two quarters. We feel investors can buy the stock at LTP and add on dips to Rs.1727-1735 band (9.8xFY22E EV/EBITDA, FY22E EV/T of $125). Financial Summary
Particulars (Rs cr) Q2FY21 Q2FY20 YoY-% Q1FY21 QoQ-% FY19 FY20 FY21E FY22E
Total Operating Income 1634 1318 24% 1005 63% 5,258.7 5,801.6 6,135.2 6,999.1
EBITDA 431 256 68% 213 102% 834.5 1,213.4 1,428.3 1,631.6
RPAT 222 80 179% 50 344% 270.4 496.4 603.1 729.8
Diluted EPS (Rs) 28.67 10.29 179% 6.46 344% 35.0 64.2 78.1 94.4
RoE-% 11.6 17.3 18.3 18.7
P/E (x) 53.9 29.4 24.2 20.0
EV/EBITDA 20.7 14.2 12.1 10.6 (Source: Company, HDFC sec)
Q2FY21 Result Update
• The volumes of the company have grown by 26.3% to 2.93 mnT in Q2FY21 compared to 2.32 mnT in Q2FY20. Grey cement volumes increased by 28% to 2.45MT while white cement grew by 9% YoY to 0.36MT. Blended realisations grew marginally on a QoQ basis as white cement/putty volumes doubled in Q2 increasing its proportion in overall mix. NSR (Rs/T) on YoY basis has declined by
1.8% to Rs.5575/t Revenue has grown by 24% y-o-y to Rs.1634 cr in Q2FY21 compared to Rs.1318 cr in Q2FY20. . However, with the reduction in overall expenditure, the EBIDTA was at Rs.431 crores as compared to Rs.256 crores in the previous year. EBIDTA/T has improved YoY by 33.5% to Rs.1471/T. Raw material (lower petcoke prices) and employee cost/ tonne (decline in contractual employees) declined on YoY basis by 13% and 19% respectively while other expenses on an absolute basis declined marginally YoY despite 26% growth in volumes.
• JKCE expects to complete the debottlenecking of clinker in Rajasthan by Q2FY22. It will then accelerate work on Greenfield expansion in Panna, MP (3.5mn MT).
• Fujairah operations in Q2 saw material improvement due to one big order during the quarter which led to 90% plus utilization on the plant level.

JK Cements Ltd.
4
Long term Triggers Presence over multiple regions with dominant No. 2 player in high margin white cement business
JK Cement has plants in Rajasthan, Karnataka, Haryana helping the company having a good hold on southern, northern and western
markets in the country. The Company is the second-largest White Cement manufacturer in India with a capacity of 2.42MTPA in India
(combined capacity white cement capacity, wall putty and allied products).. The white cement segment commands premium pricing
(almost 2x than blended realizations) which ensures consistently better operating performance compared to grey cement. Sustainable
EBITDA margin of white cement business is ~25-27% which are substantially higher than grey cement. White cement and allied products
contributed ~1/3rd of consolidated revenues for JKCEM in FY20. As per the management, they have guided a 12-15% sustainable annual
growth for the white cement segment.
Source – Company, HDFC sec Research
JK Cements Ltd.
5
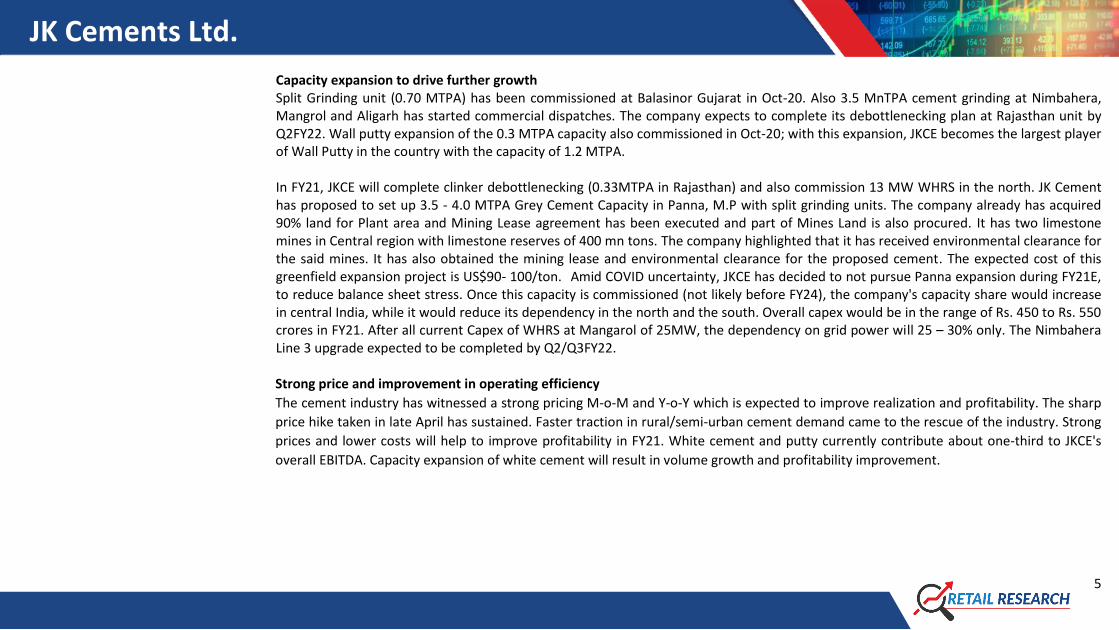
Capacity expansion to drive further growth Split Grinding unit (0.70 MTPA) has been commissioned at Balasinor Gujarat in Oct-20. Also 3.5 MnTPA cement grinding at Nimbahera, Mangrol and Aligarh has started commercial dispatches. The company expects to complete its debottlenecking plan at Rajasthan unit by Q2FY22. Wall putty expansion of the 0.3 MTPA capacity also commissioned in Oct-20; with this expansion, JKCE becomes the largest player of Wall Putty in the country with the capacity of 1.2 MTPA. In FY21, JKCE will complete clinker debottlenecking (0.33MTPA in Rajasthan) and also commission 13 MW WHRS in the north. JK Cement has proposed to set up 3.5 - 4.0 MTPA Grey Cement Capacity in Panna, M.P with split grinding units. The company already has acquired 90% land for Plant area and Mining Lease agreement has been executed and part of Mines Land is also procured. It has two limestone mines in Central region with limestone reserves of 400 mn tons. The company highlighted that it has received environmental clearance for the said mines. It has also obtained the mining lease and environmental clearance for the proposed cement. The expected cost of this greenfield expansion project is US$90- 100/ton. Amid COVID uncertainty, JKCE has decided to not pursue Panna expansion during FY21E, to reduce balance sheet stress. Once this capacity is commissioned (not likely before FY24), the company's capacity share would increase in central India, while it would reduce its dependency in the north and the south. Overall capex would be in the range of Rs. 450 to Rs. 550 crores in FY21. After all current Capex of WHRS at Mangarol of 25MW, the dependency on grid power will 25 – 30% only. The Nimbahera Line 3 upgrade expected to be completed by Q2/Q3FY22. Strong price and improvement in operating efficiency
The cement industry has witnessed a strong pricing M-o-M and Y-o-Y which is expected to improve realization and profitability. The sharp
price hike taken in late April has sustained. Faster traction in rural/semi-urban cement demand came to the rescue of the industry. Strong
prices and lower costs will help to improve profitability in FY21. White cement and putty currently contribute about one-third to JKCE's
overall EBITDA. Capacity expansion of white cement will result in volume growth and profitability improvement.

JK Cements Ltd.
6
Source – Company, HDFC sec Research
JK Cements Ltd.
7
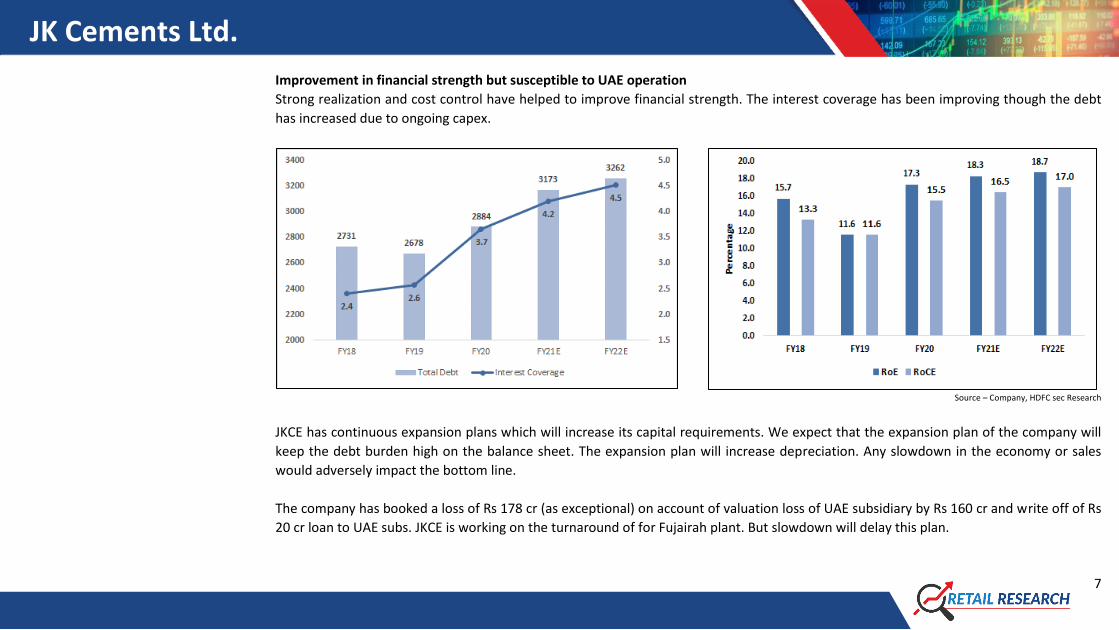
Improvement in financial strength but susceptible to UAE operation
Strong realization and cost control have helped to improve financial strength. The interest coverage has been improving though the debt
has increased due to ongoing capex.
Source – Company, HDFC sec Research
JKCE has continuous expansion plans which will increase its capital requirements. We expect that the expansion plan of the company will
keep the debt burden high on the balance sheet. The expansion plan will increase depreciation. Any slowdown in the economy or sales
would adversely impact the bottom line.
The company has booked a loss of Rs 178 cr (as exceptional) on account of valuation loss of UAE subsidiary by Rs 160 cr and write off of Rs
20 cr loan to UAE subs. JKCE is working on the turnaround of for Fujairah plant. But slowdown will delay this plan.

JK Cements Ltd.
8
What could go wrong
Covid-19 led lockdown and slowdown in the economy affect future growth
It is expected that cement demand will fall sharply in FY21E . A decline in cement demand in FY21 will bring down capacity utilization of
cement companies. Growth in the housing segment, that forms 60%-65% of cement demand, is likely to be affected given the impact of
the slowdown in economic growth as lower income growth and income cuts will result on lower discretionary spending over the next year.
Source – Company, HDFC sec Research
Majority of the construction labour have returned to their homes and are reluctantly returning to join work even after the state-wise
lifting of lockdown. Reduced availability of truck drivers is impacting inward and outward logistics.
The COVID-19 induced self-isolation impaired the home buying sentiments that has created an adverse impact on weak balance sheet
builders and they tend to defer launches of new projects.
Fall in volumes will result in lower capacity utilization resulting in lower operating leverage.

JK Cements Ltd.
9
Prolonged deterioration of core economy sectors can result in slowdown in cement demand which can result in lower volume offtake and
lower cement prices. Cement industry is a highly fixed cost intensive business. Any slowdown in demand can result in negative operating
leverage which can impact the overall profitability of the company.
Any spike in key raw materials can result in higher input cost which can impact earnings.
High Debt equity ratio
Standalone net-debt declined to Rs1360 cr in Sept 2020 from Rs1590 cr in March 2020 while leverage declined to 1.09 sequentially from
1.35 in March 2020 and 1.22 in June 2020. The management expects net debt to peak at Rs2500 cr despite growth capex due to gross debt
repayments.
About the Company
JK Cement Ltd is a part of the conglomerate JK Group, which was founded by Lala Kamlapat Singhania. JK Cement commenced with commercial production at first grey cement plant at Nimbahera, Rajasthan in May 1975. Later on, the company has set up 2 more units in Rajasthan at Mangrol and Gotan. Currently, JK Cement has an installed grey cement capacity of 14.67MTPA, 2.42MTPA of White cement & putty capacity. It manufactures grey cement, white cement and white cement-based wall putty. The company has the second largest white cement capacity of 2.42MTPA in India (combined capacity white cement capacity, wall putty and allied products); Ultratech and Travancore cement are the other major players. The company also has plants in Fujairah (UAE) with an installed capacity of 0.6MTPA (white cement) and 1.02MTPA (grey cement) in a 90:10 JV with the Government of Fujairah. It is also the 3rd largest producer of white cement in the world with cumulative white cement capacity of 1.9MT. It sells grey cement under the brand JK Cement & JK Super Cement. The Company has a captive power generation capacity of over 125.7 MWs which includes 23.2 MW of waste heat recovery power plants. Industry India is the second-largest cement producer in world. The cement industry occupies an important place in the Indian economy because of
its strong linkages with other sectors such as construction, transportation, coal and power. The sector notably plays a critical role in the
economic growth of the country, in its journey towards inclusive and decidedly conclusive growth. The construction sector alone

JK Cements Ltd.
10
constitutes about 7 per cent of the country's gross domestic product (GDP). India is the second-largest producer of cement in the world
after China, with an installed capacity of ~509 MTPA. Presently, the Indian cement industry has 225 plants, owned by 65 players.
Lower per capita cement consumption in India
Source – Statista, Shree Cement earning presentation, HDFC sec Research
Although India is among the leading producers of cement in the world, its per capita cement consumption is at 200-250 kg, which is lowest among the developing countries. The world average is 500-580 kg, while countries such as China have a per capita cement consumption of 1650-1750 kg, followed by Vietnam (800-850 kg) and Turkey (700-750 kg). The factors that could trigger cement sales are infrastructural demand especially for Government projects, as well as higher housing demand in rural and semi-urban areas. A higher realization and rising dispatches are considered to be conducive for higher profits for the cement industry. All efforts are targeted to increase sales and reach the premium segment in prices. The government also intends to expand the capacity of the railways and the facilities for handling and storage to ease the transportation of cement and reduce transportation costs. The demand for the cement industry is expected to reach 550-600 million tonnes per annum by 2025 because of the expanding demand of different end users i.e. housing, commercial construction and industrial construction. Government thrust on affordable housing for realizing its vision of “Housing for All” by 2022 and Smart City program should also help in demand growth for cement. The rate of new cement capacity additions has also slowed down considerably. Therefore, the outlook for the cement sector looks better.

JK Cements Ltd.
11
Cement, being a bulk commodity, is a freight intensive industry and long-distance transportation can prove to be uneconomical. This has resulted in cement being largely a regional play with the industry divided into five main regions viz. north, south, west, east and the central region. Cement is relatively a highly concentrated industry in India: I) the top 10 companies constitute> 60% of the market; ii) the top 5 companies enjoy a market share of around > 48%, and iii) the top 2 cement groups (Lafarge Holcim and Aditya Birla Group) enjoy a market share of around 38%. Peer Comparison as per FY20 Financial
Company CMP (As on 19-11-
2020) Mcap (Rs. Cr.)
Capacity (MTPA)
OPM% NPM% RoE% RoCE% D/E(x) TTM P/E
(x) TTM
EV/T ($) EBIDTA/T
(Rs.)
JK Cement 1885 14568 17.1 21 8 17 15 1 26.3 133 1185
ACC 1680 31582 33.4 15 9 12 17 0.0 26 108 781
Ambuja Cement 259 51428 29.7 17 8 9 17 0.0 18 187 897
Dalmia Bharat 978 19071 26.5 22 2 2 5 0.5 39 113 1091
Shree Cement 23662 85420 44.4 29 12 13 16 0.2 50 263 1458
The Ramco Cement 861 20285 16.5 21 11 12 13 0.6 34 185 981
Ultratech Cement 4778 137893 114.8 22 9 12 14 0.7 22 185 1141
India Cements 150 4650 15.6 12 1 1 4 0.7 54 65 530
Heidelberg Cement 199 4517 6.26 24 12 22 28 0.2 19 91 1122
JK Lakshmi Cement 343 4037 13.3 17 6 15 17 0.7 14 55 732
Company Regions wise Presence
North West South East Central
Ambuja Cement Y Y Y Y Y
The Ramco Cement Y Y
Ultratech Cement Y Y Y Y Y
ACC Y Y Y Y Y
Dalmia Bharat Y Y Y
Shree Cement Y Y Y Y
India Cements Y Y
JK Cement Y Y Y
JK Lakshmi Cement Y Y Y
Heidelberg Cement Y

JK Cements Ltd.
12
Financials Income Statement Balance Sheet
(Rs Cr) FY18 FY19 FY20 FY21E FY22E As at March FY18 FY19 FY20 FY21E FY22E
Net Revenue 4854 5259 5802 6135 6999 SOURCE OF FUNDS
Growth (%) 4.3 8.3 10.3 5.8 14.1 Share Capital 69.9 77.3 77.3 77.3 77.3
Operating Expenses 4066 4424 4588 4708 5367 Reserves 1905 2625 2950 3496 4149
EBITDA 787 834 1213 1428 1632 Minority Interest 0 -7 -20 -20 -20
Growth (%) 8.4 6.0 45.4 17.7 14.3 Other Equity & Liabilities 0 0 0 0 0
EBITDA Margin (%) 16.2 15.9 20.9 23.3 23.3 Shareholders' Funds 1975 2695 3007 3554 4206
Other Income 128.1 80.4 85.3 94.3 100.0 Long Term Debt 2574 2440 2704 2974 3033
Depreciation 231.3 241.3 288.0 325.5 363.3 Long Term Provisions & Others 597 668 819 745 804
EBIT 684 674 1011 1197 1368 Total Source of Funds 5146 5803 6530 7273 8043
Interest 284.1 261.1 276.4 284.7 302.4 APPLICATION OF FUNDS
Shares of Profit in Joint Ventures (net of Tax) 0.0 0.0 0.0 0.0 0.0 Net Block 4548 5111 5777 6277 7177
PBT 400 412 734 912 1066 Non-Current Investments 41 44 45 52 59
Tax 97.6 148.8 251.1 319.4 351.7 Deferred Tax Assets (net) 0 0 0 0 0
RPAT 303 264 483 592 714 Long Term Loans & Advances 183 212 179 195 214
Minority Int. 4 7 13 11 15 Other Assets 0 0 0 0 0
APAT 306.5 270.4 496.4 603.1 729.8 Total Non Current Assets 4772 5367 6001 6524 7451
Growth (%) 62.9 -6.6 83.6 21.5 21.0 Current Investments 78 394 1 1 1
EPS 37.5 35.0 64.2 78.1 94.4 Inventories 590 624 690 723 815
Trade Receivables 236 257 268 286 326
Short term Loans & Advances 179 231 520 624 718
Cash & Equivalents 573 456 634 770 609
Other Current Assets 30 83 208 239 251
Total Current Assets 1684 2045 2322 2644 2720
Short-Term Borrowings 156 238 181 199 229
Trade Payables 665 434 492 522 596
Other Current Liab & Provisions 469 843 1010 1063 1191
Short-Term Provisions 19 95 111 111 113
Total Current Liabilities 1310 1610 1793 1895 2128
Net Current Assets 375 436 529 749 592
Total Application of Funds 5146 5803 6530 7273 8043

JK Cements Ltd.
13
Cash Flow Statement Key Ratios (Rs Cr) FY18 FY19 FY20 FY21E FY22E (Rs Cr) FY18 FY19 FY20 FY21E FY22E
Reported PBT 383 412 734 912 1,066 Profitability (%)
Non-operating & EO items -128 -80 -85 -94 -100 EBITDA Margin 16.2 15.9 20.9 23.3 23.3
Interest Expenses 284 261 276 285 302 EBIT Margin 14.1 12.8 17.4 19.5 19.6
Depreciation 231 241 288 325 363 APAT Margin 5.9 5.0 8.3 9.7 10.2
Working Capital Change -39 -178 85 -84 -5 RoE 15.7 11.6 17.3 18.3 18.7
Tax Paid -98 -149 -251 -319 -352 RoCE 13.3 11.6 15.5 16.5 17.0
OPERATING CASH FLOW ( a ) 634 508 1,048 1,025 1,275 Solvency Ratio
Capex -69 -807 -1,263 -513 -1,263 D/E 1.4 1.0 1.0 0.9 0.8
Free Cash Flow 564 -299 -216 511 12 Interest Coverage 2.4 2.6 3.7 4.2 4.5
Investments 39 -32 33 -24 -27 PER SHARE DATA
Non-operating income 128 80 85 94 100 EPS 37.5 35.0 64.2 78.1 94.4
INVESTING CASH FLOW ( b ) 98 -759 -1,145 -443 -1,190 CEPS 74.5 66.2 101.5 120.2 141.5
Debt Issuance / (Repaid) -244 -64 415 196 118 BV 282 350 392 463 547
Interest Expenses -284 -261 -276 -285 -302 Dividend 10.0 10.0 7.5 6.0 8.0
FCFE 36 -624 -77 423 -173 Turnover Ratios (days)
Share Capital Issuance -4 0 -13 0 0 Debtor days 18 18 17 17 17
Dividend -70 -82 -79 -46 -62 Inventory days 43 42 41 43 43
FINANCING CASH FLOW ( c ) -602 -407 47 -134 -247 Creditors days 49 45 37 41 41
NET CASH FLOW (a+b+c) 130 -658 -51 448 -161 Working Capital Days 12 15 21 20 19
VALUATION
P/E 50.4 53.9 29.4 24.2 20.0
P/BV 6.7 5.4 4.8 4.1 3.5
EV/EBITDA 21.9 20.7 14.2 12.1 10.6
Dividend Yield 0.5 0.5 0.4 0.3 0.4
Dividend Payout 22.4 28.6 11.7 7.7 8.5 Source: Company, HDFC sec Research
One Year Price Chart

JK Cements Ltd.
14
Disclosure: I, Jimit Zaveri, (MBA - Finance), authors and the names subscribed to this report, hereby certify that all of the views expressed in this research report accurately reflect our views about the subject issuer(s) or securities. HSL has no material adverse disciplinary history as on the date of
publication of this report. We also certify that no part of our compensation was, is, or will be directly or indirectly related to the specific recommendation(s) or view(s) in this report.
Research Analyst or his/her relative or HDFC Securities Ltd. does not have any financial interest in the subject company. Also Research Analyst or his relative or HDFC Securities Ltd. or its Associate may have beneficial ownership of 1% or more in the subject company at the end of the
month immediately preceding the date of publication of the Research Report. Further Research Analyst or his relative or HDFC Securities Ltd. or its associate does not have any material conflict of interest.
Any holding in stock – No
HDFC Securities Limited (HSL) is a SEBI Registered Research Analyst having registration no. INH000002475.
Disclaimer:
This report has been prepared by HDFC Securities Ltd and is meant for sole use by the recipient and not for circulation. The information and opinions contained herein have been compiled or arrived at, based upon information obtained in good faith from sources believed to be reliable.
Such information has not been independently verified and no guaranty, representation of warranty, express or implied, is made as to its accuracy, completeness or correctness. All such information and opinions are subject to change without notice. This document is for information
purposes only. Descriptions of any company or companies or their securities mentioned herein are not intended to be complete and this document is not, and should not be construed as an offer or solicitation of an offer, to buy or sell any securities or other financial instruments.
This report is not directed to, or intended for display, downloading, printing, reproducing or for distribution to or use by, any person or entity who is a citizen or resident or located in any locality, state, country or other jurisdiction where such distribution, publication, reproduction,
availability or use would be contrary to law or regulation or what would subject HSL or its affiliates to any registration or licensing requirement within such jurisdiction.
If this report is inadvertently sent or has reached any person in such country, especially, United States of America, the same should be ignored and brought to the attention of the sender. This document may not be reproduced, distributed or published in whole or in part, directly or
indirectly, for any purposes or in any manner.
Foreign currencies denominated securities, wherever mentioned, are subject to exchange rate fluctuations, which could have an adverse effect on their value or price, or the income derived from them. In addition, investors in securities such as ADRs, the values of which are influenced
by foreign currencies effectively assume currency risk.
It should not be considered to be taken as an offer to sell or a solicitation to buy any security. HSL may from time to time solicit from, or perform broking, or other services for, any company mentioned in this mail and/or its attachments.
HSL and its affiliated company(ies), their directors and employees may; (a) from time to time, have a long or short position in, and buy or sell the securities of the company(ies) mentioned herein or (b) be engaged in any other transaction involving such securities and earn brokerage or
other compensation or act as a market maker in the financial instruments of the company(ies) discussed herein or act as an advisor or lender/borrower to such company(ies) or may have any other potential conflict of interests with respect to any recommendation and other related
information and opinions.
HSL, its directors, analysts or employees do not take any responsibility, financial or otherwise, of the losses or the damages sustained due to the investments made or any action taken on basis of this report, including but not restricted to, fluctuation in the prices of shares and bonds,
changes in the currency rates, diminution in the NAVs, reduction in the dividend or income, etc.
HSL and other group companies, its directors, associates, employees may have various positions in any of the stocks, securities and financial instruments dealt in the report, or may make sell or purchase or other deals in these securities from time to time or may deal in other securities
of the companies / organizations described in this report.
HSL or its associates might have managed or co-managed public offering of securities for the subject company or might have been mandated by the subject company for any other assignment in the past twelve months.
HSL or its associates might have received any compensation from the companies mentioned in the report during the period preceding twelve months from t date of this report for services in respect of managing or co-managing public offerings, corporate finance, investment banking or
merchant banking, brokerage services or other advisory service in a merger or specific transaction in the normal course of business.
HSL or its analysts did not receive any compensation or other benefits from the companies mentioned in the report or third party in connection with preparation of the research report. Accordingly, neither HSL nor Research Analysts have any material conflict of interest at the time of
publication of this report. Compensation of our Research Analysts is not based on any specific merchant banking, investment banking or brokerage service transactions. HSL may have issued other reports that are inconsistent with and reach different conclusion from the information
presented in this report.
Research entity has not been engaged in market making activity for the subject company. Research analyst has not served as an officer, director or employee of the subject company. We have not received any compensation/benefits from the subject company or third party in
connection with the Research Report.
HDFC securities Limited, I Think Techno Campus, Building - B, "Alpha", Office Floor 8, Near Kanjurmarg Station, Opp. Crompton Greaves, Kanjurmarg (East), Mumbai 400 042 Phone: (022) 3075 3400 Fax: (022) 2496 5066
Compliance Officer: Binkle R. Oza Email: [email protected] Phone: (022) 3045 3600
HDFC Securities Limited, SEBI Reg. No.: NSE, BSE, MSEI, MCX: INZ000186937; AMFI Reg. No. ARN: 13549; PFRDA Reg. No. POP: 11092018; IRDA Corporate Agent License No.: CA0062; SEBI Research Analyst Reg. No.: INH000002475; SEBI Investment Adviser Reg. No.: INA000011538; CIN -
U67120MH2000PLC152193
Mutual Funds Investments are subject to market risk. Please read the offer and scheme related documents carefully before investing.
Related Documents