Jiří Duspiva Nuclear Research Institute Řež, plc. Nuclear Power and Safety Division Dept. of Reactor Technology 11 th International QUENCH Workshop Karlsruhe, Germany, October 25-27, 2005 Conclusions from Conclusions from Quench-03 Test Analyses with Quench-03 Test Analyses with ICARE2 and MELCOR Codes ICARE2 and MELCOR Codes

Jiří Duspiva Nuclear Research Institute Řež, plc. Nuclear Power and Safety Division Dept. of Reactor Technology 11 th International QUENCH Workshop Karlsruhe,
Dec 15, 2015
Welcome message from author
This document is posted to help you gain knowledge. Please leave a comment to let me know what you think about it! Share it to your friends and learn new things together.
Transcript

Jiří DuspivaNuclear Research Institute Řež, plc.Nuclear Power and Safety Division
Dept. of Reactor Technology
11th International QUENCH WorkshopKarlsruhe, Germany, October 25-27, 2005
Conclusions from Conclusions from
Quench-03 Test Analyses with Quench-03 Test Analyses with
ICARE2 and MELCOR CodesICARE2 and MELCOR Codes

J. Duspiva 11th International QUENCH Workshop Karlsruhe, Germany, October 25-27, 2005
2
Background of Quench analysis in NRI Řež
Quench-03 test analysis with ICARE2(Short summary of 10th QWS presentation)
•Comparison to MELCOR 1.8.5 Improved model of Quench-03
•Comparison to MELCOR 1.8.5
•Regressive application to Quench-01 Summary and conclusions
Outline

J. Duspiva 11th International QUENCH Workshop Karlsruhe, Germany, October 25-27, 2005
3
Backgroundof NRI Quench Analyses
First NRI – Quench activities were performed with MELCOR Code Own MELCOR input model was developed for Quench-01 [1],
successfully also applied to Quench-06 [ISP-45 Blind phase] calculations Quench-03 Calculation was last with MELCOR 1.8.5 [2]
• Temperature at onset of reflooding higher than Q-01 and Q-06
• Temperature escalation was not predicted correctly
• Strong underestimation of Hydrogen production Under EU Project SARNET in TPA1/JPA1 (WP9: Early Phase of Core
Degradation ST-1 Hydrogen Generation during Core Reflooding) started application of ICARE2 Code with following schedule [3] and [4]
• Step 1 – Preparation of model and calculation of Quench-01 test
• Step 2 - Sensitivity Study on the change of important parameters
• Step 3 – Calculation of Quench-03 test
[1] J. Duspiva: Quench-01 Test Calculation with MELCOR Code, CSARP Meeting, May 7-9, 2001, Bethesda, Maryland [2] J. Duspiva: Quench-03 Test Calculation with MELCOR Code, 8 th International Quench Workshop, Karlsruhe, Germany,
October 29-31, 2002[3] J. Duspiva: Quench Test Calculations with ICARE2 Code and Comparison with MELCOR Code Results, 10 th International
Quench Workshop, Karlsruhe, Germany, October 26-28, 2004[4] J. Duspiva: Quench Test Calculations with ICARE2 Code and Comparison with MELCOR Code Results (Quench-01 and
Quench-03 Test Analyses), Report NRI Řež, UJV-12204-T, March 2005
J. Duspiva 11th International QUENCH Workshop Karlsruhe, Germany, October 25-27, 2005
4
ICARE2 Input ModelQuench Facility Nodalization
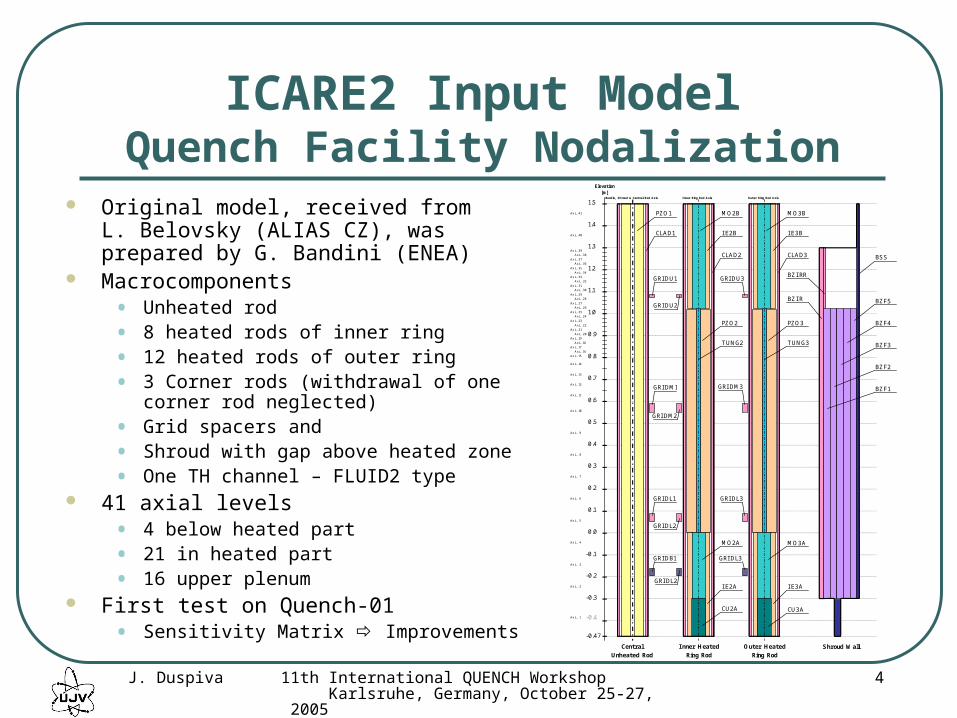
Original model, received from L. Belovsky (ALIAS CZ), was prepared by G. Bandini (ENEA)
Macrocomponents• Unheated rod
• 8 heated rods of inner ring
• 12 heated rods of outer ring
• 3 Corner rods (withdrawal of one corner rod neglected)
• Grid spacers and
• Shroud with gap above heated zone
• One TH channel – FLUID2 type 41 axial levels
• 4 below heated part
• 21 in heated part
• 16 upper plenum First test on Quench-01
• Sensitivity Matrix Improvements
1.5
1.4
1.3
1.2
1.1
1.0
0.9
0.8
0.7
0.6
0.5
0.4
0.3
0.2
0.1
0.0
-0.2
-0.3
-0.4
-0.47
CLAD1
PZO1
PZO2
MO2B
I E2B
CLAD2
TUNG2
MO2A
I E2A
CU2A
MO3A
I E3A
CU3A
TUNG3
CLAD3
I E3B
MO3B
PZO3
BZI RR
BZI R
BSS
BZF5
BZF4
BZF3
BZF2
BZF1
Central Unheated Rod
I nner Heated Ring Rod
Outer Heated Ring Rod
Shroud Wall
Ax.L. 41
Ax.L. 40
Ax.L. 39 Ax.L. 38
Ax.L. 37 Ax.L. 36
Ax.L. 35 Ax.L. 34
Ax.L. 33 Ax.L. 32
Ax.L. 31 Ax.L. 30
Ax.L. 29 Ax.L. 28
Ax.L. 27 Ax.L. 26
Ax.L. 25 Ax.L. 24
Ax.L. 23 Ax.L. 22
Ax.L. 21 Ax.L. 20
Ax.L. 19 Ax.L. 18
Ax.L. 17 Ax.L. 16
Ax.L. 15
Ax.L. 14
Ax.L. 13
Ax.L. 12
Ax.L. 11
Ax.L. 10
Ax.L. 9
Ax.L. 8
Ax.L. 7
Ax.L. 6
Ax.L. 5
Ax.L. 4
Ax.L. 3
Ax.L. 2
Ax.L. 1
Bundle, Shroud & Central Rod Axis I nner Ring Rod Axis Outer Ring Rod Axis
Elevation [m]
-0.1
GRI DU1
GRI DU2
GRI DM1
GRI DM2
GRI DM3
GRI DL1
GRI DL2
GRI DL3
GRI DU3
GRI DB1 GRI DL3
GRI DL2
J. Duspiva 11th International QUENCH Workshop Karlsruhe, Germany, October 25-27, 2005
5
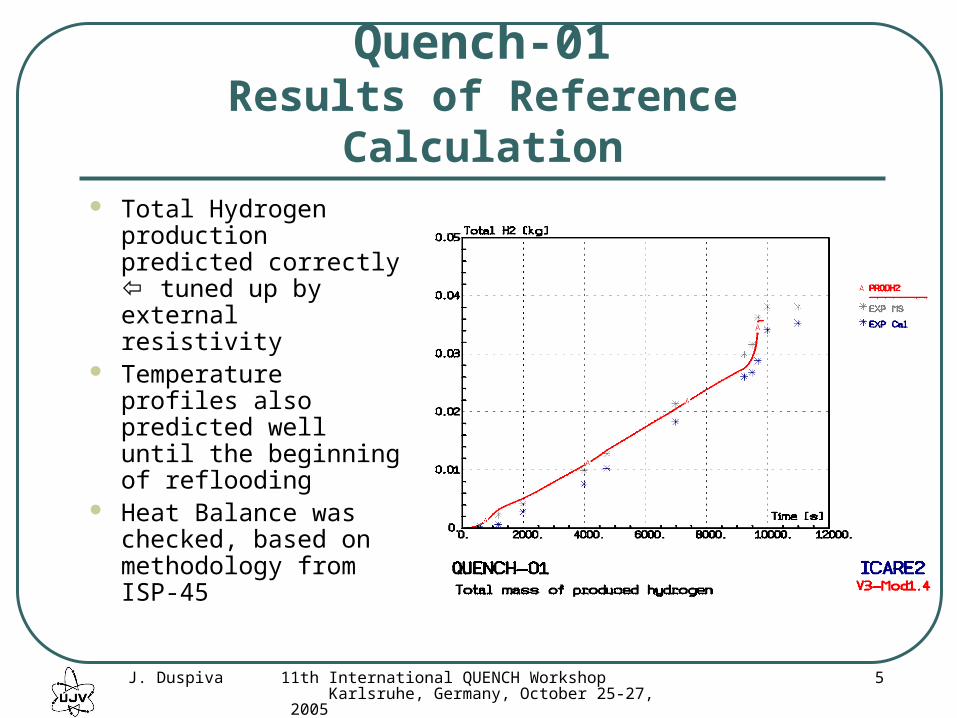
Quench-01Results of Reference Calculation Total Hydrogen
production predicted correctly tuned up by external resistivity
Temperature profiles also predicted well until the beginning of reflooding
Heat Balance was checked, based on methodology from ISP-45

J. Duspiva 11th International QUENCH Workshop Karlsruhe, Germany, October 25-27, 2005
6
Quench-03Input File Changes
Changes done in comparison with Quench-01 calculation (identical approach as in MELCOR analyses of Quench-01 and Quench-03 tests)
Redefinition of (initial and boundary conditions) Power per ring Inlet temperatures and mass flow rates
(Ar, steam and water) Initial temperatures in bundle Time of reflooding beginning Timestep definition
J. Duspiva 11th International QUENCH Workshop Karlsruhe, Germany, October 25-27, 2005
7
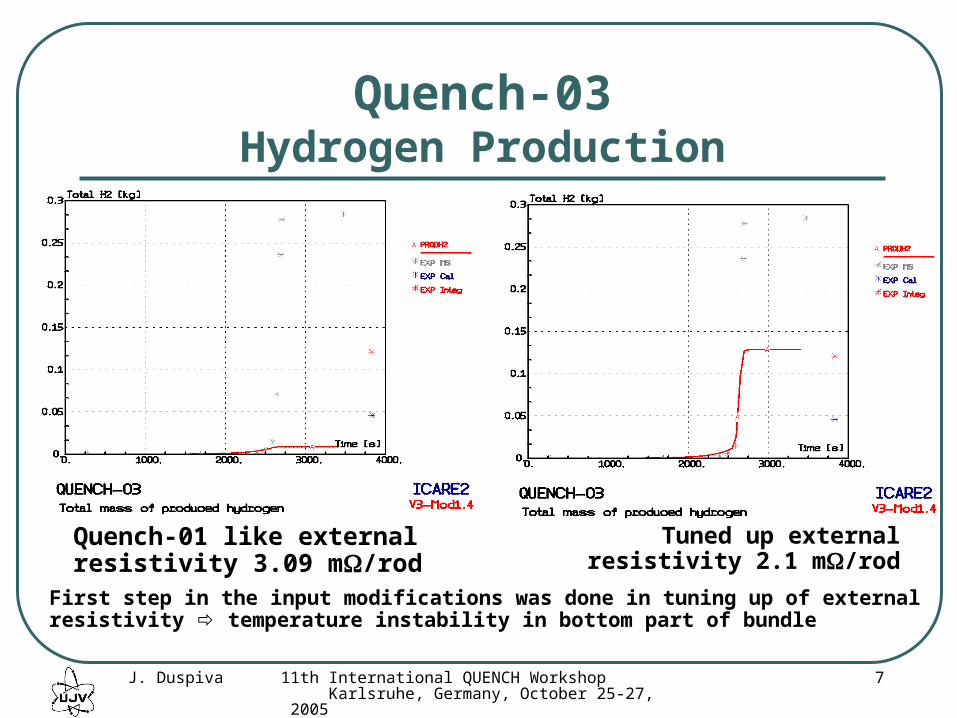
Quench-03Hydrogen Production
First step in the input modifications was done in tuning up of external resistivity temperature instability in bottom part of bundle
Tuned up external resistivity 2.1 m/rod
Quench-01 like external resistivity 3.09 m/rod
J. Duspiva 11th International QUENCH Workshop Karlsruhe, Germany, October 25-27, 2005
8
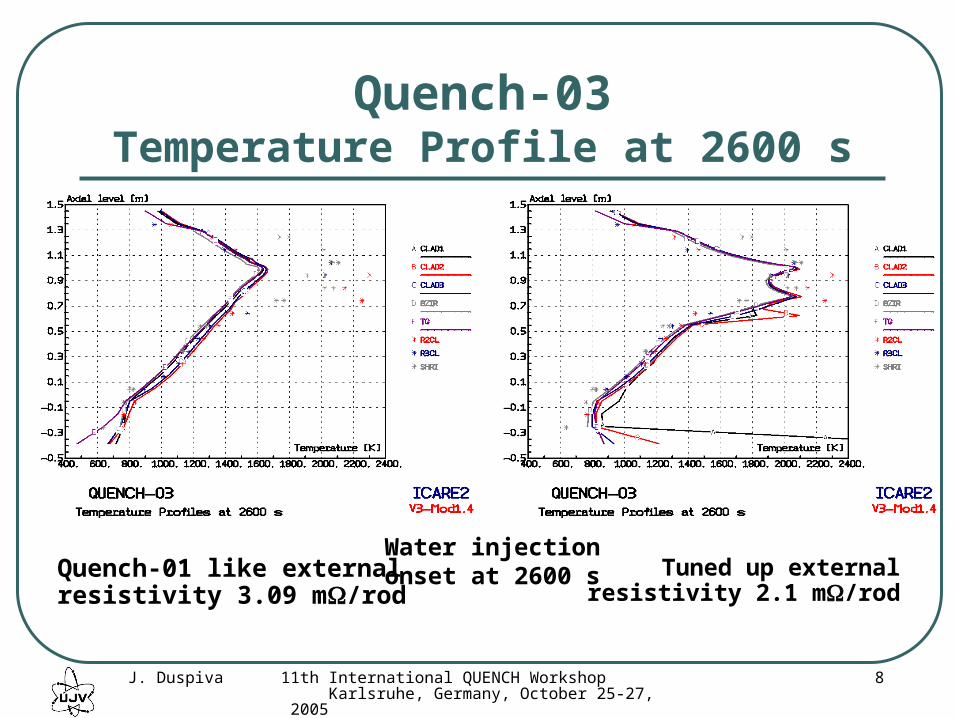
Quench-03Temperature Profile at 2600 s
Quench-01 like external resistivity 3.09 m/rod
Tuned up external resistivity 2.1 m/rod
Water injection onset at 2600 s

J. Duspiva 11th International QUENCH Workshop Karlsruhe, Germany, October 25-27, 2005
9
ICARE2 to MELCOR Comparison
Similar behaviour of both analyses for H2 production when all settings from Q-01 are applied in Q-03 (change of initial and boundary conditions)
Also temperature evolutions had a lot of similarities• Relatively good agreement of temperature prediction in lower and middle part of heated zone
• No temperature escalation results in underestimation of H2 production
[2] J. Duspiva: Quench-03 Test Calculation with MELCOR Code, 8th International QUENCH Workshop, Karslruhe October 29-31, 2002
End of 10th QWS 2004 NRI Contribution Summary
J. Duspiva 11th International QUENCH Workshop Karlsruhe, Germany, October 25-27, 2005
10
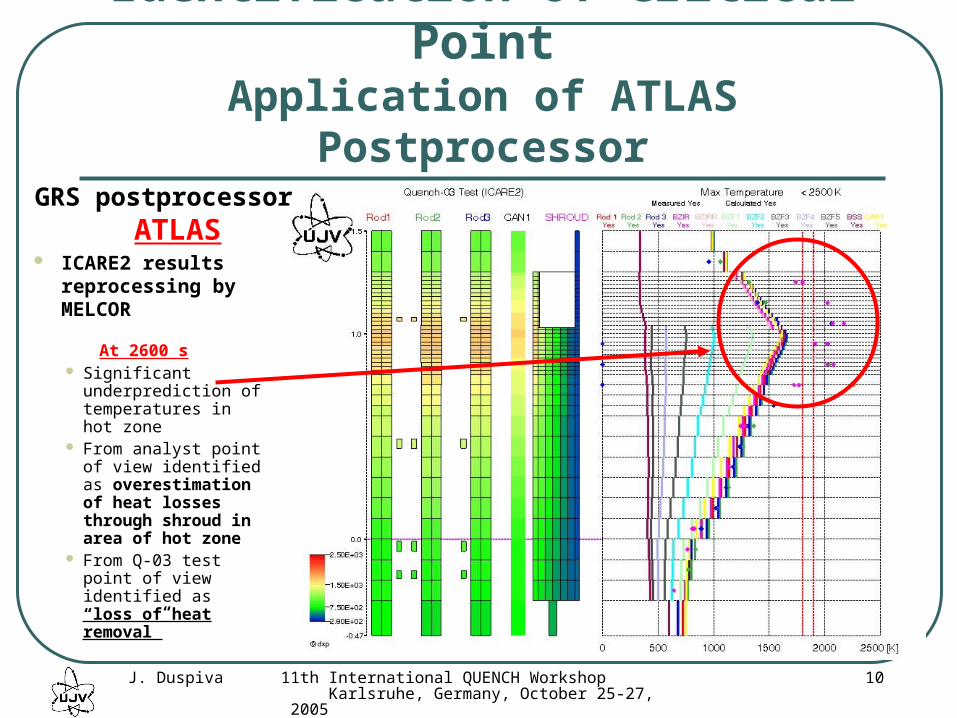
Identification of Critical Point
Application of ATLAS Postprocessor
At 2600 s Significant
underprediction of temperatures in hot zone
From analyst point of view identified as overestimation of heat losses through shroud in area of hot zone
From Q-03 test point of view identified as “loss of heat removal”
GRS postprocessor ATLAS
ICARE2 results reprocessing by MELCOR

J. Duspiva 11th International QUENCH Workshop Karlsruhe, Germany, October 25-27, 2005
11
Modelling Approach Used
More possible ways exist Definition of material properties was separated
for• BZF2-5
• BZF1 Conductivity of solid material was modified for
temperature above 550 K Final values were defined iteratively based on
temperature profiles at onset
1.5
1.4
1.3
1.2
1.1
1.0
0.9
0.8
0.7
0.6
0.5
0.4
0.3
0.2
0.1
0.0
-0.2
-0.3
-0.4
-0.47
CLAD1
PZO1
PZO2
MO2B
I E2B
CLAD2
TUNG2
MO2A
I E2A
CU2A
MO3A
I E3A
CU3A
TUNG3
CLAD3
I E3B
MO3B
PZO3
BZI RR
BZI R
BSS
BZF5
BZF4
BZF3
BZF2
BZF1
Central Unheated Rod
I nner Heated Ring Rod
Outer Heated Ring Rod
Shroud Wall
Ax.L. 41
Ax.L. 40
Ax.L. 39 Ax.L. 38
Ax.L. 37 Ax.L. 36
Ax.L. 35 Ax.L. 34
Ax.L. 33 Ax.L. 32
Ax.L. 31 Ax.L. 30
Ax.L. 29 Ax.L. 28
Ax.L. 27 Ax.L. 26
Ax.L. 25 Ax.L. 24
Ax.L. 23 Ax.L. 22
Ax.L. 21 Ax.L. 20
Ax.L. 19 Ax.L. 18
Ax.L. 17 Ax.L. 16
Ax.L. 15
Ax.L. 14
Ax.L. 13
Ax.L. 12
Ax.L. 11
Ax.L. 10
Ax.L. 9
Ax.L. 8
Ax.L. 7
Ax.L. 6
Ax.L. 5
Ax.L. 4
Ax.L. 3
Ax.L. 2
Ax.L. 1
Bundle, Shroud & Central Rod Axis Inner Ring Rod Axis Outer Ring Rod Axis
Elevation [m]
-0.1
GRI DU1
GRI DU2
GRI DM1
GRI DM2
GRI DM3
GRI DL1
GRI DL2
GRI DL3
GRI DU3
GRI DB1 GRI DL3
GRI DL2
950 K
550 K
610 K Q- 01
Q- 01 and Q- 03
600 K Q- 03
Modification of Zirconia Fibers CDS
0.00
0.05
0.10
0.15
0.20
0.25
0.30
0.35
0.40
0 500 1000 1500 2000 2500
Temperature [K]
Co
nd
uct
ivit
y [W
/m*K
]
Original
BZF1
BZF2-5
J. Duspiva 11th International QUENCH Workshop Karlsruhe, Germany, October 25-27, 2005
12
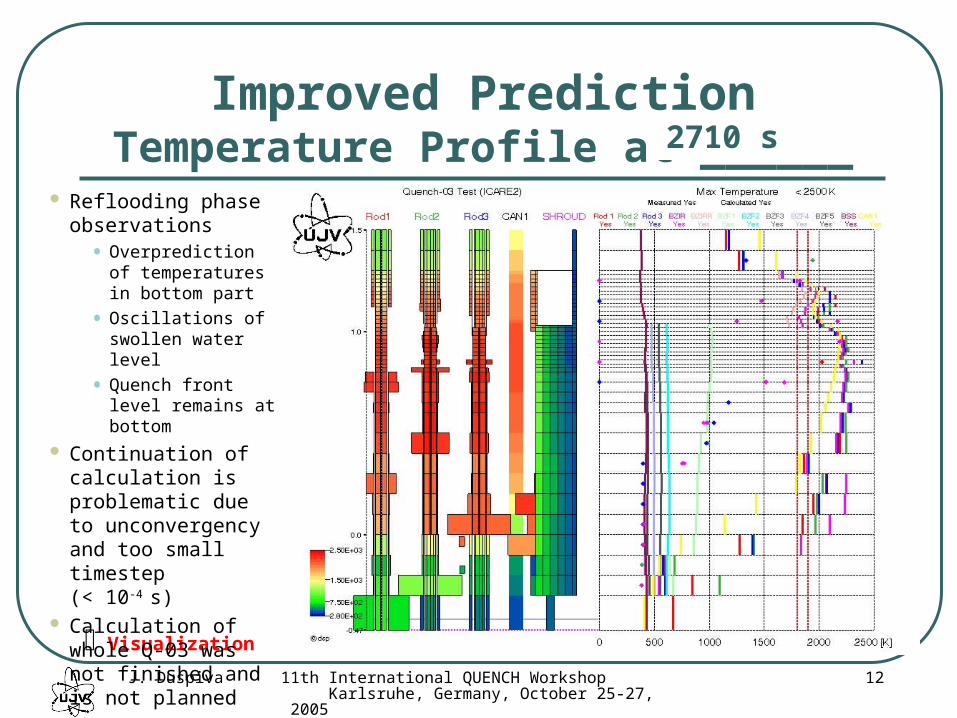
Improved PredictionTemperature Profile at ______
Temperature profiles are in agreement with measured values
Significantly lower temperature of Zirconia fiber layers
All three types of rod are degraded, shroud remains intact
Visualization
2500 s 2520 s 2540 s 2560 s 2580 s 2590 s 2600 s 2610 s 2620 s 2630 s 2640 s 2650 s 2660 s 2670 s 2680 s 2690 s 2699 s
Reflooding phase observations
• Overprediction of temperatures in bottom part
• Oscillations of swollen water level
• Quench front level remains at bottom
Continuation of calculation is problematic due to unconvergency and too small timestep (< 10-4 s)
Calculation of whole Q-03 was not finished and is not planned
2710 s
J. Duspiva 11th International QUENCH Workshop Karlsruhe, Germany, October 25-27, 2005
13
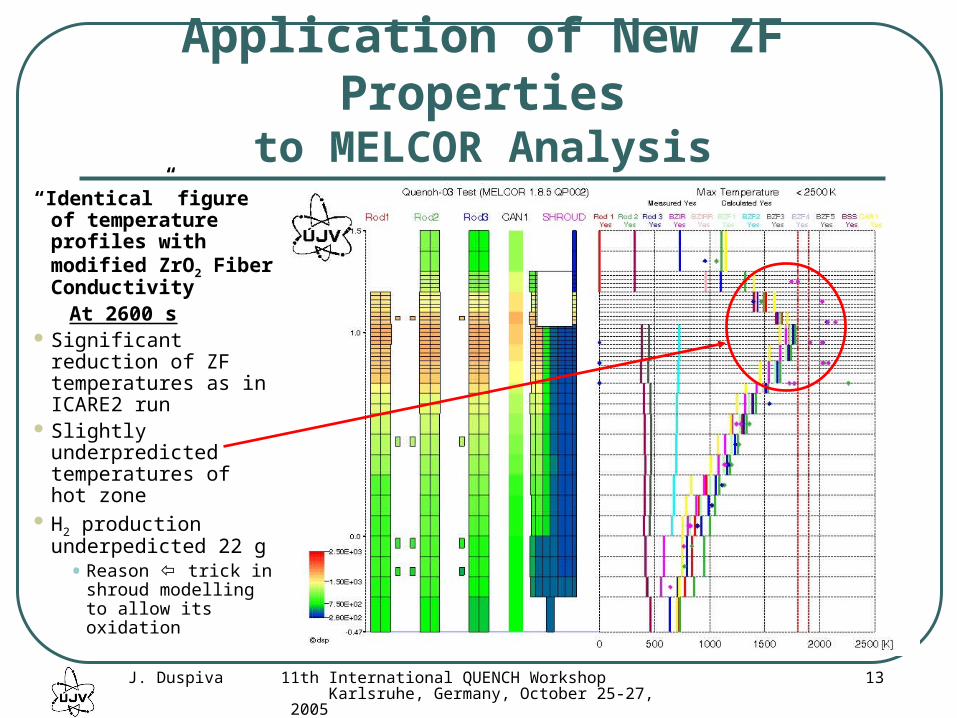
Application of New ZF Properties
to MELCOR Analysis“Identical” figure
of temperature profiles with modified ZrO2 Fiber Conductivity
At 2600 s Significant reduction
of ZF temperatures as in ICARE2 run
Slightly underpredicted temperatures of hot zone
H2 production underpedicted 22 g
•Reason trick in shroud modelling to allow its oxidation
J. Duspiva 11th International QUENCH Workshop Karlsruhe, Germany, October 25-27, 2005
14
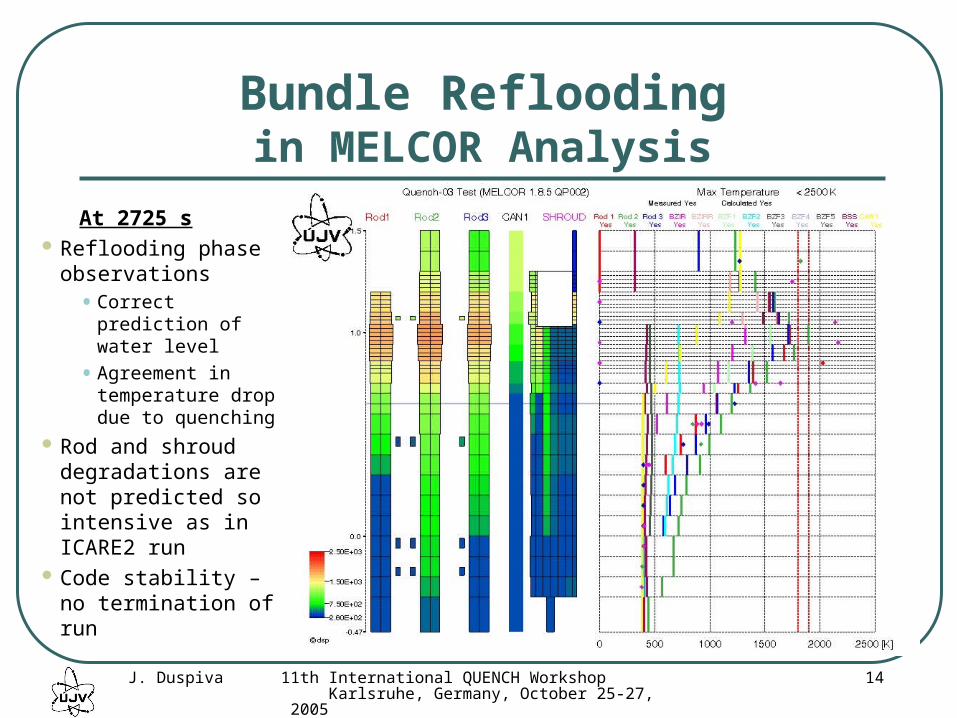
Bundle Refloodingin MELCOR Analysis
At 2725 s Reflooding phase
observations•Correct prediction
of water level
•Agreement in temperature drop due to quenching
Rod and shroud degradations are not predicted so intensive as in ICARE2 run
Code stability – no termination of run

J. Duspiva 11th International QUENCH Workshop Karlsruhe, Germany, October 25-27, 2005
15
Summary and Conclusions
Application of new postprocessing (using GRS ATLAS tool via MELCOR code) made a possible to identified cause of modelling troubles• Three screens prepared – one of them for both of codes used direct
comparison
• Working term of phenomenon identified: “loss of heat removal through shroud in hot zone”
• Modelling of this feature was done by changing of Zirconia fiber conductivity
Improved modelling resulted in very good agreement in temperature profiles at the time of water injection onset in ICARE2 analysis • In MELCOR analysis - agreement was not found, but temperature profiles
were improved too trick in shroud oxidation modelling with fixed heat transfer coefficient (COR00011 input row)
ICARE2 calculation of reflooding phase results in unconvergency and timestep reduction, oscillation in swollen water level occurred • MELCOR run was more stable during reflooding phase
J. Duspiva 11th International QUENCH Workshop Karlsruhe, Germany, October 25-27, 2005
16
Summary and Conclusions
Application of ICARE2 code allowed to identify cause, which was not possible to identify with integral code due to its modelling simplifications, but conclusions are relevant to both of codes (new features of MELCOR1.8.6 will allow more direct validation on Quench tests)
Regressive application of Zirconia fiber properties to Quench-01 analysis with ICARE2 code resulted in strong overpediction of temperatures and hydrogen production• Phenomenon occurred in Quench-03 test only, not in Quench-01, so
it is not possible to use the same model for analysis of both tests
• Final identification and description of phenomenon, which occurred in Quench-03, should be done by experimenters from FZK, only one of possible analytical approaches to model this test was presented
• Specificity of Quench-03 results from shroud behaviour • Not objective of Quench program
• Unimportant for plant applications no another analysis are needed
Output from effort is available in Report UJV-12204-T
(2)
Related Documents