1 Jindal Drilling & Industries Ltd. Initiating Coverage Jindal Drilling & Industries Ltd. Smallcap (High Risk) March 14, 2022

Welcome message from author
This document is posted to help you gain knowledge. Please leave a comment to let me know what you think about it! Share it to your friends and learn new things together.
Transcript
1
Jindal Drilling & Industries Ltd.
Initiating Coverage
Jindal Drilling & Industries Ltd.
Smallcap (High Risk)
March 14, 2022
2
Jindal Drilling & Industries Ltd.
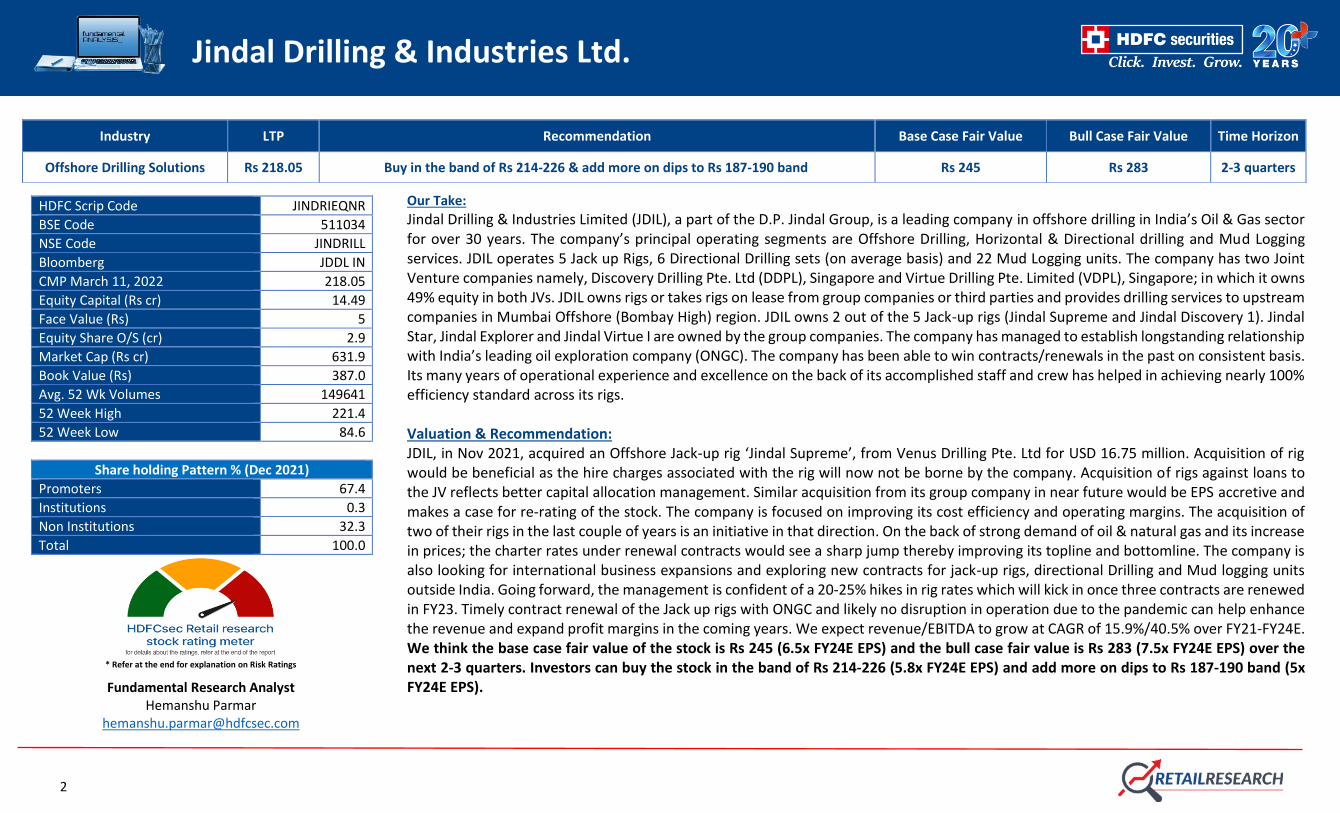
Our Take:
Jindal Drilling & Industries Limited (JDIL), a part of the D.P. Jindal Group, is a leading company in offshore drilling in India’s Oil & Gas sector for over 30 years. The company’s principal operating segments are Offshore Drilling, Horizontal & Directional drilling and Mud Logging services. JDIL operates 5 Jack up Rigs, 6 Directional Drilling sets (on average basis) and 22 Mud Logging units. The company has two Joint Venture companies namely, Discovery Drilling Pte. Ltd (DDPL), Singapore and Virtue Drilling Pte. Limited (VDPL), Singapore; in which it owns 49% equity in both JVs. JDIL owns rigs or takes rigs on lease from group companies or third parties and provides drilling services to upstream companies in Mumbai Offshore (Bombay High) region. JDIL owns 2 out of the 5 Jack-up rigs (Jindal Supreme and Jindal Discovery 1). Jindal Star, Jindal Explorer and Jindal Virtue I are owned by the group companies. The company has managed to establish longstanding relationship with India’s leading oil exploration company (ONGC). The company has been able to win contracts/renewals in the past on consistent basis. Its many years of operational experience and excellence on the back of its accomplished staff and crew has helped in achieving nearly 100% efficiency standard across its rigs. Valuation & Recommendation: JDIL, in Nov 2021, acquired an Offshore Jack-up rig ‘Jindal Supreme’, from Venus Drilling Pte. Ltd for USD 16.75 million. Acquisition of rig would be beneficial as the hire charges associated with the rig will now not be borne by the company. Acquisition of rigs against loans to the JV reflects better capital allocation management. Similar acquisition from its group company in near future would be EPS accretive and makes a case for re-rating of the stock. The company is focused on improving its cost efficiency and operating margins. The acquisition of two of their rigs in the last couple of years is an initiative in that direction. On the back of strong demand of oil & natural gas and its increase in prices; the charter rates under renewal contracts would see a sharp jump thereby improving its topline and bottomline. The company is also looking for international business expansions and exploring new contracts for jack-up rigs, directional Drilling and Mud logging units outside India. Going forward, the management is confident of a 20-25% hikes in rig rates which will kick in once three contracts are renewed in FY23. Timely contract renewal of the Jack up rigs with ONGC and likely no disruption in operation due to the pandemic can help enhance the revenue and expand profit margins in the coming years. We expect revenue/EBITDA to grow at CAGR of 15.9%/40.5% over FY21-FY24E. We think the base case fair value of the stock is Rs 245 (6.5x FY24E EPS) and the bull case fair value is Rs 283 (7.5x FY24E EPS) over the next 2-3 quarters. Investors can buy the stock in the band of Rs 214-226 (5.8x FY24E EPS) and add more on dips to Rs 187-190 band (5x FY24E EPS).
Industry LTP Recommendation Base Case Fair Value Bull Case Fair Value Time Horizon
Offshore Drilling Solutions Rs 218.05 Buy in the band of Rs 214-226 & add more on dips to Rs 187-190 band Rs 245 Rs 283 2-3 quarters
HDFC Scrip Code JINDRIEQNR
BSE Code 511034
NSE Code JINDRILL
Bloomberg JDDL IN
CMP March 11, 2022 218.05
Equity Capital (Rs cr) 14.49
Face Value (Rs) 5
Equity Share O/S (cr) 2.9
Market Cap (Rs cr) 631.9
Book Value (Rs) 387.0
Avg. 52 Wk Volumes 149641
52 Week High 221.4
52 Week Low 84.6
Share holding Pattern % (Dec 2021)
Promoters 67.4
Institutions 0.3
Non Institutions 32.3
Total 100.0
* Refer at the end for explanation on Risk Ratings
Fundamental Research Analyst Hemanshu Parmar
3
Jindal Drilling & Industries Ltd.
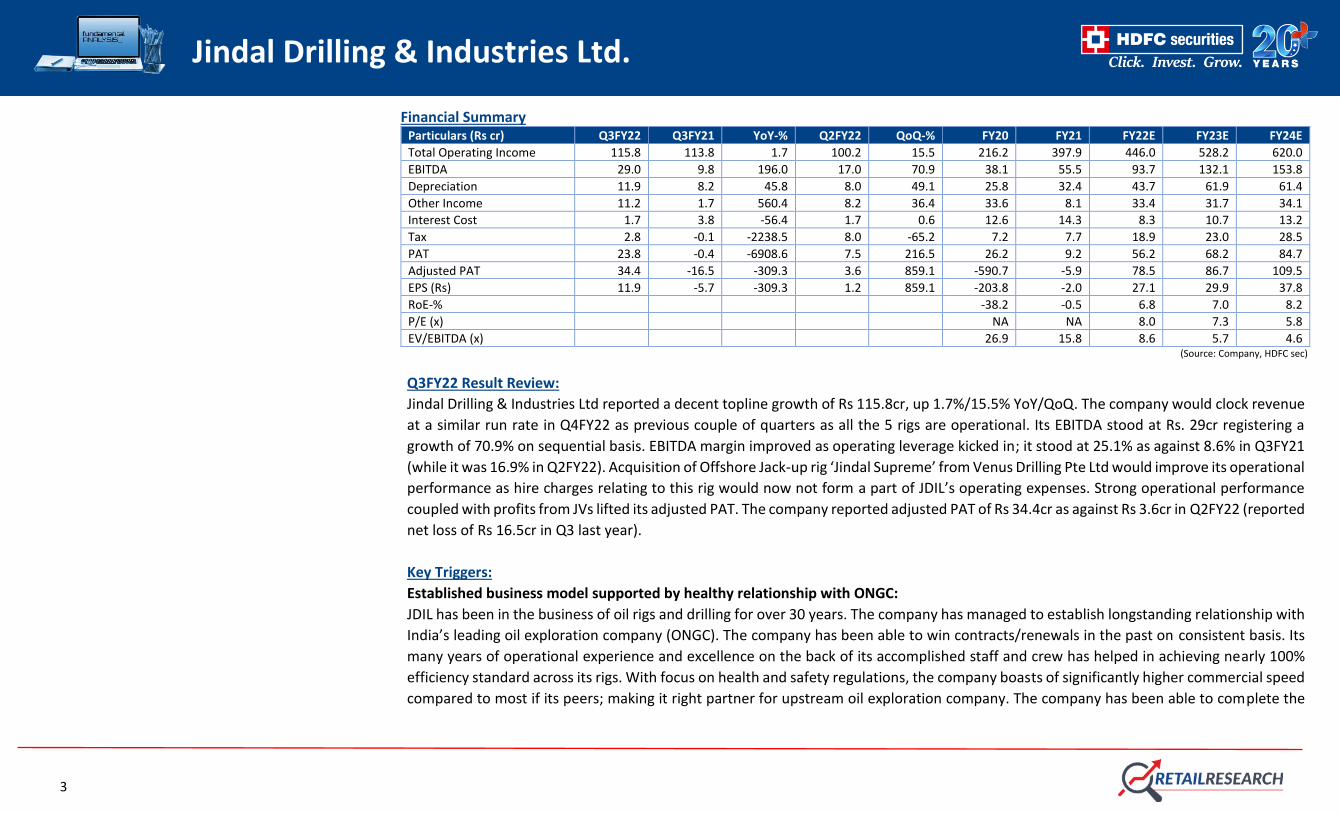
Financial Summary Particulars (Rs cr) Q3FY22 Q3FY21 YoY-% Q2FY22 QoQ-% FY20 FY21 FY22E FY23E FY24E
Total Operating Income 115.8 113.8 1.7 100.2 15.5 216.2 397.9 446.0 528.2 620.0
EBITDA 29.0 9.8 196.0 17.0 70.9 38.1 55.5 93.7 132.1 153.8
Depreciation 11.9 8.2 45.8 8.0 49.1 25.8 32.4 43.7 61.9 61.4
Other Income 11.2 1.7 560.4 8.2 36.4 33.6 8.1 33.4 31.7 34.1
Interest Cost 1.7 3.8 -56.4 1.7 0.6 12.6 14.3 8.3 10.7 13.2
Tax 2.8 -0.1 -2238.5 8.0 -65.2 7.2 7.7 18.9 23.0 28.5
PAT 23.8 -0.4 -6908.6 7.5 216.5 26.2 9.2 56.2 68.2 84.7
Adjusted PAT 34.4 -16.5 -309.3 3.6 859.1 -590.7 -5.9 78.5 86.7 109.5
EPS (Rs) 11.9 -5.7 -309.3 1.2 859.1 -203.8 -2.0 27.1 29.9 37.8
RoE-% -38.2 -0.5 6.8 7.0 8.2
P/E (x) NA NA 8.0 7.3 5.8
EV/EBITDA (x) 26.9 15.8 8.6 5.7 4.6 (Source: Company, HDFC sec)
Q3FY22 Result Review:
Jindal Drilling & Industries Ltd reported a decent topline growth of Rs 115.8cr, up 1.7%/15.5% YoY/QoQ. The company would clock revenue
at a similar run rate in Q4FY22 as previous couple of quarters as all the 5 rigs are operational. Its EBITDA stood at Rs. 29cr registering a
growth of 70.9% on sequential basis. EBITDA margin improved as operating leverage kicked in; it stood at 25.1% as against 8.6% in Q3FY21
(while it was 16.9% in Q2FY22). Acquisition of Offshore Jack-up rig ‘Jindal Supreme’ from Venus Drilling Pte Ltd would improve its operational
performance as hire charges relating to this rig would now not form a part of JDIL’s operating expenses. Strong operational performance
coupled with profits from JVs lifted its adjusted PAT. The company reported adjusted PAT of Rs 34.4cr as against Rs 3.6cr in Q2FY22 (reported
net loss of Rs 16.5cr in Q3 last year).
Key Triggers:
Established business model supported by healthy relationship with ONGC:
JDIL has been in the business of oil rigs and drilling for over 30 years. The company has managed to establish longstanding relationship with
India’s leading oil exploration company (ONGC). The company has been able to win contracts/renewals in the past on consistent basis. Its
many years of operational experience and excellence on the back of its accomplished staff and crew has helped in achieving nearly 100%
efficiency standard across its rigs. With focus on health and safety regulations, the company boasts of significantly higher commercial speed
compared to most if its peers; making it right partner for upstream oil exploration company. The company has been able to complete the
4
Jindal Drilling & Industries Ltd.
deployments in a timely manner and secure contract renewals at prevailing rig charter rates. All 5 Offshore rigs are under contract with
ONGC and its track record makes a case for contract renewals.
Acquisition of Offshore oil rig; improve its profitability:
JDIL, in Nov 2021, acquired an Offshore Jack-up rig ‘Jindal Supreme’, from Venus Drilling Pte. Ltd for USD 16.75 million. Acquisition of rig
would be beneficial as the hire charges associated with the rig will now not be borne by the company. The transaction would involve no net
cash outflow as it is funded from repayment of loans earlier extended to the joint venture company thereby improving its capital efficiencies.
With this acquisition the company now owns 2 out of 5 operational rigs; rest is owned by its group companies. The company had purchased
a jack-up rig ‘Discovery-I’ in March 2019. JDIL’s management seems to be on right track with respect to its decision to acquire the rigs. The
company has advanced large sums to its JVs (Discovery Drilling Pte Ltd & Virtue Drilling Pte Ltd) which earns nominal interest income.
Acquisition of rigs against advances reflects better capital allocation management. Similar acquisition of other rigs from its group company
in near future would be EPS accretive and make a case for re-rating of the stock.
Healthy revenue visibility:
JDIL enters into charter hire agreement with ONGC, which is normally renewed every three years. On the back of strong demand of oil &
natural gas and its increase in oil prices; the charter rates under renewal contract could see a sharp jump thereby improving its topline and
bottomline. Three (Discovery, Virtue, Star) out the five currently operational rigs are up for renewal in FY23. Substantial increase in charter
rates would improve its operational performance. Healthy demand and expected increase in the charter rates give confidence about its
revenue visibility for the next 2-3 years.
Potential increase in Rig rates in the coming years:
All the rigs of JDIL have different charter rates. Two of the Rigs (Discovery-1, Jindal star) have a rate of USD 25000-26000 per day. The other
three (Explorer, Virtue and Star) are under the rate bracket of USD 40000-45000 per day. The management is expecting the rates to rise to
USD 55000-57000 per day in the next 1-2 years. Jindal Explorer recently saw rate jump from USD 25000 per day to USD 38000 under the
renewed contract. The current rig day rates range from USD 34600-39800 (based on ONGC’s recent Jack up tender). There is now an
expectation that in the next tender, rates will increase to at least USD 50,000 due to tighter supply from the contractors that usually
participate in ONGC's tenders.
5
Jindal Drilling & Industries Ltd.
Strong Industry Tailwinds & Impressive Utilisation levels:
The Indian oil and gas market is expected to register decent growth over the next few years. Factors such as the increasing natural gas
pipeline capacity and the increasing demand for petroleum products are expected to drive the Indian oil and gas market. The Indian
Government has adopted several policies to fulfil the increasing demand. In February 2021, the government announced plans to invest
approximate US$ 102.49 billion on Oil and Gas infrastructure in next five years. The industry is expected to attract US$ 25 billion investments
in exploration and production by 2022. This is huge boast for the company as clients like ONGC are already brought in structural changes
over the past four years that have played a crucial role in expanding their interest in offshore programs.
Industry’s contracted jack up rigs saw improvement in its utilisation rate. Utilisation levels stands at an impressive 80-85%, compared to
previous year’s active utilization of 70-75%. Utilization by the end this year will be the highest since early 2015, as industry witnessed firm
demand growth.
Concerns:
Susceptible to volatility in crude oil prices: The company’s performance depends upon rig hire charges, which are influenced by offshore
expenditure by oil exploration companies. These investments are larger than onshore projects and are highly sensitive to crude oil prices.
Client concentration risk in the rigs business: All five rigs of JDIL are under contract are with one client which is ONGC. The company has
had a long-standing business relation with the oil major and currently is the only client for JDIL’s offshore drilling business. The company
has plans to offer its services outside India and diversify its clientele, but no concrete steps have been taken towards this direction.
High exposure to JV companies: The company has also extended loans of Rs 260cr to its related parties as of March-end 2021. The JVs -
Discovery Drilling Pte Ltd & Virtue Drilling Pte Ltd owns three rigs which are operated by JDIL. Interest on these advances is low as reflected
in other income. Recent acquisition of Offshore oil rig from repayment of loans earlier extended to joint venture companies would reduce
the exposure to its related parties and loans will come down to Rs 125cr post the Nov 21 transaction. Better capital resource management
would improve its low RoCE levels. Also, in FY20, the company took a hit of Rs 590cr mainly due to impairment loss of its group company
due to fall in rig prices post the sharp fall in crude oil prices. Operational profitability of JVs has not seen a steady ride. Large loss of JV would
impact it bottomline.
Risk of renewal: Although company has maintained healthy relationship with ONGC, there is always a risk of contract renewals.
6
Jindal Drilling & Industries Ltd.
Adverse order by the SC regarding dispute with ONGC: In FY21, the company received Rs 160cr from ONGC after an interim order of the
Supreme Court (SC) over a previous dispute between ONGC and JDIL. The company received the amount after furnishing a bank guarantee
to the SC. As the matter is still pending with the SC, Rs 160cr appears as other liability in the company’s financials. Any adverse final order
by the SC in the matter, could impact its financials.
Low Dividend payout: JDIL has declared dividend of Rs.0.50 per share over the last 10 years irrespective of profits. It needs to review the
payout policy to reward the shareholders from time to time.
Inter group transactions raise doubt about the protection of minority interests in JDIL: JDIL has taken oil rigs on hire from group companies
(Explorer from Maharashtra Seamless, Star 1 from a JV in which Jindal Pipes holds 70% stake, Virtue 1 from its 49:51 JV) apart from giving
loans to JVs. The minority shareholders of JDIL will have to be convinced that their rights have been sufficiently protected in this intra group
transactions.
Forex fluctuations: The revenue of JDIL is denominated in USD while the expenses are partly in USD and partly in INR. This raises the risk of
forex fluctuations from quarter to quarter. JDIL hedges 50% of its net receivables.
(Source: Company, HDFC sec)
-15%
-10%
-5%
0%
5%
10%
15%
20%
25%
30%
35%
40%
0
50
100
150
200
250
300
350
400
450
FY16 FY17 FY18 FY19 FY20 FY21 9MFY22
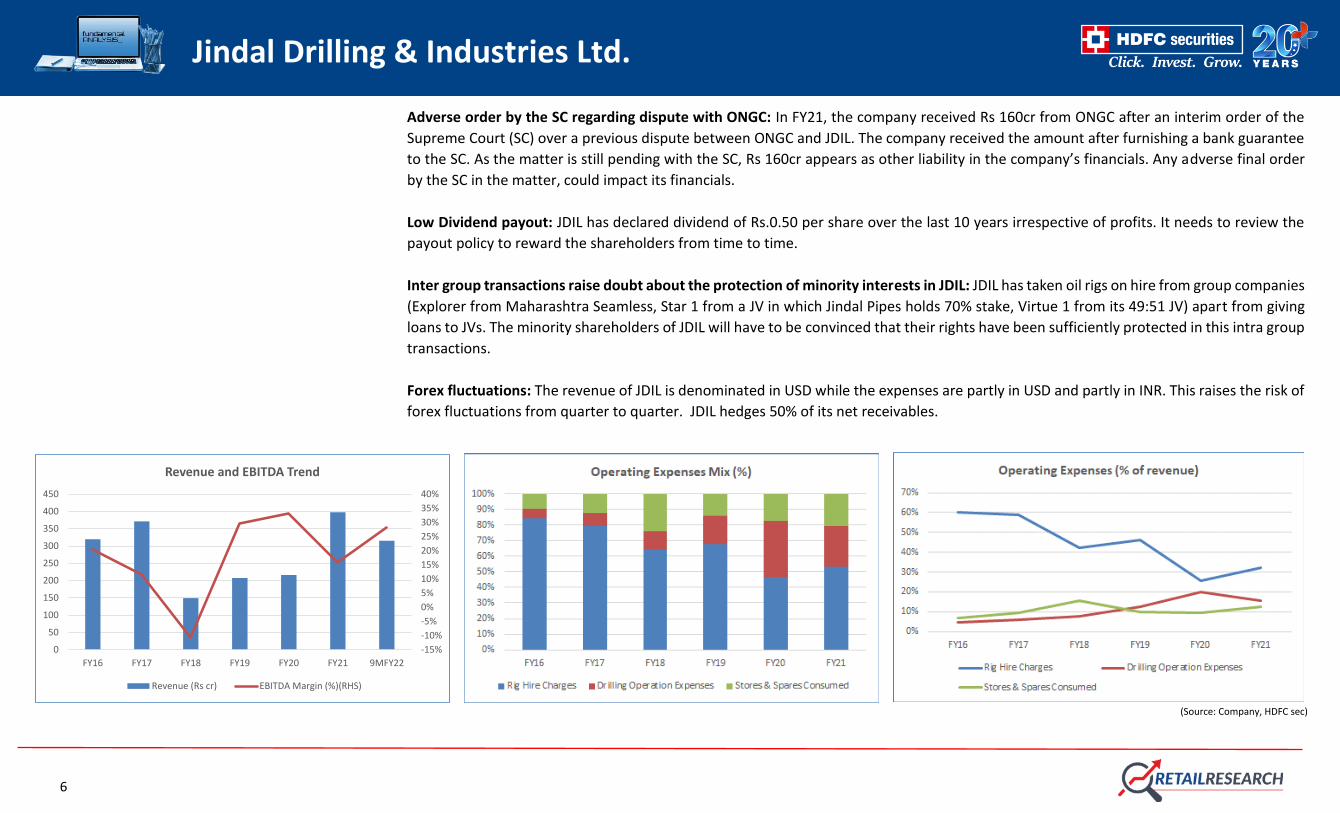
Revenue and EBITDA Trend
Revenue (Rs cr) EBITDA Margin (%)(RHS)
7
Jindal Drilling & Industries Ltd.
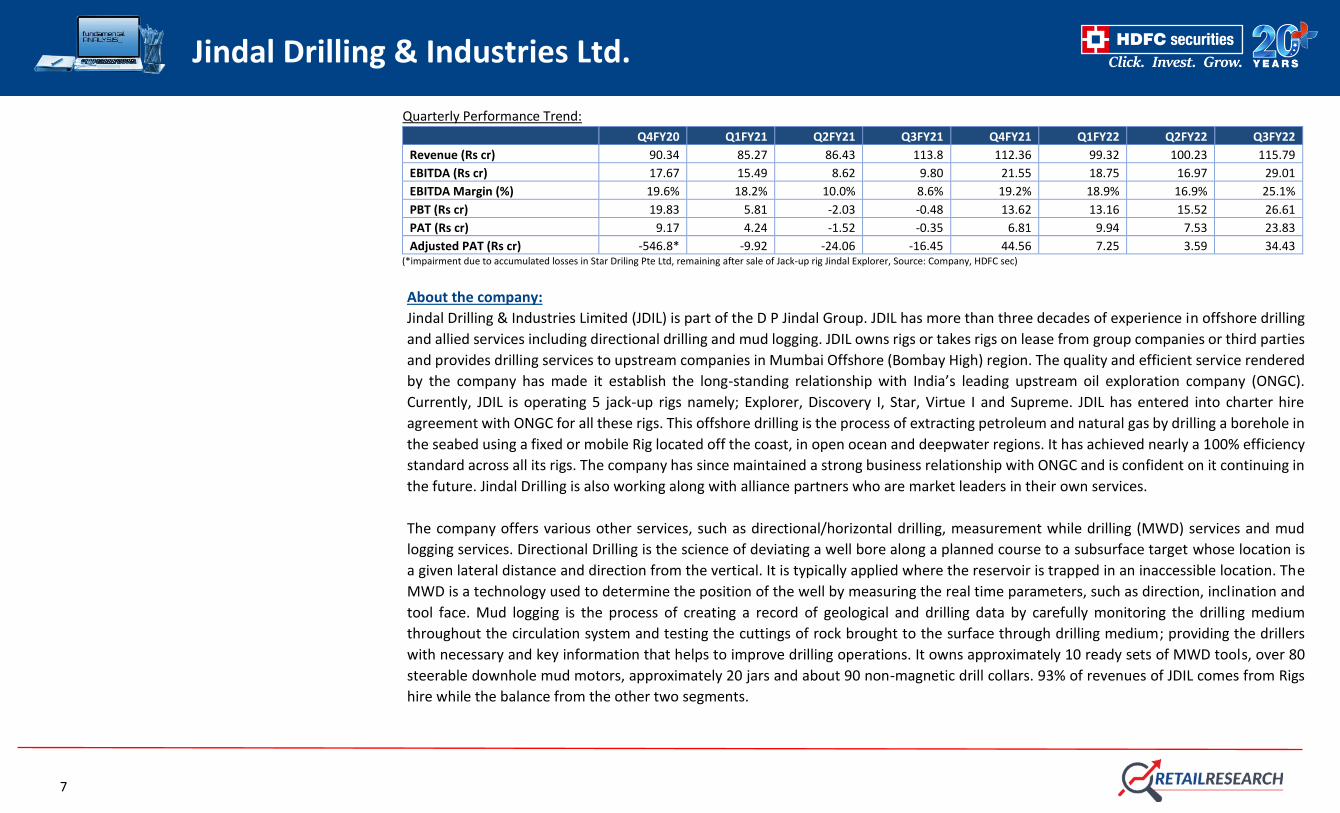
Quarterly Performance Trend:
Q4FY20 Q1FY21 Q2FY21 Q3FY21 Q4FY21 Q1FY22 Q2FY22 Q3FY22
Revenue (Rs cr) 90.34 85.27 86.43 113.8 112.36 99.32 100.23 115.79
EBITDA (Rs cr) 17.67 15.49 8.62 9.80 21.55 18.75 16.97 29.01
EBITDA Margin (%) 19.6% 18.2% 10.0% 8.6% 19.2% 18.9% 16.9% 25.1%
PBT (Rs cr) 19.83 5.81 -2.03 -0.48 13.62 13.16 15.52 26.61
PAT (Rs cr) 9.17 4.24 -1.52 -0.35 6.81 9.94 7.53 23.83
Adjusted PAT (Rs cr) -546.8* -9.92 -24.06 -16.45 44.56 7.25 3.59 34.43 (*impairment due to accumulated losses in Star Driling Pte Ltd, remaining after sale of Jack-up rig Jindal Explorer, Source: Company, HDFC sec)
About the company:
Jindal Drilling & Industries Limited (JDIL) is part of the D P Jindal Group. JDIL has more than three decades of experience in offshore drilling
and allied services including directional drilling and mud logging. JDIL owns rigs or takes rigs on lease from group companies or third parties
and provides drilling services to upstream companies in Mumbai Offshore (Bombay High) region. The quality and efficient service rendered
by the company has made it establish the long-standing relationship with India’s leading upstream oil exploration company (ONGC).
Currently, JDIL is operating 5 jack-up rigs namely; Explorer, Discovery I, Star, Virtue I and Supreme. JDIL has entered into charter hire
agreement with ONGC for all these rigs. This offshore drilling is the process of extracting petroleum and natural gas by drilling a borehole in
the seabed using a fixed or mobile Rig located off the coast, in open ocean and deepwater regions. It has achieved nearly a 100% efficiency
standard across all its rigs. The company has since maintained a strong business relationship with ONGC and is confident on it continuing in
the future. Jindal Drilling is also working along with alliance partners who are market leaders in their own services.
The company offers various other services, such as directional/horizontal drilling, measurement while drilling (MWD) services and mud
logging services. Directional Drilling is the science of deviating a well bore along a planned course to a subsurface target whose location is
a given lateral distance and direction from the vertical. It is typically applied where the reservoir is trapped in an inaccessible location. The
MWD is a technology used to determine the position of the well by measuring the real time parameters, such as direction, inclination and
tool face. Mud logging is the process of creating a record of geological and drilling data by carefully monitoring the drilling medium
throughout the circulation system and testing the cuttings of rock brought to the surface through drilling medium; providing the drillers
with necessary and key information that helps to improve drilling operations. It owns approximately 10 ready sets of MWD tools, over 80
steerable downhole mud motors, approximately 20 jars and about 90 non-magnetic drill collars. 93% of revenues of JDIL comes from Rigs
hire while the balance from the other two segments.
8
Jindal Drilling & Industries Ltd.
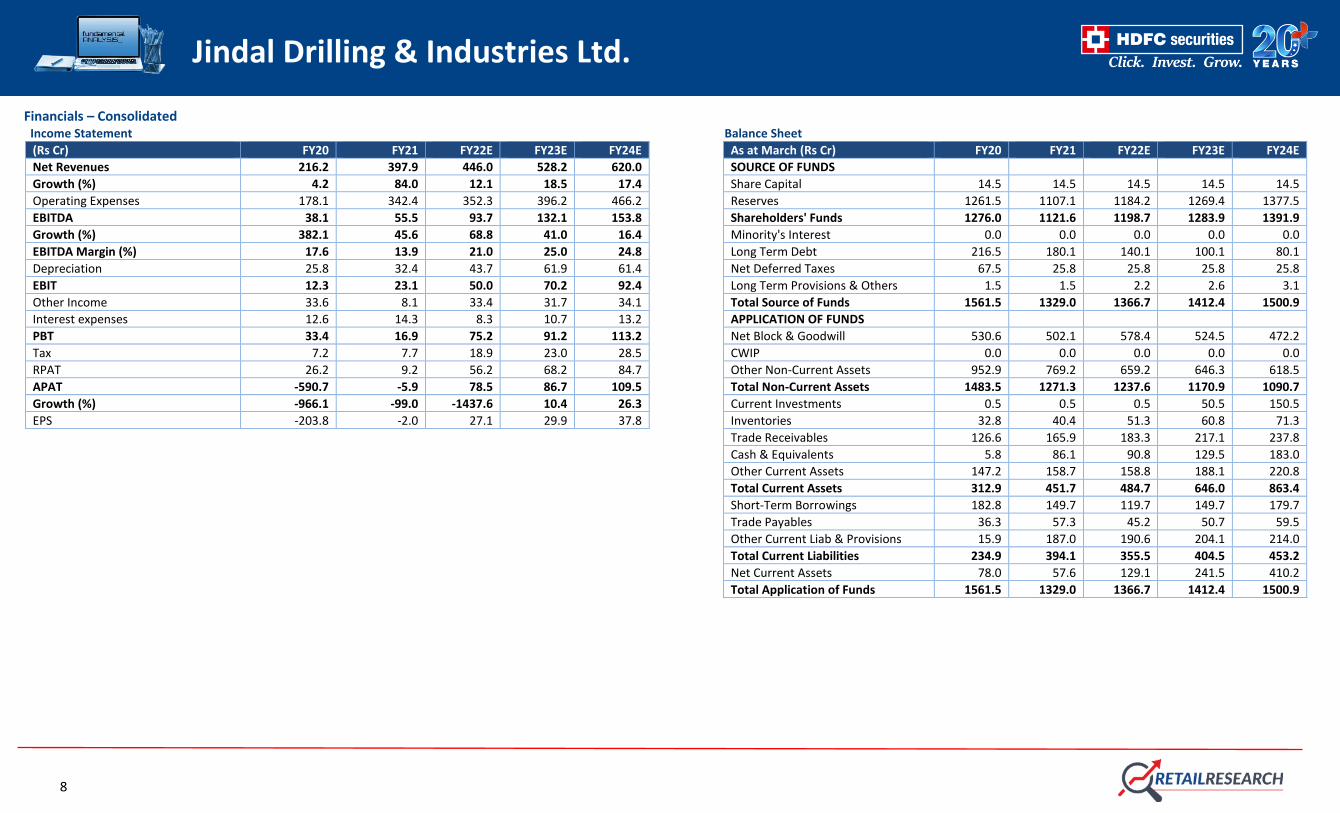
Financials – Consolidated Income Statement Balance Sheet (Rs Cr) FY20 FY21 FY22E FY23E FY24E As at March (Rs Cr) FY20 FY21 FY22E FY23E FY24E
Net Revenues 216.2 397.9 446.0 528.2 620.0 SOURCE OF FUNDS
Growth (%) 4.2 84.0 12.1 18.5 17.4 Share Capital 14.5 14.5 14.5 14.5 14.5
Operating Expenses 178.1 342.4 352.3 396.2 466.2 Reserves 1261.5 1107.1 1184.2 1269.4 1377.5
EBITDA 38.1 55.5 93.7 132.1 153.8 Shareholders' Funds 1276.0 1121.6 1198.7 1283.9 1391.9
Growth (%) 382.1 45.6 68.8 41.0 16.4 Minority's Interest 0.0 0.0 0.0 0.0 0.0
EBITDA Margin (%) 17.6 13.9 21.0 25.0 24.8 Long Term Debt 216.5 180.1 140.1 100.1 80.1
Depreciation 25.8 32.4 43.7 61.9 61.4 Net Deferred Taxes 67.5 25.8 25.8 25.8 25.8
EBIT 12.3 23.1 50.0 70.2 92.4 Long Term Provisions & Others 1.5 1.5 2.2 2.6 3.1
Other Income 33.6 8.1 33.4 31.7 34.1 Total Source of Funds 1561.5 1329.0 1366.7 1412.4 1500.9
Interest expenses 12.6 14.3 8.3 10.7 13.2 APPLICATION OF FUNDS
PBT 33.4 16.9 75.2 91.2 113.2 Net Block & Goodwill 530.6 502.1 578.4 524.5 472.2
Tax 7.2 7.7 18.9 23.0 28.5 CWIP 0.0 0.0 0.0 0.0 0.0
RPAT 26.2 9.2 56.2 68.2 84.7 Other Non-Current Assets 952.9 769.2 659.2 646.3 618.5
APAT -590.7 -5.9 78.5 86.7 109.5 Total Non-Current Assets 1483.5 1271.3 1237.6 1170.9 1090.7
Growth (%) -966.1 -99.0 -1437.6 10.4 26.3 Current Investments 0.5 0.5 0.5 50.5 150.5
EPS -203.8 -2.0 27.1 29.9 37.8 Inventories 32.8 40.4 51.3 60.8 71.3
Trade Receivables 126.6 165.9 183.3 217.1 237.8
Cash & Equivalents 5.8 86.1 90.8 129.5 183.0
Other Current Assets 147.2 158.7 158.8 188.1 220.8
Total Current Assets 312.9 451.7 484.7 646.0 863.4
Short-Term Borrowings 182.8 149.7 119.7 149.7 179.7
Trade Payables 36.3 57.3 45.2 50.7 59.5
Other Current Liab & Provisions 15.9 187.0 190.6 204.1 214.0
Total Current Liabilities 234.9 394.1 355.5 404.5 453.2
Net Current Assets 78.0 57.6 129.1 241.5 410.2
Total Application of Funds 1561.5 1329.0 1366.7 1412.4 1500.9
9
Jindal Drilling & Industries Ltd.
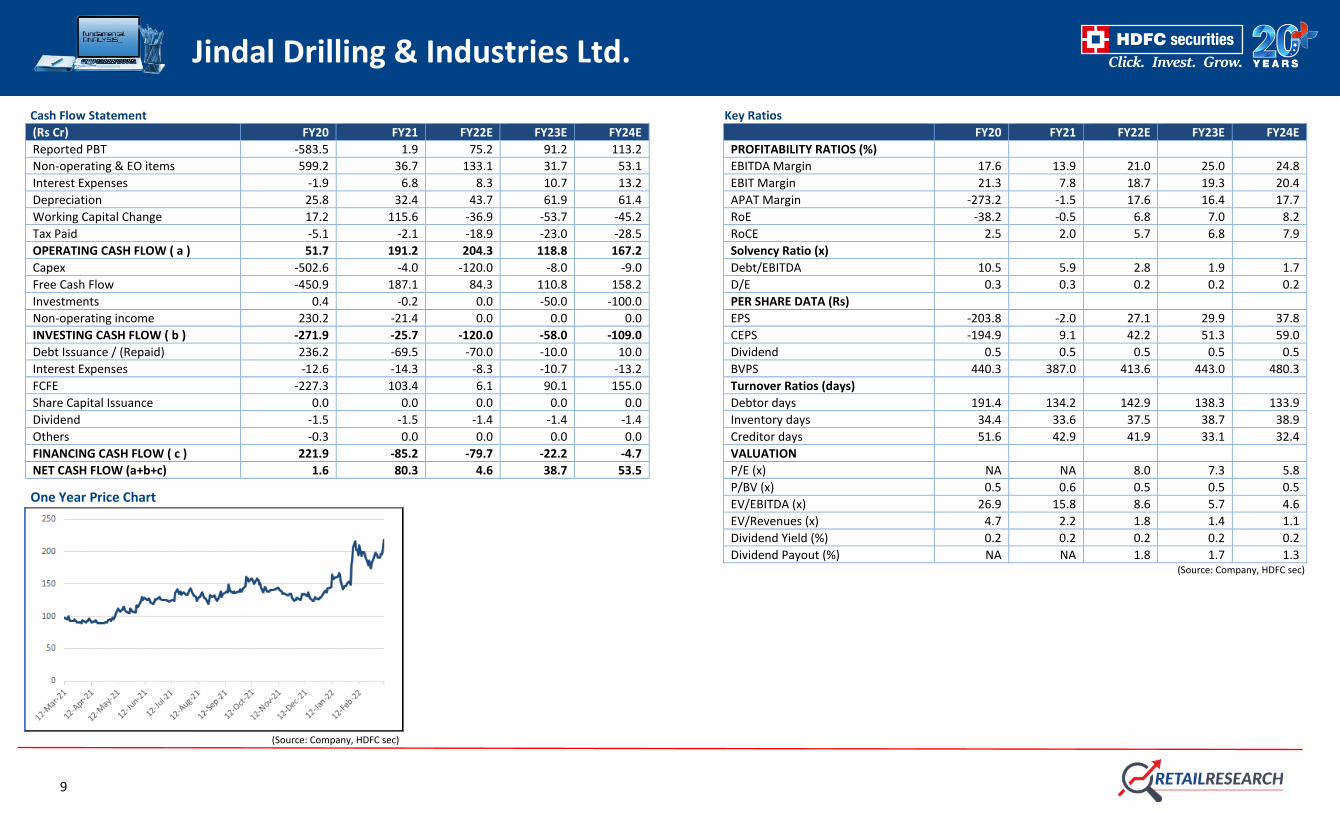
Cash Flow Statement Key Ratios
(Rs Cr) FY20 FY21 FY22E FY23E FY24E FY20 FY21 FY22E FY23E FY24E
Reported PBT -583.5 1.9 75.2 91.2 113.2 PROFITABILITY RATIOS (%)
Non-operating & EO items 599.2 36.7 133.1 31.7 53.1 EBITDA Margin 17.6 13.9 21.0 25.0 24.8
Interest Expenses -1.9 6.8 8.3 10.7 13.2 EBIT Margin 21.3 7.8 18.7 19.3 20.4
Depreciation 25.8 32.4 43.7 61.9 61.4 APAT Margin -273.2 -1.5 17.6 16.4 17.7
Working Capital Change 17.2 115.6 -36.9 -53.7 -45.2 RoE -38.2 -0.5 6.8 7.0 8.2
Tax Paid -5.1 -2.1 -18.9 -23.0 -28.5 RoCE 2.5 2.0 5.7 6.8 7.9
OPERATING CASH FLOW ( a ) 51.7 191.2 204.3 118.8 167.2 Solvency Ratio (x)
Capex -502.6 -4.0 -120.0 -8.0 -9.0 Debt/EBITDA 10.5 5.9 2.8 1.9 1.7
Free Cash Flow -450.9 187.1 84.3 110.8 158.2 D/E 0.3 0.3 0.2 0.2 0.2
Investments 0.4 -0.2 0.0 -50.0 -100.0 PER SHARE DATA (Rs)
Non-operating income 230.2 -21.4 0.0 0.0 0.0 EPS -203.8 -2.0 27.1 29.9 37.8
INVESTING CASH FLOW ( b ) -271.9 -25.7 -120.0 -58.0 -109.0 CEPS -194.9 9.1 42.2 51.3 59.0
Debt Issuance / (Repaid) 236.2 -69.5 -70.0 -10.0 10.0 Dividend 0.5 0.5 0.5 0.5 0.5
Interest Expenses -12.6 -14.3 -8.3 -10.7 -13.2 BVPS 440.3 387.0 413.6 443.0 480.3
FCFE -227.3 103.4 6.1 90.1 155.0 Turnover Ratios (days)
Share Capital Issuance 0.0 0.0 0.0 0.0 0.0 Debtor days 191.4 134.2 142.9 138.3 133.9
Dividend -1.5 -1.5 -1.4 -1.4 -1.4 Inventory days 34.4 33.6 37.5 38.7 38.9
Others -0.3 0.0 0.0 0.0 0.0 Creditor days 51.6 42.9 41.9 33.1 32.4
FINANCING CASH FLOW ( c ) 221.9 -85.2 -79.7 -22.2 -4.7 VALUATION
NET CASH FLOW (a+b+c) 1.6 80.3 4.6 38.7 53.5 P/E (x) NA NA 8.0 7.3 5.8
P/BV (x) 0.5 0.6 0.5 0.5 0.5
EV/EBITDA (x) 26.9 15.8 8.6 5.7 4.6
EV/Revenues (x) 4.7 2.2 1.8 1.4 1.1
Dividend Yield (%) 0.2 0.2 0.2 0.2 0.2
Dividend Payout (%) NA NA 1.8 1.7 1.3 (Source: Company, HDFC sec)
One Year Price Chart
(Source: Company, HDFC sec)
10
Jindal Drilling & Industries Ltd.
HDFC Sec Retail Research Rating description Green Rating stocks This rating is given to stocks that represent large and established business having track record of decades and good reputation in the industry. They are industry leaders or have significant market share. They have multiple streams of cash flows and/or strong balance sheet to withstand downturn in
economic cycle. These stocks offer moderate returns and at the same time are unlikely to suffer severe drawdown in their stock prices. These stocks can be kept as a part of long term portfolio holding, if so desired. This stocks offer low risk and lower reward and are suitable for beginners. They offer
stability to the portfolio.
Yellow Rating stocks This rating is given to stocks that have strong balance sheet and are from relatively stable industries which are likely to remain relevant for long time and unlikely to be affected much by economic or technological disruptions. These stocks have emerged stronger over time but are yet to reach the level
of green rating stocks. They offer medium risk, medium return opportunities. Some of these have the potential to attain green rating over time.
Red Rating stocks This rating is given to emerging companies which are riskier than their established peers. Their share price tends to be volatile though they offer high growth potential. They are susceptible to severe downturn in their industry or in overall economy. Management of these companies need to prove their
mettle in handling cyclicality of their business. If they are successful in navigating challenges, the market rewards their shareholders with handsome gains; otherwise their stock prices can take a severe beating. Overall these stocks offer high risk high return opportunities. Disclosure: I, Hemanshu Parmar, (ACA), authors and the names subscribed to this report, hereby certify that all of the views expressed in this research report accurately reflect our views about the subject issuer(s) or securities. HSL has no material adverse disciplinary history as on the date of publication of this report. We also certify that no part of our
compensation was, is, or will be directly or indirectly related to the specific recommendation(s) or view(s) in this report.
Research Analyst or his relative or HDFC Securities Ltd. does not have any financial interest in the subject company. Also Research Analyst or his relative or HDFC Securities Ltd. or its Associate may have beneficial ownership of 1% or more in the subject company at the end of the month immediately preceding the date of publication of the
Research Report. Further Research Analyst or his relative or HDFC Securities Ltd. or its associate does not have any material conflict of interest.
Any holding in stock – No
HDFC Securities Limited (HSL) is a SEBI Registered Research Analyst having registration no. INH000002475.
Disclaimer:
This report has been prepared by HDFC Securities Ltd and is meant for sole use by the recipient and not for circulation. The information and opinions contained herein have been compiled or arrived at, based upon information obtained in good faith from sources believed to be reliable. Such information has not been independently verified and
no guaranty, representation of warranty, express or implied, is made as to its accuracy, completeness or correctness. All such information and opinions are subject to change without notice. This document is for information purposes only. Descriptions of any company or companies or their securities mentioned herein are not intended to be
complete and this document is not, and should not be construed as an offer or solicitation of an offer, to buy or sell any securities or other financial instruments.
This report is not directed to, or intended for display, downloading, printing, reproducing or for distribution to or use by, any person or entity who is a citizen or resident or located in any locality, state, country or other jurisdiction where such distribution, publication, reproduction, availability or use would be contrary to law or regulation or what
would subject HSL or its affiliates to any registration or licensing requirement within such jurisdiction.
If this report is inadvertently sent or has reached any person in such country, especially, United States of America, the same should be ignored and brought to the attention of the sender. This document may not be reproduced, distributed or published in whole or in part, directly or indirectly, for any purposes or in any manner.
Foreign currencies denominated securities, wherever mentioned, are subject to exchange rate fluctuations, which could have an adverse effect on their value or price, or the income derived from them. In addition, investors in securities such as ADRs, the values of which are influenced by foreign currencies effectively assume currency risk.
It should not be considered to be taken as an offer to sell or a solicitation to buy any security. HSL may from time to time solicit from, or perform broking, or other services for, any company mentioned in this mail and/or its attachments.
HSL and its affiliated company(ies), their directors and employees may; (a) from time to time, have a long or short position in, and buy or sell the securities of the company(ies) mentioned herein or (b) be engaged in any other transaction involving such securities and earn brokerage or other compensation or act as a market maker in the financial
instruments of the company(ies) discussed herein or act as an advisor or lender/borrower to such company(ies) or may have any other potential conflict of interests with respect to any recommendation and other related information and opinions.
HSL, its directors, analysts or employees do not take any responsibility, financial or otherwise, of the losses or the damages sustained due to the investments made or any action taken on basis of this report, including but not restricted to, fluctuation in the prices of shares and bonds, changes in the currency rates, diminution in the NAVs, reduction
in the dividend or income, etc.
HSL and other group companies, its directors, associates, employees may have various positions in any of the stocks, securities and financial instruments dealt in the report, or may make sell or purchase or other deals in these securities from time to time or may deal in other securities of the companies / organizations described in this report.
HSL or its associates might have managed or co-managed public offering of securities for the subject company or might have been mandated by the subject company for any other assignment in the past twelve months.
HSL or its associates might have received any compensation from the companies mentioned in the report during the period preceding twelve months from t date of this report for services in respect of managing or co-managing public offerings, corporate finance, investment banking or merchant banking, brokerage services or other advisory
service in a merger or specific transaction in the normal course of business.
HSL or its analysts did not receive any compensation or other benefits from the companies mentioned in the report or third party in connection with preparation of the research report. Accordingly, neither HSL nor Research Analysts have any material conflict of interest at the time of publication of this report. Compensation of our Research
Analysts is not based on any specific merchant banking, investment banking or brokerage service transactions. HSL may have issued other reports that are inconsistent with and reach different conclusion from the information presented in this report.
Research entity has not been engaged in market making activity for the subject company. Research analyst has not served as an officer, director or employee of the subject company. We have not received any compensation/benefits from the subject company or third party in connection with the Research Report.
HDFC securities Limited, I Think Techno Campus, Building - B, "Alpha", Office Floor 8, Near Kanjurmarg Station, Opp. Crompton Greaves, Kanjurmarg (East), Mumbai 400 042 Phone: (022) 3075 3400 Fax: (022) 2496 5066
Compliance Officer: Binkle R. Oza Email: [email protected] Phone: (022) 3045 3600
HDFC Securities Limited, SEBI Reg. No.: NSE, BSE, MSEI, MCX: INZ000186937; AMFI Reg. No. ARN: 13549; PFRDA Reg. No. POP: 11092018; IRDA Corporate Agent License No.: CA0062; SEBI Research Analyst Reg. No.: INH000002475; SEBI Investment Adviser Reg. No.: INA000011538; CIN - U67120MH2000PLC152193
Mutual Funds Investments are subject to market risk. Please read the offer and scheme related documents carefully before investing.
Related Documents