Modelling of macropore flow and transport processes at catchment scale Jesper Skovdal Christiansen d , Mette Thorsen a , Thomas Clausen a , Søren Hansen b , Jens Christian Refsgaard c, * a DHI Water and Environment, Hørsholm, Denmark b Royal Veterinary and Agricultural University, Copenhagen, Denmark c Geological Survey of Denmark and Greenland, Department of Hydrology, Oster Voldgade 10, DK-1350 Copenhagen, Denmark d Atkins Danmark, Copenhagen, Denmark Received 15 August 2002; revised 20 April 2004; accepted 26 April 2004 Abstract Macropores play a significant role as a preferential flow mechanism in connection with pesticide leaching to shallow groundwater in clayey and loamy soils. A macropore description based on some of the same principles as those of the MACRO code has been added to the coupled MIKE SHE/Daisy code, enabling a physically based simulation of macropore processes in a spatially distributed manner throughout an entire catchment. Simulation results from a small catchment in Denmark suggest that although the point scale macropore processes have no dominating effect on groundwater recharge or discharge at a catchment scale, they will have significant effects on pesticide leaching to groundwater at a catchment scale. The primary function of macropores in this area is that they rapidly transport a significant part of the infiltrating water and solutes from the plough pan at 20 cm depth some distance downwards before most of it flows back into the soil matrix. This has a very significant effect on the leaching of pesticides from the surface to the groundwater table, because some of the pesticides are transported rapidly downwards in the soil profile to zones with less sorption and degradation. It is concluded that the spatial variations of macropore flows caused by the variation in topography and depth to groundwater table within a catchment are so large that this has to be accounted for in up-scaling process descriptions and results from point scale to catchment scale. q 2004 Elsevier B.V. All rights reserved. Keywords: Preferential flow; Leaching; Pesticide; Catchment; Modelling 1. Introduction The importance of macropores as a preferential flow mechanism for infiltrating water and transport of solutes has been generally recognised during a couple of decades (Beven and Germann, 1982; Barbash and Resek, 1996). Macropores play signifi- cant roles in many contexts such as leading to more infiltration and thus reducing overland flow and is rapidly transferring pesticides and other pollutants through the soil toward the groundwater. Pesticides have been detected in shallow groundwater world- wide (US Environmental Protection Agency, 1990, Journal of Hydrology 299 (2004) 136–158 www.elsevier.com/locate/jhydrol 0022-1694/$ - see front matter q 2004 Elsevier B.V. All rights reserved. doi:10.1016/j.jhydrol.2004.04.029 * Corresponding author. Fax: þ 45-3814-2050. E-mail address: [email protected] (J.C. Refsgaard).

JH_2004_299_136-158
Mar 28, 2016
GeologicalSurveyofDenmarkandGreenland,DepartmentofHydrology,OsterVoldgade10,DK-1350Copenhagen,Denmark d AtkinsDanmark,Copenhagen,Denmark Theimportanceofmacroporesasapreferential flowmechanismforinfiltratingwaterandtransport of solutes has been generally recognised during 0022-1694/$-seefrontmatterq2004ElsevierB.V.Allrightsreserved. doi:10.1016/j.jhydrol.2004.04.029 1.Introduction * Correspondingauthor.Fax:þ45-3814-2050. E-mailaddress:[email protected](J.C.Refsgaard). b a c
Welcome message from author
This document is posted to help you gain knowledge. Please leave a comment to let me know what you think about it! Share it to your friends and learn new things together.
Transcript

Modelling of macropore flow and transport
processes at catchment scale
Jesper Skovdal Christiansend, Mette Thorsena, Thomas Clausena,Søren Hansenb, Jens Christian Refsgaardc,*
aDHI Water and Environment, Hørsholm, DenmarkbRoyal Veterinary and Agricultural University, Copenhagen, Denmark
cGeological Survey of Denmark and Greenland, Department of Hydrology, Oster Voldgade 10, DK-1350 Copenhagen, DenmarkdAtkins Danmark, Copenhagen, Denmark
Received 15 August 2002; revised 20 April 2004; accepted 26 April 2004
Abstract
Macropores play a significant role as a preferential flow mechanism in connection with pesticide leaching to shallow
groundwater in clayey and loamy soils. A macropore description based on some of the same principles as those of the MACRO
code has been added to the coupled MIKE SHE/Daisy code, enabling a physically based simulation of macropore processes in a
spatially distributed manner throughout an entire catchment. Simulation results from a small catchment in Denmark suggest
that although the point scale macropore processes have no dominating effect on groundwater recharge or discharge at a
catchment scale, they will have significant effects on pesticide leaching to groundwater at a catchment scale. The primary
function of macropores in this area is that they rapidly transport a significant part of the infiltrating water and solutes from the
plough pan at 20 cm depth some distance downwards before most of it flows back into the soil matrix. This has a very significant
effect on the leaching of pesticides from the surface to the groundwater table, because some of the pesticides are transported
rapidly downwards in the soil profile to zones with less sorption and degradation. It is concluded that the spatial variations of
macropore flows caused by the variation in topography and depth to groundwater table within a catchment are so large that this
has to be accounted for in up-scaling process descriptions and results from point scale to catchment scale.
q 2004 Elsevier B.V. All rights reserved.
Keywords: Preferential flow; Leaching; Pesticide; Catchment; Modelling
1. Introduction
The importance of macropores as a preferential
flow mechanism for infiltrating water and transport
of solutes has been generally recognised during
a couple of decades (Beven and Germann, 1982;
Barbash and Resek, 1996). Macropores play signifi-
cant roles in many contexts such as leading to more
infiltration and thus reducing overland flow and is
rapidly transferring pesticides and other pollutants
through the soil toward the groundwater. Pesticides
have been detected in shallow groundwater world-
wide (US Environmental Protection Agency, 1990,
Journal of Hydrology 299 (2004) 136–158
www.elsevier.com/locate/jhydrol
0022-1694/$ - see front matter q 2004 Elsevier B.V. All rights reserved.
doi:10.1016/j.jhydrol.2004.04.029
* Corresponding author. Fax: þ45-3814-2050.
E-mail address: [email protected] (J.C. Refsgaard).

1992; EEA, 2000; Stockmarr, 2000) and preferential
flow is recognised as an important mechanism in this
connection (Barbash and Resek, 1996; Thorsen et al.,
1998).
Field scale studies of tracer movements to the
groundwater system in clayey till areas (Sidle et al.,
1998; Nilsson et al., 2001) show that rapid transport of
solutes to shallow groundwater at 4–7 m depth can be
explained by preferential flow mechanisms. Similarly,
field scale studies of preferential flow to the drains in
glacial till agricultural soils (Villholth et al., 1998;
Villholth and Jensen, 1998) have shown that macro-
pore flow is essential in describing the observed flows
and concentrations in tile drains. The results from
these field studies emphasised the importance of
taking the considerable spatial variability of hydraulic
parameters into account.
At the point scale, where only vertical flows are
considered, the classical modelling approach for
preferential flow and transport phenomena is a two-
domain or dual permeability description in one
(vertical) dimension. An example of a model code
of this type is the MACRO (Jarvis, 1994; Jarvis and
Larsson, 1998; Larsson and Jarvis, 1999), where the
vertical flow in the matrix is described by Richards’
equation and the preferential flow is assumed to take
place in a separately defined pore domain. The
interaction between the macropore and the matrix is
described by an approximation to a diffusion equation.
This macropore modelling approach has shown to
provide significantly improved description of the
pesticide breakthrough curves as compared to models
not considering preferential flows (Bergstrom and
Jarvis, 1994; Thorsen et al., 1998; Larsson and Jarvis,
1999; Armstrong et al., 2000). This model type may
be characterised as physically based, because it is
based on the point scale partial differential flow and
transport equations and contains process descriptions
and parameters, which are recognisable in the field.
Thus, it is in principle rather easy to modify this
model type to incorporate new knowledge on process
descriptions as it becomes available (Jarvis, 1998).
Hydrological models at catchment scale may be
classified according to the description of the physical
processes as conceptual or physically based, and
according to the spatial description of catchment
processes as lumped or distributed (Refsgaard, 1996
and many others). In this respect, two typical model
types are the lumped conceptual and the distributed
physically based ones. Examples of the two model
types are the Stanford Watershed Model (Crawford
and Linsley, 1966) and the MIKE SHE (Abbott et al.,
1986; Refsgaard and Storm, 1995), respectively.
In lumped conceptual catchment models preferen-
tial flow and transport are treated in a relatively simple
manner by empirical approaches. Thus, catchment
model codes that include pesticide transport com-
ponents such as HSPF (Donigian et al., 1995),
CREAMS (Knisel and Williams, 1995) and SWRRB
(Arnold and Williams, 1995) do not consider prefer-
ential flow explicitly by a two-domain approach.
Instead, the equations describing e.g. infiltration have
implicitly built in some kind of spatial variability or
preferential flow dynamics. In the CREAMS and
SWRRB, the core of the infiltration equation is the
curve number approach, while the HSPF that is based
on the classical Stanford Watershed Model considers a
combination of catchment average infiltration capacity
with its dependence on the average soil moisture
content and the spatial variability of this average
catchment infiltration capacity. However, the spatial
variability is not considered explicitly and all state
variables represent average catchment conditions, and
hence, the knowledge existing at point scale on
macropore processes and parameter values is incom-
patible with the catchment scale equations built into
these model codes.
While it is thus fundamentally very difficult to
include a physically based macropore description in
lumped conceptual catchment models, it is in
principle easier in the more sophisticated catchment
models of the distributed, physically based type,
where the process equations and parameters at the
individual computational grids are point scale
equations and as such compatible with e.g. macropore
formulations such as the one in MACRO. However,
none of the existing model codes of the distributed
physically based type presently includes a physically
based macropore description. In most of them, such as
Thales (Grayson et al., 1995), preferential flow is not
considered, while in others, such as MIKE SHE (DHI,
2000a), an empirical ‘bypass flow’ formulation is
built in as an optional add-on description. This bypass
flow is required to match observed hydrographs when
a model like MIKE SHE is used for large scale
modelling, in order to compensate for the lack of
J.S. Christiansen et al. / Journal of Hydrology 299 (2004) 136–158 137

spatial variability of soil parameters, topography,
climate input etc that is often a problem when the data
basis is scarce and/or the model grid size is very large
(Overgaard, 2000).
Many factors influence leaching of pesticides to the
phreatic aquifer. The present paper focuses on the
importance of macropore flow and transport and
specifically on the interaction between the depth to
ground water table and macropore flow processes at
the catchment scale. As macropore flow is dependent
on the soil moisture content at the beginning of the
rainfall events, it is as such sensitive to the depth of
the groundwater table that is varying considerably in
time and space throughout a catchment. The assump-
tion usually made in pesticide leaching models is to
use either a lower boundary condition that is constant
in time and space (e.g. constant gradient or constant
dept to groundwater table) or, at best, a time variable
groundwater table. No studies have so far been
reported on the possible differences of the macropore
processes between a point scale and a natural
catchment with a temporally and spatially varying
groundwater table.
The present study was carried out within the
framework of a research project aiming at modelling
of pesticide leaching, transport and degradation at
catchment scale with particular emphasis on ground-
water aspects. Some aspects of the pesticide modelling
are reported elsewhere (Brun et al., 2000; Thorsen
et al., 2000). The present paper, focusing on macropore
flow, transport and leaching to shallow groundwater at
catchment scale, has the following objectives: (1) to
describe incorporation of a physically based macro-
pore formulation into a physically based spatially
distributed catchment model; (2) to investigate how the
spatial and temporal variations of depth to the ground
water table influence macropore flows and transport at
the catchment scale; and (3) to test the extent to which
the traditional approach of using pesticide leaching
models at the point scale gives different results than
using a spatially distributed model with similar
macropore descriptions at catchment scale.
2. Catchment modelling framework
2.1. The integrated model concept
The integrated modelling concept (Fig. 1), aiming
at simulation of pesticide transport and fate at
catchment scale, is based on a coupling between a
spatially distributed hydrological model code
Fig. 1. A scetch of the integrated modelling system for simulation of pesticide transport and fate at catchment scale.
J.S. Christiansen et al. / Journal of Hydrology 299 (2004) 136–158138

operating at catchment scale (MIKE SHE) and a point
scale agro-ecosystem model code (Daisy).
MIKE SHE (Abbott et al., 1986; Refsgaard and
Storm, 1995) is a modelling system describing the
flow of water and solutes in a catchment in a
distributed physically based way. This implies
numerical solutions of the coupled partial differen-
tial equations for overland (2D) and channel flow
(1D), unsaturated flow (1D) and saturated flow
(3D) together with a description of evapotranspira-
tion and snowmelt processes. In addition an
optional macropore flow module, described below,
has been added. The solute transport processes are
described by the classical advection dispersion
equation.
Daisy (Hansen et al., 1991; Abrahamsen and
Hansen, 2000) is a 1D modelling system describing
crop production as well as water and nutrient
dynamics in the root zone according to various
management strategies, including crop rotations,
fertilisation, irrigation, soil tillage and crop residue
management. The model simulates processes such as:
plant growth and crop production; heat flux and soil
temperature; soil water uptake by plants and evapo-
transpiration; carbon and nitrogen mineralisation;
nitrification and denitrification (nitrogen transform-
ation); and nitrogen uptake by plants.
2.2. The MIKE—SHE DAISY coupling
A full coupling has been developed between
MIKE SHE and Daisy at the code level. The
pesticide application, evapotranspiration, crop
growth, and temperature calculations take place in
Daisy while the flow and solute transport is
described by MIKE SHE. All these sub modules
are being executed simultaneously. The division of
calculational tasks and the data flow between
the MIKE SHE Water Movement, MIKE SHE
Advection-Dispersion and Daisy modules are
shown in Fig. 2.
The sorption and degradation processes of pesti-
cides are simulated by use of the MIKE SHE that
includes simplified descriptions of geochemical and
microbiological processes (DHI, 2000b). The sorption
may be described by linear or non-linear equilibrium
or by kinetic sorption. Pesticide degradation is
described by a first order process.
3. The macropore flow model component
3.1. Physical processes
Macropores are defined as a secondary,
additional continuous pore domain in the unsatu-
rated zone, besides the matrix pore domain repre-
senting the microporous bulk soil. Macropore flow
is initiated when the capillary head in the micropore
domain is higher than a threshold matrix pressure
head ðctÞ; corresponding to the minimum pore size
that is considered as belonging to the macropore
domain. Water flow in the macropores is assumed to
be laminar and not influenced by capillarity,
corresponding to gravitational flow. The vertical
volumetric flux (positive upwards) qmp is then
given by:
qmp ¼ 2KmpðumpÞ ð1Þ
where KmpðumpÞ is the hydraulic conductivity of the
macropores depending on the volumetric soil
moisture content of the macropores, ump: The
continuity equation is expressed as:
›ump
›t¼ 2
›qmp
›z2 Smp ð2Þ
Fig. 2. Sequence of calculation and data exchange between MIKE
SHE AD, MIKE SHE WM and Daisy.
J.S. Christiansen et al. / Journal of Hydrology 299 (2004) 136–158 139

where Smp is a sink term for water exchange with
the surrounding matrix. Combining Eqs. (1) and (2)
yields the governing equation for the macropores:
›ump
›t¼
›ðKmpðumpÞÞ
›z2 Smp ð3Þ
The term Smp becomes a source/sink term in
Richards’ equation used in the matrix domain. This
term is given by
Smp ¼ bmpKðumatrixÞðcmp 2 cmatrixÞ ð4Þ
where cmp and cmatrix are the capillary heads in the
macropores and in the matrix, respectively, and
KðumatrixÞ is the hydraulic conductivity in the matrix
depending on the volumetric soil moisture content of
the matrix, umatrix: The exchange flow from matrix to
macropore is only considered when the capillary head
in the matrix exceeds the threshold pressure ðcmatrix $
ctÞ:bmp is a first-order linear water transfer coefficient,
which is expected to increase with decreasing distance
between macropores and with increasing hydraulic
matrix-macropore contact. It can be expressed as:
bmp ¼Cf
d2ð5Þ
where d (m) is an effective diffusion path length. Cf
(–) is a contact factor to take care of coatings at the
interior walls of the macropores. Such a coating could
be present due to e.g. root remnants, worm slime or
mineral precipitation and can decrease the contact
between matrix and macropore significantly. The
contact factor ranges from 0.0 (no contact) to 1.0 (full
contact).
In the macropores, a simple power law function is
assumed to represent the conductivity relation:
KmpðumpÞ ¼ Ks;mp
ump
us;mp
!np
ð6Þ
where Ks;mp is the saturated hydraulic conductivity of
the macropores, us;mp is the macroporosity, and n* is
an empirical exponent accounting for size distri-
bution, tortuosity, and continuity of the macropores.
n* may vary from two to six, according to Jarvis
(1994). The lower values represent soils of coarse
structure with macropore networks of narrow pore
size distribution and little tortuosity, whereas the
higher values apply to soils with a wider macropore
size distribution and larger tortuosity. If macropores
are included in the simulation the hydraulic
conductivity used to represent the soil matrix should
exclude the effect of macropores.
The actual size, form and number of macropores
are not explicitly considered in the modelling.
Instead the macropore characteristics appear
indirectly from ct; n* and bmp that in the present
formulation are dependent on soil type. The
capillary head in the macropores cmp is supposed
to vary linearly with the macropore moisture
content ump between zero (at ump ¼ us;mpÞ and ct
(at ump ¼ 0Þ: Neither root water uptake nor soil
evaporation are considered to take place from the
macropore domain.
The infiltration process description includes
water entering the macropores as well as the soil
matrix at the soil surface. In this case water is only
ponded on the ground surface when the infiltration
capacities of both pore regions are exceeded. Water
flow into the macropores commences as the matrix
infiltration capacity is surpassed.
The bottom boundary condition for flow in the
macropores is a vertical flux at a unit hydraulic
gradient. This flux is input to the saturated zone. A
coupling of the saturated zone and the unsaturated
zone is necessary when the groundwater level
fluctuates. During groundwater rise, the water
present in the macropores in the bottom unsaturated
zone layer is released instantaneously to the
groundwater and during groundwater decline, the
macropores are exposed as empty.
Internally in the macropores, solute transport is
assumed to be dominated by advection, neglecting
the influence of dispersion and diffusion.
The source/sink term ðRcÞ describing solute
exchange between matrix and macropores is given
by a combination of a diffusion component and a mass
flow component:
Rc ¼ bcumatrix
ump
emp
!ðcmp 2 cmatrixÞ þ Smpc0 ð7Þ
where bc is a mass transfer coefficient, cmp and cmatrix
are the solute concentrations in the macropores
and matrix, respectively, and c0 indicates the
concentration in either matrix or macropores depend-
ing on the direction of the exchange flow ðSmpÞ:
J.S. Christiansen et al. / Journal of Hydrology 299 (2004) 136–158140

The mass transfer coefficient, bc; can be derived as:
bc ¼ Ck
3D0f p
d2ð8Þ
where Ck (–) is the contact factor to take care of an
eventual coating at the interior walls of the macro-
pores. The contact factor ranges from 0.0 (no
contact) to 1.0 (full contact). D0 (m2s21) is the
diffusion coefficient in free water of the solute
species. f * (–) is an impedance factor that represents
and decreases with the tortuosity of the macropores.
f * ranges from 0.0 (zero diffusivity) to 1.0 (full
diffusivity). Thereby, bc depends on both solute
species and soil type.
Even though the applied macropore description
can be regarded as mechanistic with parameters
having physical meaning, some of the parameters
required to characterise the macropore system are
either difficult or impossible to measure. This is
particularly the case for the parameters regulating
exchange between matrix and macropores.
Field observations of soil structure and the
occurrence of biotic macropores can give indications
of the mass exchange parameters (Jarvis et al., 1997;
Jarvis, 1998), though recent experiences reveal that
parameters obtained from such macroscopic obser-
vations often need adjustments towards longer diffu-
sion lengths when applied to field measurements
(Saxena et al., 1994; Larsson and Jarvis, 1999). The
main reason for this is expected to be organic and clay
coatings on the aggregate surfaces which reduce mass
exchange rates between the two domains (Thoma
et al., 1992; Vinther et al., 1999)
3.2. Numerical formulation
The numerical formulation has to take into account
the fact that flows in the macropore and in the matrix
domains occur with significantly different velocities
Priority in development of the numerical scheme has
been put on preserving the water balance and ensuring
numerical stability at time steps that are not much
lower than the time steps used in solving the matrix
flow equation (Richards) alone. The solution method
is mass conserving. The time step length is controlled
by specifying certain limits for flow and exchange
flow (depths) per time step, partly for ensuring correct
dynamics of the macropore flow description and
partly to avoid instability of the Richards solution due
to high source/sink terms. The time step is controlled
by performing an extra (a priori) macropore compu-
tation at the start of each matrix flow time step—with
the matrix conditions from the previous time step. In
case the resulting maximum (a priori) macropore
flows, infiltrations, and exchange flows exceed the
specified limits, a reduced time step is estimated,
assuming linear relationship between time step length
and flow volumes (unchanged flow rates). The
procedure is repeated until the estimated maximum
flows are within limits.
After the time step check a normal time step
simulation is performed, solving the Richards’
equation for the matrix flow—with reduced source/-
sink terms from macropore-matrix exchange flows of
the previous time step. After this the corresponding
macropore time step is performed.
The calculation procedure consists of a double
sweep algorithm with the following characteristics:
3.2.1. Downwards sweep (sweep 1):
† First, a downwards sweep is performed, i.e.
downwards flow from each cell to the cell below
(or ground water table) in the macropore and in
the matrix domains, and exchange flows, are
calculated. Mass conservation is ensured by
reducing the outflow from a cell if it exceeds
the storage volume of that particular cell. The
flow is not influenced by the water content of
the receiving cell below, but the flow is set to 0 if
the cell below has no macropores.
† In the downwards sweep the downwards flow
from a cell is calculated as the average of two
estimates, and exchange flow as average of four
estimates:
– First, flow and exchange flow estimates are
calculated as function of the macropore water
content at the start of the time step. The
estimates are reduced, if they exceed the start
volume plus the inflow from the cell above.
– Second estimate is flow and exchange flow as
function of the resulting macropore water
content from first estimate, including the
inflow from the cell above (or the macropore
infiltration if upper cell). Again a reduction is
made if the resulting volume would become
negative.
J.S. Christiansen et al. / Journal of Hydrology 299 (2004) 136–158 141

– The final flow and exchange flow are
calculated as the average of the two esti-
mates. The flow is used as inflow to the cell
below (or macropore recharge to ground
water if lower cell).
† As mentioned above, each of the two macro-
pore-matrix exchange flow estimates are calcu-
lated as two sub-estimates: The first estimate is
calculated as function of the matrix water
content at the start of the time step, and the
second as function of the matrix water content as
result of estimate one. The same macropore
water content (pressure) is used for both
exchange estimates. Each sub-estimate is limited
by two conditions: Flow from macropore to
matrix is reduced if the resulting matrix water
content would exceed saturation. Flow from
matrix to macropore is reduced if the resulting
matrix pressure would be below the macropore
pressure. The macropore pressure used for
exchange calculation is calculated as the macro-
pore saturation (i.e. actual water content divided
by porosity) multiplied by the cell height, and
then reduced by the entry pressure. If the
macropores of the cell are fully saturated, the
macropore pressure of the cell above is added
(hydrostatic conditions).
3.2.2. Upwards sweep (sweep 2):
† In the second, upwards, sweep the macropore flows
and the matrix-macropore exchange flows are
reduced for situations where the macropores
would otherwise become over-saturated. The
resulting macropore water contents from sweep
no. 1 are checked, and when they exceed the
macropore porosity the flow from the cell above
and the exchange inflow from the matrix are
reduced accordingly. If the cell receives exchange
inflow from the matrix, the exchange flow and the
flow from the cell above are reduced by the same
proportion, otherwise only the flow from the cell
above is reduced. Mass conservation is ensured by
adding the flow reduction volume to the volume of
the cell above (converted to water content).
† The calculational time step is automatically
adjusted in situations with high macropore and
exchange flows so that these flows do not exceed
certain limits, which from experience is known
to generate numerical instability. In case of
an increase of the ground water table, the water
content in macropores now located below the
groundwater table will be added to the ground-
water recharge.
Due to the complex flow description it was not
possible to verify the code through tests against
analytical solutions. Instead, several tests with
different boundary conditions have indicated that the
code is able to simulate the different aspects of the
macropore flow events dynamically in accordance
with the above theoretical basis. In addition, rigorous
water balance tests have demonstrated that the
continuity equation is simulated very well.
3.3. Test of numerical formulation
The numerical algorithm for the macropore
component was previously tested by Thorsen et al.
(1998). The only modification that has been made to
the process descriptions since then is that the
macroporosity that was described as a function of
depth in the version used by Thorsen et al. (1998) now
is described as a function of soil type.
4. Model construction at catchment scale
4.1. Study area
To evaluate the importance of macropore flow at
the catchment scale a 1.5 km2 area near the village
Frankerup in the western part of Zealand, Denmark
was selected (Fig. 3). Because such a small area, in a
groundwater context, is very much influenced by its
transient boundary conditions a three-step procedure
was used. Firstly, a large area consisting of the
62.3 km2 Bjerge A catchment was modelled with a
250 m computational grid. Secondly, using a tele-
scoping approach a more detailed model was
constructed for the 13.7 km2 Øllemose Rende sub-
catchment with a 125 m computational grid. Finally,
in many of the analyses, results from the 1.5 km2
Frankerup area were extracted from the Øllemose
Rende model.
The boundaries of the larger Bjerge catchment
and the smaller Øllemose catchment as well as
J.S. Christiansen et al. / Journal of Hydrology 299 (2004) 136–158142

the Frankerup area are shown in Fig. 3. The data
required for the construction of the models have been
obtained from existing data sources as outlined
below.
4.2. Topography and river network
The topography and the location of the Bjerge and
Øllemose streams were digitised from geodetic maps
provided by Kort og Matrikelstyrelsen The river
geometry was digitised from municipal stream
regulations. Ten sub-branches with numerous detailed
cross-sections and level points were used in the
construction of the model. A constant Manning
number of 20 m1/3s21 and a leakage coefficient
between the streams and the adjacent aquifer of
1028 s21 have been applied to the entire stream
system.
In addition to the river network, sub-surface tile
drains exist over the main part of the area. The exact
location of these drains is not known. The effect of the
drains is simulated by assuming drains located 1 m
below the ground surface and all over the area. Runoff
through the drains in a particular grid is simulated as
being linearly proportional to the height of the
simulated ground water table above the drain in the
grid. The proportionality factor is a reciprocal time
constant, which on the basis of experience from
modelling of similar regimes was chosen equivalent
to 30 days.
Discharge data from the two river gauging stations,
5614 and 5610 (Fig. 3), were available for the period
from May 1978 to December 1996.
4.3. Hydrogeology
The Bjerge A catchment is a moraine landscape
characterised by a relatively flat surface and river
valleys (Klint and Gravesen, 1999) The upper layer
consists of a clayey and sandy till with a large number
of fractures and biopores. Below this layer that acts as
an aquitard, various layers and lenses of alluvial and
glacial clay and sand are located. The local geology
has been interpreted on the basis of borehole
information from 509 boreholes obtained from the
database of the Geological Survey of Denmark and
Greenland. Six geological layers functioning as
alternating aquifers and aquitards have been identified
and incorporated in the model. In Fig. 4 a west–east
cross-section of the 3D interpretation of the geology is
shown including some of the borehole information.
The adopted six-layer model is not able to describe all
details of the geology. However, in general, there
seems to be a good accordance between the borehole
information and the geological interpretation.
The hydraulic parameters have been assumed
spatially constant within each of the six geological
layers. The only exception to this is the lower
limestone aquifer that has a distributed hydraulic
conductivity according to the different types of
limestone in the area (the Danien limestone to the
south has lower conductivity than the Selandien
limestone to the north). The parameter values have
been assessed through calibration (see below). The
boundaries for the Bjerge A catchment model are
assumed to be no-flow except for the region very close
to the river outlet, where fixed heads have been
assumed for the two lower aquifer layers.
Thirty one groundwater abstraction wells are
present in the area for drinking water supplies Many
of them are small, with abstractions less than
50,000 m3/year. The main part of the abstraction
originates from two urban waterworks with pumping
in the order of 1 million m3/year. Time series of
groundwater abstractions with monthly data from the
two urban and annual data from the small rural water
works have been collected from the different sources
(Geological Survey of Denmark and Greenland, the
county of Vestsjælland and the respective water
works). For the model calibration and validation,
time series of piezometric heads have been obtained
for 19 observation wells, some of which are equipped
with multilevel screens from different geological
layers. These data were collected from the same
sources as the abstraction data.
4.4. Soil characteristics for matrix and macropore
Four soil types were found to represent the Bjerge
A catchment, comprising three mineral soils and one
organic soil Soil 1 (Loamy sand) covers 16% of the
model area, Soil 2 (Sandy loam) covers 74%, Soil 3
(Loam) covers 5%, and Soil 4 (Organic) covers 5% of
the area.
The hydraulic parameters used for characterisation
of the dominating soil type (Soil 2) originate from
J.S. Christiansen et al. / Journal of Hydrology 299 (2004) 136–158 143

intact soil samples collected just north of the Bjerge A
catchment and measured at the Danish Institute of
Agricultural Sciences, Research Station Flakkebjerg.
Parameters for Soil 1 and Soil 3 were obtained from
similar Danish soil types reported in Jacobsen (1989)
and parameters for the organic soil were obtained
from a European database (Wosten et al., 1998).
Matrix characteristics in terms of retention
curves were fitted to a modified Campbell function
(Campbell, 1974; Smith, 1992). The hydraulic
Fig. 4. Cross-section of the 3-dimentional interpreted geology of the area including some boreholes. The location of the cross-section is shown
as A–A in Fig. 3.
Fig. 3. The Bjerge A and Øllemose Rende catchment areas as defined by their topographical divides, the Frankerup area and the location of the
key hydrological stations and well sites.
J.S. Christiansen et al. / Journal of Hydrology 299 (2004) 136–158144

conductivity function was calculated according to
Burdine (1952). Table 1 shows the parameter values.
Simulations were made both with and without
macropore flow included to test the importance of this
process. As no data were available describing the
macropore systems in the soils, parameters for the
macropore model were estimated from experiences
obtained in other studies. The macropore system was
assumed to consist of biopores (worm and root
channels) beginning just below the plough layer and
ending at 1.5 m depth. The macroporosity was
assumed to decrease with depth with a porosity of
2 volumetric percent in the upper layers. The water
transfer coefficient ðbmpÞ governing water exchange
flow between matrix and macropores was selected in
order to represent a soil with approximately 11 cm
between macropores (half aggregate length ¼ 5.5
cm). The threshold value for initiation of macropore
flow ðctÞ was selected to 215 cm. These parameter
values are within the ranges recommended for the
corresponding MACRO parameters ASCALE (half
aggregate length) and CTEN ðctÞ in other studies
(Dubus and Brown, 2002; Beulke et al., 2002; Boesten
et al., 2000) as well as with parameterisation
experience in similar Danish soils (Styczen, 2002).
The saturated hydraulic conductivities were only
measured for the bulk soil samples. In order to
seperate the conductivities in matrix and macropore
values and ensure that the total saturated hydraulic
conductivity was similar in simulations with and
without macropores the saturated conductivities
shown in Table 1 were calculated as follows:
Ks;matrix ¼ Ks;bulk
us;bulk 2 us;mp
us;bulk
! 21=b
þ3
� �ð9Þ
Table 1
Hydraulic parameters for the four soil types
Soil characteristics Bulk characteristics Macropore characteristics Matrix characteristics
Soil name Depth below
ground surface
(m)
us;bulk
(–)
Ks;bulk
(m/s)
us;mp
(–)
Ks;mp
(m/s)
ct
(m)
bmp
(m22)
us;matrix
(–)
Ks;matrix
(m/s)
Campbel–
Burdine
parameters
b Hb (m)
Soil 1 loamy
sand
0–0.15 0.41 1.7 £ 1025 0 – – – 0.41 1.7 £ 1025 7.9 0.046
0.15–0.2 0.41 1.7 £ 1025 0.02 1.0 £ 1025 20.15 300 0.39 6.7 £ 10206 7.9 0.046
0.2–0.3 0.41 5.5 £ 1026 0.02 2.8 £ 1026 20.15 300 0.39 2.7 £ 1026 5.5 0.027
0.3–0.7 0.41 5.5 £ 1025 0.02 2.8 £ 1025 20.15 300 0.39 2.7 £ 1025 5.5 0.027
0.7–1.4 0.33 7.1 £ 1026 0.01 3.2 £ 1026 20.15 300 0.32 3.8 £ 1026 8.3 0.044
1.4–1.8 0.33 7.1 £ 1026 0 – – – 0.33 7.1 £ 1026 8.3 0.044
Soil 2 Sandy
Loam
0–0.15 0.47 6.0 £ 1026 0 – – – 0.47 6.0 £ 1026 8.7 0.026
0.15–0.2 0.47 6.0 £ 1026 0.02 3.5 £ 1026 20.15 300 0.45 2.5 £ 1026 8.7 0.026
0.2–0.3 0.36 1.0 £ 1027 0.02 7.2 £ 1028 20.15 300 0.34 2.8 £ 1028 9.5 0.064
0.3–0.7 0.38 1.0 £ 1026 0.02 7.4 £ 1027 20.15 300 0.36 2.6 £ 1027 11.0 0.079
0.7–1.4 0.35 5.0 £ 1027 0.01 2.6 £ 1027 20.15 300 0.34 2.4 £ 1027 11.3 0.094
1.4–1.8 0.32 1.0 £ 1027 0 – – – 0.32 1.0 £ 1027 12.6 0.149
Soil 3 Loam 0–0.15 0.36 6.2 £ 1026 0 – – – 0.36 6.2 £ 1026 12.0 0.050
0.15–0.2 0.36 6.2 £ 1026 0.02 4.9 £ 1026 20.15 300 0.34 1.3 £ 1026 12.0 0.050
0.2–0.3 0.40 1.9 £ 1026 0.02 1.3 £ 1026 20.15 300 0.38 5.8 £ 1027 10.0 0.070
0.3–0.7 0.40 1.9 £ 1025 0.02 1.3 £ 1025 20.15 300 0.38 5.8 £ 1026 10.0 0.070
0.7–1.4 0.40 1.5 £ 1026 0.01 7.9 £ 1027 20.15 300 0.39 6.8 £ 1027 13.6 0.140
1.4–1.8 0.40 1.5 £ 1026 0 – – – 0.40 1.5 £ 1026 13.6 0.140
Organic soil 0–1.8 0.77 9.3 £ 1027 0 – – – 0.77 9.3 £ 1027 5.7 0.300
J.S. Christiansen et al. / Journal of Hydrology 299 (2004) 136–158 145

Ks;mp ¼ Ks;bulk 2 Ks;matrix ð10Þ
where
Ks;matrix saturated hydraulic conductivity for the
matrix
Ks;mp saturated hydraulic conductivity for the
macropores
Ks;bulk bulk saturated hydraulic conductivity,
measured
us;bulk soil porosity
us;mp macroporosity
This approach can be questioned. A more
commonly accepted approach for catchment and
regional scale applications, where the availability of
measured hydraulic conductivity inevitably is
limited, is to use pedotransfer functions such as
Jarvis et al. (2002) where matrix conductivity is
estimated from soil texture. A comparison of results
from our approach (Eq. (9)) and the two pedotransfer
functions recommended by Jarvis et al. (2002) is
given in Table 2 for the dominant soil type in our
catchment. The two pedotransfer functions, which are
not recommended for arable topsoils, estimate the
hydraulic conductivity at a pressure head of—10 cm,
K10: Table 2 reveals that the pedotransfer functions
and our approach give conductivities of the same
order of magnitude. The main difference is that the
conductivities estimated by the pedotransfer func-
tions show a smaller variation through the profile
than the values from our approach, where the value in
the plough layer (20–30 cm) is significantly smaller
than the values for the other horizons. As the lower
value for the plough layer is believed to be a
consequence of soil structure (compaction) it is not
reflected in the soil texture and can hence not be
explained by the pedotransfer functions. Field studies
from a Danish site with similar soil and climate
conditions and with similar tillage practise showed
that the macropore flow is generated at the interface
to the plough layer (Petersen et al., 1997). We find it
essential to describe the macropore flow generation
mechanism as correctly as possible in the model, and
we therefore think that our approach (Eq. (9)) is
justifiable in the present case. On the other hand it
must be emphasised that Eq. (9), due to its empirical
basis, should not be used in other cases without
adequate support from field data
4.5. Land use
Information on land use was retrieved from the
Corine database 95% of the area is covered by
farmland, 3% by permanent grass, while forest and
urban (paved) areas each cover 1%. The dominating
agricultural crop was winter wheat that in average
covers 32% of the area (Landbrugsstatistik, 1995).
For the modelling of the Bjerge A catchment, the
entire agricultural area was assumed to be covered by
a standard winter cereal. For the more detailed
modelling of the Øllemose Rende catchment, the
crop rotations actually used in the Frankerup areas
have explicitly been simulated. The data on the crop
rotations were obtained from the farmers and the
agricultural extension service.
4.6. Climate data
Time series of daily measurements of global
radiation, mean air temperature, precipitation, and
potential evapotranspiration were provided by the
Danish Institute of Agricultural Sciences, Research
Station Flakkebjerg The daily values were distributed
uniformly within the day. The precipitation data were
corrected for wind effect and wetting according to
guidelines from the Danish Meteorological Institute
(Allerup et al., 1998). The potential evapotranspira-
tion was calculated from a modified Penman formula
(Mikkelsen and Olesen, 1991).
5. Calibration and validation of catchment model
The model calibration was carried out for the
period 1990–1996. A manual trial-and-error method
Table 2
Comparison of matrix conductivity estimated from pedotransfer
functions (Jarvis et al., 2002) and from Eq. (9) for Soil 2
Depth
horizon (m)
K10 (mm/h)
(Jarvis et al.,
2002; Eq. (4))
K10 (mm/h)
(Jarvis et al.,
2002; Eq. (6))
Ks;matrix (mm/h)
(This study,
Table 1)
0.2–0.3 0.30 0.73 0.10
0.3–0.7 0.23 0.49 0.94
0.7–1.4 0.29 0.70 0.86
1.4–1.8 0.37 1.02 0.36
J.S. Christiansen et al. / Journal of Hydrology 299 (2004) 136–158146

was used and the goodness of the simulations was
assessed from visual inspections of the simulated
versus observed discharge hydrographs at the two
gauging stations and of groundwater level heads at the
observation wells. The parameters assessed through
calibration were the hydraulic conductivities and
storage coefficients of the six geological layers
(Table 3).
Examples of calibration results are shown for a two
year period with respect to catchment discharge at
Bjerge A and three selected observations wells with
filters in the three aquifers (Fig. 5). From the figure it
appears that the average level both with regard to
runoff and groundwater heads are reasonably well
simulated, while the model only partially describes
the dynamics of the annual fluctuations of the
groundwater system.
Subsequently, a split-sample validation test was
carried out on the basis of data from the period 1986–
89, where only discharge data (no groundwater head
data) were available. Two key numerical performance
statistics are shown in Table 4 both for the calibration
and the validation periods. It is seen that the average
discharge is simulated quite well during the cali-
bration period and even slightly better during the
validation period. The hydrograph dynamics, as
reflected by the Nash-Sutcliffe criteria for model
efficiency (Nash and Shutcliff, 1970) on the other
hand shows less accurate simulation during the
validation period as compared to the calibration.
In order to obtain an indication of the capability of
the model to simulate the stream-aquifer interaction, a
few field measurements of discharge were made in the
Øllemose Rende system during the low flow season of
1998. The field data showed low flows in the order of
2–4 l/s in the Frankerup area, where the northern
tributary joins Øllemose Rende (Fig. 3). The model
was not run for the same period, but the low flows
simulated throughout the simulation period at this
location were in the order of 1 l/s. Hence this
independent test suggests that the low flow simu-
lations, and thus the baseflow contributions originat-
ing from the deeper aquifers, are simulated at the right
order of magnitude.
On the basis of the validation tests, the model can
be claimed valid for simulation of discharge with the
given accuracy level. Although groundwater head
observations were not available for the validation
period it is likely that the accuracies are similar, or
slightly poorer, than those obtained during the
calibration period. Due to lack of data it has not
been possible to validate the model with respect to the
internal flow variables such as simulations of macro-
pore flows or the individual flow components that
constitute the water balance. Hence, except from
noting that nothing in the limited validation tests
actually conducted suggests completely wrong
interpretations of these internal variables, it must be
emphasised that it is not possible to prove any model
validity for them.
6. Simulation results from catchment scale
6.1. Water balance and groundwater depths
and recharges
The flow regime simulated by the model is
illustrated for the Bjerge A catchment in Fig. 6 as
average figures for the period May 1987 to May 1995.
The period was selected so that the storage changes in
the unsaturated zones as well as in the two aquifers
Table 3
Hydraulic parameter values for the six geological layers assessed through calibration
Geological
layer
Material Horisontal hydraulic
conductivity (m/s)
Vertical hydraulic
conductivity (m/s)
Specific storage
coefficient (1/m)
Specific yield
(–)
Groundwater
abstraction
1 Till 1 £ 1027 1 £ 1028 0.0001 0.005
2 Sand 5 £ 1025 5 £ 1026 0.0001 0.005
3 Till 1 £ 1026 2 £ 1028 0.0001 0.02
4 Sand 1 £ 1024 1 £ 1025 0.0001 0.02 Yes
5 Till 2 £ 1027 2 £ 1028 0.0001 0.02
6 Limestone 2 £ 1025 2 2 £ 1024 2 £ 1026 2 2 £ 1025 0.0001 0.02 Yes
J.S. Christiansen et al. / Journal of Hydrology 299 (2004) 136–158 147
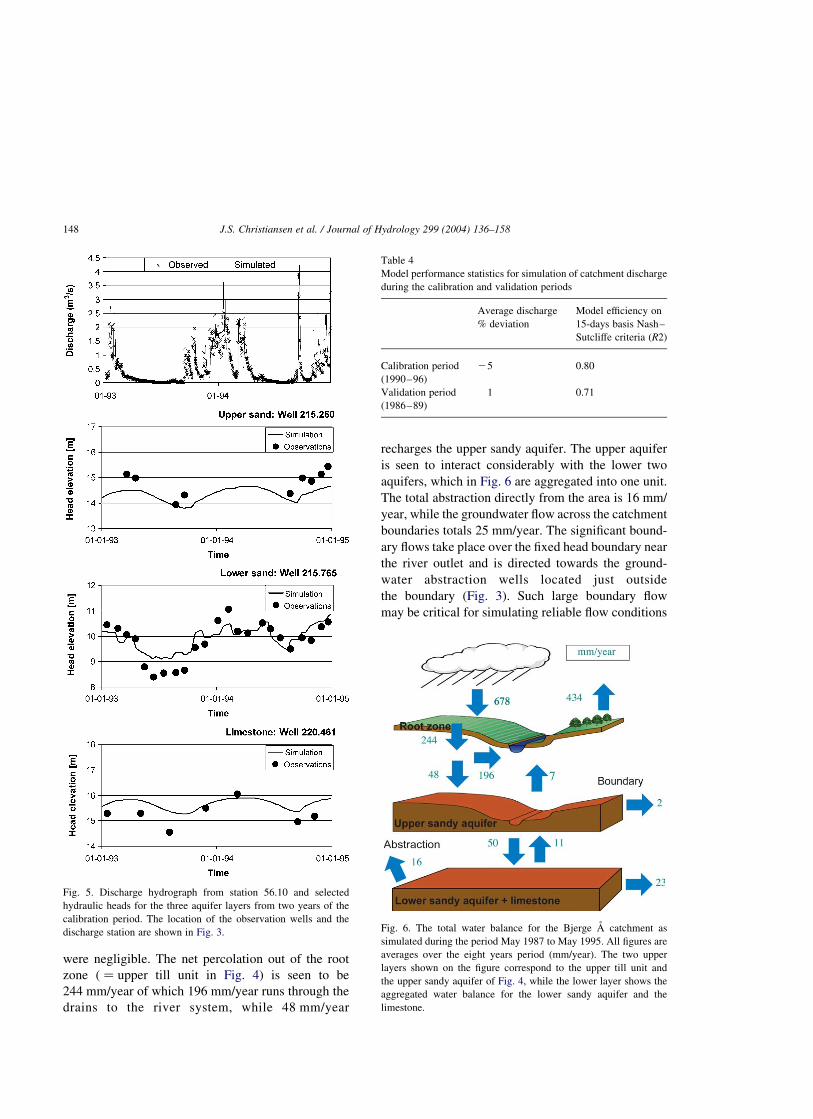
were negligible. The net percolation out of the root
zone ( ¼ upper till unit in Fig. 4) is seen to be
244 mm/year of which 196 mm/year runs through the
drains to the river system, while 48 mm/year
recharges the upper sandy aquifer. The upper aquifer
is seen to interact considerably with the lower two
aquifers, which in Fig. 6 are aggregated into one unit.
The total abstraction directly from the area is 16 mm/
year, while the groundwater flow across the catchment
boundaries totals 25 mm/year. The significant bound-
ary flows take place over the fixed head boundary near
the river outlet and is directed towards the ground-
water abstraction wells located just outside
the boundary (Fig. 3). Such large boundary flow
may be critical for simulating reliable flow conditions
Table 4
Model performance statistics for simulation of catchment discharge
during the calibration and validation periods
Average discharge
% deviation
Model efficiency on
15-days basis Nash–
Sutcliffe criteria ðR2Þ
Calibration period
(1990–96)
25 0.80
Validation period
(1986–89)
1 0.71
Fig. 5. Discharge hydrograph from station 56.10 and selected
hydraulic heads for the three aquifer layers from two years of the
calibration period. The location of the observation wells and the
discharge station are shown in Fig. 3. Fig. 6. The total water balance for the Bjerge A catchment as
simulated during the period May 1987 to May 1995. All figures are
averages over the eight years period (mm/year). The two upper
layers shown on the figure correspond to the upper till unit and
the upper sandy aquifer of Fig. 4, while the lower layer shows the
aggregated water balance for the lower sandy aquifer and the
limestone.
J.S. Christiansen et al. / Journal of Hydrology 299 (2004) 136–158148

for areas close to the boundary. However, as the
focus of the present study is primarily the small
Frankerup area and secondarily the Øllemose Rende
catchment, both located at significant distances from
the boundary, the importance of the uncertainties
generated by the critical boundary conditions are not
believed to be very significant. This is particularly the
case, because the macropore flow does not depend
on groundwater flows, but only on the groundwater
heads.
Macropore flow is, according to the above process
description, mainly governed by soil moisture con-
ditions in the root zone, which in case of shallow
groundwater table with upwards capillary flux is
influenced by the depth to the groundwater table.
(Fig. 7) shows average figures for the period 1990–
1996 for the depth to the ground water table in
the Frankerup area together with the split of
groundwater recharge into flows directly through
macropores and flows reaching the groundwater table
through the soil matrix. According to the model, the
average depth to groundwater table varies between
1 m and 3 m over the area. This is mainly governed by
the variation in topography and the location of the
river. The minimum depth of 1 m is due to the
existence of artificial tile drains at that depth. The total
recharge varies between 200 mm/year and 300 mm/
year. This spatial variation is caused partly by
differences in actual evapotranspiration between the
different crops and partly by differences in the depth
to the groundwater table causing differences in the
rate of upwards capillary flux from the shallow
groundwater table to the root zone. The recharge
that enters the groundwater storage directly through
the macropores are seen to be small, but with a
relatively large variation, between 0.1 mm/year and
1.3 mm/year.
6.2. Macropore flows at plot scales within catchment
To illustrate the flow processes and the macro-
pore dynamics, results for a two years period from
two selected calculational grid points (soil columns)
are shown in Fig. 8. The precipitation and recharge
values are aggregated to monthly values in the
figure while the water content in the macropores are
shown as average weekly values. The two grid
points are located within the Frankerup area on a hill
and in the valley close to the river, respectively. As
can be seen from the figure, the conditions at the
two grid points differ significantly with respect to
depth to groundwater table and as a result of this
also with respect to groundwater recharge and soil
moisture conditions. At the hill site, the groundwater
table varies between 1 m and 4.5 m depth. At the
valley site, the groundwater table is at the depth of
the tile drains (1 m) most of the years with a
decrease of only 0.5 2 1 m during the dry periods.
Fig. 7. The spatial variability of groundwater recharge and the depth
to the upper groundwater table for the Frankerup area as simulated
during the period 1990–96.
J.S. Christiansen et al. / Journal of Hydrology 299 (2004) 136–158 149
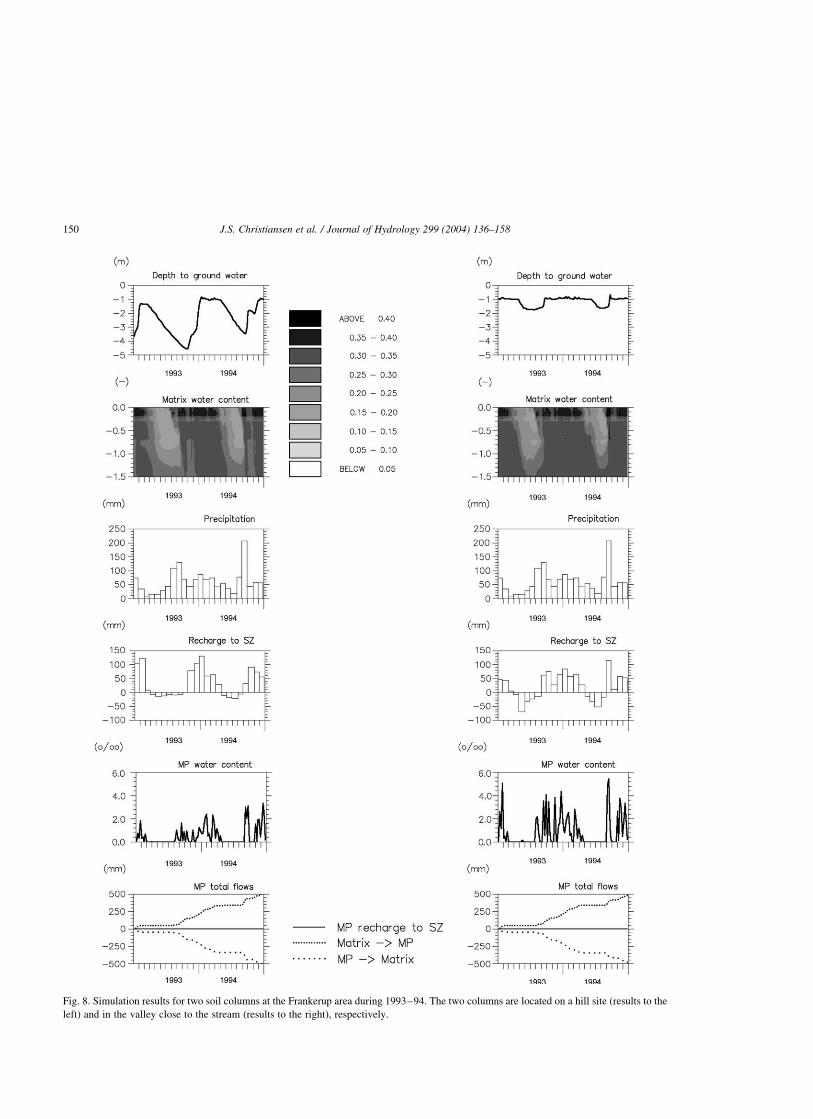
Fig. 8. Simulation results for two soil columns at the Frankerup area during 1993–94. The two columns are located on a hill site (results to the
left) and in the valley close to the stream (results to the right), respectively.
J.S. Christiansen et al. / Journal of Hydrology 299 (2004) 136–158150

Thus, the shallow groundwater table at the valley
site is seen to cause significantly higher rate of
upwards capillary flow during the summer season as
compared to the site on the hill.
The macropores are seen to contain water fre-
quently during the two years period. All the macro-
pore events are generated by high water content at
20–30 cm depth. Both locations have soil type 2
(Table 1), which is characterised by a decrease of
saturated hydraulic conductivity by two orders of
magnitude due to a plough pan at this depth. It is
furthermore noticed that for both sites, all the
macropore flux generated at this depth returns to the
soil matrix before it reaches the groundwater table.
In Fig. 9, the distribution over the Frankerup area of
macropore flows at different depths are shown as
average values for the period 1990–96. In accordance
with the results shown in Fig. 8, Fig. 9 substantiates
that macropore flow is predominantly generated in the
upper part of the profile and that almost all the
macropore flow is diverted back to the soil matrix
through diffusion before the water reaches the ground
water table. While the macropore flow that directly
recharges the groundwater is less than 0.5% of the total
groundwater recharge (Fig. 7), the amount of macro-
pore flow at 30 cm depth is more than two orders of
magnitude larger. Thus, of the macropore flow of about
170 mm/year at 30 cm depth, there is a net ‘loss’ of
about 80% before the water reaches 50 cm depth and of
about 98% before 100 cm depth. This clearly shows
that macropore flow has a very significant effect in
terms of rapidly transporting some water downwards in
the soil profile. According to the parameterisation
chosen here the transport distance in the macropores is
typically between 20 and 80 cm.
6.3. Effects of macropore flows on catchment response
An assessment of the effect of macropore flow on
the catchment response in terms of river discharge and
groundwater heads have been made by comparing
results from two model simulations with and without
macropores, respectively The results (not shown here)
showed that the effect of macropores on both
discharge and groundwater heads were negligible
with differences generally much less than one percent
of the natural variation.
6.4. Effects of macropore transport on
catchment scale
In order to assess the importance of the macropore
flow processes on the transport of solutes at catchment
scale, model simulations were conducted as follows
for the Frankerup area In order to focus on macropore
effects and eliminate the effects of rotating crops and
associated varying pesticide applications, the entire
area was assumed to be covered by the same crop,
namely winter wheat. A tracer was applied uniformly
over the area at a time in the autumn when pesticide is
typically applied and with application rates corre-
sponding to a typical autumn applied herbicide. The
tracer was applied once and the effects over the
subsequent years were simulated by the model. In
order to investigate the effects of different climate
conditions around the time of tracer application
simulations were conducted for tracer applications
in three different years, 1990, 1991 and 1992. The
simulation period was in all cases 1990–1996.
The tracer simulations were carried out for two
alternative tracers, namely a conservative non-reac-
tive tracer, and a reactive tracer (hypothetical
pesticide) with sorption and degradation parameters
as given in Table 5. The simulations were carried out
for two alternative conditions with respect to macro-
pores, namely one simulation with macropores and
another simulation without macropores (i.e. only
matrix flow).
Summary results from the simulations with respect
to fate of the tracers by the end of the simulation
period are shown in Table 6 in terms of accumulatedFig. 9. The distribution of macropore flow at different depths over
the Frankerup area as simulated during the period 1990–96.
J.S. Christiansen et al. / Journal of Hydrology 299 (2004) 136–158 151

mass fluxes and total mass balances. The tracer is
applied as a pesticide, i.e. it is assumed to be sprayed
on the leaves of the crop. The fate of the tracer in the
canopy in terms of storage, degradation and through-
fall to the soil surface is calculated by the model and
results in different throughfall rates for the three years.
Therefore, in spite of the same application rate of
500 g/ha over the entire catchment (97 grids £ 125
m £ 125 m) ¼ .75.8 kg for all three years, the fluxes
into the soil varied and were approximately 75.8, 61.9
and 64.8 kg for the three respective years.
For the conservative tracer, the differences
between the macropore and the no-macropore simu-
lations are small. The amounts of tracer that reached
the groundwater by the end of the simulation period
are approximately 67, 65 and 63% of the total tracer
inputs for the three respective application years. The
remaining amount of tracer is still retained in the
unsaturated zone at the end of the period.
The pesticide is seen to behave significantly
different in several respects. First of all, almost all
the applied amount is sorbed and degraded in the
unsaturated zone with the result that the fractions of
tracer reaching the groundwater are in the order of
1026–1023. Secondly, the differences between the
macropore and the no-macropore simulations are
significant. Thirdly, the differences among the years
are very significant. For one of the application years
(1990) the effects of the macropores are approxi-
mately a doubling of the leaching to the groundwater,
while the leaching for the two other years are
increased by factors 4 and 8, respectively. This
difference can be explained with differences in
climatic conditions and hence in macropore activities
in the weeks following the tracer application for the
three respective years.
In Table 6, a mass balance measure is calculated as
an indicator of the numerical accuracy of the
calculations. The mass balance error is simply
calculated as the input at the soil surface minus the
outgoing flux to streams minus the degradation and
sorption in the unsaturated and saturated zones minus
the storages in the unsaturated and saturated zones.
For the conservative tracer, the mass balance errors
are between 0.6 and 1.1 g, which is negligible
compared to the flux values. For the pesticide, the
mass balance errors are between 0.0 and 0.5 g, which
is negligible relative to the input at the soil surface,
but in some cases of the same order of magnitude as
the calculated flux to the saturated zone. This implies
that absolute figures of the calculated mass in the
saturated zone must be taken with reservation due to
uncertainty in the basic numerical calculations. In this
context it may be noted, however, that the uncertainty
resulting from uncertainty of the assessed sorption and
degradation parameters is significantly larger than the
errors in the numerical calculations.
The variations within the Frankerup area of the
pesticide flux at 100 cm depth are illustrated in Fig. 10
for the three application years and for the situations
with and without macropores. It should be noticed that
the y-axis is logarithmic. The significant differences
among the three years clearly appear from this figure,
with 1992 being the year generating the largest
amount of leaching to the saturated zone and 1991
being the year with the lowest leaching and without
effects of macropores. The variation across the
catchment is significant. Thus, for the 1992 appli-
cation, the variation over the catchment for the
macropore simulation is between 2 and 61 mg/ha.
And even for the 90% of the area generating leaching
closest to the average conditions, the range is from 8
to 60 mg/ha, i.e. a factor of 7.5. It is noted that the
variation over the catchment is the same for
simulations with and without macropores.
7. Discussion and conclusions
A spatially distributed model code capable of
describing macropore flow and transport processes at
Table 5
Parameter values for description of degradation and sorption for the
simulation with hypothetical pesticide
Parameter Value
Degradation rate, T 1
2
0–1 m depth 29 days (at 10 8C)
Below 1 m depth No degradation (cm3/g)
Sorption distribution coefficient, Kd (linear equilibrium) (cm)
Unsaturated zone, 0–20 1.174
Unsaturated zone, 20–70 0.294
Unsaturated zone, 70–150
Unsaturated zone, below 150 0.059
Saturated zone 0.029
J.S. Christiansen et al. / Journal of Hydrology 299 (2004) 136–158152
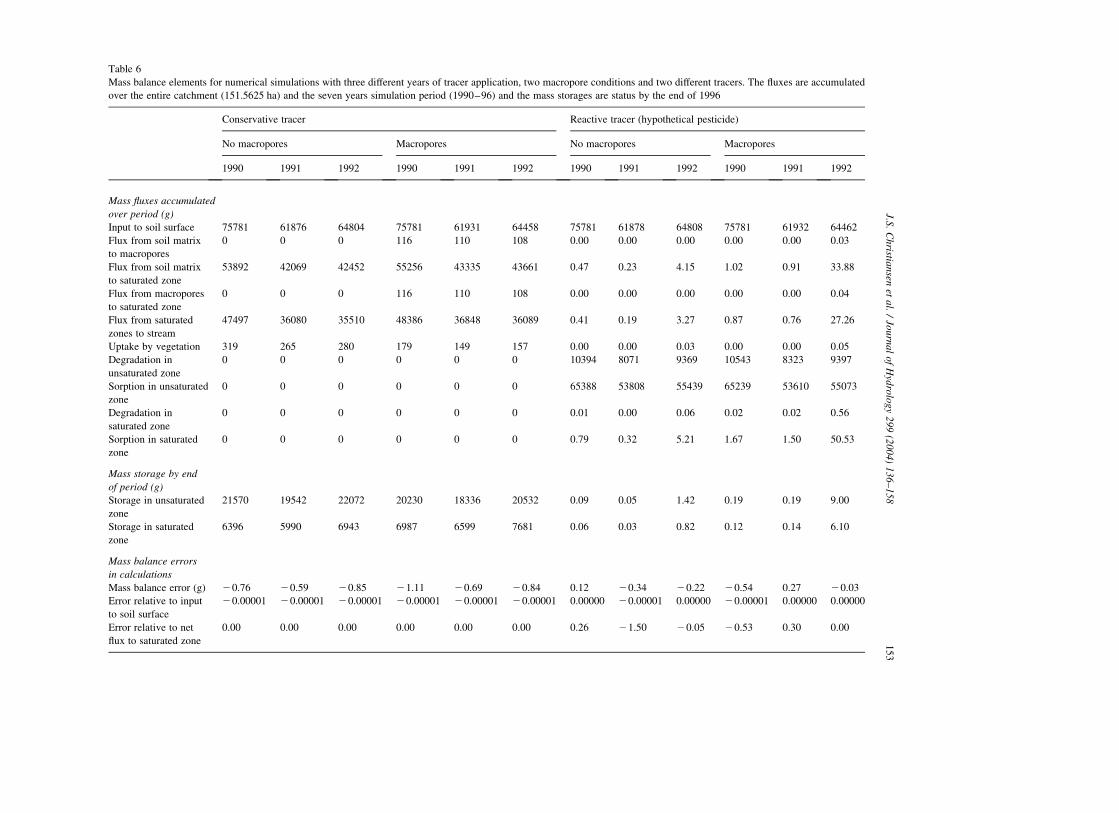
Table 6
Mass balance elements for numerical simulations with three different years of tracer application, two macropore conditions and two different tracers. The fluxes are accumulated
over the entire catchment (151.5625 ha) and the seven years simulation period (1990–96) and the mass storages are status by the end of 1996
Conservative tracer Reactive tracer (hypothetical pesticide)
No macropores Macropores No macropores Macropores
1990 1991 1992 1990 1991 1992 1990 1991 1992 1990 1991 1992
Mass fluxes accumulated
over period (g)
Input to soil surface 75781 61876 64804 75781 61931 64458 75781 61878 64808 75781 61932 64462
Flux from soil matrix
to macropores
0 0 0 116 110 108 0.00 0.00 0.00 0.00 0.00 0.03
Flux from soil matrix
to saturated zone
53892 42069 42452 55256 43335 43661 0.47 0.23 4.15 1.02 0.91 33.88
Flux from macropores
to saturated zone
0 0 0 116 110 108 0.00 0.00 0.00 0.00 0.00 0.04
Flux from saturated
zones to stream
47497 36080 35510 48386 36848 36089 0.41 0.19 3.27 0.87 0.76 27.26
Uptake by vegetation 319 265 280 179 149 157 0.00 0.00 0.03 0.00 0.00 0.05
Degradation in
unsaturated zone
0 0 0 0 0 0 10394 8071 9369 10543 8323 9397
Sorption in unsaturated
zone
0 0 0 0 0 0 65388 53808 55439 65239 53610 55073
Degradation in
saturated zone
0 0 0 0 0 0 0.01 0.00 0.06 0.02 0.02 0.56
Sorption in saturated
zone
0 0 0 0 0 0 0.79 0.32 5.21 1.67 1.50 50.53
Mass storage by end
of period (g)
Storage in unsaturated
zone
21570 19542 22072 20230 18336 20532 0.09 0.05 1.42 0.19 0.19 9.00
Storage in saturated
zone
6396 5990 6943 6987 6599 7681 0.06 0.03 0.82 0.12 0.14 6.10
Mass balance errors
in calculations
Mass balance error (g) 20.76 20.59 20.85 21.11 20.69 20.84 0.12 20.34 20.22 20.54 0.27 20.03
Error relative to input
to soil surface
20.00001 20.00001 20.00001 20.00001 20.00001 20.00001 0.00000 20.00001 0.00000 20.00001 0.00000 0.00000
Error relative to net
flux to saturated zone
0.00 0.00 0.00 0.00 0.00 0.00 0.26 21.50 20.05 20.53 0.30 0.00
J.S.
Ch
ristian
senet
al.
/Jo
urn
al
of
Hyd
rolo
gy
29
9(2
00
4)
13
6–
15
81
53

a catchment scale has been developed within the
framework of the coupled MIKE SHE/Daisy code.
The adopted macropore formulation has many
conceptual similarities to the principles behind the
well tested MACRO code, but it differs in some
important aspects. Most importantly, the water
exchange between the two pore regions (Eq. (4)) is
driven by the product of the matrix conductivity and
the pressure head difference between the pore regions,
while the approach in MACRO is based on an
approximation to the water diffusion equation. In the
existing dual-permeability model codes a variety of
approaches exist for describing the water exchange
between the two domains, and an accurate description
is recognised as a great challenge (Simunek et al.,
2003). As we have had no detailed field data to check
our formulation we cannot document that our
approach is better than other existing ones. Further-
more, the numerical formulation in our code is
different from that in the MACRO by being based
on an explicit algorithm. Our algorithm is quite fast
and mass conserving, but we have not made direct
comparison tests with MACRO or other codes.
The MIKE SHE/Daisy model was then set up for a
small catchment. The model was subject to calibration
and validation tests against discharge and ground-
water levels corresponding to standard procedures in
catchment modelling. As no field data exists for
internal variables such as macropore flow, the model’s
capability to correctly simulate macropore processes
at the catchment scale could not be documented.
The simulation results designed to investigate the
importance of macropore processes at catchment scale
can therefore not be claimed as valid, but should
rather be seen as outputs from a numerical exper-
iment. Hence, in order to confirm the findings from
the present study it will be required to have support
from dedicated field data.
There are several important sources of uncertainty
related to using a model with macropore formulations
at a catchment scale as in the present study. The most
important source is related to assessment of macropore
parameters, in particular the exchange coefficient,b; or
the related diffusion length governing the exchange of
water and solutes between macropores and matrix. In
addition, soil characteristics are known to exhibit large
spatial variations at catchment scale, but soil data in
terms of soil texture, soil structure and hydraulic
parameters will only be available for representative
soils. Simple extrapolation of such data to similar soils
in the area may not be valid with regard to
representation of macropores, because other factors
such as the management history of a particular soil
(cropping and tillage practice) has major impact on
frequency and extent of macropores (Edwards et al.,
1990; Caron et al., 1996). Another critical assumption
is the estimation of matrix hydraulic conductivity. As
field data are seldom (or never) available at catchment
scale pedotransfer functions such as the ones rec-
ommended by Jarvis et al. (2002) are often used. In
order to preserve the vertical variation in conductivity
with a low value in the plough pan we have instead used
an empirical approach based on an estimation of matrix
hydraulic conductivity from measured bulk hydraulic
conductivity. Based on past Danish field studies
(Petersen et al., 1997) we have argued that this is
likely to provide a more realistic description of the
macropore generation process in our particular case.
However, because this approach is empirical without a
sound theoretical basis, one should generally be
cautious about its use and it should not be applied in
other areas without support from field data.
We have used daily rainfall data and distributed the
rainfall evenly over the day. This approach is
definitely not applicable in many hydrological
regimes where overland flow is common and macro-
pore flow is generated due to saturation of the top soil.
However, in our case the principal macropore
Fig. 10. The spatial variability of the accumulated flux of pesticide
at 100 cm depth as simulated for the Frankerup area during the
period 1990–1996 with three alternative years of pesticide
application and with, respectively without, macropores included
in the model simulations.
J.S. Christiansen et al. / Journal of Hydrology 299 (2004) 136–158154

generation mechanism is related to saturation above
the low permeable plough pan at 20–30 cm depth.
Due to the soil moisture storage in the upper 20 cm, it
is rather the volume than the intensity of rainfall that
is important. A sensitivity analysis, where we
distributed the daily rainfall over two hours instead
of 24 hours, showed that the effect of the rainfall
intensity was small for the total amount of macropore
flow and had no impacts for the spatial variation of
macropore flow over the catchment. This is supported
by the field tracer experiments reported by Gjetter-
mann et al. (1997) who found that application of
25 mm Brilliant Blue dye tracer with intensities
varying from 3.1 to 25 mm/h resulted in macropore
flow generated above the plough pan in all cases.
The simulation results show that the macropore
processes, as they are formulated in the model for the
particular catchment, has the primary function of
rapidly transporting a significant part of the water (and
solute) from the plough pan at 20 cm depth to a depth
of 40–100 cm, where most of it flows back into the
soil matrix. Only a minor part of the macropore flow
reaches the groundwater table directly through the
macropores. It must be emphasised that we have no
specific field data to support these findings. Therefore,
we do not claim that the depths and amounts of flow in
the macropores are correct, but rather that the process
equations of the MACRO and similar codes using
typical parameter values generate such results for our
conditions. Other field studies (Villholth et al., 1998;
Nilsson et al., 2001) in similar soils and climate
suggest that the biopores in the upper soil layers are
connected with geologically generated fractures in the
deeper layers so that the combined macropore-
fracture system is able to transport tracers signifi-
cantly deeper than found in the present study.
This indicates that either the macropore parameter
values used in the present case or the process
equations may not be fully adequate for catchment
scale application.
The present study suggests that the macropore
processes appear to have only negligible effects on the
discharge and groundwater levels. This is interesting
when comparing with other catchment modelling
studies using similar distributed physically based
models (Refsgaard and Hansen, 1982; Overgaard,
2000). They report that, in order to simulate the
discharge hydrographs properly and in particular
the early peaks in the autumn after the dry summer
period, a significant part of the infiltration through the
root zone has to be routed through a fast track
bypassing the lower part of the root zone. These
hydrograph peaks are simulated quite well in our case
(Fig. 5). The reason for the necessity of introducing
the so-called bypass flow in catchment modelling is
the need to account for the spatial variability of soil
hydraulic properties, root zone depth, vegetation
types, climate input, etc. within large computational
grids (Refsgaard and Hansen, 1982; Overgaard,
2000). This is apparently not required in our case
study, where the grid size is relatively small. In any
case, our results indicate that the small scale
macropore flow processes, included in our case,
can not provide the same effects on simulated
hydrographs as the bypass flows that can be
considered a large scale phenomena.
In spite of the fact that macropore flow thus is not a
dominating process for simulation of discharge at
catchment scale, the simulation results suggest that it
has a very significant effect on the leaching of
pesticides from the surface to the groundwater table,
because some of the pesticides are transported rapidly
downwards in the soil profile to zones with less
sorption and degradation. This is in agreement with
the conclusions of Simunek et al. (2003).
An important finding from the study is the apparent
erratic nature of the macropore processes. The
generation of macropore flows depends in a very
complex manner on both the soil characteristics and
the hydrological regime. Investigation of the simu-
lation results suggests that it is not possible before-
hand to identify which rainfall events generate the
highest macropore flows and as such posses the
largest potential for pesticide leaching. The large
variations of macropore transport among the three
years of simulated tracer application show that three
different years of tracer applications are not sufficient
to estimate neither the average importance of the
macropore transport nor the average pesticide leach-
ing to groundwater.
Furthermore, the simulation results show a con-
siderable spatial variation of macropore flows and
transport throughout a catchment. Thus, the variation
of pesticide leaching to the groundwater varies in the
simulations with a factor of 30 over the catchment and
a factor of 7.5 within the 90% of the catchment, where
J.S. Christiansen et al. / Journal of Hydrology 299 (2004) 136–158 155
the leaching is closest to the median value. This
spatial variation is not caused or increased by the
macropore processes. It is simulated alone as a
consequence of variations in topography, depth to
groundwater table and distance to streams. In the
actual field situation the variation in pesticide
leaching will be significantly larger, because spatial
variations in soil physical and chemical properties and
vegetation parameters will also play a significant role.
The key finding of the present study that macro-
pore flow is highly depending on depth to ground-
water table is supported by Haria et al. (2003), who
from two field experiments on sites with deep and
shallow water tables, respectively, found that prefer-
ential flow only occurred at the site with shallow
water table. Haria et al. (2003) explained this finding
by the importance of the capillary fringe in sustaining
a higher moisture content in the unsaturated zone at
the shallow groundwater site.
The absolute figures on amount of leaching and
quantities of flow in macropores should be taken with
reservation. In order to assess this, the analysis should
be supplemented by thorough sensitivity analyses and
preferably also by additional field data to confine the
uncertainty range. However, this need for further
studies, does not disqualify the more general con-
clusions that we are making here on the spatial
variation within a catchment.
An interesting question is how large an error one
would experience by conducting pesticide leaching
simulations on a soil column basis instead of carrying
out catchment simulations. The present study with its
lack of field data and with only one field site cannot
provide the general answer to this question. However,
the simulation results indicate that the variation of
pesticide leaching within a catchment is very signifi-
cant and should be taken into account. Thus, the present
study suggests that results from column simulations
often may not provide pesticide leaching results that
are representative at a catchment scale.
The methodology applied in the present study is
basically an up-scaling methodology, where the
equations and parameter values, previously used
only at point and field scales, through a spatially
distributed approach have been applied for catchment
modelling. In this way it is possible to combine
the knowledge and experience existing at point/field
scale with the other factors, such as topography
and groundwater depth, that is known to be of
importance at catchment scale. Two general con-
clusions emerge from the simulation results: (1) The
point scale macropore processes are not important for
groundwater recharge and discharge at catchment
scale, but are nevertheless dominating processes for
pesticide leaching also at the catchment scale. (2) The
presently adopted up-scaling methodology is signifi-
cantly better than just assuming that the point scale
column simulations are representative for an entire
catchment with respect to simulation of leaching of
pesticides at catchment scale. This methodology can
be implemented by using a comprehensive 3D
catchment model as we have done, but it may be
sufficient to carry out several single column simu-
lations, if the range of columns adequately represents
the spatial and temporal variations of depth to
groundwater throughout the catchment.
Acknowledgements
This work was partly funded through the project
‘Large scale modelling of pesticide transport’ under
the Danish Environmental Research Programme.
Karen Villholth is thanked for giving valuable
comments to the manuscript.
References
Abbott, M.B., Bathurst, J.C., Cunge, J.A., O’connell, P.E.,
Rasmussen, J., 1986. An introduction to the European Hydro-
logical System—Systeme Hydrologique Europeen SHE 2:
Structure of a physically based distributed modelling system.
Journal of Hydrology 87, 61–77.
Abrahamsen, P., Hansen, S., 2000. Daisy: an open soil-crop-
atmosphere system model. Environmental Modelling and Soft-
ware 15, 313–330.
Allerup, P., Madsen, H., 1998. Standard values (1961–1990) of
precipitation corrections, Danish Meteorological Institute,
Copenhagen, (in Danish).
Armstrong, A., Aden, K., Amraoui, N., Diekkruger, B., Jarvis, N.,
Mouvet, C., Nicholls, P., Wittwer, C., 2000. Comparison of the
performance of pesticide-leaching models on a cracking clay
soil: results using the Brimstone Farm dataset. Agricultural
Water Management 44, 85–104.
Arnold, J.G., Williams, J.R., 1995. SWRRB—a watershed scale
model for soil and water resources management. In: Singh, V.J.,
(Ed.), Computer Models of Watershed Hydrology, Water
Resources Publication, pp. 847–908.
J.S. Christiansen et al. / Journal of Hydrology 299 (2004) 136–158156

Barbash, J.E., Resek, E.A., 1996. Pesticides in groundwater:
distribution, trends, and governing factors, Ann Arbor Press,
Inc, Chelsea, Michigan.
Bergstrom, L.F., Jarvis, N.J., 1994. Evaluation and comparison of
pesticide leaching models for registration purposes: overview.
Journal of Environmental Science Health A29(6), 1061–1072.
Beulke, S., Renaud, F., Brown, C.D., 2002. Development of
guidance on parameter estimation for the preferential flow
model MACRO 4.2, Cranfield Centre for EcoChemistry,
Cranfield University, Silsoe, UK.
Beven, K., Germann, P., 1982. Macropores and water flows in soils.
Water Resources Research 18(5), 1311–1325.
Boesten, J., Businelli, M., Dekmas, A., Gottesburen, B., Hanze, K.,
Jarvis, T., Jones, R., Klein, M., van der Linden, T., Rekolainen,
S., Resseler, H., Roquero, C., Maier, W.-M., Styczen, M.,
Thorsen, M., Travis, K., Vanclooster, M., 2000. FOCUS
groundwater scenarios in the EU review of active substances.
Forum for the Coordination of Pesticide Fate Models and their
Use, Version, 1.
Brun, A., Christiansen, J.S., Refsgaard, J.C., 2000. Modelling of
pesticide transport and fate in groundwater—potential, limi-
tations and data base, Miljøforskning 42, 36–39. The Strategic
Environmental Research Programme, Arhus, Denmark, (in
Danish).
Burdine, N.T., 1952. Relative permeability calculations from pore-
size distribution data. Trans. AIME 198, 35–42.
Campbell, G.S., 1974. A simple method for determining unsatu-
rated conductivity from moisture retention data. Soil Science
117, 311–314.
Caron, J., Banton, O., Angers, D.A., Villeneuve, J.P., 1996.
Preferential bromide transport through a clay loam under alfalfa
and corn. Geoderma 69, 175–191.
Crawford, N.H., Linsley, R.K., 1966. Digital simulation in
hydrology. Stanford Watershed Model IV, Department of
Civil Engineering, Stanford University, Technical Report, 39.
DHI, 2000a. MIKE SHE Water Movement User Manual, DHI
Water and Environment, Hørsholm, Denmark.
DHI, 2000b. MIKE SHE Water Quality User Manual, DHI Water
and Environment, Hørsholm, Denmark.
Donigian, A.S., Bicknell, B.R., Imhoff, J.C., 1995. Hydrological
simulation program—fortran (HSPF). In: Singh, V.J., (Ed.),
Computer Models of Watershed Hydrology, Water Resources
Publication, pp. 395–442.
Dubus, I.G., Brown, C.D., 2002. Sensivity and first-step uncertainty
analyses for the preferential flow model MACRO. Journal of
Environmental Quality 31(1), 227–240.
EEA, 2000. Sustasinable use of Europe’s water? State, prospects
and issues, European Environment Agency, Copenhagen.
Edwards, W.M., Shipitalo, M.J., Owens, L.B., Norton, L.D., 1990.
Effect of Lumbricus Terrestris L. burrows on hydrology of
continuous no-till corn fields. Geoderma 46, 73–84.
Gjettermann, B., Nielsen, K.L., Petersen, C.T., Jensen, H.E.,
Hansen, S., 1997. Preferential flow in sandy loam as affected
by irrigation intensity. Soil Technology 11, 139–152.
Grayson, R.B., Bloschl, G., Moore, I.D., 1995. Distributed
parameter parameter hydrologic modelling using vector
elevation data: THALES and TAP £ 102C. In: Singh, V.J.,
(Ed.), Computer Models of Watershed Hydrology, Water
Resources Publication, pp. 669–696.
Hansen, S., Jensen, H.E., Nielsen, N.E., Svendsen, H., 1991.
Simulation of nitrogen dynamics and biomass production in
winter wheat using the Danish simulation model Daisy.
Fertilizer Research 27, 245–259.
Haria, A.H., Hodnett, M.G., Johnson, A.C., 2003. Mechanisms of
groundwater recharge and pesticide penetration to a chalk
aquifer in southern England. Journal of Hydrology 275,
122–137.
Jacobsen, O.H., 1989. Unsaturated hydraulic conductivity for some
Danish soils. Methods and characterization of soils. Tidsskrift
for Planteavls Specialserie, Beretning nr. S, 2030.
Jarvis, N.J., 1994. The MACRO model (Version 3.1). Technical
description and sample simulations,Reports andDissert. 19,Dept.
Soil Sci., Swedish Univ. Agric. Sci., Uppsala, Sweden, 51 pp.
Jarvis, N.J., 1998. Modelling the impact of preferential flow on
nonpoint source pollution, In: Physical Nonequilibrium Pro-
cesses in Soils. Modeling and Application, Ann Arbor Press,
Inc, Chelsea, Michigan, pp. 195–217.
N.J. Jarvis, M.H. Larsson, 1998. The MACRO model (version 4.1),
Technical description, http://130.238.110.134/bgf/Macrohtm/
macro.htm
Jarvis, N.J., Hollis, J.M., Nicholls, T.H., Mayr, T., Evans, S.P.,
1997. MACRO_DB: a decision-support tool for assessing
pesticide fate and mobility in soils. Environmental Modelling
and Software 12, 251–265.
Jarvis, N.J., Zavattaro, L., Rajkai, K., Reynolds, W.D., Olsen, P.-A.,
McGechan, M., Mecke, M., Mohanty, B., Leeds-Harrison, P.B.,
Jacques, D., 2002. Indirect estimation of near-saturated
hydraulic conductivity from readily available soil information.
Geoderma 108, 1–17.
Klint, K.E.S., Gravesen, P., 1999. Fractures and biopores in
Weichselian clayey tillaquitards at Flakkebjerg, Denmark.
Nordic Hydrology 30(4/5), 267–284.
Knisel, W.G., Williams, J.R., 1995. Hydrology Component of
CREAMS and GLEAMS Models. In: Singh, V.P., (Ed.),
Computer Models of Watershed Hydrology, Water Resources
Publication, pp. 1069–1114.
Landbrugsstatistik, 1995. Agricultural Statistics, Danmarks Statis-
tik, Copenhagen, 294 pp (in Danish).
Larsson, M.H., Jarvis, N.J., 1999. Evaluation of a dual-porosity
model to predict field-scale solute transport in a macroporous
soil. Journal of Hydrology 215, 153–171.
Mikkelsen, H.A., Olesen, J.E., 1991. Comparison of methods for
estimating potential evapotranspiration, Tidsskrift for Plan-
teavls Specialserie, Beretning nr. S 2157, (in Danish, summary
in English).
Nash, I.E., Shutcliff, I.V., 1970. River flow forecasting
through conceptual models, I. Journal of Hydrology 10, 282–290.
Nilsson, B., Sidle, R.C., Klint, K.E., Bøggild, C.E., Broholm, K.,
2001. Mass transport and scale-dependent hydraulic tests in a
heterogeneous glacial till—sandy aquifer system. Journal of
Hydrology 243(3–4), 162–179.
Overgaard, J., 2000 MIKE SHE modelling on regional scale. MSc
Thesis. Department of Hydrodynamics and Water Resources,
Technical University of Denmark.
J.S. Christiansen et al. / Journal of Hydrology 299 (2004) 136–158 157

Petersen, C.T., Hansen, S., Jensen, H.E., 1997. Tillage-induced
horizontal periodicity of preferential flow in the root zone. Soil
Science Society of America Journal 61, 586–594.
Refsgaard, J.C., 1996. Terminology, modelling protocol
and classification of hydrological model codes. In: Abbott,
M.B., Refsgaard, J.C. (Eds.), Distributed Hydrological
Modelling, Kluwer Academic Publishers, Dordetch,
pp. 17–39.
Refsgaard, J.C., Hansen, E., 1982. A distributed groundwater/
surface water model for the Susa catchment. Part I—model
descriptions. Nordic Hydrology 13(5), 299–310.
Refsgaard, J.C., Storm, B., 1995. Computer Models of Watershed
Hydrology. In: Singh, V.P., (Ed.), Water Resources Publication,
pp. 809–846.
Saxena, R.K., Jarvis, N.J., Bergstrom, L., 1994. Interpreting non-
steady state tracer breakthrough experiments in sand and clay
soils using a dual-porosity model. Journal of Hydrology 162,
279–298.
Sidle, R.C., Nilsson, B., Hansen, M., Fredericia, J., 1998. Spatially
varying hydraulic and solute transport characteristics of a
fractured till determined by field tracer tests, Funen, Denmark.
Water Resources Research 34(10), 2515–2527.
Simunek, J., Jarvis, N.J., van Genuchten, M.T., Gardenas, A., 2003.
Review and comparison of models for describing non-
equilibrium and preferential flow and transport in the vadose
zone. Journal of Hydrology 272, 14–35.
Smith, R.E., 1992. An integrated simulation model of nonpoint-
source pollutants at the field scale, Department of Agriculture.
Agricultural Research Service, 120 pp.
Stockmarr, J. (Ed.), 2000. Groundwater monitoring 2000, Geologi-
cal Survey of Denmark and Greenland, Copenhagen, (in
Danish).
Styczen, M., 2002. Personal communication, DHI Water and
Environment, Hørsholm, Denmark.
Thoma, S.G., Gallepgos, D.P., Smith, D.M., 1992. Impact of
fracture coatings on fracture/matrix flow interactions in
unsaturated porous media. Water Resources Research 28,
1357–1367.
Thorsen, M., Jørgensen, P.R., Felding, G., Jacobsen, O.H.,
Spliid, N.H., Refsgaard, J.C., 1998. Evaluation of a
stepwise procedure for comparative validation of pesticide
leaching models. Journal of Environmental Quality 27(5),
1183–1193.
Thorsen, M., Hansen, S., Refsgaard, J.C., 2000. Modelling of
pesticide leaching to groundwater—potential, limitations and
data base, Miljøforskning, The Strategic Environmental
Research Programme, Arhus, Denmark, (in Danish).
US Environmental Protection Agency, 1990. Protection Agency
National survey of pesticides in drinking water wells, Phase I
Report. USEPA, Washington, DC.
US Environmental Protection Agency, 1992, 1992. Protection
Agency National survey of pesticides in drinking water wells,
Phase II Report. USEPA, Washington, DC.
Villholth, K., Jensen, K.H., 1998. Flow and transport processes in a
macroporous subsurface-drained glacial till soil. II: Model
analysis. Journal of Hydrology 207, 121–135.
Villholth, K., Jensen, K.H., Fredericia, J., 1998. Flow and transport
processes in a macroporous subsurface-drained glacial till soil.
I: Field investigations. Journal of Hydrology 207, 98–120.
Vinther, F.P., Eiland, F., Lind, A.-M., Elsgaard, L., 1999. Microbial
biomass and numbers of denitrifies related to macropore
channels in agricultural and forest soils. Soil Biology and
Biochemistry 31, 603–611.
Wosten, J.H.M., Lilly, A., Nems, A., Le Bas, C., 1998. Using
existing soil data to derive hydraulic parameters for simulation
models in environmental studies and in land use planning. Final
Report on the European Union funded project, DLO Winand
Staring Centre, The Netherlands. Report 156, pp. 106.
J.S. Christiansen et al. / Journal of Hydrology 299 (2004) 136–158158
Related Documents